Rakhine State
Department of Population
Ministry of Immigration and Population
May 2015
Census Report Volume 3 – K
THE REPUBLIC OF THE UNION OF MYANMAR
The 2014 Myanmar Population and Housing Census
The 2014 Myanmar Population and Housing Census
Rakhine State Report
Census Report Volume 3 – K
For more information contact:
Department of Population
Ministry of Immigration and Population
Office No. 48
Nay Pyi Taw
Tel: +95 67 431 062
www.dop.gov.mm
May, 2015
Census Report Volume 3–K (Rakhine)
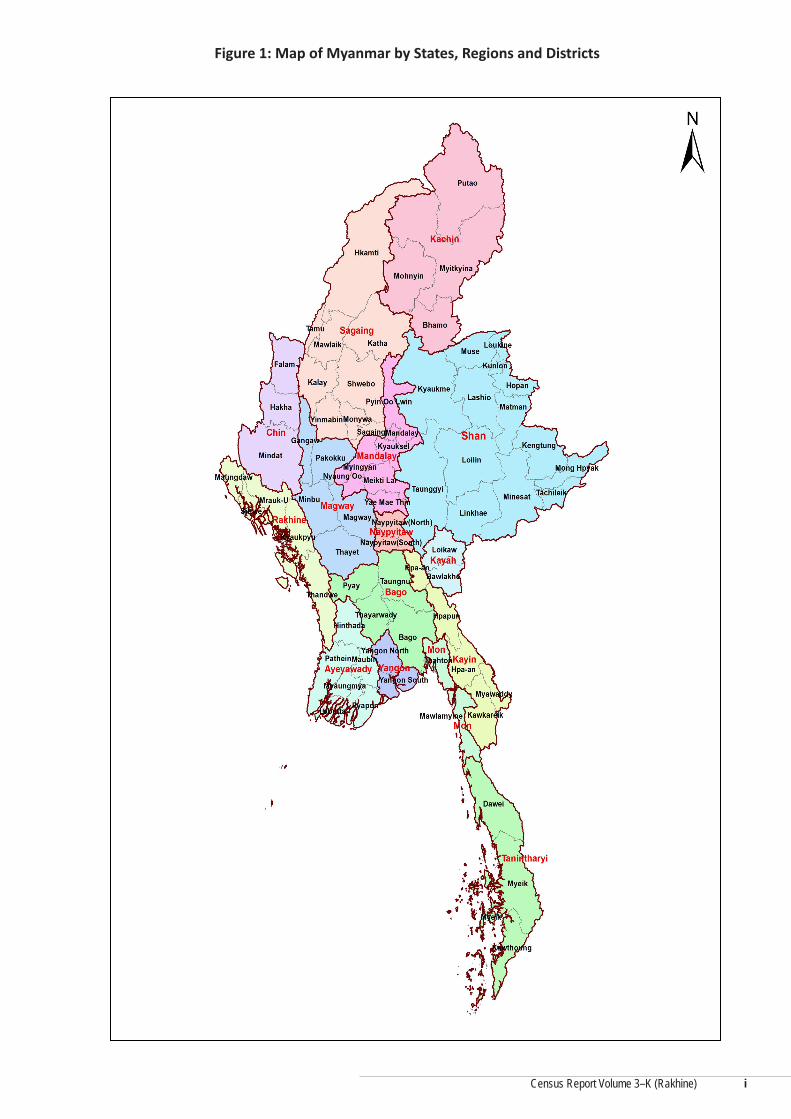
Figure 1: Map of Myanmar by States, Regions and Districts
i
Census Report Volume 3–K (Rakhine)
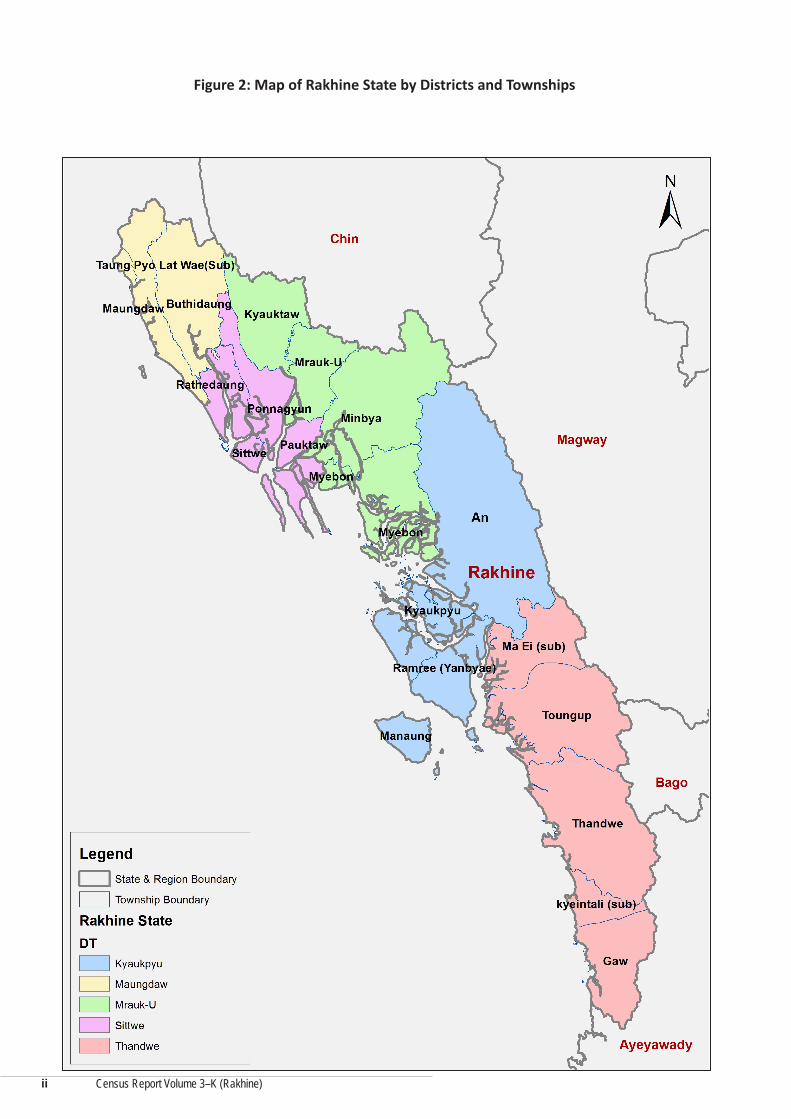
Figure 2: Map of Rakhine State by Districts and Townships
ii
Census Report Volume 3–K (Rakhine)
Foreword
The 2014 Myanmar Population and Housing Census (2014 MPHC) was conducted from 29th March to 10th April 2014 on a de facto basis. The successful planning and implementation of the census activities, followed by the timely release of the provisional results in August 2014, and now the main results in May 2015, is a clear testimony of the Government’s resolve to publish all information collected from respondents in accordance with the Population and Housing Census Law No. 19 of 2013. It is now my hope that the main results, both Union and each of the State and Region reports, will be interpreted correctly and will effectively inform the planning and decision-making processes in our quest for national and sub-national development.
The census structures put in place, including the Central Census Commission, Census Committees and officers at the State/Region, District and Township Levels, and the International Technical Advisory Board (ITAB), a group of 15 experts from different countries and institutions involved in censuses and statistics internationally, provided the requisite administrative and technical inputs for the implementation of the census. The technical support and our strong desire to follow international standards affirmed our commitment to strict adherence to the guidelines and recommendations, which form part of international best practices for census taking.
This Main Census Report – Rakhine State Report (Census Report Volume 3-K) is one of the 15 publications which fall under the third series of census reports to be released from the 2014 MPHC. It contains detailed information for Rakhine State on demographic and socio-economic characteristics of the population and households at the State/Region, District and Township level. The Union information is presented in Census Volume 2, while data for the 15 States and Regions are in their respective reports, all under Census Volume 3. The initial analysis indicates that generally the 2014 MPHC data are complete and accurate at the Union level. However, census enumeration did not cover some population groups in the northern parts of Rakhine State and in a few areas of Kachin State. In parts of Hpa Pun Township in Kayin State, only the total number of households and population by sex were submitted to the Census Office. This non-enumeration affected the Union report and the reports of the three respective States, in particular Rakhine State. The Government, with support from UNFPA, minimised the impact of these incidences as much as possible and estimated the population missed in these areas. The estimates and the methodology used for estimation of the population not counted in Rakhine State are provided in section 1.3 of this report.
On behalf of the Government, I express our gratitude to UNFPA and the development partners, namely Australia, Finland, Germany, Italy, Norway, Sweden, Switzerland, the United Kingdom and the United States of America, for their generous contributions. Their financial, technical and logistical support was critical to the success of our census. They provided useful advice and contributed immensely to various activities, including technical assistance, equipment and materials, printing of questionnaires, training of trainers and enumerators/supervisors, publicity materials and scanning of questionnaires, amongst other activities.
We are greatly indebted to the President of the Republic of the Union of Myanmar, H.E. U Thein Sein, and the Patron of the Central Census Commission, the Vice President of the Republic of the Union of Myanmar, H.E. Dr. Sai Mauk Kham, for their valuable guidance in the census process. Also to be acknowledged are the Chief Ministers in each State and Region who steered the census operations in their areas together with State/Region Directors of Immigration and National Registration, and members
iii
Census Report Volume 3–K (Rakhine)
of the Central Census Commission and Census Committees at every administrative level who worked tirelessly to support the census process. Our gratitude also goes to the technical teams at the Department of Population and UNFPA who worked around the clock to ensure that the census was implemented according to the planned timeline, and that all the reports and guidelines were produced and delivered on time. Special appreciation goes to the enumerators, supervisors and trainers who were mainly from the various ministries and other institutions.
Finally, I would like to thank all Myanmar people for their cooperation during the enumeration in particular, and support to the census process in general. I would like to reiterate our promise that the census records are strictly confidential and are being handled with the utmost care, and that they will be used for purposes of statistical compilation only.
H.E. U Khin Yi,
Minister of Immigration and Population
The Republic of the Union of Myanmar
iv
Census Report Volume 3–K (Rakhine) v
Table of Contents
Foreword .................................................................................................................................................................iiiList of Statistical Tables ............................................................................................................................................viList of Figures .........................................................................................................................................................viiiList of Acronyms and Abbreviations .......................................................................................................................ixRakhine State Figures at a Glance ...........................................................................................................................11. Introduction ................................................................................................................................................51.1. Preamble .....................................................................................................................................................51.2. The 2014 Population and Housing Census ................................................................................................51.2.1. The Management and Planning .................................................................................................................51.2.2. Enumeration Area Mapping .......................................................................................................................61.2.3. Development of Questionnaires and Manuals .........................................................................................61.2.4. Recruitment and Training ...........................................................................................................................61.2.5. Census Enumeration ...................................................................................................................................71.2.6. Data Processing ...........................................................................................................................................71.2.7. Independent Observation Mission ............................................................................................................71.2.8. Provisional Results ......................................................................................................................................81.3. Estimation of the population not counted in Rakhine State .....................................................................81.4. Quality Assurances to improve data quality ..............................................................................................92. Summary of the Main Results ..................................................................................................................112.1. Population of Myanmar and Rakhine State .............................................................................................112.2. Size and Change of Population in Rakhine State .....................................................................................122.3. Population Density ...................................................................................................................................122.4. Population by Urban and Rural area ........................................................................................................132.5. Population by Sex .....................................................................................................................................132.6. Population Age-sex Pyramid for Rakhine State ......................................................................................132.7. Births and Childhood Deaths ....................................................................................................................143. Statistical Tables ........................................................................................................................................15Annex 1: Questionnaire .......................................................................................................................................155Annex 2: Definitions and Concepts .....................................................................................................................160References ............................................................................................................................................................165
Census Report Volume 3–K (Rakhine)
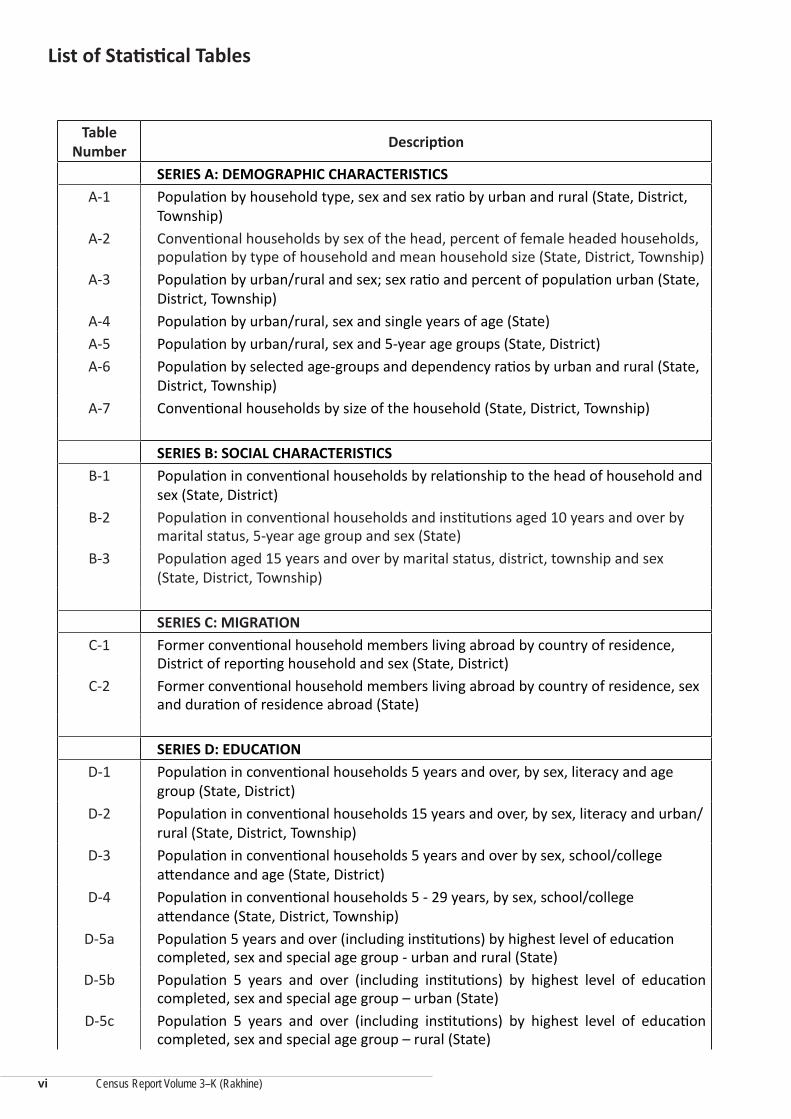
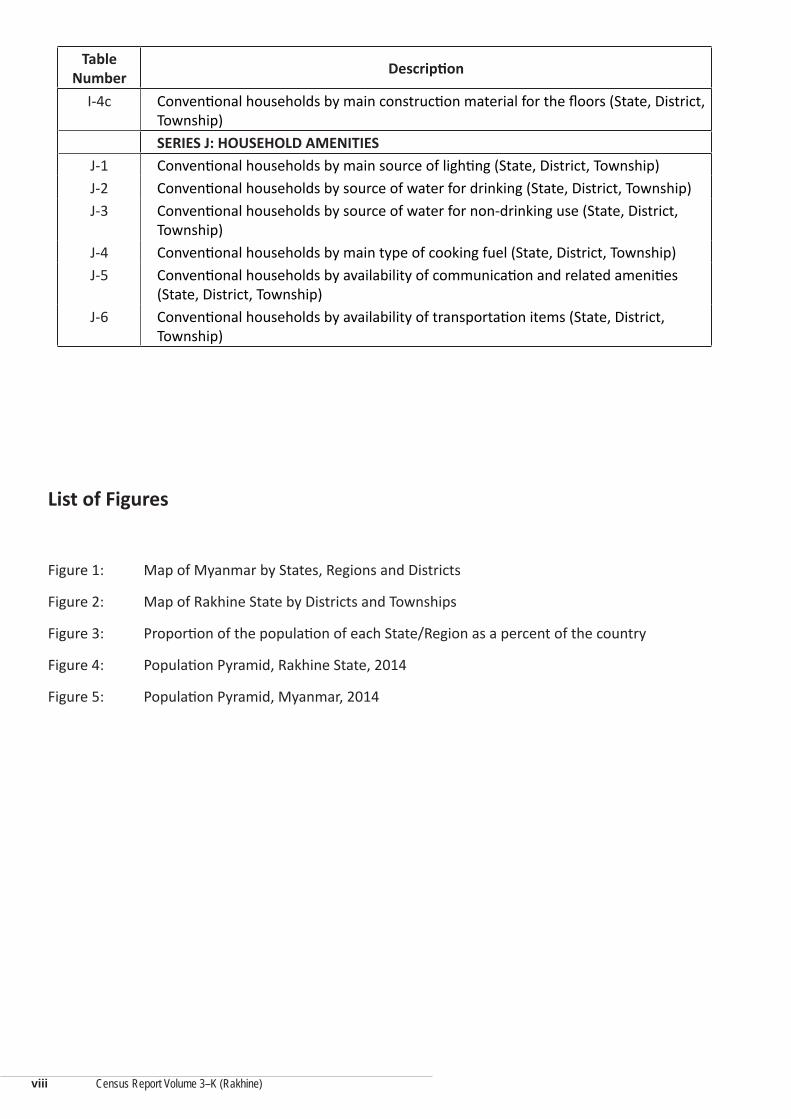
List of Statistical Tables
Table Number Description
SERIES A: DEMOGRAPHIC CHARACTERISTICSA-1 Population by household type, sex and sex ratio by urban and rural (State, District,
Township)A-2 Conventional households by sex of the head, percent of female headed households,
population by type of household and mean household size (State, District, Township)A-3 Population by urban/rural and sex; sex ratio and percent of population urban (State,
District, Township)A-4 Population by urban/rural, sex and single years of age (State)A-5 Population by urban/rural, sex and 5-year age groups (State, District)A-6 Population by selected age-groups and dependency ratios by urban and rural (State,
District, Township)A-7 Conventional households by size of the household (State, District, Township)
SERIES B: SOCIAL CHARACTERISTICSB-1 Population in conventional households by relationship to the head of household and
sex (State, District)B-2 Population in conventional households and institutions aged 10 years and over by
marital status, 5-year age group and sex (State)B-3 Population aged 15 years and over by marital status, district, township and sex
(State, District, Township)
SERIES C: MIGRATIONC-1 Former conventional household members living abroad by country of residence,
District of reporting household and sex (State, District)C-2 Former conventional household members living abroad by country of residence, sex
and duration of residence abroad (State)
SERIES D: EDUCATIOND-1 Population in conventional households 5 years and over, by sex, literacy and age
group (State, District)D-2 Population in conventional households 15 years and over, by sex, literacy and urban/
rural (State, District, Township)D-3 Population in conventional households 5 years and over by sex, school/college
attendance and age (State, District)D-4 Population in conventional households 5 - 29 years, by sex, school/college
attendance (State, District, Township)D-5a Population 5 years and over (including institutions) by highest level of education
completed, sex and special age group - urban and rural (State)D-5b Population 5 years and over (including institutions) by highest level of education
completed, sex and special age group – urban (State)D-5c Population 5 years and over (including institutions) by highest level of education
completed, sex and special age group – rural (State)
vi
Census Report Volume 3–K (Rakhine)
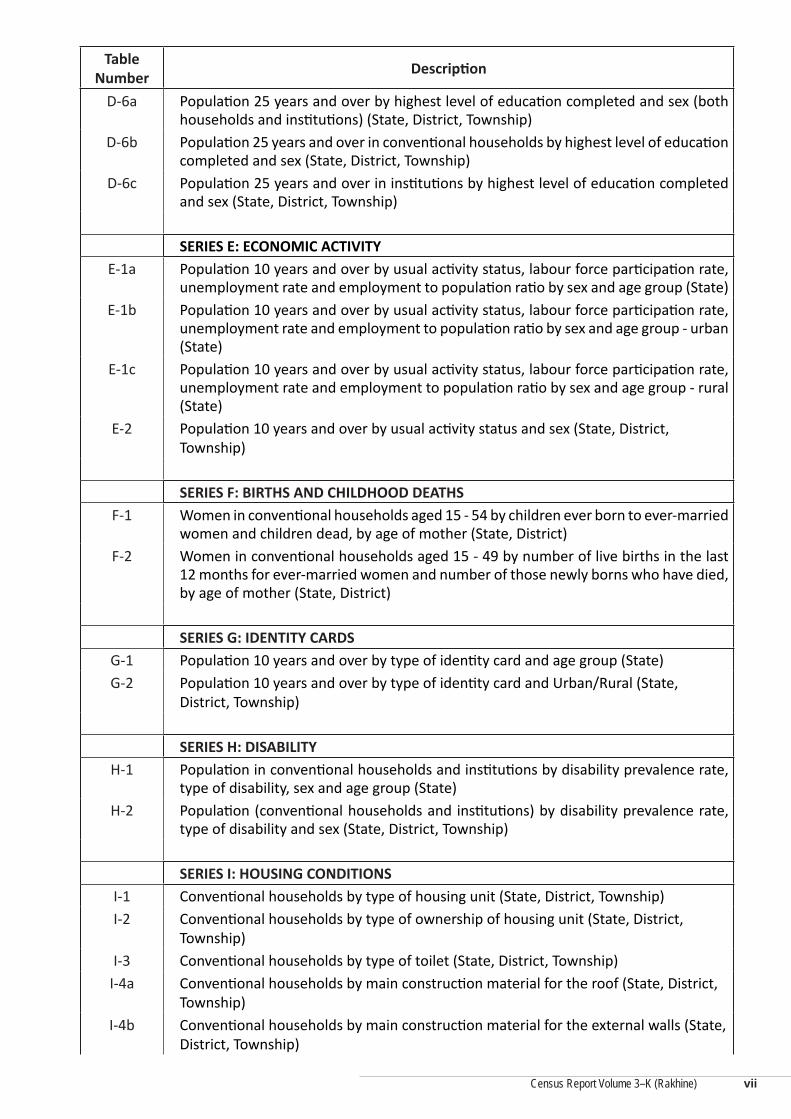
Table Number Description
D-6a Population 25 years and over by highest level of education completed and sex (both households and institutions) (State, District, Township)
D-6b Population 25 years and over in conventional households by highest level of education completed and sex (State, District, Township)
D-6c Population 25 years and over in institutions by highest level of education completed and sex (State, District, Township)
SERIES E: ECONOMIC ACTIVITYE-1a Population 10 years and over by usual activity status, labour force participation rate,
unemployment rate and employment to population ratio by sex and age group (State)E-1b Population 10 years and over by usual activity status, labour force participation rate,
unemployment rate and employment to population ratio by sex and age group - urban (State)
E-1c Population 10 years and over by usual activity status, labour force participation rate, unemployment rate and employment to population ratio by sex and age group - rural (State)
E-2 Population 10 years and over by usual activity status and sex (State, District, Township)
SERIES F: BIRTHS AND CHILDHOOD DEATHSF-1 Women in conventional households aged 15 - 54 by children ever born to ever-married
women and children dead, by age of mother (State, District)F-2 Women in conventional households aged 15 - 49 by number of live births in the last
12 months for ever-married women and number of those newly borns who have died, by age of mother (State, District)
SERIES G: IDENTITY CARDSG-1 Population 10 years and over by type of identity card and age group (State)G-2 Population 10 years and over by type of identity card and Urban/Rural (State,
District, Township)
SERIES H: DISABILITYH-1 Population in conventional households and institutions by disability prevalence rate,
type of disability, sex and age group (State)H-2 Population (conventional households and institutions) by disability prevalence rate,
type of disability and sex (State, District, Township)
SERIES I: HOUSING CONDITIONSI-1 Conventional households by type of housing unit (State, District, Township)I-2 Conventional households by type of ownership of housing unit (State, District,
Township)I-3 Conventional households by type of toilet (State, District, Township)
I-4a Conventional households by main construction material for the roof (State, District, Township)
I-4b Conventional households by main construction material for the external walls (State, District, Township)
vii
Census Report Volume 3–K (Rakhine)
Table Number Description
I-4c Conventional households by main construction material for the floors (State, District, Township)SERIES J: HOUSEHOLD AMENITIES
J-1 Conventional households by main source of lighting (State, District, Township)J-2 Conventional households by source of water for drinking (State, District, Township)J-3 Conventional households by source of water for non-drinking use (State, District,
Township)J-4 Conventional households by main type of cooking fuel (State, District, Township)J-5 Conventional households by availability of communication and related amenities
(State, District, Township)J-6 Conventional households by availability of transportation items (State, District,
Township)
viii
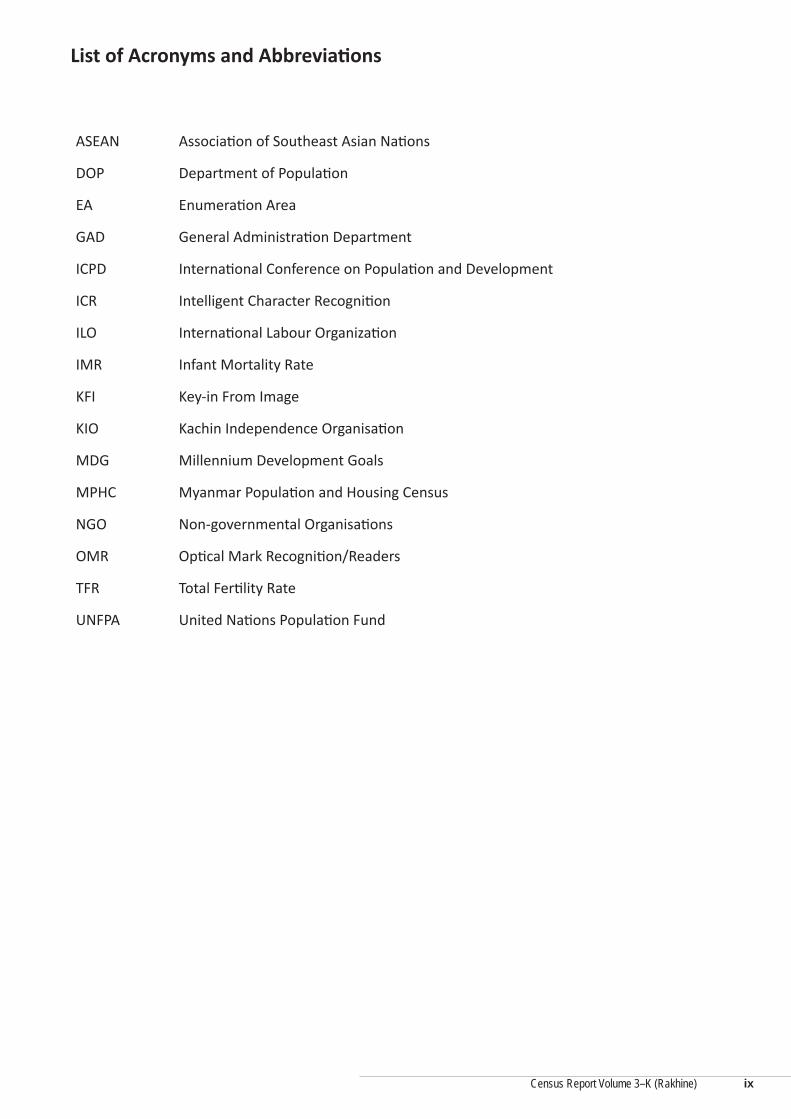
List of Figures
Figure 1: Map of Myanmar by States, Regions and Districts
Figure 2: Map of Rakhine State by Districts and Townships
Figure 3: Proportion of the population of each State/Region as a percent of the country
Figure 4: Population Pyramid, Rakhine State, 2014
Figure 5: Population Pyramid, Myanmar, 2014
Census Report Volume 3–K (Rakhine)
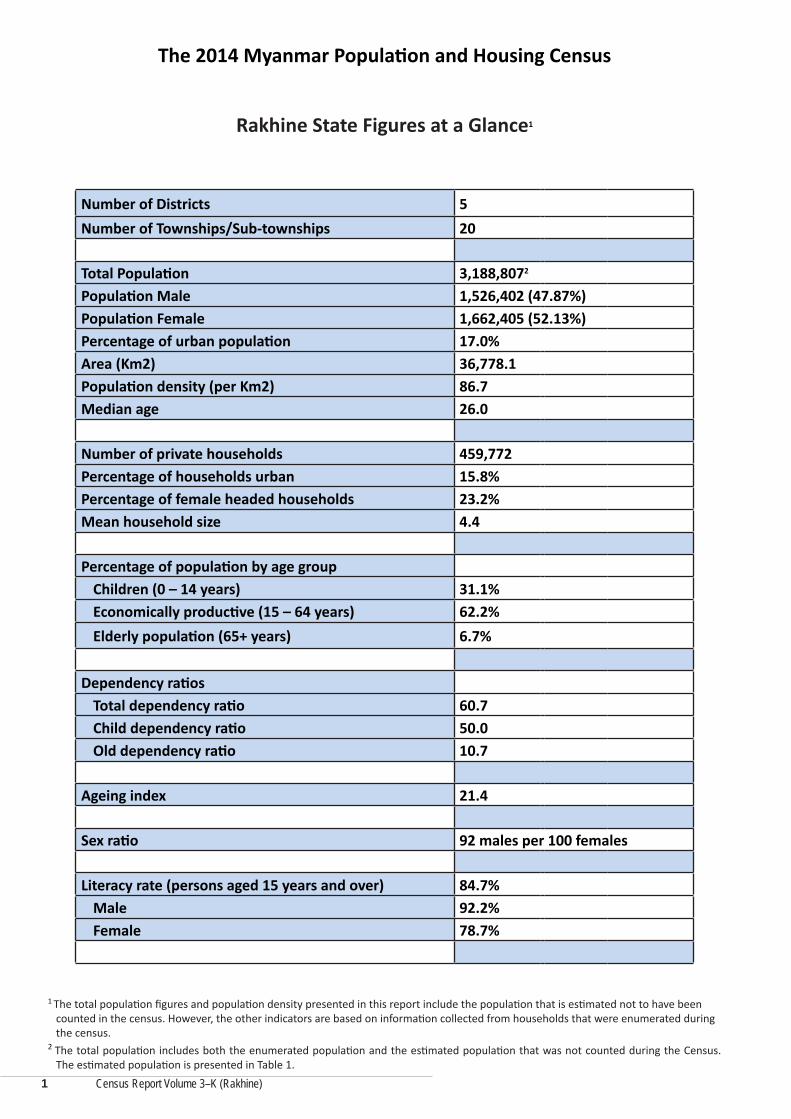
List of Acronyms and Abbreviations
ASEAN Association of Southeast Asian Nations
DOP Department of Population
EA Enumeration Area
GAD General Administration Department
ICPD International Conference on Population and Development
ICR Intelligent Character Recognition
ILO International Labour Organization
IMR Infant Mortality Rate
KFI Key-in From Image
KIO Kachin Independence Organisation
MDG Millennium Development Goals
MPHC Myanmar Population and Housing Census
NGO Non-governmental Organisations
OMR Optical Mark Recognition/Readers
TFR Total Fertility Rate
UNFPA United Nations Population Fund
ix
Census Report Volume 3–K (Rakhine)
The 2014 Myanmar Population and Housing Census
Rakhine State Figures at a Glance1
Number of Districts 5Number of Townships/Sub-townships 20
Total Population 3,188,8072
Population Male 1,526,402 (47.87%)Population Female 1,662,405 (52.13%)Percentage of urban population 17.0%Area (Km2) 36,778.1Population density (per Km2) 86.7Median age 26.0
Number of private households 459,772Percentage of households urban 15.8%Percentage of female headed households 23.2%Mean household size 4.4
Percentage of population by age groupChildren (0 – 14 years) 31.1%Economically productive (15 – 64 years) 62.2%Elderly population (65+ years) 6.7%
Dependency ratiosTotal dependency ratio 60.7Child dependency ratio 50.0Old dependency ratio 10.7
Ageing index 21.4
Sex ratio 92 males per 100 females
Literacy rate (persons aged 15 years and over) 84.7% Male 92.2%Female 78.7%
1
1 The total population figures and population density presented in this report include the population that is estimated not to have been counted in the census. However, the other indicators are based on information collected from households that were enumerated during the census. 2 The total population includes both the enumerated population and the estimated population that was not counted during the Census. The estimated population is presented in Table 1.
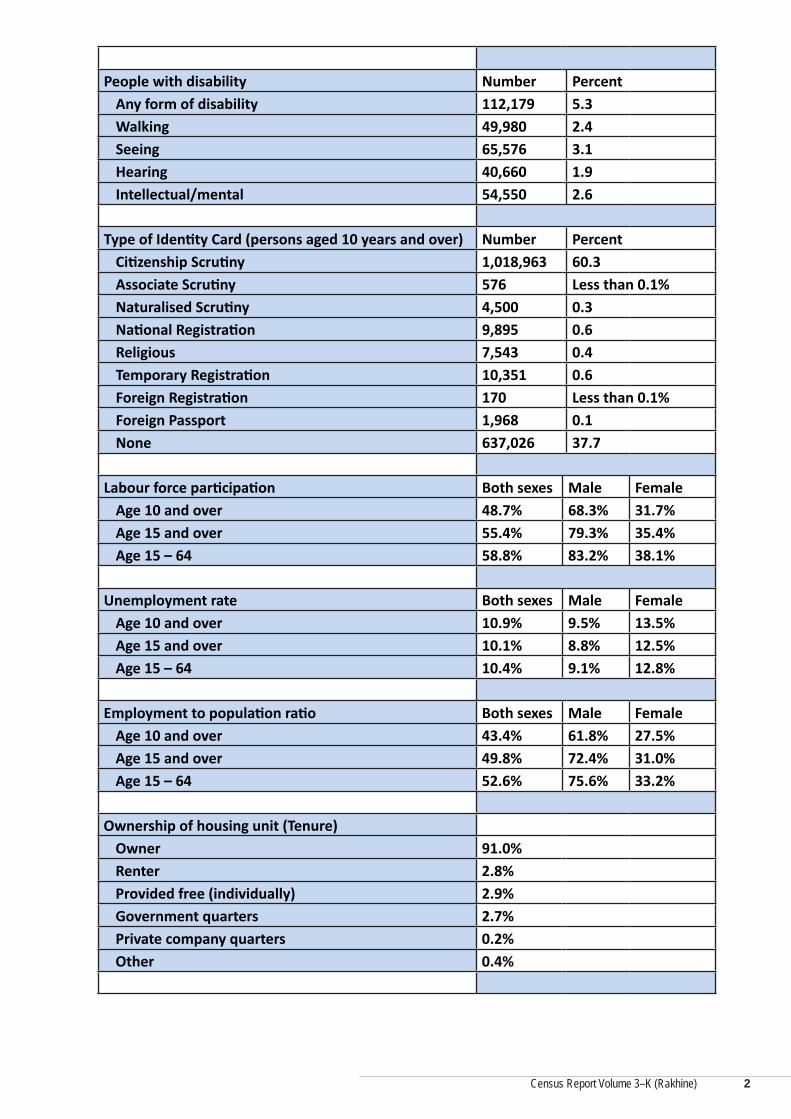
Census Report Volume 3–K (Rakhine)
People with disability Number PercentAny form of disability 112,179 5.3Walking 49,980 2.4Seeing 65,576 3.1Hearing 40,660 1.9Intellectual/mental 54,550 2.6
Type of Identity Card (persons aged 10 years and over) Number PercentCitizenship Scrutiny 1,018,963 60.3Associate Scrutiny 576 Less than 0.1%Naturalised Scrutiny 4,500 0.3National Registration 9,895 0.6Religious 7,543 0.4Temporary Registration 10,351 0.6Foreign Registration 170 Less than 0.1%Foreign Passport 1,968 0.1None 637,026 37.7
Labour force participation Both sexes Male Female Age 10 and over 48.7% 68.3% 31.7%Age 15 and over 55.4% 79.3% 35.4%Age 15 – 64 58.8% 83.2% 38.1%
Unemployment rate Both sexes Male Female Age 10 and over 10.9% 9.5% 13.5%Age 15 and over 10.1% 8.8% 12.5%Age 15 – 64 10.4% 9.1% 12.8%
Employment to population ratio Both sexes Male Female Age 10 and over 43.4% 61.8% 27.5%Age 15 and over 49.8% 72.4% 31.0%Age 15 – 64 52.6% 75.6% 33.2%
Ownership of housing unit (Tenure)Owner 91.0%Renter 2.8%Provided free (individually) 2.9%Government quarters 2.7%Private company quarters 0.2%Other 0.4%
2
Census Report Volume 3–K (Rakhine)
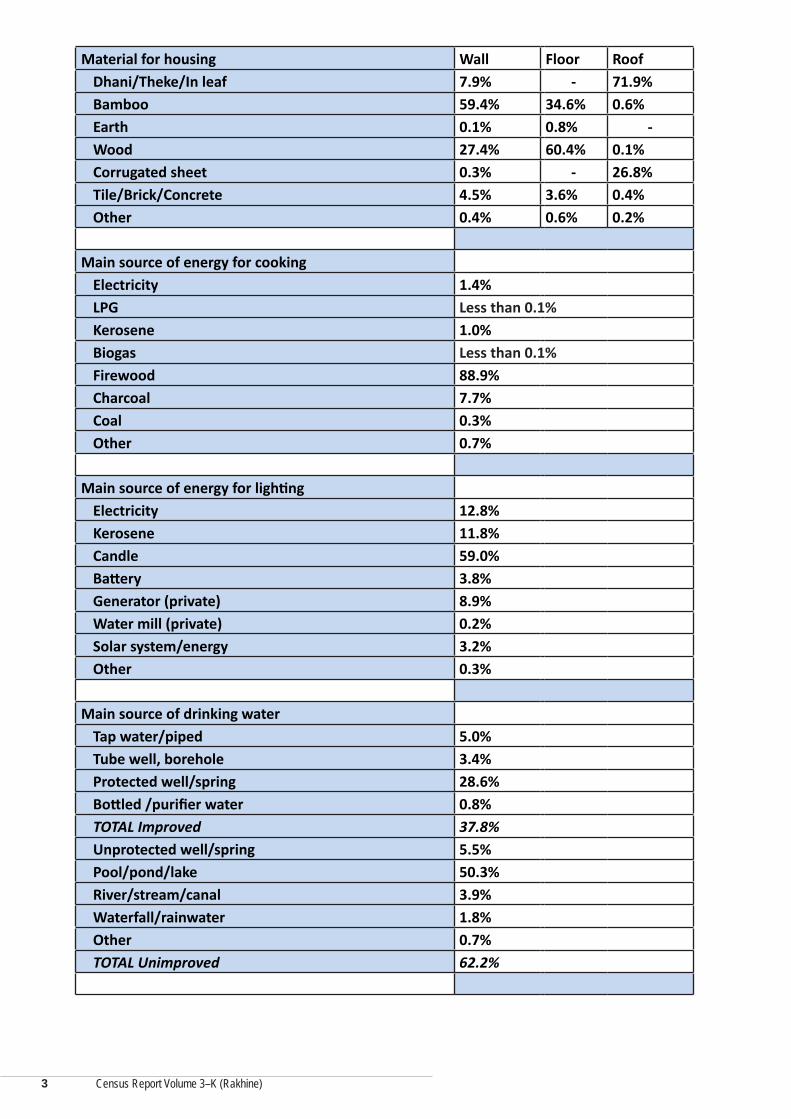
Material for housing Wall Floor RoofDhani/Theke/In leaf 7.9% - 71.9%Bamboo 59.4% 34.6% 0.6%Earth 0.1% 0.8% -Wood 27.4% 60.4% 0.1%Corrugated sheet 0.3% - 26.8%Tile/Brick/Concrete 4.5% 3.6% 0.4%Other 0.4% 0.6% 0.2%
Main source of energy for cookingElectricity 1.4%LPG Less than 0.1%Kerosene 1.0%Biogas Less than 0.1%Firewood 88.9%Charcoal 7.7%Coal 0.3%Other 0.7%
Main source of energy for lightingElectricity 12.8%Kerosene 11.8%Candle 59.0%Battery 3.8%Generator (private) 8.9%Water mill (private) 0.2%Solar system/energy 3.2%Other 0.3%
Main source of drinking waterTap water/piped 5.0%Tube well, borehole 3.4%Protected well/spring 28.6%Bottled /purifier water 0.8%TOTAL Improved 37.8%Unprotected well/spring 5.5%Pool/pond/lake 50.3%River/stream/canal 3.9%Waterfall/rainwater 1.8%Other 0.7%TOTAL Unimproved 62.2%
3
Census Report Volume 3–K (Rakhine)
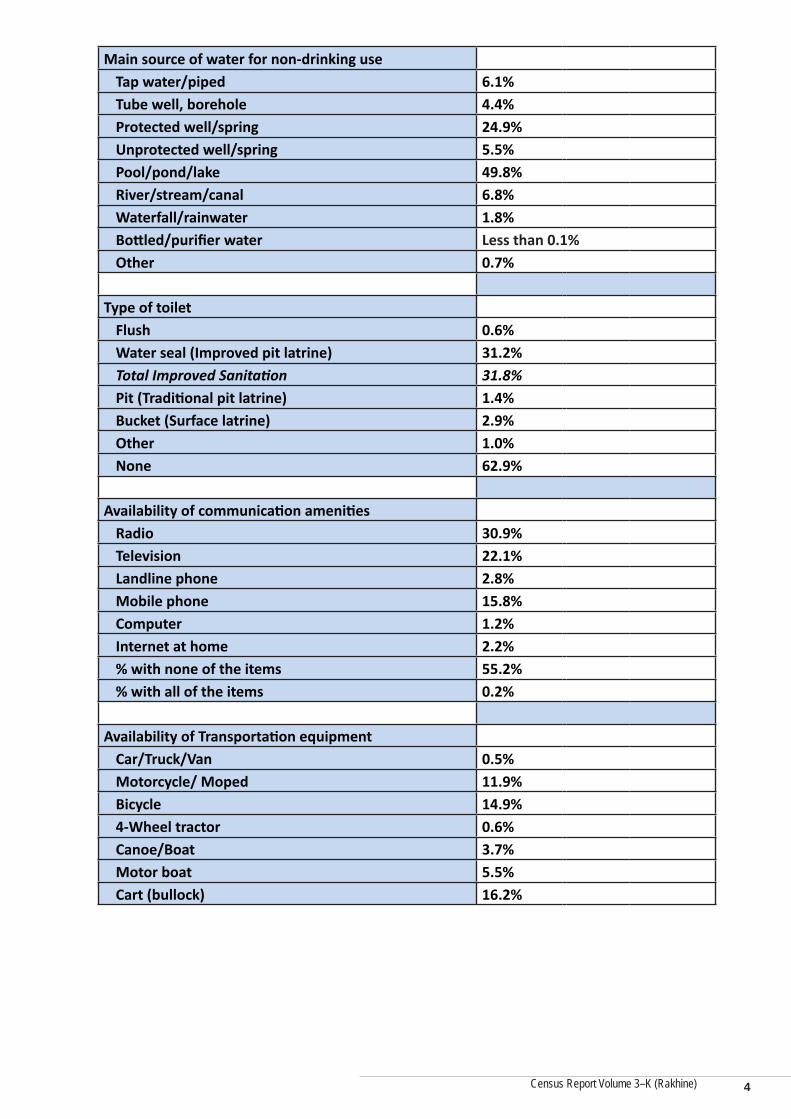
Main source of water for non-drinking useTap water/piped 6.1%Tube well, borehole 4.4%Protected well/spring 24.9%Unprotected well/spring 5.5%Pool/pond/lake 49.8%River/stream/canal 6.8%Waterfall/rainwater 1.8%Bottled/purifier water Less than 0.1%Other 0.7%
Type of toiletFlush 0.6%Water seal (Improved pit latrine) 31.2%Total Improved Sanitation 31.8%Pit (Traditional pit latrine) 1.4%Bucket (Surface latrine) 2.9%Other 1.0% None 62.9%
Availability of communication amenitiesRadio 30.9%Television 22.1%Landline phone 2.8%Mobile phone 15.8%Computer 1.2%Internet at home 2.2%% with none of the items 55.2%% with all of the items 0.2%
Availability of Transportation equipmentCar/Truck/Van 0.5%Motorcycle/ Moped 11.9%Bicycle 14.9%4-Wheel tractor 0.6%Canoe/Boat 3.7%Motor boat 5.5%Cart (bullock) 16.2%
4
Census Report Volume 3–K (Rakhine)
1. Introduction
1.1. Preamble
In April 2014, the Government of the Republic of the Union of Myanmar conducted its latest census after more than three decades without a Population and Housing Census. Population censuses were regularly conducted in Myanmar during the colonial era. In the post-independence period, comprehensive population and housing censuses were successfully undertaken in 1973, 1983 and most recently in April 2014. Despite the absence of censuses, several household based surveys such as Fertility and Reproductive Health Surveys, Family and Youth Surveys, Population Changes and Fertility Surveys, among others have regularly been carried out to guide programming and policy development in the country.
Censuses are an important source of benchmark information on the characteristics of the population and households in every country. One unique feature of a census is its ability to provide information down to the lowest administrative level. Such information is vital for planning and evidence based decision-making at every level. Additional data uses include allocation of national resources; the review of administrative boundaries; the positioning of social infrastructures such as schools, health facilities, and roads; and research. In addition, a census provides a rich source of data for monitoring national and international development initiatives, including national development plans, the Millennium Development Goals (MDG), and the International Conference on Population and Development (ICPD). This meant it was imperative for Myanmar to conduct the 2014 Population and Housing Census (2014 MPHC).
The 2014 MPHC results are being released in three phases comprising several publications. Phase one was the publishing and launch of the provisional results (Census Volume 1) in August 2014. Phase two is the publishing and launch of the main results in May 2015, comprising two series of publications: Census Volume 2, which contains detailed information at the Union and State/Region levels, and Census Volume 3, which includes a report for each of the 15 States and Regions in Myanmar. The publication of main census results that require manual coding and further consultations is planned for early 2016. Phase three of the publications will be the thematic analysis reports on the numerous themes covered in the census.
The present report is one of the 15 State and Region specific reports of the Census Volume 3 publications. This report contains the main results for Rakhine State.
The definitions of terms and concepts used in this publication and in the census process are contained in the Glossary of Annex 2.
1.2. The 2014 Population and Housing Census
1.2.1. The Management and Planning
The Department of Population (DoP) in the Ministry of Immigration and Population is responsible for the management, planning and implementation of the 2014 MPHC. The Population and Housing Census Law No. 19 of 2013 mandated DoP to collect information during censuses from every person, household and/or establishment. Through the Law, census committees and offices were created to facilitate the successful implementation of the planned census activities at every administrative level in the country. At the State and Region level the Chief Minister, as chairperson of the State/Region Census Committee, was responsible for the implementation of all census activities.
Planning for the census started in 2011 with assessments of the main components of the entire census taking process. Assessments were undertaken in mapping, data processing, risks associated with census taking, resource requirements, questionnaire development, communication publicity and advocacy, and
5
Census Report Volume 3–K (Rakhine)
lastly, analysis, publication and dissemination of results. These assessments were used to compile the Census Project Document, which guided the implementation of the entire census process.
1.2.2. Enumeration Area Mapping
The process of preparing census enumeration area (EA) maps3 began in June 2012. Township Immigration Officers who prepared the maps were trained on the objectives of the census, the roles of maps in the census process, concepts of sketching maps at Township and ward/village tract levels, and plotting new landmark features on the maps. After concatenating all the topographical sheets that make up the entire country, maps of each of the 330 Townships were printed and distributed to the respective Township Immigration field offices. The Township Immigration Officers then collected information on the total number of households and the population of institutions in each ward and village tract. The information was used to delineate enumeration areas where each enumerator was to be assigned. Maps were drawn for over 16,000 village tracts and wards. In total, 81,750 enumeration areas were identified, covering almost the entire country. In a few areas in Shan, Kachin and Kayin States, it was not possible to prepare maps using this methodology; instead sketch maps were prepared using satellite imagery.
1.2.3. Development of Questionnaires and Manuals
The development of census questionnaires and field instruction manuals started in July 2012. The process took into account data needs in the country based on consultations with data users, the Principles and Recommendations of the 2010 Round of Population and Housing Censuses, and past experiences of censuses in Myanmar and the ASEAN region.
A household questionnaire was designed to ascertain the number of persons in conventional households on 29th March 2014 (Census Night) and to collect demographic, social and economic data. Questions on housing conditions and amenities were also included in the questionnaire. Questions on former household members living outside Myanmar and household members who had died during the 12 months before Census Night were also included. In total, the questionnaire contained 41 questions (Annex 1).
An institution questionnaire containing 11 questions, which were selected from the household questionnaire, was used to collect data on persons in institutions such as hospitals, hotels, prisons, monasteries and boarding schools, as well as the floating population, which included out-door sleepers and those who were at the sea-ports on Census Night.
1.2.4. Recruitment and Training
Almost all field census personnel were teachers, recruited by the Ministry of Education and Township Census Committees. The assignment of enumerators to the areas where they were to collect data was mostly based on the ability to speak the local language and familiarity with local communities.
Training of field personnel was cascaded into four levels. A team of experts in census and survey implementation was drawn from UNFPA, the Australia Bureau of Statistics, the Registrar and Census Commissioner’s Office in India, DRS Ltd, the Department of Population (DoP) and the Department of Social Welfare. The team reviewed the training materials and developed a comprehensive training programme. The team trained core trainers, who were primarily from the Ministry of Immigration and Population and the DoP. The core trainers trained the master trainers who were mainly from universities and other government departments. The master trainers then conducted similar trainings for a team of carefully selected District trainers. These were senior teachers at the State/Region and District levels. The District trainers then proceeded to train Supervisors and Enumerators at each Township headquarters.
6
3 An enumeration area map was drawn down to the ward level in urban areas and to the village tract level in rural areas to guide census enumeration. An EA map shows clear boundaries of the area to be covered by one enumerator. It had the positions of all structures, households and their positions.
Census Report Volume 3–K (Rakhine)
All cadres of personnel were trained for five days. For Supervisors an additional day was added to take them through their roles, field operations, re-interviews, checking for errors in completed questionnaires, and communication and management skills.
1.2.5. Census Enumeration
The enumerators and supervisors reported to their respective EAs at least two days before the start of the census. The days before the start of the enumeration were used to identify enumeration area boundaries, check structures and households within each EA, and update information on EA maps and structure listing forms in instances where this was necessary.
The census enumeration aimed to count all persons who were within the borders of Myanmar on the night of 29th March 2014 (Census Night). To achieve this, Township Census Officers, with support from the committees, made arrangements to ensure that the enumeration of the population in the three key institutions (hotels, hospitals and police/prison cells) was undertaken on Census Night. The enumeration of the population was satisfactorily completed in almost all States and Regions within the planned 12 days.
Enumeration started in the first week of March, earlier than the rest of the country, in three areas of Puta-O District (Kachin State), Mine Lar Township (Shan State) and Co Co Island (Yangon Region). This was due to a special request by community leaders because of harsh weather conditions, limited access to certain areas and transportation challenges. In Wa Self-Administered Division, the training of personnel was conducted earlier, but data collection took place at the same time as the rest of the country.
There were, however, challenges in conducting the enumeration in some parts of northern Rakhine State and in certain villages in Kachin State, controlled by the Kachin Independence Organisation (KIO). In addition, enumeration did not take place in a few village tracts of Hpa Pun Township in Kayin State.
1.2.6. Data Processing
Data processing is a crucial and integral part of post-enumeration census activities. Specifically, it involves data capture, coding, editing, and analysis. The 2014 MPHC took full advantage of advances in technological developments in the implementation of data processing. While a variety of methods are available for capturing data of population and housing censuses, DoP opted for the Optical Mark Reader/Intelligent Character Recognition/Key-in from Image (OMR/ICR/KFI) scanning technology after intensive evaluation.
Census questionnaires were specially designed to be scannable and easy to handle. Enumerators were intensively trained in recording the data correctly onto these questionnaires in order to ensure accuracy, thus enhancing the efficiency of the scanning system. This allowed the questionnaires to be processed more quickly and with fewer staff compared to what would have been required if other options had been used. The scanning system functioned well, and by early October 2014 all the estimated 11.5 million forms had been captured.
1.2.7. Independent Observation Mission
An independent team of international and national observers carried out an observation mission of the enumeration in all the States and Regions. The objectives of the observation mission were to: a) document the census process, particularly the way in which data were collected in selected Townships and Enumeration Areas; b) provide feedback to the Government during and after the enumeration; c) objectively assess the exercise against international standards and national legislation; and d) document lessons learned and good practices to improve the Government’s capacity to conduct future censuses.
7
Census Report Volume 3–K (Rakhine)
The observers visited all the 15 States/Regions of Myanmar, 41 Districts (55% of the total), 121 Townships (37% of the total) and 901 Enumeration Areas (1.1% of the total). They observed 2,193 interviews across the country. At the end of the census enumeration, a report was published with the findings from the observation mission. This is available at: http://countryoffice.unfpa.org/myanmar and http://www.dop.gov.mm/.
1.2.8. Provisional Results
The 2014 MPHC provisional results were published and launched on 30 August 2014 by the Minister of Immigration and Population. The report presented the size of the population by sex at Union, State/Region, and in a few cases at District and Township levels. The provisional results publications are available online at http://www.dop.gov.mm/ and http://countryoffice.unfpa.org/myanmar/?publications
1.3. Estimation of the population not counted in Rakhine State
In parts of Rakhine State, members of some communities were not counted because they were not allowed to self-identify using a name that is not recognised by the Government. The Government made this decision in the interest of security and to avoid the possibility of violence occuring due to inter-communal tensions.
A review of information on the enumeration in Rakhine State showed that not every household or population in the three Districts of Maungdaw, Sittway and Myauk U were covered. A comparison of the enumeration data with the numbers compiled during the census mapping process provided a more coherent picture of all households in the entire Rakhine State. During the mapping of census enumeration areas, Township Immigration Officers drew sketch maps of each village tract and ward. The maps included every structure observed on the ground during the mapping exercise.
For each structure, the information collected included the number of males and females who lived in each household. The information collected from the mapping/structure listing process was consistent with the enumerated population in areas where complete enumeration took place in Rakhine State and in all areas in the country. The mapping and structure listing data can, therefore, be relied upon to estimate the population that was not counted in Rakhine State. Analysis shows that about 31 percent of the mapped population of Rakhine State was not counted in the census. At the national level, a comparison between mapping and enumeration data shows that the census enumeration figure was higher by 4 percent when compared to the information obtained from the mapping. This is because of intensive efforts by the enumerators and community support groups to cover all households and people in each EA during the enumeration period. When this national level factor was applied to the mapping data for the affected areas in Rakhine State, it was estimated that a population of 1,090,000 was likely not to have been counted during the enumeration. This population was therefore added to the overall census population as reported in the provisional results and also the main results in the Union and State/Region reports.
8
Census Report Volume 3–K (Rakhine)
1.4. Quality Assurances to improve data quality4
The planning and implementation of the 2014 MPHC took into consideration a number of strategies and activities to ensure and improve the quality of the overall census process, particularly the quality of the data. These steps were to ensure that coverage was as complete as possible and that information given by the respondents, and transcribed by the field personnel, and the data captured at the Census Data Processing Centre was accurate. Some of the main strategies implemented included:
a) Conducting assessments for each component of the census process and considering the use of the outcomes to accurately implement the respective census phases. This ensured that the best options available were selected and implemented at every stage of census operations. Assessments were carried out in components highlighted in 1.2.1 of this report.
b) An International Technical Advisory Board (ITAB) was formed made up of renowned international experts on censuses. They critically reviewed each stage of the census implementation, providing ways of improving the quality of the process where appropriate, and in general giving valuable inputs at all stages. This review by such experienced international census experts ensured that correct methodologies and guidelines were adopted at each phase.
c) Preparation of census EA maps by demarcating the entire country into small areas down to the lowest administrative units (Village Tracts and Wards). This ensured the widest coverage possible and avoided cases of omission or double counting during enumeration. The EAs were also useful to determine the exact numbers of personnel and quantities of materials required in each geographic area.
d) Designing of the census questionnaires through field testing and consultative processes with government ministries/departments, development partners, universities and research institutions and other data users. In addition, United Nations guidelines and questionnaires in similar countries were referenced as much as possible. This ensured that the information collected from the census would be relevant to data users and conformed to international standards and guidelines.
e) Preparation of field instruction manuals and training guides for training trainers (master and District), supervisors and enumerators. These materials standardised the training and data collection procedures throughout the country. The training guides integrated participatory learning methodologies, including building the inter-personal communication skills of the enumerators to improve their capacity to communicate with respondents and build trust and confidence in the census process. Experts in training were sourced from Census Offices in Australia and India, as well as from UNFPA and DRS Ltd. They supported the training of core trainers who went to the States and Regions to cascade training to field staff.
f) Comprehensive pre-testing of the entire census processes and outcomes one year before the census; from mapping to data processing to tabulation of the results and to compilation of an evaluation report. The pilot census included testing the census methodology, data collection procedures and instruments, as well as evaluating risks that had been identified around certain aspects of the census. The results of the pilot census were used to improve and tighten up the schedule, timelines, process and management for the actual census. The pilot census also assessed the political risks that had been identified in the political risk analysis, the objective was to ascertain the possible effects such risks could have on the quality of data (in terms of the readiness of respondents to participate and respond to all questions).
g) Preparing a broad census advocacy campaign, using appropriate channels in order to accurately inform the public about the census and to solicit their support. The campaign included consultations with national leaders, ethnic leaders, religious leaders and civil society organisations. The publicity campaign also brought on board national celebrities and used other channels for communication such
9
4 United Nations defines dimensions of quality in censuses as: relevance, completeness, timeliness, coherence, comparability, accessibility and accuracy.
Census Report Volume 3–K (Rakhine)
as the media, town hall meetings and posters in all parts of the country. To enable people in all areas to understand census messages, publicity materials were translated into different ethnic languages.
h) Supervision and support by the Township Census Committee members and Community Support Groups in village tracts and wards to ensure all people were enumerated within their enumeration areas. The ratio of enumerators to supervisors was 4:1.
i) Before enumeration began, all census EA maps and structure listing forms were updated to ensure that new households, who had moved in to an area after the drawing of EA maps, were captured before the census. The process also ensured that enumerators could plan their work within the census period. Two days were allocated for the updating process before the start of the enumeration, which greatly increased census coverage rates.
j) Checking and verification of the completeness of coverage in every EA against the updated structure listing forms. This was done once the enumeration had been completed in every enumeration area and it was also completed at the village tract and ward level.
k) Ensuring that all completed questionnaires and summary forms for every EA were accounted for and safely returned to the Census Data Processing Centre.
l) Utilisation of the scanning technology for data capture, to minimise data operator errors and shorten the duration of the data capture process. This was to ensure timely release of results.
m) Preparation and sharing of the data release calendar with all data users. This ensured that data users were aware of what census results would be available at which point in time.
Based on the strategies and controls implemented during the census process, initial analysis of data shows that the 2014 MPHC produced credible and good quality data, and coverage was reputable at the Union and State/Region levels except in Rakhine State. The results presented in this report are based on the enumerated population only. The estimated 1,090,000 million people not enumerated in Rakhine State are only reflected in Table 1 and the sections on population size and population density.
10
Census Report Volume 3–K (Rakhine)
2. Summary of the Main Results
2.1. Population of Myanmar and Rakhine State
The 2014 MPHC shows that Myanmar had a total population of 51,486,253 persons as of 29 March 2014. Of these, 24,824,586 were males and 26,661,667 were females.
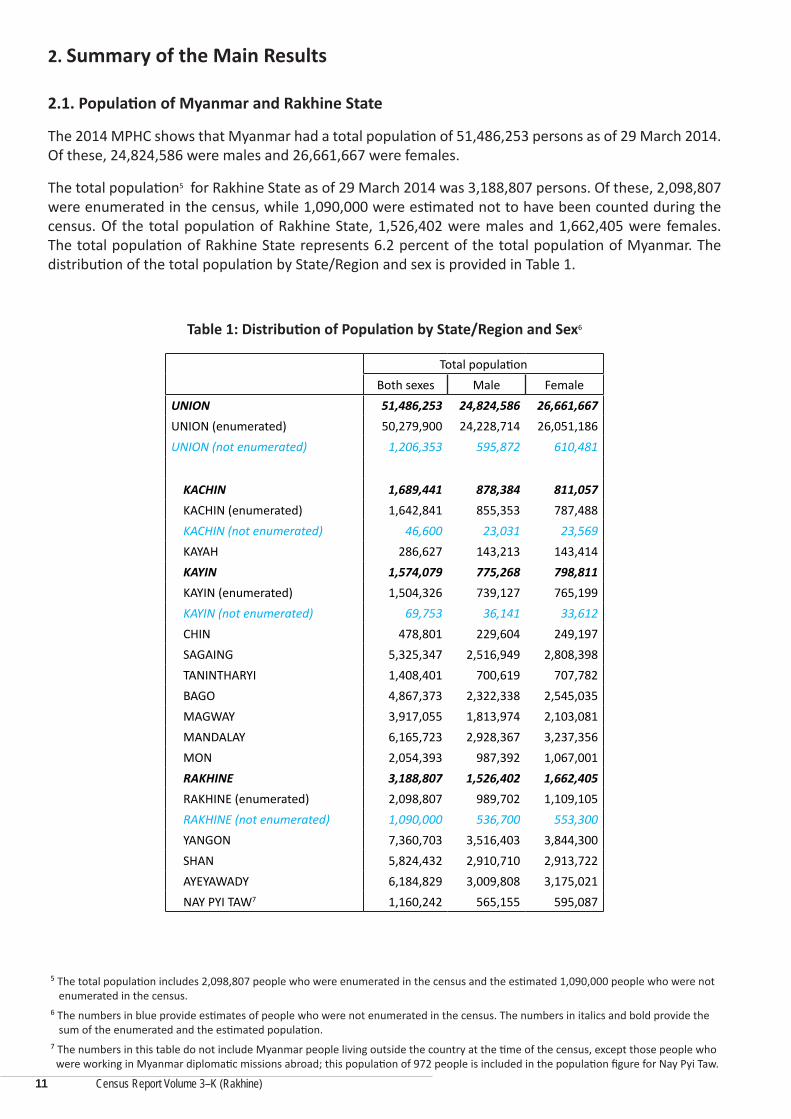
The total population5 for Rakhine State as of 29 March 2014 was 3,188,807 persons. Of these, 2,098,807 were enumerated in the census, while 1,090,000 were estimated not to have been counted during the census. Of the total population of Rakhine State, 1,526,402 were males and 1,662,405 were females. The total population of Rakhine State represents 6.2 percent of the total population of Myanmar. The distribution of the total population by State/Region and sex is provided in Table 1.
Table 1: Distribution of Population by State/Region and Sex6
Total populationBoth sexes Male Female
UNION 51,486,253 24,824,586 26,661,667UNION (enumerated) 50,279,900 24,228,714 26,051,186UNION (not enumerated) 1,206,353 595,872 610,481
KACHIN 1,689,441 878,384 811,057 KACHIN (enumerated) 1,642,841 855,353 787,488 KACHIN (not enumerated) 46,600 23,031 23,569 KAYAH 286,627 143,213 143,414 KAYIN 1,574,079 775,268 798,811 KAYIN (enumerated) 1,504,326 739,127 765,199 KAYIN (not enumerated) 69,753 36,141 33,612 CHIN 478,801 229,604 249,197 SAGAING 5,325,347 2,516,949 2,808,398 TANINTHARYI 1,408,401 700,619 707,782 BAGO 4,867,373 2,322,338 2,545,035 MAGWAY 3,917,055 1,813,974 2,103,081 MANDALAY 6,165,723 2,928,367 3,237,356 MON 2,054,393 987,392 1,067,001 RAKHINE 3,188,807 1,526,402 1,662,405 RAKHINE (enumerated) 2,098,807 989,702 1,109,105 RAKHINE (not enumerated) 1,090,000 536,700 553,300 YANGON 7,360,703 3,516,403 3,844,300 SHAN 5,824,432 2,910,710 2,913,722 AYEYAWADY 6,184,829 3,009,808 3,175,021 NAY PYI TAW7 1,160,242 565,155 595,087
11
5 The total population includes 2,098,807 people who were enumerated in the census and the estimated 1,090,000 people who were not enumerated in the census.
6 The numbers in blue provide estimates of people who were not enumerated in the census. The numbers in italics and bold provide the sum of the enumerated and the estimated population.
7 The numbers in this table do not include Myanmar people living outside the country at the time of the census, except those people who were working in Myanmar diplomatic missions abroad; this population of 972 people is included in the population figure for Nay Pyi Taw.
Census Report Volume 3–K (Rakhine)
2.2. Size and Change of Population in Rakhine State
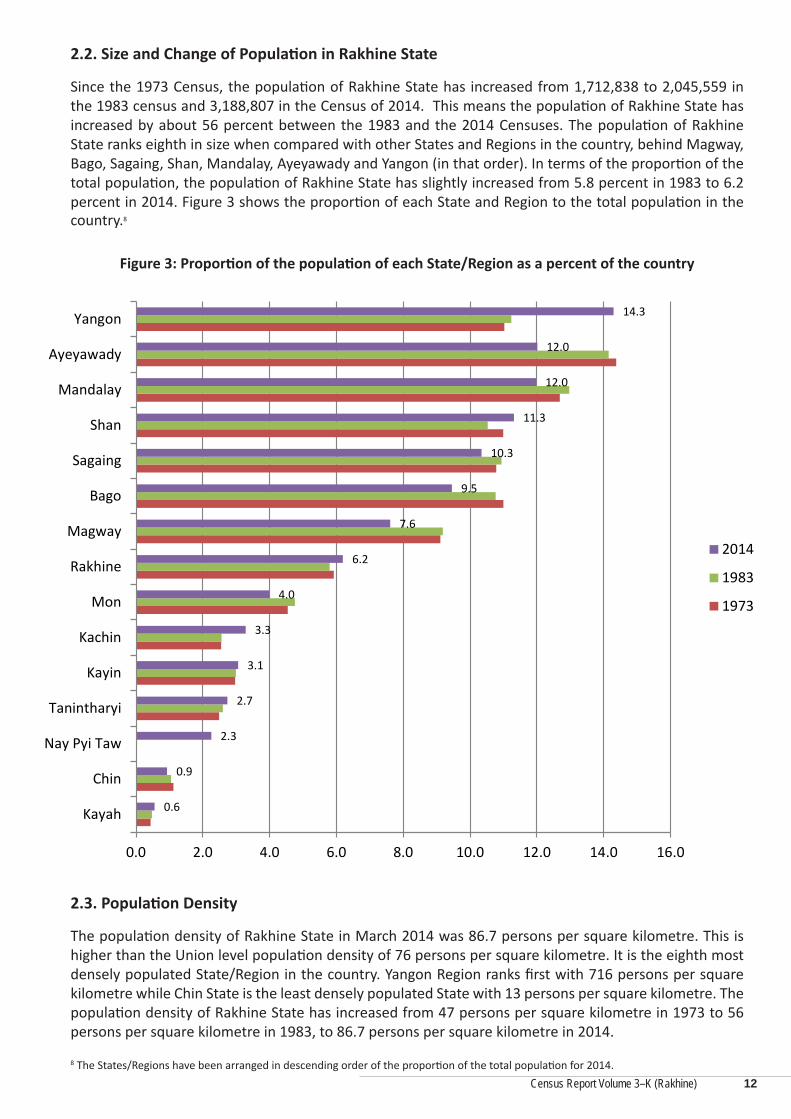
Since the 1973 Census, the population of Rakhine State has increased from 1,712,838 to 2,045,559 in the 1983 census and 3,188,807 in the Census of 2014. This means the population of Rakhine State has increased by about 56 percent between the 1983 and the 2014 Censuses. The population of Rakhine State ranks eighth in size when compared with other States and Regions in the country, behind Magway, Bago, Sagaing, Shan, Mandalay, Ayeyawady and Yangon (in that order). In terms of the proportion of the total population, the population of Rakhine State has slightly increased from 5.8 percent in 1983 to 6.2 percent in 2014. Figure 3 shows the proportion of each State and Region to the total population in the country.8
2.3. Population Density
The population density of Rakhine State in March 2014 was 86.7 persons per square kilometre. This is higher than the Union level population density of 76 persons per square kilometre. It is the eighth most densely populated State/Region in the country. Yangon Region ranks first with 716 persons per square kilometre while Chin State is the least densely populated State with 13 persons per square kilometre. The population density of Rakhine State has increased from 47 persons per square kilometre in 1973 to 56 persons per square kilometre in 1983, to 86.7 persons per square kilometre in 2014.
12
0.6
0.9
2.3
2.7
3.1
3.3
4.0
6.2
7.6
9.5
10.3
11.3
12.0
12.0
14.3
0.0 2.0 4.0 6.0 8.0 10.0 12.0 14.0 16.0
Kayah
Chin
Nay Pyi Taw
Tanintharyi
Kayin
Kachin
Mon
Rakhine
Magway
Bago
Sagaing
Shan
Mandalay
Ayeyawady
Yangon
2014
1983
1973
Figure 3: Proportion of the population of each State/Region as a percent of the country
8 The States/Regions have been arranged in descending order of the proportion of the total population for 2014.
Census Report Volume 3–K (Rakhine)
2.4. Population by Urban and Rural area
The Census results show that for every 100 persons in Rakhine State, 83 persons live in rural areas while 17 persons live in areas that are classified as urban by the GAD. At the Union level, 70 percent of the total population live in rural areas while 30 percent live in urban areas. Rakhine State has the third lowest proportion of its population living in urban areas in the country, after Ayeyawady (14 percent) and Magway (15 percent). The proportion of the urban population of the total population of Rakhine is the same as Sagaing Region at 17 percent.
2.5. Population by Sex
The population of females in Rakhine State exceeds the population of males by 136,003. The sex ratio of the population (number of males for every 100 females) is 92, which is slightly lower than the Union level sex ratio of 93 males for every 100 females. Magway has the lowest sex ratio at 86, while Kachin has the highest sex ratio at 108.
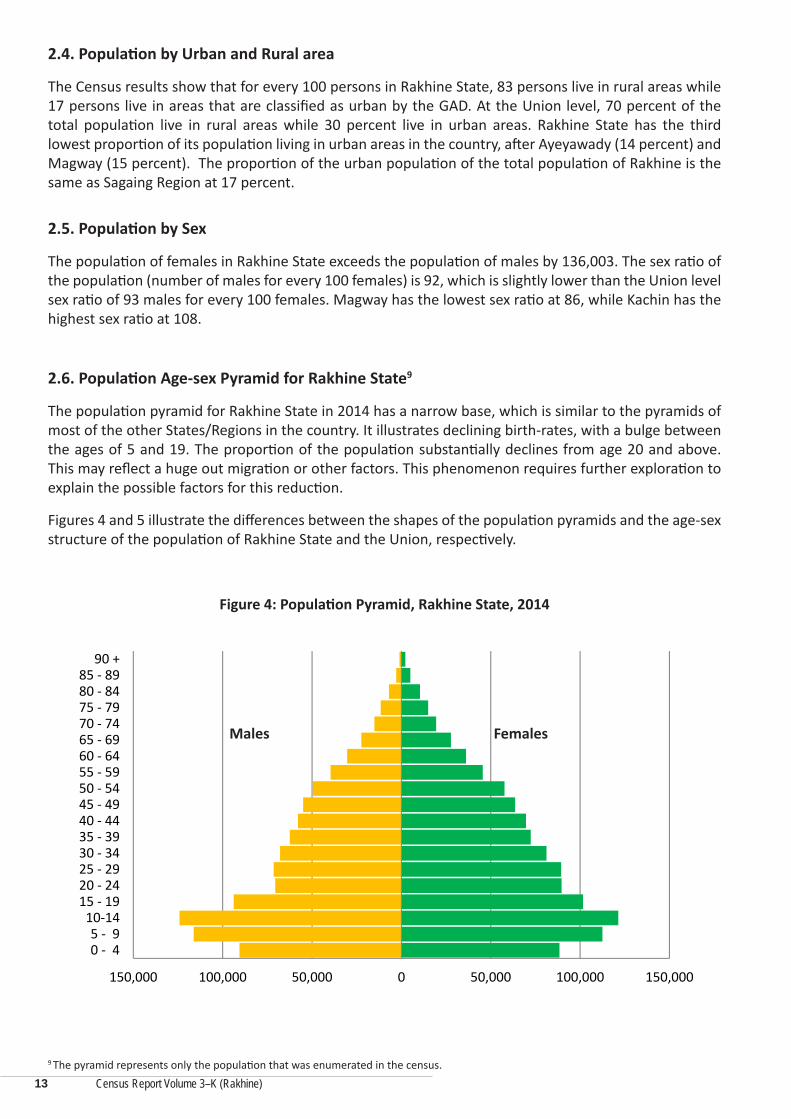
2.6. Population Age-sex Pyramid for Rakhine State9
The population pyramid for Rakhine State in 2014 has a narrow base, which is similar to the pyramids of most of the other States/Regions in the country. It illustrates declining birth-rates, with a bulge between the ages of 5 and 19. The proportion of the population substantially declines from age 20 and above. This may reflect a huge out migration or other factors. This phenomenon requires further exploration to explain the possible factors for this reduction.
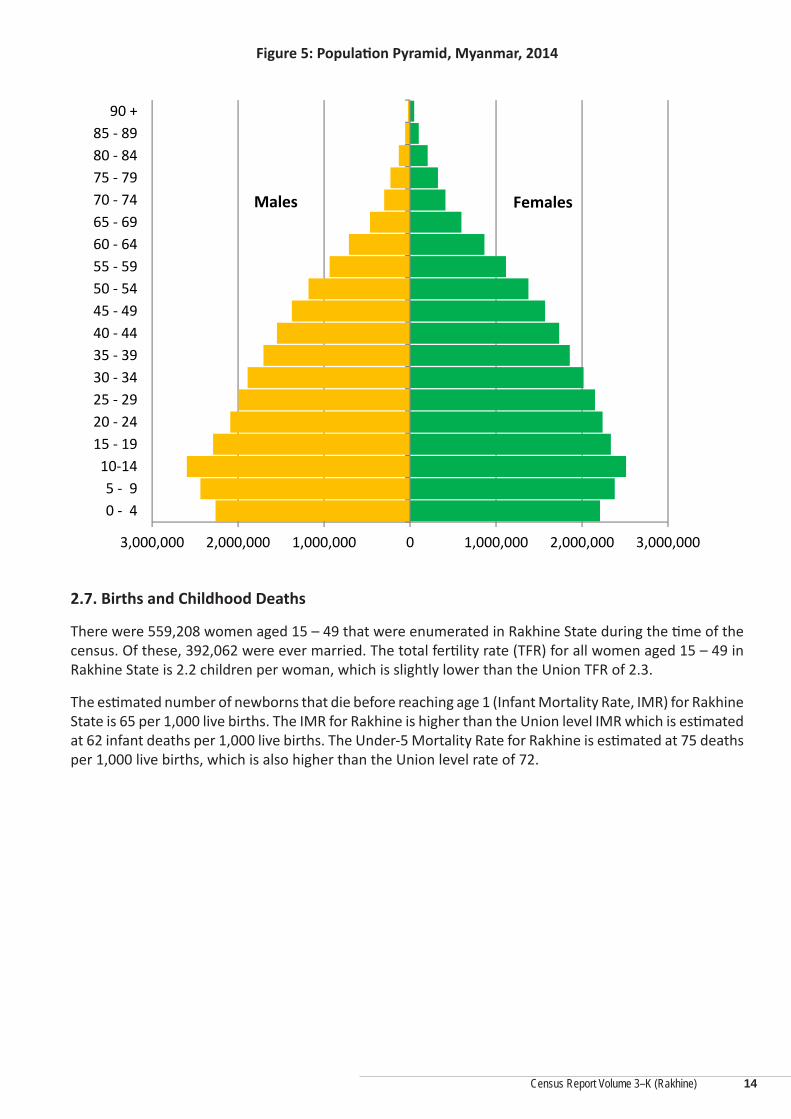
Figures 4 and 5 illustrate the differences between the shapes of the population pyramids and the age-sex structure of the population of Rakhine State and the Union, respectively.
9 The pyramid represents only the population that was enumerated in the census.
150,000 100,000 50,000 0 50,000 100,000 150,000
0 ‐ 4 5 ‐ 910‐1415 ‐ 1920 ‐ 2425 ‐ 2930 ‐ 3435 ‐ 3940 ‐ 4445 ‐ 4950 ‐ 5455 ‐ 5960 ‐ 6465 ‐ 6970 ‐ 7475 ‐ 7980 ‐ 8485 ‐ 89
90 +
Figure 4: Population Pyramid, Rakhine State, 2014
13
Figure 4: Population Pyramid, Rakhine State, 2014
FemalesMales
Census Report Volume 3–K (Rakhine)
2.7. Births and Childhood Deaths
There were 559,208 women aged 15 – 49 that were enumerated in Rakhine State during the time of the census. Of these, 392,062 were ever married. The total fertility rate (TFR) for all women aged 15 – 49 in Rakhine State is 2.2 children per woman, which is slightly lower than the Union TFR of 2.3.
The estimated number of newborns that die before reaching age 1 (Infant Mortality Rate, IMR) for Rakhine State is 65 per 1,000 live births. The IMR for Rakhine is higher than the Union level IMR which is estimated at 62 infant deaths per 1,000 live births. The Under-5 Mortality Rate for Rakhine is estimated at 75 deaths per 1,000 live births, which is also higher than the Union level rate of 72.
14
Females
3,000,000 2,000,000 1,000,000 0 1,000,000 2,000,000 3,000,000
0 ‐ 4 5 ‐ 910‐1415 ‐ 1920 ‐ 2425 ‐ 2930 ‐ 3435 ‐ 3940 ‐ 4445 ‐ 4950 ‐ 5455 ‐ 5960 ‐ 6465 ‐ 6970 ‐ 7475 ‐ 7980 ‐ 8485 ‐ 89
90 +
Figure 5: Population Pyramid, Myanmar, 2014
Males Females
Figure 5: Population Pyramid, Myanmar, 2014
Census Report Volume 3–K (Rakhine)
3. Statistical Tables
15
Myanmar Population and Housing Census,
Census Report Volume 3 - K (Rakhine)
Series A: Demographic Characteristics
Census Report Volume 3–K (Rakhine)
Census Report Volume 3–K (Rakhine)
Table A-1: Population by household type, sex and sex ratio by urban and rural
Total population Population in conventional households Population in institutions
Both sexes Male Female Sex ratio Both sexes Male Female Both sexes Male Female
RAKHINE 2,098,807 989,702 1,109,105 89.2 2,034,148 937,460 1,096,688 64,659 52,242 12,417
Urban 354,288 166,857 187,431 89.0 337,576 153,273 184,303 16,712 13,584 3,128
Rural 1,744,519 822,845 921,674 89.3 1,696,572 784,187 912,385 47,947 38,658 9,289
SITTWAY 535,583 248,670 286,913 86.7 520,903 236,167 284,736 14,680 12,503 2,177
Sittway 147,899 70,470 77,429 91.0 139,673 63,584 76,089 8,226 6,886 1,340
Ponnagyun 129,753 59,979 69,774 86.0 127,640 58,170 69,470 2,113 1,809 304
Pauktaw 145,957 68,195 77,762 87.7 143,601 66,140 77,461 2,356 2,055 301
Yathedaung 111,974 50,026 61,948 80.8 109,989 48,273 61,716 1,985 1,753 232
MYAUK U 669,131 309,949 359,182 86.3 657,999 300,615 357,384 11,132 9,334 1,798
Myauk U 189,630 87,674 101,956 86.0 186,551 85,032 101,519 3,079 2,642 437
Kyauktaw 173,100 78,041 95,059 82.1 170,787 76,054 94,733 2,313 1,987 326
Minbya 169,208 78,875 90,333 87.3 165,769 75,866 89,903 3,439 3,009 430
Myebon 137,193 65,359 71,834 91.0 134,892 63,663 71,229 2,301 1,696 605
MAUNGTAW 96,330 48,816 47,514 102.7 89,604 42,518 47,086 6,726 6,298 428
Maungtaw 38,199 19,778 18,421 107.4 35,060 16,919 18,141 3,139 2,859 280
Buthidaung 55,545 27,718 27,827 99.6 52,056 24,359 27,697 3,489 3,359 130
Taungpyoletwe(Sub-TSP) 2,586 1,320 1,266 104.3 2,488 1,240 1,248 98 80 18
KYAUKPYU 439,923 207,308 232,615 89.1 422,568 194,037 228,531 17,355 13,271 4,084
Kyaukpyu 165,352 78,762 86,590 91.0 155,649 71,671 83,978 9,703 7,091 2,612
Mannaung 56,966 24,957 32,009 78.0 56,013 24,117 31,896 953 840 113
Yanbye 97,891 44,766 53,125 84.3 95,348 42,784 52,564 2,543 1,982 561
An 119,714 58,823 60,891 96.6 115,558 55,465 60,093 4,156 3,358 798
Table A-1: Population by household type, sex and sex ratio by urban and rural 17
Census Report Volume 3–K (Rakhine)
Total population Population in conventional households Population in institutions
Both sexes Male Female Sex ratio Both sexes Male Female Both sexes Male Female
THANDWE 357,840 174,959 182,881 95.7 343,074 164,123 178,951 14,766 10,836 3,930
Thandwe 133,484 65,122 68,362 95.3 124,773 59,301 65,472 8,711 5,821 2,890
Taungup 114,437 55,673 58,764 94.7 110,475 52,416 58,059 3,962 3,257 705
Gwa 42,434 21,158 21,276 99.4 41,458 20,324 21,134 976 834 142
Maei(Sub-Tsp) 43,904 21,584 22,320 96.7 43,246 20,989 22,257 658 595 63
Kyeintali(Sub-Tsp) 23,581 11,422 12,159 93.9 23,122 11,093 12,029 459 329 130
Table A-1. Population by household type, sex and sex ratio by urban and rural 18
Census Report Volume 3–K (Rakhine)
Census Report Volume 3–K (Rakhine)
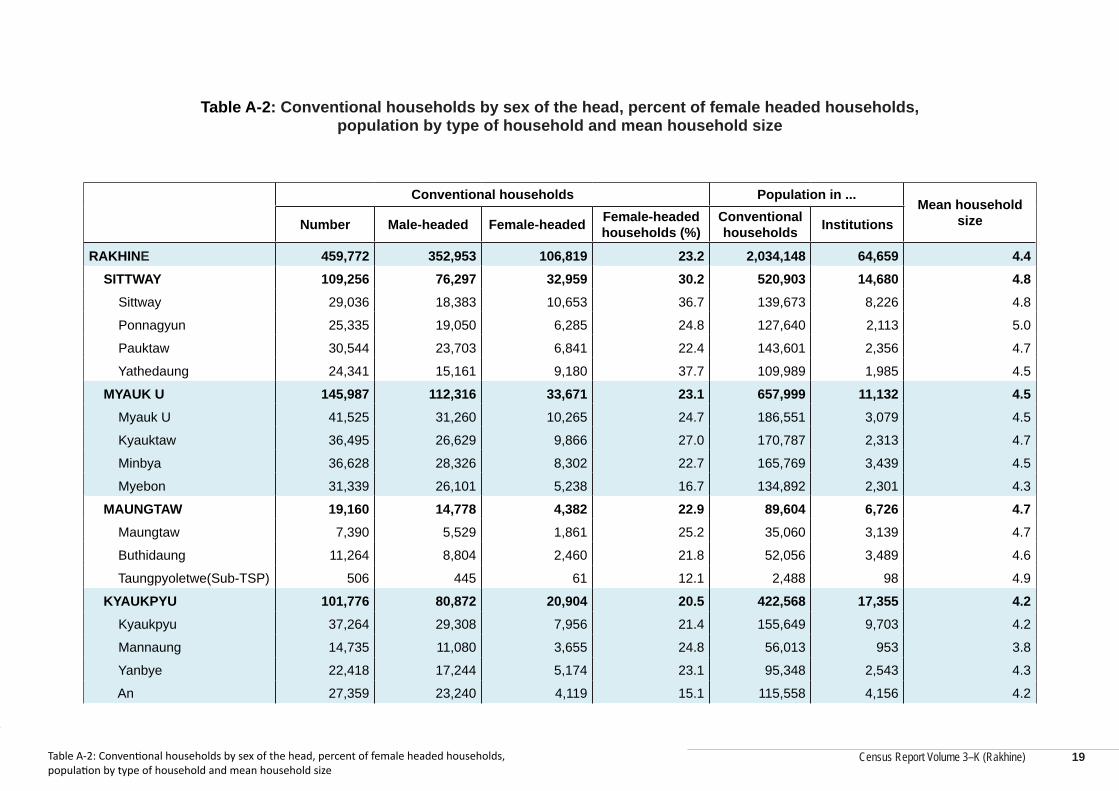
Table A-2: Conventional households by sex of the head, percent of female headed households, population by type of household and mean household size
Conventional households Population in ...Mean household
sizeNumber Male-headed Female-headed Female-headed households (%)
Conventional households Institutions
RAKHINE 459,772 352,953 106,819 23.2 2,034,148 64,659 4.4 SITTWAY 109,256 76,297 32,959 30.2 520,903 14,680 4.8 Sittway 29,036 18,383 10,653 36.7 139,673 8,226 4.8
Ponnagyun 25,335 19,050 6,285 24.8 127,640 2,113 5.0
Pauktaw 30,544 23,703 6,841 22.4 143,601 2,356 4.7
Yathedaung 24,341 15,161 9,180 37.7 109,989 1,985 4.5
MYAUK U 145,987 112,316 33,671 23.1 657,999 11,132 4.5 Myauk U 41,525 31,260 10,265 24.7 186,551 3,079 4.5
Kyauktaw 36,495 26,629 9,866 27.0 170,787 2,313 4.7
Minbya 36,628 28,326 8,302 22.7 165,769 3,439 4.5
Myebon 31,339 26,101 5,238 16.7 134,892 2,301 4.3
MAUNGTAW 19,160 14,778 4,382 22.9 89,604 6,726 4.7 Maungtaw 7,390 5,529 1,861 25.2 35,060 3,139 4.7
Buthidaung 11,264 8,804 2,460 21.8 52,056 3,489 4.6
Taungpyoletwe(Sub-TSP) 506 445 61 12.1 2,488 98 4.9
KYAUKPYU 101,776 80,872 20,904 20.5 422,568 17,355 4.2 Kyaukpyu 37,264 29,308 7,956 21.4 155,649 9,703 4.2
Mannaung 14,735 11,080 3,655 24.8 56,013 953 3.8
Yanbye 22,418 17,244 5,174 23.1 95,348 2,543 4.3
An 27,359 23,240 4,119 15.1 115,558 4,156 4.2
Table A-2: Conventional households by sex of the head, percent of female headed households, population by type of household and mean household size
19
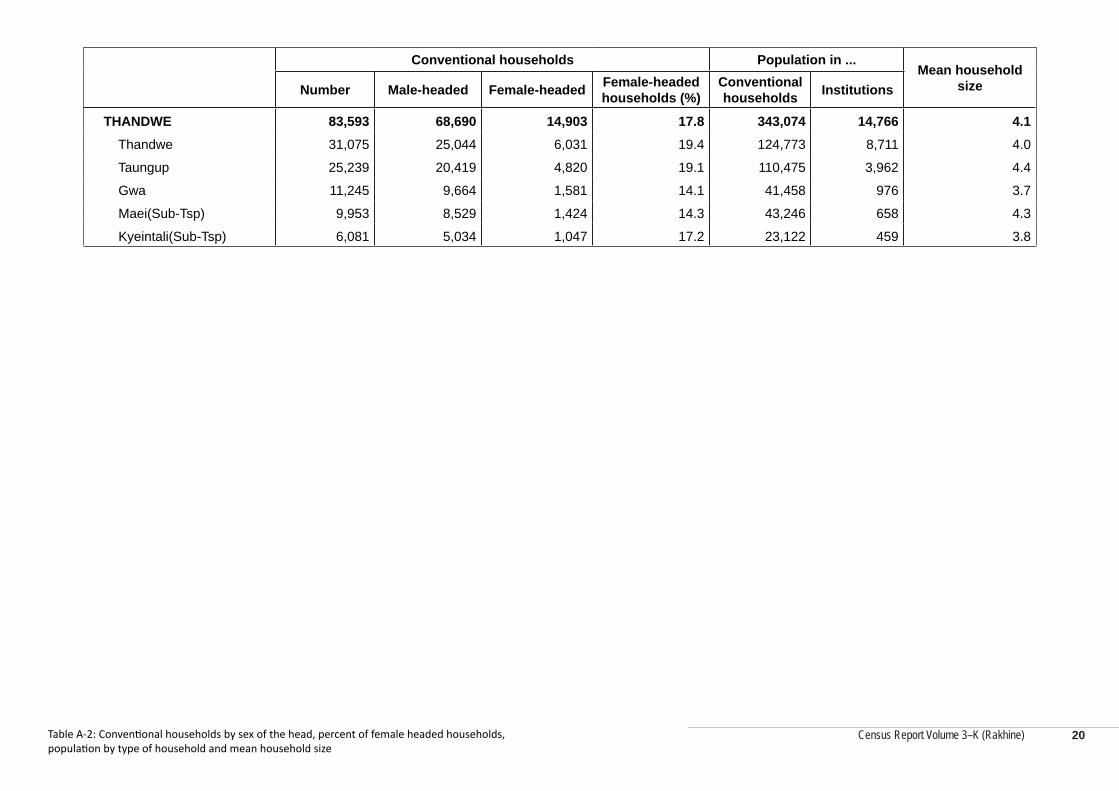
Census Report Volume 3–K (Rakhine)
Conventional households Population in ...Mean household
sizeNumber Male-headed Female-headed Female-headed households (%)
Conventional households Institutions
THANDWE 83,593 68,690 14,903 17.8 343,074 14,766 4.1 Thandwe 31,075 25,044 6,031 19.4 124,773 8,711 4.0
Taungup 25,239 20,419 4,820 19.1 110,475 3,962 4.4
Gwa 11,245 9,664 1,581 14.1 41,458 976 3.7
Maei(Sub-Tsp) 9,953 8,529 1,424 14.3 43,246 658 4.3
Kyeintali(Sub-Tsp) 6,081 5,034 1,047 17.2 23,122 459 3.8
Table A-2: Conventional households by sex of the head, percent of female headed households, population by type of household and mean household size
20
Census Report Volume 3–K (Rakhine)
Census Report Volume 3–K (Rakhine)
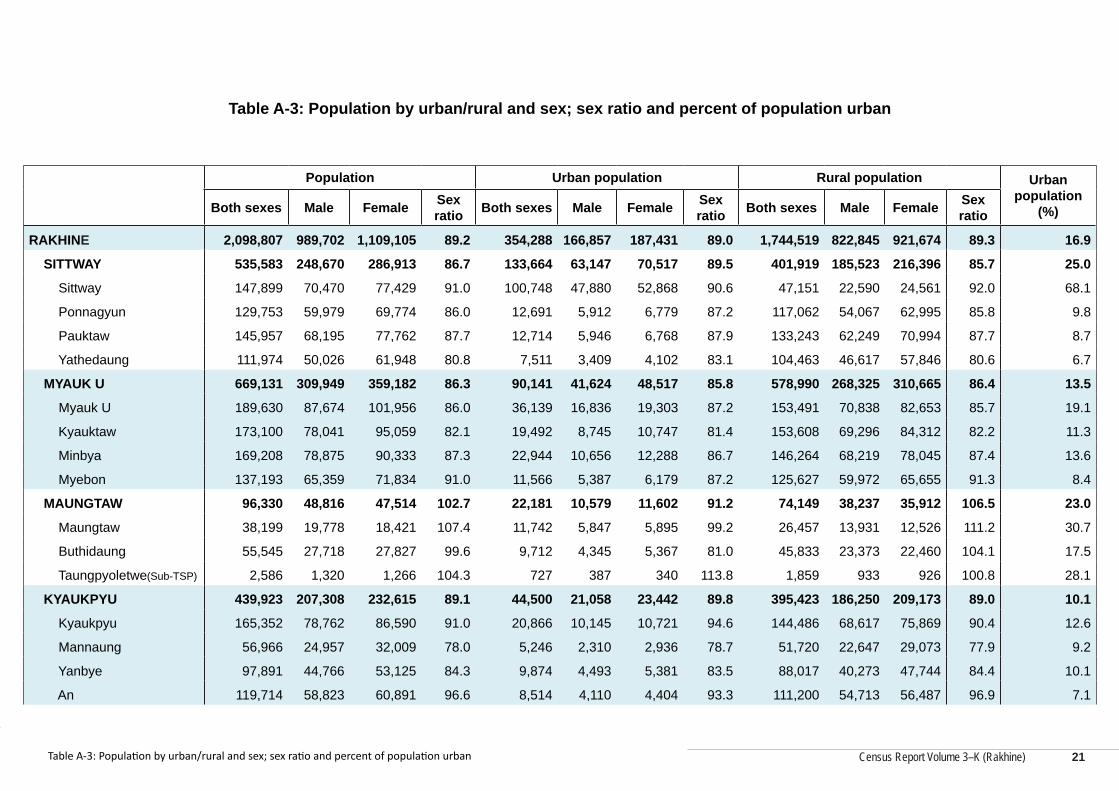
Table A-3: Population by urban/rural and sex; sex ratio and percent of population urban
Population Urban population Rural population Urban population
(%)Both sexes Male Female Sex ratio Both sexes Male Female Sex
ratio Both sexes Male Female Sex ratio
RAKHINE 2,098,807 989,702 1,109,105 89.2 354,288 166,857 187,431 89.0 1,744,519 822,845 921,674 89.3 16.9
SITTWAY 535,583 248,670 286,913 86.7 133,664 63,147 70,517 89.5 401,919 185,523 216,396 85.7 25.0
Sittway 147,899 70,470 77,429 91.0 100,748 47,880 52,868 90.6 47,151 22,590 24,561 92.0 68.1
Ponnagyun 129,753 59,979 69,774 86.0 12,691 5,912 6,779 87.2 117,062 54,067 62,995 85.8 9.8
Pauktaw 145,957 68,195 77,762 87.7 12,714 5,946 6,768 87.9 133,243 62,249 70,994 87.7 8.7
Yathedaung 111,974 50,026 61,948 80.8 7,511 3,409 4,102 83.1 104,463 46,617 57,846 80.6 6.7
MYAUK U 669,131 309,949 359,182 86.3 90,141 41,624 48,517 85.8 578,990 268,325 310,665 86.4 13.5
Myauk U 189,630 87,674 101,956 86.0 36,139 16,836 19,303 87.2 153,491 70,838 82,653 85.7 19.1
Kyauktaw 173,100 78,041 95,059 82.1 19,492 8,745 10,747 81.4 153,608 69,296 84,312 82.2 11.3
Minbya 169,208 78,875 90,333 87.3 22,944 10,656 12,288 86.7 146,264 68,219 78,045 87.4 13.6
Myebon 137,193 65,359 71,834 91.0 11,566 5,387 6,179 87.2 125,627 59,972 65,655 91.3 8.4
MAUNGTAW 96,330 48,816 47,514 102.7 22,181 10,579 11,602 91.2 74,149 38,237 35,912 106.5 23.0
Maungtaw 38,199 19,778 18,421 107.4 11,742 5,847 5,895 99.2 26,457 13,931 12,526 111.2 30.7
Buthidaung 55,545 27,718 27,827 99.6 9,712 4,345 5,367 81.0 45,833 23,373 22,460 104.1 17.5
Taungpyoletwe(Sub-TSP) 2,586 1,320 1,266 104.3 727 387 340 113.8 1,859 933 926 100.8 28.1
KYAUKPYU 439,923 207,308 232,615 89.1 44,500 21,058 23,442 89.8 395,423 186,250 209,173 89.0 10.1
Kyaukpyu 165,352 78,762 86,590 91.0 20,866 10,145 10,721 94.6 144,486 68,617 75,869 90.4 12.6
Mannaung 56,966 24,957 32,009 78.0 5,246 2,310 2,936 78.7 51,720 22,647 29,073 77.9 9.2
Yanbye 97,891 44,766 53,125 84.3 9,874 4,493 5,381 83.5 88,017 40,273 47,744 84.4 10.1
An 119,714 58,823 60,891 96.6 8,514 4,110 4,404 93.3 111,200 54,713 56,487 96.9 7.1
Table A-3: Population by urban/rural and sex; sex ratio and percent of population urban 21
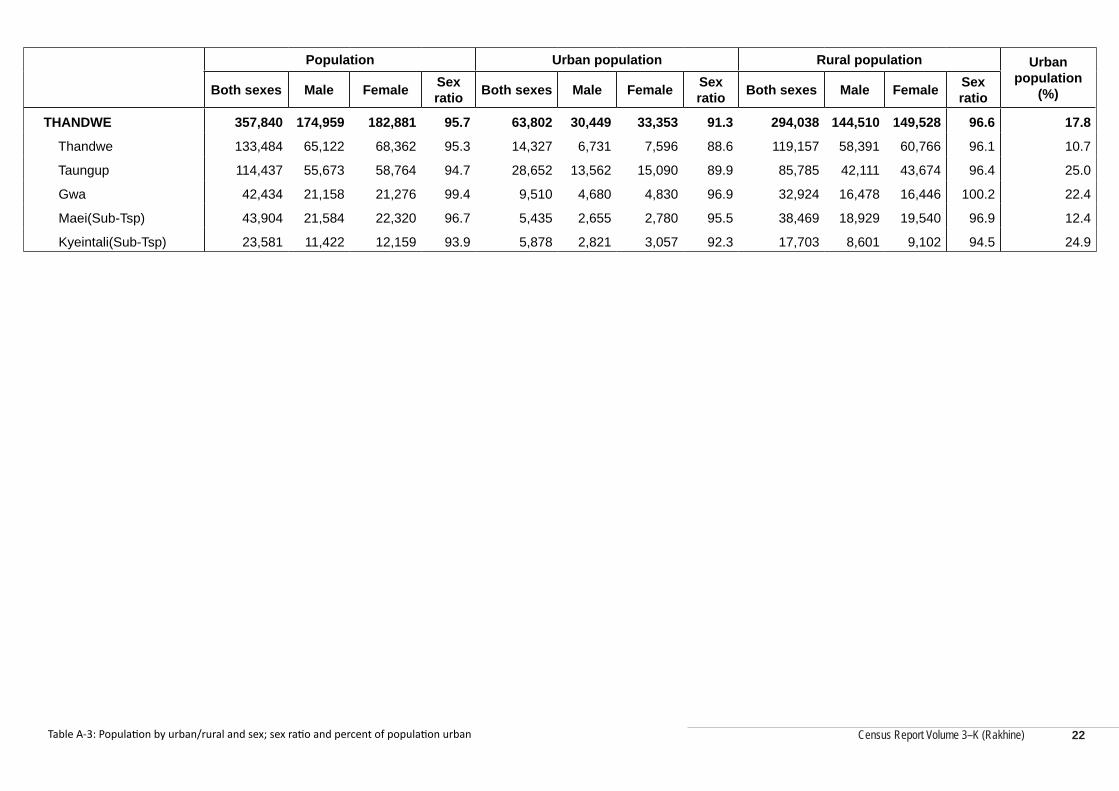
Census Report Volume 3–K (Rakhine)
Population Urban population Rural population Urban population
(%)Both sexes Male Female Sex ratio Both sexes Male Female Sex
ratio Both sexes Male Female Sex ratio
THANDWE 357,840 174,959 182,881 95.7 63,802 30,449 33,353 91.3 294,038 144,510 149,528 96.6 17.8
Thandwe 133,484 65,122 68,362 95.3 14,327 6,731 7,596 88.6 119,157 58,391 60,766 96.1 10.7
Taungup 114,437 55,673 58,764 94.7 28,652 13,562 15,090 89.9 85,785 42,111 43,674 96.4 25.0
Gwa 42,434 21,158 21,276 99.4 9,510 4,680 4,830 96.9 32,924 16,478 16,446 100.2 22.4
Maei(Sub-Tsp) 43,904 21,584 22,320 96.7 5,435 2,655 2,780 95.5 38,469 18,929 19,540 96.9 12.4
Kyeintali(Sub-Tsp) 23,581 11,422 12,159 93.9 5,878 2,821 3,057 92.3 17,703 8,601 9,102 94.5 24.9
Table A-3: Population by urban/rural and sex; sex ratio and percent of population urban 22
Census Report Volume 3–K (Rakhine)
Census Report Volume 3–K (Rakhine)
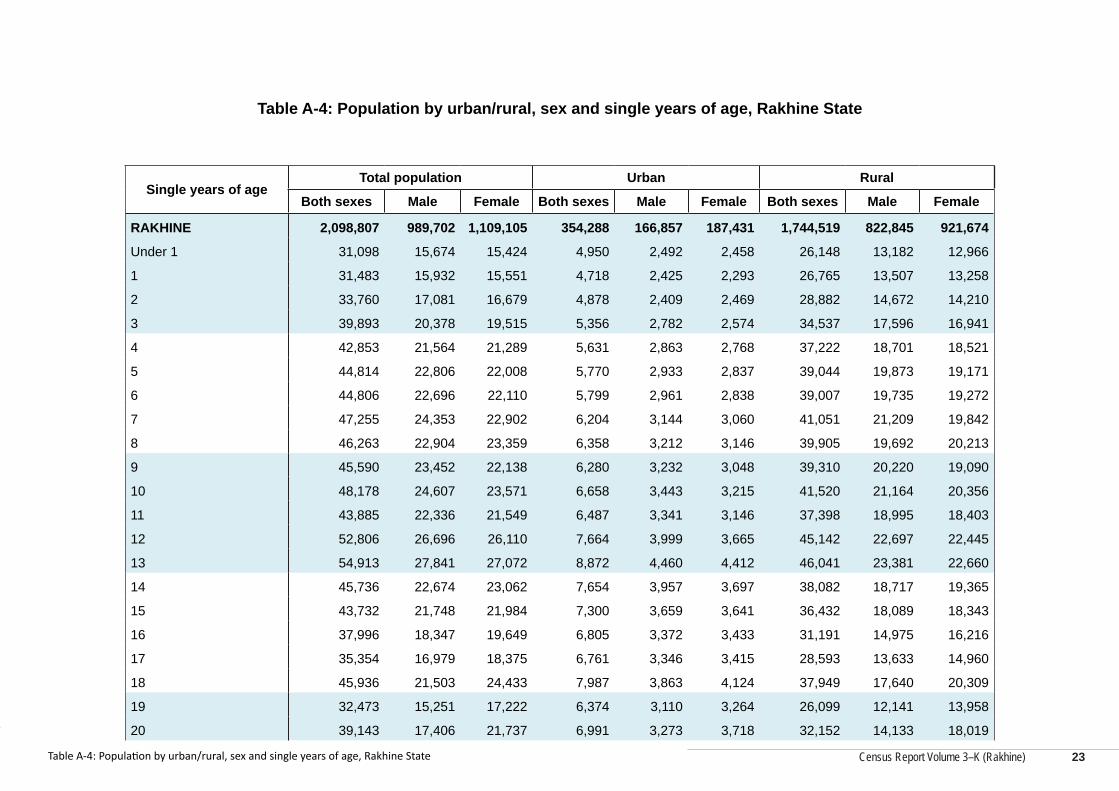
Table A-4: Population by urban/rural, sex and single years of age, Rakhine State
Single years of ageTotal population Urban Rural
Both sexes Male Female Both sexes Male Female Both sexes Male Female
RAKHINE 2,098,807 989,702 1,109,105 354,288 166,857 187,431 1,744,519 822,845 921,674
Under 1 31,098 15,674 15,424 4,950 2,492 2,458 26,148 13,182 12,966
1 31,483 15,932 15,551 4,718 2,425 2,293 26,765 13,507 13,258
2 33,760 17,081 16,679 4,878 2,409 2,469 28,882 14,672 14,210
3 39,893 20,378 19,515 5,356 2,782 2,574 34,537 17,596 16,941
4 42,853 21,564 21,289 5,631 2,863 2,768 37,222 18,701 18,521
5 44,814 22,806 22,008 5,770 2,933 2,837 39,044 19,873 19,171
6 44,806 22,696 22,110 5,799 2,961 2,838 39,007 19,735 19,272
7 47,255 24,353 22,902 6,204 3,144 3,060 41,051 21,209 19,842
8 46,263 22,904 23,359 6,358 3,212 3,146 39,905 19,692 20,213
9 45,590 23,452 22,138 6,280 3,232 3,048 39,310 20,220 19,090
10 48,178 24,607 23,571 6,658 3,443 3,215 41,520 21,164 20,356
11 43,885 22,336 21,549 6,487 3,341 3,146 37,398 18,995 18,403
12 52,806 26,696 26,110 7,664 3,999 3,665 45,142 22,697 22,445
13 54,913 27,841 27,072 8,872 4,460 4,412 46,041 23,381 22,660
14 45,736 22,674 23,062 7,654 3,957 3,697 38,082 18,717 19,365
15 43,732 21,748 21,984 7,300 3,659 3,641 36,432 18,089 18,343
16 37,996 18,347 19,649 6,805 3,372 3,433 31,191 14,975 16,216
17 35,354 16,979 18,375 6,761 3,346 3,415 28,593 13,633 14,960
18 45,936 21,503 24,433 7,987 3,863 4,124 37,949 17,640 20,309
19 32,473 15,251 17,222 6,374 3,110 3,264 26,099 12,141 13,958
20 39,143 17,406 21,737 6,991 3,273 3,718 32,152 14,133 18,019
Table A-4: Population by urban/rural, sex and single years of age, Rakhine State 23
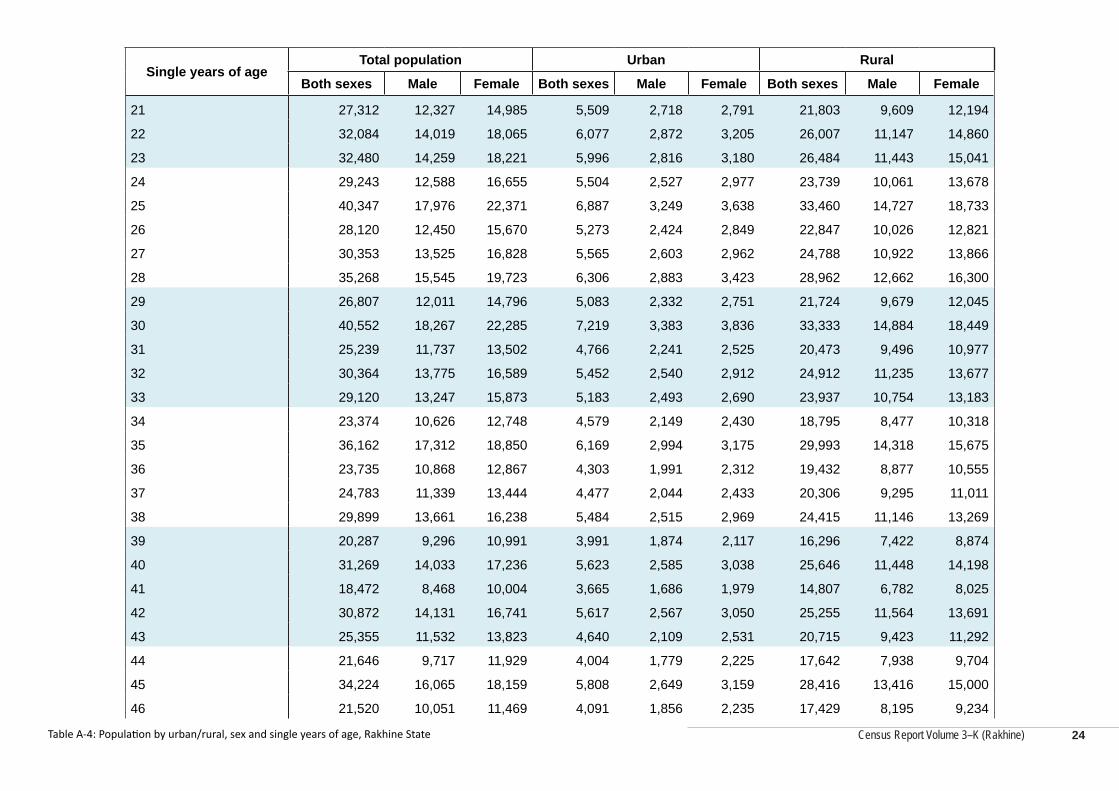
Census Report Volume 3–K (Rakhine)
Single years of ageTotal population Urban Rural
Both sexes Male Female Both sexes Male Female Both sexes Male Female
21 27,312 12,327 14,985 5,509 2,718 2,791 21,803 9,609 12,194
22 32,084 14,019 18,065 6,077 2,872 3,205 26,007 11,147 14,860
23 32,480 14,259 18,221 5,996 2,816 3,180 26,484 11,443 15,041
24 29,243 12,588 16,655 5,504 2,527 2,977 23,739 10,061 13,678
25 40,347 17,976 22,371 6,887 3,249 3,638 33,460 14,727 18,733
26 28,120 12,450 15,670 5,273 2,424 2,849 22,847 10,026 12,821
27 30,353 13,525 16,828 5,565 2,603 2,962 24,788 10,922 13,866
28 35,268 15,545 19,723 6,306 2,883 3,423 28,962 12,662 16,300
29 26,807 12,011 14,796 5,083 2,332 2,751 21,724 9,679 12,045
30 40,552 18,267 22,285 7,219 3,383 3,836 33,333 14,884 18,449
31 25,239 11,737 13,502 4,766 2,241 2,525 20,473 9,496 10,977
32 30,364 13,775 16,589 5,452 2,540 2,912 24,912 11,235 13,677
33 29,120 13,247 15,873 5,183 2,493 2,690 23,937 10,754 13,183
34 23,374 10,626 12,748 4,579 2,149 2,430 18,795 8,477 10,318
35 36,162 17,312 18,850 6,169 2,994 3,175 29,993 14,318 15,675
36 23,735 10,868 12,867 4,303 1,991 2,312 19,432 8,877 10,555
37 24,783 11,339 13,444 4,477 2,044 2,433 20,306 9,295 11,011
38 29,899 13,661 16,238 5,484 2,515 2,969 24,415 11,146 13,269
39 20,287 9,296 10,991 3,991 1,874 2,117 16,296 7,422 8,874
40 31,269 14,033 17,236 5,623 2,585 3,038 25,646 11,448 14,198
41 18,472 8,468 10,004 3,665 1,686 1,979 14,807 6,782 8,025
42 30,872 14,131 16,741 5,617 2,567 3,050 25,255 11,564 13,691
43 25,355 11,532 13,823 4,640 2,109 2,531 20,715 9,423 11,292
44 21,646 9,717 11,929 4,004 1,779 2,225 17,642 7,938 9,704
45 34,224 16,065 18,159 5,808 2,649 3,159 28,416 13,416 15,000
46 21,520 10,051 11,469 4,091 1,856 2,235 17,429 8,195 9,234
Table A-4: Population by urban/rural, sex and single years of age, Rakhine State 24
Census Report Volume 3–K (Rakhine)
Census Report Volume 3–K (Rakhine)
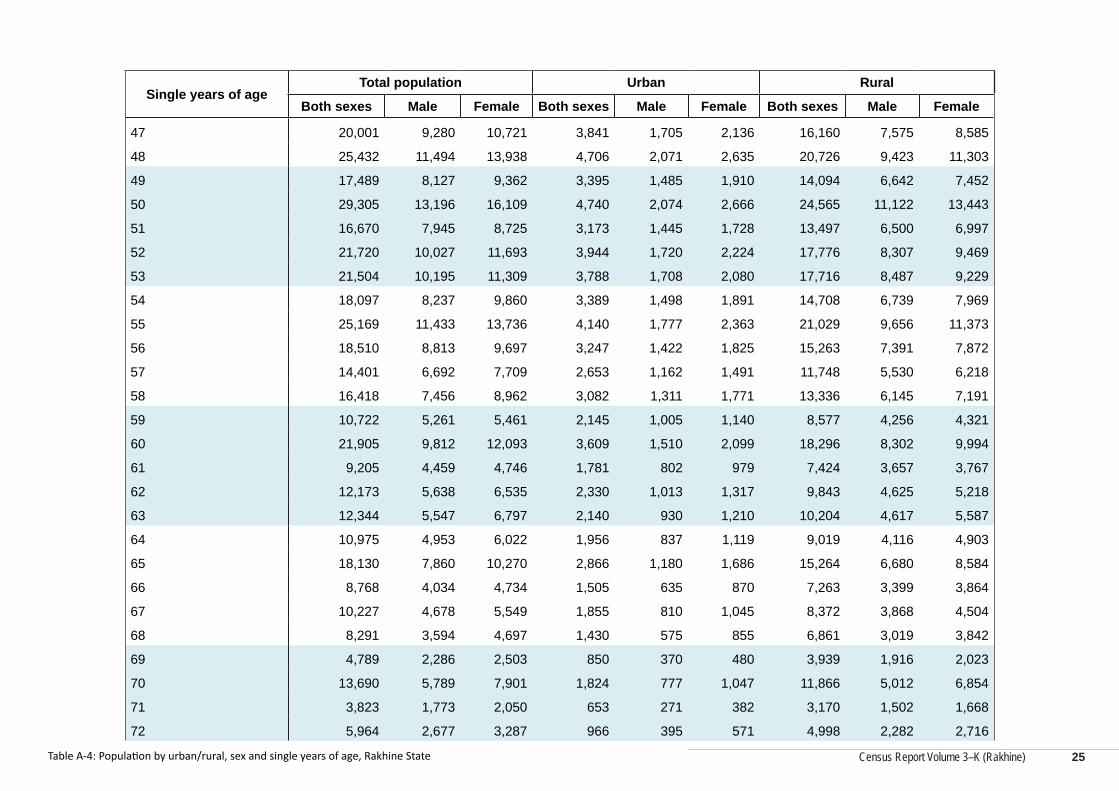
Single years of ageTotal population Urban Rural
Both sexes Male Female Both sexes Male Female Both sexes Male Female
47 20,001 9,280 10,721 3,841 1,705 2,136 16,160 7,575 8,585
48 25,432 11,494 13,938 4,706 2,071 2,635 20,726 9,423 11,303
49 17,489 8,127 9,362 3,395 1,485 1,910 14,094 6,642 7,452
50 29,305 13,196 16,109 4,740 2,074 2,666 24,565 11,122 13,443
51 16,670 7,945 8,725 3,173 1,445 1,728 13,497 6,500 6,997
52 21,720 10,027 11,693 3,944 1,720 2,224 17,776 8,307 9,469
53 21,504 10,195 11,309 3,788 1,708 2,080 17,716 8,487 9,229
54 18,097 8,237 9,860 3,389 1,498 1,891 14,708 6,739 7,969
55 25,169 11,433 13,736 4,140 1,777 2,363 21,029 9,656 11,373
56 18,510 8,813 9,697 3,247 1,422 1,825 15,263 7,391 7,872
57 14,401 6,692 7,709 2,653 1,162 1,491 11,748 5,530 6,218
58 16,418 7,456 8,962 3,082 1,311 1,771 13,336 6,145 7,191
59 10,722 5,261 5,461 2,145 1,005 1,140 8,577 4,256 4,321
60 21,905 9,812 12,093 3,609 1,510 2,099 18,296 8,302 9,994
61 9,205 4,459 4,746 1,781 802 979 7,424 3,657 3,767
62 12,173 5,638 6,535 2,330 1,013 1,317 9,843 4,625 5,218
63 12,344 5,547 6,797 2,140 930 1,210 10,204 4,617 5,587
64 10,975 4,953 6,022 1,956 837 1,119 9,019 4,116 4,903
65 18,130 7,860 10,270 2,866 1,180 1,686 15,264 6,680 8,584
66 8,768 4,034 4,734 1,505 635 870 7,263 3,399 3,864
67 10,227 4,678 5,549 1,855 810 1,045 8,372 3,868 4,504
68 8,291 3,594 4,697 1,430 575 855 6,861 3,019 3,842
69 4,789 2,286 2,503 850 370 480 3,939 1,916 2,023
70 13,690 5,789 7,901 1,824 777 1,047 11,866 5,012 6,854
71 3,823 1,773 2,050 653 271 382 3,170 1,502 1,668
72 5,964 2,677 3,287 966 395 571 4,998 2,282 2,716
Table A-4: Population by urban/rural, sex and single years of age, Rakhine State 25
Census Report Volume 3–K (Rakhine)
Single years of ageTotal population Urban Rural
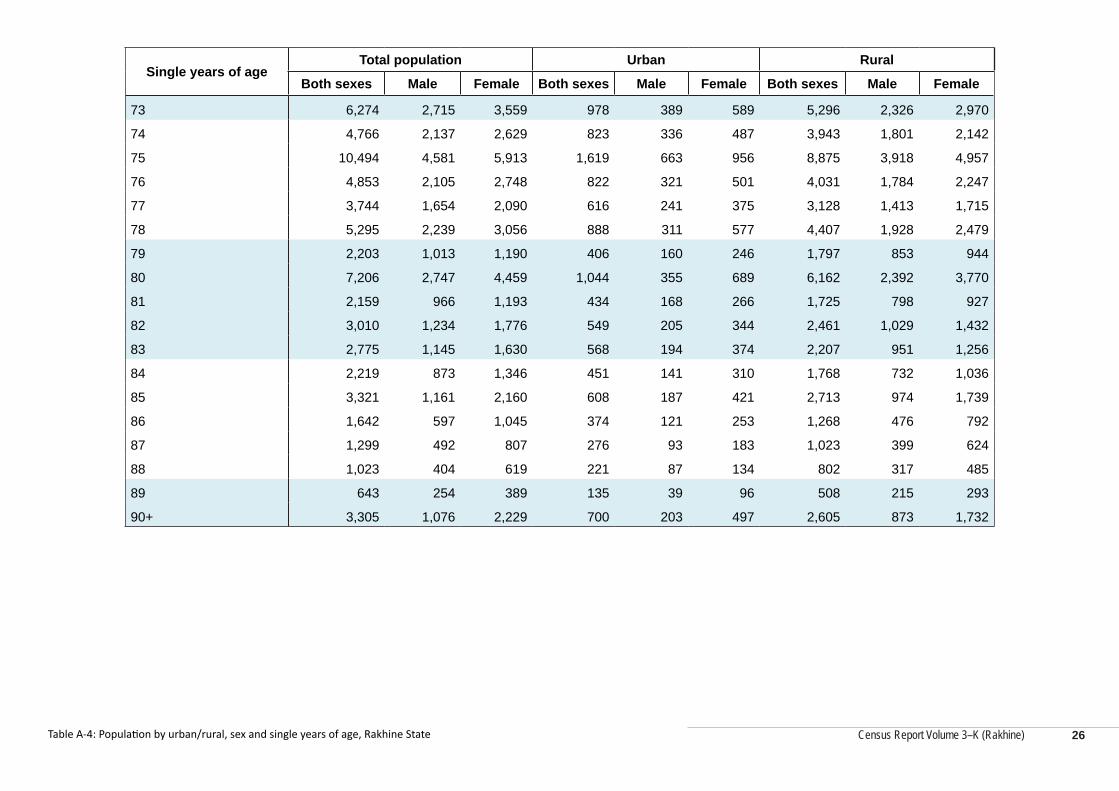
Both sexes Male Female Both sexes Male Female Both sexes Male Female
73 6,274 2,715 3,559 978 389 589 5,296 2,326 2,970
74 4,766 2,137 2,629 823 336 487 3,943 1,801 2,142
75 10,494 4,581 5,913 1,619 663 956 8,875 3,918 4,957
76 4,853 2,105 2,748 822 321 501 4,031 1,784 2,247
77 3,744 1,654 2,090 616 241 375 3,128 1,413 1,715
78 5,295 2,239 3,056 888 311 577 4,407 1,928 2,479
79 2,203 1,013 1,190 406 160 246 1,797 853 944
80 7,206 2,747 4,459 1,044 355 689 6,162 2,392 3,770
81 2,159 966 1,193 434 168 266 1,725 798 927
82 3,010 1,234 1,776 549 205 344 2,461 1,029 1,432
83 2,775 1,145 1,630 568 194 374 2,207 951 1,256
84 2,219 873 1,346 451 141 310 1,768 732 1,036
85 3,321 1,161 2,160 608 187 421 2,713 974 1,739
86 1,642 597 1,045 374 121 253 1,268 476 792
87 1,299 492 807 276 93 183 1,023 399 624
88 1,023 404 619 221 87 134 802 317 485
89 643 254 389 135 39 96 508 215 293
90+ 3,305 1,076 2,229 700 203 497 2,605 873 1,732
Table A-4: Population by urban/rural, sex and single years of age, Rakhine State 26
Census Report Volume 3–K (Rakhine)
Census Report Volume 3–K (Rakhine)
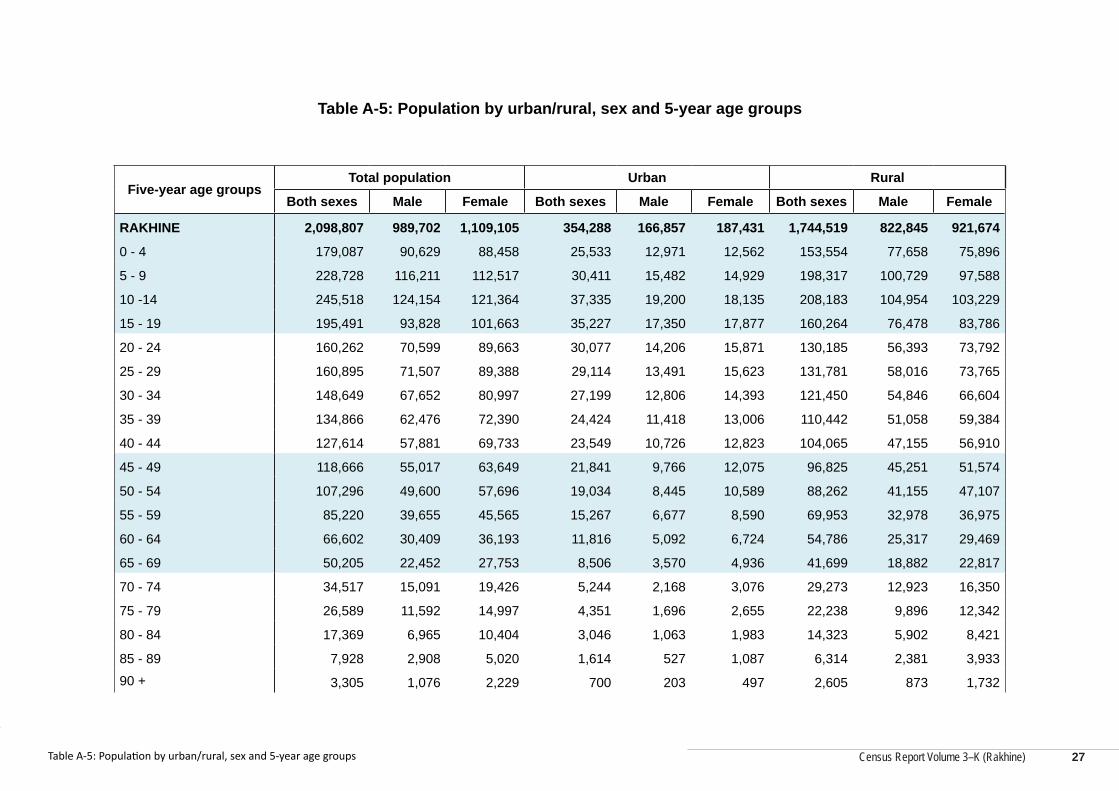
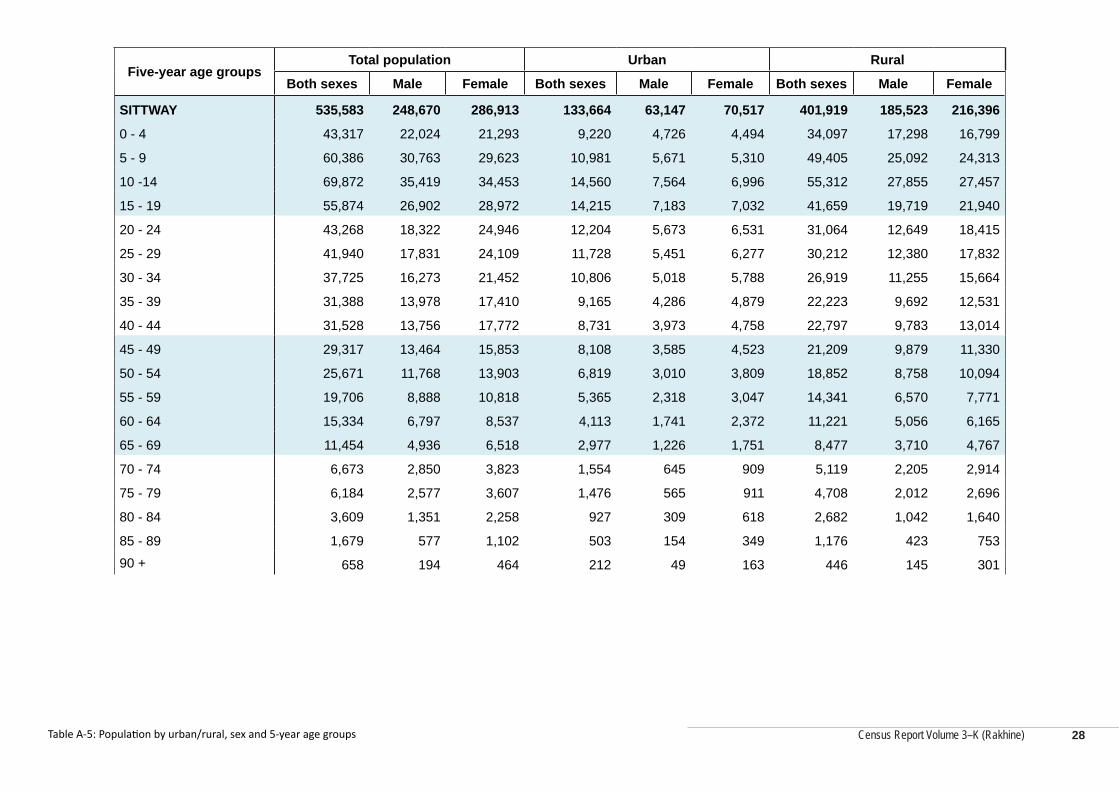
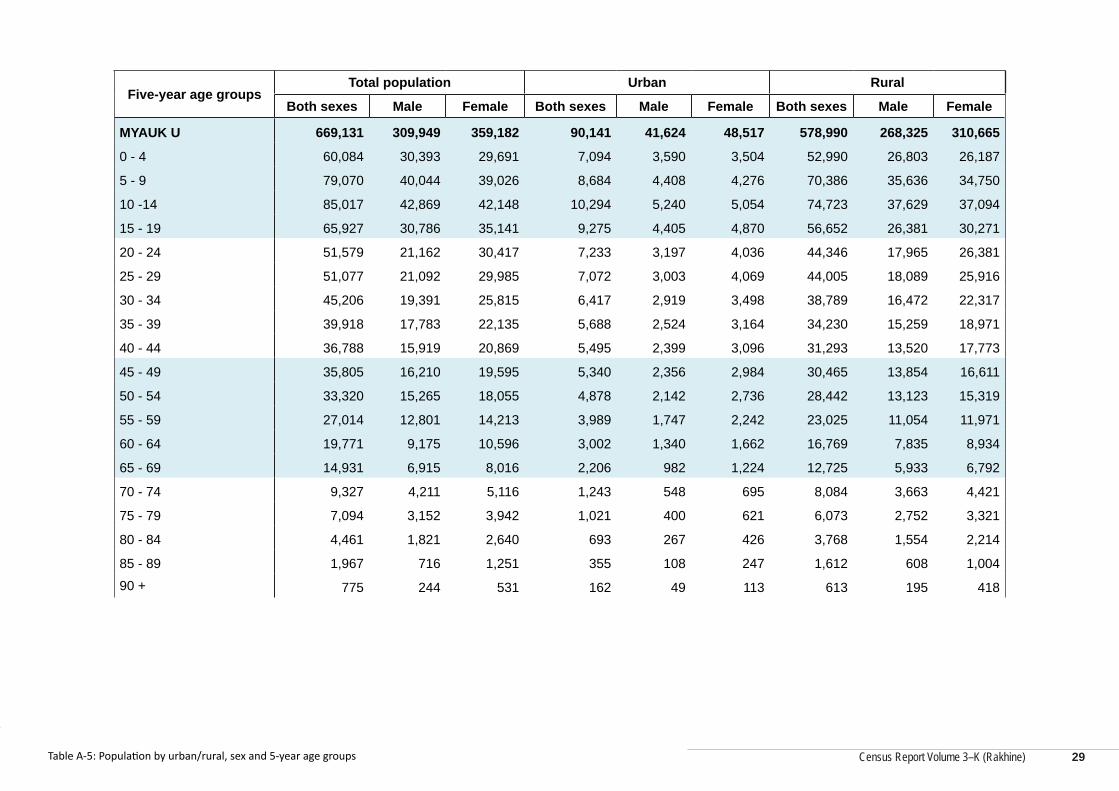
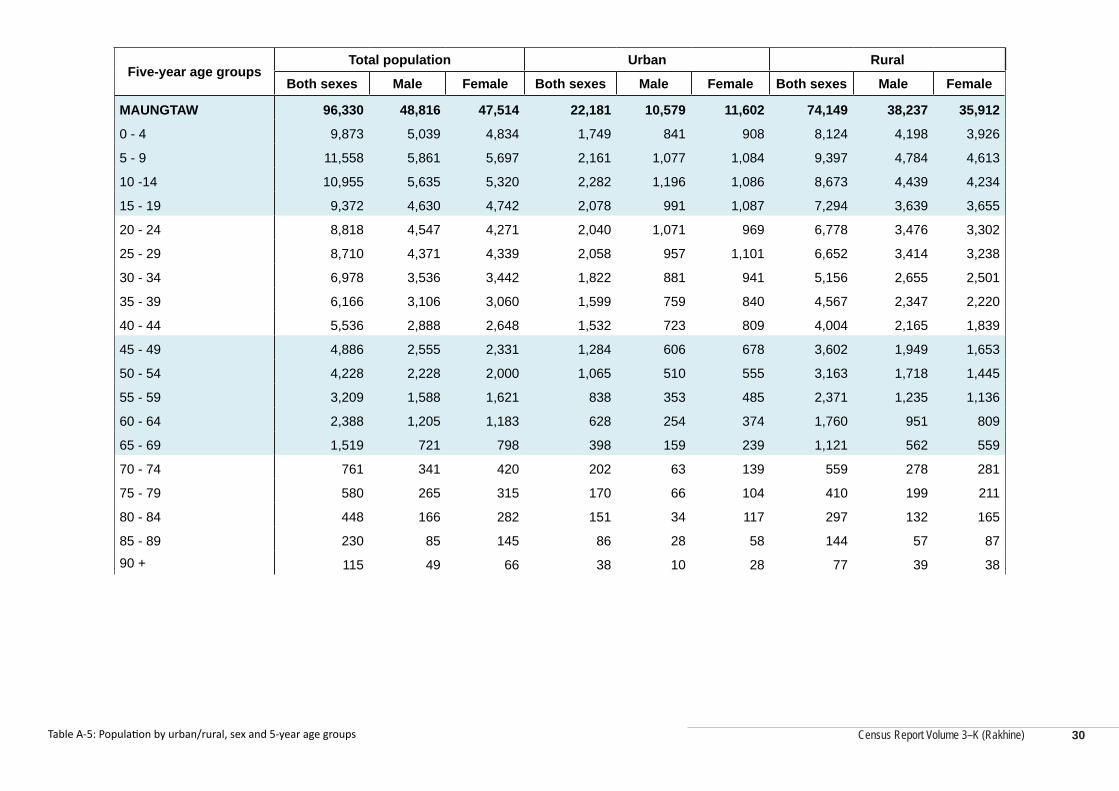
Table A-5: Population by urban/rural, sex and 5-year age groups
Five-year age groupsTotal population Urban Rural
Both sexes Male Female Both sexes Male Female Both sexes Male Female
RAKHINE 2,098,807 989,702 1,109,105 354,288 166,857 187,431 1,744,519 822,845 921,674
0 - 4 179,087 90,629 88,458 25,533 12,971 12,562 153,554 77,658 75,896
5 - 9 228,728 116,211 112,517 30,411 15,482 14,929 198,317 100,729 97,588
10 -14 245,518 124,154 121,364 37,335 19,200 18,135 208,183 104,954 103,229
15 - 19 195,491 93,828 101,663 35,227 17,350 17,877 160,264 76,478 83,786
20 - 24 160,262 70,599 89,663 30,077 14,206 15,871 130,185 56,393 73,792
25 - 29 160,895 71,507 89,388 29,114 13,491 15,623 131,781 58,016 73,765
30 - 34 148,649 67,652 80,997 27,199 12,806 14,393 121,450 54,846 66,604
35 - 39 134,866 62,476 72,390 24,424 11,418 13,006 110,442 51,058 59,384
40 - 44 127,614 57,881 69,733 23,549 10,726 12,823 104,065 47,155 56,910
45 - 49 118,666 55,017 63,649 21,841 9,766 12,075 96,825 45,251 51,574
50 - 54 107,296 49,600 57,696 19,034 8,445 10,589 88,262 41,155 47,107
55 - 59 85,220 39,655 45,565 15,267 6,677 8,590 69,953 32,978 36,975
60 - 64 66,602 30,409 36,193 11,816 5,092 6,724 54,786 25,317 29,469
65 - 69 50,205 22,452 27,753 8,506 3,570 4,936 41,699 18,882 22,817
70 - 74 34,517 15,091 19,426 5,244 2,168 3,076 29,273 12,923 16,350
75 - 79 26,589 11,592 14,997 4,351 1,696 2,655 22,238 9,896 12,342
80 - 84 17,369 6,965 10,404 3,046 1,063 1,983 14,323 5,902 8,421
85 - 89 7,928 2,908 5,020 1,614 527 1,087 6,314 2,381 3,933
90 + 3,305 1,076 2,229 700 203 497 2,605 873 1,732
Table A-5: Population by urban/rural, sex and 5-year age groups 27
Census Report Volume 3–K (Rakhine)
Five-year age groupsTotal population Urban Rural
Both sexes Male Female Both sexes Male Female Both sexes Male Female
SITTWAY 535,583 248,670 286,913 133,664 63,147 70,517 401,919 185,523 216,396
0 - 4 43,317 22,024 21,293 9,220 4,726 4,494 34,097 17,298 16,799
5 - 9 60,386 30,763 29,623 10,981 5,671 5,310 49,405 25,092 24,313
10 -14 69,872 35,419 34,453 14,560 7,564 6,996 55,312 27,855 27,457
15 - 19 55,874 26,902 28,972 14,215 7,183 7,032 41,659 19,719 21,940
20 - 24 43,268 18,322 24,946 12,204 5,673 6,531 31,064 12,649 18,415
25 - 29 41,940 17,831 24,109 11,728 5,451 6,277 30,212 12,380 17,832
30 - 34 37,725 16,273 21,452 10,806 5,018 5,788 26,919 11,255 15,664
35 - 39 31,388 13,978 17,410 9,165 4,286 4,879 22,223 9,692 12,531
40 - 44 31,528 13,756 17,772 8,731 3,973 4,758 22,797 9,783 13,014
45 - 49 29,317 13,464 15,853 8,108 3,585 4,523 21,209 9,879 11,330
50 - 54 25,671 11,768 13,903 6,819 3,010 3,809 18,852 8,758 10,094
55 - 59 19,706 8,888 10,818 5,365 2,318 3,047 14,341 6,570 7,771
60 - 64 15,334 6,797 8,537 4,113 1,741 2,372 11,221 5,056 6,165
65 - 69 11,454 4,936 6,518 2,977 1,226 1,751 8,477 3,710 4,767
70 - 74 6,673 2,850 3,823 1,554 645 909 5,119 2,205 2,914
75 - 79 6,184 2,577 3,607 1,476 565 911 4,708 2,012 2,696
80 - 84 3,609 1,351 2,258 927 309 618 2,682 1,042 1,640
85 - 89 1,679 577 1,102 503 154 349 1,176 423 753
90 + 658 194 464 212 49 163 446 145 301
Table A-5: Population by urban/rural, sex and 5-year age groups 28
Census Report Volume 3–K (Rakhine)
Census Report Volume 3–K (Rakhine)
Five-year age groupsTotal population Urban Rural
Both sexes Male Female Both sexes Male Female Both sexes Male Female
MYAUK U 669,131 309,949 359,182 90,141 41,624 48,517 578,990 268,325 310,665
0 - 4 60,084 30,393 29,691 7,094 3,590 3,504 52,990 26,803 26,187
5 - 9 79,070 40,044 39,026 8,684 4,408 4,276 70,386 35,636 34,750
10 -14 85,017 42,869 42,148 10,294 5,240 5,054 74,723 37,629 37,094
15 - 19 65,927 30,786 35,141 9,275 4,405 4,870 56,652 26,381 30,271
20 - 24 51,579 21,162 30,417 7,233 3,197 4,036 44,346 17,965 26,381
25 - 29 51,077 21,092 29,985 7,072 3,003 4,069 44,005 18,089 25,916
30 - 34 45,206 19,391 25,815 6,417 2,919 3,498 38,789 16,472 22,317
35 - 39 39,918 17,783 22,135 5,688 2,524 3,164 34,230 15,259 18,971
40 - 44 36,788 15,919 20,869 5,495 2,399 3,096 31,293 13,520 17,773
45 - 49 35,805 16,210 19,595 5,340 2,356 2,984 30,465 13,854 16,611
50 - 54 33,320 15,265 18,055 4,878 2,142 2,736 28,442 13,123 15,319
55 - 59 27,014 12,801 14,213 3,989 1,747 2,242 23,025 11,054 11,971
60 - 64 19,771 9,175 10,596 3,002 1,340 1,662 16,769 7,835 8,934
65 - 69 14,931 6,915 8,016 2,206 982 1,224 12,725 5,933 6,792
70 - 74 9,327 4,211 5,116 1,243 548 695 8,084 3,663 4,421
75 - 79 7,094 3,152 3,942 1,021 400 621 6,073 2,752 3,321
80 - 84 4,461 1,821 2,640 693 267 426 3,768 1,554 2,214
85 - 89 1,967 716 1,251 355 108 247 1,612 608 1,004
90 + 775 244 531 162 49 113 613 195 418
Table A-5: Population by urban/rural, sex and 5-year age groups 29
Census Report Volume 3–K (Rakhine)
Five-year age groupsTotal population Urban Rural
Both sexes Male Female Both sexes Male Female Both sexes Male Female
MAUNGTAW 96,330 48,816 47,514 22,181 10,579 11,602 74,149 38,237 35,912
0 - 4 9,873 5,039 4,834 1,749 841 908 8,124 4,198 3,926
5 - 9 11,558 5,861 5,697 2,161 1,077 1,084 9,397 4,784 4,613
10 -14 10,955 5,635 5,320 2,282 1,196 1,086 8,673 4,439 4,234
15 - 19 9,372 4,630 4,742 2,078 991 1,087 7,294 3,639 3,655
20 - 24 8,818 4,547 4,271 2,040 1,071 969 6,778 3,476 3,302
25 - 29 8,710 4,371 4,339 2,058 957 1,101 6,652 3,414 3,238
30 - 34 6,978 3,536 3,442 1,822 881 941 5,156 2,655 2,501
35 - 39 6,166 3,106 3,060 1,599 759 840 4,567 2,347 2,220
40 - 44 5,536 2,888 2,648 1,532 723 809 4,004 2,165 1,839
45 - 49 4,886 2,555 2,331 1,284 606 678 3,602 1,949 1,653
50 - 54 4,228 2,228 2,000 1,065 510 555 3,163 1,718 1,445
55 - 59 3,209 1,588 1,621 838 353 485 2,371 1,235 1,136
60 - 64 2,388 1,205 1,183 628 254 374 1,760 951 809
65 - 69 1,519 721 798 398 159 239 1,121 562 559
70 - 74 761 341 420 202 63 139 559 278 281
75 - 79 580 265 315 170 66 104 410 199 211
80 - 84 448 166 282 151 34 117 297 132 165
85 - 89 230 85 145 86 28 58 144 57 87
90 + 115 49 66 38 10 28 77 39 38
Table A-5: Population by urban/rural, sex and 5-year age groups 30
Census Report Volume 3–K (Rakhine)
Census Report Volume 3–K (Rakhine)
Five-year age groupsTotal population Urban Rural
Both sexes Male Female Both sexes Male Female Both sexes Male Female
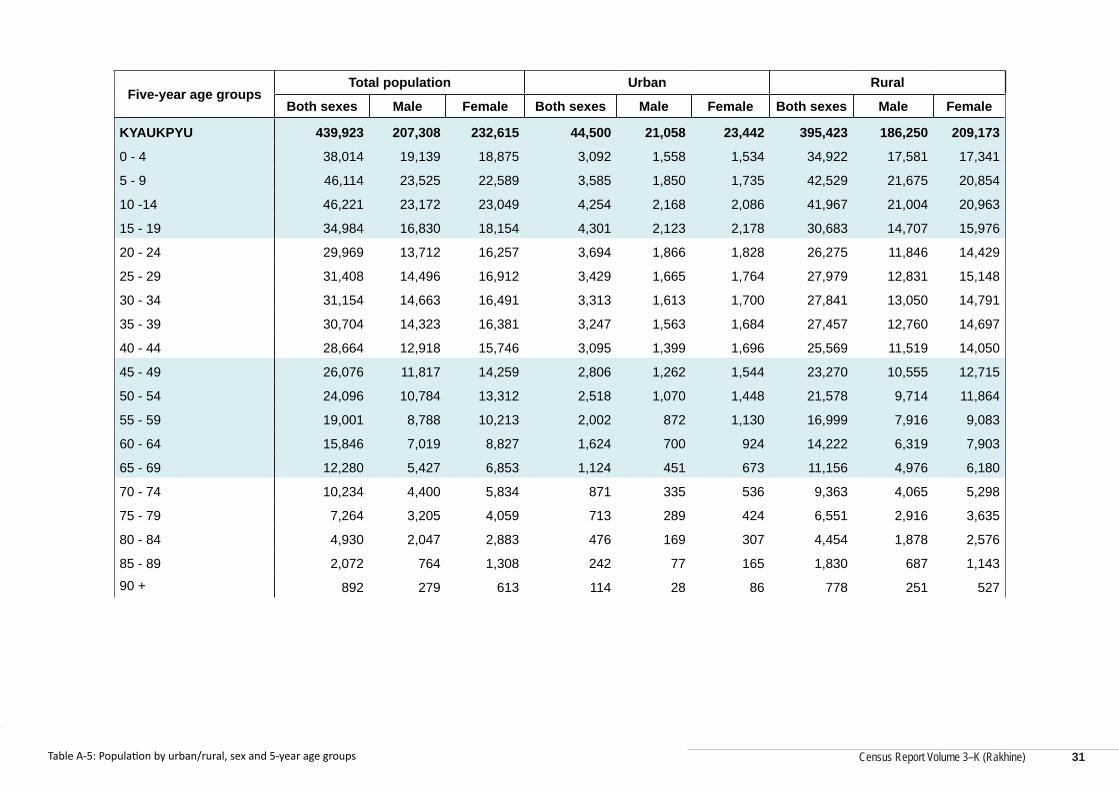
KYAUKPYU 439,923 207,308 232,615 44,500 21,058 23,442 395,423 186,250 209,173
0 - 4 38,014 19,139 18,875 3,092 1,558 1,534 34,922 17,581 17,341
5 - 9 46,114 23,525 22,589 3,585 1,850 1,735 42,529 21,675 20,854
10 -14 46,221 23,172 23,049 4,254 2,168 2,086 41,967 21,004 20,963
15 - 19 34,984 16,830 18,154 4,301 2,123 2,178 30,683 14,707 15,976
20 - 24 29,969 13,712 16,257 3,694 1,866 1,828 26,275 11,846 14,429
25 - 29 31,408 14,496 16,912 3,429 1,665 1,764 27,979 12,831 15,148
30 - 34 31,154 14,663 16,491 3,313 1,613 1,700 27,841 13,050 14,791
35 - 39 30,704 14,323 16,381 3,247 1,563 1,684 27,457 12,760 14,697
40 - 44 28,664 12,918 15,746 3,095 1,399 1,696 25,569 11,519 14,050
45 - 49 26,076 11,817 14,259 2,806 1,262 1,544 23,270 10,555 12,715
50 - 54 24,096 10,784 13,312 2,518 1,070 1,448 21,578 9,714 11,864
55 - 59 19,001 8,788 10,213 2,002 872 1,130 16,999 7,916 9,083
60 - 64 15,846 7,019 8,827 1,624 700 924 14,222 6,319 7,903
65 - 69 12,280 5,427 6,853 1,124 451 673 11,156 4,976 6,180
70 - 74 10,234 4,400 5,834 871 335 536 9,363 4,065 5,298
75 - 79 7,264 3,205 4,059 713 289 424 6,551 2,916 3,635
80 - 84 4,930 2,047 2,883 476 169 307 4,454 1,878 2,576
85 - 89 2,072 764 1,308 242 77 165 1,830 687 1,143
90 + 892 279 613 114 28 86 778 251 527
Table A-5: Population by urban/rural, sex and 5-year age groups 31
Census Report Volume 3–K (Rakhine)
Five-year age groupsTotal population Urban Rural
Both sexes Male Female Both sexes Male Female Both sexes Male Female
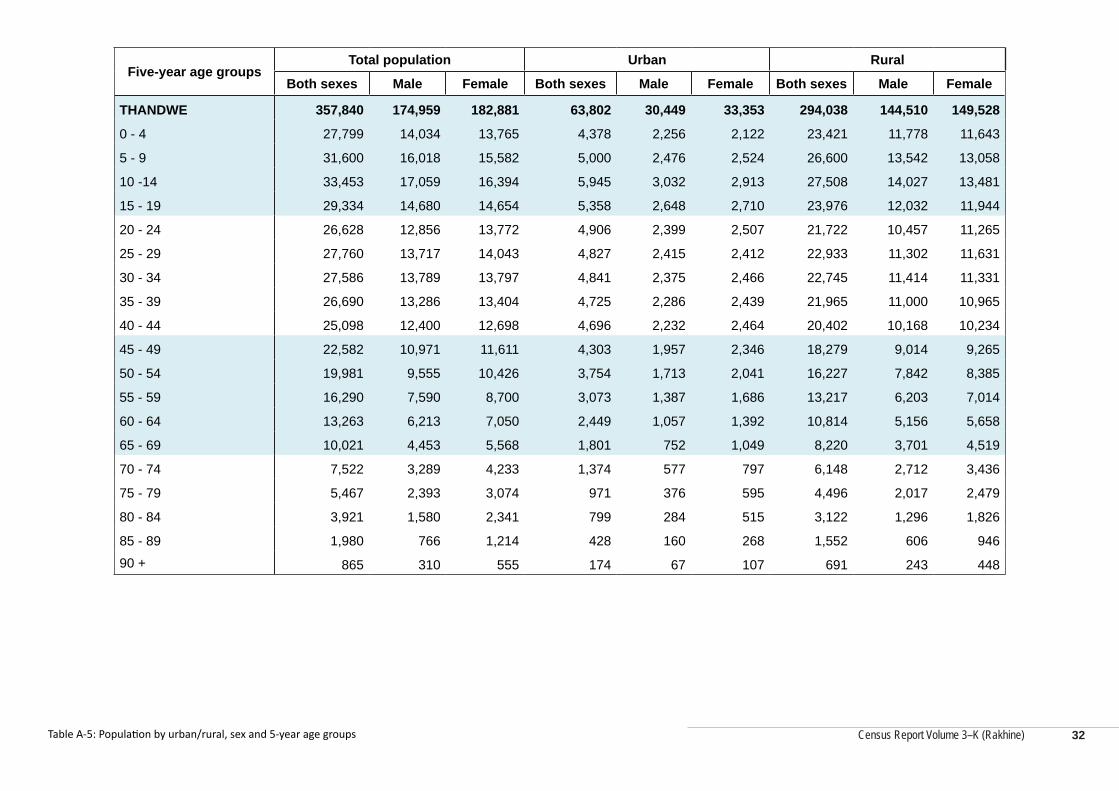
THANDWE 357,840 174,959 182,881 63,802 30,449 33,353 294,038 144,510 149,528
0 - 4 27,799 14,034 13,765 4,378 2,256 2,122 23,421 11,778 11,643
5 - 9 31,600 16,018 15,582 5,000 2,476 2,524 26,600 13,542 13,058
10 -14 33,453 17,059 16,394 5,945 3,032 2,913 27,508 14,027 13,481
15 - 19 29,334 14,680 14,654 5,358 2,648 2,710 23,976 12,032 11,944
20 - 24 26,628 12,856 13,772 4,906 2,399 2,507 21,722 10,457 11,265
25 - 29 27,760 13,717 14,043 4,827 2,415 2,412 22,933 11,302 11,631
30 - 34 27,586 13,789 13,797 4,841 2,375 2,466 22,745 11,414 11,331
35 - 39 26,690 13,286 13,404 4,725 2,286 2,439 21,965 11,000 10,965
40 - 44 25,098 12,400 12,698 4,696 2,232 2,464 20,402 10,168 10,234
45 - 49 22,582 10,971 11,611 4,303 1,957 2,346 18,279 9,014 9,265
50 - 54 19,981 9,555 10,426 3,754 1,713 2,041 16,227 7,842 8,385
55 - 59 16,290 7,590 8,700 3,073 1,387 1,686 13,217 6,203 7,014
60 - 64 13,263 6,213 7,050 2,449 1,057 1,392 10,814 5,156 5,658
65 - 69 10,021 4,453 5,568 1,801 752 1,049 8,220 3,701 4,519
70 - 74 7,522 3,289 4,233 1,374 577 797 6,148 2,712 3,436
75 - 79 5,467 2,393 3,074 971 376 595 4,496 2,017 2,479
80 - 84 3,921 1,580 2,341 799 284 515 3,122 1,296 1,826
85 - 89 1,980 766 1,214 428 160 268 1,552 606 946
90 + 865 310 555 174 67 107 691 243 448
Table A-5: Population by urban/rural, sex and 5-year age groups 32
Census Report Volume 3–K (Rakhine)
Census Report Volume 3–K (Rakhine)
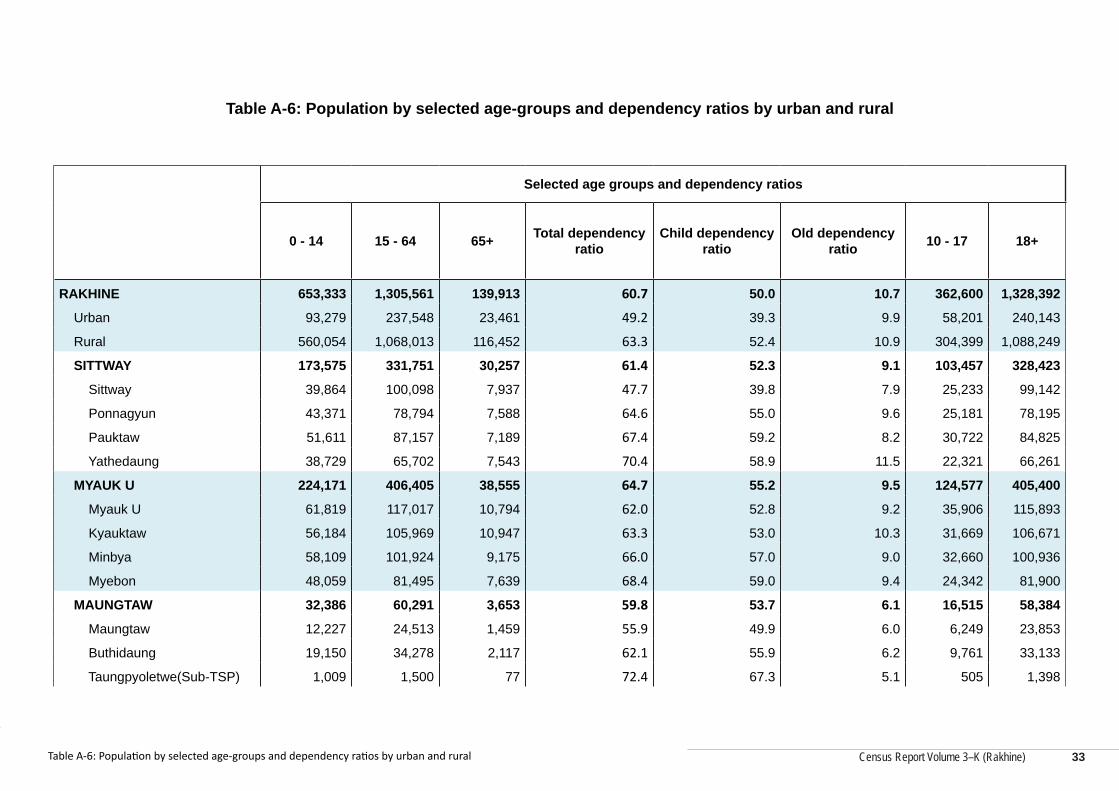
Table A-6: Population by selected age-groups and dependency ratios by urban and rural
Selected age groups and dependency ratios
0 - 14 15 - 64 65+ Total dependency ratio
Child dependency ratio
Old dependency ratio 10 - 17 18+
RAKHINE 653,333 1,305,561 139,913 60.7 50.0 10.7 362,600 1,328,392
Urban 93,279 237,548 23,461 49.2 39.3 9.9 58,201 240,143
Rural 560,054 1,068,013 116,452 63.3 52.4 10.9 304,399 1,088,249
SITTWAY 173,575 331,751 30,257 61.4 52.3 9.1 103,457 328,423
Sittway 39,864 100,098 7,937 47.7 39.8 7.9 25,233 99,142
Ponnagyun 43,371 78,794 7,588 64.6 55.0 9.6 25,181 78,195
Pauktaw 51,611 87,157 7,189 67.4 59.2 8.2 30,722 84,825
Yathedaung 38,729 65,702 7,543 70.4 58.9 11.5 22,321 66,261
MYAUK U 224,171 406,405 38,555 64.7 55.2 9.5 124,577 405,400
Myauk U 61,819 117,017 10,794 62.0 52.8 9.2 35,906 115,893
Kyauktaw 56,184 105,969 10,947 63.3 53.0 10.3 31,669 106,671
Minbya 58,109 101,924 9,175 66.0 57.0 9.0 32,660 100,936
Myebon 48,059 81,495 7,639 68.4 59.0 9.4 24,342 81,900
MAUNGTAW 32,386 60,291 3,653 59.8 53.7 6.1 16,515 58,384
Maungtaw 12,227 24,513 1,459 55.9 49.9 6.0 6,249 23,853
Buthidaung 19,150 34,278 2,117 62.1 55.9 6.2 9,761 33,133
Taungpyoletwe(Sub-TSP) 1,009 1,500 77 72.4 67.3 5.1 505 1,398
Table A-6: Population by selected age-groups and dependency ratios by urban and rural 33
Census Report Volume 3–K (Rakhine)
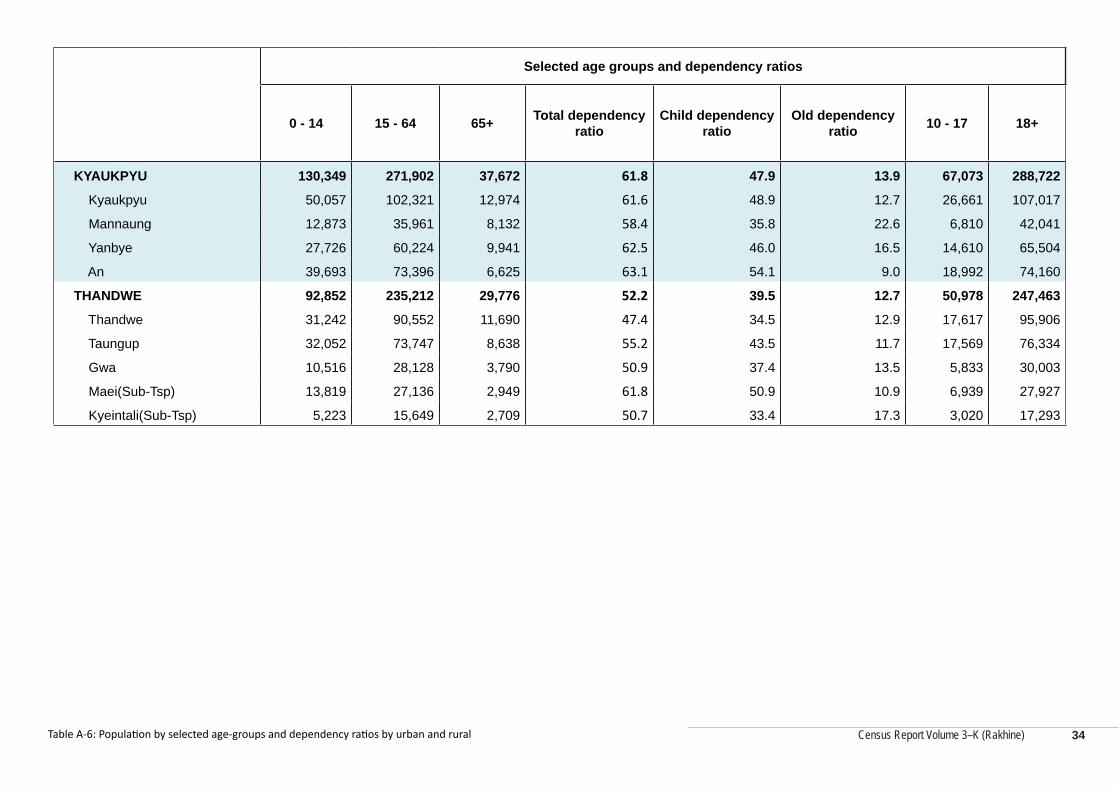
Selected age groups and dependency ratios
0 - 14 15 - 64 65+ Total dependency ratio
Child dependency ratio
Old dependency ratio 10 - 17 18+
KYAUKPYU 130,349 271,902 37,672 61.8 47.9 13.9 67,073 288,722
Kyaukpyu 50,057 102,321 12,974 61.6 48.9 12.7 26,661 107,017
Mannaung 12,873 35,961 8,132 58.4 35.8 22.6 6,810 42,041
Yanbye 27,726 60,224 9,941 62.5 46.0 16.5 14,610 65,504
An 39,693 73,396 6,625 63.1 54.1 9.0 18,992 74,160
THANDWE 92,852 235,212 29,776 52.2 39.5 12.7 50,978 247,463
Thandwe 31,242 90,552 11,690 47.4 34.5 12.9 17,617 95,906
Taungup 32,052 73,747 8,638 55.2 43.5 11.7 17,569 76,334
Gwa 10,516 28,128 3,790 50.9 37.4 13.5 5,833 30,003
Maei(Sub-Tsp) 13,819 27,136 2,949 61.8 50.9 10.9 6,939 27,927
Kyeintali(Sub-Tsp) 5,223 15,649 2,709 50.7 33.4 17.3 3,020 17,293
Table A-6: Population by selected age-groups and dependency ratios by urban and rural 34
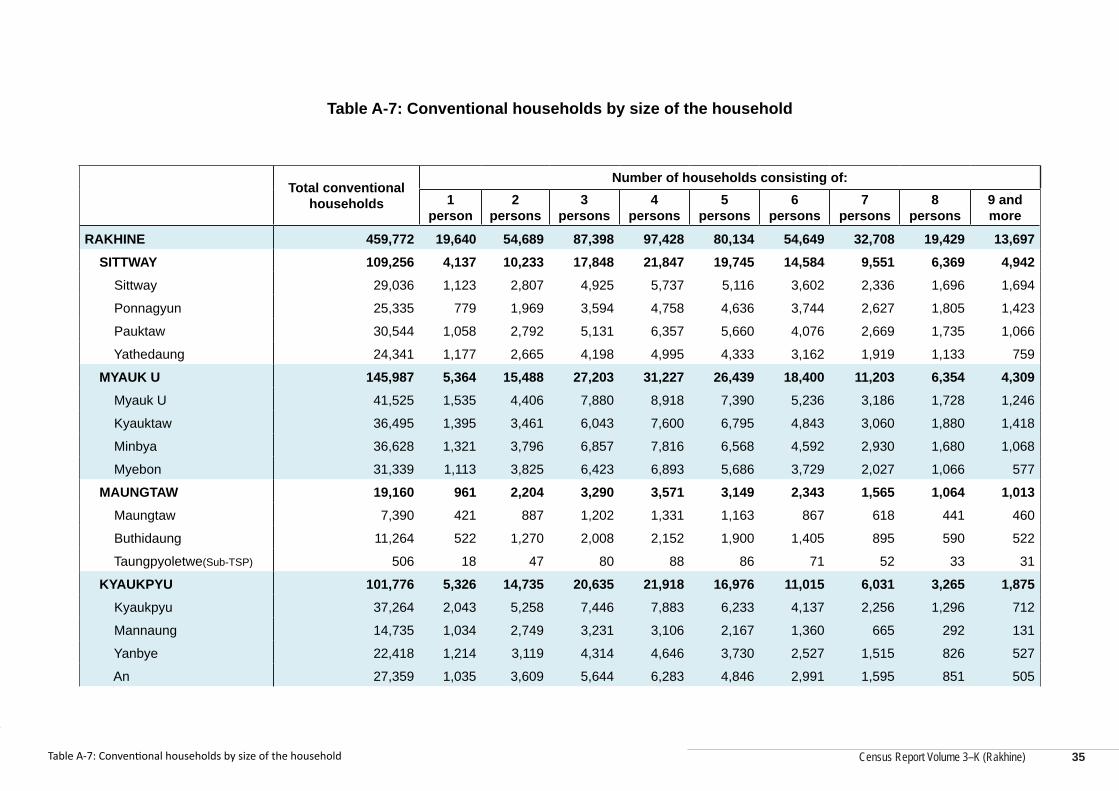
Census Report Volume 3–K (Rakhine)
Census Report Volume 3–K (Rakhine)
Table A-7: Conventional households by size of the household
Total conventional households
Number of households consisting of:1
person2
persons3
persons4
persons5
persons6
persons7
persons8
persons9 and more
RAKHINE 459,772 19,640 54,689 87,398 97,428 80,134 54,649 32,708 19,429 13,697 SITTWAY 109,256 4,137 10,233 17,848 21,847 19,745 14,584 9,551 6,369 4,942 Sittway 29,036 1,123 2,807 4,925 5,737 5,116 3,602 2,336 1,696 1,694
Ponnagyun 25,335 779 1,969 3,594 4,758 4,636 3,744 2,627 1,805 1,423
Pauktaw 30,544 1,058 2,792 5,131 6,357 5,660 4,076 2,669 1,735 1,066
Yathedaung 24,341 1,177 2,665 4,198 4,995 4,333 3,162 1,919 1,133 759
MYAUK U 145,987 5,364 15,488 27,203 31,227 26,439 18,400 11,203 6,354 4,309 Myauk U 41,525 1,535 4,406 7,880 8,918 7,390 5,236 3,186 1,728 1,246
Kyauktaw 36,495 1,395 3,461 6,043 7,600 6,795 4,843 3,060 1,880 1,418
Minbya 36,628 1,321 3,796 6,857 7,816 6,568 4,592 2,930 1,680 1,068
Myebon 31,339 1,113 3,825 6,423 6,893 5,686 3,729 2,027 1,066 577
MAUNGTAW 19,160 961 2,204 3,290 3,571 3,149 2,343 1,565 1,064 1,013 Maungtaw 7,390 421 887 1,202 1,331 1,163 867 618 441 460
Buthidaung 11,264 522 1,270 2,008 2,152 1,900 1,405 895 590 522
Taungpyoletwe(Sub-TSP) 506 18 47 80 88 86 71 52 33 31
KYAUKPYU 101,776 5,326 14,735 20,635 21,918 16,976 11,015 6,031 3,265 1,875 Kyaukpyu 37,264 2,043 5,258 7,446 7,883 6,233 4,137 2,256 1,296 712
Mannaung 14,735 1,034 2,749 3,231 3,106 2,167 1,360 665 292 131
Yanbye 22,418 1,214 3,119 4,314 4,646 3,730 2,527 1,515 826 527
An 27,359 1,035 3,609 5,644 6,283 4,846 2,991 1,595 851 505
Table A-7: Conventional households by size of the household 35
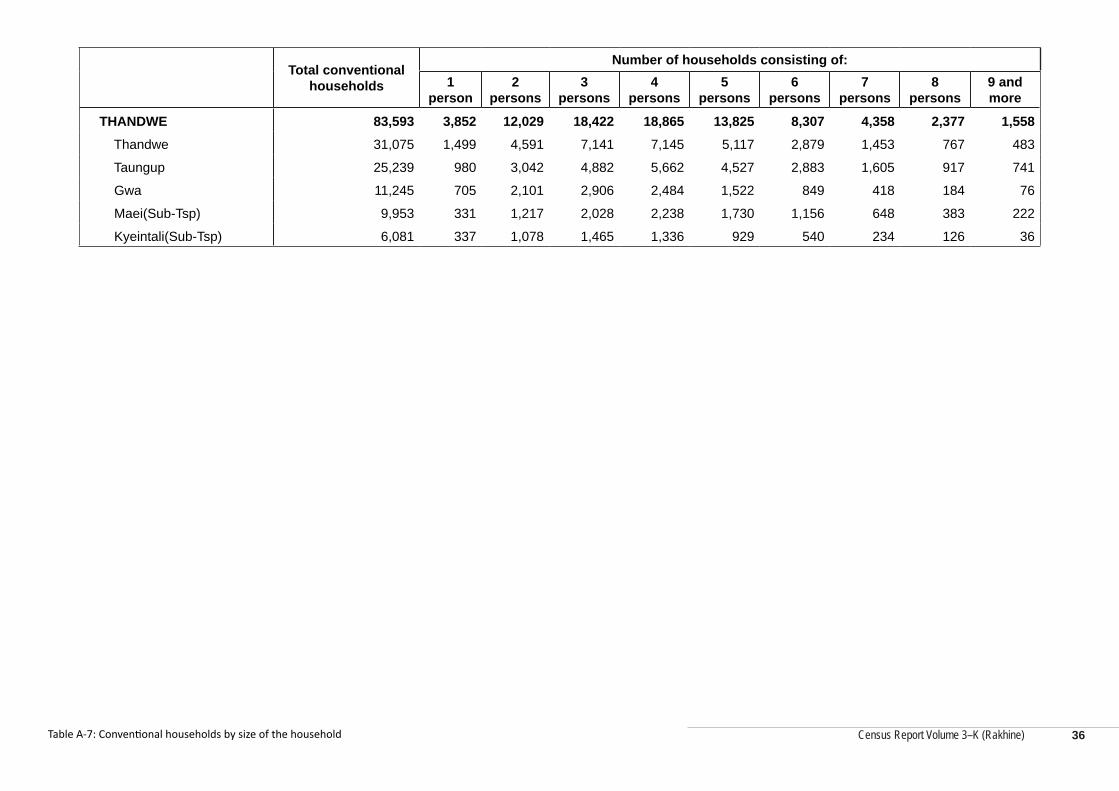
Census Report Volume 3–K (Rakhine)
Total conventional households
Number of households consisting of:1
person2
persons3
persons4
persons5
persons6
persons7
persons8
persons9 and more
THANDWE 83,593 3,852 12,029 18,422 18,865 13,825 8,307 4,358 2,377 1,558 Thandwe 31,075 1,499 4,591 7,141 7,145 5,117 2,879 1,453 767 483
Taungup 25,239 980 3,042 4,882 5,662 4,527 2,883 1,605 917 741
Gwa 11,245 705 2,101 2,906 2,484 1,522 849 418 184 76
Maei(Sub-Tsp) 9,953 331 1,217 2,028 2,238 1,730 1,156 648 383 222
Kyeintali(Sub-Tsp) 6,081 337 1,078 1,465 1,336 929 540 234 126 36
Table A-7: Conventional households by size of the household 36
Census Report Volume 3–K (Rakhine)
Myanmar Population and Housing Census,
Census Report Volume 3-K (Rakhine)
Series B: Social Characteristics
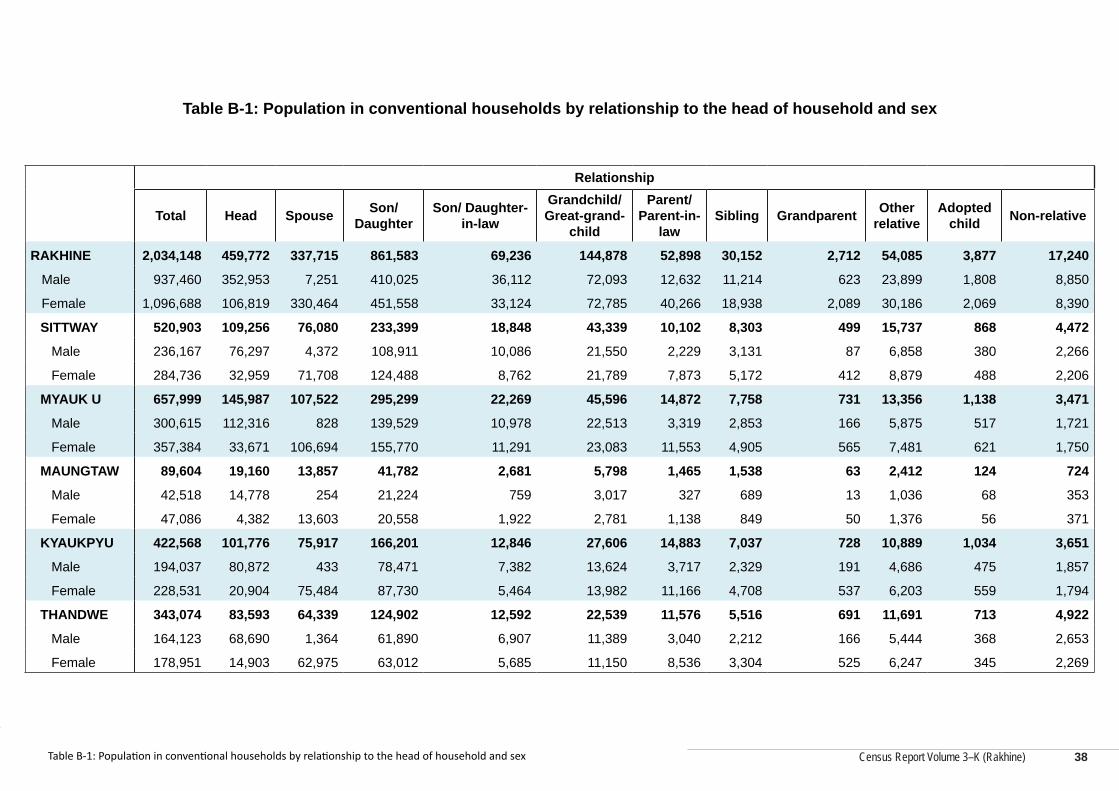
Census Report Volume 3–K (Rakhine)
Census Report Volume 3–K (Rakhine)
Table B-1: Population in conventional households by relationship to the head of household and sex
Relationship
Total Head Spouse Son/ Daughter
Son/ Daughter-in-law
Grandchild/ Great-grand-
child
Parent/ Parent-in-
lawSibling Grandparent Other
relativeAdopted
child Non-relative
RAKHINE 2,034,148 459,772 337,715 861,583 69,236 144,878 52,898 30,152 2,712 54,085 3,877 17,240
Male 937,460 352,953 7,251 410,025 36,112 72,093 12,632 11,214 623 23,899 1,808 8,850
Female 1,096,688 106,819 330,464 451,558 33,124 72,785 40,266 18,938 2,089 30,186 2,069 8,390
SITTWAY 520,903 109,256 76,080 233,399 18,848 43,339 10,102 8,303 499 15,737 868 4,472
Male 236,167 76,297 4,372 108,911 10,086 21,550 2,229 3,131 87 6,858 380 2,266
Female 284,736 32,959 71,708 124,488 8,762 21,789 7,873 5,172 412 8,879 488 2,206
MYAUK U 657,999 145,987 107,522 295,299 22,269 45,596 14,872 7,758 731 13,356 1,138 3,471
Male 300,615 112,316 828 139,529 10,978 22,513 3,319 2,853 166 5,875 517 1,721
Female 357,384 33,671 106,694 155,770 11,291 23,083 11,553 4,905 565 7,481 621 1,750
MAUNGTAW 89,604 19,160 13,857 41,782 2,681 5,798 1,465 1,538 63 2,412 124 724
Male 42,518 14,778 254 21,224 759 3,017 327 689 13 1,036 68 353
Female 47,086 4,382 13,603 20,558 1,922 2,781 1,138 849 50 1,376 56 371
KYAUKPYU 422,568 101,776 75,917 166,201 12,846 27,606 14,883 7,037 728 10,889 1,034 3,651
Male 194,037 80,872 433 78,471 7,382 13,624 3,717 2,329 191 4,686 475 1,857
Female 228,531 20,904 75,484 87,730 5,464 13,982 11,166 4,708 537 6,203 559 1,794
THANDWE 343,074 83,593 64,339 124,902 12,592 22,539 11,576 5,516 691 11,691 713 4,922
Male 164,123 68,690 1,364 61,890 6,907 11,389 3,040 2,212 166 5,444 368 2,653
Female 178,951 14,903 62,975 63,012 5,685 11,150 8,536 3,304 525 6,247 345 2,269
Table B-1: Population in conventional households by relationship to the head of household and sex 38
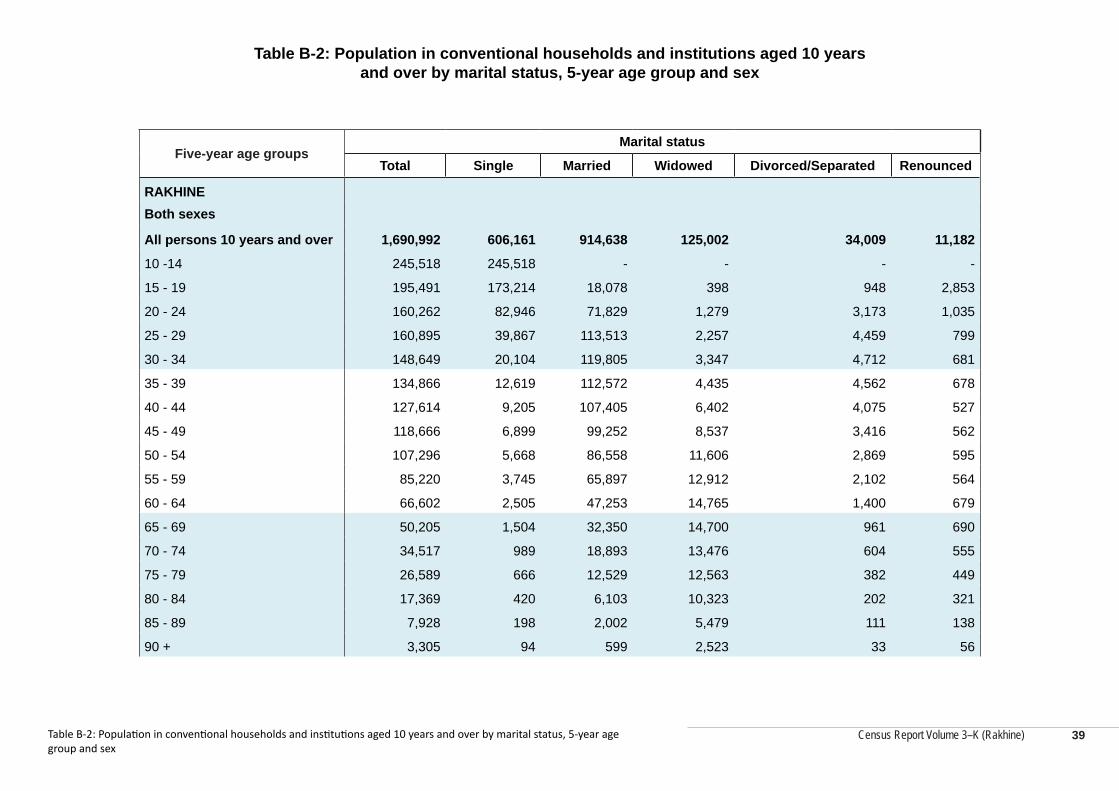
Census Report Volume 3–K (Rakhine)
Table B-2: Population in conventional households and institutions aged 10 years and over by marital status, 5-year age group and sex
Five-year age groupsMarital status
Total Single Married Widowed Divorced/Separated Renounced
RAKHINEBoth sexes
All persons 10 years and over 1,690,992 606,161 914,638 125,002 34,009 11,182
10 -14 245,518 245,518 - - - -
15 - 19 195,491 173,214 18,078 398 948 2,853
20 - 24 160,262 82,946 71,829 1,279 3,173 1,035
25 - 29 160,895 39,867 113,513 2,257 4,459 799
30 - 34 148,649 20,104 119,805 3,347 4,712 681
35 - 39 134,866 12,619 112,572 4,435 4,562 678
40 - 44 127,614 9,205 107,405 6,402 4,075 527
45 - 49 118,666 6,899 99,252 8,537 3,416 562
50 - 54 107,296 5,668 86,558 11,606 2,869 595
55 - 59 85,220 3,745 65,897 12,912 2,102 564
60 - 64 66,602 2,505 47,253 14,765 1,400 679
65 - 69 50,205 1,504 32,350 14,700 961 690
70 - 74 34,517 989 18,893 13,476 604 555
75 - 79 26,589 666 12,529 12,563 382 449
80 - 84 17,369 420 6,103 10,323 202 321
85 - 89 7,928 198 2,002 5,479 111 138
90 + 3,305 94 599 2,523 33 56
Table B-2: Population in conventional households and institutions aged 10 years and over by marital status, 5-year age group and sex
39
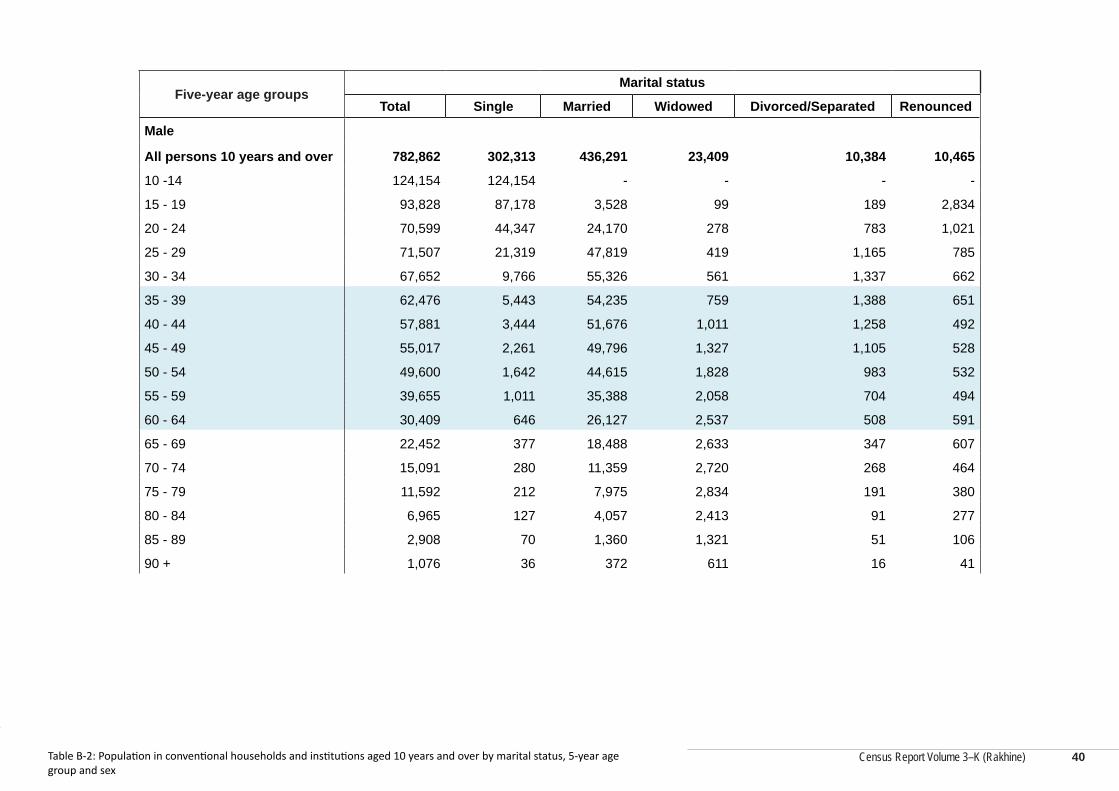
Census Report Volume 3–K (Rakhine)
Census Report Volume 3–K (Rakhine)
Five-year age groupsMarital status
Total Single Married Widowed Divorced/Separated Renounced
Male
All persons 10 years and over 782,862 302,313 436,291 23,409 10,384 10,465
10 -14 124,154 124,154 - - - -
15 - 19 93,828 87,178 3,528 99 189 2,834
20 - 24 70,599 44,347 24,170 278 783 1,021
25 - 29 71,507 21,319 47,819 419 1,165 785
30 - 34 67,652 9,766 55,326 561 1,337 662
35 - 39 62,476 5,443 54,235 759 1,388 651
40 - 44 57,881 3,444 51,676 1,011 1,258 492
45 - 49 55,017 2,261 49,796 1,327 1,105 528
50 - 54 49,600 1,642 44,615 1,828 983 532
55 - 59 39,655 1,011 35,388 2,058 704 494
60 - 64 30,409 646 26,127 2,537 508 591
65 - 69 22,452 377 18,488 2,633 347 607
70 - 74 15,091 280 11,359 2,720 268 464
75 - 79 11,592 212 7,975 2,834 191 380
80 - 84 6,965 127 4,057 2,413 91 277
85 - 89 2,908 70 1,360 1,321 51 106
90 + 1,076 36 372 611 16 41
Table B-2: Population in conventional households and institutions aged 10 years and over by marital status, 5-year age group and sex
40
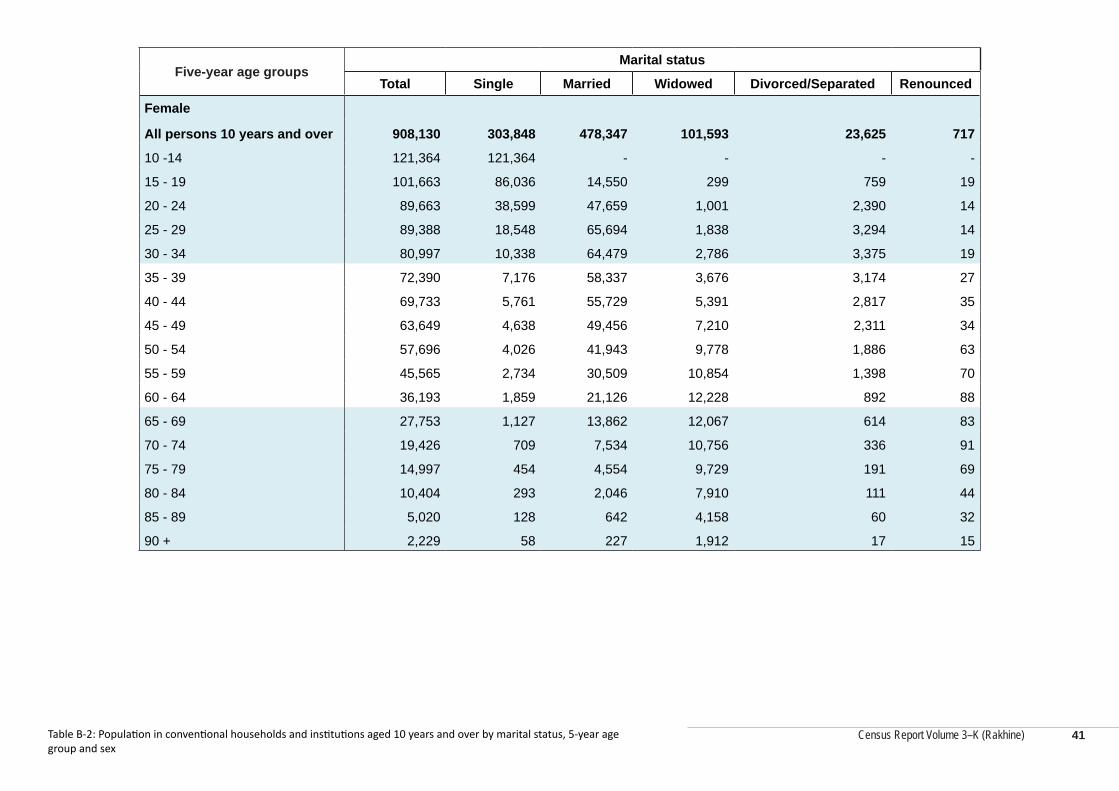
Census Report Volume 3–K (Rakhine)
Five-year age groupsMarital status
Total Single Married Widowed Divorced/Separated Renounced
Female
All persons 10 years and over 908,130 303,848 478,347 101,593 23,625 717
10 -14 121,364 121,364 - - - -
15 - 19 101,663 86,036 14,550 299 759 19
20 - 24 89,663 38,599 47,659 1,001 2,390 14
25 - 29 89,388 18,548 65,694 1,838 3,294 14
30 - 34 80,997 10,338 64,479 2,786 3,375 19
35 - 39 72,390 7,176 58,337 3,676 3,174 27
40 - 44 69,733 5,761 55,729 5,391 2,817 35
45 - 49 63,649 4,638 49,456 7,210 2,311 34
50 - 54 57,696 4,026 41,943 9,778 1,886 63
55 - 59 45,565 2,734 30,509 10,854 1,398 70
60 - 64 36,193 1,859 21,126 12,228 892 88
65 - 69 27,753 1,127 13,862 12,067 614 83
70 - 74 19,426 709 7,534 10,756 336 91
75 - 79 14,997 454 4,554 9,729 191 69
80 - 84 10,404 293 2,046 7,910 111 44
85 - 89 5,020 128 642 4,158 60 32
90 + 2,229 58 227 1,912 17 15
Table B-2: Population in conventional households and institutions aged 10 years and over by marital status, 5-year age group and sex
41
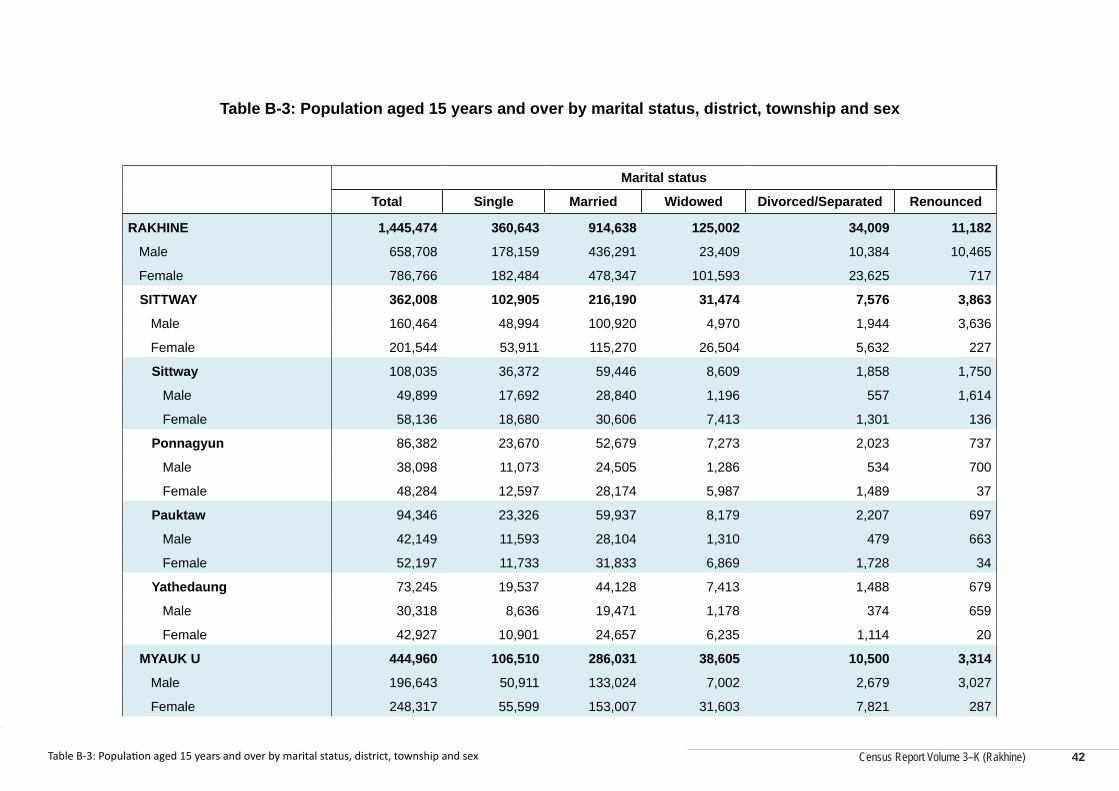
Census Report Volume 3–K (Rakhine)
Census Report Volume 3–K (Rakhine)
Table B-3: Population aged 15 years and over by marital status, district, township and sex
Marital status
Total Single Married Widowed Divorced/Separated Renounced
RAKHINE 1,445,474 360,643 914,638 125,002 34,009 11,182
Male 658,708 178,159 436,291 23,409 10,384 10,465
Female 786,766 182,484 478,347 101,593 23,625 717
SITTWAY 362,008 102,905 216,190 31,474 7,576 3,863
Male 160,464 48,994 100,920 4,970 1,944 3,636
Female 201,544 53,911 115,270 26,504 5,632 227
Sittway 108,035 36,372 59,446 8,609 1,858 1,750
Male 49,899 17,692 28,840 1,196 557 1,614
Female 58,136 18,680 30,606 7,413 1,301 136
Ponnagyun 86,382 23,670 52,679 7,273 2,023 737
Male 38,098 11,073 24,505 1,286 534 700
Female 48,284 12,597 28,174 5,987 1,489 37
Pauktaw 94,346 23,326 59,937 8,179 2,207 697
Male 42,149 11,593 28,104 1,310 479 663
Female 52,197 11,733 31,833 6,869 1,728 34
Yathedaung 73,245 19,537 44,128 7,413 1,488 679
Male 30,318 8,636 19,471 1,178 374 659
Female 42,927 10,901 24,657 6,235 1,114 20
MYAUK U 444,960 106,510 286,031 38,605 10,500 3,314
Male 196,643 50,911 133,024 7,002 2,679 3,027
Female 248,317 55,599 153,007 31,603 7,821 287
Table B-3: Population aged 15 years and over by marital status, district, township and sex 42
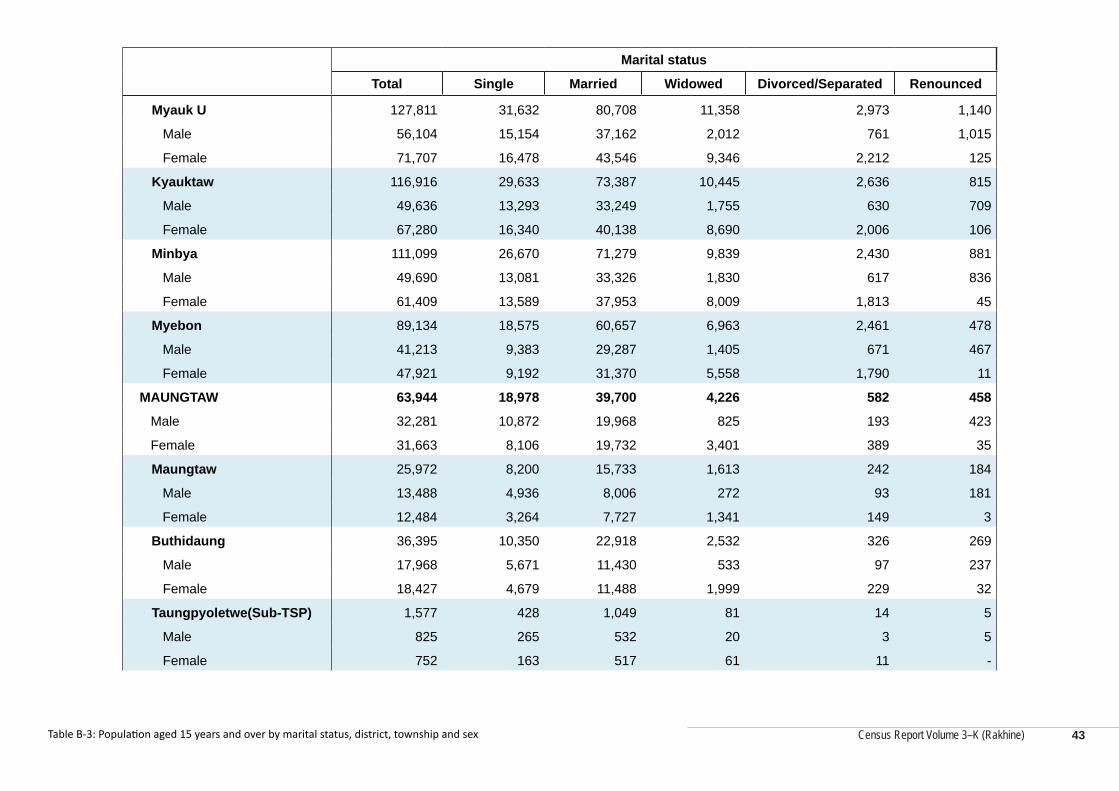
Census Report Volume 3–K (Rakhine)
Marital status
Total Single Married Widowed Divorced/Separated Renounced
Myauk U 127,811 31,632 80,708 11,358 2,973 1,140
Male 56,104 15,154 37,162 2,012 761 1,015
Female 71,707 16,478 43,546 9,346 2,212 125
Kyauktaw 116,916 29,633 73,387 10,445 2,636 815
Male 49,636 13,293 33,249 1,755 630 709
Female 67,280 16,340 40,138 8,690 2,006 106
Minbya 111,099 26,670 71,279 9,839 2,430 881
Male 49,690 13,081 33,326 1,830 617 836
Female 61,409 13,589 37,953 8,009 1,813 45
Myebon 89,134 18,575 60,657 6,963 2,461 478
Male 41,213 9,383 29,287 1,405 671 467
Female 47,921 9,192 31,370 5,558 1,790 11
MAUNGTAW 63,944 18,978 39,700 4,226 582 458
Male 32,281 10,872 19,968 825 193 423
Female 31,663 8,106 19,732 3,401 389 35
Maungtaw 25,972 8,200 15,733 1,613 242 184
Male 13,488 4,936 8,006 272 93 181
Female 12,484 3,264 7,727 1,341 149 3
Buthidaung 36,395 10,350 22,918 2,532 326 269
Male 17,968 5,671 11,430 533 97 237
Female 18,427 4,679 11,488 1,999 229 32
Taungpyoletwe(Sub-TSP) 1,577 428 1,049 81 14 5
Male 825 265 532 20 3 5
Female 752 163 517 61 11 -
Table B-3: Population aged 15 years and over by marital status, district, township and sex 43
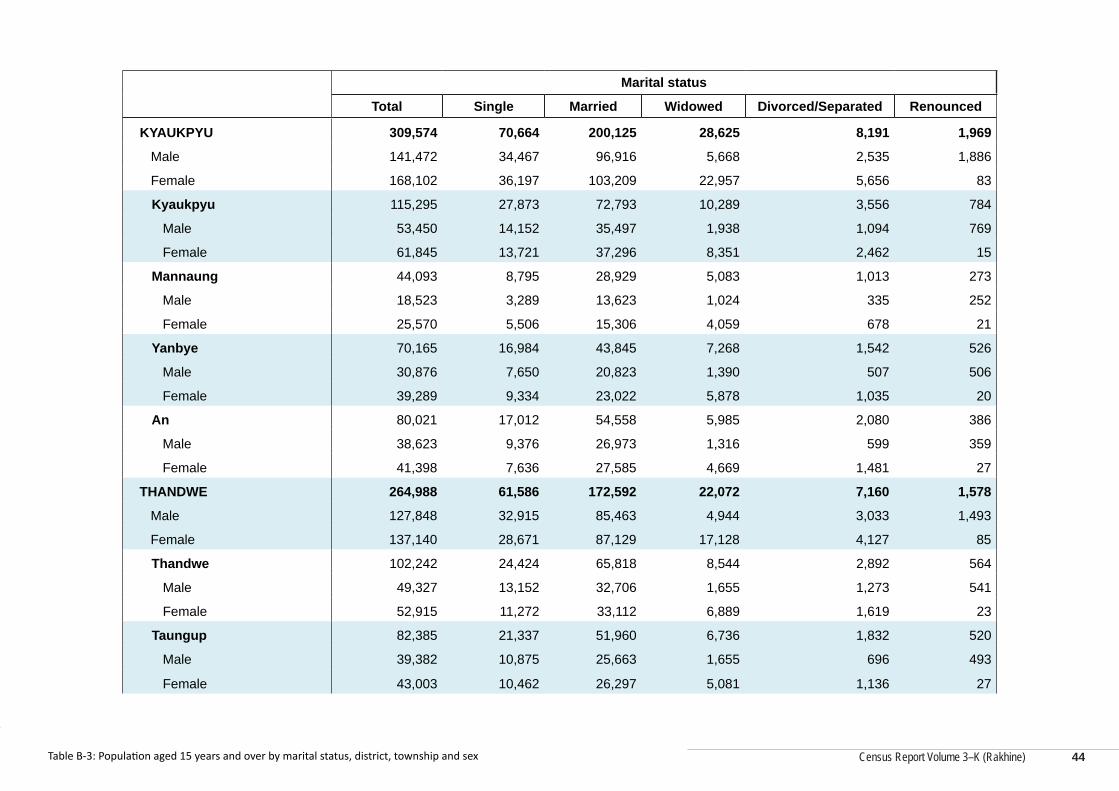
Census Report Volume 3–K (Rakhine)
Census Report Volume 3–K (Rakhine)
Marital status
Total Single Married Widowed Divorced/Separated Renounced
KYAUKPYU 309,574 70,664 200,125 28,625 8,191 1,969
Male 141,472 34,467 96,916 5,668 2,535 1,886
Female 168,102 36,197 103,209 22,957 5,656 83
Kyaukpyu 115,295 27,873 72,793 10,289 3,556 784
Male 53,450 14,152 35,497 1,938 1,094 769
Female 61,845 13,721 37,296 8,351 2,462 15
Mannaung 44,093 8,795 28,929 5,083 1,013 273
Male 18,523 3,289 13,623 1,024 335 252
Female 25,570 5,506 15,306 4,059 678 21
Yanbye 70,165 16,984 43,845 7,268 1,542 526
Male 30,876 7,650 20,823 1,390 507 506
Female 39,289 9,334 23,022 5,878 1,035 20
An 80,021 17,012 54,558 5,985 2,080 386
Male 38,623 9,376 26,973 1,316 599 359
Female 41,398 7,636 27,585 4,669 1,481 27
THANDWE 264,988 61,586 172,592 22,072 7,160 1,578
Male 127,848 32,915 85,463 4,944 3,033 1,493
Female 137,140 28,671 87,129 17,128 4,127 85
Thandwe 102,242 24,424 65,818 8,544 2,892 564
Male 49,327 13,152 32,706 1,655 1,273 541
Female 52,915 11,272 33,112 6,889 1,619 23
Taungup 82,385 21,337 51,960 6,736 1,832 520
Male 39,382 10,875 25,663 1,655 696 493
Female 43,003 10,462 26,297 5,081 1,136 27
Table B-3: Population aged 15 years and over by marital status, district, township and sex 44
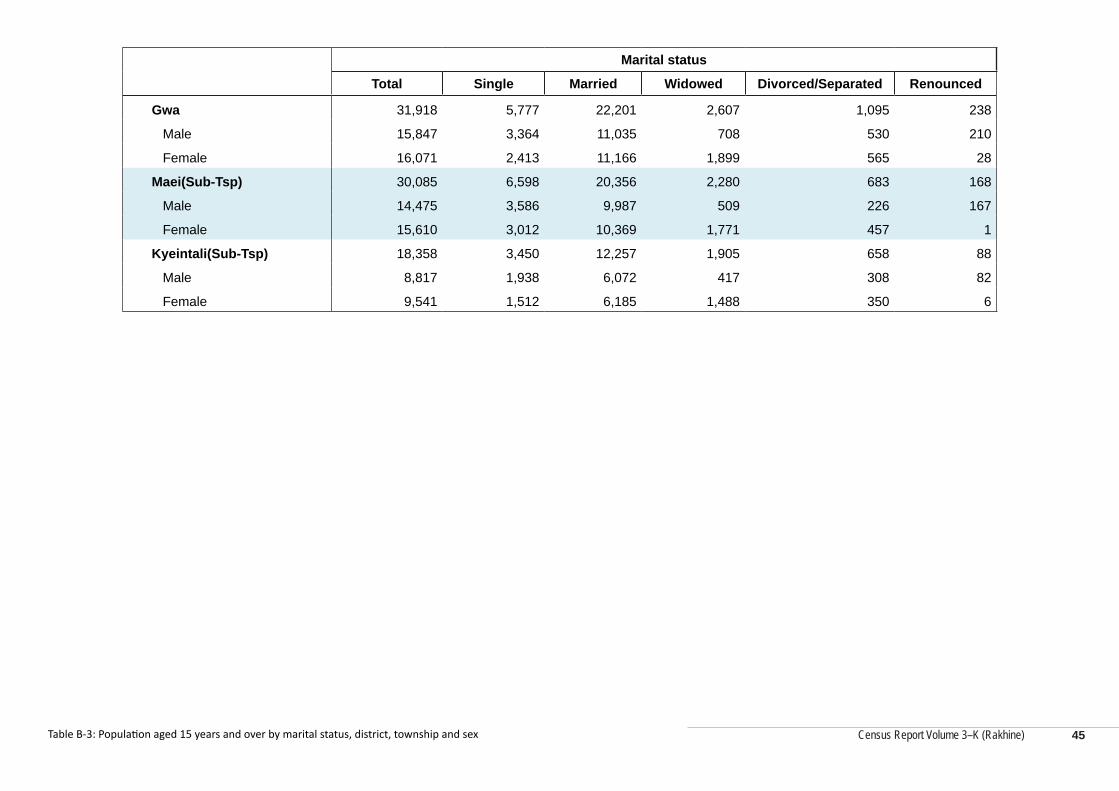
Census Report Volume 3–K (Rakhine)
Marital status
Total Single Married Widowed Divorced/Separated Renounced
Gwa 31,918 5,777 22,201 2,607 1,095 238
Male 15,847 3,364 11,035 708 530 210
Female 16,071 2,413 11,166 1,899 565 28
Maei(Sub-Tsp) 30,085 6,598 20,356 2,280 683 168
Male 14,475 3,586 9,987 509 226 167
Female 15,610 3,012 10,369 1,771 457 1
Kyeintali(Sub-Tsp) 18,358 3,450 12,257 1,905 658 88
Male 8,817 1,938 6,072 417 308 82
Female 9,541 1,512 6,185 1,488 350 6
Table B-3: Population aged 15 years and over by marital status, district, township and sex 45
Census Report Volume 3–K (Rakhine)
Myanmar Population and Housing Census,
Census Report Volume 3-K (Rakhine)
Series C: Migration
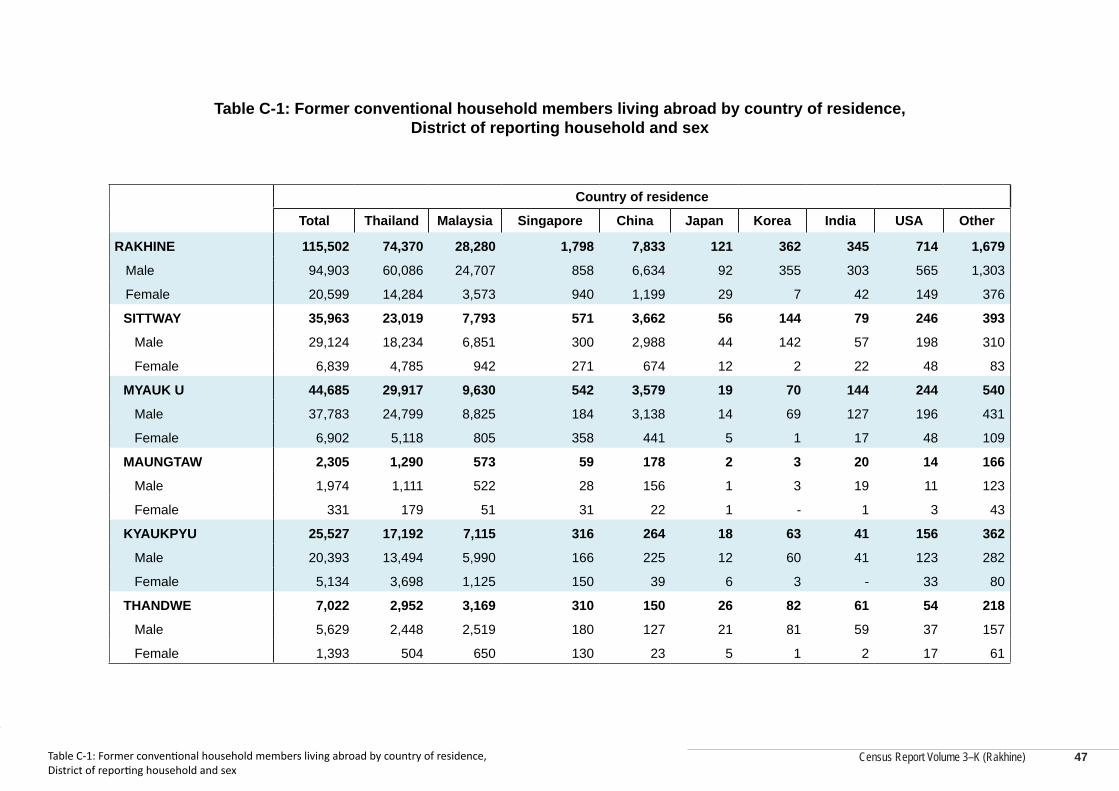
Census Report Volume 3–K (Rakhine)
Census Report Volume 3–K (Rakhine)
Table C-1: Former conventional household members living abroad by country of residence, District of reporting household and sex
Country of residence
Total Thailand Malaysia Singapore China Japan Korea India USA Other
RAKHINE 115,502 74,370 28,280 1,798 7,833 121 362 345 714 1,679
Male 94,903 60,086 24,707 858 6,634 92 355 303 565 1,303
Female 20,599 14,284 3,573 940 1,199 29 7 42 149 376
SITTWAY 35,963 23,019 7,793 571 3,662 56 144 79 246 393
Male 29,124 18,234 6,851 300 2,988 44 142 57 198 310
Female 6,839 4,785 942 271 674 12 2 22 48 83
MYAUK U 44,685 29,917 9,630 542 3,579 19 70 144 244 540
Male 37,783 24,799 8,825 184 3,138 14 69 127 196 431
Female 6,902 5,118 805 358 441 5 1 17 48 109
MAUNGTAW 2,305 1,290 573 59 178 2 3 20 14 166
Male 1,974 1,111 522 28 156 1 3 19 11 123
Female 331 179 51 31 22 1 - 1 3 43
KYAUKPYU 25,527 17,192 7,115 316 264 18 63 41 156 362
Male 20,393 13,494 5,990 166 225 12 60 41 123 282
Female 5,134 3,698 1,125 150 39 6 3 - 33 80
THANDWE 7,022 2,952 3,169 310 150 26 82 61 54 218
Male 5,629 2,448 2,519 180 127 21 81 59 37 157
Female 1,393 504 650 130 23 5 1 2 17 61
Table C-1: Former conventional household members living abroad by country of residence, District of reporting household and sex
47
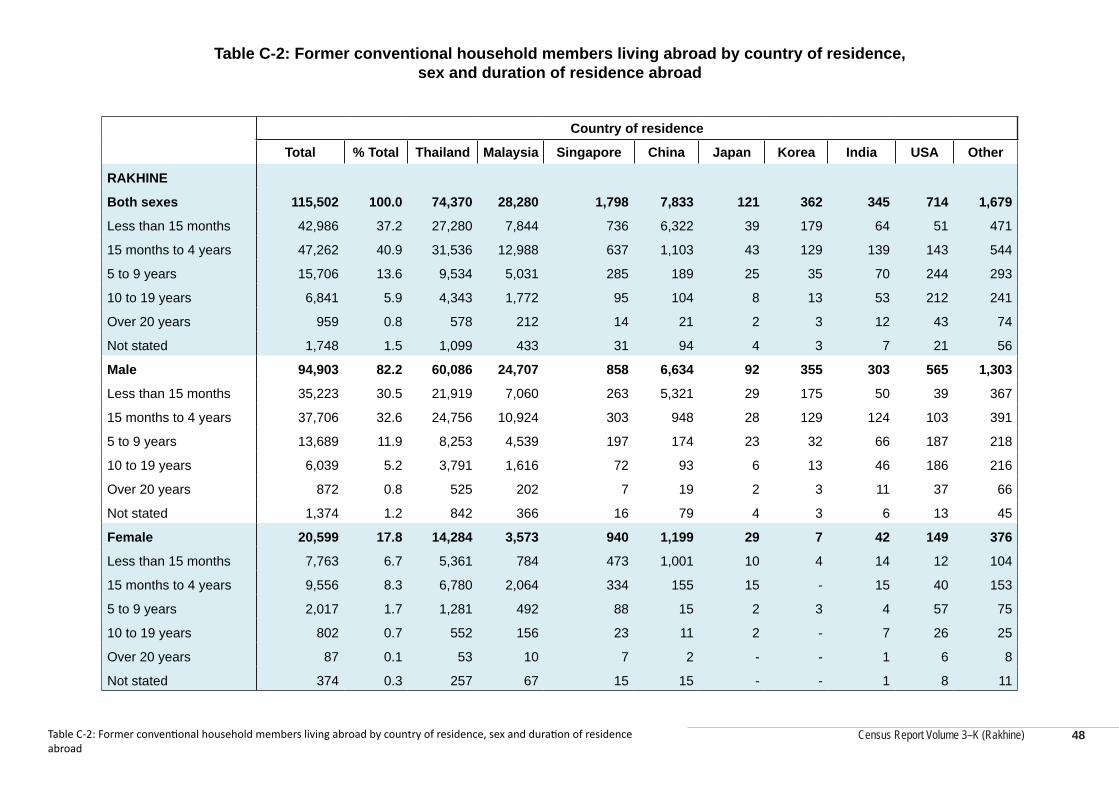
Census Report Volume 3–K (Rakhine)
Table C-2: Former conventional household members living abroad by country of residence, sex and duration of residence abroad
Country of residence
Total % Total Thailand Malaysia Singapore China Japan Korea India USA Other
RAKHINE
Both sexes 115,502 100.0 74,370 28,280 1,798 7,833 121 362 345 714 1,679
Less than 15 months 42,986 37.2 27,280 7,844 736 6,322 39 179 64 51 471
15 months to 4 years 47,262 40.9 31,536 12,988 637 1,103 43 129 139 143 544
5 to 9 years 15,706 13.6 9,534 5,031 285 189 25 35 70 244 293
10 to 19 years 6,841 5.9 4,343 1,772 95 104 8 13 53 212 241
Over 20 years 959 0.8 578 212 14 21 2 3 12 43 74
Not stated 1,748 1.5 1,099 433 31 94 4 3 7 21 56
Male 94,903 82.2 60,086 24,707 858 6,634 92 355 303 565 1,303
Less than 15 months 35,223 30.5 21,919 7,060 263 5,321 29 175 50 39 367
15 months to 4 years 37,706 32.6 24,756 10,924 303 948 28 129 124 103 391
5 to 9 years 13,689 11.9 8,253 4,539 197 174 23 32 66 187 218
10 to 19 years 6,039 5.2 3,791 1,616 72 93 6 13 46 186 216
Over 20 years 872 0.8 525 202 7 19 2 3 11 37 66
Not stated 1,374 1.2 842 366 16 79 4 3 6 13 45
Female 20,599 17.8 14,284 3,573 940 1,199 29 7 42 149 376
Less than 15 months 7,763 6.7 5,361 784 473 1,001 10 4 14 12 104
15 months to 4 years 9,556 8.3 6,780 2,064 334 155 15 - 15 40 153
5 to 9 years 2,017 1.7 1,281 492 88 15 2 3 4 57 75
10 to 19 years 802 0.7 552 156 23 11 2 - 7 26 25
Over 20 years 87 0.1 53 10 7 2 - - 1 6 8
Not stated 374 0.3 257 67 15 15 - - 1 8 11
Table C-2: Former conventional household members living abroad by country of residence, sex and duration of residence abroad
48

Census Report Volume 3–K (Rakhine)
Myanmar Population and Housing Census,
Census Report Volume 3-K (Rakhine)
Series D: Education Characteristics
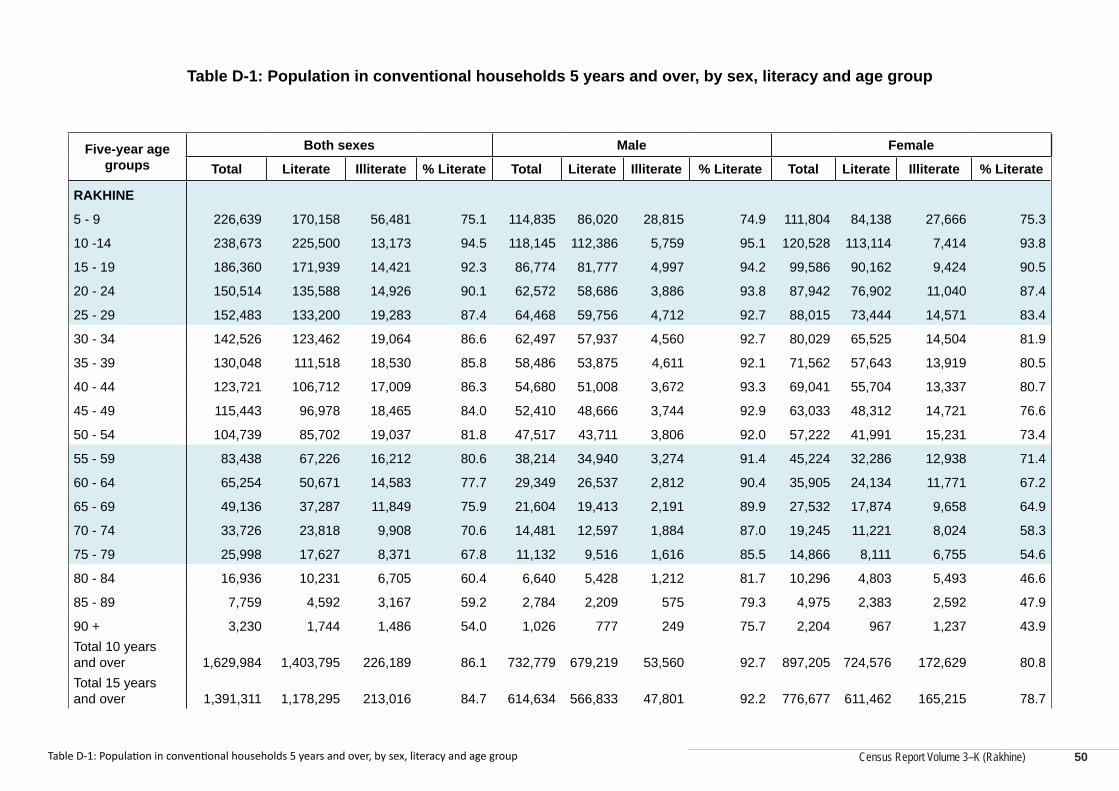
Census Report Volume 3–K (Rakhine)
Census Report Volume 3–K (Rakhine)
Table D-1: Population in conventional households 5 years and over, by sex, literacy and age group
Five-year age groups
Both sexes Male Female
Total Literate Illiterate % Literate Total Literate Illiterate % Literate Total Literate Illiterate % Literate
RAKHINE
5 - 9 226,639 170,158 56,481 75.1 114,835 86,020 28,815 74.9 111,804 84,138 27,666 75.3
10 -14 238,673 225,500 13,173 94.5 118,145 112,386 5,759 95.1 120,528 113,114 7,414 93.8
15 - 19 186,360 171,939 14,421 92.3 86,774 81,777 4,997 94.2 99,586 90,162 9,424 90.5
20 - 24 150,514 135,588 14,926 90.1 62,572 58,686 3,886 93.8 87,942 76,902 11,040 87.4
25 - 29 152,483 133,200 19,283 87.4 64,468 59,756 4,712 92.7 88,015 73,444 14,571 83.4
30 - 34 142,526 123,462 19,064 86.6 62,497 57,937 4,560 92.7 80,029 65,525 14,504 81.9
35 - 39 130,048 111,518 18,530 85.8 58,486 53,875 4,611 92.1 71,562 57,643 13,919 80.5
40 - 44 123,721 106,712 17,009 86.3 54,680 51,008 3,672 93.3 69,041 55,704 13,337 80.7
45 - 49 115,443 96,978 18,465 84.0 52,410 48,666 3,744 92.9 63,033 48,312 14,721 76.6
50 - 54 104,739 85,702 19,037 81.8 47,517 43,711 3,806 92.0 57,222 41,991 15,231 73.4
55 - 59 83,438 67,226 16,212 80.6 38,214 34,940 3,274 91.4 45,224 32,286 12,938 71.4
60 - 64 65,254 50,671 14,583 77.7 29,349 26,537 2,812 90.4 35,905 24,134 11,771 67.2
65 - 69 49,136 37,287 11,849 75.9 21,604 19,413 2,191 89.9 27,532 17,874 9,658 64.9
70 - 74 33,726 23,818 9,908 70.6 14,481 12,597 1,884 87.0 19,245 11,221 8,024 58.3
75 - 79 25,998 17,627 8,371 67.8 11,132 9,516 1,616 85.5 14,866 8,111 6,755 54.6
80 - 84 16,936 10,231 6,705 60.4 6,640 5,428 1,212 81.7 10,296 4,803 5,493 46.6
85 - 89 7,759 4,592 3,167 59.2 2,784 2,209 575 79.3 4,975 2,383 2,592 47.9
90 + 3,230 1,744 1,486 54.0 1,026 777 249 75.7 2,204 967 1,237 43.9Total 10 years and over 1,629,984 1,403,795 226,189 86.1 732,779 679,219 53,560 92.7 897,205 724,576 172,629 80.8Total 15 years and over 1,391,311 1,178,295 213,016 84.7 614,634 566,833 47,801 92.2 776,677 611,462 165,215 78.7
Table D-1: Population in conventional households 5 years and over, by sex, literacy and age group 50
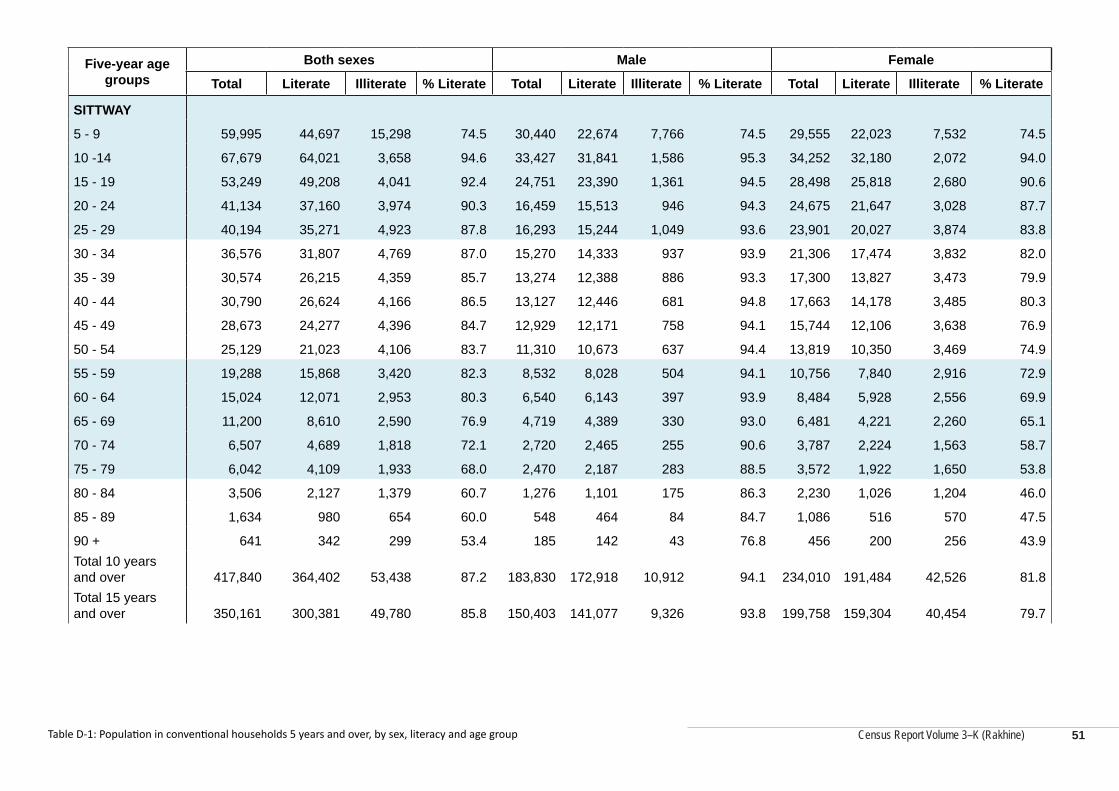
Census Report Volume 3–K (Rakhine)
Five-year age groups
Both sexes Male Female
Total Literate Illiterate % Literate Total Literate Illiterate % Literate Total Literate Illiterate % Literate
SITTWAY
5 - 9 59,995 44,697 15,298 74.5 30,440 22,674 7,766 74.5 29,555 22,023 7,532 74.5
10 -14 67,679 64,021 3,658 94.6 33,427 31,841 1,586 95.3 34,252 32,180 2,072 94.0
15 - 19 53,249 49,208 4,041 92.4 24,751 23,390 1,361 94.5 28,498 25,818 2,680 90.6
20 - 24 41,134 37,160 3,974 90.3 16,459 15,513 946 94.3 24,675 21,647 3,028 87.7
25 - 29 40,194 35,271 4,923 87.8 16,293 15,244 1,049 93.6 23,901 20,027 3,874 83.8
30 - 34 36,576 31,807 4,769 87.0 15,270 14,333 937 93.9 21,306 17,474 3,832 82.0
35 - 39 30,574 26,215 4,359 85.7 13,274 12,388 886 93.3 17,300 13,827 3,473 79.9
40 - 44 30,790 26,624 4,166 86.5 13,127 12,446 681 94.8 17,663 14,178 3,485 80.3
45 - 49 28,673 24,277 4,396 84.7 12,929 12,171 758 94.1 15,744 12,106 3,638 76.9
50 - 54 25,129 21,023 4,106 83.7 11,310 10,673 637 94.4 13,819 10,350 3,469 74.9
55 - 59 19,288 15,868 3,420 82.3 8,532 8,028 504 94.1 10,756 7,840 2,916 72.9
60 - 64 15,024 12,071 2,953 80.3 6,540 6,143 397 93.9 8,484 5,928 2,556 69.9
65 - 69 11,200 8,610 2,590 76.9 4,719 4,389 330 93.0 6,481 4,221 2,260 65.1
70 - 74 6,507 4,689 1,818 72.1 2,720 2,465 255 90.6 3,787 2,224 1,563 58.7
75 - 79 6,042 4,109 1,933 68.0 2,470 2,187 283 88.5 3,572 1,922 1,650 53.8
80 - 84 3,506 2,127 1,379 60.7 1,276 1,101 175 86.3 2,230 1,026 1,204 46.0
85 - 89 1,634 980 654 60.0 548 464 84 84.7 1,086 516 570 47.5
90 + 641 342 299 53.4 185 142 43 76.8 456 200 256 43.9Total 10 years and over 417,840 364,402 53,438 87.2 183,830 172,918 10,912 94.1 234,010 191,484 42,526 81.8Total 15 years and over 350,161 300,381 49,780 85.8 150,403 141,077 9,326 93.8 199,758 159,304 40,454 79.7
Table D-1: Population in conventional households 5 years and over, by sex, literacy and age group 51
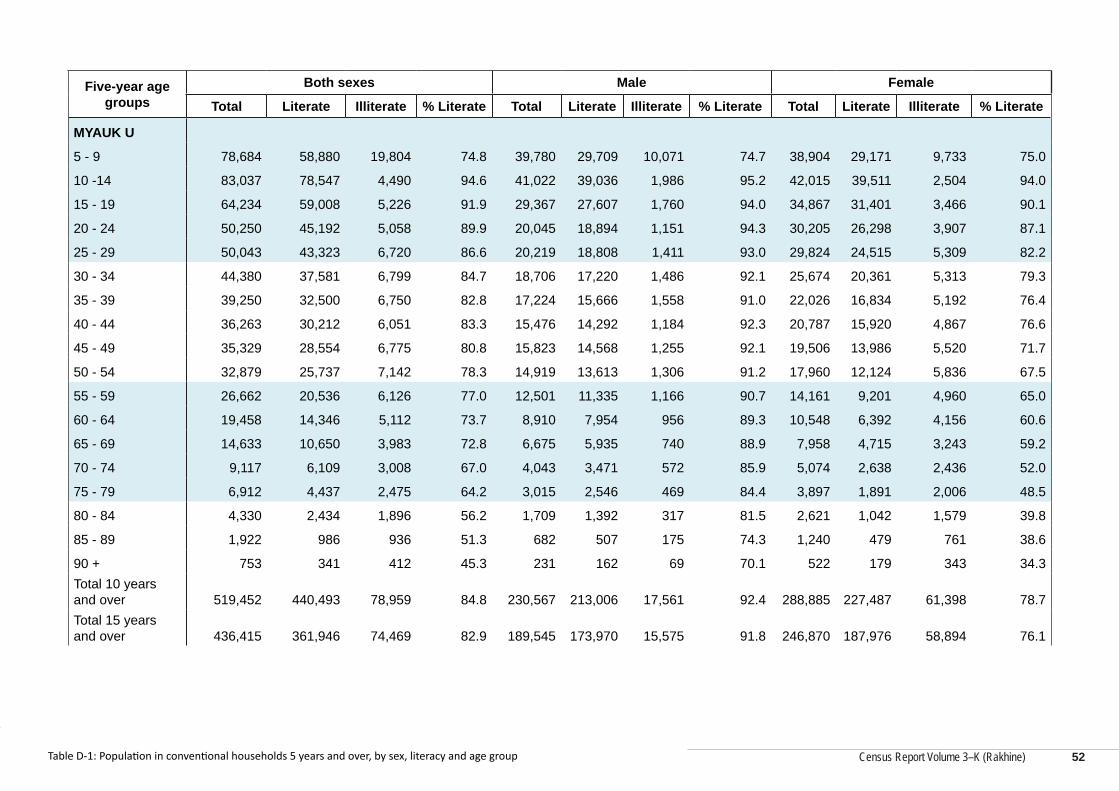
Census Report Volume 3–K (Rakhine)
Census Report Volume 3–K (Rakhine)
Five-year age groups
Both sexes Male Female
Total Literate Illiterate % Literate Total Literate Illiterate % Literate Total Literate Illiterate % Literate
MYAUK U
5 - 9 78,684 58,880 19,804 74.8 39,780 29,709 10,071 74.7 38,904 29,171 9,733 75.0
10 -14 83,037 78,547 4,490 94.6 41,022 39,036 1,986 95.2 42,015 39,511 2,504 94.0
15 - 19 64,234 59,008 5,226 91.9 29,367 27,607 1,760 94.0 34,867 31,401 3,466 90.1
20 - 24 50,250 45,192 5,058 89.9 20,045 18,894 1,151 94.3 30,205 26,298 3,907 87.1
25 - 29 50,043 43,323 6,720 86.6 20,219 18,808 1,411 93.0 29,824 24,515 5,309 82.2
30 - 34 44,380 37,581 6,799 84.7 18,706 17,220 1,486 92.1 25,674 20,361 5,313 79.3
35 - 39 39,250 32,500 6,750 82.8 17,224 15,666 1,558 91.0 22,026 16,834 5,192 76.4
40 - 44 36,263 30,212 6,051 83.3 15,476 14,292 1,184 92.3 20,787 15,920 4,867 76.6
45 - 49 35,329 28,554 6,775 80.8 15,823 14,568 1,255 92.1 19,506 13,986 5,520 71.7
50 - 54 32,879 25,737 7,142 78.3 14,919 13,613 1,306 91.2 17,960 12,124 5,836 67.5
55 - 59 26,662 20,536 6,126 77.0 12,501 11,335 1,166 90.7 14,161 9,201 4,960 65.0
60 - 64 19,458 14,346 5,112 73.7 8,910 7,954 956 89.3 10,548 6,392 4,156 60.6
65 - 69 14,633 10,650 3,983 72.8 6,675 5,935 740 88.9 7,958 4,715 3,243 59.2
70 - 74 9,117 6,109 3,008 67.0 4,043 3,471 572 85.9 5,074 2,638 2,436 52.0
75 - 79 6,912 4,437 2,475 64.2 3,015 2,546 469 84.4 3,897 1,891 2,006 48.5
80 - 84 4,330 2,434 1,896 56.2 1,709 1,392 317 81.5 2,621 1,042 1,579 39.8
85 - 89 1,922 986 936 51.3 682 507 175 74.3 1,240 479 761 38.6
90 + 753 341 412 45.3 231 162 69 70.1 522 179 343 34.3Total 10 years and over 519,452 440,493 78,959 84.8 230,567 213,006 17,561 92.4 288,885 227,487 61,398 78.7Total 15 years and over 436,415 361,946 74,469 82.9 189,545 173,970 15,575 91.8 246,870 187,976 58,894 76.1
Table D-1: Population in conventional households 5 years and over, by sex, literacy and age group 52
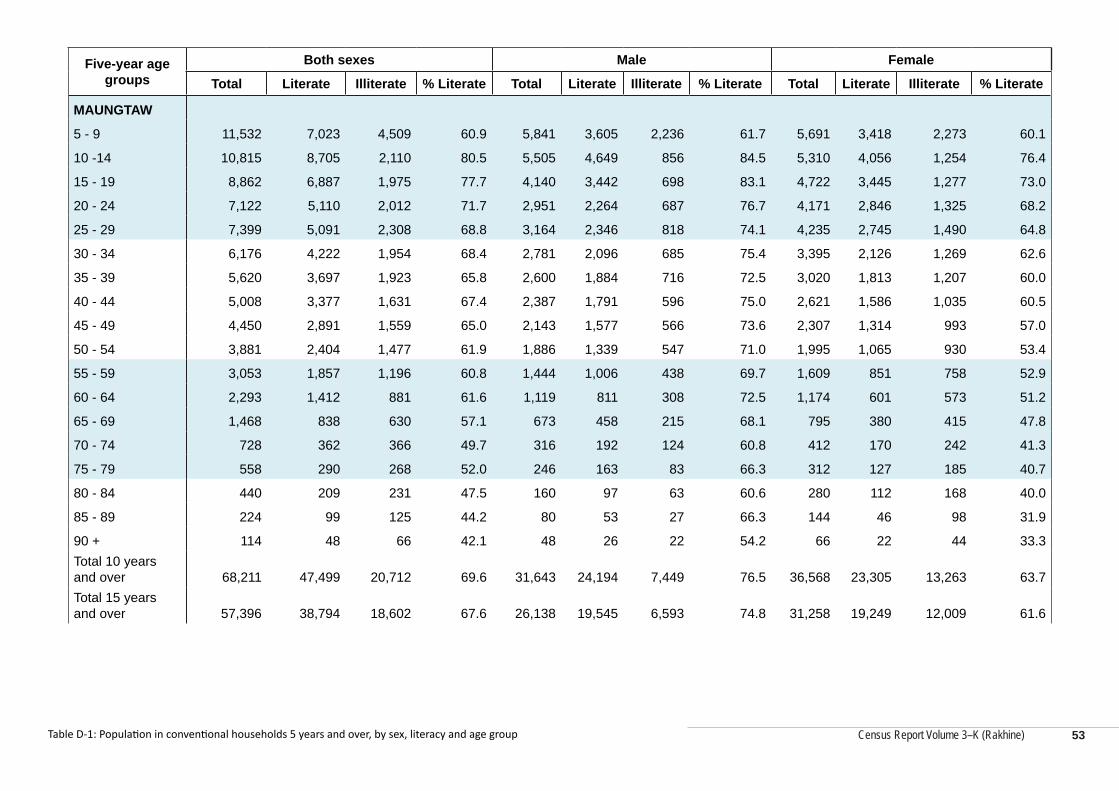
Census Report Volume 3–K (Rakhine)
Five-year age groups
Both sexes Male Female
Total Literate Illiterate % Literate Total Literate Illiterate % Literate Total Literate Illiterate % Literate
MAUNGTAW
5 - 9 11,532 7,023 4,509 60.9 5,841 3,605 2,236 61.7 5,691 3,418 2,273 60.1
10 -14 10,815 8,705 2,110 80.5 5,505 4,649 856 84.5 5,310 4,056 1,254 76.4
15 - 19 8,862 6,887 1,975 77.7 4,140 3,442 698 83.1 4,722 3,445 1,277 73.0
20 - 24 7,122 5,110 2,012 71.7 2,951 2,264 687 76.7 4,171 2,846 1,325 68.2
25 - 29 7,399 5,091 2,308 68.8 3,164 2,346 818 74.1 4,235 2,745 1,490 64.8
30 - 34 6,176 4,222 1,954 68.4 2,781 2,096 685 75.4 3,395 2,126 1,269 62.6
35 - 39 5,620 3,697 1,923 65.8 2,600 1,884 716 72.5 3,020 1,813 1,207 60.0
40 - 44 5,008 3,377 1,631 67.4 2,387 1,791 596 75.0 2,621 1,586 1,035 60.5
45 - 49 4,450 2,891 1,559 65.0 2,143 1,577 566 73.6 2,307 1,314 993 57.0
50 - 54 3,881 2,404 1,477 61.9 1,886 1,339 547 71.0 1,995 1,065 930 53.4
55 - 59 3,053 1,857 1,196 60.8 1,444 1,006 438 69.7 1,609 851 758 52.9
60 - 64 2,293 1,412 881 61.6 1,119 811 308 72.5 1,174 601 573 51.2
65 - 69 1,468 838 630 57.1 673 458 215 68.1 795 380 415 47.8
70 - 74 728 362 366 49.7 316 192 124 60.8 412 170 242 41.3
75 - 79 558 290 268 52.0 246 163 83 66.3 312 127 185 40.7
80 - 84 440 209 231 47.5 160 97 63 60.6 280 112 168 40.0
85 - 89 224 99 125 44.2 80 53 27 66.3 144 46 98 31.9
90 + 114 48 66 42.1 48 26 22 54.2 66 22 44 33.3Total 10 years and over 68,211 47,499 20,712 69.6 31,643 24,194 7,449 76.5 36,568 23,305 13,263 63.7Total 15 years and over 57,396 38,794 18,602 67.6 26,138 19,545 6,593 74.8 31,258 19,249 12,009 61.6
Table D-1: Population in conventional households 5 years and over, by sex, literacy and age group 53
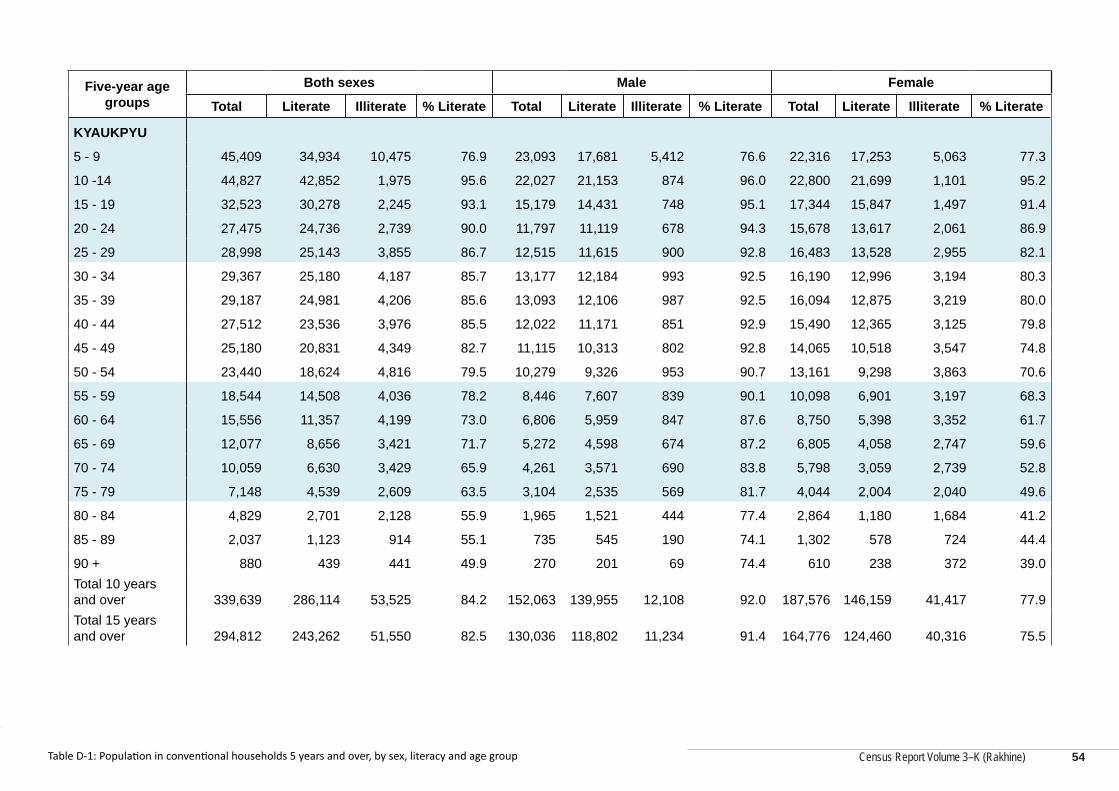
Census Report Volume 3–K (Rakhine)
Census Report Volume 3–K (Rakhine)
Five-year age groups
Both sexes Male Female
Total Literate Illiterate % Literate Total Literate Illiterate % Literate Total Literate Illiterate % Literate
KYAUKPYU
5 - 9 45,409 34,934 10,475 76.9 23,093 17,681 5,412 76.6 22,316 17,253 5,063 77.3
10 -14 44,827 42,852 1,975 95.6 22,027 21,153 874 96.0 22,800 21,699 1,101 95.2
15 - 19 32,523 30,278 2,245 93.1 15,179 14,431 748 95.1 17,344 15,847 1,497 91.4
20 - 24 27,475 24,736 2,739 90.0 11,797 11,119 678 94.3 15,678 13,617 2,061 86.9
25 - 29 28,998 25,143 3,855 86.7 12,515 11,615 900 92.8 16,483 13,528 2,955 82.1
30 - 34 29,367 25,180 4,187 85.7 13,177 12,184 993 92.5 16,190 12,996 3,194 80.3
35 - 39 29,187 24,981 4,206 85.6 13,093 12,106 987 92.5 16,094 12,875 3,219 80.0
40 - 44 27,512 23,536 3,976 85.5 12,022 11,171 851 92.9 15,490 12,365 3,125 79.8
45 - 49 25,180 20,831 4,349 82.7 11,115 10,313 802 92.8 14,065 10,518 3,547 74.8
50 - 54 23,440 18,624 4,816 79.5 10,279 9,326 953 90.7 13,161 9,298 3,863 70.6
55 - 59 18,544 14,508 4,036 78.2 8,446 7,607 839 90.1 10,098 6,901 3,197 68.3
60 - 64 15,556 11,357 4,199 73.0 6,806 5,959 847 87.6 8,750 5,398 3,352 61.7
65 - 69 12,077 8,656 3,421 71.7 5,272 4,598 674 87.2 6,805 4,058 2,747 59.6
70 - 74 10,059 6,630 3,429 65.9 4,261 3,571 690 83.8 5,798 3,059 2,739 52.8
75 - 79 7,148 4,539 2,609 63.5 3,104 2,535 569 81.7 4,044 2,004 2,040 49.6
80 - 84 4,829 2,701 2,128 55.9 1,965 1,521 444 77.4 2,864 1,180 1,684 41.2
85 - 89 2,037 1,123 914 55.1 735 545 190 74.1 1,302 578 724 44.4
90 + 880 439 441 49.9 270 201 69 74.4 610 238 372 39.0Total 10 years and over 339,639 286,114 53,525 84.2 152,063 139,955 12,108 92.0 187,576 146,159 41,417 77.9Total 15 years and over 294,812 243,262 51,550 82.5 130,036 118,802 11,234 91.4 164,776 124,460 40,316 75.5
Table D-1: Population in conventional households 5 years and over, by sex, literacy and age group 54
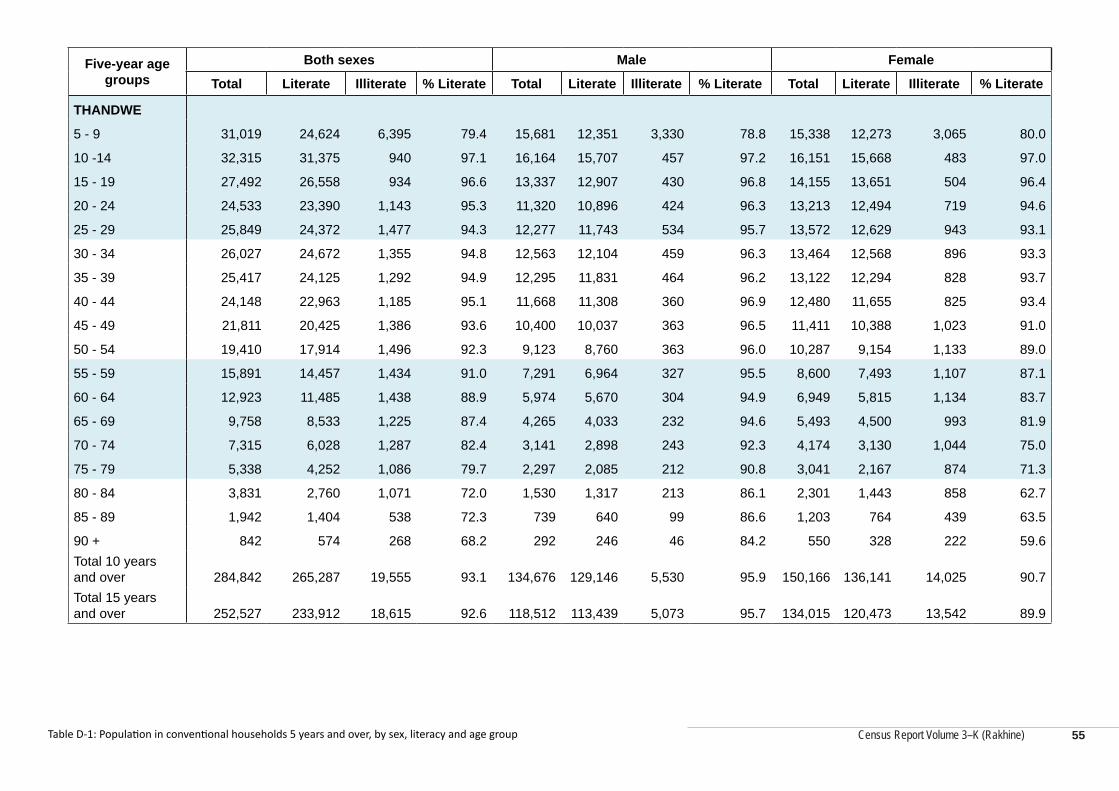
Census Report Volume 3–K (Rakhine)
Five-year age groups
Both sexes Male Female
Total Literate Illiterate % Literate Total Literate Illiterate % Literate Total Literate Illiterate % Literate
THANDWE
5 - 9 31,019 24,624 6,395 79.4 15,681 12,351 3,330 78.8 15,338 12,273 3,065 80.0
10 -14 32,315 31,375 940 97.1 16,164 15,707 457 97.2 16,151 15,668 483 97.0
15 - 19 27,492 26,558 934 96.6 13,337 12,907 430 96.8 14,155 13,651 504 96.4
20 - 24 24,533 23,390 1,143 95.3 11,320 10,896 424 96.3 13,213 12,494 719 94.6
25 - 29 25,849 24,372 1,477 94.3 12,277 11,743 534 95.7 13,572 12,629 943 93.1
30 - 34 26,027 24,672 1,355 94.8 12,563 12,104 459 96.3 13,464 12,568 896 93.3
35 - 39 25,417 24,125 1,292 94.9 12,295 11,831 464 96.2 13,122 12,294 828 93.7
40 - 44 24,148 22,963 1,185 95.1 11,668 11,308 360 96.9 12,480 11,655 825 93.4
45 - 49 21,811 20,425 1,386 93.6 10,400 10,037 363 96.5 11,411 10,388 1,023 91.0
50 - 54 19,410 17,914 1,496 92.3 9,123 8,760 363 96.0 10,287 9,154 1,133 89.0
55 - 59 15,891 14,457 1,434 91.0 7,291 6,964 327 95.5 8,600 7,493 1,107 87.1
60 - 64 12,923 11,485 1,438 88.9 5,974 5,670 304 94.9 6,949 5,815 1,134 83.7
65 - 69 9,758 8,533 1,225 87.4 4,265 4,033 232 94.6 5,493 4,500 993 81.9
70 - 74 7,315 6,028 1,287 82.4 3,141 2,898 243 92.3 4,174 3,130 1,044 75.0
75 - 79 5,338 4,252 1,086 79.7 2,297 2,085 212 90.8 3,041 2,167 874 71.3
80 - 84 3,831 2,760 1,071 72.0 1,530 1,317 213 86.1 2,301 1,443 858 62.7
85 - 89 1,942 1,404 538 72.3 739 640 99 86.6 1,203 764 439 63.5
90 + 842 574 268 68.2 292 246 46 84.2 550 328 222 59.6Total 10 years and over 284,842 265,287 19,555 93.1 134,676 129,146 5,530 95.9 150,166 136,141 14,025 90.7Total 15 years and over 252,527 233,912 18,615 92.6 118,512 113,439 5,073 95.7 134,015 120,473 13,542 89.9
Table D-1: Population in conventional households 5 years and over, by sex, literacy and age group 55
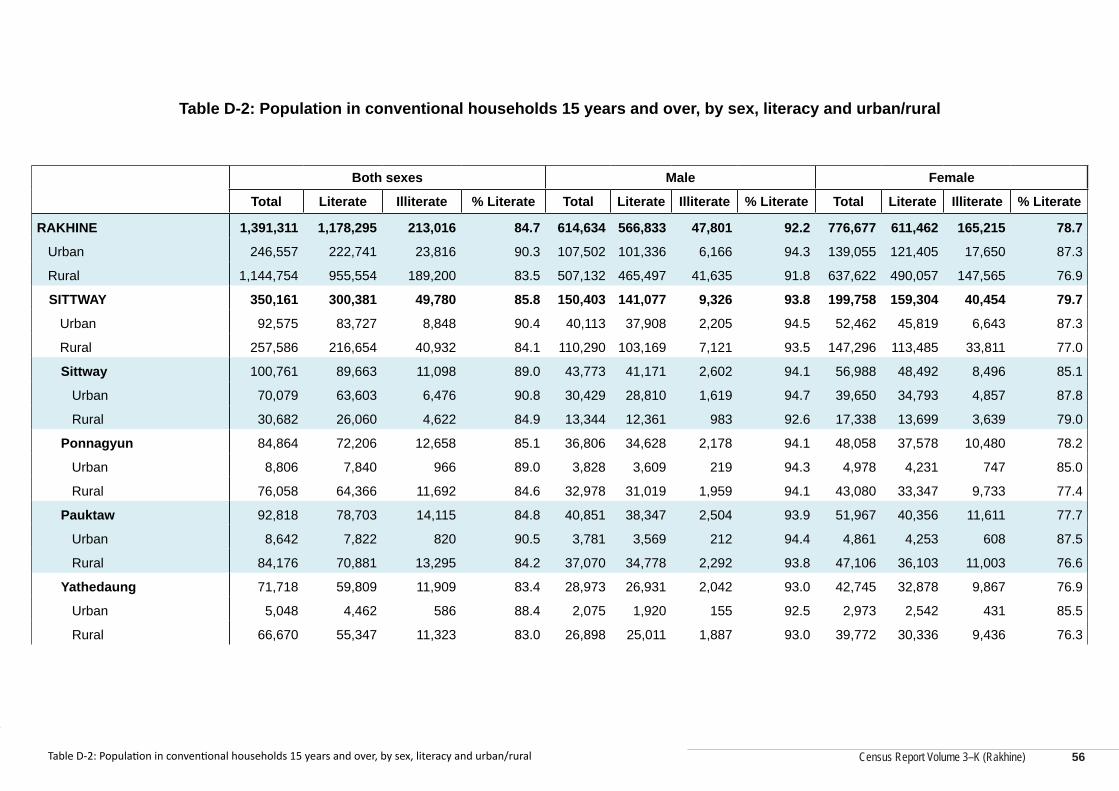
Census Report Volume 3–K (Rakhine)
Census Report Volume 3–K (Rakhine)
Table D-2: Population in conventional households 15 years and over, by sex, literacy and urban/rural
Both sexes Male Female
Total Literate Illiterate % Literate Total Literate Illiterate % Literate Total Literate Illiterate % Literate
RAKHINE 1,391,311 1,178,295 213,016 84.7 614,634 566,833 47,801 92.2 776,677 611,462 165,215 78.7
Urban 246,557 222,741 23,816 90.3 107,502 101,336 6,166 94.3 139,055 121,405 17,650 87.3
Rural 1,144,754 955,554 189,200 83.5 507,132 465,497 41,635 91.8 637,622 490,057 147,565 76.9
SITTWAY 350,161 300,381 49,780 85.8 150,403 141,077 9,326 93.8 199,758 159,304 40,454 79.7
Urban 92,575 83,727 8,848 90.4 40,113 37,908 2,205 94.5 52,462 45,819 6,643 87.3
Rural 257,586 216,654 40,932 84.1 110,290 103,169 7,121 93.5 147,296 113,485 33,811 77.0
Sittway 100,761 89,663 11,098 89.0 43,773 41,171 2,602 94.1 56,988 48,492 8,496 85.1
Urban 70,079 63,603 6,476 90.8 30,429 28,810 1,619 94.7 39,650 34,793 4,857 87.8
Rural 30,682 26,060 4,622 84.9 13,344 12,361 983 92.6 17,338 13,699 3,639 79.0
Ponnagyun 84,864 72,206 12,658 85.1 36,806 34,628 2,178 94.1 48,058 37,578 10,480 78.2
Urban 8,806 7,840 966 89.0 3,828 3,609 219 94.3 4,978 4,231 747 85.0
Rural 76,058 64,366 11,692 84.6 32,978 31,019 1,959 94.1 43,080 33,347 9,733 77.4
Pauktaw 92,818 78,703 14,115 84.8 40,851 38,347 2,504 93.9 51,967 40,356 11,611 77.7
Urban 8,642 7,822 820 90.5 3,781 3,569 212 94.4 4,861 4,253 608 87.5
Rural 84,176 70,881 13,295 84.2 37,070 34,778 2,292 93.8 47,106 36,103 11,003 76.6
Yathedaung 71,718 59,809 11,909 83.4 28,973 26,931 2,042 93.0 42,745 32,878 9,867 76.9
Urban 5,048 4,462 586 88.4 2,075 1,920 155 92.5 2,973 2,542 431 85.5
Rural 66,670 55,347 11,323 83.0 26,898 25,011 1,887 93.0 39,772 30,336 9,436 76.3
Table D-2: Population in conventional households 15 years and over, by sex, literacy and urban/rural 56
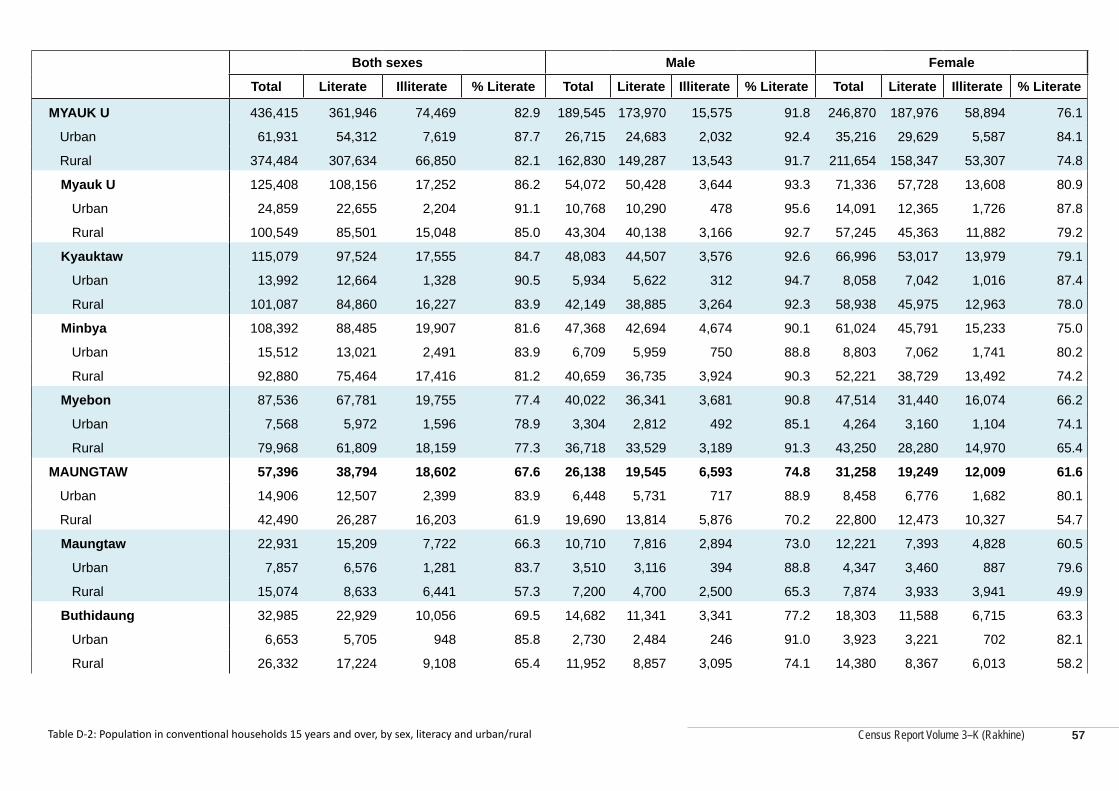
Census Report Volume 3–K (Rakhine)
Both sexes Male Female
Total Literate Illiterate % Literate Total Literate Illiterate % Literate Total Literate Illiterate % Literate
MYAUK U 436,415 361,946 74,469 82.9 189,545 173,970 15,575 91.8 246,870 187,976 58,894 76.1
Urban 61,931 54,312 7,619 87.7 26,715 24,683 2,032 92.4 35,216 29,629 5,587 84.1
Rural 374,484 307,634 66,850 82.1 162,830 149,287 13,543 91.7 211,654 158,347 53,307 74.8
Myauk U 125,408 108,156 17,252 86.2 54,072 50,428 3,644 93.3 71,336 57,728 13,608 80.9
Urban 24,859 22,655 2,204 91.1 10,768 10,290 478 95.6 14,091 12,365 1,726 87.8
Rural 100,549 85,501 15,048 85.0 43,304 40,138 3,166 92.7 57,245 45,363 11,882 79.2
Kyauktaw 115,079 97,524 17,555 84.7 48,083 44,507 3,576 92.6 66,996 53,017 13,979 79.1
Urban 13,992 12,664 1,328 90.5 5,934 5,622 312 94.7 8,058 7,042 1,016 87.4
Rural 101,087 84,860 16,227 83.9 42,149 38,885 3,264 92.3 58,938 45,975 12,963 78.0
Minbya 108,392 88,485 19,907 81.6 47,368 42,694 4,674 90.1 61,024 45,791 15,233 75.0
Urban 15,512 13,021 2,491 83.9 6,709 5,959 750 88.8 8,803 7,062 1,741 80.2
Rural 92,880 75,464 17,416 81.2 40,659 36,735 3,924 90.3 52,221 38,729 13,492 74.2
Myebon 87,536 67,781 19,755 77.4 40,022 36,341 3,681 90.8 47,514 31,440 16,074 66.2
Urban 7,568 5,972 1,596 78.9 3,304 2,812 492 85.1 4,264 3,160 1,104 74.1
Rural 79,968 61,809 18,159 77.3 36,718 33,529 3,189 91.3 43,250 28,280 14,970 65.4
MAUNGTAW 57,396 38,794 18,602 67.6 26,138 19,545 6,593 74.8 31,258 19,249 12,009 61.6
Urban 14,906 12,507 2,399 83.9 6,448 5,731 717 88.9 8,458 6,776 1,682 80.1
Rural 42,490 26,287 16,203 61.9 19,690 13,814 5,876 70.2 22,800 12,473 10,327 54.7
Maungtaw 22,931 15,209 7,722 66.3 10,710 7,816 2,894 73.0 12,221 7,393 4,828 60.5
Urban 7,857 6,576 1,281 83.7 3,510 3,116 394 88.8 4,347 3,460 887 79.6
Rural 15,074 8,633 6,441 57.3 7,200 4,700 2,500 65.3 7,874 3,933 3,941 49.9
Buthidaung 32,985 22,929 10,056 69.5 14,682 11,341 3,341 77.2 18,303 11,588 6,715 63.3
Urban 6,653 5,705 948 85.8 2,730 2,484 246 91.0 3,923 3,221 702 82.1
Rural 26,332 17,224 9,108 65.4 11,952 8,857 3,095 74.1 14,380 8,367 6,013 58.2
Table D-2: Population in conventional households 15 years and over, by sex, literacy and urban/rural 57
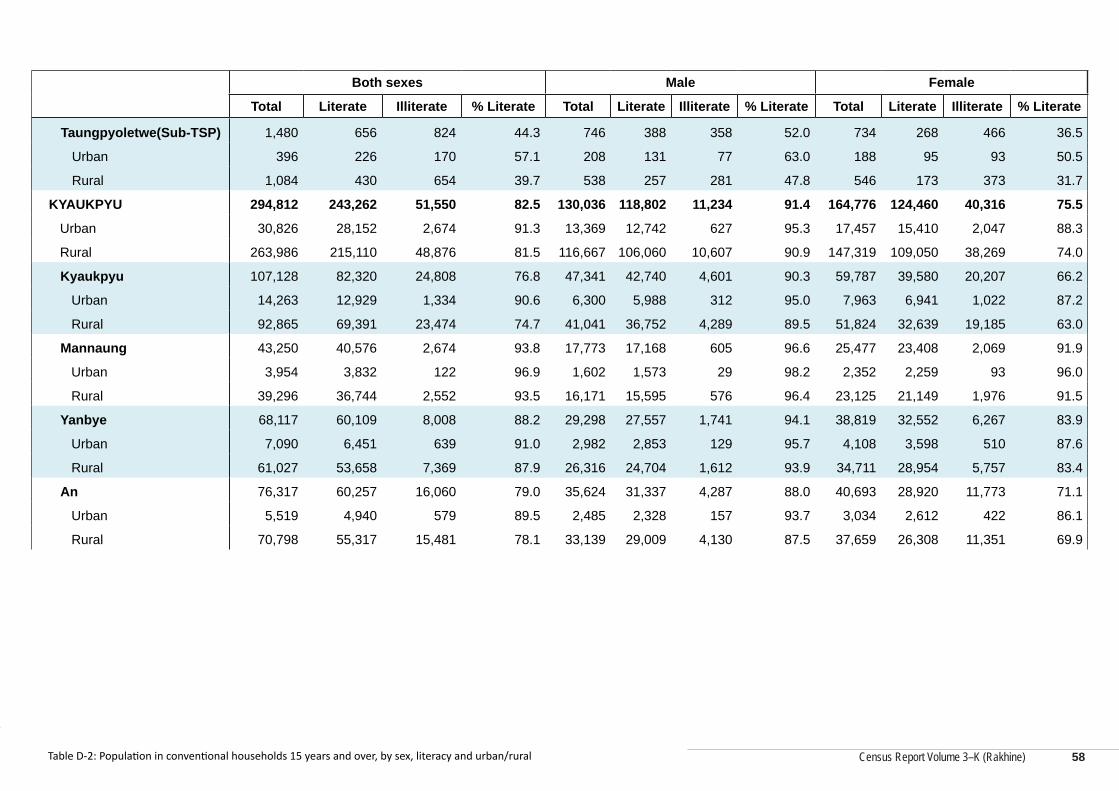
Census Report Volume 3–K (Rakhine)
Census Report Volume 3–K (Rakhine)
Both sexes Male Female
Total Literate Illiterate % Literate Total Literate Illiterate % Literate Total Literate Illiterate % Literate
Taungpyoletwe(Sub-TSP) 1,480 656 824 44.3 746 388 358 52.0 734 268 466 36.5
Urban 396 226 170 57.1 208 131 77 63.0 188 95 93 50.5
Rural 1,084 430 654 39.7 538 257 281 47.8 546 173 373 31.7
KYAUKPYU 294,812 243,262 51,550 82.5 130,036 118,802 11,234 91.4 164,776 124,460 40,316 75.5
Urban 30,826 28,152 2,674 91.3 13,369 12,742 627 95.3 17,457 15,410 2,047 88.3
Rural 263,986 215,110 48,876 81.5 116,667 106,060 10,607 90.9 147,319 109,050 38,269 74.0
Kyaukpyu 107,128 82,320 24,808 76.8 47,341 42,740 4,601 90.3 59,787 39,580 20,207 66.2
Urban 14,263 12,929 1,334 90.6 6,300 5,988 312 95.0 7,963 6,941 1,022 87.2
Rural 92,865 69,391 23,474 74.7 41,041 36,752 4,289 89.5 51,824 32,639 19,185 63.0
Mannaung 43,250 40,576 2,674 93.8 17,773 17,168 605 96.6 25,477 23,408 2,069 91.9
Urban 3,954 3,832 122 96.9 1,602 1,573 29 98.2 2,352 2,259 93 96.0
Rural 39,296 36,744 2,552 93.5 16,171 15,595 576 96.4 23,125 21,149 1,976 91.5
Yanbye 68,117 60,109 8,008 88.2 29,298 27,557 1,741 94.1 38,819 32,552 6,267 83.9
Urban 7,090 6,451 639 91.0 2,982 2,853 129 95.7 4,108 3,598 510 87.6
Rural 61,027 53,658 7,369 87.9 26,316 24,704 1,612 93.9 34,711 28,954 5,757 83.4
An 76,317 60,257 16,060 79.0 35,624 31,337 4,287 88.0 40,693 28,920 11,773 71.1
Urban 5,519 4,940 579 89.5 2,485 2,328 157 93.7 3,034 2,612 422 86.1
Rural 70,798 55,317 15,481 78.1 33,139 29,009 4,130 87.5 37,659 26,308 11,351 69.9
Table D-2: Population in conventional households 15 years and over, by sex, literacy and urban/rural 58
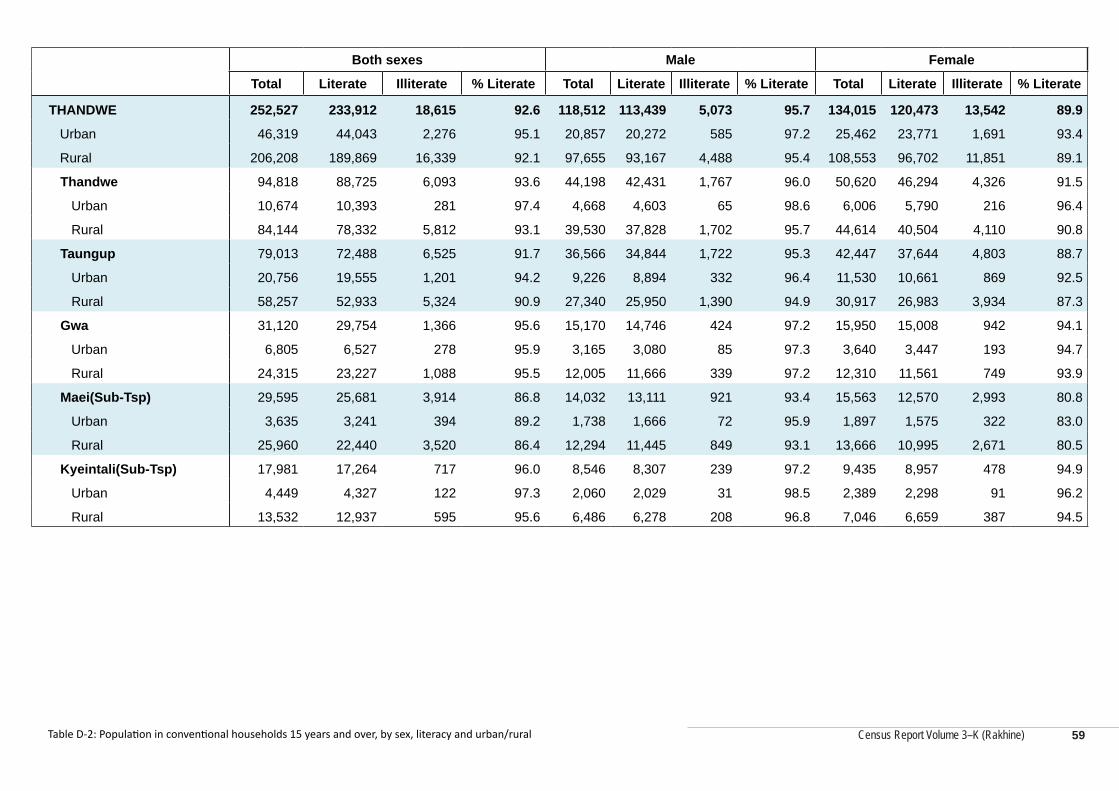
Census Report Volume 3–K (Rakhine)
Both sexes Male Female
Total Literate Illiterate % Literate Total Literate Illiterate % Literate Total Literate Illiterate % Literate
THANDWE 252,527 233,912 18,615 92.6 118,512 113,439 5,073 95.7 134,015 120,473 13,542 89.9
Urban 46,319 44,043 2,276 95.1 20,857 20,272 585 97.2 25,462 23,771 1,691 93.4
Rural 206,208 189,869 16,339 92.1 97,655 93,167 4,488 95.4 108,553 96,702 11,851 89.1
Thandwe 94,818 88,725 6,093 93.6 44,198 42,431 1,767 96.0 50,620 46,294 4,326 91.5
Urban 10,674 10,393 281 97.4 4,668 4,603 65 98.6 6,006 5,790 216 96.4
Rural 84,144 78,332 5,812 93.1 39,530 37,828 1,702 95.7 44,614 40,504 4,110 90.8
Taungup 79,013 72,488 6,525 91.7 36,566 34,844 1,722 95.3 42,447 37,644 4,803 88.7
Urban 20,756 19,555 1,201 94.2 9,226 8,894 332 96.4 11,530 10,661 869 92.5
Rural 58,257 52,933 5,324 90.9 27,340 25,950 1,390 94.9 30,917 26,983 3,934 87.3
Gwa 31,120 29,754 1,366 95.6 15,170 14,746 424 97.2 15,950 15,008 942 94.1
Urban 6,805 6,527 278 95.9 3,165 3,080 85 97.3 3,640 3,447 193 94.7
Rural 24,315 23,227 1,088 95.5 12,005 11,666 339 97.2 12,310 11,561 749 93.9
Maei(Sub-Tsp) 29,595 25,681 3,914 86.8 14,032 13,111 921 93.4 15,563 12,570 2,993 80.8
Urban 3,635 3,241 394 89.2 1,738 1,666 72 95.9 1,897 1,575 322 83.0
Rural 25,960 22,440 3,520 86.4 12,294 11,445 849 93.1 13,666 10,995 2,671 80.5
Kyeintali(Sub-Tsp) 17,981 17,264 717 96.0 8,546 8,307 239 97.2 9,435 8,957 478 94.9
Urban 4,449 4,327 122 97.3 2,060 2,029 31 98.5 2,389 2,298 91 96.2
Rural 13,532 12,937 595 95.6 6,486 6,278 208 96.8 7,046 6,659 387 94.5
Table D-2: Population in conventional households 15 years and over, by sex, literacy and urban/rural 59
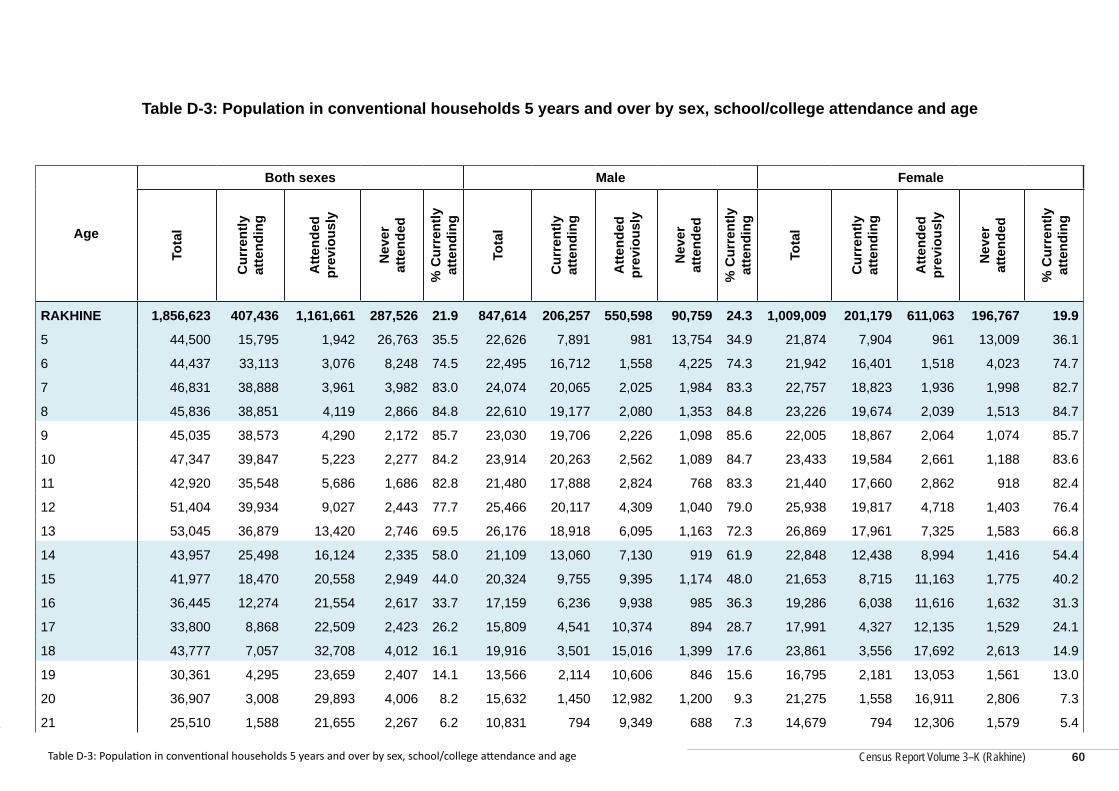
Census Report Volume 3–K (Rakhine)
Census Report Volume 3–K (Rakhine)
Table D-3: Population in conventional households 5 years and over by sex, school/college attendance and age
Age
Both sexes Male FemaleTo
tal
Cur
rent
ly
atte
ndin
g
Atte
nded
pr
evio
usly
Nev
er
atte
nded
% C
urre
ntly
at
tend
ing
Tota
l
Cur
rent
ly
atte
ndin
g
Atte
nded
pr
evio
usly
Nev
er
atte
nded
% C
urre
ntly
at
tend
ing
Tota
l
Cur
rent
ly
atte
ndin
g
Atte
nded
pr
evio
usly
Nev
er
atte
nded
% C
urre
ntly
at
tend
ing
RAKHINE 1,856,623 407,436 1,161,661 287,526 21.9 847,614 206,257 550,598 90,759 24.3 1,009,009 201,179 611,063 196,767 19.9
5 44,500 15,795 1,942 26,763 35.5 22,626 7,891 981 13,754 34.9 21,874 7,904 961 13,009 36.1
6 44,437 33,113 3,076 8,248 74.5 22,495 16,712 1,558 4,225 74.3 21,942 16,401 1,518 4,023 74.7
7 46,831 38,888 3,961 3,982 83.0 24,074 20,065 2,025 1,984 83.3 22,757 18,823 1,936 1,998 82.7
8 45,836 38,851 4,119 2,866 84.8 22,610 19,177 2,080 1,353 84.8 23,226 19,674 2,039 1,513 84.7
9 45,035 38,573 4,290 2,172 85.7 23,030 19,706 2,226 1,098 85.6 22,005 18,867 2,064 1,074 85.7
10 47,347 39,847 5,223 2,277 84.2 23,914 20,263 2,562 1,089 84.7 23,433 19,584 2,661 1,188 83.6
11 42,920 35,548 5,686 1,686 82.8 21,480 17,888 2,824 768 83.3 21,440 17,660 2,862 918 82.4
12 51,404 39,934 9,027 2,443 77.7 25,466 20,117 4,309 1,040 79.0 25,938 19,817 4,718 1,403 76.4
13 53,045 36,879 13,420 2,746 69.5 26,176 18,918 6,095 1,163 72.3 26,869 17,961 7,325 1,583 66.8
14 43,957 25,498 16,124 2,335 58.0 21,109 13,060 7,130 919 61.9 22,848 12,438 8,994 1,416 54.4
15 41,977 18,470 20,558 2,949 44.0 20,324 9,755 9,395 1,174 48.0 21,653 8,715 11,163 1,775 40.2
16 36,445 12,274 21,554 2,617 33.7 17,159 6,236 9,938 985 36.3 19,286 6,038 11,616 1,632 31.3
17 33,800 8,868 22,509 2,423 26.2 15,809 4,541 10,374 894 28.7 17,991 4,327 12,135 1,529 24.1
18 43,777 7,057 32,708 4,012 16.1 19,916 3,501 15,016 1,399 17.6 23,861 3,556 17,692 2,613 14.9
19 30,361 4,295 23,659 2,407 14.1 13,566 2,114 10,606 846 15.6 16,795 2,181 13,053 1,561 13.0
20 36,907 3,008 29,893 4,006 8.2 15,632 1,450 12,982 1,200 9.3 21,275 1,558 16,911 2,806 7.3
21 25,510 1,588 21,655 2,267 6.2 10,831 794 9,349 688 7.3 14,679 794 12,306 1,579 5.4
Table D-3: Population in conventional households 5 years and over by sex, school/college attendance and age 60
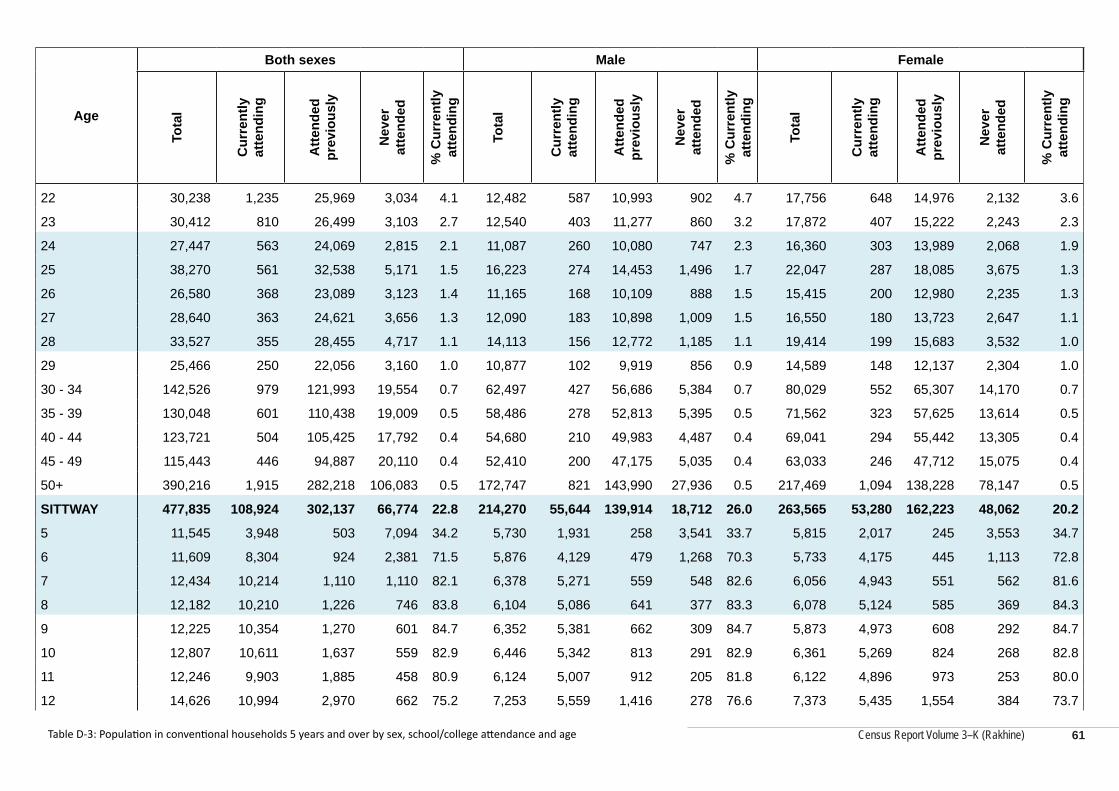
Census Report Volume 3–K (Rakhine)
Age
Both sexes Male Female
Tota
l
Cur
rent
ly
atte
ndin
g
Atte
nded
pr
evio
usly
Nev
er
atte
nded
% C
urre
ntly
at
tend
ing
Tota
l
Cur
rent
ly
atte
ndin
g
Atte
nded
pr
evio
usly
Nev
er
atte
nded
% C
urre
ntly
at
tend
ing
Tota
l
Cur
rent
ly
atte
ndin
g
Atte
nded
pr
evio
usly
Nev
er
atte
nded
% C
urre
ntly
at
tend
ing
22 30,238 1,235 25,969 3,034 4.1 12,482 587 10,993 902 4.7 17,756 648 14,976 2,132 3.6
23 30,412 810 26,499 3,103 2.7 12,540 403 11,277 860 3.2 17,872 407 15,222 2,243 2.3
24 27,447 563 24,069 2,815 2.1 11,087 260 10,080 747 2.3 16,360 303 13,989 2,068 1.9
25 38,270 561 32,538 5,171 1.5 16,223 274 14,453 1,496 1.7 22,047 287 18,085 3,675 1.3
26 26,580 368 23,089 3,123 1.4 11,165 168 10,109 888 1.5 15,415 200 12,980 2,235 1.3
27 28,640 363 24,621 3,656 1.3 12,090 183 10,898 1,009 1.5 16,550 180 13,723 2,647 1.1
28 33,527 355 28,455 4,717 1.1 14,113 156 12,772 1,185 1.1 19,414 199 15,683 3,532 1.0
29 25,466 250 22,056 3,160 1.0 10,877 102 9,919 856 0.9 14,589 148 12,137 2,304 1.0
30 - 34 142,526 979 121,993 19,554 0.7 62,497 427 56,686 5,384 0.7 80,029 552 65,307 14,170 0.7
35 - 39 130,048 601 110,438 19,009 0.5 58,486 278 52,813 5,395 0.5 71,562 323 57,625 13,614 0.5
40 - 44 123,721 504 105,425 17,792 0.4 54,680 210 49,983 4,487 0.4 69,041 294 55,442 13,305 0.4
45 - 49 115,443 446 94,887 20,110 0.4 52,410 200 47,175 5,035 0.4 63,033 246 47,712 15,075 0.4
50+ 390,216 1,915 282,218 106,083 0.5 172,747 821 143,990 27,936 0.5 217,469 1,094 138,228 78,147 0.5
SITTWAY 477,835 108,924 302,137 66,774 22.8 214,270 55,644 139,914 18,712 26.0 263,565 53,280 162,223 48,062 20.2
5 11,545 3,948 503 7,094 34.2 5,730 1,931 258 3,541 33.7 5,815 2,017 245 3,553 34.7
6 11,609 8,304 924 2,381 71.5 5,876 4,129 479 1,268 70.3 5,733 4,175 445 1,113 72.8
7 12,434 10,214 1,110 1,110 82.1 6,378 5,271 559 548 82.6 6,056 4,943 551 562 81.6
8 12,182 10,210 1,226 746 83.8 6,104 5,086 641 377 83.3 6,078 5,124 585 369 84.3
9 12,225 10,354 1,270 601 84.7 6,352 5,381 662 309 84.7 5,873 4,973 608 292 84.7
10 12,807 10,611 1,637 559 82.9 6,446 5,342 813 291 82.9 6,361 5,269 824 268 82.8
11 12,246 9,903 1,885 458 80.9 6,124 5,007 912 205 81.8 6,122 4,896 973 253 80.0
12 14,626 10,994 2,970 662 75.2 7,253 5,559 1,416 278 76.6 7,373 5,435 1,554 384 73.7
Table D-3: Population in conventional households 5 years and over by sex, school/college attendance and age 61
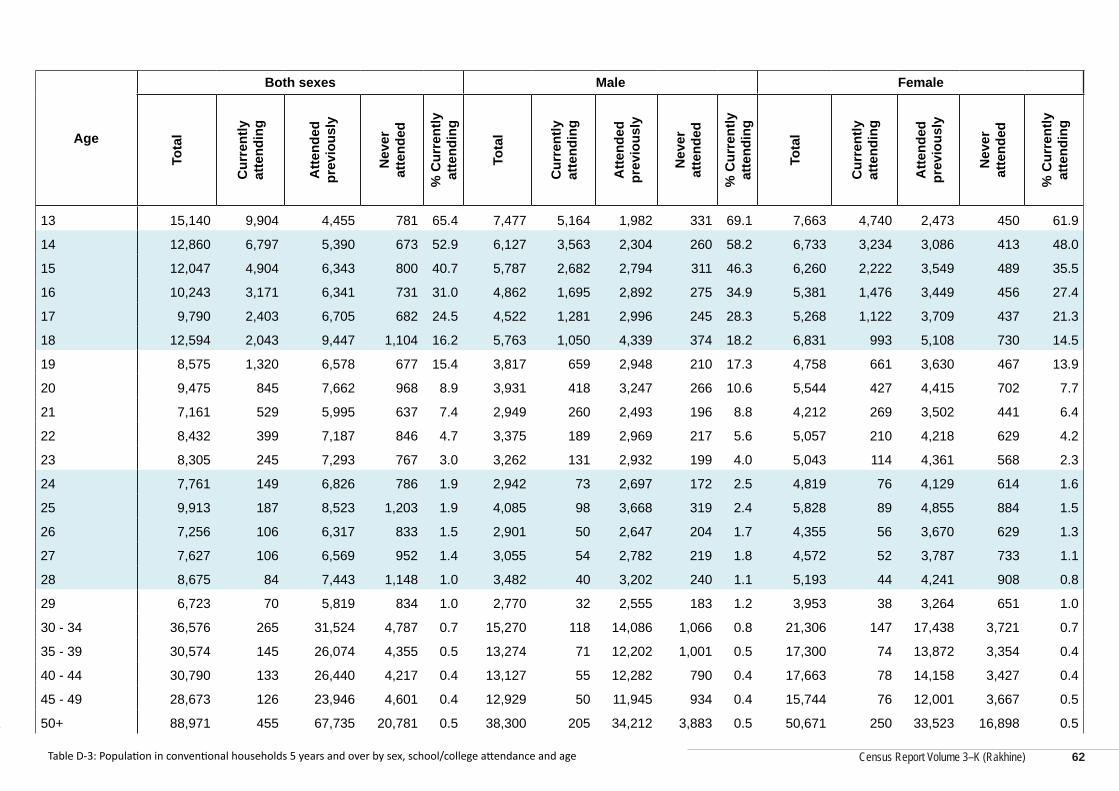
Census Report Volume 3–K (Rakhine)
Census Report Volume 3–K (Rakhine)
Age
Both sexes Male Female
Tota
l
Cur
rent
ly
atte
ndin
g
Atte
nded
pr
evio
usly
Nev
er
atte
nded
% C
urre
ntly
at
tend
ing
Tota
l
Cur
rent
ly
atte
ndin
g
Atte
nded
pr
evio
usly
Nev
er
atte
nded
% C
urre
ntly
at
tend
ing
Tota
l
Cur
rent
ly
atte
ndin
g
Atte
nded
pr
evio
usly
Nev
er
atte
nded
% C
urre
ntly
at
tend
ing
13 15,140 9,904 4,455 781 65.4 7,477 5,164 1,982 331 69.1 7,663 4,740 2,473 450 61.9
14 12,860 6,797 5,390 673 52.9 6,127 3,563 2,304 260 58.2 6,733 3,234 3,086 413 48.0
15 12,047 4,904 6,343 800 40.7 5,787 2,682 2,794 311 46.3 6,260 2,222 3,549 489 35.5
16 10,243 3,171 6,341 731 31.0 4,862 1,695 2,892 275 34.9 5,381 1,476 3,449 456 27.4
17 9,790 2,403 6,705 682 24.5 4,522 1,281 2,996 245 28.3 5,268 1,122 3,709 437 21.3
18 12,594 2,043 9,447 1,104 16.2 5,763 1,050 4,339 374 18.2 6,831 993 5,108 730 14.5
19 8,575 1,320 6,578 677 15.4 3,817 659 2,948 210 17.3 4,758 661 3,630 467 13.9
20 9,475 845 7,662 968 8.9 3,931 418 3,247 266 10.6 5,544 427 4,415 702 7.7
21 7,161 529 5,995 637 7.4 2,949 260 2,493 196 8.8 4,212 269 3,502 441 6.4
22 8,432 399 7,187 846 4.7 3,375 189 2,969 217 5.6 5,057 210 4,218 629 4.2
23 8,305 245 7,293 767 3.0 3,262 131 2,932 199 4.0 5,043 114 4,361 568 2.3
24 7,761 149 6,826 786 1.9 2,942 73 2,697 172 2.5 4,819 76 4,129 614 1.6
25 9,913 187 8,523 1,203 1.9 4,085 98 3,668 319 2.4 5,828 89 4,855 884 1.5
26 7,256 106 6,317 833 1.5 2,901 50 2,647 204 1.7 4,355 56 3,670 629 1.3
27 7,627 106 6,569 952 1.4 3,055 54 2,782 219 1.8 4,572 52 3,787 733 1.1
28 8,675 84 7,443 1,148 1.0 3,482 40 3,202 240 1.1 5,193 44 4,241 908 0.8
29 6,723 70 5,819 834 1.0 2,770 32 2,555 183 1.2 3,953 38 3,264 651 1.0
30 - 34 36,576 265 31,524 4,787 0.7 15,270 118 14,086 1,066 0.8 21,306 147 17,438 3,721 0.7
35 - 39 30,574 145 26,074 4,355 0.5 13,274 71 12,202 1,001 0.5 17,300 74 13,872 3,354 0.4
40 - 44 30,790 133 26,440 4,217 0.4 13,127 55 12,282 790 0.4 17,663 78 14,158 3,427 0.4
45 - 49 28,673 126 23,946 4,601 0.4 12,929 50 11,945 934 0.4 15,744 76 12,001 3,667 0.5
50+ 88,971 455 67,735 20,781 0.5 38,300 205 34,212 3,883 0.5 50,671 250 33,523 16,898 0.5
Table D-3: Population in conventional households 5 years and over by sex, school/college attendance and age 62
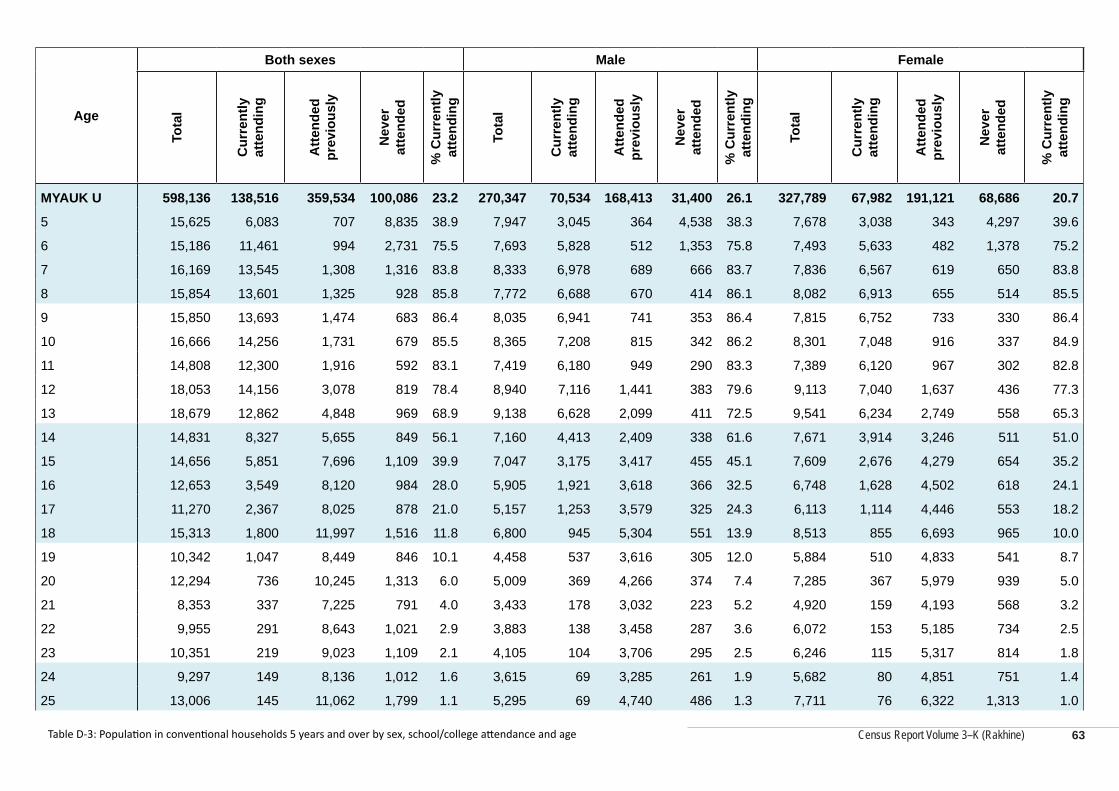
Census Report Volume 3–K (Rakhine)
Age
Both sexes Male Female
Tota
l
Cur
rent
ly
atte
ndin
g
Atte
nded
pr
evio
usly
Nev
er
atte
nded
% C
urre
ntly
at
tend
ing
Tota
l
Cur
rent
ly
atte
ndin
g
Atte
nded
pr
evio
usly
Nev
er
atte
nded
% C
urre
ntly
at
tend
ing
Tota
l
Cur
rent
ly
atte
ndin
g
Atte
nded
pr
evio
usly
Nev
er
atte
nded
% C
urre
ntly
at
tend
ing
MYAUK U 598,136 138,516 359,534 100,086 23.2 270,347 70,534 168,413 31,400 26.1 327,789 67,982 191,121 68,686 20.7
5 15,625 6,083 707 8,835 38.9 7,947 3,045 364 4,538 38.3 7,678 3,038 343 4,297 39.6
6 15,186 11,461 994 2,731 75.5 7,693 5,828 512 1,353 75.8 7,493 5,633 482 1,378 75.2
7 16,169 13,545 1,308 1,316 83.8 8,333 6,978 689 666 83.7 7,836 6,567 619 650 83.8
8 15,854 13,601 1,325 928 85.8 7,772 6,688 670 414 86.1 8,082 6,913 655 514 85.5
9 15,850 13,693 1,474 683 86.4 8,035 6,941 741 353 86.4 7,815 6,752 733 330 86.4
10 16,666 14,256 1,731 679 85.5 8,365 7,208 815 342 86.2 8,301 7,048 916 337 84.9
11 14,808 12,300 1,916 592 83.1 7,419 6,180 949 290 83.3 7,389 6,120 967 302 82.8
12 18,053 14,156 3,078 819 78.4 8,940 7,116 1,441 383 79.6 9,113 7,040 1,637 436 77.3
13 18,679 12,862 4,848 969 68.9 9,138 6,628 2,099 411 72.5 9,541 6,234 2,749 558 65.3
14 14,831 8,327 5,655 849 56.1 7,160 4,413 2,409 338 61.6 7,671 3,914 3,246 511 51.0
15 14,656 5,851 7,696 1,109 39.9 7,047 3,175 3,417 455 45.1 7,609 2,676 4,279 654 35.2
16 12,653 3,549 8,120 984 28.0 5,905 1,921 3,618 366 32.5 6,748 1,628 4,502 618 24.1
17 11,270 2,367 8,025 878 21.0 5,157 1,253 3,579 325 24.3 6,113 1,114 4,446 553 18.2
18 15,313 1,800 11,997 1,516 11.8 6,800 945 5,304 551 13.9 8,513 855 6,693 965 10.0
19 10,342 1,047 8,449 846 10.1 4,458 537 3,616 305 12.0 5,884 510 4,833 541 8.7
20 12,294 736 10,245 1,313 6.0 5,009 369 4,266 374 7.4 7,285 367 5,979 939 5.0
21 8,353 337 7,225 791 4.0 3,433 178 3,032 223 5.2 4,920 159 4,193 568 3.2
22 9,955 291 8,643 1,021 2.9 3,883 138 3,458 287 3.6 6,072 153 5,185 734 2.5
23 10,351 219 9,023 1,109 2.1 4,105 104 3,706 295 2.5 6,246 115 5,317 814 1.8
24 9,297 149 8,136 1,012 1.6 3,615 69 3,285 261 1.9 5,682 80 4,851 751 1.4
25 13,006 145 11,062 1,799 1.1 5,295 69 4,740 486 1.3 7,711 76 6,322 1,313 1.0
Table D-3: Population in conventional households 5 years and over by sex, school/college attendance and age 63
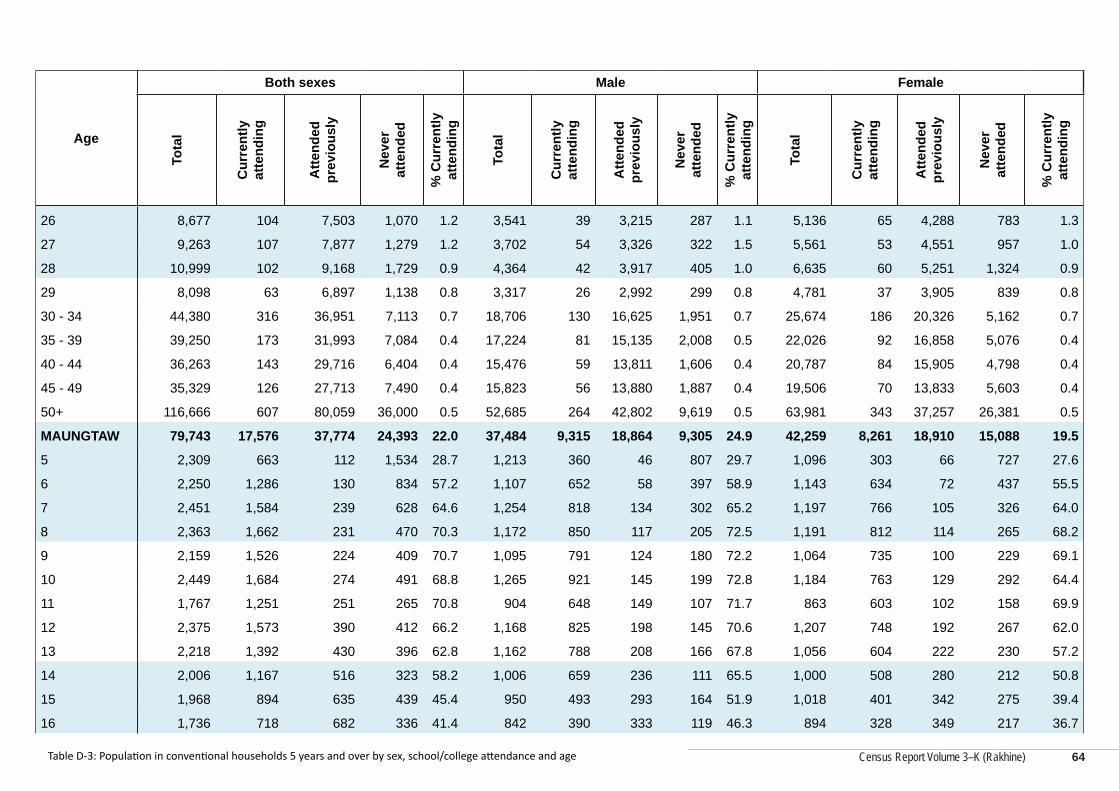
Census Report Volume 3–K (Rakhine)
Census Report Volume 3–K (Rakhine)
Age
Both sexes Male Female
Tota
l
Cur
rent
ly
atte
ndin
g
Atte
nded
pr
evio
usly
Nev
er
atte
nded
% C
urre
ntly
at
tend
ing
Tota
l
Cur
rent
ly
atte
ndin
g
Atte
nded
pr
evio
usly
Nev
er
atte
nded
% C
urre
ntly
at
tend
ing
Tota
l
Cur
rent
ly
atte
ndin
g
Atte
nded
pr
evio
usly
Nev
er
atte
nded
% C
urre
ntly
at
tend
ing
26 8,677 104 7,503 1,070 1.2 3,541 39 3,215 287 1.1 5,136 65 4,288 783 1.3
27 9,263 107 7,877 1,279 1.2 3,702 54 3,326 322 1.5 5,561 53 4,551 957 1.0
28 10,999 102 9,168 1,729 0.9 4,364 42 3,917 405 1.0 6,635 60 5,251 1,324 0.9
29 8,098 63 6,897 1,138 0.8 3,317 26 2,992 299 0.8 4,781 37 3,905 839 0.8
30 - 34 44,380 316 36,951 7,113 0.7 18,706 130 16,625 1,951 0.7 25,674 186 20,326 5,162 0.7
35 - 39 39,250 173 31,993 7,084 0.4 17,224 81 15,135 2,008 0.5 22,026 92 16,858 5,076 0.4
40 - 44 36,263 143 29,716 6,404 0.4 15,476 59 13,811 1,606 0.4 20,787 84 15,905 4,798 0.4
45 - 49 35,329 126 27,713 7,490 0.4 15,823 56 13,880 1,887 0.4 19,506 70 13,833 5,603 0.4
50+ 116,666 607 80,059 36,000 0.5 52,685 264 42,802 9,619 0.5 63,981 343 37,257 26,381 0.5
MAUNGTAW 79,743 17,576 37,774 24,393 22.0 37,484 9,315 18,864 9,305 24.9 42,259 8,261 18,910 15,088 19.5
5 2,309 663 112 1,534 28.7 1,213 360 46 807 29.7 1,096 303 66 727 27.6
6 2,250 1,286 130 834 57.2 1,107 652 58 397 58.9 1,143 634 72 437 55.5
7 2,451 1,584 239 628 64.6 1,254 818 134 302 65.2 1,197 766 105 326 64.0
8 2,363 1,662 231 470 70.3 1,172 850 117 205 72.5 1,191 812 114 265 68.2
9 2,159 1,526 224 409 70.7 1,095 791 124 180 72.2 1,064 735 100 229 69.1
10 2,449 1,684 274 491 68.8 1,265 921 145 199 72.8 1,184 763 129 292 64.4
11 1,767 1,251 251 265 70.8 904 648 149 107 71.7 863 603 102 158 69.9
12 2,375 1,573 390 412 66.2 1,168 825 198 145 70.6 1,207 748 192 267 62.0
13 2,218 1,392 430 396 62.8 1,162 788 208 166 67.8 1,056 604 222 230 57.2
14 2,006 1,167 516 323 58.2 1,006 659 236 111 65.5 1,000 508 280 212 50.8
15 1,968 894 635 439 45.4 950 493 293 164 51.9 1,018 401 342 275 39.4
16 1,736 718 682 336 41.4 842 390 333 119 46.3 894 328 349 217 36.7
Table D-3: Population in conventional households 5 years and over by sex, school/college attendance and age 64
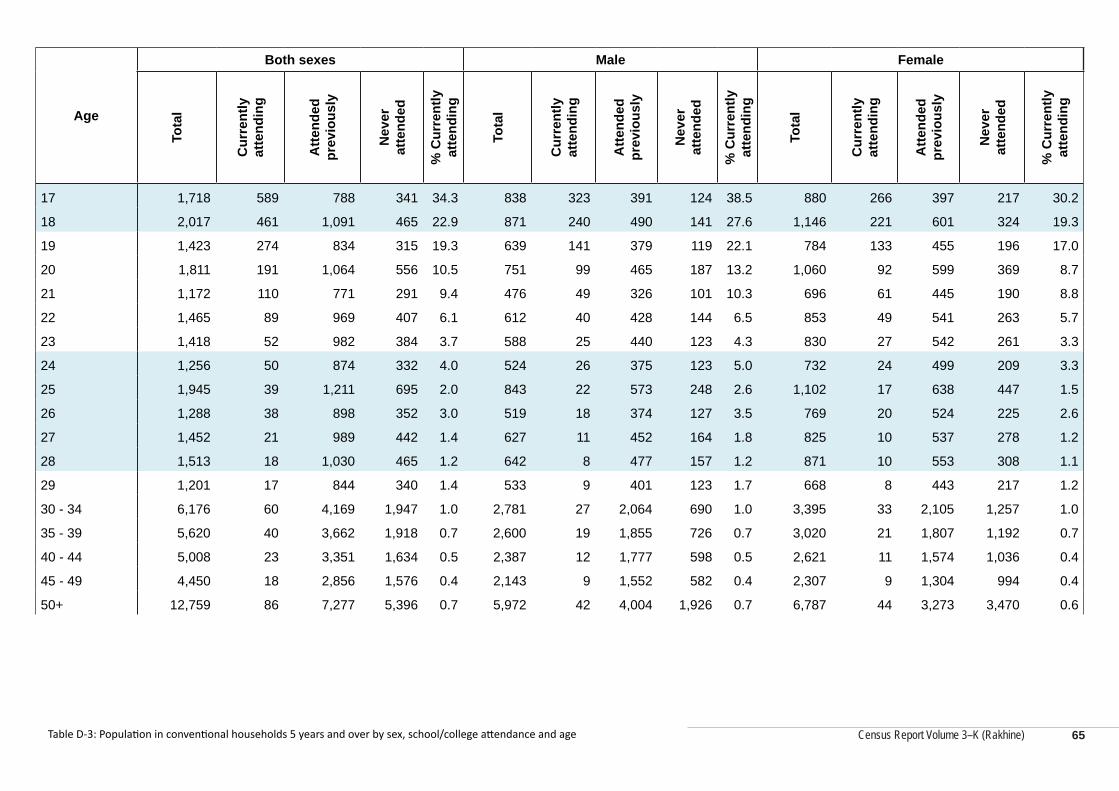
Census Report Volume 3–K (Rakhine)
Age
Both sexes Male Female
Tota
l
Cur
rent
ly
atte
ndin
g
Atte
nded
pr
evio
usly
Nev
er
atte
nded
% C
urre
ntly
at
tend
ing
Tota
l
Cur
rent
ly
atte
ndin
g
Atte
nded
pr
evio
usly
Nev
er
atte
nded
% C
urre
ntly
at
tend
ing
Tota
l
Cur
rent
ly
atte
ndin
g
Atte
nded
pr
evio
usly
Nev
er
atte
nded
% C
urre
ntly
at
tend
ing
17 1,718 589 788 341 34.3 838 323 391 124 38.5 880 266 397 217 30.2
18 2,017 461 1,091 465 22.9 871 240 490 141 27.6 1,146 221 601 324 19.3
19 1,423 274 834 315 19.3 639 141 379 119 22.1 784 133 455 196 17.0
20 1,811 191 1,064 556 10.5 751 99 465 187 13.2 1,060 92 599 369 8.7
21 1,172 110 771 291 9.4 476 49 326 101 10.3 696 61 445 190 8.8
22 1,465 89 969 407 6.1 612 40 428 144 6.5 853 49 541 263 5.7
23 1,418 52 982 384 3.7 588 25 440 123 4.3 830 27 542 261 3.3
24 1,256 50 874 332 4.0 524 26 375 123 5.0 732 24 499 209 3.3
25 1,945 39 1,211 695 2.0 843 22 573 248 2.6 1,102 17 638 447 1.5
26 1,288 38 898 352 3.0 519 18 374 127 3.5 769 20 524 225 2.6
27 1,452 21 989 442 1.4 627 11 452 164 1.8 825 10 537 278 1.2
28 1,513 18 1,030 465 1.2 642 8 477 157 1.2 871 10 553 308 1.1
29 1,201 17 844 340 1.4 533 9 401 123 1.7 668 8 443 217 1.2
30 - 34 6,176 60 4,169 1,947 1.0 2,781 27 2,064 690 1.0 3,395 33 2,105 1,257 1.0
35 - 39 5,620 40 3,662 1,918 0.7 2,600 19 1,855 726 0.7 3,020 21 1,807 1,192 0.7
40 - 44 5,008 23 3,351 1,634 0.5 2,387 12 1,777 598 0.5 2,621 11 1,574 1,036 0.4
45 - 49 4,450 18 2,856 1,576 0.4 2,143 9 1,552 582 0.4 2,307 9 1,304 994 0.4
50+ 12,759 86 7,277 5,396 0.7 5,972 42 4,004 1,926 0.7 6,787 44 3,273 3,470 0.6
Table D-3: Population in conventional households 5 years and over by sex, school/college attendance and age 65
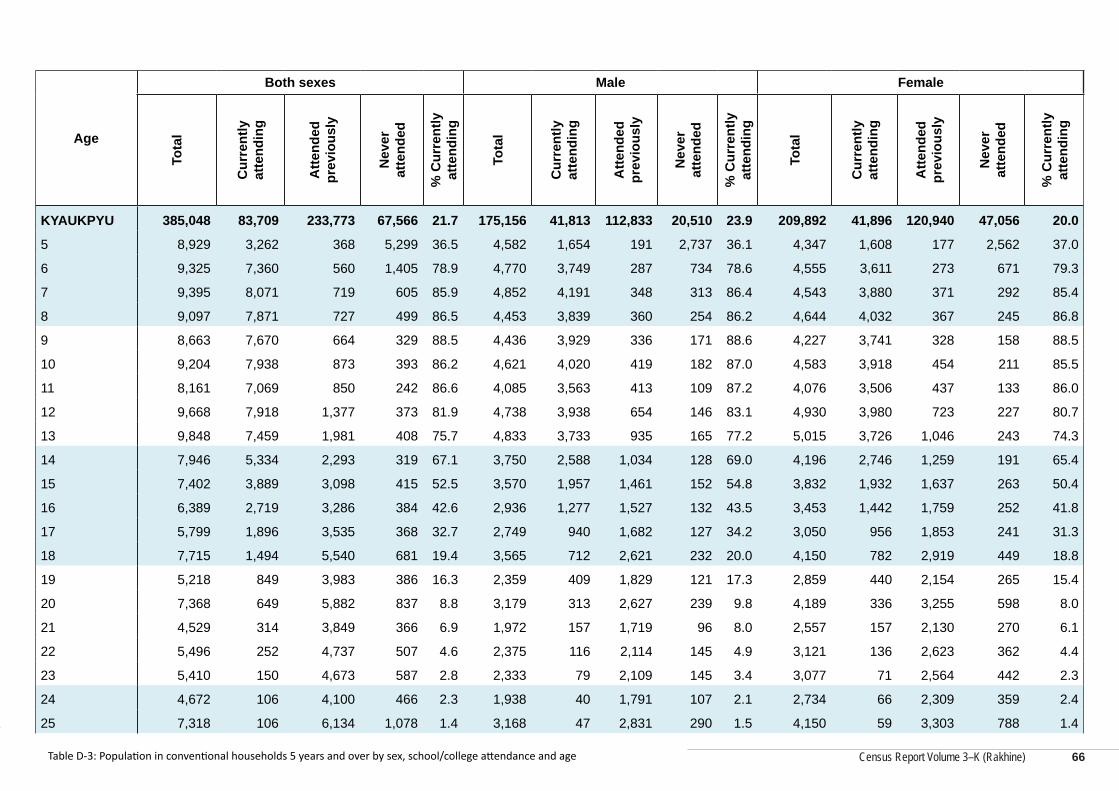
Census Report Volume 3–K (Rakhine)
Census Report Volume 3–K (Rakhine)
Age
Both sexes Male Female
Tota
l
Cur
rent
ly
atte
ndin
g
Atte
nded
pr
evio
usly
Nev
er
atte
nded
% C
urre
ntly
at
tend
ing
Tota
l
Cur
rent
ly
atte
ndin
g
Atte
nded
pr
evio
usly
Nev
er
atte
nded
% C
urre
ntly
at
tend
ing
Tota
l
Cur
rent
ly
atte
ndin
g
Atte
nded
pr
evio
usly
Nev
er
atte
nded
% C
urre
ntly
at
tend
ing
KYAUKPYU 385,048 83,709 233,773 67,566 21.7 175,156 41,813 112,833 20,510 23.9 209,892 41,896 120,940 47,056 20.0
5 8,929 3,262 368 5,299 36.5 4,582 1,654 191 2,737 36.1 4,347 1,608 177 2,562 37.0
6 9,325 7,360 560 1,405 78.9 4,770 3,749 287 734 78.6 4,555 3,611 273 671 79.3
7 9,395 8,071 719 605 85.9 4,852 4,191 348 313 86.4 4,543 3,880 371 292 85.4
8 9,097 7,871 727 499 86.5 4,453 3,839 360 254 86.2 4,644 4,032 367 245 86.8
9 8,663 7,670 664 329 88.5 4,436 3,929 336 171 88.6 4,227 3,741 328 158 88.5
10 9,204 7,938 873 393 86.2 4,621 4,020 419 182 87.0 4,583 3,918 454 211 85.5
11 8,161 7,069 850 242 86.6 4,085 3,563 413 109 87.2 4,076 3,506 437 133 86.0
12 9,668 7,918 1,377 373 81.9 4,738 3,938 654 146 83.1 4,930 3,980 723 227 80.7
13 9,848 7,459 1,981 408 75.7 4,833 3,733 935 165 77.2 5,015 3,726 1,046 243 74.3
14 7,946 5,334 2,293 319 67.1 3,750 2,588 1,034 128 69.0 4,196 2,746 1,259 191 65.4
15 7,402 3,889 3,098 415 52.5 3,570 1,957 1,461 152 54.8 3,832 1,932 1,637 263 50.4
16 6,389 2,719 3,286 384 42.6 2,936 1,277 1,527 132 43.5 3,453 1,442 1,759 252 41.8
17 5,799 1,896 3,535 368 32.7 2,749 940 1,682 127 34.2 3,050 956 1,853 241 31.3
18 7,715 1,494 5,540 681 19.4 3,565 712 2,621 232 20.0 4,150 782 2,919 449 18.8
19 5,218 849 3,983 386 16.3 2,359 409 1,829 121 17.3 2,859 440 2,154 265 15.4
20 7,368 649 5,882 837 8.8 3,179 313 2,627 239 9.8 4,189 336 3,255 598 8.0
21 4,529 314 3,849 366 6.9 1,972 157 1,719 96 8.0 2,557 157 2,130 270 6.1
22 5,496 252 4,737 507 4.6 2,375 116 2,114 145 4.9 3,121 136 2,623 362 4.4
23 5,410 150 4,673 587 2.8 2,333 79 2,109 145 3.4 3,077 71 2,564 442 2.3
24 4,672 106 4,100 466 2.3 1,938 40 1,791 107 2.1 2,734 66 2,309 359 2.4
25 7,318 106 6,134 1,078 1.4 3,168 47 2,831 290 1.5 4,150 59 3,303 788 1.4
Table D-3: Population in conventional households 5 years and over by sex, school/college attendance and age 66

Census Report Volume 3–K (Rakhine)
Age
Both sexes Male Female
Tota
l
Cur
rent
ly
atte
ndin
g
Atte
nded
pr
evio
usly
Nev
er
atte
nded
% C
urre
ntly
at
tend
ing
Tota
l
Cur
rent
ly
atte
ndin
g
Atte
nded
pr
evio
usly
Nev
er
atte
nded
% C
urre
ntly
at
tend
ing
Tota
l
Cur
rent
ly
atte
ndin
g
Atte
nded
pr
evio
usly
Nev
er
atte
nded
% C
urre
ntly
at
tend
ing
26 4,817 70 4,137 610 1.5 2,055 36 1,850 169 1.8 2,762 34 2,287 441 1.2
27 5,296 68 4,553 675 1.3 2,306 31 2,106 169 1.3 2,990 37 2,447 506 1.2
28 6,663 94 5,570 999 1.4 2,850 44 2,570 236 1.5 3,813 50 3,000 763 1.3
29 4,904 62 4,251 591 1.3 2,136 21 1,964 151 1.0 2,768 41 2,287 440 1.5
30 - 34 29,367 196 24,907 4,264 0.7 13,177 75 11,973 1,129 0.6 16,190 121 12,934 3,135 0.7
35 - 39 29,187 157 24,716 4,314 0.5 13,093 71 11,902 1,120 0.5 16,094 86 12,814 3,194 0.5
40 - 44 27,512 134 23,173 4,205 0.5 12,022 47 10,941 1,034 0.4 15,490 87 12,232 3,171 0.6
45 - 49 25,180 112 20,259 4,809 0.4 11,115 53 9,964 1,098 0.5 14,065 59 10,295 3,711 0.4
50+ 94,570 440 62,978 31,152 0.5 41,138 184 32,275 8,679 0.4 53,432 256 30,703 22,473 0.5
THANDWE 315,861 58,711 228,443 28,707 18.6 150,357 28,951 110,574 10,832 19.3 165,504 29,760 117,869 17,875 18.0
5 6,092 1,839 252 4,001 30.2 3,154 901 122 2,131 28.6 2,938 938 130 1,870 31.9
6 6,067 4,702 468 897 77.5 3,049 2,354 222 473 77.2 3,018 2,348 246 424 77.8
7 6,382 5,474 585 323 85.8 3,257 2,807 295 155 86.2 3,125 2,667 290 168 85.3
8 6,340 5,507 610 223 86.9 3,109 2,714 292 103 87.3 3,231 2,793 318 120 86.4
9 6,138 5,330 658 150 86.8 3,112 2,664 363 85 85.6 3,026 2,666 295 65 88.1
10 6,221 5,358 708 155 86.1 3,217 2,772 370 75 86.2 3,004 2,586 338 80 86.1
11 5,938 5,025 784 129 84.6 2,948 2,490 401 57 84.5 2,990 2,535 383 72 84.8
12 6,682 5,293 1,212 177 79.2 3,367 2,679 600 88 79.6 3,315 2,614 612 89 78.9
13 7,160 5,262 1,706 192 73.5 3,566 2,605 871 90 73.1 3,594 2,657 835 102 73.9
14 6,314 3,873 2,270 171 61.3 3,066 1,837 1,147 82 59.9 3,248 2,036 1,123 89 62.7
15 5,904 2,932 2,786 186 49.7 2,970 1,448 1,430 92 48.8 2,934 1,484 1,356 94 50.6
16 5,424 2,117 3,125 182 39.0 2,614 953 1,568 93 36.5 2,810 1,164 1,557 89 41.4
Table D-3: Population in conventional households 5 years and over by sex, school/college attendance and age 67
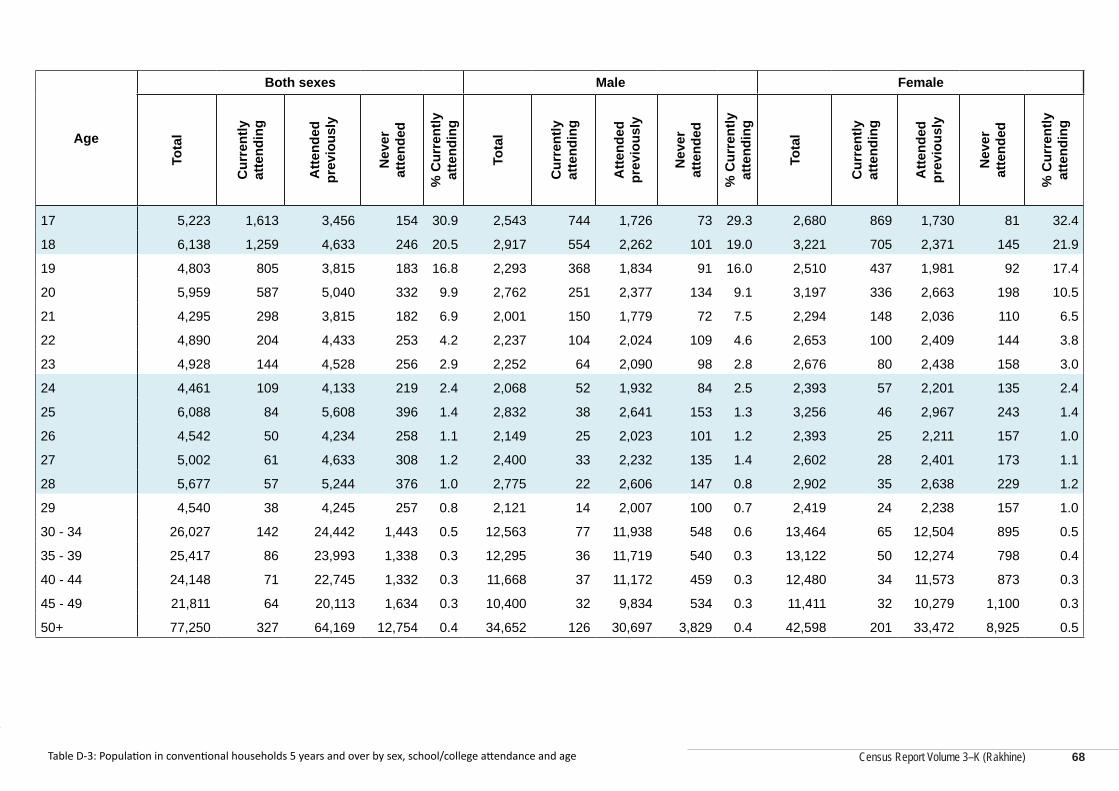
Census Report Volume 3–K (Rakhine)
Census Report Volume 3–K (Rakhine)
Age
Both sexes Male Female
Tota
l
Cur
rent
ly
atte
ndin
g
Atte
nded
pr
evio
usly
Nev
er
atte
nded
% C
urre
ntly
at
tend
ing
Tota
l
Cur
rent
ly
atte
ndin
g
Atte
nded
pr
evio
usly
Nev
er
atte
nded
% C
urre
ntly
at
tend
ing
Tota
l
Cur
rent
ly
atte
ndin
g
Atte
nded
pr
evio
usly
Nev
er
atte
nded
% C
urre
ntly
at
tend
ing
17 5,223 1,613 3,456 154 30.9 2,543 744 1,726 73 29.3 2,680 869 1,730 81 32.4
18 6,138 1,259 4,633 246 20.5 2,917 554 2,262 101 19.0 3,221 705 2,371 145 21.9
19 4,803 805 3,815 183 16.8 2,293 368 1,834 91 16.0 2,510 437 1,981 92 17.4
20 5,959 587 5,040 332 9.9 2,762 251 2,377 134 9.1 3,197 336 2,663 198 10.5
21 4,295 298 3,815 182 6.9 2,001 150 1,779 72 7.5 2,294 148 2,036 110 6.5
22 4,890 204 4,433 253 4.2 2,237 104 2,024 109 4.6 2,653 100 2,409 144 3.8
23 4,928 144 4,528 256 2.9 2,252 64 2,090 98 2.8 2,676 80 2,438 158 3.0
24 4,461 109 4,133 219 2.4 2,068 52 1,932 84 2.5 2,393 57 2,201 135 2.4
25 6,088 84 5,608 396 1.4 2,832 38 2,641 153 1.3 3,256 46 2,967 243 1.4
26 4,542 50 4,234 258 1.1 2,149 25 2,023 101 1.2 2,393 25 2,211 157 1.0
27 5,002 61 4,633 308 1.2 2,400 33 2,232 135 1.4 2,602 28 2,401 173 1.1
28 5,677 57 5,244 376 1.0 2,775 22 2,606 147 0.8 2,902 35 2,638 229 1.2
29 4,540 38 4,245 257 0.8 2,121 14 2,007 100 0.7 2,419 24 2,238 157 1.0
30 - 34 26,027 142 24,442 1,443 0.5 12,563 77 11,938 548 0.6 13,464 65 12,504 895 0.5
35 - 39 25,417 86 23,993 1,338 0.3 12,295 36 11,719 540 0.3 13,122 50 12,274 798 0.4
40 - 44 24,148 71 22,745 1,332 0.3 11,668 37 11,172 459 0.3 12,480 34 11,573 873 0.3
45 - 49 21,811 64 20,113 1,634 0.3 10,400 32 9,834 534 0.3 11,411 32 10,279 1,100 0.3
50+ 77,250 327 64,169 12,754 0.4 34,652 126 30,697 3,829 0.4 42,598 201 33,472 8,925 0.5
Table D-3: Population in conventional households 5 years and over by sex, school/college attendance and age 68
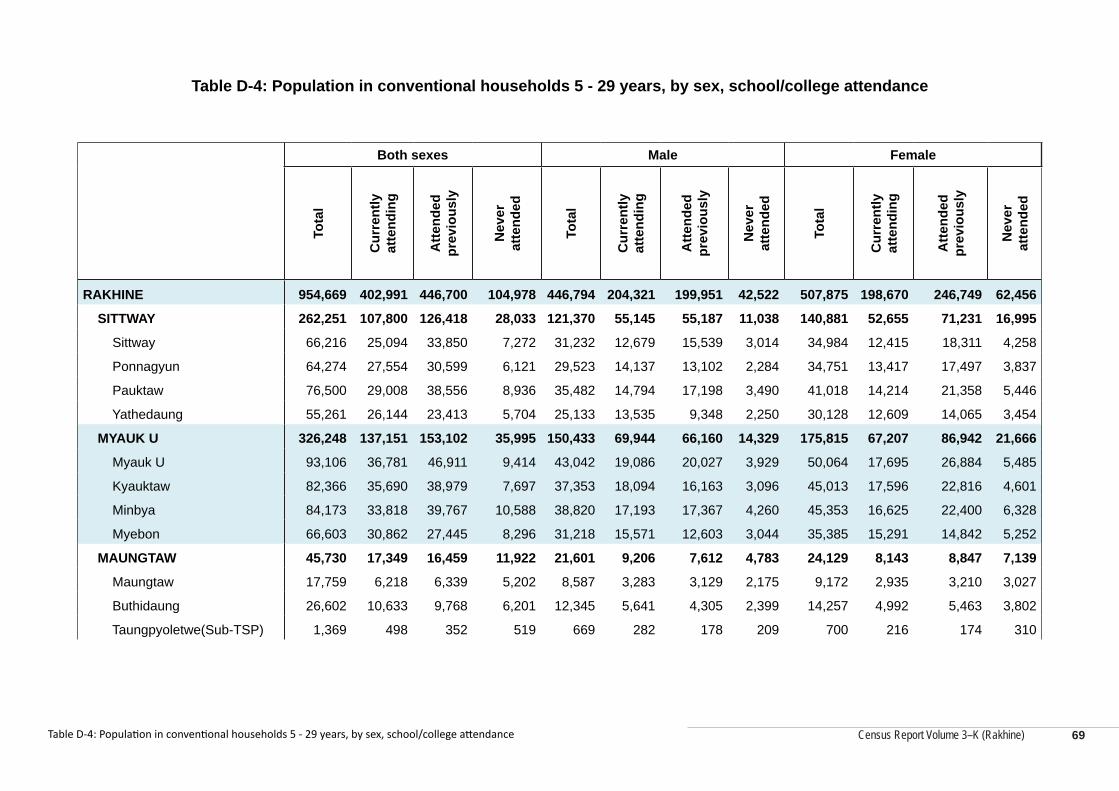
Census Report Volume 3–K (Rakhine)
Table D-4: Population in conventional households 5 - 29 years, by sex, school/college attendance
Both sexes Male Female
Tota
l
Cur
rent
ly
atte
ndin
g
Atte
nded
pr
evio
usly
Nev
er
atte
nded
Tota
l
Cur
rent
ly
atte
ndin
g
Atte
nded
pr
evio
usly
Nev
er
atte
nded
Tota
l
Cur
rent
ly
atte
ndin
g
Atte
nded
pr
evio
usly
Nev
er
atte
nded
RAKHINE 954,669 402,991 446,700 104,978 446,794 204,321 199,951 42,522 507,875 198,670 246,749 62,456
SITTWAY 262,251 107,800 126,418 28,033 121,370 55,145 55,187 11,038 140,881 52,655 71,231 16,995
Sittway 66,216 25,094 33,850 7,272 31,232 12,679 15,539 3,014 34,984 12,415 18,311 4,258
Ponnagyun 64,274 27,554 30,599 6,121 29,523 14,137 13,102 2,284 34,751 13,417 17,497 3,837
Pauktaw 76,500 29,008 38,556 8,936 35,482 14,794 17,198 3,490 41,018 14,214 21,358 5,446
Yathedaung 55,261 26,144 23,413 5,704 25,133 13,535 9,348 2,250 30,128 12,609 14,065 3,454
MYAUK U 326,248 137,151 153,102 35,995 150,433 69,944 66,160 14,329 175,815 67,207 86,942 21,666
Myauk U 93,106 36,781 46,911 9,414 43,042 19,086 20,027 3,929 50,064 17,695 26,884 5,485
Kyauktaw 82,366 35,690 38,979 7,697 37,353 18,094 16,163 3,096 45,013 17,596 22,816 4,601
Minbya 84,173 33,818 39,767 10,588 38,820 17,193 17,367 4,260 45,353 16,625 22,400 6,328
Myebon 66,603 30,862 27,445 8,296 31,218 15,571 12,603 3,044 35,385 15,291 14,842 5,252
MAUNGTAW 45,730 17,349 16,459 11,922 21,601 9,206 7,612 4,783 24,129 8,143 8,847 7,139
Maungtaw 17,759 6,218 6,339 5,202 8,587 3,283 3,129 2,175 9,172 2,935 3,210 3,027
Buthidaung 26,602 10,633 9,768 6,201 12,345 5,641 4,305 2,399 14,257 4,992 5,463 3,802
Taungpyoletwe(Sub-TSP) 1,369 498 352 519 669 282 178 209 700 216 174 310
Table D-4: Population in conventional households 5 - 29 years, by sex, school/college attendance 69
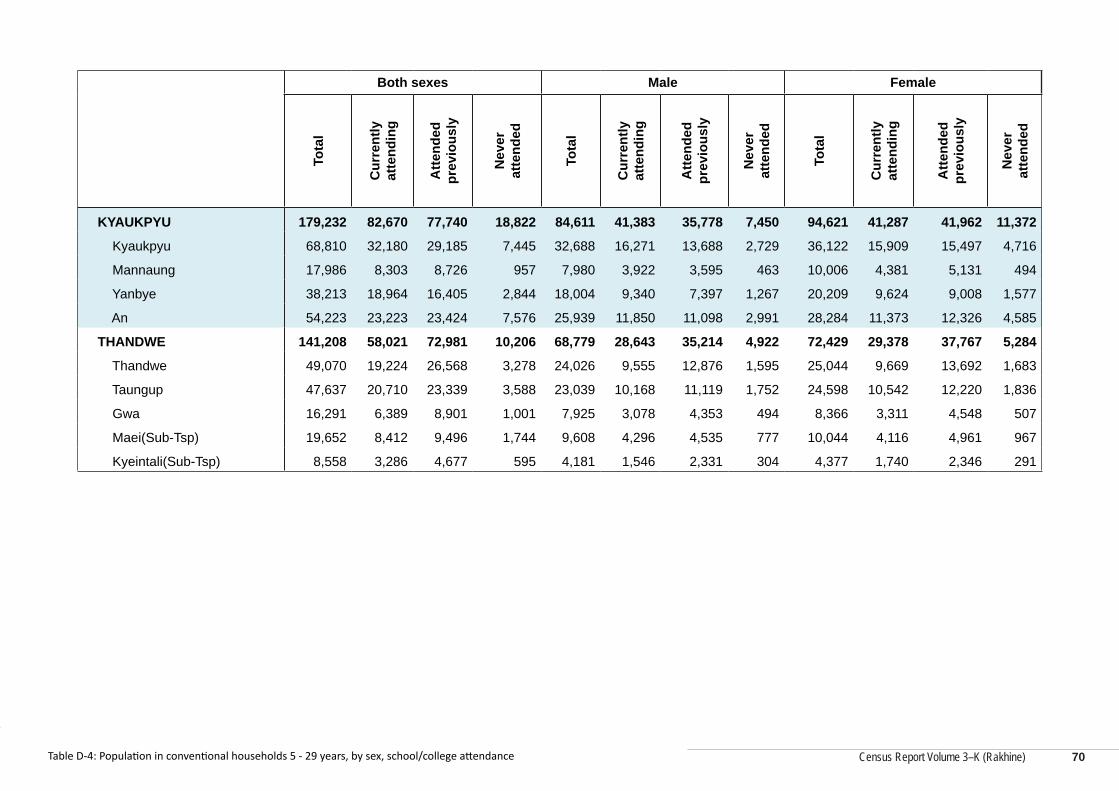
Census Report Volume 3–K (Rakhine)
Census Report Volume 3–K (Rakhine)
Both sexes Male Female
Tota
l
Cur
rent
ly
atte
ndin
g
Atte
nded
pr
evio
usly
Nev
er
atte
nded
Tota
l
Cur
rent
ly
atte
ndin
g
Atte
nded
pr
evio
usly
Nev
er
atte
nded
Tota
l
Cur
rent
ly
atte
ndin
g
Atte
nded
pr
evio
usly
Nev
er
atte
nded
KYAUKPYU 179,232 82,670 77,740 18,822 84,611 41,383 35,778 7,450 94,621 41,287 41,962 11,372
Kyaukpyu 68,810 32,180 29,185 7,445 32,688 16,271 13,688 2,729 36,122 15,909 15,497 4,716
Mannaung 17,986 8,303 8,726 957 7,980 3,922 3,595 463 10,006 4,381 5,131 494
Yanbye 38,213 18,964 16,405 2,844 18,004 9,340 7,397 1,267 20,209 9,624 9,008 1,577
An 54,223 23,223 23,424 7,576 25,939 11,850 11,098 2,991 28,284 11,373 12,326 4,585
THANDWE 141,208 58,021 72,981 10,206 68,779 28,643 35,214 4,922 72,429 29,378 37,767 5,284
Thandwe 49,070 19,224 26,568 3,278 24,026 9,555 12,876 1,595 25,044 9,669 13,692 1,683
Taungup 47,637 20,710 23,339 3,588 23,039 10,168 11,119 1,752 24,598 10,542 12,220 1,836
Gwa 16,291 6,389 8,901 1,001 7,925 3,078 4,353 494 8,366 3,311 4,548 507
Maei(Sub-Tsp) 19,652 8,412 9,496 1,744 9,608 4,296 4,535 777 10,044 4,116 4,961 967
Kyeintali(Sub-Tsp) 8,558 3,286 4,677 595 4,181 1,546 2,331 304 4,377 1,740 2,346 291
Table D-4: Population in conventional households 5 - 29 years, by sex, school/college attendance 70
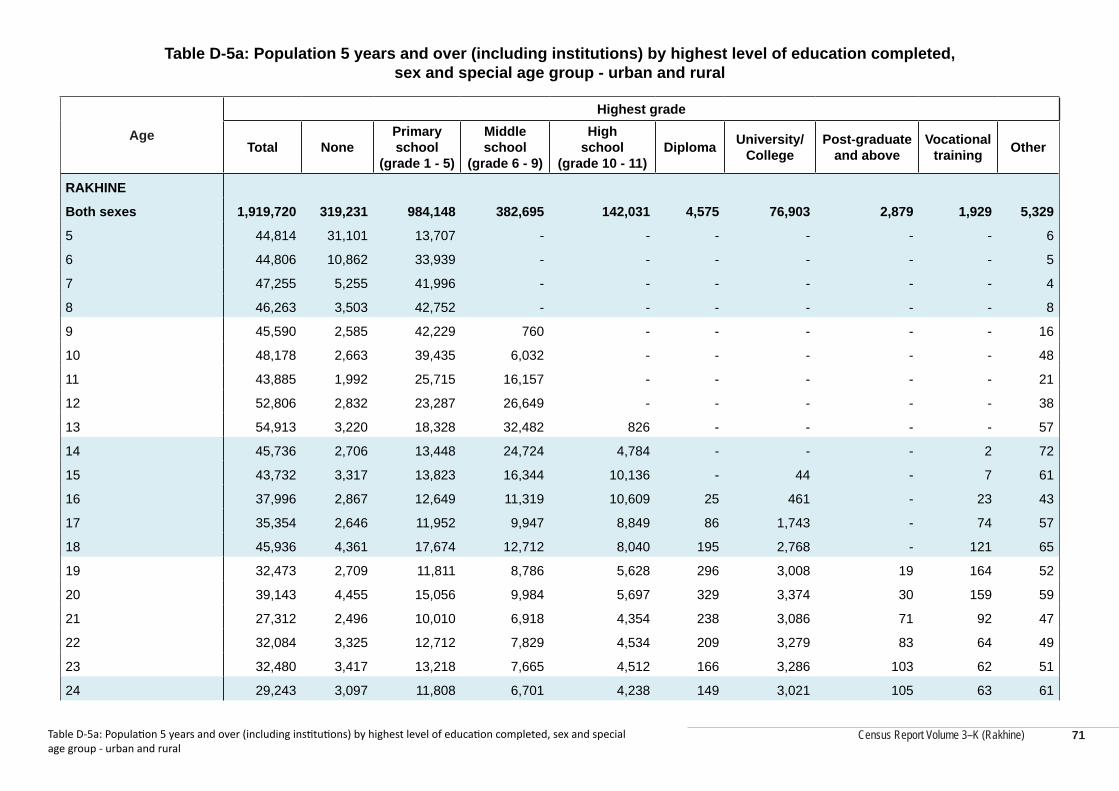
Census Report Volume 3–K (Rakhine)
Table D-5a: Population 5 years and over (including institutions) by highest level of education completed, sex and special age group - urban and rural
Age
Highest grade
Total NonePrimary school
(grade 1 - 5)
Middle school
(grade 6 - 9)
High school
(grade 10 - 11)Diploma University/
CollegePost-graduate
and aboveVocational
training Other
RAKHINE
Both sexes 1,919,720 319,231 984,148 382,695 142,031 4,575 76,903 2,879 1,929 5,329
5 44,814 31,101 13,707 - - - - - - 6
6 44,806 10,862 33,939 - - - - - - 5
7 47,255 5,255 41,996 - - - - - - 4
8 46,263 3,503 42,752 - - - - - - 8
9 45,590 2,585 42,229 760 - - - - - 16
10 48,178 2,663 39,435 6,032 - - - - - 48
11 43,885 1,992 25,715 16,157 - - - - - 21
12 52,806 2,832 23,287 26,649 - - - - - 38
13 54,913 3,220 18,328 32,482 826 - - - - 57
14 45,736 2,706 13,448 24,724 4,784 - - - 2 72
15 43,732 3,317 13,823 16,344 10,136 - 44 - 7 61
16 37,996 2,867 12,649 11,319 10,609 25 461 - 23 43
17 35,354 2,646 11,952 9,947 8,849 86 1,743 - 74 57
18 45,936 4,361 17,674 12,712 8,040 195 2,768 - 121 65
19 32,473 2,709 11,811 8,786 5,628 296 3,008 19 164 52
20 39,143 4,455 15,056 9,984 5,697 329 3,374 30 159 59
21 27,312 2,496 10,010 6,918 4,354 238 3,086 71 92 47
22 32,084 3,325 12,712 7,829 4,534 209 3,279 83 64 49
23 32,480 3,417 13,218 7,665 4,512 166 3,286 103 62 51
24 29,243 3,097 11,808 6,701 4,238 149 3,021 105 63 61
Table D-5a: Population 5 years and over (including institutions) by highest level of education completed, sex and special age group - urban and rural
71
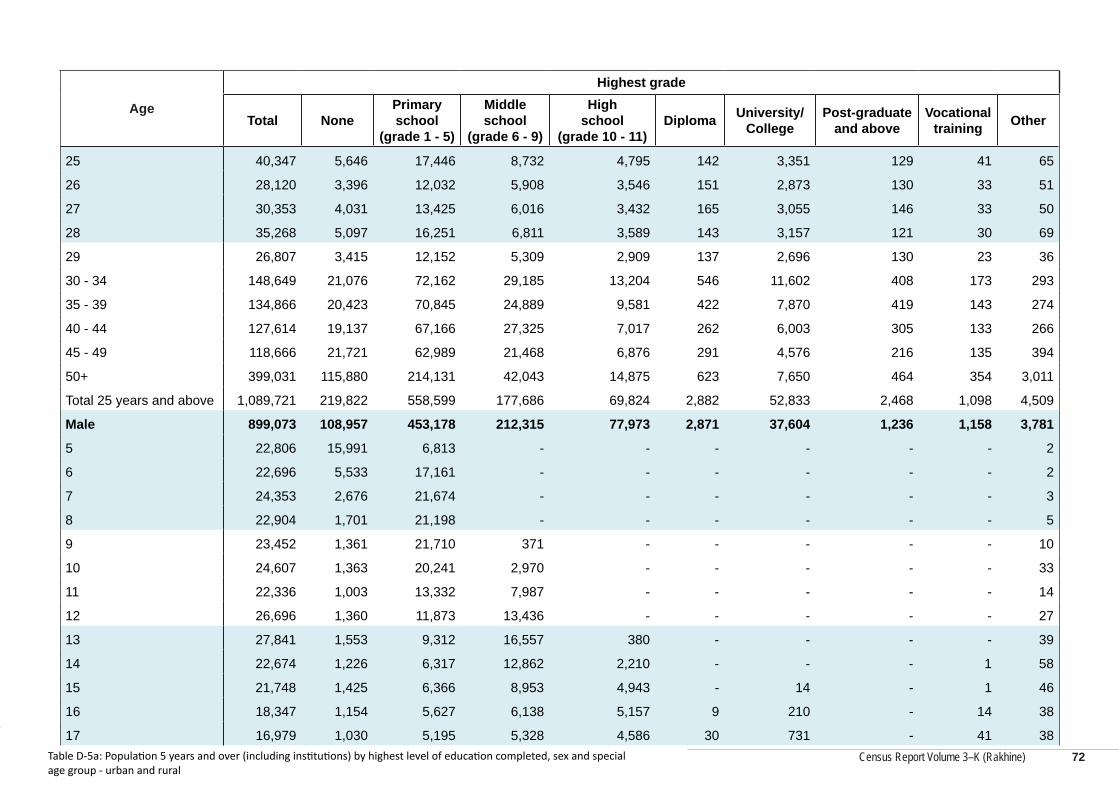
Census Report Volume 3–K (Rakhine)
Census Report Volume 3–K (Rakhine)
Age
Highest grade
Total NonePrimary school
(grade 1 - 5)
Middle school
(grade 6 - 9)
High school
(grade 10 - 11)Diploma University/
CollegePost-graduate
and aboveVocational
training Other
25 40,347 5,646 17,446 8,732 4,795 142 3,351 129 41 65
26 28,120 3,396 12,032 5,908 3,546 151 2,873 130 33 51
27 30,353 4,031 13,425 6,016 3,432 165 3,055 146 33 50
28 35,268 5,097 16,251 6,811 3,589 143 3,157 121 30 69
29 26,807 3,415 12,152 5,309 2,909 137 2,696 130 23 36
30 - 34 148,649 21,076 72,162 29,185 13,204 546 11,602 408 173 293
35 - 39 134,866 20,423 70,845 24,889 9,581 422 7,870 419 143 274
40 - 44 127,614 19,137 67,166 27,325 7,017 262 6,003 305 133 266
45 - 49 118,666 21,721 62,989 21,468 6,876 291 4,576 216 135 394
50+ 399,031 115,880 214,131 42,043 14,875 623 7,650 464 354 3,011
Total 25 years and above 1,089,721 219,822 558,599 177,686 69,824 2,882 52,833 2,468 1,098 4,509
Male 899,073 108,957 453,178 212,315 77,973 2,871 37,604 1,236 1,158 3,781
5 22,806 15,991 6,813 - - - - - - 2
6 22,696 5,533 17,161 - - - - - - 2
7 24,353 2,676 21,674 - - - - - - 3
8 22,904 1,701 21,198 - - - - - - 5
9 23,452 1,361 21,710 371 - - - - - 10
10 24,607 1,363 20,241 2,970 - - - - - 33
11 22,336 1,003 13,332 7,987 - - - - - 14
12 26,696 1,360 11,873 13,436 - - - - - 27
13 27,841 1,553 9,312 16,557 380 - - - - 39
14 22,674 1,226 6,317 12,862 2,210 - - - 1 58
15 21,748 1,425 6,366 8,953 4,943 - 14 - 1 46
16 18,347 1,154 5,627 6,138 5,157 9 210 - 14 38
17 16,979 1,030 5,195 5,328 4,586 30 731 - 41 38Table D-5a: Population 5 years and over (including institutions) by highest level of education completed, sex and special age group - urban and rural
72
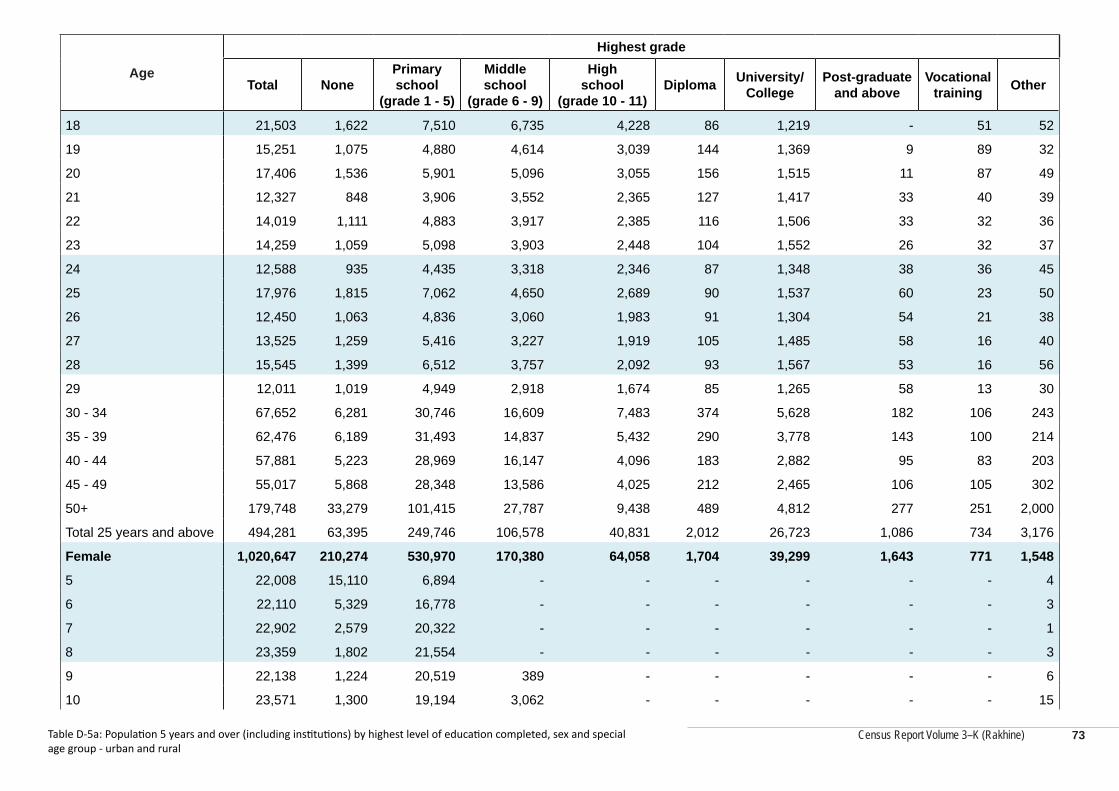
Census Report Volume 3–K (Rakhine)
Age
Highest grade
Total NonePrimary school
(grade 1 - 5)
Middle school
(grade 6 - 9)
High school
(grade 10 - 11)Diploma University/
CollegePost-graduate
and aboveVocational
training Other
18 21,503 1,622 7,510 6,735 4,228 86 1,219 - 51 52
19 15,251 1,075 4,880 4,614 3,039 144 1,369 9 89 32
20 17,406 1,536 5,901 5,096 3,055 156 1,515 11 87 49
21 12,327 848 3,906 3,552 2,365 127 1,417 33 40 39
22 14,019 1,111 4,883 3,917 2,385 116 1,506 33 32 36
23 14,259 1,059 5,098 3,903 2,448 104 1,552 26 32 37
24 12,588 935 4,435 3,318 2,346 87 1,348 38 36 45
25 17,976 1,815 7,062 4,650 2,689 90 1,537 60 23 50
26 12,450 1,063 4,836 3,060 1,983 91 1,304 54 21 38
27 13,525 1,259 5,416 3,227 1,919 105 1,485 58 16 40
28 15,545 1,399 6,512 3,757 2,092 93 1,567 53 16 56
29 12,011 1,019 4,949 2,918 1,674 85 1,265 58 13 30
30 - 34 67,652 6,281 30,746 16,609 7,483 374 5,628 182 106 243
35 - 39 62,476 6,189 31,493 14,837 5,432 290 3,778 143 100 214
40 - 44 57,881 5,223 28,969 16,147 4,096 183 2,882 95 83 203
45 - 49 55,017 5,868 28,348 13,586 4,025 212 2,465 106 105 302
50+ 179,748 33,279 101,415 27,787 9,438 489 4,812 277 251 2,000
Total 25 years and above 494,281 63,395 249,746 106,578 40,831 2,012 26,723 1,086 734 3,176
Female 1,020,647 210,274 530,970 170,380 64,058 1,704 39,299 1,643 771 1,548
5 22,008 15,110 6,894 - - - - - - 4
6 22,110 5,329 16,778 - - - - - - 3
7 22,902 2,579 20,322 - - - - - - 1
8 23,359 1,802 21,554 - - - - - - 3
9 22,138 1,224 20,519 389 - - - - - 6
10 23,571 1,300 19,194 3,062 - - - - - 15
Table D-5a: Population 5 years and over (including institutions) by highest level of education completed, sex and special age group - urban and rural
73
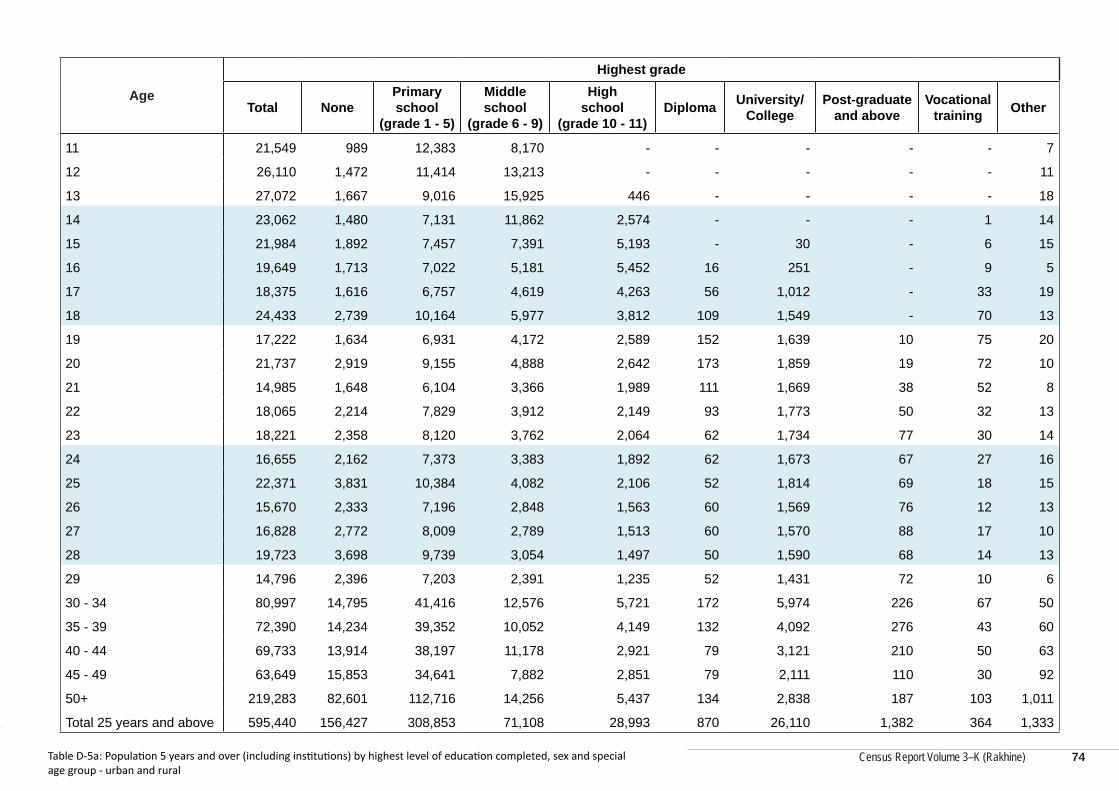
Census Report Volume 3–K (Rakhine)
Census Report Volume 3–K (Rakhine)
Age
Highest grade
Total NonePrimary school
(grade 1 - 5)
Middle school
(grade 6 - 9)
High school
(grade 10 - 11)Diploma University/
CollegePost-graduate
and aboveVocational
training Other
11 21,549 989 12,383 8,170 - - - - - 7
12 26,110 1,472 11,414 13,213 - - - - - 11
13 27,072 1,667 9,016 15,925 446 - - - - 18
14 23,062 1,480 7,131 11,862 2,574 - - - 1 14
15 21,984 1,892 7,457 7,391 5,193 - 30 - 6 15
16 19,649 1,713 7,022 5,181 5,452 16 251 - 9 5
17 18,375 1,616 6,757 4,619 4,263 56 1,012 - 33 19
18 24,433 2,739 10,164 5,977 3,812 109 1,549 - 70 13
19 17,222 1,634 6,931 4,172 2,589 152 1,639 10 75 20
20 21,737 2,919 9,155 4,888 2,642 173 1,859 19 72 10
21 14,985 1,648 6,104 3,366 1,989 111 1,669 38 52 8
22 18,065 2,214 7,829 3,912 2,149 93 1,773 50 32 13
23 18,221 2,358 8,120 3,762 2,064 62 1,734 77 30 14
24 16,655 2,162 7,373 3,383 1,892 62 1,673 67 27 16
25 22,371 3,831 10,384 4,082 2,106 52 1,814 69 18 15
26 15,670 2,333 7,196 2,848 1,563 60 1,569 76 12 13
27 16,828 2,772 8,009 2,789 1,513 60 1,570 88 17 10
28 19,723 3,698 9,739 3,054 1,497 50 1,590 68 14 13
29 14,796 2,396 7,203 2,391 1,235 52 1,431 72 10 6
30 - 34 80,997 14,795 41,416 12,576 5,721 172 5,974 226 67 50
35 - 39 72,390 14,234 39,352 10,052 4,149 132 4,092 276 43 60
40 - 44 69,733 13,914 38,197 11,178 2,921 79 3,121 210 50 63
45 - 49 63,649 15,853 34,641 7,882 2,851 79 2,111 110 30 92
50+ 219,283 82,601 112,716 14,256 5,437 134 2,838 187 103 1,011
Total 25 years and above 595,440 156,427 308,853 71,108 28,993 870 26,110 1,382 364 1,333
Table D-5a: Population 5 years and over (including institutions) by highest level of education completed, sex and special age group - urban and rural
74
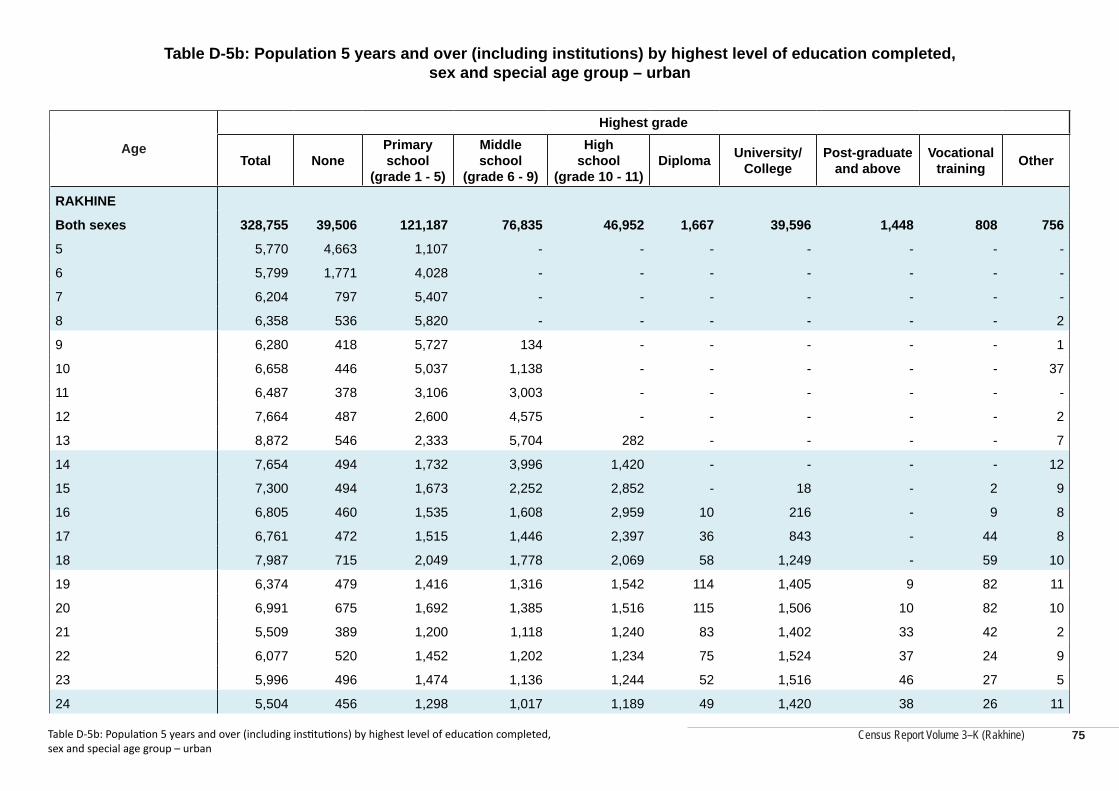
Census Report Volume 3–K (Rakhine)
Table D-5b: Population 5 years and over (including institutions) by highest level of education completed, sex and special age group – urban
Age
Highest grade
Total NonePrimary school
(grade 1 - 5)
Middle school
(grade 6 - 9)
High school
(grade 10 - 11)Diploma University/
CollegePost-graduate
and aboveVocational
training Other
RAKHINE
Both sexes 328,755 39,506 121,187 76,835 46,952 1,667 39,596 1,448 808 756
5 5,770 4,663 1,107 - - - - - - -
6 5,799 1,771 4,028 - - - - - - -
7 6,204 797 5,407 - - - - - - -
8 6,358 536 5,820 - - - - - - 2
9 6,280 418 5,727 134 - - - - - 1
10 6,658 446 5,037 1,138 - - - - - 37
11 6,487 378 3,106 3,003 - - - - - -
12 7,664 487 2,600 4,575 - - - - - 2
13 8,872 546 2,333 5,704 282 - - - - 7
14 7,654 494 1,732 3,996 1,420 - - - - 12
15 7,300 494 1,673 2,252 2,852 - 18 - 2 9
16 6,805 460 1,535 1,608 2,959 10 216 - 9 8
17 6,761 472 1,515 1,446 2,397 36 843 - 44 8
18 7,987 715 2,049 1,778 2,069 58 1,249 - 59 10
19 6,374 479 1,416 1,316 1,542 114 1,405 9 82 11
20 6,991 675 1,692 1,385 1,516 115 1,506 10 82 10
21 5,509 389 1,200 1,118 1,240 83 1,402 33 42 2
22 6,077 520 1,452 1,202 1,234 75 1,524 37 24 9
23 5,996 496 1,474 1,136 1,244 52 1,516 46 27 5
24 5,504 456 1,298 1,017 1,189 49 1,420 38 26 11
Table D-5b: Population 5 years and over (including institutions) by highest level of education completed, sex and special age group – urban
75
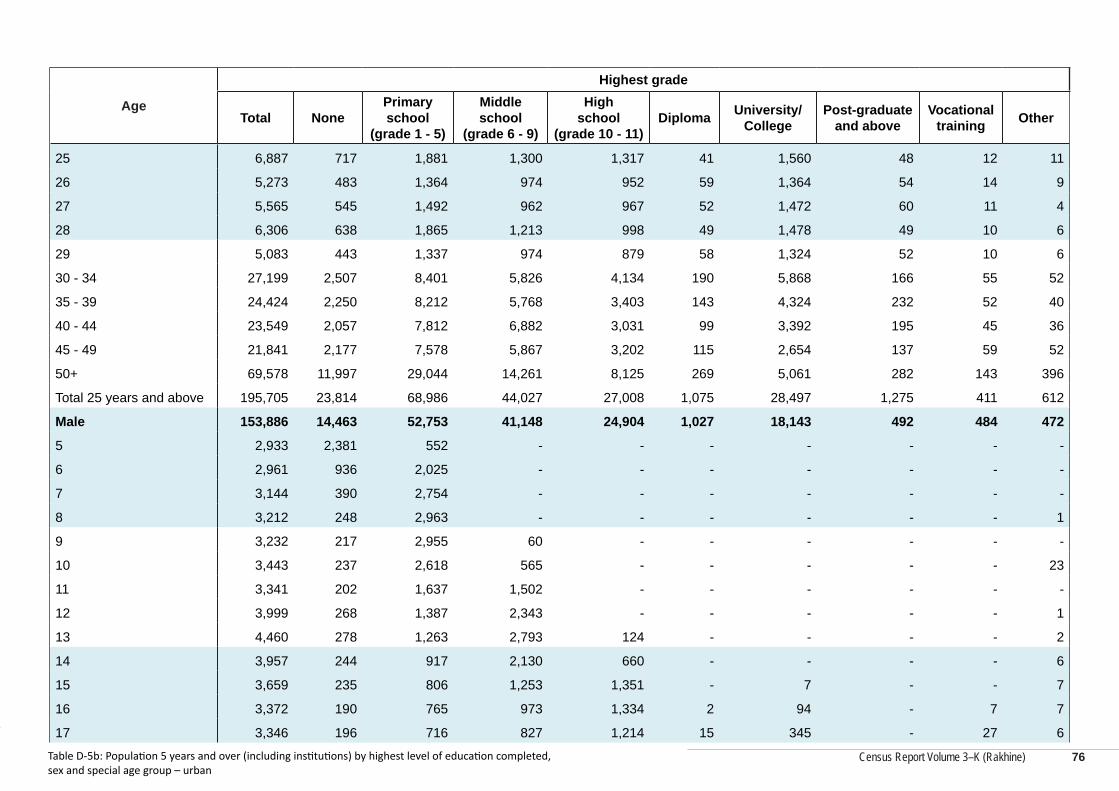
Census Report Volume 3–K (Rakhine)
Census Report Volume 3–K (Rakhine)
Age
Highest grade
Total NonePrimary school
(grade 1 - 5)
Middle school
(grade 6 - 9)
High school
(grade 10 - 11)Diploma University/
CollegePost-graduate
and aboveVocational
training Other
25 6,887 717 1,881 1,300 1,317 41 1,560 48 12 11
26 5,273 483 1,364 974 952 59 1,364 54 14 9
27 5,565 545 1,492 962 967 52 1,472 60 11 4
28 6,306 638 1,865 1,213 998 49 1,478 49 10 6
29 5,083 443 1,337 974 879 58 1,324 52 10 6
30 - 34 27,199 2,507 8,401 5,826 4,134 190 5,868 166 55 52
35 - 39 24,424 2,250 8,212 5,768 3,403 143 4,324 232 52 40
40 - 44 23,549 2,057 7,812 6,882 3,031 99 3,392 195 45 36
45 - 49 21,841 2,177 7,578 5,867 3,202 115 2,654 137 59 52
50+ 69,578 11,997 29,044 14,261 8,125 269 5,061 282 143 396
Total 25 years and above 195,705 23,814 68,986 44,027 27,008 1,075 28,497 1,275 411 612
Male 153,886 14,463 52,753 41,148 24,904 1,027 18,143 492 484 472
5 2,933 2,381 552 - - - - - - -
6 2,961 936 2,025 - - - - - - -
7 3,144 390 2,754 - - - - - - -
8 3,212 248 2,963 - - - - - - 1
9 3,232 217 2,955 60 - - - - - -
10 3,443 237 2,618 565 - - - - - 23
11 3,341 202 1,637 1,502 - - - - - -
12 3,999 268 1,387 2,343 - - - - - 1
13 4,460 278 1,263 2,793 124 - - - - 2
14 3,957 244 917 2,130 660 - - - - 6
15 3,659 235 806 1,253 1,351 - 7 - - 7
16 3,372 190 765 973 1,334 2 94 - 7 7
17 3,346 196 716 827 1,214 15 345 - 27 6
Table D-5b: Population 5 years and over (including institutions) by highest level of education completed, sex and special age group – urban
76
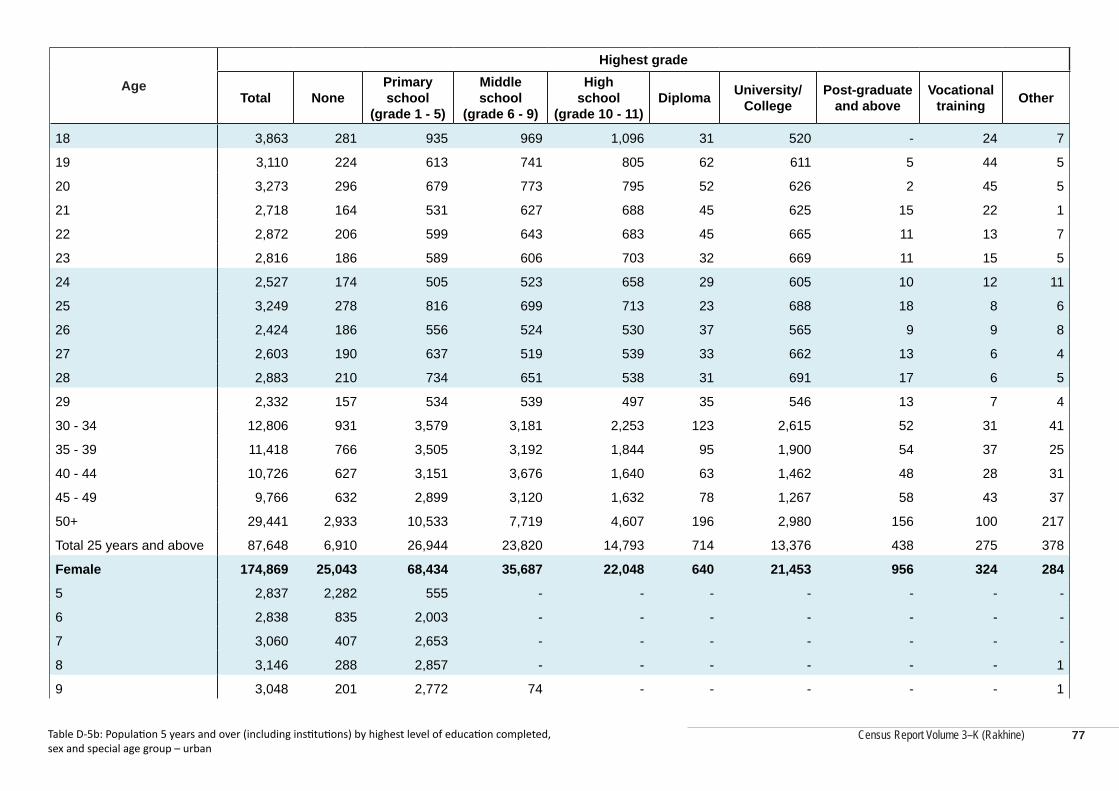
Census Report Volume 3–K (Rakhine)
Age
Highest grade
Total NonePrimary school
(grade 1 - 5)
Middle school
(grade 6 - 9)
High school
(grade 10 - 11)Diploma University/
CollegePost-graduate
and aboveVocational
training Other
18 3,863 281 935 969 1,096 31 520 - 24 7
19 3,110 224 613 741 805 62 611 5 44 5
20 3,273 296 679 773 795 52 626 2 45 5
21 2,718 164 531 627 688 45 625 15 22 1
22 2,872 206 599 643 683 45 665 11 13 7
23 2,816 186 589 606 703 32 669 11 15 5
24 2,527 174 505 523 658 29 605 10 12 11
25 3,249 278 816 699 713 23 688 18 8 6
26 2,424 186 556 524 530 37 565 9 9 8
27 2,603 190 637 519 539 33 662 13 6 4
28 2,883 210 734 651 538 31 691 17 6 5
29 2,332 157 534 539 497 35 546 13 7 4
30 - 34 12,806 931 3,579 3,181 2,253 123 2,615 52 31 41
35 - 39 11,418 766 3,505 3,192 1,844 95 1,900 54 37 25
40 - 44 10,726 627 3,151 3,676 1,640 63 1,462 48 28 31
45 - 49 9,766 632 2,899 3,120 1,632 78 1,267 58 43 37
50+ 29,441 2,933 10,533 7,719 4,607 196 2,980 156 100 217
Total 25 years and above 87,648 6,910 26,944 23,820 14,793 714 13,376 438 275 378
Female 174,869 25,043 68,434 35,687 22,048 640 21,453 956 324 284
5 2,837 2,282 555 - - - - - - -
6 2,838 835 2,003 - - - - - - -
7 3,060 407 2,653 - - - - - - -
8 3,146 288 2,857 - - - - - - 1
9 3,048 201 2,772 74 - - - - - 1
Table D-5b: Population 5 years and over (including institutions) by highest level of education completed, sex and special age group – urban
77
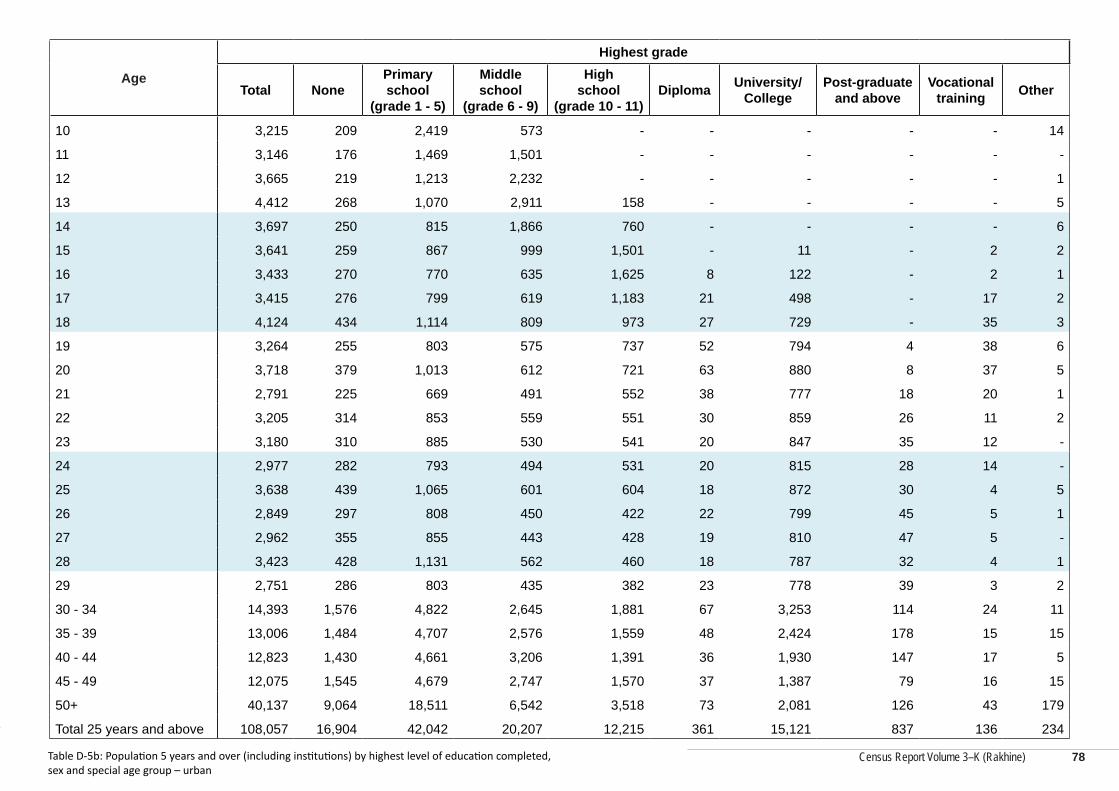
Census Report Volume 3–K (Rakhine)
Census Report Volume 3–K (Rakhine)
Age
Highest grade
Total NonePrimary school
(grade 1 - 5)
Middle school
(grade 6 - 9)
High school
(grade 10 - 11)Diploma University/
CollegePost-graduate
and aboveVocational
training Other
10 3,215 209 2,419 573 - - - - - 14
11 3,146 176 1,469 1,501 - - - - - -
12 3,665 219 1,213 2,232 - - - - - 1
13 4,412 268 1,070 2,911 158 - - - - 5
14 3,697 250 815 1,866 760 - - - - 6
15 3,641 259 867 999 1,501 - 11 - 2 2
16 3,433 270 770 635 1,625 8 122 - 2 1
17 3,415 276 799 619 1,183 21 498 - 17 2
18 4,124 434 1,114 809 973 27 729 - 35 3
19 3,264 255 803 575 737 52 794 4 38 6
20 3,718 379 1,013 612 721 63 880 8 37 5
21 2,791 225 669 491 552 38 777 18 20 1
22 3,205 314 853 559 551 30 859 26 11 2
23 3,180 310 885 530 541 20 847 35 12 -
24 2,977 282 793 494 531 20 815 28 14 -
25 3,638 439 1,065 601 604 18 872 30 4 5
26 2,849 297 808 450 422 22 799 45 5 1
27 2,962 355 855 443 428 19 810 47 5 -
28 3,423 428 1,131 562 460 18 787 32 4 1
29 2,751 286 803 435 382 23 778 39 3 2
30 - 34 14,393 1,576 4,822 2,645 1,881 67 3,253 114 24 11
35 - 39 13,006 1,484 4,707 2,576 1,559 48 2,424 178 15 15
40 - 44 12,823 1,430 4,661 3,206 1,391 36 1,930 147 17 5
45 - 49 12,075 1,545 4,679 2,747 1,570 37 1,387 79 16 15
50+ 40,137 9,064 18,511 6,542 3,518 73 2,081 126 43 179
Total 25 years and above 108,057 16,904 42,042 20,207 12,215 361 15,121 837 136 234
Table D-5b: Population 5 years and over (including institutions) by highest level of education completed, sex and special age group – urban
78
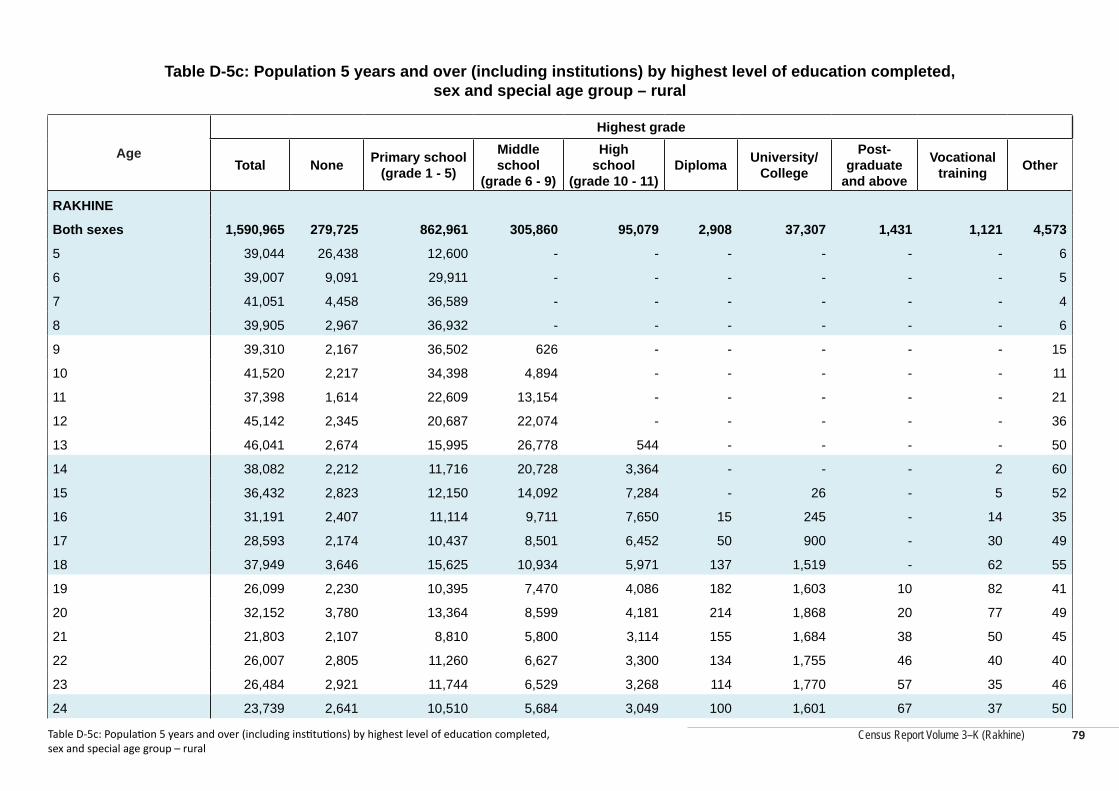
Census Report Volume 3–K (Rakhine)
Table D-5c: Population 5 years and over (including institutions) by highest level of education completed, sex and special age group – rural
Age
Highest grade
Total None Primary school (grade 1 - 5)
Middle school
(grade 6 - 9)
High school
(grade 10 - 11)Diploma University/
College
Post-graduate
and above
Vocational training Other
RAKHINE
Both sexes 1,590,965 279,725 862,961 305,860 95,079 2,908 37,307 1,431 1,121 4,573
5 39,044 26,438 12,600 - - - - - - 6
6 39,007 9,091 29,911 - - - - - - 5
7 41,051 4,458 36,589 - - - - - - 4
8 39,905 2,967 36,932 - - - - - - 6
9 39,310 2,167 36,502 626 - - - - - 15
10 41,520 2,217 34,398 4,894 - - - - - 11
11 37,398 1,614 22,609 13,154 - - - - - 21
12 45,142 2,345 20,687 22,074 - - - - - 36
13 46,041 2,674 15,995 26,778 544 - - - - 50
14 38,082 2,212 11,716 20,728 3,364 - - - 2 60
15 36,432 2,823 12,150 14,092 7,284 - 26 - 5 52
16 31,191 2,407 11,114 9,711 7,650 15 245 - 14 35
17 28,593 2,174 10,437 8,501 6,452 50 900 - 30 49
18 37,949 3,646 15,625 10,934 5,971 137 1,519 - 62 55
19 26,099 2,230 10,395 7,470 4,086 182 1,603 10 82 41
20 32,152 3,780 13,364 8,599 4,181 214 1,868 20 77 49
21 21,803 2,107 8,810 5,800 3,114 155 1,684 38 50 45
22 26,007 2,805 11,260 6,627 3,300 134 1,755 46 40 40
23 26,484 2,921 11,744 6,529 3,268 114 1,770 57 35 46
24 23,739 2,641 10,510 5,684 3,049 100 1,601 67 37 50
Table D-5c: Population 5 years and over (including institutions) by highest level of education completed, sex and special age group – rural
79
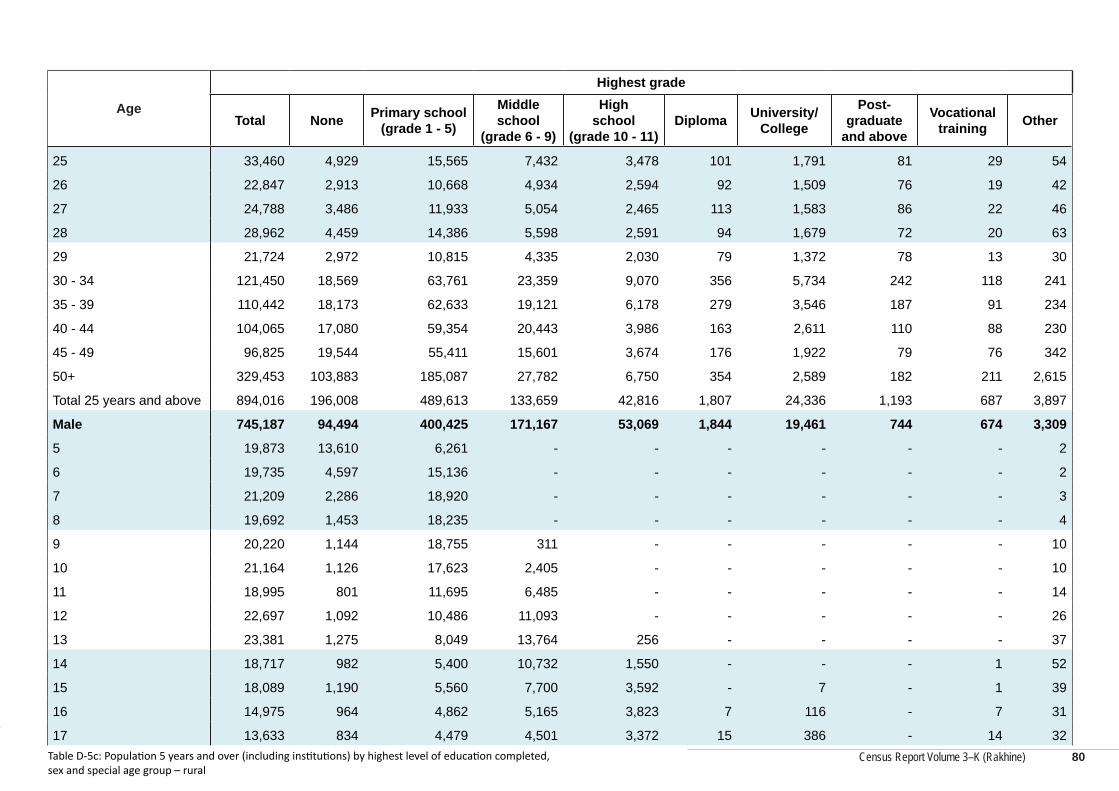
Census Report Volume 3–K (Rakhine)
Census Report Volume 3–K (Rakhine)
Age
Highest grade
Total None Primary school (grade 1 - 5)
Middle school
(grade 6 - 9)
High school
(grade 10 - 11)Diploma University/
College
Post-graduate
and above
Vocational training Other
25 33,460 4,929 15,565 7,432 3,478 101 1,791 81 29 54
26 22,847 2,913 10,668 4,934 2,594 92 1,509 76 19 42
27 24,788 3,486 11,933 5,054 2,465 113 1,583 86 22 46
28 28,962 4,459 14,386 5,598 2,591 94 1,679 72 20 63
29 21,724 2,972 10,815 4,335 2,030 79 1,372 78 13 30
30 - 34 121,450 18,569 63,761 23,359 9,070 356 5,734 242 118 241
35 - 39 110,442 18,173 62,633 19,121 6,178 279 3,546 187 91 234
40 - 44 104,065 17,080 59,354 20,443 3,986 163 2,611 110 88 230
45 - 49 96,825 19,544 55,411 15,601 3,674 176 1,922 79 76 342
50+ 329,453 103,883 185,087 27,782 6,750 354 2,589 182 211 2,615
Total 25 years and above 894,016 196,008 489,613 133,659 42,816 1,807 24,336 1,193 687 3,897
Male 745,187 94,494 400,425 171,167 53,069 1,844 19,461 744 674 3,309
5 19,873 13,610 6,261 - - - - - - 2
6 19,735 4,597 15,136 - - - - - - 2
7 21,209 2,286 18,920 - - - - - - 3
8 19,692 1,453 18,235 - - - - - - 4
9 20,220 1,144 18,755 311 - - - - - 10
10 21,164 1,126 17,623 2,405 - - - - - 10
11 18,995 801 11,695 6,485 - - - - - 14
12 22,697 1,092 10,486 11,093 - - - - - 26
13 23,381 1,275 8,049 13,764 256 - - - - 37
14 18,717 982 5,400 10,732 1,550 - - - 1 52
15 18,089 1,190 5,560 7,700 3,592 - 7 - 1 39
16 14,975 964 4,862 5,165 3,823 7 116 - 7 31
17 13,633 834 4,479 4,501 3,372 15 386 - 14 32Table D-5c: Population 5 years and over (including institutions) by highest level of education completed, sex and special age group – rural
80
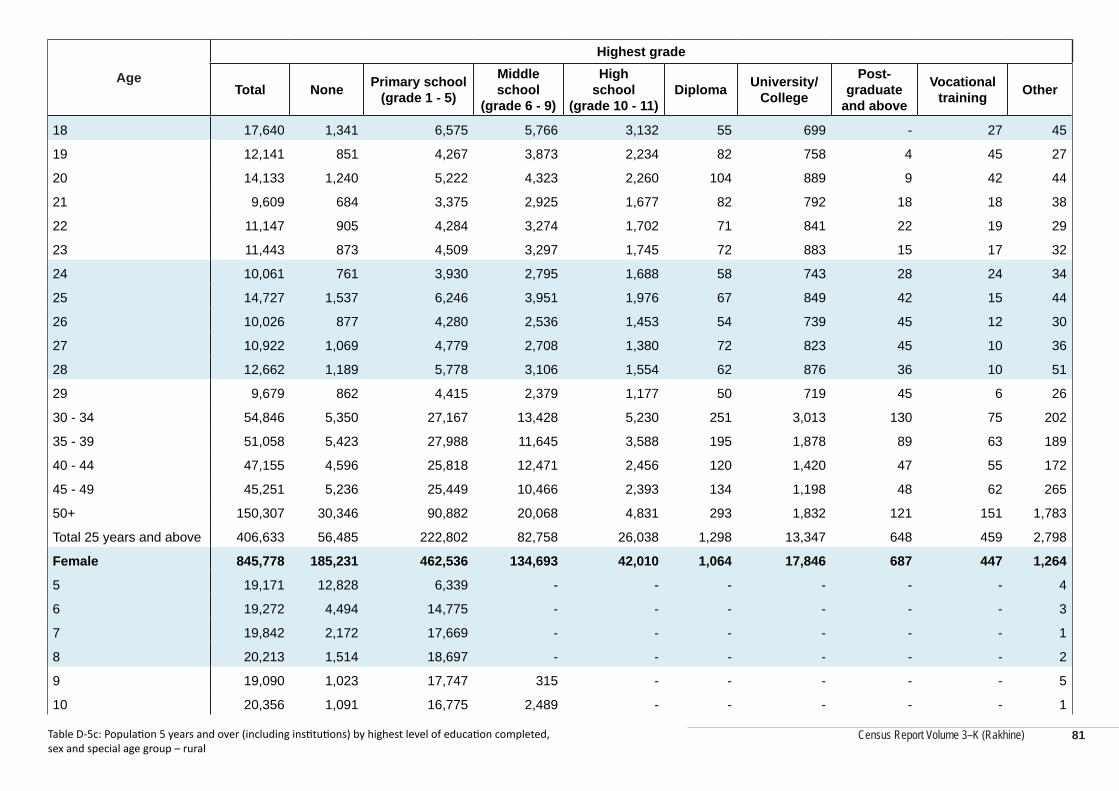
Census Report Volume 3–K (Rakhine)
Age
Highest grade
Total None Primary school (grade 1 - 5)
Middle school
(grade 6 - 9)
High school
(grade 10 - 11)Diploma University/
College
Post-graduate
and above
Vocational training Other
18 17,640 1,341 6,575 5,766 3,132 55 699 - 27 45
19 12,141 851 4,267 3,873 2,234 82 758 4 45 27
20 14,133 1,240 5,222 4,323 2,260 104 889 9 42 44
21 9,609 684 3,375 2,925 1,677 82 792 18 18 38
22 11,147 905 4,284 3,274 1,702 71 841 22 19 29
23 11,443 873 4,509 3,297 1,745 72 883 15 17 32
24 10,061 761 3,930 2,795 1,688 58 743 28 24 34
25 14,727 1,537 6,246 3,951 1,976 67 849 42 15 44
26 10,026 877 4,280 2,536 1,453 54 739 45 12 30
27 10,922 1,069 4,779 2,708 1,380 72 823 45 10 36
28 12,662 1,189 5,778 3,106 1,554 62 876 36 10 51
29 9,679 862 4,415 2,379 1,177 50 719 45 6 26
30 - 34 54,846 5,350 27,167 13,428 5,230 251 3,013 130 75 202
35 - 39 51,058 5,423 27,988 11,645 3,588 195 1,878 89 63 189
40 - 44 47,155 4,596 25,818 12,471 2,456 120 1,420 47 55 172
45 - 49 45,251 5,236 25,449 10,466 2,393 134 1,198 48 62 265
50+ 150,307 30,346 90,882 20,068 4,831 293 1,832 121 151 1,783
Total 25 years and above 406,633 56,485 222,802 82,758 26,038 1,298 13,347 648 459 2,798
Female 845,778 185,231 462,536 134,693 42,010 1,064 17,846 687 447 1,264
5 19,171 12,828 6,339 - - - - - - 4
6 19,272 4,494 14,775 - - - - - - 3
7 19,842 2,172 17,669 - - - - - - 1
8 20,213 1,514 18,697 - - - - - - 2
9 19,090 1,023 17,747 315 - - - - - 5
10 20,356 1,091 16,775 2,489 - - - - - 1
Table D-5c: Population 5 years and over (including institutions) by highest level of education completed, sex and special age group – rural
81
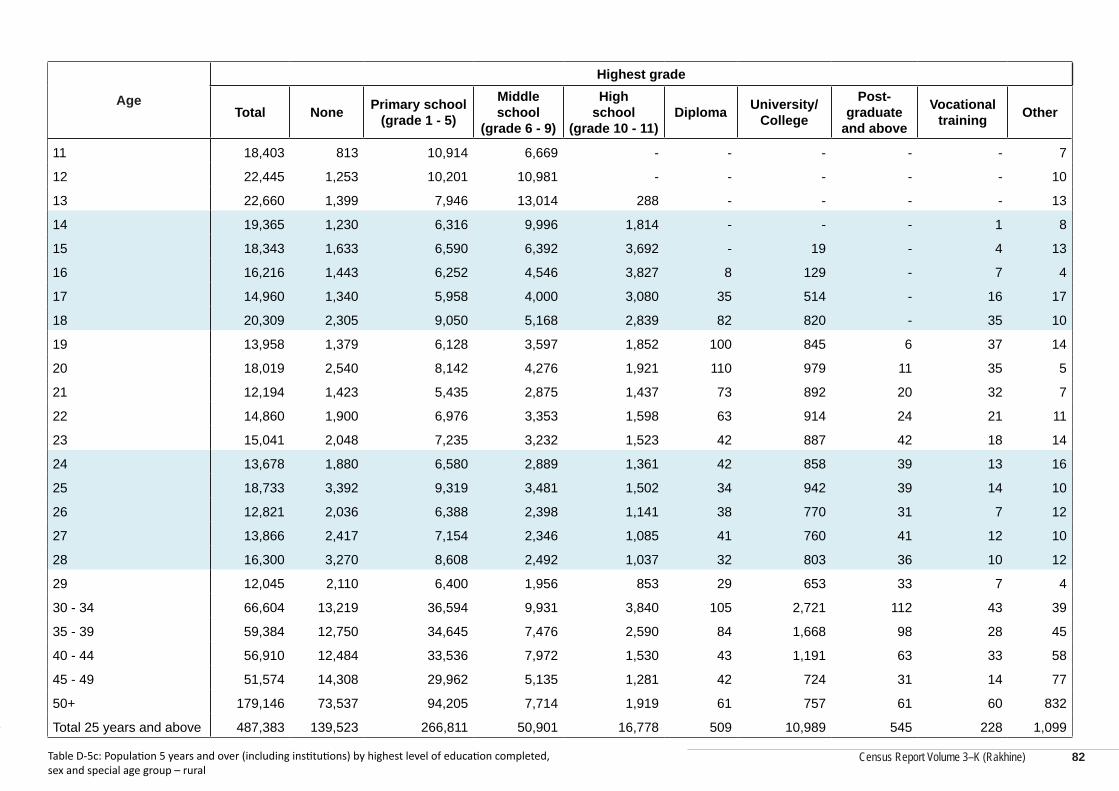
Census Report Volume 3–K (Rakhine)
Census Report Volume 3–K (Rakhine)
Age
Highest grade
Total None Primary school (grade 1 - 5)
Middle school
(grade 6 - 9)
High school
(grade 10 - 11)Diploma University/
College
Post-graduate
and above
Vocational training Other
11 18,403 813 10,914 6,669 - - - - - 7
12 22,445 1,253 10,201 10,981 - - - - - 10
13 22,660 1,399 7,946 13,014 288 - - - - 13
14 19,365 1,230 6,316 9,996 1,814 - - - 1 8
15 18,343 1,633 6,590 6,392 3,692 - 19 - 4 13
16 16,216 1,443 6,252 4,546 3,827 8 129 - 7 4
17 14,960 1,340 5,958 4,000 3,080 35 514 - 16 17
18 20,309 2,305 9,050 5,168 2,839 82 820 - 35 10
19 13,958 1,379 6,128 3,597 1,852 100 845 6 37 14
20 18,019 2,540 8,142 4,276 1,921 110 979 11 35 5
21 12,194 1,423 5,435 2,875 1,437 73 892 20 32 7
22 14,860 1,900 6,976 3,353 1,598 63 914 24 21 11
23 15,041 2,048 7,235 3,232 1,523 42 887 42 18 14
24 13,678 1,880 6,580 2,889 1,361 42 858 39 13 16
25 18,733 3,392 9,319 3,481 1,502 34 942 39 14 10
26 12,821 2,036 6,388 2,398 1,141 38 770 31 7 12
27 13,866 2,417 7,154 2,346 1,085 41 760 41 12 10
28 16,300 3,270 8,608 2,492 1,037 32 803 36 10 12
29 12,045 2,110 6,400 1,956 853 29 653 33 7 4
30 - 34 66,604 13,219 36,594 9,931 3,840 105 2,721 112 43 39
35 - 39 59,384 12,750 34,645 7,476 2,590 84 1,668 98 28 45
40 - 44 56,910 12,484 33,536 7,972 1,530 43 1,191 63 33 58
45 - 49 51,574 14,308 29,962 5,135 1,281 42 724 31 14 77
50+ 179,146 73,537 94,205 7,714 1,919 61 757 61 60 832
Total 25 years and above 487,383 139,523 266,811 50,901 16,778 509 10,989 545 228 1,099
Table D-5c: Population 5 years and over (including institutions) by highest level of education completed, sex and special age group – rural
82
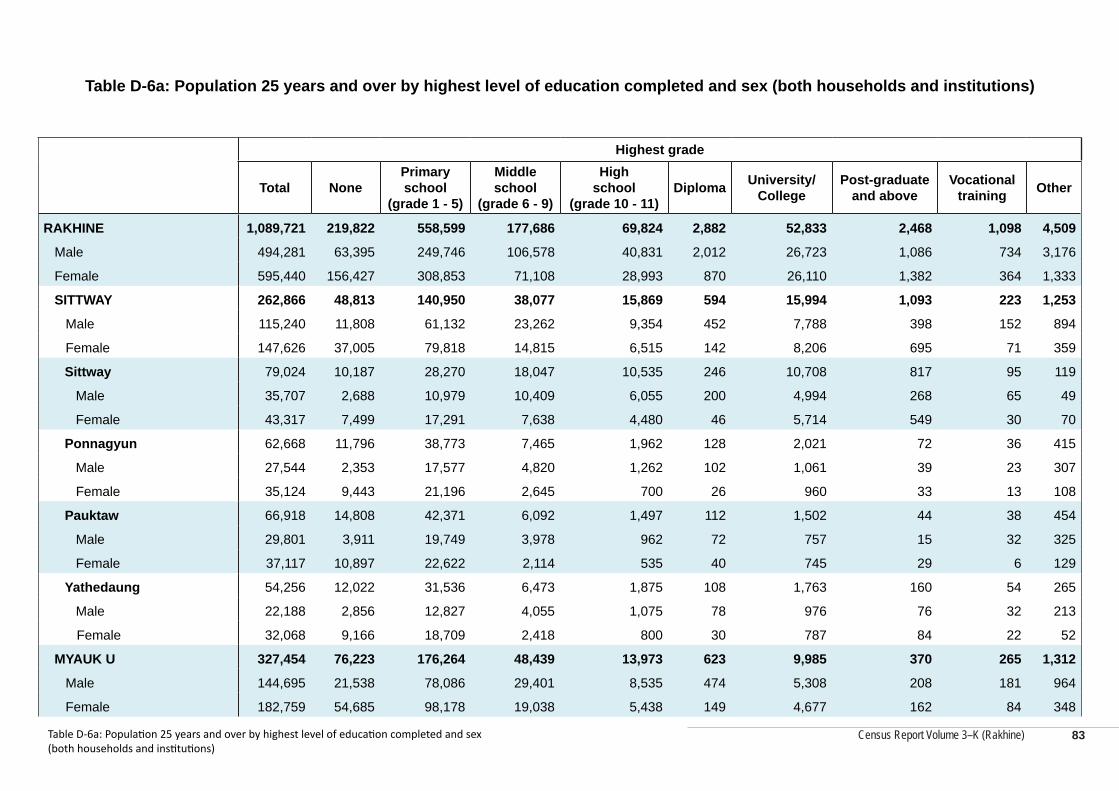
Census Report Volume 3–K (Rakhine)
Table D-6a: Population 25 years and over by highest level of education completed and sex (both households and institutions)
Highest grade
Total NonePrimary school
(grade 1 - 5)
Middle school
(grade 6 - 9)
High school
(grade 10 - 11)Diploma University/
CollegePost-graduate
and aboveVocational
training Other
RAKHINE 1,089,721 219,822 558,599 177,686 69,824 2,882 52,833 2,468 1,098 4,509
Male 494,281 63,395 249,746 106,578 40,831 2,012 26,723 1,086 734 3,176
Female 595,440 156,427 308,853 71,108 28,993 870 26,110 1,382 364 1,333
SITTWAY 262,866 48,813 140,950 38,077 15,869 594 15,994 1,093 223 1,253
Male 115,240 11,808 61,132 23,262 9,354 452 7,788 398 152 894
Female 147,626 37,005 79,818 14,815 6,515 142 8,206 695 71 359
Sittway 79,024 10,187 28,270 18,047 10,535 246 10,708 817 95 119
Male 35,707 2,688 10,979 10,409 6,055 200 4,994 268 65 49
Female 43,317 7,499 17,291 7,638 4,480 46 5,714 549 30 70
Ponnagyun 62,668 11,796 38,773 7,465 1,962 128 2,021 72 36 415
Male 27,544 2,353 17,577 4,820 1,262 102 1,061 39 23 307
Female 35,124 9,443 21,196 2,645 700 26 960 33 13 108
Pauktaw 66,918 14,808 42,371 6,092 1,497 112 1,502 44 38 454
Male 29,801 3,911 19,749 3,978 962 72 757 15 32 325
Female 37,117 10,897 22,622 2,114 535 40 745 29 6 129
Yathedaung 54,256 12,022 31,536 6,473 1,875 108 1,763 160 54 265
Male 22,188 2,856 12,827 4,055 1,075 78 976 76 32 213
Female 32,068 9,166 18,709 2,418 800 30 787 84 22 52
MYAUK U 327,454 76,223 176,264 48,439 13,973 623 9,985 370 265 1,312
Male 144,695 21,538 78,086 29,401 8,535 474 5,308 208 181 964
Female 182,759 54,685 98,178 19,038 5,438 149 4,677 162 84 348
Table D-6a: Population 25 years and over by highest level of education completed and sex (both households and institutions)
83
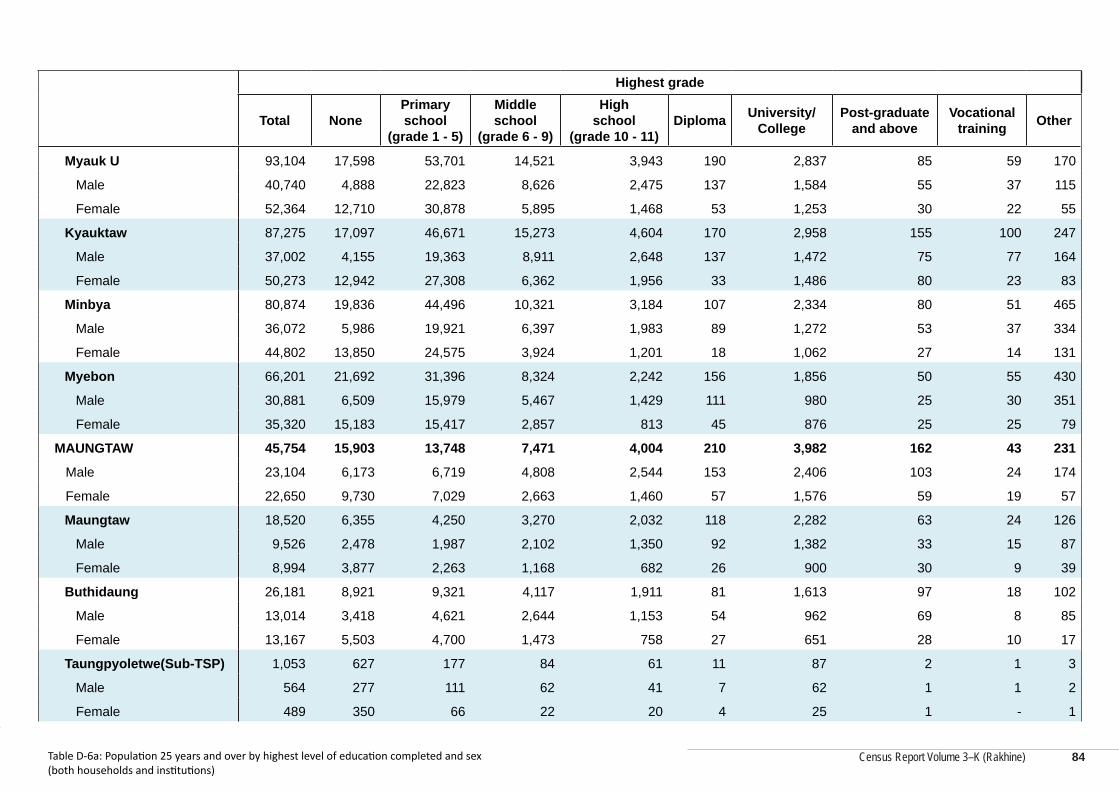
Census Report Volume 3–K (Rakhine)
Census Report Volume 3–K (Rakhine)
Highest grade
Total NonePrimary school
(grade 1 - 5)
Middle school
(grade 6 - 9)
High school
(grade 10 - 11)Diploma University/
CollegePost-graduate
and aboveVocational
training Other
Myauk U 93,104 17,598 53,701 14,521 3,943 190 2,837 85 59 170
Male 40,740 4,888 22,823 8,626 2,475 137 1,584 55 37 115
Female 52,364 12,710 30,878 5,895 1,468 53 1,253 30 22 55
Kyauktaw 87,275 17,097 46,671 15,273 4,604 170 2,958 155 100 247
Male 37,002 4,155 19,363 8,911 2,648 137 1,472 75 77 164
Female 50,273 12,942 27,308 6,362 1,956 33 1,486 80 23 83
Minbya 80,874 19,836 44,496 10,321 3,184 107 2,334 80 51 465
Male 36,072 5,986 19,921 6,397 1,983 89 1,272 53 37 334
Female 44,802 13,850 24,575 3,924 1,201 18 1,062 27 14 131
Myebon 66,201 21,692 31,396 8,324 2,242 156 1,856 50 55 430
Male 30,881 6,509 15,979 5,467 1,429 111 980 25 30 351
Female 35,320 15,183 15,417 2,857 813 45 876 25 25 79
MAUNGTAW 45,754 15,903 13,748 7,471 4,004 210 3,982 162 43 231
Male 23,104 6,173 6,719 4,808 2,544 153 2,406 103 24 174
Female 22,650 9,730 7,029 2,663 1,460 57 1,576 59 19 57
Maungtaw 18,520 6,355 4,250 3,270 2,032 118 2,282 63 24 126
Male 9,526 2,478 1,987 2,102 1,350 92 1,382 33 15 87
Female 8,994 3,877 2,263 1,168 682 26 900 30 9 39
Buthidaung 26,181 8,921 9,321 4,117 1,911 81 1,613 97 18 102
Male 13,014 3,418 4,621 2,644 1,153 54 962 69 8 85
Female 13,167 5,503 4,700 1,473 758 27 651 28 10 17
Taungpyoletwe(Sub-TSP) 1,053 627 177 84 61 11 87 2 1 3
Male 564 277 111 62 41 7 62 1 1 2
Female 489 350 66 22 20 4 25 1 - 1
Table D-6a: Population 25 years and over by highest level of education completed and sex (both households and institutions)
84
Census Report Volume 3–K (Rakhine)
Highest grade
Total NonePrimary school
(grade 1 - 5)
Middle school
(grade 6 - 9)
High school
(grade 10 - 11)Diploma University/
CollegePost-graduate
and aboveVocational
training Other
KYAUKPYU 244,621 56,334 123,799 36,895 14,665 673 10,929 363 341 622
Male 110,930 15,937 56,934 22,357 8,757 442 5,678 198 213 414
Female 133,691 40,397 66,865 14,538 5,908 231 5,251 165 128 208
Kyaukpyu 89,450 27,767 38,958 12,049 5,484 238 4,461 121 62 310
Male 41,009 7,522 19,414 7,689 3,428 174 2,441 75 46 220
Female 48,441 20,245 19,544 4,360 2,056 64 2,020 46 16 90
Mannaung 38,068 3,348 23,274 6,885 2,609 107 1,730 35 64 16
Male 16,114 933 9,389 3,646 1,325 67 711 14 21 8
Female 21,954 2,415 13,885 3,239 1,284 40 1,019 21 43 8
Yanbye 56,814 8,871 31,757 10,237 3,138 193 2,320 89 115 94
Male 24,520 2,289 12,942 6,053 1,830 114 1,140 32 73 47
Female 32,294 6,582 18,815 4,184 1,308 79 1,180 57 42 47
An 60,289 16,348 29,810 7,724 3,434 135 2,418 118 100 202
Male 29,287 5,193 15,189 4,969 2,174 87 1,386 77 73 139
Female 31,002 11,155 14,621 2,755 1,260 48 1,032 41 27 63
THANDWE 209,026 22,549 103,838 46,804 21,313 782 11,943 480 226 1,091
Male 100,312 7,939 46,875 26,750 11,641 491 5,543 179 164 730
Female 108,714 14,610 56,963 20,054 9,672 291 6,400 301 62 361
Thandwe 81,231 7,590 38,706 19,006 9,379 370 5,590 267 124 199
Male 38,867 2,767 17,319 10,620 5,037 246 2,553 102 98 125
Female 42,364 4,823 21,387 8,386 4,342 124 3,037 165 26 74
Taungup 63,788 8,147 31,914 13,243 6,049 226 3,864 152 55 138
Male 30,273 2,943 13,987 7,822 3,385 129 1,810 57 35 105
Female 33,515 5,204 17,927 5,421 2,664 97 2,054 95 20 33
Table D-6a: Population 25 years and over by highest level of education completed and sex (both households and institutions)
85
Census Report Volume 3–K (Rakhine)
Census Report Volume 3–K (Rakhine)
Highest grade
Total NonePrimary school
(grade 1 - 5)
Middle school
(grade 6 - 9)
High school
(grade 10 - 11)Diploma University/
CollegePost-graduate
and aboveVocational
training Other
Gwa 25,743 1,747 12,170 6,918 2,872 97 1,280 40 25 594
Male 12,801 680 5,665 3,852 1,545 56 586 15 17 385
Female 12,942 1,067 6,505 3,066 1,327 41 694 25 8 209
Maei(Sub-Tsp) 23,192 4,231 13,481 3,546 1,213 28 523 8 9 153
Male 11,164 1,237 6,534 2,216 758 21 276 4 6 112
Female 12,028 2,994 6,947 1,330 455 7 247 4 3 41
Kyeintali(Sub-Tsp) 15,072 834 7,567 4,091 1,800 61 686 13 13 7
Male 7,207 312 3,370 2,240 916 39 318 1 8 3
Female 7,865 522 4,197 1,851 884 22 368 12 5 4
Table D-6a: Population 25 years and over by highest level of education completed and sex (both households and institutions)
86
Census Report Volume 3–K (Rakhine)
Table D-6b: Population 25 years and over in conventional households by highest level of education completed and sex
Highest grade
Total NonePrimary school
(grade 1 - 5)
Middle school
(grade 6 - 9)
High school (grade 10 - 11) Diploma University/
College
Post-graduate
and above
Vocational training Other
RAKHINE 1,054,437 215,490 548,351 170,034 64,632 2,060 46,702 1,940 998 4,230
Male 465,288 60,147 242,107 99,917 36,096 1,237 21,503 708 642 2,931
Female 589,149 155,343 306,244 70,117 28,536 823 25,199 1,232 356 1,299
SITTWAY 255,778 47,623 139,088 36,738 14,901 386 14,680 945 202 1,215
Male 109,193 10,874 59,622 22,052 8,441 247 6,659 308 133 857
Female 146,585 36,749 79,466 14,686 6,460 139 8,021 637 69 358
Sittway 74,777 9,397 27,415 17,220 9,866 128 9,863 694 79 115
Male 32,058 2,060 10,265 9,658 5,421 83 4,272 203 51 45
Female 42,719 7,337 17,150 7,562 4,445 45 5,591 491 28 70
Ponnagyun 61,733 11,670 38,453 7,290 1,867 91 1,864 65 33 400
Male 26,764 2,264 17,322 4,668 1,177 65 923 32 20 293
Female 34,969 9,406 21,131 2,622 690 26 941 33 13 107
Pauktaw 66,018 14,676 42,009 5,938 1,386 84 1,393 42 38 452
Male 29,061 3,814 19,473 3,839 854 44 669 13 32 323
Female 36,957 10,862 22,536 2,099 532 40 724 29 6 129
Yathedaung 53,250 11,880 31,211 6,290 1,782 83 1,560 144 52 248
Male 21,310 2,736 12,562 3,887 989 55 795 60 30 196
Female 31,940 9,144 18,649 2,403 793 28 765 84 22 52
MYAUK U 321,931 75,255 174,544 47,404 13,189 459 9,223 312 257 1,288
Male 140,133 20,835 76,779 28,493 7,817 313 4,623 155 173 945
Female 181,798 54,420 97,765 18,911 5,372 146 4,600 157 84 343
Table D-6b: Population 25 years and over in conventional households by highest level of education completed and sex 87
Census Report Volume 3–K (Rakhine)
Census Report Volume 3–K (Rakhine)
Highest grade
Total NonePrimary school
(grade 1 - 5)
Middle school
(grade 6 - 9)
High school (grade 10 - 11) Diploma University/
College
Post-graduate
and above
Vocational training Other
Myauk U 91,494 17,296 53,202 14,249 3,736 131 2,589 70 57 164
Male 39,430 4,675 22,460 8,385 2,280 79 1,363 41 35 112
Female 52,064 12,621 30,742 5,864 1,456 52 1,226 29 22 52
Kyauktaw 85,987 16,809 46,347 15,060 4,396 130 2,764 141 98 242
Male 35,912 3,942 19,099 8,725 2,455 98 1,296 63 75 159
Female 50,075 12,867 27,248 6,335 1,941 32 1,468 78 23 83
Minbya 79,344 19,610 44,052 9,992 2,955 63 2,106 56 48 462
Male 34,729 5,793 19,552 6,097 1,778 46 1,067 31 34 331
Female 44,615 13,817 24,500 3,895 1,177 17 1,039 25 14 131
Myebon 65,106 21,540 30,943 8,103 2,102 135 1,764 45 54 420
Male 30,062 6,425 15,668 5,286 1,304 90 897 20 29 343
Female 35,044 15,115 15,275 2,817 798 45 867 25 25 77
MAUNGTAW 41,412 15,281 13,094 6,510 3,365 129 2,764 73 34 162
Male 19,047 5,600 6,094 3,863 1,927 73 1,335 32 15 108
Female 22,365 9,681 7,000 2,647 1,438 56 1,429 41 19 54
Maungtaw 16,589 6,301 4,068 2,826 1,648 70 1,519 28 18 111
Male 7,774 2,428 1,819 1,670 985 44 733 12 9 74
Female 8,815 3,873 2,249 1,156 663 26 786 16 9 37
Buthidaung 23,840 8,354 8,850 3,601 1,664 53 1,209 45 16 48
Male 10,766 2,896 4,165 2,132 909 26 580 20 6 32
Female 13,074 5,458 4,685 1,469 755 27 629 25 10 16
Taungpyoletwe(Sub-TSP) 983 626 176 83 53 6 36 - - 3
Male 507 276 110 61 33 3 22 - - 2
Female 476 350 66 22 20 3 14 - - 1
Table D-6b: Population 25 years and over in conventional households by highest level of education completed and sex 88
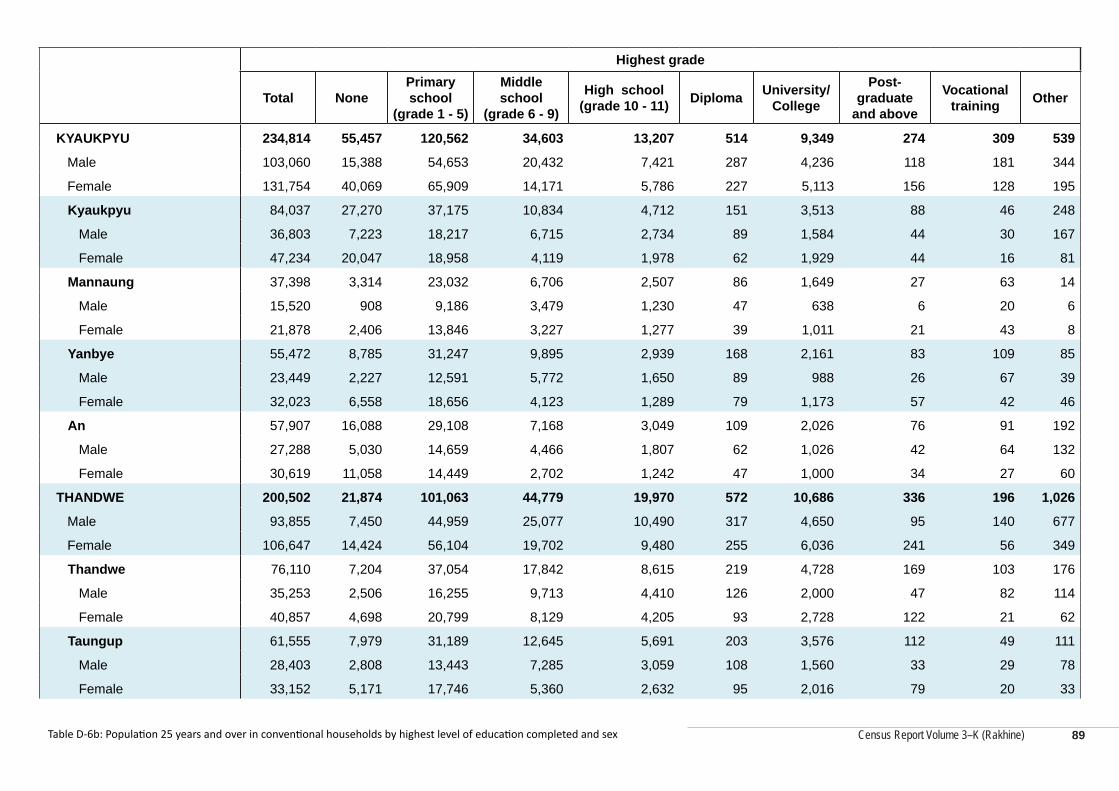
Census Report Volume 3–K (Rakhine)
Highest grade
Total NonePrimary school
(grade 1 - 5)
Middle school
(grade 6 - 9)
High school (grade 10 - 11) Diploma University/
College
Post-graduate
and above
Vocational training Other
KYAUKPYU 234,814 55,457 120,562 34,603 13,207 514 9,349 274 309 539
Male 103,060 15,388 54,653 20,432 7,421 287 4,236 118 181 344
Female 131,754 40,069 65,909 14,171 5,786 227 5,113 156 128 195
Kyaukpyu 84,037 27,270 37,175 10,834 4,712 151 3,513 88 46 248
Male 36,803 7,223 18,217 6,715 2,734 89 1,584 44 30 167
Female 47,234 20,047 18,958 4,119 1,978 62 1,929 44 16 81
Mannaung 37,398 3,314 23,032 6,706 2,507 86 1,649 27 63 14
Male 15,520 908 9,186 3,479 1,230 47 638 6 20 6
Female 21,878 2,406 13,846 3,227 1,277 39 1,011 21 43 8
Yanbye 55,472 8,785 31,247 9,895 2,939 168 2,161 83 109 85
Male 23,449 2,227 12,591 5,772 1,650 89 988 26 67 39
Female 32,023 6,558 18,656 4,123 1,289 79 1,173 57 42 46
An 57,907 16,088 29,108 7,168 3,049 109 2,026 76 91 192
Male 27,288 5,030 14,659 4,466 1,807 62 1,026 42 64 132
Female 30,619 11,058 14,449 2,702 1,242 47 1,000 34 27 60
THANDWE 200,502 21,874 101,063 44,779 19,970 572 10,686 336 196 1,026
Male 93,855 7,450 44,959 25,077 10,490 317 4,650 95 140 677
Female 106,647 14,424 56,104 19,702 9,480 255 6,036 241 56 349
Thandwe 76,110 7,204 37,054 17,842 8,615 219 4,728 169 103 176
Male 35,253 2,506 16,255 9,713 4,410 126 2,000 47 82 114
Female 40,857 4,698 20,799 8,129 4,205 93 2,728 122 21 62
Taungup 61,555 7,979 31,189 12,645 5,691 203 3,576 112 49 111
Male 28,403 2,808 13,443 7,285 3,059 108 1,560 33 29 78
Female 33,152 5,171 17,746 5,360 2,632 95 2,016 79 20 33
Table D-6b: Population 25 years and over in conventional households by highest level of education completed and sex 89
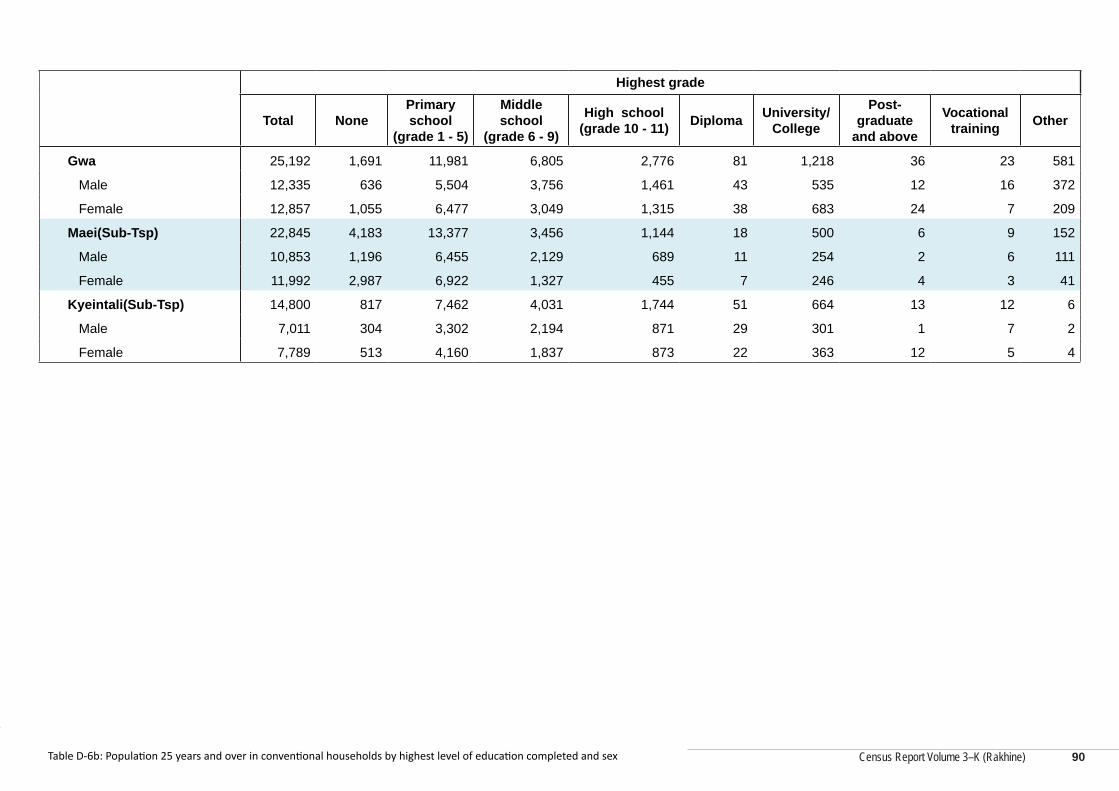
Census Report Volume 3–K (Rakhine)
Census Report Volume 3–K (Rakhine)
Highest grade
Total NonePrimary school
(grade 1 - 5)
Middle school
(grade 6 - 9)
High school (grade 10 - 11) Diploma University/
College
Post-graduate
and above
Vocational training Other
Gwa 25,192 1,691 11,981 6,805 2,776 81 1,218 36 23 581
Male 12,335 636 5,504 3,756 1,461 43 535 12 16 372
Female 12,857 1,055 6,477 3,049 1,315 38 683 24 7 209
Maei(Sub-Tsp) 22,845 4,183 13,377 3,456 1,144 18 500 6 9 152
Male 10,853 1,196 6,455 2,129 689 11 254 2 6 111
Female 11,992 2,987 6,922 1,327 455 7 246 4 3 41
Kyeintali(Sub-Tsp) 14,800 817 7,462 4,031 1,744 51 664 13 12 6
Male 7,011 304 3,302 2,194 871 29 301 1 7 2
Female 7,789 513 4,160 1,837 873 22 363 12 5 4
Table D-6b: Population 25 years and over in conventional households by highest level of education completed and sex 90
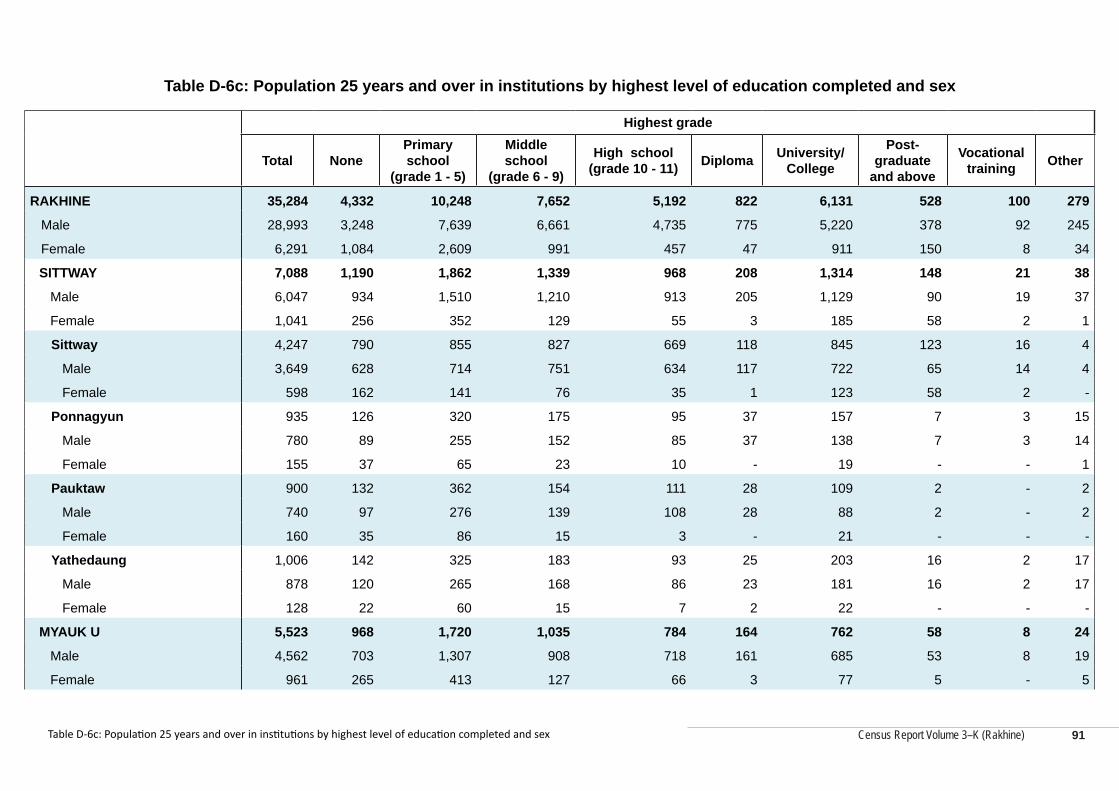
Census Report Volume 3–K (Rakhine)
Table D-6c: Population 25 years and over in institutions by highest level of education completed and sex
Highest grade
Total NonePrimary school
(grade 1 - 5)
Middle school
(grade 6 - 9)
High school (grade 10 - 11) Diploma University/
College
Post-graduate
and above
Vocational training Other
RAKHINE 35,284 4,332 10,248 7,652 5,192 822 6,131 528 100 279
Male 28,993 3,248 7,639 6,661 4,735 775 5,220 378 92 245
Female 6,291 1,084 2,609 991 457 47 911 150 8 34
SITTWAY 7,088 1,190 1,862 1,339 968 208 1,314 148 21 38
Male 6,047 934 1,510 1,210 913 205 1,129 90 19 37
Female 1,041 256 352 129 55 3 185 58 2 1
Sittway 4,247 790 855 827 669 118 845 123 16 4
Male 3,649 628 714 751 634 117 722 65 14 4
Female 598 162 141 76 35 1 123 58 2 -
Ponnagyun 935 126 320 175 95 37 157 7 3 15
Male 780 89 255 152 85 37 138 7 3 14
Female 155 37 65 23 10 - 19 - - 1
Pauktaw 900 132 362 154 111 28 109 2 - 2
Male 740 97 276 139 108 28 88 2 - 2
Female 160 35 86 15 3 - 21 - - -
Yathedaung 1,006 142 325 183 93 25 203 16 2 17
Male 878 120 265 168 86 23 181 16 2 17
Female 128 22 60 15 7 2 22 - - -
MYAUK U 5,523 968 1,720 1,035 784 164 762 58 8 24
Male 4,562 703 1,307 908 718 161 685 53 8 19
Female 961 265 413 127 66 3 77 5 - 5
Table D-6c: Population 25 years and over in institutions by highest level of education completed and sex 91
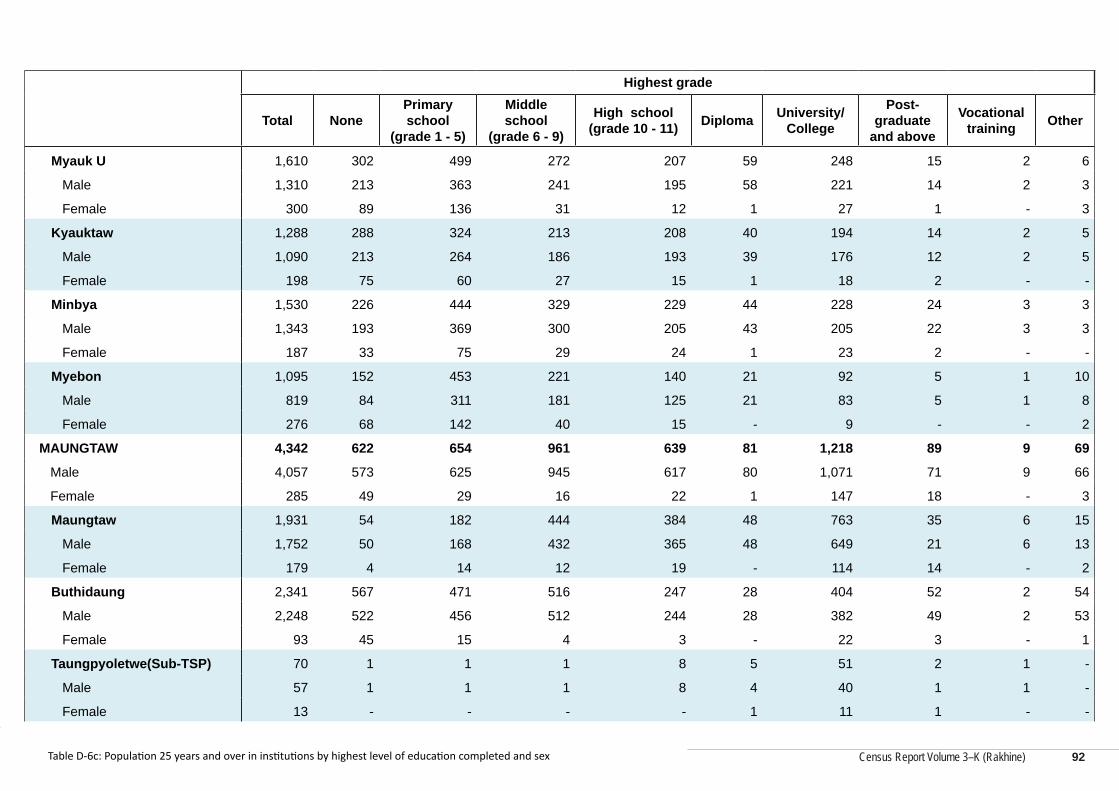
Census Report Volume 3–K (Rakhine)
Census Report Volume 3–K (Rakhine)
Highest grade
Total NonePrimary school
(grade 1 - 5)
Middle school
(grade 6 - 9)
High school (grade 10 - 11) Diploma University/
College
Post-graduate
and above
Vocational training Other
Myauk U 1,610 302 499 272 207 59 248 15 2 6
Male 1,310 213 363 241 195 58 221 14 2 3
Female 300 89 136 31 12 1 27 1 - 3
Kyauktaw 1,288 288 324 213 208 40 194 14 2 5
Male 1,090 213 264 186 193 39 176 12 2 5
Female 198 75 60 27 15 1 18 2 - -
Minbya 1,530 226 444 329 229 44 228 24 3 3
Male 1,343 193 369 300 205 43 205 22 3 3
Female 187 33 75 29 24 1 23 2 - -
Myebon 1,095 152 453 221 140 21 92 5 1 10
Male 819 84 311 181 125 21 83 5 1 8
Female 276 68 142 40 15 - 9 - - 2
MAUNGTAW 4,342 622 654 961 639 81 1,218 89 9 69
Male 4,057 573 625 945 617 80 1,071 71 9 66
Female 285 49 29 16 22 1 147 18 - 3
Maungtaw 1,931 54 182 444 384 48 763 35 6 15
Male 1,752 50 168 432 365 48 649 21 6 13
Female 179 4 14 12 19 - 114 14 - 2
Buthidaung 2,341 567 471 516 247 28 404 52 2 54
Male 2,248 522 456 512 244 28 382 49 2 53
Female 93 45 15 4 3 - 22 3 - 1
Taungpyoletwe(Sub-TSP) 70 1 1 1 8 5 51 2 1 -
Male 57 1 1 1 8 4 40 1 1 -
Female 13 - - - - 1 11 1 - -
Table D-6c: Population 25 years and over in institutions by highest level of education completed and sex 92
Census Report Volume 3–K (Rakhine)
Highest grade
Total NonePrimary school
(grade 1 - 5)
Middle school
(grade 6 - 9)
High school (grade 10 - 11) Diploma University/
College
Post-graduate
and above
Vocational training Other
KYAUKPYU 9,807 877 3,237 2,292 1,458 159 1,580 89 32 83
Male 7,870 549 2,281 1,925 1,336 155 1,442 80 32 70
Female 1,937 328 956 367 122 4 138 9 - 13
Kyaukpyu 5,413 497 1,783 1,215 772 87 948 33 16 62
Male 4,206 299 1,197 974 694 85 857 31 16 53
Female 1,207 198 586 241 78 2 91 2 - 9
Mannaung 670 34 242 179 102 21 81 8 1 2
Male 594 25 203 167 95 20 73 8 1 2
Female 76 9 39 12 7 1 8 - - -
Yanbye 1,342 86 510 342 199 25 159 6 6 9
Male 1,071 62 351 281 180 25 152 6 6 8
Female 271 24 159 61 19 - 7 - - 1
An 2,382 260 702 556 385 26 392 42 9 10
Male 1,999 163 530 503 367 25 360 35 9 7
Female 383 97 172 53 18 1 32 7 - 3
Table D-6c: Population 25 years and over in institutions by highest level of education completed and sex 93
Census Report Volume 3–K (Rakhine)
Census Report Volume 3–K (Rakhine)
Highest grade
Total NonePrimary school
(grade 1 - 5)
Middle school
(grade 6 - 9)
High school (grade 10 - 11) Diploma University/
College
Post-graduate
and above
Vocational training Other
THANDWE 8,524 675 2,775 2,025 1,343 210 1,257 144 30 65
Male 6,457 489 1,916 1,673 1,151 174 893 84 24 53
Female 2,067 186 859 352 192 36 364 60 6 12
Thandwe 5,121 386 1,652 1,164 764 151 862 98 21 23
Male 3,614 261 1,064 907 627 120 553 55 16 11
Female 1,507 125 588 257 137 31 309 43 5 12
Taungup 2,233 168 725 598 358 23 288 40 6 27
Male 1,870 135 544 537 326 21 250 24 6 27
Female 363 33 181 61 32 2 38 16 - -
Gwa 551 56 189 113 96 16 62 4 2 13
Male 466 44 161 96 84 13 51 3 1 13
Female 85 12 28 17 12 3 11 1 1 -
Maei(Sub-Tsp) 347 48 104 90 69 10 23 2 - 1
Male 311 41 79 87 69 10 22 2 - 1
Female 36 7 25 3 - - 1 - - -
Kyeintali(Sub-Tsp) 272 17 105 60 56 10 22 - 1 1
Male 196 8 68 46 45 10 17 - 1 1
Female 76 9 37 14 11 - 5 - - -
Table D-6c: Population 25 years and over in institutions by highest level of education completed and sex 94
Myanmar Population and Housing Census,
Census Report Volume 3-K (Rakhine)
Series E: Economic Characteristics
Census Report Volume 3–K (Rakhine)
Census Report Volume 3–K (Rakhine)
Table E-1a: Population 10 years and over by usual activity status, labour force participation rate, unemployment rate and employment to population ratio by sex and age group, Rakhine State
AgeUsual activity status
Total Employed Unemployed Economically inactive
Labour force participation rate (%)
Unemployment rate (%)
Employment to population ratio (%)
Rakhine Urban/RuralBoth sexes
10 -14 245,518 12,848 9,002 223,668 8.9 41.2 5.2
15 - 19 195,491 56,570 28,529 110,392 43.5 33.5 28.9
20 - 24 160,262 74,862 20,876 64,524 59.7 21.8 46.7
25 - 29 160,895 87,516 12,087 61,292 61.9 12.1 54.4
30 - 34 148,649 87,150 6,523 54,976 63.0 7.0 58.6
35 - 39 134,866 82,795 3,890 48,181 64.3 4.5 61.4
40 - 44 127,614 78,762 2,718 46,134 63.8 3.3 61.7
45 - 49 118,666 73,582 2,087 42,997 63.8 2.8 62.0
50 - 54 107,296 64,989 1,619 40,688 62.1 2.4 60.6
55 - 59 85,220 49,319 1,090 34,811 59.2 2.2 57.9
60 - 64 66,602 31,550 605 34,447 48.3 1.9 47.4
65 - 69 50,205 18,924 377 30,904 38.4 2.0 37.7
70 - 74 34,517 8,261 143 26,113 24.3 1.7 23.9
75 - 79 26,589 4,093 90 22,406 15.7 2.2 15.4
80 - 84 17,369 1,382 39 15,948 8.2 2.7 8.0
85 - 89 7,928 432 18 7,478 5.7 4.0 5.4
90 + 3,305 134 5 3,166 4.2 3.6 4.1
Total 15+ 1,445,474 720,321 80,696 644,457 55.4 10.1 49.8
Total 10+ 1,690,992 733,169 89,698 868,125 48.7 10.9 43.4
Population Age 10 - 17 362,600 40,268 24,865 297,467 18.0 38.2 11.1
Population Age 15 - 64 1,305,561 687,095 80,024 538,442 58.8 10.4 52.6
Table E-1a: Population 10 years and over by usual activity status, labour force participation rate, unemployment rate and employment to population ratio by sex and age group, Rakhine State
96
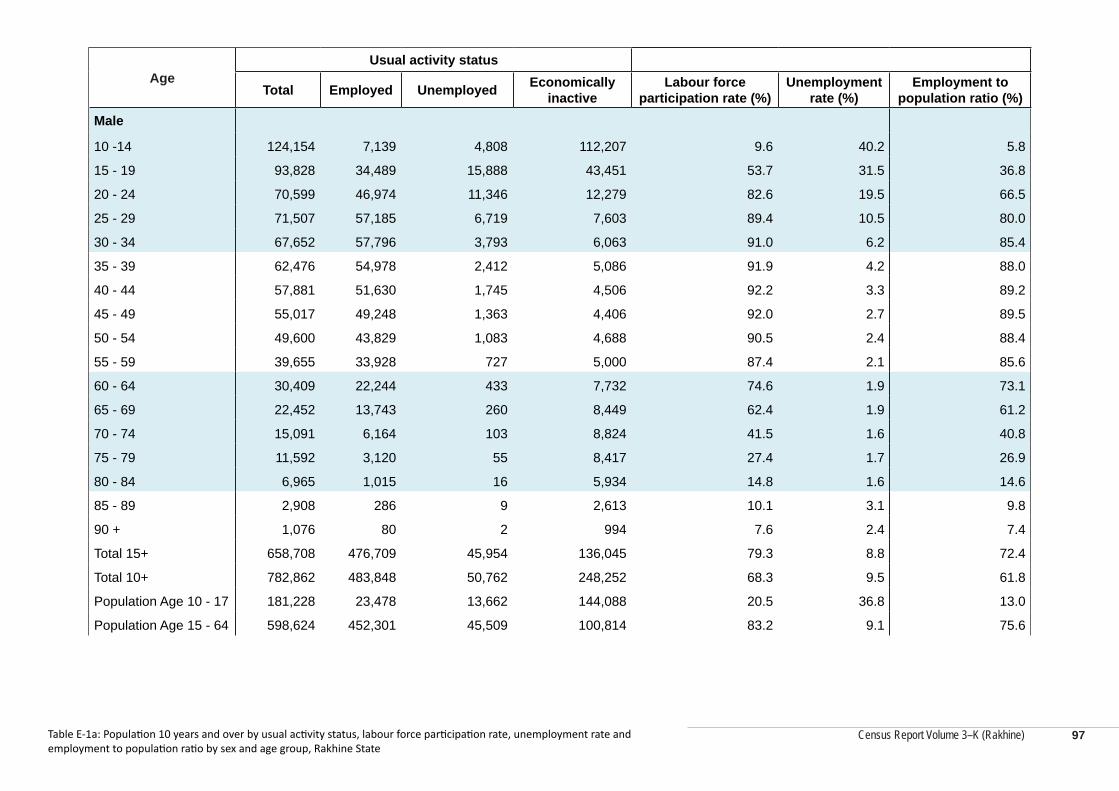
Census Report Volume 3–K (Rakhine)
AgeUsual activity status
Total Employed Unemployed Economically inactive
Labour force participation rate (%)
Unemployment rate (%)
Employment to population ratio (%)
Male
10 -14 124,154 7,139 4,808 112,207 9.6 40.2 5.8
15 - 19 93,828 34,489 15,888 43,451 53.7 31.5 36.8
20 - 24 70,599 46,974 11,346 12,279 82.6 19.5 66.5
25 - 29 71,507 57,185 6,719 7,603 89.4 10.5 80.0
30 - 34 67,652 57,796 3,793 6,063 91.0 6.2 85.4
35 - 39 62,476 54,978 2,412 5,086 91.9 4.2 88.0
40 - 44 57,881 51,630 1,745 4,506 92.2 3.3 89.2
45 - 49 55,017 49,248 1,363 4,406 92.0 2.7 89.5
50 - 54 49,600 43,829 1,083 4,688 90.5 2.4 88.4
55 - 59 39,655 33,928 727 5,000 87.4 2.1 85.6
60 - 64 30,409 22,244 433 7,732 74.6 1.9 73.1
65 - 69 22,452 13,743 260 8,449 62.4 1.9 61.2
70 - 74 15,091 6,164 103 8,824 41.5 1.6 40.8
75 - 79 11,592 3,120 55 8,417 27.4 1.7 26.9
80 - 84 6,965 1,015 16 5,934 14.8 1.6 14.6
85 - 89 2,908 286 9 2,613 10.1 3.1 9.8
90 + 1,076 80 2 994 7.6 2.4 7.4
Total 15+ 658,708 476,709 45,954 136,045 79.3 8.8 72.4
Total 10+ 782,862 483,848 50,762 248,252 68.3 9.5 61.8
Population Age 10 - 17 181,228 23,478 13,662 144,088 20.5 36.8 13.0
Population Age 15 - 64 598,624 452,301 45,509 100,814 83.2 9.1 75.6
Table E-1a: Population 10 years and over by usual activity status, labour force participation rate, unemployment rate and employment to population ratio by sex and age group, Rakhine State
97
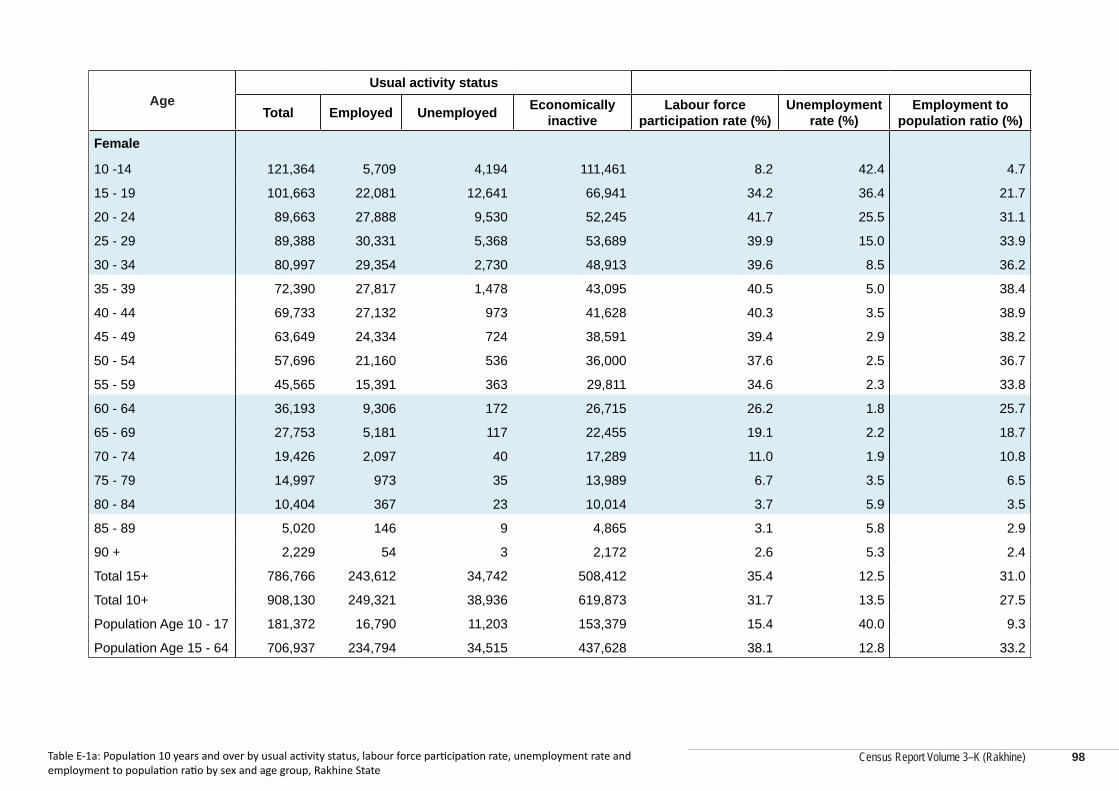
Census Report Volume 3–K (Rakhine)
Census Report Volume 3–K (Rakhine)
AgeUsual activity status
Total Employed Unemployed Economically inactive
Labour force participation rate (%)
Unemployment rate (%)
Employment to population ratio (%)
Female
10 -14 121,364 5,709 4,194 111,461 8.2 42.4 4.7
15 - 19 101,663 22,081 12,641 66,941 34.2 36.4 21.7
20 - 24 89,663 27,888 9,530 52,245 41.7 25.5 31.1
25 - 29 89,388 30,331 5,368 53,689 39.9 15.0 33.9
30 - 34 80,997 29,354 2,730 48,913 39.6 8.5 36.2
35 - 39 72,390 27,817 1,478 43,095 40.5 5.0 38.4
40 - 44 69,733 27,132 973 41,628 40.3 3.5 38.9
45 - 49 63,649 24,334 724 38,591 39.4 2.9 38.2
50 - 54 57,696 21,160 536 36,000 37.6 2.5 36.7
55 - 59 45,565 15,391 363 29,811 34.6 2.3 33.8
60 - 64 36,193 9,306 172 26,715 26.2 1.8 25.7
65 - 69 27,753 5,181 117 22,455 19.1 2.2 18.7
70 - 74 19,426 2,097 40 17,289 11.0 1.9 10.8
75 - 79 14,997 973 35 13,989 6.7 3.5 6.5
80 - 84 10,404 367 23 10,014 3.7 5.9 3.5
85 - 89 5,020 146 9 4,865 3.1 5.8 2.9
90 + 2,229 54 3 2,172 2.6 5.3 2.4
Total 15+ 786,766 243,612 34,742 508,412 35.4 12.5 31.0
Total 10+ 908,130 249,321 38,936 619,873 31.7 13.5 27.5
Population Age 10 - 17 181,372 16,790 11,203 153,379 15.4 40.0 9.3
Population Age 15 - 64 706,937 234,794 34,515 437,628 38.1 12.8 33.2
Table E-1a: Population 10 years and over by usual activity status, labour force participation rate, unemployment rate and employment to population ratio by sex and age group, Rakhine State
98
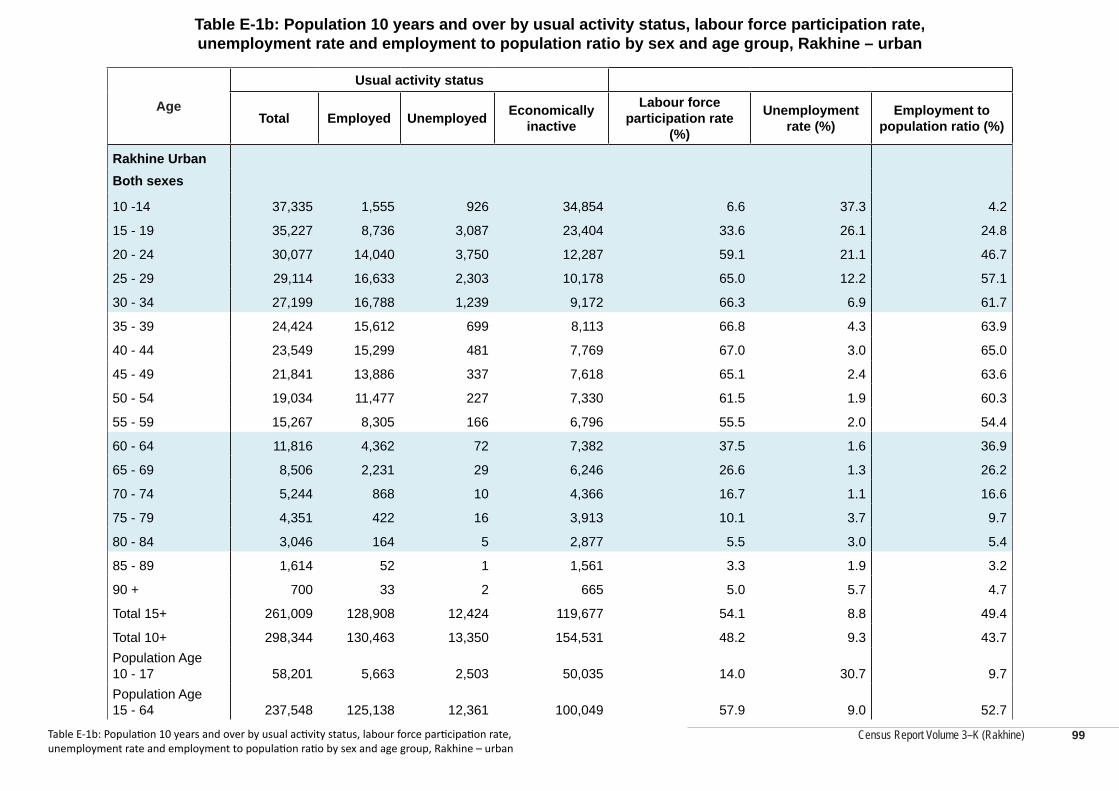
Census Report Volume 3–K (Rakhine)
Table E-1b: Population 10 years and over by usual activity status, labour force participation rate, unemployment rate and employment to population ratio by sex and age group, Rakhine – urban
Age
Usual activity status
Total Employed Unemployed Economically inactive
Labour force participation rate
(%)
Unemployment rate (%)
Employment to population ratio (%)
Rakhine UrbanBoth sexes
10 -14 37,335 1,555 926 34,854 6.6 37.3 4.2
15 - 19 35,227 8,736 3,087 23,404 33.6 26.1 24.8
20 - 24 30,077 14,040 3,750 12,287 59.1 21.1 46.7
25 - 29 29,114 16,633 2,303 10,178 65.0 12.2 57.1
30 - 34 27,199 16,788 1,239 9,172 66.3 6.9 61.7
35 - 39 24,424 15,612 699 8,113 66.8 4.3 63.9
40 - 44 23,549 15,299 481 7,769 67.0 3.0 65.0
45 - 49 21,841 13,886 337 7,618 65.1 2.4 63.6
50 - 54 19,034 11,477 227 7,330 61.5 1.9 60.3
55 - 59 15,267 8,305 166 6,796 55.5 2.0 54.4
60 - 64 11,816 4,362 72 7,382 37.5 1.6 36.9
65 - 69 8,506 2,231 29 6,246 26.6 1.3 26.2
70 - 74 5,244 868 10 4,366 16.7 1.1 16.6
75 - 79 4,351 422 16 3,913 10.1 3.7 9.7
80 - 84 3,046 164 5 2,877 5.5 3.0 5.4
85 - 89 1,614 52 1 1,561 3.3 1.9 3.2
90 + 700 33 2 665 5.0 5.7 4.7
Total 15+ 261,009 128,908 12,424 119,677 54.1 8.8 49.4
Total 10+ 298,344 130,463 13,350 154,531 48.2 9.3 43.7Population Age 10 - 17 58,201 5,663 2,503 50,035 14.0 30.7 9.7Population Age 15 - 64 237,548 125,138 12,361 100,049 57.9 9.0 52.7
Table E-1b: Population 10 years and over by usual activity status, labour force participation rate, unemployment rate and employment to population ratio by sex and age group, Rakhine – urban
99
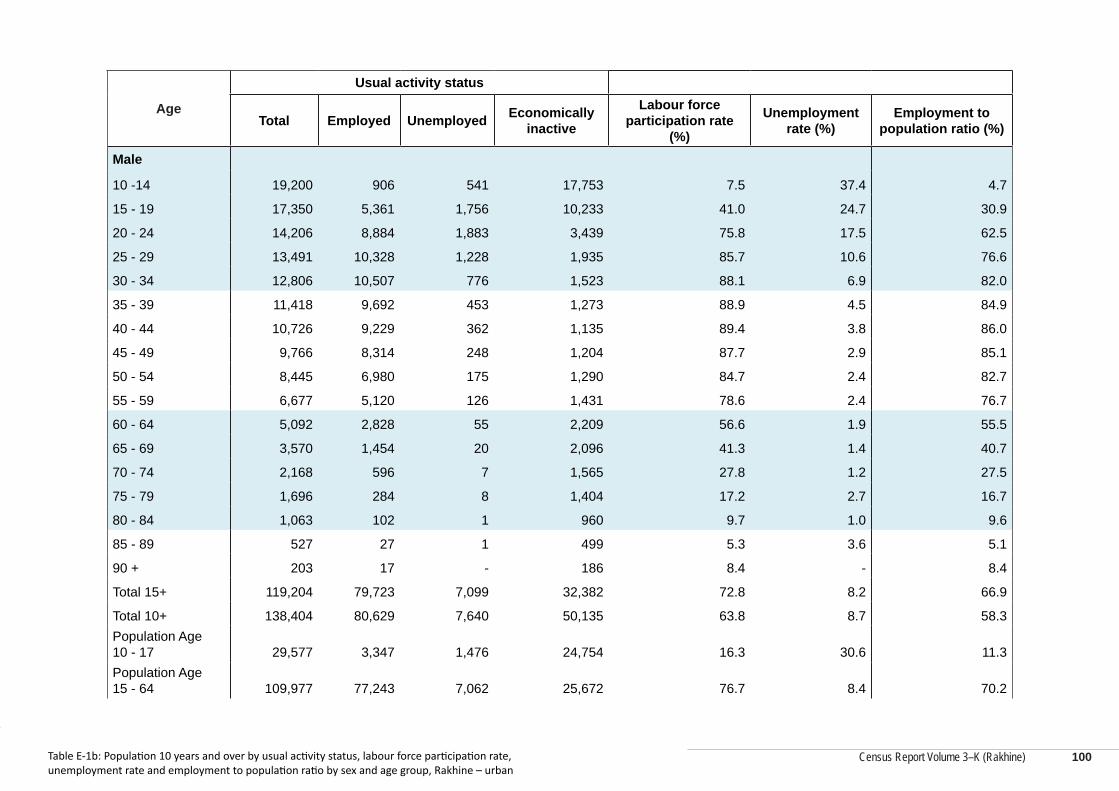
Census Report Volume 3–K (Rakhine)
Census Report Volume 3–K (Rakhine)
Age
Usual activity status
Total Employed Unemployed Economically inactive
Labour force participation rate
(%)
Unemployment rate (%)
Employment to population ratio (%)
Male
10 -14 19,200 906 541 17,753 7.5 37.4 4.7
15 - 19 17,350 5,361 1,756 10,233 41.0 24.7 30.9
20 - 24 14,206 8,884 1,883 3,439 75.8 17.5 62.5
25 - 29 13,491 10,328 1,228 1,935 85.7 10.6 76.6
30 - 34 12,806 10,507 776 1,523 88.1 6.9 82.0
35 - 39 11,418 9,692 453 1,273 88.9 4.5 84.9
40 - 44 10,726 9,229 362 1,135 89.4 3.8 86.0
45 - 49 9,766 8,314 248 1,204 87.7 2.9 85.1
50 - 54 8,445 6,980 175 1,290 84.7 2.4 82.7
55 - 59 6,677 5,120 126 1,431 78.6 2.4 76.7
60 - 64 5,092 2,828 55 2,209 56.6 1.9 55.5
65 - 69 3,570 1,454 20 2,096 41.3 1.4 40.7
70 - 74 2,168 596 7 1,565 27.8 1.2 27.5
75 - 79 1,696 284 8 1,404 17.2 2.7 16.7
80 - 84 1,063 102 1 960 9.7 1.0 9.6
85 - 89 527 27 1 499 5.3 3.6 5.1
90 + 203 17 - 186 8.4 - 8.4
Total 15+ 119,204 79,723 7,099 32,382 72.8 8.2 66.9
Total 10+ 138,404 80,629 7,640 50,135 63.8 8.7 58.3Population Age 10 - 17 29,577 3,347 1,476 24,754 16.3 30.6 11.3Population Age 15 - 64 109,977 77,243 7,062 25,672 76.7 8.4 70.2
Table E-1b: Population 10 years and over by usual activity status, labour force participation rate, unemployment rate and employment to population ratio by sex and age group, Rakhine – urban
100
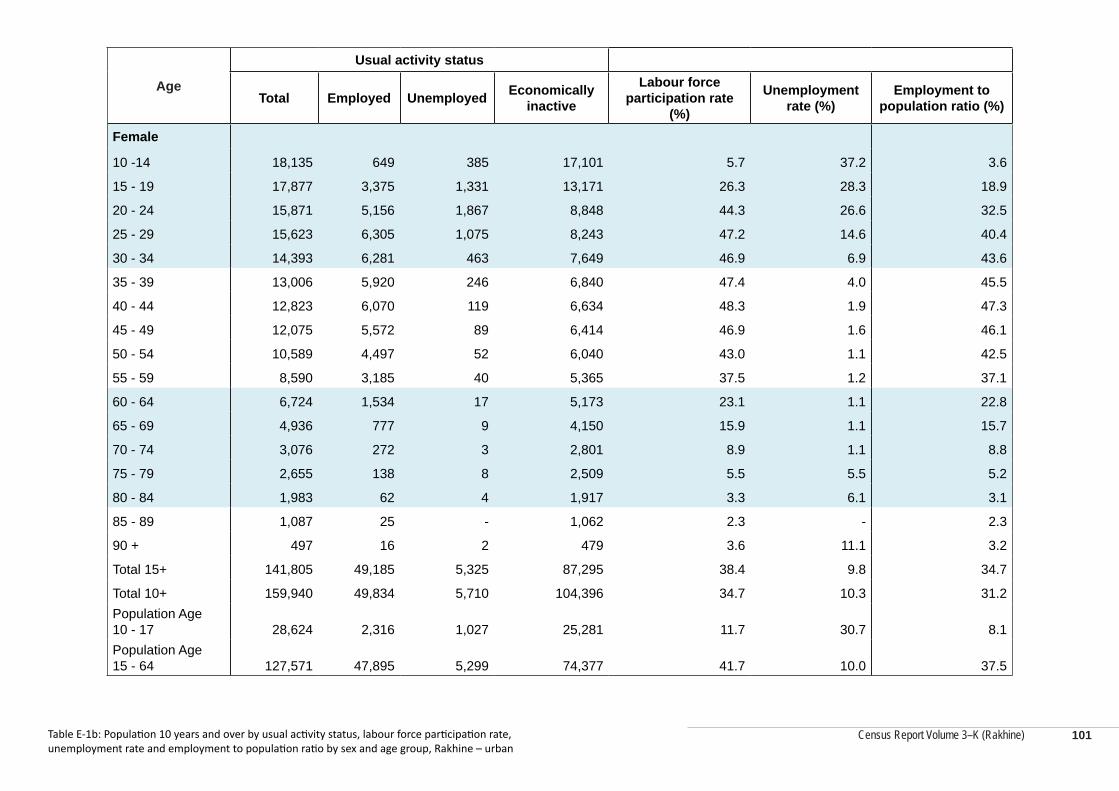
Census Report Volume 3–K (Rakhine)
Age
Usual activity status
Total Employed Unemployed Economically inactive
Labour force participation rate
(%)
Unemployment rate (%)
Employment to population ratio (%)
Female
10 -14 18,135 649 385 17,101 5.7 37.2 3.6
15 - 19 17,877 3,375 1,331 13,171 26.3 28.3 18.9
20 - 24 15,871 5,156 1,867 8,848 44.3 26.6 32.5
25 - 29 15,623 6,305 1,075 8,243 47.2 14.6 40.4
30 - 34 14,393 6,281 463 7,649 46.9 6.9 43.6
35 - 39 13,006 5,920 246 6,840 47.4 4.0 45.5
40 - 44 12,823 6,070 119 6,634 48.3 1.9 47.3
45 - 49 12,075 5,572 89 6,414 46.9 1.6 46.1
50 - 54 10,589 4,497 52 6,040 43.0 1.1 42.5
55 - 59 8,590 3,185 40 5,365 37.5 1.2 37.1
60 - 64 6,724 1,534 17 5,173 23.1 1.1 22.8
65 - 69 4,936 777 9 4,150 15.9 1.1 15.7
70 - 74 3,076 272 3 2,801 8.9 1.1 8.8
75 - 79 2,655 138 8 2,509 5.5 5.5 5.2
80 - 84 1,983 62 4 1,917 3.3 6.1 3.1
85 - 89 1,087 25 - 1,062 2.3 - 2.3
90 + 497 16 2 479 3.6 11.1 3.2
Total 15+ 141,805 49,185 5,325 87,295 38.4 9.8 34.7
Total 10+ 159,940 49,834 5,710 104,396 34.7 10.3 31.2Population Age 10 - 17 28,624 2,316 1,027 25,281 11.7 30.7 8.1Population Age 15 - 64 127,571 47,895 5,299 74,377 41.7 10.0 37.5
Table E-1b: Population 10 years and over by usual activity status, labour force participation rate, unemployment rate and employment to population ratio by sex and age group, Rakhine – urban
101
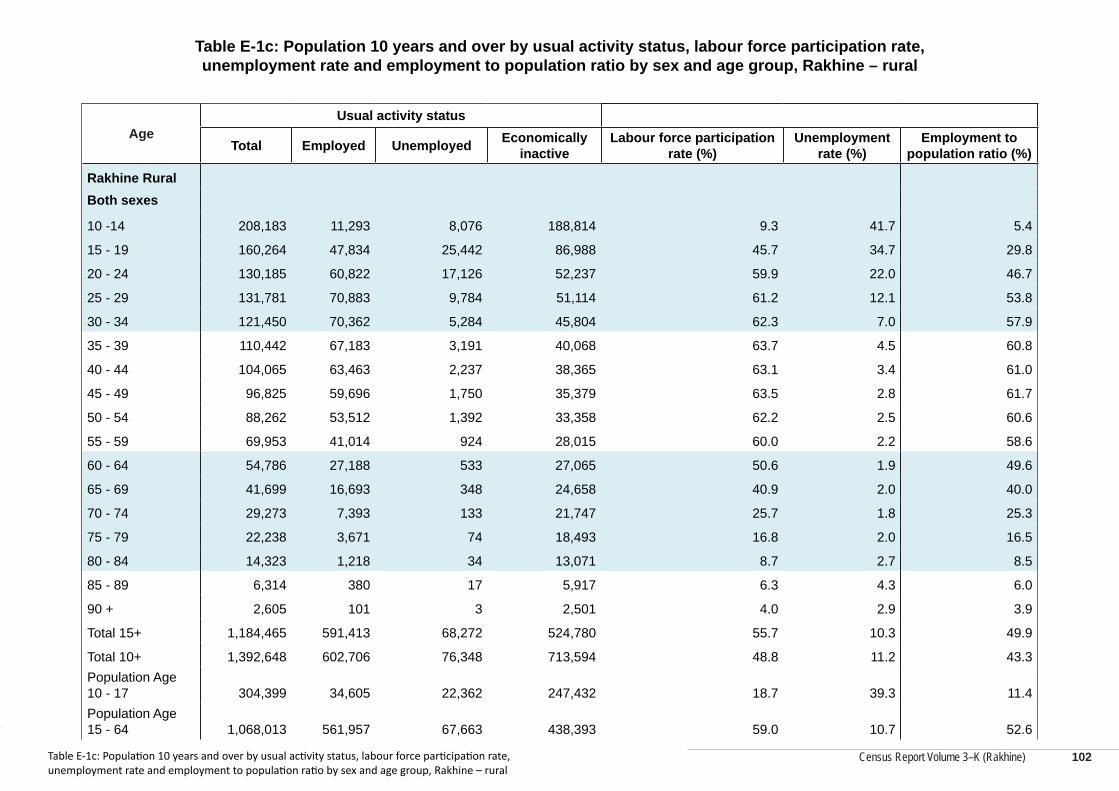
Census Report Volume 3–K (Rakhine)
Census Report Volume 3–K (Rakhine)
Table E-1c: Population 10 years and over by usual activity status, labour force participation rate, unemployment rate and employment to population ratio by sex and age group, Rakhine – rural
AgeUsual activity status
Total Employed Unemployed Economically inactive
Labour force participation rate (%)
Unemployment rate (%)
Employment to population ratio (%)
Rakhine RuralBoth sexes
10 -14 208,183 11,293 8,076 188,814 9.3 41.7 5.4
15 - 19 160,264 47,834 25,442 86,988 45.7 34.7 29.8
20 - 24 130,185 60,822 17,126 52,237 59.9 22.0 46.7
25 - 29 131,781 70,883 9,784 51,114 61.2 12.1 53.8
30 - 34 121,450 70,362 5,284 45,804 62.3 7.0 57.9
35 - 39 110,442 67,183 3,191 40,068 63.7 4.5 60.8
40 - 44 104,065 63,463 2,237 38,365 63.1 3.4 61.0
45 - 49 96,825 59,696 1,750 35,379 63.5 2.8 61.7
50 - 54 88,262 53,512 1,392 33,358 62.2 2.5 60.6
55 - 59 69,953 41,014 924 28,015 60.0 2.2 58.6
60 - 64 54,786 27,188 533 27,065 50.6 1.9 49.6
65 - 69 41,699 16,693 348 24,658 40.9 2.0 40.0
70 - 74 29,273 7,393 133 21,747 25.7 1.8 25.3
75 - 79 22,238 3,671 74 18,493 16.8 2.0 16.5
80 - 84 14,323 1,218 34 13,071 8.7 2.7 8.5
85 - 89 6,314 380 17 5,917 6.3 4.3 6.0
90 + 2,605 101 3 2,501 4.0 2.9 3.9
Total 15+ 1,184,465 591,413 68,272 524,780 55.7 10.3 49.9
Total 10+ 1,392,648 602,706 76,348 713,594 48.8 11.2 43.3Population Age 10 - 17 304,399 34,605 22,362 247,432 18.7 39.3 11.4Population Age 15 - 64 1,068,013 561,957 67,663 438,393 59.0 10.7 52.6
Table E-1c: Population 10 years and over by usual activity status, labour force participation rate, unemployment rate and employment to population ratio by sex and age group, Rakhine – rural
102
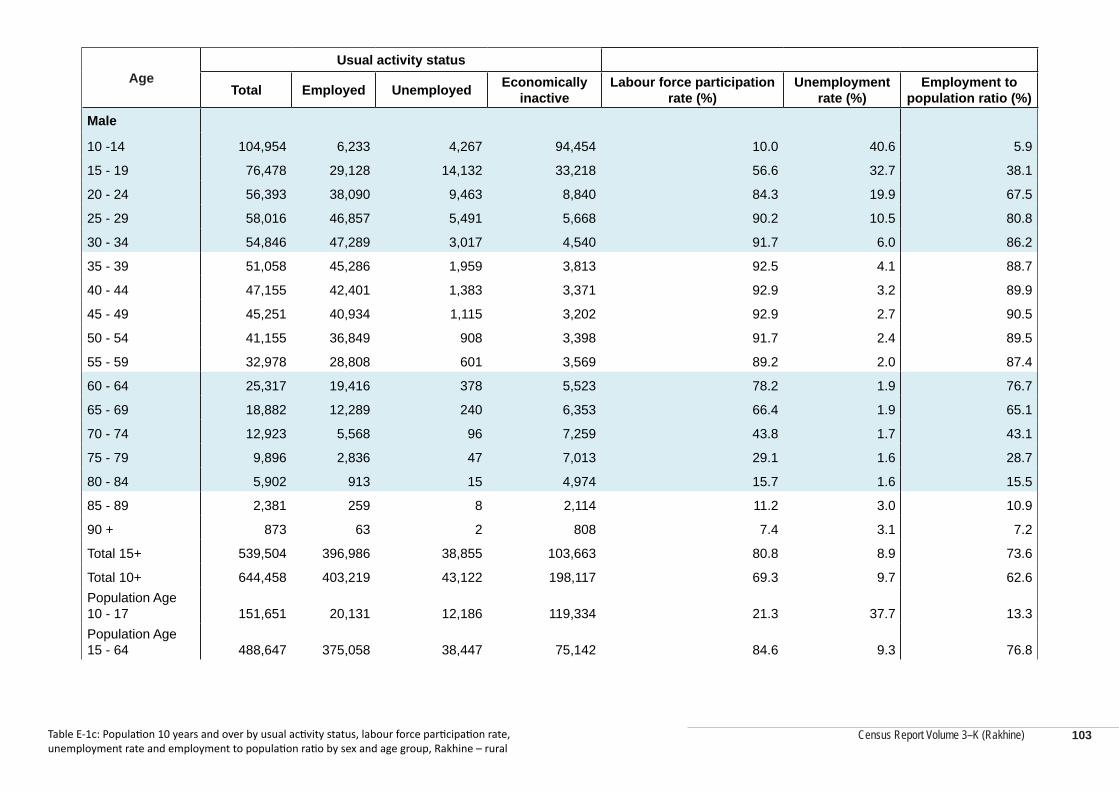
Census Report Volume 3–K (Rakhine)
AgeUsual activity status
Total Employed Unemployed Economically inactive
Labour force participation rate (%)
Unemployment rate (%)
Employment to population ratio (%)
Male
10 -14 104,954 6,233 4,267 94,454 10.0 40.6 5.9
15 - 19 76,478 29,128 14,132 33,218 56.6 32.7 38.1
20 - 24 56,393 38,090 9,463 8,840 84.3 19.9 67.5
25 - 29 58,016 46,857 5,491 5,668 90.2 10.5 80.8
30 - 34 54,846 47,289 3,017 4,540 91.7 6.0 86.2
35 - 39 51,058 45,286 1,959 3,813 92.5 4.1 88.7
40 - 44 47,155 42,401 1,383 3,371 92.9 3.2 89.9
45 - 49 45,251 40,934 1,115 3,202 92.9 2.7 90.5
50 - 54 41,155 36,849 908 3,398 91.7 2.4 89.5
55 - 59 32,978 28,808 601 3,569 89.2 2.0 87.4
60 - 64 25,317 19,416 378 5,523 78.2 1.9 76.7
65 - 69 18,882 12,289 240 6,353 66.4 1.9 65.1
70 - 74 12,923 5,568 96 7,259 43.8 1.7 43.1
75 - 79 9,896 2,836 47 7,013 29.1 1.6 28.7
80 - 84 5,902 913 15 4,974 15.7 1.6 15.5
85 - 89 2,381 259 8 2,114 11.2 3.0 10.9
90 + 873 63 2 808 7.4 3.1 7.2
Total 15+ 539,504 396,986 38,855 103,663 80.8 8.9 73.6
Total 10+ 644,458 403,219 43,122 198,117 69.3 9.7 62.6Population Age 10 - 17 151,651 20,131 12,186 119,334 21.3 37.7 13.3Population Age 15 - 64 488,647 375,058 38,447 75,142 84.6 9.3 76.8
Table E-1c: Population 10 years and over by usual activity status, labour force participation rate, unemployment rate and employment to population ratio by sex and age group, Rakhine – rural
103
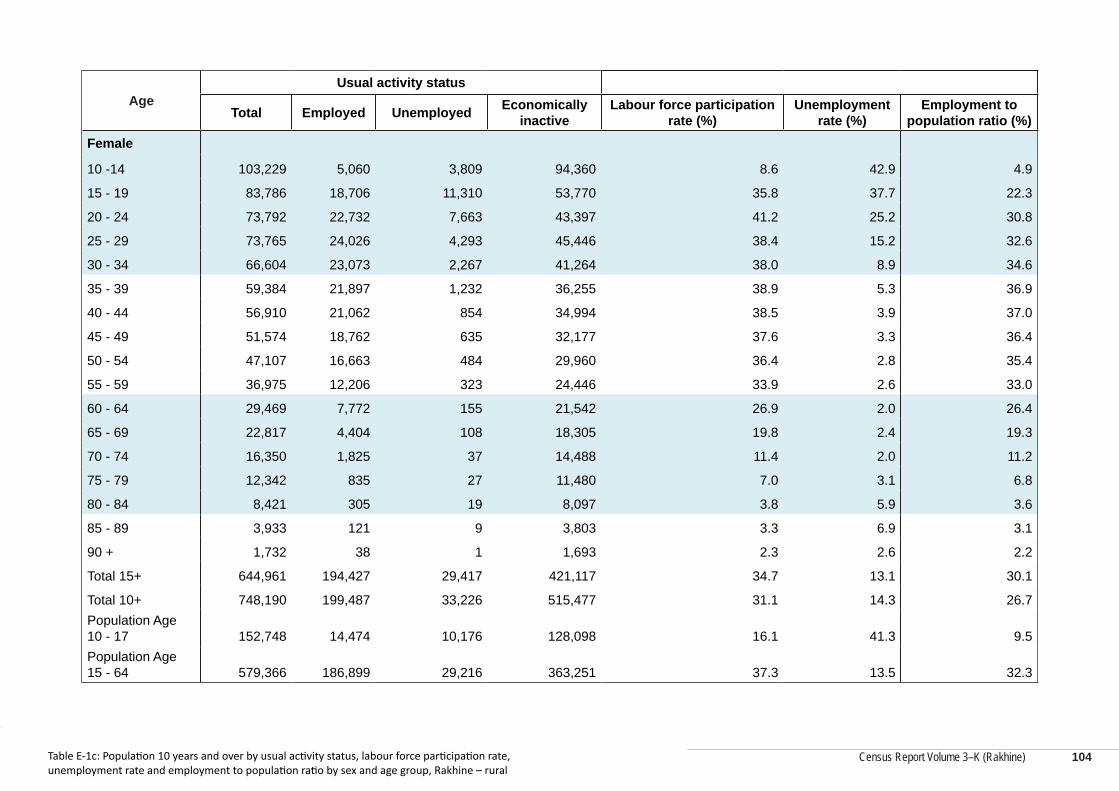
Census Report Volume 3–K (Rakhine)
Census Report Volume 3–K (Rakhine)
AgeUsual activity status
Total Employed Unemployed Economically inactive
Labour force participation rate (%)
Unemployment rate (%)
Employment to population ratio (%)
Female
10 -14 103,229 5,060 3,809 94,360 8.6 42.9 4.9
15 - 19 83,786 18,706 11,310 53,770 35.8 37.7 22.3
20 - 24 73,792 22,732 7,663 43,397 41.2 25.2 30.8
25 - 29 73,765 24,026 4,293 45,446 38.4 15.2 32.6
30 - 34 66,604 23,073 2,267 41,264 38.0 8.9 34.6
35 - 39 59,384 21,897 1,232 36,255 38.9 5.3 36.9
40 - 44 56,910 21,062 854 34,994 38.5 3.9 37.0
45 - 49 51,574 18,762 635 32,177 37.6 3.3 36.4
50 - 54 47,107 16,663 484 29,960 36.4 2.8 35.4
55 - 59 36,975 12,206 323 24,446 33.9 2.6 33.0
60 - 64 29,469 7,772 155 21,542 26.9 2.0 26.4
65 - 69 22,817 4,404 108 18,305 19.8 2.4 19.3
70 - 74 16,350 1,825 37 14,488 11.4 2.0 11.2
75 - 79 12,342 835 27 11,480 7.0 3.1 6.8
80 - 84 8,421 305 19 8,097 3.8 5.9 3.6
85 - 89 3,933 121 9 3,803 3.3 6.9 3.1
90 + 1,732 38 1 1,693 2.3 2.6 2.2
Total 15+ 644,961 194,427 29,417 421,117 34.7 13.1 30.1
Total 10+ 748,190 199,487 33,226 515,477 31.1 14.3 26.7Population Age 10 - 17 152,748 14,474 10,176 128,098 16.1 41.3 9.5Population Age 15 - 64 579,366 186,899 29,216 363,251 37.3 13.5 32.3
Table E-1c: Population 10 years and over by usual activity status, labour force participation rate, unemployment rate and employment to population ratio by sex and age group, Rakhine – rural
104
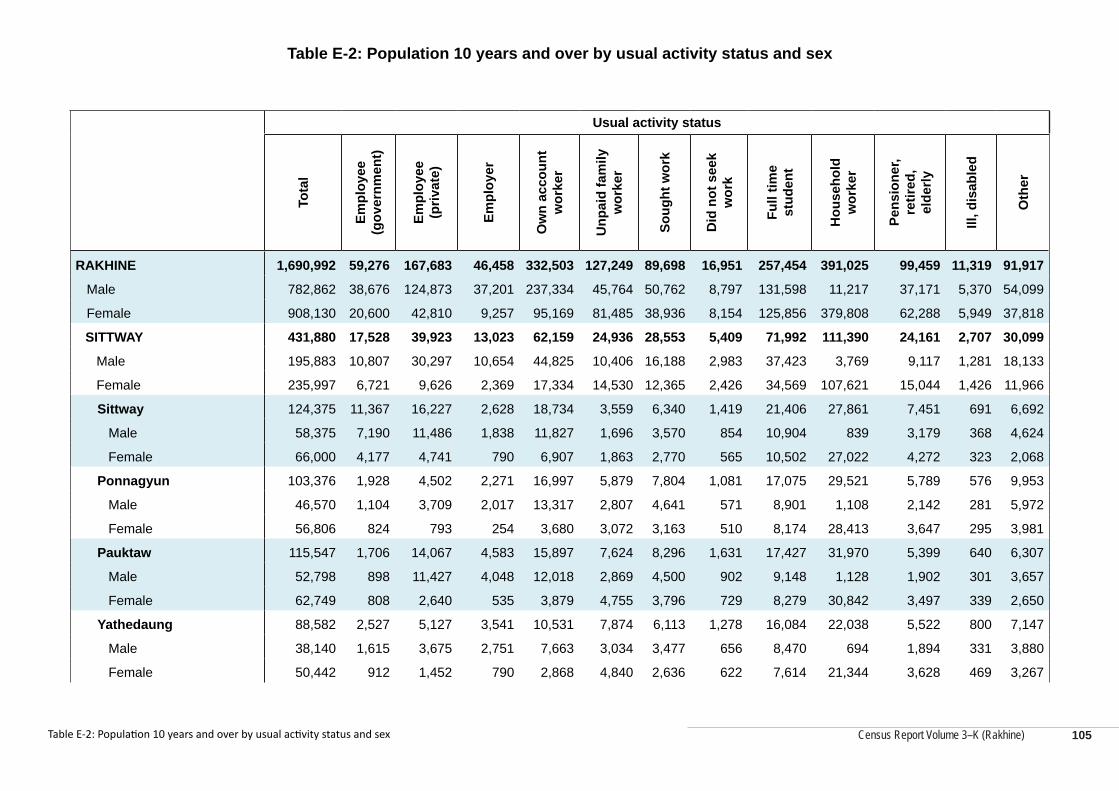
Census Report Volume 3–K (Rakhine)
Table E-2: Population 10 years and over by usual activity status and sex
Usual activity status
Tota
l
Empl
oyee
(g
over
nmen
t)
Empl
oyee
(p
rivat
e)
Empl
oyer
Ow
n ac
coun
t w
orke
r
Unp
aid
fam
ily
wor
ker
Soug
ht w
ork
Did
not
see
k w
ork
Full
time
stud
ent
Hou
seho
ld
wor
ker
Pens
ione
r, re
tired
, el
derly
Ill, d
isab
led
Oth
er
RAKHINE 1,690,992 59,276 167,683 46,458 332,503 127,249 89,698 16,951 257,454 391,025 99,459 11,319 91,917
Male 782,862 38,676 124,873 37,201 237,334 45,764 50,762 8,797 131,598 11,217 37,171 5,370 54,099
Female 908,130 20,600 42,810 9,257 95,169 81,485 38,936 8,154 125,856 379,808 62,288 5,949 37,818
SITTWAY 431,880 17,528 39,923 13,023 62,159 24,936 28,553 5,409 71,992 111,390 24,161 2,707 30,099
Male 195,883 10,807 30,297 10,654 44,825 10,406 16,188 2,983 37,423 3,769 9,117 1,281 18,133
Female 235,997 6,721 9,626 2,369 17,334 14,530 12,365 2,426 34,569 107,621 15,044 1,426 11,966
Sittway 124,375 11,367 16,227 2,628 18,734 3,559 6,340 1,419 21,406 27,861 7,451 691 6,692
Male 58,375 7,190 11,486 1,838 11,827 1,696 3,570 854 10,904 839 3,179 368 4,624
Female 66,000 4,177 4,741 790 6,907 1,863 2,770 565 10,502 27,022 4,272 323 2,068
Ponnagyun 103,376 1,928 4,502 2,271 16,997 5,879 7,804 1,081 17,075 29,521 5,789 576 9,953
Male 46,570 1,104 3,709 2,017 13,317 2,807 4,641 571 8,901 1,108 2,142 281 5,972
Female 56,806 824 793 254 3,680 3,072 3,163 510 8,174 28,413 3,647 295 3,981
Pauktaw 115,547 1,706 14,067 4,583 15,897 7,624 8,296 1,631 17,427 31,970 5,399 640 6,307
Male 52,798 898 11,427 4,048 12,018 2,869 4,500 902 9,148 1,128 1,902 301 3,657
Female 62,749 808 2,640 535 3,879 4,755 3,796 729 8,279 30,842 3,497 339 2,650
Yathedaung 88,582 2,527 5,127 3,541 10,531 7,874 6,113 1,278 16,084 22,038 5,522 800 7,147
Male 38,140 1,615 3,675 2,751 7,663 3,034 3,477 656 8,470 694 1,894 331 3,880
Female 50,442 912 1,452 790 2,868 4,840 2,636 622 7,614 21,344 3,628 469 3,267
Table E-2: Population 10 years and over by usual activity status and sex 105
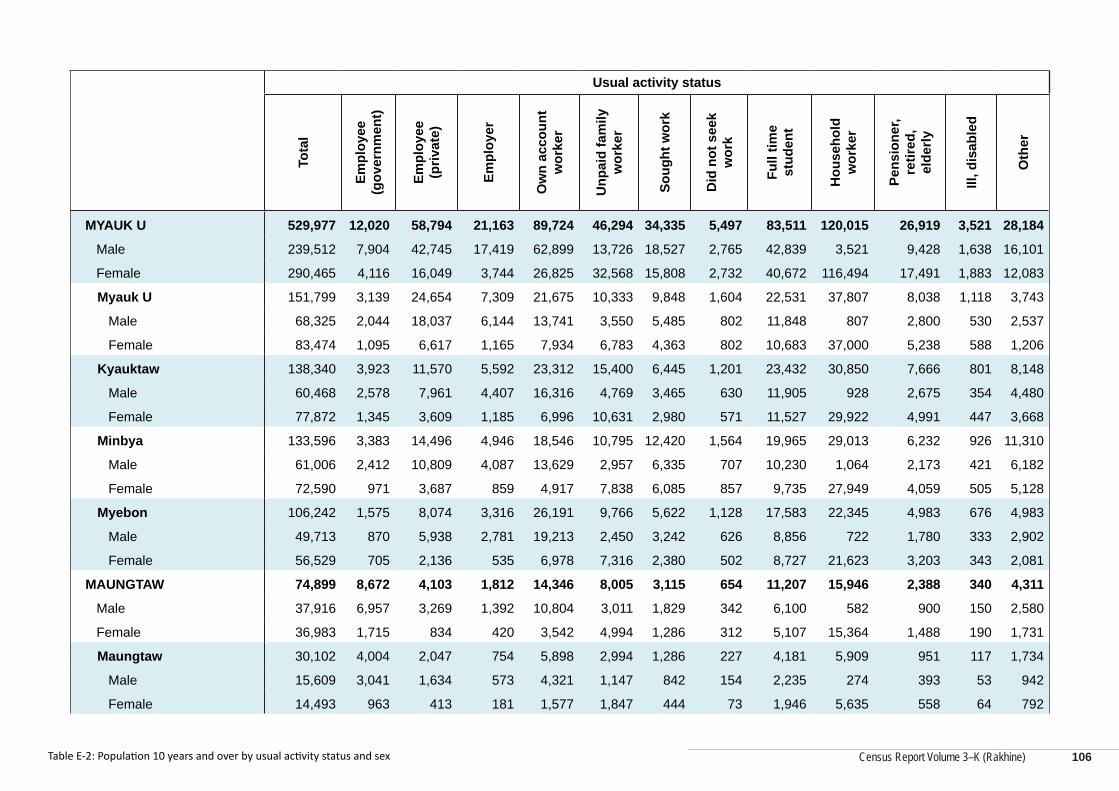
Census Report Volume 3–K (Rakhine)
Census Report Volume 3–K (Rakhine)
Usual activity status
Tota
l
Empl
oyee
(g
over
nmen
t)
Empl
oyee
(p
rivat
e)
Empl
oyer
Ow
n ac
coun
t w
orke
r
Unp
aid
fam
ily
wor
ker
Soug
ht w
ork
Did
not
see
k w
ork
Full
time
stud
ent
Hou
seho
ld
wor
ker
Pens
ione
r, re
tired
, el
derly
Ill, d
isab
led
Oth
er
MYAUK U 529,977 12,020 58,794 21,163 89,724 46,294 34,335 5,497 83,511 120,015 26,919 3,521 28,184
Male 239,512 7,904 42,745 17,419 62,899 13,726 18,527 2,765 42,839 3,521 9,428 1,638 16,101
Female 290,465 4,116 16,049 3,744 26,825 32,568 15,808 2,732 40,672 116,494 17,491 1,883 12,083
Myauk U 151,799 3,139 24,654 7,309 21,675 10,333 9,848 1,604 22,531 37,807 8,038 1,118 3,743
Male 68,325 2,044 18,037 6,144 13,741 3,550 5,485 802 11,848 807 2,800 530 2,537
Female 83,474 1,095 6,617 1,165 7,934 6,783 4,363 802 10,683 37,000 5,238 588 1,206
Kyauktaw 138,340 3,923 11,570 5,592 23,312 15,400 6,445 1,201 23,432 30,850 7,666 801 8,148
Male 60,468 2,578 7,961 4,407 16,316 4,769 3,465 630 11,905 928 2,675 354 4,480
Female 77,872 1,345 3,609 1,185 6,996 10,631 2,980 571 11,527 29,922 4,991 447 3,668
Minbya 133,596 3,383 14,496 4,946 18,546 10,795 12,420 1,564 19,965 29,013 6,232 926 11,310
Male 61,006 2,412 10,809 4,087 13,629 2,957 6,335 707 10,230 1,064 2,173 421 6,182
Female 72,590 971 3,687 859 4,917 7,838 6,085 857 9,735 27,949 4,059 505 5,128
Myebon 106,242 1,575 8,074 3,316 26,191 9,766 5,622 1,128 17,583 22,345 4,983 676 4,983
Male 49,713 870 5,938 2,781 19,213 2,450 3,242 626 8,856 722 1,780 333 2,902
Female 56,529 705 2,136 535 6,978 7,316 2,380 502 8,727 21,623 3,203 343 2,081
MAUNGTAW 74,899 8,672 4,103 1,812 14,346 8,005 3,115 654 11,207 15,946 2,388 340 4,311
Male 37,916 6,957 3,269 1,392 10,804 3,011 1,829 342 6,100 582 900 150 2,580
Female 36,983 1,715 834 420 3,542 4,994 1,286 312 5,107 15,364 1,488 190 1,731
Maungtaw 30,102 4,004 2,047 754 5,898 2,994 1,286 227 4,181 5,909 951 117 1,734
Male 15,609 3,041 1,634 573 4,321 1,147 842 154 2,235 274 393 53 942
Female 14,493 963 413 181 1,577 1,847 444 73 1,946 5,635 558 64 792
Table E-2: Population 10 years and over by usual activity status and sex 106
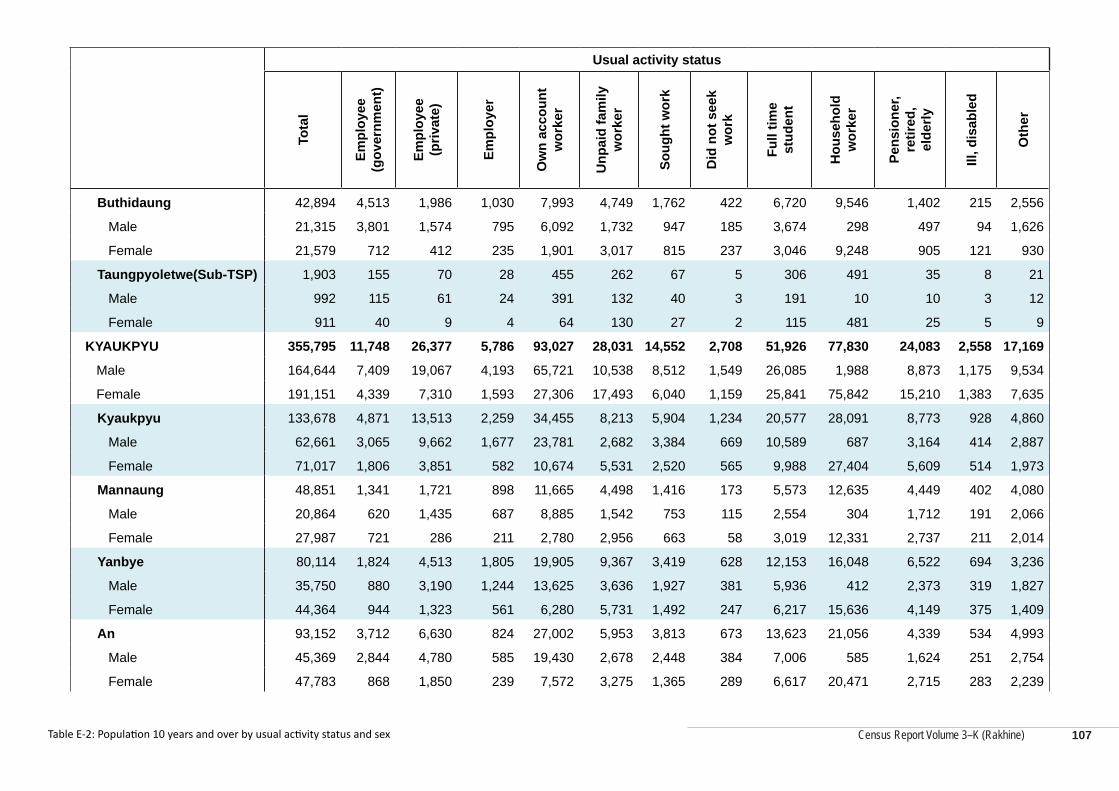
Census Report Volume 3–K (Rakhine)
Usual activity status
Tota
l
Empl
oyee
(g
over
nmen
t)
Empl
oyee
(p
rivat
e)
Empl
oyer
Ow
n ac
coun
t w
orke
r
Unp
aid
fam
ily
wor
ker
Soug
ht w
ork
Did
not
see
k w
ork
Full
time
stud
ent
Hou
seho
ld
wor
ker
Pens
ione
r, re
tired
, el
derly
Ill, d
isab
led
Oth
er
Buthidaung 42,894 4,513 1,986 1,030 7,993 4,749 1,762 422 6,720 9,546 1,402 215 2,556
Male 21,315 3,801 1,574 795 6,092 1,732 947 185 3,674 298 497 94 1,626
Female 21,579 712 412 235 1,901 3,017 815 237 3,046 9,248 905 121 930
Taungpyoletwe(Sub-TSP) 1,903 155 70 28 455 262 67 5 306 491 35 8 21
Male 992 115 61 24 391 132 40 3 191 10 10 3 12
Female 911 40 9 4 64 130 27 2 115 481 25 5 9
KYAUKPYU 355,795 11,748 26,377 5,786 93,027 28,031 14,552 2,708 51,926 77,830 24,083 2,558 17,169
Male 164,644 7,409 19,067 4,193 65,721 10,538 8,512 1,549 26,085 1,988 8,873 1,175 9,534
Female 191,151 4,339 7,310 1,593 27,306 17,493 6,040 1,159 25,841 75,842 15,210 1,383 7,635
Kyaukpyu 133,678 4,871 13,513 2,259 34,455 8,213 5,904 1,234 20,577 28,091 8,773 928 4,860
Male 62,661 3,065 9,662 1,677 23,781 2,682 3,384 669 10,589 687 3,164 414 2,887
Female 71,017 1,806 3,851 582 10,674 5,531 2,520 565 9,988 27,404 5,609 514 1,973
Mannaung 48,851 1,341 1,721 898 11,665 4,498 1,416 173 5,573 12,635 4,449 402 4,080
Male 20,864 620 1,435 687 8,885 1,542 753 115 2,554 304 1,712 191 2,066
Female 27,987 721 286 211 2,780 2,956 663 58 3,019 12,331 2,737 211 2,014
Yanbye 80,114 1,824 4,513 1,805 19,905 9,367 3,419 628 12,153 16,048 6,522 694 3,236
Male 35,750 880 3,190 1,244 13,625 3,636 1,927 381 5,936 412 2,373 319 1,827
Female 44,364 944 1,323 561 6,280 5,731 1,492 247 6,217 15,636 4,149 375 1,409
An 93,152 3,712 6,630 824 27,002 5,953 3,813 673 13,623 21,056 4,339 534 4,993
Male 45,369 2,844 4,780 585 19,430 2,678 2,448 384 7,006 585 1,624 251 2,754
Female 47,783 868 1,850 239 7,572 3,275 1,365 289 6,617 20,471 2,715 283 2,239
Table E-2: Population 10 years and over by usual activity status and sex 107
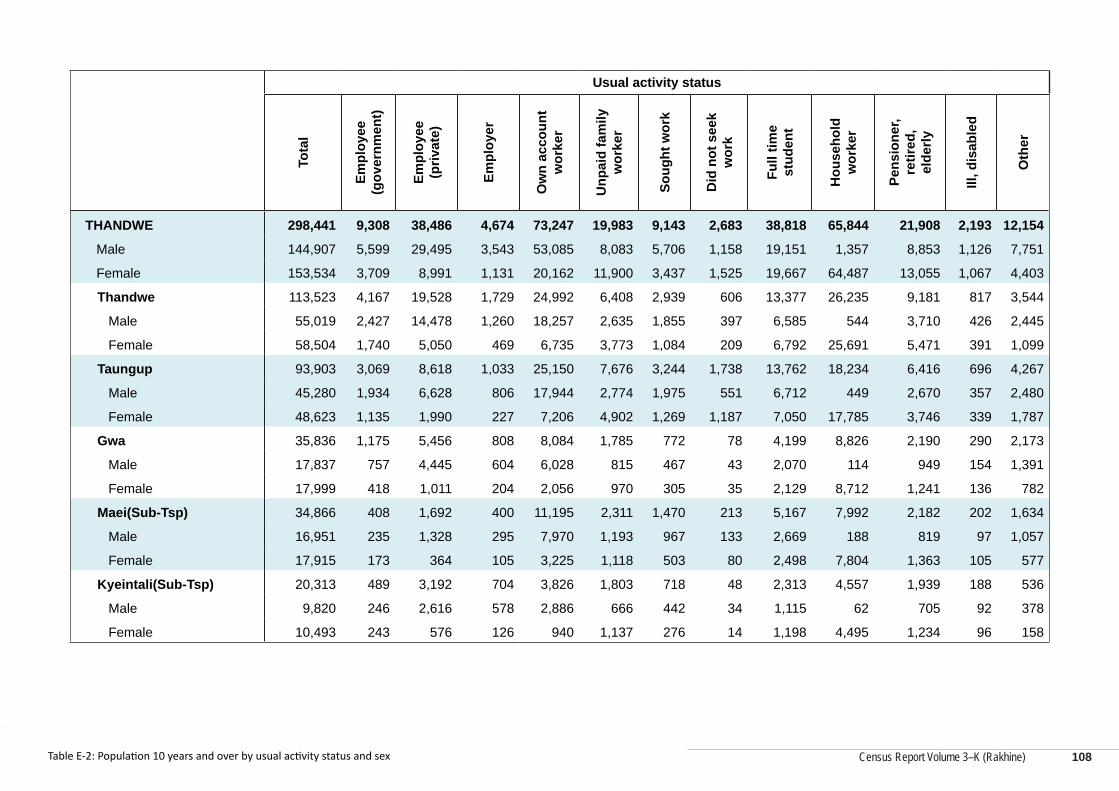
Census Report Volume 3–K (Rakhine)
Census Report Volume 3–K (Rakhine)
Usual activity status
Tota
l
Empl
oyee
(g
over
nmen
t)
Empl
oyee
(p
rivat
e)
Empl
oyer
Ow
n ac
coun
t w
orke
r
Unp
aid
fam
ily
wor
ker
Soug
ht w
ork
Did
not
see
k w
ork
Full
time
stud
ent
Hou
seho
ld
wor
ker
Pens
ione
r, re
tired
, el
derly
Ill, d
isab
led
Oth
er
THANDWE 298,441 9,308 38,486 4,674 73,247 19,983 9,143 2,683 38,818 65,844 21,908 2,193 12,154
Male 144,907 5,599 29,495 3,543 53,085 8,083 5,706 1,158 19,151 1,357 8,853 1,126 7,751
Female 153,534 3,709 8,991 1,131 20,162 11,900 3,437 1,525 19,667 64,487 13,055 1,067 4,403
Thandwe 113,523 4,167 19,528 1,729 24,992 6,408 2,939 606 13,377 26,235 9,181 817 3,544
Male 55,019 2,427 14,478 1,260 18,257 2,635 1,855 397 6,585 544 3,710 426 2,445
Female 58,504 1,740 5,050 469 6,735 3,773 1,084 209 6,792 25,691 5,471 391 1,099
Taungup 93,903 3,069 8,618 1,033 25,150 7,676 3,244 1,738 13,762 18,234 6,416 696 4,267
Male 45,280 1,934 6,628 806 17,944 2,774 1,975 551 6,712 449 2,670 357 2,480
Female 48,623 1,135 1,990 227 7,206 4,902 1,269 1,187 7,050 17,785 3,746 339 1,787
Gwa 35,836 1,175 5,456 808 8,084 1,785 772 78 4,199 8,826 2,190 290 2,173
Male 17,837 757 4,445 604 6,028 815 467 43 2,070 114 949 154 1,391
Female 17,999 418 1,011 204 2,056 970 305 35 2,129 8,712 1,241 136 782
Maei(Sub-Tsp) 34,866 408 1,692 400 11,195 2,311 1,470 213 5,167 7,992 2,182 202 1,634
Male 16,951 235 1,328 295 7,970 1,193 967 133 2,669 188 819 97 1,057
Female 17,915 173 364 105 3,225 1,118 503 80 2,498 7,804 1,363 105 577
Kyeintali(Sub-Tsp) 20,313 489 3,192 704 3,826 1,803 718 48 2,313 4,557 1,939 188 536
Male 9,820 246 2,616 578 2,886 666 442 34 1,115 62 705 92 378
Female 10,493 243 576 126 940 1,137 276 14 1,198 4,495 1,234 96 158
Table E-2: Population 10 years and over by usual activity status and sex 108
Myanmar Population and Housing Census,
Census Report Volume 3-K (Rakhine)
Series F: Births and Childhood Deaths
Census Report Volume 3–K (Rakhine)
Census Report Volume 3–K (Rakhine)
Table F-1: Women in conventional households aged 15 - 54 by children ever born to ever-married women and children dead, by age of mother
Five-year age groups Women Women ever-married Number of children ever born
Number of children dead
RAKHINE 616,430 445,298 1,231,533 156,480
15 - 19 99,586 15,339 5,079 297
20 - 24 87,942 50,348 43,883 2,622
25 - 29 88,015 70,018 109,988 7,649
30 - 34 80,029 69,955 164,009 13,592
35 - 39 71,562 64,551 199,060 20,383
40 - 44 69,041 63,388 235,450 30,486
45 - 49 63,033 58,463 239,737 38,013
50 - 54 57,222 53,236 234,327 43,438
SITTWAY 162,906 111,322 325,496 34,716
15 - 19 28,498 3,443 941 42
20 - 24 24,675 12,551 10,220 488
25 - 29 23,901 18,147 27,441 1,458
30 - 34 21,306 18,177 43,267 2,831
35 - 39 17,300 15,456 50,221 4,196
40 - 44 17,663 16,157 65,567 7,108
45 - 49 15,744 14,542 65,173 8,713
50 - 54 13,819 12,849 62,666 9,880
Table F-1: Women in conventional households aged 15 - 54 by children ever born to ever-married women and children dead, by age of mother
110
Census Report Volume 3–K (Rakhine)
Five-year age groups Women Women ever-married Number of children ever born
Number of children dead
MYAUK U 200,849 146,916 433,008 66,929
15 - 19 34,867 5,326 1,673 104
20 - 24 30,205 18,210 15,369 1,003
25 - 29 29,824 24,477 39,245 3,180
30 - 34 25,674 23,050 56,945 5,574
35 - 39 22,026 20,399 68,144 8,380
40 - 44 20,787 19,676 80,718 12,747
45 - 49 19,506 18,583 85,413 16,512
50 - 54 17,960 17,195 85,501 19,429
MAUNGTAW 26,466 18,798 57,327 6,521
15 - 19 4,722 684 331 22
20 - 24 4,171 2,461 2,714 170
25 - 29 4,235 3,431 6,426 421
30 - 34 3,395 2,965 8,187 623
35 - 39 3,020 2,749 10,133 992
40 - 44 2,621 2,449 10,345 1,223
45 - 49 2,307 2,182 10,102 1,419
50 - 54 1,995 1,877 9,089 1,651
Table F-1: Women in conventional households aged 15 - 54 by children ever born to ever-married women and children dead, by age of mother
111
Census Report Volume 3–K (Rakhine)
Census Report Volume 3–K (Rakhine)
Five-year age groups Women Women ever-married Number of children ever born
Number of children dead
KYAUKPYU 124,505 92,050 241,227 30,103
15 - 19 17,344 2,827 1,071 53
20 - 24 15,678 9,213 8,663 576
25 - 29 16,483 13,059 21,062 1,593
30 - 34 16,190 14,038 31,624 2,729
35 - 39 16,094 14,264 40,696 4,216
40 - 44 15,490 13,867 46,103 5,938
45 - 49 14,065 12,814 46,330 7,146
50 - 54 13,161 11,968 45,678 7,852
THANDWE 101,704 76,212 174,475 18,211
15 - 19 14,155 3,059 1,063 76
20 - 24 13,213 7,913 6,917 385
25 - 29 13,572 10,904 15,814 997
30 - 34 13,464 11,725 23,986 1,835
35 - 39 13,122 11,683 29,866 2,599
40 - 44 12,480 11,239 32,717 3,470
45 - 49 11,411 10,342 32,719 4,223
50 - 54 10,287 9,347 31,393 4,626
Table F-1: Women in conventional households aged 15 - 54 by children ever born to ever-married women and children dead, by age of mother
112
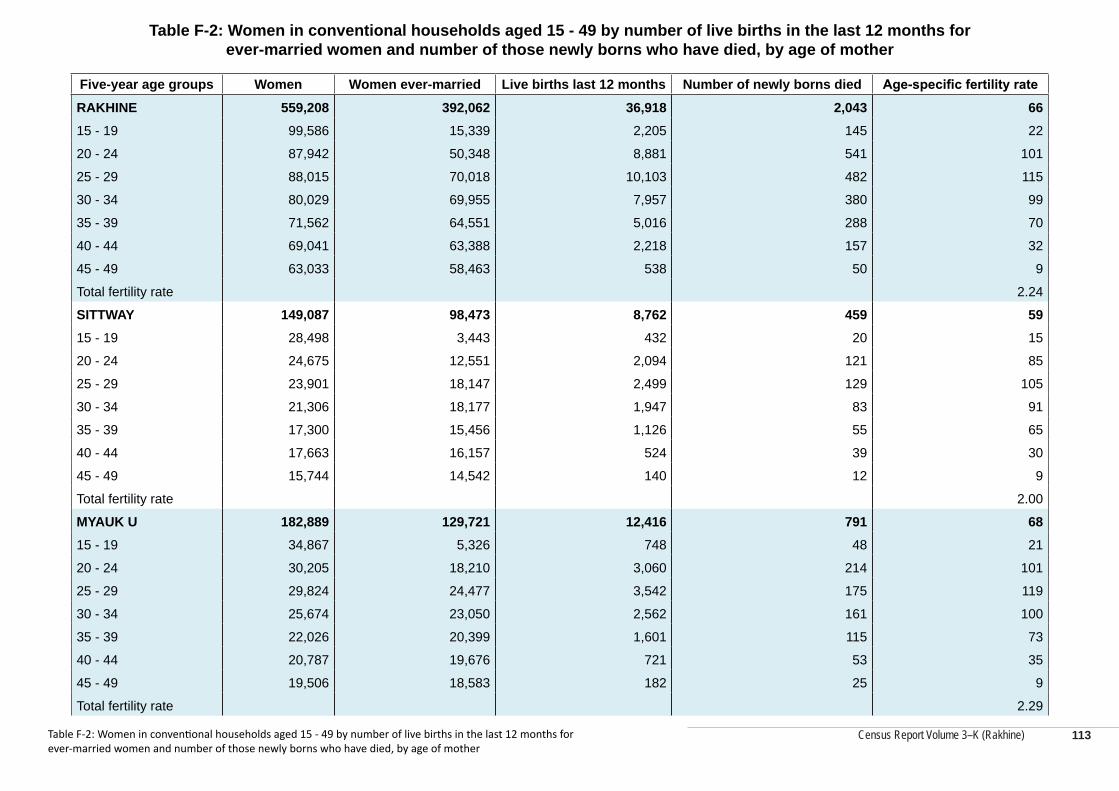
Census Report Volume 3–K (Rakhine)
Table F-2: Women in conventional households aged 15 - 49 by number of live births in the last 12 months for ever-married women and number of those newly borns who have died, by age of mother
Five-year age groups Women Women ever-married Live births last 12 months Number of newly borns died Age-specific fertility rate
RAKHINE 559,208 392,062 36,918 2,043 6615 - 19 99,586 15,339 2,205 145 22
20 - 24 87,942 50,348 8,881 541 101
25 - 29 88,015 70,018 10,103 482 115
30 - 34 80,029 69,955 7,957 380 99
35 - 39 71,562 64,551 5,016 288 70
40 - 44 69,041 63,388 2,218 157 32
45 - 49 63,033 58,463 538 50 9
Total fertility rate 2.24
SITTWAY 149,087 98,473 8,762 459 5915 - 19 28,498 3,443 432 20 15
20 - 24 24,675 12,551 2,094 121 85
25 - 29 23,901 18,147 2,499 129 105
30 - 34 21,306 18,177 1,947 83 91
35 - 39 17,300 15,456 1,126 55 65
40 - 44 17,663 16,157 524 39 30
45 - 49 15,744 14,542 140 12 9
Total fertility rate 2.00
MYAUK U 182,889 129,721 12,416 791 6815 - 19 34,867 5,326 748 48 21
20 - 24 30,205 18,210 3,060 214 101
25 - 29 29,824 24,477 3,542 175 119
30 - 34 25,674 23,050 2,562 161 100
35 - 39 22,026 20,399 1,601 115 73
40 - 44 20,787 19,676 721 53 35
45 - 49 19,506 18,583 182 25 9
Total fertility rate 2.29
Table F-2: Women in conventional households aged 15 - 49 by number of live births in the last 12 months for ever-married women and number of those newly borns who have died, by age of mother
113
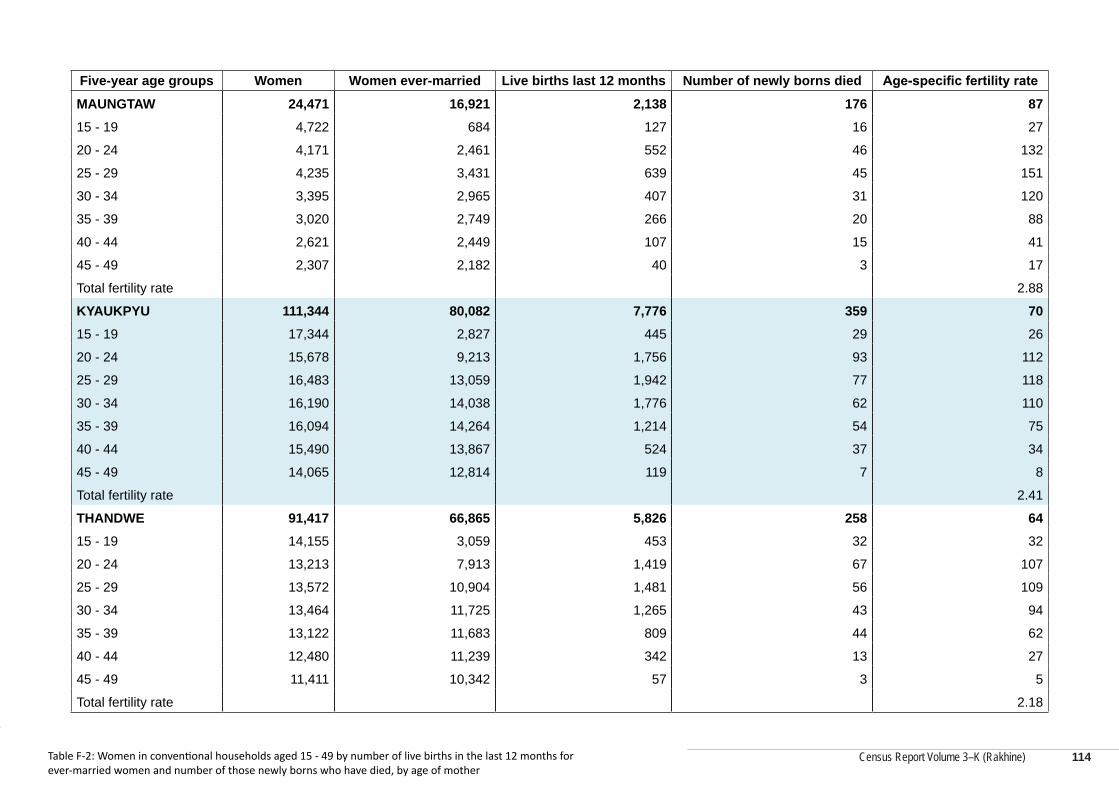
Census Report Volume 3–K (Rakhine)
Census Report Volume 3–K (Rakhine)
Five-year age groups Women Women ever-married Live births last 12 months Number of newly borns died Age-specific fertility rate
MAUNGTAW 24,471 16,921 2,138 176 8715 - 19 4,722 684 127 16 27
20 - 24 4,171 2,461 552 46 132
25 - 29 4,235 3,431 639 45 151
30 - 34 3,395 2,965 407 31 120
35 - 39 3,020 2,749 266 20 88
40 - 44 2,621 2,449 107 15 41
45 - 49 2,307 2,182 40 3 17
Total fertility rate 2.88
KYAUKPYU 111,344 80,082 7,776 359 7015 - 19 17,344 2,827 445 29 26
20 - 24 15,678 9,213 1,756 93 112
25 - 29 16,483 13,059 1,942 77 118
30 - 34 16,190 14,038 1,776 62 110
35 - 39 16,094 14,264 1,214 54 75
40 - 44 15,490 13,867 524 37 34
45 - 49 14,065 12,814 119 7 8
Total fertility rate 2.41
THANDWE 91,417 66,865 5,826 258 6415 - 19 14,155 3,059 453 32 32
20 - 24 13,213 7,913 1,419 67 107
25 - 29 13,572 10,904 1,481 56 109
30 - 34 13,464 11,725 1,265 43 94
35 - 39 13,122 11,683 809 44 62
40 - 44 12,480 11,239 342 13 27
45 - 49 11,411 10,342 57 3 5
Total fertility rate 2.18
Table F-2: Women in conventional households aged 15 - 49 by number of live births in the last 12 months for ever-married women and number of those newly borns who have died, by age of mother
114
Myanmar Population and Housing Census,
Census Report Volume 3-K (Rakhine)
Series G: Identity Cards
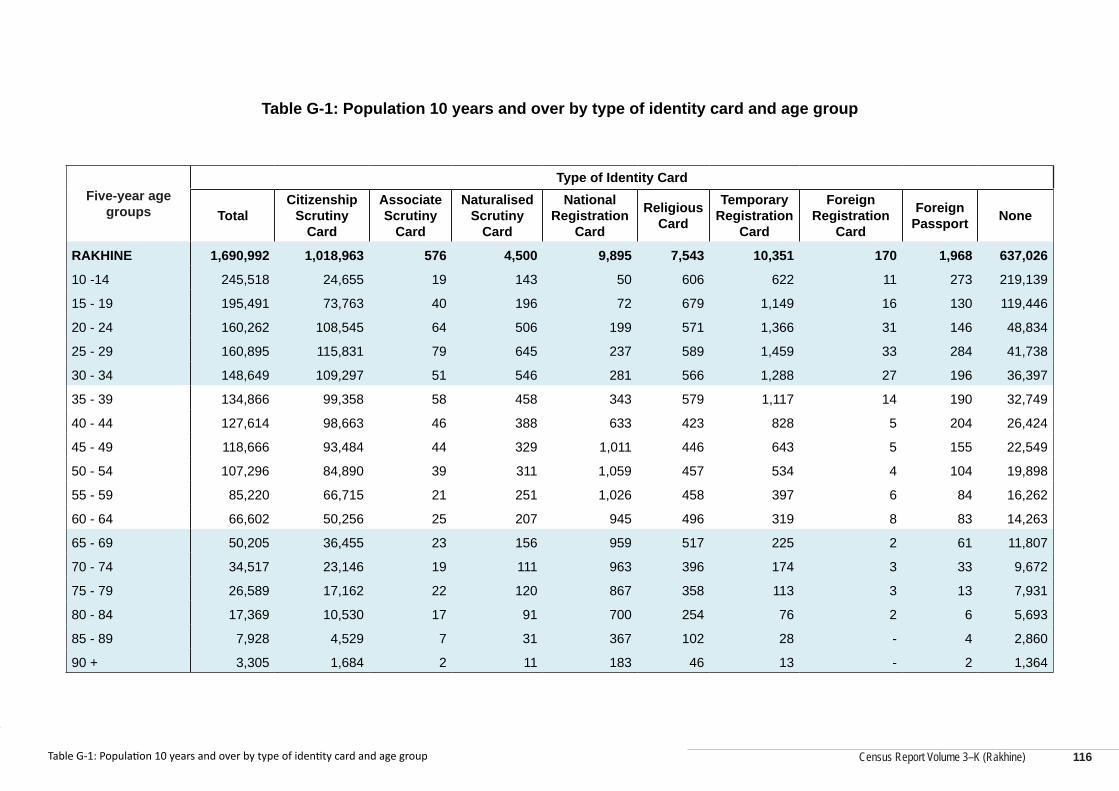
Census Report Volume 3–K (Rakhine)
Census Report Volume 3–K (Rakhine)
Table G-1: Population 10 years and over by type of identity card and age group
Five-year age groups
Type of Identity Card
TotalCitizenship
Scrutiny Card
Associate Scrutiny
Card
Naturalised Scrutiny
Card
National Registration
Card
Religious Card
Temporary Registration
Card
Foreign Registration
Card
Foreign Passport None
RAKHINE 1,690,992 1,018,963 576 4,500 9,895 7,543 10,351 170 1,968 637,026
10 -14 245,518 24,655 19 143 50 606 622 11 273 219,139
15 - 19 195,491 73,763 40 196 72 679 1,149 16 130 119,446
20 - 24 160,262 108,545 64 506 199 571 1,366 31 146 48,834
25 - 29 160,895 115,831 79 645 237 589 1,459 33 284 41,738
30 - 34 148,649 109,297 51 546 281 566 1,288 27 196 36,397
35 - 39 134,866 99,358 58 458 343 579 1,117 14 190 32,749
40 - 44 127,614 98,663 46 388 633 423 828 5 204 26,424
45 - 49 118,666 93,484 44 329 1,011 446 643 5 155 22,549
50 - 54 107,296 84,890 39 311 1,059 457 534 4 104 19,898
55 - 59 85,220 66,715 21 251 1,026 458 397 6 84 16,262
60 - 64 66,602 50,256 25 207 945 496 319 8 83 14,263
65 - 69 50,205 36,455 23 156 959 517 225 2 61 11,807
70 - 74 34,517 23,146 19 111 963 396 174 3 33 9,672
75 - 79 26,589 17,162 22 120 867 358 113 3 13 7,931
80 - 84 17,369 10,530 17 91 700 254 76 2 6 5,693
85 - 89 7,928 4,529 7 31 367 102 28 - 4 2,860
90 + 3,305 1,684 2 11 183 46 13 - 2 1,364
Table G-1: Population 10 years and over by type of identity card and age group 116
Census Report Volume 3–K (Rakhine)
Table G-2: Population 10 years and over by type of identity card and Urban/Rural
Type of Identity Card
TotalCitizenship
Scrutiny Card
Associate Scrutiny
Card
Naturalised Scrutiny
Card
National Registration
Card
Religious Card
Temporary Registration
Card
Foreign Registration
Card
Foreign Passport None
RAKHINE 1,690,992 1,018,963 576 4,500 9,895 7,543 10,351 170 1,968 637,026
Urban 298,344 212,641 118 2,127 1,580 2,629 3,099 81 249 75,820
Rural 1,392,648 806,322 458 2,373 8,315 4,914 7,252 89 1,719 561,206
SITTWAY 431,880 247,086 172 1,164 1,848 2,273 2,022 22 305 176,988
Urban 113,463 77,027 46 886 731 1,187 1,133 17 170 32,266
Rural 318,417 170,059 126 278 1,117 1,086 889 5 135 144,722
Sittway 124,375 80,454 57 908 1,036 1,121 1,376 18 194 39,211
Urban 86,228 57,460 39 820 686 1,036 1,084 16 166 24,921
Rural 38,147 22,994 18 88 350 85 292 2 28 14,290
Ponnagyun 103,376 60,427 24 77 201 383 242 2 30 41,990
Urban 10,611 7,624 4 48 19 46 27 1 - 2,842
Rural 92,765 52,803 20 29 182 337 215 1 30 39,148
Pauktaw 115,547 55,369 55 91 274 406 128 - 45 59,179
Urban 10,472 7,417 2 5 8 56 5 - 2 2,977
Rural 105,075 47,952 53 86 266 350 123 - 43 56,202
Yathedaung 88,582 50,836 36 88 337 363 276 2 36 36,608
Urban 6,152 4,526 1 13 18 49 17 - 2 1,526
Rural 82,430 46,310 35 75 319 314 259 2 34 35,082
MYAUK U 529,977 298,122 142 550 1,108 2,423 1,786 5 204 225,637
Urban 74,363 51,405 19 137 147 855 814 - 41 20,945
Rural 455,614 246,717 123 413 961 1,568 972 5 163 204,692
Table G-2: Population 10 years and over by type of identity card and Urban/Rural 117
Census Report Volume 3–K (Rakhine)
Census Report Volume 3–K (Rakhine)
Type of Identity Card
TotalCitizenship
Scrutiny Card
Associate Scrutiny
Card
Naturalised Scrutiny
Card
National Registration
Card
Religious Card
Temporary Registration
Card
Foreign Registration
Card
Foreign Passport None
Myauk U 151,799 89,540 41 46 330 838 316 2 69 60,617
Urban 29,847 21,018 11 16 31 361 52 - 30 8,328
Rural 121,952 68,522 30 30 299 477 264 2 39 52,289
Kyauktaw 138,340 81,016 32 306 265 610 160 1 67 55,883
Urban 16,334 12,379 3 59 13 128 18 - 7 3,727
Rural 122,006 68,637 29 247 252 482 142 1 60 52,156
Minbya 133,596 72,697 35 70 148 686 345 1 35 59,579
Urban 19,035 12,641 4 40 13 312 77 - 2 5,946
Rural 114,561 60,056 31 30 135 374 268 1 33 53,633
Myebon 106,242 54,869 34 128 365 289 965 1 33 49,558
Urban 9,147 5,367 1 22 90 54 667 - 2 2,944
Rural 97,095 49,502 33 106 275 235 298 1 31 46,614
MAUNGTAW 74,899 46,023 37 2,126 293 334 2,689 101 42 23,254
Urban 18,271 12,912 17 1,001 43 151 534 38 13 3,562
Rural 56,628 33,111 20 1,125 250 183 2,155 63 29 19,692
Maungtaw 30,102 18,924 21 1,645 201 138 1,196 10 23 7,944
Urban 9,808 7,082 14 567 23 72 178 1 7 1,864
Rural 20,294 11,842 7 1,078 178 66 1,018 9 16 6,080
Buthidaung 42,894 26,091 16 455 85 195 1,241 64 19 14,728
Urban 7,924 5,565 3 420 18 79 219 10 6 1,604
Rural 34,970 20,526 13 35 67 116 1,022 54 13 13,124
Taungpyoletwe(Sub-TSP) 1,903 1,008 - 26 7 1 252 27 - 582
Urban 539 265 - 14 2 - 137 27 - 94
Rural 1,364 743 - 12 5 1 115 - - 488
Table G-2: Population 10 years and over by type of identity card and Urban/Rural 118
Census Report Volume 3–K (Rakhine)
Type of Identity Card
TotalCitizenship
Scrutiny Card
Associate Scrutiny
Card
Naturalised Scrutiny
Card
National Registration
Card
Religious Card
Temporary Registration
Card
Foreign Registration
Card
Foreign Passport None
KYAUKPYU 355,795 227,541 124 252 2,267 1,404 1,149 9 858 122,191
Urban 37,823 30,090 16 31 62 211 114 7 15 7,277
Rural 317,972 197,451 108 221 2,205 1,193 1,035 2 843 114,914
Kyaukpyu 133,678 80,200 50 112 658 532 389 7 679 51,051
Urban 18,107 14,109 7 26 40 102 97 7 10 3,709
Rural 115,571 66,091 43 86 618 430 292 - 669 47,342
Mannaung 48,851 40,130 15 41 164 217 172 - 4 8,108
Urban 4,515 4,007 1 1 6 21 - - 2 477
Rural 44,336 36,123 14 40 158 196 172 - 2 7,631
Yanbye 80,114 52,574 16 47 1,254 400 359 - 21 25,443
Urban 8,310 6,238 1 2 15 38 4 - - 2,012
Rural 71,804 46,336 15 45 1,239 362 355 - 21 23,431
An 93,152 54,637 43 52 191 255 229 2 154 37,589
Urban 6,891 5,736 7 2 1 50 13 - 3 1,079
Rural 86,261 48,901 36 50 190 205 216 2 151 36,510
THANDWE 298,441 200,191 101 408 4,379 1,109 2,705 33 559 88,956
Urban 54,424 41,207 20 72 597 225 504 19 10 11,770
Rural 244,017 158,984 81 336 3,782 884 2,201 14 549 77,186
Thandwe 113,523 76,978 32 213 3,377 468 1,727 6 471 30,251
Urban 12,610 9,305 5 38 466 50 421 - 1 2,324
Rural 100,913 67,673 27 175 2,911 418 1,306 6 470 27,927
Taungup 93,903 64,190 37 66 329 323 434 19 21 28,484
Urban 24,359 19,472 4 22 57 115 39 18 6 4,626
Rural 69,544 44,718 33 44 272 208 395 1 15 23,858
Table G-2: Population 10 years and over by type of identity card and Urban/Rural 119
Census Report Volume 3–K (Rakhine)
Census Report Volume 3–K (Rakhine)
Type of Identity Card
TotalCitizenship
Scrutiny Card
Associate Scrutiny
Card
Naturalised Scrutiny
Card
National Registration
Card
Religious Card
Temporary Registration
Card
Foreign Registration
Card
Foreign Passport None
Gwa 35,836 25,941 6 70 298 133 384 3 27 8,974
Urban 8,041 6,158 2 6 31 27 17 - 2 1,798
Rural 27,795 19,783 4 64 267 106 367 3 25 7,176
Maei(Sub-Tsp) 34,866 18,088 21 36 136 110 75 3 39 16,358
Urban 4,360 2,411 6 3 15 13 13 - 1 1,898
Rural 30,506 15,677 15 33 121 97 62 3 38 14,460
Kyeintali(Sub-Tsp) 20,313 14,994 5 23 239 75 85 2 1 4,889
Urban 5,054 3,861 3 3 28 20 14 1 - 1,124
Rural 15,259 11,133 2 20 211 55 71 1 1 3,765
Table G-2: Population 10 years and over by type of identity card and Urban/Rural 120
Myanmar Population and Housing Census,
Census Report Volume 3-K (Rakhine)
Series H: Disability
Census Report Volume 3–K (Rakhine)
Census Report Volume 3–K (Rakhine)
Table H-1: Population in conventional households and institutions by disability prevalence rate, type of disability, sex and age group
Five-year age groups
Total population With some degree of disability
Total Not disabled With any of 4 disabilities
Disability prevalence
rate (%)Seeing Hearing Walking Remembering
RAKHINE
Both sexes 2,098,807 1,986,628 112,179 5.3 65,576 40,660 49,980 54,550
0 - 4 179,087 173,289 5,798 3.2 747 850 4,376 4,845
5 - 9 228,728 225,990 2,738 1.2 455 548 1,257 1,846
10 -14 245,518 242,797 2,721 1.1 626 696 932 1,557
15 - 19 195,491 193,143 2,348 1.2 619 606 820 1,237
20 - 24 160,262 157,966 2,296 1.4 509 526 906 1,102
25 - 29 160,895 158,284 2,611 1.6 631 664 920 1,175
30 - 34 148,649 145,719 2,930 2.0 842 716 941 1,261
35 - 39 134,866 131,492 3,374 2.5 1,166 809 1,009 1,328
40 - 44 127,614 122,572 5,042 4.0 2,546 984 1,310 1,713
45 - 49 118,666 111,736 6,930 5.8 4,195 1,287 1,666 2,161
50 - 54 107,296 98,113 9,183 8.6 5,951 2,053 2,482 3,021
55 - 59 85,220 75,306 9,914 11.6 6,645 2,618 3,018 3,434
60 - 64 66,602 55,383 11,219 16.8 7,768 3,820 4,221 4,532
65 - 69 50,205 38,955 11,250 22.4 8,005 4,560 4,940 5,009
70 - 74 34,517 23,714 10,803 31.3 7,877 5,430 5,622 5,647
75 - 79 26,589 16,787 9,802 36.9 7,207 5,629 5,911 5,712
80 - 84 17,369 9,664 7,705 44.4 5,714 4,978 5,355 5,081
85 - 89 7,928 4,192 3,736 47.1 2,750 2,580 2,819 2,549
90 + 3,305 1,526 1,779 53.8 1,323 1,306 1,475 1,340
Table H-1: Population in conventional households and institutions by disability prevalence rate, type of disability, sex and age group
122
Census Report Volume 3–K (Rakhine)
Five-year age groups
Total population With some degree of disability
Total Not disabled With any of 4 disabilities
Disability prevalence
rate (%)Seeing Hearing Walking Remembering
Male 989,702 939,216 50,486 5.1 28,205 17,083 21,802 23,644
0 - 4 90,629 87,626 3,003 3.3 390 447 2,259 2,509
5 - 9 116,211 114,739 1,472 1.3 258 304 684 973
10 -14 124,154 122,669 1,485 1.2 335 363 503 849
15 - 19 93,828 92,562 1,266 1.3 311 330 439 675
20 - 24 70,599 69,459 1,140 1.6 222 266 457 552
25 - 29 71,507 70,246 1,261 1.8 274 322 468 587
30 - 34 67,652 66,225 1,427 2.1 382 340 523 620
35 - 39 62,476 60,867 1,609 2.6 504 355 549 625
40 - 44 57,881 55,656 2,225 3.8 1,031 410 657 747
45 - 49 55,017 51,783 3,234 5.9 1,928 554 815 947
50 - 54 49,600 45,330 4,270 8.6 2,746 856 1,146 1,253
55 - 59 39,655 35,117 4,538 11.4 3,009 1,116 1,337 1,476
60 - 64 30,409 25,484 4,925 16.2 3,393 1,616 1,733 1,800
65 - 69 22,452 17,571 4,881 21.7 3,409 1,862 2,062 2,044
70 - 74 15,091 10,472 4,619 30.6 3,323 2,212 2,283 2,325
75 - 79 11,592 7,413 4,179 36.1 3,028 2,359 2,404 2,343
80 - 84 6,965 3,961 3,004 43.1 2,204 1,975 2,015 1,937
85 - 89 2,908 1,539 1,369 47.1 1,031 967 994 935
90 + 1,076 497 579 53.8 427 429 474 447
Table H-1: Population in conventional households and institutions by disability prevalence rate, type of disability, sex and age group
123
Census Report Volume 3–K (Rakhine)
Census Report Volume 3–K (Rakhine)
Five-year age groups
Total population With some degree of disability
Total Not disabled With any of 4 disabilities
Disability prevalence
rate (%)Seeing Hearing Walking Remembering
Female 1,109,105 1,047,412 61,693 5.6 37,371 23,577 28,178 30,906
0 - 4 88,458 85,663 2,795 3.2 357 403 2,117 2,336
5 - 9 112,517 111,251 1,266 1.1 197 244 573 873
10 -14 121,364 120,128 1,236 1.0 291 333 429 708
15 - 19 101,663 100,581 1,082 1.1 308 276 381 562
20 - 24 89,663 88,507 1,156 1.3 287 260 449 550
25 - 29 89,388 88,038 1,350 1.5 357 342 452 588
30 - 34 80,997 79,494 1,503 1.9 460 376 418 641
35 - 39 72,390 70,625 1,765 2.4 662 454 460 703
40 - 44 69,733 66,916 2,817 4.0 1,515 574 653 966
45 - 49 63,649 59,953 3,696 5.8 2,267 733 851 1,214
50 - 54 57,696 52,783 4,913 8.5 3,205 1,197 1,336 1,768
55 - 59 45,565 40,189 5,376 11.8 3,636 1,502 1,681 1,958
60 - 64 36,193 29,899 6,294 17.4 4,375 2,204 2,488 2,732
65 - 69 27,753 21,384 6,369 22.9 4,596 2,698 2,878 2,965
70 - 74 19,426 13,242 6,184 31.8 4,554 3,218 3,339 3,322
75 - 79 14,997 9,374 5,623 37.5 4,179 3,270 3,507 3,369
80 - 84 10,404 5,703 4,701 45.2 3,510 3,003 3,340 3,144
85 - 89 5,020 2,653 2,367 47.2 1,719 1,613 1,825 1,614
90 + 2,229 1,029 1,200 53.8 896 877 1,001 893
Table H-1: Population in conventional households and institutions by disability prevalence rate, type of disability, sex and age group
124
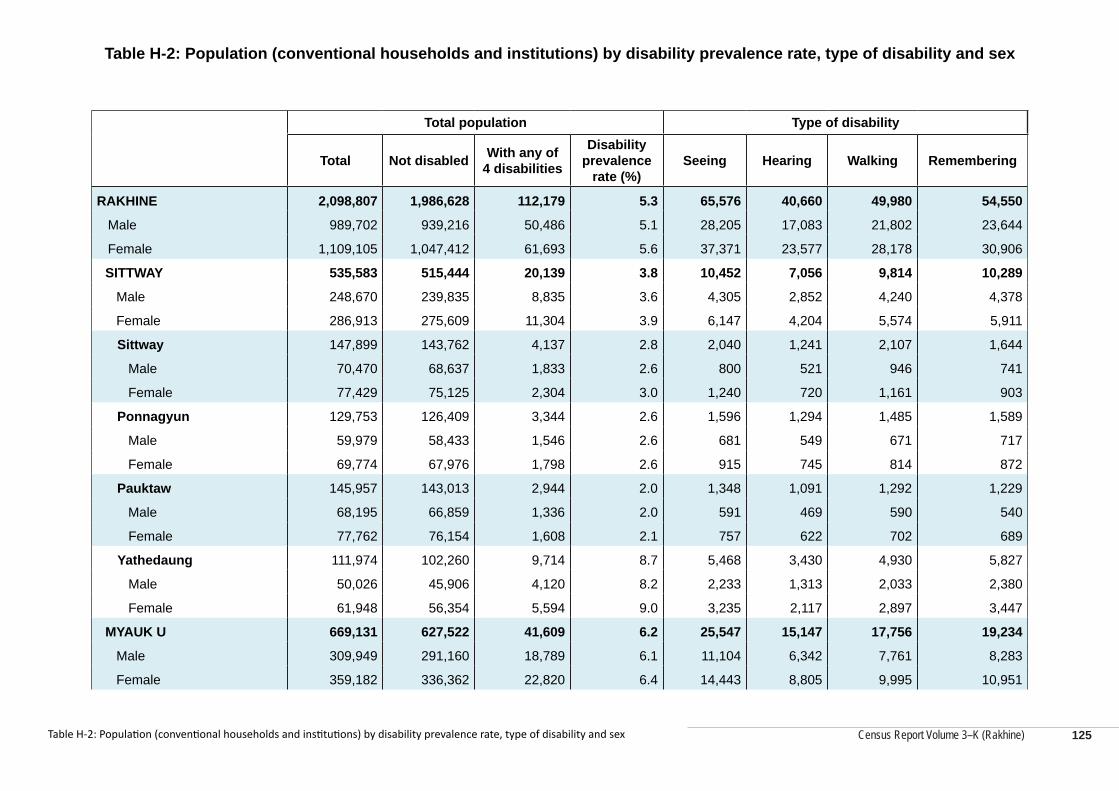
Census Report Volume 3–K (Rakhine)
Table H-2: Population (conventional households and institutions) by disability prevalence rate, type of disability and sex
Total population Type of disability
Total Not disabled With any of 4 disabilities
Disability prevalence
rate (%)Seeing Hearing Walking Remembering
RAKHINE 2,098,807 1,986,628 112,179 5.3 65,576 40,660 49,980 54,550
Male 989,702 939,216 50,486 5.1 28,205 17,083 21,802 23,644
Female 1,109,105 1,047,412 61,693 5.6 37,371 23,577 28,178 30,906
SITTWAY 535,583 515,444 20,139 3.8 10,452 7,056 9,814 10,289
Male 248,670 239,835 8,835 3.6 4,305 2,852 4,240 4,378
Female 286,913 275,609 11,304 3.9 6,147 4,204 5,574 5,911
Sittway 147,899 143,762 4,137 2.8 2,040 1,241 2,107 1,644
Male 70,470 68,637 1,833 2.6 800 521 946 741
Female 77,429 75,125 2,304 3.0 1,240 720 1,161 903
Ponnagyun 129,753 126,409 3,344 2.6 1,596 1,294 1,485 1,589
Male 59,979 58,433 1,546 2.6 681 549 671 717
Female 69,774 67,976 1,798 2.6 915 745 814 872
Pauktaw 145,957 143,013 2,944 2.0 1,348 1,091 1,292 1,229
Male 68,195 66,859 1,336 2.0 591 469 590 540
Female 77,762 76,154 1,608 2.1 757 622 702 689
Yathedaung 111,974 102,260 9,714 8.7 5,468 3,430 4,930 5,827
Male 50,026 45,906 4,120 8.2 2,233 1,313 2,033 2,380
Female 61,948 56,354 5,594 9.0 3,235 2,117 2,897 3,447
MYAUK U 669,131 627,522 41,609 6.2 25,547 15,147 17,756 19,234
Male 309,949 291,160 18,789 6.1 11,104 6,342 7,761 8,283
Female 359,182 336,362 22,820 6.4 14,443 8,805 9,995 10,951
Table H-2: Population (conventional households and institutions) by disability prevalence rate, type of disability and sex 125
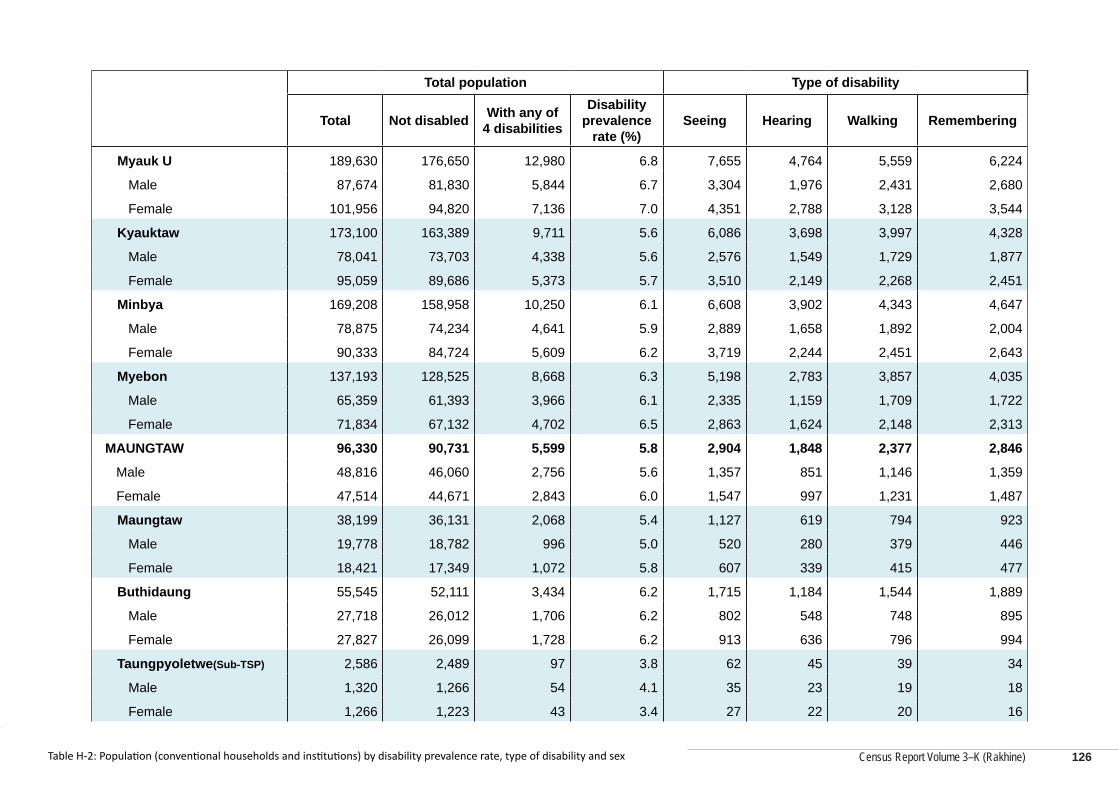
Census Report Volume 3–K (Rakhine)
Census Report Volume 3–K (Rakhine)
Total population Type of disability
Total Not disabled With any of 4 disabilities
Disability prevalence
rate (%)Seeing Hearing Walking Remembering
Myauk U 189,630 176,650 12,980 6.8 7,655 4,764 5,559 6,224
Male 87,674 81,830 5,844 6.7 3,304 1,976 2,431 2,680
Female 101,956 94,820 7,136 7.0 4,351 2,788 3,128 3,544
Kyauktaw 173,100 163,389 9,711 5.6 6,086 3,698 3,997 4,328
Male 78,041 73,703 4,338 5.6 2,576 1,549 1,729 1,877
Female 95,059 89,686 5,373 5.7 3,510 2,149 2,268 2,451
Minbya 169,208 158,958 10,250 6.1 6,608 3,902 4,343 4,647
Male 78,875 74,234 4,641 5.9 2,889 1,658 1,892 2,004
Female 90,333 84,724 5,609 6.2 3,719 2,244 2,451 2,643
Myebon 137,193 128,525 8,668 6.3 5,198 2,783 3,857 4,035
Male 65,359 61,393 3,966 6.1 2,335 1,159 1,709 1,722
Female 71,834 67,132 4,702 6.5 2,863 1,624 2,148 2,313
MAUNGTAW 96,330 90,731 5,599 5.8 2,904 1,848 2,377 2,846
Male 48,816 46,060 2,756 5.6 1,357 851 1,146 1,359
Female 47,514 44,671 2,843 6.0 1,547 997 1,231 1,487
Maungtaw 38,199 36,131 2,068 5.4 1,127 619 794 923
Male 19,778 18,782 996 5.0 520 280 379 446
Female 18,421 17,349 1,072 5.8 607 339 415 477
Buthidaung 55,545 52,111 3,434 6.2 1,715 1,184 1,544 1,889
Male 27,718 26,012 1,706 6.2 802 548 748 895
Female 27,827 26,099 1,728 6.2 913 636 796 994
Taungpyoletwe(Sub-TSP) 2,586 2,489 97 3.8 62 45 39 34
Male 1,320 1,266 54 4.1 35 23 19 18
Female 1,266 1,223 43 3.4 27 22 20 16
Table H-2: Population (conventional households and institutions) by disability prevalence rate, type of disability and sex 126
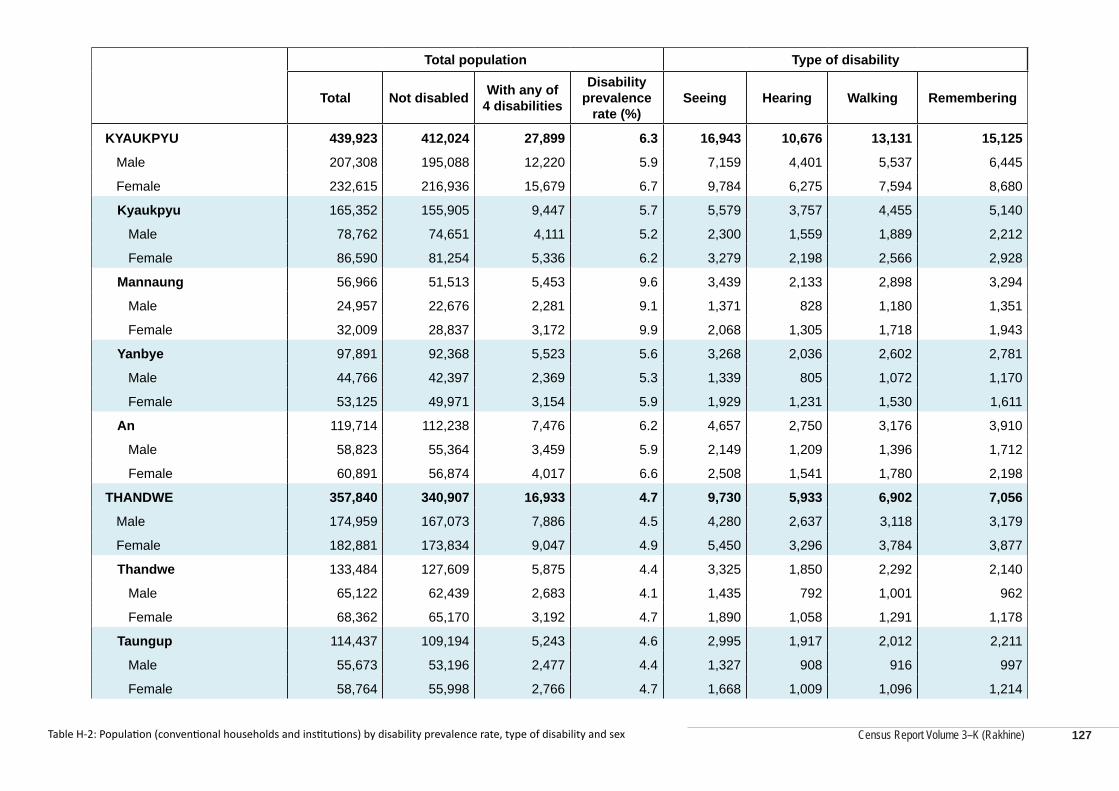
Census Report Volume 3–K (Rakhine)
Total population Type of disability
Total Not disabled With any of 4 disabilities
Disability prevalence
rate (%)Seeing Hearing Walking Remembering
KYAUKPYU 439,923 412,024 27,899 6.3 16,943 10,676 13,131 15,125
Male 207,308 195,088 12,220 5.9 7,159 4,401 5,537 6,445
Female 232,615 216,936 15,679 6.7 9,784 6,275 7,594 8,680
Kyaukpyu 165,352 155,905 9,447 5.7 5,579 3,757 4,455 5,140
Male 78,762 74,651 4,111 5.2 2,300 1,559 1,889 2,212
Female 86,590 81,254 5,336 6.2 3,279 2,198 2,566 2,928
Mannaung 56,966 51,513 5,453 9.6 3,439 2,133 2,898 3,294
Male 24,957 22,676 2,281 9.1 1,371 828 1,180 1,351
Female 32,009 28,837 3,172 9.9 2,068 1,305 1,718 1,943
Yanbye 97,891 92,368 5,523 5.6 3,268 2,036 2,602 2,781
Male 44,766 42,397 2,369 5.3 1,339 805 1,072 1,170
Female 53,125 49,971 3,154 5.9 1,929 1,231 1,530 1,611
An 119,714 112,238 7,476 6.2 4,657 2,750 3,176 3,910
Male 58,823 55,364 3,459 5.9 2,149 1,209 1,396 1,712
Female 60,891 56,874 4,017 6.6 2,508 1,541 1,780 2,198
THANDWE 357,840 340,907 16,933 4.7 9,730 5,933 6,902 7,056
Male 174,959 167,073 7,886 4.5 4,280 2,637 3,118 3,179
Female 182,881 173,834 9,047 4.9 5,450 3,296 3,784 3,877
Thandwe 133,484 127,609 5,875 4.4 3,325 1,850 2,292 2,140
Male 65,122 62,439 2,683 4.1 1,435 792 1,001 962
Female 68,362 65,170 3,192 4.7 1,890 1,058 1,291 1,178
Taungup 114,437 109,194 5,243 4.6 2,995 1,917 2,012 2,211
Male 55,673 53,196 2,477 4.4 1,327 908 916 997
Female 58,764 55,998 2,766 4.7 1,668 1,009 1,096 1,214
Table H-2: Population (conventional households and institutions) by disability prevalence rate, type of disability and sex 127
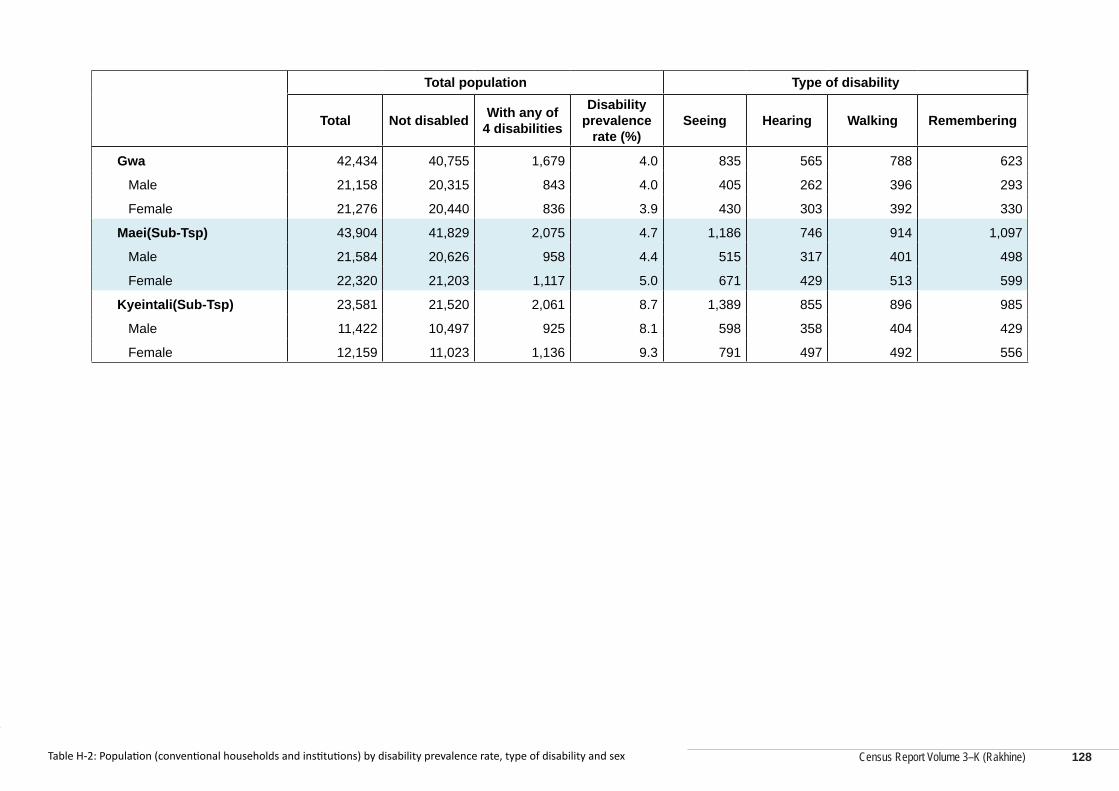
Census Report Volume 3–K (Rakhine)
Census Report Volume 3–K (Rakhine)
Total population Type of disability
Total Not disabled With any of 4 disabilities
Disability prevalence
rate (%)Seeing Hearing Walking Remembering
Gwa 42,434 40,755 1,679 4.0 835 565 788 623
Male 21,158 20,315 843 4.0 405 262 396 293
Female 21,276 20,440 836 3.9 430 303 392 330
Maei(Sub-Tsp) 43,904 41,829 2,075 4.7 1,186 746 914 1,097
Male 21,584 20,626 958 4.4 515 317 401 498
Female 22,320 21,203 1,117 5.0 671 429 513 599
Kyeintali(Sub-Tsp) 23,581 21,520 2,061 8.7 1,389 855 896 985
Male 11,422 10,497 925 8.1 598 358 404 429
Female 12,159 11,023 1,136 9.3 791 497 492 556
Table H-2: Population (conventional households and institutions) by disability prevalence rate, type of disability and sex 128
Census Report Volume 3–K (Rakhine)
Myanmar Population and Housing Census,
Census Report Volume 3-K (Rakhine)
Series I: Housing Conditions
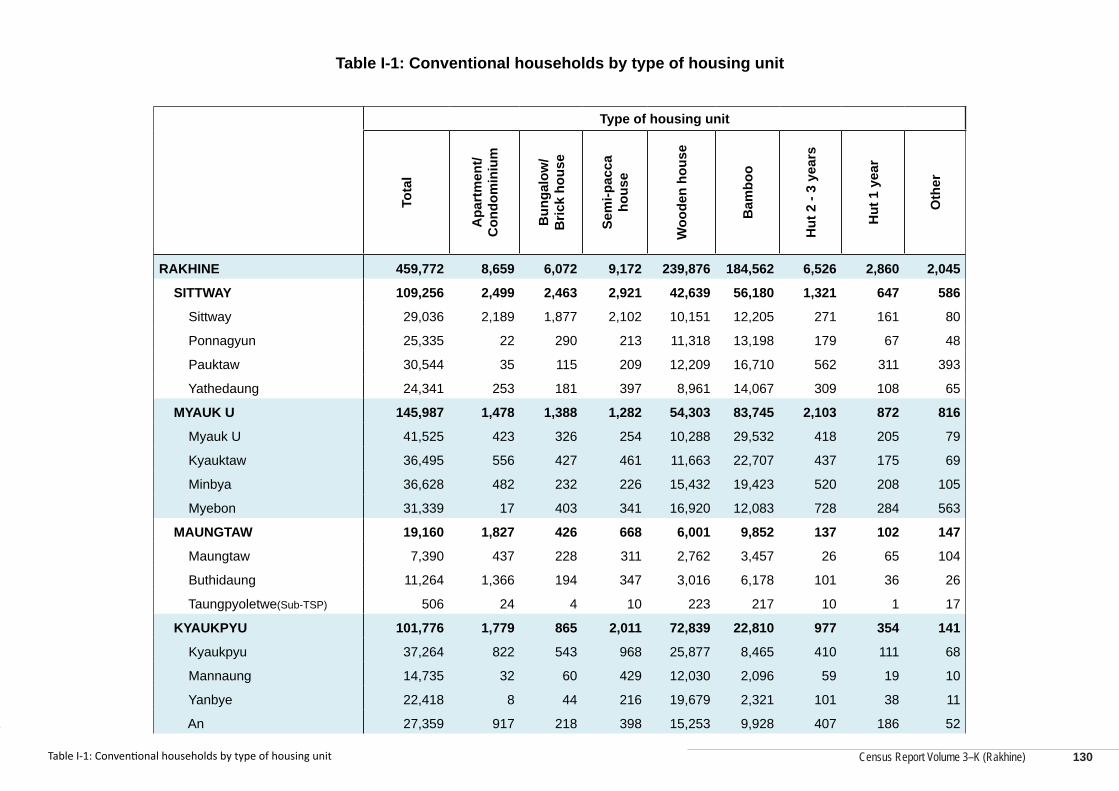
Census Report Volume 3–K (Rakhine)
Census Report Volume 3–K (Rakhine)
Table I-1: Conventional households by type of housing unit
Type of housing unit
Tota
l
Apa
rtm
ent/
Con
dom
iniu
m
Bun
galo
w/
Bric
k ho
use
Sem
i-pac
ca
hous
e
Woo
den
hous
e
Bam
boo
Hut
2 -
3 ye
ars
Hut
1 y
ear
Oth
er
RAKHINE 459,772 8,659 6,072 9,172 239,876 184,562 6,526 2,860 2,045
SITTWAY 109,256 2,499 2,463 2,921 42,639 56,180 1,321 647 586
Sittway 29,036 2,189 1,877 2,102 10,151 12,205 271 161 80
Ponnagyun 25,335 22 290 213 11,318 13,198 179 67 48
Pauktaw 30,544 35 115 209 12,209 16,710 562 311 393
Yathedaung 24,341 253 181 397 8,961 14,067 309 108 65
MYAUK U 145,987 1,478 1,388 1,282 54,303 83,745 2,103 872 816
Myauk U 41,525 423 326 254 10,288 29,532 418 205 79
Kyauktaw 36,495 556 427 461 11,663 22,707 437 175 69
Minbya 36,628 482 232 226 15,432 19,423 520 208 105
Myebon 31,339 17 403 341 16,920 12,083 728 284 563
MAUNGTAW 19,160 1,827 426 668 6,001 9,852 137 102 147
Maungtaw 7,390 437 228 311 2,762 3,457 26 65 104
Buthidaung 11,264 1,366 194 347 3,016 6,178 101 36 26
Taungpyoletwe(Sub-TSP) 506 24 4 10 223 217 10 1 17
KYAUKPYU 101,776 1,779 865 2,011 72,839 22,810 977 354 141
Kyaukpyu 37,264 822 543 968 25,877 8,465 410 111 68
Mannaung 14,735 32 60 429 12,030 2,096 59 19 10
Yanbye 22,418 8 44 216 19,679 2,321 101 38 11
An 27,359 917 218 398 15,253 9,928 407 186 52
Table I-1: Conventional households by type of housing unit 130
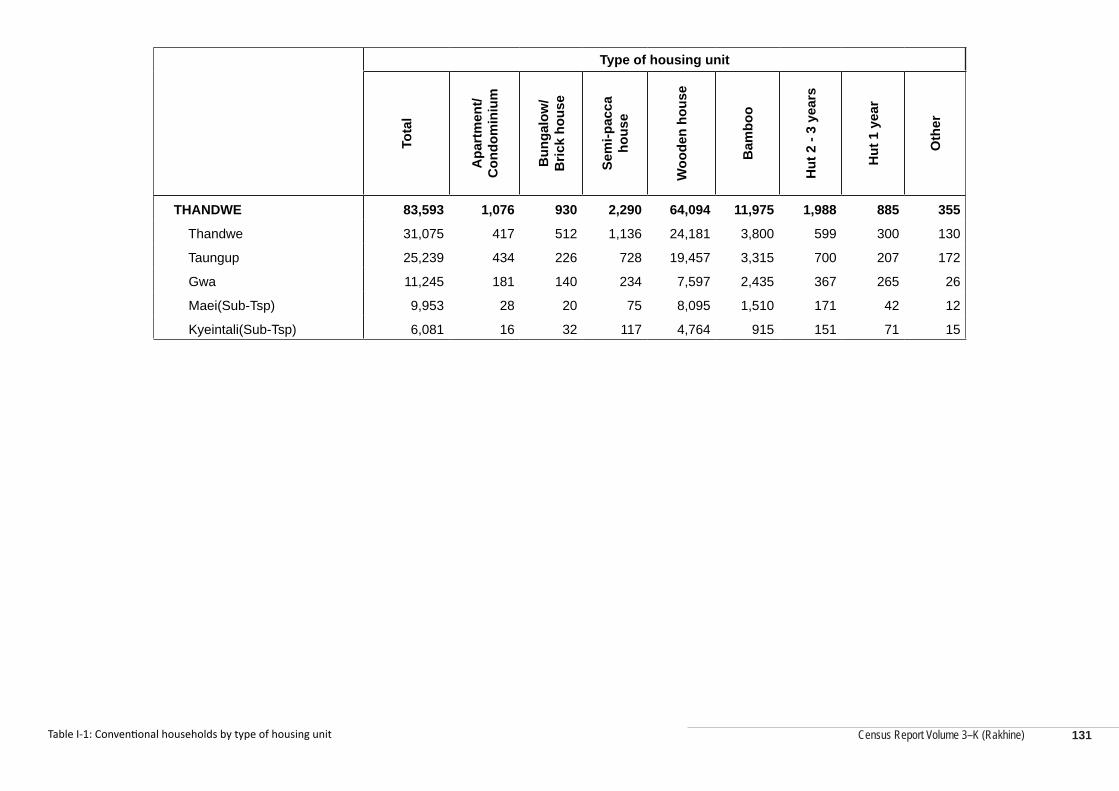
Census Report Volume 3–K (Rakhine)
Type of housing unit
Tota
l
Apa
rtm
ent/
Con
dom
iniu
m
Bun
galo
w/
Bric
k ho
use
Sem
i-pac
ca
hous
e
Woo
den
hous
e
Bam
boo
Hut
2 -
3 ye
ars
Hut
1 y
ear
Oth
er
THANDWE 83,593 1,076 930 2,290 64,094 11,975 1,988 885 355
Thandwe 31,075 417 512 1,136 24,181 3,800 599 300 130
Taungup 25,239 434 226 728 19,457 3,315 700 207 172
Gwa 11,245 181 140 234 7,597 2,435 367 265 26
Maei(Sub-Tsp) 9,953 28 20 75 8,095 1,510 171 42 12
Kyeintali(Sub-Tsp) 6,081 16 32 117 4,764 915 151 71 15
Table I-1: Conventional households by type of housing unit 131
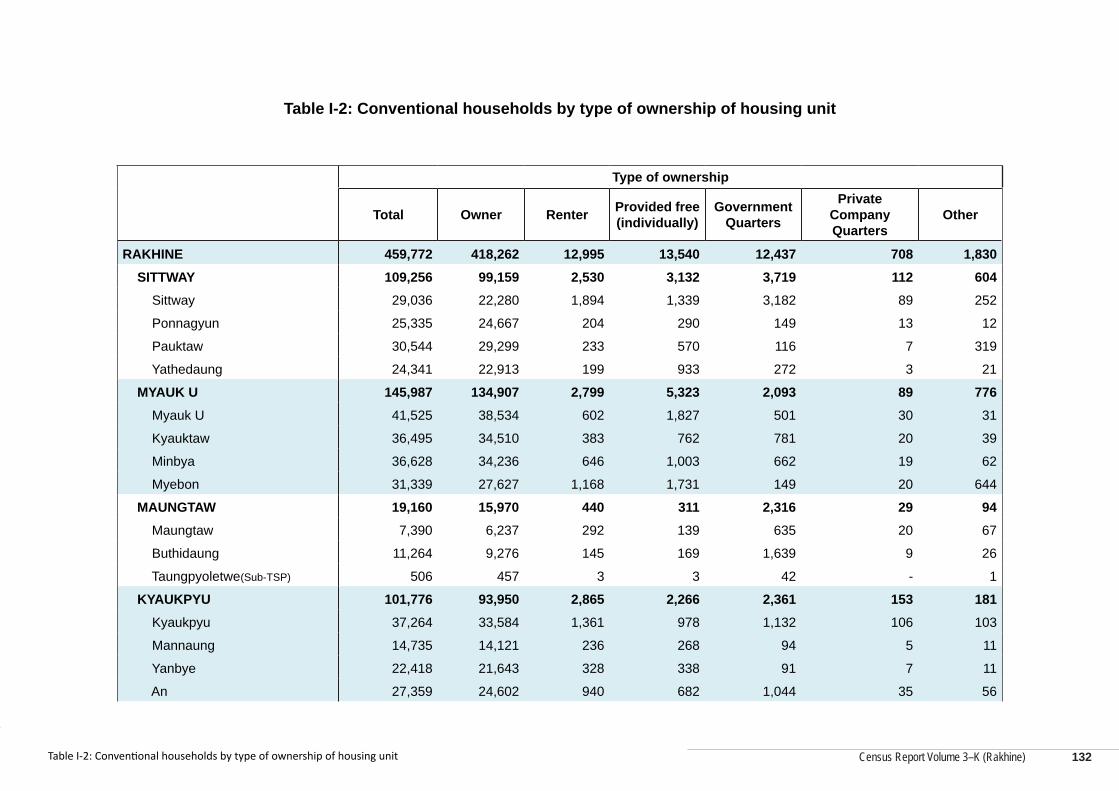
Census Report Volume 3–K (Rakhine)
Census Report Volume 3–K (Rakhine)
Table I-2: Conventional households by type of ownership of housing unit
Type of ownership
Total Owner Renter Provided free (individually)
Government Quarters
Private Company Quarters
Other
RAKHINE 459,772 418,262 12,995 13,540 12,437 708 1,830 SITTWAY 109,256 99,159 2,530 3,132 3,719 112 604 Sittway 29,036 22,280 1,894 1,339 3,182 89 252
Ponnagyun 25,335 24,667 204 290 149 13 12
Pauktaw 30,544 29,299 233 570 116 7 319
Yathedaung 24,341 22,913 199 933 272 3 21
MYAUK U 145,987 134,907 2,799 5,323 2,093 89 776 Myauk U 41,525 38,534 602 1,827 501 30 31
Kyauktaw 36,495 34,510 383 762 781 20 39
Minbya 36,628 34,236 646 1,003 662 19 62
Myebon 31,339 27,627 1,168 1,731 149 20 644
MAUNGTAW 19,160 15,970 440 311 2,316 29 94 Maungtaw 7,390 6,237 292 139 635 20 67
Buthidaung 11,264 9,276 145 169 1,639 9 26
Taungpyoletwe(Sub-TSP) 506 457 3 3 42 - 1
KYAUKPYU 101,776 93,950 2,865 2,266 2,361 153 181 Kyaukpyu 37,264 33,584 1,361 978 1,132 106 103
Mannaung 14,735 14,121 236 268 94 5 11
Yanbye 22,418 21,643 328 338 91 7 11
An 27,359 24,602 940 682 1,044 35 56
Table I-2: Conventional households by type of ownership of housing unit 132
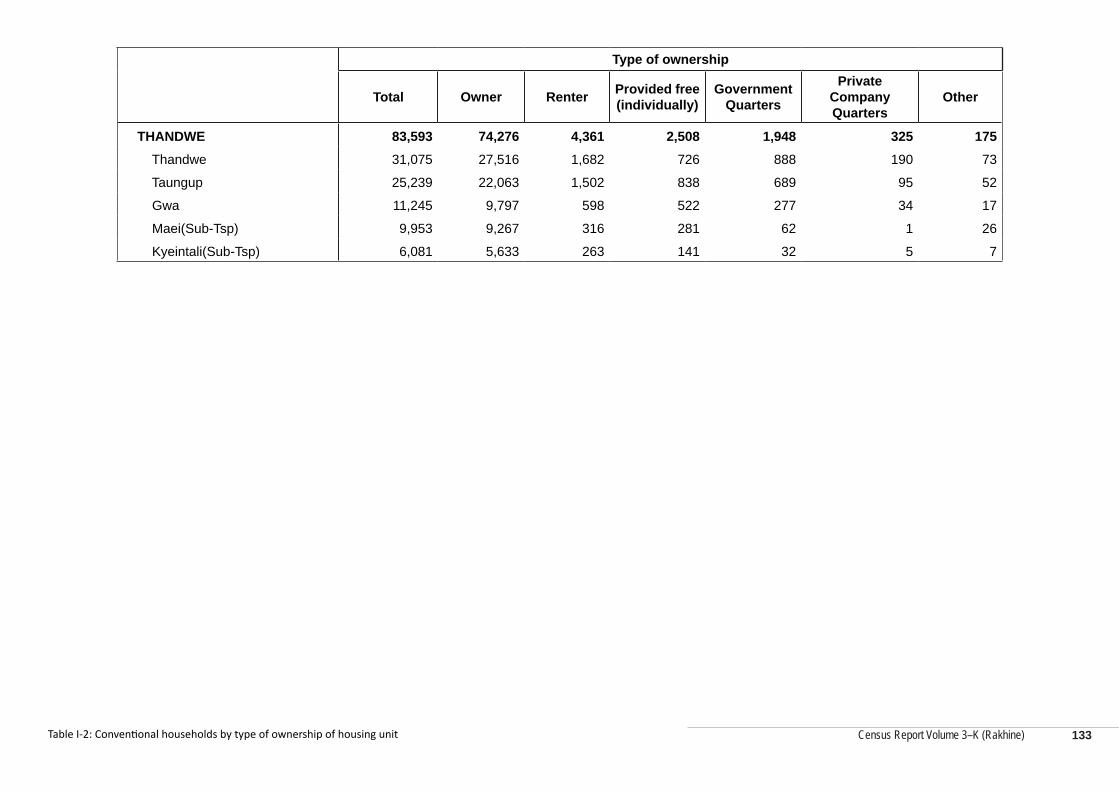
Census Report Volume 3–K (Rakhine)
Type of ownership
Total Owner Renter Provided free (individually)
Government Quarters
Private Company Quarters
Other
THANDWE 83,593 74,276 4,361 2,508 1,948 325 175 Thandwe 31,075 27,516 1,682 726 888 190 73
Taungup 25,239 22,063 1,502 838 689 95 52
Gwa 11,245 9,797 598 522 277 34 17
Maei(Sub-Tsp) 9,953 9,267 316 281 62 1 26
Kyeintali(Sub-Tsp) 6,081 5,633 263 141 32 5 7
Table I-2: Conventional households by type of ownership of housing unit 133
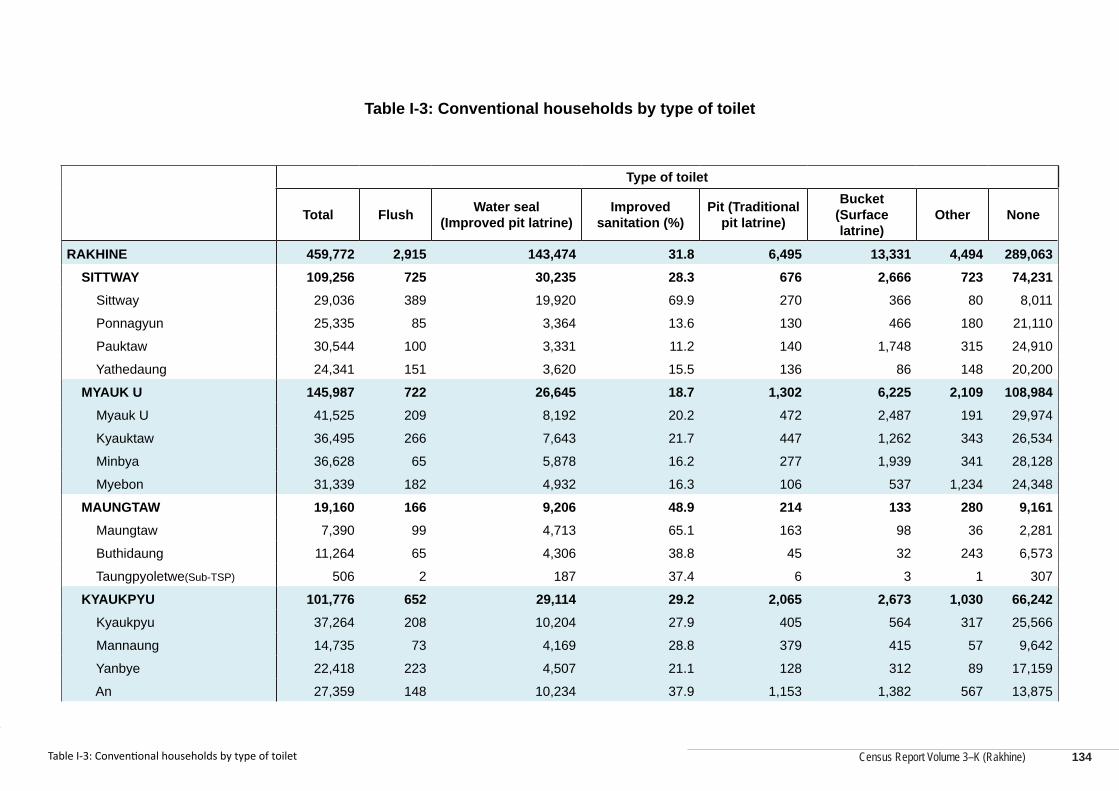
Census Report Volume 3–K (Rakhine)
Census Report Volume 3–K (Rakhine)
Table I-3: Conventional households by type of toilet
Type of toilet
Total Flush Water seal (Improved pit latrine)
Improved sanitation (%)
Pit (Traditional pit latrine)
Bucket (Surface latrine)
Other None
RAKHINE 459,772 2,915 143,474 31.8 6,495 13,331 4,494 289,063 SITTWAY 109,256 725 30,235 28.3 676 2,666 723 74,231 Sittway 29,036 389 19,920 69.9 270 366 80 8,011
Ponnagyun 25,335 85 3,364 13.6 130 466 180 21,110
Pauktaw 30,544 100 3,331 11.2 140 1,748 315 24,910
Yathedaung 24,341 151 3,620 15.5 136 86 148 20,200
MYAUK U 145,987 722 26,645 18.7 1,302 6,225 2,109 108,984 Myauk U 41,525 209 8,192 20.2 472 2,487 191 29,974
Kyauktaw 36,495 266 7,643 21.7 447 1,262 343 26,534
Minbya 36,628 65 5,878 16.2 277 1,939 341 28,128
Myebon 31,339 182 4,932 16.3 106 537 1,234 24,348
MAUNGTAW 19,160 166 9,206 48.9 214 133 280 9,161 Maungtaw 7,390 99 4,713 65.1 163 98 36 2,281
Buthidaung 11,264 65 4,306 38.8 45 32 243 6,573
Taungpyoletwe(Sub-TSP) 506 2 187 37.4 6 3 1 307
KYAUKPYU 101,776 652 29,114 29.2 2,065 2,673 1,030 66,242 Kyaukpyu 37,264 208 10,204 27.9 405 564 317 25,566
Mannaung 14,735 73 4,169 28.8 379 415 57 9,642
Yanbye 22,418 223 4,507 21.1 128 312 89 17,159
An 27,359 148 10,234 37.9 1,153 1,382 567 13,875
Table I-3: Conventional households by type of toilet 134
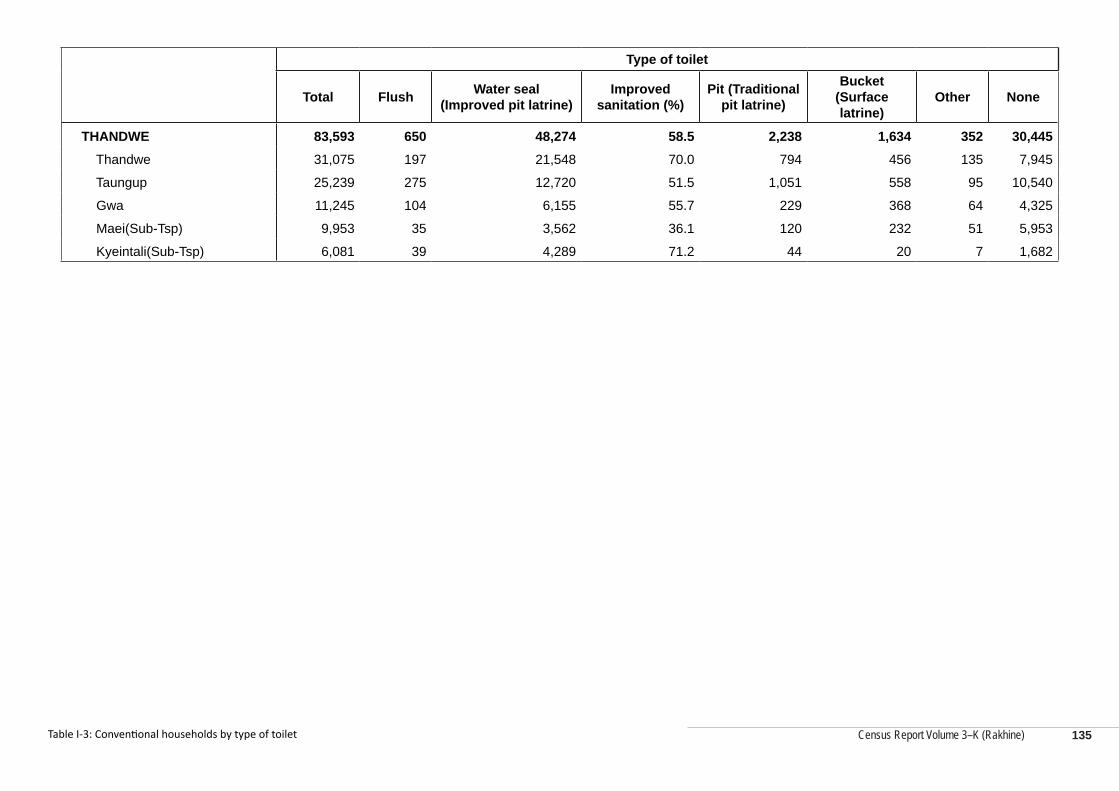
Census Report Volume 3–K (Rakhine)
Type of toilet
Total Flush Water seal (Improved pit latrine)
Improved sanitation (%)
Pit (Traditional pit latrine)
Bucket (Surface latrine)
Other None
THANDWE 83,593 650 48,274 58.5 2,238 1,634 352 30,445 Thandwe 31,075 197 21,548 70.0 794 456 135 7,945
Taungup 25,239 275 12,720 51.5 1,051 558 95 10,540
Gwa 11,245 104 6,155 55.7 229 368 64 4,325
Maei(Sub-Tsp) 9,953 35 3,562 36.1 120 232 51 5,953
Kyeintali(Sub-Tsp) 6,081 39 4,289 71.2 44 20 7 1,682
Table I-3: Conventional households by type of toilet 135
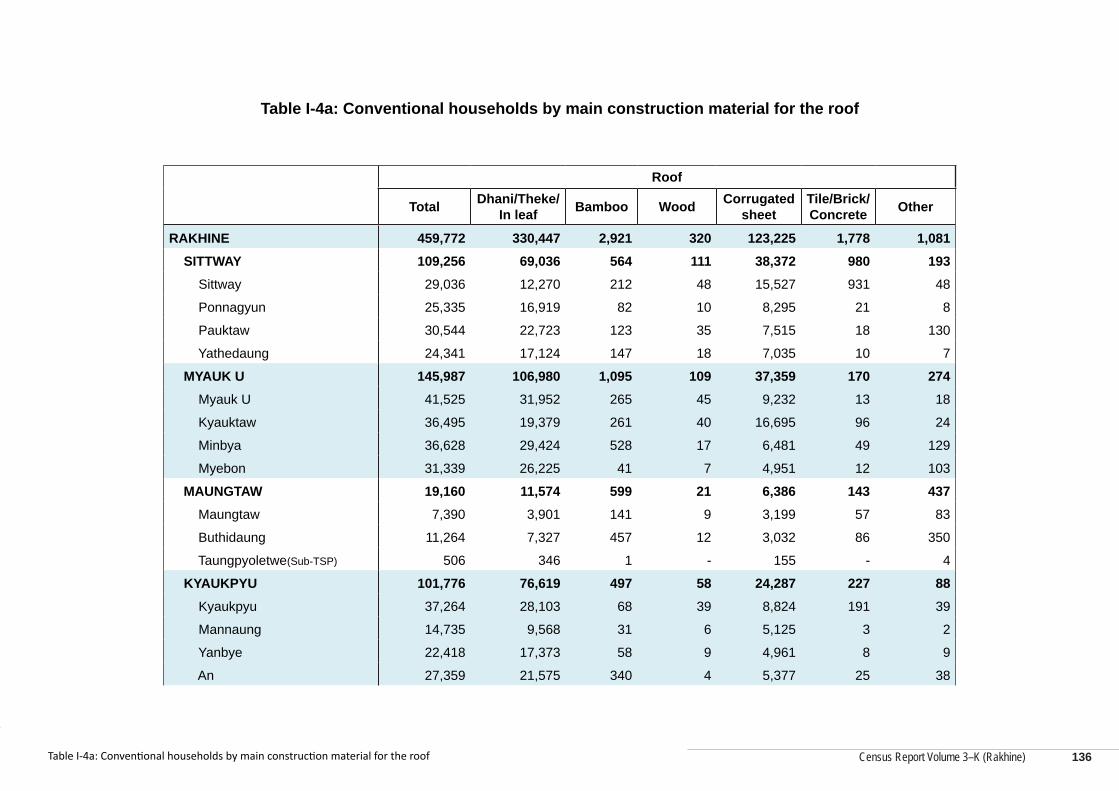
Census Report Volume 3–K (Rakhine)
Census Report Volume 3–K (Rakhine)
Table I-4a: Conventional households by main construction material for the roof
Roof
Total Dhani/Theke/ In leaf Bamboo Wood Corrugated
sheetTile/Brick/ Concrete Other
RAKHINE 459,772 330,447 2,921 320 123,225 1,778 1,081 SITTWAY 109,256 69,036 564 111 38,372 980 193 Sittway 29,036 12,270 212 48 15,527 931 48
Ponnagyun 25,335 16,919 82 10 8,295 21 8
Pauktaw 30,544 22,723 123 35 7,515 18 130
Yathedaung 24,341 17,124 147 18 7,035 10 7
MYAUK U 145,987 106,980 1,095 109 37,359 170 274 Myauk U 41,525 31,952 265 45 9,232 13 18
Kyauktaw 36,495 19,379 261 40 16,695 96 24
Minbya 36,628 29,424 528 17 6,481 49 129
Myebon 31,339 26,225 41 7 4,951 12 103
MAUNGTAW 19,160 11,574 599 21 6,386 143 437 Maungtaw 7,390 3,901 141 9 3,199 57 83
Buthidaung 11,264 7,327 457 12 3,032 86 350
Taungpyoletwe(Sub-TSP) 506 346 1 - 155 - 4
KYAUKPYU 101,776 76,619 497 58 24,287 227 88 Kyaukpyu 37,264 28,103 68 39 8,824 191 39
Mannaung 14,735 9,568 31 6 5,125 3 2
Yanbye 22,418 17,373 58 9 4,961 8 9
An 27,359 21,575 340 4 5,377 25 38
Table I-4a: Conventional households by main construction material for the roof 136
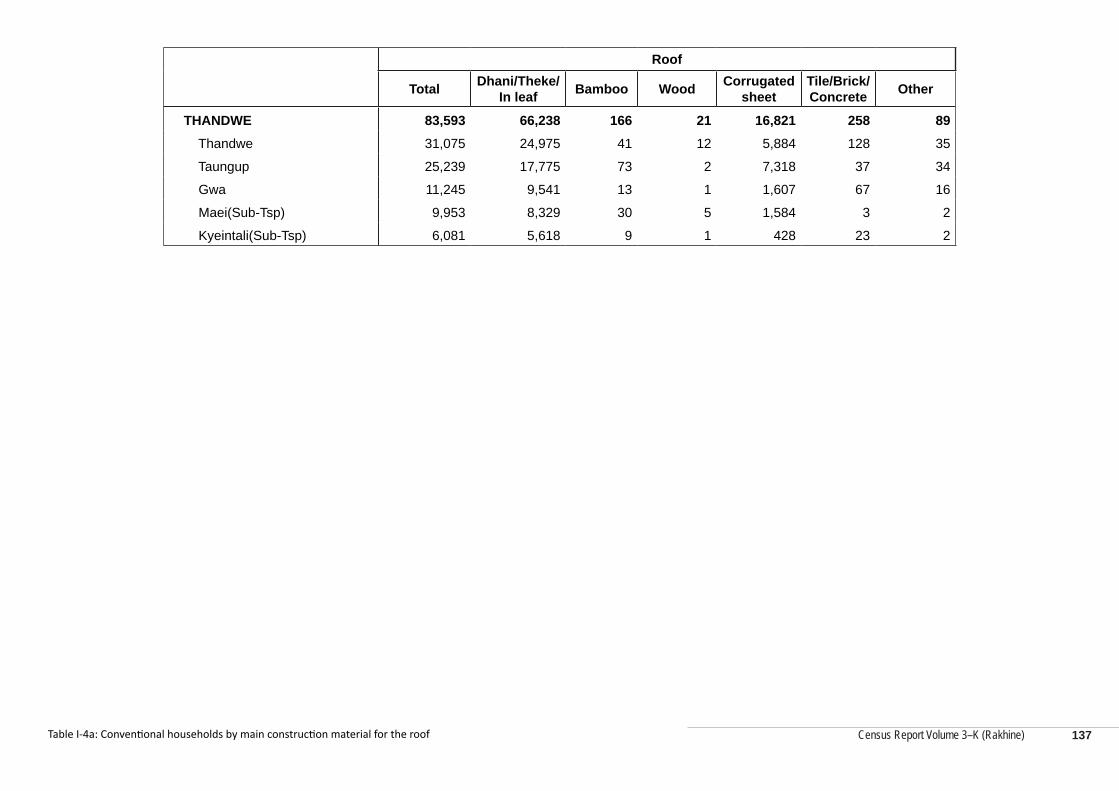
Census Report Volume 3–K (Rakhine)
Roof
Total Dhani/Theke/ In leaf Bamboo Wood Corrugated
sheetTile/Brick/ Concrete Other
THANDWE 83,593 66,238 166 21 16,821 258 89 Thandwe 31,075 24,975 41 12 5,884 128 35
Taungup 25,239 17,775 73 2 7,318 37 34
Gwa 11,245 9,541 13 1 1,607 67 16
Maei(Sub-Tsp) 9,953 8,329 30 5 1,584 3 2
Kyeintali(Sub-Tsp) 6,081 5,618 9 1 428 23 2
Table I-4a: Conventional households by main construction material for the roof 137
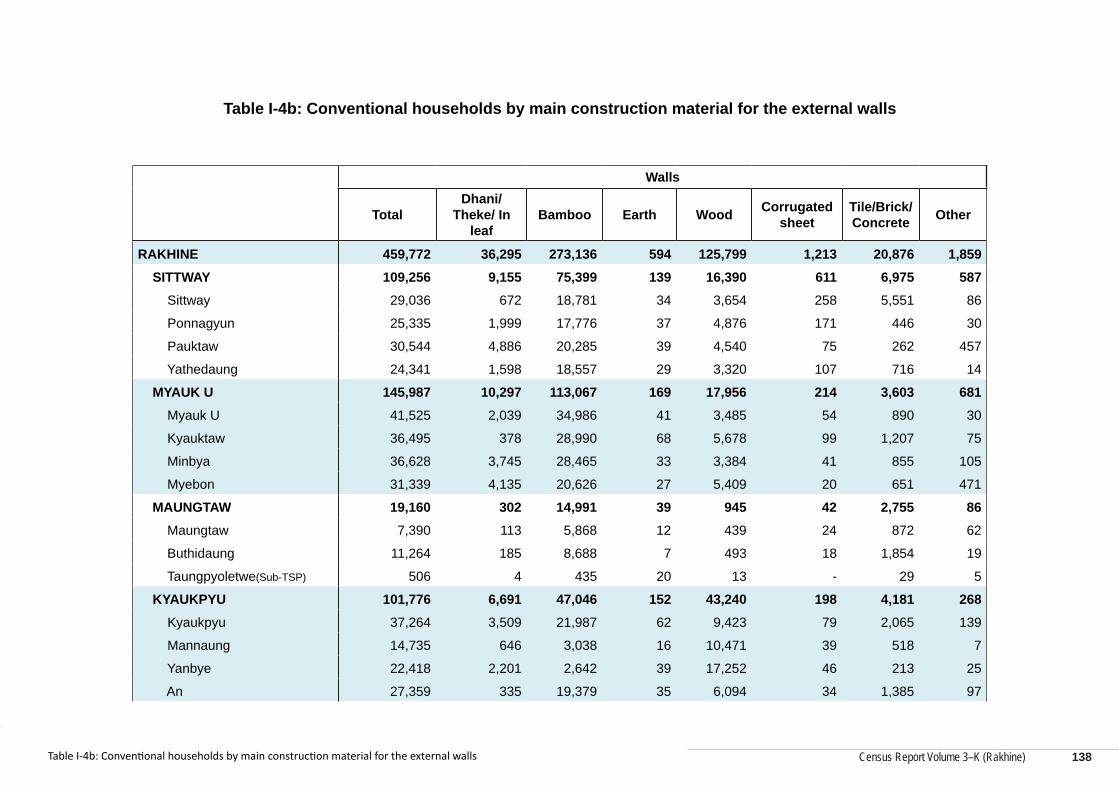
Census Report Volume 3–K (Rakhine)
Census Report Volume 3–K (Rakhine)
Table I-4b: Conventional households by main construction material for the external walls
Walls
TotalDhani/
Theke/ In leaf
Bamboo Earth Wood Corrugated sheet
Tile/Brick/ Concrete Other
RAKHINE 459,772 36,295 273,136 594 125,799 1,213 20,876 1,859 SITTWAY 109,256 9,155 75,399 139 16,390 611 6,975 587 Sittway 29,036 672 18,781 34 3,654 258 5,551 86
Ponnagyun 25,335 1,999 17,776 37 4,876 171 446 30
Pauktaw 30,544 4,886 20,285 39 4,540 75 262 457
Yathedaung 24,341 1,598 18,557 29 3,320 107 716 14
MYAUK U 145,987 10,297 113,067 169 17,956 214 3,603 681 Myauk U 41,525 2,039 34,986 41 3,485 54 890 30
Kyauktaw 36,495 378 28,990 68 5,678 99 1,207 75
Minbya 36,628 3,745 28,465 33 3,384 41 855 105
Myebon 31,339 4,135 20,626 27 5,409 20 651 471
MAUNGTAW 19,160 302 14,991 39 945 42 2,755 86 Maungtaw 7,390 113 5,868 12 439 24 872 62
Buthidaung 11,264 185 8,688 7 493 18 1,854 19
Taungpyoletwe(Sub-TSP) 506 4 435 20 13 - 29 5
KYAUKPYU 101,776 6,691 47,046 152 43,240 198 4,181 268 Kyaukpyu 37,264 3,509 21,987 62 9,423 79 2,065 139
Mannaung 14,735 646 3,038 16 10,471 39 518 7
Yanbye 22,418 2,201 2,642 39 17,252 46 213 25
An 27,359 335 19,379 35 6,094 34 1,385 97
Table I-4b: Conventional households by main construction material for the external walls 138
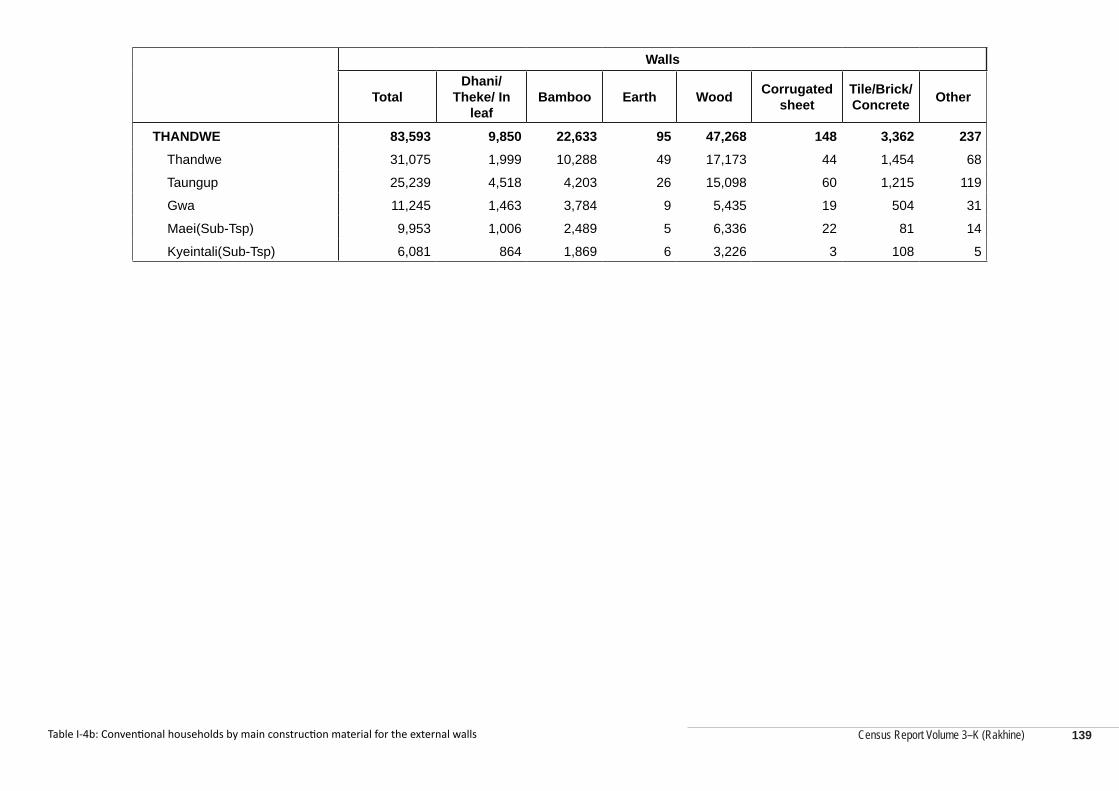
Census Report Volume 3–K (Rakhine)
Walls
TotalDhani/
Theke/ In leaf
Bamboo Earth Wood Corrugated sheet
Tile/Brick/ Concrete Other
THANDWE 83,593 9,850 22,633 95 47,268 148 3,362 237 Thandwe 31,075 1,999 10,288 49 17,173 44 1,454 68
Taungup 25,239 4,518 4,203 26 15,098 60 1,215 119
Gwa 11,245 1,463 3,784 9 5,435 19 504 31
Maei(Sub-Tsp) 9,953 1,006 2,489 5 6,336 22 81 14
Kyeintali(Sub-Tsp) 6,081 864 1,869 6 3,226 3 108 5
Table I-4b: Conventional households by main construction material for the external walls 139
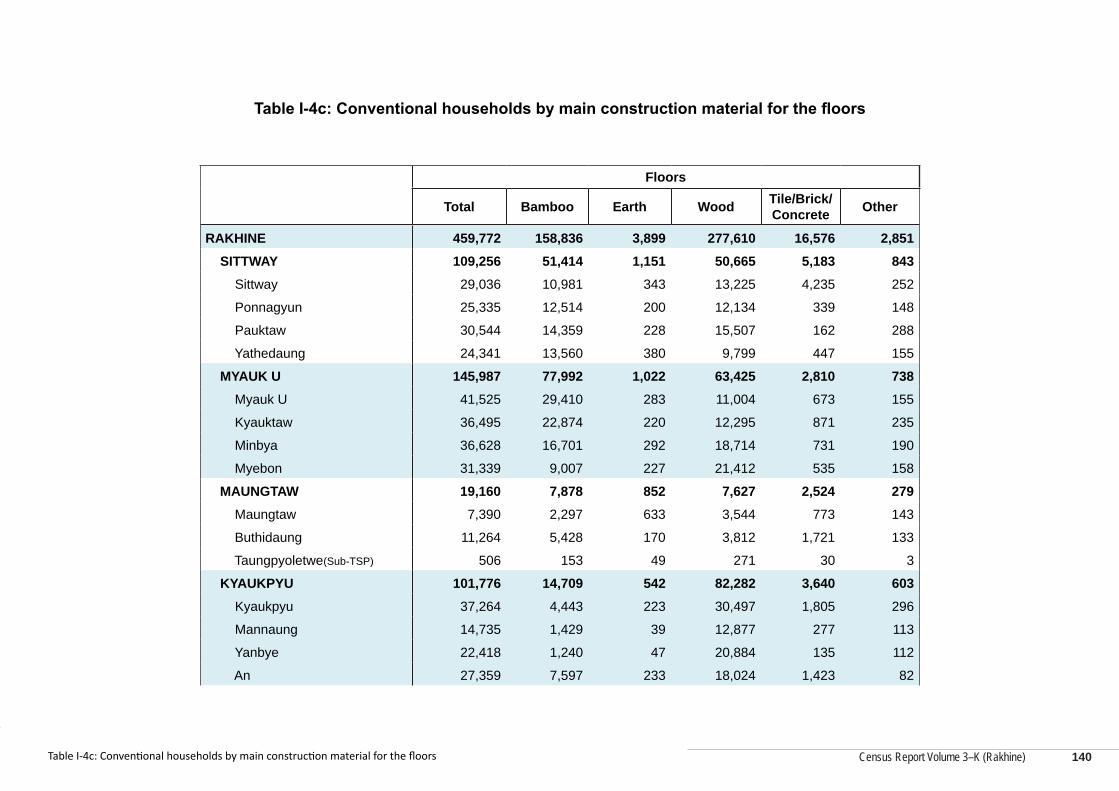
Census Report Volume 3–K (Rakhine)
Census Report Volume 3–K (Rakhine)
Table I-4c: Conventional households by main construction material for the floors
Floors
Total Bamboo Earth Wood Tile/Brick/ Concrete Other
RAKHINE 459,772 158,836 3,899 277,610 16,576 2,851 SITTWAY 109,256 51,414 1,151 50,665 5,183 843 Sittway 29,036 10,981 343 13,225 4,235 252
Ponnagyun 25,335 12,514 200 12,134 339 148
Pauktaw 30,544 14,359 228 15,507 162 288
Yathedaung 24,341 13,560 380 9,799 447 155
MYAUK U 145,987 77,992 1,022 63,425 2,810 738 Myauk U 41,525 29,410 283 11,004 673 155
Kyauktaw 36,495 22,874 220 12,295 871 235
Minbya 36,628 16,701 292 18,714 731 190
Myebon 31,339 9,007 227 21,412 535 158
MAUNGTAW 19,160 7,878 852 7,627 2,524 279 Maungtaw 7,390 2,297 633 3,544 773 143
Buthidaung 11,264 5,428 170 3,812 1,721 133
Taungpyoletwe(Sub-TSP) 506 153 49 271 30 3
KYAUKPYU 101,776 14,709 542 82,282 3,640 603 Kyaukpyu 37,264 4,443 223 30,497 1,805 296
Mannaung 14,735 1,429 39 12,877 277 113
Yanbye 22,418 1,240 47 20,884 135 112
An 27,359 7,597 233 18,024 1,423 82
Table I-4c: Conventional households by main construction material for the floors 140
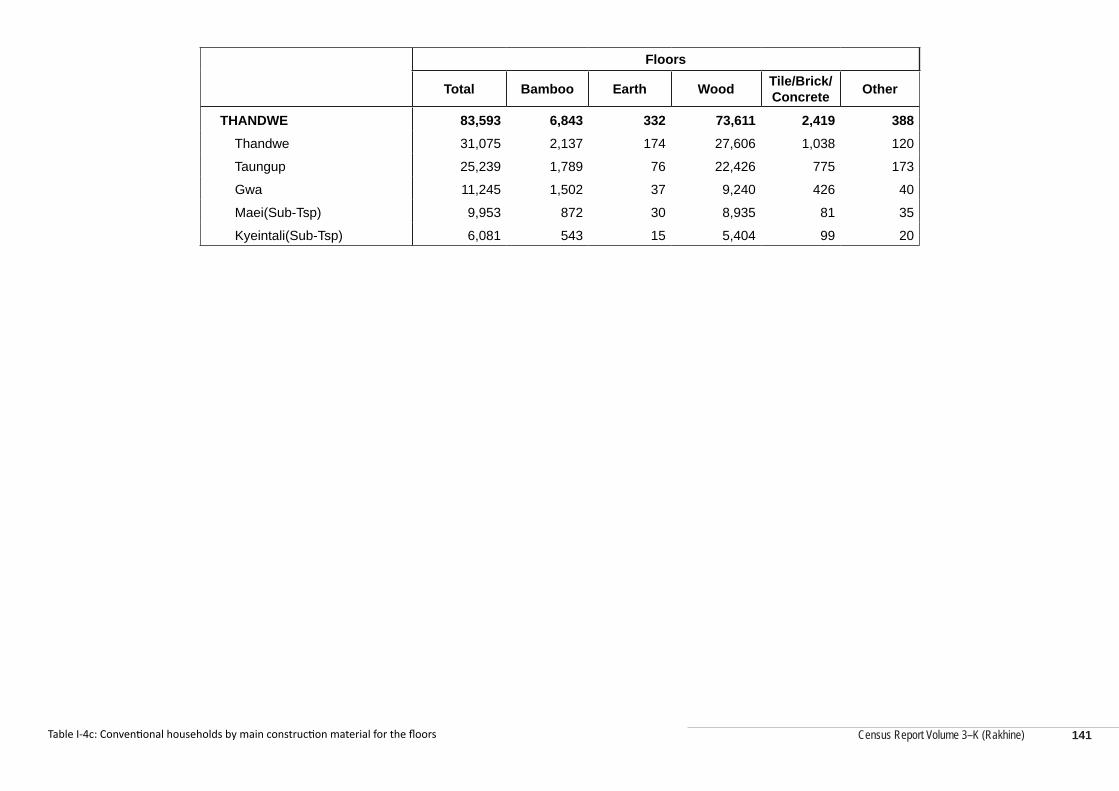
Census Report Volume 3–K (Rakhine)
Floors
Total Bamboo Earth Wood Tile/Brick/ Concrete Other
THANDWE 83,593 6,843 332 73,611 2,419 388 Thandwe 31,075 2,137 174 27,606 1,038 120
Taungup 25,239 1,789 76 22,426 775 173
Gwa 11,245 1,502 37 9,240 426 40
Maei(Sub-Tsp) 9,953 872 30 8,935 81 35
Kyeintali(Sub-Tsp) 6,081 543 15 5,404 99 20
Table I-4c: Conventional households by main construction material for the floors 141
Census Report Volume 3–K (Rakhine)
Myanmar Population and Housing Census,
Census Report Volume 3-K (Rakhine)
Series J: Household Amenities
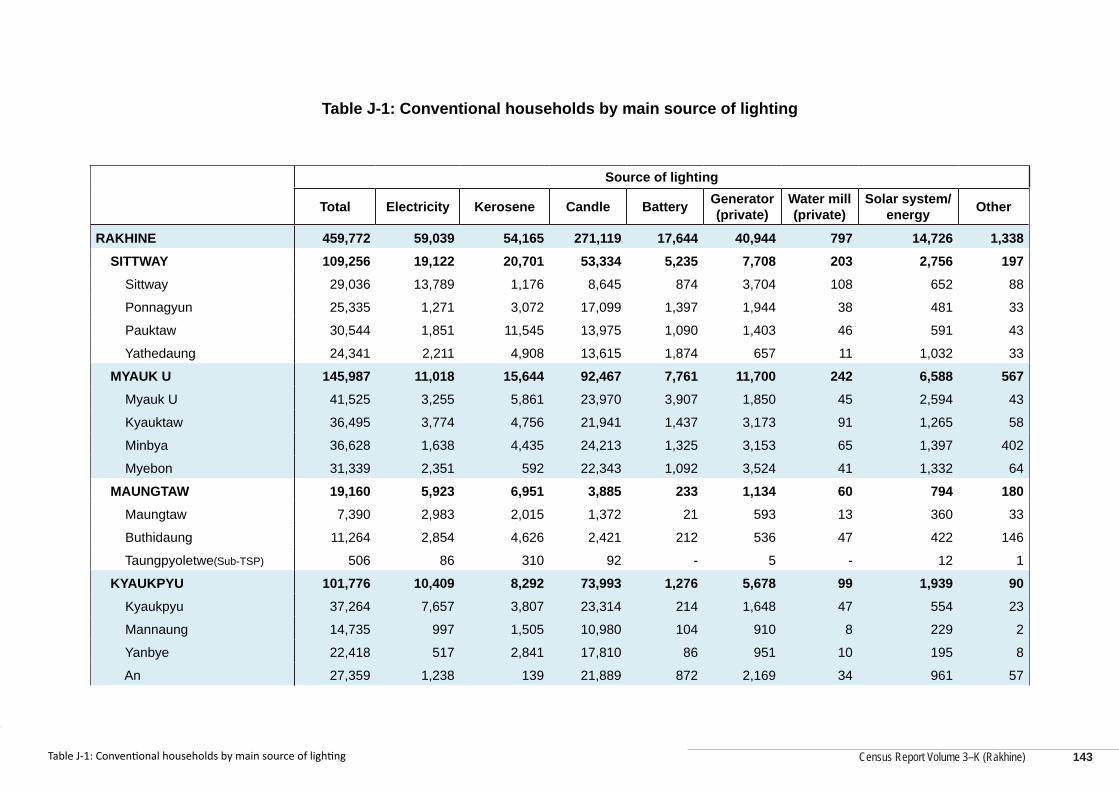
Census Report Volume 3–K (Rakhine)
Census Report Volume 3–K (Rakhine)
Table J-1: Conventional households by main source of lighting
Source of lighting
Total Electricity Kerosene Candle Battery Generator (private)
Water mill (private)
Solar system/ energy Other
RAKHINE 459,772 59,039 54,165 271,119 17,644 40,944 797 14,726 1,338 SITTWAY 109,256 19,122 20,701 53,334 5,235 7,708 203 2,756 197 Sittway 29,036 13,789 1,176 8,645 874 3,704 108 652 88
Ponnagyun 25,335 1,271 3,072 17,099 1,397 1,944 38 481 33
Pauktaw 30,544 1,851 11,545 13,975 1,090 1,403 46 591 43
Yathedaung 24,341 2,211 4,908 13,615 1,874 657 11 1,032 33
MYAUK U 145,987 11,018 15,644 92,467 7,761 11,700 242 6,588 567 Myauk U 41,525 3,255 5,861 23,970 3,907 1,850 45 2,594 43
Kyauktaw 36,495 3,774 4,756 21,941 1,437 3,173 91 1,265 58
Minbya 36,628 1,638 4,435 24,213 1,325 3,153 65 1,397 402
Myebon 31,339 2,351 592 22,343 1,092 3,524 41 1,332 64
MAUNGTAW 19,160 5,923 6,951 3,885 233 1,134 60 794 180 Maungtaw 7,390 2,983 2,015 1,372 21 593 13 360 33
Buthidaung 11,264 2,854 4,626 2,421 212 536 47 422 146
Taungpyoletwe(Sub-TSP) 506 86 310 92 - 5 - 12 1
KYAUKPYU 101,776 10,409 8,292 73,993 1,276 5,678 99 1,939 90 Kyaukpyu 37,264 7,657 3,807 23,314 214 1,648 47 554 23
Mannaung 14,735 997 1,505 10,980 104 910 8 229 2
Yanbye 22,418 517 2,841 17,810 86 951 10 195 8
An 27,359 1,238 139 21,889 872 2,169 34 961 57
Table J-1: Conventional households by main source of lighting 143
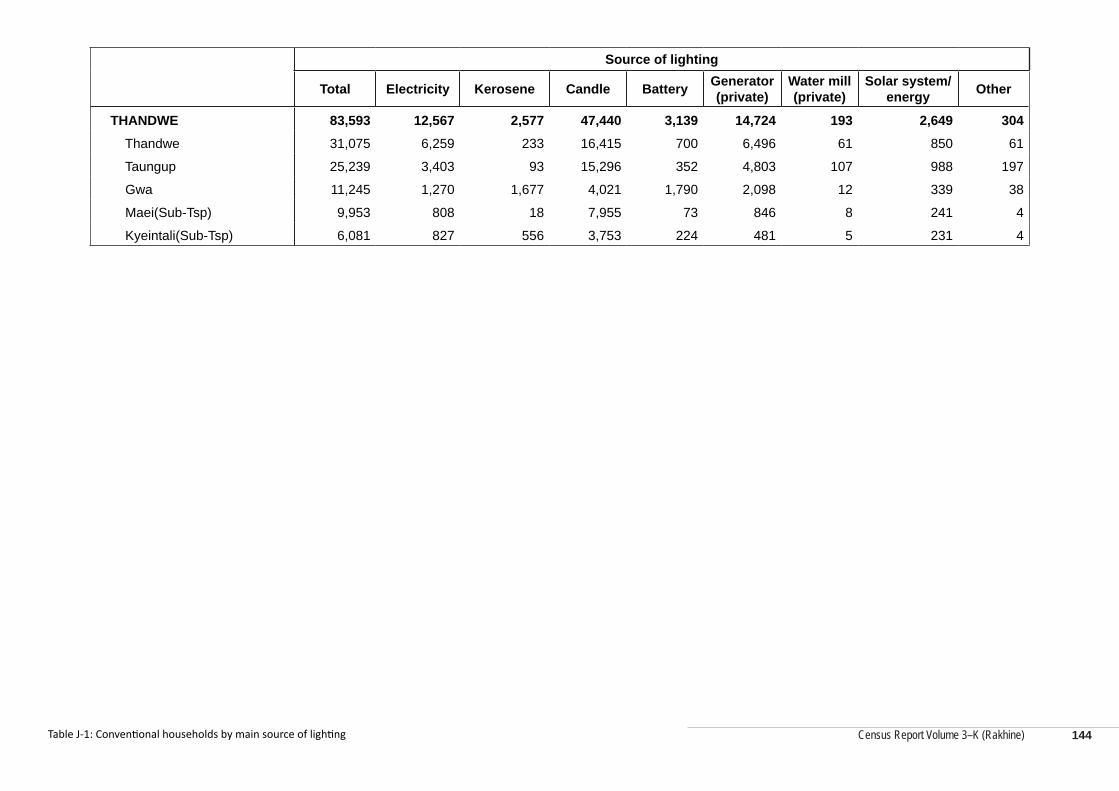
Census Report Volume 3–K (Rakhine)
Source of lighting
Total Electricity Kerosene Candle Battery Generator (private)
Water mill (private)
Solar system/ energy Other
THANDWE 83,593 12,567 2,577 47,440 3,139 14,724 193 2,649 304 Thandwe 31,075 6,259 233 16,415 700 6,496 61 850 61
Taungup 25,239 3,403 93 15,296 352 4,803 107 988 197
Gwa 11,245 1,270 1,677 4,021 1,790 2,098 12 339 38
Maei(Sub-Tsp) 9,953 808 18 7,955 73 846 8 241 4
Kyeintali(Sub-Tsp) 6,081 827 556 3,753 224 481 5 231 4
Table J-1: Conventional households by main source of lighting 144
Census Report Volume 3–K (Rakhine)
Census Report Volume 3–K (Rakhine)
Table J-2: Conventional households by source of water for drinking
Source of drinking water
Tota
l
Tap
wat
er/
Pipe
d
Tube
wel
l, bo
reho
le
Prot
ecte
d w
ell/S
prin
g
Unp
rote
cted
w
ell/S
prin
g
Pool
/Pon
d/
Lake
Riv
er/
Stre
am/
Can
al
Wat
erfa
ll/
Rai
nwat
er
Bot
tled
wat
er/W
ater
pu
rifier
Tank
er/
Truc
k
Oth
er
RAKHINE 459,772 22,749 15,832 131,381 25,392 231,119 17,960 8,484 3,545 204 3,106
SITTWAY 109,256 9,124 5,554 14,013 3,497 71,757 703 2,229 1,565 117 697
Sittway 29,036 8,277 5,366 7,045 539 5,701 3 2 1,551 117 435
Ponnagyun 25,335 308 20 1,536 1,300 21,010 474 532 6 - 149
Pauktaw 30,544 266 126 1,602 823 25,920 165 1,596 5 - 41
Yathedaung 24,341 273 42 3,830 835 19,126 61 99 3 - 72
MYAUK U 145,987 5,109 885 17,399 7,202 106,468 6,112 2,615 149 8 40
Myauk U 41,525 1,717 525 3,285 892 32,361 2,678 21 11 5 30
Kyauktaw 36,495 579 238 1,737 2,111 28,710 2,667 426 24 1 2
Minbya 36,628 377 104 2,233 1,820 30,384 376 1,324 8 1 1
Myebon 31,339 2,436 18 10,144 2,379 15,013 391 844 106 1 7
MAUNGTAW 19,160 509 3,842 3,922 1,125 4,665 3,067 1,372 572 2 84
Maungtaw 7,390 353 2,416 1,753 309 1,217 1,050 141 127 1 23
Buthidaung 11,264 154 1,277 2,073 749 3,337 1,945 1,223 445 1 60
Taungpyoletwe(Sub-TSP) 506 2 149 96 67 111 72 8 - - 1
KYAUKPYU 101,776 3,180 1,421 40,138 8,140 41,646 4,445 1,144 885 3 774
Kyaukpyu 37,264 744 1,123 10,816 1,119 21,644 368 377 794 3 276
Mannaung 14,735 6 29 10,388 1,251 2,157 409 1 9 - 485
Yanbye 22,418 1,098 40 9,300 521 11,038 407 1 4 - 9
An 27,359 1,332 229 9,634 5,249 6,807 3,261 765 78 - 4
Table J-2: Conventional households by source of water for drinking 145
Census Report Volume 3–K (Rakhine)
Source of drinking water
Tota
l
Tap
wat
er/
Pipe
d
Tube
wel
l, bo
reho
le
Prot
ecte
d w
ell/S
prin
g
Unp
rote
cted
w
ell/S
prin
g
Pool
/Pon
d/
Lake
Riv
er/
Stre
am/
Can
al
Wat
erfa
ll/
Rai
nwat
er
Bot
tled
wat
er/W
ater
pu
rifier
Tank
er/
Truc
k
Oth
er
THANDWE 83,593 4,827 4,130 55,909 5,428 6,583 3,633 1,124 374 74 1,511
Thandwe 31,075 3,860 1,679 21,588 946 1,272 1,036 369 170 74 81
Taungup 25,239 778 1,760 16,235 1,538 2,712 1,257 648 196 - 115
Gwa 11,245 93 112 7,987 1,776 62 338 76 8 - 793
Maei(Sub-Tsp) 9,953 5 534 5,483 683 2,537 697 14 - - -
Kyeintali(Sub-Tsp) 6,081 91 45 4,616 485 - 305 17 - - 522
Table J-2: Conventional households by source of water for drinking 146
Census Report Volume 3–K (Rakhine)
Census Report Volume 3–K (Rakhine)
Table J-3: Conventional households by source of water for non-drinking use
Source of non-drinking water
Tota
l
Tap
wat
er/
Pipe
d
Tube
wel
l, bo
reho
le
Prot
ecte
d w
ell/S
prin
g
Unp
rote
cted
w
ell/S
prin
g
Pool
/Pon
d/
Lake
Riv
er/
Stre
am/
Can
al
Wat
erfa
ll/
Rai
n w
ater
Bot
tled
wat
er/W
ater
pu
rifier
Tank
er/
Truc
k
Oth
er
RAKHINE 459,772 27,979 20,213 114,384 25,496 229,001 31,059 8,303 72 156 3,109
SITTWAY 109,256 9,371 8,254 14,248 3,507 69,986 1,117 2,209 41 1 522
Sittway 29,036 8,283 7,909 6,755 672 4,950 9 3 38 1 416
Ponnagyun 25,335 523 63 1,196 1,112 20,919 879 643 - - -
Pauktaw 30,544 266 162 1,663 805 26,015 165 1,433 2 - 33
Yathedaung 24,341 299 120 4,634 918 18,102 64 130 1 - 73
MYAUK U 145,987 6,061 921 12,926 5,651 102,169 15,929 2,293 4 5 28
Myauk U 41,525 1,697 564 2,361 761 32,332 3,766 22 - 5 17
Kyauktaw 36,495 1,428 44 504 573 24,224 9,315 405 - - 2
Minbya 36,628 554 163 902 1,651 29,826 2,452 1,077 1 - 2
Myebon 31,339 2,382 150 9,159 2,666 15,787 396 789 3 - 7
MAUNGTAW 19,160 920 4,119 2,732 944 5,080 3,861 1,306 7 - 191
Maungtaw 7,390 520 2,298 1,430 368 1,416 1,188 143 4 - 23
Buthidaung 11,264 399 1,678 1,213 526 3,571 2,552 1,155 3 - 167
Taungpyoletwe(Sub-TSP) 506 1 143 89 50 93 121 8 - - 1
KYAUKPYU 101,776 3,581 2,015 35,120 8,456 44,629 6,094 1,130 10 2 739
Kyaukpyu 37,264 995 1,800 10,391 1,204 21,932 349 353 8 1 231
Mannaung 14,735 9 30 9,753 1,267 2,770 412 1 - - 493
Yanbye 22,418 980 47 7,434 746 12,615 585 2 - - 9
An 27,359 1,597 138 7,542 5,239 7,312 4,748 774 2 1 6
Table J-3: Conventional households by source of water for non-drinking use 147
Census Report Volume 3–K (Rakhine)
Source of non-drinking water
Tota
l
Tap
wat
er/
Pipe
d
Tube
wel
l, bo
reho
le
Prot
ecte
d w
ell/S
prin
g
Unp
rote
cted
w
ell/S
prin
g
Pool
/Pon
d/
Lake
Riv
er/
Stre
am/
Can
al
Wat
erfa
ll/
Rai
n w
ater
Bot
tled
wat
er/W
ater
pu
rifier
Tank
er/
Truc
k
Oth
er
THANDWE 83,593 8,046 4,904 49,358 6,938 7,137 4,058 1,365 10 148 1,629
Thandwe 31,075 5,330 1,960 18,604 1,635 1,460 1,360 494 6 139 87
Taungup 25,239 2,455 2,123 14,069 1,664 2,696 1,326 777 4 9 116
Gwa 11,245 153 131 7,323 2,252 56 345 76 - - 909
Maei(Sub-Tsp) 9,953 11 644 4,836 815 2,924 721 1 - - 1
Kyeintali(Sub-Tsp) 6,081 97 46 4,526 572 1 306 17 - - 516
Table J-3: Conventional households by source of water for non-drinking use 148
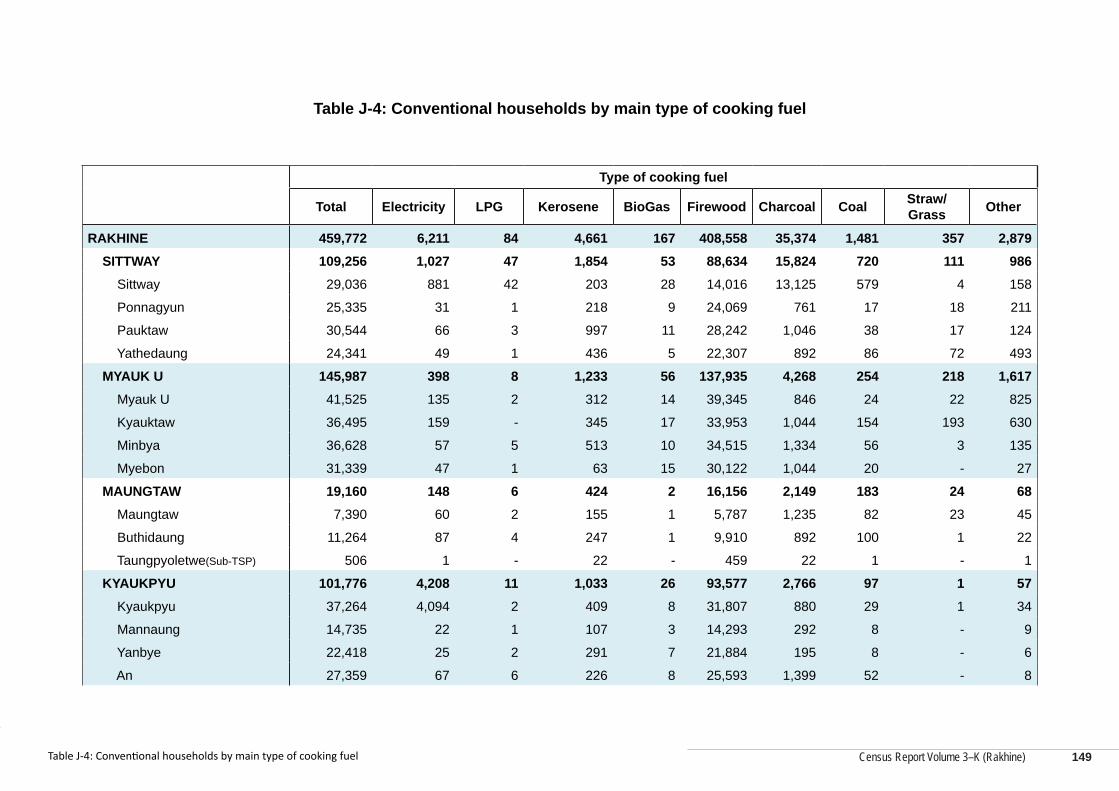
Census Report Volume 3–K (Rakhine)
Census Report Volume 3–K (Rakhine)
Table J-4: Conventional households by main type of cooking fuel
Type of cooking fuel
Total Electricity LPG Kerosene BioGas Firewood Charcoal Coal Straw/Grass Other
RAKHINE 459,772 6,211 84 4,661 167 408,558 35,374 1,481 357 2,879 SITTWAY 109,256 1,027 47 1,854 53 88,634 15,824 720 111 986 Sittway 29,036 881 42 203 28 14,016 13,125 579 4 158
Ponnagyun 25,335 31 1 218 9 24,069 761 17 18 211
Pauktaw 30,544 66 3 997 11 28,242 1,046 38 17 124
Yathedaung 24,341 49 1 436 5 22,307 892 86 72 493
MYAUK U 145,987 398 8 1,233 56 137,935 4,268 254 218 1,617 Myauk U 41,525 135 2 312 14 39,345 846 24 22 825
Kyauktaw 36,495 159 - 345 17 33,953 1,044 154 193 630
Minbya 36,628 57 5 513 10 34,515 1,334 56 3 135
Myebon 31,339 47 1 63 15 30,122 1,044 20 - 27
MAUNGTAW 19,160 148 6 424 2 16,156 2,149 183 24 68 Maungtaw 7,390 60 2 155 1 5,787 1,235 82 23 45
Buthidaung 11,264 87 4 247 1 9,910 892 100 1 22
Taungpyoletwe(Sub-TSP) 506 1 - 22 - 459 22 1 - 1
KYAUKPYU 101,776 4,208 11 1,033 26 93,577 2,766 97 1 57 Kyaukpyu 37,264 4,094 2 409 8 31,807 880 29 1 34
Mannaung 14,735 22 1 107 3 14,293 292 8 - 9
Yanbye 22,418 25 2 291 7 21,884 195 8 - 6
An 27,359 67 6 226 8 25,593 1,399 52 - 8
Table J-4: Conventional households by main type of cooking fuel 149
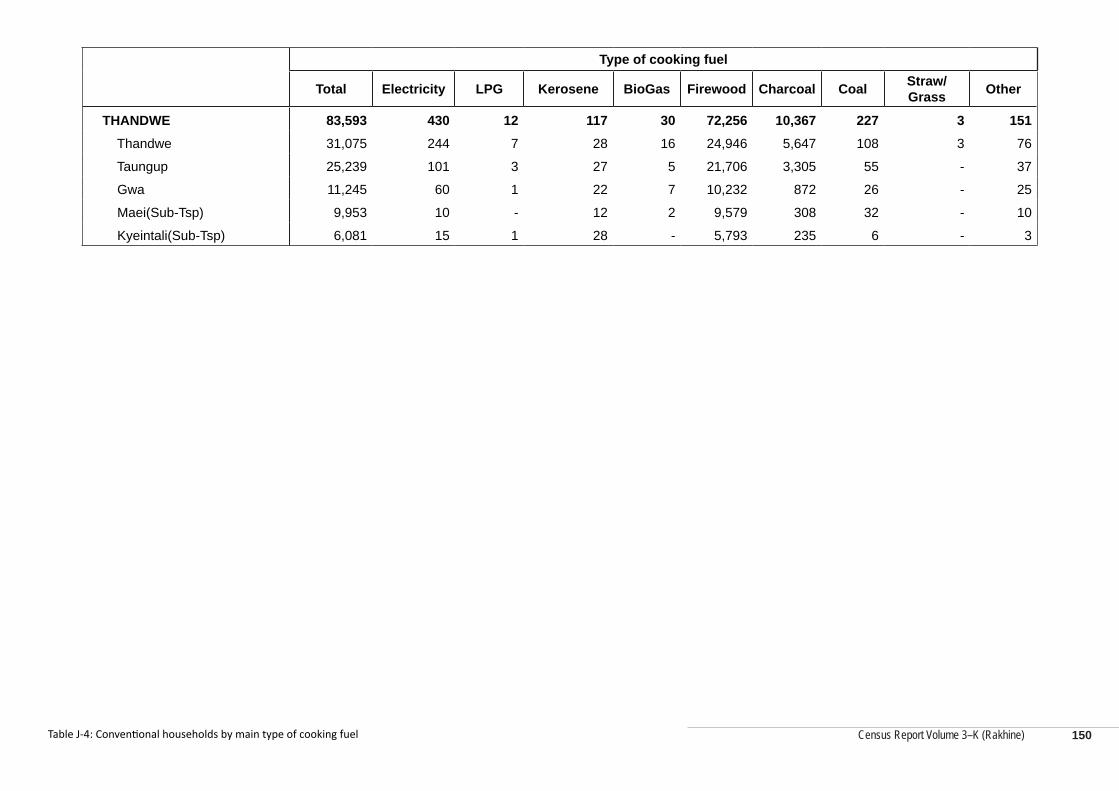
Census Report Volume 3–K (Rakhine)
Type of cooking fuel
Total Electricity LPG Kerosene BioGas Firewood Charcoal Coal Straw/Grass Other
THANDWE 83,593 430 12 117 30 72,256 10,367 227 3 151 Thandwe 31,075 244 7 28 16 24,946 5,647 108 3 76
Taungup 25,239 101 3 27 5 21,706 3,305 55 - 37
Gwa 11,245 60 1 22 7 10,232 872 26 - 25
Maei(Sub-Tsp) 9,953 10 - 12 2 9,579 308 32 - 10
Kyeintali(Sub-Tsp) 6,081 15 1 28 - 5,793 235 6 - 3
Table J-4: Conventional households by main type of cooking fuel 150
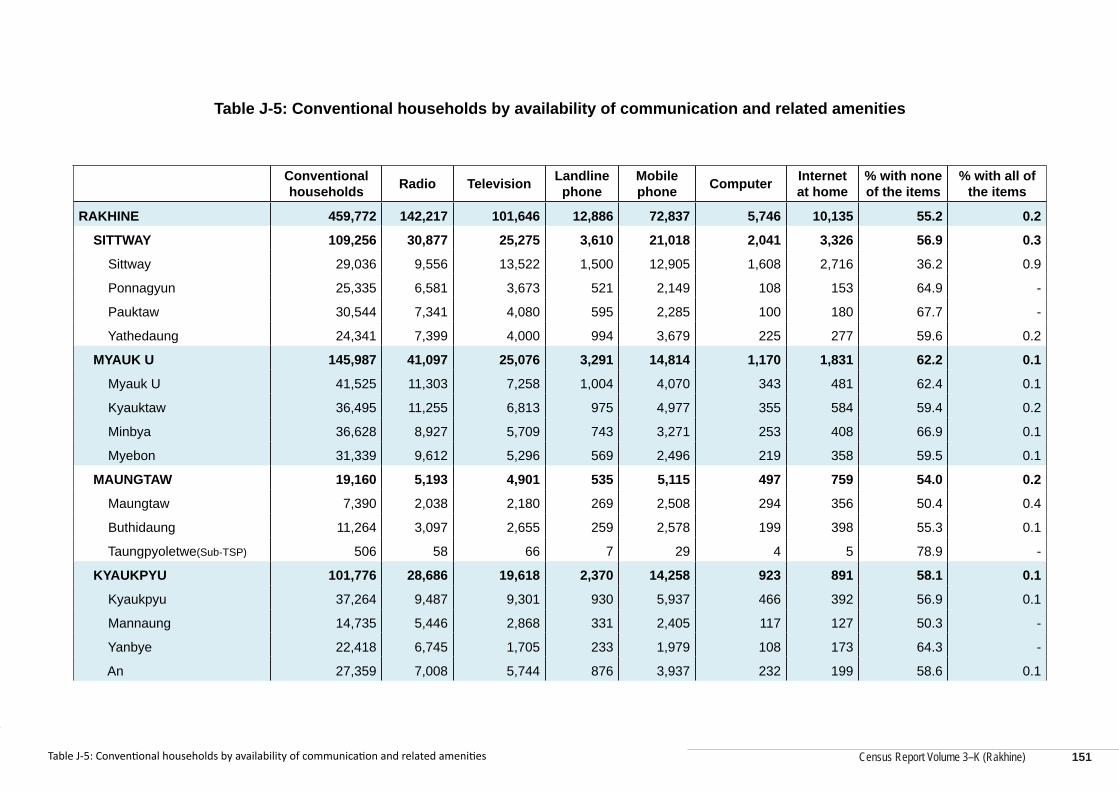
Census Report Volume 3–K (Rakhine)
Census Report Volume 3–K (Rakhine)
Table J-5: Conventional households by availability of communication and related amenities
Conventional households Radio Television Landline
phoneMobile phone Computer Internet
at home% with none of the items
% with all of the items
RAKHINE 459,772 142,217 101,646 12,886 72,837 5,746 10,135 55.2 0.2
SITTWAY 109,256 30,877 25,275 3,610 21,018 2,041 3,326 56.9 0.3
Sittway 29,036 9,556 13,522 1,500 12,905 1,608 2,716 36.2 0.9
Ponnagyun 25,335 6,581 3,673 521 2,149 108 153 64.9 -
Pauktaw 30,544 7,341 4,080 595 2,285 100 180 67.7 -
Yathedaung 24,341 7,399 4,000 994 3,679 225 277 59.6 0.2
MYAUK U 145,987 41,097 25,076 3,291 14,814 1,170 1,831 62.2 0.1
Myauk U 41,525 11,303 7,258 1,004 4,070 343 481 62.4 0.1
Kyauktaw 36,495 11,255 6,813 975 4,977 355 584 59.4 0.2
Minbya 36,628 8,927 5,709 743 3,271 253 408 66.9 0.1
Myebon 31,339 9,612 5,296 569 2,496 219 358 59.5 0.1
MAUNGTAW 19,160 5,193 4,901 535 5,115 497 759 54.0 0.2
Maungtaw 7,390 2,038 2,180 269 2,508 294 356 50.4 0.4
Buthidaung 11,264 3,097 2,655 259 2,578 199 398 55.3 0.1
Taungpyoletwe(Sub-TSP) 506 58 66 7 29 4 5 78.9 -
KYAUKPYU 101,776 28,686 19,618 2,370 14,258 923 891 58.1 0.1
Kyaukpyu 37,264 9,487 9,301 930 5,937 466 392 56.9 0.1
Mannaung 14,735 5,446 2,868 331 2,405 117 127 50.3 -
Yanbye 22,418 6,745 1,705 233 1,979 108 173 64.3 -
An 27,359 7,008 5,744 876 3,937 232 199 58.6 0.1
Table J-5: Conventional households by availability of communication and related amenities 151
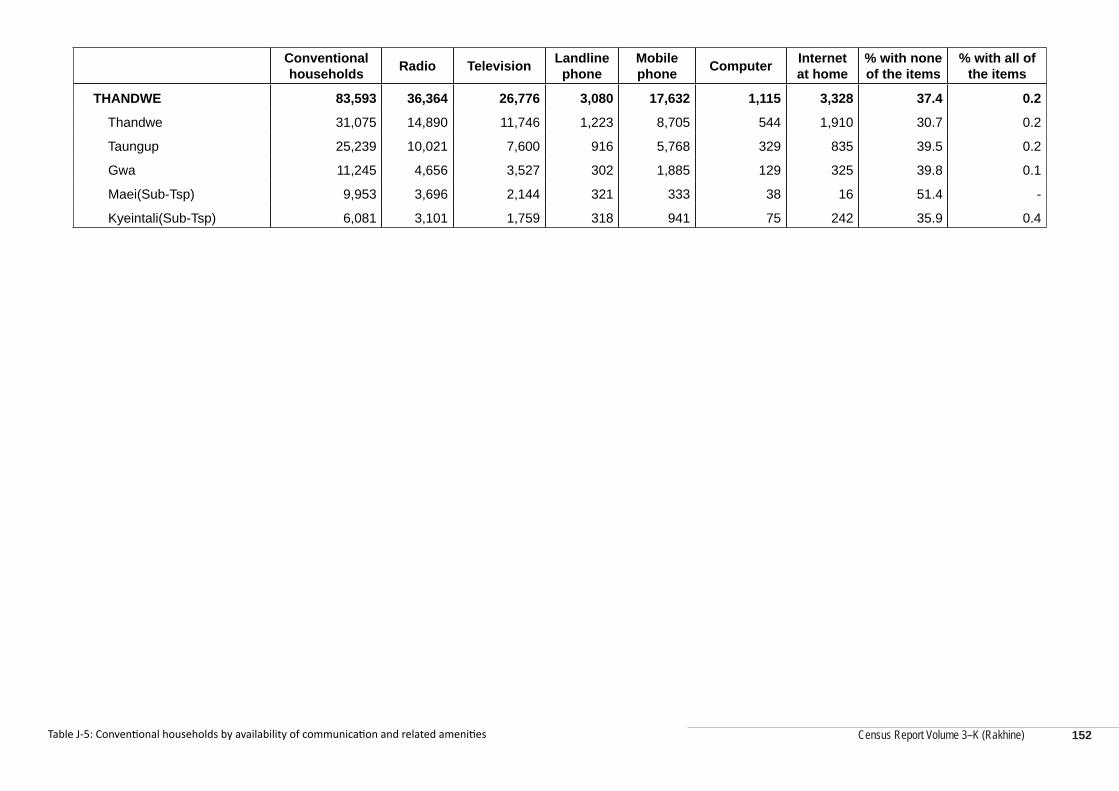
Census Report Volume 3–K (Rakhine)
Conventional households Radio Television Landline
phoneMobile phone Computer Internet
at home% with none of the items
% with all of the items
THANDWE 83,593 36,364 26,776 3,080 17,632 1,115 3,328 37.4 0.2
Thandwe 31,075 14,890 11,746 1,223 8,705 544 1,910 30.7 0.2
Taungup 25,239 10,021 7,600 916 5,768 329 835 39.5 0.2
Gwa 11,245 4,656 3,527 302 1,885 129 325 39.8 0.1
Maei(Sub-Tsp) 9,953 3,696 2,144 321 333 38 16 51.4 -
Kyeintali(Sub-Tsp) 6,081 3,101 1,759 318 941 75 242 35.9 0.4
Table J-5: Conventional households by availability of communication and related amenities 152
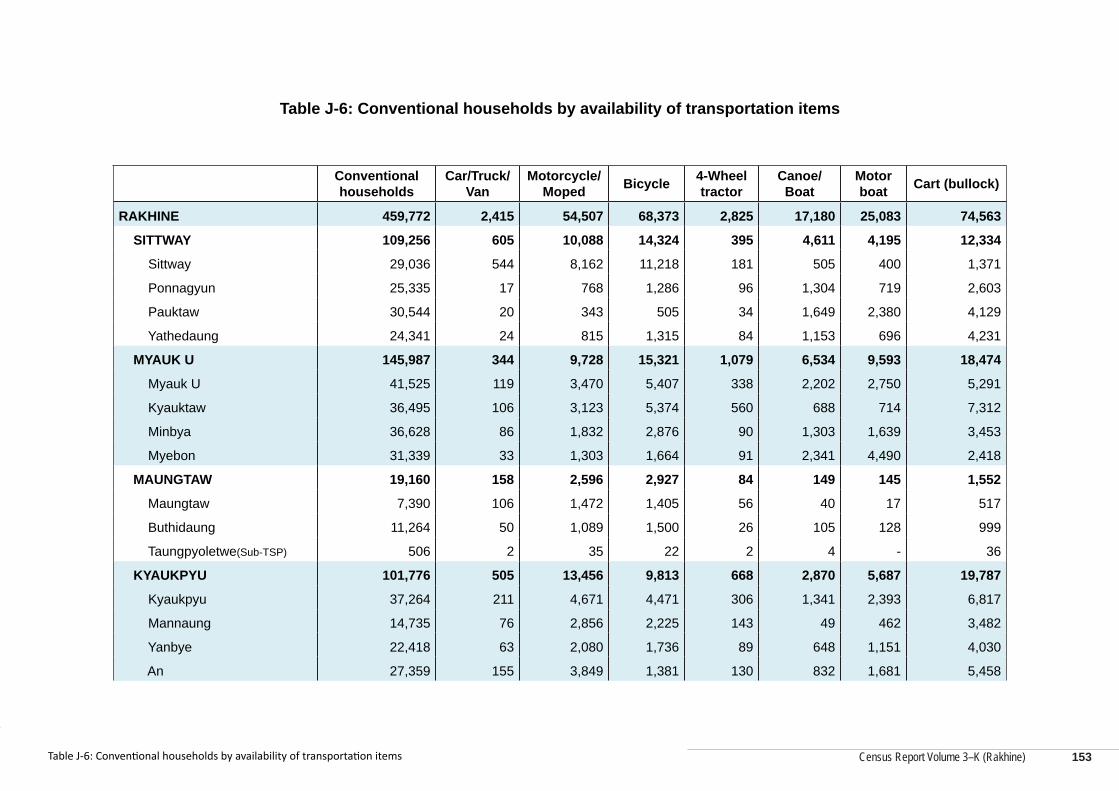
Census Report Volume 3–K (Rakhine)
Census Report Volume 3–K (Rakhine)
Table J-6: Conventional households by availability of transportation items
Conventional households
Car/Truck/ Van
Motorcycle/ Moped Bicycle 4-Wheel
tractorCanoe/Boat
Motor boat Cart (bullock)
RAKHINE 459,772 2,415 54,507 68,373 2,825 17,180 25,083 74,563
SITTWAY 109,256 605 10,088 14,324 395 4,611 4,195 12,334
Sittway 29,036 544 8,162 11,218 181 505 400 1,371
Ponnagyun 25,335 17 768 1,286 96 1,304 719 2,603
Pauktaw 30,544 20 343 505 34 1,649 2,380 4,129
Yathedaung 24,341 24 815 1,315 84 1,153 696 4,231
MYAUK U 145,987 344 9,728 15,321 1,079 6,534 9,593 18,474
Myauk U 41,525 119 3,470 5,407 338 2,202 2,750 5,291
Kyauktaw 36,495 106 3,123 5,374 560 688 714 7,312
Minbya 36,628 86 1,832 2,876 90 1,303 1,639 3,453
Myebon 31,339 33 1,303 1,664 91 2,341 4,490 2,418
MAUNGTAW 19,160 158 2,596 2,927 84 149 145 1,552
Maungtaw 7,390 106 1,472 1,405 56 40 17 517
Buthidaung 11,264 50 1,089 1,500 26 105 128 999
Taungpyoletwe(Sub-TSP) 506 2 35 22 2 4 - 36
KYAUKPYU 101,776 505 13,456 9,813 668 2,870 5,687 19,787
Kyaukpyu 37,264 211 4,671 4,471 306 1,341 2,393 6,817
Mannaung 14,735 76 2,856 2,225 143 49 462 3,482
Yanbye 22,418 63 2,080 1,736 89 648 1,151 4,030
An 27,359 155 3,849 1,381 130 832 1,681 5,458
Table J-6: Conventional households by availability of transportation items 153
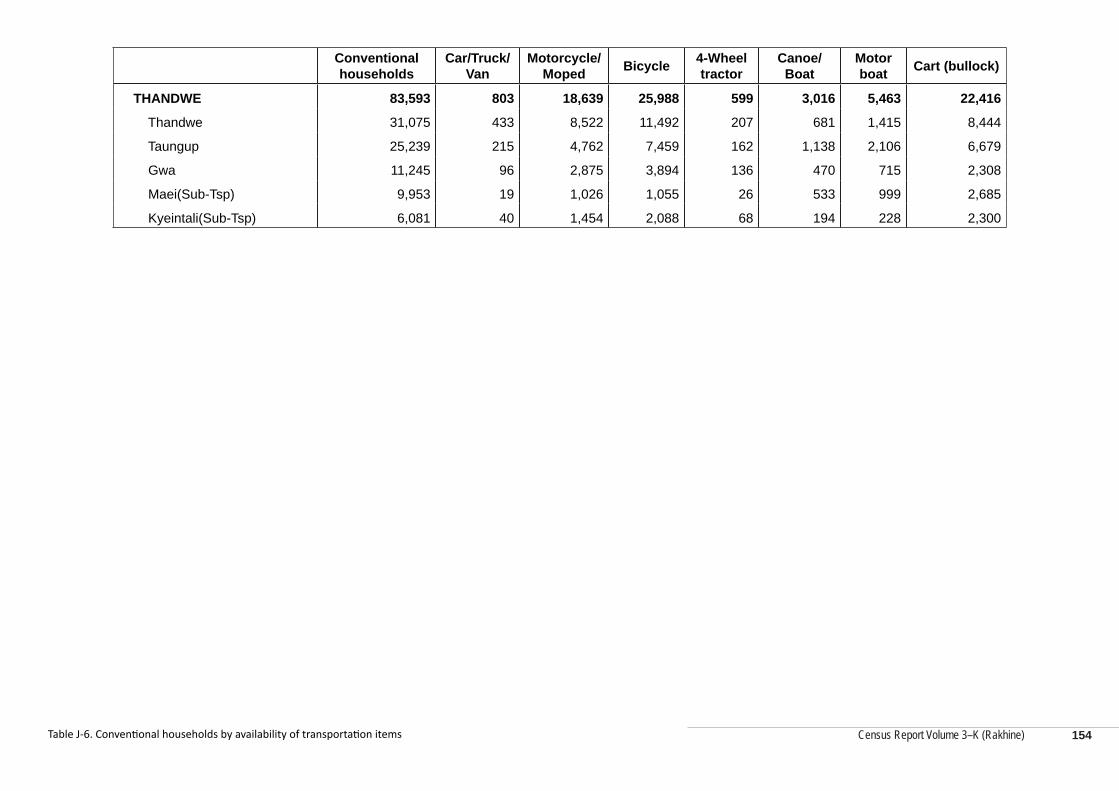
Census Report Volume 3–K (Rakhine)
Conventional households
Car/Truck/ Van
Motorcycle/ Moped Bicycle 4-Wheel
tractorCanoe/Boat
Motor boat Cart (bullock)
THANDWE 83,593 803 18,639 25,988 599 3,016 5,463 22,416
Thandwe 31,075 433 8,522 11,492 207 681 1,415 8,444
Taungup 25,239 215 4,762 7,459 162 1,138 2,106 6,679
Gwa 11,245 96 2,875 3,894 136 470 715 2,308
Maei(Sub-Tsp) 9,953 19 1,026 1,055 26 533 999 2,685
Kyeintali(Sub-Tsp) 6,081 40 1,454 2,088 68 194 228 2,300
Table J-6. Conventional households by availability of transportation items 154
Census Report Volume 3–K (Rakhine)
Census Report Volume 3–K (Rakhine)
Annex 1: Questionnaire
155
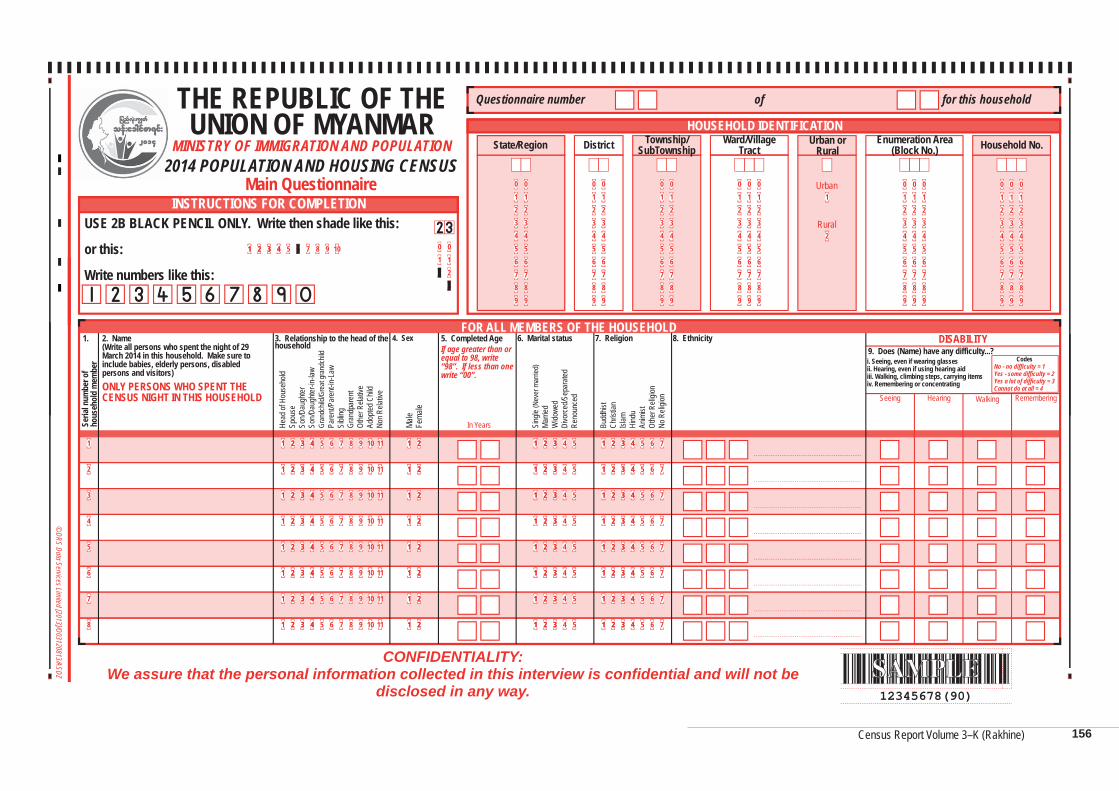
Census Report Volume 3–K (Rakhine)
12345678(90)
0123
012
1 2 3 41 2 3 4 5 6 7 8 9 10
1 2 3 41 2 3 41
2
3
4
5
6
7
8
5 6 7 8 9 10 11 1 21 2 1 2 31 2 3 4 5 1 2 3 41 2 3 4 5 6
1 2 3 41 2 3 4 5 6 7 8 9 10 11 1 21 2 1 2 31 2 3 4 5 1 2 3 41 2 3 4 5 6
1 2 3 41 2 3 4 5 6 7 8 9 10 11 1 21 2 1 2 31 2 3 4 5 1 2 3 41 2 3 4 5 6
1 2 3 41 2 3 4 5 6 7 8 9 10 11 1 21 2 1 2 31 2 3 4 5 1 2 3 41 2 3 4 5 6
1 2 3 41 2 3 4 5 6 7 8 9 10 11 1 21 2 1 2 31 2 3 4 5 1 2 3 41 2 3 4 5 6
1 2 3 41 2 3 4 5 6 7 8 9 10 11 1 21 2 1 2 31 2 3 4 5 1 2 3 41 2 3 4 5 6
1 2 3 41 2 3 4 5 6 7 8 9 10 11 1 21 2 1 2 31 2 3 4 5 1 2 3 41 2 3 4 5 6
1 2 3 41 2 3 4 5 6 7
7
7
7
7
7
7
7
78 9 10 11 1 21 2 1 2 31 2 3 4 5 1 2 3 41 2 3 4 5 6
0123456789
0123456789
0123456789
0123456789
0123456789
0123456789
0123456789
0123456789
1
2
0123456789
0123456789
0123456789
0123456789
0123456789
0123456789
0123456789
3. Relationship to the head of the household
2. Name (Write all persons who spent the night of 29 March 2014 in this household. Make sure to include babies, elderly persons, disabled persons and visitors)ONLY PERSONS WHO SPENT THE CENSUS NIGHT IN THIS HOUSEHOLD
Seria
l num
ber o
f ho
useh
old
mem
ber
1.
Head
of H
ouse
hold
Spou
seSo
n/Dau
ghter
Son/D
augh
ter-in
-law
Gran
dchil
d/Gre
at gr
andc
hild
Pare
nt/Pa
rent-
in-La
wSi
bling
Gran
dpar
ent
Othe
r Rela
tive
Adop
ted C
hild
Non R
elativ
e
FOR ALL MEMBERS OF THE HOUSEHOLD
Male
Fema
le
4. Sex
CONFIDENTIALITY:We assure that the personal information collected in this interview is confidential and will not be
disclosed in any way.
5. Completed AgeIf age greater than or equal to 98, write “98”. If less than one write “00”.
In Years
Seeing Hearing Walking Remembering
Sing
le(N
ever
mar
ried)
Marri
edW
idowe
dDi
vorce
d/Sep
arate
dRe
noun
ced
HOUSEHOLD IDENTIFICATION
INSTRUCTIONS FOR COMPLETION
Household No.Enumeration Area (Block No.)
Ward/Village Tract
Township/SubTownshipDistrictState/Region
USE 2B BLACK PENCIL ONLY. Write then shade like this:
or this:
Write numbers like this:
Urban or Rural
Urban
Rural
DISABILITY9. Does (Name) have any difficulty...?
7. Religion 8. Ethnicity
Budd
hist
Chris
tian
Islam
Hind
uAn
imist
Othe
r Reli
gion
No R
eligio
n
6. Marital status
Questionnaire number of for this householdTHE REPUBLIC OF THE UNION OF MYANMAR
2014 POPULATION AND HOUSING CENSUSMain Questionnaire
MINISTRY OF IMMIGRATION AND POPULATION
i. Seeing, even if wearing glassesii. Hearing, even if using hearing aidiii. Walking, climbing steps, carrying itemsiv. Remembering or concentrating
CodesNo - no difficulty = 1Yes - some difficulty = 2Yes a lot of difficulty = 3Cannot do at all = 4
© DRS Data Services Limited [2013]/O03120813/ASDZ
2
156
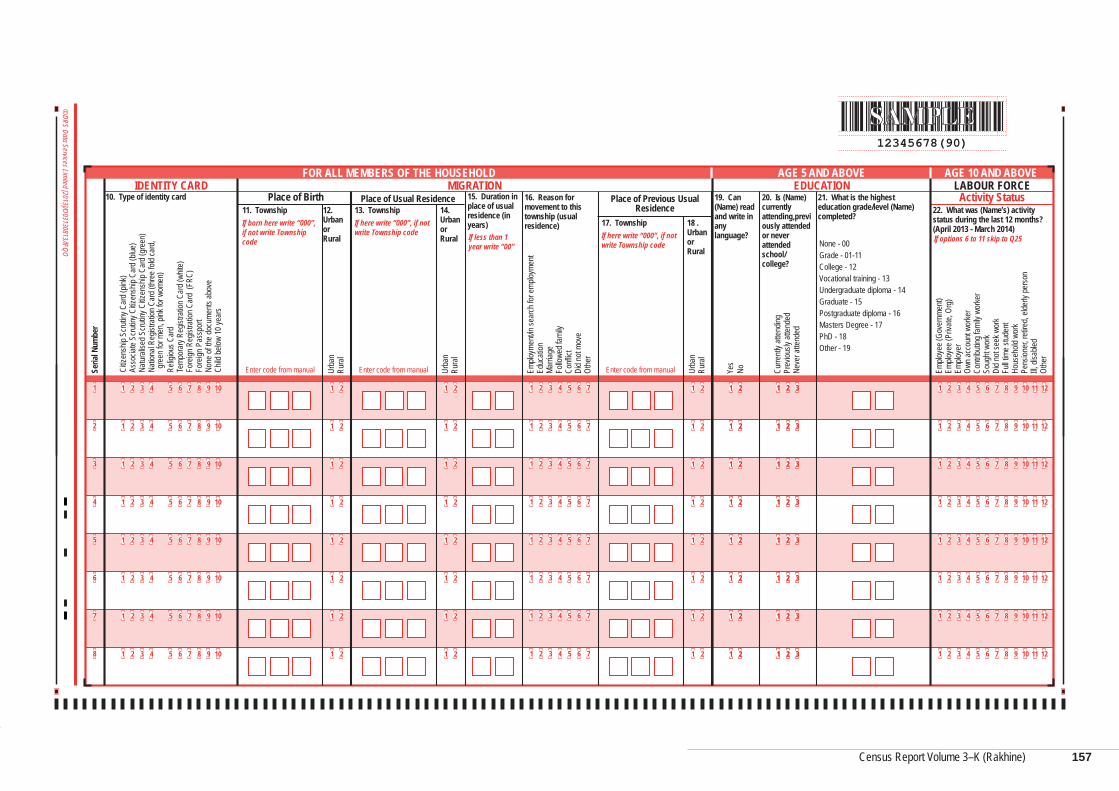
Census Report Volume 3–K (Rakhine)
Census Report Volume 3–K (Rakhine)
12345678(90)
1
2
3
4
5
6
7
8
1 2 31
1
1
1
1
1
1
1
2
2
2
2
2
2
2
2
3
3
3
3
3
3
3
3
4
4
4
4
4
4
4
4
5
5
5
5
5
5
5
5
6
6
6
6
6
6
6
6
7
7
7
7
7
7
7
7
1
1
1
1
1
1
1
1
2
2
2
2
2
2
2
2
3
3
3
3
3
3
3
3
4
4
4
4
4
4
4
4
5
5
5
5
5
5
5
5
6
6
6
6
6
6
6
6
7
7
7
7
7
7
7
7
8
8
8
8
8
8
8
8
9
9
9
9
9
9
9
9
10
10
10
10
10
10
10
10
1
1
1
1
1
1
1
1
2
2
2
2
2
2
2
2
3
3
3
3
3
3
3
3
4
4
4
4
4
4
4
4
5
5
5
5
5
5
5
5
6
6
6
6
6
6
6
6
7
7
7
7
7
7
7
7
8
8
8
8
8
8
8
8
9
9
9
9
9
9
9
9
10
10
10
10
10
10
10
10
11
11
11
11
11
11
11
11
12
12
12
12
12
12
12
12
1 2 31 2
1 2
1 2
1 2
1 2
1 2
1 2
1 2
1 2
1 2
1 2
1 2
1 2
1 2
1 2
1 2
1 2
1 2
1 2
1 2
1 2
1 2
1 2
1 2
1 2 31 2 3
1 2 31 2 3
1 2 31 2 3
1 2 31 2 3
1 2 31 2 3
1 2 31 2 3
1 2 31 2 3
1 21 2
1 21 2
1 21 2
1 21 2
1 21 2
1 21 2
1 21 2
1 21 2
Seria
l Num
ber
11. Township 12. UrbanorRural
Curre
ntly a
ttend
ingPr
eviou
sly at
tende
dNe
ver a
ttend
ed
Emplo
ymen
t/in se
arch
for e
mploy
ment
Educ
ation
Marri
age
Follo
wed f
amily
Confl
ictDi
d not
move
Othe
r
20. Is (Name) currentlyattending,previously attended or never attendedschool/college?
16. Reason for movement to this township (usual residence)
21. What is the highest education grade/level (Name) completed?
None - 00Grade - 01-11College - 12Vocational training - 13Undergraduate diploma - 14Graduate - 15Postgraduate diploma - 16Masters Degree - 17PhD - 18Other - 19
15. Duration in place of usual residence (in years)
FOR ALL MEMBERS OF THE HOUSEHOLDMIGRATIONIDENTITY CARD EDUCATION LABOUR FORCE
Activity StatusPlace of Birth
Urba
nRu
ral
Place of Usual Residence
Urba
nRu
ral
AGE 5 AND ABOVE AGE 10 AND ABOVE
If less than 1 year write “00”
If born here write “000”, if not write Township code
Enter code from manual
13. Township 14. UrbanorRural
If here write “000”, if not write Township code
If options 6 to 11 skip to Q25
Enter code from manual
Place of Previous Usual Residence
Urba
nRu
ral
17. Township 18 . UrbanorRural
If here write “000”, if not write Township code
Enter code from manual
19. Can (Name) read and write in anylanguage?
Yes
No Emplo
yee (
Gove
rnme
nt)Em
ploye
e (Pr
ivate,
Org
)Em
ploye
rOw
n acc
ount
worke
rCo
ntribu
ting f
amily
wor
ker
Soug
ht wo
rkDi
d not
seek
wor
kFu
ll tim
e stud
ent
Hous
ehold
wor
kPe
nsion
er, re
tired,
elder
ly pe
rson
Ill, di
sable
dOt
her
22. What was (Name’s) activity status during the last 12 months? (April 2013 - March 2014)
10. Type of identity card
Citiz
ensh
ip Sc
rutin
y Car
d (pin
k)As
socia
te Sc
rutin
y Citiz
ensh
ip Ca
rd (b
lue)
Natur
alise
d Scru
tiny C
itizen
ship
Card
(gre
en)
Natio
nal R
egist
ratio
n Car
d (thr
ee fo
ld ca
rd,
gre
en fo
r men
, pink
for w
omen
)Re
ligiou
s Car
dTe
mpor
ary R
egist
ratio
n Car
d (wh
ite)
Fore
ign R
egist
ratio
n Car
d (F
RC)
Fore
ign P
assp
ort
None
of th
e doc
umen
ts ab
ove
Child
below
10 ye
ars
© DRS Data Services Limited [2013]/O03130813/IFQO
157
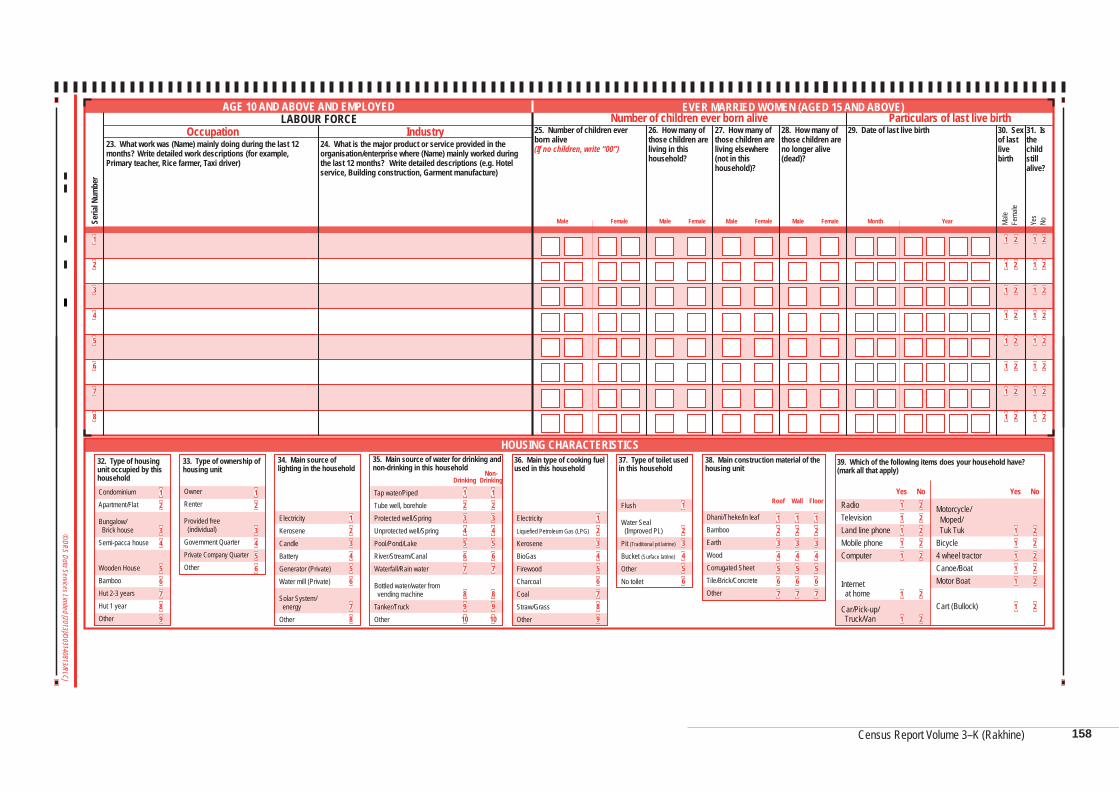
Census Report Volume 3–K (Rakhine)
1
2
3
4
5
6
7
8
1 2
1 2
1 2
1 2
1 2
1 2
1 2
1 2
1 2
1 2
1 2
1 2
1 2
1 2
1 2
1 2
1234567
89
10
12
3456
12
34
56789
1234567
89
10
123456789
123456
78
1234567
1234567
1234567
22222
2
2
11111
1
1
22222
2
11111
1
1
23456
Seria
l Num
ber
Male
23. What work was (Name) mainly doing during the last 12 months? Write detailed work descriptions (for example, Primary teacher, Rice farmer, Taxi driver)
24. What is the major product or service provided in the organisation/enterprise where (Name) mainly worked during the last 12 months? Write detailed descriptions (e.g. Hotel service, Building construction, Garment manufacture)
AGE 10 AND ABOVE AND EMPLOYED
25. Number of children ever born alive(If no children, write “00”)
26. How many of those children are living in this household?
27. How many of those children are living elsewhere (not in this household)?
28. How many of those children are no longer alive (dead)?
Female Female Female
EVER MARRIED WOMEN (AGED 15 AND ABOVE)
Male Male Month YearMale Female Yes
29. Date of last live birth 31. Is thechildstillalive?
NoMale
30. Sex of last livebirth
Fema
le
Number of children ever born aliveLABOUR FORCEOccupation Industry
Particulars of last live birth
HOUSING CHARACTERISTICS
ElectricityLiquefied Petroleum Gas (LPG)
KeroseneBioGasFirewoodCharcoalCoalStraw/GrassOther
Flush
Water Seal (Improved PL)Pit (Traditional pit latrine)
Bucket (Surface latrine)
OtherNo toilet
Dhani/Theke/In leafBambooEarthWoodCorrugated SheetTile/Brick/ConcreteOther
RadioTelevisionLand line phoneMobile phoneComputer
Internet at home
Car/Pick-up/ Truck/Van
Motorcycle/ Moped/ Tuk TukBicycle4 wheel tractorCanoe/BoatMotor Boat
Cart (Bullock)
CondominiumApartment/Flat
Bungalow/ Brick houseSemi-pacca house
Wooden HouseBambooHut 2-3 yearsHut 1 yearOther
Tap water/PipedTube well, boreholeProtected well/SpringUnprotected well/SpringPool/Pond/LakeRiver/Stream/CanalWaterfall/Rain water
Bottled water/water from vending machineTanker/TruckOther
ElectricityKeroseneCandleBatteryGenerator (Private)Water mill (Private)
Solar System/ energyOther
OwnerRenter
Provided free (individual)Government QuarterPrivate Company QuarterOther
34. Main source of lighting in the household
32. Type of housing unit occupied by this household
33. Type of ownership of housing unit
35. Main source of water for drinking and non-drinking in this household
36. Main type of cooking fuel used in this household
39. Which of the following items does your household have? (mark all that apply)
37. Type of toilet used in this household
38. Main construction material of the housing unit
DrinkingNon-
Drinking
FloorWallRoofYes No Yes No
© DRS Data Services Limited [2013]/O03140813/RLCJ
158
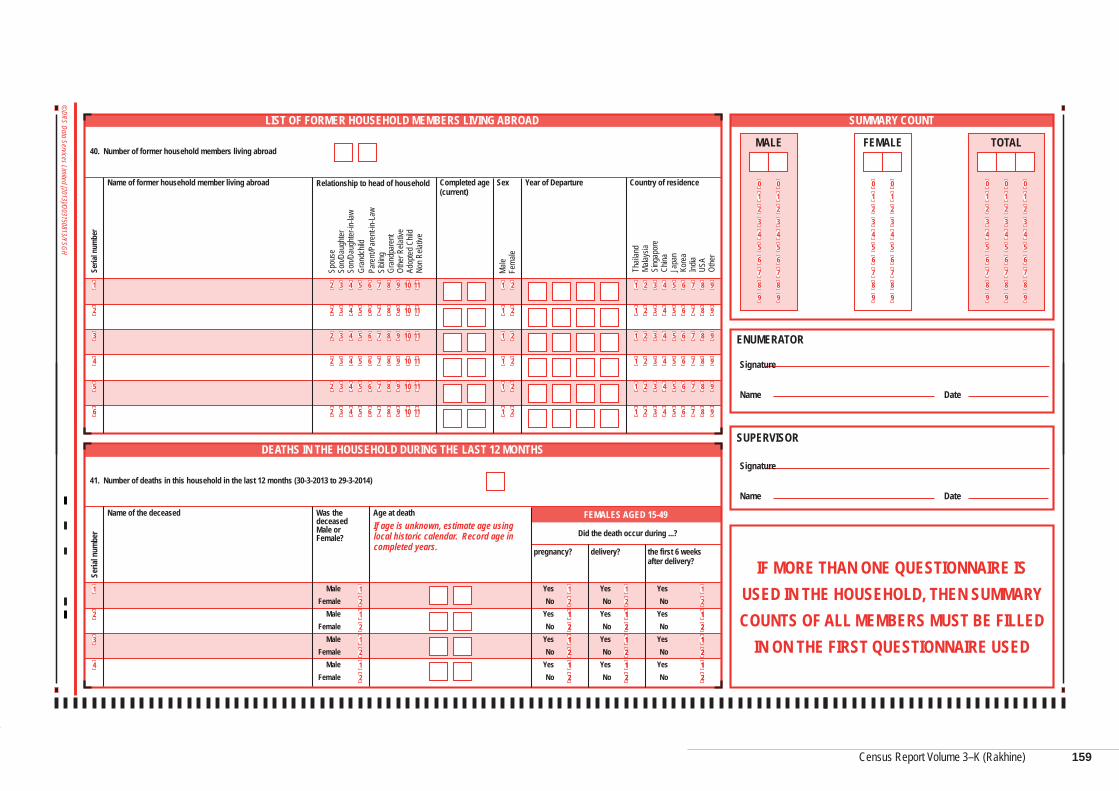
Census Report Volume 3–K (Rakhine)
Census Report Volume 3–K (Rakhine)
12
12
1212
1212
1
21
1
2
3
4
5
6
1
2
3
4
2 3 4 5 6 7 8 9 10 11
212 3 4 5 6 7 8 9 10 11
212 3 4 5 6 7 8 9 10 11
21
1
1
1
12 3 4 5 6 7 8 9
2 3 4 5 6 7 8 9
212 3 4 5 6 7 8 9 10 11 1 2 3 4 5 6 7 8 9
212 3 4 5 6 7 8 9 10 11 1 2 3 4 5 6 7 8 9
2 3 4 5 6 7 8 9
2 3 4 5 6 7 8 9
2 3 4 5 6 7 8 910 11
2
12121212
1212
12
12121212
1212
12
12121212
0123456789
0123456789
0123456789
0123456789
0123456789
0123456789
0123456789
SUMMARY COUNT
MALE FEMALE TOTAL
MaleFemale
Male
Fema
le
MaleFemale
MaleFemale
MaleFemale
Age at deathIf age is unknown, estimate age using local historic calendar. Record age in completed years.
41. Number of deaths in this household in the last 12 months (30-3-2013 to 29-3-2014)
40. Number of former household members living abroad
FEMALES AGED 15-49
Did the death occur during ...?
pregnancy? delivery? the first 6 weeks after delivery?
YesNo
YesNo
YesNo
YesNo
YesNo
YesNo
YesNo
YesNo
YesNo
YesNo
YesNo
YesNo
DEATHS IN THE HOUSEHOLD DURING THE LAST 12 MONTHS
LIST OF FORMER HOUSEHOLD MEMBERS LIVING ABROAD
Was the deceasedMale or Female?
Name of the deceased
Completed age (current)
Year of DepartureSex Country of residenceRelationship to head of householdName of former household member living abroad
Seria
l num
ber
Seria
l num
ber
ENUMERATOR
Signature
Date
SUPERVISOR
IF MORE THAN ONE QUESTIONNAIRE IS USED IN THE HOUSEHOLD, THEN SUMMARY COUNTS OF ALL MEMBERS MUST BE FILLED
IN ON THE FIRST QUESTIONNAIRE USED
Signature
Date
Name
Name
Spou
seSo
n/Dau
ghter
Son/D
augh
ter-in
-law
Gran
dchil
dPa
rent/
Pare
nt-in-
Law
Sibli
ngGr
andp
aren
tOt
her R
elativ
eAd
opted
Chil
dNo
n Rela
tive
Thail
and
Malay
siaSi
ngap
ore
China
Japa
nKo
rea
India
USA
Othe
r
© DRS Data Services Limited [2013]/O03150813/YSGH
159
Census Report Volume 3–K (Rakhine)
Annex 2: Definitions and Concepts
This section contains definitions of census terms and provides explanations which may be required to understand the census results. Most definitions contained here are based on the questions in the census questionnaires and the methodology applied in the various phases of the census process. The main concepts are detailed below.
Population: The population in this report corresponds to the de-facto population of Myanmar on Census Night (see below).
Census Enumeration: The process of visiting every household and interviewing the head of household or the most responsible member of a household in order to determine the number and characteristics of all persons and households in the country at a given time. The collection of this information is carried out through the completion of questionnaires for every conventional household and every institution.
Census Enumeration Area (EA): A Census Enumeration Area (EA) is a geographic unit down to the ward level in urban areas and the village tract level in rural areas, into which the whole country was divided for census purposes. For each EA an enumerator was deployed to undertake the enumeration within the census period. An EA contained on average 120 households.
Census Night: The night between the 29th and the 30th March 2014. Every person in Myanmar was enumerated where they spent the Census Night.
De-Facto Census: The de-facto census method enumerates persons at the place where they spend the Census Night. The census enumeration could also be carried out using a De jure approach where people are enumerated in their usual or legal place of residence. Although each approach has its own advantages and disadvantages, the de facto approach is easier to implement, it is closer to the reality of daily life and mitigates the possibility of omission and duplication. The 2014 MPHC was conducted based on the de facto approach.
Canvasser enumeration methods: There are two main methods of census enumeration, the canvasser and the householder approach. In the canvasser method, information for each individual or household is collected and recorded on the questionnaire by a pre-trained census enumerator. The householder method entails self-enumeration by each individual or household. Although the questionnaires are usually distributed, collected and checked by a census official, they can also be sent directly via mail or internet. The United Nations recommends that the canvasser method is more suitable for developing country populations or population groups who may find it difficult or who are unwilling to complete the census forms themselves. The canvasser method was used in the 2014 MPHC.
Structure: A structure is a building used for the purposes of residential, business, religious or any other activity. Only structures used for residential purposes were included in the 2014 MPHC. A structure can contain one or several housing units.
Housing Unit/Dwelling Unit: A housing unit is a place of abode or a residence occupied by one or more households. A housing unit must have a private entrance. As mentioned above, there can be one or several housing units within a structure.
160
Census Report Volume 3–K (Rakhine)
Conventional Household: A conventional household includes one or more persons who are either related or unrelated and share living quarters (single quarter or compound) and meals. The household members would be eating food prepared from the same cooking pot. In most cases, there would be one person acknowledged by the household members as the head of the household.
Institutional Household: An institutional household is a unit where a group of people are living together but it is not a conventional household. Examples include: old-people’s homes, orphanages, hospitals, boarding schools, hotels, hostels and guest houses, institutions for persons with disabilities, prisons, monasteries, convents, military and police barracks, and camps for workers.
Head of household: The head of a conventional household is the household member who makes key decisions and is recognised as head of the household by others. The head of household may be male or female. The person is not necessarily mainly responsible for earning the livelihood for the household. In the 2014 MPHC, if the head of household was not present on Census Night, the next most responsible member was reported as the de facto head.
Relationship to the Head of Household: Household members are defined by their relationship to the head of household (e.g. spouse, child, sister, brother).
Population Density: The population density relates to the number of persons in a given administrative area to the surface of the area, expressed in square kilometres (Km2). Areas covered by water are excluded from the calculation.
Rural area: Areas classified by the Department of General Administration (GAD) as village tracts. Generally these are areas with low population density and a land use which is predominantly agricultural.
Urban area: Areas classified by the GAD as wards. Generally these areas have an increased density of building structures, population and better infrastructural development.
Age: Number of years a person has lived at their last birthday in reference to the Census Night. When the age was not known, interviewers were trained to use other ways of establishing the age of the respondent, including calendars of events, conversion tables, etc. The interpretation of age information is given below:
a. The 0 (less than 1) year olds are those whose age is less than one year.
b. The 1 year olds are those aged 1 year or more but less than 2 years.
c. The 0-4 year age group are those aged less than 5 years.
d. The 5-9 year age group are those aged 5 years and more but less than 10 years.
e. The group 90+ included those aged 90 years or older.
Marital Status: Status of the enumerated person in relation to the institution of marriage. The marital status was described by five categories: Single/never married, married, widowed, divorced/separated and renounced.
161
Census Report Volume 3–K (Rakhine)
Disability: Disability is a situation where a person is at a greater risk than the general population of experiencing restrictions in performing routine activities (including activities of daily living) or participating in roles (such as work) if no supportive measures are offered. The difficulties covered in the 2014 census included:
a. Walking difficulty (wheel chairs, crutches, limping, problems climbing steps);
b. Seeing difficulty (low vision, blind);
c. Hearing difficulty (partially or completely deaf);
d. Mental/Intellectual difficulty (slow learning development making it hard to compete with their counterparts at school, other mental conditions).
Identity card: An identity card is a document used to verify aspects of a person's personal identity. There are several types of identity cards issued by the Government of Myanmar, and national passports in the case of foreigners.
Place of birth: This is the administrative township which was the usual place of residence of the mother at the time of the person’s birth. In the case of a person born outside Myanmar, the place of birth is the country where the person was born.
Place of usual residence: This is the administrative township where a person has lived for more than 6 months in the last 12 months or where she/he intends to live for more than 6 of the next 12 months.
Place of previous residence: This is the administrative township where a person usually lived before moving to the current place of usual residence. In cases where a person has not moved, the place of current usual residence and previous usual residence are the same.
Duration of residence: The number of completed years a person has lived in the township where he/she has his/her place of usual residence. This is the number of years a person has been continuously in this place without migrating to other places for long periods.
Education
Education is the process by which people learn through instruction and teaching. The 2014 MPHC placed an emphasis on literacy skills, school attendance and educational attainment. The other categorisations used under education were:
Literacy: The ability to read and write in any language with reasonable understanding.
School attendance: The attendance at any regular educational institution or systematic instruction at any level of education during the last 12 months. This included schooling at pre-primary, primary, middle, high school and tertiary institutions of higher learning. The options were: (a) Currently attending; (b) Attended previously; (c) Never attended.
Educational Attainment: The highest grade/standard/diploma/degree completed within the most advanced level attended in the education system of the country where the education was received. It covered both public and private institutions accredited by government.
162
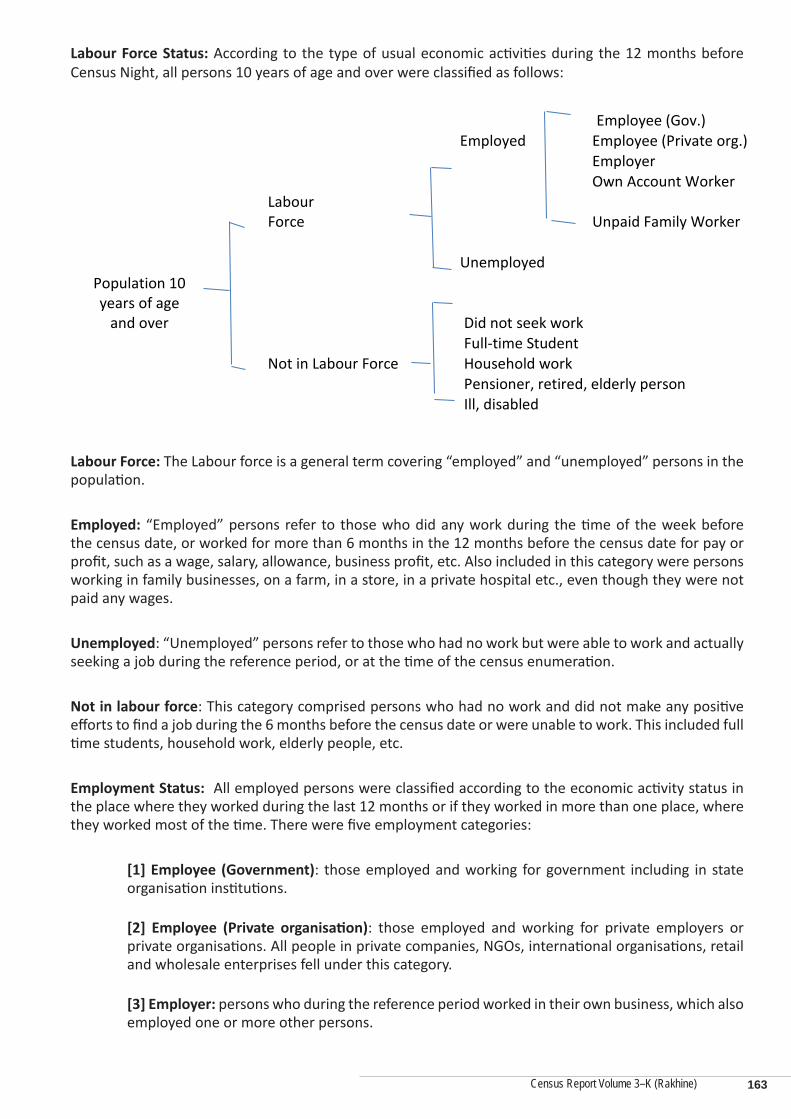
Census Report Volume 3–K (Rakhine)
Labour Force Status: According to the type of usual economic activities during the 12 months before Census Night, all persons 10 years of age and over were classified as follows:
Labour Force: The Labour force is a general term covering “employed” and “unemployed” persons in the population.
Employed: “Employed” persons refer to those who did any work during the time of the week before the census date, or worked for more than 6 months in the 12 months before the census date for pay or profit, such as a wage, salary, allowance, business profit, etc. Also included in this category were persons working in family businesses, on a farm, in a store, in a private hospital etc., even though they were not paid any wages.
Unemployed: “Unemployed” persons refer to those who had no work but were able to work and actually seeking a job during the reference period, or at the time of the census enumeration.
Not in labour force: This category comprised persons who had no work and did not make any positive efforts to find a job during the 6 months before the census date or were unable to work. This included full time students, household work, elderly people, etc.
Employment Status: All employed persons were classified according to the economic activity status in the place where they worked during the last 12 months or if they worked in more than one place, where they worked most of the time. There were five employment categories:
[1] Employee (Government): those employed and working for government including in state organisation institutions.
[2] Employee (Private organisation): those employed and working for private employers or private organisations. All people in private companies, NGOs, international organisations, retail and wholesale enterprises fell under this category.
[3] Employer: persons who during the reference period worked in their own business, which also employed one or more other persons.
Employee (Gov.)
Employed Employee (Private org.)
Employer
Own Account Worker
Labour Force
Unpaid Family Worker
Unemployed Population 10
years of age and over
Did not seek work
Full-time Student
Not in Labour Force
Household work
Pensioner, retired, elderly person
Ill, disabled
163
Census Report Volume 3–K (Rakhine)
[4] Own account worker: self-employed persons who worked in their own business or worked in their own/family business for family gain and did not have any employees.
[5] Unpaid family worker: persons who worked in a business, farm, trade or professional enterprise operated by a member of the household/family and received no pay.
Labour force participation rate: The labour force participation rate is the ratio between the labour force and the overall size of the total population of the same age range. This is an important indicator as it portrays the proportion of the population that is economically active.
Unemployment rate: The percentage of the total labour force that is unemployed but actively seeking employment and willing to work. These are people who are without work, looking for jobs and available for work.
Employment to population ratio: A statistical ratio that measures the proportion of the country's working-age population (ages 15 to 64) that is employed. The International Labour Organization (ILO) states that a person is considered employed if they have worked at least 1 hour in "gainful" employment in the most recent week.
Fertility: Fertility measures the average number of live births per women, according to their age and marital status. In the 2014 MPHC all ever married women aged 15 years and over were asked for information relating to all their live births.
Live Birth: A live birth is one where the infant shows one or more of the following signs of life immediately after birth: crying or similar sounds, movement of the limbs or any other parts of the body and/or any other tangible signs of life. The census was concerned only with children born alive. Also collected was information on the last live birth of ever married female respondents.
Sex ratio: The number of males for every 100 females in a population.
Total fertility rate (TFR): The average number of children that a woman would give birth to if all women lived to the end of their childbearing years and bore children according to the current schedule of age-specific fertility rates.
Age specific fertility rate (ASFR): The age-specific fertility rate measures the annual number of births to women of a specified age or age group per 1,000 women in that age group. Unless otherwise specified, the reference period for the age-specific fertility rates is the calendar year.
Dependency ratio: The total dependency ratio is the ratio of dependents (people younger than 15 years and older than 64) to the population of working-age (age 15-64). Data are shown as the proportion of dependents per 100 working-age population. Three different measures can be calculated: total dependency ratio, child dependency ratio and old age dependency ratio.
164
Census Report Volume 3–K (Rakhine) 165
References
1. Provisional Results; Census Report Volume (1): 2014 Myanmar Population and Housing Census: Ministry of Immigration and Population, Union of Myanmar, August 2014
2. The 1983 Population Census Report, Burma: Immigration and Manpower Department. The Socialist Republic of the Union of Burma, Ministry of Home and Religious Affairs
3. The 1973 Population Census Report (Union) – Myanmar version: Immigration and Manpower Department. The Socialist Republic of the Union of Burma, Ministry of Home and Religious Affairs
4. Overview of the Results of the 2010 Population Census; Population and Households of Japan, 2010: Statistics Bureau, Ministry of Internal Affairs and Communications, July 2013
5. Principles and Recommendations for Population and Housing Censuses, Series M No 67/Rev. 2; United Nations (2008)
6. Population, An Introduction to Concepts and Issues, Tenth Edition, San Diego State University; John R. Weeks (2008)
7. The Methods and Materials of Demography, Condensed Edition; Shyrock Henry S (1976).
8. Manual for the development of Statistical Information for Disability Programmes and Policies. Statistics Population Groups, No. 8. Sales No. E. 96.XVII.4, United Nations (1996)
9. Country Report on 2007 Fertility and Reproductive Health Survey, Department of Population, Ministry of Immigration and Population, Union of Myanmar
10. Step-by-Step Guide to the Estimation of Child Mortality; Department of International Economic and Social Affairs, Population Studies No. 107; United Nations New York 1990
To find out more information visit:
www.dop.gov.mm
http://myanmar.unfpa.org/census
The Main Results can be downloaded at:
www.dop.gov.mm
or
http://myanmar.unfpa.org/census