THE REPUBLIC OF THE UNION OF MYANMAR The 2014 Myanmar Populaon and Housing Census Department of Populaon Ministry of Labour, Immigraon and Populaon October 2017 Minbya Township Report RAKHINE STATE, MYAUK U DISTRICT

Welcome message from author
This document is posted to help you gain knowledge. Please leave a comment to let me know what you think about it! Share it to your friends and learn new things together.
Transcript

THE REPUBLIC OF THE UNION OF MYANMAR
The 2014 Myanmar Population and Housing Census
Department of Population
Ministry of Labour, Immigration and Population
October 2017
Minbya Township Report
RAKHINE STATE, MYAUK U DISTRICT


The 2014 Myanmar Population and Housing Census
Rakhine State, Myauk U District
Minbya Township Report
Department of Population
Ministry of Labour, Immigration and Population
Office No.48
Nay Pyi Taw
Tel: +95 67 431062
www.dop.gov.mm
October 2017

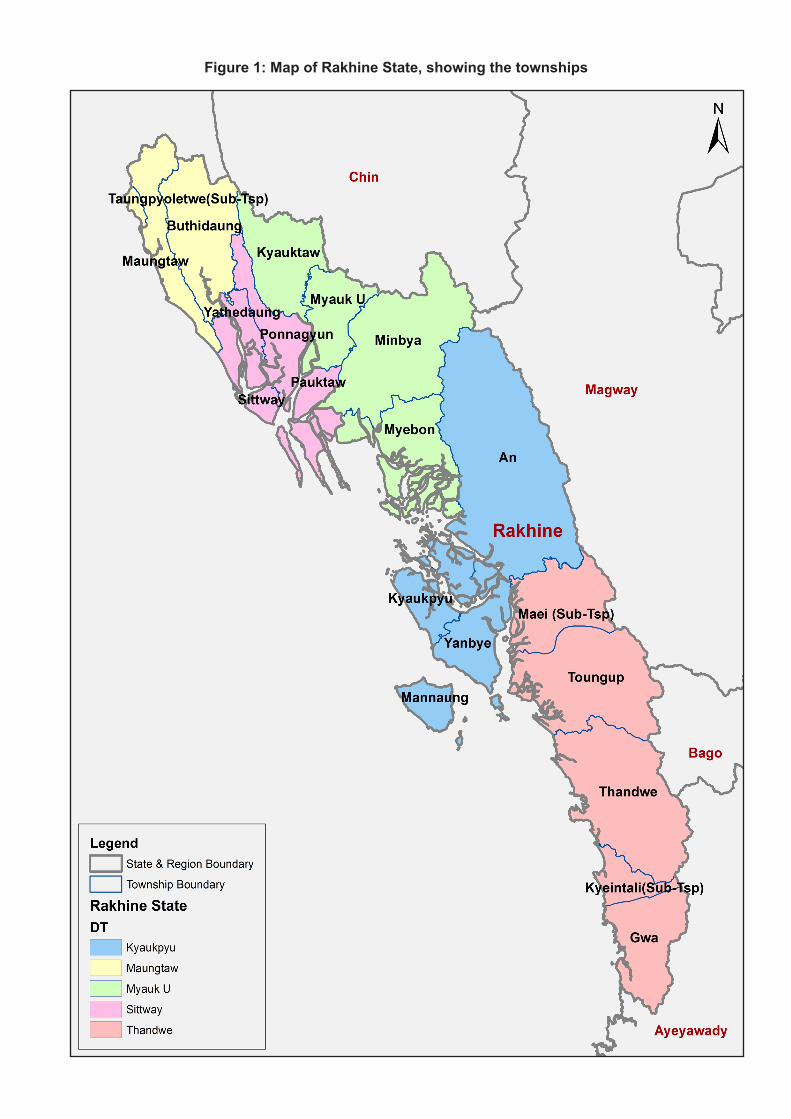
Figure 1: Map of Rakhine State, showing the townships


Minbya Township Figures at a Glance 1
Total PopulationEnumerated Population 169,208 2
Estimated Population 9,451Population males 78,875 (46.6%)Population females 90,333 (53.4%)Percentage of urban population 13.6%Area (Km2) 3,466.6 3
Population density (per Km2) 51.5 personsMedian age 23.5 years
Number of wards 3Number of village tracts 62Number of private households 36,628Percentage of female headed households 22.7%Mean household size 4.5 persons 4
Percentage of population by age groupChildren (0 – 14 years) 34.3%Economically productive (15 – 64 years) 60.3%
Elderly population (65+ years) 5.4%
Dependency ratiosTotal dependency ratio 66.0Child dependency ratio 57.0Old dependency ratio 9.0
Ageing index 15.8
Sex ratio (males per 100 females) 87
Literacy rate (persons aged 15 and over) 81.6%Male 90.1%Female 75.0%
People with disability Number Per centAny form of disability 10,250 6.1Walking 4,343 2.6Seeing 6,608 3.9Hearing 3,902 2.3Remembering 4,647 2.7

Type of Identity Card (persons aged 10 and over) Number Per centCitizenship Scrutiny 72,697 54.4Associate Scrutiny 35 <0.1Naturalised Scrutiny 70 0.1National Registration 148 0.1Religious 686 0.5Temporary Registration 345 0.3Foreign Registration * <0.1Foreign Passport 35 <0.1None 59,579 44.6
Labour Force (aged 15 – 64) Both sexes Male Female Labour force participation rate 58.4% 81.6% 39.7% Unemployment rate 18.2% 15.0% 23.5% Employment to population ratio 47.8% 69.4% 30.4%
Ownership of housing unit (Tenure) Number Per centOwner 34,236 93.5Renter 646 1.8Provided free (individually) 1,003 2.7Government quarters 662 1.8Private company quarters * 0.1Other 62 0.2
Material for housing Wall Floor RoofDhani/Theke/In leaf 10.2% 80.3%Bamboo 77.7% 45.6% 1.4%Earth 0.1% 0.8%Wood 9.2% 51.1% <0.1%Corrugated sheet 0.1% 17.7%Tile/Brick/Concrete 2.3% 2.0% 0.1%Other 0.3% 0.5% 0.4%
Main source of energy for cooking Number Per centElectricity 57 0.2LPG * <0.1Kerosene 513 1.4Biogas * <0.1Firewood 34,515 94.2Charcoal 1,334 3.6Coal 56 0.2Other 138 0.4
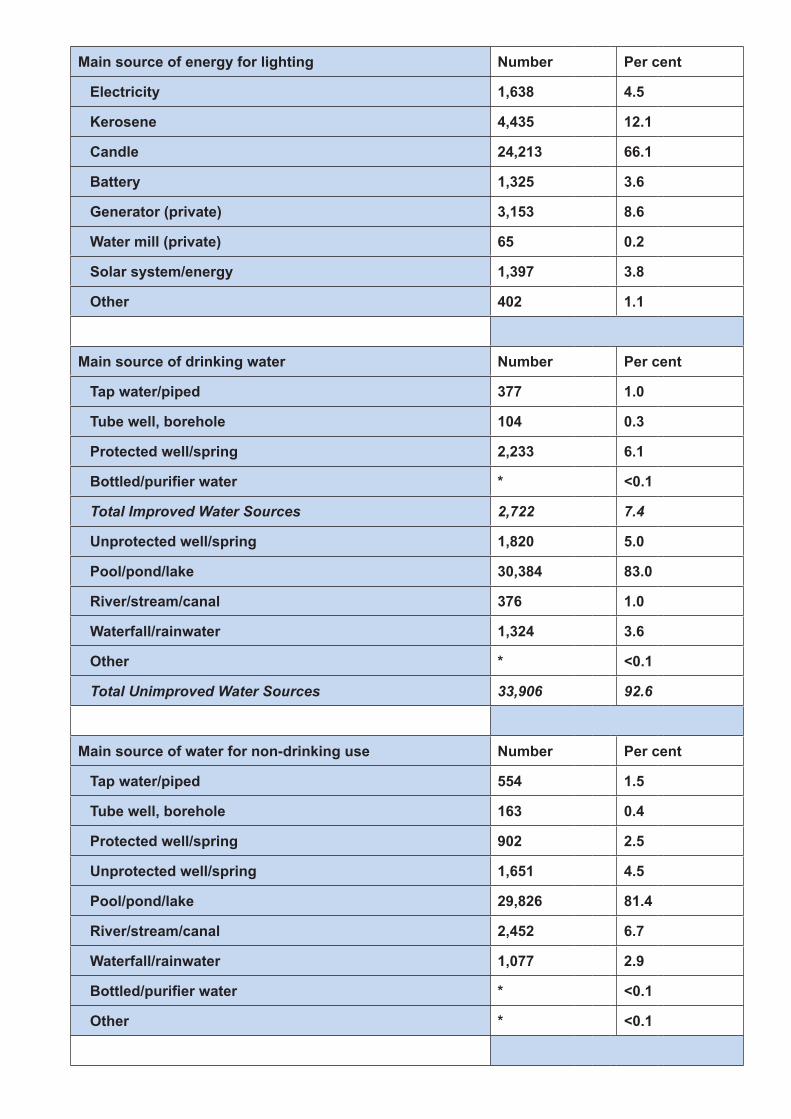
Main source of energy for lighting Number Per cent
Electricity 1,638 4.5
Kerosene 4,435 12.1
Candle 24,213 66.1
Battery 1,325 3.6
Generator (private) 3,153 8.6
Water mill (private) 65 0.2
Solar system/energy 1,397 3.8
Other 402 1.1
Main source of drinking water Number Per cent
Tap water/piped 377 1.0
Tube well, borehole 104 0.3
Protected well/spring 2,233 6.1
Bottled/purifier water * <0.1
Total Improved Water Sources 2,722 7.4
Unprotected well/spring 1,820 5.0
Pool/pond/lake 30,384 83.0
River/stream/canal 376 1.0
Waterfall/rainwater 1,324 3.6
Other * <0.1
Total Unimproved Water Sources 33,906 92.6
Main source of water for non-drinking use Number Per cent
Tap water/piped 554 1.5
Tube well, borehole 163 0.4
Protected well/spring 902 2.5
Unprotected well/spring 1,651 4.5
Pool/pond/lake 29,826 81.4
River/stream/canal 2,452 6.7
Waterfall/rainwater 1,077 2.9
Bottled/purifier water * <0.1
Other * <0.1
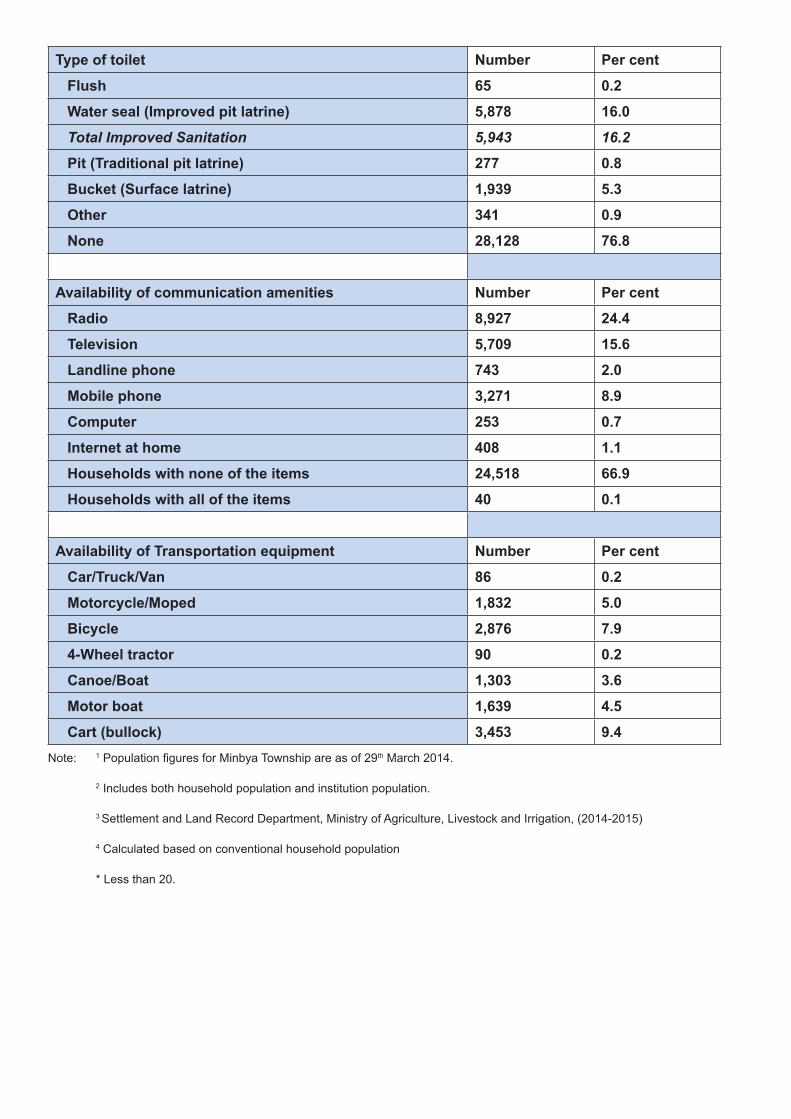
Type of toilet Number Per cent
Flush 65 0.2
Water seal (Improved pit latrine) 5,878 16.0
Total Improved Sanitation 5,943 16.2
Pit (Traditional pit latrine) 277 0.8
Bucket (Surface latrine) 1,939 5.3
Other 341 0.9
None 28,128 76.8
Availability of communication amenities Number Per cent
Radio 8,927 24.4
Television 5,709 15.6
Landline phone 743 2.0
Mobile phone 3,271 8.9
Computer 253 0.7
Internet at home 408 1.1
Households with none of the items 24,518 66.9
Households with all of the items 40 0.1
Availability of Transportation equipment Number Per cent
Car/Truck/Van 86 0.2
Motorcycle/Moped 1,832 5.0
Bicycle 2,876 7.9
4-Wheel tractor 90 0.2
Canoe/Boat 1,303 3.6
Motor boat 1,639 4.5
Cart (bullock) 3,453 9.4Note: 1 Population figures for Minbya Township are as of 29th March 2014.
2 Includes both household population and institution population.
3 Settlement and Land Record Department, Ministry of Agriculture, Livestock and Irrigation, (2014-2015)
4 Calculated based on conventional household population
* Less than 20.
1
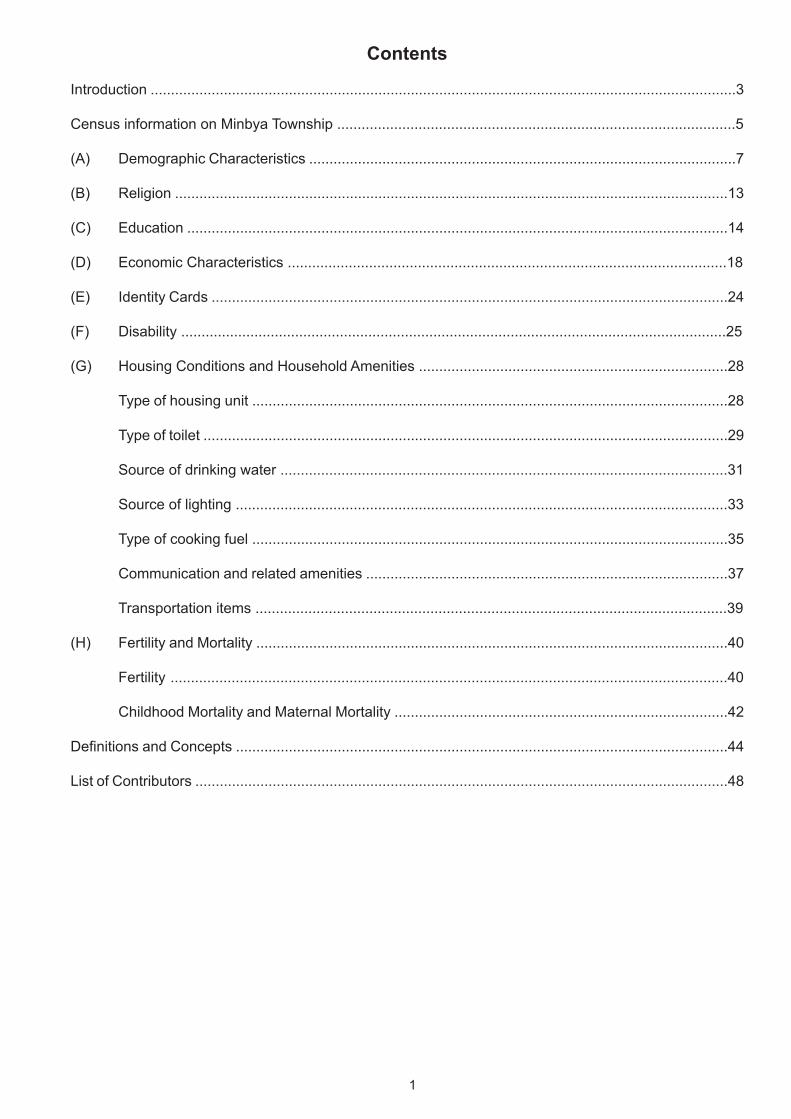
Contents
Introduction ................................................................................................................................................3
Census information on Minbya Township ..................................................................................................5
(A) Demographic Characteristics .........................................................................................................7
(B) Religion ........................................................................................................................................13
(C) Education .....................................................................................................................................14
(D) Economic Characteristics ............................................................................................................18
(E) Identity Cards ...............................................................................................................................24
(F) Disability ......................................................................................................................................25
(G) Housing Conditions and Household Amenities ............................................................................28
Type of housing unit .....................................................................................................................28
Type of toilet .................................................................................................................................29
Source of drinking water ..............................................................................................................31
Source of lighting .........................................................................................................................33
Type of cooking fuel .....................................................................................................................35
Communication and related amenities .........................................................................................37
Transportation items ....................................................................................................................39
(H) Fertility and Mortality ....................................................................................................................40
Fertility .........................................................................................................................................40
Childhood Mortality and Maternal Mortality ..................................................................................42
Definitions and Concepts .........................................................................................................................44
List of Contributors ...................................................................................................................................48


3
Introduction
In April 2014, the Government of the Republic of the Union of Myanmar conducted its latest census, after three decades without a Population and Housing Census. In the post-independence period, comprehensive population and housing censuses were only successfully undertaken in 1973, 1983 and most recently in April 2014.
Censuses are an important source of benchmark information on the characteristics of the population and households in every country. One unique feature of a census is its ability to provide information down to the lowest administrative level. Such information is vital for planning and evidence based decision-making at every level. Additional data uses include allocation of national resources; the review of administrative boundaries; the positioning of social infrastructures, drawing national development plans, service provision and developing social infrastructure, and for humanitarian preparedness and response.
The results of the 2014 Census have been published so far in a number of volumes. The first was the Provisional Results released in August 2014. The Census Main Results were launched in May 2015. These included The Union Report, Highlights of the Main Results, and reports of each of the 15 States and Regions. The reports on Occupation and Industry and Religion were launched in March 2016 and July 2016, respectively. All the publications are available online at http://www.dop.gov.mm/ and http://countryoffice. unfpa.org/myanmar/?publications.
The current set of the 2014 Census publications comprise township and sub-township reports. Their preparation involved collaborative efforts of the Department of Population and UNFPA. This report contains selected demographic and socio-economic characteristics of Minbya Township in Rakhine State. The information included in this report is the situation of 2014 March 29, Census night. The information presented in this report is based on the population and households that were enumerated during the census.
Township level information is very important. However, the level of confidence of township estimates is not the same as Union level information. Some of the townships have relatively small populations; the interpretation of these estimates should be made with caution. Some of the indicators, such as IMR/U5MR, were adopted only after careful analysis considering a number of factors to ensure consistency in the results. Estimates for townships with relatively small number of observations should not be taken as exact estimates of the mortality level, but rather they should be regarded as reasonable indicators for the scale of mortality risk they experience, an indication of which townships are better off and which are in a more vulnerable situation.

5
Census information on Minbya Township


7
(A) Demographic Characteristics
Total populationEnumerated population 169,208 *
Estimated population 9,451
Males 78,875
Females 90,333
Sex ratio 87 males per 100 females
Percentage of urban population 13.6 %
Area (Km2) 3,466.6 **
Population density (persons per Km2) 51.5 persons
Number of wards 3
Number of village tracts 62
Total Urban Rural
Population in conventional households 165,769 22,091 143,678
Number of conventional households 36,628 4,615 32,013
Mean household size 4.5 persons ***
• In Minbya Township, there are more females than males with 87 males per 100 females.
• The majority of the people in the Township live in rural areas with only (13.6%) living in urban areas.
• The population density of Minbya Township is 52 persons per square kilometre.
• There are 4.5 persons living in each household in Minbya Township. This is slightly more than to the Union average.
Note: * Includes both household population and institution population.
** Settlement and Land Record Department, Ministry of Agriculture, Livestock and Irrigation, (2014-2015)
*** Calculated based on conventional household population

8
Table 1: Population and number of conventional households by sex by ward and village tract; Minbya Township (Myauk U District, Rakhine State)
Total Males Females
Total 36,628 169,208 78,875 90,333 Ward 4,615 22,944 10,656 12,288
1 Zay Haung Paing(W) 1,874 9,356 4,363 4,993 2 Ah Lel Paing(W) 1,026 5,000 2,291 2,709 3 Auk Ywar Paing(W) 1,715 8,588 4,002 4,586
Village Tract 32,013 146,264 68,219 78,045
1 Kin Seik(VT) 814 3,837 1,760 2,077 2 Ywar Pyin(VT) 232 1,003 463 540 3 Chaik Taung(VT) 183 748 349 399 4 Taung Poet Gyi(VT) 601 2,684 1,243 1,441 5 Pan Zin Maw(VT) 241 1,065 492 573 6 Thein Taung(VT) 157 772 362 410 7 Nga/Wai(VT) 461 2,103 966 1,137 8 Bar Bu Taung(VT) 738 3,137 1,422 1,715
9 San Bar Lay(VT) 790 3,557 1,664 1,893 10 Na Yan(VT) 517 2,141 982 1,159 11 Pwint Htee(VT) 264 1,069 473 596 12 Than Shin(VT) 546 2,221 997 1,224 13 Sat Kyar(VT) 30 143 70 73 14 Ku Toet Seik(VT) 371 1,470 692 778 15 Win Zar(VT) 773 3,066 1,384 1,682 16 Pan Myaung(VT) 1,351 6,305 2,896 3,409 17 Na Ga Yar(VT) 560 2,801 1,320 1,481 18 Shwe Ta Mar(VT) 307 1,452 712 740 19 Min Hpu(VT) 845 4,164 1,940 2,224 20 Oe Pyin Taung(VT) 256 1,258 608 650 21 Pyin Yaung(VT) 541 2,618 1,236 1,382 22 Htein Pin(VT) 669 3,351 1,590 1,761 23 Thin Khaung Maw(VT) 282 1,201 530 671 24 Tha Toe(VT) 155 713 334 379
Sr Ward/Village TractNo. of
Conventional households
Population

9
Table 1: (Continued)
Total Males Females
25 Ku Lar Ma Taung(VT) 554 2,685 1,241 1,444 26 Done Gyi(VT) 448 1,910 880 1,030 27 Min Zi(VT) 571 2,764 1,293 1,471 28 Tat Yar(VT) 265 1,197 574 623 29 Hpon Thar Wa(VT) 836 3,968 1,874 2,094 30 Ngan Tet(VT) 510 2,397 1,165 1,232 31 Min Ku Lan(VT) 1,333 6,683 3,315 3,368 32 Sa Par Htar(VT) 123 584 250 334 33 Ah Wa(VT) 1,188 5,301 2,346 2,955 34 Thin Paung Chaung(VT) 575 2,595 1,169 1,426 35 Ah Htet Hnget Pyaw Chaung(VT) 906 3,983 1,952 2,031 36 May Lun(VT) 426 1,651 724 927 37 Kyaung Taung(VT) 1,280 6,143 3,226 2,917 38 Kay Tha Lar Pyun Wa(VT) 130 505 225 280 39 Kay Tha Lar Chaung Wa(VT) 657 2,660 1,220 1,440 40 Kywe Kyo(VT) 353 1,332 570 762 41 Taung Shey Pyin(VT) 594 2,851 1,407 1,444 42 Yin Bway(VT) 170 698 314 384 43 Yin Chaung(VT) 306 1,507 720 787 44 Auk Hnget Pyaw Chaung(VT) 130 537 229 308 45 Zin Yin Maw(VT) 450 2,134 1,033 1,101 46 Kyein Chaung(VT) 423 1,765 823 942 47 Hpa Laung Pyin(VT) 790 3,588 1,549 2,039 48 Thin Ga Net(VT) 454 2,085 938 1,147 49 Chaw Chaung(VT) 890 4,046 1,768 2,278 50 Thar Yar Kone(VT) 1,101 5,261 2,397 2,864 51 Yan Htaing(VT) 1,038 4,807 2,245 2,562 52 Khway Tauk Chaung(VT) 430 1,828 821 1,007 53 Aing Wan(VT) 459 2,042 973 1,069
Sr Ward/Village TractNo. of
Conventional households
Population

10
Table 1: (Continued)
Total Males Females
54 Oke Ta Rar(VT) 123 466 227 239 55 La Har Kyay(VT) 213 1,056 509 547 56 Kywe Tet(VT) 144 688 331 357 57 Khaung Laung Chaung(VT) 674 3,012 1,377 1,635 58 Sun Ye(VT) 648 3,310 1,545 1,765 59 Kyaung Yae Chaung(VT) 313 1,405 656 749 60 That Pone(VT) 255 1,120 537 583 61 Chaung Shey(VT) 306 1,604 782 822 62 Pale Pauk(VT) 263 1,217 529 688
Sr Ward/Village TractNo. of
Conventional households
Population

11
Figure 2: Population by broad age groups, Minbya Township
Table 2: Population by 5-year age groups, Minbya Township
• The proportion of productive working population between 15 to 64 years of age in Minbya Township is 60.3 per cent.
• The proportion of children aged 14 and below together with the proportion of the elderly aged 65 and over are less than the proportion of the working age group population.
• Fewer proportions of children and elderly reduce the dependency of those age groups on the working age population.
Age groups Total Males Females
Total 169,208 78,875 90,333 0 - 4 15,087 7,568 7,519 5 - 9 20,525 10,301 10,224 10 - 14 22,497 11,316 11,181 15 - 19 17,039 8,120 8,919 20 - 24 13,186 5,498 7,688 25 - 29 13,138 5,531 7,607 30 - 34 11,020 4,839 6,181 35 - 39 9,646 4,313 5,333 40 - 44 9,161 3,918 5,243 45 - 49 8,834 4,053 4,781 50 - 54 8,426 3,842 4,584 55 - 59 6,739 3,226 3,513 60 - 64 4,735 2,239 2,496 65 - 69 3,431 1,599 1,832 70 - 74 2,306 1,071 1,235 75 - 79 1,720 770 950 80 - 84 1,077 455 622 85 - 89 441 140 301 90 + 200 76 124

12
Figure 3: Population pyramid (Union, Rakhine State, Myauk U District and Minbya Township)
• The birth rate has been noticeably declining in Minbya Township since the last 10 years.
• The population has markedly declined from age group 15-19 onwards.
• Compared to Union level, there is a smaller percentage of working age group 15-64 population in Minbya Township.
• Starting from age group 15-19, there are less males than females in all age groups.

13
(B) Religion
• At the Union level, the composition of the population by religion is: 87.9% Buddhist, 6.2% Christian, 4.3% Islam, 0.5% Hindu, 0.8% Animist, 0.2% Other religion and 0.1% No religion.
• In Rakhine State, it is 96.2% Buddhist, 1.8% Christian, 1.4% Islam, 0.5% Hindu, 0.1% Animist, and less than 0.1% each for Other religion and those with No religion respectively.
Note: * Less than 0.1 per cent.

14
(C) Education
Table 3: Population aged 5 - 29 and current school attendance by sex by age
Total Males Females Total Males Females
5 4,050 2,041 2,009 1,623 789 834
6 3,981 2,005 1,976 2,970 1,497 1,473
7 4,274 2,178 2,096 3,495 1,777 1,718
8 4,096 1,980 2,116 3,442 1,664 1,778
9 4,041 2,029 2,012 3,418 1,727 1,691
10 4,414 2,184 2,230 3,635 1,800 1,835
11 3,874 1,921 1,953 3,090 1,552 1,538
12 4,889 2,352 2,537 3,669 1,799 1,870
13 4,935 2,446 2,489 3,172 1,690 1,482
14 3,781 1,818 1,963 1,823 975 848
15 3,734 1,842 1,892 1,259 723 536
16 3,208 1,519 1,689 717 403 314
17 2,851 1,327 1,524 453 237 216
18 4,002 1,777 2,225 333 186 147
19 2,550 1,086 1,464 213 106 107
20 3,191 1,294 1,897 154 81 73
21 2,098 871 1,227 71 48 23
22 2,441 960 1,481 63 31 32
23 2,559 1,033 1,526 43 19 24
24 2,414 930 1,484 35 15 20
25 3,422 1,401 2,021 36 22 14
26 2,238 945 1,293 30 10 20
27 2,302 942 1,360 30 19 11
28 2,807 1,112 1,695 28 13 15
29 2,021 827 1,194 16 10 6
Total population Currently attendingAge

15
• School attendance in Minbya Township drops after age 11 for both males and females.
• Compared to the Union, the school attendance of males and females in Minbya Township are decreasing starting from age 14.

16
Figure 7: Literacy rate, Rakhine State (aged 15 and over)
Union : 89.5%
Rakhine State : 84.7%
Myauk U District : 82.9%
Minbya Township : 81.6%

17
Table 4: Youth literacy rate (15 - 24), Minbya Township
• The literacy rate of those aged 15 and over in Minbya Township is 81.6 per cent. It is lower than the literacy rate of Rakhine State (84.7%) and the Union (89.5%). Female literacy rate is 75.0 per cent and for the males it is 90.1 per cent.
• The literacy rate for youth aged 15-24 is 89.2 per cent with 86.6 per cent for females and 92.7 per cent for males.
Table 5: Population aged 25 and over by highest level of education completed, urban/rural and sex
• Some 24.5 per cent of the population aged 25 and over have never been to school.
• Of the rural population aged 25 and over, 25.5 per cent have never been to school.
• There are 16.6 per cent of males aged 25 and over who have never attended school as against 30.9 per cent for females.
• Among those aged 25 and over, 18.8 per cent has completed primary school (grade 5) and only 2.9 per cent has completed university/college education.
SexTotal
Population(15 - 24)
Literacy Rate(15 - 24)
Total 29,048 89.2
Males 12,639 92.7
Females 16,409 86.6
(grade 1 - 4) (grade 5)
Total 80,874 19,836 24.5 29,304 15,192 10,321 3,184 107 2,334 80 51 465
Urban 11,756 2,193 18.7 2,605 1,870 2,304 1,302 28 1,336 29 16 73
Rural 69,118 17,643 25.5 26,699 13,322 8,017 1,882 79 998 51 35 392
Males 36,072 5,986 16.6 11,603 8,318 6,397 1,983 89 1,272 53 37 334
Females 44,802 13,850 30.9 17,701 6,874 3,924 1,201 18 1,062 27 14 131
OtherTotal None % Never attended
Primary school Middle school(grade 6 - 9)
High school (grade 10 - 11)
Diploma University/ College
Post-graduate and above
Vocational training

18
(D) Economic CharacteristicsTable 6: Population aged 10 and over by labour force participation rate and unemployment rate
by sex and age group
Total Males Females Total Males Females
10 - 14 11.2 11.0 11.5 59.5 57.8 61.2
15 - 19 50.6 58.1 43.8 50.5 46.9 54.7
20 - 24 59.3 81.1 43.7 34.0 30.5 38.6
25 - 29 60.1 86.7 40.7 19.9 16.6 25.1
30 - 34 60.8 88.8 38.9 11.2 8.7 15.5
35 - 39 61.6 89.2 39.3 7.2 6.0 9.4
40 - 44 61.2 90.3 39.4 5.7 4.7 7.4
45 - 49 62.1 90.1 38.4 4.7 3.8 6.4
50 - 54 60.3 89.1 36.2 4.3 3.4 6.2
55 - 59 60.3 86.6 36.2 4.0 3.4 5.4
60 - 64 49.1 74.1 26.6 4.3 3.9 5.4
65 - 69 40.5 61.6 22.1 3.3 2.8 4.4
70 - 74 28.7 46.0 13.7 4.5 4.1 5.9
75 + 13.5 22.6 6.9 5.0 2.1 11.7
15 - 24 54.4 67.4 43.8 42.6 38.9 47.2
15 - 64 58.4 81.6 39.7 18.2 15.0 23.5
Age groupsLabour Force Participation Rate Unemployment Rate
19
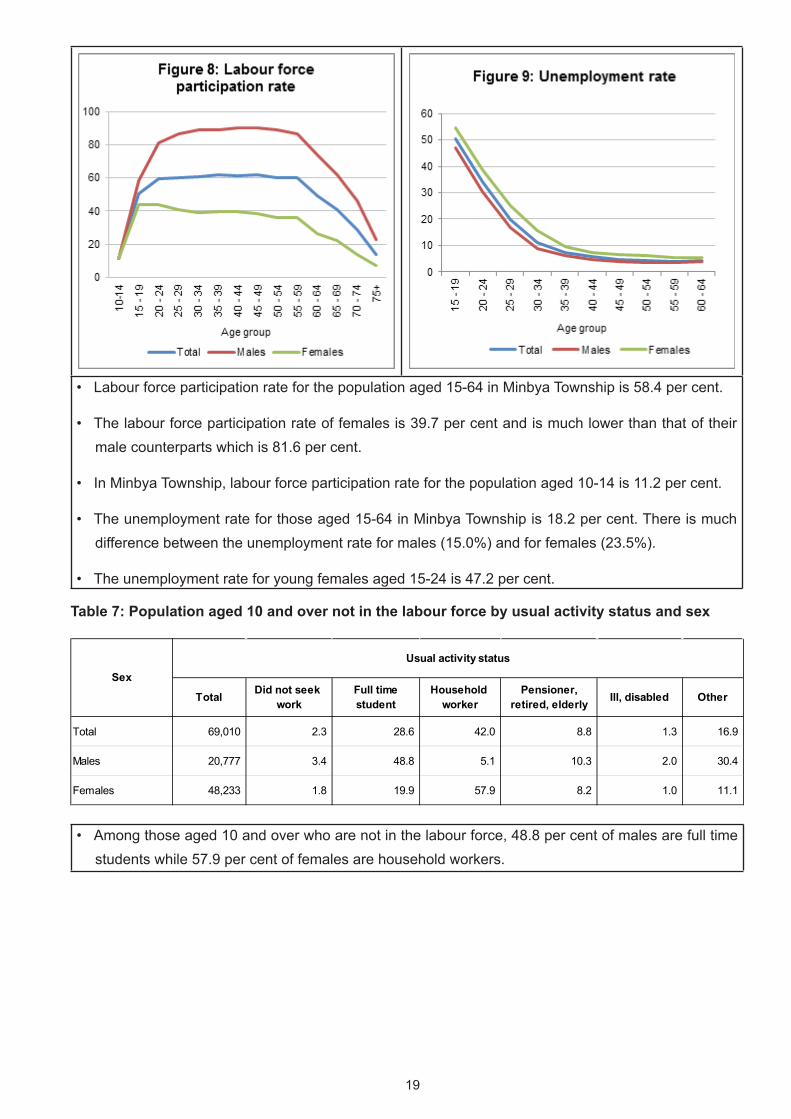
• Labour force participation rate for the population aged 15-64 in Minbya Township is 58.4 per cent.
• The labour force participation rate of females is 39.7 per cent and is much lower than that of their male counterparts which is 81.6 per cent.
• In Minbya Township, labour force participation rate for the population aged 10-14 is 11.2 per cent.
• The unemployment rate for those aged 15-64 in Minbya Township is 18.2 per cent. There is much difference between the unemployment rate for males (15.0%) and for females (23.5%).
• The unemployment rate for young females aged 15-24 is 47.2 per cent.
Table 7: Population aged 10 and over not in the labour force by usual activity status and sex
• Among those aged 10 and over who are not in the labour force, 48.8 per cent of males are full time students while 57.9 per cent of females are household workers.
Total Did not seek work
Full timestudent
Household worker
Pensioner,retired, elderly Ill, disabled Other
Total 69,010 2.3 28.6 42.0 8.8 1.3 16.9
Males 20,777 3.4 48.8 5.1 10.3 2.0 30.4
Females 48,233 1.8 19.9 57.9 8.2 1.0 11.1
SexUsual activity status

20
Table 8: Employed persons aged 15 - 64 by occupation by sex
Total Males Females Total Males Females
Total 47,207 30,280 16,927 100.0 100.0 100.0
Managers 299 245 54 0.6 0.8 0.3
Professionals 1,055 388 667 2.2 1.3 3.9
Technicians and Associate Professionals 1,063 896 167 2.3 3.0 1.0
Clerical Support Workers 450 331 119 1.0 1.1 0.7
Services and Sales Workers 3,834 1,439 2,395 8.1 4.8 14.1
Skilled Agricultural, Forestry and Fishery Workers 15,825 12,415 3,410 33.5 41.0 20.1
Craft and Related Trades Workers 3,188 2,219 969 6.8 7.3 5.7
Plant and Machine Operators and Assemblers 670 587 83 1.4 1.9 0.5
Elementary Occupations 13,404 9,725 3,679 28.4 32.1 21.7
Others - - - - - -
Not stated 7,419 2,035 5,384 15.7 6.7 31.8
Employed persons Per centOccupation
21
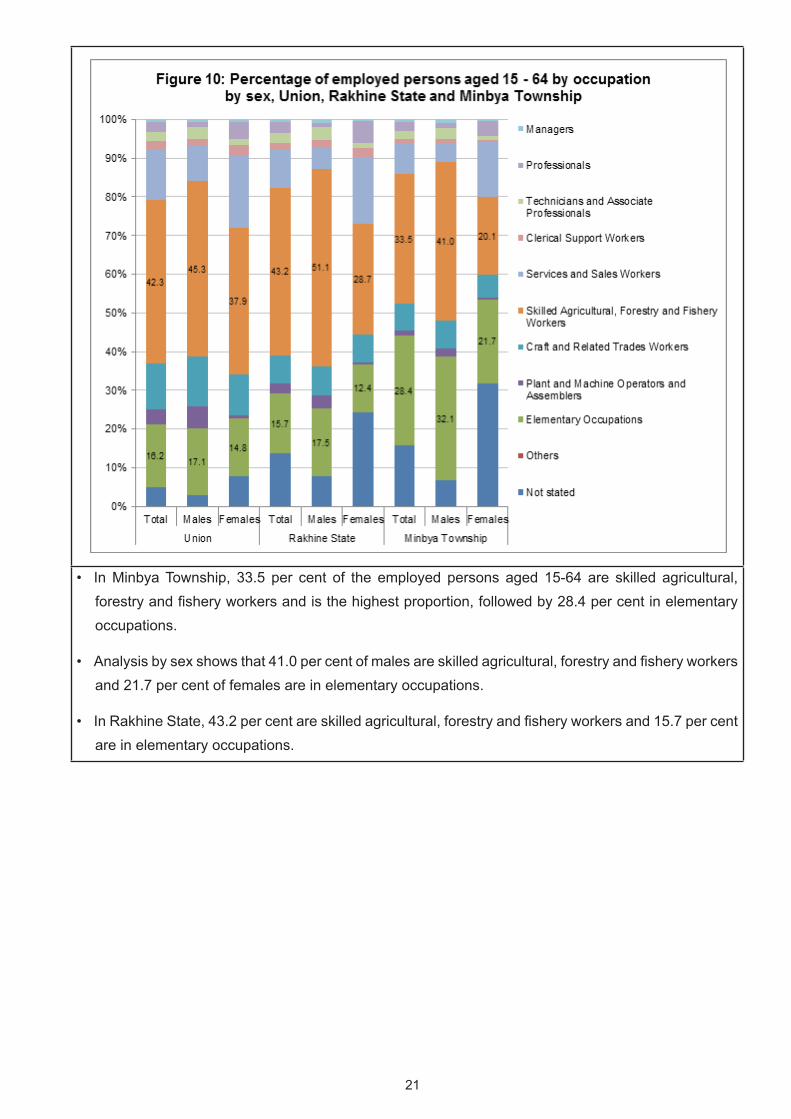
• In Minbya Township, 33.5 per cent of the employed persons aged 15-64 are skilled agricultural, forestry and fishery workers and is the highest proportion, followed by 28.4 per cent in elementary occupations.
• Analysis by sex shows that 41.0 per cent of males are skilled agricultural, forestry and fishery workers and 21.7 per cent of females are in elementary occupations.
• In Rakhine State, 43.2 per cent are skilled agricultural, forestry and fishery workers and 15.7 per cent are in elementary occupations.

22
Table 9: Employed persons aged 15 - 64 by industry by sex
Note: * Less than 0.1 per cent.
Total Males Females Total Males Females
Total 47,207 30,280 16,927 100.0 100.0 100.0
Agriculture, forestry and fishing 24,921 19,279 5,642 52.8 63.7 33.3
Mining and quarrying 181 160 21 0.4 0.5 0.1
Manufacturing 1,446 631 815 3.1 2.1 4.8
Electricity, gas, steam and air conditioning supply 17 17 - * 0.1 -
Water supply; sewerage, waste management and remediation activities 16 7 9 * * 0.1
Construction 1,376 1,059 317 2.9 3.5 1.9
Wholesale and retail trade; repair of motor vehicles and motorcycles 2,899 1,330 1,569 6.1 4.4 9.3
Transportation and storage 724 668 56 1.5 2.2 0.3
Accommodation and food service activities 1,279 350 929 2.7 1.2 5.5
Information and communication 24 18 6 0.1 0.1 *
Financial and insurance activities 29 17 12 0.1 0.1 0.1
Real estate activities - - - - - -
Professional, scientific and technical activities 26 21 5 0.1 0.1 *
Administrative and support service activities 61 43 18 0.1 0.1 0.1
Public administration including civil servants 1,168 1,038 130 2.5 3.4 0.8
Education 1,146 450 696 2.4 1.5 4.1
Human health and social work activities 163 84 79 0.3 0.3 0.5
Arts, entertainment and recreation 32 24 8 0.1 0.1 *
Other service activities 2,137 1,504 633 4.5 5.0 3.7
Activities of households as employers; undifferentiated goods- and services- producing activities of households for own use
1,170 804 366 2.5 2.7 2.2
Activities of extraterritorial organizations and bodies - - - - - -
Not stated 8,392 2,776 5,616 17.8 9.2 33.2
Employed persons Per centIndustry

23
• In Minbya Township, the proportion of employed persons working in the industry of “Agriculture, forestry and fishing” is the highest with 52.8 per cent.
• There are 63.7 per cent of males and 33.3 per cent of females working in “Agriculture, forestry and fishing” industry.
• In Rakhine State, there are 51.2 per cent of employed population working in “Agriculture, forestry and fishing” industry.

24
(E) Identity Cards
Table 10: Population aged 10 and over by type of identity card, urban/rural and sex
Note: * Less than 20 cards.
• In Minbya Township, 54.4 per cent of the population aged 10 and over have Citizenship Scrutiny Card while 44.6 per cent have none.
• Analysis by sex shows that 37.2 per cent of males and 50.8 per cent of females do not have any type of card.
Note: * Less than 0.1 per cent.
Citizenship Scrutiny Card
Associate Scrutiny Card
Naturalised Scrutiny
Card
National Registration
Card
Religious Card
Temporary Registration
Card
Foreign Registration
Card
Foreign Passport None
Total 72,697 35 70 148 686 345 * 35 59,579
Urban 12,641 4 40 13 312 77 - 2 5,946
Rural 60,056 31 30 135 374 268 * 33 53,633
Males 37,390 14 43 54 665 153 - 9 22,678
Females 35,307 21 27 94 21 192 * 26 36,901
25
(F) Disability
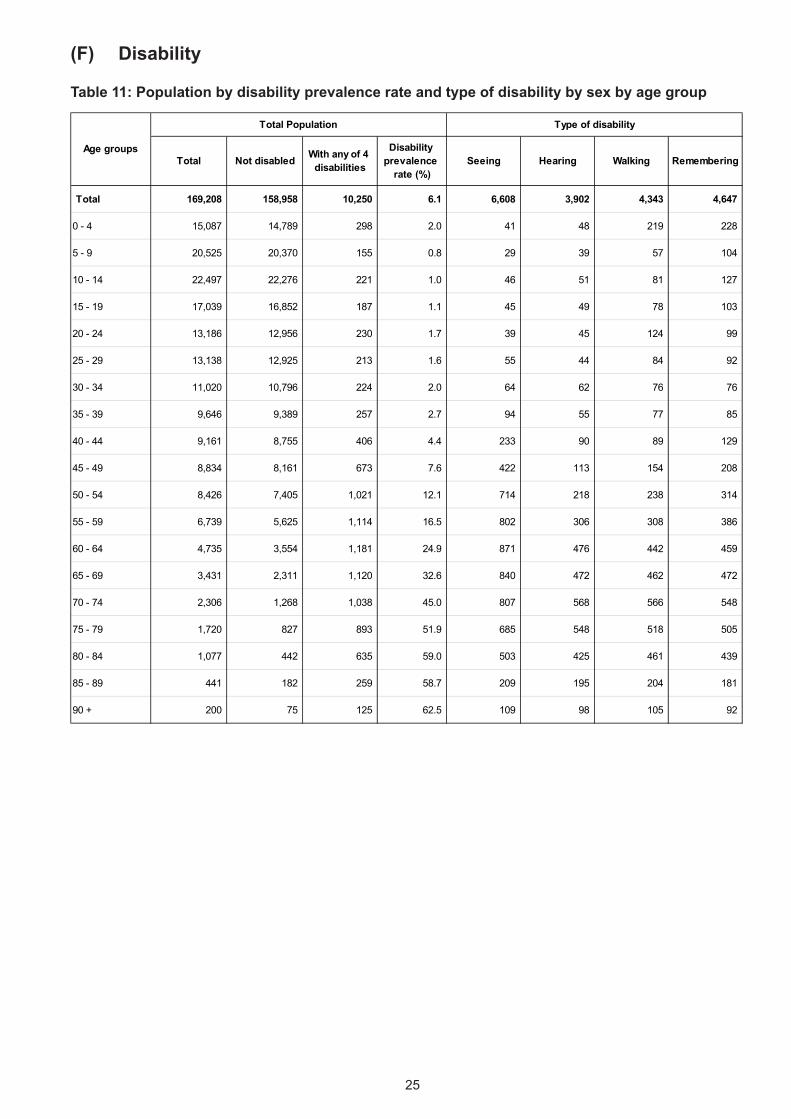
Table 11: Population by disability prevalence rate and type of disability by sex by age group
Total Not disabled With any of 4 disabilities
Disability prevalence
rate (%)Seeing Hearing Walking Remembering
Total 169,208 158,958 10,250 6.1 6,608 3,902 4,343 4,647
0 - 4 15,087 14,789 298 2.0 41 48 219 228
5 - 9 20,525 20,370 155 0.8 29 39 57 104
10 - 14 22,497 22,276 221 1.0 46 51 81 127
15 - 19 17,039 16,852 187 1.1 45 49 78 103
20 - 24 13,186 12,956 230 1.7 39 45 124 99
25 - 29 13,138 12,925 213 1.6 55 44 84 92
30 - 34 11,020 10,796 224 2.0 64 62 76 76
35 - 39 9,646 9,389 257 2.7 94 55 77 85
40 - 44 9,161 8,755 406 4.4 233 90 89 129
45 - 49 8,834 8,161 673 7.6 422 113 154 208
50 - 54 8,426 7,405 1,021 12.1 714 218 238 314
55 - 59 6,739 5,625 1,114 16.5 802 306 308 386
60 - 64 4,735 3,554 1,181 24.9 871 476 442 459
65 - 69 3,431 2,311 1,120 32.6 840 472 462 472
70 - 74 2,306 1,268 1,038 45.0 807 568 566 548
75 - 79 1,720 827 893 51.9 685 548 518 505
80 - 84 1,077 442 635 59.0 503 425 461 439
85 - 89 441 182 259 58.7 209 195 204 181
90 + 200 75 125 62.5 109 98 105 92
Age groups
Total Population Type of disability
26
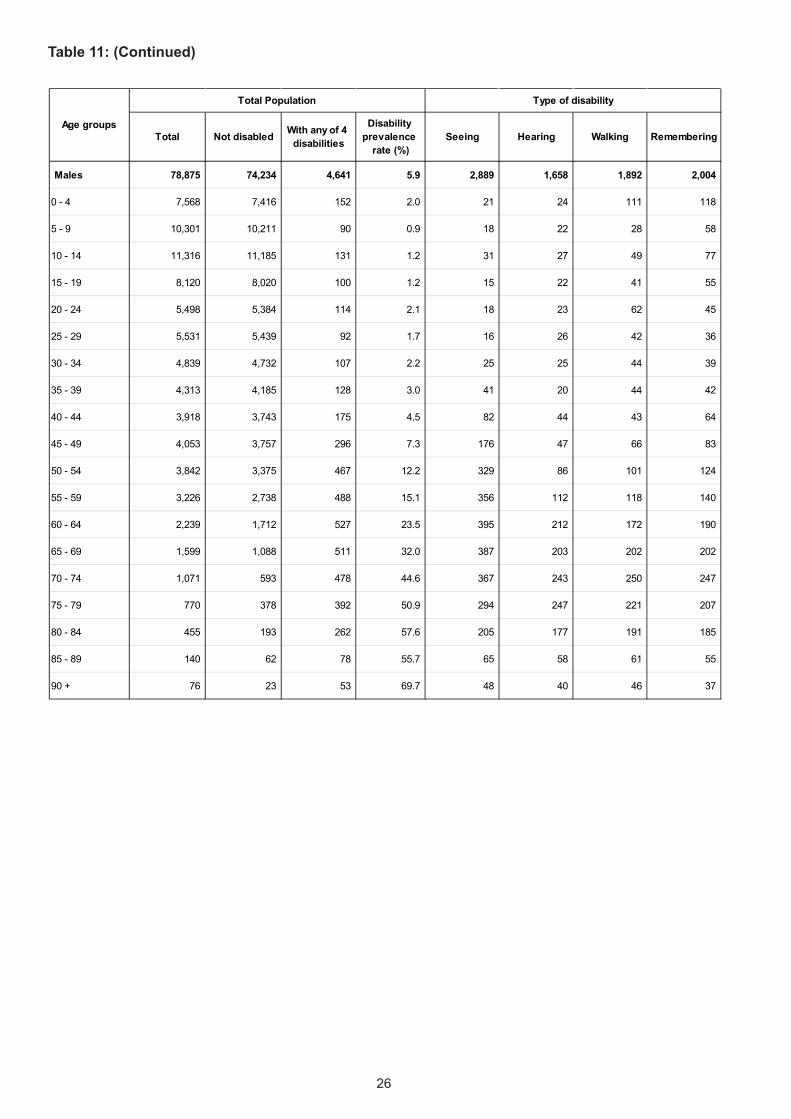
Table 11: (Continued)
Total Not disabled With any of 4 disabilities
Disability prevalence
rate (%)Seeing Hearing Walking Remembering
Males 78,875 74,234 4,641 5.9 2,889 1,658 1,892 2,004
0 - 4 7,568 7,416 152 2.0 21 24 111 118
5 - 9 10,301 10,211 90 0.9 18 22 28 58
10 - 14 11,316 11,185 131 1.2 31 27 49 77
15 - 19 8,120 8,020 100 1.2 15 22 41 55
20 - 24 5,498 5,384 114 2.1 18 23 62 45
25 - 29 5,531 5,439 92 1.7 16 26 42 36
30 - 34 4,839 4,732 107 2.2 25 25 44 39
35 - 39 4,313 4,185 128 3.0 41 20 44 42
40 - 44 3,918 3,743 175 4.5 82 44 43 64
45 - 49 4,053 3,757 296 7.3 176 47 66 83
50 - 54 3,842 3,375 467 12.2 329 86 101 124
55 - 59 3,226 2,738 488 15.1 356 112 118 140
60 - 64 2,239 1,712 527 23.5 395 212 172 190
65 - 69 1,599 1,088 511 32.0 387 203 202 202
70 - 74 1,071 593 478 44.6 367 243 250 247
75 - 79 770 378 392 50.9 294 247 221 207
80 - 84 455 193 262 57.6 205 177 191 185
85 - 89 140 62 78 55.7 65 58 61 55
90 + 76 23 53 69.7 48 40 46 37
Age groups
Total Population Type of disability

27
Table 11: (Continued)
• Six in every 100 persons in Minbya Township have, at least, one form of disability.
• Slightly more females than males have disability.
• The prevalence of disability increases with age and it increases considerably after the age of 60.
• Difficulties with seeing and remembering were the most commonly mentioned forms of disability in the Township.
Total Not disabled With any of 4 disabilities
Disability prevalence
rate (%)Seeing Hearing Walking Remembering
Females 90,333 84,724 5,609 6.2 3,719 2,244 2,451 2,643
0 - 4 7,519 7,373 146 1.9 20 24 108 110
5 - 9 10,224 10,159 65 0.6 11 17 29 46
10 - 14 11,181 11,091 90 0.8 15 24 32 50
15 - 19 8,919 8,832 87 1.0 30 27 37 48
20 - 24 7,688 7,572 116 1.5 21 22 62 54
25 - 29 7,607 7,486 121 1.6 39 18 42 56
30 - 34 6,181 6,064 117 1.9 39 37 32 37
35 - 39 5,333 5,204 129 2.4 53 35 33 43
40 - 44 5,243 5,012 231 4.4 151 46 46 65
45 - 49 4,781 4,404 377 7.9 246 66 88 125
50 - 54 4,584 4,030 554 12.1 385 132 137 190
55 - 59 3,513 2,887 626 17.8 446 194 190 246
60 - 64 2,496 1,842 654 26.2 476 264 270 269
65 - 69 1,832 1,223 609 33.2 453 269 260 270
70 - 74 1,235 675 560 45.3 440 325 316 301
75 - 79 950 449 501 52.7 391 301 297 298
80 - 84 622 249 373 60.0 298 248 270 254
85 - 89 301 120 181 60.1 144 137 143 126
90 + 124 52 72 58.1 61 58 59 55
Age groups
Total Population Type of disability
28
(G) Housing Conditions and Household Amenities
Type of housing unit
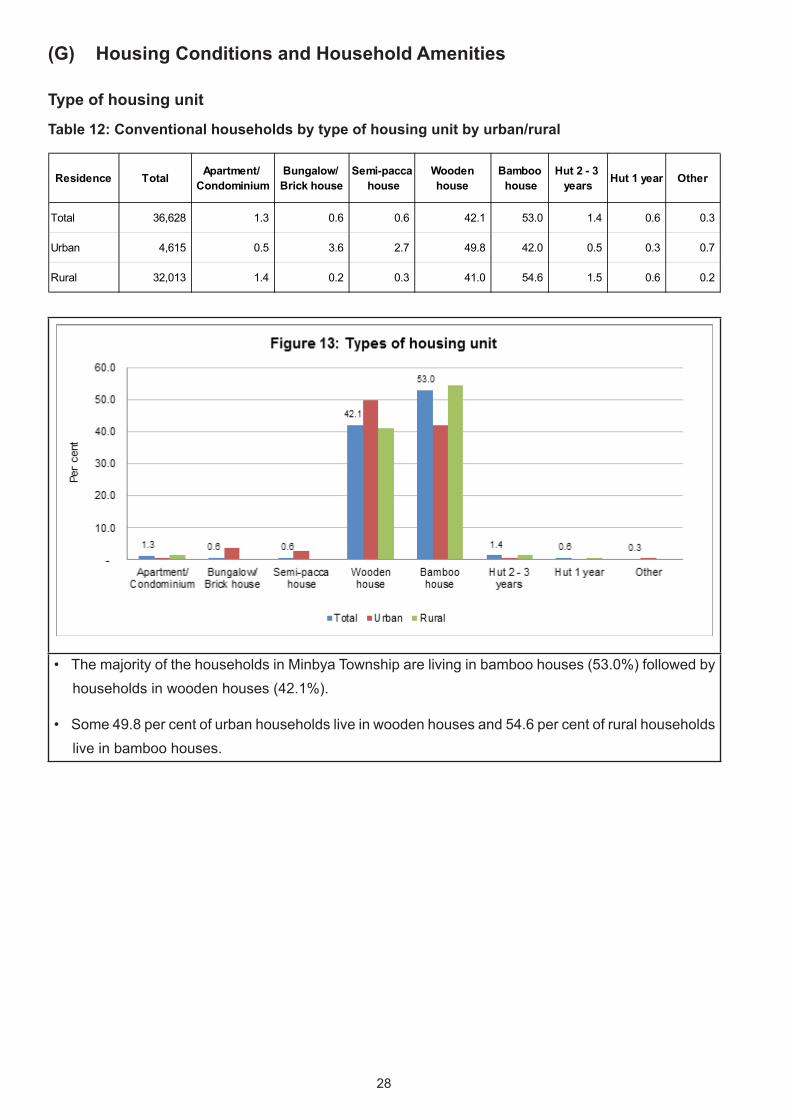
Table 12: Conventional households by type of housing unit by urban/rural
• The majority of the households in Minbya Township are living in bamboo houses (53.0%) followed by households in wooden houses (42.1%).
• Some 49.8 per cent of urban households live in wooden houses and 54.6 per cent of rural households live in bamboo houses.
Residence Total Apartment/ Condominium
Bungalow/ Brick house
Semi-pacca house
Woodenhouse
Bamboo house
Hut 2 - 3 years Hut 1 year Other
Total 36,628 1.3 0.6 0.6 42.1 53.0 1.4 0.6 0.3
Urban 4,615 0.5 3.6 2.7 49.8 42.0 0.5 0.3 0.7
Rural 32,013 1.4 0.2 0.3 41.0 54.6 1.5 0.6 0.2

29
Type of toilet
Figure 14: Proportion of households with access to improved sanitation
Union : 74.3%
Rakhine State : 31.8%
Myauk U District : 18.7%
Minbya Township : 16.2%

30
Table 13: Conventional households by type of toilet by urban/rural
• Some 16.2 per cent of the households in Minbya Township have improved sanitation facilities (flush toilet (0.2%), water seal (improved pit latrine) (16.0%)).
• Compared to other townships in Rakhine State, Minbya is in the lowest proportion of households group with improved sanitation facilities.
• The proportion of households with improved sanitation facilities in Rakhine State is 31.8 per cent while it is 74.3 per cent at the Union level.
• Some 76.8 per cent of the households in the township have no toilet facilities. For the entire Rakhine State, it is 62.9 per cent.
• In the rural areas of Minbya Township, 84.3 per cent of the households have no toilet facilities.
Total Urban Rural
0.2 0.2 0.1
16.0 62.4 9.4
16.2 62.6 9.5
0.8 1.8 0.6
5.3 10.6 4.5
0.9 0.6 1.0
76.8 24.4 84.3
Per cent 100.0 100.0 100.0
Number 36,628 4,615 32,013
Type of toilet
Total
Flush
Water seal (Improved pit latrine)
Improved sanitation
Pit (Traditional pit latrine)
Bucket (Surface latrine)
Other
None
31
Source of drinking water
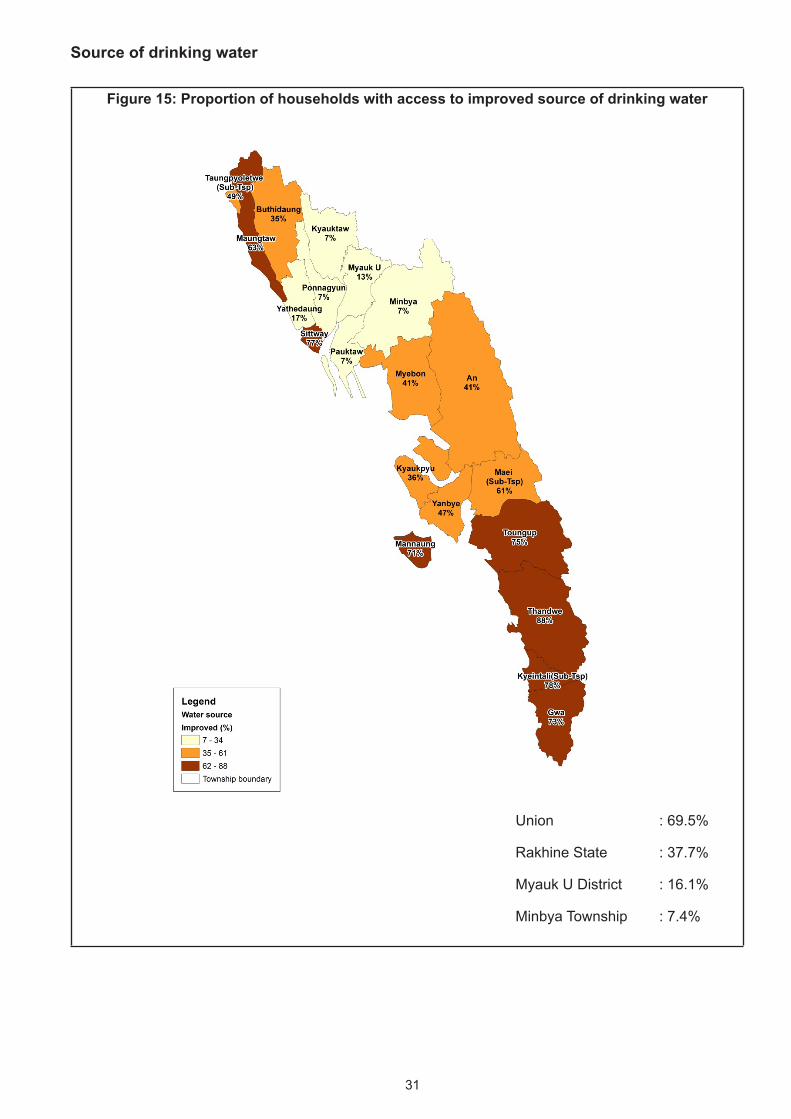
Figure 15: Proportion of households with access to improved source of drinking water
Union : 69.5%
Rakhine State : 37.7%
Myauk U District : 16.1%
Minbya Township : 7.4%

32
Table 14: Conventional households by source of drinking water by urban/rural
• In Minbya Township, 7.4 per cent of households use improved sources of drinking water (tap water/piped, tube well, borehole, protected well/spring and bottled water/water purifier).
• Compared to other townships in Rakhine State, it is in the lowest group and it is also lower than the Union average (69.5%).
• Some 83.0 per cent of the households use water from pool/pond/lake and 6.1 per cent use water from protected well/spring.
• Some 92.6 per cent of the households use water from unimproved sources.
• In rural areas, 91.5 per cent of the households use water from unimproved sources for drinking water.
Note: * Less than 0.1 per cent.
Total Urban Rural
1.0 - 1.2
0.3 - 0.3
6.1 0.1 7.0
* - *
7.4 0.1 8.5
5.0 * 5.7
83.0 99.9 80.5
1.0 * 1.2
3.6 - 4.1
* - *
92.6 99.9 91.5
Per cent 100.0 100.0 100.0
Number 36,628 4,615 32,013
Total improved drinking water
Source of drinking water
Tap water/ Piped
Tube well, borehole
Protected well/ Spring
Bottled water/ Water purifier
Total
Unprotected well/Spring
Pool/Pond/ Lake
River/stream/ canal
Waterfall/ Rain water
Other
Total unimproved drinking water
33
Source of lighting
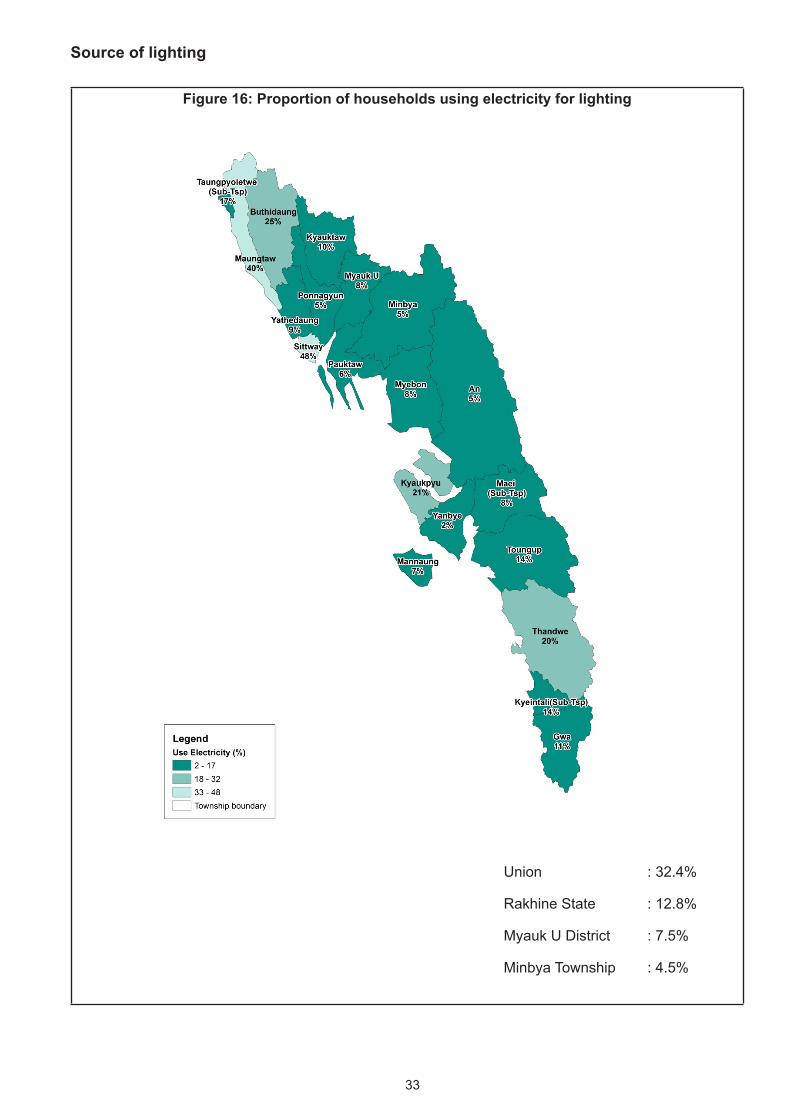
Figure 16: Proportion of households using electricity for lighting
Union : 32.4%
Rakhine State : 12.8%
Myauk U District : 7.5%
Minbya Township : 4.5%

34
Table 15: Conventional households by source of lighting by urban/rural
• In Minbya Township, 4.5 per cent of the households use electricity for lighting. This proportion belongs to the lowest group in electricity usage compared to other townships in Rakhine State. The percentage of households that use electricity in Rakhine State is 12.8 per cent.
• The use of candle for lighting is the highest in the township with 66.1 per cent.
• In rural areas, 69.5 per cent of the households mainly use candle for lighting.
Total Urban Rural
4.5 10.5 3.6
12.1 2.1 13.6
66.1 42.3 69.5
3.6 3.0 3.7
8.6 39.2 4.2
0.2 0.8 0.1
3.8 2.1 4.1
1.1 0.1 1.2
Per cent 100.0 100.0 100.0
Number 36,628 4,615 32,013
Water mill (private)
Solar system/energy
Other
Total
Source of lighting
Electricity
Kerosene
Candle
Battery
Generator (private)

35
Type of cooking fuel
Figure 17: Proportion of households using wood-related cooking fuel
Union : 81.0%
Rakhine State : 96.6%
Myauk U District : 97.4%
Minbya Township : 97.8%

36
Table 16: Conventional households by type of cooking fuel by urban/rural
• In Minbya Township, households mainly use wood-related fuels for cooking with 94.2 per cent using firewood and 3.6 per cent using charcoal.
• Only 0.2 per cent of households use electricity for cooking.
• Some 97.1 per cent of households in rural areas use firewood and 1.0 per cent use charcoal.
Note: * Less than 0.1 per cent.
Total Urban Rural
0.2 0.3 0.1
* * *
1.4 0.8 1.5
* * *
94.2 74.5 97.1
3.6 22.2 1.0
0.2 0.9 *
0.4 1.2 0.3
Per cent 100.0 100.0 100.0
Number 36,628 4,615 32,013
Charcoal
Coal
Other
Total
Type of cooking fuel
Electricity
LPG
Kerosene
BioGas
Firewood

37
Communication and related amenities
Table 17: Conventional households by availability of communication and related amenities by urban/rural
• Some 24.4 per cent of the households in Minbya Township have access to radio and is the highest among the access of communication and related amenities. Some 40.2 per cent of urban households have access to television, while the proportion for household in rural areas was 23.2 per cent having radio and the highest in urban and rural respectively.
• In Minbya Township, 15.6 per cent of the households having a television and about one in four households (24.4%) reported having a radio.
Residence Conventional households Radio Television Land line
phoneMobile phone Computer Internet at
home% with none of
the items% with all of
the items
Total 36,628 24.4 15.6 2.0 8.9 0.7 1.1 66.9 0.1
Urban 4,615 32.4 40.2 4.0 35.4 2.8 5.9 45.7 0.4
Rural 32,013 23.2 12.0 1.7 5.1 0.4 0.4 70.0 0.1

38
Figure 19: Proportion of households with access to mobile phone
• Some 8.9 per cent of the households in Minbya Township reported having mobile phones. Compared to other townships in Rakhine State, it is in the lowest group.
Union : 32.9%
Rakhine State : 15.8%
Myauk U District : 10.1%
Minbya Township : 8.9%
39
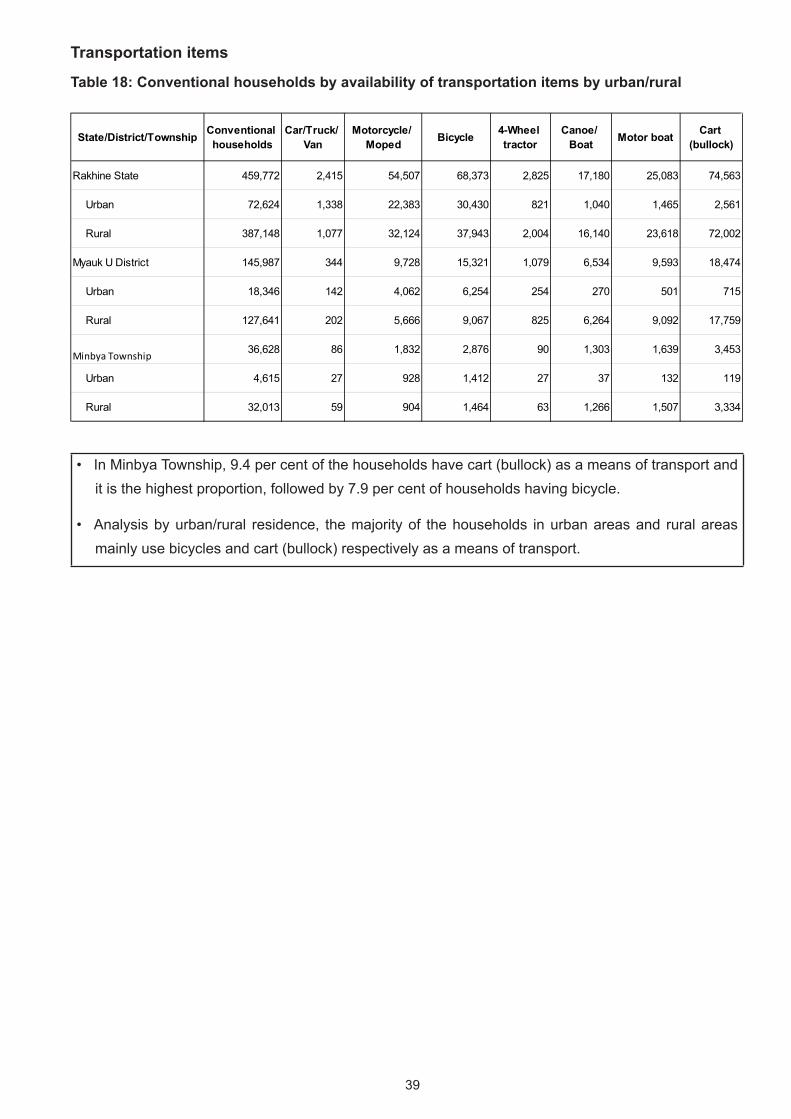
Transportation items
Table 18: Conventional households by availability of transportation items by urban/rural
• In Minbya Township, 9.4 per cent of the households have cart (bullock) as a means of transport and it is the highest proportion, followed by 7.9 per cent of households having bicycle.
• Analysis by urban/rural residence, the majority of the households in urban areas and rural areas mainly use bicycles and cart (bullock) respectively as a means of transport.
State/District/Township Conventional households
Car/Truck/ Van
Motorcycle/ Moped Bicycle 4-Wheel
tractorCanoe/
Boat Motor boat Cart (bullock)
Rakhine State 459,772 2,415 54,507 68,373 2,825 17,180 25,083 74,563
Urban 72,624 1,338 22,383 30,430 821 1,040 1,465 2,561
Rural 387,148 1,077 32,124 37,943 2,004 16,140 23,618 72,002
Myauk U District 145,987 344 9,728 15,321 1,079 6,534 9,593 18,474
Urban 18,346 142 4,062 6,254 254 270 501 715
Rural 127,641 202 5,666 9,067 825 6,264 9,092 17,759
Minbya Township 36,628 86 1,832 2,876 90 1,303 1,639 3,453
Urban 4,615 27 928 1,412 27 37 132 119
Rural 32,013 59 904 1,464 63 1,266 1,507 3,334
40
(H) Fertility and Mortality
Fertility
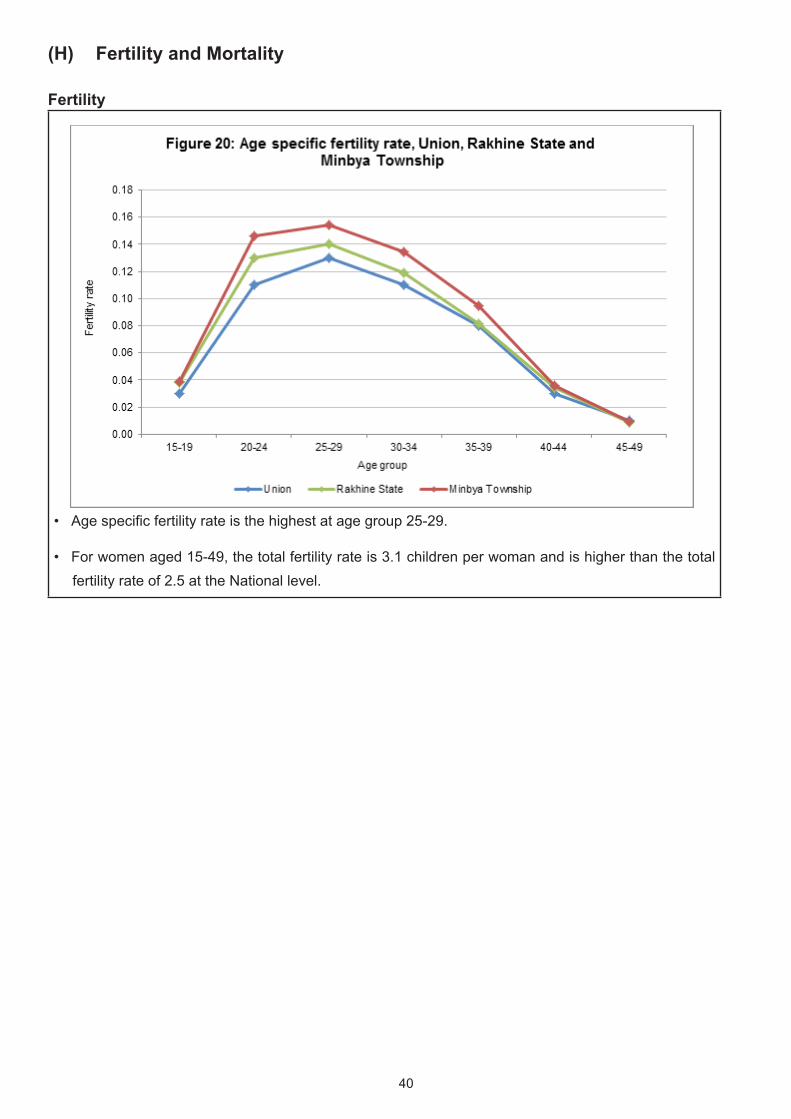
• Age specific fertility rate is the highest at age group 25-29.
• For women aged 15-49, the total fertility rate is 3.1 children per woman and is higher than the total fertility rate of 2.5 at the National level.

41
Figure 21: Total fertility rate
Union : 2.5
Rakhine State : 2.8
Myauk U District : 2.8
Minbya Township : 3.1

42
• The expectation of life at birth in Rakhine State is 65.5 years and is higher than that of National level at 64.7 years.
• The female life expectancy at 69.3 years is higher than that of the males at 61.6 years.
Childhood Mortality and Maternal Mortality
• The Infant and Under 5 mortality rates in Myauk U District are higher than the Union average. The Infant mortality in Myauk U District is 71 deaths under age one per 1,000 live births while Under 5 mortality is 83 deaths under age 5 per 1,000 live births.
• The Infant and Under 5 mortality rates in Minbya Township are higher than those in Rakhine State and lower than Myauk U District. The Infant mortality in Minbya is 69 per 1,000 live births and Under 5 mortality is 80 per 1,000 live births.
43
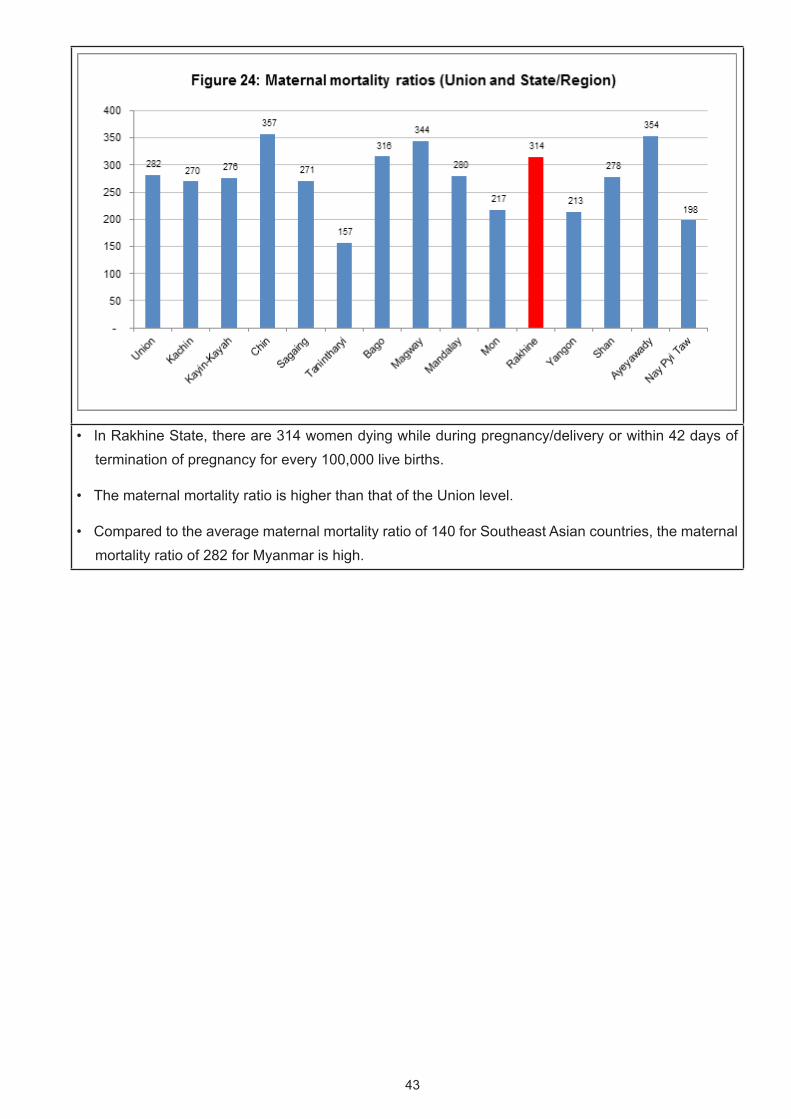
• In Rakhine State, there are 314 women dying while during pregnancy/delivery or within 42 days of termination of pregnancy for every 100,000 live births.
• The maternal mortality ratio is higher than that of the Union level.
• Compared to the average maternal mortality ratio of 140 for Southeast Asian countries, the maternal mortality ratio of 282 for Myanmar is high.

44
Definitions and Concepts
Population: The population in this report corresponds to the de-facto population of Myanmar on Census Night (see below).
Census Night: The night between the 29th and the 30th March 2014. Every person in Myanmar was enumerated where they spent the Census Night.
Rural area: Areas classified by the Department of General Administration (GAD) as village tracts. Generally these are areas with low population density and a land use which is predominantly agricultural.
Urban area: Areas classified by the GAD as wards. Generally these areas have an increased density of building structures, population and better infrastructural development.
Population Density: The population density relates to the number of persons in a given administrative area to the surface of the area, expressed in square kilometres (Km2). Areas covered by water are excluded from the calculation.
Mean Household Size: The average number of persons per household (people living in households divided by number of conventional households).
Sex ratio: The number of males for every 100 females in a population.
Dependency ratio: The total dependency ratio is the ratio of dependents (people younger than 15 years and older than 64) to the population of working-age (age 15-64). Data are shown as the proportion of dependents per 100 working-age population. Three different measures can be calculated: total dependency ratio, child dependency ratio and old age dependency ratio.
Child Dependency Ratio: is the proportion of people younger than 15 years to the working age population (15-64).
Old Dependency Ratio: is the proportion of people older than 64 years to the working age population (15-64).
Ageing Index: The number of persons aged 65 years and over per 100 people under the age of 15 years.
Median Age: The age that divides a population into two numerically equal groups; that is, half the people are younger than this age and half are older.
Education: Education is the process by which people learn through instruction and teaching. The 2014 MPHC placed an emphasis on literacy skills, school attendance and educational attainment. The other categorisations used under education were:
(a) Literacy: The ability to read and write in any language with reasonable understanding.
(b) School attendance: The attendance at any regular educational institution or systematic instruction at any level of education during the last 12 months. This included schooling at pre-primary, primary, middle, high school and tertiary institutions of higher learning. The options were: (a) Currently attending; (b) Attended previously; (c) Never attended.
45
(c) Educational Attainment: The highest grade/standard/diploma/degree completed within the most advanced level attended in the education system of the country where the education was received. It covered both public and private institutions accredited by government.
Disability: Disability is a situation where a person is at a greater risk than the general population of experiencing restrictions in performing routine activities (including activities of daily living) or participating in roles (such as work) if no supportive measures are offered. The difficulties covered in the 2014 census included:
(a) Walking difficulty (wheel chairs, crutches, limping, problems climbing steps);
(b) Seeing difficulty (low vision, blind);
(c) Hearing difficulty (partially or completely deaf);
(d) Mental/Intellectual difficulty (slow learning development making it hard to compete with their counterparts at school, other mental conditions).
Identity card: An identity card is a document used to verify aspects of a person›s personal identity. There are several types of identity cards issued by the Government of Myanmar, and national passports in the case of foreigners.
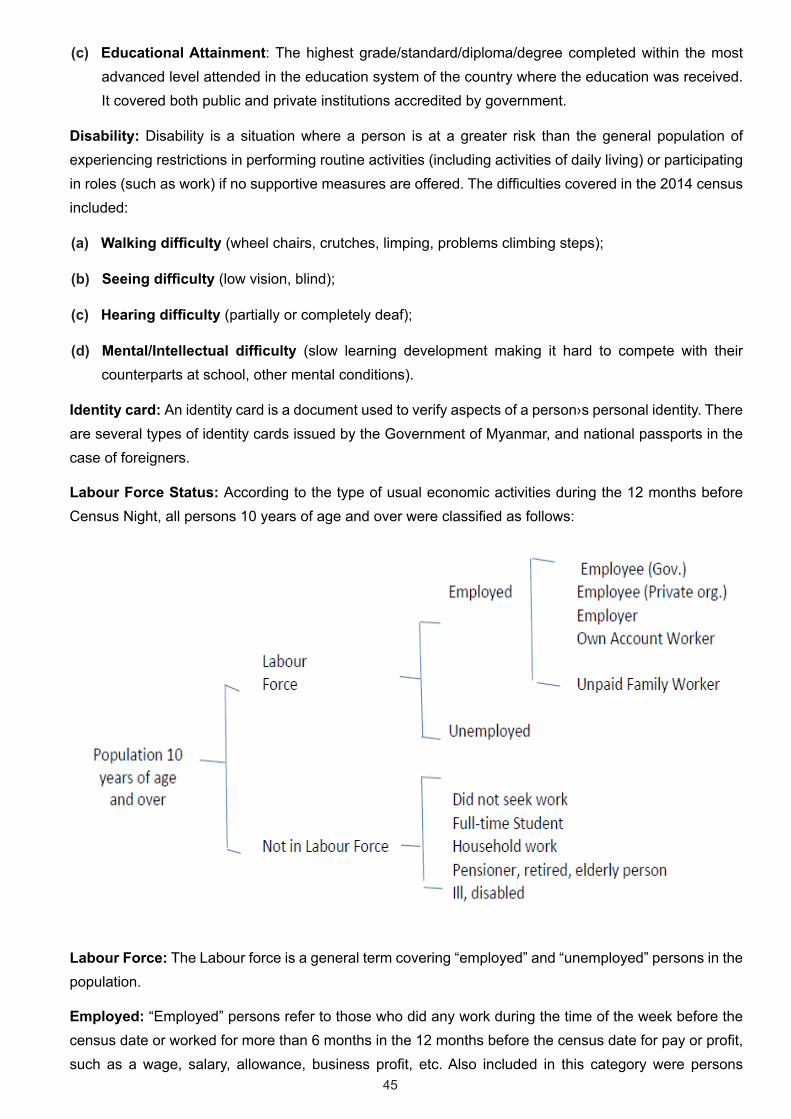
Labour Force Status: According to the type of usual economic activities during the 12 months before Census Night, all persons 10 years of age and over were classified as follows:
Labour Force: The Labour force is a general term covering “employed” and “unemployed” persons in the population.
Employed: “Employed” persons refer to those who did any work during the time of the week before the census date or worked for more than 6 months in the 12 months before the census date for pay or profit, such as a wage, salary, allowance, business profit, etc. Also included in this category were persons

46
working in family businesses, on a farm, in a store, in a private hospital etc., even though they were not paid any wages.
Unemployed: “Unemployed” persons refer to those who had no work but were able to work and actually seeking a job during the reference period, or at the time of the census enumeration.
Not in labour force: This category comprised persons who had no work and did not make any positive efforts to find a job during the 6 months before the census date or were unable to work. This included full time students, household work, elderly people, etc.
Employment Status: All employed persons were classified according to the economic activity status in the place where they worked during the last 12 months or if they worked in more than one place, where they worked most of the time. There were five employment categories:
(a) Employee (Government): those employed and working for government including in state organisation institutions.
(b) Employee (Private organisation): those employed and working for private employers or private organisations. All people in private companies, NGOs, international organisations, retail and wholesale enterprises fell under this category.
(c) Employer: persons who during the reference period worked in their own business, which also employed one or more other persons.
(d) Own account worker: self-employed persons who worked in their own business or worked in their own/family business for family gain and did not have any employees.
(e) Unpaid family worker: persons who worked in a business, farm, trade or professional enterprise operated by a member of the household/family and received no pay.
Labour force participation rate: The labour force participation rate is the ratio between the labour force and the overall size of the total population of the same age range. This is an important indicator as it portrays the proportion of the population that is economically active.
Labour force participation rate
=
Labour force (Employed + Unemployed) x 100
Total Population
Unemployment rate: The percentage of the total labour force that is unemployed but actively seeking employment and willing to work. These are people who are without work, looking for jobs and available for work.
Unemployment rate =Unemployed
x 100Labour force
(Employed + Unemployed)

47
Employment to population ratio: A statistical ratio that measures the proportion of the country’s working-age population (ages 15 to 64) that is employed. The International Labour Organization (ILO) states that a person is considered employed if they have worked at least 1 hour in “gainful” employment in the most recent week.
Employment to population ratio
=Employed
x 100Total Population
Occupation: Occupation refers to the kind of work an employed person did in the establishment during the 12 months (reference period) before the census date. Put differently, occupation is the kind of work done during the last 12 months by the person employed, regardless of the industry of the establishment. In the 2014 Myanmar Census, field data collectors were instructed to collect a detailed description of the work being done such as accounts clerk, data entry operator (clerk), legal secretary, domestic worker, fisherman, human resource manager, etc. If an employed person was engaged in two or more jobs, the kind of work was decided by the work in which he/she was mainly engaged in, that is in terms of time. The occupational classification is based on the ISCO 2008.
Industry: Industry refers to the main activity of the establishment where an employed person usually worked during the 12 months (reference period) before the census date. In the 2014 Myanmar Census, industry was explained to the enumerators as the type of economic activity carried out at the person’s place of work. It is defined in terms of the kind of goods produced or services supplied by the enterprise in which the person works and not necessarily the specific duties or functions of the person’s job. For example, a clerical officer working in stores within a factory that makes television sets. The industry should be recorded as manufacture of electrical goods. If an employed person worked in two or more establishments, “industry” was decided by the establishment where he/she worked most. The industrial classification is based on the ISIC Revision 4.
Live Birth: A live birth is one where the infant shows one or more of the following signs of life immediately after birth: crying or similar sounds, movement of the limbs or any other parts of the body and/or any other tangible signs of life. The census was concerned only with children born alive. Also collected was information on the last live birth of ever married female respondents.
Total fertility rate (TFR): The average number of children that a woman would give birth to if all women lived to the end of their childbearing years and bore children according to the current schedule of age-specific fertility rates.
Age specific fertility rate (ASFR): The age-specific fertility rate measures the annual number of births to women of a specified age or age group per 1,000 women in that age group. Unless otherwise specified, the reference period for the age-specific fertility rates is the calendar year.
48
List of Contributors
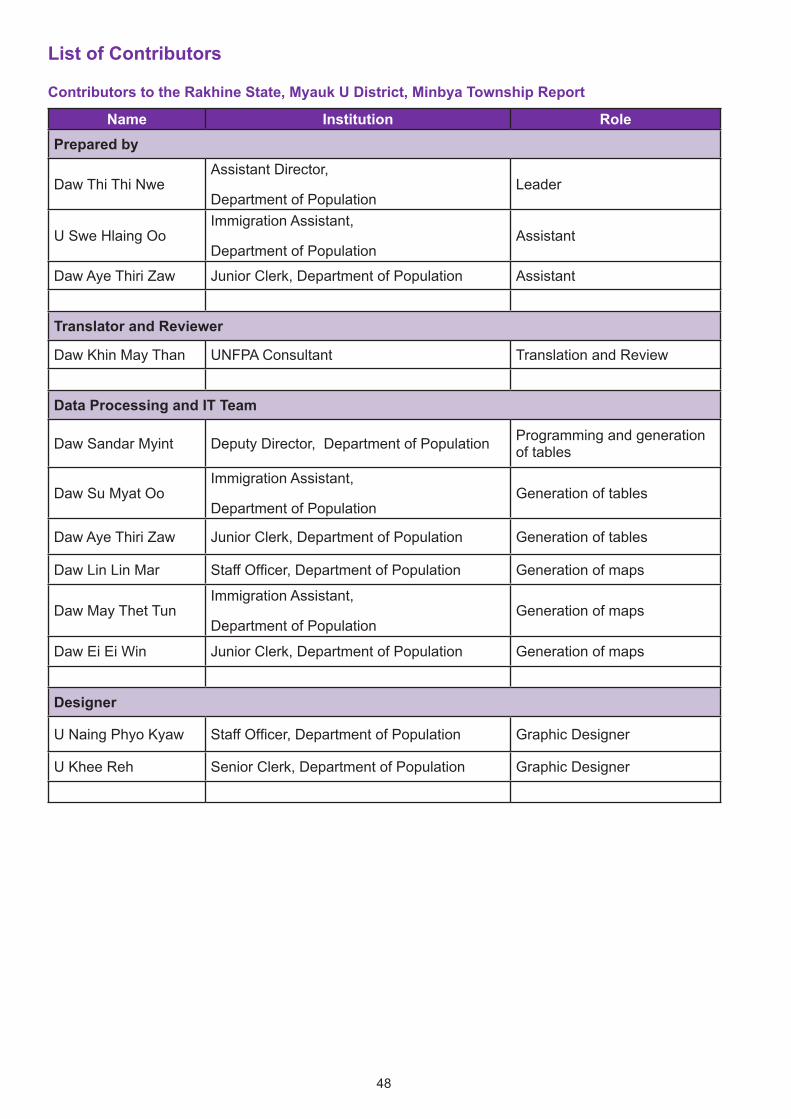
Contributors to the Rakhine State, Myauk U District, Minbya Township Report
Name Institution RolePrepared by
Daw Thi Thi NweAssistant Director,
Department of PopulationLeader
U Swe Hlaing OoImmigration Assistant,
Department of PopulationAssistant
Daw Aye Thiri Zaw Junior Clerk, Department of Population Assistant
Translator and Reviewer
Daw Khin May Than UNFPA Consultant Translation and Review
Data Processing and IT Team
Daw Sandar Myint Deputy Director, Department of Population Programming and generation of tables
Daw Su Myat OoImmigration Assistant,
Department of PopulationGeneration of tables
Daw Aye Thiri Zaw Junior Clerk, Department of Population Generation of tables
Daw Lin Lin Mar Staff Officer, Department of Population Generation of maps
Daw May Thet TunImmigration Assistant,
Department of PopulationGeneration of maps
Daw Ei Ei Win Junior Clerk, Department of Population Generation of maps
Designer
U Naing Phyo Kyaw Staff Officer, Department of Population Graphic Designer
U Khee Reh Senior Clerk, Department of Population Graphic Designer


50
The Townships Reports
can be downloaded at :www.dop.gov.mm
or
http://myanmar.unfpa.org/census
Related Documents