immigration.govt.nz
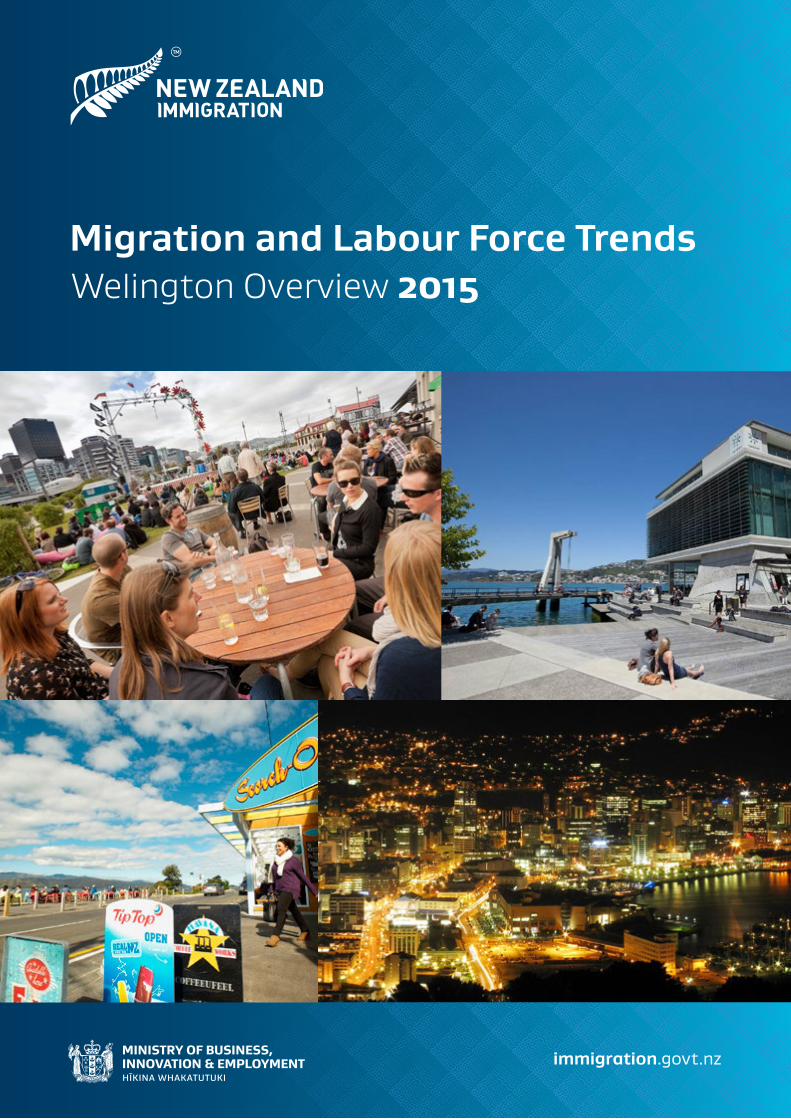
Migration and Labour Force TrendsWelington Overview 2015
2
NEW ZEALAND IMMIGRATION WELLINGTONOVERVIEW 2015
MIGRATION AND LABOUR FORCE TRENDS
© Crown Copyright 2016
The material contained in this report is subject to Crown copyright protection unless otherwise indicated. The Crown copyright protected material may be reproduced free of charge in any format or media without requiring specific permission. This is subject to the material being reproduced accurately and not being used in a derogatory manner or in a misleading context. Where the material is being published or issued to others, the source and copyright status should be acknowledged. The permission to reproduce Crown copyright protected material does not extend to any material in this report that is identified as being the copyright of a third party. Authorisation to reproduce such material should be obtained from the copyright holders.
978-0-947524-18-0 (online)
September, 2016
Table of Contents
Wellington Executive Summary 2
Introduction 3
Background 4
Wellington’s migrant demographics 6
Migration and the Wellington labour market 9
Permanent migration 13
Temporary migration 16
International students 19
Conclusion 20
Appendices 21
NEW ZEALAND IMMIGRATION WELLINGTONOVERVIEW 2015
MIGRATION AND LABOUR FORCE TRENDS
1TablesTable 1 Overseas-born population in Wellington by birthplace, 2013 7
Table 2 Number and share of overseas-born population in Wellington by their country of origin, who have been in New Zealand for under two years in 2013.
7
Table 3 Overseas and New Zealand-born population by highest qualification attained, 2013 8
Table 4 Working-age population in Wellington by labour force status and by birthplace, 2013 10
Table 5 Top source countries of Skilled Migrant Category (SMC) principal applicants in Wellington, FY 2010/11 to 2014/15
14
Table 6 Occupations of Skilled Migrant Category principal applicants, with a job offer in Wellington, FY 2013/14 and 2014/15
15
Table 7 Source country of Essential Skills workers in Wellington, FY 2010/11 to 2014/15 17
Table 8 Occupations of Essential Skills workers in Wellington, FY 2013/14 and 2014/15 18
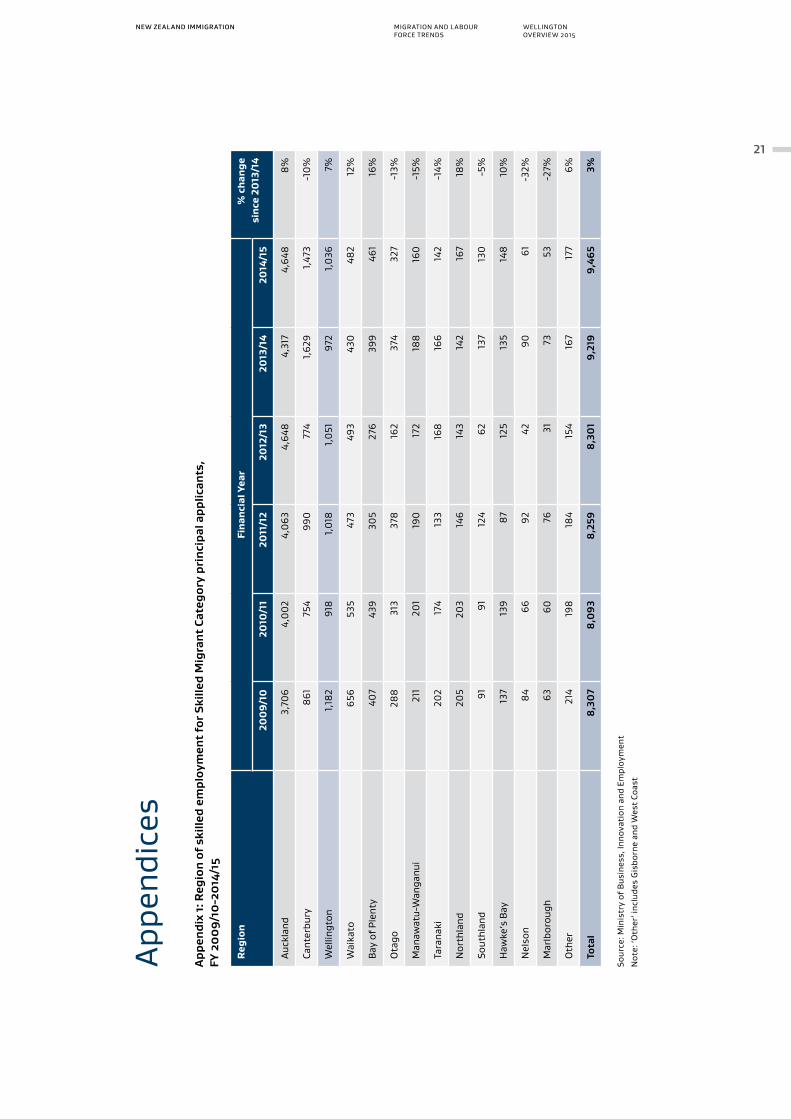
Appendix 1 Region of skilled employment for Skilled Migrant Category principal applicants, FY 2009/10 to 2014/15
21
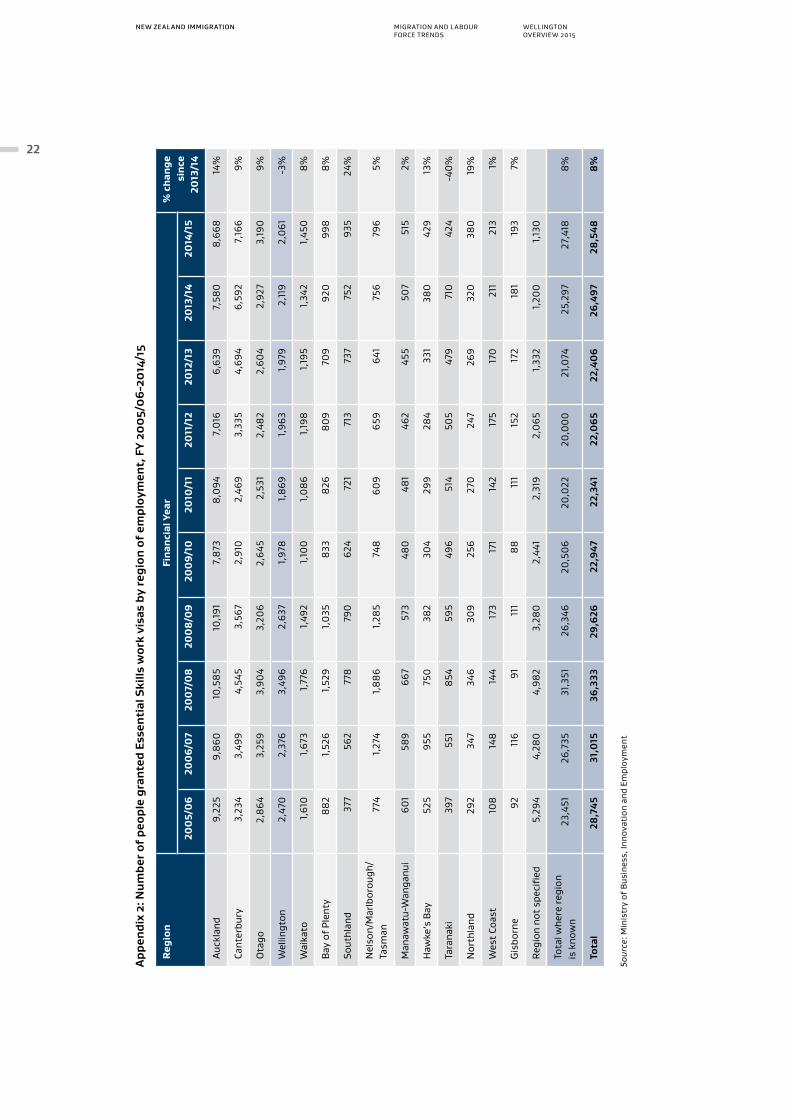
Appendix 2 Number of people granted Essential Skills work visas by region of employment, FY 2005/06 to 2014/15
22
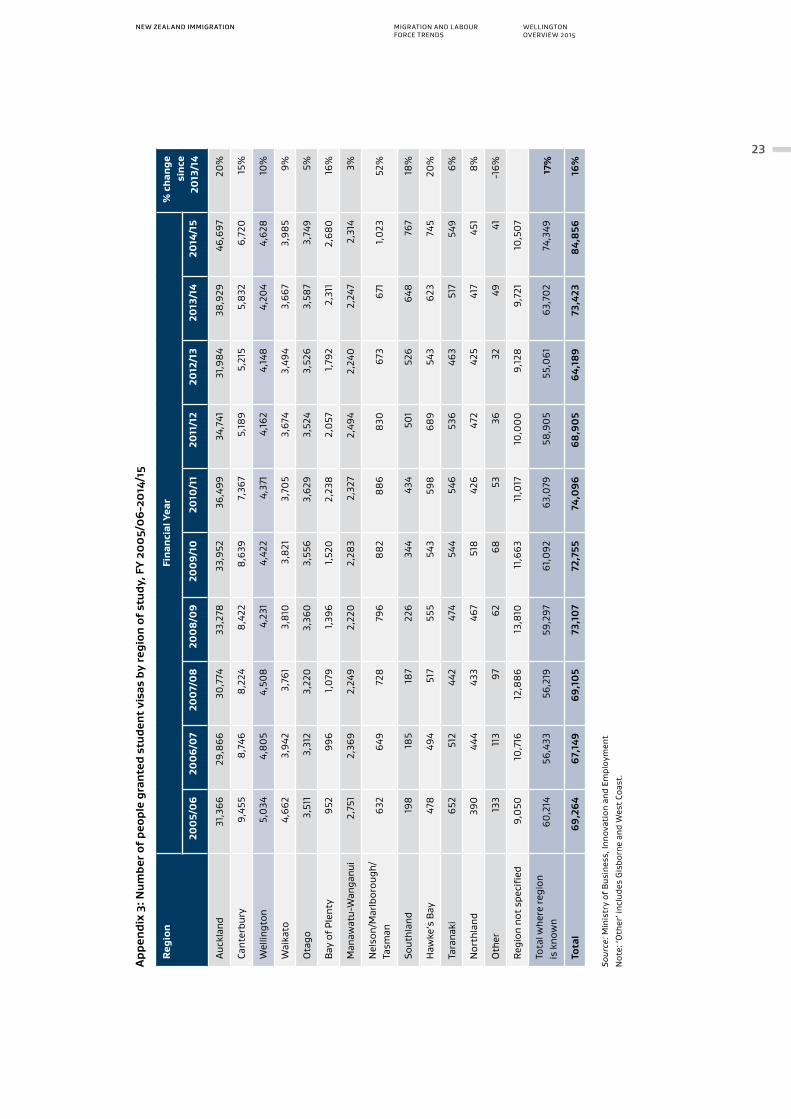
Appendix 3 Number of people granted student visas by region of study, FY 2005/06 to 2014/15 23
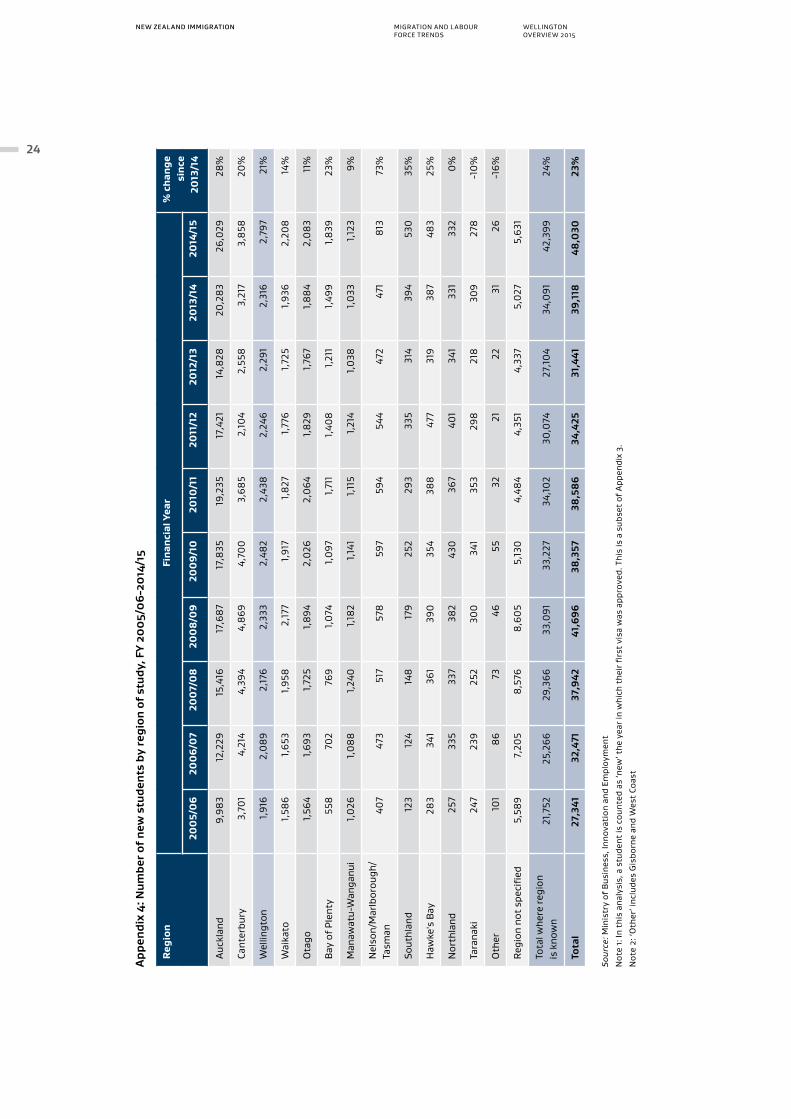
Appendix 4 Number of new students by region of study, FY 2005/06 to 2014/15 24
FiguresFigure 1 New Outcomes Framework for Migrant Settlement and Integration 5
Figure 2 The proportion of the overseas-born population compared with the New Zealand-born population in Wellington and New Zealand overall
6
Figure 3 Employment rate of overseas-born and New Zealand-born individuals in Wellington, 2001-2013
10
Figure 4 Unemployment rate of overseas-born and New Zealand-born individuals in Wellington, 2001-2013
11
Figure 5 Participation rate of overseas-born and New Zealand-born individuals in Wellington, 2001-2013
12
Figure 6 The top five source countries of Skilled Migrant Category principal applicants in Wellington, FY 2005/06 to 2014/15
14
Figure 7 The top five source countries of Essential Skills workers in the Wellington region, FY 2005/06 to 2014/15
17
2
NEW ZEALAND IMMIGRATION WELLINGTONOVERVIEW 2015
MIGRATION AND LABOUR FORCE TRENDS
Wellington Executive SummaryThe purpose of this report is to provide an overview of Wellington’s recent migrant population and migration trends, and with a particular focus on the Wellington labour market. The report shows trends to 2014/15 and compares recent immigration patterns with previous years.
The primary data sources used in this report are Statistics New Zealand’s 2013 Census of Population and Dwellings and the Ministry of Business, Innovation and Employment’s (MBIE) 2014/15 immigration administrative data. The data are publicly available through Statistics New Zealand, Immigration NZ and MBIE’s websites.
Wellington’s share of overseas-born population is similar to New Zealand overallTwenty-five percent of Wellington’s population were born overseas according to the 2013 Census. This is an increase from the 21 percent reported in the 2001 Census. Of the overseas-born residents in the region, the majority were born in the United Kingdom and Ireland and the proportion is higher compared with the overall New Zealand population (32 percent in Wellington versus 26 percent nationwide). Wellington’s overseas-born population is more likely to be highly qualified compared with its New Zealand-born population.
Wellington’s overseas-born working-age population has a lower employment rate The Wellington working-age population, in general, have a higher employment rate compared with New Zealand overall. Aggregated by birthplace, the overseas-born population in the region has a lower employment rate and lower labour market participation rate compared with the New Zealand-born population. The trend of unemployment for the overseas-born population in the region has been generally downward.
Increase in the number of Skilled Migrant Category principal applicants over the past year in WellingtonIn 2014/15, 11 percent (or 1,036 people) of New Zealand’s Skilled Migrant Category principal applicants resided in the Wellington region. This is an increase of 7 percent on the previous year. India, the United Kingdom and China were the top source countries for skilled migrants in the region.
The top three occupations of skilled migrants in Wellington in 2014/15 were Software and Applications Programmers (12 percent), Registered Nurses (8 percent), and ICT Support Technicians (5 percent).
Essential Skills temporary workers decreased over the past year in WellingtonIn 2014/15, 2,061 people were approved for temporary work visas in the region. This is a decrease of three percent on the number of Essential Skills workers in Wellington over the past year. The United Kingdom and India were the top source countries for Essential Skills workers in the region.
The top three occupations for Essential Skills workers in Wellington in 2014/15 were Chefs (10 percent), Café and Restaurant Managers (5 percent) and Aged and Disabled Carers (5 percent).
International Student numbers increase in Wellington
In the 2014/15 year, 4,628 people were granted a student visa to study in Wellington. This represents a ten percent increase from 2013/14. Wellington has the third largest share of international students in the country, after Auckland and Canterbury, making up six percent of the total student visas granted.
NEW ZEALAND IMMIGRATION WELLINGTONOVERVIEW 2015
MIGRATION AND LABOUR FORCE TRENDS
3IntroductionWellington is New Zealand’s centre of government and the world’s southernmost capital region. It has been nicknamed the ‘coolest little capital in the world’. It is strikingly positioned on the Cook Strait, following the Kapiti Coastline to the northwest, and encompassing the Rimutaka mountain ranges over to Wairarapa. Its five metropolitan areas are Wellington, Porirua, Hutt City, Upper Hutt and Masterton.
There are a number of sectors in the Wellington region that have significant competitive advantages including screen and digital, ICT, high-value manufacturing, and the primary sector. Tertiary education and research are other important contributors to the local economy. Average salaries and education levels in the region are notably higher compared with the national average.
The Wellington Regional Strategy1 was released in 2012 and set out an approach to build a long-term sustainable economy. One of the focus areas of the Strategy is ‘attracting business, investment and talent to the region’. This includes a targeted approach to attract skilled migrants and students into the region. Activities to support this include:
› Attracting and supporting international students by working through the tertiary sector and international agencies;
› Ensuring aftercare for skilled migrants and international students is in place;
› Monitoring provision of support services and retention rates for skilled migrants and students;
› Working with government agencies to inform, influence and implement programmes targeted at skills/youth development, reducing unemployment and retaining skilled migrants in the region;
› Retaining skilled people, businesses and investors.
According to the 2013 Census, Wellington has a population of 471,315 people, which is 11 percent of New Zealand’s total population. It is New Zealand’s third most populated region, after Auckland and Canterbury.
Wellington has a high proportion of people who belong to the European ethnic group. Seventy-seven percent of Wellington’s residents identify themselves as European (compared with 74 percent for New Zealand overall), 13 percent identify as Māori, 11 percent as Asian and 8 percent as Pacific.
The proportion of Wellington’s population who were born overseas is the same as for New Zealand as a whole (25 percent).
1 Wellington Regional Strategy 2012: http://www.gw.govt.nz/wellington-regional-strategy-2012/
4
NEW ZEALAND IMMIGRATION WELLINGTONOVERVIEW 2015
MIGRATION AND LABOUR FORCE TRENDS
BackgroundA driving goal of Government is to build a more competitive and internationally focused economy. Migration plays a key role in meeting this goal as it helps to grow New Zealand’s labour force, which in turn drives our economy. Migration also increases international connections that give access to foreign knowledge, foreign capital and international trade.
In July 2014, Government approved the New Zealand Migrant Settlement and Integration Strategy, a revised approach to successfully settle and integrate migrants in New Zealand.
The Migrant Settlement and Integration Strategy builds on the New Zealand Settlement Strategy which led Settlement work in New Zealand for the past decade. It places value on the economic contribution of migration and stresses the importance of the long-term integration of migrants in conjunction with successful initial settlement.
The Strategy’s aim is that migrants: “Make New Zealand their home, participate fully and contribute to all aspects of New Zealand life”.
Key to achieving this aim are the Strategy’s five outcomes – Employment, Education and Training, Inclusion, English Language and Health and Wellbeing ( see Figure 1).
Employment, and Education and Training are the key outcomes for the Strategy (reflecting their importance to the Government’s Business Growth Agenda). However all five outcomes are strongly interconnected and contribute to the Strategy’s aim, as well as to each other. For example, good English language skills and good health support migrants’ participation in employment, while education and training helps them to make social connections that support their wellbeing and inclusion.
Sixteen indicators measure progress towards achievement of the five outcomes overseas.

NEW ZEALAND IMMIGRATION WELLINGTONOVERVIEW 2015
MIGRATION AND LABOUR FORCE TRENDS
5Figure 1: New Outcomes Framework for Migrant Settlement and Integration
Overarching Outcome
Migrants make New Zealand their home,
participate fully and contribute to all aspects
of New Zealand life.
Outcome 1: EmploymentWorking-age migrants have work that matches their skills and New Zealand- ready qualifications
Outcome 2: Education and TrainingMigrants achieve educational and vocational qualifications
Outcome 5: Health and WellbeingMigrants enjoy healthy lives and feel confident and safe
Outcome 3: English LanguageMigrants confidently use English in their daily lives
Outcome 4: InclusionMigrants participate in and have a sense of belonging to their community and to New Zealand
As part of the Strategy, regional support to attract and retain migrants is being stepped up, with Immigration New Zealand establishing new Regional Partnership Agreements, the first of which was developed for the Auckland region.
Quality immigration data on the current migration population in Wellington, their participation in the workforce, as well as future projections of inward and outward migration helps inform Wellington’s economic planning, and in turn can help deliver on the outcomes defined in the Migration Settlement and Integration Strategy.
6
NEW ZEALAND IMMIGRATION WELLINGTONOVERVIEW 2015
MIGRATION AND LABOUR FORCE TRENDS
NEW ZEALAND IMMIGRATION AUCKLAND OVERVIEW 2014
MIGRATION AND LABOUR FORCE TRENDS
Wellington’s migrant demographics Wellington is the third most populated region in New Zealand. According to the 2013 Census, Wellington’s usual resident population was 471,315, or 11 percent of the total New Zealand population.
The 2013 Census showed that 25 percent of Wellington’s total population was born overseas, which matches the 25 percent of the overseas-born population recorded across the overall New Zealand population.
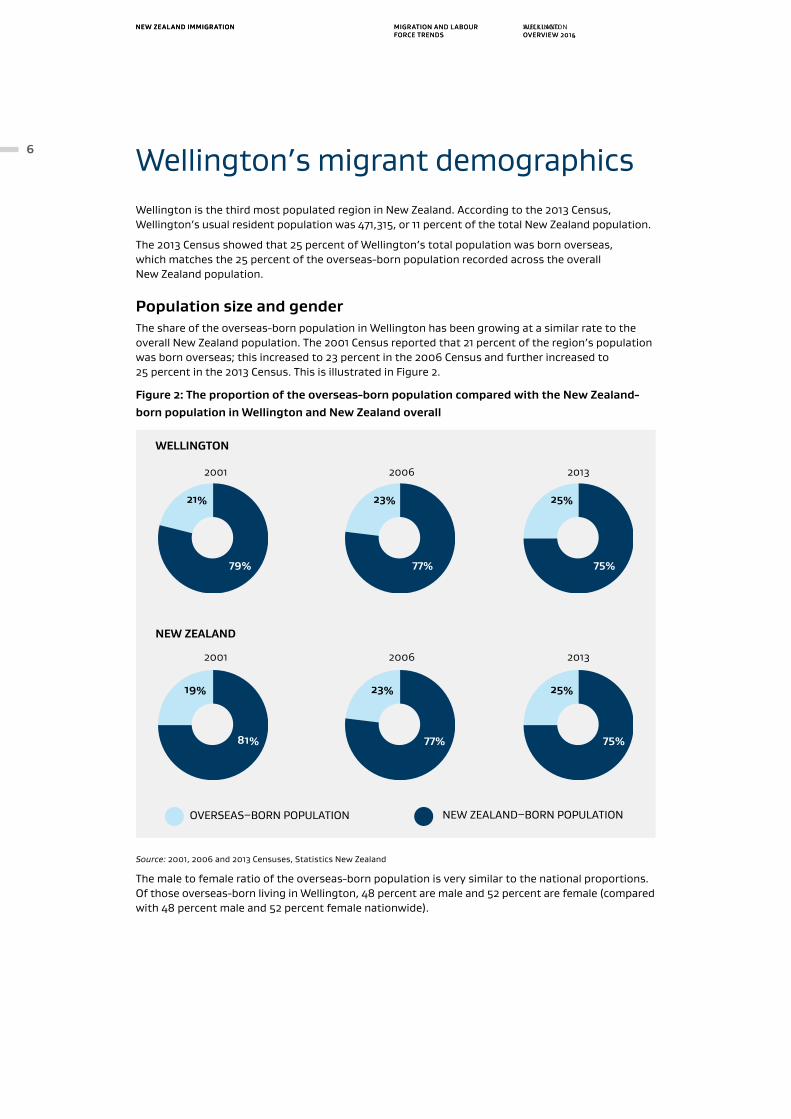
Population size and genderThe share of the overseas-born population in Wellington has been growing at a similar rate to the overall New Zealand population. The 2001 Census reported that 21 percent of the region’s population was born overseas; this increased to 23 percent in the 2006 Census and further increased to 25 percent in the 2013 Census. This is illustrated in Figure 2.
Figure 2: The proportion of the overseas-born population compared with the New Zealand-born population in Wellington and New Zealand overall
WELLINGTON
21%
2001
2001
2006
2006
2013
2013
79%
NEW ZEALAND
23% 25%
77% 75%
19%
81%
23% 25%
77% 75%
OVERSEAS–BORN POPULATION NEW ZEALAND–BORN POPULATION
Source: 2001, 2006 and 2013 Censuses, Statistics New Zealand
The male to female ratio of the overseas-born population is very similar to the national proportions. Of those overseas-born living in Wellington, 48 percent are male and 52 percent are female (compared with 48 percent male and 52 percent female nationwide).
NEW ZEALAND IMMIGRATION WELLINGTONOVERVIEW 2015
MIGRATION AND LABOUR FORCE TRENDS
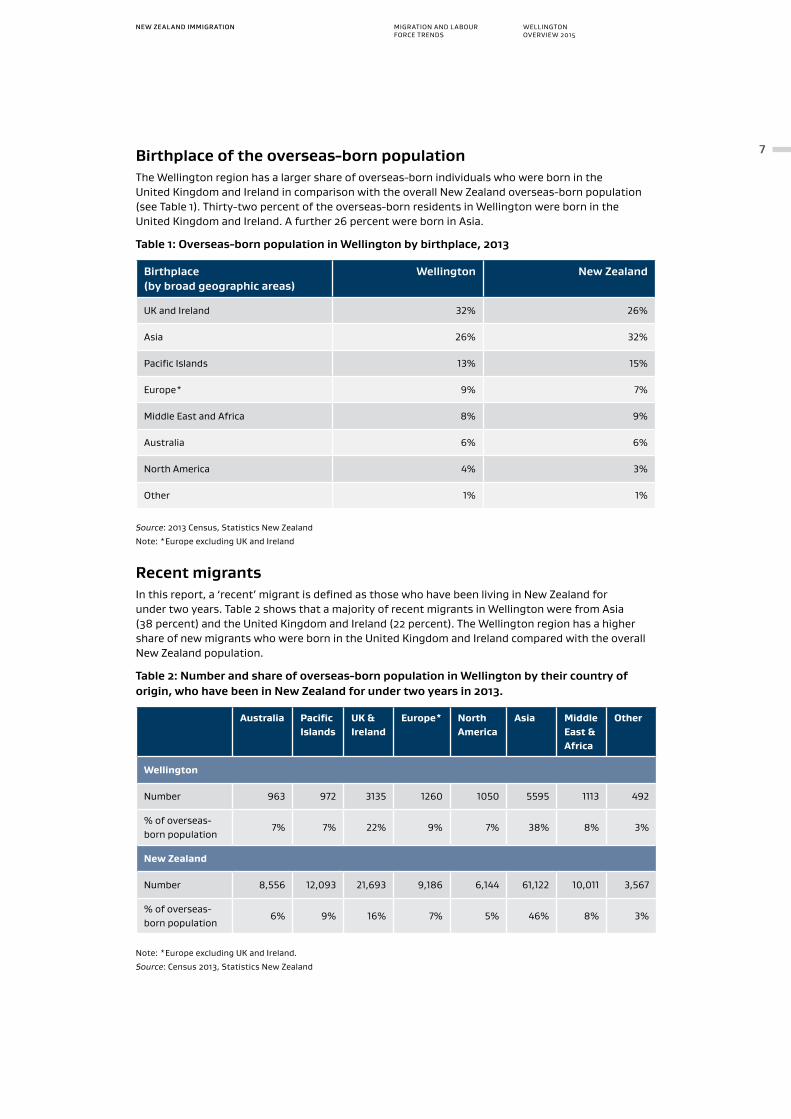
7Birthplace of the overseas-born populationThe Wellington region has a larger share of overseas-born individuals who were born in the United Kingdom and Ireland in comparison with the overall New Zealand overseas-born population (see Table 1). Thirty-two percent of the overseas-born residents in Wellington were born in the United Kingdom and Ireland. A further 26 percent were born in Asia.
Table 1: Overseas-born population in Wellington by birthplace, 2013
Birthplace (by broad geographic areas)
Wellington New Zealand
UK and Ireland 32% 26%
Asia 26% 32%
Pacific Islands 13% 15%
Europe* 9% 7%
Middle East and Africa 8% 9%
Australia 6% 6%
North America 4% 3%
Other 1% 1%
Source: 2013 Census, Statistics New Zealand
Note: *Europe excluding UK and Ireland
Recent migrantsIn this report, a ‘recent’ migrant is defined as those who have been living in New Zealand for under two years. Table 2 shows that a majority of recent migrants in Wellington were from Asia (38 percent) and the United Kingdom and Ireland (22 percent). The Wellington region has a higher share of new migrants who were born in the United Kingdom and Ireland compared with the overall New Zealand population.
Table 2: Number and share of overseas-born population in Wellington by their country of origin, who have been in New Zealand for under two years in 2013.
Australia Pacific Islands
UK & Ireland
Europe* North America
Asia Middle East & Africa
Other
Wellington
Number 963 972 3135 1260 1050 5595 1113 492
% of overseas-born population
7% 7% 22% 9% 7% 38% 8% 3%
New Zealand
Number 8,556 12,093 21,693 9,186 6,144 61,122 10,011 3,567
% of overseas-born population
6% 9% 16% 7% 5% 46% 8% 3%
Note: *Europe excluding UK and Ireland.
Source: Census 2013, Statistics New Zealand
8
NEW ZEALAND IMMIGRATION WELLINGTONOVERVIEW 2015
MIGRATION AND LABOUR FORCE TRENDS
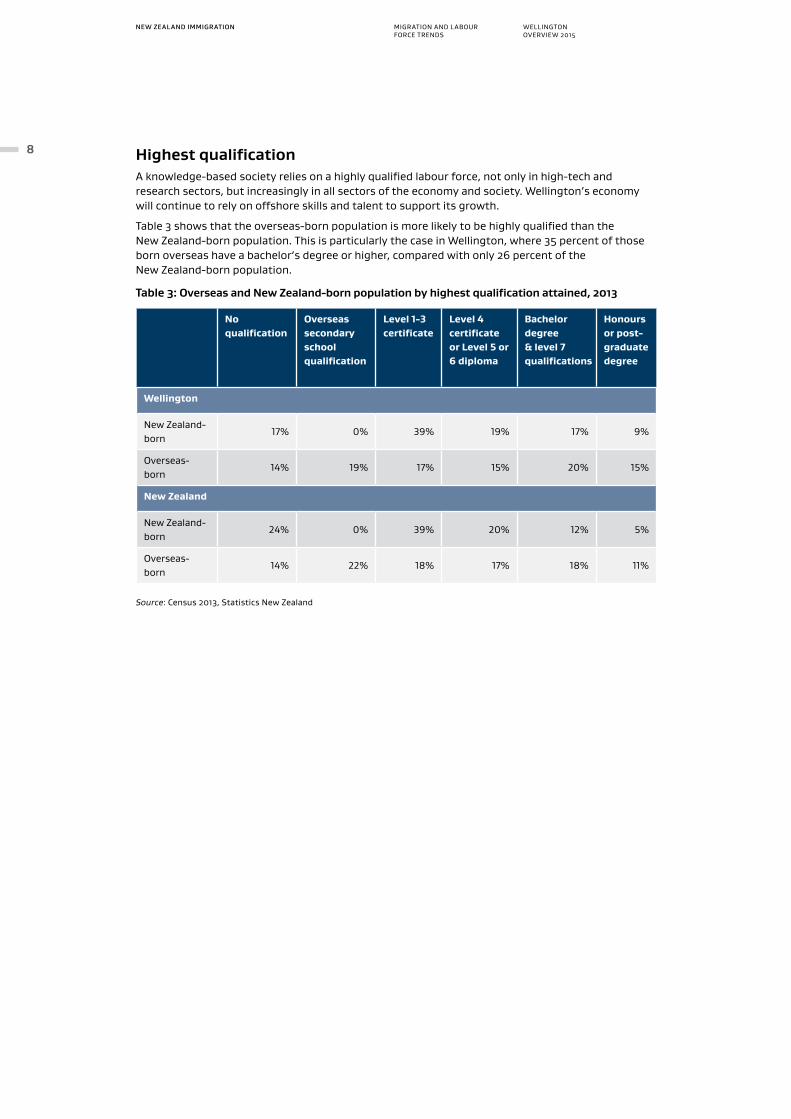
Highest qualificationA knowledge-based society relies on a highly qualified labour force, not only in high-tech and research sectors, but increasingly in all sectors of the economy and society. Wellington’s economy will continue to rely on offshore skills and talent to support its growth.
Table 3 shows that the overseas-born population is more likely to be highly qualified than the New Zealand-born population. This is particularly the case in Wellington, where 35 percent of those born overseas have a bachelor’s degree or higher, compared with only 26 percent of the New Zealand-born population.
Table 3: Overseas and New Zealand-born population by highest qualification attained, 2013
No qualification
Overseas secondary school qualification
Level 1-3 certificate
Level 4 certificate or Level 5 or 6 diploma
Bachelor degree & level 7 qualifications
Honours or post-graduate degree
Wellington
New Zealand-born
17% 0% 39% 19% 17% 9%
Overseas-born
14% 19% 17% 15% 20% 15%
New Zealand
New Zealand-born
24% 0% 39% 20% 12% 5%
Overseas-born
14% 22% 18% 17% 18% 11%
Source: Census 2013, Statistics New Zealand
NEW ZEALAND IMMIGRATION WELLINGTONOVERVIEW 2015
MIGRATION AND LABOUR FORCE TRENDS
9Migration and the Wellington labour marketImmigration New Zealand (as part of MBIE) recognises the significance that migration plays in meeting workforce needs and, together with local council and economic development agencies, has a shared interest in attracting and retaining migrants to Wellington to meet skill shortages.
Immigration New Zealand’s priorities align with the Government’s Business Growth Agenda which prioritises lifting the skills and productivity of the workforce overall and ensuring skilled migration meets New Zealand’s needs.
Wellington contextWellington’s migrants make for a labour market that is both ethnically and culturally diverse. This creates opportunities as well as challenges and reaffirms the need for the long-term economic and social integration of migrants as an integral part of the region’s economic growth.
The Wellington region’s population is projected to grow by, on average, 0.4 percent a year (a projected increase to 548,400) between 2013 and 2043.2
Wellington is the third largest regional employer in New Zealand and employs 12 percent of New Zealand’s workers. Industries with the highest share of workers in Wellington are Professional, Scientific and Technical Services (13 percent); Public Administration and Safety (12 percent); and Health Care and Social Assistance (10 percent).3
This section will focus on migrant participation in Wellington’s labour force. As stated in a technical report published by Auckland Council4: participation, employment and unemployment rates are three of the most commonly reported and widely understood indicators of the state of the labour market. Together, these three indicators can provide insight in to the pressures that individuals are facing in relation to finding and keeping a job, and the decisions they make about whether to seek work or whether to pursue other, non-work activities.
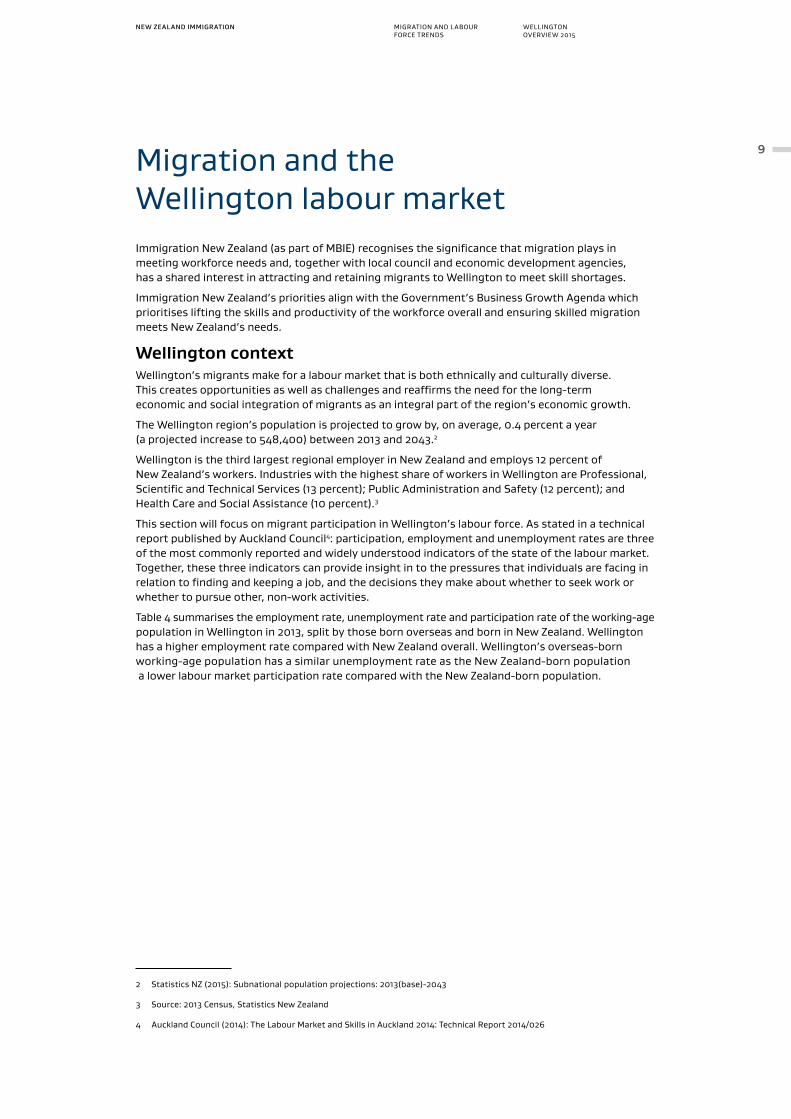
Table 4 summarises the employment rate, unemployment rate and participation rate of the working-age population in Wellington in 2013, split by those born overseas and born in New Zealand. Wellington has a higher employment rate compared with New Zealand overall. Wellington’s overseas-born working-age population has a similar unemployment rate as the New Zealand-born population a lower labour market participation rate compared with the New Zealand-born population.
2 Statistics NZ (2015): Subnational population projections: 2013(base)-2043
3 Source: 2013 Census, Statistics New Zealand
4 Auckland Council (2014): The Labour Market and Skills in Auckland 2014: Technical Report 2014/026
10
NEW ZEALAND IMMIGRATION WELLINGTONOVERVIEW 2015
MIGRATION AND LABOUR FORCE TRENDS
Table 4: Working-age population5 in Wellington by labour force status and birthplace, 2013
Employment Rate Unemployment Rate Participation Rate6
WellingtonOverseas-born 62.0% 7.2% 66.8%
New Zealand-born 66.5% 7.2% 71.6%
New ZealandOverseas-born 59.9% 7.4% 64.6%
New Zealand-born 63.6% 7.0% 68.4%
Source: 2013 Census, Statistics New Zealand
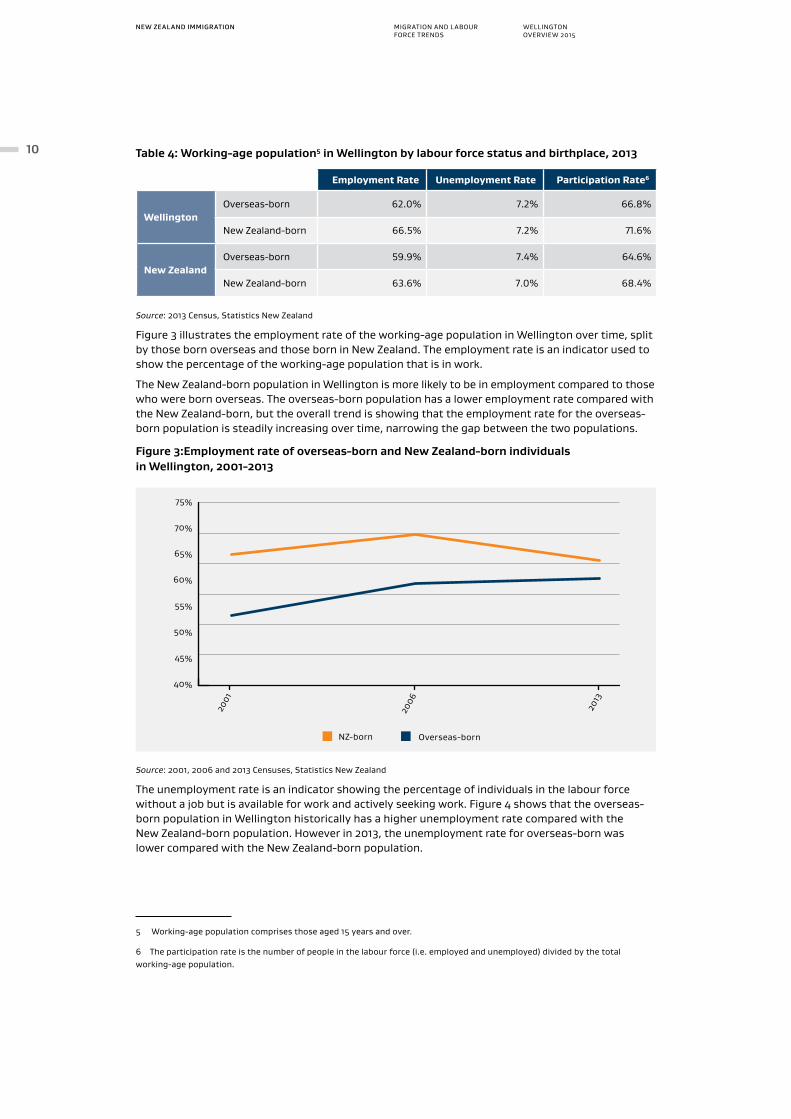
Figure 3 illustrates the employment rate of the working-age population in Wellington over time, split by those born overseas and those born in New Zealand. The employment rate is an indicator used to show the percentage of the working-age population that is in work.
The New Zealand-born population in Wellington is more likely to be in employment compared to those who were born overseas. The overseas-born population has a lower employment rate compared with the New Zealand-born, but the overall trend is showing that the employment rate for the overseas-born population is steadily increasing over time, narrowing the gap between the two populations.
Figure 3:Employment rate of overseas-born and New Zealand-born individuals in Wellington, 2001-2013
40%
45%
55%
60%
50%
Overseas-bornNZ-born
2013
2006
2001
75%
70%
65%
Source: 2001, 2006 and 2013 Censuses, Statistics New Zealand
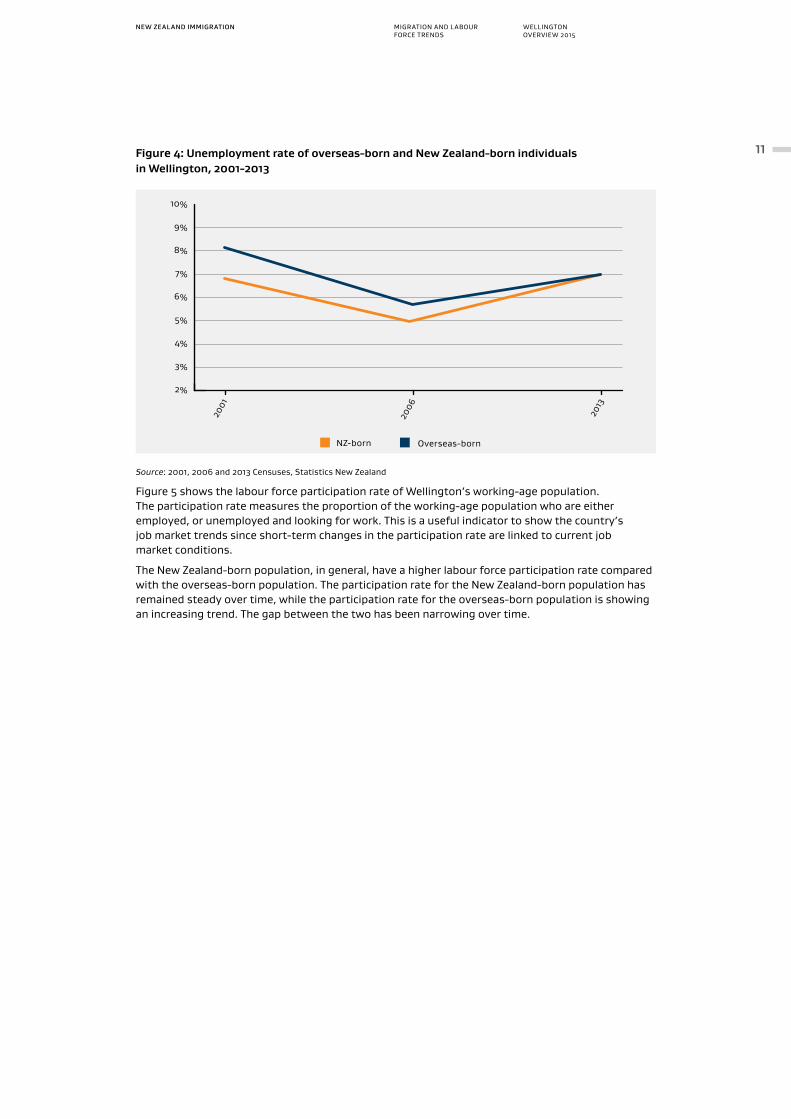
The unemployment rate is an indicator showing the percentage of individuals in the labour force without a job but is available for work and actively seeking work. Figure 4 shows that the overseas-born population in Wellington historically has a higher unemployment rate compared with the New Zealand-born population. However in 2013, the unemployment rate for overseas-born was lower compared with the New Zealand-born population.
5 Working-age population comprises those aged 15 years and over.
6 The participation rate is the number of people in the labour force (i.e. employed and unemployed) divided by the total working-age population.
NEW ZEALAND IMMIGRATION WELLINGTONOVERVIEW 2015
MIGRATION AND LABOUR FORCE TRENDS
11Figure 4: Unemployment rate of overseas-born and New Zealand-born individuals in Wellington, 2001-2013
2%
8%
9%
7%
6%
5%
10%
Overseas-bornNZ-born
2013
2006
2001
4%
3%
Source: 2001, 2006 and 2013 Censuses, Statistics New Zealand
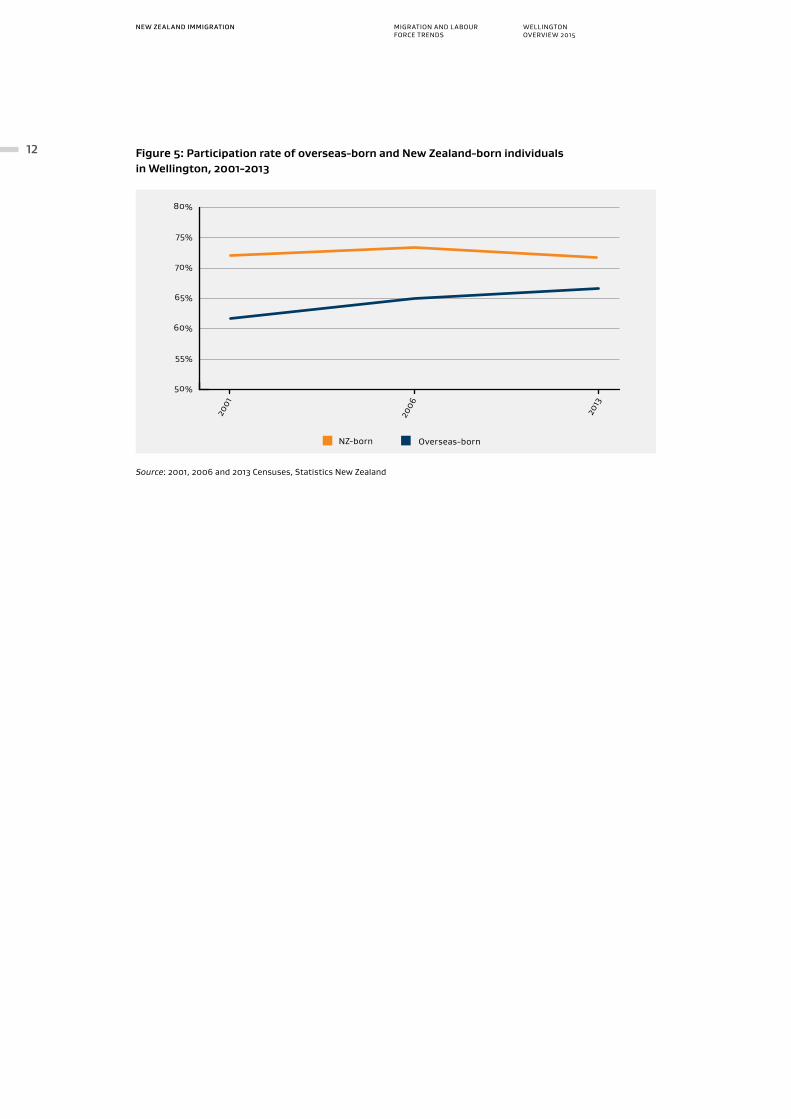
Figure 5 shows the labour force participation rate of Wellington’s working-age population. The participation rate measures the proportion of the working-age population who are either employed, or unemployed and looking for work. This is a useful indicator to show the country’s job market trends since short-term changes in the participation rate are linked to current job market conditions.
The New Zealand-born population, in general, have a higher labour force participation rate compared with the overseas-born population. The participation rate for the New Zealand-born population has remained steady over time, while the participation rate for the overseas-born population is showing an increasing trend. The gap between the two has been narrowing over time.
12
NEW ZEALAND IMMIGRATION WELLINGTONOVERVIEW 2015
MIGRATION AND LABOUR FORCE TRENDS
Figure 5: Participation rate of overseas-born and New Zealand-born individuals in Wellington, 2001-2013
50%
80%
75%
65%
70%
55%
60%
Overseas-bornNZ-born
2013
2006
2001
Source: 2001, 2006 and 2013 Censuses, Statistics New Zealand
NEW ZEALAND IMMIGRATION WELLINGTONOVERVIEW 2015
MIGRATION AND LABOUR FORCE TRENDS
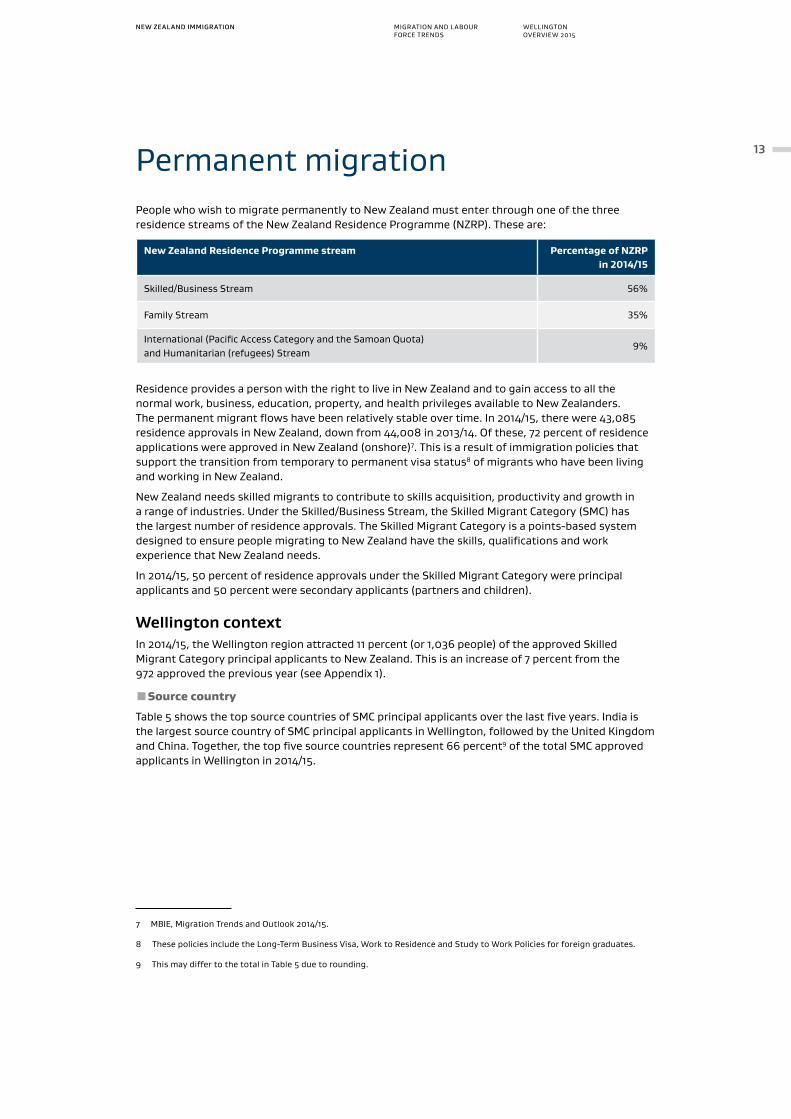
13Permanent migrationPeople who wish to migrate permanently to New Zealand must enter through one of the three residence streams of the New Zealand Residence Programme (NZRP). These are:
New Zealand Residence Programme stream Percentage of NZRP in 2014/15
Skilled/Business Stream 56%
Family Stream 35%
International (Pacific Access Category and the Samoan Quota) and Humanitarian (refugees) Stream
9%
Residence provides a person with the right to live in New Zealand and to gain access to all the normal work, business, education, property, and health privileges available to New Zealanders. The permanent migrant flows have been relatively stable over time. In 2014/15, there were 43,085 residence approvals in New Zealand, down from 44,008 in 2013/14. Of these, 72 percent of residence applications were approved in New Zealand (onshore)7. This is a result of immigration policies that support the transition from temporary to permanent visa status8 of migrants who have been living and working in New Zealand.
New Zealand needs skilled migrants to contribute to skills acquisition, productivity and growth in a range of industries. Under the Skilled/Business Stream, the Skilled Migrant Category (SMC) has the largest number of residence approvals. The Skilled Migrant Category is a points-based system designed to ensure people migrating to New Zealand have the skills, qualifications and work experience that New Zealand needs.
In 2014/15, 50 percent of residence approvals under the Skilled Migrant Category were principal applicants and 50 percent were secondary applicants (partners and children).
Wellington contextIn 2014/15, the Wellington region attracted 11 percent (or 1,036 people) of the approved Skilled Migrant Category principal applicants to New Zealand. This is an increase of 7 percent from the 972 approved the previous year (see Appendix 1).
ƨSource country
Table 5 shows the top source countries of SMC principal applicants over the last five years. India is the largest source country of SMC principal applicants in Wellington, followed by the United Kingdom and China. Together, the top five source countries represent 66 percent9 of the total SMC approved applicants in Wellington in 2014/15.
7 MBIE, Migration Trends and Outlook 2014/15.
8 These policies include the Long-Term Business Visa, Work to Residence and Study to Work Policies for foreign graduates.
9 This may differ to the total in Table 5 due to rounding.
14
NEW ZEALAND IMMIGRATION WELLINGTONOVERVIEW 2015
MIGRATION AND LABOUR FORCE TRENDS
Table 5: Top source countries of Skilled Migrant Category (SMC) principal applicants in Wellington, FY 2010/11 to 2014/15
Source country of principal applicant
2010/11 2011/12 2012/13 2013/14 2014/15
India 184 (19%) 241 (23%) 277 (26%) 268 (27%) 333 (32%)
UK 226 (24%) 238 (23%) 207 (19%) 173 (17%) 150 (14%)
Philippines 68 (7%) 55 (5%) 53 (5%) 71 (7%) 99 (9%)
China 84 (9%) 115 (11%) 129 (12%) 92 (9%) 78 (7%)
South Africa 65 (7%) 51 (5%) 45 (4%) 39 (4%) 37 (4%)
Source: Ministry of Business, Innovation and Employment
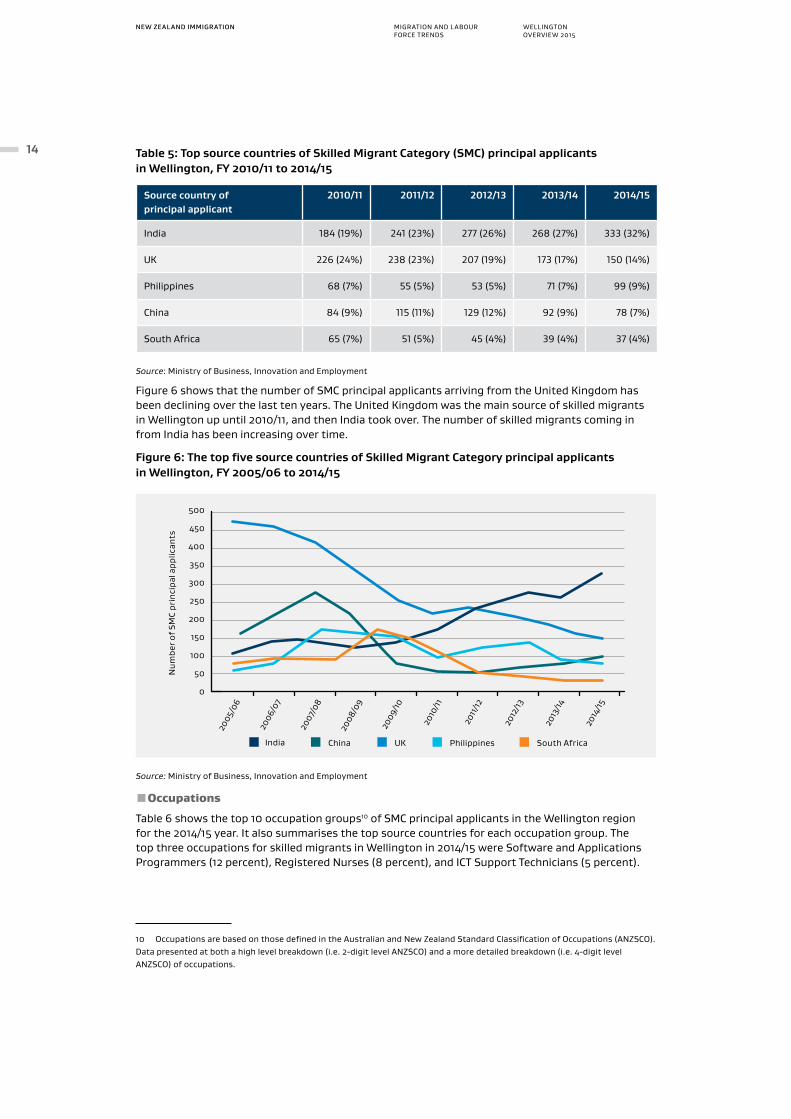
Figure 6 shows that the number of SMC principal applicants arriving from the United Kingdom has been declining over the last ten years. The United Kingdom was the main source of skilled migrants in Wellington up until 2010/11, and then India took over. The number of skilled migrants coming in from India has been increasing over time.
Figure 6: The top five source countries of Skilled Migrant Category principal applicants in Wellington, FY 2005/06 to 2014/15
200
500
0
50
100
300
150
450
250
400
350
Num
ber o
f SM
C pr
inci
pal a
pplic
ants
India China UK Philippines South Africa
2006
/07
2007
/08
2008
/09
2009
/10
2010
/11
2011
/12
2012
/13
2013
/14
2014
/15
2005
/06
Source: Ministry of Business, Innovation and Employment
ƨOccupations
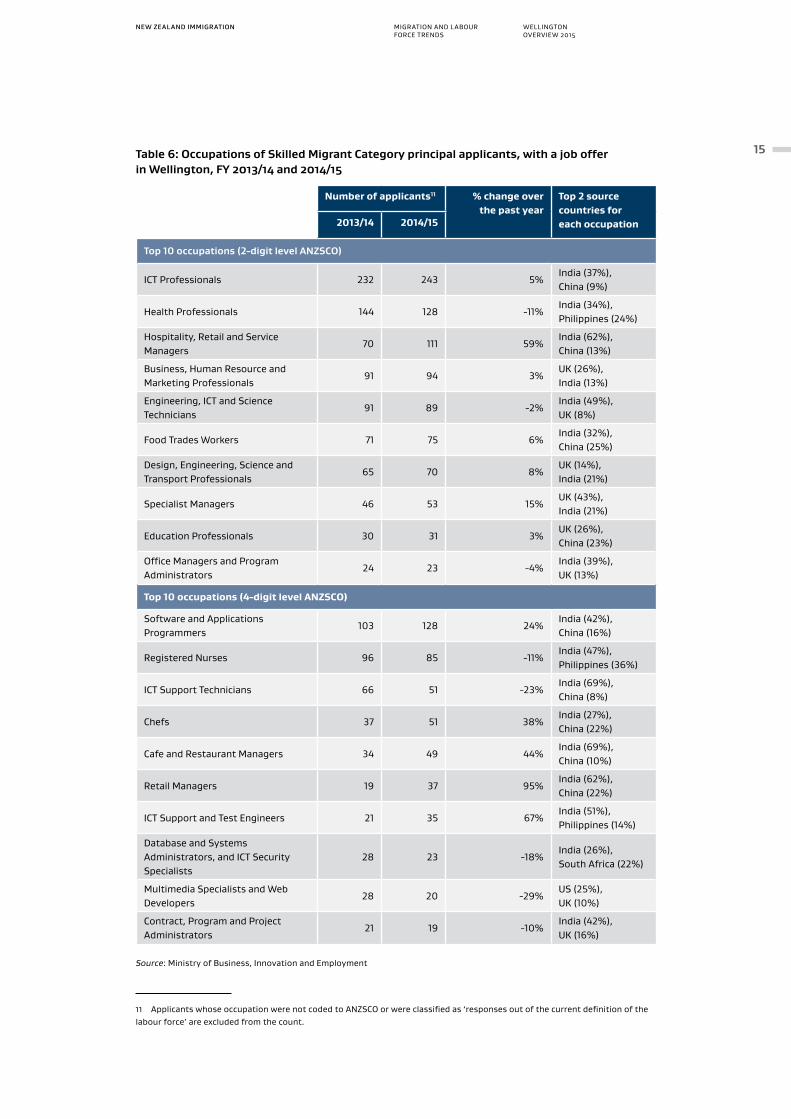
Table 6 shows the top 10 occupation groups10 of SMC principal applicants in the Wellington region for the 2014/15 year. It also summarises the top source countries for each occupation group. The top three occupations for skilled migrants in Wellington in 2014/15 were Software and Applications Programmers (12 percent), Registered Nurses (8 percent), and ICT Support Technicians (5 percent).
10 Occupations are based on those defined in the Australian and New Zealand Standard Classification of Occupations (ANZSCO). Data presented at both a high level breakdown (i.e. 2-digit level ANZSCO) and a more detailed breakdown (i.e. 4-digit level ANZSCO) of occupations.
NEW ZEALAND IMMIGRATION WELLINGTONOVERVIEW 2015
MIGRATION AND LABOUR FORCE TRENDS
15Table 6: Occupations of Skilled Migrant Category principal applicants, with a job offer in Wellington, FY 2013/14 and 2014/15
Number of applicants11 % change over the past year
Top 2 source countries for each occupation2013/14 2014/15
Top 10 occupations (2-digit level ANZSCO)
ICT Professionals 232 243 5%India (37%), China (9%)
Health Professionals 144 128 -11%India (34%), Philippines (24%)
Hospitality, Retail and Service Managers
70 111 59%India (62%), China (13%)
Business, Human Resource and Marketing Professionals
91 94 3%UK (26%), India (13%)
Engineering, ICT and Science Technicians
91 89 -2%India (49%), UK (8%)
Food Trades Workers 71 75 6%India (32%), China (25%)
Design, Engineering, Science and Transport Professionals
65 70 8%UK (14%), India (21%)
Specialist Managers 46 53 15%UK (43%), India (21%)
Education Professionals 30 31 3%UK (26%), China (23%)
Office Managers and Program Administrators
24 23 -4%India (39%), UK (13%)
Top 10 occupations (4-digit level ANZSCO)
Software and Applications Programmers
103 128 24%India (42%), China (16%)
Registered Nurses 96 85 -11%India (47%), Philippines (36%)
ICT Support Technicians 66 51 -23%India (69%), China (8%)
Chefs 37 51 38%India (27%), China (22%)
Cafe and Restaurant Managers 34 49 44%India (69%), China (10%)
Retail Managers 19 37 95%India (62%), China (22%)
ICT Support and Test Engineers 21 35 67%India (51%), Philippines (14%)
Database and Systems Administrators, and ICT Security Specialists
28 23 -18%India (26%), South Africa (22%)
Multimedia Specialists and Web Developers
28 20 -29%US (25%), UK (10%)
Contract, Program and Project Administrators
21 19 -10%India (42%), UK (16%)
Source: Ministry of Business, Innovation and Employment
11 Applicants whose occupation were not coded to ANZSCO or were classified as ‘responses out of the current definition of the labour force’ are excluded from the count.
16
NEW ZEALAND IMMIGRATION WELLINGTONOVERVIEW 2015
MIGRATION AND LABOUR FORCE TRENDS
Temporary migrationThe temporary work policy12 aims to facilitate the access of employers and industry to global skills and knowledge, while complementing the Government’s education, training, employment and economic development policies.
Work visas allow employers to recruit temporary workers from overseas to meet particular or seasonal work shortages, while still protecting employment opportunities for New Zealand workers. In 2014/15, 170,814 people were granted work visas in New Zealand, an increase of ten percent from the 155,683 approvals in the previous year.
Temporary work policies can also lead to pathways to residence for those migrants who have the skills that New Zealand needs. In 2014/15, 18 percent of temporary workers had gained residence within three years of their first work visa13.
Working Holiday makers, partners of work visa holders, partners of some student visa holders and partners of New Zealand citizens and residents can also be issued temporary work visas.
Essential Skills workersThe Essential Skills policy facilitates the entry of people required on a temporary basis to fill shortages where there are no suitably qualified New Zealand citizens or residents for the work offered.
The Essential Skills data series is a good indicator of labour demand as it is a labour market tested visa. This means that employers in New Zealand have proven that they made genuine efforts to attract and recruit suitable citizens and residents to fill a position, but have been unable to find such people.
The demand for Essential Skills workers slowed down from October 2008 with the onset of the global financial crisis and its effect on the domestic economy. Since 2012/13, there has been a gradual increase in the number of Essential Skills workers in New Zealand. In 2014/15, a total of 28,548 people were approved to work in New Zealand under the Essential Skills work policy.
Wellington contextWellington is the fourth main region of employment of Essential Skills workers in New Zealand. In 2014/15, a total of 2,061 people were approved to work in Wellington under the Essential Skills work policy (see Appendix 2). Overall, there has been a three percent decrease in the number of approved workers in the region over the previous year (compared to an 8 percent increase nationwide).
ƨSource country
Table 7 shows the top five source countries of Essential Skills workers in Wellington from 2010/11 to 2014/15. In 2014/15, the United Kingdom was the largest source country of Essential Skills workers in the region, followed by India and the Philippines. Together, the top five source countries accounted for over half (58 percent)14 of the total number of Essential Skills workers coming to jobs in Wellington.
12 This includes Essential Skills, Work to Residence, Family and Study to Work.
13 MBIE, Migration Trends and Outlook 2014/15
14 This may differ to the total in Table 7 due to rounding.
NEW ZEALAND IMMIGRATION WELLINGTONOVERVIEW 2015
MIGRATION AND LABOUR FORCE TRENDS
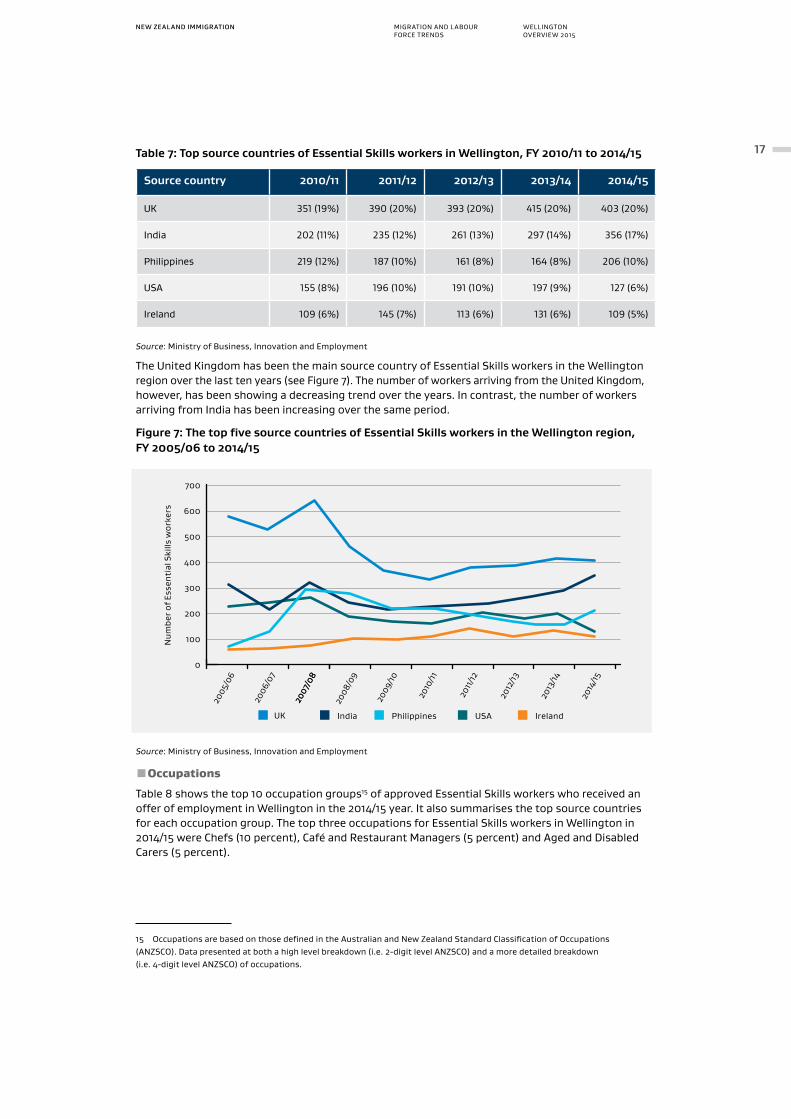
17Table 7: Top source countries of Essential Skills workers in Wellington, FY 2010/11 to 2014/15
Source country 2010/11 2011/12 2012/13 2013/14 2014/15
UK 351 (19%) 390 (20%) 393 (20%) 415 (20%) 403 (20%)
India 202 (11%) 235 (12%) 261 (13%) 297 (14%) 356 (17%)
Philippines 219 (12%) 187 (10%) 161 (8%) 164 (8%) 206 (10%)
USA 155 (8%) 196 (10%) 191 (10%) 197 (9%) 127 (6%)
Ireland 109 (6%) 145 (7%) 113 (6%) 131 (6%) 109 (5%)
Source: Ministry of Business, Innovation and Employment
The United Kingdom has been the main source country of Essential Skills workers in the Wellington region over the last ten years (see Figure 7). The number of workers arriving from the United Kingdom, however, has been showing a decreasing trend over the years. In contrast, the number of workers arriving from India has been increasing over the same period.
Figure 7: The top five source countries of Essential Skills workers in the Wellington region, FY 2005/06 to 2014/15
0
300
700
500
600
400
200
100Num
ber o
f Ess
enti
al S
kills
wor
kers
UK India Philippines USA Ireland
2005
/06
2006
/07
2007
/08
2008
/09
2009
/10
2010
/11
2011
/12
2012
/13
2013
/14
2014
/15
2007
/08
Source: Ministry of Business, Innovation and Employment
ƨOccupations
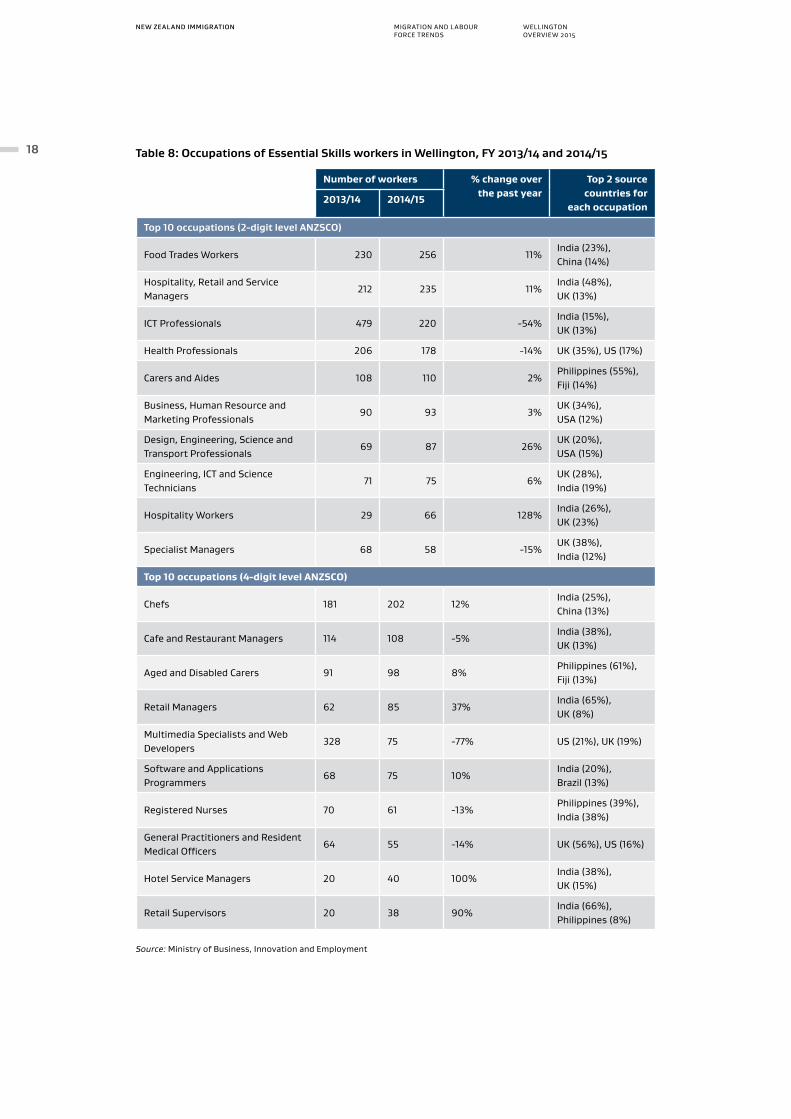
Table 8 shows the top 10 occupation groups15 of approved Essential Skills workers who received an offer of employment in Wellington in the 2014/15 year. It also summarises the top source countries for each occupation group. The top three occupations for Essential Skills workers in Wellington in 2014/15 were Chefs (10 percent), Café and Restaurant Managers (5 percent) and Aged and Disabled Carers (5 percent).
15 Occupations are based on those defined in the Australian and New Zealand Standard Classification of Occupations (ANZSCO). Data presented at both a high level breakdown (i.e. 2-digit level ANZSCO) and a more detailed breakdown (i.e. 4-digit level ANZSCO) of occupations.
18
NEW ZEALAND IMMIGRATION WELLINGTONOVERVIEW 2015
MIGRATION AND LABOUR FORCE TRENDS
Table 8: Occupations of Essential Skills workers in Wellington, FY 2013/14 and 2014/15
Number of workers % change over the past year
Top 2 source countries for
each occupation2013/14 2014/15
Top 10 occupations (2-digit level ANZSCO)
Food Trades Workers 230 256 11%India (23%), China (14%)
Hospitality, Retail and Service Managers
212 235 11%India (48%), UK (13%)
ICT Professionals 479 220 -54%India (15%), UK (13%)
Health Professionals 206 178 -14% UK (35%), US (17%)
Carers and Aides 108 110 2%Philippines (55%), Fiji (14%)
Business, Human Resource and Marketing Professionals
90 93 3%UK (34%), USA (12%)
Design, Engineering, Science and Transport Professionals
69 87 26%UK (20%), USA (15%)
Engineering, ICT and Science Technicians
71 75 6%UK (28%), India (19%)
Hospitality Workers 29 66 128%India (26%), UK (23%)
Specialist Managers 68 58 -15%UK (38%), India (12%)
Top 10 occupations (4-digit level ANZSCO)
Chefs 181 202 12%India (25%), China (13%)
Cafe and Restaurant Managers 114 108 -5%India (38%), UK (13%)
Aged and Disabled Carers 91 98 8%Philippines (61%), Fiji (13%)
Retail Managers 62 85 37%India (65%), UK (8%)
Multimedia Specialists and Web Developers
328 75 -77% US (21%), UK (19%)
Software and Applications Programmers
68 75 10%India (20%), Brazil (13%)
Registered Nurses 70 61 -13%Philippines (39%), India (38%)
General Practitioners and Resident Medical Officers
64 55 -14% UK (56%), US (16%)
Hotel Service Managers 20 40 100%India (38%), UK (15%)
Retail Supervisors 20 38 90%India (66%), Philippines (8%)
Source: Ministry of Business, Innovation and Employment
NEW ZEALAND IMMIGRATION WELLINGTONOVERVIEW 2015
MIGRATION AND LABOUR FORCE TRENDS
19International studentsInternational Education makes a considerable contribution to New Zealand’s economy. The current economic value of export education is estimated to be worth $2.75 billion16. The Leadership Statement for International Education 2011, which aims to double the economic value of international education to $5 billion over the next 15 years, includes targets to:
› increase the number of international students enrolled in New Zealand providers offshore, from 3,000 to 10,000
› double the number of international postgraduate students (particularly in programmes in addition to those at PhD level) from 10,000 to 20,000
› increase the transition rate from study to residence for international university students.
Student policy is New Zealand’s temporary entry policy for international students. It aims to attract genuine international students who have the skills and talent New Zealand needs. In 2014/15, 84,856 international students17 were approved to study in New Zealand, a 16 percent increase from 73,423 in 2013/14 (see Appendix 3).
International students have identified that they chose to study in New Zealand because of the quality and cost of education, opportunities to work after graduation and to apply for residence, and opportunities to study in an English language country18.
Many international students stay on to work in New Zealand after they complete their study. Immigration policies enable the most skilled to stay in New Zealand and take up skilled employment, so that they can help drive economic growth. In 2014/15, 43 percent of skilled migrant category principal applicants were previously on a student visa in New Zealand. Seventeen percent of full fee paying students were granted a resident visa within five years of being issued their first student visa19. The trend is a steady take up of permanent residence over time. Several factors might influence the length of time it takes a student to get residence, including the length of time of study and whether there is an intermediary move to a work visa before applying for residence.
To ensure New Zealand continues to benefit from having international students and secure a healthy growth in this sector, we must ensure that international students in New Zealand have a high quality experience, so New Zealand’s reputation as a safe and attractive education destination is maintained.
Wellington contextInternational students are an important contributor to migration into and out of New Zealand. Getting international students into Wellington plays an important role in bringing value into the region.
Wellington is home to a number of tertiary education institutions including Victoria University of Wellington, New Zealand’s most internationalised university with over 210 partner universities around the world. Graduates with the skills the region needs are encouraged to stay on and work after completing their studies.
Wellington has the third largest share of international students in the country after Auckland and Canterbury, making up 6 percent of the total student visas granted.
16 Infometrics (2015). The economic impact of international education 2014. Wellington: Education New Zealand. http://enz.govt.nz/sites/public_files/ExportEd2014.pdf
17 This includes primary and secondary school students.
18 MBIE (2010). Life After Study: International students’ settlement experiences in New Zealand.
19 MBIE, Migration Trends and Outlook 2014/15.
20
NEW ZEALAND IMMIGRATION WELLINGTONOVERVIEW 2015
MIGRATION AND LABOUR FORCE TRENDS
In 2014/15, 4,628 people intending to study in Wellington were granted student visas20. This represents a 10 percent increase from 2013/14 (see Appendix 3). There has also been an increase in the number of new international students in the region, up 21 percent between 2013/14 and 2014/15 (see Appendix 4).
Further readings on International Students ƨStudent Visa Dashboard July 2016
This dashboard was developed by Education New Zealand and is based on Immigration New Zealand (INZ) data on student visas issued. It provides a monthly summary of where in New Zealand international students are choosing to study, and what education sector they are enrolled in. Student visa data is a strong indicator of whether students are entering, staying or leaving New Zealand to study, which can be used as a predictor for future enrolment trends.
http://www.enz.govt.nz/news-and-research/research/student-visa-dashboard-for-july-2016/
ƨNew Zealand International Education Snapshot: January to August 2015
Developed for Education New Zealand, this provides a snapshot of the trends in New Zealand’s international student enrolments. It brings together data from a number of sources and the trends are represented by sector, fields of study, level of study, location of study and top movements by source country.
http://www.enz.govt.nz/news-and-research/research/new-zealand-international-education-snapshot3a-january-to-august-2015/
ConclusionThe report provides an overview of the demographics of the overseas-born population living in the Wellington region and detailed information on the source country and occupation of migrants who have come to New Zealand under the Skilled Migrant Category and the Essential Skills policy with job offers in Wellington.
Some of the key points of note are:
› Twenty-five percent of Wellington’s population are overseas-born.
› Of the overseas-born population in Wellington, 32 percent were born in the United Kingdom and Ireland and a further 26 percent were born in Asia. The proportion of the overseas-born population in Wellington who were born in the United Kingdom and Ireland is higher than the proportion for New Zealand overall.
› Eleven percent of New Zealand’s approved SMC principal applicants reside in Wellington in 2014/15, most of whom arrive from India, the United Kingdom and China.
› The top three occupations of SMC principal applicants (permanent migrants) in Wellington in 2014/15 were Software and Applications Programmers (12 percent), Registered Nurses (8 percent) and ICT Support Technicians (5 percent).
› The United Kingdom was the largest source country of Essential Skills temporary workers in Wellington (20 percent) followed by India (17 percent).
› The top three occupations for Essential Skills workers in Wellington in 2014/15 were Chefs (10 percent), Café and Restaurant Managers (5 percent) and Aged and Disabled Carers (5 percent).
› Six percent of student visas (4,628 people) granted in 2014/15, were for study in Wellington. This is an increase of 10 percent on the previous year.
20 Both new and returning.
NEW ZEALAND IMMIGRATION WELLINGTONOVERVIEW 2015
MIGRATION AND LABOUR FORCE TRENDS
21A
ppen
dice
sA
ppen
dix
1: R
egio
n of
ski
lled
empl
oym
ent
for S
kille
d M
igra
nt C
ateg
ory
prin
cipa
l app
lican
ts,
FY 2
00
9/1
0-2
014
/15
Reg
ion
Fin
anci
al Y
ear
% c
han
ge
sin
ce 2
013
/14
200
9/1
020
10/1
120
11/1
220
12/1
320
13/1
420
14/1
5
Auc
klan
d3,
706
4,0
02
4,0
634,
648
4,31
74,
648
8%
Cant
erbu
ry8
6175
499
077
41,
629
1,47
3-1
0%
Wel
lingt
on1,
182
918
1,0
181,
051
972
1,0
367%
Wai
kato
656
535
473
493
430
482
12%
Bay
of P
lent
y40
743
930
527
639
946
116
%
Ota
go28
831
337
816
237
432
7-1
3%
Man
awat
u-W
anga
nui
211
201
190
172
188
160
-15%
Tara
naki
202
174
133
168
166
142
-14%
Nor
thla
nd20
520
314
614
314
216
718
%
Sout
hlan
d91
9112
462
137
130
-5%
Haw
ke’s
Bay
137
139
87
125
135
148
10%
Nel
son
84
6692
4290
61-3
2%
Mar
lbor
ough
6360
7631
7353
-27%
Oth
er21
419
818
415
416
717
76%
Tota
l8
,30
78
,09
38
,259
8,3
01
9,2
199
,46
53%
Sour
ce: M
inis
try
of B
usin
ess,
Inno
vati
on a
nd E
mpl
oym
ent
Not
e: ‘O
ther
’ inc
lude
s G
isbo
rne
and
Wes
t Co
ast
22
NEW ZEALAND IMMIGRATION WELLINGTONOVERVIEW 2015
MIGRATION AND LABOUR FORCE TRENDS
App
endi
x 2:
Num
ber o
f pe
ople
gra
nted
Ess
enti
al S
kills
wor
k vi
sas
by re
gion
of
empl
oym
ent,
FY
200
5/0
6-2
014
/15
Reg
ion
Fin
anci
al Y
ear
% c
han
ge
sin
ce
2013
/14
200
5/0
620
06
/07
200
7/0
820
08
/09
200
9/1
020
10/1
120
11/1
220
12/1
320
13/1
420
14/1
5
Auc
klan
d9,
225
9,8
6010
,58
510
,191
7,8
738
,094
7,0
166,
639
7,58
08
,668
14%
Cant
erbu
ry3,
234
3,49
94,
545
3,56
72,
910
2,46
93,
335
4,69
46,
592
7,16
69%
Ota
go2,
864
3,25
93,
904
3,20
62,
645
2,53
12,
482
2,60
42,
927
3,19
09%
Wel
lingt
on2,
470
2,37
63,
496
2,63
71,
978
1,8
691,
963
1,97
92,
119
2,0
61-3
%
Wai
kato
1,61
01,
673
1,77
61,
492
1,10
01,
08
61,
198
1,19
51,
342
1,45
08
%
Bay
of P
lent
y8
82
1,52
61,
529
1,0
358
338
268
09
709
920
998
8%
Sout
hlan
d37
756
277
879
062
472
171
373
775
293
524
%
Nel
son/
Mar
lbor
ough
/Ta
sman
774
1,27
41,
88
61,
285
748
609
659
641
756
796
5%
Man
awat
u-W
anga
nui
601
589
667
573
480
481
462
455
507
515
2%
Haw
ke’s
Bay
525
955
750
382
304
299
284
331
380
429
13%
Tara
naki
397
551
854
595
496
514
505
479
710
424
-40
%
Nor
thla
nd29
234
734
630
925
627
024
726
932
038
019
%
Wes
t Co
ast
108
148
144
173
171
142
175
170
211
213
1%
Gis
born
e92
116
9111
18
811
115
217
218
119
37%
Reg
ion
not
spec
ified
5,29
44,
280
4,98
23,
280
2,44
12,
319
2,0
651,
332
1,20
01,
130
Tota
l whe
re re
gion
is
kno
wn
23,4
5126
,735
31,3
5126
,346
20,5
06
20,0
2220
,00
021
,074
25,2
9727
,418
8%
Tota
l28
,745
31,0
1536
,333
29,6
2622
,947
22,3
4122
,06
522
,40
626
,49
728
,548
8%
Sour
ce: M
inis
try
of B
usin
ess,
Inno
vati
on a
nd E
mpl
oym
ent
NEW ZEALAND IMMIGRATION WELLINGTONOVERVIEW 2015
MIGRATION AND LABOUR FORCE TRENDS
23A
ppen
dix
3: N
umbe
r of
peop
le g
rant
ed s
tude
nt v
isas
by
regi
on o
f st
udy,
FY
200
5/0
6-2
014
/15
Reg
ion
Fin
anci
al Y
ear
% c
han
ge
sin
ce
2013
/14
200
5/0
620
06
/07
200
7/0
820
08
/09
200
9/1
020
10/1
120
11/1
220
12/1
320
13/1
420
14/1
5
Auc
klan
d31
,366
29,8
6630
,774
33,2
7833
,952
36,4
9934
,741
31,9
84
38,9
2946
,697
20%
Cant
erbu
ry9,
455
8,7
468
,224
8,4
228
,639
7,36
75,
189
5,21
55,
832
6,72
015
%
Wel
lingt
on5,
034
4,8
05
4,50
84,
231
4,42
24,
371
4,16
24,
148
4,20
44,
628
10%
Wai
kato
4,66
23,
942
3,76
13,
810
3,8
213,
705
3,67
43,
494
3,66
73,
985
9%
Ota
go3,
511
3,31
23,
220
3,36
03,
556
3,62
93,
524
3,52
63,
587
3,74
95%
Bay
of P
lent
y95
299
61,
079
1,39
61,
520
2,23
82,
057
1,79
22,
311
2,68
016
%
Man
awat
u-W
anga
nui
2,75
12,
369
2,24
92,
220
2,28
32,
327
2,49
42,
240
2,24
72,
314
3%
Nel
son/
Mar
lbor
ough
/Ta
sman
632
649
728
796
88
28
86
830
673
671
1,0
2352
%
Sout
hlan
d19
818
518
722
634
443
450
152
664
876
718
%
Haw
ke’s
Bay
478
494
517
555
543
598
689
543
623
745
20%
Tara
naki
652
512
442
474
544
546
536
463
517
549
6%
Nor
thla
nd39
044
443
346
751
842
647
242
541
745
18
%
Oth
er13
311
397
6268
5336
3249
41-1
6%
Reg
ion
not
spec
ified
9,0
5010
,716
12,8
86
13,8
1011
,663
11,0
1710
,00
09,
128
9,72
110
,50
7
Tota
l whe
re re
gion
is
kno
wn
60,2
1456
,433
56,2
1959
,297
61,0
9263
,079
58,9
05
55,0
6163
,70
274
,349
17%
Tota
l6
9,2
64
67,
149
69
,10
573
,10
772
,755
74,0
96
68
,90
56
4,18
973
,423
84,
856
16%
Sour
ce: M
inis
try
of B
usin
ess,
Inno
vati
on a
nd E
mpl
oym
ent
Not
e: ‘O
ther
’ inc
lude
s G
isbo
rne
and
Wes
t Co
ast.
24
NEW ZEALAND IMMIGRATION WELLINGTONOVERVIEW 2015
MIGRATION AND LABOUR FORCE TRENDS
App
endi
x 4:
Num
ber o
f ne
w s
tude
nts
by re
gion
of
stud
y, F
Y 20
05/
06
-20
14/1
5
Reg
ion
Fin
anci
al Y
ear
% c
han
ge
sin
ce
2013
/14
200
5/0
620
06
/07
200
7/0
820
08
/09
200
9/1
020
10/1
120
11/1
220
12/1
320
13/1
420
14/1
5
Auc
klan
d9,
983
12,2
2915
,416
17,6
87
17,8
3519
,235
17,4
2114
,828
20,2
83
26,0
2928
%
Cant
erbu
ry3,
701
4,21
44,
394
4,8
694,
700
3,68
52,
104
2,55
83,
217
3,8
5820
%
Wel
lingt
on1,
916
2,0
89
2,17
62,
333
2,48
22,
438
2,24
62,
291
2,31
62,
797
21%
Wai
kato
1,58
61,
653
1,95
82,
177
1,91
71,
827
1,77
61,
725
1,93
62,
208
14%
Ota
go1,
564
1,69
31,
725
1,8
942,
026
2,0
641,
829
1,76
71,
88
42,
08
311
%
Bay
of P
lent
y55
870
276
91,
074
1,0
971,
711
1,40
81,
211
1,49
91,
839
23%
Man
awat
u-W
anga
nui
1,0
261,
08
81,
240
1,18
21,
141
1,11
51,
214
1,0
381,
033
1,12
39%
Nel
son/
Mar
lbor
ough
/Ta
sman
407
473
517
578
597
594
544
472
471
813
73%
Sout
hlan
d12
312
414
817
925
229
333
531
439
453
035
%
Haw
ke's
Bay
283
341
361
390
354
388
477
319
387
483
25%
Nor
thla
nd25
733
533
738
243
036
740
134
133
133
20
%
Tara
naki
247
239
252
300
341
353
298
218
309
278
-10
%
Oth
er10
18
673
4655
3221
2231
26-1
6%
Reg
ion
not
spec
ified
5,58
97,
205
8,5
768
,60
55,
130
4,48
44,
351
4,33
75,
027
5,63
1
Tota
l whe
re re
gion
is
kno
wn
21,7
5225
,266
29,3
6633
,091
33,2
2734
,10
230
,074
27,1
04
34,0
9142
,399
24%
Tota
l27
,341
32,4
7137
,942
41,6
96
38,3
5738
,58
634
,425
31,4
4139
,118
48,0
3023
%
Sour
ce: M
inis
try
of B
usin
ess,
Inno
vati
on a
nd E
mpl
oym
ent
Not
e 1:
In t
his
anal
ysis
, a s
tude
nt is
cou
nted
as
‘new
’ the
yea
r in
whi
ch t
heir
firs
t vi
sa w
as a
ppro
ved.
Thi
s is
a s
ubse
t of
App
endi
x 3.
Not
e 2:
‘Oth
er’ i
nclu
des
Gis
born
e an
d W
est
Coas
t

NEW ZEALAND IMMIGRATION WELLINGTONOVERVIEW 2015
MIGRATION AND LABOUR FORCE TRENDS
25

MB
1343
1