Volker Krey1, Christoph Bertram2,
Jiyong Eom3, Nils Johnson1, David
Mccollum1
1) International Institute for Applied Systems Analysis (IIASA), Energy program,
Laxenburg, Austria
2) Potsdam Institute for Climate Impact Research, Potsdam, Germany
3) KAIST Business School, Graduate school of green growth, Seoul, Republic
of Korea
The energy transformation
in 2°C pathways:
upscaling technology,
investment needs,
stranded assets, and
the role of energy demand

2050
2100
2030
Source: AMPERE, Riahi et al. (2015)

Implications of Delaying Action to 2030
Double-challenge:
• Acceleration of the low-
carbon transformation
• Dealing with
consequences of fossil-
fuel “lock-in”
stranded assets in the
order of 100s of GW coal
power plants
Stranded assets (coal power plants)
*Current global electricity generation in 2010 = 2.5 TWyr
Source: AMPERE, Bertram et al. (2015)
*

Upscaling rates of low-carbon
technologies (2030-2050) Annual capacity additions under 2°C target (450 ppm CO2-eq)
Source: after van der Zwaan et al. (2013); data: Eom et al. (2015), AMPERE database;
history: Platts (2014), GWEC, Greentechmedia
0
50
100
150
200
His
tory
(19
80's
)
Imm
edia
te
2030
Del
ay
His
tory
(20
14)
Imm
edia
te
2030
Del
ay
His
tory
(20
14)
Imm
edia
te
2030
Del
ay
His
tory
Imm
edia
te
2030
Del
ay
His
tory
Imm
edia
te
2030
Del
ay
Nuclear Wind Solar Coal CCS Gas CCS
Ann
ual c
apac
ity a
dditi
ons
[GW
/yr]
348 901
dem
onst
ratio
n
dem
onst
ratio
n

Billio
n U
SD
pe
r ye
ar
IMAG
E
MESSA
GE
REM
IND
TIAM
-ECN
WIT
CH
GEA
IEA
IMAG
E
MESSA
GE
REM
IND
TIAM
-ECN
WIT
CH
IMAG
E
MESSA
GE
REM
IND
TIAM
-ECN
WIT
CH
GEA
0
500
1000
1500
2000
2500
3000
3500
0
RefPol RefPol-450
2010 2010-2050 2010-2050
Energy Efficiency
Others
Liquids - Biofuels
Liquids - Fossil Fuels
Electricity - T&D and Storage
Electricity - Nuclear
Electricity - Renewables
Electricity - Fossil Fuels
Extraction - Others
Extraction - Fossil Fuels
Total: ~$1000 billion/yr (2% of global GDP)
• Fossil: ~$500 billion/yr
• Renewables: ~$250 billion/yr
• Other (Nuclear, T&D): ~$300 billion/yr
Sectoral Energy Investments
Source: LIMITS, McCollum et al. (2013)

Billio
n U
SD
pe
r ye
ar
IMAG
E
MESSA
GE
REM
IND
TIAM
-ECN
WIT
CH
GEA
IEA
IMAG
E
MESSA
GE
REM
IND
TIAM
-ECN
WIT
CH
IMAG
E
MESSA
GE
REM
IND
TIAM
-ECN
WIT
CH
GEA
0
500
1000
1500
2000
2500
3000
3500
0
RefPol RefPol-450
2010 2010-2050 2010-2050
Energy Efficiency
Others
Liquids - Biofuels
Liquids - Fossil Fuels
Electricity - T&D and Storage
Electricity - Nuclear
Electricity - Renewables
Electricity - Fossil Fuels
Extraction - Others
Extraction - Fossil Fuels
(current climate
policies, >3 ºC)
(stringent climate
policies, <2 ºC)
Sectoral Energy Investments
So
urc
e:
LIM
ITS
, M
cC
ollu
m e
t a
l. (
201
3)

An
nu
al In
ve
stm
en
t in
Re
ne
wa
ble
En
erg
y, N
ucle
ar
En
erg
y, a
nd
Effic
ien
cy fro
m 2
01
0-2
05
0 [b
illio
n U
SD
/yr]
CHIN
A+
NORTH
_AM
INDIA
+
EUROPE
LATI
N_A
M
RES
T_ASIA
REF_E
CO
N
AFR
ICA
MID
DLE
_EAST
PAC
_OECD
0
100
200
300
400
500
RefPol-450
RefPol
Dev
elop
ing
Indu
stria
lized
Wor
ld0
500
1000
1500
2000
165
110 120
45 65 80
50 60 60 20
545
245
790
(current climate policies, >3 ºC)
(stringent climate policies, <2 ºC)
Source: LIMITS, McCollum et al. (2013)
Clean-energy Investment “Gap”

Stranded investments due to premature
shut-down of coal power plants
51 53 55 57 59 60 61 58
Increasing 2030 GHG emissions (GtCO2)
Efficiency
*Total energy-related investments are currently about 1000 billion
*
Source: AMPERE, Johnson et al. (2015)

Ch
ina
So
uth
Asia
US
A +
Can
ad
a
Afr
ica
Eu
rop
e
ME
NA
Rest of the world
Stranded investments by region
Source: AMPERE, Johnson et al. (2015)

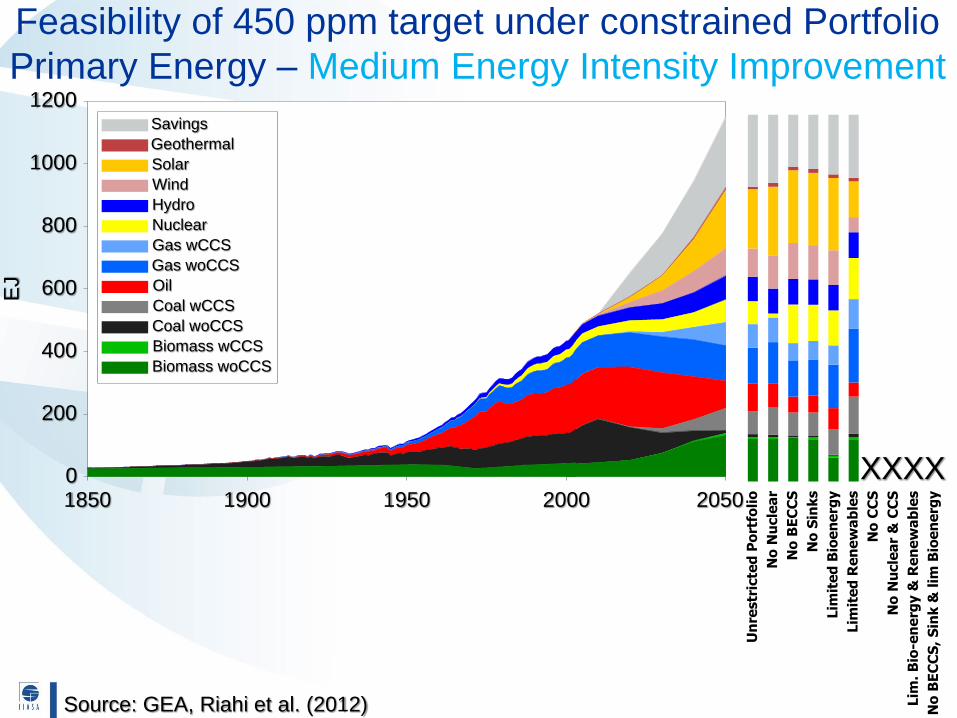
1850 1900 1950 2000 2050
EJ
0
200
400
600
800
1000
1200 Savings
Geothermal
Solar
Wind
Hydro
Nuclear
Gas wCCS
Gas woCCS
Oil
Coal wCCS
Coal woCCS
Biomass wCCS
Biomass woCCS
Supply Side Technology Variations
Source: GEA, Riahi et al. (2012)
Feasibility of 450 ppm target under constrained Portfolio
Primary Energy – Slow Energy Intensity Improvement
Un
restr
icte
d P
ort
foli
o
No
Nu
cle
ar
No
BE
CC
S
No
Sin
ks
Lim
ite
d B
ioe
ne
rgy
Lim
ite
d R
en
ew
ab
les
No
CC
S
No
Nu
cle
ar
& C
CS
Lim
. B
io-e
ne
rgy &
Re
ne
wa
ble
s
No
BE
CC
S,
Sin
k &
lim
Bio
en
erg
y
XXXXXXXX
1850 1900 1950 2000 2050
EJ
0
200
400
600
800
1000
1200 Savings
Geothermal
Solar
Wind
Hydro
Nuclear
Gas wCCS
Gas woCCS
Oil
Coal wCCS
Coal woCCS
Biomass wCCS
Biomass woCCS
Feasibility of 450 ppm target under constrained Portfolio
Primary Energy – Medium Energy Intensity Improvement
Source: GEA, Riahi et al. (2012)
Un
restr
icte
d P
ort
foli
o
No
Nu
cle
ar
No
BE
CC
S
No
Sin
ks
Lim
ite
d B
ioe
ne
rgy
Lim
ite
d R
en
ew
ab
les
No
CC
S
No
Nu
cle
ar
& C
CS
Lim
. B
io-e
ne
rgy &
Re
ne
wa
ble
s
No
BE
CC
S,
Sin
k &
lim
Bio
en
erg
y
XXXX

1850 1900 1950 2000 2050
EJ
0
200
400
600
800
1000
1200 Savings
Geothermal
Solar
Wind
Hydro
Nuclear
Gas wCCS
Gas woCCS
Oil
Coal wCCS
Coal woCCS
Biomass wCCS
Biomass woCCS
Un
restr
icte
d P
ort
foli
o
No
Nu
cle
ar
No
BE
CC
S
No
Sin
ks
Lim
ite
d B
ioe
ne
rgy
Lim
ite
d R
en
ew
ab
les
No
CC
S
No
Nu
cle
ar
& C
CS
Lim
. B
io-e
ne
rgy &
Re
ne
wa
ble
s
No
BE
CC
S,
Sin
k &
lim
Bio
en
erg
y
Feasibility of 450 ppm target under constrained Portfolio
Primary Energy – Rapid Energy Intensity Improvement
Source: GEA, Riahi et al. (2012)

Working Group III contribution to the IPCC Fifth Assessment Report
Mitigation Costs: role of technology and end-use efficiency
Source: IPCC WGIII AR5, Figure 6.24

Thank you! References
• Riahi et al. (2012) Energy Pathways for Sustainable Development.
The Global Energy Assessment: Toward a More Sustainable
Future. IIASA, Laxenburg, Austria and Cambridge University Press,
Cambridge, UK.
• McCollum et al. (2013) Energy investments under climate policy: a
comparison of global models. Clim. Change Econ., 04:1340010.
• Riahi et al. (2015) Locked into Copenhagen pledges —
Implications of short-term emission targets for the cost and
feasibility of long-term climate goals. TFSC, 90(PA):8-23.
• Bertram et al. (2015) Carbon lock-in through capital stock inertia
associated with weak near-term climate policies. TFSC, 90(PA):62-
72.
• Eom et al. (2015) The impact of near-term climate policy choices on
technology and emission transition pathways. TFSC, 90(PA):73-88.
• Johnson et al. (2015) Stranded on a low-carbon planet:
implications of climate policy for the phase-out of coal-based power
plants. TFSC, 90(PA):89-102.