V
S. B., Massachusetts Institute of Technology
1924
Submitted in Partial Fulfillment of the Requirement
for the Degree of
DOCTOR OF PHILOSOPHY
from the
Massachusetts Institute of Technology
1928
Signature of Author..... a . V . ., .* *- w
Certification by the Department of Iiology and Public Health
Professor in Charge of Researc . u . ..............-
Chairman of Departmental Co -mittee on Graduate Studen 7
* ~/e.e *.@@..ee. . .................. .
I ii
Head of Department..... ......... ...................... ..
'3
A CRITICAL STUDY OF THE HYDROLYSIS OF PROTEINS WVITH ENZYIS
AND INORGANIC REAGENTS
RIEPNZI B. PARIMR
ACI TO7LTDG:ITT
to state my appreciation
assistance given by Dr.
in the preparation of
this thesis
I wish
of the
Bunker
BIOGRAPHY
Rienzi B. Parker West Newton, Mass.
Attended the Choate School, W.7allingford, Conn., 1914-1920.
Entered Massachusetts Institute of Technology, 1920. Awarded
the degree of S. B. as of the class of 1924. Graduate stu-
dent, Massachusetts Institute of Technology, 1924-1928. Part
time assistant 1925-1927. Part time instructor, 1927 to date.
Presented to the Faculty of the Massachusetts Institute of
Technology in May, 1928, a thesis entitled "A Critical Study
of the Hydrolysis of Proteins with Enzymes and Inorganic Rea-
gents."
ii ~O I 1b1
CONTENTS
Page.
.............. 1
.............. 4
.............. 7
............. 11
............. 18
Subject
Object of the Research...................
Summary of the General Literature........
Nitrogen Linkage in the Protein Molecule.
Methods for Amino Nitrogen Determination.
The Van Slyke Method fortermination of Aliphatic
Raw Materials............
Preliminary Treatment....
Hydrolysis with Enzymes..
Hydrolysis under Pressure
Hydrolysis with Acid.....
Discussion......*...*....
Conclusions*.............
.0
.
the Gasometric DeAmino Nitrogen
0090 00. 0 0 0 *0 & 0
.......... 00000000
................. 0
.................
Bibliography....
.. 37
.. 39
.. 45
.. 84
..90
.102
.111
OBJECT OF THE RESEARCH
The results presented in this thesis are those se-
cured by a study of the methods of protein hydrolysis. Tork
was started while the author was an undergraduate at the Mass-
achusetts Institute of Technology, and the subject which it
was planned to study was then considerably wider in scope.
It was intended that a study be made of the amino acid content
of animal feedstuffs. After the proportion of amino acids
present in a foodstuff had been determined, attempts were to
be made to build up a "synthetic" animal food from waste vege-
table materials which would be combined in such a way as to
furnish the necessary proportions of amino acids.
The results obtained during this first period were
presented in an undergraduate thesis in 1924. P. ,. Bates,
who collaborated on the larger part of the undergraduate work,
also submitted a thesis in that year, and Helen Jones, Lar-
garet Kennard, and 7arren Center reported at the same time in
the section of Advanced Biological Chemistry. These reports
are on file at the Massachusetts Institute ofb Technology.
The preliminary work made it very clear that the
problem, as originally outlined, presented too broad an as-
pect for a single research. Therefore, it was narrowed down,
and the four years of graduate work which have since been gi-
-2-
ven to it were devoted to one point alone, namely, the hydro-
lysis of the proteins.
The reason why endeavor should be concentrated on
this one point is easily understood. No complete hydrolysis
of a protein has yet been made. The greatest degree of hy-
drolysis that has ever been attained is in the case of gela-
tin, where it has proved possible to carry the hydrolysis 90%
to completion (41). From this figure values drop until we
find cases in which hydrolysis can be carried only 601 to
completion (41). Losses Auring hydrolysis run, then, from
10% to 40%, dependent upon the substance hydrolyzed and the
methods and reagents used, before any system of analysis is
applied to the hydrolysate. Until such losses are prevented,
protein analysis remains uncertain.
Incomplete protein analysis occurs in two ways,
first, through the Law of Mass Action, and second, through
the formation of humin. As yet there is no methiod known of
avoiding the effects of the Law of .ass Action, for under the
conditions of hydrolysis the end products remain soluble and
reactive, and therefore equilibrium is reached while the con-
version of total nitrogen to amino nitrogen is still incom-
plete.
Humin formation is caused .by a union of amino groups
with carbohydrate under the conditions of hydrolysis. In en-
zyme hydrolyses no humin is formed, acid hydrolyses may pro-
duce it in large amounts, and alkaline hydrolyses are practi-
-3-
cally certain to increase the amount of humin over that formed
from the same protein when hydrolyzed with acid.
The important factor in the production of humin dur-
ing acid hydrolysis is the amount of carbohydrate present.
If the carbohydrate exists as carbohydrate groups in a conju-
gated protein, there is no chemical method by which it may be
removed without destruction of the amino acids which make up
the rest of the protein molecule. If the carbohydrate is not
in chemical combination but rather in a physical mixture, as
in the case of the cereals and the grains, it can be removed.
It is only reasonable to expect that such treatment will re-
duce materially the amount of humin formed.
W!hat part oxidative reactions may play in humin
formation is not known, but it is believed that oxygen is ne-
cessary to its formation. If there were any means of prevent-
ing oxidation, humin formation should be almost entirely eli-
minated.
T1-he following pages, after a brief survey of the
general literature relating to protein hydrolysis, are devo-
ted to the data secured in the study of the points just men-
tioned. The results have been almost wholly negative, but it
is hoped that they may prove valuable in showing the next man
what to avoid.
-4-
SULARY OF TH1 Gi7±1TRAL L ITERkATRTE
The literature bearing specifically on protein hy-
drolysis is sparse. That which has appeared is devoted to a
study of the kinetics of the reaction. The literature which
has appeared in an effort to better the accepted methods of
converting protein nitrogen to amino nitrogen is negligible.
In that respect, then, if in no otheri this thesis enjoys a
position that is unique.
The first time that proteins were hydrolyzed in
the laboratory was in 1820 when Braconnot (9) was successful
in hydrolyzing protein by boiling with acid. In 1839, Mulder
(48) obtained essentially the same results by treatment with
alkalies.
The work of'these two men is of historical imprortance
and nothing more, for neither one had a definite concept of
the chemical nature of the changes which took place during
their experiments. It was not until 1902 that the theory of
peptide linkage was first advanced by Hofmeister (38). The
study of the products of protein hydrolysis was begun three
years later by Siegfried (68), who treated the amino acid mix-
tures with calcium hydroxide and carbon dioxide in the cold,
thus forming carbamino acids which may be decomposed with a
precipitate of calcium carbonate on heating.
No means had yet been devised to successfully fol-
low the progress of hydrolysis, that is, the degree to which
total nitrogen is converted to amino nitrogen. In 1909, Ma-
thieu (44) attempted to use Siegfried's method (68) to follow
the progress of hydrolysi-s, but the results obtained were not
very satisfactory. In 1908, however, Sorensen (69) devised
the formol titration method which measures the amount of car-
boxyl set free. Henriques and Gjaldbak (36, 37) in 1911 ap-
plied the titration to follow the enzymatic hydrolysis of
proteins, and this work furnished the first definite chemical
evidence that amino acids are united for the most part in the
protein molecule through the peptide linkage.
The method next developed for determining the degree
of hydrolysis was that of Van Slyke (77, 80) in 1911, and this
was further perfected until by 1918 a highly accurate appara-
tus was made available for the deterrination of aliphatic a-
min6 nitrogen. The most recent development in methods for de-
termining the degree of hydrolysis is that introduced by Tore-
man (17) in 1920. It consists essentially of an improved So-
rensen (71) method.
The two methods which have been established for de-
termining the degree of hydrolysis are dependent upon the li-
beration of one or the other of two groups, carboxyl and amino,
which enter into the peptide linkage. In addition to the amino
nitrogen and to the nitrogen which is bound as humin, nitrogen
is also converted during hydrolysis to the forthof ammonia.
-6-
These facts bring us of necessity to a consideration of the
ways in which nitrogen may be combined in the protein molecule.
NITROGEN LINKAGE IN THE PROTEIN MOTCULE
The degree to which ammonia is formed during pro-
tein hydrolysis is dependent to a large extent upon the con-
ditions of the reaction. Nasse (49) in 1872 was the first
to point out that the nitrogen which gives rise to ammonia
must be differently bound in the protein molecule than that
which becomes available as amino nitrogen. The nitrogen
which is converted to ammonia during hydrolysis is now known
as amaide nitrogen, and the work of Osborne and Nolan (59),
in 1920, demonstrated with reasonable certainty that the am-
monia comes from the amides of dicarboxylic acids, provided
that the conditions least favorable to the formation of am-
monia from other sources are satisfied (90).
There are still other linkages of nitrog'en in the
protein molecule which cannot be split like the peptide lin-
kage to give amino and carboxyl groups. Those which are de-
finitely proved are the guanidine group of arginine, the im-
idazole group of histidine, and the indole ring of trypto-
phane (86). According to Fischer and Abderhalden (16), pro-
line can enter into peptide linkage not only with its car-
boxyl group but also with its imino nitrogen group. Other
types of linkages which have been suggested are the uramino
linkage (4) and the thiopeptide linkage (39).
-8-
Lloyd (41) states that the possible linkages with-
in the protein molecule are four in number. These are tabu-
lated as follows:
1. Peptide linkage:
-C - N-
0 H
2. 2:5 diketopiperazine linkage:
NTH
RIC 00I I
OC CHRM
3. The phosphorous linkage which may, according
to Lloyd, be bound in the peptide linkage. There is also the
possibility that phosphorous is bound in some unknown manner
(64).
4. The sulfur linkage which is also of unknown
constitution. Walker (88) has applied a modified nitroprus-
side reaction for the sulphydryl group and studied the re-
sults which proved to be uniformly positive for all disul-
fides tested. The application of the test to ovalbumin led
to a confirmation of the sugrestion advanced by Tarris (33)
that in the case of ovalbumin the sulphydryl group - SH formed
on denaturization of the ovalbumin does not have as a pre-
cursor a disulfide linkage - S - S - , for the application of
the test to native ovalbumin gives a negative result.
It is particularly important to keep in mind the
fact that while Fischer and Abderhalden (16) are generally
credited with having established the existence of the peptide
linkage through their isolation of numerous polypetides from
partially hydrolyzed proteins, they did not determine whether
or not all the amino acids are united in the peptide linkage.
7e know that they are not, but we do not know the proportions
in which the amino acids are distributed in the various types
of linkage. Neither do we know exactly the pronortion of
total nitrogen which is bound in peptide linkage. But if we
ignore for the moment the nitrogen which may be lost as am-
monia or bound in humin, we can say that by far the greater
portion of the remaining nitrogen is bound in peptide linkage.
This is particularly important because the only two
methods available for following the progress of hydrolysis
are dependent upon the breaking of the peptide bond. There
is no method known at present by which imino nitrogen pep-
tide linkage, as in the case of proline (16), may be detected
in the protein molecule (86).
It must be realized that in measuring the carboxyl
groups or the amino groups set free during hydrolysis, we can
never obtain a measurement which would equal 100l of the total
nitrogen because of the other linkages which are known to
exist. It is, therefore, not strictly correct to take such
measurements and express the ratio between them and the total
nitrogen as the per cent conversion, or degree of hydrolysis.
The ratio should be expressed not between the value for amino
-10-
nitrogen and the total nitrogen but between the value for a-
mino nitrogen and the total nitrogen which would be available
as amino nitrogen provided hydrolysis were complete. Unfortu-
nately, that value has never been determined for any protein.
Unless the total nitrogen value is chosen as a basis for per
cent computation, some other figure must be chosen which is
equally arbitrary. The total nitrogen value as been taken ac-
cordingly as the basis on which the degree of hydrolysis, or
per cent conversion of total nitrogen to amino nitrogen,
should be calculated in this work.
TJhile the per cent conversions thus obtained are
not quantitative, they are nevertheless comparable. An in-
crease in amino nitrogen has been taken, then, as meaning an
increase in the per cent conversion.
Amino nitrogen may be measured in two ways, either
directly by means of the Van Slyke apparatus or indirectly
through establishing the titration value for the correspond-
ing carboxyl groups which were liberated. The next step is
to consider in detail the different methods by which amino ni-
trogen may be determined.
-11-
METHODS FOR j.MTO NITROGENJT: DE :TETAT ION
Methods of Van Slyke and Sorensen -
These two methods were the first ones available for
determining the degree to which a prote'in is hydrolyzed. The
method of Sorensen preceded that of Van Slyke by about three
years (Cf. page 5, this report). While both methods have
their faults, it is probable that the liability to error in
the hands of an experienced operator is very nearly equal.
One of the difficulties encountered with the Van
Slyke method is that most of the proteins and many of their
hydrolytic products are precipitated in the nitrous acid so-
lution. 7ilson (92) believes it possible that some of the
material is occluded by the precipitation and thereby the
length of time necessary for the reaction is increased. Van
Slyke and Birchard (84) studied this point. They tried in-
creasing the time of the reaction from 2-5 minutes to 20-30
minutes, but they were uncertain whether this gave good re-
sults because of the possibility of hydrolysing some of the
protein in the reaction vessel. They decided finally that
no hydrolysis occurred, because analysis of peptides of vary-
ing composition and containing up to fourteen amino acids
yielded theoretical results.
Abderhalden and Kramm (1), in analyzing digestion
-12-
mixtures of proteins by Van Slyke's method found that great
differences in results were obtained according to whether the
reaction was run for 5 minutes or for 10 minutes. This they
believed due to hydrolysis of some of the easily split pep-
tones, although in accord with the findings of Van Slyke and
Birchard (84) no hydrolysis had been noted in previous work
with pure polypeptides. However, they did not consider this
latter point proved because of insufficient data.
Hart and Sure (34) also are in doubt as to whether
or not protein cleavage products higher than amino acids are
hydrolyzed during the course of the Van Slyke determination.
The degree to which this factor may influence the accuracy of
the determinations made in this work is considered further on
under the discussion of the methods for amino nitrogen deter-
mination (Cf. page 16, this report).
White and Thomas (90) made a comparison of the me-
thods of Van Slyke and Sorensen and found that the results
obtained with the Van Slyke method were parallel with those
obtained with the Sorensen method but slightly lower. These
workers apparently use the 5 minute reaction period during
their determinations, but they are not definite on this point.
Rogozinski (67) and Andersen (3) both noted variations be-
tween the two methods but came to the conclusion that the Van
Slyke method was the more satisfactory. Northrop (55) be-
lieves that in absolute determinations the Van Slyke determ-i-
nation is the more accurate but favors the Sorensen method
-13-
for comparative experiments where hydrolytic changes are to
be measured as it is more accurate and much more rapid.
Method of Foreman -
The method devised by Foreman (17) for amino nitro-
gen determination is a titration method and consists essenti-
ally of an improved Sorensen (71) method. The method differs
from that of Sorensen in that the titration is run in alcoho-
lic instead of aqueous solution. The advantage is that am-
monia, liberated during the reaction with formaldehyde, does
not form an ionizable compound with the phenolphthalein used
as indicator provided the concentration of alcohol is kept a-
bove 80'. Besides being imore exact, the method has an addi-
tional advantage in that it is applicable to alcoholic ex-
tracts of protein hydrolysates. This is not true of the Van
Slyke apparatus because of the volatility of the alcohol,
which may introduce an error.
Morrow (47) states that Foreman's method is prefera-
able to Sorensen's. Davies (12) found F'oreman's method entire-
ly satisfactory.
The TNinhydrin Reaction -
Harding and MacLean (29, 30) have developed a colo-
rimetric method for determining protein hydrolysis by measure-
ment of the amino acid alpha nitrogen. The reaction is run in
the presence of pyridine between the amino acids and triketo-
hydrindene hydrate, and is essentially the ninhydrin reaction.
Harding and MacLean found a close correlation between the Van
m - - -
-14-
Slyke determination and the colorimetric method. They also
mention that both corresponded well with Sorensen's method.
Discussion of the methods for Amino Nitrogen Determination -
Of the four methods outline4 the Van Slyke method
was selected as the one by which amino nitrogen determinations
would be made during this work. The reasons for this are
not hard to understand.
The method of Harding and MacLean (29, 30) was dis-
carded arbitrarily. It has never been mentioned by any other
worker and only twice by its originators. Lacking corrobora-
tion, the method did not appear to be a suitable one, parti-
cularly since others were available on which the data was
voluminous by comparison. Another drawback to this method is
that it is based on a colorimetric determination. Protein
hydrolysates obtained through the action of acids or bases
tend to be highly colored, and in many cases the color is a
true color and in solution from which it cannot be rem'oved
by an adsorbing; agent. Such colors would tend to interfere
so seriously with the colorimetric determination as to render
it valueless.
For the purposes of the present report, oreman's
method may also be disregarded, the reason being that the
method did not receive any attention from Jones and Kennard
(40) who collaborated in the earlier part of this investiga-
tion. This is difficult to understand, as one of the prob-
lems which they wished to solve was whether the Van Slyke me-
-15-
thod or the Sorensen method was the more suitable for amino
nitrogen determinations on protein hydrolysates. Their deci-
sion was in favor of the Van Slyke determination. Foreman's
method was brought to its present stage in 1920, while Jones
and K-ennard did not start work until 1924. Thy they should
have ignored Foreman's method is not known.
Jones and Kennard's (40) unfavorable report on the
Sorensen method, coupled with satisfactory experience with
the Van Slyke apparatus during the preliminary work, led to
the choosing of the Van Slyke method for all subsequent de-
terminations. Then the method of Foreman came to the writer's
attention it was inadvisable to change the method of deter-
mining amino nitrogen as a great deal of work had already
been completed on the basis of the Van Slyke determination,
If there were any reason for assuming that either
of the titration methods was superior to the Van Slyke deter-
mination, there would have been good reason for abandoning
it, but such is not the case. Authorities appear to be about
equally divided in their preference for one method or the
other (1, 3, 12, 34, 47, 55, 67, 84, 90, 92).
The Van Slyke determination is subject to errors,
and theoretically, these may take place in two ways (92).
Results may be too high, due to hydrolysis of the protein
with nitrous acid, or they may be too low due to the insolu-
bility of certain proteins in nitrous acid. There is also
the possibility that unknown and slow reacting groups may
I. --
-16-
contribute to give high results. It is very unlikely, however,
that these factors have any practical significance, particu-
larly in this work where the method was confined entirely to
determinations on protein hydrolysates.
In the first place, hydrolysis is definitely a func-
tion of temperature, and while deaminization takes place dur-
ing the determination and so upsets the equilibrium that has
been established, the reaction is run at room temperature.
This means that whatever hydrolysis does take place must be
extremely small. The experimental data furnished by Van Slyke
and Birchard (84) offers confirmation of this line of reason.
The insolubility of proteins in nitrous acid pre-
sents a serious difficulty in cases where the ratio of pro-
tein to protein derivatives is very high. Such is not the
case, however, with satisfactory protein hydrolysates. TTo
case can be called to mind where, if the per cent conversion
of total nitrogen to amino nitrogen was in excess of 30,
any difficulty was experienced with insolubility of the sam-
ple. WTith hydrolysates of lower value, the difficulty often
could be overcome by dilution of the sample before adling to
the reaction mixture. It should also be kept in mind that
hydrolyses reaching values of 30'% or less for per cent con-
version are undeserving of serious consideration, and there-
fore errors which are introduced through insolubility of the
hydrolysate in the nitrous acid mixture are not irportant.
The possibility of the effect of unknown groups is
one that cannot be ignored. Nevertheless, we know that the
greater part of the nitrogen of the protein molecule is con-
vertible to alpha amino nitrogen. Of that which remains, we
have a fairly definite idea as to the type of linkage which
exists (Cf. pages 7-10, this report). Knowing this, it is
possible to estimate to what degree those linkages will af-
fect the Van Slyke determination. The slow reacting groups
also deserve consideration. These are factors, however,
that affect the method from the strictly quantitative view-
point. They do not affect it when employed only for compa-
rative results as has been done in this work. There has
been nothing of a quantitative nature about the determina-
tions, for the results obtained were compared on an arbi-
trary basis of per cent conversion and not against a stan-
dard whose composition was definitely known.
It has, therefore, been concluded that the Van
Slyke amino nitrogen determination furnished a satisfactory
method for determining the degree of hydrolysis of protein.
Because all the experimental data is dependent upon the de-
terminations made with the Van Slyke apparatus, it seems ad-
visable to consider the apparatus and its method of use at
this point.
-17-
-18-
THE VAN SLYKE METHOD FOR THE GASOMETTRIC T)TMINATION
OF ALIPHATC AMITNO NITR OGEN
References -
Tor detailed information regarding the set-up of
the apparatus and its method of use, it is best to consult
Van Slyke's original papers (77, 79, 81, 83).
Apparatus -
The apparatus necessary for the proper carrying
out of the Van Slyke amino nitrogen determination is obtaina-
ble in two sizes, one relatively large, which is known as the
macro size, the other much smaller, known as the micro size.
Both apparatus are to all intents and purposes identical.
The only difference between them is with respect to size.
The micro apparatus employs the same reagents and is operated
in the sane manner as the macro apparatus, but the quantities
of reagents used with the micro apparatus are, of course,
smaller.
The micro apparatus has the following advantages
over the macro apparatus. First, less material need be taken
as a sample for running the determination. Second, the de-
termination can be performed in a shorter time due to the
smaller quantities of reagents involved. A micro apparatus
was used for all the determinations made in this work.
These differences from the apparatus diagrammed by
WWWWWWWV - - _MMMM
-19-
Van Slyke (79) should be noted, however. F.irst, connected to
the deaminizing bulb, D, is a second two c.c. burette, C.
This is used only for the addition of capryl alcohol, the
sample being introduced by means of the burette B. The ca-
pryl alcohol burette can be distinguished from the sample
burette by the fact that the sample burette is connected to
the deaminizing bulb by means of a two way stopcock, while
the capryl alcohol burette is connected by means of a one way
stopcock.
Second, the gas burette, F, is of three c.c. total
capacity and is graduated to one-hundredths of a c.c.
Third, the cylindrical vessel A is of 15 c.c. ca-
pacity and has two marks, one at 2.22 c.c., the other at 8.88
c.c.
Fourth, the deaminizing bulb D is of 10 c.c. capa-
city and has two marks, one at 11.1 c.c., the other at 4 c.c.
Operation -
The method of operating outlined by Van Slyke was
followed strictly. The deaminization time was taken as three
minutes because the determinations were run at 20-25*C. prac-
tically without exception. The time interval was measured ac-
curately by means of a timer. The Hempel pipette was given
two shakings, one for two minutes and one for one riinute af-
ter passing the gas from the pipette to the gas burette and
back again. This procedure was found sufficient to remove all
traces of nitric oxide.
Identically the same procedure was followed for the
blank determinations.
Limits of the Reaction -
The reaction is complete enough for measurements
that are intended for comparison and not for strictly quanti-
tative results, as every known amino acid reacts quantitative-
ly with one and only one nitrogen atom except lysine, which
reacts with two, and proline and. oxyproline, which do not re-
act at all. All the amino acids react with all their nitrogen
except tryptophane, which reacts with one-half; histidine with
one-third; arginine with one-quarter; proline and oxyuroline
with one. The foregoing estimations by van Slyke (77) have
been accepted apparently, for there is nothing in the litera-
ture to contrevert them. For confirmation, there is only the
work of Hart and Sure (34) who agreed with Van Slyke on the
reaction of lysine with nitrous acid, differing only in that
they thought 15 minutes or even 10 minutes was sufficient to
get all the reactive nitrogen if the temperature was above
3000. instead of the 30 minutes recommended by Van Slyke (77).
Testing of the Apparatus -
For the testing of the apparatus, Van Slyke recom-
mends a two c.c. sample of Kahlbaum's leucine which is made up
so as to be equivalent to 20 mgms. of leucine (81). An ac-
c-uracy of 0.005 mgm. is claimed when less than two c.c. of gas
is measured, while with more the accuracy is limited to 0.01
mgm. (81).
-21-
In this work the apparatus was tested simply by
drawing a measured amount of air into the gas burette. This
was then passed over into the deaminizing bulb. The appara-
tus was put through all the manipulations of a true determi-
nation and at the end, if the volume of air corresponded with-
in *0.01 c.c. of the original volume, the apparatus was con-
sidered to be in perfect shape.
Every precaution must be taken against air leaks as
the very smallest of these will seriously affect the accuracy
of the determinations. Wilson (91) frequently reground the
stopcocks with powdered emery and greased the stopcock at the
upper end of the gas burette after every three or four deter-
minations. The precautions observed during this work were not
as extreme, but particular care was taken that the stopcocks
were well lubricated and the rubber connections tight. The
apparatus was frequently tested as described above.
It was not found necessary to use stethoscope tub-
ing as suggested by Van Slyke (83). The regulation small'
bore pressure tubing has proved entirely satisfactory, pro-
vided it was a good fit.
Blank Determinations -
With the micro apparatus the residual gas obtained
on a blank determination should amount usually to 0.06 to 0.12
C.c. In any case, it must be under 0.2 c.c., otherwise the ni-
trite should be rejected (81). While these are the limits for
the blanks specified by Van Slyke, it has proved impossible
-22-
to keep within them during the course of this work. The dif-
ficulty of keeping these limits led naturally to a search of
the literature to determine whether other workers had experi-
enced difficulty with the blank determinations. As a result
of this survey but one reported case was found where diffi-
culty was encountered with checking the blank determinations
(63). Strangely enough, those workers who report difficulty
with checking true determinations claim to have obtained. sa-
tisfactory blanks. The difficulty which has been encountered
with checking true determinations during this work will be
dealt with at a later point (Cf. page 25, this report).
Not only has it been impossible to check the blank
determinations for the author, but within the last few months
a thesis student, supplied with an entire new Van Slyke micro
apparatus, came independently to the conclusion that the
blanks are difficult if not impossible to check.
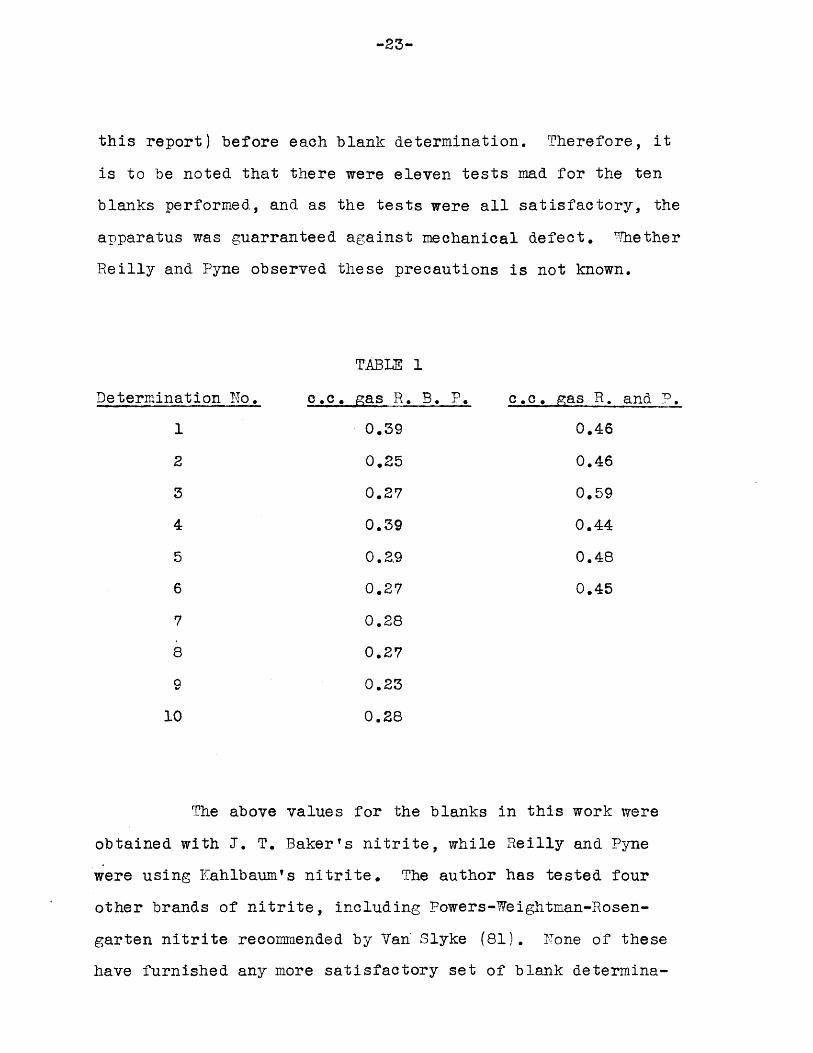
Reilly and Pyne (63), whose report furnishes the
only published case of failure to check the blanks, tested a
number of samples of sodium nitrite but found that the blanks
remained very large. Using the micro apparatus and Kahlbaum's
nitrite, they obtained the set of values for the blank shown
in Table 1. In contrast to these values is given a tabulation
of ten blank determinations made during this work. During
the series of ten determinations perfordmed here, temperature
and pressure were to all practical purposes constant, and g
the apparatus was tested by the method described (Cf. page 20,
Determination No.
TABLE 1
cC. gas R. B. P.
0.39
0.25
0.27
0.39
0.2.9
0.27
0.28
0.27
0.23
0.28
c.c. gas R. and .
0.46
0.46
0059
0.44
0.48
0.45
The above values for the blanks in this work were
obtained with J. T. Baker's nitrite, while Reilly and Pyne
were using Kahlbaum's nitrite. The author has tested four
other brands of nitrite, including Powers-Weightman-Rosen-
garten nitrite recomended by Van Slyke (81). None of these
have furnished any more satisfactory set of blank determina-
-23-
this report) before each blank determination. Therefore, it
is to be noted that there were eleven tests mad for the ten
blanks performed, and as the tests were all satisfactory, the
apparatus was guarranteed against mechanical defect. Whether
Reilly and Pyne observed these precautions is not known.
tions than the one given above.
The driving motor used through all the determinations
was an induction motor and therefore maintained a very nearly
constant speed. Reilly and Pyne make no mention of the motor
used. They do claim, however, to have analyzed the blank gas
in a Bone and "heeler apparatus, the analysis showing that the
gas consisted entirely of nitrogen. TheT found that recrys-
tallization of the nitrite led to only slightly lower values
for the blanks and did not in any way improve their ability
to secure checks. The procedure finally adopted by Reilly
and Pyne was to run an amino nitrogen determination and follow
it immediately with a blank, taking care that in the two cases
the volume of nitric oxide evolved was the same. It was found
in this work, however, that blanks could not be checked by
this method.
In view of the fact that the apparatus was mechani-
cally satisfactory, being gas tight and subject to shaking at
a nearly constant speed, one cannot avoid being forced to the
conclusion that the variation encountered in the blanks is one
inherent in the determination. ,ecessarily this means that it
is unavoidable. 7 urther strength is lent this view by the fact
that an independent research man using a separate apparatus,
and class students using the same apparatus as was employed in
this work, have obtained essentially the same results with the
blank determinations over a period covering two years. The
degree to which the inherent variation of the blanks may af-
-25-
fect the accuracy of the true determinations will be consider-
ed at a later point (Cf. page 31, this report).
Check Determinations -
The discussion just presented on the blank determi-
nations makes it clear that true determinations can never be
checked more closely than the limits imposed by the variations
of the blank determinations. Strangely enough, however, it
has been found that true determinations vary over much wider
limits than can be accounted for by the variations of the
blanks, and this fact led to a further search of the litera-
ture to determine whether other investigators had encountered
the same difficulty.
Satisfactory checks are either implied or clearly
stated by several of the workers previoly mentioned under
the discussion on the methods for determining amino nitrogen
(3, 44, 67, 90). In addition, Dernby (A) and Avery and Cullen
(B) tacitly accept the possibility of checking the true de-
terminations.
But DeBord (C) finally abandoned the Van Slyke me-
thod because of the failure to obtain consistent control anal-
yses, finding in one particular series of tests that the va-
riation was as high as 18.4 .
A Dernby, K. G. J. Biol. Chem. 35, 179(1918).
B. Avery, 0. T. and Cullen, G. E1. J. Ehxp. Med. 32, 547(1920).
C. DeBord, G. G. J. Bacteriol. 8, 7(1923).
The results presented by Lamson (D) are particularly
interesting for they cover several hundred determinations and
were produced by two men. In general, the results obtained
were quite irre-ular. Modifications 7hich were applied to the
metnod gave no perceptible improvement.
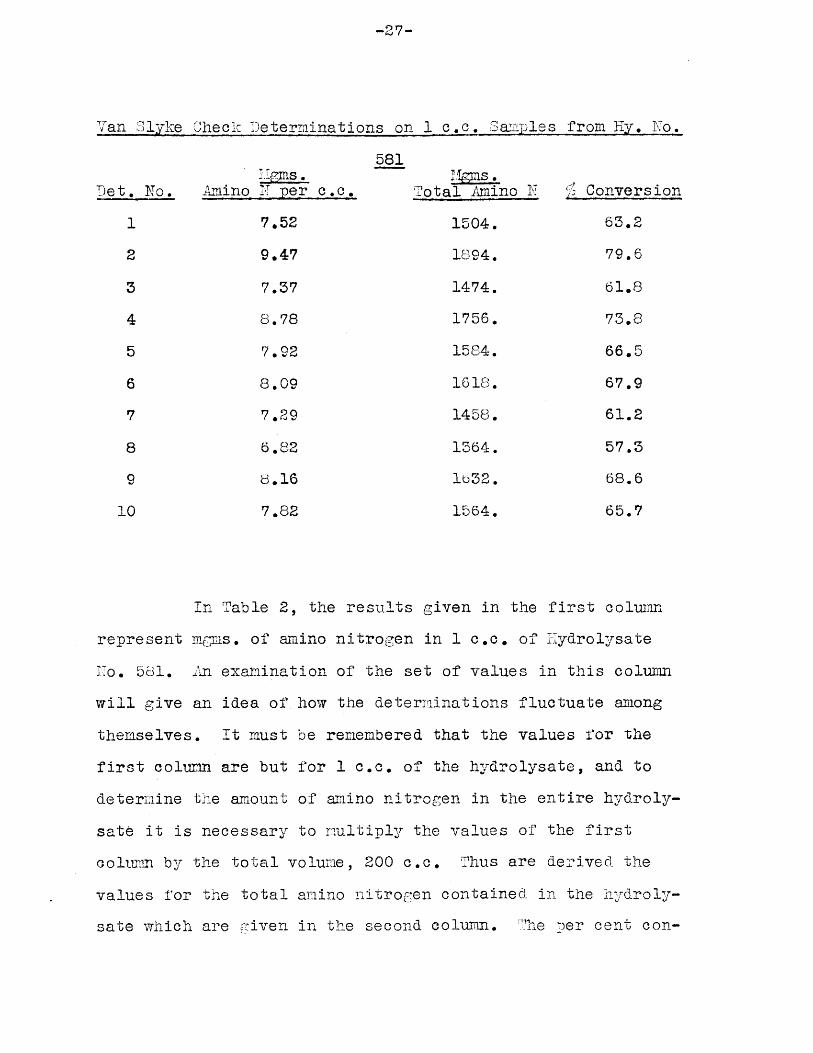
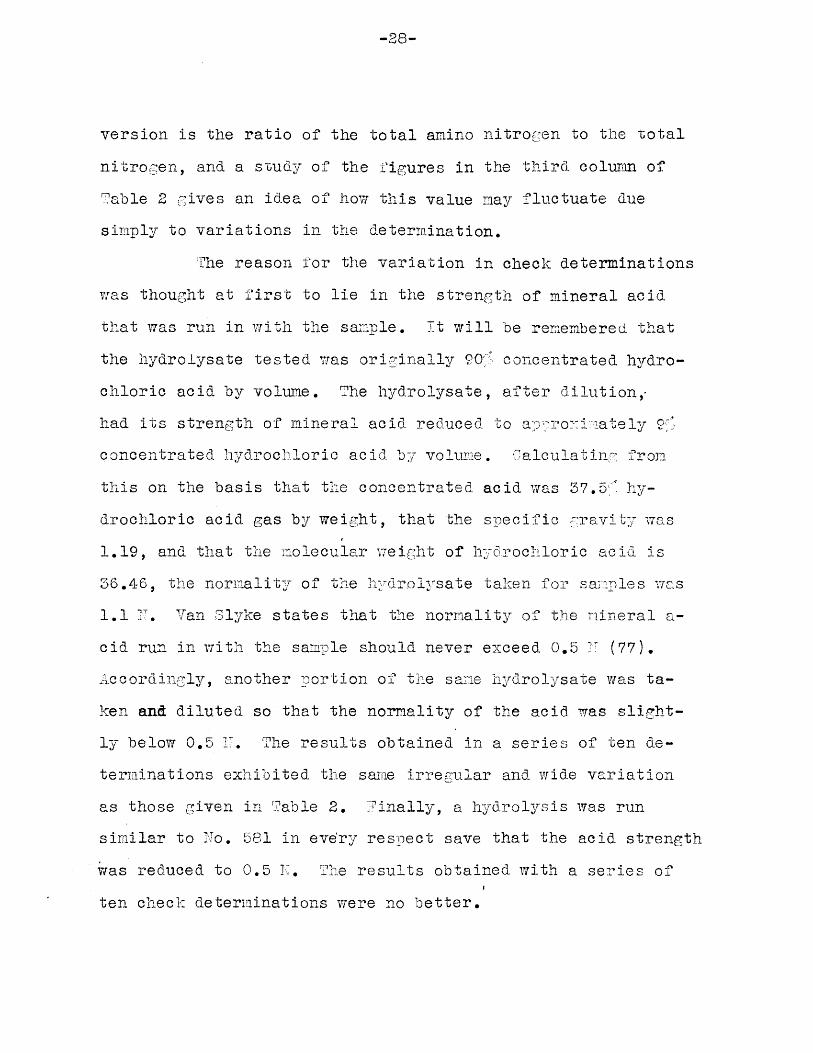
In Table 2 is given the tabulation of a series of
ten determinations made on Iydrolysate N~o. 581. The neces-
sary data on this hydrolysate is as follows:
IYDROLYSATE NO. 581
The raw material consisted of 20 gms. of dried 7ro-
co (Cf. page 36, this report). To this was added 20 ims. of
stannous chloride and 200 c.c. 90 by volume concentrated hy-
drochloric acid. The mixture was boiled under reflux for
four hours, heat being supplied with a direct flame. 'he mix-
ture was cooled under the tap, filtered, and stoppered tight-
ly. It then stood from :ay 14 to June 15, when 10 c.c. was
withdrawn and diluted volumetrically to 100 c.c. The deter-
minations were run on this dilution.
D .7 L
Van S lyke Oheck Determinations on 1 c.c. 3amiples from Hy. No.
Det. No.
1
2
3
4
5
6
7
8
9
10
Amino N per
581
c .C.
7.52
9.47
7.37
8.78
7.02
8.09
7.29
6.82
6 . 16
7.82
Mgms .Total Amino N
1504.
1894.
1474.
1756.
1584.
1618.
1458.
1,364.
1632.
1564.
SConversion
63.2
79.6
61.8
73.8
66.5
67.9
61.2
57.3
68.6
65.7
In Table 2, the results given in the first column
represent m-ms. of amino nitrogen in 1 c.c. of Ilydrolysate
bo. 581. An examination of the set of values in this column
will give an idea of how the determinations fluctuate among
themselves. It must be remembered that the values for the
first column are but for 1 c.c. of the hydrolysate, and to
determine the amount of amino nitrogen in the entire hydroly-
sate it is necessary to multiply the values of the first
colurm by the total volume, 200 c.c. Thus are derived the
values for the total amino nitrogen contained in the hydroly-
sate which are given in the second column. The per cent con-
-27-
-28-
version is the ratio of the total amino nitrogen to the total
nitrogen, and a study of the figures in the third coluim of
Table 2 gives an idea of how this value may fluctuate due
simply to variations in the determination.
The reason -or the variation in check determinations
was thought at first to lie in the strength of mineral acid
that was run in with the samle. It will be remembered that
the hydrolysate tested was originally 90< concentrated hydro-
chloric acid by volume. The hydrolysate, after dilution,-
had its strength of mineral acid reduced to p iately C,
concentrated hydrochloric acid by vo lum-e. 'alculating from
this on the basis that the concentrated acid was 37.5 I hy-
drochloric acid gas by weight, that the specific -ravity was
1.19, and that the molecular \eig:ht of hydrochloric acid is
36.46, the normalitT of the hydrolysate taken for sarles was
1.1 N. Van 31yke states that the normality of the nineral a-
cid run in with the samrle should never exceed 0.5 F (77).
Accordingly, another portion of the same hydrolysate was ta-
ken and diluted so that the normality of the acid was slight-
ly below 0.5 1. The results obtained in a series of ten de-
terminations exhibited the same irregular and wide variation
as those given in Table 2. FiJnally, a hydrolysis was run
similar to No. 581 in every respect save that the acid strength
was reduced to 0.5 N. The results obtained with a series of
ten check determinations were no better.
-29-
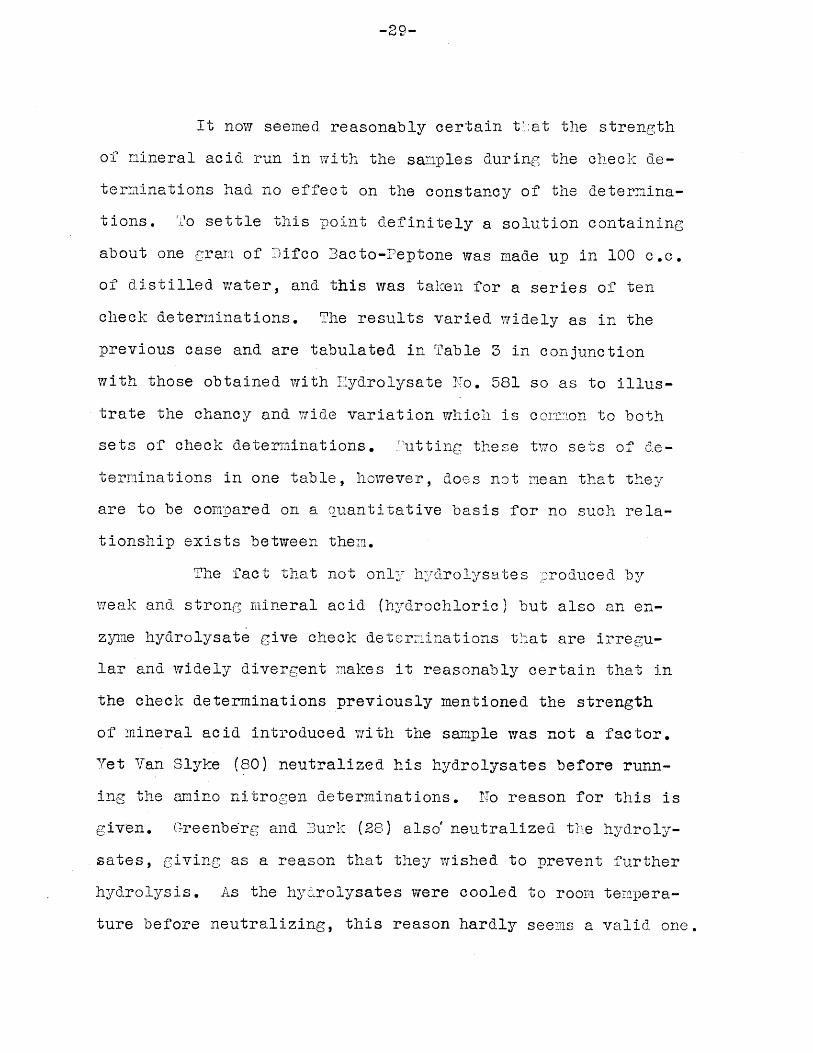
It now seemed reasonably certain t'at the strength
of mineral acid run in with the sanples during the check de-
terminations had no effect on the constancy of the determina-
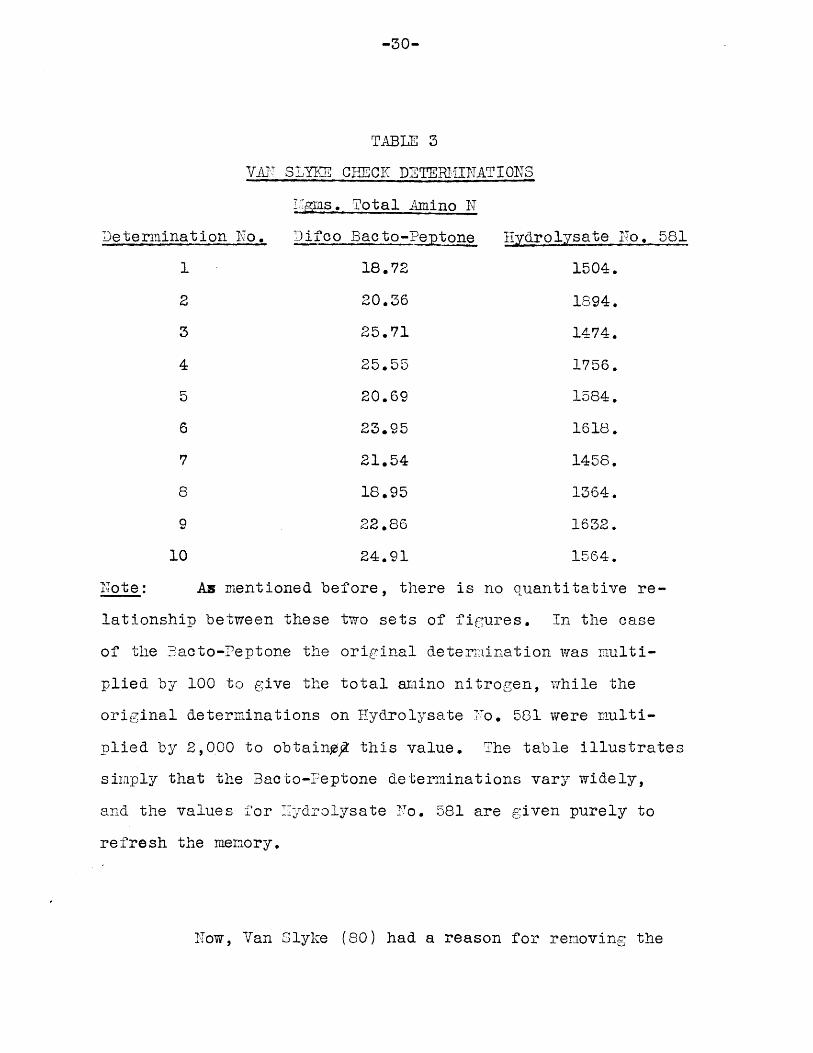
tions. To settle this point definitely a solution containing
about one !-rai of Difco 3acto-Peptone was made up in 100 c.c.
of distilled water, and this was taken for a series of ten
check determinations. The results varied widely as in the
previous case and are tabulated in Table 3 in conjunction
with those obtained with IHydrolysate No. 581 so as to illus-
trate the chancy and wide variation which is conson to both
sets of check determinations. "utting these two sets of de-
terminations in one table, however, does not mean that thev
are to be comoared on a quantitative basis for no such rela-
tionship exists between them.
The fact that not only hydrolysates produced by
weak and strong mineral acid (hydrochloric) but also an en-
zyme hydrolysate give check determinations that are irregu-
lar and widely divergent makes it reasonably certain that in
the check determinations previously mentioned the strength
of mineral acid introduced with the sample was not a factor.
Yet Van Slyke (80) neutralized his hydrolysates before runn-
ing the xaino nitrogen determinations. No reason for this is
given. Greenberg and 3urk (28) also' neutralized thre hydroly-
sates, giving as a reason that they wished to prevent further
hydrolysis. As the hydrolysates were cooled to room tempera-
ture before neutralizing, this reason hardly seems a valid one.
-30-
TABLE 3
VA TN SLY CICK DETERMINATIONS
m..gmus. Total Amino N
Determination No. Difco Bacto-Peptone Hydrolyateo.81
1 18.72 1504.
2 20.36 1894.
3 25.71 1474.
4 25.55 1756.
5 20.69 1584.
6 23.95 1618.
7 21.54 1458.
8 18.95 1364.
9 22.86 1632.
10 24.91 1564.
Note: Az mentioned before, there is no quantitative re-
lationshiD between these two sets of fig-ures. In the case
of the Facto-Peptone the original deteriination was multi-
plied by 100 to give the total amino nitrogen, while the
original determinations on Hydrolysate To. 581 were multi-
plied by 2,000 to obtaingf this value. The table illustrates
simply that the Bacto-Peptone determinations vary widely,
and the values for Hydrolysate No. 581 are given purely to
refresh the memory.
Now, Van Slyke (80) had a reason for removing the
hydrochloric acid from the hydrolysate in view of the subse-
quent treatment which it was to receive. Greenberg and Burk
(28), apparently, did not. The question therefore arises as
to whether or not it is necessary to neutralize the filtrates
before running the VTan Slyke determinations. There does not
appear to be any good reason for so doing, but the point
should be settled by experiment. Unfortunately this matter
dAd not come to the writer's attention until after the labora-
tory work had been completed and there has not yet been any
further opportunity for trying it out.
The fact remains that the Van Slyke determinations
cannot be checked closely whether run in blank or run on hy-
drolysates produced through the action of a mineral acid or
of an enzyme. The reason for this is at present unknown.
Effects of Blanks on the True Determinations -
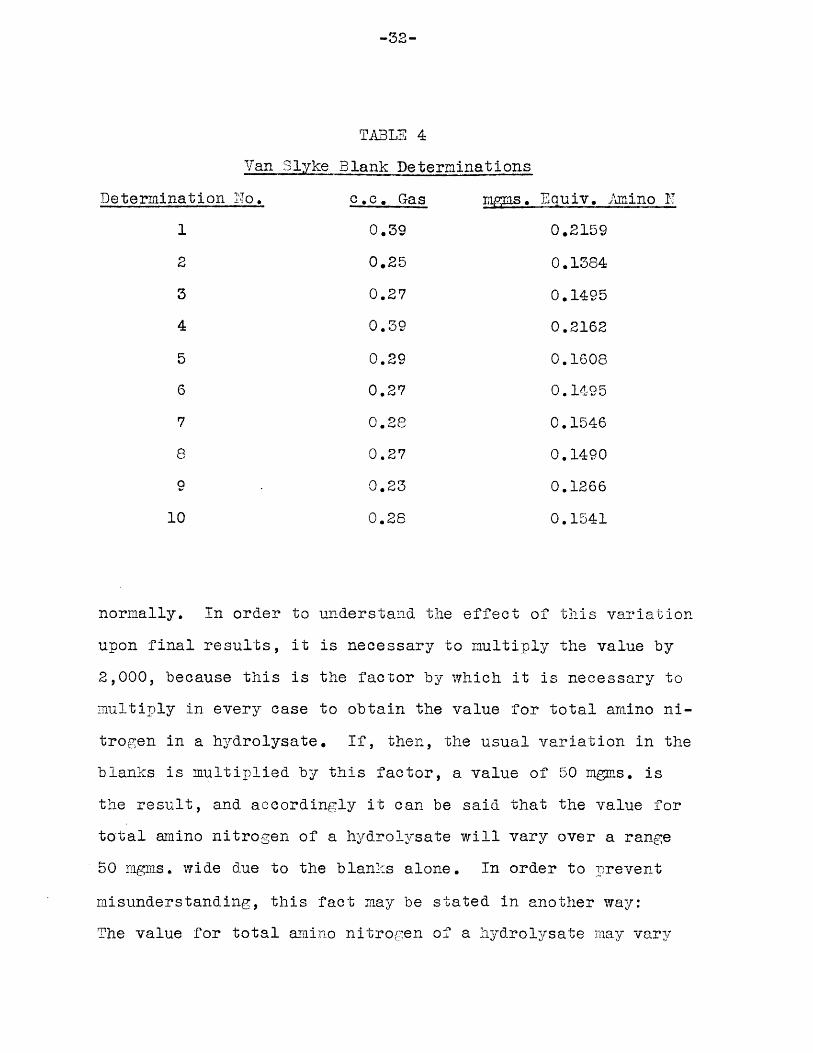
It was mentioned previously that the true determina-
tions vary over a wider range than the blank determinations
(,f. page 25, this report). Referring to Table 4, there is
a tabulation given of the series of ten blank determinations
first shown in Table 1 with the equivalent values in milli-
grams of amino nitrogen for the gas volumes evolved.
An examination of Table 4 will show that seven out
of the ten blanks listed had values falling withing the limits
of 0.1350 - 0.1600 mns. If the usual variation in the blanks
is taken as coming within these two values, there is a range
of 0.0250 m.gms. over which the blanks may be expected to vary
-32-
TABLE 4
Van Slyke Blank Determinations
Determination To.
1
2
3
4
5
6
7
8
10
c.c. Gas
0.39
0.25
0.27
0.39
0.29
0.27
0. 28
0.27
0.23
0.28
mgms. Equiv. Amino T
0.2159
0.1384
0.1495
0.2162
0.1608
0.1495
0.1546
0.1490
0.1266
0.1541
normaally. Tn order to understand the effect of this variation
upon final results, it is necessary to multiply the value by
2,000, because this is the factor by which it is necessary to
maultiply in every case to obtain the value for total amino ni-
trogen in a hydrolysate. If, then, the usual variation in the
blanks is multiplied by this factor, a value of 50 mgrms. is
the result, and accordingly it can be said that the value for
total amino nitrogen of a hydrolysate will vary over a range
50 mgms. wide due to the blanks alone. In order to prevent
misunderstanding, this fact may be stated in another way:
The value for total amino nitrogen of a hydrolysate may vary
+25 mgms. due to the effect of the blan: variation and nothing
else. That is what may be expected ordinarily. A further re-
ference to Table 4 shows that the maximum and minimum values
for the series of ten blanks are 0.2100 and 0.1200 mgms. re-
spectively. The difference between these values is 0.0200
mzi -s. , which gives a value of 180 ngzs. when multiplied by
the factor 2,000. The greatest variation in the value for to-
tal arino nitrogen of a hydrolysate will, then, be on the or-
der of +00 mgms., and this is caused by the blank alone.
A similar procedure is followed in the case of the
peptone values and those obtained for Ilydrolysate 1o. 58l.
The two sets of results 1:rom the determinations will be found
by referring back to Table 3. In the case of the peptone so-
lution, the milligrams of total amino nitrogen corresrond to
those contained in one gram of peotone, and this is in turn
closely equivalent to the amount of solid in 10 c.c. of y-
drolysate No. 581. The factor used. in the case of the poe-ptone
was 20 instead of 2,000 to reduce the two to the same terms.
In the case of hydrolysis "o. 58l there was no need of sup-
plving any additional factor, as 2,000 had already been used
to calculate th1e value for total amino nitrogen.
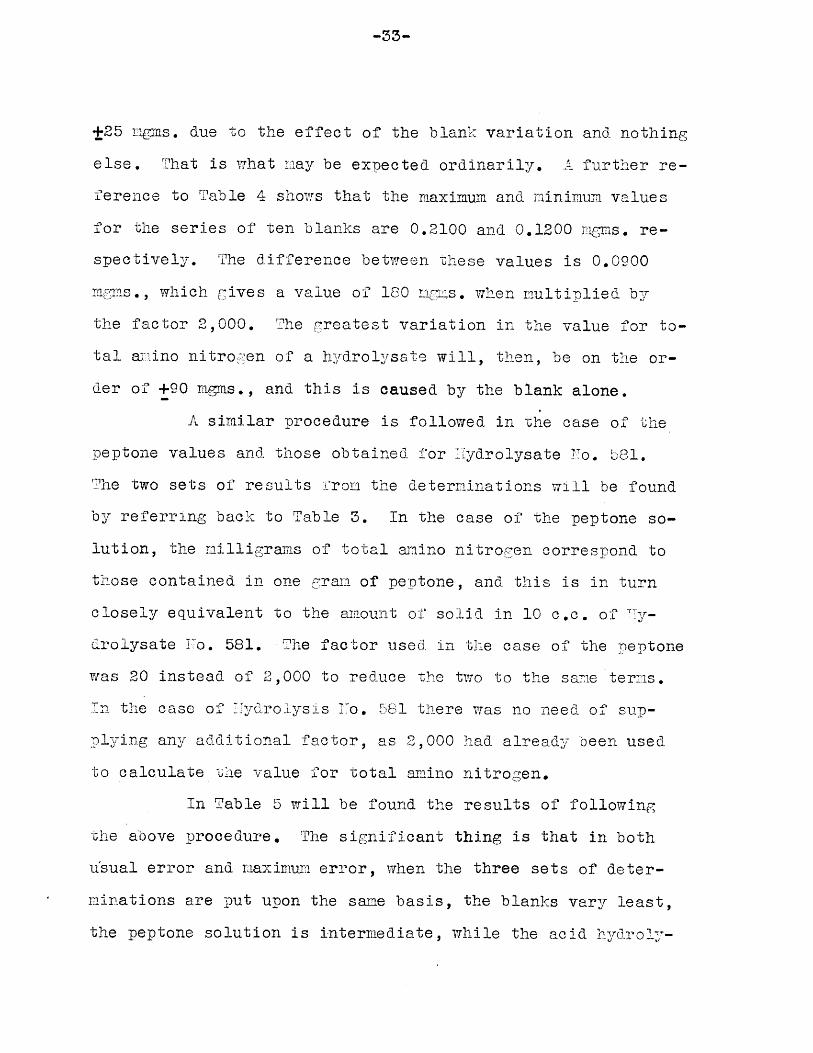
In Table 5 will be found the results of following
the above procedure. The significant thing is that in both
u'sual error and maximum error, when the three sets of deter-
minations are put upon the same basis, the blanks vary least,
the peptone solution is intermediate, while the acid hydroly-
TA.BlE 5
Errors C"onnared on Basis of Total aino - itrozen
Blank Difco Bacto-Pentone Hly. No. 581
Usual +25 +60 +100 Usual
Max. +90 +70 +275 Max.
sate exhibits the greatest degree of variation of all. It
must, therefore, be understood that in the case of the pep-
tone and Eydrolysate No. 581 a variation occurs which is far
greater than could be accounted for by the effects of the
blanks alone.
The fact that there is a greater variation in the
true determinations than in the blanks is established but
the reasons for it are not yet known. It is particularly
unfortunate that there is a variation to deal with .,reater
than that which can be accounted for by the blanks, because
on the basis of 1500 mpigms. of total anino nitrogen, which is
a fair value for a hydrolysate of the type of Po. 581, a
variation of +25 mgms. introduced by the blank - Of. Table 5
- would mean a variation in the per cent conversion value of
only about +1 o. With the maximum error supplied by the
blank the per cent conversion would be affect to the extent
of +3%. Corpare these variations in percent conversion
which are to be expected if only the blank variation is o-
perative with those actually obtained as illustrated by the
-35-
last column of Table 2. Such a comparison furnishes conclu-
sive evidence that the large errors found in the. true deter-
minations are to be blamed not upon the apparatus, not upon
the operator, but upon the method itself.
Method of Securing IResults -
The question now naturally arises - if the Van
Slyke determinations could not be checked how was it possi-
ble to do work of even a comparative nature using this me-
thod as a basis of measurement? This problem .was dealt with
in the following manner:
Examination of a very large number of check deter-
minations revealed that if three determinations were obtained
which checked closely, the average of the three 7.ould come
very close to the average of a large number. There were ex-
ceptions to this, but these were infrequent. The number of
determinations taken for checking had to be limited because
of the time consumed, and from that standpoint three checks
was nearly the limit. f there were any reason for question-
ing a value so obtained it was, of course, run over.
There were, therefore, never less than three deter-
miinations run for any value which was taken as a final re-
sult. Frequently there were many more. The limits to which
the original determinations were required to check were such
as to keep the variations in the per cent conversion values
within +5l. It was not practical to check any closer than
this with the method of measurement available, neither was

it necessary; for if the experimental work yielded the results
desired the per cent conversion would be increased to a degree
where it would rise above and no longer be obscured by errors
of measurement.
-37-
RAW MATERIALS
The materials which have been taken as subjects for
hydrolysis have varied. Durin the under-raduate work, yel-
low corn meal was used for at that time the predominant idea
was to develop a system of analysis that could be applied to
feeds and grains with good results (60). This material was
retained during the g:raduate :ork until the enzyme hydrolyses
were completed.
"'hen acid hydrolyses were started, corn meal was a-
bandoned because, with the large number of runs to be made,
the work of preparing corn meal - i. e. removal of fat and
starch - presented a problem in that so much time was consumed
by this one step. During the following year a commercial egg
flake preparation, marketed under the trade name of Keith's
Egg Flakes, was used in the hydrolyses. This product was
chosen because it furnished a fairly uniform, soluble, native
protein, suitable for repeated experiments over a long pe-
riod of time. At this stare of the investigation it was felt
that one form of protein, from the hydrolytic standpoint, was
as suitable as another.
1 commercial serum albumin preparation, trade name
lnroco,? was used in the last year of research. The reasons
for choosing this were that it ran a-little more constant
than the egg flake preparation and could be dried readily to
constant weight.
-39-
RRELIMIT1ARY TREATMENT
NTeed of Treatment -
In the case of proteins such as egg flakes or blood
serum no preliminary treatment is necessary. They are carbo-
hydrate-free save for the carbohydrate radicles of conjugated
proteins which cannot be removed chemically without destruc-
tion of the protein. Egg flakes contain practically no fat,
while the fat content of "Proco" was shown by analysis to be
0.02%.
Tith a cereal or grain, nowever, the need for puri-
fication of the protein becomes imperative. Gortner and Blish
(20) and Dowell and Menaul (13) have shown that carbohydrate
in acid hydrolysis will cause a drop in the amino nitrogen and
an increase in humin. What effect fat may have is not known,
but this is easily removed and should always be done as it is
advantageous to have the protein in a pure state, especially
if the hydrolysate is to be analyzed.
Removal of Fat -
For fat extraction an apparatus was used whose de-
tailed description may be found in the writer's undergraduate
thesis (60). Briefly, it consisted of a cylinder within a
,cylinder, the inner cylinder being supported upon the outer
one. Ether vapors passed up the space between the two cylin-
-40-
ders and was refluxed back to the top of the inner cylinder.
The condensed ether percolating through the material in the
inner cylinder constituted the extractive process.
The extractions were run for 24 hour periods. To
determine if nitrogen was lost during this treatment, fifteen
extracts were combined and concentrated. Duplicate Kjeld-
ahl determinations on the concentrate failed to reveal any
nitroren. Almost all fat was removed by this treatment as a
second run with a fresh solvent gave but negligible amounts
of' fat. About 100 c.c. of solvent were required to 125 gms.
of corn meal in the inner cylinder.
Removal of Starch -
Center (11), flollowing the technique suggested by
Ea-milton (31), employed trichloracetic acid for starch ex-
traction. Center relied upon centrifugring to separate the
trichloracetic acid from the extracted meal. This method is
unsatisfactory, for while a sharp line of demarcation exists
between the meal and the supernatant, the meal is so lig{ht
as to make it impossible to drain off more than half the su-
pernatant. The centrifuge treatment also limits the amounts,
which is undesirable as the process requires much time. Us-
ing the standard 250 c.c. centrifuge bottle on a two place
head, one is limited to about 200 gms, in weight of the meal
before extraction. Todifying the method as described below,
five to ten kilos weight of the original meal can be run
through in practically the same amount of time.
mm -
The modified method is as follows: Six extractions
were made with 26 trichloracetic acid. The extraction periods
were of one-half hour each and the ratio of liquid volume to
weight of original meal was as ten to one in all extractions.
That is, for 400 gms. of the original meal 4,000 c.c. of 2"
trichloracetic acid were used for each one of the six extrac-
tions.
Tach extraction was carried out on a boiling water
bath. The extraction was put into the boiling bath cold, and
by the end of the half hour period had come up to 75-80*C.
Care must be taken not to boil the extractions as trichlorace-
tic acid decomposes on boiling. The extractions .ere stirred
with a motor driven stirrer. Some difficulty was always en-
countered with the first extraction as the starch made the so-
lution so thick that the stirrer soon ceased to operate. The
first extraction, therefore, was stirred only during the first
few minutes.
At the end of the extraction the liquid and meal
were poured into a cloth bag. This was put into a meat press
and pressure applied gradually. The material cannot be
squeezed powerfully enough with the hands. The press is es-
sential, and the more force that can be applied, the better.
The bags do not last long due to the effect of the acid, but
-if washed out after using they are good for from thirty to
fifty pressings.
It is extraordinary to watch the change in the ex-
-42-
pressed liquid. That obtained from the first extraction is
soupy while that obtained from the sixth appears like water.
Extractions were not run until the expressed liquid was nega-
tive to iodine in potassium iodide. It is very doubtful if
this method would ever give a liquid that was starch free.
Six extractions were used because it was found that this num-
ber was necessary to remove the greatest part of the starch,
while more did not give any perceptible improvement in the
finished product.
After the sixth extraction the Drotein is washed
with a large volume of water on filter cloth and dried at
1100C. .o nitrogen is lost during the extractive process,
Combined filtrates from three runs, making eighteen extrac-
tions, 7,ere taken down to dryness, the dry product appearing
physically to be exactly like corn starch, but nitrogen free.
The low temrperature and comaratively short period of time,
coupled with tine fact tnat 25 trichloracetic acid is not a
particularly strong acid, are all unfavorable to hydrolysis,
hence this was to be expected.
The protein content of the treated meal was cal-
culated from duplicate TKjeldahl determinations which were
made on the separate roducts obtained from each of three
extractions. The K'jeldahl, or total nitrogen, value was mul-
-tiplied by 6: to give an approximation of the protein con-
tent which, by this method, was determined to be 97.6%. The
cellulose content of corn meal is on the order of 25, accord-
ing to bulletins of the Amherst Agricultural Txperiment Sta-
tion and of the U. S. Government. Consequently, about 0.5<
of the product of extraction is unaccounted for, and this is
believed due to residual starch and fat.
The corn meal protein thus prepared was used dur-
ing all the enzyme work. It was given up for the acid hydro-
lyses because of the time needed to prepare it. However,
some of the preparation was hydrolyzed with hydrochloric acid
and gave a hydrolysis as smooth and free from humin as that
obtained with an animal protein such as egg flakes or serum
albumin.
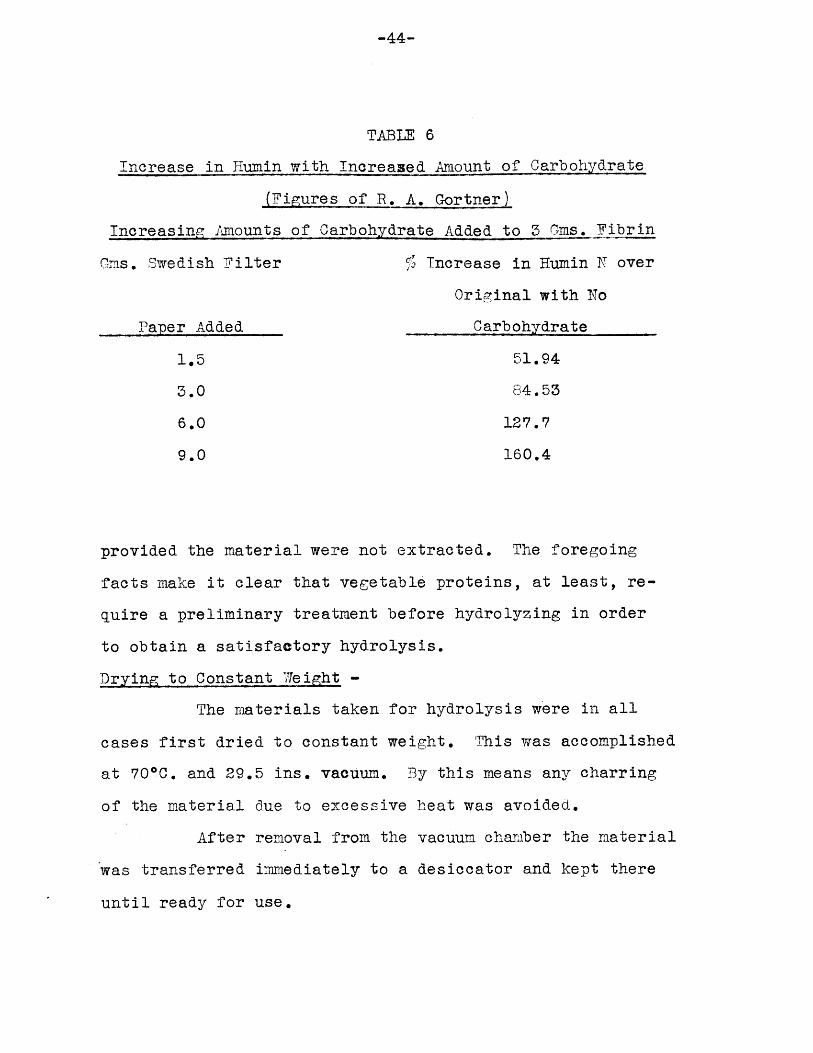
This was to be expected, because the work of Gort-
ner (18) demonstrated that the amount of carbohydrate present
determined the amount of humin formed. In Table 6 are repro-
duced figures, furnished by Gortner, which show the relation
between the addition of increasing amounts of carbohydrate
and the amount of humin formed.
Table 6 furnishes an idea of the losses that will
be encountered due to humin formation if the proportion of
carbohydrate to protein is very high. Gortner found in addi-
tion that an equal weight of carbohydrate in proportion to
the protein raised the humin nitrogen to double the value
without carbohydrate in practically every case. Ihere the ra-
tio of carbohydrate to protein is about three to one, which
is true in the case of corn meal, it is interesting to spe-
culate on what the binding of nitrogen as humin would be
-44-
TABLE 6
Increase in Humin with Increased Amount of Carbohydrate
(Figures of R. A. Gortner)
Increasing Amounts of Carbohydrate Added to 3 Gms. Fibrin
Gis. Swedish F-ilter T Increase in Humin N, over
Original with No
Paper Added Carbohydrate
1.95 51.94
3.0 84.53
6.0 127.7
9.0 160.4
provided the material were not extracted. The foregoing
facts make it clear that vegetable proteins, at least, re-
quire a preliminary treatment before hydrolyzing in order
to obtain a satisfactory hydrolysis.
Drying to Constant W7eight -
The materials taken for hydrolysis were in all
cases first dried to constant weight. This was accomplished
at 700C. and 29.5 ins, vacuum. By this means any charring
of the material due to excessive heat was avoided.
After removal from the vacuum chamber the material
was transferred inimediately to a desiccator and kept there
until ready for use.
-45-
EYDROLYSIS WITH ENZYMTE7S3
2easons for Choosing the Enzyme Method -
The chief reason for selecting enzymes as a means
of hydrolyzing proteins was that such hydrolyses were free
of humin formation. Consequently, enzymes were the hydroly-
tic agents employed by the writer during undergraduate work,
and when that was comleted it was thought advisable to con-
tinue with a study of this method of hydrolysis for a longer
period in the hope that a satisfactory technique could be de-
veloped.
hile it was recognized that in using enzymes there
would be no difficulties encountered from humin formation, it
was also known that practically no previous workers had re-
ported enzymes as being as satisfactory hydrolyzing agents as
mineral acids. ITt was the writer's belief, however, that if
the proper attention was given to the conditions of the reac-
tion, satisfactory results could be obtained. The manner in
which these conditions were worked out and the deg7ree of suc-
cess obtained with them will be discussed in the following
pages.
Enzymes Used -
During the undergraduate work two proteolytic en-
zymes were employed, Difco Pepsin 1:3,000, and Tairchild's
U. -~
-46-
Pancreatin. These were later supplanted by Difco Pepsin
1:10,000 and Fairchild's Trypsin. The trypsin, according to
information furnished by Fairchild Bros. and Foster, had a
tryptic power of ten thousand Roberts units, determined by the
meta-casein reaction originally proposed by Sir 7illiam Ro-
berts. The more powerful preparations were used because it
was soon found necessary to keep the nitrogen added with the
enzyme to a minimum; and the more potent the enzyme prepara-
tion, tne more nearly could this ideal be realized.
It was not possible to obtain preparations more po-
tent than these from commercial houses. No attempt was made
to prepare more powerful enzymes because it was felt that if
a satisfactory method of hydrolysis were developed it should
make use of the materials readily available. Also, the pre-
paration of more powerful enzymes would constitute a large
piece of research in itself.
Aside from the two enzymes, pepsin and trypsin, no
others were employed in this work. The individuality of e-
repsin is doubtful, but in any case there must have been a
goodly proportion of the so-called erepsin in the trypsin
preparations which were used. 3oth pepsin and trypsin were
necessary, however, for the writer (60) had previously shown
that not only did trypsin produce a large increase in amino
nitro:en but also that it acted upxon some material which was
untouched by pepsin. This latter fact corroborated the work
of !orthrop (56).
-47-
Conditions of the Reaction - Temperature -
Hydrolyses with both enzymes were run at 49-50*C.
While this is the optimum temperature for peptic activity,
trypsin has its optimau temperature at 45*C. The slight in-
crease over the optimum for trypsin was not sufficient to be
harmful, however.
The hydrolyses were run in a large water jacketed
incubator. The volume of water was large, and consequently,
once the incubator was up to temperature, the regulation was
good. The variation of reaction mixtures when in the incu-
bator was never more than +0.50C. after once coming up to
temperature.
Conditions of the Reaction - H-ion Concentration -
Thile it had long been recognized that there was
a vaguely defined zone of L-ion concentration in which pepsin
and tUrypsin were most active, N7orthrop (51) brought the proper
emphasis to bear upon this point. His work had to do with
the kinetics of the action of enzymes, and he concluded that
it was only over a very narrow range of L-ion concentration
that the maximum rate of conversion would be obtained.
The writer was studying, not rates, but per cent
conversion. The L-ion concentration was found to be optimum
only within narrow limits for maximum conversion (60). The
HI-ion concentration was one of the conditions of the reaction
which had to be most strictly fulfilled, for any deviation
from the optimum value was iimediately reflected in a decrease
-48-
in the per cent conversion.
The pH value for pepsin was taken as 1.8 and the
value for trypsin as 8.0. The hydrolyses, whether in the
case of pepsin or trypsin, were started at optimua value. At
11 hour intervals a small sample was withdrawn and the pHI de-
termined electrometrically. The sample was returned to the
hydrolysis and acid or alkali added as necessary to bring
back the pH value to the optimum for the enzyme in question.
A reference to the writer's undergraduate thesis
(60) will prove helpful for the method followed is given
there in detail. Less alkali or acid, as the case might be,
was required at each back titration, and during the final li-
hour interval the pH value underwent no perceptible change.
Similarly, amino nitrogen determinations made simultaneous-
ly with the p11 determinations showed a slackening off in en-
zymic activity as the end of hydrolysis was approached.
Conditions of the Reaction - Time -
The time for the completion of the reaction was pre-
viously determined under conditions of optimum reaction and
temperature (60). It was found possible to secure the utmost
peptic activity in 4- hours, while tryptic activity came to
an end after a second period of six hours duration. Provided
other conditions were carefully controlled, it was extraor-
dinary how closely one could check these time limits again
and again.
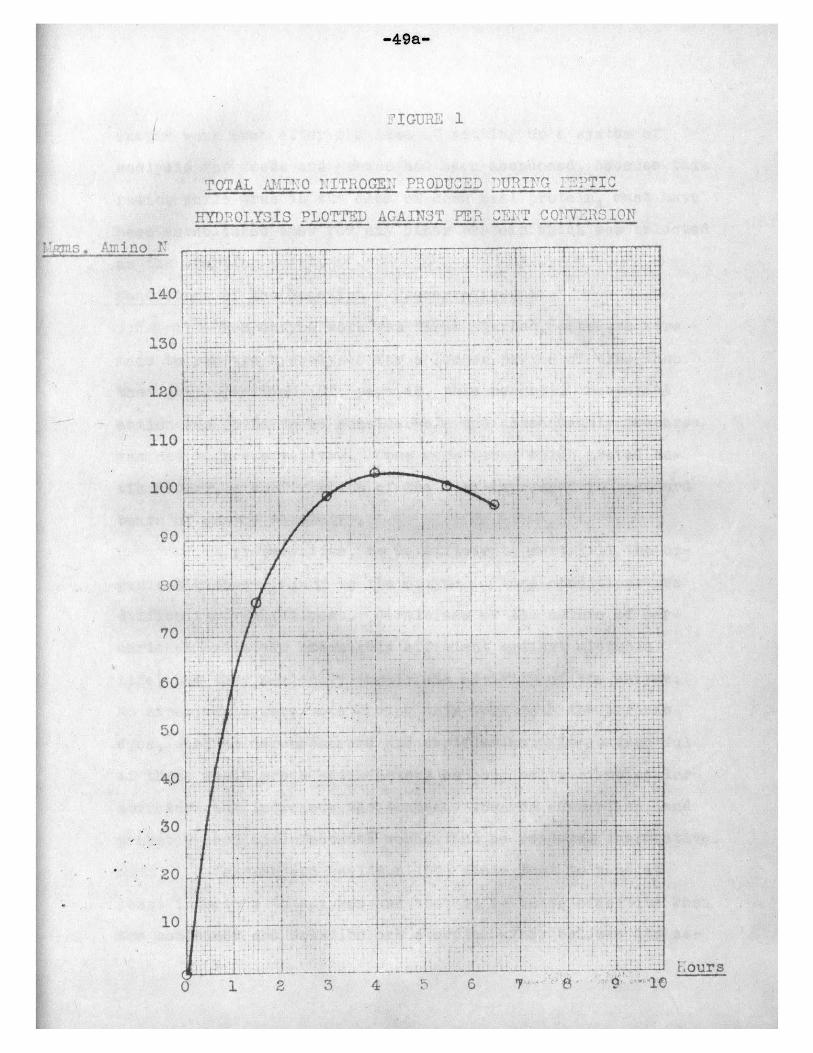
Addition of more enzyme after the optimum time had
-49-
expired, although pH and temperature were still at optimum,
did not increase the corrected amino nitrogen value. The to-
tal amino nitrogen was increased, but after this had been cor-
rected for the amount of anino nitrogen produced by autolysis
of the enzyme, the amino nitrogen showed a drop. This was al-
so true if the hydrolyses were allowed to stand beyond the op-
tinum time without addition of further enzyme.
The facts just stated were found to be true in the
case of both pepsin and trypsin. A reprroduction of a curve
obtained with one of the hydrolyses run during the writer's
undergraduate work is shown in Tigure 1, page 49a. The curve
shows that the amino nitrogen (corrected) reaches a maximua
in the case of pepsin after 417 hours have elapsed. Then
there is a loss of amino nitrogen as shown by the downward
trend of the curve. The reason for this loss will be dis-
cussed at a later point (Cf. page , this report).
Conditions of the Reaction - Ratio of .Tenstruum to 3ubstrate -
Northrop (51) had already called attention to the
fact that there was an optimum concentration of menstruum and
substrate at which hydrolysis would take place at the highest
rate. The writer (60), studying not rates but per cent con-
version, found that in the case of corn meal the best conver-
sions were obtained when the ratio of liquid to corn meal pro-
tein was as ten is to one. This condition was fulfilled in
all subsequent hydrolyses and was, of course, one reason why
corn meal protein was retained as a raw material for all the
- I I
-49a-
I7 GL7L11
TOTAL JT.CPK 0 !'ITROGEPRDUD ARTG TT
Y!0YG3PLOTTET,) AGAlYi%3T PET 2U?' 2mV-:] ION
*Pino T
140
130
120
11.0
100
~ 17717V.~14~ I K--
L i~i 4 I ., .
4,.,
.K.-
V'1; .L I
I I
- T--± ~I.}i 4
I _.4 1
p r-..~-.. -r
I. I. ~. I
1...
~1~~"~~--H
80
70
I:i*.4-.
4-.F-I.-
1K
4 2
4- I- i-.....-.-.I .. 4...
.1.'K411 L2f
'-'-I"
-$4-...
::4
1---* 'K
E~ ~
10
2
10
Eours
-50-
enzyme work even after the idea of setting up a system of
analysis for feeds and grains had been abandoned, because this
ratio, while true in the case of corn meal protein, must have
been established anew for any other protein which was selected
as the starting point.
Conditions of the Reaction - Preservatives -
7Then enzyme work was first started, attempts were
made to run the hydrolyses for a longer period of time than
that just specified (Cf. page 49, this report). Bacterial
action was found to be considerable and consequently recourse
was had to preservatives. None were found which proved sa-
tisfactory, a confirmation of the view expressed in standard
texts of enzyme chemistry.
A preservative, to be efficient, must kill the or-
ganisms without injury to the enzyme. Those conditions are
difficult of fulfillment. Germicides of the nature of mer-
curic chloride are undeniably efficient against microbial
life, but they seriously impair the activity of the enzyme.
No experiments were made during this work with the organic
dyes, such as mercurochrome and acriflavine. It is doubtful
if these would prove satisfactory as complexity of molecular
structure but increases the tendency towards adsorption, and
probably such disinfectants would thus be rendered ineffective.
.!aksman and Davidson (87) state that toluene is
least injurious to enzymes and that it is quite effective when
the container and solution are sterile. They believe its ac-
-51-
tion due to the film formed over the surface of the liquid by
toluene and not to any inherent germicidal power. The writer
used Erlenmeyer flasks for the enzyme hydrolyses which were
stoppered with cotton plugs. These were sufficient to keep
contamination out of the apparatus. Toluene, therefore, was
not used, but in the earlier experiments it had been found
useless as a preservative. The difficulty lay with the en-
zyme preparations which were heavily contaminated. "ven
though the other materials and the container were sterile,
bacteria were introduced with the enzyme, and there did not
appear at the time to be any ready means of avoiding this dif-
ficulty. The nature of the bacteria and the effects due to
their presence are discussed at a later point (Cf. page ,
this report). So far as preservatives are concerned, it is
sufficient to state that no material was found which met the
two necessary requirements - toxic to microorganisms and
benign to enzymes.
Conditions of the Reaction - Amount of Enzyme -
In the earlier work (5, 60) it was found that some
of the conversions obtained with enzyme hydrolyses were runn-
ing over 1005. This was patently absurd, and it appears that
the difficulty was that no allowance had been made for the
amino nitrogen evolved by the autolysis of the enzyme prepara-
tion.
Accordingly, samples of pepsin and trypsin were ta-
ken and autolyzed under the same set of conditions employed
-52-
during hydrolysis. It should be clearly understood that
in this control determination a combination of the two en-
zymes, pepsin and trypsin, was used. The reason was that
this is the manner in which these enzymes are employed in
the true determination. A description of the procedure
used in the control determination where the enzymes are
autolyzed applies equally well to the procedure followed
during the true determinations.
The number given to the control determination is
hydrolysis No. 110. This was not the only control hydrol-
ysis run, but is taken arbitrarily as a representative of
the determinations run for control. In the entire report
this practice has been followed, and the hydrolyses which
are selected for illustration are but isolated representa-
tives of a large group. The procedure for hydrolysis No.
110 is as follows:
HYDROLYSIS NO. 110
10 gms. of Difco 1:10,000 pepsin were added to
150 c.c. of hydrochloric acid, pH 1.8, and incubated at
49-50oC. for 4 hours. The incubator used in this determi-2
nation and all subsequent work was similar to that previ-
ously described. At the end of the 4 hour period, the2
mixture was boiled. and allowed to stand over night. The
-53-
next morning the mixture was back titrated to pH 8.0,
determinations being made electrometically to determine
when the proper pH value was reached. Incubation was now
carried out at 4 9 - 5 0 'C. for six hours. The mixture was
again boiled and allowed to stand over night. Van Slyke
determinations were run on the hydrolysate the next morn-
ing, and the total amino nitrogen was found to be 876 mgms.
As there were 10 gms. of pepsin and 10 gms. of trypsin used
during the course of the digest, making 20 gms. of combined
enzymes, it was calculated that 876t 20 = 43.8 mgms. of
amino nitrogen for each gram of combined pepsin and tryp-
sin added to the mixture. The value thus determined was
used in a subsequent series of hydrolyses, Nos. 112 - 117
inclusive, to calculate the true value of amino nitrogen.
The true value was determined by subtracting the
correction for the amino nitrogen produced by autolysis of
the enzymes from the value for total amino nitrogen found
in the hydrolysate.
The value now having been established for the auto-
lysis of combined pepsin and trypsin, a series of hydroly-
ses, Nos. 112 - 117 inclusive, were run to determine the
amount of enzymes which in proportion to a fixed amount of
menstruum and substrate would give maximum hydrolysis with
MEMO
-54-
a minimum amount of enzyme preparation. This procedure was
necessary because it was desired to keep the amount of
nitrogen added with the enzyme preparations as low as would
be consistent with a maximum conversion. The raw material
taken as a source of protein was the same throughout the
series, 10 gms. of corn meal protein which was prepared as
previously described. The only factor varied during the
series of hydrolyses, Nos. 112 - 117 inclusive, was the
amount of combined enzyme added. All other conditions re-
mained unchanged.
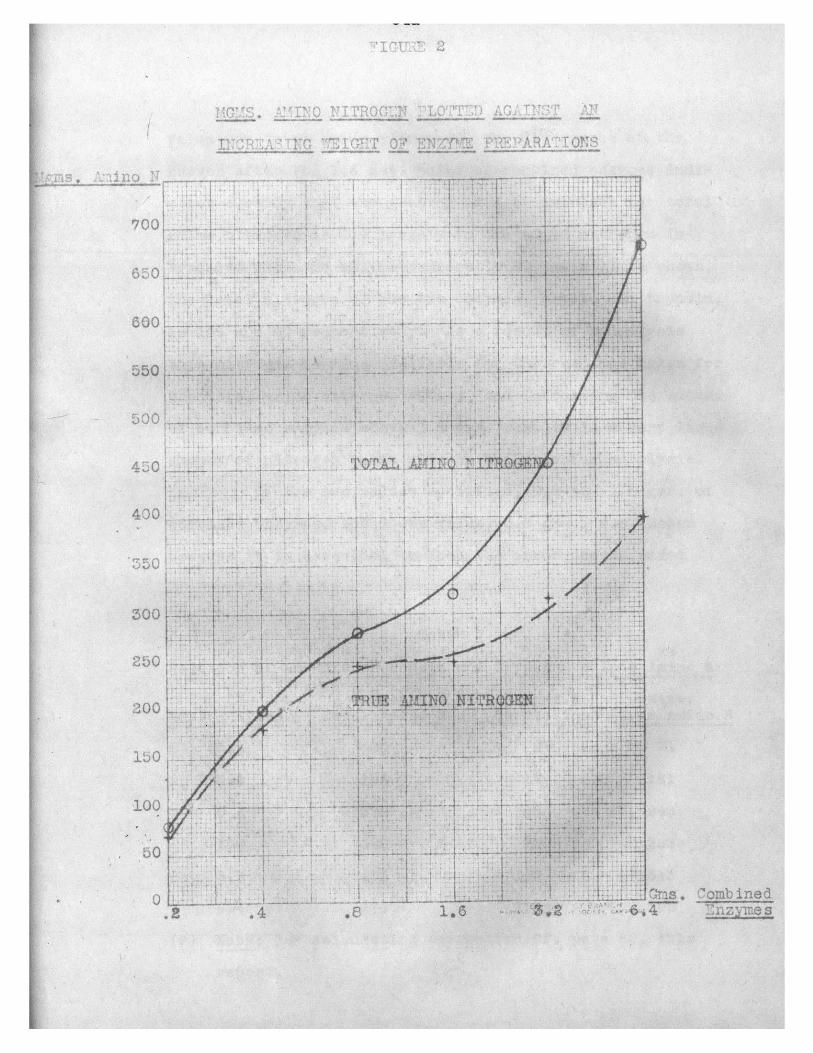
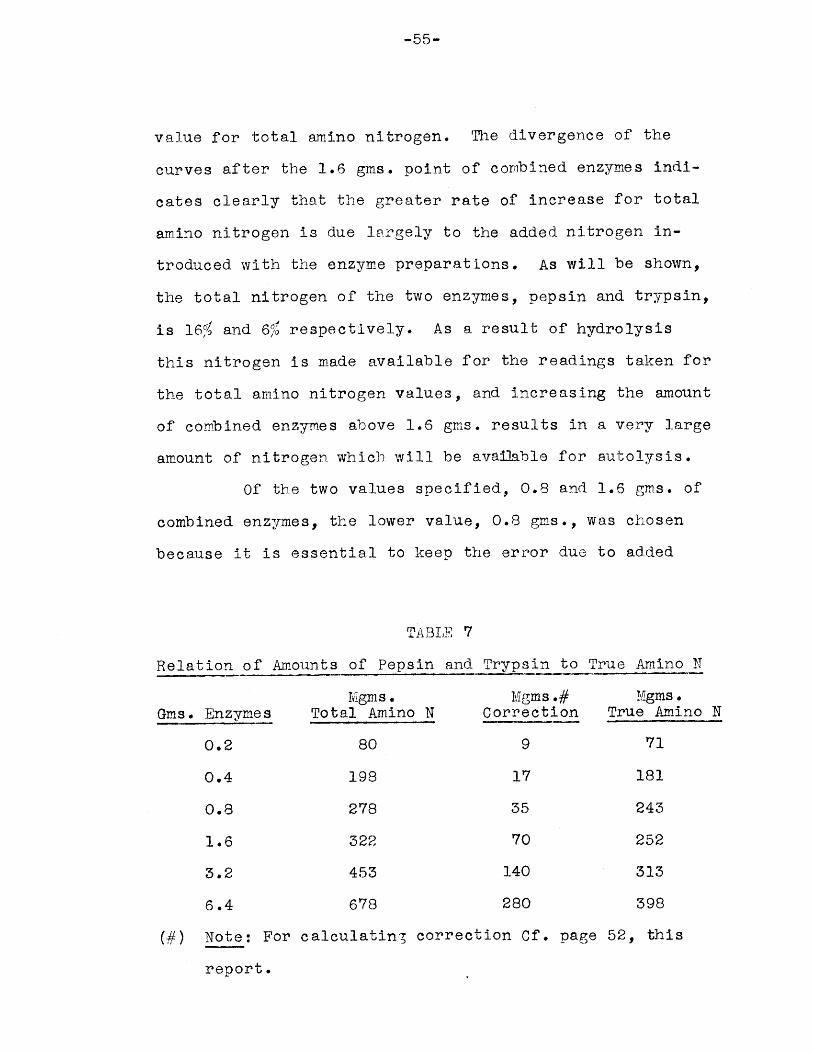
The results obtained are given in Table 7. A
curve plotted from the figures given in this table is il-
lustrated in Figure 2. The upper curve is for total amino
nitrogen produced. The lower curve represents the effect
of the amount of combined enzymes after a correction has
been applied for the autolysis of the enzyme preparations,
this correction having been established by the procedure
followed in hydrolysis No. 110.
Study of either the table or the curves indicates
that under the conditions specified the optimum amount of
combined enzymes lies between 0.8 and 1.6 gms. per 10 gms.
of corn meal protein to 150 c.c. total volume of menstruum.
Below this range the production of true amino nitrogen,
which is the value that must be carried to a maximum, is
very small. Above it, the production is increased but to
a much less extent than that increase obtained with the
'V i.2 OFNF IONS~~11N'V~~~~yr 'Mj F"TAt Y'~u A-r
1 'ii
- } -l -n
1 j I
F-7i
550
500
4003- 45 -
400 77
250300
7; Tlook --H-
50 I- 1111- i-4
.2 .4 .8 1.68
4-
L
---
-,
i00
<"4,'
4541
Af
Gras. Combined64 4 nzymes
MIMAA or_ ' -.- , 1
r
[L~
-55-
value for total amino nitrogen. The divergence of the
curves after the 1.6 gins. point of combined enzymes indi-
cates clearly that the greater rate of increase for total
amino nitrogen is due largely to the added nitrogen in-
troduced with the enzyme preparations. As will be shown,
the total nitrogen of the two enzymes, pepsin and trypsin,
is l6r1 and 61 respectively. As a result of hydrolysis
this nitrogen is made available for the readings taken for
the total amino nitrogen values , and increasing the amount
of combined enzymes above 1.6 gms. results in a very large
amount of nitrogen. which will be available for autolysis.
Of the two values specified, 0.8 and 1.6 gms. of
combined enzymes, the lower value, 0.8 gms., was chosen
because it is essential to keep the error due to added
TABLE 7
Relation of Amounts of Pepsin and Trypsin to True Amino N
VgIs. Mgms .# Mgms .Gms. Enzymes Total Amino N Correction True Amino N
0.2 80 9 71
0.4 198 17 181
0.8 278 35 243
1.6 322 70 252
3.2 453 140 313
6.4 678 280 398
(#) Note: For calculating correction Cf. page 52, this
report.
-56-
nitrogen as low as possible, and the 0.8 gms. of combined
enzymes gave a value for true amino nitrogen practically
equal to that produced by 1.6 gms. of combined enzymes.
This is readily apparent because 0.8 gms. of combined en-
zymes gives a value of 243 mgms. of true amino nitrogen
while 1.6 gms. of combined enzymes gives a value of only
252 mgms. of true amino nitrogen. Because the desired
result was practically the same in both cases, the value
of 0.8 gms. of combined enzymes was chosen as this value
would cut in half the error due to added nitrogen as com-
pared with the error introduced by 1.6 gms. of combined
enzymes.
Strength of the Enzyme Preparation -
There is no question but that the strongest ob-
tainable enzyme preparations must be used if a satisfac-
tory hydrolysis is to be obtained. The reasons for this
may be summarized as follows:
First, the stronger the preparations, the less
will be required to give maximum hydrolysis. Therefore,
the less the error introduced by nitrogen added with the
enzymes.
Second, authorities on Enzyme Chemistry (Beatty,
Bayliss, Cohnheim, Effront, Euler) agree remarkably well
on one point - that the end products of enzyme action in-
hibit the activity of the enzyme, probably through uniting
with it, the union being either adsorptive or chemical.
-57-
Regarding the first point, there is given in
Table 8 the values for total nitrogen obtained with Difco
Pepsin 1:3,000 and 1:10,000, and Fairchild's Pancreatir
and Trypsin.
These values indicate that whether the enzyme
preparation is strong or weak the amount of nitrogen added
with a unit weight will be considerable. The advantage
lies with the stronger preparation, however, because a
smaller amount need be taken to accomplish the desired re-
sult. The importance of this fact has already been demon-
strated, Table 7, and the resulting curve plotted from
this table in Figure 2, indicate clearly that a certain
amount of enzyme is necessary to effect a satisfactory con-
version of protein nitrogen to amino nitrogen. By this
statement is meant, not the amount of enzyme preparation,
but the amount of active substance, for it is the active
substance which hydrolyzes and not the inert material.
Keeping in mind, then, that a minimum amount of active
TABLE P
Per Cent Total Nitroger of' Enzyme Samples
P ep sin Trypsin
1:3,000 1:10,000 "Pancreatin" "Trypsin"
16.0% 15.5c/ 6.3% 60
-58-
material is necessary, it follows that if the required
amount of active material can be secured and the amount of
inert material reduced, this would be theoretically approach-
ing to the ideal condition for enzyme hydrolysis. Unfortu-
nately, such a thing as a pure enzyme has never been ob-
tained. The best strengths of pepsin and trypsin commer-
cially obtainable are 1:10,000 and 10,000 Roberts units
respectively, and these preparations, being the strongest,
have consequently been employed in all enzyme hydrolyses
run during the work covered by this report. The only ex-
ception to this statement is the case where the weaker
preparations have been run under the same set of conditions
as the stronger preparations in order to secure a compari-
son of efficacy of the two different strengths of hydrolyz-
ing agents. It is not practical to carry the two proteolytic
enzyme preparations, pepsin and trypsin, beyond the maximum
strength of 1:10,000 and 10,000 Roberts units respectively,
because while stronger preparations have been made they
are not available comiercially and to attempt to prepare
substances of greater orote-olytic power would constitute a
piece of research that would cover a wider field than that
covered by this entire report.
With regard to the second point, inactivation of
the enzyme by the end product, Table 9 demonstrates that
this consideration is more than theoreticnl because the
data obtained and given in this table indicates it to be
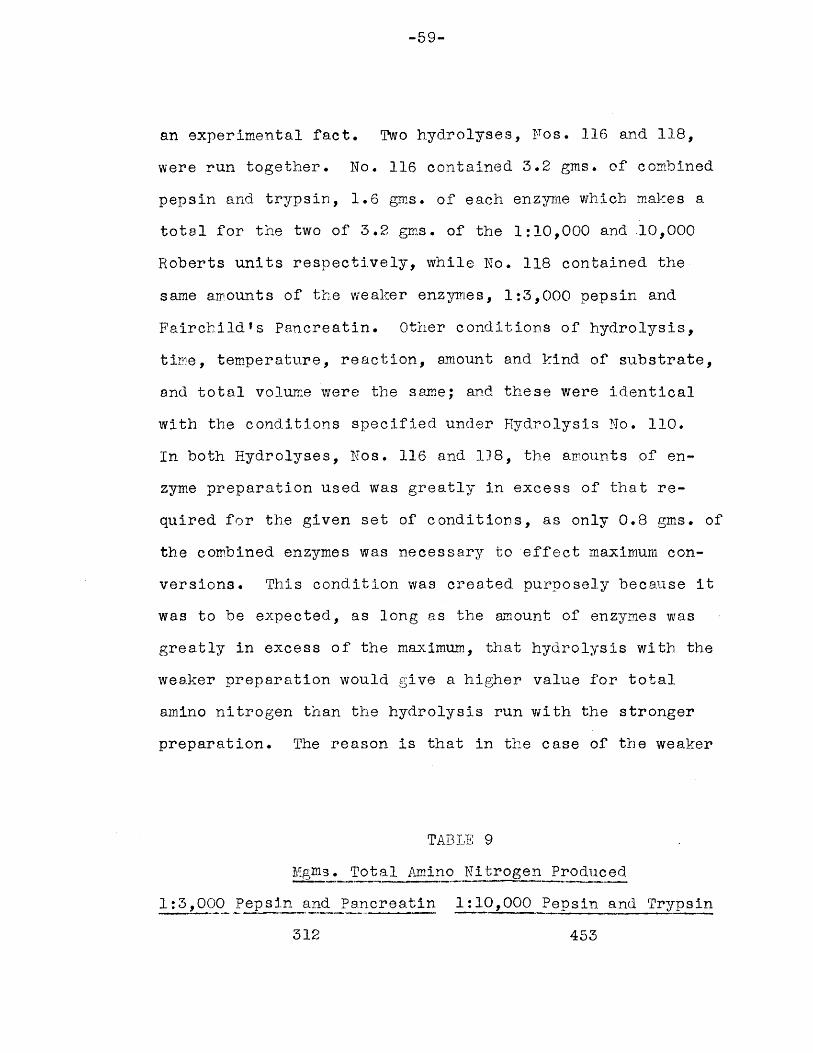
-59-
an experimental fact. Two hydrolyses, Fos. 116 and 118,
were run together. No. 116 contained 3.2 gms. of combined
pepsin and trypsin, 1.6 gms. of each enzyme which makes a
total for the two of 3.2 gmns. of the 1:10,000 and 10,000
Roberts units respectively, while No. 118 contained the
same amounts of the weaker enzymes, 1:3,000 pepsin and
Fairchild's Pancreatin. Other conditions of hydrolysis,
time, temperature, reaction, amount and kind of substrate,
and total volume were the same; and these were identical
with the conditions specified under Hydrolysis No. 110.
In both Hydrolyses, Nos. 116 and 118, the amounts of en-
zyme preparation used was greatly in excess of that re-
quired for the given set of conditions, as only 0.8 gms. of
the combined enzymes was necessary to effect maximum con-
versions. This condition was created purposely because it
was to be expected, as long as the amount of enzymes was
greatly in excess of the maximum, that hydrolysis with the
weaker preparation would give a higher value for total
amino nitrogen than the hydrolysis run with the stronger
preparation. The reason is that in the case of the weaker
TABLE 9
MNgms. Total Amino Nitrogen Produced
1:3,000 Pepsin and Pancreatin 1:10,000 Pepsin and Trypsin
312 453
-60-
preparation more nitrogen was available, not in enzymic
form, but as extraneous matter which was hydrolyzable to
some extent. The values given in Table 9 show that the
total amino nitrogen produced in the hydrolysis run with
the weaker enzyme preparations was considerably less than
that obtained in the other hydrolysis where the prepara-
tions were much more active. From this fact it is possible
to deduce one or both of two things - either the extrane-
ous material added with the weak preparation adsorbed its
share of the active enzyme and so checked the hydrolysis
prematurely; or else, there being less enzyme added in the
case of the weaker preparation (for the weight of the prep-
arations was the same in both cases) the lesser amount was
adsorbed out to such an extent that the hydrolysis could
not proceed. Whatever the reason, the fact remains. The
more active preparations are to be preferred, not only be-
cause a given weight of the preparation will push a hydrol-
ysis under an optimum set of conditions than the same
weight of a weaker preparation, but also because the error
due to added nitrogen can be cut down through using less of
the preparation.
It should also be mentioned that the type of curve
shown in Figure 2 where the amount of enzyme is plotted in
one case against the total amino nitrogen produced, and in
another against the true value for amino nitrogen, could
be obtained only if the assertion of the standard text
-61-
writers that the end products of enzyme action inactivate
the enzyme were true. This conclusion can be drawn because
a study of the first part of the curve for true amino nitro-
gen indicates no satisfactory reason as to why it should
flatten out and reach a maximum of efficiency, as compared
to the amount of enzyme added, at the 0.8 - 1.6 gms. point
unless a factor entered in which restricted the rate of
enzyme activity. The curve reveals that such a factor does
exist. In accord with theoretical consideration this factor
must consist of adsorption of the active enzyme on hydrolytic
products of protein. It must be remembered that when a com-
paratively large amount of enzyme preparation is added, such
as 3.2 gins. under the conditions of hydrolysis stated, there
is also added a large amount of inert material. This mater-
ial, by the very nature of the preparation of proteolytic
enzymes, consists entirely of protein degeneration products,
probably in the nature of peptones or lower in the scale of
protein degradation. These substances are quite as good
enzyme adsorbents as those produced by the action of the
enzyme on the protein substrate. A large amount of enzyme,
and particularly of enzymes of lower strength, results in
a large amount of protein derivatives being added to the
hydrolysis mixture when this amount is considered propor-
tionally in relation to the amount of substrate and volume
of menstruum, which in all the experimental work conducted
with enzymes was 10 gms. of corn meal protein and 150 c.c.
-62-
total volume.
The deductions given above are in accord with the
work of Northrop (53) who found that the rate of digestion
of protein by pepsin is not proportional to the total con-
centration of pepsin. It is as well to make clear at this
point that the writer was concerned chiefly not with rates
of protein hydrolysis, but with effecting maximum conver-
sions. Because of the effects of bacterial action, the
rate is an important factor which cannot be neglected; for
if enzyme hydrolyses are not carried to their maximum with-
in a minimum of time, the effects of bacteria are highly
detrimental. Nevertheless, the chief object of this re-
search, regardless of the hydrolyzing agent used, was to
effect the maximum possible conversion. In this respect
the work done and the data presented are unique, because
previous investigators, such as Northrop (50-54) and
Greenberg and Burk (28) have dealt with the kinetics of
protein hydrolysis. Such work is valuable in that a study
of the rates of conversion obtainable is bound to furnish
an idea of the efficiency of hydrolysis. It does not fol-
low necessarily that a high rate of conversion will carry
the hydrolysis to a greater degree of completion than a
slower one, but the tim.e factor is important in hydrolysis
with both enzymes and inorganic reagents.
Time is important in enzyme conversion because of
the effects produced by bacteria. As will presently be
-63-
shown, bacterial action results in the loss of amino nitro-
gen. The detrimental effects of bacterial action increase
as time goes on. It is, therefore, important in enzymic
conversions that the time taken be kept to a minimum so as
to reduce bacterial action as much as possible.
The time factor is also important in acid hydroly-
sis. Henriques and Gjaldbak (35) study the conditions for
the complete hydrolysis of proteins and found that when
proteins are hydrolyzed with acid, both amino nitrogen and
ammonia increase up to a certain point at which the amino
nitrogen attains its maximum. If the hydrolysis is carried
beyond this point a transformation of amino nitrogen into
ammonia follows, indicating a deaminization of some amino
acid or acids. Consequently, they define the end point of
hydrolysis as that point at which the amino nitrogen reaches
a maximum with the least possible formation of ammonia. It
should be noted that this end point of hydrolysis which has
just been defined is not complete hydrolysis. In fact,
since complete hydrolysis has never yet been attained, the
two points do not coincide. The timie factor, however, does
enter in here, because if the time of boiling be prolonged
beyond that necessary to reach the end point of hydrolysis
a loss will occur as deaminization results in the freeing
of amino groups as ammonia.
Van Slyke's (80) data also indicates that prolonged
heating results in a loss of amino nitrogen. After 1 hours
-64-
heating at 150C., the amino nitrogen content was 78.3 per
cent, while after three hours heating at the same tempera-
ture the value for amino nitrogen dropped to 73.4 per cent.
The work of Gortner (18-26), in which the effects of carbo-
hydrate, aldehydes, and ketones on humin formation were
studied, also indicates that tine is an important factor in
hydrolysis with mineral acids, because prolonged boiling
resulted in an increase in the amount of humin formed.
The rate at which hydrolysis takes place is, then,
a factor which will determine to a greater or less extent
the success of the conversion. The highest rate obtainable
is desirable. To that extent the studies on the kinetics
of protein hydrolysis are valuable in determining what com-
bination of reagents will be most satisfactory in effecting
maximum conversion.
The work which has been completed during this re-
search has been conspicuously successful in that the con-
versions have reached their maximum within a minimum of
time. The data previously presented shows that peptic
hydrolyses reached their maximum after 41 hours, while2
tryptic hydrolyses required but 6 hours to come to comple-
tion. These periods of time are in sharp contrast to those
employed by earlier investigators where the time intervals
employed extended over a period of weeks. As will later be
shown, the conversions secured with acid hydrolyses have
also reached their maximum in an extremely short period of
-65-
time.
Because of the time factor, the stronger enzyme
preparations must also be used because the data presented
indicates that a higher rate of conversion is secured with
a larger amount of enzyme than could be secured with less
than the optimal range of 0.8-1.6 gms. of enzyme prepara-
tion per 10 gms. corn meal protein in 150 c.c. total volume.
The Law of Mass Action - Per Cent Conversions -
It is known that hydrolyses with proteolytic en-
zymes come to an end long before the total conversion of
the protein into amino acids has been effected. It is a
question as to whether this effect is due to the kinetics
of the Law of Mass Action or to inactivation by the end
products. The writer favors the inactivation theory, for
the experimental evidence obtained in this work supports
it. The data obtained and illustrated in Figure 2, where
a comparison is shown between the different rates of pro-
duction of true amino nitrogen compared to total amino
nitrogen, indicates that it is the adsorptive factor which
is at work. This is also true of the comparative hydroly-
ses shown in Table 9.
Because the same protein can be hydrolyzed to a
greater extent with mineral acid than with enzymes, the
view that an equilibrium has been reached in enzyme hydrol-
ysis is untenable, for there is no reason why equilibrium
should be reached sooner in one case than in the other; no
-66-
reason, that is, attributable to the workings of the Mass
Law, which is the only theory that can explain the end of
hydrolytic action on the basis that an equilibrium has been
reached. Equilibrium is, therefore, explainable only on
the basis of inactivity of the enzyme by the end products.
The best per cent conversions which the writer
was able to obtain with enzyme hydrolyses were on the order
of 45 per cent. This was found to be the maximum value
obtainable in spite of the fact that the conditions have
been made most favorable for enzyme action. That is, time,
temperature, reaction, ratio of menstruum to substrate, and
concentration of the enzyme were all optimal for a funda-
mental basis of 10 gms. of corn meal protein per 150 c.c.
total volume. It is not a good conversion compared to that
which may be obtained with the same protein when treated
with mineral acid, as the conversion in that case has been
found to range from 60 to 70 per cent if the acid concen-
tration and time were optimum.
There appeared to be no further modification of
the conditions of reaction which would increase the con-
version obtainable with enzymes above 45 per cent, because
these conditions had already been determined by experiment
to be the best obtainable. It was decided, however, that
while the conversions were coming to completion more becamuse
of inactivation of the enzyme by protein degeneratim products
than by workings of the Mass Law, it would be worth while
-67-
to attempt the removal of these hydrolytic products from
the reaction mixture. If this were done, detrimental ef-
fects of the end products would be minimized if due to the
Mass Law. If due to adsorption, an addition of further
zyme should produce a greater degree of hydrolysis, because
as the protein degeleaton products were removed there would
be less to adsorb tle active enzymes.
Dialysis -
Unfortunately, one is limited in dealing with
enzyme hydrolyses by the fact that conditions of the reac-
tion can undergo hardly any variation without an almost
immediate departure from the optirum which is necessary for
the.most efficient enzyme action. Furthermore, no combina-
tion of reagents or adsorbents were found which could be
added to the reaction mixture without destroying the activ-
ity of the enzymes which, because of their susceptibility
to inactivation by the usual chemicals, cannot come into
contact with them without impairment or total destruction
of their activity. Adsorbing agents will combine with the
enzyme equally as well as protein degeneration products
because of the similarity which exists between them. It
apoeared, therefore, that dialysis was the only means by
which the end products could be removed from the sphere of
the reaction.
Accordingly an apparatus was devised of which a
diagram is given in Figure 3. A large collodion membrane
-68-
was used within which the hydrolysis was run. Into this
membrane was put the necessary combination of reagents for
the most efficient enzymic conversion, namely, 10 gms. corn
meal protein, 150 c.c. of menstruum, 0.4 gms. of first pep-
sin and then 0.4 gins. trypsin when the reaction had been
shifted to pH 8.0. The membrane containing the hydrolysis
mixture was suspended in a beaker filled with hydrochloric
acid at pH 2.0 for the peptic hydrolyses, and the acid in
the beaker was replenished by a constant level device. The
liquid in the beaker, which was outside of that contained
in the collodion membrane, was sucked slowly through a tube
which terminated in a fine capillary. Suction was applied
at the end of the apparatus by means of a suction pump. The
jet drawn through the capillary struck the sides of a flask
which was imm-(ersed in a water bath kept at 650C. Because
of the fineness of the capillary, the jet obtained was very
small, and as the spray struck the warm sides of the flask,
the temperature plus a vacuum of 29.5 ins. was sufficient
to dry the dissolved material at once. This material had
come into solution by dialysis through'the membrane. The
apoaratus was so designed that from 3800 to 4000 c.c. of
pH 2 hydrochloric acid would be drawn down from the supply
in the optimal peptic conversion time of four and one half
hours, or in the case of trypsin the same volumes of pH 8
sodium hydroxide would be drawn through in six hours. Reg-
ulation of the rate of flow was controlled by means of a
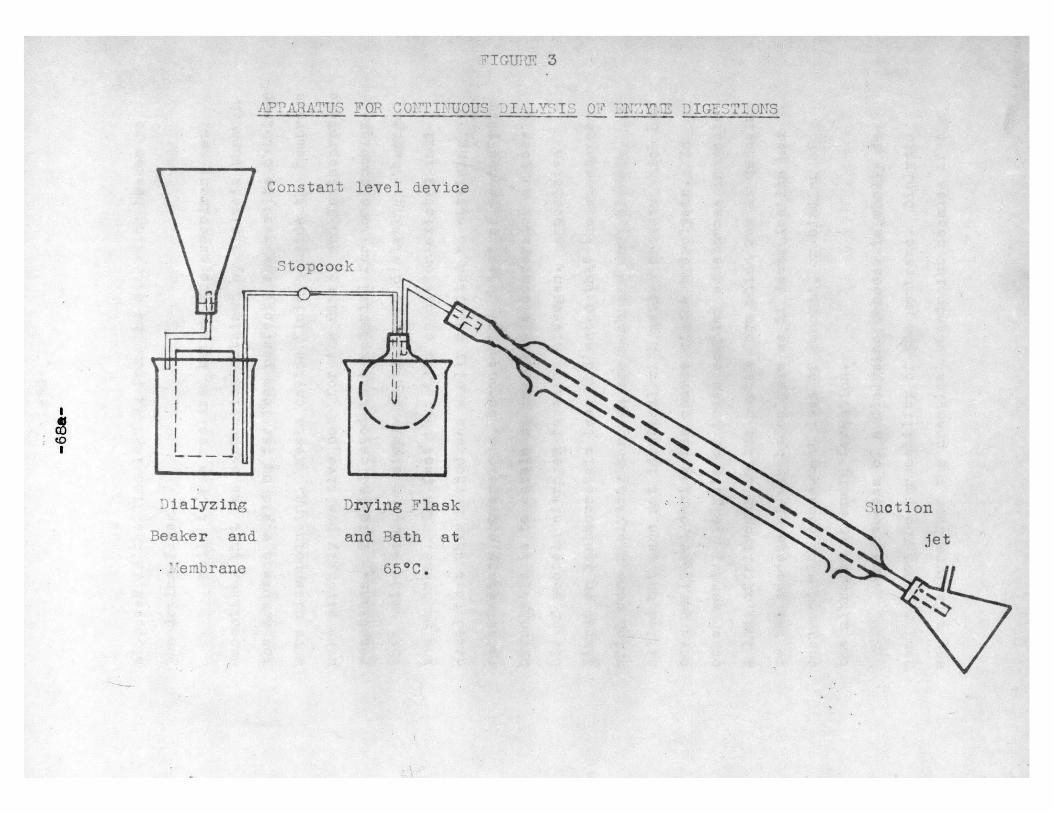
PIGUOr 3
APPARATUS FOR ONTIFTUOUS DIALY2IS OF :NzT3 DIGESTIONS
Constant level device
Stopcock
D ialyzing Drying Flask
Beaker and
Suotion
jetand Bath at
.rembrane
S
.65*C.
-69-
stopcock in the line leading from the dialyzing beaker to
the drying flask.
While it was realized before the experiment was
undertaken that the separation obtained by dialysis through
the membrane would be far from perfect, the results obtained
were disappointing. Tests on the fluid outside the membrane
were strongly positive both for the Biuret and Xanthoproteic
reactions. This indicated that material far more complex
than amino acids or simple peptids were dialyzing through
the membrane. The fact that this condition existed indi-
cated that this method was wholly unsuited to obtaining
satisfactory conversions, because the object of proteolytic
hydrolysis is to obtain as complete a conversion as possi-
ble of protein nitrogen to amino nitrogen. A positive
Biuret or Xanthoproteic test indicated that the substances
which were dialyzing through the membrane were closely
allied but were not identical with native protein which had
been unaltered during the course of the hydrolysis. In
other words, dialysis of these complex substances indicated
a loss of nitrogen in the peptid form which was as damaging
to the success of the hydrolysis as if deaminization had
occurred with consequent loss of anwonia, or binding of
the nitrogen in humin formation.
The success of a dialyzing process is wholly de-
pendent upon the permeability of the membrane. Dialysis
was a failure from the practical standpoint because of the
-70-
difficulty of securing a membrane which would be satis-
factory. There can be no question but that a simple di-
peptid such as glycyl glycine has a smaller molecular size
than a complex amino acid such as tryptophane. The type
of dialysis which was used in these experiments is a phy-
sical phenomenon, and it is dependent upon differences in
molecular size to effect a separation of one substance from
another. On the physical basis, therefore, no membrane ex-
ists which can refuse the passage of the physically small
dipetid yet allow the large amino acid to go through.
Neither does it appear that electrodialysis would
be any more successful because this process is also de-
pendent upon a physical basis for separation of substances.
There also is the difficulty introduced in this type of
procedure by electric current, which might exert a detri-
mental upon the enzyme, even inhibiting its activity en-
tirely. There is, however, t1e possibility that the mutual
solubilities of the substances which it is desired to sepa-
rate could be utilized for the removal of the hydrolytic
products, provided a membrane were used in which the amino
acids were soluble and all other orotein degeneration products
were not. The success of the dialyzing procedure if this
principle is to be followed would also be wholly dependent
upon the selection of a proper membrane. Granted that such
a membrane could be found, nevertheless, all the disad-
vantages common to the enzyme method would still be retained,
-71-
that is, the difficulties presented by bacterial action,
which if brought about by bacteria introduced with the en-
zyme preparation, and by the nitrogen which necessarily
must be added with the enzyme preparation. In view of these
difficulties, the dialyzing procedure was abandoned.
Buffer Salts -
When it was found necessary to back titrate enzyme
hydrolyses in order to keep the reaction at or near the
optimal value, it was thought that the use of buffers to
maintain the reaction would be a decided advantage. Ac-
cordingly, hydrolyses were run in which buffer solutions
were employed to give proper H ion concentration. For a
value of pH 2.0 a potassium chloride and hydrochloric acid
buffer was used, while for pH 8.0 the buffer was made up of
monopotassium phosphate and sodium hydroxide. The pH 2.0
buffer was made up using 3.73 gms. of potassium chloride
and 1.55 c.c. of concentrated hydrochloric acid made up to
one liter with water. The pH 8.0 buffer was made up with
6.8 gmns. of monopotassium. phosphate and 2 gms. of sodium
hydroxide, also made up to one liter with water. These
are the concentrations given by Clark in the text on H ion
concentration. The buffers were not made up using care-
fully purified fifth molecular solutions, but the amount of
dry substances specified was used and the pH of the result-
ing solution deternined electrometrically. According to
whether a buffer was on the acid or alkaline side of the
-72-
desired point, alkali or acid, or potassiun chloride or acid
was added to bring the buffer solution to the proper value.
The buffers thus prepared were used in the hydrolyzing mix-
tures full strength, that is, the requirement of 150 c.c.
of menstruum was fulfilled by adding to the mixture 150 c.c.
of buffer solution.
The first series of hydrolyses run with the potas-
sium chloride hydrochloric acid buffer showed that there was
no enzyme action, for there was absolutely no conversion of
protein nitrogen to amino nitrogen, and this is attributable
to the toxic effect of the high concentration of chloride
ion on the enzyme. The tryptic hydrolyses, on the other
hand, ran through to the maximum point successfully, the
time being required to effect the maximum conversion still
being six hours. Apparently, then, sodium and phosphate
ions are not toxic to trypsin.
It was not feasible to employ buffer solutions
in either the peptic hydrolysis or tryptic hydrolysis be-
cause in the case of pepsin the enzyme was rendered in-
active, while in the case of trypsin the reaction of the
buffer changed. This change was not as rapid as that noted
where sodium hydroxide alone was used, but during the six
hour interval consumed by tryptic hydrolysis, the change was
considerable as the buffer dropped from pH 8.0 to pH 6.7
to 6.8 in all cases. This change in the reaction of the
buffer is not surprising for it must be rememrbered that the
-73-
hydrolytic products, of which a considerable amount are
liberated during tryptic hydrolysis, also have the proper-
ties of buffers. Furthermore, protein hydrolysates are dis-
tinguished by the fact that they are highly buffered, and
there is no question but that the buffering effect of the hy-
drolytic products was so great as to completely overcome the
effect of the phosphate sodium hydroxide solution, because
the final pH reached at the end of tryptic hydrolysis was the
same as that which would have been attained if no buffer had
been used.
In view of these facts, therefore, it was decided
that the buffer solutions specified were totally unsuited to
hydrolyses with pepsin and with tryps in, for in the case of
pepsin, the enzyme action was inhibited entirely, and in the
case of trypsin the reaction did change. There was also a
further undesirable feature in that in the case of either
buffer a large amount of extraneous material had been intro-
duced in the form of buffer salts, which would render the hy-
drolysate difficult if not impossible to treat subsequentlf
for indentification and estimation of the individual amino
acids.
Bacterial Action -
The fact that bacteria are present in enzyme hy-
drolyses and that they were added with the enzyme preparations
has already been mentioned. That the enzyme preparations were
responsible for contamination by bacteria was demonstrated to
-M74..
be so. Control hydrolysis were run which were the same in
every respect as hydrolyses run for true conversion with the
exception that no enzymes or combination of enzymes are added.
These controls were carefully sterilized in an autoclave at
20 lbs. pressure for one hour so that there could be no ques-
tion as to the sterility of the controls. These control hy-
drolyses remained unchanged in all respects for periods which
extended up to and including three months. That no change
had taken place was evinced by the fact that Van Slyke deter-
minations on the liquid in the controls were negative. Fil-
tration of the menstruum from the substrate and subsequent
analysis for ammonia are also negative, and total nitrogen
determinations on the dried substrate corresponded with those
made before the substrate was introduced into the control
flask. It was evident, therefore, that no change had taken
place, and the controls consequently were proved to be sterile.
To certain of the sterile controls pepsin was added
in the optimum of 0.4 gms., and to others trypsin was added
in the same amount. These hydrolyses were then incubated for
the optimum time of four and one half hours and six hours
respectively. Back tritration in both cases was accomplished
by using sterile solutions and sterile pipettes. It is ap-
parent, therefore, that any contamination which occurred must
have resulted from the introduction of the enzyme preparations.
After incubation all flasks were allowed to stand
at room temperature. It was very soon evident that putrefactive
-75-
changes had set in. Within two hours there was a decided drop
in the total amino nitrogen from the maximum value which had
been obtained, and after 18 hours the appearance and odor of
the hydrolysates were conclusive evidence that decomposition
had begun. The bacteria found in the hydrolysates were in
cases of both pepsin and trypsin very large and extremely mo-
tile rods. They could be readily found under the high dry and
were the largest the writer has ever seen. It is evident that
they were thermophiles as hydrolyses contaminated with these
organisms gave evidence of putrefaction much more quickly if
the temperature was maintained at 49-50*C. than at 374C. or
room temperature. They could not have formed spores that were
highly resistant, as merely bringing a hydrolysate to a boil
was sufficient to insure sterility. No attempt was ever made
to identify the organisms. The fact of their presence was
sufficient.
The enzyme preparations could have been sterilized
by making up a glycerine extract or passing substances in
solution through a Berkfeldt filter. In the case of glycerine,
the water which dilutes the glycerine, is the solvent for the
enzyme, not the glycerine itself; hence glycerine preparations
are invariably weak. The enzyme would also be weakened by
filtration due to adsorption on the pores of the filter. The
necessity of a strong enzyme preparaticn has already been
emphasized.
-76-
Loss in Amino Nitrogen -
Referring back to Figure 1, it will be noted that
the curve far production of amino nitrogen plotted against
time rises to a maximum at the 41/2 hour point and then
assumes a downward trend. When this was first noted it was
thought there had been an error in the measurements. Checks
with other hydrolyses proved, however, that this drop was
always to be expected. The only variation was in the rapid-
ity with which it took place, and this did not extend over a
wide range.
The decrease, then, had to be accepted as a fact.
One explanation which can be given is that after equilibrium
had been reached the reaction tended to reverse itself and
the protein decomposition products were recombined with a
consequent loss in free amino nitrogen. There are many workers
who claim that the proteolytic enzymes are able to effect a
synthesis of complex products from simpler derivatives.
Borsook and Wasteneys (6, 7, 8) have presented the most recent
werk on this subject. Their papers deal with the synthesis
of protein by pepsin from peptic digestion mixtures. Taylor
(75, 76) claims to have synthesized protein with trypsin.
This success was met with after an earlier failure (74).
Satisfactory results were finally obtained because the trypsin
which was used was claimed to be non-hydrolyzable. Abderhalden
and Rona (2) state that they were unsuccessful in synthesizing
protein with trypsin. Robertson (66) claimed to have secured
-77-0
a synthesis with pe ps in, and in addition stated that the
greater the concentration of the enzyme, the greater the
synthesis obtained.
The drop in amino nitrogen can also be explained
by bacterial action. Protein cleavage procacts are an ideal
food for bacteria. The hydrolysates were heavily contaminated
with bacteria which were introduced with the enzyme prepara-
tions. On multiplying, they utilized the protein as a source
of nitrogen, and there is no doubt but that the simpler de.
rivatives would be taken first because most readily assimilable.
Of the two explanations, the second seems the more
tenable, particularly when one considers the evidence offered
in support of the idea of protein synthesis by means of the
hydrolytic enzymes, pepsin and trypsin. Borsook and Wasteneys
(6, 7, 8) make no mention of aseptic precautions other than
the addition of small amounts of chloroform. Considering the
length of time that their "syntheses" were run and the temper-
ature at which these were maintained, it would appear very
likely that the so-called synthesis was in reality an effect
arising from bacterial activity. The enzymes used by these
workers certainly were not sterile, and in the cases where they
inactivated the enzyme, in order to denonstrate that it was
the synthesizing agent, they also practically sterilized it.
No action was observed with an enzyme thus treated, which is
not surprising if we adopt the view that the bacteria contam-
inating the enzyme preparation were dead. As for temperature
-78-
effects, these workers found that at 80*C. no synthesizing
action was obtained, but it was noted at temperatures up to
this point. It is remarkable that pepsin, which has an op-s
timum of 49-50*C. in its hydrolytic action, should exhibit such
a narked change in temperature requirements for a synthetic
action. It is even more remarkable that the limit-value of
800C. should coincide with the upper temperature limit for
thermophilic bacteria. Barsook and Wasteneys (6, 7, 8) finally
point out that the reaction took place best at pH 4.0. That,
however, is not damaging to the belief that their results were
due to bacterial action rather than to any synthesis because
the organisms encountered by the writer were extremely active
at pH 1.8 to 2.0.
Taylor's (75) claim that the trypsin prepared by
him from the liver of a large Pacific Coast clam was non-
hydrolyzable seems very doubtful. Resistance to autolysis,
under favorable conditions of temperature and reaction, is not
a cbaracteristic of proteolytic enzymes. The only aseptic pre..
caution observed by Taylor was the addit ion of toluene to the
synthesizing mixtures. Five months were required for the
production of two grams of "protamin" from 400 gms. of amino
acids. After the five month interval the contents of the con-
tainer were stated to have been tested bacteriologically with
negative results, but the nature of the tests is not given;
moreover there was ample time for bacterioautolysis. Taylor
was, apparently, the only worker who gave the bacteriological
079-
aspect serious consideration, but not knowing the type of
bacteriological tests employed by him, it is difficult to tell
whether or not his synthesizing mixtures were truly sterile.
It has been the experience of the writer that toluene does not
prevent grcwth of bacteria.
Robertson (66) makes no mention whatsoever of aseptic
precautions. He worked with a pepsin of which no identifica-
tion was given other than to name a commercial brand. At the
time that his wark was carried on (1908-09) it is doubtful if
anything better than a 1:3,000 pepsin was obtainable comer-
cially. Therefore, the claim that the degree of synthesis ob-
tained was proportional to the concentration of the enzyme
reaches what is almost an absurdity, for a pepsin preparation
of 1:3,000 or less is so impure as to make it impossible to
raise the concentration of the enzyme in solution without add-
ing a large amount of extraneous material. The effect of this
is to change the relation of concentrations between menstruum,
substrate, and enzyme, which means that three variables are
introduced instead of one. To be dealing with three variables,
and ascribe the effects obtained as due to one, is not reason-
able.
The discussion just presented on methods of deter-
mining the synthetic action of protolytic enzymes makes it
clear that this fact is not yet established so definitely
that it can be relied on. Furthermore, even if it were proved
to be so, this would not mean necessarily that it had any
-80-.
bearing upon the hydrolyses run during this work, because
these were contaminated with bacteria. It seems, therefore,
most likely that the loss in amino nitrogen noted after the
optimum time had elapsed was due to bacterial action.
importance of OTtimum T -
The foregoing discussion emphasizes particularly
the importance of the time factor in enzyme hydrolyses. To
put it plainly, from the moment the hydrolysis is started it
is a race between the enzyme and the bacteria. While the
latter are outdistanced at the start, they are sure to win un-
less the hydrolysis is sterilized at the proper time. That
marks, of course, the end of all enzymic activity,
How much the tapering off of the curve shown in
Figure 1, page 49a, is due to the effects of bacterial action
is impossible to say. The effect should be relatively small
compared with that produced by adsorption of the enzyme on the
end products, because during the first part of the hydrolysis
the production of amino nitrogen is very rapid. During the
last stages, although temperature and reaction are still at the
optimum, the amino nitrogen increases much more slowly. If the
enzyme were still active the reaction should continue longer at
the higher rate because the hydrolysis can be carried to fur-
ther limits by other means. In four to six hours time the
effects of bacteria should not have become so great as to ac-
count f or much of the decrease in the production of amino ni-
trogen, but let that come to a standstill and every hour that
-81-
passes makes the destructive effects of bacteria cumulative.
Increase in Acidity - Decrease in Alkalinity -
Another phenomenon, in addition to the loss of
amino nitrogen, which is noted as a result of bacterial
action, is the increase in acidity or decrease in alkalini-
ty of the hydrolysate as determined electrometrically. That
is, after the optimum time has elapsed, the acidity increases
as the value for amino nitrogen decreases.
The acid may come from carboxylic acids which are
set free after deaminization of amino acids by bacteria.
Also, it may be hydrochloric acid liberated after the amino
group was lost, originally bound as an amino hydrochloride.
Probably both these factors are operative.
No experiments were made to determine which of
these two factors was responsible. The increase in acidity
was taken as supplying further confirmation that the loss
in amino nitrogen was due to deaminization of protein hy-
drolytic products through bacterial action.
Reasons for Abandoring the Enzyme Method -
The experimental data supplied in the foregoing
pages makes it evident that hydrolysis with enzymes, even
under the best conditions obtainable, is unsatisfactory.
The reasons why successful conversions cannot be obtained
may be summarized as follows:
(1) Addition of nitrogen with the enzymes.
(2) Low conversion compared to that obtainable
-82-
with the same protein when treated with
mineral acid.
(3) Bacterial action.
The difficulty encountered in nitrogen added with
the enzyme can be minimized by using enzymes of extreme
purity, provided the technique is available to secure them.
Some nitrogen, however, must always be added because to the
best of our knowledge and belief enzymes are nitrogeneous
in nature. A correction for added nitrogen can be made by
running a control determination on the enzyme preparations
alone, but there is no guarantee that the value thus ob-
tained will apply when the enzyme is introduced into a mix-
ture in which hydrolysis of other proteins takes place.
If the error in correction is thrown on an amino acid which
is present in the protein studied, the error in results
and conclusions will not, either qualitatively or quanti-
tatively, be as serious as if the protein were entirely
lacking in any or all of the amino acids to which the cor-
rection must be applied.
Neither does it appear that the conversions ob-
tainable with combinations of pepsin and trypsin as hydro-
lyzing agents can be pushed to any further degree than 45
per cent conversion of total nitrogen to amino nitrogen.
Conditions for hydrolysis were maintained at the
optimum, which resulted in a high rate of conversion, but
it does not appear practical to alter these conditions in
-83-
any manner which would assist in carrying the conversion
to a higher degree without impairing the efficiency of
the enzyme.
The bacteria present in enzyme preparations con-
stitute another drawback to this method of protein hydroly-
sis. Their removal cannot be accomplished without weaken-
ing the enzyme preparation, and above all this must be
avoided. In view of these facts, therefore, it was deemed
advisable to give up enzymes as hydrolytic agents for pro-
teins.
-84-
HYDROLYSIS UNYR PR3ESSURE
Reasons for Pressure Treatment -
After experimenting with dialysis as a means by
which better conversion could be obtained with enzymes,
the possibilities of increasing the per cent conversion of
enzyme hydrolyses seemed about exhausted. Before abandon-
ing the enzyme method entirely, however, it was though ad-
visable to give some hydrolyses subsequenit treatmient with
inorganic reagents. There were two possible objects to be
gained by such treatment. First, humin formation might be
greatly minimized compared to that obtained with hydrolysis
by the inorganic reagent alone. Second, the per cent con-
version might be raised above that obtainable with either
hydrolyzing agent alone.
Pressure treatment was selected because of the
satisfactory results reported by Van Slyke (80) at 150 0 C.
1for l$ hours, which appeared to be very promising, as a
good conversion had been secured in a short time.
Procedure -
Enzyme hydrolyses were run following the procedure
outlined previously. At the end of tryptic hydrolysis the
hydrolysate was boiled and allowed to stand. It was then
subjected to autoclaving. The acid autoclavings run with
0.1 'T hydrochloric acid, while 0.1 N sodium hydrox:ide was
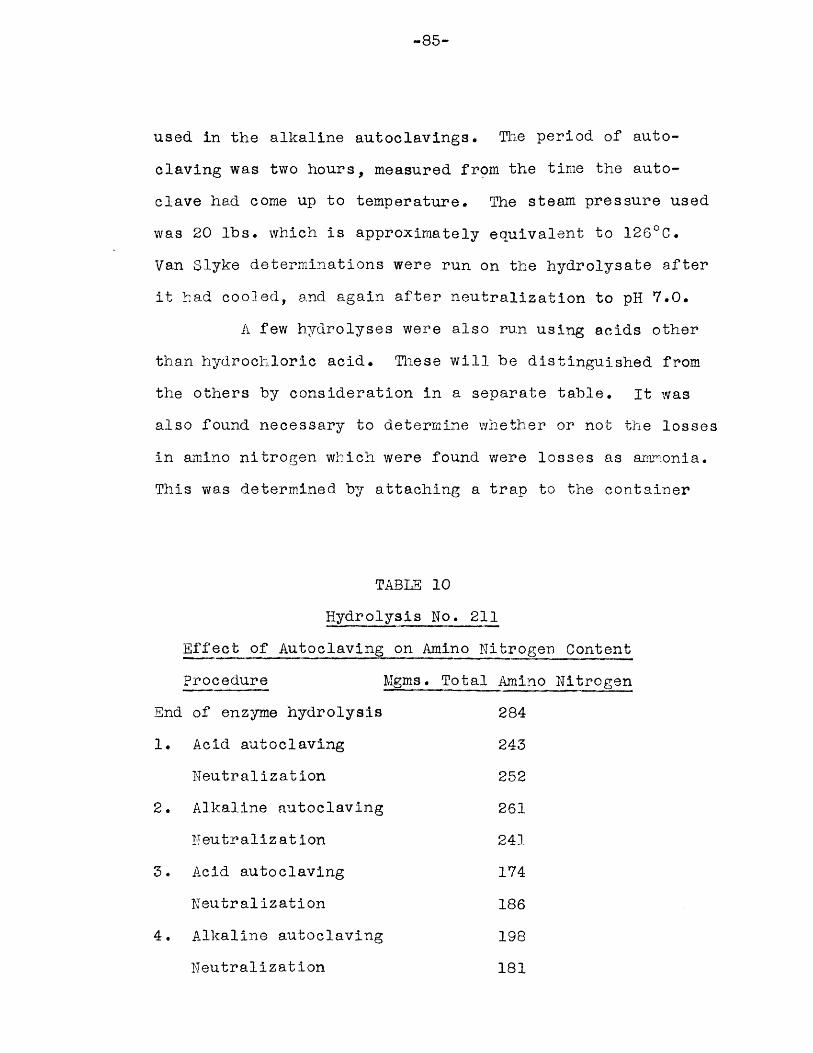
-85-
used in the alkaline autoclavings. The period of auto-
claving was two hours, measured from the timae the auto-
clave had come up to temperature. The steam pressure used
was 20 lbs. which is approximately equivalent to 1260C.
Van Slyke determinations were run on the hydrolysate after
it had cooled, and again after neutralization to pH 7.0.
A few hydrolyses were also run using acids other
than hydrochloric acid. These will be distinguished from
the others by consideration in a separate table. It was
also found necessary to determine whether or not the losses
in amino nitrogen which were found were losses as amimonia.
This was determined by attaching a trap to the container
TABLE 10
Hydrolysis No. 211
Effect of Autoclaving on Amino Nitrogen Content
Procedure
End of enzyme hydrolysis
1. Acid autoclaving
Neutralization
2. Alkaline autoclaving
Peutralization
3. Acid autoclaving
Neutralization
4. Alkaline autoclaving
Neutralization
Mgms. Total Amino Nitrogen
284
243
252
261
241
174
186
198
181
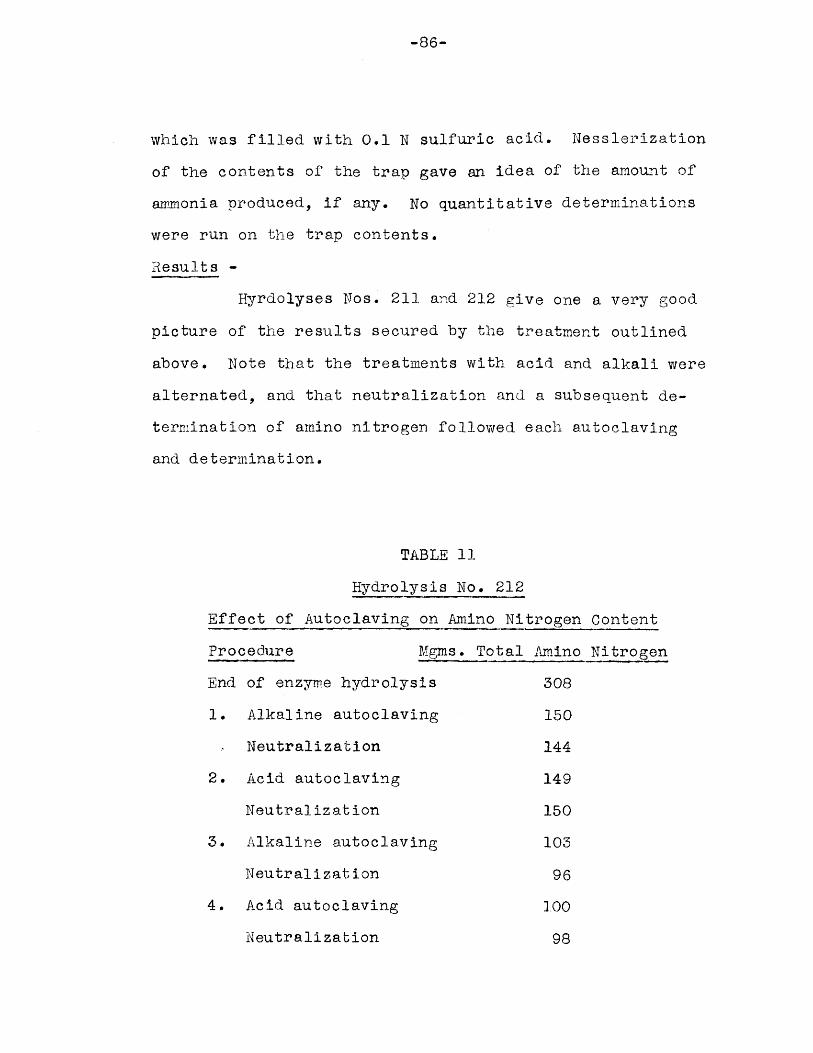
-86-
which was filled with 0.1 N sulfuric acid. Nesslerization
of the contents of the trap gave an idea of the amount of
ammonia produced, if any. No quantitative determinations
were run on the trap contents.
Results -
Hyrdolyses Nos. 211 and 212 give one a very good
picture of the results secured by the treatment outlined
above. Note that the treatments with acid and alkali were
alternated, and that neutralization and a subsequent de-
termination of amino nitrogen followed each autoclaving
and determination.
TABLE 11
Hydrolysis No. 212
Effect of Autoclaving on Amino Nitrogen Content
Procedure MgI
End of enzyme hydrolysis
1. Alkaline autoclaving
Neutralization
2. Acid autoclaving
Neutralization
3. Alkaline autoclaving
Neutralization
4. Acid autoclaving
Neutralization
ms. Total Amino Nitrogen
308
150
144
149
150
103
96
100
98
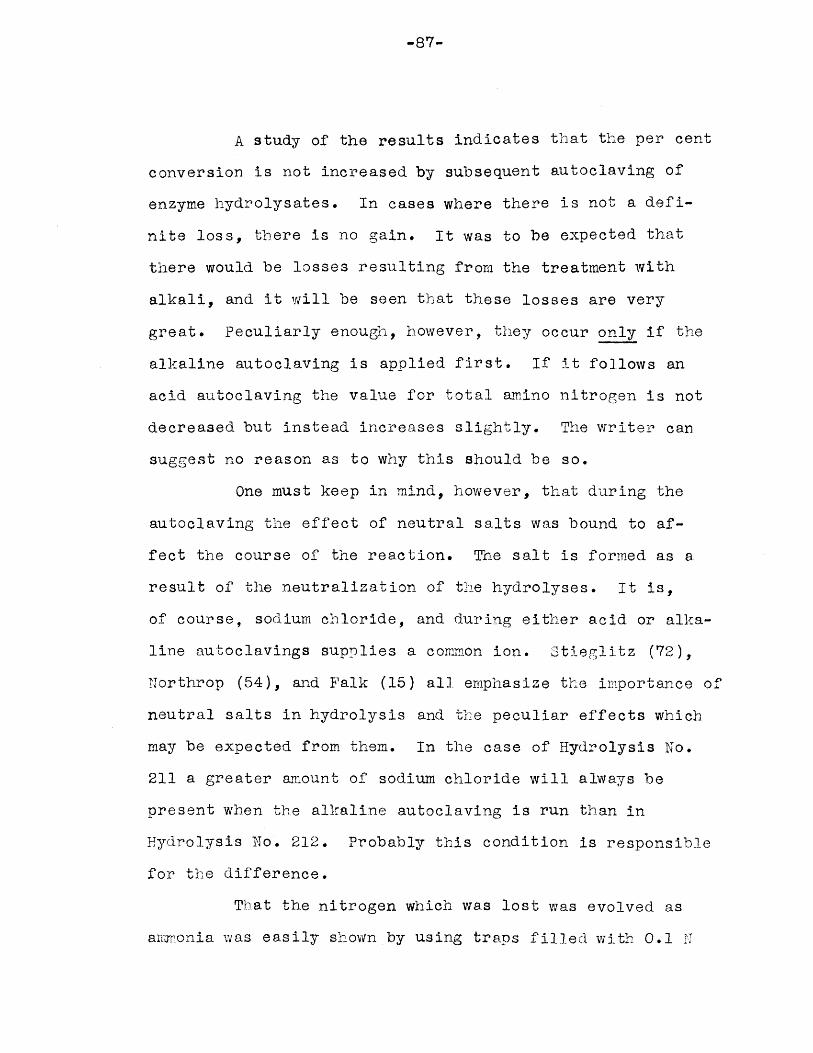
-87-
A study of the results indicates that the per cent
conversion is not increased by subsequent autoclaving of
enzyme hydrolysates. In cases where there is not a defi-
nite loss, there is no gain. It was to be expected that
there would be losses resulting from the treatment with
alkali, and it will be seen that these losses are very
great. Peculiarly enough, however, they occur only if the
alkaline autoclaving is applied first. If it follows an
acid autoclaving the value for total amino nitrogen is not
decreased but instead increases slightly. The writer can
suggest no reason as to why this should be so.
One must keep in mind, however, that during the
autoclaving the effect of neutral salts was bound to af-
fect the course of the reaction. The salt is formed as a
result of the neutralization of the hydrolyses. It is,
of course, sodium chloride, and during either acid or alka-
line autoclavings supplies a common ion. Stieglitz (72),
Northrop (54), and Falk (15) all emphasize the importance of
neutral salts in hydrolysis and the peculiar effects which
may be expected from them. In the case of Hydrolysis No.
211 a greater anount of sodium chloride will always be
present when the alkaline autoclaving is run than in
Hydrolysis No. 212. Probably this condition is responsible
for the difference.
That the nitrogen which was lost was evolved as
arironia was easily shown by using traps filled with 0.1 N
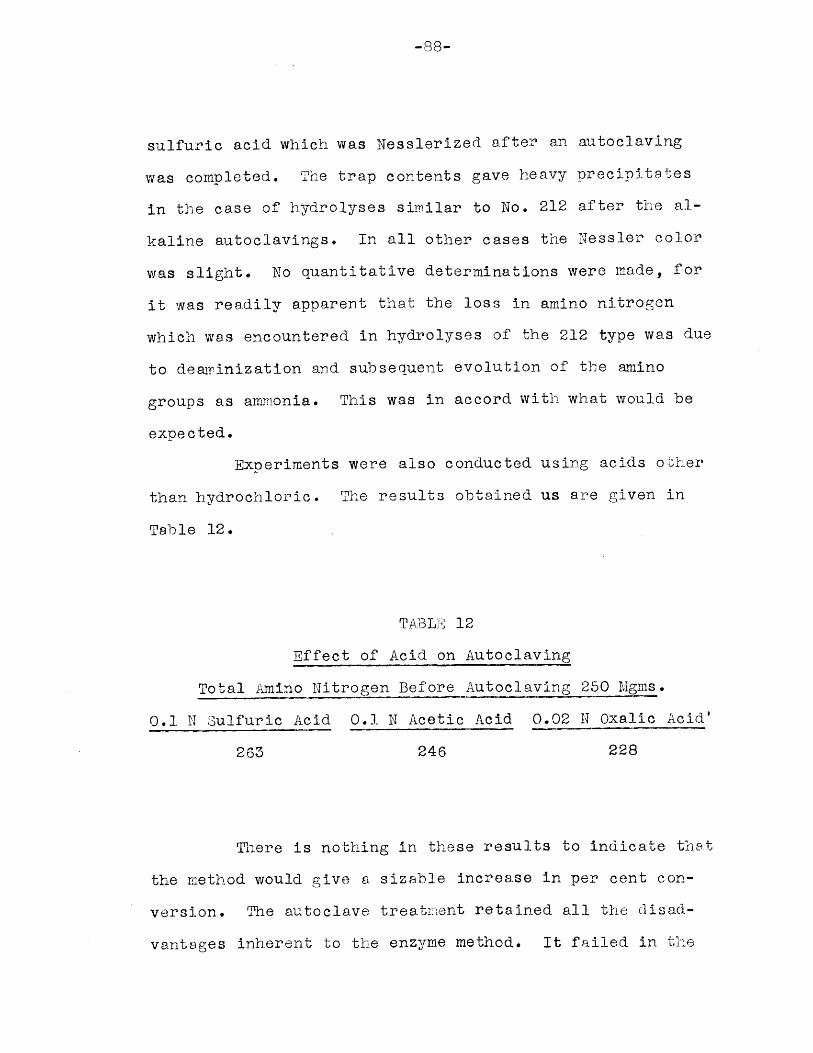
-88-
sulfuric acid which was Nesslerized after an autoclaving
was completed. The trap contents gave heavy precipitates
in the case of hydrolyses siiilar to No. 212 after the al-
kaline autoclavings. In all other cases the Nessler color
was slight. No quantitative determinations were made, for
it was readily apparent that the loss in amino nitrogen
which was encountered in hydrolyses of the 212 type was due
to dearinization and subsequent evolution of the amino
groups as aironia. This was in accord with what would be
expected.
Experiments were also conducted using acids other
than hydrochloric. The results obtained us are given in
Table 12.
TABLE 12
Effect of Acid on Autoclaving
Total Amino Nitrogen Before Autoclaving 250 Mgms.
0.1 N Sulfuric Acid 0.1 N Acetic Acid 0.02 N Oxalic Acid'
263 246 228
There is nothing in these results to indicate that
the method would give a sizable increase in per cent con-
version. The autoclave treat:ment retained all the disad-
vantages inherent to the enzyme method. It failed in the
I. -
-89-
desired purpose of increasing per cent conversion. It did
not reduce hunin formation materially. The alkaline hydro-
yses were rich in humin, but the acid hydrolyses had but
very little black insoluble humin. What humin appeared in
these hydrolyses was for the most part soluble and gave a
clear red to dark red, almost black, color to the solution.
These conditions are little, if any, better than those en-
countered with acid hydrolysis by the ordinary methods.
Steam pressure treatment of enzyme hydrolysates according-
ly was abandoned.
-90-
HYDROLYSIS W ITH ACID
Reasons for Acid Hydrolysis -
Acid hydrolysis was the final method studied. It
was undertaken only after the previous research had indicated
that enzymic hydrolysis, either in combination with inorganic
reagents or alone, was unsatisfactory.
It was known that difficulties would be encountered
with hurin formation. However, a preliminary treatment had
already been devised which removed the carbohydrate in physi-
cal union with protein. This was further amplified as de-
scribed under the procedure on "Preliminary Treatmr.ent". It
was known that this would prove helpful In the case of many
of the vegetable proteins. The object of the investigation
was, therefore, to devise a method which would prvent hurnin
formation through the combination of aldehydic constituents
and tryptophane.
Choice of an Acid -
The acid selected for all subsequent work was hy-
drochloric acid. One reason for choosing it was that Jones
and Kennard (40) had run a series of experiments using both
hydrochloric and sulfuric acids. They found that on neu-
tralization the precipitate of barium sulfate obtained with
sulfuric acid could not be filtered out. Hydrochloric acid,
on the other hand, can be removed by distillation under high
-91-
vacuum. This process is doubly advantageous in that no
salts are introduced into the hydrolysate as a result of
neutralization.
Jones and Kennard (40) also found that under the
same set of conditions hydrochloric acid gave a greater de-
gree of hydrolysis than sulfuric acid. This agrees with
data furnished by Greenberg and Burk (28) whose curves show
that there is a wide difference in the results obtained
with the two acids under like conditions of concentration,
temperature, and time. Vickery (86) and Osborne and Jones
(57) also found that sulfuric acid is a less efficient
hydrolyzing agent than hydrochloric acid.
The choice lay between these two acids, for not
only are they the best known of the mineral acids but they
are both strong acids. That is, they furnish a high concen-
tration of H ions, which is important in hydrolysis as it is
these ions which catalyze the reaction.
There was another factor which favored hydrochloric
acid, and this was the most important of all. It was planned
to run some hydrolyses in conjunction with reducing agents.
A common and easily applicable reducing agent is stannous
chloride. It is also a strong reducing agent. To use this
material it was necessary to employ hydrochloric acid so that
the anions would be the same, and this was the deciding
factor in choosing hydrochloric acid as the hydrolyzing
agent.
-92-
Causes of Humin Formation -
Gortner (18) and his collaborators demonstrated
that carbohydrate was an important factor in humin forma-
tion. The only published work that has ever question
Gortner's findings is a paper by McHargue (45). A study of
this paper makes it plain to one who has had any experience
with protein hydrolysis that the statements made are ill-
advised.
Gortner's first work established the fact that
carbohydrate contributed to humin formation, and up to cer-
tain limits the amount of humin bore a relation to the
amount of carbohydrate present. This is not true, however,
when the proportion of carbohydrate to protein becomes very
great, as the proportionality is then lost although an in-
crease in humin will be noted. It aneared that the car-
bohydrate effected humin formation in that aldehydic or
ketonic fractions, derived from the carbohydrate under the
conditions of hydrolysis, combined with tryptophane to pro-
duce black insoluble humin. The soluble humin, it is be-
lieved, arises through combination of these carbohydrate
derivatives with other amino acids, probably cystine and
tyrosine.
Gortner demonstrated that aldehydes and ketcnes
entered into humin formation because these substances when
boiled with tryptophane yielded a substance which was physi-
cally similar to the humin obtained on acid hydrolysis.
I - - -
-93-
Furthermore, hydrolysis of a protein lacking in tryptophane
decreased the formation of black insoluble humin to a
marked degree.
Choice of a Reducing Agent - Stannous Chloride -
It occurred to the writer that if hydrolyses were
run in conjunction with reducing agents, the formation of
humin should be reduced if not eliminated. Mann (43) states
on page 86 that "The formation of melanoidin depends on oxi-
dation...." It was this phrase which furnished to the
writer the clue that reducing agents might be helpful. A
thorough survey of Chemical Abstracts from 1912 to 1927 did
not indicate that any other work er had tried out the idea in
recent years. However, Gortner and Blish (20) state that
they have no way of explaining what happers when carbohy-
drate is absent and humin is formed unless tryptophane is
oxidized to indol aldehyde. They add that traces of some
other amino acid may be oxidized to the corresponding alde-
hyde. In a later paper, Gortner and Holm (25) reiterate
the belief that humin forration may be due to oxidizing
reactions.
Because of the emphasis laid on oxidation the
writer ran two hydrolyses, Nos. 371 and 372, to one of
which stannous chloride had been added and to the other
potassium dichromate. The following conditions were ob-
served in both cases: 20 grams egg flakes, 200 c.c. of
105 concentrated hydrochloric acid by volume, refluxed
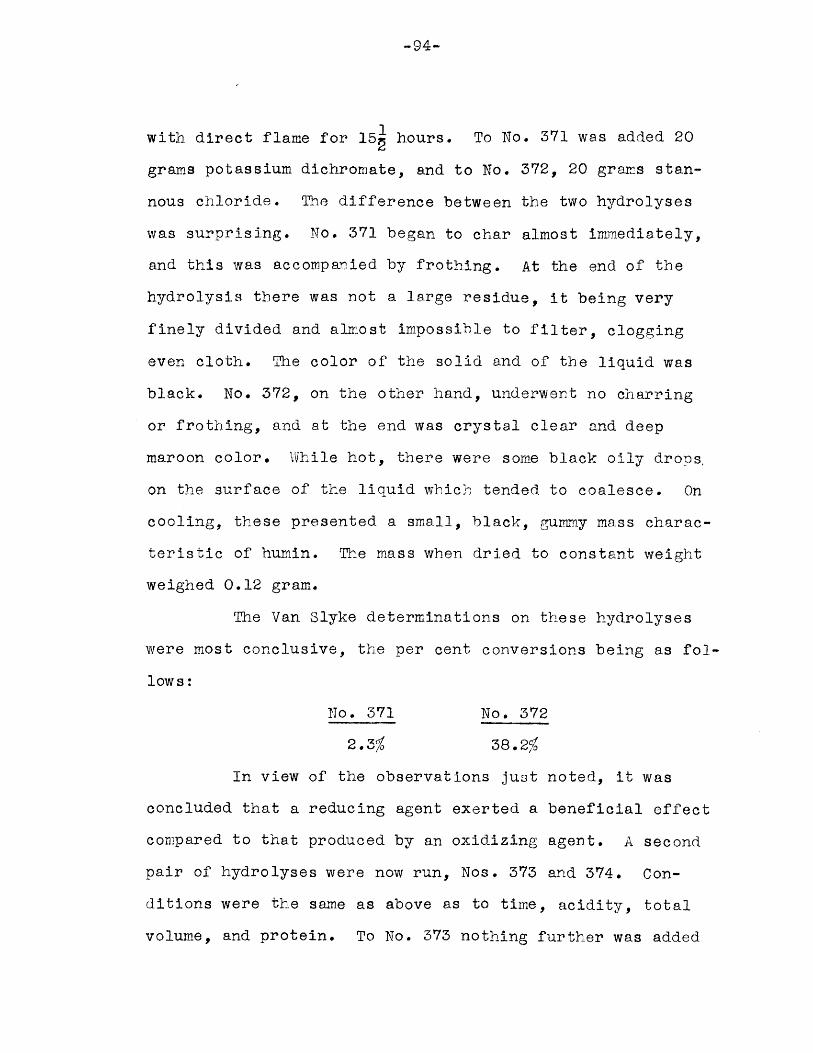
-94-
with direct flame for 15 hours. To No. 371 was added 20
grams potassium dichromate, and to No. 372, 20 grams stan-
nous chloride. The difference between the two hydrolyses
was surprising. No. 371 began to char almost immediately,
and this was accompanied by frothing. At the end of the
hydrolysis there was not a large residue, it being very
finely divided and almost impossible to filter, clogging
even cloth. The color of the solid and of the liquid was
black. No. 372, on the other hand, underwent no charring
or frothing, and at the end was crystal clear and deep
maroon color. While hot, there were some black oily drons,
on the surface of the liquid which tended to coalesce. On
cooling, these presented a small, black, gummy mass charac-
teristic of humin. The mass when dried to constant weight
weighed 0.12 gram.
The Van Slyke determinations on these hydrolyses
were most conclusive, the per cent conversions being as fol-
lows:
No. 371 No. 372
2.3% 38.2%
In view of the observations just noted, it was
concluded that a reducing agent exerted a beneficial effect
compared to that produced by an oxidizing agent. A second
pair of hydrolyses were now run, Nos. 373 and 374. Con-
ditions were the same as above as to time, acidity, total
volume, and protein. To No. 373 nothing further was added
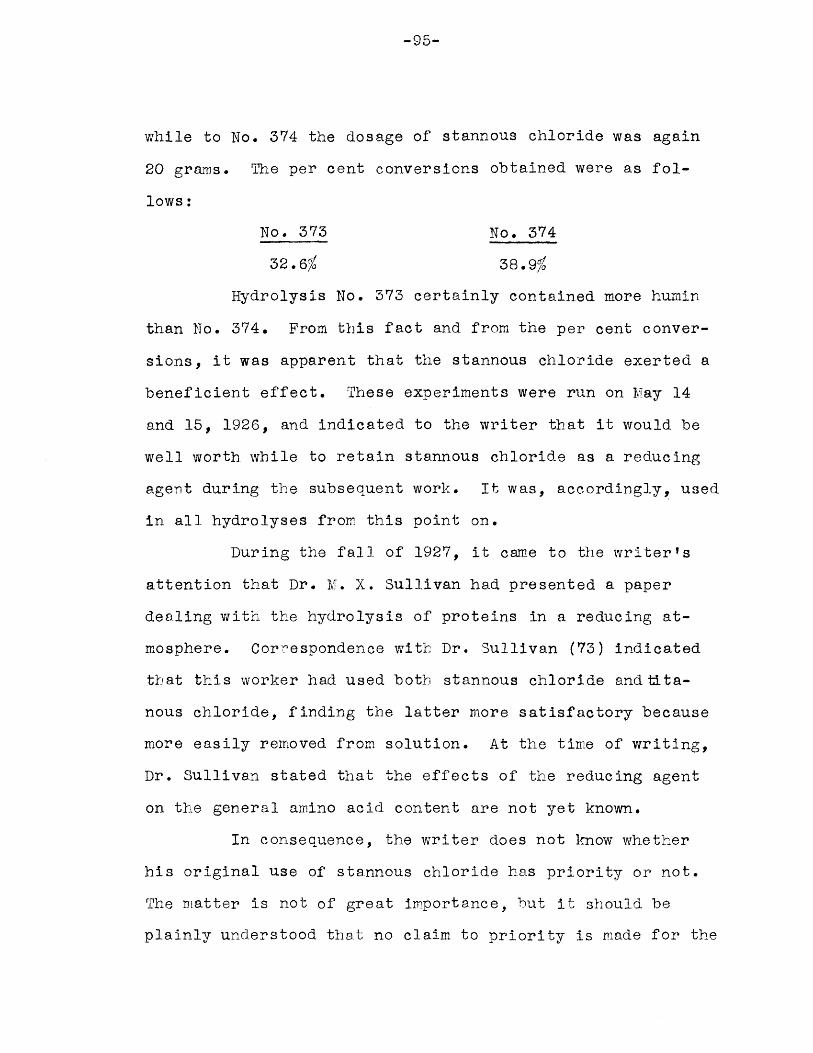
-95-
while to No. 374 the dosage of stannous chloride was again
20 grams. The per cent conversions obtained were as fol-
lows:
No. 373 No. 374
32.6% 38.9%
Hydrolysis No. 373 certainly contained more humin
than No. 374. From this fact and from the per cent conver-
sions, it was apparent that the stannous chloride exerted a
beneficient effect. These experiments were run on May 14
and 15, 1926, and indicated to the writer that it would be
well worth while to retain stannous chloride as a reducing
agent during the subsequent work. It was, accordingly, used
in all hydrolyses from this point on.
During the fall of 1927, it came to the writer's
attention that Dr. M. X. Sullivan had presented a paper
dealing with the hydrolysis of proteins in a reducing at-
mosphere. Correspondence with Dr. Sullivan (73) indicated
that this worker had used both stannous chloride and tita-
nous chloride, finding the latter more satisfactory because
more easily removed from solution. At the time of writing,
Dr. Sullivan stated that the effects of the reducing agent
on the general amino acid content are not yet known.
In consequence, the writer does not know whether
his original use of stannous chloride has priority or not.
The matter is not of great importance, but it should be
plainly understood that no claim to priority is made for the
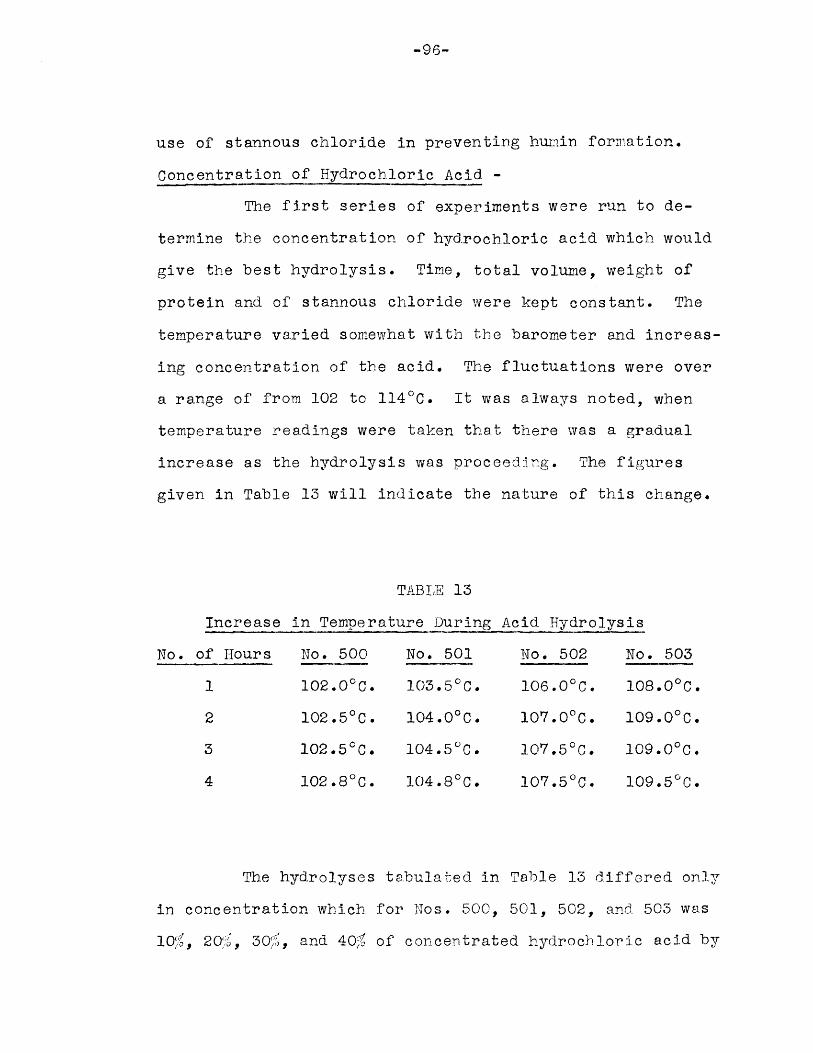
-96-
use of stannous chloride in preventing humin formation.
Concentration of Hydrochloric Acid -
The first series of experiments were run to de-
termine the concentration of hydrochloric acid which would
give the best hydrolysis. Time, total volume, weight of
protein and of stannous chloride were kept constant. The
temperature varied somewhat with the barometer and increas-
ing concentration of the acid. The fluctuations were over
a range of from 102 to 114'C. It was always noted, when
temperature readings were taken that there was a gradual
increase as the hydrolysis was proceeding. The figures
given in Table 13 will indicate the nature of this change.
TABLE 13
Increase in Temperature During
No. of Hours No. 500 No. 501
1 102.00C. 103.5 0 C.
2 102.50C. 104.00C.
3 102.540. 104.50C.
4 102.80C. 104.80C.
Acid Hydrolysis
No. 502 No. 503
106.000. 108.00C.
107.00C. 109.00C.
107.50C. 109.00C.
107.50C. 109.50C.
The hydrolyses tabulated in Table 13 differed only
in concentration which for Nos. 500, 501, 502, and 503 was
10, 20, 30(, and 40% of concentrated hydrochloric acid by
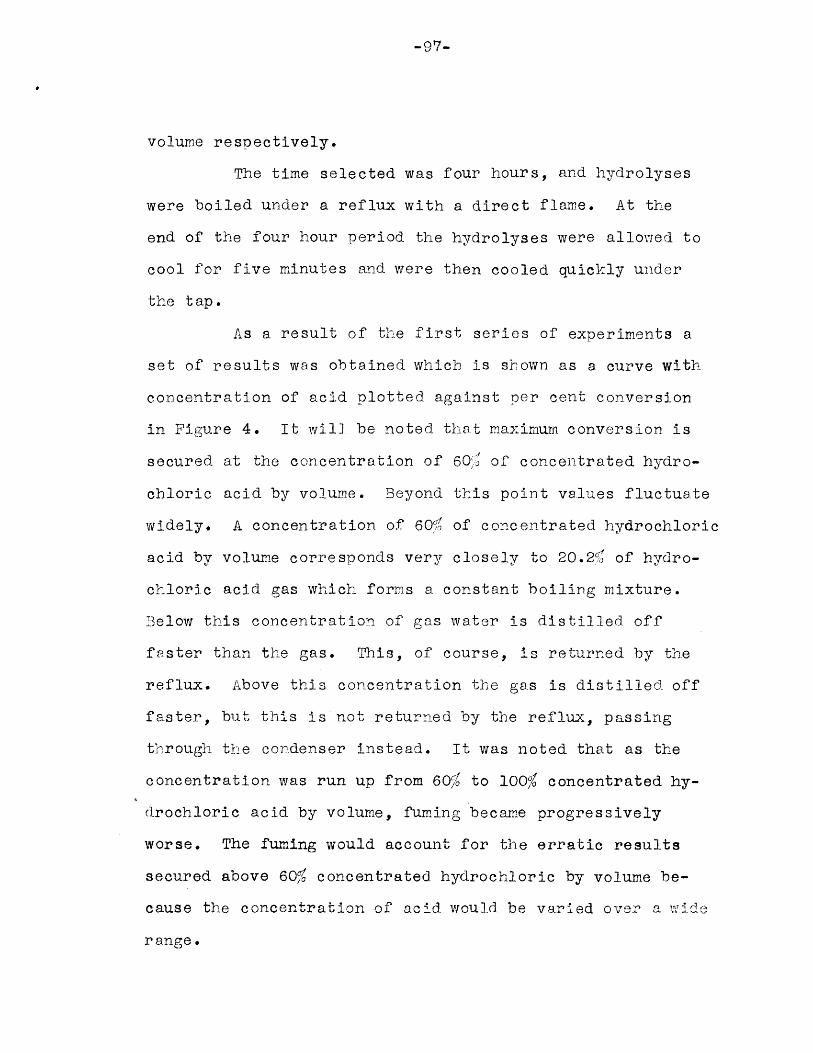
M1E~7~
-97-
volume respectively.
The time selected was four hours, and hydrolyses
were boiled under a reflux with a direct flame. At the
end of the four hour period the hydrolyses were allowed to
cool for five minutes and were then cooled quickly under
the tap.
As a result of the first series of experiments a
set of results was obtained which is shown as a curve with
concentration of acid plotted against per cent conversion
in Figure 4. It will be noted that maximum conversion is
secured at the concentration of 60j of concentrated hydro-
chloric acid by volume. Beyond this point values fluctuate
widely. A concentration of 60" of concentrated hydrochloric
acid by volume corresponds very closely to 20.2" of hydro-
chloric acid gas which forms a constant boiling mixture.
Below this concentration of gas water is distilled off
faster than the gas. This, of course, is returned by the
reflux. Above this concentration the gas is distilled off
faster, but this is not returned by the reflux, passing
through the condenser instead. It was noted that as the
concentration was run up from 60% to 100% concentrated hy-
drochloric acid by volume, fuming became progressively
worse. The fuming would account for the erratic results
secured above 60% concentrated hydrochloric by volume be-
cause the concentration of acid would be varied over a wide
range.
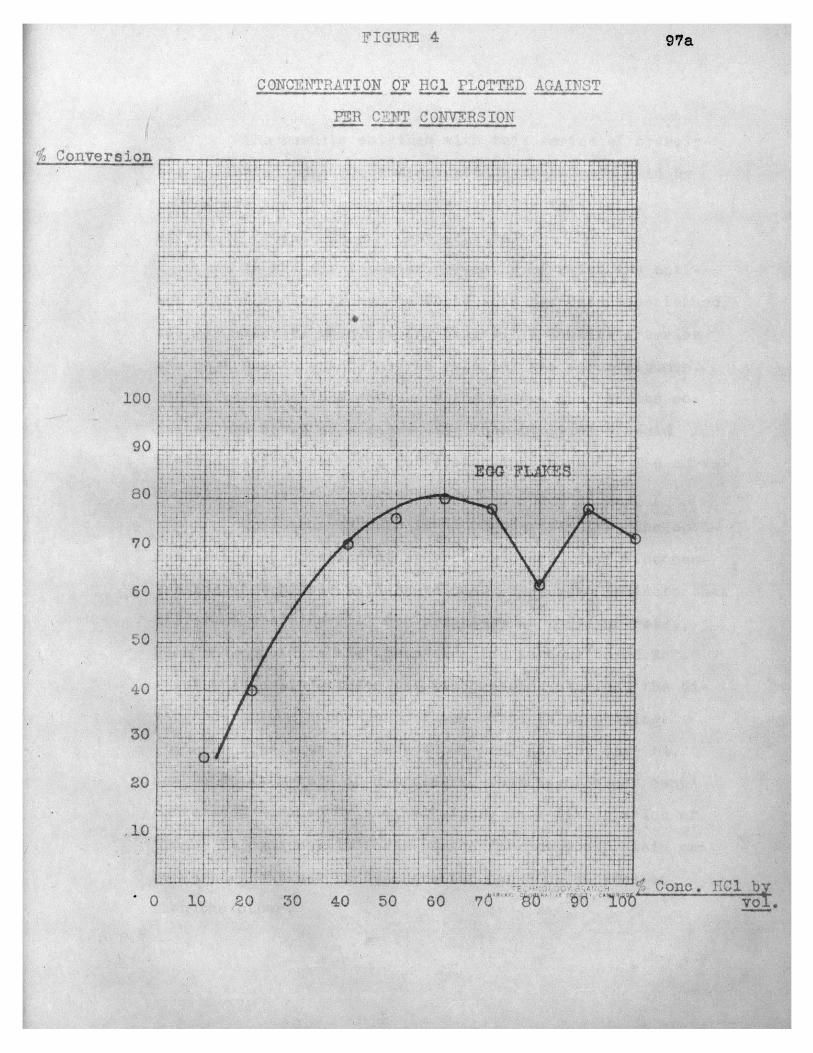
FIGURE 4
CONCENTPRATION OF 1cl PLOTTED AGAINST
Conversion
100
90
80
70
60,
40
30
20
.10
-L - - li;; b4~ 4
tt
--4t t4
4 1 T474
t T I
-4 Wi*t -:IT 7f: -71
4 I*
S- 4-1t
.i4
47
7 r
--- ~ ..i..i. '4
10 - -A -r i -4
t
4 41
4 4
-- 4
4 - --- 4 -
44
0 4
Ell4 4-
f 4
917a
PER CEN-'IT CONVERSION
T ~ ~ ~ ~ ~ ~ n F -1'';DC 470 $hP
0 LO7c
a
- 0 10 /o0 30 40+ 50 60
. 1
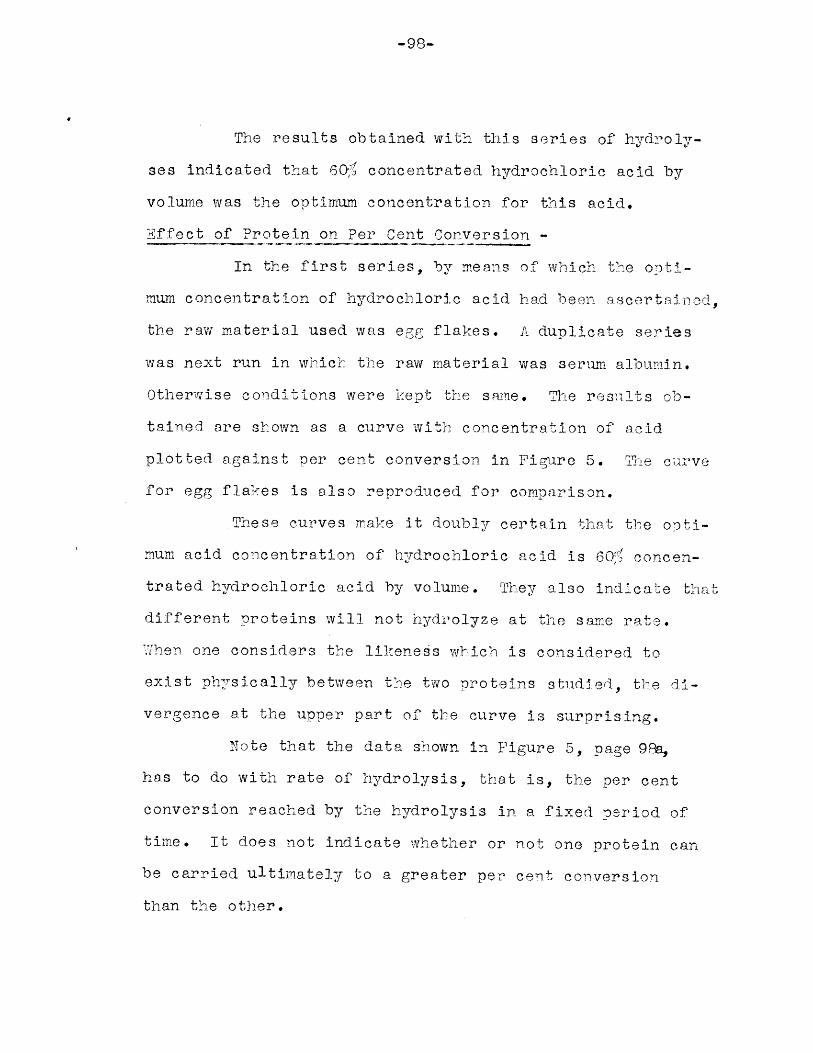
-98-
The results obtained with this series of hydroly-
ses indicated that 60j concentrated hydrochloric acid by
volume was the optimum concentration for this acid.
Effect of Protein on Per Cent Conversion -
In the first series, by means of which the opti-
mum concentration of hydrochloric acid had been ascertaieod,
the raw material used was egg flakes. A duplicate series
was next run in which the raw material was serum albumin.
Otherwise conditions were kept the same. The results ob-
tained are shown as a curve -with concentration of acid
plotted against per cent conversion in Figure 5. The c;urve
for egg flakes is also reproduced for comparison.
These curves make it doubly certain that the opti-
mum acid concentration of hydrochloric acid is 60 concen-
trated hydrochloric acid by volume. They also indicatLe that
different proteins will not hydrolyze at the same rate.
jhen one considers the likeness which is considered to
exist physically between the two proteins studied, the di-
vergence at the upper part of the curve is surprising.
Note that the data shown in Figure 5, page 983e.
has to do with rate of hydrolysis, that is, the per cent
conversion reached by the hydrolysis in a fixed period of
time. It does not indicate whether or not one protein can
be carried ultimately to a greater per cent conversion
than the other.
IMMONOW -- ii-mammi - I .- - ., I I __ - -1 1 C . 41 ____ - - -__ 1 -4
-'98a-
C O T"ATION OF Cl PLO'7T,"7 AGAIIST
F R 1 T-TT 7 N 2 E R SIN
conversion
100
0
80
70
60
50
4-0
~ K L~J'J
10
I
..- ] '
. -~- 4- e _ -
.. +-4
. ~I . - I e +
.4 4 - ,1 - 1
- I *, .4.. }
----- 4 -- i j i 4 t
4.
-7 -t -
T1 .. I
414
. 4 t
.i - ---f- - + *
14.1.,2~.2 ~.
jIii~:IAI+~tii
~4ji
tt
T+
(K0-
:1'
~20 30 40
4.2.
I. .t..L
.4
70.. 0R 4RT
Con. HC1 by
-
J,
4 I~~ ~ ~ ~ . i A 0 A"--
i
7
-99-
Effect of Stannous Chloride on Per Cent Conversion -
A series of hydrolyses was next run in wl ich all
conditions were kept as before, only now instead of vary-
ing the acid thce amount of stannous chloride added was
varied. The acid strength used throughout was 60% concen-
trated hydrochloric acid by volume.
The results obtained are shown in Figure 6. Be-
cause the values obtained vary so erratically, no definite
conclusions can be drawn. At the right end of the curve
there is a definite downward trend, but this is not surpris-
ing as the amount of stannous chloride is now so large that
what is being converted to the stannic form undoubtedly has
weakened the acid concentration and so retarded the rate
of hydrolysis.
The irregular values obtained with the amounts of
stannous chloride added from 0 to 20 grams inclusive were
thought at first to be due to errors in the determinations.
These, however, are the worst fluctuations that have been
encountered during this work, and while error is always
present due to the method of measurement, it is the writer's
belief that variations of the magnitude shown are due for
the most part to the effect of the neutral salt.
Falk (15), Northrop (55), and Stieglitz (72), among
many other writers, furnish explanation of the effect which
neutral salts can exert on the contalysis of hydrolysis by
acids. Weak electrolytes follow the Law of I"ass Action in
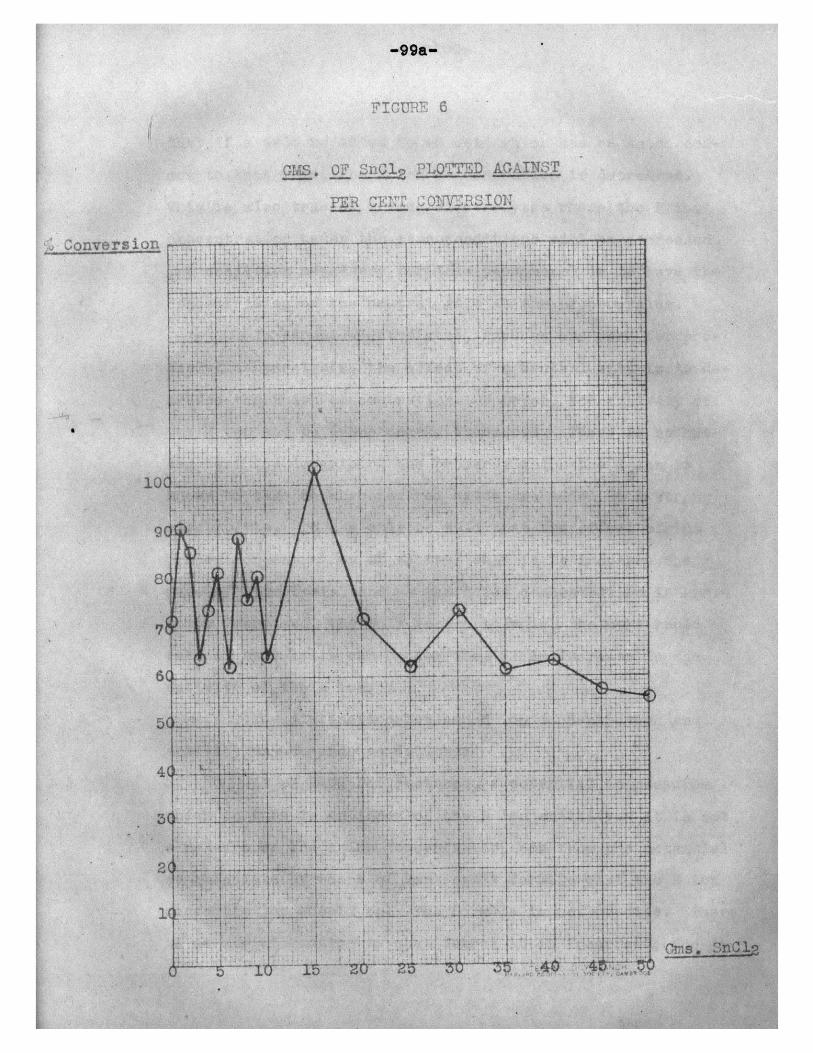
FT CtRE 6
OILS.OF Sn1 ~ AGA
CONY2IiTr tol
Sconv to Ian
~ ~Tt117t~
I I
-100-
that if a salt be added to an acid which has an anion com-
mon to that acid, the H ion concentration is decreased.
This is also true of strong electrolytes where the H ion
concentration under the same conditions will be decreased.
The condition necessary for this phenomenon is to have the
concentration of the neutral salt at the proper value.
In strong electrolytes, such as are used for pro-
leolytic hydrolysis, the effect of a neutral salt is to de-
crease the H ion concentration. However, the activity of
the H ion may be tremendously increased. There is no bet-
ter term for describing the property which the H ion is
known to take on when neutral salts are added to a strong
electrolyte. It can only be said that the effect of the
proper concentration of neutral salt is to increase the
rate of hydrolysis, and as the H ion concentration is known
to be decreased, the only reason to which the more rapid
rate of hydrolysis can be ascribed is an increase in the
activity of the H ion.
The distinction bet;een H ion concentration and
activity may be made as follows:
At pH 2.0, for instance, a potential is measured
which in turn is an index of the H ion activity. It is not
a measure of the H ion concentration for from the potential
we calculate by means of Van Enst's formula what the H ion
concentration should be. The formula is not precise. There
is no way of knowing to what degree it is incorrect, for it
-101-
is impossible to compare what is obtained from the poten-
tial reading, which is something definitely known to the
concentration of H ion, which is something indefinitely
known. In the case of dilute acids, the concentration and
the activity of H ions probably are similar, but in strong
acids there are no rules that can be anplied. Hence, if a
neutral salt is added, and the assumption is made that the
H ion concentration is decreased, there is also a perfect
right to assume that the H ion activity was increased.
The exoerimental data presented demonstrates be-
yond question that stannous chloride benefits hydrolyses
conducted with hydrochloric acid. Not only is humin forma-
tion materially reduced but the rate of hydrolysis is in-
creased. It appears reasonable, because of the stress that
has been laid by Mann (43) and Gortner (20,25) on the part
which oxidations play in hunir formation, that the reduc-
tion in humin noted during the course of these experiments
is due to the reducing property of stannous chloride. The
increase in rate of hydrolysis can, however, be attributed
only to the increased activation of the H ion, which is
brought about through the addition of a neutral salt. It
appears, therefore, that stannous chloride enjoys a dual
role in that humin formation is reduced and the rate of
hydrolysis increased.
-102-
DISCUSSION
It is evident from the data which has been pre-
sented that the results obtained during the course of this
research were largely of a negative character. They are,
however, none the less valuable because they are of assist-
ance in showing any worker, who desires to continue in this
field of research, the technique which is unsuccessful. It
is to be regretted that more ground was not covered during
this research. One must keep in mind, however, that the
difficulty experienced with the method for determining the
degree of protein hydrolysis made the work much slower than
it otherwise would have been, for the necessity of repeated
checks consumed a large amount of time. It must also be
remembered that the cases which have been cited, where spe-
cific hydrolyses have been referred to by number, are but
representative of a large number of determinations. All
the data obtained in this work was secured as a result of
no less than duplicate determinations, and there were many
instances where determinations were made in triplicate,
while the work on the Van Slyke method for amino nitrogen
determination was run in series of ten so that the experi-
mental error would be minimized in so far as was possible.
Of the negative results secured, it is evident that
protein hydrolysis by means of enzymes cannot be made
-103-
successful with the means which at present are at hand.
The difficulty presented by the nitrogen added with the
enzyme preparations is one which can be overcome only by
using an enzyme of extreme purity, and even under these
conditions the error can never be wholly eliminated because
proteolytic enzymes are nitrogenous in character. The con-
tamination of enzyme hydrolyses by bacteria also consti-
tutes so serious a drawback in this method of hydrolysis
as to indicate that the method should be abandoned. The
only means available for sterilizing enzyme preparations,
either by treatment with glycerine or filtration through a
porcelain filter, are bound to result in a lessening of
enzyme activity. Above all this is to be avoided, because
up to a definite ratio which can be experimentally estab-
lished between the concentration of enzyme, menstruum and
substrate, the amount of amino nitrogen produced is a di-
rect function of the enzyme added. Therefore, it is not
possible to use a concentration of enzyme below the opti-
mum and secure an efficient conversion, but if the enzyme
is weakened by any process of sterilization, the amount
necessary to reach the optimum concentration of active
material will be so great as to make it prohibitive because
of the large amount of nitrogen added.
The final difficulty which stands in the way of
successful enzymic conversion is adsorption of the active
material on the hydrolytic products. Such adsorption is
M
-104-
known to exist, for in no other way can the reaching equi-
librium at a lower per cent of conversion than that obtain-
able with the same protein when treated with mineral acids
be explained. Here, then, is one positive fact which can
be adduced from the experimental data presented, namely,
that protein degeneration products inhibit the activity of
proteolytic enzymes and that this phenomenon is due proba-
bly to adsorption.
Of the other positive data presented, one of the
most important advances which has been rade in this research
is the successful preparation of a vegetable protein which
was almost wholly free from fat and starch. The corn meal
which was studied, after extraction with ether and trichlo-
racetic acid, was found to have a protein content slightly
in excess of 97 per cent, which meant, if the average value
of two Der cent for cellulose content be accepted, that
the residual starch and fat could not amount to more than
one per cent at the utmost. The ability to prepare vege-
table proteins which will be free from the fat and carbo-
hydrate which exists in physical union with them is import-
ant. The amount of carbohydrate present determines the
degree of humin formation and until the technique with
stannous chloride was essayed, the only possible means of
averting humin formation was to reduce the amount of carbo-
hydrate to a minimum.
The use of stannous chloride in acid hydrolysis
-105-
was another positive fact adduced by this research. There
can be no question but that the use of this salt in combi-
nation with hydrochloric acid is decidedly beneficial. The
first experiments run indicate that the favorable action is
due to the reducing powers of this substance, as it will be
recalled that similar hydrolyses run in which an oxidizing
agent was used instead of stannous chloride, have a value
of only 2.3 per cent for per cent conversion as opposed to
39 per cent obtained with the hydrolyses using stannous
chloride, all other conditions of reaction being the same
except for the matter of oxidant and reductant.
It is further evident that stannous chloride must
produce some effect in acid hydrolysis other than that
which can be accounted for by its reducing properties. The
erratic variations extending over a wide range which are
to be noted, when the amount of salt added is changed only
one gram at a time, indicate that the salt is producing an
effect in the hydrolysis which is explainable only on the
basis of increased activity of the H ion. Stannous chloride
has, therefore, the ability not only to reduce in the case
of acid hydrolyses, but also to exert the effect of a neu-
tral salt. From this it would an-pear that the concentration
of stannous chloride is highly important in determining the
rate and possibly the degree of per cent conversion. Ex-
periments are planned which will demonstrate whether or
not the variations obtained with small increases and
-106-
decreases in the amount of stannous chloride present are
due to the introduction of a common anion.
This type of treatment with a reducing agent ap-
pears to be the only method known at the present time by
which humin formation in hydrolyses with inorganic reagents
can be minimized. It has long been an -established fact
that the customary boiling with acids under reflux resulted
in a large proportion of the protein nitrogen being lost
as humin nitrogen. This research further showed that the
degree to which the protein had already been hydrolyzed
did not affect the formation of humin to any marked degree,
because the pressure treatments which were given to enzyme
hydrolysates with inorganic reagents contained large amounts
of humin. So far as the writer has been able to determine,
this research furnishes the first case in which an agent
of the nature of stannous chloride was employed to reduce
humin formation.
The research as brought to its present stage, then,
indicates that hydrolysis with enzymes or with enzymes plus
inorganic reagents is unsuccessful. Considerable promise
is shown, however, by treatment with mistures of hydrochloric
acid and stannous chloride, for not only is humin formation
reduced but the conversions obtained have proceeded at a
higher rate. Therefore, it is recommended that further
work which is undertaken on proteir hydrolysis be conducted
only along the lines of hydrolysis with ineral acids, and
in conjunction with the proper: amount of a ±,.ducing agent
-107-
of the nature of stannous chloride.
A survey of the literature on protein analysis
made it appear that a better method of hydrolysis must be
evolved. Experimental evidence supports this assumption.
A study of the literature on the subject of protein hydrol-
ysis alone indicates that while a large amount of work has
been done which all bears more or less directly upon the
kinetics of the reaction, practically no data is available
on the all important point of securing high conversions of
total nitrogen to amino nitrogen. Of the methods for amino
nitrogen determination, it would appear that there is but
little to choose between improved titration methods or the
Van Slyke method for determining amino nitrogen. The Van
Slyke method was taken as the means for determining the de-
gree of hydrolysis in this research, and in accord with the
data presented by other workers it was found that determi-
nations which checked closely could not be obtained. This
fact is believed due to some inherent deficiency in the
reaction, since the check determinations run on acid hy-
drolysates varied over a wider range than those performed
on peptone solutions, and this obviated the possibility of
error on the part of the apparatus or operator. Neither
does it appear that any of the unknown groupings in the
protein molecule would effect the reaction seriously. Of
the four linkages recognized, other than the peptid link-
age, these are present but to a very small extent and they
-108-
are only slightly or not at all reactive with nitrous acid.
While hydrolysis with enzymes is entirely free
from humin formation, the difficulties inherent to that
method make it unsuitable. The effects due to added nitro-
gen and bacterial action, and the additional fact that
enzyme conversions cannot in the case of the same protein
be carried to as high a degree as that which can be reached
by treatment with mineral acids, make it apparent that
hydrolysis with enzymes is unsatisfactory. Because of the
nature of the difficulties presented, there does not appear
to be any means of circumventing them, and as the conditions
for enzymic activity have been carefully established and
maintained at the optimum during this research, the degree
of conversion which has been secured with the combination
of pepsin and trypsin probably can never be pushed above
the maximum value of 45 per cent, unless some means is de-
vised for removing the hydrolytic products as they are
formed.
Dialysis was tried out in an attempt to remove the
end products. The type of dialysis used, however, was
dependent upon molecular size to effect a separation of
substances. Consequently it was unsatisfactory, for in so
far as spacial dimensions are concerned, the simple dipeptid
is likely to be smaller than the complex amino acid.
Chloride ions were demonstrated as toxic to pepsin,
sodium and phosphate ions as untoxic to trypsin, as the
-109-
buffers which were made up containing one of the two combi-
nations mentioned either completely inhibited or did not
affect enzyme activity. Buffer solutions were Lou.nd unsat-
isfactory, being either toxic or else subject to change in
reaction due to the buffer effect of the hydrolytic products.
In accord with the data presented by N orthrop (5F),
it was determined that protein hydrolysis is dependent upor
the enzyme concentration, provided the amount of inert
material added with the active substance is not so great as
to act as an additional adsorbent to inhibit enzyme activity.
The experimental data also tends to show that the syntheses
of complex products from simpler protein derivatives by
pepsin or trypsin, as claimed by previous work-ers, is very
unlikely. In view of the lack of precautions taken on their
part to insure sterility of the reaction mixture, it is
probable that the decreases in amino nitrogren and the other
effects observed by them were due to nothing more than bac-
terial action. Preservatives were found of no use in pro-
tecting enzyme hydrolyses against bacterial decomnposition.
The effects of bacterial action were found to be a decrease
in the amount of total amino nitrogen and an increase in
acidity.
The treatment of previously digested proteins by
inorganic reagents was s own to be valueless, as in the
case of alkalies, deaminization appeared to as great an
extent as if there had been no previous hydrolysis, while
-110-
in the case of acids, the gain in per cent conversion was
negligible.
Stannous chloride was found to benefit hydrolyses
run with hydrochloric acid. The optimum concentration of
hydrochloric acid, under the conditions of a total volume
of 200 c.c., 20 gins. of stannous chloride and 20 gms. of
egg flakes or serum albumin, were found to be 60 per cent
concentrated hydrochloric acid by volume. Two physically
similar proteins, egg flakes and serum albumin, were found
to have under similar conditions of hydrolysis rates of de-
composition that were not the same, but differed by as
muchi as 15 per cent at the end of four hours.
Experiments run wvith varying concentrations of
stannous chloride indicated that the concentration of the
salt increased the activity of the H ion. Other work in-
dicated that humin formation was kept down because of the
reducing properties of this salt. Therefore, it would seem
that stannous chloride plays a dual role in protein hydrolT-
sis, and it is hoped that in the near future data can be
obtained which will prove whether or not the salt possesses
both properties, or acts merely as a reducing agent alone.
-111-
C ONC LUSI ONS
1. Hydrolysis with proteolytic enzymes can, un-
under the proper conditions, be run through in a fairly
short time - a matter of hours rather than weeks and months.
2. Even though the conditions be optimum, the
conversions secured with enzymes are not as great as those
that can be obtained with mineral acids. Data tends to
show that this is due to adsorption of the enzyme on the
hydrolytic products.
3. Because of the low conversions, coupled with
the oroblems presented by introduction of nitrogen and
bacteria with the enzyme preparations, enzyme hydrolyses
are unsatisfactory compared to hydrolyses with mineral
acids.
4. Treatment of enzyme hydrolysates with alka-
lies under pressure results in deaminization with evolu-
tion of ammonia. With acids, no gain is noted over the
original per cent conversion attained with enzyme. More-
over, humin formation appears not to be minimized.
5. The use of stannous chloride in acid hydro-
lyses was established as beneficial, for it both increeased
the rate of per cent conversion and decreased humin forma-
tion.
63. The optimum amount of stannous chloride under
MINSIOffif- I,,-----.,j,-= dM - -- - 1-
-112-
hydrolysis with 607 concentrated hydrochloric acid by
volume was 20 gms. stannous chloride to 20 gms. egr flacs
or sertun albumin in a total volume of 200 c.c.
-113-
Bi BLI OGRAPITY
The bibliography is arrang-ed alphabetically ac-
cording to the names of authors. In cases where two or
more writers have collaborated on one paper, reference is
made but once. The policy has been to set down the name
of the author first which was published first over the
paper in question. The only exception to this rule is
when a large number of papers have been presented under the
direction of one man and the name of one of the collabora-
tors has been published first. Under these circumstances
the paper is listed under the name of the man who directed
the work.
Each reference is given an arbitrary number and
it is by this number that the reader must id-ntify the
reference in the text.
The abbreviations employed for the journals from
which the references were taken are those accepted by the
American Chemical Society in the "List of Periodicals
Abstracted by Chemical Abstracts," 1926.
-114-
BIBLIOGRAPHY
1. Abderhalden, E. and Kram:, F. Z. Physil. Cherm. 77, 425
(1912).
2. Abderhalden, E. and Rona, P. Z. physiol. Chem. 49, 31
(1906).
3. Andersen, A. C. Biochem. Z. 70, 344 (1915).
4. Andersen, A. 0. and Hoed-Muller, R. Biochem. Z. 70, 442
(1915).
5. Bates, P. K. Undergrad. thesis T. I. T. 1924. Unpub.
6. Borsook, H. and Wasteneys, I. J. Biol. Chem. 62, 15
(1924-25).
7. Borsook, H. and Wasteneys, H. J. Biol. Chem. 62, 633
(1924-25).
8. Borsook, H.
(1924-25).
9. Braconnot,
10. Carpenter,
11. Center, W.
12. Davies, W.
13. Dowell, C.
(1919).
14. Dunn, . S.
15. Falk, G.K.
16. Fischer, E.
and Wasteneys, H. J. Biol. Chem. 62, 675
I. Ann. chim. phys. 13, 113 (1820).
). C. J. Biol. Chem. 67, 647 (1926).
T. Adv. Biochem. M. I. T. 1924. Unpub.
Biochem. J. 21, 815 (1927).
and Menaul, P. J. Biol. Chem. 40, 151
J. Am. Chem. Soc. 47, 2564 (1925).
Chemistry of Enzyme Actions. 1921.
and Abderhalden, E. Ber. 37, 3071 (1904).
-115-
17. Foreman, F.
18. Gortner, R.
19. Gortner, R.
20. Gortner, R.
W. Biochem. J. 14, 451 (1920).
A. J. Biol. Chem. 26, 177 (1916).
A. Science 48, 122 (1918).
A. and Blish, MK. J. J. Am. Chem. Soc. 37,
1630 (1915).
21. Gortner, R. A. and Bliss, G. E.
821 (1920).
22. Gortner, R. A. and Burr, G. 0.
1224 (1924).
23. Gortner, R. A. and Holm, G. E.
2477 (1917).
24. Gortner, R. A. and Holm., G. E.
J. Am. Chem. Soc. 42,
J. Am. Chem. Soc. 46,
J. Am. Chem.. Soc. 39,
J. Am. Chem. Soc. 42,
632 (1917).
25. Gortner, R. A. and Holm, G. E. J. Am. Chem. Soc. 42,
2378 (1920).
26. Gortner, R. A. and Norris, E. R. J. Am. Chem. Soc. 45,
550 (1923).
27. Grindley, H. S. and Slater, M1. E. J. Am. Chem. Soc. 37,
2762 (1915).
28. Greenberg, D. T. amd Burk, N. E.
275 (1927).
29. Harding, V. J. and MacLean, R. M.
217 (1915).
30. Harding, V. J. and Rac~ean, R. m.
J. Am. Chem. Soc. 49,
J. Biol. Chem. 20,
J. Biol. Chem. 24,
503 (1915-16).
31. Hamilton, T. S. Determination of Amino Acids of Feeds.
1921. Unpub.
Imm
-116-
32. Harned, H. 3. J. Am. Chem. Soc. 40, 1462 (1918).
33. Harris, Proc. Roy. Soc. (London) (B) 94, 426.
34. Hart, E. B. and Sure, B. J. Biol.
35. Henriques, V. and Gjaldbak, J. K.
Chem. 31, 527 (1917).
Z. Physiol. Chem. 47,
8 (1906).
36. Henriques, V. and Gjaldbak, J. K.
8 (1910).
37. Henriques, V. and Gjaldbak, J. K.
Z. physiol. Chem. 67,
Z. physiol. Chem. 75,
363 (1911).
38. Hofmeister, F. Ergebnisse Physiol. 1, 759 (1902).
39. Johnson, T. B. and Burnham, G. J. Biol. Chem. 9, 331
(1911).
40. Jones, H. T. and Kennard, M. A. Adv. Biochem. . IT
1924. Unpub.
41. Lloyd, D. J. Chemistry of the Proteins, 1926.
42. Maignon, E. F. Compt. rend. acad. sci. 178, 420, 654,
896 (1924).
43. Mann, G. Chemistry of the Proteins. 1906.
44. Mathieu, H. Compt. rend. acad. sci. 148, 1218 (1907).
45. McHargue, J. 3. J. Agric. Research 12, 1 (1918).
46. Michaelis, L. and Mendelssohn, A. Biochem. Z. 65, 1
(1914).
47. Morrow, C. A. Biochemical Laboratory Methods. 1927.
48. Mulder, G. T. J. prakt. Chem. 16, 290 (1839).
49. Nasse, 0. Arch. ges. Physiol. (Pfluger's) 6, 589 (1872).
50. Northrop, J. H. J. Gen. Physiol. 1, 607 (1918-19).
51. Northrop, J. H. J. Gen. Physiol. 2, 113 (1919-20).
-117-
52. Northrop, J. H.
53. Northrop, J. H.
54. Northrop, J. H.
55. Northrop, J. H.
56. Northrop, J. H.
J. Gen. Physiol. 2,
J. Gen. Physiol. 2,
J. Gen. Physiol. 2,
J. Gen. Physiol. 3,
J. Gen. Physiol. 4,
57. Osborne, T. B. and Jones, 1). B. Am.
465 (1919-20).
471 (1919-20).
595 (1919-20).
715 (1920-21).
57 (1921-22).
J. Physiol. 26,
305 (1910).
58. Osborne, T. B., Leavenworth, and Brautlecht. Am. J.
Physiol. 23, 194 (1908).
59. Osborne, T. B. and Nolan, 0. L. J. Biol. Chem. 43,
311 (1920).
60. Parker, R. B. Undergrad. thesis Y. I. T. 1924 Unpub.
61. Pittom, W. W. P. Biochem. J. 8, 154 (1914).
62. Pfleiderer, R. Arch. ges. Physiol. (Pfluger's) 66,605 (1897).
63. Reilley, J. and Pyne, G. Biochem. J. 21, 1062 (1927).
64. Rimington, C. and Kay, H. D. J. Soc. Chem. Ind. 44,
256 (1925).
65. Robertson, T. B. J. Biol. Chem. 3, 95 (1907).
66. Robertson, T. B. J. Biol. Chem. 5, 493, (1908-09).
67. Rogozinski, F. Z. physiol. Chem. 79, 398 (1912).
68. Siegfried, Y. Z. physiol. Chem. 44, 85 (1905).
69. Sorensen., S. P. L. Biochem. 7. 7, 45 (1908).
70. Sorensen, S. P. L. Biochem. Z. 21, 131 (1909).
71. Sorensen, S. P. L. and Jessen-Hansen, H. Biochem. 7.
7, 407 (1907-08).
72. Stieglitz, J. Am. Chem. J. 39, 29, 166, 402, 650 (1908).
-118-
73. Sullivan, M. X. Personal communication. 1928.
74. Taylor, A. Univ. Cal. Publications (Pathology) 1,
65.
Taylor, A.
Taylor, A.
Van Slyke,
Van Slyke,
Van Slyke,
Van Slyke,
Van Slyke,
Van 3lyke,
Van Slyke,
Van Slyke,
E.
E.
D.
D.
D.
D.
D.
D.
D.
D.
J.
D.
D.
D.
D.
D.D.
D.
D).
Biol. Chem. 3,
Biol. Chem. 5,
J. Biol. Chem.
J. Biol. Chem.
J. Biol. Chem.
J. Biol. Chem.
J. Biol. Chem.
J. Biol. Chem.
J. Biol. Chem.
and Birchard. F
87 (1907).
381 (1908-09).
9, 185 (1911).
10, 38 (1911-12).
12, 275 (1912).
12, 295 (1912).
16, 121 (1913).
22, 281 (1915).
23, 408, (1915).
J. J. Biol. Chem. 16,
539 (1913-14).
85. Vernon, H. M1.
86.
87.
88.
89.
90.
91.
92.
93.
J. Physiol. 30, 330 (1903).
Bickery, H. B. J. Biol. Chem. 53, 495 (1922).
Waksman, S. A. and Davidson, WJ. C. Enzymes. 1926.
Walker, E. Biochem. J. 19, 1082 (1925).
veizmann, C. and Agashe, G. S. Biochem. J. 7, 437 (1913).
White, G. F. and Thomas, A. J. Biol. Chem. 13, 111
(1912-13).
W7ilson, D. D. J. Biol. Chem. 56, 133 (1923).
Wilson, D. W. J. Biol. Chem. 56, 191 (1923).
Zelinsky, N. D. and Sadikov, V. S. Biochem. Z. 137,
397 (1923).
75.
76.
77.
78.
79.
80.
81.
82.
83.
84. .