Choosing Transportation Alternatives for Highly Perishable Goods by P. Louis Bourassa B. Eng., Metallurgical Engineering, McGill University, 1992 M. Eng., Metallurgical Engineering, McGill University, 1994 Submitted to the Engineering Systems Division in Partial Fulfillment of the Requirements for the Degree of Master of Engineering in Logistics at the Massachusetts Institute of Technology June 2006 © 2006 P. Louis Bourassa All rights reserved MASSACHU.rIU OF TECHNOLGy JUN 2 6 2006 LIBRARIES The author hereby grants to MIT permission to reproduce and to ARCHI distribute publicly paper and electronic copies of this thesis document in whole or in part. Signature of Author I A . e. - Engineering Systems Division /7 May Certified by D. s Ca;ice Executive Director, InG Progrim TYsisupe/or Accepted by / ;i SShef Professor of Civil and Environmental Engineering Professor of Engineering Systems Director, MIT Center for Transportation and Logistics

Welcome message from author
This document is posted to help you gain knowledge. Please leave a comment to let me know what you think about it! Share it to your friends and learn new things together.
Transcript
Choosing Transportation Alternatives
for Highly Perishable Goods
by
P. Louis Bourassa
B. Eng., Metallurgical Engineering, McGill University, 1992M. Eng., Metallurgical Engineering, McGill University, 1994
Submitted to the Engineering Systems Division in Partial Fulfillment of theRequirements for the Degree of
Master of Engineering in Logistics
at the
Massachusetts Institute of TechnologyJune 2006
© 2006 P. Louis BourassaAll rights reserved
MASSACHU.rIUOF TECHNOLGy
JUN 2 6 2006
LIBRARIES
The author hereby grants to MIT permission to reproduce and to ARCHIdistribute publicly paper and electronic copies of this thesis document in whole or in part.
Signature of Author I A .
e. -
Engineering Systems Division/7 May
Certified by
D. s Ca;iceExecutive Director, InG Progrim
TYsisupe/orAccepted by
/ ;i SSheffiProfessor of Civil and Environmental Engineering
Professor of Engineering SystemsDirector, MIT Center for Transportation and Logistics

Choosing Transportation Alternatives
for Highly Perishable Goodsby
P. Louis Bourassa
Submitted to the Engineering Systems Division
on May 22, 2006 in Partial Fulfillment of the
Requirements for the Degree of Master of Engineering in
Logistics
AbstractThe selection of a transportation alternative to ship perishable goods is dependent on several
interconnected factors, the most important usually being speed of delivery. This study focuses on
the distribution operation of Tyco Healthcare's (THC's) nuclear medicine group in the
continental United States. It studies the system constraints, service requirements and costs
involved in shipping highly perishable radiopharmaceuticals.
The first stage of the study describes aspects of THC's radiopharmaceutical supply chain from
order taking at the manufacturing plant to distribution of the prepared doses at the
radiopharmacies. The second stage establishes the unit costs of shipping products to three sample
regions via the four transportation alternatives currently used: ground courier, FedEx Express,
commercial airline and chartered aircraft. The third and final stage of the study analyzes three
hypothetical distribution scenarios. Its purpose was to challenge the restrictions and determine
the opportunity cost of distributing the nuclear medicine under the current operating policies.
Based on the results of all three stages, a set of cost savings recommendations is provided.
Thesis Supervisor: Dr. Chris CapliceTitle: Executive Director, MLOG Program
3


AcknowledgementsFirst and foremost, I would like to thank my thesis advisor Dr. Chris Caplice. It is he who saw
the potential in me to become a logistician. His helpfulness and guidance have been greatly
appreciated and will not be forgotten. Furthermore, the leadership he shows as the director of the
Masters of Logistics program is an inspiration.
I am very grateful to Mr. Peter Sturtevant and Mr. Charles Gianci for having given me the
opportunity to work with Tyco Healthcare and gain valuable practical experience. They have
been very supportive of the work I have done.
I am indebted to Mr. Richard "Chip" Potts, Mr. Chris Ringwald, Mr. Mike Engdale, Mr. Tom
McCormack, Mrs. Christy Bitticks, Mr. Mike Witty, and Mrs. Karen Dolph for the help they
have given me compiling all the data contained in this study. Their patience and helpfulness has
been very appreciated; without them I could not have even started the work.
Lastly, I would like to thank Ms. Elizabeth DeMichele for her continued support and help editing
the text; Mrs. Xiaowen Yang for the work we did together and; the MLog 06 class in general, it
is an honor to consider you my friends.
5

Biographical NoteP. Louis Bourassa received his Masters of Logistics degree from MIT in 2006. Prior to his return
to school, he had worked over five years as a Program Manager / Program Engineer for a
software company involved in the flight simulator industry. Before then, he worked as a process
engineer and project manager in the chemical process industry where he was involved in the
start-up of a $350M plant based on an innovative process he had help developed. In 1992, Louis
earned a Bachelor of Engineering from McGill University in metallurgy. He graduated with
Great Distinction and received seven awards/scholarships including the Henry Birks Medal. In
1994 Louis completed a Masters of Engineering from McGill University in the discipline of
metallurgy.
7

Table of ContentsA bstract ............................................................................................................................. 3
Acknowledgements .............. ............................................................................................ 5
Biographical Note ............................................................................................................. 7
Table of Contents .............................................................................................................. 9
List of Tables ................................................................................................................... 11
List of Figures ................................................................................................................. 11
1 Introduction .............................................................................................................. 131.1 M otivation ........................................................................................................... 131.2 Nuclear M edicine ................................................................................................ 141.3 Business Overview ............................................................................................. 151.4 Literature Review ............................................................................................... 161.5 Approach ............................................................................................................ 18
2 Aspects of the Supply Chain ................................................................................. 212.1 Product Description ............................................................................................ 212.2 Orders ................................................................................................................. 242.3 Production Planning and Production ................................................................. 26
2.3.1 Chrom ium .................................................................................................... 282.3.2 Gallium ........................................................................................................ 282.3.3 Indium .......................................................................................................... 282.3.4 Iodine ........................................................................................................... 292.3.5 Phosphate ................................................................................................... 292.3.6 Technetium (Generators) ........................................................................... 292.3.7 Thallium ....................................................................................................... 302.3.8 Xenon .......................................................................................................... 30
2.4 Transportation Considerations ........................................................................... 302.4.1 Planning ...................................................................................................... 302.4.2 Transportation Index ................................................................................... 322.4.3 Product Decay ............................................................................................. 332.4.4 Cost ............................................................................................................. 332.4.5 Custom er Service Level .............................................................................. 34
2.5 Transportation Alternatives ................................................................................ 342.5.1 Ground Courier ........................................................................................... 362.5.2 FedEx Express ............................................................................................ 362.5.3 Com m ercial Airline ...................................................................................... 372.5.4 Chartered Aircraft ........................................................................................ 38
2.6 Custom er Use ..................................................................................................... 39
3 Order and Cost Data ................................................................................................ 433.1 Order Dataset ..................................................................................................... 433.2 Ground Courier Costs ........................................................................................ 44
9

3.3 FedEx Express Costs ......................................................................................... 453.4 Commercial Airline Costs ...................................................................................463.5 Chartered Aircraft Costs .....................................................................................47
4 Base Costs ............................................................................................................... 494.1 Transportation Unit Costs ..................................................................................504.2 Order Data .......................................................................................................... 534.3 Base Costs ......................................................................................................... 544.4 Decay Costs ....................................................................................................... 57
5 Alternative Distribution Scenarios ........................................................................ 615.1 Shipping All Orders by Ground Courier ............................................................. 615.2 Shipping All Commercial Airline Orders by Chartered Aircraft ......................... 645.3 Shipping All Orders by FedEx Express ............................................................. 675.4 Same-Day Service Constraint ........................................................................... 70
6 Discussion ................................................................................................................ 716.1 Products with Short Fulfillment Lead Times .................................................... 726.2 Products with Long Fulfillment Lead Times .................................................... 746.3 Optimal Use of Chartered Aircrafts .................................................................... 756.4 Radiopharmacy Deliveries .................................................................................76
7 Conclusion ............................................................................................................... 797.1 Constraints ......................................................................................................... 797.2 Transportation Costs .......................................................................................... 807.3 Distribution Alternatives ..................................................................................... 807.4 Recommendations ............................................................................................. 81
Bibliography .................................................................................................................... 85
10

List of TablesTable 2.1Table 2.2Table 2.3Table 2.4Table 2.5Table 2.6Table 2.7Table 2.8Table 2.9Table 3.1Table 3.2Table 3.3Table 3.4Table 3.5Table 3.6Table 4.1Table 4.2Table 4.3Table 4.4Table 4.5Table 4.6Table 4.7Table 4.8Table 5.1Table 5.2Table 5.3Table 5.4Table 5.5Table 5.6Table 5.7Table 5.8Table 5.9
Product expiration times ................................................................................... 23Order type statistics .......................................................................................... 24Order deadlines for same day delivery ............................................................ 25Product manufacturing frequency .................................................................... 28Average daily shipments to each state in the continental U.S ........................ 32On-time delivery records .................................................................................. 34Order quantity by ship day and transportation alternative .............................. 35Shipped weight by ship day and transportation alternative ............................. 35Inventory and deliveries at sample radiopharmacy ......................................... 40Dataset field description (Tyco 2006) .............................................................. 44Ground courier costs ........................................................................................ 45Sample FedEx Express costs .......................................................................... 46Commercial airline costs ..................................................................................47Charter route details ......................................................................................... 48Charter unit costs .............................................................................................. 48Transportation unit costs .................................................................................. 50Results of regression analysis for the FedEx Express costs .......................... 51Charter costs per city ........................................................................................ 53Charter unit costs per city ................................................................................. 53Order data ......................................................................................................... 54Base costs ........................................................................................................ 55Decay costs ...................................................................................................... 58W eekly decay costs by product family ............................................................. 59Order data for shipping all orders by ground courier ....................................... 62Costs of shipping all orders by ground courier ................................................ 63Savings compared to the base scenario .......................................................... 64Order data for shipping all commercial airline orders by chartered aircraft .... 65Costs of shipping all commercial airline orders by chartered aircraft ............. 66Savings compared to the base scenario .......................................................... 67Order data for shipping all orders by FedEx Express ..................................... 68Costs of shipping all orders by FedEx Express ............................................... 69Savings compared to the base scenario .......................................................... 70
List of FiguresFigure 1.1 Diagram of transportation alternatives............................................................16Figure 2.1 Radioactive decay of a fictitious 0.5 mCi 1-123 product ................................. 23Figure 2.2 Orders by week (covering portions of 2004 and 2005) .................................. 27Figure 4.1 FedEx Express cost data, actual vs calculated .............................................. 51Figure 6.1 Diagram of the transportation timings for thallium-based products leaving the
MH plant and going to the THC radiopharmacy in North Attleboro ......................... 72
11
Figure 6.2 Coverage areas for various ranges from the St. Louis, MO area .................. 73
12

I Introduction
The selection of a transportation alternative to ship freight involves trade-offs between
interdependent factors including cost, availability, reliability of on-time delivery and speed of
delivery. Speed of delivery usually outweighs any other factor in importance when shipping
highly perishable goods. This study focuses on the distribution operation of Tyco Healthcare's
nuclear medicine group in the continental United States. It studies the system constraints, service
requirements and costs involved in shipping highly perishable nuclear medicine from their point
of manufacture.
1. 1 Motivation
The constraints associated with distributing nuclear medicine (also called radiopharmaceuticals)
include radioactive decay, production capacity, delivery time, transportation restrictions for
hazardous goods, service level (availability and timely delivery) and transportation cost.
Choosing a transportation alternative requires balancing these linked and often conflicting
constraints to achieve the desired goal.
From a broader perspective, the interest of this study lies in the perishability of the products
being distributed and the onus of providing same day delivery. It is hoped the framework used to
determine the costs and the optimal transportation alternative under the different constraints can
be applied to other goods such as food and blood products.
13
This study is sponsored in part by Tyco Healthcare (THC). Its motivation is to reduce operating
costs. THC's division responsible for manufacturing nuclear medicine spends approximately
$21.4 million (or 29%) of its annual transportation budget of $73.5 million to distribute the
radiopharmaceuticals even though they only represent approximately 16% of its sales revenue
(Tyco 2006). Furthermore, if the company can improve the way it serves its customers, it expects
to capture more sales from its competition.
1.2 Nuclear MedicineNuclear medicines are radioactive drugs typically used for the diagnosis (e.g., anatomical
imaging) and therapy of medical segments such as heart, oncology, renal, bone and lung.
All radioactive materials experience an uncontrollable, though predictable, decay (i.e., loss of
radioactivity). Nuclear medicine producers must take this perishability into consideration in their
distribution decisions. The medicine must be shipped with enough radioactivity so that it can
serve its intended purpose. However, shipping radiopharmaceuticals with too much radioactivity
is the equivalent of giving product away. Effectively, a balance must be reached between the cost
of shipping speed and product decay. Because of these characteristics, shipping
radiopharmaceuticals has been likened to shipping ice cubes without the benefit of refrigeration.
Timeliness of purchase or generation of the raw radioactive material is another factor that must
be considered when manufacturing and distributing nuclear medicine. This is because the
material begins decaying as soon as it is produced. Though the examination of the inbound
shipments of raw materials is beyond the scope of this study, some attention is given to the
coordination and planning of the raw materials generation conducted in-house by THC.
14
1.3 Business OverviewThe market for nuclear medicine in the U.S. was estimated to be $2.1 billion in 2005 (Tyco
2006). Tyco Healthcare is one of the three major suppliers in this field; the other two being
Bristol Myers Squibb and GE Healthcare (formerly Amersham Health).
THC's plant responsible for producing nuclear medicine is part of its Mallinckrodt operating
unit. It is located in Maryland Heights, a suburb of St. Louis, MO situated near that city's
international airport. The facilities employ approximately 400 people.
THC's manufactures over 125 different types of nuclear medicine. A product family consists of
different radioactivity levels and doses of a same base radioisotope. For example the gallium 67
isotope is available as gallium citrate injections of 3.3 (1.65 mL), 6.6 (3.3 mL) or 13.2 mCi (6.6
mL) of radioactivity (volume).
In addition to producing nuclear medicine (also referred to as "hot products"), the Maryland
Heights plant is responsible for producing and distributing "cold products". These are non-
radioactive medicines used to direct the hot product towards the target organ. The hot and cold
products are combined at radiopharmacies (pharmacies equipped and staffed to prepare
radiopharmaceuticals) into doses that can be administered to patients.
The hot products manufactured by THC are domestically shipped to radiopharmacies via four
transportation alternatives: ground courier, FedEx Express, commercial airlines and chartered
aircraft. Figure 1.1 shows a diagram of the four alternatives. THC also ships its products
internationally to Latin America and Canada, but those distribution networks are beyond the
scope of this study.
15
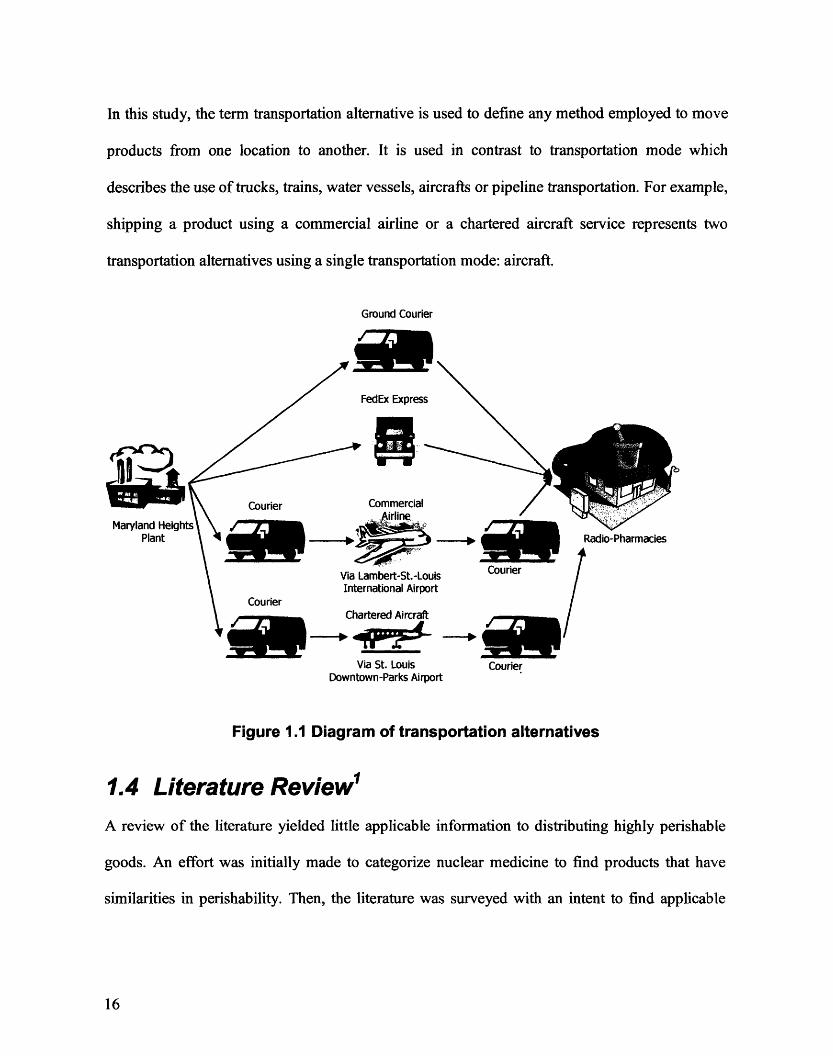
In this study, the term transportation alternative is used to define any method employed to move
products from one location to another. It is used in contrast to transportation mode which
describes the use of trucks, trains, water vessels, aircrafts or pipeline transportation. For example,
shipping a product using a commercial airline or a chartered aircraft service represents two
transportation alternatives using a single transportation mode: aircraft.
Ground Courier
FedEx Express
Commercial /A ;.r.in
Maryland HeightPlant
1 i.4 III i.
Radio-Pharmacies
.ambert-St.-Louis Courier:rnational Airport /Irtered Aircraft
..-.. Ivia st. Louis Courier
Downtown-Parks Airport
Figure 1.1 Diagram of transportation alternatives
1.4 Literature Review
A review of the literature yielded little applicable information to distributing highly perishable
goods. An effort was initially made to categorize nuclear medicine to find products that have
similarities in perishability. Then, the literature was surveyed with an intent to find applicable
16
lo
criteria for selecting transportation alternatives for these types of products. Finally, the available
literature on selecting transportation alternatives was examined. The following section considers
the relevance of the findings.
How are perishable products categorized in the literature? Nahmias (1982) classifies them as
either fixed lifetime or random lifetime. Products that have a fixed lifetime will decay at a fixed
rate. The nuclear medicine under study has a fixed decay rate; therefore, random lifetime product
assumptions are not a concern and are not considered in this study.
Federgruen, Prastacos and Zipkin (1986) present an allocation model for common perishable
products (such as blood, food and drugs) shipped from one distribution center to many locations.
Though this study does not examine inventory allocation, their model is relevant to this analysis
because it considers transportation costs. Federgruen, Prastacos and Zipkin assume that shortages
will be resolved by emergency delivery. In this study, low cost transportation alternatives will be
replaced by high cost alternatives to meet the customer's delivery time constraints. This
substitution achieves the same result as does emergency delivery in their model. It is expected
the substitution will have similar effects on total cost.
Newspapers are another example of perishable goods. Hunter and Van Buer (1996) summarize
the following features of the production and distribution of newspapers: narrow production and
distribution time constraints, no existing inventory and highly connected production/distribution
systems. To solve the newspaper delivery problem, Hunter and Van Buer divide locations into
product zones, use vehicle routing methods to find the routes that satisfy the delivery time and
transportation capacity requirements, and then track back to when the newspaper production run
Yang 2006
17
must be completed. This study includes a consideration for customer distance from the
distribution point, relationships between required delivery time, production capacity and
production scheduling.
Cullinane and Toy (2000) apply content analysis methodology to transportation mode selection.
Content analysis is a set of research tools used to determine key themes of written
communications. Using content analysis methods, the authors conclude that the five factors most
frequently used in mode selection are: freight cost, speed, transit time reliability, characteristics
of the goods and service level. All of these factors are relevant and considered in this study.
Liberatore and Miller (1995) introduce the Analytic Hierarchy Process (AHP) methodology in
carrier and mode selection. The AHP system incorporates quantitative factors and qualitative
factors, both of which will be used in this study. The common quantitative factors are freight cost
and inventory carrying cost. The common qualitative factors are perceived quality of customer
service, cargo capacity limitation and shipment tracking capabilities and shipment tracing
capabilities.
1.5 Approach
To analyze the distribution system and select suitable transportation alternatives, it is important
to understand the context of the supply chain. The first stage of this study was to map the current
radiopharmaceutical supply chain from order taking at the manufacturing plant to distribution of
the prepared doses at the radiopharmacies. This work included documenting the current decision
logic for the transportation alternative selection. Though some in-house literature was available
from THC, most of the information came from interviewing key personnel including production
planners, distribution managers, transportation analysts and a radiopharmacist. The results of this
18
investigation are provided in Chapter 2, Aspects of the Supply Chain. They are an end in
themselves in that documenting the supply chain was an objective of this study.
The second stage of the study consisted of mining the available data to gain additional insight
into THC's operations. Here, the cost data were combined with the shipping data to establish the
unit costs of shipping products to three sample regions (Dallas, Los Angeles and Orlando) via the
four transportation alternatives. An analysis is also made to approximate the cost of an additional
day of decay. The results and a discussion of these analyses are provided in Chapter 4, Base
Costs.
The third and final stage of the study consisted of analyzing alternative distribution scenarios.
This work challenged the restrictions to determine the opportunity cost of distributing the nuclear
medicine under current operating policies. A spreadsheet model was built that calculates the
distribution costs using the base freight data with as limited modification as possible. For
example, if THC provided courier costs on a per-delivery basis, the model computed costs on a
per-delivery basis instead of averaging the costs on a per-order basis. The objective of this
approach was to provide as accurate a total cost as possible. The results and a discussion of this
analysis are provided in Chapter 5, Alternative Distribution Scenarios.
The remainder of this document includes a description of the raw data provided by THC
(Chapter 3), a discussion of ideas and possible avenues to investigate to further reduce THC's
distribution costs (Chapter 6) and, a conclusion that summarizes the findings and
recommendations of the study (Chapter 7).
19

2 Aspects of the Supply Chain
This chapter describes various aspects of THC's radiopharmaceuticals supply chain. The first
section provides details on the products manufactured at the Maryland Heights (MH) plant. The
following sections are arranged to follow the flow of an order from its arrival at the plant to the
distribution of a prepared dose at a client's radiopharmacy. More specifically, an overview is
provided on the types of orders and the order-taking process. Then, the manufacturing planning
approach and production processes are summarized for the various hot products. This is followed
by a description of the four transportation alternatives currently used and the considerations
involved in their selection. Finally a summary of the operations at one of THC's radiopharmacy
is provided.
2.1 Product DescriptionTHC's nuclear medicine can be categorized in nine product families based on the radioisotope
used in their manufacturing. They are chromium (Cr) 51, gallium (Ga) 67, indium (In) 111,
iodine (I) 123 and 131, technetium (Tc) 99, phosphate (P) 32, thallium (T) 201 and xenon (Xe)
133. The product families are comprised of different concentrations and doses of a given isotope.
The different radiopharmaceuticals decay at different rates depending on the isotope they are
based on. For instance, from their original radioactivity, Ga-based products decay at a rate of
0.95% per hour compounded hourly or 20.5% on the first day (1-(1-0.0095)24). Likewise, for
1-123-based products, the decay rate is 5.12% per hour compounded hourly; for Tc-based
21
products it is 1.04% per hour compounded hourly and; for Tl-based products it is 0.88% per hour
compounded hourly. Due to the differences in decay rates, some products start-off with a
proportionally higher level of radioactivity compared to their nominal (or stated) value.
Radioactive decay is exponential in nature; the decay rates, as presented above, are only
representative of the first few days following manufacturing.
The radioactivity of a substance is measured in Curies (Ci) or Becquerels (Bq) with the latter
being the SI standard unit. One Curie is equivalent to 1000 mCi, 3.7 X 10 °10 Bq and the amount
of material that will produce 3.7 X 101° nuclear decays per second.
Table 2.1 lists the calibration and expiration times of all the product families manufactured by
THC. The calibration time is defined as the delay between the time a product has been
manufactured to the time its radioactivity is measured to a meet its specification. At THC, for a
product to meet quality specification, its measured radioactivity must be within 10% of its
nominal value. For example, a 9.1 mCi (nominal value) capsule of sodium Iodide 131 must have
a radioactivity between 8.2 and 10.0 mCi at calibration time.
If a product's radioactivity is below its nominal value, it does not mean it can no longer be used.
The expiration time is defined as the length of time it takes for a product to no longer have the
required effectiveness from the time it has been manufactured. Figure 2.1 shows the decay of a
fictitious 1-123 product with an initial radioactivity of 1.7 mCi, a nominal radioactivity of 0.5
mCi and a decay rate of 5.12% per hour.
22

Table 2.1 Product expiration times
Product Family Calibration Time Expiration Time(days) (days)
Chromium Approximately 14 84
Gallium 3 14
Indium-111, 6 7OctreoScan®Indium-111 5 8ChlorideIodine-123 1 2
lodine-131 12 to 14 17 to 60depending on product depending on product
Phosphate 11 to 18 24 to 60depending on product depending on product
Technetium 0 14
Thallium 5 (Sunday through Wednesday) 97 (Thursday)
Xenon 9 21
0 10 20 30 40 50
Time from Manufacture (hours)
60
Figure 2.1 Radioactive decay of a fictitious 0.5 mCi 1-123 product
Though all products are not manufactured daily (see section 2.3), most of them can be shipped
daily due to the availability of stock. Of course, the caveat is that stocked items lose
radioactivity. Customers know the manufacturing plant's production schedule and will typically
23
1.800
1.600
1.400
- 1.2002G
., 1.000.5
to 0.8000
a: 0.600
0.400
0.200
0.000
-��---
order items when they are freshest, i.e., before their calibration time. This may allow the
radiopharmacy to extract more doses from a given product.
2.2 OrdersOrders are classified as Standing or Demand. Standing orders are based on contracts established
weeks to months in advance with customers. They call for regular shipments of product in
previously agreed upon frequency, quantity and delivery times. For example, customer A has a
Standing order that calls for the delivery of 20 vials of a Tl-based product every Monday.
Adjustments to the quantities are typically allowed up to one day before the manufacturing is
scheduled. It is common to have at least one customer make a change to its standing order on any
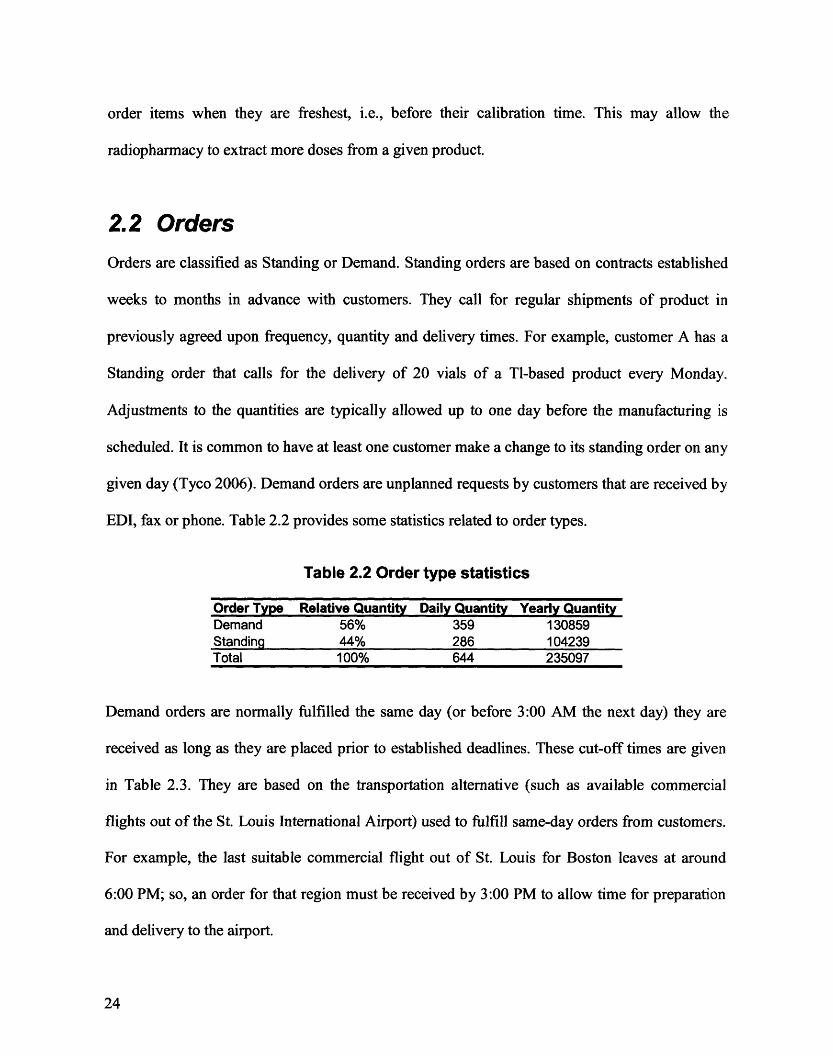
given day (Tyco 2006). Demand orders are unplanned requests by customers that are received by
EDI, fax or phone. Table 2.2 provides some statistics related to order types.
Table 2.2 Order type statistics
Order Type Relative Quantity Daily Quantity Yearly QuantityDemand 56% 359 130859Standing 44% 286 104239Total 100% 644 235097
Demand orders are normally fulfilled the same day (or before 3:00 AM the next day) they are
received as long as they are placed prior to established deadlines. These cut-off times are given
in Table 2.3. They are based on the transportation alternative (such as available commercial
flights out of the St. Louis International Airport) used to fulfill same-day orders from customers.
For example, the last suitable commercial flight out of St. Louis for Boston leaves at around
6:00 PM; so, an order for that region must be received by 3:00 PM to allow time for preparation
and delivery to the airport.
24
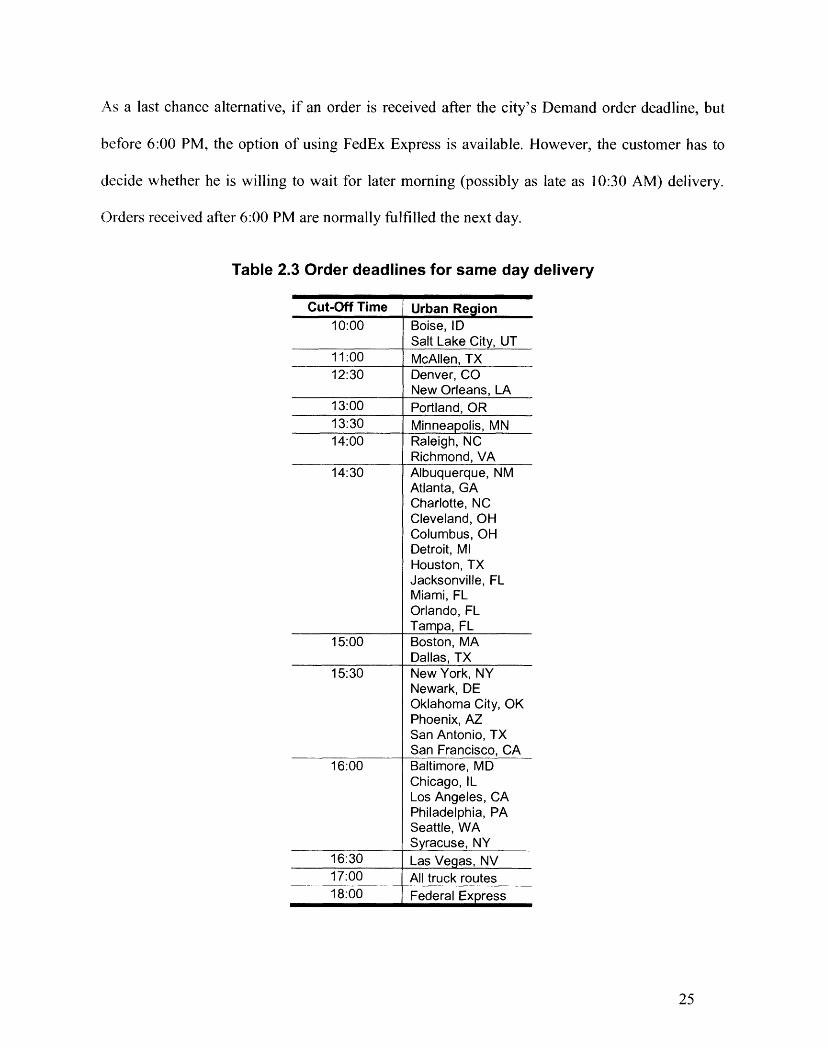
As a last chance alternative, if an order is received after the city's Demand order deadline, but
before 6:00 PM, the option of using FedEx Express is available. However, the customer has to
decide whether he is willing to wait for later morning (possibly as late as 10:30 AM) delivery.
Orders received after 6:00 PM are normally fulfilled the next day.
Table 2.3 Order deadlines for same day delivery
Cut-Off Time Urban Region10:00 Boise, ID
Salt Lake City, UT11:00 McAllen, TX12:30 Denver, CO
New Orleans, LA13:00 Portland, OR
13:30 Minneapolis, MN14:00 Raleigh, NC
Richmond, VA14:30 Albuquerque, NM
Atlanta, GACharlotte, NCCleveland, OHColumbus, OHDetroit, MIHouston, TXJacksonville, FLMiami, FLOrlando, FLTampa, FL
15:00 Boston, MADallas, TX
15:30 New York, NYNewark, DEOklahoma City, OKPhoenix, AZSan Antonio, TXSan Francisco, CA
16:00 Baltimore, MDChicago, ILLos Angeles, CAPhiladelphia, PASeattle, WASyracuse, NY
16:30 Las Vegas, NV
17:00 All truck routes18:00 Federal Express
25

Regardless of the type of order, they are all checked to ensure the customer is licensed to receive
that particular radioactive product. The licenses are issued by regulatory bodies and copies must
be supplied by the customer to THC to obtain service.
2.3 Production Planning and ProductionDemand forecasting is done using an Excel-based system. It was developed in-house and uses
historical data that may be adjusted, by an experienced production planner, for any foreseeable
changes. The manufacturing is scheduled to meet the shipment drop-off times. These are based
on the departure time of the transport used to service a particular region. For example, the
chartered flight to Detroit, MI may leave at 10:30 AM on Sundays, so the orders going to the
Detroit region must leave the MH plant by around 9:30 AM. The ordering deadlines (shown in
Table 2.3) are different from the shipment drop-off times in that a Demand order might require
the use of a transport that was not scheduled.
THC's production planners have characterized the demand for the Ga, Tc (the generators), TI
and Xe-based products to typically be level and straightforward to forecast. They observed the
demand for In-based products is less level and thus harder to forecast. Similarly, they noted the
demand for Cr, -123, 1-131, and P-based products tend to be based on Demand orders and are
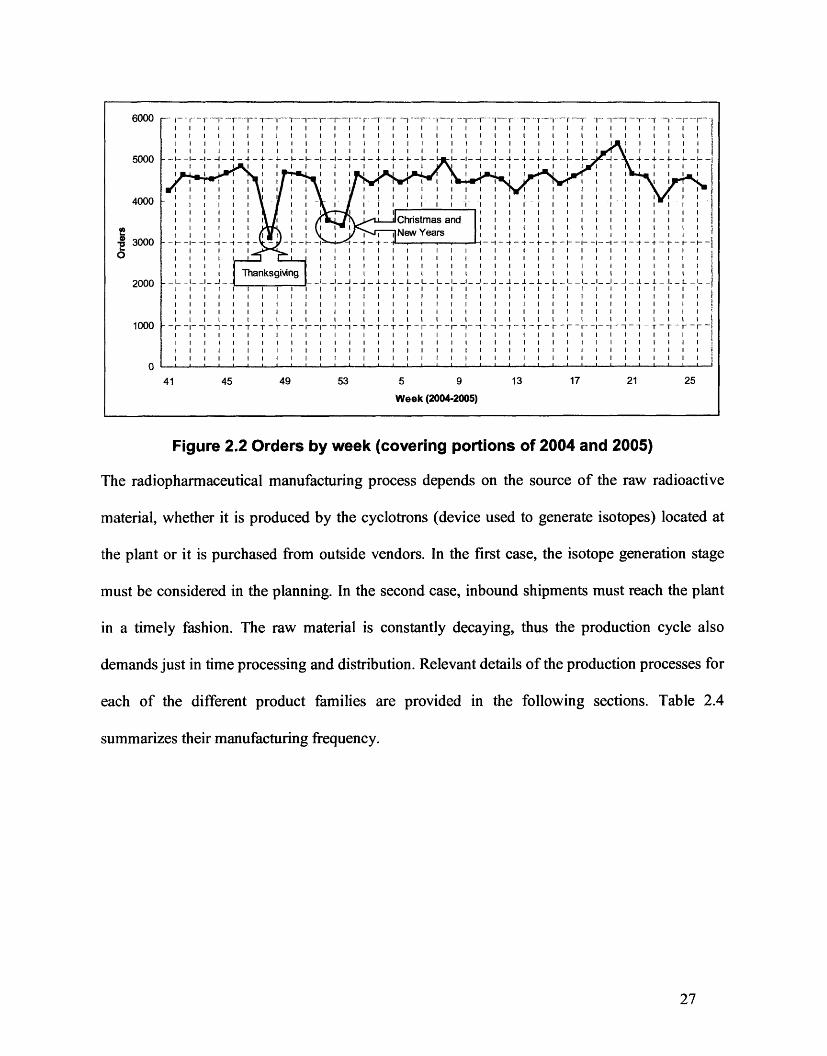
thus, the hardest to forecast. At an aggregate level, total orders by week are relatively constant
over the period shown in Figure 2.2. For the given period, the average is 4501 orders per week
with a standard deviation of 417 to make a coefficient of variation of 9.2%. The maximum
quantity of orders in a week for the period is 5392; the minimum (due to holidays) is 3111.
26
OvUU -- - r-r 'i~T -I~r -- T I'-F- -- I-- I F- f 1 .1. -
5 0 0 0 I- I - I I I I I I I I I I I I I I - I - I - I - I I - I - I -
o I I I I I I I I I jJ I I I I II I I I I I I I I II I I I I I I I I I I I I I I , , ,l I I I ,
2000 L_,- _,1J--... I - , - ,- -L-,-0 ... .----- ]- .,,- [1 - t-- - t-it [- - -- I 1- -41 -1-[. -1 --1 - 1 - 1- 1-T T- .~ .... --0~~~~~~~~~I I I I I I I I I I I ! I I I I I I I I I I I I I I I I II ~~~~~ ~ ~~~ ~ ~ ~ ~~~~~~~~~I I I L I I I rI~ I I, , I ., , , I I , .I_ r.' I I ,
I I I I I I I I I I I I I I I I I I I I I I ' I I I I I I I I I I I
41 45 49 53 5 9 13 17 21 25
Week (2004-2005)
Figure 2.2 Orders by week (covering portions of 2004 and 2005)
The radiopharmaceutical manufacturing process depends on the source of the raw radioactive
material, whether it is produced by the cyclotrons (device used to generate isotopes) located at
the plant or it is purchased from outside vendors. In the first case, the isotope generation stage
must be considered in the planning. In the second case, inbound shipments must reach the plant
in a timely fashion. The raw material is constantly decaying, thus the production cycle also
demands just in time processing and distribution. Relevant details of the production processes for
each of the different product families are provided in the following sections. Table 2.4
summarizes their manufacturing frequency.
27

Table 2.4 Product manufacturing frequency
Product Family Manufacturing Frequency
Chromium 6/ year
Gallium 2/ week
Indium-111, 2/ weekOctreoScan®Indium-111 2/ weekChlorideIodine-123 4 / week
Iodine-131 3 / week
Technetium 4 / week
Phosphate 26 / year
Thallium 6/ week
Xenon 1 / week
2.3.1 Chromium
Chromium-based products are manufactured every other month. The raw material arrives on the
second weekend of the month. The production process takes approximately 2 days. The finished
product is normally available for shipment by the third week of the production month. Inventory
is kept in-house to respond to Demand orders; stock-outs are rare.
2.3.2 Gallium
Gallium-based products are manufactured on Tuesdays and Fridays. Production will either
precede or follow the production of the Tl-based products depending on how it best fits the
schedule. The generation of radioactive Ga also shares cyclotron capacity with the TI production.
2.3.3 Indium
Indium chloride solutions are manufactured for shipping by Tuesdays and Fridays; OctreoScan®
(based on In-111) is manufactured for shipping by Tuesdays and Sundays. Both their production
28

processes follow an analogous path, with similar timings, to that of Tl-based products. The
generation of radioactive In shares cyclotron capacity with the TI production.
2.3.4 Iodine
Products based on the 1-123 isotope are manufactured for shipment on Sundays, Mondays,
Tuesdays and Wednesdays. Products based on the 1-131 isotope are manufactured three days a
week: Monday, Wednesday and Thursday; raw material is also delivery three days a week.
Inventory of I-131 products are kept in-house to respond to Demand orders.
2.3.5 Phosphate
Phosphate-based products are manufactured every other week. The raw material arrives the
Saturday before the week of production. Two types of products are made. Both take a day to
manufacture. One type becomes available for shipping on Tuesday, the other on Wednesday.
Inventory is kept in-house to respond to Demand orders.
2.3.6 Technetium (Generators)
The radioactive molybdenum (Mo) used to manufacture the technetium generators arrives from
Petten, Netherlands, at 8:00 PM on Saturdays, Sundays, Tuesdays and Thursdays. It is diluted to
required concentrations all night. The first shipments start leaving the plant at 6:00 AM.
Some limited inventory of radioactive Mo is kept in-house to respond to Demand orders. It
becomes useless within a couple of days.
29

2.3.7 Thallium
Thallium-based medicines are manufactured six days a week, Saturday through Thursday. On a
production day, the high radioactivity TI generated in the cyclotrons is typically available by
11:00 AM. The next stage of the process, after the generation, is to measure the intermediate
product radioactivity to determine the amount available for further processing. Dilution and
dispensing to order begins at 1:00 PM. After the individual solutions are sterilized by autoclave
and packaged, they are sent to the Distribution department for final packaging and labeling. All
orders must arrive there by midnight. They start leaving the plant at around 1:30 AM.
2.3.8 Xenon
The raw material for Xenon-based products arrives weekly on Tuesday morning. Manufacturing
takes approximately a day. The finished product becomes available for shipping by 6:00 AM the
following day on Wednesday. Inventory of this product is kept to satisfy demand when not in
production.
2.4 Transportation Considerations
2.4.1 Planning
THC's transportation planning only depends on the required delivery times and the
transportation alternative used to ship an order. It does not depend on the production schedule
(recall that production is planned to meet the transportation drop-off times). Customers typically
require their orders by 3:00 AM, sometimes earlier, for preparation and delivery to their
customers by 8:00 AM the same day.
30

Order preparations are prioritized by drop-off times, not by customer volume, i.e., purchase
volume. Due to Demand orders or other limitations (such as TI limits) some customers receive
more than one delivery per day. The transportation planning must also consider such situations.
When using the ground courier alternative, planning involves providing enough time for the
orders to get to their destination. The FedEx Express alternative requires that the packages be
ready at the set pick-up time. The commercial airline alternative requires coordinating the
delivery to the originating airport with the specific flights, and the pick-up from the gateway
airports to the radiopharmacies. Finally, the chartered aircraft alternative requires the same
coordination as the commercial airline, but the itinerary of the flights can also be customized to
the specific needs of THC. For the commercial airline and chartered aircraft alternatives, the
need for three service providers results in an increased potential for late delivery or other
mishaps in addition to higher costs since three organizations must be paid.
Table 2.5 provides the average number of orders shipped per day (not including Saturday) during
the period covering Octoberl, 2004 to June 30, 2005. It gives an approximation of the breadth of
the U.S. distribution network.
31

Table 2.5 Average daily shipments to each state in the continental U.S.
State Daily Orders State Daily Orders State Daily OrdersFL 61.4 SC 14.6 NV 5.9PA 60.0 MN 14.1 WI 5.7CA 47.2 MA 13.6 AZ 5.0TX 43.1 OR 12.2 ND 4.9OH 37.0 WA 12.2 WY 3.7NY 35.8 WV 11.9 NM 3.3MO 33.7 IN 11.8 ID 3.1TN 25.8 CO 11.8 NE 3.0IL 24.8 KS 11.6 ME 2.8MI 24.5 KY 11.1 UT 2.5GA 22.1 OK 10.7 VT 1.3NC 21.7 CT 10.7 DC 1.1VA 19.3 IA 7.3 DE 0.9MD 19.0 MT 7.1 RI 0.3NJ 18.1 MS 6.7 NH 0.2AL 18.0 AR 6.5LA 17.8 SD 6.4
Grand Total 753.3
2.4.2 Transportation Index
Nuclear medicine has an additional limiting characteristic in addition to the usual volume and
weight capacities of a given transport. Transportation restrictions apply based on the
radioactivity of a shipment. The Transportation Index (or TI) is used to categorize this attribute.
The TI level represents the maximum radiation emission at 1 meter from the external surfaces of
a given package and is equivalent to one tenth of a measurement in microsieverts. Regulations
require that the measures must be taken on each face of each parcel shipped and must be listed
on the parcel labeling. Different transportation rules apply depending on the TI level of a given
shipment.
When selecting a transportation alternative, TI levels are a significant issue only for commercial
airlines. Of the two companies used by THC, one has imposed a TI limit of 5 per plane (this was
32

increased from a limit of 4 from less than two years ago) and the other has a limit of 3 per plane.
As an indicator of the limit this represents, the lowest TI level for a Tc generator is 0.8, the
highest is 5.2.
Though the other transportation alternatives must take extensive safety precautions when moving
radioactive goods, the service providers have received exemptions from the U.S. Department of
Transportation allowing unlimited TI levels.
2.4.3 Product Decay
As described in the introductory chapter, product decay is a major concern when shipping
nuclear medicine and plays a key role when deciding on a transportation alternative. Most
products decay by approximately 20% to 30% within a day of manufacturing and some even up
to 72% (see section 2.1). Because of the added cost of this decay, the use of ground couriers has
been limited to radiopharmacies reachable within a few hours of road travel (approximately
within 500 miles of the Maryland Heights plant). The three other transportation alternatives used
by THC include an airlift portion to minimize delivery delays.
2.4.4 Cost
Of course, as in any competitive environment, costs play an important role. The main objective
of this study is to look at ways to reduce the transportation costs of the nuclear medicine. THC
has ranked the cost of the four different transportation alternatives as follows (from least to most
expensive): ground courier, FedEx Express, commercial airline and chartered aircraft. This order
and other costs considerations are studied in greater details in the chapters that follow.
33
2.4.5 Customer Service Level
THC considers customer service level to be a key differentiator from its competitors and, as
such, of up most importance. Given the choice, a customer would rather receive a fresher
product. Therefore, the distribution network is arranged such that the customers receive product
typically within 26 hours of manufacturing for their high volume radiopharmaceuticals (the Tl-
based products and the Tc generators). Moreover, the company's policy is to provide same-day
service for Demand orders whenever possible.
On-time delivery (when an order arrives at its destination before the agreed upon delivery time)
is also an important consideration. Each of the transportation alternatives has a good record;
results for October 2004 to October 2005 are shown in Table 2.6.
Table 2.6 On-time delivery records
MH plant to distribution 99.7%
Chartered aircraft 95.9%
Commercial airline 1 98.0%
Ground Courier 1 99.9%
Ground Courier 2 99.8%
Ground Courier 3 99.8%
FedEx Express 97.0%
Average (by provider, not shipment) 98.6%Results are self-reported by the ground couriers.
They should be used for qualitative purposes only.
2.5 Transportation AlternativesThis section describes the usage, advantages, disadvantages and peculiarities of the four
transportation alternatives. Table 2.7 shows the number of orders shipped tabulated by day and
alternative. Table 2.8 shows the sum of the order weights tabulated by day and alternative. The
data is reviewed in the following sub-sections.
34
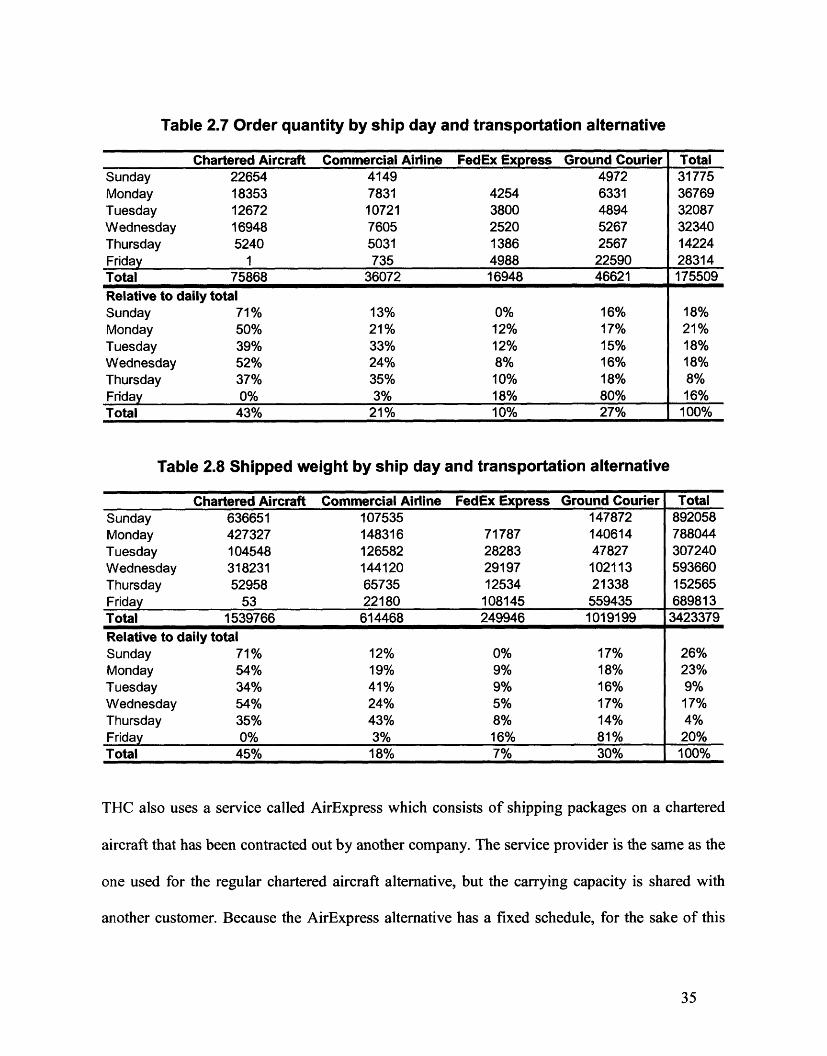
Table 2.7 Order quantity by ship day and transportation alternative
Chartered Aircraft Commercial Airline FedEx Express Ground Courier TotalSunday 22654 4149 4972 31775Monday 18353 7831 4254 6331 36769Tuesday 12672 10721 3800 4894 32087Wednesday 16948 7605 2520 5267 32340Thursday 5240 5031 1386 2567 14224Friday 1 735 4988 22590 28314Total 75868 36072 16948 46621 175509
Relative to daily totalSunday 71% 13% 0% 16% 18%Monday 50% 21% 12% 17% 21%Tuesday 39% 33% 12% 15% 18%Wednesday 52% 24% 8% 16% 18%Thursday 37% 35% 10% 18% 8%Friday 0% 3% 18% 80% 16%Total 43% 21% 10% 27% 100%
Table 2.8 Shipped weight by ship day and transportation alternative
Chartered Aircraft Commercial Airline FedEx Express Ground Courier TotalSunday 636651 107535 147872 892058Monday 427327 148316 71787 140614 788044Tuesday 104548 126582 28283 47827 307240Wednesday 318231 144120 29197 102113 593660Thursday 52958 65735 12534 21338 152565Friday 53 22180 108145 559435 689813Total 1539766 614468 249946 1019199 3423379Relative to daily totalSunday 71% 12% 0% 17% 26%Monday 54% 19% 9% 18% 23%Tuesday 34% 41% 9% 16% 9%Wednesday 54% 24% 5% 17% 17%Thursday 35% 43% 8% 14% 4%Friday 0% 3% 16% 81% 20%Total 45% 18% 7% 30% 100%
THC also uses a service called AirExpress which consists of shipping packages on a chartered
aircraft that has been contracted out by another company. The service provider is the same as the
one used for the regular chartered aircraft alternative, but the carrying capacity is shared with
another customer. Because the AirExpress alternative has a fixed schedule, for the sake of this
35
study, it has been grouped with the commercial airline alternative that shares this characteristic.
This simplification was deemed acceptable considering that over the October 2004 to June 2005
period, less than 1% of orders and weight were shipped by the AirExpress service.
2.5.1 Ground Courier
By order quantity (27% of orders) and weight (30% of total weight), ground courier is the second
most frequently used transportation alternative. Of the four, THC perceives it as being the least
expensive given a fixed transportation lead time. However, over long distances, ground-based
transportation alternatives are slower than air ones. This can result in situations where product
decay costs are more important than the savings achieved by using a ground courier.
Considering its low cost, that TI issues are not a significant concern and that it is relatively
simple to coordinate logistically, ground courier is used for all radiopharmacies within 500 miles
of the Maryland Heights plant.
Ground courier is also used for shipping to most radiopharmacies on Fridays (see Table 2.7).
Due to limited Saturday delivery requirements, two days of transport are available for the orders
to reach the customers. Arguably two or more days of transportation lead time could be used
every day. The reasons why this is not currently done are discussed in Chapter 5.
2.5.2 FedEx Express
Due to its perceived relative low cost compared to the other air mode alternatives, rapid service,
convenience and capability of handling radioactive goods, FedEx Express could be considered
an attractive transportation alternative. However, because it cannot promise deliveries before
10:30 AM, use of this alternative is constrained to shipments to more remote, sparsely populated
36
regions where volume is low and customers are more willing to accept later deliveries. This
limitation is reflected in its usage data: only 10% of orders (7% of weight) are shipped via FedEx
Express. Again, Friday usage is pronounced due to the acceptability of two-day delivery.
2.5.3 Commercial Airline
Commercial airlines offer quick service and, as a general rule for THC, are used whenever
possible to limit the quantity of chartered flights. The most restrictive factors of this alternative
are the availability of timely flights out of the serving airport and the aforementioned airline-
imposed Tl limit of 5 or 3 per plane depending on the service provider. On average, only 6
orders (with a coefficient of variance of 0.9) are placed on any given flight.
Flight availability is further limited by the constraint of having to use wide body aircrafts where
a significant physical separation can be established between the passengers and the radioactive
goods. Other concerns include the occasional flight cancellations, delays, missed connections
and the limited operating hours of the cargo facilities.
Usage of this alternative falls between that of the chartered aircraft and ground courier. The
exceptions being Fridays, where most orders are shipped via ground courier, and Sundays, due to
the limited amount of flights out of St. Louis.
When using this alternative, additional coordination is required. A ground courier must transport
the packages from the manufacturing plant to the Lambert-St.-Louis International Airport and
then from the destination airport to the radiopharmacies. A single service provider is used for the
origin airport delivery, but various local couriers are used for the last leg of the itinerary. Only
one company is contracted per region. In addition to complicating coordination, using three
37
service providers to ship an order results in higher costs (three organizations to pay) and
increased potential for late delivery or other mishaps.
The base rate for the commercial airline service is on a per-pound basis with a minimum charge
threshold equivalent to a 100-pound package for the airports of interest in this study. Since THC
rarely (if ever) ships radiopharmaceutical packages weighing more than 100 lbs by commercial
airline, the base rate can be simplified to a per-package basis. Therefore, to reduce costs when
using this alternative, it becomes advantageous to consolidate individual orders into a larger
package, i.e., smaller boxes are placed in a bigger box to minimize costs. The larger packages are
subsequently broken down into their smaller components by the ground couriers that are
responsible for making the deliveries from the gateway airports to the individual
radiopharmacies.
The technetium generators are never consolidated due their specialized packaging and weight, in
addition to the U.S. Department of Transportation's restriction that only like products can be
consolidated. Theoretically, consolidating two generators is allowable, but would result in an
excessive package weight (above 100 lbs) and potentially excess TI. Consolidation is also used
with the chartered aircraft service for the purpose of easing manipulation.
2.5.4 Chartered Aircraft
Perceived by THC as a high cost solution, the use of chartered aircraft service is limited to high
volume regions. Tyco employs a single service provider. It is the only one currently qualified for
TI exemption from the U.S. Department of Transportation thus allowing it to carry high volumes
of radioactive goods. The main advantages to using this alternative are the absence of TI
limitations, the flexible operating hours for early or late deliveries, the speed of service, and the
38
ability for one charter to serve many gateway cities. Usage reflects these benefits: 43% of orders
(or 45% by weight) are shipped by chartered aircraft.
One of the disadvantages of this alternative is that the relatively small planes occasionally max-
out on volume (this occurs approximately twice per year - Tyco 2006). Furthermore, similarly to
commercial airlines, a ground courier must be used to transport the packages from the
manufacturing plant to the St. Louis Downtown Parks Airport and then another from the
destination airport to the radiopharmacies. Again, this results in more involved coordination,
higher costs since three organizations must be paid and an increased potential for late delivery or
other mishaps.
Currently, chartered aircraft service is used five days a week: Sunday through Thursday. In all
there are 9 routes serving 12 different cities located East and South of St. Louis: Atlanta,
Baltimore, Cleveland, Charlotte, Detroit, Fort Lauderdale, Columbus, Memphis, Orlando,
Raleigh/Durham, Richmond and New York. The other regions are served by a mix of the
remaining transportation alternatives.
The chartered airline currently uses two types of airplanes to service THC: Caravan and Lear.
The first has more capacity (up to 51 generator, for example), but a slower rated speed of 200
mph. The second has a lower capacity (up to 39 generators, for example), but is much faster with
a rated speed of 500 mph. Expectedly, the Lear jet is favored for longer routes.
2.6 Customer UseWhen studying the production planning and distribution of the nuclear medicine, it is important
to not only consider the manufacturing side of the supply chain, but also the customer side. This
39
section provides an overview of relevant supply chain information at THC's radiopharmacy in
North Attleboro, MA. For the sake of this study, the data is considered representative of all
THC's customers.
Table 2.9 provides details of the inventory and delivery schedule of hot products at the facility.
Any product not requiring "As needed" delivery is under a Standing order supply agreement.
Table 2.9 Inventory and deliveries at sample radiopharmacy
Product Family Inventory on Hand DeliveriesChromium None As needed (very limited volume)
Gallium Yes Twice a week
Indium-111, OctreoScan® None As needed, but next day service required
Indium-111, Chloride None As needed
Iodine-123 None Monday through Thursday
Iodine-131 None As needed
Phosphate None As needed (very limited volume)
Technetium Yes 3 to 4 per week
Thallium Yes Every day (except Saturday)Sometimes twice a day
Xenon Yes Once a week
Typically, radiopharmacies receive orders every day and sometimes even several times a day.
Deliveries must be received before approximately 3:00 AM the following day to allow
processing and distribution to the end clients. In the case of the sample radiopharmacy discussed
above, it normally receives its orders by 12:30 AM (sometimes a second shipment may arrive
between 2:00 AM to 3:00 AM). The prepared medicine leaves the radiopharmacy on one of three
delivery runs to the end client:
1. Orders received the day before (those that were not fulfilled the day before) are delivered
by 8:00 AM.
40
2. Orders in by 9:00 AM are delivered by noon the same day.
3. Orders in by 11:00 AM are delivered by 2:00 PM the same day. This run is not regularly
scheduled.
41


3 Order and Cost Data
The analyses presented in this study are based on the order and cost data provided in this chapter.
The data was made available by THC; some of it is masked due to its competitive sensitivity.
3.1 Order Dataset
Order information came in the form of a Microsoft Access database consisting of selected data
for all orders shipped from October 1, 2004 to June 30, 2005. It originated from the order
processing and distribution modules of THC's Oasis system (their own manufacturing resource
planning software). The dataset contained 182,771 records with the information described in
Table 3.1.
43
Table 3.1 Dataset field description (Tyco 2006)
Field Description
Order Unique internal code assigned by THC'S Customer Service. Used to differentiate orders.
Order type Standing or Demand (described in section 2.2)
Weight Order weight including its packaging
Shipment date Date the order was shipped.
Shipment time Time the order left the Maryland Heights plant.
Mode Transportation alternative (with flight number if applicable)
FGCNID Internal codes assigned on a day-by-day basis identifying gateway locations, and alsotaking into account product and time restrictions for certain deliveries (not used inanalysis)
Gateway Port of entry where a ground courier will pick-up a package to deliver it to a customer,i.e., a radiopharmacy.
Ground courier Service provider that will deliver an order from a gateway to a customer.
Ship to name Company name of the owner of the radiopharmacy delivered to.
Ship to city City where the customer is located.Ship to state State where the customer is located.MHMAN Maryland Heights manifest number, assigned to each order as it is closed.FGNMPK Consolidation code and box number. Both these fields are used to determine when aFGBXNO shipment was consolidated with other shipments.
After removing the orders that were not shipped to continental U.S. locations and those that were
listed as "HOLD" in the transportation alternative field, the dataset shrunk to 175,840 records.
This subset was used to generate all the order data presented in this document.
3.2 Ground Courier CostsThe costs for the ground courier services are provided in Table 3.2. They are split into three
categories. The first is for the delivery of packages from the Maryland Heights plant to the origin
airports when using the commercial airline or chartered aircraft alternatives. The service provider
has a team of drivers solely dedicated to the Maryland Heights plant. They shuttle back and forth
to the airports to meet the flight departure times. The company chargers $50 per hour for this
service and it has been estimated (Tyco 2006) that a trip to the St. Louis Downtown Airport
44
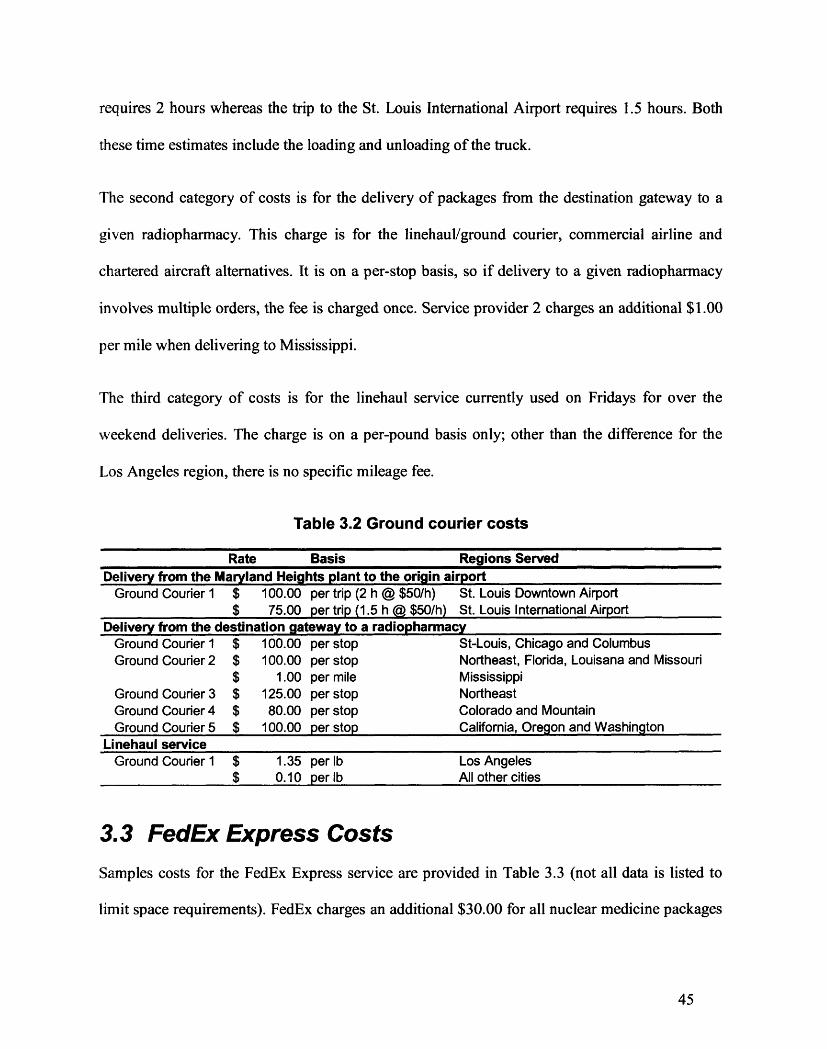
requires 2 hours whereas the trip to the St. Louis International Airport requires 1.5 hours. Both
these time estimates include the loading and unloading of the truck.
The second category of costs is for the delivery of packages from the destination gateway to a
given radiopharmacy. This charge is for the linehaul/ground courier, commercial airline and
chartered aircraft alternatives. It is on a per-stop basis, so if delivery to a given radiopharmacy
involves multiple orders, the fee is charged once. Service provider 2 charges an additional $1.00
per mile when delivering to Mississippi.
The third category of costs is for the linehaul service currently used on Fridays for over the
weekend deliveries. The charge is on a per-pound basis only; other than the difference for the
Los Angeles region, there is no specific mileage fee.
Table 3.2 Ground courier costs
Rate Basis Regions ServedDelivery from the Maryland Heights plant to the origin airport
Ground Courier 1 $ 100.00 per trip (2 h @ $50/h) St. Louis Downtown Airport$ 75.00 per trip (1.5 h @ $50/h) St. Louis International Airport
Delivery from the destination gateway to a radiopharmacyGround Courier 1 $ 100.00 per stop St-Louis, Chicago and ColumbusGround Courier 2 $ 100.00 per stop Northeast, Florida, Louisana and Missouri
$ 1.00 per mile MississippiGround Courier 3 $ 125.00 per stop NortheastGround Courier 4 $ 80.00 per stop Colorado and MountainGround Courier 5 $ 100.00 per stop California, Oregon and Washington
Linehaul serviceGround Courier 1 $ 1.35 per lb Los Angeles
$ 0.10 per lb All other cities
3.3 FedEx Express Costs
Samples costs for the FedEx Express service are provided in Table 3.3 (not all data is listed to
limit space requirements). FedEx charges an additional $30.00 for all nuclear medicine packages
45

due to the hazardous nature of the goods. Zones represent range buckets from a given origin. For
example, shipping from St. Louis, MO to New York, NY represents a zone 5 range.
Table 3.3 Sample FedEx Express costs
Zone > 2 3 4 5 6 7 8
0.34 lbs $ 5.00 $ 5.69 $ 5.98 $ 6.28 $ 6.53 $ 6.86 $ 7.061 lb $ 5.50 $ 6.63 $ 7.94 $ 8.65 $ 9.35 $ 9.87 $ 10.05
2 lbs $ 5.85 $ 7.15 $ 8.91 $ 9.69 $ 10.48 $ 10.82 $ 11.183lbs $ 6.47 $ 7.51 $ 9.87 $ 10.58 $ 11.61 $ 11.97 $ 12.224lbs $ 6.82 $ 7.94 $ 10.82 $ 11.79 $ 12.67 $ 13.11 $ 13.375 lIbs $ 7.26 $ 8.29 $ 11.71 $ 12.67 $ 13.71 $ 14.24 $ 14.68
6lbs $ 7.51 $ 8.72 $ 12.48 $ 13.54 $ 14.85 $ 15.38 $ 15.817 lbs $ 7.78 $ 9.35 $ 13.37 $ 14.76 $ 16.07 $ 16.50 $ 16.778lbs $ 8.04 $ 9.87 $ 14.15 $ 15.54 $ 17.12 $ 17.47 $ 17.649lbs $ 8.29 $ 10.31 $ 15.20 $ 16.68 $ 18.34 $ 18.70 $ 18.96
... ... ... ... ... ... .....
3.4 Commercial Airline CostsTHC uses two commercial airlines to ship its packages. One of these companies transports
89.5% of all orders sent by this alternative. Its rates were considered to be representative of both
service providers; they are listed in Table 3.4. Essentially, to ship a package to any city other
than those listed in the table, it costs $154.60 if the package weights less than 5 bs; $153.60 per
package + $0.20 per lb if the package weights between 5 lbs and 67 lbs, inclusively; $149.60 per
package + $0.26 per lb if the package weights between 68 lbs and 99 lbs, inclusively and; $91.25
per package + $0.79 per lb if the package weights more than 100 lbs.
46
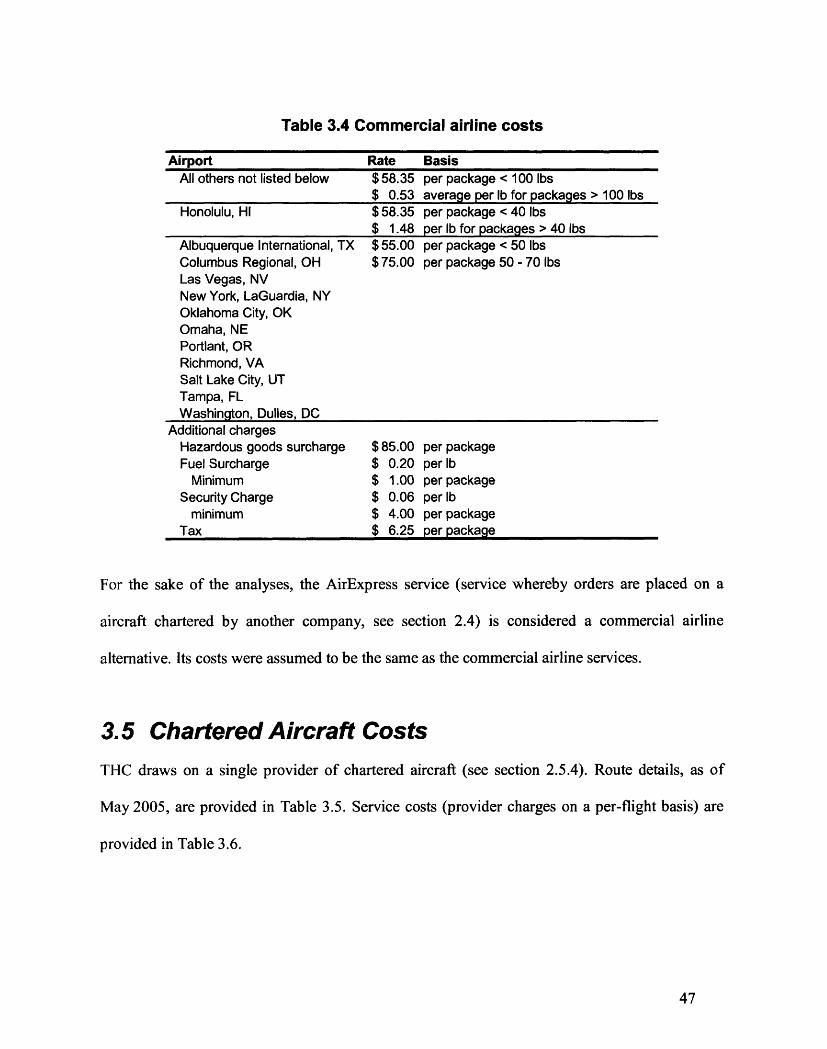
Table 3.4 Commercial airline costs
Airport Rate BasisAll others not listed below $58.35 per package < 100 lbs
$ 0.53 average per lb for packages > 100 lbs
Honolulu, HI $ 58.35 per package < 40 lbs$ 1.48 per lb for packages > 40 lbs
Albuquerque International, TX $ 55.00 per package < 50 lbsColumbus Regional, OH $ 75.00 per package 50 - 70 lbsLas Vegas, NVNew York, LaGuardia, NYOklahoma City, OKOmaha, NEPortlant, ORRichmond, VASalt Lake City, UTTampa, FLWashington, Dulles, DC
Additional chargesHazardous goods surcharge $85.00 per packageFuel Surcharge $ 0.20 per lb
Minimum $ 1.00 per packageSecurity Charge $ 0.06 per lb
minimum $ 4.00 per packageTax $ 6.25 per package
For the sake of the analyses, the AirExpress service (service whereby orders are placed on a
aircraft chartered by another company, see section 2.4) is considered a commercial airline
alternative. Its costs were assumed to be the same as the commercial airline services.
3.5 CharteredAircraft Costs
THC draws on a single provider of chartered aircraft (see section 2.5.4). Route details, as of
May 2005, are provided in Table 3.5. Service costs (provider charges on a per-flight basis) are
provided in Table 3.6.
47
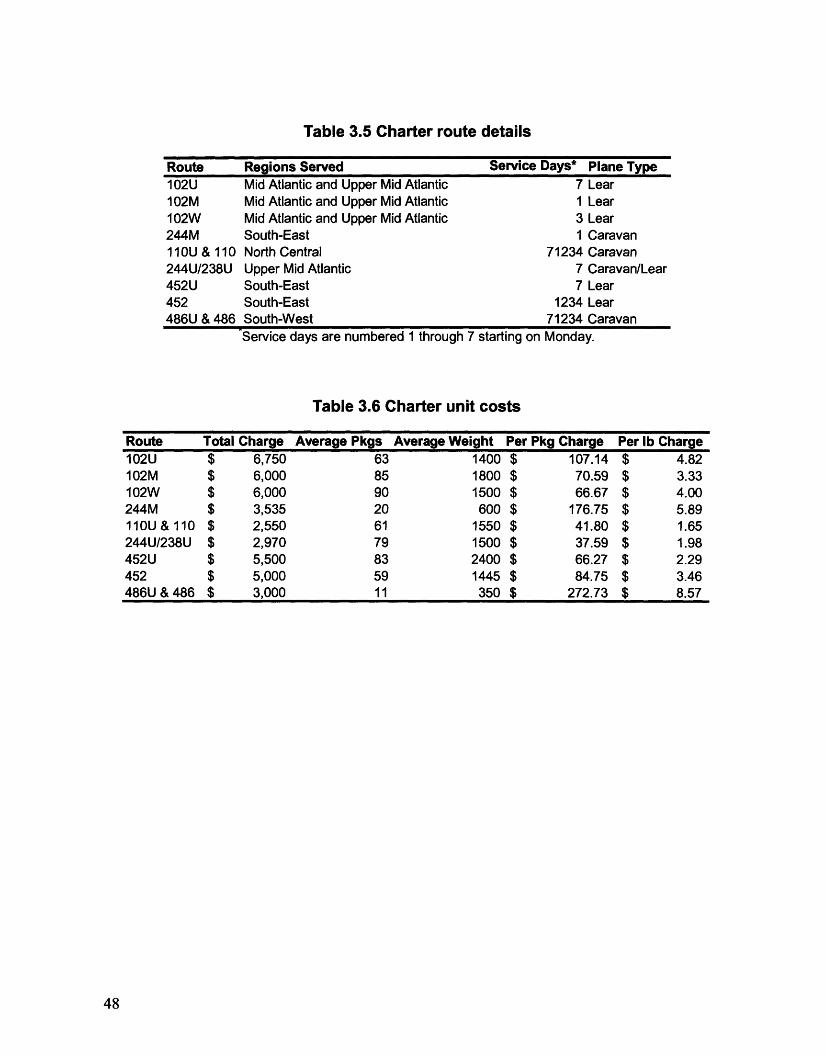
Table 3.5 Charter route details
Route Regions Served Service Days* Plane Type102U Mid Atlantic and Upper Mid Atlantic 7 Lear102M Mid Atlantic and Upper Mid Atlantic 1 Lear102W Mid Atlantic and Upper Mid Atlantic 3 Lear244M South-East 1 Caravan110U & 110 North Central 71234 Caravan244U/238U Upper Mid Atlantic 7 Caravan/Lear452U South-East 7 Lear452 South-East 1234 Lear486U & 486 South-West 71234 Caravan
Service days are numbered 1 through 7 starting on Monday.
Table 3.6 Charter unit costs
Route Total Charge Average Pkgs Average Weight Per Pkg Charge Per lb Charge102U $ 6,750 63 1400 $ 107.14 $ 4.82102M $ 6,000 85 1800 $ 70.59 $ 3.33102W $ 6,000 90 1500 $ 66.67 $ 4.00244M $ 3,535 20 600 $ 176.75 $ 5.89110U & 110 $ 2,550 61 1550 $ 41.80 $ 1.65244U/238U $ 2,970 79 1500 $ 37.59 $ 1.98452U $ 5,500 83 2400 $ 66.27 $ 2.29452 $ 5,000 59 1445 $ 84.75 $ 3.46486U & 486 $ 3,000 11 350 $ 272.73 $ 8.57
48
4 Base Costs
The cost of shipping all orders from October 1, 2004 to June 30, 2005 was calculated for three
different regions: Dallas, Los Angeles and Orlando. The mix of transportation alternatives in the
analysis represents the actual distribution operation employed by THC over the 39-week period
(the date range of the provided dataset). The results of this analysis represent the base costs from
which the costs of alternative distribution scenarios can be compared.
For the sake of the analysis, the Dallas region consists of the all the customers in the following
cities: Abilene, Dallas, Fort Worth, Galveston, Houston, Lubbock, Lufkin, Nacogdoches,
Sherman, Sugar Land, Tyler, Waco and Wichita Falls.
The Los Angeles region consists of the all the customers in the following cities: Anaheim,
Bakersfield, Camp Pendleton, Colton, Commerce, Fullerton, La Jolla, Loma Linda, Lompoc,
Long Beach, Los Angeles, Mission Hills, Oceanside, Palm Springs, Placenta, Ridgecrest, San
Diego, San Luis Obispo, Santa Barbara, Torrance, Van Nuys and West Hills. This represents
California customers located approximately south of Bakersfield.
The Orlando region consists of the all the customers in the following cities: Bay Pines, Daytona
Beach, Fort Myers, Gainesville, Jacksonville, Jacksonville beach, Leesburg, Ocala, Orlando,
Ormond Beach, Saint-Petersburg, Sanford, Sarasota, Tallahassee, Tampa, West Melbourne,
Winter Park and Winter Haven. This region is essentially a quadrilateral with Tallahassee at the
49
NW corner, Jacksonville at the NE corner, Melbourne at the SE corner and Fort Myers at the SW
corner.
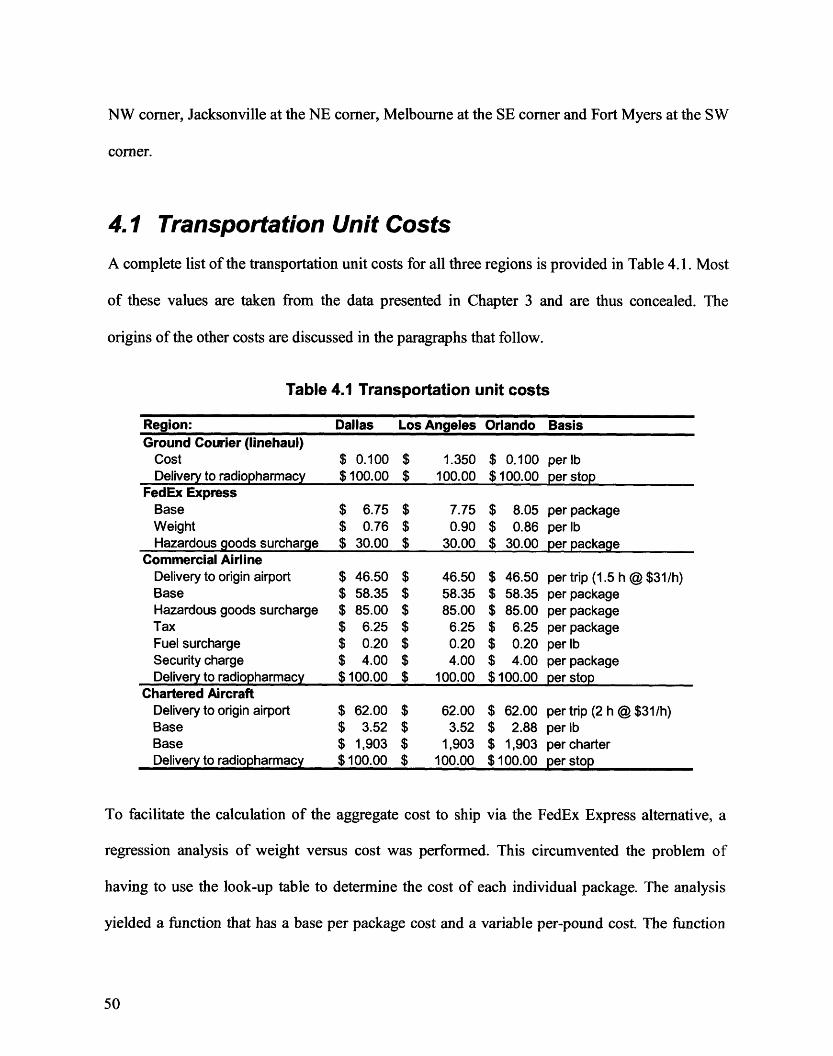
4. 1 Transportation Unit CostsA complete list of the transportation unit costs for all three regions is provided in Table 4.1. Most
of these values are taken from the data presented in Chapter 3 and are thus concealed. The
origins of the other costs are discussed in the paragraphs that follow.
Table 4.1 Transportation unit costs
Region:Ground Courier (linehaul)
CostDelivery to radiopharmacy
FedEx ExpressBaseWeightHazardous goods surcharge
Commercial AirlineDelivery to origin airportBaseHazardous goods surchargeTaxFuel surchargeSecurity chargeDelivery to radiopharmacy
Chartered AircraftDelivery to origin airportBaseBaseDelivery to radiopharmacy
Dallas Los
$ 0.100$100.00
$ 6.75$ 0.76$ 30.00
$ 46.50$ 58.35$ 85.00$ 6.25$ 0.20$ 4.00$100.00
$ 62.00$ 3.52$ 1,903$100.00
Angeles
1.350100.00
7.750.90
30.00
46.5058.3585.006.250.204.00
100.00
62.003.52
1,903100.00
Orlando
$ 0.100$ 100.00
$ 8.05$ 0.86$ 30.00
$ 46.50$ 58.35$ 85.00$ 6.25$ 0.20$ 4.00$100.00
$ 62.00$ 2.88$ 1,903$100.00
Basis
per lbper stop
per packageper lbper package
per trip (1.5 h @ $31/h)per packageper packageper packageper lbper packageper stop
per trip (2 h @ $31/h)per lbper charterper stop
To facilitate the calculation of the aggregate cost to ship via the FedEx Express alternative, a
regression analysis of weight versus cost was performed. This circumvented the problem of
having to use the look-up table to determine the cost of each individual package. The analysis
yielded a function that has a base per package cost and a variable per-pound cost. The function
50
-I
-
---I
allows the precise calculation of the costs at an aggregate level using the total quantity and
weight of packages sent. Partial results of the regressions are presented in Table 4.2. Figure 4.1
compares the actual FedEx Express costs to the calculated ones. The fit is accurate enough to
provide a good estimate of costs.
4.2 Results of regression analysis for the FedEx Express costs
Zone Example Base Cost Variable Cost R2
(/package) (/lb)4 St. Louis to Dallas $ 6.75 $ 0.76 0.9956 St. Louis to Orlando $ 8.05 $ 0.86 0.9947 St. Louis to Los Angeles $ 7.75 $ 0.90 0.993
............... 7-- - --- -.............................. I -I..................
IIII
- I- - -
I
I
I
I
II
I
I
I
I
I
IIII-1-IIIIIIIIIII
F F
F F F F F
- F --Ir-----m 1 F F F F I
I F I I
F F I sF F I i
F~ ~ ~ ~~ _ F I
I ' I ' ' I i
I| I| ~ F F |Zone 4 Actual Cost_____Zone 4 - Calculated CostI I I F'--§
........ Zone 6 - Actual CstI ~ ' F I
I, ~ .I F F Zone 6 - Calculated Cost
I, ~ ~ ' "' ' Zone 7 - Actual CostI F F F l~.... Zone 7 -Calculated Cost
I I F F I I F
0 10 20 30 40 50 60
Package Weight (bs)
70 80 90 100
51
Table
$120.00
$100.00
$80.00
$60.00
$40.00
0
$20.00
Figure 4.1 FedEx Express cost data, actual vs calculated
-··-··----
li
In determining the costs for the commercial airline alternative, all packages were assumed to
weight less than 68 lbs and more than 5 lbs. In all three regions studied, there were a total of only
five packages that weighed more then 100 lbs and they were all shipped by FedEx Express.
Consequently, the base cost of $58.35 per package was correctly used since there were no
packages that were charged a premium for weighing more than 100 lbs. Any weight above 67 lbs
would have incurred and additional security charge of $0.06 per lb which was deemed
insignificant. The calculations include the fuel surcharge of $0.20 per lb but not the floor charge
of $1.00, this results in light packages (those weighting less than 5 lbs) being undercharged by as
much as $0.80. This amount was also deemed insignificant.
Though further accuracy would have been achieved if the actual cost of the AirExpress service
had been included in the analysis compared to using the commercial airline costs, it is estimated
the results would not have changed significantly.
The cost per-charter was estimated to be the average of the per-city charge (see Table 4.3). The
cost per-pound of shipping by chartered aircraft to a given city was estimated to be the average
of the unit costs for the charters serving that city. In cases where a city is not currently being
served by chartered aircraft, the average unit cost per city was used. Table 4.4 provides details of
these calculations.
52

Table 4.3 Charter costs per city
Route Total Charge Qty of Cities Charge per City102U $ 6,750 4 $ 1,688102M $ 6,000 4 $ 1,500102W $ 6,000 3 $ 2,000244M $ 3,535 1 $ 3,535110U& 110 $ 2,550 3 $ 850244U/238U $ 2,970 1 $ 2,970452U $ 5,500 3 $ 1,833452 $ 5,000 4 $ 1,250486U &486 $ 3,000 2 $ 1,500
Average: $ 1,903
Table 4.4 Charter unit costs per city
city Average per Package Cost Average per Lb ChargeRaleigh $ 88.87 $ 4.08Richmond $ 88.87 $ 4.08Baltimore $ 81.47 $ 4.05New York $ 70.50 $ 3.53Atlanta $ 109.25 $ 3.88Detroit $ 41.80 $ 1.65Cleveland $ 41.80 $ 1.65Columbus $ 41.80 $ 1.65Charlotte $ 75.51 $ 2.88Orlando $ 75.51 $ 2.88Miami $ 84.75 $ 3.46Memphis $ 272.73 $ 3.46New Orleans $ 272.73 $ 8.57Average: $ 103.51 $ 3.52
4.2 Order Data
The order data for the three regions studied are presented in Table 4.5 (values were rounded to
conceal the true per-unit costs). The total weight of shipments, quantity of orders, linehauls and
flights were relatively straightforward to determine from the order dataset. For the commercial
airline data, the quantity of packages represents the actual amount of consolidated packages
shipped. The value was generated by counting the number of packages whose box number did
not begin with a B and adding the count of packages whose box number begun with a given B
53

value (e.g., B01, B02, etc.) for a given day and flight. The quantity of deliveries represents the
quantities of radiopharmacies delivered to on a given day. The value was determined by counting
each distinctive ship-to name and city (some customers have more than one radiopharmacy in a
given region). In the case of commercial airline and chartered aircraft cargo, the delivery count
also takes into consideration multiple daily deliveries to a radiopharmacy due to orders arriving
on different flights.
Region:
Ground Courier (lineTotal weight of ordeQuantity of ordersQuantity of linehaulsQuantity of deliverie
FedEx ExpressTotal weight of ordeiQuantity of orders
Commercial AirlineTotal weight of ordeiQuantity of ordersQuantity of flightsQuantity of packageQuantity of deliverie.
Chartered AircraftTotal weight of orderQuantity of ordersQuantity of flightsQuantity of deliveries
Total weight of all ordeTotal orders
Table 4.5 Order data
Dallas Los Angeles,haul)rs 20000 4000
900 30039 39
s 300 150
rs 6000 22000700 1300
rs 32000 330002400 2100
600 300s 1000 800
800 800
rs 64000 900002600 3000
150 150s 700 1000Wrs 122000 149000
6600 6700
Orlando Un
12600 lbs700
39300
6000 lbs400
19000 lbs600200400200
150000 lbs7400
2002400
1876009100
4.3 Base CostsThe calculated base costs are presented in Table 4.6 (these are the accurate values based on the
true order and unit costs). For the chartered aircraft alternative two subtotals and per-order values
were calculated. One uses the per-pound cost basis; the other uses the per-chartered-flight cost
54
its-I
-
-
-
-
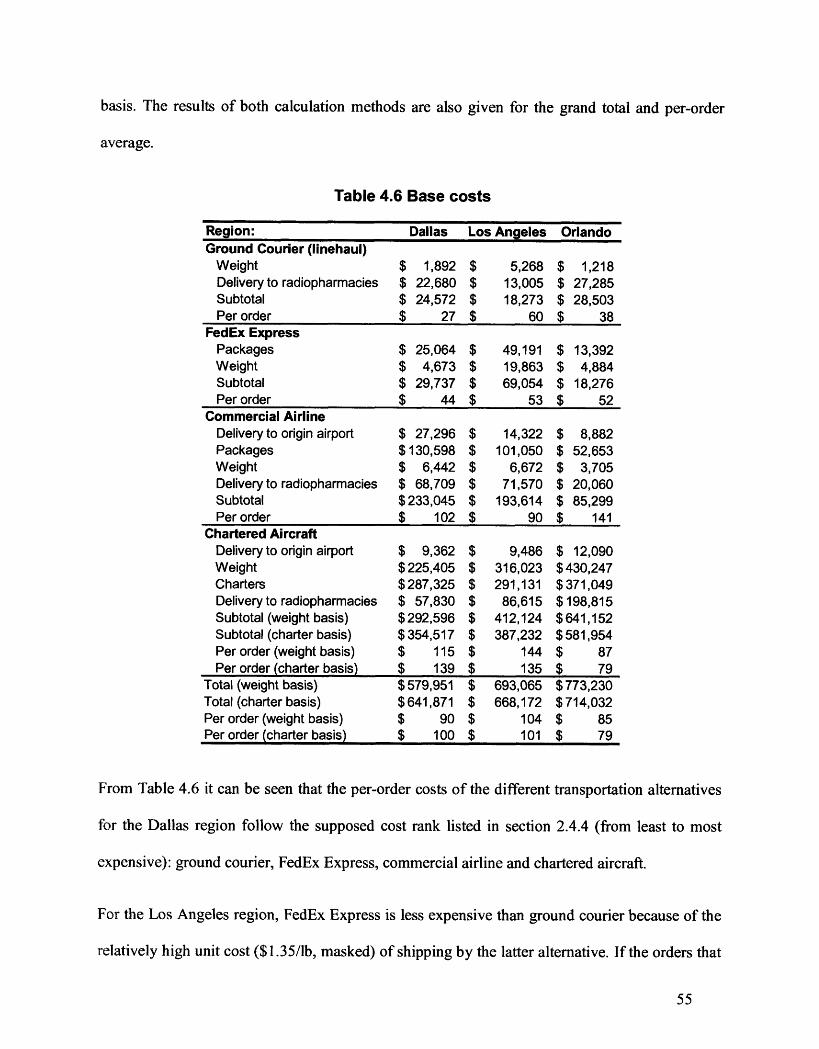
basis. The results of both calculation methods are also given for the grand total and per-order
average.
Table 4.6 Base costs
Region: Dallas Los Angeles OrlandoGround Courier (linehaul)
Weight $ 1,892 $ 5,268 $ 1,218Delivery to radiopharmacies $ 22,680 $ 13,005 $ 27,285Subtotal $ 24,572 $ 18,273 $ 28,503Per order $ 27 $ 60 $ 38
FedEx ExpressPackages $ 25,064 $ 49,191 $ 13,392Weight $ 4,673 $ 19,863 $ 4,884Subtotal $ 29,737 $ 69,054 $ 18,276Per order $ 44 $ 53 $ 52
Commercial AirlineDelivery to origin airport $ 27,296 $ 14,322 $ 8,882Packages $130,598 $ 101,050 $ 52,653Weight $ 6,442 $ 6,672 $ 3,705Delivery to radiopharmacies $ 68,709 $ 71,570 $ 20,060Subtotal $233,045 $ 193,614 $ 85,299Per order $ 102 $ 90 $ 141
Chartered AircraftDelivery to origin airportWeightChartersDelivery to radiopharmaciesSubtotal (weight basis)Subtotal (charter basis)Per order (weight basis)Per order (charter basis)
Total (weight basis)Total (charter basis)Per order (weight basis)Per order (charter basis)
$ 9,362$225,405$287,325$ 57,830$292,596$ 354,517$ 115
$ 139$579,951$641,871
$ 90$ 100
$ 9,486$ 316,023$ 291,131$ 86,615$ 412,124$ 387,232$ 144$ 135$ 693,065$ 668,172$ 104$ 101
$ 12,090$430,247$ 371,049$198,815$641,152$581,954$ 87$ 79$773,230$714,032$ 85$ 79
From Table 4.6 it can be seen that the per-order costs of the different transportation alternatives
for the Dallas region follow the supposed cost rank listed in section 2.4.4 (from least to most
expensive): ground courier, FedEx Express, commercial airline and chartered aircraft.
For the Los Angeles region, FedEx Express is less expensive than ground courier because of the
relatively high unit cost ($1.35/lb, masked) of shipping by the latter alternative. If the orders that
55
-I
\ ,
are normally shipped by the Friday ground-courier transport can be ready for the Friday FedEx
drop-off time and the customer is willing to accept (earlier) Saturday deliveries, it is worthwhile
to further investigate the possibility of switching the transportation alternatives. The estimated
cost saving is $7 per order.
For the Orlando region, the chartered aircraft alternative is less expensive than the commercial
airline alternative. This difference is due to flight loading. In the case of the Dallas region, there
were 2550 orders shipped on 151 chartered flights resulting in a loading of approximately 17
orders per charter. The Los Angeles region has a slightly higher load ratio at approximately 19
orders per charter (2867/153). The Orlando region has a loading factor of 38 orders per charter
(7353/195). Considering that a chartered flight has a flat fee of approximately $1900 and that the
air portion of the commercial airline alternative is a conservative $50 per order, it becomes
advantageous to use a chartered aircraft when shipping more than 38 orders per day to a given
region.
Comparing the transportation alternatives on a regional basis also yields some interesting
insights. In the case of the ground courier alternative, shipping to the Los Angeles region is
significantly more expensive due to the aforementioned high unit costs ($1.35/lb versus $0.10/lb
for the Dallas and Orlando regions). Considering the relative high cost of the deliveries to the
radiopharmacies, the differences in per-order costs are also partially explained by the number of
orders per delivery. Dallas has an attractive ratio of 3.4 orders per delivery compared to 2.0 and
2.3 for the Los Angeles and Orlando regions, respectively.
Predictably, the difference in per-order costs of the FedEx Express alternative is reflective of the
travel distance to the various regions.
56
The difference in per-order costs of the commercial airline alternative is mostly due to the order
to package ratio. The Los Angeles region has a relatively high 2.6 orders compared to 2.1 and
1.4 for the Dallas and Orlando regions, respectively. This result highlights the benefit of
consolidating packages. Based on discussions with personnel at the Maryland Heights plant,
consolidation has already been maximized to the extent allowable by law.
The difference in per order costs of the chartered aircraft alternative is mostly due to the
aforementioned flight loading.
Comparing the results obtained by using the weight or charter cost basis, there is no clear
advantage to either method. For the Dallas region, the weight basis yields a lower cost, but for
the Los Angeles and Orlando regions the charter basis yields a lower cost. The service provider
charges on a per-flight basis. So, if a more accurate charter cost could be obtained, it would be
best to use this value compared to a potentially unrepresentative per-pound value that is based on
an average.
Overall, the Orlando region has the lowest per-order cost. This result is a consequence of the
high volume of packages shipped by chartered aircraft.
4.4 Decay CostsTable 4.7 shows the weekly costs to add one day of radioactivity for an assortment of THC
products. More explicitly, the costs are for an additional day of radioactivity, not for an
additional week of radioactivity. The sales data represent the totals for a sample week in
November 2005. The unit cost of activity for the Ga, Tc and Tl-based products has been rounded
to $0.25/mCi and that of 1-123-based products to $5.00/mCi. The weekly decay costs by product
57
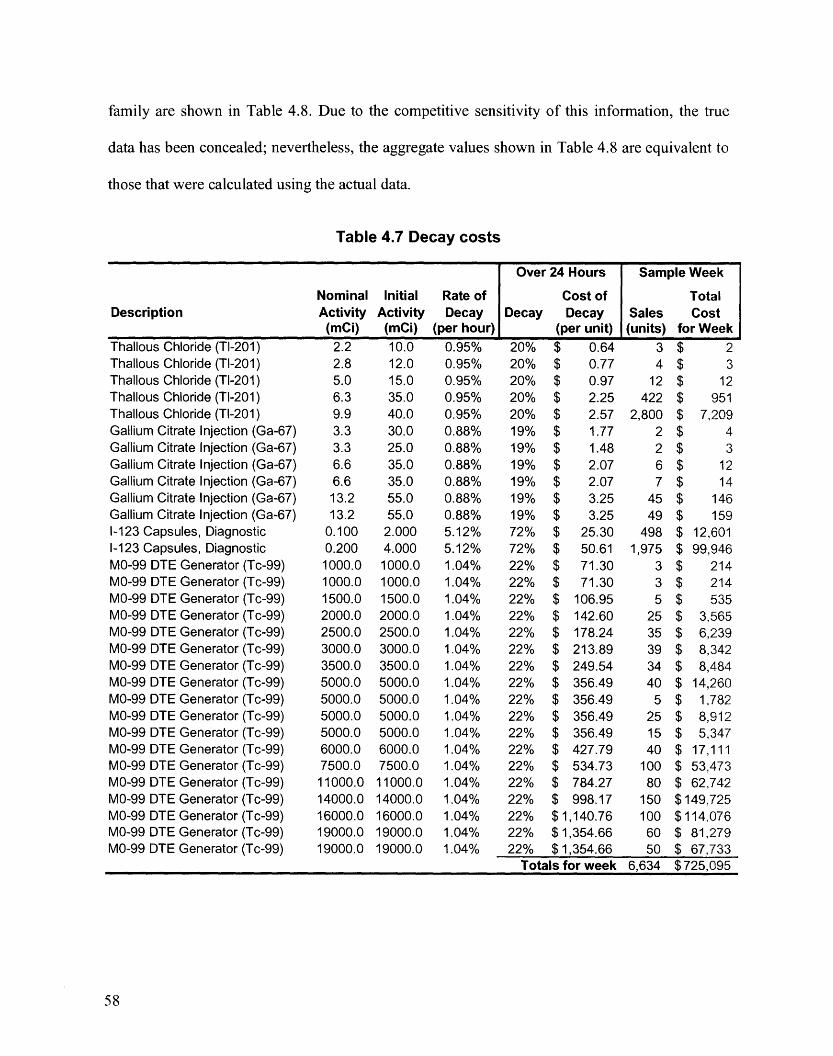
family are shown in Table 4.8. Due to the competitive sensitivity of this information, the true
data has been concealed; nevertheless, the aggregate values shown in Table 4.8 are equivalent to
those that were calculated using the actual data.
Table 4.7 Decay costs
Over 24 Hours Sample Week
Nominal Initial Rate of Cost of TotalDescription Activity Activity Decay Decay Decay Sales Cost
(mCi) (mCi) (per hour) (per unit) (units) for Week
Thallous Chloride (TI-201) 2.2 10.0 0.95% 20% $ 0.64 3 $ 2Thallous Chloride (TI-201) 2.8 12.0 0.95% 20% $ 0.77 4 $ 3Thallous Chloride (TI-201) 5.0 15.0 0.95% 20% $ 0.97 12 $ 12Thallous Chloride (TI-201) 6.3 35.0 0.95% 20% $ 2.25 422 $ 951Thallous Chloride (TI-201) 9.9 40.0 0.95% 20% $ 2.57 2,800 $ 7,209Gallium Citrate Injection (Ga-67) 3.3 30.0 0.88% 19% $ 1.77 2 $ 4Gallium Citrate Injection (Ga-67) 3.3 25.0 0.88% 19% $ 1.48 2 $ 3Gallium Citrate Injection (Ga-67) 6.6 35.0 0.88% 19% $ 2.07 6 $ 12Gallium Citrate Injection (Ga-67) 6.6 35.0 0.88% 19% $ 2.07 7 $ 14Gallium Citrate Injection (Ga-67) 13.2 55.0 0.88% 19% $ 3.25 45 $ 146Gallium Citrate Injection (Ga-67) 13.2 55.0 0.88% 19% $ 3.25 49 $ 1591-123 Capsules, Diagnostic 0.100 2.000 5.12% 72% $ 25.30 498 $ 12,6011-123 Capsules, Diagnostic 0.200 4.000 5.12% 72% $ 50.61 1,975 $ 99,946M0-99 DTE Generator (Tc-99) 1000.0 1000.0 1.04% 22% $ 71.30 3 $ 214M0-99 DTE Generator (Tc-99) 1000.0 1000.0 1.04% 22% $ 71.30 3 $ 214M0-99 DTE Generator (Tc-99) 1500.0 1500.0 1.04% 22% $ 106.95 5 $ 535M0-99 DTE Generator (Tc-99) 2000.0 2000.0 1.04% 22% $ 142.60 25 $ 3,565M0-99 DTE Generator (Tc-99) 2500.0 2500.0 1.04% 22% $ 178.24 35 $ 6,239M0-99 DTE Generator (Tc-99) 3000.0 3000.0 1.04% 22% $ 213.89 39 $ 8,342M0-99 DTE Generator (Tc-99) 3500.0 3500.0 1.04% 22% $ 249.54 34 $ 8,484M0-99 DTE Generator (Tc-99) 5000.0 5000.0 1.04% 22% $ 356.49 40 $ 14,260M0-99 DTE Generator (Tc-99) 5000.0 5000.0 1.04% 22% $ 356.49 5 $ 1,782M0-99 DTE Generator (Tc-99) 5000.0 5000.0 1.04% 22% $ 356.49 25 $ 8,912M0-99 DTE Generator (Tc-99) 5000.0 5000.0 1.04% 22% $ 356.49 15 $ 5,347M0-99 DTE Generator (Tc-99) 6000.0 6000.0 1.04% 22% $ 427.79 40 $ 17,111M0-99 DTE Generator (Tc-99) 7500.0 7500.0 1.04% 22% $ 534.73 100 $ 53,473M0-99 DTE Generator (Tc-99) 11000.0 11000.0 1.04% 22% $ 784.27 80 $ 62,742M0-99 DTE Generator (Tc-99) 14000.0 14000.0 1.04% 22% $ 998.17 150 $149,725M0-99 DTE Generator (Tc-99) 16000.0 16000.0 1.04% 22% $ 1,140.76 100 $ 114,076M0-99 DTE Generator (Tc-99) 19000.0 19000.0 1.04% 22% $1,354.66 60 $ 81,279M0-99 DTE Generator (Tc-99) 19000.0 19000.0 1.04% 22% $1,354.66 50 $ 67,733
Totals for week 6,634 $725,095
58

Table 4.8 Weekly decay costs by product family
Product Family Cost Fractional CostTI $ 8,176 1%Ga $ 339 0%1-123 $ 112,546 16%Tc $ 604,034 83%Total $ 725,095 100%
The cost of Tc decay represents a large portion of the total (83%) due to the relatively high sales
volume and initial activity. Compared to the other product families, they lose a significant and
thus expensive amount of radioactivity in a short period of time. For example, a generator with
an original radioactivity of 19.0 Ci will lose 4.2 Ci of radioactivity or $1054 of value (at
$0.25/mCi) over a period of 24 hours. The decay costs of 1-123 are also relatively high due to the
high decay rate (5.12% per hour) and the high raw material cost ($5.00 per mCi).
From what is known of Bristol-Myers Squibb's (BMS's) strategy, their policy is to ship their
orders by FedEx Express for delivery by 10:30 AM the next day (Tyco 2006). As seen in
section 2.6, for the radiopharmacies, this can represent an additional day of decay compared to a
delivery in the early AM (before 3:00). For the Tc-based products only, it is also BMS's policy
not to compensate for this extra day of decay. If this policy was applied by THC, the total cost of
an additional day of decay (as calculated above) would drop from $725k to $121k.
The analysis assumes that the sales data for the sample week is representative of the sales data
for all weeks. This assumption can be deemed reasonable considering the relatively constant
demand shown in Figure 2.2. Moreover, the analysis does not cover the sales for all product
families. Therefore, the results in Table 4.7 and Table 4.8 are meant to provide an idea of the
59

order of magnitude of the decay cost. They will be used in the next chapters when discussing
distribution alternatives and recommendations.
60
5 Alternative DistributionScenarios
This chapter studies three alternatives to the distribution operation of THC presented in
Chapter 4. The first describes a situation where all orders are shipped by ground courier. The
second alternative describes a situation where all orders originally shipped by commercial airline
are shipped by chartered aircraft. Finally, the third describes a situation where all orders are
shipped by FedEx Express. The period covered is the same as for Chapter 4, that is, from
October 1, 2004 to June 30, 2005.
5.1 Shipping All Orders by Ground CourierThe modified order data representing a situation where all orders are shipped by a single daily
linehaul service to a given region are presented in Table 5.1 (values were rounded to conceal the
true per-unit costs). The resulting transportation costs are presented in Table 5.2 (these are the
accurate values based on the true order and unit costs). The analysis assumes that the unit costs
presented in Chapter 3 would remain the same; however, increased usage could result in
additional savings to those presented below.
61
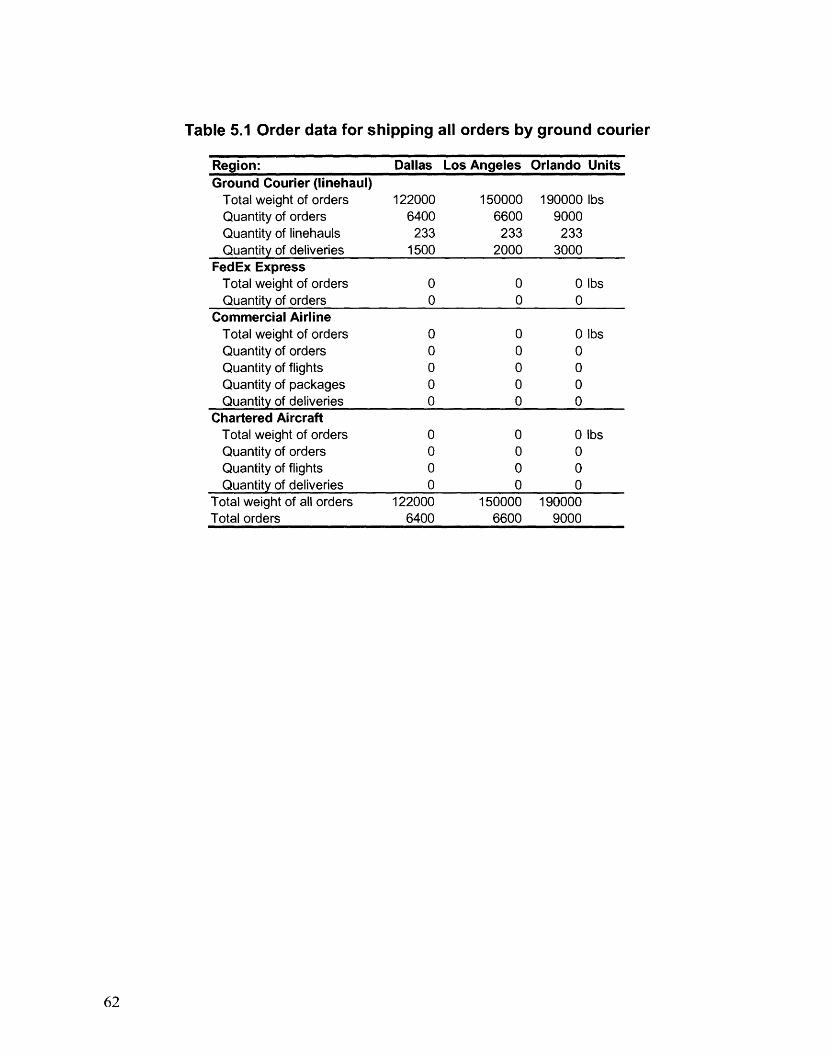
Table 5.1 Order data for shipping all orders by ground courier
Region: Dallas Los Angeles Orlando Units
Ground Courier (linehaul)Total weight of orders 122000 150000 190000 IbsQuantity of orders 6400 6600 9000Quantity of linehauls 233 233 233Quantity of deliveries 1500 2000 3000
FedEx ExpressTotal weight of orders 0 0 0 lbs
Quantity of orders 0 0 0Commercial Airline
Total weight of orders 0 0 0 lbs
Quantity of orders 0 0 0Quantity of flights 0 0 0Quantity of packages 0 0 0Quantity of deliveries 0 0 0
Chartered AircraftTotal weight of orders 0 0 0 lbs
Quantity of orders 0 0 0Quantity of flights 0 0 0Quantity of deliveries 0 0 0
Total weight of all orders 122000 150000 190000Total orders 6400 6600 9000
62

Table 5.2 Costs of shipping all orders by ground courier
Region: Dallas Los Angeles OrlandoGround Courier (linehaul)
Weight $ 11,824 $ 186,672 $ 18,055Delivery to radiopharmacies $127,962 $ 171,785 $244,460Subtotal $139,786 $ 358,457 $262,515Per order $ 22 $ 54 $ 29
FedEx ExpressPackages $ - $ - $ -Weight $ - $ - $ -Subtotal $ - $ - $ -Per order N.A. N.A. N.A.
Commercial AirlineDelivery to origin airport $ $ - $Packages $ $ - $Weight $ $ - $Delivery to radiopharmacies $ - $ - $Subtotal $ $ - $Per order N.A. N.A. N.A.
Chartered AircraftDelivery to origin airport $ - $ - $Weight $ - $ - $Charters $ - $ - $Delivery to radiopharmacies $ - $ - $Subtotal (weight basis) $ - $ - $Subtotal (charter basis) $ - $ - $Per order (weight basis) N.A. N.A. N.A.Per order (charter basis) N.A. N.A. N.A.
Total (weight basis) $139,786 $ 358,457 $262,515Total (charter basis) $139,786 $ 358,457 $262,515Per order (weight basis) $ 22 $ 54 $ 29Per order (charter basis) $ 22 $ 54 $ 29
Considering service provider costs alone, ground courier is the least expensive transportation
alternative to distribute nuclear medicine. Furthermore, additional cost reduction is achieved in
this scenario by limiting the deliveries to a given radiopharmacy to one per day. Actual savings
compared to the base scenario are considerable as can be seen in Table 5.3. Savings for the
Dallas region are more substantial due to a decrease in the total number of deliveries.
63
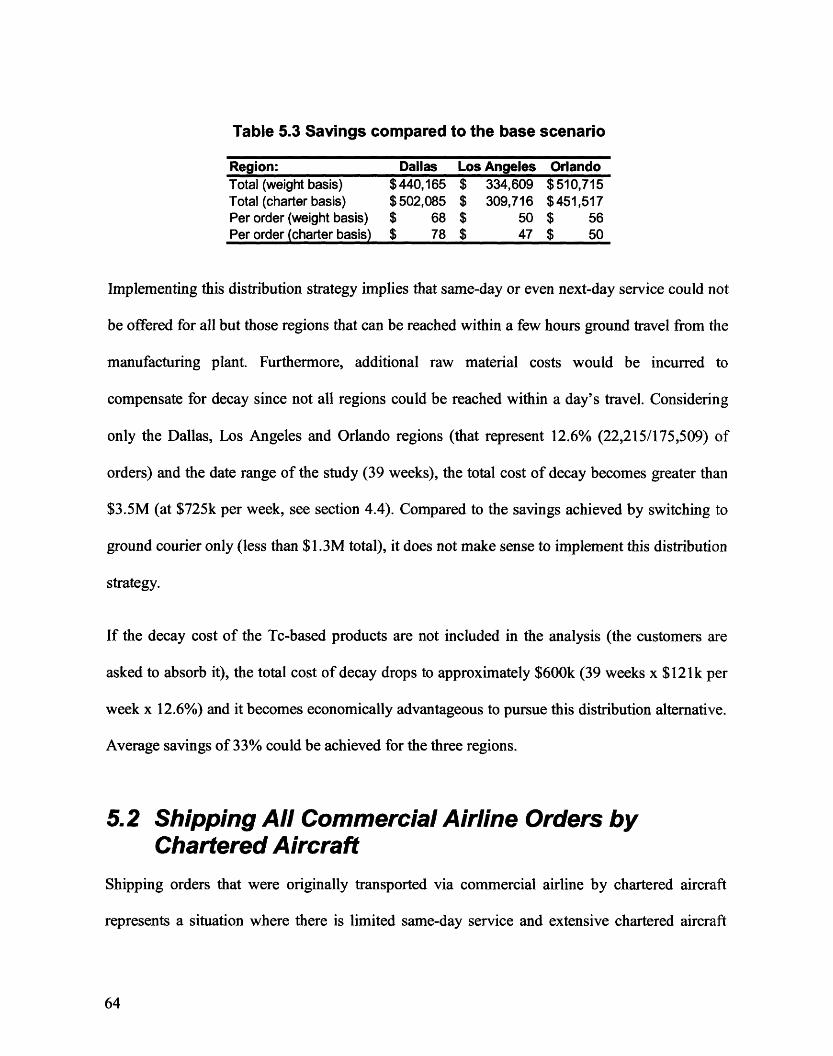
Table 5.3 Savings compared to the base scenario
Region: Dallas Los Angeles OrlandoTotal (weight basis) $440,165 $ 334,609 $510,715Total (charter basis) $502,085 $ 309,716 $451,517Per order (weight basis) $ 68 $ 50 $ 56Per order (charter basis) $ 78 $ 47 $ 50
Implementing this distribution strategy implies that same-day or even next-day service could not
be offered for all but those regions that can be reached within a few hours ground travel from the
manufacturing plant. Furthermore, additional raw material costs would be incurred to
compensate for decay since not all regions could be reached within a day's travel. Considering
only the Dallas, Los Angeles and Orlando regions (that represent 12.6% (22,215/175,509) of
orders) and the date range of the study (39 weeks), the total cost of decay becomes greater than
$3.5M (at $725k per week, see section 4.4). Compared to the savings achieved by switching to
ground courier only (less than $1.3M total), it does not make sense to implement this distribution
strategy.
If the decay cost of the Tc-based products are not included in the analysis (the customers are
asked to absorb it), the total cost of decay drops to approximately $600k (39 weeks x $121k per
week x 12.6%) and it becomes economically advantageous to pursue this distribution alternative.
Average savings of 33% could be achieved for the three regions.
5.2 Shipping All Commercial Airline Orders byChartered Aircraft
Shipping orders that were originally transported via commercial airline by chartered aircraft
represents a situation where there is limited same-day service and extensive chartered aircraft
64
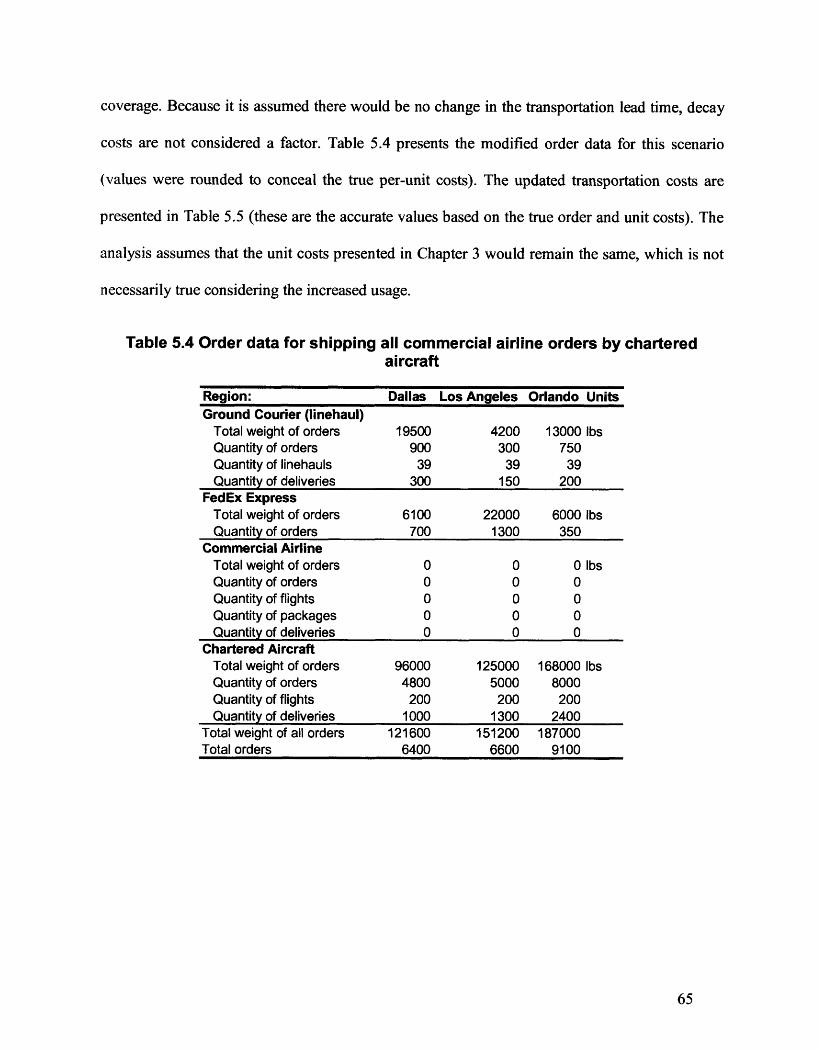
coverage. Because it is assumed there would be no change in the transportation lead time, decay
costs are not considered a factor. Table 5.4 presents the modified order data for this scenario
(values were rounded to conceal the true per-unit costs). The updated transportation costs are
presented in Table 5.5 (these are the accurate values based on the true order and unit costs). The
analysis assumes that the unit costs presented in Chapter 3 would remain the same, which is not
necessarily true considering the increased usage.
Table 5.4 Order data for shipping all commercial airline orders by charteredaircraft
Region: Dallas Los Angeles Orlando Units
Ground Courier (linehaul)Total weight of orders 19500 4200 13000 lbsQuantity of orders 900 300 750Quantity of linehauls 39 39 39Quantity of deliveries 300 150 200
FedEx ExpressTotal weight of orders 6100 22000 6000 lbsQuantity of orders 700 1300 350
Commercial AirlineTotal weight of orders 0 0 0 lbsQuantity of orders 0 0 0Quantity of flights 0 0 0Quantity of packages 0 0 0Quantity of deliveries 0 0 0
Chartered AircraftTotal weight of orders 96000 125000 168000 IlbsQuantity of orders 4800 5000 8000Quantity of flights 200 200 200Quantity of deliveries 1000 1300 2400
Total weight of all orders 121600 151200 187000Total orders 6400 6600 9100
65

Table 5.5 Costs of shipping all commercial airline orders by chartered aircraft
Region: Dallas Los Angeles Orlando
Ground Courier (linehaul)Weight $ 1,892 $ 5,268 $ 1,218Delivery to radiopharmacies $ 22,680 $ 13,005 $ 27,285Subtotal $ 24,572 $ 18,273 $ 28,503Per order $ 27 $ 60 $ 38
FedEx ExpressPackages $ 25,064 $ 49,191 $ 13,392Weight $ 4,673 $ 19,863 $ 4,884Subtotal $ 29,737 $ 69,054 $ 18,276Per order $ 44 $ 53 $ 52
Commercial AirlineDelivery to origin airport $ - $ - $ -Packages $ - $ - $ -Weight $ - $ - $ -Delivery to radiopharmacies $ - $ - $ -Subtotal $ - $ $ -Per order N.A. N.A. N.A.
Chartered AircraftDelivery to origin airportWeightChartersDelivery to radiopharmaciesSubtotal (weight basis)Subtotal (charter basis)Per order (weight basis)Per order (charter basis)
Total (weight basis)Total (charter basis)Per order (weight basis)Per order (charter basis)
$ 12,028$ 338,785$ 369,146$ 81,012$431,825$462,186$ 89$ 96$486,134$516,495$ 76$ 80
$$$$$$$$$$$$
12,152433,453372,952110,925556,530496,029
111
99643,857583,356
9788
$ 14,384$483,598$441,453$202,555$700,537$658,392$ 88$ 83$747,316$ 705,171$ 83$ 78
The transportation cost savings of this alternative compared to the base scenario are presented in
Table 5.6. Though they are not as substantial as the scenario involving ground courier service
only (where savings ranging from $47 to $78 per order were calculated), the savings would
amount to a significant amount when considering all regions and a period of a year. Further
savings could potentially be negotiated with the charter service due to increased usage.
66
--I
-

Table 5.6 Savings compared to the base scenario
Region: Dallas Los Angeles OrlandoTotal (weight basis) $ 93,817 $ 49,208 $25,914Total (charter basis) $125,376 $ 84,817 $ 8,861Per order (weight basis) $ 15 $ 7 $ 3Per order (charter basis) $ 19 $ 13 $ 1
A large part of the cost reduction can be attributed to the increase in flight loading. For the
Dallas region, the quantity of orders per flight increased from 17 to 25 (47% more). The Los
Angeles region saw its quantity of orders per flight jump from 19 to 26 (37% more). The
Orlando region actually saw its quantity of orders per flight drop from 38 to 34 (the increase in
the number of flights from 5 per week to 6 per week was not compensated by a proportional
increase in orders). Additional savings were achieved by assuming that a single delivery per day
would be required to supply the radiopharmacies.
5.3 Shipping All Orders by FedEx ExpressShipping all orders by the FedEx Express alternative represents a similar distribution system to
that of Bristol-Myers Squibb (BMS), one of THC's major competitors (Tyco 2006). The
modified order data for this scenario are presented in Table 5.7 (values were rounded to conceal
the true per-unit costs). The resulting transportation costs are presented in Table 5.8 (these are
the accurate values based on the true order and unit costs).
67
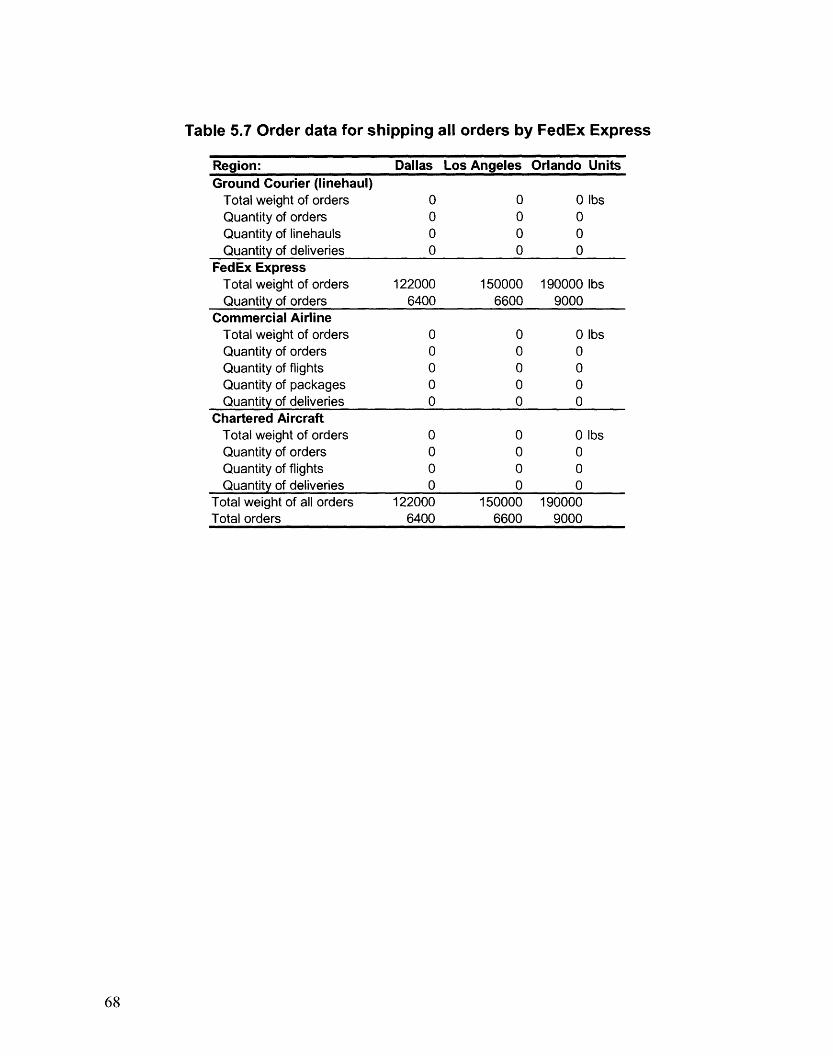
Table 5.7 Order data for shipping all orders by FedEx Express
Region: Dallas Los Angeles Orlando UnitsGround Courier (linehaul)
Total weight of orders 0 0 0 lbs
Quantity of orders 0 0 0Quantity of linehauls 0 0 0Quantity of deliveries 0 0 0
FedEx ExpressTotal weight of orders 122000 150000 190000 lbs
Quantity of orders 6400 6600 9000Commercial Airline
Total weight of orders 0 0 0 lbs
Quantity of orders 0 0 0Quantity of flights 0 0 0Quantity of packages 0 0 0Quantity of deliveries 0 0 0
Chartered AircraftTotal weight of orders 0 0 0 IbsQuantity of orders 0 0 0Quantity of flights 0 0 0Quantity of deliveries 0 0 0
Total weight of all orders 122000 150000 190000Total orders 6400 6600 9000
68
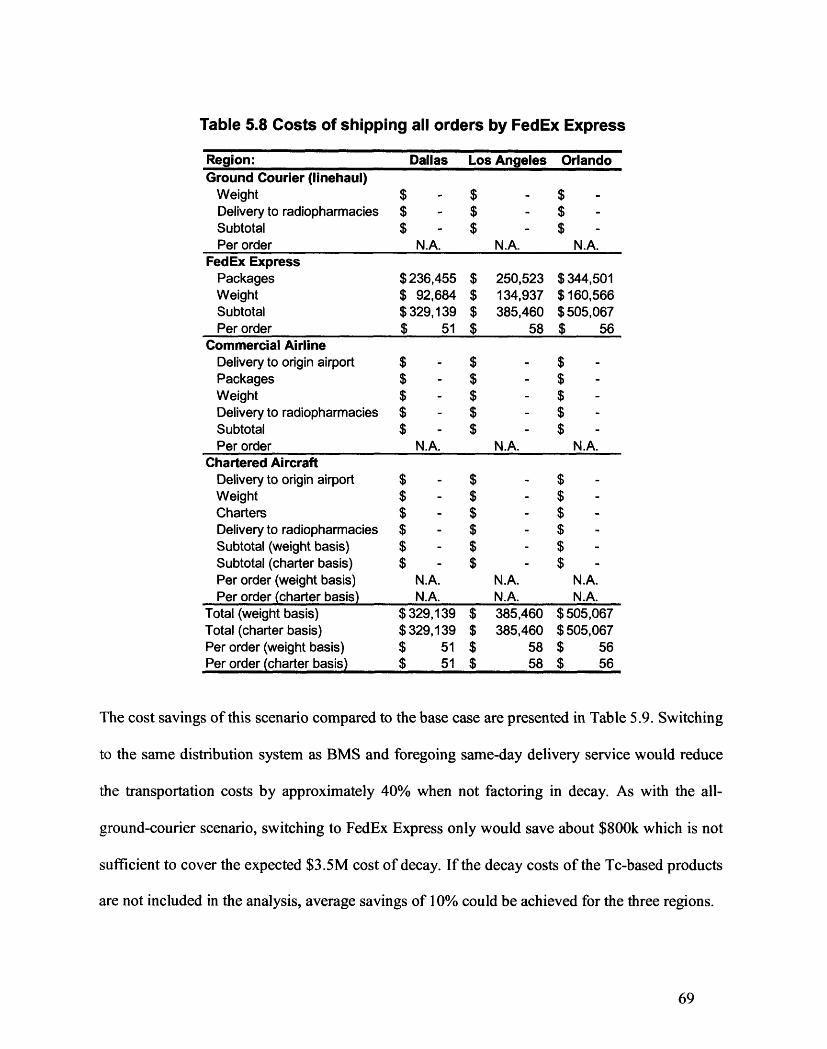
Table 5.8 Costs of shipping all orders by FedEx Express
Region: Dallas Los Angeles Orlando
Ground Courier (linehaul)Weight $ - $ - $Delivery to radiopharmacies $ - $ - $Subtotal $ - $ - $Per order N.A. N.A. N.A.
FedEx ExpressPackages $236,455 $ 250,523 $ 344,501Weight $ 92,684 $ 134,937 $160,566Subtotal $329,139 $ 385,460 $505,067Per order $ 51 $ 58 $ 56
Commercial AirlineDelivery to origin airport $ - $ - $Packages $ - $ - $Weight $ - $ - $Delivery to radiopharmacies $ - $ - $Subtotal $ - $ - $ -Per order N.A. N.A. N.A.
Chartered AircraftDelivery to origin airport $ - $ - $Weight $ - $ -$Charters $ - $ - $Delivery to radiopharmacies $ - $ -$Subtotal (weight basis) $ - $ -$Subtotal (charter basis) $ - $ -$Per order (weight basis) N.A. N.A. N.A.Per order (charter basis) N.A. N.A. N.A.
Total (weight basis) $ 329,139 $ 385,460 $505,067Total (charter basis) $329,139 $ 385,460 $505,067Per order (weight basis) $ 51 $ 58 $ 56Per order (charter basis) $ 51 $ 58 $ 56
The cost savings of this scenario compared to the base case are presented in Table 5.9. Switching
to the same distribution system as BMS and foregoing same-day delivery service would reduce
the transportation costs by approximately 40% when not factoring in decay. As with the all-
ground-courier scenario, switching to FedEx Express only would save about $800k which is not
sufficient to cover the expected $3.5M cost of decay. If the decay costs of the Tc-based products
are not included in the analysis, average savings of 10% could be achieved for the three regions.
69
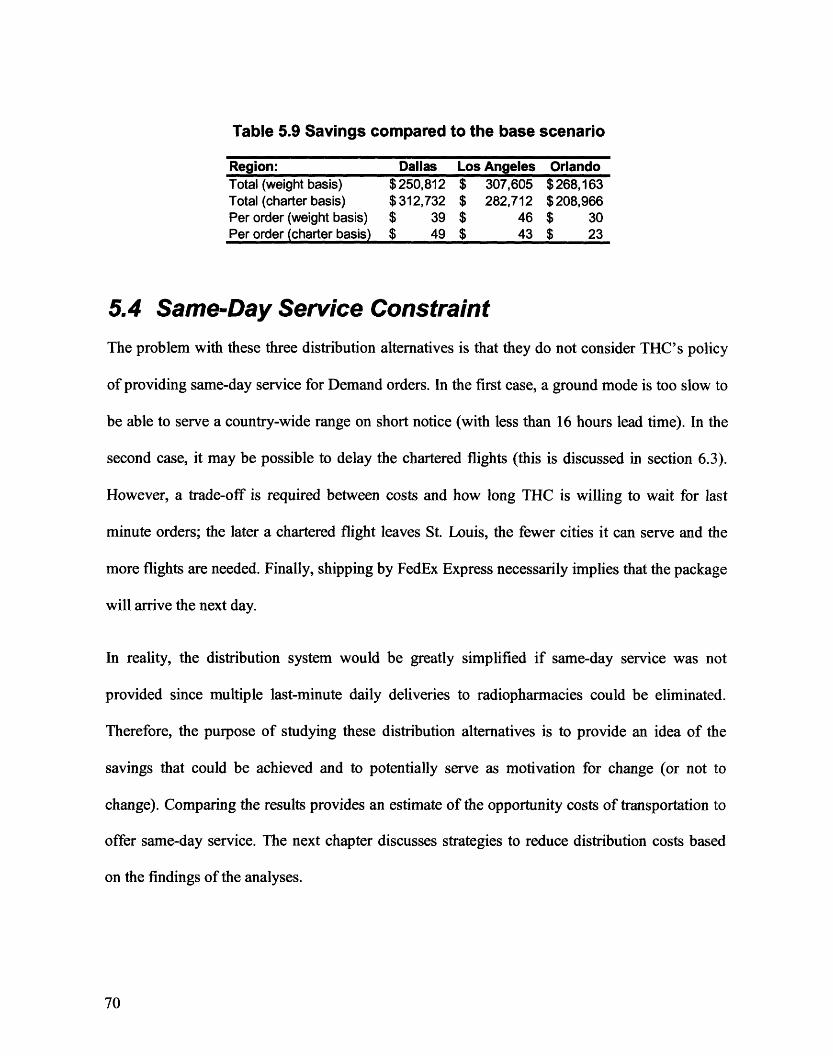
Table 5.9 Savings compared to the base scenario
Region: Dallas Los Angeles OrlandoTotal (weight basis) $250,812 $ 307,605 $268,163Total (charter basis) $312,732 $ 282,712 $208,966Per order (weight basis) $ 39 $ 46 $ 30Per order (charter basis) $ 49 $ 43 $ 23
5.4 Same-Day Service ConstraintThe problem with these three distribution alternatives is that they do not consider THC's policy
of providing same-day service for Demand orders. In the first case, a ground mode is too slow to
be able to serve a country-wide range on short notice (with less than 16 hours lead time). In the
second case, it may be possible to delay the chartered flights (this is discussed in section 6.3).
However, a trade-off is required between costs and how long THC is willing to wait for last
minute orders; the later a chartered flight leaves St. Louis, the fewer cities it can serve and the
more flights are needed. Finally, shipping by FedEx Express necessarily implies that the package
will arrive the next day.
In reality, the distribution system would be greatly simplified if same-day service was not
provided since multiple last-minute daily deliveries to radiopharmacies could be eliminated.
Therefore, the purpose of studying these distribution alternatives is to provide an idea of the
savings that could be achieved and to potentially serve as motivation for change (or not to
change). Comparing the results provides an estimate of the opportunity costs of transportation to
offer same-day service. The next chapter discusses strategies to reduce distribution costs based
on the findings of the analyses.
70
6 Discussion
From Table 2.1 it can be seen that not all product families of nuclear medicine are highly
perishable and required same day or next day delivery to remain usable. For the sake of this
discussion, the product families will be categorized as either Short Fulfillment Lead Times
(SFLT) or Long Fulfillment Lead Times (LFLT) items. The SFLT products are those based on
1-123, Tc and TI. The medicines based on iodine-123 have a high decay rate, 5.12% per hour and
a high raw material cost, $5.00 per mCi. These characteristics are reflected in their relatively
short shelf life (less than 2 days). They require expedited service for timely delivery to the end
client. The products based on technetium are considered SFLT items because of their high level
of radioactivity. In absolute terms, they lose a significant and thus expensive amount of
radioactivity in a short period of time Of the approximate $725,000 weekly cost to extend all
product life by a day, 83% of the total is for Tc-based products (see section 4.4). Finally,
thallium-based products are considered SFLT because of their high sales volume and the limited
production capacity. Longer transportation lead times would require higher initial activities
which would further limit production capacity.
The LFLT products are based on chromium, gallium, indium, iodine-131, phosphate and xenon.
Because they have a more limited sales volumes and shelf-lives ranging from 7 to 84 days (see
Table 2.1), they are considered to have longer fulfillment lead times than their SFLT
counterparts. Next day delivery service is an imperative only if customer service is considered a
constraint.
71
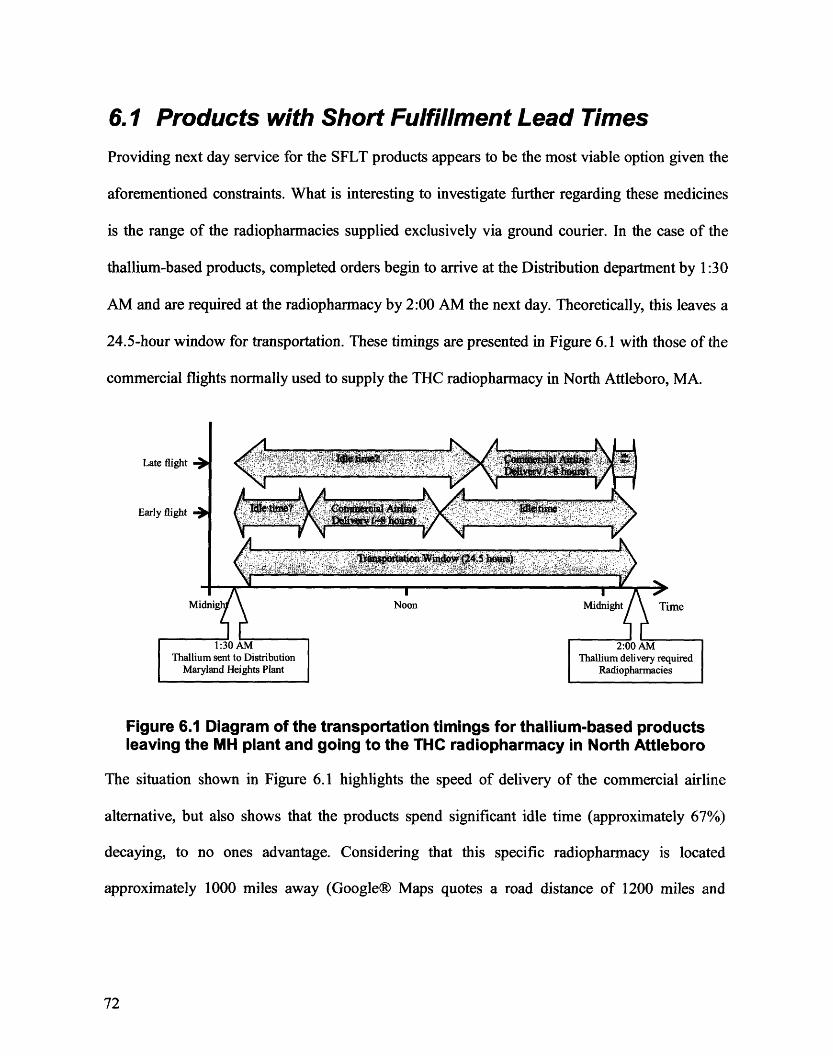
6.1 Products with Short Fulfillment Lead TimesProviding next day service for the SFLT products appears to be the most viable option given the
aforementioned constraints. What is interesting to investigate further regarding these medicines
is the range of the radiopharmacies supplied exclusively via ground courier. In the case of the
thallium-based products, completed orders begin to arrive at the Distribution department by 1:30
AM and are required at the radiopharmacy by 2:00 AM the next day. Theoretically, this leaves a
24.5-hour window for transportation. These timings are presented in Figure 6.1 with those of the
commercial flights normally used to supply the THC radiopharmacy in North Attleboro, MA.
Late flight
Early flight ->
40;~~W,"-..
Midnig Noon Midnight Time
1:30 AM 2:00AMThallium sent to Distribution Thallium delivery required
Maryland Heights Plant Radiopharmacies
Figure 6.1 Diagram of the transportation timings for thallium-based productsleaving the MH plant and going to the THC radiopharmacy in North Attleboro
The situation shown in Figure 6.1 highlights the speed of delivery of the commercial airline
alternative, but also shows that the products spend significant idle time (approximately 67%)
decaying, to no ones advantage. Considering that this specific radiopharmacy is located
approximately 1000 miles away (Google® Maps quotes a road distance of 1200 miles and
72
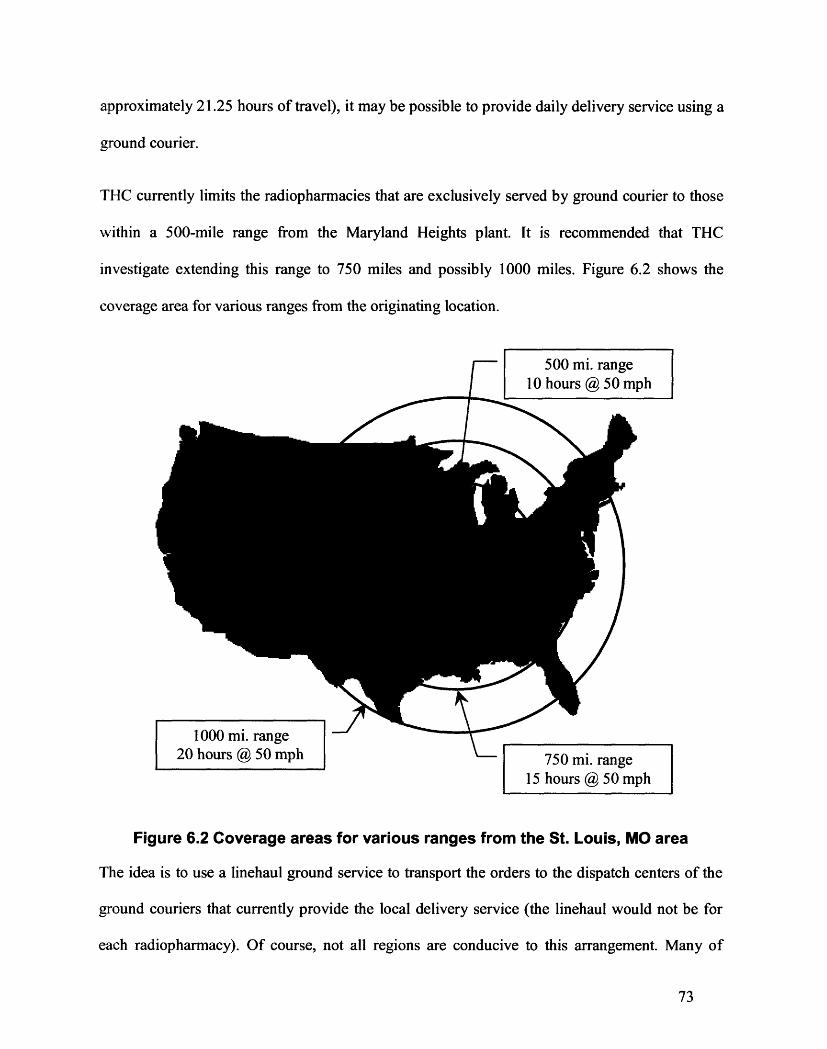
approximately 21.25 hours of travel), it may be possible to provide daily delivery service using a
ground courier.
THC currently limits the radiopharmacies that are exclusively served by ground courier to those
within a 500-mile range from the Maryland Heights plant. It is recommended that THC
investigate extending this range to 750 miles and possibly 1000 miles. Figure 6.2 shows the
coverage area for various ranges from the originating location.
1000 mi. range -
20 hours @ 50 mph 750 mi. range15 hours @ 50 mph
Figure 6.2 Coverage areas for various ranges from the St. Louis, MO area
The idea is to use a linehaul ground service to transport the orders to the dispatch centers of the
ground couriers that currently provide the local delivery service (the linehaul would not be for
each radiopharmacy). Of course, not all regions are conducive to this arrangement. Many of
73
·
I - -.... I z IL
I Ad
them are located beyond the 1000-mile range and would still need to be serviced by air-mode
alternatives (FedEx Express, commercial airline or chartered aircraft). Other issues including
whether daily ground transportation service is available or not and rules for driver hour of
service would still need to be resolved. The production schedule of the other SFLT products
would also have to be adjusted to suit the transport departure times. Furthermore, to respond to
same day Demand orders, a late-afternoon flight on a commercial airline could be used.
From the analysis presented in Chapter 5, it is estimated that approximately $50 per order could
be saved when shipping to Dallas, TX (650 miles, 11.5 hours away (Googleg Maps)). Likewise,
it is estimated that approximately $40 per order could be saved when shipping to Orlando, FL
(1000 miles, 19.5 hours away (Google® Maps)). These estimates include an allowance of
approximately $10-28 dollars for the Demand orders.
6.2 Products with Long Fulfillment Lead TimesFor LFLT products, using a combination of optimized inventory levels, demand forecasting from
the radiopharmacies and an increased initial radioactivity of the medicines, it may be possible for
the radiopharmacies to only require replenishment via the weekly ground courier delivery.
Increasing the initial radioactivity of the LFLT products may be another strategy to reduce
THC's transportation costs especially for those product families with a shorter shelf-life, i.e.,
those based on gallium and indium. For example, consider the gallium citrate injection with a
nominal radioactivity of 13.2 mCi. Increasing the shelf life by 4 days incurs a cost of $18.37 per
injection (considering an initial radioactivity of 55.0 mCi, a decay rate of 0.88% and a raw
material cost of $0.25/mCi). Therefore, for a cost differential of approximately $100 per package
74
between shipping via commercial airline or ground courier, an order would have to be larger than
5 injections for the commercial airline alternative to be more economical.
Another option to reduce transportation costs of the LFLT nuclear medicines would be to use
THC's own radiopharmacies as regional distribution centers. This way, Demand orders could be
fulfilled not by expensive air freight from the Maryland Heights plant, but by using the quick and
relatively inexpensive in-house delivery service of THC's radiopharmacies (note that some of the
Demand orders for SFLT products could also be fulfilled in this manner).
Convincing THC's customers to optimize their inventory levels and improve their forecasts is
probably not an easy task considering they have little to gain from it. These objectives could also
be performed by THC if the radiopharmacies were willing to share sales data. This may be
difficult to achieve as well considering the customer is often also the competitor. Convincing
THC's own radiopharmacies would probably by an easier task. This change would be especially
beneficial if the radiopharmacies were used as regional distribution centers since it would then
become possible to aggregate demand for an entire region. This would make forecasting more
accurate, resulting in lower safety stock levels and thus lower inventory costs.
6.3 Optimal Use of Chartered AircraftsCompared to the commercial airline alternative, chartered flights have the advantage of a flexible
schedule that can be adjusted by THC. An analysis could be made to determine the optimal
departure times. On one hand, it appears advantageous to delay the flights as much as possible to
increase the probability of placing late Demand orders on them. On the other hand, if the flights
left earlier, the delivery range for the ground couriers could be extended.
75
For example, a single charter may be able to serve both the San Francisco and Los Angeles
regions if it landed early enough and somewhere in between; San Diego is approximately a 7 to 9
hour drive away from San Jose. Holding delivery costs to the radiopharmacies constant, the daily
savings would be approximately $1900, the cost of a chartered flight. The cost of shipping an
order by commercial airline to the Los Angeles region is approximately $57 (see Table 4.6), not
including the radiopharmacy delivery fee. Therefore, as long as there are fewer than 34 Demand
orders ($1900/$57) that can be included in a later departure flight, it is advantageous to have the
charter leave sooner. While these calculations provide an estimate of the potential daily savings
for a single region, other factors have to be considered, including whether the aircraft would
have enough capacity for all the orders.
6.4 Radiopharmacy DeliveriesThe fee to deliver orders from a region's gateway to a radiopharmacy is a significant contributor
to the total cost of transportation (see Table 4.6). Though the cost data did not clearly reflect this
fact, one can intuitively surmise it is best to maximize the order-to-delivery ratio. Unfortunately,
the quantity of orders is not something easily controllable by a Distribution department.
However, in THC's case, the quantity of deliveries is something that can potentially be adjusted.
It is recommended THC investigate the possibility of limiting the amount of deliveries to once
per day per radiopharmacy. For all but expedited delivery cases, the ground courier could be
asked to hold orders until they have all been received for the day (i.e., after the arrival of the last
flight in). For example, in the case of the THC radiopharmacy in North Attleboro, it receives
orders from commercial airline flights in the afternoon and in late night (around 12:30 AM).
Savings could be achieved if the orders were only delivery once, when the late shipment arrives.
76

Of course, this would only be feasible if the nuclear medicine was only required by the
radiopharmacy in the early AM.
77

7 Conclusion
7. 1 Constraints
Of the many constraints Tyco Healthcare faces when choosing transportation alternatives for the
distribution of its nuclear medicine, five stand out as most critical: product decay must be
minimized; an alternative must be available to provide same-day order fulfillment; orders must
be delivered early, typically before 3:00 AM; hazardous good restrictions (i.e., the
Transportation Index) limit the quantity of orders that can be placed on a commercial flight and;
total costs must be minimized.
Products based on the iodine 123, technetium and thallium isotopes require delivery within
approximately one day of manufacturing to minimize costly decay. Products based on the
chromium, gallium, indium, iodine 131, phosphate and xenon isotopes are less time sensitive and
may be delivered within a few days of manufacturing, some within a few weeks. However,
THC's customers typically prefer to receive the freshest possible product because it allows them
to extract more doses from a unit.
THC's customers (radiopharmacies), need their orders in the early AM in order to meet their
delivery requirements to their customers (hospitals, clinics, ...).
79
7.2 Transportation Costs
An analysis of the transportation costs from the manufacturing plant in MH to the Dallas, Los
Angeles and Orlando regions showed that the ranking of the transportation alternatives by cost
was dependent on the region served. For the Dallas region, the order (from least to most
expensive) was: ground courier, FedEx Express, commercial airline and chartered aircraft.
Comparatively, when shipping to the Los Angeles region, FedEx Express is less expensive than
ground courier due to the relative high per-pound charge of the latter alternative (hypothetically
$1.35/lb compared to $0.10/lb for all other regions - true costs have been masked). For the
Orlando region, the chartered aircraft alternative is less expensive than the commercial airline,
on average, by approximately $60 per order. This difference is due to the loading factor of the
airplane. Since the charter service provider charges on a per-flight basis regardless of loading, it
becomes advantageous to use this alternative when shipping approximately more than 38 orders
per day to a given region.
The cost analysis also confirmed the benefit of consolidating orders when shipping by
commercial airline. This practice should be maximized to the extent allowable by regulations.
7.3 Distribution AlternativesWhen analyzing the possibility of using the ground courier or FedEx Express alternatives to ship
all goods, it was found that the additional raw radioactive material costs incurred to compensate
for even a single day of decay (approximately $38M per year in additional raw material) far
outweighed the savings associated with these scenarios. However, if THC were to follow Bristol-
Myers Squibb's policy of not compensating for the extra day of decay of the Tc-based products,
saving of approximately 33% or 10%, respectively, could be achieved. Studying a scenario
80
involving the shifting of all commercial airline service to chartered aircraft service revealed that
significant savings could be achieved (up to $19 per order for the Dallas region) due to the
increased loading of the chartered aircrafts. The caveat with these strategies is that they curtail
same-day order fulfillment in some, if not all, regions.
7.4 RecommendationsUnder the current manufacturing schedule, there exists a relatively long delay (in terms of
perishable goods) between the time a product is ready for distribution and the time an order is
needed at a customer's facility. In the case of Tl-based products, this window is up to 24.5 hours
long. It is recommended that the possibility of extending the range of pharmacies served by a
ground courier service from 500 to 750 miles or even 1000 miles be further investigated. The
savings are estimated to be in the order of $50 per order to the Dallas region and $40 per order to
the Orlando region even if the cost of using the commercial airline alternative to fulfill same-day
order requests is factored in.
Shifting the production of the 1-123, Tc and T-based products to a few hours earlier, thus
increasing the time available for distribution, would further support the usage of ground
transportation. A trade-off analysis would have to be made to compare the cost of decay and the
increase in range of the ground courier alternative.
Products based on Cr, Ga, In, I-131, P and Xe have a lower sales volume and a longer shelf-life
(ranging from 7 to 85 days) than those based on 1-123, Tc and T. Using optimized inventory
levels, demand forecasting from the radiopharmacies and minimal increase in initial radioactivity
of the medicines, it could be possible for the radiopharmacies to only require replenishment via a
weekly ground courier delivery. Optionally, to further reduce transportation costs of these
81
products, it is recommended THC investigate using its own radiopharmacies as regional
distribution centers. Demand orders could then be fulfilled not by expensive air freight from the
Maryland Heights plant, but by using the quick and relatively inexpensive in-house delivery
service of the radiopharmacies. This option has the added advantage of aggregating demand for
the entire region, thus improving the forecast accuracy which results in lower safety stock levels
and lower inventory costs.
Under a weekly delivery system, inventory levels would only have to be checked once per week
(periodic review). The "order up-to" inventory level would be calculated using the Base Stock
model. The costs for such a policy would have to be compared to a policy where the longer
shelf-life products are shipped with the shorter shelf-life products, i.e., more frequently. It may
turn out that conducting a daily check of inventory (continuous review) with its associated
economic order quantity and lower safety stock levels may be less expensive particularly if
decay costs are taken into consideration.
Determining an appropriate inventory policy (continuous review vs. weekly shipments) would
have to be made by region and should consider all transportation alternatives available. For
example, if a region is served by chartered flights, the cost of adding packages to shipments is
minimal compared to a region only served by commercial airline. In this case, continuous
inventory review would probably be advantageous.
Chartered flights have the added advantage of an adjustable schedule. It is recommended that the
departure time of each route be attentively studied. Within the constraints of this transportation
alternative, there exists a time that maximizes the savings associated with having a flight leave
later or earlier. Delaying has the advantage of increasing the probability of placing same-day
82
orders on the flight whereas having a flight leave earlier allows for a larger region to be served
by the ground courier that delivers orders from the gateway airport to the radiopharmacies.
Another possible cost saving measure would be to limit the deliveries to radiopharmacies to one
per day (currently, multiple deliveries per day to a given radiopharmacy are a common
occurrence). For all but expedited delivery cases, the ground courier contracted to provide the
service could be asked to hold orders until they have all been received for the day (i.e., after the
arrival of the last flight in).
Finally, as a last cost saving consideration, it is recommended THC investigate shifting the
Thursday production to Friday. Currently, the Maryland Heights plant shuts down production
every Friday. The Thursday production is shipped, by ground courier/linehaul, on Friday for
Sunday delivery to most radiopharmacies since there is little demand for Saturday deliveries. If
the plant shut down on Thursday, produced on Friday and shipped via the regular distribution
network on Saturday, it would be possible to save on the decay costs incurred when shipping
over two days.
83

BibliographyCullinane, K. and Toy, N. (2000), "Identifying Influential Attributes in Freight Route/Mode
Choice Decision: A Content Analysis", Transportation Research Part E, pp. 41-53.
Federgruen, A., Prastacos,G. and Zipkin, P.H. (1986), "An Allocation and Distribution Model
for Perishable Products", Operation Research, Vol. 34, No. 1, pp. 75-82.
Hurter, A. P. and Van Buer M.,G. (1996), "The Newspaper Production/Distribution Problem",
Journal of Business Logistics, Vol. 17, No. 1, pp. 85-107.
Liberatore, M.J. and Miller, T. (1995), "A Decision Support Approach For Transportation
Carriers and Mode Selection", Journal of Business Logistics, Vol. 16, No. 2, pp. 85-115.
Nahmias, S. (1982), "Perishable Inventory Theory: A Review", Operation Research, Vol. 30,
No. 4, pp. 680-708.
Tyco Healthcare (2006), private conversations with company managers and analysts.
Yang, X. (2006), "Choosing Transportation Alternatives for Highly Perishable Goods", Master's
Thesis, School of Engineering, MIT.
85
Related Documents