Logistics Clusters: Prevalence and Impact by Liliana Rivera M.S. Environmental B.A. Economics, Universidad de Los Andes, Colombia, 2003 Economics, University of Maryland - Universidad de Los Andes, Colombia, 2004 M. Eng. Supply Chain Management and Logistics, MIT, 2010 Submitted to the Engineering Systems Division in partial fulfillment of the requirement for the degree of Doctor of Philosophy at the Massachusetts Institute of Technology June 2014 © Massachusetts Institute of Technology. All rights reserved Signature redacted Signature of Author............... .......................................................................................... Engineering Systems Division June1,2014 Certified b y Signature reaactea ...... ............................................................................. /V Yossi Sheffi Elis-/a Gra /Professor Engineering Systems and Civil and Environmental Engineering Thesis Supervisor Certified h Sianature redacted y ................ ..... ............... ........ ........ Karen Polenske Peter de Florez Professor of Regional Political Economy Department of Urban Studies and Planning ..................................................... Signature redacted y .............. Accepted by............. Si~ Lisa D'Ambrosio Research Scieptist, MIT AgeLab Qinature redacted ................................................................... ..... Roy Welsch Profe!or of Statistics and Management Science and Engineering Systems Signature redacted Richard Larson Mitsui Professor of Engineering Systems Chair, Engineering Systems Division Education Committee MASSACHUSETTS INS1fftE OF TECHNOLOGY JUN 19 2014 LIBRARIES

Welcome message from author
This document is posted to help you gain knowledge. Please leave a comment to let me know what you think about it! Share it to your friends and learn new things together.
Transcript
Logistics Clusters: Prevalence and Impactby
Liliana Rivera
M.S. EnvironmentalB.A. Economics, Universidad de Los Andes, Colombia, 2003Economics, University of Maryland - Universidad de Los Andes, Colombia, 2004M. Eng. Supply Chain Management and Logistics, MIT, 2010
Submitted to the Engineering Systems Divisionin partial fulfillment of the requirement for the degree of
Doctor of Philosophy
at theMassachusetts Institute of Technology
June 2014© Massachusetts Institute of Technology. All rights reserved
Signature redactedSignature of Author............... ..........................................................................................
Engineering Systems DivisionJune1,2014
Certified by Signature reaactea...... .............................................................................
/V Yossi SheffiElis-/a Gra /Professor Engineering Systems and Civil and Environmental Engineering
Thesis Supervisor
Certified h Sianature redactedy ................ ..... ... ..... .. .. ........... ........
Karen PolenskePeter de Florez Professor of Regional Political Economy Department of Urban Studies and Planning
..................................................... Signature redacted
y ..............
Accepted by.............
Si~
Lisa D'AmbrosioResearch Scieptist, MIT AgeLab
Qinature redacted................................................................... .....Roy Welsch
Profe!or of Statistics and Management Science and Engineering Systems
Signature redactedRichard Larson
Mitsui Professor of Engineering SystemsChair, Engineering Systems Division Education Committee
MASSACHUSETTS INS1fftEOF TECHNOLOGY
JUN 19 2014
LIBRARIES

2
Logistics Clusters: Prevalence and Impact
by
Liliana Rivera
Submitted to the Engineering Systems Divisionin partial fulfillment of the requirement for the degree of
Doctor of Philosophy
Abstract
Governments around the world are investing significant resources in the development and expansion oflogistics clusters. This dissertation analyzes the cluster phenomenon focusing on four topics. First, itdevelops a methodology to identify clusters and applies it to the context of the US. By analyzing the caseof logistics clusters, this thesis contributes to a more general debate in the industrial clusters literature:while many authors see industrial clusters growing, others see them dispersing. Evidence of increasingconcentration of the logistics industry in clusters in the US over time is tested and documented. Inaddition, some evidence that logistics activities in counties inside clusters show higher growth than incounties outside clusters is found.
Second, this thesis studies the relationship between freight accessibility and logistics employment in theUS. It develops an accessibility measure based on a gravity model, focusing on four different modes oftransportation: road, rail, air, and maritime. Using a Partial Least Squares model, these four differentfreight accessibility measures are combined into two constructs, continental and intercontinental freightaccessibility, and then analyzed against logistics employment. Results show that highly accessiblecounties attract more logistics employment than other counties. The analyses also show that it isimportant to control for the effect of population, since it explains the most variation in the logisticsemployment across counties.
Third, this dissertation also analyzes the benefits of logistics clusters, possibly explaining their continuousgrowth and wide popularity among both private agents and policy makers during the last decade. Usinginterview data and grounded theory, four major driving forces that may explain their growing presence areidentified: collaboration, value added services, upward mobility and job creation at different levels.
Finally, using a quantitative approach this thesis analyzes two major effects of agglomeration on firmslocated within logistics clusters: more collaboration and the provision of more value added services. Usingsurvey data and structural equation modeling these hypotheses are tested using information from theZaragoza (Spain) Logistics Cluster. The results show that companies located in logistics clusters docollaborate more and offer more value added services than companies that are not agglomerated.
Thesis Supervisor: Yossi SheffiTitle: Elisha Gray 11 Professor of Engineering Systems and Civil and Environmental Engineering
3

4

Acknowledgments
I want to thank my advisor Prof. Yossi Sheffi for his help and unlimited support over the last 4 years.Yossi's patience, feedback and confidence in me made this dissertation possible. I admire his endlesscreativity and his ability to always give the right advice.
I thank my committee members Karen Polenske, Lisa D'Ambrosio and Roy Welsch for their valuablecomments and suggestions. Karen reminded me that perseverance is a key part of a PhD and life ingeneral. Lisa was always there encouraging me to continue, and Roy asked questions that improved thequality of this thesis.
I also want to thank Fran Van den Heuvel and Jan Fransoo from Technische Universiteit Eindhoven.Frank was a visiting student at MIT-Center for Transportation and Logistics -CTL in the fall of 2011, weworked together during his stay in Cambridge. This enriching collaboration led to Chapter 2 of thisdissertation. Jan was a visiting Professor at CTL and his advice was key for me to get on track with mydissertation.
I am grateful to people at the CTL, especially to Edgar Blanco and Bruce Arntzen, who were my firstconnections to MIT. Edgar was also my thesis advisor during the Master is Supply Chain Management inmy first year at MIT. Their insight has always been valuable.
I benefited from conversations with Roberto Perez-Franco, about qualitative methods for research (andabout life); and with Basak Kalkaci, Shardul Phadnis and Tony Craig about the content and quality of myresearch.
I want to thank the Zaragoza Chamber of Commerce and Zaragoza Logistics Center for their invaluablehelp in conducting the survey for chapter 4.
Last but not least, I thank my family for their unconditional love and support. My parents who have alwaysbeen there for me (even from far away), my husband Andres who has always believed in me and madethis PhD journey possible, and my son Gabriel Emilio who literally gave me the last kicks I needed tofinish this dissertation.
S

6
Table of Contents
1. Introduction ................................................................................................................................. 131.1. W hy study logistics clusters?..................................................................................................... 131.2. Research questions..........................................................................................................................14
1.2.1. Agglom eration of logisticsfirms.......................................................................................... 141.2.2. Im pact of the agglom eration of logistics firm s............................................................. 15
1.3. Outline..................................................................................................................................................16
2. Logistics agglom eration in the US .................................................................................... 172.1. Introduction ....................................................................................................................................... 172.2. Industrial and Logistics Clusters............................................................................................ 182.3. Exploratory research ...................................................................................................................... 192.4. Identifying Clusters..........................................................................................................................212.5. M odel....................................................................................................................................................22
2.5.1. Data .................................................................................................................................................... 252.6. Results: Cluster Identification.................................................................................................. 26
2.6.1. Comparison of the results with those of other methods ............................................. 282.7. Results: Trends and Dynam ics............................................................................................... 30
3. Relationship between freight accessibility and logistics employment in UScounties ................................................................................................................................................. 33
3.1. Introduction ....................................................................................................................................... 333.2. Relationship between accessibility and employment ..................................................... 343.3. Accessibility m easures ................................................................................................................... 363.4. Freight accessibility measures for logistics establishments in the US....................... 37
3.4.1. Gravity-based accessibility m easures ............................................................................... 383.4.2. Road accessibility .......................................................................................................................... 383.4.3. Air, m aritim e, and rail accessibility.................................................................................. 39
3.5. Accessibility of US counties and the relation to logistics.............................................. 403.5.1. M aterial used .................................................................................................................................. 403.5.2. M ethodology.................................................................................................................................... 433.5.3. Results................................................................................................................................................ 4 5
4. The benefits of logistics clusters....................................................................................... 494.1. Introduction ....................................................................................................................................... 494.2. Industrial Agglom eration Literature ..................................................................................... 50
4.2.1. Industrial clusters benefits......................................................................................................... 504.2.2. Logistics clusters............................................................................................................................ 514.2.3. Assum ptions ..................................................................................................................................... 52
4.3. M ethods ............................................................................................................................................... 524.3.1. Sam ple ............................................................................................................................................... 524.3.2. Data collection................................................................................................................................ 554.3.3. Data analysis................................................................................................................................... 55
7
4.4. Results ................................................................................................................................................ 614.4.1. Operational advantages from collaboration ................................................................ 614.4.2. Value added services .................................................................................................................... 6 24.4.3. Upw ard m obility ............................................................................................................................ 624.4.4. Job grow th at m ultiple levels ............................................................................................. 63
5. Impacts of agglomeration on logistics firms................................................................ 655.1. Introduction ....................................................................................................................................... 655.2. Collaboration and logistics clusters..................................................................................... 665.3. Value added services and logistics clusters ....................................................................... 675.4. The m odel ........................................................................................................................................... 68
5.4.1. Collaboration m easures.............................................................................................................. 685.4.2. Value added services m easures........................................................................................... 695.4.3. Impact of location and company size on collaboration and value added services70
5.5. D ata collection...................................................................................................................................725.6. D escriptive analysis.........................................................................................................................735.7. M odel estim ation and results.................................................................................................. 78
6. Con clusions .................................................................................................................................. 8 16.1. Further research...............................................................................................................................82
R eferences......................................................................................................................................... 119
8
List of Figures
2.1 Determ ination of LEP Cutoff Value................................................................................................ 25
2.2. Number of logistics clusters considering different critical values, 2008.....................................26
2.3 U S Logistics Clusters 2008..................................................................................................................27
2.4 Logistics Clusters and Free Trade Zones in the US.........................................................................28
2.5. Concentration of Logistics activities using LQ, 2008...................................................................29
2.6. Concentration of Logistics activities using HCLQ, 2008.............................................................29
2.7. U S Logistics Clusters, 1998 ................................................................................................................. 30
3.1. Impedance function used, based on primary range of operations of US trucks and an average
sp eed of 55 m iles p er hour........................................................................................................................39
3.2. Top 50% counties based on logistics employment..........................................................................41
3.3. Measurement and structural model with gravity-based accessibility measures......................45
3.4. Model with gravity-based accessibility measures............................................................................46
3.5. Interaction effects based on standardized coefficients and constructs.....................................48
5.1. Structural Equation Model of the relationship between logistics clusters with collaboration and
valu e added services.............................................................................................................. ................ 68
5.2. Population and sample distributions by sector............................................................................73
5.3. Scatter plots of collaboration construct indicators and establishment size............................76
5.4. Scatter plots of frequency of value-added services and establishment size................................77
5.5. Scatter plots of importance of value-added services and establishment size............................77
5.6. SEM results...................................................................................... ............ ... --....................------ 79
9

10
List of Tables
3.1. Descriptive statistics of US counties............................................................................................. 42
3.2. Pearson correlation coefficients.................................................................................................... 42
3.3. Item weights of the gravity-based accessibility measures on the accessibilityconstructs............................................................................................................................................................46
4.1. Interviews Sam ple..............................................................................................................................53
4.2. Developm ent of Coding Categories.........................................................................................................................56
4.3. Benefits of Logistics Clusters.............................................................................................................57
5.1. Descriptive statistics of indicators................................................................................................ 74
5.2. Descriptive statistics of construct indicators outside the logistics cluster................................ 75
5.3. Descriptive statistics of construct indicators inside the logistics cluster.................................. 75
11

12
Chapter 1
Introduction
The introduction of this dissertation contains three sections. The first provides the context for the thesisand explains the motivation. The second presents the research questions and the third explains theoutline.
1.1. Why study logistics clusters?
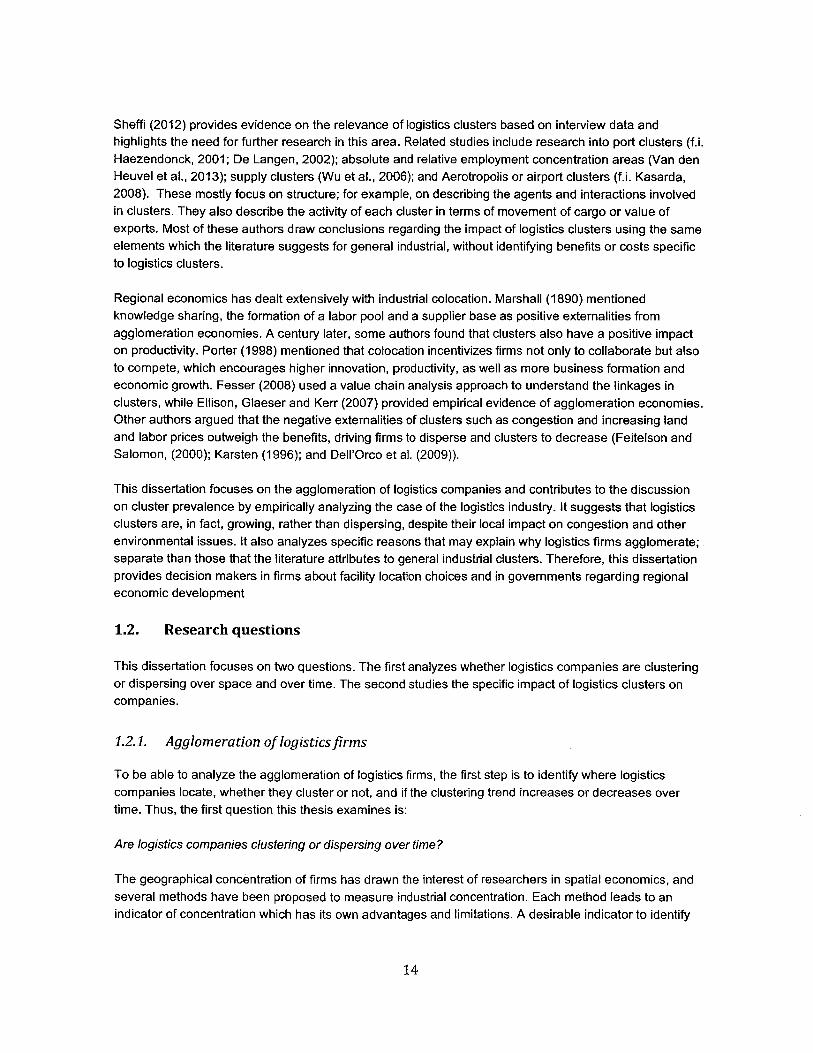
Logistics agglomerations defined as the geographical concentration of logistics-related activities are agermane (and popular) subject among logistics firms and policy makers all over the world. Places likeSingapore, Los Angeles, Rotterdam, Chicago, Zaragoza, Santos, and many others are large clustersattracting many logistics activities. Anecdotal evidence suggests that they are advantageous in terms ofconnections to other locations worldwide, availability of labor, collaboration among firms, and transportaccessibility. Policy makers are also interested in logistics clusters because of their positive impact onregional economic growth (Rollins et al., 2011). However, there is a lack of empirical evidence to showthe extent and magnitude of this phenomenon.
Many governments are investing considerable resources to either develop or expand logistics hubs'.These investments are driven by the expectation of positive impacts on the economy. For example,Panama has a five-year plan with an expected investment of more than $2 billion to position the countryas the logistics hub for the Americas. Part of the expected returns in value added services include US$1.5billion along with the creation of over 30,000 direct and indirect jobs by 2020. Similarly, the Dallaslogistics hub is being developed with over $500 million invested in the surrounding areas. A significantshare of this investment (25%) comes from public sources. The hub is expected to create over 60,000direct and indirect jobs with an estimated economic impact of more than $60 billion for the region by2035.
The importance of logistics agglomerations is even higher because of globalization. Logistics clusters arethe nodes of the global supply chains. These clusters comprise intermodal and multi-modal facilities withefficiencies in of transportation and storage that allow for freight consolidation. As globalizationaccelerates, these efficiencies are likely to attract even more cargo to logistics clusters and do so morefrequently, allowing for lower costs and better levels of service (Sheffi, 2012).
Despite the growing importance of logistics clusters for both companies and regional governments, thereare scant studies in the logistics and supply chain literature referring specifically to this phenomenon.
1 In this thesis cluster, hub and agglomeration both refer to the geographical concentration of logistics firms.
2 The content of this chapter has also been presented in Rivera et al. (2014).3 The content of this chapter has also been presented in Van den Heuvel et al. (2014). Besides Liliana Rivera andYossi Sheffi this paper was coauthored by Fran Van de Heuvel, Peter de Langen, Jan Fransoo, Karel van Donselaar,and Ad de Jong from the Eindhoven University of Technology.
13
Sheffi (2012) provides evidence on the relevance of logistics clusters based on interview data andhighlights the need for further research in this area. Related studies include research into port clusters (f.i.Haezendonck, 2001; De Langen, 2002); absolute and relative employment concentration areas (Van denHeuvel et al., 2013); supply clusters (Wu et al., 2006); and Aerotropolis or airport clusters (f.i. Kasarda,2008). These mostly focus on structure; for example, on describing the agents and interactions involvedin clusters. They also describe the activity of each cluster in terms of movement of cargo or value ofexports. Most of these authors draw conclusions regarding the impact of logistics clusters using the sameelements which the literature suggests for general industrial, without identifying benefits or costs specificto logistics clusters.
Regional economics has dealt extensively with industrial colocation. Marshall (1890) mentionedknowledge sharing, the formation of a labor pool and a supplier base as positive externalities fromagglomeration economies. A century later, some authors found that clusters also have a positive impacton productivity. Porter (1998) mentioned that colocation incentivizes firms not only to collaborate but alsoto compete, which encourages higher innovation, productivity, as well as more business formation andeconomic growth. Fesser (2008) used a value chain analysis approach to understand the linkages inclusters, while Ellison, Glaeser and Kerr (2007) provided empirical evidence of agglomeration economies.Other authors argued that the negative externalities of clusters such as congestion and increasing landand labor prices outweigh the benefits, driving firms to disperse and clusters to decrease (Feitelson andSalomon, (2000); Karsten (1996); and Dell'Orco et al. (2009)).
This dissertation focuses on the agglomeration of logistics companies and contributes to the discussionon cluster prevalence by empirically analyzing the case of the logistics industry. It suggests that logisticsclusters are, in fact, growing, rather than dispersing, despite their local impact on congestion and otherenvironmental issues. It also analyzes specific reasons that may explain why logistics firms agglomerate;separate than those that the literature attributes to general industrial clusters. Therefore, this dissertationprovides decision makers in firms about facility location choices and in governments regarding regionaleconomic development
1.2. Research questions
This dissertation focuses on two questions. The first analyzes whether logistics companies are clusteringor dispersing over space and over time. The second studies the specific impact of logistics clusters oncompanies.
1.2.1. Agglomeration of logisticsfirms
To be able to analyze the agglomeration of logistics firms, the first step is to identify where logisticscompanies locate, whether they cluster or not, and if the clustering trend increases or decreases overtime. Thus, the first question this thesis examines is:
Are logistics companies clustering or dispersing over time?
The geographical concentration of firms has drawn the interest of researchers in spatial economics, andseveral methods have been proposed to measure industrial concentration. Each method leads to anindicator of concentration which has its own advantages and limitations. A desirable indicator to identify
14
and define logistics clusters should: i) identify the concentration of activities, ii) indicate where thatconcentration is located iii) give a sense of the size of the concentration in the geographic area, iv)guarantee that the concentration is due to the presence of external economies of scale, v) work with theavailable data, and vi) be replicable.
The Location Quotient (LQ) method is the most commonly used indicator for identifying clusters(Polenske, 2003) because it requires little data. It is defined as the ratio of a particular industry's share ina geographical area's employment (say, a metropolitan area or a county) and that industry's share ofemployment in a larger reference area (in many cases the whole country). Thus, this index providesinformation about the relative weight of a particular industry's employment in a geographical area (relativeto the reference area). However, the LQ does not provide information regarding the absolute size of theindustry and it does not guarantee that concentration is due to external economies of scale. The absolutesize of the industry is relevant because LQ is a fraction, and the same result could be obtained througheither a large numerator or a small denominator. Also, an increase in an industry's LQ does notnecessarily imply the industrial cluster grows, since this could also be due to the reference area
dispersing. According to Forslid (2002, p. 287), "The differing sizes of the regions make relative indices aless attractive choice as a measure of industrial concentration." In addition, the LQ does not account for
the difference between a single large firm in a region and a set of multiple firms. Thus, it does notdistinguish whether the concentration of an activity is due to internal or external economies of scale.
To address these problems, this dissertation proposes a method that combines two indicators: theHorizontal Clustering Location Quotient (HCLQ), which solves the first problem related to the magnitudeof concentration, and the Logistics Establishments Participation (LEP), which solves the second problemregarding the presence of external economies of scale. This method is applied to the US because of theavailability of data at a low level of geographical aggregation, specifically at the county level.
1.2.2. Impact of the agglomeration of logisticsfirms
Economic literature has mentioned the benefits of colocation. These externalities include knowledgesharing, the formation of a labor pool and a supplier base, and increments in productivity and innovation.Other authors have identified additional benefits in industrial clusters. For example, Appold (1995)mentioned that being close to competitors expands a firm's market area and encourages new businessformation. Boari (2001) showed that the spatial agglomeration of firms generated spillovers of knowledge,technology and managerial practices.
Although there are many studies about the impact of clusters in industries such as information technology(f.i. Moulaert and Djellal, 1995; Globerman et al., 2005; Huber, 2012; Angel, 1991; Fallick et al., 2006;Grondeau, 2007), there are only a few references looking at the impact of the agglomeration of logisticsfirms and their conclusions are not similar. Sheffi (2012) claims that the colocation of logistics companieshas specific impacts on companies and employees, which is in addition to the impact observed in generalindustrial clusters. Interview data suggest that these benefits attract logistics firms to both new andestablished clusters. However, other authors claim that there are no benefits of logistics clusters and theyhave negative impact on society. Morgan (2012) states that the geographical concentration oftransportation, distribution and logistics companies does not provide benefits to companies or regions.Berechman (1994) says the agglomeration of logistics firms generates negative externalities, like
transport congestion, which encourage firms to disperse rather than locate inside a cluster.
15
The impact of the logistics agglomeration is studied in this thesis, by using qualitative and quantitativemethods in order to contribute to the discussion and to provide information to firms and policy makersrelevant in their decision making processes. Thus, the second question this dissertation analyzes, basedon the answer to the first question, is:
What are the consequences for logistics firms (from clustering)?
The results of this thesis agree with those of Sheffi (2012). Logistics clusters encourage morecollaboration and value added services for logistics firms, higher levels of upward mobility for employeesand employment creation for economic regions. These benefits are specific to the logistics sector and donot extend to other sectors.
1.3. Outline
This thesis has two parts related to the two research questions: 1. Are logistics companies clustering ordispersing over time? and 2. What are the consequences for logistics firms? Each part comprises twochapters (See Appendix 1.A for a graphic summary of the dissertation).
In the first part, chapter 2 analyzes the prevalence of logistics clusters by looking specifically at the caseof the United States. Based on interviews and exploratory research the hypothesis that logisticscompanies are clustering and that this phenomenon is growing over time is analyzed. Then a two-indicator method to identify logistics clusters is introduced, aiming to satisfy the six conditions posed insection 1.1. This method is applied to the US, using county level data for the logistics sector (in terms ofemployment and establishments) in 1998 and 2008. The results show that the growth of logisticsoperations between 1998 and 2008 was higher in counties located inside the identified clusters than incounties outside of them.
Chapter 3 explores the relationship between freight accessibility and logistics employment. Using thesame data, gravity based accessibility measures (road, air, maritime and rail accessibility) at the countylevel are developed. Then, a partial least squares model is used to analyze the relationship. The resultsdemonstrate a positive correlation between freight accessibility and logistics employment at the countylevel in the US, even after controlling for the effect of county population.
In the second part, chapter 4 investigates the specific benefits of logistics clusters, using survey methodsto gather data (135 interviews) and grounded theory to analyze it. Results suggest that agglomeratedlogistics firms enjoy more opportunities to collaborate and offer value added services, and that logisticsclusters also seem to increase upward mobility for employees and create more logistics jobs at differentlevels. Chapter 5 analyzes the extent of collaboration and the provision of value added services inlogistics clusters. Using data from a survey conducted in the Zaragoza logistics cluster in Spain and astructural equation model, the thesis shows that agglomerated logistics firms enjoy higher levels ofcollaboration and value added services than firms located outside logistics clusters.
Finally, chapter 6 presents the conclusions and opportunities for further research.
16
Chapter 2
Logistics agglomeration in the US 2
2.1. Introduction
Governments around the world are investing significant resources in the development of new and theexpansion of existing logistics clusters, all of which are central nodes of the global freight transportationnetwork. They are motivated, in large part by a job creation agenda. For instance, the Government ofArag6n in Spain invested over E680 Million to develop Plataforma Logistica - Zaragoza (PLAZA), thelargest logistics park in Europe and the core of the Aragon logistics cluster. Panama is in the process ofdeveloping significant logistics clusters at both ends of the canal as part of the strategy to position thecountry as the center for trade and logistics for the Americas (Council of the Americas, 2011; Governmentof Panama, 2010). While new logistics hubs are being developed, existing clusters are expanding in scaleand scope. These include major ones such as Singapore, Rotterdam, Duisburg (Germany), Dubai,Santos (Brazil), and multiple US locations such as New York, Miami, Chicago, Dallas/Ft Worth, Memphis,Louisville and Los Angeles.
Logistics can be broadly defined as the group of functions associated with production, design, andmarketing, which include "...transportation, warehousing and facilities planning, and location"(Kasilingman, 1998). These activities add value to companies' supply chain and increasecompetitiveness.
The logistical need to move material, parts, and products into manufacturing, distribution and retaillocations creates the (derived) demand for freight transportation. To this end, efficient transportationoperations are crucial for efficient logistics since transportation costs are a relevant part of the retail price(Xu and Hancock, 2004). Also, the pressure to time-compress logistical operations and provide high levelof service gives transportation a central role in logistics (Groothedde, 2005; Stank and Goldsby, 2000).Furthermore, as stated by Rodrigue and Hesse (2006) "...the role of transportation is considered morethan a mere support to the mobility of freight within global commodity chains, but an integral part of thevalue generation process."
Dozens of interviews all around the world suggest that logistics clusters are growing. This finding is in linewith the many authors who document and explain the advantage of industry agglomeration, or clustering.They cite tacit knowledge exchange, the development of a local supply base, and the availability of aspecialized labor pool (Marshall, 1890; Fesser, 2008; Ellison et al., 2010). Other authors point out that theregions where these clusters reside enjoy high economic growth and a higher rate of innovation and
2 The content of this chapter has also been presented in Rivera et al. (2014).
17
capital formation than regions that do not include clusters (Porter 2000, 2003; Delgado et al., 2010,Benneworth and Henry, 2004). Other researchers, however, claim that negative externalities of clusters,the development of information technologies and the efficiency of global supply chains diminish theadvantages of geographical proximity, leading to dispersion of like-businesses (Caincross, 1997;Polenske 2001, 2003; Henderson and Shalizi, 2001). Also, Feitelson and Salomon (2000) point out to theincreasing congestion in transportation networks that could lead to dispersion of logistics activities.
Although large investments in logistics clusters seem to suggest that policy makers believe in theirpositive effects, and though there are some studies that account for their benefits (see for instanceKasarda, 2008; De Langen, 2002, 2004a; Wu et al., 2006), the prevalence of logistics clusters has notbeen studied yet. This chapter defines logistics clusters, explains their advantages and tests thisprevalence. It then uses a two-factor metric to identify logistics clusters in the US, validating the resultsthrough several approaches. Using data from 1998 and 2008 it provides evidence that logistics activitiesseem to be, in fact, agglomerating rather than dispersing over time.
Section 2.2 reviews the state of the art in clusters research, with an emphasis on logistics, and providessome context for the analysis. Section 2.3 presents findings from exploratory research used to developthe thesis of the chapter. Section 2.4 reviews the methodologies used to identify clusters, while Section2.5 depicts the model and the data used in analysis of the US. Sections 2.6 and 2.7 present the results,including a statistical analysis. Finally Section 2.8 concludes with final observations.
2.2. Industrial and Logistics Clusters
The literature concerning industrial clusters dates back to Marshall (1890), who discusses agglomerationeconomies and enumerates the externalities-based advantages for firms to co-locate. Economistsdistinguish among several types of agglomerations. Marshall (1890), and Weber and Friedrich (1929)discussed external economies of scale, resulting from multiple firms agglomerating geographically, asopposed to internal economics of scale, where a single firm expands its production (see, for exampleIsard and Schooler, 1959). Hoover (1937) defined two types of external economies of scale: urbanizationand localization. Urbanization economies arise when many firms from different industries concentrate inthe same region; localization economies arise when firms from a particular sector locate in the sameregion. This chapter is focused on external economies of scale and localization economies of logisticsfirms and operations.
Porter (1998) summarized the main benefits of industrial clustering as follows: "A cluster allows eachmember to benefit as if it had greater scale or as if it had joined with others formally, without requiring it tosacrifice its flexibility." A related branch of literature argues that clustered firms enjoy not only the benefitsof agglomeration economies (Fesser, 2008; Ellison et al., 2010), but also higher collective learning andtacit knowledge exchange (Keeble and Wilkinson, 2000; Maskell, 2001; Cohen and Fields, 1999; Leamerand Stoper, 2001). Intra-cluster competition drives firms to succeed by increasing their productivity,supercharging innovation, and by stimulating new business formation (Porter, 2000; Delgado et al.,2010). This also results is high economic growth (Baptista, 1998), reinforcing the importance ofgeographical concentration and supporting a continuing clustering trend.
However, several authors argued that the efficiency of supply chains, and advanced communicationstechnologies represent the "end of geography" (O'Brien, 1992) and the "death of distance" (Cairncross,
18
1997). Others point to the negative externalities of clusters such as congestion and higher prices of landand labor, creating incentives for firms to leave clusters (Henderson and Shalizi, 2001; Glasmeier andKibler, 1996; Teubal et al., 1991), as a result of "Dispersion Economies" (Polenske, 2003).
This chapter explores the role of clusters in logistics and transportation. A logistics cluster is defined asthe geographical concentration of firms providing logistics services, such as third-party-logistics (3PL-s),transportation carriers, warehousing providers and forwarders. Naturally, logistics clusters also includesuppliers for such activities, such as packaging manufacturers and transportation maintenance depots.
The academic literature includes only a few articles about logistics clusters with little mention of theirprevalence. Van den Heuvel et al. (2011) studied the logistics industry within three Provinces in theNetherlands, concluding that the concentration of relative and absolute employment in logistics firmsthere has increased in recent years.
The emergence of a logistics cluster depends on the quality of transportation service available in a region(Hong, 2007). Bok (2009) highlighted accessibility and general infrastructure quality as the main factorsaffecting the location preference of firms. Better accessibility typically drives logistics operations to locaterelatively close to each other (Berechman, 1994), as it reduces costs for firms (Rietveld, 1994). Hong(2007) asserted that transportation accessibility is one of the important determinants of location decisionsof foreign logistics firms.
Most of the literature related to logistics clusters is specific to ports or airports and not to the logisticssector in general. Haezendonck (2001), Kink and De Langen (2001) and De Langen (2002, 2004a,2004b) investigated maritime clusters, arguing that, based on their findings, the concentration of maritimeactivities in clusters is likely to increase. This is not surprising as one considers the, more familiar,increased concentration of airlines in "hub fortresses." The economics of hubs for maritime and air freightare similar.
Martin and Roman (2003) document the agglomeration of airfreight carriers in hub airports while Lindsayand Kasarda (2011) developed the concept of "Aerotropolis" - a full urban development around anairport. Interestingly, despite the attraction of airport and port clusters some observations suggest thattheir growth is sometimes constrained by lack of land and environmental regulations. The focus of thischapter, in any case, is on logistics clusters in general, many of which are not focused on either a port oran airport.
Finally, Wu et al. (2006) argue that China's economic advantage goes beyond labor costs, and can beexplained, in large measure, by the presence of "supply clusters." These clusters provide all the logisticsservices needed for the management of global supply chains. They add: "the large number of supplyclusters formed in China in recent years has contributed significantly to the nation's manufacturingcompetitiveness."
2.3. Exploratory research
During 2010 and 2011 the author conducted 135 interviews as part of an exploratory research with actors
in and around logistics clusters, resulting in three main findings relevant to the work reported in thischapter. First, these interviews suggest that logistics companies are clustering and those clusters are
19
growing. Second, Governments play a key and necessary role in logistics clusters' development. Andthird, logistics clusters attract transportation carriers who build their networks around such clusters.
A description of the methodology of data collection through interviews and the analysis of this qualitativedata is beyond the scope of this chapter and is the subject of chapter 4. In summary, the first stage wasexploratory and consequently open interviews were used to collect data. In the second stage more datawas gathered through semi structured interviews to confirm the initial findings (Babbie, 2010). Theinterviews were conducted in existing logistics clusters in Singapore, the Netherlands (Amsterdam andRotterdam), Germany (Duisburg and Frankfurt), Spain (Zaragoza), Panama (Panama City and Colon),Dubai, Brazil (Campinas and Santos - both in the State of Sao Paulo), Cartagena (Colombia), and theUS (New York, Miami, Chicago, Dallas/Ft Worth, Memphis, Louisville and Los Angeles). The data wasanalyzed using grounded theory tools (Glaser and Strauss, 1967; Glaser, 1978), and following Charmaz(2006). The process included coding and clustering analysis to organize the data, as well as an evolvingrevision of the categories and results.
The interview data suggest a consensus on the advantages of logistics clusters for companies andregional economies. As many researchers point out, lower cost may not be the only reason why a firmselects a particular location (see, for example, Castells 1996, DiPasquale and Wheaton 1996, Porter2001, Polenske 2003). Just as important, if not more, is the high-level of transportation services.
Sheffi (2010) summarizes the transportation cost and service advantages of logistics clusters, includingeconomies of scope, scale, and density; better service, and liquidity. Economies of scope arise due to thepresence of many shippers, helping the balance of movements in and out of the cluster, minimizingequipment idle time and empty repositioning moves. Economies of scale result from lower costs while theconcentration of logistics operations in the cluster produces higher freight volumes, allowing carriers touse larger conveyances and enjoy higher utilization. Economies of density arise because the larger thenumber of companies in the cluster, the more efficient pickup and delivery operations get. Better level ofservice result from the higher freight volume leading to higher frequency of services as well as moredirect services in and out of the logistics cluster. Finally, liquidity or price stability is the result of manyshippers located in the same geography, served by many transportation carriers, thus minimizingsituations of short-term mismatch between demand and equipment availability.
These advantages create a positive feedback loop rooted mainly in the economics of transportation: asmore firms join the cluster, transportation costs go down and service improves, which in turn attracts morefirms to the cluster, further reducing costs and improving transportation services.
In addition, the interviews suggest that companies in logistics clusters share equipment, lease space toeach other for short-term surges and lulls in activity; and work effectively together when a logisticscontract is moved from one provider to another. Cluster companies also have more weight in lobbying thelocal government, which in the case of logistics clusters the focus is typically on improved infrastructureand regulatory relief.
While many authors studying other industrial clusters (mainly high technology ones) argue that the role ofgovernment in their development and growth is minimal (OECD, 2001; Wadhwa, 2010), government is amajor player in logistics clusters. This is due not only to the significant transportation infrastructurerequirements of such clusters, but also due to the need for a favorable regulatory, tax, and trade policyenvironment. The interviews suggest that government interest in logistics clusters is, not surprisingly,
20
primarily driven by the potential benefits for the local economy with an emphasis on jobs. Interestingly,they are also viewed - mainly in the US - as a vehicle for "economic justice" based on "professionalmobility": providing starting jobs that pay better than the hotel or the agricultural industries to employeeswithout high level education, and allowing them to be promoted from within as this industry values "on thefloor experience" in its executives.
The interview data suggest that the major investments that are going into new and existing logistics
clusters will go on, and that these clusters are growing (not dispersing); this is the basic hypothesisexplored statistically in this chapter.
2.4. Identifying Clusters
Before tackling the question whether US logistics operations are clustering or dispersing, one needs toidentify the location of concentrations of logistics activities. Even by itself such identification can be ofvalue; it can help firms identify sites to set up distribution activities. Governments using this information
can identify competing regions that can then be used to benchmark effective policies (infrastructure,regulation, and administrative efficiency, among others) for success of logistics clusters.
Several of the most common indices employed to measure industry geographical concentration includethe Location Quotient (LQ), Horizontal Clustering Location Quotient (HCLQ), Locational Gini Coefficient(LGC), Herfindahl-Hirschman Index (HHI), and the Ellison-Glaeser Index (EGGCI). Appendix 2.A containsthe formal definition of these indices.
Location Quotient (LQ) has widely been used in economic geography and regional economics since the1940s (Miller et al., 1991). In fact, it was used by De Langen (2004a) in his analysis of maritime clusters.This technique has remained popular in large part because it requires relatively little data (Isserman,1977). LQ is the ratio of employment share of the industry of interest in the area of interest and theemployment share of that industry in a reference area (which is typically the country).
Some of the studies that have used this technique include Paige and Nenide (2008) in their analysis ofthe agglomeration trends in the Central San Joaquin Valley in California; Braunerhjelm and Carlsson(1999) who set to identify cluster activity and its evolution in Ohio and Sweden; Held (1996), whoaddressed the question about the State's participation in generating economic development through acluster approach in the Hudson Valley of New York; and others (Zook, 2000 and Malmberg and Maskell,2002).
A value of the LQ greater than one suggests a higher than average share of employment in an industry ofinterest in a given area. Although this index provides information about the relative weight of a particularindustry's employment in a geographical area (relative to a reference area), it does not provide
information regarding the absolute size of the industry (Feser et al., 2002).
To correct this issue, Fingleton et al. (2004) proposed the Horizontal Cluster Location Quotient (HCLQ),which weighs LQ values with an indicator of magnitude, such as the local area share of nationwide jobs ina given industry. It thus takes into account both the relative and absolute local importance of the industry
under study. HCLQ is the number of jobs in the local industry that exceeds the number that would
produce LQ = 1 (Ratanawaraha and Polenske, 2007). An example is found in Echeverri-Carroll and Ayala
21
(2010). They analyze wage differentials caused by the agglomeration of high-tech companies in certaincities of the United States. Using the HCLQ they suggest that clustering is the key factor behindinnovation flows, knowledge spillovers and other cooperative linkages among firms.
Two additional measures of industry clusters include the Locational Gini Coefficient (LCG) and theHerfindahl-Hirschman Index (HHI). The former was proposed by Krugman (1991) to examine regionalincome disparities, based on the Gini coefficient used widely in studies of income inequality and poverty(see for example, Chakravarty, 1990; Lambert, 1989; Atkinson and Bourguignon, 2000). The LGC is anumber that captures the distribution of employment in an industry across geographic areas, relative tothe distribution of total employment. It signals the relative concentration pattern of employment in acertain economic sector in a given area in relation to other sectors in the same area.
The HHI is defined as the aggregation of the industrial shares of all areas in a region, usually the country(Kim et al., 2000). It measures the extent to which a given industry is distributed throughout a largenumber of sub-areas (say, counties or other geographical sub-units).
Neither the LCG nor the HHI are aimed at identifying logistics (or any other) clusters. They measureindustry concentration in a country (or other reference area), but do not provide information on where theconcentration is located within that reference area. As such these indices are not considered further inthis chapter (they are defined, though in Appendix 2.A).
The main criticism of the LQ and HCLQ indices (and also of the LGC and HHI), is that, being based onemployment, they do not account for the difference between a single large firm in a region and a set ofmultiple firms, that is, "they do not distinguish whether the concentration of an activity is due to internal orexternal economies of scale" (Ratanawaraha and Polenske, 2007).
One of the most sophisticated methods to measure the degree of spatial concentration of firms is theEllison-Glaeser Index (EGGCI), which "eliminates the effect of the random distribution of establishmentson firms' locations by comparing the estimated spatial HHI for a given industry to the expected value ofHHI" (Li, 2006). However, the application of this measure is limited due to the extensive datarequirements and its sensitivity to the geographic units used. Additional limitations are rooted in thedifficulty of comparing the value of the index at the international level, because of the different sizesamong regions and countries (Ratanawaraha and Polenske, 2007). Consequently this index is alsoomitted from further discussion.
2.5. Model
A desirable indicator for identifying and defining logistics clusters should: i) identify the concentration ofactivities, ii) indicate where that concentration is located iii) give a sense of the size of the concentration inthe geographic area, iv) guarantee that the concentration is due to the presence of external economies ofscale, v) work with the available data, and vi) be replicable.
To tackle this challenge, this approach described here combines two indicators: the Horizontal ClusteringLocation Quotient (HCLQ) and a newly defined Logistics Establishments Participation (LEP) index. HCLQidentifies both the location and magnitude of the concentration of logistics activities. The LEP guaranteesthat the concentration is due to the presence of external economies. Both indices require a minimum
22
amount of available data (employment and establishment data), which in the US is available at the countylevel, from government statistics, thus allowing for replication. A cluster in this study is defined as a
county with concentration of logistics activities or several adjacent counties with such concentration.
HCLQ is defined as:
HCLQ 1 = Ej - E
Where:
E = Number of employees in the logistics industry in county j, and
E,= Expected number of logistics employees in county j, which is calculated as the number of logistics
jobs in the county that would produce a Location Quotient equal to one.
HCLQj > 0 implies that county j has a higher concentration of employment in the logistics industry than
the country as a whole. The magnitude of the concentration is indicated by the absolute value (extra
number of logistics employees in the county).
Since the objective here is to identify logistics clusters, there is a need to have not only concentration oflogistics employment, but also external economies of scale. This is particularly important since, asHenderson (2003) reports, activity at small and medium firms contributes significantly to external
economies of scale. Thus, this chapter introduces a Logistics Establishments' Participation (LEP) index,representing the share of the countrywide logistics establishments that a county has. It is defined asfollows:
es1LEPj ES
ES
Where:
esj = Number of logistics establishments in county j, and
ES = Number of logistics establishments in the country.
The larger the LEP of a given county, the larger is the number of logistics establishments located in the
county. A cutoff value of 0.1% was chosen. It implies that to be considered a cluster, a region has to haveat least 0.001 of the logistics establishments of the nation (in addition to HCLQ>0). This cutoff value waschosen using the known group validity method (Babbie, 2010) shown below. The rationale for and theeffects of the choice of the LEP cutoff value are shown in Section 2.6. The process leading to theparticular value of 0.1% can be summarized as follows:
1. Known clusters - Data from reports and interviews with experts in the logistics industry from the MITCenter for Transportation and Logistics, the Harvard Institute for Strategy and Competitiveness andthe Indiana Business Research Center were used to draw a list of seven known logistics clusters inthe US today. This list included Los Angeles, Chicago, Memphis, Louisville, Miami, Houston and NewYork/New Jersey.
23
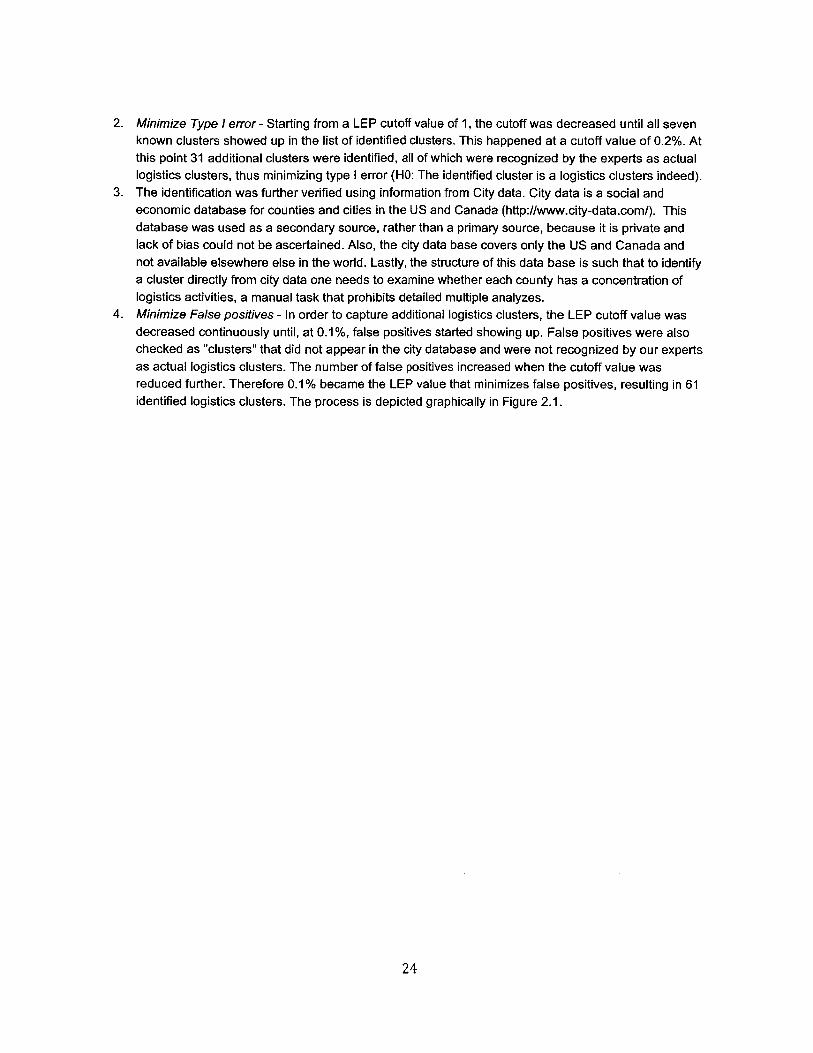
2. Minimize Type / error - Starting from a LEP cutoff value of 1, the cutoff was decreased until all sevenknown clusters showed up in the list of identified clusters. This happened at a cutoff value of 0.2%. Atthis point 31 additional clusters were identified, all of which were recognized by the experts as actuallogistics clusters, thus minimizing type I error (HO: The identified cluster is a logistics clusters indeed).
3. The identification was further verified using information from City data. City data is a social andeconomic database for counties and cities in the US and Canada (http://www.city-data.com/). Thisdatabase was used as a secondary source, rather than a primary source, because it is private andlack of bias could not be ascertained. Also, the city data base covers only the US and Canada andnot available elsewhere else in the world. Lastly, the structure of this data base is such that to identifya cluster directly from city data one needs to examine whether each county has a concentration oflogistics activities, a manual task that prohibits detailed multiple analyzes.
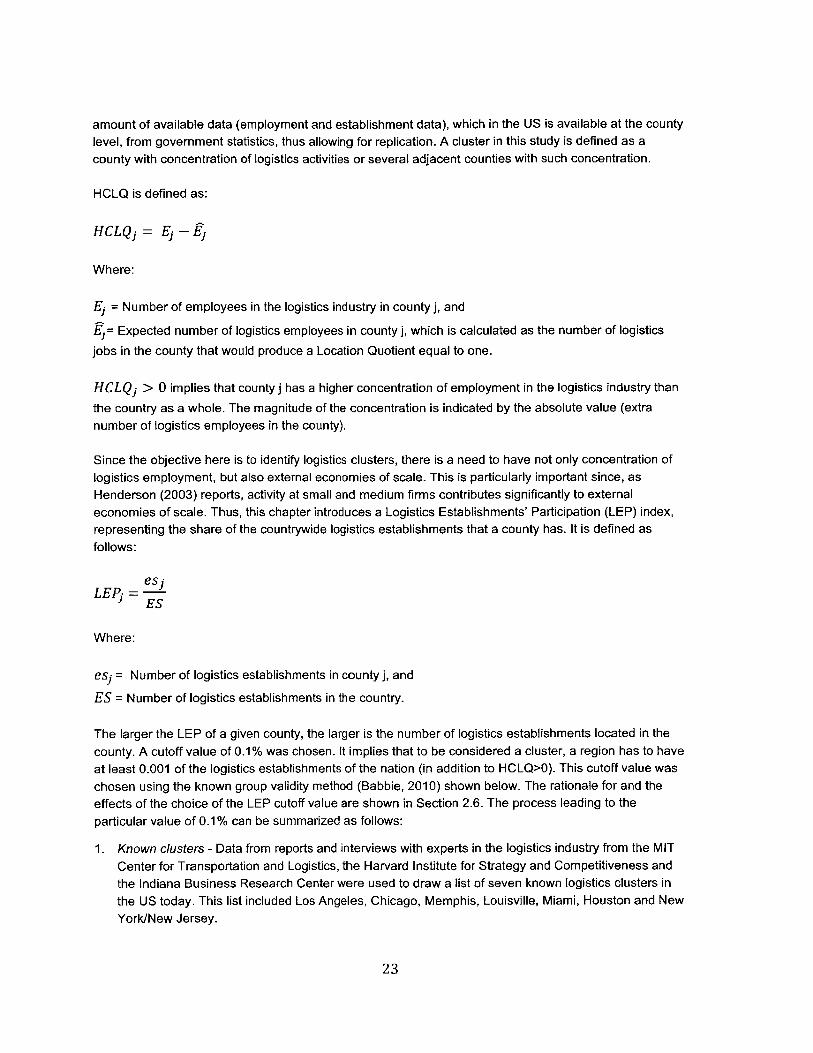
4. Minimize False positives - In order to capture additional logistics clusters, the LEP cutoff value wasdecreased continuously until, at 0.1%, false positives started showing up. False positives were alsochecked as "clusters" that did not appear in the city database and were not recognized by our expertsas actual logistics clusters. The number of false positives increased when the cutoff value wasreduced further. Therefore 0.1% became the LEP value that minimizes false positives, resulting in 61identified logistics clusters. The process is depicted graphically in Figure 2.1.
24
False Positives
200
180
160
140
S120
100S 80 - - -..... -. -.
6 80 ---- -- ------
40
200
LEP Values
Figure 2.1 Determination of LEP Cutoff Value
2.5.1. Data
The data consisted of employment and establishments at the county level for 3,095 US counties
25
Logistics Clusters300
250
200
150
S100
50
0
LEP Values
Known clusters
7
6
5
I'4
1
0
LEP Values
0 6 v 1 143
Irlo, Iz,
(excluding those of Hawaii, Alaska and Puerto Rico), based on the North American Industry ClassificationSystem (NAICS). Six-digit classification was used, based on the County Business Patterns (CBP) andStatistics of U.S. Businesses (SUSB) from the U.S. Census Bureau. The logistics sector definitionincludes the subsectors depicted in Table 2.B.1 in Appendix 2.B. Even a casual inspection of the datasource reveals the heavy weight of transportation activities in the database.
2.6. Results: Cluster Identification
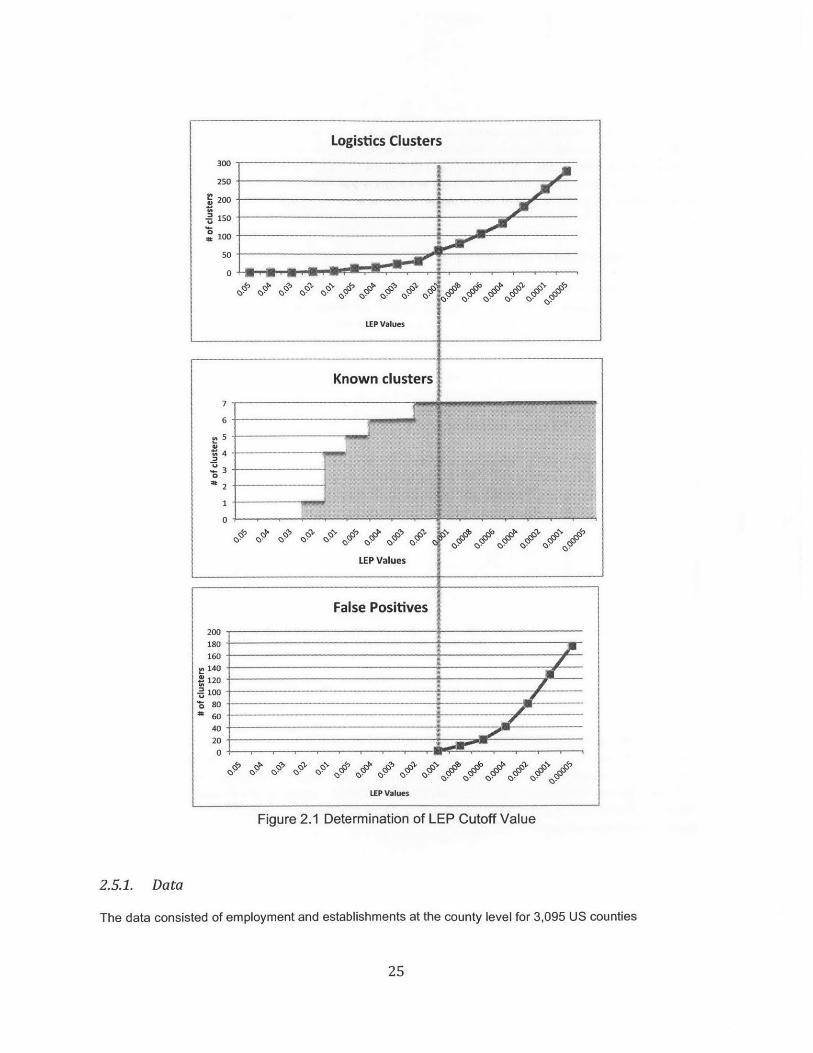
With the data at hand, the sensitivity of the number of clusters identified to the LEP critical value wasexamined, since unlike LQ, LEP does not have a "natural" cutoff value and the process described in thelast section was of our own making. Figure 2.2 depicts the number of logistics clusters (defined as agroup of one or more adjacent counties with HCLQ > 0) as a function of different levels of LogisticsEstablishments' Participation cutoff value (horizontal axis). When choosing a small critical value, thenumber of potential clusters explodes. When choosing a high critical value, the restriction onestablishments (absolute concentration) increases and the number of logistics clusters identified goes tozero. A critical value of 0.1% leads to the inclusion of just over half (51%) of the logistics establishmentsin the US (and 76% of the employment), while identifying 61 clusters (comprising 97 counties).
450400
.~3501
.2 300
'~250 -
200
E 150z 100
s0
Critical values
Figure 2.2. Number of logistics clusters considering different critical values, 2008
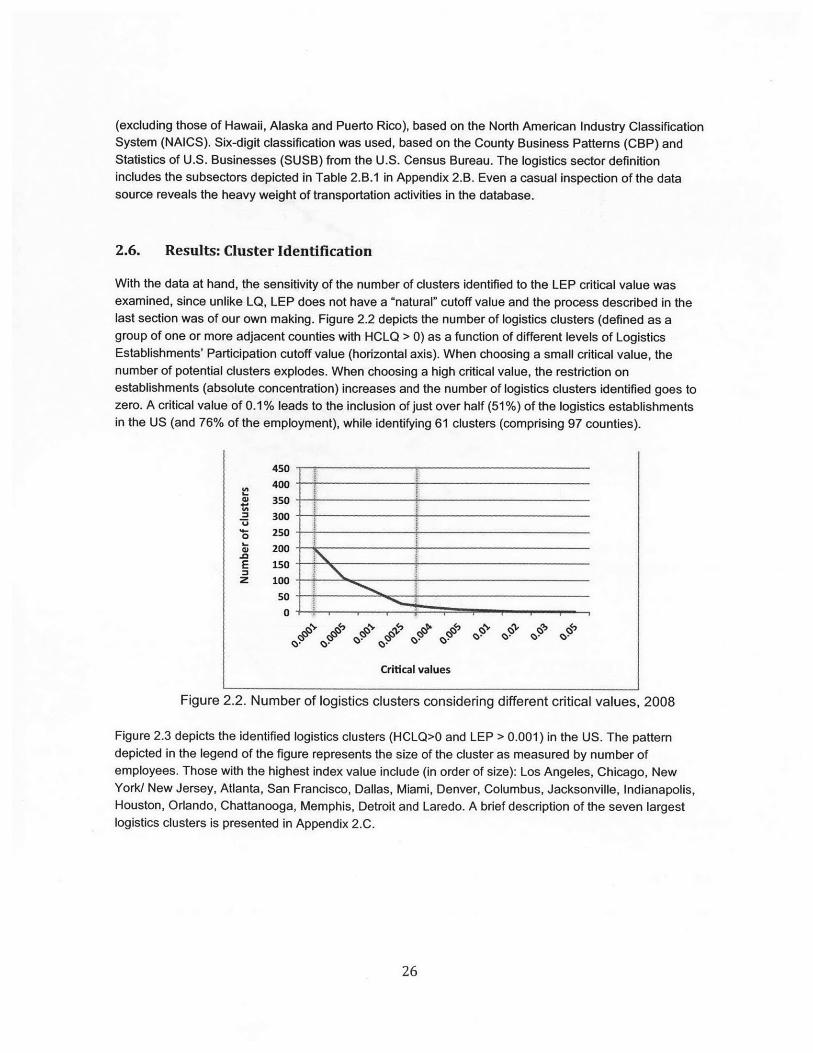
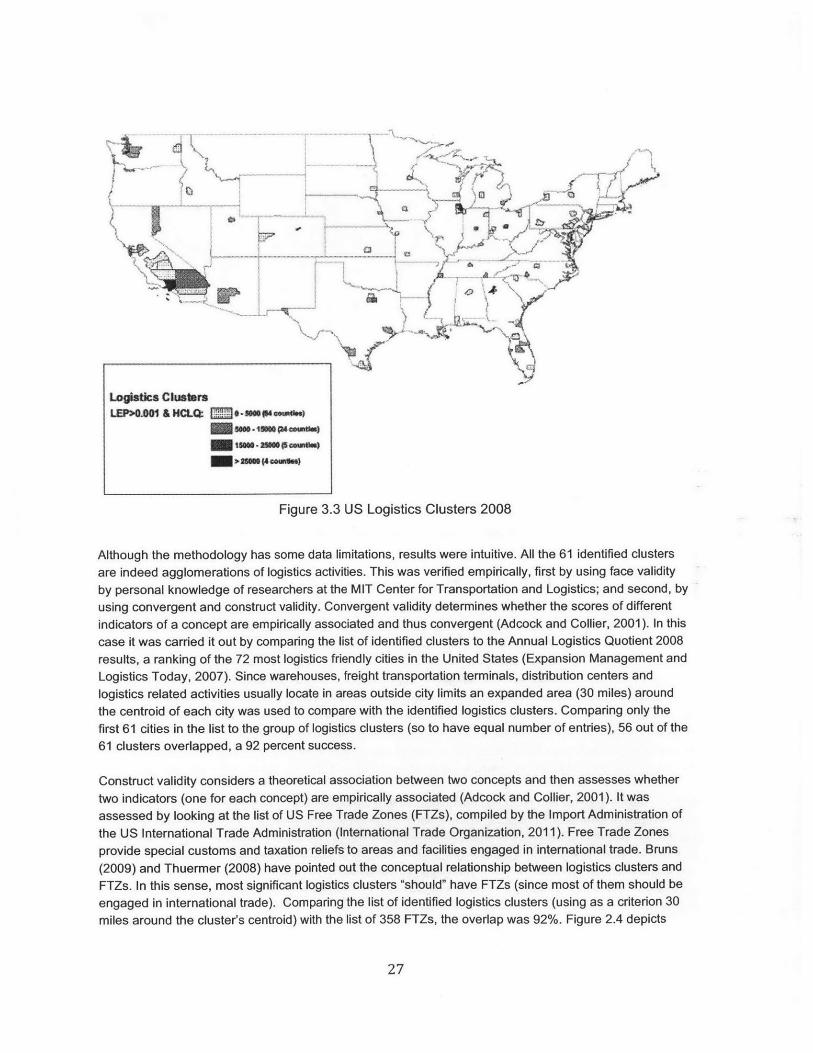
Figure 2.3 depicts the identified logistics clusters (HCLQ>0 and LEP > 0.001) in the US. The patterndepicted in the legend of the figure represents the size of the cluster as measured by number ofemployees. Those with the highest index value include (in order of size): Los Angeles, Chicago, NewYork/ New Jersey, Atlanta, San Francisco, Dallas, Miami, Denver, Columbus, Jacksonville, Indianapolis,Houston, Orlando, Chattanooga, Memphis, Detroit and Laredo. A brief description of the seven largestlogistics clusters is presented in Appendix 2.C.
26
.. ... ... ... ..... ... ... ... .. .. .. .. .. .. .. .. -... .. .. .. ..
.. ..........v-j
I.......
...... ..... .. .. .. .
Wot
Logbtics CatursLEP>O.W1 & HCLQ ---- sumsop*
inRW.1USSM..wmu)
Figure 3.3 US Logistics Clusters 2008
Although the methodology has some data limitations, results were intuitive. All the 61 identified clustersare indeed agglomerations of logistics activities. This was verified empirically, first by using face validity
by personal knowledge of researchers at the MIT Center for Transportation and Logistics; and second, byusing convergent and construct validity. Convergent validity determines whether the scores of differentindicators of a concept are empirically associated and thus convergent (Adcock and Collier, 2001). In this
case it was carried it out by comparing the list of identified clusters to the Annual Logistics Quotient 2008results, a ranking of the 72 most logistics friendly cities in the United States (Expansion Management andLogistics Today, 2007). Since warehouses, freight transportation terminals, distribution centers and
logistics related activities usually locate in areas outside city limits an expanded area (30 miles) around
the centroid of each city was used to compare with the identified logistics clusters. Comparing only the
first 61 cities in the list to the group of logistics clusters (so to have equal number of entries), 56 out of the61 clusters overlapped, a 92 percent success.
Construct validity considers a theoretical association between two concepts and then assesses whether
two indicators (one for each concept) are empirically associated (Adcock and Collier, 2001). It wasassessed by looking at the list of US Free Trade Zones (FTZs), compiled by the Import Administration of
the US International Trade Administration (International Trade Organization, 2011). Free Trade Zones
provide special customs and taxation reliefs to areas and facilities engaged in international trade. Bruns
(2009) and Thuermer (2008) have pointed out the conceptual relationship between logistics clusters and
FTZs. In this sense, most significant logistics clusters "should" have FTZs (since most of them should be
engaged in international trade). Comparing the list of identified logistics clusters (using as a criterion 30miles around the cluster's centroid) with the list of 358 FTZs, the overlap was 92%. Figure 2.4 depicts
27
[
..............
.IL
'Xiw
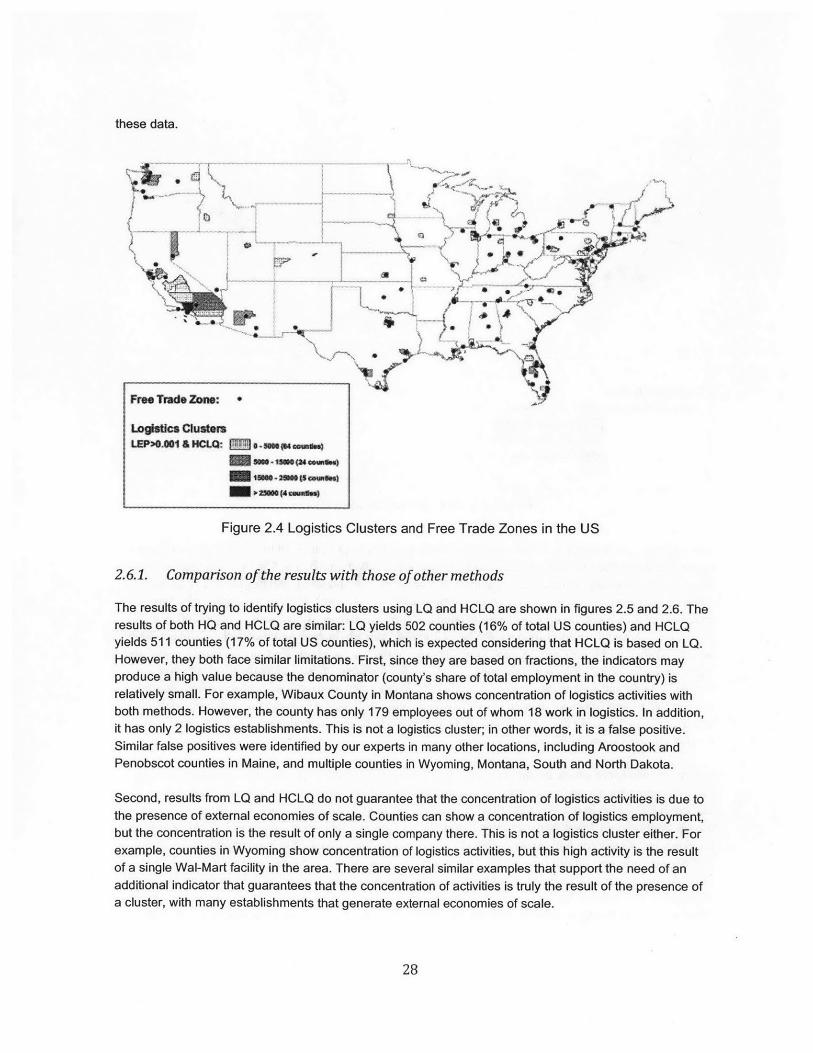
these data.
IFree Trade Zciw:
... ... ... .. .. ........ ...... .. ....................... .
..... ..... .....
...... ...... .. ........ ....... .....#
00 AMR~
.. .... ....- 1
\ aI k'*
Logisoca CluterLEP* 014 HCLQ: I -am#.s *..
= -=Wowman.) II
Figure 2.4 Logistics Clusters and Free Trade Zones in the US
2.6.1. Comparison of the results with those of other methods
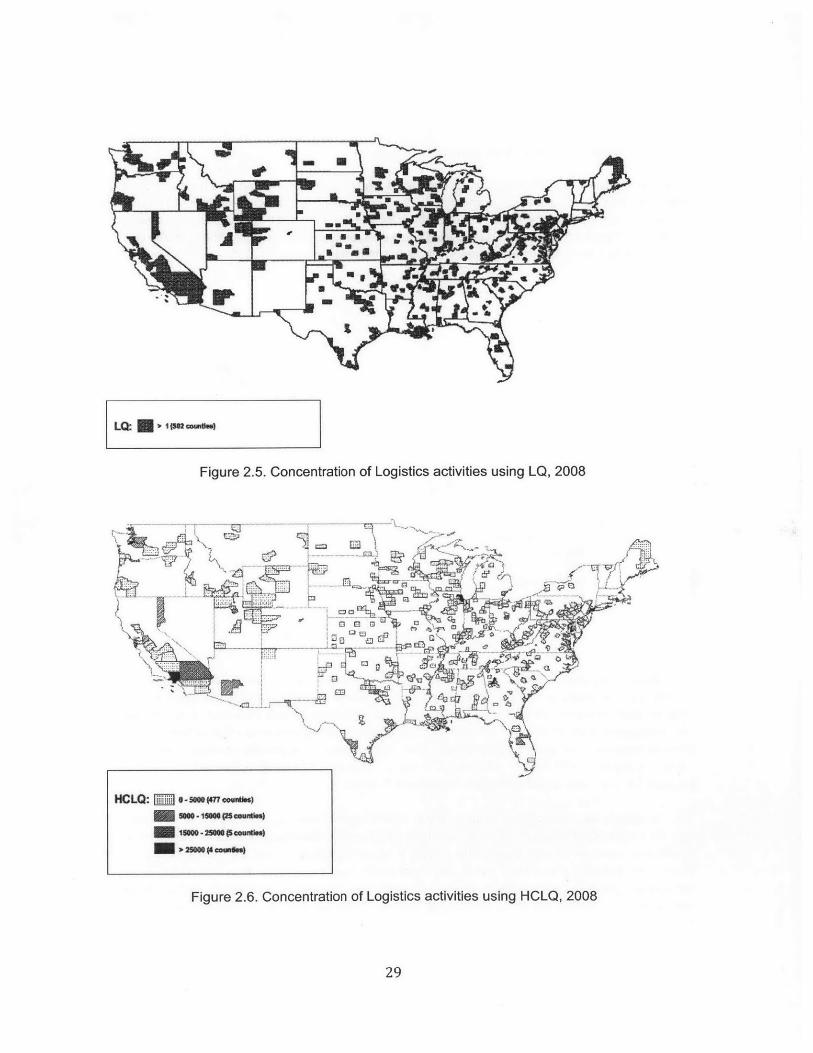
The results of trying to identify logistics clusters using LQ and HCLQ are shown in figures 2.5 and 2.6. Theresults of both HQ and HCLQ are similar: LQ yields 502 counties (16% of total US counties) and HCLQyields 511 counties (17% of total US counties), which is expected considering that HCLQ is based on LQ.However, they both face similar limitations. First, since they are based on fractions, the indicators mayproduce a high value because the denominator (county's share of total employment in the country) isrelatively small. For example, Wibaux County in Montana shows concentration of logistics activities withboth methods. However, the county has only 179 employees out of whom 18 work in logistics. In addition,it has only 2 logistics establishments. This is not a logistics cluster; in other words, it is a false positive.Similar false positives were identified by our experts in many other locations, including Aroostook andPenobscot counties in Maine, and multiple counties in Wyoming, Montana, South and North Dakota.
Second, results from LQ and HCLQ do not guarantee that the concentration of logistics activities is due tothe presence of external economies of scale. Counties can show a concentration of logistics employment,but the concentration is the result of only a single company there. This is not a logistics cluster either. Forexample, counties in Wyoming show concentration of logistics activities, but this high activity is the resultof a single Wal-Mart facility in the area. There are several similar examples that support the need of anadditional indicator that guarantees that the concentration of activities is truly the result of the presence ofa cluster, with many establishments that generate external economies of scale.
28
.4....
LQ E pfauam
Figure 2.5. Concentration of Logistics activities using LQ, 2008
. ........
0'q
CD...... ....
10 C JcP
LVI A
Figure 2.6. Concentration of Logistics activities using HCLQ, 2008
29
HCLQ: M s-sNO 4w7 anmS)- NW-seepwnw
- oeasss.e.- flu-peo-SIs
al
Mason
= 4%
z
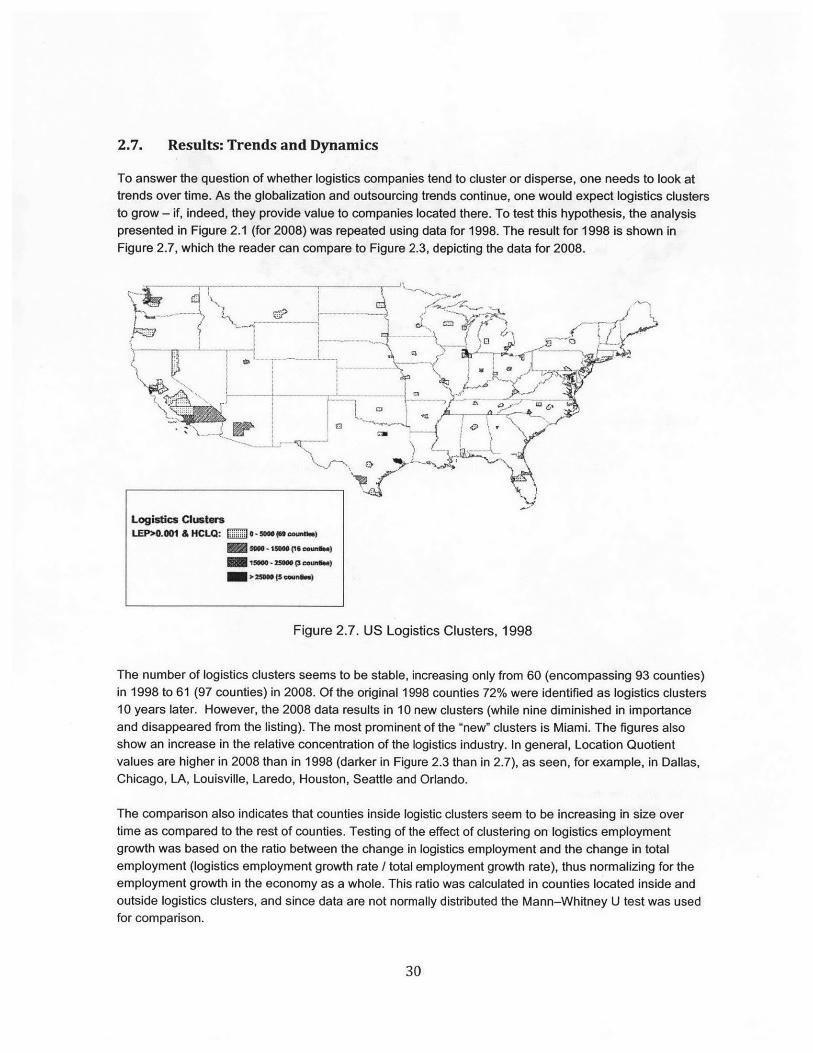
2.7. Results: Trends and Dynamics
To answer the question of whether logistics companies tend to cluster or disperse, one needs to look attrends over time. As the globalization and outsourcing trends continue, one would expect logistics clustersto grow - if, indeed, they provide value to companies located there. To test this hypothesis, the analysispresented in Figure 2.1 (for 2008) was repeated using data for 1998. The result for 1998 is shown inFigure 2.7, which the reader can compare to Figure 2.3, depicting the data for 2008.
LEP> .C-...... ... .
PZZ-7 ~ ~4, .....
Figrei.7.USicgsticlCusstsr99
The number of logistics clusters seems to be stable, increasing only from 60 (encompassing 93 counties)in 1998 to 61 (97 counties) in 2008. Of the original 1998 counties 72% were identified as logistics clusters10 years later. However, the 2008 data results in 10 new clusters (while nine diminished in importanceand disappeared from the listing). The most prominent of the "new" clusters is Miami. The figures alsoshow an increase in the relative concentration of the logistics industry. In general, Location Quotientvalues are higher in 2008 than in 1998 (darker in Figure 2.3 than in 2.7), as seen, for example, in Dallas,Chicago, LA, Louisville, Laredo, Houston, Seattle and Orlando.
The comparison also indicates that counties inside logistic clusters seem to be increasing in size overtime as compared to the rest of counties. Testing of the effect of clustering on logistics employmentgrowth was based on the ratio between the change in logistics employment and the change in totalemployment (logistics employment growth rate / total employment growth rate), thus normalizing for theemployment growth in the economy as a whole. This ratio was calculated in counties located inside andoutside logistics clusters, and since data are not normally distributed the Mann-Whitney U test was usedfor comparison.
30
The Mann-Whitney U test or Wilcoxon rank sum test is a non-parametric statistical hypothesis test used
to assess whether one of two samples of independent observations tends to have larger values than theother (Corder and Foreman, 2009). The test is a non-parametric analog to the independent samples t-test(see e.g. Cooper and Schindler, 2003) and can be used when it cannot be assumed that the dependentvariable is normally distributed (it is only assumed that the variable is ordinal).
Several studies have applied the Wilcoxon Rank Sum Test (WRST) to compare the distribution ofdifferent responses or validate the effectiveness of a policy. In the field of transportation studies, Rosneret al. (2003) points that the WRST is frequently used when comparing measures of location because"...the underlying distributions are far from normal or not known in advance" (Rosner et al., 2003). VanAuken and Crum (1985) used it to study the effect of the motor carrier act of 1980, and Xenias andWhitmarsh (2013) used it to analyze the differences in opinion between two groups (experts and theBritish public) regarding the sustainability of the transportation network.
This approach is more convenient than other tests because "it is easier to enter ranks into a program forparametric analysis than it is to find or write a program for a nonparametric analysis" (Conover and Iman,
1981). When studying clustering effects, the use of parametric techniques tends to underestimate the p-values and reduce the range of the confidence interval, which is why nonparametric techniques arepreferred over the F-tests and t-tests that are sensitive to the non-normality of the data. Sawilowsky(2005) claimed that it is a mistake to choose the t-test over the WRST when the interest is to test the shiftin location parameters, because it can be non-robust. Even if normality assumptions are nearly met bythe data, t-tests have a smaller power than the Wilcoxon rank sum test (De Winter and Dodou, 2010).When the data is non-normal its efficiency can exceed that of the t test by 100% (Meeter, 1968).
The null hypothesis was that there was no difference in the ratio of logistics employment growth to totalemployment growth between counties inside and outside logistics clusters, versus the alternativehypothesis that there was a difference:
HO: (logistics employment growth rate inside logistics clusters
total employment growth rate inside logistics clusters
(logistics employment growth rate outside logistics clusters
\ total employment growth rate outside logistics clusters)
Versus
H: (logistics employment growth rate inside logistics clusters
total employment growth rate inside logistics clusters
(logistics employment growth rate outside logistics clusters
k total employment growth rate outside logistics clusters )
The results suggest that there is a statistically significant difference between the underlying distributionsof employment growth inside and outside logistics clusters (z = -5.962, p = 0.0000). The employmentgrowth inside logistics clusters was higher since the actual rank sums were higher than the expected ranksums under the null hypothesis. Appendix D presents the outputs of the statistical tests using STATA.
31
Due to the importance of external economics to the clustering phenomenon, an additional test examinedthe difference in the ratio between the change in logistics establishments and the change of totalestablishments (to account for changes in the whole economy) between counties located inside andoutside logistics clusters (logistics establishments' growth rate / total establishments growth rate). Theresults show that the null hypothesis of a similar growth rate (z = -2.896, p = 0.0038) can be rejected,leading to a conclusion (with 99% confidence) that there has been a difference in growth. The number ofestablishments inside logistics clusters grew at a higher rate in counties located outside clusters becausethe actual rank sums were higher than the expected rank sums under the null hypothesis (see Appendix2.D).
These tests support the assertion that the growth of logistics operations, in terms of employment andestablishments, was higher for counties located inside the identified clusters between 1998 and 2008,than for counties outside clusters. A comparison of Figure 2.7 to Figure 2.3 is in line with this finding. Asmentioned above, the relative concentration of the logistics industry increased between 1998 and 2008and in general - HCLQ values are higher in 2008. Some existing clusters seem to be expanding even toneighboring counties. That was the case, in particular, in Dallas, Atlanta and Allentown/Harrisburg (PA).For instance, in Atlanta, logistics operations were agglomerated in Chatham and Clay counties in 1998,and ten years later they extended to three additional counties (Decatur, Franklin and Worth). In theAllentown/Harrisburg region the logistics industry was concentrated in York, Luzerne, Lehigh, Lancaster,Delaware and Berks counties in 2008, while this concentration was observed only in York in 1998.Naturally, the decline of logistics activities in some Mid-West areas may be a reflection of the decreasingmanufacturing activities in the US heartland, while the increase in other areas is likely rooted in theincreased cross country trade flows, and in particular, imports.
32
Chapter 3
Relationship between freight accessibilityand logistics employment in US counties 3
3.1. Introduction
One of the key factors to a region's economic performance is a reliable and efficient transportationinfrastructure. "A well-developed transportation system provides adequate access to the region, which inturn is a necessary condition for the efficient operation of the manufacturing, retail, labor, and housingmarkets" (Ozbay et al., 2006, p.3). The accessibility of a location is, naturally, an important factor for thelocation decision of logistics companies (such as third party logistics service providers, warehouses,motor carriers, and the logistics/distribution operations of retailers, distributors and manufacturers). Betteraccessibility results in lower transportation costs and a shorter time to the market (Limbo and Venables,2001), which have a direct impact on the cost and service level that logistics operations enjoy. Therefore,logistics employment is expected to be concentrated in areas that are highly accessible. Hence, it is notsurprising that improvements to the road network significantly affect the location of agglomerations oflogistics firms (Taniguchi et al., 1999), that logistics clusters in the US are primarily developed close tomajor airports and seaports and in central areas such as Chicago, Kansas City and Dallas (Rivera et al.,2014), or that logistics establishments in the Netherlands relocate relatively often in areas with intermodalterminals (Van den Heuvel et al., 2013). This chapter analyzes whether there is a general relationbetween freight accessibility and logistics employment. This topic may be especially relevant givenHesse's (2008) argument that logistics investments may accelerate economic development of areas. Thisargument is also advanced by Sheffi (2012), who demonstrates that logistics clusters attractmanufacturing sub-clusters.
Several studies have found that accessibility is an important factor for urbanization (population andemployment growth, see e.g. Jiwattanakulpaisarn et al., 2010; Song et al., 2012). However, therelationship between freight accessibility and logistics employment has hardly been studied. Such ananalysis requires a measure of freight accessibility. Although freight accessibility is important for locationdecisions of companies (Porter and Rivkin, 2012), limited efforts have been put in developing freightaccessibility measures. This chapter addresses these gaps; a freight accessibility index is developed and
the relationship between freight accessibility and logistics employment is analyzed.
3 The content of this chapter has also been presented in Van den Heuvel et al. (2014). Besides Liliana Rivera andYossi Sheffi this paper was coauthored by Fran Van de Heuvel, Peter de Langen, Jan Fransoo, Karel van Donselaar,and Ad de Jong from the Eindhoven University of Technology.
33
The remainder of this chapter is structured as follows. Section 3.2 presents an overview of the relevantliterature on the relationship between accessibility and employment, while Section 3.3 reviews theacademic literature on accessibility measures. Section 3.4 presents an accessibility measure especiallydeveloped for freight transport. Using data at the county level in the US, Section 3.5 presents the analysisinto the relation between freight accessibility and logistics employment per county, based on a PartialLeast Squares model. Finally, Section 3.6 concludes the chapter and discusses options for furtherresearch.
3.2. Relationship between accessibility and employment
"The more accessible an area is to the various activities in a community, the greater its growth potential"(Hansen, 1959, p.1). Many studies analyze the relationship between accessibility and growth. Thompsonand Taniguchi (2001) argue that the construction of transportation infrastructure (increasing accessibility)leads to employment growth and lower consumer prices of commodities. Weisbrod et al. (1993) foundthat the impact of airport-induced job growth on land use in the vicinity of airports is substantial. Areaswithin four miles of airports added jobs two to five times faster than the overall suburban ring in which theairport is located. Most of the employment was concentrated around the airport or along a major accesscorridor within fifteen minutes of the airport. Jiwattanakulpaisarn et al. (2010) found that increasedaccessibility is a determinant of state employment growth in the service sector. Song et al. (2012)concluded that accessibility is closely linked to industrial agglomerations in the Seoul metropolitan area.Allen et al. (1993) found that accessibility has a significant effect on employment growth rates in centralbusiness districts (CBD) and areas outside the central city (OCC); no significant effect was found in therest of the central city areas (RCC). The research was conducted in the 60 largest Metropolitan StatisticalAreas (MSAs) in the US; MSAs were subdivided in CBDs, RCCs and OCCs.
The effect of accessibility on labor supply is also analyzed thoroughly (see e.g. Hansen, 1959; Banisterand Berechman, 2000; Berechman and Paaswell, 2001; Ozbay et al., 2006; Du and Mulley, 2007). Acommon approach is to assume that individuals allocate their total daily hours between work and nonwork activities. Hence, reduced travel time will result in more time available for both work and leisure timeactivities. Given assumptions on work/leisure time substitution as well as on the income effect fromreduced travel times and costs, improved accessibility has a positive effect on the amount of labor thatindividuals are willing to supply (Ozbay et al., 2006).
In addition, many authors research the relationship between transport infrastructure investments andspatial development (e.g., Rietveld, 1994, Berechman, 1994, Berechmen et al., 2006, and Ribeiro et al.2010). General conclusions are that transport infrastructure investments can both have positive(increased population or gross product) and negative economic impacts (degradation of the region). Fortransport infrastructure investments to positively influence an area's economic growth, transportationshould be an input in the processes of the firms in the area, it should increase accessibility within a well-defined region, and it should not generate significant negative environmental externalities (Berechman,1994). For logistics firms, transport infrastructure definitely is an important input for their activities.Whether accessibility influences the amount of logistics employment per region is evaluated in thischapter.
Chi (2010) shows a positive effect of highway expansion on population change in rural and suburbanareas on a minor-civil division level in Wisconsin, US. In urban areas, there is no effect. In addition, Chi
34
(2012) shows that airport accessibility and highway improvement promote population growth in rural
areas. In suburban areas, airport accessibility promotes population growth, but highway accessibilityfacilitates population flows out of the area. In urban areas, highways and airports have no significanteffect on population growth. Chi (2010, 2012) explains these outcomes by the facilitator role ofinfrastructure. Infrastructure facilitates people to travel from one location to the other, but by itself,infrastructure does not create a comparative advantage when none exists. The reasoning is thatimproved accessibility in rural areas reduces travel time and costs to other regions; in urban areas,infrastructure development reached maturity, meaning that extra investments do not result in growth ordevelopment of the area.
Peez (2004) analyzed the relationship between intermodal network accessibility and the spatialdistribution of economic activities in a sample of east Asian cities with populations of 100,000 persons ormore. The roadway-airway network was used to study this effect. Result show that bivariate analyses intothis relationship provide incomplete pictures: when economic/political effects were accounted for, theinfluence of accessibility on economic activity (measured with population and GDP) vanished.
Other literature investigates the importance of road transport infrastructure in the location decision of
firms. Leitham et al. (2000) researched the importance of road links to location choices of managers ofnewly built industrial premises in the UK. The conclusion is different for different types of relocating firms:firms from within the UK indicate the importance of road links as high, while firms from outside the UKwere found to rate road links as unimportant. Similarly, Hong (2007) researched the influence of roadtransport infrastructure on location decisions of foreign logistics firms in Chinese cities. Again, theoutcomes are different for different types of firms: locations of logistics establishments are less likely to beinfluenced by provincial road transport infrastructure than headquarters and new firms were moreattracted by road transport than mature firms.
This study expands Bowen's (2008) study, in which he correlated the number and growth of warehouseestablishments per US county to accessibility. Based on an analysis in 143 counties part of 50 randomlyselected MSAs, Bowen (2008) found a high correlation between the number of warehouseestablishments in a county and the county's air and highway accessibility, in 1998 and 2005. He alsofound a high correlation between these accessibility measures and the growth in the number ofwarehouse establishments in the period 1998-2005.
Hesse (2008) argues that because of the need for inexpensive space and extraordinary transportationaccessibility by logistics operations, logistics investments may work as precursors in economicdevelopment of areas. This argument is also advanced by Sheffi (2012), who demonstrates that logisticsclusters attract manufacturing sub-clusters.
However, none of the aforementioned works specifically analyze the relationship between freightaccessibility and logistics employment. In the logistics industry high accessibility is a desirable conditionfor a firm's location, because it represents lower transportation costs and shorter time to markets (Limboand Venables, 2001). Hence, areas with better accessibility are expected to attract logistics firms,increasing the associated logistics employment. This chapter investigates the hypothesis that areas withhigher accessibility have higher levels of logistics employment. Based on the outcomes of Paez (2004),this chapter will not only analyze bivariate relationships, but also include structural equation models into
the analyses. Furthermore, many aforementioned studies either only research metropolitan areas (e.g.,Allen et al. 1993, Bowen, 2008) or find differences between urban and rural areas (e.g., Chi, 2010, 2012).
35
In line with this, the analysis differentiates between metropolitan and non-metropolitan areas, to be ableto look at differences of the relationship between freight accessibility and logistics employment in thesetypes of areas.
3.3. Accessibility measures
There are many accessibility measures available (e.g., Ingram, 1971; Morris et al., 1978; Handy andNiemeier, 1997; EI-Geneidy and Levinson, 2006; Bowen, 2008). Most are specifically developed forpassenger transport. Only a few authors explicitly analyzed freight accessibility. Thomas et al. (2003)analyze freight accessibility in Belgium based on three different transportation modes: road, rail, andwaterways. These authors use gravity-based measures weighting the nodes of the transportation systemby population and economic activity. They conclude that there is a positive relation between thetransportation infrastructure and population, but economic activities are less associated with thetransportation system than with the population.
Lim and Thill (2008) and Thill and Lim (2010) also analyzed highway freight accessibility by means of agravity-based measure. These authors weight the shipping costs by a measure of economic opportunitythat is designed as a combination of population, employment, final demand, and intermediate demands ofmanufactured goods. They find that the implementation of intermodal networks reduces the gap ofaccessibility among peripheral and central regions in the US.
To analyze the relationship between accessibility and the number of warehouse establishments, Bowen(2008) defined four different accessibility measures, based on different modes of transportation. Airaccessibility was measured by an ordinal value based on the distance to the nearest airport and the air-cargo tonnage handled at that airport. Similarly, maritime accessibility was measured with an ordinalvalue on indices based on the distance to the nearest container port and the number of containershandled at that port. Road and rail accessibility were measured with density-based measures, as theymeasure accessibility by the density of (rail)roads per region. Road accessibility was defined as the totalcenterline length of the interstate and other elements of the national highway system within a countydivided by the county's area. Similarly, rail accessibility was defined as the length of all Class I railroadswithin a county divided by the county's area.
This chapter extends and improves this analysis. Like Bowen, accessibility measures based on fourdifferent modes of transportation are defined. Bowen's measures are relatively easy to calculate. Themajor criticism on the density-based measures is that they calculate accessibility values per countyindependent of the accessibility of adjacent counties. In it proposed that (freight) accessibility is alsodetermined by (rail)roads in adjacent counties. Then gravity-based accessibility measures (see e.g.Handy and Niemeier, 1997; Thomas et al., 2003; EI-Geneidy and Levinson, 2006) that do consideradjacent counties are used. These measures are based on the following definition of accessibility(Hansen, 1959, p. 73) "accessibility at point 1 to a particular type of activity at area 2 ... is directlyproportional to the size of the activity at area 2 ... and inversely proportional to some function of thedistance separating point 1 from area 2. The total accessibility [to the type of activity of interest] at point 1is the summation of the accessibility to each of the individual areas around point 1". Gravity-basedmeasures weight opportunities, usually the quantity of an activity in a certain area, by impedance,generally a function of distance, travel time, or travel costs.
36
Two other commonly used accessibility measures are the cumulative opportunity and random utilitymeasures (Handy and Niemeier, 1997, Peez et al. 2012). Cumulative opportunity measures count thenumber of opportunities that can be reached within a predetermined travel time or distance. Gravity-based measures can be formulated as cumulative opportunity measures with the impedance functionequal to one if within the predetermined distance/time and zero otherwise (Koenig, 1980; Handy andNiemeier, 1997). The major disadvantage of the cumulative opportunity measures is the arbitrary cut-offvalue used for the predetermined travel time or distance. For example, if the airports within 70 Km arecounted, an airport at 68 Km is taken into account, while an airport at 72 Km is not. This disadvantagecan be overcome by making use of fuzzy decision making, which is based on boundaries that are notsharply defined (e.g., Bellman and Zadeh, 1970). As this method also results in fuzzy outcomes, gravity-based accessibility measures, which use travel times to weight the opportunities in other areas instead ofcrisp cut-off values, are used.
Random utility measures use preferences of individual travelers to estimate the utility of certain choices(for example, mode choice in travel to work). A metric that takes into account the contribution of all suchutilities for a set of individuals in a location is used as an accessibility measure. A common example is themultinomial logit model which uses a maximum likelihood estimator to calculate the parameter of the
utility of each alternative, given data about the attributes of that and competing alternatives. Thedenominator of the multinomial logit model can be used as an accessibility measure, since it is a scalarsummary of the expected utility of a set of travel alternatives (Ben-Akiva and Lerman, 1985). Thesemeasures were originally developed to model individuals' travel choices and reflect the individual'sattributes. Utility-based measures use observable temporal and spatial transportation components of
specific choices in person-specific choice sets (Handy and Niemeier, 1997). In the case of freighttransport, these person (in this case company) specific choices can be approximated by a function ofactivity and distance. The result essentially is a monotone increasing function of the gravity-basedmeasure (Geurs and Van Wee, 2004).
Finally, due to the increased computational power of geographical information systems (GIS), space-timeaccessibility measures have been proposed that explicitly acknowledge an individual's travel behavior(Miller, 1999; Neutens et al., 2010). These measures are specifically focused on the participation ofindividual people in certain activities, while the accessibility measures described above assume that allalternatives are available for all individuals. This type of accessibility measure is not used for two reasons.First, the analysis is place-based, meaning that we want to measure the accessibility of a certain location,not of specific individuals. The goal is to compare the accessibility to the amount of logistics employmentper location. Second, the goal is to measure accessibility such that it is relevant for logistics firms, notindividual people.
3.4. Freight accessibility measures for logistics establishments in the US
This section describes the accessibility measures in detail. For comparison, Appendix A presents the
measures used by Bowen (2008). The modes of transportation that are included are road, air, maritime,
and rail transport.
37
3.4.1. Gravity-based accessibility measures
As described in Section 3.3, gravity-based measures use the distance or travel time to other areas andthe activity in these other areas to measure accessibility. The following standardized measure Agj is used
for all US counties i E /}.
Ag1 - gi with ag w- f(t )-j. ag,j jEI
Where:Agi = Accessibility (gravity-based) of county i,w= Weight representing the importance of location j,ti= Measure of separation between counties i and j (generally being distance or time),f(ti-) = Impedance function,I = Number of US counties (= 3109).
Gravity-based measures explicitly take into account that accessibility not only in the ease with which otherareas can be reached, but also the importance of these areas. This is determined by the weight wj. Withvarious ways of measuring the importance of locations and of determining the separation (impedance)between counties, several gravity-based measures for freight accessibility are defined.
3.4.2. Road accessibility
For the road accessibility measure, tj is defined as the travel time in minutes between the center points ofcounties i and j.4 The following impedance function is used:
[1 if i = j
f(t, )= jb-c"',j ifi jandt rtma.0 otherwise
where tmax = 720 (see below), b = 1.0000 and c = 0.0166.
The impedance function is based on data describing the primary range of operations of US trucks (USCensus, 2002). As these data present the number of truck trips for five different range classes, theseindicate what weight should be given to activities within a certain travel time. A negative exponentialfunction fits these data best. Figure 3.1 presents the function used in this chapter. Because f(ti,j)approaches zero as tI, increases, a maximum tmax is used, obviating the need for a complete matrix oftravel times between all 3109 US counties.
4 These travel times were determined using the US detailed streets map from Tele Atlas North America 2007,available from ESRI (www.esri.com, accessed December 2012).5 Parameters were determined by fitting the best function on the data, with CurveExpert Professional 1.3(www.curveexpert.net, accessed December 2012). This software uses the Levenberg-Marquardt method to solvenonlinear regressions, which combines the steepest-descent method and a Taylor series based method (Levenberg,1944; Marquardt, 1963).
38
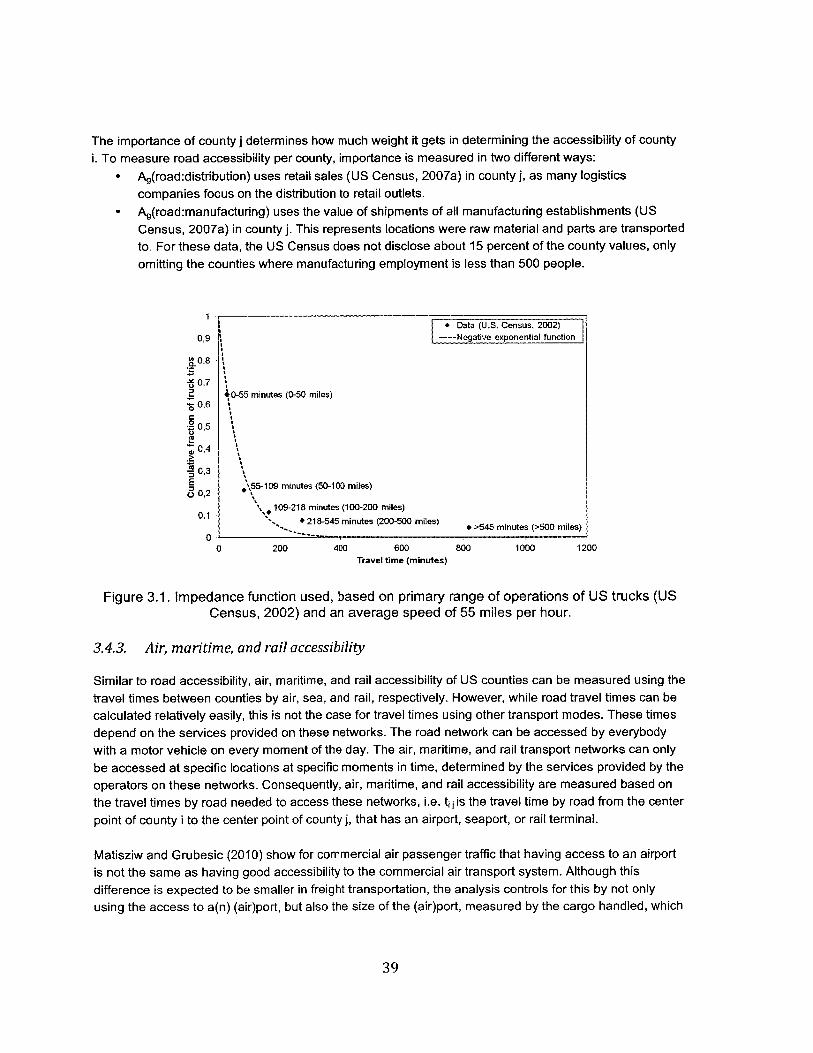
The importance of county j determines how much weight it gets in determining the accessibility of countyi. To measure road accessibility per county, importance is measured in two different ways:
- Ag(road:distribution) uses retail sales (US Census, 2007a) in county j, as many logisticscompanies focus on the distribution to retail outlets.
- Ag(road:manufacturing) uses the value of shipments of all manufacturing establishments (USCensus, 2007a) in county j. This represents locations were raw material and parts are transportedto. For these data, the US Census does not disclose about 15 percent of the county values, onlyomitting the counties where manufacturing employment is less than 500 people.
+ Data (U.S. Census, 2002)0,9 ---- Negative exponential function
40,8 1
-1 0,7 - o. 0-55 minutes (0-50 miles)
0,6
0,5
0,4
-20,3
E\55-109 minutes (50-100 miles)00,2
0,! 109-218 minutes (100-200 miles)N 218-545 minutes (200-500 miles) * >s4 minutes (>500 miles)
0 200 400 600 800 1000 1200Travel time (minutes)
Figure 3.1. Impedance function used, based on primary range of operations of US trucks (USCensus, 2002) and an average speed of 55 miles per hour.
3.4.3. Air, maritime, and rail accessibility
Similar to road accessibility, air, maritime, and rail accessibility of US counties can be measured using thetravel times between counties by air, sea, and rail, respectively. However, while road travel times can becalculated relatively easily, this is not the case for travel times using other transport modes. These timesdepend on the services provided on these networks. The road network can be accessed by everybodywith a motor vehicle on every moment of the day. The air, maritime, and rail transport networks can onlybe accessed at specific locations at specific moments in time, determined by the services provided by theoperators on these networks. Consequently, air, maritime, and rail accessibility are measured based onthe travel times by road needed to access these networks, i.e. ti, is the travel time by road from the centerpoint of county i to the center point of county j, that has an airport, seaport, or rail terminal.
Matisziw and Grubesic (2010) show for commercial air passenger traffic that having access to an airportis not the same as having good accessibility to the commercial air transport system. Although thisdifference is expected to be smaller in freight transportation, the analysis controls for this by not onlyusing the access to a(n) (air)port, but also the size of the (air)port, measured by the cargo handled, which
39
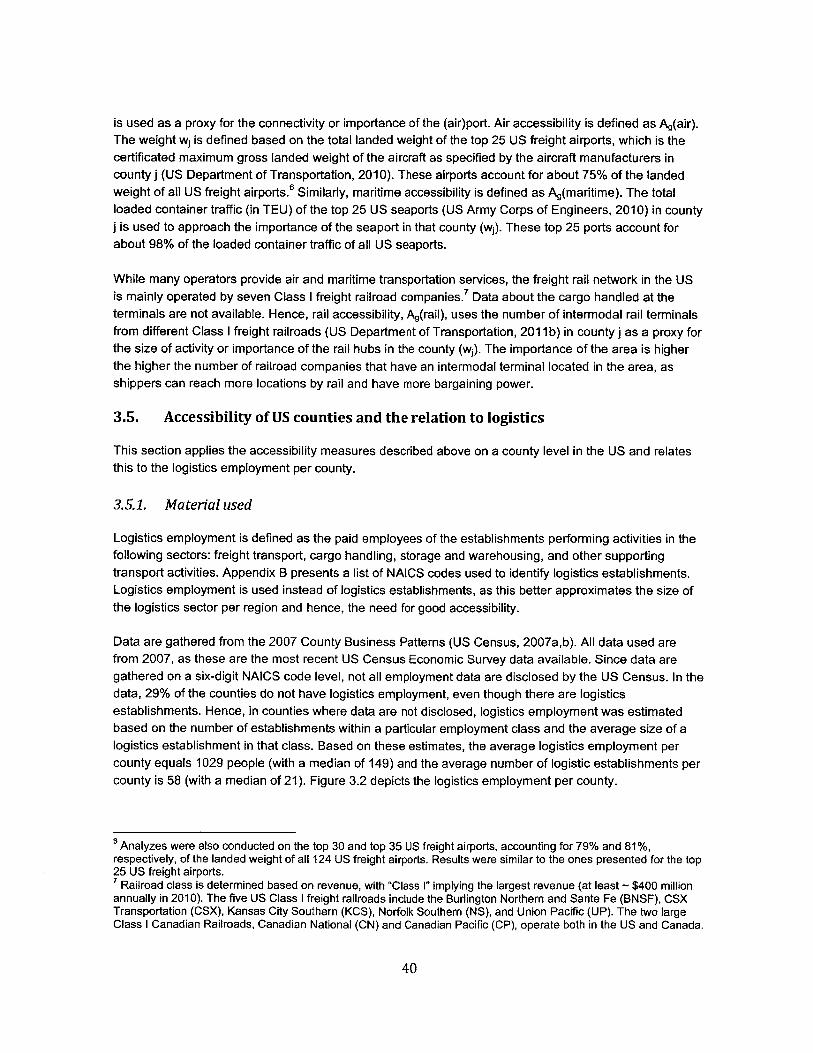
is used as a proxy for the connectivity or importance of the (air)port. Air accessibility is defined as Ag(air).The weight w; is defined based on the total landed weight of the top 25 US freight airports, which is thecertificated maximum gross landed weight of the aircraft as specified by the aircraft manufacturers incounty j (US Department of Transportation, 2010). These airports account for about 75% of the landedweight of all US freight airports.6 Similarly, maritime accessibility is defined as Ag(maritime). The totalloaded container traffic (in TEU) of the top 25 US seaports (US Army Corps of Engineers, 2010) in countyj is used to approach the importance of the seaport in that county (w;). These top 25 ports account forabout 98% of the loaded container traffic of all US seaports.
While many operators provide air and maritime transportation services, the freight rail network in the USis mainly operated by seven Class I freight railroad companies.7 Data about the cargo handled at theterminals are not available. Hence, rail accessibility, Ag(rail), uses the number of intermodal rail terminalsfrom different Class I freight railroads (US Department of Transportation, 2011 b) in county j as a proxy forthe size of activity or importance of the rail hubs in the county (w1). The importance of the area is higherthe higher the number of railroad companies that have an intermodal terminal located in the area, asshippers can reach more locations by rail and have more bargaining power.
3.5. Accessibility of US counties and the relation to logistics
This section applies the accessibility measures described above on a county level in the US and relatesthis to the logistics employment per county.
3.5.1. Material used
Logistics employment is defined as the paid employees of the establishments performing activities in thefollowing sectors: freight transport, cargo handling, storage and warehousing, and other supportingtransport activities. Appendix B presents a list of NAICS codes used to identify logistics establishments.Logistics employment is used instead of logistics establishments, as this better approximates the size ofthe logistics sector per region and hence, the need for good accessibility.
Data are gathered from the 2007 County Business Patterns (US Census, 2007a,b). All data used arefrom 2007, as these are the most recent US Census Economic Survey data available. Since data aregathered on a six-digit NAICS code level, not all employment data are disclosed by the US Census. In thedata, 29% of the counties do not have logistics employment, even though there are logisticsestablishments. Hence, in counties where data are not disclosed, logistics employment was estimatedbased on the number of establishments within a particular employment class and the average size of alogistics establishment in that class. Based on these estimates, the average logistics employment percounty equals 1029 people (with a median of 149) and the average number of logistic establishments percounty is 58 (with a median of 21). Figure 3.2 depicts the logistics employment per county.
6 Analyzes were also conducted on the top 30 and top 35 US freight airports, accounting for 79% and 81%,respectively, of the landed weight of all 124 US freight airports. Results were similar to the ones presented for the top25 US freight airports.7 Railroad class is determined based on revenue, with "Class I" implying the largest revenue (at least - $400 millionannually in 2010). The five US Class I freight railroads include the Burlington Northern and Sante Fe (BNSF), CSXTransportation (CSX), Kansas City Southern (KCS), Norfolk Southern (NS), and Union Pacific (UP). The two largeClass I Canadian Railroads, Canadian National (CN) and Canadian Pacific (CP), operate both in the US and Canada.
40
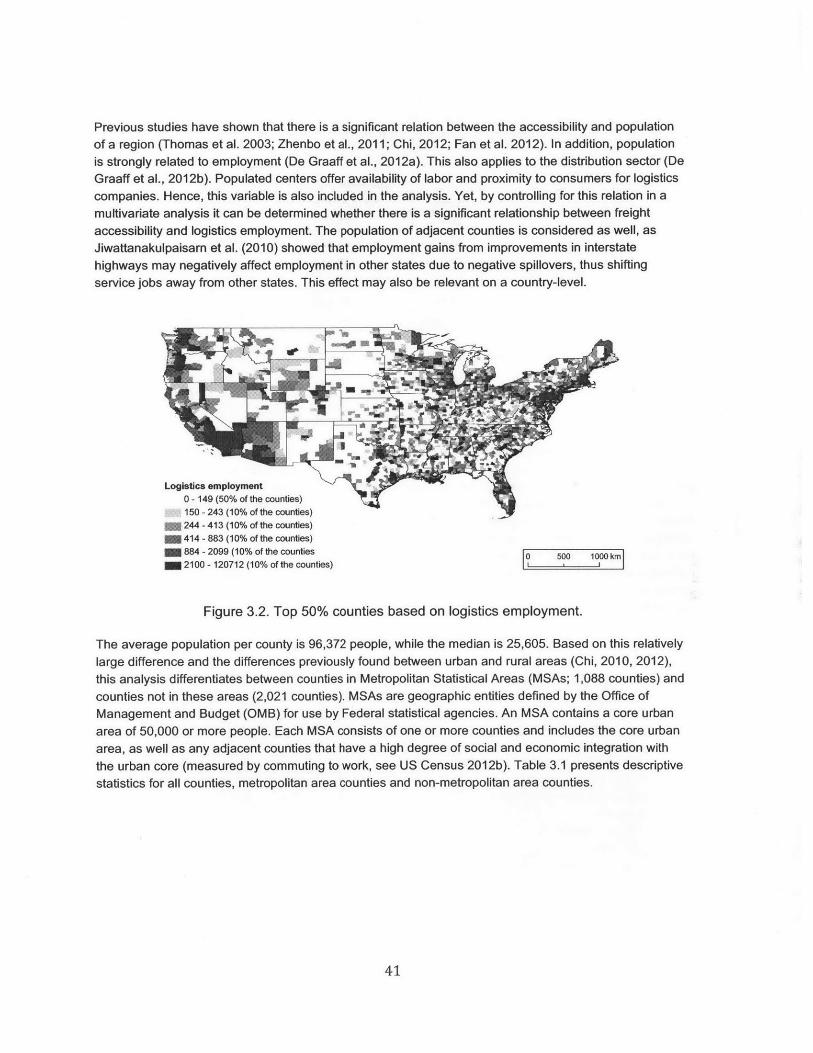
Previous studies have shown that there is a significant relation between the accessibility and populationof a region (Thomas et al. 2003; Zhenbo et al., 2011; Chi, 2012; Fan et al. 2012). In addition, populationis strongly related to employment (De Graaff et al., 2012a). This also applies to the distribution sector (DeGraaff et al., 2012b). Populated centers offer availability of labor and proximity to consumers for logisticscompanies. Hence, this variable is also included in the analysis. Yet, by controlling for this relation in amultivariate analysis it can be determined whether there is a significant relationship between freightaccessibility and logistics employment. The population of adjacent counties is considered as well, asJiwattanakulpaisarn et al. (2010) showed that employment gains from improvements in interstatehighways may negatively affect employment in other states due to negative spillovers, thus shiftingservice jobs away from other states. This effect may also be relevant on a country-level.
Logistics employment0 - 149 (50% of the counties)150 - 243 (10% of the counties)244 - 413 (10% of the counties)
1 414 - 883 (10% of the counties)884 - 2099 (10% of the counties2100 - 120712 (10% of the counties)
Figure 3.2. Top 50% counties based on logistics employment.
The average population per county is 96,372 people, while the median is 25,605. Based on this relativelylarge difference and the differences previously found between urban and rural areas (Chi, 2010, 2012),this analysis differentiates between counties in Metropolitan Statistical Areas (MSAs; 1,088 counties) andcounties not in these areas (2,021 counties). MSAs are geographic entities defined by the Office ofManagement and Budget (OMB) for use by Federal statistical agencies. An MSA contains a core urbanarea of 50,000 or more people. Each MSA consists of one or more counties and includes the core urbanarea, as well as any adjacent counties that have a high degree of social and economic integration withthe urban core (measured by commuting to work, see US Census 2012b). Table 3.1 presents descriptivestatistics for all counties, metropolitan area counties and non-metropolitan area counties.
41
0 500 1000 kmnI I I I
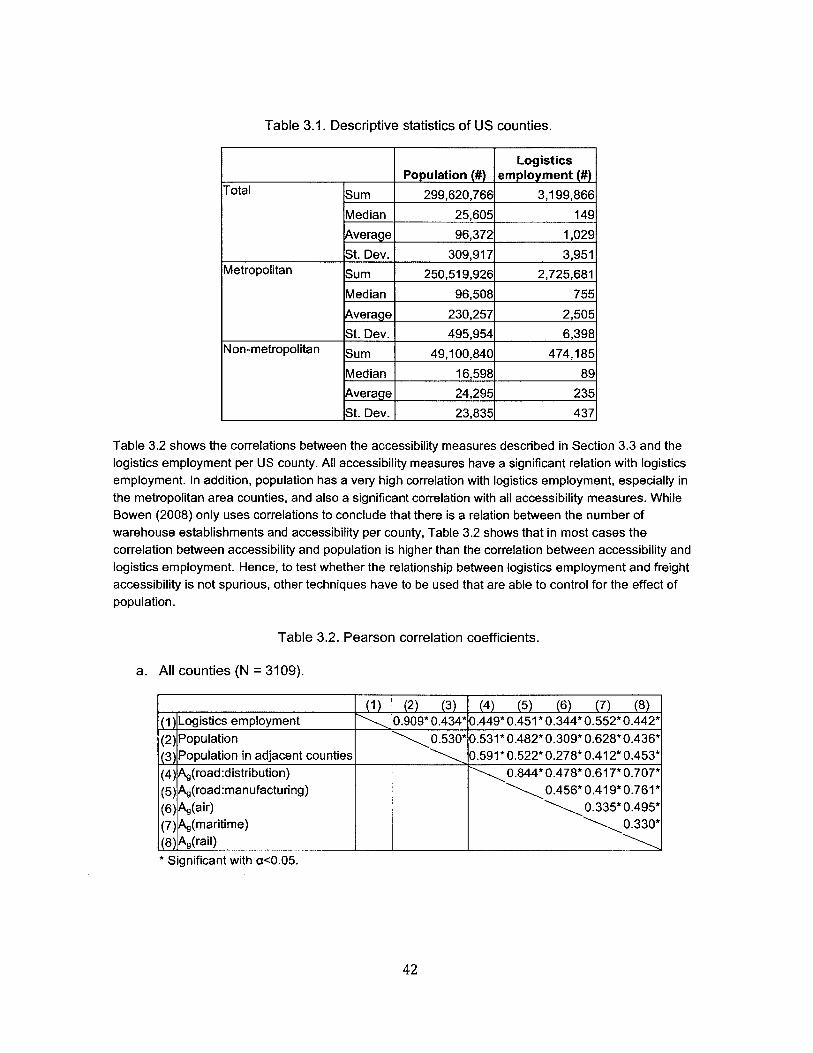
Table 3.1. Descriptive statistics of US counties.
LogisticsPopulation (#) employment (#)
Total Sum 299,620,766 3,199,866
Median 25,605 149
Average 96,372 1,029
St. Dev. 309,917 3,951Metropolitan Sum 250,519,926 2,725,681
Median 96,508 755
Average 230,257 2,505St. Dev. 495,954 6,398
Non-metropolitan Sum 49,100,840 474,185
Median 16,598 89Average 24,295 235St. Dev. 23,835 437
Table 3.2 shows the correlations between the accessibility measures described in Section 3.3 and thelogistics employment per US county. All accessibility measures have a significant relation with logisticsemployment. In addition, population has a very high correlation with logistics employment, especially inthe metropolitan area counties, and also a significant correlation with all accessibility measures. WhileBowen (2008) only uses correlations to conclude that there is a relation between the number ofwarehouse establishments and accessibility per county, Table 3.2 shows that in most cases thecorrelation between accessibility and population is higher than the correlation between accessibility andlogistics employment. Hence, to test whether the relationship between logistics employment and freightaccessibility is not spurious, other techniques have to be used that are able to control for the effect ofpopulation.
Table 3.2. Pearson correlation coefficients.
a. All counties (N = 3109).
(1) (2) (3) (4) (5) (6) (7) (8)(1) Logistics employment 0.909* 0.434* 0.449*0.451 * 0.344* 0.552*0.442*(2) Population 0.530* 0.531 * 0.482* 0.309*0.628*0.436*(3) Population in adjacent counties 0.591*0.522*0.278*0.412*0.453*(4) Ag(road:distribution) 0.844*0.478*0.617*0.707*(5)Ag(road:manufacturing) 0.456*0.419*0.761*(6)Ag(air) 0.335* 0.495*(7)Ag(maritime) 0.330*(8) Ag(rail)* Significant with a<0.05.
42
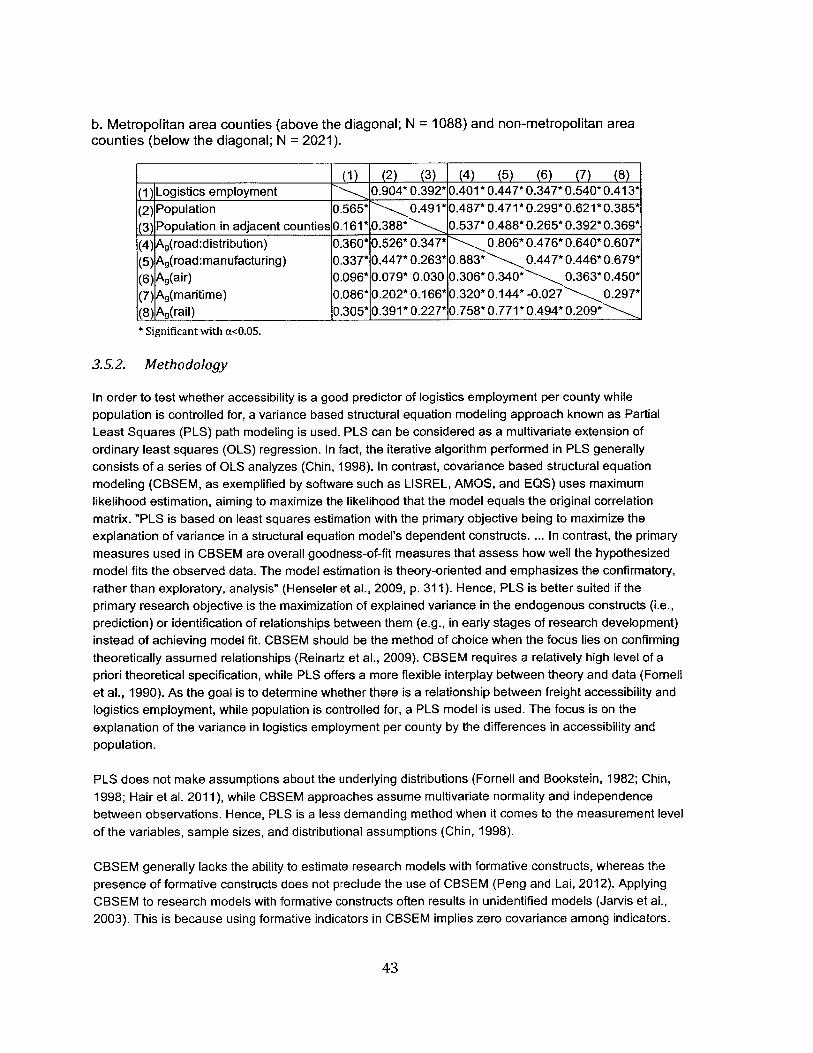
b. Metropolitan area counties (above the diagonal; N = 1088) and non-metropolitan areacounties (below the diagonal; N = 2021).
(1) (2) (3) (4) (5) (6) (7) (8)(1) Logistics employment 0.904* 0.392*0.401 * 0.447* 0.347* 0.540*0.413*
(2) Population 0.565* 0.491 * 0.487* 0.471 * 0.299*0.621 * 0.385*(3) Population in adjacent counties 0.161 * 0.388* 0.537*0.488*0.265*0.392*0.369*(4) Ag(road:distribution) 0.360* 0.526* 0.347* 0.806* 0.476* 0.640*0.607*(5) Ag(road:manufacturing) 0.337* 0.447* 0.263*0.883* 0.447*0.446*0.679*(6) Ag(air) 0.096* 0.079* 0.030 0.306* 0.340* 0.363*0.450*(7) Ag(maritime) 0.086* 0.202* 0.166*0.320*0.144* -0.027 0.297*(8) Ag(rail) 0.305* 0.391 * 0.227* 0.758* 0.771 * 0.494* 0.209** Significant with a<0.05.
3.5.2. Methodology
In order to test whether accessibility is a good predictor of logistics employment per county whilepopulation is controlled for, a variance based structural equation modeling approach known as PartialLeast Squares (PLS) path modeling is used. PLS can be considered as a multivariate extension ofordinary least squares (OLS) regression. In fact, the iterative algorithm performed in PLS generallyconsists of a series of OLS analyzes (Chin, 1998). In contrast, covariance based structural equationmodeling (CBSEM, as exemplified by software such as LISREL, AMOS, and EQS) uses maximumlikelihood estimation, aiming to maximize the likelihood that the model equals the original correlationmatrix. "PLS is based on least squares estimation with the primary objective being to maximize theexplanation of variance in a structural equation model's dependent constructs. ... In contrast, the primarymeasures used in CBSEM are overall goodness-of-fit measures that assess how well the hypothesizedmodel fits the observed data. The model estimation is theory-oriented and emphasizes the confirmatory,rather than exploratory, analysis" (Henseler et al., 2009, p. 311). Hence, PLS is better suited if theprimary research objective is the maximization of explained variance in the endogenous constructs (i.e.,prediction) or identification of relationships between them (e.g., in early stages of research development)instead of achieving model fit. CBSEM should be the method of choice when the focus lies on confirmingtheoretically assumed relationships (Reinartz et al., 2009). CBSEM requires a relatively high level of apriori theoretical specification, while PLS offers a more flexible interplay between theory and data (Fornellet al., 1990). As the goal is to determine whether there is a relationship between freight accessibility andlogistics employment, while population is controlled for, a PLS model is used. The focus is on theexplanation of the variance in logistics employment per county by the differences in accessibility andpopulation.
PLS does not make assumptions about the underlying distributions (Fornell and Bookstein, 1982; Chin,1998; Hair et al. 2011), while CBSEM approaches assume multivariate normality and independencebetween observations. Hence, PLS is a less demanding method when it comes to the measurement levelof the variables, sample sizes, and distributional assumptions (Chin, 1998).
CBSEM generally lacks the ability to estimate research models with formative constructs, whereas thepresence of formative constructs does not preclude the use of CBSEM (Peng and Lai, 2012). ApplyingCBSEM to research models with formative constructs often results in unidentified models (Jarvis et al.,2003). This is because using formative indicators in CBSEM implies zero covariance among indicators.
43
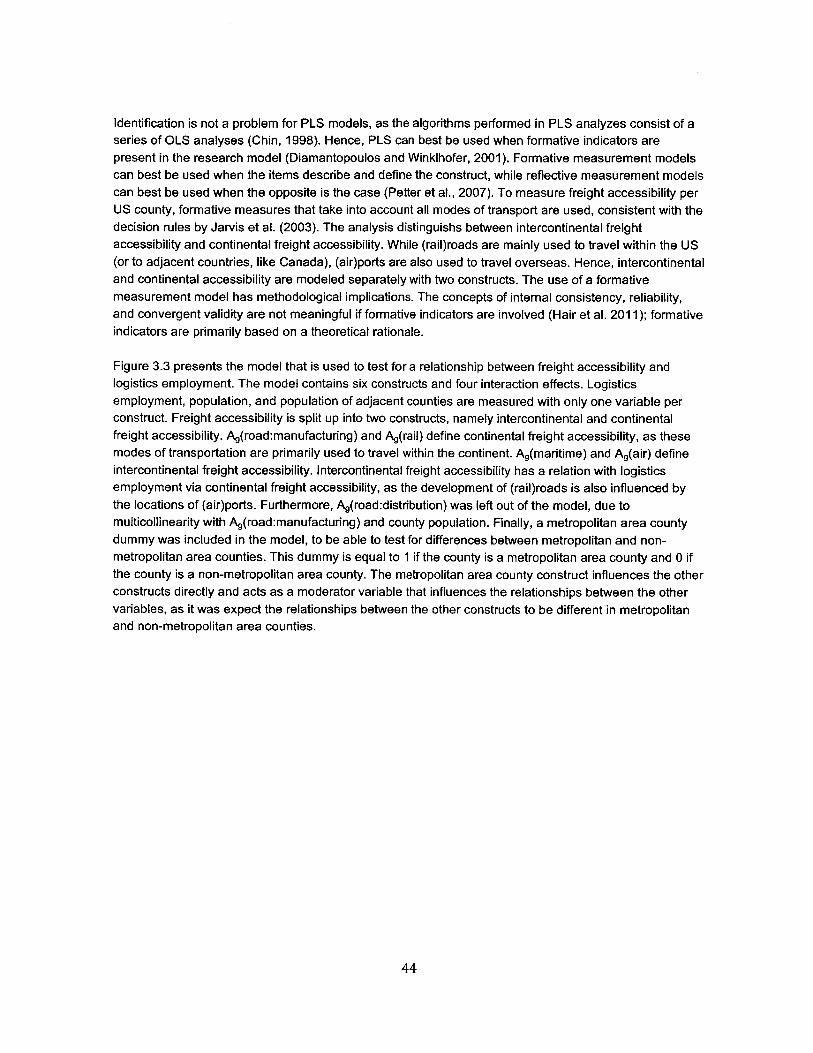
Identification is not a problem for PLS models, as the algorithms performed in PLS analyzes consist of aseries of OLS analyses (Chin, 1998). Hence, PLS can best be used when formative indicators arepresent in the research model (Diamantopoulos and Winklhofer, 2001). Formative measurement modelscan best be used when the items describe and define the construct, while reflective measurement modelscan best be used when the opposite is the case (Petter et al., 2007). To measure freight accessibility perUS county, formative measures that take into account all modes of transport are used, consistent with thedecision rules by Jarvis et al. (2003). The analysis distinguishs between intercontinental freightaccessibility and continental freight accessibility. While (rail)roads are mainly used to travel within the US(or to adjacent countries, like Canada), (air)ports are also used to travel overseas. Hence, intercontinentaland continental accessibility are modeled separately with two constructs. The use of a formativemeasurement model has methodological implications. The concepts of internal consistency, reliability,and convergent validity are not meaningful if formative indicators are involved (Hair et al. 2011); formativeindicators are primarily based on a theoretical rationale.
Figure 3.3 presents the model that is used to test for a relationship between freight accessibility andlogistics employment. The model contains six constructs and four interaction effects. Logisticsemployment, population, and population of adjacent counties are measured with only one variable perconstruct. Freight accessibility is split up into two constructs, namely intercontinental and continentalfreight accessibility. Ag(road:manufacturing) and Ag(rail) define continental freight accessibility, as thesemodes of transportation are primarily used to travel within the continent. Ag(maritime) and Ag(air) defineintercontinental freight accessibility. Intercontinental freight accessibility has a relation with logisticsemployment via continental freight accessibility, as the development of (rail)roads is also influenced bythe locations of (air)ports. Furthermore, Ag(road:distribution) was left out of the model, due tomulticollinearity with Ag(road:manufacturing) and county population. Finally, a metropolitan area countydummy was included in the model, to be able to test for differences between metropolitan and non-metropolitan area counties. This dummy is equal to 1 if the county is a metropolitan area county and 0 ifthe county is a non-metropolitan area county. The metropolitan area county construct influences the otherconstructs directly and acts as a moderator variable that influences the relationships between the othervariables, as it was expect the relationships between the other constructs to be different in metropolitanand non-metropolitan area counties.
44
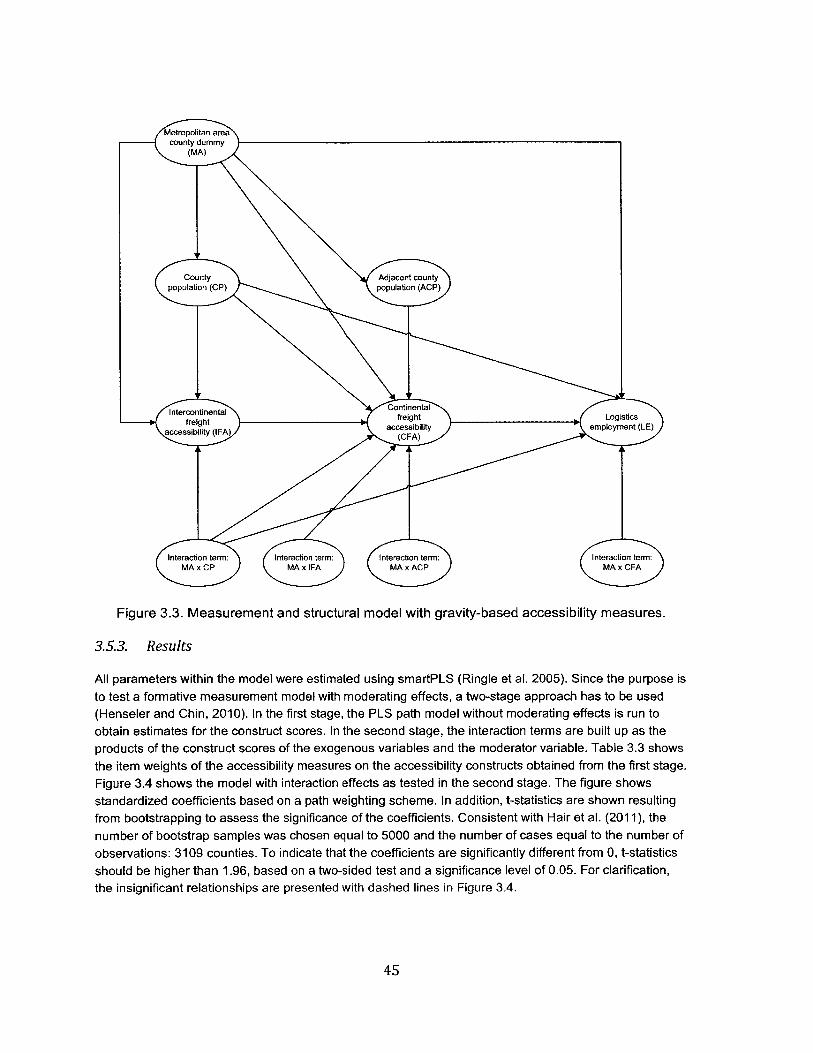
Metropolitan areacounty dummy
(MA)
County Adjacent countypopulation (CP) population (ACP)
accssiilty IF acce siilt emplomn (LE
Interaction term: Interaction term: Interaction term: Interaction term:MA xCP MA x IFA MA xACP MA x CFA
Figure 3.3. Measurement and structural model with gravity-based accessibility measures.
3.5.3. Results
All parameters within the model were estimated using smartPLS (Ringle et al. 2005). Since the purpose isto test a formative measurement model with moderating effects, a two-stage approach has to be used(Henseler and Chin, 2010). In the first stage, the PLS path model without moderating effects is run toobtain estimates for the construct scores. In the second stage, the interaction terms are built up as theproducts of the construct scores of the exogenous variables and the moderator variable. Table 3.3 showsthe item weights of the accessibility measures on the accessibility constructs obtained from the first stage.Figure 3.4 shows the model with interaction effects as tested in the second stage. The figure showsstandardized coefficients based on a path weighting scheme. In addition, t-statistics are shown resultingfrom bootstrapping to assess the significance of the coefficients. Consistent with Hair et al. (2011), thenumber of bootstrap samples was chosen equal to 5000 and the number of cases equal to the number ofobservations: 3109 counties. To indicate that the coefficients are significantly different from 0, t-statisticsshould be higher than 1.96, based on a two-sided test and a significance level of 0.05. For clarification,the insignificant relationships are presented with dashed lines in Figure 3.4.
45

Table 3.3. Item weights of the gravity-based accessibility measures on the accessibilityconstructs
Continental freight accessibility Intercontinental freightaccessibility
Item weight t statistic Item weight t statisticAo(road:manufacturing) 0.631 5.308A0(rail) 0.433 3.517A,(maritime) 0.760 8.347A,(air) 0.443 3.911
Metropolitan area- - county dummy - - - - - - - - - - - - - - - - - - - - - - - - - - - - - - -
(MA)
0.033 \-0.016(t 1.01) 0.383 (t= 1.51)
0.317 (t = 1&.75)\(t = 8.27)
-0.035County (t= 1.05) Adjacent county
population (CP) population (ACP)
\ 0.159\ (t = 3. 05)
0.7920.724 1.828 \(t =18.03)
(t=6.58) (t=5.77)
Intercontinental Continental
accessibility (IFA) 0.541 accessibility 0.038 employment (LE)(t =7.90) (C FA) (t = 2.58)
-0.122 1-1.644 ...- ' 0.092(t = 1.00) (t = 4.76) (t = 1.91) 0.027
(I = 1.43)
-0.272 I 0.067(t = 3.59) (t = 1.08)
Interaction term: Interaction term: Interaction term: Interaction term:MA x CP MA x IFA MAxACP MA x CFA
Figure 3.4. Model with gravity-based accessibility measures
As can be seen in Figure 3.4, both the relationships between continental freight accessibility and logisticsemployment and the relationship between intercontinental and continental freight accessibility aresignificant. Hence, freight accessibility explains part of the variation in the logistics employment percounty. The model that includes the direct relation between intercontinental freight accessibility andlogistics employment was also analyzed, but the extra relation turned out not to be significant.
46
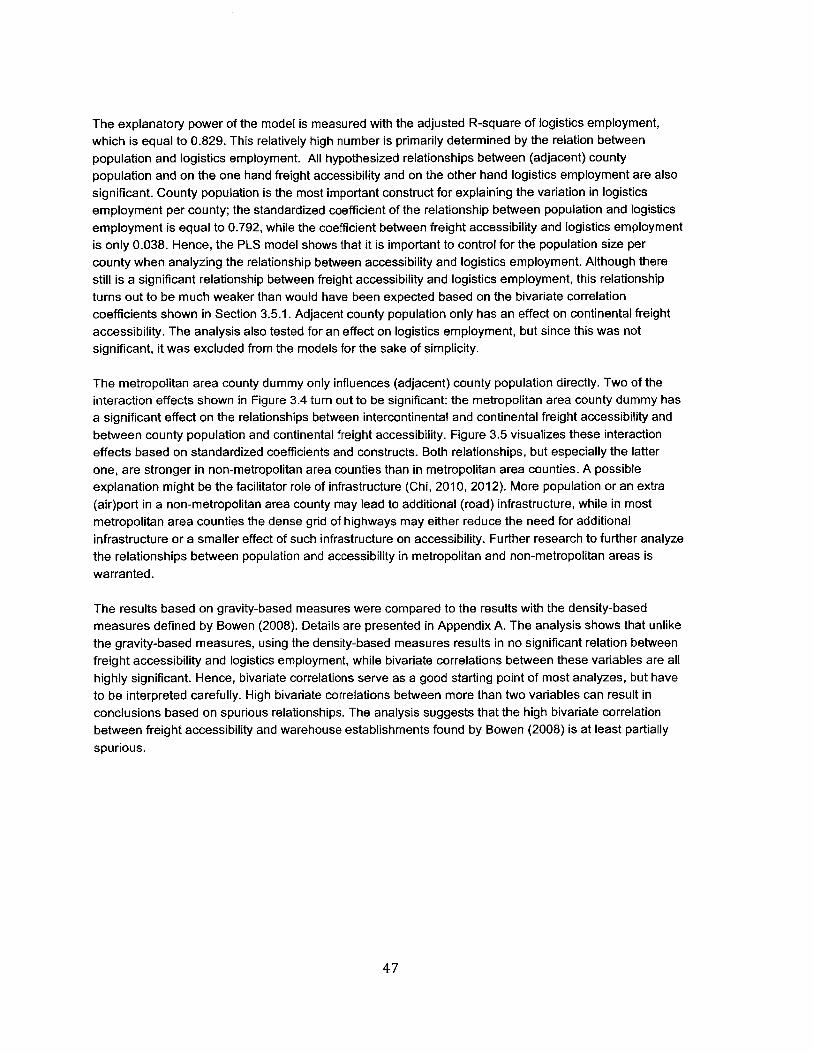
The explanatory power of the model is measured with the adjusted R-square of logistics employment,which is equal to 0.829. This relatively high number is primarily determined by the relation betweenpopulation and logistics employment. All hypothesized relationships between (adjacent) countypopulation and on the one hand freight accessibility and on the other hand logistics employment are alsosignificant. County population is the most important construct for explaining the variation in logisticsemployment per county; the standardized coefficient of the relationship between population and logisticsemployment is equal to 0.792, while the coefficient between freight accessibility and logistics employmentis only 0.038. Hence, the PLS model shows that it is important to control for the population size percounty when analyzing the relationship between accessibility and logistics employment. Although therestill is a significant relationship between freight accessibility and logistics employment, this relationshipturns out to be much weaker than would have been expected based on the bivariate correlationcoefficients shown in Section 3.5.1. Adjacent county population only has an effect on continental freightaccessibility. The analysis also tested for an effect on logistics employment, but since this was notsignificant, it was excluded from the models for the sake of simplicity.
The metropolitan area county dummy only influences (adjacent) county population directly. Two of theinteraction effects shown in Figure 3.4 turn out to be significant: the metropolitan area county dummy hasa significant effect on the relationships between intercontinental and continental freight accessibility andbetween county population and continental freight accessibility. Figure 3.5 visualizes these interactioneffects based on standardized coefficients and constructs. Both relationships, but especially the latterone, are stronger in non-metropolitan area counties than in metropolitan area counties. A possibleexplanation might be the facilitator role of infrastructure (Chi, 2010, 2012). More population or an extra(air)port in a non-metropolitan area county may lead to additional (road) infrastructure, while in mostmetropolitan area counties the dense grid of highways may either reduce the need for additionalinfrastructure or a smaller effect of such infrastructure on accessibility. Further research to further analyzethe relationships between population and accessibility in metropolitan and non-metropolitan areas iswarranted.
The results based on gravity-based measures were compared to the results with the density-basedmeasures defined by Bowen (2008). Details are presented in Appendix A. The analysis shows that unlikethe gravity-based measures, using the density-based measures results in no significant relation betweenfreight accessibility and logistics employment, while bivariate correlations between these variables are allhighly significant. Hence, bivariate correlations serve as a good starting point of most analyzes, but haveto be interpreted carefully. High bivariate correlations between more than two variables can result inconclusions based on spurious relationships. The analysis suggests that the high bivariate correlationbetween freight accessibility and warehouse establishments found by Bowen (2008) is at least partiallyspurious.
47
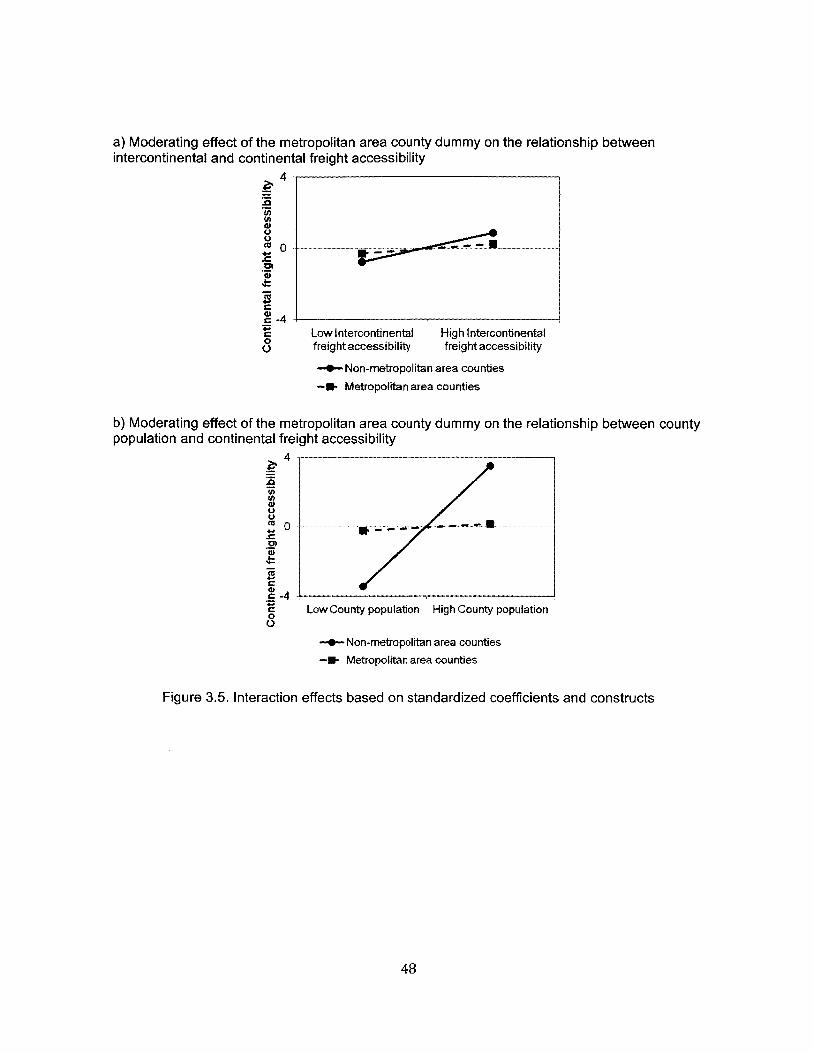
a) Moderating effect of the metropolitan area county dummy on the relationship betweenintercontinental and continental freight accessibility
Low Intercontinentalfreight accessibility
High Intercontinentalfreight accessibility
-- Non-metropolitan area counties
-- Metropolitan area counties
b) Moderating effect of the metropolitan area county dummy on the relationship between countypopulation and continental freight accessibility
(0
0
00
0
Low County population High County population
- Non-metropolitan area counties
-- Metropolitan area counties
Figure 3.5. Interaction effects based on standardized coefficients and constructs
48
0
-40
O -
.......- -.......... -......- ..... -..
Chapter 4
The benefits of logistics clusters
4.1. Introduction
The geographical concentration of companies from the same industry has been observed across almostall industrial sectors. Examples include information technologies in Silicon Valley, financial services in,Lower Manhattan, and wineries in California. Such "clustering" (the term was coined by Porter 1998,2000, 2008) also takes place in the logistics sector. Singapore, the Netherlands, Los Angeles, Panamaand Sao Paulo are some examples of "logistics clusters". As Sheffi (2010) suggests, logistics clustersinclude three types of companies: firms that offer logistics services like transportation carriers and thirdparty logistics services providers (3PLs); the logistics division of industrial and retail firms; and industrialfirms for whom logistics operations represent an important part of their cost, as is the case of automobileand bulk commodity manufactures.
Although there is a notable literature regarding industrial clusters not much has been published aboutlogistics clusters. Some authors have studied specialized logistics-related clusters such as clustersaround ports and airports but little research exists on logistics clusters as an industry. Recently, Sheffi(2012) called attention to the uniqueness of the agglomeration of logistics companies, stating thatlogistics clusters provide particular benefits in addition to those observed in most other industrial clusters.The objective of this article is to further investigate those specific benefits of logistics clusters.
The data for this research are drawn from interviews conducted over a period of 27 months all around theworld as part of an ongoing research project to understand how and why logistics clusters work. Contraryto some industrial clusters, logistics clusters have increased in size and number in the last decade. Riveraet al. (2014) found some evidence of the increasing prevalence of logistics operations in clusters in theUS. In this chapter, the results of an inductive study aimed at identifying and analyzing several specificadvantages that may explain this trend of logistics agglomerations are reported.
The remainder of this chapter is structured as follows. Section 4.2 provides an overview of the literatureon logistics clusters. Section 4.3 presents the method and explains the process for data collection. Theresults are presented in section 4.4. Finally, section 4.5 concludes this chapter and presents opportunitiesfor further research.
49
4.2. Industrial Agglomeration Literature
This section provides a limited review of the vast literature on the benefits of industrial agglomeration ingeneral and then focuses on the limited references discussing logistics clusters. It concludes with thebasic assumption of the study.
4.2.1. Industrial clusters benefits
Several authors have studied the benefits of the agglomeration of industrial firms. Marshall (1890)mentioned three positive externalities from co-location: knowledge sharing, the formation of a labor pooland the development of a supplier base. Appold (1995) also highlighted the importance of co-locatingclose to competitors. He argued that agglomeration high levels of cooperation could benefit firms becauseit expands their market areas. Stocking savings (i.e saving storage space in warehouses) and speedierdevelopment of new products account for this larger market base. The author additionally argued that thelocation decision of a firm would yield higher levels of productivity and economic efficiency becausecompanies share a larger amount of "nontradable business inputs" such as knowledge, information andtrust. In the 90's, Porter (1998) coined the term industrial cluster emphasizing that such agglomeration ofindustrial firms encourages them not only to collaborate but also to compete. The combination ofcollaboration and competition incentivizes firms to operate at higher levels of innovation and productivity,encouraging the formation of new businesses in the cluster and leading to economic growth.
Clusters can influence the macro-outcomes of a region. Gambardella and Giarratana (2010) use datafrom 146 U.S cities to test the impact of management corporations and knowledge clusters on regionalsalaries. The authors define a knowledge cluster as the geographical concentration of firms that producesknowledge spillovers, such as Silicon Valley. They find that average salaries in knowledge clusters arehigher. Romanelli and Khessina (2005) argue that the formation of clusters in a region influences the kindand the amount of resources that the region attracts, which promotes economic growth and innovation. Inthis sense, the external and internal perceptions about the cluster determine the region's industrialidentity. Boari (2001), in a study in Italy, showed that clusters of small companies have emerged aroundleading organizations in order to take advantage of the spillover effect of technology and managerialpractices. Porter (2000, pp. 17) added that clusters can "capture important linkages, complementarities,and spillovers in terms of technology, skills, information, marketing, and customer needs... ." Theyprovide an industrial base for the formation and development of public goods such as educationalorganizations that provide training programs for the cluster's workforce and research institutions that canfurther the technology and processes used in the cluster.
Perez-Aleman (2010) studied the mentioned linkages in a cluster of dairy producers in Nicaragua. Theauthor states that the inter-firm relationships inside the cluster help build collective and learningcapabilities, allowing for the improvement of local practices and production organization. Rosenkopf andPadula (2008) study the formation of alliances between new entrants and incumbents in clusters in themobile communications industry. The authors conclude that the geographical proximity enhances thedegree of involvement among firms, which in turn reinforces their reputations and prominence. All of thisattracts more firms to the cluster, creating a reinforcing feedback loop. Reuer and Lahiri (2013) alsoanalyze the formation of strategic alliances among firms and the effects of geographical distance in thesemiconductor industry. The results show that the larger the geographical distance between companies,the greater the difficulty for firms to build collaborative relationships.
50
Nonetheless, other researchers have pointed out several disadvantages of industrial agglomeration(Henderson and Shalizi, 2001, Polenske, 2003, Karsten, 1996). Some claim that spatial concentration isno longer needed because information technologies "shortens distances" and improves coordinationbetween companies without necessarily being co-located (Cairncross, 1997), while others argue that theefficiency of global supply chains decreases the need of geographical proximity (Polenske, 2003).Industrial agglomeration may also not be desirable because it generates traffic congestion, an increase inland prices, and negative externalities in the local environment like pollution (Richardson, 1995, Karsten,1996). Some of these authors argue that these factors lead firms to disperse (Henderson and Shalizi,2001). Moreover, being in a cluster may not necessarily imply knowing or trusting colleague firms, thusnot leading to additional collaboration (Dell'Orco, Sassanelli and Tiso, 2009). Furthermore, the distributionof benefits and costs when companies collaborate can lead to some of them becoming free-riders, whichis why some co-located establishments prefer not to engage in time-consuming activities like planning orcoordinating (Van Der Horst and De Langen, 2008).
Possibly as a result of these factors industrial clusters do not always grow and some of them shrink anddisappear. In contrast, logistics clusters seem to be growing all over the world, as it seems that thebenefits of spatial agglomeration of logistics firms are positive.
4.2.2. Logistics clusters
Authors studying logistics clusters (or related clusters) focus mostly on their structure, describing theagents and interactions involved or needed for their existence (Haezendonck, 2001). For example,Kasarda (2008) studies the urban development around an airport coining the term "aerotropolis." Heargues that aerotropolis locations are "engines of local economic development, attracting aviation-linkedbusinesses of all types to their environs" (Lindsey and Kasarda, 2011). These businesses include time-sensitive manufacturing and distribution facilities; hotel, entertainment, retail, convention, and tradecomplexes; and office buildings for air-travel intensive executives and professionals. Other authorsinvestigate performance issues, including those elements that may establish why one cluster is betterthan another, either in terms of movement of cargo or in terms of their institutional structure (Klink and DeLangen, 2001; De Langen, 2002, 2004).
The few researchers who studied logistics clusters report positive impact. Kasarda (2008) argues that therapid expansion of airport-linked commercial facilities is turning today's air gateways into the anchors of21st century metropolitan development. Wu et al. (2006) study supply clusters in China and argue thatthey may have contributed significantly to the nation's increased manufacturing competitiveness.Researchers, who mention the positive impacts of logistics clusters, focus on those impacts that theliterature attributes to industrial clusters in general (See for example FIAS-World Bank, 2008; De Langen,2002, 2003; Kasarda, 2008; Lindsey and Kasarda, 2011), most notably the increase in regionalemployment.
Sheffi (2012) mentioned operational advantages related to lower cost and better service that lead firms tolocate in logistics clusters. These advantages result from (i) the interchangeability of logistics services,allowing for cooperation between non-competing firms;(ii) the large amount of freight moving in and out oflogistics clusters, which allows for the use of larger conveyances at higher utilization, leading to lowertransportation costs as compared with non-cluster locations; (iii) higher frequency of service and moredirect connections to more destinations, leading to higher level of transportation services. Additional
51
benefits in logistics clusters result from the liquidity of the transportation market in a cluster owing to thelower volatility in freight volumes and conveyance availability as a result of risk pooling. Van Den Heuvelet al. (2012) argue that firms located inside logistics clusters have better access to repair facilities and ahigher expansion potential than firms that do not co-locate. They also have opportunities to sharetransport capacity, leading to a reduction transportation costs and thus an improvement of economicefficiency (Buvik and Halskau, 2001; Krajewska at al., 2008). Furthermore, Jing and Cai (2010)mentioned that logistics clusters result in good transportation infrastructure in the region due to thecluster's influence on local government investment decisions, resulting in further economic development.
While, globally, logistics clusters reduce the environmental impacts of transportation (owing to the use oflarge conveyances and high load factors), the local environmental impact is likely to be negative in termsof congestion, noise and pollution, even though they are not as injurious as heavy industry. There isrecent evidence, however, that the concentration of logistics assets in a cluster results in an impetus aswell as opportunities for green innovation in using renewable and clean energy for transportation andwarehousing (Sheffi, 2012).
4.2.3. Assumptions
This article aims to further explore and analyze the benefits of logistics clusters. As Isabella (1990, p.9)mentions "interpretative studies draw on a number of critical assumptions." This study assumes that thecollective thoughts of the interviewed people reflect the reality inside logistics clusters and correctlyidentify their benefits. Interviews were directed at high level people with knowledge of the internaloperation of the companies involved and of the cluster environment in general, to get not only informationabout the cluster but also about its relation with the rest of the economy.
The inductive study was designed to explore the following questions: (i) what are the benefits of logisticsclusters? and (ii) are they similar (or different) to those provided by other industrial clusters?
4.3. Methods
The study consisted of interviewing 135 individuals all over the world. Participants were asked to describeand discuss the logistics cluster operation, the reasons for their companies to choose those locations,and the advantages and disadvantages of their current location. Specific examples were sought whenpossible. The study included two stages. In the first one, open interviews were conducted to collect datawhich were then analyzed using tools from grounded theory to produce conceptual categories (benefits oflogistics clusters). In the second stage, more data was collected through semi-structured interviews andanalyzed using grounded theory tools to provide further evidence and details on the previously definedconceptual categories.
4.3.1. Sample
The first stage comprised 62 interviews conducted during 2010 and 2011 with actors in and aroundlogistics clusters, including executives of logistics service providers, logistics operations of shippers, topgovernment officials, world port and airport authorities, non-governmental organizations (such as
52
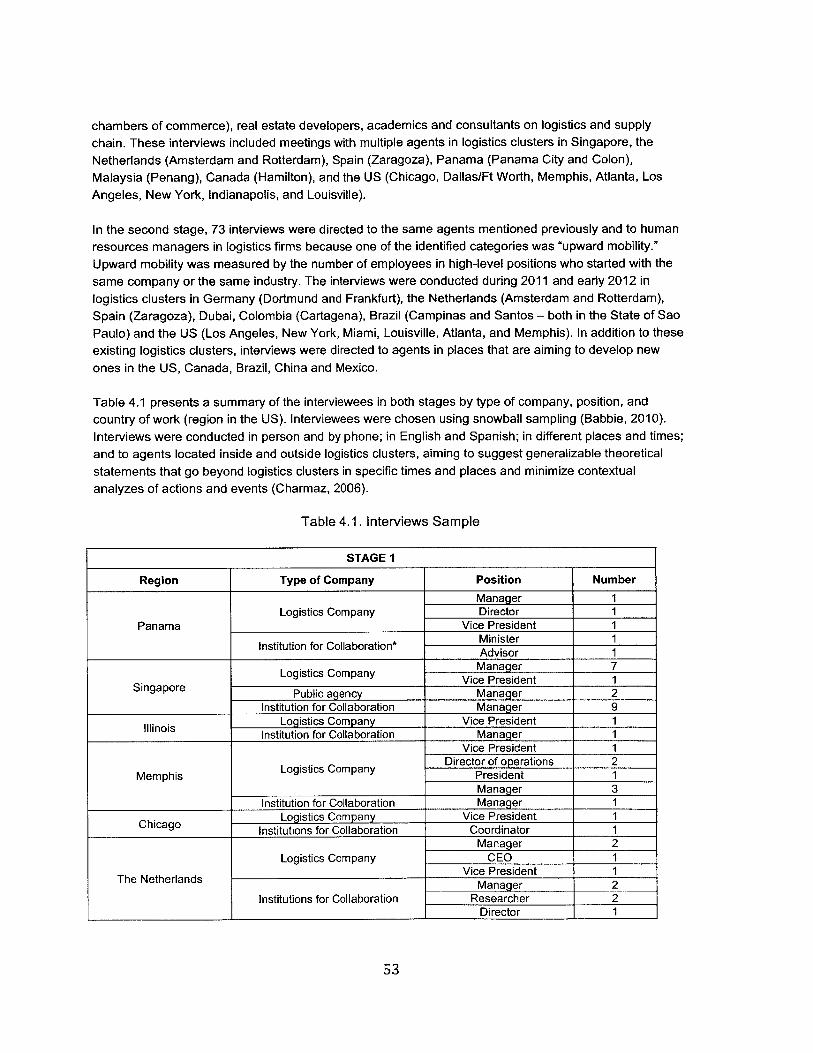
chambers of commerce), real estate developers, academics and consultants on logistics and supplychain. These interviews included meetings with multiple agents in logistics clusters in Singapore, theNetherlands (Amsterdam and Rotterdam), Spain (Zaragoza), Panama (Panama City and Colon),Malaysia (Penang), Canada (Hamilton), and the US (Chicago, Dallas/Ft Worth, Memphis, Atlanta, LosAngeles, New York, Indianapolis, and Louisville).
In the second stage, 73 interviews were directed to the same agents mentioned previously and to humanresources managers in logistics firms because one of the identified categories was "upward mobility."Upward mobility was measured by the number of employees in high-level positions who started with thesame company or the same industry. The interviews were conducted during 2011 and early 2012 inlogistics clusters in Germany (Dortmund and Frankfurt), the Netherlands (Amsterdam and Rotterdam),Spain (Zaragoza), Dubai, Colombia (Cartagena), Brazil (Campinas and Santos - both in the State of SaoPaulo) and the US (Los Angeles, New York, Miami, Louisville, Atlanta, and Memphis). In addition to theseexisting logistics clusters, interviews were directed to agents in places that are aiming to develop newones in the US, Canada, Brazil, China and Mexico.
Table 4.1 presents a summary of the interviewees in both stages by type of company, position, and
country of work (region in the US). Interviewees were chosen using snowball sampling (Babbie, 2010).Interviews were conducted in person and by phone; in English and Spanish; in different places and times;and to agents located inside and outside logistics clusters, aiming to suggest generalizable theoreticalstatements that go beyond logistics clusters in specific times and places and minimize contextualanalyzes of actions and events (Charmaz, 2006).
Table 4.1. Interviews Sample
STAGE 1
Region Type of Company Position Number
Manager 1Logistics Company Director 1
Panama Vice President 1
Institution for Collaboration* Adisor 1
Logistics Company VicMana rent 1Singapore Public agency Manager 2
Institution for Collaboration Manager 9Logistics Company Vice President 1Illinois Institution for Collaboration Manager 1
Vice President 1
Logistics Company Director of operations 2Memphis President 1
Manager 3Institution for Collaboration Manager 1
Chicago Logistics Company Vice President 1Chicag _ _ Institutions for Collaboration Coordinator 1
Manager 2Logistics Company CEO 1
The Netherlands Vice President 1Manager 2
Institutions for Collaboration Researcher 2Director 1
53
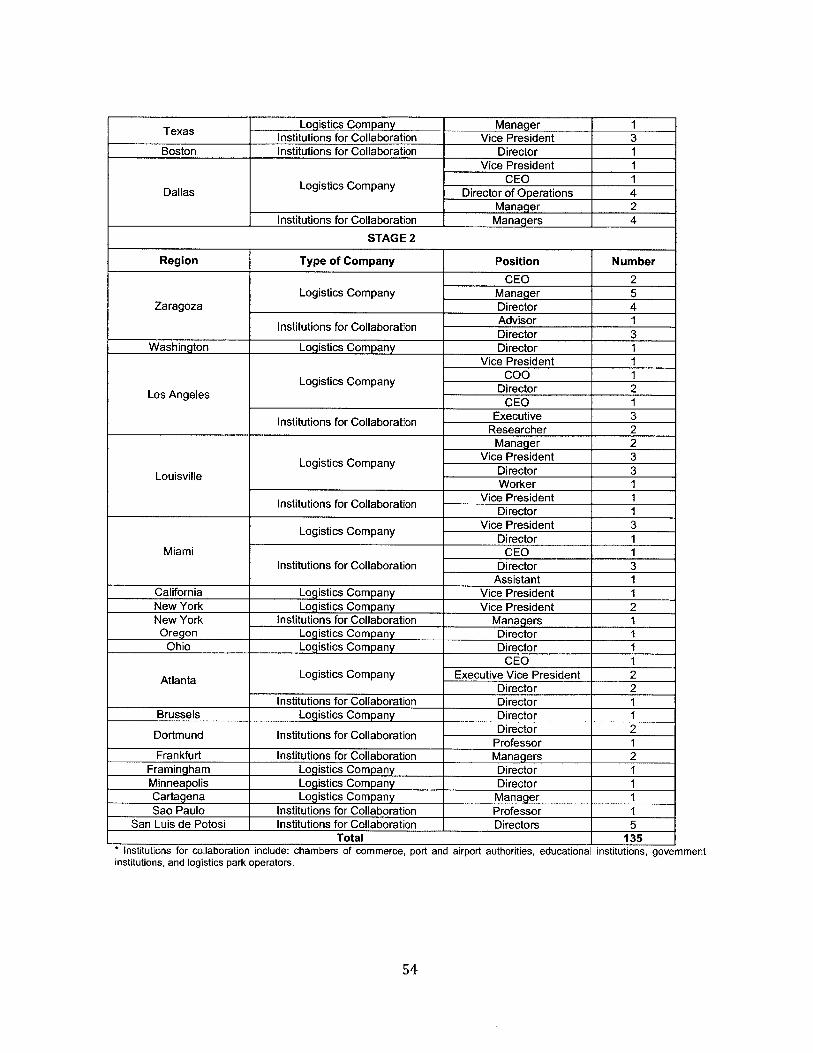
Texas Logistics Company Manager 1Institutions for Collaboration Vice President 3
Boston Institutions for Collaboration Director 1Vice President 1
LgsisCmayCEO 1Dallas Logistics Company Director of Operations 4
Manager 2Institutions for Collaboration Managers 4
STAGE 2
Region Type of Company Position Number
CEO 2Logistics Company Manager 5
Zaragoza Director 4
Institutions for Collaboration dior 3
Washington Logistics Company Director 1Vice President 1
Logistics Company coo 1
Los Angeles Director 2CEO 1
Institutions for Collaboration Executive 3Researcher 2
Manager 2
Logistics Company Vice President 3
Louisville Director 3Worker 1
Institutions for Collaboration Vice President 1Director 1
Logistics Company Vice President 3Director 1
Miami CEO 1Institutions for Collaboration Director 3
Assistant 1California Logistics Company Vice President 1New York Logistics Company Vice President 2New York Institutions for Collaboration Managers 1Oregon Logistics Company Director 1
Ohio Logistics Company Director 1CEO 1
Atlanta Logistics Company Executive Vice President 2Director 2
Institutions for Collaboration Director 1Brussels Logistics Company Director 1
Dortmund Institutions for Collaboration Precssor 1Frankfurt Institutions for Collaboration Managers 2
Framingham Logistics Company Director 1Minneapolis Logistics Company Director 1Cartagena Logistics Company Manager 1Sao Paulo Institutions for Collaboration Professor 1
San Luis de Potosi Institutions for Collaboration Directors 5Total 135
* ~ IUII~11lUlU~dl~ lLlU.UIIIUI 1tIi1~UprInstitutions or coiaborark operators.
institutions, and logistics park operators.and airport authorites, educatiainsutions, government
54
4.3.2. Data collection
The objective of the first stage of the research was exploratory: to obtain insights regarding the reasonsthat logistics clusters are growing and the specific reasons for logistics firms to locate close to each other.Consequently all the interviews included only open-ended questions. Such interviews allow for thepossibility of new (to the interviewers) points of view and observations, which were not considered a-priori(Wimmer and Dominick, 1997. Open-ended or unstructured interviews use a broad range of questions,asked in any order as the interview develops (Breakwell, et al., 1995), and allow the interviewer to godeeper into themes that develop during the interview itself (Wimmer and Dominick, 1997). Eachinterviewee provided data about his/her career in logistics (position, working experience, other companiesand places of work) and discussed in as much detail as possible his/her thoughts on the reasons thattheir company was there, including what makes that location preferable to others, and what makes thatcluster 'successful'.
The objective of the second stage was to collect more data, focusing on those benefits identified in thefirst stage. This time, semi-structured interviews were used because the interviews focused on thecategories identified in the first stage. Semi-structured interviews allow for some predeterminedquestions, without loosing the freedom to ask for clarification or to go deeper into specific pointsmentioned by the respondents (Babbie, 2010). In the second stage questions were more specificallydirected towards getting more information on the four initial categories identified in the first stage, askingthe interviewees to provide as much detail as possible and give related examples. Again interviews wereconducted in person and by phone, in English and Spanish.
Appendix A depicts the questions used to guide both sets of interviews. Interviews lasted between 30 and60 minutes. All interviews were tape-recorded and transcribed, so that the raw data could be analyzed.Although each interview covered the same general topics, some of them explored in depth areas ofspecial significance mentioned by an interviewee.
4.3.3. Data analysis
The data analysis was conducted using grounded theory tools (Glaser and Strauss, 1967). "Thisapproach requires that data and theory be constantly compared and contrasted throughout the datacollection and analysis process. Evolving theory directs attention to previously established importantdimensions while the actual data simultaneously focus attention on the theory's suitability as a frame forthe most recent data being collected" (Isabella, 1990, p. 12). This research started with an evolving theorybefore the actual data collection, based on first-hand experiences with and professional observations oflogistics clusters which the author was involved with (one in Spain and one in Latin America) and theagreement between private sector and policy makers about their 'success.'
During the first stage of data collection, notes of facts, specific details, and additional information that anumber of interviewees seem to repeat as well as ideas generating from debate sessions with colleaguesaugmented the evolving theory, as suggested by Van Maanen (1983) and quoted in Isabella (1990). Theanalysis of the data followed Charmaz (2006). The process included initial line by line coding, focusedcoding and axial coding. The process consisted in assigning codes to each passage of the interviewdepending on what the coder perceived was the idea the interviewed was trying to convey and checkingfor key words in the responses (Volkoff et al., 2007). To organize the material, some clustering analysis
55
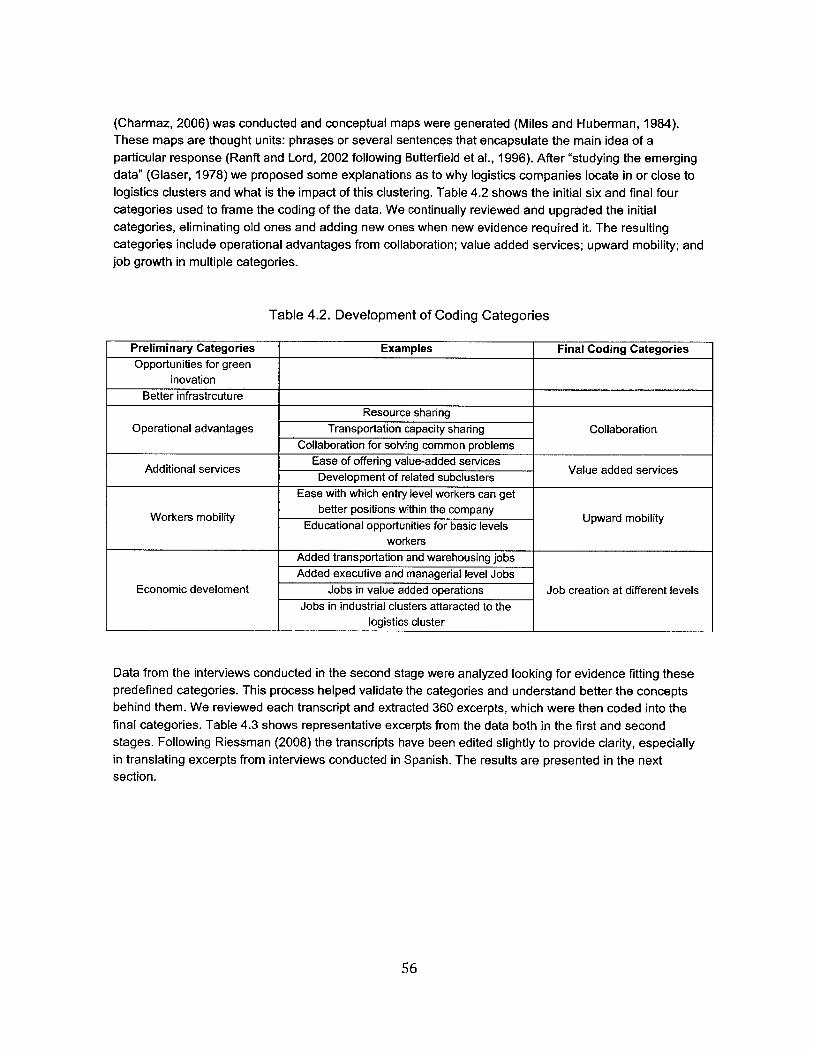
(Charmaz, 2006) was conducted and conceptual maps were generated (Miles and Huberman, 1984).These maps are thought units: phrases or several sentences that encapsulate the main idea of aparticular response (Ranft and Lord, 2002 following Butterfield et al., 1996). After "studying the emergingdata" (Glaser, 1978) we proposed some explanations as to why logistics companies locate in or close tologistics clusters and what is the impact of this clustering. Table 4.2 shows the initial six and final fourcategories used to frame the coding of the data. We continually reviewed and upgraded the initialcategories, eliminating old ones and adding new ones when new evidence required it. The resultingcategories include operational advantages from collaboration; value added services; upward mobility; andjob growth in multiple categories.
Table 4.2. Development of Coding Categories
Preliminary Categories Examples Final Coding CategoriesOpportunities for green
inovationBetter infrastrcuture
Resource sharingOperational advantages Transportation capacity sharing Collaboration
Collaboration for solving common problems. Ease of offering value-added services added
Additional services Development of related subclusters Value servicesEase with which entry level workers can get
Workers mobility better positions within the company Upward mobilityEducational opportunities for basic levelsworkers
Added transportation and warehousing jobsAdded executive and managerial level Jobs
Economic develoment Jobs in value added operations Job creation at different levelsJobs in industrial clusters attaracted to the
logistics cluster
Data from the interviews conducted in the second stage were analyzed looking for evidence fitting thesepredefined categories. This process helped validate the categories and understand better the conceptsbehind them. We reviewed each transcript and extracted 360 excerpts, which were then coded into thefinal categories. Table 4.3 shows representative excerpts from the data both in the first and secondstages. Following Riessman (2008) the transcripts have been edited slightly to provide clarity, especiallyin translating excerpts from interviews conducted in Spanish. The results are presented in the nextsection.
56
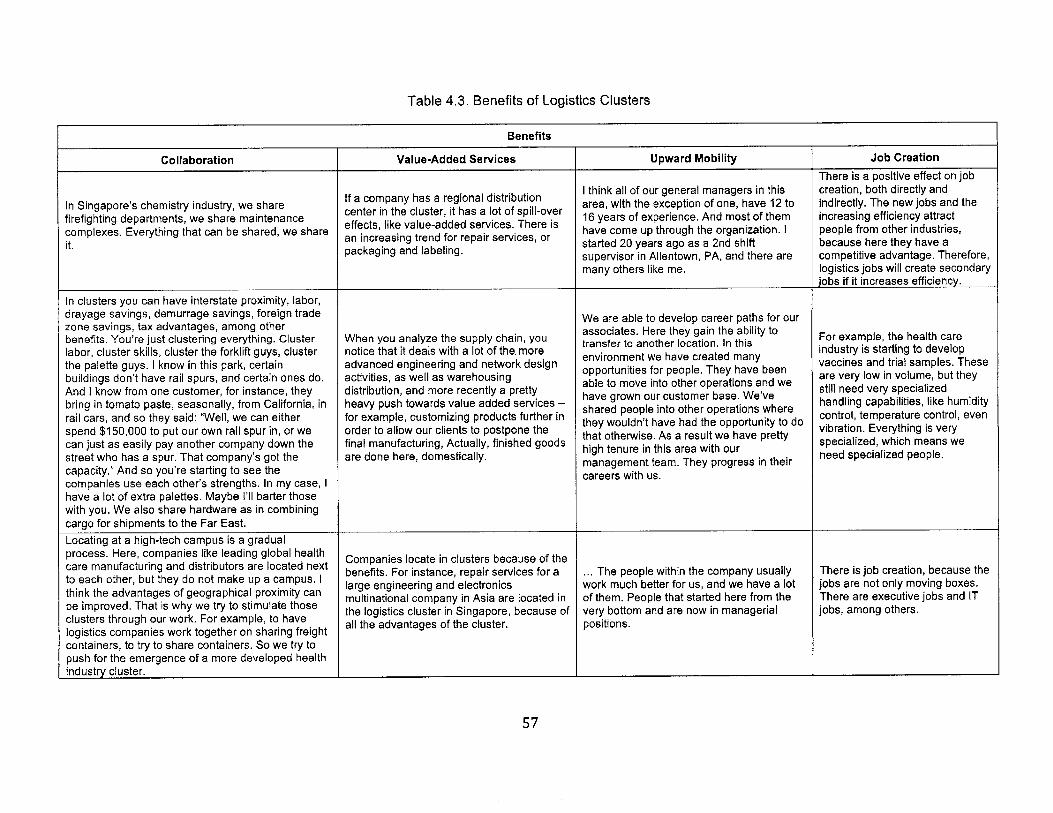
Table 4.3. Benefits of Logistics Clusters
Benefits
Collaboration Value-Added Services Upward Mobility Job Creation
There is a positive effect on job
If a cI think all of our general managers in this creation, both directly andIn Singapore's chemistry industry, we share cf icompany has a regional distribution area, with the exception of one, have 12 to indirectly. The new jobs and thefirefighting departments, we share maintenance center in the cluster, it has a lot of spill-over 16 years of experience. And most of them increasing efficiency attractcomplexes. Everything that can be shared, we share effects, like value-added services. There is have come up through the organization. I people from other industries,it. an increasing trend for repair services, or started 20 years ago as a 2nd shift because here they have a
packaging and labeling, supervisor in Allentown, PA, and there are competitive advantage. Therefore,many others like me. logistics jobs will create secondary
jobs if it increases efficiency.
In clusters you can have interstate proximity, labor,drayage savings, demurrage savings, foreign trade We are able to develop career paths for ourzone savings, tax advantages, among other associates. Here they gain the ability tobenefits. You're just clustering everything. Cluster When you analyze the supply chain, you transfer to another location. In this For example, the health care
labor, cluster skills, cluster the forklift guys, cluster notice that it deals with a lot of the. more environment we have created many industry is starting to developthe palette guys. I know in this park, certain advanced engineering and network design opportunities for people. They have been vaccines and trial samples. Thesebuildings don't have rail spurs, and certain ones do. activities, as well as warehousing able to move into other operations and we are very low in volume, but theyAnd I know from one customer, for instance, they distribution, and more recently a pretty have grown our customer base. We've still need very specializedbring in tomato paste, seasonally, from California, in heavy push towards value added services - shared people into other operations where handling capabilities, like humidityrail cars, and so they said: "Well, we can either for example, customizing products further in they wouldn't have had the opportunity to do control, temperature control, evenspend $150,000 to put our own rail spur in, or we order to allow our clients to postpone the that otherwise. As a result we have pretty vibration. Everything is verycan just as easily pay another company down the final manufacturing, Actually, finished goods high tenure in this area with our specialized, which means westreet who has a spur. That company's got the are done here, domestically. management team. They progress in their need specialized people.capacity." And so you're starting to see the careers with us.companies use each other's strengths. In my case, Ihave a lot of extra palettes. Maybe I'll barter thosewith you. We also share hardware as in combiningcargo for shipments to the Far East.Locating at a high-tech campus is a gradualprocess. Here, companies like leading global health Companies locate in clusters because of thecare manufacturing and distributors are located next benefits. For instance, repair services for a ... The people within the company usually There is job creation, because theto each other, but they do not make up a campus. I large engineering and electronics work much better for us, and we have a lot jobs are not only moving boxes.think the advantages of geographical proximity can multinational company in Asia are located in of them. People that started here from the There are executive jobs and ITbe improved. That is why we try to stimulate those the logistics cluster in Singapore, because of very bottom and are now in managerial jobs, among others.clusters through our work. For example, to have all the advantages of the cluster. positions.logistics companies work together on sharing freightcontainers, to try to share containers. So we try topush for the emergence of a more developed healthindustry cluster.
57
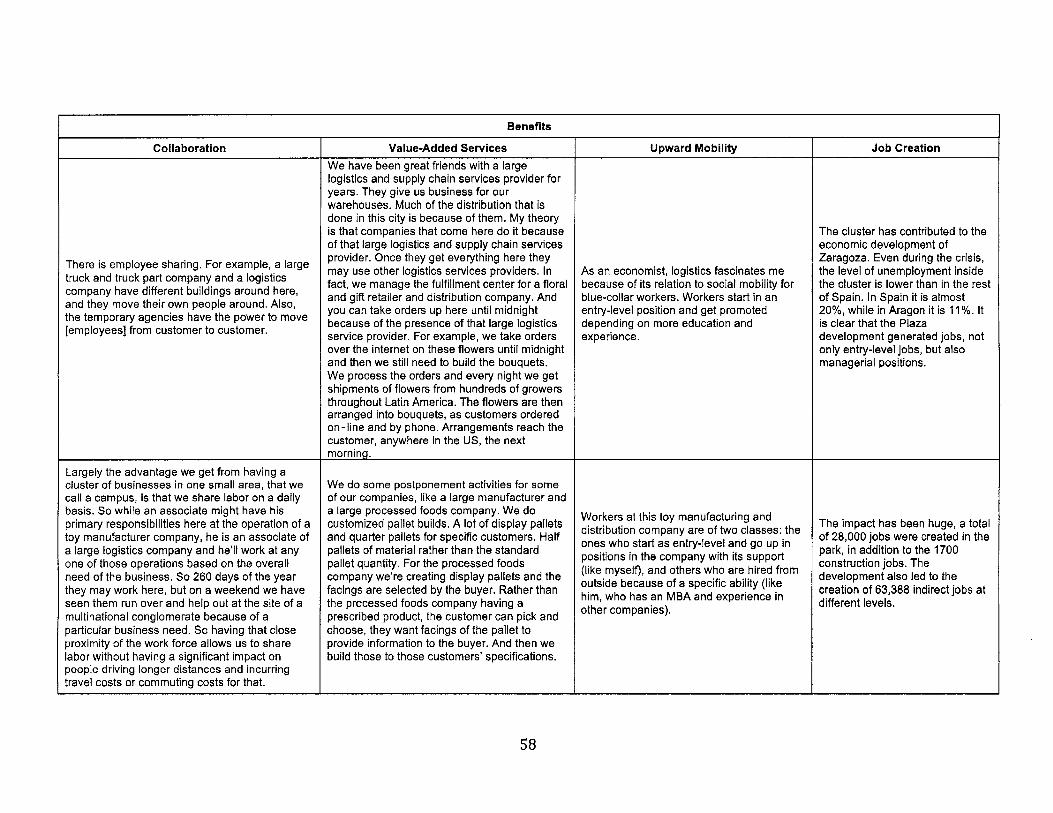
Benefits
Collaboration Value-Added Services Upward Mobility Job CreationWe have been great friends with a largelogistics and supply chain services provider foryears. They give us business for ourwarehouses. Much of the distribution that isdone in this city is because of them. My theoryis that companies that come here do it because The cluster has contributed to theof that large logistics and supply chain services economic development of
There is employee sharing. For example, a large provider. Once they get everything here they Zaragoza. Even during the crisis,. may use other logistics services providers. In As an economist, logistics fascinates me the level of unemployment inside
truck and truck part company and a logistics fact, we manage the fulfillment center for a floral because of its relation to social mobility for the cluster is lower than in the restcompany have different buildings around here, and gift retailer and distribution company. And blue-collar workers. Workers start in an of Spain. In Spain it is almostand they move their own people around. Also, you can take orders up here until midnight entry-level position and get promoted 20%, while in Aragon it is 11%. Itthe temporary agencies have the power to move because of the presence of that large logistics depending on more education and is clear that the Plaza[employees] from customer to customer. service provider. For example, we take orders experience. development generated jobs, not
over the internet on these flowers until midnight only entry-level jobs, but alsoand then we still need to build the bouquets. managerial positions.We process the orders and every night we getshipments of flowers from hundreds of growersthroughout Latin America. The flowers are thenarranged into bouquets, as customers orderedon-line and by phone. Arrangements reach thecustomer, anywhere in the US, the nextmorning.
Largely the advantage we get from having acluster of businesses in one small area, that we We do some postponement activities for somecall a campus, is that we share labor on a daily of our companies, like a large manufacturer andbasis. So while an associate might have his a large processed foods company. We do Workers at this toy manufacturing andprimary responsibilities here at the operation of a customized pallet builds. A lot of display pallets distribution company are of two classes: the The impact has been huge, a totaltoy manufacturer company, he is an associate of and quarter pallets for specific customers. Half oe y a of 28,000 jobs were created in thea large logistics company and he'll work at any pallets of material rather than the standard oneswoss e ny w ndsuort park, in addition to the 1700one of those operations based on the overall pallet quantity. For the processed foods (like myself), and others who are hired from construction jobs. Theneed of the business. So 260 days of the year company we're creating display pallets and the development also led to thethey may work here, but on a weekend we have facings are selected by the buyer. Rather than outiwho becaus of a specific abiity ke creation of 63,388 indirect jobs atseen them run over and help out at the site of a the processed foods company having a other companies). different levels.multinational conglomerate because of a prescribed product, the customer can pick andparticular business need. So having that close choose, they want facings of the pallet toproximity of the work force allows us to share provide information to the buyer. And then welabor without having a significant impact on build those to those customers' specifications.people driving longer distances and incurringtravel costs or commuting costs for that.
58
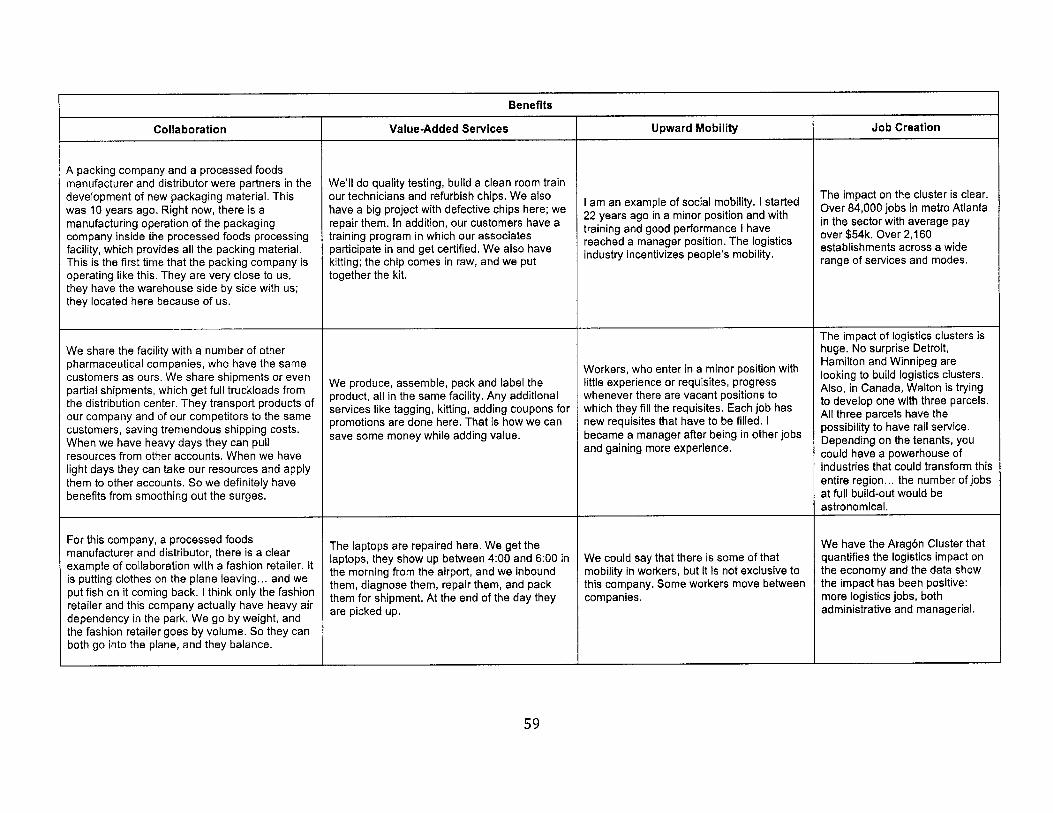
Benefits
Collaboration Value-Added Services Upward Mobility Job Creation
A packing company and a processed foodsmanufacturer and distributor were partners in the We'll do quality testing, build a clean room traindevelopment of new packaging material. This our technicians and refurbish chips. We also I am an example of social mobility. I started The impact on the cluster is clear.was 10 years ago. Right now, there is a have a big project with defective chips here; we 22 years ago in a minor position and with Over 84,000 jobs in metro Atlantamanufacturing operation of the packaging repair them. In addition, our customers have a training and good performance I have in the sector with average paycompany inside the processed foods processing training program in which our associates reached a manager position. The logistics over $54k. Over 2,160facility, which provides all the packing material. participate in and get certified. We also have ryincentivizes people's mobility, establishments across a wideThis is the first time that the packing company is kitting; the chip comes in raw, and we put industry range of services and modes.operating like this. They are very close to us, together the kit.they have the warehouse side by side with us;they located here because of us.
The impact of logistics clusters isWe share the facility with a number of other huge. No surprise Detroit,pharmaceutical companies, who have the same Workers, who enter in a minor position with Hamilton and Winnipeg arecustomers as ours. We share shipments or even We produce, assemble, pack and label the little experience or requisites, progress looking to build logistics clusters.partial shipments, which get full truckloads from product, all in the same facility. Any additional whenever there are vacant positions to Also, in Canada, Walton is tryingthe distribution center. They transport products of services like tagging, kitting, adding coupons for which they fill the requisites. Each job has to develop one with three parcels.our company and of our competitors to the same promotions are done here. That is how we can new requisites that have to be filled. I All three parcels have the
stomers saving tremendous sh pping costs. save some money while adding value. became a manager after being in other jobs Depening on he tenant , youWhn e ae eaydas he anpuland gaining more experience, couldin av ah poehous oresources from other accounts. When we have could have a powerhouse oflight days they can take our resources and apply industries that could transform thisthem to other accounts. So we definitely have entire region... the number of jobsbenefits from smoothing out the surges. at full build-out would be
astronomical.
For this company, a processed foods The laptops are repaired here. We get the We have the Arag6n Cluster thatmanufacturer and distributor, there is a clear laptops, they show up between 4:00 and 6:00 in We could say that there is some of that quantifies the logistics impact onexample of collaboration with a fashion retailer. It the morning from the airport, and we inbound mobility in workers, but it is not exclusive to the economy and the data showis putting clothes on the plane leaving... and we them, diagnose them, repair them, and pack this company. Some workers move between the impact has been positive:put fish on it coming back. I think only the fashion them for shipment. At the end of the day they companies. more logistics jobs, bothretailer and this company actually have heavy air are picked up. administrative and managerial.dependency in the park. We go by weight, andthe fashion retailer goes by volume. So they canboth go into the plane, and they balance.
59
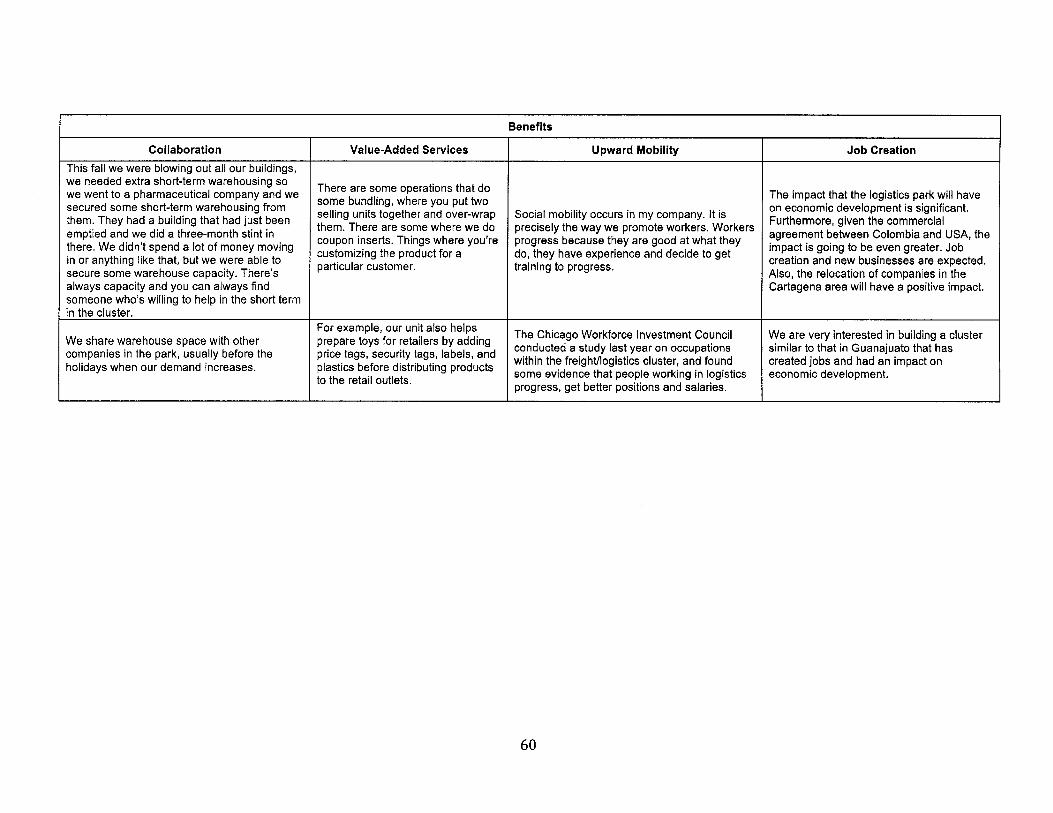
60
Benefits
Collaboration Value-Added Services Upward Mobility Job Creation
This fall we were blowing out all our buildings,we needed extra short-term warehousing so There are some operations that dowe went to a pharmaceutical company and we some bundling, where you put two The impact that the logistics park will havesecured some short-term warehousing from selling units together and over-wrap Social mobility occurs in my company. It is on economic development is significant.them. They had a building that had just been them. There are some where we do precisely the way we promote workers. Workers Furthermore, given the commercialemptied and we did a three-month stint in them. Thers. some where weu'repre se they re orers Wore agreement between Colombia and USA, thethere. We didn't spend a lot of money moving coupon inserts. Things where you're progress because they are good at what they impact is going to be even greater. Jobin or anything like that, but we were able to customizing the product for a do, they have experience and decide to get creation and new businesses are expected.secureparticular customer. training to progress. Also, the relocation of companies in thealways capacity and you can always find Cartagena area will have a positive impact.someone who's willing to help in the short termin the cluster.
For example, our unit also helps The Chicago Workforce Investment Council We are very interested in building a clusterWe share warehouse space with other prepare toys for retailers by adding conducted a study last year on occupations similar to that in Guanajuato that hascompanies in the park, usually before the price tags, security tags, labels, and within the freight/logistics cluster, and found created jobs and had an impact onholidays when our demand increases. plastics before distributing products some evidence that people working in logistics economic development.to the retail outlets. progress, get better positions and salaries.
4.4. Results
The interview data suggests that the agglomeration of logistics firms provides specific benefits tocompanies derived mostly from opportunities for collaboration and for offering value added services.Logistics clusters also offer upward mobility for the employees and more jobs at different levels.
4.4.1. Operational advantagesfrom collaboration
The main driver of these advantages is that transportation and logistics assets across industries aresimilar, since the operations performed do not depend, by and large, on the content of the box but ratherinclude standard activities: picking, sorting, loading, transporting, tracking, unloading and delivery. Thisquality facilitates transportation and logistics capacity sharing among companies. There are severalexamples of this type of collaboration, as two managers mentioned:
A fashion retailer ships finished garments using a 747-cargo plane from Zaragoza (Spain) toJohannesburg (South Africa). A neighboring operation in the same logistics park, a processedfoods manufacturer and distributor, is bringing fish packed in ice from South Africa to Spain. "Welease the plane together, creating a round trip to reduce costs. Furthermore, on the northbound tripwe share the same trip. We put light raw material (wool) on top of their heavy pallets of ice-packedfish, thus utilizing both the volume and weight limits of the 747. The result is lower costs for bothcompanies."
A multinational cleaning products manufacturer sends a weekly truckload shipment of 20,000 lbs.from their distribution center (DC) in Fairburn, Georgia to a retailer's distribution center in Florida. Amanufacturer of batteries and personal care products operates a distribution center next door andsends a 9,000 lbs. less-than-truckload (LTL) shipment every week to the same retailer distributioncenter. The companies collaborated to create a single weekly truckload shipment, picking up everyweek at one DC and then the other, delivering to the same retailer DC in Florida. The retailer had tochange its ordering pattern and delivery acceptance slots and both manufacturers had to changetheir processes and coordinate shipment schedules in order to enable the collaboration. As a resultboth manufactures reduced their transportation costs, and the retailer reduced dock congestion.The program has now been expanded by the cleaning products manufacturer to DCs located in fiveother logistics clusters and with many other companies.
The same characteristic also means that firms inside logistics clusters experience more collaborationthrough resource sharing like warehousing space, employees, and equipment in case a temporary surgein demand creates a need. One interviewee mentioned:
A specialized gifts retail company has a peak in demand just before Valentine's Day. Theirdistribution has been outsourced to a large supply chain service provider operating from a logisticscampus in Louisville, KY. To accommodate the increased demand the supply chain serviceprovider uses space, warehouse belts and employees from other park operations.
Logistics clusters also provide special opportunities for collaboration even among competitors. Forinstance:
In Memphis, a large logistics company facilitates and sets up forums for its partners and customersin the health industry to talk about logistics issues. Companies claim to get significant operationalknowhow in these forums. Meetings usually involve around 10 companies and they can discusscommon problems and proposed solutions. One manager mentioned "these forums represent a
61
safe environment where we can talk even with competitors, off course without revealing the tradesecrets". Another manager added, "you can talk about general or specific topics together and haveopen discussions about it or how it could be improved".
All these advantages grow as the size of the cluster grows, more freight flows in and out, and even morefirms join the cluster, creating a positive feedback loop of growth.
4.4.2. Value added services
Over time, a logistics cluster becomes more than just a location for warehousing and transportationactivities. As products spend time in distribution centers, companies have an opportunity to add value tothese products by tagging, packaging, preparing for retail display and performing postponed operationsbefore the product are moved into the retail channels.
In the Zaragoza facility, a sports articles manufacture and distributor consolidates all its operationsbeyond production: packing, kitting, labeling, and others, including final delivery. The CEOcommented, "The company can even postpone some of the sport products, shirts, balls, ... evenpromotional kits. The reason behind this strategy is the cost savings resulting from the efficienciesand economies of scale of performing all the activities at the same place".
Building on the good transportation services in and out of logistics clusters and on the distributionprowess already there, companies locate return and repair facilities there, leading to high-paying jobs fortechnicians and engineers. As a couple of the interviewed managers commented:
A large manufacturing company in Memphis processes every night about 1,500 laptop computersin need of repair. A faulty laptop can be dropped off by 20:00 at a FedEx station anywhere in theUS; by early the following morning it will be in the company's repair facility where techniciansdiagnose the problem and attempt to fix it. Most laptops will be repaired and sent back by the endof the day to be delivered 36 hours later to their owners.
A Miami based forwarder with operations in Colon Free Trade Zone in Panama, saw an opportunityto provide value added services to the second hand equipment division of a large US-basedmachine manufacturer. In the past, the manufacturer used to store its used equipment in Panamafor months. When an order was placed, it's second hand equipment division hired the forwarder toship the equipment to Miami for refurbishment and then to the customer. The forwarder proposedto the manufacturer to do the refurbishment in Panama and then ship it directly to the customer.The new value added service required a significant investment from the forwarder, but it paid offsoon. In 2011, the company refurbished 5,000 parts of equipment not only for that manufacturer butalso for a competitor who moved its operations to Panama and also works with the forwarder totake advantage of the value added service.
4.4.3. Upward mobility
The logistics industry recruits people with relatively low levels of education and gives them the opportunityto progress in the labor market, since the industry value "on the floor experience." Clusters facilitate thisphenomenon because of the concentration of firms. As one of the interviewee mentioned:
62
The logistics industry is made up of a variety of sectors involved in receiving, processing, storing and movinggoods, whose jobs require short, moderate or long term on-the-job learning, not degrees. This represents apool of upwardly mobile opportunities to the large and growing number of marginally educated workers,which can later get promoted given their experience. Thus, logistics is one of those sectors that leads toaccess to middle class without college education.
Since logistics companies have to deal with spikes in demand during holidays, new product launches,and changes of operations, companies hire many short term and temporary employees. This representsan opportunity for the companies to identify prospective candidates and hire them on a full time bases inthe future. Naturally, it also represents an opportunity for full time employment seekers to provethemselves. As a manager said:
When the demand increases, we hired temp workers for the short term. That is good for us. If we like aperson we will offer financial aid to continue his education and a flexible type of contract that allows him tofinish schooling and continue working with the company. That is how we can pick good workers andguarantee they are going to continue working with us, because of the dual advantage of gaining experienceas well as improving their education level.
UPS, the largest logistics company in the US exemplifies this "promote from within" philosophy.Accenture (2006) reported that 54 percent of current full time management employees of UPS rose fromnon-management positions, and 78 percent of its vice presidents started in non-management positions(Accenture, 2006).
Logistics sectors (wholesale trade, truck transportation, support services for transportation, generalwarehousing and storage, air, rail and water transportation) employ large numbers of blue collar workerswith access to the type of "skill ladder" circumstances that have traditionally only been found inmanufacturing. Husing (2004) in a report to the Southern California Association of Governments identifiedlogistics as a potential sector to capture employees who used to work in the manufacturing sector. Hereports that the logistics sector provided competitive salaries from 1990s to 2003 in Southern California,and he anticipated a continuation of this trend. As the author stated during the interview:
"Today the data confirmed that analysis was correct, logistics presents an opportunity to capturemanufacturing unemployment".
Data from Los Angeles County shows that the average salary for logistics employees is similar to that ofmanufacturing and construction (Husing, 2007) and data from Chicago shows similar results (ChicagoMetropolitan Agency for Planning, 2012).
4.4.4. Job growth at multiple levels
Governments the world over have been investing in logistics clusters to support trade and economicgrowth. For instance AllianceTexas attracted more than 265 companies creating 30,000 direct jobs andmore than 63,000 indirect jobs by 2011 (AllianceTexas, 2012). The most striking feature of these clusters,however, is their role as an engine of job growth at multiple levels. On the basic level there are the directlogistics jobs involving the storage and movement of cargo. Yet logistics is not all manual labor becausethe industry is one of the heaviest users of sophisticated information and communications technologies.
63

Logistics also requires complex cross-border accounting and financial acumen, in addition to managerialand executive functions. As one interviewee in the Los Angeles County mentioned:
Logistics jobs pay, on the average, salaries commensurate with manufacturing. These includes jobs inrail transportation, air transportation, support services for transportation, truck transportation andwarehousing and storage sectors. Significantly, the weighted average for the group was more than$40,000 for 2003. The average increases significantly if you add executive and managerial positions.
The job creation in logistics clusters goes significantly further. As mentioned before, logistics clustersinvolved many value-added jobs dealing with repair, returns, retail preparation and related activities,requiring relatively advanced job skills. In the case of the forwarder and the machine manufacturer, theinterviewer added "to provide the value added service, the forwarder had to get equipment to perform therefurbishment, hire more people, train the mechanics and get certified by the manufacturer".
In many cases design-intensive consumer goods companies (such as clothing, toys, and housewares)choose to co-locate headquarters and design centers near their major global distribution hubs in order tobe "close to the action." This means that high paying jobs move to the cluster. As one interviewedmanager comment:
Our DC is here because of the cluster advantages, but because of our business we also have peoplein this facility working in designing, taking pictures, modeling, etc.
Two other factors make jobs in logistics clusters desirable. First, due to the undifferentiated nature oflogistics operation, logistics clusters offer regional job stability. Jobs in a logistics cluster are not tied tothe business cycle of any one industry and thus regional employment is overall more stable. Second,logistics jobs in local distribution clusters are not "off-shoreable". The economics of transportation dictatethat transporting shipments over long distances have to be conducted using the largest possibleconveyances, while local distribution has to take place in proximity to customer locations. Thus, localdistribution has to be performed locally.
64
Chapter 5
Impacts of agglomeration on logisticsfirms
5.1. Introduction
The study of clusters and their economic impact has been a topic of interest for governments and firms
since the work of Marshall (1890) on agglomeration economies. Porter (1998) defined a cluster as "thegeographic concentration of interconnected companies in the same industry, which both compete andcooperate". Among the advantages of co-location the author identifies increased productivity, newtechnological and delivery possibilities, easier access to information, ease of new business formation, andbenefits coming from working together with other institutions like universities and public organizations.
Several authors have identified collaboration as one of the main benefits of locating in industrial clustersbecause it increases efficiency and reduce costs (Appold, 1995, Buvik and Halskau, 2001), thus having apositive effect on firms' competitiveness (Huo, 2012). Inter-firm collaboration in a cluster can alsoencourage economic growth. Such growth can result from companies jointly investing in specific assetssuch as physical resources, infrastructure, human resources and technology that contribute to regionalgrowth (Rollins, Pekkarinen and Mehtala, 2011). Co-location can also foster strategic alliances wherecompanies share their productive factors and existing facilities, leading to lower costs and higherperformance (Chapman et. al, 2003).
Other authors claim that the benefits of clustering are no longer relevant and companies do not need tolocate in physical proximity to others in order to collaborate. For example, Cairncross (1997) argues thatthe development and adoption of information technologies (IT) has become a more important factor thanlocation in fostering inter-firm collaboration. Lazerson and Lorenzoni (1999) state that collaboration inclusters does not always lead to better performance, especially for smaller companies because theycannot take advantage of the operational processes implemented in larger firms. These forces are thereason why authors like Molina-Morales and Martinez-Fernendez (2009) and Wheeler (2003) contendthat the pattern of economic growth related to agglomerations follows an inverted-U-shape in time andthat the incentives to agglomerate are not enough in an age where globalization and the elimination oftrade barriers can lead to firm dispersion (Henderson and Shalizi, 2001).
Value-added services are commercial offerings that go beyond the standard offering in any givenindustry. Ettlie and Reza (1992) suggest that agglomeration helps capture value in the production process
and develop new products and materials, new processes, new services, and new organizational forms, allof which give a firm an advantage in the market place. There are only a few studies on value added
services in clusters. Chapman et al. (2003) state that the development of value added services isfacilitated by the adoption of technology, and Appold (1995) adds that geographical proximity accounts for
65
the provision of new services that enhance productivity and competitiveness. Other authors argue thattoday companies "may accept customization requests and consequent catalogue extensions, no longeras a threat, but as a market opportunity..." (Battezzati and Magnani, 2000, p. 424). They add that in Italy,industrial agglomerations have encouraged and made the process of customization more efficient; forinstance, companies in the furniture cluster in Majano, Italy customize products through special coloringaccording to consumer orders.
Value added services could be adopted by both large and small companies. Soinio et al. (2012) arguethat logistics service providers (LSPs) and small medium sized enterprises (SME) can work together todevelop these value-added activities. In their application to the SME sector in Finland, the authors claimthat logistics services have evolved from transportation and warehousing to advanced supply-chainsolutions. The adoption of value-added services helps SMEs overcome their suboptimal supply-chaineffectiveness.
This chapter analyzes the extent of collaboration and the provision of value added services in logisticsclusters. Logistics clusters are defined as the agglomeration of firms offering logistics services (Third-Party Logistics Providers - 3PLs, transportation carriers, and warehouse operators) in the samegeographical region. In addition, the definition encompasses the logistics functions of manufacturers andretailers located in the same region, as well as companies with logistics intensive operations such asautomobile manufactures or bulk commodities distributors, for whom logistics is a large part of the cost(Sheffi, 2012).
Interview data suggest that firms located close to other logistics companies experience higher levels ofcollaboration and offer more value added services compared to similar companies located outsidelogistics clusters (Rivera et al., 2014). Using data from a survey conducted in the Zaragoza logisticscluster, in Aragon (Spain) (see the map in appendix A), this chapter tests this finding using a structuralequation model and estimates the magnitude of the phenomenon.
The rest of the chapter is organized as follows. Section 2 presents a literature review of collaboration inlogistics clusters, while section 3 reviews the literature on value added services in logistics clusters.Section 4 describes the theoretical model. Section 5 presents the methodology, including a description ofthe survey, the questionnaire, the sampling and the research propositions. Section 6 contains theestimation results and discussion. Finally, section 7 concludes the chapter and suggests opportunities forfurther research.
5.2. Collaboration and logistics clusters
The collaboration argument stems from the fact that logistics clusters allow resident firms to shareresources and transportation capacity. Using interview data, Sheffi (2012) reports that logistics firmslocated in clusters experience operational advantages when they collaborate. These benefits come fromsharing tangible (transportation capacity and warehousing equipment) and intangible assets (knowledgeand information). Pekkarinen (2005) contends that long-term relationships among firms allow them tobundle air-cargo and implement new warehousing activities, as well as easily adopt informationtechnologies. Long-term alliances between logistics firms can lead to higher performance in producthandling and product tracking, which in turn increases customer satisfaction (Chapman et. al, 2003).
Logistics clusters also allow firms to take advantage of low transportation costs because of competitionbetween freight carriers (Limao and Venables, 2001). Collaboration also allows firms to use the repair
66
and maintenance facilities of other colocated companies (Van Den Heuvel et. al, 2012). These additionaloperational advantages contribute to higher productivity in logistics clusters. Lannone (2012) in a study ofseaports stated that the implementation of certain procedures within the regional logistics system (suchas inspection or administrative controls) takes place whenever infrastructure managers, shipping lines,intermodal carries and customs agents cooperate and integrate processes. Moreover, Jing and Cai(2010) argued that the agglomeration of logistics firms in China increased the demand for logisticsservices, making them more specialized and effective.
In contrast several authors argue that clustering does not necessarily lead to collaboration. Dell'Orco,Sassanelli and Tiso (2009) argue that trust issue may interfere with inter-firm relationships. "As aconsequence, transportation costs and external diseconomies such as accidents, pollution and trafficcongestion increase for companies in the cluster" (pp. 322). Van Der Horst and De Langen (2008) studiedthe limits of collaboration in ports. They found that there is a general unwillingness of firms to share spaceor exchange cargo in trucks and large vessels at the hinterland part of the supply chain because firmsperceive cooperation as a time-consuming activity. Also, the unbalanced distribution of costs and benefitsmay reduce the motivation of some firms to invest in capacity because others will simply become free-riders.
5.3. Value added services and logistics clusters
Most modern logistics service providers have developed offerings that go far beyond simple warehousingor transportation. Appold (1995) observes that providing additional services makes a logisticsestablishment more competitive. Value added services include tagging, kitting, labeling, returnsmanagement, repairs, recycling, packaging, preparing for retail display and many other activities. Also,businesses involved in logistics operations can add value to the products they handle by performingpostponement activities, allowing manufacturers to customize products in response to demand, therebyreducing the discounting and disposal of unsold items (Sheffi, 2012).
The notion that value-added services (VAS) are important for explaining why firms agglomerate was oneof the conclusions in the study of Reichhart and Holweg (2008). According to the authors, local value-added must be considered in the analysis of a cluster's configuration. In the interviews they held withexecutives at manufacturing and logistics firms, the respondents indicated: "local value-added is thedriving dimension behind a number of further operational decisions and dimensions... It even determinesthe investments required for setting up co-located facilities" (p. 64). In this case, re-location decisionswere made on the basis of performing postponement activities like late configurations, final assembly,quality checks, functional testing, or pre-assembly tasks. Cluster infrastructure that facilitates thedevelopment of VAS can also incentivize manufacturers and suppliers to create sub-clusters ofspecialized logistics services related to the products handled, such as the medical devices distributioncluster in Memphis or the heavy equipment repair and distribution in Colon, Panama (Sheffi, 2012).
In contrast, several authors do not find that logistics clusters create an incentive to provide value addedservices. Morgan (2012) studies transportation, distribution and logistics clusters and argues that theactivities developed in these clusters do not add value to the product in the supply chain. Although third-party logistics providers can offer efficient services such as receiving, storing, managing, or shipping, allof these processes are part of the basic function of moving goods from one place to another withoutadding value. Similarly, Van Hoek and Van Dierdonck (2000) show that in comparison to manufacturingfirms, logistics companies do not employ, to a large extent, value-adding activities in the shipping
operation. They surmise that value-adding measures may cause the firms' costs to rise rendering them
67
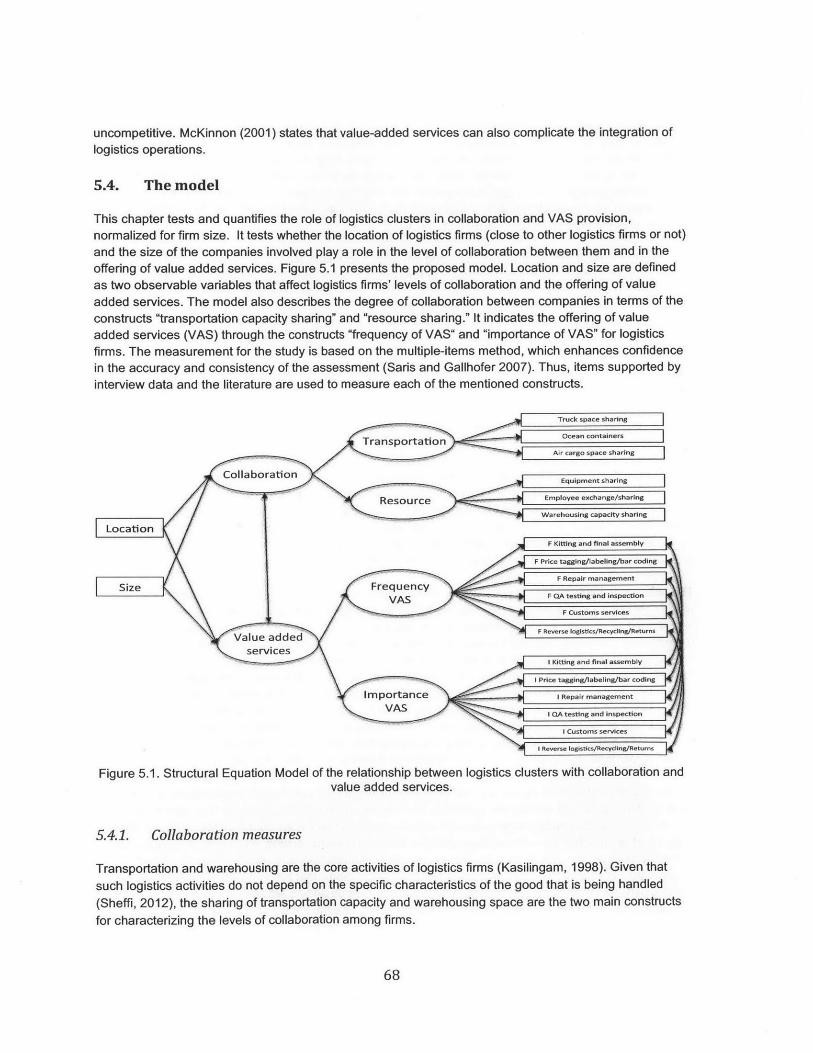
uncompetitive. McKinnon (2001) states that value-added services can also complicate the integration oflogistics operations.
5.4. The model
This chapter tests and quantifies the role of logistics clusters in collaboration and VAS provision,normalized for firm size. It tests whether the location of logistics firms (close to other logistics firms or not)and the size of the companies involved play a role in the level of collaboration between them and in theoffering of value added services. Figure 5.1 presents the proposed model. Location and size are definedas two observable variables that affect logistics firms' levels of collaboration and the offering of valueadded services. The model also describes the degree of collaboration between companies in terms of theconstructs "transportation capacity sharing" and "resource sharing." It indicates the offering of valueadded services (VAS) through the constructs "frequency of VAS" and "importance of VAS" for logisticsfirms. The measurement for the study is based on the multiple-items method, which enhances confidencein the accuracy and consistency of the assessment (Saris and Gallhofer 2007). Thus, items supported byinterview data and the literature are used to measure each of the mentioned constructs.
Value spddedain
Oever cotinr
Transportation oencnanr
valu added services.in
5.4.1. ~ Collaboration aue
suhle d not on tEquipment sharing
ResourceEmployee exchange/sharing
r wWarehousing capacity sharing
LocationF Kitting and final assembly
F Price tagging/labelingbrcdn
F Repair management
Size Fre quency\f6 F QA testing and inspection
F Customs services
F Reverse logistlcs/Recycling/Returns
servicesI Kitting and final assem bly
I Price tagging/labeling/bar coding
Im portance 1 Repair management
VAS I QA testing and inspection
I customs services
I I Reverse logistics/Recycling/Returns
Figure 5.1. Structural Equation Model of the relationship between logistics clusters with collaboration andvalue added services.
5.4.1. Collaboration measures
Transportation and warehousing are the core activities of logistics firms (Kasilingam, 1998). Given that
such logistics activities do not depend on the specific characteristics of the good that is being handled
(Sheffi, 2012), the sharing of transportation capacity and warehousing space are the two main constructs
for characterizing the levels of collaboration among firms.
68
The elements of the "transportation sharing" construct include sharing space in trucks, ocean containers
and air cargo. Van Den Heuvel et al. (2012) reports that firms that collaborate tend to send part of their
freight in the trucks of colleague firms. Schuldt and Werner (2007) also mention that under high levels of
communication and strong inter-company linkages, shipping companies will share spaces in containers
and will ultimately cooperate to design more efficient shipping routes. The authors find a strong and
positive relation between the number of clusters, the number of containers, and the number of
conversations among the company's managers. This evidence supports ocean container sharing as an
indicator of transportation capacity sharing and collaboration. Finally, Pekkarinen (2005) claims that long-
term relationships between companies allow them to share air cargo space.
Collaboration in logistics clusters can also materialize in the form of resource sharing. Sheffi (2012)
reports on logistics companies exchanging workers and equipment to cope with demand volatility
generated by seasonality or product launches. Consequently, the frequency of such exchanges can be
used as an indicator of resource sharing and collaboration. Also, Van Den Heuvel et al. (2012) report that
co-located logistics companies lend or rent their warehouses to colleague firms. Thus, employee
exchange, equipment sharing, and warehousing capacity sharing are used as measurements of the
construct "resource sharing". Both "resource sharing" and the "transportation construct" mentioned above
are the measurements used for the construct "collaboration".
5.4.2. Value added services measures
Logistics has become an important source of efficiency for firms not only because it lowers distribution
and storage costs, but also because it offers opportunities for cost reductions in related areas of activity
as well as improvements in the level of customer service (Bowersox, 1990). The model measures two
characteristics of the VAS: importance and frequency. Value added services are important in the sense
that they create competitive advantages through increased customer service levels (Skjoett-Larsen,
2000). The frequency of offering value added services can impact just-in-time delivery strategies and
distribution costs (Reichhart and Holweg, 2008).
Lu (2000) finds that value-added services, equipment strategies, and facility strategies are important
features of logistics companies. Lu defines value added services as "the ability to provide services like
customs clearance, inspections, consolidation, door-to-door services, and just-in-time service deliveries."
Reichhart and Holweg (2008) mention post-manufacturing activities like quality checks, final assembly,
and repair tasks, while Van Hoek and Van Dierdonck (2000) also include tagging, labeling, kitting, and
bar coding. Liu and Lyons (2011) in a study of third-party logistics service providers (3PLs) and the
relation between VAS and financial performance use activities such as labeling/marking, packaging,kitting, assembly/re-assembling/installation, and repair. Based on interview data, the value-added
services modeled in this chapter include all the activities mentioned above, plus reverse logistics,
recycling and returns' management (Sheffi, 2012).
The arrows in Figure 4.1 depict the relationship between collaboration and value added services. As
collaboration levels increase, companies learn from each other and are able to develop more
sophisticated value added services. This makes collaboration even more valuable, which encouragescompanies to collaborate more, creating a continuous positive feedback loop. The model also includes
arrows between importance and frequency of value added services, because it is expected that a value
added service that is important to the firm may also be offered more frequently and vice versa.
69
5.4.3. Impact of location and company size on collaboration and value added services
This section presents the four hypotheses tested in the chapter:
HI: Logistics firms located in clusters experience higher levels of collaboration than firms located outsideclusters.H2: Logistics firms located in clusters offer more value added services than firms located outside clusters.H3: Larger firms collaborate more than smaller firms.H4: Larger firms offer more value added services than smaller firms.
Location, collaboration and value added services
Pekkarinen (2005) states that locating in a logistics cluster allows firms to generate long-termrelationships, facilitating resource sharing and operational collaboration, which leads to higher levels ofcompetitiveness. Perez-Aleman (2005) extends the concept of collaboration to include coordinatedlearning. The emergence of clusters allows firms to improve their capabilities, internal processes andproducts due to the learning synergies among them.
Several studies, however, claim that agglomeration is not always beneficial for firms. As discussed above,Dell'Orco, Sassanelli and Tiso, (2009) argue that trust may interfere with collaboration. In some cases,collaboration costs could be higher than its benefits or knowledge outflows could turn out to be morevaluable for competitors than knowledge inflows for the firm, deterring companies from collaborating(Lammarino and McCann, 2006).
Examining the contrasting positions, Martin and Sunley (2003) suggest that a cluster's impact oncollaboration between firms needs to be studied further. They indicate that Porter's first ideas onagglomerations neither explain (or acknowledge) the existence of relocation costs, nor do they addressthe issues of opportunity costs related to locating a certain distance from the cluster.
Thus, the first hypothesis is:
HI: Logistics firms located in clusters experience higher levels of collaboration than firms located outsideclusters.
There are few studies of value-added services in logistics clusters. Several authors argue that the co-location of firms accentuates the development of value-adding activities that go beyond transportationand warehousing processes (Pekkarinnen, 2005; Reichhart and Holweg, 2008). Sheffi (2012) contendsthat the intricate relationships that emerge among firms inside a logistics cluster allow them to performservices other than warehousing and distribution. Reichhart and Holweg (2008) state that a firm'sdecision to relocate to a cluster is influenced by the possibility of performing post-manufacturing activitieslike quality checks, final assembly, functional testing, or pre-assembly tasks. Other authors argue thatlogistics clusters are not advantageous in offering value added services. For instance Morgan (2012)concludes that co-located transportation, distribution, and logistics firms do not add value to the product inthe supply chain.
70
Thus the second hypothesis is:
H2: Logistics firms located in clusters offer more value added services than firms located outside clusters.
Size, collaboration and value added services
Collaboration among companies and adoption of value added services are expected to be positivelycorrelated with firm size, because larger firms have operational and financial capabilities that can facilitatethese processes. In addition, developing value added services and collaborating with other firms fostersproductivity and growth (Paige and Nenide, 2008), creating a positive feedback loop. Thus, the modeltakes into account firm size.
Although there are only few results regarding the relationships between collaboration and firm size in thelogistics sector, such research was carried out in other industrial contexts. In manufacturing, severalauthors argue that firm size can have positive, negative or no effect on inter-firm collaboration. Reichhartand Holweg (2008) suggest that most co-located facilities in a cluster belong to large companies who
perceive benefits from colocation. These benefits include improving just-in-time delivery arrangements,
lowering transportation costs, facilitating face-to-face meetings and fostering better mutual understandingbetween the managers of colocated companies. The authors mention that although there might be smallproduction facilities located in the cluster, they mostly belong to large, global suppliers. Nadvi (1999) alsolooked at the differences in collaboration as a result of firm size. He argues that large companiesoutperform smaller ones in cooperation regarding technical upgrades, production organization, and labortraining.
Mytelka and Farinelli (2000) distinguish among three types of clusters according to firm size: informal,organized and innovative. The first comprises micro and small firms that exhibit little cooperation, trustand innovation, while competing with each other. The second is made up of medium-sized companiesthat cooperate to some extent; while the third, involving large companies, exhibits high levels ofcooperation, extensive linkages and high trust.
Rabellotti (1999) provides contrary evidence, arguing that small firms collaborate to a larger extent thanlarge ones. The author showed that small firms in the shoe cluster in Mexico exhibit high levels ofcooperation and increased horizontal and vertical linkages, which in turn improved their performance.Similarly, Stank and Daugherty (1997), in a study on the impact of environmental variables on the
formation of collaborative relations between manufacturers and third-party logistics service providers,found that high transaction volume had a negative effect on the formation of cooperative relationships.Intuitively, this result may mean that manufacturers see high volume purchases as a "bargaining tool" (p.62). The authors also tested whether firm size and organizational structure determine these negativerelations but none of the measures proved to affect the emergence of cooperative relationships.
Thus, the relationship between company size and its degree of collaboration in logistics companies leadsto the third hypothesis:
H3: Larger firms collaborate more than smaller firms.
Firm size may also affect the ability to develop value-added services. Carrie (2000) indicated that therelocation decisions of large multinationals account for the development of value-adding activities and
71
have a positive effect on the regions where they relocate. But, when a cluster is made up of indigenoussmall firms, multinationals would not enter and the extent of VAS offerings would be lower. Rugman andVerbeke (2003) also found evidence supporting the role of large multinational enterprises in the value-added activities of "transnational industrial clusters" (clusters with a large foreign component, mostlycomprising multinational enterprises). The authors argue that the presence of large multinationals andtheir ability to use local resources determines the extent to which value-added services are developedinside the cluster. This suggests that if a multinational encounters problems accessing the "identity driventies" in the local environments (i.e encounters trust-related problems), then its ability to develop VAS willbe reduced. Evangelista and Sweeney (2006) state that large logistics service providers (LSPs) haverelatively higher information technologies capabilities than their smaller counterparts, facilitating supplychain integration and the emergence of value adding capabilities.
Other authors find that small companies move faster and more easily to offer value added services thanlarge companies. Soinio et al. (2012) indicated that although small and medium-sized companies do notview VAS as an important factor for their performance, they still work with logistics service providers todevelop VAS, which improves the supply chain performance as a whole. Maltz (1994) claims that smallshipping companies have greater needs for assistance in technological aspects than larger ones. Hence,they are more interested in contracting with third-party logistics providers who can offer value addedservices.
The forth hypothesis of the structural model is then:
H4: Larger firms offer more value added services than smaller firms.
5.5. Data collection
The survey method was employed to gather data at the Zaragoza Logistics Cluster in Arag6n, Spain (seeappendix 5.A). This cluster is one of the biggest in Europe. It comprises rail, road and air infrastructure,as well as several logistics parks, including PLAZA - Plataforma Logistica de Zaragoza, the largestlogistics park in Europe. It also includes smaller parks such as PLATEA - Plataforma Logistica de Teruel,PLHUS - Plataforma Logistica de Huesca and Mercazaragoza. An on-line questionnaire was pre-testedthrough a pilot survey during July 2010. It was sent to six companies inside and six outside the Zaragozalogistics parks, spanning different sizes: four large, four medium and four small companies. Thequestionnaires, in Spanish and English, are presented in Appendix 5.B
The measurement for the study is based on the multiple-items method, which enhances confidence in theaccuracy and consistency of the assessment (Saris and Gallhofer 2007). Measures were gathered usingLikert-type scale questions ranging from 1 to 5. Three questionnaires were designed; each one with adifferent order of answer-choices to avoid the response order problem (Schuman and Presser, 1996).Specifically, questions 2, 7 and 8 in the questionnaire were used to study collaboration and value-addedservices of logistics companies. The data for location were gathered from the information about thefacilities' address, while the data for size were based on the number of employees in the facility. Thequestions related to collaboration focused on the frequency with which firms share space in trucks, oceancontainers, air cargo and warehouses; as well as employees and equipment. While the ones related tovalue added logistics services asked about the frequency and importance of providing value-addedservices such as price tagging, kitting, repair management, reverse logistics, managing hazardousmaterials, custom services and quality assessments.
72
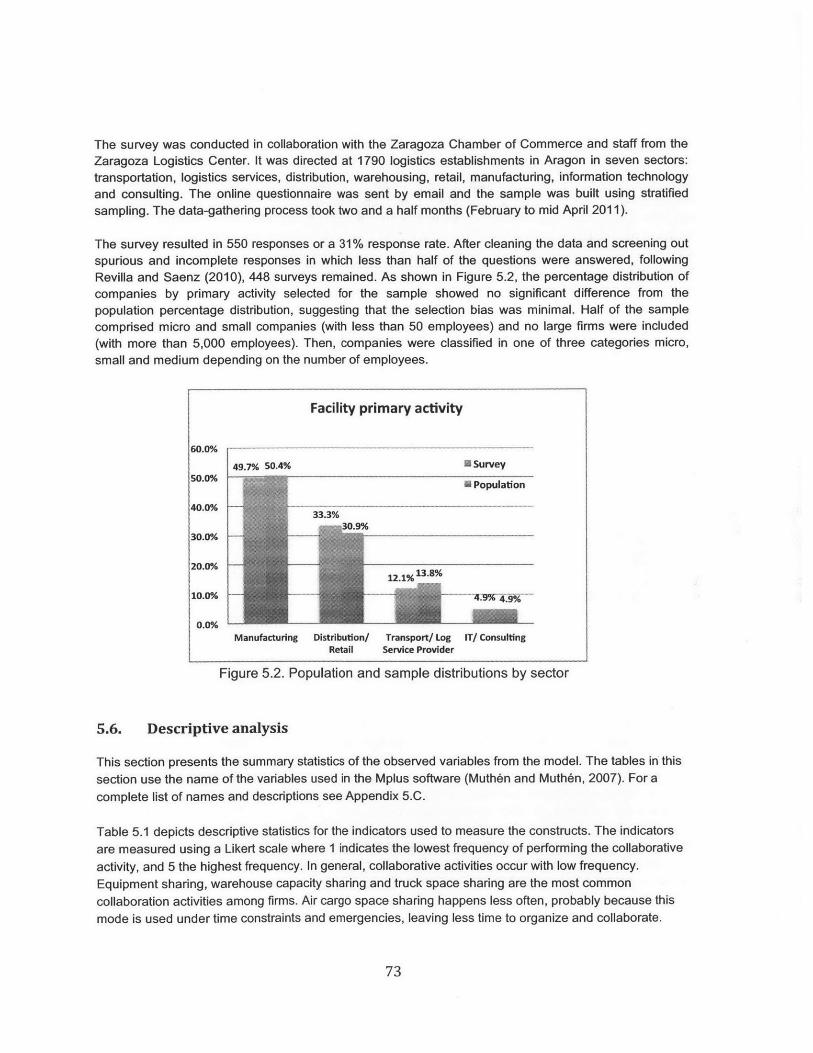
The survey was conducted in collaboration with the Zaragoza Chamber of Commerce and staff from theZaragoza Logistics Center. It was directed at 1790 logistics establishments in Aragon in seven sectors:transportation, logistics services, distribution, warehousing, retail, manufacturing, information technologyand consulting. The online questionnaire was sent by email and the sample was built using stratifiedsampling. The data-gathering process took two and a half months (February to mid April 2011).
The survey resulted in 550 responses or a 31% response rate. After cleaning the data and screening outspurious and incomplete responses in which less than half of the questions were answered, followingRevilla and Saenz (2010), 448 surveys remained. As shown in Figure 5.2, the percentage distribution ofcompanies by primary activity selected for the sample showed no significant difference from thepopulation percentage distribution, suggesting that the selection bias was minimal. Half of the samplecomprised micro and small companies (with less than 50 employees) and no large firms were included(with more than 5,000 employees). Then, companies were classified in one of three categories micro,small and medium depending on the number of employees.
Facility primary activity
60.0%
49.7% 50.4% 11 Survey
530.0%
50.0%0 Population
40.0% 11.3%
wa30.9%30.0%
20.0%12.1%13.8%
10.0%--~~~-
0.0%Manufacturing Distribution/ Transport/ Log IT/ Consulting
Retail Service Provider
Figure 5.2. Population and sample distributions by sector
5.6. Descriptive analysis
This section presents the summary statistics of the observed variables from the model. The tables in thissection use the name of the variables used in the Mplus software (Muthcn and Muthen, 2007). For acomplete list of names and descriptions see Appendix 5.C.
Table 5.1 depicts descriptive statistics for the indicators used to measure the constructs. The indicatorsare measured using a Likert scale where 1 indicates the lowest frequency of performing the collaborativeactivity, and 5 the highest frequency. In general, collaborative activities occur with low frequency.Equipment sharing, warehouse capacity sharing and truck space sharing are the most commoncollaboration activities among firms. Air cargo space sharing happens less often, probably because thismode is used under time constraints and emergencies, leaving less time to organize and collaborate.
73
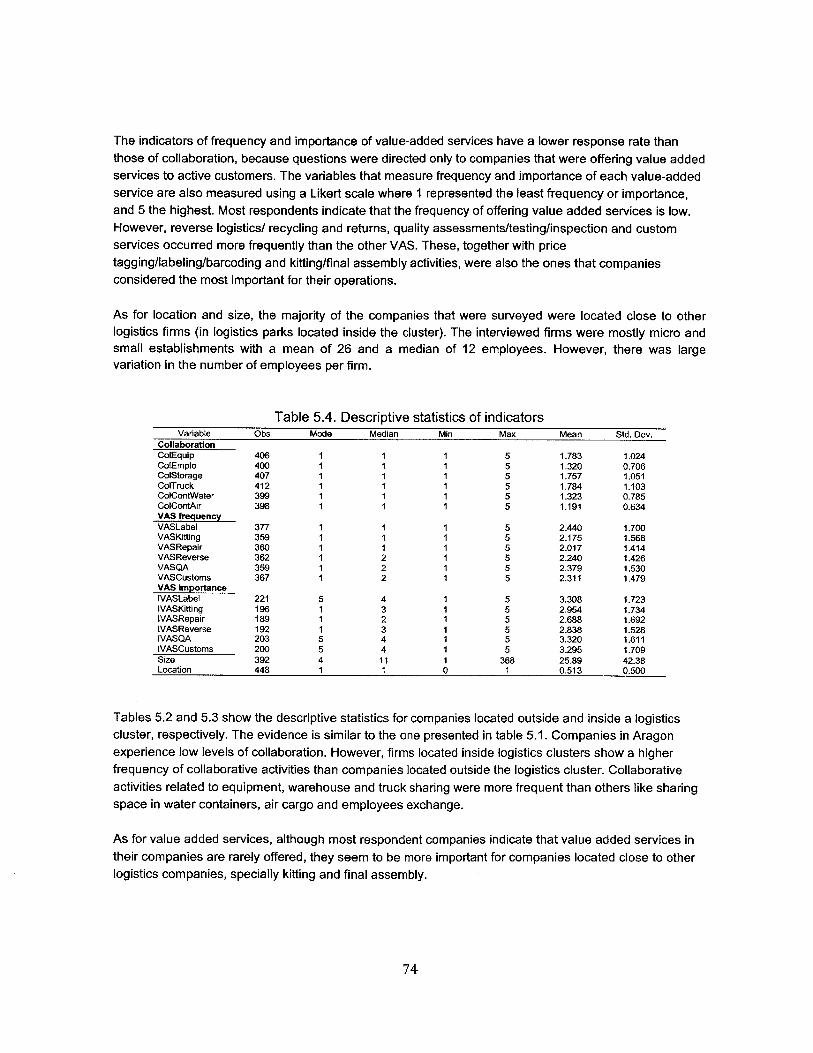
The indicators of frequency and importance of value-added services have a lower response rate thanthose of collaboration, because questions were directed only to companies that were offering value addedservices to active customers. The variables that measure frequency and importance of each value-addedservice are also measured using a Likert scale where 1 represented the least frequency or importance,and 5 the highest. Most respondents indicate that the frequency of offering value added services is low.However, reverse logistics/ recycling and returns, quality assessments/testing/inspection and customservices occurred more frequently than the other VAS. These, together with pricetagging/labeling/barcoding and kitting/final assembly activities, were also the ones that companiesconsidered the most important for their operations.
As for location and size, the majority of the companies that were surveyed were located close to otherlogistics firms (in logistics parks located inside the cluster). The interviewed firms were mostly micro andsmall establishments with a mean of 26 and a median of 12 employees.variation in the number of employees per firm.
Table 5.4.
However, there was large
Descriptive statistics of indicatorsVariable Obs Mode Median Min Max Mean Std. Dev.
CollaborationColEquip 406 1 1 1 5 1.783 1.024ColEmplo 400 1 1 1 5 1.320 0.706ColStorage 407 1 1 1 5 1.757 1.051ColTruck 412 1 1 1 5 1.784 1.103ColContWater 399 1 1 1 5 1.323 0.785ColContAir 398 1 1 1 5 1.191 0.634VAS frequencyVASLabel 377 1 1 1 5 2.440 1.700VASKitting 359 1 1 1 5 2.175 1.568VASRepair 360 1 1 1 5 2.017 1.414VASReverse 362 1 2 1 5 2.240 1.426VASQA 359 1 2 1 5 2.379 1.530VASCustoms 367 1 2 1 5 2.311 1.479VAS importanceIVASLabel 221 5 4 1 5 3.308 1.723IVASKitting 196 1 3 1 5 2.954 1.734IVASRepair 189 1 2 1 5 2.688 1.692IVASReverse 192 1 3 1 5 2.838 1.528IVASQA 203 5 4 1 5 3.320 1.611IVASCustoms 200 5 4 1 5 3.295 1.709Size 392 4 11 1 368 25.89 42.38Location 448 1 1 0 1 0.513 0.500
Tables 5.2 and 5.3 show the descriptive statistics for companies located outside and inside a logisticscluster, respectively. The evidence is similar to the one presented in table 5.1. Companies in Aragonexperience low levels of collaboration. However, firms located inside logistics clusters show a higherfrequency of collaborative activities than companies located outside the logistics cluster. Collaborativeactivities related to equipment, warehouse and truck sharing were more frequent than others like sharingspace in water containers, air cargo and employees exchange.
As for value added services, although most respondent companies indicate that value added services intheir companies are rarely offered, they seem to be more important for companies located close to otherlogistics companies, specially kitting and final assembly.
74
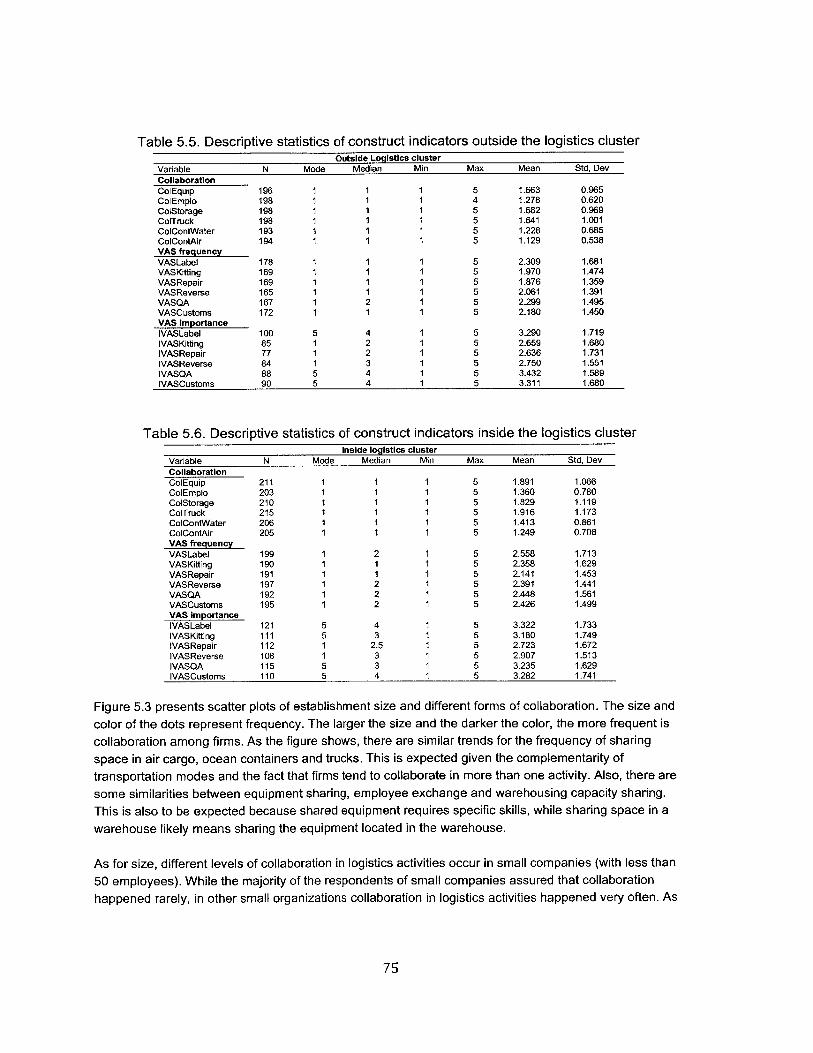
Table 5.5. Descriptive statistics of construct indicators outside the logistics clusterOutside Logistics cluster
Variable N Mode Median Min Max Mean Std, DevCollaborationColEquip 196 1 1 1 5 1.663 0.965ColEmplo 198 1 1 1 4 1.278 0.620ColStorage 198 1 1 1 5 1.682 0.969ColTruck 198 1 1 1 5 1.641 1.001ColContwater 193 1 1 1 5 1.228 0.685ColContAir 194 1 1 1 5 1.129 0.538VAS frequencyVASLabel 178 1 1 1 5 2.309 1.681VASKitting 169 1 1 1 5 1.970 1.474VASRepair 169 1 1 1 5 1.876 1.359VASReverse 165 1 1 1 5 2.061 1.391VASQA 167 1 2 1 5 2.299 1.495VASCustoms 172 1 1 1 5 2.180 1.450VAS importanceIVASLabel 100 5 4 1 5 3.290 1.719IVASKitting 85 1 2 1 5 2.659 1.680IVASRepair 77 1 2 1 5 2.636 1.731IVASReverse 84 1 3 1 5 2.750 1.551IVASQA 88 5 4 1 5 3.432 1.589IVASCustoms 90 5 4 1 5 3.311 1.680
Table 5.6. Descriptive statistics of construct indicators inside the logistics clusterInside logistics cluster
Variable N Mode Median Min Max Mean Std, DevCollaborationColEquip 211 1 1 1 5 1.891 1.066ColEmplo 203 1 1 1 5 1.360 0.780ColStorage 210 1 1 1 5 1.829 1.119ColTruck 215 1 1 1 5 1.916 1.173ColContWater 206 1 1 1 5 1.413 0.861ColContAir 205 1 1 1 5 1.249 0.708VAS frequencyVASLabel 199 1 2 1 5 2.558 1.713VASKitting 190 1 1 1 5 2.358 1.629VASRepair 191 1 1 1 5 2.141 1.453VASReverse 197 1 2 1 5 2.391 1.441VASQA 192 1 2 1 5 2.448 1.561VASCustoms 195 1 2 1 5 2.426 1.499VAS importanceIVASLabel 121 5 4 1 5 3.322 1.733IVASKitting 111 5 3 1 5 3.180 1.749IVASRepair 112 1 2.5 1 5 2.723 1.672IVASReverse 108 1 3 1 5 2.907 1.513IVASQA 115 5 3 1 5 3.235 1.629IVASCustoms 110 5 4 1 5 3.282 1.741
Figure 5.3 presents scatter plots of establishment size and different forms of collaboration. The size andcolor of the dots represent frequency. The larger the size and the darker the color, the more frequent iscollaboration among firms. As the figure shows, there are similar trends for the frequency of sharingspace in air cargo, ocean containers and trucks. This is expected given the complementarity oftransportation modes and the fact that firms tend to collaborate in more than one activity. Also, there aresome similarities between equipment sharing, employee exchange and warehousing capacity sharing.This is also to be expected because shared equipment requires specific skills, while sharing space in awarehouse likely means sharing the equipment located in the warehouse.
As for size, different levels of collaboration in logistics activities occur in small companies (with less than50 employees). While the majority of the respondents of small companies assured that collaborationhappened rarely, in other small organizations collaboration in logistics activities happened very often. As
75
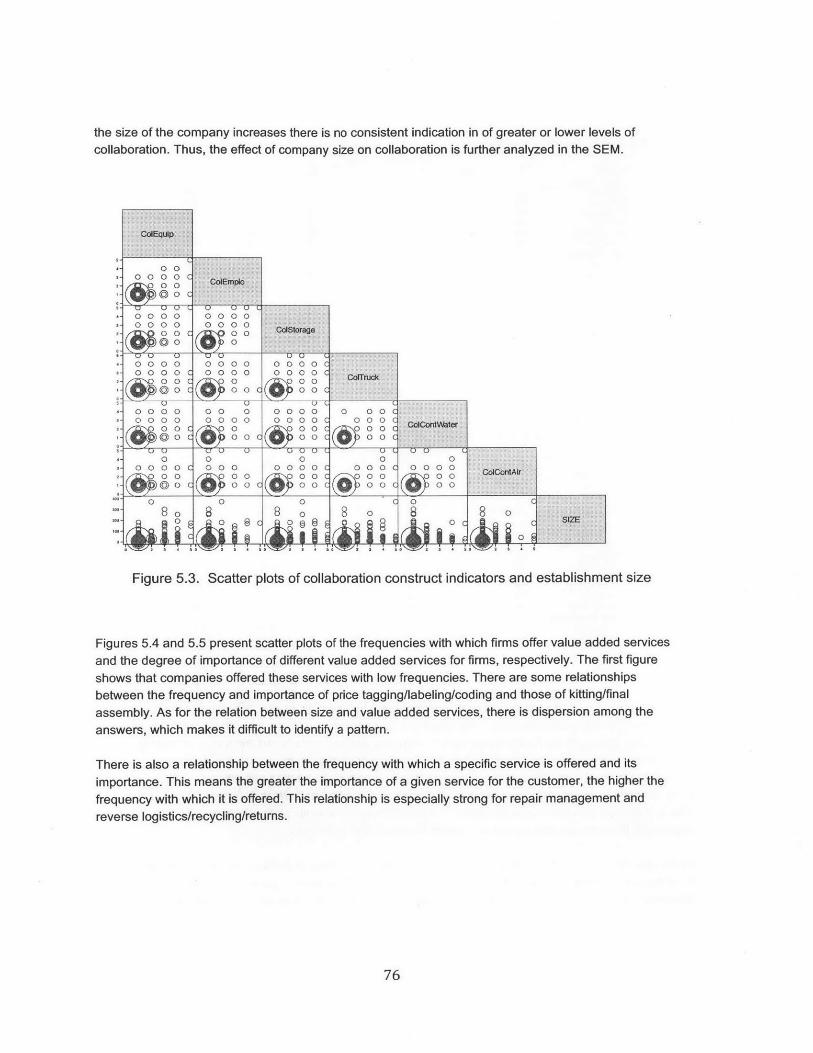
the size of the company increases there is no consistent indication in of greater or lower levels ofcollaboration. Thus, the effect of company size on collaboration is further analyzed in the SEM.
00
0 0000
0 00 000
0000
L)
00 C
ocO C0OC
000oc0oC
0
0 00 0 C
0 Q
8
0000
o 00 0
000
U U000
0 0 0
000
( o C
o- W00 0 0
0 00 0 C
0
0
A" j
0~
0 0
0 0
0 I
8
0000
0j
00
O0C0 0C
0
0 0co 0 0 CC
8 0j
0o 0 o 00 0 0
API\0 0
080 SIZE
CCC
I.
CC
0
0
I
Figure 5.3. Scatter plots of collaboration construct indicators and establishment size
Figures 5.4 and 5.5 present scatter plots of the frequencies with which firms offer value added servicesand the degree of importance of different value added services for firms, respectively. The first figureshows that companies offered these services with low frequencies. There are some relationshipsbetween the frequency and importance of price tagging/labeling/coding and those of kitting/finalassembly. As for the relation between size and value added services, there is dispersion among theanswers, which makes it difficult to identify a pattern.
There is also a relationship between the frequency with which a specific service is offered and itsimportance. This means the greater the importance of a given service for the customer, the higher thefrequency with which it is offered. This relationship is especially strong for repair management andreverse logistics/recycling/returns.
76
W I XF O
0
1
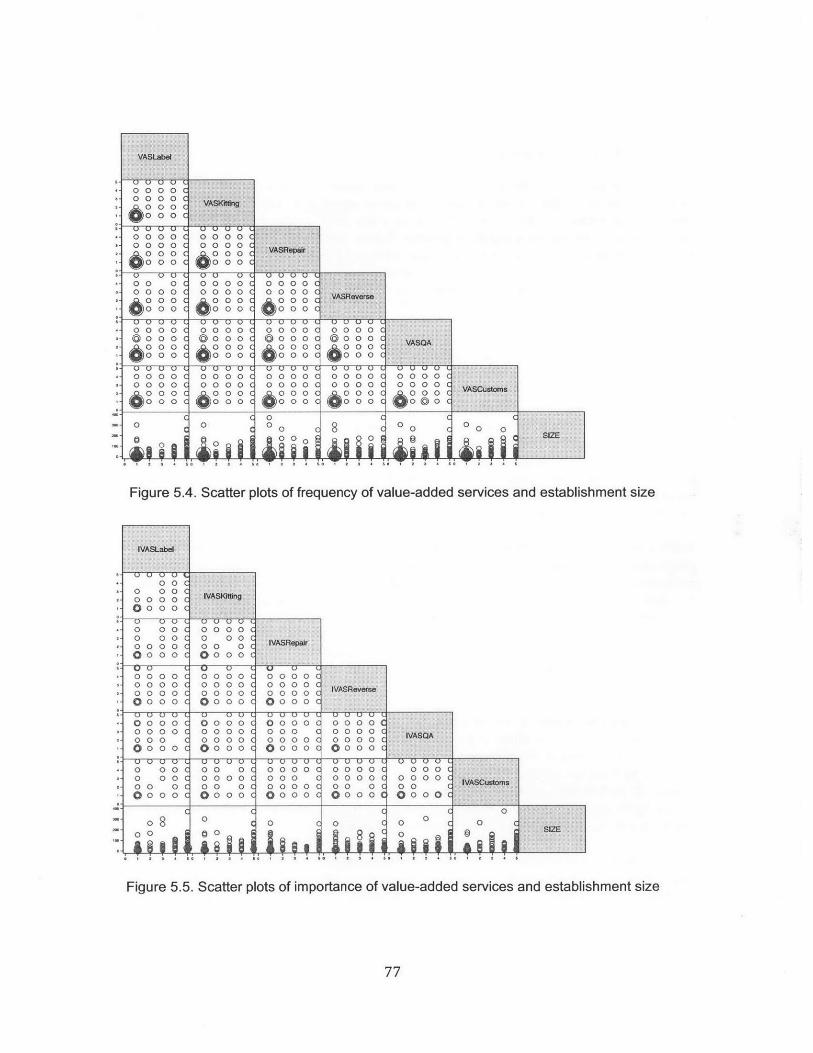
0 0 0C
0 0 0C
O 0 OC0 O O O CO O O C0 0 0
0 0
j V0 00 0
0003
0000
0 C0 ci0 CI0 C0000
C
Cso
do 0 0 C0 0C
0 0 00 C
0 0 00 C60 00 C
0 0 0 C
00 o
0 0
w V00
lob
0000
0o ci
09
0000
C
iii
0 0 0
0 000 0
(o 00 00~0 0
w w0 00 0 0000
0 0log0
0000
CCCC
cCCCC
i I
0o000000
0 0 060 0
60 000o00
0 0 0 0 C
0 0 0 C00 C0c
S (
0 00 04 00
10 0-11
0 00 00 0@(0 C
C00
Figure 5.4. Scatter plots of frequency of value-added services and establishment size
0 0 C
o 0 0 0 C
0 O0O C0 0C
o 0 0 0 C
00 00 C
o 0 0 0 C0 0 0 00 0 o oC
ki0000
0000
0000
%J0000
00
00 0
0
00
0000
0 O C00O O Co0 0 0 C0 0 O0C
00 00 C
0 000 C0 0 0 0 C
0000
0000
0000
0000
00 0
00 0
0000
0000
0000
0000
0 00 00 000
0000
0000
0000
0000
0000
0 00 00 0O C
0 CC
0 00 0
0
00
CCCC
IASRevese
0000
0000
0000
0000
0000
0 0 0
00
o
0000
0000
CCCC
CCCC
IVASQA
000
0000
00
0
00
0IVAS~uwoms
00F 5 c p of i c o v s vc
S 1 2 3 4 S 0 1 a 3 . a0 1 2 3 4 S 0 1 2 3 4 50 1 2 3 4 S . 1 2 1 4 5
Figure 5.5. Scatter plots of importance of value-added services and establishment size
77
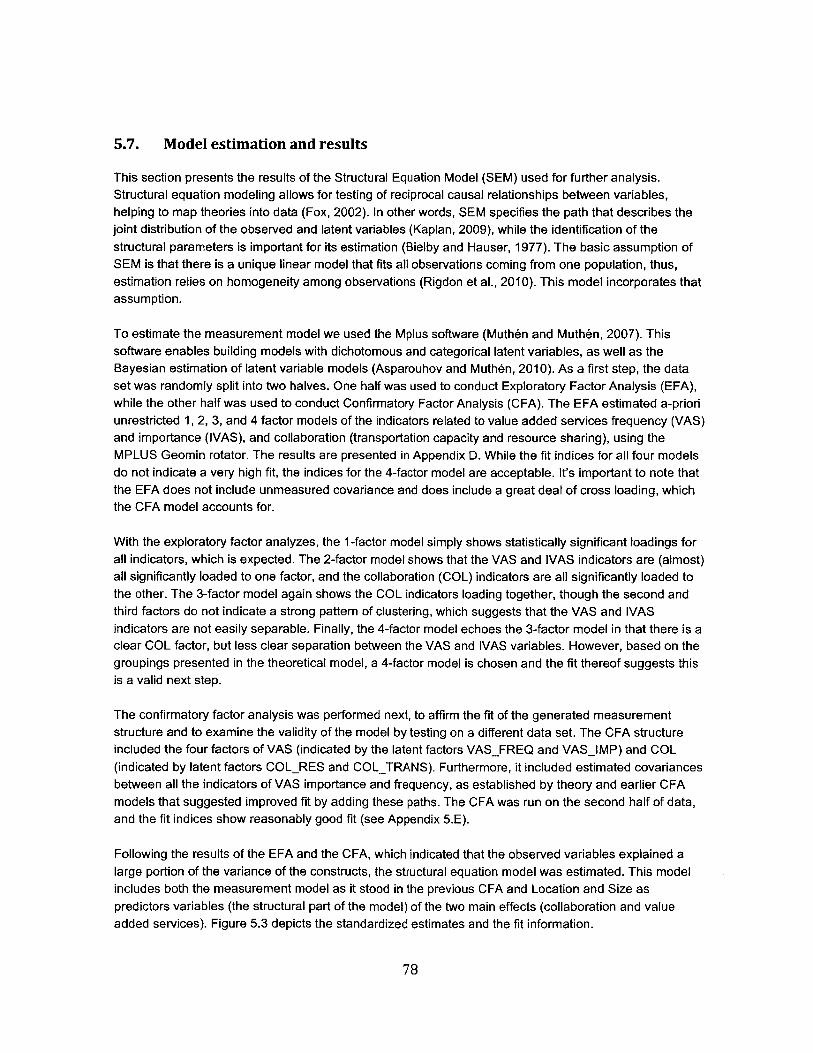
5.7. Model estimation and results
This section presents the results of the Structural Equation Model (SEM) used for further analysis.Structural equation modeling allows for testing of reciprocal causal relationships between variables,helping to map theories into data (Fox, 2002). In other words, SEM specifies the path that describes thejoint distribution of the observed and latent variables (Kaplan, 2009), while the identification of thestructural parameters is important for its estimation (Bielby and Hauser, 1977). The basic assumption ofSEM is that there is a unique linear model that fits all observations coming from one population, thus,estimation relies on homogeneity among observations (Rigdon et al., 2010). This model incorporates thatassumption.
To estimate the measurement model we used the Mplus software (Muthen and Muthen, 2007). Thissoftware enables building models with dichotomous and categorical latent variables, as well as theBayesian estimation of latent variable models (Asparouhov and Muthen, 2010). As a first step, the dataset was randomly split into two halves. One half was used to conduct Exploratory Factor Analysis (EFA),while the other half was used to conduct Confirmatory Factor Analysis (CFA). The EFA estimated a-prioriunrestricted 1, 2, 3, and 4 factor models of the indicators related to value added services frequency (VAS)and importance (IVAS), and collaboration (transportation capacity and resource sharing), using theMPLUS Geomin rotator. The results are presented in Appendix D. While the fit indices for all four modelsdo not indicate a very high fit, the indices for the 4-factor model are acceptable. It's important to note thatthe EFA does not include unmeasured covariance and does include a great deal of cross loading, whichthe CFA model accounts for.
With the exploratory factor analyzes, the 1-factor model simply shows statistically significant loadings forall indicators, which is expected. The 2-factor model shows that the VAS and IVAS indicators are (almost)all significantly loaded to one factor, and the collaboration (COL) indicators are all significantly loaded tothe other. The 3-factor model again shows the COL indicators loading together, though the second andthird factors do not indicate a strong pattern of clustering, which suggests that the VAS and IVASindicators are not easily separable. Finally, the 4-factor model echoes the 3-factor model in that there is aclear COL factor, but less clear separation between the VAS and IVAS variables. However, based on thegroupings presented in the theoretical model, a 4-factor model is chosen and the fit thereof suggests thisis a valid next step.
The confirmatory factor analysis was performed next, to affirm the fit of the generated measurementstructure and to examine the validity of the model by testing on a different data set. The CFA structureincluded the four factors of VAS (indicated by the latent factors VASFREQ and VASIMP) and COL(indicated by latent factors COLRES and COLTRANS). Furthermore, it included estimated covariancesbetween all the indicators of VAS importance and frequency, as established by theory and earlier CFAmodels that suggested improved fit by adding these paths. The CFA was run on the second half of data,and the fit indices show reasonably good fit (see Appendix 5.E).
Following the results of the EFA and the CFA, which indicated that the observed variables explained alarge portion of the variance of the constructs, the structural equation model was estimated. This modelincludes both the measurement model as it stood in the previous CFA and Location and Size aspredictors variables (the structural part of the model) of the two main effects (collaboration and valueadded services). Figure 5.3 depicts the standardized estimates and the fit information.
78
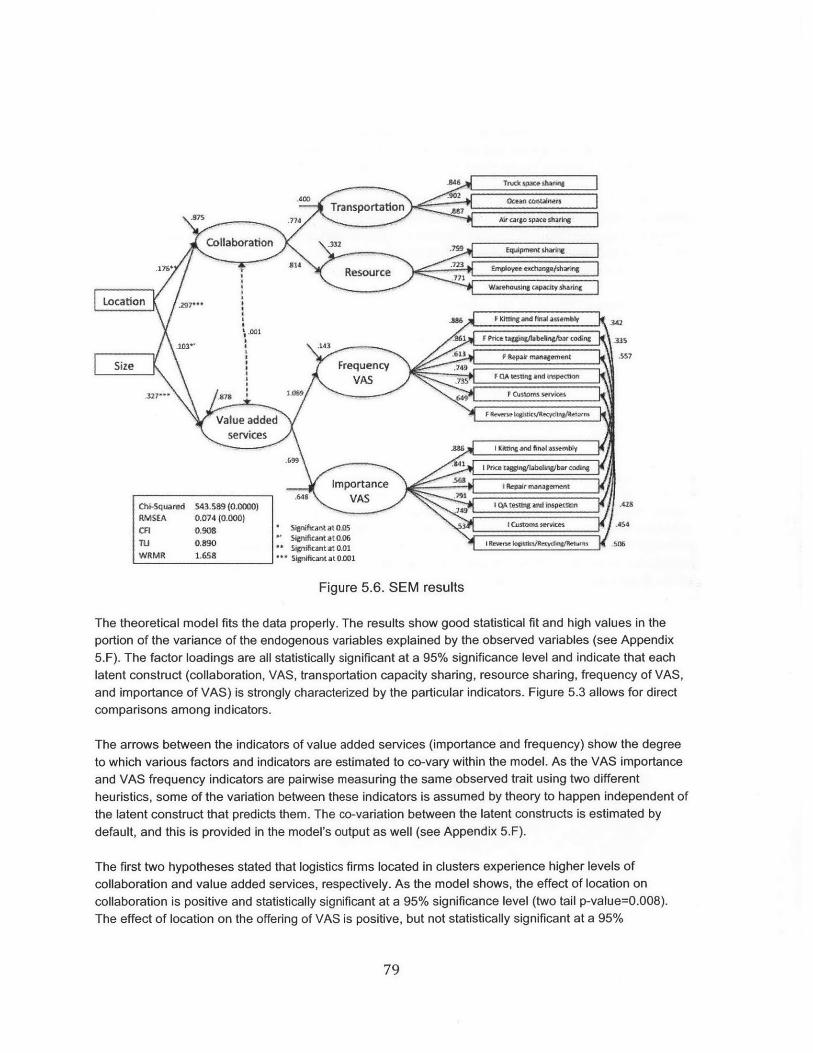
Warehauwng capac y s arnng
Location
.88 F Kititigand finad assem*ly 32
.. 1 Prlc tagg gJabeISnasbar coding
po nepai angement .5S7
ChiWSquared s43.589 (0.0000) s a an28RMSEA 0.074 (0.000)
CH098* Significant at 0.05 53Custonms iervicee .4
Ms F Killrcn ing andf in as e .3WRMR 6ep isignificant atOOnS
Figure 5.6. SEM results
The theoretical model fits the data properly. The results show good statistical fit and high values in theportion of the variance of the endogenous variables explained by the observed variables (see Appendix5.F). The factor loadings are all statistically significant at a 95% significance level and indicate that eachlatent construct (collaboration, VAS, transportation capacity sharing, resource sharing, frequency of VAS,and importance of VAS) is strongly characterized by the particular indicators. Figure 5.3 allows for directcomparisons among indicators.
The arrows between the indicators of value added services (importance and frequency) show the degreeto which various factors and indicators are estimated to co-vary within the model. As the VAS importanceand VAS frequency indicators are pairwise measuring the same observed trait using two differentheuristics, some of the variation between these indicators is assumed by theory to happen independent ofthe latent construct that predicts them. The co-variation between the latent constructs is estimated bydefault, and this is provided in the model's output as well (see Appendix 5.F).
The first two hypotheses stated that logistics firms located in clusters experience higher levels ofcollaboration and value added services, respectively. As the model shows, the effect of location oncollaboration is positive and statistically significant at a 95% significance level (two tail p-value=O.008).The effect of location on the offering of VAS is positive, but not statistically significant at a 95%
79
significance level, yet it is significant at the 94% level (two tail p-value=0.06). Hypotheses 3 and 4 statethat larger firms collaborate more and offer more value added services than smaller firms. The effect ofsize is positive and statistically significant in both cases at a 99% significance level (p-value<0.001).
Thus, with the CFA results showing a good and valid fit of the measurement model, we conclude that co-location and size are significant predictors for collaboration and the offering of value added services.Therefore we conclude that differences in location and size do explain differences in the levels ofcollaboration and value added services for logistics firms. Larger co-located firms collaborate more andoffer more value added services than smaller non-co-located logistics firms.
The indicators used to measure the constructs in the model are all supported by qualitative interviews andthe relevant literature. The results show that collaboration, especially transportation capacity sharing isstrongly influenced by the two constructs proposed. Also, VAS importance and VAS frequency arestrongly influenced by kitting, price tagging/labeling, quality assurance testing, and custom services; andabout two thirds as strongly by repair management and reverse logistics. This is expected becauselabeling, kitting and quality assurance are more common value added services, while handling of repairmanagement and reverse logistics are of a more specific nature -- requiring more specialized labor andspecial IT -- and not many companies offer them.
The model shows that larger companies collaborate more than smaller ones and also offer more valueadded services. Although arguments for and against this conclusion are found in the literature, this resultis in line with common logistics clusters practices as observed in our interviews. For instance, logisticsclusters developers usually target larger companies that play the role of anchors and attract othercompanies to locate in the cluster. Our results are in line with previous research findings, such as those ofSheffi (2012), Reichhart and Holweg (2008) and Pekkarinen (2005). Those research efforts, however,were mostly based on qualitative research including interviews and case studies. This chapter providesadditional quantitative support by using detailed survey data and structural equation modeling.
80
Chapter 6
Conclusions
Global supply chains are shaping the development and nature of the logistics industry. Globalizationresults in flows over longer distances, underscoring the importance of efficient storage, transportation,consolidation, and transshipment activities. The agglomeration of logistics activities in clusters enhancesthe efficiency of global supply chains by reducing the cost and improving the service of the underlyingtransportation networks, making them more efficient and, in turn, enhancing globalization. Thus, theagglomeration of logistics firms is getting increased attention among companies and policy makers.
This dissertation reports evidence of increasing concentration of the US logistics industry in clusters,which seem to be growing over time. The statistical evidence of the growth trend of clustering is alsosupported by empirical evidence from interviews with private sector executives, governmentrepresentatives, members of academia, and Chambers of Commerce conducted around the world. Itseems that the presence of agglomeration economies is still an important factor for logistics firms' (andlogistics functions') location decisions, since they allow firms to achieve lower transportation costs, bettertransportation service and higher flexibility.
Every measure of concentration has limitations, and the combination approach presented in thisdissertation is no exception, even though it overcomes many of the issues bedeviling existing methods.For example, while it seems to produce good results in the US context, it will be difficult to apply acrossthe globe if the objective is to make international comparisons because of the different regional sizes.Furthermore, although one can imagine more sophisticated models, the lack of granular data would limittheir usefulness. Further research on more universal methodologies to measure cluster growth that allowcomparative studies among logistics clusters with different sizes and locations will be useful.
Anecdotal evidence suggests that logistics companies are attracted to highly accessible locations (Sheffi,2012). To be able to measure this relationship, a freight accessibility measure was developed. Thismeasure is based on a gravity model and considers four different modes of transportation: road, air,maritime, and rail. A correlation analysis on a county level in the US suggests positive correlationbetween freight accessibility and logistics employment. However, county population also has a highcorrelation with both freight accessibility and logistics employment. To test whether the bivariaterelationship between freight accessibility and logistics employment is not spurious, a Partial LeastSquares model was used. Results show that there is, indeed, a positive correlation between freightaccessibility and logistics employment on a county level. Even after controlling for the effect of countypopulation, more accessible counties have more logistics employment. Population, though, is the mostimportant variable in explaining differences in logistics employment levels per county. Thus, accessibilityis an important determinant of the attractiveness of counties for logistics activities and hence, should betaken into account in government policies designed to attract logistics firms. However, although freight
81
accessibility turns out to have an effect on the logistics employment per county, policy makers should beaware of the strong relationship between both these constructs and the county population.
Logistics clusters are growing all over the world, raising the question of what is behind that growth andwhy companies locate in those areas. As a first step to understand this phenomenon, this thesis uses aqualitative approach and reports on exploratory research based on data from interviews and theapplication of grounded theory tools to analyze it. Besides the advantages offered by all industrialclusters, the data suggest that logistics clusters provide some specific benefits that are behind thepositive feedback mechanism underlying their growth. This thesis documented four of these factors.Initially interview data suggest that employees of logistics firms have more opportunities for upwardmobility and logistics clusters are engines of job creation. It also suggests that companies located close toother logistics firms enjoy more collaboration and value added services.
Although collaboration and value-added services have been studied in the context of global supplychains, the contribution of this research is centered on the impact of firm location (inside or outsidelogistics clusters) on them. Using a quantitative approach, this thesis demonstrates that logisticscompanies located close to each other do collaborate more, and offer more value added services thancompanies that are not agglomerated. Thus, logistics clusters do provide these potential advantages tocompanies located there, which in turn has positive externalities. Higher levels of collaboration lead tolower costs and more efficiency, which in turn increase firms' competitiveness (Buvik and Halskau, 2001;Huo, 2012). Clusters may also encourage economic growth because firms' cooperation and their swaywith local governments lead to improvements in infrastructure, human capital and technology (Rollins,Pekkarinen and Mehtala, 2011). More value added services also help new products and processdevelopment, which increase firms' productivity, revenues and customer satisfaction levels (Appold,1995; Battezzati and Magnani, 2000). In addition, more value added services represent opportunities fornew market development and for closer ties to customers.
These results have important implications for companies that are considering locating or relocating.Assuming that logistics clusters provide good enablers in terms of good infrastructure, accommodativepolicy and trust/information exchange, co-locating close to other firms can lead to higher efficiency andcompetitiveness. A firms' ability to cut distribution costs and increase customer satisfaction is enhancedwhen they can collaborate to minimize empty space in transportation vehicles, increase utilization ofstorage facilities, reconcile delivery routes with each other, and adopt technologies that can enhance theirmarket offering.
6.1. Further research
Despite the growing literature on clusters, logistics clusters in particular have received scant attention.The work reported here raises a rich set of possibilities for future research, as logistics clusters in the USkeep growing in size and number, and thus in economic relevance. These opportunities includeunderstanding the connection between the formation of logistics clusters and regional economicdevelopment, studying how governments can enhance logistics clusters in their areas, and exploringdeeper particular benefits of employment in logistics clusters such as "upward mobility". These subjectsmay provide a significant contribution - especially to emerging markets - in terms of industrial policy.
In this thesis, accessibility was defined based on four different modes of transportation, namely road, rail,maritime, and air transportation. From a policy perspective, an interesting follow-up question on this
82
analysis would be whether there is a difference in the use of more sustainable transport modes (rail andmaritime) in counties with a higher accessibility to these modes. While in this thesis we were interested in
the combined level of accessibility, policy makers may be more interested in the attractiveness ofcounties based on "sustainable accessibility", i.e. whether counties with a good rail and/or maritimeaccessibility attract (additional) logistics employment. In such an analysis, it is important to measurewhether the logistics companies located in these counties also actually use these modes of transport.Hence, additional data are needed for such an analysis.
The analysis of collaboration and value added services in this thesis is limited because the data is derivedfrom a single logistics cluster in Aragon, Spain, and, owing to the use of a cross-sectional database,which cannot account for inter-temporal variations. However, this study adds to the growing body ofknowledge regarding firms' location choices and governments' decisions regarding regional public policywith respect to logistics cluster development and expansion.
83

84
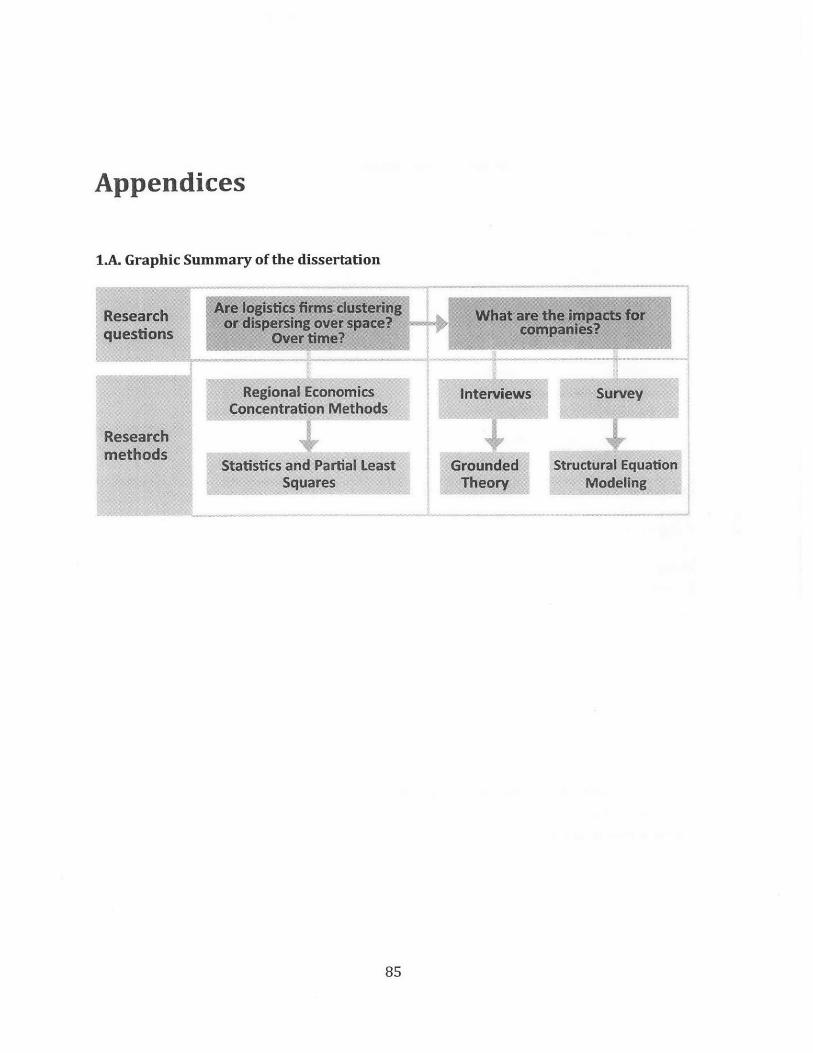
Appendices
I.A. Graphic Summary of the dissertation
Regional EconomicsConcentration Methods
85
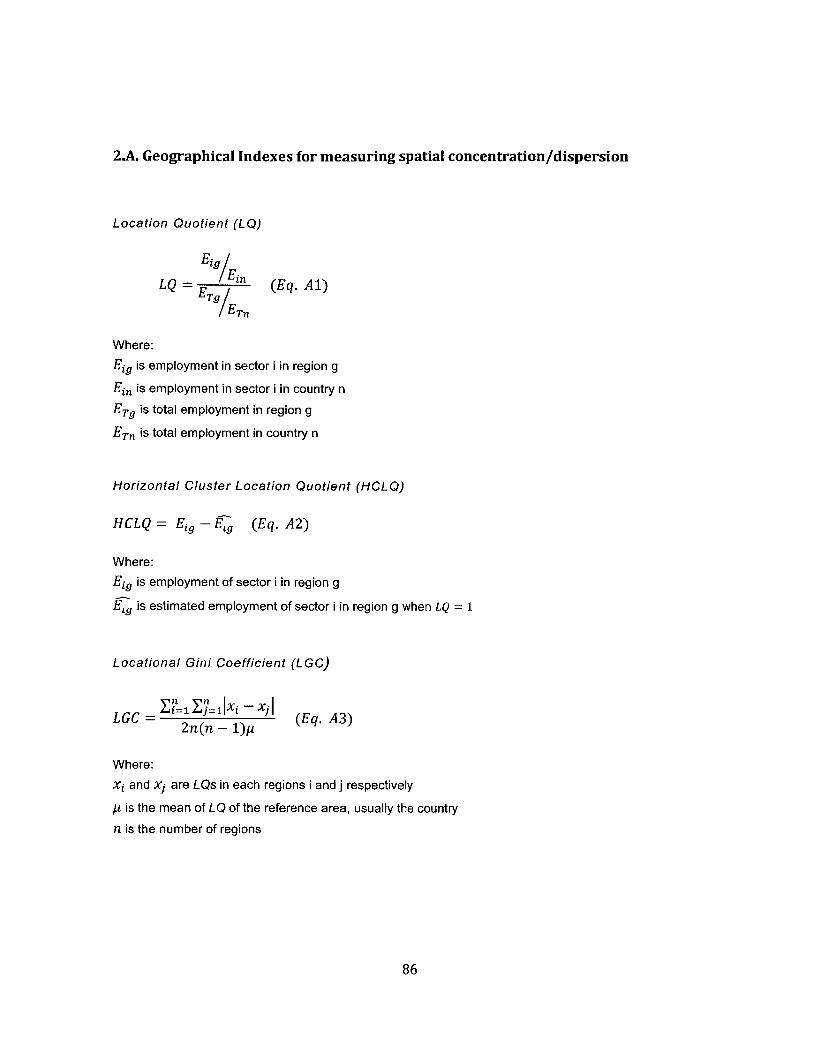
2.A. Geographical Indexes for measuring spatial concentration/dispersion
Location Quotient (LQ)
ELQ = ET '/ (Eq. Al)
/ ETfl
Where:
Ejg is employment in sector i in region g
Ein is employment in sector i in country n
ETg is total employment in region g
ETf, is total employment in country n
Horizontal Cluster Location Quotient (HCLQ)
HCLQ = Eig - Eig (Eq. A2)
Where:
Ejg is employment of sector i in region g
Eg is estimated employment of sector i in region g when LQ = 1
Locational Gini Coefficient (LGC)
LGC= 1i i xi (Eq. A3)2n(n - 1)y
Where:
xi and x1 are LQs in each regions i and j respectively
pt is the mean of LQ of the reference area, usually the countryn is the number of regions
86

Herfindahl-Hirschman Index (HHI)
HHI = s- x,) 2 (Eq. A4)i=1
Where
si is the industrial employment share in region i
xi is the total employment share in region i
The Ellison-Glaeser Index (EGGCI)
Y1_1(si -x,) 2 -(1 _ x 2 ) Z7zj 2
EGGCI = (Eq.AS)(1- f_ x2)(1 - 1Z 2)
Where:
si is the industrial employment share in region ixi is the total employment share in region i
zi is the market share of each individual firm in region j
87
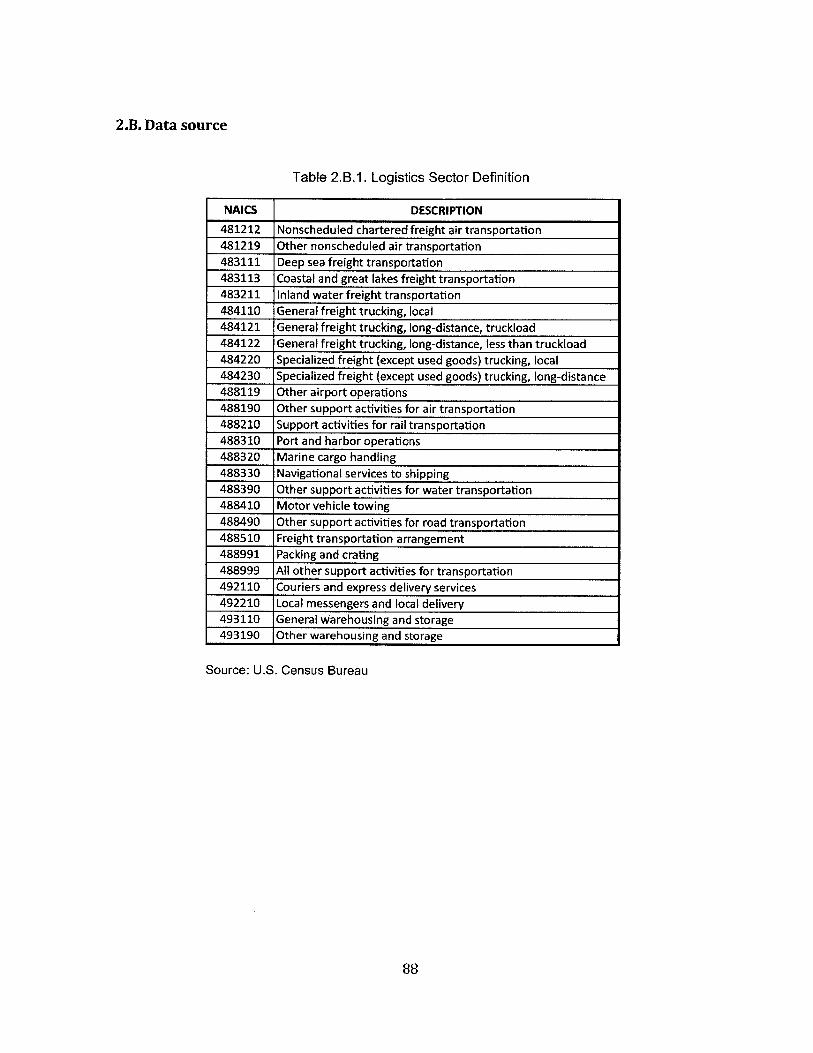
Table 2.B.1. Logistics Sector Definition
NAICS DESCRIPTION
481212 Nonscheduled chartered freight air transportation481219 Other nonscheduled air transportation483111 Deep sea freight transportation483113 Coastal and great lakes freight transportation483211 Inland water freight transportation484110 General freight trucking, local484121 General freight trucking, long-distance, truckload484122 General freight trucking, long-distance, less than truckload484220 Specialized freight (except used goods) trucking, local484230 Specialized freight (except used goods) trucking, long-distance488119 Other airport operations488190 Other support activities for air transportation488210 Support activities for rail transportation488310 Port and harbor operations488320 Marine cargo handling488330 Navigational services to shipping488390 Other support activities for water transportation488410 Motor vehicle towing488490 Other support activities for road transportation488510 Freight transportation arrangement488991 Packing and crating488999 All other support activities for transportation492110 Couriers and express delivery services492210 Local messengers and local delivery493110 General warehousing and storage493190 Other warehousing and storage
Source: U.S. Census Bureau
88
2.B. Data source
2.C. Brief description of the Seven Largest Logistics Clusters in the US
- Southern California's logistics cluster is the largest in the country. The two largest U.S. ports, LosAngeles and Long Beach, are located right next to each other and in total account for approximately35 percent of the maritime container traffic in and out of the US. Its location on the Pacific Ocean withaccess to rail and road infrastructure and large commercial and logistics facilities make this clusterthe larges in he nation (Feemster et al., 2011).
- Chicago is a major industrial center and one of the world's leading shipping and distribution hubs. It isthe focal point of all US railroads. In addition, Chicago's trading tradition, access to the Great Lakeroutes inland waterways, connectivity to major highways, four airports and large logistics parks (suchas Elwood, Joliet, Logistics Park Chicago) make it an important logistics hub (Citydata.com).
- The operations of the Port Authority of New York and New Jersey include the world's busiest airportsystem and marine terminals and ports (Port Authority of New York and New Jersey, 2010). The areais well connected to the rest of the country by several interstate highways and railroad (CSX andNorfolk Southern).
* Hartsfield-Jackson Atlanta International Airport, the busiest airport in the world by passenger traffic,also has significant cargo activity (Rosenberg, 2011). The area is served by the CSX and NorfolkSouthern Railroads, which allow for intermodal capabilities important for both container and bulkdistribution.
- Because of its natural landlocked harbor, San Francisco has been a major trade and shipping centerthroughout its history. Today, with Oakland and several other smaller ports, as well as its airports, theBay area handles a significant share of West Coast trade. The port of San Francisco offers storageand handling facilities for a wide variety of containers.
- The core of the Dallas cluster is the Dallas-Fort Worth International Airport, whose cargo shipmentstripled in the last 10 years. Besides air operations, the presence of interstate highways and railroadconnections make the cluster a leading distribution center for the Southwest.
- Miami International Airport is a major trade hub and serves as the principal commercial distributioncenter between North and South America (Miami-Dade Aviation Department, 2011). It has highwayand rail connection. Two railway systems, Florida Eastern Railroad and Tri-Rail connect Miami by railto the CSX and Norfolk Southern.
89
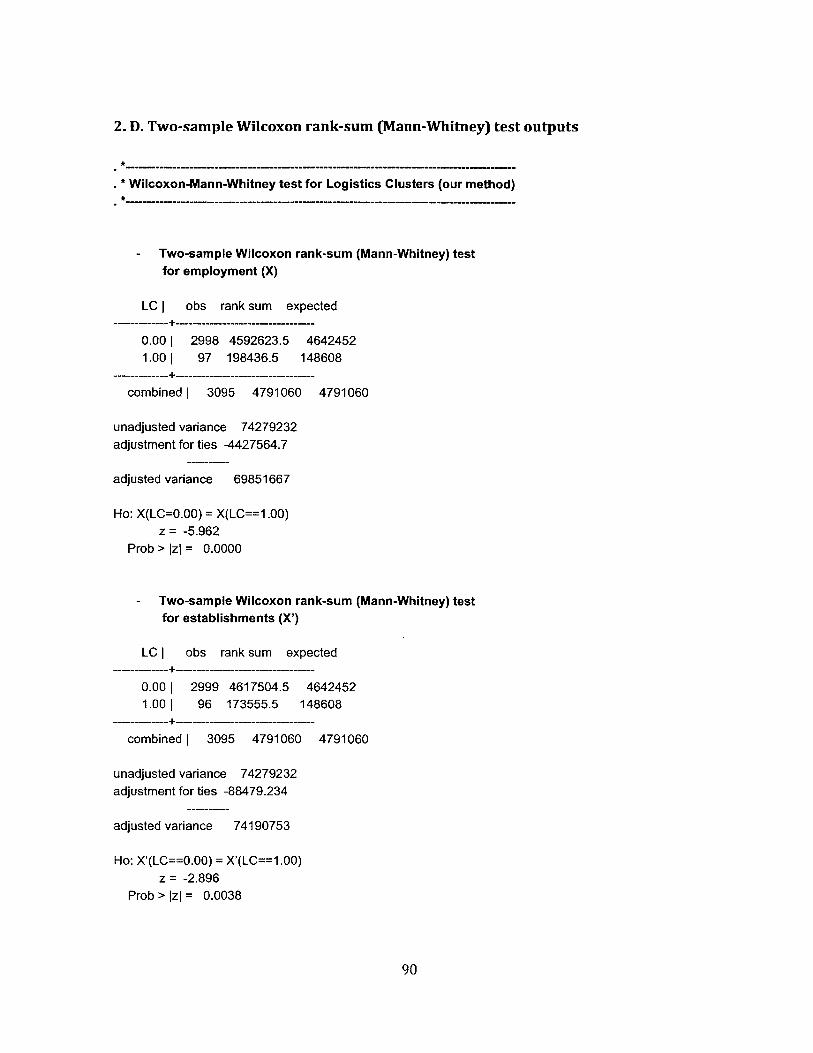
2. D. Two-sample Wilcoxon rank-sum (Mann-Whitney) test outputs
-*-------------------------------------------------
* Wilcoxon-Mann-Whitney test for Logistics Clusters (our method)*-------------------------------------------
- Two-sample Wilcoxon rank-sum (Mann-Whitney) testfor employment (X)
LC I obs rank sum expected---------------------------------------
0.00 1 2998 4592623.5 46424521.00 1 97 198436.5 148608
---------------------------------------
combined 1 3095 4791060 4791060
unadjusted variance 74279232adjustment for ties -4427564.7
adjusted variance 69851667
Ho: X(LC=0.00) = X(LC==1.00)z = -5.962
Prob > IzI = 0.0000
- Two-sample Wilcoxon rank-sum (Mann-Whitney) testfor establishments (X')
LC I obs rank sum expected---------------------------------------
0.00 | 2999 4617504.5 46424521.00 I 96 173555.5 148608
---------------------------------------combined | 3095 4791060 4791060
unadjusted variance 74279232adjustment for ties -88479.234
adjusted variance 74190753
Ho: X'(LC==0.00) = X'(LC==1.00)z = -2.896
Prob > IzI = 0.0038
90
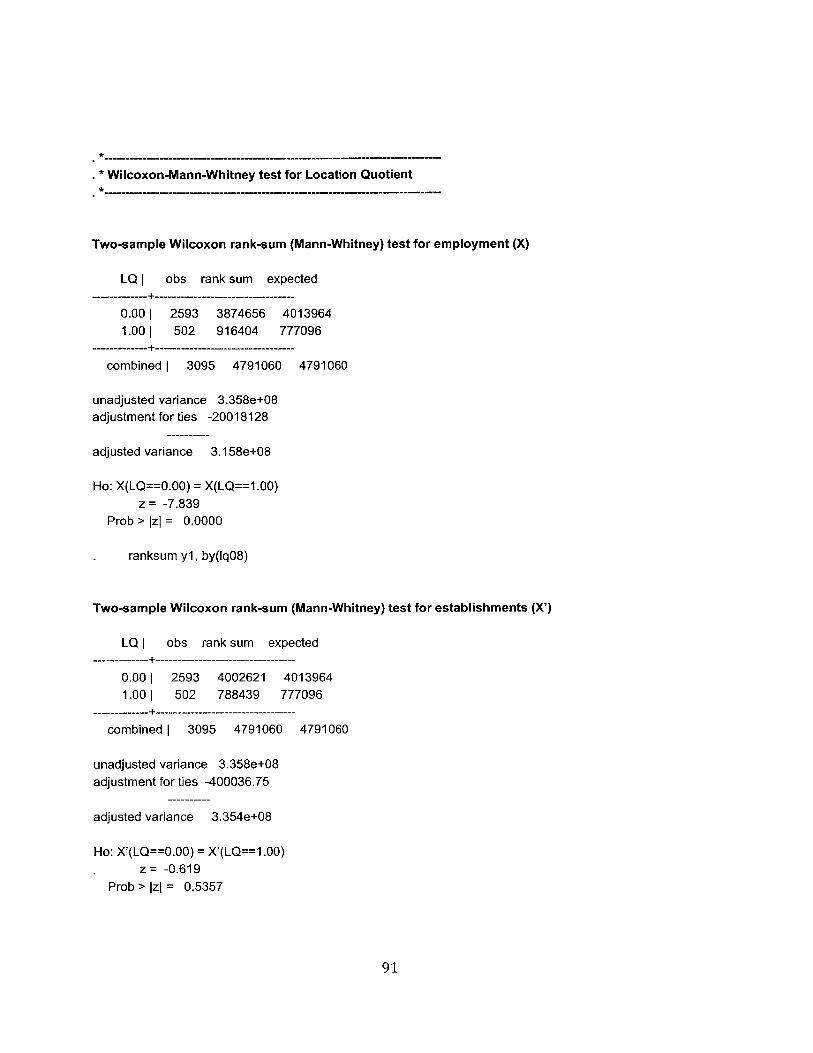
. -*-------------------------------------
* Wilcoxon-Mann-Whitney test for Location Quotient*--------------------------------------
Two-sample Wilcoxon rank-sum (Mann-Whitney) test for employment (X)
LQ I obs rank sum expected---------------------------------------
0.00 | 2593 3874656 40139641.001 502 916404 777096
---------------------------------------combined 1 3095 4791060 4791060
unadjusted variance 3.358e+08adjustment for ties -20018128
adjusted variance 3.158e+08
Ho: X(LQ==0.00) = X(LQ==1.00)z = -7.839
Prob > Izi = 0.0000
ranksum yl, by(lq08)
Two-sample Wilcoxon rank-sum (Mann-Whitney) test for establishments (X')
LQ I obs rank sum expected---------------------------------------
0.00| 2593 4002621 40139641.00 | 502 788439 777096
---------------------------------------combined | 3095 4791060 4791060
unadjusted variance 3.358e+08adjustment for ties -400036.75
adjusted variance 3.354e+08
Ho: X'(LQ==0.00) = X'(LQ==1.00)z = -0.619
Prob > Izi = 0.5357
91
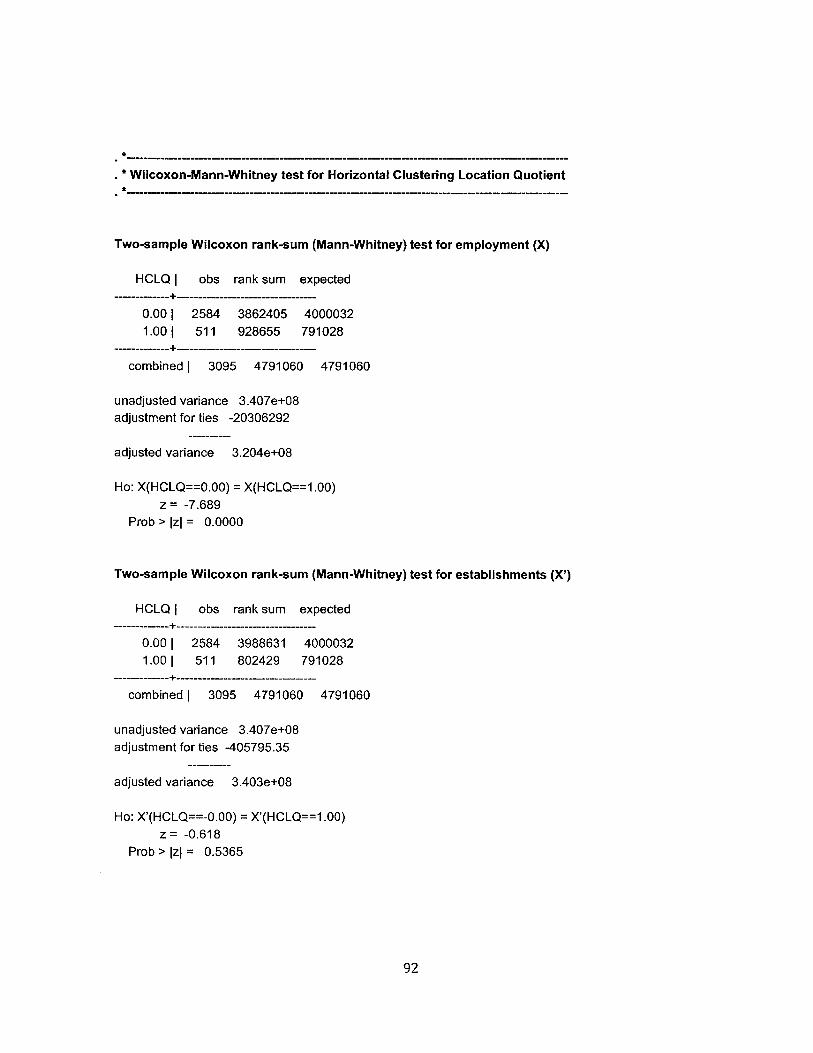
*--------------------------- -- ----------------
* Wilcoxon-Mann-Whitney test for Horizontal Clustering Location Quotient*--------------------------------------------
Two-sample Wilcoxon rank-sum (Mann-Whitney) test for employment (X)
HCLQ I obs rank sum expected---------------------------------------
0.00 1 2584 3862405 40000321.00 1 511 928655 791028
---------------------------------------combined | 3095 4791060 4791060
unadjusted variance 3.407e+08adjustment for ties -20306292
adjusted variance 3.204e+08
Ho: X(HCLQ==0.00) = X(HCLQ==1.00)z = -7.689
Prob > Izi = 0.0000
Two-sample Wilcoxon rank-sum (Mann-Whitney) test for establishments (X')
HCLQ I obs rank sum expected----------------------------------------
0.001 2584 3988631 40000321.00 1 511 802429 791028
---------------------------------------combined 1 3095 4791060 4791060
unadjusted variance 3.407e+08adjustment for ties -405795.35
adjusted variance 3.403e+08
Ho: X'(HCLQ==-0.00) = X'(HCLQ==1.00)z = -0.618
Prob > Izi = 0.5365
92
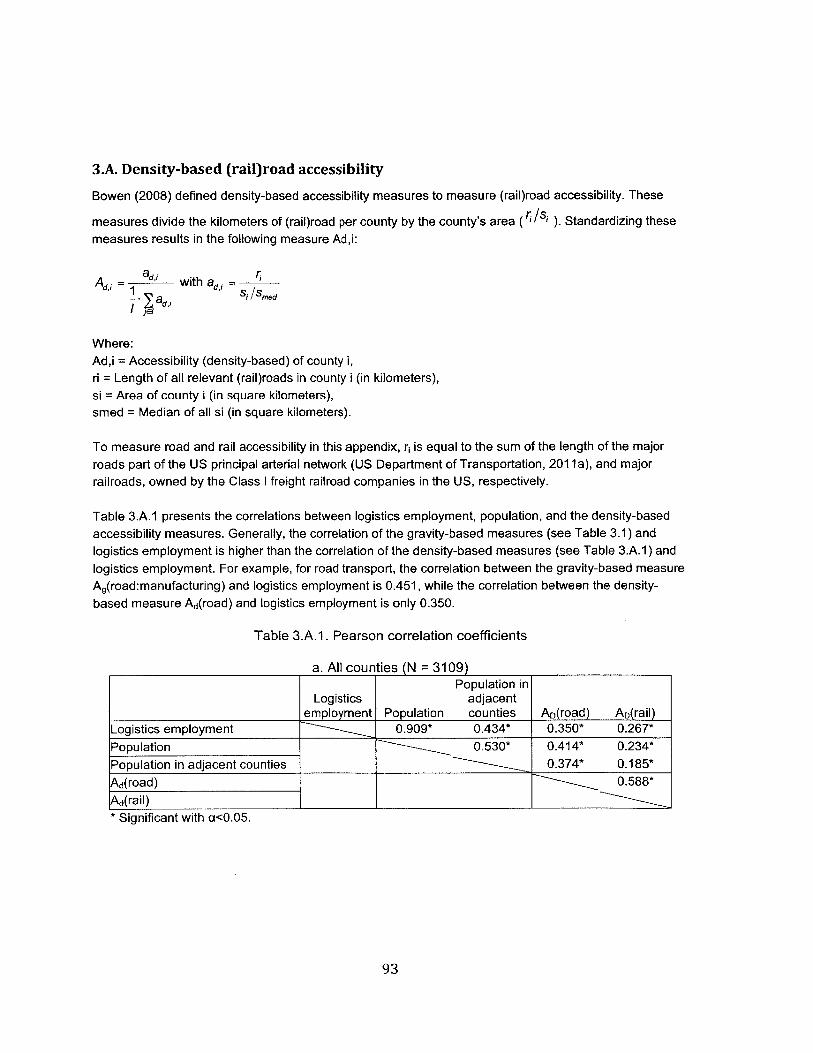
3.A. Density-based (rail)road accessibility
Bowen (2008) defined density-based accessibility measures to measure (rail)road accessibility. These
measures divide the kilometers of (rail)road per county by the county's area ( /s ). Standardizing thesemeasures results in the following measure Ad,i:
Ad, = ad' with a:, = r
Sad i/Sm
Where:Ad,i = Accessibility (density-based) of county i,ri = Length of all relevant (rail)roads in county i (in kilometers),si = Area of county i (in square kilometers),smed = Median of all si (in square kilometers).
To measure road and rail accessibility in this appendix, ri is equal to the sum of the length of the majorroads part of the US principal arterial network (US Department of Transportation, 2011 a), and majorrailroads, owned by the Class I freight railroad companies in the US, respectively.
Table 3.A.1 presents the correlations between logistics employment, population, and the density-basedaccessibility measures. Generally, the correlation of the gravity-based measures (see Table 3.1) andlogistics employment is higher than the correlation of the density-based measures (see Table 3.A.1) andlogistics employment. For example, for road transport, the correlation between the gravity-based measureAg(road:manufacturing) and logistics employment is 0.451, while the correlation between the density-based measure Ad(road) and logistics employment is only 0.350.
Table 3.A.1. Pearson correlation coefficients
a. All counties (N = 3109)Population in
Logistics adjacentemployment Population counties AD(road) AD(rail)
Logistics employment 0.909* 0.434* 0.350* 0.267*Population 0.530* 0.414* 0.234*Population in adjacent counties 0.374* 0.185*Ad(road) 0.588*Ad(rail)* Significant with a<0.05.
93
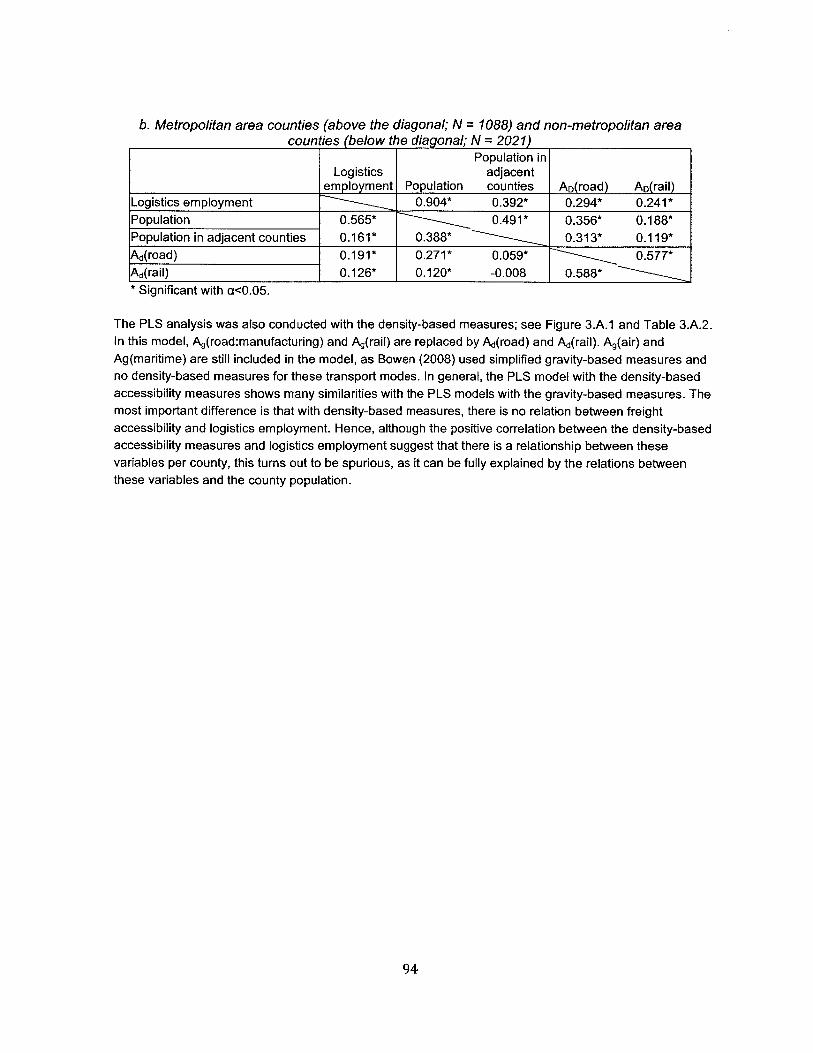
b. Metropolitan area counties (above the diagonal; N = 1088) and non-metropolitan areacounties (below the diagonal; N = 2021)
Population inLogistics adjacent
employment Population counties AD(road) AD(rail)Logistics employment 0.904* 0.392* 0.294* 0.241*Population 0.565* 0.491* 0.356* 0.188*Population in adjacent counties 0.161* 0.388* 0.313* 0.119*Ad(road) 0.191* 0.271* 0.059* 0.577*Ad(rail) 0.126* 0.120* -0.008 0.588** Significant with a<0.05.
The PLS analysis was also conducted with the density-based measures; see Figure 3.A.1 and Table 3.A.2.In this model, Ag(road:manufacturing) and Ag(rail) are replaced by Ad(road) and Ad(rail). Ag(air) andAg(maritime) are still included in the model, as Bowen (2008) used simplified gravity-based measures andno density-based measures for these transport modes. In general, the PLS model with the density-basedaccessibility measures shows many similarities with the PLS models with the gravity-based measures. Themost important difference is that with density-based measures, there is no relation between freightaccessibility and logistics employment. Hence, although the positive correlation between the density-basedaccessibility measures and logistics employment suggest that there is a relationship between thesevariables per county, this turns out to be spurious, as it can be fully explained by the relations betweenthese variables and the county population.
94
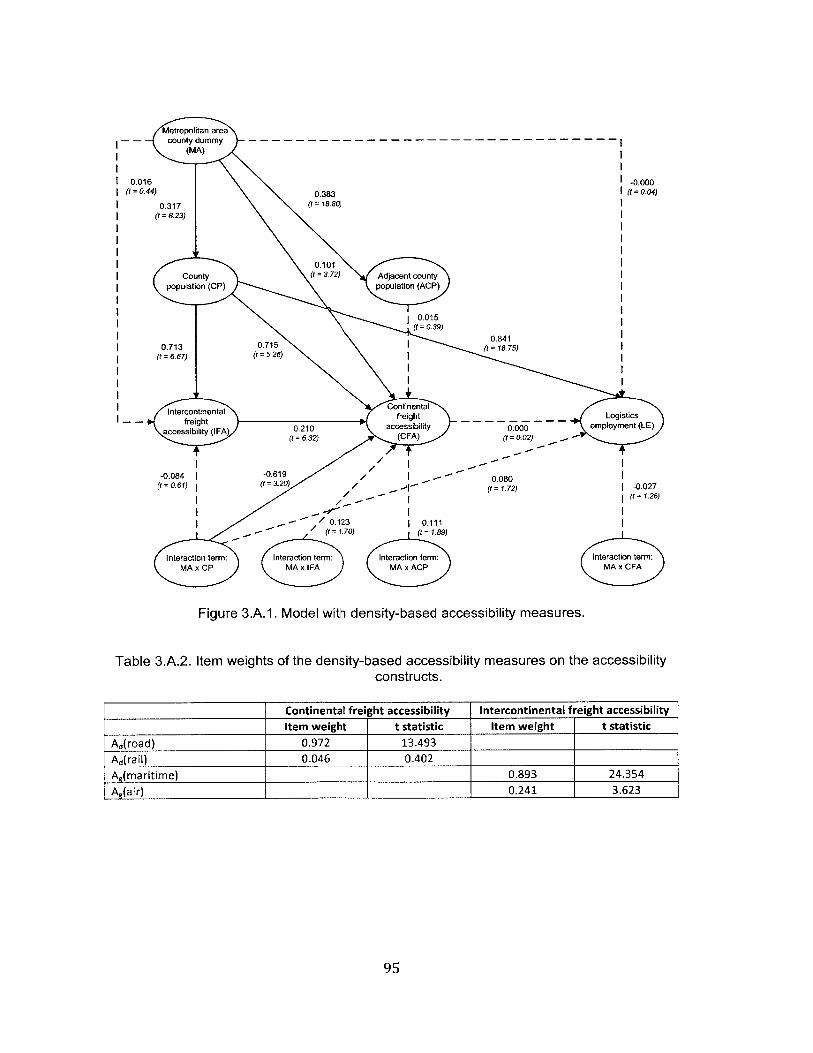
Metropolitan areacounty dummy - - - - - - - - - - - - - - - - - - - - - - - - - - - - - - -
(MA)
0.016 -0.000(t 0.44) 0.383 (t =o.04)
0.317 (t = 18.80)(t= 8.23)
0.101County (t = 3.72) Adjacent county
population (CP) population (ACP)
0.015(t = 0. 39)
-0.084 -0861
0.713 0.715 (t= 18.75)(t = 6.67) (t = 5.26)
Intercontinental Continental
tfreight s.LogistContinental freight accessibility Intec.2tinentfbility 0.000 employmen(l(t a6.t32) (CFAi) (t = 0.02)
-0.084 04-0.619 , .-- _.080(t = 0.61) (t = 3.20) -- (t = 1. 72) -0.027
(t = 1.26)
0.123 __ 0.111-(t = 1.70) (t =4 1. 839)
Interaction term: Interaction term: Interaction term: Interaction term:MA xCP MA x IFA MA xACP MA x CFA
Figure 3.A. 1. Model with density-based accessibility measures.
Table 3.A.2. Item weights of the density-based accessibility measures on the accessibilityconstructs.
Continental freight accessibility Intercontinental freight accessibilityItem weight t statistic Item weight t statistic
Ad(road) 0.972 13.493
Ad (rai 1) 0.046 0.402
AJmaritime) 0.893 24.354
AQair) 0.241 3.623
95
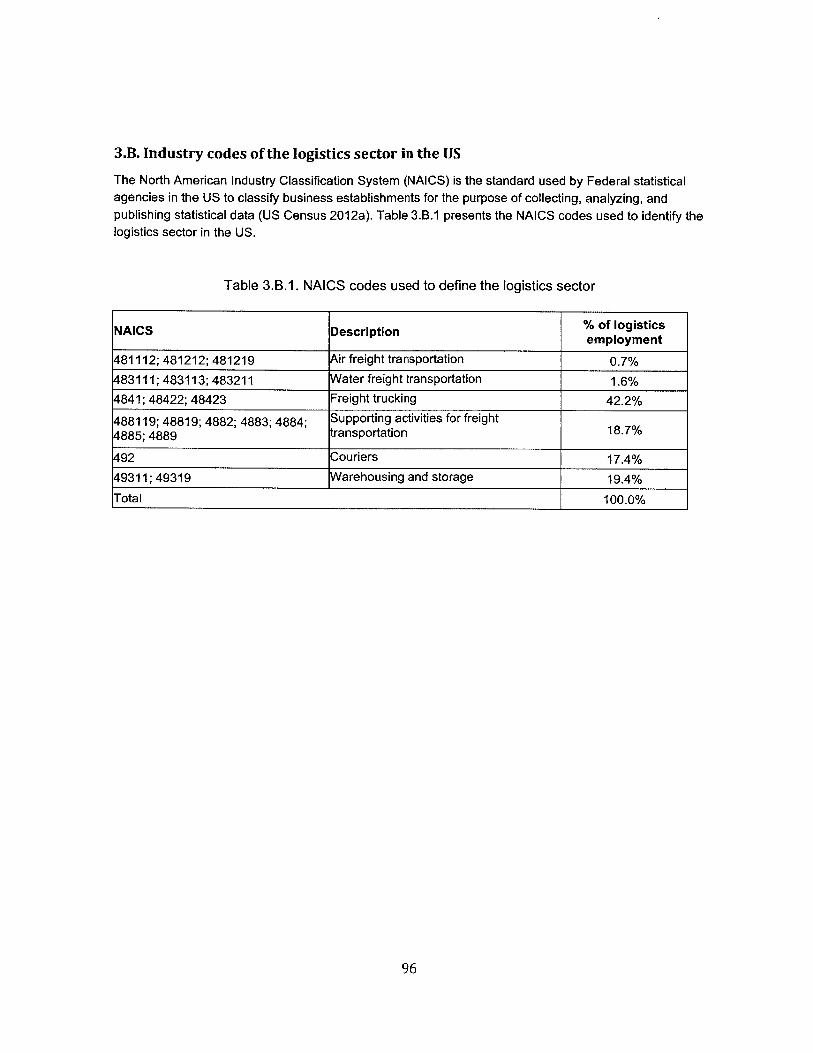
3.B. Industry codes of the logistics sector in the US
The North American Industry Classification System (NAICS) is the standard used by Federal statisticalagencies in the US to classify business establishments for the purpose of collecting, analyzing, andpublishing statistical data (US Census 2012a). Table 3.B.1 presents the NAICS codes used to identify thelogistics sector in the US.
Table 3.B.1. NAICS codes used to define the logistics sector
NAICS Description % of logisticsemployment
481112; 481212; 481219 Air freight transportation 0.7%483111; 483113; 483211 Water freight transportation 1.6%4841; 48422; 48423 Freight trucking 42.2%
488119; 48819; 4882; 4883; 4884; Supporting activities for freight4885; 4889 transportation 18.7%
492 Couriers 17.4%49311; 49319 Warehousing and storage 19.4%Total 100.0%
96
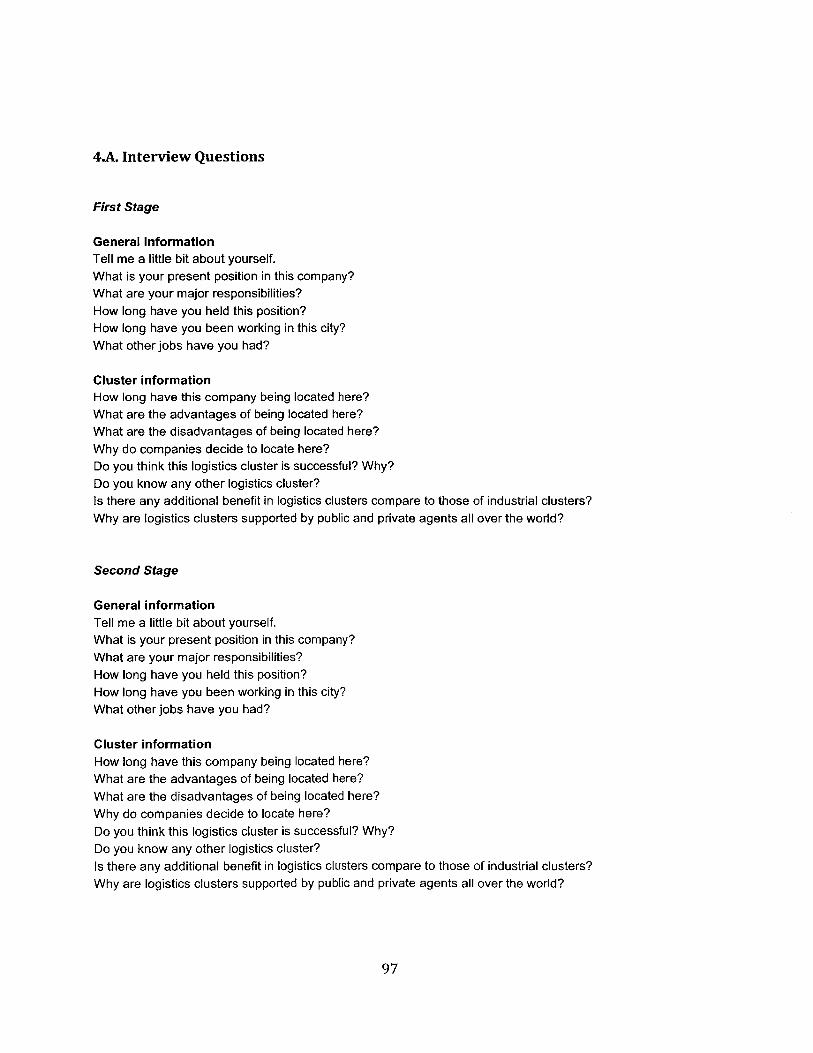
4A. Interview Questions
First Stage
General informationTell me a little bit about yourself.What is your present position in this company?What are your major responsibilities?How long have you held this position?How long have you been working in this city?What other jobs have you had?
Cluster informationHow long have this company being located here?What are the advantages of being located here?What are the disadvantages of being located here?Why do companies decide to locate here?Do you think this logistics cluster is successful? Why?Do you know any other logistics cluster?Is there any additional benefit in logistics clusters compare to those of industrial clusters?Why are logistics clusters supported by public and private agents all over the world?
Second Stage
General informationTell me a little bit about yourself.What is your present position in this company?What are your major responsibilities?How long have you held this position?How long have you been working in this city?What other jobs have you had?
Cluster informationHow long have this company being located here?What are the advantages of being located here?What are the disadvantages of being located here?Why do companies decide to locate here?Do you think this logistics cluster is successful? Why?Do you know any other logistics cluster?Is there any additional benefit in logistics clusters compare to those of industrial clusters?Why are logistics clusters supported by public and private agents all over the world?
97

CollaborationHas your company ever collaborate with other company in the cluster?Could you mention some examples? How?How often does your company collaborate?How did the collaboration started? Who contact whom? Was there any facilitator?Did your company get any benefit/cost from collaborating?
Value added servicesDoes your company offer/demand logistics value added services?Could you mention some examples? How?Does your company offer/demand them to active clients?Is there any difference on offering/demanding value added services if you are inside or outside thelogistics cluster?
Upward mobilityDoes your company recruit entre level workers?Does your company offer education benefits to workers? How? What kind?How long do employees in your company stay in average?How do employees get promoted in your company?Do employees in your company experience upward mobility?
98
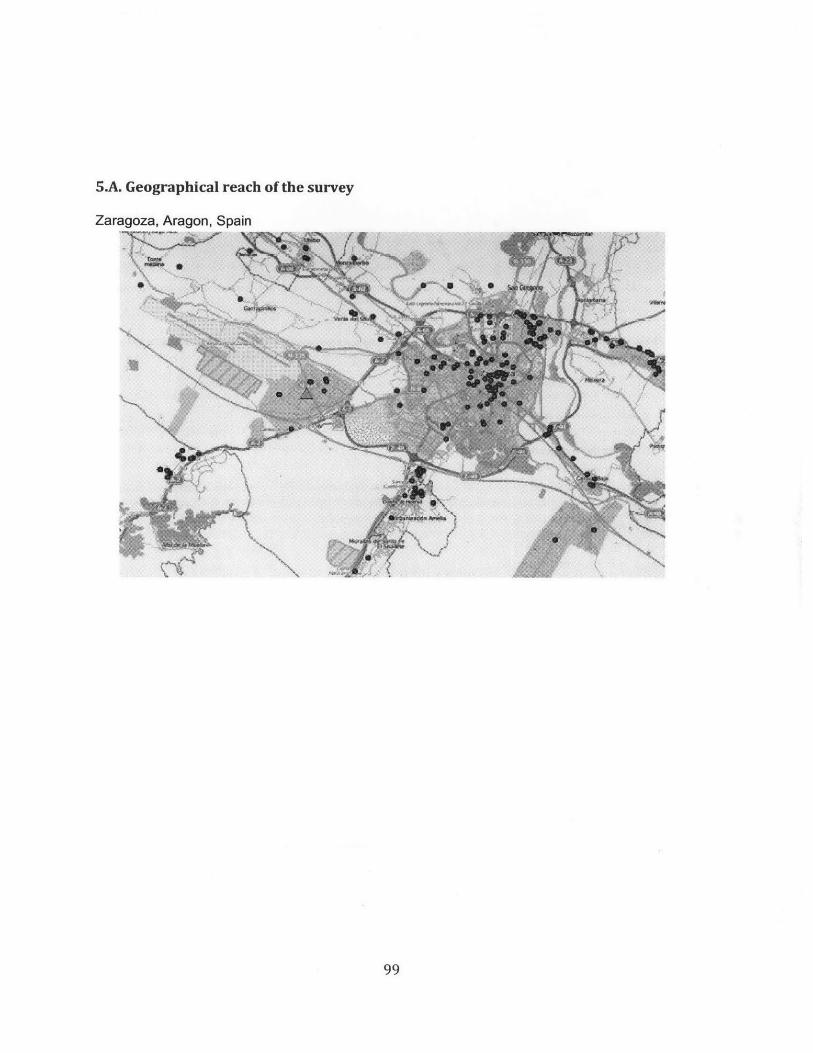
5A. Geographical reach of the survey
Zaragoza, Aragon, Spain
N
99
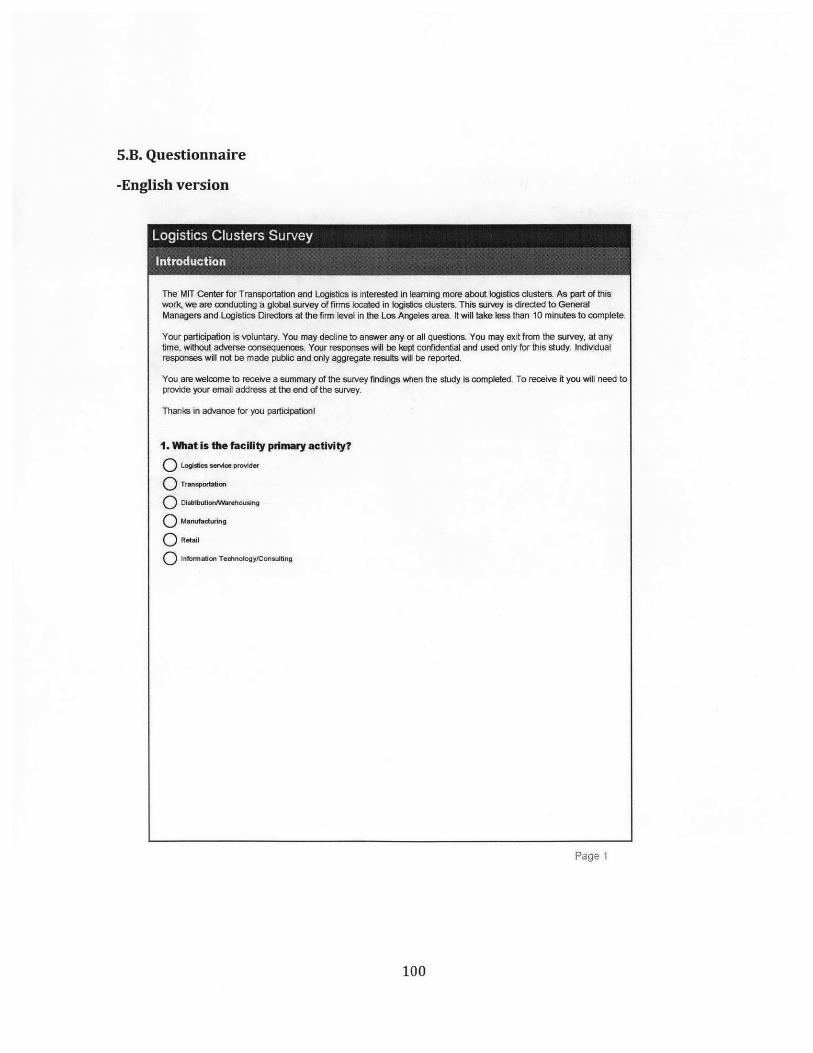
5.B. Questionnaire
-English version
The MIT Center for Transportation and Logistics is irnterested: in learning more about logistics clusters. As part of thiswork, we are conducting a gtobal survey of firrms located in logistics clusters. This survey is directed to GeneralManagers and Logistics Directors at the firm level in the Los. Angeles area. It will take less than 10 minutes to complete.
Your participation is voluntary. You may decline to answer any or all questions. You may exit from the survey, at anytime, without adverse consequences. Your responses will be kept confidential and used only for this study. Individualresponses will not be made public and only aggregate results will be reported.
You are welcome to receive a summary of the survey findings when the study is completed. To receive it you will need toprovide your email address at the end of the survey.
Thanls in advance for you participationi
1. What is the facility primary activity?
Q LogisUcs serAvice provider
Q Transportation
Q DistributionNMarehousing
0 ( -r--
O Retail
Q Informnation Technology/Consulting
Page 1
100
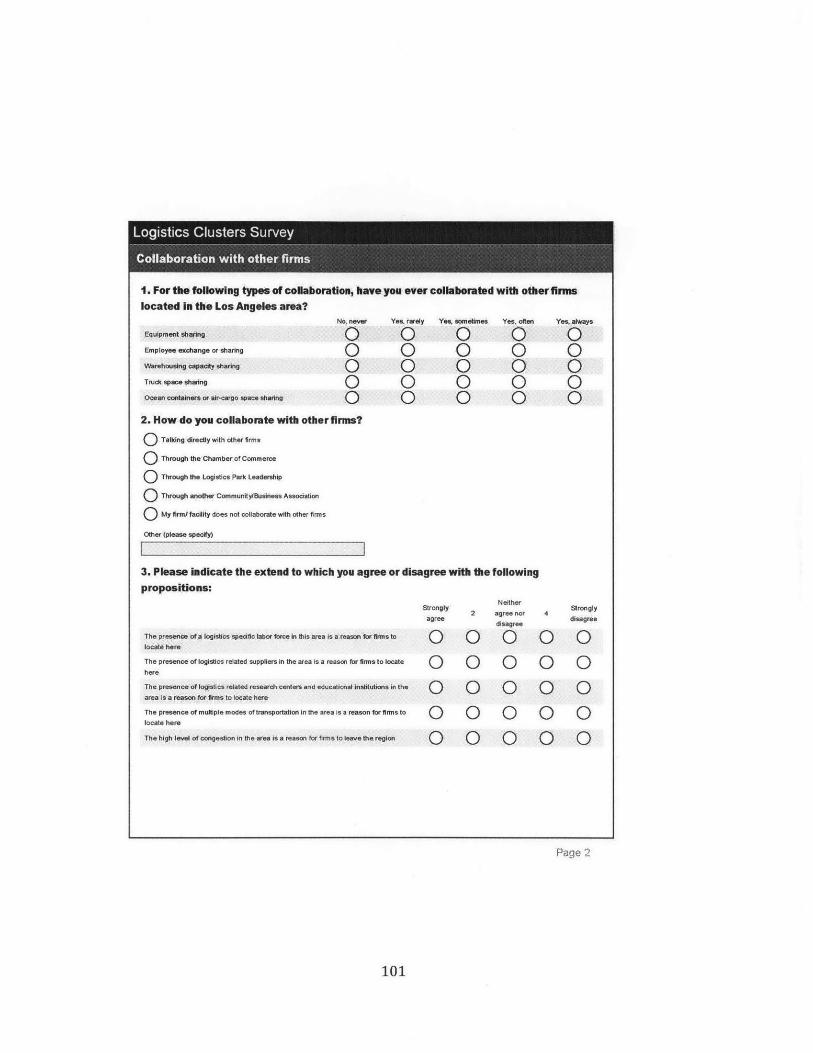
1. For the following types of collaboration, have you ever collaborated with other fimislocated In the Los Angeles area?
Equipment sharing
Employee exchange or sharing
Warehousing capacity sharing
Truck space slimng
.Ocean containers or air-cargo space sharing:
No never Yes, rarely Yes, sometimes Yes, often Yes, always
0 0 0 0 0o 0 0 0 0o o 0 0 0o 0 0 0 0
2. How do you collaborate with other firms?
Q Talking directly with other firms
Q Through the Chamber of Commerce
Q Through the Logistics Park Leadership
Q Through another Community/Business Association
Q My firm/ facility does not collaborate with other firms
Other (please specify)
3. Please indicate the extend to which you agree or disagree with the followingpropositions:
NeitherStrongly 2 agree noragree disagree
The Preseie of a logistics specific labor iforce in this area is acreason for ffms to C C ()locaid here
The presence of logistics related suppliers in the area is a reason for firms to locate ) 0 0here
The presence of logistics related research centers and educational Institutions in the 0 0 0area 1s a reason for fims to locate here
The presence of multiple modes of transportation in the area is a reason for firms to 0 0 0locate here
The high level of congestion in the area is a reason for firmis to leave the region 0 ) 0
Paqe 2
101
Stronglydisagree
000 0
0 00 00 0
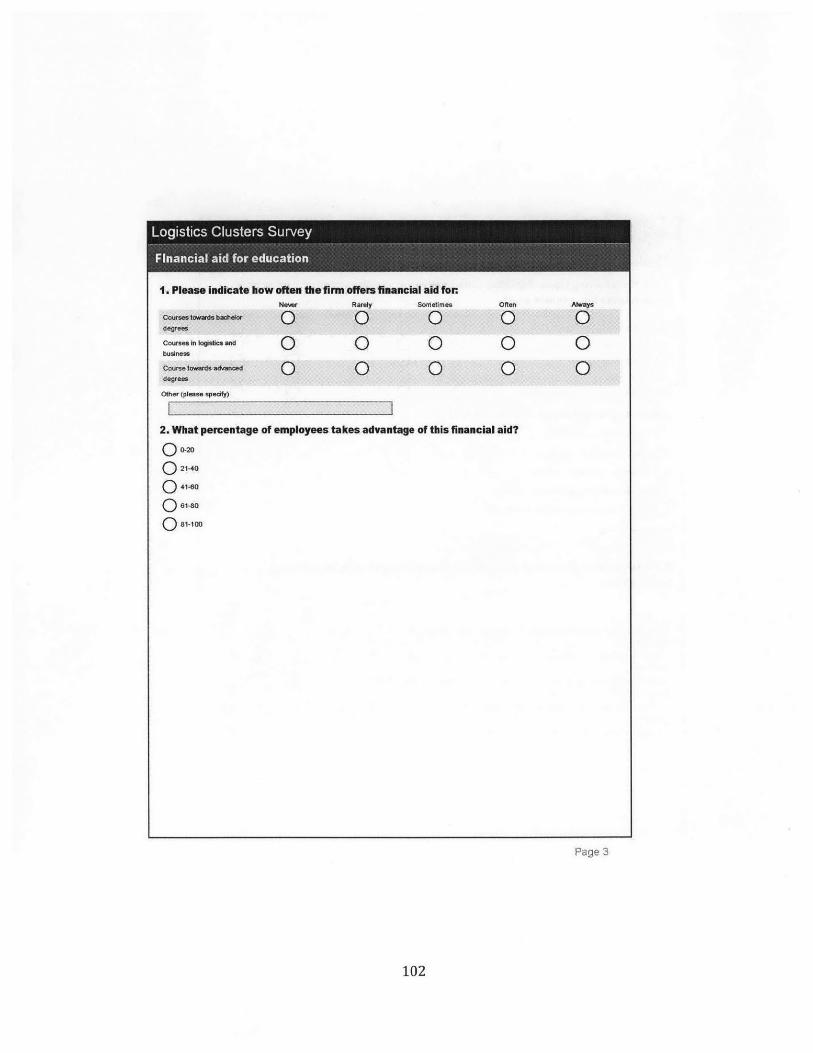
1. Please indicate how often the firm offers financial aid forNeer Rarely Sometimes
Coiurseloars bachlor 0 0 0degrees
Courses In logistics and 0 0 Qbusiness
Course towerds advanceddegrees
Other (please specify)
0 0 0
Often Always
0 0
o 00 0
2. What percentage of employees takes advantage of this financial aid?S0-20
Q 21-40
0 41-60
0)61-80
0 81-100
Page 3
102
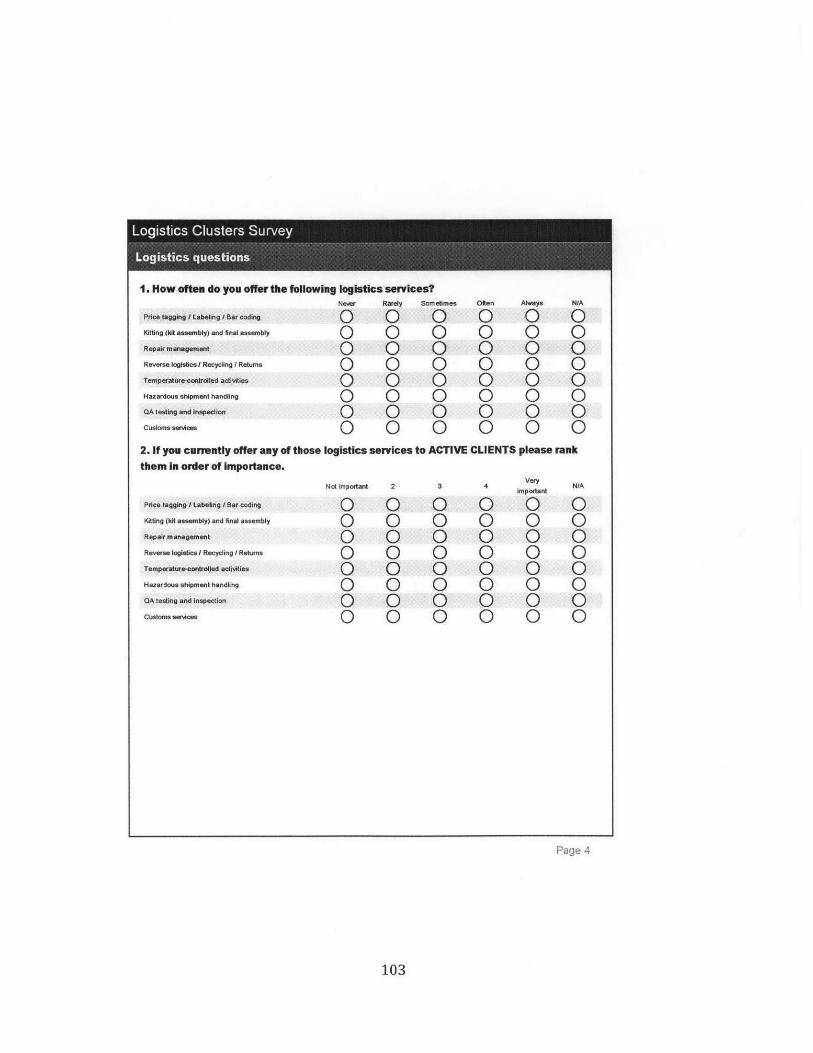
1. How often do you offer the following logistics services?Never Rarely Sometimes Often Alays MA
Price tagging I Labeling I Bar coding 0 0 0 0 0 0iing (kit assembly) and final assembly 0 Q Q Q 0 Q
Repair management 0 0 0 0 0 0Reverse logistics/I Recycling I Returns 0 0 0 0 0 0Tomperature-conroled aptI~ies 0 Q 0 Q0 0Hazardous shipment handling 0 0 0 0QA testing and Inspec tio In 0 Q 0 0 0 0Custo-s-i 0 0 0 0 0 0
2. If you currently offer any of those logistics services to ACTIVE CLIENTS please rankthem in order of importance.
Not important 2 3 4 VNAimportant
Pice taggingI Labeling Bar coding O 0 0 0 0 0Kitting (kit assembly) and final assembly 0 Q Q Q 0 0Repair management 0 0 0 0 0 0Reverse logistics I Recycling I Returns Q Q Q Q 0 0Temperaur'emmtrel actviies 0 0 0 0 0 0Hazardous shipment handling 0 0 0 0 0 0QA testing and inspection 0 0 0 0 0 0Customs services 0) r) C) C) C) C)
Page 4
103
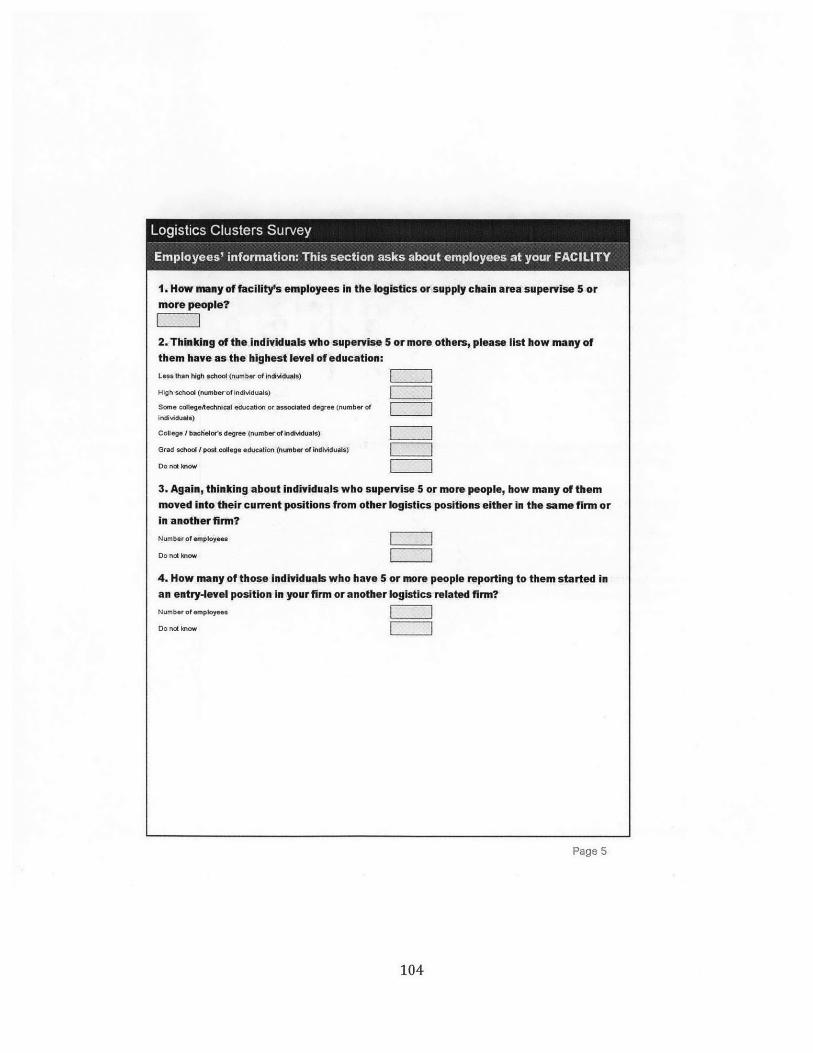
1. How many of facilityfs employees in the logistics or supply chain area supervise 5 ormore people?
2. Thinking of the individuals who supervise 5 or more others, please list how many ofthem have as the highest level of education:Less than high school (number of individuals)
High school (number of individuals)
Some college/technical education or associated degree (number ofindividuals)
College I baclielor's degree (number of indMduals) [1111]Grad school I post college education (number of individuals)
Do not know
3. Again, thinking about Individuals who supervise 5 or more people, how many of themmoved into their current positions from other logistics positions either in the same firm orin another firm?Number of employees
Do not know
4. How many of those individuals who have 5 or more people reporting to them started inan entry-level position in your firm or another logistics related firm?Number of employees
Do not knowL
Page 5
104
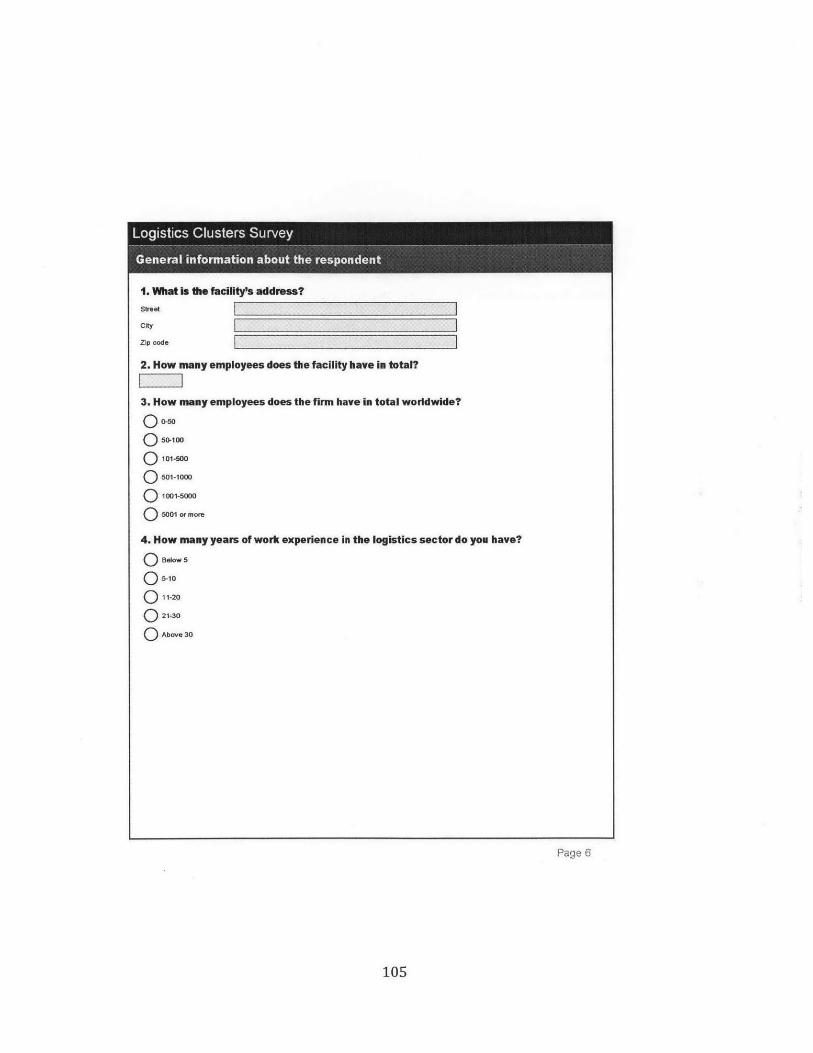
1. What Is the facility' address?Street
city
Zip code
2. How many employees does the facility have in total?
3. How many employees does the firm have in total worldwide?
0 0-50
0 101-50
Q 501-1000
Q 1001-5000
Q 5001 or more
4. How many years of work experience in the logistics sector do you have?
O Below 5
0 s-io
Q 11-20
0 21-30
Q Aboe30
Page 6
105
1. Thank you for your participation In the Logistics Clusters Survey!
If you are Interested in receiving a summary of the results, please provide us your emailaddress below. We plan on sending these out in fall 2012. This is voluntary and all emailaddresses will be kept confidential and only used in relation to this survey.
Email address:
Page 7
106
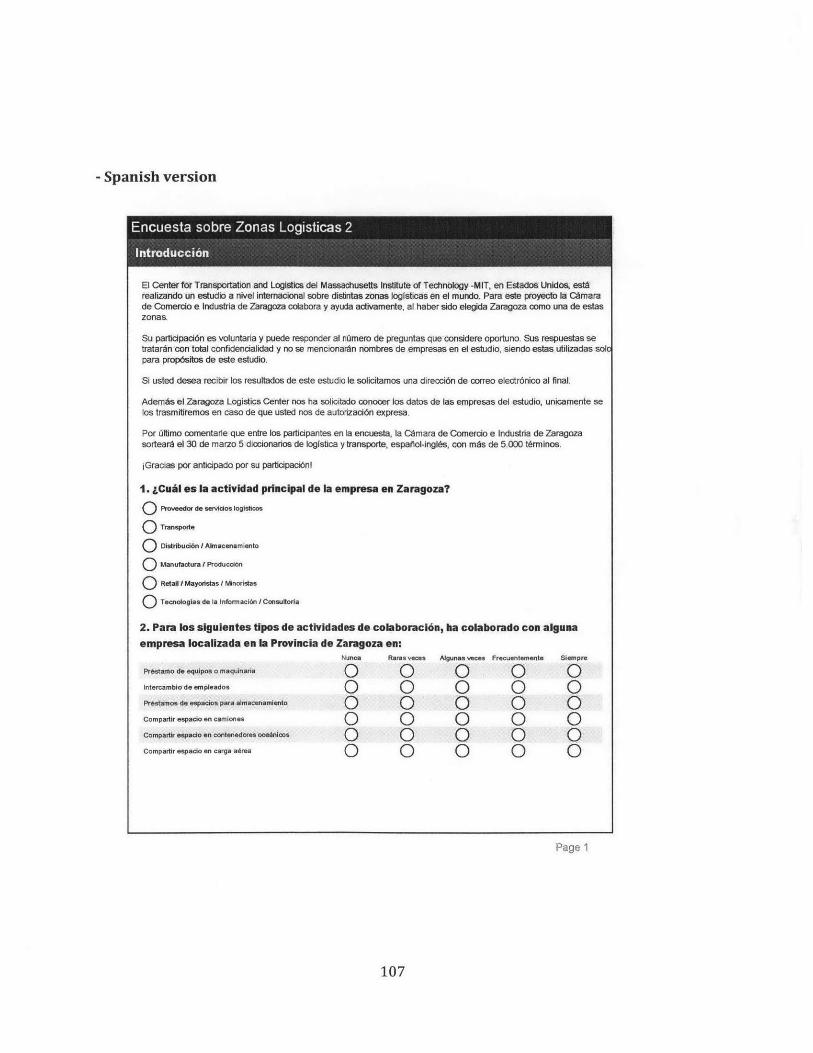
- Spanish version
El Center for Transportation and Logistics del Massachusetts Institute of Technology -MIT, en Estados Unidos, es*realizando un estudio a nivel intemacional sobre distintas zonas logisticas en el mundo, Para este prayecto la C~marade Comercio e Industria de Zaragoza colabora y ayuda activamente, al haber sido elegida Zaragoza como una de estaszonas.
Su participaci6n es voluntaria y puede responder al n~imero de preguntas que considere oportuno. Sus respuestas setratarin con total confidencialidad y no se mencionardn nombres de empresas en el estudio, siendo estas utilizadas solcpara prop6sltos de este estudio.
Si usted desea recibir los resultados de este estudio le solicitamos una direcci6n de correo etectr6nico al final.
Aderns el Zaragoza Logistics Center nos ha solicitado conocer los datos de las empresas del estudio, unicamerite selos trasmitiremos en caso de que usted nos de autorizaci6n expresa.
Por Otimo comentarle que entre los participantes en la encuesta, la Cemara de Comercio e Industria de ZaragozasortearA el 30 de marzo 5 diccionarios de logistica y transporte, espatiol-ingles, con m§s de 5.000 terminos.
iGracias por anticipado por su participaci6n!
1. LCual es Ia actividad principal de la empresa en Zaragoza?
Q Prao'eedor de serviaos loglaicos
Q Transporte
Q Distribuci6n I Abuacenamiento
0 Manufactura 1 Producc16n
Q Retail I Mayoristas I Nnoristas
O Tecnologlas de la Informacd6n I Consultoria
2. Pam los siguientes tipos de actividades de colaboracl6n, ha colaborado con algunaempresa localizada en [a Provincia de Zaragoza en:
Nunca Rarasveces Algunas veces Frecuentemente Siempre
Proatarno de equiposo amaquinaria Q Q Q Q 0
Intercamblo de empleados 0 0 0 0 0Prtstamus ide espacies pa alMacenamiento.0(i
Compartir espacio en camiones 0 0 Q Q 0
Compartr espaclo en contaedores oce~ntaos 03 01 0 03 0Compartir espacio en carga aerea 0 Q Q 0 (
Page 1
107
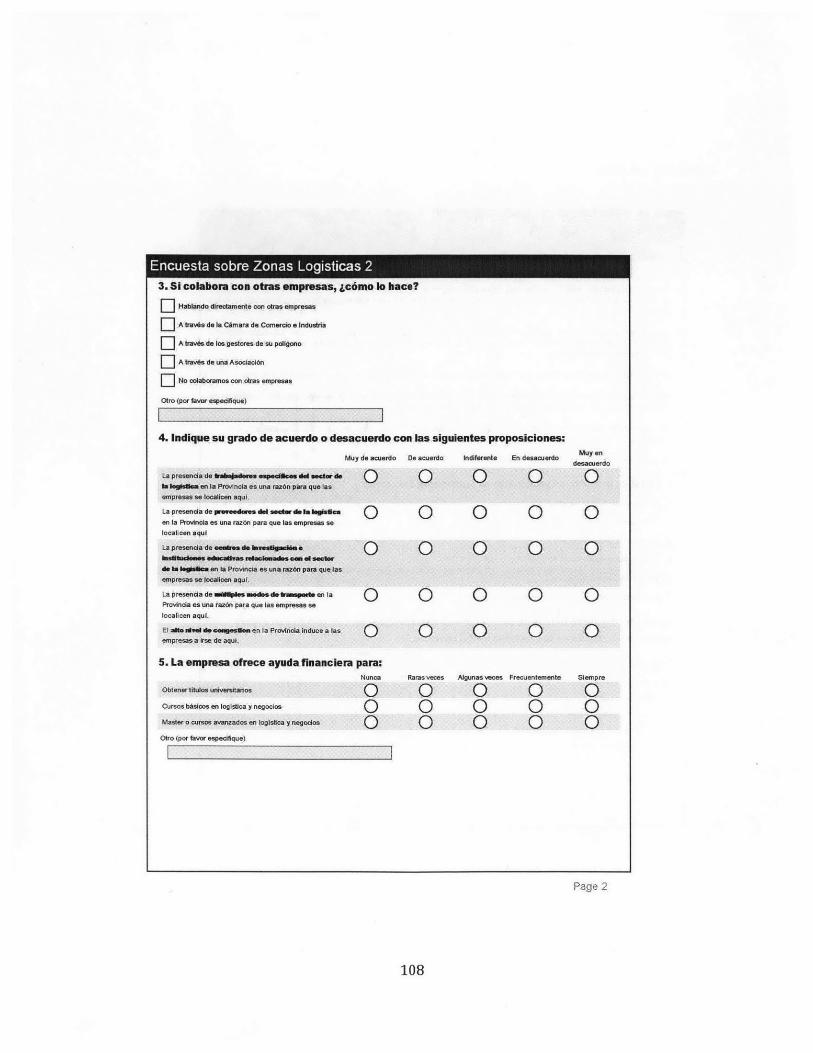
Encuesta sobre Zonas Logisticas 2
3. 81 colabora con otras empresas, Lcomo lo bace?
Hablando directamente con otrs empresas
A travs do la Cimara do Comerclo e Industria
AtraviAsde los gestores do su pollgono
W A travis do una Asoclacl6n
n No colaboramos con otras emprosas
Otro (por favor espedifique)
4. Indique su grado de acuerdo o desacuerdo con las siguientes proposiciones:
Muy de acuerdo De acuerdo
La prosonda de babm~mdows eqaeoco id sot o.(3lI k*um on In Piovslncia es una raz6n peru quo Insempresas se locallcen aqu I.
La presnomr d do p A, dm1 usoleda i le 1,a ()en la Provincia es una raz6n para quo las empresas selocalloon aquil
La presena do emob do b a USa- b"sOibudlms od laclosmaas earn o sa_dIse lo$Os~m en la ProvInca es una razon pas que lasgmpresas s focalicen aquL
La presencla do ogalu. medsoo dospet en Ia 0Provincia es una raz6n para quo las empressas selocalicen aqul.
El alt dlldeeoe uog-qp oen la Provincia induce a las (Oempresasa irse.e Aqul.
5. La empresa ofrece ayuda financlera para:Nunca
Obtener ttulos unrivws0tarios
Cursos bisloos en logistica y negocios 0
Master o cursos avanzados en logistica y negodos 03
Otro (por favor especlAque)
U
Indiferente En desmouerdo Myndosoerdoo o 0
o 0 0 0
o o 0 0
o o 0 0
0 0 0 0
Raras veces
000
Algunas veces
000
Frecuentemente
000
Siempre
000
Page 2
108
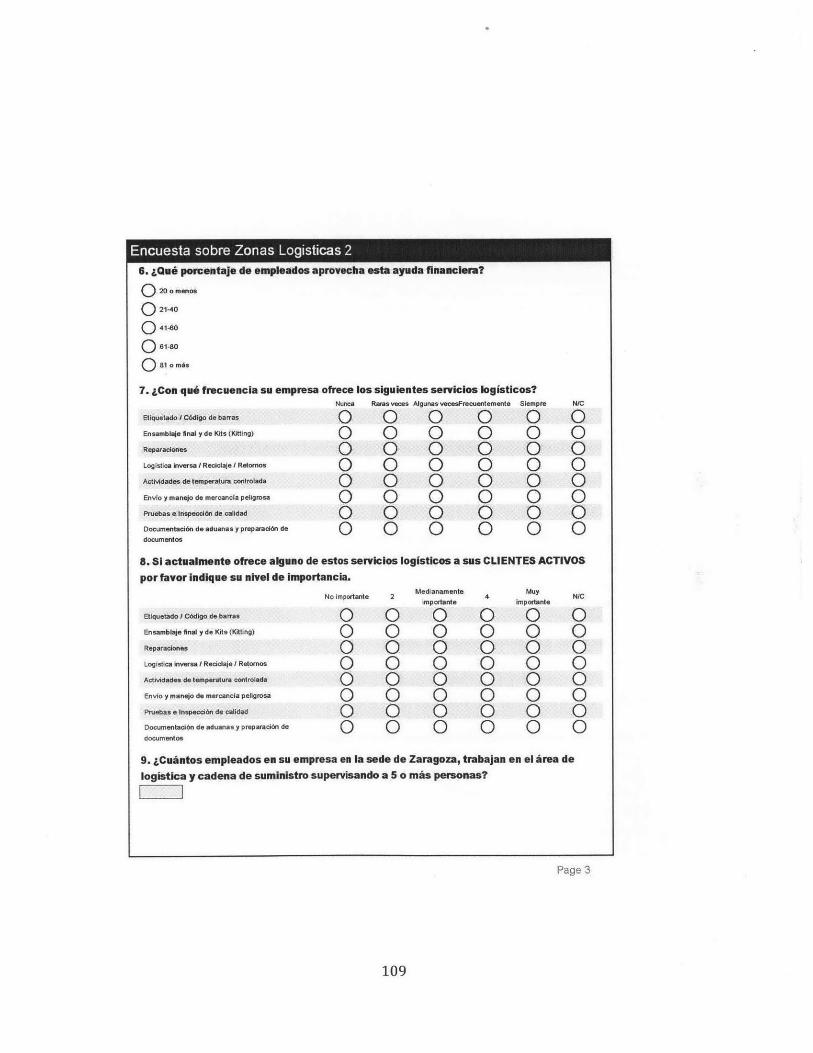
Encuesta sobre Zonas Logisticas 2
6. ;Qus porcentaje do emplieados aprovecha esta ayuda financlem?
S20 o menos
O 21-40
0j 41-60
0 81-80
81 o m&s
7. &Con quo frecuencia su empresa ofrece los siguientes serviclos logisticos?Nunca Rarsveces AlgunasvecesFrecuentemente Slempre N/C
Etiquetado / Codigo de barras 0 0 0 0 0 0Ensamblaje final y do Kits (Kitting) 0 0 0 0 ) 0
Reparaciones 0 0 0 0 0 0Logistica inversa / Reciclaje / Retomos 0 0 C ) 0 CAcividades doempertur cntriolada C) 0C 0 0I C) C0Envlo y manejo do mercancla peligrosa 0 ) ) C 3 0
Pruebas 6 nspecci~rr do caidad 0 0 0 0 0 0Documentaci6n do aduanas y preparacin de 0 ( 0 ( 0 0documentos
8. Si actualmente ofrece alguno de estos serviclos logisticos a sus CLIENTES ACTIVOSpor favor indique su nivel do importancia.
No importante 2 Medianamente N/Cimportante importante
Elquetaft I Udlgo de bamaS 0 0 0 0 0 0Ensamblaje final y do Kits (KItting) 0 0 0 C 0 )Reparaciones C) 0) (0 0) C 0Logistica inversa I Reciclaje / Retornos 0 0 0 0 0 0Actividades dotermparatura controlada C 0 0 0 0 0Envlo y manejo do mercancla peligrosa 0 ) ( 0 ) 0
Pruebas e inspecc.i6n do caided 0 0 0 0 C ODocumentaci6n do aduanas y preparaci6n de C 0 0 ) 0 0documentos
9. LCuAntos empleados en so empresa en la sede de Zaragoza, trabajan en eI irea delogistica y cadena de suministro supervisando a 5 o mis personas?
Page 3
109
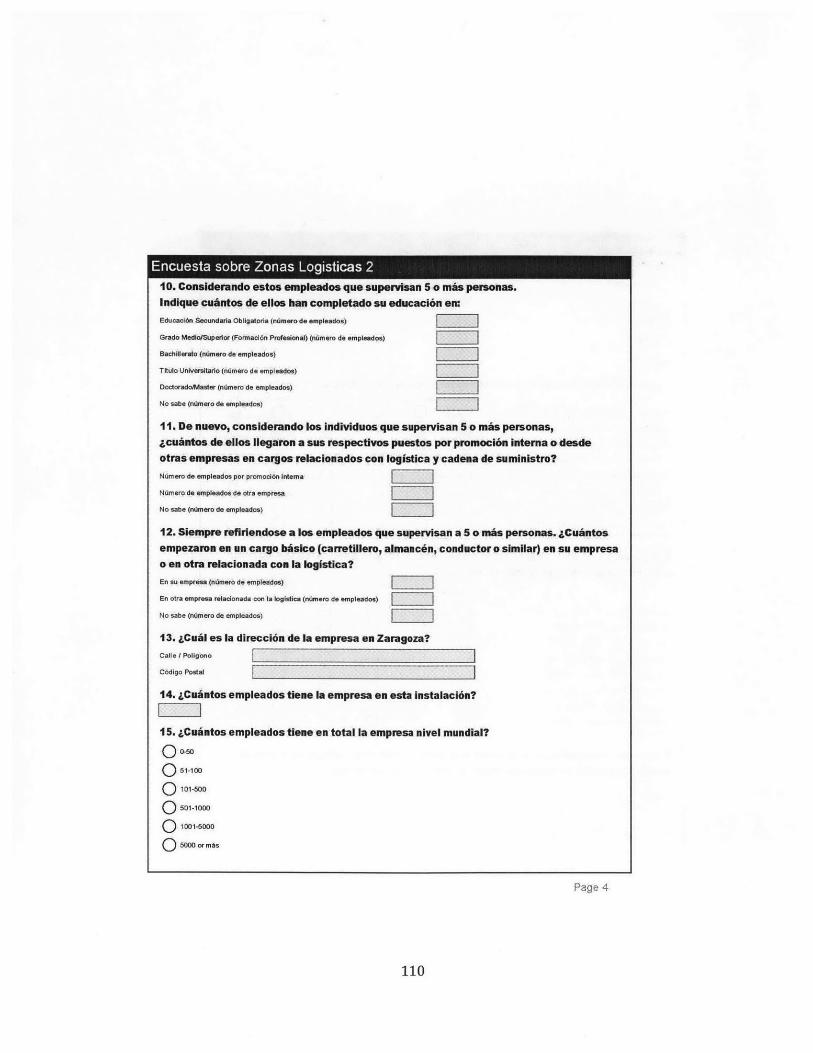
10. Consderando estos empleados quo supervisan 5 o mis personas.Indique cuintos do eilos ban completado su educacion on:Educaci6n Secundari Obligatoria (numerode empleados)
Grado Medio/Superior (Formac6n Profesional) (ntmero do empleados)
Bachillerato (numero de empleados)
Tftulo Universitario (nMmero de empleados)
Doctorado/Master (nfimero de empleados)
No sabe (numero do. empleados)
11. Do nuevo, considerando los individuos quo supervisan 5 o mis personas,Lcuantos de ollos Ilegaron a sus respectivos puestos por promocion interna o desdeotras empresas en cargos relacionados con logistica y cadena do suministro?N ~mero de empleados por promoci6n intema
Ntunero.de empleados de otra empresa
No sabe (nmrero de empleados)
12. Siempre refirlendose a los empleados que supervisan a 5 o mis personas. &Cuantosempezaron on un cargo bisico (carretillero, almanc6n, conductor o similar) en su empresao en otra relacionada con Ia logistica?En su empresa.(ndmero de empteados)En otra etepresa relaclonada con la logistica (ntnmero do empleados)
No sabe (nhmero de empleados)
13. LCuil es Ia direcci6n do Ia empresa en Zaragoza?Calle / Poligono
C6digo Postal
14. ,Cunintos empleados tiene In empresa en esta instalaci6n?
15. ,Cuantos empleados tione en total Ia emprosa nivel mundial?
o 0-50
0 51-100
0 101-500
0 501-1000
0 1001-5000
Q 000 or ms
Page 4
110
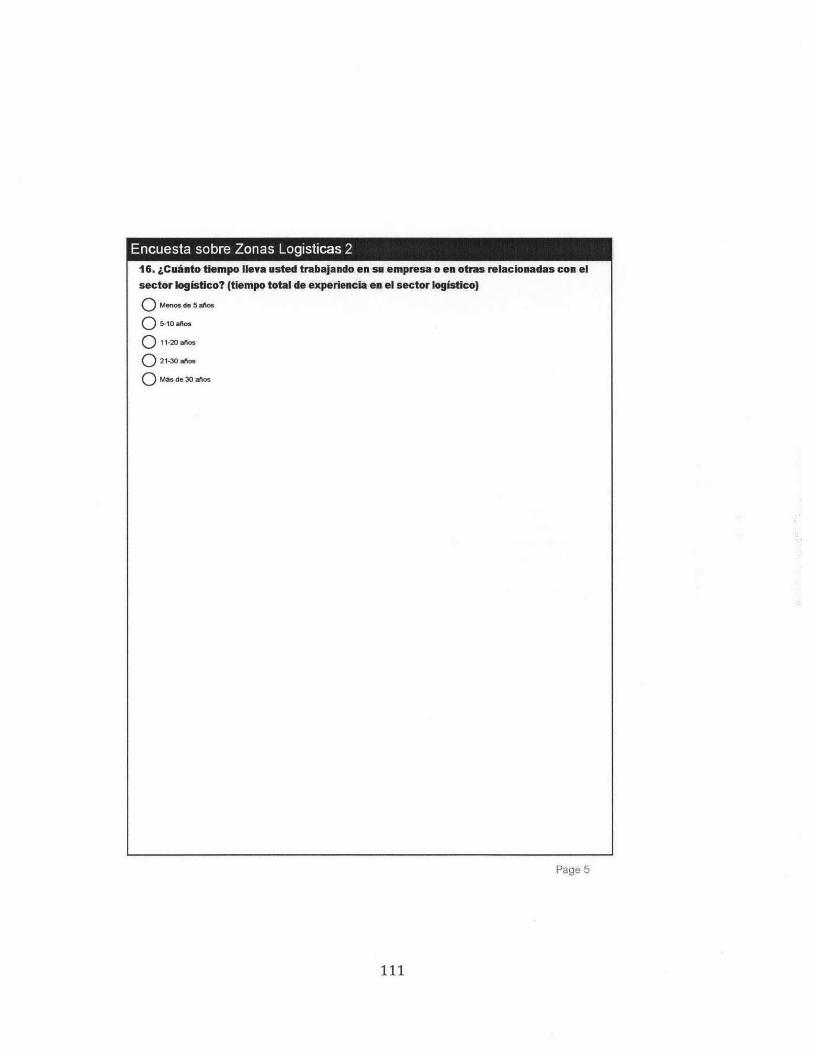
16. &CuAnto tiempo Ileva usted trabajando en s. empresa o en otras relacionadas con elsector logistico? (tiempo total do experiencla n el sector logistico)
Q Menos de 5 aos
5-10 aos
Q 11-20 aflos
Q 21-30 aios
Q M*sde30aflos
Page 5
111
1. ;Graclas por su participaclin on Ia Encuesta do Clusters LogisticosI
Tenemos planeado enviar los resultados del estudlo a finales do 2012. SI usted estainteresado en recibir un resumen de estos resultados, por favor escriba su correoelectr6nico a continuacidn. Este proceso es voluntario y todos los correos electr6nicosserAn guardados con confidencialidad y solo utilizados pam prop6sitos de estaencuesta.
Direcc6m do correo electronico:
2. La Fundaci6n Zaragoza Logistics Center (ZLC) nos ha solicitado conocer los datos delas emprosas del estudlo con el fin do mantenerle informado sobre noticias y eventosrelacionadas con la actividad formativa o investigadora de ZLC. si posteriormente deseadarse de baja puede hacerlo a trav6s do [email protected] o los otros medios do contactoque pondran asu disposicion.
Autorizo a ceder mis datos al Zaragoza Logistics Center
Ssi
0 No
Page 6
112
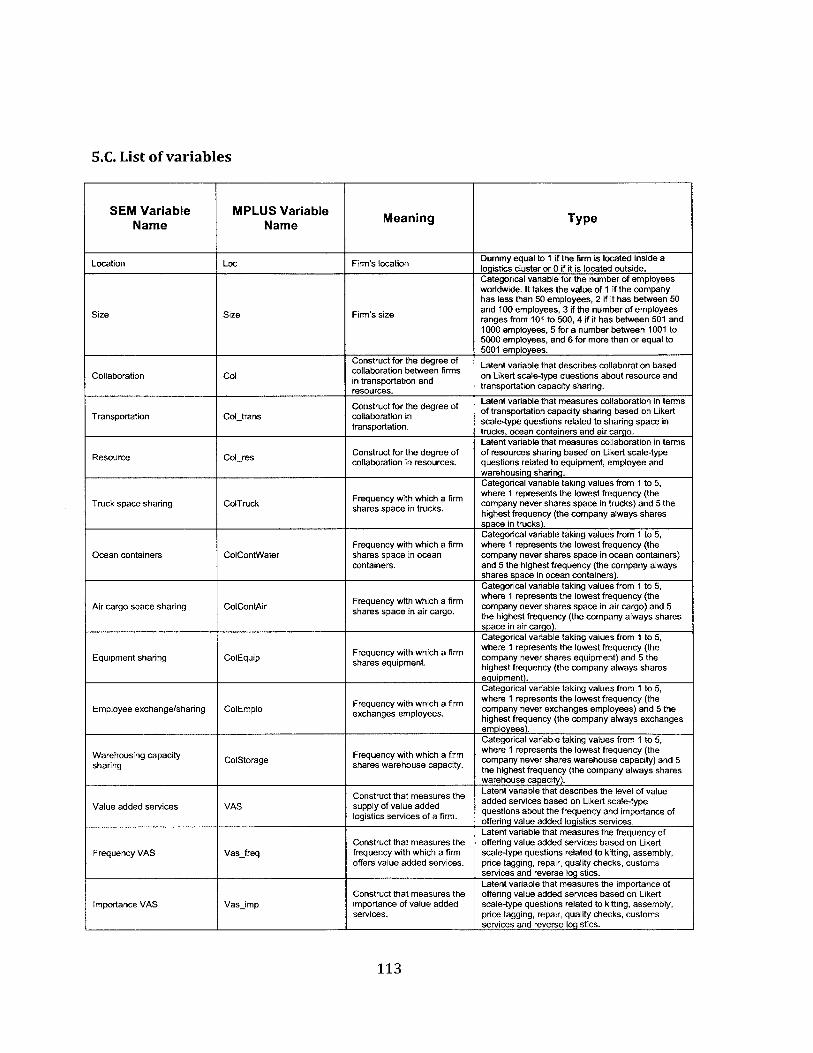
S.C. List of variables
SEM Variable MPLUS Variable Meaning TypeName Name
Location Loc Firm's location Dummy equal to I if the firm is located inside alogistics cluster or 0 if it is located outside.Categorical variable for the number of employeesworldwide. It takes the value of 1 if the companyhas less than 50 employees, 2 if it has between 50
Size Size Firm's size and 100 employees, 3 if the number of employeesranges from 101 to 500, 4 if it has between 501 and1000 employees, 5 for a number between 1001 to5000 employees, and 6 for more than or equal to5001 employees.
Construct for the degree of Latent variable that describes collaboration basedCollaboration Col collaboration between firms on Likert scale-type questions about resource andin transportation and transportation capacity sharing.
_____________________resources.
Construct for the degree of Latent variable that measures collaboration in terms
Transportation ColCtrans collaboration in of transportation capacity sharing based on Likert
transportationaoration scale-type questions related to sharing space intrucks, ocean containers and air cargo.Latent variable that measures collaboration in terms
Resource Colres Construct for the degree of of resources sharing based on Likert scale-typecollaboration in resources. questions related to equipment, employee and
warehousing sharing.Categorical variable taking values from 1 to 5,
Frequency with which a firm where 1 represents the lowest frequency (theTruck space sharing ColTruck shares space in trucks. company never shares space in trucks) and 5 the
highest frequency (the company always sharesspace in trucks).Categorical variable taking values from 1 to 5,
Frequency with which a firm where 1 represents the lowest frequency (theOcean containers ColContWater shares space in ocean company never shares space in ocean containers)
containers. and 5 the highest frequency (the company alwaysshares space in ocean containers).Categorical variable taking values from 1 to 5,
Frequency with which a firm where 1 represents the lowest frequency (theAir cargo space sharing ColContAir shares space in air cargo. company never shares space in air cargo) and 5
the highest frequency (the company always sharesspace in air cargo).Categorical variable taking values from 1 to 5,
Equipment sharing ColEquip ncwith which a firm where 1 represents the lowest frequency (theEqipen hain olqupshares equipment. company never shares equipment) and 5 the
highest frequency (the company always sharesequipment).Categorical variable taking values from 1 to 5,
Frequency with which a firm where 1 represents the lowest frequency (theEmployee exchange/sharing ColEmplo exchanges employees. company never exchanges employees) and 5 the
highest frequency (the company always exchangesemployees).Categorical variable taking values from 1 to 5,
Warehousing capacity Frequency with which a firm where 1 represents the lowest frequency (thesharing ColStorage shares warehouse capacity. company never shares warehouse capacity) and 5
the highest frequency (the company always shareswarehouse capacity).
Construct that measures the Latent variable that describes the level of value
Value added serices VAS supply of value added added services based on Likert scale-type
logistics services of a firm. questions about the frequency and importance ofoffering value added logistics services.Latent variable that measures the frequency of
Construct that measures the offering value added services based on LikertFrequency VAS Vasfreq frequency with which a firm scale-type questions related to kitting, assembly,
offers value added services. price tagging, repair, quality checks, customsservices and reverse logistics.Latent variable that measures the importance of
Construct that measures the offering value added services based on LikertImportance VAS Vas-imp importance of value added scale-type questions related to kitting, assembly,
services. price tagging, repair, quality checks, customsservices and reverse logistics.
113
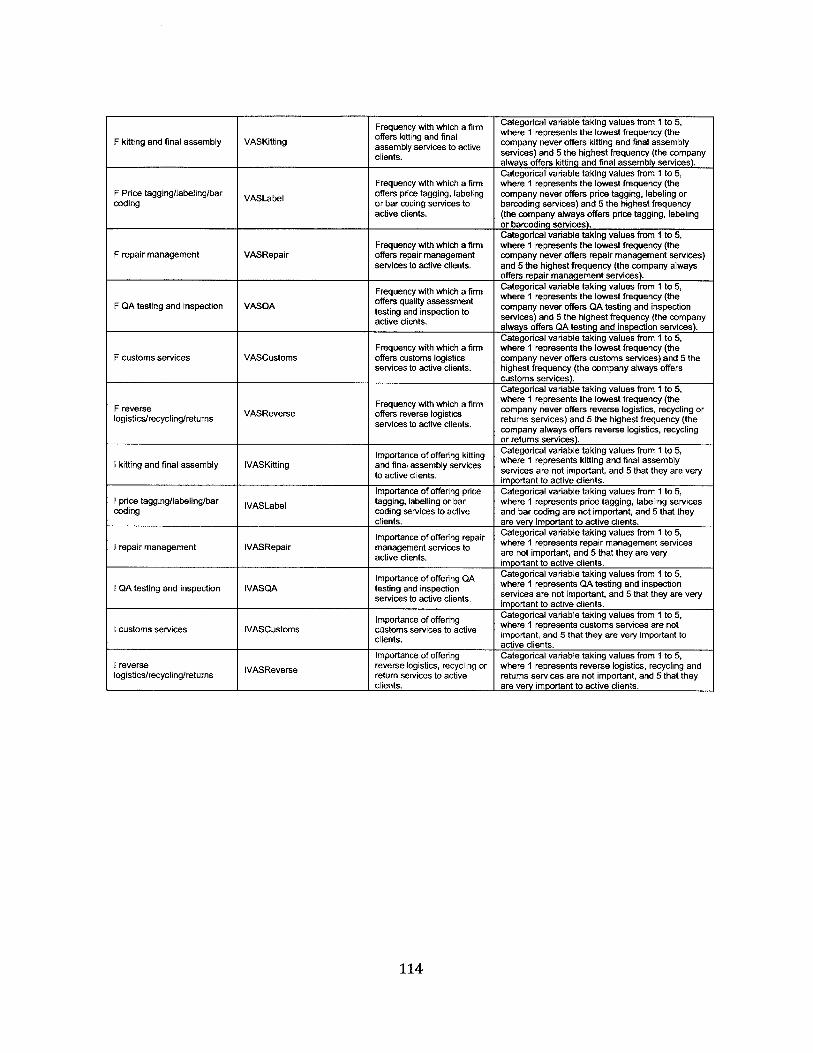
Frequency with which a firm Categorical variable taking values from 1 to 5,offers kitting and final where 1 represents the lowest frequency (the
F kitting and final assembly VASKitting assembly services to active company never offers kitting and final assemblyclients. services) and 5 the highest frequency (the company
always offers kitting and final assembly services).Categorical variable taking values from 1 to 5,
Frequency with which a firm where 1 represents the lowest frequency (theF Price tagging/labeling/bar VASLabel offers price tagging, labeling company never offers price tagging, labeling orcoding or bar coding services to barcoding services) and 5 the highest frequency
active clients. (the company always offers price tagging, labelingor barcoding services).Categorical variable taking values from 1 to 5,
Frequency with which a firm where 1 represents the lowest frequency (theF repair management VASRepair offers repair management company never offers repair management services)
services to active clients. and 5 the highest frequency (the company alwaysoffers repair management services).
Frequency with which a firm Categorical variable taking values from 1 to 5,offers quality assessment where 1 represents the lowest frequency (the
F QA testing and inspection VASQA testing and inspection to company never offers QA testing and inspection
active clients, services) and 5 the highest frequency (the companyalways offers QA testing and inspection services).Categorical variable taking values from 1 to 5,
Frequency with which a firm where 1 represents the lowest frequency (theF customs services VASCustoms offers customs logistics company never offers customs services) and 5 the
services to active clients. highest frequency (the company always offerscustoms services).Categorical variable taking values from 1 to 5,
Frequency with which a firm where 1 represents the lowest frequency (theF reverse VASReverse offers reverse logistics company never offers reverse logistics, recycling orlogistics/recycling/returns services to active clients. retums services) and 5 the highest frequency (the
company always offers reverse logistics, recyclingor retums services).
Importance of offering killing Categorical variable taking values from 1 to 5,I kitting and final assembly IVASKitting and final assembly services herve s arprenot iportint, and 5 atte e veryto active clients, important to active clients.
Importance of offering price Categorical variable taking values from 1 to 5,I price tagging/labeling/bar IVASLabel tagging, labelling or bar where 1 represents price tagging, labeling servicescoding coding services to active and bar coding are not important, and 5 that they
clients. are very important to active clients.Importance of offering repair Categorical variable taking values from 1 to 5,
I repair management IVASRepair management services to where 1 represents repair management services
active clients. are not important, and 5 that they are veryimportant to active clients.
Importance of offering QA Categorical variable taking values from 1 to 5,1 OA testing and inspection IVASQA testing and inspection where 1 represents QA testing and inspection
services to active clients. services are not important, and 5 that they are veryimportant to active clients.
Importance of offering Categorical variable taking values from 1 to 5,
I customs services IVASCustoms customs services to active here 1 represents customs services are notclients.important, and 5 that they are very important to
active clients.Importance of offering Categorical variable taking values from 1 to 5,
I reverse IVASReverse reverse logistics, recycling or where 1 represents reverse logistics, recycling andlogistics/recycling/returns retum services to active retums services are not important, and 5 that they
clients. are very important to active clients.
114
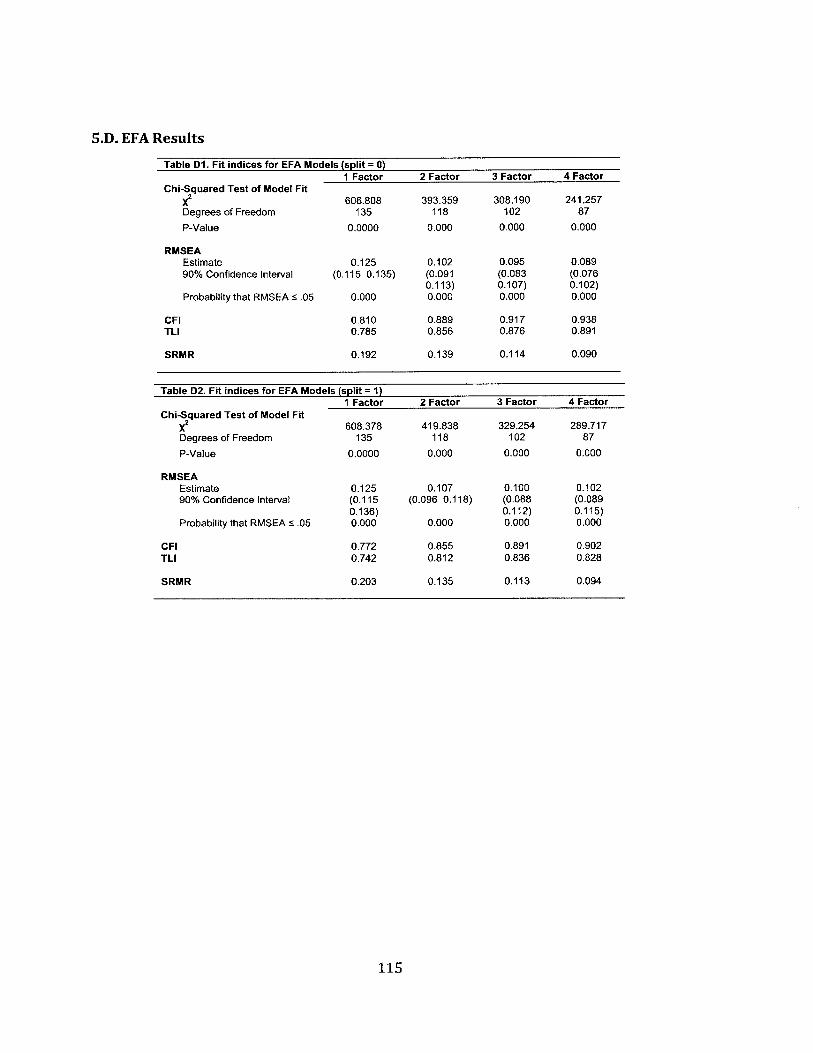
S.D. EFA Results
Table D1. Fit indices for EFA Models (split = 0)I Factor 2 Factor 3 Factor 4 Factor
Chi-Squared Test of Model FitX 606.808 393.359 308.190 241.257Degrees of Freedom 135 118 102 87
P-Value 0.0000 0.000 0.000 0.000
RMSEAEstimate 0.125 0.102 0.095 0.08990% Confidence Interval (0.115 0.135) (0.091 (0.083 (0.076
0.113) 0.107) 0.102)Probability that RMSEA S .05 0.000 0.000 0.000 0.000
CFI 0.810 0.889 0.917 0.938TLI 0.785 0.856 0.876 0.891
SRMR 0.192 0.139 0.114 0.090
Table D2. Fit indices for EFA Models (split = 1)1 Factor 2 Factor 3 Factor 4 Factor
Chi-Squared Test of Model FitX 608.378 419.838 329.254 289.717Degrees of Freedom 135 118 102 87
P-Value 0.0000 0.000 0.000 0.000
RMSEAEstimate 0.125 0.107 0.100 0.10290% Confidence Interval (0.115 (0.096 0.118) (0.088 (0.089
0.136) 0.112) 0.115)Probability that RMSEA < .05 0.000 0.000 0.000 0.000
CFI 0.772 0.855 0.891 0.902TLI 0.742 0.812 0.836 0.828
SRMR 0.203 0.135 0.113 0.094
115
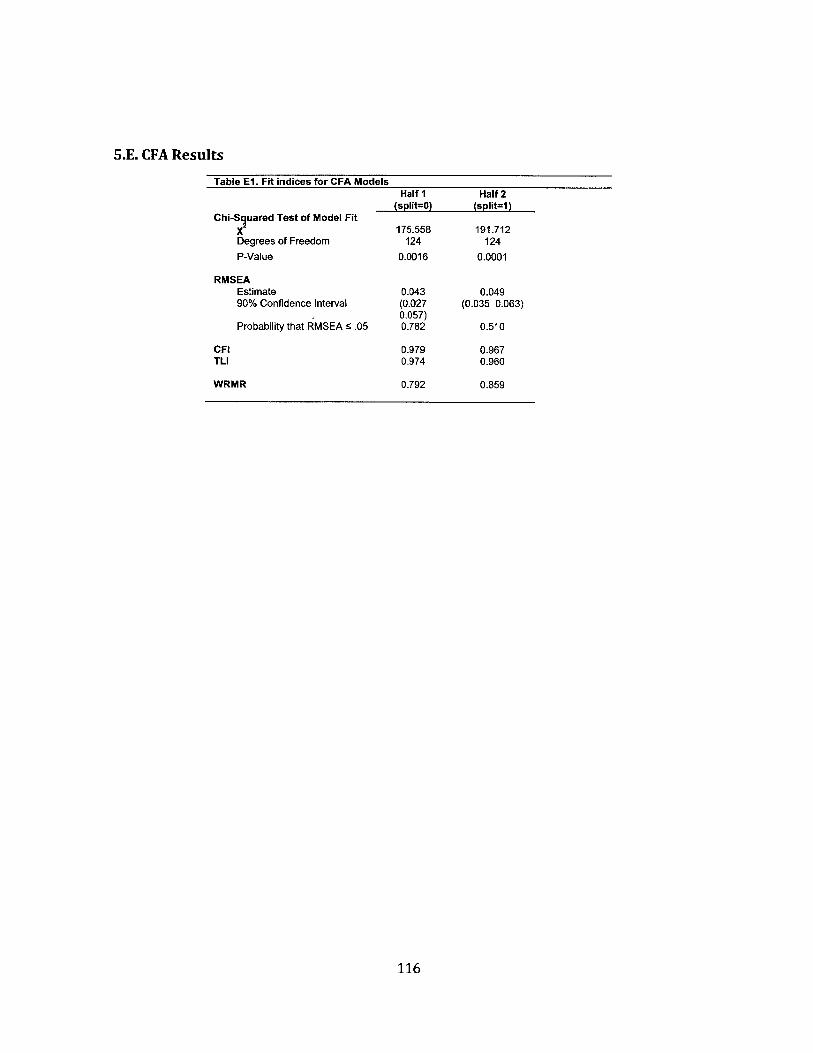
5.E. CFA Results
Table El. Fit indices for CFA ModelsHalf I Half 2
(split=O) (split=1)Chi-Sruared Test of Model Fit
x 175.558 191.712Degrees of Freedom 124 124P-Value 0.0016 0.0001
RMSEAEstimate 0.043 0.04990% Confidence Interval (0.027 (0.035 0.063)
0.057)Probability that RMSEA S .05 0.782 0.510
CFI 0.979 0.967TLI 0.974 0.960
WRMR 0.792 0.859
116
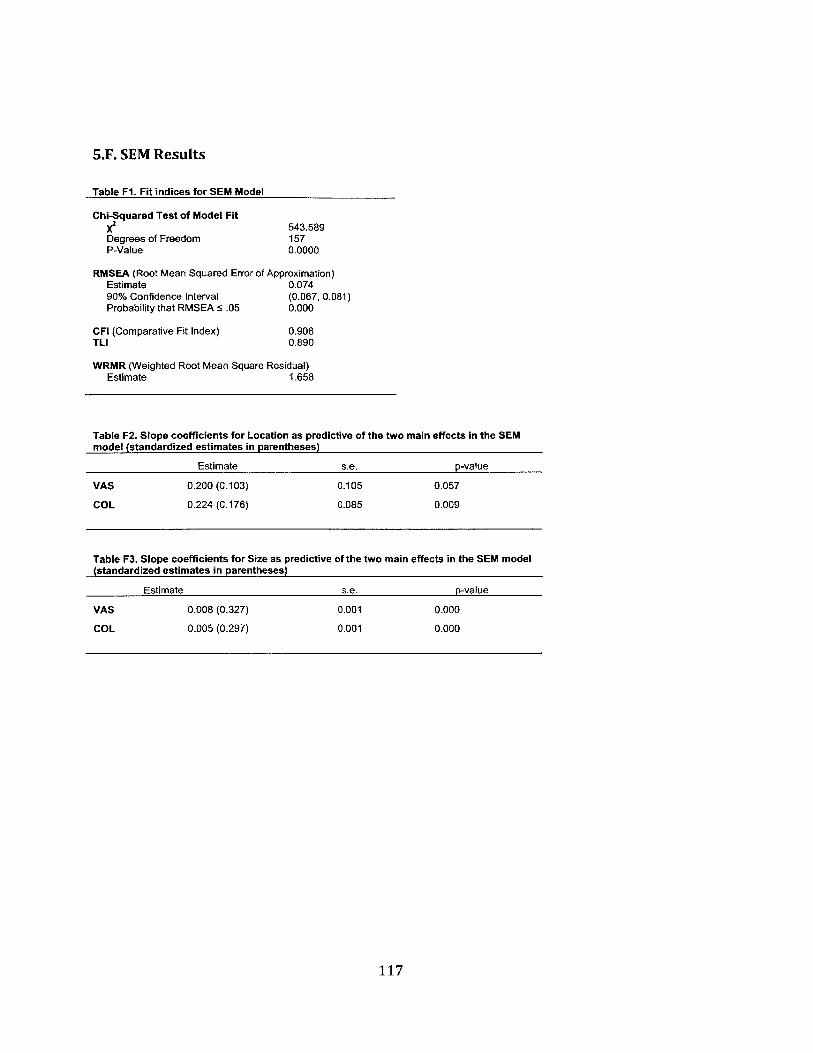
5.F. SEM Results
Table Fl. Fit indices for SEM Model
Chi-Squared Test of Model FitX2Degrees of FreedomP-Value
543.5891570.0000
RMSEA (Root Mean Squared Error of Approximation)Estimate 0.07490% Confidence Interval (0.067, 0.081)Probability that RMSEA S .05 0.000
CFI (Comparative Fit Index)TLI
0.9080.890
WRMR (Weighted Root Mean Square Residual)Estimate 1.658
Table F2. Slope coefficients for Location as predictive of the two main effects in the SEMmodel (standardized estimates in parentheses)
Estimate s.e. p-value
VAS 0.200 (0.103) 0.105 0.057
COL 0.224 (0.176) 0.085 0.009
Table F3. Slope coefficients for Size as predictive of the two main effects in the SEM model(standardized estimates in parentheses)
Estimate s.e. p-value
VAS 0.008 (0.327) 0.001 0.000
COL 0.005 (0.297) 0.001 0.000
117

118
References
Adcock, R., Collier, D (2001) A Shared Standard for Qualitative and Quantitative Research. TheAmerican Political Science Review 95, 529-546.
Allen, W.B., Liu, D., and Singer, S. (1993) Accessibility measures of U.S. metropolitan counties.Transportation Research Part B, 27(6), 439-449.
AllianceTexas (2012) Alliance Logistics Park Total Economic Impact from 1990 through 2008,http://www.alliancetexas.com/Home.aspx..
Angel, D. P. (1991). High-technology agglomeration and the labor market: the case of SiliconValley. Environment and Planning A, 23(10), 1501-1516.
Appold, S. (1995) Agglomeration, Interorganizational Networks, and Competitive Performance in the U.SMetalworking Sector. Economic Geography, 71 (1), 27-54.
Asparouhov, T., and Muthen, B. (2010). Bayesian analysis of latent variable models usingMplus.Unpublished manuscript. www. statmodel. com/download/BayesAdvantagesl8. pdf.
Atkinson, A.B., Bourguignon, F. (2000) Introduction: Income Distribution and Economics. Handbook ofIncome Distribution ed Atkinson, A.B., Bourguignon, F. Elsevier, Amsterdam.
Babbie, Earl R. (2010). The Practice of Social Research (12th ed.). Wadsworth: Cengage Learning.p. 530. ISBN 9780495598411
Banister, D., and Berechman, J. (2000) Transport investment and economic development. Spon Press,London.
Baptista, R. (1998) Clusters, innovation and growth: a survey of the literature. The Dynamics of IndustrialClustering: International Comparisons in Computing and Biotechnology ed Swann, G., Prevezer,M. and Stout, D. Oxford University Press, Oxford.
Battezzati, L. and Magnani, R. (2000) Supply chains for FMCG and industrial products in Italy: Practicesand the advantages of postponement. International Journal of Physical Distribution and LogisticsManagement, 30(5), 413-424.
Bellman, R.E. and Zadeh, L.A. (1970) Decision-making in a fuzzy environment. Management Science, 17(4), 141-164.
Ben-Akiva, M. and Lerman, S.R. (1985) Discrete choice analysis, Theory and application to traveldemand. The MIT Press, Cambridge, MA.
Benneworth, P., Henry, N. (2004) Where is the value added in the cluster approach? Hermeneutictheorizing, economic geography and clusters as a multiperspectival approach. Urban Studies 41,1011-1023.
Berechman, J. (1994) Urban and regional economic impacts of transportation investment: a criticalassessment and proposed methodology. Transportation Research Part A: Policy and Practice,28(4), 351-362.
Berechman, J. and Paaswell, R. (2001) Accessibility improvements and local employment: An empiricalanalysis. Journal of Transportation Statistics, 4(2/3), 49-66
Berechman, J., Ozmen, D., and Ozbay, K. (2006). Empirical analysis of transportation investment andeconomic development at state, county and municipality levels. Transportation, 33(6), 537-551.
Bielby, W. T., and Hauser, R. M. (1977). Structural equation models. Annual Review of Sociology,3, 137-161.
Boari, C. (2001) Industrial Clusters, Focal Firms, and Economic Dynamism: A Perspective from Italy.
World Bank Institute, Washington D.C.
119
Bok, M. (2009), Estimation and validation of a microscopic model for spatial economic effects of transportinfrastructure. Transportation Research Part A: Policy and Practice, 43, 44-59.
Bowen, J. (2008) Moving places: the geography of warehousing in the US. Journal of TransportGeography, 16, 379-387.
Bowersox, D. J. (1990). The strategic benefits of logistics alliances (pp. 2-8). Harvard Business Review.Braunerhjelm, P. and Carlsson, B. (1999). Industry Clusters in Ohio and Sweden. Small Business
Economics, 12(4), 279-293.Breakwell, G. M, S. Hammond, and C. Fife-Schaw (1995). Research Methods in Psychology. London:
Sage.Bruns, A. (2009) Emerging Logistics Hubs. Site Selection Magazine.Buvik, A., and Halskau, 0. (2001) Relationship duration and buyer influence in just-in-time relationships.
European Journal of Purchasing and Supply Management, 7, 111-119.Butterfield, K., L. Trevino and G. A, Ball (1996) Punishment from the managers' perspective: A grounded
investigation and inductive model. Academy of Management Journal. 39 1479-1512.Cairncross, F. (1997) The Death of Distance. Orion Business Books, London.Castells, M. (1996) The New Economy: Informationalism, globalization, Networking. The Rise of the
Network Society. Blackwell Publishers, Maiden MA, pp. 77-162.Chakravarty, S.R. (1990) Ethical Social Index Numbers. Springer-Verlag, New York.Chapman, R., Soosay, C and Kandampully, J. (2003) Innovation in logistic services and the new business
model: A conceptual framework.International. Journal of Physical Distribution and LogisticsManagement, 33(7), 630-650.
Charmaz, K. (2006). Constructing grounded theory: a practical guide through qualitative analysis.Thousand Oaks, CA: Sage Publications.
Chi, G. (2010) The impacts of highway expansion on population change: an integrated spatial approach,Rural Sociology, 75(1), 58-89.
Chi, G. (2012) The impacts of transport accessibility on population change across rural, suburban andurban areas: A case study of Wisconsin at sub-county levels. Urban Studies, 49, 2711-2731.
Chicago Metropolitan Agency for Planning (2009) Industry Cluster Analysis: Regional Economic BaseAnalysis. Chicago Metropolitan Agency for Planning, Chicago, IL.
Chin, W.W. (1998) The partial least squares approach to structural equation modeling. Modern Methodsfor Business Research ed G.A. Marcoulides. Lawrence Erlbaum Associates, New Jersey.
Conover, W. J and Iman, R. (1981). Rank Transformations as a bridge between parametric andnonparametric statistics. The American Statistician, 35(3), PP. 124-129.
Cooper, D.R. and Schindler, 2003. Business Research Methods, International edition, New York:McGraw-Hill, eighth ed.
Corder, G.W., Foreman, D.1. (2009) Nonparametric Statistics for Non-Statisticians: A Step-by-StepApproach. Wiley, New Jersey.
Council of the Americas (2011) Join us for Panama: Where the World Meets. Council of the Americas.De Graaff, T., Van Oort, F.G., and Florax, R.J.G.M. (2012a) Regional population-employment dynamics
across different sectors of the economy. Journal of Regional Science, 52(1), 60-84De Graaff, T., Van Oort, F.G., and Florax, R.J.G.M. (2012b) Sectoral heterogeneity accessibility and
population-employment dynamics in Dutch cities. Journal of Transport Geography, 25, 115-127De Langen, P. (2002) Clustering and Performance: The Case of Maritime Clustering in the Netherlands.
Maritime Policy and Management, 29, 209-221.De Langen, P. (2004) Analyzing the Performance of Seaport Clusters. Shipping and Ports in the Twenty-
first Century ed Pinder, D., Slack, B., Seul, Korea, pp. 82-98.
120
De Langen, P. (2004) The Performance of Seaport Clusters; A Framework to Analyze ClusterPerformance and an Application to the Seaport Clusters of Durban, Rotterdam and the LowerMississippi, Rotterdam School of Management / Rotterdam School of Economics. ErasmusUniversity Rotterdam, Rotterdam.
Dell'Orco, M., Sassanelli, D. and Tiso, A. (2009) Optimization of logistics in industry districts throughcreation of a community of agents. Chemical Engineering Transactions, 18, 321-326.
Delgado, M., Porter, M. , Stern, S. (2010) Clusters and entrepreneurship. Journal of EconomicGeography 10, 495-518.
De Winter, J.C.F. and Dodou, D., 2010. Five-point Likert items: t test versus Mann-Whitney-Wilcoxon,Practical Assessment, Research and Evaluation. 15 (11), 1-12.
Diamantopoulos, A. and Winklhofer, H.M. (2001) Index construction with formative indicators: analternative to scale development, Journal of Marketing Research, 38, 269-277.
DiPasquale, D., Wheaton, W.C. (1996) Urban Economics and Real Estate Markets. Prentice Hall,Englewood Cliffs, NJ.
Du, H. and Mulley, C. (2007) The Short-Term Land Value Impacts Of Urban Rail Transit: QuantitativeEvidence from Sunderland, UK. Land Use Policy, 24(1), 223-233.
Echeverri-Carroll, E., and Ayala, S. G. (2010). Gender Wage Differentials and the Spatial Concentrationof High-Technology Industries. In Progress in Spatial Analysis (pp. 287-309). Springer BerlinHeidelberg.
Ellison, G., Glaeser, E.L. (1997) Geographic Concentration in U.S. Manufacturing Industries: A DartboardApproach. Journal of Political Economy 105, 879-927.
Ellison, G., Glaeser E. L., Kerr, W. (2010) What Causes Industry Agglomeration? Evidence fromCoagglomeration Patterns. American Economic Review 100, 1195-1213.
EI-Geneidy, A. and Levinson, D. (2006) Access to destinations: development of accessibility measures.Report #1 in the series Access to Destinations Study. Minnesota Department of Transportation,Research Service Section, St. Paul, MN.
Ettlie, J. and Reza, E. (1992) Organizational Integration and Process Innovation. Academy ofManagement Journal, 35(4), pp. 795-827.
Evangelista, P., and Sweeney, E. (2006). Technology usage in the supply chain: the case of small 3PLs.International Journal of Logistics Management, 17(1), 55-74.
Expansion Management and Logistics Today (2007) Americas Most Logistics Friendly Cities. ExpansionManagement, Material Handling and Logistics.
Fallick, B., Fleischman, C. A., & Rebitzer, J. B. (2006). Job-hopping in Silicon Valley: some evidenceconcerning the microfoundations of a high-technology cluster. The Review of Economics andStatistics, 88(3), 472-481.
Fan, X., Tian, S., Shen, T., and Zhang, J. (2012) The accessibility assessment of national transportationnetwork and analysis of spatial pattern. Future Control and Automation ed W. Deng, pp. 415-423.Springer-Verlag, Berlin.
Feemster, T., Circ, R., Gibson, J. (2011) Logistics Market Trends United States First Half 2011. Grubband Ellis, Grubb and Ellis.
Feitelson, E. and Salomon, I. (2000), The implication of differential network flexibility for spatial structures.Transportation Research Part A: Policy and Practice, 34, 459-479.
Fesser, E. (2008) Clusters and the design of innovation policy for developing economies. The Economicsof Regional Clusters: Networks, Technology and Policy eds Blien, U., Maier, G. Edward Elgar,Cheltenham, pp. 191-213.
121
Fesser, E. J., Goldstein, H. A., Renski, H., Renault, C. 2002. The geographic clustering of high techindustry, science, and innovation in Appalachia.
FIAS (2008) "Special Economic Zones: Performance, Lessons Learned, and Implications for ZoneDevelopment." World Bank, Washington, DC (http://www.ifc.org/ifcext/fias.nsf/Attach-mentsByTitle/SEZpaperdiscussion/$FILE/SEZs+report_ April2008.pdf).
Fingleton, B., Igliori, D., Moore, B. (2004) Employment Growth of Small High-Technology Firms and theRole of Horizontal Clustering: Evidence from Computing Services and R. D in Great Britain, 1991-2000. Urban Studies, 41, 773-799.
Fornell, C., and Bookstein, F.L. (1982) Two structural equation models: LISREL and PLS applied toconsumer exit-voice theory. Journal of Marketing, 19, 440-452.
Fornell, C., Lorange, P., and Roos, J. (1990) The cooperative venture formation process: a latent variablestructural modeling approach, Management Science, 36(10), 1246-1255.
Forslid, R., Haaland, J. I., & Midelfart Knarvik, K. H. (2002). A U-shaped Europe?: A simulation study ofindustrial location. Journal of International Economics, 57(2), 273-297.
Fox, J. (2002). Structural equation models. appendix to an r and s-plus companion to applied regression,McMaster University, Canada, ht tp://cran. r-project. org/doc/contrib/Fox-Companion/appendixsems. pdf. model. International Journal of Human Sciences, 500-520.
Gambardella, A. and Giarratana, M. (2010) Organizational Attributes and the Distribution of Rewards in aRegion: Managerial Firms vs. Knowledge Clusters. Organization Science, 21(2), 573-586.
Geurs, K.T. and Van Wee, B. (2004) Accessibility evaluation of land-use and transport strategies: reviewand research directions. Journal of Transport Geography, 12, 127-140.
Glaser, B. G., A. L. Strauss (1967). The Discovery of Grounded Theory: Strategies for QualitativeResearch. Chicago, IL: Aldine.
Glaser, B. G., (1978). Theoretical sensitivity. Mill Valley, CA: The Sociology Press.Glasmeier, A.K., Kibler, J. (1996) Power Shift: The Rising Control of Distributors and Retailers in the
Supply Chain for Manufactured Goods. Urban Geography 17, 740- 757.Globerman, S., Shapiro, D., & Vining, A. (2005). Clusters and intercluster spillovers: their influence on the
growth and survival of Canadian information technology firms. Industrial and CorporateChange, 14(1), 27-60.
Government of Panama (2010) Panama Plan Estrategico de Gobierno 2010-2014. Gaceta Oficial Digital.Grondeau, A. (2007). Formation and emergence of ICT clusters in India: the case of Bangalore and
Hyderabad. GeoJournal, 68(1), 31-40.Groothedde, B. (2005). Collaborative logistics and transportation networks-A modeling approach to hub
network design. Netherlands.Haezendonck, E. (2001) Essays on Strategy Analysis for Seaports. Garant, Leuven, Belgium.Held, J. R. (1996). Clusters as an economic development tool: Beyond the pitfalls. Economic
Development Quarterly, 10(3), 249-261.Hair, J.F., Ringle, C.M., and Sarstedt, M. (2011) PLS-SEM: Indeed a Silver Bullet. Journal of Marketing
Theory and Practice, 19(2), 139-151.Handy, S. and Niemeier, D. (1997) Measuring accessibility: an exploration of issues and alternatives.
Environment and Planning A, 29, 1175-1194.Hansen, W. (1959) How accessibility shapes land use. Journal of American Institute of Planners, 25, 73-
76.Henderson, J. V., Shalizi, Z. (2001) Geography and Development. Journal of Economic Geography 1, 81-
105.Henderson, J. V. (2003) Marshall's scale economies. Journal of Urban Economics 53, 1, 1-28.
122
Henseler, J., Ringle, C.M., and Sinkovics, R.R. (2009) The use of partial least squares path modeling ininternational marketing, Advances in International Marketing, 20, 277-319.
Henseler, J. and Chin, W.W. (2010) A comparison of approaches for the analysis of interaction effectsbetween latent variables using Partial Least Squares path modeling, Structural EquationModeling, 17, 82-109.
Hesse, M. (2008) The city as a terminal: The urban context of logistics and freight transport. AshgatePublishing Company, Burlington, VT.
Hong, J. (2007). Transport and the location of foreign logistics firms: The Chinese experience.Transportation Research Part A: Policy and Practice, 41, 597-609.
Hoover, E.M. (1937) Spatial price discrimination. Review Economic Studies 4, 182-191.Huber, F. (2012). Do clusters really matter for innovation practices in Information Technology?
Questioning the significance of technological knowledge spillovers. Journal of EconomicGeography, 12(1), 107-126.
Huo, B. (2012) The impact of supply chain integration on company performance: an organizationalcapability perspective. Supply Chain Management: An international Journal, 17(6), 596-610.
Husing (2004) Logistics and distribution: An answer to regional upward social mobility. Report presentedto the Southern California Association of Governments, http://www.scaQ.ca.gov/goodsmove/pdf/HusingLogisticsReport.pdf.
Husing (2007) Economic Impact of Goods Movement On Southern California. Report presented to theSouthern California Multi-County Goods Movement Taskforce,http://www.scag.ca.gov/goodsmove/ pdf/HusingLogisticsReport.pdf.
Ingram, D. (1971) The concept of accessibility: a search for an operational form. Regional Studies, 5,101-107.
International Trade Organization (2011) Free Trade Zones. Import Administration, United StatesDepartment of Commerce.
Jarvis, C.B., MacKenzie, S.B., and Podsakoff, P.M. (2003) A critical review of construct indicators andmeasurement model misspecification in marketing and consumer research. Journal of ConsumerResearch, 30(2),199-218.
Jiwattanakulpaisarn, P., Noland, R.P., and Graham, D.J. (2010) Causal linkages between highways andsector-level employment. Transportation Research Part A, 44, 265-280
Isabella, L. (1990). Evolving interpretation as a change unfolds: How managers construe keyorganizational events. Academy of Management Journal, 33: 7-41.
Isard, W., Schooler, E.W. (1959) Industrial complex analysis, agglomeration economies, and regionaldevelopment. Journal of Regional Science 1, 19-33.
Isserman, A.M. (1977) The Location Quotient Approach to Estimating Regional Economic Impacts.Journal of the American Institute of Planners 43, 33-41.
Jing, N. and Cai, W. (2010) Analysis on the spatial distribution of logistics industry in the developed EastCoast Area in China. Annals of Regional Science, 45 (2), 331-350.
Kaplan, D. (2009). Structural Equation Modeling: Foundations and Extensions. SAGE Publications, INC,California.Karsten, J. (1996) Limits to industrial agglomeration. Kiel Working Paper, No. 762.
Karsten, J. (1996) Limits to industrial agglomeration. Kiel Working Paper, No. 762.Kasarda, J. (2008) The Evolution of Airport Cities and the Aerotropolis. Airport Cities: The Evolution.
Insight Media, London.Kasilingman, G. (1998), Logistics and transportation. Design and planing. London, Kluwer academics
Publishers. 343.
123
Keeble, D., Wilkinson, F. (2000) High-technology clusters, networking and collective learning in Europe.Ashgate, Aldershot.
Kim, Y., Barkley, D., Henry M.S. (2000) Industry Characteristics Linked to Establishment Concentrationsin Nonmetropolitan Areas. Journal of Regional Science 40, 231-259.
Klink, H.A.V., De Langen, P. W. (2001) Cycles in Industrial Clusters: the Case of the Shipbuilding Industryin the Northern Netherlands. Tjdschrift Sociale en Eonomische Geografie 92, 449- 463.
Koenig, J. (1980) Indicators of urban accessibility: theory and application. Transportation, 9, 145-172.Krajewska, M. A., Kopfer, H., Laporte, G., Ropke, S and Zaccour, G. (2008) Horizontal Cooperation
among Freight Carriers: Request allocation and Profit Sharing. The Journal of the OperationalResearch Society, 59(11), 1483-1491.
Krugman, P. (1991) Geography and trade. MIT Press, Cambridge, MA.Lambert, P.J. (1989) The Distribution and Redistribution of Income: A Mathematical Analysis. Basil
Blackwell Inc, Cambridge, MA.Lammarino, S. and McCann, P. (2006) The structure and evolution of industrial clusters: Transactions,
technology and knowledge spillovers. Research Policy, 35, 1018-1036.Lannone, F. (2012), The private and social cost efficiency of port hinterland container distribution through
a regional logistics system. Transportation Research Part A: Policy and Practice, 46, 1424-1448.Lazerson, M. and Lorenzoni, G. (1999). The firms that feed industrial districts: A return to the Italian
source. Industrial and Corporate Change, 8(2), 235-266.Leamer, E.E. and M. Storper (2001) The Economy Geography of the Internet Age, Journal of
International Business Studies, 32(4), 641-665.Leitham, S., McQuaid, R.W., and Nelson, J.D. (2000) The influence of transport on industrial location
choice: a stated preference experiment. Transportation Research Part A: Policy and Practice, 34,515-535.
Levenberg, K. (1944) A method for the solution of certain non-linear problems in least squares. Quarterlyof Applied Mathematics, 2, 164-168.
Li, S. (2006) Clustering versus dispersing economic activities. White Paper. Department of Urban Studiesand Planning, MIT, Cambridge, MA.
Lim, H. and Thil, J.-C. (2008) Intermodal freight transportation and regional accessibility in the UnitedStates. Environment and Planning A, 40, 2006-2025.
Limbo, N. and Venables, A. (2001) Infrastructure, geographical disadvantages, transport costs, and trade.The World Bank Economic Review, 15(3), 451-479.
Lindsay, G. and Kasarda, J. (2011) Aerotropolis: The way we will live next, First ed. Farrar, Straus andGiroux, New York.
Liu, C. L., and Lyons, A. C. (2011). An analysis of third-party logistics performance and service provision.Transportation Research Part E: Logistics and Transportation Review, 47(4), 547-570.
Lu, C. S. (2000). Logistics services in Taiwanese maritime firms. Transportation Research Part E:Logistics and Transportation Review, 36(2), 79-96.
McKinnon, A. (2001) Handbook of Logistics and Supply Chain Management, Edited by A.M Brewer et. al.Malmberg, A., and Maskell, P. (2002). The elusive concept of localization economies: towards a
knowledge-based theory of spatial clustering. Environment and planning A, 34(3), 429-450.Maltz, A. (1994). Outsourcing the warehousing function: economic and strategic considerations. Logistics
and Transportation Review, 30(3).Marquardt, D.W. (1963) An algorithm of least-squares estimations of non-linear parameters. SIAM
Journal of Applied Mathematics, 11(2), 431-441.Marshall, A. (1890) Principles of economics. Macmillan, London New York.
124
Martin, J. and Rom n, C. (2003), Hub location in the South-Atlantic airline market A spatial competition
game. Transportation Research Part A: Policy and Practice, 37, 865-888.Martin, R., and Sunley, P., (2003). Deconstructing clusters: chaotic concept or policy panacea? Journal of
Economic Geography, 3 (1), 5-35.Maskell, P. (2001) Knowledge creation and diffusion in geographic clusters. International Journal of
Innovation Management 5, 213-238.Matisziw, T. C., and Grubesic, T. H. (2010). Evaluating locational accessibility to the US air transportation
system. Transportation Research Part A: Policy and Practice, 44(9), 710-722.Meeter, D. (1968). Book Reviews, Journal of the American Statistical Association, 62, pp. 1505Miami-Dade Aviation Department (2011) Cargo Hub. Miami.Miles M.B. and Huberman A.M. (1984) Qualitative Data Analysis: A Sourcebook of New Methods.
Newbury Park, CA: Sage.Miller, M., Gibson, L., Wright, G. (1991) Location Quotient: A Basic Tool for Economic Development
Analysis. Economic Development Review 9, 65-68.Miller, H.J. (1999) Measuring space-time accessibility benefits within transportatio networks: basic theory
and computational procedures. Geographical Analysis, 31 (1), 1-26.Molina-Morales, F. And Martinez-Fernendez, M. (2009) Too much love in the neighborhood can hurt: how
an excess of intensity and trust in relationships may produce negative effects on firms. StrategicManagement Journal, 30(9), 1013-1023.
Morris, J., Dumble, P., and Wigan, M. (1978) Accessibility indicators for transport planning. TransportationResearch Part A, 13A, 91-109.
Muthen, L. K., and Muthen, B. 0. (2007). 1998-2007. Mplus User's Guide. Los Angeles, CA: Muthen andMuth6n.
Moulaert, F., & Djellal, F. (1995). Information technology consultancy firms: economies of agglomerationfrom a wide-area perspective. Urban Studies, 32(1), 105-122.
Mytelka, L., and Farinelli, F. (2000). Local clusters, innovation systems and sustained competitiveness.Discussing papers 5, The United Nations University, Institute for New Technologies.
Nadvi, K. (1999) Collective Efficiency and Collective Failure: The response of the Sialkot SurgicalInstrument Cluster to Global Quality Pressures. World Development, 27(9), 1605-1626
Neutens, T., Schwanen, T., Witlox, F., and De Maeyer, P. (2010) Equity of urban servic delivery: acomparison of different accessibility measures. Environment and Planning A, 42, 1613-1635.
O'Brien, R. (1992) Global financial integration: the end of geography. Council on Foreign Relations Press,New York.
OECD (2001) Social Sciences and Innovation OECD Publishing, Paris, France.Ozbay, K., Ozmen, D., and Berechman, J. (2006) Modeling and Analysis of the Link between
Accessibility and Employment Growth. Journal of Transportation Engineering, 132(5), 385-393.Peez, A. (2004) Network accessibility and the spatial distribution of economic activity in Eastern Asia.
Urban Studies, 11, 2211-2230.P ez, A., Scott, D.M., and Morency, C. (2012) Measuring accessibility: positive and normative
implementations of various accessibility indicators. Journal of Transport Geography, 25, 141-153Paige, J. and Nenide, B. (2008), The evolution of regional industry clusters and their implications for
sustainable economic development. Economic Development Quatery, 22(4), 290-302.Pekkarinen, 0. (2005) Northwest Russian Transport Logistics Cluster: Finnish Perspective. Northern
Dimension Research Centre, Lappeenranta University of Technology.Peng, D.X. and Lai, F. (2012) Using partial least squares in operations management research: a practical
guideline and summary of past research, Journal of Operations Management, 30, 467-480.
125
Perez-Aleman, P. (2005). Cluster formation, institutions and learning: the emergence of clusters and
development in Chile. Industrial and Corporate Change, 14(4), 651-677.Perez-Aleman, P. (2010) Collective Learning in Global Diffusion: Spreading Quality Standards in a
Developing Country Cluster, Organization Science, 22(1), 173-189.Petter, S., Straub, D., and Rai, A. (2007) Specifying formative constructs in information systems research.
MIS Quarterly, 31(4), 623-656.Polenske, K. (2001) Competitive advantage of regional internal and external supply chains, Essays in
honor of Benjamin H. Stevens ed Lahr, M., Miller, R. Elsevier Publishers, Amsterdam, pp. 259-284.
Polenske, K. (2003) Clustering in Space Versus Dispersing Over Space: Agglomeration Versus DispersalEconomies. Symposium 2002. Universities of Trollhatten/Uddevalla, Trollh~tten, Sweden.
Port Authority of New York and New Jersey (2010) Overview of Facilities and Services. New York, NY.Porter, M. (1998) Clusters and the new economics of competitiveness. Harvard Business Review 76, 77-
90.Porter, M. (2000) Location, competition, and economic development: local clusters in a global economy.
Economic Development Quartely 12, 15-42.Porter, M. (2001) Regions and the new economics of competition. Global city-regions ed Scott, A.J.
Oxford University Press, New York,1 39-157.Porter, M. (2003) The economic performance of regions. Regional Studies 37, 549-578.Porter, M. (2008) On Competition, Updated and Expanded Edition. Harvard Business School Press,
Boston, MA.
Porter, M.E. and Rivkin, J.W. (2012) Choosing the United States. Harvard Business Review, March 2012.Rabellotti, R. (1999). Recovery of a Mexican cluster: devaluation bonanza or collective efficiency?. World
Development, 27(9), 1571-1585.Ranft, A. and Lord, M. (2002) Acquiring New Technologies and Capabilities: A Grounded Model of
Aquisition Implementation. Organization Science, 3(4), 420-441.Ratanawaraha, A., Polenske K. (2007) Measuring Geography of Innovation: A Literature Review. The
Economic Geography of Innovation ed Polenske, K. Cambridge University Press, Cambridge,England.
Reichhart, A. and Holweg, M. (2008) Co-located supplier clusters: forms, functions and theoreticalpespectives. International Journal of Operations and Production Management, 28(1), 53-78.
Reinartz, W., Haenlein, M., and Henseler, J. (2009) An empirical comparison of the efficacy ofcovariance-based and variance-based SEM, International Journal of Research in Marketing, 26,332-344.
Reissman, C. K. (2008). Narrative Methods for the Human Sciences. Thousand Oaks, CA: Sage.Reuer, J. and Lahiri, N. (2013) Searching for Alliance Partners: Effects of Geographic Distance on the
Formation of RandD Collaborations, Organization Schience, August, 22.Revilla, E. and Saenz, M. J. (2010) Supply chain disruption management: global convergence vs national
specificity. Zaragoza Logistics Center, Working Paper 2010.Ribeiro, A., Antunes, A.P., and Paez, A. (2010), Road accessibility and cohesion in lagging regions:
empirical evidence from Portugal based on spatial econometric models. Journal of TransportGeography, 18,125-132.
Richardson, H. (1995), Urban Agglomeration and Economic Growth, 123-155.Rietveld, P. (1994), Spatial economic impacts of transport infrastructure supply. Transportation Research
Part A: Policy and Practice, 28(4), 329-341.Ringle, C.M., Wende, S., and Will, A. (2005) SmartPLS. www.smartpls.de.
126
Rivera, L., Sheffi, Y. and Welsch R. (2014) Logistics clusters in the US. Transportation Research Part A:
Policy and Practice 59, 222-238.Rollins, M., Pekkarinen, S. And Mehtala, M. (2011) Inter-firm customer knowledge sharing in logistics
services: an empirical study. International Journal of Physical Distribution and LogisticsManagement, 41(10), 956-971.
Romanelli, E. and Khessina, 0. (2005) Regional Industrial Identity: Cluster Configurations and EconomicDevelopment. Organization Science, 16(4), 344-358.
Rosenkopf, L. and Padula, G. (2008) Investigating the Microstructure of Network Evolution: AllianceFormation in the Mobile Communications Industry. Organization Science, 19(5), pp. 669-687.
Rosenberg, M. (2011) Busiest Airports. New York.Rosner, B., Glynn, R. and Lee, M-L. (2003). Incorporation of Clustering Effects for the Wilcoxon Rank
Sum Test: A Large-Sample Approach. Biometrics, 59, pp. 1089-1098.Rugman, A. M., and Verbeke, A. (2003). Multinational enterprises and clusters: An organizing framework.
In Governing Knowledge-Processes (pp. 151-169). Gabler Verlag.Saris, W. E., and Gallhofer, I. (2007). Design, Evaluation and Analysis of Questionnaires for Survey
Research, New Jersey: Wiley Interscience Hoboken.
Sawilowsky, S. (2005). Misconceptions leading to choosing the t test over the Wilcoxon Mann-WhitneyTest for shift in location parameters. Journal of Modern Applied Statistical Methods, 4(2), pp. 598-600.
Schuman and Presser (1996). Questions and answers in attitude surveys: Experiments on question form,wording, and context. Sage Publications, Thousand Oaks, CA.
Sheffi, Y. (2010) Logistics Intensive Clusters. EPOCA 20, 11-17.Sheffi, Y. (2012) Logistics Clusters: Delivering value and driving growth. MIT Press, Cambridge, MA.Skjoett-Larsen, T. (2000). Third party logistics-from an interorganizational point of view. International
Journal of Physical Distribution and Logistics Management, 30(2), 112-127.Soinio, J., Tanskanen, K. and Finne, M. (2012) How logistics-servie providers can develop value-added
services for SMEs: a dyadic perspective. The International Journal of Logistics Management,23(1), 31-49.
Song, Y., Lee, K., Anderson, W.P., and Lakshmanan, T.R. (2012) Industrial agglomeration and transportaccessibility in metropolitan Seoul. Journal of Geographical Systems, 14, 299-318
Stank, T. P., and Daugherty, P. J. (1997). The impact of operating environment on the formation ofcooperative logistics relationships. Transportation Research Part E: Logistics and TransportationReview, 33(1), 53-65.
Stank, T and Goldsby, T. (2000), A framework for transportation decision making in an integrated supplychain. Supply Chain Management: An International Journal, 5(2), 71-77.
Taniguchi, E., Noritaki, M., Yamada, T., and Izumitani, T. (1999) Optimal size and location planning ofpublic logistics terminals. Transportation Research Part E, 35, 207-222
Teubal, M., Yinnon, T., Zuscovitch, E. (1991) Networks and Market Creation. Research Policy, 20, 381-392.
Thill, J.-C. and Lim, H. (2010) Intermodal containerized shipping in foreign trade and regional accessibilityadvantages. Journal of Transport Geography, 18, 530-547.
Thomas, I., Hermia, J.P., Vanelslander, T., and Verhetsel, A. (2003) Accessibility to freight transport
networks in Belgium: a geographical approach. Tijdschrift voor Economische en SocialeGeografie, 94, 424-438.
127
Thompson, R., and Taniguchi, E. (2001) City logistics and freight transport. The Handbook of Logisticsand Supply-Chain Management, Handbooks in Transport #2 eds A.M. Brewer, K.J. Button, andD.A. Hensher, pp. 393-404. Pergamon/Elsevier, London.
Thuermer, K.E. (2008) Red-hot logistics parks and inland ports address shippers' distribution needs.American Journal of Transportation.
US Army Corps of Engineers (2010) Waterborne Commerce Statistics Center, Navigation Data Center,http://www.ndc.iwr.usace.army.mil/, accessed December 2012.
US Census (2002) Economic Census, Vehicle Inventory and Use Survey,www.census.gov, accessedDecember 2012.
US Census (2007a) County Business Patterns,www.census.gov, accessed December 2012.US Census (2007b) Population Estimates,www.census.gov, accessed December 2012.U.S. Census (2012a) Introduction to NAICS, www.census.gov/eos/www/naics/, accessed December
2012.US Census (2012b) Metropolitan and Micropolitan Areas Main, www.census.gov/population/metro/,
accessed December 2012.US Department of Transportation (2010) Freight Facts and Figures,
http://ops.fhwa.dot.gov/freight/freight analysis/nat freight stats/docs/10factsfigures/index.htm,accessed December 2012.
US Department of Transportation (2011a) FHWA Functional Classification Guidelines,http://www.fhwa.dot.gov/planning/fcsec2 1.htm, accessed December 2012.
US Department of Transportation (2011 b) National Transportation AtlasDatabase,http://www.bts.gov/publications/national transportation atlas database/2011http://www.rita.dot.gov/bts/sites/rita.dot.gov.bts/files/publications/national transportation atlas database/201 1 /index.html, accessed December 2012.
Van Auken, H. and Crum, M. (1985). The impact of the motor carrier act of 1980 on motor carriercommon stock returns. Transportation Research Part A: General, 19(1), pp. 43-49.
Van den Heuvel, F., De Langen, P., Van Donselaar, K., Fransoo, J. (2011) Identification of EmploymentConcentration Areas. Research School for Operations, Management and Logistics, Beta WorkingPaper series 354.
Van den Heuvel, F., Langen, P., Van Donselaar, K. And Fransoo, J. (2012) Proximity matters: symergiesthrough co-location of logistics establishments. Beta Working Paper Series, 380
Van den Heuvel, F.P., Rivera, L., Van Donselaar, K.H., De Jong, A., Sheffi, Y., De Langen, P.W., andFransoo, J.C., 2014. Relationship between freight accessibility and logistics employment in UScounties. Transportation Research Part A: Policy and Practice. 59: 91-105.
Van der Horst, M. and De Langen, P. (2008) Coordination in Hinterland and Transport chains: a Majorchallenge for the seaport community. Maritime Economics and logistics, 10, 108-129.
Van Hoek, R. and Van Dierdonck, R. (2000) Postponed manufacturing supplementary to transportationservices? Transportation Research, 36, 205-217
Van Maanen, J. (1983) Epilogue: Qualitative methods reclaimed. In: J. Van Maanen (Ed.), Qualitativemethodology, 247-268. Beverly Hills, Calif.: Sage Publications.
Volkoff, 0., Strong, D. and Elmes, M. (2007) Technological Embeddedness and Organizational Change.Organizational Science, 18(5), 832-848.
Wadhwa, V. (2010) Top-Down Tech Clusters Often Lack Key Ingredients. Bloomberg Businessweek.Weber, A., Friedrich, C.J. (1929) Theory of the location of industries. University of Chicago Press,
Chicago, I1.
128
Weisbrod, R.M., Reed, J.S., and Neuwirth, G.E. (1993) Airport area economic development model. Paperpresented at the PTRC International Transport Conference, Manchester, England.
Wimmer, R. D and J.R. Dominick (1997). Mass Media Research: An Introduction. Belmont, MA:Wadsworth.
Wu , L., Yue, X. , Sim, T. (2006) Supply Clusters: A Key to China's Cost Advantage. Supply ChainManagement Review 46-51.
Xenias, D. and Whitmarsh, L. (2013). Dimensions and determinants of expert and public attitudes tosustainable transport policies and technologies. Transportation Research Part A: Policy andPractice, 48, pp. 75-85.
Xu, J., and Hancock, K. L. (2004). Enterprise-wide freight simulation in an integrated logistics andtransportation system. Intelligent Transportation Systems, IEEE Transactions on, 5(4), 342-346.
Zhenbo, W., Jiangang, X., Chuanglin, F., Lu, X., and Yi, L. (2011) The study on county accessibility inChina: Characteristics and effects on population agglomeration. Journal of GeographicalSciences, 21(1), 18-34.
Zook, M. A. (2000). The web of production: the economic geography of commercial Internet contentproduction in the United States. Environment and Planning A, 32(3), 411-426.
129
Related Documents

![Round schedule Notices issued by Ofcom under … · Airspan [REDACTED] EE [REDACTED] H3G [REDACTED] Telefonica [REDACTED] Vodafone [REDACTED] Bidder Eligibility events available (start](https://static.cupdf.com/doc/110x72/5ba4d8c509d3f257608be093/round-schedule-notices-issued-by-ofcom-under-airspan-redacted-ee-redacted.jpg)


![From: [REDACTED] Sent: 05 July 2013 11:04 To: [REDACTED ...€¦ · From: [REDACTED] Sent: 05 July 2013 11:04 . To: [REDACTED] Cc: [REDACTED] Subject: FW: Ekwendeni Hospital Aids](https://static.cupdf.com/doc/110x72/601c89910d63e778dd12db97/from-redacted-sent-05-july-2013-1104-to-redacted-from-redacted-sent.jpg)