Development of a Mobile-Enabled Vibration Perception Threshold Device to Screen for Peripheral Neuropathy by Jessica Ong S.B., Massachusetts Institute of Technology (2015) Submitted to the Department of Mechanical Engineering in partial fulfillment of the requirements for the degree of Master of Science in Mechanical Engineering at the MASSACHUSETTS INSTITUTE OF TECHNOLOGY September 2017 @ Massachusetts Institute of Technology 2017. All rights reserved. AuthorSignature redacted Certified by... 7 MASSACHUSEGS INSTUTE OF TECHNOLOGY SEP 22017 LIBRARIES 'ARCHIVES Department of Mechanical Engineering Signature redacted August 25, 2017 Mandayam A. Srinivasan Senior Research Scientist, Mechanical Enginering Certified by... Signature red acted Thesis Supervisor Mohan Thanikachalam Research Affiliate, Research Laboratory of Electronics A ccepted by ....................... Thesis Supervisor ... Signature redacted Rohan Ybeyaratne Professor of Mechanical Engineering Chairman, Department Committee on Graduate Students

Welcome message from author
This document is posted to help you gain knowledge. Please leave a comment to let me know what you think about it! Share it to your friends and learn new things together.
Transcript
Development of a Mobile-Enabled Vibration
Perception Threshold Device to Screen for
Peripheral Neuropathy
by
Jessica Ong
S.B., Massachusetts Institute of Technology (2015)
Submitted to the Department of Mechanical Engineeringin partial fulfillment of the requirements for the degree of
Master of Science in Mechanical Engineering
at the
MASSACHUSETTS INSTITUTE OF TECHNOLOGY
September 2017
@ Massachusetts Institute of Technology 2017. All rights reserved.
AuthorSignature redacted
Certified by...
7
MASSACHUSEGS INSTUTEOF TECHNOLOGY
SEP 22017
LIBRARIES'ARCHIVES
Department of Mechanical Engineering
Signature redactedAugust 25, 2017
Mandayam A. SrinivasanSenior Research Scientist, Mechanical Enginering
Certified by... Signature red acted Thesis Supervisor
Mohan ThanikachalamResearch Affiliate, Research Laboratory of Electronics
A ccepted by .......................
Thesis Supervisor
... Signature redactedRohan Ybeyaratne
Professor of Mechanical EngineeringChairman, Department Committee on Graduate Students

2
Development of a Mobile-Enabled Vibration Perception
Threshold Device to Screen for Peripheral Neuropathy
by
Jessica Ong
Submitted to the Department of Mechanical Engineeringon August 25, 2017, in partial fulfillment of the
requirements for the degree ofMaster of Science in Mechanical Engineering
Abstract
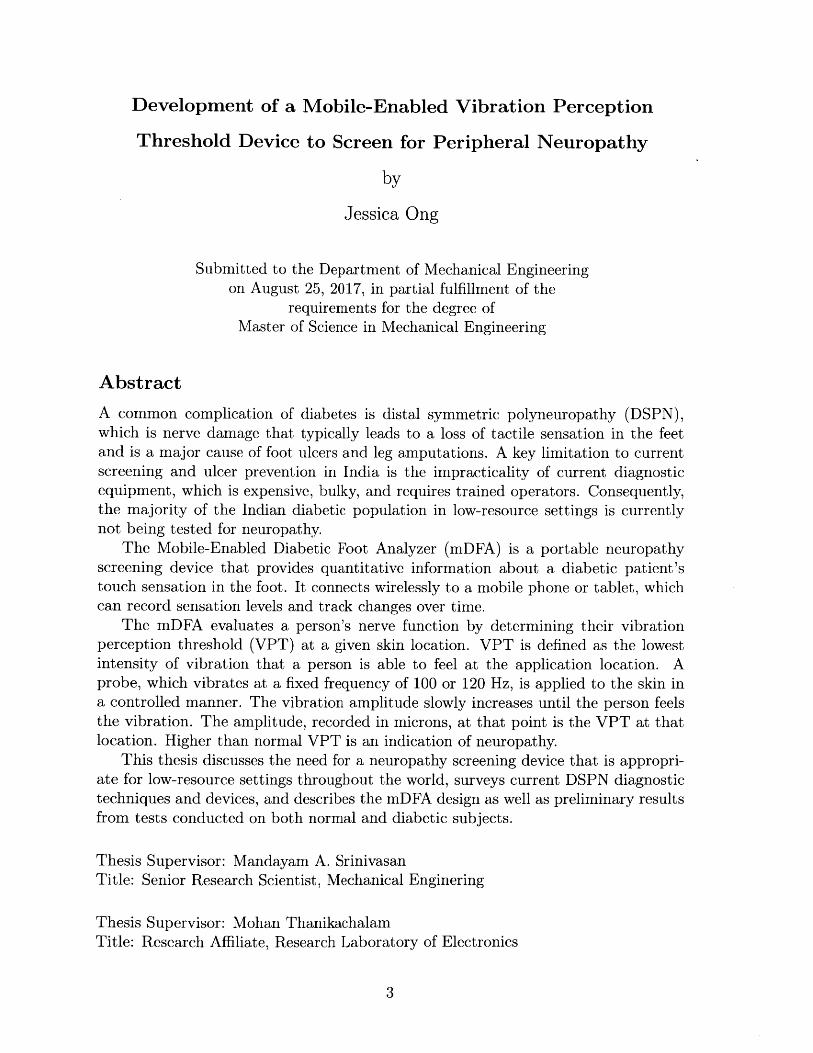
A common complication of diabetes is distal symmetric polyneuropathy (DSPN),which is nerve damage that typically leads to a loss of tactile sensation in the feetand is a major cause of foot ulcers and leg amputations. A key limitation to currentscreening and ulcer prevention in India is the impracticality of current diagnosticequipment, which is expensive, bulky, and requires trained operators. Consequently,the majority of the Indian diabetic population in low-resource settings is currentlynot being tested for neuropathy.
The Mobile-Enabled Diabetic Foot Analyzer (mDFA) is a portable neuropathyscreening device that provides quantitative information about a diabetic patient'stouch sensation in the foot. It connects wirelessly to a mobile phone or tablet, whichcan record sensation levels and track changes over time.
The mDFA evaluates a person's nerve function by determining their vibrationperception threshold (VPT) at a given skin location. VPT is defined as the lowestintensity of vibration that a person is able to feel at the application location. Aprobe, which vibrates at a fixed frequency of 100 or 120 Hz, is applied to the skin ina controlled manner. The vibration amplitude slowly increases until the person feelsthe vibration. The amplitude, recorded in microns, at that point is the VPT at thatlocation. Higher than normal VPT is an indication of neuropathy.
This thesis discusses the need for a neuropathy screening device that is appropri-ate for low-resource settings throughout the world, surveys current DSPN diagnostictechniques and devices, and describes the mDFA design as well as preliminary resultsfrom tests conducted on both normal and diabetic subjects.
Thesis Supervisor: Mandayam A. SrinivasanTitle: Senior Research Scientist, Mechanical Enginering
Thesis Supervisor: Mohan ThanikachalamTitle: Research Affiliate, Research Laboratory of Electronics
3

4
Acknowledgments
I would first like to thank my advisors, Dr. Mandayam A. Srinivasan and Dr. Mohan
Thanikachalam. I am very thankful to have had the opportunity to work with them
the past two years. Srini provided guidance and advice on the engineering aspects of
the device, and his expertise on haptics was invaluable. Mohan's perspectives as a
doctor were critical throughout this project, as well as his daily communication with
Agada Hospital.
A big thanks Abhijit Biswas for sharing his experience with psychophysical testing
with me and helping me problem solve coding and electronics issues.
This project was supported by the Tata Center for Technology and Design, and
I would like to thank all the Tata Center staff for their tireless efforts to provide us
with the resources and support that we needed.
Special thanks to Nevan Hanumara, who was always up for giving me advice,
sanity checks, and a good laugh when I needed it, and was an encouraging cheerleader
throughout the process.
I am very thankful to all the staff at Agada Hospital, who welcomed me with smiles
and coffee every summer and winter. I am especially grateful to Kalai, Raj Kumar,
Gowtham, and Sripriya for all the effort they put into working with me throughout
the year and making my visits productive and enjoyable.
Thanks to my roommates, Nate, Dorian, Peter, Kelsey, and Molly, for all your
support and prayers and letting me take over the living room those last several days
of thesis writing.
Finally, I am thankful for the constant love and support from my parents and
siblings, Chris, Brandon, and Elizabeth. I would never have made it without them.
Especially thanks to mom and dad, who spent hours reading my draft and gave me
extremely helpful comments and edits.
5

6
.. ................. - ............

Contents
1 Introduction 17
1.1 M otivation . . . . . . . . . . . . . . . . . . . . . . . . . . . . . . . . . 18
1.2 Community Health Programs in India . . . . . . . . . . . . . . . . . . 19
1.3 T hesis Scope . . . . . . . . . . . . . . . . . . . . . . . . . . . . . . . . 21
2 Distal Symmetric Polyneuropathy (DSPN) 23
2.1 Sensory Nerve Physiology . . . . . . . . . . . . . . . . . . . . . . . . 24
2.2 Symptoms and Progression . . . . . . . . . . . . . . . . . . . . . . . . 27
2.3 Treatm ent . . . . . . . . . . . . . . . . . . . . . . . . . . . . . . . . . 28
2.4 Financial Burden of Neuropathy . . . . . . . . . . . . . . . . . . . . . 28
3 Existing Technology 31
3.1 Gold Standard: Nerve Conduction Study . . . . . . . . . . . . . . . . 32
3.2 Vibration Perception Threshold . . . . . . . . . . . . . . . . . . . . . 32
3.2.1 Biothesiometer . . . . . . . . . . . . . . . . . . . . . . . . . . 34
3.2.2 Reporting Units and Reliability . . . . . . . . . . . . . . . . . 36
3.2.3 Examination Method . . . . . . . . . . . . . . . . . . . . . . . 41
3.2.4 Vibration Frequency . . . . . . . . . . . . . . . . . . . . . . . 41
3.2.5 Impact of Age, Gender, Weight, and Race . . . . . . . . . . . 41
3.3 Other Methods . . . . . . . . . . . . . . . . . . . . . . . . . . . . . .. 43
3.3.1 Punch Skin Biopsy . . . . . . . . . . . . . . . . . . . . . . . . 43
3.3.2 Monofilament . . . . . . . . . . . . . . . . . . . . . . . . . . . 43
3.3.3 Tuning Fork . . . . . . . . . . . . . . . . . . . . . . . . . . . . 44
7

4 Design 45
4.1 Functional Requirements . . . . . . . . . . . . . . . . . . . . . . . . . 46
4.1.1 Portable . . ... . . . . . . . . . . . . . . . . . . . . . . . . . . 47
4.1.2 Quantitative . . . . . . . . . . . . . . . . . . . . . . . . . . . . 47
4.1.3 Intuitive . . . . . . . . . . . . . . . . . . . . . . . . . . . . . . 49
4.1.4 Quick . . . . . . . . . . . . . . . . . . . . . . . . . . . . . . . 49
4.1.5 Acceptable . . . . . . . . . . . . . . . . . . . . . . . . . . . . . 50
4.2 Actuator Selection . . . . . . . . . . . . . . . . . . . . . . . . . . . . 50
4.2.1 Actuator Options . . . . . . . . . . . . . . . . . . . . . . . . . 52
4.2.2 Voice Coil Sourcing . . . . . . . . . . . . . . . . . . . . . . . . 55
4.3 Sensor Selection . . . . . . . . . . . . . . . . . . . . . . . . . . . . . . 58
4.4 Mechanical Design . . . . . . . . . . . . . . . . . . . . . . . . . . . . 61
4.4.1 Housing and Surround Support . . . . . . . . . . . . . . . . . 62
4.4.2 Probe and Suspension Flexure . . . . . . . . . . . . . . . . . . 65
4.5 Electrical Configuration . . . . . . . . . . . . . . . . . . . . . . . . . 68
4.6 Software . . . . . . . . . . . . . . . . . . . . . . . . . . . . . . . . . . 68
4.6.1 Arduino Sketch . . . . . . . . . . . . . . . . . . . . . . . . . . 71
4.6.2 Computer Software . . . . . . . . . . . . . . . . . . . . . . . . 75
4.6.3 Mobile Application . . . . . . . . . . . . . . . . . . . . . . . . 77
5 Human Subject Tests 79
5.1 Setup.. . ... ..... .... . .......... . . . . . . . . . . . . 80
5.2 Risks . . . . . . . . . . . . . . . . . . . . . . . . . . . . . . . . . . . . 80
5.3 Subject Recruitment and Compensation . . . . . . . . . . . . . . . . 81
5.4 Protocol . . . . . . . . . . . . . . . . . . . . . . . . . . . . . . . . . . 81
5.5 Data Analysis, Results, and Discussion . . . . . . . . . . . . . . . . . 83
5.6 Conclusion . . . . . . . . . . . . . . . . . . . . . . . . . . . . . . . . . 88
6 Conclusion and Future Work 89
6.1 Summary . . . . . . . . . . . . . . . . . . . . . . . . . . . . . . . . . 89
6.2 Future W ork . . . . . . . . . . . . . . . . . . . . . . . . . . . . . . . . 90
8
List of Figures
1-1 Value proposition: The mDFA is a tool that identifies the 25% of dia-
betics who develop neuropathy, allowing healthcare workers to educate
patients and avoid potential life-altering complications such as ulcers,
infections, and amputations. . . . . . . . . . . . . . . . . . . . . . . . 19
2-1 The nervous system consists of two parts. Central nervous system
(CNS): brain and spinal cord. Peripheral nervous system (PNS): nerves
[Szym ik, 2011]. . . . . . . . . . . . . . . . . . . . . . . . . . . . . . . 24
2-2 Diagram of the main components in a nerve cell. The cell body contains
the nucleus. Dendrites receive information from other neurons. The
axon conveys the action potential in the form of an electrochemical
impulse. Axon terminals transfer messages to adjacent neurons. . . . 25
2-3 Diagram showing the four types of mechanoreceptors in the skin: Pacinian
corpuscle, Meissner corpuscle, Merkel cell, and Ruffini corpuscle [Blausen.com
staff, 20141. . . . . . . . . . . . . . . . . . . . . . . . . . . . . . . . . 26
2-4 Drawing of a Pacinian corpuscle showing the many layers of lamellae
[G ray, 1918] .. . . . . . . . . . . . . . . . . . . . . . . . . . . . . . . . 27
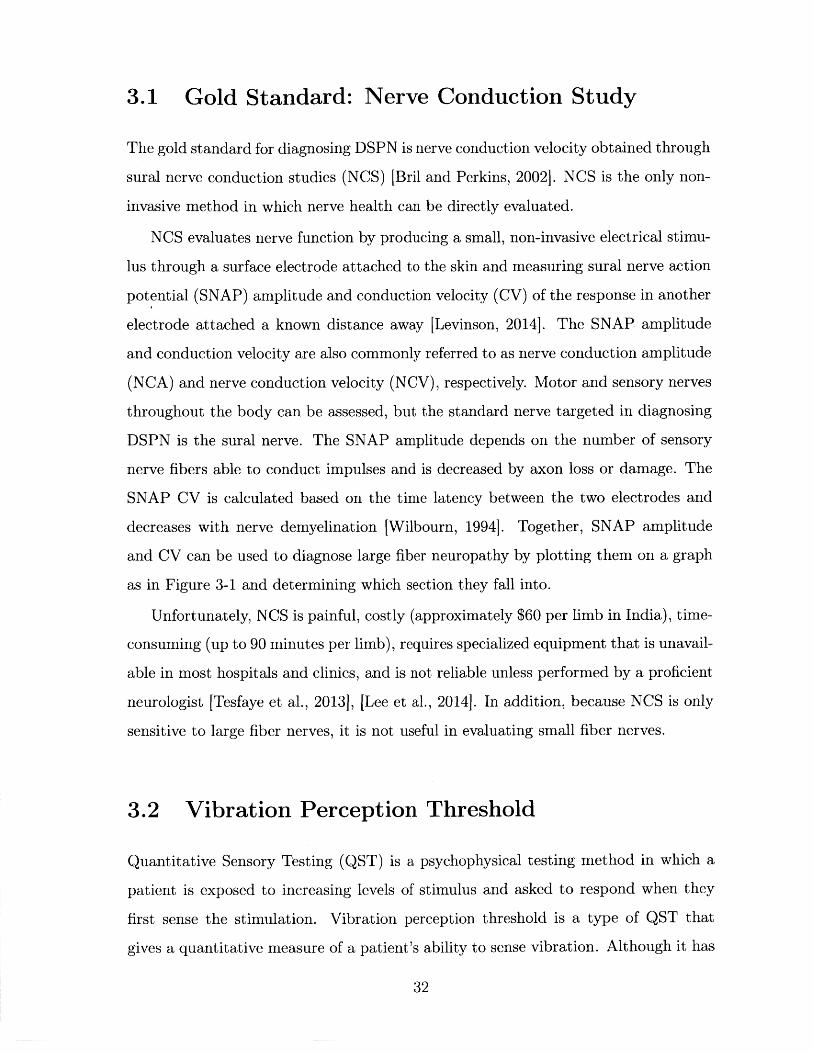
3-1 Chart provided by NeuroMetrix to be used for clinical interpretation of
SNAP amplitude and CV by recorded the NC-Stat DPNCheck device
[N euroM etrix] . . . . . . . . . . . . . . . . . . . . . . . . . . . . . . . 33
9
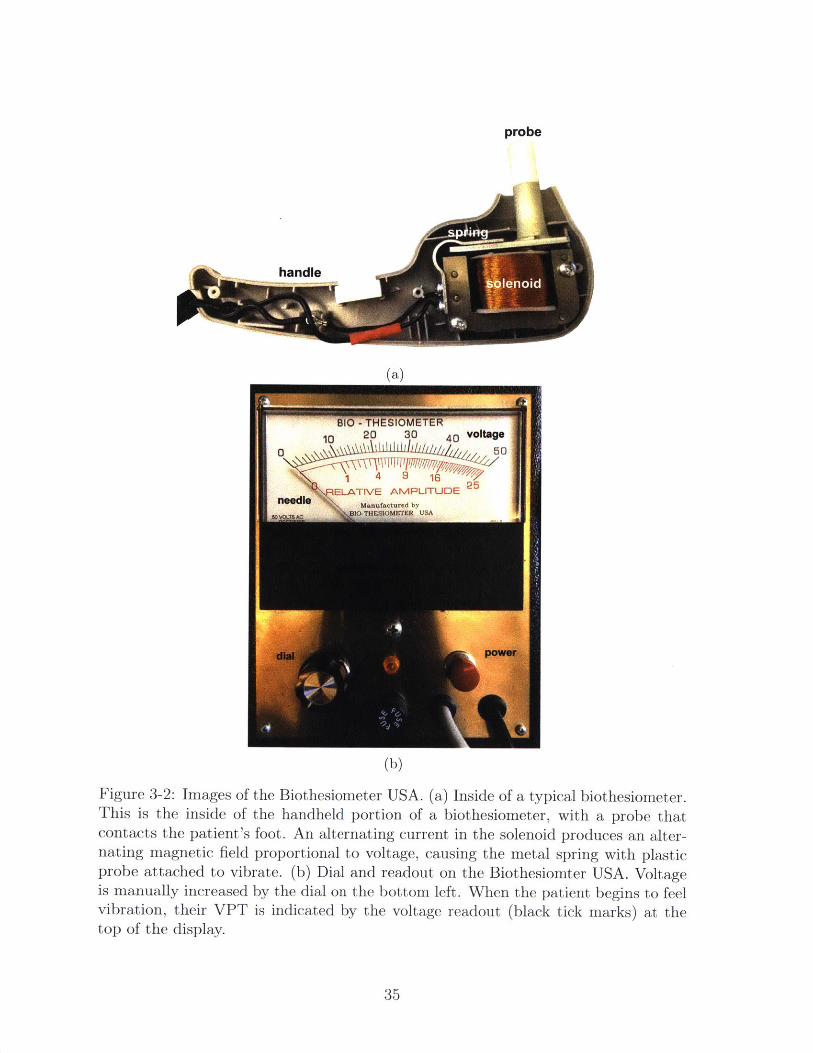
3-2 Images of the Biothesiometer USA. (a) Inside of a typical biothesiome-
ter. This is the inside of the handheld portion of a biothesiometer, with
a probe that contacts the patient's foot. An alternating current in the
solenoid produces an alternating magnetic field proportional to volt-
age, causing the metal spring with plastic probe attached to vibrate.
(b) Dial and readout on the Biothesiomter USA. Voltage is manually
increased by the dial on the bottom left. When the patient begins to
feel vibration, their VPT is indicated by the voltage readout (black
tick marks) at the top of the display. . . . . . . . . . . . . . . . . . . 35
3-3 The six locations on each foot that the ThesioWIN protocol examines. 36
3-4 The ThesioWIN being used to test a patient for neuropathy. The
ThesioWIN's mechanical workings are the same as that of the Biothe-
siometer USA, but it includes a digital readout and optional computer
connectivity. . . . . . . . . . . . . . . . . . . . . . . . . . . . . . . . . 37
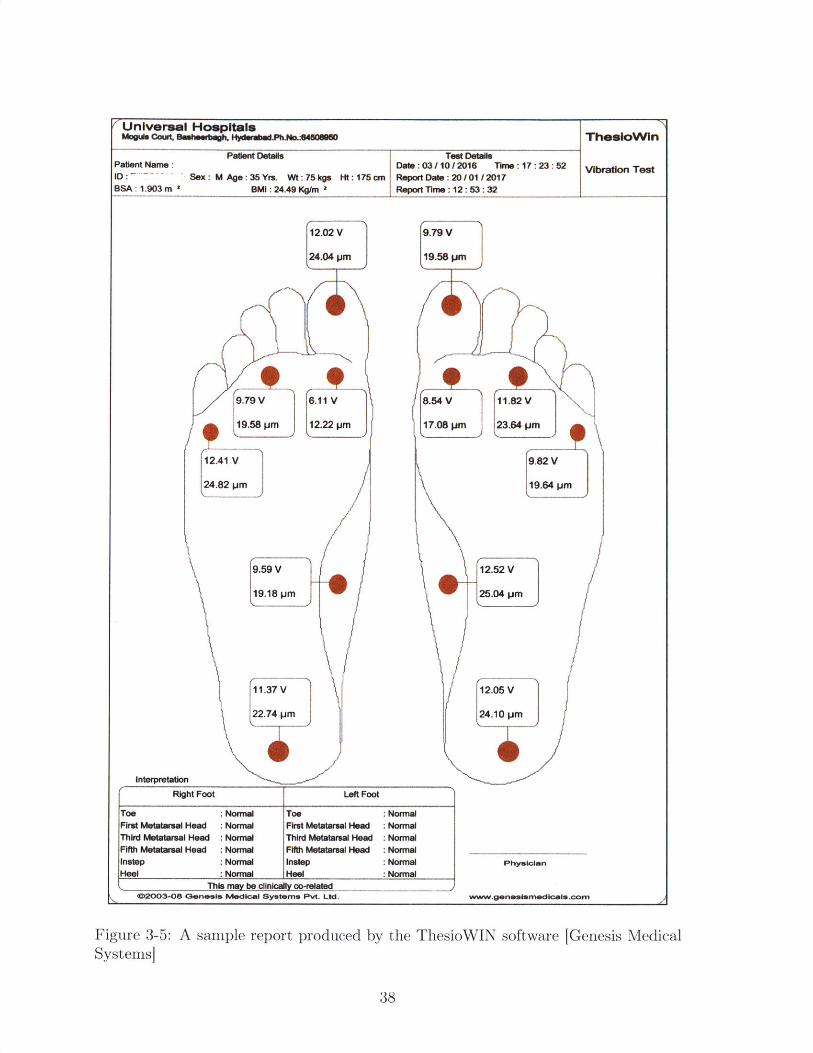
3-5 A sample report produced by the ThesioWIN software [Genesis Medical
System s] . . . . . . . . . . . . . . . . . . . . . . . . . . . . . . . . . . 38
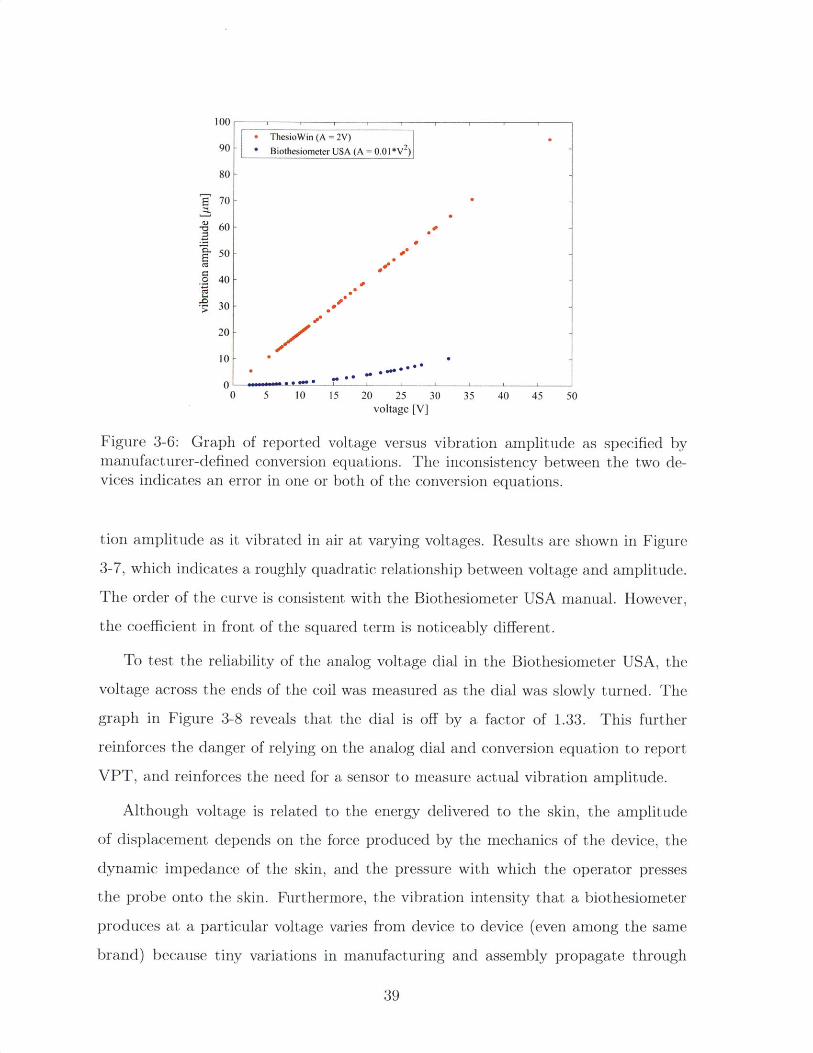
3-6 Graph of reported voltage versus vibration amplitude as specified by
manufacturer-defined conversion equations. The inconsistency between
the two devices indicates an error in one or both of the conversion
equations. . . . . . . . . . . . . . . . . . . . . . . . . . . . . . . . . . 39
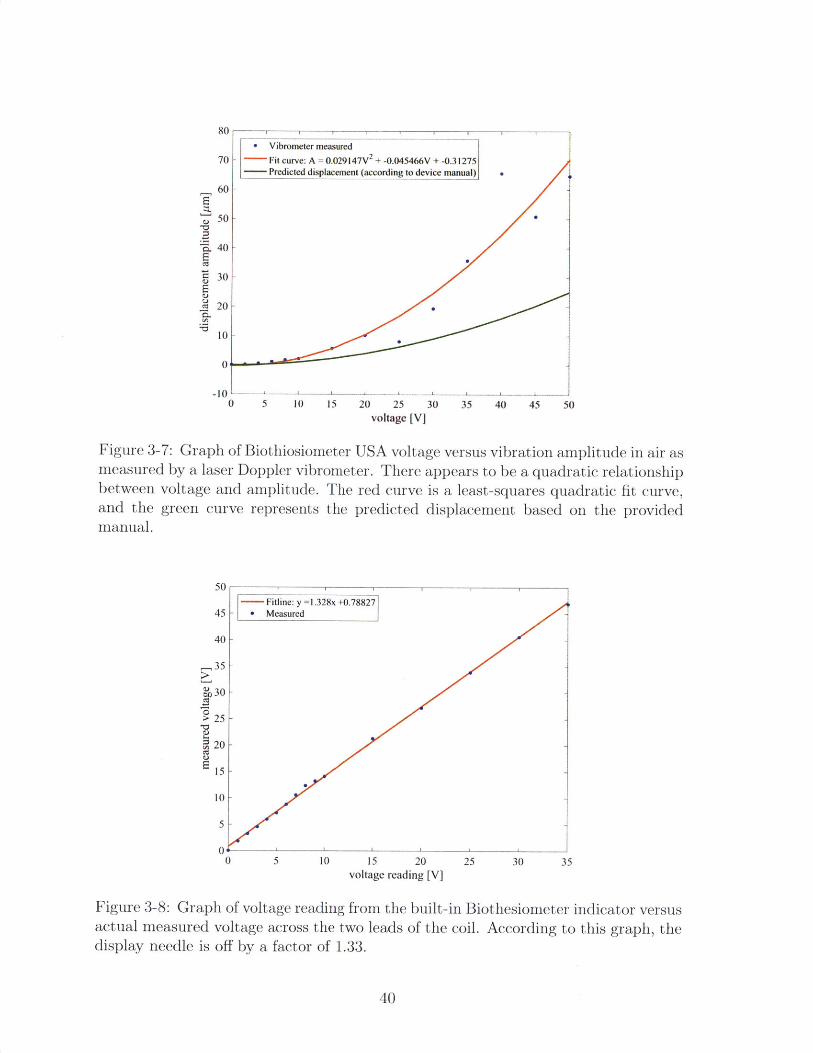
3-7 Graph of Biothiosiometer USA voltage versus vibration amplitude in
air as measured by a laser Doppler vibrometer. There appears to be a
quadratic relationship between voltage and amplitude. The red curve
is a least-squares quadratic fit curve, and the green curve represents
the predicted displacement based on the provided manual. . . . . . . 40
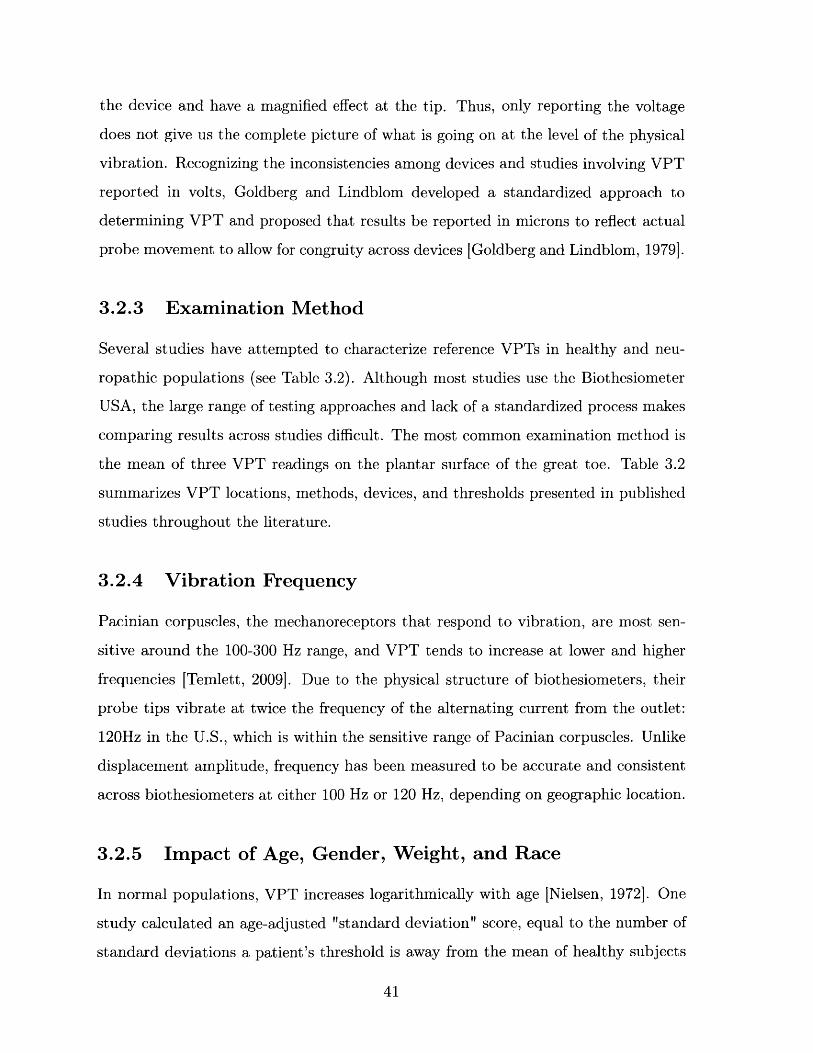
3-8 Graph of voltage reading from the built-in Biothesiometer indicator
versus actual measured voltage across the two leads of the coil. Ac-
cording to this graph, the display needle is off by a factor of 1.33. . . 40
3-9 A Semmes-Weinstein monofilament is a sharp filament that buckles
under a known force IServier Medical Art, 20131. . . . . . . . . . . . . 44
10
4-1 The final mDFA prototype is white and has a black probe. A cable
connects the device to the controller and electronics assembly in the
black box. . . . . . . . . . . . . . . . . . . . . . . . . . . . . . . . . . 45
4-2 Examples of bags that CHWs carry as they walk throughout local
villages every day. . . . . . . . . . . . . . . . . . . . . . . . . . . . . . 47
4-3 Example of the ERM motor used in the iPhone 4. . . . . . . . . . . . 52
4-4 (a) Diagram of a typical LRA. (b) Example bode plot showing a spike
in gain at the natural frequency [Precision Microdrives] .. . . . . . . . 53
4-5 A typical piezoelectric stack actuator is a stack of piezo components
with a strain gauge sensor attached [Physik Instrumente]. . . . . . . . 54
4-6 Diagram of a typical solenoid, including a return spring. [Electronics
T utorials]. . . . . . . . . . . . . . . . . . . . . . . . . . . . . . . . . . 54
4-7 Cross-section of the linear voice coil actuator that was selected for the
mDFA. The magnet assembly (green base and yellow axially magne-
tized magnet) is fixed to the housing, while the coil assembly (grey and
blue coil holder with orange coil) translates horizontally when current
is passed through the coil. . . . . . . . . . . . . . . . . . . . . . . . . 55
4-8 Examples of early mDFA prototypes that used voice coils with inte-
grated linear bearings. Due to the variable surface on the sole of the
foot, these versions were prone to jamming. . . . . . . . . . . . . . . 57
4-9 Diagrams of an LVDT. (a) Cut-out view of the inside [Wapcaplet,
2007]. (b) Diagram showing the physics of an LVDT [Fenixdiaz, 2009].
An alternating current is passed through the primary coil. Depending
on where the iron core is located, differing amounts of magnetic flux
will reach each secondary coil, creating a voltage difference between
the secondary coils. . . . . . . . . . . . . . . . . . . . . . . . . . . . . 59
11

4-10 Photo of an attempt to use a piezo film as a sensor. One end of the
film was rigidly attached to white biothesiometer probe, while the other
end rested on a screw attached to the biothesiometer housing. As the
probe vibrates relative to the housing, the piezo film bends, producing
a voltage potential across its leads. . . . . . . . . . . . . . . . . . . . 60
4-11 A linear magnetic encoder uses a series of alternating magnetic poles to
sense detect relative position between a magnetic strip and Hall-effect
sensor [AM S, 20131. . . . . . . . . . . . . . . . . . . . . . . . . . . . . 61
4-12 Inside of the final prototype with half of the housing removed. .... 62
4-13 Color-coded CAD model showing the final mDFA prototype. (a) Ex-
ploded view. (b) Cross-sectional view. . . . . . . . . . . . . . . . . . 63
4-14 (a) Example reading taken with the Biothesiometer USA, which does
not have a surround support touching the skin. Operator movement
during the reading can be seen in the linear migration of wave's neutral
axis. The fit wave (solid red) does not match the data (blue dots). (b)
Example reading taken with the mDFA with surround support. The
wave stays constant because the surround support provides a reference
that is attached to the skin. . . . . . . . . . . . . . . . . . . . . . . . 65
4-15 Flexures that inspired the probe suspension design. (a) A four-armed
flexure used to mount the coil assembly to the housing and magnet
assembly of a voice coil speaker. (b) A large, double-layered flexure
that allows free vertical motion and accommodates a small degree of
play in other DOF. . . . . . . . . . . . . . . . . . . . . . . . . . . . . 66
4-16 Views of a CAD model of the probe and suspension flexure assembly. 67
4-17 Top row: test rigs used to evaluate flexure performance. Bottom two
rows: a subset of the flexure material and dimensions that were tested. 67
4-18 Block diagram showing the electronic configuration of the mDFA. . . 69
4-19 Final main electronics PCB after soldering. . . . . . . . . . . . . . . . 69
4-20 Blank custom PCB front (left) and back (right) before soldering. . . . 70
12
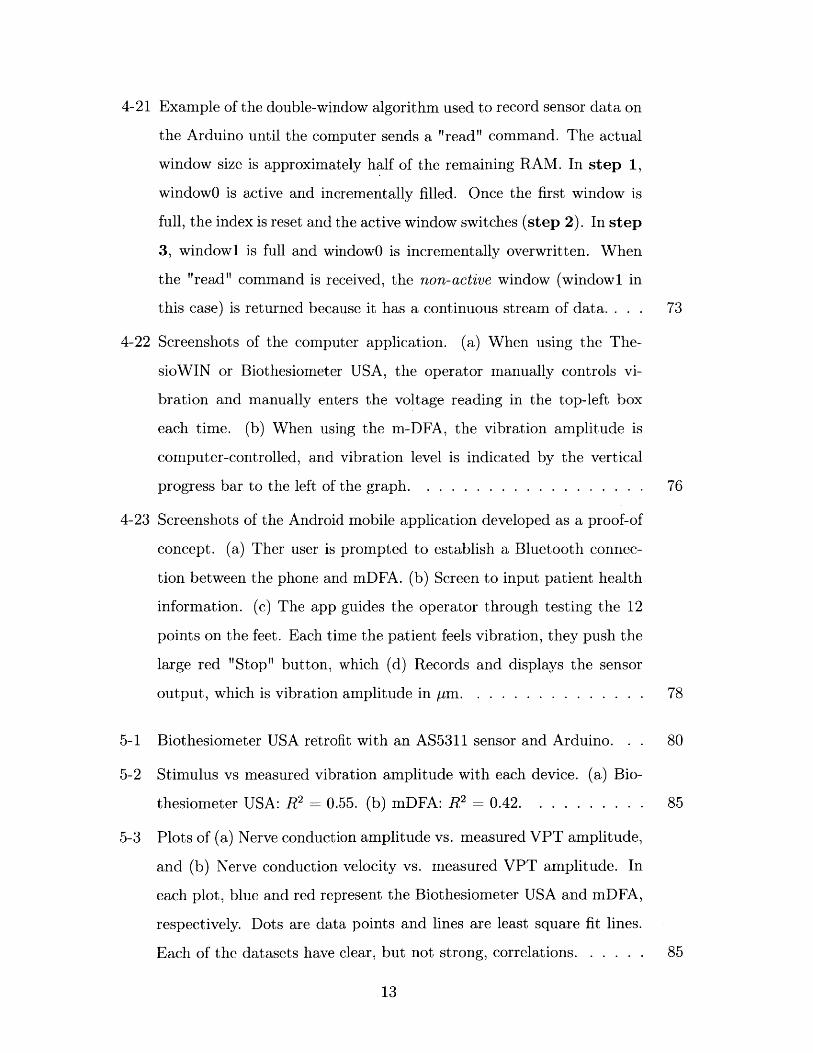
4-21 Example of the double-window algorithm used to record sensor data on
the Arduino until the computer sends a "read" command. The actual
window size is approximately half of the remaining RAM. In step 1,
windowO is active and incrementally filled. Once the first window is
full, the index is reset and the active window switches (step 2). In step
3, windowi is full and windowO is incrementally overwritten. When
the "read" command is received, the non-active window (windowl in
this case) is returned because it has a continuous stream of data. . . . 73
4-22 Screenshots of the computer application. (a) When using the The-
sioWIN or Biothesiometer USA, the operator manually controls vi-
bration and manually enters the voltage reading in the top-left box
each time. (b) When using the m-DFA, the vibration amplitude is
computer-controlled, and vibration level is indicated by the vertical
progress bar to the left of the graph. . . . . . . . . . . . . . . . . . . 76
4-23 Screenshots of the Android mobile application developed as a proof-of
concept. (a) Ther user is prompted to establish a Bluetooth connec-
tion between the phone and mDFA. (b) Screen to input patient health
information. (c) The app guides the operator through testing the 12
points on the feet. Each time the patient feels vibration, they push the
large red "Stop" button, which (d) Records and displays the sensor
output, which is vibration amplitude in rm. . . . . . . . . . . . . . . 78
5-1 Biothesiometer USA retrofit with an AS5311 sensor and Arduino. . . 80
5-2 Stimulus vs measured vibration amplitude with each device. (a) Bio-
thesiometer USA: R2 = 0.55. (b) mDFA: R2 = 0.42. . . . . . . . . . 85
5-3 Plots of (a) Nerve conduction amplitude vs. measured VPT amplitude,
and (b) Nerve conduction velocity vs. measured VPT amplitude. In
each plot, blue and red represent the Biothesiometer USA and mDFA,
respectively. Dots are data points and lines are least square fit lines.
Each of the datasets have clear, but not strong, correlations. . . . . . 85
13
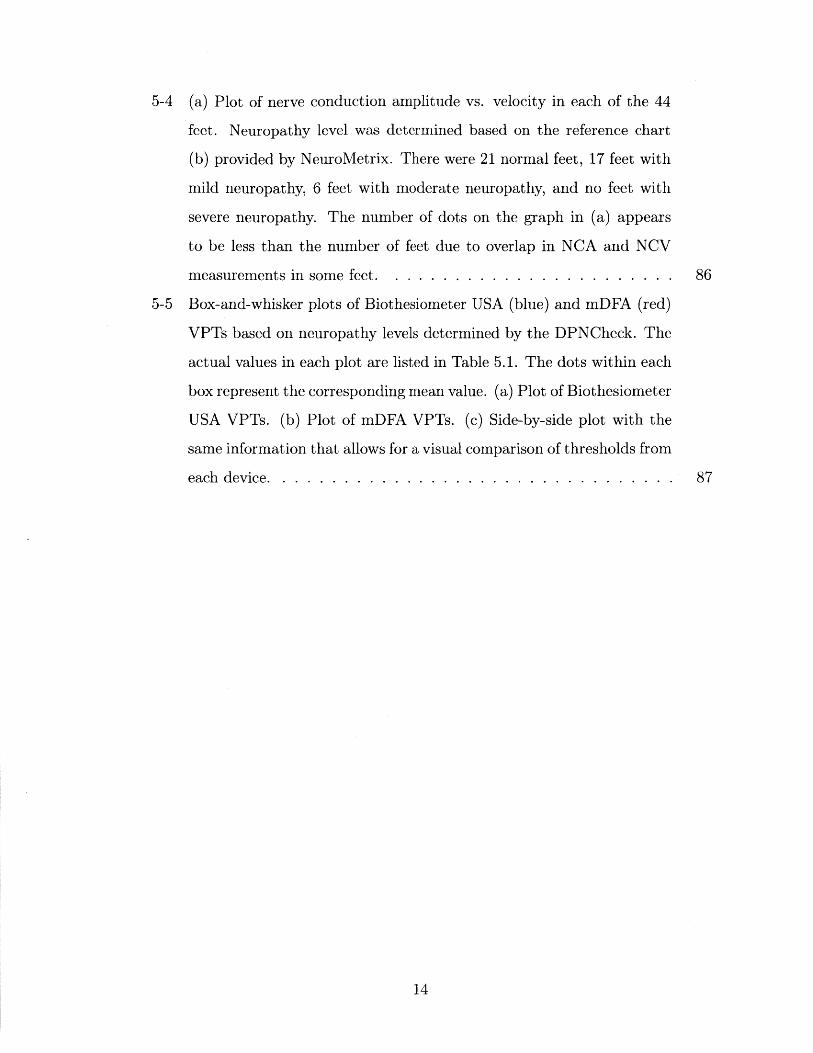
5-4 (a) Plot of nerve conduction amplitude vs. velocity in each of the 44
feet. Neuropathy level was determined based on the reference chart
(b) provided by NeuroMetrix. There were 21 normal feet, 17 feet with
mild neuropathy, 6 feet with moderate neuropathy, and no feet with
severe neuropathy. The number of dots on the graph in (a) appears
to be less than the number of feet due to overlap in NCA and NCV
measurements in some feet. . . . . . . . . . . . . . . . . . . . . . . . 86
5-5 Box-and-whisker plots of Biothesiometer USA (blue) and mDFA (red)
VPTs based on neuropathy levels determined by the DPNCheck. The
actual values in each plot are listed in Table 5.1. The dots within each
box represent the corresponding mean value. (a) Plot of Biothesiometer
USA VPTs. (b) Plot of mDFA VPTs. (c) Side-by-side plot with the
same information that allows for a visual comparison of thresholds from
each device. . . . . . . . . . . . . . . . . . . . . . . . . . . . . . . . . 87
14

List of Tables
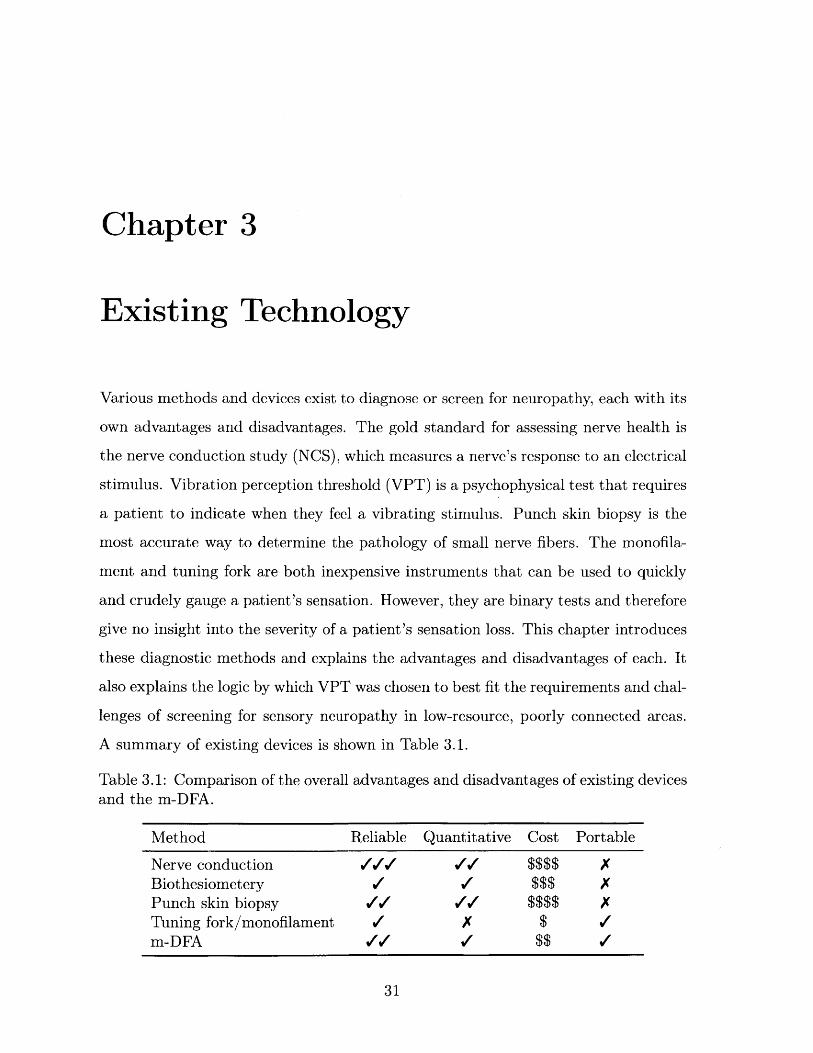
3.1 Comparison of the overall advantages and disadvantages of existing
devices and the m-DFA. . . . . . . . . . . . . . . . . . . . . . . . . . 31
3.2 A summary of previous studies that contained different devices, meth-
ods, and results. . . . . . . . . . . . . . . . . . . . . . . . . . . . . . . 42
4.1 Functional requirements and design parameters for the m-DFA. . . 46
4.2 Summary of actuator options and their properties, as well as specific
reasons why certain actuators were eliminated. Resolution, efficiency,
and voltage numbers obtained from [Electronics Tutorials, Precision
Microdrives, Bala, 2015, Thorlabs] . . . . . . . . . . . . . . . . . . . 51
4.3 Pugh chart weighing actuator options, with LRA chosen as the datum.
Based on this assessment, a linear voice coil actuator was chosen. . . 51
4.4 Moticont LVCM-016-013-01 voice coil actuator specifications. . . . . . 58
4.5 Bill of materials for the electronics. Prices listed are costs for small-
quantity prototypes. . . . . . . . . . . . . . . . . . . . . . . . . . . . 70
4.6 Arduino protocol for receiving simple commands from a computer or
mobile phone. The computer can either ask the Arduino to return a
set of sensor readings, or change the vibration level. . . . . . . . . . . 71
5.1 Summary of reults from the study. 44 feet were separated into normal,
mild, and moderate neuropathy based on NCS. For each category and
each device, the mean, standard error and 95% confidence interval are
shown. The upper adjacent, 75th percentile, median, 25th percentile,
and lower adjacent define the boundaries in the box plots in Figure 5-5. 84
15

16
Chapter 1
Introduction
Healthcare infrastructure in much of the developing world has historically focused on
treating infectious diseases such as HIV/AIDS, respiratory infections, and tuberculo-
sis. However, as average lifespans, quality of life, and access to healthcare increases
around the world, it has become increasingly apparent that non-communicable dis-
eases (NCDs) also need to be addressed as a global health problem. For the first time
in history, more people are dying of NCDs than infectious diseases. According to
the World Health Organization's 2014 global status report on non-communicable dis-
eases, NCDs are the leading cause of death worldwide, and nearly 75% of NCD-related
deaths occur in low- and middle-income countries [World Health Organization, 2014].
Diabetes is an example of a non-communicable chronic disease that now pervades
developing countries as much as their developed counterparts. In fact, India has over-
taken the United States as the "Diabetes Capital of the World" [Joshi and Parikh,
20071. When patients are properly treated and implement lifestyle changes, their con-
dition (as well as complications that may arise) is manageable and they can expect to
enjoy a relatively unaffected day-to-day life. However, untreated complications often
develop into serious health problems that can lead to severe impairment and decrease
in quality of life. The primary diabetes complications are retinopathy (eye dam-
age), nephropathy (kidney damage), neuropathy (nerve damage), and cardiovascular
disease.
One of most common diabetes complications is distal symmetric polyneuropathy
17
(DSPN), which is nerve damage that typically leads to loss of touch sensation in
the feet. DSPN is also known as distal symmetric neuropathy, distal symmetric
sensorimotor polyneuropathy, distal symmetric peripheral neuropathy, and diabetic
sensorimotor polyneuropathy. Up to 25% of diabetic patients will develop a foot ulcer
as a result of DSPN [Shankhdhar et al., 2008], and 5-24% of those ulcers will lead
to amputation [Alexiadou and Doupis, 2012]. In fact, ulcers precede 85% of diabetic
amputations [Pradeepa et al., 2008].
1.1 Motivation
DSPN causes patients to lose sensation in their feet, which is especially problematic in
rural areas where locals frequently walk around barefoot or with minimally protective
sandals. The combination of lack of pain with an impaired immune response can cause
a small cut or ulcer to become infected and in the worst cases require amputation.
This can be devastating to people whose livelihoods often rely on their ability to walk.
A patient history of foot ulcers increases the likelihood of amputation by a fac-
tor of 36, and at least half of foot ulcers in neuropathic diabetics can be prevented
by appropriate treatment and patient education [Gow and Moore, 2014], [Shankhd-
har et al., 20081. As with many symptoms and complications of diabetes, the most
effective approach to controlling DSPN is glycemic management. In addition, pre-
venting further foot damage can be achieved by managing the effects of neuropathy
through daily foot care and inspection, immediate treatment of even minor foot cuts
and injuries, and protective footwear [Ali, 2003]. In many rural populations, diabetic
patients with DSPN are often not concerned with foot damage if they are not expe-
riencing pain, and are sometimes even unaware of their injuries. It is essential that
they are identified, made aware of the risk of further damage or amputation, and
taught proper foot care practices [Shankhdhar et al., 2008].
For a variety of reasons that will be discussed later in this thesis, diabetic patients
in most parts of the world are currently not being tested for neuropathy, leaving them
vulnerable to life-altering injuries. The purpose of this research was to develop a de-
18

vice called the Mobile Enabled Diabetic Foot Analyzer (mDFA) that can be operated
by minimally trained workers in flexible settings to screen for diabetic neuropathy.
Identifying patients who display signs of neuropathy will allow doctors to focus their
efforts on educating those patients on how to curb the effects of the condition and
prevent it from worsening. Figure 1-1 summarizes the current state and affects of di-
abetic neuropathy in rural India, and the benefits that identifying neuropathy would
provide.
L Rural diabetic Patients do not Ulcers, infections,patients are not understand and amputations Reduced quality
- tested for risk/seriousness due to Improper of Ifeneuropathy of neuropathy foot care
Basic neuropathy Opportunity to Foot carescreening educate patients If behavior change inta qualty ofaccessible to nerve damage is and awareness lifeknown diabetics indicated reduces injury
-25% of diabetics Up to 85% ofdevelop amputations dueneuropathy to ulcers can be
prevented
Figure 1-1: Value proposition: The mDFA is a tool that identifies the 25% of diabeticswho develop neuropathy, allowing healthcare workers to educate patients and avoidpotential life-altering complications such as ulcers, infections, and amputations.
1.2 Community Health Programs in India
The mDFA was developed in partnership with Agada Hospital in Chennai, Tamil
Nadu, India. Agada Hospital specializes in diabetes treatment and also operates a
community health program in surrounding rural villages in Tamil Nadu.
In 2003 the Tamil Nadu government passed a Health Policy that "aims to.. .combat
non-communicable diseases and accidents, strengthen management of health systems
19
and increase effectiveness of the public sector healthcare services. The policy focuses
on improving the health status of the general population, which special emphasis
on low-income, disadvantaged and tribal communities" ITNHSPI. The Tamil Nadu
Health Systems Project (TNHSP) was created to carry out the Health Policy. In
addition to the goals described above, the TNHSP also aims to create "awareness
about non-communicable diseases and screening for those conditions." It operates
through Primary Health Centers (PHCs) that are dispersed throughout the state and
offer free lab services, medications, and diabetes treatment.
To extend the reach of TNHSP, the National Network for Organ Sharing (NNOS)
recently developed the Rural Non-Communicable Disease Prevention Program (R-
NCDPP) under the direction of Dr. Mohan Thanikachalam. Dr. Thanikachalam is
the founder of NNOS, director of Agada Hospital (the partner hospital of R-NCDPP),
and one of the primary advisors to the mDFA project. According to the R-NCDPP
proposal, the program is "a cost-effective, scalable Public-Private Partnership (PPP)
model for case finding, care linkage and treatment compliance for NCDs within exist-
ing rural healthcare infrastructure." Through R-NCDPP, local paid community health
workers (CHWs) are trained in basic understanding and treatment of diabetes. These
CHWs perform regular home visits to villagers who have already been identified to
suffer from diabetes and/or hypertension. CHW productivity is monitored daily by
the project coordinator at Agada Hospital. The coordinator also travels to the villages
each week to check up on CHWs and provide training and support.
CHWs use a mobile application called CommCare that is part of an m-Health
cloud-based platform (developed in conjunction with the software company Dimagi)
to collect data and educate patients. The use of mobile technology also serves to stan-
dardize care administered from person to person. Through the m-Health application,
patients also receive SMS messages with reminders and provider messages.
The mDFA was designed with CHWs in mind. The R-NCDPP CHWs in particular
were interviewed and consulted often throughout the design process. These women
periodically tested various prototypes and provided their feedback. Designing the
device to be operable in the lowest-resource settings by minimally trained workers
20

allows it to have a potentially far-reaching impact in larger clinics and hospitals,
private primary care offices, and other community health programs throughout India
and the world.
1.3 Thesis Scope
Tackling the problem of diabetic neuropathy requires various levels of intervention,
and is not as simple as prescribing a medication or treatment that is guaranteed to
cure or reverse the condition. Unfortunately, once neuropathy has begun to develop
it is not reversible. However, its progress can be slowed though glycemic management
and its effects can be controlled by proper foot care. For patients whose foot sensation
is impaired, it is essential that they are educated on the seriousness of the condition
and how best to prevent wounds and ulcers. In much of the developed world, foot
problems are a well-known complication of diabetes and people know to watch out for
neuropathy. However, in developing areas where diabetes has become common but
awareness has not yet caught up, patients are often neither aware of, nor concerned
about neuropathy. Because behavior change and proper foot care is the only way
to prevent neuropathy-related morbidity, it is essential that patients understand the
reality and seriousness of neuropathy.
The purpose of the mDFA project was to design a device that can screen for
diabetic neuropathy in the context of resource-constrained areas around the world,
particularly India. The hope is to identify and treat the onset of DSPN early to stop
the "firefighting" that often happens when patients present at hospitals with already
severely infected feet that are much more difficult to treat.
This first half of this thesis sets the stage for the mDFA by describing the patho-
physiology of diabetic neuropathy, listing existing technology to test for neuropathy,
and discussing the unique challenges of diagnosing and treating neuropathy in low-
resource settings. The second half of this thesis outlines the design process, presents
preliminary clinical data, and discusses ongoing and future plans to manufacture and
distribute the system.
21

22
Chapter 2
Distal Symmetric Polyneuropathy
(DSPN)
Up to 50% of diabetic patients have one or more types of neuropathy [Quan, 2017],
which in the simplest term means nerve damage. There are two main types of neu-
ropathy in diabetic patients: sensorimotor and autonomic. Sensorimotor neuropathy
is the most common form of nerve damage, and is the focus of this thesis. It affects the
sensory and motor nerves and causes either positive symptoms like hypersensitivity
and pain, or negative symptoms such as loss of sensation. Autonomic neuropathy af-
fects the cardiovascular, urogenital, gastrointestinal, pupillomotor, thermoregulatory,
and sudomotor systems [Freeman, 20141.
For clarity and consistency throughout this thesis, diabetic sensorimotor neuropa-
thy will be referred to as distal symmetric polyneuropathy (DSPN) or diabetic neu-
ropathy. Other synonymous terms that can be found throughout literature are distal
symmetric sensorimotor polyneuropathy, diabetic sensorimotor neuropathy, and dia-
betic peripheral neuropathy.
The words in the variations of DSPN names are useful in understanding the char-
acteristics that define this type of neuropathy and set it apart from others:
* Distal - Begins farthest away from the brain (in the toes) and progresses up the
body.
" Peripheral - Outside of the central nervous system.
23
" Symmetric - Affects both the left and right side equally.
* Sensorimotor - Affects sensory and motor nerves.
" Polyneuropathy - Disorder of the peripheral nerves that affects both sides.
2.1 Sensory Nerve Physiology
In order to understand what goes wrong when nerves are impaired, it is useful to
understand the normal anatomy and function of sensory nerves.
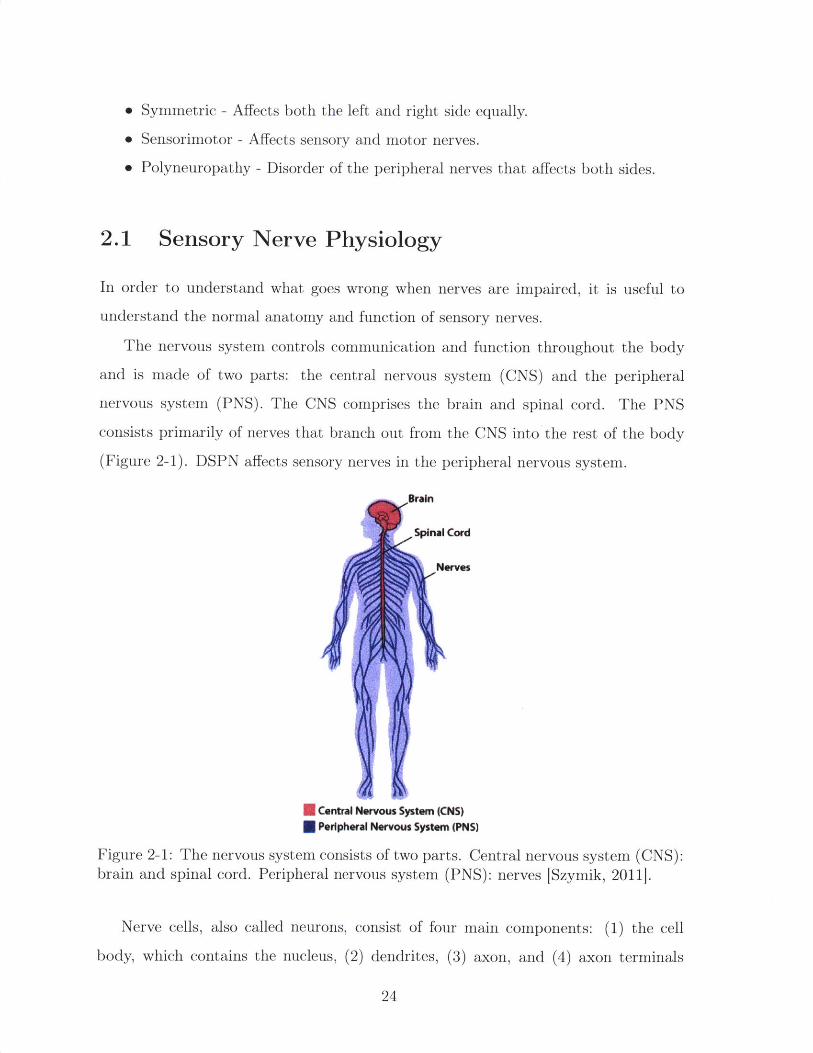
The nervous system controls communication and function throughout the body
and is made of two parts: the central nervous system (CNS) and the peripheral
nervous system (PNS). The CNS comprises the brain and spinal cord. The PNS
consists primarily of nerves that branch out from the CNS into the rest of the body
(Figure 2-1). DSPN affects sensory nerves in the peripheral nervous system.
Brain
Spinal Cord
Nerves
Central Nervous System (CNS)Peripheral Nervous System (PNS)
Figure 2-1: The nervous system consists of two parts. Central nervous system (CNS):brain and spinal cord. Peripheral nervous system (PNS): nerves [Szymik, 2011].
Nerve cells, also called neurons, consist of four main components: (1) the cell
body, which contains the nucleus, (2) dendrites, (3) axon, and (4) axon terminals
24
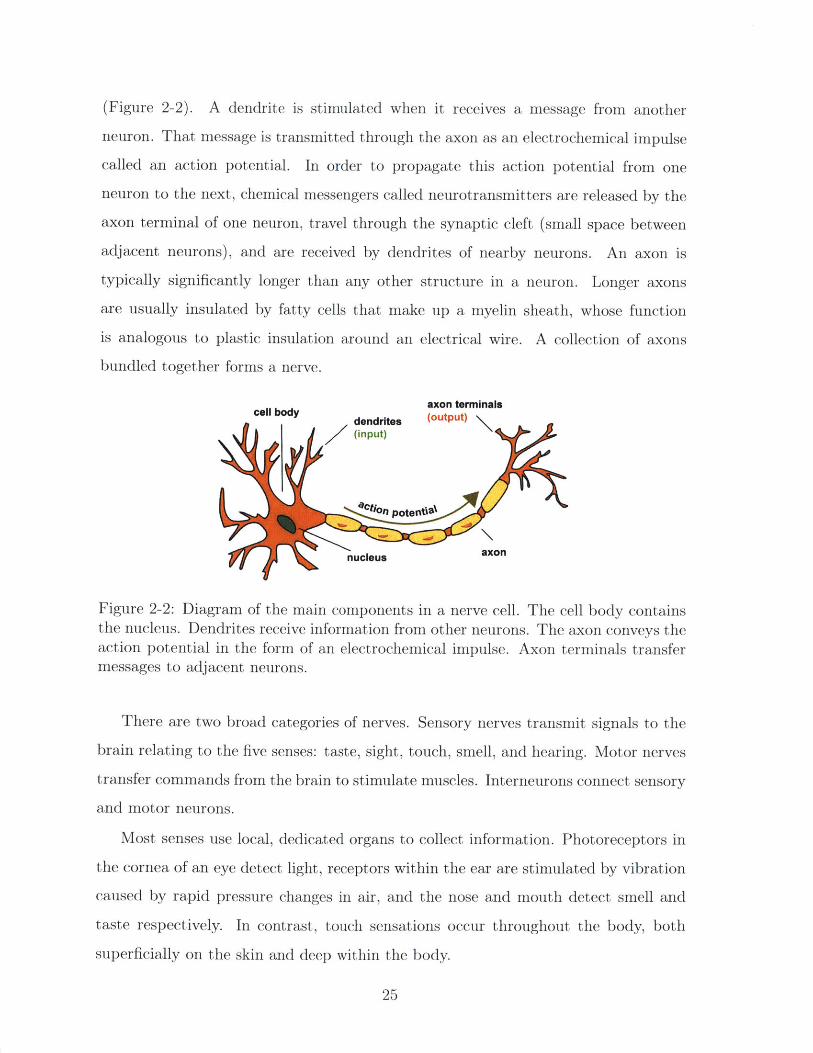
(Figure 2-2). A dendrite is stimulated when it receives a message from another
neuron. That message is transmitted through the axon as an electrochemical impulse
called an action potential. In order to propagate this action potential from one
neuron to the next, chemical messengers called neurotransmitters are released by the
axon terminal of one neuron, travel through the synaptic cleft (small space between
adjacent neurons), and are received by dendrites of nearby neurons. An axon is
typically significantly longer than any other structure in a neuron. Longer axons
are usually insulated by fatty cells that make up a myelin sheath, whose function
is analogous to plastic insulation around an electrical wire. A collection of axons
bundled together forms a nerve.
axon terminalscell body dendrites (output)
(input)
Q~inPotent:8
nucleus axon
Figure 2-2: Diagram of the main components in a nerve cell. The cell body containsthe nucleus. Dendrites receive information from other neurons. The axon conveys theaction potential in the form of an electrochemical impulse. Axon terminals transfermessages to adjacent neurons.
There are two broad categories of nerves. Sensory nerves transmit signals to the
brain relating to the five senses: taste, sight, touch, smell, and hearing. Motor nerves
transfer commands from the brain to stimulate muscles. Interneurons connect sensory
and motor neurons.
Most senses use local, dedicated organs to collect information. Photoreceptors in
the cornea of an eye detect light, receptors within the ear are stimulated by vibration
caused by rapid pressure changes in air, and the nose and mouth detect smell and
taste respectively. In contrast, touch sensations occur throughout the body, both
superficially on the skin and deep within the body.
25
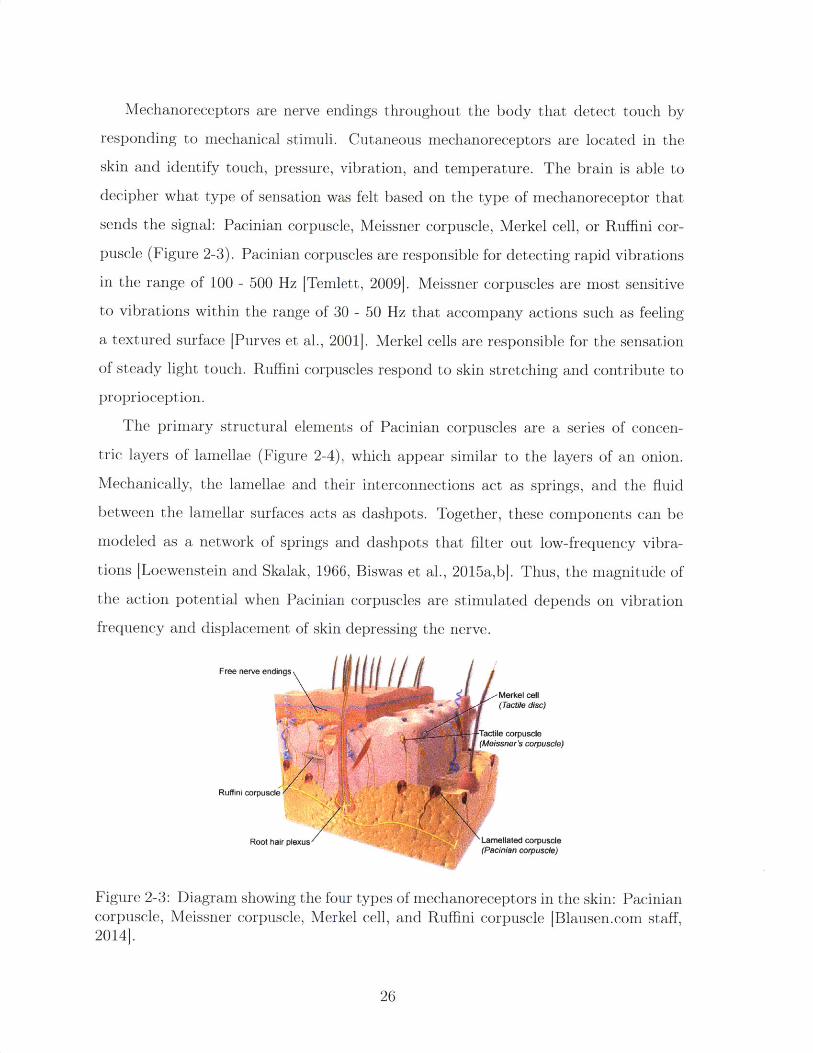
Mechanoreceptors are nerve endings throughout the body that detect touch by
responding to mechanical stimuli. Cutaneous mechanoreceptors are located in the
skin and identify touch, pressure, vibration, and temperature. The brain is able to
decipher what type of sensation was felt based on the type of mechanoreceptor that
sends the signal: Pacinian corpuscle, Meissner corpuscle, Merkel cell, or Ruffini cor-
puscle (Figure 2-3). Pacinian corpuscles are responsible for detecting rapid vibrations
in the range of 100 - 500 Hz [Temlett, 2009]. Meissner corpuscles are most sensitive
to vibrations within the range of 30 - 50 Hz that accompany actions such as feeling
a textured surface [Purves et al., 2001]. Merkel cells are responsible for the sensation
of steady light touch. Ruffini corpuscles respond to skin stretching and contribute to
proprioception.
The primary structural elements of Pacinian corpuscles are a series of concen-
tric layers of lamellae (Figure 2-4), which appear similar to the layers of an onion.
Mechanically, the lamellae and their interconnections act as springs, and the fluid
between the lamellar surfaces acts as dashpots. Together, these components can be
modeled as a network of springs and dashpots that filter out low-frequency vibra-
tions [Loewenstein and Skalak, 1966, Biswas et al., 2015a,b]. Thus, the magnitude of
the action potential when Pacinian corpuscles are stimulated depends on vibration
frequency and displacement of skin depressing the nerve.
Free nerve endings
-Merkel cell(Tactile disc)
Tactile corpuscle(Meissner's corpuscle)
Ruffini corpuscle
Root hair plexus Larnellated corpuscle(Pacinian corpuscle)
Figure 2-3: Diagram showing the four types of mechanoreceptors in the skin: Paciniancorpuscle, Meissner corpuscle, Merkel cell, and Ruffini corpuscle [Blausen.com staff,2014].
26
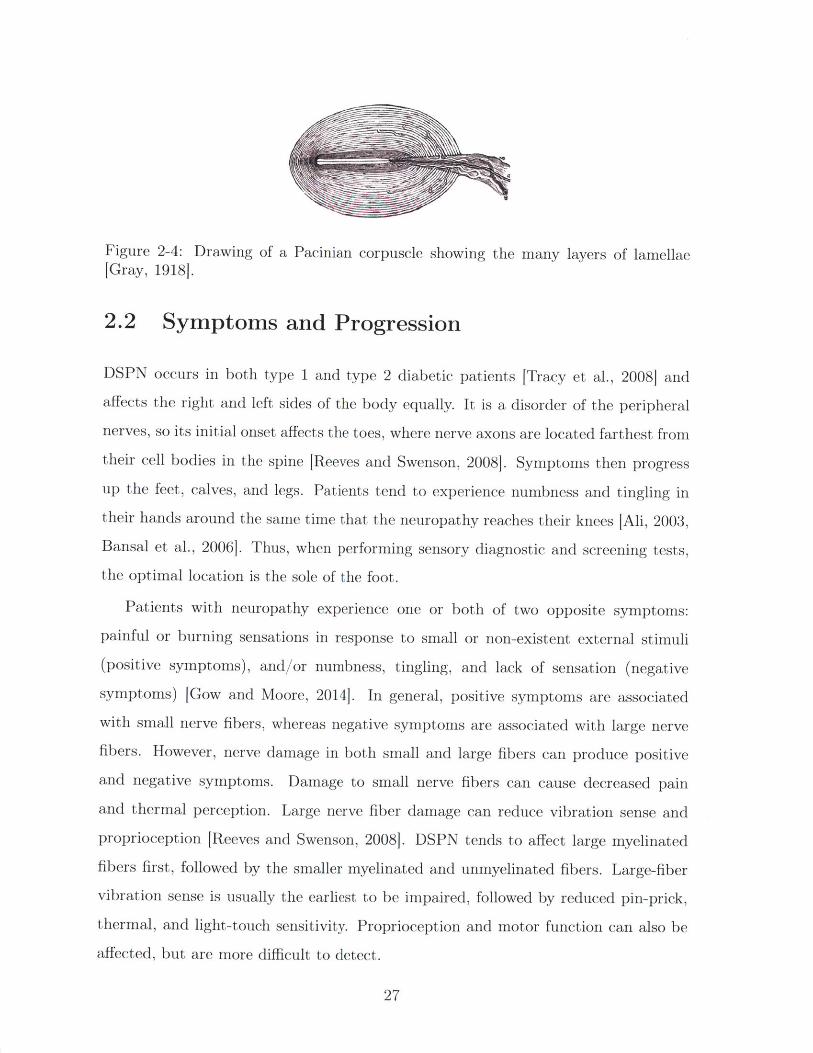
Figure 2-4: Drawing of a Pacinian corpuscle showing the many layers of lamellae[Gray, 1918J.
2.2 Symptoms and Progression
DSPN occurs in both type 1 and type 2 diabetic patients [Tracy et al., 2008] andaffects the right and left sides of the body equally. It is a disorder of the peripheral
nerves, so its initial onset affects the toes, where nerve axons are located farthest from
their cell bodies in the spine [Reeves and Swenson, 20081. Symptoms then progress
up the feet, calves, and legs. Patients tend to experience numbness and tingling in
their hands around the same time that the neuropathy reaches their knees [Ali, 2003,Bansal et al., 2006]. Thus, when performing sensory diagnostic and screening tests,the optimal location is the sole of the foot.
Patients with neuropathy experience one or both of two opposite symptoms:
painful or burning sensations in response to small or non-existent external stimuli
(positive symptoms), and/or numbness, tingling, and lack of sensation (negative
symptoms) [Gow and Moore, 2014]. In general, positive symptoms are associated
with small nerve fibers, whereas negative symptoms are associated with large nerve
fibers. However, nerve damage in both small and large fibers can produce positive
and negative symptoms. Damage to small nerve fibers can cause decreased pain
and thermal perception. Large nerve fiber damage can reduce vibration sense and
proprioception [Reeves and Swenson, 2008]. DSPN tends to affect large myelinated
fibers first, followed by the smaller myelinated and unmyelinated fibers. Large-fiber
vibration sense is usually the earliest to be impaired, followed by reduced pin-prick,
thermal, and light-touch sensitivity. Proprioception and motor function can also be
affected, but are more difficult to detect.
27
2.3 Treatment
Treating diabetic neuropathy is challenging because it requires consistent, prolonged
patient compliance. A variety of drugs are effective in lessening pain in painful neu-
ropathy [Calabek et al., 2014], but there is little evidence that pharmacological treat-
ments can reverse DSPN once it has developed [Garrow and Boulton, 20061. Thus,
DSPN treatment focuses on glycemic management and proper foot care.
Over the span of multiple years, glycemic control can prevent worsening of or
occasionally improve diabetic neuropathy [Tesfaye et al., 20101. Because controlling
blood sugar also decreases other diabetes symptoms and complications, it is one of
the first methods that doctors recommend to combat neuropathy.
Beyond glycemic management, proper foot care is essential in managing DSPN on
a day-to-day basis and preventing wounds. Patients should wear closed-toe shoes that
protect the feet from sharp objects, or sandals at a minimum, when walking outside.
Footwear specifically designed to offload pressure points is ideal. Shoes and orthotics
are available in both off-the-shelf and custom-made versions. Patients should inspect
their feet for calluses, cuts, and wounds daily. An active ulcer or infection needs to
be treated immediately by a medical professional [Gow and Moore, 20141.
An ulcer is difficult to treat in diabetics because they are prone to slow healing
due to an impaired immune response, which increases the risk of amputation. Thus,
diligent, long-term foot care and ulcer prevention is the best approach to treating
DSPN.
2.4 Financial Burden of Neuropathy
Neuropathy is the most common diabetes complication, with 24.6% of diabetics devel-
oping DSPN at some point. In comparison, 16.6% of diabetics develop retinopathy
[Kaveeshwar and Cornwall, 2014]. In India, patients with diabetes spend an av-
erage of Rs. 8,822 annually on diabetes-related expenses, 3.2% of which is spent
on laser treatment for retinopathy [Chandra et al., 2014]. This gives an average
28
of Rs. 282.3 spent on laser treatment per person per year. Assuming that treat-
ment for neuropathy costs roughly the same as that for retinopathy, we can esti-
mate that the cost of neuropathy is Rs. 282.3 x 24.6 = Rs. 418.35 per person perp 16.6%
year. There are 62 million diabetics in India [Kaveeshwar and Cornwall, 2014].
62 million x Rs. 418.35 ~ Rs. 26 billion ~ $239 million per year.
On the patient level, the financial burden of neuropathy depends on many factors.
Early in the clinical course of neuropathy when a patient has been diagnosed but
has not yet developed any wounds requiring treatment, custom orthotics or special
shoes may be the only major costs. An infected wound accrues cost when treatment
is needed. In the most extreme cases, mobility limitations caused by amputations
can lead to job loss. Thus, the most cost-effective way of relieving the financial bur-
den of neuropathy is simple preventative foot care measures to reduce the occurrence
of ulcers. Screening for DSPN will allow healthcare workers and doctors to iden-
tify patients for whom education and close monitoring are most needed to prevent
progression of DSPN.
29

30
Chapter 3
Existing Technology
Various methods and devices exist to diagnose or screen for neuropathy, each with its
own advantages and disadvantages. The gold standard for assessing nerve health is
the nerve conduction study (NCS), which measures a nerve's response to an electrical
stimulus. Vibration perception threshold (VPT) is a psychophysical test that requires
a patient to indicate when they feel a vibrating stimulus. Punch skin biopsy is the
most accurate way to determine the pathology of small nerve fibers. The monofila-
ment and tuning fork are both inexpensive instruments that can be used to quickly
and crudely gauge a patient's sensation. However, they are binary tests and therefore
give no insight into the severity of a patient's sensation loss. This chapter introduces
these diagnostic methods and explains the advantages and disadvantages of each. It
also explains the logic by which VPT was chosen to best fit the requirements and chal-
lenges of screening for sensory neuropathy in low-resource, poorly connected areas.
A summary of existing devices is shown in Table 3.1.
Table 3.1: Comparison of the overall advantages and disadvantages of existing devicesand the m-DFA.
Method Reliable Quantitative Cost Portable
Nerve conduction /// // $$$$ XBiothesiometery / / $$$ XPunch skin biopsy // // $$$$ XTuning fork/monofilament / X $ /m-DFA // / $$ /
31
3.1 Gold Standard: Nerve Conduction Study
The gold standard for diagnosing DSPN is nerve conduction velocity obtained through
sural nerve conduction studies (NCS) [Bril and Perkins, 20021. NCS is the only non-
invasive method in which nerve health can be directly evaluated.
NCS evaluates nerve function by producing a small, non-invasive electrical stimu-
lus through a surface electrode attached to the skin and measuring sural nerve action
potential (SNAP) amplitude and conduction velocity (CV) of the response in another
electrode attached a known distance away [Levinson, 2014]. The SNAP amplitude
and conduction velocity are also commonly referred to as nerve conduction amplitude
(NCA) and nerve conduction velocity (NCV), respectively. Motor and sensory nerves
throughout the body can be assessed, but the standard nerve targeted in diagnosing
DSPN is the sural nerve. The SNAP amplitude depends on the number of sensory
nerve fibers able to conduct impulses and is decreased by axon loss or damage. The
SNAP CV is calculated based on the time latency between the two electrodes and
decreases with nerve demyelination [Wilbourn, 19941. Together, SNAP amplitude
and CV can be used to diagnose large fiber neuropathy by plotting them on a graph
as in Figure 3-1 and determining which section they fall into.
Unfortunately, NCS is painful, costly (approximately $60 per limb in India), time-
consuming (up to 90 minutes per limb), requires specialized equipment that is unavail-
able in most hospitals and clinics, and is not reliable unless performed by a proficient
neurologist [Tesfaye et al., 20131, [Lee et al., 2014]. In addition, because NCS is only
sensitive to large fiber nerves, it is not useful in evaluating small fiber nerves.
3.2 Vibration Perception Threshold
Quantitative Sensory Testing (QST) is a psychophysical testing method in which a
patient is exposed to increasing levels of stimulus and asked to respond when they
first sense the stimulation. Vibration perception threshold is a type of QST that
gives a quantitative measure of a patient's ability to sense vibration. Although it has
32
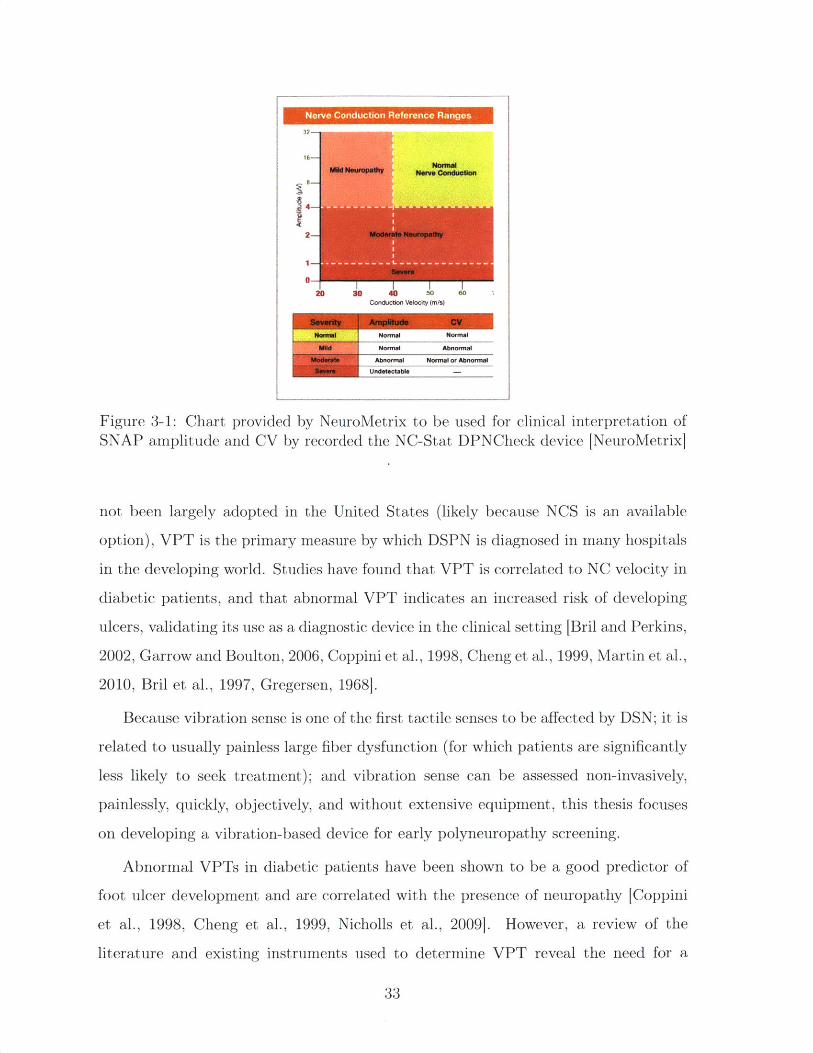
Figure 3-1: Chart provided by NeuroMetrix to be used for clinical interpretation ofSNAP amplitude and CV by recorded the NC-Stat DPNCheck device [NeuroMetrix]
not been largely adopted in the United States (likely because NCS is an available
option), VPT is the primary measure by which DSPN is diagnosed in many hospitals
in the developing world. Studies have found that VPT is correlated to NC velocity in
diabetic patients, and that abnormal VPT indicates an increased risk of developing
ulcers, validating its use as a diagnostic device in the clinical setting [Bril and Perkins,
2002, Garrow and Boulton, 2006, Coppini et al., 1998, Cheng et al., 1999, Martin et al.,
2010, Bril et al., 1997, Gregersen, 1968].
Because vibration sense is one of the first tactile senses to be affected by DSN; it is
related to usually painless large fiber dysfunction (for which patients are significantly
less likely to seek treatment); and vibration sense can be assessed non-invasively,
painlessly, quickly, objectively, and without extensive equipment, this thesis focuses
on developing a vibration-based device for early polyneuropathy screening.
Abnormal VPTs in diabetic patients have been shown to be a good predictor of
foot ulcer development and are correlated with the presence of neuropathy [Coppini
et al., 1998, Cheng et al., 1999, Nicholls et al., 2009]. However, a review of the
literature and existing instruments used to determine VPT reveal the need for a
33
Nerve Conduction Reference Ranges
32-
MU Neupadw omnalM~d euraalft Nerve Condtiotlom
2 Moderate Neuropathy
I-I
203 30 40 50 0Conduction Veaocity (m/s)
Normal I Noral Normal
Wld I Normal Abnormal
U Abnormal Normal or AbnormalUndatactabla
more consistent and accurate device that reports results in terms of displacement. In
addition, existing devices are outdated and power-hungry, as they require an outlet
to run. The small forces and displacements required to stimulate Pacinian corpuscles
indicate that a portable, battery-operated device is sufficient to determine degree of
VPT, even in severely neuropathic patients. Thus, this thesis focuses on developing
a portable device that can accurately measure and track VPT in diabetic patients
with and without DSN.
3.2.1 Biothesiometer
Vibration perception threshold is measured using a biothesiometer, which has a
fingertip-sized probe that vibrates at a fixed frequency and variable amplitude (Fig-
ure 3-2a). An operator places the probe at a testing site on the foot and applies a
pressure approximately equal to the weight of the handheld portion of the device.
The operator then turns a dial, which increases the vibration amplitude until the
patient indicates that he feels the vibration. This gives the patient's VPT for that
location of the foot. This procedure is repeated at several other locations on each
foot.
The Biothesiometer USA (Bio-Medical Instrument Co., Newbury, OH) is the most-
used device in biothesiometric studies available in the literature. A photo of the inside
of the device with labeled components is shown in Figure 3-2a. An electromagnet
that consists of a wire coil wrapped around an iron core is connected to a mains
power supply. The alternating current produces an alternating magnetic field, which
acts on a cantilevered steel plate. The attraction force of the steel plate to the coil
increases with increasing magnetic field strength, so that it vibrates at twice the mains
frequency (2 - 60Hz = 120Hz in the U.S. and 2 - 50Hz = 100Hz in India). Attached to
the vibrating steel plate is a 0.5in diameter plastic probe that is placed on the skin.
Vibration intensity is varied by manually turning a dial. An analog needle indicates
the voltage that is being inputted into the coil (Figure 3-2b).
One of the most common biothesiometers used in Indian hospitals is the The-
sioWIN (Recorders and Medicare Systems Pvt Ltd., Panchklula, India), which is
34
probe
(a)
(b)
Figure 3-2: Images of the Biothesiometer USA. (a) Inside of a typical biothesiometer.This is the inside of the handheld portion of a biothesiometer, with a probe thatcontacts the patient's foot. An alternating current in the solenoid produces an alter-nating magnetic field proportional to voltage, causing the metal spring with plasticprobe attached to vibrate. (b) Dial and readout on the Biothesiomter USA. Voltageis manually increased by the dial on the bottom left. When the patient begins to feelvibration, their VPT is indicated by the voltage readout (black tick marks) at thetop of the display.
35
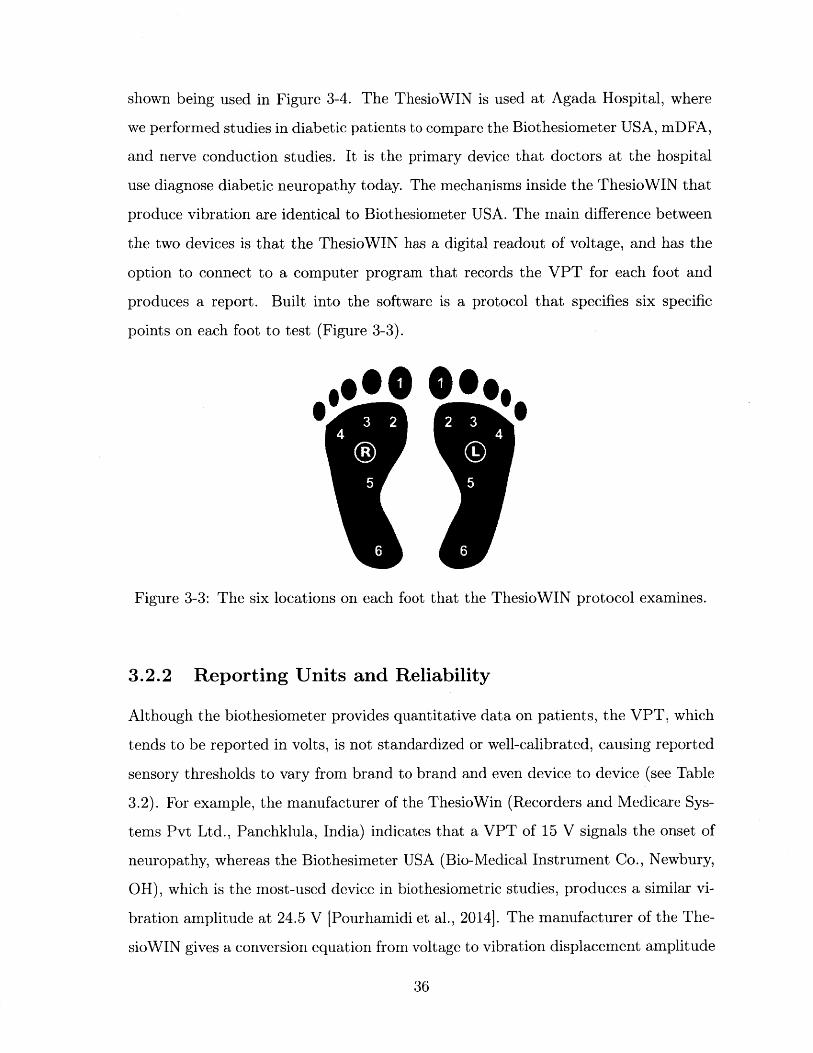
shown being used in Figure 3-4. The ThesioWIN is used at Agada Hospital, where
we performed studies in diabetic patients to compare the Biothesiometer USA, mDFA,
and nerve conduction studies. It is the primary device that doctors at the hospital
use diagnose diabetic neuropathy today. The mechanisms inside the ThesioWIN that
produce vibration are identical to Biothesiometer USA. The main difference between
the two devices is that the ThesioWIN has a digital readout of voltage, and has the
option to connect to a computer program that records the VPT for each foot and
produces a report. Built into the software is a protocol that specifies six specific
points on each foot to test (Figure 3-3).
..o0 0@.
3.2.2 Reporting Units and Reliability
Although the biothesiometer provides quantitative data on patients, the VPT, which
tends to be reported in volts, is not standardized or well-calibrated, causing reported
sensory thresholds to vary from brand to brand and even device to device (see Table
3.2). For example, the manufacturer of the ThesioWin (Recorders and Medicare Sys-
tems Pvt Ltd., Panchklula, India) indicates that a VPT of 15 V signals the onset of
neuropathy, whereas the Biothesimeter USA (Bio-Medical Instrument Co., Newbury,
OH), which is the most-used device in biothesiometric studies, produces a similar vi-
bration amplitude at 24.5 V IPourhamidi et al., 2014j. The manufacturer of the The-
sioWIN gives a conversion equation from voltage to vibration displacement amplitude
36
-- -1111--- 1 -- '11-1, 1-1-11- 11 -1-11 -1--'_'_"__ " 11-1 1~ 1 " -' -" - '- Jr. I I I , -, , ". -- , - , " " ' ---- , 11111- .11 - ., , , 11 1, 1 -1 1 -_ __ , " -__ - - - - .- - . - - _-,1-_'____'_'_" "" -_-
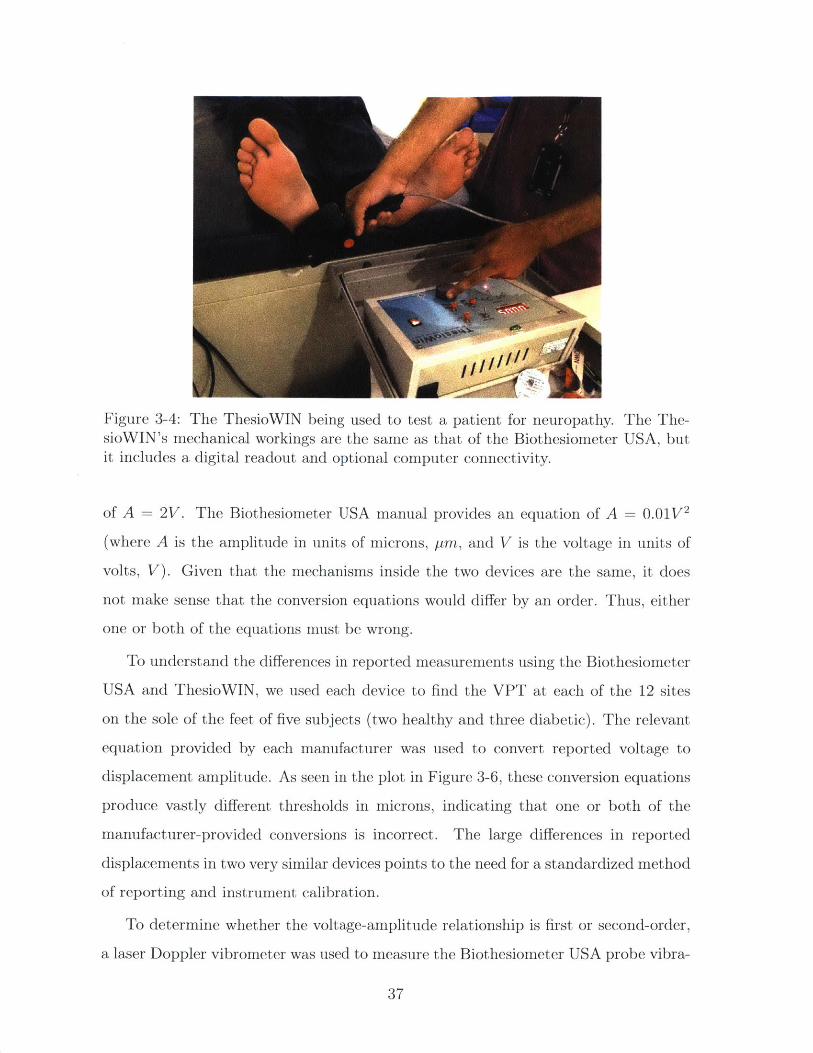
Figure 3-4: The ThesioWIN being used to test a patient for neuropathy. The The-sioWIN's mechanical workings are the same as that of the Biothesiometer USA, butit includes a digital readout and optional computer connectivity.
of A = 2V. The Biothesiometer USA manual provides an equation of A = 0.01V2
(where A is the amplitude in units of microns, pm, and V is the voltage in units of
volts, V). Given that the mechanisms inside the two devices are the same, it does
not make sense that the conversion equations would differ by an order. Thus, either
one or both of the equations must be wrong.
To understand the differences in reported measurements using the Biothesiometer
USA and ThesioWIN, we used each device to find the VPT at each of the 12 sites
on the sole of the feet of five subjects (two healthy and three diabetic). The relevant
equation provided by each manufacturer was used to convert reported voltage to
displacement amplitude. As seen in the plot in Figure 3-6, these conversion equations
produce vastly different thresholds in microns, indicating that one or both of the
manufacturer-provided conversions is incorrect. The large differences in reported
displacements in two very similar devices points to the need for a standardized method
of reporting and instrument calibration.
To determine whether the voltage-amplitude relationship is first or second-order,
a laser Doppler vibrometer was used to measure the Biothesiometer USA probe vibra-
37
Universal HospitalsMagd Cour Bashabo, Hrlbsd.Ph.No.6A4800I TheoW n
Patent Details Teat DetailsPatient Name: Dae :03/1012016 Time : 17: 23: 52 Vibration TeSt
Sex: MAge:35Yra. Wt:75kgs Ht:175cm Report Date: 20 / 01 / 2017BSA: 1.903 m BMI : 24.49 Kgm 2 Report Time: 12: 53: 32
12.02 V
24.04 pm
9.79 V 6.11 V
19.58 pm 12.22 pm
12.41 V
24.82 pm
9.59 V
19.18 pm
11 .37 V
22.74 pm
InterpretationRight Foot Left Foot
Toe : Normal ToO : NormFirst Metatarsal Head : Normal First Metatarsal Head : NormThird Metatarsal Head : Normal Third Metatarsal Head : NormFifth Metatarsal Head : Normal Fifth Metatarsal Head : NormInstep : Normal Instep : NormHeel :Normal Heel :Norm
This may be clinically co-relatedC2003-08 Genesis Medical Systems Pvt. Ltd.
9.79 V
19.58 pm
8.54 V 11.82 V
17.08 prn 23.64 pm
9.82 V
19.64 pm
12.52 V
25.04 pm
12.05 V
24.10 pmn
alaiaial __________
al Physicianal
www.geneslsmecdicals.comi
Figure 3-5: A sample report produced by the ThesioWIN software [Genesis MedicalSystems]
38
100 1_1_1_1_1_1_1* ThesioWin (A = 2V)
90 * Biothesiometer USA (A =0.0 1*V 2
80 -
S70-
60 -,
50
40-
20 -3
207
10- 0 a..0 L_ I0 ---
0 5 10 15 20 25 30 35 40 45 50voltage [V]
Figure 3-6: Graph of reported voltage versus vibration amplitude as specified bymanufacturer-defined conversion equations. The inconsistency between the two de-vices indicates an error in one or both of the conversion equations.
tion amplitude as it vibrated in air at varying voltages. Results are shown in Figure
3-7, which indicates a roughly quadratic relationship between voltage and amplitude.
The order of the curve is consistent with the Biothesiometer USA manual. However,
the coefficient in front of the squared term is noticeably different.
To test the reliability of the analog voltage dial in the Biothesiometer USA, the
voltage across the ends of the coil was measured as the dial was slowly turned. The
graph in Figure 3-8 reveals that the dial is off by a factor of 1.33. This further
reinforces the danger of relying on the analog dial and conversion equation to report
VPT, and reinforces the need for a sensor to measure actual vibration amplitude.
Although voltage is related to the energy delivered to the skin, the amplitude
of displacement depends on the force produced by the mechanics of the device, the
dynamic impedance of the skin, and the pressure with which the operator presses
the probe onto the skin. Furthermore, the vibration intensity that a biothesiometer
produces at a particular voltage varies from device to device (even among the same
brand) because tiny variations in manufacturing and assembly propagate through
39
80
70
-E
60
50
40
30
20
10
0
-IA0
Vibrometer measured- - Fit curve: A = 0.029147V2 + -0.045466V + -0.31275
- Predicted displacement (according to device manual) .
-, I0 5 10 15 20 25 30 35 40 45 50
voltage [V]
Figure 3-7: Graph of Biothiosiometer USA voltage versus vibration amplitude in air asmeasured by a laser Doppler vibrometer. There appears to be a quadratic relationshipbetween voltage and amplitude. The red curve is a least-squares quadratic fit curve,and the green curve represents the predicted displacement based on the providedmanual.
0 5 10 15 20voltage reading [V]
25 30 35
Figure 3-8: Graph of voltage reading from the built-in Biothesiometer indicator versusactual measured voltage across the two leads of the coil. According to this graph, thedisplay needle is off by a factor of 1.33.
40
- Fitline: y =1.328x +0.78827* Measured
50
45
40
,35
30
> 25-a
20
E15
10
5
n
-10
the device and have a magnified effect at the tip. Thus, only reporting the voltage
does not give us the complete picture of what is going on at the level of the physical
vibration. Recognizing the inconsistencies among devices and studies involving VPT
reported in volts, Goldberg and Lindblom developed a standardized approach to
determining VPT and proposed that results be reported in microns to reflect actual
probe movement to allow for congruity across devices [Goldberg and Lindblom, 1979].
3.2.3 Examination Method
Several studies have attempted to characterize reference VPTs in healthy and neu-
ropathic populations (see Table 3.2). Although most studies use the Biothesiometer
USA, the large range of testing approaches and lack of a standardized process makes
comparing results across studies difficult. The most common examination method is
the mean of three VPT readings on the plantar surface of the great toe. Table 3.2
summarizes VPT locations, methods, devices, and thresholds presented in published
studies throughout the literature.
3.2.4 Vibration Frequency
Pacinian corpuscles, the mechanoreceptors that respond to vibration, are most sen-
sitive around the 100-300 Hz range, and VPT tends to increase at lower and higher
frequencies [Temlett, 2009]. Due to the physical structure of biothesiometers, their
probe tips vibrate at twice the frequency of the alternating current from the outlet:
120Hz in the U.S., which is within the sensitive range of Pacinian corpuscles. Unlike
displacement amplitude, frequency has been measured to be accurate and consistent
across biothesiometers at either 100 Hz or 120 Hz, depending on geographic location.
3.2.5 Impact of Age, Gender, Weight, and Race
In normal populations, VPT increases logarithmically with age [Nielsen, 1972]. One
study calculated an age-adjusted "standard deviation" score, equal to the number of
standard deviations a patient's threshold is away from the mean of healthy subjects
41
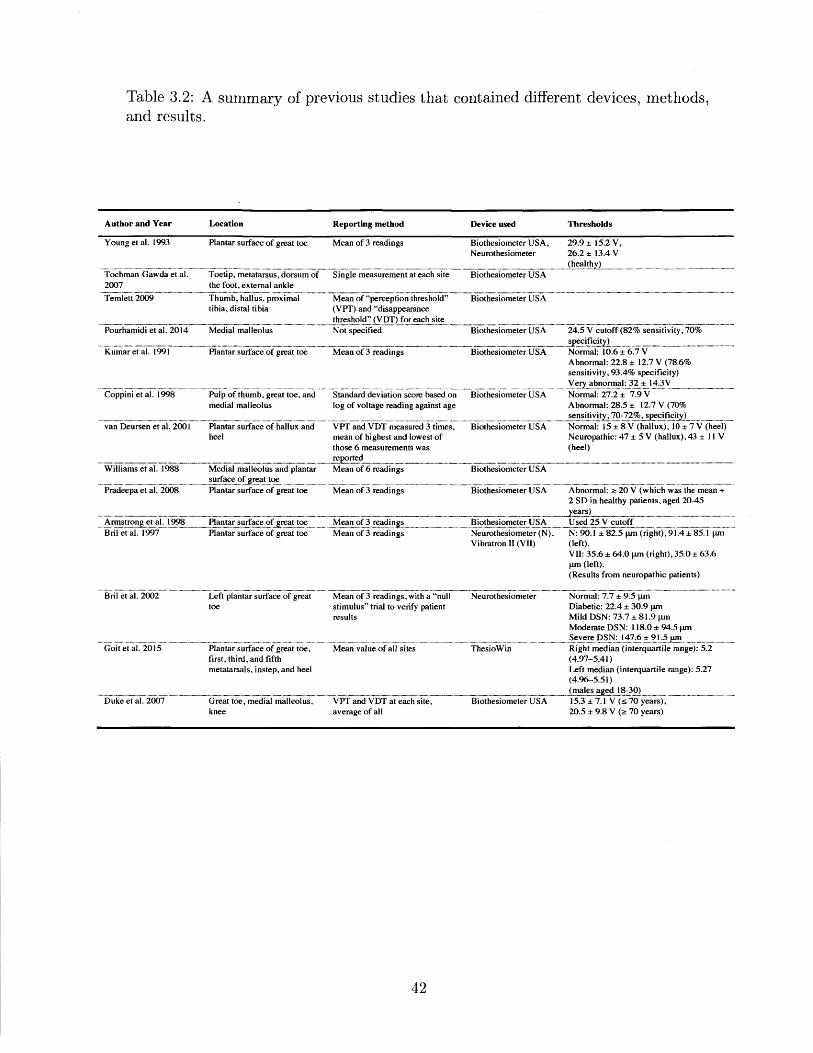
Table 3.2: A summary of previous studies that contained different devices, methods,and results.
Author and Year Location Reporting method Device used Thresholds
Young et al. 1993 Plantar surface of great toe Mean of 3 readings Biothesiometer USA, 29.9 15.2 V,Neurothesiometer 26.2 13.4 V
(healTochman-Gawda et al. Toetip, metatarsus, dorsum of Single measurement at each site Biothesiometer USA2007 the foot, external ankle
Temlett 2009 Thumb, hallus, pmximal Mean of "perception threshold" Biothesiometer USAtibia, distal tibia (VPT) and "disappearance
threshold" (VDT) for each sitePourhamidi et al. 2014 Medial malleolus Not specified Biothesiometer USA 24.5 V cutoff (82% sensitivity, 70%
Kumar et al. 1991 Plantar surface of great toe Mean of 3 readings Biothesiometer USA Normal: 10.6 6.7 VAbnormal: 22.8 12.7 V (78.6%sensitivity, 93.4% specificity)Very abnormal: 32:1-143V
Coppini et al. 1998 Pulp of thumb, great toe, and Standard deviation score based on Biothesiometer USA Normal: 27.2 7.9 Vmedial malleolus log of voltage reading against age Abnormal: 28.5 12.7 V (70%
sensitivity, 70-72%, specificity)van Deursen et al. 2001 Plantar surface of hallux and VPT and VDT measured 3 times, Biothesiometer USA Normal: 15 8 V (hallux), 10 7 V (heel)
heel mean of highest and lowest of Neuropathic: 47 5 V (hallux),43 I I Vthose 6 measurements was (heel)..............reported
Williams et al. 1988 Medial malleolus and plantar Mean of 6 readings Biothesiometer USA
surfae o reat toePradeepa et al. 2008 Plantar surface of great toe Mean of 3 readings Biothesiometer USA Abnormal: 2 20 V (which was the mean +
2 SD in healthy patients, aged 20-45
Armstrong et at. 1998 Planta urfe of toe Mean of 3 readings Biothesiometer USA Used 25 V cutoffBril et al. 1997 Plantar surface of great toe Mean of 3 readings Neurothesiometer (N), N: 90.1 82.5 pm (fight), 91.4 85.1 pm
Vibratron II (VII) (left).VII: 35.6 64.0 [Lm (right), 35.0 63.6pm (left).(Results from neuropathic patients)
Bril et at. 2002 Left plantar surface of great Mean of 3 readings, with a "nul Neurothesiometer Normal: 7.7 9.5 pmtoe stimulus" trial to verify patient Diabetic: 22.4 30.9 pm
results Mild DSN: 73.7 81.9 pmModerate DSN: 118.0 94.5 pmSevere DSN: 147.6 915pm
Goit et al. 2015 Plantar surface of great toe, Mean value of all sites ThesioWin Right median (interquartile range): 5.2first, thin, and fifth (4.97-5.41)metatarsals, instep, and heel Left median (interquartile range): 5.27
(4.96-5.51).........-... (nmes aged 8-30)
Duke et al. 2007 Great toe, medial malleolus, VPT and VDT at each site, Biothesiometer USA 15.3 7.1 V (s70 years),knee average of all 20.5 9.8 V ( 70 years)
42
of a similar age, and defined a patient's VPT as abnormal if they fell above the 95th
percentile [Coppini et al., 19981. Other research shows that VPT in healthy subjects
also varies based on testing location, gender, weight, and race [van Deursen et al.,
2001, Dimitrakoudis and Bril, 2002, Nicholls et al., 2009]. Aside from age, there is no
consensus on how these parameters should be reflected in an adjusted VPT.
3.3 Other Methods
Aside from nerve conduction studies and vibration perception threshold, other meth-
ods to detect diabetic neuropathy include punch skin biopsy, monofilament tests, and
tuning fork tests.
3.3.1 Punch Skin Biopsy
Punch skin biopsy is a reliable and trusted method of evaluating small-fiber nerve
function [Tesfaye et al., 2013]. However, it is invasive, and like NC studies, is time-
and resource-consuming. In addition, because it only assesses damage to small-fibers,
skin biopsy is not effective in detecting early signs of neuropathy that damage large
fibers.
3.3.2 Monofilament
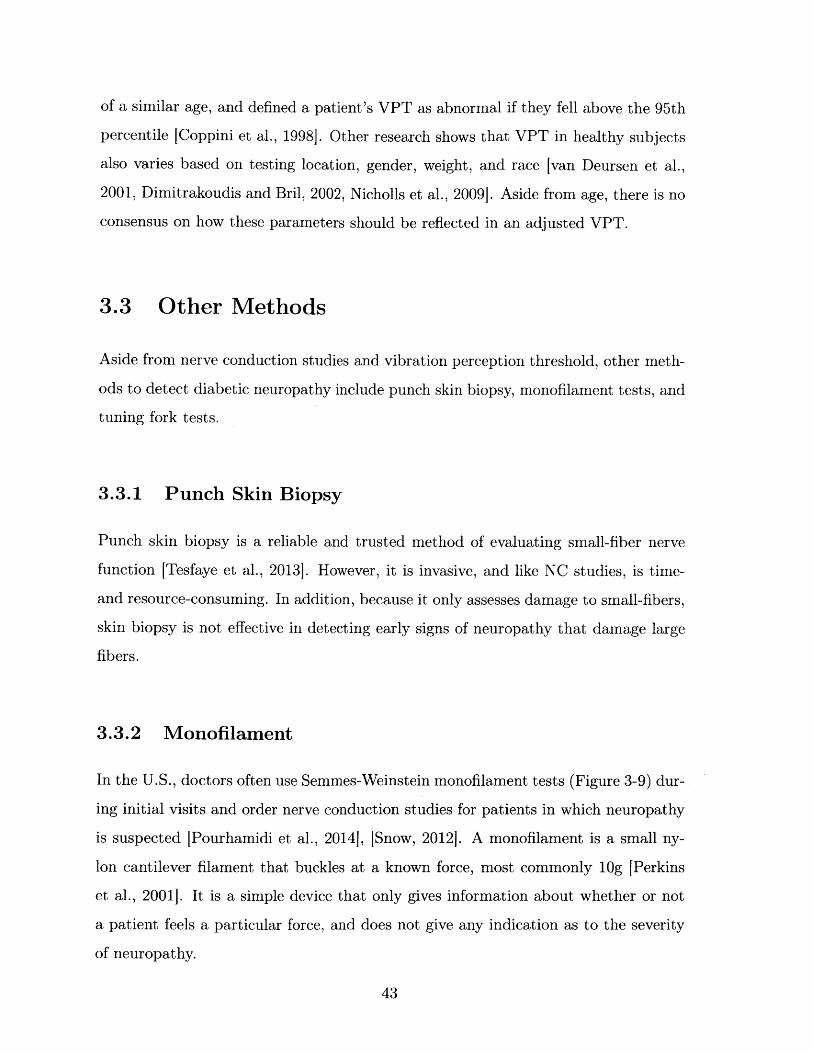
In the U.S., doctors often use Semmes-Weinstein monofilament tests (Figure 3-9) dur-
ing initial visits and order nerve conduction studies for patients in which neuropathy
is suspected [Pourhamidi et al., 20141, [Snow, 20121. A monofilament is a small ny-
lon cantilever filament that buckles at a known force, most commonly 10g [Perkins
et al., 20011. It is a simple device that only gives information about whether or not
a patient feels a particular force, and does not give any indication as to the severity
of neuropathy.
43
Figure 3-9: A Semmes-Weinstein monofilament is a sharp filament that buckles undera known force [Servier Medical Art, 2013].
3.3.3 Tuning Fork
In addition to the monofilament test, doctors often use a tuning fork to verify suspicion
that a patient is losing sensation in the feet. 128 Hz tuning forks are typically used in
the primary care setting [Lee et al., 2014]. Vibration intensity depends on the variable
manner in which the instrument is first struck, and fades as it is damped by the skin
and over time [Temlett, 2009]. Thus, the vibration intensity cannot be controlled and
tuning forks cannot provide a quantitative indication of severity of neuropathy.
44
Chapter 4
Design
This chapter outlines the design process and reasoning behind major decisions, and
describes the mechanical, electrical, and software components of the final prototype.
The first section provides an outline of functional requirements and defines design
parameters that stem from them. Next, potential options for an actuator, sensor,
and controller are examined, and the decisions for each are explained based on the
functional requirements and design parameters. The second half of this chapter de-
scribes the electrical configuration, mobile and computer software, and mechanical
design of the final prototype.
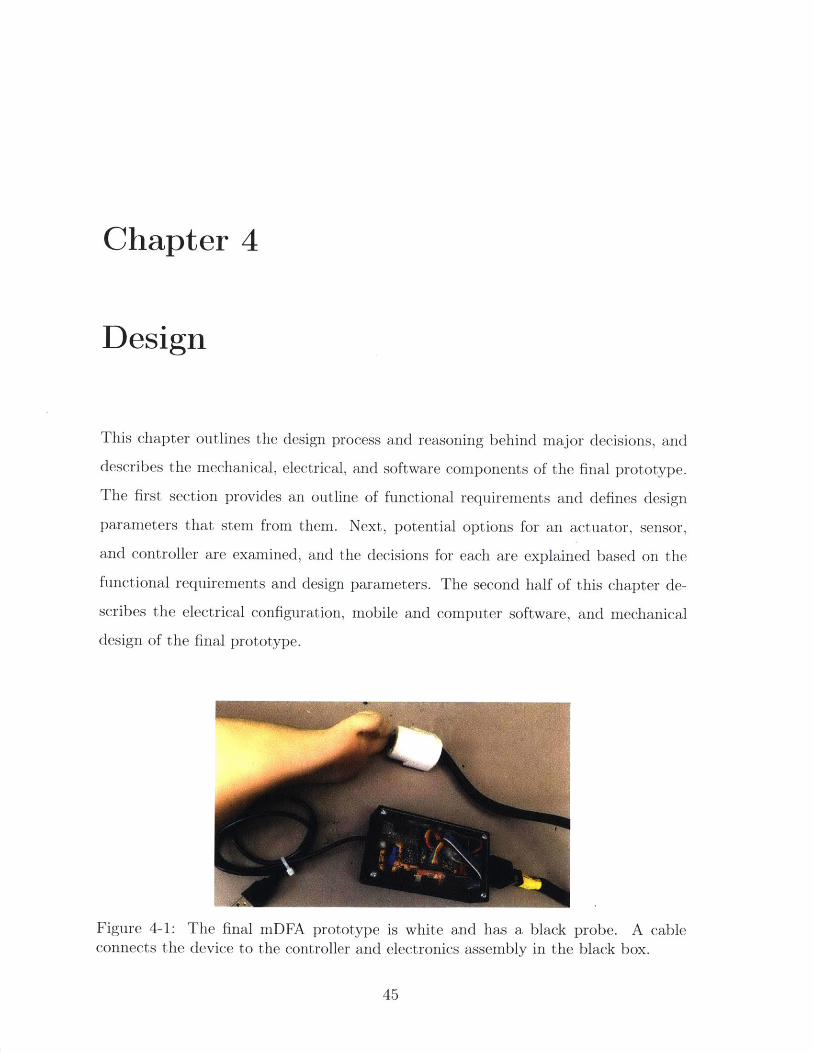
Figure 4-1: The final mDFA prototype is white and has a black probe. A cableconnects the device to the controller and electronics assembly in the black box.
45
4.1 Functional Requirements
The motivation behind the mDFA is to prevent neuropathy-related lower leg injuries
that can severely impact patients' quality of life and ability to support themselves,
particularly in low-resource areas of India. In addition to technical, biological, and
psychophysical considerations, the social context in which patients live and receive
care significantly impacted the design approach.
With an understanding of the advantages and disadvantages of existing technology,
India's healthcare system, and patient preferences, the goal of the mDFA is to provide
a device that can be used to identify diabetic patients who may be losing foot sensation
at the early stages of neuropathy. This goal leads to the functional requirements that
are discussed in this section: the mDFA must be portable, quantitative, intuitive,
quick, and acceptable (Table 4.1).
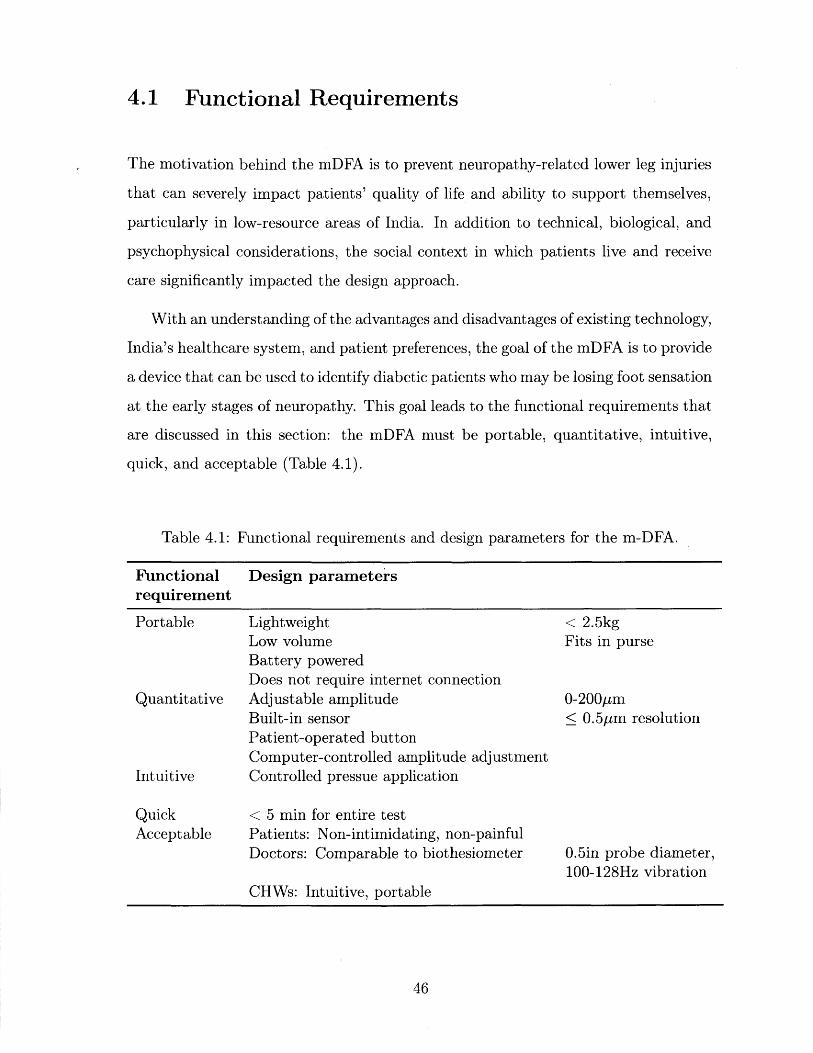
Table 4.1: Functional requirements and design parameters for the m-DFA.
Functionalrequirement
Portable
Quantitative
Intuitive
QuickAcceptable
Design parameters
LightweightLow volumeBattery poweredDoes not require internet connectionAdjustable amplitudeBuilt-in sensorPatient-operated buttonComputer-controlled amplitude adjustmentControlled pressue application
< 5 min for entire testPatients: Non-intimidating, non-painfulDoctors: Comparable to biothesiometer
< 2.5kgFits in purse
0-200pm< 0.5pm resolution
0.5in probe diameter,100-128Hz vibration
CHWs: Intuitive, portable
46
MR _-_--,","J)WJW, -, M"fflR_
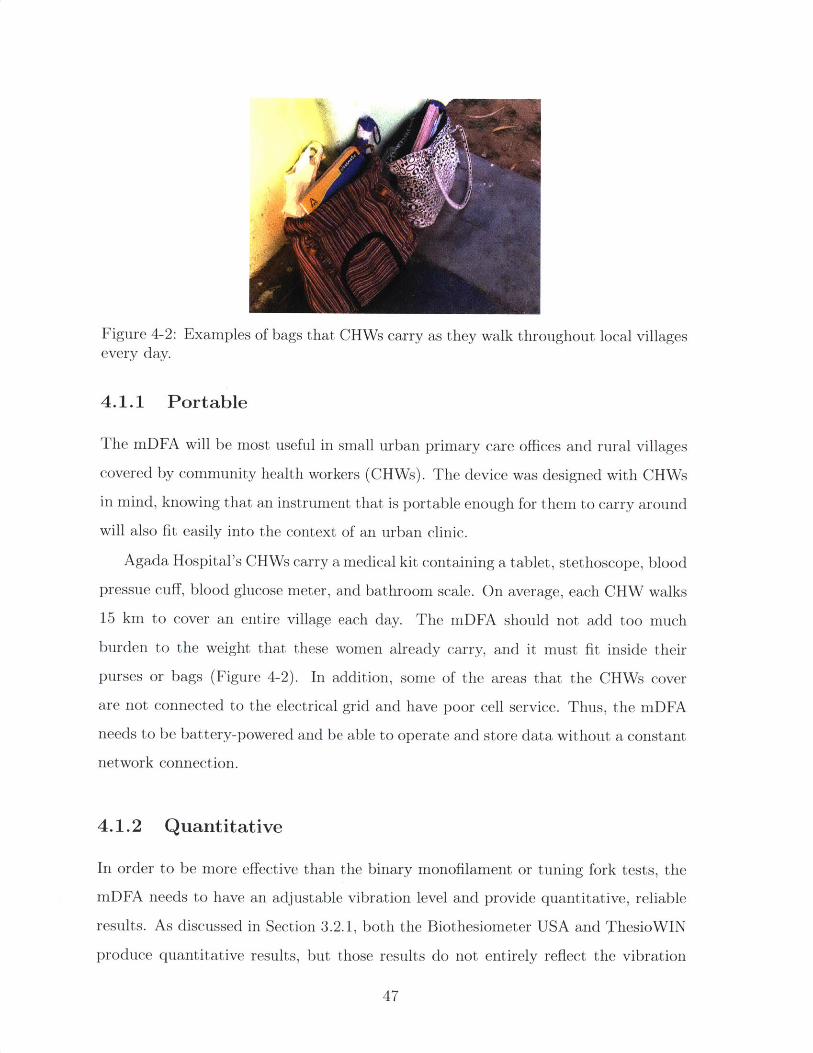
Figure 4-2: Examples of bags that CHWs carry as they walk throughout local villagesevery day.
4.1.1 Portable
The mDFA will be most useful in small urban primary care offices and rural villages
covered by community health workers (CHWs). The device was designed with CHWs
in mind, knowing that an instrument that is portable enough for them to carry around
will also fit easily into the context of an urban clinic.
Agada Hospital's CHWs carry a medical kit containing a tablet, stethoscope, blood
pressue cuff, blood glucose meter, and bathroom scale. On average, each CHW walks
15 km to cover an entire village each day. The mDFA should not add too much
burden to the weight that these women already carry, and it must fit inside their
purses or bags (Figure 4-2). In addition, some of the areas that the CHWs cover
are not connected to the electrical grid and have poor cell service. Thus, the mDFA
needs to be battery-powered and be able to operate and store data without a constant
network connection.
4.1.2 Quantitative
In order to be more effective than the binary monofilament or tuning fork tests, the
mDFA needs to have an adjustable vibration level and provide quantitative, reliable
results. As discussed in Section 3.2.1, both the Biothesiometer USA and ThesioWIN
produce quantitative results, but those results do not entirely reflect the vibration
47
that a patient actually feels. Thus, it is important to include a sensor that measures
vibration at the probe.
Most published studies that determine VPT thresholds only assess subjects with
normal sensation. Of the studies that involve subjects with impaired sensation, only
Bril and Perkins provide results in units of microns [Bril and Perkins, 20021. Their
study involved 478 subjects including non-diabetics, diabetics without known neu-
ropathy, and diabetics with known DSPN. They reported an average VPT of 7.7
9.5pm in normals; 22.4 30.9pm in diabetics without neuropathy; 73.7 t 81.9pm
in diabetics with mild neuropathy, 118.0 94.5pum in diabetics with moderate neu-
ropathy, and 147.6 91.5pm in diabetics with severe neuropathy.
Based on the Bril and Perkins, we decided to design the mDFA with a vibration
amplitude up to 200pm. This means that all but the most severely neuropathic
patients will have a VPT within the range of the mDFA. Any patient with a VPT
above 200pm definitely needs treatment, however, above that point, the exact VPT is
not clinically relevant. The advantage of designing for a specific vibration amplitude
instead of making the device as powerful as possible is that the vibrator will be smaller
and lighter, allowing for a smaller battery, greater portability, and lower cost.
Another simple way to increase accuracy of the reading is to introduce a button
for the patient to push when he or she feels the vibration. This eliminates the time
delay and consequent errors due to the patient verbally alerting the operator and
waiting for the operator to stop turning the dial and take a reading.
Finally, instead of relying on the operator to turn a dial that may have backlash,
hysteresis, or otherwise cause a reading to overshoot a patient's actual VPT, the
mDFA should have the option of having a computer-controlled amplitude ramp. This
also allows us to experiment with various psychophysical methods if desired. In the
scope of this thesis we only use steadily increasing amplitude, but future work could
include experimentation to determine the optimal psychophysical method.
48
4.1.3 Intuitive
In order for the device to be a viable solution to neuropathy screening, it must be
intuitive and accessible to those who will be operating it. This includes people who
fall within the large spectrum of minimally trained healthcare workers, to private
primary care doctors. Because the experience level of users will be highly variable, it
is essential that the device perform as consistently as possible across users.
Probe-to-skin application force should be standardized so that results are not
blurred by either too light or too strong of a baseline pressure. Some options to
accomplish this include: incorporating a force-sensing resistor (FSR) with readout;
strapping the device to the foot; spring-loading the device; including some sort of
buckling mechanism that produces constant force when bucked; or adding a surround
support that stabilizes the device against the foot. With the exception of FSR and
a buckling mechanism, each of these options was tested in at least one prototype
iteration. The final mDFA design uses a surround support to anchor the device to
the foot.
4.1.4 Quick
During each patient visit, a CHW records the patient's weight, takes their blood
pressure and heart beat, tests their blood glucose levels, goes through a survey of
questions, and sits with the patient as they watch educational videos. The mDFA
testing protocol cannot add too much time to the total visit.
In addition, patient fatigue and focus must be taken into account when determin-
ing test duration. Because the test requires that the patient pay attention and react
as quickly as possible, we must stay well within a range that allows a patient to focus.
Temporary vibration-induced paraesthesia must also be avoided.
Taking patient fatigue and vibratory analgesia into account, and after consulting
both the R-NCDPP CHWs and their supervisor, we settled on a maximum testing
duration of five minutes.
The maximum duration requirement of five minutes can be met by (1) optimizing
49
the testing protocol to get the most accurate data with the least number of readings,
and (2) incorporating software the guides the operator through the protocol and
involves a minimum amount of clicking.
4.1.5 Acceptable
A perfectly designed machine that is never used is a failure. The mDFA must be
acceptable by patients, doctors, and operators in order to succeed. Different factors
are important to each of these stakeholders.
Patients must consent to performing the test. The device cannot be intimidating
or threatening, and they need to be assured that the vibration does not hurt or tickle.
They also need to be comfortable enough to lie supine and allow the operator to touch
their feet with the device.
Doctors must trust the results of the test. In order for doctors to trust and
interpret mDFA results, they need to understand how the device compares to regular
biothesiometers and nerve conduction studies, which they are already familiar with.
Thus, we aim to duplicate the biothesiometer in as many characteristics as possible,
while improving on the pain points. The mDFA has a 0.5in diameter probe, and
vibrates at a frequency of 100-128Hz.
CHWs must be willing to operate the device. It needs to be simple and intuitive
enough to use, and portable enough to carry on foot every day.
4.2 Actuator Selection
The actuator is the component that has the highest impact on total device cost, size,
weight, and power consumption. Various actuation strategies were weighed against
each other in order to select the best type for this application. The available options,
including eccentric rotating mass (ERM) motor, linear resonant actuator (LRA),
piezoelectric transducer, solenoid, and voice coil motor, are discussed in this section
and summarized in Table 4.2. Based on a Pugh chart comparing the options in Table
4.3, a linear voice coil actuator was selected.
50
...... ... .
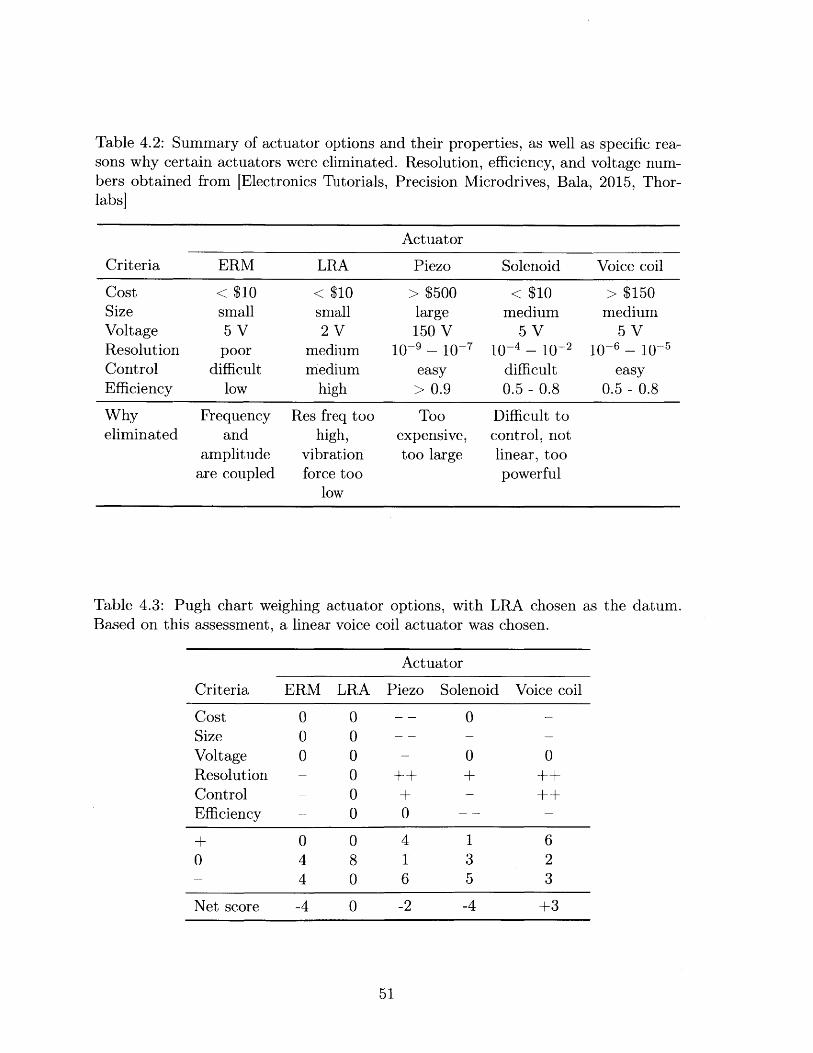
Table 4.2: Summary of actuator options and their properties, as well as specific rea-sons why certain actuators were eliminated. Resolution, efficiency, and voltage num-bers obtained from [Electronics Tutorials,labs]
Precision Microdrives, Bala, 2015, Thor-
Actuator
Criteria ERM LRA Piezo Solenoid Voice coil
Cost < $10 < $10 > $500 < $10 > $150Size small small large medium mediumVoltage 5 V 2 V 150 V 5 V 5 VResolution poor medium 10-9 - 10-7 10-4 - 10-2 10-6 - 10-5Control difficult medium easy difficult easyEfficiency low high > 0.9 0.5 - 0.8 0.5 - 0.8
Why Frequency Res freq too Too Difficult toeliminated and high, expensive, control, not
amplitude vibration too large linear, tooare coupled force too powerful
low
Table 4.3: Pugh chart weighing actuator options, with LRA chosen as the datum.Based on this assessment, a linear voice coil actuator was chosen.
Actuator
Criteria ERM LRA Piezo Solenoid Voice coil
Cost 0 0 -- 0Size 0 0 --
Voltage 0 0 - 0 0Resolution - 0 ++ + ++Control - 0 + - ++Efficiency - 0 0 -- -
+ 0 0 4 1 60 4 8 1 3 2- 4 0 6 5 3
Net score -4 0 -2 -4 +3
51
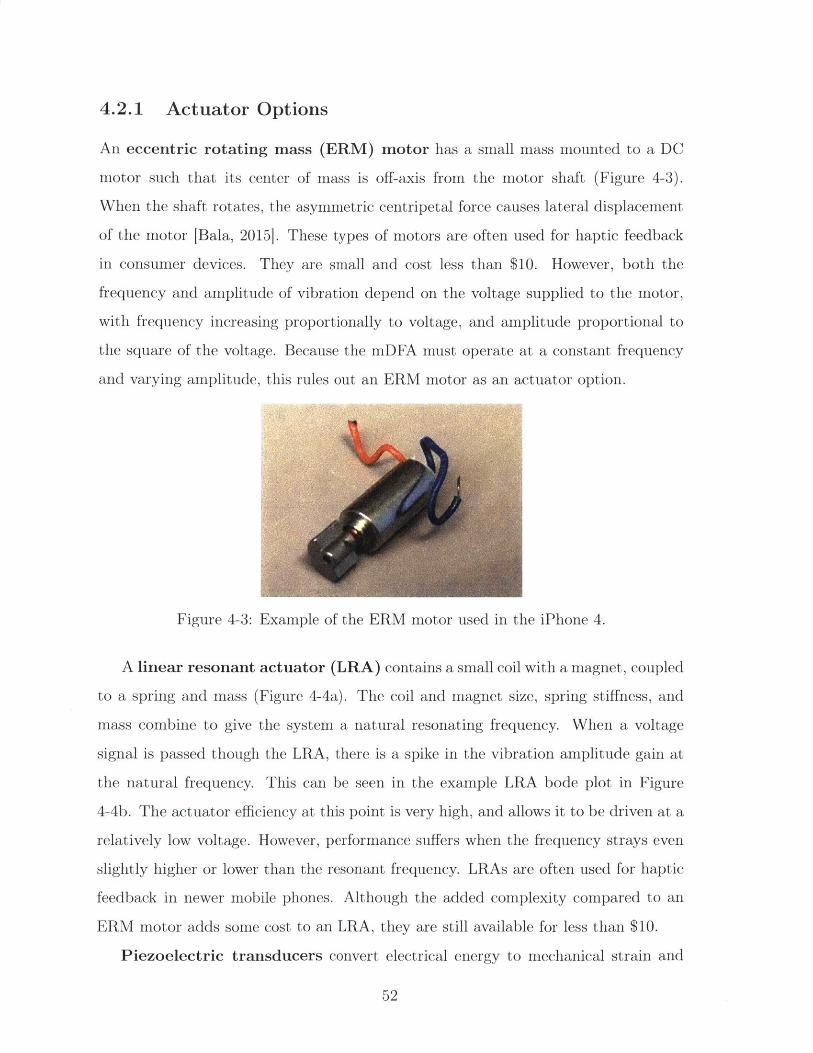
4.2.1 Actuator Options
An eccentric rotating mass (ERM) motor has a small mass mounted to a DC
motor such that its center of mass is off-axis from the motor shaft (Figure 4-3).
When the shaft rotates, the asymmetric centripetal force causes lateral displacement
of the motor [Bala, 2015]. These types of motors are often used for haptic feedback
in consumer devices. They are small and cost less than $10. However, both the
frequency and amplitude of vibration depend on the voltage supplied to the motor,
with frequency increasing proportionally to voltage, and amplitude proportional to
the square of the voltage. Because the mDFA must operate at a constant frequency
and varying amplitude, this rules out an ERM motor as an actuator option.
Figure 4-3: Example of the ERM motor used in the iPhone 4.
A linear resonant actuator (LRA) contains a small coil with a magnet, coupled
to a spring and mass (Figure 4-4a). The coil and magnet size, spring stiffness, and
mass combine to give the system a natural resonating frequency. When a voltage
signal is passed though the LRA, there is a spike in the vibration amplitude gain at
the natural frequency. This can be seen in the example LRA bode plot in Figure
4-4b. The actuator efficiency at this point is very high, and allows it to be driven at a
relatively low voltage. However, performance suffers when the frequency strays even
slightly higher or lower than the resonant frequency. LRAs are often used for haptic
feedback in newer mobile phones. Although the added complexity compared to an
ERM motor adds some cost to an LRA, they are still available for less than $10.
Piezoelectric transducers convert electrical energy to mechanical strain and
52
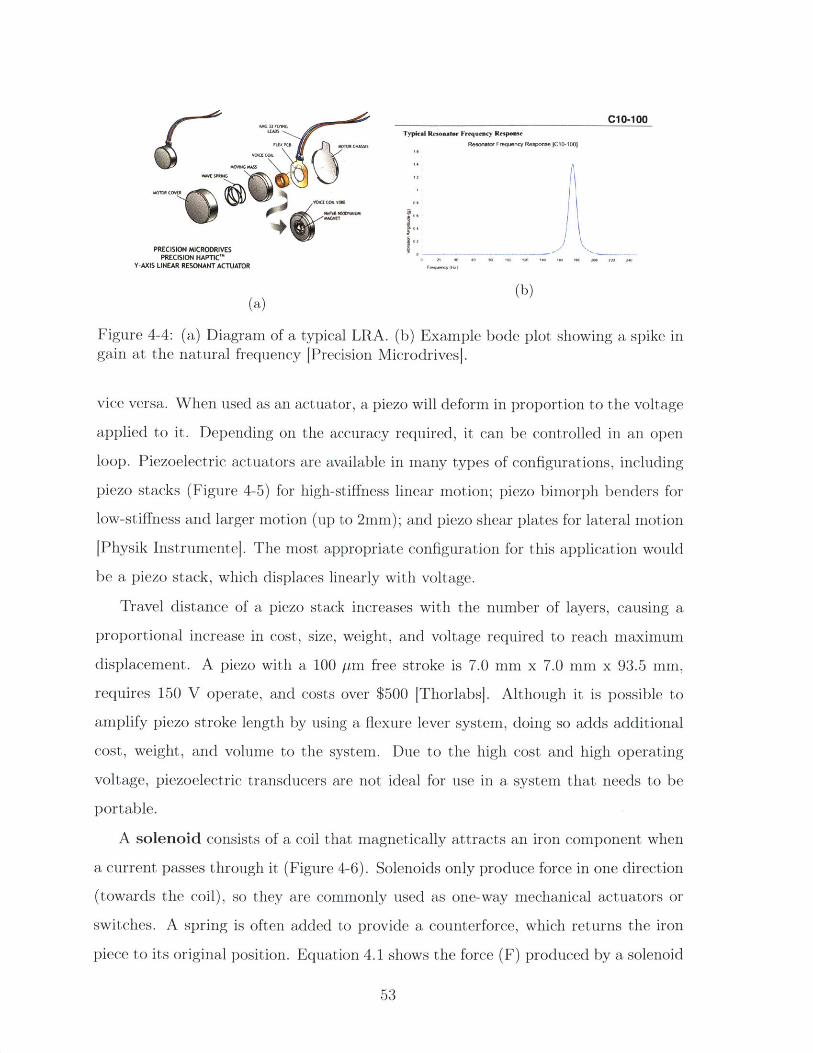
m~m...C1o-100LEAM Typical Resonater Frequency Response
Vol a COIL P" KS IResonaler Frequency Response ICI-100j
VWESPMNG1 2
M0101 cov"1%
Mt cf. OR lue U
PRECISION MICRODRIVESP~RECISION HAPInC'"2 12 0 12 1" 202 M
Y-AXIS LINEAR RESONANT ACTUATOR r
(a) (b)
Figure 4-4: (a) Diagram of a typical LRA. (b) Example bode plot showing a spike ingain at the natural frequency [Precision Microdrives].
vice versa. When used as an actuator, a piezo will deform in proportion to the voltage
applied to it. Depending on the accuracy required, it can be controlled in an open
loop. Piezoelectric actuators are available in many types of configurations, including
piezo stacks (Figure 4-5) for high-stiffness linear motion; piezo bimorph benders for
low-stiffness and larger motion (up to 2mm); and piezo shear plates for lateral motion
[Physik Instrumente]. The most appropriate configuration for this application would
be a piezo stack, which displaces linearly with voltage.
Travel distance of a piezo stack increases with the number of layers, causing a
proportional increase in cost, size, weight, and voltage required to reach maximum
displacement. A piezo with a 100 pm free stroke is 7.0 mm x 7.0 mm x 93.5 mm,
requires 150 V operate, and costs over $500 [Thorlabs]. Although it is possible to
amplify piezo stroke length by using a fiexure lever system, doing so adds additional
cost, weight, and volume to the system. Due to the high cost and high operating
voltage, piezoelectric transducers are not ideal for use in a system that needs to be
portable.
A solenoid consists of a coil that magnetically attracts an iron component when
a current passes through it (Figure 4-6). Solenoids only produce force in one direction
(towards the coil), so they are commonly used as one-way mechanical actuators or
switches. A spring is often added to provide a counterforce, which returns the iron
piece to its original position. Equation 4.1 shows the force (F) produced by a solenoid
53
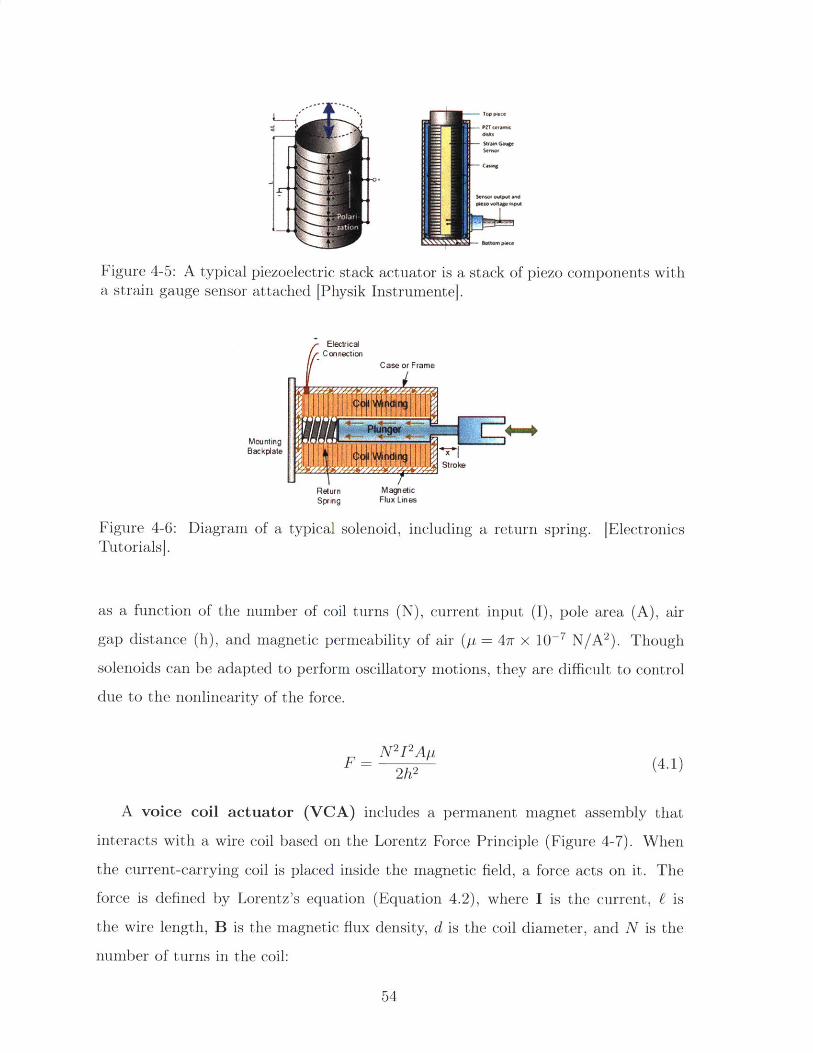
Figure 4-5: A typical piezoelectric stack actuator is a stack of piezo components witha strain gauge sensor attached [Physik Instrumentel.
ElectricalConnection
Case or Frame
Mounting ~i
Rsturn MagntcSpring Flux Lines
Figure 4-6: Diagram of a typical solenoid, including a return spring. [ElectronicsTutorialsj.
as a function of the number of coil turns (N), current input (I), pole area (A), air
gap distance (h), and magnetic permeability of air (p = 4wr x iO--7 N/A 2). Though
solenoids can be adapted to perform oscillatory motions, they are difficult to control
due to the nonlinearity of the force.
N2 I2 ApF= 2h2 (4.1)
A voice coil actuator (VCA) includes a permanent magnet assembly that
interacts with a wire coil based on the Lorentz Force Principle (Figure 4-7). When
the current-carrying coil is placed inside the magnetic field, a force acts on it. The
force is defined by Lorentz's equation (Equation 4.2), where I is the current, E is
the wire length, B is the magnetic flux density, d is the coil diameter, and N is the
number of turns in the coil:
54
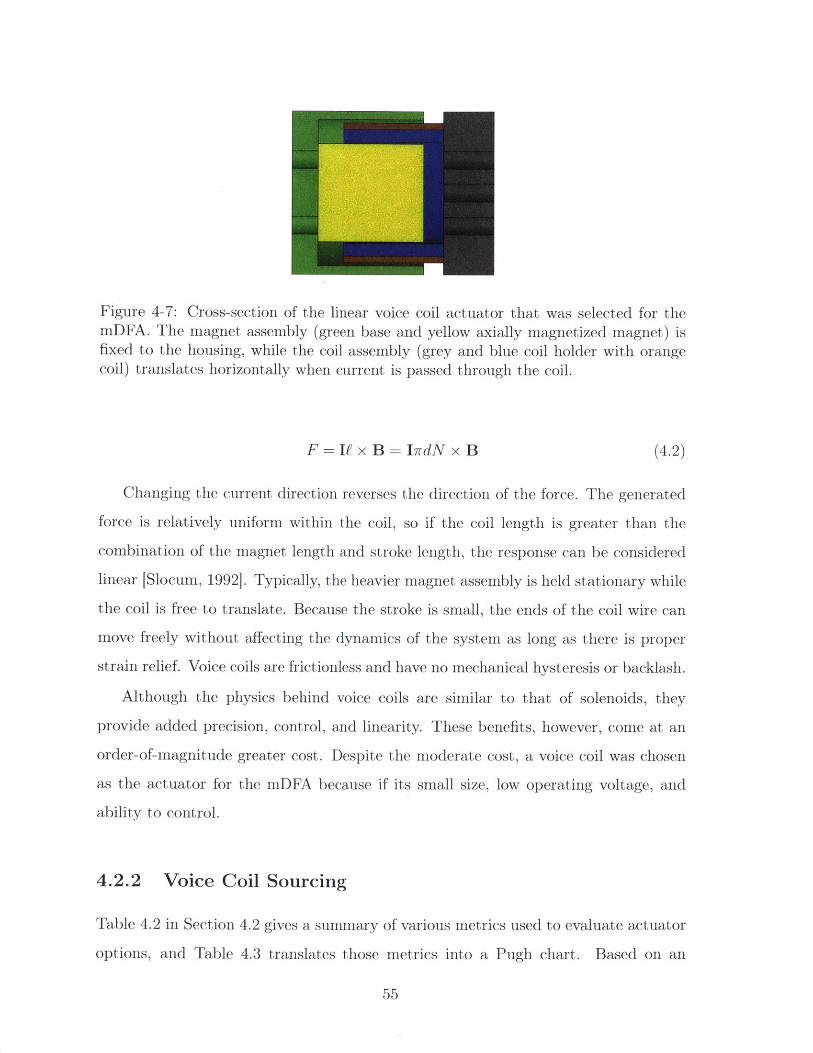
Figure 4-7: Cross-section of the linear voice coil actuator that was selected for themDFA. The magnet assembly (green base and yellow axially magnetized magnet) isfixed to the housing, while the coil assembly (grey and blue coil holder with orangecoil) translates horizontally when current is passed through the coil.
F = If x B = IrdN x B (4.2)
Changing the current direction reverses the direction of the force. The generated
force is relatively uniform within the coil, so if the coil length is greater than the
combination of the magnet length and stroke length, the response can be considered
linear [Slocum, 19921. Typically, the heavier magnet assembly is held stationary while
the coil is free to translate. Because the stroke is small, the ends of the coil wire can
move freely without affecting the dynamics of the system as long as there is proper
strain relief. Voice coils are frictionless and have no mechanical hysteresis or backlash.
Although the physics behind voice coils are similar to that of solenoids, they
provide added precision, control, and linearity. These benefits, however, come at an
order-of-magnitude greater cost. Despite the moderate cost, a voice coil was chosen
as the actuator for the mDFA because if its small size, low operating voltage, and
ability to control.
4.2.2 Voice Coil Sourcing
Table 4.2 in Section 4.2 gives a summary of various metrics used to evaluate actuator
options, and Table 4.3 translates those metrics into a Pugh chart. Based on an
55
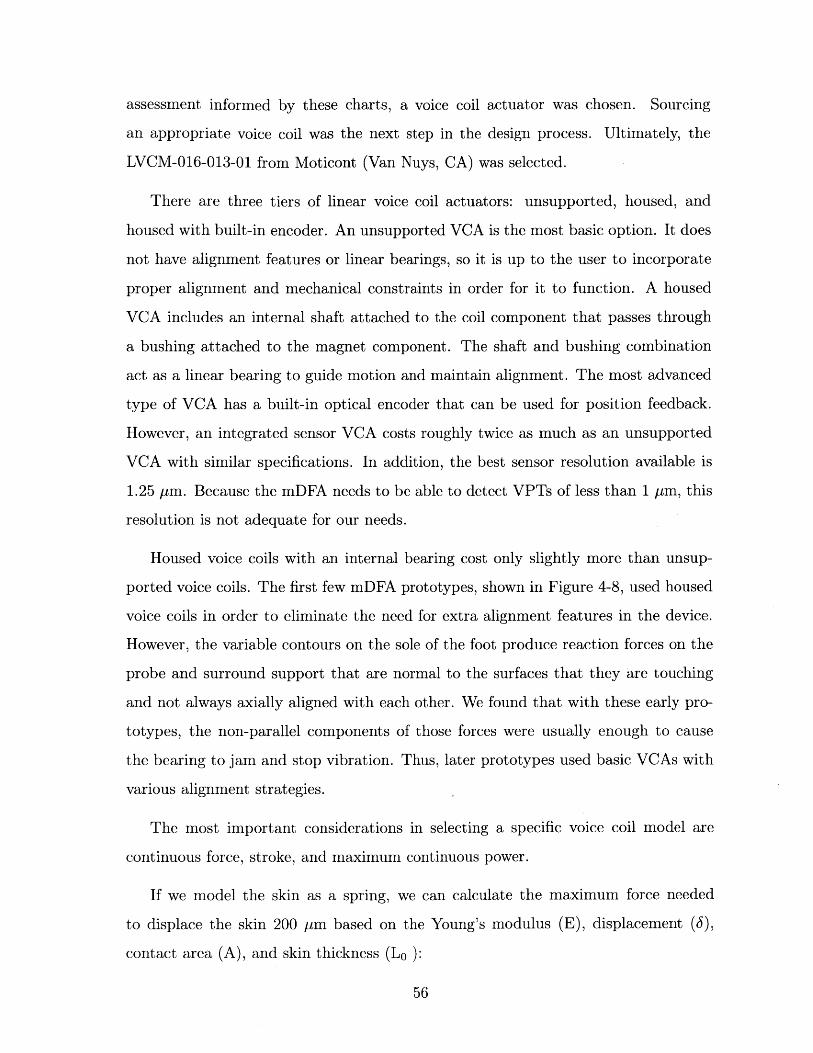
assessment informed by these charts, a voice coil actuator was chosen. Sourcing
an appropriate voice coil was the next step in the design process. Ultimately, the
LVCM-016-013-01 from Moticont (Van Nuys, CA) was selected.
There are three tiers of linear voice coil actuators: unsupported, housed, and
housed with built-in encoder. An unsupported VCA is the most basic option. It does
not have alignment features or linear bearings, so it is up to the user to incorporate
proper alignment and mechanical constraints in order for it to function. A housed
VCA includes an internal shaft attached to the coil component that passes through
a bushing attached to the magnet component. The shaft and bushing combination
act as a linear bearing to guide motion and maintain alignment. The most advanced
type of VCA has a built-in optical encoder that can be used for position feedback.
However, an integrated sensor VCA costs roughly twice as much as an unsupported
VCA with similar specifications. In addition, the best sensor resolution available is
1.25 pm. Because the mDFA needs to be able to detect VPTs of less than 1 pm, this
resolution is not adequate for our needs.
Housed voice coils with an internal bearing cost only slightly more than unsup-
ported voice coils. The first few mDFA prototypes, shown in Figure 4-8, used housed
voice coils in order to eliminate the need for extra alignment features in the device.
However, the variable contours on the sole of the foot produce reaction forces on the
probe and surround support that are normal to the surfaces that they are touching
and not always axially aligned with each other. We found that with these early pro-
totypes, the non-parallel components of those forces were usually enough to cause
the bearing to jam and stop vibration. Thus, later prototypes used basic VCAs with
various alignment strategies.
The most important considerations in selecting a specific voice coil model are
continuous force, stroke, and maximum continuous power.
If we model the skin as a spring, we can calculate the maximum force needed
to displace the skin 200 pm based on the Young's modulus (E), displacement (6),
contact area (A), and skin thickness (Lo ):
56
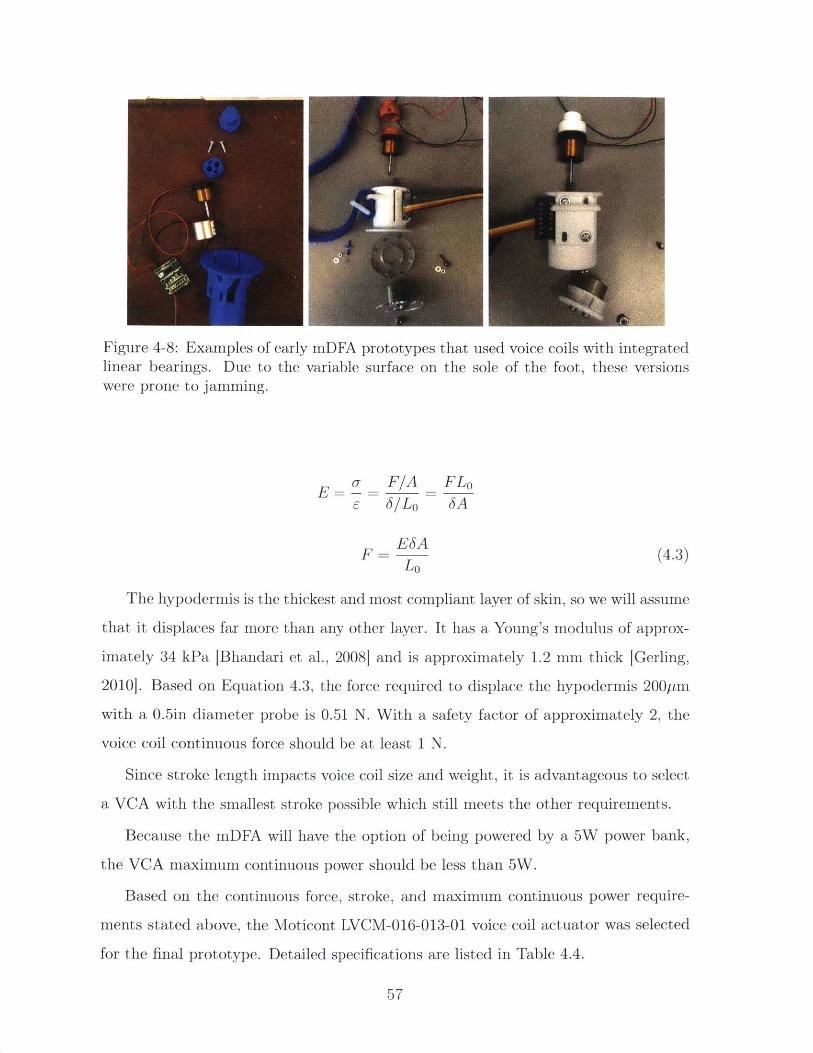
Figure 4-8: Examples of early mDFA prototypes that used voice coils with integratedlinear bearings. Due to the variable surface on the sole of the foot, these versionswere prone to jamming.
- F/A FLo
ESAF- (4.3)
Lo
The hypodermis is the thickest and most compliant layer of skin, so we will assume
that it displaces far more than any other layer. It has a Young's modulus of approx-
imately 34 kPa [Bhandari et al., 2008] and is approximately 1.2 mm thick [Gerling,
20101. Based on Equation 4.3, the force required to displace the hypodermis 200Pm
with a 0.5in diameter probe is 0.51 N. With a safety factor of approximately 2, the
voice coil continuous force should be at least 1 N.
Since stroke length impacts voice coil size and weight, it is advantageous to select
a VCA with the smallest stroke possible which still meets the other requirements.
Because the mDFA will have the option of being powered by a 5W power bank,
the VCA maximum continuous power should be less than 5W.
Based on the continuous force, stroke, and maximum continuous power require-
ments stated above, the Moticont LVCM-016-013-01 voice coil actuator was selected
for the final prototype. Detailed specifications are listed in Table 4.4.
57
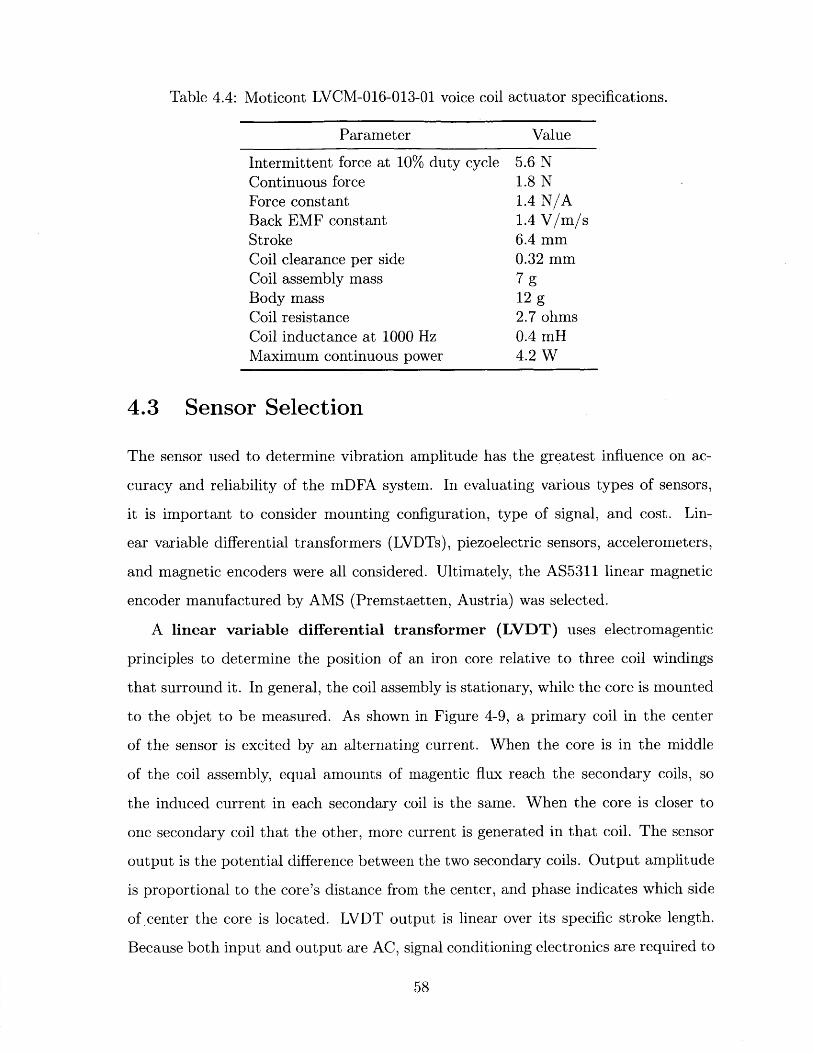
Table 4.4: Moticont LVCM-016-013-01 voice coil
Parameter Value
Intermittent force at 10% duty cycle 5.6 NContinuous force 1.8 NForce constant 1.4 N/ABack EMF constant 1.4 V/m/sStroke 6.4 mmCoil clearance per side 0.32 mmCoil assembly mass 7 gBody mass 12 gCoil resistance 2.7 ohmsCoil inductance at 1000 Hz 0.4 mHMaximum continuous power 4.2 W
4.3 Sensor Selection
The sensor used to determine vibration amplitude has the greatest influence on ac-
curacy and reliability of the mDFA system. In evaluating various types of sensors,
it is important to consider mounting configuration, type of signal, and cost. Lin-
ear variable differential transformers (LVDTs), piezoelectric sensors, accelerometers,
and magnetic encoders were all considered. Ultimately, the AS5311 linear magnetic
encoder manufactured by AMS (Premstaetten, Austria) was selected.
A linear variable differential transformer (LVDT) uses electromagentic
principles to determine the position of an iron core relative to three coil windings
that surround it. In general, the coil assembly is stationary, while the core is mounted
to the objet to be measured. As shown in Figure 4-9, a primary coil in the center
of the sensor is excited by an alternating current. When the core is in the middle
of the coil assembly, equal amounts of magentic flux reach the secondary coils, so
the induced current in each secondary coil is the same. When the core is closer to
one secondary coil that the other, more current is generated in that coil. The sensor
output is the potential difference between the two secondary coils. Output amplitude
is proportional to the core's distance from the center, and phase indicates which side
of center the core is located. LVDT output is linear over its specific stroke length.
Because both input and output are AC, signal conditioning electronics are required to
58
''Mr, " , , " , "", ", , - , --. , , ", ........... , "IV., - I I ", " - I I I 1. i . . , - .-111.- 11 - .1 1. --',-;_-__-, --- _- -,, ----,_-!r-- --
actuator specifications.
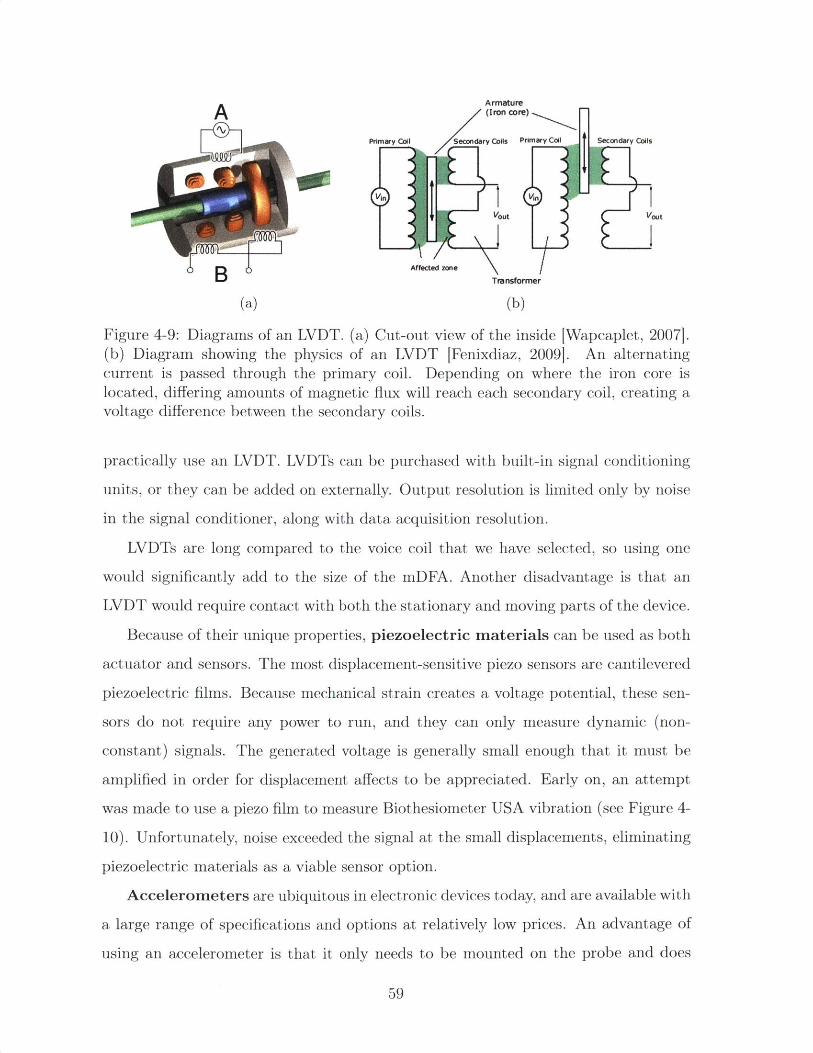
Armature(Iron core)
Primary Coil Secondary Cois Primary Coil Secondary Coils
in Vin
Vout Vout
B Afected zone Transformer
(a) (b)
Figure 4-9: Diagrams of an LVDT. (a) Cut-out view of the inside [Wapcaplet, 20071.(b) Diagram showing the physics of an LVDT [Fenixdiaz, 2009]. An alternatingcurrent is passed through the primary coil. Depending on where the iron core islocated, differing amounts of magnetic flux will reach each secondary coil, creating avoltage difference between the secondary coils.
practically use an LVDT. LVDTs can be purchased with built-in signal conditioning
units, or they can be added on externally. Output resolution is limited only by noise
in the signal conditioner, along with data acquisition resolution.
LVDTs are long compared to the voice coil that we have selected, so using one
would significantly add to the size of the mDFA. Another disadvantage is that an
LVDT would require contact with both the stationary and moving parts of the device.
Because of their unique properties, piezoelectric materials can be used as both
actuator and sensors. The most displacement-sensitive piezo sensors are cantilevered
piezoelectric films. Because mechanical strain creates a voltage potential, these sen-
sors do not require any power to run, and they can only measure dynamic (non-
constant) signals. The generated voltage is generally small enough that it must be
amplified in order for displacement affects to be appreciated. Early on, an attempt
was made to use a piezo film to measure Biothesiometer USA vibration (see Figure 4-
10). Unfortunately, noise exceeded the signal at the small displacements, eliminating
piezoelectric materials as a viable sensor option.
Accelerometers are ubiquitous in electronic devices today, and are available with
a large range of specifications and options at relatively low prices. An advantage of
using an accelerometer is that it only needs to be mounted on the probe and does
59
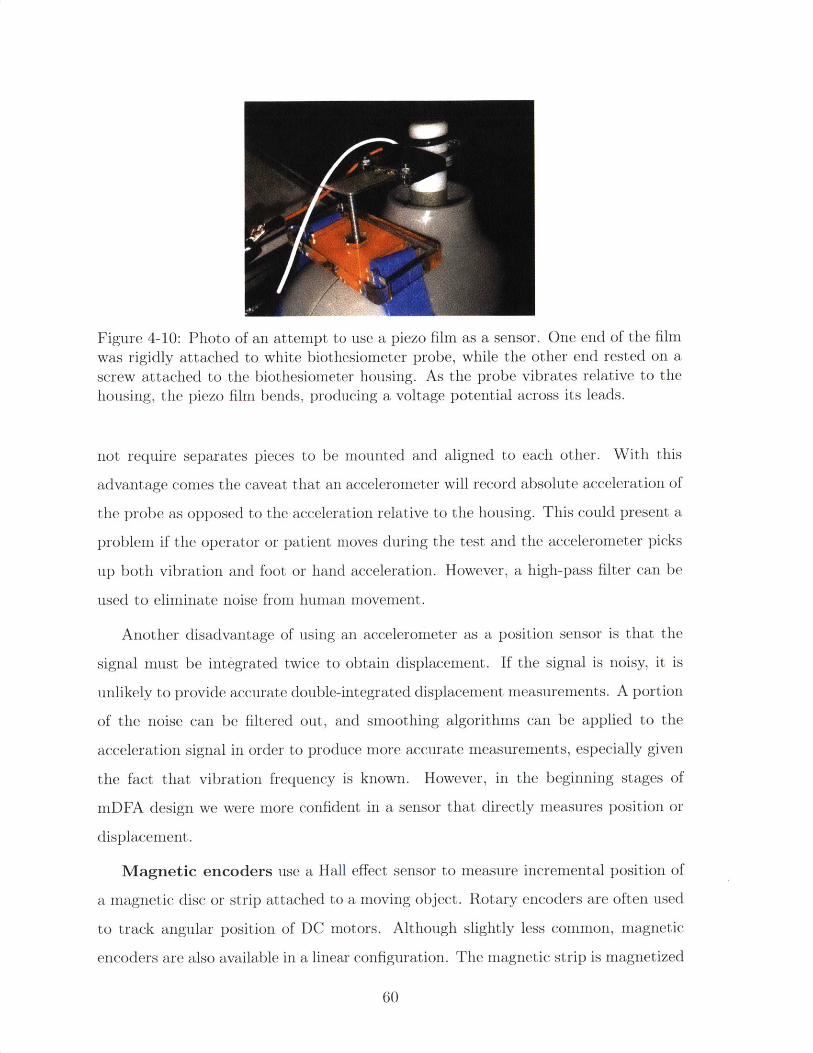
Figure 4-10: Photo of an attempt to use a piezo film as a sensor. One end of the filmwas rigidly attached to white biothesiometer probe, while the other end rested on ascrew attached to the biothesiometer housing. As the probe vibrates relative to thehousing, the piezo film bends, producing a voltage potential across its leads.
not require separates pieces to be mounted and aligned to each other. With this
advantage comes the caveat that an accelerometer will record absolute acceleration of
the probe as opposed to the acceleration relative to the housing. This could present a
problem if the operator or patient moves during the test and the accelerometer picks
up both vibration and foot or hand acceleration. However, a high-pass filter can be
used to eliminate noise from human movement.
Another disadvantage of using an accelerometer as a position sensor is that the
signal must be integrated twice to obtain displacement. If the signal is noisy, it is
unlikely to provide accurate double-integrated displacement measurements. A portion
of the noise can be filtered out, and smoothing algorithms can be applied to the
acceleration signal in order to produce more accurate measurements, especially given
the fact that vibration frequency is known. However, in the beginning stages of
mDFA design we were more confident in a sensor that directly measures position or
displacement.
Magnetic encoders use a Hall effect sensor to measure incremental position of
a magnetic disc or strip attached to a moving object. Rotary encoders are often used
to track angular position of DC motors. Although slightly less common, magnetic
encoders are also available in a linear configuration. The magnetic strip is magnetized
60
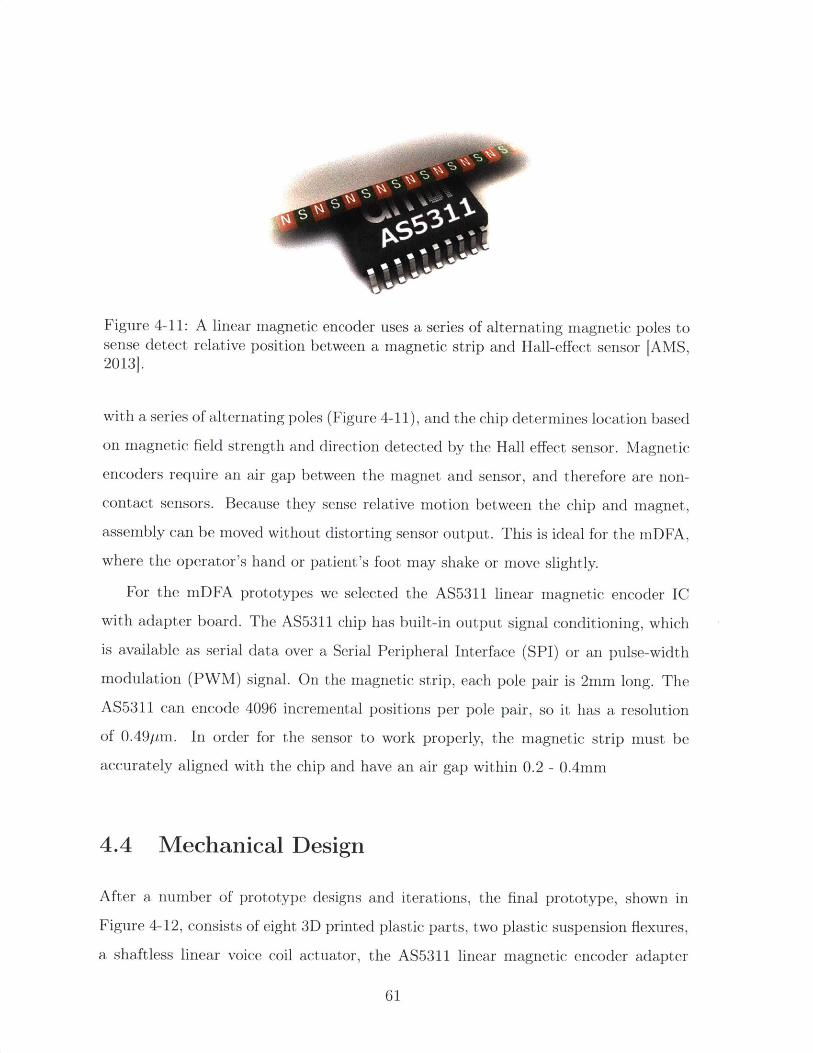
Figure 4-11: A linear magnetic encoder uses a series of alternating magnetic poles tosense detect relative position between a magnetic strip and Hall-effect sensor [AMS,2013].
with a series of alternating poles (Figure 4-11), and the chip determines location based
on magnetic field strength and direction detected by the Hall effect sensor. Magnetic
encoders require an air gap between the magnet and sensor, and therefore are non-
contact sensors. Because they sense relative motion between the chip and magnet,assembly can be moved without distorting sensor output. This is ideal for the mDFA,where the operator's hand or patient's foot may shake or move slightly.
For the mDFA prototypes we selected the AS5311 linear magnetic encoder IC
with adapter board. The AS5311 chip has built-in output signal conditioning, which
is available as serial data over a Serial Peripheral Interface (SPI) or an pulse-width
modulation (PWM) signal. On the magnetic strip, each pole pair is 2mm long. The
AS5311 can encode 4096 incremental positions per pole pair, so it has a resolution
of 0.49ptm. In order for the sensor to work properly, the magnetic strip must be
accurately aligned with the chip and have an air gap within 0.2 - 0.4mm
4.4 Mechanical Design
After a number of prototype designs and iterations, the final prototype, shown in
Figure 4-12, consists of eight 3D printed plastic parts, two plastic suspension flexures,
a shaftless linear voice coil actuator, the AS5311 linear magnetic encoder adapter
61
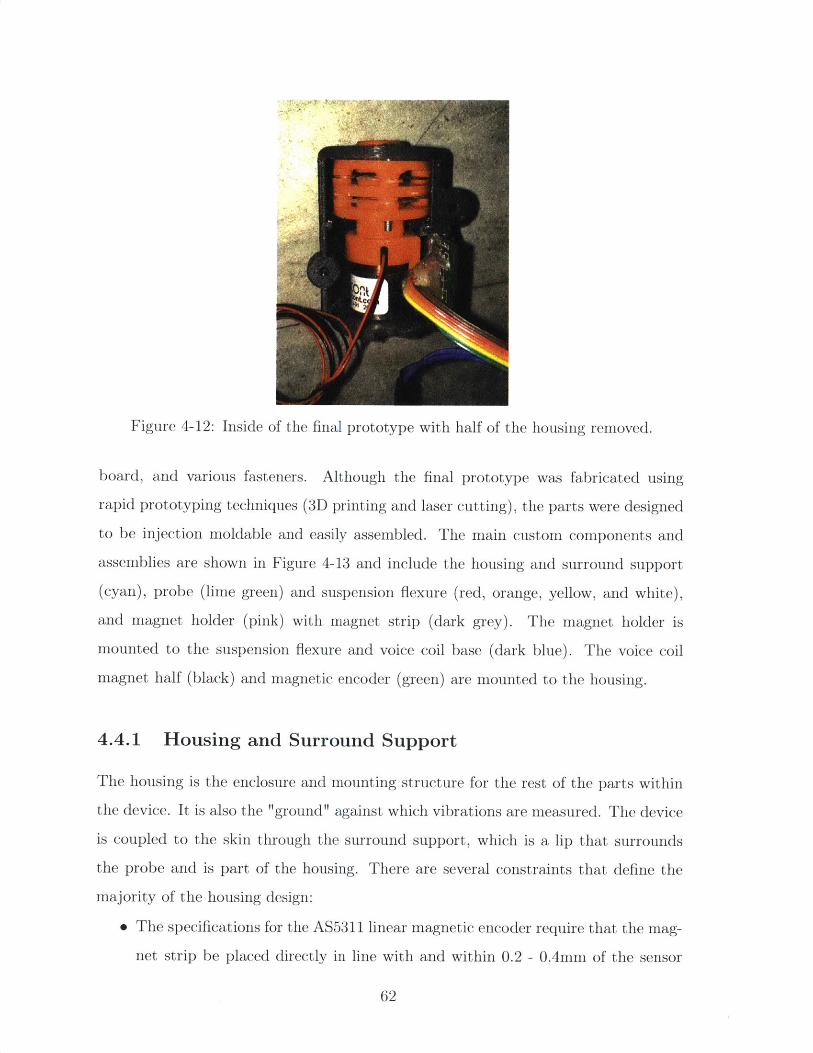
Figure 4-12: Inside of the final prototype with half of the housing removed.
board, and various fasteners. Although the final prototype was fabricated using
rapid prototyping techniques (3D printing and laser cutting), the parts were designed
to be injection moldable and easily assembled. The main custom components and
assemblies are shown in Figure 4-13 and include the housing and surround support
(cyan), probe (lime green) and suspension flexure (red, orange, yellow, and white),
and magnet holder (pink) with magnet strip (dark grey). The magnet holder is
mounted to the suspension flexure and voice coil base (dark blue). The voice coil
magnet half (black) and magnetic encoder (green) are mounted to the housing.
4.4.1 Housing and Surround Support
The housing is the enclosure and mounting structure for the rest of the parts within
the device. It is also the "ground" against which vibrations are measured. The device
is coupled to the skin through the surround support, which is a lip that surrounds
the probe and is part of the housing. There are several constraints that define the
majority of the housing design:
* The specifications for the AS5311 linear magnetic encoder require that the mag-
net strip be placed directly in line with and within 0.2 - 0.4mm of the sensor
62
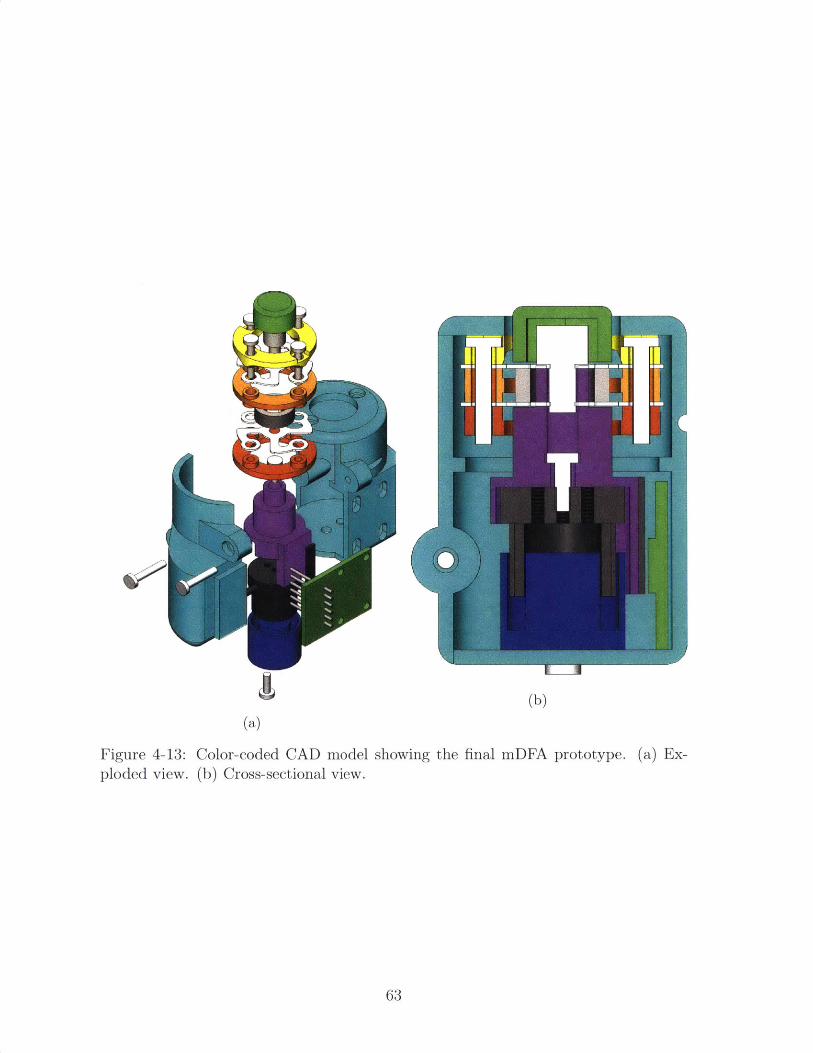
KR _____IA
(b)(a)
Figure 4-13: Color-coded CAD model showing the final mDFA prototype. (a) Ex-ploded view. (b) Cross-sectional view.
63
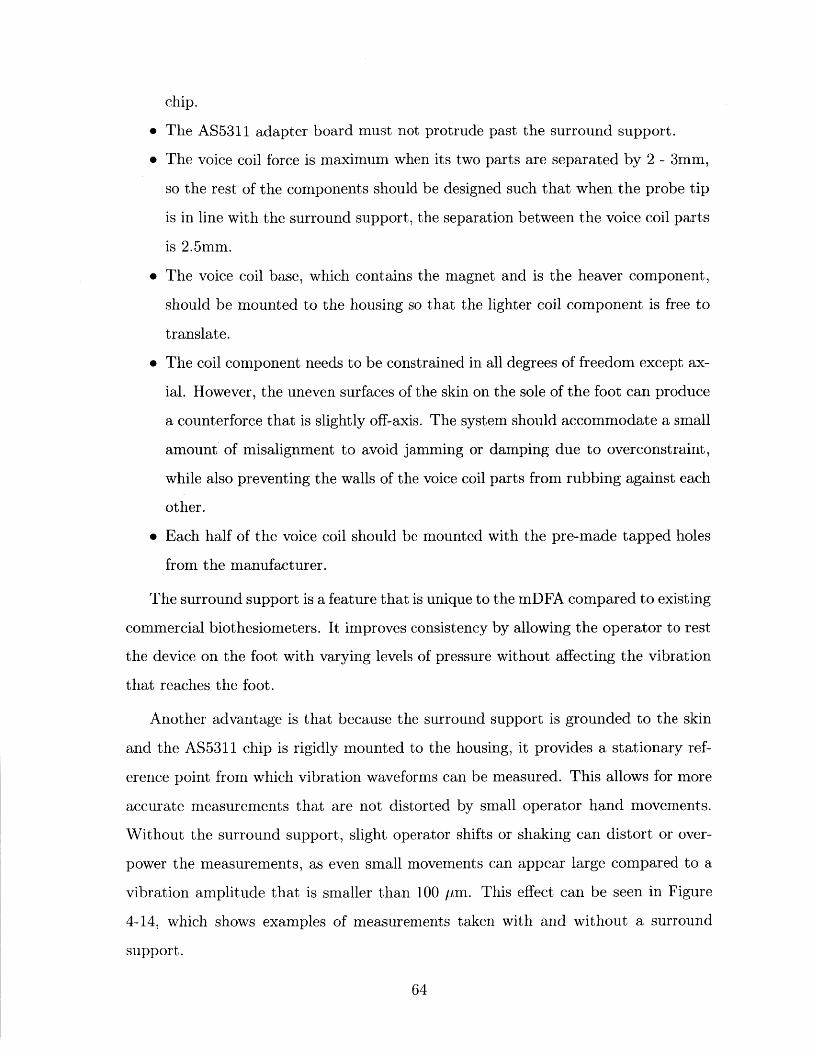
chip.
" The AS5311 adapter board must not protrude past the surround support.
" The voice coil force is maximum when its two parts are separated by 2 - 3mm,
so the rest of the components should be designed such that when the probe tip
is in line with the surround support, the separation between the voice coil parts
is 2.5mm.
" The voice coil base, which contains the magnet and is the heaver component,
should be mounted to the housing so that the lighter coil component is free to
translate.
" The coil component needs to be constrained in all degrees of freedom except ax-
ial. However, the uneven surfaces of the skin on the sole of the foot can produce
a counterforce that is slightly off-axis. The system should accommodate a small
amount of misalignment to avoid jamming or damping due to overconstraint,
while also preventing the walls of the voice coil parts from rubbing against each
other.
" Each half of the voice coil should be mounted with the pre-made tapped holes
from the manufacturer.
The surround support is a feature that is unique to the mDFA compared to existing
commercial biothesiometers. It improves consistency by allowing the operator to rest
the device on the foot with varying levels of pressure without affecting the vibration
that reaches the foot.
Another advantage is that because the surround support is grounded to the skin
and the AS5311 chip is rigidly mounted to the housing, it provides a stationary ref-
erence point from which vibration waveforms can be measured. This allows for more
accurate measurements that are not distorted by small operator hand movements.
Without the surround support, slight operator shifts or shaking can distort or over-
power the measurements, as even small movements can appear large compared to a
vibration amplitude that is smaller than 100 pm. This effect can be seen in Figure
4-14, which shows examples of measurements taken with and without a surround
support.
64
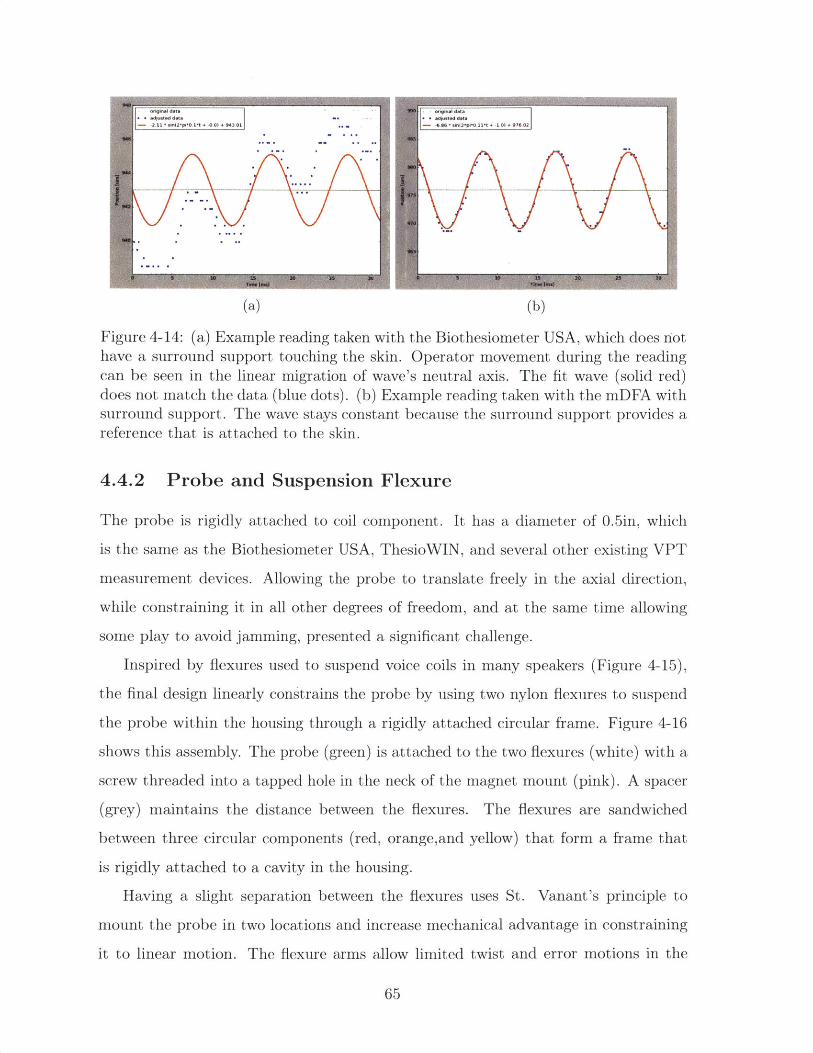
(a) (b)
Figure 4-14: (a) Example reading taken with the Biothesiometer USA, which does riothave a surround support touching the skin. Operator movement during the readingcan be seen in the linear migration of wave's neutral axis. The fit wave (solid red)
does not match the data (blue dots). (b) Example reading taken with the mDFA withsurround support. The wave stays constant because the surround support provides areference that is attached to the skin.
4.4.2 Probe and Suspension Flexure
The probe is rigidly attached to coil component. It has a diameter of 0.5in, which
is the same as the Biothesiometer USA, ThesioWIN, and several other existing VPT
measurement devices. Allowing the probe to translate freely in the axial direction,
while constraining it in all other degrees of freedom, and at the same time allowing
some play to avoid jamming, presented a significant challenge.
Inspired by flexures used to suspend voice coils in many speakers (Figure 4-15),
the final design linearly constrains the probe by using two nylon flexures to suspend
the probe within the housing through a rigidly attached circular frame. Figure 4-16
shows this assembly. The probe (green) is attached to the two flexures (white) with a
scire 4readed into a tapped hole in the neck of the magnet mount (pink). A spacer
(grey) maintains the distance between the flexures. The flexures are sandwiched
between three circular components (red, orange,and yellow) that form a frame that
is rigidly attached to a cavity in the housing.
Having a slight separation between the flexures uses St. Vanant's principle to
mount the probe in two locations and increase mechanical advantage in constraining
it to linear motion. The flexure arms allow limited twist and error motions in the
65
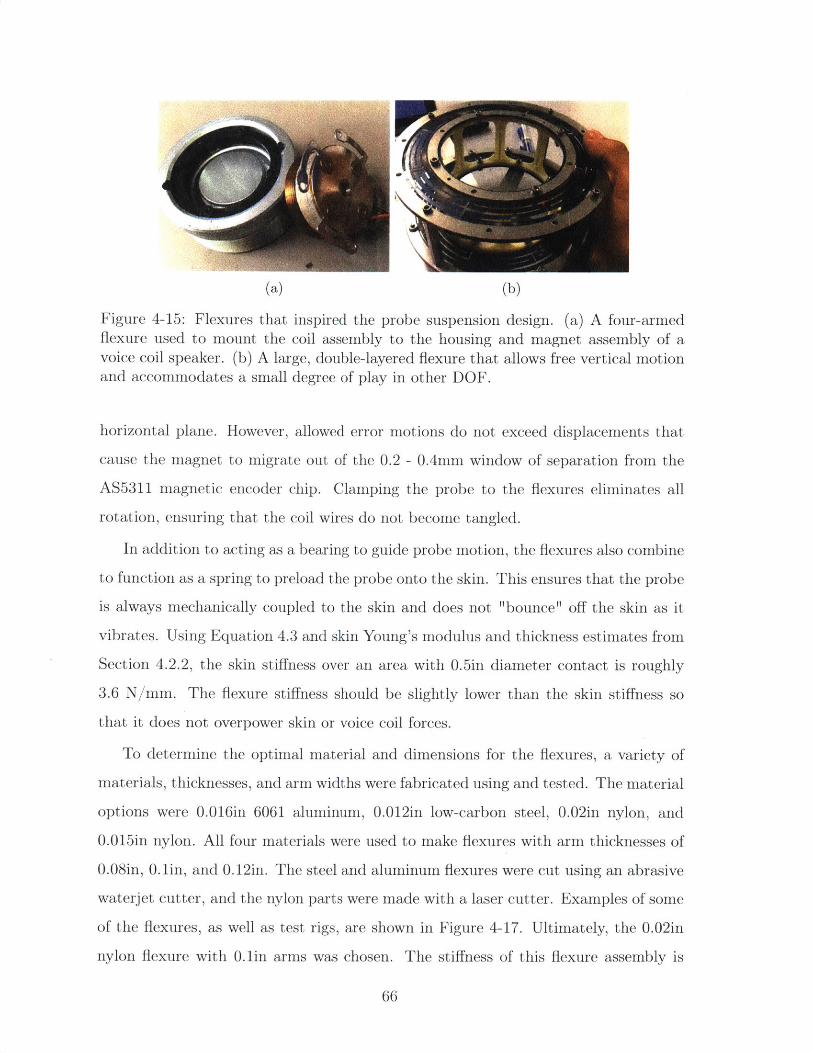
(a) (b)
Figure 4-15: Flexures that inspired the probe suspension design. (a) A four-armedflexure used to mount the coil assembly to the housing and magnet assembly of avoice coil speaker. (b) A large, double-layered flexure that allows free vertical motionand accommodates a small degree of play in other DOE.
horizontal plane. However, allowed error motions do not exceed displacements that
cause the magnet to migrate out of the 0.2 - 0.4mm window of separation from the
AS5311 magnetic encoder chip. Clamping the probe to the flexures eliminates all
rotation, ensuring that the coil wires do not become tangled.
In addition to acting as a bearing to guide probe motion, the flexures also combine
to function as a spring to preload the probe onto the skin. This ensures that the probe
is always mechanically coupled to the skin and does not "bounce" off the skin as it
vibrates. Using Equation 4.3 and skin Young's modulus and thickness estimates from
Section 4.2.2, the skin stiffness over an area with 0.5in diameter contact is roughly
3.6 N/mm. The flexure stiffness should be slightly lower than the skin stiffness so
that it does not overpower skin or voice coil forces.
To determine the optimal material and dimensions for the flexures, a variety of
materials, thicknesses, and arm widths were fabricated using and tested. The material
options were 0.016in 6061 aluminum, 0.012in low-carbon steel, 0.02in nylon, and
0.015in nylon. All four materials were used to make flexures with arm thicknesses of
0.08in, 0.lin, and 0.12in. The steel and aluminum flexures were cut using an abrasive
waterjet cutter, and the nylon parts were made with a laser cutter. Examples of some
of the flexures, as well as test rigs, are shown in Figure 4-17. Ultimately, the 0.02in
nylon flexure with 0.1in arms was chosen. The stiffness of this flexure assembly is
66
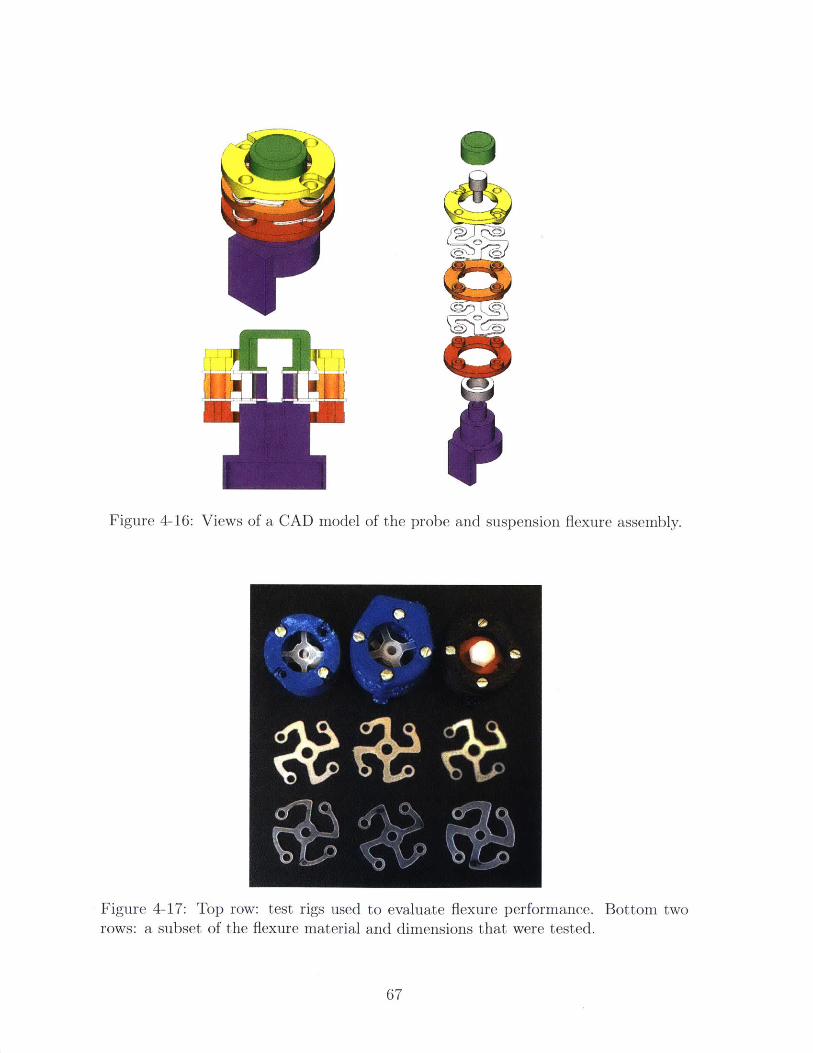
~4F 1<
Figure 4-16: Views of a CAD model of the probe and suspension flexure assembly.
Figure 4-17: Top row: test rigs used to evaluate flexure performance.rows: a subset of the flexure material and dimensions that were tested.
Bottom two
67
~ji~
II
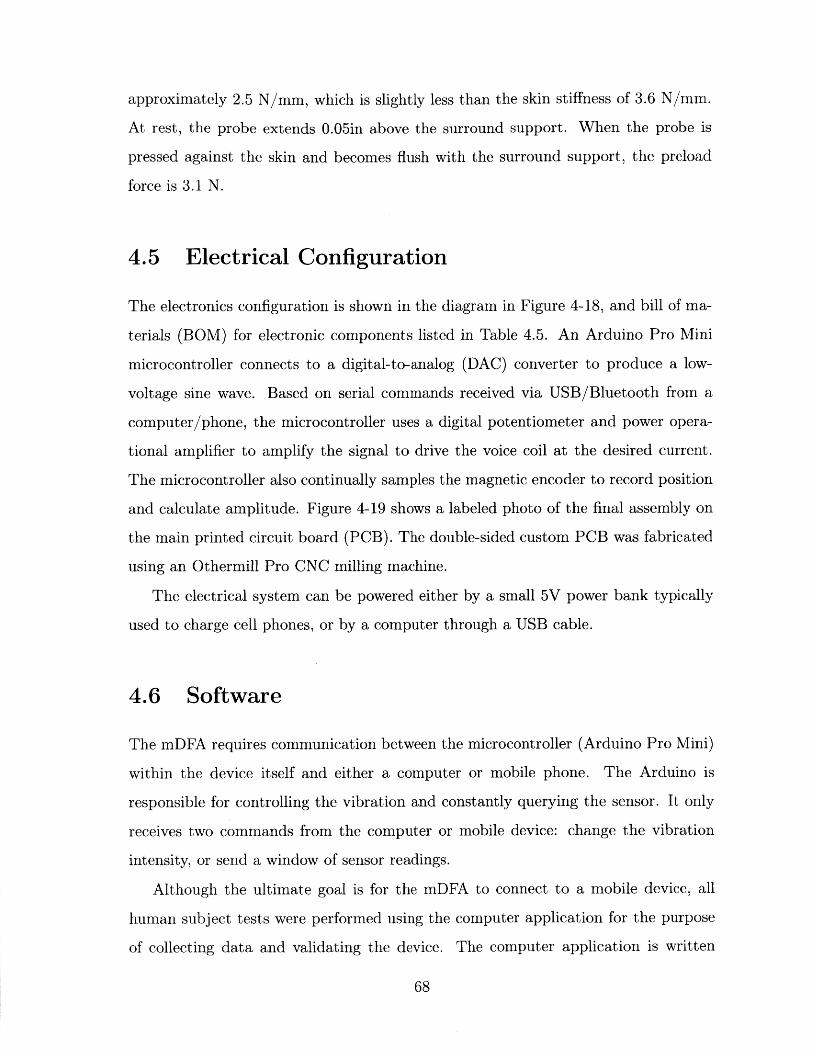
approximately 2.5 N/mm, which is slightly less than the skin stiffness of 3.6 N/mm.
At rest, the probe extends 0.05in above the surround support. When the probe is
pressed against the skin and becomes flush with the surround support, the preload
force is 3.1 N.
4.5 Electrical Configuration
The electronics configuration is shown in the diagram in Figure 4-18, and bill of ma-
terials (BOM) for electronic components listed in Table 4.5. An Arduino Pro Mini
microcontroller connects to a digital-to-analog (DAC) converter to produce a low-
voltage sine wave. Based on serial commands received via USB/Bluetooth from a
computer/phone, the microcontroller uses a digital potentiometer and power opera-
tional amplifier to amplify the signal to drive the voice coil at the desired current.
The microcontroller also continually samples the magnetic encoder to record position
and calculate amplitude. Figure 4-19 shows a labeled photo of the final assembly on
the main printed circuit board (PCB). The double-sided custom PCB was fabricated
using an Othermill Pro CNC milling machine.
The electrical system can be powered either by a small 5V power bank typically
used to charge cell phones, or by a computer through a USB cable.
4.6 Software
The mDFA requires communication between the microcontroller (Arduino Pro Mini)
within the device itself and either a computer or mobile phone. The Arduino is
responsible for controlling the vibration and constantly querying the sensor. It only
receives two commands from the computer or mobile device: change the vibration
intensity, or send a window of sensor readings.
Although the ultimate goal is for the mDFA to connect to a mobile device, all
human subject tests were performed using the computer application for the purpose
of collecting data and validating the device. The computer application is written
68
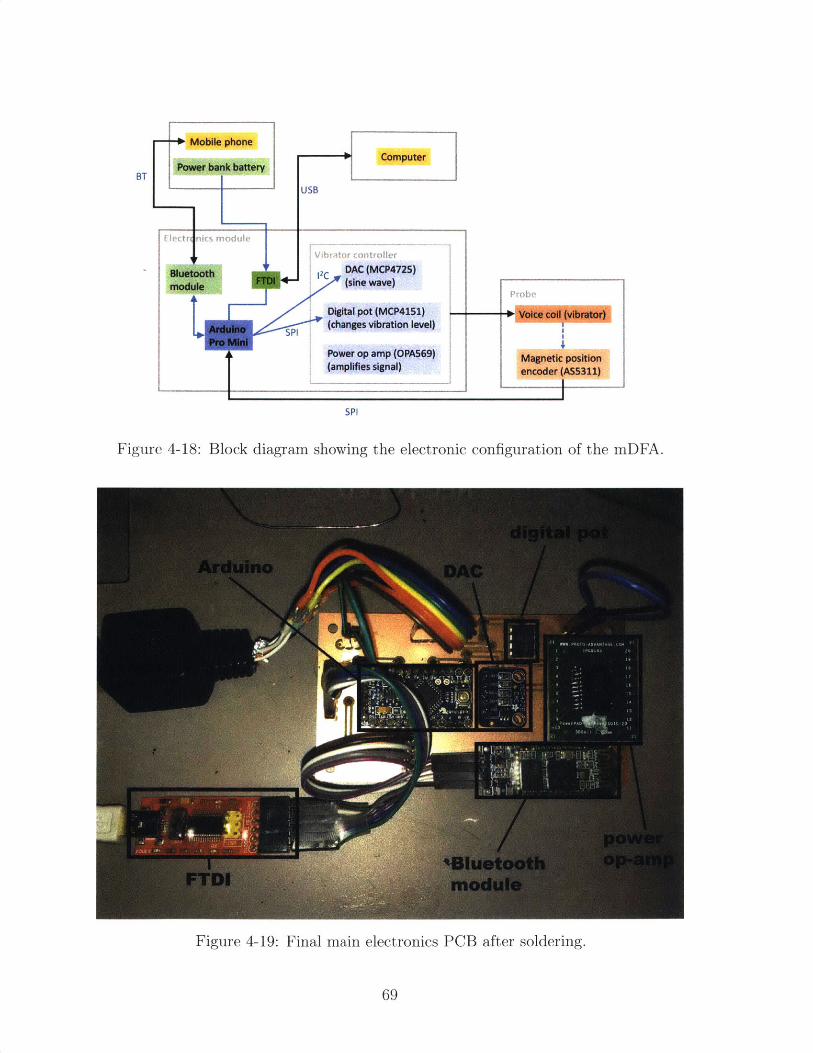
-0+ Mobile phoneComputer
USB
E rtrict, module
vibt ort rn
Bluetooth 2 DAC (MCP4725)module (sine wave)
Digital pot (MCP4151)
Arduino SPI (changes vibration level)Pro M
Power op amp (OPA569)(amplifies signal)
SPI
Figure 4-18: Block diagram showing the electronic configuration of the mDFA.
Figure 4-19: Final main electronics PCB after soldering.
69
BT
Voice coil (vibrator)
Magnetic positionencoder (A55311)
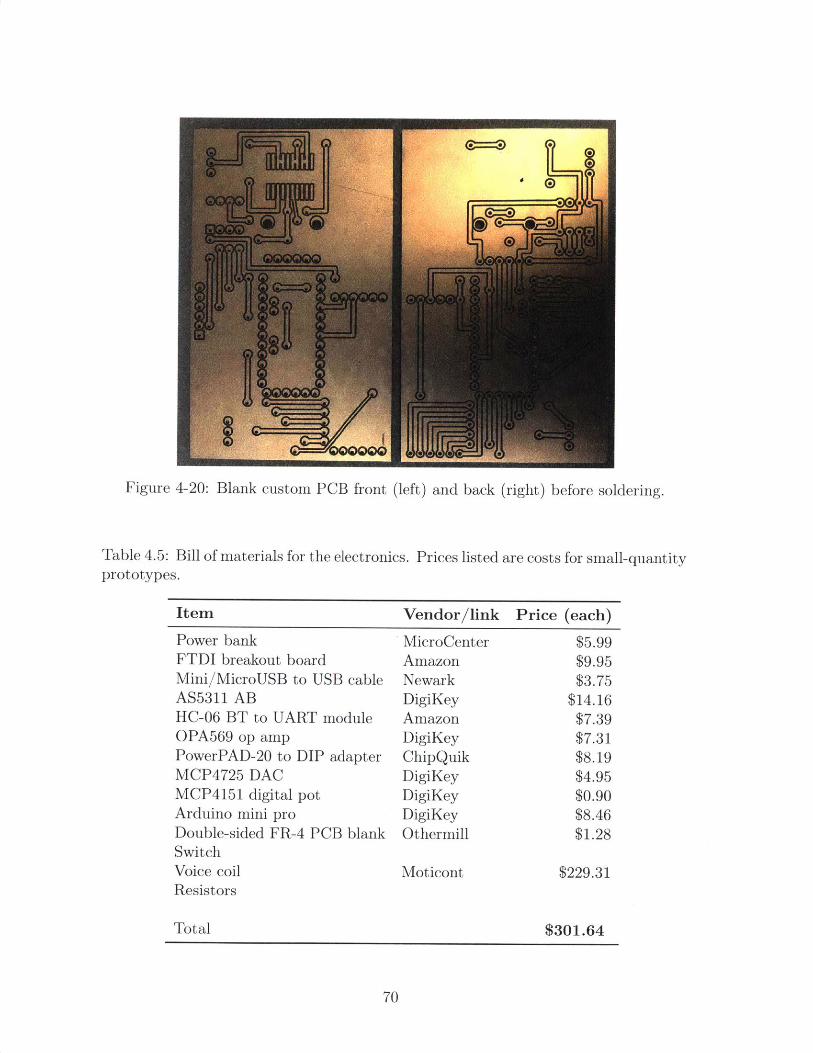
Figure 4-20: Blank custom PCB front (left) and back (right) before soldering.
Table 4.5: Bill of materials for the electronics. Pricesprototypes.
listed are costs for small-quantity
Item Vendor/link Price (each)
Power bank MicroCenter $5.99FTDI breakout board Amazon $9.95Mini/MicroUSB to USB cable Newark $3.75AS5311 AB DigiKey $14.16HC-06 BT to UART module Amazon $7.39OPA569 op amp DigiKey $7.31PowerPAD-20 to DIP adapter ChipQuik $8.19MCP4725 DAC DigiKey $4.95MCP4151 digital pot DigiKey $0.90Arduino mini pro DigiKey $8.46Double-sided FR-4 PCB blank Othermill $1.28SwitchVoice coil Moticont $229.31Resistors
Total $301.64
70
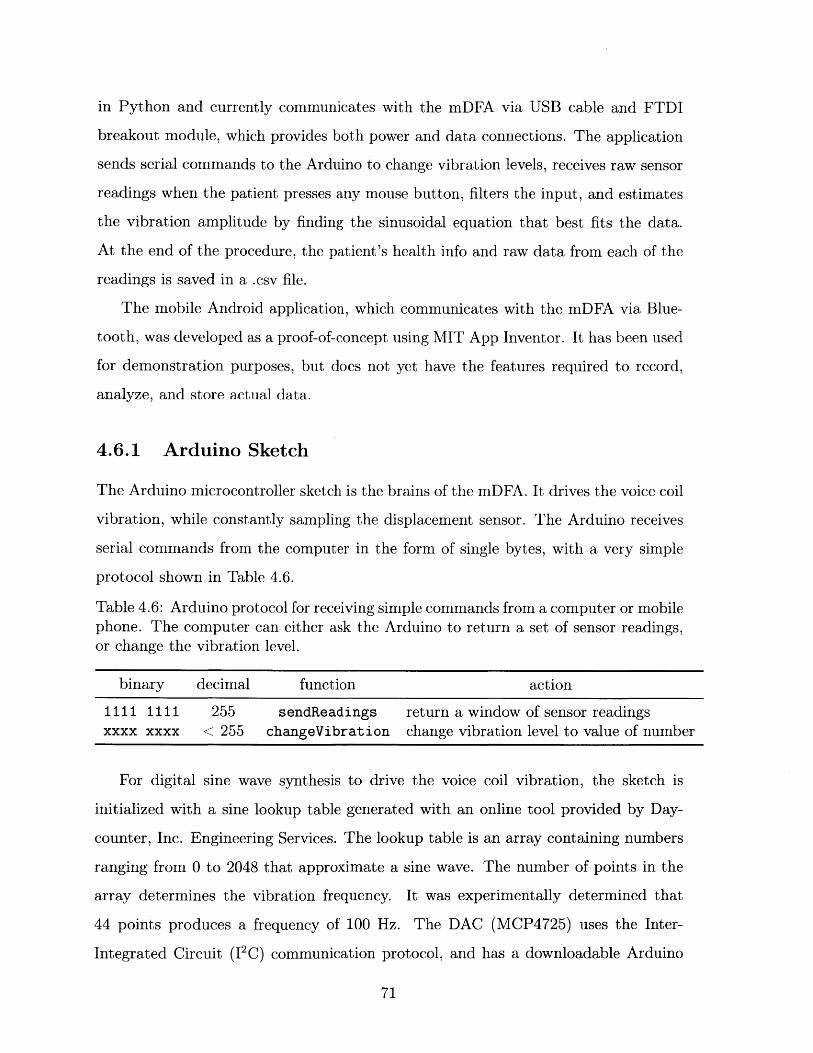
in Python and currently communicates with the mDFA via USB cable and FTDI
breakout module, which provides both power and data connections. The application
sends serial commands to the Arduino to change vibration levels, receives raw sensor
readings when the patient presses any mouse button, filters the input, and estimates
the vibration amplitude by finding the sinusoidal equation that best fits the data.
At the end of the procedure, the patient's health info and raw data from each of the
readings is saved in a .csv file.
The mobile Android application, which communicates with the mDFA via Blue-
tooth, was developed as a proof-of-concept using MIT App Inventor. It has been used
for demonstration purposes, but does not yet have the features required to record,
analyze, and store actual data.
4.6.1 Arduino Sketch
The Arduino microcontroller sketch is the brains of the mDFA. It drives the voice coil
vibration, while constantly sampling the displacement sensor. The Arduino receives
serial commands from the computer in the form of single bytes, with a very simple
protocol shown in Table 4.6.
Table 4.6: Arduino protocol for receiving simple commands from a computer or mobilephone. The computer can either ask the Arduino to return a set of sensor readings,or change the vibration level.
binary decimal function action
1111 1111 255 sendReadings return a window of sensor readingsxxxx xxxx < 255 changeVibration change vibration level to value of number
For digital sine wave synthesis to drive the voice coil vibration, the sketch is
initialized with a sine lookup table generated with an online tool provided by Day-
counter, Inc. Engineering Services. The lookup table is an array containing numbers
ranging from 0 to 2048 that approximate a sine wave. The number of points in the
array determines the vibration frequency. It was experimentally determined that
44 points produces a frequency of 100 Hz. The DAC (MCP4725) uses the Inter-
Integrated Circuit (12C) communication protocol, and has a downloadable Arduino
71
library that takes maps commands between 0 and 2048 to Vss and VDD, where in
this case Vss = OV and VDD = 5V.
The Arduino samples the position sensor roughly every 300 hps, which is a fre-
quency of approximately 3300 Hz. Forwarding a continuous stream of sensor data
from the Arduino to computer at that frequency is not possible due to the execution
time of the Serial. write ( function. Thus, "windows" of data points are stored and
only sent to the computer when the Arduino receives a "read" command. The ideal
way to store the data would be to have a continuously scrolling window of readings.
However, shifting every item in the array cannot happen within the 300 pus between
sensor samples. The solution is to have two arrays of bytes that provide adjacent
snapshots of data. Figure 4-21 illustrates the double-window method used to store
rolling data on the Arduino. The amount of RAM left after taking into account other
variables in the sketch is split in half and allocated to each array. One window is
"active" at any given time, and there is an index variable that keeps track of the
current index within the active window. Every time the Arduino samples the sensor
during a loop, it stores the new data point at the current index in the active window
and advances the index. When it reaches the end of the window, the index is reset
to 0 and the other window becomes active and begins to fill up from the beginning.
After the windows initially fill up, the active window will have a break in continuity
at the current index. To avoid this discontinuity, the non-active window is sent to the
computer when a "read" command is received. This means that the reading sent to
the computer represents the waveform approximately 30 ms before the "read" com-
mand was sent. Compared to the average human reaction time of 282 ms [Human
Benchmark], this time difference is negligible.
Both the AS5311 magnetic position encoder and MCP4151 digital potentiometer
use variations of the Serial Peripheral Interface (SPI) communication protocol, so
they are timed to avoid communication overlaps. Separate settings for each chip are
initialized at the beginning of the sketch.
Before executing the main loop, both a serial port (for communication via FTDI
and USB) and virtual software serial port are (for communication via Bluetooth) are
72
11- 1
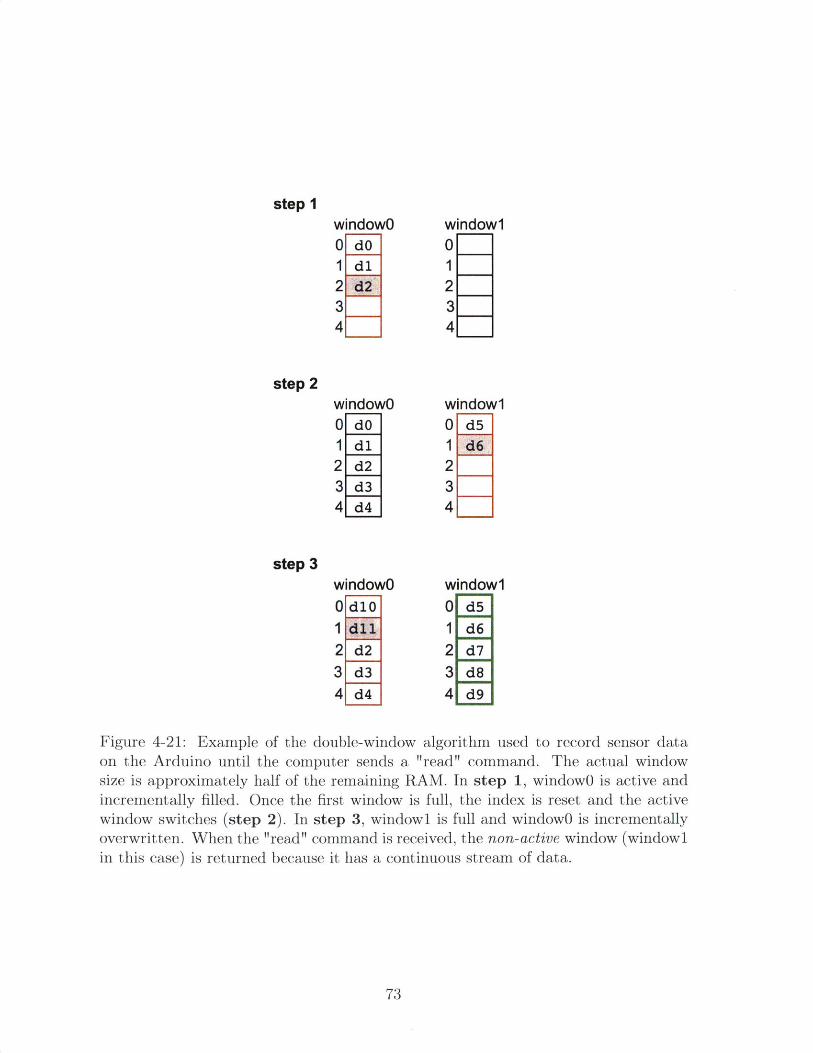
step IwindowO window10 dO 01 dl 12 d2 2
3 34 4
step 2windowO window10 dO 0 d51 dl 1 d62 d2 2
3 34 4
step 3windowO window10d10 0 d51 1 d62 d2 2 d73d3 3 d84 d4 4d9
Figure 4-21: Example of the double-window algorithm used to record sensor dataon the Arduino until the computer sends a "read" command. The actual windowsize is approximately half of the remaining RAM. In step 1, windowO is active andincrementally filled. Once the first window is full, the index is reset and the activewindow switches (step 2). In step 3, windowi is full and windowO is incrementallyoverwritten. When the "read" command is received, the non-active window (windowlin this case) is returned because it has a continuous stream of data.
73
opened.
The main function within the sketch is the loop, which continuously executes as
long as the Arduino is powered. Within loop, the following commands are executed:
" Look up the current point in the sine table, set the DAC to that point, and
advance the pointer index.
" Take a position reading from the AS5311 sensor (readSensor function). The
reading will be a number between 0 and 2048, which maps to the magnet pole
pair length of 2mm.
" Check for a new command through either the Serial or Bluetooth ports. If
there is a new integer in either of the buffers, execute either the sendReadings
or changeVibration functions based on Table 4.6 to send a window of data
back or change the vibration level.
The readSensor function has several steps. First, it samples the AS5311 magnetic
encoder for the magnet position at that exact moment in time. Each sample returns
a series of three bytes that combine to reveal the position. The bytes are in the form:
bO = D11-D1O-D9-D8-D7-D6-D5-D4
bi = D3-D2-D1-DO-OCF-COF-LIN-MagINC
b2 = MagDEC-EvenPAR-X-X-X-X-X-X
Since not all of the bits include useful information, the relevant bits (D11-DO) are
extracted and converted to an integer. Next, the time (in microseconds) at which
the position reading was taken is recorded and saved. Finally, the position and time
integers are split into two bytes each and saved into the current working window:
window[i] = posHigh; //Most significant position byte
window[i+1] = posLow; //Least significant position byte
window[i+2] = timeHigh; //Most significant time byte
window[i+3] = timeLow; //Least significant time byte
The writeReading function is responsible for writing the non-active window to
the serial port. It uses the built-in Serial. write function instead of Serial. print,
which is much slower. Serial. write sends binary data, which will later need to be
parsed and interpreted by the computer.
74

The changeVibration function uses SPI to change the resistance of the digital
potentiometer, which scales 8-bit commands from 0 - 255 to 0 - 10kQ.
In addition to being used to control the mDFA device, this sketch was also used on
Arduinos on the ThesioWIN and Biothesiomter USA that were retrofit with AS5311
sensors.
4.6.2 Computer Software
A custom computer program was used for all mDFA and biothesiometer data col-
lection. The program was written in Python, which is free and was easy to install
remotely on computers at Agada Hospital in Chennai, India for collaboration. When
the mDFA is connected to a computer it is powered through the USB connection and
does not need to be connected to an external battery. A wireless computer mouse is
given to the patient to click each time they feel vibration.
The program guides the operator through the protocol, which can be customized
with desired devices, number of trials, and reading order. First, it prompts the user
to enter basic demographic and health information about the patient. The data col-
lection window then appears, and instructions tell the operator to place the probe on
the foot before turning on vibration. Pressing the <R> key or the "Start" button acti-
vates the sensor. On the ThesioWIN and Biothesiometer USA, the operator manually
turns the vibration dial on the respective device until the patient feels vibration and
clicks a mouse button. When using the mDFA, the computer automatically sends
commands to the device to control vibration while the operator only holds the probe
to the foot. When the patient presses any mouse button, the software sends a "read"
command to the Arduino, receives a byte array representing a window of vibration
at that point in time, parses the data, calculates a fit sine curve, and displays both
the raw and fit data. When using the ThesioWIN or Biothesiometer USA, a pop-up
window prompts the user to enter the corresponding voltage displayed at that point.
When the protocol has finished, all patient information and data are saved into a
single . csv file. This file can be read and re-displayed on the Python program later,
or it can be imported into MATLAB for data analysis.
75
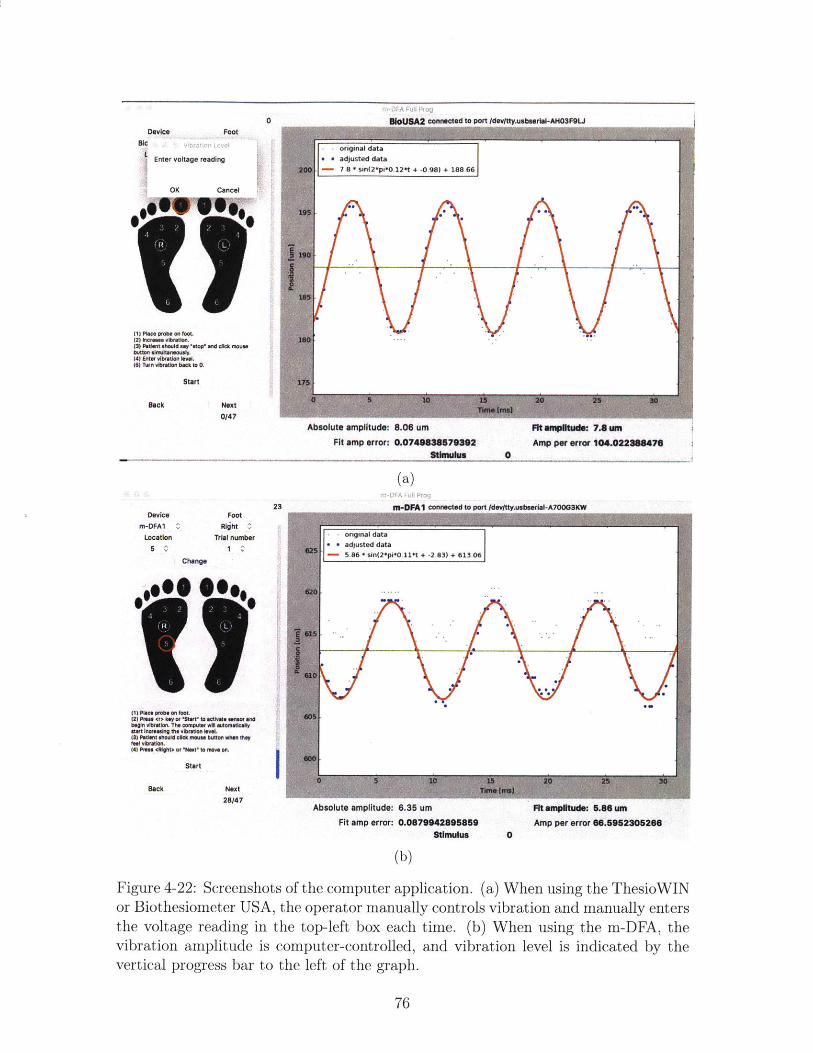
nWi7)lA u&I FPoi
pisnniewid M8 nnrt Maiua , nbehArIm.IAMfl"OI .1
Device Footim
Enter voltage reading
OK Cancel
OR 0 s
200
195
190
185
11) Place probe on toet.(2) increm vibration.(3) Patient should 'stop" mnd clck mousebutton simultaneously.(4) Enter vibration lenat(6) Turn vibration back to 0.
Start
Back
180
V'5
Next0147
s adjusted data- 7.8 * sin(2*pi*0.12*t + -0.98) + 188.66
(N A *
15 20 30Time [me]
Absolute amplitude: 8.06 umFit amp error: 0.0749838679392
Stimulus
Fit amplitude: 7.8 unAmp per error 104.022388476
0
(a)
m-DFA1 connected to port Idevtty.usbeerla-A700G13W
original data
5 adjusted data- 5.86 * sin(2*p *0.11*t + -2.83) + 613.06
615
I
(I) Place probe on toot.(2) Press -(* ki0y or "Ibff) to activate serum anodbegin ibretion. The omputer wN eutomatloalv0)8* Inoftaig the vibrationl leve(3) Pe1101 should cliok moua. buttlwn they 00)foal vibrationl.(4) Press 44890ht or 'Next' to move n
Start
Back Next28147
I
610 V./N- A
V1
15 20. .5Time [mS)
Absolute amplitude: 6.35 um Fit amplitude: 5.86 umFit amp error: 0.0879942895859 Amp per error 66.5952305266
Stimulus 0
(b)
Figure 4-22: Screenshots of the computer application. (a) When using the ThesioWINor Biothesiometer USA, the operator manually controls vibration and manually entersthe voltage reading in the top-left box each time. (b) When using the m-DFA, thevibration amplitude is computer-controlled, and vibration level is indicated by thevertical progress bar to the left of the graph.
76
0
Device
Location5 Cag
Change
FootRljhtC
Trial number1 V^
23
4.6.3 Mobile Application
Although the mDFA will ultimately be deployed in conjunction with a mobile ap-
plication, the current mobile version was developed as a proof-of-concept and is not
intended to model the real version. It was developed by Michael Fragoso, an under-
graduate researcher visiting the MIT TouchLab over a summer, for Android devices
using MIT App Inventor, a web-based visual programming language.
When the mDFA is in "mobile" mode, the device itself is powered by a 5W (5V,
1A) power bank, and communicates with the mobile device via Bluetooth using a
software serial port.
Figure 4-23 shows screenshots of the app. The first screen prompts the user to
connect to the Bluetooth device. After entering patient health information, the app
guides the operator through the 12 points on the foot. In the current implementation,
vibration level is controlled by the operator by pressing one of the buttons labeled
1-8 or advancing the slider. When the patient feels vibration, they push the large red
"Stop" button. At this point, the phone sends the "read" command to the mDFA,
which returns a window of raw data. A popup window in the app shows the current
vibration level and sensor output. The displayed sensor output is half of the difference
between the highest and lowest positions in the window. This roughly approximates
the vibration amplitude, assuming that the window of data is actually a perfect sine
wave.
77

Q m-DFA
@ CONNECT DEVICEConnection Status:Device Connected
PROCEED
CHANGE PATIENT
Developed by Michael Fragoso
®T m-DFAPatient Information:
Name:
Age:
Sex: ] M ] F
Weight:
Height:
Diabetes: IY M N
Duration of Diabetes:
kg
cm
years
Neuropathy: D YD N [ Unknoin
(a)
0*** O@Se
Choose the vibration level:
Vibration Level:
207
(c)
(b)
(d)
Figure 4-23: Screenshots of the Android mobile application developed as a proof-ofconcept. (a) Ther user is prompted to establish a Bluetooth connection between thephone and mDFA. (b) Screen to input patient health information. (c) The app guidesthe operator through testing the 12 points on the feet. Each time the patient feelsvibration, they push the large red "Stop" button, which (d) Records and displays thesensor output, which is vibration amplitude in pm.
78
Chapter 5
Human Subject Tests
To validate the mDFA and explore vibration perception thresholds in people with
both normal and diminished sensation, human subject tests were performed at both
MIT and Agada Hospital in Chennai, India. During each test a series of readings
was taken using the Biothesiometer USA and mDFA. Nerve conduction studies using
the NC-Stat DPNCheck from NeuroMetrix (Waltham, MA) were used as the gold
standard to categorize each subject as having normal sensation or mild, moderate, or
severe neuropathy. The study was approved by both Agada Hospital's Institutional
Review Board (IRB) and the Committee on the Use of Humans as Experimental
Subjects (COUHES), which is MIT's IRB.
The goals of the study were to:
1. Compare the mDFA with the Biothesiometer USA and assess the validity of the
mDFA as a viable alternative to the biothesiometer.
2. Evaluate the relationship between the mDFA and nerve conduction results.
3. Establish VPT thresholds in normal and neuropathic subjects.
This chapter describes the study setup and design, patient population, and results.
Although the number of study participants was relatively low, the mDFA was found
to be comparable to the Biothesiometer USA and VPT measured with both devices
correlated with neuropathy degree as determined by nerve conduction studies.
79
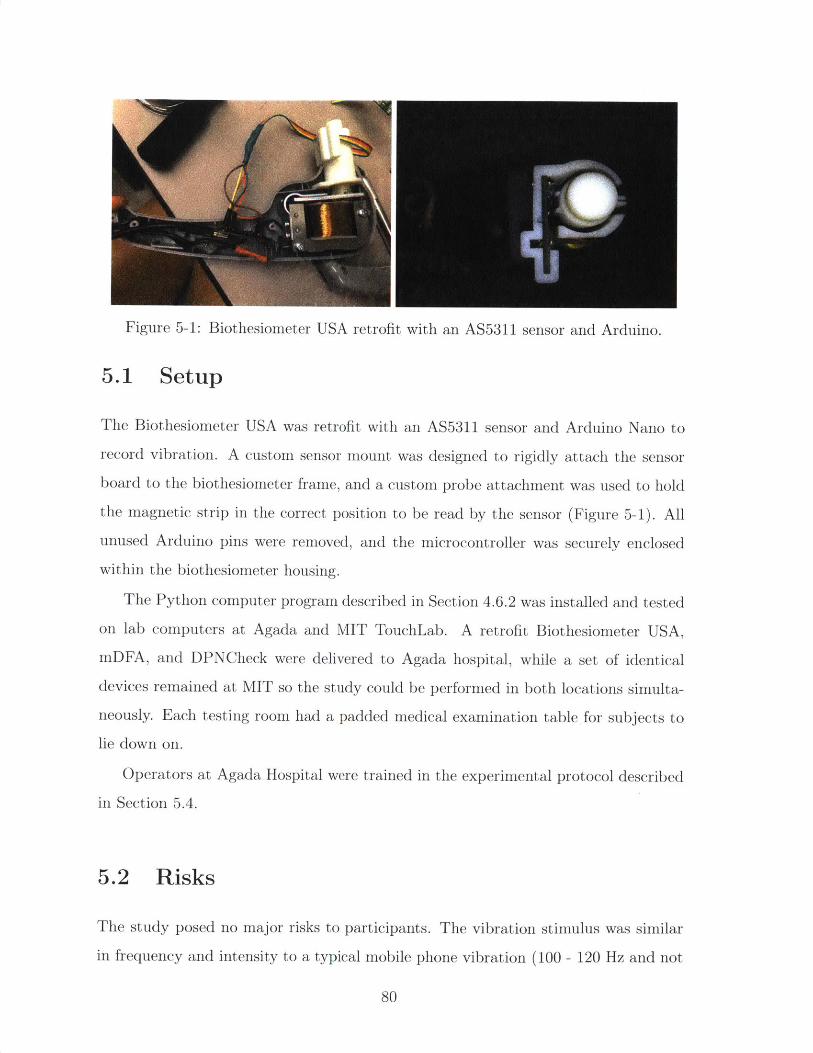
Figure 5-1: Biothesiometer USA retrofit with an AS5311 sensor and Arduino.
5.1 Setup
The Biothesiometer USA was retrofit with an AS5311 sensor and Arduino Nano to
record vibration. A custom sensor mount was designed to rigidly attach the sensor
board to the biothesiometer frame, and a custom probe attachment was used to hold
the magnetic strip in the correct position to be read by the sensor (Figure 5-1). All
unused Arduino pins were removed, and the microcontroller was securely enclosed
within the biothesiometer housing.
The Python computer program described in Section 4.6.2 was installed and tested
on lab computers at Agada and MIT TouchLab. A retrofit Biothesiometer USA,mDFA, and DPNCheck were delivered to Agada hospital, while a set of identical
devices remained at MIT so the study could be performed in both locations simulta-
neously. Each testing room had a padded medical examination table for subjects to
lie down on.
Operators at Agada Hospital were trained in the experimental protocol described
in Section 5.4.
5.2 Risks
The study posed no major risks to participants. The vibration stimulus was similar
in frequency and intensity to a typical mobile phone vibration (100 - 120 Hz and not
80
I
exceeding 100 pm amplitude). The combined duration of vibration exposure was less
than 10 minutes, and each individual stimulus was less than 30 seconds. Thus, the
stimuli used in the study was well within a safe and comfortable range, and posed no
risk to subjects. All three devices were thoroughly cleaned with alcohol wipes after
each use. People with open foot wounds or infections were excluded from the study.
Participation was voluntary, and if a subject felt uncomfortable at any point, they
were free to terminate the study with no repercussions.
5.3 Subject Recruitment and Compensation
At Agada Hospital, existing diabetic patients were recruited for the study and com-
pensated with a free foot exam and blood test. We were particularly interested in
enrolling diabetic patients with a range of neuroapthy (none, mild, moderate, and
severe). In total, 13 Agada patients participated in the study, 10 of whom were
diabetic.
Participation in the study at the MIT site was open to any adult volunteer. Sub-
jects were recruited through email advertisements and word of mouth. They were
compensated with a $10 Amazon gift card at the end of the session. 9 volunteers
participated in the study at MIT. Based on self-report, none of them had diabetes.
5.4 Protocol
At the beginning of each session, the experimenter explained the study and experi-
mental protocol, and gave the subject a chance to ask questions. Each of the vibrating
devices was turned on and the subject was asked to touch the probes and confirm
that they were comfortable with these stimuli touching their feet. They were then
asked to sign an informed consent form. Basic demographic and health information
(age, sex, weight, height, and diabetes status) was then obtained. To ensure con-
fidentiality and prevent bias in data analysis, subjects were assigned a random ID
number to de-identify their name from their personal information and test results.
81
When ready, the subject relaxed in a supine position and the experimenter cleaned
the plantar surface of both feet. The subject was given a wireless mouse (with the
LED taped to prevent the cursor from moving) and instructed to click it whenever
they felt vibration. In addition, they wore earmuffs to prevent them from hearing
any vibrations. When the subject was ready, the experimenter followed the protocol
below:
1. The subject's VPT was first measured using the Biothesiometer USA. The 12
points shown in Figure 3-3 were each tested twice. For each reading, the op-
erator lightly placed the probe on the subject's foot, taking care not to let
the sensor touch the skin. Using the manual dial, the experimenter slowly in-
creased the vibration amplitude unti-l the subject clicked the mouse to indicate
they sensed vibration. The experimenter entered the voltage displayed on the
biothesiometer at that point, and advanced to the next screen. This process-
was repeated for each reading, with the computer program guiding the operator
in where to place the probe each time.
2. Next, the program prompted the experimenter to switch to the mDFA. The
same 12 points in Step (1) were tested twice. For each reading, the experimenter
firmly placed the device on the foot so that the entire surface of the surround
support was in contact with the skin. This ensured that the probe was preloaded
onto the skin. After placing the device on the foot, the experimenter pressed the
<R> key or "Start" button to initiate vibration. The computer automatically
ramped up the vibration until the patient clicked the mouse. This was repeated
until all points had been tested twice.
3. The program then prompted the operator to record nerve conduction velocity
and amplitude using the DPNCheck. An unused biosensor was inserted into
the DPNCheck and a small amount of conductive gel was applied to each of the
metal leads. The volunteer's ankles and calves were thoroughly scrubbed with
disposable preparation pads. After ensuring that the volunteer was comfortable
in the appropriate position and their leg muscles were relaxed, their nerve con-
82
duction velocity and amplitude were recorded on both legs and results entered
into the computer program.
After each subject, alcohol wipes were used to clean the biothesiometer, mDFA,
and DPNCheck.
5.5 Data Analysis, Results, and Discussion
The results of the study are summarized in Table 5.1. In total, 22 subjects partic-
ipated in the study at Agada Hospital and MIT, so a total of 44 feet were tested.
Based on DPNCheck results, 21 feet were normal, 17 feet had mild neuropathy, and 6
feet had moderate neuropathy. None of the subjects had severe neuropathy in either
foot.
The mean Biothesiometer USA VPT was measured to be 0.7 t 0.2pum in normal
feet, 1.4 0.4pam in feet with mild neuropathy, and 2.6 t 1.6pm in feet with moderate
neuropathy. The mean mDFA VPT was 1.9 t 0.6pum in normal feet, 5.9 2.1pam in
feet with mild neuropathy, and 9.8 4.7pum in feet with moderate neuropathy. VPTs
measured with the Biothesiometer USA were consistently higher than those measured
with the mDFA due to differences in mechanical contact with skin. The relationship
is linear.
Figure 5-2 shows device voltage input versus measured vibration amplitude for
both the Biothesiometer USA and mDFA. Although both showed a linear relation-
ship, the Biothesiometer USA was clearly more repeatable in producing a vibration
amplitude that could be predicted by the inputted voltage. However, the coefficient
of determination, R2 = 0.55, in the Biothesiometer USA was still poor and indicates
that we should not rely on stimulation voltage to determine VPT. The weak corre-
lation between mDFA input and measured amplitude can be attributed to the fact
that the mDFA flexure suspension pressing the probe into the skin is not as stiff as
the steel plate coupled to the probe in the Biothesiometer USA. This is acceptable
because the mDFA was designed to use the sensor to determine VPT, and does not
83
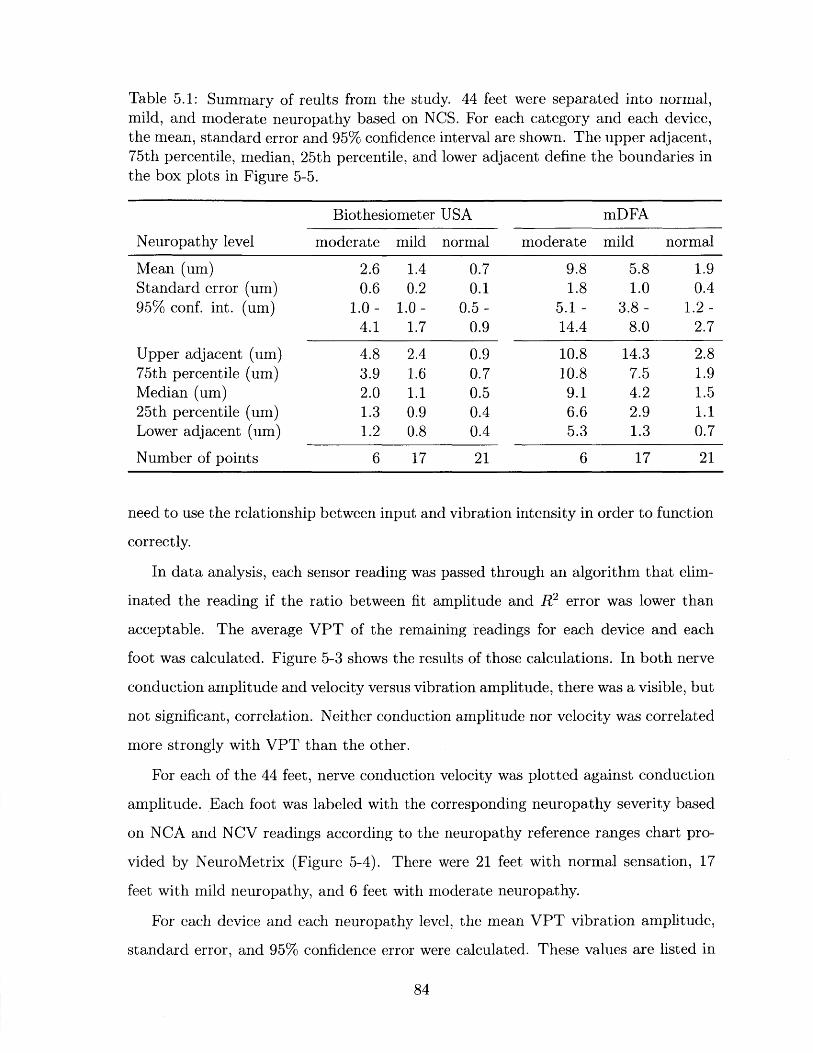
Table 5.1: Summary of reults from the study. 44 feet were separated into normal,mild, and moderate neuropathy based on NCS. For each category and each device,the mean, standard error and 95% confidence interval are shown. The upper adjacent,75th percentile, median, 25th percentile, and lower adjacent define the boundaries inthe box plots in Figure 5-5.
Biothesiometer USA mDFA
Neuropathy level moderate mild normal moderate mild normal
Mean (um) 2.6 1.4 0.7 9.8 5.8 1.9Standard error (um) 0.6 0.2 0.1 1.8 1.0 0.495% conf. int. (um) 1.0- 1.0- 0.5- 5.1- 3.8- 1.2-
4.1 1.7 0.9 14.4 8.0 2.7
Upper adjacent (um) 4.8 2.4 0.9 10.8 14.3 2.875th percentile (um) 3.9 1.6 0.7 10.8 7.5 1.9Median (um) 2.0 1.1 0.5 9.1 4.2 1.525th percentile (um) 1.3 0.9 0.4 6.6 2.9 1.1Lower adjacent (um) 1.2 0.8 0.4 5.3 1.3 0.7
Number of points 6 17 21 6 17 21
need to use the relationship between input and vibration intensity in order to function
correctly.
In data analysis, each sensor reading was passed through an algorithm that elim-
inated the reading if the ratio between fit amplitude and R2 error was lower than
acceptable. The average VPT of the remaining readings for each device and each
foot was calculated. Figure 5-3 shows the results of those calculations. In both nerve
conduction amplitude and velocity versus vibration amplitude, there was a visible, but
not significant, correlation. Neither conduction amplitude nor velocity was correlated
more strongly with VPT than the other.
For each of the 44 feet, nerve conduction velocity was plotted against conduction
amplitude. Each foot was labeled with the corresponding neuropathy severity based
on NCA and NCV readings according to the neuropathy reference ranges chart pro-
vided by NeuroMetrix (Figure 5-4). There were 21 feet with normal sensation, 17
feet with mild neuropathy, and 6 feet with moderate neuropathy.
For each device and each neuropathy level, the mean VPT vibration amplitude,
standard error, and 95% confidence error were calculated. These values are listed in
84
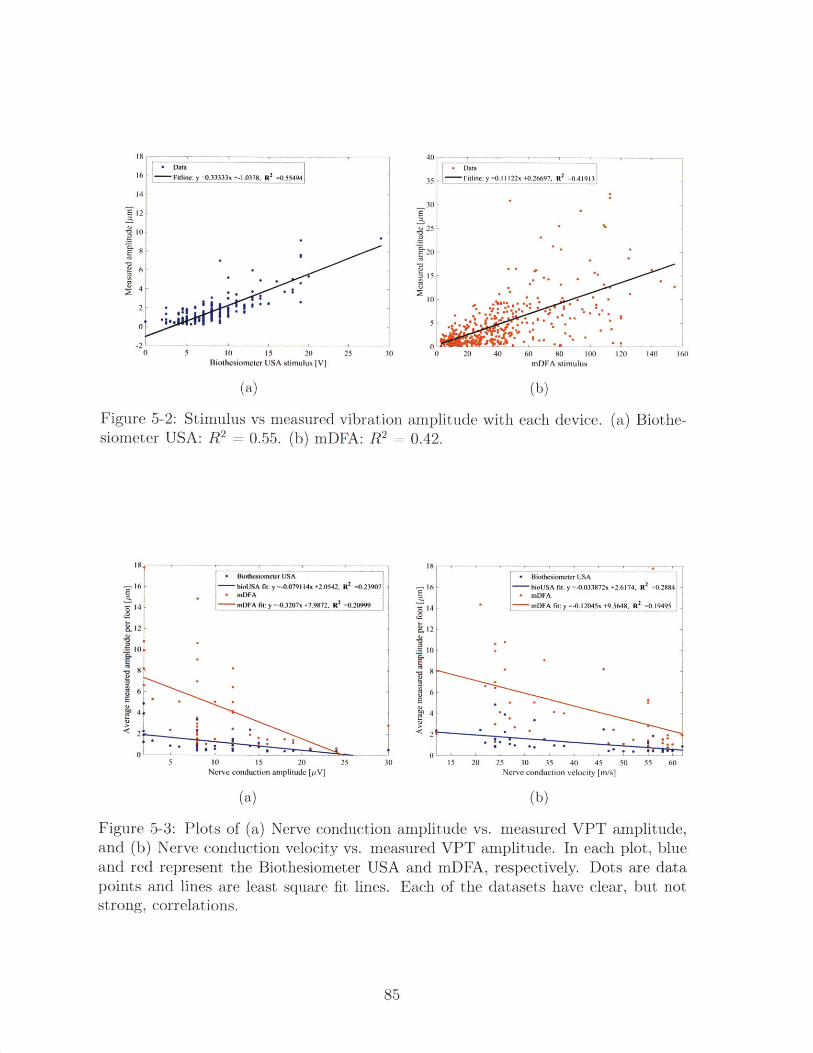
' 8 -- - 1 , .16 ne:y=0.33333x +-1.0378, R
2 =0.55494
14
E12
10
E8
2 6 |-
0 5 10 15 20 25 3Biolhesiometer USA stimulus [Vj
(a)
40 ---, ---
35 . Fitline:y=0.11122x+0.26697, R2
=0.419l3
30
.E 20
20 -
0 , - . -0 20 40 60 80 10( 120 140 160
mDFA stimulus
(b)
Figure 5-2: Stimulus vs measured vibrationsiometer USA: R2 = 0.55. (b) mDFA: R2 =
amplitude with each device.0.42.
(a) Biothe-
Biothesiomneter USA- bioUSA fit: y =-0.079114x +2.0542, R2
=0.23907mDFAmDFA fit: y =-0.3207x +7.9872. Rf
2=0.20999
6
4
5 10 15 20 25Nerve conduction amplitude [p.V]
(a)
-16
14
12
10
6E
4
<2
0130
e *
.1- .
15 20 25 30 35 40 45 50 55 60Nerve conduction velocity [m/s]
(b)
Figure 5-3: Plots of (a) Nerve conduction amplitude vs. measured VPT amplitude,and (b) Nerve conduction velocity vs. measured VPT amplitude. In each plot, blueand red represent the Biothesiometer USA and mDFA, respectively. Dots are datapoints and lines are least square fit lines. Each of the datasets have clear, but notstrong, correlations.
85
- I6 -
12
10
E
0 Biothcsiomcter USA
- bioUSA fit: y =-0.033872x +2.6174, R2 =0.2884 -
* mDFAmDFA fit: y =-0.12045x +9.5648, R
2=0.19495 .
0
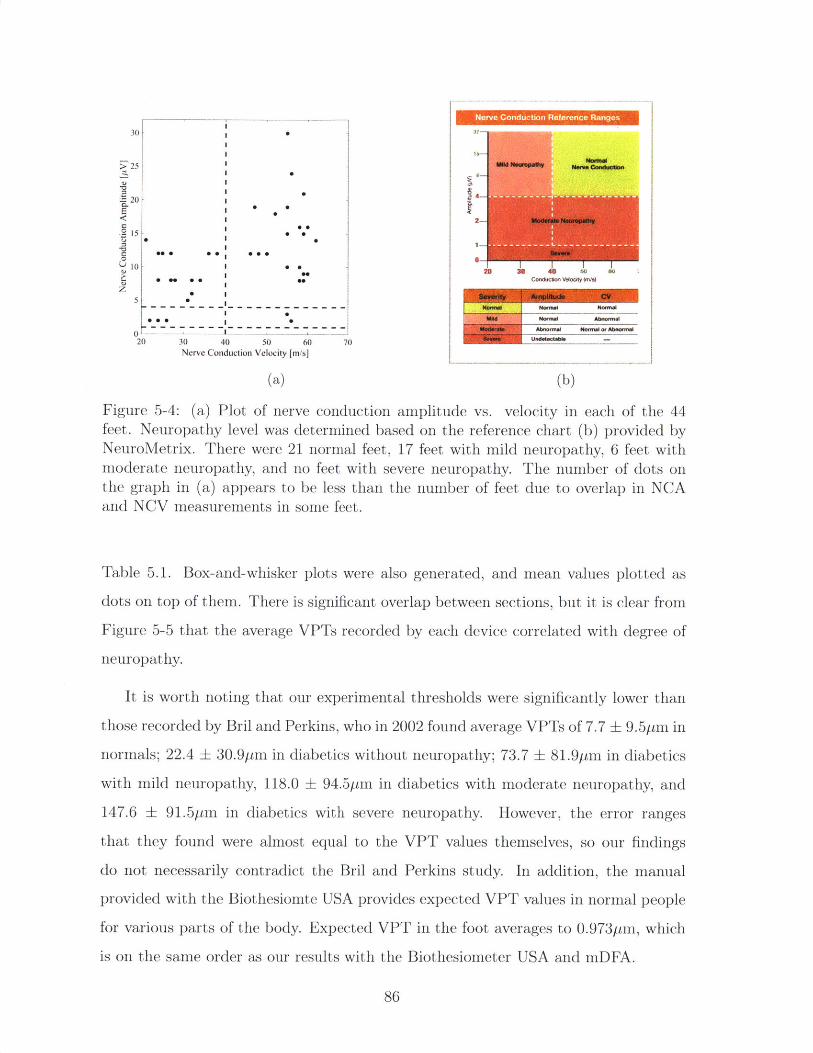
30]
525I 0
20
1 0 -2 0 0 00 0 6 7
0I
0 000
00
20 30 40 50 60 70Nerve Conduction Velocity [m/s]
(a)
Nerve Conduction Reference Ranges
2 Modw*IDNona
0ne~ u
20 30 0 (b)
Figure 5-4: (a) Plot of nerve conduction amplitude vs. velocity in each of the 44feet. Neuropathy level was determined based on the reference chart (b) provided byNeuroMetrix. There were 21 normal feet, 17 feet with mild neuropathy, 6 feet withmoderate neuropathy, and no feet with severe neuropathy. The number of dots onthe graph in (a) appears to be less than the number of feet due to overlap in NCAand NCV measurements in some feet.
Table 5.1. Box-and-whisker plots were also generated, and mean values plotted as
dots on top of them. There is significant overlap between sections, but it is clear from
Figure 5-5 that the average VPTs recorded by each device correlated with degree of
neuropathy.
It is worth noting that our experimental thresholds were significantly lower than
those recorded by Bril and Perkins, who in 2002 found average VPTs of 7.7 9.5pm in
normals; 22.4 + 30.9pm in diabetics without neuropathy; 73.7 81.9pni in diabetics
with mild neuropathy, 118.0 94.5pm in diabetics with moderate neuropathy, and
147.6 91.5pm in diabetics with severe neuropathy. However, the error ranges
that they found were almost equal to the VPT values themselves, so our findings
do not necessarily contradict the Bril and Perkins study. In addition, the manual
provided with the Biothesiomte USA provides expected VPT values in normal people
for various parts of the body. Expected VPT in the foot averages to 0.9731tm, which
is on the same order as our results with the Biothesiometer USA and mDFA.
86
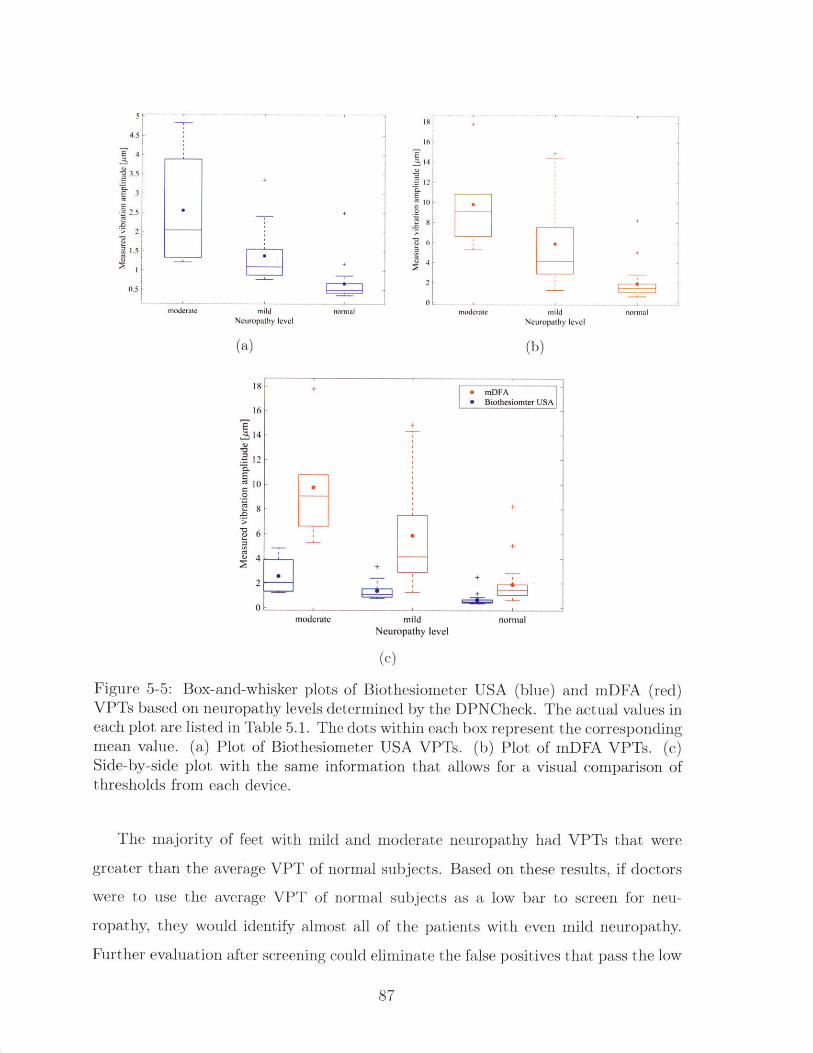
4.5-
3.5
3
2.5
> 2
mildNeuropathy level
(a)
normal
16
S14
12
EC
.2
0moderate
Neuro
(b)
normal
18 +* mDFA1 Biothesiomter USA
16S+
14
. 12
10
8 +
4 -
2
moderate mild normalNeuropathy level
(c)
Figure 5-5: Box-and-whisker plots of Biothesiometer USA (blue) and mDFA (red)VPTs based on neuropathy levels determined by the DPNCheck. The actual values ineach plot are listed in Table 5.1. The dots within each box represent the correspondingmean value. (a) Plot of Biothesiometer USA VPTs. (b) Plot of mDFA VPTs. (c)Side-by-side plot with the same information that allows for a visual comparison ofthresholds from each device.
The majority of feet with mild and moderate neuropathy had VPTs that were
greater than the average VPT of normal subjects. Based on these results, if doctors
were to use the average VPT of normal subjects as a low bar to screen for neu-
ropathy, they would identify almost all of the patients with even mild neuropathy.
Further evaluation after screening could eliminate the false positives that pass the low
87
mild'pathy level
bar. A larger study with more data would allow us to generate a receiver operating
characteristic (ROC) curve to optimize sensitivity and specificity.
Average VPTs recorded with the mDFA were consistently higher than VPTs
recorded with the Biothesiometer USA. This difference can likely be attributed to
the fact that the mDFA surround support pre-tensions the skin and changes its me-
chanical properties. In addition, the preload applied to the skin before vibration
is stronger in the Biothesiometer USA, and likely also contributes to the difference
in mechanical properties of the skin at the measurement point. Because the aver-
age results between the two devices differ by a linear factor, the mDFA can still be
easily compared to the Biothesiometer USA, which is FDA-approved, and seen as a
reasonable alternative in clinical use.
5.6 Conclusion
The goal of the mDFA is to provide a neuropathy screening device that is suitable for
use in low-resource settings. Because vibration perception threshold is a psychophys-
ical measurement that relies on patient reaction and does not directly measure nerve
function, it is not suitable for use as a diagnostic exam. However, preliminary results
prove that the mDFA can provide significant value to patients and doctors around
the world who do not have access to neuropathy screening or diagnostic tests. Work
is needed to further test the device and gather data, especially in patients with neu-
ropathy, to establish thresholds that correspond to various degrees of neuropathy.
Nevertheless, the results of the preliminary validation study performed at Agada
Hospital and MIT add confidence in the mDFA as a useful screening tool that can
aid healthcare professionals in identifying patients who require close monitoring and
education on preventative foot care.
88
Chapter 6
Conclusion and Future Work
Distal symmetric polyneuropathy is a common diabetes complication that is best
treated through glycemic management and daily measures to prevent ulcers. Unfor-
tunately, the majority of diabetics in low-resource settings are not assessed for neu-
ropathy and consequently are not educated on proper foot care. This thesis presented
a portable mechanical device that is a practical solution for neuropathy screening in
resource-constrained contexts.
6.1 Summary
Chapter 1 provided motivation for the mDFA by introducing diabetes as a global
health problem. It explained the negative impact that neuropathy has on low-income
patients, and described our partnership with Agada Hospital in India.
In Chapter 2, DSPN was explained in terms of its psychophysiology, symptoms,
and treatment options, and the resulting financial impact. Understanding the phys-
iology of nerves affected by DSPN impacted the functional requirements and design
parameters used to specify the mDFA design.
Chapter 3 was a survey of commercially available devices to diagnose neuropathy.
It also introduced VPT and discussed factors that affect VPT, previous studies, and
drawbacks of existing biothesiometers. The goal was for the mDFA to perform at
least as well as existing devices, while also improving upon the pain points of current
89
biothesiometers.
In Chapter 4 we defined functional requirements and described the design pro-
cess and final prototype in detail. Actuator and sensor selection were outlined. The
mechanical prototype design was presented along with electronic system and accom-
panying computer and mobile software.
Finally, Chapter 5 detailed a human subject study that validated the mDFA
against biothesiometers and compared it with NCS. Although there is a need for a
much larger quantity of data, the initial results were encouraging and showed that
the device met the functional requirements.
6.2 Future Work
The motivation behind the mDFA project was to provide a device to help prevent
the devastating implications of neuropathy in poor, rural populations by identifying
patients with loss of sensation and teaching them how to manage the complication. In
order for this goal to be reached, the mDFA needs to be developed into a commercial
product and rigorously tested to determine VPTs in people with varying levels of
DSPN.
The most immediate task is industrial design, which includes ergonomics, design
for manufacture (DFM), and design for assembly (DFA). The mechanical device must
also be designed to incorporate electrical components. After the designs are complete
and industrial prototypes are built, tooling can be fabricated. Certification and device
characterization can be done using prototypes before manufacturing begins.
In addition to device design, large human subject experiments are needed to col-
lect data and determine appropriate threshold cutoffs for each degree of neuropathy.
Without extensive data to dictate cutoff values, the mDFA has limited value.
90
Bibliography
K. Alexiadou and J. Doupis. Management of Diabetic Foot Ulcers. Diabetes Therapy,3(1), April 2012.
R. Azman Ali. Management of Diabetic Neuropathy. Malaysian Journal of MedicalScience, 10(2):27-30, Jan 2003.
AMS. AS5311 Multi-pole strip magnet, 2013.
S. Bala. Eccentric Rotating Mass (ERM) Actuators.https://blog.somaticlabs.io/eccentric-rotating-mass-erm-actuators/,2015. Accessed: 2017-08-21.
V. Bansal, J. Kalita, and U. K. Misra. Diabetic neuropathy. Postgraduate MedicalJournal, 82(964):95-100, Feb 2006.
R. Bhandari, S. Negi, and F. Solzbacher. A novel mask-less method of fabricatinghigh aspect ratio microneedles for blood sampling. Electronic Components andTechnology Conference, pages 1306-1309, May 2008.
A. Biswas, M. Manivannan, and M. A. Srinivasan. Layered Biomechanical Model ofthe Pacinian Corpuscle. IEEE Transactions on Haptics, 8(1):31-42, 2015a.
A. Biswas, M. Manivannan, and M. A. Srinivasan. Vibrotactile Sensitivity Threshold:Nonlinear Stochastic Mechanotransduction Model of the Pacinian Corpuscle. IEEETransactions on Haptics, 8(1):102-113, 2015b.
Blausen.com staff. Medical gallery of Blausen Medical2014. WikiJournal of Medicine, 1(2):10, 2014. URLhttps://en.wikiversity.org/wiki/WikiJournal-ofMedicine/Medical_gallery_.ofBlausenMedical_2014.
V. Bril and B. A. Perkins. Comparison of vibration perception thresholds obtainedwith the Neurothesiometer and the CASE iv and relationship to nerve conductionstudies. Diabetic Medicine, 19(8):661-666, Aug 2002.
V. Bril, J. Kojic, M. Ngo, and K. Clark. Comparison of a Neurothesiometer andVibration in Measuring Vibration Perception Thresholds and Relationship to NerveConduction Studies. Diabetes Care, 20(9):1360-1362, Sep 1997.
91
B. Calabek, B. Callaghan, and E. Feldman. Therapy for diabetic neuropathy: anoverview. In Zochodne and Malik [2014], chapter 22, pages 317-333.
P. Chandra, B. Gogate, P. Cogate, N. Thite, A. Mutha, and A. Walimba. Economicburden of diabetes in urban Indians. The Open Opthamology Journal, 8:91-94, Nov2014.
W.-Y. Cheng, Y.-D. Jiang, L.-M. Chuang, C.-N. Huang, L.-T. Heng, H.-P. Wu, T.-Y.Tai, and B. J. Lin. Quantitative sensory testing and risk factors of diabetic sensoryneuropathy. Journal of Neurology, 246(5):394-398, May 1999.
D. Coppini, P. Young, C. Weng, A. MacLeod, and P. Sonksen. Outcome on diabeticfoot complications in relation to clinical examination and quantitative sensory test-ing: A case-control study. Diabetic Medicine, 15(9):765-771, Apr 1998.
D. Dimitrakoudis and V. Bril. Comparison of sensory testing on different toe surfaces:Implications for neuropathy screening. Neurology, 59(4):611-613, 2002.
Electronics Tutorials. Linear Solenoid Actuator.http://www.electronics-tutorials.ws/io/io_6.html. Accessed: 2017-08-21.
Fenixdiaz. LVDT fuction. https://commons.wikimedia. org/wiki/File: Lvdt_how.gif, 2009.
R. Freeman. Diabetic autonomic neuropathy. In Zochodne and Malik [2014J, chap-ter 6, pages 63-79.
A. Garrow and A. Boulton. Vibration perception threshold - A valuable assessmentof neural dysfunction in people with diabetes. Diabetes/Metabolism Research andReviews, 22(5):411 - 419, Sep 2006.
Genesis Medical Systems. Print Report - 1.http://www.genesismedicals.com/thesiowin/.
G. Gerling. SA-I mechanoreceptor position in fingertip skin may impact sensitivityto edge stimuli. Applied Bionics and Biomechanics, 7(1):19-29, May 2010.
J. M. Goldberg and U. Lindblom. Standardised method of determining vibratory per-ception thresholds for diagnosis and screening in neurological investigation. Journalof Neurology, Neurosurgery, and Psychiatry, 42(9):793-803, Sep 1979.
D. Gow and P. Moore. Assessing diabetic peripheral neuropathy in primary care.Best Practice Journal, (61):36-47, 2014.
H. Gray. Anatomy of the Human Body. Lea and Febiger, 1918.
G. Gregersen. Vibratory Perception Threshold and Motor Conduction Velocity inDiabetics and Non-Diabetics. Acta Medica Scandinavica, 183:61-65, Apr 1968.
92
Human Benchmark. Reaction time statistics.https: //www. humanbenchmark. com/tests/reactiontime/statistics. Ac-cessed: 2017-08-21.
S. Joshi and R. Parikh. India - Diabetes capital of the world: Now heading towardshypertension. The Journal of the Association of Physicians of India, 55:323-324,June 2007.
S. Kaveeshwar and J. Cornwall. The current state of diabetes mellitus in India.Australasian Medical Journal, 7(1):45-48, 2014.
J. Lee, E. Halpern, L. Lovblom, E. Yeung, V. Bril., and B. Perkins. Reliability andValidity of a Point-of-Care Sural Nerve Conduction Device for Identification ofDiabetic Neuropathy. PLoS One, 9(1):e86515, Jan 2014.
D. Levinson. Questionable Billing for Medicare Electrodiagnostic Tests. U.S. Depart-ment of Helath and Human Services, 2014.
W. Loewenstein and R. Skalak. Mechanical transmission in a Pacinian corpuscle. Ananalysis and a theory. Journal of Physiology, 182(2):346-378, Jan 1966.
C. Martin, B. Waberski, R. Pop-Busui, P Cleary, S. Catton, J. Albers, and E. Feldmanadn W. Herman. Vibration Perception Threshold as a Measure of Distal Symmet-rical Peripheral Neuropathy in Type 1 Diabetes: Results from the DCCT/EDICstudy. Diabetes Care, 33(12):2635-2641, Dec 2010.
NeuroMetrix. Nerve Conduction Reference Ranges.http://www.dpncheck.com/learn-about-dpncheck/test-results.html.
P. Nicholls, J. McKnight, D. Loretta, K. Desikan, D. Lockwood, E. Wilder-Smit,and W. vanBrakel. Reference values for nerve function assessments among a studypopulation in northern India - I: Vibration sensation thresholds. Neurology Asia2009;, 14(2):129-139, 2009.
V. Nielsen. The peripheral nerve function in chronic renal failure. IV. An analysisof the vibratory perception threshold. Acta Medica Scandinavica, 191(4):287-296,1972.
B. A. Perkins, D. Olaleye, B. Zinman, and V. Bril. Simple Screening Tests for Pe-ripheral Neuropathy in the Diabetes Clinic. Diabetes Care, 24(2):250-256, Feb2001.
Physik Instrumente. Piezo Motion Control Tutorial.http://www.pi-usa.us/piezo-motiontutorial/index.php-cell. Accessed:2017-08-21.
K. Pourhamidi, L. B. Dahlin, E. Englund, and 0. Rolandsson. Evaluation of clinicaltools and their diagnostic use in distal symmetric polyneuropathy. Primary CareDiabetes, 8(1):77-84, Apr 2014.
93
R. Pradeepa, M. Rema, J. Vingnesh, M. Deepa, R. Deepa, and V. Mohan. Prevalenceand risk factors for diabetic neuropathy in an urban south Indian population: theChennai Urban Rural Epidemiology Study (CURES-55). Diabetic Medicine ", 25(4):407-412, 2008.
Precision Microdrives. Linear Resonant Actuators - LRAs.https : //www. precisionmicrodrives. com/vibration-motors/linear-resonant-actuators-lras.
D. Purves, G. Augustine, D. Fitzpatrick, L. Katz, A. LaMantia, J. McNamara, andS. Williams. Mechanoreceptors Specialized to Receive Tactile Information. Neuro-science - NCBI Bookshelf, 2001.
D. Quan. Diabetic Neuropathy. http: //emedic ine. meds cape. com/article/1170337-overview, 2017. Accessed: 2017-08-03.
A. Reeves and R. Swenson. Chapter 21 - Neuromuscular system disorders.https://www.dartmouth.edu/ dons/part_3/chapter_21.html, 2008.
Servier Medical Art. Monofilament. https : //www. flickr. com/photos/serviermedicalart/9758845821/in/photostream/, 2013.
K. Shankhdhar, L. K. Shankhdhar, U. Shankhdhar, and S. Shankhdhar. Diabetic footproblems in India: An overview and potential simple approaches in a developingcountry. Current Diabetes Reports, 8(6):452-457, Dec 2008.
A. Slocum. Precision Machine Design. Prentice Hall, 1992.
K. Snow. Evaluation of Diabetic Peripheral Neuropathy(DPN): An Overview. NEU-ROMetrix, 2012.
B. Szymik. A Nervous Journey. http://askabiologist.asu. edu/part s -nervous -system, May 2011. Accessed: 2017-08-07.
J. A. Temlett. An assessment of vibration threshold using a biothesiometer comparedto a C128-Hz tuning fork. Clinical Neuroscience, 16(11):1435-1438, Aug 2009.
S. Tesfaye, A. Boulton, and et. al P. Dyck. Diabetic neuropathies: Update on defi-nitions, diagnosis criteria, estimation of severity, and treatment. Diabetes Care, 33(7):2285-2293, Sep 2010.
S. Tesfaye, A. Boulton, and A. Dickenson. Mechanisms and Management of DiabeticPainful Distal Symmetrical Polyneuropathy. Diabetes Care, 36(9):2456-2465, Sep2013.
Thorlabs. Discrete Piezoelectric Stacks, 5.2 pm to 100.0 pm Travel.https: //www. thorlabs . com/newgrouppage9. cfm?objectgroup_-id=8040. Ac-cessed: 2017-08-21.
94
TNHSP. Proect overview. http://www.tnhsp.org/project. Accessed: 2017-08-21.
J. Tracy, P. Dyck, and B. James. The Spectrum of Diabetic Neuropathies. PhysicalMedicine and Rehabilitation Clinics of North America, 19(1):1-26, Feb 2008.
R. van Deursen, M. Sanchez, J. Derr, M. Becker, J. Ulbrecht, and P. Cavanagh.Vibration perception threshold testing in patients with diabetic neuropathy: ceilingeffects and reliability. Diabetic Medicine, 18(8):469-475, Jun 2001.
Wapcaplet. LVDT. https://commons.wikimedia.org/wiki/File:LVDT.png, 2007.
A. Wilbourn. Sensory nerve conduction studies. Journal of Clinical Neurophysiology,11(6):584-601, 1994.
World Health Organization. Global status report on noncommunicable diseases. WHOPress, Geneva, Switzerland, 2014.
D.W. Zochodne and R.A. Malik, editors. Handbook of Clinical Neurology, volume123. Elsevier B.V., Amsterdam, The Netherlands, first edition, 2014.
95
Related Documents