Can buzz on Twitter predict TV ratings and viewers? A study of US TV shows premiering in fall 2013 By Shiladitya Ray SUBMITTED TO THE SYSTEM DESIGN AND MANAGEMENT PROGRAM IN PARTIAL FULFILLMENT OF THE REQUIREMENTS FOR THE DEGREE OF Master of Science in Engineering and Management at Massachusetts Institute of Technology May, 2014 [Jue. 20i43 02014 Shiladitya Ray. All rights reserved. The author hereby grants to MIT permission to reproduce and to distribute publicly paper and electronic copies o iis thesis document in whole or in part. Signature redacted Signatu re of A utho r ......................... .;A................... ............................... ...................................... Shiladitya Ray System D anagement rogram MIT School of Engineering and N Irpn Sch 01 of Ma gement Certified by................................................................................S ig n a tu re re d a c te d Prof Scott Stern David Sarnoff Professor of Management of Technology Chair of the Technological Innovation, Entrepreneurs and Strategic Management Group MI SlAnagemt Accepted by.......................................................................Signature redacted- TASSA HNUSOES IGSITUTE Director, System Design and Management Fellows Program ~0 Senior Lecturer in Engineering Systems Division OCT 26 016 Massachusetts Institute of Technology - Engineering Systems Division rn C/ LIBRARIES The author hereby grants to MIT permission to age 0 of 93 reproduce and to distribute publicly paper and 4Iectronic copies of this thesis document in whole or in part in any medium now known or hereafter created.

Welcome message from author
This document is posted to help you gain knowledge. Please leave a comment to let me know what you think about it! Share it to your friends and learn new things together.
Transcript
Can buzz on Twitter predict TV ratings and viewers?A study of US TV shows premiering in fall 2013
By
Shiladitya Ray
SUBMITTED TO THE SYSTEM DESIGN AND MANAGEMENT PROGRAM INPARTIAL FULFILLMENT OF THE REQUIREMENTS FOR THE DEGREE OF
Master of Science in Engineering and Managementat
Massachusetts Institute of Technology
May, 2014 [Jue. 20i43
02014 Shiladitya Ray. All rights reserved.
The author hereby grants to MIT permission to reproduce and to distribute publicly paper andelectronic copies o iis thesis document in whole or in part.
Signature redactedSignatu re of A utho r ......................... .;A................... ............................... ......................................
Shiladitya RaySystem D anagement rogram
MIT School of Engineering and N Irpn Sch 01 of Ma gement
Certified by................................................................................S ig n a tu re re d a c te dProf Scott Stern
David Sarnoff Professor of Management of TechnologyChair of the Technological Innovation, Entrepreneurs and Strategic Management Group
MI SlAnagemt
Accepted by.......................................................................Signature redacted-TASSA HNUSOES IGSITUTE Director, System Design and Management Fellows Program
~0 Senior Lecturer in Engineering Systems Division
OCT 26 016 Massachusetts Institute of Technology - Engineering Systems Division
rnC/ LIBRARIES
The author hereby grants to MIT permission to age 0 of 93reproduce and to distribute publicly paper and4Iectronic copies of this thesis document inwhole or in part in any medium now known orhereafter created.

This page has been intentionally left blank.
Page 1 of 93
Abstract
Watching television has always been a social activity. People like to sit down with friends and family to
watch it and then discuss it not only with one's friends and family but at work (water cooler
conversations). Just as television has moved ahead with advances in technology, so too has our viewing
habits changed with technology. The advent of the internet brought in online forums where people could
interact with other fans and discuss opinions on TV shows (amongst others). The new wave of social media
applications brought in yet another platform for viewers to express their opinions. Twitter, founded in
2006, and one of the poster childs of social media wave, provided a real-time platform for users to express
their opinions and follow what other people are discussing or any other trending topic. Television
networks have embraced social TV on the assumption that social media makes people less likely to use
time-shifting technologies and hence skip advertising. Twitter provides the perfect platform for television
audiences to interact with each other in real-time. Through several strategic initiatives, Twitter has
established an early lead as a big player in the Social TV space. Television networks also wooed its
audience through various actions on Twitter and other social technology platforms. This paper looks at
the impact of actions of networks and viewers on Twitter on the ratings and viewership figures for shows
which premiered in Fall 2013 on US television networks. One of the key findings was that current episode's
ratings and viewership were significantly correlated with previous episode's. Further, ratings were
correlated to the number of tweets by the show handle in the week leading upto an episode airing
whereas viewership is more correlated with community actions and engagement.
Page 2 of 93
Table of ContentsAcknowledge ments ...................................................................................................................................... 7
1 . In tro d u ctio n ......................................................................................................................................... 8
1.1 Background and M otivation ......................................................................................................... 8
1.2 How this paper is organized ......................................................................................................... 9
2 . T e le v isio n ........................................................................................................................................... 1 0
2.1 Television through the ages ....................................................................................................... 10
2.2 Revenue M odel .......................................................................................................................... 11
2.3 Im pact on modern technology ................................................................................................... 11
2 .4 S o cia l T V ..................................................................................................................................... 1 3
2.5 Social Networks and TV .............................................................................................................. 16
2 .5 .1 T w itte r ..................................................................................................................................... 1 6
2.6 Twitter - positioned for TV? ....................................................................................................... 16
2.7 Twitter's Approach ..................................................................................................................... 18
2.8 Twitter and TV Advertising ......................................................................................................... 18
2 .8 .1 Face b o o k ................................................................................................................................ 19
2.8.2 TVtag (form erly GetGlue) ....................................................................................................... 20
2.8.3 Others players ........................................................................................................................ 20
2.8.4 Social TV comes of age - 2011 ................................................................................................ 20
2.9 Threat to networks ..................................................................................................................... 21
2.10 W hat have the networks done ................................................................................................... 21
2 .1 0 .1 B B C ..................................................................................................................................... 2 2
2 .10 .2 B rav o T V ............................................................................................................................. 2 2
3 . T w itte r T V ........................................................................................................................................... 2 2
3.1 Twitter - positioned for TV? ....................................................................................................... 22
3.2 Twitter's Approach ..................................................................................................................... 24
3.3 Twitter and TV Advertising ......................................................................................................... 24
3.4 Twitter's Social TV efforts ........................................................................................................... 25
3.4.1 Acquisitions in Social TV space ............................................................................................... 25
3.4.2 Hiring TV executives ............................................................................................................... 25
3.4.3 Twitter: TV related products .................................................................................................. 26
3.5 Twitter and TV Integration ......................................................................................................... 28
Page 3 of 93
3.5.1 The m om ent Twitter met TV ............................................................................................. 28
3.5.2 #Trum pRoast .......................................................................................................................... 29
3.6 TV Ratings................................................................................................................................... 29
3.6.1 Significance............................................................................................................................. 29
3.6.2 Dem ographics.........................................................................................................................29
3.6.3 Rating Agencies......................................................................................................................30
3.6.4 Ratings calculation methodology...................................................................................... 30
3.7 Relationship between Twitter and TV ratings....................................................................... 31
3.8 Nielsen Tw itter TV Ratings ...................................................................................................... 33
4. Theory and Hypothesis....................................................................................................................... 34
5. Collecting and Organizing Data ...................................................................................................... 36
5.1 Defining the requirements .................................................................................................... 36
5.2 Organizing the d ataset ................................................................................... ....... 36
5.2.1 Sum m ary Statistics ............................................................................................................. 37
5.2.2 Correlation amongst variables ...................................................................................... 37
5.3 Categorizing Data ....................................................................................................................... 37
6. Analysis an d Results ........................................................................................................................... 39
6.1 Single category analysis - Genre .............................................................................................. 39
6.2 Single category analysis - Networks ...................................................................................... 39
6.3 Prediction M odels ...................................................................................................................... 40
6.4 Lim itations..................................................................................................................................43
7. Closing Rem arks ................................................................................................................................. 44
7.1 Further work ............................................................................................................................... 44
7.2 Future - Road Ahead .................................................................................................................. 45
8. References..........................................................................................................................................46
9. Appendices.........................................................................................................................................51
9.1 Tw itter 101.................................................................................................................................51
9.2 Appendix A - Data Gathering and Technical Im plem entation ................................................. 52
9.2.1 Twitter APIs Consumed ................................................................................................. 53
9.2.2 API Data Items - Inputs and Outputs ............................................................................. 54
9.2.3 Frequency of polling...........................................................................................................56
9.2.4 Using Python ...................................................................................................................... 57
9.2.5 Technical Setup and Architecture.................................................................................. 57
Page 4 of 93
9 .2 .6 D ata co lle cte d ..................................................................................................................... 5 8
9 .3 A p pend ix B - Ta ebles ................................................................................................................... 59
9.4 Appendix C - Regression Tables ............................................................................................. 71
List of FiguresFIGURE 1 LOCATIONS WHERE CONSUMERS WATCHED TV WORLDWIDE IN 2013 (SOURCE: STATISTA 2014)................12
FIGURE 2 TELEVISION OWNERSHIP OVERTIME (SOURCE NIELSEN 2011) .............................................................. 13
FIGURE 3 ACTIVITIES PERFORMED ON SECOND SCREEN (SOURCE: STATISTA 2013) ............................................... 15
FIGURE 4 - ELECTRONIC DEVICES USED SIMULTANEOUSLY WHILE WATCHING TV (SOURCE: STATISTA 2013) ............... 16
FIGURE 5 TWO-WAY CAUSAL IMPACT OF TWITTER AND TV RATINGS (2013)..........................................................19
FIGURE 6 EXAMPLE OF A TWITTER ALERT ABOUT TV SHOWS ............................................................................ 27
FIGURE 7 IMPACT OF TV RATINGS ON TWITTER VOLUME (US 2013) (SOURCE: STATISTA 2013) ............................. 31FIGURE 8 INFLUENCE ON TWEETS ON TV RATINGS BY PROGRAM GENRE (SOURCE - STATISTA 2013).........................32
FIGURE 9 TW ITTER M ETRICS ACROSS NETW ORKS..................................................................................................63
Page 5 of 93
List of TablesTABLE 1 US TV INDUSTRY REVENUE 2012..........................................................................................................11
TABLE 2 TW ITTER - TERMINOLOGY ................................................................................................................. 52
TABLE 3 TW ITTER API DETAILS....................................................................................................................... 54
TABLE 4 TW ITTER API - INPUT AND OUTPUT ITEMS ............................................................................................ 56
TABLE 5 TW ITTER API - POLLING FREQUENCY UPPER LIMIT .................................................................................. 56
TABLE 6 DATA COLLECTION FREQUENCY..............................................................................................................57
TABLE 7 TECHNICAL ARCHITECTURE ................................................................................................................... 58
TABLE 8 - DATA COLLECTION VOLUMES .............................................................................................................. 58
TABLE 9 VARIABLES LIST AND DEFINITIONS .......................................................................................................... 61
TABLE 10 VARIABLES - SUMMARY OF OBSERVATIONS......................................................................................... 62
TABLE 13 CORRELATION OF VARIABLES - PART 1 OF 3 ....................................................................................... 65
TABLE 14 CORRELATION OF VARIABLES - PART 2 OF 3 ....................................................................................... 66
TABLE 15 CORRELATION OF VARIABLES - PART 3 OF 3 ....................................................................................... 67
TABLE 16 VARIABLE CATEGORIZATION .............................................................................................................. 68
TABLE 17 SHOW DETAILS ................................................................................................................................. 70
TABLE 18 SHOW GENRE AND TW ITTER METRICS...................................................................................................71
TABLE 19 TW ITTER METRICS FOR A BC ............................................................................................................... 72
TABLE 20 TW ITTER METR ICS FOR CBS ................................................................................................................ 72
TABLE 21 TW ITTER METRICS FOR FOX................................................................................................................73
TABLE 22 TW ITTER METRICS FOR NBC ............................................................................................................... 73
TABLE 23 IMPACT OF TW ITTER ON RATING AND VIEWERS......................................................................................74
TABLE 24 IMPACT OF GENRE ON RATINGS AND VIEWERS.................................................................................... 75
TABLE 25 IMPACT OF GENRE AND TW ITTER TOGETHER ON RATINGS AND VIEW ERS .................................................. 77
TABLE 26 ABC AND ITS TW ITTER METRICS - IMPACT ON RATINGS ........................................................................ 79
TABLE 27 NBC AND ITS TW ITTER METRICS - IMPACT ON RATINGS ........................................................................... 81
TABLE 28 CBS AND ITS TW ITTER METRICS - IMPACT ON RATINGS..........................................................................83
TABLE 29 FOX AND ITS TW ITTER METRICS - IMPACT ON RATINGS .......................................................................... 85
TABLE 30 ABC AND ITS TW ITTER METRICS - IMPACT ON VIEW ERSHIP.................................................................... 87
TABLE 31 NBC AND ITS TW ITTER METRICS - IMPACT ON VIEW ERSHIP ................................................................... 89
TABLE 32 CBS AND ITS TW ITTER METRICS - IMPACT ON VIEW ERSHIP ..................................................................... 91
TABLE 33 FOX AND ITS TW ITTER METRICS - IMPACT ON VIEW ERSHIP......................................................................93
Page 6 of 93

AcknowledgementsI have quite a few people to thank for this effort.
First and foremost, I thank Prof. Scott Stern from MIT Sloan School of Management. My first interaction
with Scott was when I registered for his class - Entrepreneurship Lab in spring 2013. I was bowled over by
not only his teaching but also by the depth of knowledge across a variety of industries. I knew that I wanted
to do my thesis with him. His guidance, encouragement has steered me to where I am today. Scott -
Thanks.
Scott's another contribution was in putting me in touch with another brilliant individual - Anil Doshi,
Doctoral candidate at Harvard Business School. Anil and I got on well from the start and over numerous
whiteboard sessions, cups of coffee we pulled together this project literally from scratch. Anil - I have
been fortunate to get to know you. I have learnt lots from you.
I would like to thank the SDM and Sloan faculty, staff, and students from whom I learned so much over
the last years. It has a wonderful experience.
Lastly and definitely not the least to Sudeshna, my wife who gave me the support to take this break and
have this lifetime experience. I will forever be indebted to you for this!!
Page 7 of 93

1. IntroductionSocial TV is has is gaining a lot of traction in recent times. Twitter has placed itself as one of the leaders in
this space. In this paper, I look at the impact of the buzz on Twitter for premiere shows for the prior week
leading up to a show episode airing and whether that buzz can be correlated to ratings and viewership for
that show episode. Categorizing actions of viewers and networks, I have looked at the new shows and
how actions by each of these communities on Twitter impact ratings, viewership and ultimately success.
1.1 Background and MotivationStarting from the discovery of television in 1926 by John Baird, television has reinvented itself over the
years and is regarded as an influential media. The television set has become ubiquitous in homes and
businesses alike for use as a source of entertainment, news and sports. Advertising is a major source of
revenue for television studios. Advertisers look out for eyeballs of their target demographic and the
pervasive reach of TVs across all sections of age groups and society makes it a good choice to showcase
their products. Hence, ratings and viewership figures of TV shows are an important yardstick to measure
the effectiveness of business' advertising investments.
At the beginning of the decade, MIT Technology Review listed Social TV as one of the 10 technology trends
to watch out for. Although Social TV has been in discussion since the start of the millennium, it's the rise
of social networking which has been the tipping point in Social TV getting the momentum.
The advent of technologies promoting 'watch anywhere anytime' gives people the ability to skip
advertisements. This is bad news for both advertisers and the networks. The problem statement then
becomes, how do networks get people to tune into live television? Social Media powered 'Social TV' gives
the networks a ray of hope. There is some early evidence that buzz on social media gets people to tune
into live television.
Of the social networks, Twitter has taken a lead to promote itself as the platform of choice for Social TV.
It has made strategic acquisitions, brought on board former television executives and developed products
which benefit advertisers and viewers. Indeed, 2013 was a landmark year for Twitter's television efforts.
It acquired Bluefin Labs and Trendrr as well as in partnership with Nielsen, launched 'Nielsen Twitter TV
Ratings'. These are pretty interesting and fast moving times for Twitter as it tries to cement its leadership
in the Social TV space.
Established television shows such as Family Guy, Scrubs, EastEnders, The Simpsons have over the years
developed a cult fan following. New/Premiere television shows have a challenge in trying to establish
Page 8 of 93
themselves. In the run up to a premiere and during the season a lot of money is spent on traditional
advertising as well as on promotion through social networking channels. Should the networks promote
their shows on Twitter? Should what specific actions should they take to drive up ratings and viewership?
Can we predict an episode's ratings and viewership based on the buzz on Twitter? These are some of the
questions which I have tried to answer in this paper.
L2 How this paper is organizedThis paper starts off by looking briefly at the history and evolution of television over the ages and how
modern technology has impacted it. This leads on to a discussion about Social TV where I look at how
Social TV impacts actual television. I look at the key players in the Social TV space and the leading social
networking companies efforts in this space.
The paper then goes on to take a closer look at Twitter and how it has geared itself up to the Social TV
revolution. This is followed by a discussion on TV ratings and a preview of the recently launched Nielsen
Twitter TV ratings.
The second half of this paper, is more about quantitative analysis. Starting off by laying the hypothesis in
Section 4, I then look at data variables required and then categorize them into network and people
actions. The last quartile of the paper analyzes the results of regression analysis. The results are discussed
in detail before drawing on the conclusion.
Page 9 of 93

2. Television
2.1Television through the agesApart from the discovery of the Internet, television is arguably one of the most influential discoveries of
the 20th century.
From January 26, 1926 (Kamm and Baird 2002) when John Baird first demonstrated a working television
system, at his laboratory in London to the current electronic ultra-high definition sets, the television set
has undergone a number of significant technological innovations.
Television rapidly spread across the world. In most cases it was backed by considerable government
funding. In the United Kingdom, BBC (British Broadcasting Corporation), funded by public license fee
arrangements spread its wings from radio to television. Similar patterns were played out in Canada, France
and other nations.
President Truman's speech at the Japanese Peace Treaty Conference in San Francisco on September 4,
1951 was the first national live television broadcast (The New York Times 1951) in U.S.
Introduction of cable and satellite television in the seventies, vastly increased the capacity in terms of the
number of channels offered. This also encouraged privately owned networks and channels and saw shows
being targeted towards particular audience segments. This era also saw the emergence of subscription
television channels Sky TV in UK, and HBO in the US and many others.
Monaghan reports that by the end of the 60's, there were approximately 78 million television sets across
the US. According to Stephens, by the end of the 90's, 98% of homes in the US had at least one television
set (Stephens) and they watched it daily for an average of seven hours.
The 80's saw the popularization of the video cassette recorders (VCRs) which gave viewers the ability not
only to rent and watch movies in their own homes and according to their own schedule but also to record
and replay television programs. The 90s saw the introduction of the Internet which has since had a
significant impact on all aspects of our lives. In 2009, analog television signals stopped broadcasting and
television became fully digital. This along with other technology advances has further brought television
and internet together. The impact of internet and modern technologies are discussed in detail in Section
2.2 - Revenue Model.
Page 10 of 93

2.2 Revenue ModelIn July 1941, the Federal Communications Commission (FCC) in the US granted permission for TV networks
to broadcast advertisements. Stewart (1941) reports that the first official, paid advertising appeared on
US television over New York station WNBT (now WNBC) before a baseball game between the Brooklyn
Dodgers and Philadelphia Phillies (Luckin 2013).
Since then, paid advertising on television seen a massive growth and is one of the key revenue drivers for
both broadcast and cable networks. As seen in
, nearly $62 billion was spent in the US by businesses on television advertising. Given the importance of
this revenue stream to broadcasters, they are incentivized to produce better content which engages its
viewers. On the other hand, businesses are looking to showcase their product or service to their target
Source of Revenue in 2012 in billion U.S.revenue dollars
Advertising 61.9
Subscription 109.1
Total 171
Table 1 US TV Industry Revenue 2012
consumer segments.
2.3 Impact on modern technologyAdvances in technology has impacted almost all aspects of our daily lives including our television watching
habits. The move to digital technologies in 2009 from the old analogue signals, has opened up a number
of opportunities in converging television and internet and has changed the way people consume
television. The primary enabler has been the fact that internet and broadband has been ubiquitous. Higher
broadband speeds both at home and on the move and a plethora of devices to consume video on has
made it possible for people to watch their programs 'anywhere anytime' they wish. As seen in Figure 1
Locations where consumers watched TV worldwide in 2013, although the vast majority of people watch
television at home, viewers also watch television while on the move - at shopping malls, cafes, workplaces
(II) and while commuting.
Page 11 of 93

At hom* - Rh. ~W
in O sefo VeA"n *O
~OWWOntVin hWMs *99n uWVAOV
Cn *A~ *no *tOA
48
I-I 23
-- Is
S tO 20 30 40 so
Sbale df respoubenn Mt '
60 70 so so
Figure 1 Locations where consumers watched TV worldwide in 2013 (Source: Statista 2014)
Introduction of Digital Video Recorders (DVRs), helped people to record a show while they watched
another in parallel or attended to other things in their daily life. DVRs also allowed one to skip advertising.
Given the dependence of television networks on advertising (Section 2.2 Revenue Model), this feature
was not seen in a good light by the networks.
The emergence of social networking platforms in the late 2000's, provided a means for audiences to seek
out like-minded individuals and engage with them real-time. This is discussed in detail in the following
Section 2.4 - Social TV.
Page 12 of 93
.............. ............................
.............. ................... ...... ............
35

2.4 Social TVThe proliferation of social media platforms and technologies allowed television to be shared in new ways.
Modern mobile devices -smartphone, tablet and laptop, gives a viewer, freedom of location and schedule
to not only consume television but also to actively participate in real-time conversations on social media
platforms. These second screens help viewers to connect with their social media channels and interact
with one's social network to discuss television shows. This essentially is the concept of 'Social TV" in a
nutshell. Social television's aim is to connect viewers with their social networks in real time so that they
can "virtually' consume television together.
Since early days, watching television has always been a social activity. Viewers watch it together and then
discuss with family on the dinner table or at work next day in what is referred to as 'water-cooler'
conversations. The Economist (2011) likened Facebook and Twitter to 'digital water-coolers' with respect
to such conversations.
Wohn and Na (2011), reflected on how as television became more affordable, viewing habits moved from
communal to individual. Nielsen (2011), in its "Television Audience Report" for 2010-11 reported that the
average number of television sets per household had increased from 1.57 in 1975 to 3.01 in 2012.
Interestingly, 57% of households in 1975 had 1 television set whereas 56% of households in 2012 had 3
or more sets, with just 15% having one set. This gradual change can be observed in Figure 2 Television
ownership overtime, below.
Television Set Ownership
% of TV Households Number of Sets per Household
1 Set
2 Sets
3 or More Sets
Average Number 75 '80 '85 90 '95 '00 s ')6 '07 '08 '09 10 '11 '12ofSets Per Household 1.57 1.6 1.83 2.00 2.28 2.43 2.62 2.73 2.79 2.83 2.86 2.93 2.97 3.01
Figure 2 Television ownership over time (Source Nielsen 2011)
Page 13 of 93
Talbot (2012) sees the first and second screens to be co-conspirators. He talks how television networks
instead of seeing mobile devices as enemies are embracing them to "knock down our living room walls
and turn our discrete little family watching TV experience into a social event for a whole village of
television fans".
Proulx and Shepatin (2012) views the popularity of social media giving rise to "real-time organic social
expressions that act as a participatory companion to our favorite TV broadcasts".
Ynon Kreiz, CEO of Endemol Group, the television group responsible for producing successful shows such
as Big Brother, Deal or no Deal, remarked in January 2011 (Kastelein 2011): "Everyone says that social
television will be big. I think it's not going to be big - it's going to be huge". This came after, MIT
Technology Review (Bulkeley 2010) in 2010 named Social TV as one of the 10 most important emerging
technologies. David Rowan (2011), editor of Wired, named Social TV as one of the 6 technology trends
anticipated to take off.
Given these predictions, it is no surprise that the leading social networking platforms such as Facebook
with 1.3 billion (Facebook Statistics 2014) monthly active users and Twitter with more than 645 million
(Twitter Statistics 2014) active users wanted a piece of the action. According to Statista (2011), over 50%
of 18-34 year old users on Facebook and Twitter are fans or followers of television networks and shows.
Although this engagement, progressively decreases with to 25% for those older than 55, given there are
more than 2 billion users across these two social networking platforms, it is still a considerable number.
All social media platforms incorporate real-time feeds. Viewers can thus engage in interactions and
conversations and hence multi-task while watching television. By encouraging constant interaction within
one's network and creating like-minded focus groups, social networking has enabled the rise of 'Social
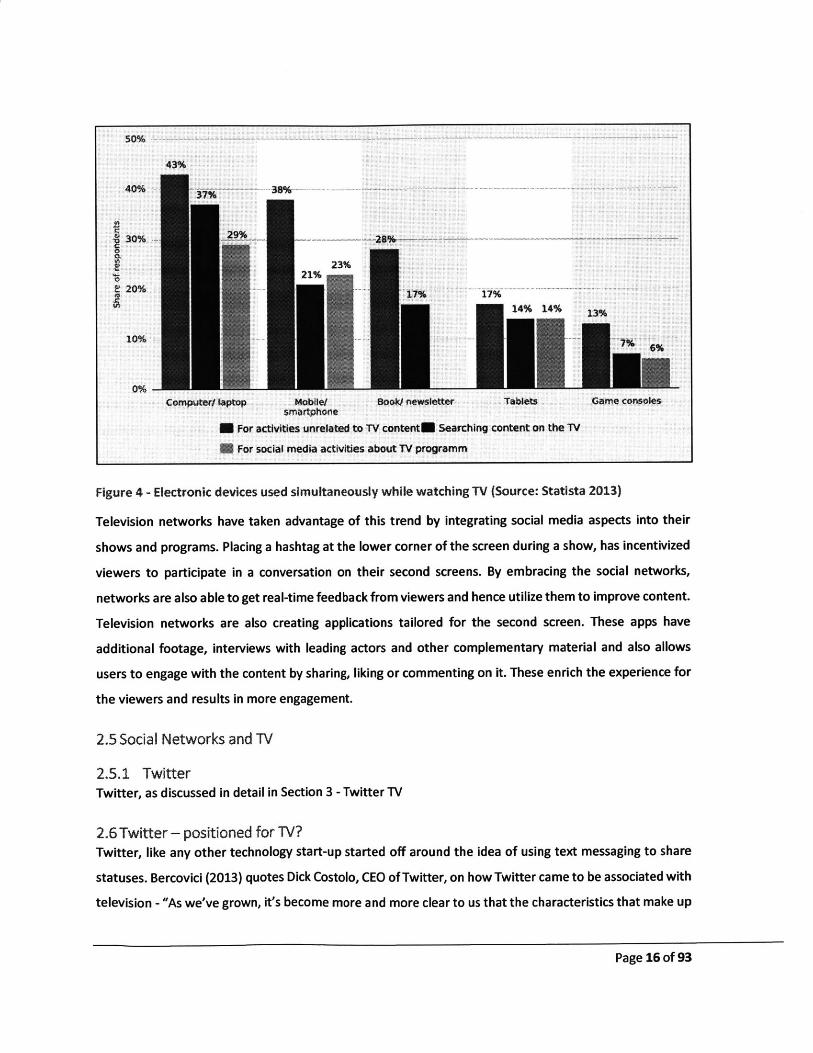
TV'. In fact, in 2012 in the US, more than 50% of the viewers (Statista 2012) admitted to using social media
platforms across all devices (laptop, tablet, mobile) while watching television. Figure 4 - Electronic devices
used simultaneously while watching TV, depicts that nearly a third of people while watching television
simultaneously use electronic devices for social media activities related to the show being watched. This
figure is expected to go up.
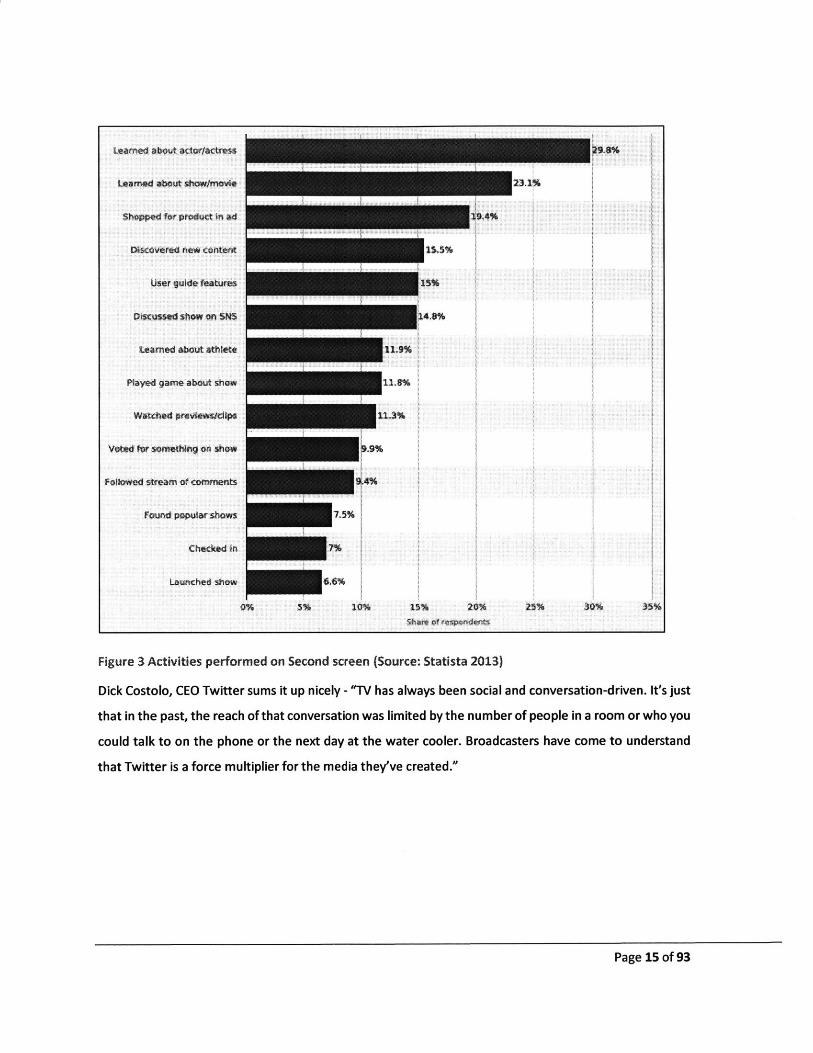
Viewers using the second screen engage in a plethora of activities in while simultaneously watching live
television. As depicted in Figure 3 Activities performed on Second screen, the top 3 common activities are
learning about actors and shows and shopping for a product showcased in advertisement.
Page 14 of 93
Learned abouit. rtt
$lvpped for pdOIta
Mse-overed new C ggent,
User guide features
Learned AbOt a3thire
Played game about show
Voted for sore4hing on show
Folio wed team of comments
Pbund popular show-,
Checked ir
Launched stiae
I-
7 5%
7%
0% 5% 10%
-15%
*113%
518%
a meo see
2% 30%
Figure 3 Activities performed on Second screen (Source: Statista 2013)
Dick Costolo, CEO Twitter sums it up nicely - "TV has always been social and conversation-driven. It's just
that in the past, the reach of that conversation was limited by the number of people in a room or who you
could talk to on the phone or the next day at the water cooler. Broadcasters have come to understand
that Twitter is a force multiplier for the media they've created."
Page 15 of 93
.81%
50%
43%
40% 37
S30% 28%
23%
101%
Computer/ laptop Mobile/ Booki newsletter Tablets Game consolessmartphone
U For activities unrelated to TV contentE Searching content on the TV
SFor social media activities about TV programm
Figure 4- Electronic devices used simultaneously while watching TV (Source: Statista 2013)
Television networks have taken advantage of this trend by integrating social media aspects into their
shows and programs. Placing a hashtag at the lower corner of the screen during a show, has incentivized
viewers to participate in a conversation on their second screens. By embracing the social networks,
networks are also able to get real-time feedback from viewers and hence utilize them to improve content.
Television networks are also creating applications tailored for the second screen. These apps have
additional footage, interviews with leading actors and other complementary material and also allows
users to engage with the content by sharing, liking or commenting on it. These enrich the experience for
the viewers and results in more engagement.
2.5 Social Networks and TV
2.5.1 TwitterTwitter, as discussed in detail in Section 3 - Twitter TV
2.6 Twitter - positioned for TV?Twitter, like any other technology start-up started off around the idea of using text messaging to share
statuses. Bercovici (2013) quotes Dick Costolo, CEO of Twitter, on how Twitter came to be associated with
television - "As we've grown, it's become more and more clear to us that the characteristics that make up
Page 16 of 93

Twitter - public, real-time and conversational - make it a perfect complement to television.
Broadcasters have come to understand that Twitter is a force multiplier for the media they've created."
Before Twitter, the office water-cooler, cafeteria and the dining table at home was where television shows
and events were most commonly discussed. During the 1990's and 2000's, some viewers also participated
in online discussion forums. Unless one was watching a program with family, none of these methods
facilitated real-time discussions. This is where Twitter came in. Twitter, based on 140 character messages
on the theme 'What are you doing?' made it easy for users to post and view categorized 'tweets' and
hence engage in conversations. Social TV analytics firm, SocialGuide (2013) reported that in Q2 2013, 19
million unique Twitter users posted 263 million tweets about live television shows. This represented year
to year a 38% increase in tweet volume and a 24% increase in number of unique people tweeting.
Harrington (2013) et al. view Twitter as an important backchannel through which social activity is
sustained and made more widely visible. By providing users with an alternate opportunity to contribute
more actively to the wider media sphere, Twitter acts as a backchannel to live television.
Ungerleider (2014) points out that other than creating a buzz and encouraging people to switch on to live
broadcast, Twitter has the opportunity to serve as both an advertising platform and a market research
service for TV commercial campaigns.
Twitter is based on a platform of cutting-edge software which opens up opportunities to measure and
track a lot of data points. At a very simplistic level, it is possible to track the buzz on Twitter for a particular
show. Cumulatively, this can be used as to extrapolate the viewership of a show. When put on a timeline,
one can analyze audience reactions to particular moments on the program. Further, semantic analysis of
tweets can give valuable feedback around the show.
Television networks use Twitter to create a buzz by encouraging users to interact and hence bring in
loyalty and in turn live viewership. Through live-tweeting during the show or otherwise, a direct
connection with the cast is fostered which brings in fan loyalty. Twitter is also used to maintain buzz about
a show between scheduled weekly screenings.
Twitter's Chloe Sladden (2011) mentions how Twitter is at the center for Social TV. She says "What we're
seeing now is that Twitter is, in fact, about flocking audiences back to a shared experience, and that usually
means a live one...lf you're not watching live -- and reading the comments from friends, your favorite
celebrities, and even total strangers via Twitter -- you're missing half the show."
Page 17 of 93
Wohn and Na (2011), suggest that Twitter picked up a void in the television space where formal social
television systems failed. They see people using Twitter to selectively seek others who have similar
interests and communicate their thoughts real-time while viewing television. Harrington et al. (2013)
describes Twitter as a virtual lounge room which connects active audiences of particular television shows
at an unprecedented scale and hence amplifying audience activities.
Brozek (2013) analyzed tweets from the show 'Pretty Little Liars'. She asserts that the hashtags produced
by the network and show on the screen are a huge part of the ongoing discussion occurring on Twitter.
She says that 'although fans may not be having conversations with each other through hashtags, they are
still letting their opinions be heard by writing their thoughts about the show while including the suggested
hashtag'. She goes onto suggest that Twitter has helped to overhaul how the modern world watched
television.
Middleton (2014) asserts that Twitter and other social media platforms are making television more
engaging and that brands should consider using these platforms to maximize their advertising ROL.
2.7 Twitter's ApproachTwitter from the start, realized that being at loggerheads with the networks and vying for the advertising
revenue all by itself may not work. Instead it adopted a partnership approach. Bercovici (2013), sums up
Twitter's approach best - 'We come in peace. Let's make money together.' McGirt (2013), refers to a
conversation with a network executive with regards to Twitter's approach - "Look Mr. Broadcaster, we
don't want to eat your lunch at all. We are your friend. We don't want to steal any money from you. We
respect everything you do. We think we can be additive and make us both better."
This policy was exemplified by Chloe Sladden, Head of North America media at Twitter. She decided not
to charge television networks for sharing Twitter's expertise to demonstrate how Twitter could help
networks to reverse the trend of 'watch anywhere anytime'.
2.8 Twitter and TV Advertisingand Section 9.1 - Twitter 101 below, provides a platform for real-time conversation resulting in
spontaneous engagement with like-minded individuals. Television is a frequently discussed topic on
Twitter. As discussed in detail in subsequent sections, Twitter has taken several initiatives to make itself
the platform of choice for television related buzz. According to Nielsen, 32 million people in the US
tweeted about television in 2012. Television networks have also incorporated Twitter elements into their
Page 18 of 93
programming by showing hashtags and live tweets on the screen and also having the show cast live-tweet
during a live show.
Overthe years, entertainment related topics have been a prominent feature on trending topics on Twitter.
Silverman (2010) reported that 28% of the trending topics on Twitter were related to entertainment and
nearly a third of all entertainment topics were related to television. Cheong (2009) found entertainment
related topics to be 27% of the trending topics on Twitter.
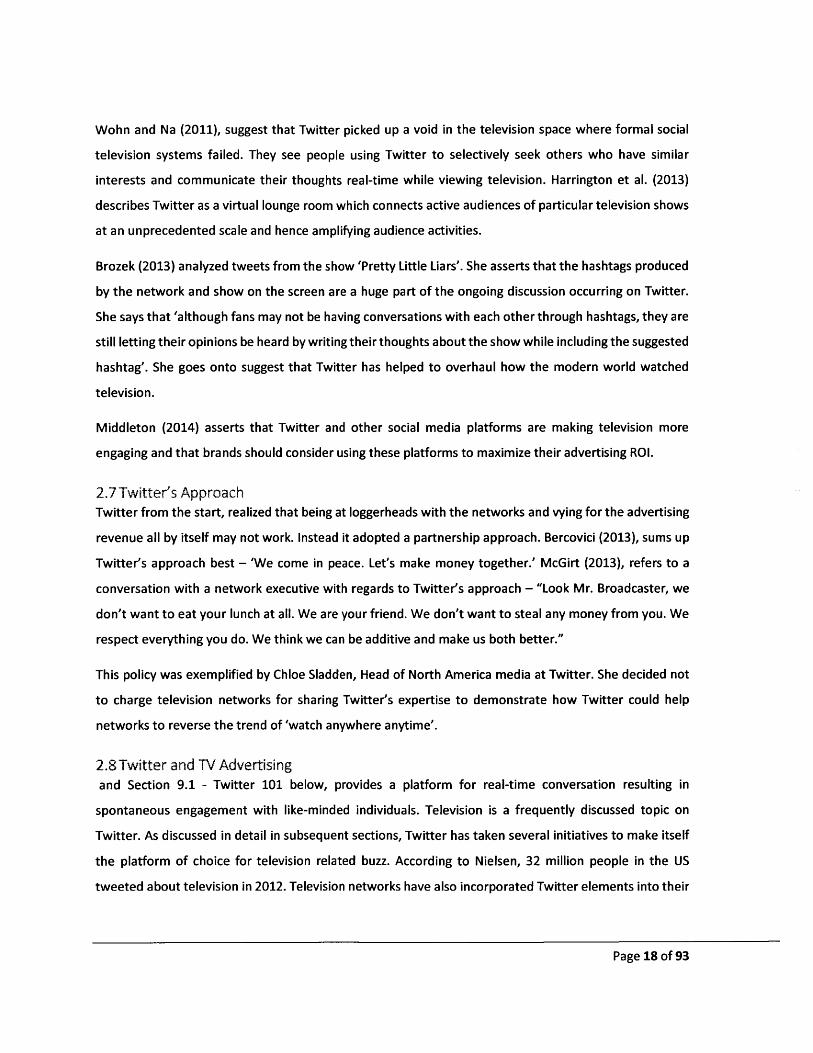
As seen in Figure 5 Two-way causal impact of Twitter and TV ratings (2013), a recent Nielsen (2013) study
depicts the two-way relationship between Twitter and TV ratings. The study found that in 29% of the
episodes tweets influenced TV ratings versus 49% of shows where ratings caused more tweets.
Figure 5 Two-way causal impact of Twitter and TV ratings (2013)
2.8.1 FacebookFacebook is the market leader as far as social networking goes. By providing users with an ability to share
content as well as interact, in a variety of ways, with one's network, it has a detailed grasp on an user's
preferences. 'Fan Pages' on Facebook serve as a complementary portal to host additional content and
hence keep users engaged.
At the 'TV of Tomorrow' conference in May 2011, Justin Osofsky, Facebook's Director of Media
Partnerships (Constine 2011) mentioned that 275 million users had 'liked' a television show on Facebook.
Osofsky (2011) went on to mention that 17 of the 100 most 'liked' pages on Facebook represented
Page 19 of 93
40%
0%
Ratings cause tweetsTweets cause ratings
television programs. Through these pages, the television shows announce updates, provides additional
exclusive content to their legions of fans and in the process provide a richer experience and engagement
to their fans.
Rush (2013) noted Facebook's efforts to enter the social television market. She reported that Facebook
was planning to send weekly reports to the four largest television networks in America - ABC, NBC, Fox
and CBS and other selected partners, on the buzz their shows were creating on Facebook.
2,8.2 TVtag (formerly GetGlue)GetGlue describes itself as a social networking platform for television fanatics. Launched in 2010, it allows
its users to 'check-in' to television shows. After 'checking in' users can engage in real-time conversations
with others fans/users who have also 'checked-in'. GetGlue also provides a capability to integrate with
Facebook and Twitter and thus exposing a user's activities to his/her wider social network on these
platforms.
As a reward for 'checking in' users receive points, earn virtual stickers and discounts from television
networks. Dubois (2010), likened GetGlue as 'The Foursquare of Entertainment'.
In March 2011, GetGlue reported a significant milestone of reaching 1 million registered users and that
up to 20% of primetime tweets originated from GetGlue. In September 2011, GetGlue reported 11.5
million check-ins, a 130% jump over 3 months (Alex 2011).
2.8.3 Others playersWhile the big leaders in social networking Facebook and Twitter by virtue of their immense network
effects lead the Social TV phenomenon, others are also trying to make their presence felt as pure social
TV and second screen applications. Noteworthy firms are Fanhattan, BuddyTV and Zeebox.
In an immensely competitive field, these new platforms are struggling to get traction. Perrette (2013) sees
this problem as a critical divider - "...TV programmers don't have much use for most of them.
Television, being a national medium, needs a national companion to be viable, and there's not many
that have that."
2.8.4 Social TV comes of age - 20112011 was probably the year where the Twitter cemented its place as the leader in Social TV. Two of the
leading events in the entertainment industry - Grammy and Oscars (in particular) created a lot of buzz on
Twitter.
Page 20 of 93
With a major push from social media platforms and Twitter in particular leading the way, the 2011
Grammy Awards was highest rated in the decade. It was driven by live performances by Justin Bieber and
Lady Gaga amongst others, both of whom have millions of followers on Twitter. Such was the impact that
Grammy's was the top trending topic on Twitter for a complete week (Silverman 2011).
The Grammy's were soon followed by Oscar night which saw more than 1.2 million tweets (Tsotsis 2011)
during the show's live broadcast, from 388,000 users. Twitter estimated that the tweets were potentially
delivered to more than 1.66 billion users.
2.9 Threat to networksA plethora of new technologies is helping viewers to watch television according to their own schedule.
With Digital Video Recorders (DVR) gaining mass acceptance, viewers can record a show and then watch
it as per their own schedule. Gaining prominence of Hulu, Netflix and other such internet based
companies, which provide 'watch anywhere, anytime' services add to networks woes.
DVRs and such technologies provide means to skip advertisements. Hence, the 'watch anywhere anytime'
syndrome sounds the death knell for the networks for whom advertising is a critical source of revenue.
This is where Nielsen's research as discussed in Section 3.7 - Relationship between Twitter and TV ratings,
provides a ray of hope for the television studios. The study determined that in US, increases in Twitter
volume correlated with increases in TV ratings across all age groups. The correlation was stronger for
younger audiences. Pomerantz (2013), recommends television studios to make shows that people feel
the need to watch live and discuss in their social circles right away. Just depicting a hashtag at the bottom
of the screen won't lead to better buzz on Twitter and in turn possibly higher ratings.
2.10 What have the networks doneMany of the television shows have integrated aspects of social media into their shows.
To guide the user buzz on Twitter, networks display suggested/dedicated hashtags on screen. This helps
categorize the discussion and also feature on Twitter's trending topics, hence creating more buzz around
the show. Networks also leverage the conversations on Twitter by displaying tweets on the screen real-
time thereby making Twitter an integral part of the show-experience.
Networks have also created separate Twitter handles for each show e.g. @AGENTSOFSHIELD and
@ALMOSTHUMANFOX for "Agents of S.H.I.E.L.D." and "Almost Human respectively. Through these show
handles, they communicate with fans and keep them engaged by tweeting additional content, interesting
Page 21 of 93

titbits, re-tweeting actor/producer and other select tweets and replying to tweets from people and thus
creating a conversation. A similar engagement strategy is adopted on Facebook as well.
Networks are also partnering with check-in applications e.g. GetGlue and incentivizing viewers by offering
special badges for checking-in to live shows. This helps to drive engagement by creating a momentum.
2.10.1 BBCBBC's current affairs program Free Speech incorporates a Twitter based panelist approval platform called
"Power Bar". When presented with a "Power Bar" question, viewers are asked to tweet #freespeechyes
or #freespeechno based on their approval or disapproval to the question. Throughout the show, the
results are updated and displayed on screen, real-time thus creating a more interactive experience.
2.10.2 Bravo TVBravo TV, a cable and satellite channel owned by NBC, in December, 2010 launched additional real-time
social media engagement tools for its audience. Kastelein (2010) quotes Lisa Hsia, Senior Vice President
of Bravo Digital Media - "By creating tools that instigate them into action on certain topics, we'll learn
even more about what our audience likes and dislikes, which will in turn help us expand our digital
offerings."
It launched 'Tweet Battle' where fans could challenge one another to a debate on a trending topic.
Spectators could comment on the debate or support one side. 'Tweet Tracker' measured the Twitter
activity around certain shows and displayed a selection of tweets from the audience. Further, it gave
advertisers opportunities to connect with fans and thereby giving them opportunities to drive their
brand's engagement through real-time conversations with its audience.
Kosur (2013) reported the launch of Bravo's "Twitter Rewards Program". Users had to mention the
hashtag - WWHL (Watch What Happens Live) or @TheBravoholic. Prizes included, amongst others, the
channel congratulating the fan live on air and control of @TheBravoholic Twitter account for a week. Such
gamification techniques incentivized fans to engage with Twitter and thus create a buzz for the network
which it could amplify more to garner ratings.
3. Twitter TV
3.1 Twitter - positioned for TV?Twitter, like any other technology start-up started off around the idea of using text messaging to share
statuses. Bercovici (2013) quotes Dick Costolo, CEO of Twitter, on how Twitter came to be associated with
Page 22 of 93
television - "As we've grown, it's become more and more clear to us that the characteristics that make up
Twitter - public, real-time and conversational - make it a perfect complement to television.
Broadcasters have come to understand that Twitter is a force multiplier for the media they've created."
Before Twitter, the office water-cooler, cafeteria and the dining table at home was where television shows
and events were most commonly discussed. During the 1990's and 2000's, some viewers also participated
in online discussion forums. Unless one was watching a program with family, none of these methods
facilitated real-time discussions. This is where Twitter came in. Twitter, based on 140 character messages
on the theme 'What are you doing?' made it easy for users to post and view categorized 'tweets' and
hence engage in conversations. Social TV analytics firm, SocialGuide (2013) reported that in Q2 2013, 19
million unique Twitter users posted 263 million tweets about live television shows. This represented year
to year a 38% increase in tweet volume and a 24% increase in number of unique people tweeting.
Harrington (2013) et al. view Twitter as an important backchannel through which social activity is
sustained and made more widely visible. By providing users with an alternate opportunity to contribute
more actively to the wider media sphere, Twitter acts as a backchannel to live television.
Ungerleider (2014) points out that other than creating a buzz and encouraging people to switch on to live
broadcast, Twitter has the opportunity to serve as both an advertising platform and a market research
service for TV commercial campaigns.
Twitter is based on a platform of cutting-edge software which opens up opportunities to measure and
track a lot of data points. At a very simplistic level, it is possible to track the buzz on Twitter for a particular
show. Cumulatively, this can be used as to extrapolate the viewership of a show. When put on a timeline,
one can analyze audience reactions to particular moments on the program. Further, semantic analysis of
tweets can give valuable feedback around the show.
Television networks use Twitter to create a buzz by encouraging users to interact and hence bring in
loyalty and in turn live viewership. Through live-tweeting during the show or otherwise, a direct
connection with the cast is fostered which brings in fan loyalty. Twitter is also used to maintain buzz about
a show between scheduled weekly screenings.
Twitter's Chloe Sladden (2011) mentions how Twitter is at the center for Social TV. She says "What we're
seeing now is that Twitter is, in fact, about flocking audiences back to a shared experience, and that usually
Page 23 of 93

means a live one...If you're not watching live -- and reading the comments from friends, your favorite
celebrities, and even total strangers via Twitter -- you're missing half the show."
Wohn and Na (2011), suggest that Twitter picked up a void in the television space where formal social
television systems failed. They see people using Twitter to selectively seek others who have similar
interests and communicate their thoughts real-time while viewing television. Harrington et al. (2013)
describes Twitter as a virtual lounge room which connects active audiences of particular television shows
at an unprecedented scale and hence amplifying audience activities.
Brozek (2013) analyzed tweets from the show 'Pretty Little Liars'. She asserts that the hashtags produced
by the network and show on the screen are a huge part of the ongoing discussion occurring on Twitter.
She says that 'although fans may not be having conversations with each other through hashtags, they are
still letting their opinions be heard by writing their thoughts about the show while including the suggested
hashtag'. She goes onto suggest that Twitter has helped to overhaul how the modern world watched
television.
Middleton (2014) asserts that Twitter and other social media platforms are making television more
engaging and that brands should consider using these platforms to maximize their advertising ROI.
3.2 Twitter's ApproachTwitter from the start, realized that being at loggerheads with the networks and vying for the advertising
revenue all by itself may not work. Instead it adopted a partnership approach. Bercovici (2013), sums up
Twitter's approach best - 'We come in peace. Let's make money together.' McGirt (2013), refers to a
conversation with a network executive with regards to Twitter's approach - "Look Mr. Broadcaster, we
don't want to eat your lunch at all. We are your friend. We don't want to steal any money from you. We
respect everything you do. We think we can be additive and make us both better."
This policy was exemplified by Chloe Sladden, Head of North America media at Twitter. She decided not
to charge television networks for sharing Twitter's expertise to demonstrate how Twitter could help
networks to reverse the trend of 'watch anywhere anytime'.
3.3 Twitter and TV AdvertisingMidha (2014), writes about how TV ad targeting boosts brands and how Twitter increases television ad
ROL. Twitter collaborated with Symphony Advanced Media, a leading media analytics firm, to understand
how Twitter users were impacted by ads. The analysis demonstrated that viewers. who use Twitter
simultaneously while watching television are less likely to change channels during ad breaks. As per the
Page 24 of 93
research, viewers who don't use their smartphone/mobile device while watching, change channels during
ad breaks 17% of the time. For smartphone/mobile device users, the corresponding number is 13% while
specifically users engaged on Twitter are, at 8%, least likely to play with their remotes during ad breaks.
A possible explanation of this could be that viewers using their smartphones while watching television are
perhaps too engrossed with their devices to want to change channels during the ad breaks.
Millward Brown Capital, a specialist advertising and marketing research agency, worked with Twitter to
compare the impact of television ads amongst viewers who simultaneously watched television and used
Twitter with those who watched television without Twitter. According to the research, viewers who don't
use a mobile device while watching television had an ad recall of 40% while those viewers who used
Twitter while watching television had an ad recall of 53%.
3.4Twitter's Social TV efforts
3.4.1 Acquisitions in Social TV spaceSince 2008, Twitter has been making strategic acquisitions to add and stabilize its product offerings. In
2013, it made two key acquisitions to bolster its Social TV presence further.
Bluefin LabsIn February 2013, Twitter announced (Rowghani 2013) the acquisition of Bluefin Lab. Incubated at MIT
Media Lab, Bluefin Labs uses advanced machine learning to correlate Twitter activity to television shows.
Bluefin's technology has been key to Twitter in its monetization efforts through advertising products
aimed at Twitter users who are deemed to be engaged in conversations around television shows or any
particular event.
TrendrrIn August 2013, Twitter further bolstered its Social TV by acquiring Trendrr (Ha 2013). Trendrr's products
provides television studios and advertising agencies with tools to track television engagement across
multiple social networks including Twitter. By acquiring Trendrr, Twitter was able to offer additional
services to television networks, publishers and other organizations.
3.4.2 Hiring TV executivesAs part of its focus on television and in an effort to woo television networks, Twitter got on board several
former television executives into senior leadership positions.
Page 25 of 93

Fred Graver, a veteran television executive having worked at ABC Cable, Disney and MTV, joined Twitter
in 2012 as Creative Director of Media Partnerships. Adam Bain was brought on board as 'President of
Revenue' from Fox. Chloe Sladden, currently Head of Media for North America joined from Current TV
where she produced Emmy award winning programs.
3.4.3 Twitter: TV related productsTwitter sensing its growing popularity as a platform for television viewers, has either through acquisitions,
organically or in partnership with media companies developed products specifically aimed at the
television audience. The television networks have also on their own developed products using Twitter as
a platform.
Based on studies (Section 3.3 - Twitter and TV Advertising) which correlate viewers using Twitter with
higher engagement, Twitters products have primarily been aimed at advertisers to connect with 'engaged'
viewers.
TVAd Targeting - AmplifyTV Ad Targeting was launched for US advertisers in 2013 and subsequently rolled out in Europe. It is based
on the assumption that a viewer live-tweeting about a show has a higher probability of viewing the
commercials aired as well. Twitter, using its proprietary video finger printing technology, is able to
determine where and when an advertisement ran on TV. Through advanced machine learning technology
from Bluefin Labs, which it acquired in February 2013, Twitter can also recognize viewers who tweeted
about the show on which the advertisement aired. It can then push 'Promoted Tweets' and other content
to these 'engaged' users.
Fleishman (2013), Product Manager at Twitter believes that synchronized Twitter and TV ad campaigns
makes it easy for advertisers to reinforce their brand messages while still fresh in viewers minds and hence
complement their television advertising investments.
Indeed according to Young (2013), Revenue Product Manager at Twitter, advertisers running both TV
commercials and 'Promoted Tweets' had a 95% stronger message association, 58% higher purchase
intent, 8-16% more sales, and 36% lower customer acquisition costs.
Video PromotionIn a slight variation of the model described above, Twitter also distributes short video clips to the
'engaged' users of television shows. The video clips, which are owned by the network, start off with an
advertisement which Twitter and the partner jointly sell.
Page 26 of 93
According to Bercovici (2013), it's a win-win situation for both as the network utilizes its large copy-righted
video inventory and Twitter is able to serve its users superior content. With Tweets helping to drive ratings
and premium content driving tweets, Adam Bain, Revenue Head at Twitter sees it as a self-propelling eco-
system.
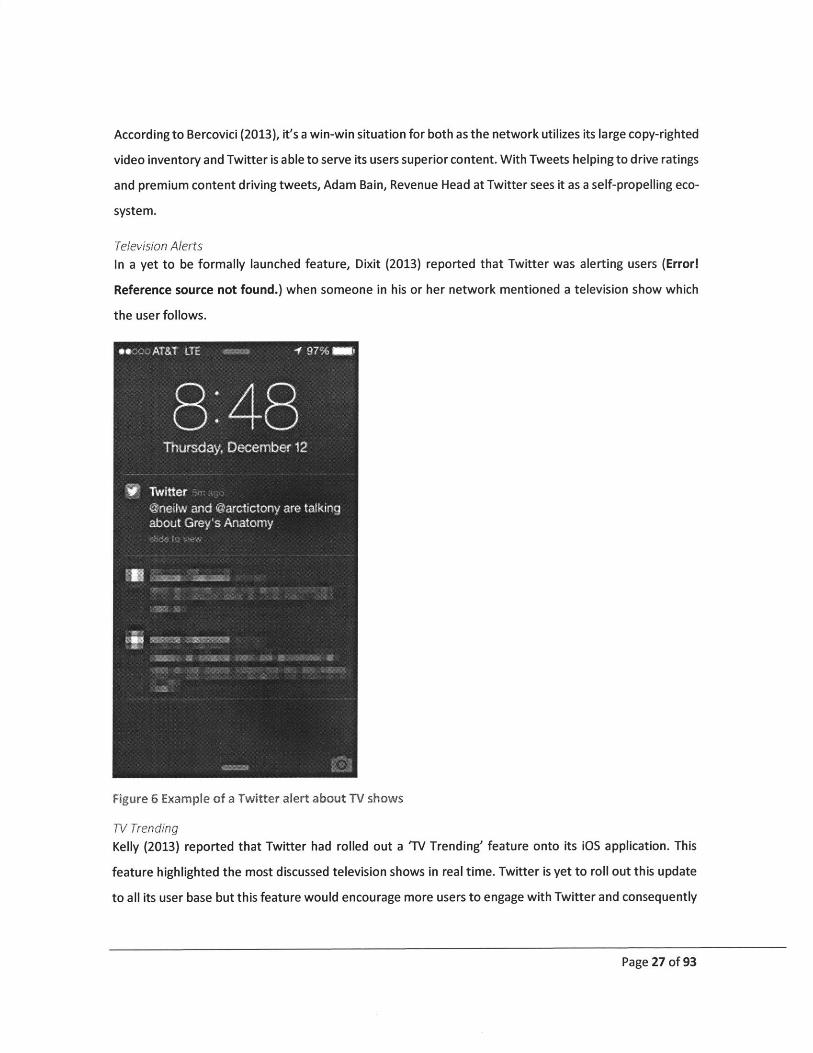
Television AlertsIn a yet to be formally launched feature, Dixit (2013) reported that Twitter was alerting users (Errorl
Reference source not found.) when someone in his or her network mentioned a television show which
the user follows.
Figure 6 Example of a Twitter alert about TV shows
TV TrendingKelly (2013) reported that Twitter had rolled out a 'TV Trending' feature onto its iOS application. This
feature highlighted the most discussed television shows in real time. Twitter is yet to roll out this update
to all its user base but this feature would encourage more users to engage with Twitter and consequently
Page 27 of 93

watch the show live. With more engagement, Twitter would also be able to push more advertising
products to the user.
3.5 Twitter and TV Integration
3.5.1 The moment Twitter met TVIn 2007, soon after the launch of Twitter, Greg Yaitanes, an Emmy award winning director and an early
investor in Twitter, collaborated with Twitter co-founder Biz Stone to integrate Twitter with television.
Yaitanes was at that time an executive producer of the show 'Drive' on FOX. Being an early investor into
Twitter, Yaitanes saw Twitter's potential impact on the entertainment industry by providing a platform
for fans to share their views and comments.
Yaitanes and Stone, setup a Twitter handle for 'Drive' and live-tweeted during the show's premiere. At
short notice and with scant publicity, the Twitter handle added over 700 friends and had ten thousand
page views. Given this was very early on in Twitter's life, the result was very encouraging and showed a
glimmer of things to come. An extract (Laporte 2013) of the email exchange between Stone, Yaitanes and
Dave Sliozis, FOX executive, is below.
From: Biz Stone [email address redacted]Date: Wed, Apr 18, 2007 at 4:23 PMSubject: Our Twitter Drive ExperimentTo: Greg Yaitanes, Dave Sliozis
Guys,
That was really fun! Thanks for taking the time to do this experiment with us--technically speakingwe made history. Foxdrive was the first ever Director's Commentary during a broadcast premiere.
With short notice and only a small mention in an email, the profile page we set up on Twitter forDrive quickly added 732 friends and saw close to 10k page views. ...... Overall, modest numbersbut the response from the Web was overwhelmingly positive. Folks recognized this as a never-before-been done combination of mobile technology and television. There were about 170 blogposts and at least two news articles written about the experiment.
Quotes ranging from "Awesome, amazing, outstanding use of the technology" to "Normally I'drecord the show so I could watch it later and fast forward through the commercials. Instead Iwatched it in real time so I could get the commentary" were common in the blogs I was readingover the weekend.
Page 28 of 93

Overall, I'd say this is an awesome starting point. With on air-promotion and a little more strategy,Twitter could fuel some interesting discussion and interaction with Fox programming. Would loveto chat more about that if you guys are interested.
Thanks,Biz
3.5.2 #TrumpRoastAccording to Schneider (2011), March 15th episode of "Roast of Donald Trump" on Comedy Central was
its most watched Tuesday in history. In what was seen as the first official integration of Twitter hashtags
and television programs, Comedy Central ran the hashtag "#trumproast" at the bottom of the screen,
throughout the show. During the live broadcast, the hashtag was tweeted more than 27,000 times.
Additionally, there were thousands of other tweets that mentioned Donald Trump or one of his roasters.
By using the hashtag, Comedy Central was able to group the entire buzz on Twitter together resulting in
the hashtag, "#trumproast", being listed as a trending topic on Twitter resulting in record-boosting
viewership figures.
3.6TV RatingsTV ratings are a key metric and a measure of the viewership of a particular television program. It is defined
as the percentage of potential audience members who are tuned into a particular program at a given time.
3.6.1 SignificanceTV ratings are extremely significant for TV networks as it helps them understand their audiences better
and hence improve and produce better shows which can attract more viewers. Networks also use ratings
data to decide which shows to keep, which to cancel and which to renew.
Advertising is a key source of income for TV networks. Higher ratings usually translate to more advertising
revenue for the network. Advertisers pay to air their commercials on TV networks using rates that are
based on ratings data.
3.6.2 DemographicsIn measuring the viewership, the demographic is also taken into account. The popular categorizations are-
* P2+ = Persons aged 2 or more
* P12-34 = Persons aged 12 to 34
* P18-49 = Persons aged 18 to 49
* A18-34 = Adults aged 18 to 34
Page 29 of 93

* Men 18-34 = Male aged 18 to 34
* Women 18-34 = Female aged 18 to 34
Because of our focus on primetime shows, we have considered ratings in the P18-49 category.
3.6.3 Rating AgenciesRatings are usually collected by independent agencies. Each country appoints its own independent body
for calculating TV ratings. In the US, Nielsen is responsible for TV ratings. Broadcasters' Audience Research
Board (BARB) and BBM Canada are responsible for measuring TV ratings in the UK and Canada
respectively. Since the scope of this paper, is around US television shows, Nielsen ratings have been
considered.
3.6.4 Ratings calculation methodologyMost rating agencies at their core, use statistical sampling techniques to rate TV shows. This involves
creating a "sample audience" and then counting how many in that audience view each program. The data
is then extrapolated to estimate the number of viewers in the entire population watching the show.
To collect sample data (Nielsen), rating agencies install electronic meter boxes also known as 'Set Meters'
in the homes of their sample audience. The boxes track when TV sets are on and what channels is being
watched and when. Then by monitoring what is on TV at any given time, the company is able to keep track
of how many people watch which program. The collected data is sent to the company's servers every
night and at other predefined intervals. The agency then combines the box data with a database of
programs that appear on each TV channel. The rating agencies perform audits and quality checks on the
data to confirm true results.
Rating agencies also use what is referred to as a 'People Meter'. By using a specially designed remote
controller, it is able to recognize which member of the household watching TV. This enables collection of
demographic data.
Usually, in the US Nielsen targets 5,000 randomly selected households to be a part of the representative
sample for the ratings. Nielsen's estimates that in the US, 114.2 million (Fixmer 2012) households have
TVs. The key is to ensure a representative sample.
Apart from electronic boxes, diaries are also used to collect viewing information from sample homes. For
example, Nielsen processes more than two million paper diaries from households across the country. Each
year in November, February, May, and July known as "sweeps" rating periods, seven-day diaries are sent
Page 30 of 93

to households to manually fill out what is watched on television and by whom. During the sweeps period,
diaries are mailed to new panels of households each week. At the end of the month, viewership data is
aggregated.
3.7 Relationship between Twitter and TV ratingsNielsen (2013) published a study which confirmed a relationship between Twitter and TV Ratings. The
study determined that in US, increases in Twitter volume correlated to increases in TV ratings for varying
age groups, revealing a stronger correlation for younger audiences. As seen in Figure 7 Impact of TV
Ratings on Twitter volume (US 2013), in the 18-34 year age bracket, an 8.5% increase in Twitter volume
corresponded to a 1% ratings increase for premiere episodes, and a 4.2% increase in Twitter volume
corresponded to a 1% ratings increase for midseason episodes. In the 35-49 year age bracket, a 14%
increase in Twitter volume corresponded to a 1% ratings increase.
15% 4
18.412.5%
10%
2.5%
Premiere Midseason* 18 to 34 years U 35 to 49 years
Figure 7 Impact of TV Ratings on Twitter volume (US 2013) (Source: Statista 2013)
The study also identified that in addition to previous year's rating and advertising spend, Twitter was one
of three statistically significant variables for TV ratings. Andrew Somosi, CEO of SocialGuide, which
provides insight into the social impact of TV and whom Nielsen acquired in 2012, remarked - "Twitter's
presence as a top three influencer tells us that Tweeting about live TV may affect program engagement."
Page 31 of 93
50%
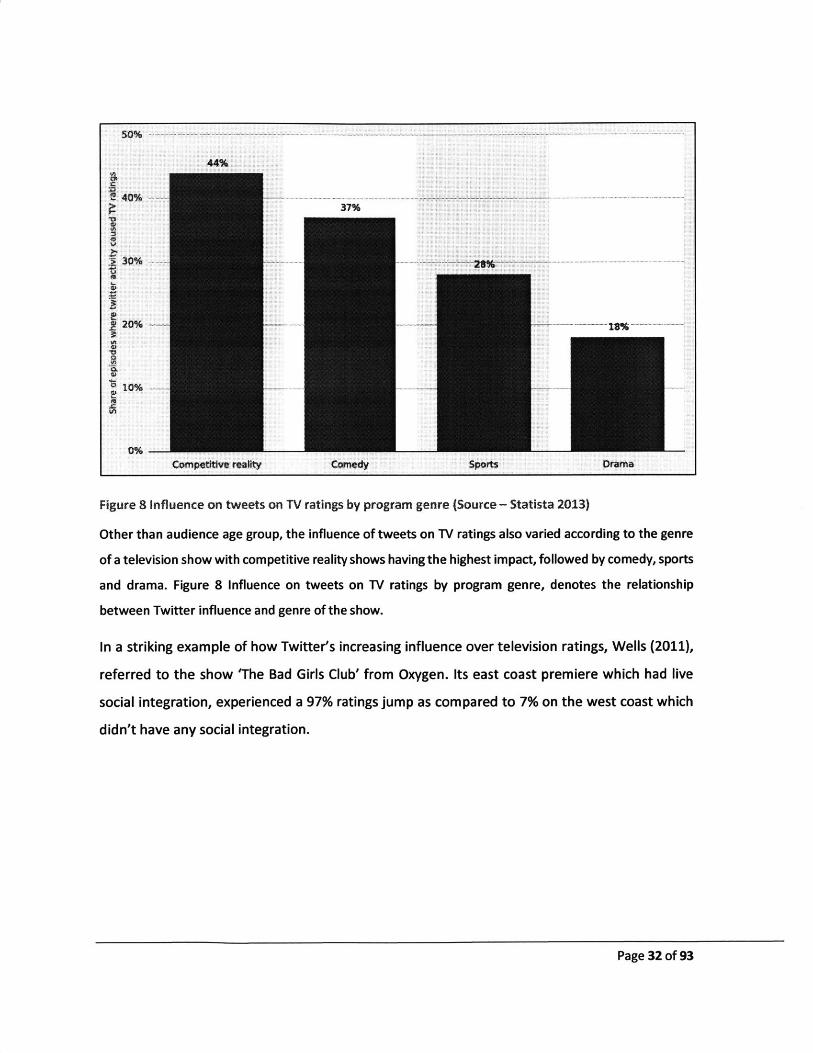
Figure 8 Influence on tweets on TV ratings by program genre (Source - Statista 2013)
Other than audience age group, the influence of tweets on TV ratings also varied according to the genre
of a television show with competitive reality shows having the highest impact, followed by comedy, sports
and drama. Figure 8 Influence on tweets on TV ratings by program genre, denotes the relationship
between Twitter influence and genre of the show.
In a striking example of how Twitter's increasing influence over television ratings, Wells (2011),
referred to the show 'The Bad Girls Club' from Oxygen. Its east coast premiere which had live
social integration, experienced a 97% ratings jump as compared to 7% on the west coast which
didn't have any social integration.
Page 32 of 93
44%
S40%
530%
S20%
0
10%
0% -
3.7%
Competitive reality
.... ... .................... ......................... ................ ................ ........ ..............
Comedy Sports Drama
3.8 Nielsen Twitter TV RatingsTwitter realized from its own metrics how viewers were using Twitter while watching television. The buzz
around live television shows on Twitter was increasing massively. In 2012, 32 million (Nielsen 2013) unique
people in the US tweeted about television. Q2 2013 saw a 38% year on year increase in tweet volume and
a 24% increase in new users. Although the volume of tweets and users are easily quantifiable, the
influence and reach of the buzz wasn't quantifiable to advertisers and television networks.
Back in 2012-2013, with an IPO imminent and pressure from investors to increase revenue streams,
Twitter wanted to demonstrate the influence and reach of its platform to the advertisers and television
networks. In October 2013, Twitter partnered with Nielsen, to launch 'Nielsen Twitter TV Ratings'. The
ratings would measure not only volume - users and tweets but also reach through unique audience and
impressions delivered and thus provide a correlation between the buzz on Twitter and show ratings.
At its launch, the ratings revealed that the Twitter TV audience for an average episode was 50 times more
than the authors generating Tweets. If 2,000 people tweet about a show, those tweets are delivered to
100,000 people who are seeing those tweets.
Stelter (2013) treats the ratings with a bit of caution. He says that although measuring 'unique audience'
gives a good insight of the footprint to which the tweets were delivered, it was not a good predictor of
how many of those users watched the show after viewing the Tweet. Further, he questions Nielsen's
approach to measuring 'unique audience' since a television related tweet may show up on a user's
timeline, whenever it is loaded and it is likely that the user may just scroll through it.
According to Wakamiya et al. (2011), measuring TV ratings is useful not only to television networks and
advertisers but also to audiences. They posit that television networks would want listen to opinions on
their contents from a wide range of audience.
Wakamiya et al. attempted to come up with a better TV ratings based on tweets as "crowd's voices" and
focused on segregating audiences and non-audiences for realizing better TV ratings. By using Naive Bayes
Classifier as a baseline method, they devised a learning based message analysis to decide if an audience
is viewing television. Perhaps incorporating this research into the Nielsen Twitter TV Ratings, will give it a
further edge.
Page 33 of 93
4. Theory and HypothesisSocial Networks have penetrated many aspects of our daily lives. For many of us, especially those who are
technologically savvy, posting our thoughts and activities and sharing them with our online social circles
comes naturally. Television hasn't been immune to this wave. Advances in technology have given
audiences the ability to watch television 'anywhere anytime' and more importantly skip advertising and
thus threaten one of its main revenue streams. Amidst these challenges, television networks have been
struggling to keep up its viewership figures.
Social Networks have in some sense provided a lifeline to the television networks. There is evidence that
an engaged social media television fan has a higher propensity to tune in for live shows. Thus television
networks, rather than resist the wave of social networking have adopted it as an additional channel to
engage its audience.
While a lot of start-ups entered the Social TV space, they were always at a disadvantage because they
lacked the people on their platform to be able to take advantage of network effects. Twitter and Facebook
had an established popular platform.
Twitter by posing the question 'What's happening?' provides a natural complement to television
background chatter. Twitter also took a series of specific steps to court all the 3 sides - television
networks, advertisers and audiences. They have partnered with various research agencies to depict how
Twitter helps to drive audience back to watching live television and how these users are more engaged
than non-Twitter users. In producing these reports they naturally had their own interests at heart. I
wanted to take an independent look at whether the buzz on Twitter really translated into benefits for
television networks and advertisers - in other words does a buzz on Twitter give rise better ratings and
viewership figures. I wanted to look at this in a number of ways.
First is to measure the impact of new followers and keeping existing users engaged. New followers over
the course of a week leading up to an airing is a sign of people who have developed an interest in the
show. This should have a positive impact on viewership. The more the number of tweets mentioning the
show which are then favorite-d and re-tweeted, the more the buzz that would be generated which is
expected to translate to a positive impact on the show's rating and viewership figures. Re-tweeting a
show's updates or marking them as favorites indicate an 'engaged' user. It is expected that such positive
engagement actions, should have an impact on ratings and viewership.
Page 34 of 93
Secondly, a show can take a number of actions - befriending a follower or user, replying to their tweets
and thus engaging in a conversation and of course tweeting updates and exclusive content for its fans.
Again, all such activities contribute towards keeping the fan engaged and can be reasonably expected to
increase viewership and ratings.
All shows may not have the same impact on ratings and viewership uniformly across the board. Game and
reality shows, due to their nature can be expected to have considerable buzz than others. Sitcoms also
have mass appeal so I would expect them to have considerable buzz. Unfortunately, the show's which
premiered in fall 2013, were mainly sitcoms and drama. The rest of the shows were spread across other
genres. Given the thin spread across the other genres, we may not be able to interpret results across the
board.
Networks have also been taking advantage of the myriad ways in which Twitter allows one to engage with
its network. Since most of the forms of engagement is available to all it would be interesting to see which
of the levers/variables each one use, which ones they don't and how effective they are in their Twitter
campaigns.
Looking at a prediction model, I expect that the rating and viewership of a show episode to be correlated
with the various Twitter-related variables listed in Table 9 Variables list and definitions.
Page 35 of 93
5. Collecting and Organizing Data
5.1 Defining the requirementsThe purpose of the project required to collect television show buzz from Twitter over a period of
time. The initial task was to define the data required to prove the hypothesis documented in
Section 4 - Theory and Hypothesis. The data was categorized as follows -
- Network actions
- People actions
Network actions include obviously tweeting updates, adding friends, re-tweeting updates from
actors/cast and audience, marking audience tweets as favorites, replying to audience tweets or
engaging with the audience.
The audience can follow the show handle and get instant updates directly from the show, re-
tweet updates from their friends as well as show actors and show handle, mark a tweet as a
favorite and engage in a dialogue/reply to tweets from other audience/show followers, show and
actors.
In a nut-shell, the purpose was to gather data on how the show and its actors were engaging with
their audience and conversely how the audience was interacting with the show. Operationally,
the aim was to cover a time period of at least 4-6 weeks before the fall season started and going
well into the season so as to be able to interpret data for shows which were cancelled, renewed
or not renewed.
5.2 Organizing the datasetUsing television network and updates and other reputable television aggregation sites such as www.futoncritic.com andwww.futoncritic.com and www.zap2it.com, a list of shows premiering in fall 2013 across the major networks was arrived at.networks was arrived at, Further details about the shows such as airing schedule and Twitter handle were also gatheredalso gathered from the above sites and Twitter.com. Using native API's provided by Twitter, various data items wereitems were collected over a period of time. Table 2 Twitter - Terminology
Appendix A - Data Gathering and Technical Implementation, covers the technical details of the data
collection exercise.
Page 36 of 93
The collected raw dataset was by default organized into consecutive days across all shows. Most shows
are aired once weekly. My objective as stated in Section 4 - Theory and Hypothesis, earlier is to look at
the impact of the buzz on Twitter the prior week leading up to a show episode airing and whether that
buzz can be correlated to ratings and viewership for that show episode. To this end, the data set was re-
organized and grouped into a weekly time period. To do this, the profile, show and mentions data were
added up weekly against the day of the week the show aired. To achieve this, a number of additional data
items and variables had either to be derived or collected from external sources based on the core data
set. These and other variables have been defined in Table 9 Variables list and definitions.
5.2.1 Summary StatisticsTable 10 Variables - Summary of observations, depicts the summary statistics across all the 29 shows for
the 259 show-weeks when an episode was aired.
5.2.2 Correlation amongst variablesTable 11, Table 12 and Table 13 shows the correlations amongst the variables listed in Table 9 Variables
list and definitions.
5.3 Categorizing DataAs the first step in analysis, the data items gathered were classified into simpler categories. The list of data
items collected is listed in Table 4 Twitter API - Input and Output items. The data items were categorized
in to two dimensions.
The first one was based on the nature of the data represented in the data item. A data item was classified
into either 'profile' related or 'tweet' related. The number of friends and followers are characteristics of
the user handle/profile of the show and hence classified as 'profile' related data. On the other hand,
replies to a tweet/status update by the show handle or by one of the public mentioning the show handle
or the show hashtag is an action on a tweet and hence classified as 'tweet' related data. Similarly retweets
(RT) and marking a show related tweet as a favorite are again actions on a tweet, and hence classified as
'tweet' related data.
The other classification is based on the type of user performing a certain action. The user base was split
into two - one who are related to the show i.e. the marketing or social media departments of the shows,
who are responsible for maintaining the show handles on Twitter and two - the audience or public in
general.
Page 37 of 93
Based on this thumb rule, tweets by the show handle, adding friends to the show profile and responding
to audience tweets about the show are actions taken by the show and hence classified as 'show'. On the
other hand, since all shows typically keep their profile as public i.e. users can add themselves as followers.
Hence, 'followers' is a community driven action. Similarly, retweeting tweets from the show handle or
marking tweets from the show handle as a favorite are 'community' actions as they are done by the
audience. The audience when tweeting about a show mentions the show handle or the show hashtag or
both. These tweets can be re-tweeted by others following him/her, replied to and marked as a favorite.
Since these are all audience actions, they have been categorized as a 'community' action. The classification
is summarized in Table 14 Variable categorization.
A word of caution on the mentions data items - retweets, replies and favorites. It is possible that in
addition to actions by other members of the public, tweets mentioning the show are retweeted or marked
as a favorite by the show handle as well. In the dataset, the mentions data haven't been differentiated
between actions by the show handle and actions by the general audience. Since a tweet can only be
retweeted or marked as a favorite once, the show handle retweeting or marking a tweet as a favorite can
at a maximum increment the counts by 1. Thus the effect of possibly including a show action in this data
set will not change any trend/results.
Page 38 of 93

6. Analysis and Results
6.1 Single category analysis - GenreI started off by looking at the overall data gathered and seeing how the various data items across shows
and category classifications referred to in Section 5.3 - Categorizing Data, relate to each other. Initially, I
wanted to see how the buzz on twitter varied across the genre of the shows. Table 15 Show Details, lists
shows against the various genres. Amongst the premiere shows in Fall 2013, Sitcoms look to be a favorite
of the television producers, followed by drama.
One would assume that the television network's marketing department, going all out to promote its
shows across all the major social media channels including Twitter. Table 16 Show genre and Twitter
metrics, at an aggregate level details the correlation between show genre and Twitter metrics, (18-1)
illustrates the relationship between new tweets and show genre. What is striking is that Period shows
have a negative correlation with 'New Tweets'. Indeed as evidenced in (18-1), (18-3), (18-4), (18-5) and
(18-7), Period shows are negatively correlated with 'New Followers', 'Mentions RT', 'Mentions Reply' and
'Mentions Count'- most of the community actions. One possible explanation for this could be that Period
shows appeal to a slightly more mature audience who may not be that much into Twitter as younger age-
groups are.
Drama, Sitcoms and Game shows don't depict any significant correlation with any of the Twitter metrics
across network and community actions. This is particularly surprising for Game shows, which are usually
associated with a lot of audience buzz. In fact both the game shows which premiered in fall 2013 - Master
Chef Junior and Million Seconds were successful and ran full season. While Master Chef Junior has been
renewed for the next season, there hasn't been any announcement about 'Million Seconds' yet. Sitcoms
appeal to all age-groups and across the 16 premiere shows classified as sitcoms, community engagement
not being significant is striking. What can be a possible reason for this? One reasonable explanation could
be that since sitcoms appeal across a diverse range of age-groups, its effects are spread across thinly.
6.2 Single category analysis - NetworksTable 17 - Table 20 illustrate the impact of the various network and community actions for the major
networks - ABC, CBS, FOX and NBC respectively. CBS (Table 18) stands out in that there is a negative
correlation across nearly all the community and network actions. This pattern is repeated, to a slightly
lower extent with Fox (Table 19). Looking at Figure 9 Twitter metrics across Networks, we see that the
weekly average score per show across all the networks and community actions is the lowest for CBS
Page 39 of 93

amongst the four major networks. CBS has an average 0.46 tweets per show episode implying that its
network actions are quite low. FOX, the leader in this metric tweets more than 7 times as that of CBS
which translates to more than twice in terms of community actions. Clearly for CBS, the lack of network
action is translating into lack of community actions and hence engagement.
6.3 Prediction ModelsWe then looked at whether the Twitter engagement metrics could be used to predict an episode's ratings
and viewers figures. We looked at it in 2 ways - firstly as a function of Network and then with Genre.
Co-relation with previous episodeFor all the networks (ABC - Table 24, NBC - Table 25, CBS - Table 26 and Fox - Table 27), the correlation
between current episode's rating and the previous episode's/week's rating was significant. Nielsen
Research (2013) had identified that the previous year's show rating was one of the top 3 significant factors
influencing a show's ratings. While Nielsen's study has looked at established shows or shows which have
been running for atleast one season. In this paper, we looked at new i.e. premiere shows to predict the
next episode's rating. According to our findings, for premiere shows, the previous episode's rating is
extremely significant (at the 1% level) for the current episode's. In fact, each unit increment of the
previous episode's rating increases the current episode's one by approximately 0.29 for ABC, 0.286 for
NBC, 0.284 for CBS and 0.29 for Fox. This implies that ratings in general are sticky i.e. the initial impression
of a show carries forward to subsequent episodes of a show. This also points out that there is no substitute
for good programming.
Viewership figures (ABC - Table 28, NBC - Table 29, CBS - Table 30 and Fox - Table 31), also display a similar
trend although the correlation is somewhat subdued with the previous episode's viewership being
significant at the 10% level. Across the four major networks, each unit increment of the previous episode's
viewership increased the current episode's by approximately 0.19.
Ratings - Co-relation with New TweetsAcross all the networks, only 'New Tweets' has a correlation with current episodes ratings. Indeed, each
tweet by the show handle increases the current episodes rating by approximately 0.78 (ABC - Table 24,
NBC - Table 25, CBS - Table 26 and Fox - Table 27). No other Twitter metric across network and community
actions have any significant impact on ratings. The above does point to the fact that tweeting by show's
marketing departments does have an impact on ratings. This is in line with Nielsen's research as discussed
in Section 3.7 - Relationship between Twitter and TV ratings, which determined that in US, increases in
Twitter volume correlated with increases in TV ratings. While it can be assumed that Nielsen's result was
Page 40 of 93

perhaps done at a more aggregate level and this study focuses on premiere shows only for which the
number of tweets by the show handle significantly affects ratings. There is bound to be a ceiling in terms
of the maximum number of tweets which will impact the ratings i.e. 7 tweets by the show handle will not
guarantee a 5 point rating.
What is striking is that the impact of community actions on rating is not significant. This is contrary to
popular belief that buzz on Twitter helps to drive ratings. Why this behavior? Our hypothesis that more
community engagement, helps to keep the fan interested in the week long lull between episode airings,
has been invalidated. A possible explanation for this could be that when it comes to rating a show, a user
turns to his or her own judgment and is not influenced by community feedback.
Viewershio- Co-relation with community actionsWhile community actions are not significant in driving ratings, they are significant for driving viewership.
Across all the networks (ABC - Table 28, NBC - Table 29, CBS - Table 30 and Fox - Table 31), community
metrics - 'Mentions RT', "Mentions Replies' and 'New Followers' have a significant correlation with
viewership.
0.37 Million re-tweets of a tweet mentioning the show hashtag or handle in the week before an episode
airs increases the viewers by 1 million. Similarly, 15,384 new followers in the week running up to an
episode airing increases the viewership by 1 million and 262 replies to tweets mentioning the show
hashtag or handle increases the viewership by 1 million.
This is in line with the perception that buzz on Twitter contributes to increased viewership. We have been
able to breakdown the 'buzz' and point out specific metrics which help to drive viewership. Users who
start to follow a show in the run-up to an episode airing indicate an interest in that show which is
translated into viewership. Re-tweets also indicate a fan who is engaged with the show and reading
through the tweets and then sharing it with his network. Twitter's user interface makes it easy to re-tweet
and hence the large number of re-tweets required to drive up the viewership. Replies to a tweet
mentioning the show indicate a greater engagement with the show and a conversation between fans or
the show handle or actors themselves.
What is surprising is that the number of tweets mentioning the show hashtag or handle is not significant.
This implies that its specific actions taken by the community to interact with each other e.g. sharing
another's tweet (re-tweet) or replying to a tweet, which imply more engagement within the community
members and translate to drive up viewership figures.
Page 41 of 93
Ratings - Network drivers
From (26-3), New Followers have a negative correlation with Ratings for ABC. No other metric is significant
influence on ratings for ABC. NBC (Table 25) has a few levers which it can use to drive up its ratings. New
Tweets (27-1), New Followers (27-3), Show RT (27-4), Show Fav (27-5) and Show Reply (27-6) are
correlated with ratings. For CBS (Table 26), New Tweets (28-1), New Friends (28-2), New Followers (28-3),
Show RT (28-4) and Show Reply (28-5) influence ratings while for Fox (Table 27), Mentions Count (29-7)
has a positive influence but Show Reply (29-6) has a negative correlation with ratings.
From the above, with the exception of ABC, across all networks, one thing which stands out is that
'Mentions' metrics don't seem to drive ratings. However, other community actions e.g. Show Fav, Show
RT, Show Reply all have positive influences. 'Show' metrics originate from the show/network handle. This
points that trend for a degree of authenticity which is important for ratings. Rather than be swayed by
other people's comments about the show, it's the show's words (tweets) or actions (adding new friends)
which seem to matter for ratings.
It is difficult to explain why 'Show Reply' has a negative correlation for Fox. The best way to determine
that would be to analyze the contents of the conversation. It could be that the show handle is rude to
users, or said something controversial which didn't go down well.
Overlapping the ratings metrics with the average metrics per show for each of the networks Figure 9
Twitter metrics across Networks, is a good way to visualize which of the networks actions are bearing
fruit. CBS and NBC lead the way with 5 of the metrics driving results positively. Infact, CBS seems to the
most effective as its metrics per show is the lowest (e.g. New Tweets of 0.46 per show per week as
opposed to NBC's 3.37) in all the categories but still those impact ratings. This leads us to think that quality
of interaction is more important and there is an optimum level of the various interactions and also the
presence of another factor - possibly genre.
Viewership - Network drivers
Correlation of viewership for the networks (ABC - Table 28, NBC - Table 29, CBS - Table 30 and Fox - Table
31) across the various Twitter metrics throws up some interesting observations. None of the Twitter
metrics are significant for ABC. For NBC, community actions - Show Fav (31-5), Show Reply (31-6),
Mentions Count (31-7), Mentions RT (31-8) and Mentions Reply (31-10) are positively correlated with
ratings. For Fox it is only Show Reply (33-6) which influences and for CBS they are Show Fav (32-5) and
Mentions Fav (32-9).
Page 42 of 93
ABC's results are surprising. Of the 8 ABC shows which debuted and were part of our dataset,
What explains the difference in behavior across the networks? The genre of shows could be a possible
factor. However, across our show dataset and the main genre's considered Crime, Drama and Sitcoms
were spread across the networks. Keeping aside ABC's findings, for the other networks, some aspect of
community engagement is seen to be correlated to ratings. Further research with textual analysis may
give us some clues into the differences. However it cannot be denied that to increase viewership,
networks need to encourage more engagement on Twitter - with the show handle and amongst the
audience themselves.
ABC's results cannot be explained. As seen in Figure 9 Twitter metrics across Networks, across all the
Twitter variables they have considerable metrics and seem to be doing what their competitors are doing
as well.
6.4 LimitationsWhile, the data set that was captured from Twitter is quite exhaustive, it may not be the complete list of
all tweets originating from a handle or for a given hash tag or search term. For complete access to all
tweets about a show/topic, access to the Twitter 'fire hose' is required. Access to the Twitter 'fire hose' is
a very expensive option. There is a risk that the trends observed above may not hold for the entire dataset.
Page 43 of 93

7. Closing RemarksFrom Section 6 - Analysis and Results above, a major observation is that the rating and viewership of a
particular episode of a premier show airing during primetime is significantly dependent on the
corresponding ratings and viewership figures of the previous episode. While a buzz on social media can
help to drive up ratings to an extent, nothing can replace good programming as being a key success factor.
Adding new friends also has a positive effect on ratings and viewers. The recommendation to marketing
departments of the TV shows would to keep audience engaged through relevant tweets and exclusive
content.
New 'followers' also has a positive effect on viewership. While, one way to add more followers could be
to create more buzz, the other way could be to trawl through the twitter feed and see who are tweeting
about the show - either mentioning the show handle or through hash tags, but not following the show
handle. These users could be 'followed' and it is likely that they would in-turn 'follow' the show handle
back. Although the RTs of mentions and marking mentions as a favorite may seem to be statistically
significant in predicting the viewership for an episode. Driving up engagement of Twitter is key to more
viewership. Networks should incentive users to not only to tweet more but to interact with each other
and replies to other's tweets, marking them as favorites and re-tweet. In this paper we have seen how
Bravo has taken steps to encourage more of this type of engagement, other major networks will need to
follow and devise their own innovative engagement methods.
NBC's Head of Research, Wurtzel (2014) recently remarked that 'social media is not a game changer yet
in influencing television viewing'. This was in the context of media habits observed during the Winter
Olympics at Sochi. The context of Olympics is different from prime-time soaps which as seen earlier display
correlations between buzz on social media platforms and viewership and rating figures. This was also
echoed by Sirkin (2014), who said "More niche programming, such as dramas or reality television
programs, could show more correlations between social media activity and viewership."
7.1 Further workThis study has focused primarily on aggregated numbers and trends. Given the corpus of nearly three
hundred thousand tweets for shows which premiered in fall 2013, further analysis in terms of
directionality and sentiment analysis can be done. This can then be correlated with ratings and viewership
figures and hence decisions taken by TV executives behind cancelling and renewing shows can be
understood better.
Page 44 of 93
Another line of study could be to look at the influence of intense or 'super' fans over their online social
network. A 'super' fan is one who fanatically tweets during and after each show telecast. Such a fanatical
fan will need to be defined e.g. x number of tweets per show/weekly. Such fans are big influencers in their
social circles - have a large number of friends and followers. It is envisaged that shows with more ardent
fans have higher ratings.
7.2 Future - Road AheadOur entertainment activities have always had a social aspect to it - be it watching the latest Star Wars
with friends or the crunch ball game. Technology over and over again has disrupted our lives in numerous
directions and will continue to do so. Social media platforms have transformed television viewing by
providing a way for instant gratification through virtual 'group viewing' experience. This trend will
continue as networks take advantage of digital and mobile platforms to form a better picture of the
aggregated likes and dislikes of viewers and thus provide personalized programs.
The current model of television production has a big weakness in that producers have no idea of whether
the show will be a success before the show airs - when a lot of the investment has already been done.
New production houses are already disrupting this by taking in feedback directly from viewers at the start
of the process. This mitigates the risk of failure to a large extent and is also good news for the advertisers
as it gives them guaranteed eye balls.
Speaking of advertising, Davies (2010), Media Partner at Deloitte had an interesting take in his report -
'Television and social media: friends forever?' - 'While the current relationship between television and
social media/networks is largely symbiotic, in the medium-term it has the potential to turn combative,
with competition for audience time and advertising budgets steadily intensifying. As the reach, usage and
value of social media and networks steadily rise, this could cause advertising budgets to get diverted from
television."
Whatever happens, the $450 billion world-wide television market, will be a battleground where networks
and advertisers all try to engage their audiences across multiple channels. Television's love affair with
Twitter is still in its infancy and this is surely a space to look out for in the coming years.
Page 45 of 93
8. ReferencesAlex (2011). GetGlue hits 1 Million users and 100 Million data points. Online report, retrieved from:http://blog.getglue.com/?p=6842
Alex (2011). GetGlue Summer Stats: 130% Growth, record 11.7M Check-ins in August. Online report,retrieved from: http://blog.tvtag.com/?p=8976
Alexa (2013). Top Sites in United States. Online report, retrieved from:http://www.alexa.com/topsites/countries/US, Retrieval Date - February 1, 2014
BBC, History -John Logie Baird. Online report, retrieved from:http://www.bbc.co.uk/history/historic-figures/bairdlogie.shtml
BBC, How it Works - The Powerbar. Online report, retrieved from:http://www.bbc.co.uk/programmes/b01s4sk3
Bercovici, J. (2013). Can Twitter Save TV? (And Can TV Save Twitter?). Online report, retrieved from:http://www.forbes.com/sites/effbercovici/2013/10/07/can-twitter-save-tv-and-can-tv-save-twitter/
Brown, L. (2013). 'MasterChef Junior' renewed for Season 2 on FOX. Online report, retrieved from:http://blog.zap2it.com/frominsidethebox/2013/12/masterchef-junior-renewed-for-season-2-on-fox.html
Bulkeley, W. (2010). 10 Breakthrough Technologies, TR10: Social TV - Relying on relationships to rebuildTV audiences., MIT Technology Review. Online report, retrieved from:http://www2.technologyreview.com/article/41854l/trIO-social-tv/
Brozek, M. (2013). #PrettyLittleLiars: How Hashtags Drive The Social TV Phenomenon. Online report,retrieved from: http://digitalcommons.salve.edu/pell-theses/93/
Cheong, M. (2009).'What are you Tweeting about?': A survey of Trending Topics within Twitter'
Constine, J. (2011). 1.65 Billion Likes of TV Shows Indicates Facebook's Importance to Television. Onlinereport, retrieved from: http://www.insidefacebook.com/2011/05/18/tv-shows-facebook-television/
Crunchbase (2014). Twitter - Company Overview. Online report, retrieved from:http://www.crunchbase.com/company/twitter
Deloitte (2010). Television and social media: friends forever?. Online report, retrieved from:http://www.deloitte.com/view/enGB/uk/industries/tmt/ef38f6b64ee8a2lOVgnVCM10000Ola56fOOaRCRD.htm
Dixit, P. (2013). Twitter Is Starting To Alert You When Your friends Talk About TV Shows. Online report,retrieved from: http://www.fastcompany.com/3023477/fast-feed/twitter-is-starting-to-you-when-your-friends-talk-about-tv-sshows
Dubois, L. (2010). GetGlue: The Foursquare of Entertainment?. Online report, retrieved from:http://www.inc.com/news/artices/2010/10/getglue-the-foursquare-of-entertainment-checkin.html
Page 46 of 93
Facebook Statistics (2014). Online report, retrieved from: http://www.statisticbrain.com/facebook-statistics/, Date Retrieved - 01.01.2014
Fixmer, A. (2012). Nielsen Cuts 500,000 U.S. TV Homes on Census, Web Viewing. Online report, retrievedfrom: http://www.bloomberg.com/news/2012-09-25/niesen-cuts-u-s-tv-homes-by-500-000-on-census-shift-to-web.html
Fleischman (2013). Extend TV commercials on Twitter: Premiering TV ad targeting. Online report,retrieved from: https://blog.twitter.com/2013/extend-tv-commercials-on-twitter-premiering-tv-ad-targeting
Georgiou, A. (2013). Are TV ratings possible with Twitter?. Diss. University of Bristol, 2013
Github, bear/python-twitter. Online report, retrieved from: https://github.com/bear/python-twitter
Github, requests/requests-oauthlib. Online report, retrieved from:https://github.com/requests/requests-oauthlib
Ha, A. (2013). With Trendrr Acquisition, Twitter Continues To Beef Up Its Social TV Efforts. Online report,retrieved from: http://techcrunch.com/2013/08/28/twitter-continues-to-beef-up-its-social-tv-efforts-with-trendrr-acquisition/
Harrington, S. & Highfield, T. & Bruns, A. (2013). More than a backchannel: Twitter and television.Journal of Audience & Reception Studies, Vol 10, Issue 1
Luckin, D. (2013). What The First Commercial Ever Shown On American TV Looked Like. Online report,retrieved from: http://news.wjct.org/post/what-first-commercial-ever-shown-american-tv-looked
Kamm, A. and Baird, M. (2002). John Logie Baird: A Life - A Personal Biography. NMSE - Publishing Ltd,p. 69
Kastelein, R. (2010). Social TV: Bravo TV launches Twitter Campaigns. Online report, retrieved from:http://www.appmarket.tv/component/content/article/882.htm
Kastelein, R. (2011). Endemol CEO - "Social TV is Going to Be Huge". Online report, retrieved from:http://www.appmarket.tv/opinion/1003-endemol-ceo-qsocial-tv-is-going-to-be-hugeq.html
Kelly, S. (2013). Twitter Testing 'TV Trending' Feature. Online report, retrieved from:http://mashable.com/2013/08/14/twitter-tv-trending/
Kosur, J. (2013). Addicted To Twitter? Bravo Will Reward Your TV Watching Habits. Online report,retrieved from: http://socialnewsdaily.com/8360/addicted-to-twitter-bravo-will-reward-your-tv-watching-habits/
Laporte, N. (2013). Artifact: The Moment Twitter Met TV. Online report, retrieved from:http://www.fastcompany.com/3019566/reverse-engineered/artifact-the-moment-twitter-met-tv
Middleton, H. (2014). TV & Twitter: Power of the second screen. Online report, retrieved from:http://wearesocial.net/blog/2014/02/tv-twitter-power-screen/
Page 47 of 93

Midha, A. (2014). TV x Twitter: New findings for advertisers and networks. Online report, retrieved from:https://blog.twitter.com/2014/tv-x-twitter-new-findings-for-advertisers-and-networks
McGirt, E (2013). Twitter woos TV Networks Advertisers IPO. Online report, retrieved from:http://www.fastcompany.com/3018620/twitter-woos-tv-networks-advertisers-ipo
Monaghan, E. Television Through the Decades and the Ways It Changed Our World. Online report,retrieved from: http://tv.toptenreviews.com/standard/television-through-the-decades-and-the-ways-it-changed-our-world.htm
Nielsen (2011). Television Audience Report 2010-2011. Online report, retrieved from:http://www.nielsen.com/us/en/reports/2011/television-audience-report-2010-2011.html
Nielsen (2013). New Study Confirms Correlation Between Twitter and TV Ratings. Online report,retrieved from: http://www.nielsen.com/us/en/newswire/2013/new-study-confirms-correlation-between-twitter-and-tv-ratings.html
Nielsen (2013). Nielsen launches Nielsen Twitter TV ratings. Online report, retrieved from:http://www.nielsensocial.com/nielsen-launches-nielsen-twitter-tv-ratings/
Nielsen (2013). New Study Confirms Correlation Between Twitter and TV Ratings. Online report,retrieved from: http://www.nielsen.com/us/en/newswire/2013/new-study-confirms-correlation-between-twitter-and-tv-ratings.html
Nielsen, TV Measurement. Online report, retrieved from: http://nielsen.com/us/en/nielsen-solutions/nielsen-measurement/nielsen-tv-measurement.html
Proulx, M. and Shepatin, S. (2012). Social TV: How Marketers Can Reach and Engage Audiences byConnecting Television to the Web, Social Media, and Mobile. John Wiley and Sons. 2012.
Pomerantz, D. (2013). Can Twitter Save Live TV?, Retrieved from:http://www.forbes.com/sites/dorothypomerantz/2013/03/20/can-twitter-save-ive-tv/
Reitz, K. Requests: HTTP for Humans. Online report, retrieved from: http://docs.python-requests.org/en/latest/
Rowan, D. (2011). Six tech trends to expect in 2011. Online report, retrieved from:http://www.wired.co.uk/news/archive/2011-01/1I/david-rowan-predictions-2011
Rowghani, A. (2013). Welcoming Bluefin Labs to the Flock. Online report, retrieved from:https://blog.twitter.com/2013/welcoming-bluefin-labs-to-the-flock
Rusli, E. (2013). Facebook Woos TV Networks With Data. Online report, retrieved from:http://blogs.wsj.com/digits/2013/09/29/facebook-woos-tv-networks-with-more-data/
Schneider, M. (2011). New to Your TV Screen: Twitter Hashtags. Online report, retrieved from:http://www.tvguide.com/News/New-TV-Screen-1032111.aspx
Silverman, M. (2010). What Twitter's Trending Topics Told Us About the World in 2010. Online report,retrieved from: http://mashable.com/2010/12/22/top-twitter-trends-2010-charts/
Page 48 of 93

Silverman, M. (2011). Top 10 Twitter Trends This Week - Feb-19 2011. Online report, retrieved from:http://mashable.com/2011/02/19/trending-topics-chart-twitter/
Statista (2012). Activities performed while watching TV in the United States in 2012 - by device. Onlinereport, retrieved from: http://www.statista.com/statistics/258397/
Statista (2013). Impact of TV ratings on twitter volume in the U.S. 2013,Retrieved from:http://www.statista.com/statistics/277674/
Statista (2013). Influence of tweets on TV ratings in the U.S. 2013, by program. Online report, retrievedfrom: http://www.statista.com/statistics/277637/
Statista (2013). Simultaneous use of devices while watching TV worldwide in 2013, by activity anddevice. Online report, retrieved from: http://www.statista.com/statistics/258647/
Statista (2013). Mobile device usage while watching TV in the United States 2013. Online report,retrieved from: http://www.statista.com/statistics/277319/
Statista (2013). New Study Confirms Correlation Between Twitter and TV Ratings. Online report,retrieved from: http://www.nielsen.com/us/en/newswire/2013/new-study-confirms-correlation-between-twitter-and-tv-ratings.html
Statista (2013). Two-way causal impact of Twitter and TV ratings 2013. Online report, retrieved from:http://www.statista.com/statistics/277633/
Statista (2014). Revenue of the TV industry in the United States in 2012 and 2017. Online report,retrieved from: http://www.statista.com/statistics/243875/
Statista (2011). U.S. users who are Twitter followers or Facebook fans of TV networks or shows in 2011,by age. Online report, retrieved from: http://www.statista.com/statistics/190741/
Statista (2014). Locations where consumers watched TV worldwide in 2013. Online report, retrievedfrom: http://www.statista.com/statistics/270046/
Steel, E. (2014). Social media not yet a 'game changer' for boosting TV viewership. Online report,retrieved from: http://www.ft.com/cms/s/0/1ac5e370-cbfc-1e3-a934-00144feabdcO.html
Stelter, B. (2013). Nielsen to Measure Twitter Chatter About TV Shows. Online report, retrieved from:http://www.nytimes.com/2013/10/07/business/media/nielsen-to-measure-twitter-chatter-about-tv.html?_r=0
Stephens, M. History of Television. Online report, retrieved from:http://www.nyu.edu/classes/stephens/History%20of%2oTelevision%20page.htm
Stewart (1941). "Imagery For Profit", New York Times, July 6, 1941
Stone, B. (2011). Happy Birthday Twitter!. Online report, retrieved from:https://blog.twitter.com/2011/happy-birthday-twitter
Talbot, G. (2012). How Social Television is Making a Second Screen Connection. Online report, retrievedfrom: http://www.real.com/resources/social-television/
Page 49 of 93
The Economist (2010). An interactive future. Online report, retrieved from:http://www.economist.com/node/15980787
The New York Times (1951). "Truman to Be Televised In First National Hook-Up"
Tsotsis, A. (2011). The Oscars, On Twitter: Over 1.2 Million Tweets, 388K Users Tweeting. Online report,retrieved from: http://techcrunch.com/2011/02/28/the-oscars-twitter/
Wohn, Y. and Na, E. (2011). Tweeting about TV: Sharing television viewing experiences via social mediamessage streams. Online report, retrieved from:http://firstmonday.org/ojs/index.php/fm/article/view/3368/2779
Twitter. (2013). GET users/show. Online report, retrieved from:https://dev.twitter.com/docs/api/1.1/get/users/show
Twitter. (2013). GET statuses/user timeline. Online report, retrieved from:https://dev.twitter.com/docs/api/1.1/get/statuses/user-timeline
Twitter. (2013). GET search/tweets. Online report, retrieved from:https://dev.twitter.com/docs/api/1.1/get/search/tweets
Twitter Statistics (2014). Online report, retrieved from: http://www.statisticbrain.com/twitter-statistics/, Date Retrieved - 01.01.2014
Ungerleider, N. (2014). Why Twitter Loves TV. Online report, retrieved from:http://www.fastcompany.com/3026062/why-twitter-loves-tv
Wakamiya, S. & Lee, R. & Sumiya, K. (2011). Twitter based TV audience behavior estimation for betterTV ratings
Wells, E. (2013). Does Twitter Drive TV Ratings?. Online report, retrieved from:http://www.redbeemedia.com/blog/does-twitter-drive-tv-ratings
Yarrow, J (2013). Twitter Has A Surprisingly Small Number Of US users. Online report, retrieved from -http://www.businessinsider.com/twitter-has-a-surprisingly-small-number-of-us-users-2013-10
Young, 0. (2013). TV conversation targeting launches in the UK and US: Coming soon to Brazil, Canada,France, and Spain. Online report, retrieved from: https://blog.twitter.com/2013/tv-conversation-targeting-launches-in-the-uk-and-us-coming-soon-to-brazil-canada-france-and
Page 50 of 93
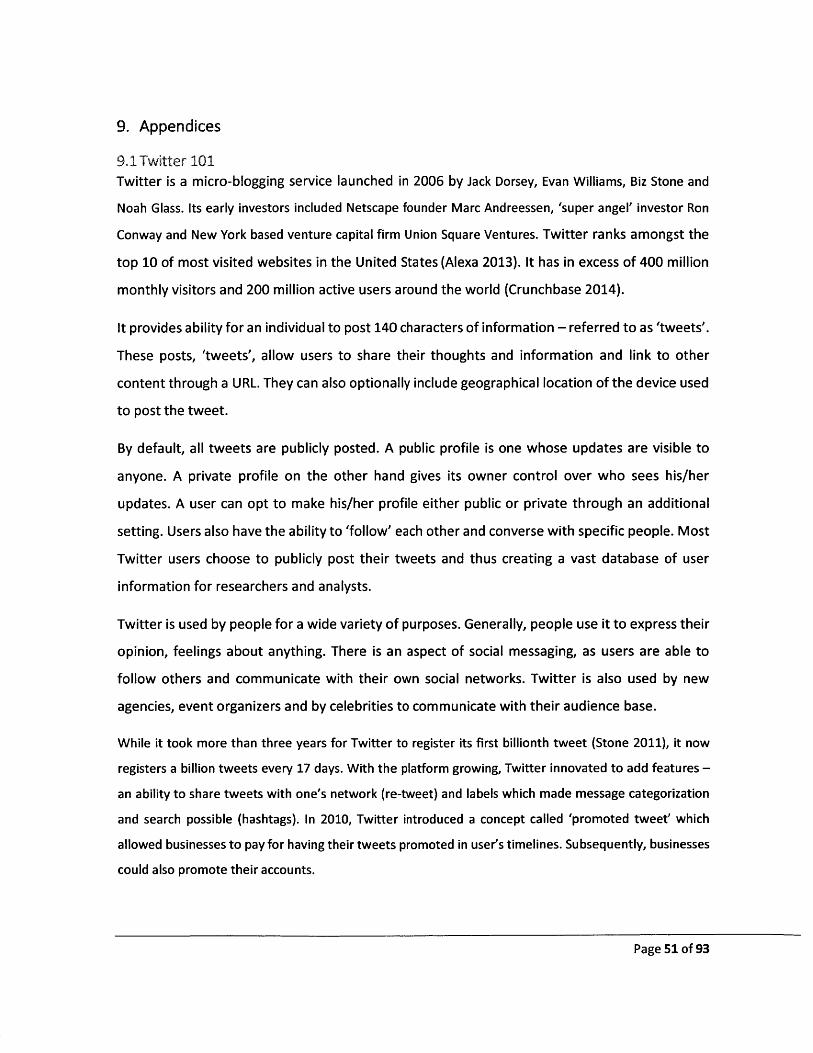
9. Appendices
9.1Twitter 101Twitter is a micro-blogging service launched in 2006 by Jack Dorsey, Evan Williams, Biz Stone and
Noah Glass. Its early investors included Netscape founder Marc Andreessen, 'super angel' investor Ron
Conway and New York based venture capital firm Union Square Ventures. Twitter ranks amongst the
top 10 of most visited websites in the United States (Alexa 2013). It has in excess of 400 million
monthly visitors and 200 million active users around the world (Crunchbase 2014).
It provides ability for an individual to post 140 characters of information - referred to as 'tweets'.
These posts, 'tweets', allow users to share their thoughts and information and link to other
content through a URL. They can also optionally include geographical location of the device used
to post the tweet.
By default, all tweets are publicly posted. A public profile is one whose updates are visible to
anyone. A private profile on the other hand gives its owner control over who sees his/her
updates. A user can opt to make his/her profile either public or private through an additional
setting. Users also have the ability to 'follow' each other and converse with specific people. Most
Twitter users choose to publicly post their tweets and thus creating a vast database of user
information for researchers and analysts.
Twitter is used by people for a wide variety of purposes. Generally, people use it to express their
opinion, feelings about anything. There is an aspect of social messaging, as users are able to
follow others and communicate with their own social networks. Twitter is also used by new
agencies, event organizers and by celebrities to communicate with their audience base.
While it took more than three years for Twitter to register its first billionth tweet (Stone 2011), it now
registers a billion tweets every 17 days. With the platform growing, Twitter innovated to add features -
an ability to share tweets with one's network (re-tweet) and labels which made message categorization
and search possible (hashtags). In 2010, Twitter introduced a concept called 'promoted tweet' which
allowed businesses to pay for having their tweets promoted in user's timelines. Subsequently, businesses
could also promote their accounts.
Page 51 of 93
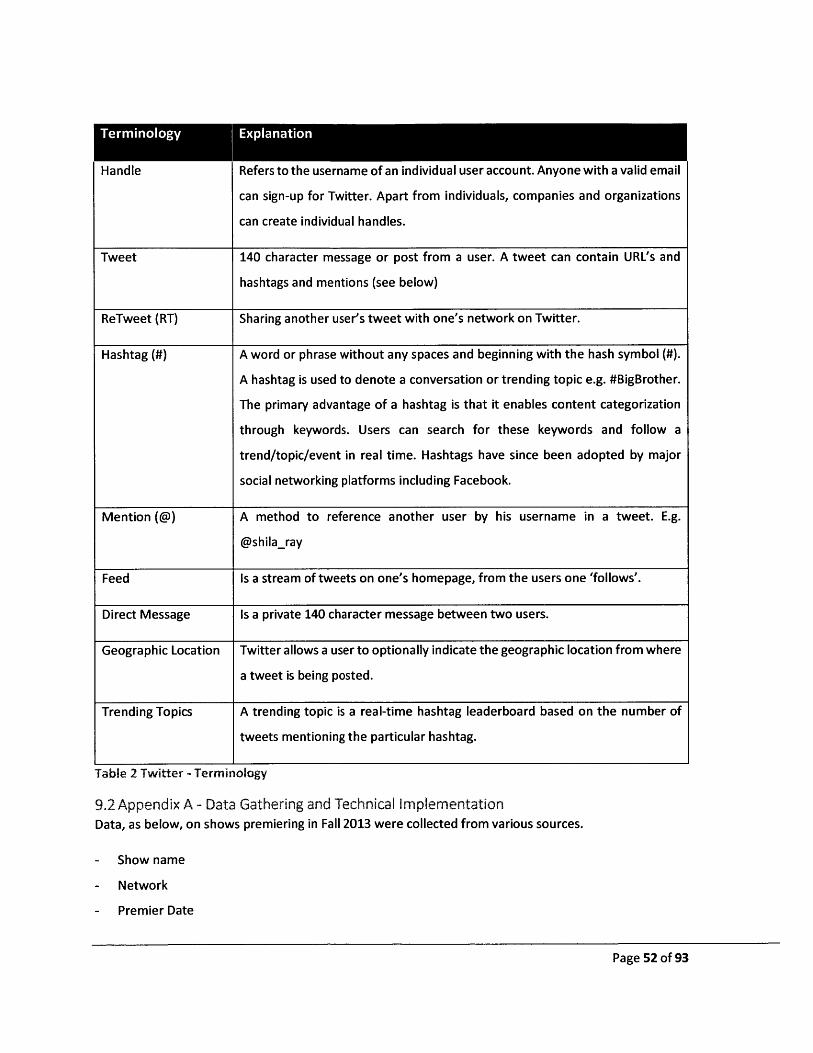
Handle Refers to the username of an individual user account. Anyone with a valid email
can sign-up for Twitter. Apart from individuals, companies and organizations
can create individual handles.
Tweet 140 character message or post from a user. A tweet can contain URL's and
hashtags and mentions (see below)
ReTweet (RT) Sharing another user's tweet with one's network on Twitter.
Hashtag (#) A word or phrase without any spaces and beginning with the hash symbol (#).
A hashtag is used to denote a conversation or trending topic e.g. #BigBrother.
The primary advantage of a hashtag is that it enables content categorization
through keywords. Users can search for these keywords and follow a
trend/topic/event in real time. Hashtags have since been adopted by major
social networking platforms including Facebook.
Mention (@) A method to reference another user by his username in a tweet. E.g.
@shilaray
Feed Is a stream of tweets on one's homepage, from the users one 'follows'.
Direct Message Is a private 140 character message between two users.
Geographic Location Twitter allows a user to optionally indicate the geographic location from where
a tweet is being posted.
Trending Topics A trending topic is a real-time hashtag leaderboard based on the number of
tweets mentioning the particular hashtag.
Table 2 Twitter - Terminology
9.2 Appendix A - Data Gathering and Technical ImplementationData, as below, on shows premiering in Fall 2013 were collected from various sources.
- Show name
- Network
- Premier Date
Page 52 of 93

- Regular Start Date (if different from Premiere date)
- End Date
- Time slot
- Frequency - daily, weekly - day of week
- Show Handle
- Show Hashtag
- Show URL
- Handles of actors, producers associated with the show (if available)
A variety of sources were used to collate this data. Other than the schedule from television networks, the
following popular independent aggregating sites was referred to -
a. Futon Critic - www.thefutoncritic.com
b. Zap 2 It - www.zap2it.com
A full list of shows for which data was setup is listed in Table 15 Show Details.
9.2.1 Twitter APIs ConsumedTwitter exposes a wide number of APIs for developers to extract data from the Twitter network
and build applications. It offers two types of APIs - REST and Streaming. Without going into the
technical differences between the two, at a very high level the Streaming API is better suited for
real-time end-user driven applications and decouples the application logic from its data store.
REST APIs on the other hand are more suited towards distributed client-server architectures. For
this project, REST v1.1 was used.
For the purposes of this project, the following three APIs -
1. User Profile: Users/showa
2. Show Timeline: Statuses/usertimelineb
a Twitter (2013), GET users/show, Retrieved from:https://dev.twitter.com/docs/api/1.1/get/users/showb Twitter (2013), GET statuses/usertimeline, Retrieved from:https://dev.twitter.com/docs/api/1.1/get/statuses/usertimeline
Page 53 of 93
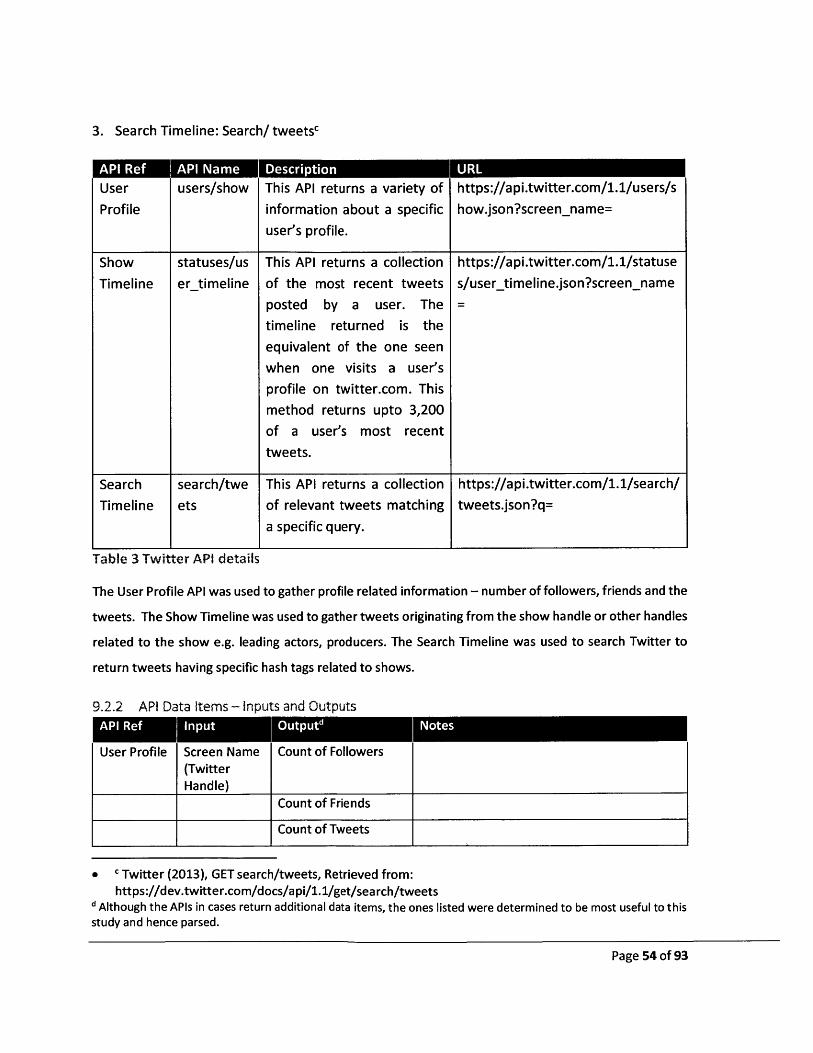
3. Search Timeline: Search/ tweetsc
AP Ref API Name 'Description URL
User users/show This API returns a variety of https://api.twitter.com/1.1/users/s
Profile information about a specific how.json?screenname=
user's profile.
Show statuses/us This API returns a collection https://api.twitter.com/1.1/statuse
Timeline er-timeline of the most recent tweets s/user timeline.json?screenname
posted by a user. The =
timeline returned is the
equivalent of the one seen
when one visits a user's
profile on twitter.com. This
method returns upto 3,200
of a user's most recent
tweets.
Search search/twe This API returns a collection https://api.twitter.com/1.1/search/
Timeline ets of relevant tweets matching tweets.json?q=
a specific query.
Table 3 Twitter API details
The User Profile API was used to gather profile related information - number of followers, friends and the
tweets. The Show Timeline was used to gather tweets originating from the show handle or other handles
related to the show e.g. leading actors, producers. The Search Timeline was used to search Twitter to
return tweets having specific hash tags related to shows.
9.2.2 API Data Items - Inputs and Outputs
Screen Name(TwitterHandle)
Count of Followers
Count of Friends
Count of Tweets
C Twitter (2013), GET search/tweets, Retrieved from:https://dev.twitter.com/docs/api/1.1/get/search/tweets
d Although the APIs in cases return additional data items, the ones listed were determined to be most useful to thisstudy and hence parsed.
Page 54 of 93
User Protile

Veritied status ot the account
Show Screen Name TweetID An unique identifier for a Tweet;Timeline (Twitter automatically assigned by Twitter.
Handle)Created/Timestamp UTC time when the Tweet was created
Screen Name aka user handle or user name on Twitter e.g.
President Obama's Twitter handle is
@BarackObama
ReTweet Indicates whether this Tweet has been
retweeted by the authenticating user.
Number of re-Tweets Number of times a Tweet has been
retweeted.
Favourited Indicates whether the tweet has been
marked as a favorite by users. Twitter doesn't
seem to use this feature.
Number of Favourited Number of times a tweet has been marked asTweets
a favorite.
InReplyToStatusid If Tweet is a reply, represents the original
Tweet's ID.
InReplyToScreenName If the represented Tweet is a reply, this field
will contain the screen name of the original
Tweet's author.
Co-ordinates The longitude and latitude of the Tweet's
location
Place Indicates that the tweet is associated with a
"Place". Places are specific, named locations
with corresponding geo coordinates.
Geographic location Similar to 'Place' above
Text of Tweet The actual text of the status update or Tweet.
Search or Search string Tweet_IDMentions (show hash Created/TimestampTimeline reted/Timestamp
Page 55 of 93
vermea

tag, showname/s)
Screen Name
ReTweet
Number of re-Tweets
Favourited
Number of FavouritedTweetsInReplyToStatusld
InReplyToScreenName
Co-ordinates
Place
Geographic location
Text of Tweet
Table 4 Twitter API - Input and Output items
9.2.3 Frequency of pollingTwitter imposes restrictions in terms of the number of times, each of the above APIs can be
consumed within a specified time period. These are mentioned below in Table 5 Twitter API -Polling
frequency upper limit. Consequently, this imposed a limit on our data collection strategy.
User Profile 180 requests / user / 15 min
Show Timeline 180 requests / user / 15 min
Search Timeline 180 requests / user / 15 min
Table 5 Twitter API - Polling frequency upper limit
Keeping in mind the above restrictions, the data collection strategy had to be adapted to be in
line with the above limits. The implemented frequencies are mentioned below in Table 6 Data
collection frequency.
User Profile Once daily for each handle/show
Page 56 of 93

Show Peak - @ 15 minutes from 1 hour before start of show to 1 hour after forTimeline both east and West coasts.
Off-Peak - hourly
Search Peak - @ 15 minutes from 1 hour before start of show to 1 hour after forTimeline both east and West coasts.
Off-Peak - hourly
Table 6 Data collection frequency
9.2.4 Using PythonPython is a popular object-oriented open-source dynamic scripting language. Python was chosen due to
the wide availability of open-source add-on libraries. The version of Python used is 2.7.4 as it was a more
stable version over the most recent 3.3.
The following open-source modules were used -
1. Requests-OAuthlib - This library provides capabilities to send secure authorized requests to the
Twitter API.
2. Requestst - Requests is an elegant and simple HTTP library for Python.
3. twitters - This library provides a pure Python interface for the Twitter API.
9.2.5 Technical Setup and ArchitectureAt the core of the technical setup is a custom Python program. The purpose of the program is to
call the appropriate Twitter API with appropriate parameters based on the request type,
consume the response from Twitter, parse it and write it to a local CSV file. This Python program
ran simultaneously on two medium instances of Windows servers on Amazon Web Services
(AWS) and was invoked by pre-configured tasks configured on the servers. The output CSV files
were zipped up daily and imported to a local server running an instance of MySQL server. The
' Github, requests/requests-oauthlib, Retrieved from: https://github.com/requests/requests-oauthlibf Reitz, Requests: HTTP for Humans, Retrieved from: http://docs.python-requests.org/en/latest/9 g Github, bear/python-twitter, Retrieved from: https://github.com/bear/python-twitter
Page 57 of 93

CSV files are then imported into tables on the database corresponding to the type of request -
user profile, show timeline, search timeline.
Table 7 Technical Architecture
9.2.6 Data collectedOver a period from August - December, 2013, the data collected for 348 shows (Appendix 2) is
as follows:
User Profile -62k
Show Timeline (Tweets) 225k
Search Timeline (Tweets & Mentions) 2.97 Million
Table 8 - Data Collection volumes
Page 58 of 93
a
MySQL.
U
amazonwebswvlow
I
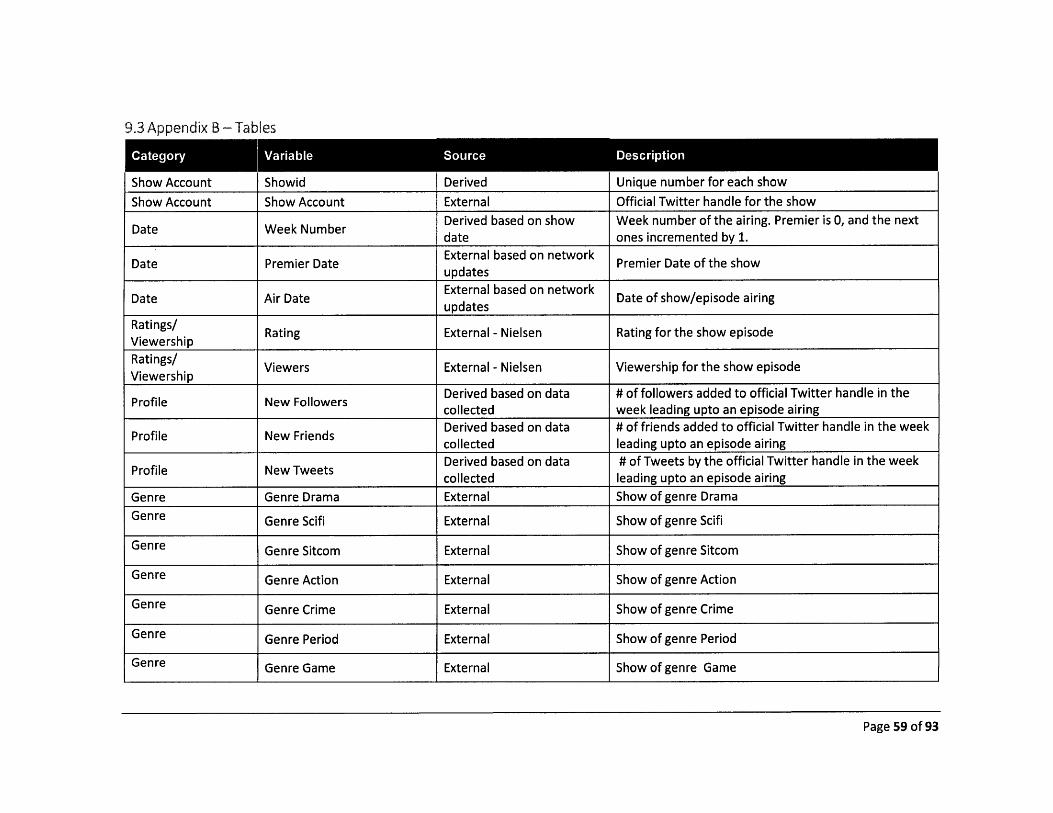
9.3 Appendix B - Tables
Show Account Showid Derived Unique number for each show
Show Account Show Account External Official Twitter handle for the show
Date Week Number Derived based on show Week number of the airing. Premier is 0, and the nextdate ones incremented by 1.
Date Premier Date External based on network Premier Date of the showupdates
Date Air Date External based on network Date of show/episode airingupdates
Ratings/h. Rating External - Nielsen Rating for the show episodeViewershipRatings/ Viewers External - Nielsen Viewership for the show episodeViewership
Derived based on data # of followers added to official Twitter handle in theProfile New Followers collected week leading upto an episode airing
Derived based on data # of friends added to official Twitter handle in the weekProfile New Friends collected leading upto an episode airing
Derived based on data # of Tweets by the official Twitter handle in the weekProfile New Tweets collected leading upto an episode airing
Genre Genre Drama External Show of genre DramaGenre Genre Scifi External Show of genre Scifi
Genre Genre Sitcom External Show of genre Sitcom
Genre Genre Action External Show of genre Action
Genre Genre Crime External Show of genre Crime
Genre Genre Period External Show of genre Period
Genre Genre Game External Show of genre Game
Page 59 of 93

Genre Genre Horror External Show of genre Horror
Result Result Cancelled External - network updates Boolean value indicates show was cancelled
Result Result Renewed External - network updates Boolean value indicates show was renewed
Result Result Full-season External - network updates Boolean value indicates show ran full season
# of tweets, in the week leading upto an episode airing,Mentions Mentions RT Derived bed d on data mentioning the show name, show handle or an
collected associated hashtag which have been re-tweeted
# of tweets, in the week leading upto an episode airing,Mentions Mentions Reply Derived bed d on data mentioning the show name, show handle or an
collected associated hashtag which are in reply to another tweet
# of tweets, in the week leading upto an episode airing,Mentions Mentions Tweet Derived bed d on data mentioning the show name, show handle or an
collected associated hashtag# of tweets, in the week leading upto an episode airing,
Derived based on data mentioning the show name, show handle or anMentions Mentions Fav collected associated hashtag which have been marked as a
favoriteDerived based on data # of tweets, in the week leading upto an episode airing,
showSho RTcollected by the official show handle which have been re-tweeted
Show Show Reply Derived bed d on data by the official show handle, which are marked as repliescollected to an audience tweet
Derived based on data # of tweets, in the week leading upto an episode airing,Show Show Tweets collected by the official show handle
# of tweets, in the week leading upto an episode airing,
Show Show Fav Derived bed d on data by the official show handle which have been marked ascollected
a favorite
Network Network External Television network the show runs on
Page 60 of 93
Genre FantasyGenreIShow of genre FantasyExternal
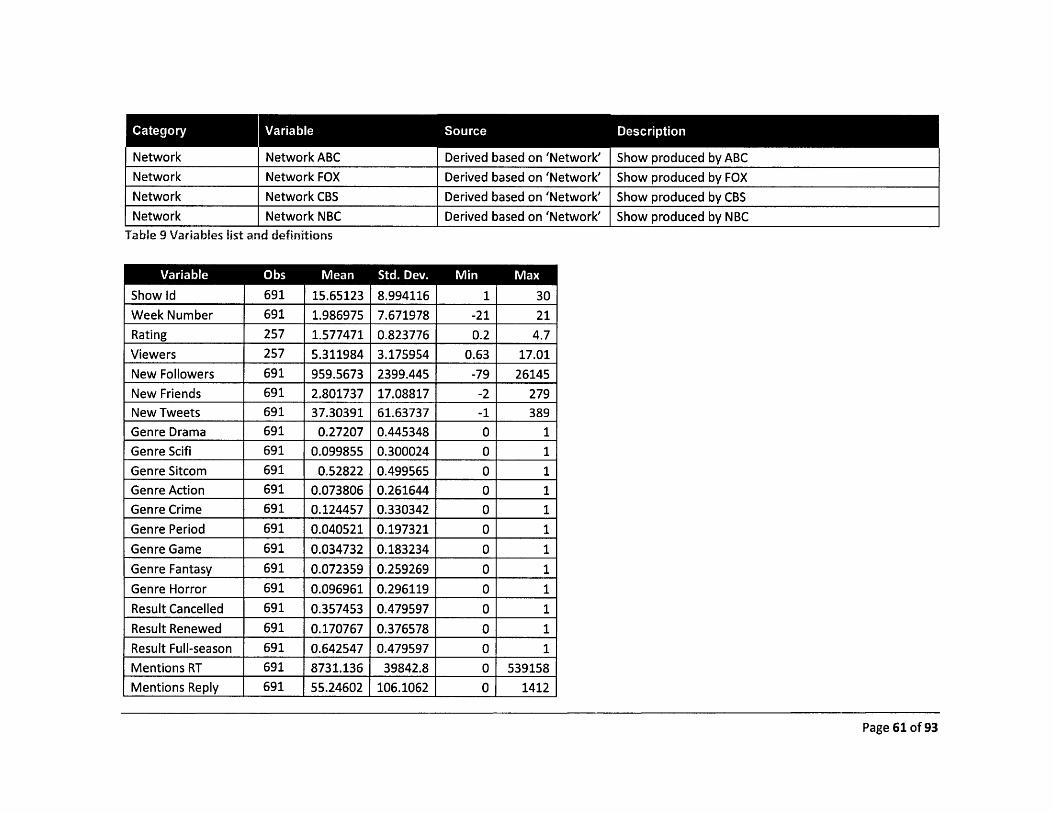
Network Network ABC Derived based on 'Network' Show produced by ABCNetwork Network FOX Derived based on 'Network' Show produced by FOXNetwork Network CBS Derived based on 'Network' Show produced by CBSNetwork Network NBC Derived based on 'Network' Show produced by NBC
Table 9 Variables list and definitions
...a-eO. -. . - .Show Id 691 15.65123 8.994116 1 30Week Number 691 1.986975 7.671978 -21 21
Rating 257 1.577471 0.823776 0.2 4.7Viewers 257 5.311984 3.175954 0.63 17.01New Followers 691 959.5673 2399.445 -79 26145New Friends 691 2.801737 17.08817 -2 279New Tweets 691 37.30391 61.63737 -1 389Genre Drama 691 0.27207 0.445348 0 1Genre Scifi 691 0.099855 0.300024 0 1Genre Sitcom 691 0.52822 0.499565 0 1Genre Action 691 0.073806 0.261644 0 1Genre Crime 691 0.124457 0.330342 0 1Genre Period 691 0.040521 0.197321 0 1Genre Game 691 0.034732 0.183234 0 1Genre Fantasy 691 0.072359 0.259269 0 1Genre Horror 691 0.096961 0.296119 0 1Result Cancelled 691 0.357453 0.479597 0 1Result Renewed 691 0.170767 0.376578 0 1Result Full-season 691 0.642547 0.479597 0 1Mentions RT 691 8731.136 39842.8 0 539158Mentions Reply 691 55.24602 106.1062 0 1412
Page 61 of 93
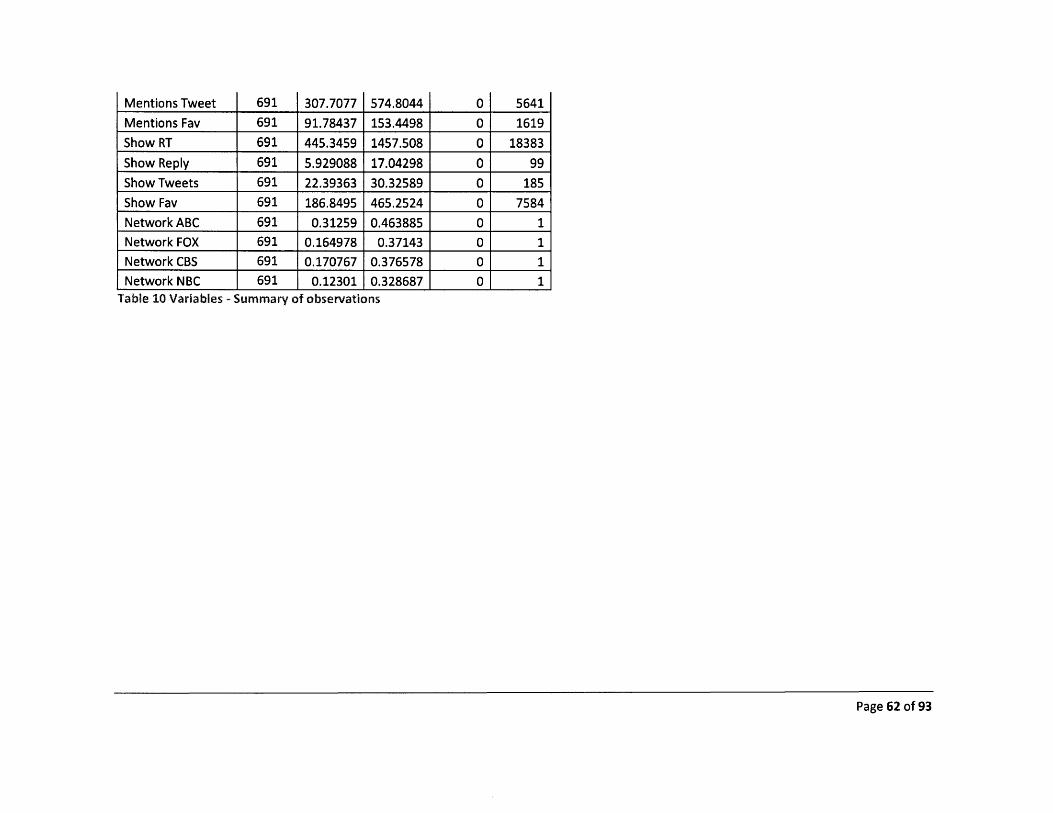
Mentions Fav 691 91.78437 153.4498 0 1619Show RT 691 445.3459 1457.508 0 18383Show Reply 691 5.929088 17.04298 0 99Show Tweets 691 22.39363 30.32589 0 185Show Fav 691 186.8495 465.2524 0 7584Network ABC 691 0.31259 0.463885 0 1Network FOX 691 0.164978 0.37143 0 1Network CBS 691 0.170767 0.376578 0 1Network NBC 691 0.12301 0.328687 0 1
Table 10 Variables - Summary of observations
Page 62 of 93
Mentions Tweet 691 307.7077 574.8044 0 5641
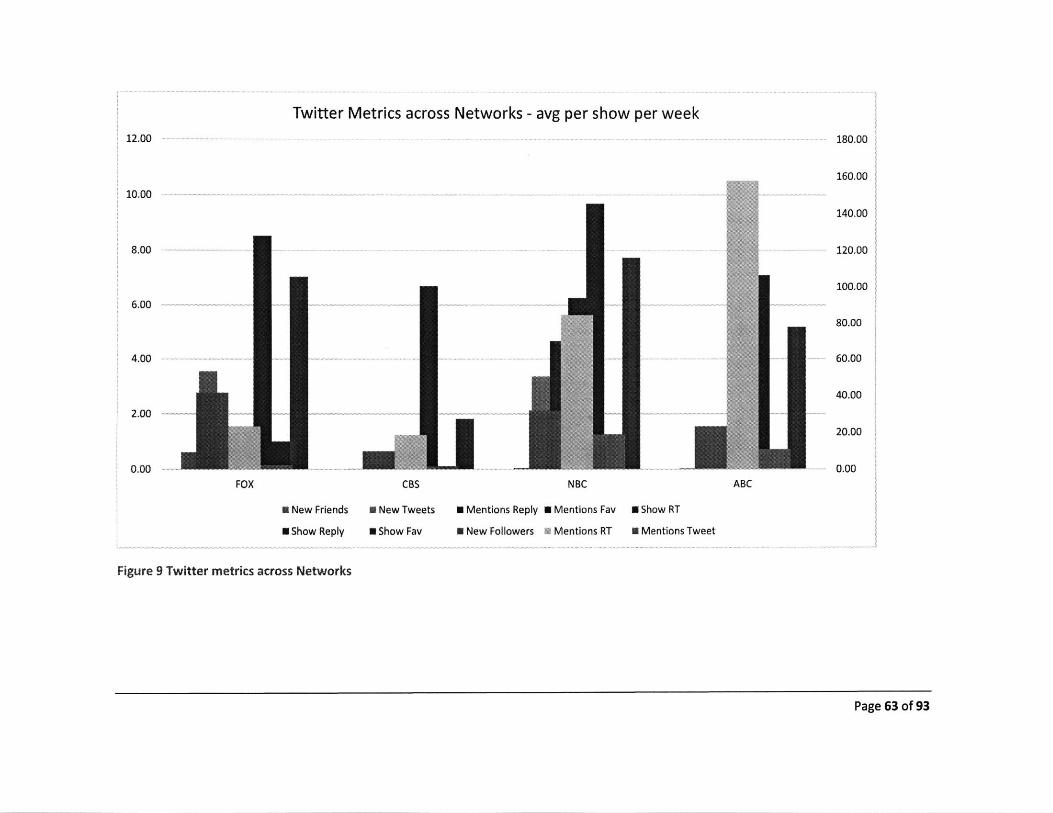
Twitter Metrics across Networks - avg per show per week12.00 - - -- 180.00
160.0010.00 - - -.--.-
140.00
8.00 ------ - - 120.00
100.006.00 - - - - - - - -
80.00
4.00 - 60.00
40.00
2.00 -
20.00
0.00 0.00FOX CBS NBC ABC
* New Friends 0 New Tweets 0 Mentions Reply a Mentions Fav E Show RT
* Show Reply a Show Fav U New Followers m Mentions RT n Mentions Tweet
Figure 9 Twitter metrics across Networks
Page 63 of 93
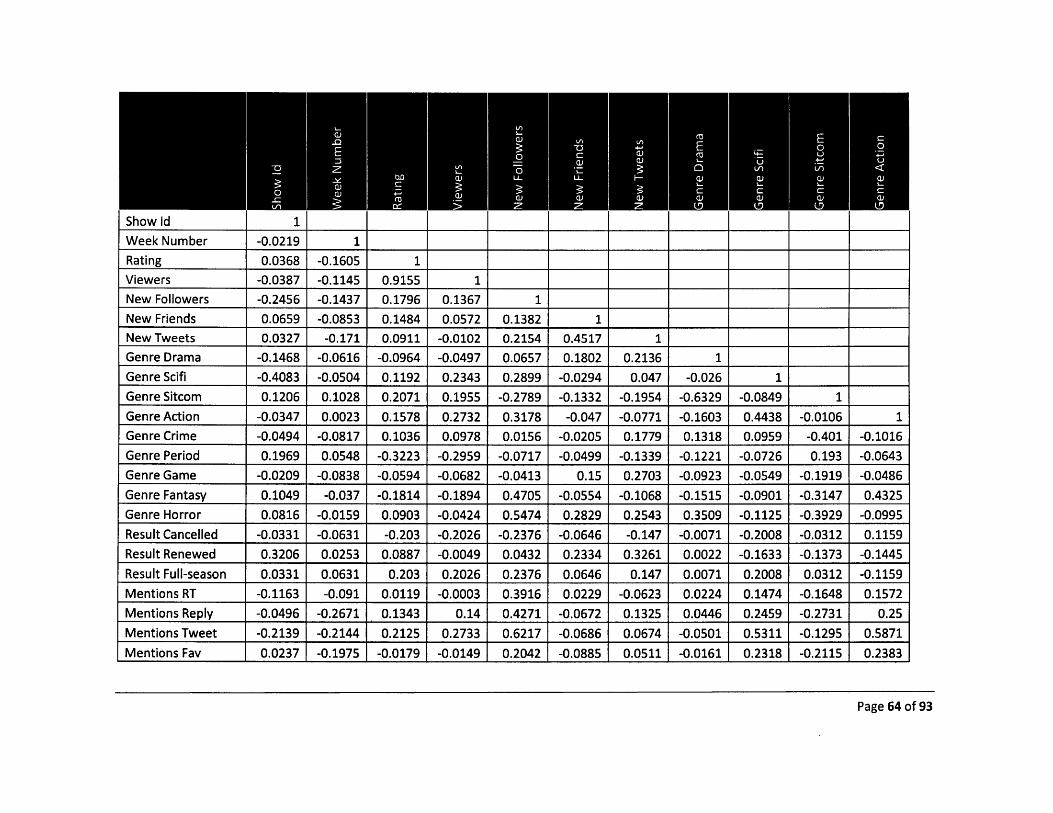
Show Id 1Week Number -0.0219 1Rating 0.0368 -0.1605 1Viewers -0.0387 -0.1145 0.9155 1New Followers -0.2456 -0.1437 0.1796 0.1367 1New Friends 0.0659 -0.0853 0.1484 0.0572 0.1382 1New Tweets 0.0327 -0.171 0.0911 -0.0102 0.2154 0.4517 1Genre Drama -0.1468 -0.0616 -0.0964 -0.0497 0.0657 0.1802 0.2136 1Genre Scifi -0.4083 -0.0504 0.1192 0.2343 0.2899 -0.0294 0.047 -0.026 1Genre Sitcom 0.1206 0.1028 0.2071 0.1955 -0.2789 -0.1332 -0.1954 -0.6329 -0.0849 1Genre Action -0.0347 0.0023 0.1578 0.2732 0.3178 -0.047 -0.0771 -0.1603 0.4438 -0.0106 1Genre Crime -0.0494 -0.0817 0.1036 0.0978 0.0156 -0.0205 0.1779 0.1318 0.0959 -0.401 -0.1016Genre Period 0.1969 0.0548 -0.3223 -0.2959 -0.0717 -0.0499 -0.1339 -0.1221 -0.0726 0.193 -0.0643Genre Game -0.0209 -0.0838 -0.0594 -0.0682 -0.0413 0.15 0.2703 -0.0923 -0.0549 -0.1919 -0.0486
Genre Fantasy 0.1049 -0.037 -0.1814 -0.1894 0.4705 -0.0554 -0.1068 -0.1515 -0.0901 -0.3147 0.4325Genre Horror 0.0816 -0.0159 0.0903 -0.0424 0.5474 0.2829 0.2543 0.3509 -0.1125 -0.3929 -0.0995Result Cancelled -0.0331 -0.0631 -0.203 -0.2026 -0.2376 -0.0646 -0.147 -0.0071 -0.2008 -0.0312 0.1159Result Renewed 0.3206 0.0253 0.0887 -0.0049 0.0432 0.2334 0.3261 0.0022 -0.1633 -0.1373 -0.1445
Result Full-season 0.0331 0.0631 0.203 0.2026 0.2376 0.0646 0.147 0.0071 0.2008 0.0312 -0.1159Mentions RT -0.1163 -0.091 0.0119 -0.0003 0.3916 0.0229 -0.0623 0.0224 0.1474 -0.1648 0.1572Mentions Reply -0.0496 -0.2671 0.1343 0.14 0.4271 -0.0672 0.1325 0.0446 0.2459 -0.2731 0.25Mentions Tweet -0.2139 -0.2144 0.2125 0.2733 0.6217 -0.0686 0.0674 -0.0501 0.5311 -0.1295 0.5871Mentions Fav 0.0237 -0.1975 -0.0179 -0.0149 0.2042 -0.0885 0.0511 -0.0161 0.2318 -0.2115 0.2383
Page 64 of 93
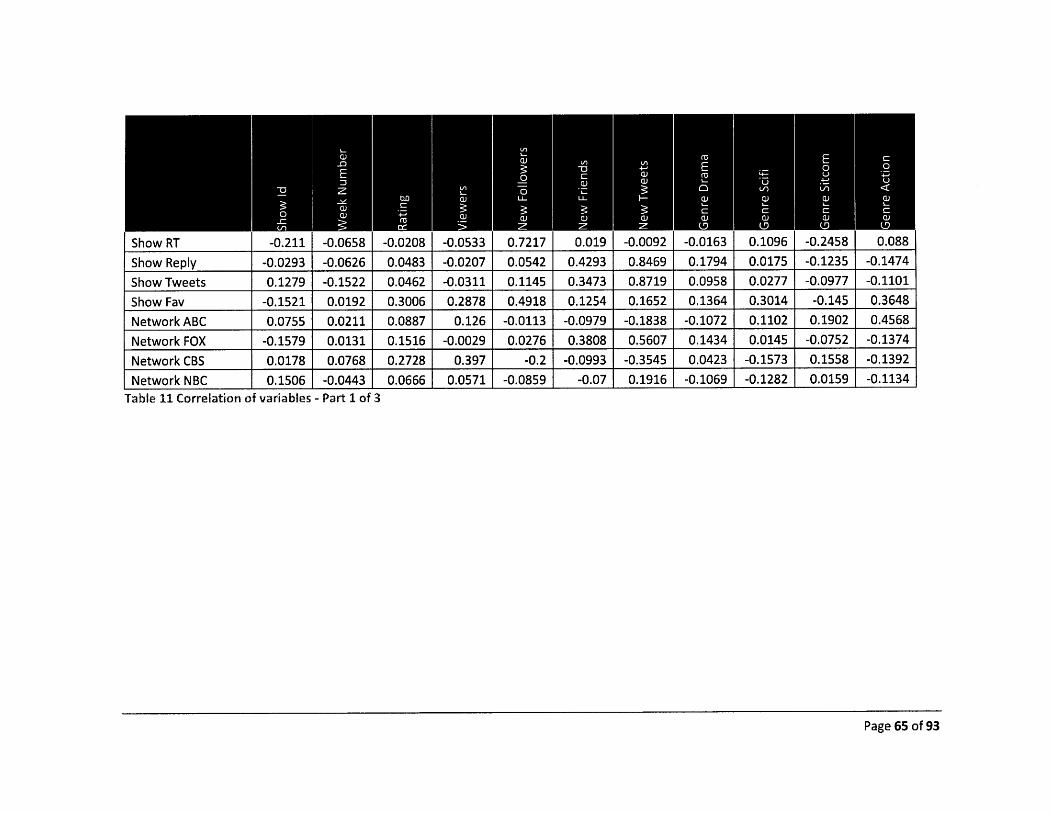
Show RT -0.211 -0.0658 -0.0208 -0.0533 0.7217 0.019 -0.0092 -0.0163 0.1096 -0.2458 0.088
Show Reply -0.0293 -0.0626 0.0483 -0.0207 0.0542 0.4293 0.8469 0.1794 0.0175 -0.1235 -0.1474
Show Tweets 0.1279 -0.1522 0.0462 -0.0311 0.1145 0.3473 0.8719 0.0958 0.0277 -0.0977 -0.1101
Show Fav -0.1521 0.0192 0.3006 0.2878 0.4918 0.1254 0.1652 0.1364 0.3014 -0.145 0.3648
Network ABC 0.0755 0.0211 0.0887 0.126 -0.0113 -0.0979 -0.1838 -0.1072 0.1102 0.1902 0.4568
Network FOX -0.1579 0.0131 0.1516 -0.0029 0.0276 0.3808 0.5607 0.1434 0.0145 -0.0752 -0.1374
Network CBS 0.0178 0.0768 0.2728 0.397 -0.2 -0.0993 -0.3545 0.0423 -0.1573 0.1558 -0.1392
Network NBC 0.1506 -0.0443 0.0666 0.0571 -0.0859 -0.07 0.1916 -0.1069 -0.1282 0.0159 -0.1134Table 11 Correlation of variables - Part 1 of 3
Page 65 of 93
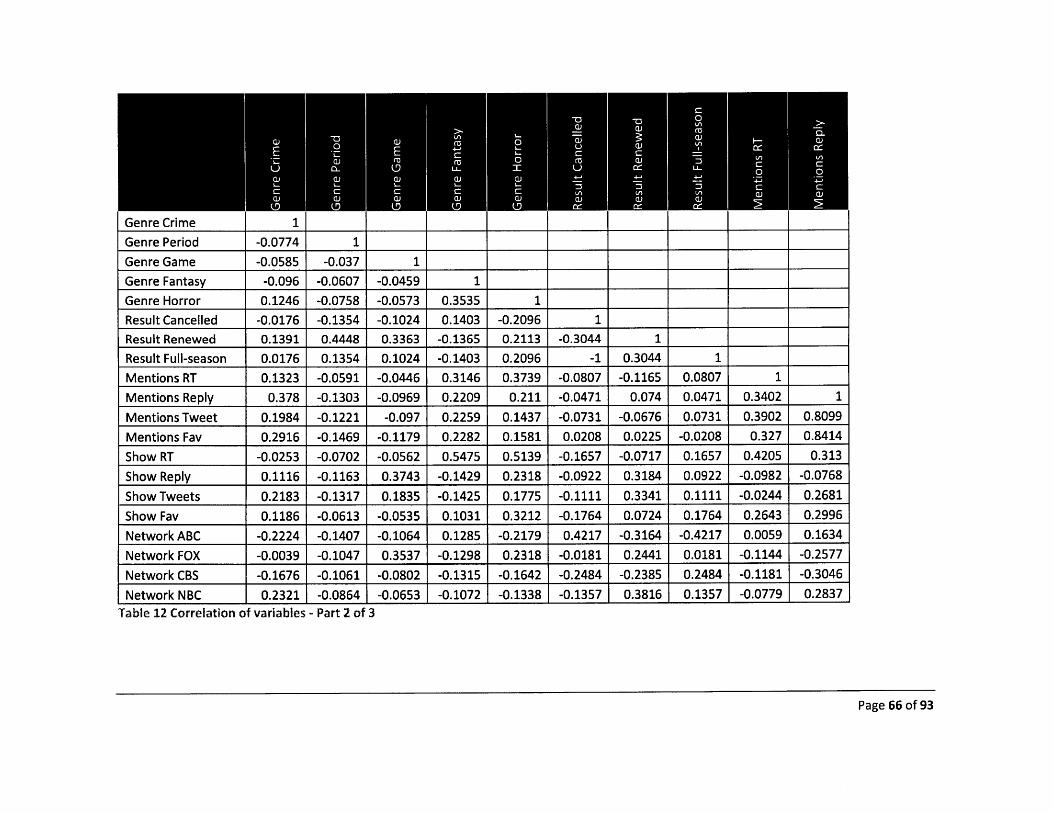
Genre Crime 1Genre Period -0.0774 1Genre Game -0.0585 -0.037 1Genre Fantasy -0.096 -0.0607 -0.0459 1
Genre Horror 0.1246 -0.0758 -0.0573 0.3535 1
Result Cancelled -0.0176 -0.1354 -0.1024 0.1403 -0.2096 1Result Renewed 0.1391 0.4448 0.3363 -0.1365 0.2113 -0.3044 1
Result Full-season 0.0176 0.1354 0.1024 -0.1403 0.2096 -1 0.3044 1
Mentions RT 0.1323 -0.0591 -0.0446 0.3146 0.3739 -0.0807 -0.1165 0.0807 1
Mentions Reply 0.378 -0.1303 -0.0969 0.2209 0.211 -0.0471 0.074 0.0471 0.3402 1
Mentions Tweet 0.1984 -0.1221 -0.097 0.2259 0.1437 -0.0731 -0.0676 0.0731 0.3902 0.8099
Mentions Fav 0.2916 -0.1469 -0.1179 0.2282 0.1581 0.0208 0.0225 -0.0208 0.327 0.8414
Show RT -0.0253 -0.0702 -0.0562 0.5475 0.5139 -0.1657 -0.0717 0.1657 0.4205 0.313
Show Reply 0.1116 -0.1163 0.3743 -0.1429 0.2318 -0.0922 0.3184 0.0922 -0.0982 -0.0768
Show Tweets 0.2183 -0.1317 0.1835 -0.1425 0.1775 -0.1111 0.3341 0.1111 -0.0244 0.2681
Show Fav 0.1186 -0.0613 -0.0535 0.1031 0.3212 -0.1764 0.0724 0.1764 0.2643 0.2996
Network ABC -0.2224 -0.1407 -0.1064 0.1285 -0.2179 0.4217 -0.3164 -0.4217 0.0059 0.1634
Network FOX -0.0039 -0.1047 0.3537 -0.1298 0.2318 -0.0181 0.2441 0.0181 -0.1144 -0.2577
Network CBS -0.1676 -0.1061 -0.0802 -0.1315 -0.1642 -0.2484 -0.2385 0.2484 -0.1181 -0.3046
Network NBC 0.2321 -0.0864 -0.0653 -0.1072 -0.1338 -0.1357 0.3816 0.1357 -0.0779 0.2837Table 12 Correlation of variables - Part 2 of 3
Page 66 of 93
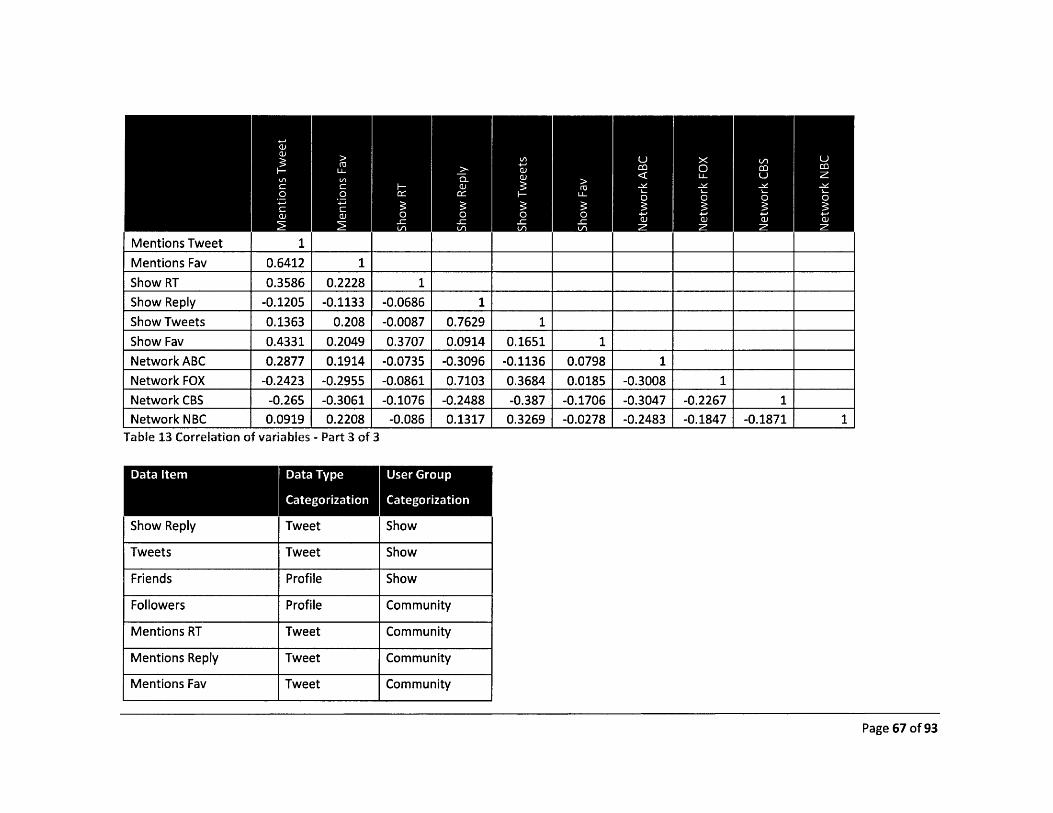
Mentions Fav 0.6412 1
Show RT 0.3586 0.2228 1Show Reply -0.1205 -0.1133 -0.0686 1
Show Tweets 0.1363 0.208 -0.0087 0.7629 1Show Fav 0.4331 0.2049 0.3707 0.0914 0.1651 1Network ABC 0.2877 0.1914 -0.0735 -0.3096 -0.1136 0.0798 1Network FOX -0.2423 -0.2955 -0.0861 0.7103 0.3684 0.0185 -0.3008 1Network CBS -0.265 -0.3061 -0.1076 -0.2488 -0.387 -0.1706 -0.3047 -0.2267 1Network NBC 0.0919 0.2208 -0.086 0.1317 0.3269 -0.0278 -0.2483 -0.1847 -0.1871 1
Table 13 Correlation of variables - Part 3 of 3
Show Reply Tweet Show
Tweets Tweet Show
Friends Profile Show
Followers Profile Community
Mentions RT Tweet Community
Mentions Reply Tweet Community
Mentions Fav Tweet Community
Page 67 of 93
Mentions Tweet 1

Mentions I weet i weet
Show RT Tweet
Show Fav Tweet
Table 14 Variable categorization
Community
Community
Community
Page 68 of 93

Agents of SHIELD AGENTSOFSHIELD 24-Sep Tue 8/7c No Yesscifi,sitcom,action 10 11.8 2.8
ALMOSTHUMANF drama,FOX Almost Human OX 18-Nov Mon 8/7c No Yes scifi,
I_ crime 6 9.4 2.1
ABC Back in the Game BACKINTHEGAME 25-Sep Wed 8:30/7:30c Yes No No sitcom____TV ___10 6.4 1.8
ABC Betrayal BETRAYALABC 29-Sep Sun 10/9c Yes No No drama 10 3.5 0.9FOX Brooklyn nine-nine BROOKLYN99FOX 17-Sep Tue 8:30/7:30c No Yes sitcom 11 3.8 1.6CBS The Crazy Ones CRAZYONESCBS 26-Sep Thu 9/8c No Yes sitcom 11 9.4 2.4
CW The Originals CWORIGINALS 3-Oct Tue 8/7c No Yes fantasy,horror 9 2.2 1.0
CW Reign CWREIGN 17-Oct Thu 9/8c No Yes drama,________period 8 1.8 0.7
CW The Tomorrow People CWTP 9-Oct Wed 9/8c No Yes scifi 9 1.8 0.7FOX Dads DADSONFOX 17-Sep Tue 8/7c Yes No No sitcom 11 3.6 1.4CBS Hostages HOSTAGESCBS 23-Sep Mon 10/9c No Yes drama 13 5.2 1.2
AMC Low Winter Sun LOWWINTERSUNA 11-Aug Sun 10/9c Yes No No crimeMC ___________9 1.3 0.5
ABC Lucky 7 LUCKY7ABC 24-Sep Tue 10/9c Yes No No drama 2 3.5 1.0
FOX astrche Juior MASTERCHEFJRFOFOX Masterchef Junior X 27-Sep Fri 8/7c No Yes Yes game 7 4.0 1.4
NBC Michael J Fox Show MICHAEUFOXSHO 26-Sep Thu 9:30/8:30c No YesW sitcom 10 3.9 1.2
FOX Whe Million Second MILLIONSECONDS 9-Sep ek 8/7c No Yes gameQuizP nigets 1 10 4.7 1 1.2
Page 69 of 93
ABC

NBC The Blacklist NBCBLACKLIST 23-Sep Mon 10/9c No Yes Yes crime 10 10.1 3.1
NBC Dracula NBCDRACULA 25-Oct Fri 10/9c No Yes drama,crime 6 3.5 1.2
NBC Ironside NBCIRONSIDE 2-Oct Wed 10/9c Yes No No drama 4 5.2 1.1NBC Welcome to the Family NBCWELCOME 3-Oct Thu 8:30/7:30c Yes No No sitcom 3 2.6 0.9
NBC Sean saves the world SEANSAVESWORL 3-Oct Thu 9/8c No Yes Yes sitcom 9 36 1.1
sitcom,SHO Masters of sex SHOMASTERS 29-Sep Sun 10/9c No Yes Yes period 12 1.1 0.4
FOX Sleepy Hollow SLEEPYHOLLOWF 16-Sep Mon 9/Bc No Yes Yes drama,OX ___pM n_/_ N Yes Yes horror 11 7.9 2.8
ABC Super Fun Night SUPERFUNNIGHT 2-Oct Wed 9:30/8:30c Yes No sitcom 9 5.9 2.1
ABC The Goldbergs BC 24-Sep Tue 9/8c No Yes sitcom 11 .AB heGl brsBC 11_____ 5.5_ 1.8_ __
CBS The Millers THEMILLERSCBS 3-Oct Thu 8:30/7:30c No Yes sitcom 10 11.1 2.7ABC Trophy Wife TROPHYWIFEABC 24-Sep Tue 9:30/8:30c No Yes sitcom 10 4.3 1.4CBS We are men WEAREMENCBS 30-Sep Mon 8:30/7:30c Yes No No sitcom 2 6.0 1.9
ABC Once upon a time in WONDERLANDOU 10-Oct Thu 8/7c Yes No action,Wonderland AT fantasy 8 4.0 1.1
Table 15 Show Details
NB 1 - Blank value indicates no decision announced publicly by January 1, 2014.
NB 2 - Ratings and Viewership information sourced from Nielsen through www.tvseriesfinale.com
Page 70 of 93
CBS Mom IMOMCBS I23-Sep Mon 9:30/8:30c Yes sitcom 12 7.2 2.1No
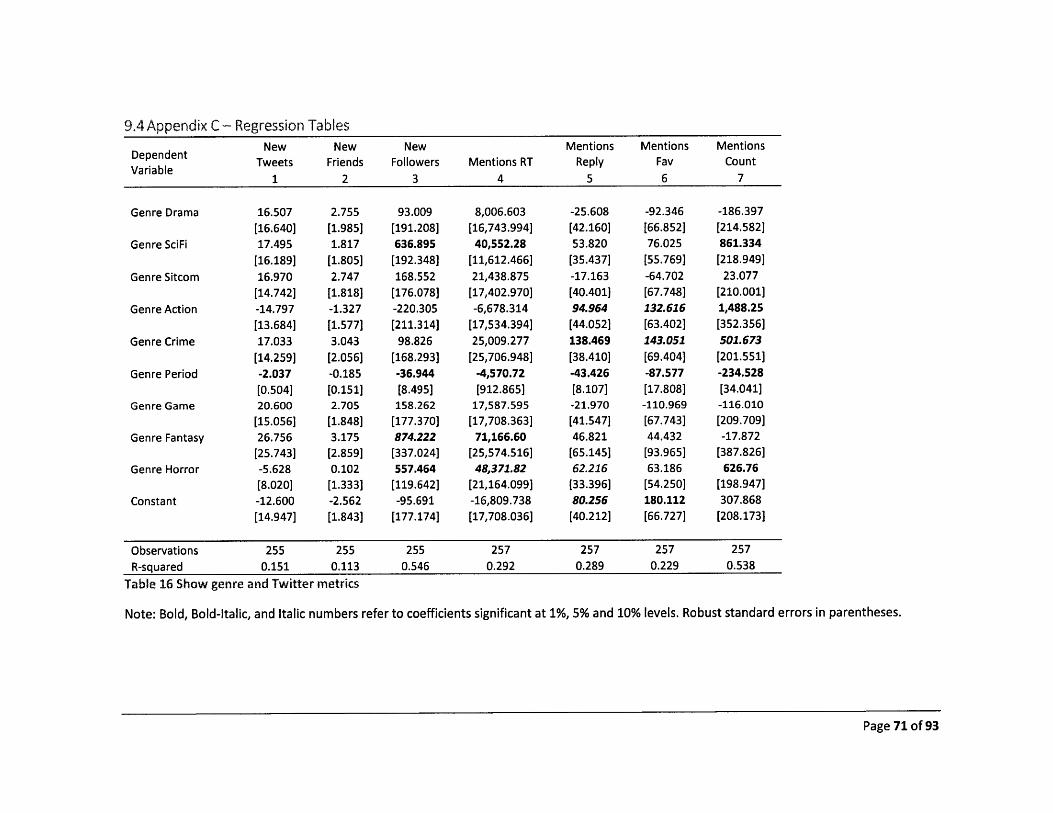
9.4 Appendix C - Regression Tables
Dependent New New New Mentions Mentions Mentions
Variable Tweets Friends Followers Mentions RT Reply Fav Count1 2 3 4 5 6 7
Genre Drama 16.507 2.755 93.009 8,006.603 -25.608 -92.346 -186.397[16.640] [1.985] [191.208] [16,743.994] [42.160] [66.852] [214.582]
Genre SciFi 17.495 1.817 636.895 40,552.28 53.820 76.025 861.334[16.189] [1.805] [192.348] [11,612.466] [35.437] [55.769] [218.949]
Genre Sitcom 16.970 2.747 168.552 21,438.875 -17.163 -64.702 23.077[14.742] [1.818] [176.078] [17,402.970] [40.401] [67.748] [210.001]
Genre Action -14.797 -1.327 -220.305 -6,678.314 94.964 132.616 1,488.25[13.684] [1.577] [211.314] [17,534.394] [44.052] [63.402] [352.356]
Genre Crime 17.033 3.043 98.826 25,009.277 138.469 143.051 501.673[14.259] [2.056] [168.293] [25,706.948] [38.410] [69.404] [201.551]
Genre Period -2.037 -0.185 -36.944 -4,570.72 -43.426 -87.577 -234.528[0.504] [0.151] [8.495] [912.865] [8.107] [17.808] [34.041]
Genre Game 20.600 2.705 158.262 17,587.595 -21.970 -110.969 -116.010[15.056] [1.848] [177.370] [17,708.363] [41.547] [67.743] [209.709]
Genre Fantasy 26.756 3.175 874.222 71,166.60 46.821 44.432 -17.872[25.743] [2.859] [337.024] [25,574.516] [65.145] [93.965] [387.826]
Genre Horror -5.628 0.102 557.464 48,371.82 62.216 63.186 626.76[8.020] [1.333] [119.642] [21,164.099] [33.396] [54.250] [198.947]
Constant -12.600 -2.562 -95.691 -16,809.738 80.256 180.112 307.868[14.947] [1.843] [177.174] [17,708.036] [40.212] [66.727] [208.173]
Observations 255 255 255 257 257 257 257R-squared 0.151 0.113 0.546 0.292 0.289 0.229 0.538
Table 16 Show genre and Twitter metrics
Note: Bold, Bold-Italic, and Italic numbers refer to coefficients significant at 1%, 5% and 10% levels. Robust standard errors in parentheses.
Page 71 of 93
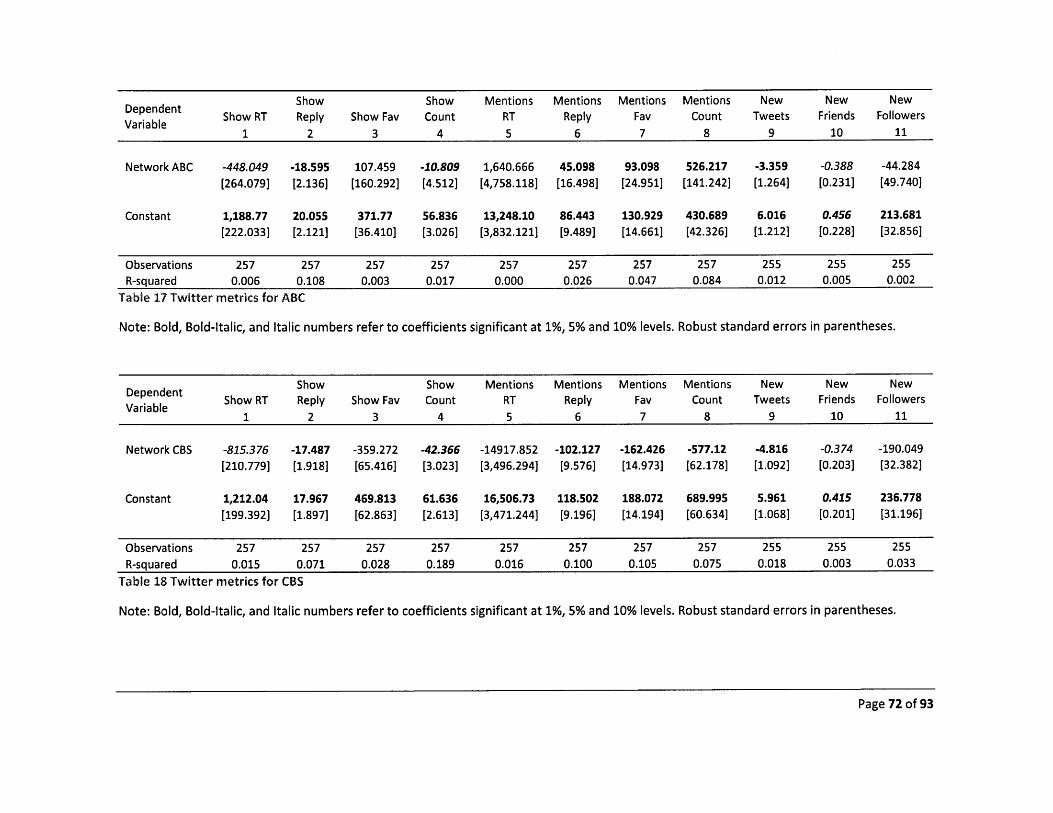
Dependent Show Show Mentions Mentions Mentions Mentions New New New
Variable Show RT Reply Show Fav Count RT Reply Fav Count Tweets Friends Followers
1 2 3 4 5 6 7 8 9 10 11
Network ABC -448.049 -18.595 107.459 -10.809 1,640.666 45.098 93.098 526.217 -3.359 -0.388 -44.284
[264.079] [2.136] [160.292] [4.512] [4,758.118] [16.498] [24.951] [141.242] [1.264] [0.231] [49.740]
Constant 1,188.77 20.055 371.77 56.836 13,248.10 86.443 130.929 430.689 6.016 0.456 213.681[222.033] [2.121] [36.410] [3.026] [3,832.121] [9.489] [14.661] [42.326] [1.212] [0.228] [32.856]
Observations 257 257 257 257 257 257 257 257 255 255 255R-squared 0.006 0.108 0.003 0.017 0.000 0.026 0.047 0.084 0.012 0.005 0.002
Table 17 Twitter metrics for ABC
Note: Bold, Bold-Italic, and Italic numbers refer to coefficients significant at 1%, 5% and 10% levels. Robust standard errors in parentheses.
Dependent Show Show Mentions Mentions Mentions Mentions New New New
Variable Show RT Reply Show Fav Count RT Reply Fav Count Tweets Friends Followers
1 2 3 4 5 6 7 8 9 10 11
Network CBS -815.376 -17.487 -359.272 -42.366 -14917.852 -102.127 -162.426 -577.12 -4.816 -0.374 -190.049[210.779] [1.918] [65.416] [3.023] [3,496.294] [9.576] [14.973] [62.178] [1.092] [0.203] [32.382]
Constant 1,212.04 17.967 469.813 61.636 16,506.73 118.502 188.072 689.995 5.961 0.415 236.778[199.392] [1.897] [62.863] [2.613] [3,471.244] [9.196] [14.194] [60.634] [1.068] [0.201] [31.196]
Observations 257 257 257 257 257 257 257 257 255 255 255R-squared 0.015 0.071 0.028 0.189 0.016 0.100 0.105 0.075 0.018 0.003 0.033
Table 18 Twitter metrics for CBS
Note: Bold, Bold-Italic, and Italic numbers refer to coefficients significant at 1%, 5% and 10% levels. Robust standard errors in parentheses.
Page 72 of 93
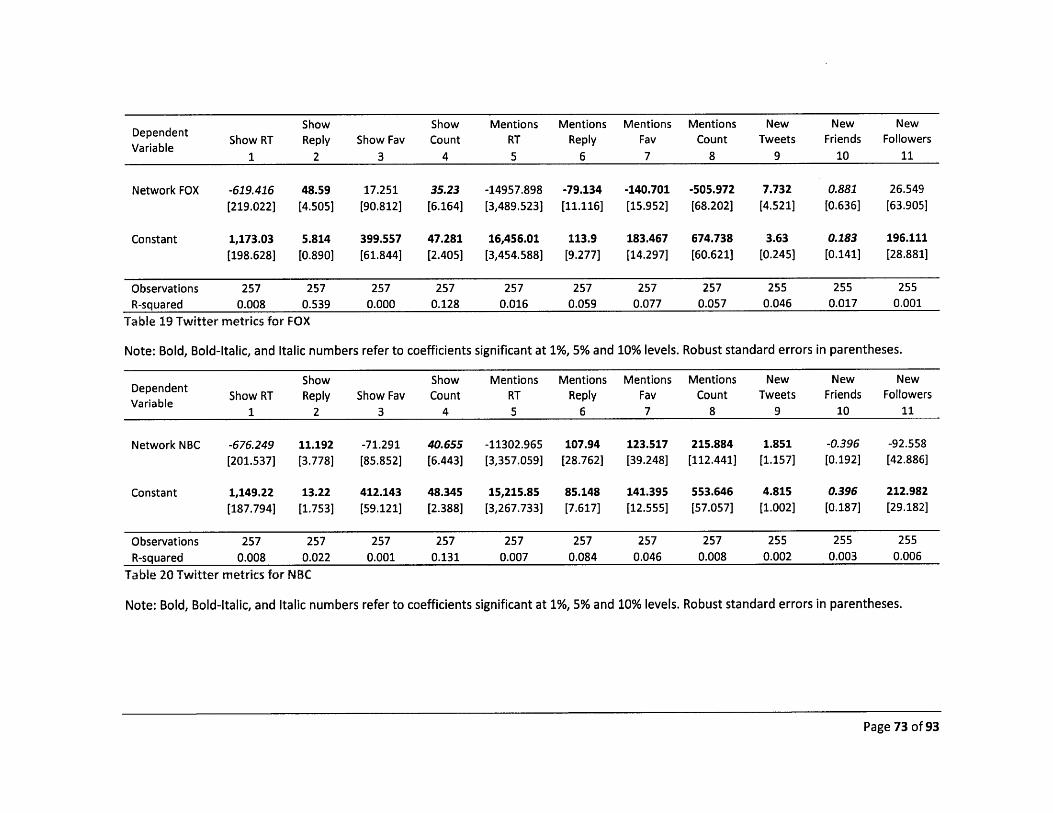
Dependent Show Show Mentions Mentions Mentions Mentions New New New
Variable Show RT Reply Show Fav Count RT Reply Fav Count Tweets Friends Followers
1 2 3 4 5 6 7 8 9 10 11
Network FOX -619.416 48.59 17.251 35.23 -14957.898 -79.134 -140.701 -505.972 7.732 0.881 26.549
[219.022] [4.5051 [90.812] [6.164] [3,489.523] [11.116] [15.952] [68.202] [4.521] [0.636] [63.905]
Constant 1,173.03 5.814 399.557 47.281 16,456.01 113.9 183.467 674.738 3.63 0.183 196.111[198.628] [0.890] [61.844] [2.405] [3,454.588] [9.277] [14.297] [60.621] [0.245] [0.141] [28.881]
Observations 257 257 257 257 257 257 257 257 255 255 255R-squared 0.008 0.539 0.000 0.128 0.016 0.059 0.077 0.057 0.046 0.017 0.001
Table 19 Twitter metrics for FOX
Note: Bold, Bold-Italic, and Italic numbers refer to coefficients significant at 1%, 5% and 10% levels. Robust standard errors in parentheses.
Dependent Show Show Mentions Mentions Mentions Mentions New New New
Variable Show RT Reply Show Fav Count RT Reply Fav Count Tweets Friends Followers1 2 3 4 5 6 7 8 9 10 11
Network NBC -676.249 11.192 -71.291 40.655 -11302.965 107.94 123.517 215.884 1.851 -0.396 -92.558[201.537] [3.778] [85.852] [6.443] [3,357.059] [28.762] [39.248] [112.441] [1.157] [0.192] [42.886]
Constant 1,149.22 13.22 412.143 48.345 15,215.85 85.148 141.395 553.646 4.815 0.396 212.982
[187.794] [1.753] [59.121] [2.388] [3,267.733] [7.617] [12.555] [57.057] [1.002] [0.187] [29.182]
Observations 257 257 257 257 257 257 257 257 255 255 255R-squared 0.008 0.022 0.001 0.131 0.007 0.084 0.046 0.008 0.002 0.003 0.006
Table 20 Twitter metrics for NBC
Note: Bold, Bold-Italic, and Italic numbers refer to coefficients significant at 1%, 5% and 10% levels. Robust standard errors in parentheses.
Page 73 of 93
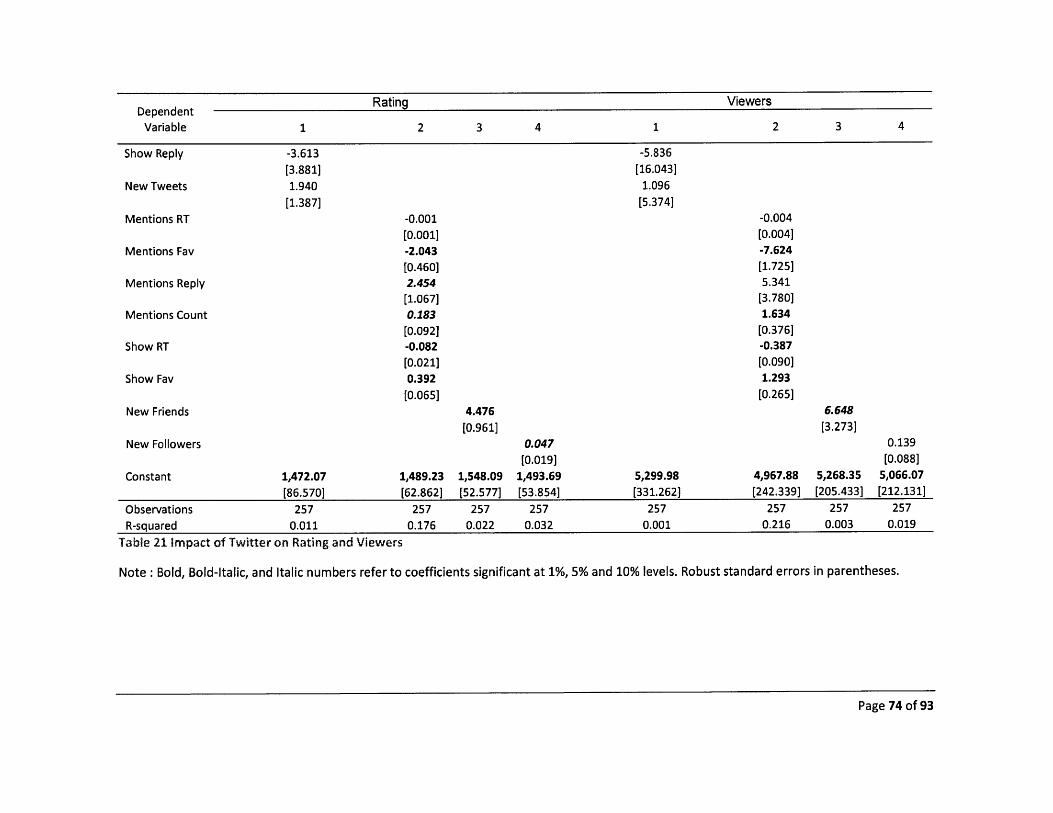
Dependent Rating Viewers
Variable 1 2 3 4 1 2 3 4
Show Reply -3.613 -5.836[3.881] [16.043]
New Tweets 1.940 1.096[1.387] [5.374]
Mentions RT -0.001 -0.004[0.001] [0.004]
Mentions Fav -2.043 -7.624[0.460] [1.725]
Mentions Reply 2.454 5.341[1.067] [3.780]
Mentions Count 0.183 1.634[0.092] [0.376]
Show RT -0.082 -0.387[0.021] [0.090]
Show Fav 0.392 1.293[0.065] [0.265]
New Friends 4.476 6.648[0.961] [3.273]
New Followers 0.047 0.139[0.019] [0.088]
Constant 1,472.07 1,489.23 1,548.09 1,493.69 5,299.98 4,967.88 5,268.35 5,066.07[86.570] [62.862] [52.577] [53.854] [331.262] [242.339] [205.433] [212.131]
Observations 257 257 257 257 257 257 257 257R-squared 0.011 0.176 0.022 0.032 0.001 0.216 0.003 0.019
Table 21 Impact of Twitter on Rating and Viewers
Note : Bold, Bold-Italic, and Italic numbers refer to coefficients significant at 1%, 5% and 10% levels. Robust standard errors in parentheses.
Page 74 of 93

Dependent Variable Rating Viewers
Genre Drama
Genre SciFi
Genre Sitcom
Genre Action
Genre Crime
Genre Period
Genre Game
Genre Fantasy
Genre Horror
Constant
ObservationsR-squared
Table 22 Impact
-259.530[294.783]-202.927[235.267]433.455[285.203]1,196.41[236.048]411.046
[267.245]-1,384.94[56.413]-45.769
[333.496]-1,401.52[399.593]1,011.44[202.945]1,331.48[284.403]
2570.364
of Genre on Ratings and Viewers
Note : Bold, Bold-Italic, and Italic numbers refer to coefficients significant at 1%, 5% and 10% levels. Robust standard errors in parentheses.
Page 75 of 93
809.263[958.993]400.423
[711.543]2,605.01[944.486]4,992.52[712.013]2,182.77[846.259]-4,764.34[238.653]787.341
[932.289]-3,523.70
[1,205.938]1,837.34[623.311]3,232.66[930.826]
2570.357
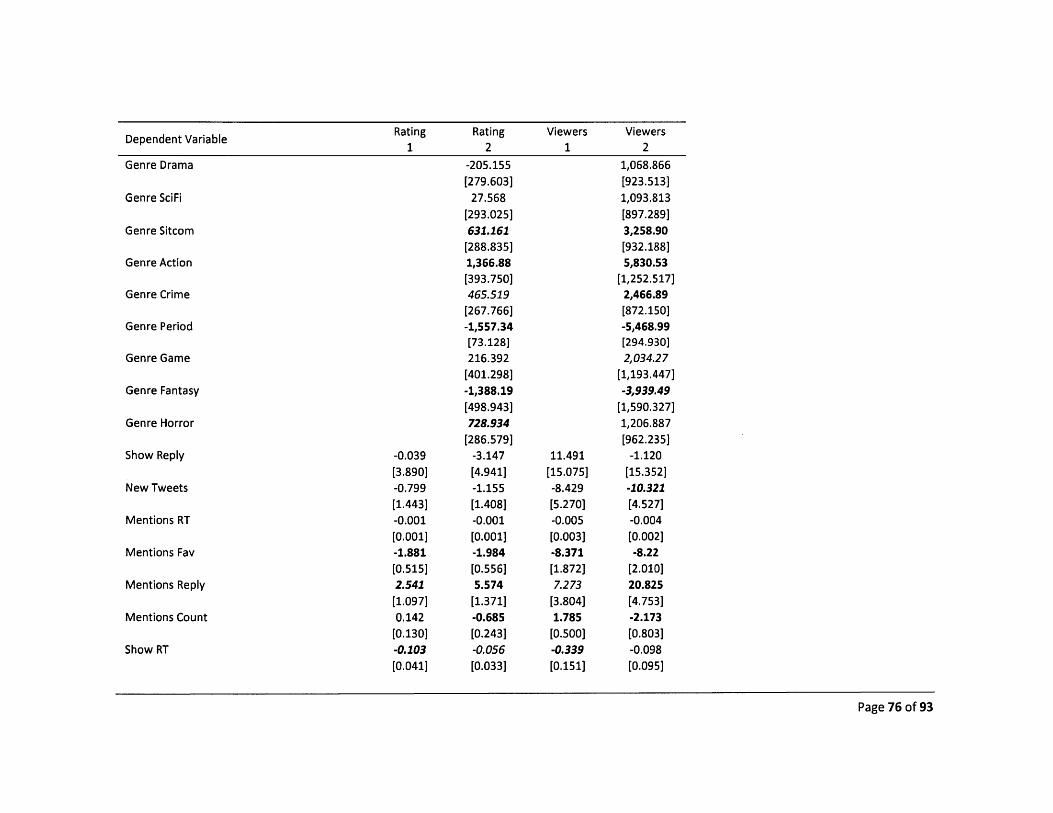
Dependent Variable Rating1
Genre Drama
Genre SciFi
Genre Sitcom
Genre Action
Genre Crime
Genre Period
Genre Game
Genre Fantasy
Genre Horror
Show Reply
New Tweets
Mentions RT
Mentions Fav
Mentions Reply
Mentions Count
Show RT
-0.039[3.890]-0.799[1.443]-0.001[0.001]-1.881[0.515]2.541[1.097]0.142
[0.130]-0.103[0.041]
Page 76 of 93
Rating2
-205.155[279.603]
27.568[293.025]631.161[288.835]1,366.88[393.750]465.519[267.766]-1,557.34[73.128]216.392[401.298]-1,388.19[498.943]728.934[286.579]
-3.147[4.941]-1.155[1.408]-0.001[0.001]-1.984[0.556]5.574
[1.371]-0.685[0.243]-0.056[0.033]
Viewers1
11.491
[15.075]-8.429[5.270]-0.005[0.003]-8.371[1.872]7.273
[3.804]1.785[0.500]-0.339[0.151]
Viewers2
1,068.866[923.513]1,093.813[897.289]3,258.90[932.188]5,830.53
[1,252.517]2,466.89[872.150]-5,468.99[294.930]2,034.27
[1,193.447]-3,939.49
[1,590.327]1,206.887[962.235]
-1.120
[15.352]-10.321[4.527]-0.004
[0.002]-8.22
[2.010]20.825[4.753]-2.173[0.803]-0.098[0.095]
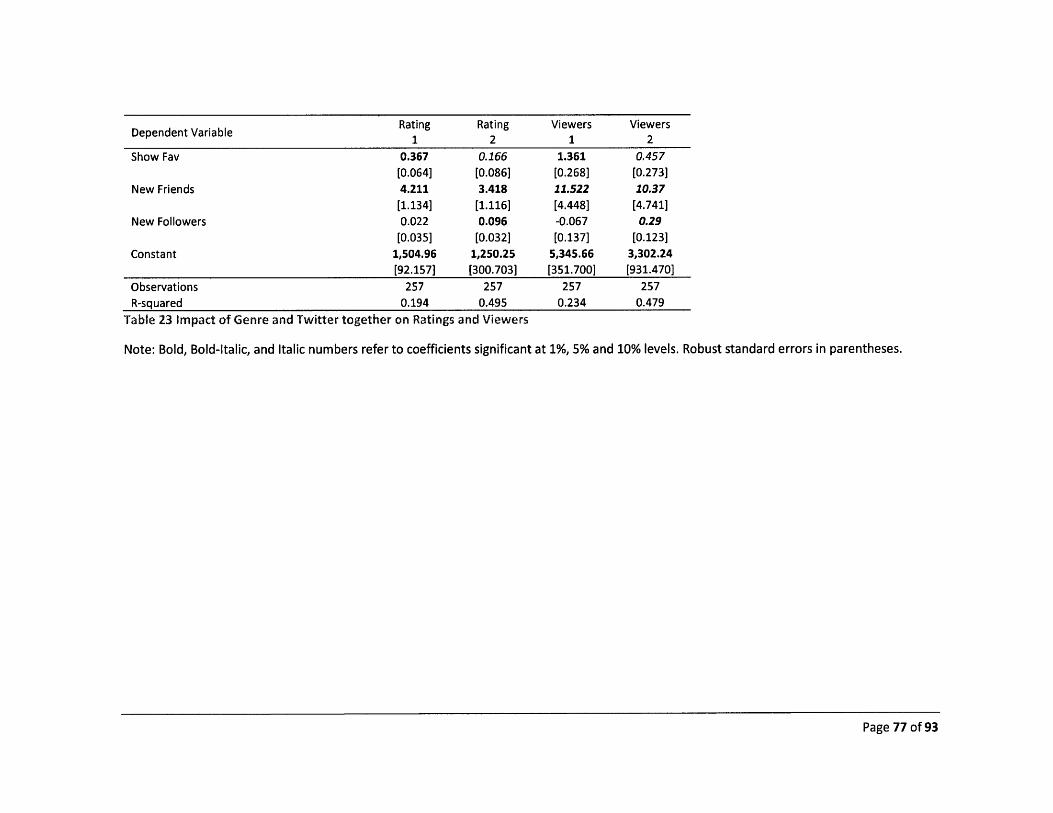
Dependent Variable Rating Rating Viewers Viewers1 2 1 2
Show Fav 0.367 0.166 1.361 0.457[0.064] [0.086] [0.268] [0.273]
New Friends 4.211 3.418 11.522 10.37[1.134] [1.116] [4.448] [4.741]
New Followers 0.022 0.096 -0.067 0.29[0.035] [0.032] [0.137] [0.123]
Constant 1,504.96 1,250.25 5,345.66 3,302.24[92.157] [300.703] [351.700] [931.470]
Observations 257 257 257 257R-squared 0.194 0.495 0.234 0.479
Table 23 Impact of Genre and Twitter together on Ratings and Viewers
Note: Bold, Bold-Italic, and Italic numbers refer to coefficients significant at 1%, 5% and 10% levels. Robust standard errors in parentheses.
Page 77 of 93

Network ABC * Show Fav
Network ABC * Show Reply
Network ABC * Mentions Count
-0.069[0.042]
-7.423[9.383]
-0.046
Page 78 of 93
Dependent Variable: RatingPrior week Ratings
New Tweets
New Friends
New Followers
Show RT
Show Fav
Show Reply
Mentions Count
Mentions RT
Mentions Fav
Mentions Reply
Network ABC * New Tweets
Network ABC * New Friends
Network ABC * New Followers
Network ABC * Show RT -0.025[0.028]
10.292[0.053]0.927[0.472]0.432[0.415]0.012[0.010]0.003[0.006]-0.001[0.028]-2.738[1.997]-0.001[0.037]0.000[0.000]-0.138[0.168]-0.217[0.261]-0.361[0.552]
20.298[0.054]0.782[0.308]0.502[0.421]0.012[0.010]0.003[0.006]-0.000[0.028]-2.371[1.682]-0.016[0.036]0.000[0.000]-0.113[0.153]-0.198[0.254]
-2.339[2.267]
30.283[0.053]0.576[0.313]0.391
[0.420]0.032[0.008]-0.001[0.006]0.024[0.029]-2.191[1.678]0.049[0.037]0.000[0.000]-0.192[0.146]-0.267[0.271]
40.29
[0.054]0.786[0.312]0.444
[0.417]0.014
[0.011]0.003
[0.006]0.011
[0.035]-2.430[1.751]-0.007[0.034]0.000
[0.000]-0.142[0.161]-0.176[0.263]
50.287[0.054]0.755
[0.314]0.448[0.420]0.015[0.011]0.002[0.006]0.026
[0.037]-2.407[1.729]-0.024[0.033]0.000
[0.000]-0.138[0.155]-0.102[0.258]
60.291
[0.052]0.819
[0.318]0.443
[0.425]0.013
[0.009]0.003
[0.006]-0.001[0.030]-2.402[1.693]-0.008[0.035]0.000
[0.000]-0.133[0.156]-0.204[0.263]
70.292[0.052]0.791
[0.307]0.440[0.413]0.013[0.010]0.003[0.006]-0.001[0.031]-2.409[1.715]0.039[0.078]0.000(0.000]-0.148[0.151]-0.335[0.316]
80.292
[0.052]0.787[0.310]0.453[0.423]0.013[0.009]0.003[0.005]-0.003[0.028]-2.349[1.679]-0.010[0.035]0.000[0.000]-0.120[0.152]-0.218[0.260]
90.294
[0.052]0.784[0.311]0.459
[0.424]0.012
[0.010]0.002[0.006]-0.008[0.032]-2.331[1.676]-0.004
[0.036]0.000[0.000]-0.028[0.186]-0.311[0.273]
100.292
[0.052]0.793[0.312]0.454
[0.423]0.012
[0.010]0.003[0.006]-0.003
[0.030]-2.369[1.709]-0.007[0.034]0.000[0.000]-0.125[0.155]-0.210[0.278]
-0.031[0.008]

[0.064]Network ABC * Mentions RT -0.000
[0.002]Network ABC * Mentions Fav -0.314
[0.205]Network ABC * Mentions Reply -0.050
[0.304]Constant 1,012.93 1,006.90 1,002.98 1,013.73 1,017.93 1,016.03 1,013.36 1,014.66 1,022.88 1,014.30
[75.920] [76.469] [75.949] [75.664] [78.092] [74.971] [75.070] [75.495] [74.247] [75.160]
Observations 209 209 209 209 209 209 209 209 209 209
R-squared 0.458 0.459 0.467 0.458 0.460 0.459 0.458 0.457 0.460 0.457
Number of Shows 29 29 29 29 29 29 29 29 29 29
Table 24 ABC and its Twitter metrics - impact on Ratings
Note: Bold, Bold-Italic, and Italic numbers refer to coefficients significant at 1%, 5% and 10% levels. Robust standard errors in parentheses. Fixed
effects regression with standard errors clustered at the show level. Dependent variable is rating times 1000.
Page 79 of 93
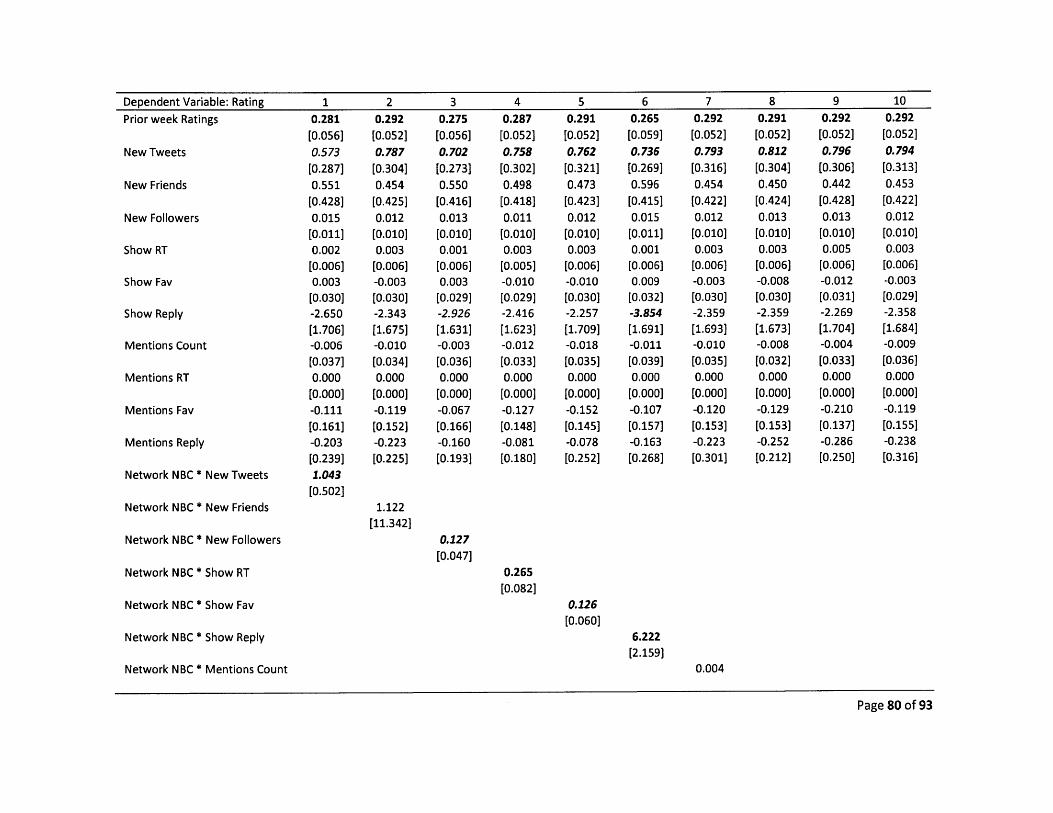
Dependent Variable: RatingPrior week Ratings
New Tweets
New Friends
New Followers
Show RT
Show Fav
Show Reply
Mentions Count
Mentions RT
Mentions Fav
Mentions Reply
Network NBC * New Tweets
Network NBC * New Friends
Network NBC * New Followers
Network NBC * Show RT
Network NBC * Show Fav
Network NBC * Show Reply
Network NBC * Mentions Count
10.281[0.056]0.573[0.287]0.551
[0.428]0.015
[0.011]0.002[0.006]0.003[0.030]-2.650[1.706]-0.006[0.037]0.000[0.000]-0.111[0.161]-0.203[0.239]1.043[0.502]
1.122[11.342]
0.127[0.047]
0.265[0.082]
0.126[0.060]
6.222[2.159]
0.004
Page 80 of 93
20.292[0.052]0.787[0.304]0.454
[0.425]0.012
[0.010]0.003[0.006]-0.003[0.030]-2.343[1.675]-0.010[0.034]0.000[0.000]-0.119[0.152]-0.223[0.225]
30.275[0.056]0.702[0.273]0.550
[0.416]0.013
[0.010]0.001
[0.006]0.003[0.029]-2.926[1.631]-0.003[0.036]0.000[0.000]-0.067[0.166]-0.160[0.193]
40.287[0.052]0.758[0.302]0.498
[0.418]0.011
[0.010]0.003[0.005]-0.010[0.029]-2.416[1.623]-0.012[0.033]0.000[0.000]-0.127[0.148]-0.081[0.180]
50.291[0.052]0.762[0.321]0.473[0.423]0.012[0.010]0.003[0.006]-0.010[0.030]-2.257[1.709]-0.018[0.035]0.000[0.000]-0.152[0.145]-0.078[0.252]
60.265
[0.059]0.736
[0.269]0.596[0.415]0.015[0.011]0.001[0.006]0.009[0.032]-3.854[1.691]-0.011[0.039]0.000[0.000]-0.107[0.157-0.163[0.268]
70.292[0.052]0.793[0.316]0.454[0.422]0.012
[0.010]0.003
[0.006]-0.003[0.030]-2.359[1.693]-0.010[0.035]0.000
[0.000]-0.120[0.153]-0.223[0.301]
80.291[0.052]0.812[0.304]0.450
[0.424]0.013[0.010]0.003
[0.006]-0.008[0.030]-2.359[1.673]-0.008[0.032]0.000[0.000]-0.129[0.153]-0.252[0.212]
90.292[0.052]0.796[0.306]0.442
[0.428]0.013
[0.010]0.005
[0.006]-0.012[0.031]-2.269[1.704]-0.004[0.033]0.000
[0.000]-0.210[0.137]-0.286[0.250]
100.292[0.052]0.794
[0.313]0.453
[0.422]0.012[0.010]0.003[0.006]-0.003[0.029]-2.358[1.684]-0.009[0.036]0.000[0.000]-0.119[0.155]-0.238[0.316]
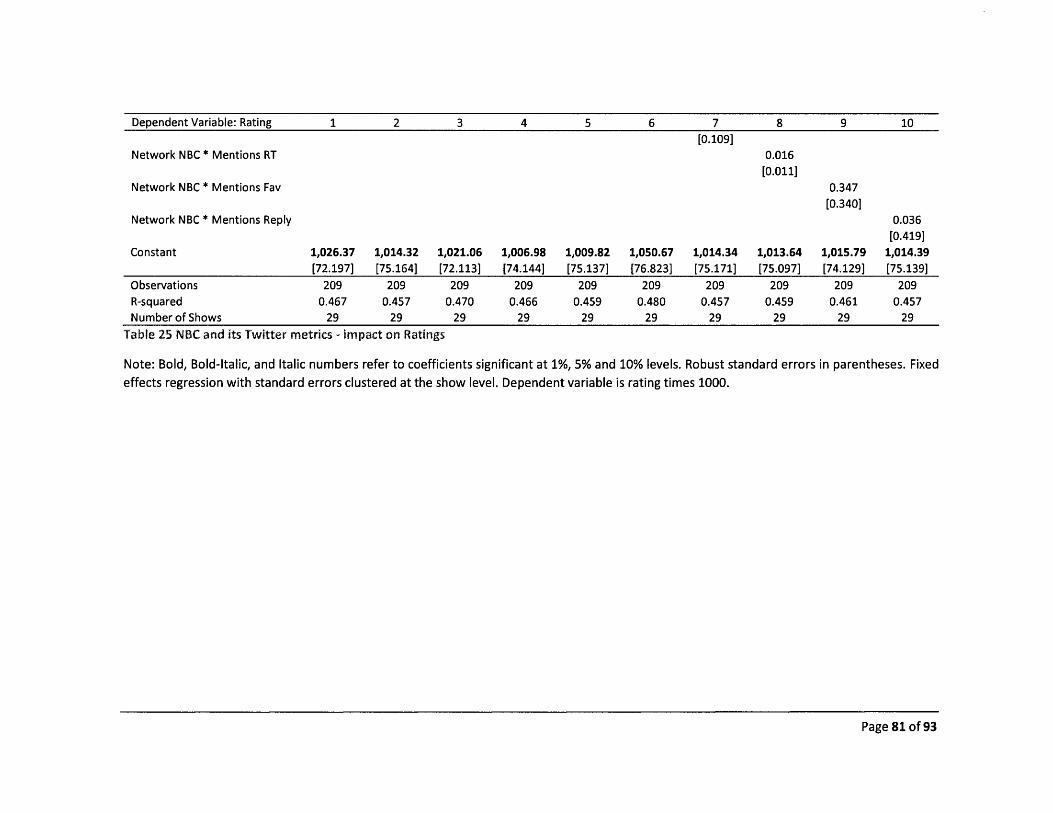
Dependent Variable: Rating 1 2 3 4 5 6 7 8 9 10[0.109]
Network NBC * Mentions RT 0.016[0.011]
Network NBC * Mentions Fav 0.347[0.340]
Network NBC * Mentions Reply 0.036[0.419]
Constant 1,026.37 1,014.32 1,021.06 1,006.98 1,009.82 1,050.67 1,014.34 1,013.64 1,015.79 1,014.39[72.197] [75.164] [72.113] [74.144] [75.137] [76.823] [75.171] [75.097] [74.129] [75.139]
Observations 209 209R-squared 0.467 0.457Number of Shows 29 29
Table 25 NBC and its Twitter metrics - impact on Ratings
2090.470
29
2090.466
29
2090.459
29
2090.480
29
2090.457
29
2090.459
29
2090.461
29
2090.457
29
Note: Bold, Bold-Italic, and Italic numbers refer to coefficients significant at 1%, 5% and 10% levels. Robust standard errors in parentheses. Fixedeffects regression with standard errors clustered at the show level. Dependent variable is rating times 1000.
Page 81 of 93
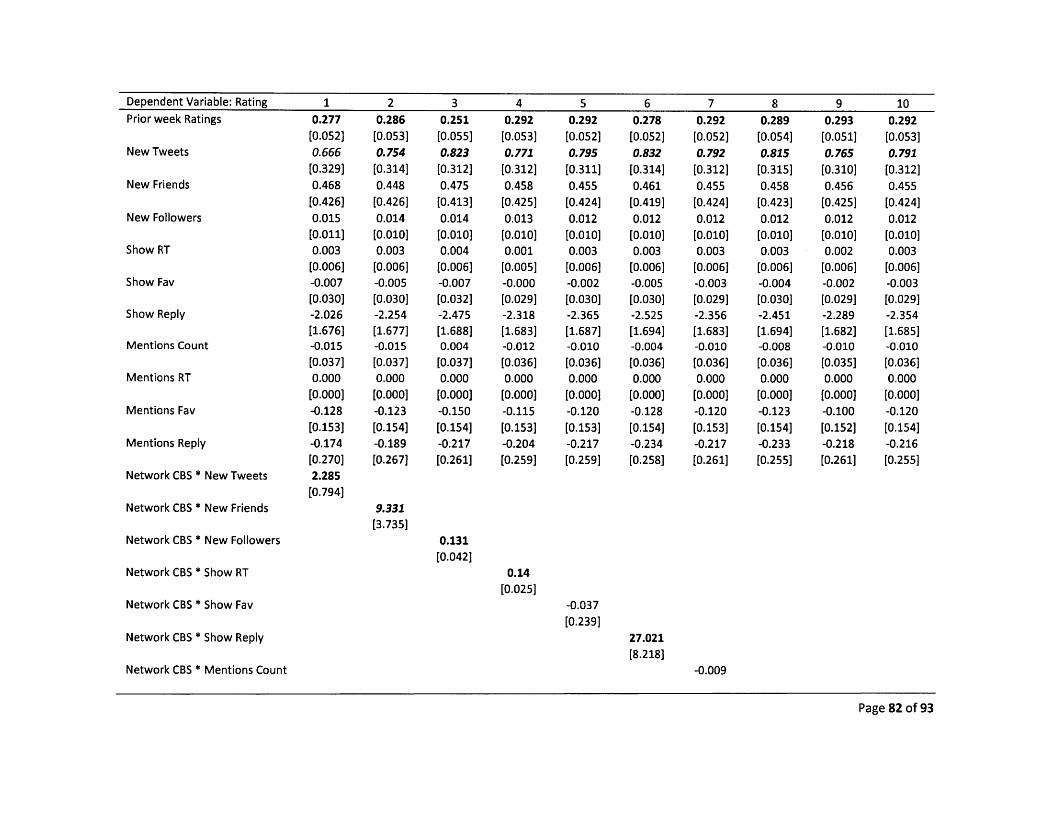
Dependent Variable: RatingPrior week Ratings
New Tweets
New Friends
New Followers
Show RT
Show Fav
Show Reply
Mentions Count
Mentions RT
Mentions Fav
Mentions Reply
Network CBS * New Tweets
Network CBS * New Friends
Network CBS * New Followers
Network CBS * Show RT
Network CBS * Show Fav
Network CBS * Show Reply
Network CBS * Mentions Count
0.131[0.0421
0.14[0.025]
-0.037[0.239]
27.021[8.218]
-0.009
Page 82 of 93
10.277[0.052]0.666[0.329]0.468[0.426]0.015[0.011]0.003[0.006]-0.007[0.030]-2.026[1.676]-0.015[0.037]0.000[0.000]-0.128[0.153]-0.174[0.270]2.285
[0.794]
20.286[0.053]0.754[0.314]0.448[0.426]0.014[0.010]0.003[0.006]-0.005[0.030]-2.254[1.677]-0.015[0.037]0.000[0.000]-0.123[0.154]-0.189[0.267]
9.331[3.735]
30.251
[0.055]0.823[0.312]0.475
[0.413]0.014[0.010]0.004[0.006]-0.007[0.032]-2.475[1.688]0.004
[0.037]0.000[0.000]-0.150[0.154]-0.217[0.261]
40.292
[0.053]0.771
[0.312]0.458
[0.425]0.013
[0.010]0.001
[0.005]-0.000[0.029]-2.318[1.683]-0.012
[0.036]0.000
[0.000]-0.115[0.153]-0.204[0.259]
50.292
[0.052]0.795[0.311]0.455
[0.424]0.012
[0.010]0.003
[0.006]-0.002
[0.030]-2.365[1.687]-0.010[0.036]0.000
[0.000]-0.120
[0.153]-0.217[0.259]
60.278
[0.052]0.832[0.314]0.461
[0.419]0.012
[0.010]0.003
[0.006]-0.005
[0.030]-2.525[1.694]-0.004
[0.036]0.000
[0.000]-0.128
[0.154]-0.234
[0.258]
70.292
[0.052]0.792
[0.312]0.455
[0.424]0.012
[0.010]0.003
[0.006]-0.003
[0.029]-2.356[1.683]-0.010
[0.036]0.000
[0.000]-0.120
[0.153]-0.217[0.261]
80.289
[0.054]0.815
[0.315]0.458
[0.423]0.012
[0.010]0.003
[0.006]-0.004
[0.030]-2.451
[1.694]-0.008
[0.036]0.000
[0.000]-0.123
[0.154]-0.233[0.255]
90.293
[0.051]0.765
[0.310]0.456
[0.425]0.012
[0.010]0.002
[0.006]-0.002
[0.029]-2.289[1.682]-0.010
[0.035]0.000
[0.000]-0.100
[0.152]-0.218
[0.261]
100.292
[0.053]0.791
[0.312]0.455
[0.424]0.012
[0.010]0.003
[0.006]-0.003
[0.029]-2.354
[1.685]-0.010
[0.036]0.000
[0.000]-0.120
[0.154]-0.216
[0.255]

[0.254]Network CBS * Mentions RT 0.012
[0.006]Network CBS * Mentions Fav -2.022
[1.480]Network CBS * Mentions Reply -0.064
[2.768]Constant 1,029.47 1,022.06 1,060.79 1,005.32 1,014.93 1,032.37 1,014.38 1,017.55 1,017.64 1,014.34
[75.252] [76.806] [79.787] [76.496] [74.656] [75.956] [75.100] [77.140] [74.205] [75.391]
Observations 209 209 209 209 209 209 209 209 209 209
R-squared 0.464 0.460 0.474 0.464 0.457 0.466 0.457 0.460 0.464 0.457
Number of Shows 29 29 29 29 29 29 29 29 29 29
Table 26 CBS and its Twitter metrics - impact on Ratings
Note: Bold, Bold-Italic, and Italic numbers refer to coefficients significant at 1%, 5% and 10% levels. Robust standard errors in parentheses. Fixed
effects regression with standard errors clustered at the show level. Dependent variable is rating times 1000.
Page 83 of 93
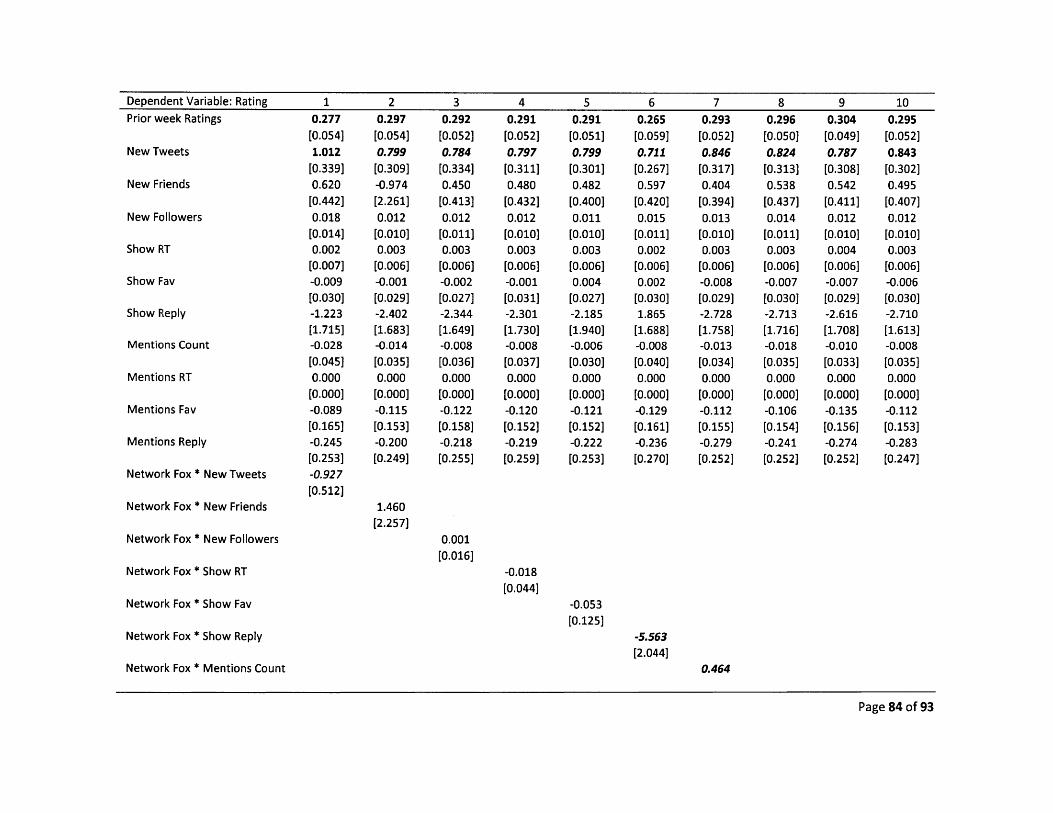
Dependent Variable: RatingPrior week Ratings
New Tweets
New Friends
New Followers
Show RT
Show Fav
Show Reply
Mentions Count
Mentions RT
Mentions Fav
Mentions Reply
Network Fox * New Tweets
Network Fox * New Friends
Network Fox * New Followers
Network Fox * Show RT
Network Fox * Show Fav
Network Fox * Show Reply
Network Fox * Mentions Count
1.460[2.257]
0.001[0.016]
-0.018[0.044]
-0.053[0.125]
-5.563[2.044]
0.464
Page 84 of 93
10.277
[0.054]1.012
[0.339]0.620[0.442]0.018[0.014]0.002[0.007]-0.009[0.030]-1.223[1.715]-0.028[0.045]0.000
[0.000]-0.089[0.165]-0.245[0.253]-0.927[0.512]
20.297[0.054]0.799[0.309]-0.974[2.261]0.012[0.010]0.003[0.006]-0.001[0.029]-2.402[1.683]-0.014[0.035]0.000
[0.000]-0.115[0.153]-0.200[0.249]
30.292
[0.052]0.784
[0.334]0.450
[0.413]0.012
[0.011]0.003
[0.006]-0.002[0.027]-2.344[1.649]-0.008[0.036]0.000
[0.000]-0.122[0.158]-0.218[0.255]
40.291
[0.052]0.797[0.311]0.480
[0.432]0.012
[0.010]0.003
[0.006]-0.001[0.031]-2.301[1.730]-0.008[0.037]0.000[0.000]-0.120[0.152]-0.219[0.259]
50.291[0.051]0.799[0.301]0.482
[0.400]0.011
[0.010]0.003
[0.006]0.004
[0.027]-2.185[1.940]-0.006[0.030]0.000[0.000]-0.121
[0.152]-0.222[0.253]
60.265
[0.059]0.711
[0.267]0.597
[0.420]0.015
[0.011]0.002
[0.006]0.002
[0.030]1.865
[1.688]-0.008[0.040]0.000[0.000]-0.129[0.161]-0.236[0.270]
70.293
[0.052]0.846
[0.317]0.404
[0.394]0.013[0.010]0.003[0.006]-0.008
[0.029]-2.728[1.758]-0.013
[0.034]0.000
[0.000]-0.112
[0.155]-0.279[0.252]
80.296
[0.050]0.824
[0.313]0.538
[0.437]0.014
[0.011]0.003[0.006]-0.007
[0.030]-2.713
[1.716]-0.018
[0.035]0.000
[0.000]-0.106
[0.154]-0.241
[0.252]
90.304
[0.049]0.787
[0.308]0.542
[0.411]0.012
[0.010]0.004
[0.006]-0.007
[0.029]-2.616[1.708]-0.010
[0.033]0.000
[0.000]-0.135
[0.156]-0.274
[0.252]
100.295
[0.052]0.843
[0.302]0.495
[0.407]0.012
[0.010]0.003[0.006]-0.006
[0.030]-2.710[1.613]-0.008
[0.035]0.000
[0.000]-0.112
[0.153]-0.283[0.247]

Dependent Variable: Rating 1 2 3 4 5 6 7 8 9 10[0.176]
Network Fox * Mentions RT 0.022[0.015]
Network Fox * Mentions Fav 2.456[1.210]
Network Fox * Mentions Reply 1.472[1.305]
Constant 1,033.95 1,008.79 1,013.99 1,014.09 1,013.95 1,054.06 1,009.15 1,009.09 997.136 1,008.80[70.342] [76.893] [74.917] [74.878] [74.538] [77.602] [75.801] [73.652] [72.739] [75.531]
Observations 209 209R-squared 0.466 0.458Number of Shows 29 29
Table 27 FOX and its Twitter metrics - impact on Ratings
2090.457
29
2090.458
29
2090.458
29
2090.476
29
2090.466
29
2090.460
29
2090.471
29
2090.461
29
Note: Bold, Bold-Italic, and Italic numbers refer to coefficients significant at 1%, 5% and 10% levels. Robust standard errors in parentheses. Fixed
effects regression with standard errors clustered at the show level. Dependent variable is rating times 1000.
Page 85 of 93

Dependent Variable: ViewersPrior week Viewers
New Tweets
New Friends
New Followers
Show RT
Show Fav
Show Reply
Mentions Count
Mentions RT
Mentions Fav
Mentions Reply
Network ABC * New Tweets
Network ABC * New Friends
Network ABC * New Followers
Network ABC * Show RT
Network ABC * Show Fav
Network ABC * Show Reply
Network ABC * Mentions Count
-0.141[0.143]
-0.108[0.420]
-0.187[0.411]
0.818[39.098]
-1.206
Page 86 of 93
10.193
[0.100]-0.592[1.460]0.555[0.695]0.061[0.031]0.001[0.015]0.196
[0.215]3.663
[5.727]-0.370[0.485]0.003
[0.001]-2.133[1.569]
3.78[1.440]0.589
[2.272]
20.197[0.102]-0.393[1.322]0.663[0.608]
0.06[0.030]0.001
[0.015]0.209
[0.202]2.964
[5.615]-0.373[0.475]0.002
[0.001]-2.149[1.509]3.855
[1.483]
-6.755[7.155]
30.187[0.101]-1.361[1.995]0.212[0.830]0.146[0.065]-0.014[0.019]0.326
[0.327]3.841
[5.779]-0.087[0.777]0.002
[0.002]-2.476[1.695]3.506
[1.867]
40.192[0.102]-0.397[1.424]0.468
[0.723]0.067[0.026]0.001
[0.014]0.260
[0.424]2.732
[5.252]-0.343[0.514]0.002
[0.002]-2.255[1.817]3.942[1.733]
50.191
[0.102]-0.472[1.512]0.493
[0.694]0.067[0.024]-0.002[0.015]0.281
[0.381]2.914
[5.602]-0.393[0.411]0.003[0.001]-2.208[1.589]4.074[1.881]
60.193
[0.100]-0.373[1.294]0.519
[0.680]0.06
[0.029]0.001
[0.015]0.200
[0.212]3.043[5.533]-0.356[0.464]0.003[0.001]-2.160[1.532]3.778[1.507]
70.202[0.094]-0.428[1.267]0.126[0.760]0.079[0.021]0.007
[0.013]0.272
[0.302]1.654
[4.848]0.934
[1.529]-0.001[0.004]-2.900[1.943]0.687[2.812]
80.193[0.100]-0.425[1.405]0.497[0.693]0.065[0.029]-0.002[0.016]0.210[0.216]3.107
[5.656]-0.350[0.469]0.003
[0.002]-2.161[1.499]3.756[1.432]
90.192[0.101]-0.347[1.347]0.500[0.695]0.059[0.031]0.005[0.020]0.217[0.234]2.965[5.585]-0.375[0.453]0.003
[0.002]-2.480[1.999]
4.1[1.942]
100.198[0.095]-0.324
[1.291]0.467
[0.695]0.065[0.026]0.003[0.014]0.223[0.244]2.345
[5.282]-0.220[0.596]0.002[0.001]-2.407[1.677]4.131[1.442]
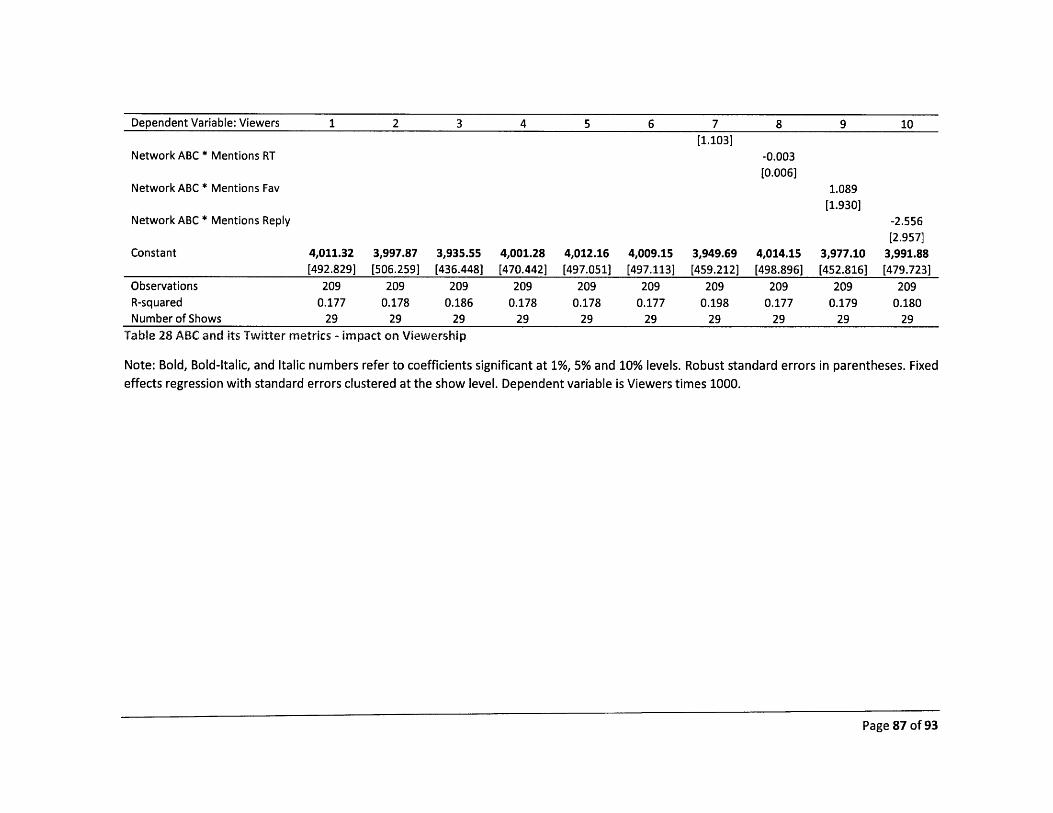
Dependent Variable: Viewers 1 2 3 4 5 6 7 8 9 10[1.103]
Network ABC * Mentions RT -0.003[0.006]
Network ABC * Mentions Fav 1.089[1.930]
Network ABC * Mentions Reply -2.556[2.957]
Constant 4,011.32 3,997.87 3,935.55 4,001.28 4,012.16 4,009.15 3,949.69 4,014.15 3,977.10 3,991.88[492.829] [506.259] [436.448] [470.442] [497.051] [497.113] [459.212] [498.896] [452.816] [479.723]
Observations 209 209 209 209 209 209 209 209 209 209R-squared 0.177 0.178 0.186 0.178 0.178 0.177 0.198 0.177 0.179 0.180Number of Shows 29 29 29 29 29 29 29 29 29 29
Table 28 ABC and its Twitter metrics - impact on Viewership
Note: Bold, Bold-Italic, and Italic numbers refer to coefficients significant at 1%, 5% and 10% levels. Robust standard errors in parentheses. Fixedeffects regression with standard errors clustered at the show level. Dependent variable is Viewers times 1000.
Page 87 of 93

Dependent Variable: ViewersPrior week Viewers
New Tweets
New Friends
New Followers
Show RT
Show Fav
Show Reply
Mentions Count
Mentions RT
Mentions Fav
Mentions Reply
Network NBC * New Tweets
Network NBC * New Friends
Network NBC * New Followers
Network NBC * Show RT
Network NBC * Show Fav
Network NBC * Show Reply
Network NBC * Mentions Count
-131.605[172.094]
0.017[0.307]
2.089[1.178]
2.6[1.002]
24.035[8.112]
1.698
Page 88 of 93
10.188[0.096]-0.693[1.223]0.653[0.647]0.064
[0.032]-0.000[0.015]0.210
[0.200]2.605
[5.625]-0.348[0.465]0.002[0.001]-2.146[1.520]3.777[1.491]1.572
[2.880]
20.188[0.112]0.154[1.059]0.579[0.662]0.056[0.033]-0.000[0.016]0.189[0.179]1.666
[5.082]-0.422[0.400]0.003[0.001]-2.235[1.691]4.501[2.166]
30.192[0.100]-0.380[1.253]0.529[0.669]
0.06[0.031]0.001
[0.015]0.201
[0.203]2.961
[5.889]-0.354[0.462]0.003[0.001]-2.155[1.540]3.783[1.455]
40.162[0.120]-0.515[1.434]0.811[0.706]0.059
[0.036]-0.002[0.014]0.137
[0.139]2.466
[5.130]-0.371[0.460]0.003
[0.002]-2.222[1.636]4.761[3.071]
50.182
[0.100]-0.924[1.914]0.869
[0.832]0.053
[0.041]0.009
[0.017]0.060
[0.111]5.014
[7.231]-0.515[0.394]0.004
[0.002]-2.822[2.101]6.600
[4.234]
60.171
[0.102]-0.595[1.279]1.014
[0.549]0.068
[0.032]-0.005[0.015]0.251
[0.226]-2.616[2.710]-0.353[0.466]0.003
[0.001]-2.082[1.422]3.855
[1.355]
70.211
[0.084]0.143
[0.999]0.234
[0.715]0.067[0.022]0.009[0.018]0.206[0.241]1.417[4.356]-0.187[0.533]0.001[0.002]-2.066[1.282]0.809[2.107]
80.236
[0.065]0.147
[0.952]0.379[0.680]0.049
[0.037]0.022[0.029]0.040[0.083]3.207[4.785]-0.272[0.444]0.001[0.002]-2.458
[2.161]2.448[2.734]
90.188
[0.109]-0.379[1.375]0.598[0.690]
0.06[0.032]-0.013[0.021]0.253[0.263]2.443
[5.527]-0.397[0.420]0.003[0.001]-1.559[0.766]4.233[1.918]
100.198
[0.096]-0.284
[1.287]0.422
[0.698]0.062
[0.028]0.004
[0.015]0.200
[0.216]2.913
[5.399]-0.268[0.502]0.002
[0.002]-2.100
[1.444]2.592
[1.699]

Dependent Variable: Viewers 1 2 3 4 5 6 7 8 9 10[0.583]
Network NBC * Mentions RT 0.615[0.211]
Network NBC * Mentions Fav -2.323[2.967]
Network NBC * Mentions Reply 1.975[0.917]
Constant 4,028.72 4,038.33 4,011.88 4,048.39 3,954.16 4,108.54 3,873.40 3,723.43 4,020.22 3,979.68
[478.375] [559.957] [490.984] [526.556] [457.780] [492.108] [432.737] [355.780] [509.054] [482.996]
Observations 209 209 209 209 209 209 209 209 209 209
R-squared 0.178 0.188 0.177 0.201 0.219 0.194 0.203 0.284 0.186 0.179
Number of Shows 29 29 29 29 29 29 29 29 29 29
Table 29 NBC and its Twitter metrics - impact on Viewership
Note: Bold, Bold-Italic, and Italic numbers refer to coefficients significant at 1%, 5% and 10% levels. Robust standard errors in parentheses. Fixed
effects regression with standard errors clustered at the show level. Dependent variable is Viewers times 1000.
Page 89 of 93

Dependent Variable: ViewersPrior week Viewers
New Tweets
New Friends
New Followers
Show RT
Show Fav
Show Reply
Mentions Count
Mentions RT
Mentions Fav
Mentions Reply
Network CBS * New Tweets
Network CBS * New Friends
Network CBS * New Followers
Network CBS * Show RT
Network CBS * Show Fav
Network CBS * Show Reply
Network CBS * Mentions Count
22.441
[15.861]0.657
[0.335]-0.068
[0.052]-1.135
[0.393]87.790
[53.717]-1.209
Page 90 of 93
10.182
[0.096]-0.735[1.587]0.532[0.724]0.067[0.029]0.001[0.015]0.191[0.205]4.057
[6.060]-0.368[0.456]0.002
[0.001]-2.175[1.491]3.847[1.456]6.770
[5.863]
2
0.19[0.100]-0.459
[1.403]0.494
[0.708]0.063[0.029]0.001[0.015]0.197[0.205]3.296
[5.711]-0.366[0.456]0.003
[0.001]-2.165[1.496]3.827[1.472]
30.138[0.076]-0.165
[1.381]0.501[0.693]0.063[0.036]0.006[0.016]0.183[0.210]2.622
[5.962]-0.278
[0.497]0.002
[0.001]-2.265[1.513]3.501[1.438]
4
0.193
[0.099]-0.360[1.356]0.517
[0.690]0.06
[0.030]0.002
[0.015]0.199[0.207]3.020[5.618]-0.355
[0.463]0.002
[0.001]-2.164
[1.497]3.773[1.472]
50.192
[0.098]-0.275
[1.342]0.511
[0.682]0.058
[0.031]-0.001
[0.016]0.226
[0.219]2.737
[5.611]-0.340
[0.470]0.003[0.001]-2.159
[1.503]3.761[1.481]
60.181
[0.096]-0.227
[1.333]0.512
[0.686]0.06
[0.031]0.003[0.015]0.194
[0.206]2.525
[5.586]-0.333
[0.472]0.002
[0.001]-2.178
[1.504]3.662[1.450]
70.194
[0.098]-0.281
[1.341]0.527
[0.676]0.057
[0.031]-0.001[0.016]0.212
[0.210]2.820
[5.622]-0.334
[0.473]0.003
[0.002]-2.146
[1.500]3.732
[1.509]
80.192
[0.101]-0.342
[1.362]0.519
[0.689]0.06
[0.030]0.002
[0.015]0.199
[0.207]2.931
[5.619]-0.352
[0.465]0.002
[0.001]-2.165
[1.500]3.756
[1.472]
90.193
[0.098]-0.450
[1.362]0.521
[0.697]0.061[0.030]-0.001
[0.015]0.205
[0.207]3.240
[5.641]-0.354
[0.464]0.003
[0.001]-2.100
[1.503]3.777
[1.480]
100.195
[0.099]-0.392
[1.357]0.521
[0.692]0.06
[0.030]-0.000[0.016]0.207
[0.208]3.103
[5.633]-0.357
[0.465]0.003
[0.001]-2.152
[1.497]3.84
[1.481]

Dependent Variable: Viewers 1 2 3 4 5 6 7 8 9 10[0.956]
Network CBS * Mentions RT 0.014[0.031]
Network CBS * Mentions Fav -6.447[2.617]
Network CBS * Mentions Reply -6.382[4.800]
Constant 4,046.70 4,025.25 4,225.88 4,013.84 4,024.65 4,065.82 4,011.73 4,012.97 4,025.13 4,010.51
[478.006] [498.194] [398.235] [494.162] [492.260] [484.896] [489.538] [500.595] [488.039] [491.266]
Observations 209 209 209 209 209 209 209 209 209 209
R-squared 0.180 0.178 0.198 0.177 0.179 0.181 0.179 0.177 0.180 0.178
Number of Shows 29 29 29 29 29 29 29 29 29 29
Table 30 CBS and its Twitter metrics - impact on Viewership
Note: Bold, Bold-Italic, and Italic numbers refer to coefficients significant at 1%, 5% and 10% levels. Robust standard errors in parentheses. Fixed
effects regression with standard errors clustered at the show level. Dependent variable is Viewers times 1000.
Page 91 of 93

Dependent Variable: ViewersPrior week Viewers
New Tweets
New Friends
New Followers
Show RT
Show Fav
Show Reply
Mentions Count
Mentions RT
Mentions Fav
Mentions Reply
Network Fox * New Tweets
Network Fox * New Friends
Network Fox * New Followers
Network Fox * Show RT
Network Fox * Show Fav
-0.305
[0.271]-0.691
[0.524]Network Fox * Show Reply
Network Fox * Mentions Count
Page 92 of 93
-22.358
[7.951]0.336
10.184
[0.095]0.139[1.650]0.872[0.611]0.072[0.035]-0.002[0.016]0.188[0.213]5.631[6.041]-0.395[0.456]0.003
[0.001]-2.084[1.535]3.668[1.443]-2.099[1.980]
20.199
[0.102]-0.316[1.306]-7.923
[5.296]0.058
[0.030]0.001
[0.015]0.210
[0.206]2.720
[5.539]-0.380[0.468]0.002
[0.001]-2.145[1.511]3.912[1.526]
8.639[5.293]
30.2
[0.093]-0.796
[1.759]0.271
[0.792]0.030
[0.062]0.008
[0.017]0.252
[0.271]3.612
[5.978]-0.233[0.640]0.002
[0.002]-2.296[1.650]3.71
[1.608]
40.192
[0.100]-0.272
[1.329]0.945
[0.744]0.054
[0.031]0.003[0.014]0.243
[0.234]3.960[6.126]-0.327
[0.483]0.002
[0.001]-2.167
[1.506]3.73
[1.473]
50.19
[0.100]-0.269
[1.330]0.867
[0.746]0.048
[0.032]0.002
[0.014]0.290
[0.263]5.268
[6.558]-0.295
[0.504]0.002
[0.002]-2.177
[1.514]3.699
[1.489]
60.170
[0.103]-0.701
[1.289]1.036
[0.537]0.067[0.032]0.000[0.016]0.224
[0.223]20.129
[8.927]-0.341
[0.470]0.002
[0.001]-2.167
[1.453]3.565
[1.399]
70.193
[0.099]-0.325
[1.389]0.480
[0.659]0.061
[0.030]0.001
[0.015]0.196
[0.210]2.761
[5.958]-0.357
[0.461]0.002
[0.001]-2.157
[1.504]3.734
[1.471]
80.194
[0.099]-0.451
[1.403]0.344
[0.799]0.056[0.033]0.001
[0.015]0.210
[0.219]3.809
[6.318]-0.340
[0.488]0.003
[0.001]-2.187
[1.518]3.824
[1.508]
90.193
[0.099]-0.369
[1.357]0.527
[0.707]0.06
[0.030]0.001
[0.015]0.200
[0.208]3.009
[5.728]-0.356
[0.463]0.003
[0.001]-2.164
[1.498]3.774
[1.470]
100.193
[0.099]-0.333
[1.412]0.544
[0.711]0.06
[0.030]0.001
[0.015]0.198
[0.211]2.802
[6.185]-0.354
[0.460]0.002
[0.001]-2.158
[1.506]3.737
[1.494]
0.078
[0.107]

Dependent Variable: Viewers 1 2 3 4 5 6 7 8 9 10[0.372]
Network Fox * Mentions RT -0.045[0.061]
Network Fox * Mentions Fav 0.246[1.993]
Network Fox * Mentions Reply 0.954[2.229]
Constant 4,051.80 3,991.29 3,970.51 4,005.73 4,005.35 4,131.54 4,010.19 4,006.46 4,009.53 4,009.26
[468.093] [504.973] [459.033] [488.706] [485.496] [501.758] [494.600] [491.460] [495.019] [495.174]
Observations 209 209 209 209 209 209 209 209 209 209
R-squared 0.179 0.179 0.180 0.179 0.182 0.192 0.177 0.178 0.177 0.177
Number of Shows 29 29 29 29 29 29 29 29 29 29
Table 31 FOX and its Twitter metrics - impact on Viewership
Note: Bold, Bold-Italic, and Italic numbers refer to coefficients significant at 1%, 5% and 10% levels. Robust standard errors in parentheses. Fixed
effects regression with standard errors clustered at the show level. Dependent variable is Viewers times 1000.
Page 93 of 93
Related Documents