CONSTRUCTING REGIONAL HISTORIES: TIME AND TRANSITION
THE SOUTHERN LEVANT (5500-3500 BC)
Mark Blackharn
A thesis submitted in conformity with the requirements
for the degree o f Doctor of Philosophy
Graduate Department o f Anthropology
University of Toronto
O Copyright by Mark Blackham, August 1999
National Library Bibliothèque nationale I *u of Canada du Canada
Acquisitions and Acquisitions et Bibliographie Services services bibliographiques
395 Wellington Street 395. rue Wellington OttawaON K1A ON4 ûtîawa ON K1A ON4 Canada Canada
The author has granted a non- exclusive licence ailowing the National Library of Canada to reproduce, loan, distribute or sell copies of this thesis in rnicrofom, paper or electronk formats.
The author retains ownership of the copyright in this thesis. Neither the thesis nor substantial extracts fiom it may be printed or otherwise reproduced without the author's pennission.
L'auteur a accordé une licence non exclusive permettant à la Bibliothèque nationale du Canada de reproduire, prêter, distribuer ou vendre des copies de cette thèse sous la forme de microfiche/film, de reproduction sur papier ou sur format électronique.
L'auteur conserve la propriété du droit d'auteur qui protège cette thèse. Ni la thèse ni des extraits substantiels de celle-ci ne doivent être imprimés ou autrement reproduits sans son autorisation.
Constructing Regional Histories: Time and Transition in the Southem Levant (5500-3500 BC). Doctor of Philosophy, 1999. Mark Blackham Department of Anthropology, University of Toronto.
ABSTRACT
For al1 archaeological research, chronological frameworks are the foundation on which any
reconstruction or interpretation of historical process must rest. Both the resolution of a chronology and the
researc h objectives of the archaeologist determine what questions can be asked or answered. Rarely,
however, are chronological sequences definitive and they are never entirely objective, despite the
increasing sophistication of method. Their construction is guided not only by contemporary research
paradigms but also by a number of theoretical and methodological assumptions. Chronologies, like social,
economic, political, or ideological reconstructions, are interpretations of the data, and their validation
rests not so much on experiment or empirical testing as it does on their coherence when al1 sources are
considered.
The objectives of this study are two-fold. The first objective is to introduce alternative methods for
the const~ction of chronoIogica1 frameworks in order to determine the developmental sequence of
Chalcolithic ( 5 100-3500 BC) society in the Jordan Valley region of the southern Levant. In this regard, it
addresses a number of issues relating to settlement and social change throughout the period and proposes
several explanations based on the sequence of events. The second objective is to evaluate the theoretical
and methodological understandings associated with the classification of chronological units. This study
advocates the integration of al1 sources of chronological information for the purpose of composing
regional histories. It introduces the Unitary Association Method of Relative Dating (UAM) as a means of
constnicting relative sequences and demonstrates the usefulness of Bayesian methods for improving the
precision of radiocarbon dates using stratipphic information as apriori staternents. In the final analysis,
the agreement of both the relative and the radiocarbon sequence is considered.
Acknowledgements
Many thanks to al1 of those people who have read previous drafts of this work, or of related
papers, and who have given me critical assessments and advice. In particular, 1 thank Ted
Banning, Michael Chazan, Tim Harrison. David G. Smith, Steven Bourke. Michael Schiffer, Kay
Prag. James Barrett. Jefiey Dean. William Dever, Reid Femng, Edward Harris, Jack Holladay,
Thomas Levy. Julie Stein. and Patricia Urban.
1 am gratehl to Jean Guex and Jean Savary of the Université de Laussanne for permitting
me to use the Biograph computer program. Professor Guex has always been willing to give me
advice and assistance on the principles and operations of the Unitary Association Method. 1 also
thank Christopher Bronk Ramsey for his help with the &Cal program. 1 am indebted to Roelf
Beukens and Lamy Pavlish, who were always helpful with my nurnerous questions about
radiocarbon method. Thanks also to Douglas Baird and Graham Philip for sharing some of their
recent radiocarbon dates from Tell esh-Shuna North.
I am indebted to Plenum Press for granting me permission to publish excerpts from an
article entitled "The Unitary Association Method of Relative Dating and its Archaeological
Application". which appeared in volume 5 of the Journal of Archaeological Method and Theory.
Field and lab work formed a large part of my research and, in this regard, 1 thank Kevin
Fisher, David Lasby, and Ted Banning as well as the Jordanian Department of Antiquities, Ghazi
Bisheh, Sultan Shrayda Isrna-il Milhim, and Ibrahim Zu'bi. For the Tulaylat Ghassul material, I
thank the Pontifical Biblical Institute in JemsaIem. Robert North, William Fulco, and Scott
Lewis for their invaluable assistance. Richard Harper, Catherine Commenge, and the Israeli
Antiquities Authority, including Hava Katz and the good people at the Romema storage facility
also assisted me in Jerusalem. In the Toronto lab, 1 was helped by many volunteers, including

Caroline Puzinas, Raadei Kugarajah, Dayle Elder, Debborah Pinto, Deepika Femandez,
Katherine Duff. Sarah Moon. Ian Webster. Mike Tetreau, Thomas Suh. Andrew Baker, Blair
Barr, and Chris Petersen. Many thanks to them dl.
In part, research was huided by a research grant from the British School of Archaeology in
Jerusalem and by a Canadian Social Sciences and Humanities Research Council Doctoral
Fellowship. 1 am particularly gratefbl to Ted Banning for letting me borrow much of his
equipment dunng our excavations at Tell Fendi, as well as for his constant support of my
research, his constructive criticism, improving my grammar, and being a good friend.
Table of Contents ...
List of Tables ........................................................................................................................... vil1 ............................................................................................................................. List of Figures x . . ........................... List of Appendices ... ...................................................................................... xii
1 . EPISTEMOLOGIES, ONTOLOGIES . AND PERIODIZATION ............................................. 1 ................................................................................................................................. Introduction 1
Chalcolithic Society ................................................................................................................ 3 Social Collapse ........................................................................................................................ 4
Time, Events, and Periodization ................................................................................................. 6 ........................................................................................................................................ Tirne 6 ...................................................................................................................................... Events . . 7
Transitions ............................................................................................................................... 8 ......................................................................................................................... Periodization 10
....................................................................................................... Ontologies and Typologies 14 ............................................................................................... Essentialism and Materialism 15
Evolutionists ......................................................................................................................... 17 Dating Models ........................................................................................................................... 20
2 . THE SOUTHERN LEVANT (5500-3500 BC) ...................................................................... 23 Introduction .......................................................................................................................... 23 The Region ................................................................................................................................ 23
........................................................................................................ Geography and Climate 23 Settlement and Interaction .................................................................................................... 36 . . Economics, Trade, and Social Organization ........................................................................ 38
................................................................................................ Chronology and Interpretations 41 Wadi Rabah and Early Chalcolithic ...................................................................................... 45 . . .............................................................................................................. The Transition Issue 50
........................................................................................................ Views on the Transition 50 The Problem with Time ........................................................................................................ 55
3 . PERIODIZATION METHODS ................................................................................................ 65 Phasing and Correlation ............................................................................................................ 65
........................................................................... Relative Dates and Time Placement Dates 65 .................................................................................. Cross-Dating and Phase Construction 66
Defining a Phase ...................................................................... ........................... 71 Time Placement Dates and Phase Construction .................................................................... 75 The Unitary Association Method ......................................................................................... 84
Units of Analysis ....................................................................................................................... 85 Artifacts ................................................................................................................................. 86 Homologues and Analogues ................................................................................................. 88
.................................... .................................. Spatial Variation and Arti fact Diachroneity ... 90 Stratigraphic Uni& of Analysis ............................................................................................. 93 Lithostratigraphy ................................................................................................................... 94 Biostratigraphy and Ethnostratigraphy ................................................................................. 94 Chronostratigraphy ............................................................................................................... 95 Ethnozones ............................................................................................................................ 96 Factors Affecting Correlation ............................................................................................ 98
UAM and Seriation ................................................................................................................... 99 ..................................................................................................... A Method of Classification 102
4 . A DEMONSTRATTON OF METHOD ....................................... ..... ................................. 108 Introduction ........ .. ................................................................................................................. 108 Superpositional Relationships and Reproducibility ........................................................... 109 . . Real and Virtual Assoc~ations ............... .. ........................................................-.................... 111
..................................................................... Local and Maximal Horizons ............. ........ 113 ...... ..................................................................................---.................... Neighbourhoods ... 115 ..................................................................................................................... Maximal Cliques 116
Superpositions of Maximal Cliques .................................................................................... 118 The Resolution of Contradictions and Cycles .................................................................... 119
............................................................................................................... Unitary Associations 122 ................................................................................................................ Correlation of Strata 123
Discussion of Method ............................................................................................................. 125 Sections- Composite and Combined ....................................................................................... 128
5 . ANALYSIS ............................................................................................................................. 130 ............................................................................................................................. Introduction 130 ........................................................................................................................... Classification 132 ......................................................................................................................... Systematics 134
Sites and Stratigraphy ............................................................................................................. 140 Jericho ................................................................................................................................. 141
................................................................................................................. Tulaylat Ghassul 143 Tell csh-Shuna North .................... ...... .......................................................................... 145
.......................................................................... .............................. Tabaqat al-Buma .... 147 Tell el-MaQar ...................................................................................................................... 148 JiftIik ................................................................................................................................... 149 Tell Abu Habil .................................................................................................................... 149 Tell Umm Harnmad ..........................~................................................................................. 150 Abu Harnid ......................................................................................................................... 151 Ghrubba ............................................................................................................................... 152 Neve Ur ............................................................................................................................... 153
............................................................................................................................... Tel Tsaf 153 Tell Fendi ............................................................................................................................ 154
Data Structure and Input ..........................................................................~.............................. 155 ............................................................................................................. Combined Sections 157
............................................................................................................... Regional Analysis 164 .......................................................................................... Evaluating the Relative Sequence 172
.................................................................................................................. Radiocarbon Dates 176 Abu Hamid .......................................................................................................................... 182
................................................................................................................. Tabaqat al-Buma 191 Tulaylat Ghassul ................................................................................................................. 197
.......................................................................................................... Tel1 esh-Shuna North 207 Tel Tsaf ............................................................................................................................... 208 Jericho ................................................................................................................................. 208
....................................................................................................... The Regional Sequence 211 6 . DISCUSSION ............................ .... .................................................................................. 219
..................................................................................................... Settlement and Interaction 2 19 .............................................................................................................................. Diversity 221 . . .......................................................................................................... Tradition and Change 223
..................................................................................................................... Connectedness 235 Historical Summary ................................................................................................................ 244
The Early Bronze Age Transition ....................................................................................... 250 Conclusion .............................................................................................................................. 254
7 . APPENnICES ...................................................................~.~....~............................................. 257 ............................................................................................................... REFERENCES CITED 366
vii
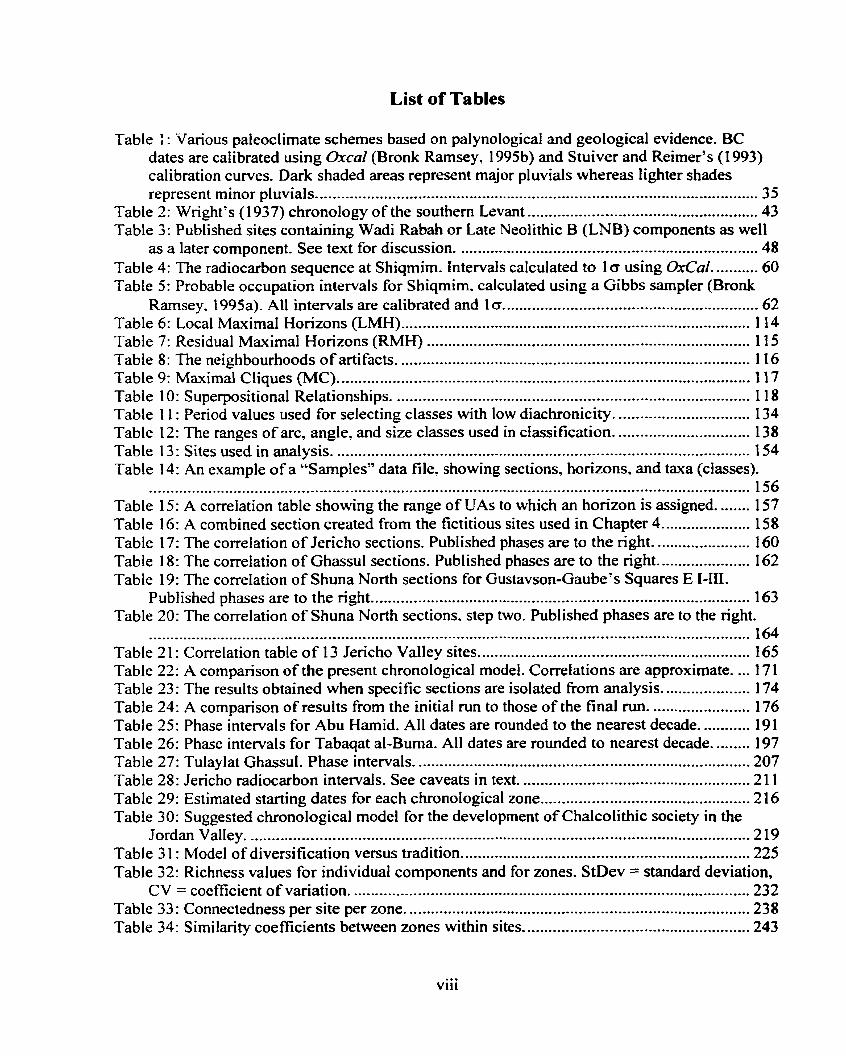
List of Tables
Table : : Various paieoclimate schemes based on palynological and geological evidence . BC dates are calibrated using Oxcal (Bronk Ramsey. 1995b) and Stuiver and Reimer's (1 993) calibration curves . Dark shaded areas represent major pluvials whereas lighter shades represent minor pluvials ........................................................................................................ 35
..................... ......................... Table 2: Wright's (1937) chronology of the southern Levant ,.. 43 Table 3: Published sites containing Wadi Rabah or Late Neolithic B (LNB) components as well
as a later component . See text for discussion ....................................................................... 48 ........... Table 4: The radiocarbon sequence at Shiqmim . Intervals calculated to 1 a using OxCal 60
Table 5: Probable occupation intervals for Shiqmim . calculated using a Gibbs sampler (Bronk Ramsey . 1995a) . All intervals are calibrated and l o ............................................................ 62
Table 6: Local Maximal Horizons (LMH) . .... ............................................................................. 114 Table 7: Residual Maximal Horizons (RMH) ............................................................................ 115 Table 8: The neighbourhoods of artifacts ................................................................................... 116 Table 9: Maximal Cliques (MC) .......................................... ... ................................................ 117 Table 10: Superpositional Relationships .................................................................................... 118
.................... Table 1 1 : Period values used for selecting classes with low diachronicity ... .... I34
................................ Table 12: The ranges of arc, angle, and size classes used in classification 138 Table 13 : Sites used in analysis .............................. .... .......................................................... 154 Table 14: An example of a "Samples" data file . showing sections. horizons. and taxa (classes) .
................................................................. ............................................................................ 156 Table 15: A correlation table showing the range of UAs to which an horizon is assigned ........ 157
..................... Table 16: A combined section created from the fictitious sites used in Chapter 4 158 Table 17: The correlation of Jericho sections . Published phases are to the right ....................... 160
...................... Table 18: The correlation of Ghassul sections . Published phases are to the right 162 Table 19: The correlation of Shuna North sections for Gustavson-Gaube's Squares E I-III .
Published phases are to the right ......................................................................................... 163 Table 20: The correlation of Shuna North sections . step two . Published phases are to the right .
............................................................................................................................................. 164 .............................. ...-..-..*.................. Table 21 : Correlation table of 13 Jericho Valley sites .. 165
Table 22: A comparison of the present chronological model . Correlations are approximate .... 171 ..................... Table 23: The results obtained when specific sections are isolated from analysis 174
........................ Table 24: A comparison of results from the initial run to those of the final run 176 Table 25: Phase intervals for Abu Hamid . All dates are rounded to the nearest decade ............ 191
......... Table 26: Phase intervals for Tabaqat al-Burna . All dates are rounded to nearest decade 197 Table 27: Tulaylat Ghassul . Phase intervals ............... .. .............................................................. 207
...................................................... Table 28: Jericho radiocarbon intervaIs . See caveats in text 211 Table 29: Estimated starting dates for each chronological zone ............................................. 216 Table 30: Suggested chronological model for the development of Chalcolithic society in the
Jordan Valley ..................................................................................................................... 219 .................................................................... Table 3 1 : Model of diversification versus tradition 225
Table 32: Richness values for individual components and for zones . StDev = standard deviation, . . CV = coefficient of variatron .............................................................................................. 232
Table 33: Connectedness per site per zone ................................................................................ 238 ..................................................... Table 34: Similarity coefficients between zones within sites 243
viii
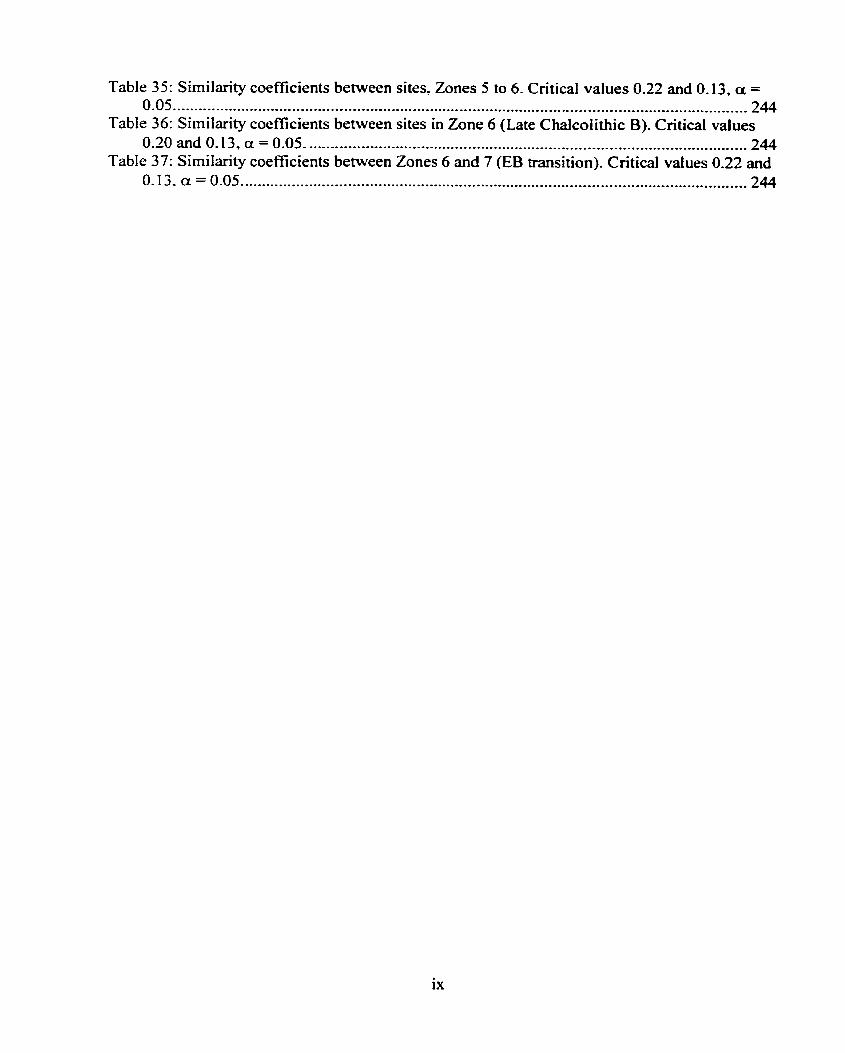
Table 35: Similarity coefficients between sites . Zones 5 to 6 . Critical values 0.22 and 0.13, a = 0.05 ...................................................................................................................................... 244
Table 36: Similarity coefficients between sites in Zone 6 (Late Chalcolithic B ) . Critical values ............................................................... .................................... 0.20 and 0.13. a = 0.05 ,.., 244
Table 37: Similarity coefficients between Zones 6 and 7 (EB transition) . Critical vdues 0.22 and .................................................................................... ................................ 0.13. a = 0.05 .. 244
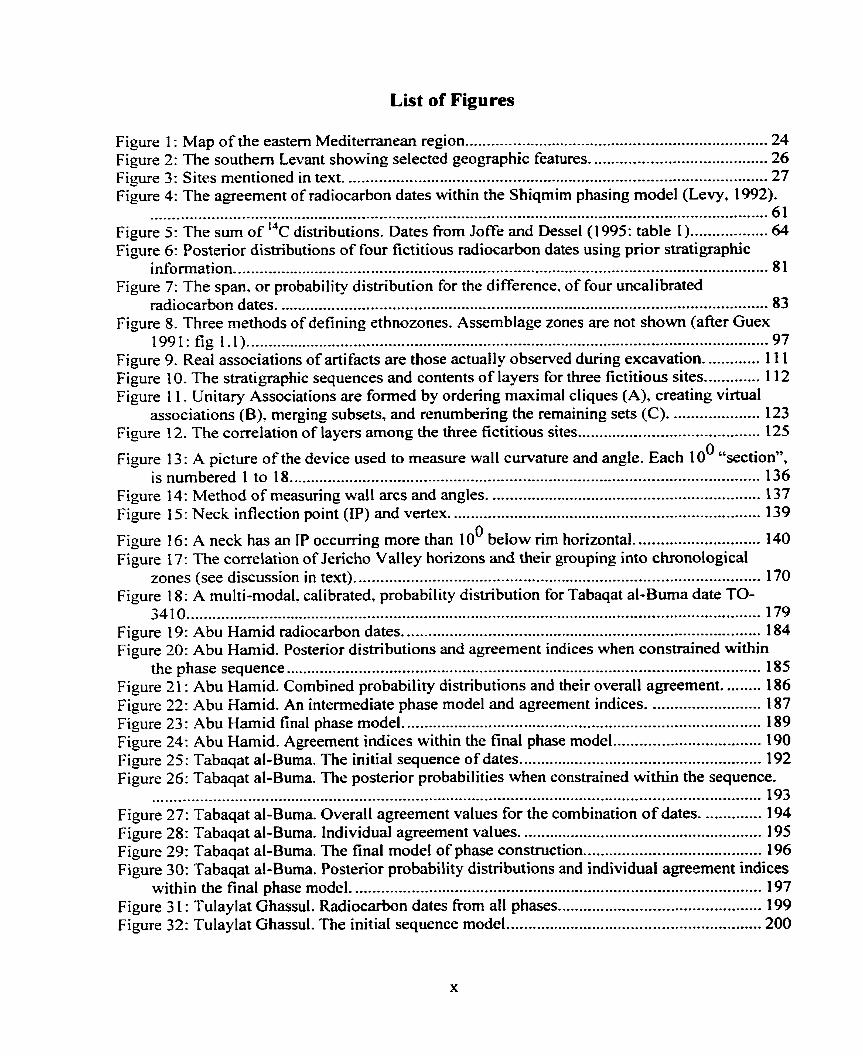
List of Figures
Figure 1 : Map of the eastem Mediterranean region ...................................................................... 24 Figure 2: The southem Levant showing selected geogaphic features ....................................... 26 Figure 3: Sites mentioned in text .................................................................................................. 27 Figure 4: The agreement of radiocarbon dates within the Shiqmim phasing model (Levy, 1992) .
............................................................................................................................................... 61 Figure 5 : The sum of "C distributions . Dates from Joffe and Dessel (1995: table 1) .................. 64 Figure 6: Posterior distributions of four fictitious radiocarbon dates using prior stratigaphic
information ............................................................................................................................ 81 Figure 7: The span . or probability distribution for the difference, of four uncalibrated
radiocarbon dates .................................................................................................................. 83 Figure 8 . Three methods of defining ethnozones . Assemblage zones are not shown (afier Guex
1991: fig 1.1) ......................................................................................................................... 97 ............. Figure 9 . Real associations of artifacts are those actually observed during excavation 111 ............. Figure 1 0 . The stratigraphic sequences and contents of layers for three fictitious sites 112
Figure 1 1 . Unitary Associations are formed by ordering maximal cliques (A), creating virtual associations (B) . merging subsets, and renumbering the remaining sets (C) ..................... 123
. Figure 12 The correlation of layers among the three fictitious sites ................................... 125
Figure 13: A picture of the device used to rneasure wall curvature and angle . Each 10' "section". .......................................................... is numbered 1 to 18 .. . . . 136
............................................................... Figure 14: Method of measunng wall arcs and angles 137 ........................................................................ Figure 15: Neck inflection point (IP) and vertex 139
O Figure 16: A neck has an IP occumng more than 10 below rim horizontal ............................. 140 Figure 17: The correlation of Jericho Valley horizons and their grouping into chronologicd . .
zones (see discussion in text) .............................................................................................. 170 Figure 18: A multi.moda1 . calibrated. probability distribution for Tabaqat al-Buma date TO- .
3410 ..................................................................................................................................... 179 ................................................................................... Figure 19: Abu Hamid radiocarbon dates 184
Figure 20: Abu Hamid . Posterior distributions and agreement indices when constrained within .............................................................................................................. the phase sequence 185
Figure 21 : Abu Hamid . Combined probability distributions and their overall agreement ......... 186 .......................... Figure 22: Abu Hamid . An intermediate phase mode1 and agreement indices 187
........................ Figure 23: Abu Hamid final phase mode1 ... .................................................. 189 .................................. Figure 24: Abu Hamid . Agreement indices within the final phase mode1 190
...................................................... . Figure 25 : Tabaqat al-Buma The initial sequence of dates 192 Figure 26: Tabaqat al-Buma . The posterior probabilities when constrained within the sequence .
............................................................................................................................................. 193 .............. Figure 27: Tabaqat al-Buma . Overall agreement values for the combination of dates 194
. ................................................... Figure 28: Tabaqat al-Buma Individual agreement values 195 Figure 29: Tabaqat al-Buma . The final mode1 of phase construction ..................................... 196 Figure 30: Tabaqat al-Buma . Posterior probability distributions and individual agreement indices
within the final phase mode1 ............................................................................................... 197 Figure 3 1 : Tulaylat Ghassul . Radiocarbon dates fiom al1 phases ............................................ 199 Figure 32: Tulaylat Ghassul . nie initial sequence mode1 .......................................................... 200
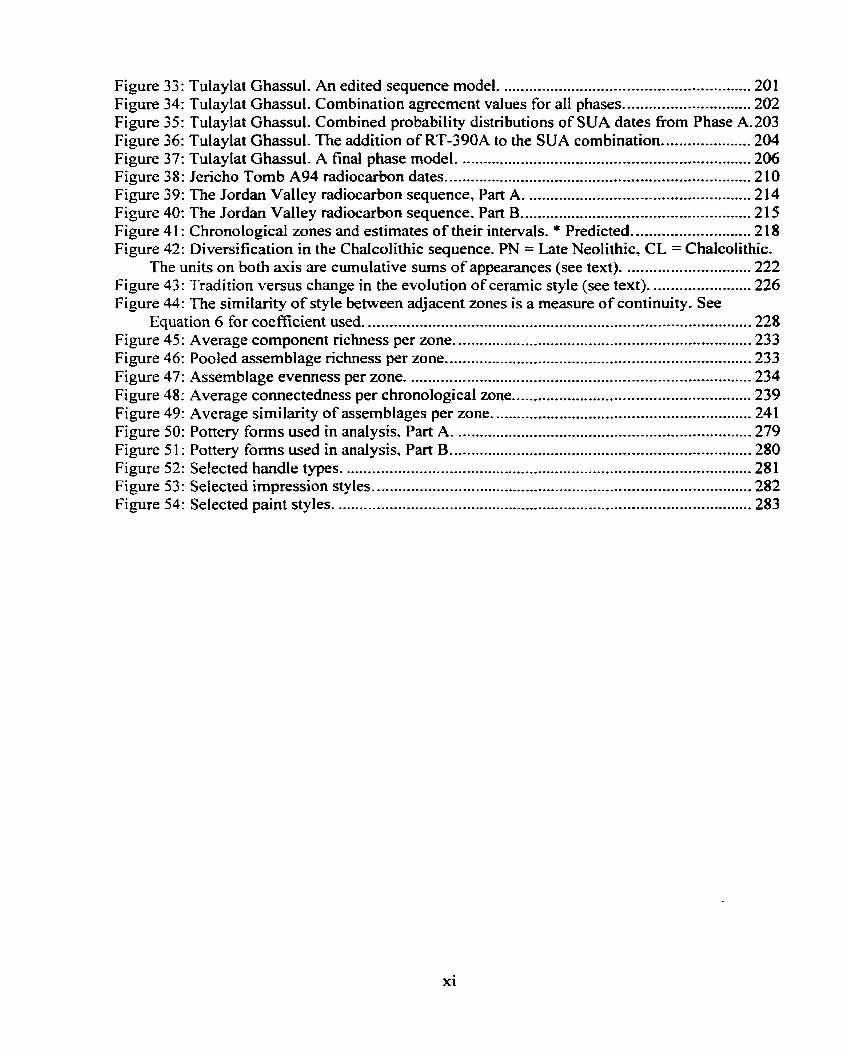
Figure 33: Tulaylat Ghassul . An edited sequence mode1 ..................................................... 201 Figure 34: Tulaylat Ghassul . Combination agreement values for al1 phases .............................. 202 Figure 35: Tulaylat Ghassul . Combined probability distributions of SUA dates fkom Phase A.203 Figure 36: Tulaylat Ghassul . The addition of RT-390A to the SUA combination ..................... 204 Figure 37: Tulaylat Ghassul . A final phase mode1 ..................................................................... 206 Figure 38: Jencho Tomb A94 radiocarbon dates ............................... ... ......... 210 Figure 39: The Jordan Valley radiocarbon sequence, Part A ................................................ 214 Figure 40: The Jordan Valley radiocarbon sequence . Part B ........ .. ................. .. ..................... 215 Figure 4 1 : Chronological zones and estimates of their intervals . * Predicted ............................ 218 Figure 42: Diversification in the Chalcolithic sequence . PN = Late Neolithic, CL = Chalcolithic .
The units on both avis are cumulative sums of appearances (see text) .............................. 222 Figure 43: Tradition versus change in the evolution of ceramic style (see text) ........................ 226 Figure 44: The similarity of style between adjacent zones is a measure of continuity . See
Equation 6 for coefficient used ............................. .... .................................................... 228 Figure 45: Average component richness per zone ...................................................................... 233 Figure 46: Pooled assemblage richness per zone ...................... ... ...................................... 233 Figure 47: Assemblage evenness per zone ............................................................................ 234 Figure 48: Average connectedness per chronological zone ........................................................ 239 Figure 49: Average similarity of assemblages per zone ................................... ., ........................ 241 Figure 50: Pottery forms used in analysis . Part A ....................................... ... ....................... 279 Figure 5 1 : Pottery forms used in analysis, Part B ..................... ... ........ .. ................ 280 Figure 52: Selected handle types .............................................................................................. 281 Figure 53: Selected impression styles ......... .. .............................................................................. 282 Figure 54: Selected paint styles .................................................................................................. 283
List of Appendices
Appendix A: Appendix B: Appendix C: Appendix D: Appendix E:
Radiocarbon Dates ................................................................................................ 258 ........................................................ ..................... Sites. Sections . Horizons ..... 262
.......................................................................................... Main Types and Series 271 Al1 Classes ............................................................................................................. 284
..................................................................................................... Rim Lip Classes 296 Appendix F: Main Classes and Rim Lip Classes ........................................................................ 298 Appendix G: Data Dictionary and Measurement System .................................................... 300 Appendix H: Publication Key ................................................................... 302 Appendix 1: List of Measures .......................................................... .... . . 303 Appendix J: Combined Data Files ............................................................................................. 342 Appendix Appendix Appendix Appendix
K: Final Data File ....................................................................................................... 347 L: First Appearances .................................................................................................. 351 M: Last Appearances ................................................................................................. 355
............................................................................................................ N: UA Matrix 357
1. EPISTEMOLOGIES, ONTOLOGIES, AMD PERIODIZATION
Introduction
The general objective of this study is to improve our understanding of inter-regional
interactions in prehistory by introducing systematic techniques for the construction of regional
time periods. A more specific objective is to evaluate the role that regional interactions and
senlement played in the development and demise of Chalcolithic (4600-3500 BC') societies in
the southern Levant (Jordan, Israel, and southern areas of Syria and Lebanon). with a particular
focus on the Jordan Valley region.
The tenet that guides this research is that archaeology is an historical science. On this
prernise, constructing a sequence of events for any region is an important aspect of the discipline
and vital to out understanding of the long-tenn processes of social change. The resolution of an
archaeological sequence limits the questions that can be asked of the data and, to some degree,
pre-determines the results. This is particularly tme whenever we attempt to explain the role of
regional interactions in the development of human societies. As used here, regional interactions
are understood to be the full range of interchanges taking place between autonomous
sociopolitical units situated within a single geographical region (Renfrew, i 986: 1). These
include imitation, ernulation. cornpetition, warfate. and the exchange of material goods and
information. Each kind of interaction carries its own implications for the nature of culture
change, and even the lack of regional interactions can have meaning in terms of both regional
and local development.
Calibrated radiocarbon dates are shown as ''years BC" and uncalibrated dates as "years bp".
Distinguishing and interpreting the interplay between human communities depends on our
ability to determine that two or more settlements within a particular locale were contemporary
for a specified interval. This rnay seem obvious. yet many archaeological analyses are still
conducted on the assumption, rather than the determination, of contemporaneity. Adrnittedly,
detennining the CO-existence of Settlements is not an easy task in the absence of calendar dates.
In most cases, archaeologists rely on either a relative sequence or an estirnate of calendar time.
The methods used in this endeavour V a r y considerably but belong to two main groups; those that
produce a relative sequence. such as senation techniques. and those that produce probabilistic
intervals, such as radiocarbon dates. The objective of either approach is to associate, for two or
more sites, al1 aspects of material culture in a shared space-time matrix so that a sequence of
regional events can be discemed and social processes inferred. The relevance of our
interpretations depends on Our ability to reconstruct a space-tirne frarnework that most accurately
portrays the sequence of events selected for study. Final interpretations. however, do not depend
entirely on the construction of time units; they are also conditioned by research objectives, local
paradigms of research, and limitations of method.
This study touches on these issues in general, but its methodological focus is to address
problerns that relate to the construction of archaeological time periods. As a general thesis, 1
argue that our perception of past sociaI change on a regional level is limited and conditioned by
the way in which we view and construct periods. Periodization is a product of both current
paradigms of research and the methods and assumptions used to compare and correlate activities
at two or more settlements. In an atternpt to improve our understanding of regional histories, 1
introduce and evaluate the Unitary Association Method of Relative Dating (Guex, 199 2 ;
Blackham, 1998) and propose a method for constructing sets of associated artifact classes that
improves the reliability of the relative chronological units constructed.
A related objective is to evaluate the role of regional interactions in the development and
eventual demise of Chalcolithic societies and associated settlement systems in the southern
Levant. The premise of interaction studies is that inter-community relations are a factor of
sociopolitical change. Interaction studies are ofien concemed with the effects of regional affairs
on local trajectories of sociopolitica1 development. Due to tirne and space restrictions, issues
relating to the development of social complexity in the region cannot be dealt with at length but,
in short, 1 argue that sociopolitical change at this time was conditioned by both ecological and
polit ical factors. Increasingl y complex political systems appearing in Egypt and Mesopotamia
probably served as political and economic models for leaders and opportunists in the southem
Levant. In this model. the development of social complexity was fuelled by staple finance and
resource specialization, a situation encouraged by the exposure of additional f m l a n d in the
Jordan Valley and by the increasing diversification of crops, including olives and other fniits.
The collapse of Chalcolithic societies is probably related to increasing regional competition over
land. agicultural resources, and the control of trade in copper (cf. Johnson and Earle 1987: 18;
Schortman and Urban 1987, 1992; Rice 199 1 : 257).
Chalcolithic Society
When we speak of "Chalcolithic societies" we imply an acceptance of the notion that
specific material cultures can be associated with certain ethnic or social groups. The viability of
this notion has been debated for some time (e-g., Bordes and Sonneville-Bordes, 1970; Binford,
1973; Hiland, 1977; Hodder, 1977% 1982; Sackett, 1993). It is clear fiom a nurnber of studies
that the relationship between style, ethnicity, and geographic boundaries is not necessarily direct
(Hodder, 1977a; Wobst, 1977; Plog, 1978: Wiessner. 1 983; DeBoer, 1993). Nonetheless, it is
difficult to escape the general impression that stylistic variation in material culture assemblages
does. to sorne degree. reflect social or group identity. Weissner (1 984: 229), for example,
demonstrates that the meaning of style is complex. but still maintains that social identification
via cornparison forms the primary behavioural basis for style. And Sackett (1993) clearly sees a
relationship between stylistic choice and cultural identity- In another instance, DeBoer (1993:
102) concludes that. afler years of studying style and kinship relations among the Shipibo-
Conibo settlements in Pem, he cannot disregard the notion that boundaries, or marked
disruptions in stylistic gradients, represent migration or cultural borders. The social meaning o f
style is not discussed at length here but, for the purposes of the present study, 1 accept the view
that differences in material culture can reflect differences in group identity.
Social Collapse
When terms such as the "rise" and "collapse" of Chalcolithic societies or cultures are used,
we imply that the appearance or disappearance of distinctive material cultures is analogous to the
appearance or disappearance of specific social groups. OAen. this is how the situation is viewed
in the southem Levant, particularly with respect to the apparent collapse of Chalcolithic societies
just before the advent of the Early Bronze Age (3500-3 100 BC).
Rapid changes in social organization in the Early Bronze Age, as inferred fiom changes in
material culture, were at f int attnbuted to migrations and conquests (Wright, 1958: 37; Lapp,
1970: 29; Kenyon, 197 1 : 84). More recently. similar theses have been proposed (Yakar, 1989;
Ben-Tor, 1992; Portugali and Gophna, 1993; Gophna, 1995) and there is a continuing trend to
view the end of the Chalcolithic as a penod of social collapse (Gophna, 1995; Joffe and Dessel,
1995; Levy, 1995). Recent approaches differ from previous views only in regard to the
explanation of events. New explanations of social collapse differ primarily in their explicitness
about the process of collapse and. in this regard, tend to follow Tainter (1988), who views
collapse as a reduction in the level of social complexity. or YoRee and Cowgill(1988), who
suggest that collapse results fiom political fragmentation. This topic is discussed in more detail
in Chapter 2 (see "The Transition Issue" p. 50).
Many Chalcolithic sites within the southern Levant show little evidence of occupational
continuity into the following Early Bronze Age, a factor that suggests either regionai
abandonment or rapid social change. While the notion of regional abandonment seems simplistic
and unlikely, the results of the present analysis cannot convincingly refiite the idea. There have
been several attempts to root Early Bronze Age communities in the preceding Chalcolithic
tradition (e.g. de Miroschedj i, 197 1 ; Callaway, 1972; Hanbury-Tenison, 1986; Braun, 1996) but,
in the present analysis of the Jordan Valley material, there is little published evidence to support
any theory of continuity. The results obtained here are. no doubt, affected by the small sample of
sites but, ironically, there is good reason to return for a new look at the migration and invasiulr
theories first proposed almost 40 years ago (Wright. 1958: 37; Lapp. 1970: 29; Kenyon, 197 1 :
84). What is needed at the next stage of inquiry is to step beyond using simple statements of
migration or conquest as explanations and to determine how these social changes occurred and
what effects they had. But, in order to begin this inquiry, we need to return to the task at hand,
which is to define the sequence of events for the Chalcolithic period.
Time, Events, and Periodization
Time
Our understandings about time, chronological sequences, and events affect our
archaeological interpretations. Time is not empirical in nature because we cannot observe or
measure it directly except in reference to events. This does not imply, however. that it is not real.
Two contributions of Einstein's (1961) theory of relativity are that it put an end to the notion of
absolute time and implied there c m be no space apart from time. AI1 motion and activity takes
place relative to the position of the observer and occurs within a four-dimensional rnatrix of
space-time (Hawking. 1988: 24). Thus. modem. scientific time is subjective rather than
objective. relative rather than absotute. and cannot be defined as an a priori principle of order
(Porter, 198 1 : 68). Time is the dimension of interaction, or change, that is measured differently
by each of the interacting entities. While it is oflen thought of as a continuum, continuity is not
an essential quality of time. The Newtonian idea that events take place along a continuous
dimension of time has been replaced by the view that events (motion and interaction) create time
as they emerge into actuality and that the actual units of time are defined by the duration of each
emergent process. Events. therefore. do not exist as infinitesimal points along a single dimension
but rather have duration defined by the nature of the event itself. Even in quantum theory, time,
as welI as energy, appears in separate chunks (quanta) of variable duration. Quanta cannot be
split because their very existence defines interactions between events and they require a
minimum duration to become what they are. It is the event (interaction of matter) that gives
meaning to tirne, not vice versa.
If space-time is an inseparable entity, as relativity theory suggests. then it is unlikely that the
property of discreteness is reasonable only in space-like fiames and not time-like fianes (contra
Dunnell, 1982: 10). Any object in space cannot have an existence outside of time; every entity
has an age; a beginning and an end. Spatial dimensions may be easier for us to comprehend and
to visualize but space is no more a reality than time. In fact. in the framework of modern science,
we can measure time more accurately than space (Hawking, 1988: 22). Chronological units may
be relative and arbitrary. but time is a measurable dimension (Rarnenofsky. 1998: 74).
Events
According to relativity theory. space and time are curved but, at the scale of the planet,
linear time is a close approximation (Rarnenofsky. 1998: 77). I f an event has duration, as
suggested above. then it must also have a beginning and an end. An event is usually defined as a
'thing that happens' but is oflen characterized as a change in state. For every event, there must be
a duration of the event's non-occurrence (Yamaguchi, 199 1 : 1 ). In other words, events have
borders. Imagine that the event of interest is the construction of a clay pot. At what point does
the pot begin? Did it begin when the person who made it first decided to become a potter, or at
the point where she laid the raw clay on the wheel? When an event ends does not seem as
dificult to define as its beginning. We could Say that the event ended with the firing of the pot
because, at this point, a change of state occurs and we believe this change is important. In
another example, we may not be able to determine the events of non-occurrence that led up to the
development of agriculture. but we would have less difficulty in identifying the material remains
of agriculture in the archaeoIogical record.
We see that there is a two-sided chronological nature for each event. In one way, an event
takes time (a duration event) but, in another, it is the point at which a change of state occurs (a
terminal event). Terminal events are marked temporally at the end-point of their duration. The
important point is that events are constructs and, for any event of interest, we need to be clear
about what kind of an event it is and, depending on the type chosen. to define recognizable
characteristics of the beginning. duration, and end of the event. In an extension of this idea, it is
clear that events can have fùzzy borders: they are not concrete entities. Where they begin and
end is a subjective matter, and is predicated on research objectives and event definitions.
Transitions
What does an archaeologist mean by the t e m "cultural transition"? What is the nature of the
event, is it a duration event or a termina1 event, and how is it recognized? By using the term. we
imply that a significant social change occurred. but this may not necessarily be the case. In the
example studied here, the transition fiom the Chalcolithic to the Early Bronze Age appears to be
a terminal event because the duration of the process leading up to the change of state from
'Chalcolithic' to 'Early Bronze' has never been defined. Only the end point of the event is
defined, primarily in ternis of changes in pottery form and style, although these changes do
appear to be accornpanied by other traits. such as regionalized changes in architectural style and
mortuary behaviour. The empirical nature of the event is not social change but a change in the
kinds of artifacts found. Explanations for the changes in artifacts. or artifact patterns, and the
extent to which these changes have social meaning for the Early Bronze Age is an issue that still
needs clarification. although there is some discussion on the topic (Albright, 1932a; de
Miroschedji, 197 1 : Thompson, 1979: Amiran, 1985: Hanbury-Tenison, 1986; Baruch, 1987;
Ben-Tor, 1992; Gonen, 1992; Gophna, 1995; Braun, 1996).
Transitions. as terminal events. are ofien used to define archaeological periods. By
implication, the Chalcolithic period is defined as the period that begins at the transition fiom the
Late Neolithic penod to the Chalcolithic period and ends at the transition fiom the Chalcolithic
penod to the Early Bronze Age. Each transitional event is a terminal event that is defined by a
change in pottery style and fom, although the beginning of the Chalcolithic penod is still hazy
in this regard. Thus. a penod is a chronological unit, Iike an hour or a day. An archaeological
period is ofien defined as the period of time extending between specified terminal events, which,
in this case. are changes in assemblages (the reference points). The most important difference
between the two chronological units is that the archaeological period, as defined on the evidence
of assemblages. is of unknown duration, at least until the terminal events can be fixed in
calendrical time. Until then, it remains a relative chronological unit measured on an ordinal
scale.
It is clear from historical records that political changes do not always coincide with changes
in archaeological assemblages (Charlton. 198 1 : 155). This is readily apparent when comparing
political periods to archaeological periods for the Islarnic Penod in Palestine (cf. Schick, 1998:
80). In this example. there is no chronological correlation between the seven political periods and
the eight archaeological penods defined. This lack of correlation may or rnay not be meaningfùi
to archaeological interpretation. For instance. do the constructed historical penods have any
meaning in t ems of changes in sociopolitical organization between the Ayyubid and MamIuk
periods? In other cases. certain historical events do coincide with changes in the pottery
sequence, but these events do not necessarily align with changes in govemment (Mason, 1997:
1 94). It follows, therefore. that changes in artifact assemblages may or may not adequately
represent sociopolitical events of interest and that the articulation between artifacts, culture, and
regional interactions is not obvious (e.g., Deetz. 1967; Flannery. 1968; Allen and Richardson,
197 1 ; Hodder, 1977b; S. Plog, 1993: Fry. 1980; D. Arnold, 1989; Rosen, 1986; J. Arnold, 1991;
P. Arnold, 199 1 ; Longacre, 199 1 ; DeBoer, 1993; Hayden and Schulting, 1 997).
The degree to which changes in artifact types serve as meaningful chronological or spatial
divisions remains controversial. Ford (1 962: 45). for example. suggests that two sites occupied
for the sarne penod of time would be unlikely to have the same sequence of artifacts. implying
that they would be dificult to correlate. While few would disagree with Ford's observation, it is
not clear that the lack of similar sequences is an insurnountable problem for chronological
analyses. Ford's concems. like those of the materialists discussed below. relate to the belief that
similarity is the only factor by which correlations cm be drawn. But this is not necessady the
case. In the analysis that follows. it \vil1 be demonstrated that two sites with absolutely no
comrnon artifact types or attributes can be correlated using transitive associations and
superpositional relationships.
Periodization
The act of creating periods is called perioditation. In common usage, an archaeological
'period? has a longer duration than. for instance. a 'phase', which is a terrn used to represent a
brief penod of time for either a specific locality or a region (Willey and Phillips, 1958: 22).
Further discussion on the utility of these terms is given in Chapter 2 but, for al1 intents and
purposes. a period can represent any duration of tirne. The term "penod". as it is used here,
connotes a synchronic construct in which events and conditions occumng within a given interval
are treated as analyticalIy conternporaneous (Smith, I9W: 27). Periodization is often cnticized
because it is seen to suppress sequential time information, thereby conflating events and masking
culture processes (F. Plog, 1973; Dunnell. 1982: 13; Lyman et al., 1997: 198). Cornparison
between periods then becomes a step-like approach to the study of the evolution of culture when,
it is presumed, the process is actually continuous. Ascher (1961 : 324) made a similar argument
when he warned against viewing archaeological periods or phases as snapshots in tirne (the
Pompeii premise).
The use of periodization has other significant effects on the study and interpretation of
history. In a discussion of the periodization of European history, Green (1995: 99) cornplains
that:
". . .îripartite penodization has gripped Western academe like a straightjacket
detemining how we organize departments of history, train graduate students, form
professional societies. and publish many of our best professional journals. It pervades
our habits of mind; it defines turf; it generates many of the abstractions that sustain
professional discourse. It determines how we retain images and how we perceive the
beginning, middle, and ending of things. It is insidious, and it is sustained by powerful
vested interests as well as by sheer inertia."
Green's comments could apply equally well to the discipline of archaeology and suggea
that, to varying degrees. a set of ideas. or a paradigm of thought. controls and directs the thnist of
research for any period under study. The main difference between periodization in history and
that in archaeology is that the latter usually has no internal chronology. The European medieval
period, for example. can still be rendered down to smaller time units; there is a sequence of
events within each period that can be located in calendrical time. This is generally not the case in
archaeology. Most archaeological pet-iods are defined on the b a i s of terminal events and, with
the exception of a few, fortunate geographic areas where dendrochronology has proven
especially useful, short, internal divisions can seldorn be determined.
Periodization has two effects on archaeological research. First. it creates an analyticai
problem because the entire sequence of events within a specified period is conflated. The effect
is similar to making the last 300 years of European history a single event. Second. periodization
generates academic prcb!ems, bringing with it a set cf ûbstiïciions that may or may not be valid.
While the reaction against periodization has its merits. we cannot entirely escape the need
for creating periods. Hours, days, years, and centuries are al1 periods of time. The argument
against periodization is that time is a continuum and, consequently. periodization distorts the
sequence of events. This is an ideal notion but not a practical one. In order to make cornparisons
between different points in time. some degree of penodization is required because it is
methodologically impossible to study continuous change (Smith. 1992: 27). Taken to its
extreme, it assumes that o u interpretation of events could be improved if were possible to relate
the history of any society on a second-by-second basis, which is unlikely. The paradox is
mitigated to some degree if we accept the notion that each event has duration and that smaller
time intervals do not necessarily improve Our interpretation of events. in some cases, the time
between events may have Little relevance because it is the sequence of events that is important.
Binford (1 98 1 : 197) suggests that archaeological events are a 'different order of reality' and that
the archaeological record needs to be treated in terms of archaeological time.
On the other hand, a lack of temporal resolution can be problematic. For exarnple, the
Chalcolithic period of the southem Levant is approximately 1000 years in duration (on the b a i s
of calibrated radiocarbon dates). Further divisions within this period have been suggested but
they have never been widely adopted from a regional perspective, either because tendered
divisions are poorty defined in terms of artifacts (e.g., Wright, 1937; de Miroschedji, 1971; de
Vaux. 1 97 1 ; Levy, 1992b; Joffe and Dessel. 1 995) or because they are too site-specific (e-g.,
Kaplan, l958b; Hennessy, 1968; Bourke et al., 1995; Gopher, 1995). The problem stems
primarily fiom a lack of any firm association of radiocarbon dates with particular classes of
artifacts and. because of the degree of spatial variation in assemblages, to poor artifact
associations and cross-dating potential. As a consequence, studies tend to group Chalcolithic
sites as if they were contemporary for the entire period. This cluster of Chalcolithic sites is oflen
compared to a cluster of Early Bronze Age 1 (EB 1) sites formed in a similar manner (e-g., Levy
and Alon, 1983; Gophna and Portugali. 1988; Esse, 199 1 : Joffe, 199 1 a, 1993). The problem with
the assumption of contemporaneity in settlement pattern studies is that it is highiy unlikely that
al1 Chaicolithic sites were occupied at 4600 BC and abandoned at 3500 BC. In fact, most sites
for this penod appear to be short-lived. A study of settlement patterns in shorter, 1 00-year
intervals would probably give us an entirely different picture of events. Once again, however, the
degree of temporal resolution required varies according to research objectives and the nature of
the question (Knapp. 1992: 8; Ramenofsky, 1998: 78-79).
The historical relationship between kinds of events and tirne h e w o r k s is Braudel's (1980)
major theme. Braudel's work is a product of the French Annales school of historical research
(Bloch, 1953; Stoianovich, 1976; Le Goff and Nora. 1985; Hodder. 1987; Bintliff, 199 1 a;
Knapp, 1992). His major contribution to the Annales school was his notion that events are not al1
the same and each must be measured on its appropriate time scale. For example. a marriage
ceremony and the evoiution of Homo sapiens are two different events that require considerably
different time scalss of inquiry. Both events operate on different levels of tirne that Smith (1992:
26) calls "ethnographic time" and gbarchaeological time", respectively. Braudel sees the
development of human societies as dominated by three groups of processes, or dynamics,
operating at different time scales. These are: 1. Short-term history ( Z 'histoire événementielle),
which is the history of individuals as recorded in narrative, 2. Medium-terni history
(conjoncture), which is structural history concerned with social and econornic cycles,
demographic cycles, dated regional histories. worldviews. and ideologies. It includes the waxing
and waning of sociopolitical systems. 3. Long-term history (la longue durée), which is structural
history on a grander scale and includes geohistory. the history of civilizations, persistent world
views, and dominant technologies (Bintliff, 199 1 b: 6). In archaeology, long-term history is likely
to get the most attention while medium-term history is possible as dating methods improve. It is
extremely unlikely, however, that archaeology will ever be able to write short-tenn history. It
may be able to describe individual processes on the basis of. for example, lithic core
reconstruction or microdebitage patteming but this is not the sarne as a history of individuals.
Braudel's important contribution was to formulate the idea that multiple temporal scales can be
applied to any segment of time. depending on the issue k i n g addressed (Smith, 1992: 27).
There is interplay between time and events. On the one hand. the nature and duration of the
event are suggestive of an appropriate time h ime while, on the other. some events camot be
observed if the time-frame is too broad.
Ontologies and Typologies
The reaction against the use of periodization is epitomized in the recent work by Lyman et
al. (1 997). Their admitted stance is materialist and evolutionist and, from this vantage point, they
confiont notions of essentialism, which they equate with the culture history paradigm. Their
view is that change is continuous and, therefore, cannot be periodized for fear of obscuring
important elements of change. The act of periodization is seen as an extension of the essentialkt
ontology to the creation of time units.
Essentialisrn and Materialism
Essentialism, in its simplest form. means that a thing has properties only relative to some
other property. In other words. it occurs when archaeologists attach a priori meaning, which may
or may not be warranted, to an artifact type. a phase. or a certain kind of finish on pottery. The
notion that a specific cerarnic assemblage or pottery type represents a Chalcolithic "society" as if
it were a real entity, is essentialist.
The evolutionary anthropologists offer the materialist approach as a viable alternative to
essentialist views. The term "materialistT', as it is used in the context of archaeological
systematics. was coined by Dunnell (1982) to identifL an ontology that differentiates between the
"actual" and the "ideal'? and between "typological" and "population" thinking, which are terms
used in the biologicai sciences (e.g.. Hull. 1965; Lewontin. 1974; Sober. 1980; Mayr. 1994). The
way that Lyman et al. (1 997) and Dunnell (1982, 1986) use the terni "materialist" is from the
standpoint that theories in archaeology should have empirical foundation. Their philosophical
stance is pnmarily that of positivist induction (see Bell [1994: 18 11 for an overview).
In the materialist view, essentialism errs by creating average types, or ideals, that do not
necessarily fit any single object but are intended to represent a group of objects. These average
types are represented by modal vaiues. Problems are seen to arise when the process of change is
considered because it entails companng modal values for specific attributes rather than their
variations. In other words, they daim there is no accounting for intemal variation @unne11 1986:
153; M a y , 1994: 158). Dunnell maintains that. in the essentialist view, the phenomenological
world consists of a finite set of discrete entities and implies that classes (or types) of phenomena
are treated in the same way. Altematively, he maintains that materialists recognize types for what
they reall y are; il lusionary, transitory configurations.
The problem with the matenalist view is that it assumes that al1 attributes are quantifiable
and. therefore, reducible to an average value with an associated error term. But many types c m
be extremely difficult to quantifi and are more effectively qualified. Whether quantified or
qualified, Adams and Adams (1 991: 72) suggest that types (or attributes) must be defined by
either modalities or by boundaries; an idea £kt put forward by Rouse (1960). It is unlikely that
attributes c m be defined or recognized only in terms of intemal variability because, despite the
degree of variability, one needs to define a point (boundary) at which that variability no longer
defines a particular attribute.
Materialists suggest that the creation of time periods groups artifacts in arbitrary chunks of
tirne, distorting, or conflating, the tme picture of the evolution of specific artifacts and, by
extension, culture. In addition, stratigaphic units. while potentially ernpirical, are seen as
inappropriate grouping mechanisms because the artifact contents of each unit could possibly be
mixed from different time periods. The materialist's solution. therefore, is to trace each artifact
cIass individually through time in order to understand and explain its evolution. By what method
each class is traced through time is unclear. but presumably by using seriation.
The materialists see periods as essentialist constructions that display, as their characteristics
or properties. representative specimens (types) of each artifact class. They suggest that many
culture historians. in the act of periodization. come to view a period as a real entity and cannot
distinguish between an ideational and empirical unit (Lyman et al. 1997: 93; DumeIl, 1995: 34-
35). While there is some truth to this remark, it could just as easily be directed toward many
processualists, post-processualists, or materialists. It is more likely that the confusion
surrounding the use of periods extends beyond both theoretical orientations and the ability to
distinguish between ideational and empiricai units. As suggested above. periods are the products
of classification and need to be clearly defined in terms of events. space, time, and artifacts (cf.
Stein, 1987. 1990, 1992).
Evolu tionists
The evolutionist epistemology treats time as a continuum on which similarity is ordered.
Evolutionists are not necessarily maintaining that the time scale of evolution must be continuous
but rather that culture change is continuous and that some means of observing continuous
variation is needed. As mentioned previously, they believe that a continuous Stream of
development can be traced by focusing on changes in a single attribute or characteristic, (e.g.,
Dumeil, 1986; Mayr, 1994; Teltser, 1995; Lipo. 1997; Lyman et al., 1997). In archaeology, this
approach is best reified methodologically with seriation techniques. which, in theory, convert
differences in attribute similarity to a chronological order. The view is that seriation cm measure
continuous variation for specific traits (Lipo, 1997: 304). This is true to some degree, because
seriation does not actually measure time: it measures similarities or differences between
predefined classes of artifacts or attributes. The dimension of time is inferred on the premise of
rnonotonic change.
The clairn that archaeologists can track continuous culture change seems highly unlikely.
And the implication that seriation techniques are more reliable than stratigraphie analyses is
equaIly improbable. Continuous change in human societies is not analogous to changes observed
in archaeological remains. Artifacts. wilike cultures or societies, are discrete. There can be no
observation of continuous change in an artifact, only the difference between two or more
empirical units can be observed. Any reference to 'change' over time is purely metaphorical.
Pots do not grow handles or pass them on to the next generation of pots. Change in the design of
a pot really means that the next pot manufactured had a different design than the first one. Living
cultures may be in a "constant state of flux" (Lyman et al. 1997: 5) or "in the process of
becoming" (Dunnell 1982: 8), but artifacts are not. There was at no time a genetic connection
between pots. only information transfer between people. Any notion that constant change c m be
observed in the archaeological record is. in itself. essentialist because we are assuming both that
the property of difference in artifacts is related to the process of evolution and that this difference
represents "continuous change". Archaeological data display only differences fiom which
change is inferred. The evolutionists are correct when they daim that typological thinking cannot
account for continuous change and. consequently. evolution must occur in steps or jumps frorn
one difference to another (Lyman et al. 1997: 5; Mayr. 1994: 2). But it is unlikely that population
genetics or population thinking could do otherwise with archaeological data, simply because
there is no continuum to be observed, only the steps. Another difficulty is determining which
individuds belong to any population before measurements are taken. Some qualifications need to
be defined before individuals can be selected. And finally. to measure change between
populations over time requires some means to detennine the temporal association of individuals
within a population.
Creating associations arnong artifacts remains a problem for evolutionists because of their
primarily strata-free approach to interpretation. In the DunneIIian approach, each artifact class
must have its own trajectory of change and, therefore, the whole of evolution is seen to occur as
an almost infinite number of individual trajectories. In fact, Lyman et ai. (1997) are suspicious of
concepts or methods of time reckoning that rely on stratigraphic superposition or association.
They remind us that, while superposition orders depositional units, it does not necessarily order
the contents of those units in their true order of appearance (Lyman et ai. 1997: 74, 77; DunneI1,
198 1 : 75). This statement may be true but it is a little simplistic. Many other kinds of evidence
can be used to detennine a sequence on the basis of contents. For instance, findings fiom a
nurnber of excavations w-ill otten determine the most likely sequence of pottery types.
Determining a ceramic sequence is inferential and is based on an ongoing process of discovery
and andysis. If, over the course of excavations, we can demonstrate that Pot A appears before
Pot B nine times out of ten, then whenever A is found associated with B, we know there is a Iow
probability that the mixed context will date any earlier than the first appearance of Pot B.
Lyman et al. (1 997: 173) daim that the use of stratigraphically defined associations is more
damaging than helphl and that the use of strata as collection units (and the use of essentialist
type fossils) disallows the detection of continuous change at the levei of culture units. But
artifacts found together in a single context are temporally associated, whether or not they were
made at different times. The interesting problem is to determine how they becarne associated and
what this means in terms of archaeological interpretation. Despite their suspicion of the
reliability of stratigraphic contests for ordering artifacts, the materialists do not offer an
alternative rnethod for ascertaining associations and this is one of the weaknesses of their
approach. How, indeed, can we discern artifact patterning or discuss issues relevant to past
hurnan societies if we cannot associate artifacts? What the evolutionists are implying is that
stratigraphic context plays a minor role in the determination of culture change. Instead, they
suggest that we should seek out change by studying developments in individual classes. The
problem with this approach is that it has no practical application in the analysis of hurnan
interactions.
In sum, periodization is a fonn of classification that is essential to any study of regional
processes of culture change. On an ideal level, a period is a space-time unit that, at its finest
resolution, represents the remains of al1 human activity on a past landscape for any instant in
time. Attaining this ideal seems unlikely but. nonetheless, it remains a goal of archaeological
method. On a practical level, al1 archaeological penods represent a duwtion of time and it is the
length of that duration that determines what questions can be asked or answered. The daim that
archaeological change should be measured on a continuous (interval) scale rather than in steps
(ordinal scale) because time is continuous is actually moot. At best, archaeological time units can
only approximate an interval scale of measurement. Even in the few isolated cases where
dendrochronologies c m narrow durations to 20 or 30-year intervals (e-g., Schlanger and
Wilshusen, 1993), we are still creating periods with their associated mors of measurement. -
Change in the archaeological record cannot be monitored on an interval scale of measurement
given the present state of scientific development, and the furùier back in time our inquiries take
us, the more improbable this notion becornes.
Regional time penods, like any other class of phenomenon, are created in order to associate
archaeological materials from a number of sites within a single duration. Most methods used to
create periods rely almost exclusively on the homogeneity of assemblages as a measure of
temporal affinity. But this is not necessary, as will be demonstrated, and phases c,ui be created in
a systematic manner based on theoretical models that use either relative or time placement
(absolute) dates, or both (discussed fùrther in Chapter 3). Each dating method has inherent
strengths and weaknesses but. when used together, their ability to define periods, both in terms of
time and assembIages, is enhanced.
Dating Models
AI1 dating models are theoretical. Even a calendar date rests on astronomie theory and a
number of assumptions. Excluding seriation techniques, relative dating models are based
pnmarily on the stratipphic "law of superposition" (Harris, 1979), which maintains that any
stratigraphic unit covenng another must necessarily be younger. Logically, this law cannot be
disputed but, practically. it is oflen dificult to define a stratigraphic unit. In archaeology, as in
geofogy, a unit (deposit) should be defined lithologically. using characteristics such as soil
composition, inclusion size. sorting. and colour. In the field, however. the distinctions between
deposits never seem quite as obvious as they do in theory, and much time is spent discussing
where one deposit ends and another begins and which one overlays the other. Certainly, fûrther
advances in soil science and technique will enhance our ability to distin y ish deposits and the
formation processes that created them. Nonetheless. defining a "context" requires a number of
assumptions and grouping artifacts on the basis of this context requires a further set of
assumptions as well as bridging arguments (Dean. 1 978). There is always roorn for error and the
greater the cornplexity of the problem, the greater the chances that the stratigraphic sequence as
constructed is not a true picture of events.
The law of superposition cannot be easily extended to the contents of stratigraphic units.
Stratipphic units, if correctly defined. will order their contents by the date of deposition but
will not necessarily order the contents by their date of manufacture, as discussed above. Despite
these dificulties, the usefulness of context cannot be ignored. 1 reiterate two points. First, a
deposit. whether sealed or not, is the only means we have for determining the association of
artifacts in prehistory. Second. the reliability of these associations can be determined only with
additional evidence. such as by the number of observed superpositions.
Cross-dating is a method used to date deposits by means of their contents when those
contents have been independently dated by some other means. For example, certain kinds of
pottery from known periods can be used to associate two separate deposits in time. A
considerabie range of error can accompany cross-dating. This is because, even if a date is known,
as with a dated coin. the dated object can only act as a terminus post quem. In other words, the
deposit c m date no earlier than the date of the coin but it could date much later-
A related logic is that of terminus aHte quem. If a dated wal1 or other feature covers a
deposit, then the deposit can date no later than that particular feature. The use of a terminus ante
quem is seldom feasible and, in most cases. artifacts are used as a terminus post quem by setting
a lower limit on the date of deposits. Where the possibility of intrusive artifacts can be mled out,
the youngest artifact necessarily sets the lower limit. If for exarnple, Late Iron Age pottery is
found in association with Early Bronze Age pottery, we know that the date of the deposit can be
no earlier than the Late Iron Age period.
Absolute dates, such as radiocarbon dates, are not truly absolute. Dean calls these kinds of
dates "tirne-placement" dates (Smiley, 1955; Dean, 1978) because, once calibrated, they are
actually probabilistic intervals (e.g. 3000 * 50 BC). A time-placement date acts as a terminus
posr quem for any deposit provided that we can safely associate the dated materïak with the
deposit in question. Models of period construction using either time-placement or relative dates
are discussed in more detail in Chapter 3.
The next chapter introduces the southem Levant and discusses the particular problerns of
archaeological interpretation associated with the Chalcolithic period. Chapter 3 deals specificaily
with models of pet-iod construction and related classification issues. Chapter 4 introduces the
Unitary Association Method of Relative Dating and gives a simple demonstration. Chapter 5
comprises the actual analysis of the period, explains the classification system in more detail, and
discusses issues relevant to the analysis at hand. Chapter 6 is a discussion of the results and their
impIications for the prehistory of the southern Levant during the Chalcolithic period.
2. THE SOUTHERN LEVANT (5500-3500 BC)
Introduction
In the southem Levant, the Chalcolithic penod follows the Late Neolithic period (5500-4600
BC) and precedes the Early Bronze Age 1 (3500-3 100 BC). The generally accepted range for the
Chalcolithic is 4600-3500 E3C. although it is likely that these dates are correct for only a very
specific pet-iod of Chalcolithic occupation in the region.
The advent of the Late Neolithic period is marked by the appearance of pottery and, .
economically, it is associated with smaIi communities and subsistence agriculture. In the
following Chalcolithic period, agriculture and animal husbandry continue as the economic basis
of society, although evidence of preserved textiles. copper artifacts, and improved pottery
manufacturing techniques suggest that economies were becoming more diversified and
specialized. Cornmunities were substantially larger than in the previous period, reaching, for
instance? 20 ha at TulayIat (Tuleilat) Ghassul (Bourke. 1997a: 395) just north of the Dead Sea,
and 9.5 ha at Shiqmirn (Levy and Alon. 1987: 154) in the northern Negev (Figure 3).
The Region
Geography and Climate
The Levant encompasses the eastem Mediterranean shores and adjacent highlands, including
parts of Syria, Lebanon, Israel. Palestine, and Jordan (Figure 1). The use of the term "Levant"
dates to the time of the Crusades in the 1 Ilh century when it referred to the Middle East in
general. Today, archaeologists use the term "southem Levant" to include Palestine, Jordan,
Israel, and the southern-most parts of Lebanon and Syria, which are generally those areas south
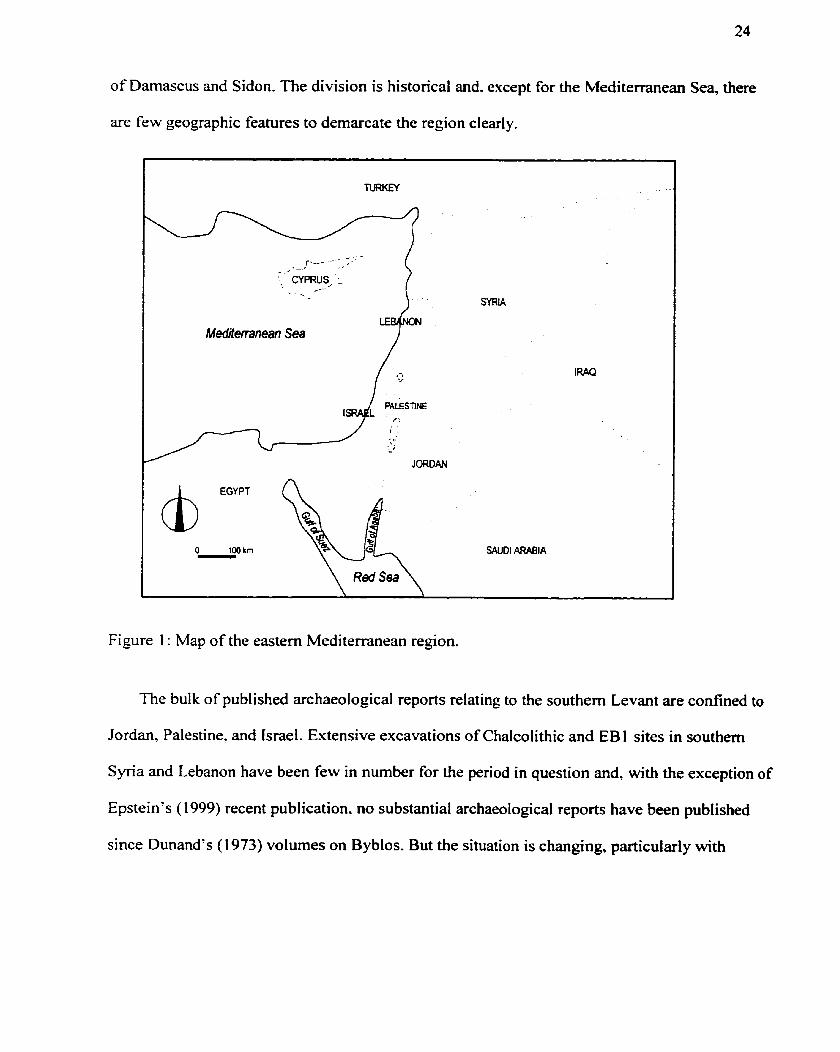
24
of Damascus and Sidon. The division is historical and. except for the Mediterranean Sea, there
are few geographic features to demarcate the region clearly.
, CYPRUS, i ,-- . L mRlA
LE Mediterranean Sea
IRAQ
Figure 1 : Map of the eastern Mediterranean region.
The bulk of published archaeological reports relating to the southern Levant are confïned to
Jordan, Palestine. and Israel. Extensive excavations of Chalcolithic and EBI sites in southem
Syria and Lebanon have been few in number for the period in question and, with the exception of
Epstein's (1999) recent publication. no substantial archaeological reports have been published
since Dunand's (1 973) volumes on Byblos. But the situation is changing, particularly with
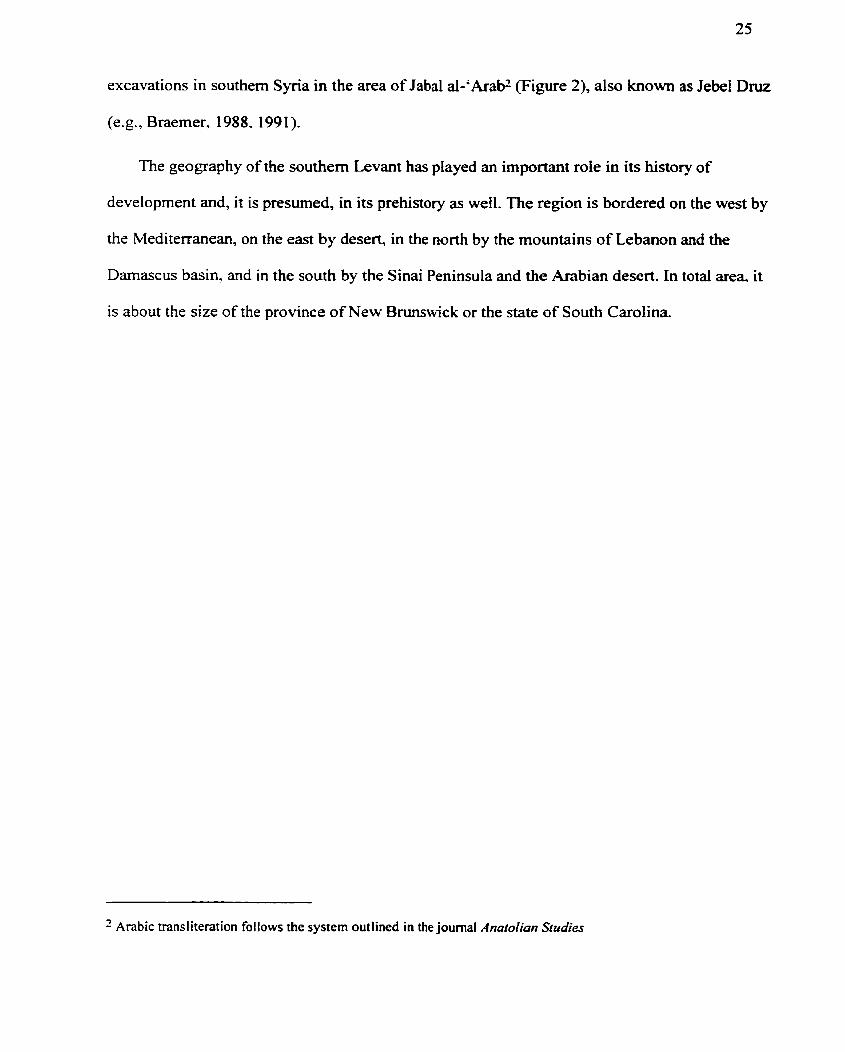
excavations in southem Syria in the area of Jabal al-'Arab2 (Figure 2), also known as Jebel Druz
( e g , Braemer, 1988. 1991).
The geography of the southern Levant has played an important roie in its history of
development and, it is presumed, in its prehistory as well. The region is bordered on the West by
the Mediterranean, on the east by desert, in the north by the mountains of Lebanon and the
Damascus basin. and in the south by the Sinai Peninsula and the Arabian desert. In total area it
is about the size of the province of New Bruns\Ilck or the state of South Carolina.
Qrabic transliteration follows the system outlined in the journal Anarolian Srudia
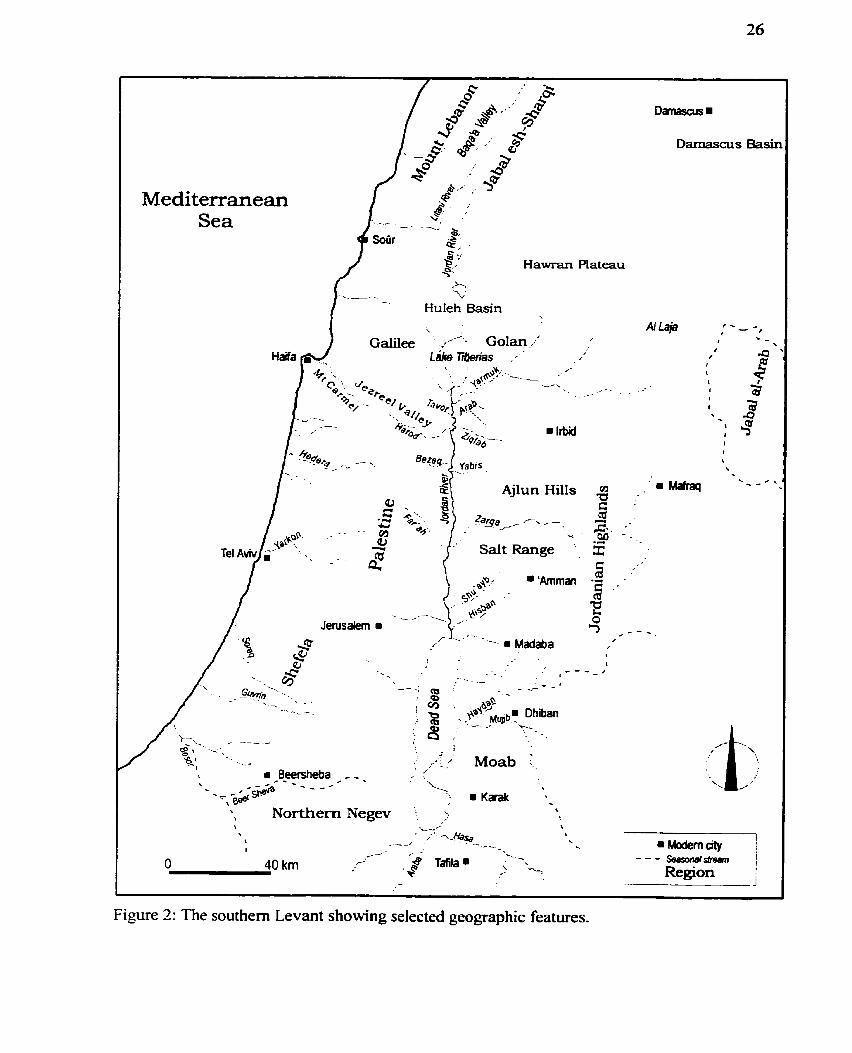
Hawran mateau
Figure 2: The southem Levant showing selected geogtaphic features.
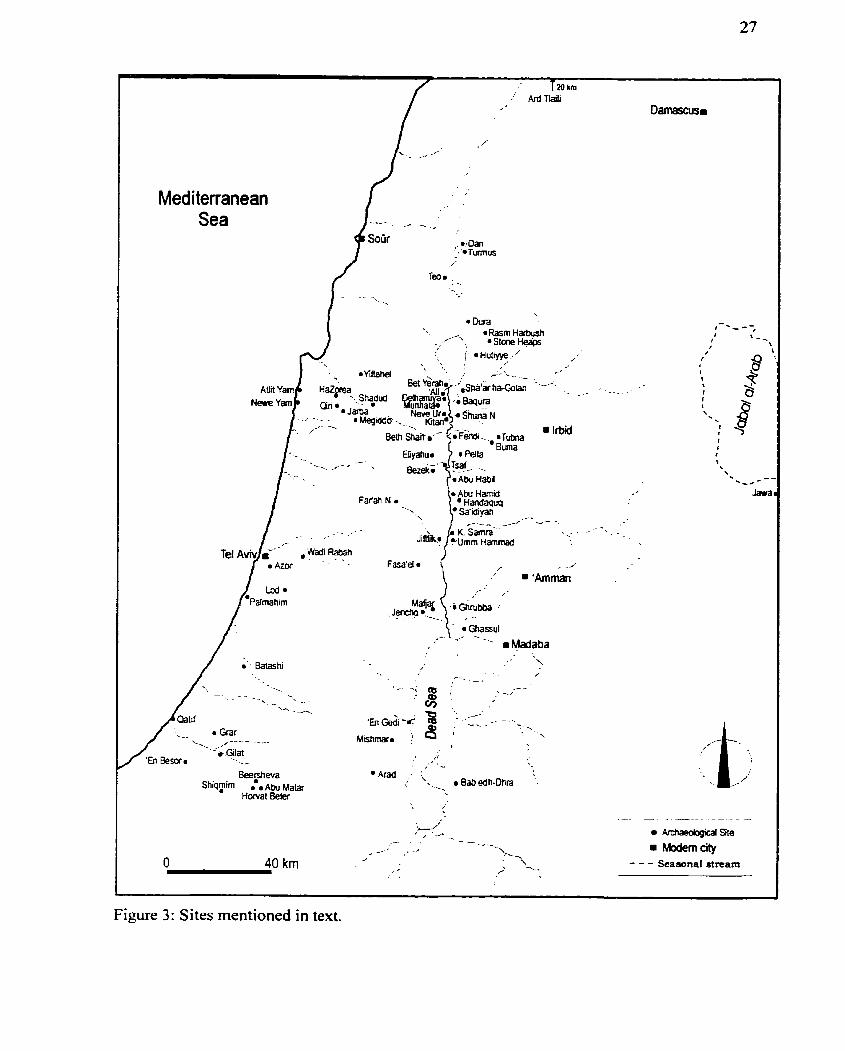
Meditenanean - - - - - _ _- __,
-- - . - - .- A
Archaedogical Site
m Modem city
Figure 3: Sites mentioned in text.
The region consists of a number of environmental zones that vary primarily by soi1 type,
elevation. and annual precipitation. Soils covering the limestone outcrops of highland regions are
primarily red Mediterranean (terra rossa) (Bender, 1974: 187). The Jordan and Jezreel valleys
consist of colluvial and alluvial soils mixed with lisan marls. Yellow steppe soils surround the
Dead Sea and extend south into Tafila and the Negev, and grey desert soils extend fiirther south
to the Gulf of Aqaba. Much of the Golan (Jawlan) and the Hawran (Hauran) is a basalt outcrop
covered by yet low steppe soils. These basal t outcroppings extend southeast through Jabal al-
'Arab and into the eastem Jordanian plateau to an area known as the Black Desert. Sandy red
soils occur on the coastal plain and, further south, loess deposits stretch into the Sinai.
The climate of the region is predominately Mediterranean but there are several
environmental zones. The mountains of Lebanon to the north receive the highest mean annual
precipitation (>900 mm) in the region whereas Galilee. the Hawran, the Jabal al-'Arab ( D u e ) ,
the northem Coastal plain, the West Bank highlands, the 'Ajlûn, and the Salt ranges al1 have
annual means ranging between 500 and 900 mm. The southem coastal plain, the highlands just
east of the Jordan Rift, the Jordan Valley, and the plateau extending into the Mafraq region have
mean annual rainfalls between 100 and 500 mm. The rest of the region receives, on average, less
than 100 mm of precipitation per annum. Much of the rainfall is intense and occurs almost
exclusively in the winter months (November to March).
The Jordan Valley region, which is the geographic focus of this study, is fertile but receives
little rainfall, particularly in the south. Much of the present agriculture within the valley relies on
imgation and is dedicated primarily to fruit trees and vegetables. Throughout the region, crops of
wheat, barley, and vegetables are cultivated where rainfall allows, or where alternative water
sources are available. In the highlands, the olive is a popular crop that has been cultivated in the
region since at Ieast the Chalcolithic period (Neef, 1990; Liphschitz et al., 1991 : Epstein, 1993;
Galili and Sharvit, 1995).
Natural vegetation zones are the best approximation of regional environmental zones. There
are three primary vegetation zones: Mediterranean, irano-Turanian steppe, and desert, although
microenvironrnents exist throughout. These zones are more closely associated with elevation and
rainfall patterns than they are with soi1 types. This means that p s t climatic conditions would
have greatly affected the potential for the development of agriculture and anima1 husbandry
within the region and this, to sorne degree. would have influenced regional settlement patterns
and inter-regional interactions.
Reconstructions of paleoclimate and paleoenvironment for the 5* and 4" miIlennia BC
remain unresolved and much of the evidence is contradictory (e-g., Neev and Emery, 1967;
Crown, 1972; Horowitz. 1974: Neev and Hall, 1977; Bottema and van Zeist, 198 1 ; Bintliff and
van Zeist, 1982; Goldberg and Bar-Yosef, 1982; Darmon. 1984; van Zeist. 1985; Koucky and
Smith, 1 986; Goldberg and Rosen. 1 987; Leroi-Gourhan and Darmon, 1 987; Goodfriend, 1 990;
Rossignol-Strick. 1993; Goldberg. 1994). Many reconstructions focus on periods preceding the
Neolithic. but a combination ofresults derived from various analytical techniques tends to
support the view that the Late Neolithic and the initial stages of the Chalcolithic were warm and
wet. whiie the Early Bronze Age was accompanied by increasingly arid conditions.
Recent paleoclimate research for the eastem Mediterranean region employs a nurnber of
data sources, including deep-sea cores, land cores, fauna, pollen analysis, sapropels (organic sea
layers indicating increased fiesh water runo@, marine oxygen isotope levels, the depth of certain
corals, and stalagmites (e-g., Rossignol-Strick, 1 993; Fontugne et al., 1994, Frumkin et al.,
1 999). Rossignol-Strick (1 993) concluded that two optimum periods (warm and wet) separated
by a b ie f dry penod occurred within the Mediterranean region in the last 10,000 years; one from
9000 to 7500 bp3 and another frorn 7000 to 6000 bp. The conclusions reached by Goldberg and
Rosen ( 1 987: 29) are similar. They see two wetter intervals. one extending fiom 9000 to 7000 bp
and another at 5500 bp. Fontugne et al. (1994: 83). in their analysis of Nile river discharge,
concluded that major flooding occurred between 9300 and 8000 bp, although the pluvial penod
extended for a longer period. ranging between 9300 and 4000 bp.
Funher support for a wetter climate during these periods cornes from the Ghab marsh in
northwestem Syria (Niklewski and van Zeist, L 970; van Zeist and Woldring, 1980) and fiom
pollen cores from the Huleh Basin, north of Lake Tiberias (Horowitz. 1974, 1979; Bottema and
van Zeist. 198 1 : 1 16; Baruch, 1986). Paleobotanical evidence fiom the Huleh basin for the
penod 1 1000-2000 bp. suggests that a rnixed forest of primarily deciduous oak (Quercus), pine
(Pin us). pistac hio (Pistacia paiaest ina), olive (Olea e iwopaea), and cedar (Cedrus) existed
throughout most of the sequence. Different genera covered the region in variable proportions,
depending on elevation and rainfall (see also Baruch and Bottema, 199 1). According to the
Huleh pollen diagram. forests expanded between 7500 and 5000 bp and the variety of species
increased (Bottema and van Zeist. 198 1 : 1 16; van Zeist and Bottema, 1982). Pollen cores fiom
the Ghab region of northwestern Syria date back to 1 ZOO0 bp. In addition to the genera
mentioned above, these included ash (Fracinus) and alder (Alnus orienralis) (Niklewski and van
Zeist, 1970; van Zeist and Woldrïng, 1980). Alder is often found in nvenne forests together with
willow (Salk) and plane (Plutanus) (Zohary, 1973: 378). Alder, along with other marsh plants,
was also identified in basal levels at Tulaylat Ghassul, a Chalcolithic site located in a
3 Ail paleoenvironmental dates are those given by the authors and these are assumed to be uncalibrated unless
explicitly stated otherwise.
now-desertic area just north of the Dead Sea (Webley. 1969). When these forests occurred in the
Ghab sequence is uncertain. The sequence is poorly dated and. afier the peak period in 10000 bp,
it is possible to determine only that the next period of forest expansion in the mid-Holocene
occurred p io r to 4000 bp.
Accepting that optimal periods, or pluvials, occurred does not necessarily imply that the
intervening or following climatic periods were desertic or in any way similar to that seen today.
For instance, Fontugne et al. (1 994) maintain that. up to 4000 bp, the climate was significantly
wetter in the eastem Mediterranean than it is today. Their results suggest that the rate and extent
of climatic change may not have been great enough to be a causal factor for economic or
sociopolitical change.
Severai early historical accounts tend to support the notion that past climates and
environments were quite different than they are now. In one Egyptian account from the Middle
Kingdom (2023-1633 BC), the environment of the land of the Asiatics (Levant) was described as
". . .aMicted with water. dificult fiom many trees. the ways thereof painfûl because of the
mountains" (Wilson. 1969c: 41 6; Joffe, 1991 b: 6). This description would have been apt for the
south Levantine Coast before the rnarshes were drained in modem times.
In another case. an oficial of Thutmose [II (1490-1436 BC) obtained cedar timbers fiom
Lebanon that he claimed were 60 cubits (approx. 28 m) in length (Wilson, 1969a: 243), which
may not be too much of an exaggeration as the average height for these trees (Cedrus libani) in
ideal conditions is 24 m (Little, 1996: 258). Another oficial from the time of Amenhotep II
(1 447- 142 1 BC) writes of forests in the Orontes region of Syria teeming with gazelle. hares, and
wild asses (Wilson, 1969a: 246). Later, in the 1 3'h century BC, a royal official of Hori speaks of
the sarne region being ". ..overgrown with cypresses and oaks and cedars which reach the
heavens." and claims that "Lions are more nurnerous than leopards or hyenas." (Wilson, 1969b:
477). Most of these references refer to the Lebanon region, and probably the Litani River valley
(Figure 2), and some caution is needed in their application to areas in the south. Nonetheless, it is
likely that environmental conditions in the south were quite different from those seen today and,
for the Chalcolithic period and the initial phases of the Early Bronze Age in particular, the
climate was probably wetter and the flora and fauna more diversified.
Events and interactions within the region for this period were afTected by other changes. Sea
levels continued to rise, as witnessed by the increasing number of Neolithic sites found under
water off the coast of Israel (Galili and Weinstein-Evron. 1985; Galili er al.. 1989, 1993; Galili
and Sharvit, 1995), and inland lakes were disappearing (Begin et al., 1974; McClure, 1976;
Begin et al., 1980; Koucky and Smith, 1986).
During the Upper Pleistocene, most of the Jordan depression, from the Hula Basin to just
south of the Dead Sea, was covered by a saline lake calted Lake Lisan (Begin et al., 1974, 1980;
Bender, 1974: 26; Neev and Hall, 1977; Horowitz. 1979). Past variations in the depth of the lake
are determined by geological anaiyses and these variations are used as climatic indicators to
estimate pluvial and interpluvial periods. On present evidence from the Dead Sea region, the lake
is thought to have reached a maximum elevation of -1 80 m ASL by 13000 to 1 1000 bp, a time
that coincides with Natufian archaeological assemblages (Macmber and Head 1991 : 170) . At
this height, it would have k e n approximately 80 to 100 m deep. M e r reaching a maximum, the
lake is believed to have receded rapidly, partially refilled between 10000 and 7000 bp, and
dropped again from 7000 to 5000 bp (Goldberg and Rosen, 1987: 25; Neev and Hall 1977: 2).
Changing Dead Sea levels suggest that another pluvial occurred between 4000 and 2500 bp.
Except for the last pluvial. this scenario fits with the climatic evidence given previously.
Koucky and Smith (1 986) maintain that the sudden drainage of Lake Lisan by 1 1000 bp was
caused by tectonic activity centred about the Marma Faiyad narrows, which is located in the
Jordan Valley between Wadi Yabis and Wadi Zarqa. Their theory is that tecto~if shifis t i ~ ~ e d
the upper portion of the lake to the north and the lower to the south, causing ~Eike Lisan to drain
through the Wadi Araba and into the Gulf of Aqaba leaving behind the Dead '%a and a northe*
lake called Lake Baysan. Picard (1 929) previousiy proposed the existence of a northem l a k a
theory also supported by Begin et al. ( L 974). Both Picard and Begin et al. noticed a distinct
difference in lake sediments between the nonhem and southem areas. The preWnce osmcod,
gastropod, and fieshwater diatoms in these sedirnents suggested that the northCm l*e was
freshwater rather than saline. It is possible, however. that the inflow of fresh vlater from the
north caused the northern end of the take to be less saline.
The desiccation of either Lake Baysan or Lake Lisan does not appear to hP'e k e n an
isolated event. Radiocarbon-dated geornorphological events in Saudi Arabia sriggest that inland
Ide s existed there from 9000 - 6000 bp (McClure. 1976). The recession of thd Saudi lakes and
Lake Lisan at about the same tirne appears to fit most of the climatic evidence, hi ch suggests
that more arid conditions prevailed after 6000 bp. The drying of these lakes mPY alsO be d a t e d
to changing monsoon patterns (Rossignol-Strick. 1 993: 146).
Goldberg (1 994: 92-93) maintains that Koucky and Smith's (1 986) theo j of a so-cakd
Lake Baysan is untenable. He takes the view that the lake remained a unified flhole and that the
disappearance of Lake Lisan resulted from desiccation rather than tectonic activity- O n the basis
of environmental and settlement studies in the lower Jordan Valley (~chuldeniein and Goldberg9
1 98 1 ; Bar-Yosef, 1 987; Hovers and Bar-Yosef, 1989). Goldberg maintains th& the E=~Y
Neolithic (ca. 10000 to 8500 bp) ".. .was characterized by a water table risc, alluviation and
presumably wetter conditions" (Goldberg, 1994: 94). but he is not clear on whether or not he
agrees with Neev and Hall's (1977) argument that the lake refilled at this time. Bar-Yosef and
Gopher (1 997: 248) maintain that the archaeological evidence does not support Koucky and
Smith's theory. In particular, they cite the Pre-Pottery Neolithic A (ca. 8500-7500 BC) site of
Gesher, which lies at -245 mASL. The elevation of this site contradicts any notion that the area
was flooded at this tirne. More important. is Macumber and Head's (1 991) research in Wadi al-
Hammeh, Jordan, a tributary of the Jordan River about 30 km south of Lake Tiberius. They
concluded that Lake Lisan began to dry by 11.000 bp and make no suggestion that it refilled at
any time thereafter, although they do imply that the valley region would have remained a flood
plain for sorne tirne. Their work supports the findings of earlier research around the Dead Sea,
which also disputes any notion of a separate Lake Baysan.
In summary, the climate was probably wetter throughout the Neolithic and in the initial
stages of the Chalcolithic. Greater precipitation occurred in now-arid zones, such as the northem
Negev. The climate, as well as lake levels. played important roles in the determination of
seulement patterns and of regional interactions. Table 1 sumrnarizes the pluvial periods predicted
by various geological and palynological analyses. Both the Ghab and Jordan depression pluvials
appear earlier than the rest. Baruch (1994) suggests that the Ghab sequence, rather than the
Huleh, is dated too early. If this is the case. then perhaps Neev and Hall's (1977) high Dead Sea
levels, which are also poorly dated, are too early as well.
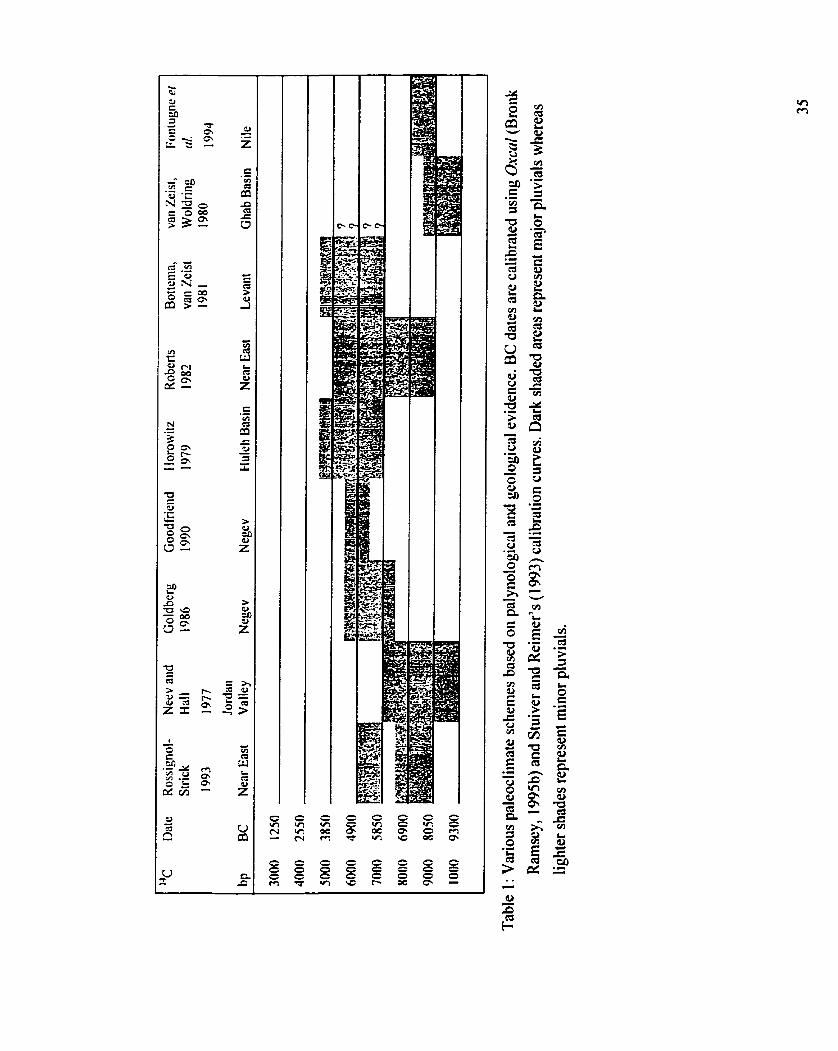
Settlement and Interaction
The exposure and desiccation of the Jordan Valley prior to the Chalcolithic period set the
stage for major social and economic changes within the southern Levant. Not only did it offer
tremendous potential for an increase in agricultural yields but it also opened up est-west routes
within the region and allowed for increased inter-regional interaction. The Jordan Valley was not
the only area opened to settlement as a result of clirnatic changes. More sites began to appear
through the Jezreel Valley and in the Hula Basin. particularly in the Early Bronze Age (see Joffe,
199 1 b, 1993).
At about the sarne time as these geomorphological and climatic changes were taking place,
important political changes were occurring within the greater Near Eastern region. An expanding
Syro-Mesopotarnian influence was forming to the northeast and, to the southwest, important
political changes were taking place in Egypt in the Pre-Dynastic period, which preceded the
unification of Upper and Lower Egypt under the First Dynasty. It is likely that the sociopoiitical
changes occurring in these two regions were related in some manner, as archaeological evidence
suggests that some kind of interaction occurred between them (Kantor. 1952, 1992; H o f i a n ,
1990: 392; Moorey, 1990). In light of these developments, the Levant was probably a crossroads
of exchange in commodities and information at this tirne, and any explanation of social change
for the region should consider exogenous as well as endogenous sociopolitical factors.
Main routes of travel and, presumably, interaction between regions wouid have been dong
the Mediterranean Coast, or by way of the highlands to the east of the Jordan Valley. Judging
fiom the location of the Earty Bronze Age sites of Jawa (Helms, 1975, 1976, 1977) and Khirbet
Umbashi (Braemer pers. comm.). located near Jabal al-'Arab in the Mafiaq desert region of
Jordan, it is possible that eastern routes to Mesopotarnia were used also.
Interna1 routes would have followed similar patterns along the littoral, the highlands, the
Jezreel and Jordan Valleys. the Wadi 'Araba and. south of Damascus, along the Hawran plateau.
The desiccation of the Jordan Valley would have greatly increased the potential for east-west
interaction in regions south of the Huleh Basin. Increasing levels of east-west interaction are
strongly implied by the similarity between Chalcolithic assemblages occun-ing at Tulaylat
Ghassul (Mallon et al., 1934; Koeppel. 1940; North, 196 1 ; Hennessy. 1969: Lee, 1973; Bourke
et al., 1995; Bourke. 1 997a; Blackfiam. 1999) and 4bu Hamid (Doll fus and Kafafi, 1986, 1988,
1993; Love11 et al., 1997) on the east and those in the Beersheba region to the west (e.g., Perrot,
1 954; Dothan. 1959; Goph- 1980; Gilead and Goren, 1986; Levy. 1987; Gilead et al., 199 1 ;
Gilead, 1995).
The time and ease of bave1 between and within regions would rely on a number of factors,
including mode of transport, the condition of routes, water and food supplies, and the degree of
regional hostility. Judging fiom faunal remains and laden figurines, it is likely that donkey
(Eqziris asinus) and, possibly, cattle (Bos raurus) were used as beasts of burden by the
Chalcolithic period (Josien, 1 955; Angress, 1959; Epstein, 1 985; Grigson, 1995). Grigson (1 993)
maintains that domestic horse remains (Eqrtus caballus) were found in context with Chalcolithic
assemblages at Shiqmim (Levy, 1987) but, to date, this is an isolated observation. It is most
likely that nearly al1 travel was on foot and, in some cases, by donkey.
The travel time between points depends on the speed of travel and the condition of the route,
which can be dificult to judge for the period in question. But if we assume that well-used paîhs
were taken at a leisurely Pace of 4 k d u for 6 hr a day, it would take 30 days to travel from
Cairo to Damascus, 8 days from the northem Negev to Mt. Carmel, and 4.5 days through the
Jordan Valley from Lake Tiberias to the Dead Sea. In the early 1800s, it took the Swiss
adventurer. John Burkhardt (1 992 [1822]) 73 days to ride an "old mare" fiorn Damascus to Moab
and then on to Cairo. During this tirne, he spent aImost 30 days at various places, including a 20-
day forced detention by the shaykh of Karak. In light of travel times. it is clear that the potential
for sociopoIiticaI interaction and trade was good. The presence of imported items at many sites
tends to confinn that interaction was intense. although the nature of exchange is unclear. But
even if trade was down-the-line rather than direct, there would still have k e n some form of
social interaction and information flow (Renfiew, 1975: 4 1-43),
Archaeological surveys have identified hundreds of Chalcotithic and EBI sites throughout
the region (Glueck, 1934. 1935, 1939; Amiran, 1953; Aharoni, 196 1 ; Ibrahim et al., 1976;
Amiran et al.. 1 980; Oren and Gilead. 198 1 ; Banning and Fawcett, 1983; Broshi and Gophna,
1984; Hanbury-Tenison et al., 1984; Lenzen et al.. 1987: MacDonald. 1988; Muheisen, 1988;
Yassine el al., 1 988b, 1988~; Herr et al., 199 1 ; Joffe, 199 1 b; MacDonald, 1992; Palumbo, 1994).
Two areas that have been extensively researched for Chalcolithic material are the Beersheba
region and the Jordan Valley, but important sites have been excavated on the Jezreel and Coastal
Plains.
Economics, Trade, and Social Organization
The appearance of different household features and artifacts at Chalcolithic sites suggest that
changes in social organization and economic strategies were occumng at this time. Brick or
Stone storage silos, underground silos, and large storage jars (up to 1 m wide and 1.6 m tall) are
characteristic of the Chalcolithic period and imply a marked change in the organization of
production from the Late Neolithic. By this time, settlements were Iarger, ranging to more than
20 ha at Tdaylat Ghassul (Bourke, 1997a: 395) and Pella (Smith and Hanbury-Tenison, 1986:
24). At Tulaylat Ghassul (henceforth. Ghassul), buildings were complex. Mud-brick walls were
built on Stone foundations using standardized mud-bricks, and floors and walls were plastered
and painted. Some buildings were probably two stones high. One wall found at Tulayl3 (a ruZay1
is a small hill) was still standing to a height of 4 m (Mallon et al. 1934: 36) and, judging From the
remains of the collapsed wall in North's (1 961) Area E2-3, Wall 16 once stood to a height of at
least 3.3 m. The height of these walls suggests that some buildings either had two stories or had
lofts, perhaps used for storage (Blackham, 1999). We also see the beginnings of intemal
plurnbing as evidenced by underground water channels and cisterns, which were usually Lime
coated (Mallon et al.. 1934: 43; Koeppel, 1940: 30 and p1.32.2; North, 1961 : Areas B and El).
The variety of domestic plant and animal remains found at various sites suggests that the
inhabitants of the region subsisted on mixed farming and pastoralism during the Chalcolithic
penod and added cultivated fruit crops in the Early Bronze (see Josien. 1955; Ducos, 1968;
Zohary and Speigei-Roy, 1975: Moore, 1983; van Zeist, 1988; Banning, 1985; Zohary and Hopf,
1988; Henry, 1989: Byrd, 1 992; and Grigson, 1 995 for overviews).
Cereals and legumes were common foods that had been in use for some time, and included
two-row and six-row barley (Horderrrn vzrlgare and H. sativtrrn), ernmer and einkorn wheat
(Triticurn tzrrgidum and T. monococcum). lentils (Lens esculenta), peas (Pisurn sativum), and
chickpea (Cicer arietinum). Al1 of these species were found in context at Naha1 Mishmar and
Horvat Beter (Zaitschek, 1959, 196 1 ). Mallon et al. (1 934: 40) report that most silos and
presurnably large storage jars at Ghassul contained grains, date pits (Phoenix dactyliJera), or
olive pits (Olea europaea). From the same site, Hennessy (1983: 58) located wheat, barley, peas,
and olives in large storage jars, and Bourke (pers. comm.) adds that a date pit was recorded from
his Late Chalcolithic levels (see also Bourke, 1997a; Blackham, 1999). Broad beans (Vicia faba),
olives (Olea europaea), dates (Phoenix dactylgera), and walnuts (Juglans sp.) were reported at
Nahal Mishmar (Zaitschek. 1961), but much of it was not carbonized and its provenience is
suspect. However? the excellent state of preservation observed in fabncs and other materials
within the cave site precludes any outright dismissal of the evidence. Flax (Linum
usitatissimurn). figs (Ficus carica), and olives were observed in EB 1 deposits at Tell Handaquq
North (biabry. 1995). Jericho (Hopf. l983), and Bab edh-Dhra (Richardson and McCreery,
1978).
Domestic anirnals included goat (Capra himrs). sheep (Ovis aries). pig (Sus scrofa), cattle
(Bos raurrrs). and probably dog (C'anis sp.) (Josien, 1955; Angress, 1959; Ducos, 1968; Lee,
1973; Finnegan, 1978; Clutton-Brock, 1979, 198 1 ; Kohler-Rollefson et al.? 1988; Gngson, 1989,
1 993 1 995; Rosen and Elder. 1993; Banning et al.. 1994; Horowitz, 1996). Other anirnals are
not well reported but assemblages are known to include gazelle (GuzeIla gazella), deer
(Cervidae). donkey (Eqtcus asininus), birds (Phasianidae) and fish. The use of fish as a food is
implied from copper hooks found at Ghassul (Lee, 1973: 281).
Evidence from a number of sites attests to the manufacture and use of linen and woolen
textiles, leather goods, basketry, and mats (Benoit et al., 1961 ; Crowfoot and Crowfoot, 1961 ;
Aharoni. 1962; Bar Adon, 1980). Other products include stone vessels and figures, carved
ivories, stone and clay figurines. gold rings, omaments of beads, pendants, bracelets, and
neckIaces made from bone. limestone, imported shell, hematite, cornelian, jade, and serpentine
(Mallon et al., 1934; Lee, 1973; Elliot, 1977; Amiran and Porat, 1984; Epstein, 1988; Gilead and
Goren, 1989; Gopher et al., 1990; K. Wright 1994). Copper goods include the fish hooks
mentioned above as well as axes, maceheads, pins, beads, points, rings, chisels, scepterç, and
bowls. These appear at a number of sites in the northem Negev as well as at Nahal Mishrnar,
Ghassul, Meser, and Palmahim (see Hanbury-Tenison, 1986; Goren, 1992 for an overview). The
production of these goods as well as an increasing standardization in the production of certain
pottery forrns (Kangas, 1994) and mud brick sizes (Blackharn, 1999) suggests that a widening
and more cornplex economic system was developing. incorporating a degee of localized craft
specialization and trade (Levy, 1986; Rosen, 1986; Kemer, 1997).
Exchange within the region is evidenced pt-imarily by sourcing materials, such as copper,
basait, pottery fabrics, shells, and semi-precious Stones (Ben-Tor, 1 986; S halev and Northover,
1987; Esse, 199 1 : Levy. 1995). Retated arguments for inter-regional contacts are usualiy drawn
frorn similarities in pottery styles, architecture. figurines, lithics and other objects. The evidence
points to an increasing degree of exchange within the southern Levant. In the following EB,
there is mounting evidence of Mesopotarnian stylistic influences in the north and Egyptian
incursions into the south, as suggested by the finds at Byblos (Dunand 1973), Tell Erani (Brandl,
1989; Kempinski and Gilead, 199 1) and Naha1 Tillah (Levy er al., 1997). At this time, cylinder
seals (signature starnps) and ideogarns (such as the Narmer serekh. a syrnbol used by the first
king of Egypt) are added to the evidence for contact (Wright. 195 1 ; Dothan, 1953, 1971 ; Kaplan,
1959; H e ~ e s s y . 1967; Ben-Tor. 1 976; Weinstein. 1984b; Oren. 1989; Kempinski and Gilead,
1991).
Chronology and Interpretations
The chronology of the region has its own history of development. In 1937, G. E. Wright
defined an absolute and relative chronology for the southern Levant that spanned fiom the
Neolithic through the Early Bronze Age. He based his sequence on published reports for several
sites, including Jericho (Garstang, 1932, 1935. 1 936), Beth Shan (Fitzgerald. 1934, 1933,
'Affileh (Maisler, 1933; Sukenik, 1936). Gezer (Macalister, 1902, 1907. 19 12), Tell Beit Mirsim
(Albright, 1932b, 1933), Megiddo (Engberg and Shipion, 1934), and the Wadi Ghazzeh sites
(MacDonaid et al.. 1932). In this work, which was strongly influenced by the views of Albright
(193 1. 1932a). Wright (1937: viii) defined four chronological subdivisions for the Chalcolithic,
and four "ages" for the Early Bronze, of which only the first hvo are considered here (Table 2).
Wright borrowed the Early Bronze Age scheme fiom Albright (1933), who, in tum, based his
divisions on the Early Helladic chronology (Wright 1937: 56). Albright (1 922, 1926, 193 1,
1932a) had been concerned about the chronology of the region for some tirne. His efforts were
arnong the first to bnng some order to a rather ad hoc series of excavations that were conducted
prïmariiy to validate Biblical narratives (Lee, 1973: 3). Albright created his sequence using
Syrian pottery found in Egyptian tombs at Abydos (Petrie, 1900, 1901) to anchor the Levantine
Early Bronze sequence to the Egyptian First Dynasty. Many of the initial fomuIations were
based on the stratified sequence of Chalcolithic and Early Bronze Age pottery fiom Megiddo
(Engberg and Shipton, 1934) and Beth Shan (Fitzgerald, 1935) where the tendency to excavate
with little attention to stratigraphie detail ied to many false associations of artifacts (e.g., Early
Neolithic mixed with Early Bronze artifacts).
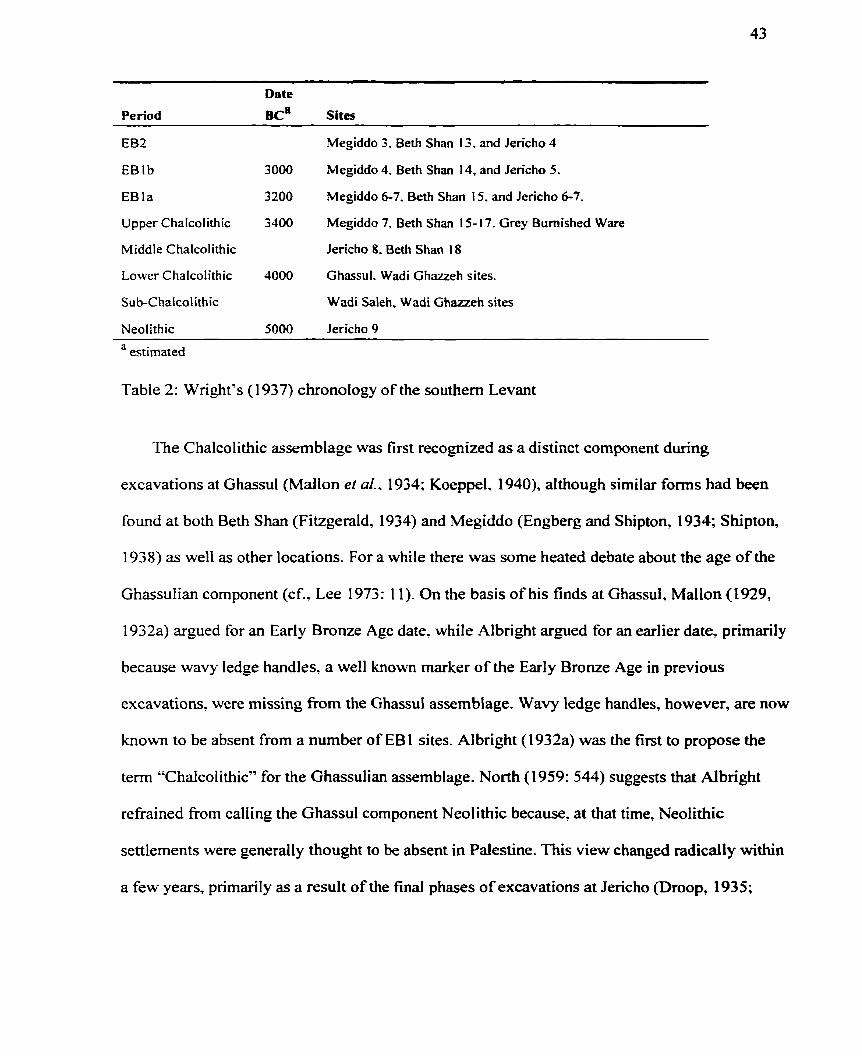
Period
- - . -
Date
B C ~ Sites -- --
EB2
EB 1 b
EB la
Upper Chalcolithic
Middle Chalcolithic
Lower Chalcolithic
Sub-Chalcolithic
Neolithic
- ~p - - -
Megiddo 3, Beth Shan 1 3, and Jericho 4
3000 Megiddo 4. Beth Shan 14, and Jericho 5.
3200 Megiddo 6-7, Beth Shan 15. and Jericho 6-7.
3400 Megiddo 7. Beth Shan 15-1 7. Grey Burnished Ware
Jericho 8. Beth Shan 18
4000 Ghassul. Wadi Ghazzeh sites.
Wadi Saleh, Wadi Ghazzeh sites
5000 Jericho 9
a estirnated
Table 2: Wright's (1 937) chronology of the southern Levant
The Chalcolithic assemblage was first recognized as a distinct component during
excavations at Ghassul (Mallon et al.. 1934; Koeppel. 1940), although similar forms had been
found at both Beth Shan (Fitzgerald, 1934) and Megiddo (Engberg and Shipton, 1934; Shipton,
1938) as well as other locations. For a while there was some heated debate about the age of the
Ghassuiian component (cf., Lee 1973: 1 1). On the basis of his finds at Ghassul, Mallon (1929?
1932a) argued for an Early Bronze Age date, while Albright argued for an earlier date, primarily
because wavy ledge handles, a well known marker of the Early Bronze Age in previous
excavations, were missing fiom the Ghassul assemblage. Wavy ledge handles, however, are now
known to be absent from a number of EBI sites. Albright (1932a) was the first to propose the
term "Chalcolithic" for the Ghassulian assemblage. North (1 959: 544) suggests that Albright
refiained fiom calling the Ghassul component Neolithic because, at that time, Neolithic
settlements were generally thought to be absent in Palestine. This view changed radicaliy within
a few years, primsully as a result of the final phases of excavations at Jericho (Droop, 1935;
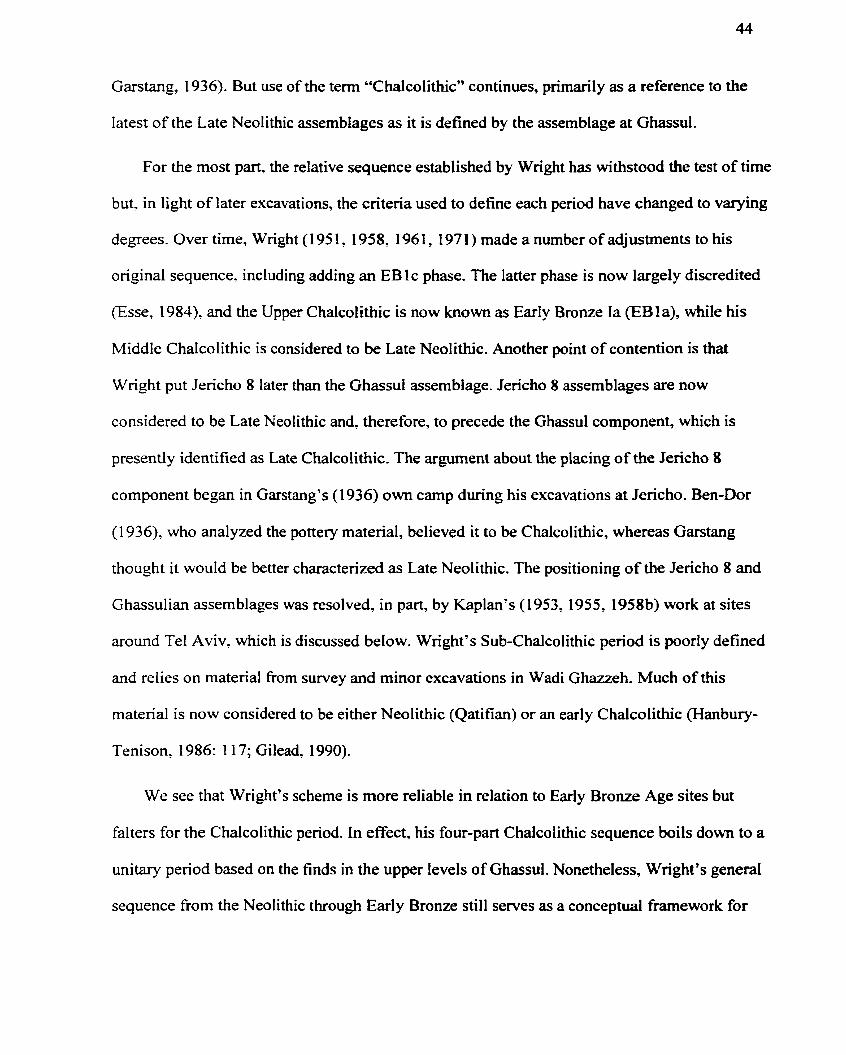
Garstang, 1936). But use of the term "Chalcolithic" continues, primarily as a reference to the
Iatest of the Late Neolithic assemblages as it is defined by the assemblage at Ghassul.
For the most part, the relative sequence established by Wright has withstood the test of time
but. in light of later excavations, the criteria used to define each period have changed to varying
degrees. Over time, Wright (1 95 1, 1958, 196 1, 1971) made a number of adjustments to his
original sequence, including adding an EBlc phase. The latter phase is now largely discredited
(Esse. 1984). and the Upper Chalcolithic is now known as Early Bronze [a (EB 1 a), while his
Middle Chalcolithic is considered to be Late Neolithic. Another point of contention is that
Wright put Jericho 8 later than the Ghassul assemblage. Jericho 8 assemblages are now
considered to be Late Neolithic and, therefore, to precede the Ghassul component, which is
presently identified as Late Chalcolithic. The argument about the placing of the Jericho 8
component began in Garstang's (1936) own camp during his excavations at Jericho. Ben-Dor
(1 936), who analyzed the pottery material, believed it to be Chaicolithic, whereas Garstang
thought it would be better characterized as Late Neolithic. The positioning of the Jericho 8 and
Ghassulian assemblages was resolved, in part, by Kaplan's (1953, 1955, 1958b) work at sites
around Tel Aviv. which is discussed below. Wright's Sub-Chalcolithic period is poorly defined
and relies on material from survey and minor excavations in Wadi Ghazzeh. Much of this
material is now considered to be either Neolithic (Qatifian) or an early Chalcolithic (Hanbury-
Tenison, 1986: 1 17; Gilead, 1990).
We see that Wright's scheme is more reliable in relation to Early Bronze Age sites but
falters for the Chalcolithic penod. In effect, his four-part Chalcolithic sequence boils down to a
unitary period based on the finds in the upper levels of Ghassul. Nonetheless, Wright's general
sequence from the Neolithic through Early Bronze still serves as a conceptual fiamework for
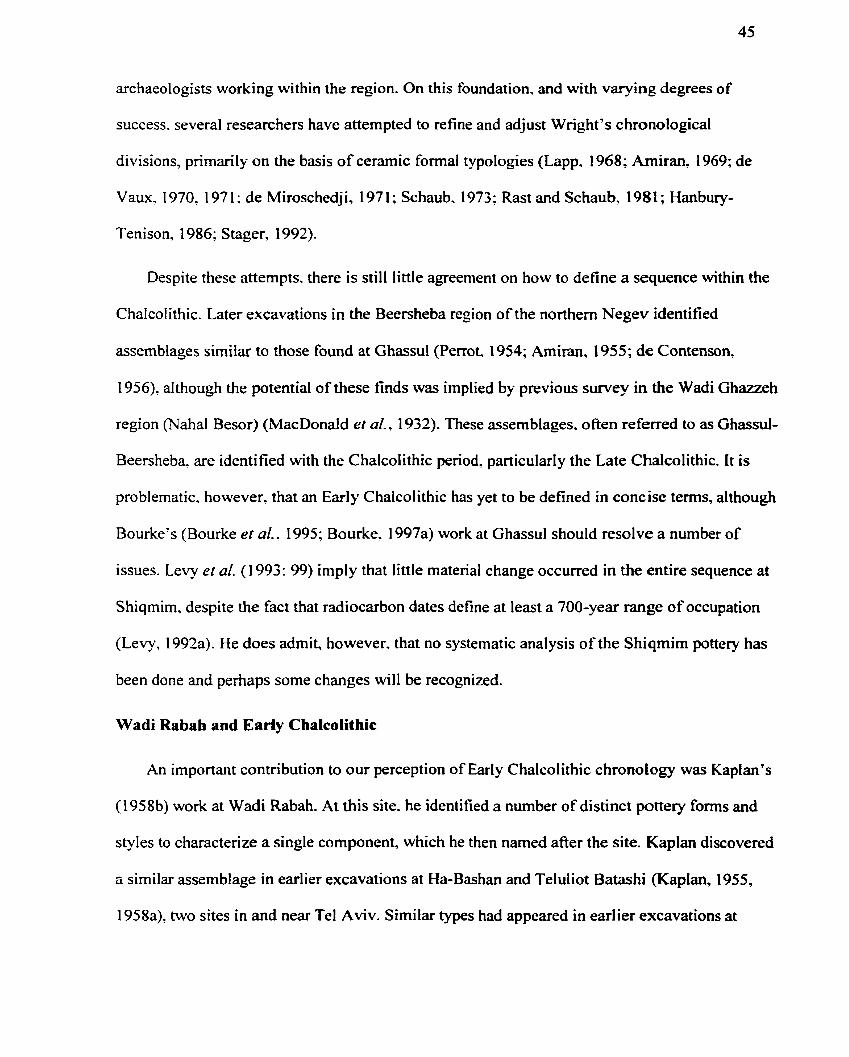
archaeologists working within the region. On this foundation, and with varying degrees of
success. several researchers have attempted to refine and adjust Wright's chronological
divisions, primarily on the basis of ceramic formal typologies (Lapp. 1968; Amiran, 1969; de
Vaux. 1970, 197 1 ; de Miroschedji, 197 1 : Schaub. 1973: Rast and Schaub, 198 1 ; Hanbury-
Tenison, 1986; Stager, 1992).
Despite these attempts. there is still little agreement on how to define a sequence within the
Chaicolithic. Later excavations in the Beersheba region of the northern Negev identified
assemblages simiiar to those found at Ghassul (Perrot. 1954; Amiran, 1955; de Contenson,
1956), although the potential of these finds was implied by previous survey in the Wadi Ghazzeh
region (Naha1 Besor) (MacDonald et al., 1932). These assemblages, ofien referred to as Ghassul-
Beersheba, are identified with the Chalcolithic period. particularly the Late Chalcolithic. It is
problematic. however. that an Early Chalcolithic has yet to be defined in concise terms, although
Bourke's (Bourke et al.. 1995; Bourke. 1997a) work at Ghassul should resolve a number of
issues. Levy et al. (1 993: 99) imply that little matenal change occurred in the entire sequence at
Shiqmim. despite the fact that radiocarbon dates define at least a 700-year range of occupation
(Levy, l992a). He does admit, however. that no systematic analysis of the Shiqmim pottery has
been done and perhaps sorne changes will be recognized.
Wadi Rabah and Early Chalcolithic
An important contribution to Our perception of Early Chalcolithic chronology was Kaplan's
(1958b) work at Wadi Rabah. At this site. he identified a number of distinct pottery forms and
styles to characterize a single component, which he then named afier the site. Kaplan discovered
a similar assemblage in earlier excavations at Ha-Bashan and Teluliot Batashi (Kaplan, 1955,
1958a), two sites in and near Tel Aviv. Similar types had appeared in earlier excavations at
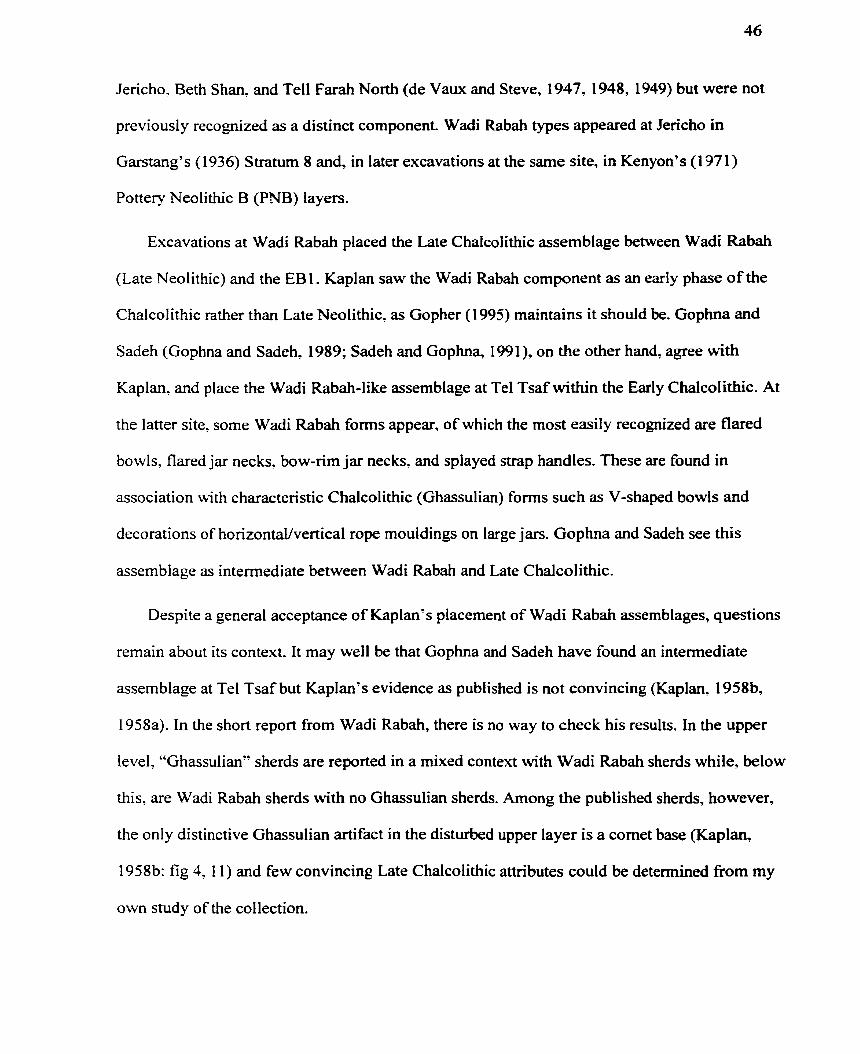
Jericho. Beth Shan. and Tell Farah North (de Vaux and Steve, 1947, 1948, 1949) but were not
previously recognized as a distinct component, Wadi Rabah types appeared at Jericho in
Garstang's (1936) Stratum 8 and, in later excavations at the sarne site, in Kenyon's (1 971)
Pottery Neolithic B (PNB) layers.
Excavations at Wadi Rabah placed the Late Chalcolithic assemblage between Wadi Rabah
(Late Neolithic) and the EB 1. Kaplan saw the Wadi Rabah component as an early phase of the
Chalcolithic rather than Late Neolithic? as Gopher (1995) maintains it should be. Gophna and
Sadeh (Gophna and Sadeh, 1989; Sadeh and Gophna, 1991), on the other hand, agree with
Kaplan, and place the Wadi Rabah-like assemblage at Tel Tsaf within the Early Chalcolithic. At
the latter site, some Wadi Rabah forms appear. of which the most easily recognized are flared
bowls, flared jar necks. bow-rim jar necks, and splayed strap handles. These are found in
association with characteristic Chalcolithic (Ghassulian) fonns such as V-shaped bowls and
decorations of horizontaWvertica1 rope mouldings on large jars. Gophna and Sadeh see this
assemblage as intermediate between Wadi Rabah and Late Chalcolithic.
Despite a general acceptance of Kaplan's placement of Wadi Rabah assemblages, questions
remain about its context. It may well be that Gophna and Sadeh have found an intermediate
assemblage at Tel Tsaf but Kaplan's evidence as pubiished is not convincing (Kaplan, 1958b,
1958a). In the short report from Wadi Rabah, there is no way to check his results. In the upper
level, "Ghassulian" sherds are reported in a mixed context with Wadi Rabah sherds while, below
this, are Wadi Rabah sherds with no Ghassulian sherds. Among the published sherds, however,
the only distinctive Ghassulian artifact in the disturbed upper layer is a cornet base (Kaplan,
1958b: fig 4, 1 1) and few convincing Late Chalcolithic attributes could be detennined from my
own study of the collection.
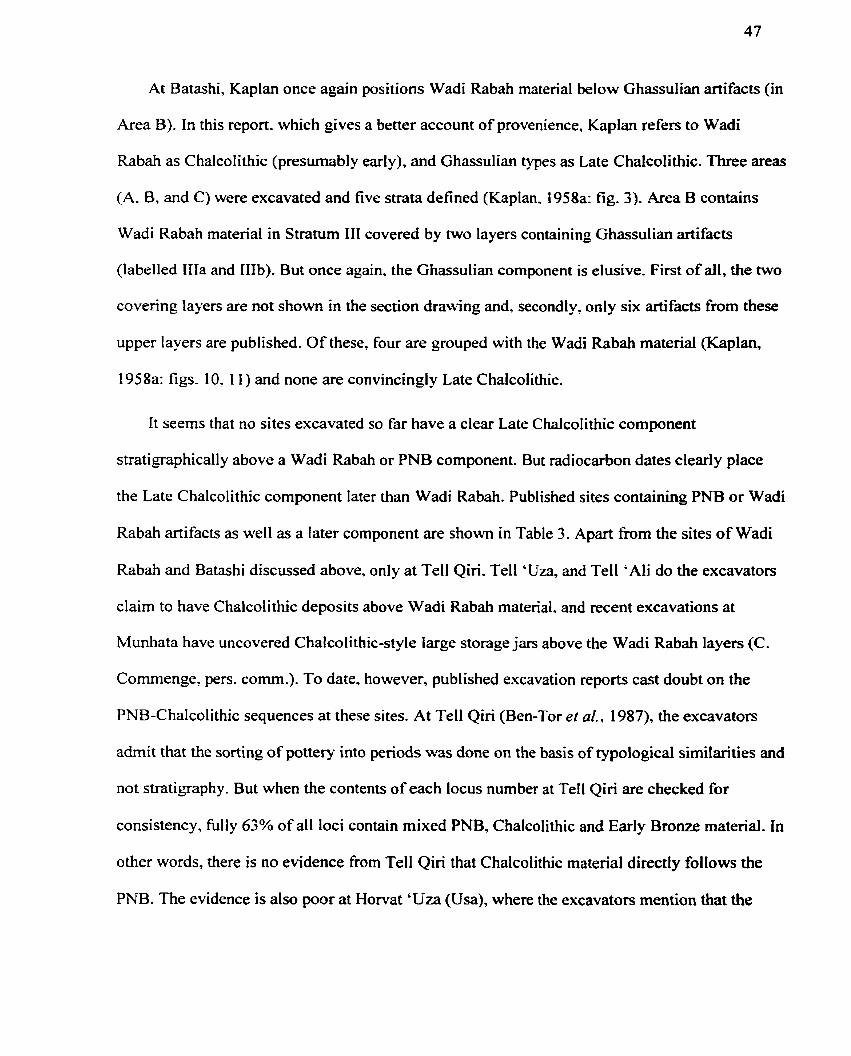
At Batashi, Kaplan once again positions Wadi Rabah material below Ghassulian artifacts (in
Area B). In this report. which gives a better account of provenience, Kaplan refers to Wadi
Rabah as Chalcolithic (presumably early). and Ghassulian types as Late Chalcolithic. Three areas
(A, B, and C) were excavated and five strata defined (Kaplan. 1958a: fig. 3). Area B contains
Wadi Rabah material in Stratum III covered by two layers containing Ghassulian artifacts
(labelled IIIa and IIIb). But once again. the Ghassulian component is elusive. First of d l , the two
covering layers are not shown in the section drawing and. secondly, only six artifacts from these
upper layers are published. Of these, four are grouped with the Wadi Rabah material (Kaplan,
1958a: figs. 10. 1 1 ) and none are convincingly Late Chalcolithic.
It seems that no sites excavated so far have a clear Late Chalcolithic component
stratigraphically above a Wadi Rabah or PNB component. But radiocarbon dates clearly place
the Late Chalcolithic component Iater than Wadi Rabah. Published sites containing PNB or Wadi
Rabah artifacts as well as a later component are shown in Table 3. Apart fiom the sites of Wadi
Rabah and Batashi discussed above, only at Tell Qiri. Tell 'Uza, and Tell 'Ali do the excavators
claim to have Chalcolithic deposits above Wadi Rabah material. and recent excavations at
Munhata have uncovered Chalcolithic-style large storage jars above the Wadi Rabah layers (C.
Comrnenge. pers. comrn.). To date. however, published excavation reports cast doubt on the
PNB-Chalcolithic sequences at these sites. At Tell Qiri (Ben-Tor et al., 1987), the excavators
admit that the sorting of pottery into periods was dune on the b a i s of typological similarities and
not stratigraphy. But when the contents of each locus number at Te11 Qiri are checked for
consistency, h l l y 63% of al1 loci contain mixed PNB, Chalcolithic and Early Bronze material. in
other words, there is no evidence fiom Tell Qiri that Chalcolithic material directly follows the
PNB. The evidence is also poor at Horvat 'Uza (Usa), where the excavators mention that the
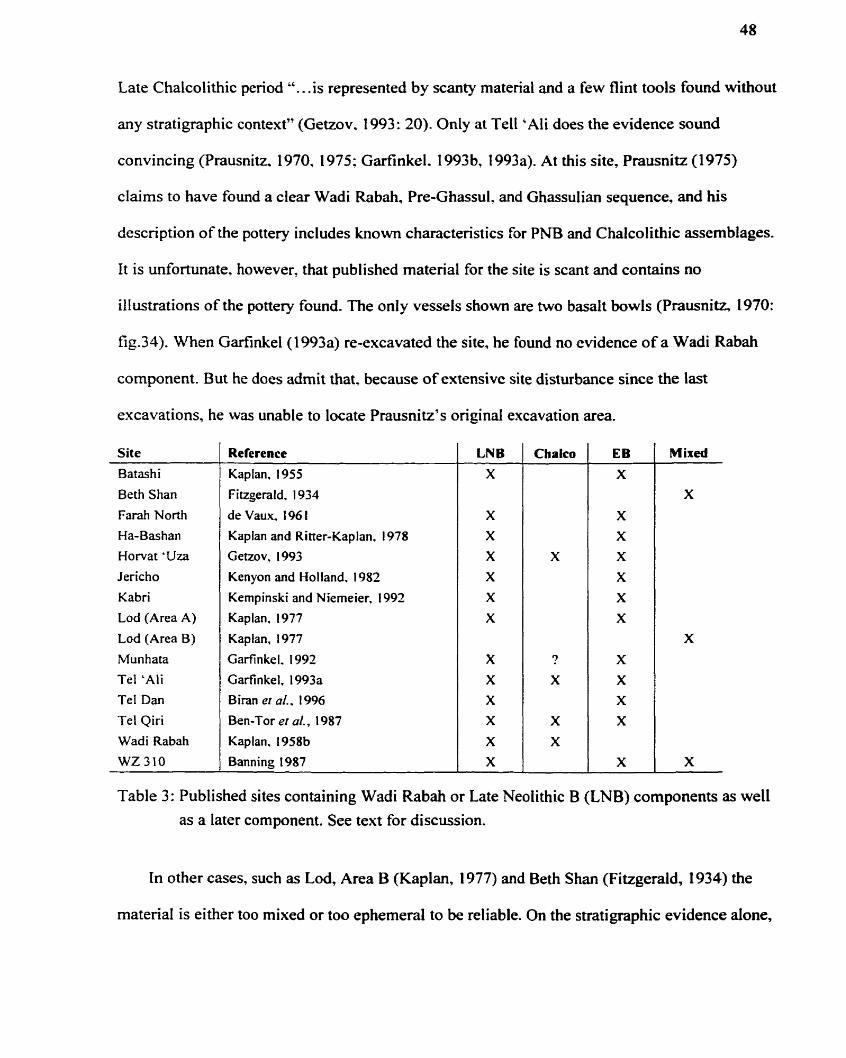
Late Chalcolithic period ". . .is represented by scanty material and a few flint tools found without
any stratigraphic context" (Getzov, 1993: 20). Only at Tell 'Ali does the evidence sound
convincing (Prausnitz, 1970, 1975: Garfinkel. 1993b, 1993a). At this site, Prausnitz (1975)
claims to have found a clear Wadi Rabah, Pre-Ghassul. and Ghassulian sequence. and h is
description of the pottery includes known characteristics far PNB and Chalcolithic assemblages.
It is unfortunate. however, that published material for the site is scant and contains no
illustrations of the pottery found. The only vesseIs show are two basalt bowls (Prausnitz, 1970:
fig.34). When Garfinkel(1993a) re-excavated the site, he found no evidence of a Wadi Rabah
component. But he does admit that. because of extensive site disturbance since the last
excavations, he was unable tu locate Prausnitz's original excavation area.
Site
Batashi
Beth Shan
Farah North
Ha-Bas han
Horvat 'Uza
Jericho
Kabri
Lod (Area A)
Lod (Area B)
Munhata
Tel 'Ali
Tel Dan
Te1 Qiri
Wadi Rabah
WZ 310
Reference - - - -- - -
Kaplan, 1955
Fiîzgerald, 1934
de Vaux. 196 1
Kaplan and Ritter-Kaplan, 1978
Getzov, 1993
Kenyon and Holland, 1982
Kernpinski and Niemeier, 1992
Kaplan. 1977
Kaplan, 1977
Garfinkel. 1992
Gafinkel, 1993a
Biran el a(. , 1 996
Ben-Tor er al., 1987
Kaplan, 19586
Banning 1987
LNB X
X X
X X X
X
X X X X X X
Chalco Mixed
Table 3: Published sites containing Wadi Rabah or Late Neolithic B (LNB) components as well
as a later component. See text for discussion.
In other cases, such as Lod, Area B (Kaplan, 1977) and Beth Shan (Fitzgerald, 1934) the
material is either too mixed or too ephemeral to be reliable. On the stratigraphic evidence aione,
it is difficult to make a clear distinction between the Late Neolithic, or Early Chalcolithic, and
the onset of the Chalcolithic, although the assemblages are distinct in many respects.
In surnmary, the Wadi Rabah component couid overlap the Chalcolithic component to some
degree but we should be cautious about accepting chronological and typological schemes that
impIy clear divisions. The confusion over the placement of Wadi Rabah is exemplified in the
Kahn excavations (Kempinski and Niemeier, 1992) where, in the same report, Schefielowitz
( 1 992: 1) refers to the Wadi Rabah component as Early Chalcolithic but Goren (1992: 12) calls it
PNB.
Continuing excavations at Ghassul (Bourke et al., 1994; Bourke et al., 1995; Bourke, 1997a,
1997b) should soon resolve the problem of defining an Early Chalcolithic because there is good
evidence of a long sequence of localized development at the site. More work on this subject is
has been completed (Lovell, 1999) but was unavailable at the time of writing. The major
difliculty at Ghassul is that there is Little typological similarity between either the Early (H-1) or
Middle (E-G) phases (as defined by Bourke 1997) at Ghassul and more regionaiized Pottery
NeoIithic assemblages.
The difficulties in chronology and typology have led to a proliferation of terms where Wadi
Rabah. Jericho 8, PNB, and Early Chalcolithic ofien refer to similar assemblages thought to be
roughly contemporaneous (cf. Gopher, 1995). Despite the arguments about placement, the final
analysis conducted here determined that both the Wadi Rabah and so-called Early Chdcolithic
assemblages are more closely afiliated with Late Neolithic than Chalcolithic assemblages, as
Gopher suggests (see also Table 1 1, p. 134). In this study, original t e m s are retained where
needed for clarification but, in general, are subswned under the single rubric "Late Neolithic B"
(LNB), while earlier Late Neolithic assemblages are referred to as "Late Neolithic A" (LNA).
The Transition Issue
On the other end of the Chalcolithic sequence, the transition h m the Chalcolithic to EB 1 in
the southem Levant has been an area of interest for the past 50 years. This interval attracts
considerable attention because of the implications for rapid social change. Some standardization
of production is evident in the EB ceramic assemblages, which acquire more formai similarity
and have greater regional distributions. There were also significant changes in burial practices.
figurines. artwork. and h n e d lithic tools. These relatively sudden changes have led to
numerous debates about the origin of Early Bronze Age material culture and the fate of
preceding Chalcolithic pe60d societies (Albright, l9Xa; Wright, 1958, 196 1 ; Amiran, 1970,
1985; de Vaux. 19701 1971; de Miroschedji. 1971; Hennessy, 1982; Schaub, 1982; Hanbury-
Tenison, 1 986; Helms. 1987: Gilead, 1988; Braun, 1989; Ben-Tor. 1992; Gophna 1 995; Levy,
1995). One reason for the attention given to the transition is that Early Bronze Age assemblages
are associated with the later construction of several walled settlements throughout the region
(Schaub. 19821, particularty in the Early Bronze Age II (3 100-2800 BC). This phenornenon, in
itself. has been associated with increasing environmental change, social complexity, mde,
regional conflict. and incipient state development (Schaub, 1982; Richard, 1987; Esse, 1989;
JO ffe, 1 99 1 a; Portugali and Gophna, 1 993 : Finkelstein, 1 995).
Views on the Transition
Previous works have addressed the transition from the Chalcolithic to the Early Bronze fiom
a number of perspectives in (Wright. 1958; Arniran. 1985; Hanbury-Tenison, 1986; Braun, 1989,
1996) and proposed many different hypotheses to explain the nature of the transition period
(Wright, 1958: 37; Lapp, 1970: 29; Kenyon, 1971 : 84; Ben-Tor, 1989, 1992; Yakar, 1989;
Portugali and Gophna 1993; Gophna, 1995). The transition appears to have been one of sudden
and drastic change when many sites and regions were abandoned. To explain events, some
researchers have adopted a catastrophic. or crisis. view of social change. and see the end of the
Chalcolithic as a period of social collapse (Gophna 1995: Joffe and Dessel 1995; Levy 1995:
241). Tainter (1988: 4, 23) defines collapse as a political process that results in the loss of an
established level of sociopolitica~ complexity. where cornplexity is characterized by degrees of
inequality (ranking) and heterogeneity. In this case. heterogeneity refers to a distribution of
occupations and social roles. If occupations and social roles are distributed equally within the
population, then distribution is homogenous and complexity is low. But if some occupations or
social roles become the domain of a small group, then the distribution becomes heterogeonous
and complexity increases. Tainter's model assumes the existence of a hierarchy of social forms,
each defined by levels of social complexity. In this regard, Tainter employs the concept of
cultural evolution and sociopolitical integration developed by Service (2971) and Fried (1967)
and advanced by Johnson and Earle (1987).
Yoffee (1 979) highlights some of the difficulties inherent in using a cultural evolutionary
model to explain the rise and fall of civilizations and advises us to abandon hierarchical
taxonomie schemes. Like Tainter, however, he measures socio-economic change in degrees of
social stratification and particularly in subsystemic differentiation and integration (Yoffee, 1979:
24), which is similar in concept to heterogeneity. Yoffee and Cowgill(1988) attribute collapse to
political fragmentation, an event that occurs when centralized political control declines and
smalier polities, once within the circle of control, become autonomous. Social collapse is also
associated with site abandonment or demographic decline, as in the Mayan example (Culbert,
1988).
Gophna (1 995: 272) argues for a complete "chronostratigraphic" gap between the end of the
Chalcolithic and the onset of the EB 1. He attributes this gap to a severe demographic and
sociocultural crisis and daims that the southem Levant was " ... utterly deserted." He notes that
one inconsistency to his hypothesis is the typological and technological similarity of some EBI
pottery to the preceding Chalcolithic wares. which suggests some thread of continuity in the
transmission of knowledge. To explain this difficulty, Gophna suggests that remnants of a
"swiving Chaicolithic population" existed dong the coastal plain, particularly in Lebanon. It
was there that societies associated with EBI pottery took shape. moved south, and resettled the
southem Levant. Gilead (1993) makes a similar argument. suggesting that the northem Negev
was unoccupied for 400 to 500 years. While both Gilead's and Gophna's theories fit some of the
data, they cannot account for the sirnilarities in material culture through time, and fait to account
for recent radiocarbon dates fiom a number of Chalcolithic and EBl sites that suggest it is
uniikely the whole region was abandoned for several centuries (cf., Callaway and Weinstein,
1977; Weinstein, l984a; Carmi. 1987; Carmi and Segal, 1992; Levy, 1992a; Stager, 1992;
Gilead, 1994; Cami et al., 1995; JoRe and Dessel. 1995; Segal and Carmi, 1996; Bruins and van
der Plicht, 1998).
The Beersheba sites in the Northern Negev, like many Chalcolithic sites in the southern
Levant, were abandoned and seldom reoccupied, and it is this phenornenon, rather than a
decrease of social complexity that has led researchers to conclude that a collapse occurred. But
abandonment does not necessarily irnply social colIapse. Generally, the process can be
understood only in a broad regional and sociocultural context (Tomka and Stevenson, 1993:
19 1). A nurnber of Chalcolithic sites in the Jezreel and Jordan Valleys as well as the southem
Coast show continuity into the Early Bronze Age, and the possibility exists that, rather than a
period of collapse, this was a time of rapid social change accompanied by site relocation or
migration. This change could result fiom either adaptive (Harrison. 1997) or rnaladaptive
(Rosen. 1995) responses to changes in socioeconomic and environmental conditions.
While we are often given the impression that the Negev region was abandoned, it is clear
that Chalcolithic settlernents were followed immediately by EBI communities (see Levy 1987:
table 4.2). In some cases. EBI settlements were constructed at the sarne locations. This is true
not only for the Negev region but for the greater region as well (Levy and Alon, 1983; Gophna
and Portugali, 1988; Oren, 1989; JoEe. 199 1 b: Palumbo, 1994). The problem is that there exists
no clear genetic relationship between Chalcolithic and EB assemblages.
It is possible that the process of abandonment did not occur as suddenly or last as long as the
present ordering of data suggests. Site abandonrnent and resettlement is generally an ongoing
process that c m be explained by a variety of factors (cf., Cameron and Tomka, 1993). If the
typological differences seen arnong various Beersheba sites are chronological and not
sociocultural, a possibility Gilead (1995: 480) suggests, then the abandonrnent and resettlement
of Chalcolithic sites wïthin the region may have been a gradua1 process that continued into the
EB.
Esse (1989) considered the possibility of secondary state formation to explain change in the
EarIy Bronze Age. He viewed walled settlements as instruments for centralizing control over the
region in the late EB1, although he notes that rnost were not constmcted until well into the Early
Bronze II. It is not clear, therefore, that the process of secondary state formation was a factor of
change for the transitional period. Nonetheless. the stage rnust have been set for inter-regional
interactions at this time. There is evidence of Egyptian influence at the Early Bronze Age site of
Erani (Weinstein, 1 984b; Kempinski and Gilead, 199 1 ) and Palestinian artifacts appear at Maadi
in the Egyptiar, Delta (Caneva et al., 1989) at about the same time. In the north, Dark-Faced
Burnished Ware (Stager. 1992: 25), to which the Palestinian EB 1 Grey Bumished Ware is
allegedly related, is often used to draw connections to Anatolian assemblages. But this parallel
may be a little simplistic as there is a long tradition of Late Neolithic dark-bumished pottery in
both the southern and northem Levant. Hanbury-Tenison (1 986: 99) suggests strong southern
Syrian connections by way of the Hawran steppe. which he feels manifests itself at the fortified
site of Jawa and the Jordan Valley site of Tell Umm Harnmad, both of which contain distinctive
EB 1 wares. Once again, however. the Egyptian and Syrian evidence occurs in an Early Bronze
Age context and any link between events at this time and those in the preceding Chalcolithic
remain tentative at best.
Joffe and Dessel (1995: 5 14) maintain that the collapse of Chalcolithic society was partly
due to a disruption of established procurement networks. brought about by local or regional
competition for resources. Copper artifacts fiom the Beersheba region are traced to the Wadi
Faynan region south of the Dead Sea (Shalev and Nonhover. 1987), and Ilan and Sebbane (1 989)
suggest that copper from the same region was traded with Egypt. where there are no copper
sources.
Another factor that could account for social disruption at this time is warfare, or political
coercion, and we should not overlook this as a possible agent of change. Conceivably, warfare
with Lower Egypt could account for abandonment of the Negev sites in the south (Levy 1995:
243) and explain the persistence of Chalcolithic communities in the north. There is little direct
archaeological evidence for warfare, but it is clear fiom numerous ethnographic accounts that
instruments of war are not needed for effective coercion (Gilman, 1991 : 150). Conflict c m exist
on a local level where cornpetition for the control of land and other resources sets the stage for
the economic exploitation of less powerfd groups and for the rapid growth of elites.
Others argue that social developments at the time were exclusively indigenous (e.g.,
Callaway, 1 972; Braun. 1 996; Hanbury-Tenison 1 986: 253; de Miroschedj i 1 97 1 ). Hanbury-
Tenison (1 986: 25 1) and Braun (1996: 7) maintain that the Early Bronze Age societies were a
local and gradua1 outgrowth of former Chalcolithic societies. but they do not agree on where this
eraduai transition occurred. Braun sees closer ties between the two periods in the southernmost C
regions of the southem Levant, whereas Hanbury-Tenison claims the affinities are in the
northern and central Jordan Valley. Dothan (1971), on the other hand, views the abandonment of
southem sites as a migration of people to the Jezreel and northem Jordan Vdleys.
Climatic change has also been suggested as a factor leading to the abandonment of the
northern Negev region. Joffe (1 99 l a: 8). citing Goldberg and Rosen's (1 987) work, suggests that
an increase in rainfall during this period. which roughly corresponds to the advent of the Early
Bronze Age at about 3500 BC. created massive alluviation, which disrupted the ". . . highly
specialized and adapted economic systems of the semi-arid northem Negev Chalcolithic, based
on water management and floodwater farming." There is, however. little archaeologicai evidence
to suggest that modes of subsistence for the region as a whole changed significantly fiom the
Chalcolithic to the Early Bronze Age.
The Problem with Time
The present division of events. which groups the data into a Chalcolithic period and an EBl,
tends to conflate the sequence of events, thereby over-emphasizing the differences between the
two periods. Joffe and Dessel (1995: 508) suggest that the apparent gap between the Chalcolithic
and EB 1 is a consequence of using Chalcolithic radiocarbon dates not drawn fiom the final
phases of the period and. at the same time, using EB1 dates that are from the middle of that
period. The apparent gap strengthens Our inclination to separate and consolidate the two periods.
Hanbury-Tenison (1 986: 252) suggests that many of our perceptions about events for this time
result fiom our tendency to cluster the periods around previously obtained dates.
Fitting the data into dissimilar chronological classes causes problems when we attempt to
compare variables between the two clusters. particularly when the temporal 'width' of each class
is highly variable. For example, the Chalcolithic period is thought to span more than 1000 years,
while the EB 1 spans about 300 years, and the tendency is to group any sites with characteristic
materials into one period or the other. An examination of a number of settlement studies for the
southem Levant demonstrates the popularity of this approach (Lew and Alon, 1983; Gophna and
Portugali, 1988; Esse, 199 1 ; Joffe. 199 1 a. 1993). But the tendency to group sites as if they were
contemporaneous is unavoidable when there exists no explicit critena for distinguishing smaller
intervals of time. Using the present chronological frmework, significant cultural and settlement
changes cannot be recognized, thus any explmations of change will be very generalized.
Recently, several attempts have been made to remedy the problem using radiocarbon dates, but
the meanings of these dates are ofien misunderstood.
Radiocarbon Information
Terminal events for the Chalcolithic are generally defined by radiocarbon dates, although it
is likely that some revisions need to be made. Dates fiom the important site of Ghassul suggest
that its occupation was longer, and started earlier, than previously suspected (Weinstein, l984a;
Neef, 1990; Bourke, 1997a). For instance. site occupation began between 5590-5380 BC and
ended between 3990-3790 BC (to la), giving a probable occupation span of 1450-1 750
calibrated yearsJ. The oldest date is not a statistical outlier; in fact, five dates are within the same
range (Appendix A). This span covers the whole of the Pottery Neolithic B (Wadi Rabah), which
is generally estimated to range between 5500-4600 BC. As an exarnple, the dates at Tabaqat al-
Burna, a well-documented Late Neolithic site in northern Jordan (Banning et al., 1987, 1989,
1992; Blackham. 1997), yield a probable occupation range of 5670 to 5050 BC (la). It is of
interest that the cornet and the (milk) churn, two hallmarks of Chalcolithic assemblages, appear
in Bourke's (1997a: 308) Middle phase at Ghassul, which means that calendar dates associated
with these characteristic artifacts may have to be pushed back. The dates fiom Ghassul, as well
as those fiom Shiqmim (discussed below), make Kaplan's find of a cornet fragment in close
association with Wadi Rabah material appear reasonable.
Gilead (1990) suggests that the transition to the Early Chalcolithic is represented at a
number of sites near Tel Qatif in Naha1 Besor (MacDonald et al., 1932; Roshwalb, 198 1 ;
Epstein, 1984). His analysis is based primarily on a cornparison of pottery and lithics, but one
radiocarbon date was taken (Pta-2968 6040 * 80, 5050-4840 BC*). if this date is accurate, it
would place the Qatifian at the end of Bourke's (1997) Middle phase at Ghassul, which would
also align with the Middle Phase at Abu Harnid. This places the Qatifian later than the Early
Chalcolithic assemblages, which means it is unlikely to have been a transition site. Biit the
published Qatifian material (Epstein? 1984; Gilead. 1 !NO), aithough sparse, has characteristics
similar to earlier assemblages, which suggests, altematively, that the single radiocarbon
detemination for this site may be too late.
4 Using the Oxcal computer program (Bronk Ramsey 1998) and a Gibbs sampler, which are discussed in detail on page 176. 5 AI1 radiocarbon intervals are given as a one-sigma range unIess noted othenvise.
The termination of the Chalcolithic penod appears more clearly defined than the beginning.
In terms of artifact assemblages. the EB 1 component seems quite distinctive, but there is still
some controversy about the absolute date for this transition. Hanbury-Tenison (1986) argues that
a long period intervened between what is conventionally known as the Late Chalcolithic and the
EB 1. a penod he calls the "Post-Ghassulian". He claims that several Post-Ghassulian sites have
been found just north of the Beersheba regi~n and to the east of the Jordan Valley (Hanbury-
Tenison, 1984, 1986: 1 17). Braun (1 996: 6) makes a simiiar argument for a "Latest
Chalcolithic", although his use of the term is somewhat ambiguous. Recent evaluations of
radiocarbon evidence for the Chalcolithic and Early Bronze Age (Weinstein, l984a; Bowman et
al., 1 990: Levy, 1 992a; Gilead, 1994: Joffe and Dessel. 1995; Bruins and van der Plicht, 1998)
tend to support Hanbury-Tenison' s argument for a Post-Ghassulian interval.
Some radiocarbon dates marking the Chalcolithic-Early Bronze transition may be in need of
revision. A recent re-evaluation of British Museum radiocarbon dates fiom Trench III at Jencho
detemined that dates produced up to 1984 were as much as 200-300 '"c years too young (Bruins
and van der Plicht. 1998: 627). If this is the case, then the EB1 (Proto-Urban) dates fiom Jericho
(BM-1774. BM-1775. BM-1328, BM-1329 in Appendix A) could be pushed back as far as 3700
BC, coming closer to the dismissed Glasgow date of 4230-3820 BC (GL-24).
The problem of defining phases within the Chalcolittiic period is not entirely alleviated with
radiocarbon dates. Some recent chronological schemes tend to employ radiocarbon dates alone
(i.e., without ieference to diagnostic artifacts) in an attempt to frame the period (e.g., Levy,
1 992a; Joffe and Dessel? 1995).
Usinç radiocarbon dates and stratigraphic context fiom Shiqmim, Levy (1 992: 350-35 1)
defined three phases of occupation. Early (4520-4400 BC)6, Main (4240-3990 BC), and Last
(3940-3700 BC). His phasing tends to fit within the presently accepted chronological scheme for
the Chalcolithic period but there are methodological problems with his interpretations (Gilead,
1994: 3). Levy determined the span of these occupations by averaging the radiocarbon dates
h m his Phases IV md III. II. and 1. respectively. But the eady Shiqmim dates camot be
statistically cornbined or averaged with any confidence. The results of either a Chi-square test
( d e l O, T=115, a5%=18.3) or an agreement index are well below expected values (indices are
discussed in more detail on p. 75). These tests fail even if the two oldest dates fiom the Upper
village are removed. This suggests that the early period is not a single event and should be
divided into smaller occupation periods.
What we need to determine is the span of the early phases at Shiqmim rather than their
average. Using a Gibbs sampler (Bronk Ramsey 1998), and reporting al1 results at I a, the likely
span of the earliest occupation is 970-1370 cal. years with a starting date between 5260 and 4850
BC. Removing the two outliers, the span becomes 1030-1340 cal. years with a starting date
between 4780 and 4550 BC. In either case. the initial occupation is earlier than that given by
Levy and the duration of the phase is longer. Note that. if al1 dates are included, the initiai
occupation at Shiqmim approaches the estimate for Ghassul.
The situation changes if we wish to consider the sequence as a whole. In this case, we make
the assurnption that the stratigraphic information is correct; that is, that Phase II follows Phase
III, etc. In this analysis, the span of each phase is calculated using the given radiocarbon dates
and a Gibbs sarnpler but the phasing data is constrained by the stratigraphic information. We
Levy's figures are rounded to the nearest decade.
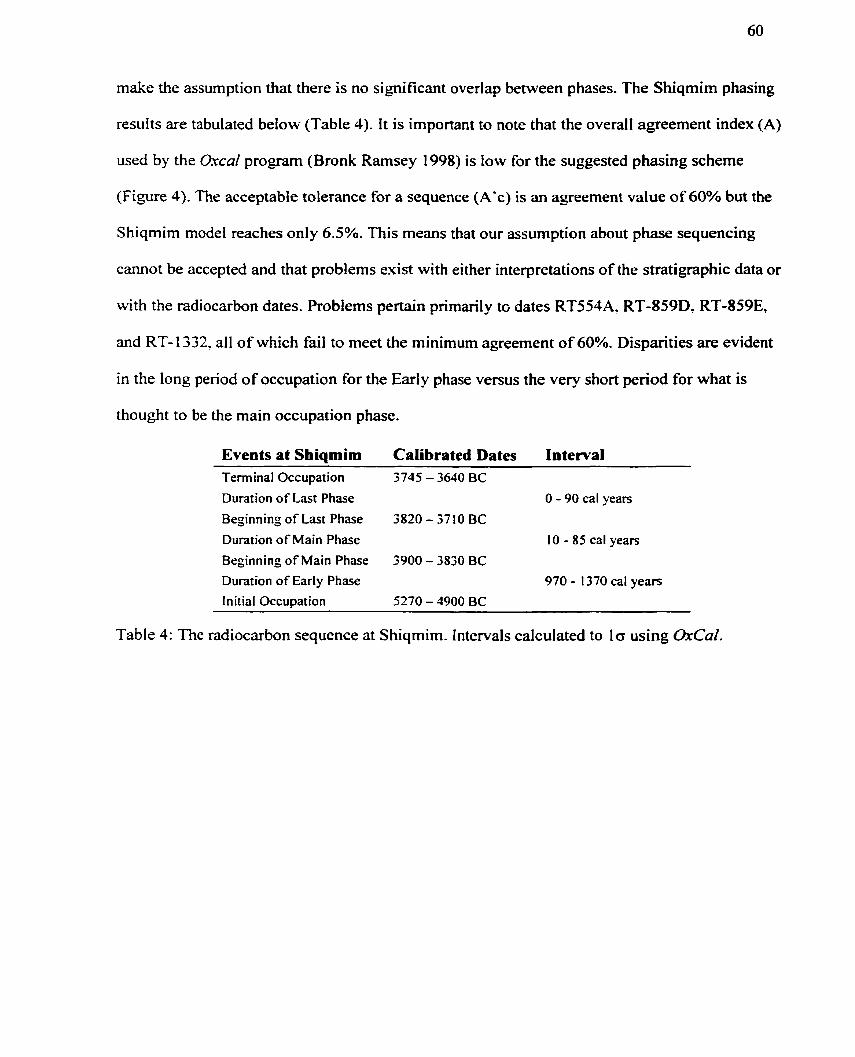
make the assumption that there is no significant overlap between phases. The Shiqmim phasing
results are tabulated below (Table 4). It is important to note that the overail agreement index (A)
used by the Orcal program (Bronk Ramsey 1998) is low for the suggested phasing scheme
(Figure 4). The acceptable tolerance for a sequence (A'c) is an agreement value of 60% but the
Shiqmim mode1 reaches only 6.5%. This means that our assumption about phase sequencing
cannot be accepted and that problems exist with either interpretations of the stratigraphie data or
with the radiocarbon dates. Problems pertain pnmanly tc dates RT554A. RT-859D, RT-859E,
and RT- 1 332. al1 of which fail to meet the minimum agreement of 60%. Disparities are evident
in the long period of occupation for the Early phase versus the very short period for what is
thought to be the main occupation phase.
Events at Shiqmim Terminal Occupation
Duration of Last Phase
Beginning of Last Phase
Duration of Main Phase
Beginning of Main Phase
Duration of Early Phase
Initial Occupation
Calibrated Dates Intewal 3745 - 3640 BC
O - 90 cal years
3820 - 37 IO BC 10 - 85 cal years
3900 - 3830 BC
970 - 1 370 cal years
5270 - 4900 BC
Table 4: The radiocarbon sequence at Shiqmirn. Intervals calculated to la using OxCal.
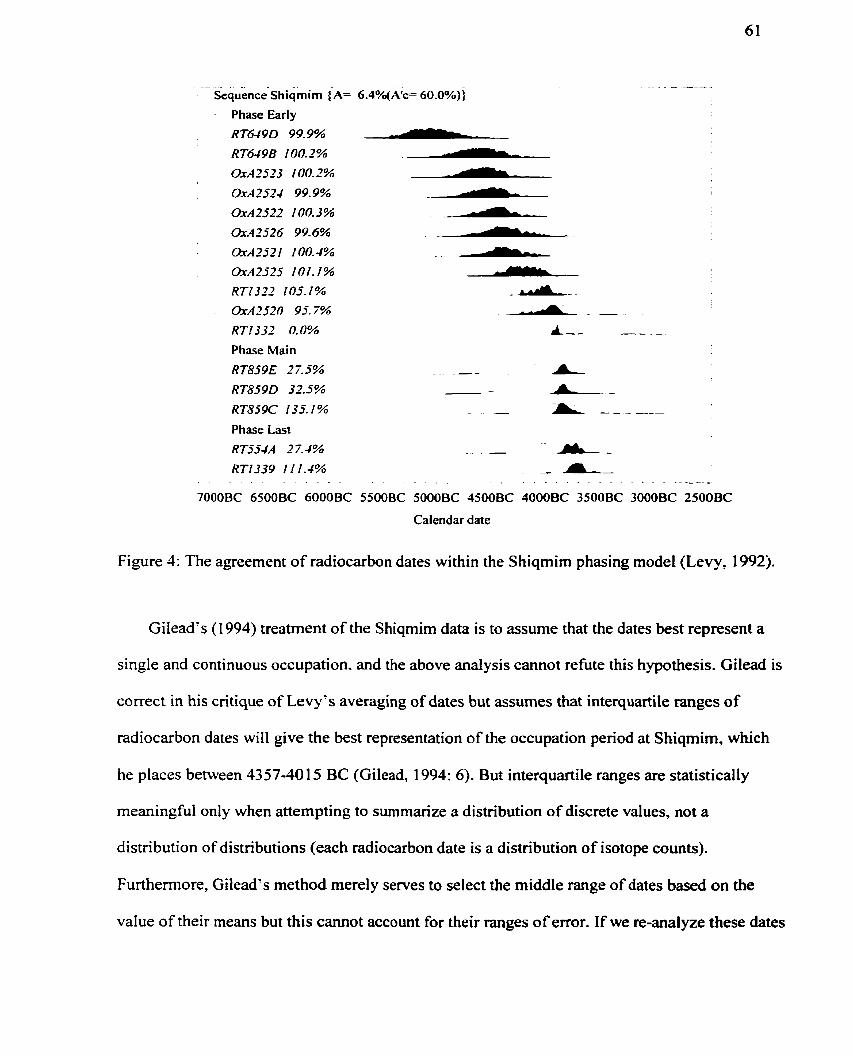
- - - -A -- - - - ~e~uénce-shicqrnirn (A= 6 .4%(A '~ 60.0%))
Phase Early
RT649D 99.9% - RT649B 100.2% - 0x42523 100.2% - OxAZ52.4 99.9% -A &A2522 100.3% --A &A2526 99.6%
&A252 1 100.4% A &A2525 101.1% A RT1322 105.1 % - A-- w 2 5 2 0 95.7% -A - -
RT1332 0.0% A-- -- -
Phase Main
RT859E 27.5% -- - - & - RT859D 32.5% - -- RT859C 135.1% - - L - - _ --- - Phase Last
RT55JA 27.4% - - &- RT1339 1 II.4%
A - 1 _
- - - A
7000BC 65OOBC 6000BC SSOOBC 5000BC 4500BC 4000BC 3500BC 3000BC 2500BC
Calendar date
Figure 4: The agreement of radiocarbon dates within the Shiqmim phasing mode1 (Levy, 1992 j.
Gilead's (1 994) treatment of the Shiqmim data is to assume that the dates best represent a
single and continuous occupation. and the above analysis cannot refute this hypothesis. Gilead is
correct in his critique of Levy's averaging of dates but assumes that interquartile ranges of
radiocarbon dates will give the best representation of the occupation penod at Shiqmim, which
he places between 4357-40 15 BC (Gilead, 1994: 6). But interquartile ranges are statistically
meaningful only when attempting to surnmarize a distribution of discrete values, not a
distribution of distributions (each radiocarbon date is a distribution of isotope counts).
Furthermore, Gilead's method merely serves to select the middle range of dates based on the
value of their means but this cannot account for their ranges of error. If we re-analyze these dates
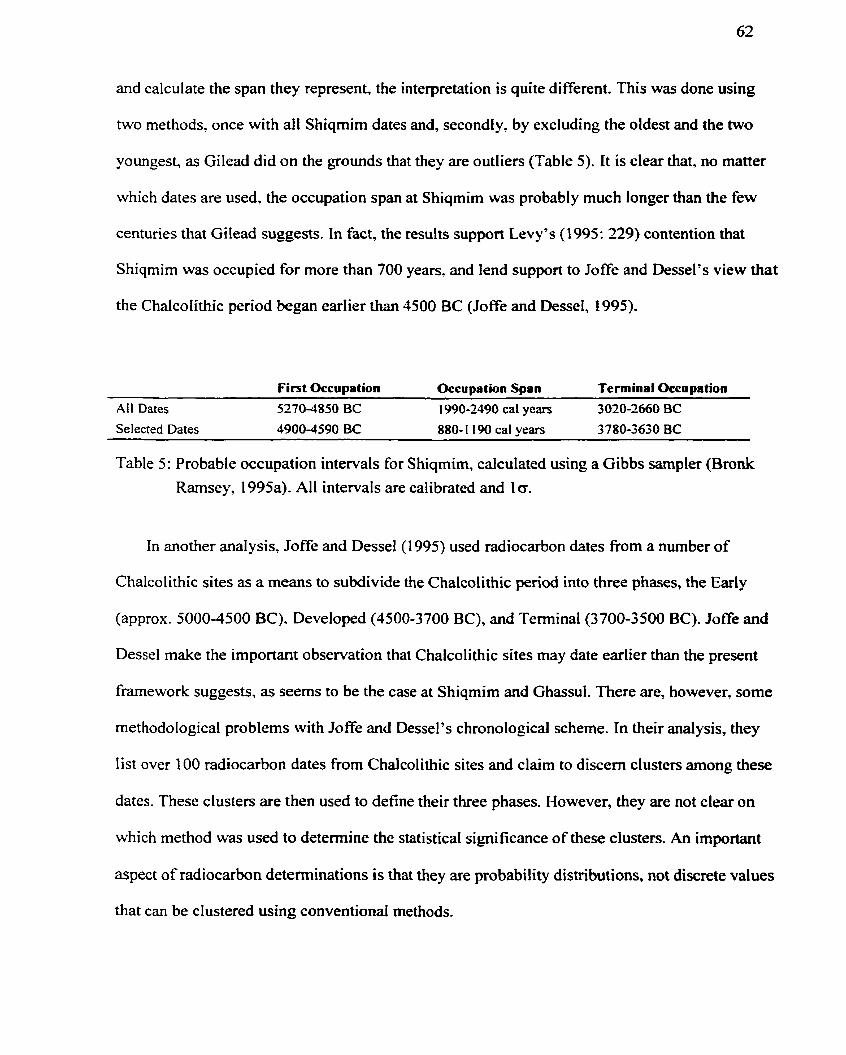
and calculate the span they represent. the interpretation is quite different. This was done using
two methods. once with al1 Shiqmim dates and. secondIy. by excluding the oldest and the two
youngest, as Gilead did on the grounds that they are outliers (Table 5). It is clear that, no matter
which dates are used. the occupation span at Shiqmim was probably much longer than the few
centuries that Gilead suggests. In fact, the results support Levy's ( 2 995 : 229) contention that
Shiqmim was occupied for more than 700 years. and lend support to Joffe and Dessel's view that
the Chalcoiithic period began earlier than 4500 BC (JofTe and Dessel, 1995).
First Occupation Occupation Span Terminal Occupation
Al1 Dates 52704350 BC 1990-2490 cal years 3020-2660 BC
Selected Dates 4900-4590 BC 880- 1 190 cal years 3780-3630 BC
Table 5 : Probable occupation intervals for Shiqmim, calculated using a Gibbs sampler (Bronk Rarnsey, 1995a). Al1 intervals are calibrated and 1 o.
In another analysis, Joffe and Dessel (1995) used radiocarbon dates fi-om a number of
Chalcolithic sites as a means to subdivide the ChaIcolithic period into three phases, the Early
(approx. 5000-4500 BC). Developed (4500-3700 BC), and Terminal (3700-3500 BC). Joffe and
Dessel make the important observation that Chalcolithic sites may date earlier than the present
framework suggests, as seems to be the case at Shiqmim and Ghassul. There are, however, some
methodological problems with Joffe and Dessel's chronological scheme. In their analysis, they
list over 100 radiocarbon dates from Chalcolithic sites and claim to discem clusters arnong these
dates. These clusters are then used to define their three phases. However, they are not clear on
which method was used to determine the statistical significance of these clustee. An important
aspect of radiocarbon determinations is that they are probability distributions, not discrete values
that c m be clustered using conventional methods.
Radiocarbon dates are separated by the degree to which their probability distributions
overlap. If we sort al1 of Joffe and Dessel's dates by the value of their means, as they have done
(Joffe and Dessel. 1995: table 1). and use a Chi-square test on adjacent dates to test for
agreement. there is no pair that is significantly different. In other words. each adjacent pair can
be combined and there is no ciustering arnong al1 dates: they represent a continuous Stream of
time within which only arbitrary divisions c m be made. Joffe and Dessel (1995: 51 1) daim that
the bulk of dates cluster between 4300-3900 BC, but this statement is misieading. Using this Iine
of reasoning, if 1000 dates were taken from a single context (Le.. occupation phase), the "bulk"
of dates would cluster differently than if they were spread over a long period of time. There is no
reason to expect samples to cluster in the middle of meaningfbl periods or phases.
A more appropriate method for discerning "groups" among radiocarbon dates is to sum ail
probability distnbutions and look for modes in the summed distributions. In effect, summing
distributions creates an average distribution for ail dates (see also p. 75). Once again,
calculations are performed using OxCaZ (Bronk Ramsey 1998). A total of 1 16 radiocarbon dates
fiom Chalcolithic contexts were included in analysis (fiom Joffe and Dessel 1995: table 1). The
resulting distribution has two main modes; one fiom 5500 to 4800 BC and another f?om 4700 to
3800 BC (la) (Figure 5). It could be argued that the results obtained are influenced by the shape
of the calibration curve and the individual dates obtained. But the calibrated interval from 4500
to 4900 BC is relatively smooth and the sample is large by statistical standards. This method is
not entirely satisfactory because low points imply the absence of settlement (regional
abandonment), which seems unlikely. Only with reservation could we suggest that, on the basis
of radiocarbon clustering, there were two main occupation penods in the southern Levant.
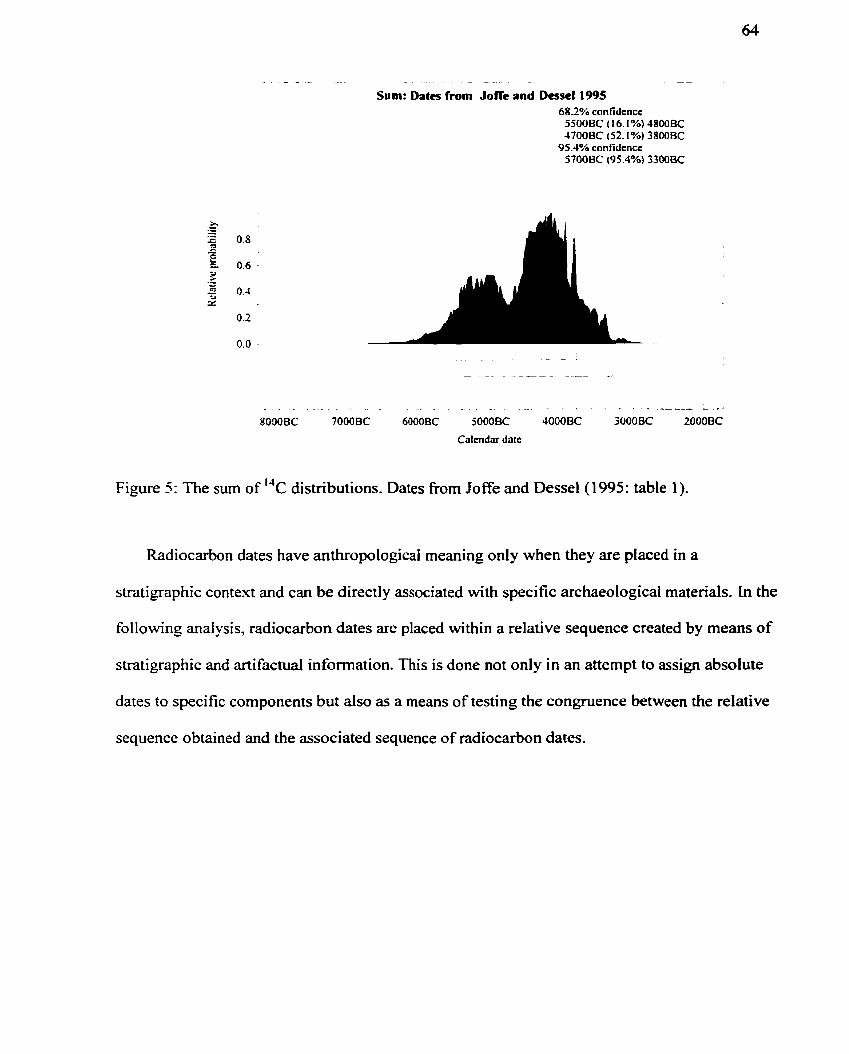
Sum: Dates from Jofïe and Dessel 1995 68.2% confidence
5500BC ( 16.1 %) 48OOBC 1700BC (52.1%) 3800BC
95.4% confidencc 5700BC (95.4%) 3300BC
- . - - - -. - - . * - .. - - - - . - - _-_ -_+ - - 1
8000BC 7000BC 6000BC jOOOBC JOOOBC 300OBC 2000BC
Figure 5 : The surn of "C distributions. Dates from Joffe and Dessel (1995: table 1).
Radiocarbon dates have anthropological meaning only when they are placed in a
stratigraphic context and can be directly associated with specific archaeological materials. In the
following analysis, radiocarbon dates are placed within a relative sequence created by means of
stratigraphic and artifactual information. This is done not only in an attempt to assign absolute
dates to specific components but also as a means of testing the congruence between the relative
sequence obtained and the associated sequence of radiocarbon dates.
3. PEWODIZATION METHODS
Phasing and Correlatioo
Relative Dates and Time Placement Dates
Regional chronologies depend on relative dating methods that reconstmct a sequence of past
events for two or more sites by associating artifacts for a contemporaneous interval. Changes in
artifact types become chronological markers that c m be used to identify time periods. Dates
provided by these methods are called "relative placement dates" (Smiley, 1955; Dean, 1978:
525). These dates are ordinal-scale measures; the value of any date can be 'gteater than' or 'less
than' another, but the duration of any event and the magnitude of the interval separating events
are unknown. Relative dates are generaliy distinguished from "absolute" dates, such as those
obtained by means of radiocarbon dating or thermoluminescence (TL) dating, but Dean (1978),
borrowing from the work of Smiley (1 955): prefers the terms "absolute placement date" for
calendrical dates and "time placement date" for dates that represent probabilistic time intervais.
This terminology is more precise. For exarnple, a calibrated radiocarbon date is a time placement
date. A date of 5000 * 100 years BC derived from wood charcoal describes a time interval in
which the actual date of the event (the time of death for the wood fibre) has a 68% chance of
falling between 4900 to 5 100 BC.
Time placement dates, especially those measured on the radiocarbon time scale, are ofien
used inappropnately as a relative dating technique. This is usually done by ordering radiocarbon
dates by their means, a practice that ovenimplifies the meaning of radiocarbon results and
ignores the multi-modal distributions of calibrated dates and the size of standard errors
(Bowman, 1990: 57). There are specific procedures for comparing and combining radiocarbon
dates (e.g.. Ward and Wilson. 1978, 1981) and we should be cautious with our assurnptions. In
general. the tenn "relative dating" does not apply to the ordering of time placement dates.
Cross-Dating and Phase Construction
The assumption that similar objects or traits are closer in time, while intuitively appealing,
has, to my knowledge, never been tested in a scientific manner and, with lirnited examples, it
could be demonstrated that objects similar in appearance are not necessarily contemporary. For
example, modem imitations of Egyptian scarabs, which are stamp seals dating to the Middle
Kingdom (c. 2023-1633 BC), c m be purchased today fiorn museum shops.
A stronger argument for contemporaneity c m be made if we restate the premise in terms of
relationships between properties. In this case. we make the assumption that it is the similar
associutions between properties that are more closely related in tirne (Spaulding, 1978). In other
words. we are claiming that sets of simiIar elements carry more weight in determining
contemporaneity than do single elements. Larger (or richer) sets are more specific in their
identity and tend towards exclusivity while single elements c m be extremely generalized and
inclusive. The more speci fic the identity of a set, the greater the potential for demonstrating
contemporaneity between any two assemblages that share the set.
The b a i s for this argument lies in ethnographic and historical observation of spatial and
temporal variation for attributes of material culture. Artifact similarities, or the presence of
traded goods and materials. display fall-off patterns (negative associations) when graphed against
distance (Renfrew, 1972; Hodder, 1974, 1978; Hodder and Orton, 1976). Similar fall-off patterns
have been demonstrated for stylistic attributes (Klimek, 1935; Milke, 1949; Clarke, 1968: 145;
Hodder, 1978; DeBoer, 1993). If we accept fall-off pattems as a premise of regional studies, then
the similarity of artifacts or styles is inversely proportional to spatial distance and, as the distance
from a centre of origin increases, the probabilip that a specific style will be found decreases.
Patterns of similarity are not always direct. as Hodder (1 977a 198 1. 1982) demonstrated in
his ethnoarchaeological studies in Zambia and Kenya. Like Wiessner (1 983, 1 984), he found that
certain artifacts and stylistic motifs were used as a means of establishing goup identity and were
not necessarily shared by other adjacent groups. The implication is that stylistic boundaries do
not necessarily relate to communication or information flow. These findings are not, however,
justification for discrediting stylistic similarity as a means of drawing correlations. Our
interpretations about the usefulness of style are strongly affected by Our assumptions and
methods. In particular, we need to consider the stylistic and geographic scale of inquiry. For
example. Hodder (1977) used women's ear decoration (among other traits) as found among the
Njemps, Tugen, and Pokot of the Baringo District to study variations in the spatial distribution of
style. One of these decorations is a short leather strap that hangs from the ear lobe. Decorations
on these straps differ among the tribal groups mentioned and these stylistic differences are used
to define group identities. Hodder daims they do not reflect communication patterns. But one
point that is not explicitly mentioned by Hodder is that women in all groups Wear ear-straps, and
that the ear-strap itself is a unique artifact usehl for defining a larger group identity as well as a
Iarger circle of social interaction and communication. As one travels away fiom the Baringo
District, there will corne a point at which no ear-straps are worn. The implication is that there are
boundaries to stylistic inquiry as much as there are geographic boundaries to style. The people of
the Baringo district may not share al1 aspects of styie or always use simiiar artifacts but,
nonetheless, they do share some.
The associational content of any object set is determined by its context of discovery.
Retuming to the scarab. we may notice that one was made of faience while another of plastic.
This is a direct association of stylistic and material properties in the context of a single entity.
The histoncal trajectories of materials developrnent and use would lead us to infer that the
faience scarab is more likely to be earlier than the plastic one. If we exclude material properties,
we could turn to the space-time context of discovery. For instance, the faience scarab may have
been found in an archaeologicd context associated with numetous other objects identified with
Middle Kingdom assemblages. In this case, an additional assumption is made that certain spatial
relationships represent temporal relationships, but more is said about this below. The plastic
scarab. on the other hand. rnay be found in temporal association with, for instance, modem
cornputers. Once again, trajectories of technological development suggest that the context
containing the cornputer is later in time. While technological histories are used in both examples,
a history of style could play a similar role.
In surn. there are three main factors to consider when assessing contemporaneity on the basis
of artifacts and their properties: the history of property developrnent, the history of property
associations (sets of associated elements), and the comparative richness of associational sets. The
history of property development would include the first and last known appearances of either
single properties or sets of properties. In the absence of historical records, archaeologists rely on
stratigraphie context to establish the historical sequence of properties. The posterior information
is then used to formulate a priori statements for fùrther testing.
Complaints about the use of artifacts as "index fossils" (Lyman et al. 1997: 76) are
warranted when the index fossil is a single entity, as explained above. However, this is not the
case when we use sets of associated properties, which we could cal1 "index sets". In fact, most
archaeologists have been aware of the importance of associational context for some time. In the
early 1800s. C. 1. Thomsen (in Trigger, 1989: 73-79) systematically grouped European artifacts
on material properties (stone. bronze, iron). functional properties (e.g., knives, adzes, neckiaces),
and stylistic properties (shape, ornamentation. deCoration)- To this. we could add other attributes,
such as manufacturing techniques.
Comparing similarities in objects proved a useful tool. but the inferential basis for senation
and. ultimately. chronology lay in what Thomsen and MonteIlius (Montelius, 1986 [1885))
calied "closed finds" such as burials, hoards, or other closed contexts. Artifacts found in
undisturbed contexts tended to confinn the synchronie associations of objects and, by extension,
the contemporaneity of objects or, at least, the contemporaneity of the use-life of objects. The
assumption of synchronicity within closed contexts also underlies Petrie's (1 889) largely
successful seriation of pottery from Egyptian Pre-dynastic burials.
The use of context, or depositional units, as a means of grouping and sorting artifacts into a
temporal framework is a theoretical model, not an empirical reality. As in any model, there are
expectations that may or may not be met. Ideally, the stratigraphie model is predicated on
geomorphological relationships. A deposit is defined by its physical characteristics and conforrns
to the law of superposition, which States that upper Iayers are more recent than those they
overlay. The depositional unit, which is defined in more detail below, is a duration event. It has a
beginning and an end and is the result of either natural or human activity.
Addressing the assumptions above, we note that artifacts within a deposit are related in time
but the nature of this temporal relationship is not always one of contemporaneity. We could
excavate Late Neolithic, Chalcotithic and Early Bronze Age artifacts, mix them up and redeposit
them. These artifacts would now be related in a single depositional event but they are not ail
related by date of manufacture, nor do they necessarily suggest any cultural context. Our faith in
the reliability of associations is greater for closed contexts than for those determined from a
loose amalgam of deposits. In closed contexts, we can be more certain of the cultural context of
artifacts but we still cannot assume that each artifact was manufactured at approximately the
same time. Some artifacts may have been curated.
The assumptions about artifacts located in a single depositional context should be restated.
First. the artifacts are conternporaneous only in tenns of their association in a single deposit. But
this association is a valuable and unique chronological indicator because, using the example
above, it would be impossible for the mixed context to occur in the Late Neolithic. The
association. therefore, acts as a terminus post qzrern. In an ideal situation, al1 associated artifacts
would have the same manufactunng date but, realistically, this seldom occurs. Nonetheless, the
possibility of mixing is not necessarily an impediment because our a priori knowledge about the
nature of associations relies on a study of stratigraphic relationships.
The associational relationships among artifacts c m be questioned using superpositional
relationships. If artifact X is found to occur above artifact Y more ofien than below it, the
inference can be made that X is probably Iater than Y . The strength of the inference relies on the
fiequency of occurrence at each site and on the nurnber of sites in which a similar relationship is
observed. For example, if we observe that X occurs above Y in 90% of al1 contexts at one site,
and in 80% of al1 contexts at another, then we are more confident of the relationship than we
would be if the observations at the second site were only 20% of al1 contexts. In any assessment
of chronological ordering among artifact classes, superpositional relationships need to be
considered prior to associational ones.
Superpositional relationships c m inform us as to the validity of associations and the
sequence of index sets but only associational relationships c m be used to approach the problem
of correlating strata within a single site or between sites. We have already noted that the strength
of any inference about contemporaneity is predicated on the number of associated elements
between any two locales. But now it is necessary to determine how similarity is used to associate
strata within a chronological framework.
Defining a Phase
Much of the confùsion surrounding relative dating and the creation of relative time units in
archaeology (such as components. phases, and periods) stems fiom confounding artifacts.
geography, and time (Stein. 1992: 75) and fiom an inadequate distinction between ideational and
empirical units (Dunnell, 1986: 15 1). Ideational units. such as classes of artifacts, are conceptual
units intensionally (not intentionally) defined. whereas empirical units. such as the artifact itself,
are actual entities. extensionully defined and physically located in time and space (see Dunnell,
1972 : 15- L 8). The intension of a terrn (the class) is dependent on the meanings (criteria of the
class) and not just on the reference (the artifact), whereas the extension of a terrn (the class) is
the set of things to which it refers ("hole-mouth jars" refer to al1 jars of this type).
Regional time periods are generally thought of as either phases or horizons. The most
popular definition of a phase is that given by Willey and Phillips (1958: 22) viho describe it as:
". .. an archaeological unit possessing traits sufficiently characteristic to distinguish it
fiom al1 other units similarly conceived, whether of the sarne or other cultures or
civilizations, spatially limited to the order of magnitude of a locality or region and
chronologically limited to a brief interval of tirne."
This definition appears relativçly unchanged in introductory texts to archaeology (e.g.,
Fagan, 1998) and is considerably vague. This definition of a phase makes it untenable as a rneans
of establishing contemporaneous intervals for two or more locales except in very general and
arnbiguous terms. It is clear that a phase is defined by specific critena (traits) but it is not clear
whether these traits should be mutually exclusive and independent for the recognition of a phase,
or whether they are meant to define necessary and sufficient conditions for the membership of a
specific component in a particular phase. Furthemore. as defined, the phase is spatially and
temporally limited but we are unsure about the limit of the region or how a "brief interval of
time" is determined in the absence of calendrical dates. Willey and Phillips (1 958: 22) are aware
of the ambiguity in definition and, because of the number of variables in formulation, state
". . .that it is neither possible nor desirable to define the scope [of a phase] except within rather
broad limits." In fact, they claim that there is no direct relationship between a phase and a region
(Willey and Phillips 1958: 29).
Phases are ofien confùsed with cultures and. in many cases, are treated synonyrnously.
Childe ( 1 95 1 : 40) defined archaeological culture ". . .as an assemblage of associated traits that
recur repeatedly" and Clarke (1 968: 285) saw culture as "...a polythetic set of specific and
cornprehensive artifact types which consistently recur together in assemblages within a limited
geographical area." But identifiing a phase with a particular "culture" or with "cultural traits" is
unnecessary and potentially misleading. Changes in artifacts are not necessarily related to either
sociocultural events or rneanings. In fact, the very notion of an archaeological culture is
questionable (Hodder and Orton, 1976: 199). The notion of culture, like any aspect of hurnan
organization derived fiom archaeological materials, is an interpretation of the data, not an
integral part of it,
In this study, a phase is defined as a relative time unit that is constructed for a specified
geographic region and identified by a unique set of archaeological classes (elements). It is a
continuous period of time for which temporal boundaries can be defined either in terms of
artifacts or time placement dates. A phase is an ideational and pragmatic time unit created to
represent a penod for a specified region (intensionally defined), whereas a component is an
empirical unit (extensionally defined) represented by an actual assemblage of archaeological
materials identified at a specified site for a particular time of occupation (Lyman et al. 1997:
190). It must have spatial limitations, whether or not these physical limits have been observed. A
phase, although it is used to define a regional occupation period, is not spatidly limited in
theory. It is a clâss of relative time. created by defining the necessary and suficient requirements
for membership. It has no physical existence. A phase is used to group components fiom
different sites just as, for example. the definition of a "V-shaped bowl" is used to group
individua1 bowls.
By grouping components, the phase is assumed to correlate these sarne components for a
particular interval of time. Components from individual sites may or may not be a member of a
specific phase. The unique set that identifies a phase is constructed fiom the associational
relationships observed in al1 local components for al1 sites within the specified region. These sets
are mutually exclusive but not necessarily independent. A phase is a polythetic group, meaning it
is not necessary for a component to possess al1 elements of the set to be a member of the phase
(see Clarke, 1968: 37). A site component is deemed a member of the phase if the elements of the
component form a subset of the phase set.
It is possible for a component to belong to one or more phases, depending on the specificity
of the set and the richness of the component assemblage. For exarnple, we could define two
phases for ttvo sites (A and B) within a specified region. Each phase is a unique set of elements;
Phase 1 {a b, c, d, e). and Phase 2 {a, b. c, f). I f a component at site A contains {a, b, f), it c m
be identified with Phase 2 only. but if a component at Site B contains elements {a, b, c f , it could
be identified tvith either Phase I or 2, or both. As the number and uniqueness of elements
decreases for either phase or component, so does our ability to correlate cornponents with a
single phase.
Phases, as they are defined here, are retative time units that are defined by two hdamenta l
criteria; a specified region and a set of specified artifact classes. If the area under study is
expanded, or sites are added, or if a new system of classification is employed, the phase elements
and, possibly, the duration of the phase will change. The phase serves to unite components in
time by identifiing membership on the ba is of phase subsets. This definition differs fiom that of
Willey and Phillips, who relate initial phase identification with a "type site" and, using this
component as a base of comparison. attempt to correlate other components to it on the basis of
their similarities. With the latter method. problems with association become acute the M e r
away we travel frorn the "centre" of original phase identification. Willey and Phillips (1958: 27)
are aware of this difficulty when they attempt to use their notion of phase as a chronological tool:
"They [phases] flow outward, so to speak, ofien propelled by their originators, uniting
to themselves their weaker correlates over a widening circle. The process is necessarily
accompanied by a progressive generaiization of definition until much of their original
usehlness to research is impaired."
The way in which strata, components, and pliases are conceptualised and forrned is
discussed at more length in the section entitled "Stratigraphic Units of Analysis".
Time Placement Dates and Phase Construction
Time placement dates are ofien used to determine the contemporaneity of occupation levels
at two or more sites and, thereforq to construct phases. If, for exarnple, we obtain the same
calibrated age of 5000 * 50 BC at two diffierent sites, we assume they are contemporaneous. But
this is not necessarily the case. Many assumptions need to be made before we can link two sites
by means of time placement dates.
The radiocarbon method is discussed in detail in a number of publications (Taylor, 1987;
Newgrosh. 1988; Bowman, 1990; Bronk Ramsey, 1994; Taylor and Aitken, 1997) and the
subject is treated here only with respect to its use in correlating archaeological materials in a
regional context. A calibrated radiocarbon date is a time placement date that estimates a
probability interval in which an event is expected to have occurred. Uncalibrated radiocarbon
''years'? or "dates" are not syncnyrnous with calendrical years; they are intervals based on isotope
half-lives and counts. In fact, in many cases. radiocarbon "dates" and calendrical dates wiII differ
by more than 1000 "years".
When considering the validity of radiocarbon dates. it is important to distinguish between
their accuracy and precision. New radiocarbon techniques (e.g.. Accelerator Mass Spectrometry)
have improved the precision of radiocarbon dates ji-e., reduced standard errors) but improved
precision does not mean improved accuracy. For example, a radiocarbon sample may produce a
calibrated date of 3000 * 10 years BC. which is very precise, but if the radiocarbon sarnple is
intrusive and the tnie date of the context is 4000 BC, then it is not very accurate. This is not
meant to imply that al1 radiocarbon dates are unreliable but rather that we cannot equate
precision with accuracy. The calibration of radiocarbon dates using dendrochronology has
improved the accuracy of dates but not of radiocarbon test results. and calibration cannot account
for the selection of inappropriate sarnples.
Taylor (1987: 106) distinguishes four kinds of factors that can affect the accuracy and
precision of radiocarbon deteminations ("c). These include:
1. Sample composition factors. which incIude the possibility of contamination,
fiactionation effects. and the time-span represented by the sample. For example, the
sample could be obtained from either a 300-year oak tree or a seed. Both have quite
different implications for the interpretation of the date (Bowman, 1990: 15).
2. Experimental factors, which pertain to laboratory errors and methods.
3. Systemic factors. such as reservoir effects and trend variations.
4. Sample provenience factors, which pertain to the reliability of the association
between the radiocarbon sample and the phenomenon we wish to date.
The potentially troublesome relationships that can exist between time placement dates and
their archaeological contexts is cogently surnmarized by Dean (1 978). who refers to these
problems as "dating anomalies". He de fines four types:
1. Disjunction - a dated event ('"c) is earlier than a target event, where a target event is
the event we wish to date.
2. Disparity - the target event is earlier than the dated event..
3. Gap - the time gap between the dated event and the reference event. A reference
event is the potentially datable event that is most closely related to the phenomenon to
which the date is to be applied (Dean 1978: 228). Incorporating old wood into a
structure is a reference event that is closely related to an occupation period (target
event) but a I4c date taken fiom old wood will date the death of the wood (dated event),
which is not necessady the occupation penod.
4. Hiatus - the time gap between the reference event and the target event.
From Dean's assessment. it is clear that enors in radiocarbon dating derive primarily fiom
tu:o main sources, the quality of the sample and the context of the sample. A key point of my
argument is that the principles of relative dating are germane to al1 dating techniques because,
regardless of whether relative. interval, or absolute dating methods are used, archaeologists
cannot escape the need to determine both the sequence of deposits and the reliability of contexts
used to draw associations. We need contextual bndging arguments to establish that radiocarbon
sarnples (dated events) were actually associated with the events of interest (Dean 1978). Any
methods or principles used to determine the reliability of association between sample and artifact
are the sarne as those used to create a relative sequence of archaeological materials. These
matenals are not in thernselves target events because any "event" is an interpretation of the
presumed systemic context of the archaeological data. In most cases, the target event is the
period of site occupation- When using radiocarbon dates, we need to judge the association of the
carbon sarnple to artifacts of interest and. for TL dates. we may need to know how dated pottery
is associated with a particular building or some faunal material.
The limitations of the radiocarbon method are illustrated by Campbell et al. (1979) in their
cornparison of radiocarbon dates with known calendrical event. In this case, they obtained
measurements on 10 samples of charcoal and carbonized p i n derived from a thin, burned layer
of reliable provenience in order to date the massacre of the inhabitants of Cadbury C a d e by
Roman troops (AD 45-61). Their results suggest that it is unlikely that radiocarbon dates can
achieve an accuracy of less than 300 years (Le., *150 years). Their rather pessimistic conclusion
is supported by Taylor (1 987: 141), who maintains that the typical range of uncertainty for
middle and late Holocene dates would be a minimum of 200 years and, for the early Holocene,
300 years. But, since the publication of these comments. new techniques have been developed
that help to improve the precision of radiocarbon dates by using Bayesian methods that integrate
stratigraphic information as a priori statements (Buck et al., 1991 ; Buck et ai., 1992; Buck et al.,
1994a; Buck et al.. 1994b; Buck et al., 1 996). With these methods. a stratigraphic sequence
provides upper and lower constraints for calculations, thereby reducing associated ranges of
error. An application of this method is given below.
The way in which radiocarbon dates are either applied or combined relies on the samples,
their context, and the stratigraphic mode1 constructed for purposes of analysis. ïhere are severd
ways to combine radiocarbon probability distributions but only three are relevant to the present
work. If dates are taken from the sarne sample or object, they are combined before calibration
(Bronk Ramsey, 1995a). If they are not from the same sample but there exists archaeofogical
evidence to support the assumption that radiocarbon samples date the same event or related
events, then the dates are combined nfrer calibration. Finally, if we do not assume that a group of
radiocarbon determinations date the sarne event but. instead, we assume there is some
chronologically meaningfid relationship among them, the probability distributions can be
szrmmed.
The first two methods assume a close relationship between radiocarbon probability
distributions. Bronk Ramsey (1998) suggests that the combinations are justified when there is
good reason to assume that dated events occurred within a "short" period of time. In other words,
the interval between events should be small in cornparison to the errors associated with the
dating methods. Statistically, it is necessary to determine the likelihood that al1 dates are fiom the
sarne population of dates, which means their probability distributions should overlap to some
degree. The likelihood that two dates from the samc sampte are in agreement c m be assessed
using a Chi-square test (Bowman. 1990: 58). If they are thought to date related events, an
"agreement index" or a "likelihood index" is used to determine the likelihood that a probability
distribution fiom one date will combine well with the other dates (Bronk Ramsey, 1995a). These
indices define overlap integrals for the probability distributions. A similar index is used to assess
the position of a single probability distribution within a sequence of dates or to give an overall
rating on the viability of the sequence.
In most archaeologicai cases. we treat dates derived from several samples and use the
method that combines dates after caiibration. The results obtained here are provided by the
&Cal Program v3.0 (Bronk Ramsey. 1998). The Agreement Index generated by the prograrn
assesses the compatibi lity of the dates chosen for combination.
If the agreement indices indicate that a set of dates are unlikely candidates for combination,
then we either eliminate the dates that are not compatible and run the tests again or, if we believe
that the dates do represent the duration of deposits. we can retain them to constnict a phase
interval. One way to consmict a phase interval is by using the sum of probability distributions.
When dates are summed, there is no assumption that the dates relate to a single event and no
agreement index is calculated. Instead, the sum of dates is a best estimate for the chronological
distribution of events. With this method. probability distributions are averaged and associated
errors are not necessarily decreased as they are with other combination methods.
The results of summed dates cannot be viewed in the same way as combined dates. When
dates are combined (but not summed), we are actually reconstructing a new probability
distribution and the conclusions that we draw fiom it relate to a confidence intervai. For
example. if we set the confidence interval to 95%, then we are saying there is a 95% chance that
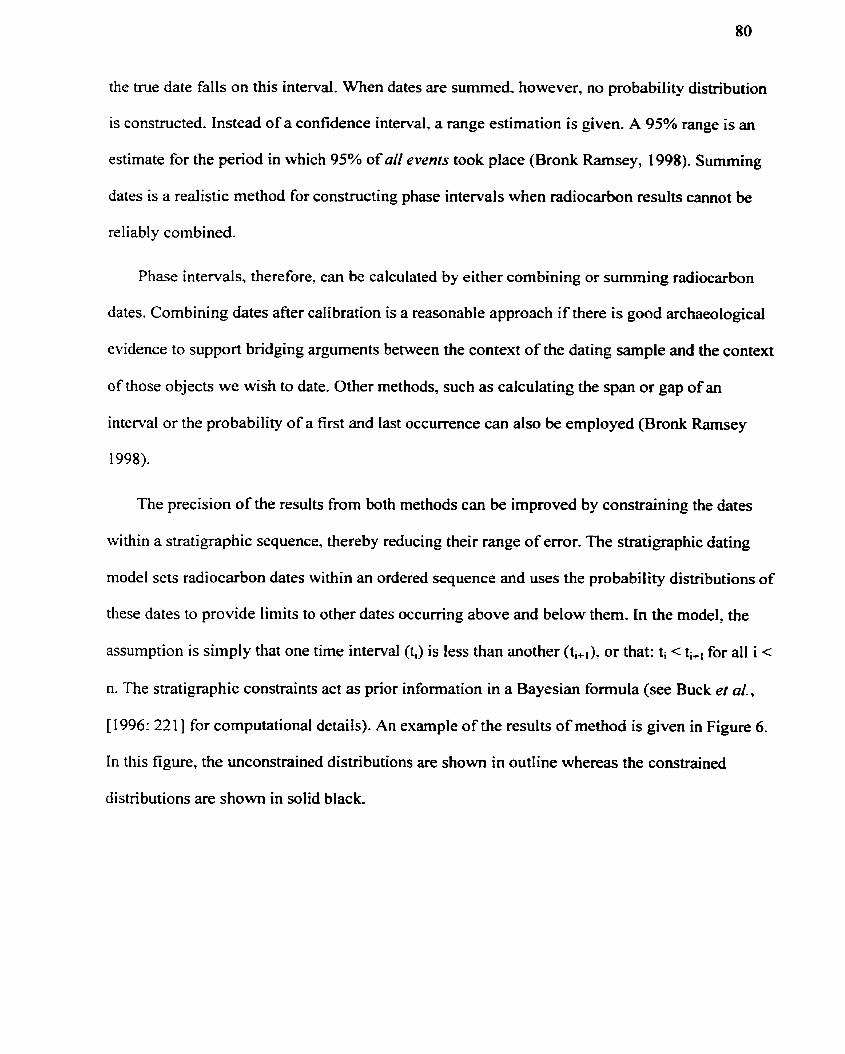
the true date falls on this interval. When dates are summed. however, no probability distribution
is constructed. Instead of a confidence interval. a range estimation is given. A 95% range is an
estimate for the penod in which 95% of ail events took place (Bronk Rarnsey, 1998). Surnming
dates is a realistic method for constructing phase intervals when radiocarbon results cannot be
reliably combined.
Phase intervals, therefore. c m be calculated by either combining or summing radiocarbon
dates. Combining dates afier calibration is a reasonable approach if there is good archaeological
evidence to support bridging arguments between the context of the dating sample and the context
of those objects we wish to date. Other methods, such as calculating the span or gap of an
interval or the probability of a first and last occurrence can also be employed (Bronk Ramsey
1998).
The precision of the results from both methods can be improved by constraining the dates
within a stratigraphic sequence. thereby reducing their range of error. The stratigraphic dating
model sets radiocarbon dates within an ordered sequence and uses the probability distributions of
these dates to provide limits to other dates occumng above and below them. In the model, the
assumption is simply that one time interval (ti) is less than another (ti+,). or that: ti < t;+, for al1 i <
n. The stratigraphic constraints act as prior information in a Bayesian formula (see Buck et al,,
[1996: 2211 for computational details). An example of the results of method is given in Figure 6.
In this figure, the unconstrained distributions are shown in outline whereas the constrained
distributions are shown in solid black.
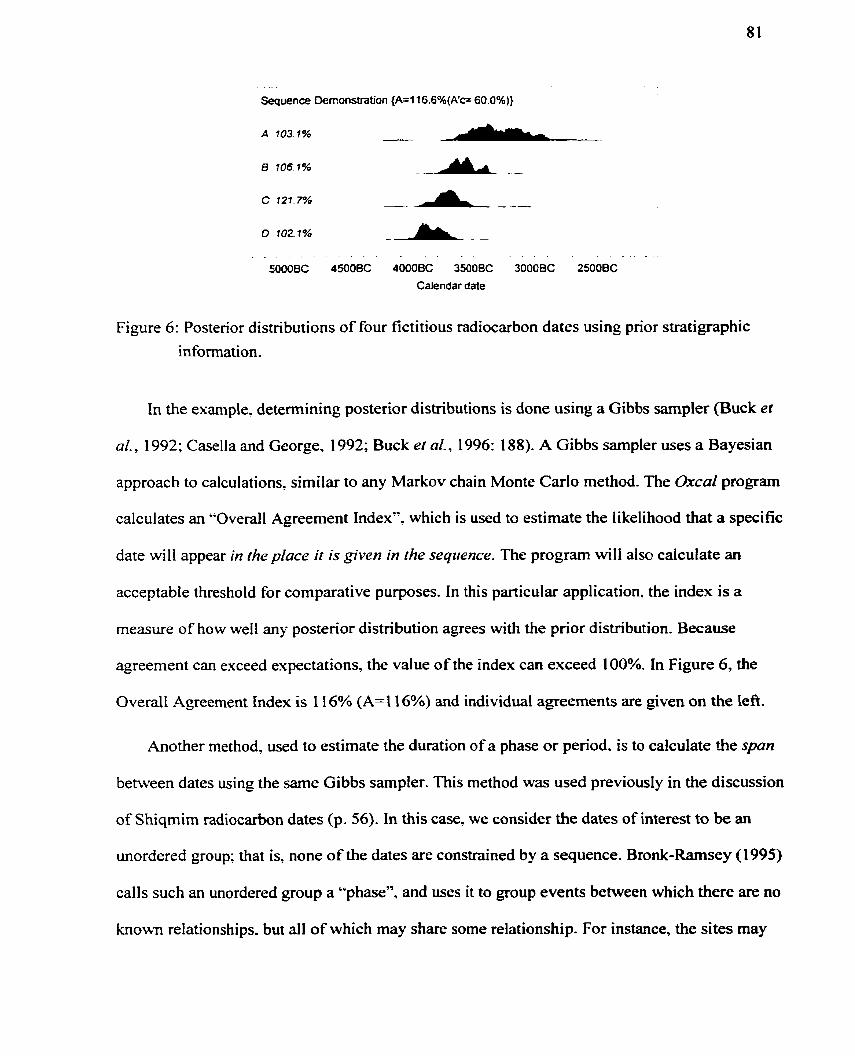
Sequenœ Demonstration {A=l16.6%(A'c= 60.0%))
Calendar date
Figure 6: Postenor distributions of four fictitious radiocarbon dates using prior stratigraphie
information.
In the exarnple. determining posterior distributions is done using a Gibbs sampler (Buck et
al., 1992; Casella and George, 1992; Buck et al., 1996: 188). A Gibbs sampler uses a Bayesian
approach to calculations. similar to any Markov chain Monte Carlo method. The Oxcal program
calculates an *'Overall Agreement Index". which is used to estimate the likelihood that a specific
date will appear in ihe place ir is given in ihe sequence. The prograrn will also calculate an
acceptable threshold for comparative purposes. In this particular application? the index is a
measure of how well any posterior distribution agrees with the pnor distribution. B e c a w
agreement can exceed expectations, the value of the index c m exceed 100%. In Figure 6, the
Overall Agreement Index is 1 16% (A=l16%) and individual agreements are given on the lefi.
Another method, used to estimate the duration of a phase or period. is to cakulate the spart
between dates using the same Gibbs sarnpler. This method was used previously in the discussion
of Shiqmim radiocarbon dates (p. 56). In this case. we consider the dates of interest to be an
unordered group; that is, none of the dates are constrained by a sequence. Bronk-Rarnsey (1995)
calls such an unordered group a "phase", and uses it to gmup events behueen which there are no
known relationships, but al1 of which may share some relationship. For instance, the sites may
contain sirnilar artifacts, which leaas us to believe there is some relationship between them. The
"spui" function is used to calculate the probability distribution for the difference between the
first and last events of the phase group. Once again. the phase grouping is used when there is no
compelling stratigraphic or archaeological evidence to suggest that any two events (e.g., site
occupations) are related.
As an example, consider four uncalibrated dates from four sites within a region: A, 5000
50; B, 5 100 k 50; C, 5300 * 50; and D, 5300 * 50. When the span of these dates is calcuiated, a
probability distribution for the difference is produced (Figure 7). In effect. the span represents a
phase or a penod constructed from the probability distributions of the time placement dates. In
this particuiar case, there is a 68% probability that the true age difference between the first and
last events is between 230 and 440 calendar years, and a 95% probability that the true age
difference lies somewhere on the interval between 140 and 530 calendar years. On the basis of
this information, we could construct a phase with a duration of 390 calendar years (530-140)
with a 95% probability that al1 events (site occupations) occurred within this interval. It should
be noted that there is no assumption of contemporaneity between these events.
Figure 7: The span. or probability distribution for the difference, of four uncalibrated radiocarbon dates.
The length of the span depends, to a large extent, on individual radiocarbon determinations,
related standard errors, and the points along which the probability distributions (Gaussian)
intercept the calibration curve. Theoretically. there is no limit to the span of a phase but, if our
interest lies with those sites or occupations that were probably contemporary, then we still need
to determine whether or not the probability distributions are compatible.
Correlating individual sites, or their occupation levels, is not a saaighaonvard task and it is
a mistake to assume that two sites with the same radiocarbon deteminations were contemporary.
For example, if samples from two sites had the same date of 5000 & 50 bp and WC assume both
dates are acczirare, there is a 68% probability that the true age difference between events lies
somewhere between O to 2 10 calendar years. In other words, it is possible for the two events to
be over 200 years apart, despite the fact that both have the same radiocarbon determinations.
Greater standard errors and the positioning of the Gaussian distribution to the calibration curve
can increase the interval substantially. Once again, ranges of error c m be reduced by positioning
radiocarbon dates within a stratigraphic sequence, highlighting the need to establish the
archaeological context of radiocarbon samples (see p. 80).
The potential separation of occupations in time and the limitations to radiocarbon dating
accuracy has serious implications for interaction or settlement pattern studies that use
radiocarbon dates alone to draw correlations. If our objective is to improve the association of
radiocarbon dates with specific occupations, then regional sequences must be based on al1
sources of information, including arti facts and stratigraphy .
The Unitary Association Method
One of the objectives of this study is to introduce a new method of relative dating, to
demonstrate its operational principles. and to apply it to a case study in the southern Levant. The
Unitary Association Method of Relative Dating (UAM) is an analytical procedure devised by the
geologist, Jean Guex (1 977, 1987, 1988. 1991 ) to correlate sedimentary beds in geological sites.
The method is graph theoretic and employs deterministic techniques. such as those cornmon to
linear algebra. in order to manipulate data through logical steps, or algorithms (see Guex and
Davaud, 1984: Savary and Guex, 1990, 199 1).
The UAM builds on concepts and methods that rnany archaeologists use intuitively in the
field. Guex's major contribution was to implement mathematical procedures that allow
systematic correlation of stratigaphic units by the associational and superpositional relationships
of their contents. Although the method was originally intended to correlate stratigraphic units on
the basis of their fossil content. it can also be used to correlate archaeological strata on the basis
of artifact content, provided certain methodological concems are addressed.
To date, the most popular technique for ordering either artifacts or strata (using groups of
artifacts) is seriation. The principles and assumptions underlying various seriation methods have
been discussed at length elsewhere (Rouse. 1967; DunnelI, 1970; Cowgill, 1972; LeBlanc, 1975;
Marquardt. 1978; Baxter, 1994; Duff, 1996) and are mentioned here only to clarifi certain points
of cornparison.
One advantage of UAM over traditional relative dating techniques. such as seriation, is that
the results of the method are not as susceptible to spatial variation in artifact assemblages.
Consequently. its application is not constrained to specific localities containing similar artifact
sequences or 'traditions'. Another advantage is that we do not need to assume that artifact styles
change gradually over time or that the relative Frequencies of these styles change monotonically
(their popularity increases or decreases through time). This feature of analysis makes it possible
for UAM to order archaeological strata that contain stylistically unrelated assemblages. How the
method is used to create phases is explained in detail in Chapter 4. But first a few important
concepts need to be introduced.
Units of Analysis
The relative dating of archaeological strata is inseparable from the study of artifact
classification and stratification. In effect. whenever a site's stratigraphic sequence is constructed,
we have relatively dated those deposits. Yet when we attempt to correlate these deposits with
those fiom another site, we must rely on the relationships of their artifactual contents, rather than
stratigraphic principles.
The primary data used for relative dating are artifact cIasses and stratigraphic units.
Stratigraphie units, like artifacts, are not al1 the sanie and have their own system of classification.
While the analyticd units discussed below are applicable to any consideration of archaeological
materials or of relative dating techniques, the emphasis is on the definition of units used in the
Unitary Association Method of Relative Dating (UAM).
Artifacts
The strengths and weakness of UAM c m best be appreciated through an understanding of
what a "class" represents and how different classifications affect the results of analysis. An
axiom of classification is that it is arbitrary or subjective (Jevons. 1874: 394; Dunnell, 1971 : 47).
It is difficult to escape the fact that the individual who classifies an object is the one who
determines which criteria are relevant to analysis. Rarely, in any discipline, is consensus on
rnatters of classification ever reached. Consequently, the subjective nature of artifact
classification c m be an impediment to regional studies and to chronological analyses, both of
which are based on comparative methods.
A taxon is an object class that was created by means of systematics (a system of
classification). The units of analysis are not the real objects themselves but, rather, they are
classes that we have defined on the basis of specific criteria. There are generally several
categories of criteria. For example, a certain class of bowl may be defined on the basis of values
appearing in three categories; rim diameter. base diarneter and wall curvature. Which bowls are
included in this class depends on the range of variation that we define as acceptable for
mernbership. In the category of nm diarneter, for instance, we may specifi a range of 10-1 2 cm.
This makes a rim diarneter of 10-12 cm a citerion of membership. On the basis of al1 criteria, we
may locate a population of 100 bowls betonging to the class. There is. therefore, a distinction
between the ideational unit (class) and the empincal unit (a bowl). If we make a change in any
criteria of the class (say in rim diameter) we would probably not locate the same population of
bowls. Dunnell (1971 : 45) calls the set of criteria used to distinguish a class the significara, and
the artifact or empirical unit that was selected using this criteria, the denotutum. There is some
confusion in archaeological literature about whether a "type" is an ideational or an empirical unit
(Dunnell, 1986: 154). In this study, 1 equate a type with the significata, or class. In other words,
it is an ideational unit that is defined o n the basis of specific criteria. However, when reference is
made to a specific empirical unit. like a bowl. that unit can be identified by association with its
type. For exarnple. al1 Type A bowls are empirïcal units that possess the necessary properties for
inclusion in class "A" (Le.. they are denotata), although these bowls may Vary in other regards
not specified by the critena. It would be possible, for instance, to have both a painted and an
unpainted Type A bowl if the presence of paint is not a criterion for membetship in the class. It is
clear that the variable nature of classification and the preferences of different researchers will
affect the formation of classes and the results of analysis. Archaeologists working within a
particular region may or may not agree on classification schemes or on which criteria should be
used to define a particular class (e.g., see Plog, 1978: 159).
Artifact classifications are created to serve various purposes (Hill and Evans, 1972: 244;
Klejn, 1982: 5 1 ; Adams and Adams. 199 1 : 157). Our putpose is instrumental (Adams and
Adams 199 1 : 158), meaning that we want the classified material to tell us something about the
date of a site rather than about the material itself, and it is comparative, because we rely on
similar classes of materials to draw correlations. The ideal attributes in our systern of
classification would have a short duration, be widely dispersed in a short period of time, and
wouId preserve well in a number of different depositional environments (Lemon, 1990: 155). In
addition, a classification system is needed that c m account for spatial variation in assemblages
and time-lags in artifact appearances. Many of these ideal attributes cannot be determined a
priori because, for example. we have no pnor knowledge about the duration of a class or its rate
of dispersion. But they can be determined a posteriori, at which time modifications to the
classification can be made and new analyses conducted.
In seriation analyses, it is often assumed that the use of individual attributes as data will
yield better results than a type (group of aitributes) because important information can be lost or
subsumed within a type (LeBlanc. 1975). However, in a contrary finding, Duff (1 996) reanalysed
LeBlanc's material from Pueblo de los Muertos. and found that the use of types instead of
attributes yielded similar results. The reason for this is that, whether types or attributes are used,
both kinds of data are qualified and' as units of analysis in seriation techniques, both are
measured on a nominal scale. They are the same kinds of data. Al1 dasses are nominal-scale
variables and al1 attributes measured on a ratio-scale must ultimately be integrated into a
nominal-scale variable. A rim diameter of 20 cm is an attribute measured on a ratio-scale but it is
not very usehl to group ail vessels that are exactZy 20 cm in rim diameter, or to compare al1 20
cm rim diameters without reference to a class of vessei, such as a "bowl".
There is no reason to suggest that a particular attribute class is any more chronologically
significant than a selected group of attributes (a type). It is primarily the nature of the data and
how it relates to the chronological problem at hand that determines the success of analysis
(Rouse, 1967: 159). The decision to use either individual attributes or types in a chronological
analysis must be left to the discretion of the researcher and depends to a great extent on a
working knowledge of attribute variations over time and space for any regional assemblage.
Homologues and Analogues
Stratigraphic correlations are based on the premise that similar artifacts are closely related in
time but similarities can be caused by a number of factors and some caution is needed when
defining the criteria on which contemporaneity is presumed. The Egyptian scarabs discussed
previously are a good example of how different categories of information can affect our results.
If form alone is used. erroneous correlations would be drawn, but when the type of material is
added as a criterion, temporal differences are clear. Kroeber (1 93 1 : 1 5 1) differentiated between
homologous and analogous similarities to draw attention to this issue. He suggested that
similarities should be specific and structural. For the scarabs, the similarity of fonn aione would
be analogous. while nÿ-O scarabs of similar form and made of faience are more Likely to be
homologous in their similarity. In other words. homologous similarities are those that are
historicaity, or systemically, related while analogous similarities are only superficial and have no
historical relationship (Lyman et al. 1997: 9). For the study at hand. homologous similarities are
more likely to be contemporary.
AnaIogues and homologues are also known by other terms. Clarke (1 968: 229), for instance,
calls them "independent types" and "transform types" respectively. Analogues are also known as
homeomorphs, convergent types, or independent inventions. These terms suggest that similarity
between forms is either accidental or îunctionally derived. not historically related. But there are
exceptions. In some cases, it c m be demonstrated that hnctional equivalents or independent
inventions are historically related because the development of both may require a similar
scientific milieu or Ievel of technotogical development. For example, the independent invention
of radio transmission by both Graham Be11 and Guglielmo Marconi was, for al1 intents and
purposes, contemporaneous. In a similar vein, the apparently independent invention of copper in
the Near East, the Balkans, and iberia at about the same time (Renfiew, 1979) undoubtedly has
some relationship to pnor knowledge of matenals and pyro-technology within the greater region.
Implicit in the premise that the d e p e of homologous similarity is related to temporal
affinity is the notion that there are cultural processes whereby information about artifact design
and consû-uction is passed from one individual to another. It also implies that information
content changes through time and. on the basis of previous discussion, over space as well. The
term 'homology' carries an explicitly evolutionary view of artifact development which stresses
the importance of the perseverance of similarities over time. This aspect of similarity is
important to al1 relative dating techniques. The most important aspect of information transfer for
the correlation of sites is a knowledge of how ideas or objects are transmitted between
settlements. Processes by which this occun Vary. and include forms of cornmodity exchange or
the ways in which people exchange. accept, or reject ideas.
Spatial Variation and Artifact Diachroneity
Inter-site spatial variation in artifact assemblages makes correlation between strata difficult
because, as noted previously. when the distance between any two sites increases, it is less likely
that they will have any artifact types or attributes in common. Archaeologically, there are two
aspects to spatial variation; one is synchronie and the other diachronic. Synchronie spatial
variation is observed as a snapshot in time. It is the ideal state representing a true picture of
artifact distributions over a particular landscape for any instance. As one travels from one point
to another, observed changes in material culture can be attributed to differences in either local
traditions or historical trajectories. Altematively. diachronic spatial variation is a product of time
and a source of error when we attempt to correlate layers on the basis of similarity. It occurs
when artifacts or artifact styles are first made at one location and appear much later at another.
This creates a tendency to misalign two individual occupations. Artifacts that follow this pattern
are diachronous (Guex 199 1 : 102) and can include items that were traded, curated, or excavated.
They could also include items or ideas that were emulated at a later date, like the revival of
Greco-Roman architecture in 18" century Europe. Here, the tenn "diachronous" rather than
"diachronic" is used because there is no implication that the artifacts are changing over time but
rather that they are creating boundary effects in chronological units that are time-transgressive.
Deetz and Dethlefsen (1 965) noted the effects of artifact diachroneity, or time-lags, on the
correlation of strata and referred to it as the "Doppler effect".
When diachronous objects go unnoticed in an analysis of relative chronology, the effect is to
group Iandscapes (components) from different periods of time into a single penod. Because it is
impossible, in most cases, to reduce the resolution of archaeological time penods to much less
than 5 0 or 1 00 years, the potential for diachronous arti facts appearing in any component is great.
The result is that events are conflated to some degree and spatial variation is confounded with
temporal variation. Diachronie spatial variation occurs because of the limitations of
chronological methods, and each method affects this variation in different ways.
As the magnitude of diachroneity (Le.. the interval between the first appearance at one site
and the fint appearance at another) increases, correlations become less precise. Practically
speaking, most ideas and artifacts are diachronous to some degree. but an artifact that took even
10 years to spread throughout a region will have a negiigible effect on the correlation of strata.
The point at which artifact diachroneity becomes a problem depends on the chronological
resolution expected for any particular analysis. Ideally, the period over which time-lags occur
should be no greater than the period of occupation k ing investigated (Read, 1979: 91).
The distinction between synchronie and diachronic spatial variation is important because
seriation techniques are affected by both the differences in cultural traditions and the
diachroneity of artifacts. UAM, on the other hand, is unaffected by variations in cultural
traditions. but it is affected by diachronous attributes, although these cm be isolated to improve
correlations.
Artifact Intervals and Associations
The length of time during which artifacts of a particular class are made and used affects any
method of stratigraphic correlation that assumes that similar artifacts are contemporary. In
geology, when we speak of the 'existence' of a past life form. we refer to the total life-span for
that species From the moment of its first appearance to its last. This is calfed its existence
interval. When the tenn 'existence' is used for artifacts it cannot, of course, have the same
meaning. Ideally, the term refers to the use-life of an artifact, or the time that it remained in a
systemic context. On a practical levet, however, the term connotes an interval of time that is
based on an artifact's archaeological context, which may or may not be systemic. ClearIy,
existence intervals can be affected by the appearance of undetected analogues. by the ways in
which a . artifact is re-used. intrusions. or when site disturbances go umoticed (cf. Schiffer,
1987: 28. 1 3 7). Assurning these depositionai factors have been accounted for, the existence
interval of an artifact is defined as the time interval between its first known stratigraphic
appearance and its last known stratigraphic appearance.
When the existence intervals of two or more artifact types overlap, the types are said to
share a concurrent interval. In other words. if artifact A is found in strata 1 to 4, and artifact B is
found in strata 3 to 5, then they are concurrent for the interval represented by strata 3 and 4. in
terms of set theory, the shared interval is the intersection of the two existence intervals. Thus, if
artifacts share the same concurrent interval, it is assumed they are associated for that interval.
Overlapping existence intervals. as they are used here, should not be confused with the concept
of "overlapping assemblages" (Childe. 195 1 : 47; Willey and Phillips, 1958: 33) or "association
groups" (Hodder and Orton, i 976: 199). These are spatial, not chronological, terxns.
The association of two or more arti facts does not imply that they were always concurrent. If
one artifact has an existence interval of 300 years and another found in association wjth it has an
interval of 50 years, then there was a period of at least 250 years when the two did not CO-occur.
Therefore, if two artifacts are found together, we know that the time span of this association can
be no greater than the minimum existence interval, which, in our example, would be 50 years. If
a third artifact is added to the set of artifacts. it may be possible to further reduce the concurrent
interval. While it is ofien impossible to know an artifact's true existence interval, as a general
rule, the chances of encountering a smaller concurrent interval increase as the number of
associated artifacts increases (an index set). This fact gives strength to chronological arguments
based on the cross-dating of two or more associated artifacts (Childe, 1956: 32; Schiffer, 1987:
3 17).
stratigraphic Units of Analysis
In addition to artifact classes, stratigraphic units and their relationships forrn essential
components of UAM. The basis of most chronological frameworks, regardless of the dating
method, is a comprehensive study of site stratification (Butzer. 1987: 7 1 ; Stein, 1992: 7 1). Many
of the stratigraphic terms and definitions used here are taken fiom Stein (1992) and Gasche and
Tunca (1 983) who, on the basis of the North Americun Straiigruphic Code (NACSN, l983),
have adopted and interpreted certain aspects of stratigraphic nomenclature for the purposes of
archaeological study. Stein suggests that archaeological layers be described, divided, and
interpreted first as lithostratigraphic units, then as ethnostratigraphic units (defined by artifact
content), and finally as chronostratigraphic units (grouped by artifact content). There are good
methodological reasons for following this procedural sequence, as will become clear.
Lithostratigraphy
A lithostratigraphic unit is defined, distinguished, and delimited on the basis of its physical
characteristics. It is stratified and usually conforms to the Law of Superposition (NACSN, 1983:
856). In the field. archaeologists differentiate deposits using lithological criteria, such as
sediment or soi1 cotour and composition. For archaeological purposes, deposits are the srnailest
lithostratigraphic units that can be defined at an archaeological site; they are comprised of a
three-dimensional volume of material that is spatially discrete. and distinguishable on the b a i s
of observable physical properties (Schiffer, 1987: 265; Stein, 1987: 339). They generally result
from a single depositional episode.
Ofien it is desirable to group deposits into larger lithological units. Stein (1992: 78) suggests
the use of the tenn "Iayer" for these grouped deposits but, generally, the term c m be used
interchangeably with "stratum." Layers are synthetic units, lithologically defined, that should be
mappable across the entire site. This definition of iayer is usefiil, but not ail archaeological
deposits are easily grouped into larger units on Iithoiogical critena alone. especially in the
geological sense of the term. However. archaeological analyses have the added advantage of
correlating site deposits across an area by using construction and collapse events as stratigraphie
boundaries, particularly where substantial architecture existed (cf. Blackham, 1997).
Biostratigraphy and Ethnostratigraphy
In geology, a biostratigraphic unit is a body of rock defined or characterized by its fossil
content (NACSN, 1983: 863). Gasche and Tunca (1983: 33 1) apply the concept to deposits that
are defined by their artifact content and cal1 them erhnostrafigraphic unifs. M i l e this term
implies that stratigraphic units are defined by their cultural materials. it may also have other,
unwanted connotations. The prefix 'ethno' generally refers to a people, or a single cultural group
but, at any point in time, a particuIar site or region may have k e n comprised of several different
cultures or ethnic groups. The use of the term, therefore, is not meant to imply that a stratigraphic
unit corresponds with any ethnic group.
Lith~strati~gaphic units are defined at their spatial boundaries by their physical
characteristics and, in tum, these same boundaries delimit the artifact content of that unit.
Altematively, an ethnostratigraphic unit is defined by these contents, but the two terms do not
necessarily refer to the same stratigraphic unit. For example. if two or more lithostratigraphic
units have the sarne contents, they belong to a single ethnostratigraphic unit.
Chronostratigraphy
When stratigraphic units are defined at their boundaries by the variable of time, they become
chronostratigrcphic unifs. Theoretically, chronostratigraphic units are regional units that can be
lithologically defined in their upper and lower limits by isochronic horizons. An isochronic
horizon defines a regional landscape for a given period of time. Isochronic horizons are dificult
to identifi except. for exarnple, in cases where a regional covering of volcanic ash or eolian
deposits can be recognized. A chronostratigraphic unit is described in the sarne manner as
"layer," except that it is regional in scope,
A chronozone is a chronostratigraphic unit. It defines the srnailest regional layer and is
usually of a short interval, but it can span any period of time depending on its purpose. Stein
(1 992: 85) calls chronozones based on artifactual data ethnochronozones. The relationship
between chronostratigraphic units and ethnostratigraphic units is a close one because the latter
are often used to define the former and the distinction between the two is not always clear.
Lemon (1 990: 2 10) daims that, on a practical level, biozones (ethnozones) are chronozones and
that the only differcnce between the two is one of interpretation and description.
It should be remembered, however, that an ethnostratigraphic unit can be diachronous on its
upper and lower limits because of spatial variation in assemblages. By contrast, a
chronostratigraphic unit is ideally isochronic at its boundaries. Ultimately, therefore, the
identification of chronostratigraphic units remains the pnmary objective of chronological
anai yses.
E thnozones
The fundamental unit of a biostratigraphic classification is a biozone. These are bodies of
sediments that are defined by the presence, absence, or relative abundance of a certain taxon or
assemblages of taxa (Lemon, 1990: 204). Stein (1992: 80) proposes the use of the terni
ethnozone. of which there are three principal kinds: assemblage zones. abundance zones, and
interval zones (NACSN, 1983: 863; Guex, 1991 : 1; Stein, 1992: 80). An ethnozone is used as a
means ofdefining the chronological Iimits of an ethnostratigraphic unit. In effect, an ethnozone
is equivalent to an archaeological phase.
Assemblage Zone. An assemblage zone is charactenzed by the association of three or more
artifact types. It can be geographically (horizontally) or stratigraphically (vertically) restricted,
depending on the artifacts that define it. The use of assembtage zones is a popular method in
archaeology for identifiing phases.
Abztndmce Zone. An abundance zone (also called an acme zone) is characterized by
quantitatively distinct maxima of relative abundance for one or more artifact types. What this
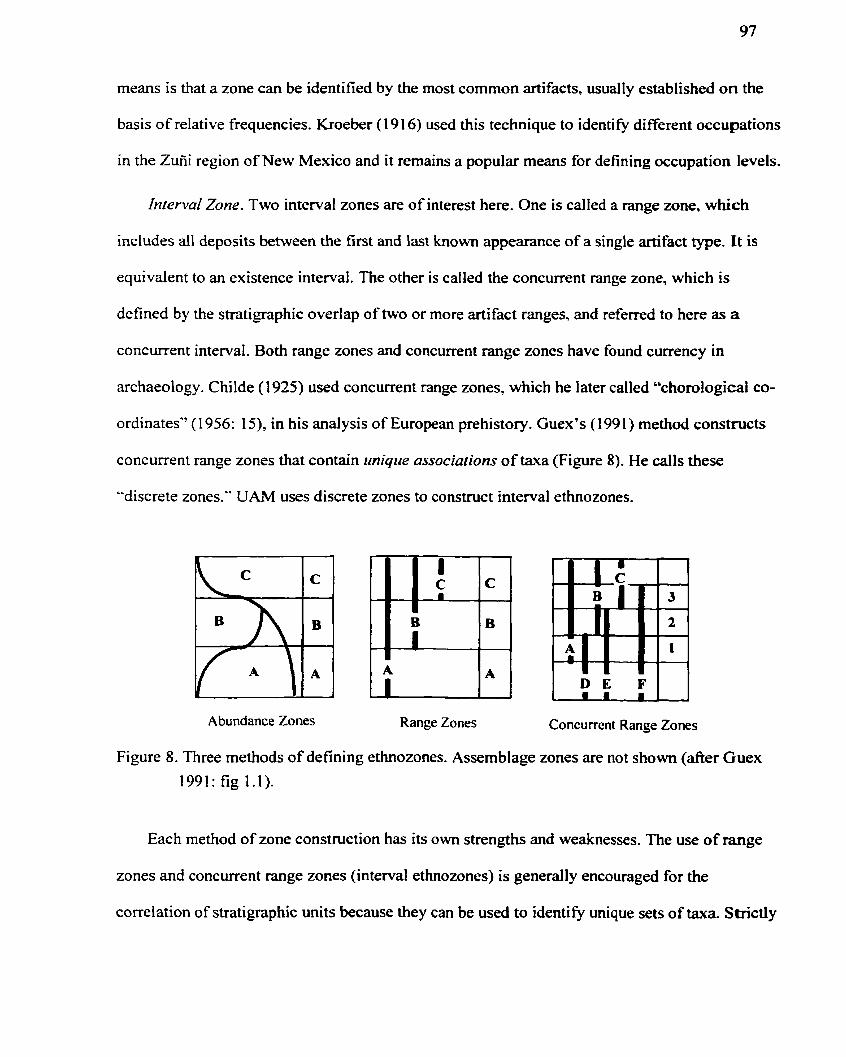
means is that a zone c m be identified by the most common artifacts, usually established on the
basis of relative frequencies. Kroeber (1 9 16) used this technique to identifi different occupations
in the Zufii region of New Mexico and it remains a popular means for defining occupation levels.
Interval Zone. Two interval zones are of interest here. One is called a range zone, which
includes dl deposits between the first and 1 s t known appearance of a single artifact type. It is
equivalent to an existence interval. The other is called the concurrent range zone, which is
defined by the stratigraphic overlap of two or more artifact ranges, and referred to here as a
concurrent interval. Both range zones and concurrent range zones have found currency in
archaeology. Childe (1925) used concurrent range zones, which he later called "chorological co-
ordinates" (1 956: l s), in his analysis of European prehistory. Guex's (1 99 l ) method constructs
concurrent range zones that contain trniqrre associations of taxa (Figure 8). He calls these
"discrete zones.'' UAM uses discrete zones to construct interval ethnozones.
Abundance Zones Range Zones Concurrent Range Zones
Figure 8. Three methods of defining ethnozones. Assemblage zones are not shown (after Guex
1991: fig 1.1).
Each method of zone construction has its own strengths and weaknesses. The use of range
zones and concurrent range zones (interval ethnozones) is generally encouraged for the
correlation of stratigraphic units because they c m be used to identify unique sets of taxa. Stnctly
speaking, a concurrent range zone is an assemblage zone, but one that is explicitly defined by
overlapping existence intervals. Abundance zones. although they c m be usehl for local
correlations, are generally not used by geologists because of the many factors that affect the
relative frequencies of taxa fiom location to location. This is true for archaeological data as well,
and the results depend to a geat degree on the effects of differential site functions (e-g., activity
areas), differential deposition. site disturbances. differential preservation. and differential
recovery, al1 of which serve to affect artifact counts and relative frequencies.
To summarize the discussion so far. artifact associations are first determined by the
lithostratigraphic units (deposits) that contain them, then. on the ba i s of these associations,
ethnozones are used to define ethnostratigraphic units. Ethnozones c m be constructed in several
different ways, depending on how the data are organized. UAM constructs ethnozones by using
concurrent range zones. From Guex's discussion and his classification of terms, it is evident that
he takes the same view as Lemon's, that is, that biozones (ethnozones) and chronozones are, in
practice, much the sarne.
Factors Affecting Correlation
From the previous discussion, it is clear that attempts to correlate strata face a nurnber of
practical problems. the inost common of which are:
CZassijcaiion. The classification of artifacts is fundamental to drawing relationships
between settlements and presents one of the most difficult challenges. Classifications need to be
explicit, systematically constructed, and internally consistent (Dunnell, 197 1 : 60).
Artfacf ussociations. The assumptions on which artifact associations are based must be
clearly defined. Correlating stratigraphy on the basis of assurned associations can be misleading
and often results in tautological arguments.
Commun artifacfs. Within any geographic region of study, each site must have some artifact
types in common with at least one other site if they are to be successfùlly correlated. The degree
of confidence in any correlation of strata is a fùnction of the number of common types or
attributes they contain.
Spatial variation. Synchronic and diachronie spatiaI variations affect our ability to draw
accurate correlations between distant locales.
Deposilional andpost-depositional factors. Any number of site-disturbance processes can
affect the archaeological context of artifacts and produce errors of association and superposition.
UAM and Seriation
M i l e seriation orders groups of artifacts on the basis of homologous similarities, UAM
orders these sarne groups on the basis of artifact superposition. The UAM does. however, assume
that existence intervals represent periods of continuity for any artifact class. When we claim that
any two artifacts, which were widely separated in time, are the sarne class of artifact, then we are
implying that there is a homologous link between them and that no perceptible change in that
class c m be recognized for the period of time designated by the interval. The different
techniques each method has for ordering strata dictates their respective strengths and
weaknesses.
Seriation methods ignore the context of Ends when ordering either artifacts or strata defined
by a group of artifacts. For example, if we are interested in the chronological development of a
specific artifact type. such as Dethlefsen and Deetz's (1966) gravestones. no stratipphic
sequence or association of artifacts is required because the gravestones can be ordered by their
stylistic similarities alone. Ordering artifacts in this way is the basis of seriation methods and,
clearly, the method is advantageous in situations where the context of finds is doubtfiil or
unknown.
Seriation orders a single class of artifact on the presence or dimensions of specific attributes,
such as a certain kind of handle or decoration on a pot and it orders groups of artifacts in a
similar manner except. in these cases. we treat the group as an object to be seriated and the
individual artifact classes become the attributes of the group. This is the basis of seriation
techniques when they are used to order and correlate the strata of regionai sites. The problem
with seriating strata is that seriation methods are particularly susceptible to the effects of
diachronie spatial variation.
The UAM. like seriation methods. initially groups artifacts using lithostmtigraphic units and
also assumes that similar artifacts are more closely related in time. Rather than using coefficients
of sirnilarity to order groups of artifacts, however, it uses the superpositional relationships
between sets of artifacts for this purpose. Consequently, the results are not affected by spatial
variations in the same way. For example. assume that sites A, B, and C were contemporaneous.
Site A has no artifacts in common with site C but site B has artifacts in common with both A and
C. In this case, spatiaI variation exists between assemblages. Seriation methods would create a
sequence of A-B-C or C-B-A whereas UAM, using superpositional and associationai
information, could determine that al1 sites were contemporary for that interval. Its spatial
limitation is that, without site B, no correlation could be drawn between A and C. This same
limitation applies to seriation methods.
M i l e UAM is relatively unaffected by spatial variation, it is affected by artifact
diachroneity. The advantage of UAM is that diachronous artifacts can be identified and isolated
in order to improve correlations. The identification of diachronous artifacts is also usehl to trace
the movement of specific artifacts from one community to the next.
Like seriation methods, UAM has its limitations- The method is not useful for sites in which
superpositions and associations are unknown. It is possible. however, to integate unstratified, or
single-period. sites into any anatysis that inchdes stratified sites, provided that these sites have
some artifacts in common with the stratified sites.
The UAM works best when al1 strata are of short. but not necessarily equal, duration.
Dunnell (1970: 3 12) suggests that al1 units in a seriation should be of comparable duration so as
not to affect the distribution of the classified objects used to create the ordering. In other words,
when the defining lithological unit represents a greater period of tirne* so will the group of
artifacts it contains. This will create unwanted associations that result in a loss of chronoiogical
resohtion. For example, if a unit spans 300 years and we group its contents as a single
ethnostratigraphic unit, then we are assuming that al1 artifacts contained are contemporary.
The assurnptions underlying relative dating methods can be problematic. For either cross-
dating, seriation, or UAM, we must be confident that the similarities obsewed between artifacts
represent the dimension of time and are not caused by other factors (Marquardt 1978: 259). In
addition, we must account for problems associated with spatial variation and artifact
diachroneity.
A Method of Classification
In this section. 1 suggest a method of arti fact classification that is specifically designed to
improve correlation results when using either seriation or UAM techniques. For the purpose of
correlation, it is useful to use artifacts or attributes that were widespread and of short duration,
although it is often difficult to pre-detennine which artifacts these were. More essential to the
task at hand is to develop a system of classification with units that approximate the way in which
ideas were transmitted fiom one settlement to the next, or from individual to individual. The
dynarnics of information transfer suggest that a permzrfafional rnefhod of artifact classification
would be the most efficient.
The system of classification used here is actually two-fold. First, artifacts are classified
using a combination of intensional and extensional definitions. For example, intensional
definitions of pottery wouId include rim diarneter and base diameter rneasurements. Extensional
definitions, on the other hand, are used in those cases where a pictwe is worth a thousand words,
such as an illustration of a complicated vessel wall shape. Primary divisions are based on form
and size, which. for most pottery sherds, are the vessel wall shape and rim diarneter, respectively.
Because, in most cases. sherds and not whoie pots comprise the assemblage to be classed, the
system is devised to include whole vessels as well as various sherd types and individual
attributes. The second aspect of classification is to permutate the attributes to create all possible
combinations. This approach is discussed at more length below.
The system of classification used in this study makes no distinction between style and
function, or style and form. The stance taken here is that forma1 variation is, in many instances, a
manifestation of isochrestic variation (Sackett, 1993) and, as such, can be a usefùl characteristic
for defining chronological and spatial limits. Isochrestic variation means that variation operates
whhin social parameters and that choices made by local artisans are largely dictated by the
technological traditions of the social group to which they belong (Sackett 1993: 33). This idea is
not new and is often associated with the "normative" approach used in traditional archaeology
(Le.. culture history). The idea of isochrestic variation was severely criticized by Binford (1989:
55) because. he claims. it cannot account for either culture change or variability and, in effect,
implies that culture causes culture. But beyond Binford's polemic. it is clear that ethnic traditions
play a vital roie in the reproduction of style and form. meaning that the selection environment for
cultural traits is often other cultural traits (Shennan 1991 : 35).
While it may be important to separate style fiom fùnction in an evolutionary approach to
artifact classification (Dunnell. 1978; Neiman, 1996), it is not important to make these
distinctions in a purely chronological approach. From an evolutionary point of view, stylistic
traits are considered to be selectively neutral for the populations in which they occur while
functional traits are not. As a corollary. stylistic traits are seen as stochastic occurrences while
fùnctional traits are the result of deterministic mechanisrns. If. however, we accept isochrestic
variation as a socially meaningfûl operative. then neither stylistic nor forma1 characteristics can
be considered entirely neutral. People have choices but the choices they are able to make are
limited by their knowledge of available options. by prevailing technologies, and by social
pressures (Cavalli-Sforza and Feldman 198 1 ; Boyd and Richerson 1985; Shennan 1989; Rogers
197 1, 198 1, 1995). These factors are al1 conditioned by an individual's cultural milieu.
Chronological analyses are not concerned with explanations of style or fùnction. Regardless
of how or why certain traits affect their populations, stylistic, functional, and technological
attributes are useful if they change over time (Dunnell, 1978: 196). In fact, it is impossible to
have a prion knowledge about which characteristics will be important to chronological analyses.
Any final anal ysis is informed both by prior analysis and by experience in the field. Ideally, we
must consider as many categories of information as is practically possible and then test them for
variation over time.
An important aspect of interaction studies and regional chronological analyses is how
information was passed from one settlement to another and how this information manifested
itself in the production of artifacts. Studies of information transfer confimi that ideas are
exchanged and adopted most fiequently between two individuals who have similar cultural
identities. share similar beliefs, and have a similar social status and education (Lazarsfeld and
Merton, 1964; Rogers and Kincaid, 198 1 ; Rogers. 1995: 18, 286). Individuals who are alike in
these ways are homophilous, a term that c m be extended to include two or more communities
within any specified region. In other words, information transfer and the adoption of ideas is
more likely to occur between communities that share cultural beliefs. meanings, and
understandings (see also DeBoer. 1993). But the differential transfer and adoption of ideas is
rarely straightforward.
When an artifact, trait' characteristic. or property is introduced into a community; it becomes
an innovation; it is something new. Rogers (1 983) defines an innovation as "...an idea, practice
or object that is perceived as new by an individual or other unit of adoption." While we have no
direct knowledge of the perceptions of people in prehistory. there must have existed a point at
which certain ceramic attributes were new to the community. An in-depth study of information
transfer between communities is beyond the scope of this study, but one important aspect is to
note how innovative ideas are emulated and integrated into the production of existing objects.
Putting aside the effects of diachroneity for the moment, it is this integative process that creates
the observed spatial variation in artifact production (cf., Wissler, 1 923 ; Linton, 1 936; Barnett,
1953; Kroeber, 1 963: Plog, 1978. 1980: Rogers. 1983; van der Leeuw and Torrence, 1989;
Basalla, 1990; Conkey and Hastorf, 1990; Schortman and Urban, 1992; DeBoer, 1993).
The effects of emulation are not limited to whole artifacts, where one particular artifact class
is either present or absent at any Iocale. In many cases. only specific aspects of an idea or object
are accepted, while others are rejected. On the basis of over 100 cultural studies, Rogers (1971,
1983: 177) claims that, for any innovation, over 50% of al1 adopters wili select only certain
aspects of it, while 20% make wholesale changes. This suggests that. in the absence of
controlling forces over production and distribution, ideas are accepted and implemented
differentially. Factors that account for the differential selection of attributes or ideas by any one
individuai or social group Vary and, in many cases, depend on the compatibility of the idea with
local beliefs and values, its relative advantage. its reproductive complexity, and the degree of
risk involved with its acceptance. For the project at hand, the highly variable nature of
information transfer suggests that a system of artifact classification is needed that can account for
partial emulation without losing important chronological information.
To accommodate this variation, a permutational approach to artifact classification is used
(see Smith Cl9871 for a similar approach). The classification system creates both superclasses
and subclasses of pottery style and forrn. SubcIasses are attributes, or attribute intervals, that are
created on the ba i s of nominal and ratio-scale variables, including, for example, rim diameter,
form, rim lip type, and decoration type. Superclasses, on the other hand, are defined on
combinations of these subclasses. The reason for doing this is that, by using only subclasses
(attributes) in analysis, it is possible to miss important combinations of attributes. Altematively,
the use of only superclasses risks a loss of information that also may be chronologically relevant.
For example, a common pottery type in the southern Levant for the period investigated is a
"hole-mouthed jar". This jar can be identified primarily by its fonn but was manufacmred with
several rim lip designs and different kinds of appliqué (e-g., "rope" mouldings). If we create
three subclasses where "A" represents f o m and size. "B" represents lip design, and "C" defines
the decoration, then the superclass is "ABC." Yet the possibility exists that hole-mouth jars with
rope mouldings appear at all sires at a specific time, regardless of the rim lip design. To
overcome this problem. and to retain as much information as possible. each superclass is
permutated to create every possible combination of subclasses. Using our example, pot ABC is
divided into the set {MK. AB, AC. BC, A, B. C}. which represents the pot in al1 combinations
of attributes.
Two concems arise in using this typological scheme. First of all, it is possible to create
unwieldy numbers of classes. In practice, however, this seldom occurs. The UAM uses
presence/absence data and incidence matrices. meaning that each horizon can contain only one
representation of each class. If four sherds found in one local horizon have rope mouldings, the
rope moulding attribute is entered only once for that horizon- Another consideration is that many
combinations will be unmatched: that is, they will appear at only one site. Unrnatched artifacts
are not always usehl for a chronological analysis and are usually removed. This greatly reduces
the total number of useful classes. Second, this typological system has the effect of entering one
artifact as several types (i.e., super and subclasses) and it may appear that the types created are
not mutually exclusive or independent because the associations of attributes are created fiom a
single entity. But the associations themselves are mutually exclusive and, despite the fact that
many attributes are based on sherds rather than whole pots, the clzisses remain independent
because only one is used per context. A number of experimentai analyses. each using different

methods of classification, demonstrated that correlations were irnproved with this technique (cf.,
Blackham, 1998).
4. A DEMONSTRATION OF METHOD
The UAM uses the presence or absence of artifacts as data, and performs its mathematical
operations using incidence matrices. There have been several discussions concerning the relative
merits of using either presencelabsence or abundance data in constmcting relative chronologies
(Dempsey and BaumhofT. 1963: 499; Hole and Shaw. 1967: 78; Marquardt, 1978: 41 8; Baxter,
1994: 38). The point most ofien made against presence/absence data is that the results are highly
susceptible to artifact intrusions resulting Iiom site disturbances, while methods employing
abundance data do not present this problem. The counter argument is that results obtained using
abundance data will often reflect a distribution for a very localized sequence, and may not be
applicable to the whole site. let alone a region. This is particularly the case if the site is large or if
sampling is limited. Abundance data will also diminish the importance of rare items that may be
unique to specific time periods but appear in relative isolation. The problems with abundance
data argue against their use on a regional scale. For presence/absence da@ UAM attempts to
counter inherent difficulties by using a combination of transitive principles and inferences about
contextual relationships. With either kind of data, the effects of differential deposition,
differential preservation, site disturbance, differential recovery. and the misclassification of
artifacts will present potential problems.
UAM is based on relatively simple mathematical principles but c m be computationally
cornplex when large numbers of layers and artifacts are involved. The analysis performed here
uses a cornputer program cal1ed Biograph: version 2-02' (Savary and Guex, 1990, 199 1).
The description of analyticai method given below is greatly simplified, perhaps
oversimplified on some points. The objective of this demonstration is to provide a clear and
elementary sequence of steps that will facilitate an understanding of the process. In al1 instances,
1 have atternpted to situate the method within an archaeologicai framework. For the purposes of
demonstration, three fictitious sites have k e n created and are used throughout (Figures 3.1 and
3.2). The objective of the exercise is to correlate the layers of these sites.
"Section" is a term used to refer to a single stratigraphic sequence. If a site was excavated in
a number of separated excavation units, each unit is a potential section. More is said on sections
at the end of this chapter. The Biograph program numbers strata from the bottom up. This format
is retained in the demonstration of method.
Superpositional Relationships and Reproducibility
For any two artifacts. only two superpositional relationships can be observed, one where
artifact X occurs below another, 2, ( X a 2) and the other where X is above Z (Xe 2). In graph
theory, these reiationships would be expressed respectively as an arc below or an arc above.
Artifact superpositions are determined from the reiationships observed at eac h site.
Biograph: Version 2.02 is DOS based. The program is available fiom Professor Jean Guex, Universite de
Lausanne, Institut de Géologie et Paléontologie, BFSH 2. Lausanne CH-1015, Switzerland. A more detailed
expianation of the theoretical concepts on which the program is based appears in Savary and Guex ( 1 990, 1991) and
Guex (1991).
The determination of superpositional relationships can be problematic when using
presence/absence data because, as mentioned, they are particularly susceptible to the effects of
artifact intrusions. The UAM attempts to counter this problem by recording the reproducibility of
the observed relationship. A superpositional relationship between two artifacts is said to be
reproducible if that same relationship is found at more than one site. Reproducibility is a way of
weighting certain relationships. The assumption here is that a relationship gains 'global'
reliability when it is observed at more than one location. The frequencies of reproducibilities are
recorded so that X [4] 3 Z would indicate that X is found below Z at 4 sites. Because each
artifact relationship carries a value of at least one [ l ] (Le.. found in at least one site), the value of
al1 reproducibilities must be, at least. the value of al1 arcs.
The Biograph program provides the option of calculating the total values of superpositions
by using the value of either arcs or reproducibility or the sum of both. The way superposition
totals are calculated c m have a considerable effect on the ordering of sets. For instance, if only
reproducibilities are counted, then we are giving a similar weight to arcs and reproducibilities
because reproducibilities contain the set of arcs. If. however, we count both arcs and
reproducibilities. then we are actually counting arcs twice and giving more weight to
superpositional relationships observed within sites than to those reproduced between sites. In this
analysis, only reproducibilities were counted. giving emphasis to relationships observed at two or
more sites.
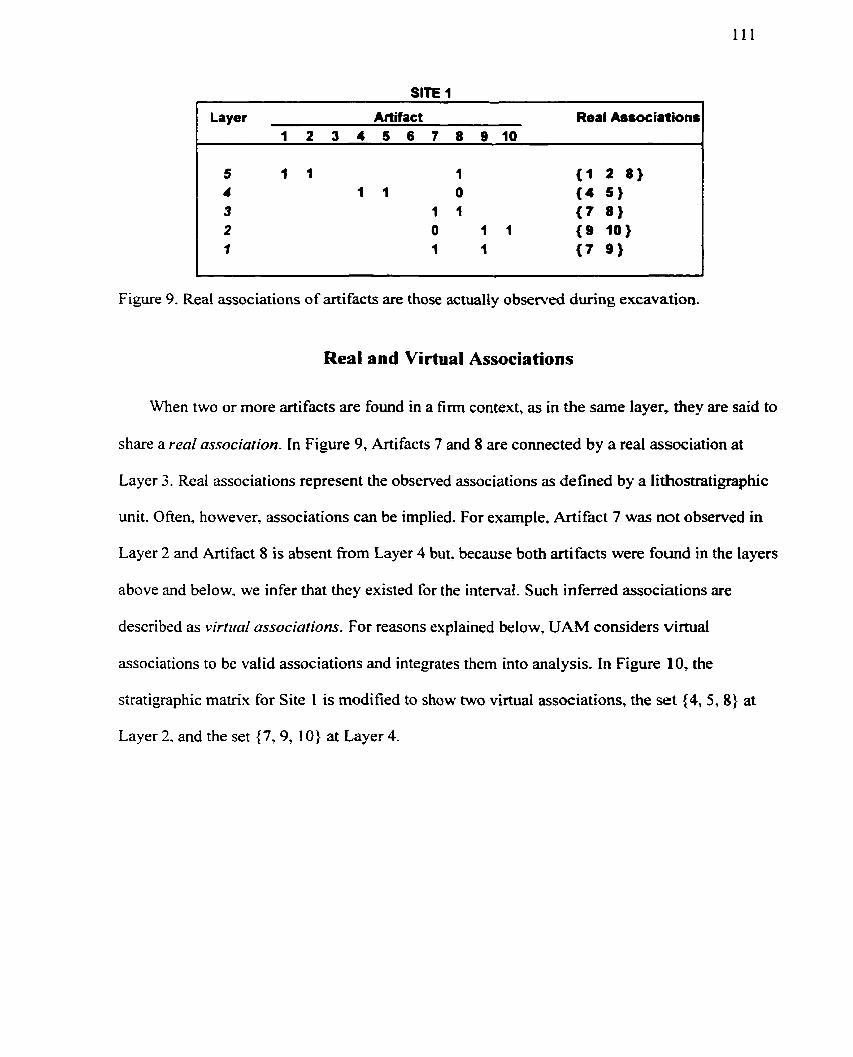
Layer Artifact Real Assaciations 1 2 3 4 5 6 7 8 9 1 0
Figure 9. Real associations of artifacts are those actually obsenfed during excavation.
Real and Virtual Associations
When two or more artifacts are found in a firm context, as in the same layer, they are said to
share a real associafion. In Figure 9. Artifacts 7 and 8 are comected by a real association at
Layer 3. Real associations represent the observed associations as defined by a lithostratigraphic
unit. Often, however, associations can be implied. For exarnple, Artifact 7 was not observed in
Layer 2 and Artifact 8 is absent From Layer 4 but. because both artifacts were found in the layers
above and below. we infer that they existed for the interval. Such inferred associations are
described as virtlcol associations. For reasons explained below, UAM considers vimial
associations to be valid associations and integrates them into analysis. In Figure 10, the
stratigraphie matrix for Site 1 is modified to show two virtual associations, the set (4, 5,8) at
Layer 2, and the set (7.9, 10) at Layer 4.
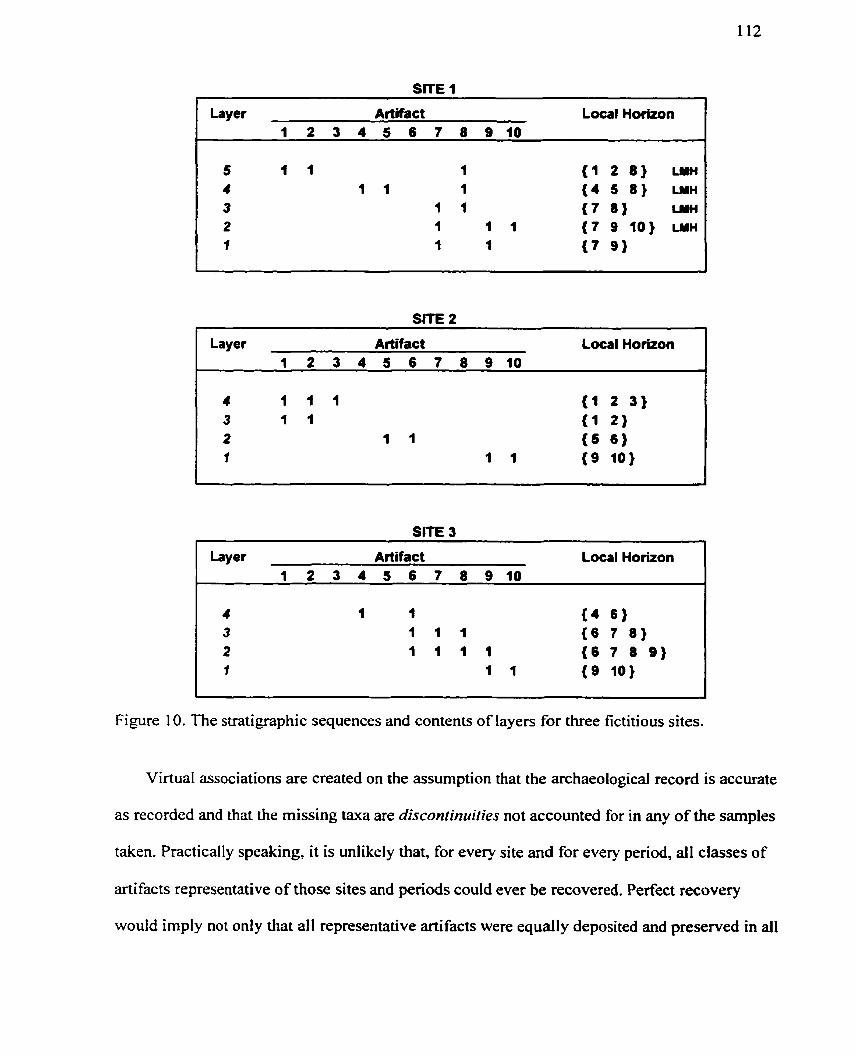
SlTE 1
Layer Arüfact Local Horizon 1 2 3 4 5 6 7 8 9 1 0
5 1 1 1 { l 2 8 ) WH
4 1 1 1 { 4 5 8 ) WH
3 1 1 { 7 8 ) W H
2 1 1 1 { 7 9 10) LMH
f 1 1 { 7 9 )
SrrE 2
Layer Artifact Local Horizon 1 2 3 4 5 6 7 8 9 1 0
SlTE 3
Layer Artifact Local Horizon 1 2 3 4 5 6 7 8 9 1 0
Figure 10. The stratigraphie sequences and contents of layers for three fictitious sites.
Virtual associations are created on the assurnption that the archaeological record is accurate
as recorded and that the missing taxa are disconrinuities not accounted for in any of the samples
taken. Practically speaking, it is unlikely that, for every site and for every penod, al1 classes of
artifacts representative of those sites and penods could ever be recovered. Perfect recovery
would imply not only that al1 representative artifacts were equally deposited and preserved in al1
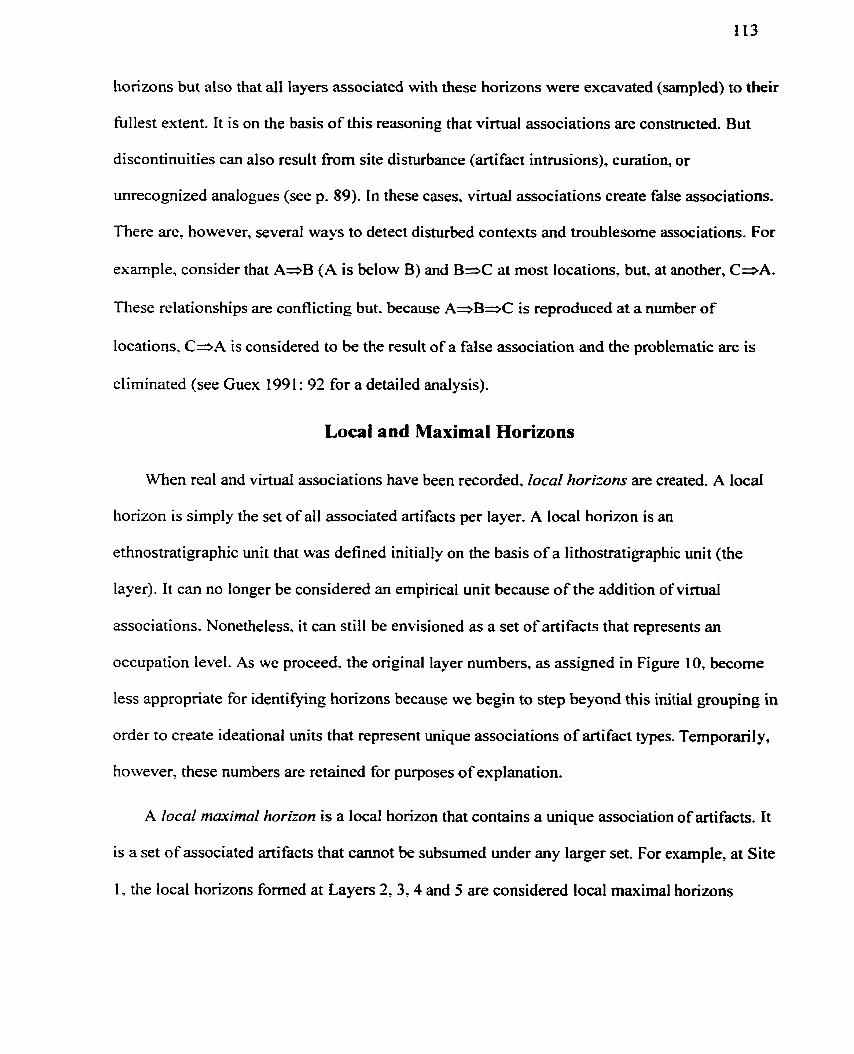
horizons but also that al1 layers associated with these ~ O ~ Z O ~ S were excavated (sampled) to their
fullest extent. It is on the ba i s of this reasoning that virtual associations are constmcted. But
discontinuities can also result from site disturbance (artifact intrusions). curation, or
unrecognized analogues (see p. 89). In these cases. virtual associations create false associations.
There are, however. several ways to detect disturbed contexts and troublesome associations. For
example, consider that A-B (A is below B) and B-.C at most locations. but, at another, CSA.
These reiationships are conflicting but. because A a B z C is reproduced at a number of
locations, C a A is considered to be the result of a false association and the problematic arc is
eliminated (see Guex 199 1 : 92 for a detailed analysis).
Local and Maximal Horizons
When reat and virtuai associations have been recorded. local horizons are created. A local
horizon is simply the set of al1 associated artifacts per layer. A local horizon is an
ethnostratigraphic unit that was defined initially on the basis of a lithostratigraphic unit (the
layer). It can no longer be considered an empirical unit because of the addition of virtual
associations. Nonetheless, it can still be envisioned as a set of artifacts that represents an
occupation level. As we proceed. the original layer numbers, as assigned in Figure 10, become
less appropriate for identifying horizons because we begin to step beyond this initial grouping in
order to create ideational units that represent unique associations of artifact types. Temporarily,
however, these numbers are retained for purposes of explanation.
A local maximal horizon is a local horizon that contains a unique association of artifacts. It
is a set of associated arti fac ts that cannot be subsumed under any larger set. For example, at Site
1, the local horizons formed at Layers 2 , 3 . 4 and 5 are considered local maximal horizons
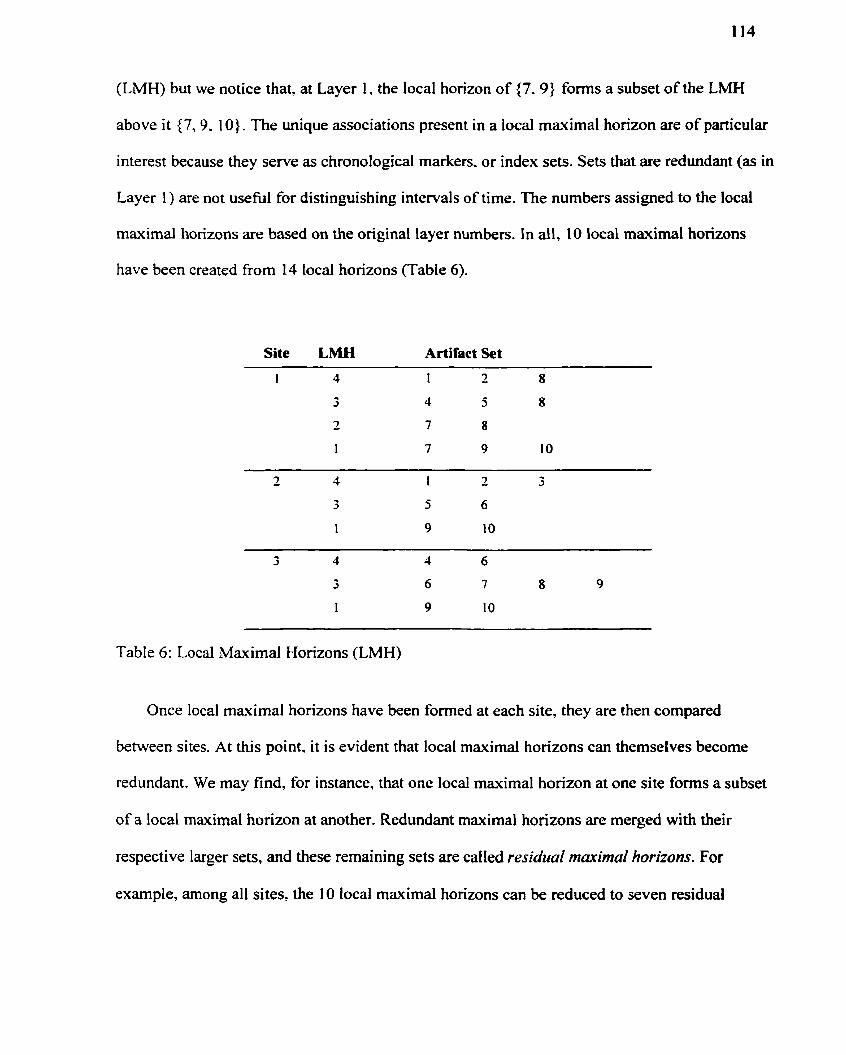
(LMH) but we notice that. at Layer 1, the local horizon of (7 .9) foms a subset of the LMH
above it (7,9. 1 O}. The unique associations present in a local maximal horizon are of particular
interest because they serve as chronological markets, or index sets. Sets that are redundant (as in
Layer 1) are not useful for distinguishing intervals of time. The numbers assigned to the local
maximal horizons are based on the original layer numbers. In ail. 10 local maximal horizons
have been created fiom 14 local horizons (Table 6).
Site LMH Artifact Set
Table 6: Local Maximal Horizons (LMH)
Once local maximal horizons have been formed at each site, they are then compared
between sites. At this point, it is evident that local maximal horizons can themselves become
redundant. We may find, for instance, that one local maximal horizon at one site foms a subset
of a local maximal horizon at another. Redundant maximal horizons are merged with their
respective larger sets, and these remaining sets are called residral marimal horizons. For
example, among al1 sites, the 10 local maximal horizons can be reduced to seven residual
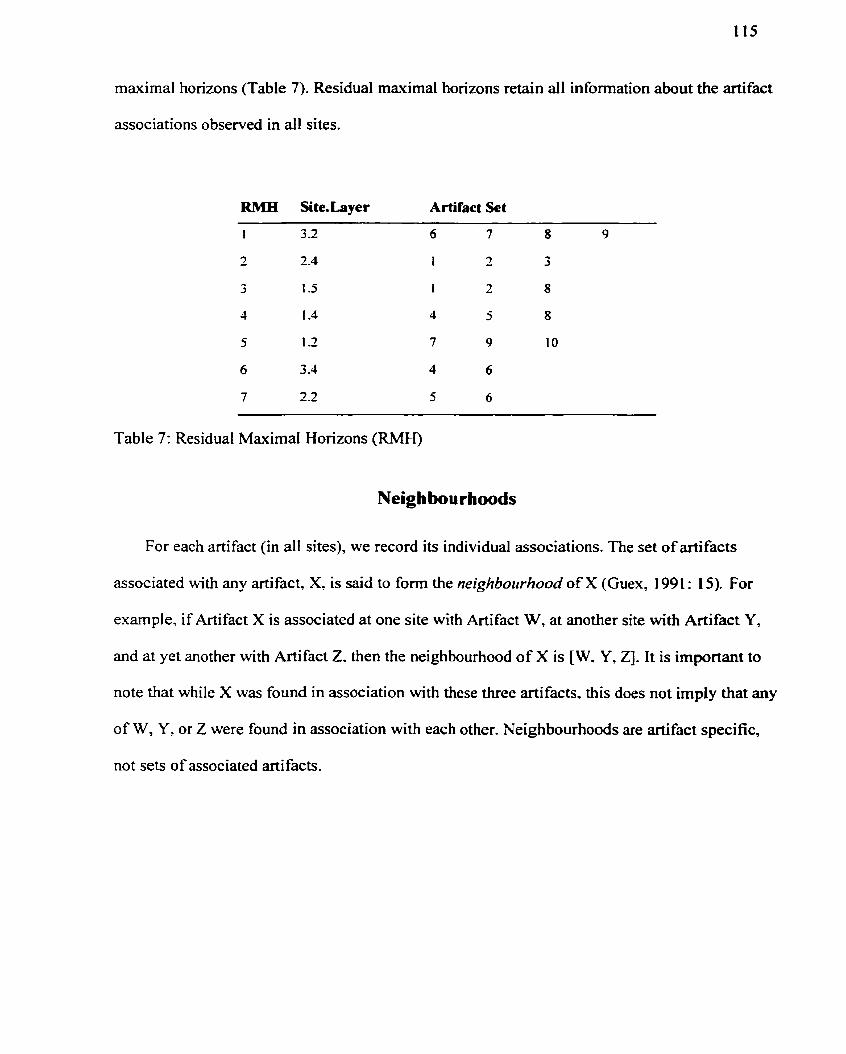
maximal horizons (Table 7). Residual maximal horizons retain al1 information about the artifact
associations observed in al1 sites.
RMH Site.Layer Artifact Set
-- - - --
Table 7: Residual Maximal Horizons (RMH)
Neigh bourhoods
For each artifact (in al1 sites), we record its individual associations. The set of artifacts
associated with any artifact, X, is said to forrn the neighbortrhood of X (Guex, 199 1 : 15). For
exarnple, if Artifact X is associated at one site with Artifact W, at another site with Artifact Y,
and at yet another with Artifact 2. then the neighbourhood of X is [W. Y, Z]. It is important to
note that while X was found in association with these three artifacts, this does not imply that any
of W, Y, or Z were found in association with each other. Neighbourhoods are artifact specific,
not sets of associated artifacts.
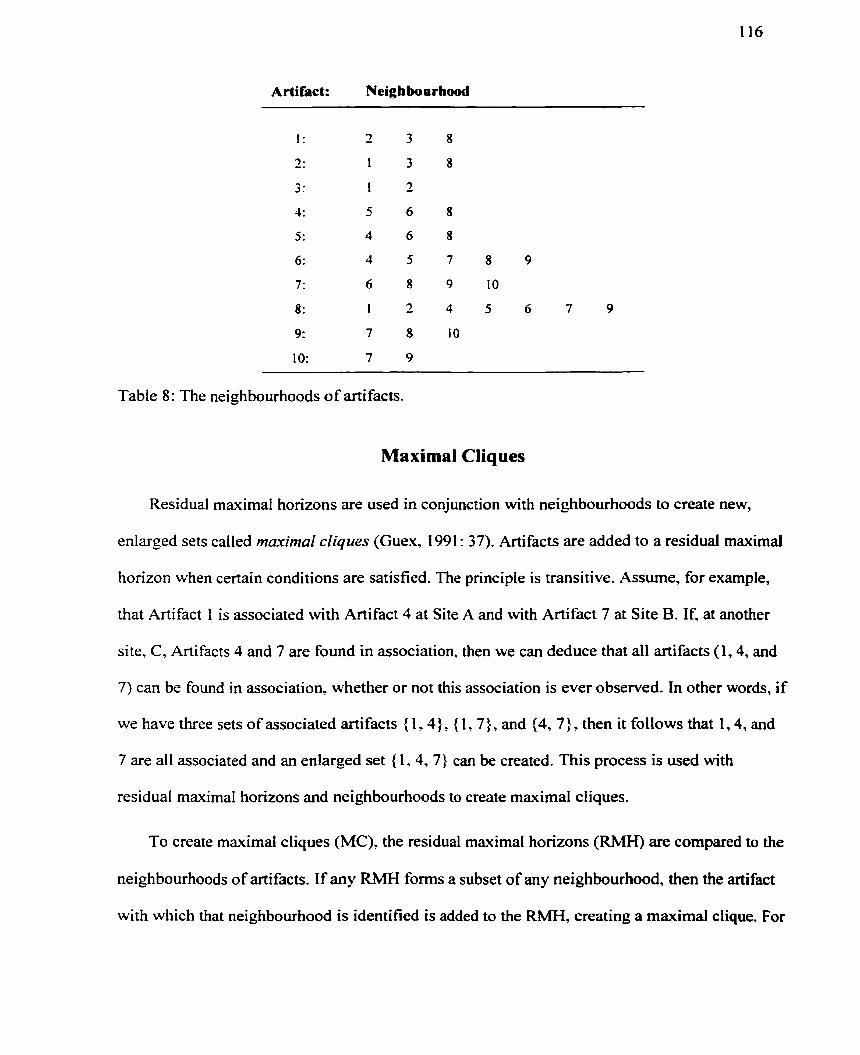
Artifact: Neighbourbood
Table 8: The neighbourhoods of artifacts.
Maximal Cliques
Residual maximal horizons are used in conjunction with neighbourhoods to create new,
enlarged sets called marimal cliques (Guex, 1991 : 37). Artifacts are added to a residual maximal
horizon when certain conditions are satisfied. The principle is transitive. Assume, for example,
that Artifact 1 is associated with Artifact 4 at Site A and with Artifact 7 at Site B. If, at another
site. C, Artifacts 4 and 7 are found in association, then we can deduce that al1 artifacts (1,4, and
7) can be found in association, whether or not this association is ever observed. In other words, if
we have three sets of associated artifacts ( 1.41, { 1,7), and (4, 7:, then it follows that 1,4, and
7 are al1 associated and an enlarged set ( 1,4, 7) can be created. This process is used with
residuaI maximal horizons and neighbourhoods to create maximal cliques.
To create maximal cliques (MC), the residual maximal horizons are compared to the
neighbourhoods of artifacts. If any RMH fonns a subset of any neighbourhood, then the artifact
6 t h which that neighbourhood is identified is added to the RMH, creating a maximal clique. For

exarnple, consider RMH 4 and its set of associated artifacts, {4, 5. 8) (Table 7). Compare this set
to the neighbourhoods listed in Table 8. We see that RMH 4 forms a subset of the Artifact 6
neighbourhood. This means that, because al1 elements of RMH 4 are associated with Artifact 6,
then Artifact 6 is associated with al1 artifacts in RMH 4. Deductive logic justifies the addition of
Artifact 6 to RMH 4 and, in the process. creates a new set of associated artifacts' (4, 5,6. 8).
This enlarged set is called a maximal clique and is denoted with an asterisk (MC 1 in Table 9).
MC Site.Layer Artifact Set
a This MC contains RMHs 4.6, and 7 (Table 7)
Table 9: Maximal Cliques (MC).
RMHs 6 and 7 can be enlarged in the sarne way, creating sets (4. 5 ,6 ) and f 5,6,8)
respectively. But these enlarged sets are not unique because they both form subsets of the newly
created MC 1 (4, 5 , 6, 8 f . Consequently, these two sets are merged with MC 1. This process
creates five maximai cliques.
To summarise the procedures thus far, local horizons are initially defined at each site on the
basis of lithological context, and the artifacts contained within each context become elements in
a set of artifacts (the local horizon). At each site, those local horizons containing redundant sets
are eliminated, or merged, to leave only local maximal horizons. Local maximal horizons are
then compared between sites and, once again, any redundant sets (subsets) are merged with their
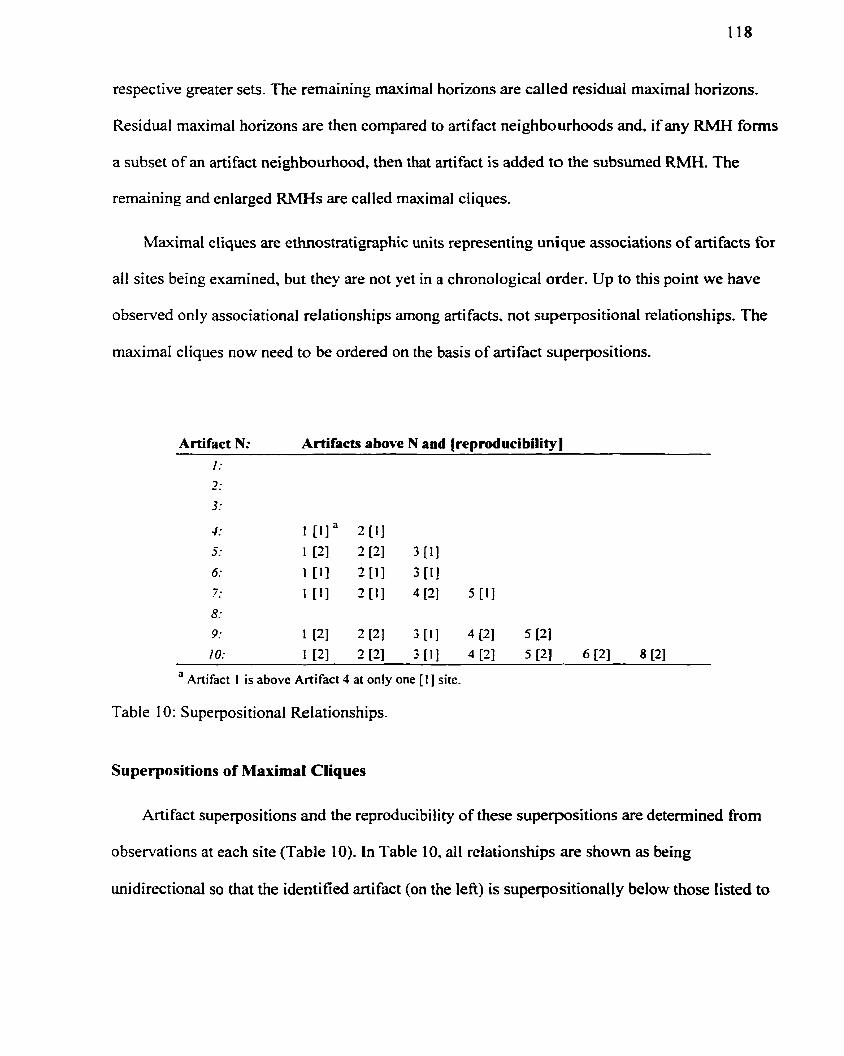
respective greater sets. The remaining maximal horizons are called residual maximal horizons.
Residual maximal horizons are then compared to arti fact neighbourhoods and, if any RMH forrns
a subset of an artifact neighbourhood, then that artifact is added to the subsurned RMH. The
remaining and enlarged RMHs are called maximal cliques.
Maximal cliques are ethnostratigraphic units representing unique associations of artifacts for
al1 sites being exarnined, but they are not yet in a chronological order. Up to this point we have
observed only associational relationships among artifacts, not superpositional relationships. The
maxima1 cliques now need to be ordered on the ba i s of artifact superpositions.
Artifact N: Artifacts above N and [reproducibility)
" Artifact 1 is above Artifact 4 at only one [ I I site.
Table 10: Superpositional Relationships.
Superpositions of Maximal Cliques
Artifact superpositions and the reproducibility of these superpositions are determined from
observations at each site (Table 10). In Table 10, al1 relationships are shown as king
unidirectional so that the identified artifact (on the lefi) is superpositionally below those listed to
its immediate right. The number of times any relationship is reproduced is shown in brackets.
For example, Artifact 1 is found above Artifact 5 at two 121 sites.
The stratigraphie relationships between maximal cliques are determined by the surn of the
relationships of the artifacts they contain (Le.. the sum of arcs). There are three possible
relationships resulting between any two maximal cliques, MC 1 and MC 2 (Guex 1991: 81):
1. Superpositionai - When the sum of arcs among classes (or taxa) determines that one
maximal clique, MC 1. is above (or below) another maximal clique, MC 2.
2. Undetermined - When the superpositional relationships among classes is undetermined,
then the rehtionship between MC 1 and MC 2 is undetermined.
3. Confiicting - If contradictions and cycles occur among classes, these need to be resolved.
The Resolution of Contradictions and Cycles
A conflicting relationship occurs when one or more artifacts are found both above and
below other artifacts. A contradiction is a conflicting relationship that occurs between fwo
artzj3cr types when one artifact is fomd both above and below the other. A cycle is another kind
of relational conflict that occurs between three or more artifncts. For example, a cycle would
occur when X is above Y? Y is above Z, and yet Z is above X. Cycles can be quite complex and
can involve any number of artifacts. When cycles occur among sets of artifacts (MCs), these
related sets are called strongly connected components. The conflicting relationships among
strongly comected components need to be eliminated before completing the analysis. This is
accomplished b y identi fiing and eliminating the most problematic arti fact relationships one at a
time until the cycle is resolved, In most cases, a strongly connected compnent involving many
artifacts c m be resolved with the elimination of a small number of contradictions. The objective
of analysis is to eliminate as few relationships as possible in order to preserve superpositional
information.
The Biograph program uses a simple technique to resolve contradictions and to determine
the superpositional relationships between mwimal cliques. The relationship between any two
cliques is solved by calculating the nurnber of superpositions and their reproducibilities.
When artifact X is above artifact Y, the relationship is expressed as X t Y (an arc above),
and when artifact X is below artifact Y it is expressed as X Y (an arc below). The
reproducibility of X e Y is represented as 'RA' and, fur X i Y, as 'RB'.
The calculation of superposition is as follows: For any pair of maximal cliques MC 1 and
MC 2, total the X c= Y and the X -. Y relative to any one clique. in addition, total the nurnber of
reproducibilities for each superpositional relationship. The relative position of each maximal
clique. MC 1, to every other maximal clique, MC 2. is determined by calculating the following
values (Guex, 1991 : 8 1):
Equation 1: Value Above (VA) = Sum o f X c= Y + Sum of RA
Equation 2: Value Below (VB) = Sum of X Y + Sum of RB
And then determining:
I f VA > VB. then MC 1 is above MC 2
If VA < VB, then MC 1 is below MC 2
If VA = VB, then the relationship is undetermined.
This procedure is followed for al1 maximal cliques. It resolves contradictions and detemines
superpositional relationships on the basis of observed relationships. During this process, cycles
are detected and eliminated. As an example of how this is done. consider the possibility that
cycle MC 1 = MC 2 => MC 3 => MC 1 occurs. To resolve this cycle, it is necessary to retum to
the VA and VB values calculated above. For each pair of MCs. we compare the values of VA
and VBI take the minimum value and divide it by the maximum value. This creates a coefficient
where the highest possible value is 1. A value o f 1 indicates that the relationship between two
maximal cliques is undetermined because there is an equal iiumber o f opposing superpositions.
The highest coefficient values will. therefore, point to the most problematic relationships
occuning within a cycle. The formula is:
Equation 3: Min [VA, VB]
C = Max [VA, VB]
Where C = coefficient
In a three-point cycle (i.e., involving three MCs), eliminating one contradiction will
eliminate the cycle. Where more than three points are involved, the cycle could persist and, if
this is the case, the operation is repeated. In this way, it is possible to retain the maximum
number of superpositional relationships by removing only those that are the most problematic. If,
as a result o f this operation, any two cliques have an undetemined relationship, it does not imply
that these cliques cannot be ordered. They still retain determined relationships with al1 other
cliques.
The results of analysis can be no better than the input data. Due to the generally incomplete
nature of excavation sarnples, contradictions naturally occur but, if heavily disturbed sediments
are defined as lithological units. higher numbers of cycles and contradictions will result and the
possibility of making poor determinations increases. In these situations, it is less likely that any
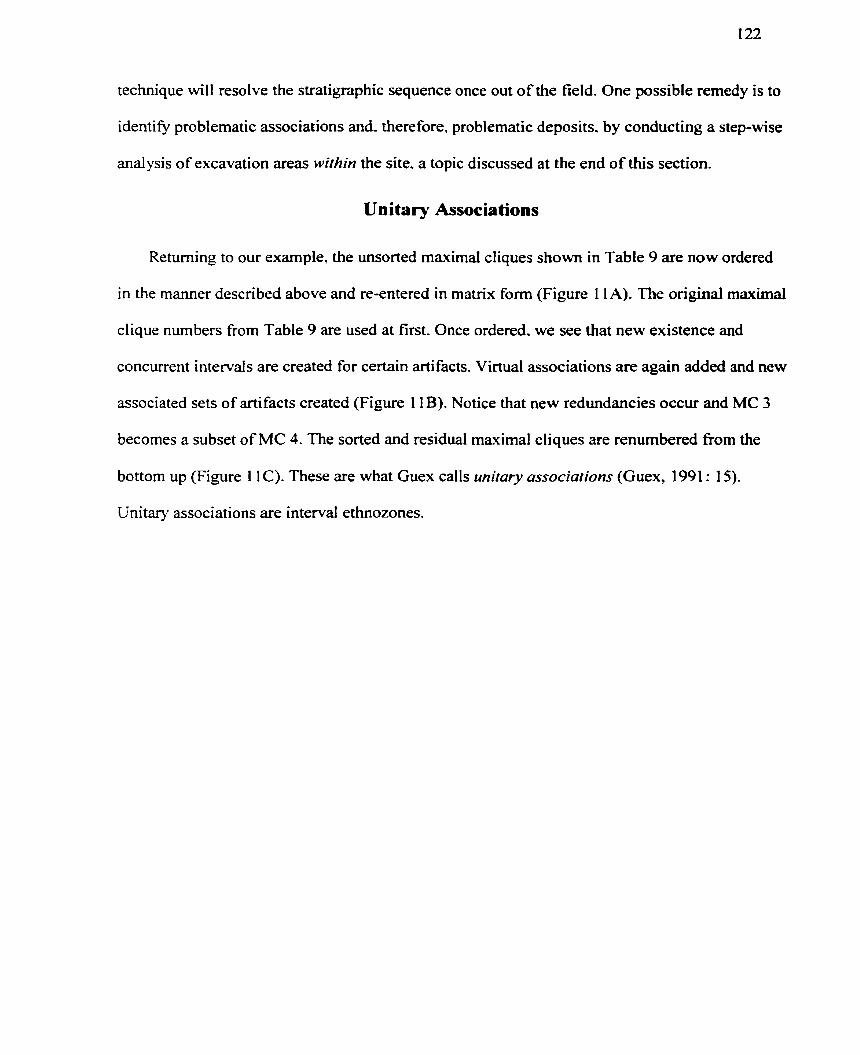
technique will resolve the stratigraphie sequence once out of the field. One possible remedy is to
identify problematic associations and. therefore, problematic deposits. by conducting a step-wise
analysis of excavation areas rvithin the site, a topic discussed at the end of this section.
Unitary Associations
Retuming to our example, the unsorted maximal ciiques shown in Table 9 are now ordered
in the manner described above and re-entered in matrix form (Figure 1 1A). The original maximal
clique numbers from Table 9 are used at first. Once ordered. we see that new existence and
concurrent intervals are created for certain artifacts. Virtual associations are again added and new
associated sets of artifacts created (Figure 1 1 B). Notice that new redundancies occur and MC 3
becomes a subset of MC 4. The sorted and residual maximal cliques are renurnbered from the
bottom up (Figure 1 1 C). These are what Guex calls unitary associations (Guex, 1991 : 15).
Unitary associations are interval ethnozones.
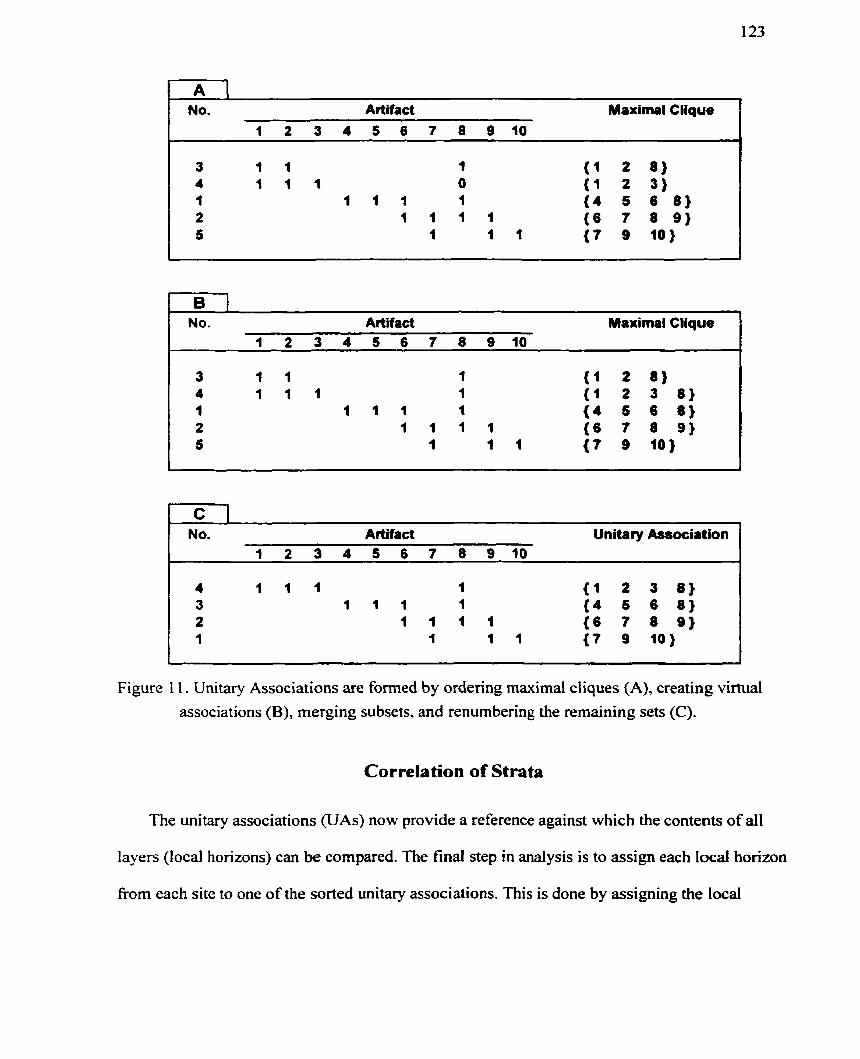
- - - - - - r Artifact Maximal Clique
1 2 3 4 5 6 7 8 9 1 0
B 1 No. Artifact Maximal Clique
1 2 3 4 5 6 7 8 9 1 0
3 1 1 1 { 1 2 8 ) 4 1 1 1 1 ( 1 2 3 8 ) 1 1 1 1 1 4 5 6 8) 2 1 1 1 1 { 6 7 8 9 ) 5 1 1 1 ( 7 9 10)
ICI No. Atifact Unitary Association
1 2 3 4 5 6 7 8 9 1 0
Figure 1 1 . Unitary Associations are formed by ordering maximai cliques (A), creating virtual associations (B), merging subsets. and renumbering the remaining sets (C).
Correlation of Strata
The unitary associations (UAs) now provide a reference against which the contents of al1
layers (local horizons) can be compared. The final step in anaiysis is to assign each local horizon
fiom each site to one of the sorted unitary associations. This is done by assigning the local
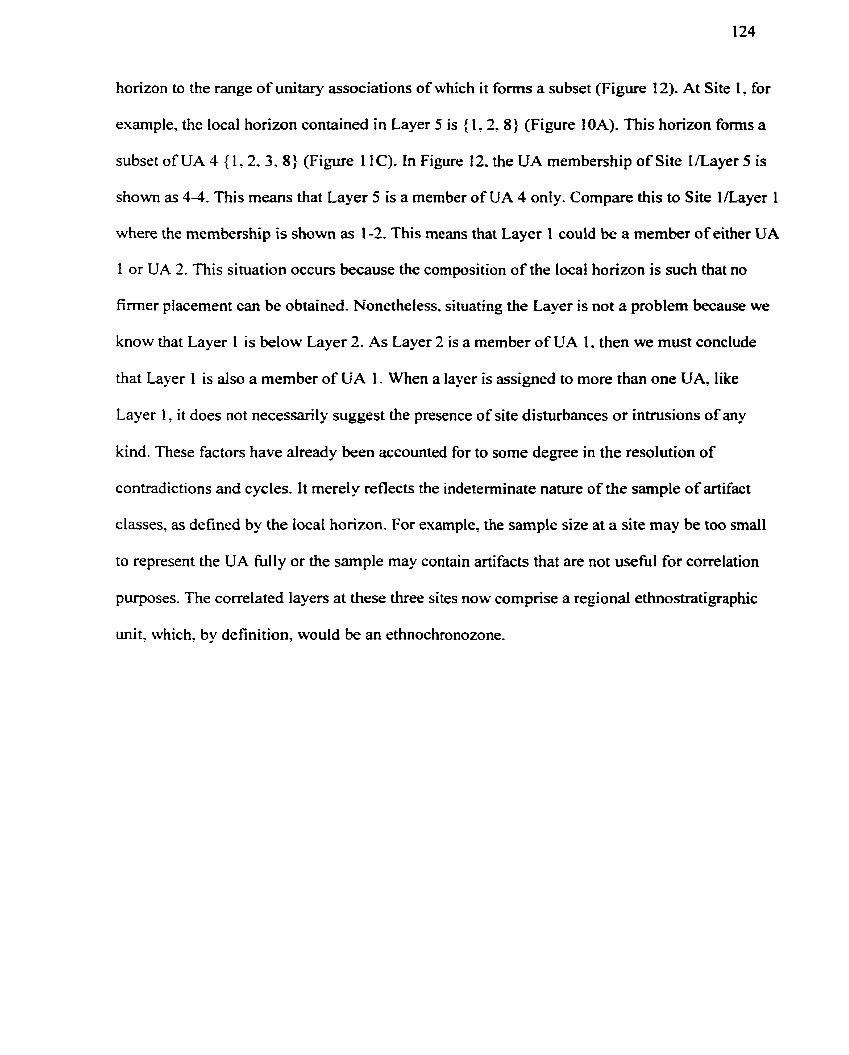
horizon to the range of unitary associations of which it fonns a subset (Figure 12). At Site 1, for
example, the local horizon contained in Layer 5 is ( 1.2. 8) (Figure 1 OA). This horizon forms a
subset of UA 4 { 1,2. 3, 8 ] (Figure 1 1 C). In Fi y r e 12. the UA membership of Site Iaayer 5 is
shown as 4-4. This means that Layer 5 is a member of UA 4 only. Compare this to Site laayer 1
where the membership is shown as 1-2. This means that Layer 1 could be a member of either UA
1 or UA 2. This situation occurs because the composition of the local horizon is such that no
firmer placement can be obtained. Nonetheless. situating the Layer is not a problern because we
know that Layer 1 is below Layer 2. As Layer 2 is a member of UA 1 . then we must conclude
that Layer 1 is also a member of UA 1. When a layer is assigned to more than one UA, like
Layer 1 , it does not necessarily suggest the presence of site disturbances or intrusions of any
kind. These factors have already been accounted for to some degree in the resoiution of
contradictions and cycles. It mereiy reflects the indeterminate nature of the sample of artifact
classes, as defined by the local horizon. For example. the sample size at a site may be too small
to represent the UA fully or the sample may contain artifacts that are not useful for correlation
purposes. The correlated layers at these three sites now comprise a regional ethnostratigraphic
unit, which, by de finition, would be an ethnochronozone.
CORRELAliON TABLE
Site 1 Site 2 Site 3 Layer UA &yer UA Layer UA
Figure 12. The correlation of layers arnong the three fictitious sites.
Discussion of Method
The demonstration of method was intended to highlight the operational principles of UAM.
The demonstration and the results obtained are idealised. In most practical applications, the
nature of the data needs to be carehilly evaluated and the results thoughtfully interpreted.
Experience has demonstrated that we cannot just throw hundreds of artifact classes into analysis
and expect good results.
The necessary first steps in analysis are to create an artifact typology, define deposits, and
construct a sequence of these deposits for each site. A Harris rnatrix (Harris, 1975, 1989) works
well for constnicting the sequence and cornputer programs are available to facilitate the process
(e.g., Scollar et al., 1997; Hundack et al, 1 998). The initial preparation of data cannot be over-
emphasised because the accuracy of results is directly linked to the degree that artifact
associations represent true contemporary associations. The validity of any association must be
determined in the field, a fact that underscores the need for geoarchaeological analyses of
contexts and rigorous methods of stratigraphie control.
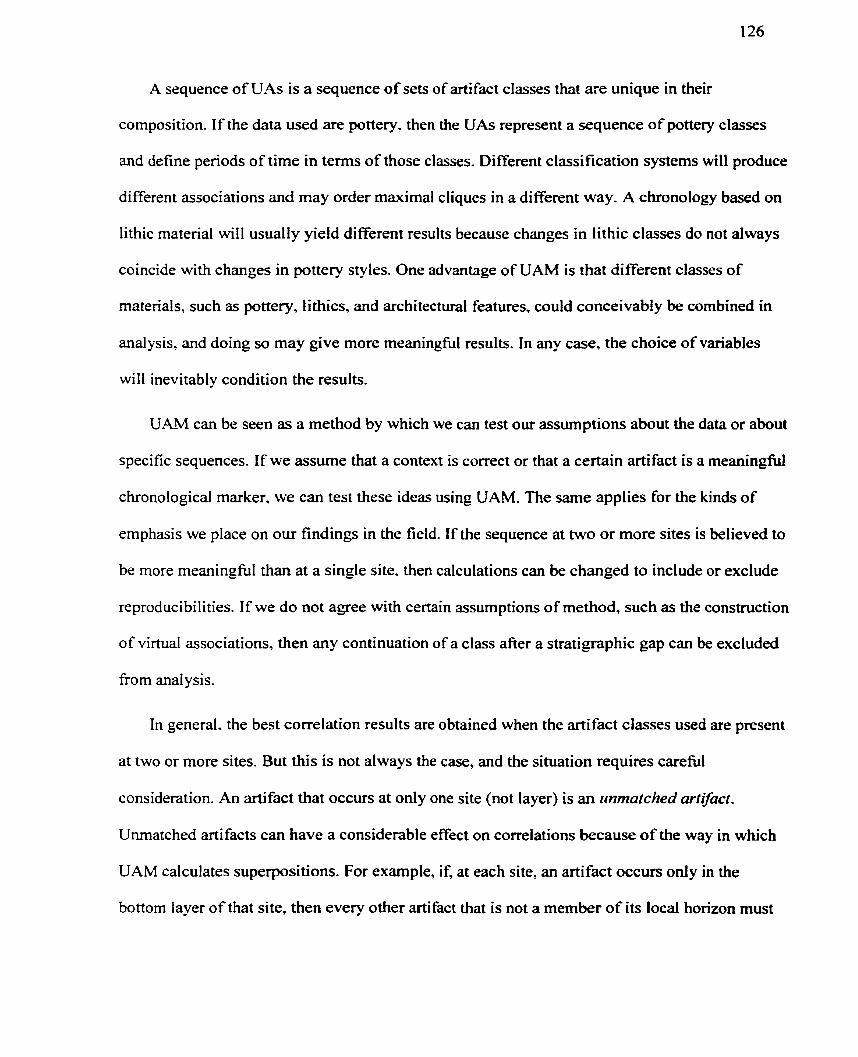
A sequence of UAs is a sequence of sets of artifact classes that are unique in their
composition. If the data used are pottery, then the UAs represent a sequence of pottery classes
and define periods of time in terms of those classes. Different classification systems will produce
different associations and may order maximal cliques in a different way. A chronology based on
lithic material will usually yield different results because changes in lithic classes do not always
coincide with changes in pottery styles. One advantage of UAM is that different classes of
materials, such as pottery, lithics, and architectural featwes, could conceivably be combined in
analysis, and doing so may give more meaningfùl results. In any case. the choice of variables
wilI inevitably condition the results.
UAM can be seen as a method by which we can test our assumptions about the data or about
specific sequences. If we assume that a context is correct or that a certain artifact is a meaningfid
chronological marker, we can test these ideas using UAM. The sarne applies for the kinds of
emphasis we place on our findings in the field. If the sequence at two or more sites is believed to
be more meaningfûl than at a single site. then calculations can be changed to include or exclude
reproducibilities. If we do not agree with certain assumptions of method, such as the construction
of virtuaI associations, then any continuation of a class after a stratigraphic gap can be excluded
fiom analysis.
In general. the best correlation results are obtained when the artifact classes used are present
at two or more sites. But this is not always the case, and the situation requires careful
consideration. An artifact that occurs at only one site (not layer) is an ttnrnatched artifact.
Unmatched artifacts c m have a considerable effect on correlations because o f the way in which
UAM calculates superpositions. For example, if, at each site, an artifact occurs only in the
bottom layer of that site, then every other artifact that is not a member of its local horizon must
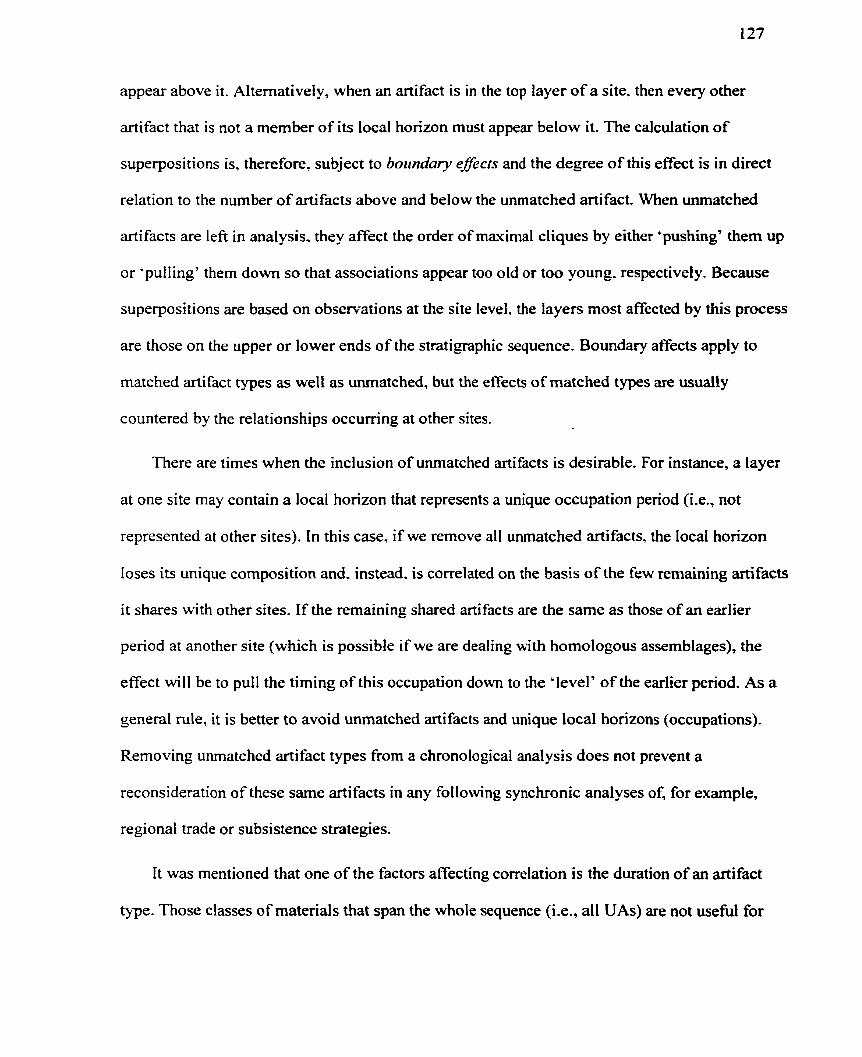
appear above it. Alternatively, when an artifact is in the top layer of a site. then every other
artifact that is not a member of its local horizon must appear below it. The calculation of
superpositions is, therefore, subject to botrndary eflects and the degree of this effect is in direct
relation to the nurnber of artifacts above and below the unmatched artifact. When unrnatched
artifacts are le f i in anal ysis. they affect the order of maximal cliques by either 'pushing' them up
or *pulling' them down so that associations appear too old or too Young. respectively. Because
superpositions are based on observations at the site Ievel. the layers most affected by this process
are those on the upper or lower ends of the stratigraphie sequence. Boundary affects apply to
matched artifact types as well as unrnatched, but the effects of matched types are usually
countered by the relationships occurring at other sites.
There are times when the inclusion of unmatched artifacts is desirable. For instance, a layer
at one site may contain a local horizon that represents a unique occupation period (Le., not
represented at other sites). In this case, if we remove al1 unrnatched artifacts. the local horizon
Ioses its unique composition and. instead. is correlated on the basis of the few remaining artifacts
it shares with other sites. If the remaining shared artifacts are the same as those of an earlier
penod at another site (which is possible if we are dealing with homologous assemblages), the
effect will be to pull the timing of this occupation down to the 'level' of the earlier penod. As a
general rule. it is better to avoid unmatched arti facts and unique local horizons (occupations).
Removing unmatched artifact types fiorn a chronological analysis does not prevent a
reconsideration of these same artifacts in any following synchronie analyses of, for example,
regional trade or subsistence strategies.
It was mentioned that one of the factors affecting correlation is the duration of an artifact
type. Those classes of materials that span the whole sequence (i.e., al1 UAs) are not useful for
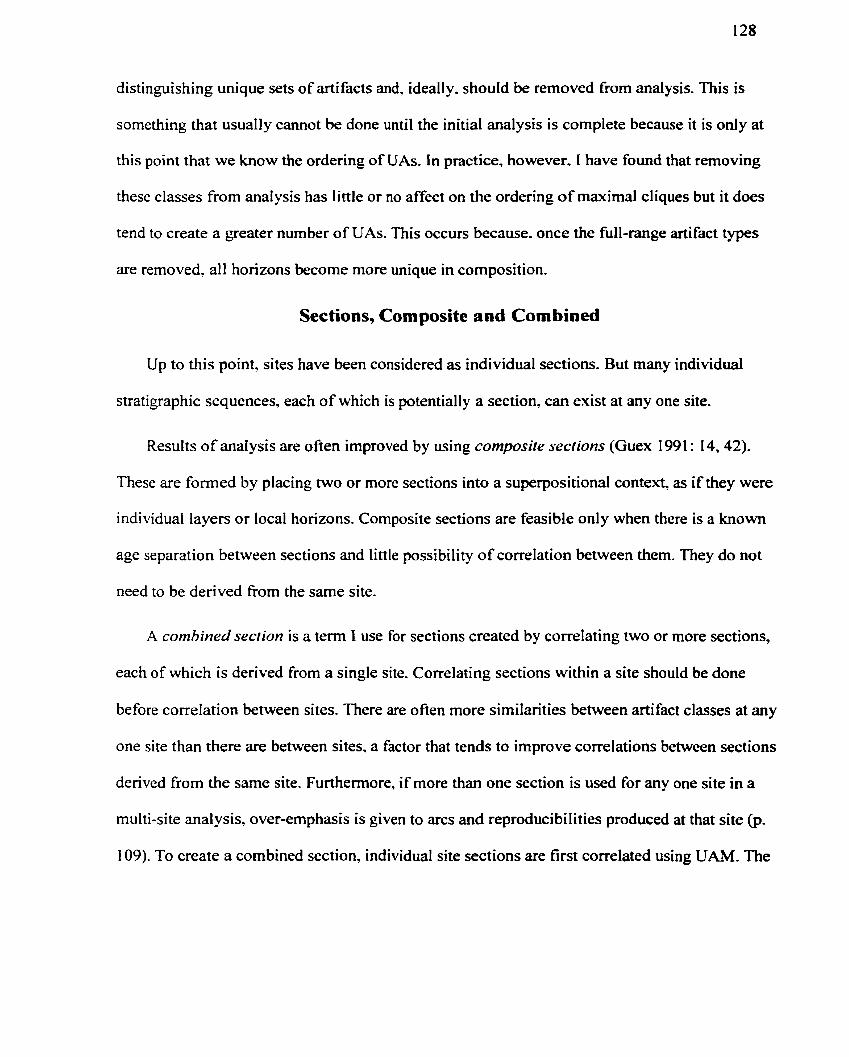
distinguishing unique sets of artifacts and, ideally, should be removed fiom analysis. This is
sornething that usuaIly cannot be done until the initial analysis is complete because it is only at
this point that we know the ordering of UAs. In practice. however. 1 have found that removing
these classes from analysis has little or no affect on the ordering of maximal cliques but it does
tend to create a greater number of UAs. This occurs because. once the full-range artifact types
are removed. al1 horizons become more unique in composition.
Sections, Composite and Corn bined
Up to this point. sites have been considered as individual sections. But many individual
stratigraphie sequences. each of which is potentially a section, c m exist at any one site.
Results of analysis are ofien improved by using composite sections (Guex 1991 : 14,42).
These are formed by placing two or more sections into a superpositional context, as if they were
individual layers or local horizons. Composite sections are feasible only when there is a known
age separation between sections and Little possibility of correlation between them. They do not
need to be derived fiom the same site.
A combined section is a term I use for sections created by correlating two or more sections,
each of which is denved from a single site. Correlating sections within a site should be done
before correlation between sites. There are ofien more similarities between artifact classes at any
one site than there are between sites, a factor that tends to improve correlations between sections
derived from the same site. Furthemore, if more than one section is used for any one site in a
multi-site anal ysis, over-emphasis is given to arcs and reproduci biIi ties produced at that site (p.
109). To create a combined section, individual site sections are first correlated using UAM. The

resulting unitary associations are then treated as if they were local horizons for that site. For a
practical application, see the following chapter.
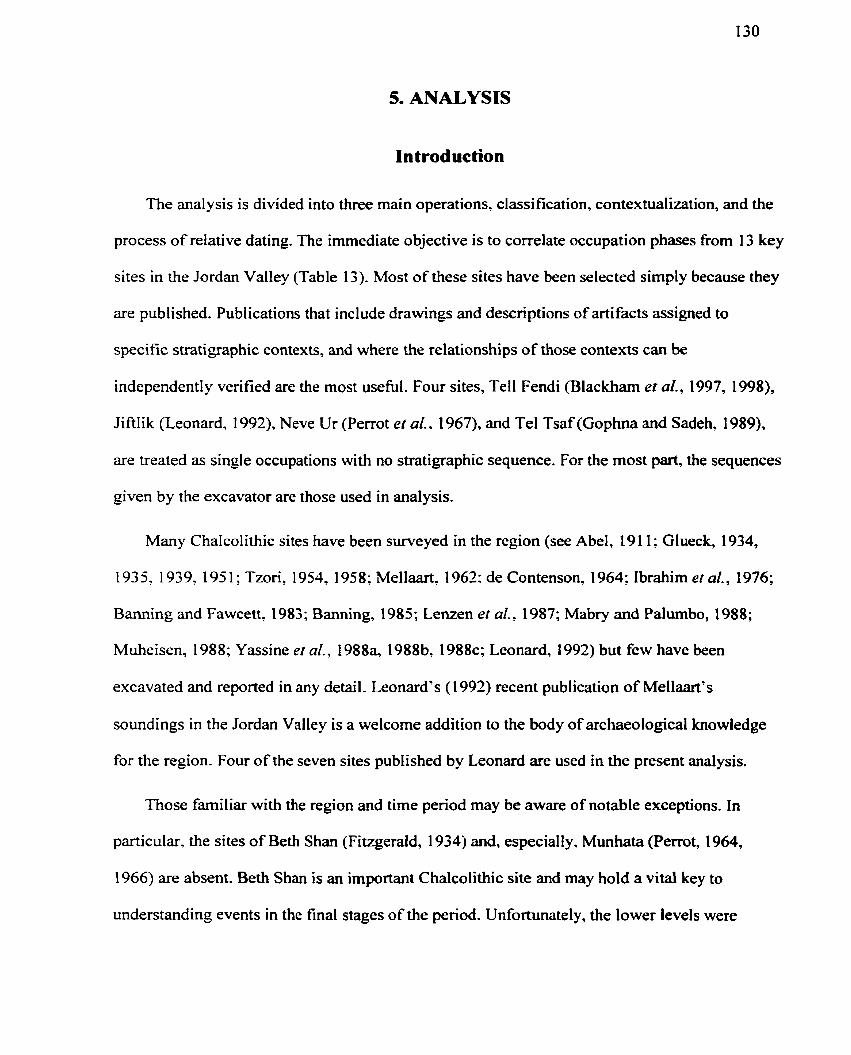
5. ANALYSES
Introduction
The analysis is divided into three main operations, classification, contextualization, and the
process of relative dating. The immediate objective is to correlate occupation phases fiom 13 key
sites in the Jordan Valley (Table 1 3). Most of these sites have been selected simply because they
are published. Publications that include drawings and descriptions of artifacts assigned to
specific stratigraphic contexts, and where the relationships of those contexts can be
independently verified are the most usefùl. Four sites, Tell Fendi (Blackham et al., 1997, 1 998),
JiftIik (Leonard, 1 992), Neve Ur (Perrot et al.. 1967), and Tel Tsaf (Gophna and Sadeh. 1989),
are treated as single occupations with no stratigraphic sequence. For the most part, the sequences
given by the excavator are those used in analysis.
Many ChaIcolithic sites have been surveyed in the region (see Abel, 19 1 1 J Glueck, 1934,
1 93 5 , 1 939, 195 1 ; Tzori, 1954, 1958: Mellaart, 1 962: de Contenson. 1964; ibrahim et al., 1976;
Banning and Fawcett. 1983: Banning. 1985: Lenzen et al., 1987; Mabry and Palumbo, 1988;
Muheisen, 1988; Yassine er al., 1988% l988b, 1988~; Leonard, 1992) but few have been
excavated and reported in any detail. Leonard's (1 992) recent publication of Mellaart's
soundings in the Jordan Valley is a welcome addition to the body of archaeological knowledge
for the region. Four of the seven sites published by Leonard are used in the present analysis.
Those familiar with the region and time period may be aware of notable exceptions. In
particular, the sites of Beth Shan (Fitzgerald, 1934) and, especially, Munhata (Perrot, 1964,
1966) are absent. Beth Shan is an important Chalcolithic site and may hold a vital key to
understanding events in the final stages of the period. Unfortunately, the lower levels were
excavated when little was known about either the Late Neolithic or the Chalcolithic periods.
Consequently, most material was reported in extremely mixed contexts, and lower strata include
artifacts ranging from the earliest stages of the Late Neolithic to the Early Bronze Age.
Excavations have been renewed under the direction of A. Mazar but Neolithic levels have not yet
been reached.
Munhata is of interest because it contains Wadi Rabah material, and it would be useful to
correlate this material with other sites in the region. Much of the pottery from Perrot's
excavations is published (Perrot, 1964, 1965. 1966; Gopher, 1989; Garfinkel, 1992) and is
reported in two main stratigraphic contexts. a Shaiar Hagolan Stage (Layer 2b) and a Rabah
Stage (Layer 2a). There are, however, some methodological problems with the data as reported,
especially as concems the objectives of the present analysis. Garfin.kel(l 992: 18-19) reports that
the published rnaterial is divided into the two respective layers on a typological basis, not a
stratigraphic one. In other words, there is little stratigraphic b a i s for the grouping of artifacts.
The stratigraphy at Munhata is extremely complex and Garfinkel was faced with the difficult
task of using secondary sources. His typological division is probably correct for the most part
and there is almost certainly a sequence of Yarmukian-style pottery to the Wadi Rabah style.
Despite these difficultiest it may be possible to identiQ relatively unrnixed contexts by
conducting a detailed contextual analysis of the information reported by Garfinkel, especially for
the Northem Area (Garfinkel, 1992: fig. 8) where Wadi Rabah material was found overlying the
Yarrnukian. But this task has not been undertaken here.
Classification
Classification is limited primarily to pottery sherds. although some other artifacts are
included. The method of classification is paradigmatic and permutational. Paradigrnatic
classification assumes that al1 criteria are equivalent. unstructured. unweighted and directly
associated ( D u ~ e l l . 197 1 : 70). The permutational method treats each paradigmatic class as a set
of elements (attributes). Classes created by this method are subsets of this larger set and no
regard is given to the order of elements within the subset. When al1 possible combinations are
considered. the number of classes increases exponentially but there are practical limitations, as
discussed in Chapter 3. Each combination, therefore. becomes a class of its own. This method is
employed to bypass the problem of whether to use attributes or types in seriation or UAM
analyses and to retain as much information as possible.
The cnteria selected for the classification system are vesse1 form, rim lip design. decorative
techniques, and handle design (Appendix C and Figures 49-53). The final classes and their code
numbers are given in Appendix D.
The range of classes is by no means definitive or exhaustive and does not represent the full
range of attributes recorded. In all, 1958 entnes were recorded fiom al1 13 sites. From these,
5338 combinations were produced, representing 738 classes. Many more combinations are
possible but were not created because of limitations of method and because some kinds of
combinations are simply not practical.
Of the original 738 classes created, those selected for analysis had to meet two criteria. First,
each class must appear in at Ieast two individual contexts (local horizons), but both contexts can
be fiorn a single site. Classes appearing in two contexts at one site have the effect of uniting local
horizons at that site and of reinforcing superpositional relationships for those classes appearing at
two or more sites. Second. those classes that are "long-lived", or highly diachronic, while not
entirely detrimental to analysis, are not as effective as short-lived classes. Theoretically, there is
no way of knowing which cIasses are diachronic before analysis but the procedure for detecting
and eliminating diachronic classes is laborious. Here. 1 have used the conventional chronological
scheme (i.e.. LNA to EB) as a priori information to Iimit the number of classes used.
Within the conventional scheme, many difTerent tenns are used to describe different culture
areas for different time periods, a distinction needed for localized assemblages, but the
application of these terms to regional horizons is Iimited. As mentioned previously (p. 49), 1 use
the terrn Late Neolithic A (LNA) to refer to the many components associated with the early part
of the Late Neolithic. and Late Neolithic B (LNB) for the later phase (Table 11).
Each period is ranked and a number assigned. Classes distributed over a range greater than
one period (e.g., 1-3) have been eliminated fiom analysis. Classes that appear in only two
contexts have a strong effect on correlations and are limited to a period range of zero. For
example, a type that occurs in only one Late Chalcolithic context and one Early Bronze Age
context would be excluded fiom analysis. Limiting classes to a single period does not decrease
their value because there still exists a considerable range of uncertainty within any single period.
Once applied, limitations to classes reduce the final number of classes to 368. These are listed in
Appendix D.
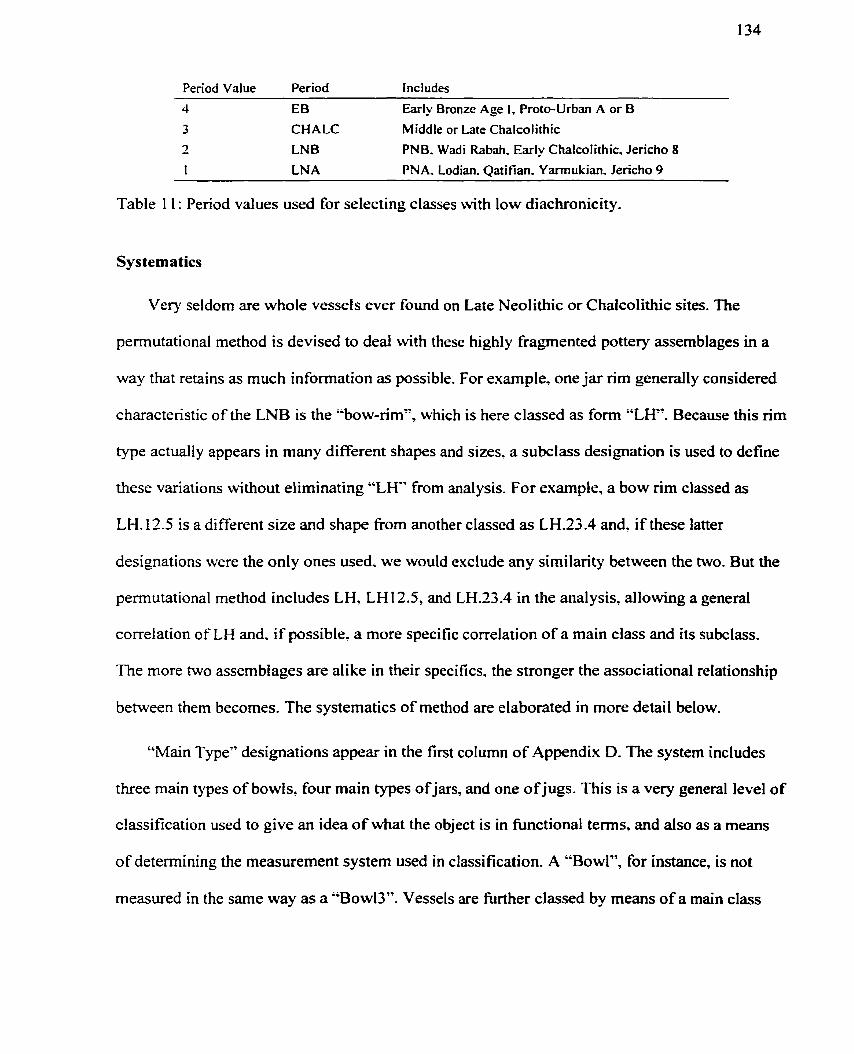
Period Value Period Includes EB Early Bronze Age 1, Proto-Urban A or B
3 CHALC Middle or Late Chalcoiithic 2 LNB PNB. Wadi Rabah. Early Chalcolithic, Jericho 8
1 LNA PNA, Lodian, Qatifian. Yarmukian. Jericho 9
Table 1 1 : Period values used for selecting classes with low diachronicity.
Systematics
Very seldom are whole vessels ever found on Late Neolithic or Chaicolithic sites. The
permutational rnethod is devised to deal with these highly fragmented pottery assemblages in a
way that retains as much information as possible. For example, one jar rim generdly considered
characteristic of the LNB is the "bow-rim", which is here classed as form "LW. Because this rim
type actually appears in many different shapes and sizes. a subclass desigiation is used to define
these variations without eliminating "LH" from analysis. For example, a bow rim classed as
LH. 12.5 is a different size and shape from another classed as LH.23.4 and, if these latter
designations were the onIy ones used. we would exclude any sirnilarity between the two. But the
permutational method includes LH, LH12.5, and LH.23.4 in the analysis, allowing a general
correiation of LH and. if possible. a more specific correlation of a main class and its subclass.
The more two assemblages are alike in their specifics. the stronger the associational relationship
between hem becomes. The systematics of method are elaborated in more detail below.
"Main Type" designations appear in the first column of Appendix D. The system includes
three main types of bowls, four main types ofjars, and one of jugs. This is a very general level of
classification used to give an idea of what the object is in functional terms, and also as a means
of determining the measurement system used in classification. A "Bowl", for instance, is not
measured in the sarne way as a "Bowl3". Vessels are fbrther classed by means of a main class
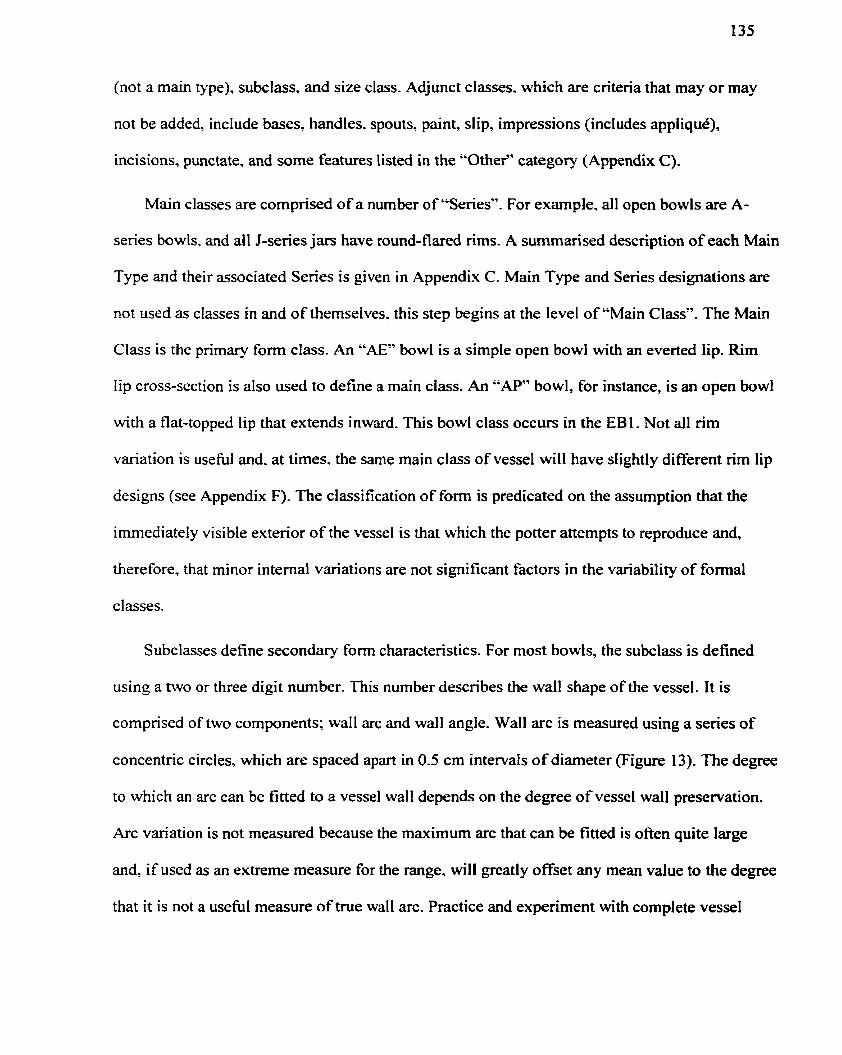
(not a main type), subclass. and size class. Adjunct classes. which are criteria that rnay or may
not be added, include bases. handles. spouts, paint, slip, impressions (includes appliqué),
incisions, punctate, and some features listed in the "Other" category (Appendix C).
Main classes are comprised of a number of "Series". For exarnple, al1 open bowls are A-
series bowls, and ail J-series jars have round-flared rims. A surnmarised description of each Main
Type and their associated Series is given in Appendix C. Main Type and Senes designations are
not used as classes in and of themselves. this step begins at the level of "Main Class". The Main
Class is the primary form class. An "AE" bowl is a simple open bowl with an everted lip. Rim
Iip cross-section is also used to define a main class. An "APw bowl, for instance, is an open bowl
with a flat-topped lip that extends inward. This bowl class occurs in the EBl. Not al1 rim
variation is useful and, at times. the same main class of vessel will have slightly different rim lip
designs (see Appendix F). The classification of form is predicated on the assumption that the
irnmediately visible exterior of the vessel is that which the potter attempts to reproduce and,
therefore, that minor intemal variations are not significant factors in the variability of forma1
classes.
Subclasses define secondas- form characteristics. For most bowls, the subclass is defined
using a two or three digit number. This number describes the wall shape of the vessel. It is
compnsed of two components; wall arc and wall angle. Wall arc is measured using a series of
concentric circles, which are spaced apart in 0.5 cm intervals of diameter (Figure 13). The degree
to which an arc can be fitted to a vessel wall depends on the degree of vessel wall preservation.
Arc variation is not measured because the maximum arc that can be fitted is often quite large
and, if used as an extreme measure for the range, will greatly offset any mean value to the degree
that it is not a useful measure of true wall arc. Practice and expenment with complete vessel
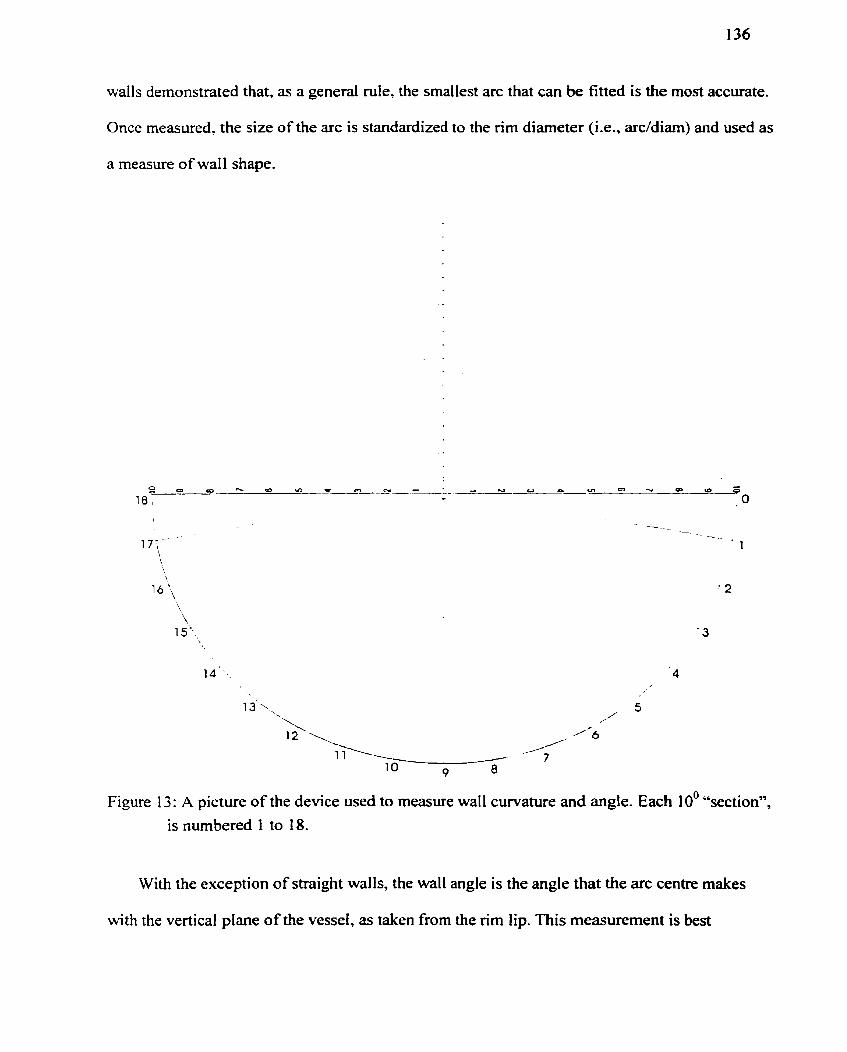
walls demonstrated that, as a general rule. the smallest arc that can be fitted is the most accurate.
Once measured, the size of the arc is standardized to the rim diameter (Le., addiam) and used as
a measure of wall shape.
Figure 13: A picture of the device used to measure wall curvature and angle. Each 10' "section",
is numbered 1 to 18.
With the exception of straight walls, the wall angle is the angle that the arc centre rnakes
with the vertical plane of the vessel, as taken from the rim lip. This measurement is best
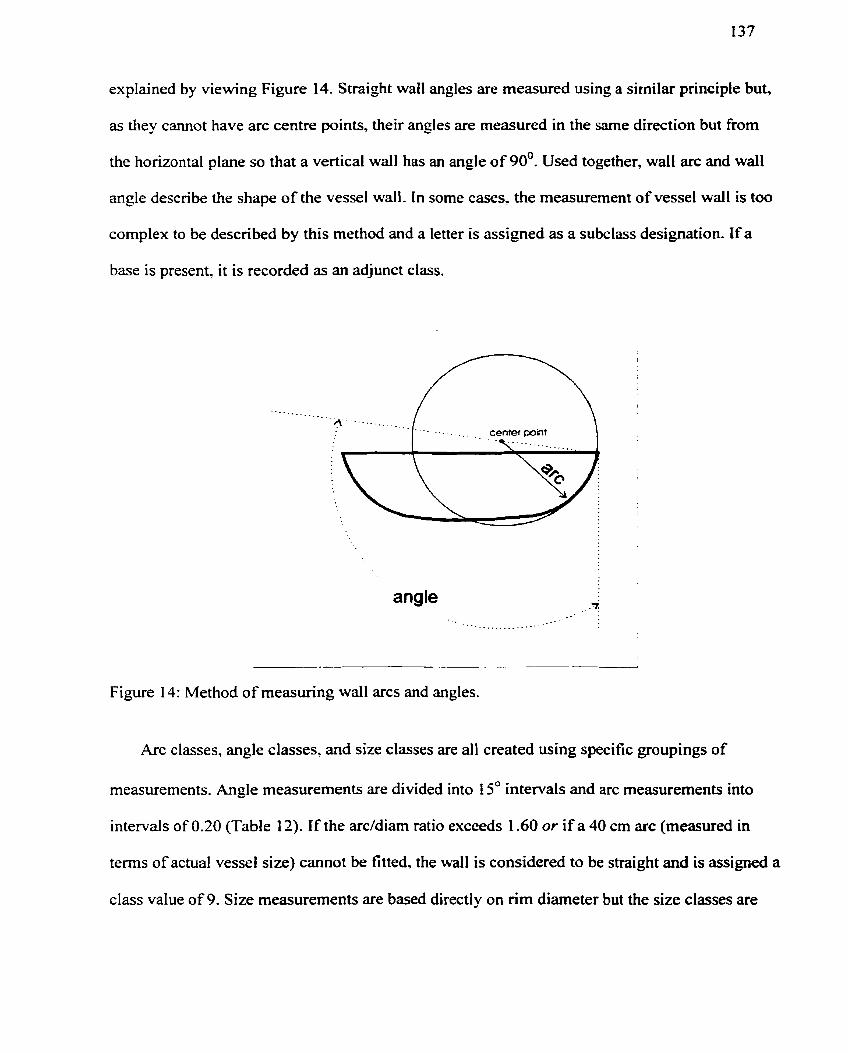
expIained by viewing Figure 14. Straight wail angles are rneasured using a sirnila. principle but,
as they cannot have arc centre points, their angles are measured in the same direction but fiom
the horizontal plane so that a vertical wall has an angle of 90'. Used together, wall arc and wall
angle describe the shape of the vessel wall. In some cases. the measurement of vessel wall is too
cornplex to be described by this method and a letter is assigned as a subclass designation. I f a
base is present, it is recorded as an adjunct class.
angle ..-ri . -
-
Figure 14: Method of measuring wall arcs and angles.
Arc classes, angle classes. and size classes are al1 created using specific groupings of
measurements. Angle measurements are divided into 15" intervals and arc measurements into
intervals of 0.20 (Table 12). If the arc/diam ratio exceeds 1.60 or if a 40 cm arc (measured in
terms of actual vessel size) cannot be titted. the wall is considered to be straight and is assigned a
class value of 9. Size measurements are based directly on rim diarneter but the size classes are
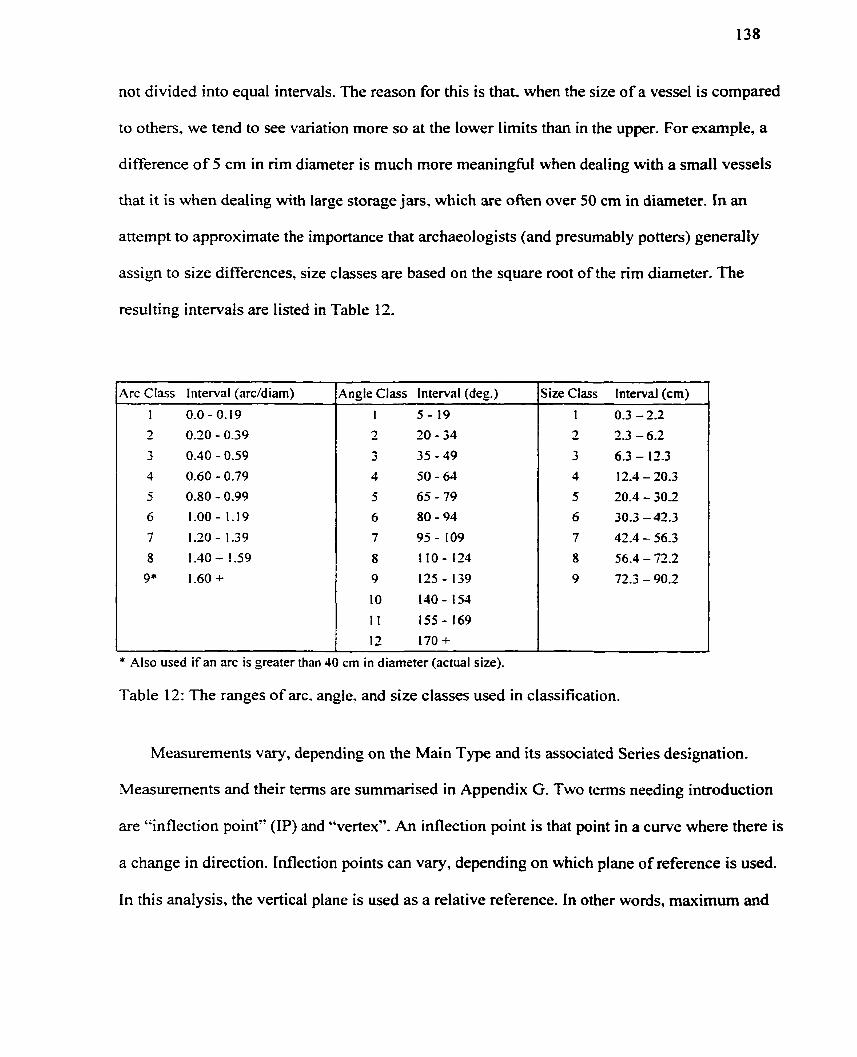
not divided into equal intervals. The reason for this is that. when the size of a vesse1 is compared
to others. we tend to see variation more so at the lower limits than in the upper. For exarnple, a
difference of 5 cm in rim diameter is much more meaningfiil when dealing with a small vessels
that it is when dealing with large storage jars, which are ofien over 50 cm in diameter. In an
attempt to approximate the importance that archaeologists (and presumably potters) generally
assign to size differences. size classes are based on the square root of the rim diameter. The
resulting intervals are listed in Table 12.
4rc Class Interval (addiam)
Also used if an arc is greater than 40 cm in diameter (actual size).
Table 12: The ranges of arc. angle, and size classes used in classification.
--
Angle Class Interval (deg.)
I 5 - 19
2 20 - 34
3 35 - 49
4 50 - 64 5 65 - 79
6 80 - 94
Measurements Vary. depending on the Main Type and its associated Series designation.
-
Size Class lnterval (cm)
1 0.3 - 2.2
2 2.3 - 6.2
3 6.3 - 12.3 4 12.4 - 20.3
5 20.4 - 30.2
6 30.3 - 42.3
Measurements and their terms are summarised in Appendix G. Two terms needing introduction
are "inflection point" (IP) and %erte?cT'. An inflection point is that point in a curve where there is
a change in direction. Inflection points can Vary, depending on which plane of reference is used.
In this analysis, the vertical plane is used as a relative reference. In other words, maximum and
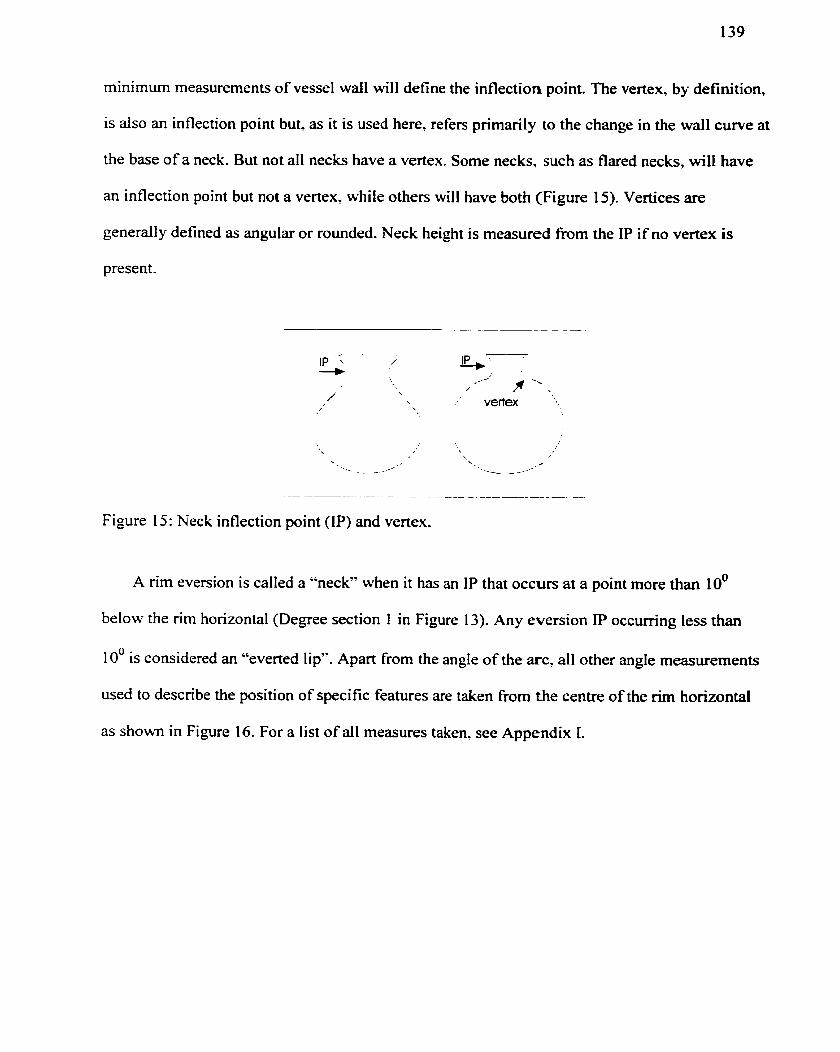
minimum measurements of vesse1 wall will define the inflection point. The vertex, by definition,
is also an inflection point bu t as it is used here, refee p ~ i m ~ i l y to the change in the wall curve at
the base of a neck. But not al1 necks have a vertex. Some necks, such as flared necks, will have
an inflection point but not a vertex, while others will have both (Figure 15). Vertices are
generally defined as angular or rounded. Neck height is measured from the IP if no vertex is
present.
Figure 15: Neck inflection point (IP) and vertex.
A rim eversion is called a "neck" when it has an IP that occurs at a point more than 10'
below the nm horizontal (Degree section 1 in Figure 13). Any eversion IP occurring less than
10' is considered an *'everted lip". Apart from the angle of the arc. al1 other angle measurements
used to describe the position of specific features are taken from the centre of the rim horizontal
as shown in Figure 16. For a list of al1 measures taken, see Appendix 1.
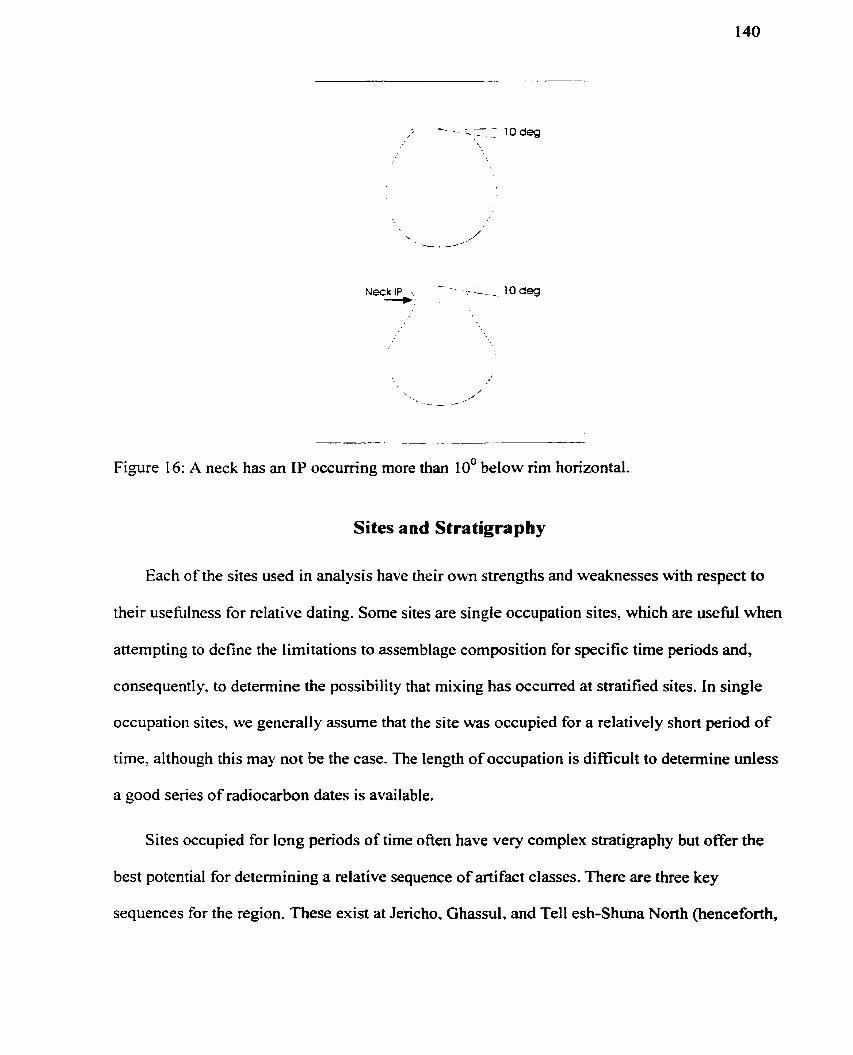
Figure 16: A neck has an IP occurring more than 10' below rim horizontal.
Sites and Stratigraphy
Each of the sites used in analysis have their own strengths and weaknesses with respect to
their usefùlness for relative dating. Some sites are single occupation sites, which are usehl when
attempting to define the limitations to assemblage composition for specific time periods and,
consequently, to determine the possibility that mixing has occurred at stratified sites. In single
occupation sites, we generally assume that the site was occupied for a relatively short period of
time, although this may not be the case. The length of occupation is diEcult to detennine unless
a good senes of radiocarbon dates is available.
Sites occupied for long periods of tirne often have very complex stratipphy but offer the
best potential for determining a relative sequence of artifact classes. There are three key
sequences for the region. These exist at Jencho, Ghassul, and Tell esh-Shuna North (henceforth,
Shuna North). These sites were excavated in more than one area and the results derived fiom
selected areas are treated as individual sections. At ail three sites, combined sections (see p. 128)
were produced before final analysis.
In other cases, as at Umm Harnmad, the results from multiple areas are treated as a single
unit, or section. but this is done only when these areas are adjacent and clear stratigraphic
relationships can be drawn between them. In the remainder of cases where excavation is limited
to a single area and verification of stratigraphic relationships is not possible, the excavator's
sequence or phasing is accepted. A summary of sites is given in Table 13.
Jericho
Jericho (Tell es-Sultan) is perhaps the best known site in the Jordan Valley. It is located just
northwest of the Dead Sea. The mound is 21 m high and covers 4 ha (Kenyon, 1971 : 39). The
location of surrounding tombs suggests that, at certain times, the limits of settlement may have
extended welI beyond the city wai 1s. C. Watzinger and E. Sellin ( 19 1 3) excavated at Jericho
between 1907 and 1909. but the first extensive and systematic excavations at Jericho were
directed by J. Garstang (1932, 1935. 1936) and later excavations were directed by K. Kenyon
(1 960. 1965; Kenyon and Holland, 198 1, 1982. 1983). Garstang's primary excavations were
conducted in the northeast corner of the mound, which he cleared to a depth of 17 rn, and defined
1 7 occupation levels, ranging fiom the Natufian (ca. 10500-8500 BC) to the Iron Age (1 200-
IO00 BC). Later. under Kenyon's direction. five main areas of the site were excavated, atong
with a nurnber of tombs. The main areas excavated by Kenyon are Trench 1, Trench 11, Trench
III, Square MI, Squares EI-II-VI, Squares EIII-IV, and Squares HII-III- N. The trench areas are
divided into a number of smaller areal units, also called squares, which are not entirely consistent
in their dimensions but usually range fiom 5 to 10 m per side.
Garstang's levels are nurnbered fiom the top down. His Level IX is roughly equivalent to
Kenyon's PNA and Level VI11 to her PNB. For the most part, there appears to be a general
absence of Late Chalcolithic material at the site (North, 1982) and Garstang's next level, Level
VII, consists primarily of EB1 artifacts (Kenyon's Proto-Urban Period). But the matter is not
clear cut. Both Kenyon and Garstang publish Chalcolithic-style artifacts, such as two cornets
(Garstang, 1935: pl. 33-30: Kenyon and Holland, 1983: fig. 13, 2), which are highly distinctive
artifacts of the Late Chalcolithic. Both were assigned to EB1 (or Proto-Urban) levels. Garstang
published more material similar to the classical Chalcolithic assemblages than did Kenyon, and it
is possible that a Chatcolithic settlement did exist at the site but was limited in area or was
siniated off the main mound. The material from Garstang's Tombs 354. 355, and 356 is clearly
CIialcolithic and, in many respects. is similar to the material coming fiom the upper levels at
nearby Maîjar (cf. Droop. 1935: pl. 43; Hemessy, 1969: fig 7% 13; Leonard. 1992: pl. 4).
Two of Kenyon's main areas were used in the present analysis, Trench II and Squares EIII-
IV. Trench II is used because, of al1 areas excavated. it has some of the least disturbed Late
Neolithic deposits. Squares EIII-IV were used for two reasons. First, the sequence has a full
range of deposits fiom the Late Neolithic to the Early Bronze Age and, second, it is well known
from a previous publication (Hennessy, 1967). Garstang's stratigraphic sequence was not used.
Kenyon grouped the stratigraphic units of Trench II by "Stages" and "Phases" and, in some
cases, a subphase was used. A phase is a subunit of a stage.With the exception of subphases, d l
labels are in Roman numerals. For exarnple. "Tr.II.XII.xliv(Pit A4a)" refers to Trench II, Stage
XII, Phase xliv, Pit A4a. In this analysis, Phases are the smallest stratigraphic unit used for
Trench TI.
Squares EIII-IV were excavated by Hennessy (1967). Ln this are% labelling was done a little
differently. No stage designations are given and al1 stratigraphic units are called "Phases", some
of which include subphases. Each phase is given a letter designation. For example, "EIII-
IV.JJ(S)" refers to Squares EIII-IV, Phase JJ, subphase S. Once again, phases are the srnailest
stratigraphic unit used ir? analysis.
For a detailed list of the horizon numbers used and their corresponding stratigraphic units,
see Appendix B. A combined section for Jericho was created from one section at Trench II and
one at Squares EIII-IV. The material from Kenyon's (1960) Tomb A94 was included as a
separate section because of the radiocarbon dates associated with it (Burleigh, 1983: 504). These
sections are discussed in more detail below.
Tulaylat Ghassul
Ghassul is a 20 ha site located just northeast of the Dead Sea. The distinctive materid
excavated at this site was the first used to define the Chalcolithic penod in the southern Levant.
Several articles discuss Ghassu17s history of excavations and 1 will not belabour the subject here
escept to give a brief outline (see Hemessy, 1 989; Bourke, 1997a; Blackham, 1999). Ghassul
was originally excavated in the 1930s by the Pontifical Biblical Institute (Mallon, 1930b, 1930%
1 93 1. 1 932% 1 932b, 1933; Mallon et al.. 1934; Koeppel, 1935, 1 937, 1 939, 1940). Excavations
resumed again for a brief period in 1959 (North, 196 1 ). In the 1 960s, excavations came under the
direction of J. H e ~ e s s y , and then S. Bourke, both of the University o f Sydney (Hennessy, 1968,
1969, 1982. 1989: Bourke et al., 1995; Bourke, 1997a).
Despite years of excavation at the site, there are few detailed sequences of the material to
draw upon. This situation promises to change in the near future with upcoming publications from
the University of Sydney (e-g., Lovell. 1999). The sequences used here were derived from
Hennessy's Area A 11 (l969), Bourke's squares A X, A XI, and H II, and a sequence recreated
from a study of North's excavations in his Areas B3-1-2 and El (Blackharn. 1999). In ail cases,
the stratigraphic units used in analysis are those given in the publications and corresponding
horizon numbers are listed in Appendix B.
in addition to a Chalcolithic sequence. the site contains a unique Late Neolithic component.
But until more information becomes available, it will rernain poorly defined. Despite this
difficulty, the present analysis was able to locate this material within the Late Neolithic
sequence.
The information for Bourke's Areas AX' AXI, and HI1 is taken from a single preliminary
report (Bourke er ai.. 1995) and. although artifacts and their contexts are well reported, there was
little material that could be used on a regional comparative bais. Areas AX and AXI were
excavated adjacent to Hennessy's (1969. 1989) Area AI. The two areas were aligned
stratigraphically so that Area AX sarnpled the upper portion of Hennessy's area and Area XI the
lower portion. On this information, 1 attempted to analyze Bourke's Areas as a single unit,
placing Area X above Area XI. In a prelirninary analysis, this attempt proved unsuccessful
because of the number of contradictions produced within the sequence. In particular, problems
related to placing cornets (Code 896) and streaky-wash slip (Code 927) belorv the lowest layers
of Area AX. as they were reported. Sirnilar problems occurred in Blackharn's (1999)
reconstruction of the sequence in North's Area El. In this case, the lowest level had to be
eliminated frorn analysis, a procedure that greatly reduced the number of relational
contradictions produced. Al1 reported areas at Ghassul are treated as individual sections and, as
at Jericho, a composite section was constructed.
Tell esh-Shuna North
Shuna North (or Tell esh-Shuneh bIashaweh) is situated just south of Lake Tiberias on the
north side of the Wadi 'Arab. It is a large site and covers approximately 17 ha at its greatest
extent (Philip and Baird. 1993: 13). The site was first excavated under the direction of H. de
Contenson ( 1 960b. l96Oa 196 1 ) and later excavations were conducted by J. Mellaart (Leonard,
1992). C. Gustavson-Gaube (1 985- 1986. 1987) and, more recently. by G. Philip and D. Baird
(Baird. 1 987; Philip and Baird. 1993; Baird and Philip. 1994). The recent excavations by Baird
and Philip promise to be rewarding. To date. however. only three stratigraphic sequences
relevant to the present study are published; one fiom de Contenson's (1960: 12-3 1 ; figs. 1-1 6)
excavations, one from Gustavson-Gaube, (in particular, see Gustavson-Gaube 1986: fig. 4) and
another from Mellaart's excavations (Leonard 1992: 34-63, pls. 8-19). De Contenson's report
shows excellent stratigraphic detail but. unfortunately, because the artifacts are seldom reported
in any specific contsxt. it is not as useful as Gustavson-Gaube's or Mellaart's, Gustavson-Gaube
escavated three main areas: Squares EI. II. and III. which were al1 adjacent. In one square, EI,
excavations were taken down to natural soil. Gustavson-Gaube's (1986: 82) stratigraphic
analysis is ver). detailed and, in all. she defined 109 sequential strata, numbered 60m the top
down) and three main phases; an Early Phase (strata 1 14-55). a Middle Phase (strata 56-23) and
a Late Phase (strata 22-7). The Early Phase is defined as "PNB-relateaate Chalcolithic", while
the Middle and Late Phases are assigned to the Early Bronze Age. Not al1 of this sequence was
used in the present analysis. The analytical focus here is to refine the LNBKhalcolithic
sequence. which requires defining an upper and lower limit. For this reason, the EBl was
included only to the degree to which it can define an upper limit to the sequence as well as
answer questions about any possible relationships between the Late Chalcolithic and the EB 1.
Gustavson-Gaube's sequence was used up to Stratum 40 (i.e., 114-40). The intent of the division
was to include several strata containing Grey Bumished Ware (GBW). also cdled Esdraelon
ware. This type is considered to be characteristic of initial site occupation in the Early Bronze
Age.
Gustavson-Gaube's sequence is extremely detailed and serves as a tribute to her careful
excavations. 1 do not, however, agree with al1 correlations drawn between excavation units
(Gustavson-Gaube. 1986: fig. 4). The stratigraphic relationships as shown in section drawings
and plans (Gustavson-Gaube 1986: figs. 2,3,6,7) are relatively clear as they appear above
Stratum 75 but, below this point, strata are divided into at least three rnultilinear sequences. A
multilinear sequence is compnsed of two or more separated sequences that are sandwiched
between known upper and lower limits but between which stratigraphic relationships cannot be
drawn without using alternative sources of information (Harris. 1984? 1989; Harris er al., 1993;
Triggs. 1993). Triggs ( 1993) approaches the problem by using seriation techniques to correlate
the unconnected strata in multilinear sequences. This is the same approach 1 use here but with
UAM techniques rather than seriation.
Those strata above Stratwn 75, and for which stratigraphic relationships are clear, were
grouped into seven local horizons (Appendix B), whereas the lower strata (1 14-76) of Squares E
1 and E II were entered as separate local horizons @ut using Gaube's strata nurnbers) and
correlated using UAM techniques. Because each square was covered by the sarne deposits (i.e.,
Stratum 75 and up), the upper portion of each section is the same ( shom as Horizons 7-13 in
each Section). This "doubling" of the upper section does not weight results in its favor because
the operation was perfomed before any correlation with either Mellaart's sequence or any other
sequence. Mellaart's section was included only after correlating Gustavson-Gaube's units. For a
more detailed discussion, see "Data Structure and Input" (p. 15.5)-
MellaartTs sequence at Shuna was taken from a different location han that of either de
Contenson or Gustavson-Gaube and does not contain any of the Late Neolithic or Chalcolithic
material reported by them. Of al1 the Jordan Valley excavations conducted by Mellaart, those at
Shuna North were the most extensive. He excavated three trenches (1. II. and III) but only Trench
II was excavated to natural soi1 (Leonard 1992: 34). MeIIaart defined 20 Iayers in this trench,
which he numbered from the top down. Some of these layers were comprised of sublayers
(Leonard 1992: 57). Layers were grouped into four "periods" labelled II to V. Period 1 was
reserved for de Contenson's early phases. for which Mellaart found no evidence. Mellaart
believed that his four periods were roughly equivalent to Chalcolithic. Early Bronze 1' Early
Bronze II! and Early Bronze III periods. On the basis of this informationl a portion of Mellaart's
sequence was included in analysis in order to correlate these deposits with those of Gustavson-
Gaube and create a combined section. However, as will be demonstrated, Mellaart's Layers 19
and 20 contain no Chalcoiithic matenal and belong entirely to the Early Bronze Age.
Mellaart's Iayer numbers were used to group his strata into nine local horizons. This section
is the one used with those of Gustavson-Gaube (1986) to create a combined section for Shuna
North (Appendix B)
Tabaqat al-Buma
Tabaqat al-Buma (survey no. WZ 200) is a Late Neolithic site located in Wadi Ziqlab,
northwestern Jordan. The site was excavated in 1990 and 1992 under the direction of E.B.
Banning (Banning et al.. 1987, 1989, 1992, 1996). The site is relatively small and was probably a
farmstead (Banning. 1 995, 1998: Banning and Siggen, 1997). The stratigraphy of the site was
studied in detail (Blackham, 1994. 1997) and a senes of radiocarbon dates obtained. Six phases
were defined (0-5). The lowermost phase contains Epipalaeolithic material (1 5000 - 13000 BC)
and the uppermost contains Late Roman/Byzantine remains. Phases 1 to 4 contain Late Neolithic
matsrial and these are the uni& used to create four local horizons in the present analysis. Just as
some layers at Shuna North. Umm Hammad. and Jericho were used to define an upper limit to
the Chalcolithic sequence, the pottery and radiocarbon dates fiom Tabaqat al-Buma were
esuemely usefùl for defining a lower limit.
Tell el-Mafjar was excavated by J. Mellaart (Mellaart. 1962: Leonard. 1992: 9-23, pls. 2-5)
in the 1950s and is one of seven sites at which he made soundings. A single sounding was made
(Trench 1) covering an area of approximately 19 rn2 and reached natural soi1 at a depth of 2 m
(Leonard, 1992: 9). Mellaart defined three pits of uncertain use. On the basis of excavations in
the central and largest pi t he defined six layers. three in the pit and three above it. These were
numbered from the top d o m .
Leonard (1 992: 18) suggests that the upper three layers (1 -3) be combined because they
were open loci. They were. however. kept separate in this analysis on the contention that al1
layers were open loci at one point in time and the artifact sequence for these three layers is
probabIy just as valid as any other. An additional horizon (7) was created for surface artifacts.
A preliminary comparative and chronological analysis of the contents of these layers (see
below) determined that a considerable degree of artifact mixing had occurred during their
formation. This is particularly the case for Mellaart's Layers 3 and 5 (Horizons 2 and 4 in
UAM), the contents of which created so many contradictions that they had to be completely
eliminated from analysis. Otherwise, the results are regular and consistent with regional results,
supporting Leonardœs suggestion that the central pit may have formed the base of a seasonal
shelter.
Jiftlik
Jifilik is another site in Mellaart's Jordan Valley survey (Leonard 1992: 5-8, pl. 1). It is
si tuated on the north side of Wadi Far'ah about 4 km from the present course of the Jordan River
(Leonard 1992: 5 ) . It was not excavated systematically and al1 artifacts reported were collected
from a section cut made by road-widening activities. Mellaart estimated that the deposits were 1
to 2 m thick. For analysis. Jiftlik was treated as a single occupation site. It contains a distinctly
C halcoIi thic assemblage that includes cornets.
Tell Abu Habil
Tell Abu Habil is located close to the east bank of the Jordan River (on the Eastern Ghor)
about 3 km south of Wadi Yabis. It is a low m o u d that covers about 1 ha. but few other
topographie details are available. The site was excavated by de Contenson (1 960b: 3 1-48, pls.
20-3 1 ) and by Mellaart (Leonard 1992: 64-76. pls. 20-22). Both excavations are reported with
section drawings and artifacts in context but Leonard's publication of Mellaart's excavation
includes a Iarger and more diversified assemblage and is the one used in andysis.
Mellaart defined 13 layers and associated sublayers numbered from the top d o m (Leonard
1992: 73). These he grouped into five periods. or levels, labelled 1-IV fiom the bottom up. Not
enough artifacts were reported to enable a layer-by-layer analysis and. consequently, Mellaart's
period groupings were used as local horizons.
Tell Umm Hammad
Umm Hammad (or Tell Umm Hamad esh-Sherqi) is situated on the north bank of the Wadi
Zarqa at its confluence with the Jordan River (Leonard 1992: 77). It is a low moud covering
approximately 2 ha. The site was excavated by Mellaart (Leonard 1992: 77- 102, pls. 23-33) and,
more recently. by S. Helms (1 983, 1984, 1986, 1987; Betts, 1992). The site was occupied
pnmdy in the Early Bronze Age but was included here because its chronoiogical position in
the Chalcolithic-Early Bronze Age sequence remains uncertain. Mellaart excavated three
trenches and assigned the various layers to either Late Chalcolithic or Early Bronze Age levels
(primarily EB 1 ). It is clear. however. that Mellaart's classification of "Late Chalcolithic"
artifacts was based on de Vaux and Steve's (de Vaux and Steve, 1947, 1948, 1949; de Vaux,
195 1. 1952, 1955, 1957, 196 1 ) excavations and classification of materials at Tell Far'ah North.
The matenal that Mellaart calls Late Chalcolithic is the sarne as de Vaux's "Chalcolithique
Szipériew". However. in subsequent excavations, this distinctive assemblage was re-assigned to
the EB1 by de Miroshedji (1971: 30-41). He called it Proto-Urban D @ré-urbaine D) after
Kenyon's terminology (Leonard 1992: 83) and it is ofien referred to as Umm Hammad Ware
(Hanbury-Tenison, 1986: 137).
Helms excavated eight areal units at the site (Betts, 1992: fig. 9) to varying depths. The
strata fiom al1 excavations were grouped into four stages comprised of 22 phases (Betts 1992:
fig. 36). On the basis of surface finds, which include some Chalcolithic material, HeIms (1992)
suggests that the earliest deposits of Square 2 are Chalcolithic. These deposits contained the
remains of some architecture but no artifacts so. while it is possible that some Chalcolithic
occupation occurred, it is difficult to state conclusively that the lowest levels were formed during
this period.
Helms, Iike Mellaart. recovered a number of pieces of Grey Burnished Ware (GBW) in the
earliest levels (see particularly Betts. 1992: figs. 2 15-2 17). As mentioned earlier, this ware is
oflen associated with the first Early Bronze Age occupation of the region. Proto-Urban D wares
were found positioned above the GBW. This observation led Hanbury-Tenison (1986: 106-107)
to suggest that the sequence at Umm Harnrnad, as well as the Early Bronze sequence at Shuna
North. represented a long period which preceded the Proto-Urban (EB1) deposits at Jericho. If
Hanbury-Tenison is correct, then the history of the Chalcolithic to EB 1 transition is better
understood from the archaeological record at these sites-
To test these ideas. only a selected portion of Helms' sequence as it appears in the most
recent publication (Betts 1992) was used in analysis. Material frorn four adjacent uni& (Squares
1.2. 3. and 4) was included and the sequence limited to HelmTs (1 992) Phases 1-4. Note that
phase numbers used in the 1992 publication differ from those given in articles published by
Heims p io r to 1986.
Abu Hamid
Abu Harnid is situated near the Jordan River approximately 5 km north of Wadi Kufrinja.
The site is extensive and surface finds suggest that it covered 5.6 ha (Dollfus et ai., 1988: 571
and fig. 2). Abu Hamid was excavated over a number of seasons under the CO-direction o f G.
Dollfüs and Z. Kafafi (Dollfùs and Kafafi, 1986, 1987. 1988, 1993; Dollfùs ei a l , 1988). They
defined five lithostratigraphic units and three main occupation levels; lower, middle, and upper
(Dollfbs and Kafafi 1993: 242-245). The lower level contains Late Neolithic pottery while the
upper two levels contain Chalcolithic material.
Several publications have appeared. giving excellent syntheses of subsistence economics,
architecture, manufacturing techniques and ritual artifacts for the period (in particular, see
Dollfus and Kafafi. 1988). However, relatively little of the material was published in any way
useful to the analysis at hand. Information for the the Lower and Middle levels is derived
pnmarily From Do11 fùs and Kafafi (1 993) while Dollfûs et al. (1 988) supplied infiormation for the
upper levels.
Abu Hamid is a key site for the region and the material retrieved from the upper levels is
very sirnilar to that occurring in the upper levels at Ghassul (Lovell et ai.. 1997). Furthemore,
several important radiocarbon dates have been published (Neef. I W O : Dollfirs and Kafafi, 1993;
Love11 et al. 1997). which help to position the Chalcolithic period in an absolute chronological
frarnework.
Ghrubba
Ghnibba is located on the southem side of Wadi Nimrin, approximately 10 km north of
Ghassul (Mellaart. 1956: 24). The size of the site was not determined and most material comes
from a small sounding that Mellaart excavated as part of his survey of the region (Meilaart,
1963). Most of the material reported comes from a large pit (ca. 3 m in diameter), exposeci
partially on its southern side. Mellaart defined 16 layers numbered fiom the top down. Layers 1-
4 cover the pit deposits, while Layers 5-16 were within the pit. Mellaart suggested that. because
several sherds found within the lower deposits could be refitted, the interval of time separating
the deposits was short. In fact, of the 13 2 sherds reported, 20 were reconstructed from sherds
found in layers 5-1 2 and 6 from sherds found in Layers 13- 16 (Mellaart 1956: 34-38). It is
unlikely. therefore. that any significant period of time separated the several layers. On the basis
of this information. Layers 5- 12 are treated as a single deposit overlying another deposit formed
by Layers 13-16. This division is supported to some degree by the lithological nature of Layer
13, which is a layer of sandy soi1 separating the two greater deposits of ash layers. In addition,
Mellaart mentions that. below layer 13. there is a qualitative change in pottery composition
(Mellaart 1956: 26). In all. tluee phases have been defined for Ghrubba: an upper ( l ayes 1 4 ) ,
middle (Layers 5- 12), and a lower (Layers 13-1 6).
Neve Ur
Neve Ur is located on the west bank of the Jordan River. approximately 14 km south of
Lake Tiberias (Perrot et ai.. 1967). Its spatial limit has not been detennined but. based on surface
Ends. it probably covered 2-3 ha. Neve Ur is reported as a single-occupation site. Only one
publication exists. and includes no plans or section drawings. The amount of published matenal
is slight but. nonetheless. it is an important site for any understanding of Chalcolithic settlement
within the region.
Tel Tsaf
Tel Tsaf is situated less than 1 km West of the Jordan River on the south side of Naha1
Bezeq. It was identified as a Chalcolithic site in Tzori's survey of the Beth Shan Valley (Tzori,
1954, 1958: Gophna and Sadeh, 1989: 3). Excavations covered about 100 rn' over several
seasons and reached natural soi1 at a depth of approximately 2 m (Gophna and Kislev, 1979;
Gopher, 1988; Gophna and Sadeh, 1989; Sadeh and Gophna, 199 1 ). Gophna and Sadeh (1 989: 4-
9) define two Strata (1 and II) numbered fiom the top down, and assigned hivo phases to Stratum
1. They attribute the remains in Stratum 1 to an Early Chalcolithic occupation and those fiom
Stratum II to the "Pottery Neolithic". But only one sherd was recovered from Stratum II (Gophna
and Sadeh 1989: 3 1). limiting the present analysis to Straturn 1. The site is treated as a single
occupation site primarily because the context of finds was not always differentiated between
Phases 1 and 2 of Stratum 1. One other point that could indicate a short-term occupancy for the
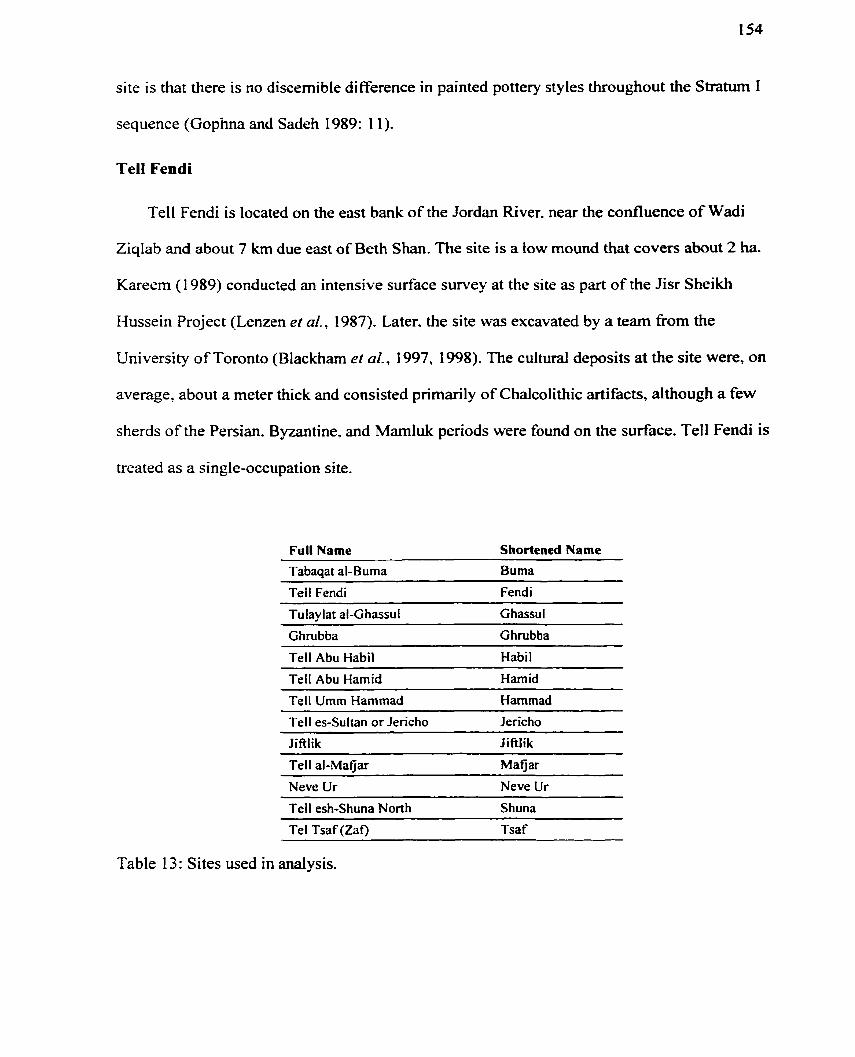
site is that there is no discemibIe difference in painted pottery styles throughout the Straturn I
sequence (Gophna and Sadeh 1989: 1 1).
Tell Fendi
Tell Fendi is located on the east bank of the Jordan River, near the confluence of Wadi
Ziqlab and about 7 km due east of Beth Shan. The site is a tow mound that covers about 2 ha.
Kareem (1 989) conducted an intensive surface survey at the site as part of the Jisr Sheikh
Hussein Project (Lenzen et al.. 1987). Later. the site was excavated by a team from the
University of Toronto (Blackharn et al-. 1997, 1998). The cultural deposits at the site were, on
average, about a meter thick and consisted primarily of Chalcolithic artifacts, although a few
sherds of the Persian. Byzantine. and Marnluk petiods were found on the surface. Tell Fendi is
treated as a single-occupation site.
Full Name Shortend Name
Tabaqat al-Buma Buma
Tell Fendi Fendi
Ghrubba Ghrubba - -- - -
Tell Abu Habil Habil
Tell Abu Hamid Hamid
Tell Umm Hammad -
Hammad
Tell es-Sultan or Jericho Jericho
Jiftlik Jifilik
Tell al-Mafjar Matjar
Neve Ur Neve Ur
Tell esh-Shuna North Shuna
Tel Tsaf (Zao Tsa f
Table 1 3 : Sites used in analysis.
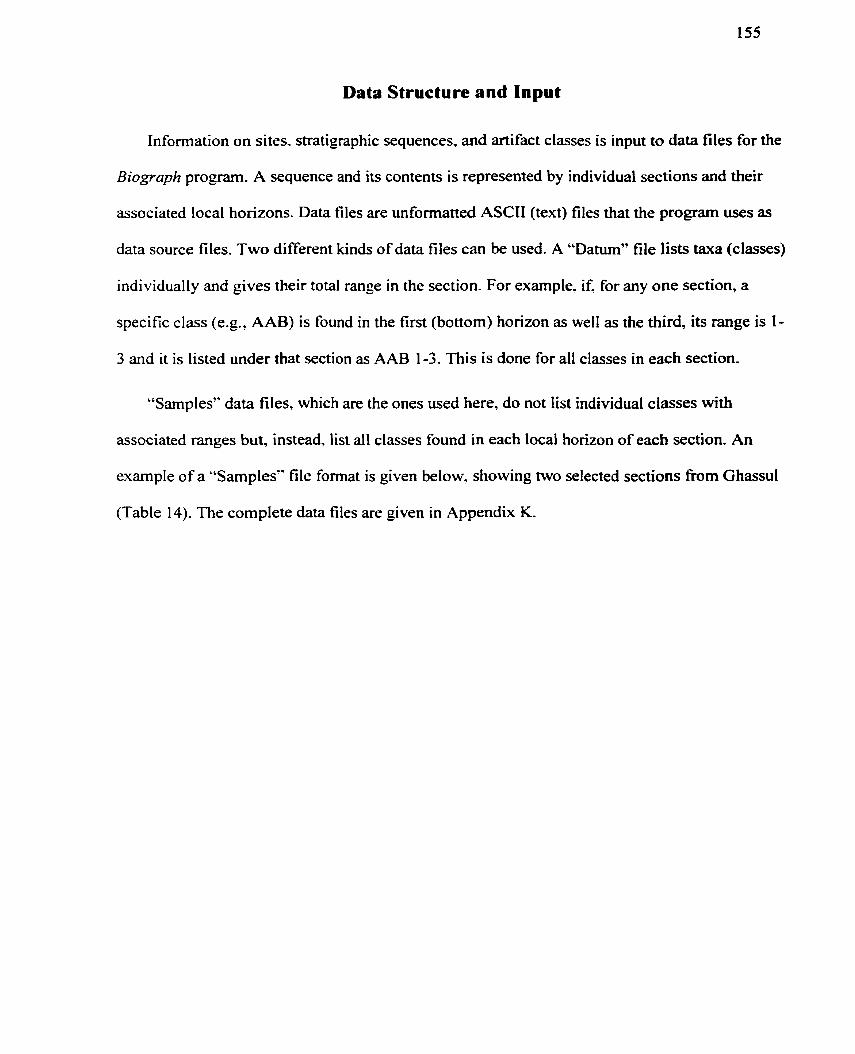
Data Structure and Input
Information on sites. stratigraphic sequences, and artifact classes is input to data files for the
Biograph program. A sequence and its contents is represented by individual sections and their
associated local horizons. Data files are unformatted ASCII (text) files that the program uses as
data source files. Two different kinds of data files can be used. A "Datum" file lists taxa (classes)
individualIy and gives their total range in the section- For exarnple. if. for any one section, a
specific class (e-g., AAB) is found in the first (bottom) horizon as well as the third, its range is 1-
3 and it is Iisted under that section as AAB 1-3. This is done for al1 classes in each section.
"Samples" data files, which are the ones used here, do not list individual classes with
associated ranges but, instead, list al1 classes found in each local horizon of each section. An
example of a "Sarnples" file format is given below. showing two selected sections from Ghassul
(Table 14). The complete data files are given in Appendix K.
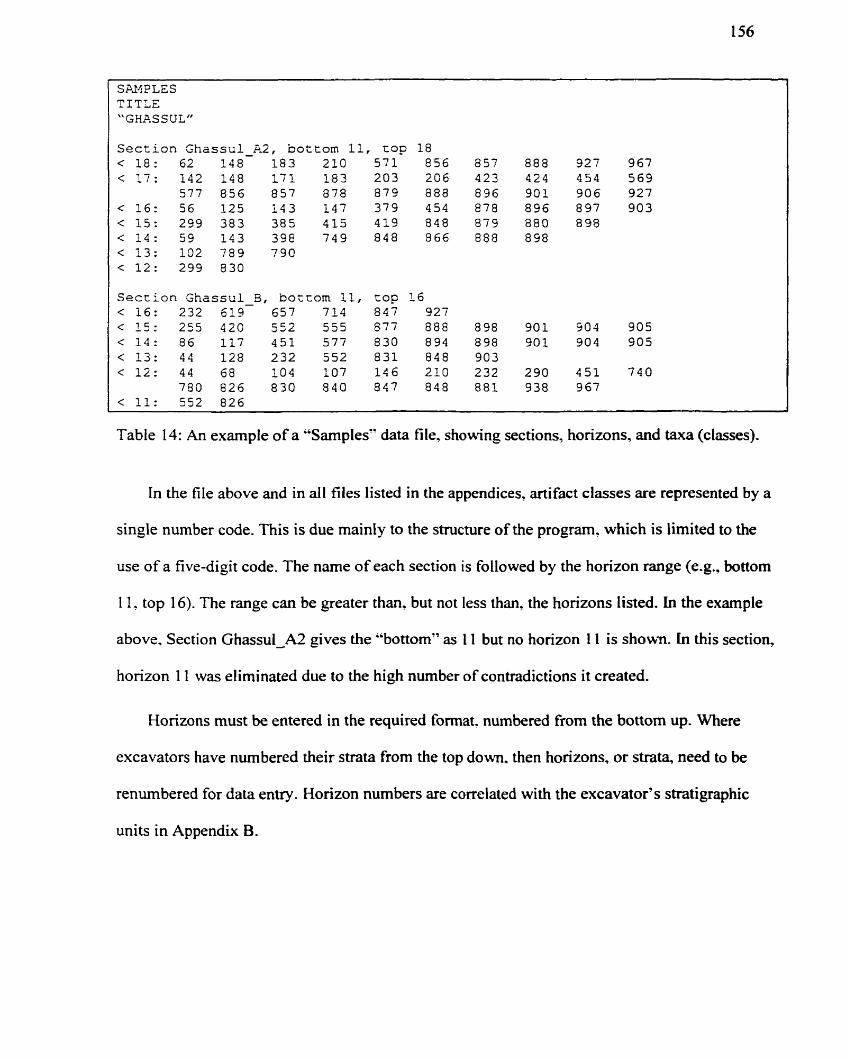
SAMPLES TITLE "GH!SSUL"
Section Uhassul-P-2, bottom 11, rop 18 < 1 8 : 62 1 4 8 1 8 3 210 5 7 1 8 5 6 857 888 927 967 C 1 7 : 142 148 171 183 2 0 3 206 4 2 3 4 2 4 4 5 4 569
577 8 5 6 8 5 7 878 8 7 9 8 8 8 8 9 6 9 0 1 9 0 6 927 < 16 : 5 6 125 1 4 3 147 379 4 5 4 878 8 9 6 8 9 7 9 0 3 C 1 5 : 299 383 385 4 1 5 4 1 9 8 4 8 879 880 898 < 1 4 : 5 9 143 398 749 848 866 888 898 < 13 : 102 7 8 9 790 c 12 : 299 8 3 0
Table 14: An exarnple of a "Samples" data file, showing sections, horizons, and taxa (classes).
In the file above and in al1 files listed in the appendices, artifact classes are represented by a
single number code. This is due mainly to the structure of the program. which is limited to the
use of a five-digit code. The n m e of each section is followed by the horizon range (e-g., bottom
1 1. top 16). The range c m be greater than, but not less than. the horizons Iisted. in the example
above. Section GhassuldA2 gives the "bottom" as 1 1 but no horizon 1 1 is shown. In this section,
horizon 1 1 was eliminated due to the high number of contradictions it created.
Horizons must be entered in the required format. numbered From the bottom up. Where
excavators have numbered their strata from the top down. then horizons, or strata, need to be
renumbered for data enûy. Horizon numbers are correlated with the excavator's stratigraphie
units in Appendix B.
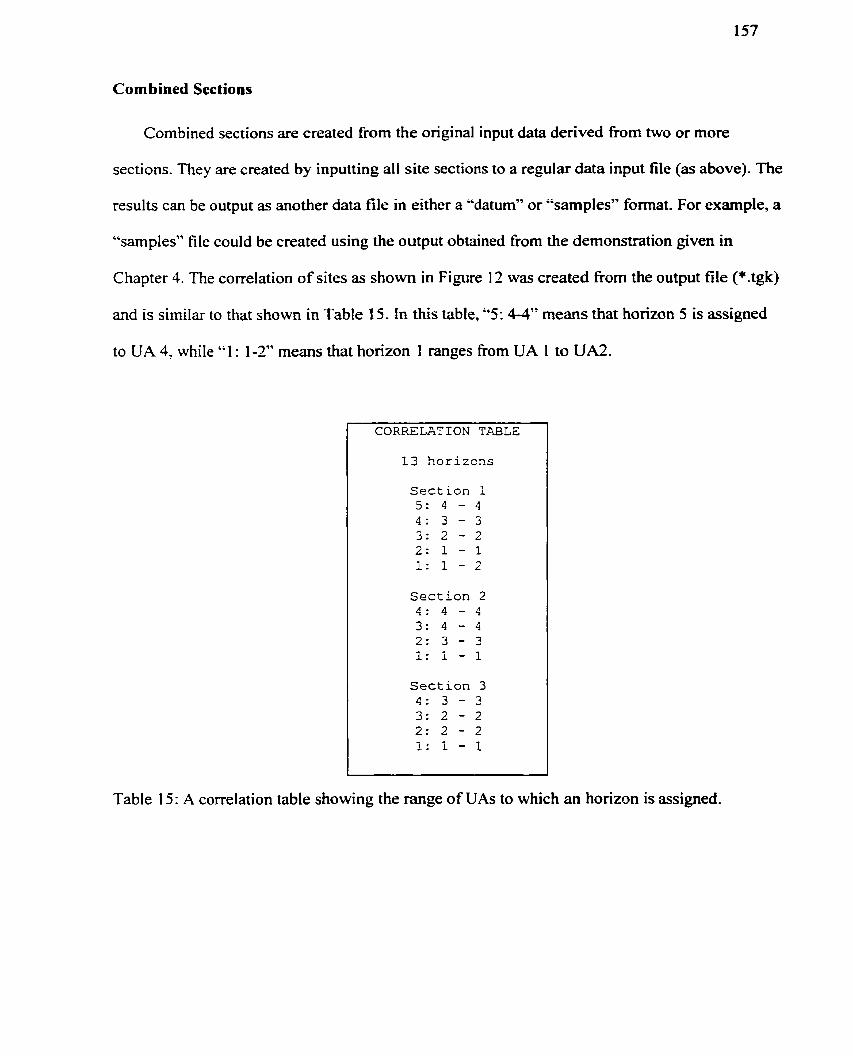
Corn bined Sections
Combined sections are created from the original input data derived from two or more
sections. They are created by inputting al1 site sections to a replar data input file (as above). The
results can be output as another data file in either a "datum" or '6samples" format. For example, a
"samples" file could be created using the output obtained fiom the demonstration given in
Chapter 4. The correlation of sites as shown in Figure 12 was created from the output file (* .tgk)
and is similar to that show-n in Table 15. In this table, "5: 4-4" means that horizon 5 is assigned
to UA 4. while "1 : 1-2" means that horizon 1 ranges from UA 1 to UA2.
CORRILATION TABLE
13 horizons
Section i 5 : 4 - 4 4: 3 - 3 3 : 2 - 2 2 : l - 1 1 : l - 2
Section 2 4: 4 - 4 3 : 4 - 4 2 : 3 - 3 1: i - 1
Section 3 4: 3 - 3 3: 2 - 2 2: 2 - 2 1: 1 - 1
Table 15: A correlation table showing the range of UAs to which an horizon is assigned.
In the combined section, the UAs become horizons. For example, in Table 15, four horizons
will be created in a combined section because there are only four UAs. The combined section
shown in a "samples" format is given in Table 16.
T I T L E :
SECTION ConDinea: boccom 1 - t o p 4
Table 16: A combined section created from the fictitious sites used in Chapter 4.
ï he information contained in a cornbined section is one analytical step away from the
original input data. If. in the example given above. you want to know the relative placement of a
specific horizon, Say Horizon 3 from Section 2. you must first refer to the correlation table
(Table 15) and note the UA number to which it is assigned. In this case, Horizon 3 from Section
2 is contained in Horizon 4. in the Section labelled 'Combined' (Table 16). Horizon 4 is simply
the UA number from the original analysis.
Data files used to make combined sections are included in Appendix J and the resulting
combined sections are as they appear for each site in the data files included in Appendix K.
Associated with each data file in its corresponding correlation table. The correlation table serves
as a cross-reference for the composite section. as mentioned above. How to interpret correlation
tables is explained in Chapter 4 (p. 123). AI1 sequences have been produced using the Biograph
2.02 program, counting both arcs and reproducibiîities, and sorting by first appearances.
For each site. detailed stratigraphic information is given in Appendix B.
Jericho
The correlation of horizons within sections may not always turn out as expected. In Jericho,
Trench II, Horizons 1 -3 (Phases 4 1 -43) are attributed to the PNA, whereas 3-4 (Phases 44-45)
are PNB. We would expect these to correlate with lower levels in Square EIII-IV. In Square EIII-
IV. Horizons 1-2 (Phases MM-LL) are defined as PNA layers and Horizons 3-9 (Phases KK-CC)
are attributed to the PNB. But. when correlated, these horizons do not align according to this
scheme (Table 17). The Iower deposits of Square EIII-N clearly contain PNA-style pottery but
these deposits are mixed and also contain PNB-style pottery.
The correlation of Jericho horizons displays marked differences in their assigned ranges that
could be attributed to a number of factors (Table 17). For example, Horizons 1-10 of Section E3
(Square EIII-IV) correlate with a single horizon (Horizon 4) of Section T2 (Trench II) and it
appears as though a considerable arnount of chronological resolution is lost. Some of the factors
that could account for the poor resolution are that excavation areas or layers were different in
composition. excavated in smaller excavation units, reported as grouped units, or were entered
into analysis as grouped units. The latter two factors probably account for most of the difference.
Phase 44 (Horizon 4) in Trench II is a large deposit and, as such, draws many more associations
between artifact classes.
Smaller excavation units were reported for Trenc h II but their true stratigraphic relationships
were not given and, although the stratigraphy is published (Kenyon and Holland, 1981), a
preliminary analysis suggests that not ail contexts of interest can be confidently placed. For these
reasons, the stratigraphic order of phases has been accepted as given (in particular, see Kenyon
and Holland. 1982, 1983)
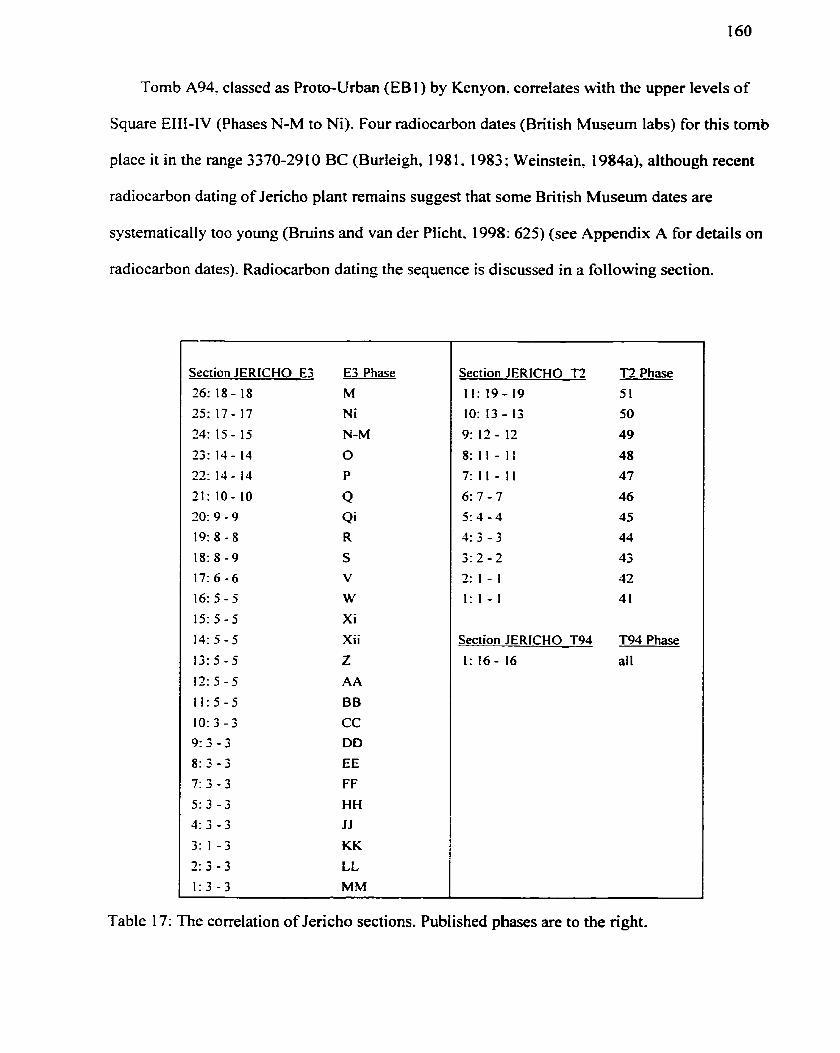
Tomb A94, classed as Proto-Urban (EBI) by Kenyon. correlates with the upper levels of
Square EIII-IV (Phases N-M to Ni). Four radiocarbon dates (British Museum labs) for this tomb
place it in the range 3370-29 10 BC (Burleigh, 1 98 1. 1983 ; Weinstein, 1984a), although recent
radiocarbon dating of Jericho plant remains suggest that some British Museum dates are
systematically too young (Bruins and van der Plicht. 1998: 625) (see Appendix A for details on
radiocarbon dates). Radiocarbon dating the sequence is discussed in a following section.
Section JERICHO E3
26: 18 - 18
25: 17- 17
24: 15 - IS 23: 14 - 14
22: I4 - I4
21: I O - 10 20 :9 -9
19: 8 - 8
18: 8 - 9
17: 6 - 6
16: 5 - 5
I 5 : j - 5
14: 5 - 5
I 3 : 5 - 5
1 2 ~ 5 - j
11 : s -5
10: 3 - 3 9 : 3 - 3
8: 3 - 3
7: 3 - 3
5 : 3 - 3
3 : 3 - 3
3: 1 - 3
2 : 3 - 3
1 :3 -3
E3 Phase
M
N-M
X i
Xi i
Section JERKHO 7 2
1 1 : 19- 19
IO: 13 - 13
9: I t - 12
8: 1 1 - 1 1
7: 1 1 - 1 1
6 : 7 - 7
5 : 4 - 4
4 : 3 - 3
3 : 2 - 2
211-1
I : 1 - I
Section JERlCHO T94
1: 16- 16
T2 Phase 5 1
50
49
48
47
46
45
44
43
42
41
T94 Phase
ail
Table 17: The correlation of Jericho sections. Published phases are to the right.
Ghassul
There are six Ghassul sections in al1 and each section has between one and seven local
horizons. Not al1 excavated horizons are represented because not al1 artifact classes met the
criteria set out above (p. 132)- Ghassul. like many sites, contains a very diversified assemblage,
but classes that appear at only one site are not always useful to the present analysis. This often
iirnits the number of classes that can be entered and accounts for both the small nurnber of
classes appearing in some Ghassul horizons as well as the elimination of entire horizons.
As mentioned in "Sites and Stratipphy", Areas A1 0 (A X) and A l 1 (A Xi) at Ghassul do
not conform to expectations. Area A 1 1 should be stratigraphically below the deposits in Area
A10 (Bourke et al.. 1995: 36) but the artifacts found place it above. To avoid a high number of
contradictions and yet retain as much information as possible, these units were kept separate.
Bourke's (1995) report is preliminary and, no doubt, the material reported is far from being
representative of the entire assembIage. Nonetheless. on the basis of published artifacts, their
reported contexts, and the classification system used here, these are the correlations obtained.
Sections B and E are based on reconstructions of North's (1 96 1) excavated sequence
(Blackharn, 1999). It is likely that North's stratigraphie divisions lack the resolution of more
recent excavations. There is, however, very Iittle of the more recent material published to date.
Furthemore. North's reconstnicted sequence fits well with the present evidence and few
contradictions were produced.
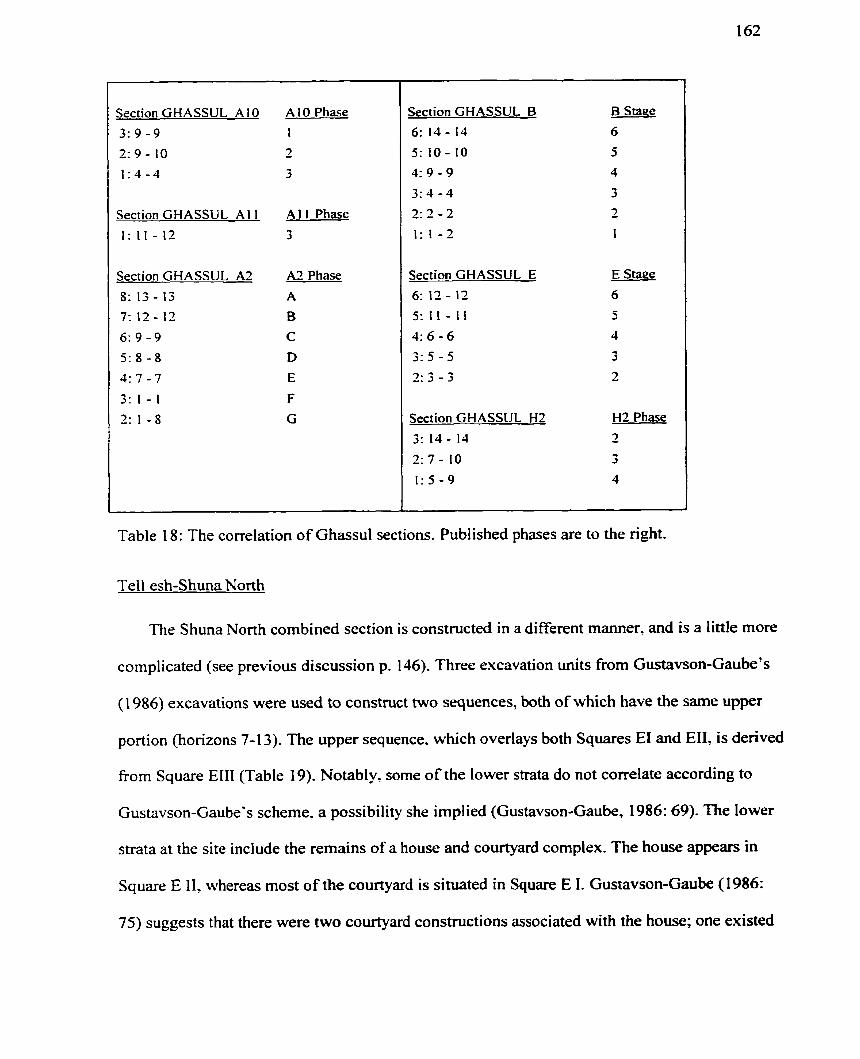
Section GHASSUL A I O A10 Phase
3: 9 - 9 1
2:9- 10 2 1 : 4 - 4 3
Section GHASSUL A l l Al l Phase
1: 1 1 - 12 3
Section GHASSUL AS A2 Phase 8: 13 - 13 A
7: 12 - 12 B
6 : 9 - 9 C
5 : s - 8 D
4 : 7 - 7 E
3 : l - 1 F
2: 1 - 8 G
Section GHASSUL B
6: 14 - 14
5: 10 - I O
419-9
3 :4 -4 2 2 - 3 1: 1 - 2
Section GHASSUL E 6: 12 - 12
5: 1 1 - 1 1
4 : 6 - 6 3 : 5 - 5
2 3 - 3
Section GHASSUL H2
3: 14 - 14
2: 7 - IO
1:s-9
E Staae
6
5
4
3
2
H 2 Phase
2
3 4
Table t 8: The correlation of Ghassul sections. Published phases are to the right.
Tell esh-Shuna North
The Shuna North combined section is constmcted in a different manner, and is a little more
complicated (see previous discussion p. 146). Three excavation units fiom Gustavson-Gaube's
(1986) excavations were used to construct two sequences, both of which have the same upper
portion (horizons 7-1 3). The upper sequence. which overlays both Squares EI and EII, is denved
fiom Square EIII (Table 19). Notably. some of the lower strata do not correlate according to
Gustavson-Gaube's scheme, a possibility she implied (Gustavson-Gaube, 1986: 69). The lower
strata at the site include the remains of a house and courtyard cornplex. The house appears in
Square E II, whereas most of the courtyard is situated in Square E 1. Gustavson-Gaube (1986:
75) suggests that there were two courtyard constnictions associated with the house; one existed

from Strata 109- 102. and another from Strata 92-89. The results obtained here would contradict
her only in that the second courtyard complex is older than the final phase of house construction
in Square E II. For example. Horizons 4-6 (Strata 9 1-8 1 ) of Section E 1-3 (Square E 1) would be
placed above Horizon 6 (Stratum 82) of Section E2-3 (Square E II). This suggests that the
second courtyard was associated with another building not found in excavation.
Section El 3
13: 13 - 13
12: 12 - 12
I I : 1 1 - 1 1
10: 10 - 10
9 : 9 - 9
8 : 8 - 8
7 :7 -7
6 : 6 - 6
5 : 6 - 6
4 :6-6
3: 1 - 3 3 - 1 - 3 -. 1: 3 - 4
EI 3 Strata
41
42
43
5 1-48
60-52
7 1-6 1
75-72
8 1
88
9 1
1 O4
112
1 I4
Section E2 3
13: 13 - 13
12: 12 - 12
I I : 1 1 - 1 1
10: 10 - 10
9: 9 - 9
8: 8 - 8
7 :7 -7
6 : 5 - 5
5 : 4 - 4
4 : 2 - 2
3 :2 -4
2 1 - 1
1: 1 - 4
E2 3 Strata
41
42
43
5 1-48
60-52
71-61
75-72
82
84
87
88
95
1 O9
Table 19: The correlation of Shuna North sections for Gustavson-Gaube's Squares E I-III.
Published phases are to the right.
Once the sequence in Squares E 1-111 is deterrnined and a combined section created,
Mellaart's sequence fiom Trench II (Section TR2) is added. These two sections are correlated
and another combined section created. The final combined section is two steps away fiom the
original data input and reading it can be confüsing, particularly because there are 13 horizons in
each section as well as 13 UAs (see Appendix B: Sites, Sections, Horizons).
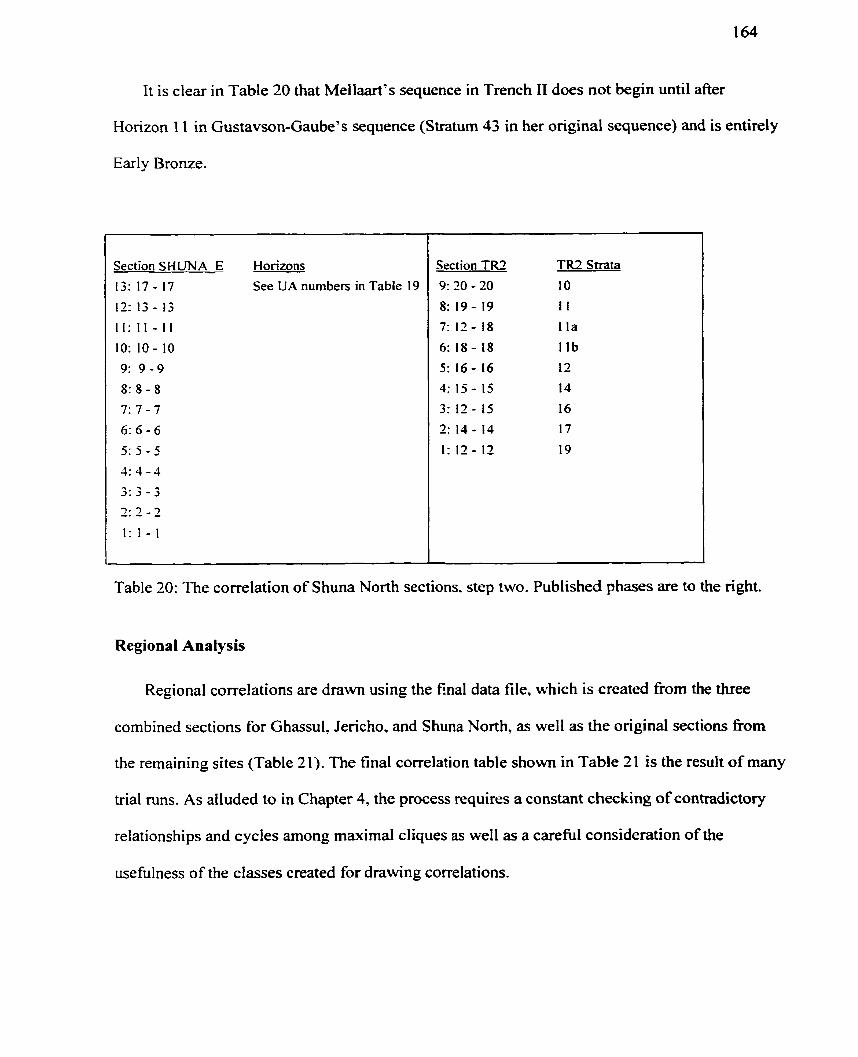
It is clear in Table 20 that Mellaart's sequence in Trench II does not begin until after
Horizon 1 1 in Gustavson-Gaube's sequence (Stratum 43 in her original sequence) and is entirely
Early Bronze.
Section SHUNA E Horizons
13: 17 - 17 See UA numbers in Table 19
12: 13 - 13
11: 1 1 - 1 1
IO: 10 - 10
9: 9 - 9
8 : 8 - 8
7 : 7 - 7
6 ~ 6 - 6
5 : 5 - 5
4:4-3
3: 3 - 3
2 2 - 2
1 : l - 1
Section TR2
9: 20 - 20
8: 1 9 - 19
7: 12- 18
6: 18 - t8
5: 16- 16
4: 15 - 15
3: 12 - 15
2: 14 - 14 1 : 12 - 12
TR2 Strata
1 O
I I
I la
I l b 12
14
16
17
19
Table 20: The correlation of Shuna North sections. step two. Published phases are to the right.
Regional Analysis
Regional correlations are drawn using the final data file, which is created fiom the three
combined sections for Ghassul. Jericho, and Shuna North, as well as the original sections fiom
the remaining sites (Table 21). The final correlation table shown in Table 21 is the result of many
trial runs. As alluded to in Chapter 4, the process requires a constant checking of contradictory
relationships and cycles among maximal cliques as well as a carefùl consideration of the
usefûlness of the cfasses created for drawing correlations.
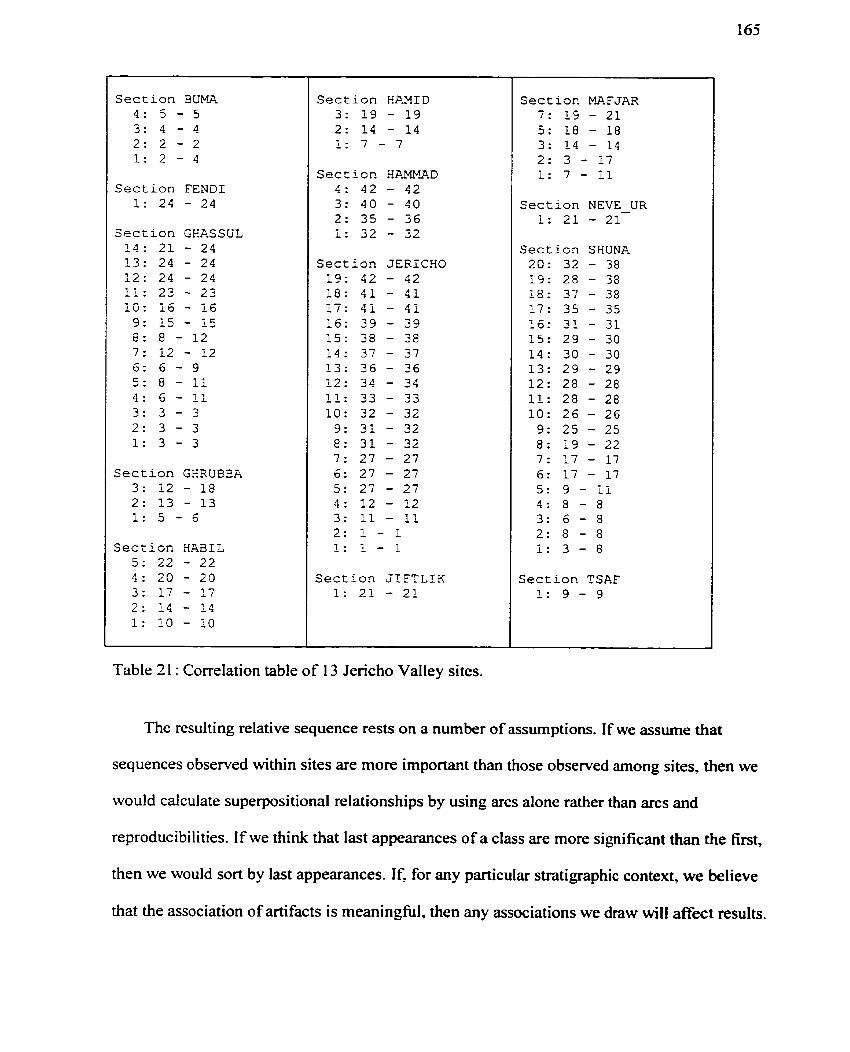
Section BUMA 4: 5 - 5 3: 4 - 4 2 : 2 - 2 1: 2 - 4
Section FEND1 1: 24 - 24
Section GRASSUL 1 4 : 2 1 - 24 13: 24 - 24 1 2 : 24 - 24 11: 2 3 - 23 iû: 1 6 - 16
9: 1 5 - 1 5 8 : 8 - 1 2 7 : 1 2 - 1 2 6 : 6 - 9 5: 8 - 11 4 : 6 - 1 1 3 : 3 - 3 2 : 3 - 3 1: 3 - 3
Section GHRUEEA 3 : 1 2 - 18 2 : 1 3 - 13 1: 5 - 6
Section HABIL 5 : 22 - 22 4 : 20 - 20 3 : 1 7 - 17 2 : 1 4 - 1 4 1: 1 0 - 10
Section HPMID 3: 1 9 - 1 9 2: 1 4 - 14 1: 7 - 7
Section HAMMAD 4 : 42 - 42 3: 40 - 40 2 : 35 - 3 6 1: 3 2 - 32
Section JERICHO 19 : 42 - 4 2 1 8 : 4 1 - 4 1 17: 41 - 4 1 16 : 3 9 - 39 1 5 : 38 - 38 1 4 : 37 - 37 13 : 3 6 - 36 12 : 3 4 - 34 11: 3 3 - 33 1 0 : 32 - 32
9: 3 1 - 32 8 : 3 1 - 32 7 : 2 7 - 27 6: 27 - 27 5 : 27 - 27 4 : 1 2 - 1 2 3: 11 - 11 2 : 1 - 1 1: 1 - 1
Section J I F T L I K 1: 2 1 - 2 1
Section MAFJAR 7 : 19 - 21 5 : 1 8 - 18 3 : 1 4 - 1 4 2: 3 - 17 1: 7 - 11
Section NEVE-UR 1: 2 1 - 21
S e c t i ~ n SHUNA 20: 32 - 38 1 9 : 28 - 38 1 8 : 3 7 - 38 1 7 : 35 - 35 10 : 3 1 - 3 1 15 : 2 9 - 30 1 4 : 30 - 30 1 3 : 2 9 - 29 12 : 28 - 28 11: 28 - 28 1 0 : 2 6 - 26 9: 25 - 25 8 : 1 9 - 2 2 7 : 1 7 - 17 6: 1 7 - 17 5 : 9 - I l 4 : 8 - 8 3 : o - 9 2 : 8 - 8 1: 3 - 8
Section TSAF 1 : 9 - 9
Table 21 : Correlation table of 13 Jericho Valley sites.
The resulting relative sequence rests on a nurnber of assumptions. If we assume that
sequences observed within sites are more important than those observed among sites, then we
would calculate superpositional relationships by using arcs alone rather than arcs and
reproducibilities. If we think that last appearances of a class are more significant than the fiat,
then we would sort by 1st appearances. If, for any particular stratigaphic context, we believe
that the association of artifacts is meaningful, then any associations we draw will affect results.
And, perhaps most important of all, if we assume that particular attributes or classes are
significant temporal markers. then our choice of attributes will affect the order of the final
sequence.
It is difficult to foresee al1 implications of the associations we draw and, at times, our
assurnptions about which chronoIogical markers are important can be simplistic. When al1
associations are drawn, we may find that the results are unexpected. Albeit. in other situations,
and on the basis of experiences in the field, we may seriously question the results. I f this occurs,
we can judge the probability of the sequence in relation to al1 other sources of information
available and. if we feel it is unacceptable for any particular reason, then we need to return to the
analysis and question our original assumptions about contexts, associations, superpositions, and
classification.
Clusterine and Zone Construction
There is no firmly prescribed method for the grouping of UAs, but some method is required
in order to draw correlations between sites. The most obvious correlations are those between site
horizons belonging to the same UA. If horizons do not belong to the same UA, then some
method or line of reasoning is needed to justifL their grouping into a single chronological zone
(hereafler, zone). Another subroutine of the Biogruph program (BG - T07) produces a "gap ratio",
which is actually a dissimilarity measure, to measure the "distance" between UAs (Guex 199 1 :
166).
For each pair of adjacent UAs, K1 and K2, a distance @) is calculated as follows:
Equation4: D = ( b / k , ) + ( c / k , )
Where b is the number of elements present in K1 and absent in K2, c is the number of elements present in K 2 and absent in KI, kl is the number of elements in KI, and k_7 is
the number of elements in K2.
This measure is usefil for locating the greatest differences between adjacent UAs and is
ofien, although not always, usefui for defining upper and lower limits to UA groups. It does not
necessarily group UAs on the basis of the similarities of their contents.
An alternative method is to cluster UAs using comrnonly known clustering methods. The
UAs shown in Figure 17 are grouped using the Sokal and Sneath 4 (SS4) distance similarity
measure and the Ward clustering method (Sherman, 1990: 2 17; NoniSis, 1993: 104,139) (see
Appendis N for full matrix detaik). The 554 distance measure cdculates the conditional
probability that a characteristic is present or absent in one item (UA) given that the characteristic
is present or absent in the other item. The measure is:
a / ( a + b ) + a / ( a + c ) + d / ( b + d ) + d / ( c + d ) Equation 5: SS4 =
4
Where a = present-present. b = present-absent. c = absent-present. d = absent-absent.
The SS4 measure is usefùl for the present purposes because the primary concem is to group
adjacent UAs. We are not interested in how similar UA1 is to UA42 because the order of UAs
has already been established by a different means. Note that the SS4 rneasure includes joint
absences (d). In archaeological exercises of this sort, joint absences are ofien excluded ( e g , the
Jaccard coefficient is popular) because it is dificult to know whether the absence of evidence is
a significant factor. The construction of UAs, however, includes the addition of vùtual
associations for the existence interval of any particular class. Consequently, absences are
meaningful and should be included in the clustering exercise.
Clustering results have two extreme limits, ranging fiom a single cluster that includes al1
elements (UAs) to a number of clusters equal to the number of elements (in this case 42 UAs).
ffiowing how many clusters are appropriate can be difficult to determine. The nurnber of zones
used here were limited to nine because these were capable of defining comrnonly accepted
periods and yet provided an empirical basis for fiu-ther chronological divisions. Many more
zones could be added but. on the basis of present archaeological knowledge, this would be
impractical. Despite the volume of data entered for analysis. the amount of relevant
archaeological information available for relative dating remains sparse and variations in horizon
placement are inevitable. The sequence obtained is robust but the positions of individual
horizons will Vary within a certain range. depending on how catculations are performed and on
which classes are used. It is better to view the placement of horizons as events occuning within
their relatively homogenous zones rather than events occurring in a firm sequence deterrnined by
individual UAs.
An alternative method of viewing the results in the chronological table (Table 21) is given
below in Figure 17. In this figure. UAs are grouped into their respective zones and known
radiocarbon dates are added. Solid black intervals mean that the particular site horizon is
assigned to a single UA, hatched black intervals indicate that the horizon spans two UAs and,
finally. grey intemals mean that the horizon spans three or more UAs. Radiocarbon dates and the
intervals assigned to each UA are discussed in detail on page 176.
The Late Neolithic terms appear as described in a previous section (p. 49). In this analysis,
Tabaqat al-Buma is correlated with the earliest horizon at Jericho and placed in the LNA zone.
However, the former site is primarily LNB in character and any similarities between the two
components are remote. It is likely that the placement of the Tabaqat al-Buma horizon is subject
to boundary effects produced by the UAM (see p. 127).
The Chalcolithic phases are labelled di fXerentl y from JO ffe and Dessel's (1 995) mode1
because not al1 of their terms seem to fit the data entirely. Their tripartite scheme fits quite well
in tems of radiocarbon years. especially for Zones 5-6. which can be correiated closely with
their Developed. and Late Developed periods. One probIem with their mode1 is the vague
definition of the Early period, which includes "the many different traditions that precede the
Developed Chalcolithic" (Joffe and Dessel. 1995: 5 14). I am also uncornfortable with the use of
the term "Developed". simpl y because it goes against the grain of al1 that is generally understood
to be Late Chalcolithic. For this reason. 1 suggest the terms "Late Chalcolithic A" for their
Developed and "Late Chalcolithic B" for Late Developed (Table 22). ï l e i r notion of a Terminal
Chalcolithic is probably correct. The mounting evidence fiom a nurnber of Chalcolithic sites
within the greater region suggests that events occurring in this period were unique and, more
likely than not, were associated with the Chalcolithic-EB Z transition. Apart fiom Shuna North,
however, there is little other published evidence of Terminal Chalcolithic occupation in the
Jordan Valley. For this reason, Zone 6 is divided by a dotted line that represents a theoretical
division between Late Chalcolithic B and Terminal Chalcolithic. This division is represented in
the cluster analysis as cluster number 13. and so is not far removed from t'ie 9 clusters defined.
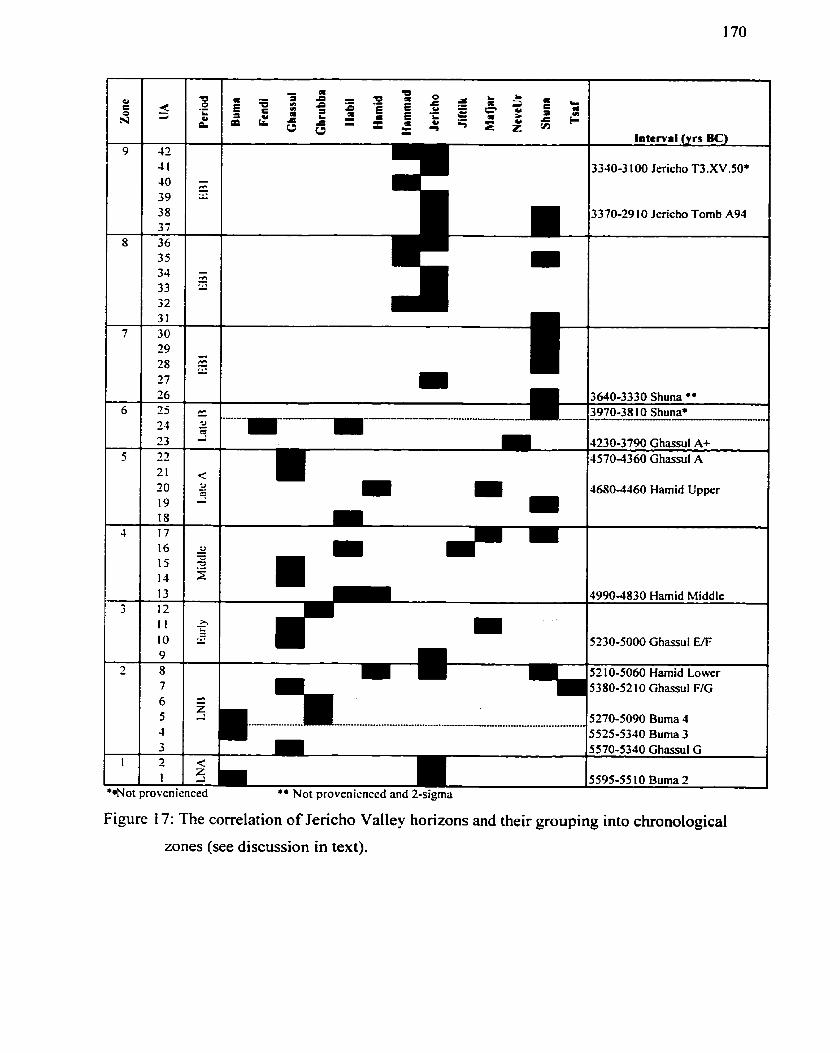
*.Nat proven
Figure 17: The correlation of Jericho Valley horizons and their grouping into chronological
zones (see discussion in text).
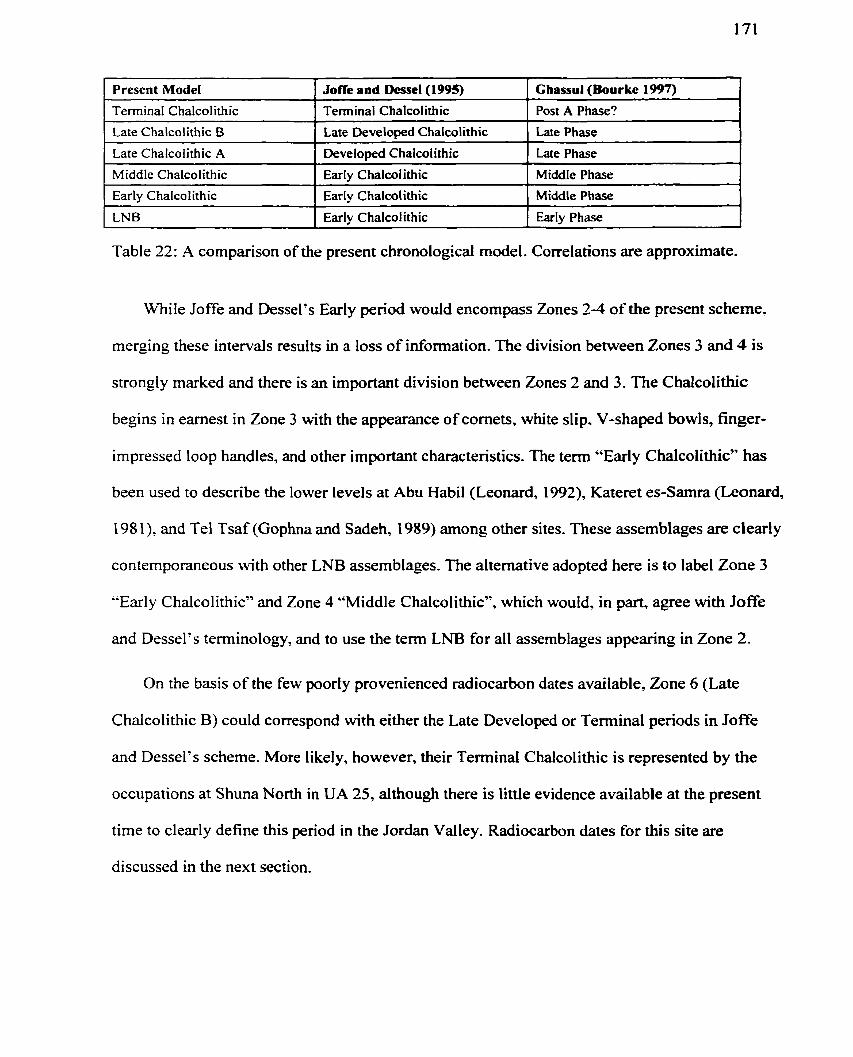
Late Phase
Late Phase
Middle Phase
Middle Phase
EarIy Phase
Ghassul (Bourke 1997)
Post A Phase?
Presen t Mode1
Terminai Chalcolithic
, Late Chalcolithic B
Late Chalcolithic A
Middle Chalcolithic
Early Chalcolithic
LNB
Table 22: A comparison of the present chronologIcal model. Correlations are approximate.
Jofle and Dessel (1 995)
Terminal Chalcolithic
Late Developed Chalcolithic
Developed Chalcolithic
EarIy Chalcolithic
Early Chalcolithic
Early Chalcolithic
M i l e Joffe and Dessel's Early period would encompass Zones 2-4 of the present scheme.
merging these intervals results in a loss of information. The division between Zones 3 and 4 is
strongly marked and there is an important division between Zones 2 and 3. The Chalcolithic
begins in earnest in Zone 3 with the appearance of cornets, white slip. V-shaped bowls, finger-
impressed loop handles, and other important characteristics. The tenn "Early Chalcolithic" has
been used to describe the lower levels at Abu Habil (Leonard, 1992), Kateret es-Samtci (Leonard,
198 1): and Tel Tsaf (Gophna and Sadeh, 1989) arnong other sites. These assemblages are clearly
contemporaneous with other LNB assemblages. The alternative adopted here is to label Zone 3
"Early Chalcolithic" and Zone 4 "Middle Chalcolithic", which would, in part, agree with Joffe
and Dessel's terminology, and to use the term LNB for al1 assemblages appearing in Zone 2.
On the basis of the few poorly provenienced radiocarbon dates available, Zone 6 (Late
Chalcolithic B) could correspond with either the Late Developed or Terminal periods in Joffe
and Dessel's scheme. More likely, however, their Terminal Chalcolithic is represented by the
occupations at Shuna North in UA 25, although there is little evidence available at the present
time to clearly define this period in the Jordan Valley. Radiocarbon dates for this site are
discussed in the next section.
The EB 1 assemblages are al1 labelled as EB because they cannot be differentiated
chronologically into EB l a or EB 1 b simply on the grounds of red slip or line-painting. The results
agree with the notion that EB l a and EB 1 b are stylistic, not chronological groupings. Red-slipped
decoration itself does not play a significant chronological role unless it appears on a specific
vesse1 form (e.g., most bowl classes). Line-painted ware appears early (Zone 7) in the EB Z
sequence. as do bevelled rim bowls. hemispherical bowls. Grey Burnished Ware, and Band Slips,
among other traits. These may appear in significant numbers at different stages but recalt that the
abundance of artifacts does not play a significant role in differentiating periods except to inform
the anaIyst on the probable association of materials. Some characteristics that do play a role in
dividing Zones 7 and 8 are certain foms of rounded bowls or bowls with inturned rims, folded or
scalloped ledge handles. large holemouth jars with bevelled or thickened rims, large jars with
sharp intums in the upper part and with channelled rim lips, Iarge furinel-neck jars (Umm
Harnrnad style), numerous variations in flared-rim jars, a proliferation of jar neck styles. splash
and dribble paint (Braun 1996). and small bottles with small loop handles on the shoulder (see
Appendix L).
Evaluating the Relative Sequence
Radiocarbon dates are discussed in the next section and fürther observations are drawn in
the final chapter. For the moment. 1 draw attention to the final sequence and suggest methods for
c hec king i ts CO herence and consistency.
Problems with specific horizons c m often be located by noting discrepancies in the
correlation table. If a horizon belongs to a large uncertainty interval (Le., it is associated with a
wide range of UAs) there is good reason to suspect that a problem exists with the composition of
that horizon. Composition problems are related to four main factors; a misplaced horizon, rnixed
contents within a horizon, mis-classification, or too few taxa. In Table 2 1, for example, Habit
Horizon 1' is assigned to the UA range of 5-7. In this case. the uncertainty interval is caused by
too few classes.
Another method of locating troublesome horizons is to study the contradictions occumng
between maximal cliques. The Biograph program uses a subroutine (BGT09) for this purpose
(see p. 1 19). The routine caiculates the number of 'arcs above' and 'arcs below' for each pair of
mmimal cliques. It also calculates a coefficient devised to measure the degree of contradictions
occuring between maximal cliques (Equation 3). The coefficient is the ratio of arcs such that a
value of 1 (maximum value possible) means that there is an equal number of opposing arcs and
the superpositional relationship between the cliques cannot be determined. Values of 1 and other
high values up to a pre-determined limit can be used as an indicator of troublesome horizons.
Another means of Iocating sources of conflict is to isolate those horizons that most ofien
occur in strongly connected components (p. 1 19). Strongly connected cornponents consist of
maximal cliques that are involved in cycles. Those ma?timal cliques most often implicated are
suspect. Unfortunately, the Biograph program in its present configuration is not easily
manipulated for summaries of this sort and the process of locating and isolating troublesome
local horizons and classes is cumbersome and time-consuming. A parallel method that is faster,
but perhaps not as effective, is to isolate horizons or whole sections individually from analysis
and then record the change in the number of strongly connected components and undetennined
arcs. Recall that contradictions are not necessanly problematic if they can be resolved.
Unresolved contradictions are expressed as undetennined arcs. During analysis, several sections
were removed one at a time and the reduction in contradictions, strongly connected components
(SCC), vertices (maximal cliques) involved in SCC, and undetennined arcs recorded (Table 23).
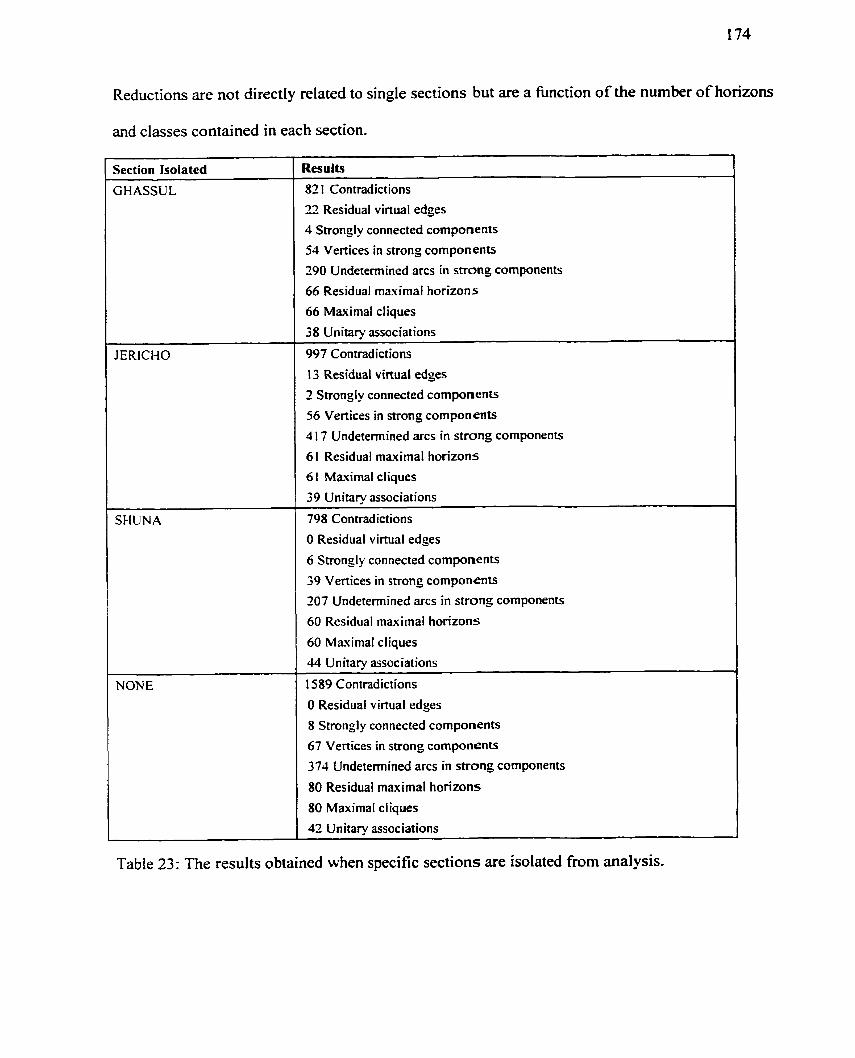
174
Reductions are not directly related to single sections but are a function of the number of horizons
and classes contained in each section.
82 1 Contradictions
22 Residual virtual edges
4 Strongly connected components
54 Vertices in strong components
290 Undetermined arcs in strong components
66 Residual maximal horizons
66 Maximal cliques
38 Unitary associations
997 Contradictions
13 Residual vinual edges
2 Strongly connected components
56 Vertices in strong components
4 17 Undetennined arcs in strong components
6 1 Residual maximal horizons
61 Mâuimal cliques
39 Unitary associations
798 Contradictions
O Residual virtual edges
6 Strongly connected components
39 Vertices in strong components
207 Undetennined arcs in strong components
60 Residual maximal horizons
60 Maximal cliques
44 Unitary associations
1589 Contradictions
O Residual virtual edges
8 Strongly connected components
67 Vertices in strong components
374 Undetemined arcs in strong components
80 Residual maximal horizons
80 Maximal cliques
Table 23: nie results obtained when specific sections are isolated fiom analysis.
The bottom row of Table 23 contains the results of the complete analysis with ail sections.
When the individual results are compared. we see that the greatest reduction in contradictions
(1 589-798 = 791) occurs when Shuna is removed. This suggests that the Shuna sequence is
responsible for most of the contradictory evidence. although it is worth noting that, if we accept a
95% confidence interval in a two-tailed t-test, there is no significant difference arnong al1 three
values @ = 0.005). The sarne c m be said for both vertices in SCC @ = 0.01 1) and undetermined
arcs (p = 0.038). But a significant drop in SCCs (8-2=6) occurs when the Jericho section is
removed @ =0.074). This is not entireiy surprising because it is one of the most complicated
sections. containing numerous horizons and classes. Nonetheless. based on these results, specific
horizons within the Jerkho sequence could be isolated to locate horizons responsible for the
greatest nurnber of SCCs.
A similar process was used in the present analysis to identifi problematic horizons in
combined sections as well as in the final analysis of al1 sections. This helped to reduce cycles and
improve correlations. The final run differed considerably from the first and resulted in a
decreased number of horizons. contradictions. SCCs and undetermined arcs (Table 24). It is
difficult to know how to judge the reliability of the correlations obtained without using outside
sources of information, such as radiocarbon dates, as collaborating evidence. In an ideal
situation, there would be no contradictions and no cycles, which suggests that a measure of
contradictions should be functionally related to the degree of confidence we place in the
sequence. As mentioned above. one file that can be used is for this purpose is the subroutine
BG-T09 (Relationships between the Maximal Cliques), which gives the swn of arcs for each
pair of maximal cliques. In d l . there are 8 1 horizons in 13 sections, rneaning that there are 8 l2 12
= 3280 possible cornparisons to make. This number can Vary, depending on how many residual
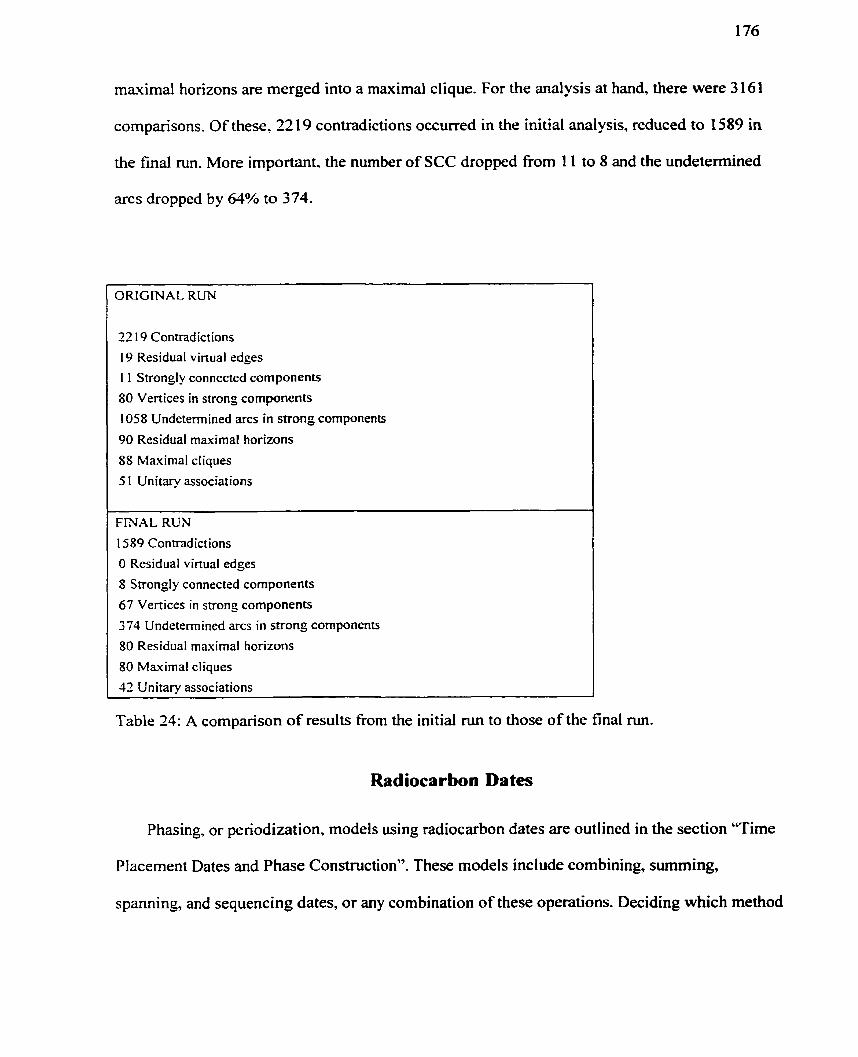
maximal horizons are merged into a maximal clique. For the malysis at hand, there were 3 161
comparisons. Of these. 22 19 contradictions occurred in the initial analysis, reduced to 1589 in
the final run. More important. the number of SCC dropped from 1 1 to 8 and the undetermined
arcs dropped by 64% to 374.
ORIGINAL R W
22 19 Connadictions
19 ResiduaI virtual edges
1 1 Strongly connected components
80 Vertices in strong components
1058 Undetemined arcs in strong components
90 Residual maximal horizons
88 Maximal cliques
5 1 Unitary associations
--
F M A L RUN
1589 Contradictions
O Residual virtual edges
8 Strongly connected components
67 Vertices in strong components
374 Undetemined arcs in strong components
80 Residual maximal horizons
80 Maximal cliques
42 Unitary associations
Table 24: A cornparison of results fiom the initial nui to those of the tinal run.
Radiocarbon Dates
Phasing, or periodization, models using radiocarbon dates are outlined in the section "Tirne
Placement Dates and Phase Construction". These models include combining, summing,
spanning, and sequencing dates, or any combination of these operations. Deciding which method
or mode1 is appropriate depends to a great degree on both the archaeological and radiometric
information available. In each of the cases treated below, the objective is to create a
chronological mode1 that incorporates and retains as much information as possible. Radiocarbon
probability distributions are combined if they corne from the same context (or phase) and if they
are in agreement (see betow).
By combining the dates. I make the assumption that an occupation phase, as defined by the
excavator, represents a 'bhort-lived" event. Recall that this term is used relative to an
archaeological time scale and that the definition of "short" is relative to the degree of error
associated with the dating method. It is possible to generalise by noting that most AMS
radiocarbon dates have a two-sigma error range of 1 OG-200 radiocarbon years. By combining the
dates, we are. thetefore, making an assumption that the occupation phase had a duration less than
100 radiocarbon years. An alternative approach is to let statisticd methods detemine whether or
not the occupation was "short". In other words. if probability distributions can be s u c c e s s ~ l y
combined. then the interval was short. This method rests on the assumption that two or more
radiocarbon dates with similar probability distributions represent a similar time period.
In al1 del iberations, cali brated probability distri butions need to be assessed individually.
Calibrated dates do not always produce smooth. single-mode distributions that can be easily
interpreted. and it is a mistake to accept uncritically either a one-sigma (68.2% confidence
interval) or a two-sigma (95.4% confidence interval) range of standard deviation. For example,
consider the multi-modal distribution for Tabaqat al-Buma date TO-34 10 in Figure 1 8. This
figure shows the uncalibrated radiocarbon probability distribution on the y-axis, the
corresponding calibratior! curve, and the calibrated probability distribution on the x-mis. The
points along which the original distribution intercept the calibration curve (on the horizontai)
determines the shape of the caiibrated distribution. In the resulting multi-modal distribution, we
need to determine which portion of the curve adequately represents the true date of occupation
(assuming for the moment that it is accurate). For instance, does the full range of the 95.4%
confidence interval give an effcient and sufficient representation of the date obtained? The full
two-sigma range is 5440-5080 BC, which is 360 calendar years. However, we observe that a f i I l
88.8% of the 95.4% interval falls between 5440-5200 BC, a range of only 240 calendar years.
What this means for interpretation is that there is an 88.8% probability that the true date of the
event falls between 5440-5200 BC. Notice that this interval is only 20 years longer than the
68.2% interval (5420-5220 BC) and yet the probability is much higher. This estimate represents
neither a one-sigma nor a full two-sigma range. although it necessarily occurs within the two-
sigma interval. Depending on research objectives. the 88.8% range may be a better estimate of
the probable date of occupation than the multi-modal one or two-sigma ranges.
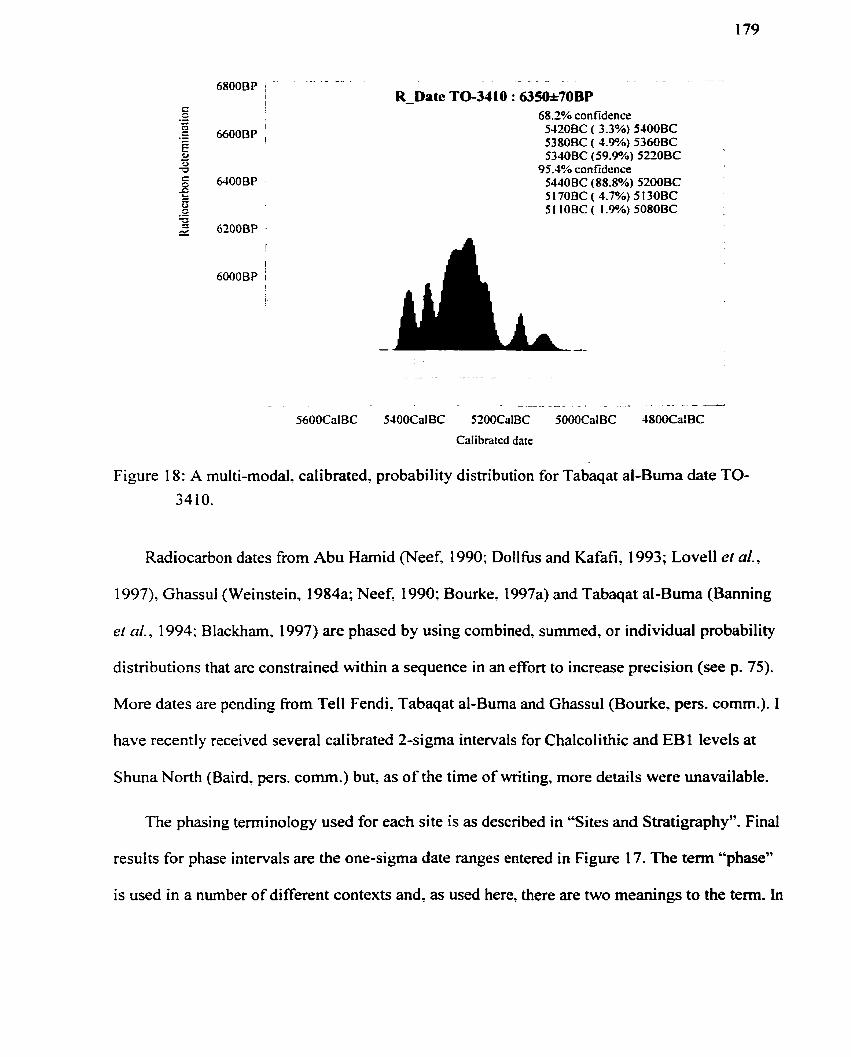
- - - - - - - - - 6800BP ; -
! ; R-Date TO-3410 : 635W7OBP
C S -- - 68.2% confidence CJ I .r 6600BP , 5420BC ( 3.3%) 54ûQBC - 5380BC ( 4.994) 5360BC g - "2
5340BC (59.9%) 5220BC 3 95.4% con fidcnce
4 ,OoBp 5440BC (88.8%) 5200BC
= O 5 170BC ( 4.7%) 5 130BC
C .- 5 1 1 OBC ( 1 -9%) 5080BC
6200BP .
Calibrated date
Figure 1 8: A multi-modal. calibrated. probability distribution for Tabaqat al-Buma date TO- 3410.
Radiocarbon dates fkom Abu Hamid (Neef. 1990 Doilfus and Kafafi, 1993; Love11 et al.,
1 997), Ghassul (Weinstein, l984a; Neef, 1990; Bourke, 1997a) and Tabaqat al-Buma (Banning
el al., 1994: Blackhm, 1997) are phased by using cornbined, surnmed. or individual probability
distributions that are constrained within a sequence in an effort to increase precision (see p. 75).
More dates are pcnding fiom Tell Fendi, Tabaqat al-Buma and Ghassul (Bourke. pers. comm.). 1
have recently received several calibrated 2-sigma intervals for Chalcolithic and EBl levels at
Shuna North (Baird, pers. cornm.) but, as of the time of writing, more details were mavailable.
The phasing terrninology used for each site is as described in "Sites and Stratigraphy". Final
results for phase intewals are the one-sigma date ranges entered in Figure 17. The term "phase"
is used in a number of different contexts and, as used here, there are two meanings to the term. In
the first instance, a phase is the narne assigned by the excavator to a group of stratigraphie wiits.
Second, as the terrn is used in the OxCal Program. a phase refers to an unordered group of
radiocarbon deteminations that are assumed to have some chronologicd relationship (Bronk
Ramsey 1998). In other words, the dates are believed to represent the chronology of a phase.
Recall that the agreement index used by the OxCal program can be used to evaluate a
number of resulting probability distributions. The agreement index (A) is designed to evaluate
the significance of results derived from Bayesian analysis by measuring how well any posterior
distribution agrees with a prior distribution. The threshold value of A corresponds to a Chi-
squared test with a significance level set at 0.05 (Bronk Ramsey 1998). Agreement values arz
expressed as percentages. If the agreement value is below the threshold value, then the posterior
distribution is considered to be significantly different fiom the prior distribution. In sum,
agreement indices are used to measure the agreement of:
1. individual probability distributions within a sequence
2. individual probability distributions within a combination
3. individual probability distributions within a sequence aper combination
4. a cornbined probability distribution within a sequence
5. the overall agreement of a combination of probability distributions
6 . the overall agreement of a sequence of probability distributions, which can
include any assortment of individual or combined distributions.
The overall agreement index threshold (An) for date combinations c m Vary, unlike the
overall agreement index threshold (A'c) for sequences, which is set at 60%.
For each site. an attempt is made to improve the resolution of phase chronology with the
information at hand, which. in some cases. is quite limited. Wtiere possible, radiocarbon
distributions are combined in an effort to reduce associated errors and, therefore, probability
intervals. Where it is not possible to combine dates, they are placed in their most probable
position within the phase. For example, if a single date does not fit a combination because its
distribution is significantly older than the others. it is placed chronologically pnor to the
combination but within the sarne phase. The resulting individual and combined distributions are
then constrained wi thin the sequence to increase precision.
There are a number of factors that c m affect potential combinations. First, if the associated
errors of each date are small, it is less Iikely that they c m be combined because their probability
distributions will not overlap to any significant degree. This is not a concem to the present
analysis because the final objective is not to combine dates but to increase the precision of any
dates associated with an occupation phase. Dates with small associated errors are, by definition,
already precise. Second, a successful combination of dates implies that al1 dates involved
represent a similar penod of time. But this does not mean that our dating samples represent the
same event of interest (Le.. time of occupation). The radiocarbon method dates the death of an
organism, which is not necessarily the time of site occupation. Ideally. we would like to use
dates taken from short-lived material such as twigs or grains rather than from old wood. It is
possible, for instance, to have two similar dates from each type of material, but the short-lived
material is more likely to date an occupation event. A piece of charred wood, for example, might
be much older and could have been reused over a long penod of time (see p. 77). It is possible,
therefore, that two dates cannot be combined when. in fact. the materials fiom which they are
derived were related to a single occupation event. On the other hand, if these two incompatible
dates are summed on the basis of their shared context. it is possible to calculate an occupation
interval that is older and longer than the actual interval.
In light of these dificulties. dates derived from short-lived material are given more weight
in the decision-making process. I f dates fiom one context are derived fiom both short-lived and
long-lived material. the radiocarbon distribution fkom the short-lived matenal can act to limit the
ranges of the others. For example, we could expect dates taken from long-lived material to be
significantly older than those from short-lived material, but they should not be significantly
younger. This approach cannot always be implemented because, at times, the type of sample
material used for dating is not reported or. when it is reported, it is poorly defined. For instance,
when the sarnple is described simply as "wood". it is impossible to know whether the wood is
derived frorn a short-lived twig or from long-lived inner tree rings.
Site formation processes c m also affect the kinds of dates obtained for any particular phase.
Past and present site activities move samples fiom their original contexts. The dating samples
could possibly be residual or intrusive. producing older or younger dates, respectively. These
kinds of problems c m be located and corrected if sufficiently detailed stratigraphie information
was recorded in the field. But as far as the present analysis is concemed. there is no way to
determine if a sarnple was residud or intrusive and the reported proveniences must be accepted
as given.
Abu Hamid
The Abu Harnid sequence consists of eight dates. three in the Upper phase, one in the
Middle phase, and five in the Lower phase (Figure 19). One date (Ly-6258,5205+95 bp) from
the Lower phase is omitted from ensuing calculations because it is ctearly out of place
(agreement = 0.0%). The remaining dates are placed within the phase sequence to check the
individual agreement indices for the sequence of remaining probability distributions. The
resulting distributions (in solid black) are posterior probability distributions produced by the
Gibbs sampler under the constraints given (Figure 20). They can differ from the original,
calibrated, but unconstrained distributions (in black outline). The agreement indices appear to the
right of each date (lab number) and are compared to the threshold value of 60%. In the Abu
Harnid exarnple. al1 individual dates are agreeable within the sequence as modelled and the
overall agreemenr index for the entire sequence also agrees (A=105.8%). The overall agreement
is a measure of how welI the constructed model -'works". It is worth noting that, in some cases,
an individual probability distribution c m be significantly different within the sequence of
probability distributions when. at the same time, the overall agreement is above the threshold
value. Each model needs to be assessed individually and choices made about individual dates.
The guiding pnnciple 1 use for al1 following models is that both individual and overall agreement
values should equal or exceed their associated agreement index threshold values.
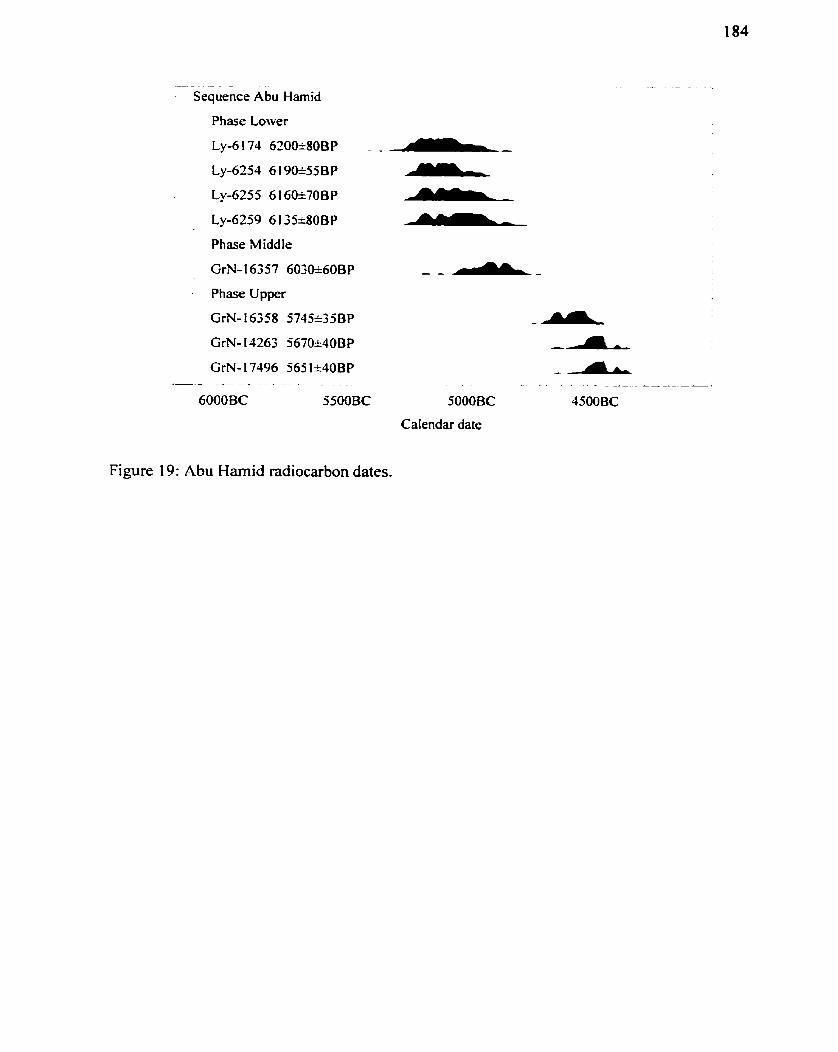
- - -
- Sequence Abu Hamid
Phase Lower
Ly-6 174 620&80BP - -
Ly-6254 6 1 9OI55 BP
Ly-6255 6 16W70BP
Ly-6259 6 135*80BP
Phase Middle
GrN-16357 603k60BP
Phase Upper
GrN- 16358 5745135BP
GïN- 14263 567&40BP
GrN- 17496 565 1 c40BP m--- A - - - - - - . .
6000BC 5500BC . . - -A -
5000BC 4500BC
Calendar date
Figure 19: Abu Harnid radiocarbon dates.
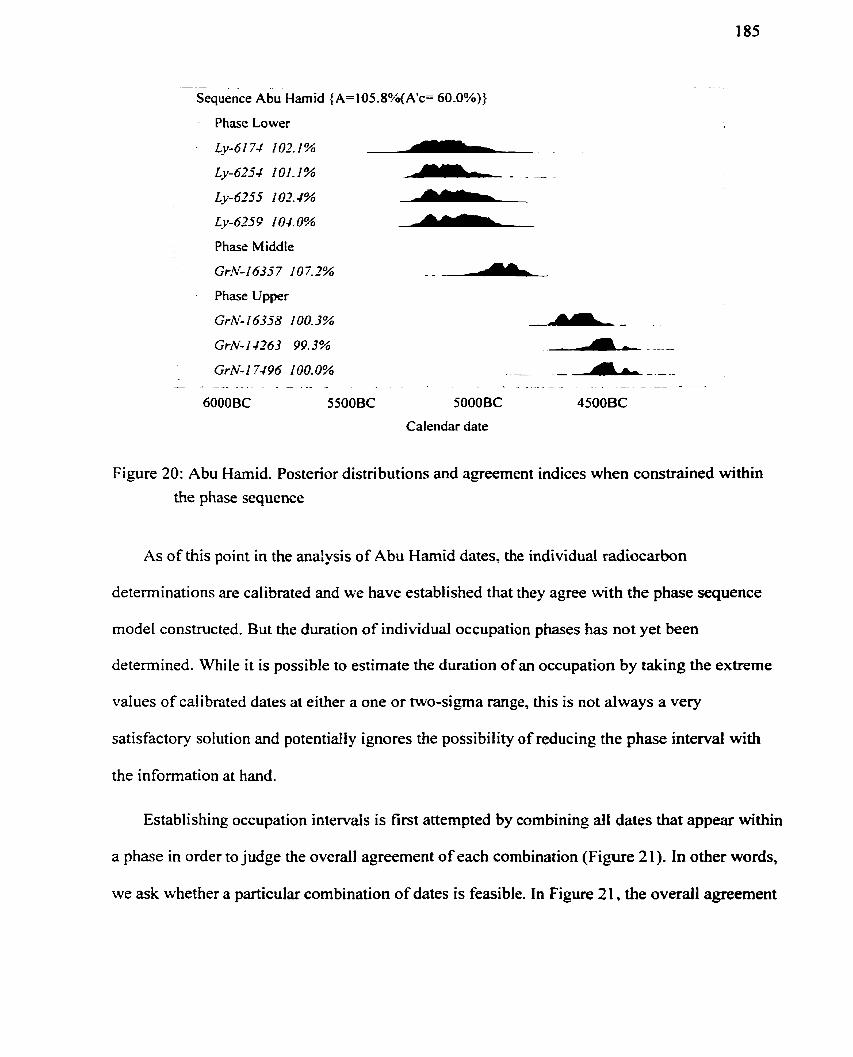
-
Sequence Abu Harnid {A=105.8%(A1c= 60.0%))
- Phase Lower
Ly-6174 102.1% 1 Ly-6254 101.1% --
Ly-6,355 102.1% - Ly-625 9 1 04. 0% - Phase Middle
GrN-16357 107.2% - - -A Phase Upper
GrN-16358 100.3% --
GrN-14263 99.3% - A - GrN-17496 100.0% - - .- -A- --- - . - -- - - - --
6000BC 55OOBC 5000BC 45OOBC
Calendar date
Figure 20: Abu Hamid. Posterior distributions and agreement indices when constrained within the phase sequence
As of this point in the anaiysis of Abu Hamid dates, the individual radiocarbon
deteminations are calibrated and we have established that they agree with the phase sequence
mode1 constructed. But the duration of individual occupation phases has not yet been
determined. While it is possible to estimate the duration of an occupation by taking the extreme
values of calibrated dates at either a one or two-sigma range, this is not always a very
satisfactory solution and potentially ignores the possibility of reducing the phase interval with
the information at hand.
Establishing occupation intervals is first attempted by combining al1 dates that appear within
a phase in order to judge the overall agreement of each combination (Figure 21). In other words,
we ask whether a particular combination of dates is feasible. in Figure 2 1, the overall agreement
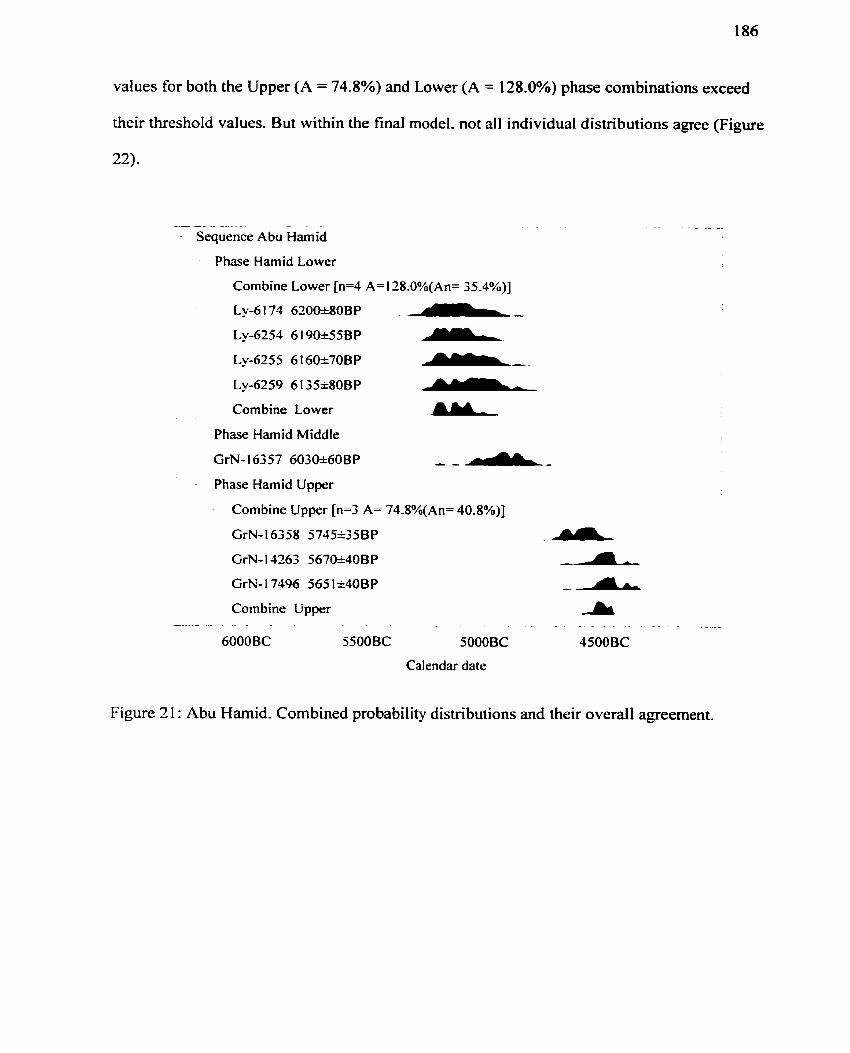
values for both the Upper (A = 74.8%) and Lower (A = 128.0%) phase combinations exceed
their threshold values. But within the final model. not al1 individual distributions agree (Figure
- - - . . . .
- Sequence Abu ~ a r n i d
- Phase Hamid Lower
Combine Lower [n=4 A=128.O%(An= 35.4%)]
Ly-6 1 74 620Ok80BP -- Ly-6254 6 1 9M55 B P rn Ly-6255 6 16&70BP m- Ly-6259 6 135r80BP - Combine Lower .AM-.
Phase Hamid Middle
GrN-16357 603W6OBP , -A- Phase Hamid Upper
Combine Upper [n=3 A= 74.8%(An= 40.8%)]
GrN-16358 574555BP -- GrN-14263 5670i40BP -A GrN- 1 7496 565 1 i40BP -A Combine Upper
- - -- . - . . - . A
6000BC 5500BC 5000BC 4500BC
Calendar date
Figure 2 1 : Abu Hamid. Combined probability distributions and their overall agreement.
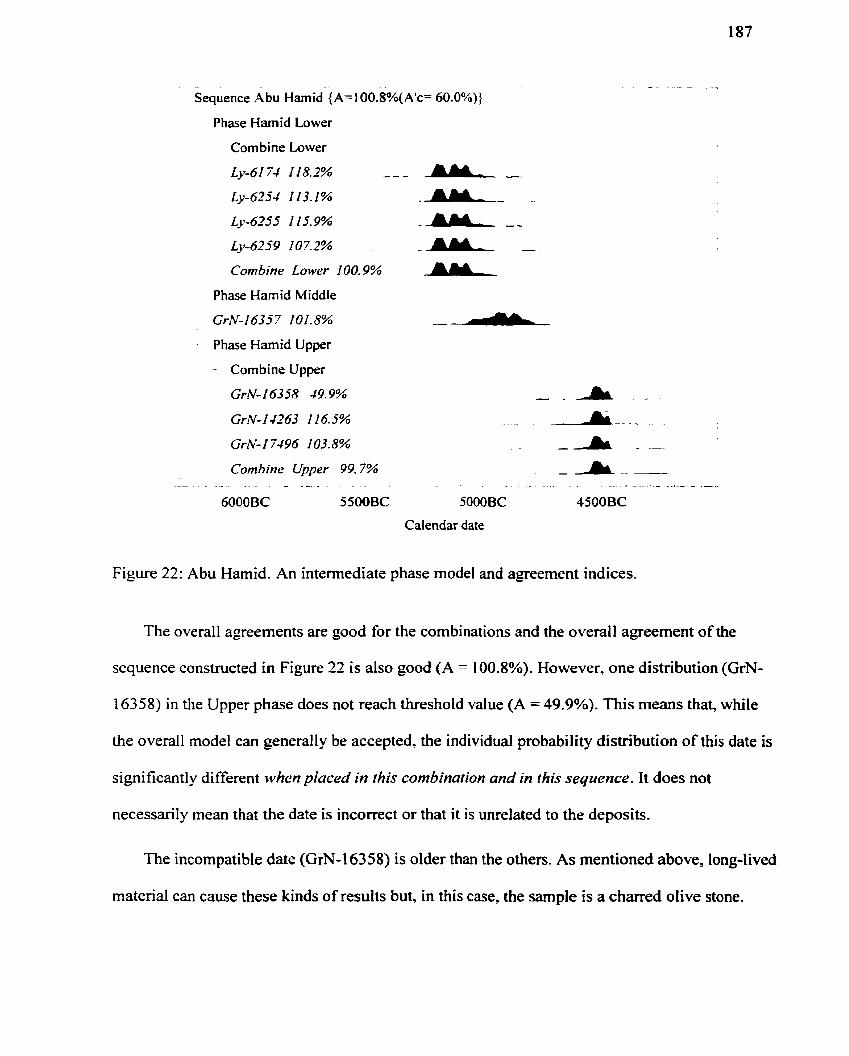
Sequence Abu Hamid (A= 1 00.8%(A1c= 60.0%))
Phase Hamid Lower
Combine Lower
Ly-6174 118.2% - - - - Ly-6254 1 13.1 %
Ly-6255 1 159%
Ly-6259 107.2%
Combine Lower 100.9%
Phase Hamid Middle
GrN-163.77 101.8%
Phase Harnid Upper
- Combine Upper
GrN-16358 49.9%
GrN-14263 116.5%
GrN- 1 7496 103.8%
Corn bine Upper 99.7% - - . - . - - . -
6000 BC 5500BC
Calendar date
Figure 22: Abu Hamid. An intermediate phase mode1 and agreement indices.
The overall agreements are good for the combinations and the overall agreement of the
sequence constmcted in Figure 22 is also good (A = 1 00.8%). However, one distribution (GrN-
163 58) in the Upper phase does not reach threshold value (A = 49.9%). This means that, while
the overall mode1 c m generally be accepted, the individual probability distribution of this date is
significantly different when placed in this combination and in this sequence. It does not
necessarily mean that the date is incorrect or that it is unrelated to the deposits.
The incompatible date (GrN-16358) is older than the others. As mentioned above, long-lived
material can cause these kinds of results but, in this case, the sarnple is a charred olive stone.
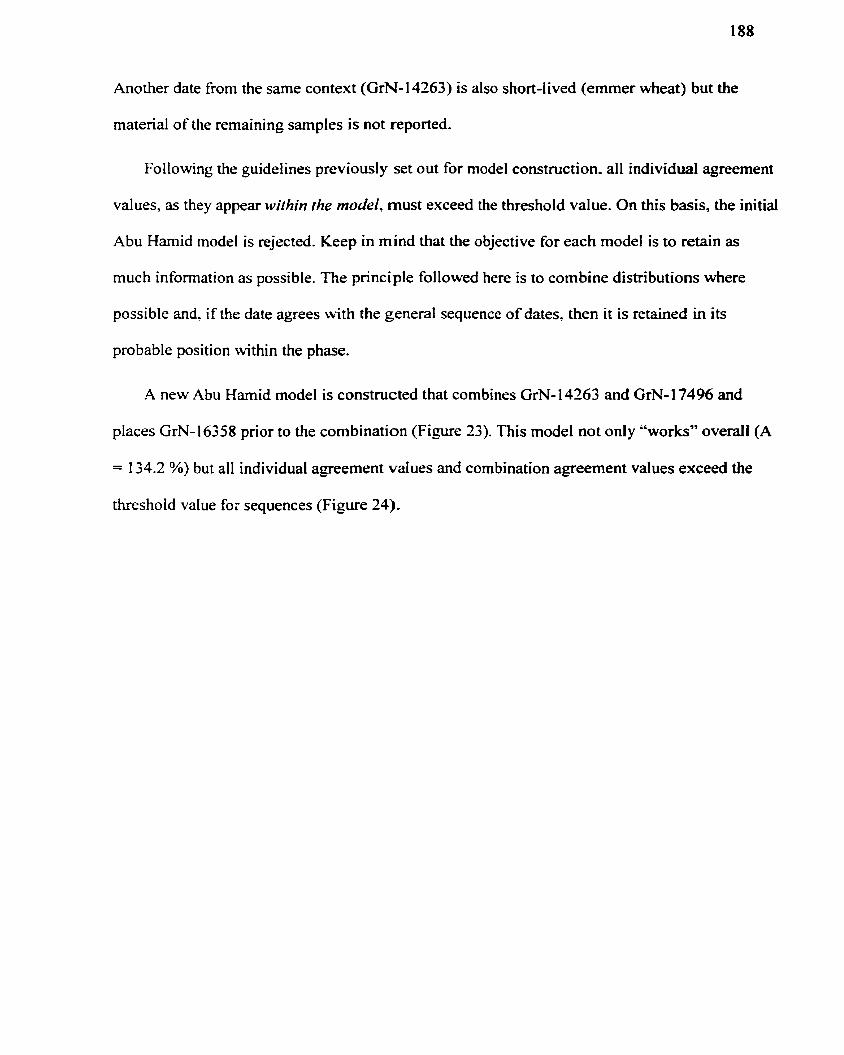
Another date from the same context (GrN-14263) is also short-lived (emmer wheat) but the
material of the remaining samples is not reported.
Folfowing the guidelines previously set out for model construction. al1 individual agreement
values, as they appear wifhin the model, must exceed the threshold value. On this basis, the initial
Abu Hamid model is rejected. Keep in mind that the objective for each model is to retain as
much information as possible. The principle followed here is to combine distributions where
possible and. if the date agrees with the generaf sequence of dates, then it is retained in its
probable position within the phase.
A new Abu Hamid model is constructed that combines GrN-14263 and GrN-17496 and
places GrN-16358 prior to the combination (Figure 23). This model not only "works" overall (A
= 1 34.2 %) but al1 individual agreement vatues and combination agreement values exceed the
threshold vaIue foi sequences (Figure 24).
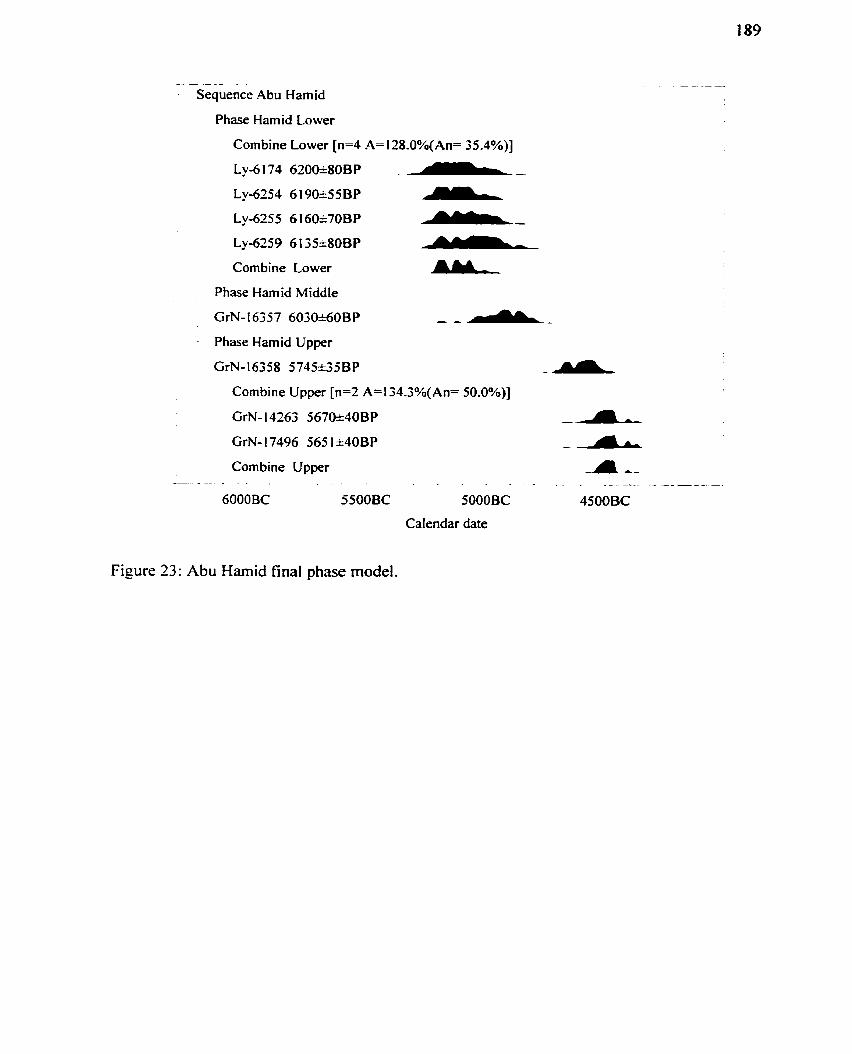
- - - - -
Sequence Abu Hamid
Phase Hamid Lower
Combine Lower [n=4 A=128.O%(An= 35.4%)]
Ly-6 1 74 6200I80B P -- Ly-6254 6 19*55BP - Ly-6255 6 160i70BP -A
Ly-6259 6I35iSOBP - Combine Lower &
Phase Hamid Middle
GrN-16357 603*60BP A -A- Phase Hamid Upper
GrN-16358 5745k35BP -r Combine Upper [n=2 A=134.3%(An= 50.0%)]
GrN- 14263 567W40BP -A GrN- 17496 565 1 k40BP -A Combine Upper
-- - - A --
- . . . - -
6000BC 5500BC 5000BC 4500BC
Calendar date
Figure 23: Abu Hamid final phase model.
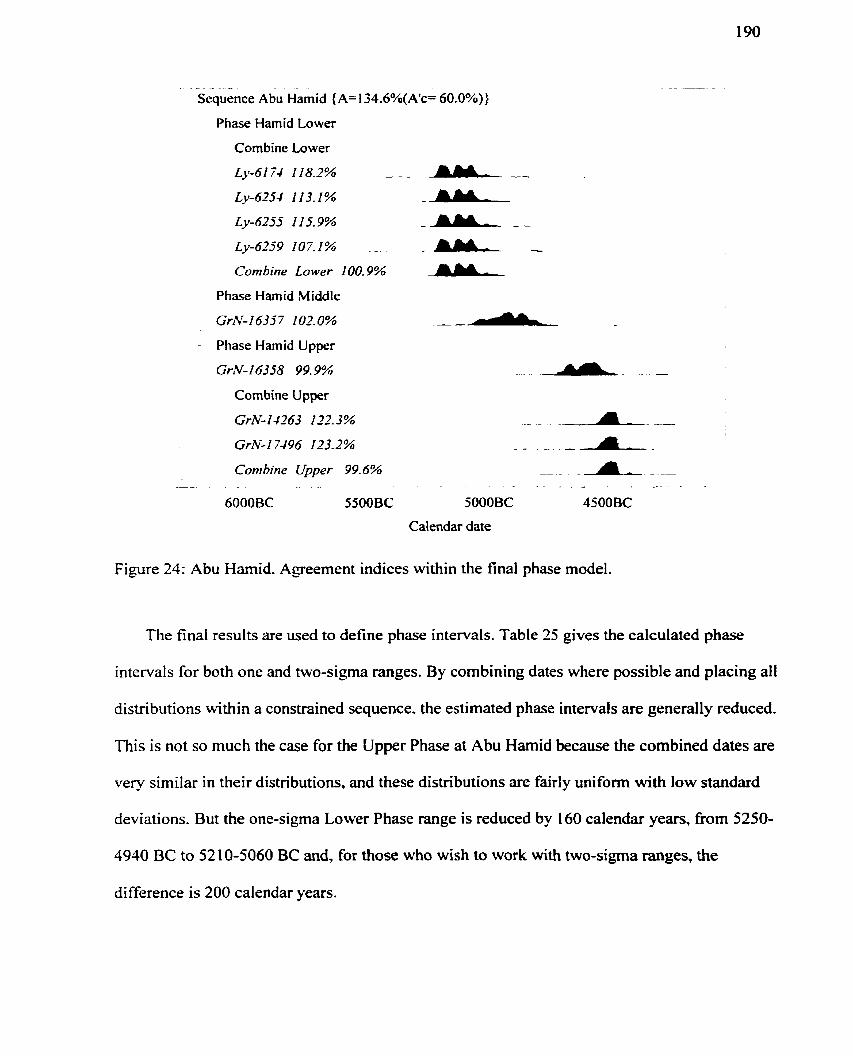
- - - -. - . -- -
Sequence Abu Hamid {A= 1 34.6%(A1c= 60.0%))
Phase Harnid Lower
Combine Lower
Ly-6174 118.2% --- --
Ly-6254 1 13.1 % ---
Ly-6255 1 15.9% - --
Ly-6259 107.1% -- -
Combine Lower 100.9%
Phase Hamid Middle
Gfl-16357 1020%
Phase Hamid Upper
Combine Upper
GrN-14263 122.3% A - - -A GrN-17496 123.2% - -. - A.- Combine Upper 99.6% -- .A, -
- - - - - - - . - . - . * - -
6000BC 5500BC 5000BC 4500 BC
Calendar date
Figure 24: Abu Hamid. Agreement indices within the final phase model.
The final results are used to define phase intervals. Table 25 gives the calculated phase
intervals for both one and two-sigma ranges. By cornbining dates where possible and placing al1
distributions within a constrained sequence. the estimated phase intervals are generally reduced.
This is not so much the case for the Upper Phase at Abu Hamid because the combined dates are
very similar in their distributions. and these distributions are fairly uniform with low standard
deviations. But the one-sigma Lower Phase range is reduced by 160 calendar years, tiom 5250-
4940 BC to 52 10-5060 BC and, for those who wish to work with two-sigma ranges, the
difference is 200 calendar years.
At this stage, the sum of al1 constrained distributions can be used to estimate the length of a
phase. More often than not, however, the results of surns differ little from taking the end points
of the 1 or 2-sigma intervals at either end of the sequence. An alternative method is to estirnate
the Span of the phase with constrained dates. In this case, the product is an estimate of the
interval in calibrated years rather than probable intervals at end points (Le., 400 years vs 3900 * 100 to 3500 100 BC). When surns are used, either the 68% or 95% intervals can be used to
define the length of a phase. For example. in the Upper Phase, GrN-16358 is used to define the
oldest point while the combination of dates is used to define the youngest point. Deciding on
which interval to use for a phase is somewhat arbitrary. Decisions should be guided by the shape
of the combined or constrained probability distributions and on assumptions about the
stratigraphic sequence. For example, if we assume that the Upper Phase at Abu Hamid follows
the Middle Phase without intemption then we would expect the end points of the intervals to
meet or overlap to some degree. This occurs only if we use the 2-sigma ranges (Table 25). In this
particular case, however, some discretion is required because there is only one Middle Phase
date.
Table 25: Phase intends for Abu Hamid. Al1 dates are rounded to the nearest decade.
Tabaqat al-Buma
A similar process is used to âssess the Tabaqat al-Buma dates (Banning 1994; Blackham
1997). Not al1 dates fiom the site are s h o w becausr several date the Kebaran occupation while
yrs BC (ta)
4720-4400
5060-4790
5230-5000
Phase
U P P ~ ~ Middle
yrs BC (la)
4680-4460
4990-4830
Lower ] 52 10-5060
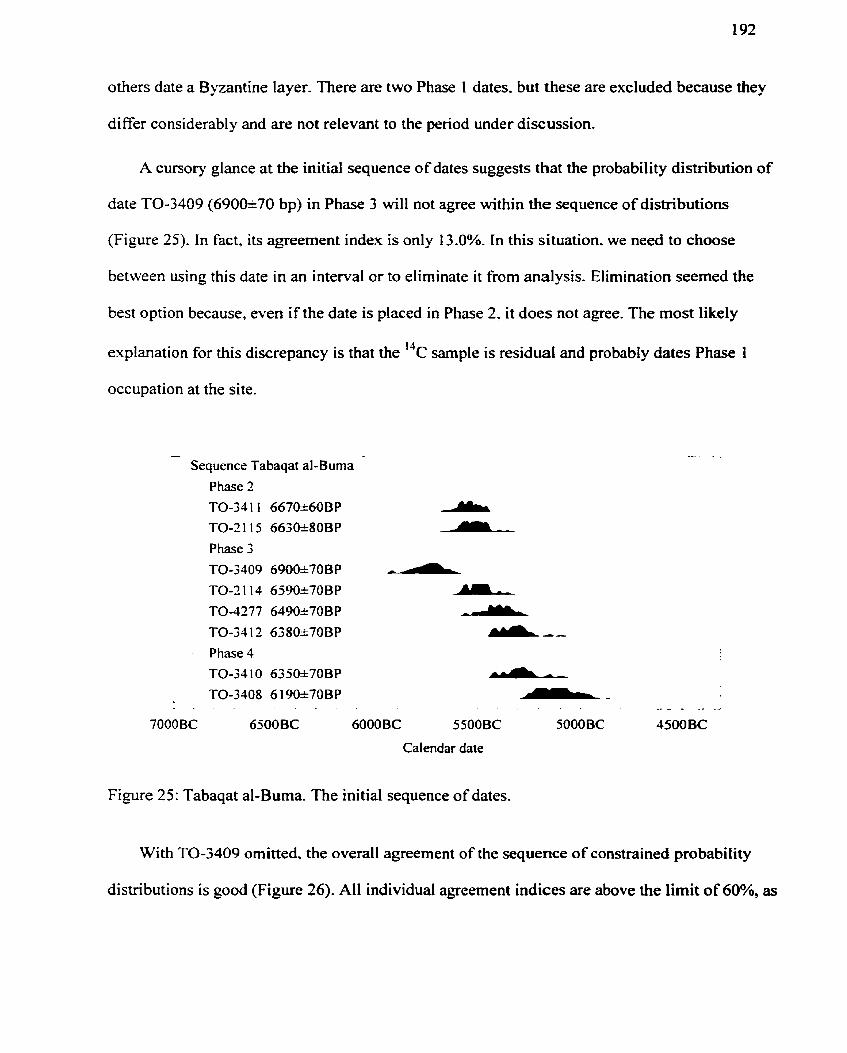
others date a Byzantine layer. There are two Phase 1 dates. but these are excluded because they
differ considerably and are not relevant to the pied under discussion.
A cursory glance at the initial sequence of dates suggests that the probability distribution of
date TO-3409 (690B70 bp) in Phase 3 will not agree within the sequence of distributions
(Figure 25). In fact. its agreement index is only 1 3.0%. In this situation. we need to choose
between using this date in an interval or to eliminate it from analysis. Elimination seemed the
best option because, even if the date is placed in Phase 2. it does not agree. The most likely
explmation for this discrepancy is that the 'k sample is residual and probably dates Phase 1
occupation at the site.
.-.
Sequence Tabaqat al-~uma
Phase 2 TO-34 1 I 667k60BP
TO-2 1 15 6630+80BP
Phase 3 TO-3409 6900i70BP
TO-2 1 14 6590k70BP
TO-4277 6490I70BP
TO-34 12 6380k70BP
Phase 4
TO-34 10 6350*70BP - TO-3408 6 190~70BP
- . . . . . --
- - . .
7000BC 6500BC 6000BC 5500BC 5000BC 4500BC
Calendar date
Figure 25: Tabaqat al-Buma. The initial sequence of dates.
With TO-3409 omitted, the overall agreement of the sequence of constrained probability
distributions is good (Figure 26). Al1 individual agreement indices are above the limit of 6O%, as
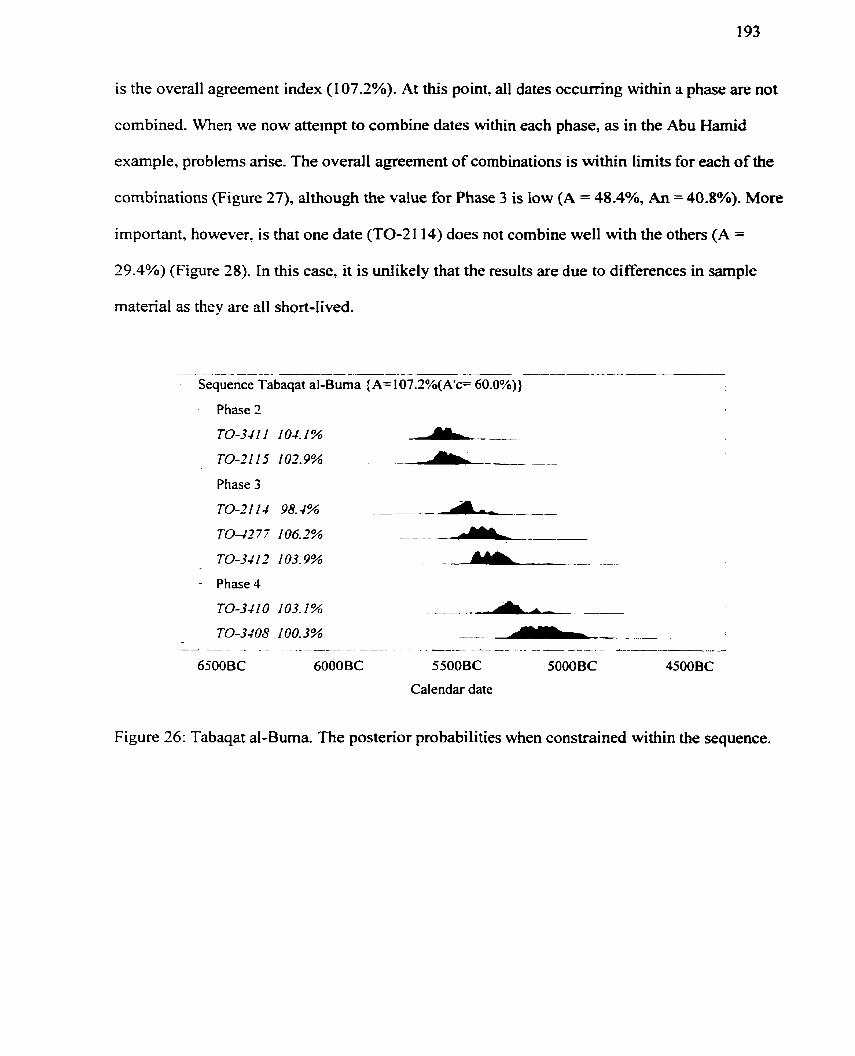
is the overall agreement index (1 07.2%). At this point, ail dates occurring within a phase are not
combined. When we now atteinpt to combine dates within each phase, as in the Abu Hamid
example, problems arise. The o v e d l agreement of combinations is within limits for each of the
cornbinations (Figure 27), although the value for Phase 3 is low (A = 48.4%, An = 40.8%). More
important, however. is that one date (TO-2114) does not combine well with the others (A =
29.4%) (Figure 28). In this case. it is unlikely that the results are due to differences in sarnple
matenal as they are al1 short-Iived.
- - - - - - - - - .- - -- ----- -
- Sequence Tabaqat al-Buma (A= 1 O7.2%(A'c= 60.0%))
Phase 2
TU-3411 104.1% _ _ -a--- TO-ZII.5 102.9% - ---- --
Phase 3
TU-2114 98.4% ---
TO-43 7 7 1 06.2% -- A--- TO-34 12 1 03.9% -.
Phase 4
TO-341 O 103.1 % --- --
TO-3408 100.3% .-- -- -A--- A - - ----A------A- A . --
6500BC 6000BC 5500BC 5000BC 4500 BC
Calendar date
Figure 26: Tabaqat al-Buma. The posterior probabilities when constrained within the sequence.
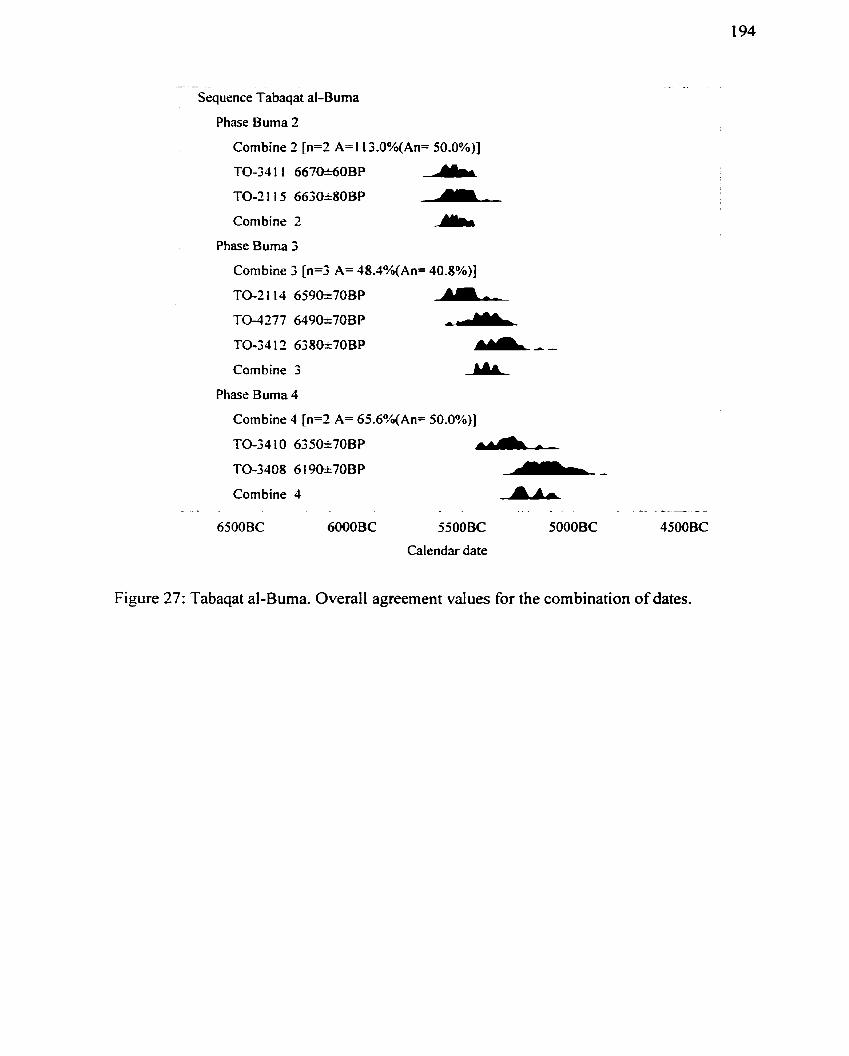
-. -
- Sequence Tabaqat al-Buma
Phase Buma 2
Combine 2 [n=2 A= l l3.O%(An= 50.0%)]
TO-34 1 1 667W60BP - TO-2 1 1 5 6630h80BP A Combine 2 -
Phase Buma 3
Combine 3 [n=3 A= 48.3%(An= 40.8%)j
TO-2 I 14 6590r70BP n TO-4277 649W70BP a TO-3412 6380L70BP
Combine 3 .AL Phase Buma 4
Combine 4 [n=2 A= 65,6%(An= 50.0%)]
TO-3 4 1 0 63 Sm70 B P A TO-3408 6 1 9W70BP -- Combine 4
- . . &
. . - - - 2
6500BC 6000BC 5500BC 5000BC 4500BC
Calendar date
Figure 37: Tabaqat al-Buma. Overall agreement values for the combination of dates.
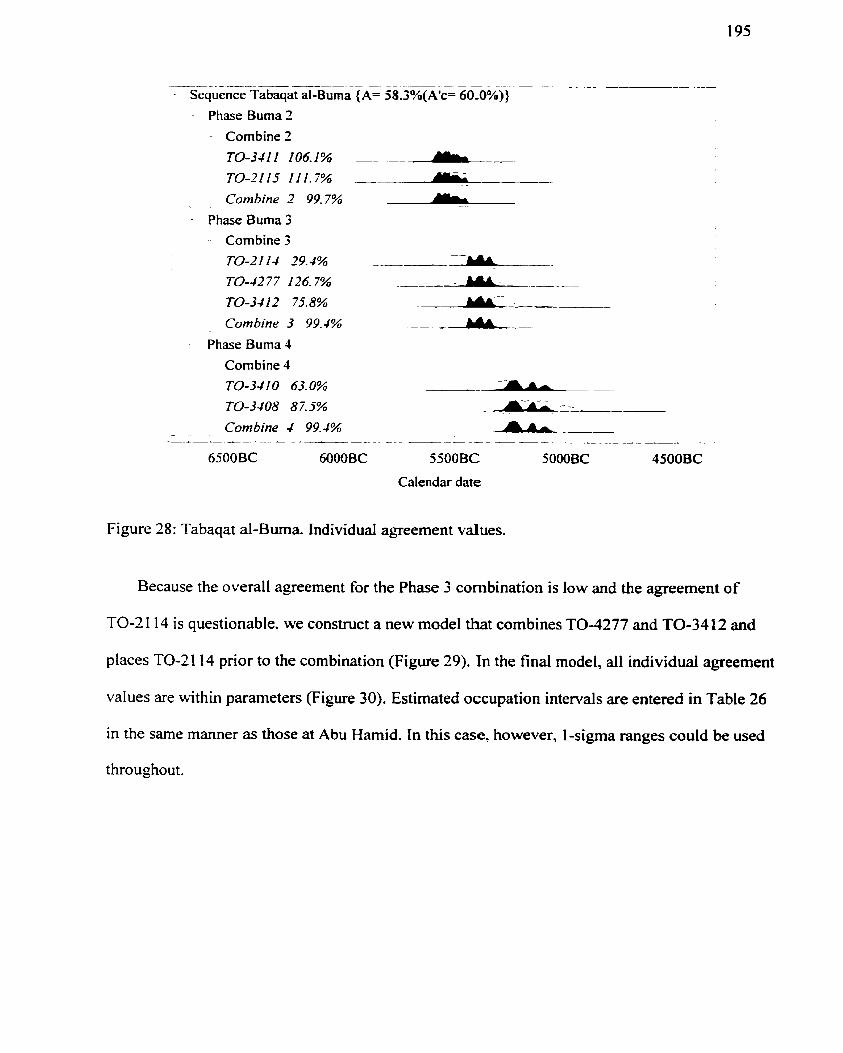
- -- - - - Sequence Tabaqat al-Buma (A= 58.3%(Agc= 60-0%))
- Phase Buma2
- Combine 2
TO-341 1 106.1% - _
TU-2115 111.7%
Combine 2 99.7% I"L Phase Buma 3
Combine 3
TO-2114 29.5%
TO-42 77 126.7%
TO-3 4 12 75.8% --A
Combine 3 99.4% _-A-- Phase Buma 4
Combine 4
TO-3 J I O 63.0% -- --
TO-3 JO8 873% ----
Combine 4 99.4% - A-- A - - - --- - A--p
6500BC 6000BC SSOOBC 500OBC 4500BC
Calendar date
Figure 28: Tabaqat al-Buma. Individual agreement values.
Because the overall agreement for the Phase 3 combination is low and the agreement of
TO-2 1 14 is questionable, we construct a new model that combines TO-4277 and TO-34 12 and
places TO-2114 prior to the combination (Figure 29). In the final model, al1 individuai agreement
values are within parameters Figure 30). Estimated occupation intervals are entered in Table 26
in the same manner as those at Abu Hamid. In this case. however, 1-sigma ranges could be used
throughout.

-- - - - - - - - . -
Sequence Tabaqat al-Buma
Phase Buma 2
Combine 2 [n=2 A= l i 3.O%(An= 50.0%)]
TO-3411 6670I60BP - TO-2 1 1 5 6630L80BP
Combine 2 A Phase Buma 3
TO-2 1 1 4 6590*70B P A Combine 3 [n=2 A= l Oj.S%(An= 50.0%)]
TO4277 6490I70BP a T0-3412 638W70BP
Combine 3 C-LI Phase Burna 4
Combine 4 [n=2 A= 65,6%(An= 50.0%)]
TO-34 10 6350I70BP & TO-3408 619W70BP I- Combine 4
.- - L
. - . -> -A A -
6500BC 6000BC 5500BC 5000BC 4500BC
Calendar date
Figure 29: Tabaqat al-Buma. The final mode1 of phase construction.
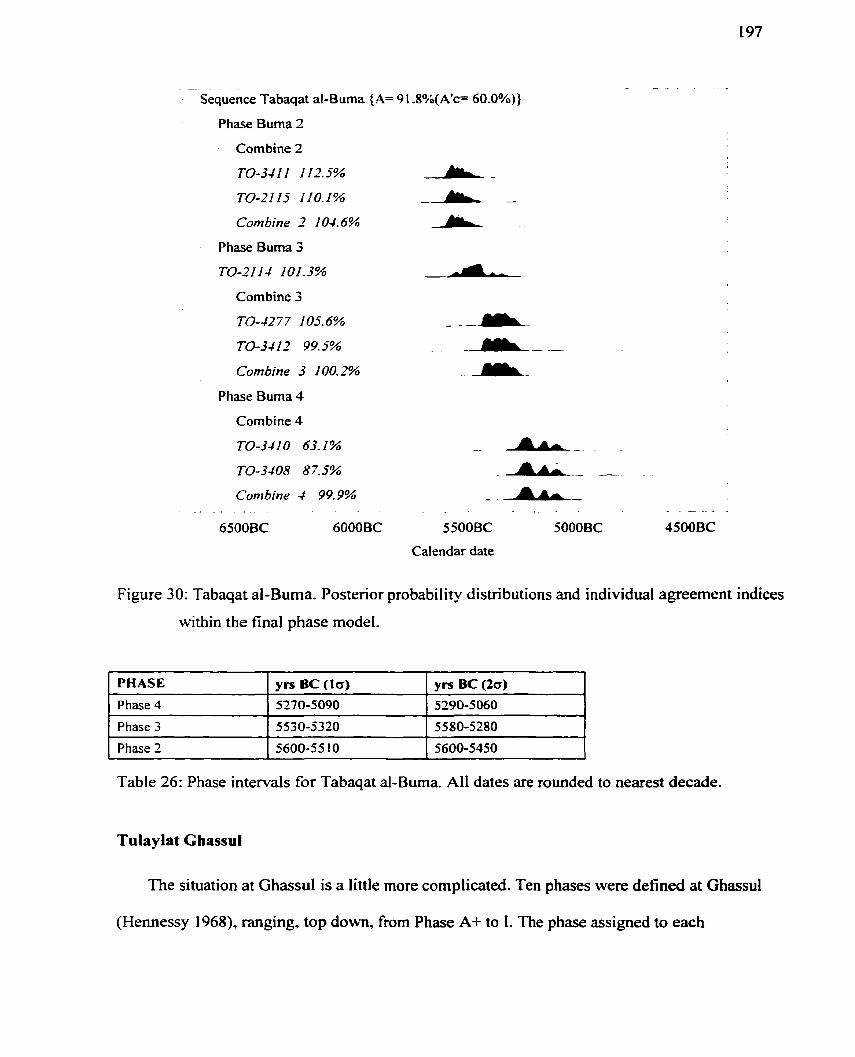
-- .
- Sequence Tabaqat al-Buma (A= 9 1 .8°/b(A'c= 60.0%))
Phase Buma 2
Combine 2
Corn bine 2 1 O-/. 6%
Phase Buma 3
7'0-2114 101.3% A Combine 3
TG42 7 7 1 05.6% - -
TO-3412 99.5%
Combine 3 100.2%
Phase Buma 4
Combine 4
Combine 4 99.9% - _ A- - . - . . - - . . . . .. . . -- -- - .
6500BC 6000BC 5500BC 500OBC 4500BC
Calendar date
Figure 30: Tabaqat al-Buma. Posterior probability distributions and individual agreement indices
within the final phase mode].
Table 26: Phase intervais for Tabaqat al-Buma. Al1 dates are rounded to nearest decade.
PHASE
Phase 4
Phase 3
Phase 2
Tulaylat Ghassul
The situation at Ghassul is a little more complicated. Ten phases were defined at Ghassul
(Hennessy 1968), ranging. top down, from Phase A+ to 1. The phase assigned to each
yrs BC (10)
5270-5090
5530-5320
5600-55 10
yrs BC (Za) 5290-5060
5580-5280
5600-5450
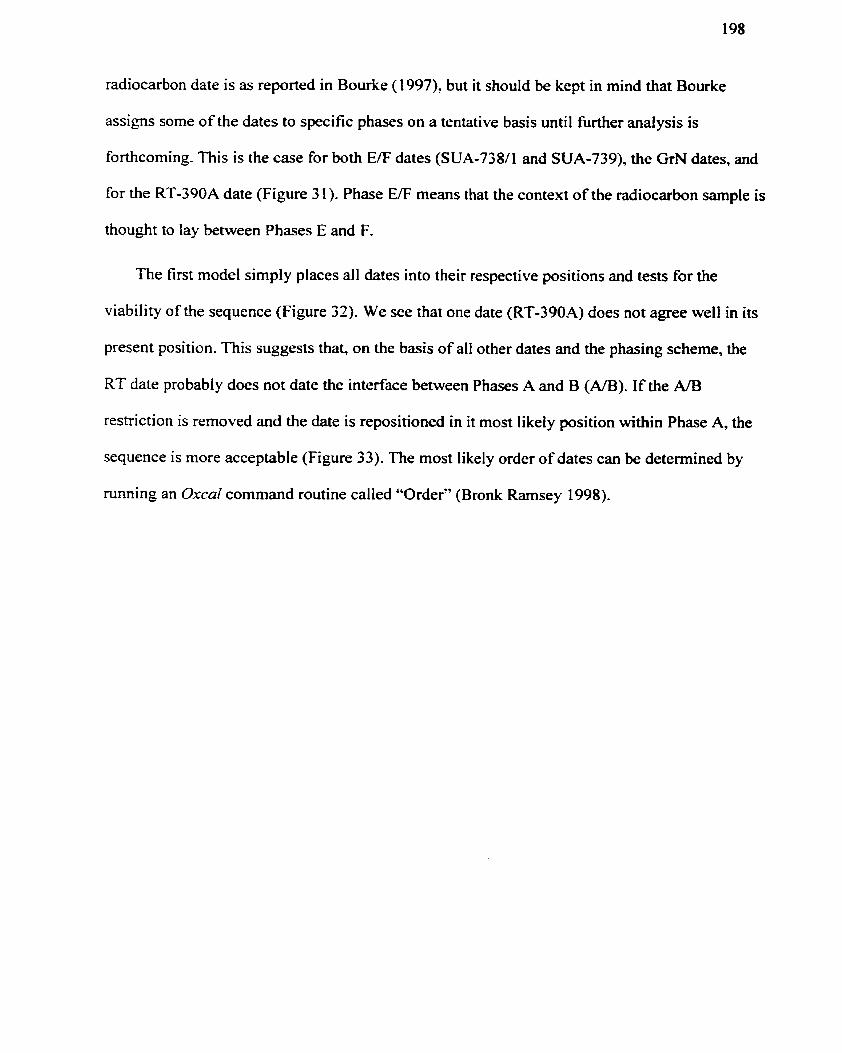
radiocarbon date is as reported in Bourke (1997)' but it should be kept in mind that Bourke
assig-ns some of the dates to specific phases on a tentative basis until further analysis is
forthcoming. This is the case for both E/F dates (SUA-738/1 and SUA-739), the GrN dates, and
for the RT-390A date (Figure 3 1). Phase E/F means that the context of the radiocarbon sample is
thought to lay between Phases E and F.
The first mode1 simply places a11 dates into their respective positions and tests for the
viability of the sequence (Figure 32). We see that one date (RT-390A) does not agree well in its
present position. This suggests that, on the basis of al1 other dates and the phasing scheme, the
RT date probably does not date the interface between Phases A and B (A/B). If the AIB
restriction is removed and the date is repositioned in it most likely position within Phase A, the
sequence is more acceptable (Figure 33). The most likely order of dates can be determined by
running an Oxcal command routine called "Order" (Bronk Ramsey 1998).
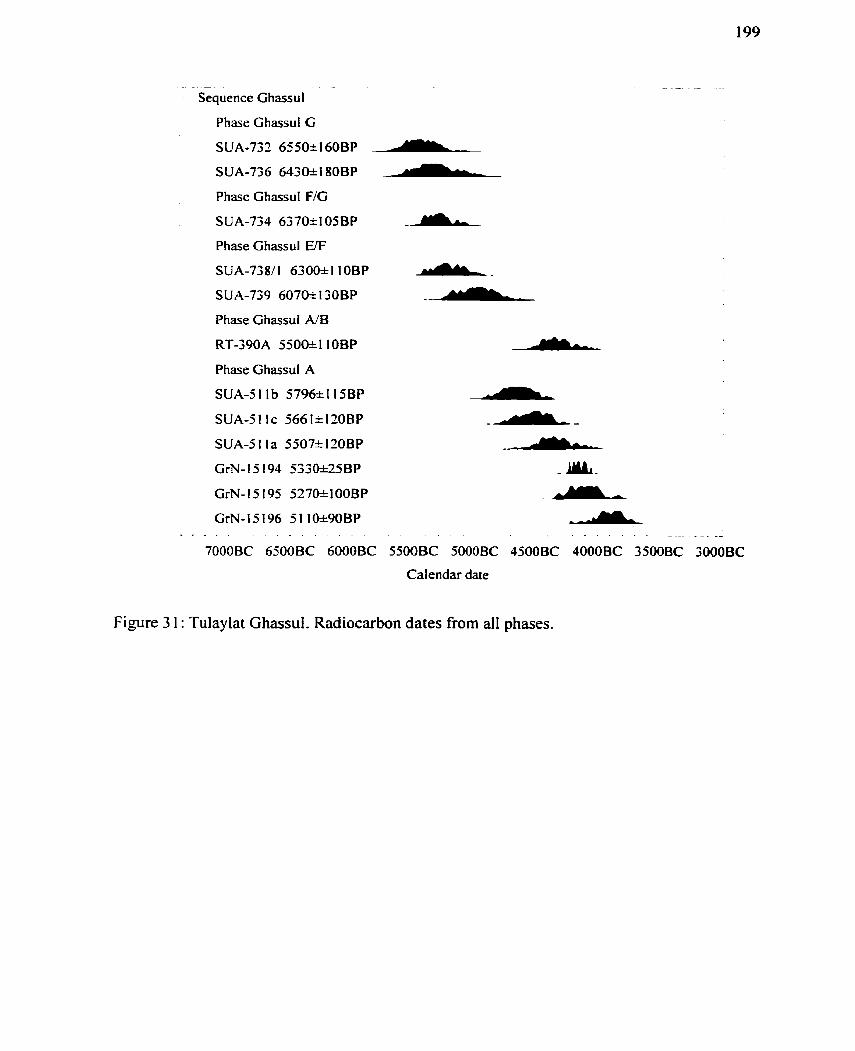
- - - - Sequence Ghassul
Phase Ghassul G
SUA-732 655W160BP
SUA-736 6430I180BP
Phase Ghassul F/G
SUA-734 637m105BP
Phase Ghassul E/F
SUA-738/ 1 63OO* 1 10BP
SUA-739 6070-11 30BP
Phase Ghassul N B
RT-390A 550@110BP
Phase Ghassul A
SUA-SI Ib 5796si 15BP
SUA-5 1 1 c 566 1 = 120BP
SUA-5 1 l a 55072 120BP
GrN-15 194 533e25BP
GrN- 15 195 5270-Lf 00BP
GrN-15196 51 lW90BP - * A . . . . . - - - - - -
7000BC 6500BC 6000BC 5500BC 5000BC 4500BC 4000BC 35OOBC 3OOOBC
Calendar date
Figure 3 1 : Tulayiat Ghassul. Radiocarbon dates fiom al1 phases.
.
Sequence GhassuI {A= 72. I %(A'c= 60.0%))
Phase Ghassul G
Phase Ghassul F/G
Phase Ghassul WF
SU.4-738/I 100.5% _A SUA-739 102.8%
Phase Ghassul A/B
RT-390A 27.9% A -
Phase Ghassul A
SUA-5116 76.8%
SUA-SIIC 106.4%
SUA-Slla 104.0%
GrN- 1.5 1 94 98.7%
GrN-15195 100.0%
GrN- 15 196 99.6% . . . .
7000BC 6500BC 6000BC
- A- - - -
--
-'YL -
A A - - - . . - - - . - -*- - - -
5500BC 5000BC 4500BC 40005C 3500BC 3OOOBC
Calendar date
Figure 32: Tulaylat Ghassul. The initial sequence model.
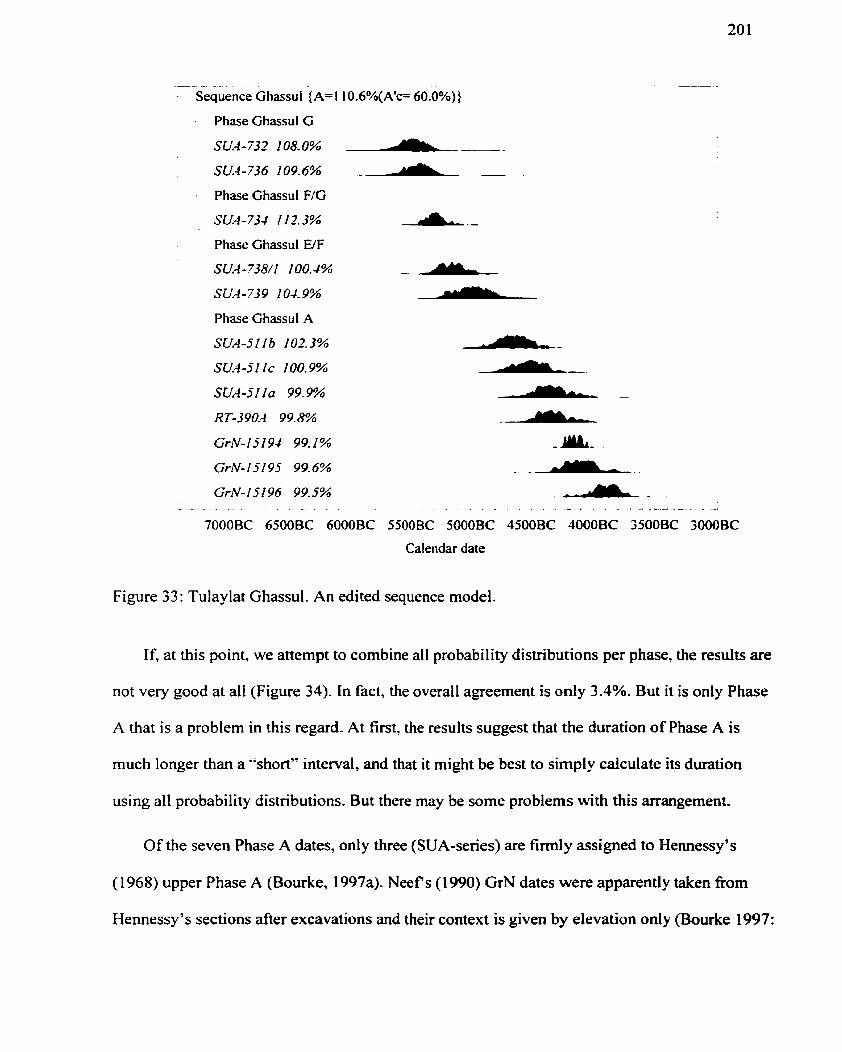
-- -
Sequence Ghassul {A=l l 0.6%(A1c= 60.0%))
Phase Ghassul G
SUA-732108.0% - . --
SU4-736 109.6% -A -
Phase Ghassul F/G
SUA- 734 11 2.3% A- Phase Ghassul E/F
SU.4-73811 100.4%
SU-4-739 lO-/-g%
Phase Ghassul A
SUA-51 1 b 102.3%
SUA-51 I C 100.9%
SUA-Slla 99.9%
RT-390A 99.8%
GrN-]SI94 99.1%
GrN-15 1 95 99.6%
GrN-15196 99.5% A - - - . - & .
7000BC 6500BC 6000BC
A- -- A --
A -
- U A -
- ---
-A- - . . . - - . - - . -
5500BC 5000BC 4500BC 4000BC 3500BC 3000BC
CaIendar date
Figure 33: Tulaylat Ghassul. An edited sequence model.
If. at this point, we attempt to combine al1 probability distributions per phase, the results are
not very good at al1 (Figure 34). In fact, the overall agreement is only 3.4%. But it is only Phase
A that is a problem in this regard. At first, the results suggest that the duration of Phase A is
much longer than a "short" interval, and that it might be best to simply calculate its duration
using al1 probability distributions. But there may be some problems with this arrangement.
Of the seven Phase A dates, only three (SUA-series) are firmly assigned to Hemessy's
(1968) upper Phase A (Bourke, 1997a). Neefs (1990) GrN dates were apparently taken fiom
Hemessy's sections afier excavations and their context is given by elevation oniy (Bourke 1997:
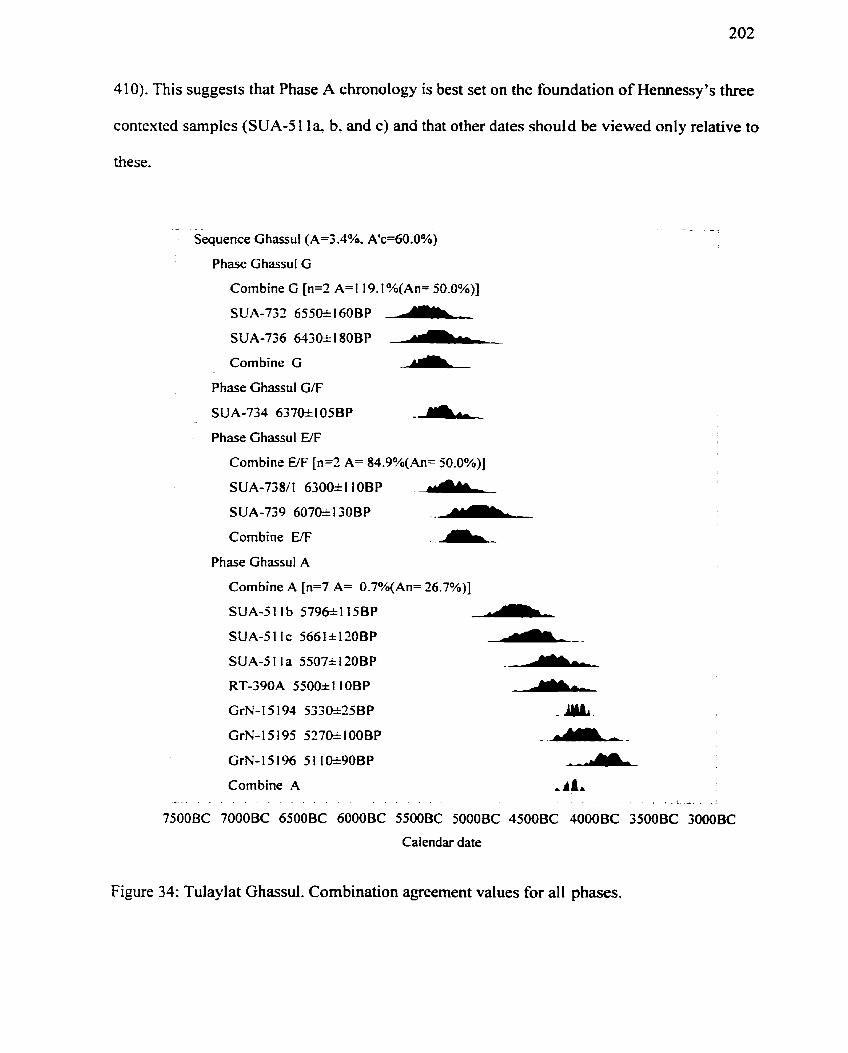
410). This suggests that Phase A chronology is best set on the foundation of iiemessy's three
contexted samples (SUA-5 1 la b. and c ) and that other dates should be viewed onIy relative to
these.
- ..
Sequence G hassul (A=3.4%, A'c=60.0%)
Phase Ghassul G
Combine G [n=2 A=I 19.1 %(An= 50.0%)]
SUA-732 655E160BP
SUA-736 643W180BP - Combine G -
Phase Ghassul G/F
SUA-734 637W105BP -- - Phase Ghassul WF
Combine E/F [n=2 A= 84.9%(An= 50.0%)]
SUA-738/1 630û+110BP -A SUA-739 607EI30BP - --
Combine E/F - - -- Phase Ghassul A
Combine A [n=7 A= 0.7%(An= 26.7%)]
SUA-5 l l b 5796k 1 15BP - SUA-5 1 l c 5661k120BP a- -
SUA-5 1 l a 5507k 120BP --
RT-390A 5500I 1 1 OBP a GrN-15 194 5330i25BP -lu GrN-15 195 5270i I OOBP -A- GrN-15196 51 10190BP A Combine A A.
Calendar date
Figure 34: Tulaylat Ghassul. Combination agreement values for al1 phases.
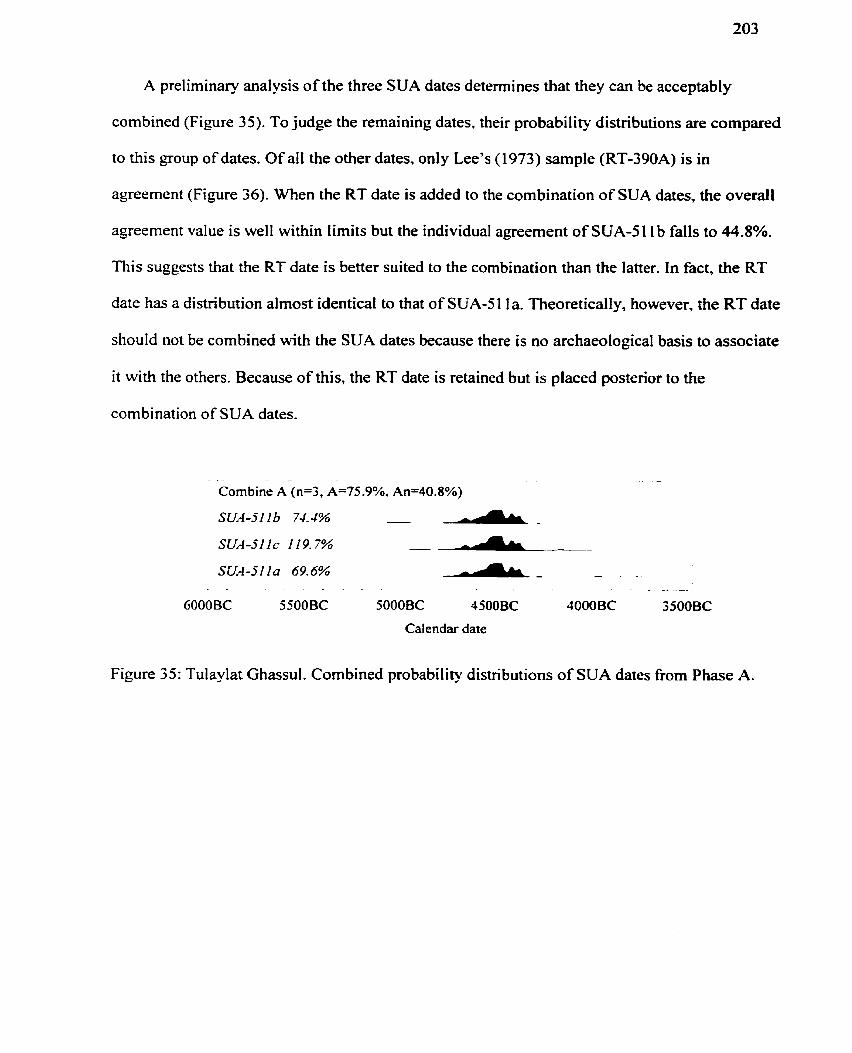
A preliminary anaiysis of the three SUA dates determines that they can be acceptably
combined (Figure 35). To judge the remaining dates, their probability distributions are compared
to this group of dates. Of al1 the other dates, only Lee's (1973) sample (RT-390A) is in
agreement (Figure 36). When the RT date is added to the combination of SUA dates, the overall
agreement value is well within limits but the individual agreement of SUA-51 1b falls to 44.8%.
This suggests that the RT date is better suited to the combination than the latter- In fact, the RT
date has a distribution almost identical to that of SUA-5 1 1 a. Theoreticaily, however, the RT date
should not be combined with the SUA dates because there is no archaeological basis to associate
it with the others. Because of this, the RT date is retained but is placed postenor to the
combination of SUA dates.
- -
Combine A (n=3, A=75.9%, An=40.8%)
SUA-SI l b 7-4. -4% - A- l
SUA-SI Ic 119.7% - A- SUA-SI la 69.6% d- -
- * -- --
6000BC 5500BC 5OOOBC 4500 BC 4000BC 3SOOBC
Calendar date
Figure 35: Tulaylat Ghassul. Cornbined probability distributions of SUA dates fiom Phase A.
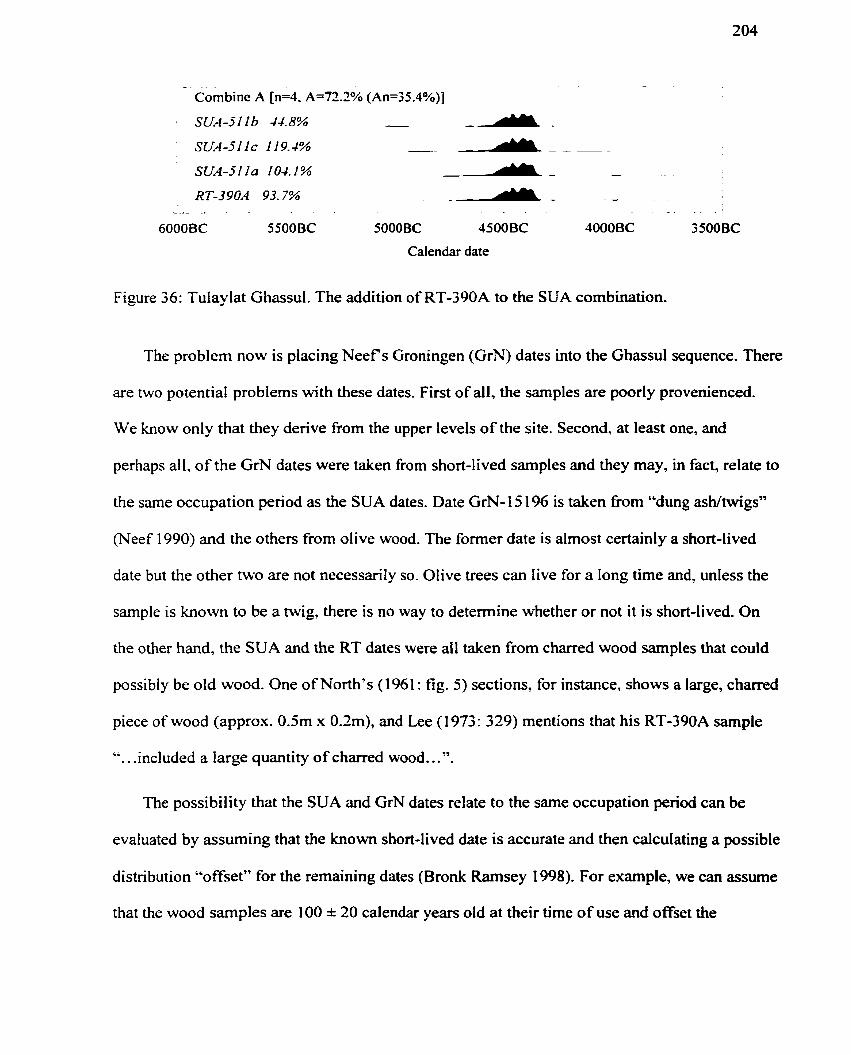
Combine A [n=4. A=72.2% (An=35.4%)]
SU"-jllb 44.8% - -A -
SU4-51 zc Il 9.4% -- A--- SUA-Slla 104.1% - --
RT-390A 93.7% -A- - -- . - . .
6000BC 5500BC 5000BC 4500BC 4000BC 3500BC
Calendar date
Figure 36: Tulayiat Ghassul. The addition of RT-390A to the SUA combination.
The problem now is placing Neef ç Groningen (GrN) dates into the Ghassul sequence. There
are two potential problems with these dates. First of dl , the samples are poorly provenienced.
We know only that they derive fiom the upper levels of the site. Second. at least one, and
perhaps d l , of the GrN dates were taken h m short-lived samples and they may, in fact, relate to
the same occupation period as the SUA dates. Date GrN- 15 196 is taken fiom "dung ash/twigsW
(Neef 1990) and the others fiom olive wood. The former date is almost certainly a short-lived
date but the other two are not necessarily so. Olive trees can live for a Iong time and, unless the
sample is known to be a twig, there is no way to determine whether or not it is short-lived. On
the other hand, the SUA and the RT dates were al1 taken fiom charred wood samples that could
possibly be old wood. One of North's (1961 : fig. 5) sections, for instance, shows a large, charred
piece of wood (approx. 0.5m x 0.2m), and Lee (1973: 329) mentions that his RT-390A sample
". . .included a large quantity of charred wood.. .".
The possibility that the SUA and GrN dates relate to the same occupation period can be
evaluated by assuming that the known short-lived date is accurate and then calcuIating a possible
distribution "offset" for the remaining dates (Bronk Ramsey 1998). For example, we can assume
that the wood samples are 100 * 20 calendar years old at their time of use and offset the
individual SUA distributions by this amount. If our assumptions are correct, we should be able to
combine the offset distribution with the younger date. Several trial runs suggest that the
individual SUA dates would need to be offset from 150 to 450 years in order to agree with the
GrN dates and the combination of dates would need to be offset by at least 400 + 20 years. It is
unlikely, therefore. that the SUA and RT dates relate to the same event as the GrN dates unless
we are willing to assume that a11 of the wood sarnples were approximately 400 years old at their
time of use. Another possibility is that the three GrN dates were contaminated with younger
carbon. These samples were collected below the surface of the site but were taken from
Hemessy's old excavation walls, and perhaps al1 of them were contaminated on exposure,
although this is an unlikely scenario.
If we accept Hemessy's three dates as a reliable basis for Phase A chronology, then the oniy
viable position for the GrN dates is above Phase A. They certainly fit into the accepted
Chalcolithic time h e and, judging from their consistency. they seem as reliable as any other
dates for the period. If we assume the GrN dates represent an occupation at the site, then they are
probably associated with Hemessy's Phase A+. or final occupation of the site. Hemessy (1969)
had originally defined nine phases (LA) on the basis of excavations in Area A but, in subsequent
excavations. found it necessary to add a tenth, which he called Phase A+ (Hennessy, 1982,
1989). Bourke et al. (1995: 58). on the basis of their excavations in Area H, have gone so far as
to suggest a "post-A phase of occupation" at the site.
In the final mode1 for Ghassul. Neef s three GrN dates are assumed to relate to Phase A+
occupation, which is possibly related to the Terminal Chalcolithic but more likely represents a
Late Chalcolithic B interval. They are not combined because there is no archaeological evidence
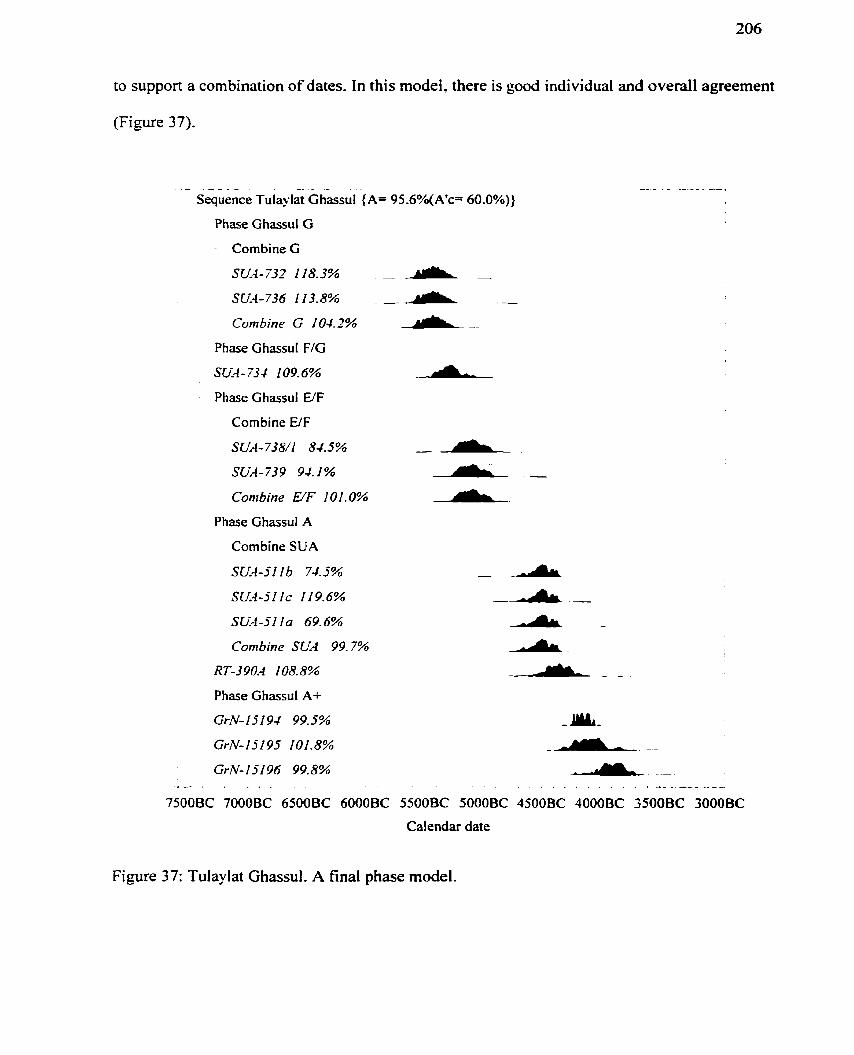
to support a combination o f dates. In this modei, there is good individual and overall agreement
(Figure 37).
-
Sequence ~ u l a ~ l a t G hassul {A= 95 .6%(Aec= 60.0%))
Phase Ghassul G
- Combine G
SU-4-732 118.3% --a -
SU-4-736 1 13-8% 'c., --
Combine G 104.2% A -- Phase Ghassut F/G
SUA-734 109.6% --.AL- Phase Ghassul WF
Combine WF
SUA- 73811 84.5% -- SUA-739 94.1% -
Combine E/F 101.0%
Phase Ghassul A
Combine SUA
SUA-Sllb 7&5% -
S U - 5 1 1 ~ 119.6% --A - -
SU4-51 l a 69.6% A -
Combine SL% 99.7% A RT-390A 108.8%
Phase Ghassul A+
GrN-15194 99.5%
GrN-15195 101.8%
GrN-15196 99.8% - - - . . . . . A . - A - -
7500BC 7000BC 6500BC 6000BC 5500BC 5000BC 4500BC 4000BC 3500BC 3000BC
Calendar date
Figure 37: Tulaylat Ghassul. A final phase model.
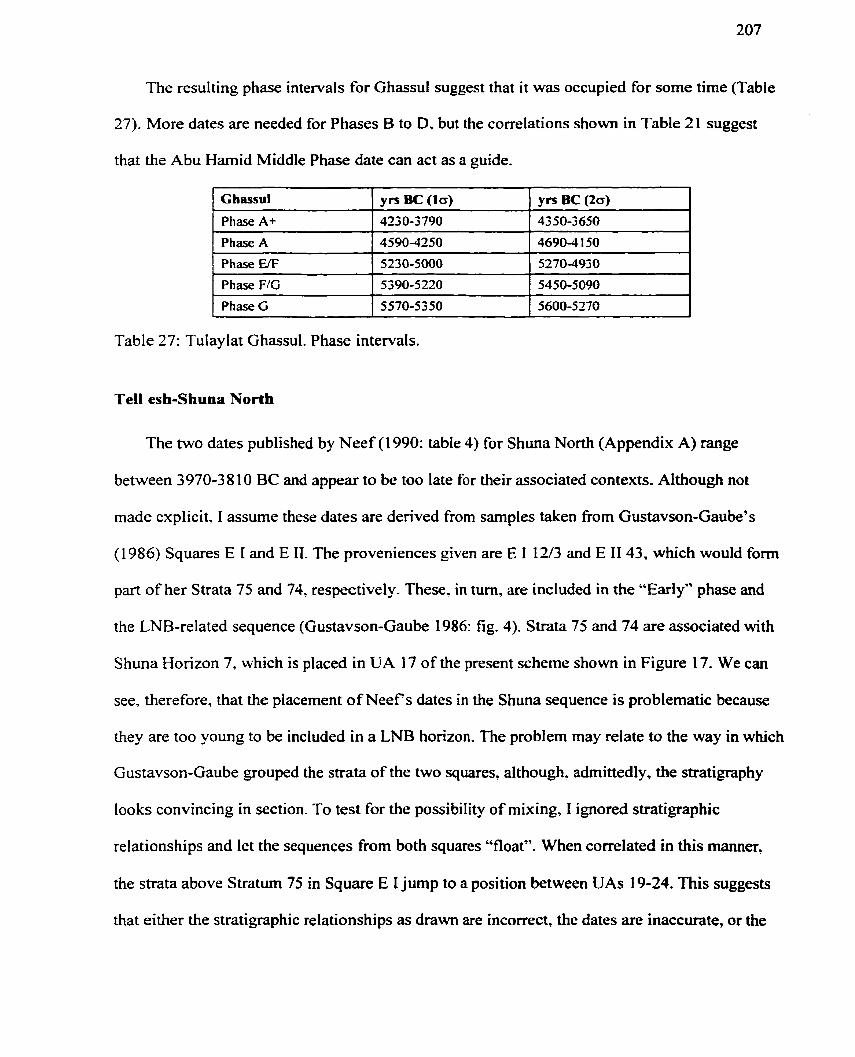
The resulting phase intervals for Ghassul suggest that it was occupied for some time (Table
27). More dates are needed for Phases B to D, but the correlations shown in Table 21 suggest
that the Abu Hamid Middle Phase date can act as a guide.
1 Chassul 1 Yrs BC ( 1 0 ) 1 Yrs Be (ta) 1 1 Phase A+
1 Phase A - -
1 Phase EIF 1 5230-5000 1 5270-4930 1 1 Phase F/G 1 5390-5220 1 5450-5090 1
Table 27: Tulaylat Ghassui. Phase intervals.
1 1
Tell esh-Shuna North
Phase G 5570-5350
The two dates published by Neef (1990: table 4) for Shuna North (Appendix A) range
between 3970-38 10 BC and appear to be too late for their associated contexts. Although not
made explicit. 1 assume these dates are derived from sarnples taken from Gustavson-Gaube's
(1 986) Squares E 1 and E II. The proveniences given are E 1 12/3 and E II 43, which would form
part of her Strata 75 and 74, respectively. These, in turn. are included in the "Early" phase and
the LNB-related sequence (Gustavson-Gaube 1986: fig. 4). Strata 75 and 74 are associated with
Shuna Horizon 7, which is placed in UA 17 of the present scheme shown in Figure 17. We can
see, therefore, that the placement of Neef s dates in the Shuna sequence is problematic because
they are too young to be included in a LNB horizon. The problem may relate to the way in which
Gustavson-Gaube grouped the strata of the two squares, although, admittedly, the stratigraphy
looks convincing in section. To test for the possibility of mixing, 1 ignored stratigraphic
relationships and let the sequences from both squares "float". When correlated in this manner,
the strata above Stratum 75 in Square E 1 jump to a position between UAs 19-24. This suggests
that either the stratigraphic relationships as drawn are incorrect, the dates are inaccurate, or the
5600-5270 1
sarnples (including the pottery) were intrusive. 1 assume the latter and place these questionable
dates in UA 24. which is the interface between the Terminal Chalcolithic occupation and the
EBI (Figure 17).
Recent dates from Shuna North (Baird, pers. comm.). for which 1 have only calibrated 2-
sigma intervals, support my previous contention about the placement of Neef s dates. Five of
these dates are fiom Chalcolithic levels and one interval is reported for the EBI . Three
Chalcolithic dates (rounded to nearest decade) range from 5070 to 4720 BC, another two from
5 140 to 4830 BC. and a last, which agrees with the GrN dates, from 3960 to 3660. The EBl
dates range from 3640 to 3330 BC. Baird suggests that the dates represent a gap in occupation
between the Early and Late Chalcolithic. 1 would agree, having reached the same conclusion in
an independent analysis of Gustavson-Gaube's relative sequence (see p. 242). This gap occurs in
Zone 6 (Late Chalcolithic B) but could possibly include Zone 5. The recent Shuna radiocarbon
date for the EB 1 is entered into the regionai sequence as an unprovenienced interval (Figure 17,
p. 170). None of these dates necessarily disagree with the relative sequence as constructed.
Tel Tsaf
The Tel Tsaf dates are also problematic. One is 6720 I 460 bp (RT-508A) and the other
6980 * 490 bp (RT-?), which calibrate in the range of 6050-5050 BC and 6400-5300 BC,
respectively (Weinstein, 1984a: 334; Gilead. 1988: 400; Gophna and Sadeh, 1989: 33). Both
have high associated errors and are not very useful. but they agree with the final sequence.
Jericho
Two sets of radiocarbon dates are used to judge the Jericho sequence; those from Tomb A94
(Burleigh, 198 1, 1983; Weinstein, 1984a) and two relevant dates taken fiom Trench III (T3)
(Bruins and van der Plicht. 1998). Trench 3 does not forrn part of the relative sequence
constmcted earlier but, nonetheless, the determinations are usefùl for dating the end of Kenyon's
(Kenyon and HoIland. 1982) Proto-Urban (EBI) period. Unfortunately, there are no dates for
either Trench II or for Square EIII-IV that can be used in the present analysis.
Tornb A94 forrns a part of the relative sequence and belongs to Jericho Horizon 16 in the
composite section (Table 21). This horizon forms a subset of UA 39 in the final analysis. There
are five dates from this context but al1 are troublesome. The first date (GL-24, 521W110 bp)
published seems too old for an E N provenience (4230-3820 BC) and, on the basis of four new
British Museum dates (Burleigh 1983: 764), it was dismissed (Figure 38). Later, however,
Bowman et al. (1990) found that many British Museum (BM) dates issued between 1980 and
1984, which would include the Tomb 94 BM dates, were in error. Their results were confirmed
by Bruins and Plicht (1998: 625). who concluded that most of these dates are 200-300 I4c years
too Young. These studies bring into question the usefulness of al1 Tomb 94 dates. Nonetheless,
for lack of better comparative material, 1 list the dates here and let the readers reach their own
conclusions.
Kenyon (1 960: 16-25) defines eight depositional episodes and multiple burials in this tornb
and it was probably used over a long period of time. She defined the pottery assembIage as
Proto-Urban A (PUA), which she believed to be the earliest of the Early Bronze age deposits at
the site (Proto Urban B and C follow). Proto Urban A and B pottery styles are now generally
recognized as EB 1 a and EB 1 b, respectively. The relative placement of Tomb 94A, however,
does not support Kenyon's (1960) notion that the assemblage in the tomb occurs early in the
Jericho EB 1 sequence (see Table 17).
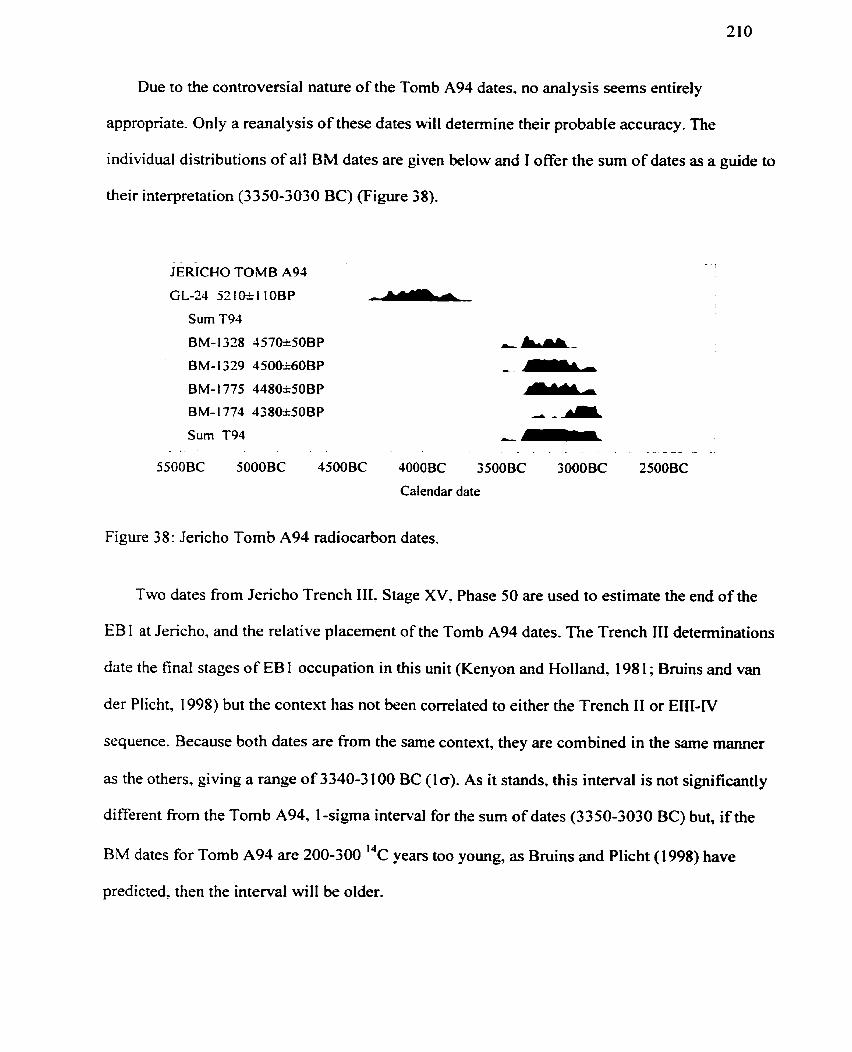
Due to the controversial nature of the Tomb A94 dates, no analysis seems entirely
appropriate. Only a reanalysis of these dates will detennine their probable accuracy. The
individual distributions of al1 BM dates are given below and 1 offer the sum of dates as a guide to
their interpretation (3350-3030 BC) (Figure 38).
BM-
BM-
BM-
B M-
Sum - - -
5500BC
JERICHO TOM8 A94
GL-24 S2I&l IOBP - Surn T94
1338 4570I50BP -- 1329 4500i60BP --
1775 448W50BP - 1774 438W50BP A -a T94 Lm
. - - - - A - .
5000BC 4500BC 4OOOBC 3500BC 3OOOBC 2500BC
Calendar date
Figure 38: Jencho Tomb A94 radiocarbon dates.
Two dates from Jericho Trench III, Stage XV. Phase 50 are used to estimate the end of the
EB 1 at Jericho, and the relative placement of the Tomb A94 dates. The Trench III determinations
date the final stages of EB 1 occupation in this unit (Kenyon and Holland, 198 1 ; Bruins and van
der Plicht, 1998) but the context has not been correlated to either the Trench II or EIII-N
sequence. Because both dates are from the same context, they are combined in the same manner
as the others. giving a range of 3340-3 100 BC ( la) . As it stands. this interval is not significantly
different from the Tomb A94. 1 -sigma interval for the sum of dates (3350-3030 BC) but, if the
BM dates for Tomb A94 are 200-300 I4c years too Young, as Bruins and Plicht (1998) have
predicted, then the interval will be older.
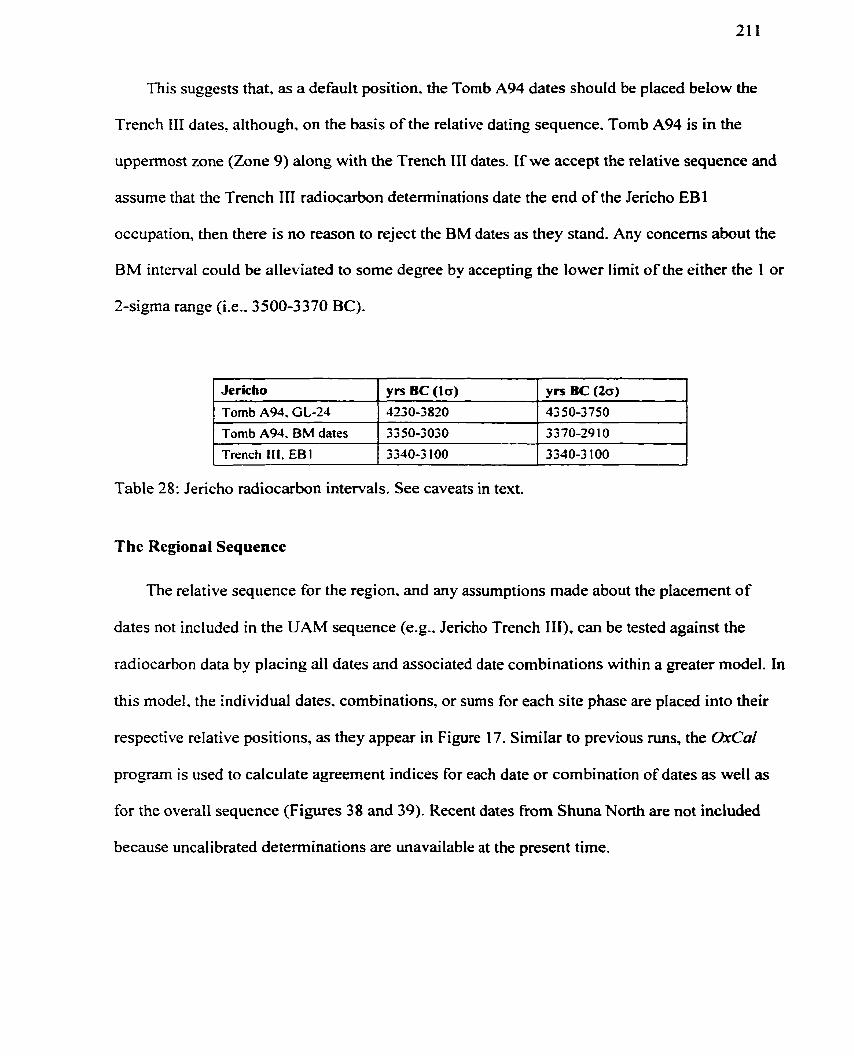
This suggests that, as a default position, the Tomb A94 dates should be placed below the
Trench III dates. although, on the basis of the relative dating sequence. Tomb A94 is in the
uppermost zone (Zone 9) along with the Trench III dates. If we accept the relative sequence and
assume that the Trench III radiocarbon determinations date the end of the Jericho EB1
occupation, then there is no reason to reject the BM dates as they stand. Any concerns about the
BM interval could be atleviated to some degree by accepting the lower limit of the either the 1 or
2-sigma range (Le.. 3500-3370 BC).
Jericho
Tomb A94. G L-24
Table 28: Jerïcho radiocarbon intervals. See caveats in text.
Tomb A94, BM dates
Trench I I I , EB1
The Regional Sequence
yrs BC (ln)
4230-3820
The relative sequence for the region. and any assumptions made about the placement of
dates not included in the UAM seqcence (e-g.. Jericho Trench III). can be tested against the
radiocarbon data by placing ail dates and associated date combinations within a greater model. In
this model, the individual dates. combinations, or sums for each site phase are placed into their
respective relative positions, as they appear in Figure 17. Similar to previous runs, the &Cal
program is used to calculate agreement indices for each date or combination of dates as well as
for the overall sequence (Figures 38 and 39). Recent dates from Shuna North are not included
because uncalibrated determinations are mavailabte at the present time.
y rs BC ( 2 0 )
4350-3750
33 50-2030
3340-3 1 O0
3 3 70-29 1 0
3340-3 1 O0
The overall agreement of the sequence is good (A=73.8%) but three individual dates do not
reach the threshold value of 60%. That is. they do not entirely agree with the sequence as
constmcted. One of these occurs in Jericho Tomb A94 (BM-1774). another in Ghassul Phase A
(SUA-5 1 1 b), and the last in Buma Phase 4 (TO-3408). In each individual site model, al1
agreement indices were above threshold value but the value of any particular index will change
when a new model is constmcted. as they do here. These discrepancies do not necessarily mean
that the sequence is incorrect as constructed because a number of assumptions were made that
can account for the low values. For instance. starting from the top (oldest), the agreement index
for date TO-3408 fiom Tabaqat al Burna is 54.8%. which suggests that the combination for
Buma 4 should be above Ghassul F/G and not below it. There is, however. only one date for the
Ghassul F/G context and any conclusions should remain tentative. In this case. the disagreement
is not a serious problem because the agreement index is close to the threshold value and, in the
final analysis. both the Ghassul F/G and the Buma 4 dates are used to construct the Zone 2
interval.
The Ghassul Phase A dates are constrained on their lower limit by the distributions of the
Abu Harnid Upper dates. This accounts for the poor agreement of SUA-5 1 1 b (41.6%), which is
older than the others. Recall that the SUA dates were taken fiom wood samples and that, as a
consequence, they have the potential to yield dates that are older than those of the actual
occupation. Rather than accommodate this older date, it is probably best to leave it truncated, as
it appears in the sequence, and to accept the constrained posterior distribution of the Phase A
dates.
Jerkho BM-1774 date has a low agreement value (16.6%). The reason for this is that we
assumed the BM dates were older than the Jericho Trench III dates and, within the sequence, the

Trench III dates constrain their upper (younger) distributions. The poor fit o f the BM-1774 date
is due to the fact that it is too young and, since we are aware that the BM dates could be older
than they are, the elimination o f this date is not a concern.
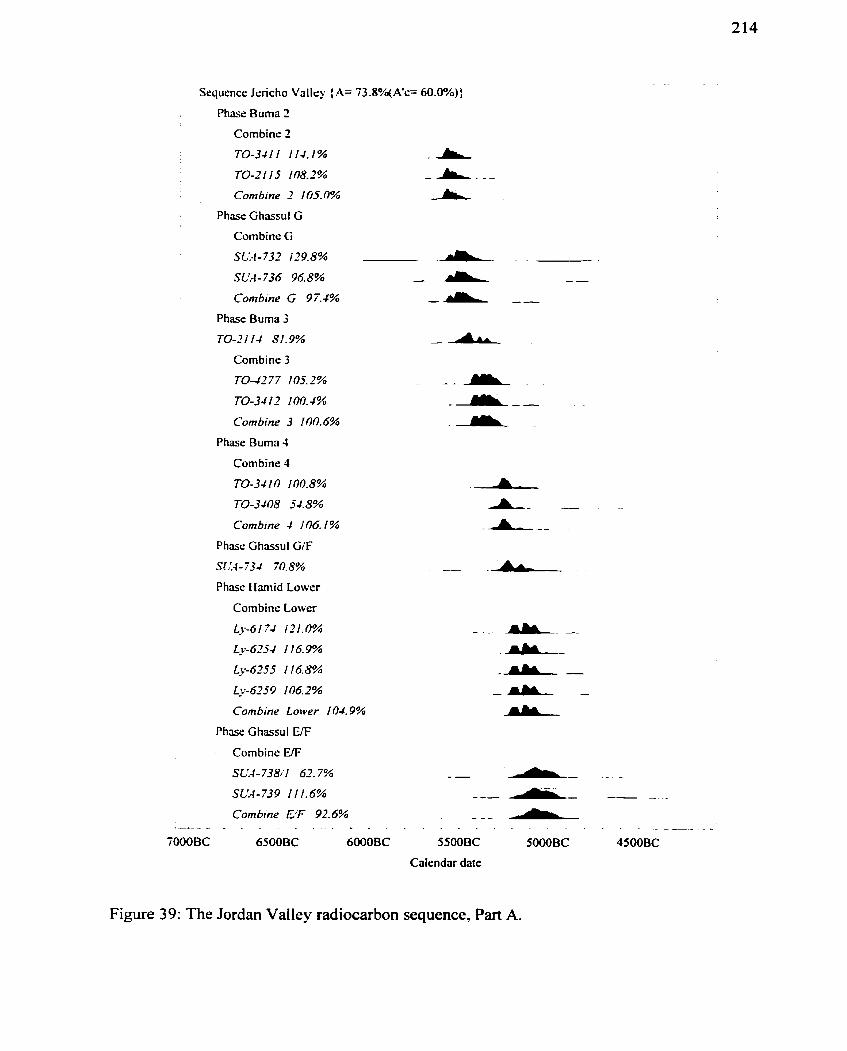
- - - .
Sequence Jsricho Valley {A= 73.8?4(A'c= 60.0%) j
Phase Buma 2
Combine 2
TO-3-41! 114.1% -A 7-0-2115 108.2% A A . - -
Combine 7 105.0% A Phase Ghassul G
Combine G
Sud-732 179.5% .- .
SLId- 736 96.8% -- & --
Combine ô 97.4% -A -- Phase Buma 3
TO-71 14 81.9% -A Combine 3
TO-4777 105.7% - -
TO-3412 100.4% -*-- Combine 3 100.6% -* -
Phase Buma 4
Combine J
TO-3410 100.8%
70-3408 34.8%
Combine 4 106.1%
Phase Ghassul G/F
SL!4- 734 70.8%
Phasc Hamid Loiver
Combine Lower
- 6 1 7 4 121.0%
- 6 7 5 4 1 16.9%
LI-6-55 1 16.8%
L~-6259 106.2%
Combine Lorver 104.9%
Phase Ghassul WF
Combine E/F
SUA- 738;l 67.7%
SLL-I-739 11 1.6%
Combine E'F 92.6% . ---- - - . . . . . . . . .
7000 BC 6SOOBC 6000BC
-- A- --- - - - -
- - - A . . . *
SSOOBC 5000BC 4500BC
CaIendar date
Figure 39: The Jordan Valley radiocarbon sequence, Part A.
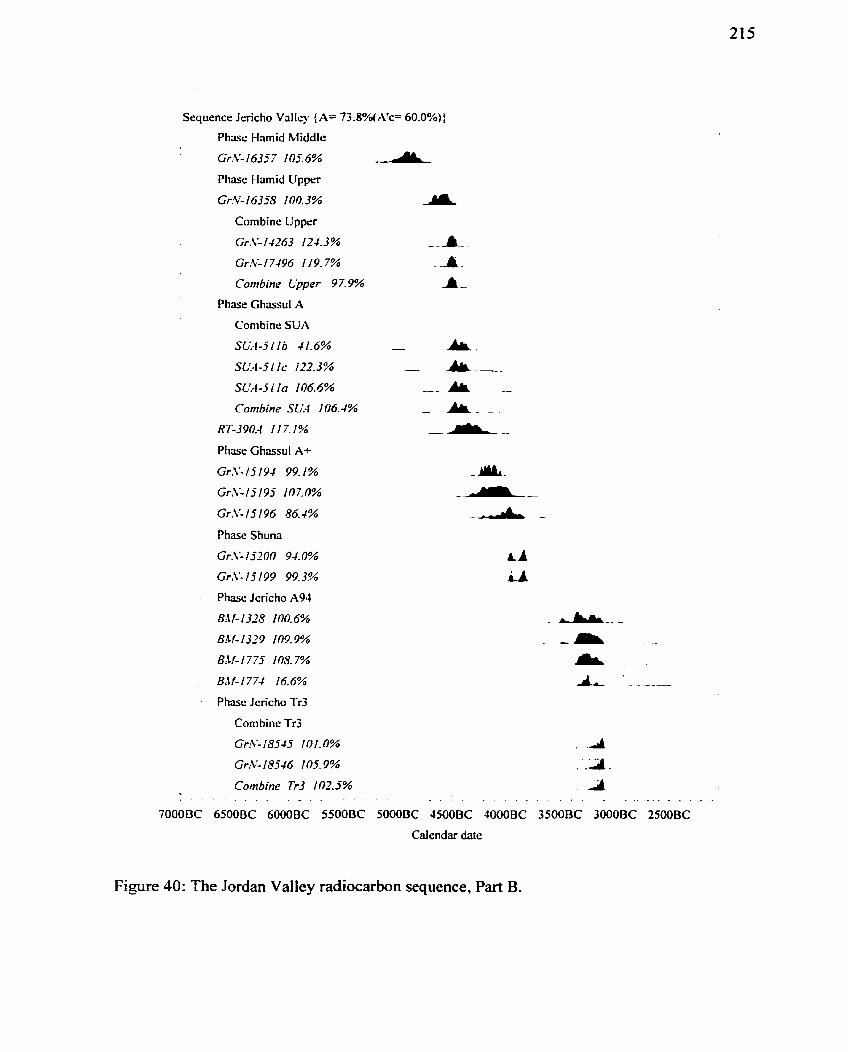
Sequence Jerich0 Vallcy {A= 73.8%(A1c= 60.0%) )
Phase Hamid Middle
Gray- 1635 7 105.6% -A Phase Hamid Upper
Gr%- 16358 100.3%
Combine Upper
Gr,%'- 14263 124.3%
Gr.V- 1 74 96 1 19.7%
Combine C'pper 97.9%
Phase Ghassul A
Combine SUA
SUA-51 1b 41.6%
SL!.I-5 1 IC 172.3%
S U - 5 1 la 106.6%
Combine SUA 106. 4%
RT-390.4 11 7.1%
Phase Ghassul A+
Gr.V 15 194 99.1 %
Gr,!+-15/95 107.0%
Gr.LI- 15 196 86.4%
Phase Shuna
Gr.\- 152 00 9 4.0%
Gr,\'- 15/99 99.3%
Phase Jcricho A94
Bi\[- 1328 100.6%
B11f-1329 109.9%
BM- 1 775 1 Os. 7%
B'tf-1774 16.6%
Phasc Jcricho Tr3
Combine Tr3
Gr:V- 1854.5 10 1.0%
Gr&+- 18546 105.9%
Combine Tr3 /02..5% . . . . - . . - .
7000BC 6500BC 6000BC 5500BC 5000BC JSOOBC 4000BC 3500BC 3000BC 2500BC
Caiendar date
Figure 40: The Jordan Valley radiocarbon sequence, Part B.
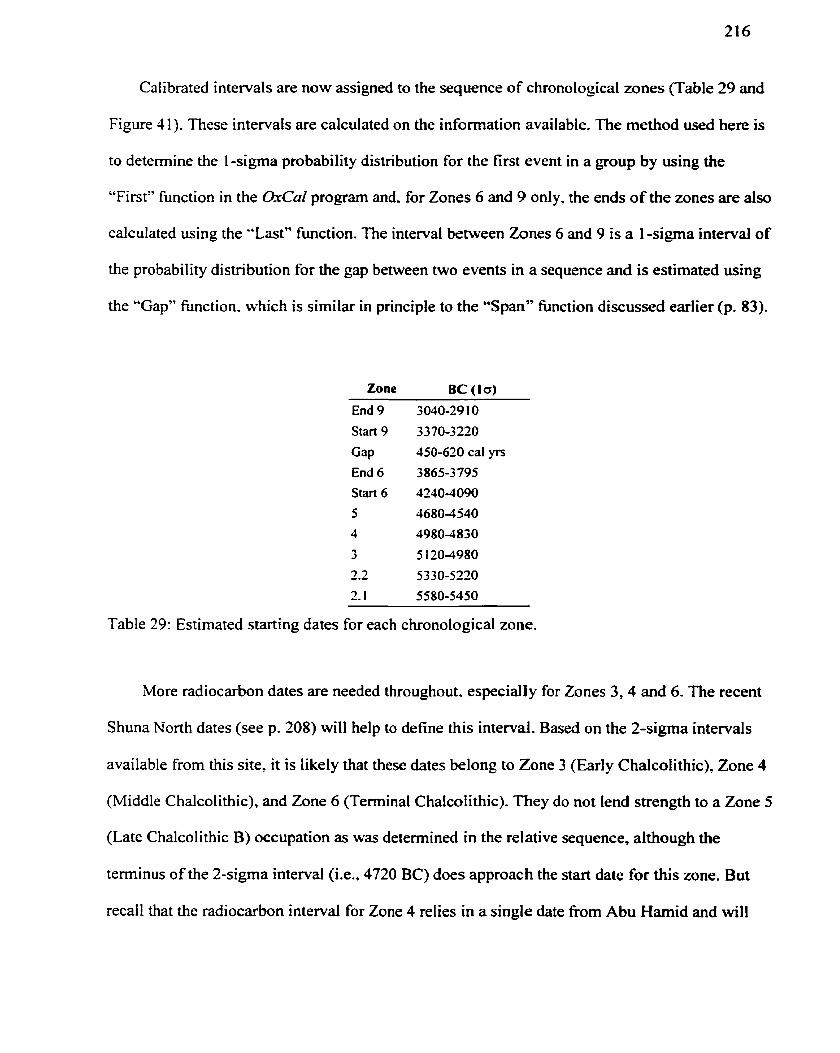
Calibrated intervals are now assigned to the sequence of chronological zones (Table 29 and
Figure 41). These intervals are calculated on the information available. The method used here is
to detemine the 1 -sigma probability distribution for the first event in a group by using the
"First" hnction in the OxCal program and. for Zones 6 and 9 only, the ends of the zones are also
calculated using the "Last" fwiction. The interval between Zones 6 and 9 is a 1 -sigma interval of
the probability distribution for the gap between two events in a sequence and is estimated using
the "Gap" fùnction. which is similar in principle to the "Span" fünction discussed earlier (p. 83).
Zone B C (1 a)
End 9
Start 9
Gap End 6
Start 6
5
4
3
2.2
2.1
3040-29 10
3370-3220
450-620 cal yrs
3865-3795
4240-4090
4680-4540
4980-4830
5 i 30-4980
53 30-5220
5580-5450
Table 29: Estimated starting dates for each chronological zone.
More radiocarbon dates are needed throughout. especially for Zones 3,4 and 6. The recent
Shuna North dates (see p. 208) will help to define this interval. Based on the 2-sigma intervals
available from this site, it is likely that these dates belong to Zone 3 (Early Chalcolithic), Zone 4
(Middle Chalcolithic), and Zone 6 (Terminal Chalcolithic). They do not Iend strength to a Zone 5
(Late Chalcolithic B) occupation as was deterrnined in the relative sequence, although the
terminus of the 2-sigma intervd (i.e., 4720 BC) does approach the start date for this zone. But
recall that the radiocarbon interval for Zone 4 relies in a single date fiom Abu Hamid and will
likely need revision when more information becomes available. The gap in the Shuna North
relative sequence is based on a following discussion of the Shuna sequence (p. 242), and is
supported by the recent radiocarbon dates (Figure 41). The Terminal Chalcolithic period is
inferred from radiocarbon dates derived from a number of sites in the southern Levant (Joffe and
Dessel 1995).
The gap shown in the EB 1 radiocarbon sequence is a result of the lack of dates for the three
main EB 1 sites used, but dates fiom other EBI sites in the region could be correlated to the
assembles of each zone without much difficulty. The Chalcolithic-Early Bronze transitional
period. as determined from the Jordan Valley sites used in analysis, occurs in Zone 6, and
remains uncertain in its upper limit.
The L N B period (Zone 2) is split at the point determined by the clustering method (p. 166)
in order to draw a distinction between the early LNB and a later period. In the second half of this
zone (Zone 2.2). the Tell Tsaf and Wadi Rabah components predominate. Assemblages generally
thought of 3s Late Chalcolithic begin to appear in the Early Chalcolithic of the present scheme
and are marked by distinctive artifacts. such as cornets and V-shaped bowls with painted rim
bands (see Appendix L)
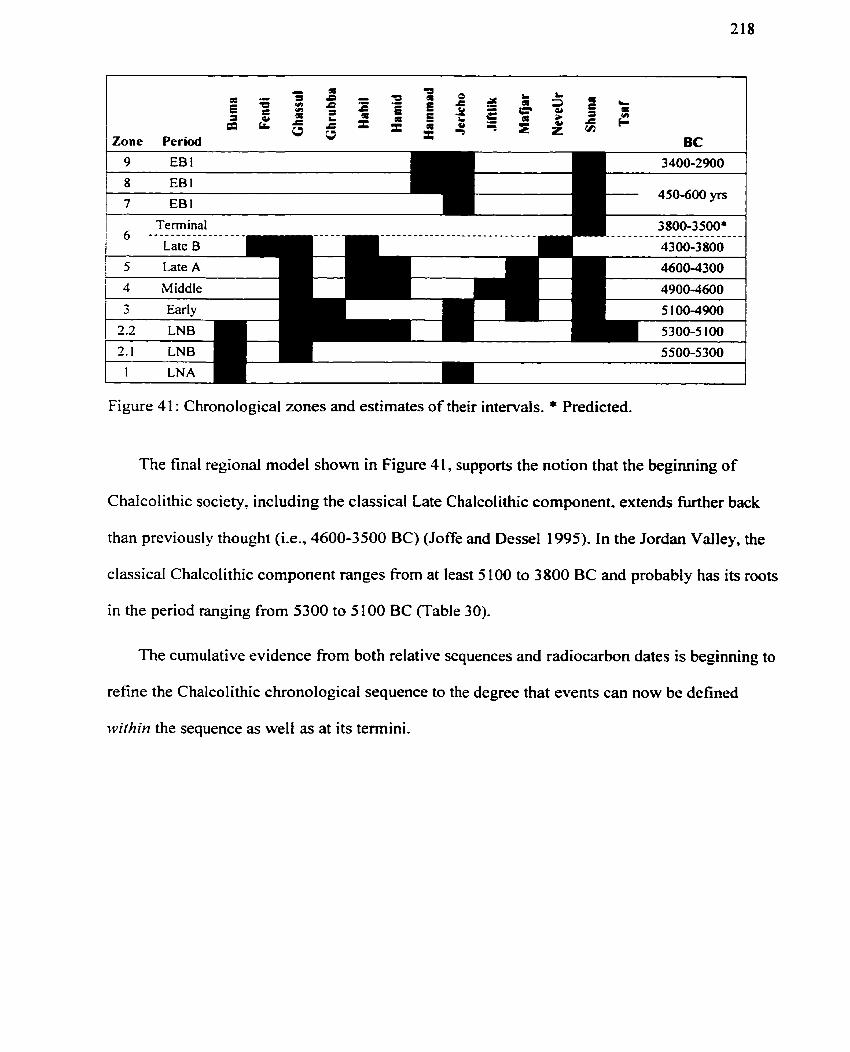
9 EB 1
8 EB 1
3 800-3 SOO* . . . . . . . . . . . . . . . . . . . . . . . . 4300-3 800
5 Late A 4600-4300
4 Middle 4900-4600
5 1004900
5500-5300
Figure 4 1 : Chronologicd zones and estimates of their intervals. * Predicted.
The final regional mode1 shown in Figure 41, supports the notion that the beginning of
Chalcolithic society, including the classical Late Chalcolithic component. extends M e r back
than previously thought (Le., 4600-3500 BC) (Joffe and Dessel 1995). In the Jordan Vailey, the
classical ChalcoIithic component ranges fiom at least 5 100 to 3800 BC and probably has its roots
in the period ranging from 5300 to 5 100 BC (Table 30).
The cumulative evidence from both relative sequences and radiocarbon dates is beginning to
refine the Chalcolithic chronologicat sequence to the degree that events can now be defined
rvifhin the sequence as welt as at its temini.
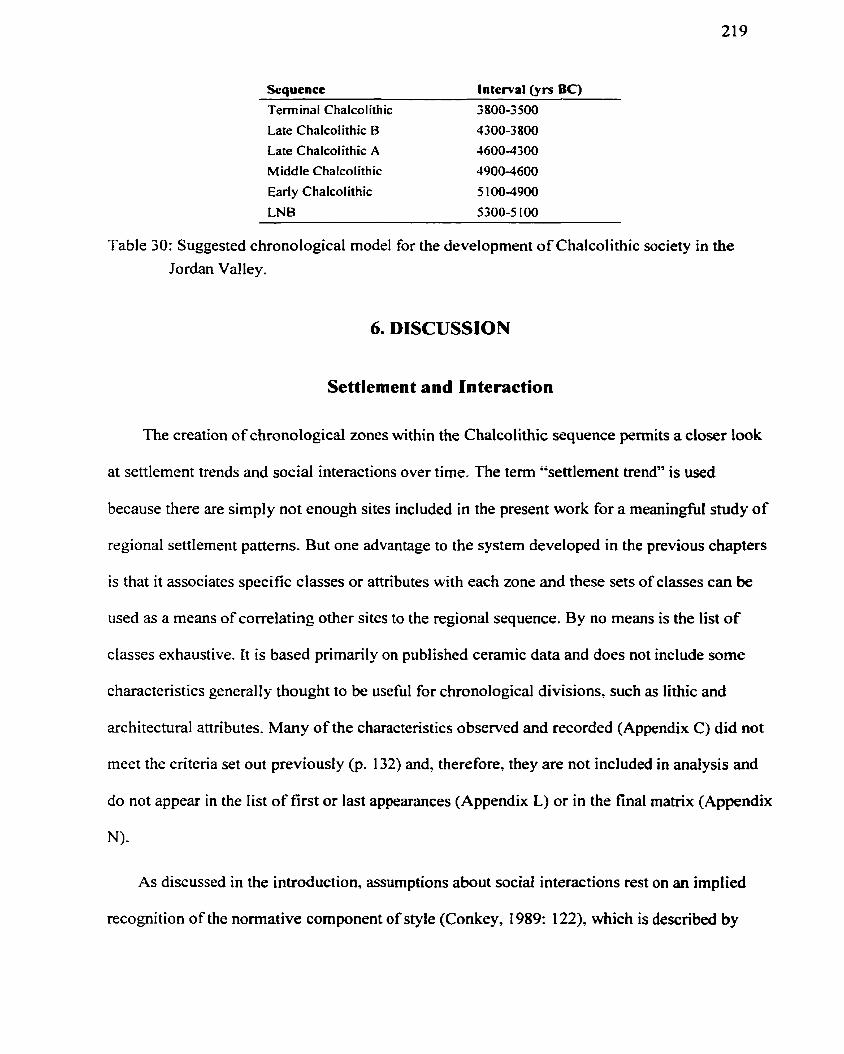
Sequence Interval (yrs BC) -
Terminal Chalcolithic 3 800-3 500
Late Chalcolithic B Late Chalcolithic A
Middle Chalcolithic 4900-4600
EarIy Chalcolithic
LNB - - -
Table 30: Suggested chrono logical model for the development of C halcolithic society in the
Jordan Valley.
6. DISCUSSION
Settlement and Interaction
The crcation of chronological zones within the Chalcolithic sequence permits a closer look
at settlement trends and social interactions over time. The term "settlement trend" is used
because there are simply not enough sites included in the present work for a meaningful study of
regional settlement patterns. But one advantage to the system developed in the previous chapters
is that it associates specific classes or attributes with each zone and these sets of classes can be
used as a means of correlating other sites to the regional sequence. By no means is the list of
classes exhaustive. It is based primarily on published ceramic data and does not include some
characteristics generally thought to be useful for chronological divisions, such as lithic and
architectural attributes. Many of the characteristics observed and recorded (Appendix C) did not
meet the criteria set out previously (p. 132) and, therefore, they are not included in analysis and
do not appear in the list of first or last appearances (Appendix L) or in the final rnatrix (Appendix
NI-
AS discussed in the introduction, assumptions about social interactions rest on an implied
recognition of the normative component of style (Conkey, 1989: 122), which is descnbed by
Sackett (1977. 1993) as isochrestic variation (see p. 102). The same assumptions can be used in
an historical approach to style. The term "tradition", for example. implies a temporal continuity
in the character of assemblages. one that is assumed to relate to group identity.
One aspect this research can address is that conceming the nature of ChalcoIithic settlement
in the Jordan Valley in both the initial and final phases of occupation. Questions are often raised
about whether or not rapid changes in settlement patterns. or social organization in general, are
related to endogenous or exogenous factors of change. If we assume that endogenous change is
related to a continuity of stylistic tradition, then the relative sequence, as constructed by UAM,
can be used to assess this continuity relative to other factors.
To facilitate discussion of regional events in each zone. 1 appraise regional assemblages, or
horizons, in terms of their formal and stylistic diversity, and connectedness. Changes in style are
compared to traditions in style for the purpose of evaluating settlement trends. Connectedness is
a network term used in communication studies to refer to the degree to which two or more
individuak share information. In this case. it is a rneasure of the degree to which two or more
sites share stylistic and formal ceramic attributes. The sharing of stylistic attributes is ofien
associated with a degree of socid interaction but. as several studies have indicated, the
relationship between the use of style and the marner of social interaction can be quite complex
(for reviews, see Deetz, 1967; Friedrich, 1970; Hodder, I977a; Sackett, 1977; Wobst, 1977;
Conkey, 1978, 1990; Plog, 1978; Wiessner. 1983, 1984; DeBoer, 1993). Nonetheless, 1 accept
the views of DeBoer and others that, in general, a sharing of style represents an exchange of
ideas and information (see also Renfiew, 1975, 1986; Plog 1980).
Diversity
Diversity in classes or assemblages c m be evaluated using measures of richness and
evenness (Bobrowsky and Ball. 1989). The way it is used here, richness is a relative measure of
the nurnber of different classes present per zone, and c m be used as a way to judge the
homogeneity of a regional sarnple fiom zone to zone. More hornogenous (less rich) samples are
assurned to represent a move towards a less diverse and perhaps more standardized regional
assemblage. A homogeneous regional distribution of style suggests that there was a relatively
free transmission of style among communities and a move away from group differentiation.
Evenness values are used to judge the interna1 distribution of class abundance within any sample.
In other words, it is a measure of the uniformity of the distribution of relative proportions of the
classes. It can be used to determine if one or more classes are over-represented within a regional
zone, suggesting perhaps that there were functional differences in pottery use fiom one zone to
the next. Measures of richness and evenness are applied below. following a closer look at UAM
output.
The results of UAM provide an alternative way to view diversity. Rather than looking at
diversity as a static rneasure, it is possible to observe the process of diversification over time.
This is done by plotting the progressive appearance and disappearance of artifact and attribute
classes per UA (Figure 43). Actually, we plot the cumulative sum of each. putting first
appearances on the x-axis and last appearances on the y-axis. Each UA represents a step forward
in relative time and, with each step, some new classes (styles and forms) appear while others are
no longer used. The mode1 used here is based on the assumption that styiistic change is random
and that, in general, appearances will equai disappearances over time. When plotted, random
results would produce a relatively straight line in much the same direction as the time arrow
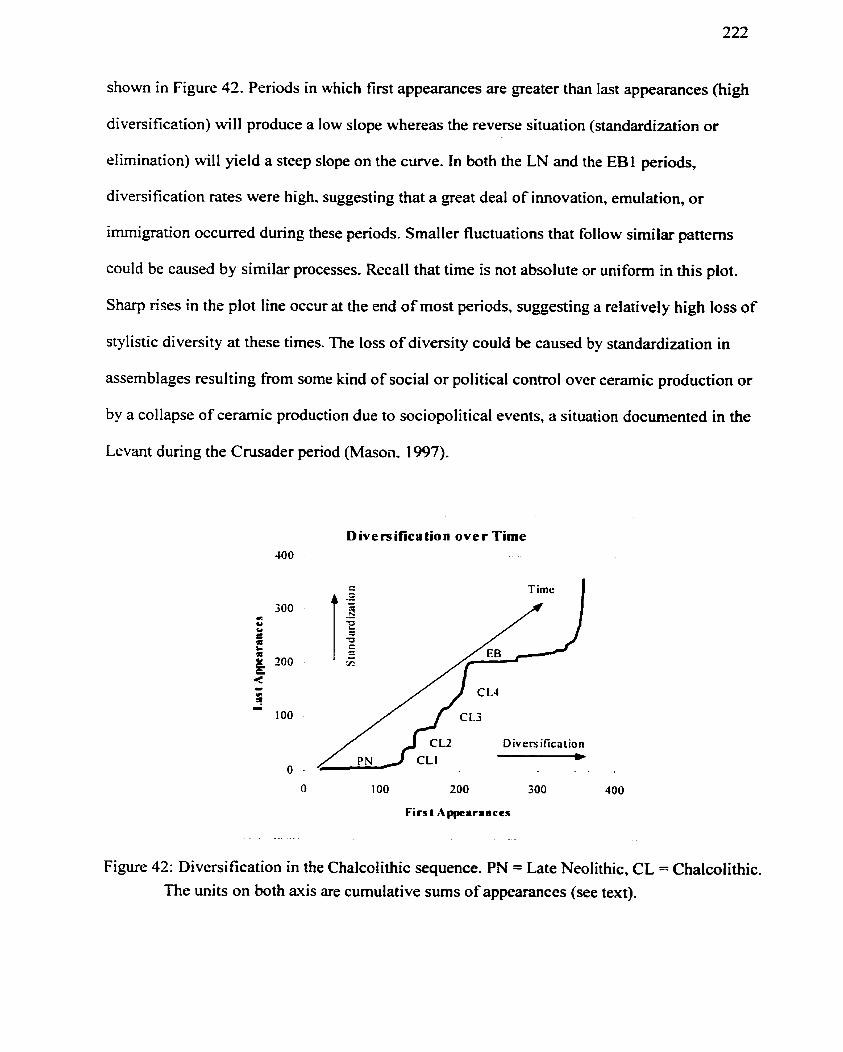
shown in Figure 42. Penods in which first appearances are greater than last appearances (hi&
diversification) will produce a low slope whereas the reverse situation (standardization or
elimination) will yield a steep slope on the curve. In both the LN and the EBI periods,
diversification rates were high. suggesting that a great deal of innovation, emulation, or
immigration occurred during these penods. Smal ler fluctuations that follow similar patterns
could be caused by similar processes. Recall that time is not absolute or uniform in this plot.
Sharp rises in the plot line occur at the end of most periods, suggesting a relatively high loss of
stylistic divenity at these times. The loss of diversity could be caused by standardization in
assemblages resulting fiom some kind of social or political control over ceramic production or
by a collapse of ceramic production due to sociopolitical events, a situation docurnented in the
Levant dunng the Crusader period (Mason. 1997).
Dive is ifica tion ove r Time JO0
E Time 1
Diversification I
Firs t A ppcaranccs
Figure 42: Diversification in the Chalcolithic sequence. PN = Late Neolithic, CL = Chalcolithic. The units on both axis are cumulative sums of appearances (see text).
Tradition and Change
The amount of information available limits our ability to make specific statements about the
nature of past social changes. Our interpretations of the data c m Vary. depending on the degree
to which we believe change has occurred and on the relationships we draw between style and
social change. For historical periods, there is often a strong association between changes in
artistic expression and sociopolitical change, The European Renaissance is one exarnple. But to
what degree the causes of change c m be linked to internat cultural processes or result from
inter-regional interactions is difficult to ascertain. The Renaissance was a time of tremendous
social change that began in a localized region (Italy). but it cannot be disassociated from a petiod
of European global discovery. It is unlikely that the causes of sociopolitical events at this time
can be clearly separated fiom inter-regionai affairs.
In light of the complex nature of social change. any attempt to attribute causes of change to
either endogenous or exogenous factors alone is not necessarily usefùl nor informative, and is
ofien simplistic. Nonetheless. any explanation of events for the region cannot begin until those
events are defined. no matter how loosely. I t would be misleading, for instance, to attempt to
explain social change arnong the Aztecs without reference to the incursions of Spain. And what
conclusions would we draw fiom the matenal evidence in Mexico if we were to completely
dismiss theories of invasion or migration simply because they do not sit well with contemporary
paradigms of anthropological thought?
The immediate problem facing regional studies is to determine the extent of change in
regional material cultures and to relate these changes to different kinds of sociopolitical change.
Steps in this direction could be taken by appraising, for example, the degree to which Aztec
materid culture was reproduced (and what was reproduced) in relation to the entire body of
material culture in both contact and pre-contact periods. Studies of this nature would be a move
towards understanding and interpreting changes in regional assemblages.
The results of UAM can be used as proxy mesures to evaluate these changes, depending on
the degree to which we link stylistic change to social change. One way to evaluate the nature of
the changes observed in Figure 42 is to track continuity in style (tradition) versus the
diversification of style (innovation). A simple mode1 is outlined below that attempts to link the
differential interplay of stylistic tradition and change to sociopolitical process (Table 3 1). As
with al1 rnodels. it is predicated on a number of assumptions. For instance, if there was a hi&
degree of stylistic diversification and yet traditional styles were retained, it implies that many
new stylistic innovations were introduced while, at the same time, there was no disruption in the
local transmission of style. In this case. the source of diversification could be attributed to either
endogenous or exogenous factors. If, however, there was a sudden break with traditional style
and this was accompanied with, or immediately followed by, a significant introduction of new
styles, then it impks that change is due to exogenous or inter-regional factors. In another case,
significant breaks with tradition accompanied by relatively Iittle change in stylistic innovation,
suggests that changes may be due to local sociopolitical or environmental events. Finally, the
lack of diversification accompanied by the maintenance of tradition would reflect a stable and
conservative reproduction of style.
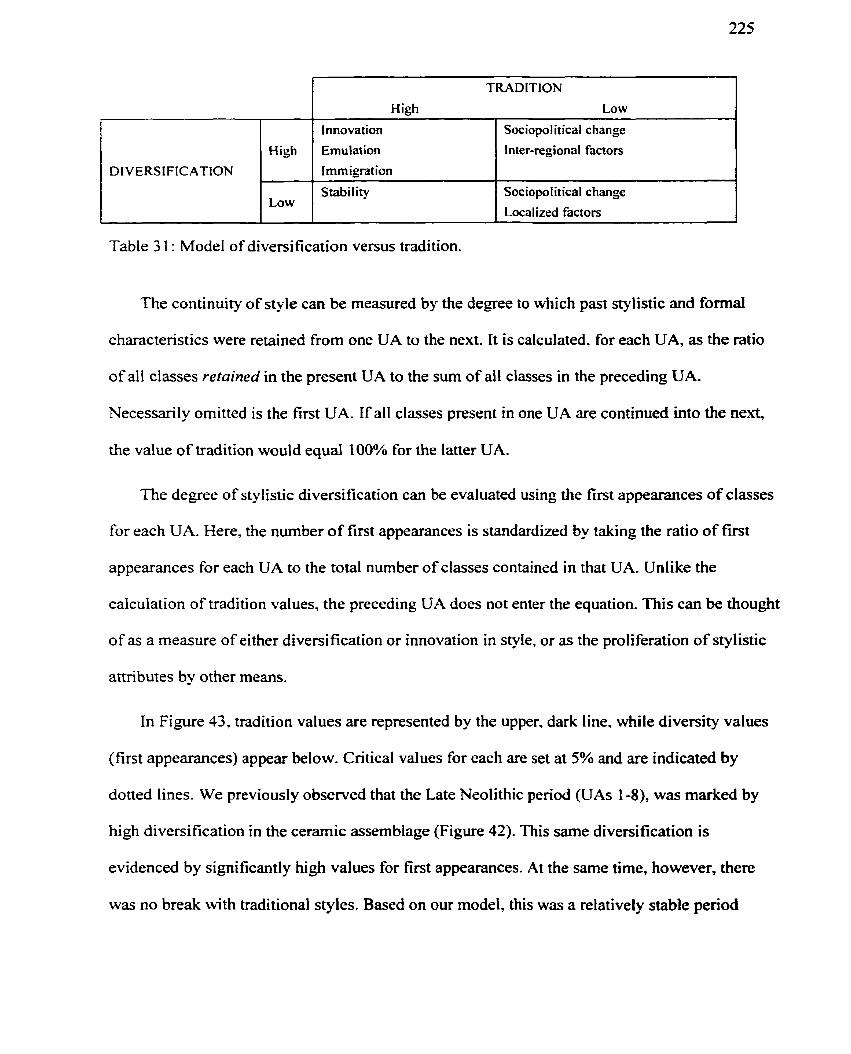
-- - - -- -- -
Table 3 1 : Mode1 of diversification versus tradition.
The continuity of style c m be measured by the degree to which past stylistic and formd
characteristics were retained from one UA to the next. It is calculated. for each UA, as the ratio
of al1 classes retained in the present UA to the sum of al1 classes in the preceding UA.
Necessarily omitted is the first UA. If al1 classes present in one UA are continued into the next,
the value of tradition would equal 100% for the latter UA.
DIVERSIFICATION
The degree of stylistic diversification c m be evaluated using the first appearances of classes
for each UA. Here, the number of first appearances is standardized by taking the ratio of first
appearances for each UA to the total number of classes contained in that UA. Unlike the
calculation of tradition values, the preceding UA does not enter the equation. This c m be thought
of as a measure of either diversification or innovation in style. or as the proliferation of stylistic
attributes by other means.
High Low
High
Low
In Figure 43, tradition values are represented by the upper, dark line. while diversity values
(first appearances) appear below. Critical values for each are set at 5% and are indicated by
dotted lines. We previously observed that the Late Neolithic period (üAs 1-8), was marked by
high diversification in the ceramic assemblage (Figure 42). This same diversification is
evidenced by significantly high values for first appearances. At the same time, however, there
was no break wvith traditional styles. Based on our model, this was a relatively stable period
Innovation
Emulation
Immigration
Stabil ity
Sociopolitical change
Inter-regional factors
Sociopolitical change
Localized factors
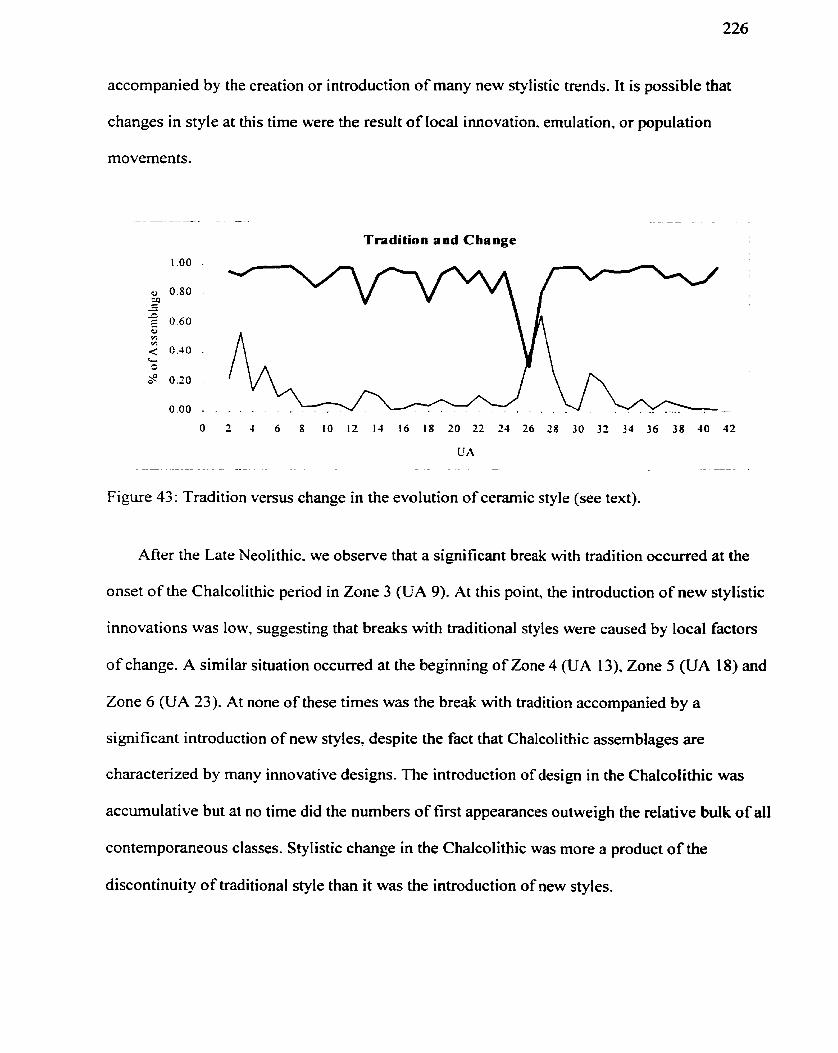
accompanied by the creation or introduction of many new stylistic trends. It is possible that
changes in style at this time were the result of local innovation. emulation, or population
movements.
- - - - - . -
Tradition and Change
Figure 43: Tradition versus change in the evolution of cerarnic style (see text).
After the Late Neolithic. we observe that a signi ficant break with tradition occurred at the
onset of the Chalcolithic penod in Zone 3 (UA 9). At this point, the introduction of new stylistic
innovations was low, suggesting that breaks with iraditional styles were caused by local factors
of change. A similar situation occurred at the begiming of Zone 4 (UA 13), Zone 5 (iJA 18) and
Zone 6 (UA 23). At none of these times was the break with tradition accompanied by a
significant introduction of new styles, despite the fact that Chalcolithic assemblages are
characterized by many innovative designs. The introduction of design in the Chalcolithic was
accumulative but at no time did the numbers of first appearances outweigh the relative bulk of ail
contemporaneous classes. Stylistic change in the Chalcolithic was more a product of the
discontinuity of traditional style than it was the introduction of new styles.
The most drastic change in both tradition and the introduction of new styles occurred in the
Early Bronze Age (Zone 7), most notably between UAs 25 and 26. This particular pattern, in
which a significant break with tradition was accompanied by a significant introduction of new
styles, was the only one of its kind throughout the 2000-year sequence. By UA 26, only 3 1 % of
al1 previous stylistic traditions were maintained whereas, at the sarne time. 38% of the horizon
was comprised of new characteristics of form and style. This proportion increased to 65% by the
following U.4 27 but. unlike UA 26. this period was strongly c o ~ e c t e d with the previous UA.
That is, fully 8 1 % of the UA 27 composition was the same as it was in UA 26 (Le., EB 1). The
same trend is observed even if the UAs are grouped into previously defined zones. Clearly, there
was a significant break with the past that would be dificult to attribute solely to local factors of
change.
Moving on. we see that a significant diversification of style accounted for the transition to
EB Zone 8 (UA 3 1). The last time a similar pattern of development occurred was at the transition
fiorn the LNA to the LNB in Zone 2 (UA 3). Like the previous pattern. the introduction of new
styles was accompanied with no associated break in tradition, suggesting a Iocal innovation or
emulation of style. However, additional analyses suggest that the sarne processes were not
occurring in each transitional penod (see below). The remainder of the Early Bronze period was
reIativeIy stable.
Continuity in pottery style can also be assessed using similarity mesures. The premise is
that continuity of stylistic traditions is represented by the similarity of class composition in any
two adjacent zones. By this method, al1 characteristics present in one zone are compared to those
in the next. But the characteristics used include aZZ those recorded per zone and, unlike the
cornparison of first and last appearances. are not Iimited to chronological attributes only. The
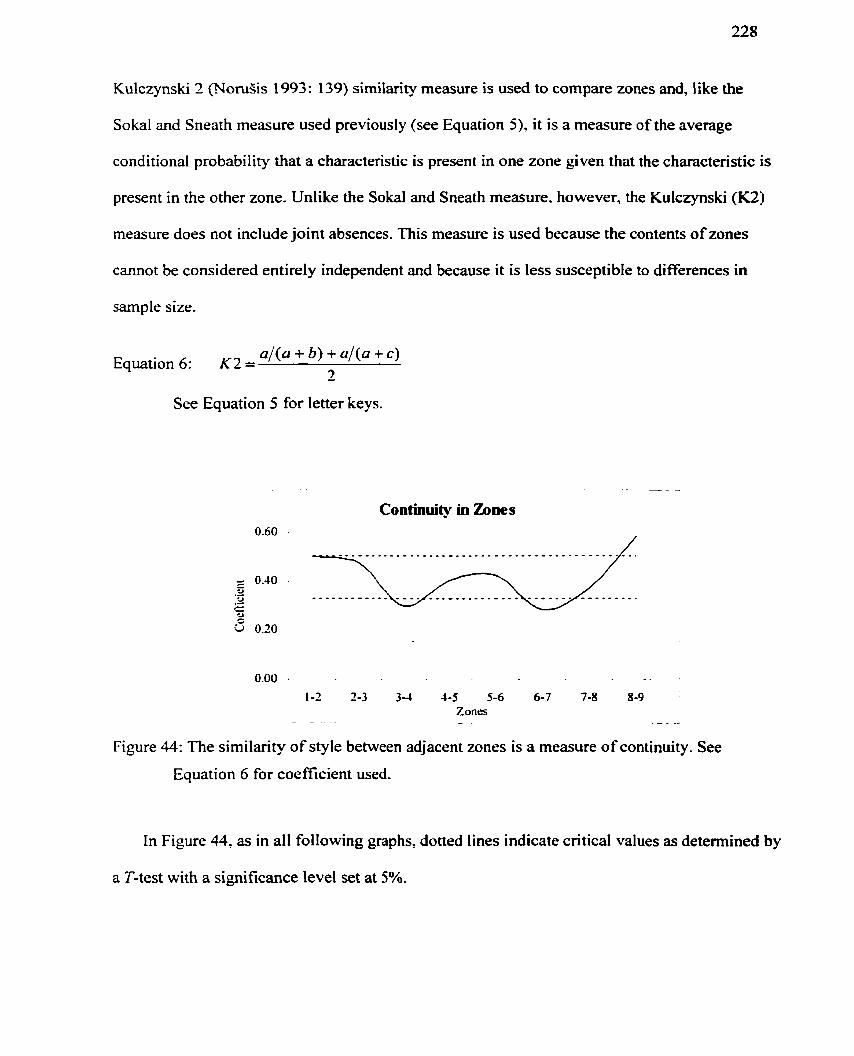
Kulczynski 2 (NoruSis 1993: 139) similarity measure is used to compare zones and, like the
Sokal and Sneath measure used previously (see Equation 5), it is a measure of the average
conditional probability that a characteristic is present in one zone given that the characteristic is
present in the other zone. Unlike the Sokal and Sneath measure. however. the Kulczynski (K2)
measure does not include joint absences. This measure is used because the contents of zones
cannot be considered entirely independent and because it is less susceptible to differences in
Equation 6: K 2 = a/(a + b) + a/(a + c )
3
See Equation 5 for letter keys.
Continuity in Zones
1-2 2-3 3 4 4-5 5-6 6-7 7-8 8-9 Zones
- - .. . - ---.
Figure 44: The similarity of style between adjacent zones is a measure of continuity. See
Equation 6 for coefficient used.
In Figure 44: as in al1 following graphs, dotted lines indicate critical values as determined by
a T-test with a significance level set at 5%.
The resulting similarity measures tend to support previous outcomes (Figure 44). In the Iast
chapter. it was noted that artifacts generally associated with Chalcolithic assemblages began to
appear in Zone 3 (Early Chalcolithic), but that this zone was more similar in composition to the
previous LNB period than to the following Middle Chalcolithic. The same conclusion is reached
here when al1 classes are included in zone composition. The significant break with continuity of
style occurred in the transition from Zone 3 to 4 (Early to Middle Chalcolithic), d e r the
introduction. or creation. of several classic Chalcolithic foms and styles. In the Early
Chaicolithic. these classic styles occur mainly at Ghassul (for those sites sampled) and become
cornmon at other sites by the Middle Chalcolithic. At this time. Wadi Rabah and Halafian-like
styles have ceased entirely, an event that seems to correspond with the abandonment of Jericho.
The implication is that significant changes took place at the onset of the Chalcolithic and, as
suggested above. these changes were probably associated with local sociopolitical events.
The transition from Zone 6 to 7 (Late Chalcolithic B or. probably. Terminal Chalcolithic to
Early Bronze) represents another significant break in continuity, as we might expect fkom
previous results. On the other hand, by the final stages of the EB1, there was a significant
conrinuity of style. Notice that, by grouping UAs into zones and by including al1 characteristics,
the sharp differences evident in Figure 43 are mitigated to some degree. The transition to the
Chalcolithic. for instance. appears as significant as the transition to the EBI, which it may have
been. The main difference, which is not clear using only similarity measures. is that Chalcolithic
styles were more rooted in local traditions.
Richness and Evenness
Previously, similar patterns of tradition and change were observed for the LNB and EB Zone
8. But measures of diversity suggest that different processes were at work for each period. The
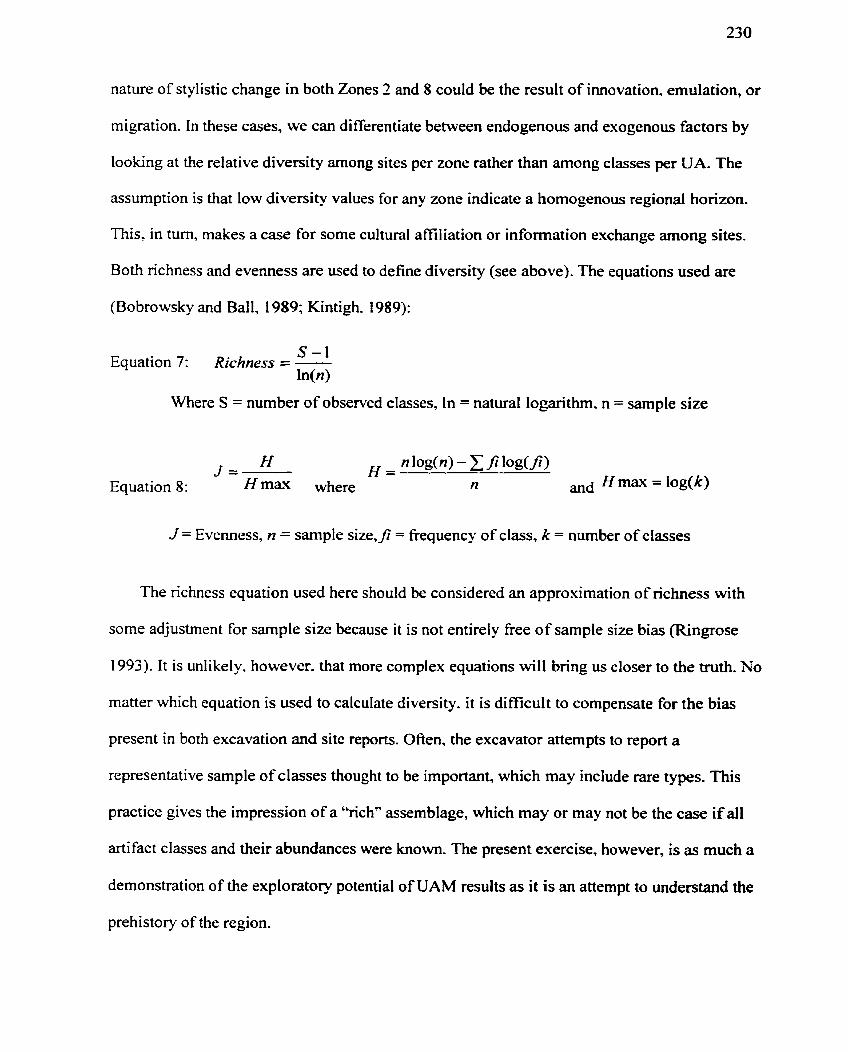
nature of stylistic change in both Zones 2 and 8 could be the result of innovation. emulation, or
migration. In these cases, we c m differentiate between endogenous and exogenous factors by
looking at the relative diversity among sites per zone rather than arnong classes per UA. The
assumption is that low diversity values for any zone indicate a homogenous regional horizon.
This. in mm, makes a case for some cultural affiliation or information exchange among sites.
Both nchness and evenness are used to define diversity (see above). The equations used are
(Bobrowsky and Ball, 1989; Kintigh. 1989):
S-1 Equation 7: Richness = - wo
Where S = number of observed classes. In = natural logarithrn. n = sample size
J = Evenness. n = sample size,fi = frequency of class, k = number of classes
The richness equation used here should be considered an approximation of richness with
some adjustment for sample size because it is not entirely fiee of sample size bias (Ringrose
1993). It is unlikely. however. that more complex equations will bring us closer to the huth. No
matter which equation is used to calculate diversity. it is dificult to compensate for the bias
present in both excavation and site reports. Oflen, the excavator attempts to report a
representative sample of classes thought to be important, which may include rare types. This
practice gives the impression of a "rich" assemblage, which may or may not be the case if al1
artifact classes and their abundances were known. The present exercise, however, is as much a
demonstration of the exploratory potential of UAM results as it is an attempt to understand the
prehistory of the region.
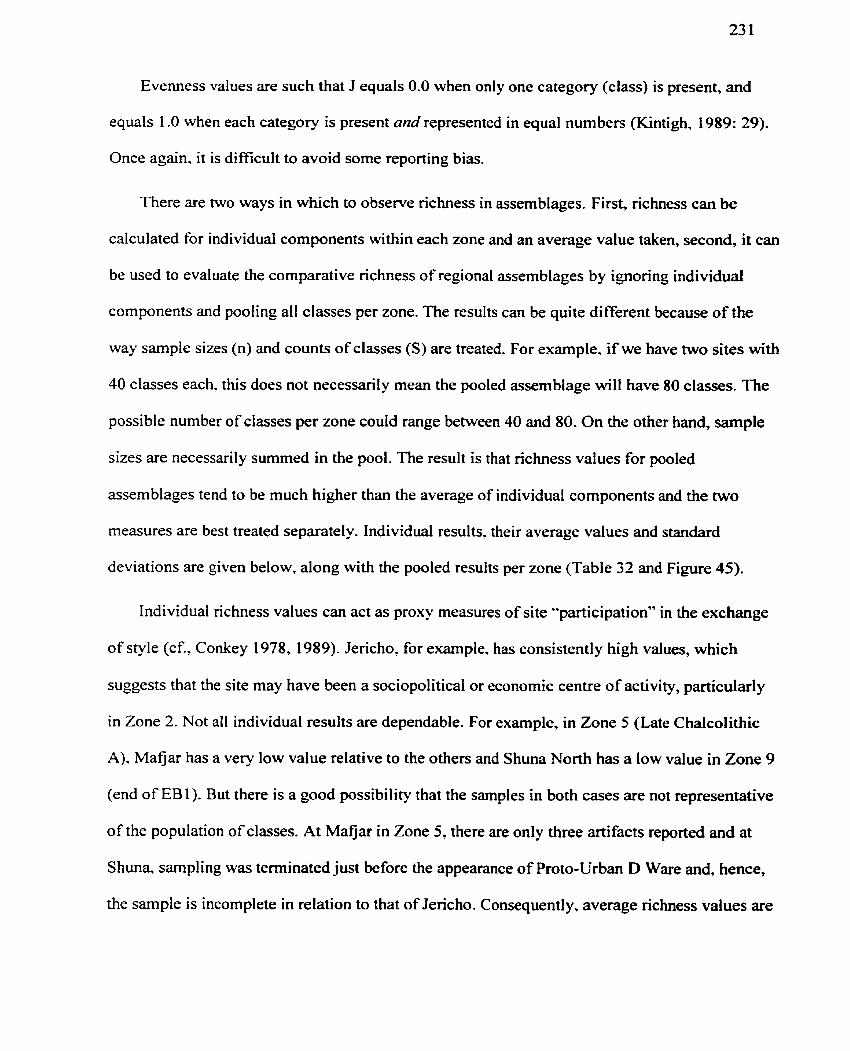
Evenness values are such that J equals 0.0 when only one category (class) is present, and
equals 1 .O when each category is present and represented in equal numbers (Kintigh, 1989: 29).
Once again, it is dificult to avoid some reporting bias.
There are two ways in which to observe t-ichness in assemblages. First, richness can be
calculated for individual components within each zone and an average value taken, second, it can
be used to evaluate the comparative richness of regional assemblages by ignoring individual
components and pooling al! classes per zone. The results c m be quite different because of the
way sarnple sizes (n) and counts of classes (S) are treated. For exarnple. if we have two sites with
40 classes each. this does not necessarity mean the pooled assemblage will have 80 classes. The
possible number of classes per zone could range between 40 and 80. On the other hand, sample
sizes are necessarily summed in the pool. The result is that richness values for pooled
assemblages tend to be much higher than the average of individual components and the two
rneasures are best treated separately. Individual results, their average values and standard
deviations are given below, along with the pooled results per zone (Table 32 and Figure 45).
Individual richness values can act as proxy measures of site '*participation" in the exchange
of style (cf., Conkey 1978? 1989). Jericho. for example. has consistently high values, which
suggests that the site may have been a sociopolitical or economic centre of activity, particularly
in Zone 2. Not al1 individual results are dependable. For example, in Zone 5 (Late Chalcolithic
A). Mafjar has a very low value relative to the others and Shuna North has a low value in Zone 9
(end of EBI). But there is a good possibility that the samples in both cases are not representative
of the population of classes. At Mafjar in Zone 5, there are only three artifacts reported and at
Shuna, sampling was terminated just before the appearance of Proto-Urban D Ware and, hence,
the sample is incomplete in relation to that of Jencho. Consequently, average richness values are
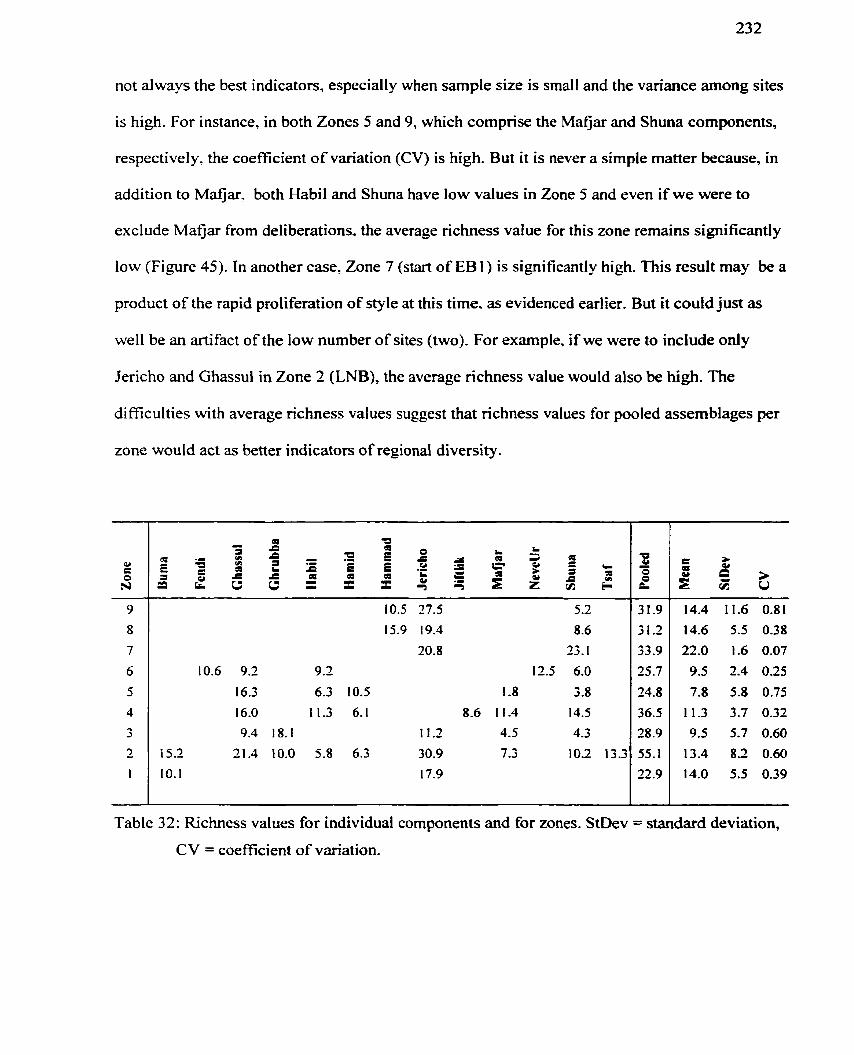
not always the best indicators, especially when sample size is small and the variance among sites
is high. For instance, in both Zones 5 and 9, which comprise the Mafjar and Shuna components,
respectively. the coefficient of variation (CV) is high. But it is never a simple rnatter because, in
addition to Mafjar, both Habil and Shuna have low values in Zone 5 and even if we were to
exclude Mafjar frorn deliberations. the average richness value for this zone remains significantly
low (Figure 45). In another case. Zone 7 (start of EB 1) is significantly high. This result may be a
product of the npid proliferation of style at this time. as evidenced earlier. But it could just as
well be an artifact of the low number of sites (two). For example. if we were to include only
Jencho and Ghassul in Zone 2 (LNB), the average nchness value would also be high. The
difficulties with average richness values suggest that richness values for pooled assemblages per
zone would act as better indicators of regionaI diversity.
Table 32: Richness values for individual components and for zones. StDev = standard deviation,
CV = coefficient of variation.
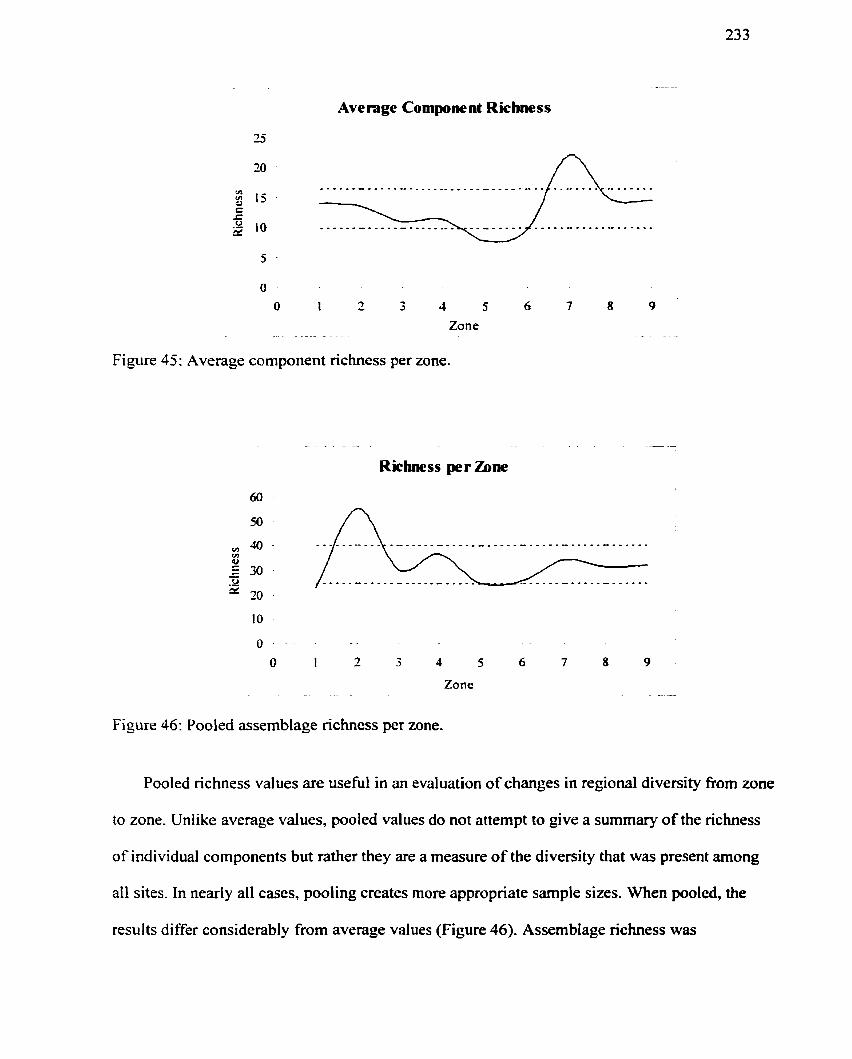
Average Component Richness
0 .
O 1 2 3 4 5 6 7 8 9
Zone
Figure 45: Average cornponent richness per zone.
- - - - -
Richness per Zone
60
Zone . . --
Figure 46: Pooled assemblage richness per zone.
Pooled richness values are usehl in an evaluation of changes in regional diversity from zone
to zone. Unlike average values, pooled values do not attempt to give a summary of the richness
of individual components but rather they are a measure of the diversity that was present arnong
ail sites. In nearly al1 cases, pooling creates more appropriate sarnple sizes. When pooled, the
results differ considerably from average values (Figure 46). Assemblage richness was
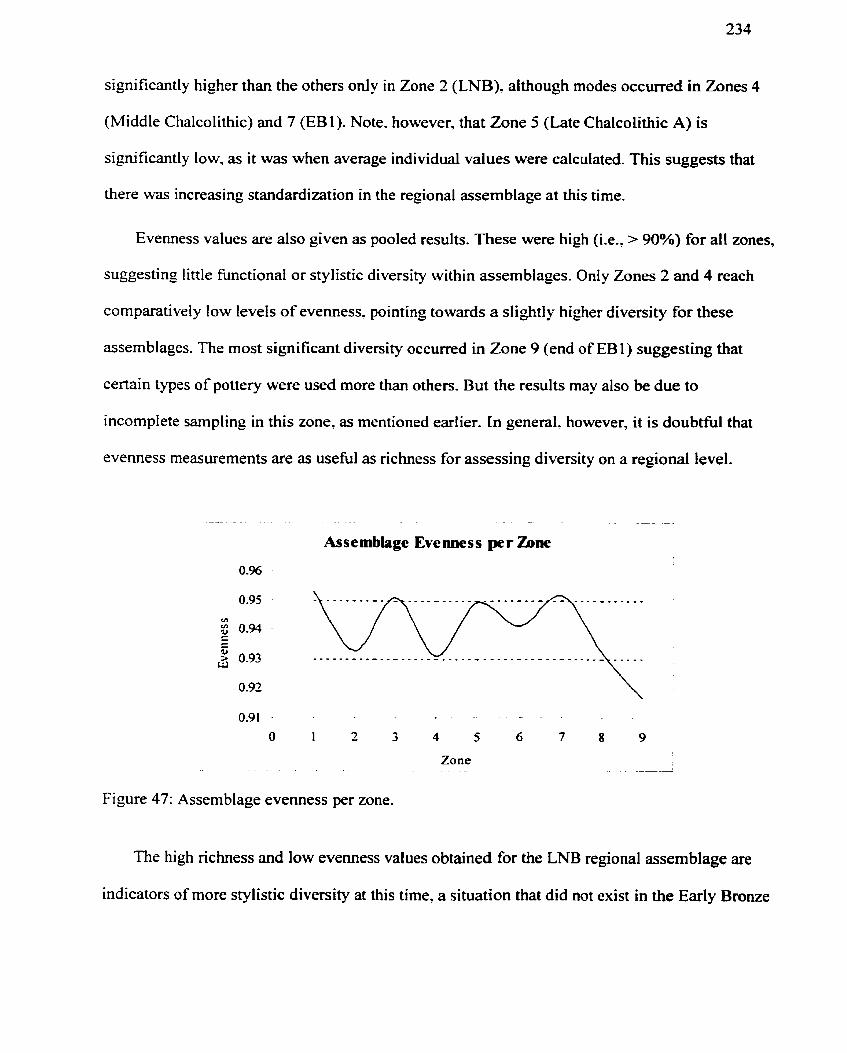
significantly higher than the othen only in Zone 2 (LNB). although modes occurred in Zones 4
(Middle Chalcolithic) and 7 (EBI). Note. however, that Zone 5 (Late Chalcolithic A) is
significantly low, as it was when average individual values were calculated. This suggests that
there was increasing standardization in the regional assemblage at this time.
Evenness values are also given as pooled results. These were high (i-e., > 90%) for al1 zones,
suggesting little Functional or stylistic diversity within assemblages. Only Zones 2 and 4 reach
comparatively low levels of evenness. pointing towards a slightly higher divenity for these
assemblages. The most significant diversity occurred in Zone 9 (end of EB 1) suggesting that
certain types of pottery were used more than others. But the results may also be due to
incomplete sampling in this zone, as mentioned earlier. In general. however, it is doubtful that
evenness measurements are as usehl as nchness for assessing diversity on a regionai level.
- - - -
Assemblage Evenness per Zone
Zone -
Figure 47: Assemblage evenness per zone.
n i e high nchness and low evenness values obtained for the LNB regional assemblage are
indicators of more stylistic divenity at this time, a situation that did not exist in the Early Bronze
Age. Not only was there a significant diversity among sites in the LNB but there was aiso a
significant continuity of tradition in pottery styles. The increase in stylistic diversity was either
the result of a move towards Iocalized differentiation. perhaps motivated by a desire to enforce
group identity, or from an influx to the region of social groups with their own stylistic
preferences. More than likely, the observed diversity results fiom a combination of both
processes. In support of migration theories, several pardlels have been drawn between Halafian
wares, a style that probably originated in northeastem Syria and a number of Late Neolithic
pottery styles and foms found in the southern Levant (Wright. 195 1 ; Kaplan, 1960; Leonard,
198 1 ; Gophna and Sadeh, 1989).
Connectedness
Connectedness in communication or network studies is defined as the ratio of shared
characteristics to the possible number of shared characteristics arnong al1 individuals mage and
Harary. 199 1). It is important to note that connectedness is not a measure of similarity.
S imi Iarities between assemblages are treated below. When discussing connectedness in
communication studies, it is generally assumed that each individual can share information
equally with another. But when dealing with archaeological deposits representing past
comrnunities of uncertain sizes and populations, different assumptions and methods are required.
We made a basic assumption that shared styles represent shared information but we cannot
assume that al1 sites had the potential to share al1 styles. For example, we would not expect a
village of 1000 people to share a similar repertoire of style found in a city of two million
inhabitants. Furthemore, we cannot assume that al1 artifacts reported are those represented at the
site. Some adjustment is needed for the sample size of reported classes.
For present purposes. cormectedness is defined as the ratio of shared attributes to the
predicted number of shared attributes. It is dificult to eliminate entirely the effects of differential
deposition, recovery, preservation, or recording when comparing assembfages. The method used
here attempts to alleviate this problem to some degree by comparing the number of dirirent
classes shared to those we would expect to be shared given the number of different classes
present in each reported assemblage. The number of classes at each site is standardized to the
total number of classes present per zone by calculating the ratio of different classes per site to the
total number of different classes in each zone. We make the assurnption that the proportion of
classes reported for each site is representative of the actual proportion of classes, although this
may not actually be the case. The probability that any two sites will share the same artifact
cIasses is the product of the ratios. If. for example. we have 100 different classes among two
sites. one of which has 20 classes and the other 90. then the probability of locating any class at
the first site is 20/100 = 0.20 and. for the second, is 90/100 = 0.90. In a random model, the
probability that these two sites would share any particular class is (0.20)(0.90) = 0.18. Since
there are 1 00 di fferent classes, then the expected number of shared classes would be (0.18)(1 00)
= 18. In the final solution, a relative measure of connectedness is calculated as the ratio of the
number of observed to expected classes. 1- for instance, 10 shared classes are observed, then the
measure of connectedness is 1 O/18 =0.56. A connectedness value of 1 means that the number of
observed classes equals the number expected. The average connectedness value for any one site
is the average of its connectedness values at al1 other contemporaneous sites or:
Z Obs
Equation 9: S = P I P'N n-1
where: S = average connectedness for Site 1. Obs = shared classes observed, pl =
probability of class at site 1, pz = probability of class at site 2, N = total number of
different classes, n = number of sites
The resulting co~ectedness values are proxy measures of information exchange between
past communities that are assurned to be roughly conternporaneous in each tirne zone. In dl but
one case (Shuna North, Zone 2), the values obtained are either within or below expected values
(Table 33). Individual values for each site act as a relative measure of integration within the
system of sites for each zone. For example. in Zone 2. Shuna North has a significantly high
connectedness value (1.48), imptying that. based on the number of classes at each site, it shared
sigriificantly more pottery characteristics than expected? The Shuna North cornrnunity appears to
have been more regionally integrated than the other LNB sites, a situation that rivals the results
using richness values alone (Table 32). Richness values suggest that Jericho is more integrated
into the regional system than Shuna North. i suggest that connectedness values are better
indicators of information exchange than richness simply because they account for differences in
individual sarnple sizes on a site-by-site basis.
But the figures in Table 33 do not reveal anything about connectedness values for individual
pairs of sites (unless there are only NO), nor do they account for the effects of distance or
geographic and cultural boundaries. For instance, in Zone 6, Tell Fendi and Shuna North have
significantly low values (Z =-2.85 and -3.37, respectively. 2-critical = 1.65) within the system of
sites but, between the two of them, there was no significant difference in the number of shared
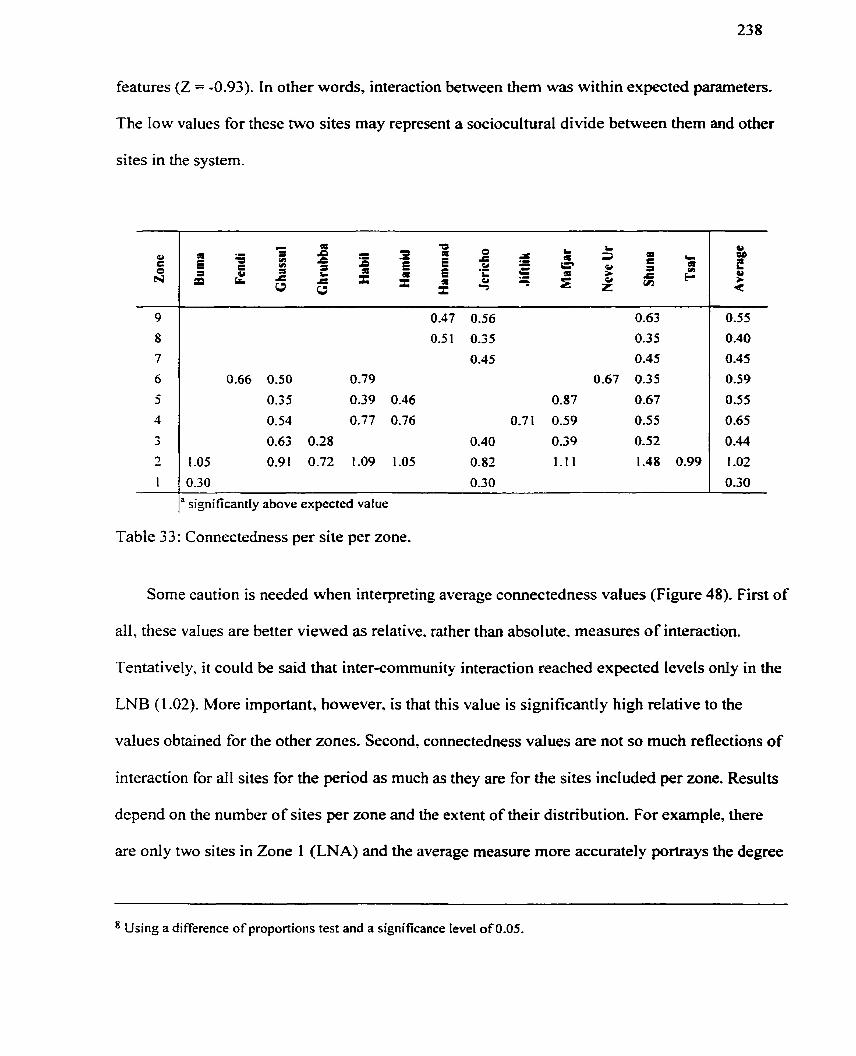
features (Z = -0.93). In other words, interaction between them was within expected parameters.
The low values for these two sites may represent a sociocultural divide between them and other
sites in the system.
f la significantly above expected value
Table 33: comectedness per site per zone.
Some caution is needed when interpreting average comectedness values (Figure 48). First of
all. these values are better viewed as relative, rather than absolute. measures of interaction.
Tentatively. it could be said that inter-community interaction reached expected levels only in the
LNB (1.02). More important, however. is that this value is significantly high relative to the
values obtained for the other zones. Second, connectedness values are not so much reflections of
interaction for al1 sites for the period as much as they are for the sites included per zone. Results
depend on the number of sites per zone and the extent of their distribution. For example, there
are only two sites in Zone 1 (LNA) and the average measure more accurately portrays the degree
Using a difference of proportions test and a significance level of 0.05.
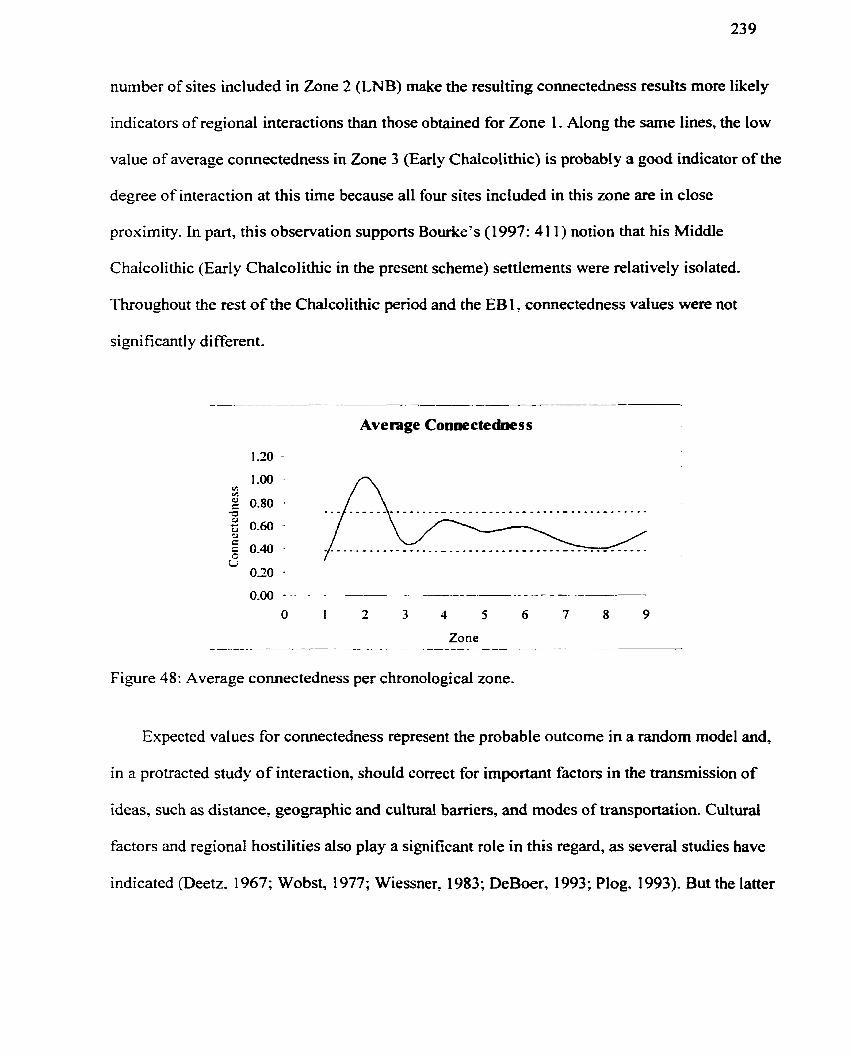
number of sites included in Zone 2 (LNB) make the resulting connectedness results more likely
indicators of regional interactions than those obtained for Zone 1 . Along the same Iines, the low
value of average co~ectedness in Zone 3 (Early Chalcolithic) is probably a good indicator of the
degree of interaction at this time because al1 four sites inchded in this zone are in close
proximity. In part, this observation supports Bourke's (1997: 41 1) notion that his Middle
Chakolithic (Early Chalcolithic in the present scheme) settlements were relatively isolated.
Throughout the rest of the Chdcolithic period and the EB 1. connectedness values were not
significantly different.
--
Ave rage Connectednes s
Zone -- . - - -
Figure 48: Average connectedness per chronological zone.
Expected values for connectedness represent the probable outcome in a random mode1 and,
in a protracted study of interaction, should correct for important factors in the transmission of
ideas, such as distance, geographic and cultural barriers, and modes of transportation. Cultural
factors and regional hostilities also play a significant role in this regard, as several studies have
indicated (Deetz. 1967; Wobst, 1977; Wiessner, 1983; DeBoer, 1993; Plog, 1993). But the latter
factors are more difficult tu predict in an archaeological model, although certain processes can be
inferred on the basis of deviations fiom the model.
Connectedness and Similaritv
Comectedness should not be confùsed with similarity. Similarity measures are ofien used as
proxy measures of social interaction but they tend to gauge structural sirnilarities in assemblages
rather than provide a theoreticai b a i s of cornparison. They are exploratory rather than predictive.
Comectedness is a way of judging the degree of stylistic sharing observed to that which is
expected while similarity is cdculated as the ratio of the number of classes shared relative to the
size of individual samples. If we use the Kulczynski 2 shilarity measure given above (p. 228),
the results obtained are quite different (Figure 49). in this case, we do not predict how many
characteristics any two sites could possibly share within the pool of classes but rather we observe
shared characteristics relative to the size of each individual sample and ignore the poo1 of
available classes. The measure used here differs fiom the similarity measure used previously (p.
228). which gauges the similarity of adjacent zones with no respect to individuai assemblages.
What is being measured here is the similarity among assemblages in the sarne zone.
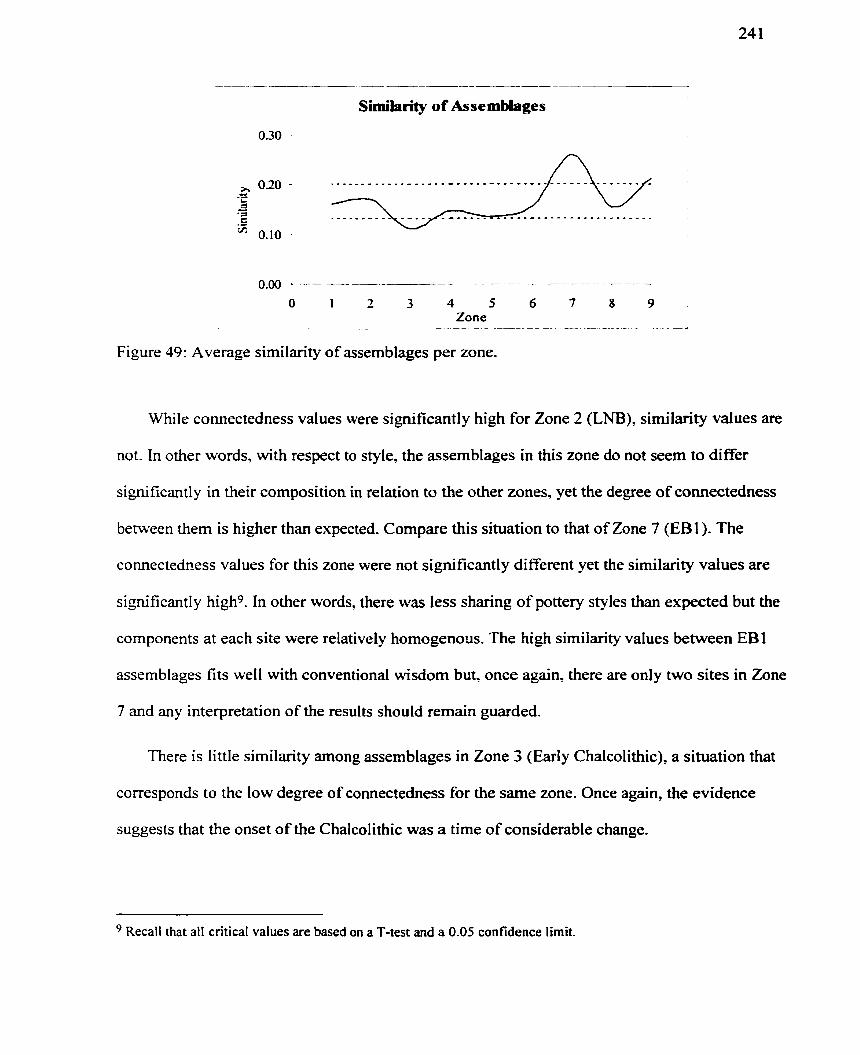
Similarity of Assemblages
1 2 3 4 5 6 7 8 9 . Zone
- - - - - - . p - . - - - - - - - - - . - - - - - - - - 7 . . - . . - . . - - - - - . - . - p > - -
Figure 49: Average similarity of assemblages per zone.
While co~ectedness values were significantly high for Zone 2 (LNB), sirnilarity values are
not. in other words, with respect to style, the assemblages in this zone do not seem to differ
significantly in their composition in relation to the other zones. yet the degree of connectedness
between them is higher than expected. Compare this situation to that of Zone 7 (EB1). The
connectedriess values for this zone were not significantly diflerent yet the similarity values are
significantly high? In other words, there was less sharing of pottery styles than expected but the
components at each site were relatively homogenous. The high similarity values between EBI
assemblages fits well with conventional wisdom but, once again, there are only two sites in Zone
7 and any interpretation of the results shouId remain guarded.
There is little similarity among assemblages in Zone 3 (Early Chalcolithic), a situation that
corresponds to the low degree of connectedness for the same zone. Once again, the evidence
suggests that the onset of the Chalcolithic was a time of considerable change.
Recall that al1 critical values are based on a T-test and a 0.05 confidence limit.
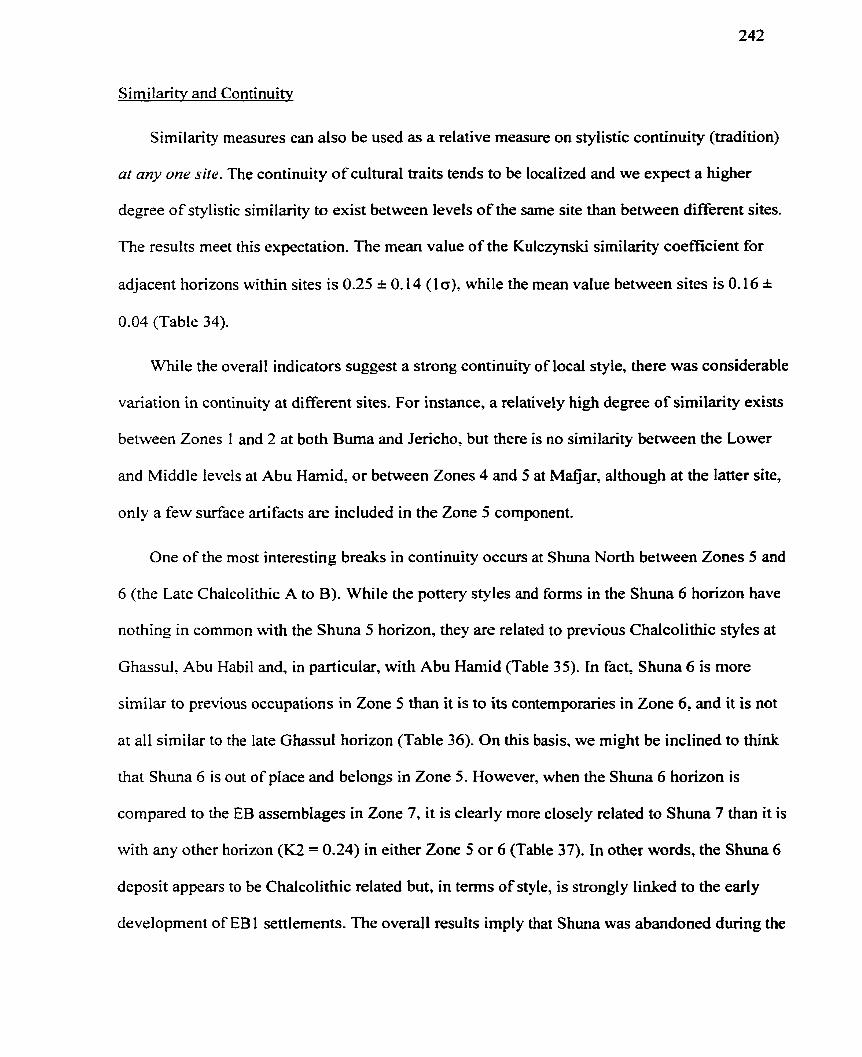
Similarïtv and Continuitv
Similarity measures can also be used as a relative measure on stylistic continuity (tradition)
ar any one site. The continuity of cultural traits tends to be localized and we expect a higher
degree of stylistic similarity to exist between levels of the same site than between different sites.
The results meet this expectation. The niean value of the Kulczynski similarity coefficient for
adjacent horizons within sites is 0.25 i 0.14 (Io). while the mean value between sites is 0.16 k
0.04 (Table 34).
While the overall indicators suggest a strong continuity of local style, there was considerable
variation in continuity at different sites. For instance, a relativeiy hi& degree of similarity exists
between Zones 1 and 2 at both Buma and Jericho, but there is no similarity between the Lower
and Middle levels at Abu Hamid, or between Zones 4 and 5 at Mafjar, although at the latter site,
only a few surface artifacts are included in the Zone 5 component.
One of the most interesting breaks in continuity occurs at Shuna North between Zones 5 and
6 (the Late Chalcolithic A to B). While the pottery styles and forms in the Shuna 6 horizon have
nothing in common with the Shuna 5 horizon, they are related to previous Chalcolithic styles at
Ghassul, Abu Habil and, in particular, with Abu Harnid (Table 35). In fact, Shuna 6 is more
sirnilar to previous occupations in Zone 5 than it is to its contemporaries in Zone 6, and it is not
at al1 similar to the late Ghassul horizon (Table 36). On this basis, we might be inclined to think
that Shuna 6 is out of place and belongs in Zone 5. However, when the Shuna 6 horizon is
compared to the EB assemblages in Zone 7, it is clearly more closely related to Shuna 7 than it is
with any other horizon (K2 = 0.24) in either Zone 5 or 6 (Table 37). In other words, the Shuna 6
deposit appears to be Chalcolithic related but, in terms of style, is strongly linked to the early
development of EB 1 settlements. The overall results irnply thzt Shuna was abandoned during the
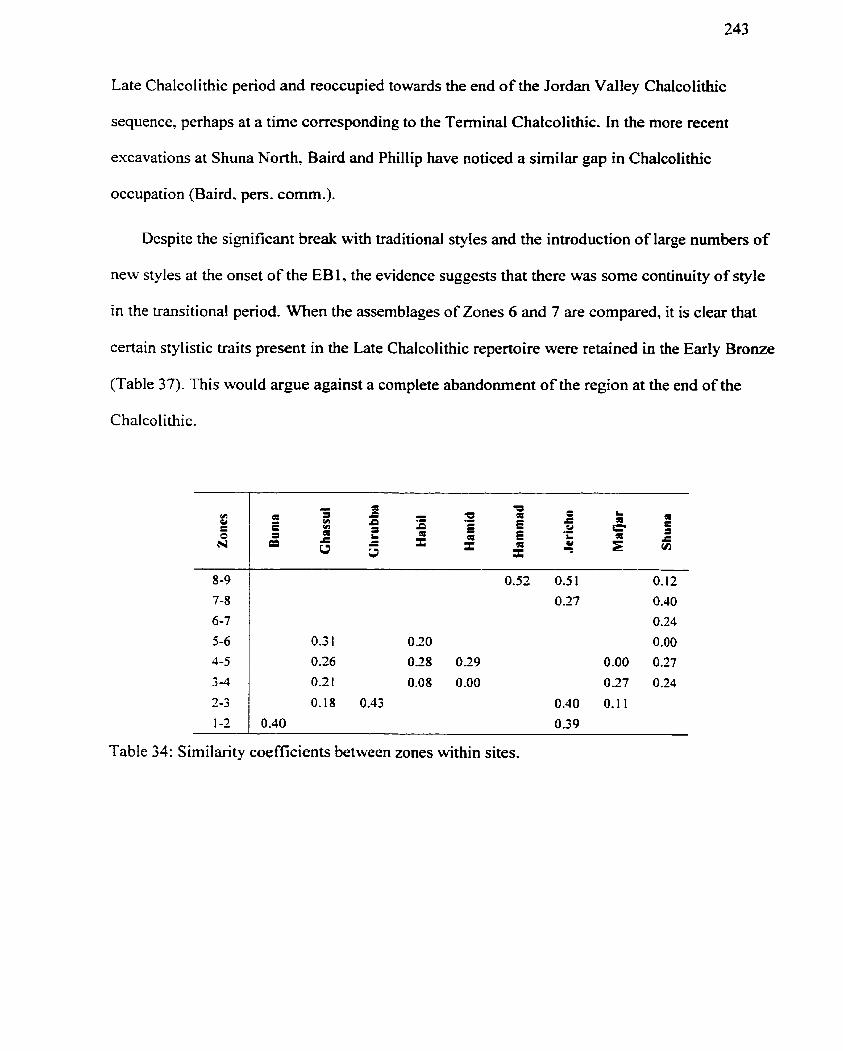
Late Chalcolithic period and reoccupied towards the end of the Jordan Valley Chalcolithic
sequence, perhaps at a time corresponding to the Terminal Chdcolithic. In the more recent
excavations at Shuna North, Baird and Phillip have noticed a similar gap in Chalcolithic
occupation (Baird. pers. comm.).
Despite the significant break with traditional styles and the introduction of large nurnbers of
new styles at the onset of the EBI? the evidence suggests that there was some continuity of style
in the transitional period. When the assemblages of Zones 6 and 7 are compared, it is clear that
certain stylistic traits present in the Late Chalcolithic repertoire were retained in the Early Bronze
(Table 37). This would argue against a complete abandonment of the region at the end of the
Chalcolithic.
Table 34: Similarity coefficients between zones within sites.
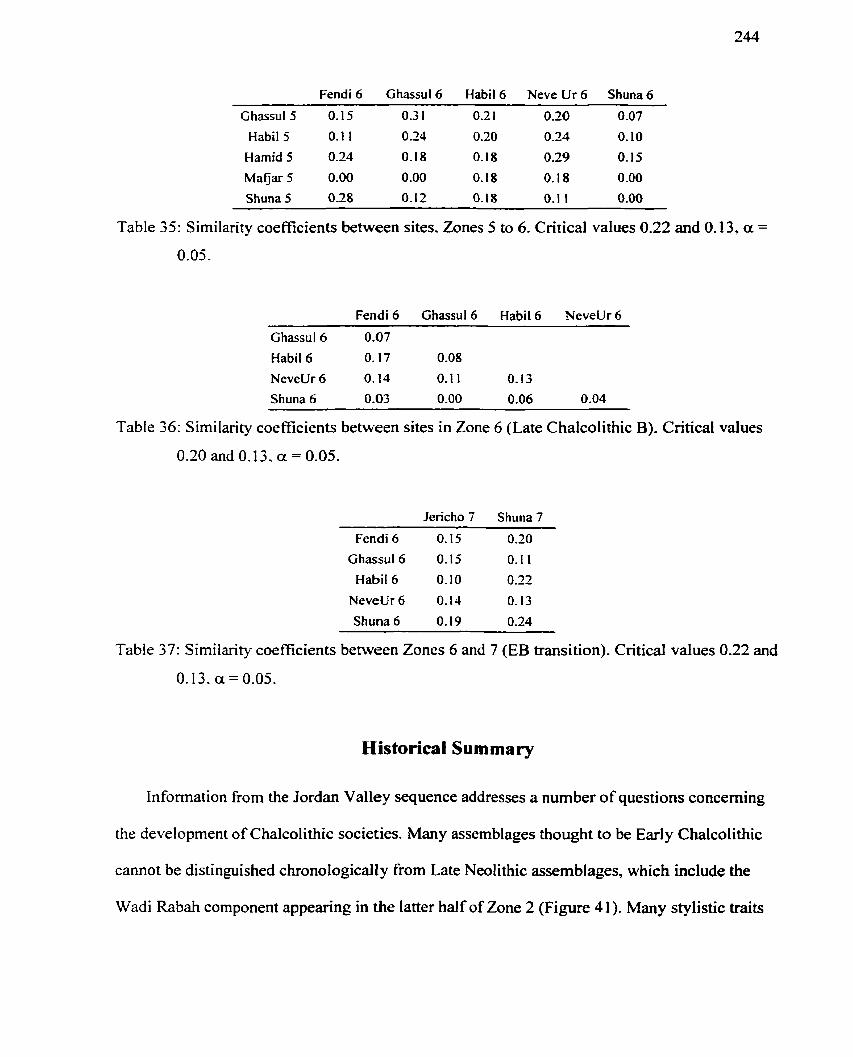
Fendi 6 Ghassul6 Habil6 Neve Ur 6 Shuna 6 - - - - - - .
Ghassul 5 0.15 0.3 1 0.2 1 0.20 0.07
Habil 5 0.1 1 O .24 0.20 0.24 O. 10
Hamid 5 0.24 0.18 0.18 0.29 0.15
Mafjar 5 0.00 0.00 O. 18 O. 18 0.00
Shuna 5 0.28 0.12 O. 18 0.1 1 0.00
Table 35: Similarity coefficients between sites. Zones 5 to 6. Critical values 0.22 and 0.13, a =
0.05.
Fendi 6 Ghassul6 Habit 6 NeveUr 6 - - - - -- - -
Ghassul 6 0.07
Habil6 O. 17 0.08
NeveUr 6 O. 14 0.1 1 0.13
Shuna 6 0.03 0.00 0.06 0.04 - -
Table 36: Sirnilarity coefficients between sites in Zone 6 (Late Chalcolithic B). Critical values
0.20 and 0.13, oc = 0.05.
Jerkho 7 Shuna 7
Fendi 6 0.15 0.20
Ghassul 6 0.15 0.1 1
Habii 6 O. I O 0.22
NeveUr 6 0.14 0.13
Shuna 6 O. 19 0.24
Table 37: Similarity coefficients between Zones 6 and 7 (EB transition). Citical values 0.22 and
0.13. a = 0.05.
Historical Summary
Information from the Jordan Valley sequence addresses a nurnber of questions conceming
the development of Chalcolithic societies. Many assemblages thought to be Early Chalcolithic
cannot be distinguished chronologicaily from Late Neolithic assemblages, which include the
Wadi Rabah component appearing in the latter half of Zone 2 (Figure 4 1). Many stylistic traits
from the LNB continued into the classic Chalcolithic phase, as the evidence from a number of
sites suggests. For example, V-shaped bowls and pie-crust nms originate in this period, although
they become more prolific in later periods.
Much of the confusion concerning the chronological relationship of LNB and Wadi Rabah-
like cornponents is a consequence of their contemporaneity. Despite the diversity in LNB
assemblages. they are probably best described as Late Neolithic (Gopher 1995). The differences
between these assemblages can be probably attributed to cultural differences rather than
chronological separation. It is most likely that, based on the evidence presented above, the high
degree of regional diversity observed for this time was a result of increasing contacts with
northem neighbours or some migration to the region. Long-distance migration is often associated
with economic factors and usually occurs with subgroups of the original populations rather than
en masse (Lewis 1982: 1 17; Anthony 1990: 900). If immigration to the region did occur at this
time, the event could possibly be associated with economic oppomuiities presented by the
increasing exposure of the Jordan Valley to cultivation, although this would not explain Late
Neolithic settlement elsewhere in the region. Of note, is that the timing of settlement coincided
with a rise in sea levels, a phenornenon evidenced by the submerged Wadi Rabah sites dong the
Israeli Coast (Galili and Weinstein-Evron, 1985; Galili and Nit, 1993; Galili and Sharvit, 1995).
A similar rise in sea levels would have occurred along the Persian Gulf (Nutzel, 1975; Vita-
Finci. 1978) and this may help to explain population movements and the appearance of Halafian
styles in the region.
The Chalcolithic penod began in Zone 3 with the introduction of a number of artifacts and
attributes generally identified with classic Chalcolithic assemblages. This penod, which began
around 5000 BC, is described here as Early Chalcolithic. Pottery styles change noticeably fiom
the previous period but this break is related more to a decline in stylistic continuity rather than in
the adoption of new styles. In many ways. the horizons present in Zones 2.2 and 3 are similar.
The unique stylistic character of the Chalcolithic assemblages in Zone 3 was probably an
outgrowth of stylistic combinations drawn fiom the highly diverse assemblages in the previous
period. The assemblage at Tel Tsaf best represents the mixing of stylistic traditions for the
previous period and can be seen as a LNB-Chaicolithic transitional site, as Gophna and Sadeh
( 1 989) suggest. At what point one differentiates Chalcolithic from LNB is arbitmy, but the
division created by UAM and clustering methods agrees closely with conventional markers. The
Chalcolithic begins with classical or "full" cornets (Bourke, 1997a), white slips, impressed or
incised loop handles, small animal figurines, deep bowls with inverted rims, scalloped moulding
near rims? rope mouldings at the base of jar nec ks. and painted styles that include a mixture of
pendants and line designs (see Appendix L for first appearances and Appendix M for 1 s t
appearances).
Of interest is that Jericho is represented in the Early Chalcolithic (Zone 3), primariIy by the
horizon present in Trench II. Stage 45. Much of this assemblage has Wadi Rabah characteristics
but it also includes a number of stylistic traits similar to those found in Chalcolithic assemblages.
Recall thst two cornets were found at Jencho (Garstang, 1935: pl. 33,30; Kenyon and Holland,
1983: fig. 13.2) and that Garstang's Tombs 354-6 contain matenal of Chalcolithic style. There
was probably a degree of interaction at Jericho during the onset of the Chalcolithic penod but a
turn of unexplained events led to the site's abandonment at this time. This horizon represents the
last occupation at Jericho until the advent of the Early Bronze Age over 1000 years later.
The inclusion of Ghrubba in Zone 3 is unexpected because the upper layer at this site (as
defined on p. 152) is very similar to the one below. The results obtained are possibly due to the
inclusion of a number of stylistic traits that are similar to the early Chalcolithic materiai. More
likely, the upper Ghrubba horizon dates the last events on site. Some surface artifacts, for
instance. are clearly Chaicolithic (cf., Mellaart 1956: fig. 4, 60).
The onset of the Chalcolithic in Zone 3 is a period of weakened interaction between
communities. At the sarne time, the regional assemblage was less diverse. This means that, while
there was little sharing of pottery styles. there was also little overall variety in the styles and
foms used. Many of the styles used previously had sirnply been discontinued. This and other
evidence (continuity and sirnilarity) suggest that the Early Chalcolithic wras a period of
significant stylistic change.
By the Middle Chalcolithic (Zone 4), the assemblages reached a high level of distinctiveness
with the introduction of a nurnber of different foms and styles. including ta11 pedestaled (and
fenestrated) bowls. a proliferation of cornet styles and decorations. S-shaped necks such as those
found on churns. tool impressed bands at or near rim lips, dark-faced burnished ware, large loop
handles with trianglar cross-sections. white slips on open bowls. and a size standardization of
red-slipped V-shaped bowls. Other distinctive artifacts include bone shuttles used for weaving.
There was a degree of diversity in this zone, as witnessed by the differences in the Shuna North
assemblage.
During this tirne. Chalcolithic styles that began at Ghassul began to spread throughout the
reçion, as reflected by a greater degree of regional integration. There does not, however, appear
to have been an increase in communication between sites beyond the levels expected.
There is less divenity in the Late Chalcolithic A. By this time (Zone 5) , the regional
assemblage has become more standardized. Few new styles were introduced but a nurnber of
previous styles were discontinued. It is during this t h e that the Chalcolithic style becomes
regional in scope. although there remain several localized patterns of stylistic development.
Recent dates from the Golan (Carmi et al.. 1995) suggest that Chaicolithic settlements occurred
there between 4500 and 3300 BC (1 o). In relation to the early dates from Ghassul and Abu
Hamid, these settlements are late in the developmental sequence, despite their proximity to the
Jordan Valley. Similady. Chalcolithic radiocarbon dates pubtished by Joffe and Dessel (1995),
which are overwhelmingly representative of the Negev region. suggest that the Beersheba sites
were, for the most part, later occupations. Earlier dates are published for Shiqmim, but it is
unlikely that they span the time penod suggested by Levy (I992a) or that they represent the total
span of Beersheba settlement (see p.50 for discussion). Radiocarbon dates fiom Naha1 Mishmar
(Bar Adon. 1980; Carrni and Segal, 1992) and pre-burial contexts at Peqi'in Cave (Segal et al.,
1998) are also later. although one buriai date fiom the latter site extends earlier (RT-2380,5255-
5083 BC). The present evidence suggests that Chalcolithic styles began in the Jordan Valley
(noticeably at Ghassul) and were being carried to other regions by 4900 BC, reaching a regional
florescence by 4600 BC.
On the basis of the dates available, the last occupation phase of the Chalcolithic in the
Jordan Valley began around 4300 BC (Late Chalcolithic B). The onset of this penod coincides
with Joffe and Dessel's (1 995) Late Developed penod and its full scope may embrace their
Terminal Chalcolithic interval as well. There is simply not enough radiocarbon evidence at this
time to draw firm conclusions. With the exception of the final occupation at Ghassul, the other
four sites occupied at this time (Te11 Fendi, Abu Habil, Neve Ur, and Shuna North) are in the
north of the Jordan Valley. The Chalcolithic horizon at Pella (McNicoll et al., 1982; Hanbury-
Tenison, 1 985; Smith and Hanbury-Tenison, 1 986; Bourke et al., 1 994) would also belong in this
zone, including assemblages fiom both Areas XIV and XXV. Hanbury-Tenison's "Post-
Ghassuliant phase (Hanbury-Tenison. 1986; McNicolI et al.. 1986) was not recognized at any of
the sites included in analysis and may be an important missing component. The assemblage at
Tell Fendi is similar to the latter phase in many respects but lacks dl defining characteristics.
The assemblages at Delharniya (Stekelis 1967; Arniran 1977) and Pella in the Jordan Valley, and
Tell Turmus (Dayan 1969; Epstein 1977. 1978) in the Huleh Valley seem to comply with
Hanbury-Tenison's definition of Post-Ghassulian. Radiocarbon dates fiom these sites would go a
long way in resolving terminai events for the period.
Shuna North is also a key site for understanding the Chalcolithic to EBI transition.
Gustavson-Gaube's (1986) Stratum 50 at the site is defined as a black charcoal and ash layer that
covers most of the areas excavated. in this same horizon are artifacts that cioseiy resemble those
from Tell Fendi and Pella as well as some remnants of Grey Bumished Ware (GBW). Based on
the results obtained above. the GBW is probably intrusive. It is uniikely that the GBW is
contemporary with the Late Chalcolithic B artifacts because no similar association was found at
either of the other sites. It does. however. suggest that the last Chalcolithic occupation at Shuna
North was not far removed fiom the onset of the Early Bronze Age. At first impression, the
evidence suggests that occupation at Shuna North continued without interruption throughout the
Chalcolithic (Bourke 1997: 41 1). and into the Early Bronze Age. But the previous cornparison of
similarity within the sequence demonstrates that this was not the case. A significant break
occurred between the Late A and Terminal Chalcoli thic levels at Shuna North. It may be that the
horizon at Shuna Zone 6 is actually Early Bronze or transitional. RecaIl that it is similar to the
components at Abu Hamid and Abu Habil but Grey Bumished Ware does not appear at the site
until the onset of the EBl in Zone 7. The sarne scenano may have occurred at Beth Shan
(Fitzgerald. 1934, 1935). Tell Kitan (Eisenberg, 1993), and Tell el-Handaquq North (Mabry,
1989, 1995) but more information is needed on these sites.
Hanbury-Tenison (1 986: 106) suggested that the EB 1 sequence at Jericho included only the
latter half of the sequence as known from Umm Hammad and Shuna North. He is probably
correct for Shuna North but, on the present evidence, this is unlikely to be the case at Umm
Hammad (Betts. 1992). It seems that both Jericho and Shuna North were occupied before any
settlement occurred at Umm Hammad, despite the fact that Grey Burnished Ware appears at
Umm Hammad as well as Shuna North. Recall, however. that the constructed sequence is
relative and the actual duration of Zone 7 c m o t be detennined without additional radiocarbon
dates. It may actually be very short. Chalcolithic settlement at Umm Hammad remains
undetennined. Helms (1992) found Chalcolithic wares on the surface of the site and presurned
that his lowest occupation layer was also Chalcolithic. But no artifacts were associated with this
deposit.
The Early Bronze sequence for Shuna North is incomplete for Zone 9 because data enîry
was stopped at Stratuni 40. Data entry for Umm Harnrnad was stopped before the appearance of
Proto-Urban D Ware. or Umm Hammad Ware, styles common at Tell Farah North and Beth
Shan. Umm Hammad Ware was onginally described as ChalcoZithiqiïe Superieirr by de Vaux
and Steve (de Vaux and Steve. 1947) but is now generally recognized as a component of the
Early Bronze 1. According to the sequence constructed here, the Umm Hammad Ware appears
Iater in the EB 1 sequence than Hanbury-Tenison thought.
The Early Bronze Age Transition
The onset of the Early Bronze Age is represented by a highly significant break with
traditional motifs and, at the same time, the introduction of significantly high numbers of new
styles. Arguments have been made for the local development of Early Bronze Age matenal
culture, notably by Perrot (1984) and de Miroschedji (1 971), the latter of whom sees a 300-400
year development from the Chalcolithic. They are possibly correct for the length of the
intewening interval. although 1 suspect it is shorter (200 yrs). More to the point, however, 1 argue
that this intervening period is best represented by Chalcolithic conununities (Terminal) rather
than EB 1 . Braun (1 989. 1 996) and Hanbury-Tenison (1 986) also argue for stylistic continuity
from Chalcolithic to EBI communities. No doubt there is some continuity of stylistic tradition,
as demonstrated above. but it is unlikely that al1 change at this time can be attributed to local
causes. The results obtained here suggest that only 3 1 % of previous stylistic and formal
traditions were retained between the Chalcolithic and Early Bronze Age transition. No such
scenario had occurred over the previous 2000 years. The only other time that similar significant
breaks occurred was in the Chalcolithic period but, in contrast, the Iowest point in continuity
reached at that time was only 73%.
The present results suggest that drastic social change occurred in the early Bronze Age
transitional period. This observation is hardly new but the evidence presented here argues against
local factors as the root of change. Interpreting these changes really requires some knowledge of
the time that lapsed between the demise of Chalcolithic material culture and the rke of the Early
Bronze. If the period was long, then the people associated with both cultures were probably
widely separated in time and a feasible argument exists for some sort of environmental problern
or intemal warfare, a possibility Levy (1 995) suggests. But the summary of environmental data
given in Chapter 2 does not support any theory of environmental degradation to the degree that it
would affect subsistence patterns. And there are few artifacts of war or violence that can be
associated with the Chalcolithic. For instance, projectile points were virtually non-existent at this
time. Maceheads were common and, white these may be indicative of warfare (as clearly
portrayed in Egyptian iconography for the same period. such as on the Narmer palette), they may
just as well have been symbols of authority rather than everyday weapons of warfare.
I f the transitional period was short. as mounting radiocarbon evidence suggests (Weinstein,
1984a; Carmi, 1987; Carmi and Segal. 1992; Ehrich, 1992; Segal and Carmi, 1996) then it is
more likely that the people associated with these two material cultures had crossed paths. If this
was the case. then there is some argument for an intrusive Early Bronze Age society. This
contention is supported not only by the degree of change observed in pottery styles but can ais0
be correlated to numerous other changes in material culture, including architecture and m o r t u q
behaviour (for discussion see Hanbury-Tenison 1986: Ben-Tor. 1992). The most Iikely scenario
would then be one of either warfare or large-scale immigration to the region, although evidence
for warfare in the EBI is as sparse as it is for the Chalcotithic.
The causes and patterns of migration are ofien cornplex and are generally linked to a host of
other processes (Anthony 1990: 897). Anthony describes a nurnber of different migration
patterns, including a type of long-distance migration called "leapfrogging". This is a form of
inter-regional migration where great distances are jumped or bypassed due to the agency of
advance scouts who collect information on a particular area and relay it back to the potential
migrants. Archaeological patterns forrned by this type of migration are often in the form of
"islands'? of settlement in desirable locations, and perhaps this was what occurred in the southern
Levant. But demonstrating that migration, or popuIation movements (Rouse, 1986) occurred,
generally requires proof of outside origins for the presumed exogenous element, and locating a
materiai culture that resernbles and precedes the Early Bronze has proven difficult. Gophna
suggests that Early Bronze Age societies had connections with the Lebanon region, aithough, to
date, there is little evidence to support any claim of origins in this region. Reported material fiom
surveys and excavations in the Beqa'a are sparse (Kirkbride, 1969; Copeland, 1969) and, at
Byblos (Dunand, 1973), the stratigraphic context of finds is so poorly recorded that it is unlikely
that any comparative chronological analysis would be useful. Ben-Tor (1989) also suggests that
EBI origins for the southem Levant are related to events in southern and coastal Lebanon and
draws a nurnber of parallels between Byblos artifacts and the Early Bronze Age assemblages
found throughout the region. It is a plausible theory but difficulties with provenience at Byblos,
as well as other EB1 sites, coupled with the lack of radiocarbon dates, rnake it difficuit to
estabIish coherent arguments for the precedence of styles in Lebanon.
If societies associated with Early Bronze Age assemblages acnialiy evolved within the
southern Levant, then the area in which changes first occurred has not yet been located with any
certainty. Braun (1 996: 6) theorizes that the transition occurred in the south and is best
represented at several Afiidar sites, Palmahim Quarry, and Wadi Ghazzeh H. On the other hand,
Hanbury-Tenison (1 986: 69) sees a number of northern and southem sites as Post-Ghassulian
transitional sites. including Shuna North, Pella, Umm Hammad, Azor. Seita, and Wadi
Ghaueh H. For the most part, however, he believes that Umm Hammad was a key transitional
site, although the evidence presented here does not support his theory.
Another possible scenario that could account for the pattern of settlement observed in the
transitional period would be regional abandonment, followed by re-occupation of the area
(Gophna 1995). The strong break with traditional styles would then imply ihat either a diflerent
cultural group inhabited the are* or that a long period of time intervened between occupations,
giving time for stylistic preferences to change elsewhere. If this was the case, we would expect to
find a smooth transition from Chalcolithic to EB styles elsewhere in the Levant. Recent
radiocarbon dates from the Golan sites (Carmi et al.. 1999, as well as from the Negev and
coastal areas (Le.. Peqi'in. Segal et al.. 1998) imply that Chalcolithic sites in the Jordan Valley
were abandoned at about the same time as major settlement began at higher elevations, although
the radiocarbon information for the Jordan Valley region is far fiom complete. If this was the
case. then perhaps the movernent of settlements to higher ground, a phenornenon generally
identified with Early Bronze Age communities. actually began in the Chalcolithic. Such a change
in settlement patterns could possibly be attributed to the domestication of the olive, a miit that
grows best in terra rosa mils at higher elevations. There is mounting evidence for olive
processing at highland Chalcolithic sites (Banning 1985: 140; Banning et al., 1998; Neef, 1990;
Liphschitz et al, 199 1 ; Epstein, 1993).
Conclusion
Constructing regional histories using archaeological methods requires the integration of
different kinds of data derived from a number of different sources. Both the collection of data
and the methods used to analyze it are based on theoretical fiameworks and a number of
methodological assumptions. Each method has its own strengths and weaknesses and it is
important to know their limits. It is unlikely that either relative or absolute dating methods will
ever be used to the exclusion of the other. No one would accept a radiocarbon date of 10000 BC
for a Chalcolithic assemblage, simply because the accumulated stratigraphic and radiocarbon
evidence is strong enough to refbte it. Radiocarbon dates alone are usehl for drawing parallels
between sites for which little relative dating information is available, checking already
established sequences. and assigning time placement dates to matenal culture events. Relative
dating methods are important for establishing the order of site occupations, correlating material
cultures, and for testing ad hoc assumptions about the sequence of events. Regardless of which
method is used. al1 rely on stratigraphie analyses and establishing relational contexts in order to
give rneaning to interpretations. Published reports that clearly define the superpositional,
associational, and areal context of deposits. artifacts. features, and dating samples are invaluable
and lay the groundwork for future research.
Events define periods and, paradoxically. periods can define events. The duration of any
period limits and defines our interpretations of the data. as Braudel (1980) and Smith (1992)
obsenred. Given the present state of research in the Jordan Valley. it is unlikely that periods of
Iess than 200 years in duration c m be defined, which still limits any discussion of political
process to general terms.
Chronological frameworks are a necessary requirement for any archaeological study that
attempts to understand the development of sociopolitical complexity. Chronologies are
non-definitive. theoretical constructs. They rest on assurnptions about the meaning and
importance of observed changes in matenal culture, and they rest on a myriad of assumptions
relating to method. The duration and terminal events of an archaeological period are defined
pnmarily by changes in material culture, which are ofken presumed to represent significant
sociopolitical events. Event definition is generally given precedence over absolute dates when it
cornes to delimiting periods, even when good radiornetric dates are available. For example, it is
the change in material culture that defines the onset of the Early Bronze Age, not the date of
3500 BC. And, as much as we would like to construct accurate histories and understand social
process, any attempt to delimit periods in ternis of social or economic deveIopments is an
interpretation of the material culture, not an integral part of it. Neither the Chalcolithic period nor
the Early Bronze Age are empirically defined by sociopolitical or economic events. They are

defined by changes in patterns of matenal culture. which we might interpret as meaningfül
sociopolitical or economic events.

7. APPENDICES
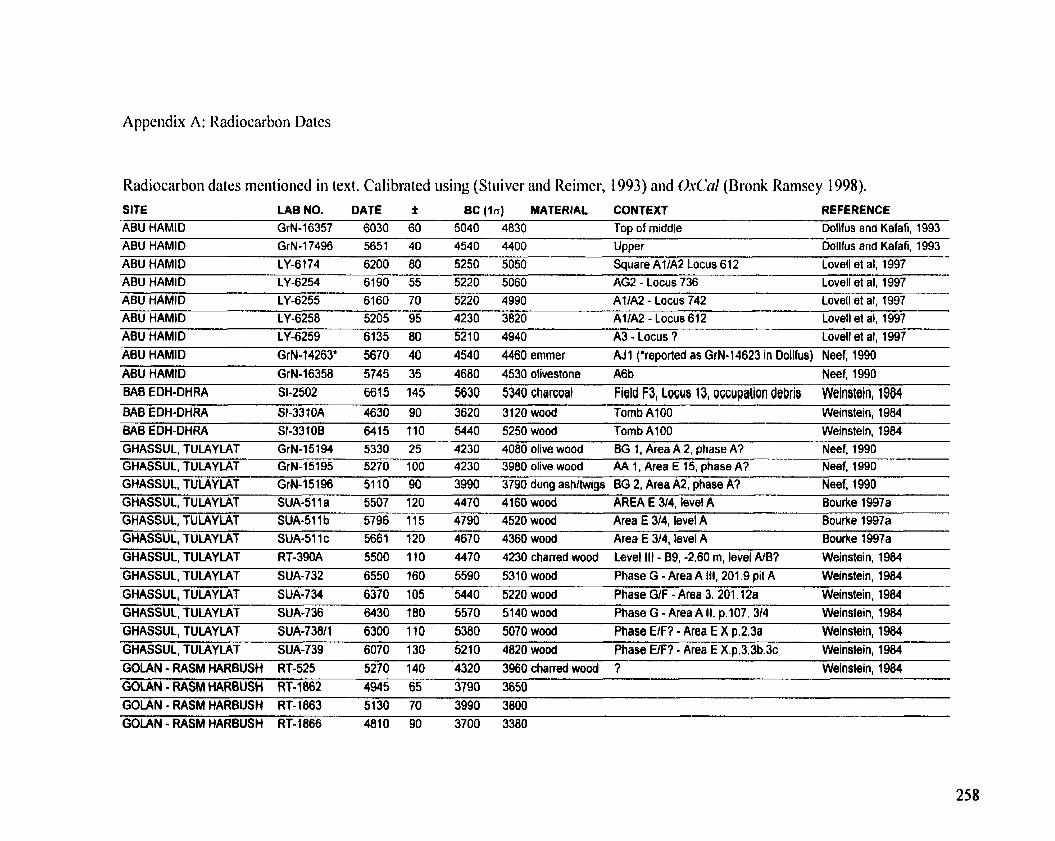
Appendix A: Radiocarbon Dates
Radiocarbon dates nientioned in text. Calibrateci using (Stuiver and Keimer, 1993) and O.v(.NI ( D ~ m k Raiiisey 1998). SITE LA6 NO. DATE f BC ( la) MATERIAL CONTEXT REFERENCE ABU HAMlD GrN-16357 6030 60 5040 4830 Top of middle Dollfus and Kafafi, 1993 ABU HAMID GrN-17496 5651 40 4540 4400 UPPer Dollfus and Kafafi, 1993 ABU HAMID LY-6174 6200 80 5250 5050 Square AllA2 Locus 612 Loveil el al, 1997 ABU HAMID LY -6254 6190 55 5220 5060 AG2 - Locus 736 Lovell et al, 1997 ABU HAMlD LY-6255 6160 70 5220 4990 AllA2 - Locus 742 Lovell et al, 1997 ABU HAMID LY-6258 5205 95 4230 3820 AllA2 - Locus 612 Lovell et al, 1997 ABU HAMID LY-6259 6135 80 5210 4940 A3 - Locus ? Lovell et al, 1997 ABU HAMID GrN-14263' 5670 40 4540 4460 emmer AJ 1 ('reported as GrN- 14623 in Dollfus) Neef, 1990 ABU HAMlD GrN-16358 5745 35 4680 4530olivestone A6b Neef, 1990 BAB EDH-DHRA SI -2 502 6615 145 5630 5340 charçoat Field F3, Loçus 13, oççupation debris Weinstein, 1904 BAB EDH-DHRA Sb33 1OA 4630 90 3620 3120 wood Tomb Al00 Weinstein, 1984 BAB EDH-DHRA SI-33106 6415 110 5440 5250 wood Tomb A100 Weinstein, 1984 GHASSUL, TULAYLAT GrN-15194 5330 25 4230 4080 olive wood BG 1, Area A 2, phase A? Neef, 1990 GHASSUL, TULAYLAT GrN-15195 5270 100 4230 3980 olive wood AA 1, Area E 15, phase A? Neef, 1990 GHASSUL, TULAYLAT GrN-15196 51 10 90 3990 3790 dung ashltwigs BG 2, Area A2, phase A? Neef, 1990 GHASSUL, TULAYLAT SUA-511 a 5507 120 4470 4160 wood AREA E 314, level A Bourhe 1997a GHASSUL, TULAYLAT SUA-511 b 5796 115 4790 4520 wood Area E 314, level A Bourke 1997a GHASSUL, TULAYLAT SUA-511 c 5661 120 4670 4360 wood Area E 314, level A Bourke 1997a GHASSUL, TULAYLAT RT-390A 5500 110 4470 4230 charred wood Level III - B9, -2.60 ml level AIB? Weinstein, 1984 GHASSUL, TULAYLAT SUA-732 6550 160 5590 5310 wood Phase G - Area A Ill, 201.9 pit A Weinstein, 1984 GHASSUL, TUIAYLAT SUA-734 6370 105 5440 5220 wood Phase GIF - Area 3.201.12a Weinstein, 1984 GHASSUL, TULAYLAT SUA-736 6430 180 5570 5140 wood Phase G - Area A II. p.107. 314 Weinstein, 1984
GHASSUL, TULAYCAT SUA-73811 6300 110 5380 5070 wood Phase €IF? - Area E X p.2.3a Welnstein, 1984 GHASSUL, TULAYLAT SUA-739 6070 130 5210 4820 wood Phase €IF? - Area E X.pS3,3b.3c Weinstein, 1984
GOLAN - RASM HARBUSH RT-525 5270 140 4320 3960 charred wood ? Weinstein, 1984
GOLAN - RASM HARBUSH RT-1862 4945 65 3790 3650 GOLAN - RASM HARBUSH RT-1863 5130 70 3990 3800 GOLAN - RASM HARBUSH RT-1066 4810 90 3700 3380
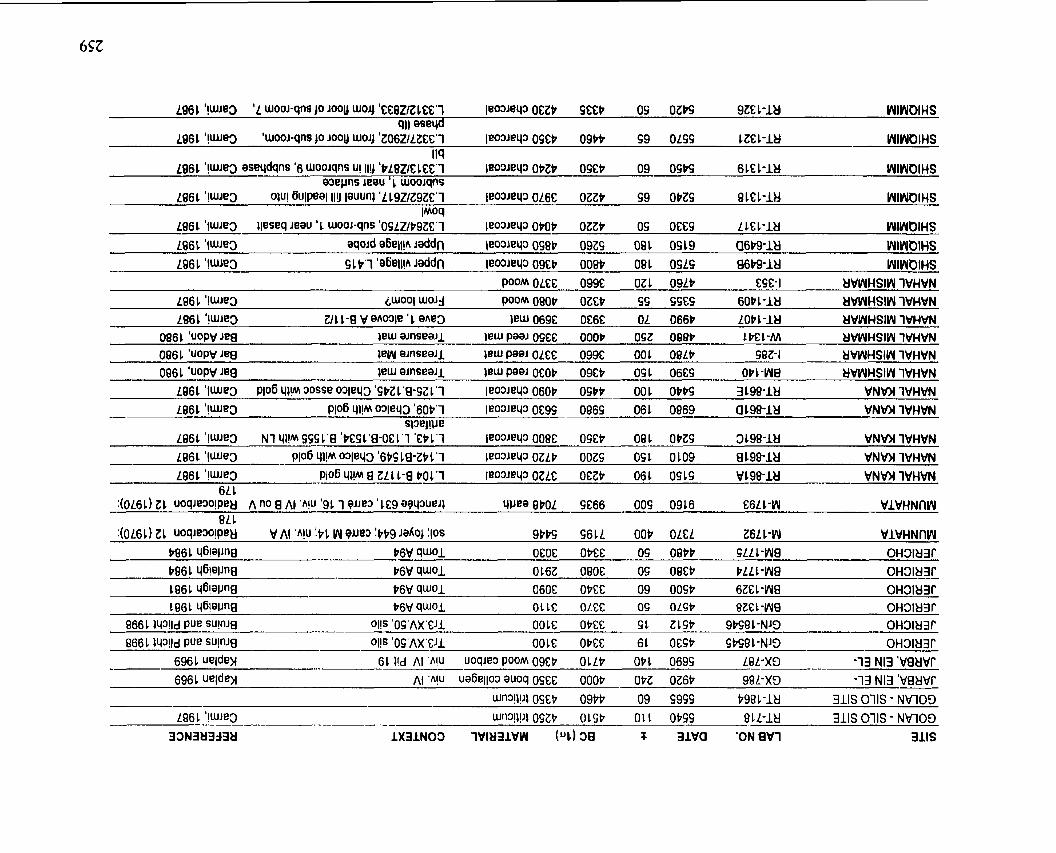
9PPÇ S61L OOb OLEL Z6L1-W WlVHNnW ffl61 @!alin8 P6W W O l OEOE OPEE 05 08PP ÇLLL-WB 0~31t13r ~ 0 6 1 W l ~ n f l b6V ( I w o 1 O16Z OBOE OÇ OûEP PLLL-WB 0~31~31- 186 1 46!al~n0 P6V W J O l 060E OPE€ 09 OOÇP 6161-W8 OH31M3r 1 86 1 4 6 ! @ l ~ n ~ t6W 0 1 011'2 OLEE OÇ O L W 816 1-VUB OH31t13r
866 t W ! l d Pue Su!nJa o l ! ~ 'OÇ'AX'EJI 00LG OPCE Ç1 ZLÇP 9PS8L-NJE) 0 ~ 3 1 ~ 866 1 w l d pue SU!^ ol!S 'OS'AX'EJI OOlE OPEE 61 OEÇP ÇPS81-NJC) OH3183r
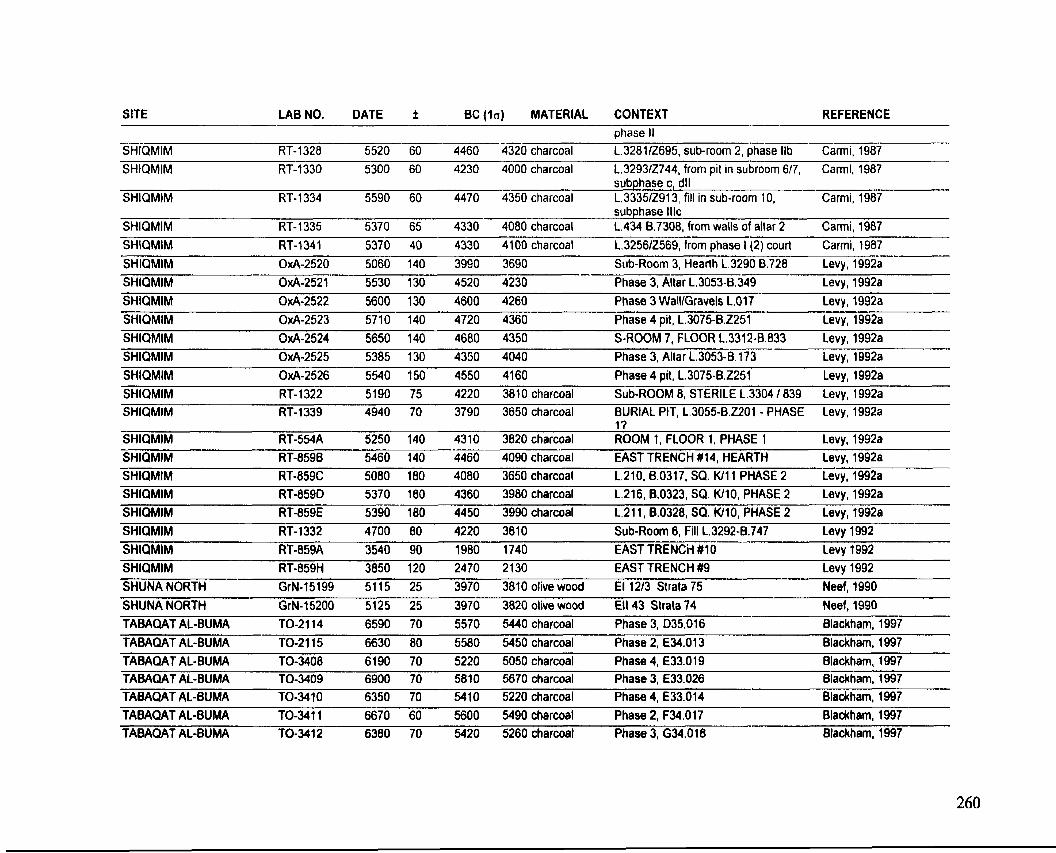
SITE LA6 NO. DATE f BC (In) MATERIAL CONTEXT REFERENCE phase Il
SHlQMlM RT- 1328 5520 60 4460 4320 charcoal L.32811Z695, sub-room 2, phase Ilb Cani , 1987 SHIQMIM RT- t 330 5300 60 4230 4000 charcoal L.329312744, from pit in subroom 6/7, Carmi, 1987
subphase c, dl1 SHIQMIM RT-1334 5590 60 4470 4350 charcoal L.333512913, fiIl in sub-room 10, Cami, 1987
subphase lllc SHlQMlM RT- 1335 5370 65 4330 4080 charcoal L.434 8.7308, from walls of altar 2 Carmi, 1987 SHlQMlM RT-1341 5370 40 4330 4100 charcoal L.325612569, from phase 1 (2) court Carmi, 1987 SHlQMlM OxA-2520 5060 140 3990 3690 Sub-Room 3, Hearth L.3290 B.728 Levy, 1992a SHlQMlM OxA-2521 5530 130 4520 4230 Phase 3, Altar L.3053-8.349 Levy, 1992a SHlQMlM OxA-2522 5600 130 4600 4260 Phase 3 WalllGravels L.017 Levy , 1992a SHtQMIM OxA-2523 5710 140 4720 4360 Phase 4 pit, L.3075-8.2251 Levy, 1992a SHlQMlM OxA-2524 5650 140 4680 4350 S-ROOM 7, FLOOR L.3312-8.833 Levy, 1992a SHlQMlM OxA-2525 5385 130 4350 4040 Phase 3, Altar L.3053-B. 173 Levy, 1992a
SHlQMlM OxA-2526 5540 150 4550 4160 Phase 4 pit, L.3075-8.2251 Levy, 1992a SHlQMlM RT-1322 5190 75 4220 3810 charcoal Sub-ROOM 8, STERILE L.3304 1 839 Levy, 1992a SHlQMlM RT-1339 4940 70 3790 3650 charcoal BURIAL PIT, L.3055-8.Z201 - PHASE Levy, 1992a
1 ? SHlQMlM RT-554A 5250 140 4310 3820 charcoal ROOM 1, FLOOR 1, PHASE 1 Levy, 1992a SHlQMlM RT-859B 5460 140 4460 4090 charcoat EAST TRENCH #14, HEARTH Levy, 1992a SHlQMlM RT-859C 5080 180 4080 3650 charcoal L,210, 8.0317, SQ. KI1 1 PHASE 2 Levy, 1992a SHlQMlM RT-859D 5370 180 4360 3980 charcoal L.216,8.0323, SQ. W10, PHASE 2 Levy, 1992a SHlQMlM RT-859E 5390 180 4450 3990 charcoal L.211,0.0328, SQ. W10, PHASE 2 Levy, 1992a SHIQMIM RT-1332 4700 80 4220 3810 Sub-Room 6, Fill L.3292-8.747 Levy 1992 SHlQMlM RT-859A 3540 90 1980 1740 EAST TRENCi-I #10 Levy 1992 SHlQMlM RT-859H 3850 120 2470 2130 EAST TRENCH $9 Levy 1992 SHUNA NORTH GrN-15199 51 15 25 3970 3810 olive wood El 1213 Strata 75 Neef, 1990 SHUNA NORTH GrN-15200 5125 25 3970 3820 olive wood El1 43 Strata 74 Neef, 1990 TABAQAT AL-BUMA TO-2114 6590 70 5570 5440 charcoal Phase 3, D35.016 Blackham, 1997 TABAQAT AL-BUMA TO-2115 6630 80 5580 5450 charcoal Phase 2, €34.01 3 Blackham, 1997 TABAQAT AL-BUMA TO-3408 6190 70 5220 5050 charcoal Phase 4, €33.019 Blackham, 1997 TABAQAT AL-BUMA TO-3409 6900 70 5810 5670 charcoal Phase 3, €33.026 Blackham, 1997 TAUQAT AL-BUMA TO-34 10 6350 70 5410 5220 charcoal Phase 4, €33.014 Blackham, 1997 TABAQAT AL-BUMA TO-3411 6670 60 5600 5490 charcoal Phase 2, F34.017 Blackham, 1997 TABAQAT AL-BUMA TO-34 1 2 6380 70 5420 5260 charwal Phase 3, G34.018 Blackham, 1997
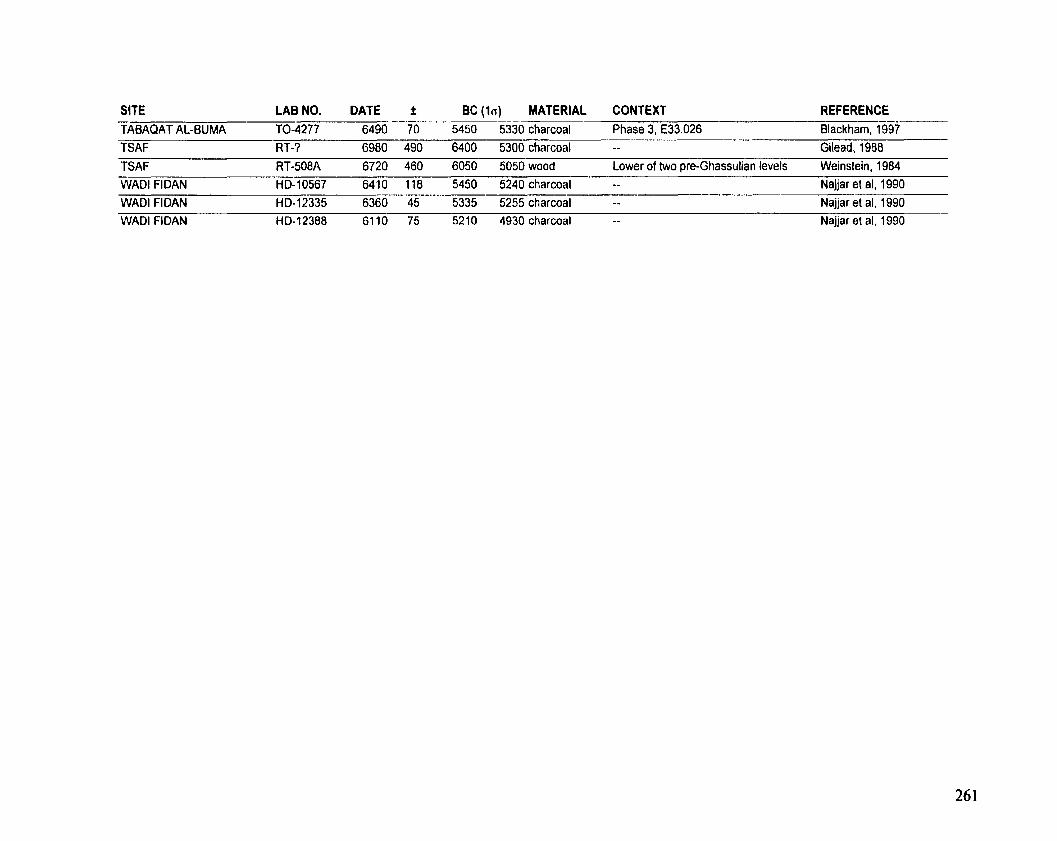
SITE LAB NO. DATE f BC (10) MATERIAL CONTEXT REFERENCE TABAQAT AL-BUMA T0-4277 6490 70 5450 5330 charcoal Phase 3, E33.026 Blackham, 1997
TSAF RT-? 6980 490 6400 5300 charcoal -- Gilead, 1988
TSAF RT-508A 6720 460 6050 5050 wood Lower of M o pre-Ghassulian levels Weinstein, 1984
WADl FlOAN HD-10567 6410 118 5450 5240 charcoal -- Najjar et al, 1990
WADl FIDAN HD-12335 6360 45 5335 5255 charcoal -- Najjar et al, 1990 WADl FIDAN HO-12388 6110 75 5210 4930 charcoal -- Najjar et al, 1990
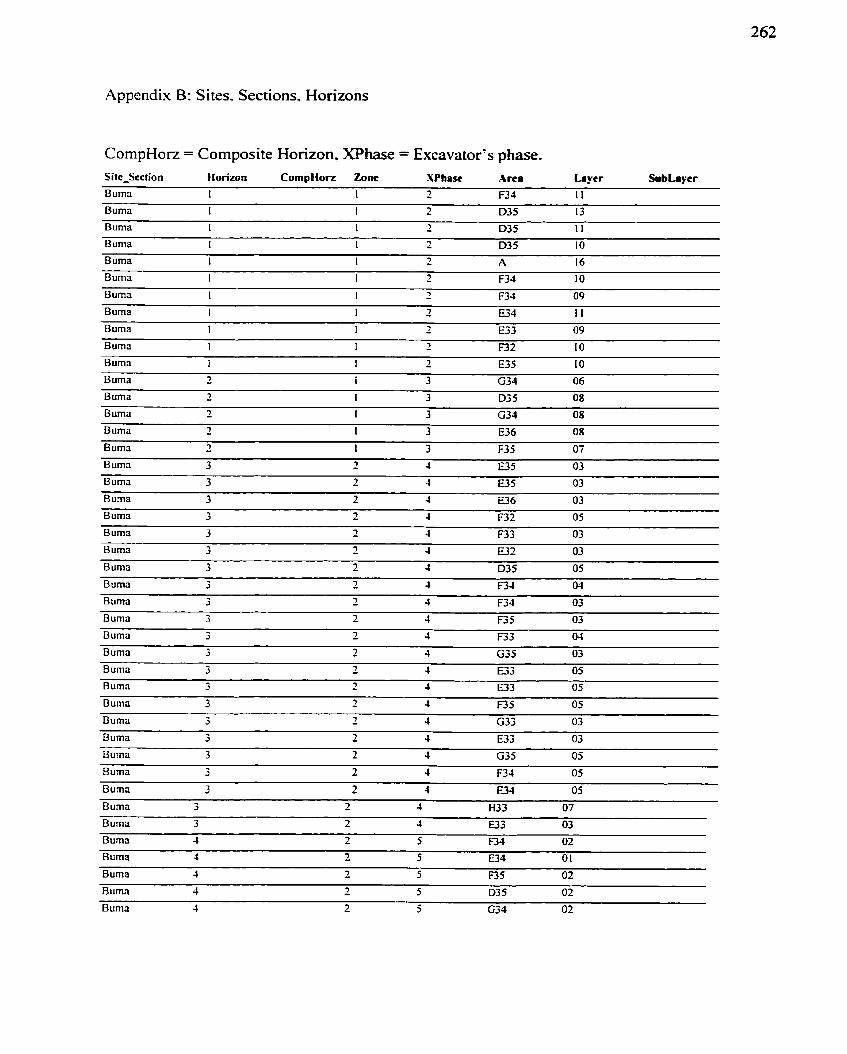
Appendix B: Sites. Sections. Horizons
CompHorz = Composite Horizon. XPhase = Excavator's phase. SiteSection Horizon CornpHon Zone XPhase A rea Laver SubLaïcr
Buma 1 1 2 F33 1 1
Burna 1 1 2 035 13
Burna I 1 - 7 D35 I I
Buma 1 1 - 1 D35 1 O
Burna 1 I - 1 F34 09
Buma 1 1 - 7 E.33 09
Burna 1 1 2 ~ 3 2 10
Buma - 7 1 3 (33.1 08
Burna - 1 I 3 U 6 08
Buma - 7 1 3 F3 5 07
B urna 3 - 1 4 E35 03
Buma 3 2 4 E35 03
Buma 3 2 4 E36 03
Burna 3 - 7 4 D3 5 O5
Burna 3 - 1 J F33 04
Buma 3 - 1 4 F34 03
Burna 3 - 7 4 ~ 3 5 03
Burna 3 - 7 4 F33 0-1
Buma 3 2 4 G33 03
Buma 3 2 4 E33 03
Buma 3 2 4 G35 05
Buma 3 2 4 F34 O5
Buma 3 - 7 4 E34 05
Buma 3 - 7 4 H33 0 7
Burna 3 2 4 0 3 03
Buma 4 - 7 5 F34 02
Buma 4 2 5 U4 O 1
Burna 4 2 5 F35 02
Buma 4 - 7 5 D3 5 02
Bu ma 3 2 5 G34 02
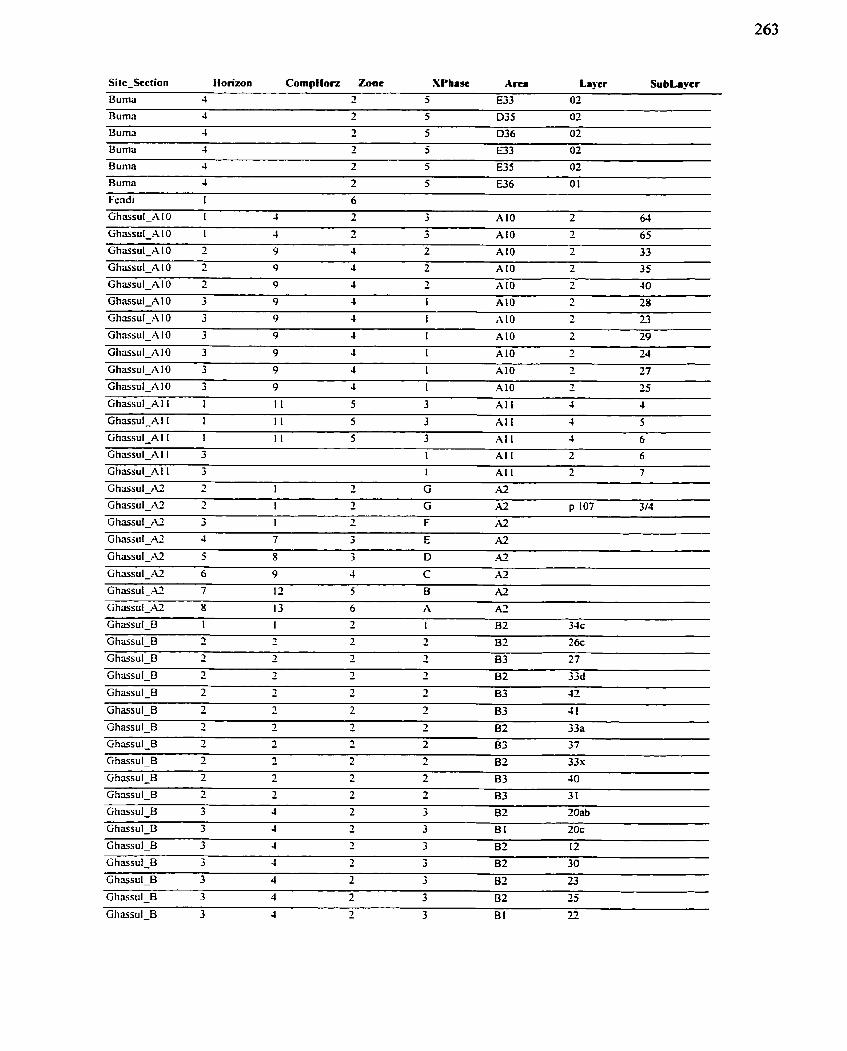
Sitc-Section Ilorizon CornpHon Zone SPhasc Are. Laper Subbycr
Burna 4 - 7 5 E33 02
Burna 4 - 7 5 D35 02
Burna J 2 5 D36 02
Burna 4 2 5 U 3 02
Burna 4 - 7 5 U S 02
Fcndi I 6
Ghmsul-c\ l O I 4 2 3 AI0 2 64
GhssuI-X 1 O 1 4 - 7 3 A I0 2 65
Ghassul-AI0 2 9 4 2 AI0 - 7 33
Ghassui-AI0 2 9 4 2 AI0 - 7 35
Ghssul-A10 2 9 4 - i AI0 - 7 40
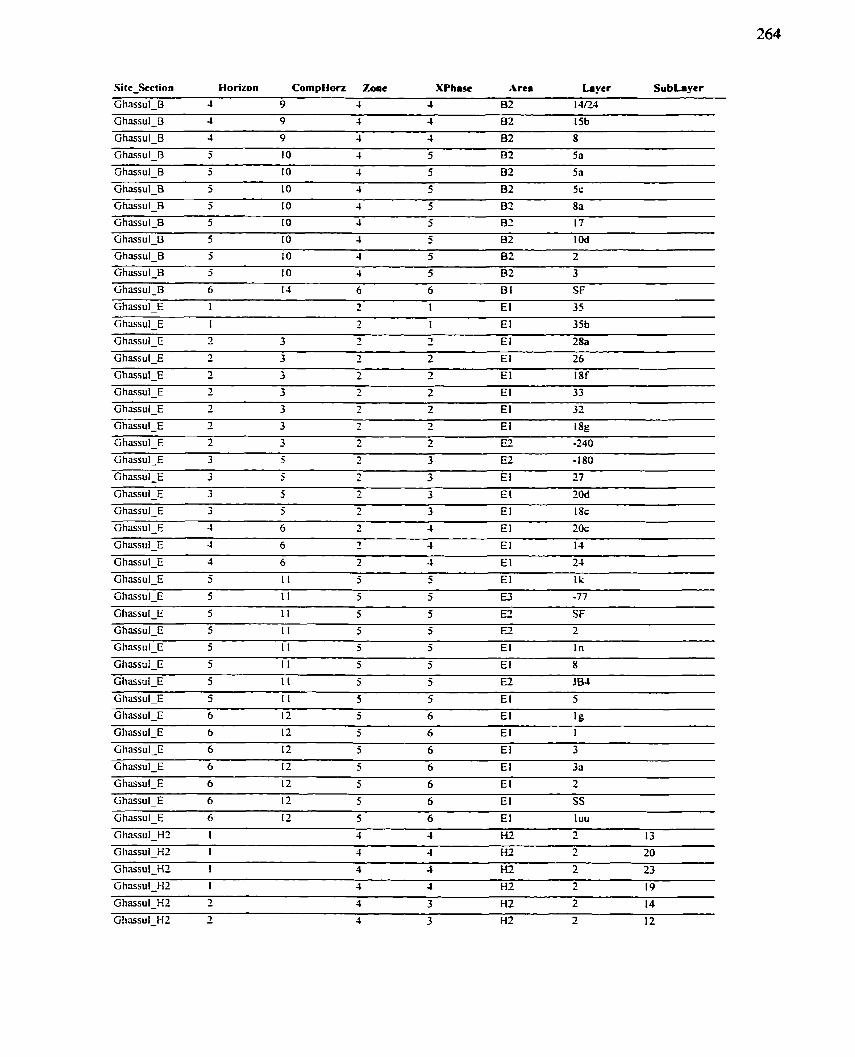
Si te-Section Horizon Cornpifon Zone XPhasc Arcs Lay t r SubLaycr
Ghassul-B 4 9 4 J 62 14/24
Ghassul-B 4 9 4 4 62 15b
Ghassul-B 4 9 4 4 BZ 8
Ghassul-B 5 1 O 4 5 E32 5a
Ghrissul-B 5 1 O 4 5 BZ 5a
Ghassul-B 5 1 O 4 5 BZ Sc
Ghassul-B 5 1 O 4 5 8 2 8a
Ghassul-8 5 1 O 4 5 BZ 17 Ghi~sul-B % 1 O 4 5 62 I Od
Ghassul-B 5 1 O 4 5 BZ 7
Ghassul-B 5 1 O 4 5 BZ 3
Ghassut-B 6 14 6 6 B I SF
GhassuIE 1 - 7 1 El 3 5
Ghassul-E I - 7 1 E l 3Sb Ghassul-E 3 3 2 - 7 E l 28a
Ghassul-E - 7 3 2 - i E 1 26
Ghassul-E 2 3 2 2 E l 18f
Gha~sd-E 2 3 - 1 2 E l 33 Ghass~l-E 2 3 - 1 - 7 E l 32
Ghassul-E - 7 3 2 - 7 E l 189 Ghassul-E 2 3 .. 7 t E2 -240
Gh~~sul-E 3 5 - 7 3 E2 -180
Ghassul-E 3 5 2 3 E I 27
Ghassul-E 3 5 2 3 E l IOd Ghassul-E 3 5 - 7 3 E 1 I8c
Ghassul-E 4 6 - 7 J E l 2Oc
Ghassul-E 4 6 - 7 4 E l 14
Ghassul-E 4 6 2 4 E 1 24
Ghassul-E 5 1 1 5 5 E 1 ik
Ghassul-E 5 1 l 5 5 E3 -77
GhassuI-E 5 1 I 5 5 EZ SF
Ghassul-E 5 1 I 5 5 EZ 2
Ghassul-E 5 I I 5 5 E l I n
Ghassul-E 5 II 5 5 E 1 8
Ghassul-E S 11 5 5 EZ J B 4
Ghassul-E 5 I I 5 5 E l 5
Ghassul-E 6 12 5 6 E l 1 g Ghassul-E 6 12 5 6 E l I
Ghassul-E 6 12 5 6 E l 3
Ghassul-E 6 12 5 6 E 1 33
Ghassul-E 6 12 5 6 El 2
G hassul-E 6 12 5 6 E 1 SS
Ghassul-E 6 12 5 6 E l l uu
Ghassul-Hz 1 4 4 HZ - 7 13
Ghazsul-HZ 1 4 4 H 2 2 20
G hassul-H7 1 4 4 HZ 2 23
Ghzm~l-FI2 I 4 4 HZ 2 19
Ghassul-HZ Z 4 3 H2 2 14 Ghassul-HZ - 7 4 3 H2 2 12
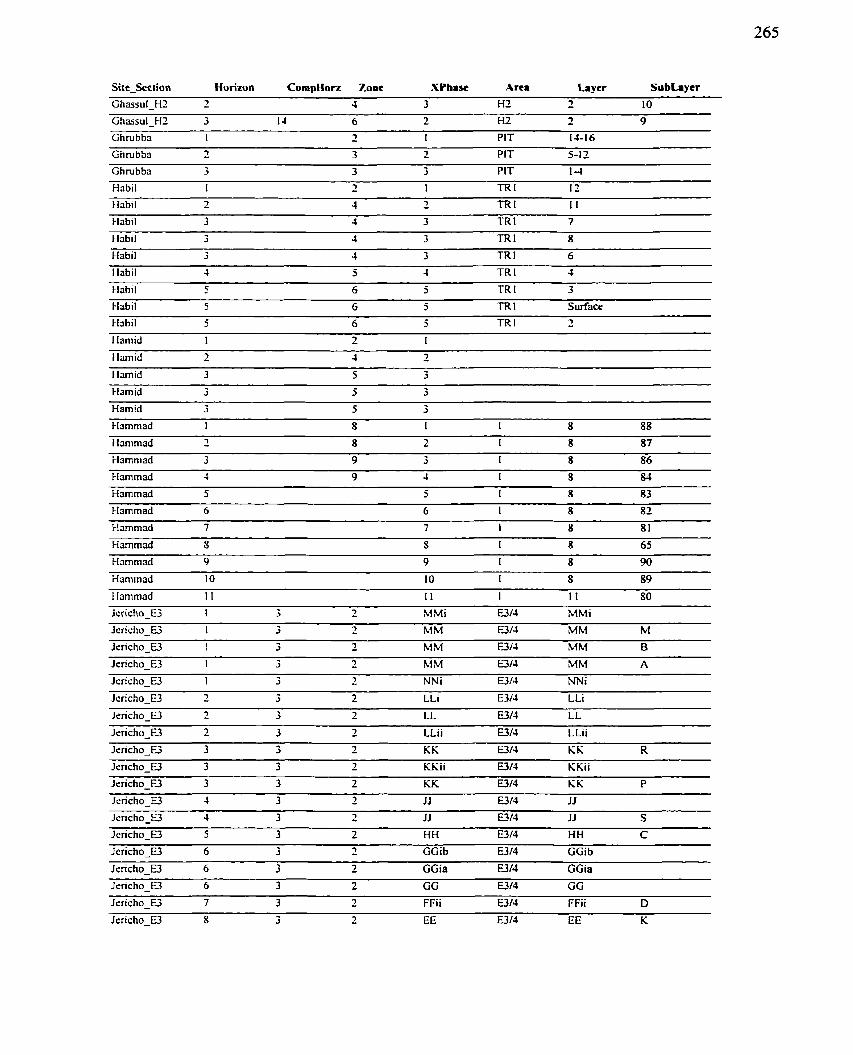
Site-Sction Horizon CornpHon Zone SPLasc Arca Laye+ SubLayer
GhassuI-HZ - 7 4 3 H t - 7 1 O
Ghassul-HZ 3 14 6 2 H2 2 9
Ghrubba 1 2 t PIT 14-16
Ghrubba - -i 3 2 PIT 5-12
Ghmbba 3 3 3 PIT I - l
Wabil 1 - 7 1 TR 1 12
Habil 2 4 - i TR I 1 I
Habil 3 4 3 TR 1 7
- - - - -
tlabil 5 6 5 TR 1 3
Hiibil 5 6 5 TR 1 Surface
tiahil 5 6 5 TRI - 7
1 lamid 1 2 1
Hamid 2 -
Hamid 3 5 3
tfamid 3 5 3
Hamid 3 5 3
f-lammad I 8 I I 8 88
f iammad 2 8 2 I 8 87
H m n i a d 3 9 3 I 8 86
t-fammad 4 9 J 1 8 M Harnrnad 5 5 1 8 83
- -
tiammad 6 6 I 8 82
Hammad 7 7 1 8 8 1
tiammad 9 9 1 8 90
Hammad 10 1 O 1 8 89
Hammad I I 1 I I I I 80
Jcricho-E3 I 3 Z MMi E314 MMi
Jcricho-E3 I 3 2 MM E314 MM b!
Jrricho-E3 1 3 2 MM H l 4 iM M B Jericho-U 1 3 - 7 MM a 1 4 MM A
Jcricho-E3 I 3 - 7 NN i E3/4 NNi
Jcricho-E3 - 7 3 - 7 LLi E3/4 LLi
Jcricho-U - 7 3 2 LL €314 LL
Jericho-E3 - 7 3 2 LLii U W LLii
Jcricho-E3 3 3 - 7 KK B I 4 KK R
Jcricho-E3 3 3 - 7 KKii B I 4 KKii
Jericho-E3 3 3 - 7 KK E314 Ki i P
Jçricho-E3 4 3 2 JJ E3/4 JJ
Jcricho-E3 4 3 2 J J E314 JJ S
Jcricho-E3 5 3 2 HH E314 HH C
Jcricho_E3 6 3 - 3 GGib E314 GGib
Jcricho-E3 6 3 2 GGia B I 3 GGia
Jericho-E3 6 3 2 GG E314 GG
Jcricho-E3 7 3 - 7 FFii E314 FFii D
Jrricho-E3 8 3 2 EE W13 EE K
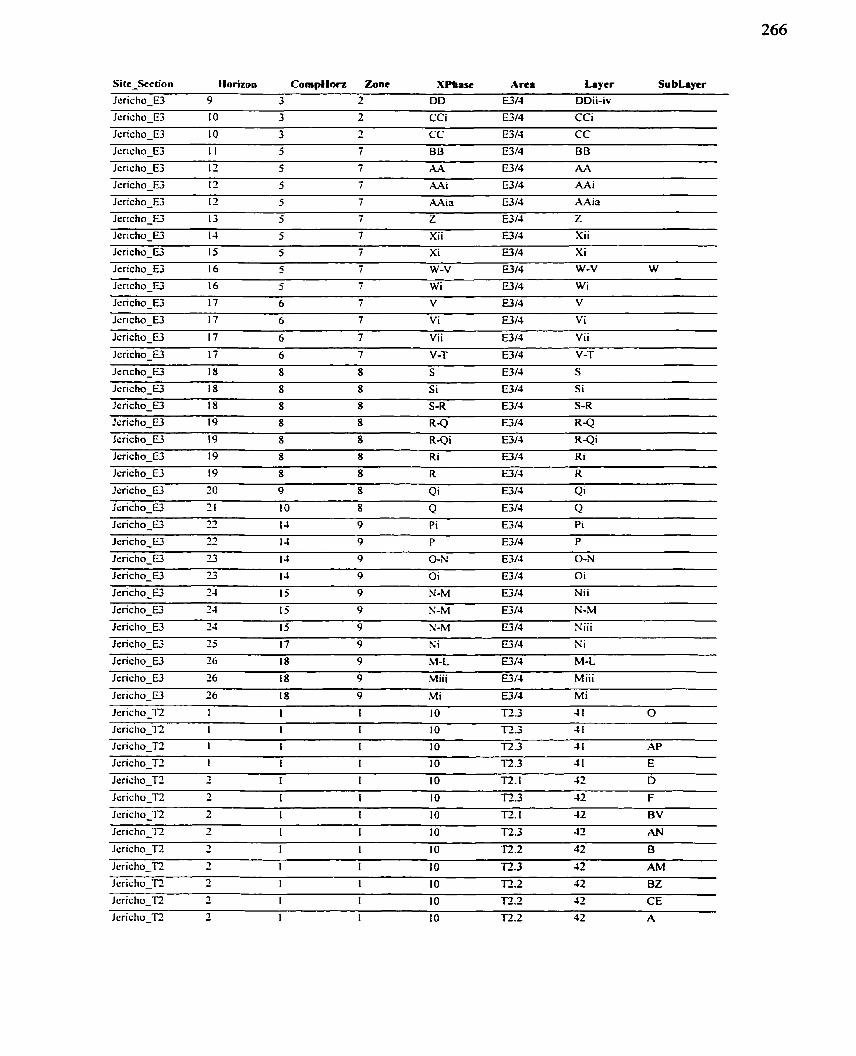
Site-Section Horizon CornpHon Zone XPhasc Arta Laycr Subiaytr
Jcric ho-E3 9 3 - 7 D D E314 DDii-iv
Jcricho-E 1 O 3 2 CCi €314 CCi
Jsricho-E3 1 O 3 - 7 CC €314 C C
Jcricho-E3 I I 5 7 BB €314 BB
Jcricho-E3 I Z 5 7 iL4 E314 AA
Jcricho-E3 12 5 7 AAi E314 AAi
Jcricho-E3 12 5 7 AAiâ E3 14 AAia
Jericho-E3 13 5 I Z E3 14 Z - Jcricho-E3 I J 5 7 Xii U/3 Xii
Jcricho-W 15 5 7 Xi E3 14 Xi
Jericho-E3 16 5 7 W-V €314 W-V W
Jericho-E3 16 5 7 Wi E314 Wi
Jericho-E3 17 6 7 V E314 V
Jcricho-f3 17 6 7 Vi E3A Vi
Jcricho-E3 17 6 7 Vii E314 Vii
Jcricho-E3 17 6 7 V-T E3 14 V-T
Jsricho-E3 18 8 8 S E3 14 S
Jcricho-E3 18 8 8 Si E314 Si
Jcric ho-= 18 8 8 S-R E3/4 S-R
Jcricho-E3 19 8 8 R-Q E314 R-Q
Jcricho-E3 19 8 8 R-Qi E314 R-Qi
Jcricho-E3 19 8 8 Ri U14 Ri
Jcricho-E3 19 8 8 R U14 R
Jcricho-E3 70 9 8 Qi €314 QI Jzricho-E3 2 1 1 O 8 Q E314 Q Jcricho-E3 -- -I 7 14 9 Pi 014 Pi
Jcricho-E3 -- 7 7 14 9 P E314 P
Jcricho-E3 13 14 9 O-N €314 O-N
Jcricho-E3 23 14 9 Oi E3 1.1 Oi
Jrricho-U 24 15 9 N-M E3 14 Nii
Jsricho-E3 74 15 9 N-hl E314 N-M
Jcricho-E3 24 15 9 N-M E3 14 Niii
Jcricho-W 25 17 9 Ni E3 1.1 Ni Jericho-E3 26 18 9 hl-L E3/4 M-L Jericho-E3 16 18 9 Miii E313 Miii
Jericho-E3 76 18 9 iM i E314 Mi
Jrricho-TZ 1 1 1 1 O T2.3 4 I O Jericho-TZ 1 I I 1 O 1-23 4 1
Jericho-T2 1 1 1 1 O T2 -3 4 f AP
Jcricho-TZ I 1 1 10 T2.3 4 1 E Jericho-i7 - 7 1 1 1 O T2.1 42 D Jcricho-l2 - 7 1 I 1 O T2.3 42 F Jcricho-Tl2 - 7 I 1 10 R. 1 42 BV
Jericho-TZ - 7 1 I 1 O TZ.3 42 AN
Jericho-T2 2 I I 10 T2.2 42 B Jcricho-TZ - 1 I I 1 O Tt.3 42 AM Jericho-TZ - 7 1 I 10 R.2 42 BZ Jcricho-TZ - 7 I 1 10 72.2 42 CE Jcricho-E - 7 1 I 1 O T2.2 42 A
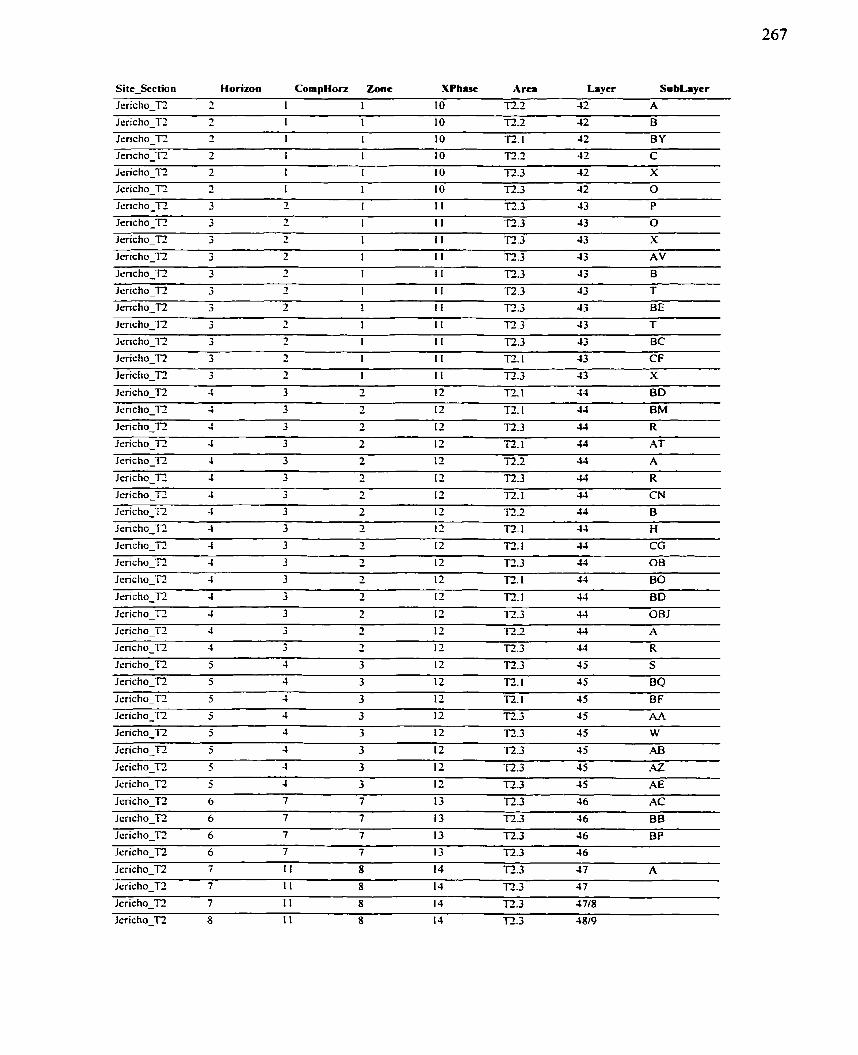
Site-Section Horizon CompHorz Zone XPhast A r n toyr S u b h y c r
J e r i ~ h o - ~ - 7 I 1 1 O l2.2 42 A
J e r i ~ h o - ~ - 7 I I 1 O R . 2 42 B
Jericho-T, Z I 1 1 O TZ. I 42 BY
Jericho-Tt 2 1 1 I O T2.2 42 C
Jerkho-T7 2 I I 1 O R . 3 12 X lericho-TZ - 7 I 1 1 O T2.3 42 O
J e r i ~ h o - ~ 3 2 1 1 I 72.3 43 P
Jeric ho-T2 3 - 7 1 I I T2.3 43 O
Jericho-T2 3 - 7 I 1 1 T2.3 13 X
Jericho-T2 3 - I 1 1 I T2.3 43 AV
Jericho-TZ 3 - 7 1 I I T2.3 53 B Jçricho-TZ 3 - 7 1 I I 17.3 13 T Jeric ho-T2 3 2 I 1 1 E . 3 43 BE
Jericho-T2 3 - -i 1 1 1 n.3 43 T
Jcricho-T2 3 - 7 I I I R . 3 43 BC
Jcricho-TZ 3 - i 1 I I l-2 1 43 CF
Jericho-Tt 3 - 7 1 1 I T2.3 43 X
Jericho-T- 4 3 2 12 TZ. 1 44 BD Jrricho-TZ 4 3 2 12 Tt. l 44 BM Jcricho-TZ J 3 - 7 12 T2.3 44 R
3 cricho-T2 4 3 - 7 12 TZ. 1 44 AT
Jericho-TZ J 3 2 12 n.2 44 A
Jcric ho-= 4 3 - 7 12 T2.3 55 R Jcricho-l2 J 3 - 7 I Z TZ. I 44 CN Jericho-T2 4 3 - 7 12 TZ.2 44 B Jcricho-T, 4 3 2 12 E. 1 44 H Jcricho-TZ 4 3 - 7 12 E. 1 44 CG
Jericho-TZ 4 3 2 12 E . 3 J-I OB
Jcricho-TZ 4 3 2 12 TZ. 1 44 BO
Jericho-T- J 3 - 7 12 17.1 44 BD Jericho-T2 4 3 - 7 12 E . 3 44 OBJ
Jcricho-TZ 4 3 - 7 12 T2.2 J-I A
Jericho-T2 4 3 - i I Z n . 3 33 R
Jcricho-Tt 5 4 3 12 T2.3 45 S
Jcricho-TZ 5 J 3 12 E. 1 45 BQ
Jericho-E 5 4 3 12 F-. 1 45 BF Jcricho-R 5 4 3 12 T2.3 4 5 AA
Jcricho-Tî, 5 J 3 12 n - 3 4 5 W
Jericho-TZ 5 4 3 12 T2.3 4 5 AB
Jericho-TI 5 J 3 12 72.3 55 A2 Jcricho-T2 5 4 3 12 n.3 45 /\E
Jericho-TZ 6 7 7 13 72 -3 46 AC
Jericho-T2 6 7 7 13 T2.3 46 BB Jcricho-T2 6 7 7 13 R . 3 46 BP
Jericho-T2 6 7 7 13 T2.3 46
J e r i ~ h o - ~ 7 I I 8 14 T2.3 47 A J c r i ~ h o - ~ 7 1 l 8 14 T2.3 47
Jcricho-T2 7 I I 8 14 T2.3 47/8
Jcricho-Tî 8 I I 8 1 1 T2.3 4819
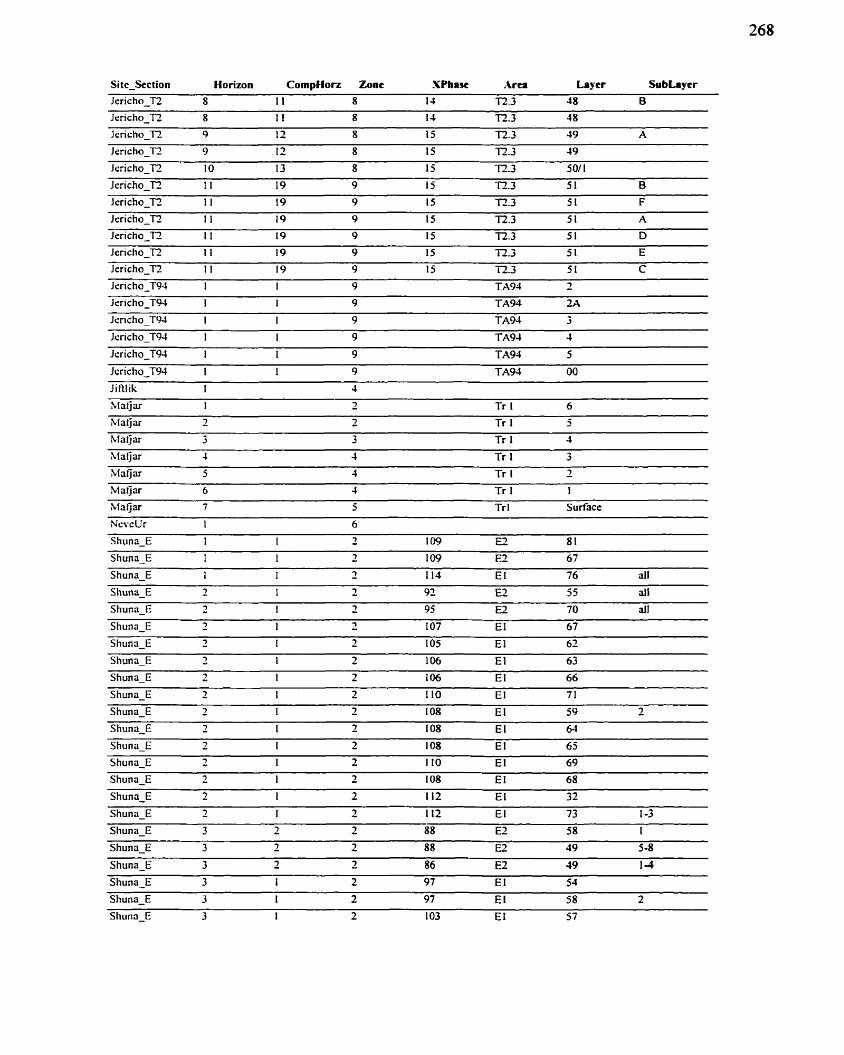
Site-Section Horizon CornpHon Zone SPhruc Arta Loyer Subhycr
-
Jcricho-Tî, 9 12 8 15 T2.3 49 A
Jericho-32 9 12 8 IS R.3 49
Jcricho-Tî- 1 O 13 8 15 T2.3 501 1
Jericho-T2 I I 19 9 15 T2.3 5 1 B
Jcricho-Tt 1 I 19 9 15 E . 3 5 1 F
Jcricho-T2 I I 19 9 15 72.3 5 1 A
Jericho-Tt I I 19 9 15 72.3 5 1 D
Jericho-T2 I I 19 9 15 TZ.3 5 1 E
Jericho-T2 II 19 9 15 T1.3 5 1 C
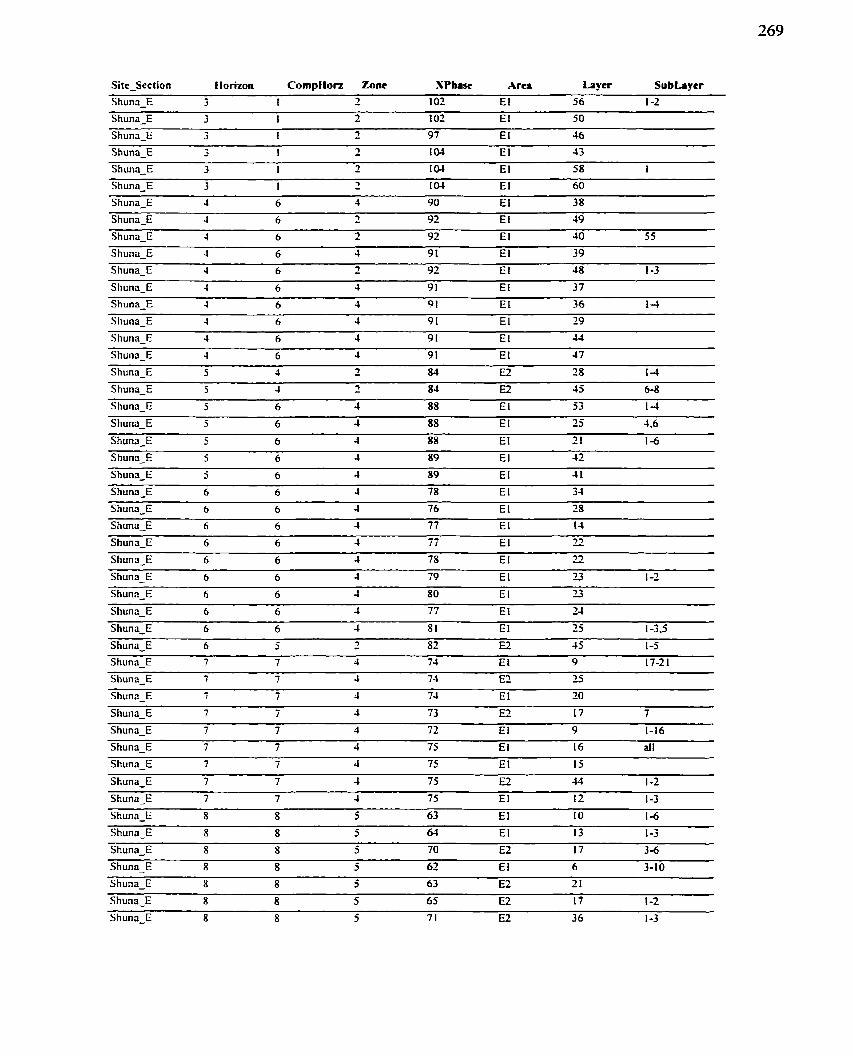
SiteSection Horizon CompAon Zone SPhuc Arc8 ia y cr Su b b y e r
Shuna-E 3 1 2 1 O? E 1 56 1 -2
Shun-E 3 1 2 102 El 50
S h u n ~ E 3 I .. 7 97 El 46
Shuna-E 3 I 2 1 0 1 El 43
ShunaE 3 1 2 Io4 El 58 1
ShunaE 3 I - -J Io4 El 60
Shuna-E 4 6 3 90 El 38
Shuna-E 4 6 2 92 E 1 49
Shuna-E 4 6 - 7 92 E 1 40 5 5
ShunaE 4 6 4 9 1 El 39
Shuna-E 4 6 - 7 92 E 1 48 1 -3
ShunaE 4 6 4 9 1 E I 37
Shuna-E J 6 4 9 1 E I 36 14
Shuna-E 4 6 4 9 1 E 1 19
Shuna-E 4 6 4 9 1 E 1 44
Shuna-E 4 6 4 9 1 E l 4 7
Shuna-E 5 J - 7 84 E2 28 I - J
Shuna-E 5 J - 7 84 E2 45 6-8
ShunaE 5 6 4 88 E i 53 1-4
Shuna-E 5 6 4 88 El 25 4.6
Shuna-E c 6 1 88 E 1 2 1 1 -6
ShunaE 5 6 1 89 E 1 42
ShunaE 5 6 4 89 E 1 4 1
Shuna-E 6 6 4 78 El 34
Shuna-E 6 6 4 76 E 1 78
Shuna-E 6 6 4 77 E l IJ
ShunaE 6 6 4 77 E 1 - 7 7
S hum-E 6 6 4 78 El - 77
Shuna-E 6 6 4 79 E 1 23 I -2
ShunaE 6 6 1 80 El 23
ShunaE 6 6 4 77 E i 24
Shuna-E 6 6 4 8 1 E 1 25 1 -3.5
S h u n ~ E 6 5 Z 82 EZ 45 1-5
ShunaE 7 7 4 74 E 1 9 17-21
Shuna-E 7 7 4 74 EZ 15
Shuna-E - I 7 4 74 E 1 70
Shuna-E 7 7 J 73 E2 17 7
Shuna-E 7 7 1 72 E 1 9 1-16
Shuna-E 7 7 4 75 E 1 16 id 1
Shuna-E 7 7 4 75 E 1 15
Shuna-E 7 7 4 75 E2 44 1-2
Shuna-E 7 7 4 75 El 12 1-3
S huna-E 8 8 5 63 E 1 10 1 -6
Shuna-E 8 8 5 65 E 1 13 1 -3
Shuna-E 8 8 5 70 E2 17 3-6
ShunaE 8 8 5 62 E I 6 3-10
ShunaE 8 8 5 63 E2 2 1
Shuna-E 8 8 5 65 E2 I f 1-2
Shuna-E 8 8 5 7 1 E2 3 6 1-3
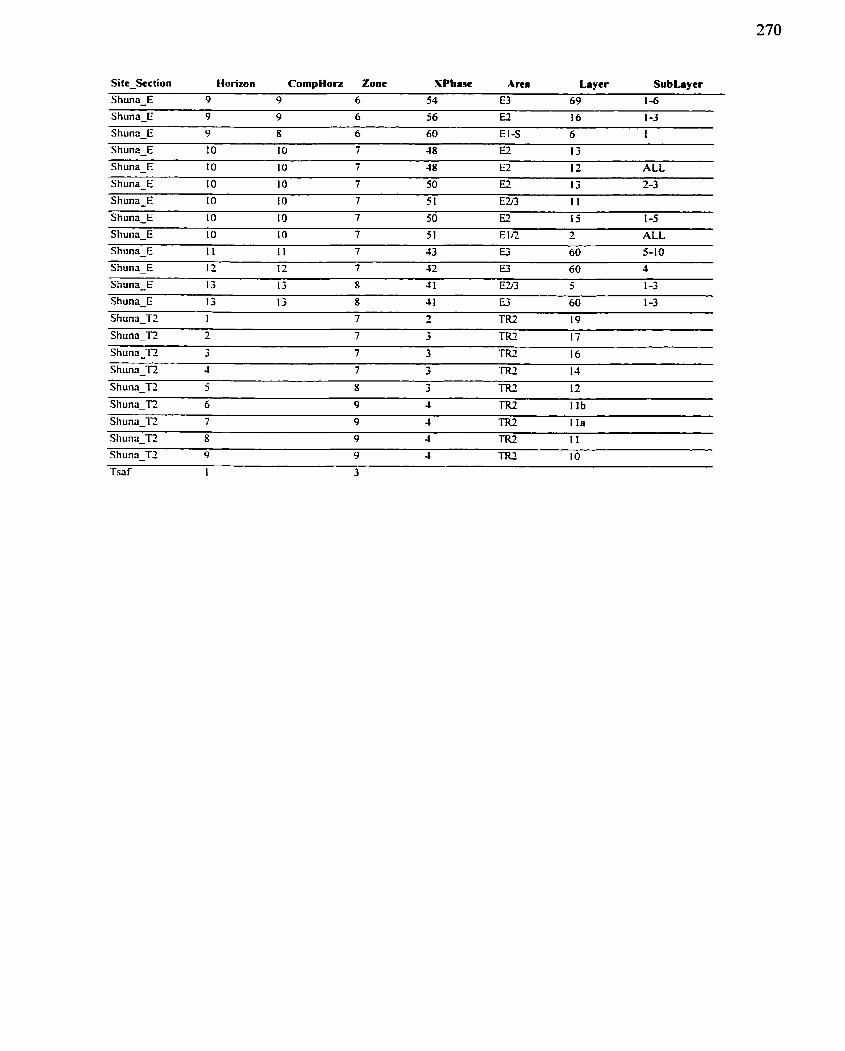
Sitc-Section Horizon CornpHon Zone SPbasc Arca Laycr S u b h y t r
Shuna-E 9 9 6 54 E3 69 14
Shuna-E 9 9 6 56 €2 16 1 -3
Shunri-E 9 8 6 60 El-S 6 1
S h u n a E 1 O 1 O 7 48 E2 13
Shuna-E IO 10 7 48 E2 12 ALL
Shuna-E 1 O 1 O 7 50 EZ 13 2-3
S h u n - E 1 O 1 O 7 5 1 E2/3 I I
Shuna-E 1 O 1 O 7 50 E! 15 1-5
Shuna-E 1 O 10 7 5 1 E IR 2 ALL
Shuna-E 1 1 I I 7 43 0 60 5-10
Shuna-E 12 12 7 42 U 60 4
Shuna-E 13 13 8 4 1 E2/3 5 1 -3
Shuna-E 13 13 8 4 I E3 60 1 -3
Shuna-T? I 7 2 TR2 19
Shuna-T, 2 7 3 TR2 17 Shuna-T, 3 7 3 TRZ 16
Shuna-TZ 4 7 3 TR2 14
S h u n - E 5 8 3 TR2 12
Shuna-T, 6 9 4 TR2 I l b Shuna-T3 7 9 4 TRZ i I a
Shunri-E 8 9 4 TR2 I l Shunri-T2 9 9 4 Tt2 10
Tsrif I 3
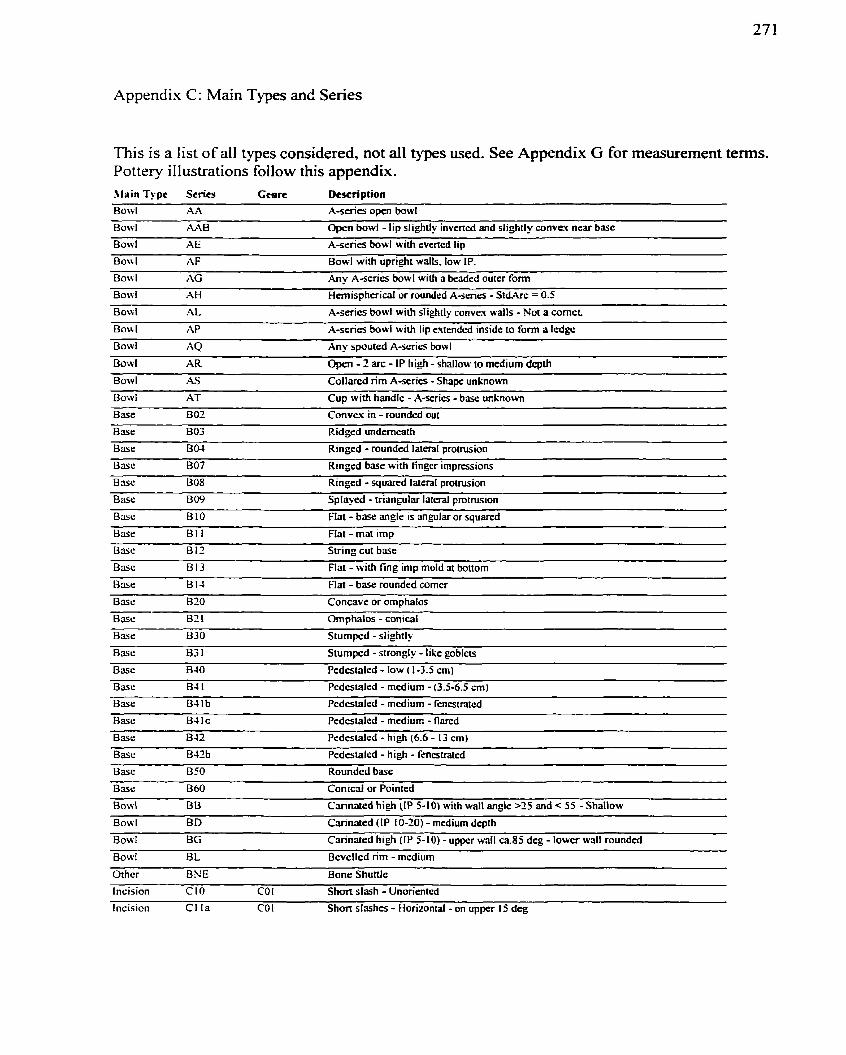
Appendix C: Main Types and Series
This is a list of al1 types considered, not al1 types used. See Appendix G for measurement terms. Pottery illustrations follow this appendix. \lain Type Series Ccnrc Description
Bowl iV\ A-senes open bowl
Bowl &IB Open bowl - l ip slightly invcned and slightIy conve? near base
Bowl AE A s e r i a bowl wilh evcncd lip
Bowl AF Bowl with upright walls, low IP.
Bowl AG Any A-series bowl with a beaded outcr f o m pp --
Bowl AH Hcmisphcrid or rounded A-~cries - StdArc = 0.5
Bowl AL A-sencs bowl wilh slightly convex walls - Not a cornct - pp . - - --
Bou l AP A-serics bowi with lip extendcd inside to form a ledgc -- - - -
Bowl XQ Any spouted A-scna bowl
Bowl AR Open - 2 an: - IP hi& - shalIow ro medium dcpth
Bowl AS Collarcd r im A-series - Shape unknown
Bowl AT Cup wiif i handlc - A-series - base ucknown
Base BO2 Convev in - rounded out
B s c BO3 Ridged underneah
Basc BO4 Ringcd - rounded lateral protu ion
Base BO7 Ringcd base wiih fingcr impressions
Base BO8 Ringed - squared lateral prouusion
Base BO9 Splayed - trianfular lateral proirusion
Base B10 FIat - base angle is angular or squarcd
Base B I 1 Flat - mat irnp
Base B I 2 String cut base
Base B I 3 Flat - with fing imp rnold at bottom
Base B I 4 Flat - base rounded corner
Base BZO Concave or omphalos
Base BZ 1 Omphalos - conical
Base 830 Stumped - slightly
Base B3 1 Sturnpcd - suongly - lilie goblets
Base BJO Pcdcstaled - low ( 1-3.5 cm)
Base BJ 1 Pcdcstaled - rncdium - (3.5-6.5 cm)
Base B4Ib Pcdestalcd - rncdium - fencstratcd
Base B4 lc Pcdcstalcd - medium - flared
Base BJZ Pcdestalcd - high (6.6 - 13 cm)
Base B J l b Pedestaled - high - fcnesuated
Basc BSO Roundcd base
Base B60 C o n i a i or Pointed
Bowl B B Carinatcd hi& (IP 5-10) with wall angle >25 and < 55 - Shallow
Bowl B D CarÏnatcd (IP 10-20) - medium depth
Bond BG Carinatcd high (IP 5-10) - upper wafl ca85 dcg - lower wall rounded
Bowl B L Bcvcllçd rim - medium -
Othcr BNE Bone Shutlle
lncision C 1 O CO 1 Short slash - Unonented
Incision C l l a CO I Short slashes - Horizontal - on uppcr 15 dcg
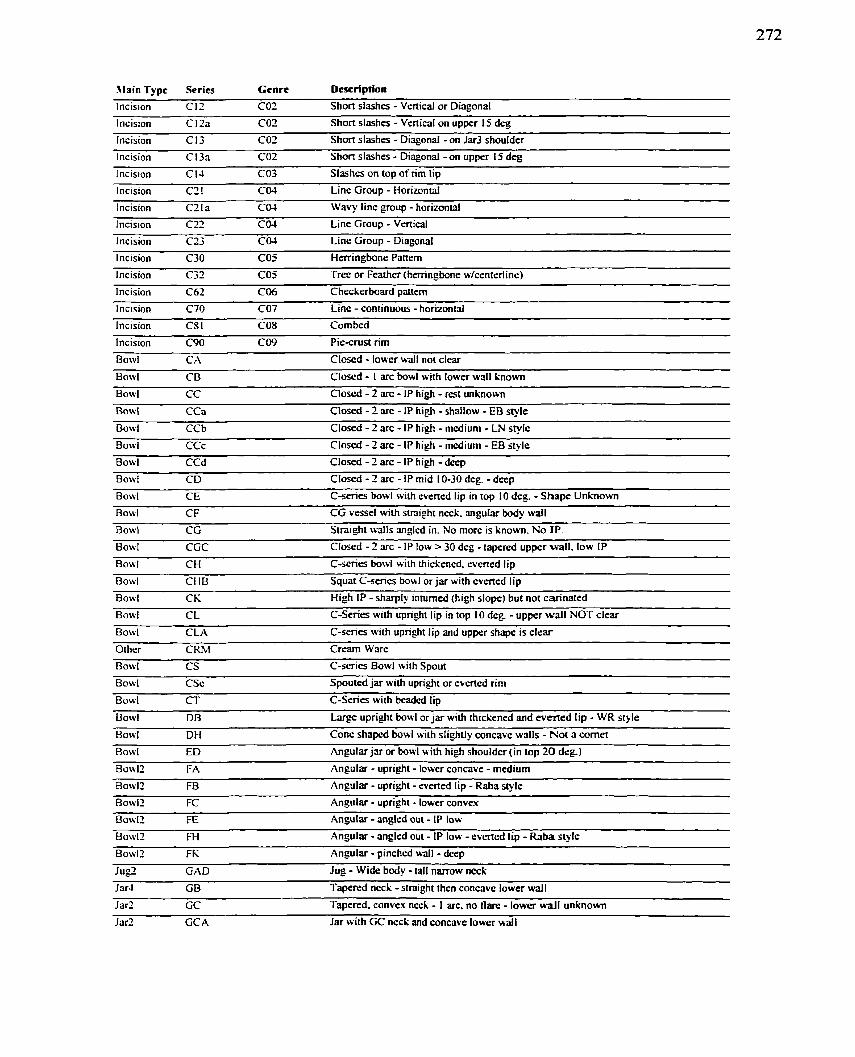
Slain Type Series Genre Description
Incision CIZ C02 Shon slashes - Vertical or Diagonal
Incision C12a C02 Short slashes - Vertical on upper 15 deg
Incision C13 COZ Short slashes - Diagonal - on Jar3 shoulder
Incision C13a COZ Shon stashes - Diagonal -on upper 15 deg
Incision C I 4 CO3 Slmha on top o f rim lip
Incision CZ I C W Line Group - Horizontal
(ncision C2 I a COJ Wavy line group -horizontal
Incision C22 COJ Line Group - Vertical
Incision C23 COJ Line Group - Diagonal
Incision C30 C05 Herringbone Panem
Incision C37 C05 Tree or Fealhcr (hemngbone w/centeriinc)
Incision C62 C06 Checkerboard pattern
Incision C70 C07 Line - continuous - horizontal
Incision C8 1 CO8 Com bed
Incision C90 C09 Pie-crust rim
Bowl CA CIosed - lower wall nor clear
Bowl CB Closed - i arc bowl with lower wall known
Bowl CC Closed - 2 arc - IP high - rest unknown
Bowl CCa Closed - 2 arc - IP high - shallow - EB style
Bowl CCb Closed - 2 arc - [P high - medium - LN style
Bowl CCc Closed - 2 arc - IP high - medium - EB style
Bowl CCd Closed - 2 arc - IP high -deep
Bowl CD Closed - 2 arc - IP mid 10-30 dcg. - dcep
Bowl CE C-series bowl with evened lip in top 10 dcg. - Shape Unknown
Bowl C F CG vessel with slnight neck anguiar body wall
Bowl CG Straight walls angled in. No more is known. N o IP.
Bowl CGC Closed - 2 arc - IP low > 30 dcg - tapered upper wall. low IP
Bowl CH C-series bowl with thickened. evened lip
Bowl CHB Squat C-series bowl or jar with everted l ip
Bosvl CK High IP -sharply inturned (high slope) but not carinated
Bowl CL C-Series with upright tip in top 10 deg - upper wal l NOT clear
Bowl CLA C-series with upright l ip and upper shape is clear
Othcr CRM C r m Ware
Row1 CS C-scries Bowl with Spout
Bowl CSc Spouted jar with upright or cvcrted rim
Bowl CT C-Scrics with beaded lip
Bowl DB Large upright bawl or jar with thickened and everted l ip - WR style
Bowl DH Cone shaped bowl with slightly concave walls - h'ot a comet
Bowl ED Angularjar or bowl with high shoulder (in top 20 deg)
Bon.12 FA Angular - upright - lowvcr concave - medium
Bowl:! FB Angular - upright -everted lip - Raba style
Bowl2 FC Angular - upright - lower convex
Bowl? FE Angular - angled out - IP low
Bowl? FH Angular - anglrd out - IP low -evened lip - Raba style
Bowl:! FK Angular - pinchcd wall - deep
J ug2 GAD Jug - Wide body -tall narrow neck
l ar4 GB Tapered neck - stnight then concave lower wall
J ar? GC Tapcred. convex neck - 1 arc. no flare - lower wall unknown
Jar2 GCA Jar with GC neck and concave lower wail

Main Type Series Genre Description
Jar2 GCB Jar with GC neck concave Iower wall and fiat base
Jar2 GCC GC jar - steep walled. tall. narrow. Lower unknow
J ar7 GD Funnel neck - wall slightly concavc -Concave Iower - - ---- - - -
Jar2 GF Tapercd neck (8 or 9). cverted. no vertex - N;I CL Jar2 Gl Any Funnel neck or closed fonn wilh beaded Iip
J ar2 GL Outcurved 2 afc - use as default for 2 arc. Not flared.
Jar, Ghl Shon rolled rim foldcd down - hat rim
Jar4 GS Tapered neck with bulged walls and evened Iip - S e U Handlc Hl 1 Hl 1 Knob - Conical - rounded short ( 1 -3: 0.4-0.6)
HandIr H 13 Hl3 Knob - Disc -Flat topped (3-5: 0.24.4)
Handle HZ0 H20 Knob/Ledge - thick, short (2.5-3.5; 0.3-0.5)
Handle HZOa H20 KnobILedge - triangular - LN style (2-3.5: 02-05]
Handle H20c H2O KnobfLedgc - uptumed
Handls H t Od HZOd Knob/Lcdgc - finger irnp. LNChalc sqIc
Handlc H20c H23 Lcdgc - thin. tongue - EB s q f e (2-3.5: 0.4-0.6)
Handle H2Of H23 Lcdge - thin. tongue - Sernted edge (2-3.5; 0.4-0.6)
Handlc HZ la HZla Ledge - broad - plain (2.5-6.0: 0.74.3)
tlandlc H2t b H3 1 Ledge - bmad - folded - continuous (2.5-6.0: 02-0.3)
Handle HZIc HZ lc Ledge - broad -W. (2.5-6.0; 0.24% Handle HZld HZ l d Lrdge - broad - Finger irnpressed (2.56.0; 0.2-03)
Handle HZle t12 1 Ledge - broad - foldcd - 7 or more laps (2.5-6.0; 0.2-0.3)
Handlc H72 HZZ LedgeILug - plain rounded - sharp uptum - Jawa style
Handle H24a Hz-1 Lcdge - wstigal - s h o n long. thick. S e knoMedge ( 1.5-3 5: 0 .143)
Handle HZ4c H23 Lcdge - vestigd - rced imp. to glve semted effect ( 1.5-3.5: 0.1-0.3)
Handlr: HZ-id H23 Ledge - vestigal - plain - at carination - GBW style
Handlc LI26 H 26 Lcdge - broad - pushed up laps. sulloped (3.0-6.0: 0.2-0.3)
t Iandle H30a H30 Loop - largc - round cross-section ( 1 1-1 5: 1.5-2-0)
Hmdle 1 l30b Cl30 Loop - large - round cross-section - ût neck vertex ( l 1-1 5: 1.5-2.0)
Handlr H3Oc H30 Loop - large with nail or fingcr impressions ( 1 1 - 15; 1.5-2.0)
Handlc t130s H3Os Loop - Stnp handlc - wide oval or flac cross-section (6-12: 1.0-2.0)
HandIc H3Or H3 O Loop - largc - triangular cross-section ( I 1 - 1 5: 1.5-2.0)
Handle H33a H33 Loop - small - plain (4.0-8.0: 1 .O-3.0)
Handle H33b H33 Loop - small - plain - upper (4.0-8.0; 1.0-3.0)
Handlt: H33c H33 Loop - srnall - plain - on neck vertes (4.0-8.0; 1.0-3.0)
Handle H33d H33 Loop - with clay band
Wandlc H33e H33 Loop - small - plain - rim IO shouldcr (4.0-8.0: 1 .O-3.0)
Handle H33f H33 Loop - small - plain - ai Bo@ Ma. or Mid (4.0-8.0; 1.0-3.0)
Handlc H33g H33 Loop. small. On jar shoulder (4.0-8.0; 1 .O-3.0)
Handle H3 5 H3 5 Loop - spfaycd - position unknown (4.0-8.0; 1.0-3.0)
Handle H37b H37 Loop - Jug - high - rim io lower body
Handle H37e H37 Loop - jug - medium - rim to shoulder
Handlc HJOa H4O Lug - horiz - plain
Handlc H4Ob i 122 LcdgdLug - plain uiangular - upiurned (1 .O-3.0; 0.34.6)
Handle HJOc H40 Lug - horiz - plain - upper
Handle HJ 1 H4 1 Lug - unorienied - picrced
Handle H4 1 a 114 1 Lug - horiz - pierced
Wandle H4lb H4 1 Lug - horiz - pierced - at shoulder or carination
Handlc Ci3 1 c H 43 Lug - horiz - duai - pierced
Firuidlc H4lf H4 I Lug - horiz - picrccd - uptumed
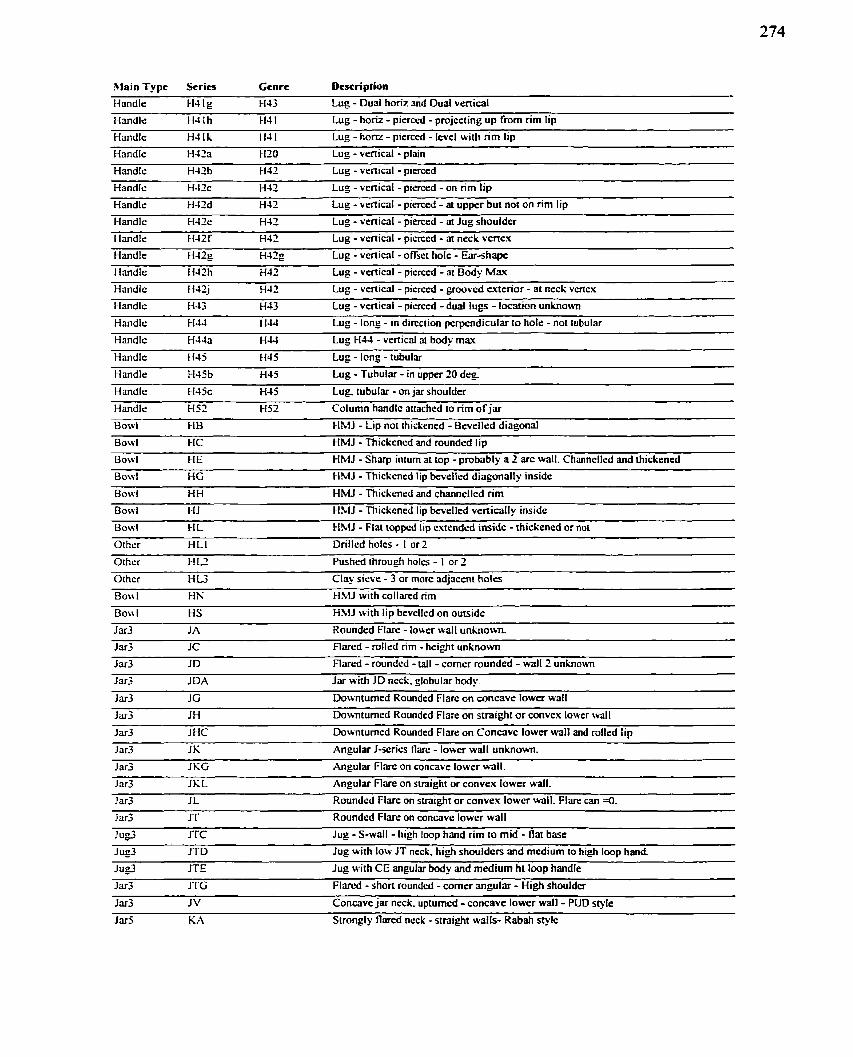
-- - -- - - -
Hondle H4 l g H43 Lug - Dual honz and Dual venical
$lain Type Scria Genre Description
-- -
Handle H4 lh FI4 1 Lug - horiz - picrced - projecting up from r im lip
Handlc H4 l li 114 1 Lug - horiz - pierced - Ievel with nm lip
Handle H4Za HtO Lug - venicid - plain
Handle H4Zb L I 1 1 Lug - vertical - pierced
Handle H42c H 42 Lug - vcnical - picrced - on rim l ip
Handlc H4td H42 Lug - vertical - pierced - at upper but not on r im lip
Handle iHJlc H42 Lug - venical - pierced - al Jug shouldcr
Handlt: H42f HJ:! Lug - vcnical - pierccd - rü neck venex
Handle HJ2g H4Zg Lug - vertical - offsct holc - Ear-shape
I4andle H4Zh t147 Lug - vertical - pierccd - at Body Max
Handlc H42j H 42 Lug - vcnical - picrccd - groovcd exterior - at ncck vcrtcx -
l landlr H G H43 Lug - vertical - piuced - dual lugs - location unhown
Handlc FI44 HU-- Lug - long - in dircciion perpendicular to hole - not tubular - -
Handlr H44a HJJ Lug HU - vertical at body max --- -
Handlc HJ5 HJ5 LUC - long - tubular
Handle HJ5b H45 Lug - Tubular - in upper 20 deg.
Handlc H45c H45 Lug. tubular - on jar shouldcr
Handle H52 H52 Column handlc artachcd to r im o f ja r
Bowl HB HMJ - Lip not thickcned - Bcvcllcd diagonal
Bowl HC H U I - Thickencd and rounded l ip
Bowl HE HMJ - Sharp inturn at top - probably a 2 arc wall. Channcllcd and rhickcncd
Bowl HG HMJ - Thickcncd lip bevettcd diagonally inside
Bowl HH H U I - Thickencd and channclled r im
Bowl 14 J HMJ - Thickencd Iip bevelled vert ial ly inside
Bowl H L HMJ - Flat topped iip cxtendsd inside - rhickcned or not
Othcr HL1 Drillcd holcs - 1 or 2
Othcr HL- Pushcd throuçh holcs - I or Z
Other HL3 CI- sieve - 3 or more adjacent hola
Bowl HN HMJ with collarcd rim
Bou I HS HMJ wiih l ip bevclled on outsidr
J ar3 J A Rounded Fliue - lowcr wall unknown.
Jar3 JC Flarcd - rollcd rirn - height unknown
Jar3 JD Flared - rounded - tall- corner roundcd - waJI2 unknom
Jar3 J DA Jar with JD ncck. globular body.
Jar3 JG Dounturned Roundcd Flarc on concave lower wall
Jar3 JH Downtumcd Rounded Flare on straight or convcx loiver wall
J ar3 J HC Do\vnturncd Rounded Flarc on Concave lower waIl and rolled lip
Jar3 K Angular J-scries llarc - lowcr wall unknown.
J ar3 J KG Angular FIare on concave lowcr wall.
Jar3 JKL Angular Flare on stnight or convex iower wall.
Jar3 J L Roundcd Flare on straighr or convex lower wall. Flare can =O.
Jar3 JT Roundcd Flarc on concave lowcr wall
Ju@ J'TC Jug - S-wall - high loop hand r im Io mid - flat base
Ju@ JTD Jug with low JT ncck. high shoulders and medium to hi& bop hand.
Jug3 JTE Jug wiih CE angular body and medium h i loop handle
Jar3 JTG Flamd - short roundcd - corner any la r - High shouldcr
Jar3 J V Concave jar ncck uptumed - concave lower watl - PUD sfvlc
1x5 KA Suongly flared ncck - stnight walls- Rabah stylc
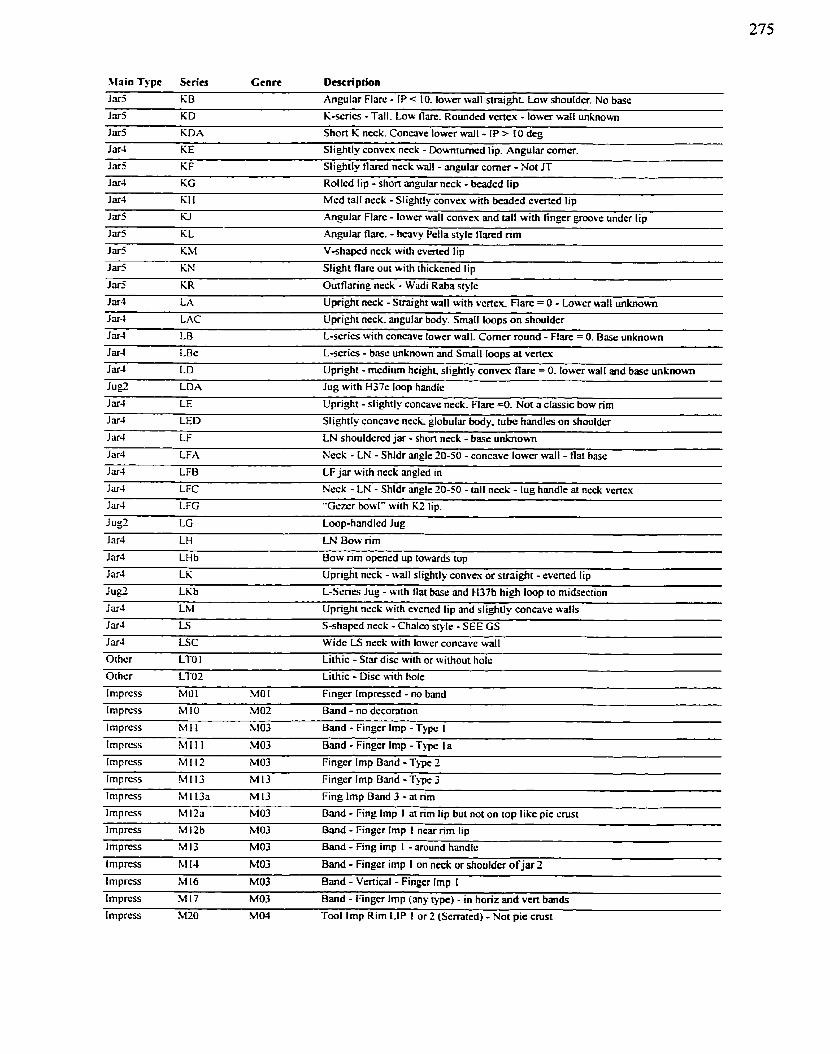
Main Type Stries Genre Description
Jar5 KI3 Angulrir Flue - If < 10. lower wall straight Low shoulder. No base
Jar5 KD liseries - Tall, Low flue. Round4 vcnex - lower wall unknown
Jar5 KDA Short K neck. Concave lower wall - IF > 10 deg
Jar4 KE Slightly convex neck - Downtumed Iip. Angular corner.
Jar5 K F Slightly f lved neck ~ . a l l - mgular corner - Not TT Jar? KG Rolled lip - shon angulv neck - beaded I ip
J ar? KH Med tall nesk - Slightly convex wiui beadcd cvened lip
J ar5 lil Aneular Flare - lowcr wall convex and tall wilh finger groove under l ip
Jar5 K L .bgular flm. - heavy Pella style flared rirn
Jar5 KM Vshaped neck wich evencd lip
Jar5 KN Slight flare out wiih thickcned lip
Jar5 KR Outflaring neck - Wadi Raba style
Jar4 W Upright ncck - Straight wall with vcnex FFlarr = O - Lower wall unknown Jar4 LAC Upright neck. angular body. Small loops on shoulder
J ar4 LB L-series with concave lower wall. Corner round - F l a c = O. Base unknown
J ar4 LBc L-series - base unknown and Small loops at venex
Jar4 L D Upright - medium height. slightly conve.. flare = 0. lower walI and base unknown Jug2 LD A Jug with H37e loop handle
Jar4 LE Upright - slightly concave neck. Flarc 4. Not a classic bow rim
Jar4 LED Slightly concave ncck globular body. tube handles on shouldcr
J ar-i LF LN shouldercd jar - shon nesk - base unknown
Jar4 LFA Neck - L N - ShIdr angle 20-50 - concave lower wall - flat base
Jar4 LFB LF jar with neck angled in
Jar4 LFC Ncck - LN - Shldr angle 20-50 - tall neck - lug hmdle at nrck venex
Jar4 LFG -Gezer bowl" with liZ lip.
Jug2 LG Loop-handlcd Jug
Jar.) LH L N Bow r im - - -
Jar4 LHb Bow nrn opened up iowards top
Jar4 LK Upright neck - w d l slightly convex or suaight - mened lip
J u s LKb L-Series Jug - with flat base and H37b high loop to midseciion
Jar4 L M Upright neck with evened lip and slighily concave walls
Jar4 LS S-shapcd neck - Chaico style - SEE GS
J ar4 LSC Widc LS neck with lower concave wall
0lhc.r LTO l Lithic - Star disc with or without holr
Oiher LTOZ Lithic - Disc with hole
Impress MO 1 MOI Fingcr lmpressed - no band
I r n p ~ u s M I O MO2 Band - no dccontion
Irnprcss M I 1 MO3 Band - Finger Imp -Type I
Impress M l 1 I MO3 Band - Fingcr Imp - Type l a
lmpress h.1 I I Z MO3 Finger Imp Band - Tlpc 2
1 m p r a s M I 13 M l 3 Finger Imp Band - T ~ Q C 3
Imprcss M 113a hl 13 Fing Imp Band 3 - at rim
Imprcus M 12a MO3 Band - Fing Imp I ai rim lip but not on top like pie cmst
Irnprcss M 12b MO3 Bmd - Fingcr Imp 1 ncar r im lip
lmprcss M 13 MO3 Band - Fing imp I - m u n d handle
lmpress M l 4 hl O3 Band - Finger imp I on neck or shoulder ofjar 2
lmprcss M 16 M 03 Band - Vertical - Finger Imp 1
lmprcss M 17 MO3 Band - Finger Imp (any ~ p e ) - in horiz and vert bands
lrnpress MZO MW T m l Imp Rim LIP I or 2 (Scmted) - Not pic c r u t
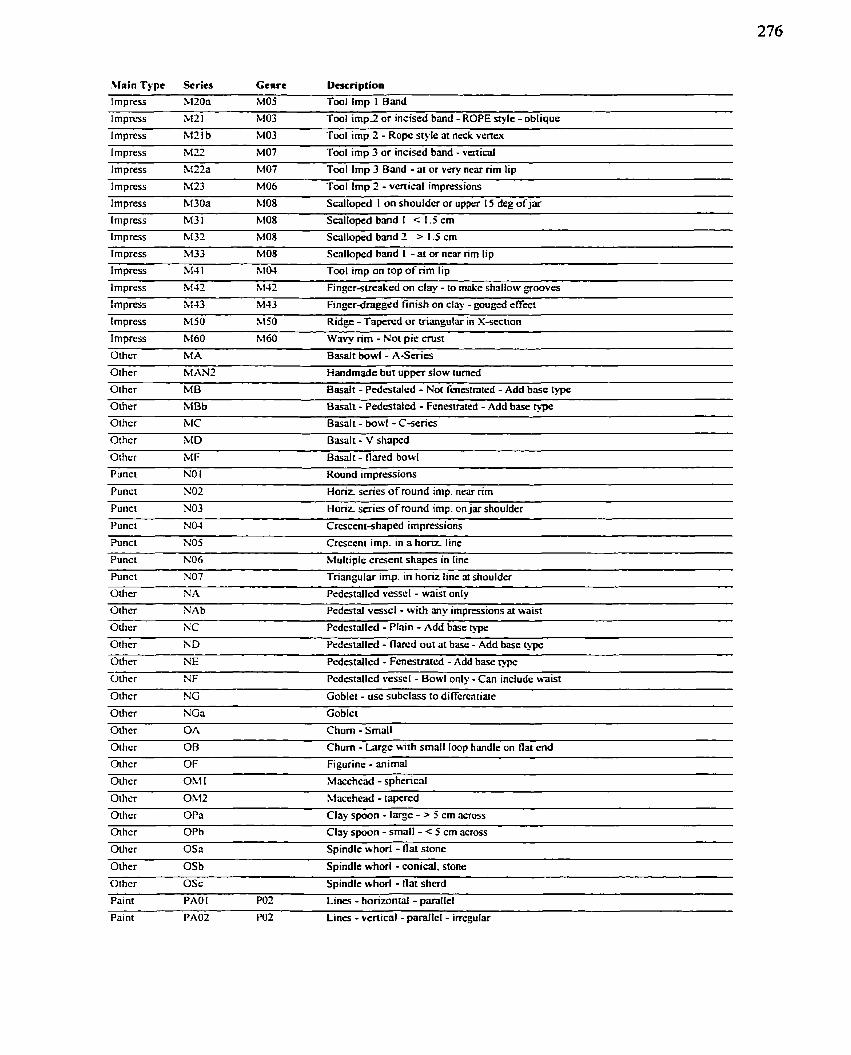
Ylain Type Scrics Ccnrc Description
Imprcss M103 MO5 Tool Imp I Band
Irnpress XI2 1 MO3 Tool imp2 or incised band - ROPE style - oblique
Impress hf71b M 03 Tml imp 2 - Rope style at neck venex
Impress X E MO7 Tool imp 3 or inciscd band - ver t id
Impress M l a MO7 Tool Imp 3 Band - at or vrry near rim lip
Imprcss 1M23 MO6 Tool Imp 2 - vcnicai impressions
Im press hI3Oa MO8 Sd loped 1 on shouldcr or upper 15 deg ofjar
lmpress M 3 1 MO8 Scallopcd band 1 < 1.5 cm
lmprcss M32 MO8 Scalloped band 2 > 1.5 cm
lrnpress M33 MO8 Scalloped band 1 - at or near rim lip
lmpress MJ l blM Tool imp on top o f rim lip --
Irnpr~~ss M 42 M.(? ~in~er-streaked on clay - to rnake shallow grooves
lrnpms M-1-13 hl43 ~ i n ~ e r d r a g g e d finish on cl- - gougcd effccf
Irnpress M50 kt50 Ridge - Tapercd or triangular in X-section
Imprcss M60 M60 Waw rirn - Nol pie cnist
Other MA Basalt bowl - A-Series
Othcr MAN2 Handmade but upper slow turned
Other M B Basalt - Pcdcstaled - Not fenestntcd - Add base type
Oihcr MBb Basal1 - Pedcstaled - Fenwtratcd - Add base ope Othcr blC Basalt - bowl - C-series
Othsr MD Basalt - V sh-d
Other M F Basalt - flared bowl
Punct NO 1 Round impressions
Punct NO2 Horit ser ia o f round imp. n w rim
Punct NO3 Horiz. sçriw o f round imp. on jar shouldcr
Punct NO4 Crescent-shaped impressions
Punct NO5 Cresccnt imp. in a hor i r line
Punct NO6 Multiple cresent shapes in Iine
Punct NO7 Triangular imp. in horiz iinc at shoulder
Other NA Pedatalled vesscl - waist only
Othcr NAb Pcdestai vesse1 - with any impressions at waist
Othcr NC Pcdatalled - Plain - Add base type
Other ND Pedestallcd - flarcd out al base - Add basc q-pc Othcr NE Pcdestallcd - Fcnesuated - Add base p p e - Othcr NF Pedestallcd vesscl - Bowl only -Cm include waist
Othsr NG Goblet - use subclass 10 diffcrenriate
Other NGa Goblet
Oiher OC\ Chum - Small
Othcr OB Chum - Largc with srnall Ioop handle on flat end
Othrr OF Figurine - animal
Oihcr Oh1 l Macehçad - sphcncal
Other OM2 Macchead - tapercd
Orhcr OPa Clay spoon - large - > 5 cm across
Othcr OPb Clay spoon - small - c 5 cm across
Othcr Osa Spindle whorl - flat stone
Other OSb Spindle whorl - conical. stone
Othcr OSc Spindle whorl - llat sherd
Paint PA0 1 PO2 Lines - horizontal - pmllel
Paint PA02 PO2 Lines - vertical - parallet - incgular
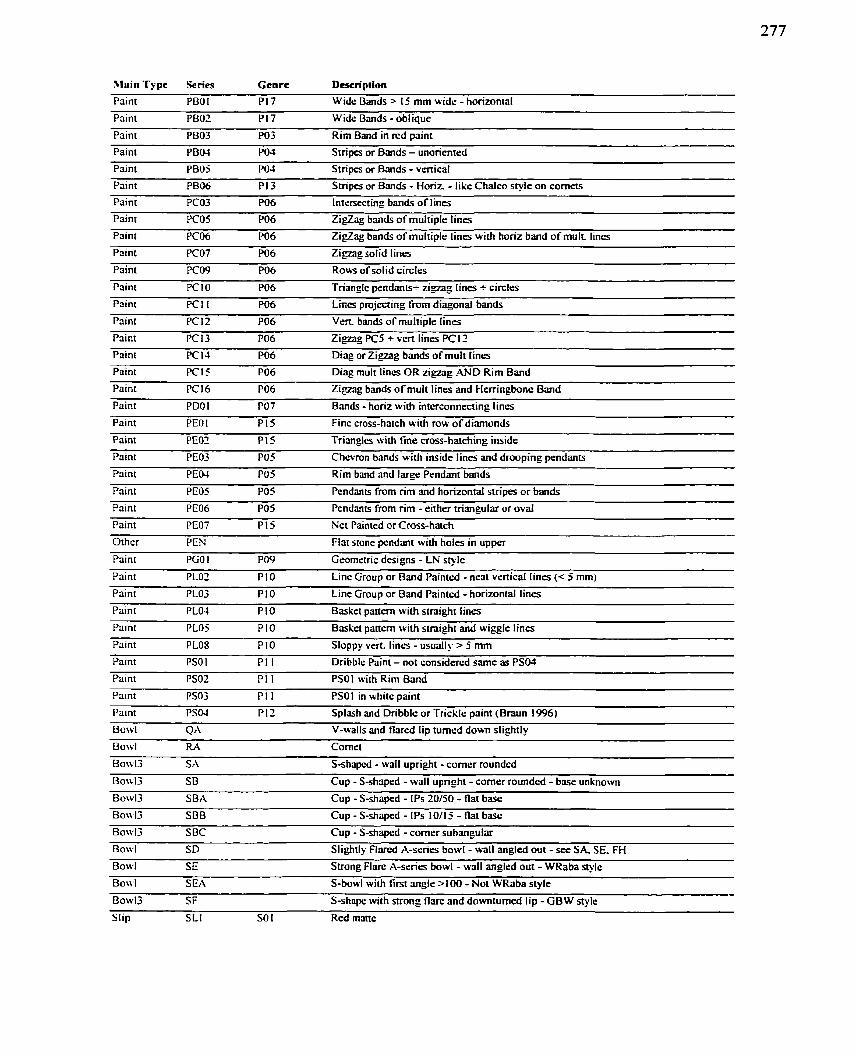
>lain Tvpe Series Genre Description
Paint PB0 1 Pl7 W ide Bands > 1 5 mm widc - horizontal
Paint PB02 P l7 Widr Bands - oblique
Paint PB03 PO3 Rim Band in rcd paint
Paint PBM PO3 Stripes or Bands - unoricnied
Paint PB05 PO4 Stripes or Bmds - vertical
Paint PB06 Pl 3 Stripci or Bmds - Horiz - like Chalco style on cornets
Paint PC03 PO6 Intenecting bands o f lines
Painr PCOS PO6 Zi-g bmds o f multiple lines
Paint PC06 PO6 Z i g a g bands o f multiple l i n a with horiz band o f mult lincs
Paint Pî07 PO6 Zigmg solid lines
Paint PC09 PO6 Rows o f solid circIcs
Paint PC l O PO6 Triangle pendants+ zigzag Iines + circles
Pain; PCl 1 PO6 Lincs pmjccting fmm diagonal bands
Paint PCl2 PO6 Ven. bands o f rnuliiple lines
Paint PC13 PO6 Zigzag PC5 + vert l i n a PC 12
Paint PClJ PO6 Diag or Zignig bands o f mult lines
Paint PClS PO6 Diag mult Iincs OR z i p g AND Rim Band
Paint PC16 PO6 Zigzag bands o f mult Iines and Herringbone Band
Paint PD0 1 PO7 Bands - horiz with intcrconnecting lincs
Paint PEO 1 P 15 Fine cross-hatch with row o f dimonds
Paint PEOZ P l5 Triangles with fine cross-hatching inside
Paint PE03 PO 5 Chevron bands with inside lines and drooping pendants
Paint PEOJ PO5 Rim band and large Pendant bands
Paint PE05 PO5 Pcndanls from r im m d horizontai stripes or bands
Paint PE06 PO5 Pendants from n m - either triangulv ar oval
Paint PE07 PIS Net Paintcd or Cross-hatch
Other PEN Flat stone pendrint with holes in upper
Paint PGO l PO9 Gmmetric dnigns - L N style
Paint PL02 PI0 Line Group or Band Paintcd - neat venicd Iines (< 5 mm)
Paint PL03 PI0 Line Group or Band Painted -horizontal lines
Painr PL04 PI0 Basket pattern with straight lines
Paint PL05 PI O Basket pattern with stnight and wiegle lines
Paint PL08 PI O Sloppy vert. lines - usually > 5 mm
Paint PSO 1 PI 1 Dribble Paint - not considercd samc as PSOl
Paint PS02 Pl 1 PSOl with Rim Band
Paint PS03 P l 1 PSO 1 in white paint
Paint PSOJ PI2 Splash and Dribble or TrickIe paint (Braun 1996)
Bowl Qb\ V-walls and flared lip tumed down slightly
Bowl RA Cornct
Bow13 SA S-shapcd - wall upright -corner roundcd
BowU SB Cup - S-shaped - wall upright - corner roundcd - base unlinowvn
Bowl3 SBA Cup - S-shaped - IPs 20/50 - flat base
Borv13 SBB Cup - S-shapcd - IPs 10/15 - flat basc
BowI3 SBC Cup - S-shaped - corner subangulx
Bowl S D Slightly Fliucd A-series bowl - wall angled out - s e c SA. SE. FH BorvI SE Strong Flarc A-senes bowl - wall angled out - WRaba style
Bowl SEA S-bowl with first mgle > 100 - Not WRaba style
Bowl3 SF S-shape with strong flare and downturned l ip - GBW stylc
Slip SLI SO 1 Red mattc
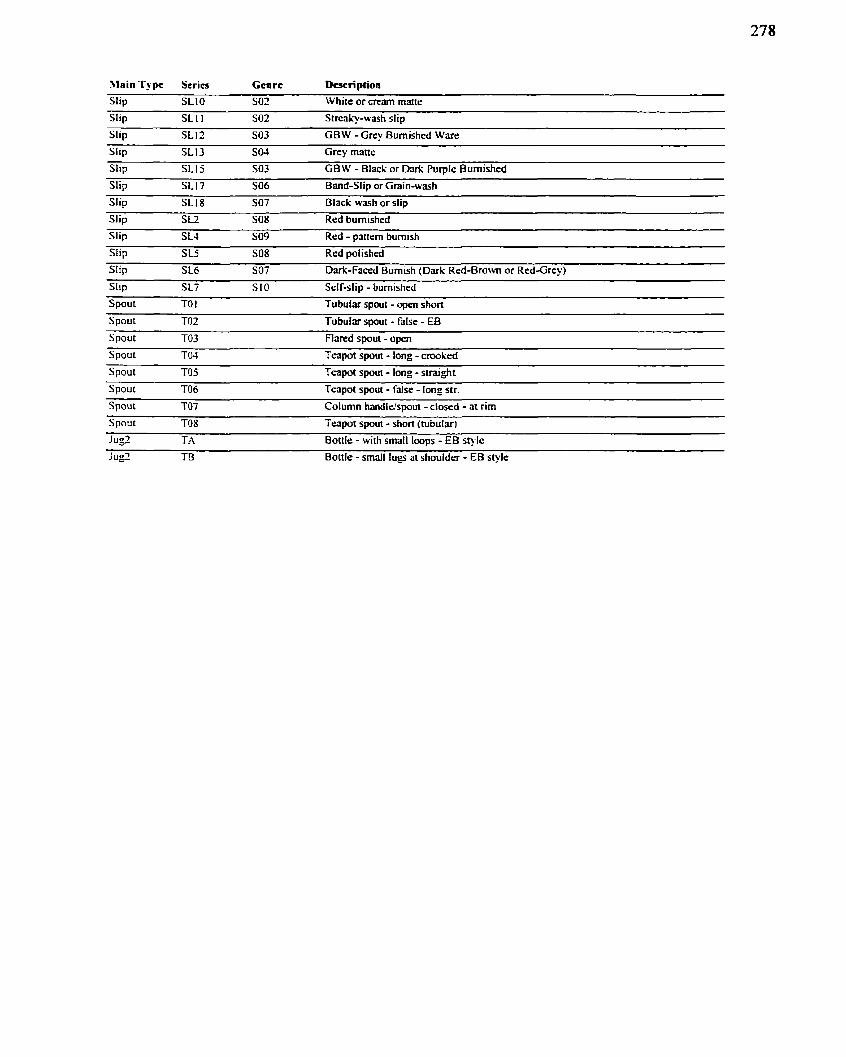
\lain Type Serirs Genre Dcscri pfion
Slip SLlO SOZ White or mm msinr
Slip SL l l S02 Slrcahy-wash slip
Slip SLlZ S03 GBW - Grey Bumished Wafe
Slip SL13 S M Grey rnattc
Slip SL 15 S03 GBW - Black or Dark Purplc Bumished
Slip SL17 S06 Band-Slip or Grain-wash
Slip SLIS S07 Black wash or slip
Slip S U SO8 Red bumished
Slip SLJ S09 Red - panern burnish
Slip S L5 SOS Red polished
Slip SL6 S07 Dark-Faced Bumish (Dark Red-Brown or Red-Grey)
Slip S L7 SI0 Sclf-slip - burnished
Spout TO I Tubular spout -open shon
Spout TOZ Tubulx spout - false - EB
Spout T03 Fiared spout - open
Spout TM Teapoi spout - long - crooked
Spout TOS Teapot spout - long - straight
Spout T06 Teapot spoui - false - long str.
Spout T07 Column handlrlspout - closed - rit nm
Spout TO8 Teapot spout - shon (tubular)
Jug2 TA Bottle - with srnall loops - EB style
Jug2 TB Bonle - srnall l u s at shouider - EB style
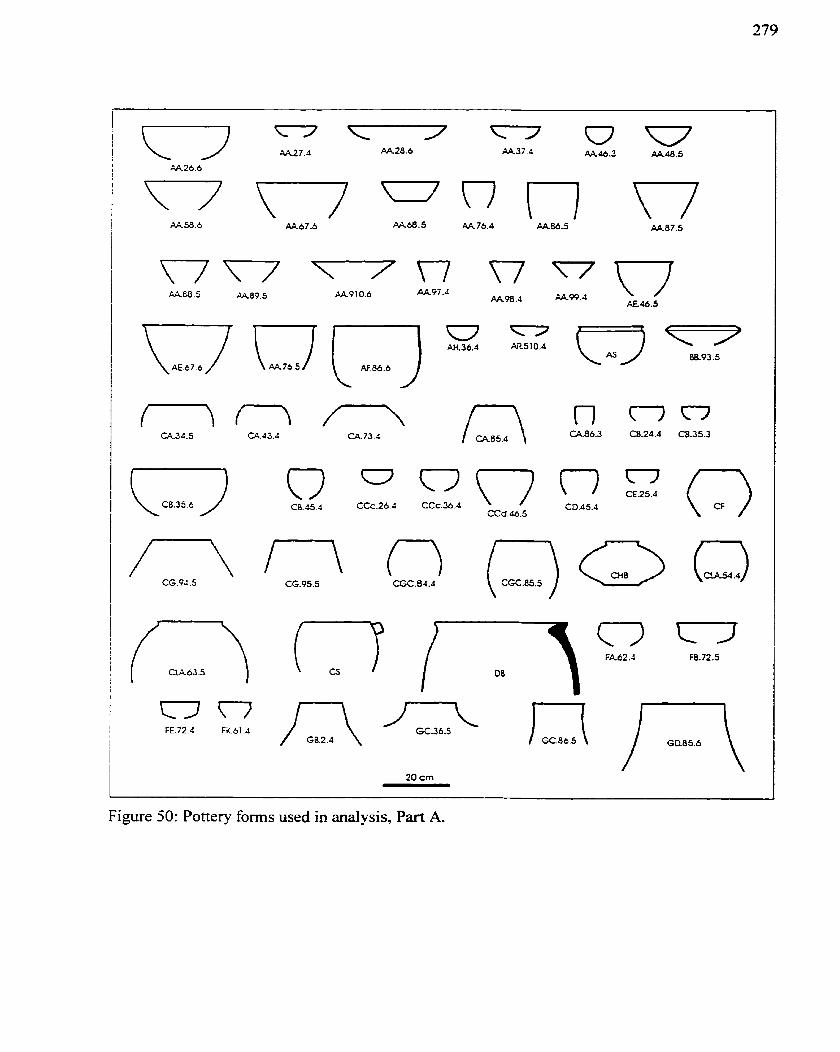
Figure 50: Pottery forrns used in analysis, Part A.
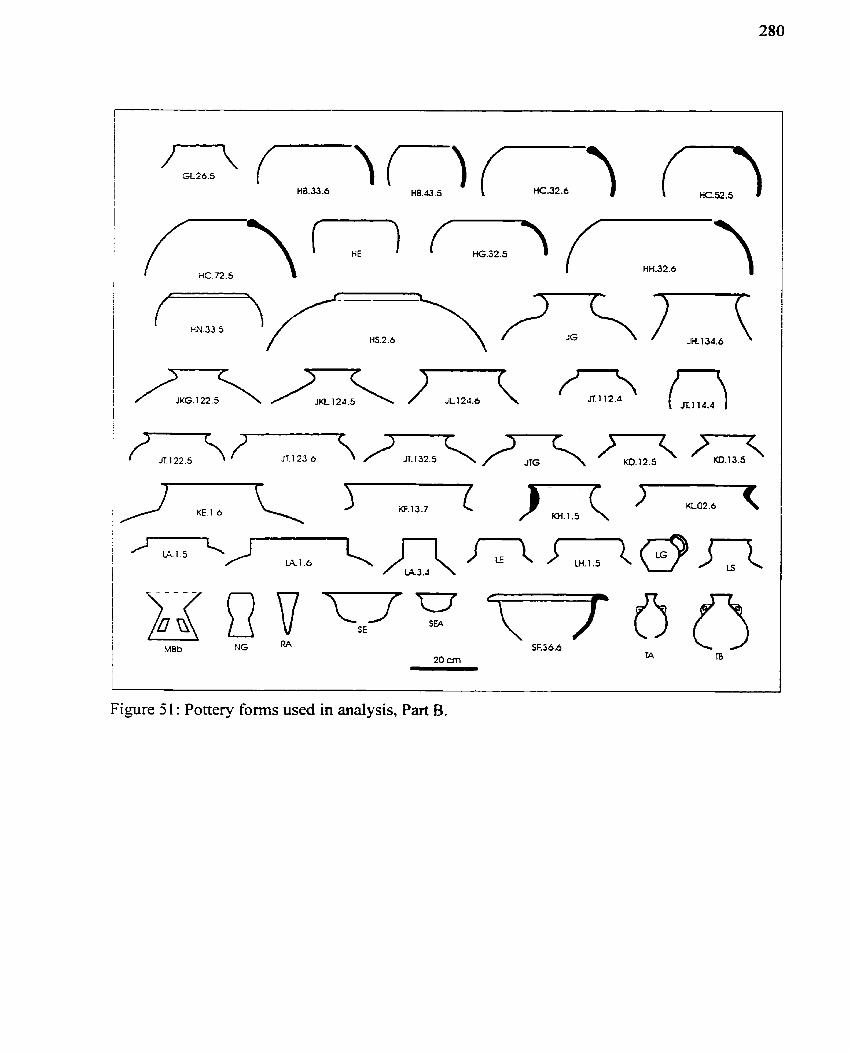
- -< KH. 1.5 J-Tz-x
Figure 5 1 : Pottery forms used in analysis, Part B.
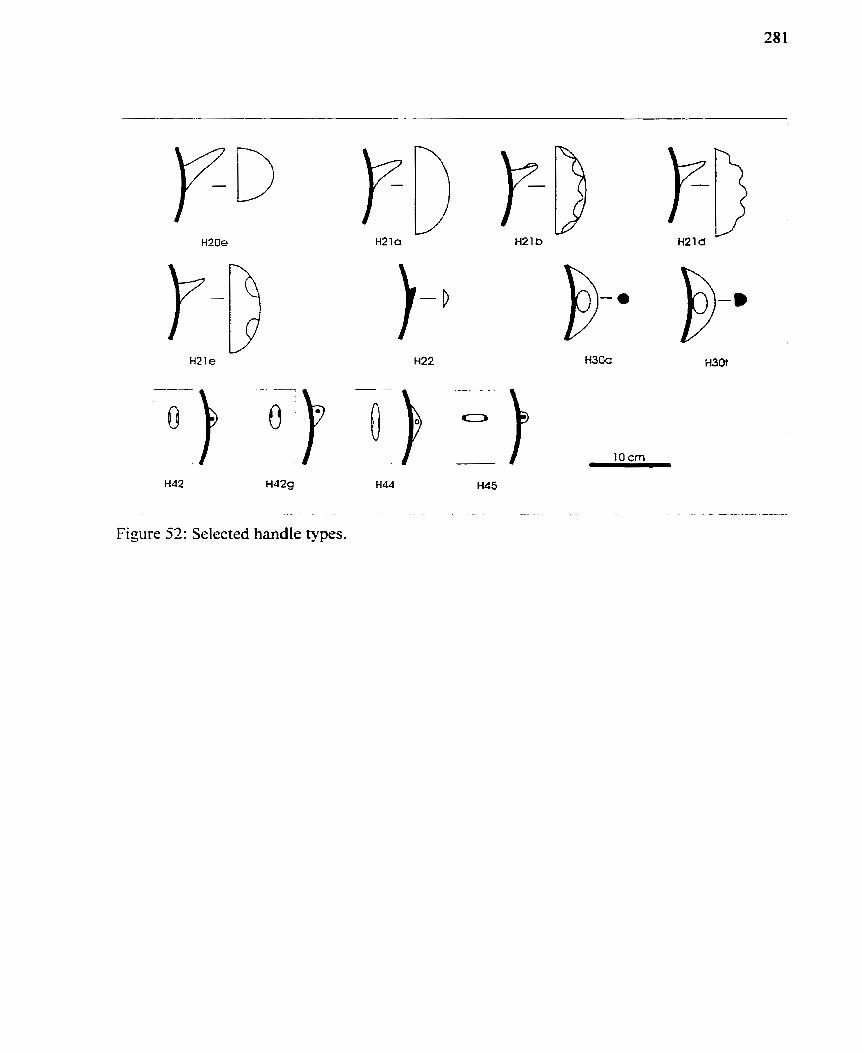
Figure 52: Selected handle types.
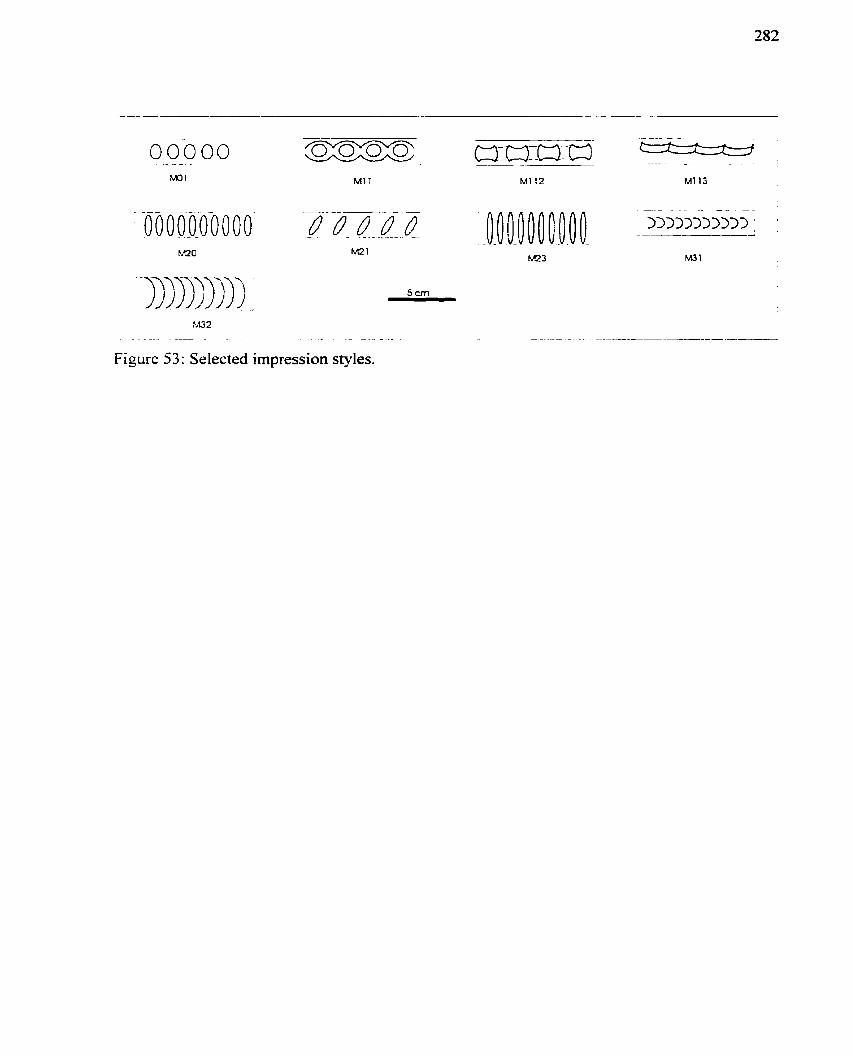
?n32 --
Figure 53: Selected
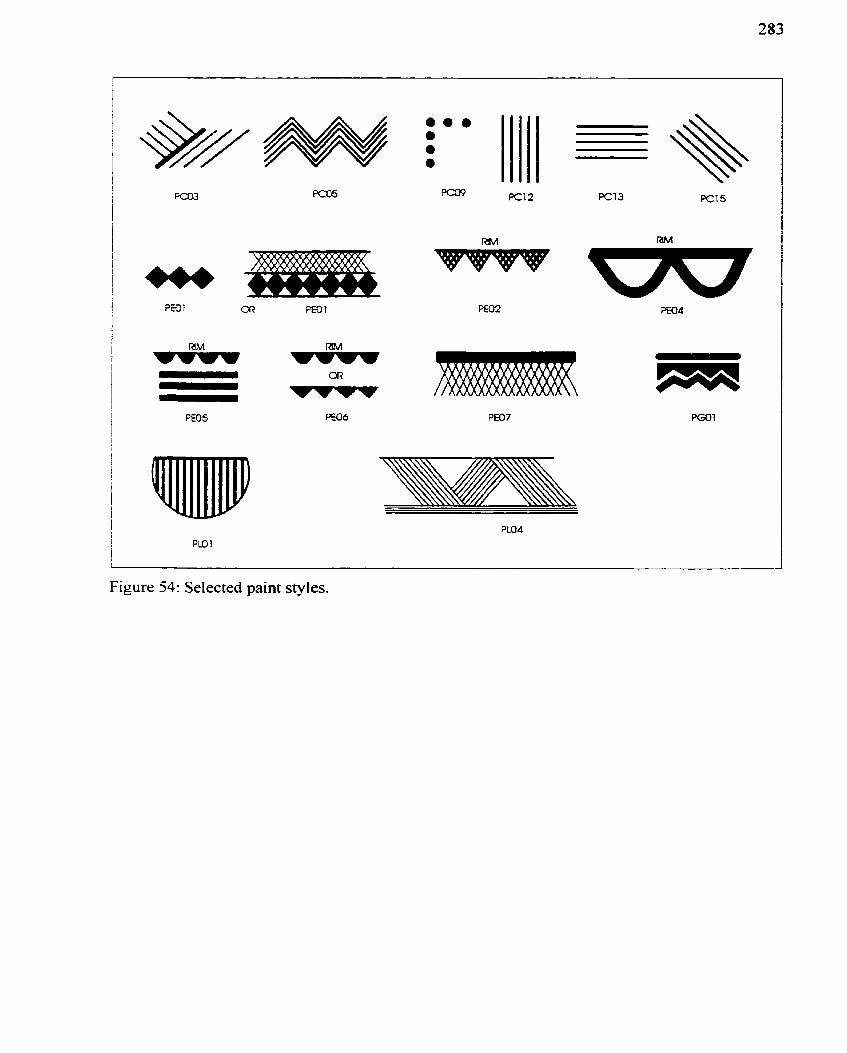
a.. . a 0
Figure 54: Selected paint styles.
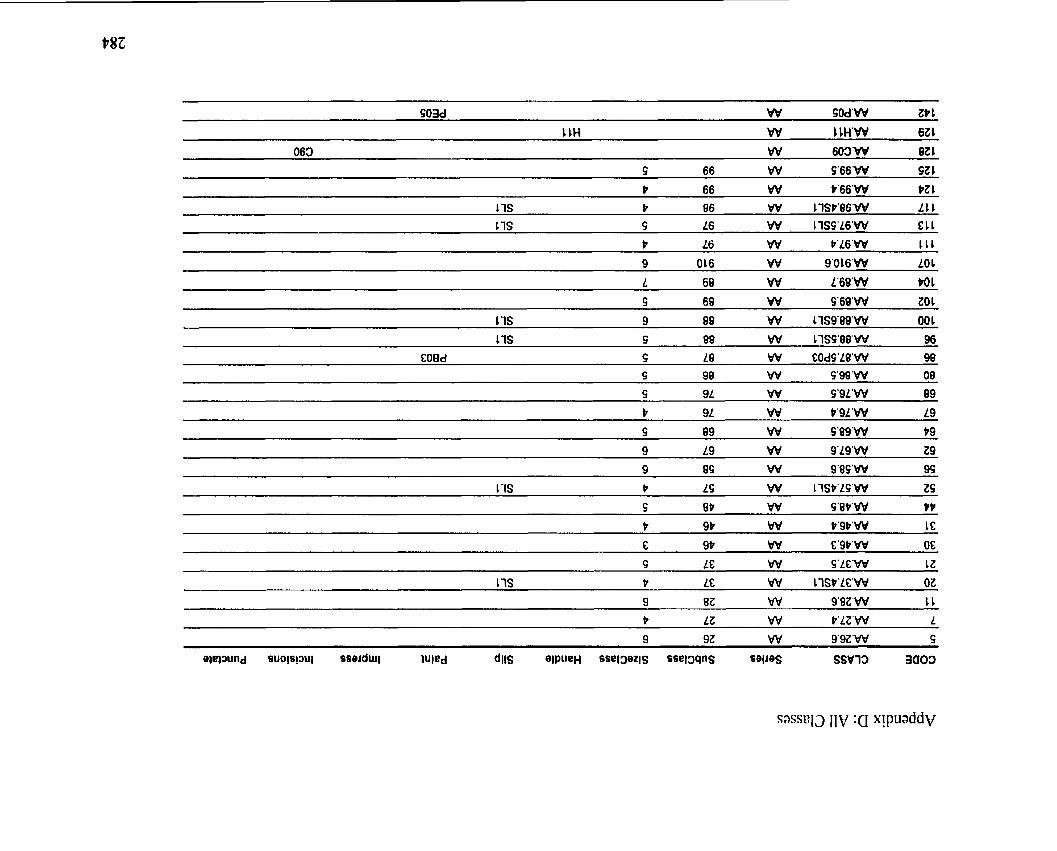
S03d W SOd'W Z t 1
1 LH W 1 CH'W 6Z C
063 W 603'W 8Z L S 66 W S'66'W GZ L
C 9 t W E'9b'WW OE
Q LC W S'LC'W 1Z
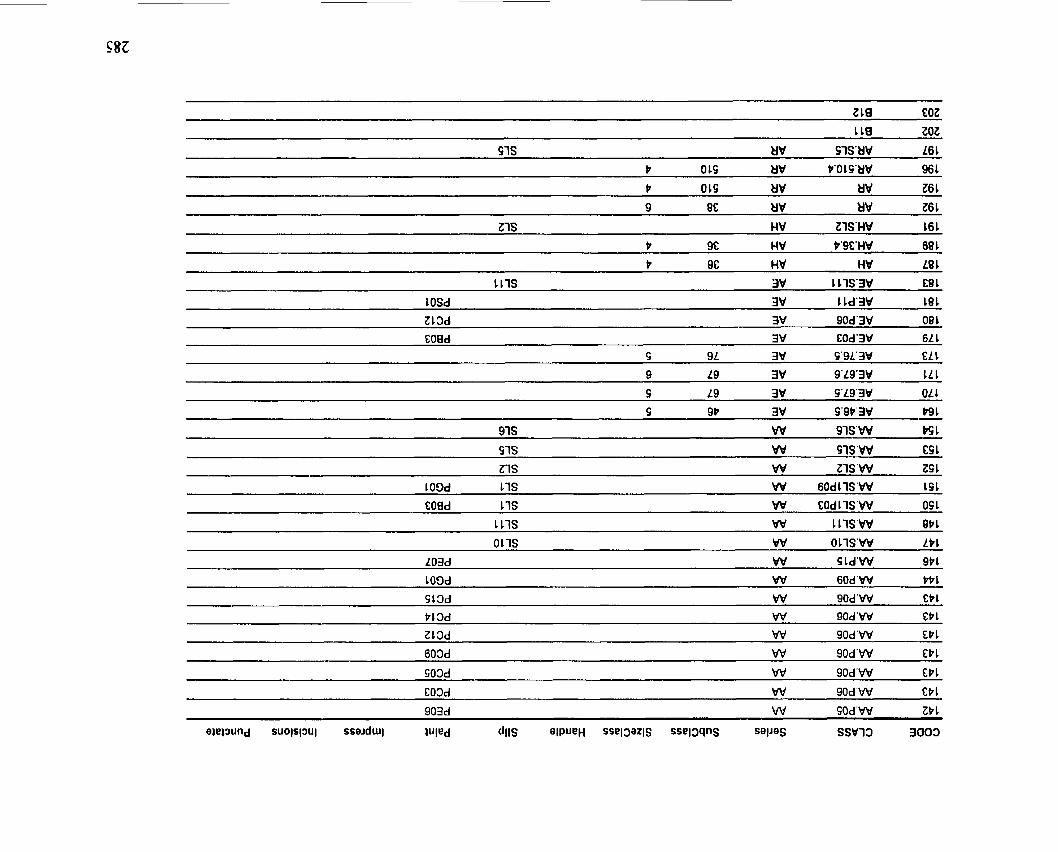
-- - -- -
111s 3w 1 LlS'3V E8 1
L OSd 3W 1 ld'3V 18L
Z13d 3 W 90dW O0 1 EOBd 3V EOd'3V 6L 1
S 9L 3w Ç'9L'3V EL 1
9 L9 3w 9'L9'3W IL1
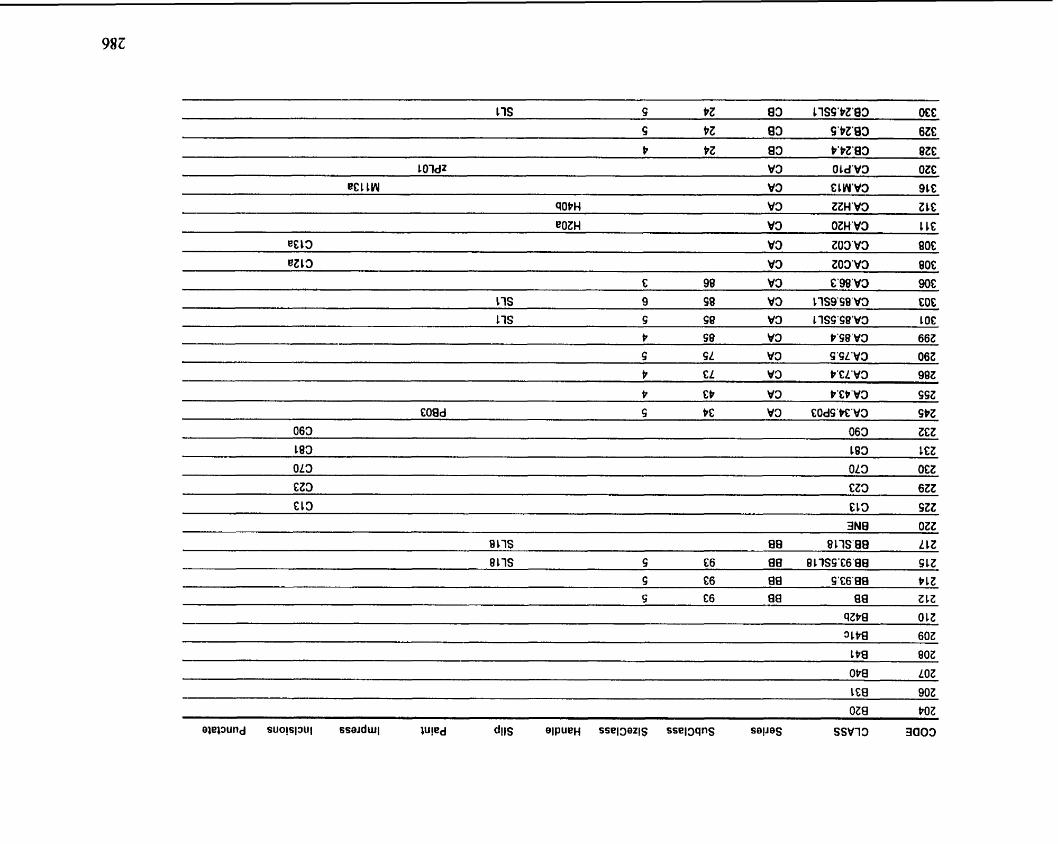
-- -- -
11s Ç PZ 83 LlSS'PZ'03 OEE
Ci PZ 83 Ç'PZ'fl3 6ZE
P PZ 83 P'PZ'83 BZE
1 Oldz W 3 OLd'V3 OZC
eCl LW V 3 C 1 W'V3 91E
qOPH V 3 ZZH'V3 Z CC
eOZH V 3 OZH'V3 t CG
eE13 V 3 Z 0 3 W 80E
eZ13 V 3 Z O 3 W 808
E 98 V 3 Ea9û'V3 90E US 9 Ç 8 W 3 17S9'98'V3 COE
11s Ç Ç 8 V 3 11SÇ'S8'V3 L OC
P Ç 8 V3 P'Ç8'W3 662
5 SL W 3 Ç'ÇL'W3 06Z
P EL V 3 P'CL'V3 98Z
t EP V 3 P'CP'V3 ÇSZ
C08d S PE V 3 EOdÇ'PC'V3 SPZ
3NB OZZ
8 LlS He Bl lS '9B LLZ
811s Ç E6 98 8 L7SÇ'C6'88 S l Z
5; C6 88 Ç'C6'9B P lZ
- -- -- - -- --
OP8 LOZ
oza POZ
e l g m d suo!spul sse~dui l lu P d d l l ~ elPueH ssel3ezlS ssel3qnS se l~eç SSV13 3 a 0 3
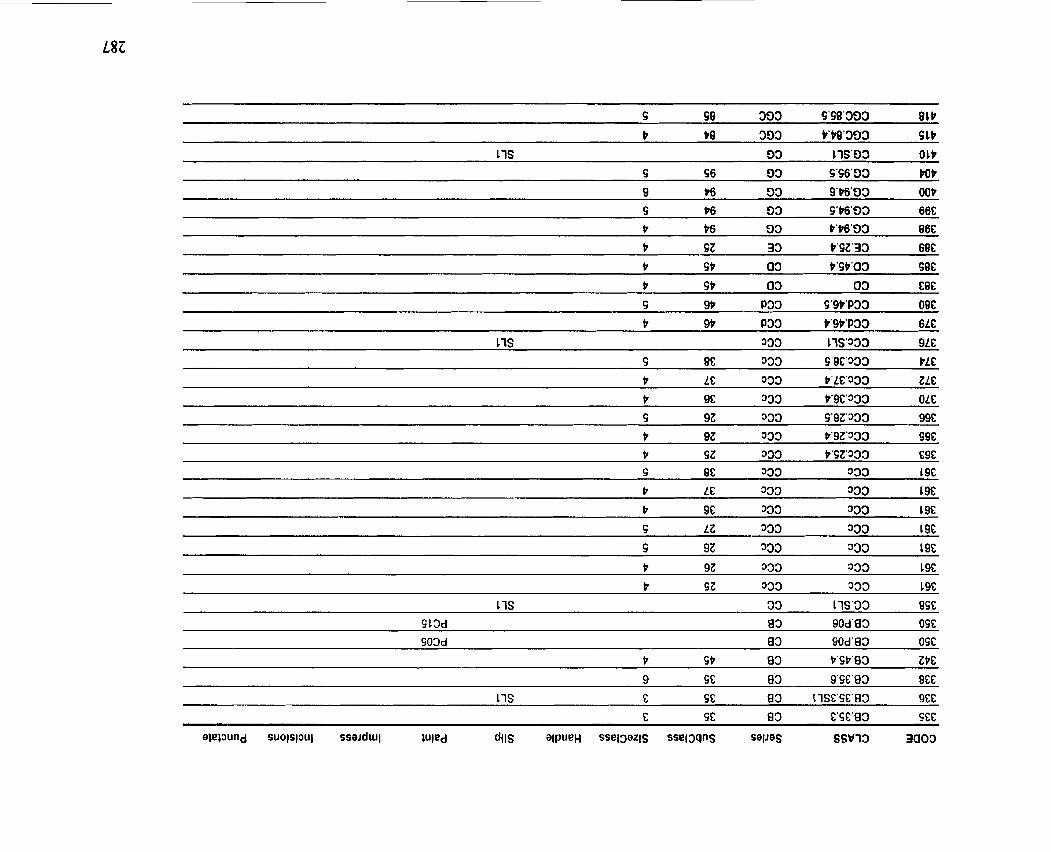
Ç ÇB 393 Ç4Ç8'393 8 1P
P $0 393 P'P8'303 S 1P
11s 93 l l S ' 0 3 OlP
Ç Ç6 93 Ç'Ç6'93 POP
9 96 33 9 W 9 3 OOP
Ç P6 93 Ç 'W'03 66E
P P6 93 P ' W ' 3 3 066
P SZ 33 P'ÇZ'33 68C
P ÇP a3 P ? W O ~ SBE
P ÇP 03 03 E8C
S 9P P 3 3 Ç'9PeP33 OB€
tr 9P P33 tra9t 'P33 6LC
17s 333 l l S ' 3 3 3 9LE
Ç 8E 3 3 3 ÇüC 'W3 PLE
P LE 333 P'LC'333 ZLE
P 9C 333 Pa9C'333 OLE
9 92 333 Ç'gZ'W3 9%
t 92 333 P'9Z'XXI 49C
t ÇZ 333 t 'SZ'333 E9E 9 BE 333 333 L9E
P LE 333 333 1%
b 9E 333 333 L 9E
Ç L Z 333 333 196
Ç 9 1 333 333 L9C
11s 33 l l S ' 3 3 BÇE
Ç Lad 83 90d.83 OÇE
S03d 83 904'83 OSE
t S t 83 t'SP'83 ZPE
9 SE 83 9'96'83 BEC
17s E SE 8 3 I l S C ' Ç E ' 8 3 9CE
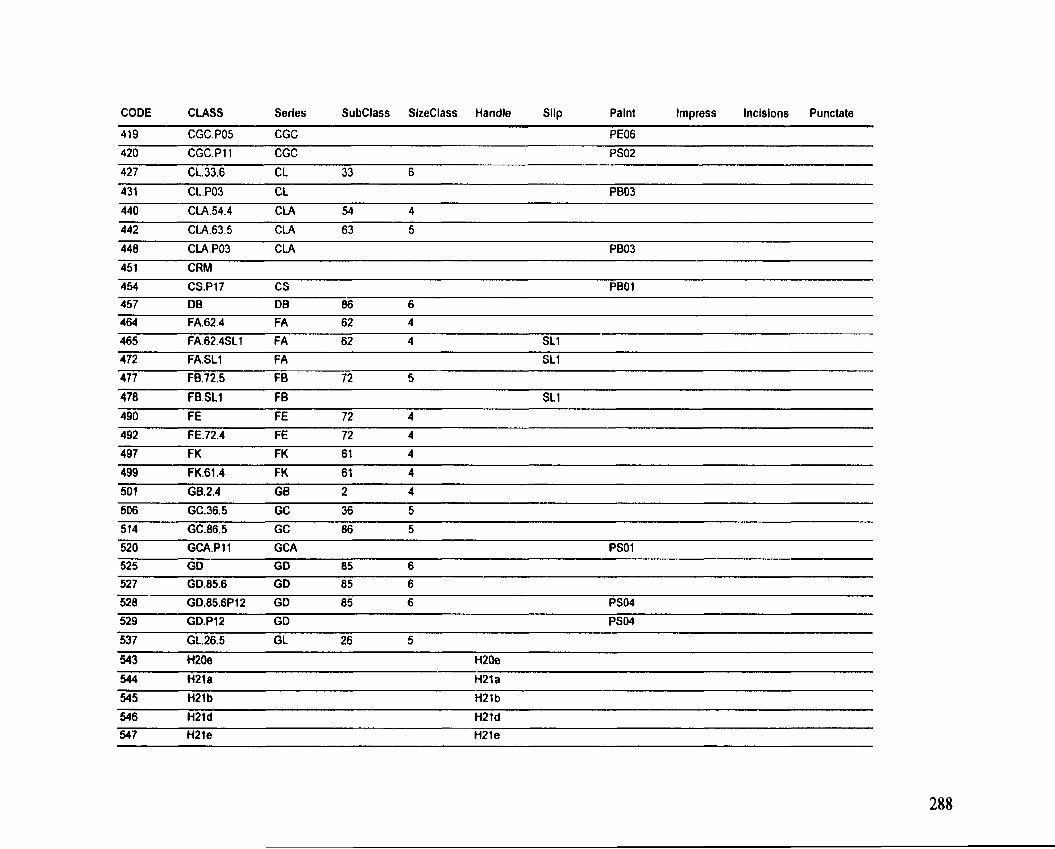
CODE CLASS Serles SubClass SizeClass Handle Slip Palnt lmpress lnclsions Punctate
419 CGC.PO5 CGC PE06
420 CGC.Pl1 CGC PS02
427 CL.33.6 CL 33 6
431 CL.PO3 CL PB03
440 ClA.54.4 CLA 54 4
442 CLA.63.5 C M 63 5
448 CLA.PO3 CLA PB03
451 CRM
506 GC.36.5 GC 36 5
514 GC.86.5 GC 86 5
520 GCA.Pl1 GCA PSO1
525 GD GD 85 6
527 GD.85.6 GD 85 6 - 528 G0.85.6P12 GD 85 6 PS04
529 GD.Pl2 GD PS04
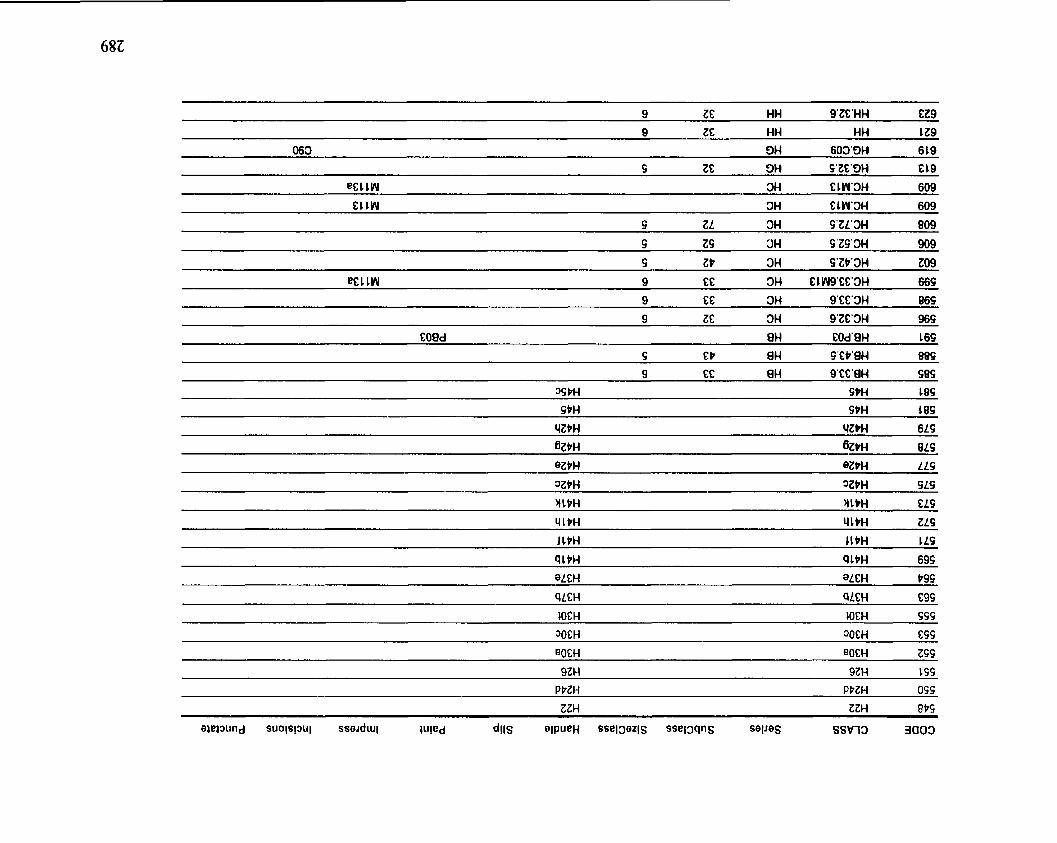
106H IOEH ÇÇÇ
30CH DOEH EÇÇ
eOCH eOCH ZSS
9ZH 9 Z H 1%
PbZH PPZH 0Ç Ç
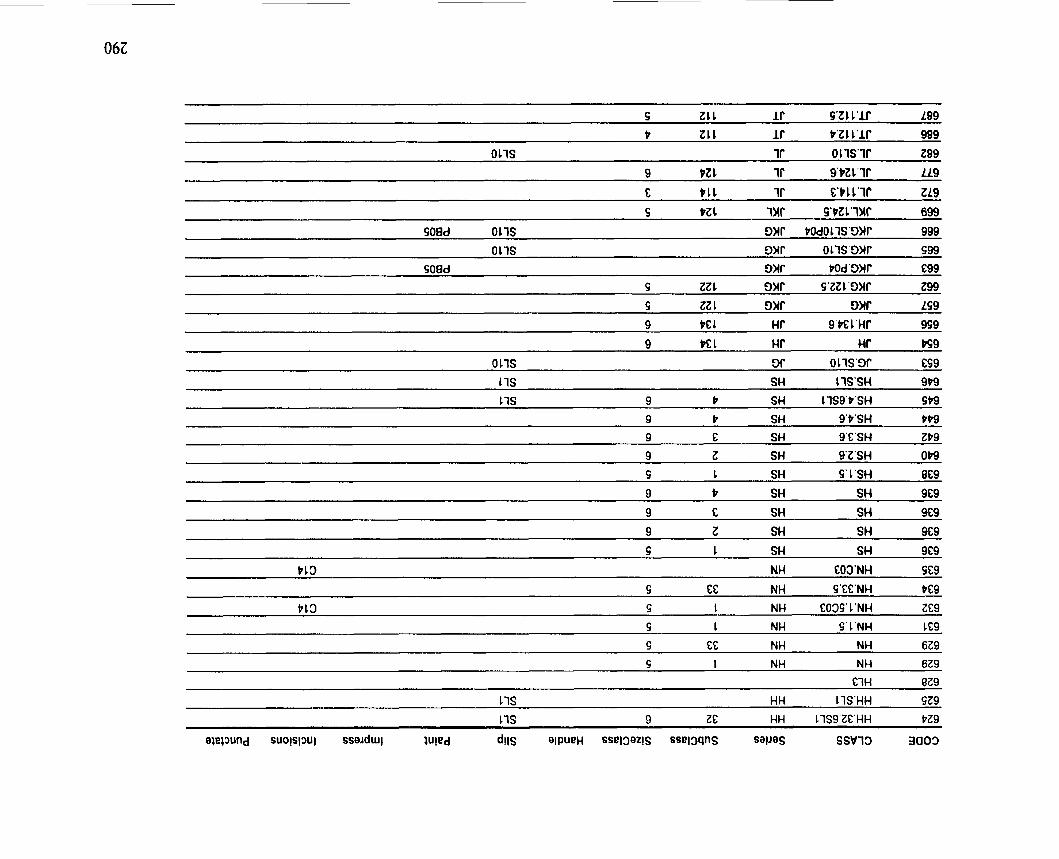
Ç 1 SH SH 9 E 9
P l 3 NH 603'NH SE9
Ç CE NH Ç'CC 'NH t C 9
P l 3 S 1 NH E 0 3 Ç ' L'NH Z E9
Ç 1 NH 9' 1'NH C E9
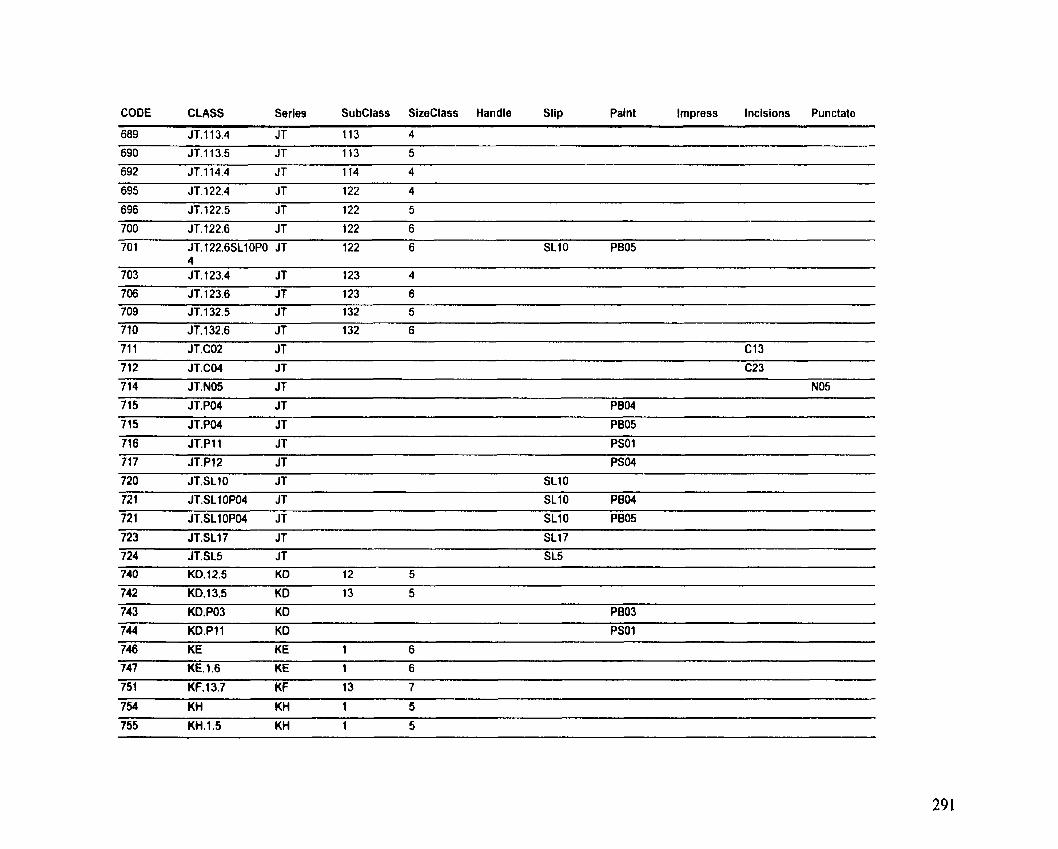
CODE CLASS Serles SubClass SizeClass Handle Slip Palnt Impress Incisions Punctate
689 JT. 11 3.4 JT 113 4 - 690 JT. 11 3.5 JT 113 5
- -
695 JT. 122.4 JT 122 4
696 JT.122.5 JT 122 5
700 JT.122.6 JT 122 6
70 1 JT. t 22.6SL10PO JT 122 6 SLlO PB05 4
703 JT. 123.4 JT 123 4
706 JT. 123.6 JT 123 6
709 JT. 132.5 JT 132 5
710 JT. 1 32.6 JT 132 6
720 JTSL10 JT SLlO
72 1 JT.SLlOP04 JT SLlO PB04
72 1 JT.SL1 OP04 JT SL10 PB05
723 JT.SL17 JT SL17
724 JT.SL5 JT SL5
740 K0.12.5 KD 12 5
742 KD.13.5 KD 13 5
743 UO.PO3 KD PB03
744 UD.Pl1 KD PSOl
746 KE KE 1 6 747 KE. 1.6 KE 1 6
751 KF. 13.7 KF 13 7
754 KH KH 1 5
755 KH.15 KH 1 5
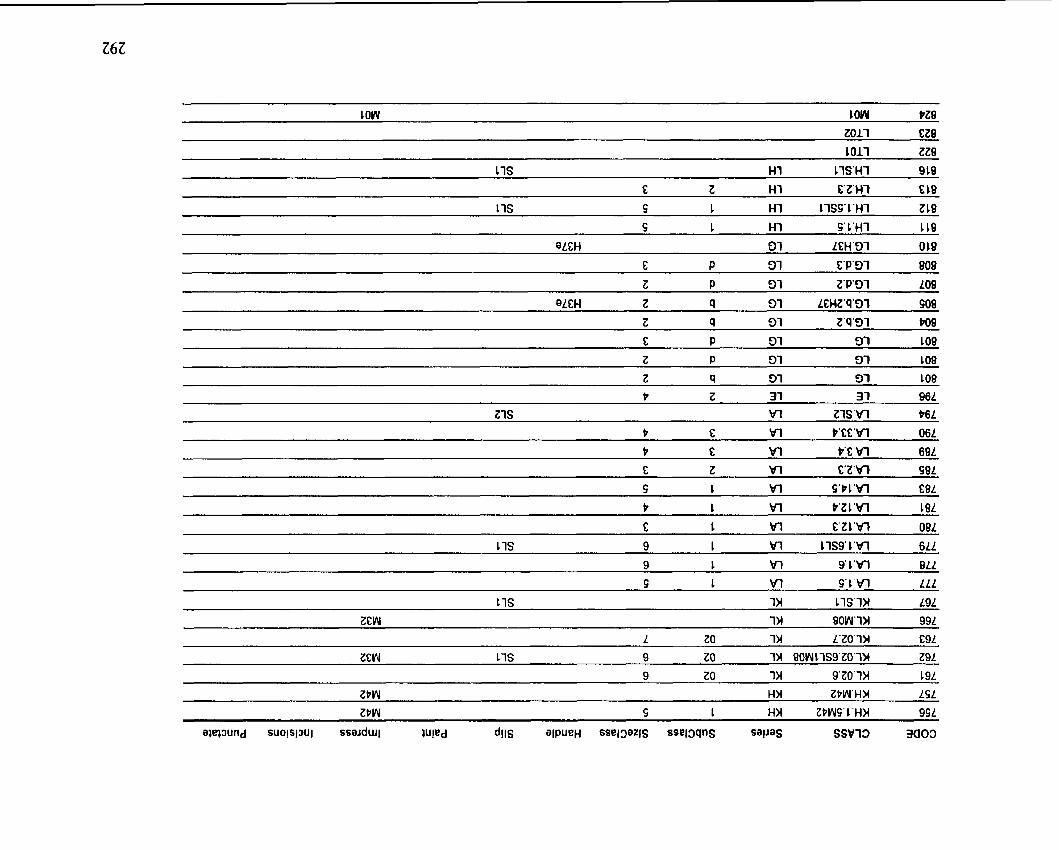
Ç 1 M Ç' L a V I LLL
11s i n IWIN L ~ L
zcw i n 8 o w ~ 9 9 ~
L ZO l n L'ZO' lM E 9 L
zcvu 1 1 s 9 zo i n ~ O W L ~ S ~ ~ Z O ~ - I ~ Z ~ L 9 10 1Y 9 ' Z O ' l M 1 9 L
ZPW HM ZPVU'HM LSL
ZP W S L HN ZPYUÇ' L'HM 9SL
elq3und suo]s]3ul sse~duij IuPd d l l ~ QlPueH ssel30zlS ssel3qnS sa!~es SSVl3 3Q03
ZN0 ZWO 6ÇB
JO JO 890
11W VN EOW'VN trÇ0
P VN P' 9'VN 6Ç8
ÇON SON LM CON CON 9M
98 W q 9 W CM
ZtrW ZPW 6E8
CE W GER 868
- - - -
PIS PlS EtrG
ZEW LIS 1% 00W 17s 6C6
LZW LIS 8 X SOW 11s 8E6
Zl lW i l s W 3 COWllS 9€6
Ll1S L LIS 066
Z 11s Z 11s 916
111s 111s LZ6
E 13 011s l r 2030 11s S Z ~
ç n s AS S C ~ S ' AS E Z ~
9 9E dS 9'9C'dS 1 26
9 96 JS 4 s 6 L6
111s VU 1 L l S ' W 906
1OSd 011s VM CCdOllS'tltl 506
011s WM O l lS 'W Po6
11s W n S ' W E06
C OSd tltl L 1d 'W 106
e W 860
17s f, 16 W LISC'LG'W L60
6 L6 VU L'L6.W 960
E L8 Vt l C'L0'Vü P60
POSd WSd 068
EOSd EOSd 608
ZOSd ZOSd 088
-4ppendi.u E: Rim Lip Classes
Lip XSection Description A l Stnight - Rounded lip
A2 Stnight - Tapercd lip
A3 a Squared - Flat-top lip
M b Squared - Unthickened flat lip - stance angled in -
h j c Squarcd - unthickencd -stance anglcd out
.Gd Squarcd - bevellcd in - slightly cvcrted - sec aIso other R I fonns
M e Flat top - Slightly crened
A4 Squarcd. Bevellcd in vertic31 - not thickened
B 1 Thickcncd. rounded - not everted
B7 Thickcncd one side. munded - inner
B3 Thickmed inside - Flat top
B-l V-[hickencd flat top but not a strong flarc like PUD
B j a A B I rim with a bead added near lip - not a collar nm
B5d A BZ lip with a finger grmvc: along upper lip - makes a slight uptum
86 Thickened - slightly - tianened
B 7 Thickencd - Bcvclled out
CZ Strongl y Thickened - roundrd lip - cvcried
C3 a Thickencd - rounded - collared
C3b Thickened - tapered - Collared
CS Thickcned - taperrd - cmtes upturned look
C 7 Thickencd slighrly - tapercd at tip and slightly evened to upright
CS Roundcd but tumcd up OR sli@tIy cvcrtcd but upright
D 1 V-Thickcned - flat toppcd lip
DZ V-Thickcned - flat topped lip - bevellsd diagonal
Dla V-Thickcned - ilat topped lip - bcvellcd vcnical
D3b Thickcned and beaded outside
D6 Likc B I a but pinched at end to form inncr guner
E l Slightly evcrtcd - rounded back
EZa Angular f i xe - extcnded - anglular corner
E3 Evcned to horizontal - erxtcnded
EJ Flarcd m d dowmturncd - rounded baclc
Flared ruid roilcd
E6 Angular !lare - thick - Pella style
E6b Pella style but long and ifrin
E7 lip - thickened - Fendi style
F3 c Bevellcd out - sharp edge - - --
FJ Bulgc ont: side - outer
GJ Carinatcd in uppcr 5 d c l c s - cxtendcd - rounded
G-lb Like G4 but tapered
G 7 Closed - invcned - like PU bowls
H 1 Beadcd insidc - squared back
HZ Invcricd - Tapered - horizontal
H4 Beaded - inside - rounded back
JI Beadcd bolh sida - rounded top
J2 Bcadcd both s ida - flat topped - extendrd

Lip XSection Description J7 Beadcd or rollcd - outside - rounded back
K 1 Outcr fingcr çroovc - thickcned
1i3 Pinchcd lip. giving a slighr ounum or everted look
KJb invertcd Ilarc - like PUD but not so pronounccd
K 5 Shon upright
K 6 Shon - stnight - angled oui
K7 Flarcd out - Rounded
K7b Flared rim with flat ledge 10 inside
K8 Angular Flare
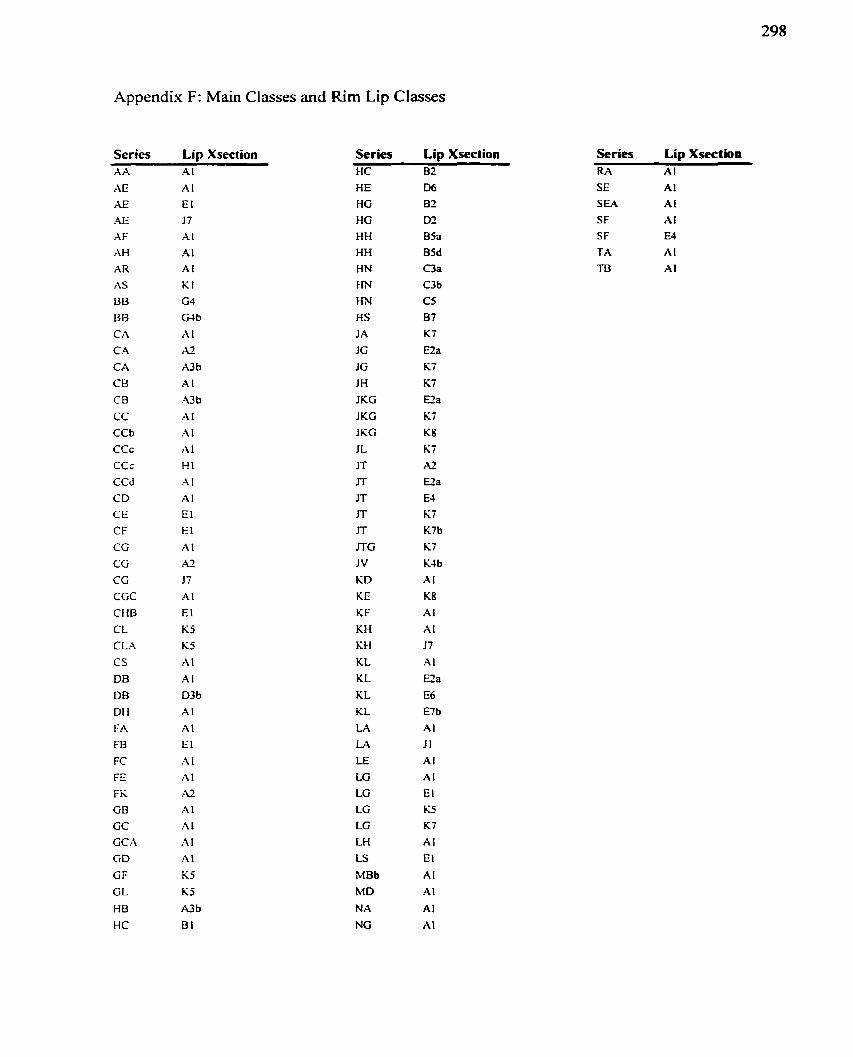
Appendix F: Main Classes and Rim Lip Classes
.&A
XE AE
.4E
AF
AH
AR
AS
BB
RB CA
CA
CA
CB
CB
CC
CCb
ccc ccc CCd CD CE
CF CG CG
CG CGC CHB CL CLA
C S DB OB
DH
FA
FB
FC
FE
FI;
GB
CC GC A
GD GF
G L H B HC
Series Lip Xsection Series Lip Xsection A l H C B2
HE HG HG H H H H HN
HN
HN
HS J A
JG
JG J H
JKG
JKG JKG
J L
JT JT JT JT JT
JTG JV
KD KE
IiF K H K H KL KL KL KL tA LA LE LG LG LG LG LH LS
MBb MD NA
NG
Series Lip Xsection RA Al
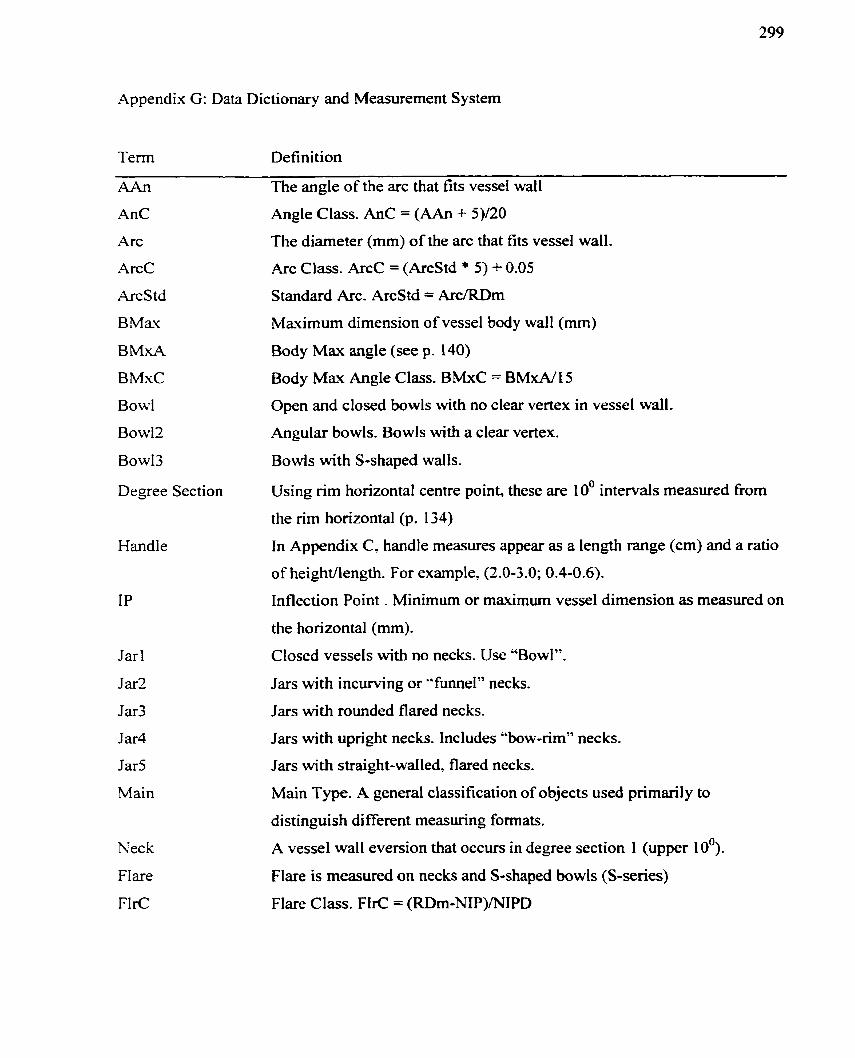
Appendix G: Data Dictionary and Measurement System
Terrn Definition
A h
AnC
Arc
ArcC
Arcs td
BMm
BMxA
BMxC
Bowl
Bowl2
Bowl3
Degree Section
Handle
Jar 1
Jar2
Jar3
Jar4
Jar5
Main
Neck
F lare
FlrC
The angle of the arc that fits vessel wall
Angle Class. AnC = (AAn + 5)/20
The diameter (mm) of the arc that fits vesse1 wall.
Arc Class. ArcC = (ArcStd * 5) + 0.05
Standard Arc. Arcs td = Arc/RDm
Maximum dimension of vessel body wall (mm)
Body Max angle (see p. 140)
Body Max Angle Class. BMxC = BMxA/IS
Open and closed bowls with no clear vertex in vessel wall.
Angular bowls. Bowls with a clear vertex.
Bowls with S-shaped walls.
Using rim horizontal centre point, these are 10' intervals measured fiom
the nm horizontal (p. 134)
In Appendix C , handle measures appear as a length range (cm) and a ratio
of heightllength. For example, (2.0-3.0; 0.4-0.6).
Inflection Point . Minimum or maximum vessel dimension as measured on
the horizontal (mm).
Closed vessels with no necks. Use "Bowl".
Jars with incurving or "funnel" necks.
Jars with rounded flared necks.
Jars with upright necks. Includes "bow-rirn" nec ks.
Jars with straight-walled, flared necks.
Main Type. A general classification of objects used primarily to
distinguish different measuring formats.
A vessel wall eversion that occurs in degree section 1 (upper 10').
Flare is measured on necks and S-shaped bowls (S-series)
Flare Class. FIrC = (RDm-N1P)RVIPD
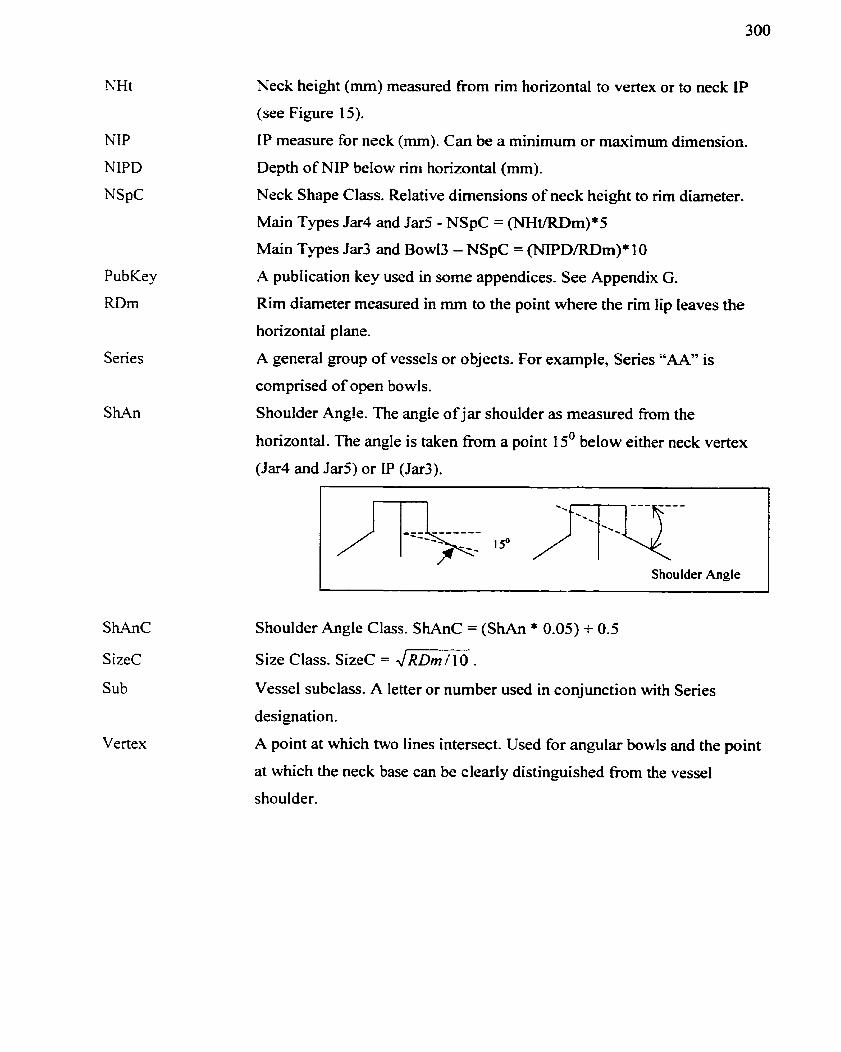
NIP
NIPD
NSpC
ShAnC
S izeC
Sub
Vertex
Neck height (mm) measured fiom rim horizontal to vertex or to neck IP
(see Figure 15).
IP measure for neck (mm). Can be a minimum or maximum dimension.
Depth of NIP below rini horizontal (mm).
Neck Shape Class. Relative dimensions of neck height to rim diameter.
Main Types Jar4 and Jar5 - NSpC = (NHt/RDm)*5
Main Types Jar3 and BowI3 - NSpC = (NIPD/RDm)* 1 O
A publication key used in some appendices. See Appendix G.
Rim diameter measured in mm to the point where the rim lip leaves the
horizontal plane.
A general group of vessels or objects. For example, Series "AA" is
comprised of open bowls.
Shoulder Ang!e. The angle of jar shoulder as measured fiom the
horizontal. The angle is taken fiom a point 15' below either neck vertex
(Jar4 and Jars) or IP (Jar3).
Shoulder Angle Class. ShAnC = (ShAn * 0.05) + 0.5
Size Ciass. SizeC = J R D ~ / 10 .
Vesse1 subclass. A letter or number used in conjunction with Series
designation.
A point at which two lines intenect. Used for angular bowls and the point
at which the neck base can be clearly distinguished from the vesse1
shoulder.
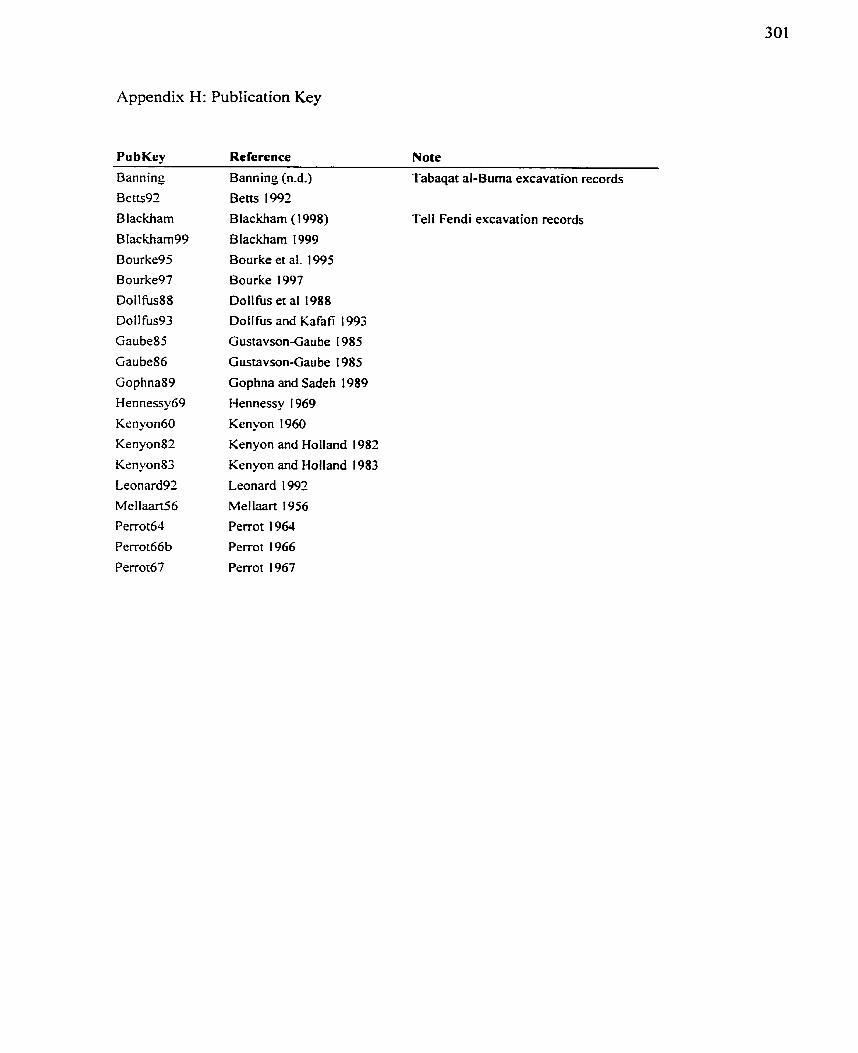
Appendix H: Publication Key
Pu bKey Reference Note
Banning
Betts92
B lackharn
Blackham99
Bourke95
Bourke97
DoIlfus88
Do11 fus93
Gaube85
Gaube86
Gophna89
Hennessy69
Kenyon6O
Kenyon82
Kenyon83
Leonard92
MeIlaart56
Perrot64
Perrot66b
Perrot67
Banning (n-d.) Tabaqat al-Buma excavation records
Betts 1992
Blackham (1998) Teli Fendi excavation records
Blackharn 1999
Bourke et al. 1995
Bourke 1997
DoIlfus et al 1988
Doll fus and Kafafi 1993
Gustavson-Gaube 1985
Gustavson-Gaube 1985
Gophnaand Sadeh 1989
Hennessy 1969
Kenyon 1960
Kenyon and Holland 1982
Kenyon and Holland 1983
Leonard 1992
Mellaart 1956
Perrot 1964
Perrot 1966
Perrot 1967
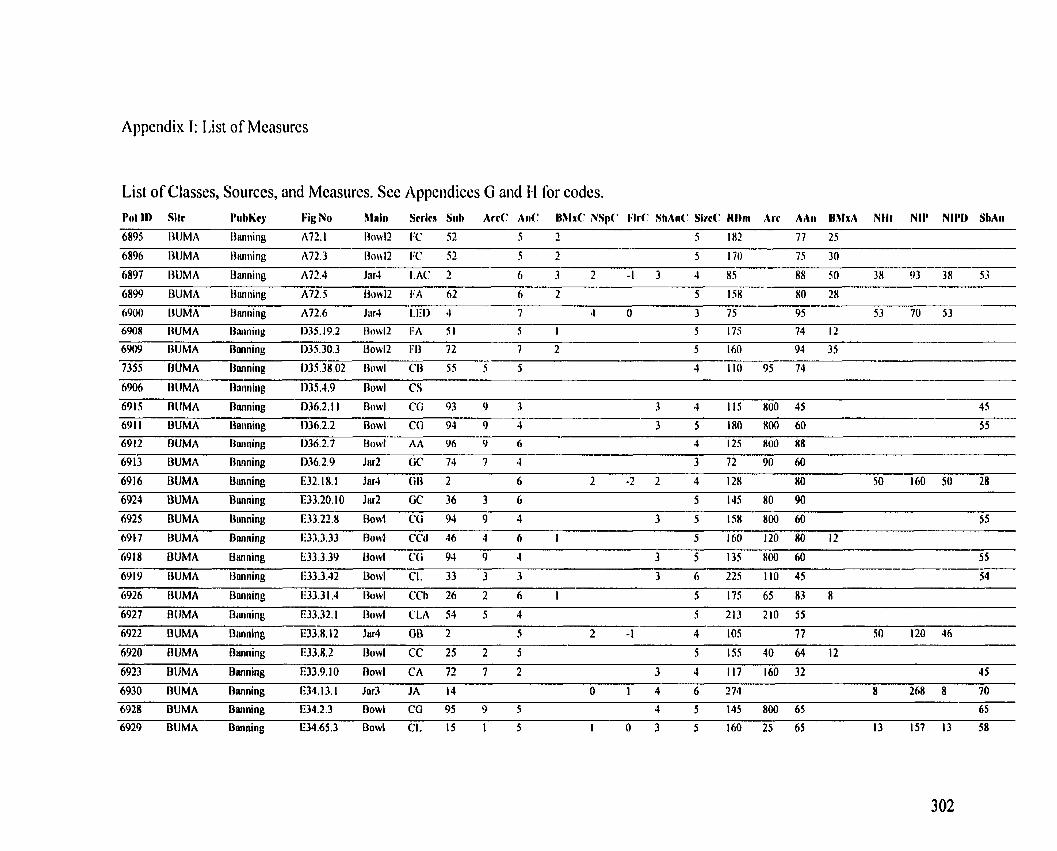
Appeiidix 1: List of Measures
List of Classes, Sources, and Measures. Sec Appendices G niid 1-1 for codes. Pot II) Site PuhKey Fig No hlr i i i Scrics Siih ArcC ,Ml IMx(: NSpC FlrC ShAiiC SincC H h i Arc AI\II IlhfirA Ntlt NII' NIPI) ShAii
6899 BUMA Ihnnirig A723 lhw12 I:A 62 6 2 5 I S H 80 28
6900 I3UMA Iiiuiiiing A72.6 Jiir4 LI31 4 7 4 0 3 75 95 53 70 53
6909 RlJMA I3mning D35.30.3 liow12 I:B 72 7 2 5 160 94 35
7355 BUMA Bmning 1)35.38.02 Rowl Cl3 55 5 5 4 110 95 74
6906 OUMA Dmining 1135.49 I3owl CS - 6915 RUMA nanning D36.2.1 1 Ihw l CO 93 9 3 3 4 115 800 45 4 5
691 1 BUMA Ihining 1136.2.2 Bowl CG 04 9 4 3 5 180 HO0 60 5 5
6912 OUMA Dnniiing 1136.2.7 Bowl AA 96 9 6 4 125 ROO UR - 6913 UUMA Bnnning D36.2.9 Jnr2 (iC 74 7 4 3 72 90 60
6924 UUMA Rnnning E33.20.10 Jnr2 GC 36 3 6 5 145 80 90
6925 BUMA Druining E33.22.8 Bowl CG 94 9 4 3 5 158 800 60 5 5
6917 DUMA Banning 1133.3.33 Rowl CCd 46 4 6 I 5 160 120 80 12
6918 BUMA i3urining E33.3.39 Bowl CG 94 9 4 3 5 135 800 60 5 5
6919 13UMA Bnnning 1133.3.42 13owl CI. 33 3 3 3 6 225 1 I O 45 54
6926 I3UMA Bunriing 1:33.31.4 lbw l CCh 26 2 6 1 5 175 65 83 8
6927 BUMA Bmninp E33.32.1 13owl C1.A 54 5 4 5 213 210 55
6922 BUMA I3ruining E33.8.12 Jar4 GD 2 5 2 -1 4 105 7 7 50 120 46
6920 BUMA Bunning E33.8.2 Bawl CC 25 2 5 5 155 40 64 12
6923 BllMA Bmning E33.9.10 Bowl CA 72 7 2 3 4 117 160 32 4 5
6928 BUMA Banning E34.2.3 Dowl CG 95 9 5 4 5 145 800 65 65
6929 BUMA Banning E34.65.3 Bowl CI. 15 1 5 1 O 3 5 160 25 65 13 157 13 58
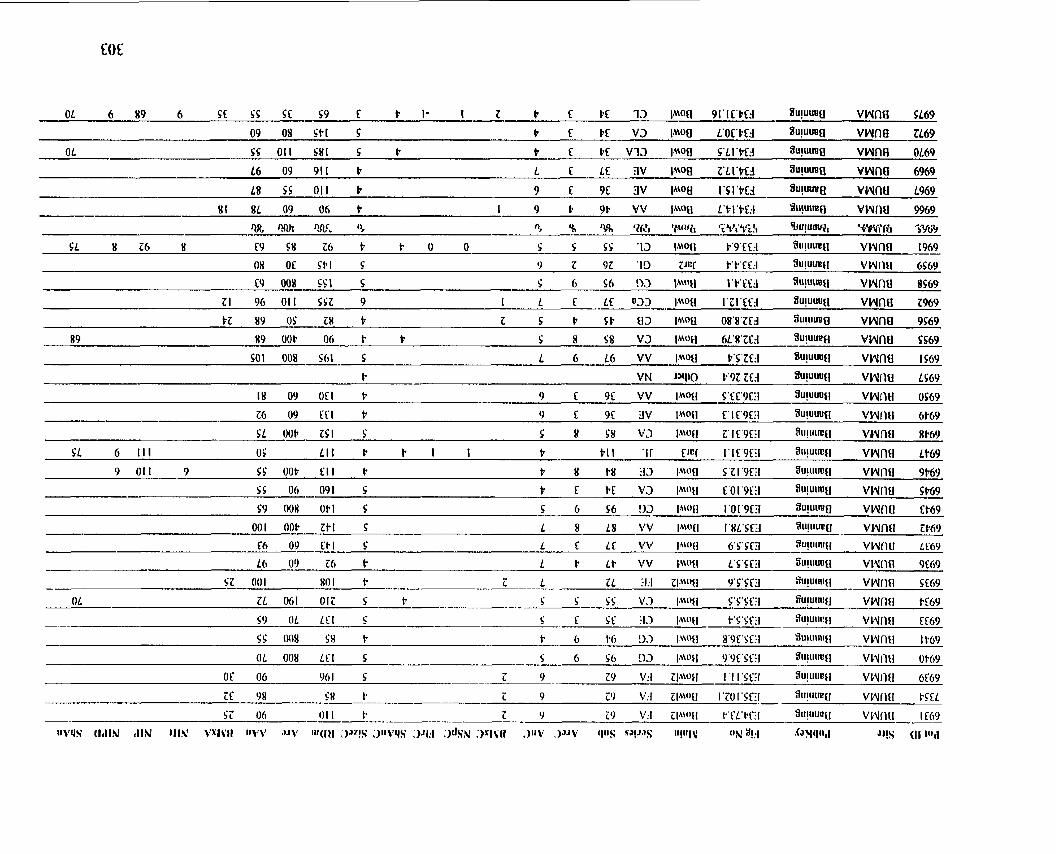
bz 89 OS LX b z s P ~b 83 I ~ ( W 0 8 ' 8 ' 1 ~ ~ %UWI vwne us69
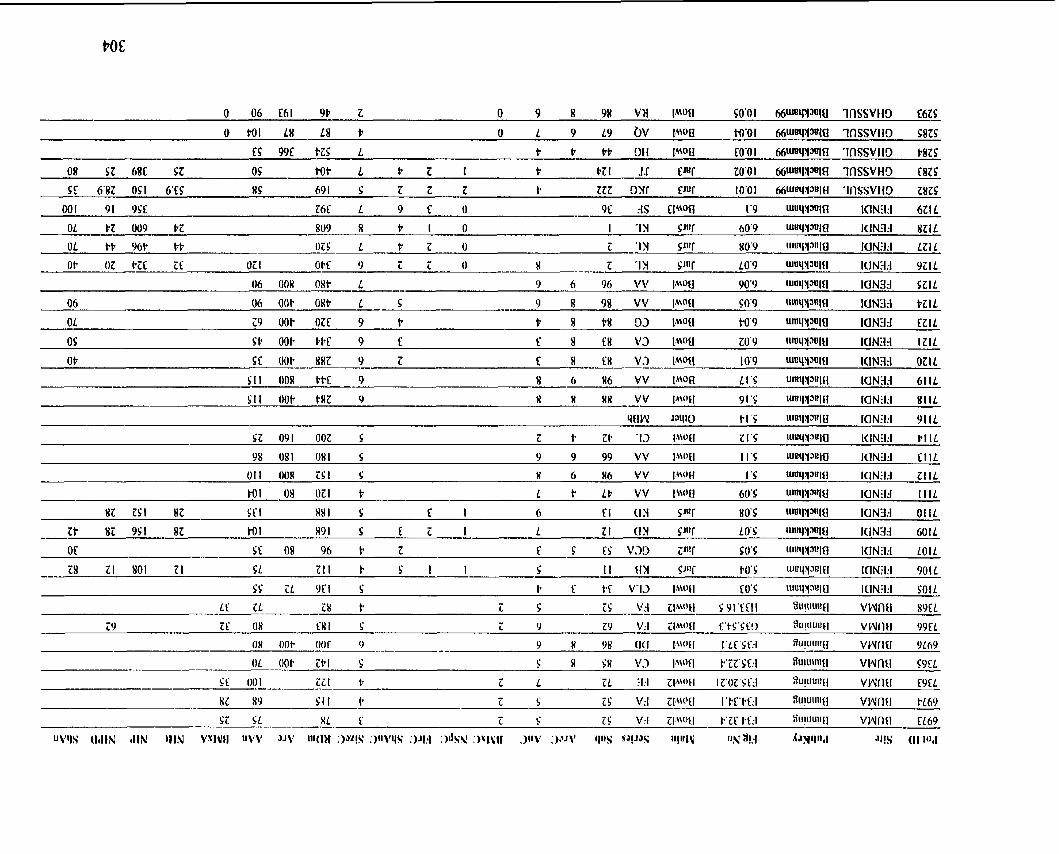
8i: Z S I 82 S C 1 HHI S f I 6 CI (11 SJnl BO'S 1u~ilWlti IUN3:I O1 1 L
~ t 82 9s1 sz WI 891 s c z I L ZI CM SJUY IO'S i u ~ ~ i ICIN~J GOI L
Of SC 08 Y6 b Z f S ES V30 Z J Y SO'S iWlWl lClN3:I LO l L
28 11 801 21 S L Zll t S I 1 S 1 1 1 S J V PO'S iiiuill Wl I<INEIJ 90 1 L
SS L Of1 S P E tC V I 3 I , W l IO'S ~ll~l~y3u~fl l(lN3rl SOIL
LI TL ~8 t 2 s CS VA I I S'Yi 'f ZII WWI V W ~ ~ I 8~
z9 TL ox (81 s z Y ZY VA I O r'ts'sc~) g [ i ! ~ w VWII~I 9 9 f ~
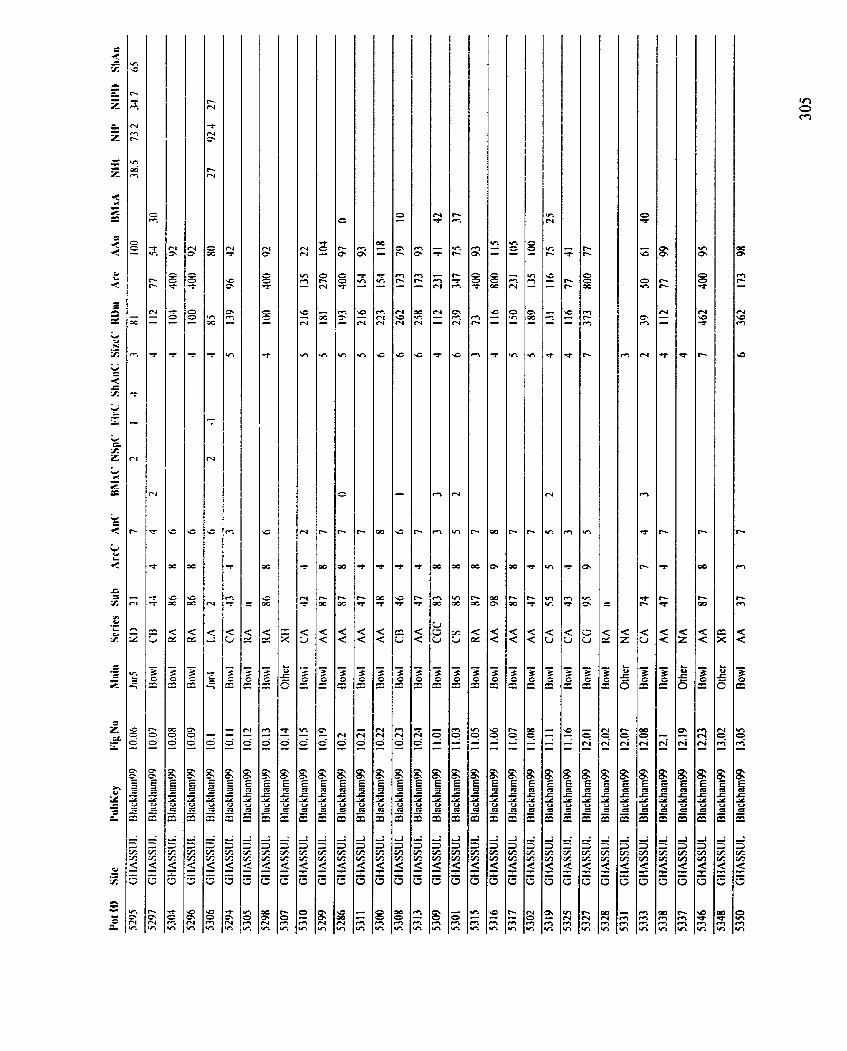
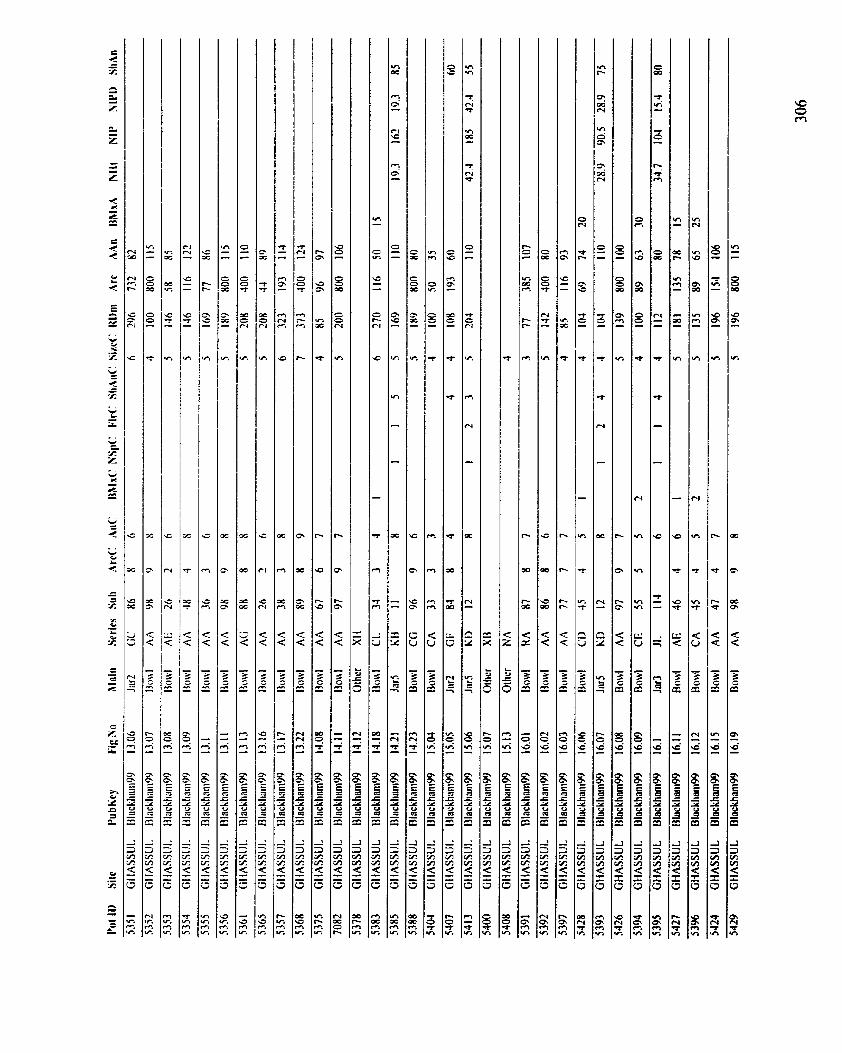
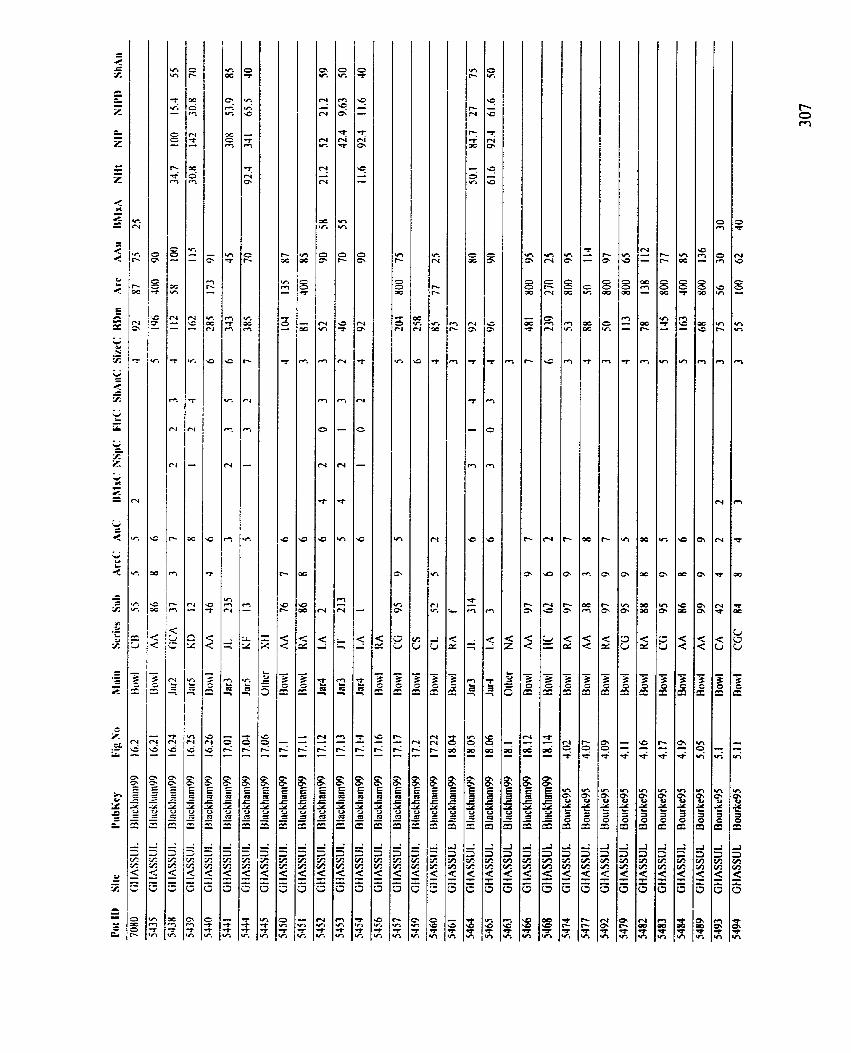
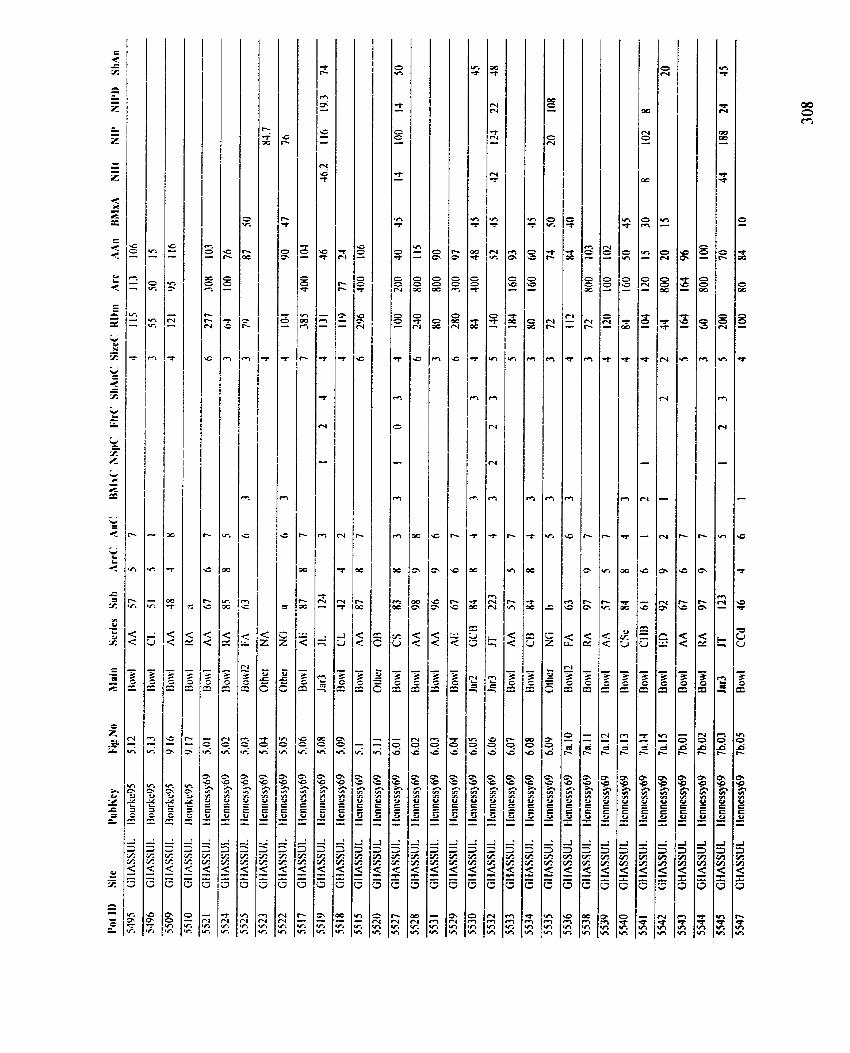
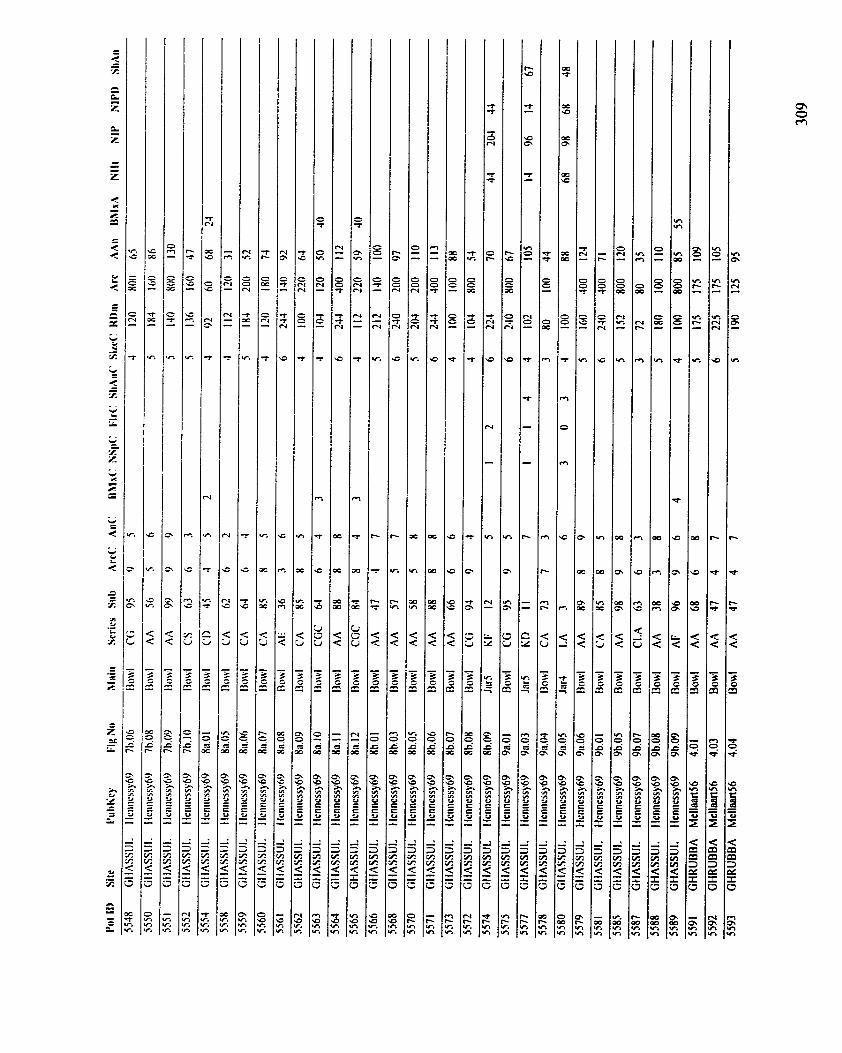
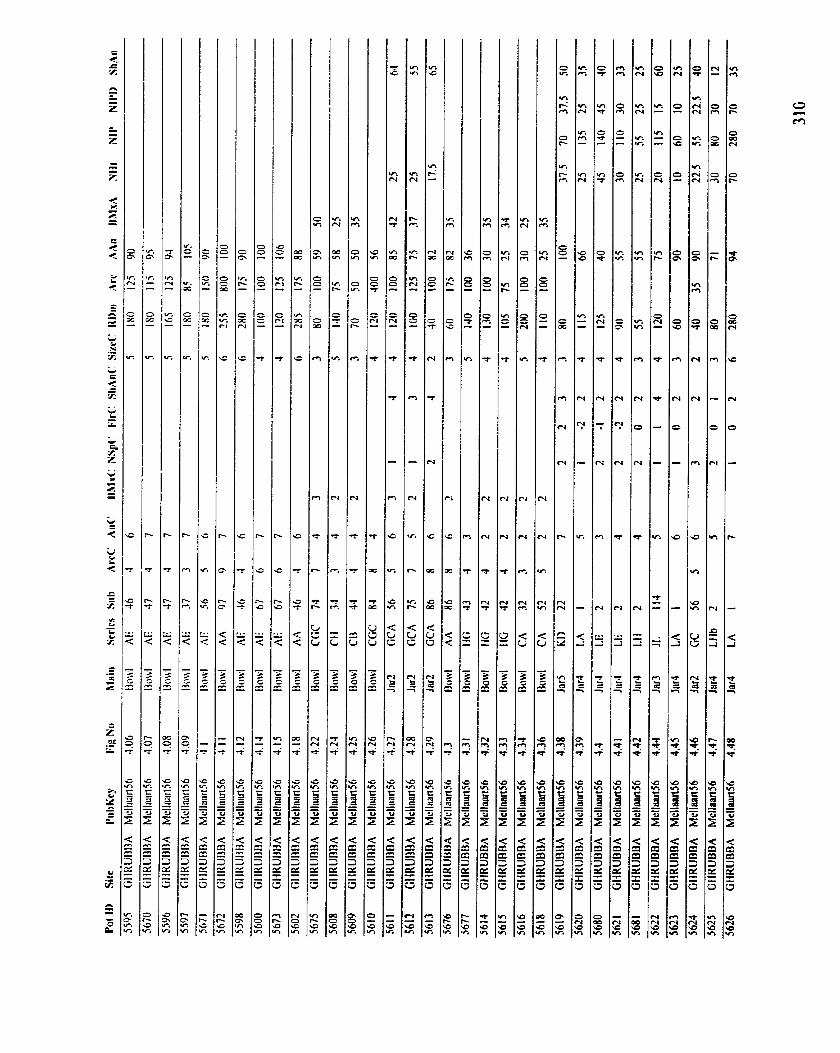
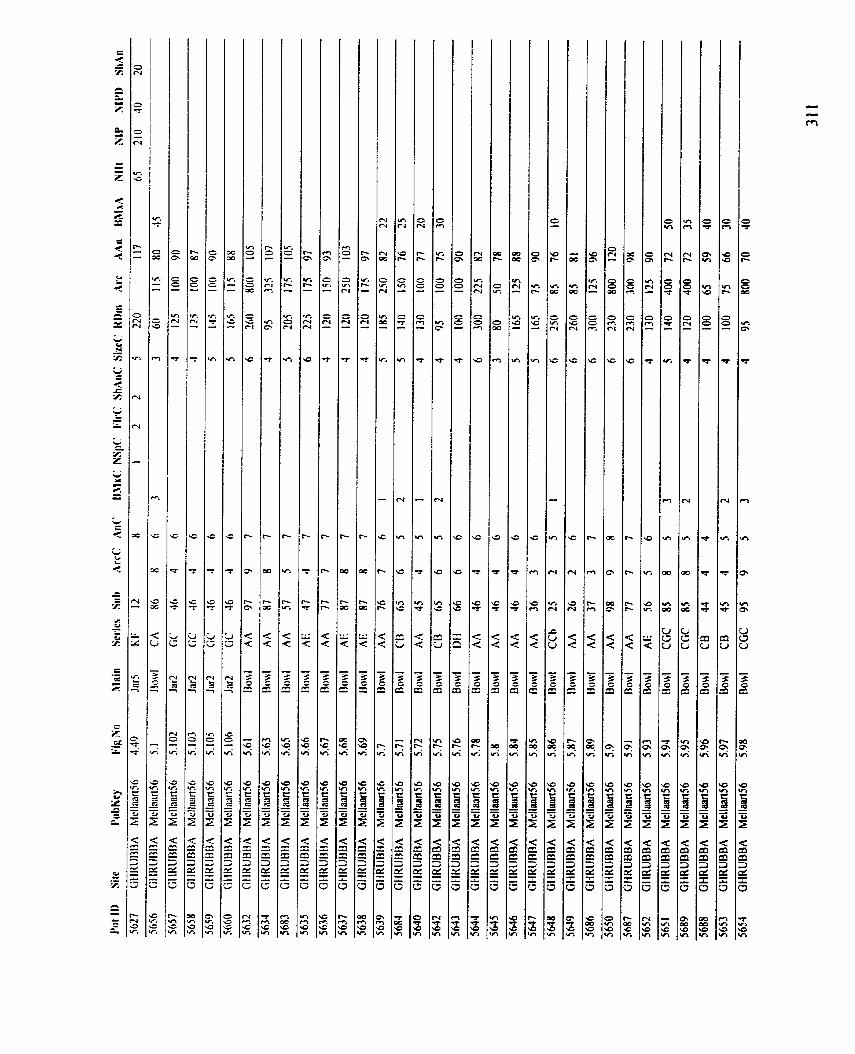
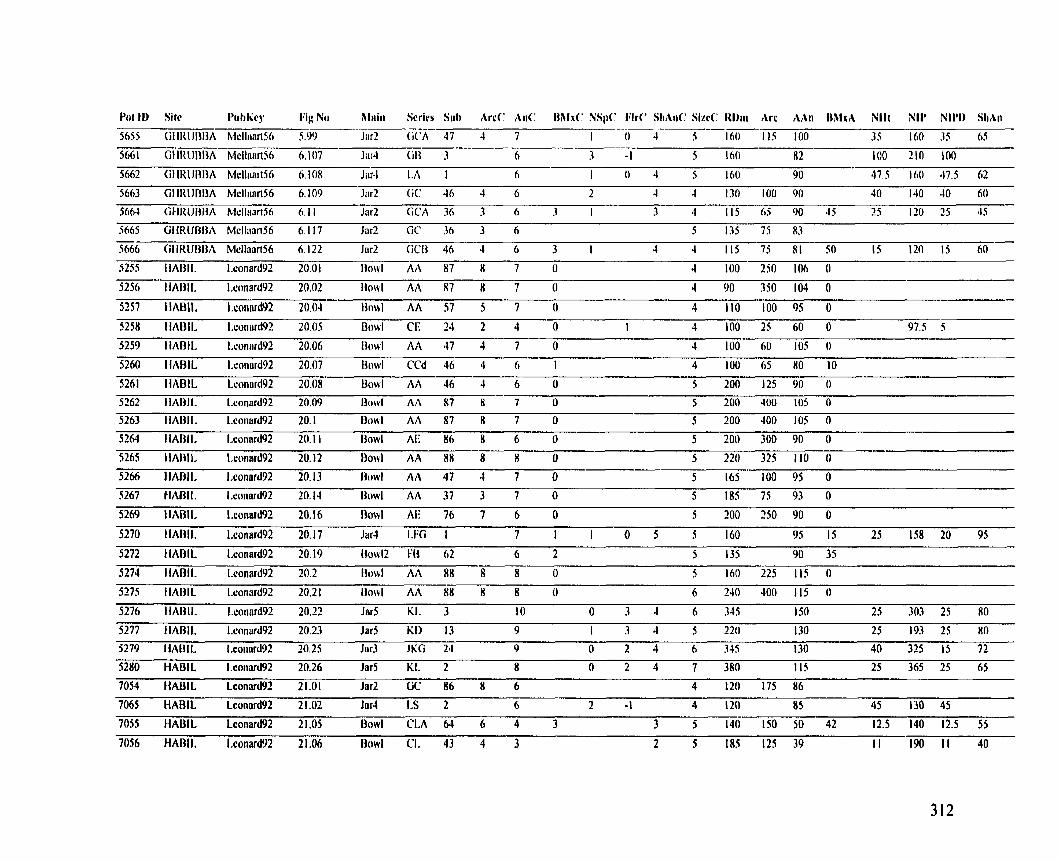
- 5666 GtIRUl3DA blrllnan56 6 122 J1tr2 GCI3 46 4 6 3 I 4 4 115 73 X I 50 15 I20 I5 60
5255 I IARII. I.eonnrd92 20.01 I h v l At\ 87 H 7 0 4 100 250 106 0
5256 11ABII. I.connrd92 20.02 I h w l AA 87 H 7 0 4 90 350 I04 0
5257 t IAt311, I.connrd92 20.04 I h v l AA 57 5 1 0 4 110 100 95 0
525% t1ABII. I.conurd92 20.05 13owl CI' 24 2 4 0 I 4 100 25 60 0 97.5 5
5259 IIADIL I.eonnrd92 20.06 I3owl AA 47 4 7 0 4 100 60 105 0
5260 I IABII, I.eonnrd92 20.07 IJowl CCd 46 4 6 I 4 100 65 80 10
5261 IIADIL I.connrd92 20.08 Uowl )\A 46 4 6 0 5 200 125 90 0
5162 liA1311, Iaonord92 20.09 13owl AA 87 H 7 0 5 200 400 I05 0
5263 I1ABI I. l.conurd92 20. I 13o\vl AA 87 8 7 0 5 200 400 105 0
5264 IiAnll. I.connrd92 20. l l I3owl Al: H6 A 6 0 5 201) 300 90 0
5266 IIABII. I.conard92 20.13 I3owl AA 47 4 7 0 5 165 1 0 0 9 5 0
5267 l lAf l lL I.connrd92 20.14 I h w l AA 37 3 7 0 5 185 75 93 0
5269 I IARII. I.connrd92 20.16 Dowl A 1 76 7 6 0 5 200 250 90 0
5270 IIADIL Lconnrd92 20.17 Jar4 LFG I 7 t I 0 5 5 160 95 15 25 158 20 95
5272 t1ADIL Ixonard92 20.19 llow12 I 62 6 2 5 135 90 35
5274 t IADII. I.eonerd92 20.2 I h v l A h 88 8 H 0 5 160 225 115 0
5275 IIABIL I.connr492 20.2 1 llowl A h 88 8 8 0 6 240 400 115 0
5276 I IADlL Lconard92 20.22 lnr5 KI. 3 I 0 0 3 4 6 345 I SO 25 303 25 80
5277 I IABIL I.ronnrd92 20.23 Jar5 I 13 9 1 3 4 5 220 130 25 193 25 80
5280 HABIL Lconnrd92 20.26 Jnr5 KI. 2 8 0 2 4 7 380 l I S 25 365 25 65
7054 HABIL Lconnrd92 21.01 Jar2 GC 86 8 6 4 I20 175 86
7065 HAHIL Leonard92 21.02 Jar4 1.S 2 6 2 -1 4 I20 85 45 130 45
7055 HABIL Leonard92 21.05 Bowl C I A 64 6 4 3 3 5 140 I50 50 42 12.5 140 12.5 55
7056 HADlL I.consrd92 21.06 Bowl CI. 43 4 3 2 5 185 125 39 11 190 11 40
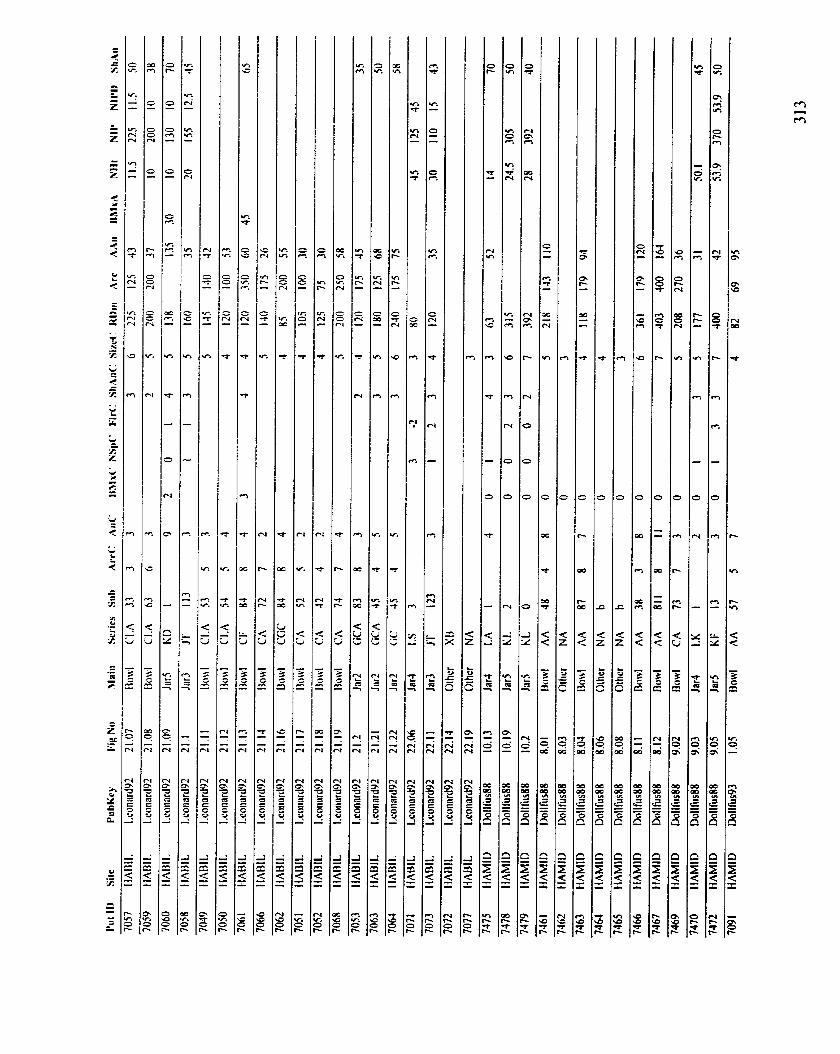
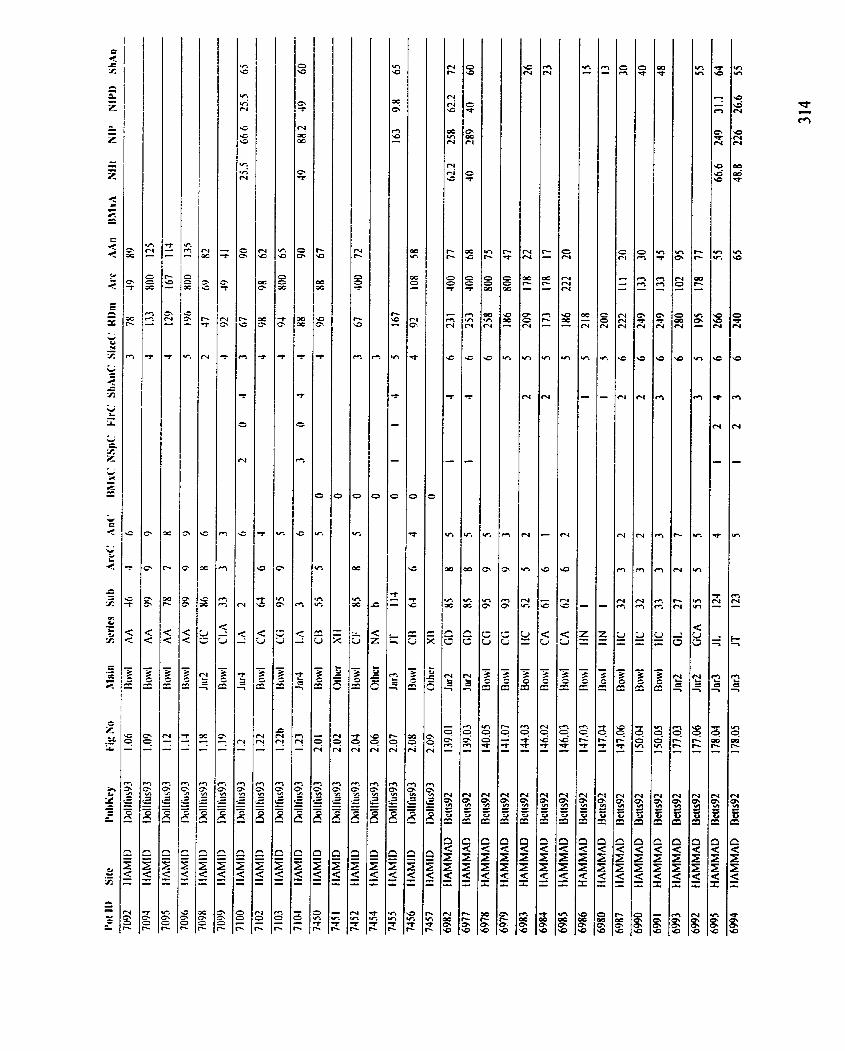
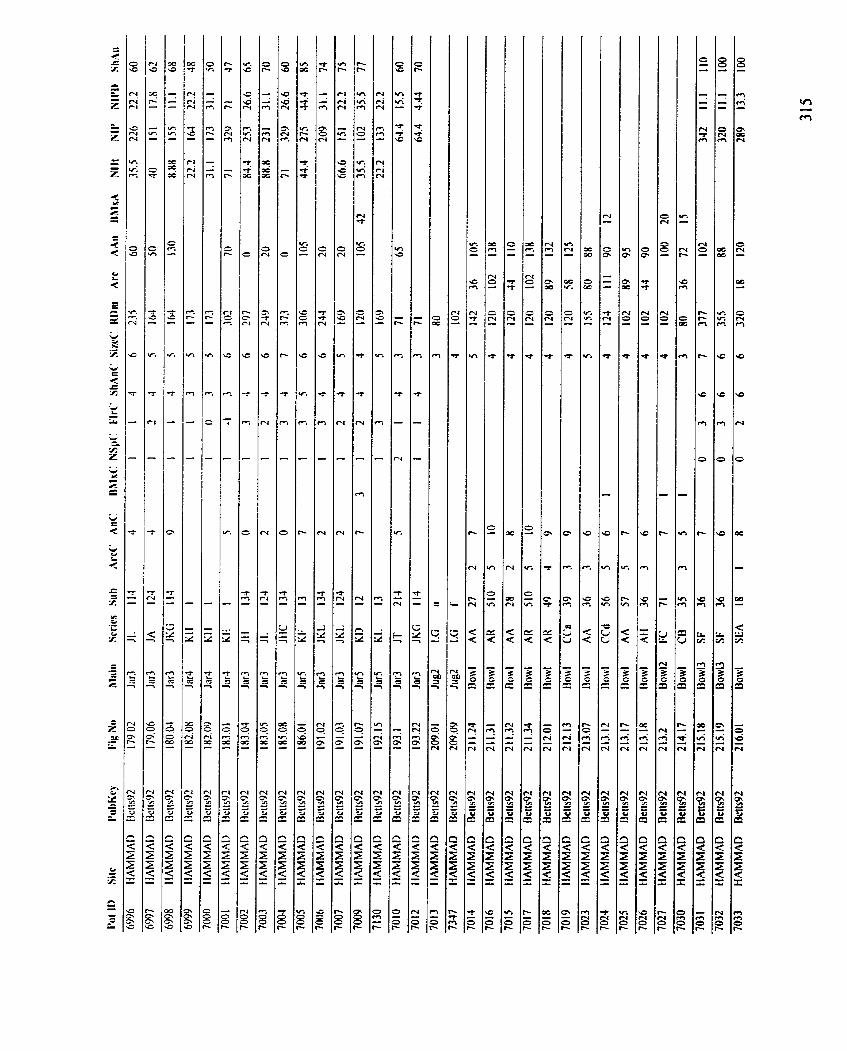
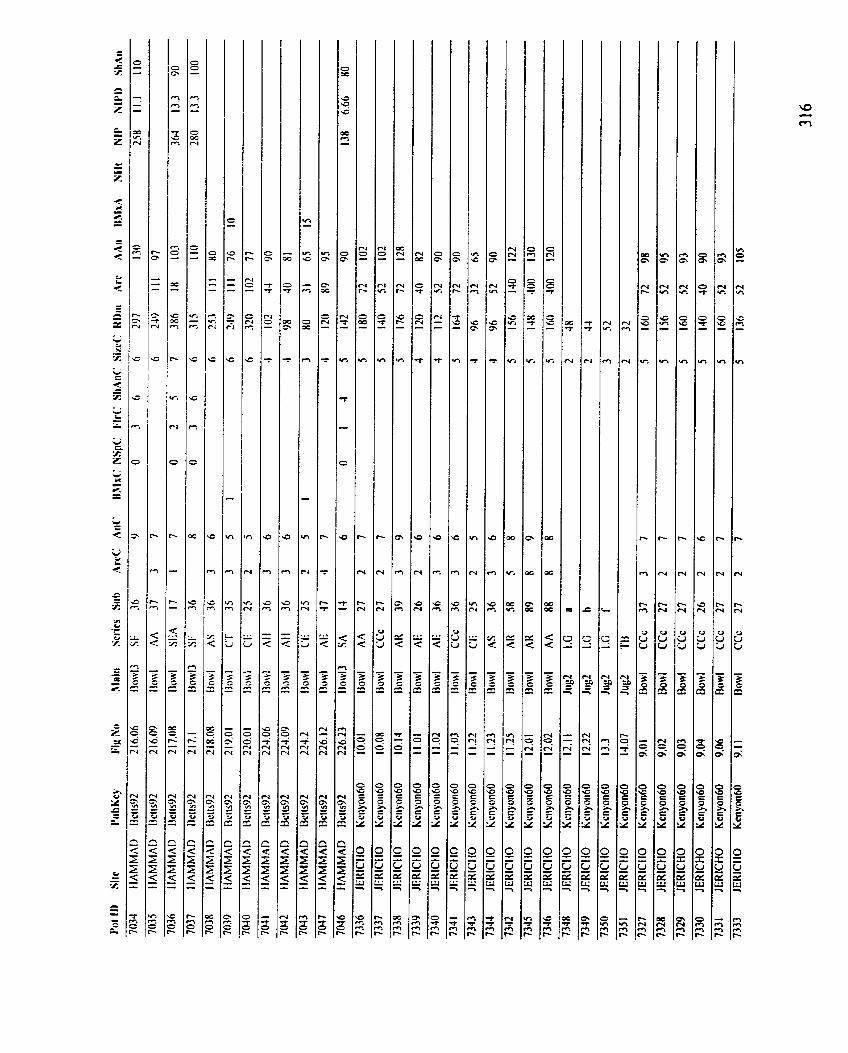
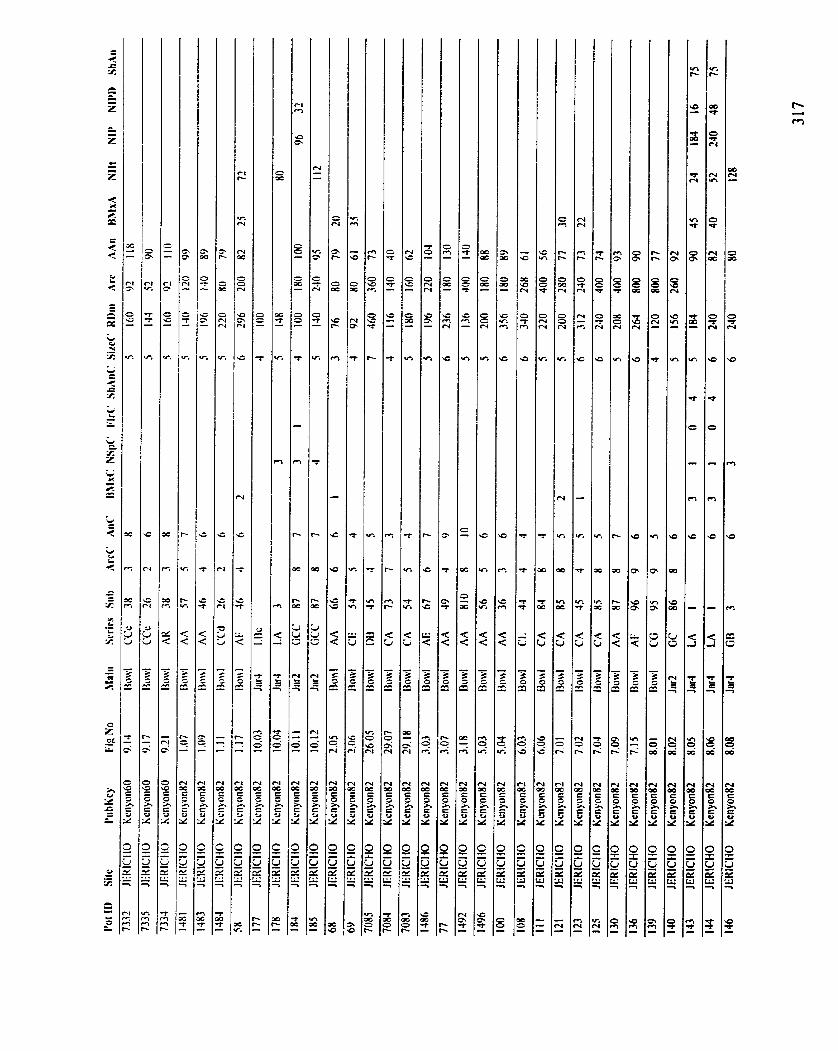
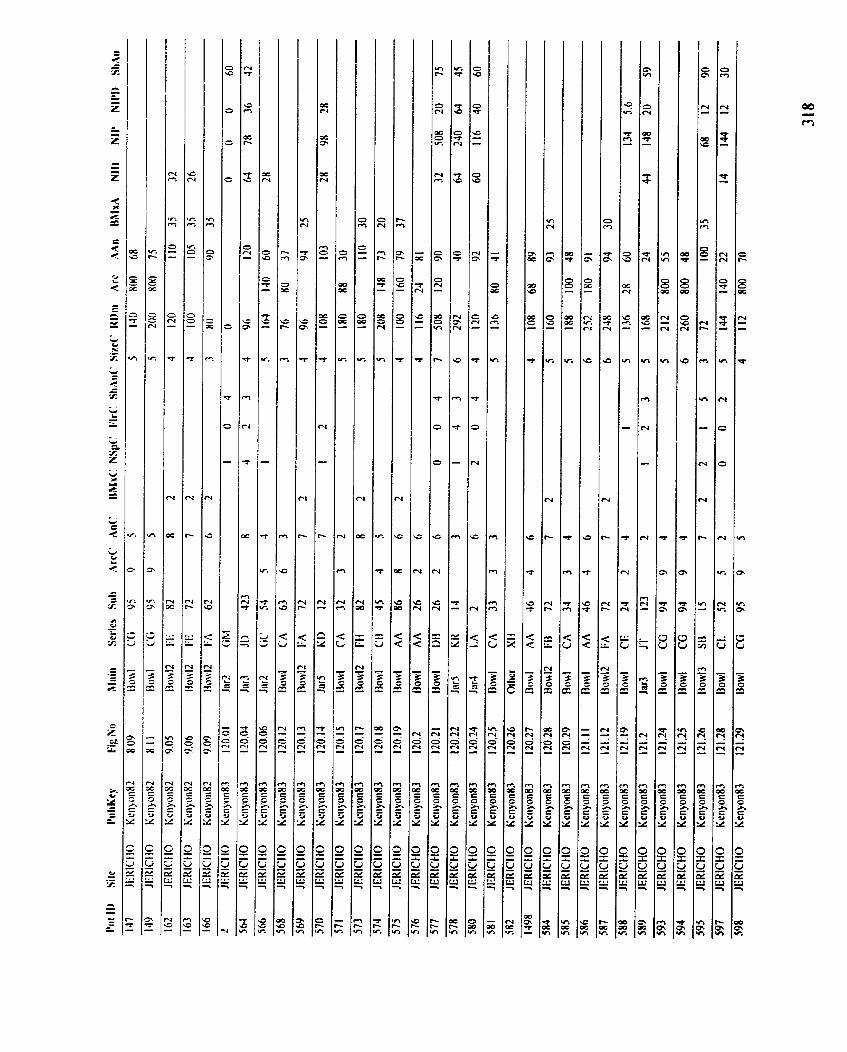
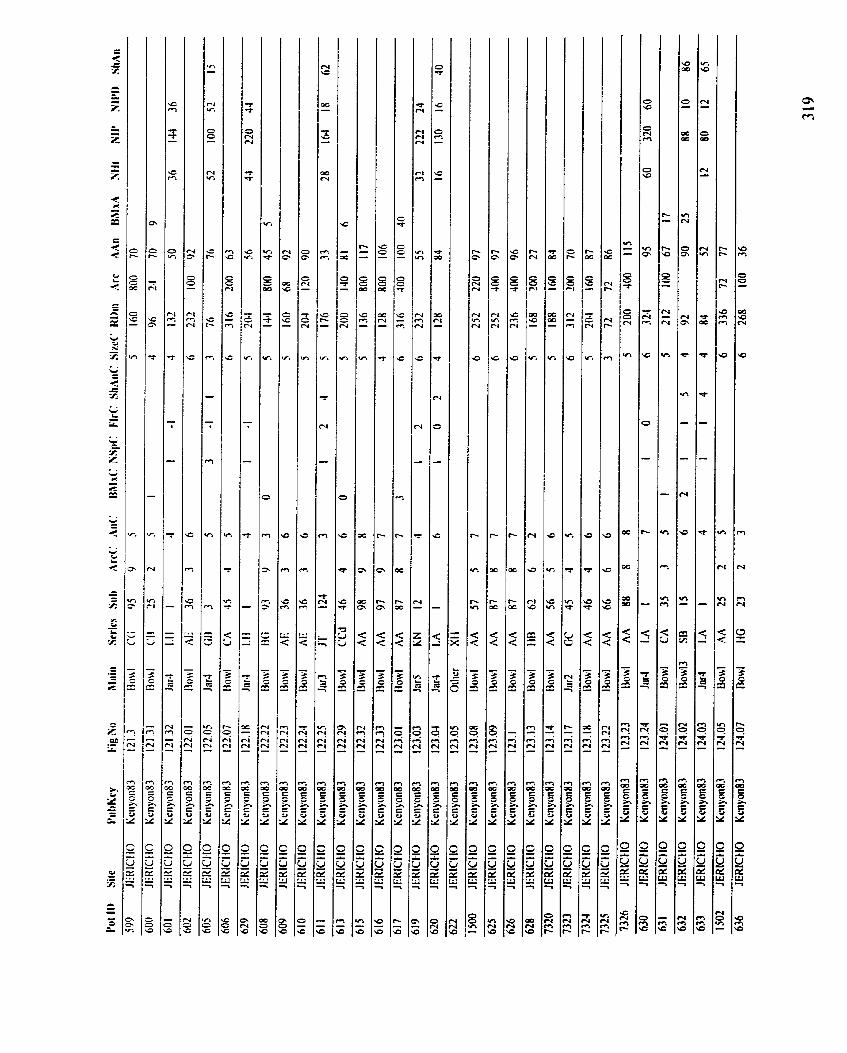
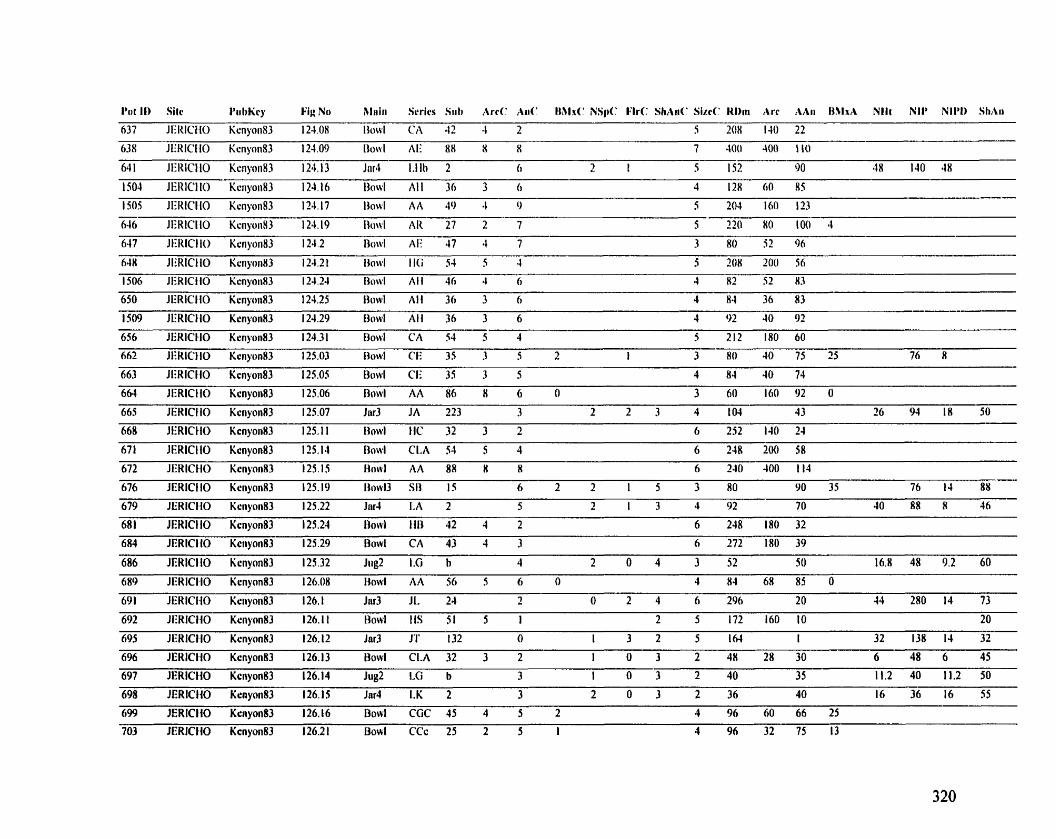
I ' c i t l l ) Silc I'ti bt icy Fia No filain Scrics Stib Arc(' Ait(' l x ' S I r S I I ' S i l n Arc r\lli~ I#blxA N t l t Nll' NI IW SIIAII
637 JEIZICf IO Kcriyon83 124 08 I lowl CA 43 4 2 S 208 140 22
638 JERICI IO Kcnyon83 124.09 Ilotvl AI: 88 X X 7 400 JO0 110
64 l JIXICIIO KcriyoiiR3 124. 13 Jar4 1.1 Il) 2 O 2 I 5 152 90 48 110 48
1504 JERlC110 KcriyoriU3 124.16 Ihtl A 30 3 O 4 128 60 85
1505 JERICI IO Kcnyonfl3 124.17 Ih$l AA 4 4 9 5 20.1 160 123 - 646 JEHICIIO KçnyoiiH3 124.19 lh~l AR 27 2 7 S 720 80 100 4
647 JEIUCIIO Kcnyon83 124 2 Dowl A 47 4 7 3 80 S2 96
64H J I ~ K I C ~ I O Kcnyon83 121.21 I3owl l l G 54 5 4 5 208 200 56
1506 JERICIIO Kcnyoii83 I 24 24 I o AI1 40 4 6 4 82 52 83
650 JERICI10 Kcnyon83 124.25 I3owl A l i 36 3 6 4 H4 36 83
1509 JERICIIO Kcnyon83 124.29 I iowl A I 36 3 6 4 02 40 92
656 JERlCtlO Kcnyoii83 124.31 Ilorvl CA 51 5 4 5 212 180 60
662 JERICIIO Kcnyon83 125.03 I iowl CE 35 3 5 2 I 3 S0 10 75 25 76 R
663 JERICI10 Kenyan83 125.05 13owl CE 35 3 5 4 84 40 74
664 JERICI10 Kcnyoii83 125.06 Dowl AA 86 8 6 0 3 60 160 92 O
665 JEHICIIO KcnyonU3 125.07 Jiu3 JA 223 3 2 2 3 4 10.1 4 3 26 94 IR 50
668 IERICI I O Kcnyon83 125.1 1 I iowl t1C 32 3 2 6 252 140 24
671 JERICIIO Kcnyon83 135.14 Dowl C1.A 54 5 4 6 248 200 58
672 JERlCIlO Kcnpori83 125 15 f h r 1 AA 88 8 H 6 240 400 114
676 JERICI IO Kcnyon83 125. 19 IIowl3 SR IS 6 2 2 1 5 3 80 90 35 76 14 88
679 JERICt I O Kenyon83 125.22 Jar4 IA 2 5 2 1 3 4 92 70 40 88 8 46
681 JEHICI IO Kcnyon83 125.24 tlowl IlIl 42 4 2 6 248 180 32
684 JERICIIO Kcnyon83 125.29 Dow1 CA 43 4 3 6 272 180 39
686 JERICI10 Kcnyon83 125.32 Jiig2 1.G h 4 2 0 4 3 52 5 O 16.8 48 9.2 60
689 JERICt IO Kcnynn83 126.08 f3owl AA 56 5 6 O 4 84 68 85 O
691 JERICI I O Kcnyori83 126.1 Jar3 JI. 21 2 O 2 4 6 296 20 14 280 14 73
692 JERICI10 Kcnyon83 126.1 1 13owl Ils 51 5 1 2 5 172 160 10 20
695 JERlCllO Kcnyon83 126.12 Jar3 Jï' 132 O 1 3 2 5 164 1 32 138 14 32
696 JERICHO Kenyon83 126.13 Uowl C1.A 32 3 2 I 0 3 2 48 28 30 6 48 6 45
697 JERICHO Kcnyon83 126.14 Jug2 LG b 3 I 0 3 2 40 3 5 11.2 40 11.2 50
698 JERICHO Kcnyon83 126.15 Jar4 LK 2 3 2 0 3 2 36 40 16 36 16 55
699 JERICHO Kcnyon83 126.16 Dow1 CGC 45 4 5 2 4 96 60 66 25
703 JERICHO KcnyonR3 126.2 1 Dowl CCc 25 2 5 1 4 96 32 75 13
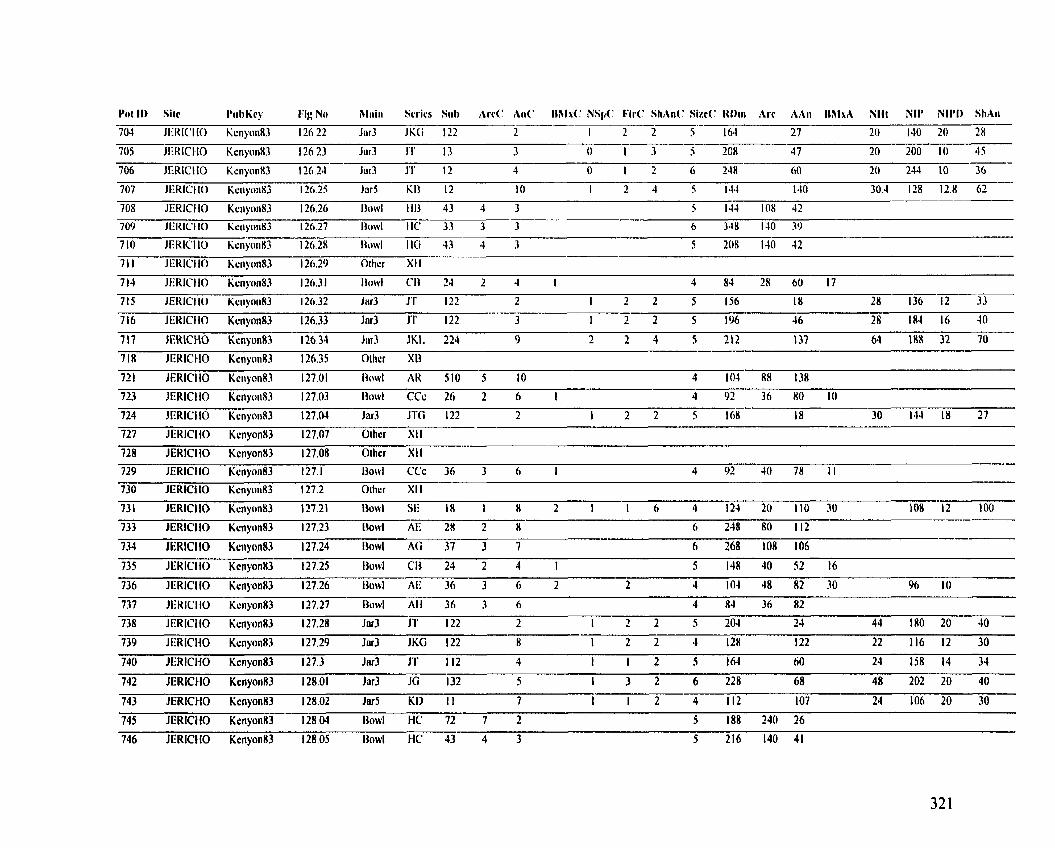
O I l Silc hi bKcy I:ig No hlaiii Srrics Siib A r c I I IlAls<: NSpC I:lr(: ShAnC Sire<: H h i Arc I I I I l Kilt MI' RIIW SIIAII
704 JEIZICI IO Kciiyon83 126.22 Jrir3 JKG 122 2 I 2 2 S 164 2 7 20 110 20 28
705 JIXICIIO KcnyonX3 126.23 Jrir3 l'i' 13 3 O 1 3 5 20H 17 20 200 10 45
706 JERICI IO KciiyoiiX3 126 24 Jiir3 J 12 4 O I Z 6 248 60 20 244 10 36
707 JEKICIIO KciiyoiiX3 126 25 Jar5 KI3 12 1 0 1 2 4 5 1-44 1-40 30.4 128 12.8 62
708 JERICI IO Kc1iyonH3 126.26 I3owl 1113 43 4 3 5 144 108 42
709 Jli l l lClIO KciiyoiiK3 120.27 I3owl I IC 33 3 3 6 348 140 39
710 JEKICIIO KciiyoiiH3 126.28 I h v l I I C i 13 4 3 5 208 140 42
71 1 JEKIC'I IO Kcnyon83 126.29 Othcr XI I
7 14 JERICl IO Kcnyor183 126.3 1 Ilowl CI3 24 2 1 1 4 84 28 60 17
7 15 JEKICIIO KeiiyonIi3 126.32 Jar3 J 122 2 I 2 2 5 156 18 28 136 12 33
717 JEKlCIlO KenyonU3 126.34 Jar3 JKI. 224 9 2 2 4 5 212 137 64 188 32 70
7 18 JERlCllO KenyonR3 126.35 Ollicr XB
721 JERICIIO Kciiyon83 127.01 Iht AR 510 5 10 4 104 88 138
727 JERICIIO Kcnyon83 127.07 Olhcr NI
728 JERICI10 Kcnyon83 127.08 OIhcr Xi1
729 JERICI IO KenyonR3 127.1 Ilo\vl CCc 36 3 6 I 4 92 40 78 11
730 JERICI 10 Kcnyon83 127 2 0th XI I
731 JERlCllO Kcnyonll3 127.21 I h v l SE 18 1 8 2 I I b 4 124 20 110 30 108 12 100
733 KRICI10 KcnyonR3 127.23 I3owl AE 28 2 H 6 248 80 112
734 JERICIIO Kenyan83 127 24 I3owl AG 37 3 7 b 268 108 IO6
735 JERICIIO Kcnyon83 127.25 Ilowl CI3 24 2 4 I 5 140 40 52 16
736 JERICIIO Krnyon83 127.26 l3owl A l l 36 3 6 2 2 4 104 48 R2 30 96 10
737 JERlCllO KcnyonR3 127.27 I3owl A 36 3 6 4 84 36 82
738 JERlCilO Kcnyon83 127.28 Jar3 JI' 122 2 1 2 2 5 204 24 44 !HO 20 40
739 JERICH0 Kcnyon83 127.29 Jar3 JKG 122 8 1 2 2 4 12R 122 22 116 12 30
740 JERICHO Kenyan83 127.3 Jar3 J'T 112 4 I 5 164 60 1 2 24 158 I J 34
742 JERICI10 Kcnyon83 128.01 Jar3 JG 132 5 1 3 2 6 228 68 48 202 20 40
743 JERICHO Kcnyon83 128.02 Jar5 KD II 7 I 1 2 4 112 107 24 106 20 30
745 JERICtIO Kcnyon83 128.04 Ilowl tic 72 7 2 5 188 240 26
746 JERICH0 KcnyonU 128.05 Bowl tic 43 4 3 5 216 140 JI
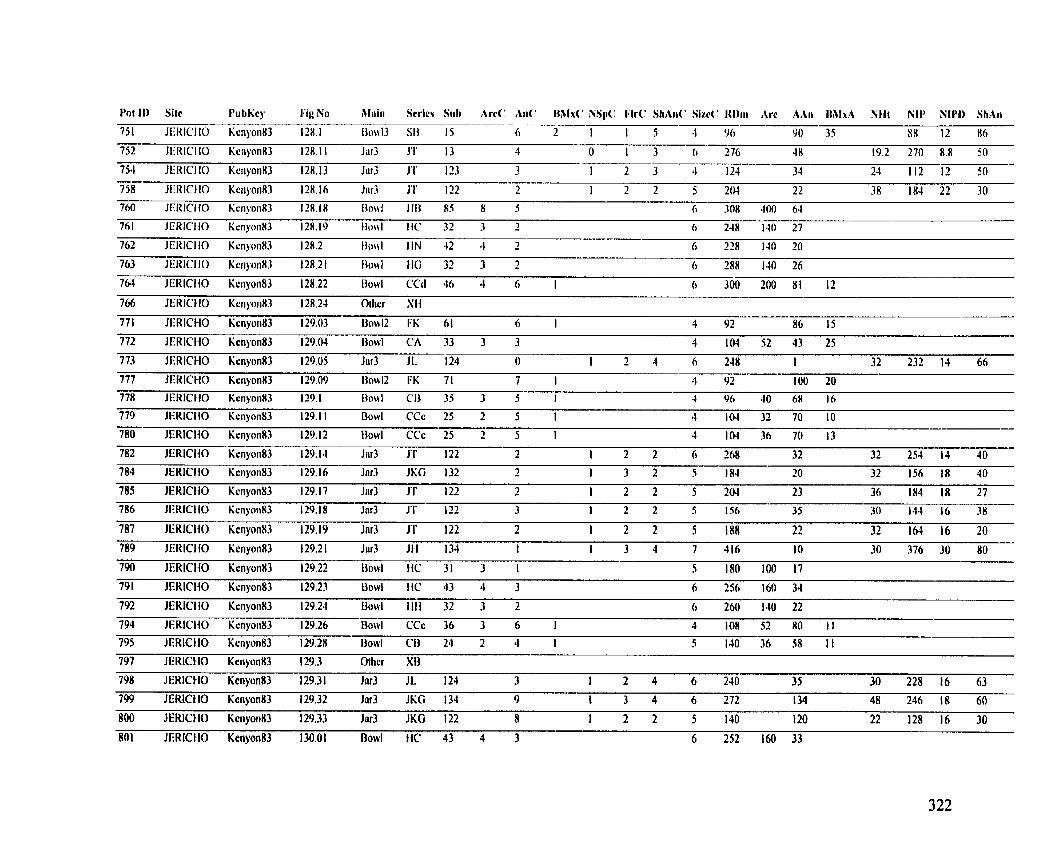
l'nt II) Site IBuhKeg I;ig No Bliiiii Srrics Siib Arc(' ,ln(' I N I r S h S i c IIII Arc A I I l N l l t NII' NI IW S11:in
75 1 I I X I C I IO Kciiyoii83 128.1 3 SI3 15 6 2 I 1 5 4 96 90 35 HH 12 Hh
752 f ERICI IO Kcnyon83 128.1 1 Jiiï3 J I 13 4 O 1 3 O 276 4 8 19.2 270 8.8 50
754 JERICI IO KciiyonH3 128.13 Jiir3 J'I' 123 3 1 2 3 4 124 34 24 112 12 50
758 JERICI I O Kcngoii83 128.16 Jiu3 J'I' 132 2 1 2 2 5 ?(LI 22 38 184 22 30
761 JERICIIO Kcnyon83 128.19 t h r 1 t 32 3 3 6 248 140 27
762 JERICI IO Kcnyon83 128.2 l h v l l IN 42 4 3 6 228 1.10 20
763 JEKICIIO Kciiyon83 128.2 1 I3owl II(; 32 3 2 6 288 140 26
764 J t:'KICIlO Kciiyoii83 128.22 llowl C'Cd 46 4 6 I 6 300 200 81 12
766 JEHIC110 Kcnyon83 I2R.24 Oilicr S I I
771 IERICliO Kcnyoii83 129.03 Uowl2 K 61 6 I 4 92 86 15
772 JERICI10 Kcnyon83 129.04 I3owl CA 33 3 3 4 5 2 43 25
773 JERICI-IO Kcnyoii83 129.05 Jar3 JI. 124 0 1 3 4 6 248 I 32 233 14 66
777 JERICI.10 Kcnyon83 129.09 l3ow12 IX 71 7 I 4 92 100 20
778 JERICIIO Kenyoii83 129.1 13otd CI1 35 3 5 I J 96 40 68 16 - 779 JllRlCl IO Kcnyon83 129.1 1 Rowl CCc 25 2 5 I 4 104 32 70 10
780 JEHICI40 Kciiyon83 129.12 l3owl CCc 25 2 5 I 4 104 36 70 13
782 JERlCllO Kcnyoii83 129.14 Jnr3 JI' 122 2 1 2 2 6 268 3 2 32 254 14 40
784 JERlCllO Kcnyon83 129. 16 Jar3 JKG 132 2 1 3 2 5 184 30 32 156 18 40
785 JEKlCllO Kcnyon83 129.17 Jw3 J'I' 122 2 1 2 2 5 201 2 3 36 184 18 27
786 JI3KIClIO KcnyoiiR3 129. I R Jrir3 JI' 122 3 1 2 2 5 156 3 5 30 144 16 38
781 JERICH0 Kenyon83 129.19 Jar3 J'l' 122 2 1 2 2 5 188 2 2 32 161 16 20
789 JEHICI10 Kenyon83 129.2 1 Jar3 JI1 134 I 1 3 4 7 416 1 O 30 376 30 80
79û JERICH0 Kcnyonll3 129.22 Iiowl I IC 31 3 1 5 180 100 17
791 JEHICI10 Kcnyon83 129.23 Dowl IlC 43 4 3 6 256 160 34
792 JEKICI I O Kenyon83 129.24 13owl I 111 32 3 2 6 260 140 22
794 JERlCf IO Kenyon83 129.26 Bowl CCc 36 3 6 I 4 IOR 52 80 11
795 JERICI IO Kcnyan83 129.28 I3owl CR 24 2 4 I 5 140 36 58 11
797 JERICI I O KenyonR3 129.3 Othcr Xt3
798 JERICHO Kcnyon83 129.31 Jar3 JL 124 3 1 2 4 6 240 35 30 228 16 63
799 JERICIIO Kcnyont3 129.32 Jar3 JKG 134 9 1 3 4 6 272 134 48 246 18 60
800 JERICHO Kenyon83 129.33 Jw3 JKG 122 8 1 2 2 5 140 120 22 128 16 30
801 JEKICIIO KenyonR3 130.01 Rowl HC 43 4 3 6 252 160 33
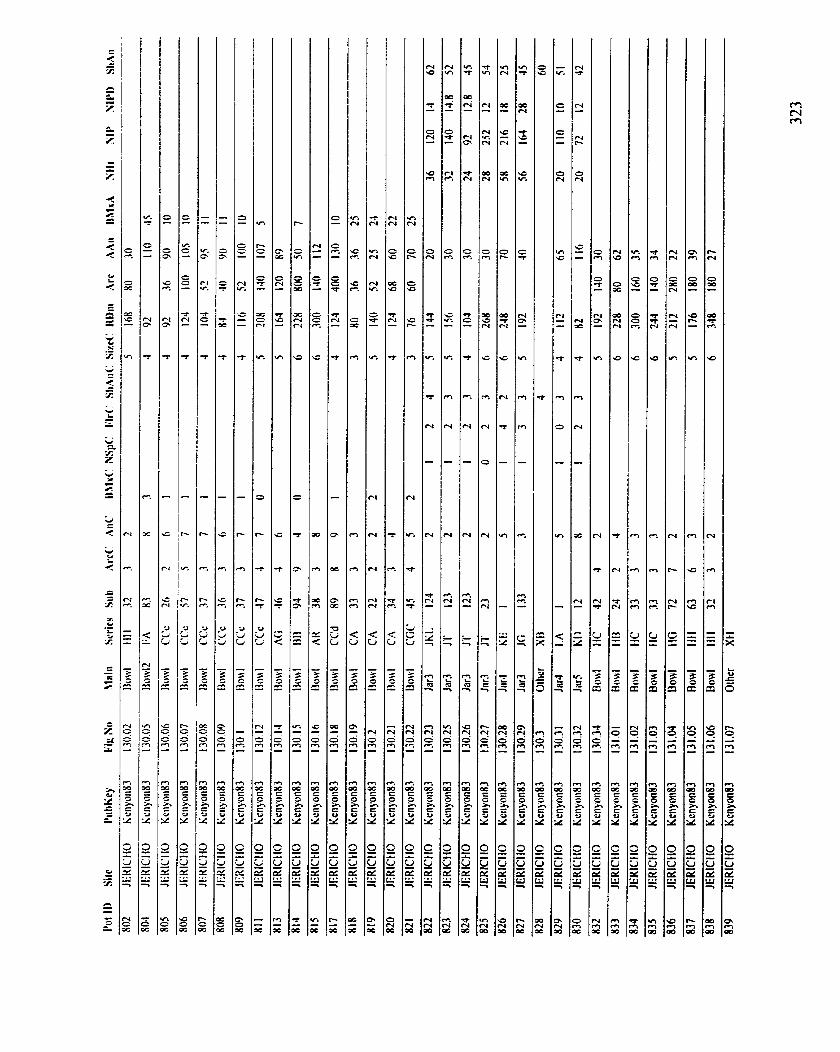
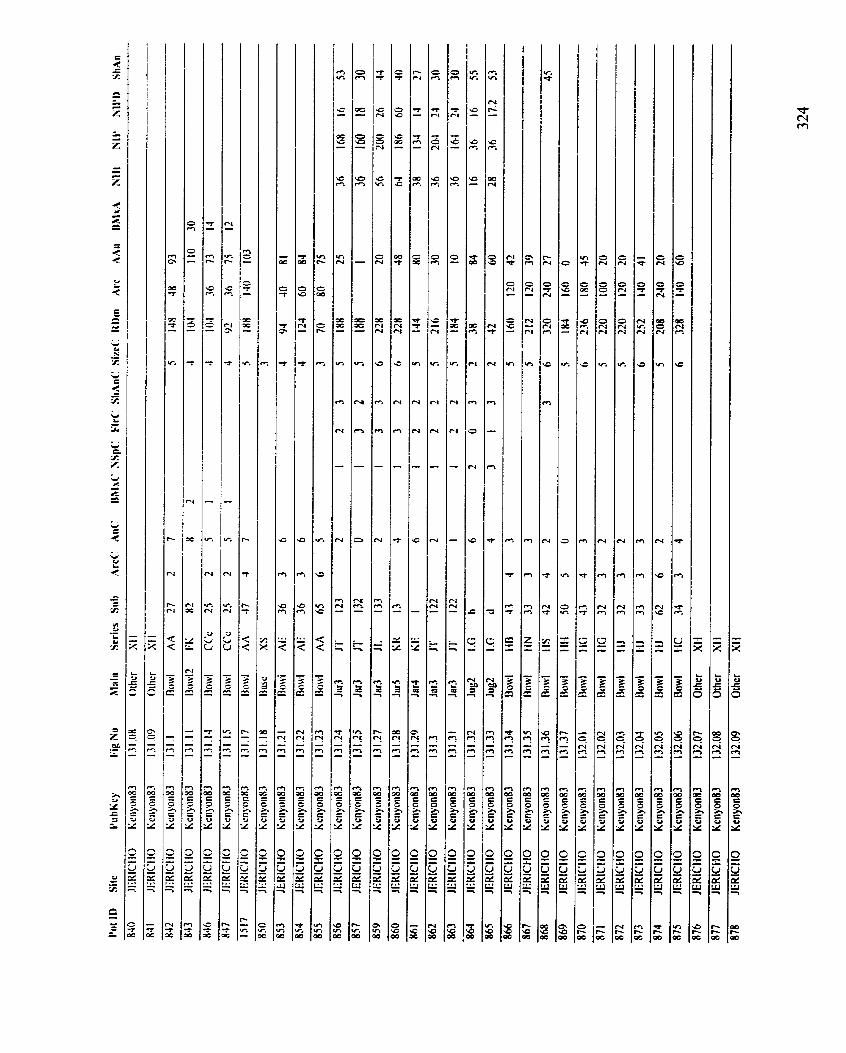
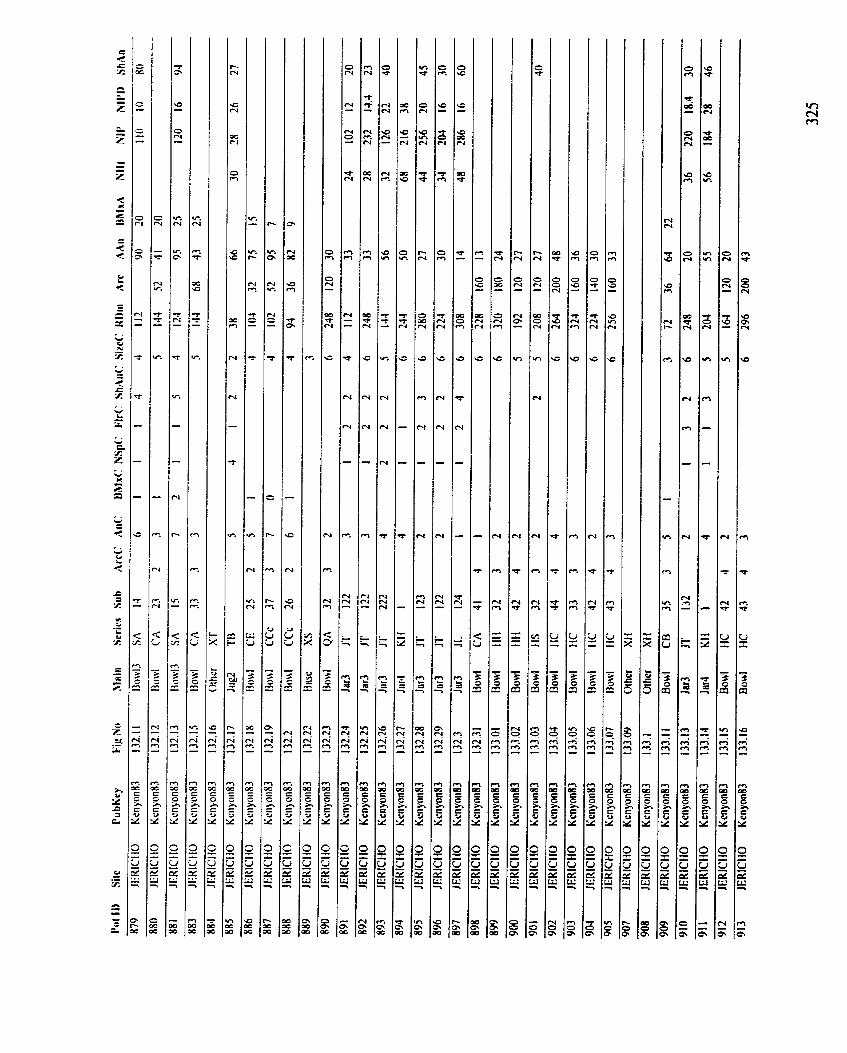
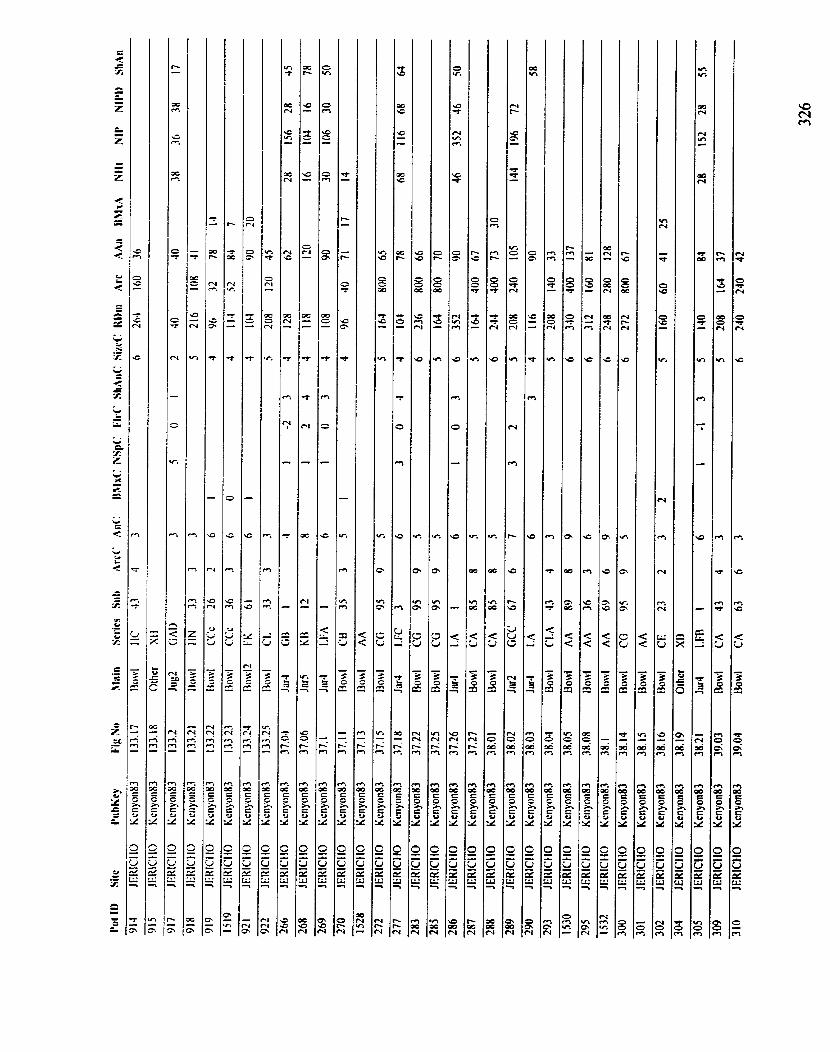
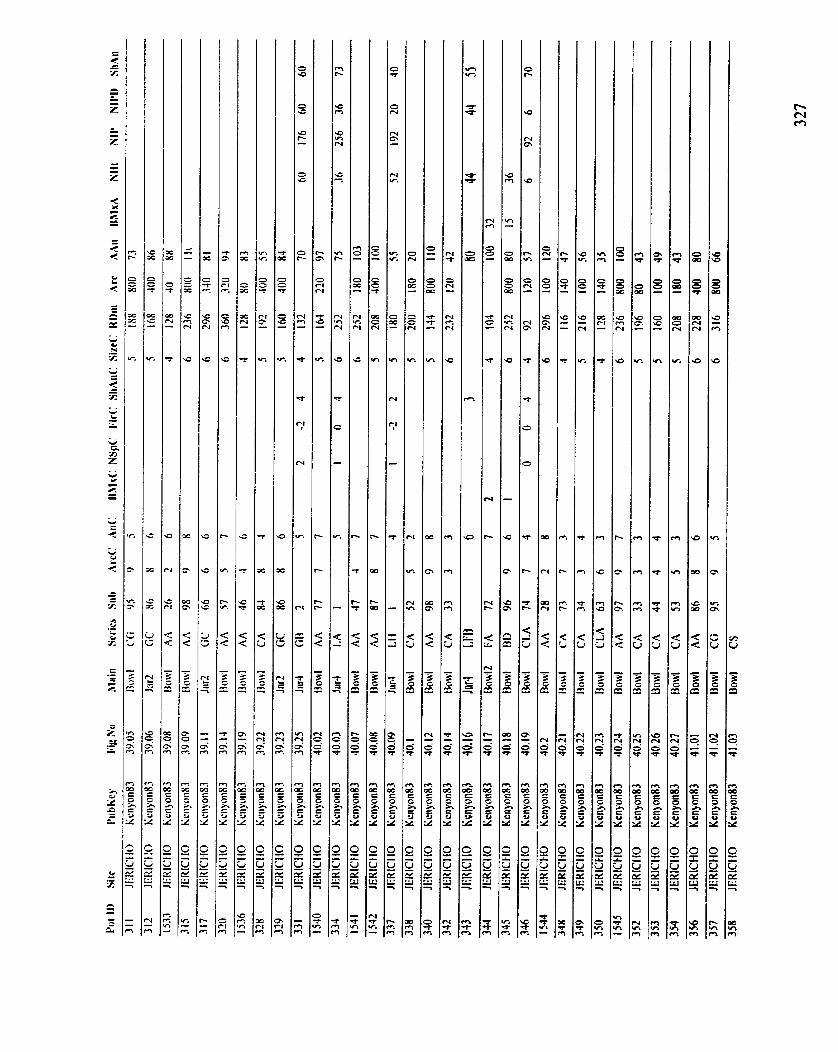
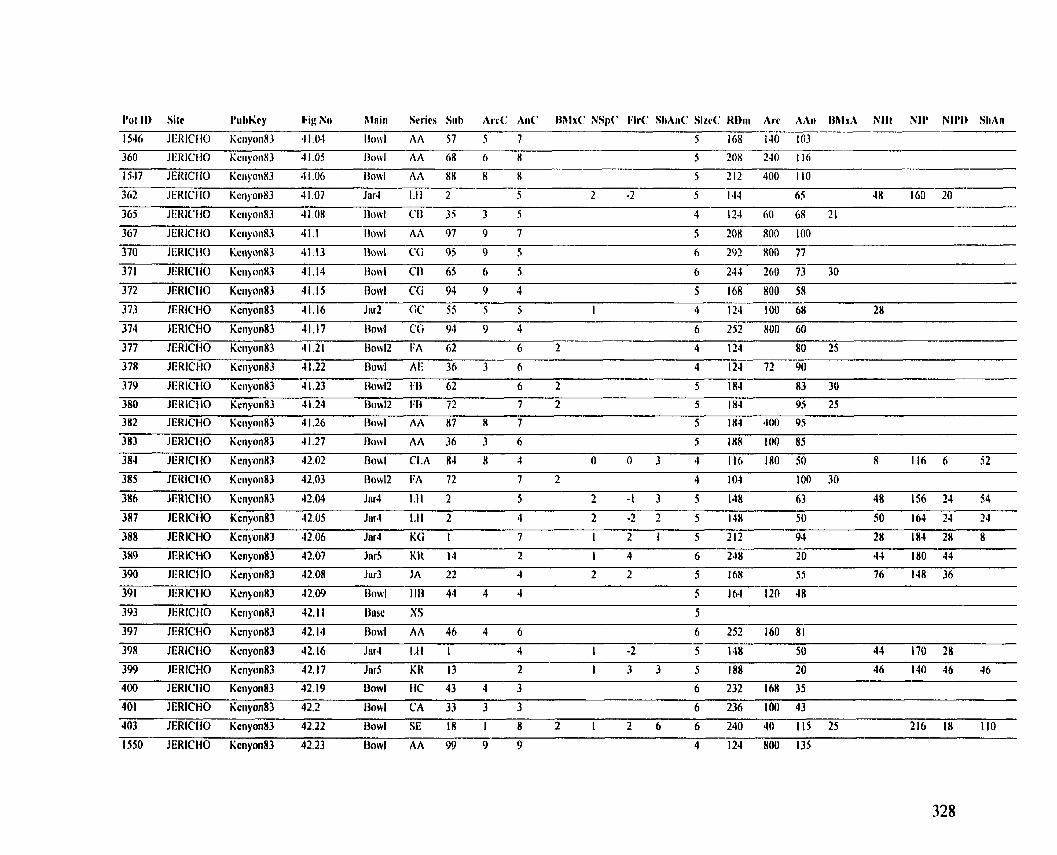
1546 JllRlCllO Kcnyon83 4 1.04 I I A A 57 5 7 5 108 140 IO3
360 JIiRICI IO KcriyonX3 4 1 05 Ilo\$l A 68 O X 5 208 240 116
1547 JERICI40 );ciiyoii83 4 I .O6 IIouI AA BH 8 H 5 212 400 110
362 JERICI10 Kcn)on83 41 07 Jm-4 1.1 1 2 5 2 -2 5 1.14 6 5 48 160 20
365 JIIRICIIO Kcnyori83 41 08 I I CI1 35 3 5 4 124 61) O$ 21
367 JEKICIIO Kciiyoii8.3 41 I liowl AA 97 9 7 5 208 800 100
370 JERICI10 Kcnyon83 41 13 I\owl CO 95 9 S 6 202 800 77
371 JERICI10 Kciiyoii83 41.14 Ilott l CI) 65 O 5 6 244 260 73 30 - 372 JEKlCliO Kcnyoii83 4 1.15 Ilowl CG 94 O 4 5 168 800 58
373 IERICIIO Kcnyon83 41 16 Jar2 C ' 55 5 5 I 4 124 100 68 2 8
374 JERICINI Kcnyon83 41 17 B o t ~ l C(i 94 9 4 6 252 800 60
377 JERICI10 Kciiyon83 41 21 Rowl2 FA 62 6 2 4 174 80 25
378 JERICIIO Kciiyon83 41 22 I3owl AI' 36 3 6 4 124 72 90
379 JERICI10 Kcnyon83 41 23 hw12 FI) 62 6 2 5 184 83 30
380 JERICiIO Kcnyon83 41 24 Dow12 FI3 72 7 2 5 ln4 95 25
382 JERICH0 Kcnyoii83 41 26 I h w l AA 87 8 7 5 1x4 400 95
383 JERICtIO Kcnyon83 41.27 Dowl A h 36 3 6 5 In8 IO0 85
384 JERICHO Kcnyon83 42 02 DouI C1.A 84 8 4 0 0 3 4 116 IR0 50 8 I I O 6 52
315 JERICI10 Kcnyon83 42.03 I 3 o ~ I 2 IFA 72 7 2 4 104 100 30
3H6 JERlCllO KcnyonR3 52 û4 Jnr? 1.11 2 5 2 - 1 3 5 148 63 48 156 21 54
387 JERICI10 Kenyoii83 42 05 Jnr4 1.11 2 4 2 -2 2 5 148 50 50 164 24 14
388 JERICHO KcnyoiiR3 42.06 Jar? KG I 7 I 2 I 5 212 94 28 184 28 8
3N9 JERICHO Kcnyoii83 42.07 Jars KR 14 2 1 4 6 248 2 O 44 IBO 44
390 J13RICI IO Kenyon83 42.08 Jar3 JA 22 4 2 2 5 lh8 5 5 76 148 36
391 JERICI10 Kcnyoii83 42.09 I l t I l 44 4 4 5 I 120 48
393 JEHICIIO Kcnyon83 42.1 1 Ihsc XS 5
397 JERICHO KcnyonB3 42.14 l3owl A h 46 4 6 6 252 160 81
398 JERICI10 Kcnyoii83 42.16 Jar4 L I 1 4 1 -2 5 148 50 44 170 28
399 JERlCtlO Kenyan83 42 17 Jar5 KR 13 2 1 3 3 5 188 20 46 140 46 46
400 JERICtIO Kcnyon83 42.19 Uowl HC 43 4 3 6 232 168 35
401 JERICHO KeiiyonB3 42.2 ~ o w l CA 33 3 3 6 236 100 43
403 JERICI10 Kcnyon83 42.22 Iiowl SE 18 1 8 2 1 2 6 6 240 40 115 25 216 18 110
1550 JERICHO Kcnyon83 42 23 Bowl AA 99 9 9 4 124 800 135
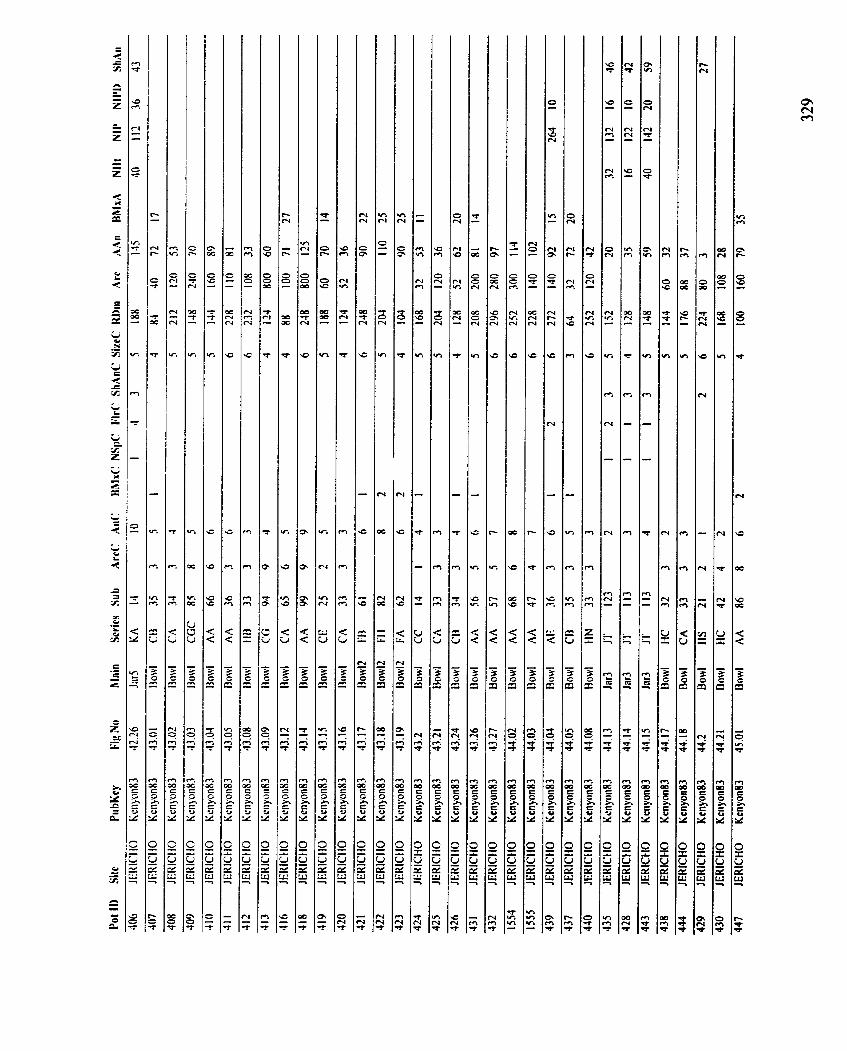
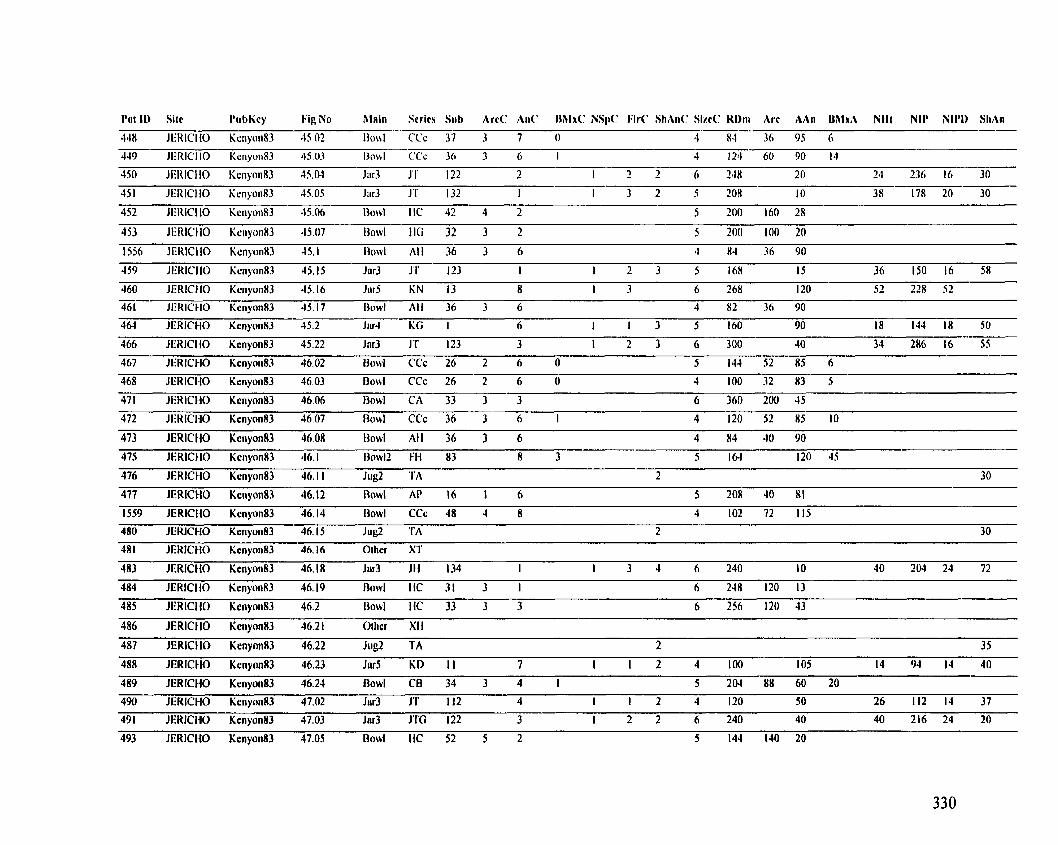
l'iit Il) Sitc t'iihiicy F i No hlnii i Scrics Sul) C C A n ' I i i ï l x C NSpC IM' ShAii<' S i d : HI)iii Arc Ah i i IM lxh Ntlt NII' NII'I) SIiAii
448 JEKICIIO Kcriyori83 45.02 I h r l l C'Cc 37 3 7 O 4 84 36 95 6
449 JI3RIC110 Kcriyon83 45.03 Ilowl ('Cc 36 3 6 I 4 124 60 90 14
451 JI3RIC~10 Krnyon83 45.05 Jiu3 J'l' 132 I I 3 2 5 208 1 O 38 178 20 30
453 JIiRICIIO Kcriyoii83 4 5 07 I h v l ]K i 32 3 2 5 200 100 20
1556 JERICI10 KcnyonX3 45.1 h w l A l l 36 3 O 4 84 36 90
459 JIIHICII0 Kcriyoii83 45. I 5 Jrir3 J I' 123 I I 2 3 5 168 15 36 150 16 58
460 JEKICIIO Kcnyoii83 45.16 Jar5 KN 13 H I 3 6 268 120 52 228 52
461 J131tlCtIO Kcnyon83 45.17 I3orvl A l i 36 3 6 4 82 36 90
463 JERICtIO KenyonU 45.2 Jnr4 KG I 6 I 1 3 5 160 90 18 144 IN 50
466 JERICI10 Kcnyon8.3 45.22 Jnr3 J 123 3 1 2 3 6 300 40 34 286 16 55
467 KHICk10 Kcnyoii83 46.02 Uowl C'Cc 26 2 6 O 5 144 52 85 6
468 JERICI10 Kenyon83 46 03 Boul CCc 26 2 6 O 4 100 32 N3 5
47 l JERICI10 Kenyon83 46.06 CA 33 3 3 6 360 200 15
472 JERICI10 Kenyan83 46.07 Bowl CCc 36 3 6 I 4 120 52 85 10
473 JEKICIIO Kcnyon83 46 08 tlowl A l l 36 3 6 4 84 40 90
475 JERlCllO Kcnyon83 46.1 IIow12 I l 83 8 3 5 164 120 15
476 JEHICHO Kenyon83 46. I I Jug2 TA 2 30
477 JERICliO KcnyanûJ 46.12 Howl AP 16 1 6 5 208 40 SI
1559 JERICIIO Kcnyon83 46.14 l lowl CCc 48 4 8 4 102 72 115
4R0 JEKICHO Kcnyon83 46.15 Jti@ TA 2 30
481 JERICHO KcnyoiiU 46.16 Othcr ST
483 JERICHO Kcnyon83 46.IR Jar3 JII 134 I 1 3 4 6 240 10 40 203 24 72
484 JERICI10 Kcnyon83 46.19 IIowl I IC 31 3 1 6 248 120 13
485 JEHICIIO Kenyon83 46.2 Iiowl I IC 33 3 3 6 256 120 43
486 JERICI IO Kciiyon83 46.2 1 Oikcr XI1
487 JERICIIO KrnyonD 46.22 Ji@ TA 2 35
488 JERICI IO Kcnyon83 46.23 Jar5 K D I I 7 l 1 2 4 100 1 05 14 93 14 40
489 JERICHO Kenyon83 46.24 Oowl CD 34 3 4 I 5 20.1 88 60 20
490 JERICHO Kcnyon83 47.02 Jw3 JT 112 4 I 1 2 4 120 50 26 112 14 37
491 JERICHO Kenyon83 47.03 Jar3 Jï'G 122 3 I 2 2 6 240 40 40 216 24 20
493 JERICHO Kcnyon83 47.05 Bowl I IC 52 5 2 5 144 140 20
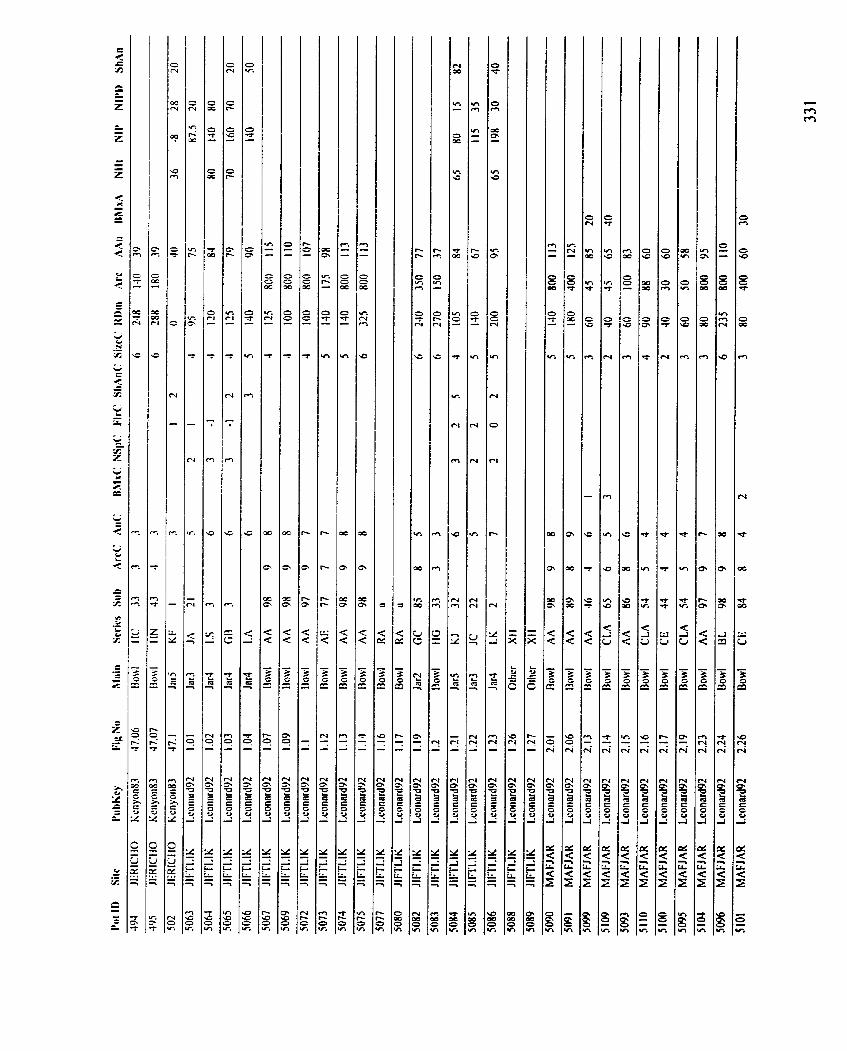
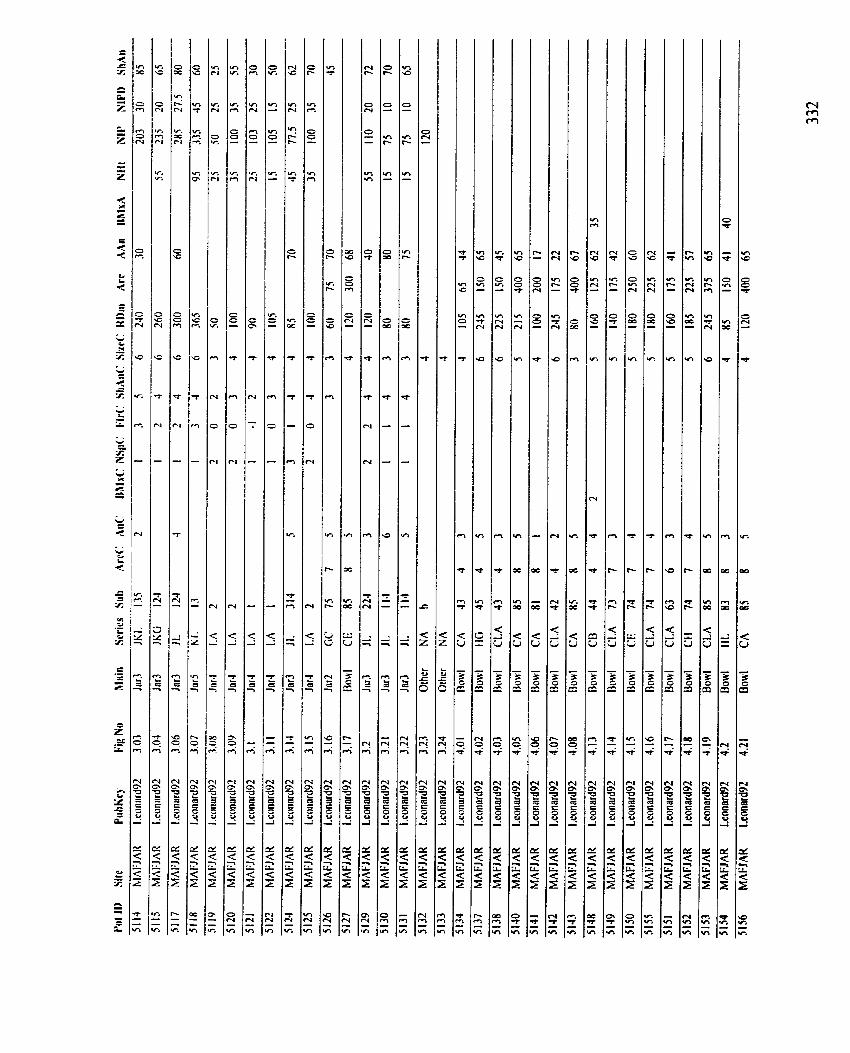
'CL OC
C r?
r? O N
a r?
C 7 N
G
It.
-.
-
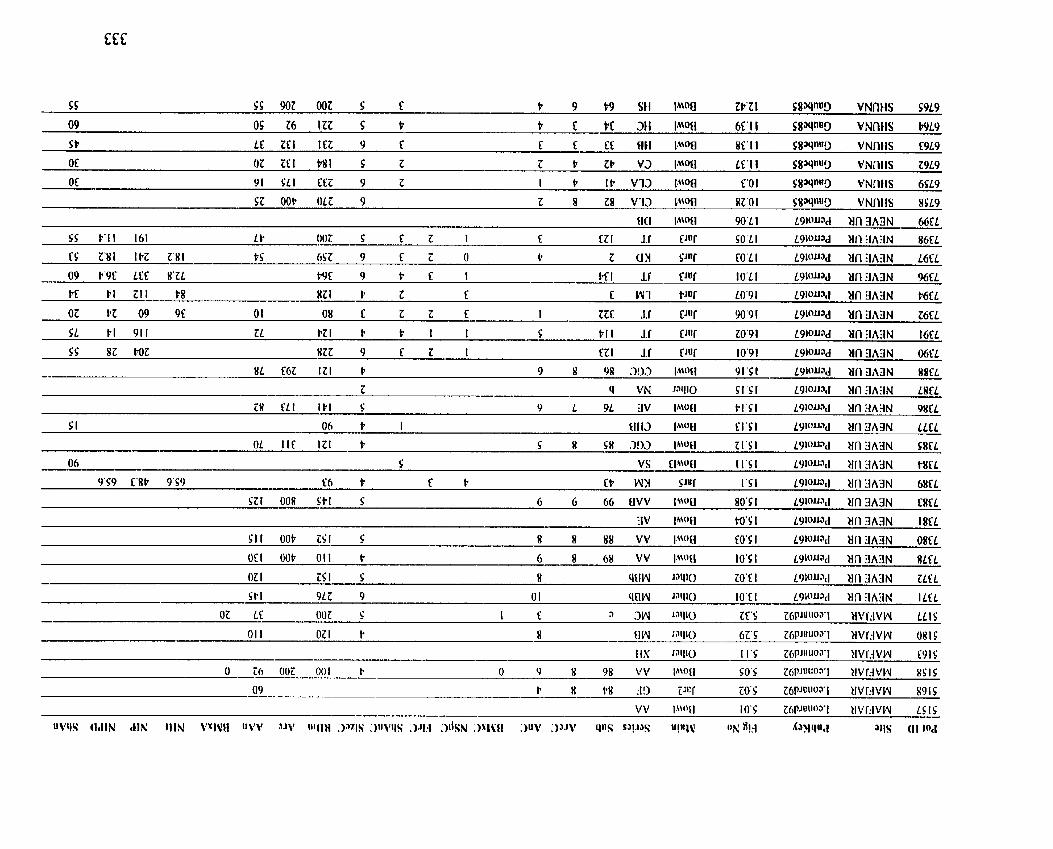
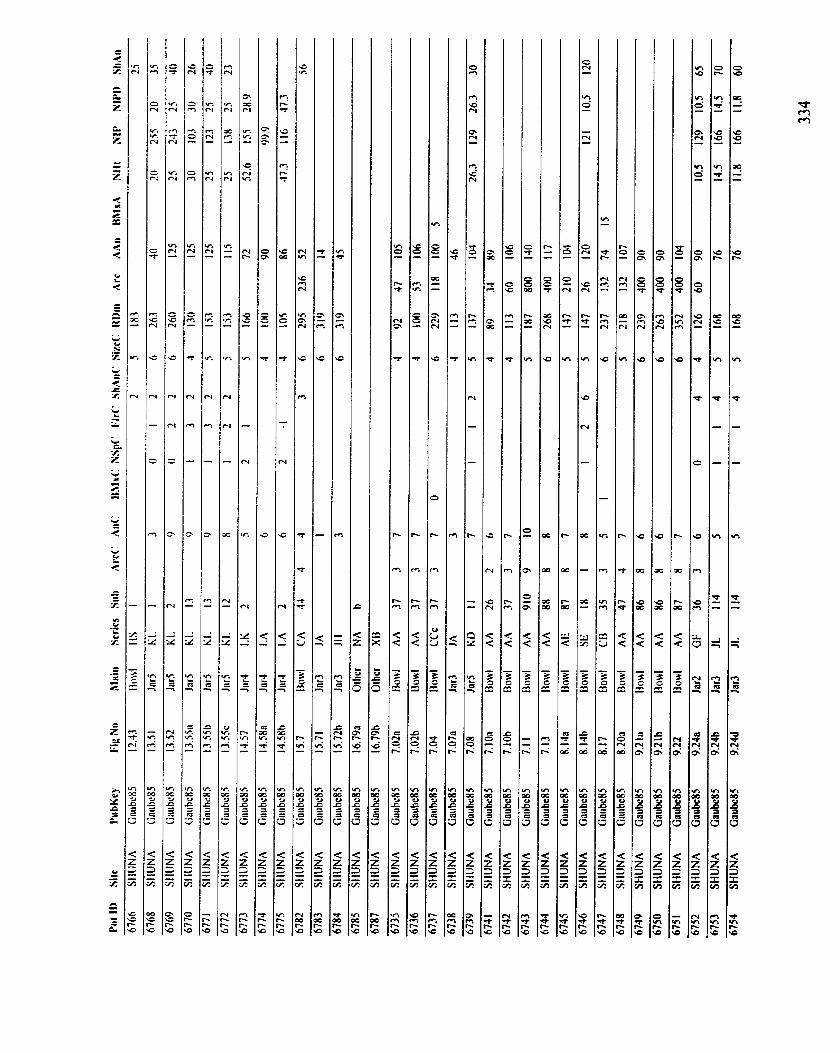
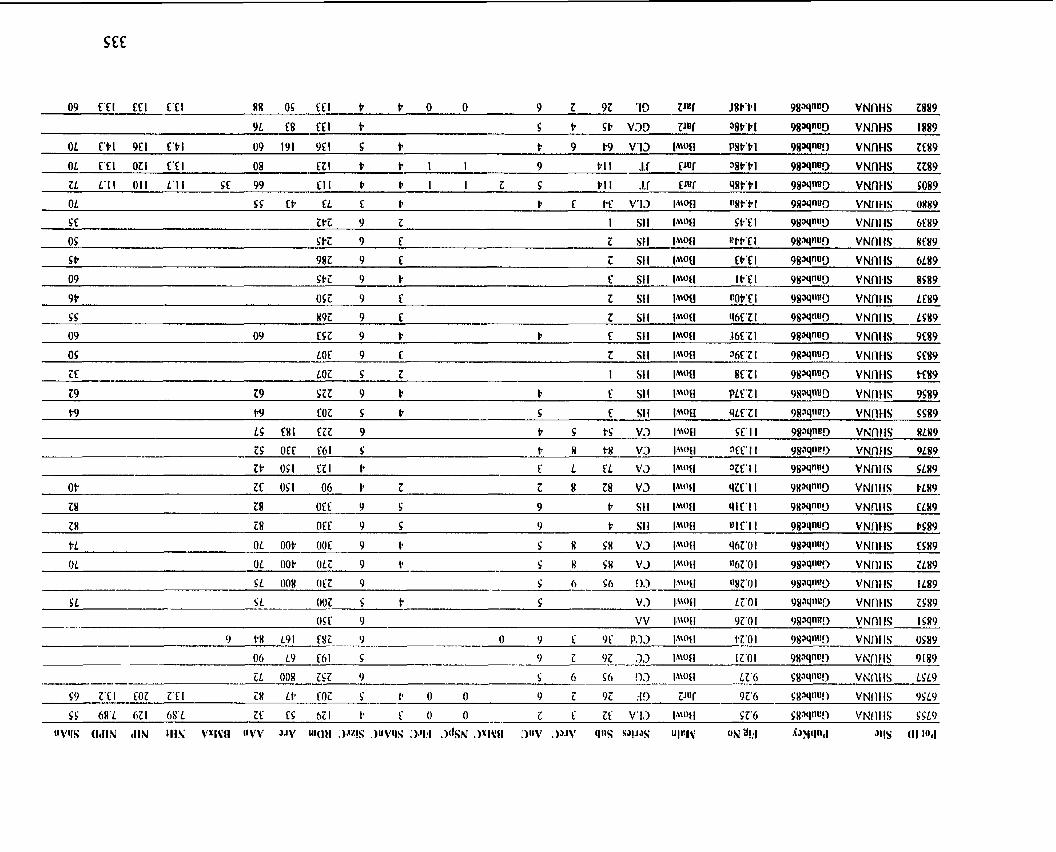
SCC
09 f 'E l f f l f ' f l 88 05 ZCI P P O 0 9 Z 95 19 Z W J8P'P I Y 8 W W VNCIHS 2889
OL C'bl 9CI f ' b l 09 191 9CI S P b 9 t9 V13 1 W 1 P8P'P I 9839nW VNfl t lS ZE89
OL f'f I OZI E'EI 08 EZI P P I I 9 PI I jar f~ 38b'P l 9 8 V Q VNnHS 2209
ZL L'l I 01 1 1'1 1 S f 99 E l l P P I I Z S PI I L f E.t"f 98P'PI 9 8 W W VNnI lS SO89
S S 1192 9 f Z SII I8"OEl 116f'ZI 9 8 W W VNCII-IS LS09
09 09 ESZ 9 t b f SII I ~ ~ o t l J6f'Zl 9 8 W 0 9 VNCIl{S 9E09
0 S LOf 9 f Z St1 lMoU 961'21 98-lclWI VNCItlS Sf89
Z f LO2 S Z I SII IWI 8f'Z I 9 8 3 V W VNflllS PC89
Z 9 Z9 SZZ 9 b P C SH l"'0tl PLC'Z I 9 8 W W VNII I iS 9S89
Z t O S I EZ1 t E L EL V 3 I h W 3 Z f ' I l 9 8 W W VNCIIlS SL89
OL OL O O t OLZ 9 1. S 8 $8 V3 IWl W ' O I 9NWn!) VNnt lS 2189
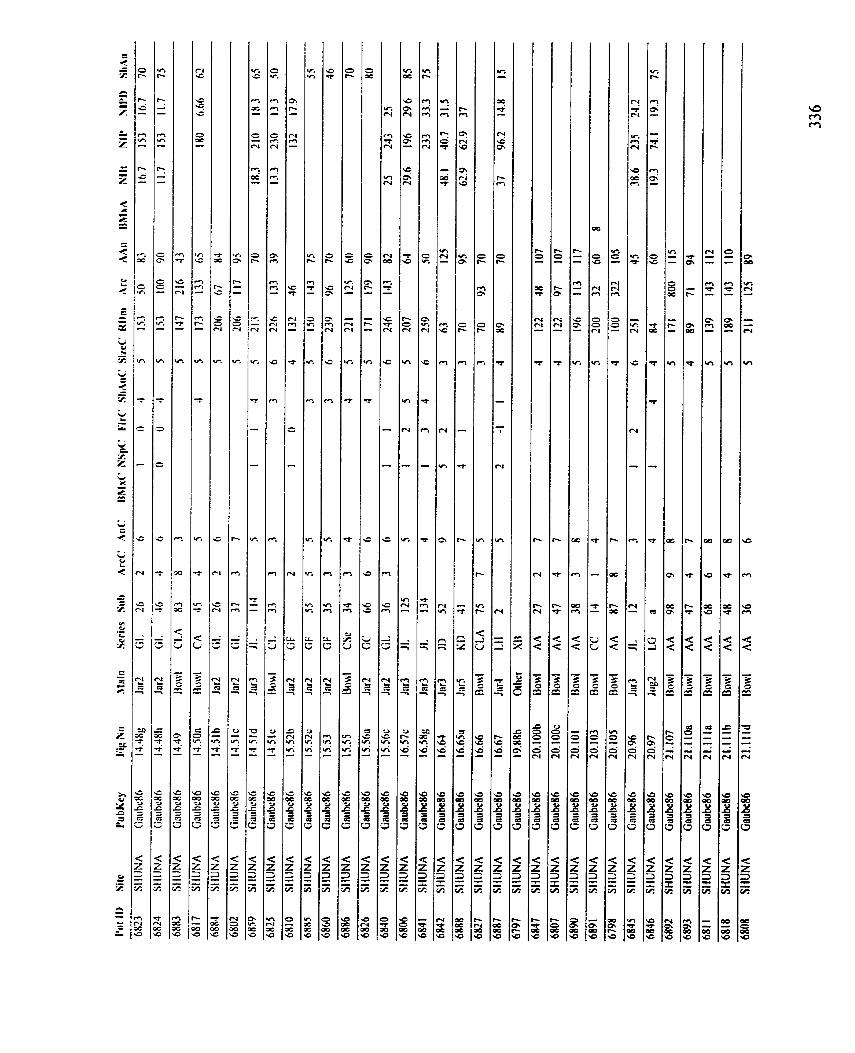
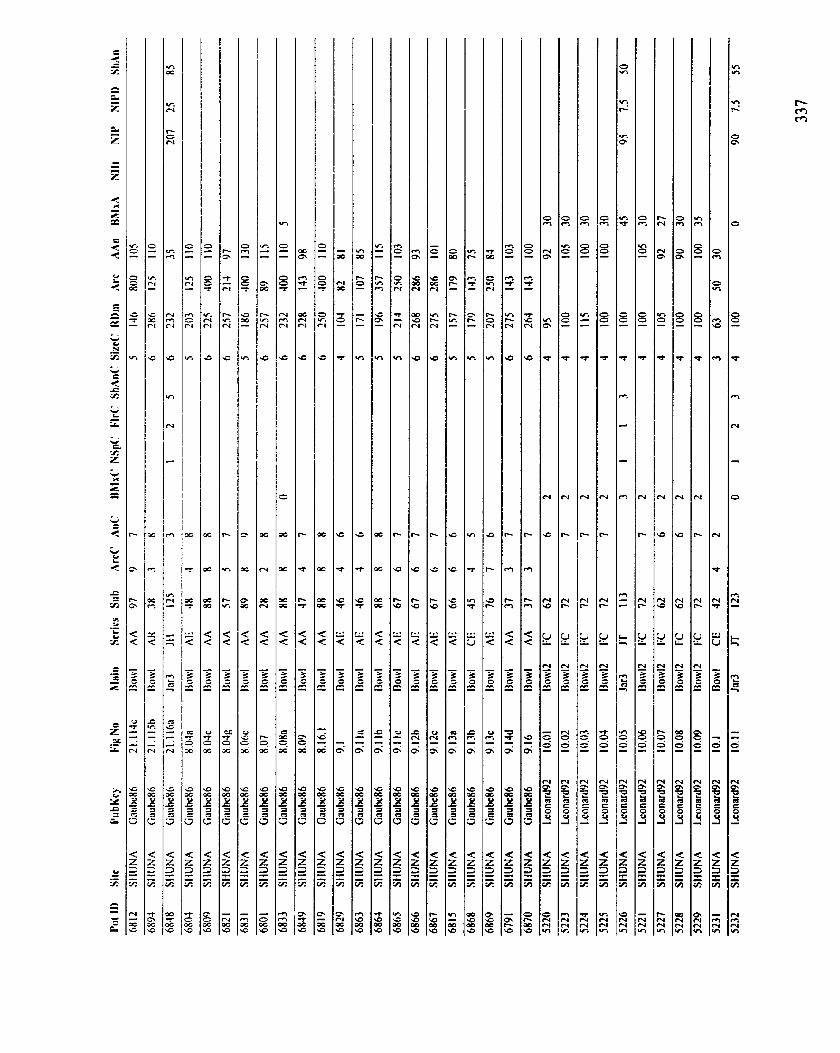
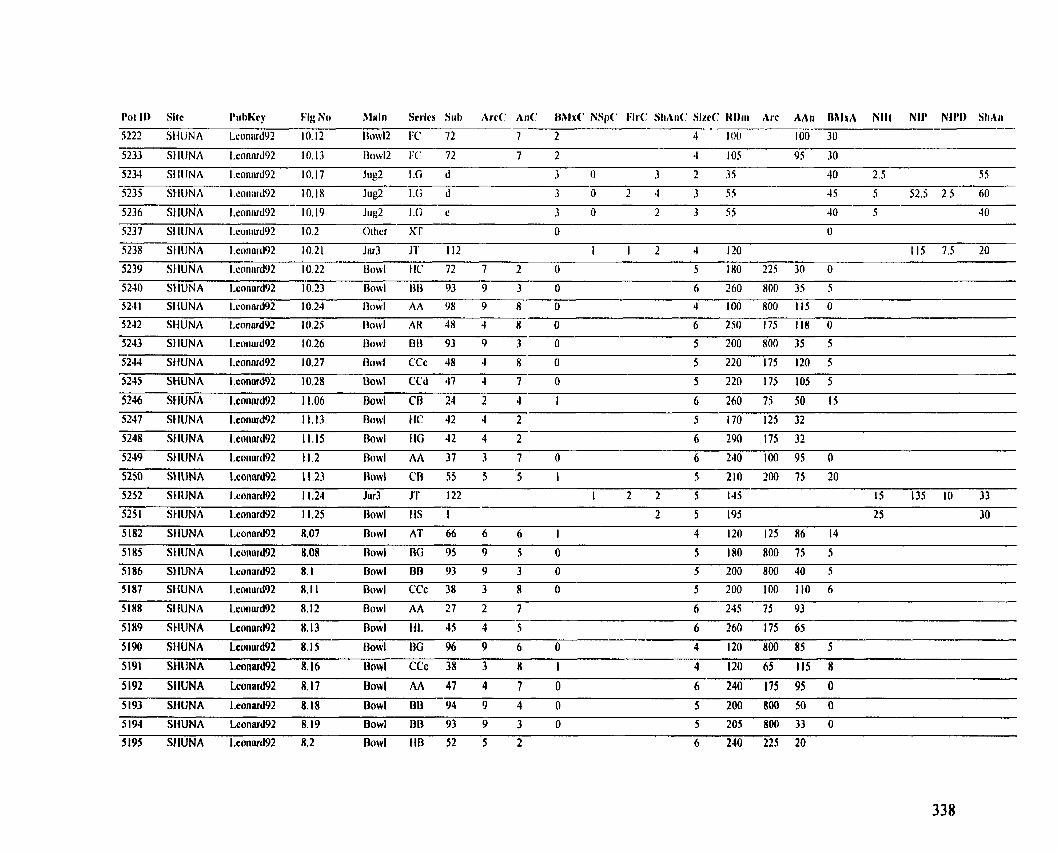
Pot II) Siit 1'11 hlicy Fig 80 h l d n Srrics Siil) Arc(: lin<: HhIx(T N p ( : IW: SIiAii<: SizcC IWi i i Arc AAii nMxA Niit Nil' Nil'i) ShAn
5222 SI IUNA I.conord92 10.12 Ii»wl2 I:C 72 7 2 4 1 O0 100 30
5233 Si IUNA I.connrd92 10.13 llow12 I:C 72 7 2 4 105 95 30
5234 SI A I.connrd92 10.17 Jiig2 !.Ci d 3 O 3 2 35 4 O 2.5 5 5
5235 SI IUNA I.eoniird92 10.18 Jug2 1.G d 3 0 2 4 3 55 45 5 52.5 2.5 60
5236 St IUNA I.eonnrd92 10.19 Jiig2 1.G c 3 O 2 3 55 4 O 5 4 O
5238 SlllJNA I.connrd92 10.21 Jnr3 J I ' 1 12 I 1 2 4 120 I I 5 7.5 20
5239 SIIUNA I.connrd92 10.22 Ij»wl l 72 7 2 O 5 180 325 30 O
5240 SI 1UNA 1-coniird02 10.23 1301~1 IIR 93 9 3 O 6 260 800 35 S 5241 SIIUNA I.conard92 10.24 tlowl AA 9N 9 8 O 4 100 800 II$ O
5242 SIIUNA I.connrd92 10.25 Iio\vl AH 4H 4 8 O 6 250 175 I I 8 O
5243 SIIUNA I.conard92 1 0 26 Dow1 811 93 9 3 O 5 200 800 35 5 - 5244 SHUNA I.connrd92 10.27 I3owl CCc 48 4 8 O 5 220 175 120 5
5245 SWJNA I.conurd92 10.28 I ~H ! CC4 47 4 7 0 5 220 175 105 5
5246 SIIUNA I.eoncrd92 11.06 Iiowl CD 24 2 4 1 6 260 75 50 15
5247 SIIUNA I.conurd92 1 1.13 Iio\vl IIC 42 4 2 5 170 125 32
5248 St IUNA I.connrd92 1 1.15 Rowl IlCi 42 4 2 6 290 175 32
5252 SI-IUNA I.cnnard92 1 1.24 Jur3 J'l' 122 1 2 2 5 145 15 135 I O 33
5251 SHlJNA Leonnrd92 1 1.25 Ilowl IIS I 7 5 195 2 5 30
5 182 SHUNA I.connrd92 8.07 Rowl AT 66 6 6 I 4 120 125 86 14
5 185 SI IUN A I.ccinnrd92 8.08 Ilowl RG 95 9 5 O 5 180 800 75 5
5186 SIIUNA I.conard92 8.1 Ilowl Rn 93 9 3 0 5 200 800 40 5
5187 SHUNA l.conard92 8.11 Bowl C'Cc 38 3 8 O 5 200 100 110 6
5188 SliUNA Lconnrd92 8.12 Bowl AA 27 2 7 6 245 75 93
5189 SCIUNA Lconnrd92 8.13 nowi 111. 45 4 5 6 260 175 65
5190 SIIUNA Lcoiinrd92 8.15 nowl DG 96 9 6 O 4 120 800 85 5
5191 SHUNA Lconard92 8.16 Dowl CCc 38 3 8 I 4 120 65 115 8
5192 SHUNA Lconar&2 8.17 Bowl AA 47 4 7 O 6 240 175 95 O
5193 SHUNA I.conarû92 8.18 aowl 013 94 9 4 O 5 200 800 50 O
51W SHUNA Lconard92 R.19 Bowl BB 93 9 3 O 5 205 800 33 0
5195 SHUNA Leonard!l2 8.2 nowl ~ I B 52 5 2 6 240 225 20
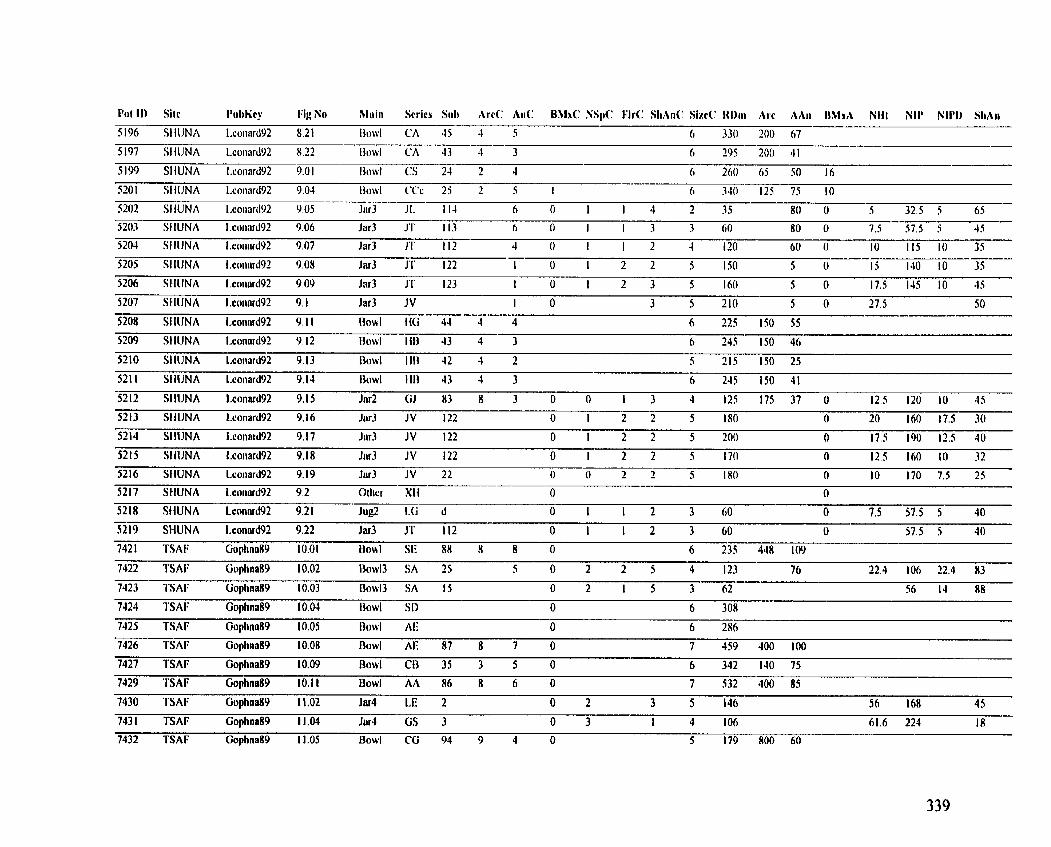
5 196 SIIIJNA l.coiitird92 8.21 I I CA 45 4 5 O 330 200 07
5 197 SI IIJNA l.conrird92 8.22 Ihwl CA 43 4 3 O 295 200 41
5 Io<) SI 1UNA I.coriiird92 9.0 1 Iio\vl CS 24 2 4 O 260 65 50 16
5201 SIIUNA I.coniird92 9.04 I I C'Cc 25 2 5 I 6 340 125 75 10
5202 SI IUNA I.coiinrtl92 9.05 Jiir3 JI. I I 4 6 0 I 1 4 2 35 80 O 5 32.5 5 65
5203 SI 1UNA I.coniird92 9.06 Jer3 Jï' 1 13 O 0 I 1 3 3 60 80 0 7.5 57.5 S 45
5204 SI IUNA I.coiicird92 9.07 Jiir3 Jï' 1 13 4 0 I I ? 4 120 60 O -
I O 115 10 35
5205 SIIUNA l.eonnrd92 9.08 Jur3 11' 122 1 O I 2 2 5 150 5 O 15 140 10 35
5206 SIIUNA l.coiiardY2 9.09 Jiir3 1ï' 123 I O I 2 3 5 160 5 O 17.5 145 10 45
5207 SHIJNA I.coiinrd92 9.1 Jiu3 JV 1 O 3 5 210 5 O 27.5 5 O
5208 SIIIINA 1-coiinrd92 9-11 Ilowl I K i 44 4 4 6 225 150 55
5209 SIIUNA I.çonnrd92 9.12 Iiciwl Ill3 43 4 3 b 245 150 46
5210 SIIIJNA l.coiinrd92 9.13 Iiowl 1111 42 4 2 5 215 150 25
521 1 SI iiJNA L.conard92 9. 14 Iio\vl 1113 43 4 3 6 211; 150 II
5212 SllUNA l.eoiiard92 9.15 Jar2 GJ 83 R 3 O O 1 3 4 125 175 37 O 12.5 120 10 45
5213 SIIUNA Lconar&2 9.16 Jar3 JV 122 O I 2 2 5 180 0 20 160 17.5 30
5216 SIIUNA Lconnrd92 9.19 Jar3 JV 22 0 0 2 2 5 180 O I O 170 7.5 25
5219 SHUNA Ixonard92 9,22 Jar3 J'I' 113 3 60 O 57.5 5 4 O O I 1 2
7423 TSAF Gophni189 10.03 lio\v13 SA 15 O 2 1 5 3 62 56 14 UR
7426 TSAF Gophna89 10.08 Rowl AE 87 8 7 O 7 459 400 loci
7427 TSAF Gophna89 10.09 Dowl CB 35 3 5 O 6 342 140 75
7429 TSAF Gophna89 10.1 1 Bowl AA 86 8 6 O 7 532 400 85
7430 TSAF Gophna89 1 1 .O2 Jar4 LE 2 O 2 3 5 146 56 16R 4 5
7431 TSAF Gophna89 1 1 .û4 Jar4 GS 3 O 3 I 4 106 61.6 224 18
7432 TSAF Gophnn89 1 1 .O5 Bowl CG 94 9 4 O 5 179 800 60
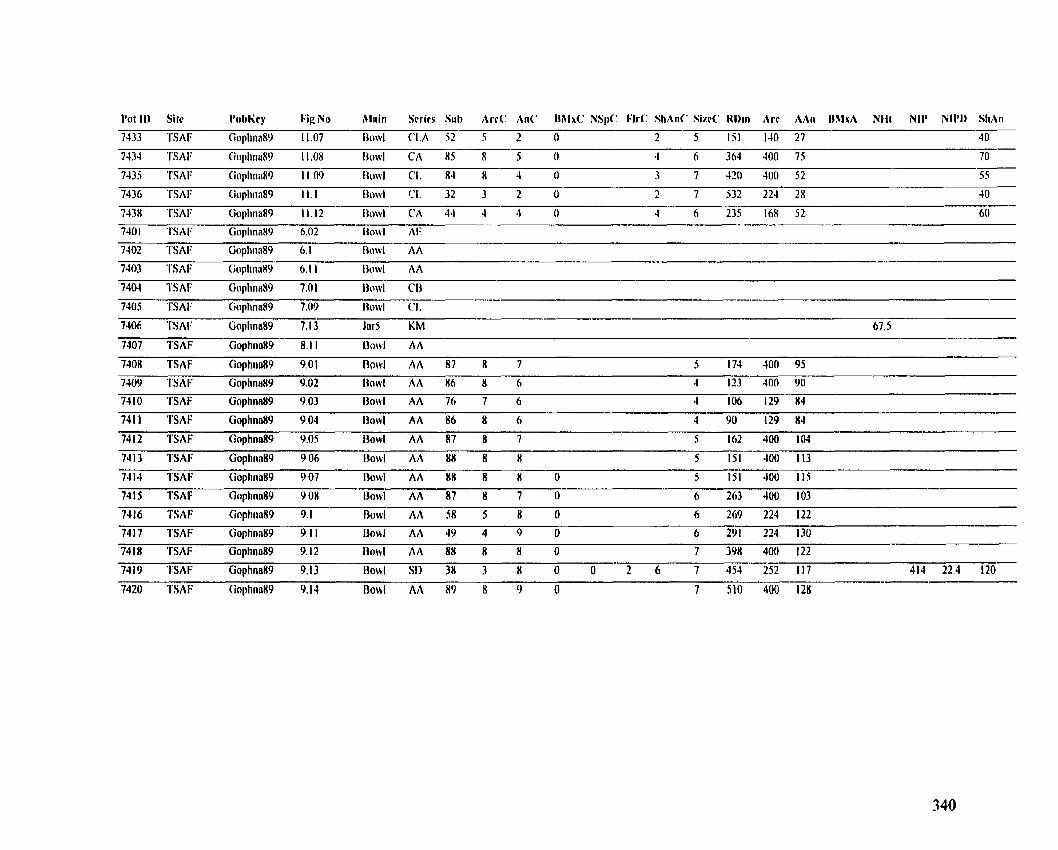
7433 'I'SAF CioplinaR9 1 1 .O7 Iiowl C'1.A 5 2 S 2 O 7 5 151 140 27 4 O
7435 'fSAf: (ioplinaH9 1 1 .û9 Iiowl CI. 84 8 4 O 3 7 420 400 52 5 5
7430 1'SAI: (iopliiii189 1 1 . 1 0 1 -1. 32 3 2 O 7 7 532 224 28 4 O
7438 'I'SAI: CiopliriaR9 1 1.12 Ilowl CA 44 4 4 Q 4 0 235 16X 52 60
7401 'fSAf: CioplinnR9 6.02 I o Al:
7403 'l'Shi: Goplinu89 6.1 1 130wl AA
7404 'I'SAF Goplina89 7.01 Iiciwl CI3 7
7405 TSAI: Goplinu89 7.09 Iiowl Cl.
7406 I'SAI: Goplino89 7.1 3 Jiu5 KM 67.5
7407 TSAF Goplino89 8.1 1 Lhwl AA
7408 TSAI: Gophna89 9.0 1 Dow1 AA 87 R 7 5 174 400 95
74W TSAI: Gopknu89 9.02 Bowl AA 86 8 6 4 123 400 90
7410 TSAF Gophna89 9.03 13o\r.I AA 76 7 6 4 106 129 X4
711 3 1'SAF Gophna89 9.04 I3owl Ah 86 8 6 4 90 129 84
7412 TSAF Gophno89 9.05 I h v l A 87 8 7 5 162 400 104
7413 I'SAF Gophiin89 9.06 l3owl A h 88 8 8 5 151 400 113
74 1 4 'TSAF Goplina89 9.07 l o l AA 88 8 X O 5 151 400 115
7415 TSAF Goplina89 9,OH Ilmvl A h 87 8 7 0 6 263 400 103
7416 TSAF Gophila89 9, l I3awl AA 58 5 8 O 6 269 224 122
7417 TSAF Gophnn89 9.1 1 Ilowl AA 49 4 9 O 6 291 224 130
7418 TSAF Gophna89 9.12 Rowl AA 88 8 11 O 7 398 400 122
74 19 'TSAF Goplina89 9.13 Ilowl SI) 38 3 8 O O 2 6 7 454 252 117 414 22.4 120
7420 TSAF Gophna89 9-14 nowl AA 89 8 0 O 7 510 400 128
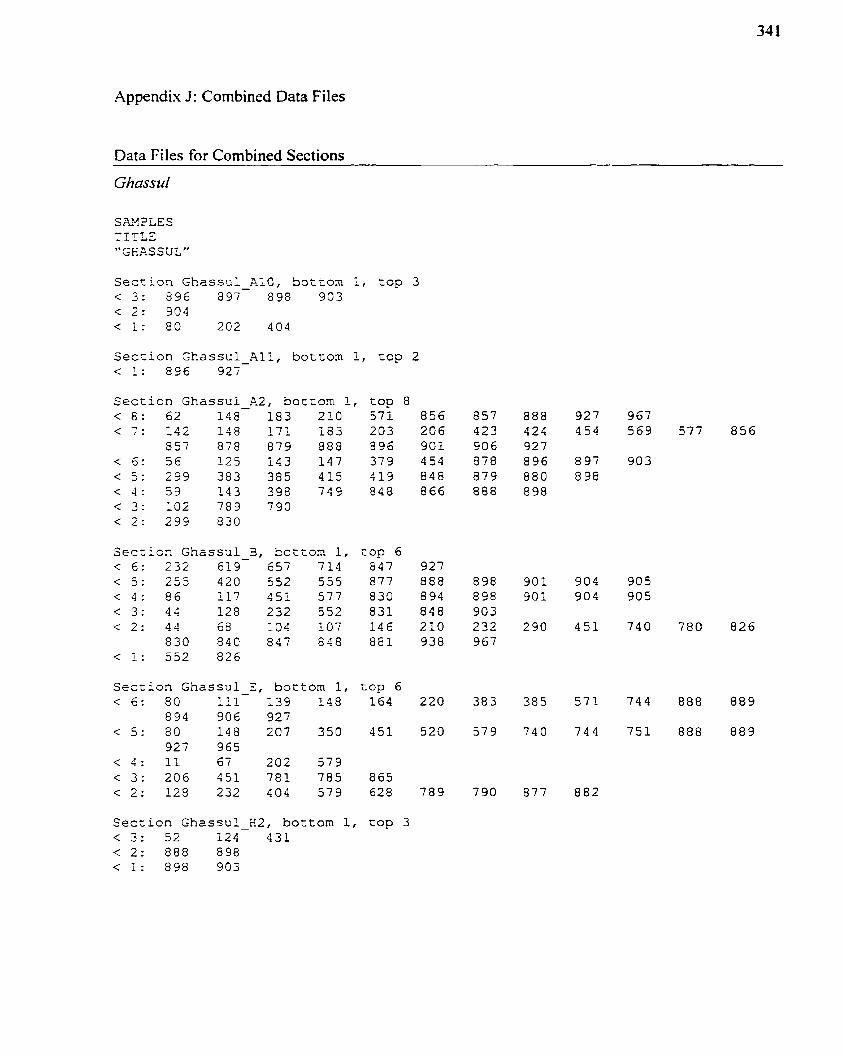
Appendix J: Combined Data Files
Data Files for Combined Sections
Ghassul
SAMPLES TTTLE "GHASSUL"
Section Ghassul-3-10, bottom 1, top 3 < 3: 896 897 â 9 8 903 < 2: 904 < 1 : 80 2 0 2 404
Seccion Ghâssul-All, borrom 1, ï o p 2 < 1: 896 927
Seccion Ghassul-A2, botrom 1, ï op 8 < â : 6 2 148 183 210 571 856 857 888 927 967 < 7 : 1 4 2 148 171 183 203 206 423 424 454 569 577 856
857 878 879 888 896 901 906 927 < 6 : 5 6 125 143 147 379 454 878 896 897 903 < 5 : 2 9 9 383 385 415 419 848 879 880 898 < 4 : 59 143 398 7 4 9 848 866 888 898 < 3 : IO2 789 790 c 2: 2 9 9 830
Section Ghassul - 5 , botcorn 1, î o p 6 < € : 232 019 457 714 8 4 7 927
Section Ghassul - E, bottom 1, top 6 < 6: 80 lil 139 148 164 220 383 385 571 744 888 889
894 906 927 < 5 : 80 148 207 350 451 520 579 740 744 751 888 889
927 965 < O : 11 67 202 579 < 3: 2û6 451 781 785 865 < 2 : 128 232 404 5 7 9 628 789 790 877 882
Section Ghassul 2 2 , bottom 1, top 3 < 3 : 52 124- 431 < 2: 888 898 < 1 : 898 903
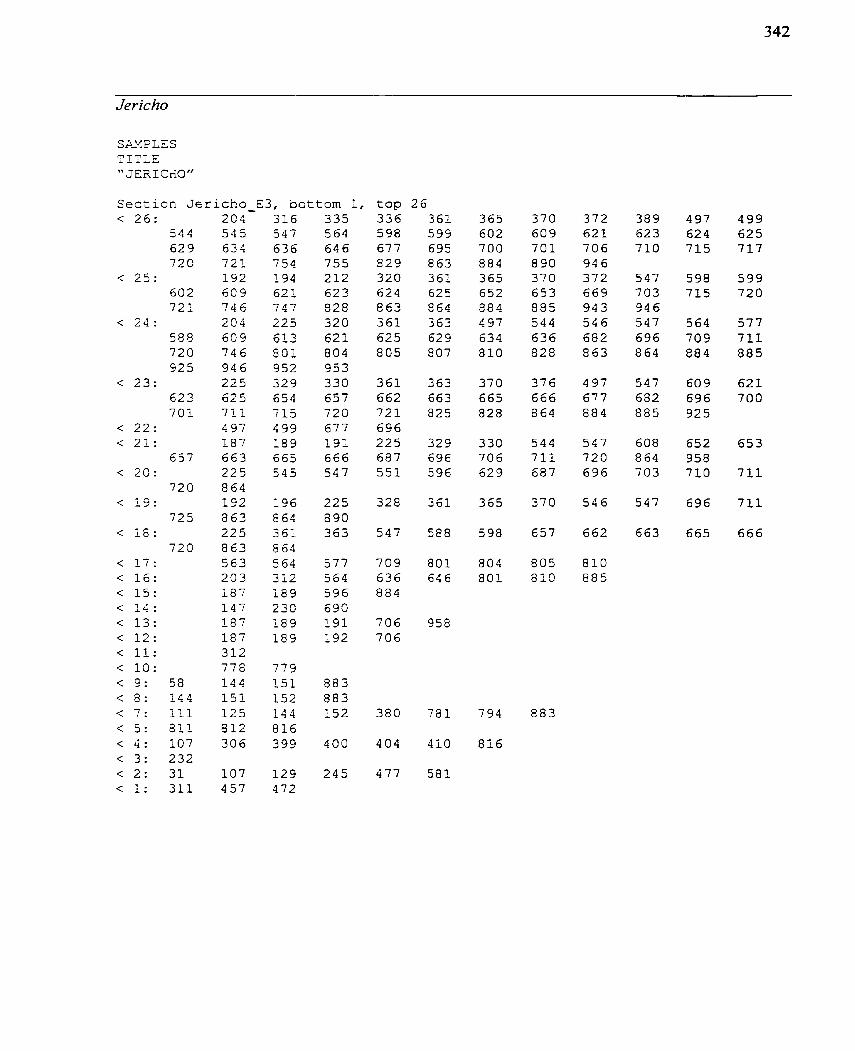
Section Jericho-E3, oottom 1, < 26 : 204 316 335
544 545 547 564 629 634 636 6 4 6 72C 7 2 1 754 7 5 5
< 25 : 1 9 2 194 212 602 609 6 2 1 623 7 2 1 7 4 6 747 328
< 2 4 : 204 225 320 585 6G9 6 7 3 6 2 1 720 7 4 6 8 0 1 804 925 9 4 6 952 953
< 23: 225 329 330 623 625 654 657 7 0 1 7 1 1 7 1 5 720
< 22 : 497 499 677 < 21 : 1 8 7 1 8 9 1 9 1
657 663 665 6 6 6 < 20: 225 545 547
720 864 < 19 : 1 9 2 1 9 6 225
7 2 5 8 6 3 864 890 < 16: 2 2 5 3 6 1 363
7 2 0 8 6 3 8 6 4 < 1 7 : 5 6 3 564 577 < 1 6 : 2 0 3 312 5 6 4 < 1 5 : 187 1 8 9 5 9 6 < 1 4 : 147 230 690 < 13: 187 1 8 9 1 9 1 < 12: 1 8 7 1 8 9 1 9 2 < 11: 3 1 2 < 10 : 778 779 < O : 58 144 1 5 1 8 8 3 < 8 : 144 1 5 1 152 8 8 3 < 7 : 111 1 2 5 144 1 5 2 < 5: 8 1 1 8 1 2 816 < 4 : 107 3 0 6 399 400 < 3 : 2 3 2 < 2 : 3 1 107 129 2 4 5 < 1: 3 1 1 457 472
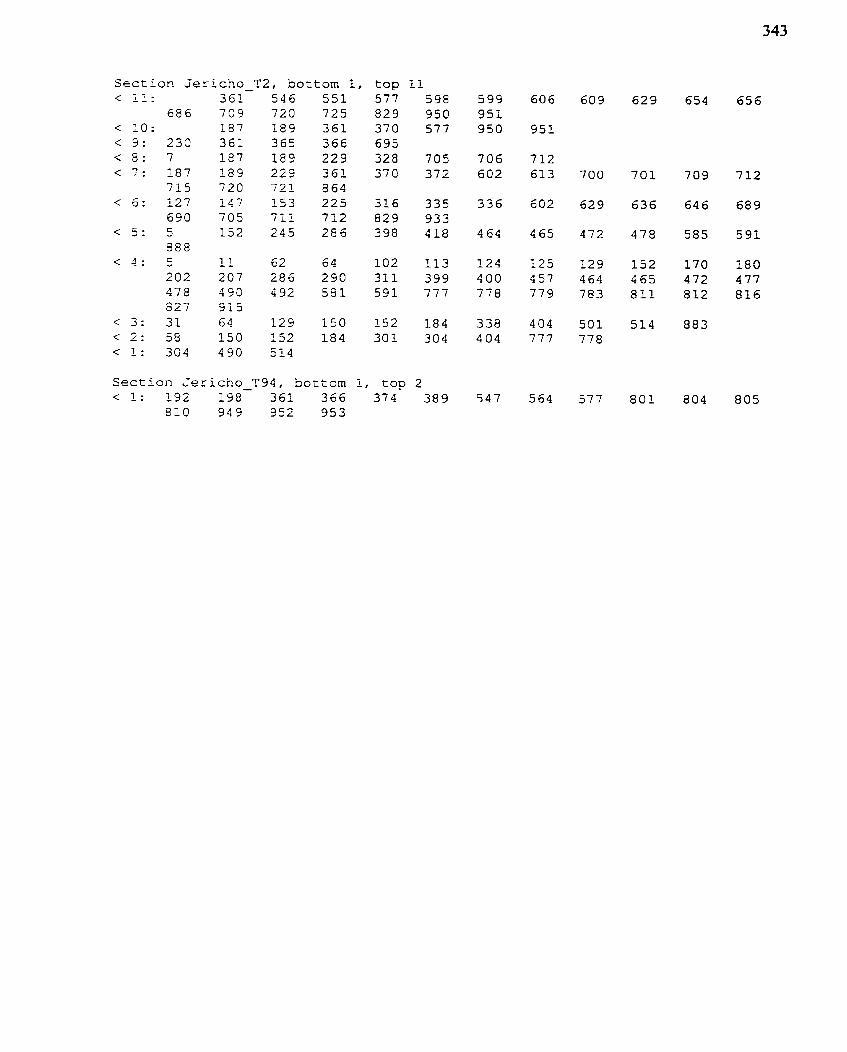
S2ction Sericho-T2, bottox 1, top 11 < II: 361 546 5 5 1 577 598
686 7 0 5 720 7 2 5 829 950 < 1 0 : 187 1 8 9 3 6 1 370 577 < 9 : 2 3 0 3 6 1 365 3 6 6 655 < 3: 7 1 8 7 189 229 328 7 0 5 < 7 : 187 1 8 9 229 3 6 1 370 372
7 1 5 720 721 8 6 4 < 6: 127 147 153 225 316 335
690 705 7 1 1 7 1 2 8 2 9 933 < 5: 5 1 5 2 245 2 8 6 398 418
8 8 8 < 4: 5 11 62 64 1 0 2 1 1 3
2 0 2 2 0 7 2 8 6 290 3 1 1 399 478 490 492 5 8 1 5 9 1 777 ô27 4 1 3
< 3 : 3 1 6 4 129 1 5 0 1 5 2 184 < 2 : 55 1 5 0 1 5 2 184 3 0 1 304 < 1 : 304 490 5 1 4
Section Jericho-T94, ~ o t t o m I, top 2 < 1: 1 9 2 198 361 3 6 6 374 3 8 9
810 9 4 9 952 953
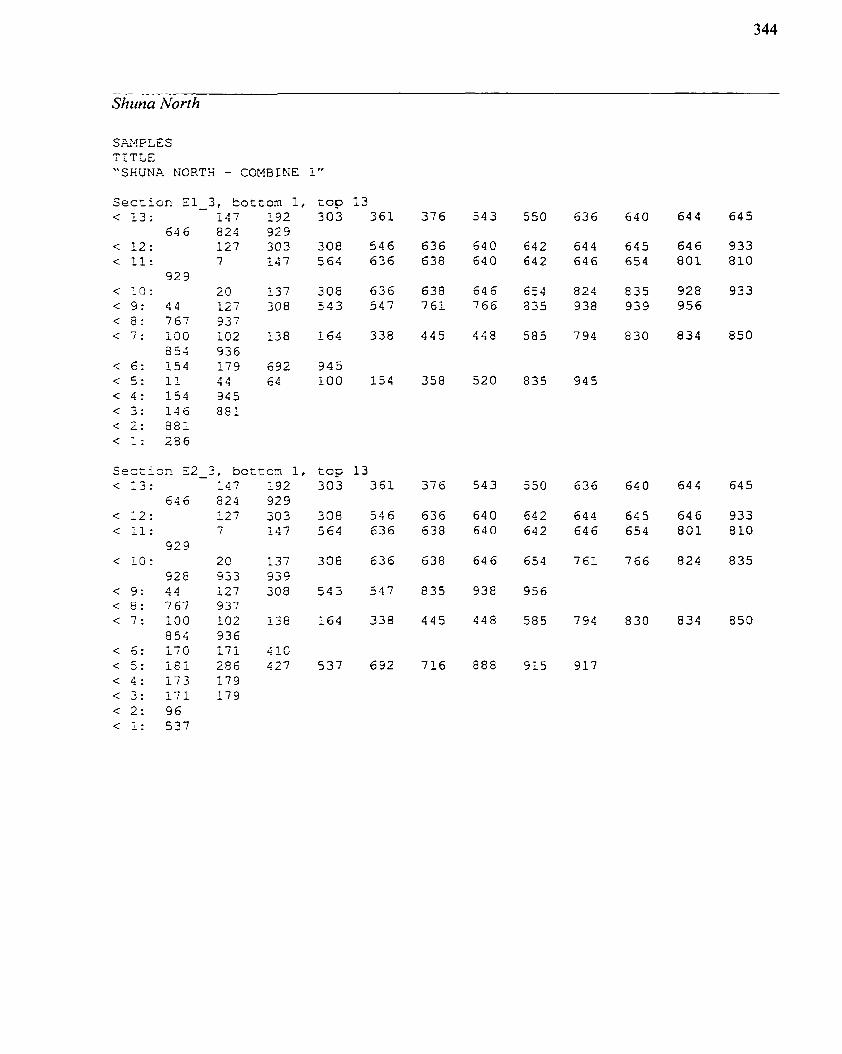
S?>IFLkS TZTLE "SHUN-P- MORTS - COVBINE 1"
Secîion El-3, Soccorn 1, < 13: 147 192
6 4 6 824 929 < 1 2 : 127 303 < 11: 7 147
929 < 10: 20 137 < 9: 44 127 305 < a : 767 937 < 7 : 130 102 138
853 936 < 6: 1 5 4 179 692 < 5 : 11 4 4 04 < 4 : 1 5 4 945 < 3 : 1 4 6 881 < 2 : 881 < 1: 286
- - Section c2-2, bcttom 1, top 13
6 4 O < 12: < Il:
929 < 10:
928 < 9: 4 4 < 8 : 767 < 7 : 100
854 < 6 : 170 < 5: 181 < 4 : 1 7 3 < 3 : 1 7 1 < 2 : 9 6 c i : 537
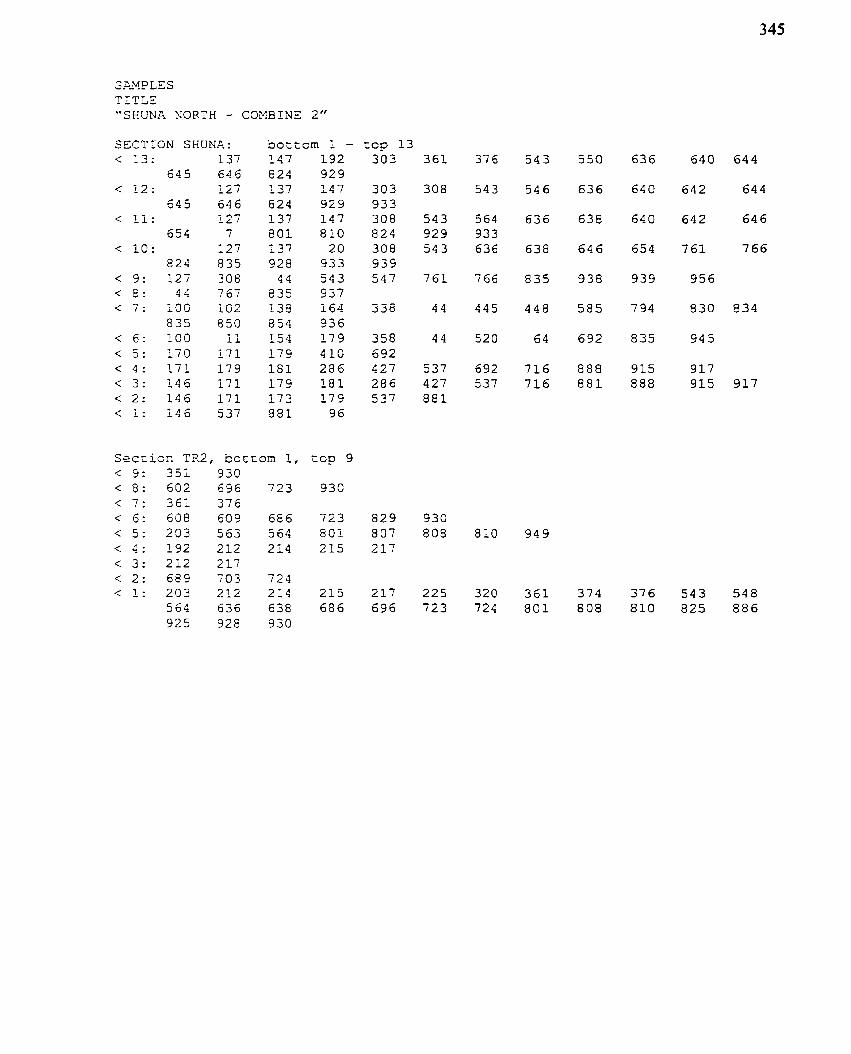
S M P L E S T I T L E "SHUNA NORTH - COXBINE 2"
SECTION SHUNA: < 13: 137
645 646 < 12: 127
645 646 < II: 127
654 7 < 10: 127
824 835 < 9: 127 308 < E: 4 4 767 < 7: LOG i û b
8 3 5 8 5 0 < 6: 100 i i < 5: 170 171 < 4: 171 179 < 3 : 1 4 6 1 7 1 < 2: 146 171 < 1 : 146 537
Dotcorn 1 - cop 13 147 192 303 3 6 1 376 824 929 137 147 303 308 543 824 929 933 137 1 4 7 308 543 564 a o ï 810 824 029 933 137 20 308 543 636 928 933 939 44 543 547 761 766
e 3 5 937 136 6 33Û 44 445 8 5 4 936 154 179 358 44 520 179 410 692 181 2 8 6 427 537 692 179 181 2 8 6 427 537 173 179 537 881 881 96
S e c t i o n TR2 , botcon 1, top 9 < 5: 3 5 i 9 3 0 < 8 : 602 696 723 930 < 7: 3 6 1 376 < 6 : 6 0 8 609 686 723 829 930 < 5 : 233 5 0 3 564 801 307 808 810 949 < 4: 192 212 214 215 217 < 3 : 2i2 217 < 2: 689 703 724 < 1 : 203 212 214 215 217 225 320 3 6 1 374 376 543 548
564 636 638 686 6 9 7 2 3 724 801 8 0 8 810 825 886 925 928 930
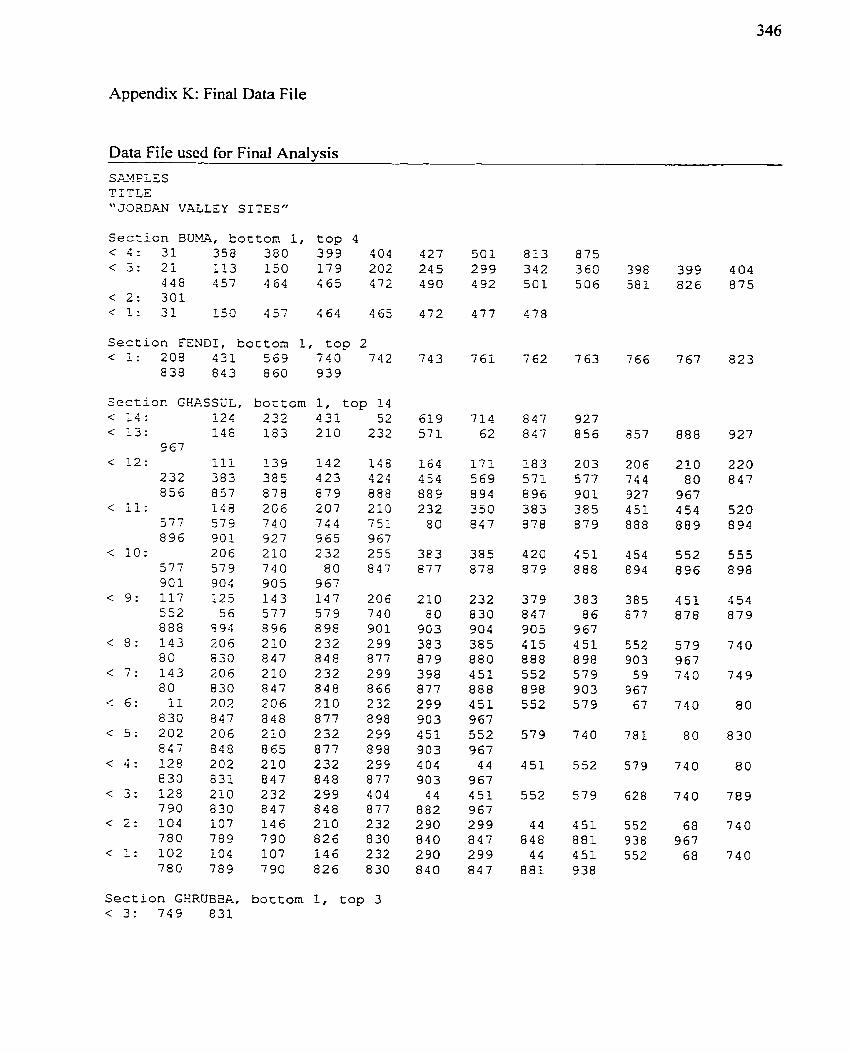
Appendix K: Final Data File
Data File used for Final Analysis
S?IMPLES TITLE "JORDP-N VALLEY SITES"
Section BUFA, bottom 1, top 4 < 4 : 31 358 3 8 0 3 9 9 404 < 3 : 21 113 150 1 7 9 202
4 4 8 4 5 7 4 6 4 4 6 5 4 7 2 < 2 : 3 0 1 < 1 : 3 1 150 457 4 6 4 465
Section FENDI, bottom 1, top 2 < 1: 208 4 3 1 569 7 4 0 7 4 2
8 3 8 8 4 3 8 6 0 9 3 9
Section GHRSSUL, bottom 1, top 14
Section GHRUBBA, boctom 1, top 3
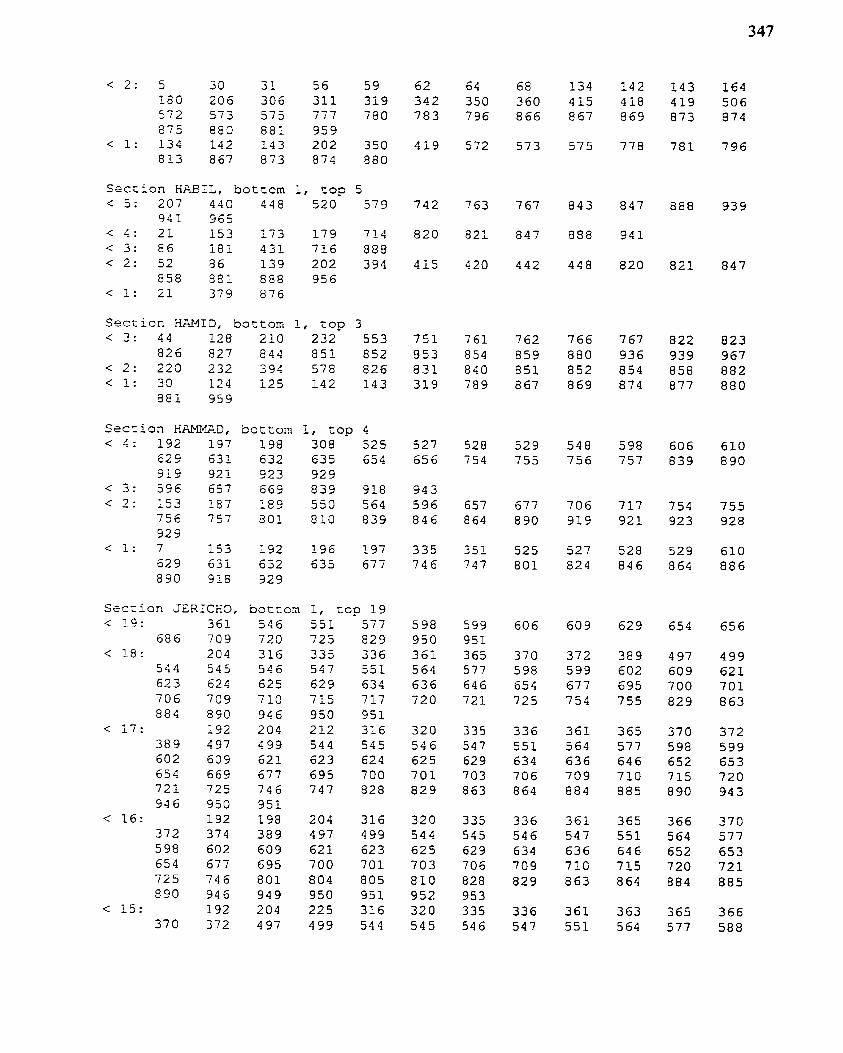
Ssction KABIL, bottcm 1, cop 5 < 5 : 207 440 448 520 579
9 4 1 565 4 4 : 2 1 153 1 7 3 1 7 9 714 < 3 : 8 6 1 8 1 4 3 1 7 1 6 888 < 2 : 52 8 6 1 3 9 2 0 2 394
858 8 8 1 888 956 < 1: 2 1 379 8 7 6
Section HAMTD, bottorn 1, top 3 < 7 : 44 128 210 2 3 2 553
8 2 6 827 844 8 5 1 852 < 2 : 222 232 394 578 826 < 1 : 39 124 1 2 5 1 4 2 143
8 8 1 959
Seciion HFd4KEnD, bottom 1, top 4 < a : 192 197 198 308 525
5 2 9 6 3 1 632 635 654 919 9 2 1 923 929
< 3 : 596 657 669 8 3 9 918 < 2 : 1 5 3 187 1 8 9 550 564
7 5 6 757 8 0 1 810 8 3 9 92 9
< i: 7 153 1 9 2 1 9 6 197 629 6 3 1 632 635 677 890 918 929
S e c t i o n JERICHO, < 1 9 : 3 6 1
6 8 6 709 < 18: 204
544 545 623 624 7 0 6 7C9 884 890
< 1 7 : 192 3 8 9 497 602 609 654 669 7 2 1 725 946 950
< 16: 192 372 374 598 602 654 677 7 2 5 746 8 4 0 946
< 15 : 192 370 372
'oottcm 1, top 19 5 4 6 5 5 1 577 720 7 2 5 829 316 335 336 5 4 6 547 5 5 1 625 6 2 9 634 710 715 717 946 950 9 5 1 204 2 1 2 316 499 544 545 6 2 1 623 624 677 695 700 746 747 8 2 8 9 5 1 1 9 8 204 316 389 497 499 609 6 2 1 623 695 7 0 0 7 0 1 8 0 1 804 805 949 950 9 5 1 204 2 2 5 316 497 499 544
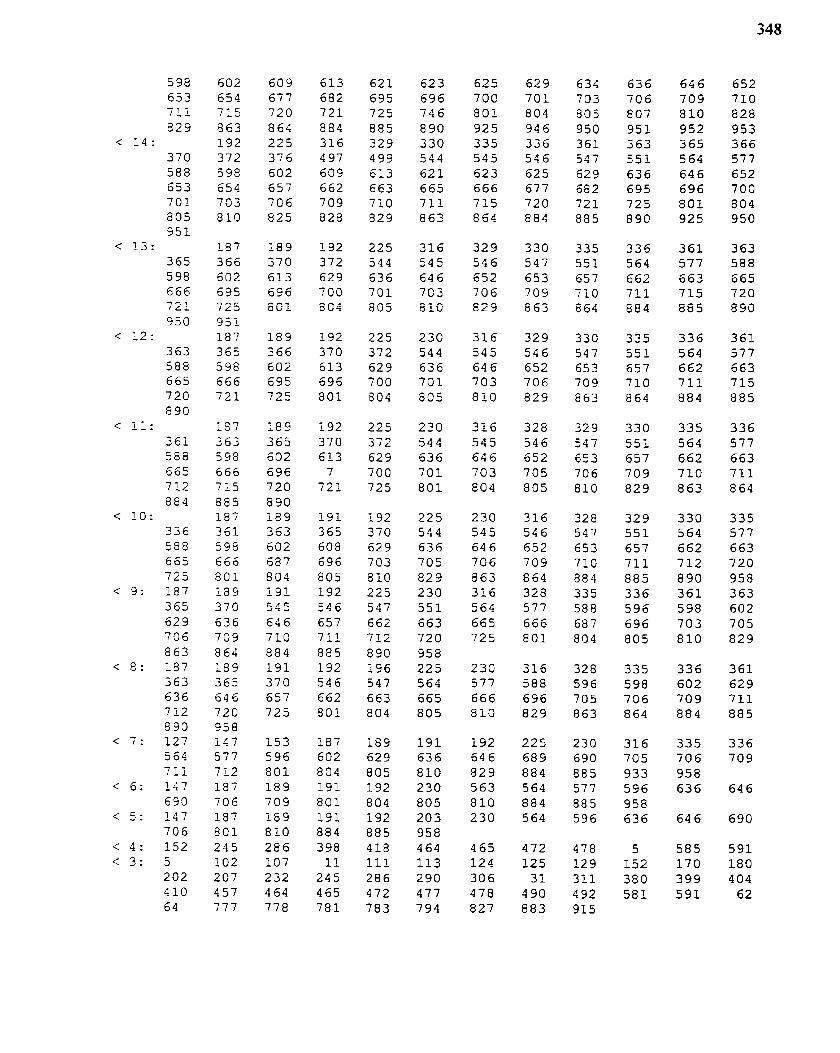
598 653 7 1 i 829
< 1 4 : 3 7 0 5 8 8 653 7 0 1 805 4 5 1
< 13: 365 598 666 7 - 3 1 2 1
950 < 12:
363 588 665 720 8 90
< II: 3 6 1 5 8 8 665 712 8 8 4
< 10 : 336 588 665 725
< 9 : 187 365 629 7 0 6 8 6 3
< 8 : 187 3 6 3 636 712 8 90
< 7: 127 504 711
< 6: 147 693
< 5 : 147 7 0 6
< 4 : 152 < 3: 5
202 410 64
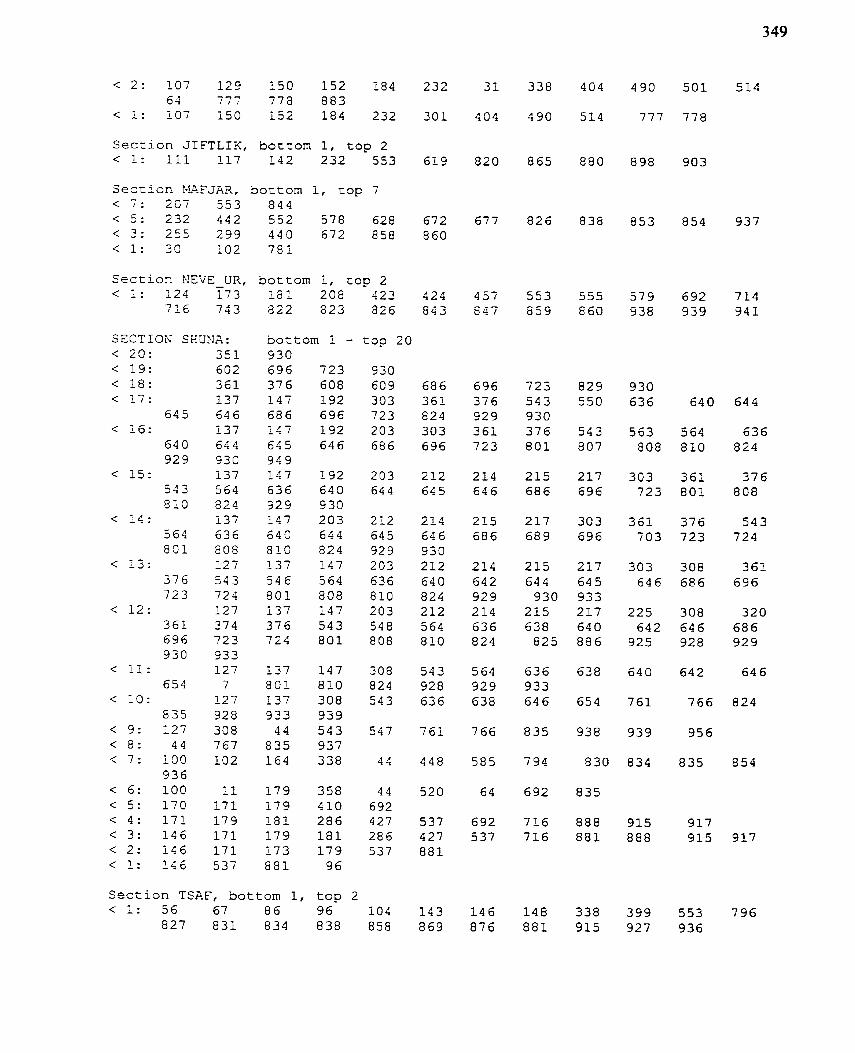
Section Z I F T L I K , Dottom 1, top 2 < 1: 111 117 142 232 553 619 820 865 880 898 903
Section EIAE'JAR, boctom 1, top 7 < 7 : 207 5 5 3 844 < 5 : 232 442 552 578 628 672 677 826 8 3 8 853 854 937 < 3: 255 299 440 672 858 860 C l : 30 102 7 8 1
Section FIEYE UR, bottom 1, top 2 - < 1 : 124 173 181 208 423 424 457 553 555 579 692 714
716 743 a 2 2 823 828 8 4 3 a 4 7 e s 5 860 938 939 341
SECTION SEUNA: bottom 1 - top 20 < 20: < 19: < 18: < 17:
6 4 5 < 16:
640 9 2 9
< 15: 543 810
< 14: 564 8 0 1
< 13: 376 723
< 12: 361 6 9 6 930
< II: 654
< 10: a 3 5
< 9: 127 < 8: 44 < 7: 100
936 < 6: 100 < 5: 170 < 4: 1 7 1 < 3: 146 < 2: 146 < 1 : 140
Section TSAF, bottom 1, top 2 c l : 56 67 8 6 96 104 143 146 148 338 399 553 796
827 831 834 838 858 869 876 881 915 927 936
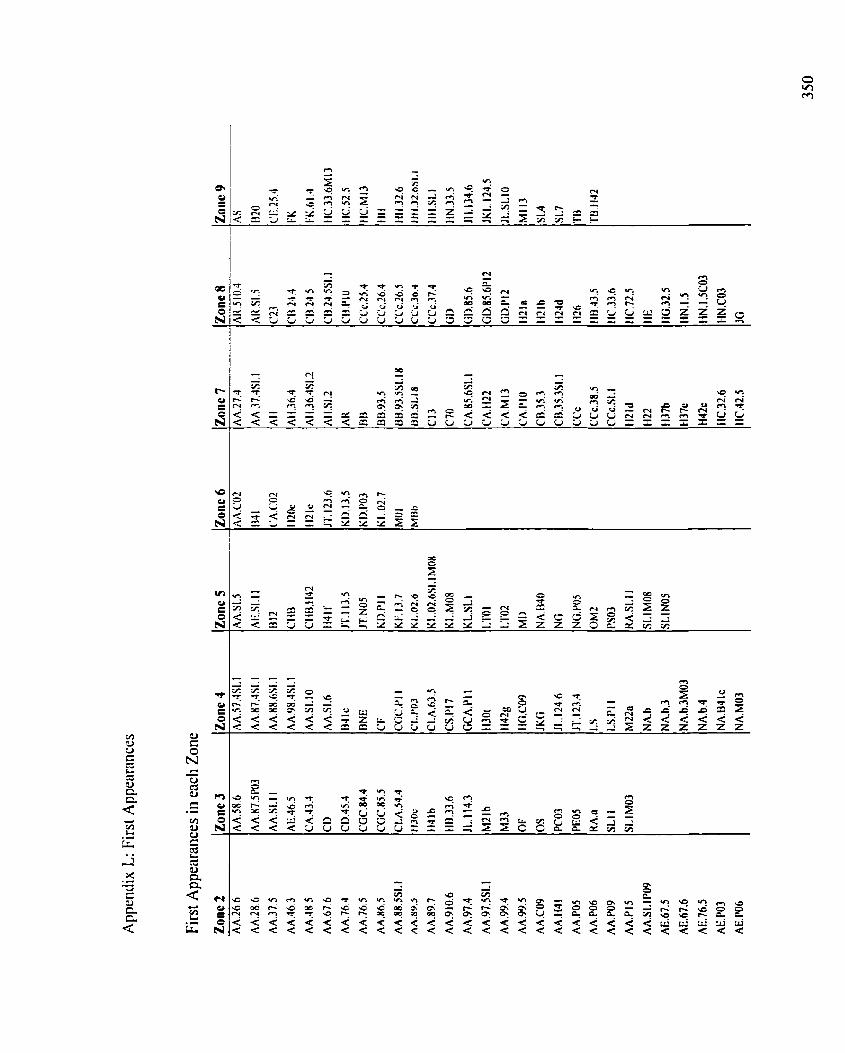
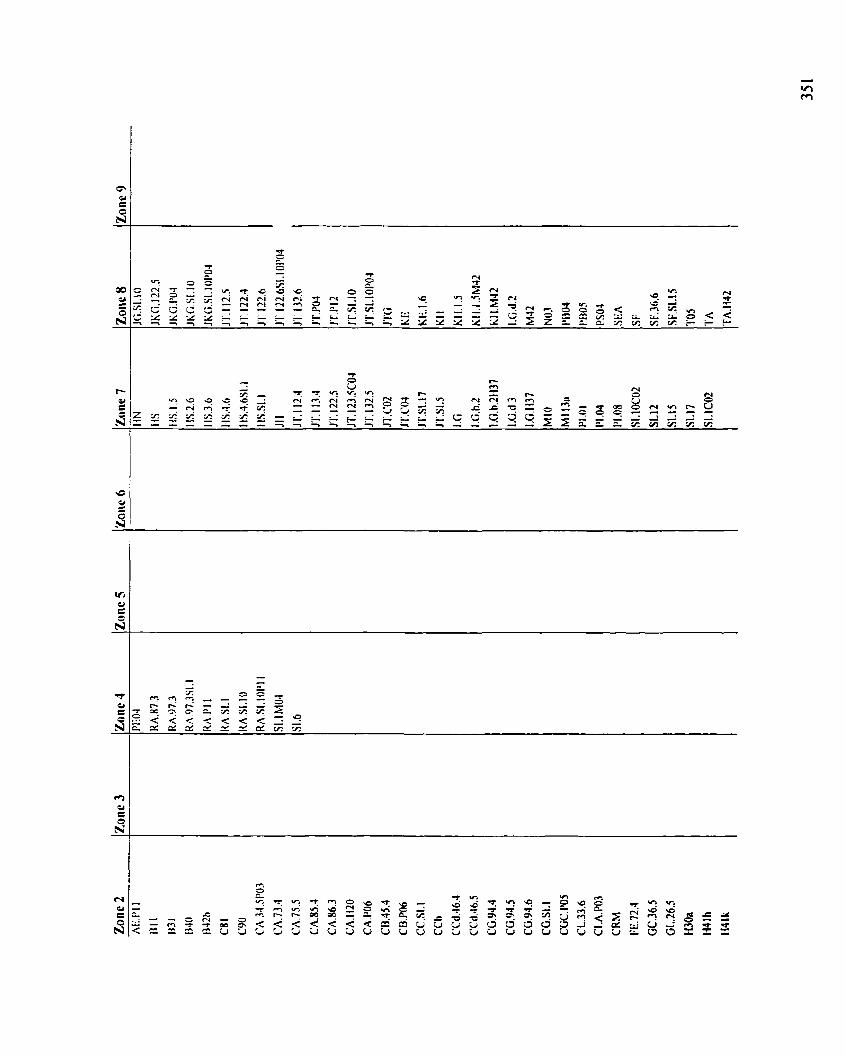
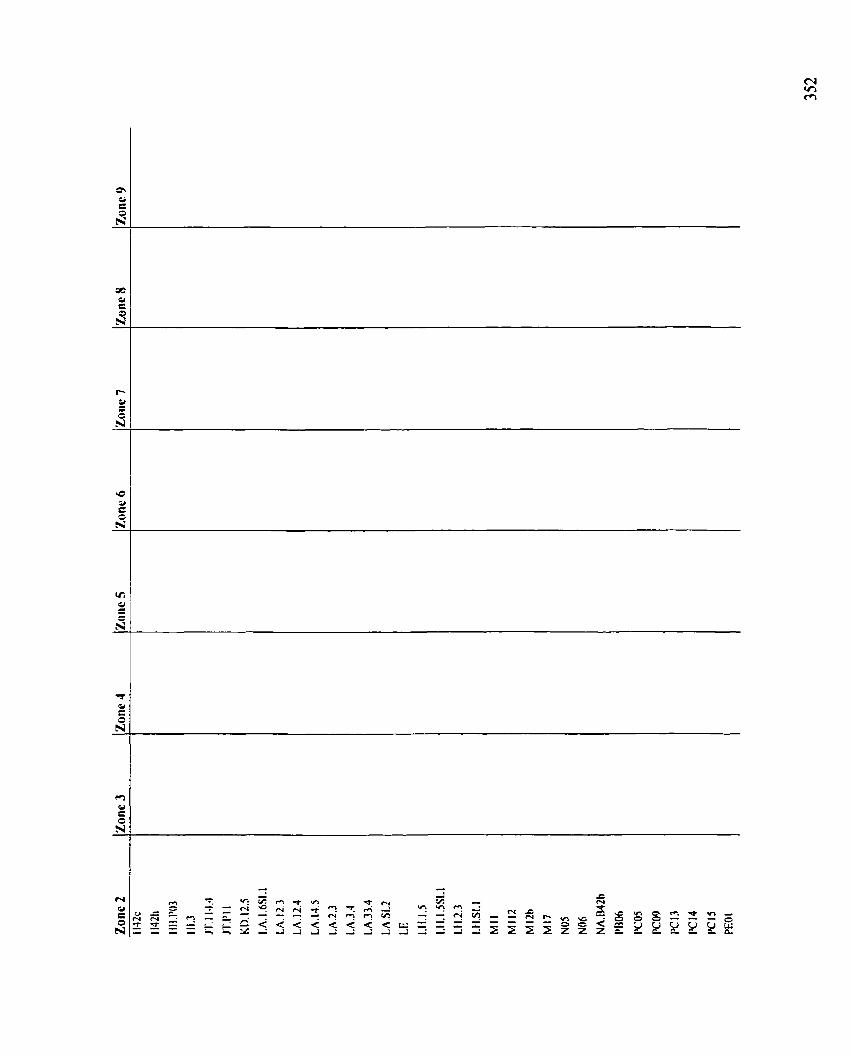
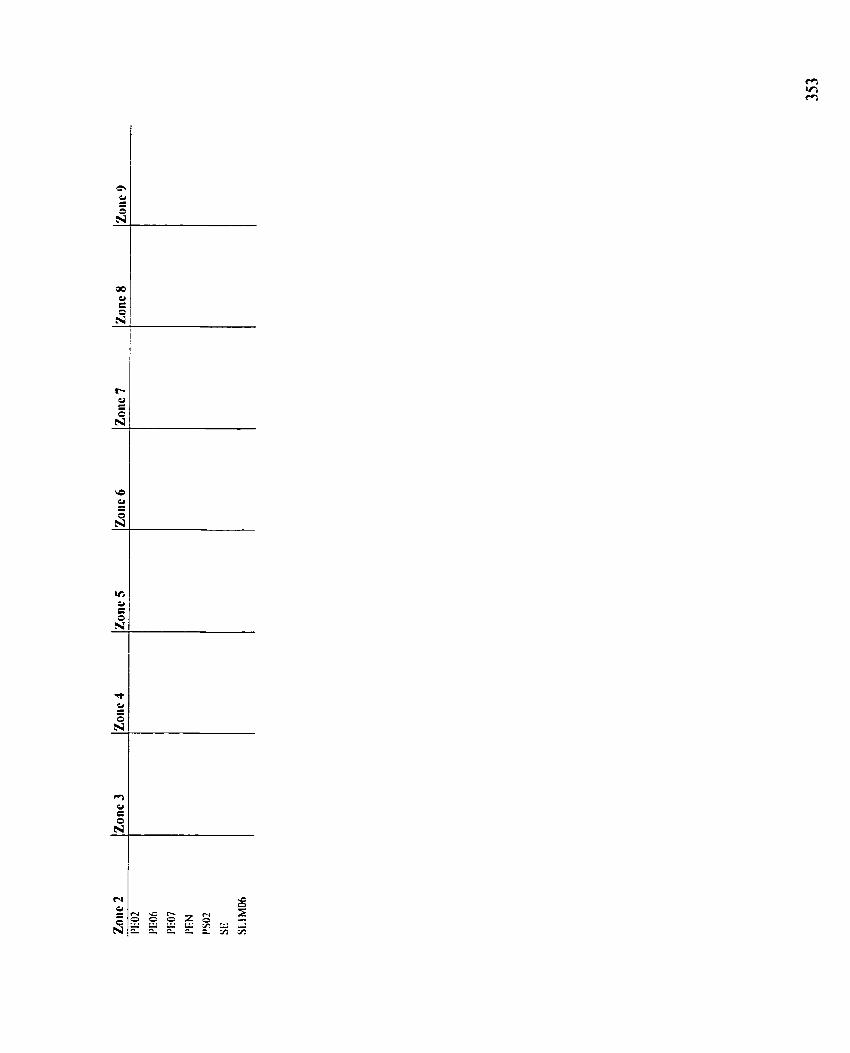
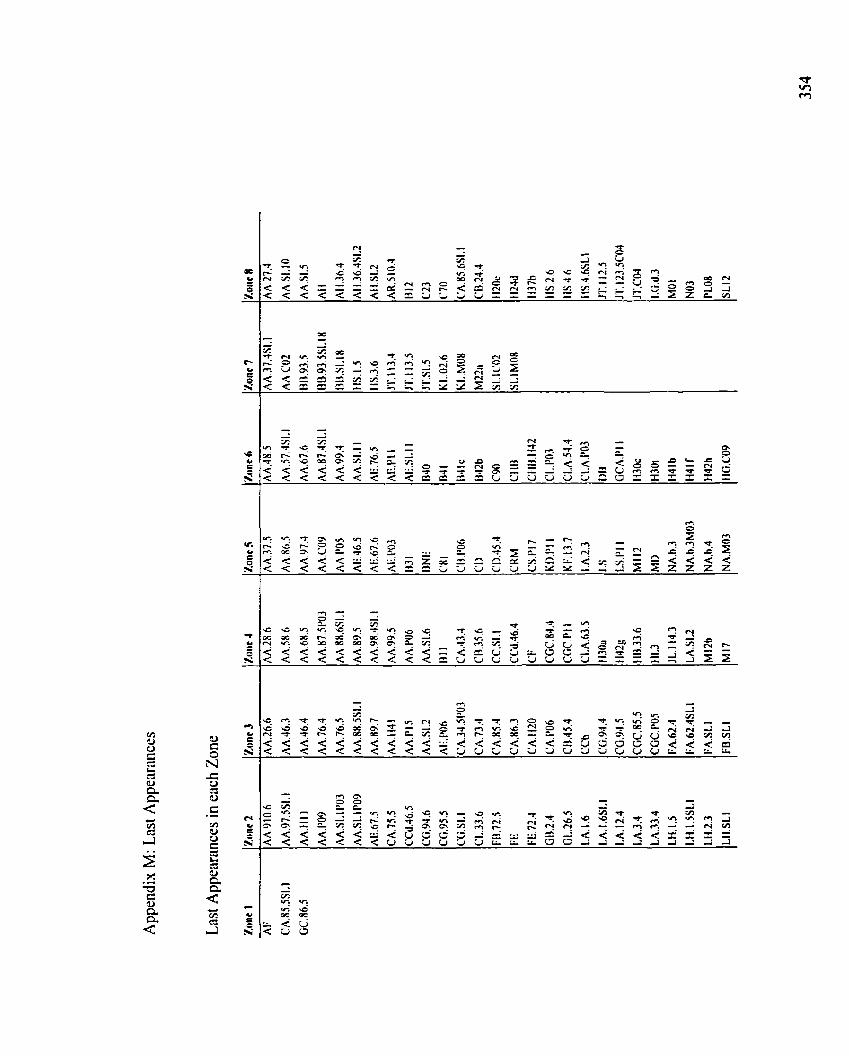
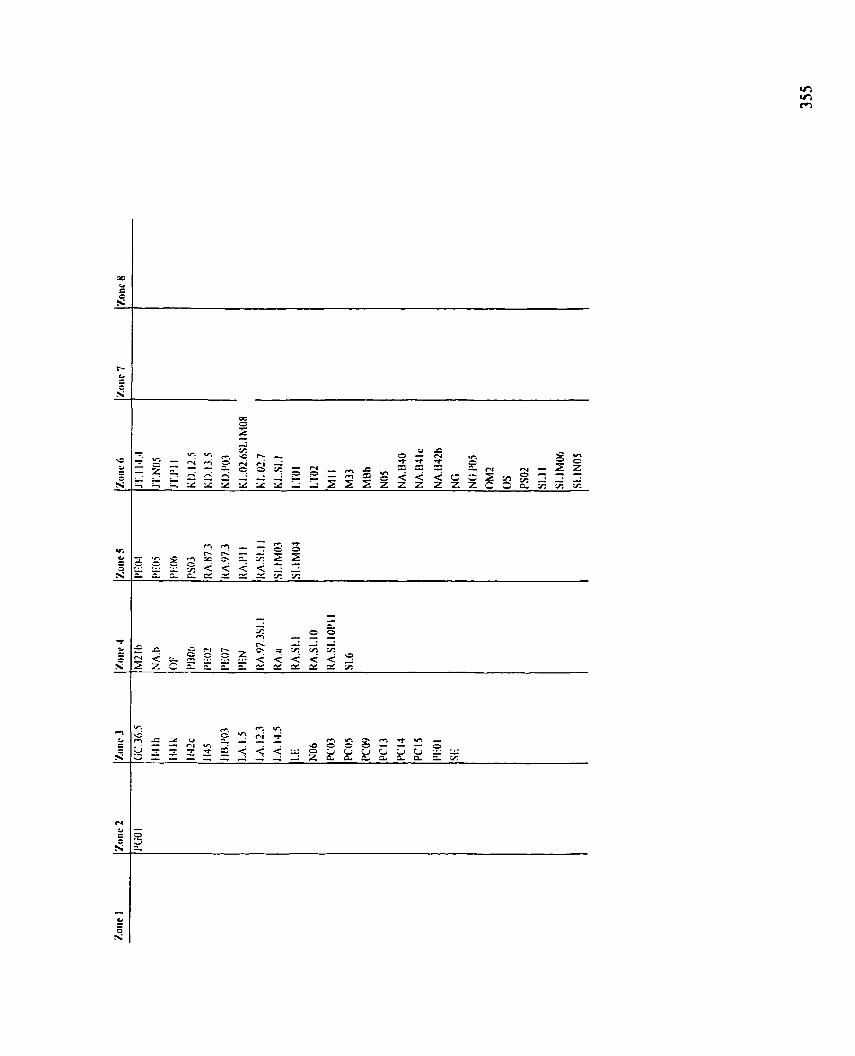
, . . 2
r- - - - = -a. 'A- N < ~ - C % Z ~ ; ~ C ( < + Z Z E ~ & = = ~ ~ - Y Y ~
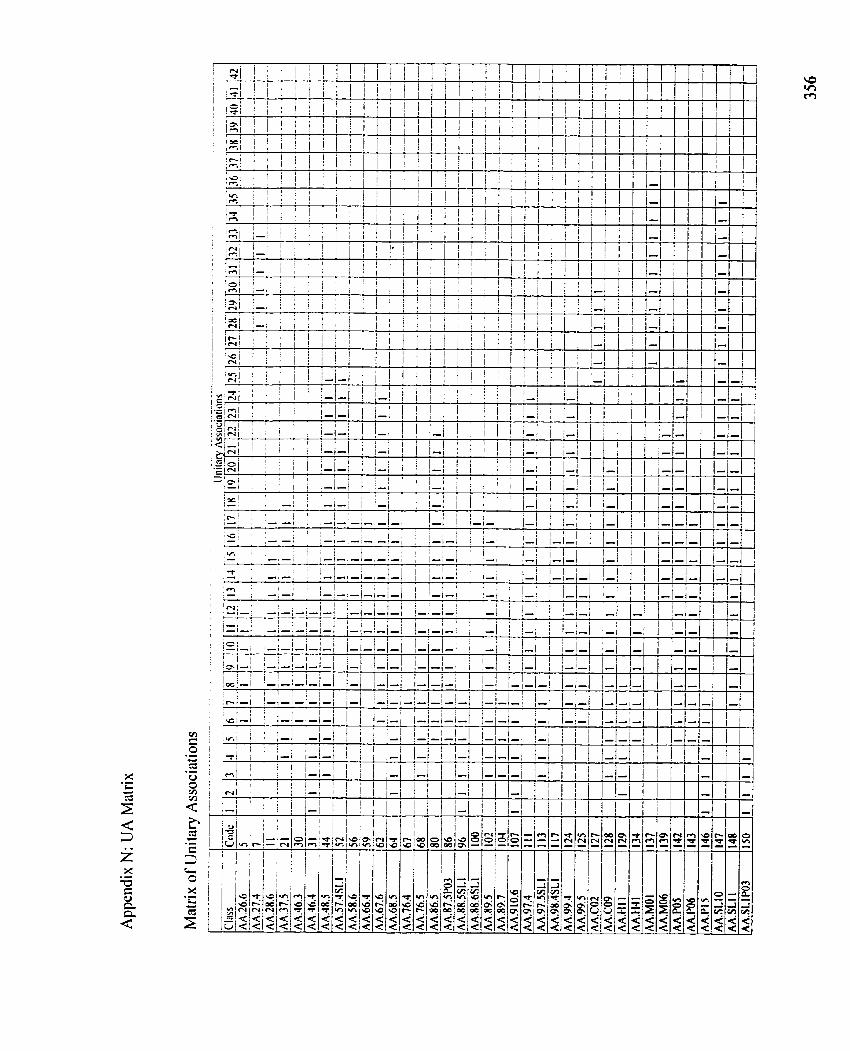
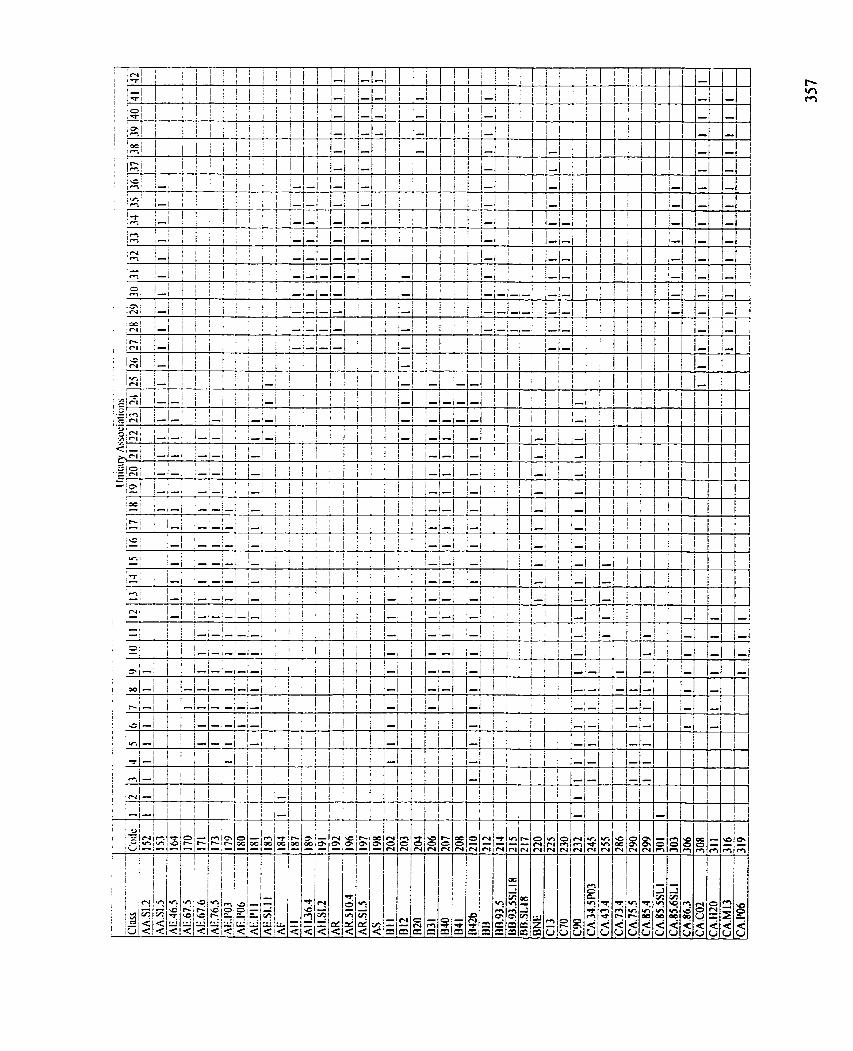
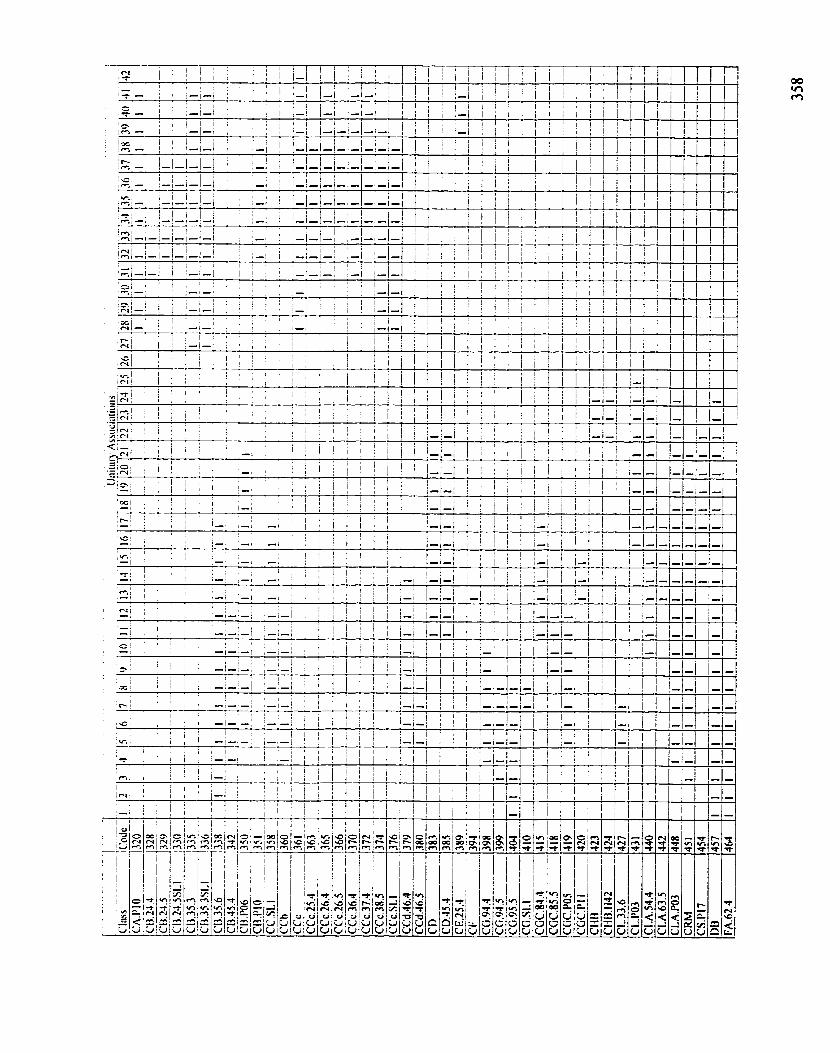
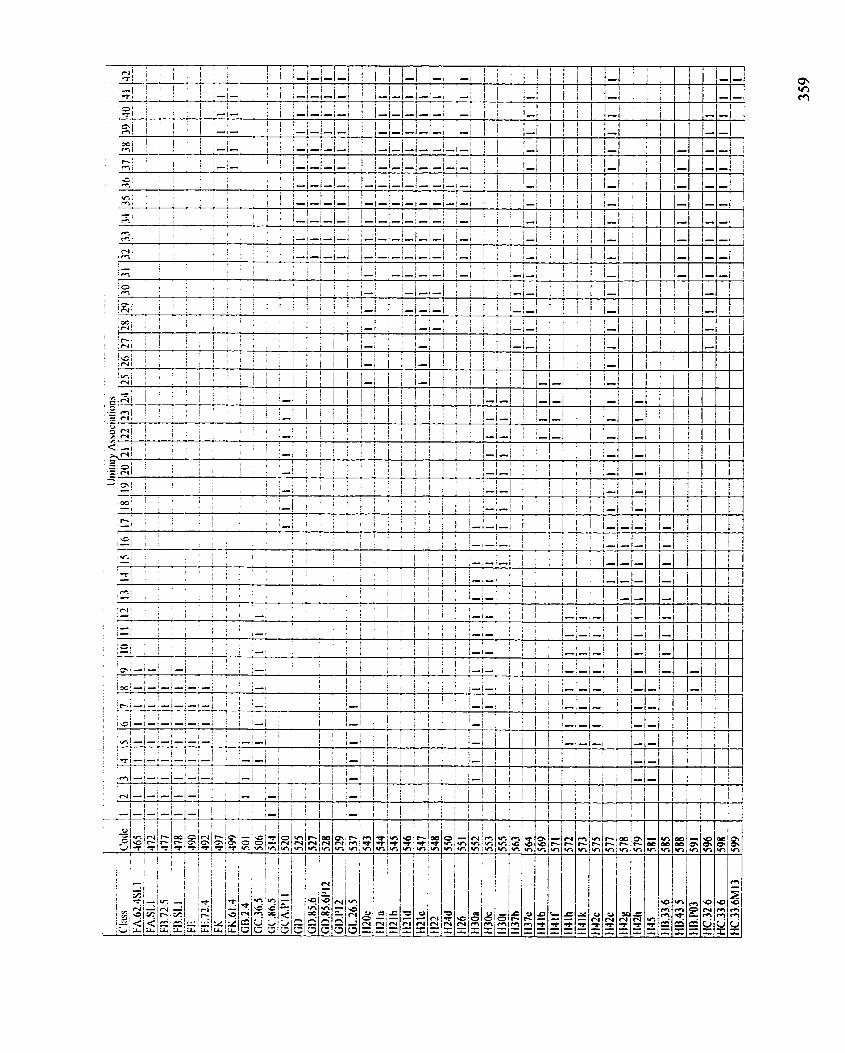
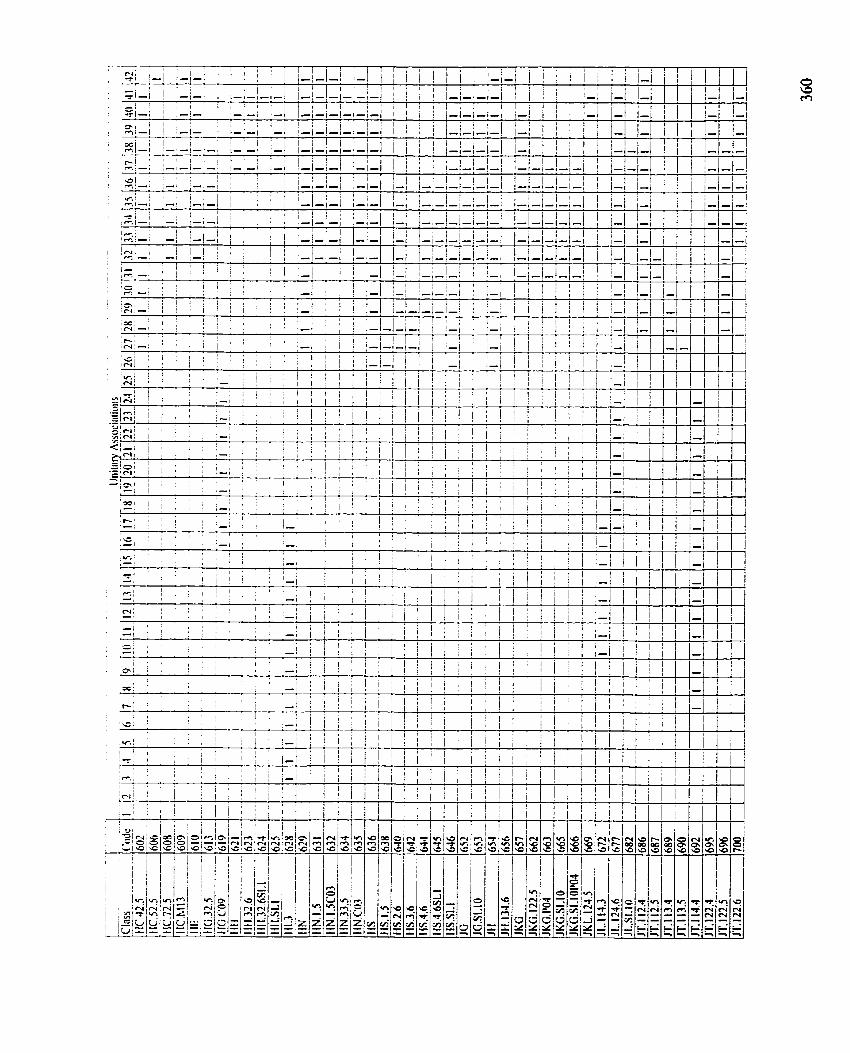
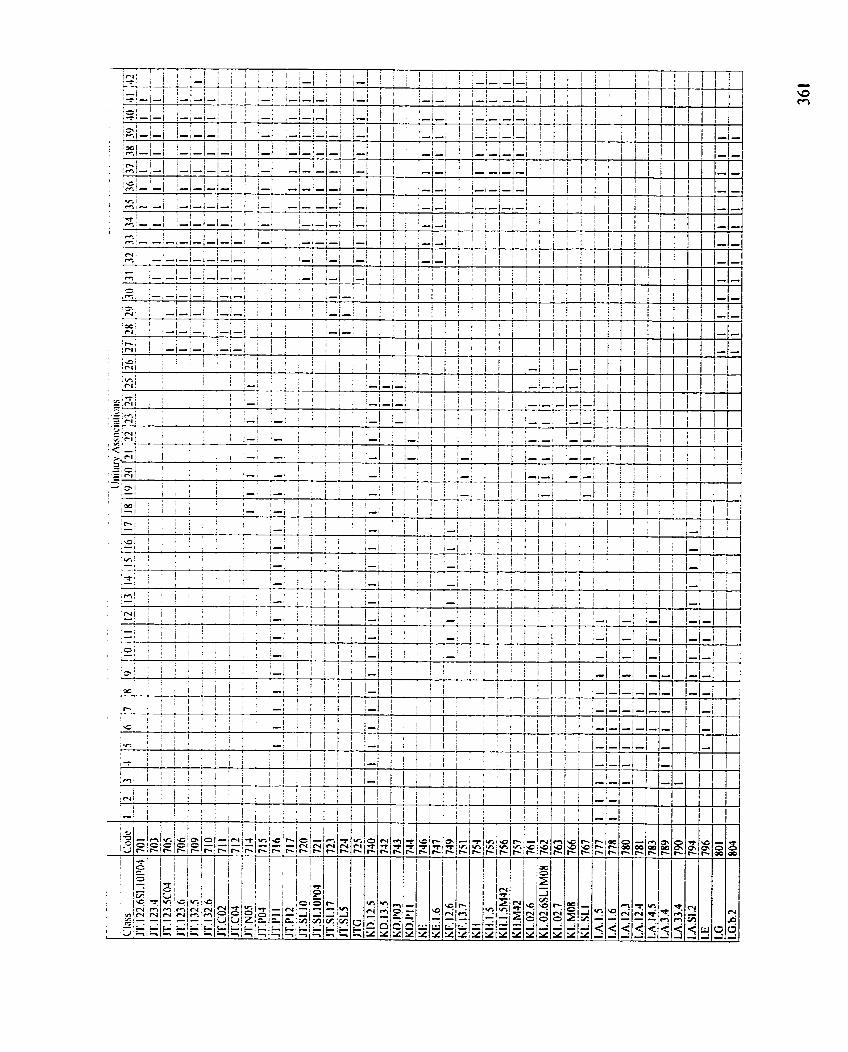
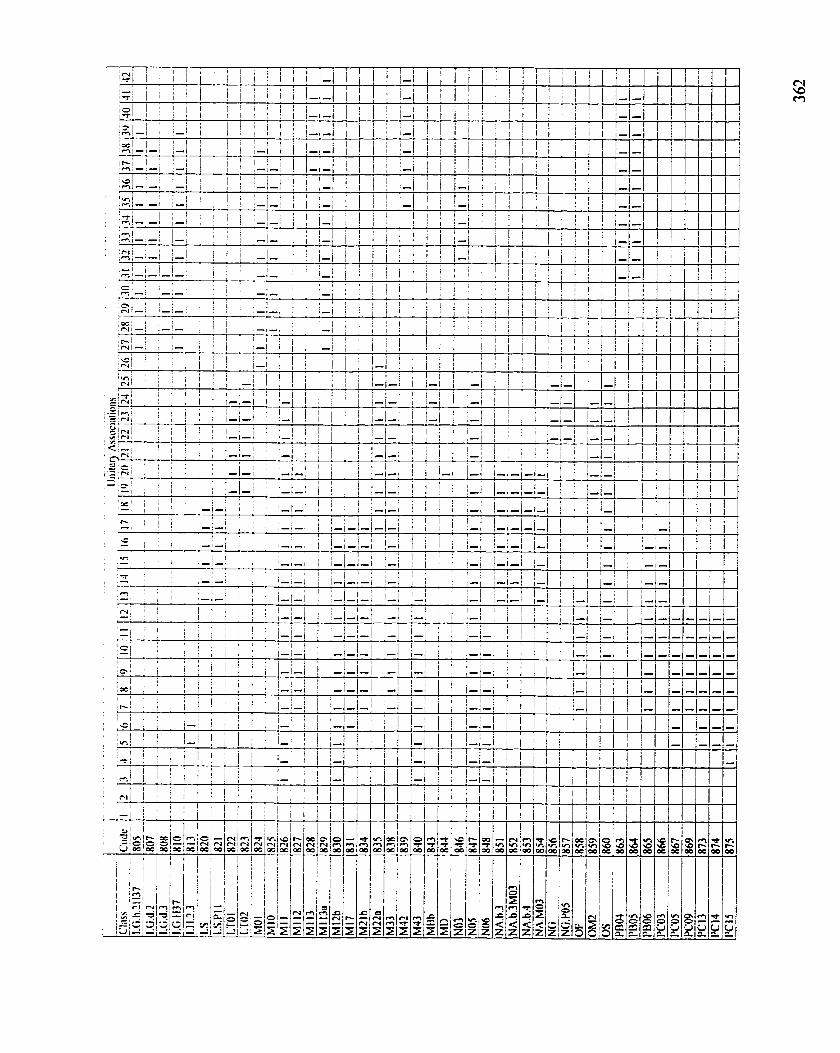
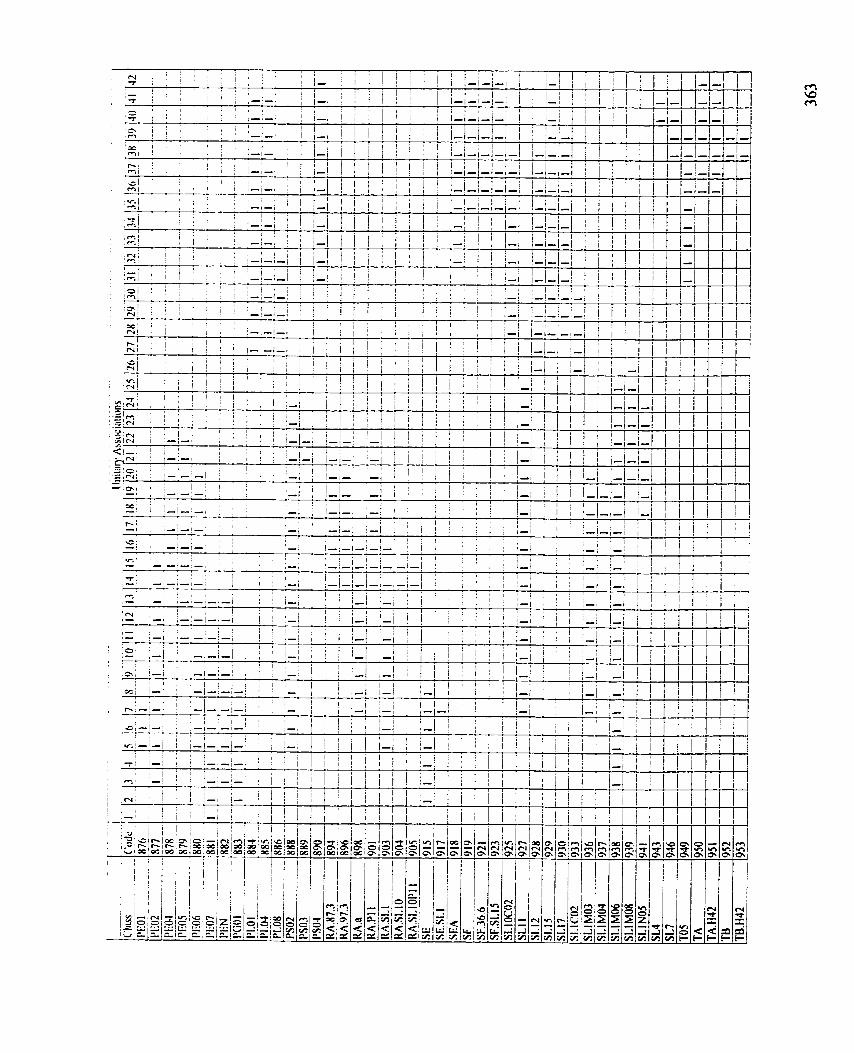
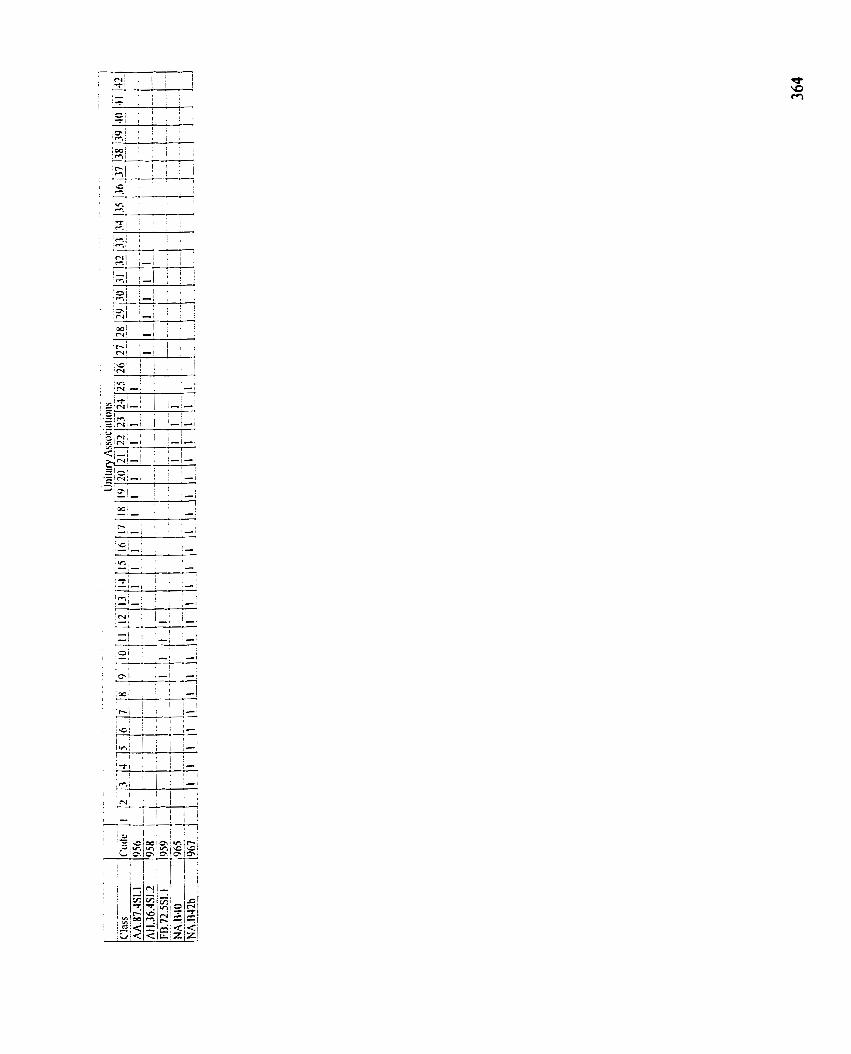
REFERENCES CITED
Abel. F. M. (1 91 1 ). Exploration de la Vallée du Jourdain. Revue Biblique 8: 408-436.
Adams. W. Y .. and Adams. E. W. (1 99 1). Archaeological Typology and Practical Realiîy: A Dialecricai Approach To Artifact Ciassification And Sorting, Cambridge University Press, Cambridge.
Aharoni, Y. (1 96 1 ). The Expedition to the Judean Desert. Israel Erploration Journal 1 1 : 1 1-34.
Aharoni, Y. (1 962). The Expedition to the Judean Desert. israel Erploration Journal 12: 1 67-262.
Albright, W. F. (1 922). Palestine in the Earliest Histoncal Period (1 922). Jourrzaf of the Palesfine Oriental Society 2: 1 10- 1 3 8.
Albright, W. F. (1926). The Jordan Valley in the Bronze Age. Anntral of the Arnerican Schools of Oriental Research 6: 13-74.
Albright? W. F. ( 1 93 1). Recent Progress in the Late Prehistory of Palestine. Bulletin of rhe American School of Oriental Research 42: 13- 15.
Albright. W. F. (1932a). The Chalcolithic Age in Palestine. Blrlletin of the American Schools of Oriental Research 48 : 1 0- 1 3.
Albright. W. F. (1 932b). The Excavation of Tell Beit Mirsim, Volume 1 : The Pottery of the First Three Campaigns. Annual of fhe American Schools of Oriental Research 12.
Albright, W. F. (1933). The Excavation of Tell Beit Mirsim, [AI The Bronze Age Pottery of the 4th Carnpaign. Anniral of the American Schools of Oriental Research 1 3 : 55- 95.
Allen, W. L., and Richardson, J. B., II1 (1971). The Reconstruction of Kinship fiorn Archaeological Data: The Concepts, the Methods, and the Feasibility. American Antiqrtity 36: 41 -53.
Arniran, R. (1953). The Pattern of Settlement in Palestine. Israel Exploration Journal 3: 65-78, 192-209,2jO-260.
Arniran. R. (1955). The 'Cream Ware' of Gezer and the Beersheba Late Chalcolithic. Israel fiplorut ion Journal 5 : 240-245.
Amiran, R. (1969). Ancient Pottery of The Holy Land, Massada Press. Jerusalem.
Amiran. R. (1970). The Beginning of Urbanization in Canaan. In Saunders, J. A. (ed.)? Near Eastern Archaeology in the Twentieth Century: Essays in Honor ofNelson Glrreck. Doubleday, Garden City. New York, pp. 83-100.
Amiran. R. (1977). Pottery from the Chalcolithic Site near Tell Delharniy- and Some Notes on the Character of the Chalcolithic-Early Bronze 1 Transition. Erefz lsrael 13: 48-56. (Hebrew).
h i r a n , R. (1985). The Transition tiom the Chalcolithic to the EarIy Bronze Age. In Avirarn. J. (ed.). Biblical Archaeology Today. Proceedings of the International Congress on Biblical Archaeology, 1994, Jenisalem, pp. 108-1 12.
Arniran, R., Alon. D.. Amon, D., Goethert, R.. Gavish, R., and Amiran, D. H. K. (1980). The Arad Countryside, Levant 12: 22-29.
Amiran, R.. and Porat. N. ( 1 984). The Basalt Vessels of the Chalcolithic Period and Early Bronze Age 1. Tel Aviv 11: 11-19.
Angress. S. (1 959). Mammal Remains from Horvat Beter (Beersheba). 'Atiqof 2: 53-71.
Anthony, D. W. (1990). Migration in Archaeology: The Baby and the Bathwater. Arnerican Anthropologist 92: 895-914.
Arnold, D. E. (1 984). Social interaction and ceramic design: communiiy-wide correlations in Qzrinua, Peru, Institute of Archaeology. University of California, Los Angeles.
Arnold. D. E. ( 1 98 9). Ceramic Theory and Culfrrval Process ( first pu bl is hed 1 98 9, Cambridge University Press, Cambridge.
Arnold. J. E. (1991). Transformation of a Regional Economy: Sociopolitical Evolution and the Production of Valuables in Southem California. Antiquity 65: 953-962.
Arnold, J. E. (1 996a). Organizational Transformations: Power and Labor arnong Maritime Hunter-gatherer Societies. In Arnold, J. E. (ed.), Emergent Complexiry: The Evolution of Intermediare Societies, International Monographs in Prehistory, Ann Arbor, pp. 59-73.
Arnold, J. E. (1 996b). Understanding the Evolution of Intermediate Societies. In Arnold, J . E . (ed . ). Emergent Complexity : The Evolu f ion of Intermediate Societies, International Monographs in Prehistory, Ann Arbor, pp. 1-1 2.
Arnold, P. J. (1 99 1). Domestic Ceramic Production and Spatial Organization, Cambridge University Press, Cambridge.
Ascher, R. (1 96 1 ). Analogy in Archaeological Interpretation. Southwest Journal of Anthropolop 17: 3 17-325.
Baird. D. (1 987). A Prelirninary Analysis of the Chipped Stone fiom the 1985 Excavations at Tell Esh-S huna North. Annual of the Department of Antiquities of Jordan 3 1 : 46 1-479.
Baird, D.. and Philip. G. ( 1994). Preliminary Report on the Third (1 993) Season of Excavations at Tell esh-Shuna North, Levant 26: 11 1-133-
Banning. E. B. ( 1 985). Pastoral and Agricultural Land Use in the Wadi Ziqlab. Jordan: an Archaeological and Ecological Szmey. Unpublished Ph.D. thesis, Department of Near Eastern Studies, University of Toronto, Toronto.
Banning, E. B. (1 995). Herders or Homesteaders? Biblical Archeulogist 58(1): 2- 13.
Banning. E. B. (1 998). The Neolithic Perîod: Triurnphs of Architecture, Agiculture. and Art. Near Eastern Archaeology 6 114): 188-237.
Banning. E. B.. Blackham. M.. and Lasby. D. (1998). Excavations at WZ 121. a Chalcolithic Site at Tubna in Wadi Ziqlab. Annual of the Department of Antiguities ofJordan 42: 141-159.
Banning. E. B.. Dods, R. R., Field. J . J.. Kuijt, 1.. McComstan, J., Siggers, J., Taani. H., and Triggs. J. (1 992). Tabaqat al-Burna: 1990 Excavations at a Kebaran and Late Neolithic Site in Wadi Ziqlab. .4nnual of the Department ofAntiquities of Jordon 36: 43-69.
Banning, E. B.. Dods, R. R.. Field. J . J.. Maltby, S. L., McComston, J., Monckton, S., Rubenstein, R., and Sheppard, P. (1989). Wadi Ziglab Project 1987: A Preliminary Report. Annual of the Deportment ufAntiquities of Jordan 33: 43-58.
Banning, E. B.. Dods, R. R., McComstan, J., Monckton, S., and Sheppard, P. (1987). Report on the Wadi Ziqlab Project 1986 Season of Excavations. Annuaf of the Department of Aniquities of Jordan 3 1 : 321-339.
Banning, E. B.. and Fawcett, C. (1983). Man-Land Relationships in the Ancient Wadi Ziglab: Report of the 198 1 Survey. Annual of the Deporrment of Antiquities of Jordan 27: 291 - 309.
Banning, E. B.. Rahimi, D., and Siggers, J. (1994). The Late Neolithic of the Southern Levant: Hiatus, Settlement Shift or Observer Bias? The Perspective fiom Wadi Ziqlab. PnZéorienr 20(2): 15 1 - 164.
Banning, E. B., Rahimi, D.. and Siggers, J. (1996). The 1992 Season of Excavations in Wadi Ziqlab, Jordan. Anniral of the Department of An tiqui fies of Jordan 40
Banning, E. B., and Siggers, J. (1997). Technotogical Strategies at a Late Neolithic Farmstead in Wadi Ziqlab, Jordan. In Gebel, H. G. K., Kafafi, Z., and Rollefsont G. O. (eds.). The Prehisrory of Jordan. II. Perspectives jï-orn 199 7, Studies in Early Near Eastern Production, Subsistence. and Environment 4. Ex oriente, Berlin, pp. 319-331.
Bar Adon. P. (1 980). The Cave of the Treasure, Israel Exploration Society, Jerusdem.
Barnett, H. G. ( 1 953). Innovation: The Basis of Cultural Change, McGraw-Hill, New York.
Baruch. U. (1986). The Late Holocene Vegetational History of Lake Kinneret (Sea of Galilee). [srael. Paléorient 1 2(2): 37-48.
Baruch, U. (1 987). The Early Bronze Age, Chalcolithic and Neolithic Periods. In Ben- Tor, A., and Portugati, Y. (eds.), Tell Qiri: A Village in the Jezreel Valley, The Hebrew University of Jerusalem, Jerusalem, pp. 274-299.
Baruch, U. (1 994). The Late Quaternary Pollen Record of the Near East. In Bar-Yosef, O., and Kra R. S. (eds.). Lare Quaternary Chronology and Paleoclimates of fhe Eastern Medirerranean, Radiocarbon, Tucson, pp. 103-1 19.
Baruch, U., and Bottema, S. (1991). Palynologicat Evidence for Climatic Changes in the Levant ca. 17000-9000 B.P. In Bar-Yosef, O., and Valla, F. R. (eds.), The Natufian Cztltrrre in rhe Levant, International Monographs in Prehistory. Ann Arbor, pp. 11 - 20.
Bar-Yosef. O. ( 1 987). Prehistory of the Jordan Rift. Israel Journal of Earrh Sciences 36: 107-1 19.
Bar-Yosef, O.. and Gopher, A. (eds.). (1997). An Early Neolithic Village in the Jordan Valley, P m I : The Archaeologv of Netiv Hagdud. Amencan School of Prehistoric Research. Bulletin 43. Peabody Museum of Archaeology and Ethnology, Cambridge.
Basalla, G. (1 990). The Evolurian of Technolo~ (first published 1988), Cambridge University Press, Cambridge.
Baxter, M. J. (1 994). Fxploratory Multivariate Analysis in Archaeology. Edinburgh University Press, Edinburgh.
Begin, Z. B.. Ehrlich. A.. and Nathan, Y. (1974). Lake Lisan, the P[eisiocene Precursor of the De~7dSea. Vol. Bulletin 63. Israel Geological Survey, Israel Geologicai Survey, Jerusalem.
Begin, Z. B.. Ehrlich. A., and Nathan, Y. (1980). Stratigraphy and Facies Distribution in the Lisan Formation: New evidence from the Area South of the Dead Sea. Israel Jozrrnal of Earth Sciences 29: 1 82- 1 89.
Bel 1, J. A. (1 994). Reconstmcting Prehistory: Scientific Method in Archaeology, Temple University Press, Philadelphia.
Bender, F. (1 974). Geology of Jordan, Gebrüder Borntraeger, Berlin.
Ben-Dor, 1. (1 936). Pottery of the Middle and Late Neolithic Penods. Liverpool Annals of Archaeology and Anfhropology 23: 77-90.
Benoit, P., Milik, J. T., and Vaux, R., de. (1961). Discoveries in the Judean Desert II, Les grottes de Murabba'at., Oxford.
Ben-Tor, A. (1 976). A Cylinder Seal from 'En Besor. 'Atiqot 1 1 : 13-15.
Ben-Tor. A. (1986). The Trade Relations of Palestine in the Early Bronze Age. Journal of the Econornic and Social ffistory of the Orient 29: 1-27.
Ben-Tor, A. (1 989). Byblos and Early Bronze 1 Palestine. In Miroschedji. P. R. de (ed.), L 'urbanisation de la Palestine à l'âge du Brotze ancien: Bilan et perspectives des recherches actrrefZes, Vol. 527, BAR International Series, BAR, Oxford, pp. 41 -52.
Ben-Tor, A. (1992). The Early Bronze Age. In Ben-Tor, A. (ed.), The Archaeology of Ancient Israel, Yale University Press, New Haven, pp. 8 1 - 125.
Ben-Tor, A.. Portugali, Y., Avissar, M.' Baruch, U., and Hunt, M. (1987). Tell Qiri: A ViZZage in the Jezree( Vafley. Qedem 24, (ser. ed.. Bar-On. Negev. A., and Stem, E.), The Hebrew University of Jerusalem. Jerusalem.
Betts. A. V. G. (ed.). (1992). Excavations at Tell Umm ffarnmad f982-198./. The Early Assemblages (EBI-II). Excavations and Explorations in the Hashemite Kingdom of Jordan, Edinburgh University Press, Edinburgh.
Binford, L. R. ( 1973). Interassemblage Variability: The Mousterian and the 'Functional Argument'. In Renfrew, C. (ed.), The Explanution of Culture Change, Duckworth, London, pp . 227-254.
Binford, L. R. (198 1). Behavioural Archaeology and the Pompeii Premise- Journal of A n rhropological Anthropology 3 7: 195-208.
Binford, L. R. (1 989). Styles of Style. Journal of Anthropological Archaeology 8: 5 1-67.
Bintliff, J. (ed.). (1991a). The Annales School and Archaeology, Leicester University Press. London.
Bintliff J. (1 99 1 b). The Contribution of an Annaliste/Structural History Approach to ArchaeoIogy. In Bintliff, J. (ed.), The Annales School and Archaeology, Leicester University Press. London
Bintliff. J. L.. and van Zeist, W., van. (eds.). (1982). Palaeociimates, Palaeoenvironments and Human Commrcnities in the Eastern Mediterranean Region in Lafer Prehistory. International Series 133, British Archaeological Reports, Oxford.
Biran, A.. Ilan, D., and Greenberg, R. (1996). Dan L Hebrew Union CoIlege, Jerusalem.
Blackham, M. (1 994). Chronological Correiations of Archaeological Stratigraphy: An Intrasite Test at Tabaqat al-Bûma, Jordan- MSc. thesis, Department of Anthropology, Toronto.
Blackham. M. (1997). Changing Settlement at Tabaqat al-Bûma in Wadi Ziqtab, Jordan: A Stratigraphic Andysis. In Gebel, H. G., Kafafi. Z., and Rollefson, G. O. (eds.), Prehistory of Jordan, II. PerspectivesfLom 1997, Studies in Early Near Eastern Production. Subsistence. and Environment 4. Ex Oriente, Berlin, pp. 345 -360.
Blackham, M. (1998). The Unitary Association Method of Relative Dating and its Archaeological Application. Journal of Archaeological Method and Theory 5(2): 1 65-207.
Blackham, LM. (1 999). Tulaylat Ghassul: An Appraisal of Robert North's Excavations (1 959-60). Levant : 19-64.
Blackham, M., Fisher, K., and Lasby, D. (1998). Tell Fendi, a Late Chalcolithic Settlement in the Lower Wadi Ziqlab, Jordan. Annual of the Department of Anriquifies of Jordan 42: 16 1-1 77.
Blackham. M., Lasby, D.. and Fisher, K. (1997). Excavations at Tell Fendi, a Late Chalcolithic Site in the Jordan Valley, Jordan. Classical Viervs 4 1 : 1 7-2 1.
Bloch, M. (1 953). The Historian's Crafl, Vintage Books, New York.
Bobrowsky. P. T.. and Bail, B. F. (1989). The Theory and Mechanics of Ecological Diversity in Archaeology. In Leonard, R. D., and Jones, G. T. (eds.), Quantxfiing Diversi@ in Archaeology, Cambridge University Press, Cambridge. pp. 4-12.
Bordes, F., and Sonneville-Bordes, D. d. (1970). The Significance of Variability in Paleolithic Assemblages. World Archaeology 2: 6 1 .
Bottem- S.: and van Zeist, W. (1 98 1). Palynologicai Evidence for the Climatic History of the Near East. 50.000-6,000 BP. In Cauvin, J., and Sanlaville, P. (eds.), Préhisroire d u Levant. Colloques Internationaux. 598, CNRS, Paris, pp. 1 I 1-1 32.
Bourke, S., Sparks, R., Sowada K.? and Mairs. L. (1994). Preliminary Report on the Fourteenth Season of Excavation by the University of Sydney at Pella in Jordan. Annual of the Department of Antigztities of Jordan 38: 8 1-126.
Bourke, S. J. ( 1997a). The iPre-Ghassulian" Sequence at Teleilat Ghassul: Sydney University Excavations 1975- 1995. In Gebel, H. G., Kafafi. Z., and Rollefson, G. O. (eds.). Prehistory of Jordan, II. Perspectives from 1997, Studies in Early Near Eastern Production, Subsistence, and Environment 4, Ex Oriente. Berlin, pp. 395- 417.
Bourke, S. J. (1997b). The Urbanisation Process in the South Jordan Valley: Renewed Excavations at Teleilat Ghassul 1994/1995. In Hadidi, A. (ed.), Strtdies in the Archaeology and History of Jordan VI, Routledge, London, pp. 249-259.
Bourke, S. J., Seaton, P. L.. Sparks, R. T., Lovell. J. L., and Maits, L. D. (1995). A First Season of Renewed Excavation by the University of Sydney at Tulaylat Al-Ghassul. Annual of the Department of An fiquilies of Jordan 3 9: 3 1 -63.
Bowman, S. (1 990). Radiocarbon Dating, British Museum, London.
Bowman. S. G. E.. Arnbers, J. C., and Leese, M. N. (1990). Reevaluation of British Museum Radiocarbon Dates Issued between 1980 and 1984. Radiocarbon 32: 59-79.
Boyd, R., and Richerson, P. J. (1 985). Cullure and the Evolutionary Process, University of Chicago, Chicago.
Braemer. F. (1988). Prospections Archaéologiques dans le Hawran II. Syria 65: 99-137.
Braemer, F. (1991). Tell Zheir: ViIlage d'altitude dans le Jebel el 'Arab (Syrie). Paléorient 17(1): 143-1 52.
Brandl. B. (1 989). Observations on Earl y Bronze Age Strata of Tel Erani. In Miroschedji, P. R. de (ed.), L'rrrbanisation de la Palestine ù Z'ûge du Brome ancien: Bilan et perspectives des recherches actuelles, Vol. 52 7, BAR, Oxford, pp. 3 57-3 87.
Braudel, F. (1 980). On History. University of Chicago Press, Chicago.
Braun, E. (1989). The Transition fiom the Chalcolithic to the Early Bronze Age 1 in Nonhem Israel and Transjordan: 1s there a Missing Link? In Miroschedji, P. R. de (ed.). L'zwbanisation de la Palestine à l'age du Broa7-e ancien: Bilan et perspectives des recherches actuelles, Vol. 527 (i), BAR International Series, BAR, Oxford, pp. 7-27.
Braun, E. (1996). Cultural Diversity and Change in the Early Bronze 1 of Israel and Jordan. PhD thesis, . Tel Aviv.
Bronk Ramsey. C. (1 994). Analysis of Chronological Information and Radiocarbon Calibration. Archaeological Cornputing Neivslefier 4 1 : 1 1 - 16.
Bronk Ramsey. C. (1 99%). Radiocarbon Calibration and Analysis of Stratigraphy: The OxCal Program. Radiocar bon - Proceedings of the 1 5 th International Radiocarbon Conference. Glasgow.
Bronk Ramsey, C. (1 995b). Radiocarbon Calibration and Analysis of Stratigraphy: The OxCal Program. Radiocarbon 72(2): 425-430.
Bronk Ramsey, C. (1998). &Cal Program, ,3beta2 edition. Oxford Radiocarbon AcceIerator Unit. Oxford.
Broshi. M.. and Gophna R. (1984). The Settlements and Population of Palestine During the Earl y Bronze Age II - I I I . BulIetin of the American Schools of Oriental Research 253: 41-53.
Bruins. H. J.. and van der Plicht, J. (1998). Early Bronze Jencho: High Precision 14C Dates of Short-lived Paleobotanic Remains. Radiocarbon 40(2): 62 1-628.
Buck. C. E.. Cavanagh, W. G.. and Litton. C. D. (1996). Bayesian Approach to Interpreting Archaeological Data. Statistics in Practice, (ser. ed., Bamen, V.), John Wiley and Sons. Chichester.
Buck, C. E.. Chnsten, J. A., Kenworthy. I. B., and Litton, C. D. (1994a). Estimating the duration of archaeological activity using "k determinations. Oxji3t-d Journal of Archaeology I3(2): 229-240.
Buck, C. E., Kenworthy, J. B., Litton, C. D.' and Smith, A. F. M. (1991). Combining archaeological and radiocarbon information: a Bayesian approach to calibration. Antiqztiîy 65: 808-821.
Buck, C. E., Litton, C. D., and Scott, E. M. (1994b). Making the most of radiocarbon dating: some statistical considerations. Anfiqui@ 68: 252-263.
Buck, C. E., Litton, C. D.. and Smith, A. F. M. (1 992). Calibration of Radiocarbon Results Pertaining to Related Archaeological Events. Journal of Archaeological Science 1 9: 497-5 1 2.
Burkhardt, J. L. ( 1992 [ 18221). Trmels in Syria and the Ho& Land, BPCC Wheaton Ltd., Exeter.
Burleigh. R. (1 98 1). Radiocarbon Dates. In Holland, T. A. (ed.), Excavations at Jericho, Vol. 3: The Architecture and Stratigraphy of the Tell. British School of Archaeology in Jerusalem, London. pp. 50 1-504.
Burleigh, R. (1983). Appendix D - Additional Radiocarbon Dates for Jericho. In Kenyon, K. M., and Holland, T. A. (eds.), Ercavu~ions at Jericho, Vol. 5. British School of Archaeology in Jerusalem, London, pp. 760-765.
Butzer, K. W. (1 987). Archaeology as Human EcoZop (first published 1982), Cambridge University Press. Cambridge.
Byrd: B. F. (1992). The Dispersal of Food Production Across the Levant. In Begauer, A. B ., and Price, T. D. (eds.), Transitions to Agriculrure in Prehistory, Monographs in World Archaeology No. 4, Prehistory Press, Madison
Callaway. J. A. (1972). The Early Bronze Age Sanctuaty ut Ai (et-Tell). Vol. 1, Bernard Quaritch Ltd. London.
Callaway, J. A.. and Weinstein, J. M. (1977). Radiocarbon Dating of Palestine in the Early Bronze Age. Bulletin of the Arnerican Schools of Oriental Research 225: 1-16.
Cameron, C. M., and Tomkq S. A. (eds.). (1 993). A bandonment of Settlernen~s and Regions, Cambridge University Press, Cambridge.
CarnpbelI, J. A., Baxter, M. S., and Alcock, L. (1979). Radiocarbon Dates for the Cadbury Massacre. Antiqrdy 53: 3 1-38.
Caneva t., Frangipane, M., and Palmieri, A. (1989). Recent Excavations at Maadi (Egypt). In Krzyzaniak, L., and Kobusiewicz, M. (eds.), Late Prehistory of the Nile Basin and the Sahara, Polish Academy of Sciences, Poznan, pp. 287-293.
Carmi, 1. (1 987). Rehovot Radiocarbon Measurements III. Radiocarbon 29: 100-1 14.
Carmi, 1.. Epstein, C., and Segal, D. (1995). Radiocarbon Dates fiom Chalcolithic Sites in the Golan. Xtiqot 27: 207-209.
Carmi, I., and Segal, D. (1 992). Rehovot Radiocarbon Measurements IV. Radiocarbon 34: 1 15-1 32.
Casella G.. and George. E. 1. (1 992). Explaining the Gibbs sampler. The American Starirician 46(3): 1 67- 1 74.
Cavalli-Sforza. L. L., and Feldman, M. W. (1981). Cultural Transmission and Evofution: A Ouanritutive - Approach. Princeton University Press. Princeton.
Charlton, T. H. (1 98 1). Archaeology, Ethnohistory, and Etfinology. Archaeological Merhod and Theory 4: 129- 1 76.
Childe, V. G. ( 1 925). The Dawn of European CiviIi~ation~ Kegan Paul, London.
Childe, V. G . (1 95 1). Social Evolution, E.A. Watts. London.
Childe. V. G. (1956). Piecing Together the Past: The Interpretation of Archaeological Data Routledge and Kegan Paul, London.
Clarke. D. L. (1968). AnaMical Archaeology. Methuen Co., London.
Clutton-Brock. J. (1 979). The Mammalian Remains from the Jerich0 Tell. Proceedings of rhe Prehistoric Society 45: 135- 157.
C lutton-Broc k. J. ( 1 98 1 ). Domesticated Animals fiom Early Times, Heinemann and British Museum Natural History, London.
Conkey, M. W. (1978). Style and Information in Cultural Evolution: Toward a Predictive Model for the Paleolithic. In Redman. C. L. (ed.), Social ArchaeoZogy. Academic Press, New York. pp. 6 1-85.
Conkey. M. W. (1989). The Use of Diversity in Stylistic Analysis. In Leonard, R. D., and Jones, G. T. (eds.), Qtranflfiing Diversity in Archaeology, Cambridge University Press, Cambridge. pp. 1 18- 129.
Conkey, M. W. (1990). Expenmenting with Style in Archaeology: Some Historical and Theoretical Issues. in Conkey, M. W., and Hastoe C. A. (eds.), The Uses of Sfyle in Archaedogv, New Directions in Archaeology. Cambridge University Press, Cambridge. pp. 5- 17.
Conkey. M. W.. and Hastorf. C. A. (eds.). (1990). The Uses of @le in Archaeology. New Direct ions in Archaeoiogy. Cambridge University Press, Cambridge.
Contenson, H. de (1956). La céramique chalcolithique de Beersheba; étude typologique. Israel Explora tion Journal 6: 163-238.
Contenson, H. de (1 960a). La Chronologie Relative du Niveau le Plus Ancien de Tell Esh-Shuna (Jordanie). Mélanges de 1 'Université Saint-Joseph de Beyrouth 38(4): 57- 77.
Contenson. H. de (1960b). Three Soundings in the Jordan Valley. Annual of the Deparrment of Antiqziities of Jordan 4/5 : 1 2-98.
Contenson, M. de (1961). Remarques sur le Chalcolithique Recent de Tell Esh-Shuna. Revue Biblique 68: 546-556.
Contenson, H. de (1964). The 1953 Survey of the Yarmouk and Jordan Valleys. Annual of the Department of Antiquities of Jordan 8/91 30-46.
Copeland, L. (1969). Neolithic Village Sites in the South Beqm Lebanon. Mélanges de I 'Universitk Saint-Joseph de Beyrouth 45: 85- 1 14.
Cowgill. G. L. (1972). Models. methods and techniques for seriation. In Clarke, D. L. (ed.), Models in Archaeolcgy. Methuen, London, pp. 38 t -424.
Cressman. L. S. (1 95 1 ). Western Prehistory in the Light of Carbon 14 Dating. Sorflhrvestern Journal of Anrhropolo~ 7: 289-3 13.
Crowfoot, G. M., and Crowfoot. E. (1961). The Textiles and Basketry. In Benoit, P., Milik, J. T.. and Vaux, R., de. (eds.), Discoveries in the Judean Desert Il: Les Grottes de itiuraba'ut. Oxford. pp. 5 1-63.
Crown, A. D. (1972). Toward a Reconstruction of the Climate of Palestine 8000 BC O BC. Jorirnal of Near Eastern Studies 3 1 : 3 1 2-330.
Culbert, T. P. (1 988). The Collapse of Classic Maya Civilization. In Yoffee, N., and Cowgil l. G. L. (eds.), The Collapse of Ancient States und Civilizations, The University of Arizona Press, Tucson, pp. 69- IO 1.
Darmon. F. (1984). Analyses Polliniques de Duex Sites de la Basse Vallée du Jourdain: Fazael VIII et Salibiya IX. Paléorient 1 O(2): 106- 1 10.
Dayan. Y. (1 969). Tell Turmus in the Huleh Valley. Israel Exploration Journal 19: 65- 78.
Dean, J. S. (1978). Independent Dating in Archaeological Analysis. In Schiffer, M. B. (ed.), Advances in Archaeological Method and Theory, Vol. 1 Academic Press, New York, pp. 223-255.
DeBoer, W. R. ( 1 993). Interaction, Imitation, and Communication as Expressed in Style: the Ucayali Experience. In Conkey, M. W., and Hastort C. A. (eds.), The Uses of Style in Archaeology, Cambridge University Press, Cambridge, pp. 82-104.
Deetz, J. (1 967). The Dynamics of Slylistic Change in Arikara Ceramics, University of Illinois Press, Urbana.
Deetz, J., and Dethlefsen. E. (1965). The Doppler Effect and Archaeology: A Consideration of the Spatial Aspects of Senation. Southwestern Journal of AnthropoZogy 2 l(3): 196-206.
Dempsey, P.. and Baumhoff, M. (1963). The Statistical Use of Artifact Distributions to Establish Chronological Sequence. American Anfiquify 28(4): 496-509.
Dethlefsen. E., and Deetz, J. (1 966). Death's Heads, Cherubs, and Willow Trees: Experimental Archaeology in Colonial Cemeteries. American Antiquiiy 3 1 : 502-5 10.
Dollfus, G.. and Kafafi, Z- (1986). Abu Hamid, Jordanie Premiers Résultats. Paléorienf 12(I): 91-100,
Dollfus. G., and Kafafi. 2. (1987). Abu Hamici, Yarmouk University and CNRS, Amman.
Dollfus, G.. and Kafafi. 2. (1 988). Abu Hamid: Vilhge du 4e Millenaire de la VaZZee du Jourdain, Centre Culturel Francais and The Department of Antiquities of Jordan. Amman.
Do11 fus, G., and Kafafi. 2. ( 1 993). Recent Researches at Abu Hamid. Annual of the Depariment of Anfiquilies of Jordan 37: 241 -262.
Dollfus. G.. Kafafi. Z., Rewerski, J., Vaillant, N., Coqueniot, E., Desse, J., and Neef, R. (1988). Abu Hamid. an Early Fourth Millenniurn Site in the Jordan Valley. In Garrard. A. N., and Gebel, H. G. (eds.), The Prehisfory of Jordan: The State of Research in 1986. Vol. 396 (ii), BAR International Series. BAR Oxford, pp. 567- 601.
Dothan. M. (1953). Hi& Loop-Handled Cups and Early Relationships between Mesopotamia Palestine, and Egypt. Palestine Erploration Quarterly 85: 132- 13 7.
Dothan, M. (1 959). Excavations at Horvat Beter (Beersheba). 'Atiqot 2: 1-42.
Dothan, M. (1971). The Late Chalcolithic Period in Palestine: Chronology and Foreign Contacts. Eretz-lsrael 10: 126- 13 1.
Droop. J. P. (1 935). Jericho: City and Necropolis, Fifih Report. Pottery of the Chalcolithic and Neolithic LeveIs, 193 5. Annals of Archaeology and Anrhropology 22(3-4): 169- 173.
Ducos, P. ( 1 968). L 'Origine des Animaux Domestiques en Palestine, Institut de Préhistoire, Bordeaux.
Duff. A. 1. (1996). Ceramic Micro-Senation: Types or Attributes? American Antiquify 61(1): 89-101.
Dunand. M. (1973). Fouilles de Byblos, Tome 5, Librairie d'Amérique et d'orient, Paris.
Dunnell, R. C. (1970). Seriation Method and its Evaluation. Arnerican Antiquiîy 35(3): 305-3 19.
Dumell, R. C. (1 97 1). Sysrematics in Prehisrory, Free Press, New York.
Dunnell, R. C. (1 978). Style and Function: A Fundamental Dichotorny. Arnerican Anriqui@ 43 : 1 92-202.
Dunnell. fi. C. (198 1). Seriation, Groups. and Measurements. In Cowgill, G. L., Whallon, R., and Ottaway, B. S. (eds.), bfanejo de Daros y Metudos Matematicos de Arqzteologia, Union internacional de Ciencias Prehistoricas y Protohistoricas, Mexico D.F., pp. 35-99.
DumeIl, R. C. (1 982). Science, Social Science and Common Sense: the Agonizing Dilemma of Modern Archaeology. Journal of Anthropological Research 38(1): 1-25.
Dumeil, R. C . ( 1 986). Methodological Issues in Americanist Artifact Classification. In Schi ffer. M. B. (ed.), Advances in Archaeological Me fhod and Theory, Vol. 9, Academic Press. New York, pp. 149-207.
Dwinell. R. C. (1995). What Is It That Actually Evolves? In Teltser, P. A. (ed.), EvoIurionary Archaeoloay: hfethodological Issues, University of Arizona, Tucson, pp. 33-50.
Earle. T. (ed.). (1991). Chiefdoms: Power, Econorny, and IdeoZogy, Cambridge University Press, Cambridge.
Ehrich, R. W. (ed.). (1992). Chronologies in Old World ArchaeoZogy, 3rd edition. Vol. II, University of Chicago Press, Chicago.
Einstein, A. (1 96 1 ). Relativity: The Special and General Theory, Crown Publishers, New York.
Eisenberg. E. (1993). Kitan, Tell. In Stem, E. (ed.), The New Encyclopaedia of Archaeological Excavafions in the Ho& Land, Vol. 3, The Israel Exploration Society and Carta New York, pp. 878-88 1.
Elliot, C. (1977). The Religious Beliefs of the Ghassulians c. 4000-3 100 BC. Palestine fiploraiion Qrrarterly 109: 3-25.
Engberg, R. M., and Shipton, G. M. (eds.). ( 1934). Notes on the Chalcolithic und Early Bronze Age Pot~ery ofMegiddo. Vol. 1 O. Studies in Oriental Civilization. University of Chicago, Chicago.
Epstein, C. (1975). Basalt Pillar Figures from the Golan. Israel Fxploration Journal 25(4): 193-20 1 .
Epstein. C. (1 977). The Chalcolithic Culture of the Golan. Biblical Archaeologist 40(2): 5 7-62.
Epstein, C. (1 978). A New Aspect of Chalcolithic Culture. Bulletin of the American Schools of Oriental Research 229: 27-45.
Epstein. C. (1 984). A Pottery Neolithic Site near Tel QatiF. Israel Exploration Journal 3 4(4): 209-3 1 9.
Epstein. C . (1985). Laden Animal Figurines fiom the Chalcolithic Period in Palestine. BASR 258: 53-62.
Epstein. C. ( 1 988). Basalt PiIlar Figures from the Golan and the Huleh Region. lsrael Explorn~ion Jozirnal38(4): 205-223.
Epstein, C. (1993). Oil Production in the Golan Heights During the Chalcolithic Period. Tel Aviv 20: 133-146.
Epstein. C. (1999). The Chalcolithic Crrlrure of the Golan. israeli Antiquities Authority, Jerusalem.
Esse, D. L. (1984). A Chronological Mirage: Reflections on EarIy Bronze Ic in Palestine. Journal of Near Eastern Studies 43(4): 3 1 7-33 0.
Esse, D. L. (1 989). Secondary State Formation and Collapse in Early Bronze Age Palestine. In Miroschedji. P. R. de (ed.), L'zrrbanisation de la Palestine à l'âge du Bronze ancien: Bilan et perspectives des recherches actuelles, Vol. 527 (ii), BAR International Senes, BAR. Oxford. pp. 8 2-96.
Esse, D. L. (1 99 1 ). Strbsistence, Trade, and Social Change in Early Bronze Age Palestine. Studies in Ancient Oriental Civilization No. 50, The Oriental Institute of the University of Chicago, Chicago.
Fagan, B. M. (1 998). In the Beginning: An Introdzrction to Archaeology, Harper Collins, New York.
Feinman, G. M., and Neitzel. J. (1984). Too Many Types: An Overview of Sedentary Prestate Societies in the Amencas. In Schiffer. M. B. (ed.), Advances in Archaeological Method and Theory, Vol. 7, Academic Press, New York, pp. 39-102.
Field. J. (1993). Rainfall Patterns and Landscape Changes in Wadi Ziglab, Jordan. In Jarnieson, R. W., Abonyi, S.. and Mirau., N. (eds.), Culture and Environment: A Fragile Coexislence, Proceedings of the 24th Annual Chacmool Conference, The Archaeological Association of the University of Calgary, Calgary, pp. 257-259.
Finkelstein, 1. (1995). Two Notes on Early Bronze Age Urbanization and Urbanism. Tel Aviv 22: 47-69.
Finnegan, M. (1 978). Faunal Remains from Bâb edh-Dhrâ', 1975. Annual of rhe American Schools of Oriental Research 43: 5 1-54.
Fitzgerald, G. M. (1 934). Excavations at Beth Shan in 1933. Palestine Exploration Fund Qzrarterly Staremenf 66: 1 23- 1 34.
Fitzgerald, G. M. (1 935). The Earliest Pottery of Beth Shan. Museum Journal, Philadelphia 24(1): 5-22.
Flannev, K. (1968). The Olmec and the Valley of the Oaxaca: A Mode1 for Inter- regional Interaction in Formative Timcs. In Benson, E. (ed.), Dumbarton Oaks Conference on the Olmec, Dumbarton Oaks. Washington, DC. pp. 79-1 17.
Fontugne, M.? Arnold. M.. Lebeyrie, L., Paterne, M.. Calvert- S. E., and Duplessy, J.-C. (1 994). Paleoenvironments, Sapropel Chronology and Nile River Discharge during the Last 20,000 Years as Indicated by Deep-Sea Sediment Records in the Eastern Mediterranean. In Bar-Yosef, O., and Kra, R. S. (eds.), Late Quaternary Chronology and Paleoclimates of the Eastern ibfediterranean, Radiocarbon. Tucson, pp. 75-88.
Ford, J. A. ( 1 962). A Quanritative Merhod for Deriving Cultural Chronology. Pan Amencan Union Technical Bulletin No. 1, Museum of Anthropology, Columbia-
Fried, M., H. (1 967). The Evolzrtion of Political Society, Random House, New York.
Friedrich. M. H. (1970). Design Structure and Social Interaction: Archaeological implications of an Ethnographie Analysis. American Antiquity 35: 332-343.
Frumkin, A.. Ford. D. C., and Schwartz, H. P. (1999). Contintental Oxygen Isotopic Record of the Last 170,000 Years in Jerusalem. Quaternary Research 51: 3 17-327.
Fry, R. E. ( 1980). Models and Methods in Regional Ekchunge. SAA Papers No. 1. Society for Amencan Archaeology, Washington, D.C.
Galili, E., Dahari. U., and Sharvit, J. (1 993). Undenvater S w e y s and Rescue Excavations along the Israeli Coast. International Journal of Nautical Archaeology 21: 61-77.
Galili, E.. and Nir, Y. (1993). The Submerged Pre-Pottery Neolithic Water Well of Atlit- Yam, Northem Israel, and its Paleoenvironmentd Implications. Holocene 3: 265- 270.
Galili, E.. and Sharvit, J. (1995). Evidence of Olive Oil Production fiom the Submerged Site at Kfar Samir. Israel. Mitekufai Ha 'even. Journal of the Israel Prehistoric Sociew 26: 122-1 33.
Galili, E., and Weinstein-Evron, M. (1 985). Prehistory and Paleoenvironments of Submerged Sites Along the Carmel Coast of Israel. Paléorient 1 1 : 37-52.
Galili, E., Weinstein-Evron, M., and Zohary. D. (1989). Holocene Sea Level Changes Based on Submerged Archaeological Sites off the Northem Carmel Coast in Israel. Quaternary Research 29: 36-42.
Garfinkel. Y. (1 992). The Pottery Assemblages ofthe Sha'ar Hagolan and Rabah Stages of Munhaia (Israel), Les Cahiers du Centre de Recherche Français de Jérusalem, NO. 6, Paris.
Garfinkel. Y. (1993a). Tel 'Ali. In Stem, E. (ed.), The New Encyclopedia of Archaeological Excavations in the Holy Land, Vol. 1, The Israel Exploration Society and Carta, New York, pp. 53-55.
Garfinkel. Y. (1 993 b). Tel 'Eli. Excavations a n d Sitrveys in Israel 12: 19.
Garstang, J. ( 1 932). Jericho: City and Necropolis. Annals of Archueolagy and Anihropology 19: 3-22.
Garstang. J. (1 93 5). lericho: City and Necropolis. Fiflh Report. General Report for 193 5. The Early Bronze Age. Annals of Archaeology and Anthropology 22(3-4): 143- 168.
Garstang, J. (1 936). Jerïcho; City and Necropolis: Report for Sixth and Concluding Season, 1936. Liverpool Annals of Archaeology and Anthropology 23 : 67-1 00.
Gasche, H., and Tunca, 0. (1983). Guide to Archaeostratigraphic Classification and Terminology: Definitions and Principles. Journal of Field Archaeology 10: 325-334.
Getzov, N. (1993). i-iùrvat 'Uza. Excavations andsurveys in Israel 13: 19.
Gilead, 1. (1988). The Chalcolithic Period in the Levant. Jotrrnal of World Prehistory 2(4): 397-443.
Gilead, 1. (1 990). The Neolithic-Chalcolithic Transition and the Qatifian of the Northem Negev and Sinai. Levant 22: 47-63.
Gilead. 1. (1 992). Farmers and Herders in Southern Israel During the Chalcolithic Period. In Bar-Yosef. 0.. and Khazanov, A. (eds.), Pastoralism in the Levanr. Monographs in World Prehistory No. 10, Prehistory Press. Madison, Wisconsin, pp. 29-41.
Gilead, 1. (1 993). Sociopolitical Organization in the Northen Negev at the End of the Chalcolithic Period. In Biran, A., and Aviram, J. (eds.), Biblical Archaeohgy Today 1990, Israeli Exploration Society, Jenisalem, pp. 82-97.
Gilead. 1. (1 994). The History of the Chalcolithic Settlernent in the Nahal Beer Sheva Area: The Radiocarbon Aspect. Bulletin of the American Schools of Orientai Research 296: 1-1 3.
Gilead. 1. (1 995). Grar: A Chalcolithic Site in the Northern Negev, Ben-Gurion University of the Negev Press, Beersheba.
Gilead, 1.. and Goren. Y. (1986). Stations of the Chalcolithic Period in Nahal Sekher, Northern Negev. Paléorient 12(1): 83-90.
Gilead, 1.. and Goren. Y. (1 989). Petrographic Andysis of Fourth Milleniurn B.C. Pottery and Stone Vessels fiom the Northem Negev, Israel. Bitlletin of the American Schools of Oriental Research 275: 5- 14.
Gilead. I., Rosen, S.. and Fabian, P. (1991). Excavations at Tell Abu-Matar (the Hatzerim Neighborhood), Beer Sheva. Journal of The Israel Prehisforic Society 24: 173- 179.
Gilman. A. (1 99 1). Trajectories Towards Social Complexity in the Later Prehistory of the Mediterranean. In Earie, T. (ed.). Chiefdorns: Power. Economy, and Ideologv, Cambridge University Press. Cambridge. pp. 146- 168.
Glueck, N. (1 934). Explorations in Eastern Palestine 1. Annual of the American Schools of Oriental Research 14.
Glueck, N. (1 935). Excavations in Eastern Palestine II. Annual of the American Schools of Oriental Research 1 5.
Glueck. N. (1 939). Explorations in Eastern Palestine III. Annual of the American Schools of Oriental Research 1 8- 19.
Glueck, N. (195 1 ). Explorations in Eastern Palestine IV. Annual of the American Schools of Oriental Research 25-27.
Goldberg, P. (1 994). Interpreting Late Quaternary Continental Sequences in Israel. In Bar-Yosef, 0.. and Kra, R. S. (eds.), Late Quaternary Chronofom and Paleoclimates of the Eastern Mediterranean, Radiocarbon, Tucson, pp. 89-1 02.
Goldberg, P., and Bar-Yosef, 0. (1 982). Environmentai and Archaeologicai Evidence for CIimatic Change in the Southern Levant and Adjacent Areas. In Bintliff, J. L., and van Zeist, W. (eds.), Palaeoclimates, Palaeoenvironments and Htrrnan Cornmunities in the Eastern n/fediterranean Region in Luter Prehistory, International Senes 1 3 3, BAR, Oxford, pp. 399-414.
Goldberg, P., and Rosen, A. (1987). Early Holocene Paleoenvironments o f Israel. In Le\ y, T. E. (ed. ), Shiqrnim 1: Studies Concerning Chalcolithic Societies in the Norrhern hregev Desert, Israel(1982-1984), Vol. 356 (i), BAR International Series, BAR, Oxford. pp. 23-33.
Gonen, R. (1993). The Chalcolithic Period, In Ben-Tor, A. (ed.), The Archaeology of .Anckrtr IsraeZ. Yale University Press, New Haven. pp. 10-39.
Goodfriend. G. A. (1 990). Rainfall in the Negev Desert during the Middle Holocene, based on 13C of Organic Matter in Land Snail Shells. Quaternary Research 34: 186- 197.
Gopher, A. (1 988). The Flint Industry from Tel Tsaf. Tel Aviv 15/16: 37-46.
Gopher. A. (1 989). The Flint Assemblages of Munhatta - Final Report. Vol. 4. Les Cahiers Du Centre de Recherche Français de Jerusalem, Association Paleonent, Paris.
Gopher, A. (1 995). Early Pottery-Bearing Groups in Israel - The Pottery Neolithic Period. In Levy, T. E. (ed.), The Archaeology of Society in the Holy Land, Leicester University Press. London, pp. 205-225.
Gopher. A., Tsuk, 2.. and Gophna R. (1990). Earliest Gold Artifacts Discovered in the Southem Levant. Current Anthropology 3 l(4): 436-443.
Gophna, R. (1 980). Excavations at 'En Besor. 1976. 'Atiqot 14: 9-1 6.
Gophna, R. (1 995). Early Bronze Age Canaan: Some Spatial and Demographic Observations. In Levy, T. E. (ed.), The Archaeology of Society in the Holy Land, Leicester University Press, London, pp. 269-279.
Gophna R., and Kistev, M. (1979). Tel Saf. Revue Biblique 86: 112-1 14.
Gophna. R., and Portugali, Y. (1988). Settlement and Demographic Processes in Israel's Cos ta l Plain fiom the Chalcolithic to the Middle Bronze Ages. Bulletin of the American School of Oriental Research 269: 1 1-36.
Gophna, R., and Sadeh, S. (1989). Excavations at Tel Tsaf: An Early Chalcolithic Site in the Jordan Valley. Tel Aviv 15/16: 3-36.
Goren, Y. (1 992). Technological Study of the Late Pottery Neolithic Ceramic Assemblage from Kabri, Area B. In Kempinski. A., and Niemeier. W. (eds.), E~cavations or Kabri: Preliminary Report of 1991 Season, Tel Aviv University, Tel Aviv
Green, W. A. (1 995). Periodizing World History. History and nteory 34: 99-1 1 1.
Grigson. C. (1989). Shiqmim 1 - Archaeozoological Aspects. Mitekufat Hueven 22: 1 1 1 - 114.
Grigson. C. (1 993). The Earliest Dornestic Horses in the Levant. Journal of Archaeological Science 20: 645-655.
Grigson, C. (1 995). Plough and Pasture in the Early Economy of the Southern Levant. In Levy, T. E. (ed.). The Archaeology of Society in the Holy Land. Leicester University Press, London. pp. 245-267.
Guex, J. (1 977). Une nouvelle méthode d'analyse biochronologique. Bulletin Laboratoire Géologie. Université de Lattssanne 224: 3 09-3 22.
Guex. J . ( 1 9 8 7). Corrélations b iochronologiqzies et associations unitaires, Presses Polytechniques Romandes, Laussane.
Guex. J. (1 988). Guex, J. (1 988). Utilizations des horizons maximaux résiduels et bioc hrono logie. Bulletin Laboratoire Géologie, Université de Laussanne 3 00: 1 3 5- 142.
Guex. J. (1 99 1). Biochronological Correlations. Springer-Verlag, Berlin.
Guex. J., and Davaud, E. (1984). Unitary Associations Method: Use of Graph Theory and Cornputer Algorithm. Cornputers and Geosciences 1 O(1): 69-96.
Gustavson-Gaube. C. (1986). Tell esh-Shuna North 1985: A Preliminary Report. Annual of the Department of Antiqziities of Jordan 30: 69-98.
Gustavson-Gaube. C. (1 987). Tell esh-Shuna North: 1984 and 1985. In Hadidi. A. (ed.), Studies in the Archaeology and History of Jordan III, Department of Antiquities, Amman and Routledge & Kegan Paul Ltd, London
Gustavson-Gaube. C.. and Erskine, R. A. (1 985). Tell esh-Shuna North 1 984: A Preliminary Report. Annual of the Department of Antiquities of Jordan 29: 43-87.
Hage, P., and Harary, F. (1 99 1). Exchange in Oceania, Academic Press. New York.
Haland. R. (1 977). Archaeological Classification and Ethnic Groups: A Case Study from Sudanese Nubia. Nonvegian Archaeological Review 10: 1-1 7.
Hanbury-Tenison, J. W., Hart, S.. Watson, P. M., and Falkner, R. K. (1984). Wadi Arab Survey. 1983. Annual of the Department of Antiquities oflordan 28: 385-424.
Hanbury-Tenison. J. (1985). A Late Chalcolithic Bowl-Stand fiom Pella, Jordan. Palesrine Exploration Qtrarrerly 1 1 7: 100- 10 1.
Hanbury-Tenison, J. W. (1 986). The Late Chalcolithic to Early Bronze I Transition in Palestine and Transjordan. BAR International Series. No. 3 1 1, British Archaeologicai Reports, Oxford.
Hanbury-Tenison. J. W., Hart. S.. Watson. P. M., and Falkner. R. K. (1984). Wadi Arab S w e y . 1983. Annrral of the Department of An tiqui fies of Jordan 28: 385-424.
Harris. E. C. (1 975). The Stratigraphic Sequence: A Question of Time. F'orid Archaeology 7: 109- 131.
Harris? E. C. ( 1 979). Principles of Archaeological Stratigmphy. First Edition edition, Academic Press, London.
Harris. E. C. (1984). The Analysis of Multilinear Stratigraphic Sequences. Scottish hchaeological Revierv 3 : 1 27- 1 3 3.
Harris. E. C. (1 989). Principles of Archaeological Stratigraphy, Second edition, Academic Press. London.
Harris. E. C.. Brown. M. R., and Brown, G. J. (1 993). Practices of Archaeological S~ratigraphy. Academic Press, London.
Harrison. T. P. (1 997). Shifting Patterns of Settlement in the Highlands of Central Jordan during the Early Bronze Age. Bulletin of the American School of Oriental Research 306: 1-37.
Hawking, S. W. (1 988). A Brief History of Tirne: Frorn the Big Bang to Black Holes, Bantam Books. New York.
Hayden. B., and Schulting, R. (1997). The Plateau Interaction Sphere and Late Prehistoric Culturd Complexity. Arnerican Antiquity 62: 5 1-85.
E-Ielms, S. W. (1975). Jawa 1973: A Preliminary Report. Levant 7: 20-38.
Helms. S. W. (1976). Jawa Excavations 1975: A Preliminary Report. Levant 8: 1-35.
Helms, S. W. (1 977). Jawa Excavations 1975: Third Preliminary Report. Levant 9: 2 1-35.
Helms, S. W. (1983). The EB N (EB-MB) Cemetery at Tiwal Esh-Sharqi in the Jordan Va1 ley, 1983. Annual of the Department of Antiquities of Jordan 28: 55-85.
Helms. S. W. ( 1 984). Excavations at Tell Umm Hammad Esh-Sharqiya in the Jordan Valley 1982. Levant 16: 35-54.
Helms. S. W. ( 1 986). Excavations at Tell Umm Hammad, 1984. Levanr 18: 25-50.
Helms, S. W. (1 987). Jawa Tell Umm Hammad and the EB l/Late Chalcolithic Landscape. Levanr 19: 49-80.
Helms. S. W. (1992). Stratipphy. In Betts. A. V. G. (ed.), Excuva~ions ar Te22 h m Harnmad l98N984: The Early Assemblages (EB 1-II), Excavations and Explorations in the Hashemite Kingdom of Jordan, Edinburgh University Press, Edinburgh. pp. 15-29.
Hennessy. J. B. ( 1 967). The Foreign Relations of Palestine during the Earl y Bronze Age, Random House, New York.
Hennessy, J. B. (1 968). Teleilat Ghassul. Revue Biblique 75: 247-250.
Hennessy, J. B. ( 1 969). Prel iminary Report on a First Season of Excavations at Teleilat Ghassul. Levanr 1 : 1-24.
Hennessy, J. B. (1 982). Teleilat Ghassul: I t s Place in the Archaeology of Jordan. In Hadidi. A. (ed.), Studies in the History and Archaeo20g.v of Jordan 1, Routledge & Kegan P., London. pp. 55-58.
H e ~ e s s y , J. B. (1989). Ghassul. Teleilat. In Homes-Fredericq, D., and Hemessy, J. B. (eds.), Al-chaeology of Jordan 2. Field Reports. Szïrveys and Sites A-K, Akkadica, Leuven, pp. 230-24 1.
Henry. D. 0. ( 1 989). From Foraging ro Agricuhwe, University of Pemsylvani~ Philadelphia.
Hem, L. G.. Geraty! L. T., LaBianca, O. S., and Younker, R. W. (eds.). (1991). Madaba Plains Projecr: The 198 7 Season ut TeiZ el ' Wmeiri and Vicinity and Strbsequent Stzrdies. Andrews University Press, Berrien Springs, Michigan.
Hill, J. N., and Evans. R. K. (1972). A Model for Classification and Typology. in Clarke, D. L. (ed.), Models in ArchaeoZogy, Methuen, London, pp. 23 1-273.
Hodder. 1. (1 974). Regression Analysis of Some Trade and Marketing Patterns. WorZd Archaeologv 6: 1 72- 1 89.
Hodder. 1. (1 977a). The Distribution of Material Culture Items in the Baringo District, W. Kenya. Man 12: 239-269.
Hodder, 1. (1977b). Some New Directions in the Spatial Andyis of Archaeological Data at the Regionai Scale (Macro). In Clarke, D. L. (ed.). Spatial Archaeology, Academic Press, N.Y.. . pp. 223-35 1.
Hodder. 1. (1 978). Social Organization and Human Interaction: The Development of Some Tentative Hypotheses in Terms of Material Culture. In Hodder, 1- (ed.), The Spatial Organization of Culture, Duckworth, London, pp. 199-269.
Hodder, 1. (1 98 1). Society, Economy, and Culture: an Ethnographie Case Study amongst the Lozi. In Hodder, I., and Isaac, G. (eds.), Pattern of the Past: Sttrdies in Honour of Dmid Clarke. N . Hammond. Cambridge, pp. 67-95.
Hodder, 1. (1082). $mbols in Action. Cambridge University Press. Cambridge.
Hodder. 1. (1 987). The Contribution of the Long-Terrn. In Hodder, 1. (ed.), The Archaeologv of the Long Term, Cambridge University Press, Cambridge, pp. 1-8.
Hodder, I., and Orton. C. R. (1976). Spatial Anakÿsis in ArchaeoIogy., Cambridge University Press. Cambridge.
HoFFman, M. A. (1990). Egypt Before the Pharoahs: The Prehistoric Foundations of Egyptian Civilization. Originally published in 1979, Dorset Press, New York.
Hole? F., and Shaw. M. (1 967). Computer analysis of chronological seriation. Rice University Stzrdies 53(3).
Hopf. M. (1983). Jerkho Plant Remains. In Kenyon, K. M., and Holland. T. A. (eds.), Elrcavations at Aericho, Vol. 5. , pp. 5 76-62 1 .
Horowitz, A. (1 974). Preliminary Palynological Indications as to the Climate of Israel durkg the last 6000 Years. Puléorient 2: 407-414.
Horowitz, A. (1 979). The Quaternary of lsrael, Academic Press, New York.
Horowitz, L. K. (1996). The Faunal Remains from MeTona. 'Atiqof 28: 37-39.
Hovers, E.. and Bar-Yosef, 0. (1989). Settlement and Subsistence Patterns in the Lower Jordan Valley from Epipaleolithic to Neolithic Times. In Hershkovitz, 1. (ed.), People and Culture in Change, International Series 508, BAR, Oxford, pp. 37-5 1.
Hull, D. L. (1965). The Effect of Essentiafism on Taxonomy - Two Thousand Years of Stasis. British Jozrrnal of Philosophy of Science 1 5: 2-1 5.
Hundack, C., Mutzel, P., Pouchkarev, I., and Thome, S. (1998). ArchEd. MP II, Saarbrücken, Gennany.
Ibrahim. M., Sauer, J. A., and Yassine, K. (1976). The East Jordan Valley Survey, 1975. Bzilletin of rhe Arnerican School of Oriental Research 222: 4 1 -66.
Ilan, O., and Sebbane, M. (1 989). Copper Metallurgy, Trade and the Urbanization of Southern Canaan in the Chalcolithic and Early Bronze Age. In Miroschedji, P. de (ed.), L 'zcrbanisafion de la Palestine à l Zge du Brame ancien: Bilan er perspectives des recherches actuelles, Vol. 527 (i), BAR International Series, BAR, Oxford, pp. 139-162.
Jevons. W. S. (1 874). The Pnnciples of Science: A Treatise on Logic and Scientific Method. Vol. S. MacMillan and Co., London.
Joffe, A. H. (1991 a). Early Bronze I and the Evolution of Social Complexity in the Southern Levant. Journal of Medirerranean Archaeology 4(1): 3-58.
JO ffe, A. H. ( 1 99 1 b). Sertlement and Society in Early Bronze I and II Canaan. Ph.D. thesis, University of Arizon- Tucson.
JO ffe, A. H. (1 993). Settlernent and Society in the Euriy Bronze Age I and II, Southern Levanr. Vol. 4. Monographs in Mediterranean Archaeology, (ser. ed.. Knapp. A. B.), Sheffield Academic Press, Sheffield.
Joffe, A. H.. and Dessel. J. P. (1995). Redefining Chronology and Terminology for the Chalcolithic of the Southem Levant. Czrrrent Anfhropology 36(3): 507-5 18.
Johnson. A. W., and Earle, T. (1 987). The Evolution of Human Society. Stanford University Press. Stanford.
Josien, T. (1 955). La Faune Chalcolithique Gisements Palestiniens de Bir Es-Safadi et Bir Abou Matar. Israel Erploration Journal 5 : 246-256.
Kangas. S. E. (1994). Social and Economic Organization during the Chalcolithic Penod in the Northem Negev. Israel: A Study of Ceramic Variability. PhD thesis, Brandeis University, Department of Classical and Oriental Studies, Waltham, MA.
Kantor, H. J. (1 952). Further Evidence for Early Mesopotamian Relations with Egypt. Journal of Near Eastern Studies 1 1 : 239-250.
Kantor, H. J. (1992). The Relative Chronology of Egypt and Its Foreign Correlations before the First Intermediate Period. In Ehrich, R. W. (ed.), Chronologies in Old World Archaeology, Third edition, Vol. 1, The University of Chicago Press, Chicago, pp. 3-21.
Kaplan, J. (1 953). Archaeological Survey on the Left Bank of the Yarkon River. Eretr- Israel2: (Hebrew).
Kaplan, J. (1 955). Tuleil Batashi in the Sorek Valley. Israel Erplorafion Jozirnal5: 273- 274.
Kaplan, J. (1958a). Excavations at Teluliot Batashi in the Vale of Sorek. Eretz-israel S(Eng1ish summary): 9-24 (Hebrew).
Kaplan, J. (1 958b). Excavations at Wadi Rabah. lsrael fikploration Journal 8: 149- 1 60.
Kaplan. J. (1 959). The Connections of the Palestinian Chalcolithic Culture with Prehistoric Egypt. lsrael lFrplaration Journal 9: 134- 136.
Kaplan. J. (1 960). The Relation of the Chalcolithic Pottery of Palestine to Halafian Ware. Brtlletin of the American Schools of Oriental Research I 59: 32-36.
Kaplan. J. (1 977). Neolithic and Chalcolithic Remains at Lod. Eretz Israel 13: 57-75 (in Hebrew with English surnrnary).
Kaplan, J., and Ritter-Kaplan, H. (1978). Tel Aviv. In Yonah, M. A. (ed.), Encyclopaedia of Archaeological E~cmations in the Ho& Land, Israel Exploration Society and Massada Press, Oxford, pp. 1 1 59- 1 168.
Kareem? J. (1 989). Tell Fendi: Jisr Sheikh Hussein Project, 1 986. Annual ofthe Department of A ntiquities in Jordan 33 : 97- 109.
Kempinski, A., and Gilead. 1. (1991). New Excavations at Tel Erani: A Preliminary Report of the 1985-1988 Seasons. Tel Aviv 18: 165-191.
Kempinski, A.. and Niemeier, W. (eds.). (1 993). Ercavations a[ Kabri: Preliminary Report of 1991 Season. Tel Aviv University, Tel Aviv.
Kenyon, K. (1 97 1). Archaeology in the Hoiy Land, 3rd edition, Praeger Publishers, New York.
Kenyon, K., and Holland. T. A. ( 1 982). Excavations at Jericho, Vol. 4: The Pottery Type Series and Other Finds, (ser. ed., Holland, T. A.), British School of Archaeology in Jerusalem, London.
Kenyon, K. M. (1 960). Excavations ut Jericho, Vol. 1: The Tombs Excavated in 1952-3, British School of Archaeology in Jerusalem, London.
Kenyon, K. M- (1965). Excavations at Jericho, Vol. 2: The Tombs Excavated in 1955-8, British School of Archaeology in Jerusalem, London.
Kenyon, K. M., and Holland, T. A. (198 1). Excavations ut Jericho, Vol. 3: The Architeet tire and Stratigraphy of the Tell, (ser. ed., Holland, T. A.), The British SchooI of Archaeology in Jerusalem, London.
Kenyon, K. M., and Holland, T. A. (1983). Excavaiions ut Jericho, Vol. 5: The Poftery Phases of the Tell and Ofher Finds, (ser. ed-, Holland, T. A-). British School of Archaeology in Jerusalem, London.
Kerner, S. (1 997). Specialization in the Chalcolithic in the Southem Levant. In Gebel, H. G. K., Kafafi. 2.. and Rollefson, G. O. (eds.), The Prehistory of Jordan, II. Perspectives from 1997, Ex Oriente, Berlin, pp. 41 9-427.
Kintigh, K. (1989). Sarnple Size, Significance, and Measures of Diversity. In Leonard, R. D., and Jones. G. T. (eds.). Quaniifiing Diversity in Archaeology, Cambridge University Press. Cambridge. pp. 25-36.
Kirkbride. D. (1 969). Early Byblos and the Beqa'a. MéIanges de l 'Liniversiré Saint- Joseph de Beyrot& 45: 45-60.
Klejn. L. S. (1982). Archaeological Typology. Vol. 153. BAR International Series, BAR, Oxford.
Klimek, S. (1 935). The Structure of Californian Indian Culture. University of California Publications in Arnerican Archaeology and Ethnology 37: 1-70.
Knapp, A. B. (1992). Archaeology and Annales: Time. Space, and Change. In Knapp, A. B . (ed.). Archaeologv, Annales, and Ethnohistory, Cambridge University Press, Cambridge. pp. 1-2 1 .
Koeppel. R. (1 935). Teleilat Ghassul irn Jordantal. Biblica 16: 24 1-256.
Koeppel. R. ( I 937). Maiadi und Ghassul. Biblica 18: 443-449.
Koeppel. R. (1939). Die achte Grabung in Ghassul: vorlaufiger Bericht. Biblica 19: 260- 266.
Koeppel, R. (1940). Teleilat Ghassul II, Institut Bibiique Pontifical, Rome.
Kohler-Rollefson. 1.. Gillespie. W.. and Metzger. M. (1988). The Fauna fiom Neolithic 'Ain Ghazal. In Garrard, A. N., and Gebel, H. G. (eds.), The Prehistory of Jordan: The Stafe of Research in 1986, Vol. 396 (ii), BAR International Series, BAR, Oxford, pp. 423-430.
Koucky, F. L.. and Smith, R. H. (1 986). Lake Baysan and the Prehistoric Settlement of the Northern Jordan Valley. Paléorieni 12(2): 27-36.
Kroeber. A. L. (1916). Zuni Potsherds. Anthropological Papers of the Arnerican Museum of Natural History 1 8(1): 7-37.
Kroeber. A. L. (1 93 1). Historical Reconstruction of Culture Growths and Organic Evolution. American Anrhropologist 3 7: 149- 156.
Kroeber, A. L. ( 1 963). Anthropology: Culture Patterns and Processes, Harbinger, New York.
Lapp, P. W. (1968). Bab edh-Dhra Tomb A76 and Early Bronze 1 in Palestine. Bulletin of the Arnerican Schoof of Oriental Research 189: 12- 14.
Lapp, P. W. (1 970). Palestine in the Early Bronze Age. In Canders, J. A. (ed.), Essa-ys in Honor of Nelson Glzieck, Doubleday, Garden City, NY, pp. 10 1 - 13 1.
Lazarsfeld, P. F,. and Merton. R. K. (1964). Friendship as Social Process: A Substantive and Methodological Analysis. In Berger. M. (ed.), Freedom and Control in Modern Society. Octagon. New York, pp. 23-63.
Le Goff. J., and Nora, P. (eds.). ( 1985). Consh-zrcting the Past: Essays in Historical Merhodology. Cambridge University Press, Cambridge.
LeBlanc, S. A. (1975). Micro-seriation: A Method for Fine Chronologicai Differentiation. American Anliqztiîy 40: 22-3 8.
Lee, J. R. (1 973). Chalcolirhic Ghassul: New Aspects and Master Typology. Ph.D. thesis, Hebrew University of Jerusalem. Jerusalem.
Leeuw, S. E.. van der. and Torrence, R. (eds.). (1989). What's New?: A CIoser Look ut the Process of Innovation. Unwin Hyman. London.
Lemon, R. R. (1 990). Principles of Stratigraphy, Merrill Publishing Company, Columbus. OH.
Lenzen, C. J., Kareem, J.. and Thorpe, S . (1987). The Jisr Sheikh Hussein Project, 1986. Anmial of rhe Department of Antiqrrities of Jordan 3 1 : 3 13-3 19.
Leonard, A. J. (1 98 1 ). Kataret Es-Samra: A Late Bronze Age Cemetary in Transjordan? Anntral of the Department of An tiqui ties in Jordan 25 : 1 79- 195.
Leonard, A. J. (1 992). The Jordan Valley Sztrvey, 1953: Some Unpublished Soundings Conducted by James Mellaart. Vol. 50. The Annual of the Amencan Schools of Oriental Research, Eisenbrauns, Winona Lake. Indiana.
Leroi-Gourhan. A.. and Darmon, F. (1987). Analyses Palynologiques de Sites Archéologiques du Pléistocène Final dans la Vallée du Jourdain. Israel Journal of Earth Sciences 36: 65-72.
Levy. T. E. (1986). Social Archaeology and the Chalcolithic Period: Explaining Social Organizational Change During the 4th Milleniurn in Israel. Michrnanim 3: 5-20.
Levy, T. E. (ed.). (1 987). Shiqmim 1: Studies Conceming Chalcolithic Societies in the Northern Negev Desert, Israel (1 982- 1984). Vol. 3 56 (ii). BAR International Series, BAR, Oxford.
Levy, T. E. (1 992a). Radiocarbon Chronotogy of the Beersheba Culture and Predynastic Egypt. In Brink, E. C. M., van den. (ed.), The Nile Delta in Transition: 4th-3rd Mllennium B. C.. Israel Exploration Society, Jenisalem, pp. 345-3 56.
Levy, T. E. (1992b). Transhumance, Subsistence, and Social Evotution in the Northern Negev Desert- in Bar-Yosef, O., and Khazanov, A. (eds.), Pastoralism in the Levant, Monographs in World Prehistory No. 10, Prehistory Press. Madison, Wisconsin, pp. 65-82.
Levy, T. E. (1995). Cult, Metallurgy and Rank Societies - Chalcolithic Penod (ca. 4500 - 3500 BCE). In Levy, T. E. (ed.), The Archaeology of Society in the Holy Land. Leicester University Press, London, pp. 226-244.
Levy, T. E.. and Alon, D. (1 983). Chalcolithic Settlement Patterns in the Northem Negev Desert. Current Anrhropoloa? 24: 1 05- 107.
Levy, T. E.. and Alon, D. (1987). Excavations in the Shiqmim Village. In Levy, T. E. (ed.). Shiqmim 1. International Series 356 (i), BAR, Oxford, pp. 153-2 18.
Levy, T. E.. Alon, D.. Goldberg, P., Grigson, C.. Smith, P., Buikstra. J. E., Holl, A., Rowan, Y., and Sabari. P. (1993). Protohistoric Investigations at the Shiqmim Chalcolithic Village and Cemetary: Interim Report on the 1988 Season. Annual of rhe American Schools of Oriental Research 5 1 : 87- 1 06.
Levy. T. E.. Alon. D.. and Smith. P. (1997). Egyptian-Canaanite Interaction at Naha1 Tillah. Israel (ca. 4500-3000 BCE): An Interim Report on the 1994-1995 Excavations. Brrlletin of the Arnerican School of Oriental Research 307: 1 -5 1.
Lewis, G. J. (1 982). Hztman Migration: A Geographical Perspective, St. Martin's Press, New York.
Lewontin, R. C. (1 974). The Genefic Basis of Evolutionary Change, Columbia University Press, New York.
Linton, R. (1 936). The Study of Man, Appleton Century Crofis, New York.
Liphschitz. N.. Gophna, R., Hartman, M.. and Biger, G. (1 991). The Beginnllig of Olive (Olea europaea) Cultivation in the Old World: A Reassessment. Jozrrnal of Archaeological Science 1 8: 44 1 -453.
Lipo. C. P. (1 997). Population Structure. Cultural Transmission, and Frequency Seriation. Journal of Anthropological Archaeology 1 6: 3 0 1 -3 3 3.
Little. E. L. (ed.). (1996). National Audubon Society Field Guide to North Amencan Trees, Alfred A. ffiopf. New York.
Longacre. W. A. (ed.). (1 99 1 ). Cerarnic Ethnoarchoeology. The University of Arizona Press, Tucson.
Lovell, J. (1 999). The Late Neolithic and Chalcolirhic Periods in the Sozlthern Levant: New Data fiom Teleilat Ghasszrl. Jordan. unpublished Ph.D. thesis, University of Sydney. Sydney, Australia.
Lovell, J., Kafafi, Z., and Dollfus, G. (1997). A Preliminary Note on the Cerarnics from the Basal Levels of Abu Hamid. In Gebel, H. G., Kafafi, 2.. and Rollefson, G. O. (eds.), Prehistory of Jordan, II. Perspectives from 1997, Studies in Early Near Eastern Production, Subsistence. and Environment 4, Ex Oriente, Berlin, pp. 36 1- 3 70.
Lyman. R. L.. O'Brien. M. J., and Dunnell. R. C. (1997). The Rise and Full of Culfure History, Plenum, New York.
Mabry, J . (1 989). Investigations at Tell el-Handaquq. Jordan (1987-88). Annztal of the Departmen, ofAntiquities of Jordan 33: 59-95.
Mabry, J., and Palumbo. G. (1988). The 1987 Wadi Yabis Survey. Annuul of the Deparrrnenf of Antiquities of Jordan 32: 275-305.
Mabry, J. B. (1 995). Early Town DeveIopment and Water Management in the Jordan Valley: Investigations at Tell el-Handaquq North. Annual of the Arnerican Schools of Oriental Rcsearch 53 : 1 1 5- 154.
Macalister, R. A. S. (1902). First Quarterly Report on the Excavations at Gezer. Palestine Exploration Fund Quarterly Statemenr 34: 3 1 7-375.
Macalister, R. A. S. (1 907). Fourteenth Quarterly Report on the Excavations at Gezer. Palestine Exploration Fund Quarterly Saternent 3 9: l 84-204.
Macalister, R. A. S. (1 9 12). The Excavations of Gezer, 11, Bernard Quaritch Ltd, London.
MacDonald. B. (ed.). ( 1 988). The Wadi el Hasa Archaeological Survey, 1979- 1983. West-Central Jordan. Wilfred Laurier University Press, Waterloo.
MacDonald. B. (ed.). (1992). The Southern Ghors and Northeast 'Arabah Archaeological Sttrvey. J. R. ColIis Publications. Sheffield.
MacDonald, E.. Starkey. J. L.. and Harding, L. (1932). Beth Peler II, Prehistoric Fora, British School of Archaeology in E w t . London-
Macumber. P. G.. and Head, M. J. (1991). implications of the Wadi al-Hammeh Sequences for the Terminal Drying of Lake Lisan, Jordan. Palaeogeography, Palaeoclintatology, Palaeoecoiogy 84: 163- 173.
Maisler, B. (1 933). Ancient Remains at Afule. Bulletin of the Jewish Palestinian Erpioration Society l(3): 2 1 -22.
Mallon, A. (1929). Notes sur Quelques Sites du Ghor Oriental. Biblica 10: 214-232.
MaIlon, A. (1 93Oa). Les Fouilles de l'Institut Biblique Pontifical dans la Vallée du Jourdain: Rapport Préliminaire. Biblica 11: 3-22.
Mallon, A. (1930b). Les Fouilles de l'Institut Biblique Pontifical dans la Vallée du Jourdain: Rapport Préliminaire de la Deuxième Campagne. Biblica 1 1 : 129-1 48.
Mallon, A. (1 93 1). Les Fouilles de l'Institut Biblique Pontifical dans la Vallée du Jourdain. Biblica 12: 257-270.
Mallon, A. (1 932a). La Civilisation du X m e Millénaire dans la Vallée du Jourdain: Les Fouilles de Teleilat Ghassul. Syria 13: 333-344.
Mallon. A. ( 1 932b). Les Fouilles de l'Institut Biblique Pontifical dans la Vallée du Jourdain: Rapport Préliminaire de la Campagne de l'Hiver 193 1-32. Bibka 13: 273- 383.
Mallon. A. (1 933). Les Fouilles de l'Institut Biblique Pontifical dans la Vallée du Jourdain: Rapport Préliminaire de la Campagne 1 932-3 3. Biblica 14: 294-302.
Mallon, A., KoeppeI. R., and Neuville. R. (1 934). Teleilat Ghassul I, Institut Biblique Pontifical, Rome.
Marquardt, W. H. (1 978). Advances in Archaeological Seriation. In Schiffer, M. B. (ed.), Advances in Archaeological Method and Theory, Vol. 1, Academic Press, New York, pp. 245-3 14.
Mason, R. B. (1 997). Medieval Syrian Lustre-painted and Associated Wares: Typology in a Multidisciplinary Study. Levant 29: 169-200.
Mayr, E. (1 994). Typological versus Population Thinking. In Sober, E. (ed.), Conceprual Issues in Evolutionary BiaZogy, 2nd edition. MIT Press, Cambridge. MA, pp. 158- 160.
McClure, H. A. ( 1 976). Radiocarbon Chronology of Late Quatemary Lakes in the Arabian Desert. Nature 263: 755-756.
McNicoll. A., Smith, R. H., and H e ~ e s s y , B. (eds.). (1982). Pella in Jordan 1. Australian National Gallery, Canberra.
McNicoll, A., Smith. R. H.. Hemessy, B. J., and Potts, T. (eds.). (1 986). Pella in Jordan 2, Austraiian National Gallery, Canberra,
Mellaart, J. (1956). The Neolithic Site of Ghnibba. Annual of the Department of Antiqztities in Jordan 3 : 24-40.
Mellaart. J. (1 962). Preliminary Report of the Archaeological Survey in the Yarrnuk and Jordan Valley for the Point Four Irrigation Scheme. Annzral of the Department of Antiqrtities of Jordan 6,7: 126- 157.
Milke, W. ( 1 949). The Quantitative Distribution of Cultural similarities and their Cartographie Representation. Americun ilnthropologisr 5 1 : 237-252.
Miroschedj i_ P. R. de ( 1 97 1 ) . L'Epoque Pre-urbaine en Palestine, J. Gabalda, Paris.
Miroschedji, P. R. de (ed.). (1989). L'urbanisation de la Palestine à l'âge du Bronze ancien: Bilan et perspectives des recherches actuelles. BAR International Series 727 (ii), BAR. Oxford.
Montelius, 0. (1986). Dating in fhe Bronze Age: Wilh Special Reference fo Scandinavia (first published 1885 as Om tidsbestamning inom bronsildem med sZirskildt pli Scandinavien. K. Vitterhets Historie och Antiqvitets Akademiens Handlingar, Stockholm). The Royal Academy of Letters and Antiquities, Stockholm.
Moore, A. M. T. (1973). The Late Neolithic in Palestine. Levant 5: 36-68.
Moore. A. M. T. (1983). The First Farmers in the Levant. In Young, T. C. J., Smith, P. E. L., and Mortensen, P. (eds.), The Hilly Flanks and Beyond, University of Chicago, Chicago, pp. 91 -1 1 1 .
Moorey, P. R. S. (1990). From Gulf to Delta in the Fourth Millenium: The Syrian Connection. Eretz-Israel2 1 : 62-69*.
Muheisen, M. (1 988). A Survey of Prehistoric Sites in the Jordan Valley (1985). In Garrard, A. N., and Gebel, H. G. (eds.), The Prehistory of Jordan: The State of Research in 1986, BAR International Series 396 (ii), BAR, Oxford, pp. 503-522.
Muheisen, M., Gebel, H. G., Hanns, C.? and Neef, R. (1988). Excavations at 'Ah Rahub, a Final Natufian and Yarrnoukian Site near Irbid (1985). In Garrard, A. N., and Gebel, H. G. (eds.), The Prehistory of Jordan: The State of Research in 1986, BAR International Series 396 (ii), BAR, Oxford, pp. 473-502.
NACSN (1983). North Arnerican Cornmision on Stratigraphic Nomenclature: North Arnerican Stratigraphic Code. American Association of Petroleum Geologists Bulletin 67: 84 1-875.
Najjar, M., Abu Dayya A., Suleiman, E., Weisgerber, G., and Hauptmann, A. (1990). Tell Wadi Feinan, the First Pottery Neolithic Tell in the South of Jordan. Annual of the Department of Antiquities of Jordan 34: 27-56.
Neef. R. (1 990). Introduction, Development and Environmental Implications of Olive Culture: the Evidence from Jordan. In Bottema, S., Entjes-Nieborg, G., and van Zeist, W. (eds.), Man's Role in the Shaping of the Eastern Mediferranean Landscape, Rotterdam, pp. 295-306.
Neev, D., and Emery, K. 0. (1 967). The Dead Sea. Geological Survey of lsrael Bulletin No. J I .
Neev, D., and 1 i : . K. ( 1 a / 77). Climatic Fluctt~ations during the Holocene as Reflected by rhe Dead Sea Levels. International Conference on Terminal Lakes, Weber State College. Ogden, Utah.
Neiman. F. D. (1996). Stylistic Variation in Evolutionary Perspective: Inferences fiorn Decorative Div~rsity and Interassemblage Distance in Illinois Woodland Ceramic Assemblages. Arnerican Antiquity 60: 7-36.
Neuville, R., and Mallon, A. (1 93 1). Les debuts de I'age des metaux dans les grottes du desert du Judee. Syria 12: 24-47.
Newgrosh, B. (1 988). Scientific Dating Methods and Absolute Chronology. Journal of the Ancient Chronobgy Forum 2: 60-68.
Niklewski, J., and van Zeist, W. (1970). A Late Quaternary Pollen Diagram from Northwestern Syria. Acta Botanica Neerlandica 19: 737-754.
North, R. (1 959). "Ghassulian" in Palestine Chronological Nomenclature. Biblica 40: 54 1-555.
North, R. (1 96 1). Ghassiil 1960 Excavation Reporf. Analecta Biblica: Investigationes Scientificae in Res Biblicas, No. 14, Pontificio lstituto Biblico, Rome.
North, R. (1 982)- The Ghassulian Lacuna at Jericho. Studies in the History of Archaeology of Jordan I. Pontifical Biblical Institute, Rome, pp. 59-66.
NomSis, M. J. (1993). SPSS for Windows: Professional Statisiics Release 6.01 SPSS Inc., Chicago.
Nutzel, W. (1 975). The Formation of the Arabian Gulf fiom 13000 B.C. Sumer 3 1 : 10 1 - 110.
Oren. E. D. (1989). Early Bronze Age settlement in northern Sinai: A mode1 for Egypto- Canaanite interconnections. In Miroschedj i. P. de (ed.), L 'urbanisation de la Palestine à l 'âge du Bronze ancien: Bilan et perspectives des recherches actuelles., Vol. 527 (ii), BAR International Series, BAR, Oxford, pp. 389-405.
Oren, E. D., and Gilead, 1. (1 98 1). Chaicolithic Sites in Northeastern Sinai. Tel Aviv 8: 25-44.
Palurnbo. G. (ed.). (1 994). The Jordan Antiqiiities Database and Information System: A Sztrnmary of the Datu, The Department of Antiquities of Jordan and The Amencan Center of Oriental Research, Amman.
Perrot, J. (1 954). The Excavations at Tell Abu Matar. near Beersheba (1953- 1954). Bullelin of the Israel Erploration Sociey 1 8: 1 2 1 - 128.
Perrot, J. (1964). Les duex premières campagnes de fouilles à Munhatta (1962-3). premiers résultats. Syria 4 1 : 323-345.
Perrot, J. (1 965). Munhata. Israel Exploration Journal 1 5 : 248-249.
Perrot, J. (1966). La troisième campagne de fouilles à Munhata (1 964). Syria 43: 49-60.
Perrot, J. (1984). Structures d'Habitat, Mode de Vie et Environnement. Les Villages Souterrains des Pasteurs de Beershéva. dans le Sud dïsrael, au IV Millénaire Avant llEre Chrétienne. Paléorient 1 O(1): 75-96.
Perrot, J., Zori, N., and Reich, Y. (1967). Neve Ur, un nouvel aspect du Ghassoulien. IsraeZ E~ploration Journal 1 7(4): 20 1 -232.
Petrie, F. (1 889). Sequences in Prehistonc Remains. Journal of the Royal A nt hropological Insiitute 29: 29 5-3 0 1 .
Petrie, M. W. F. (1 90 1 ). The Royal Tombs of the Earliest Dynasties. Egypt Exploration Fund Memoir 21, London.
Petrie. W. M. F. (1900). The Royal Tombs of the First Dynasty. Egypt Exploration Fund Memoir 18. London.
Philip. G., and Baird. D. (1993). Preliminary Report on the Second (1992) Season of Excavations at Tell esh-Shuna North. Levant XXV: 13-36.
Picard. L. (1 929). Zur Geologie der Besan-Ebene. Zeitschrifi des deutschen Paldstina- Vereins 52: 24-90.
Plog, F. T. (1973). Diachronic Anthropology. In Redman, C. L. (ed.), Research and Theory in Current Archaeology, John Wiley & Sons. New York. pp. 18 1 - 198.
Plog. S. (1978). Social Interaction and Stylistic Similarity: A Reanalysis. In Schiffer, M. B. (ed.), Advances in Archaeological Method and Theory, Vol. 1, Academic Press, New York, pp. 143- 182.
P log, S. ( 1 980). Styiistic Variation in Prehistoric Ceramics, Cambridge University Press, Cambridge.
Plog. S. (1986a). Change in regional trade networks. In Plog, S. (ed.). Spatial Organization and Exchange: Archaeological Survey on Northern BZack Mesa, Southern IIIinois University Press, Carbondale. pp. 283-309.
P log. S. (ed.). ( 1 986b). Spatial Organization and Erchange: Archaeological Survey on Northern Black Mesa: Southern Illinois University Press, Carbondale.
Plog, S. (1 993). Sociopolitical Implications of Stylistic Variation in the Amencan Southwest. In Conkey, M., and Hastorf. C. (eds.), The Uses of Style in Archaeology. Pb edition. New Directions in Archaeology. Cambridge University Press, Cambridge, pp. 61 -72.
Porter. D. H. (1 98 1 ). The Emergence of the Past: A Theory of Historical Expianation, University of Chicago Press, Chicago.
Portugali, l., and Gophna, R. (1 993). Crisis. Progress and Urbanization: The Transition from Early Bronze I to Early Bronze II in Palestine. Tel Aviv 20: 164-1 86.
Prausnitz. M. W. (1 970). From Hunter to Farmer and Trader, Sivan Press, Jerusalem.
Prausnitz. M. W. ( 1 975). 'Ali, Tell. Encyclopaedia of Archaeological Orcavations in the Holy Land, Israel Exploration Society and Masada Press, Jerusalem, pp. 6 1-64.
Ramenofsky. A. F. (1998). The Illusion of Time. In Ramenofsky, A. F., and Steffen, A. (eds.). Unit Issues in Archaeology: Measuring Time, Space, and Material, The University of Utah Press, Sait Lake City, pp. 74-84.
Rast. W. E., and Schaub. R. T. (1982). The Southeastern Dead Sea Plain Expedirion: An lnrerim Report of the 1977 Season. Vol. 46. AASOU, (ser. ed., Callaway, 1. A.), Arnerican Schools of Oriental Research, Cambridge, MA.
Read, D. W. (1979)- The Effective Use of Radiocarbon Dates in the Seriation o f Archaeological Sites. In Berger, R.. and Suess, H. E. (eds.), Radiocarbon Dating, University of California, Berkeley, pp. 89-94.
Renfrew, C. (1 972). The Emergence of Civilization, Methuen, London.
Renfiew, C. (1975). Trade as Action at a Distance: Questions of Integration and Communication. In Sabloff. J. A., and Lamberg-Karlovsky, C. C. (eds.)* Ancient Civilization and Trade, University of New Mexico Press, Albuquerque, pp. 1-60.
Renfiew, C. (1 979). Problems in European Prehistory, Edinburgh University Press, Edinburgh.
Renfiew, C. (1 986). Introduction: Peer Polity Interaction and Socio-political Change. In Renfiew, C., and Cherry, C. F. (eds.), Peer Poliiy Interaction and Sociopolirical Change, Cambridge University Press, Cambridge, pp. 1-1 8.
Rice, P. (1 99 1 ). Speciaf ization. Standardization, and Diversity: A Retrospective. in Bishop. R. L., and Lange, F. W. (eds.), The Ceramic Legacy ofAnna O. Shepard, University Press of Colorado, Boulder, pp. 257-279.
Richard, S. (1987). The Early Bronze - The Rise and Collapse of Urbanism. Biblical Archaeologist 50: 22-43.
RichardsonT J. B., and McCreery, D, (1978). Preliminary Analysis of the Plant Rernains from Eâb edh-Dhrâ, 1975. Annual of the American Schools of Oriental Research 43: 55-56.
Ringose, T. J. (1993). Diversity Indices and Archaeology. In Andresen, J., Madsen, T., and Sco 1 lar, 1. (eds. ), Computer Applications and Quanritative Methods in Archaeoiogy, Aarhus University Press, Aarhus, pp. 279-285.
Rogers, E. M. ( 1 97 1 ). Communication of Innovations: A Cross-Culturai Approuch, MacMillan Co.. New York.
Rogers. E. M. (1983). Dzffusion of Innovations, 3rd edition, Collier Macmillan, New York.
Rogers, E. M. (1995). Diffusion of lnnovations, 4îh edition, The Free Press, New York.
Rogers, E. M.. and Kincaid, D. L. (1 98 1 ). Communication Networks: Toward a New Paradigm for Research. Free Press, New York.
Rollefson, G. O. (1 993). The Origins of the Yarmoukian at 'Ain Ghazal. Paléorient 19(1): 91-100.
Rosen, S. A. (1986). The Analysis of Trade and Craft Specialization in the Chalcolithic Period: Cornparisons from Different Realms of Material Culture. Michmanim 3: 21- 32.
Rosen. S. A., and Elder, 1. (1993). Horvat Beter Revisited: The 1982 Salvage Excavations. 'Atiqot 22: 13-3 1.
Rosen. A. M. (1995). The Social Response to Environmental Change in Early Bronze Age Canaan. Journal ofAnrhropalogical Archaeolagy 11: 26-44.
Roshwal b, A. F. ( 1 98 1 ). Protohisrory in the Wudi Ghazzeh - A Typological and Technological Study Based on the 12.facDonald Excavations. PhD thesis. , London.
Rossignol-Strick. M. (1993). Late Quaternary Climate in the Eastern Mediterranean Region. Paléorient 19(1): 135-1 52,
R o h a n . M . S . (1994). Evolutionary Typologies and Cultural Complexity. In Stein, G., and Rothmna. M. S. (eds.), Chiefdoms and Early States in the Near East, Monographs in World Archaeology No. 1 8, Prehistory Press, Madison, pp. 1-1 0.
Rouse. 1. (1 960). The Classification of Artifacts in Archaeology. American Antiquiiy 25:
Rouse, 1. (1967). Seriation in Archaeology. In Riley, C. L., and Taylor. W. W. (eds.), American Historical Anthropology: Essay in Honor of Leslie Spier, Southem Illinois Press, Carbondale. pp. 153- 195.
Rouse, 1. (1 986). Migrutions in Prehktory: Inferring Populafion Movementflom Cztltural Rernains. Yale University Press, London.
Sackett, J. R. (1 977). The Meaning of Style in Archaeology: A General Model. American Antiqziity 42: 369-380.
Sackett, J. R. (1 993). Style and Ethnicity in Archaeology: The Case for Isochrestism. In Conkey, M. W ., and Hastorf, C. A. (eds.), The Uses of Sîyie in Archaeology, Cambridge University Press, Cambridge, pp. 32-43.
Sadeh. S., and Gophni R. (1991). Observations on the Chalcolithic Cerarnic Sequence in the Middle Jordan Valley. Journal of irhe Israel Prehistoric Society 24: 135-148.
Savary, J., and Guex. J. (1 990). Biograph: Version 2-02, Université de Laussanne, Laussanne.
Savary, J.. and Guex, J. (1 99 1). BioGraph: un nouveau programme de construction des corrélation biochronologiques basées sur les associations unitaires. Bulletin Laboratoire Géologie. Université de Laussanne 3 13 : 3 17-334.
Schaub, R. T. (1973). The Early Bronze Age l a - Ib Pottery of the Bab edh-llhra Cernetery, Jordan, University of Michigan, Ann Arbor.
Schaub, R. T. (1982). The Ongins of the Early Bronze Age Walled Town Culture of Jordan. in Hadidi, A. (ed.), Sfudies in the Hisrory and ArchaeoZogy of Jordars & Routledge & Kegan Paul. London, pp. 67-75.
Scheftelowitz, N. ( 1 992). Area B: Architecture, Stratigraphy and Pottery. In Kempinski, A., and Niemeier, W. (eds.), Eicavations at Kabri: Preliminary Report of 1991 Season, Tel Aviv University, Tel Aviv, pp. 1.
Schick, R. (1998). Palestine in the Early lslamic Period: Luxuriant Legacy. Near Easiern Archaeology 6 l(2): 73- 108.
Schiffer, M. B. (1 987). Formation Processes of the Archeological Record, University of New Mexico Press, Albuquerque. NM.
SchIanger. S. H., and Wilshusen, R. H. (1993). Local Abandonrnents and Regional Conditions in the North Amencan Southwest. In Cameron, C. M., and Tomka, S. A. (eds.), Abandonment of Settlements and Regions. Cambridge University Press, Cmbndge, pp. 85-98.
Schortrnan, E. M., and Urban, P. A. (1987). Modeling Interregional Interaction in Prehistory. In Schi ffer, M. B. (ed.), Advances in Archaeological lMethod and Theory, Kol. I I , Academic Press, New York, pp. 37-95.
Schortman. E. M., and Urban, P. A. (eds.). (1 992). Resources, Power, and Interregional Interaction, Plenum Press, New York.
Schuldenrein, J., and Goldberg, P. (1 98 1). Late Quaternary Palaeoenvironrnents and Prehistoric Site distribution in the Lower Jordan Valley. A Preliminary Report. Paléorient 7: 57-72.
Scollar, I., Herzog, I., Rehmet, J.. and Greenacre, M. J. (1997). The Bonn Archaeological Statistics Package, Version 5-38, . The Unkelbach Valley Software Works, Remagen, Germany.
Segal, D., and Carmi, 1. (1 996). Rehovot Radiocarbon Date List V. Ytiqot 29: 79-1 06.
Segal, D., Carmi. 1.. Gal. Z., Smithline, H., and Shalem, D. (1998). Dating a Chalcolithic Burial Cave in Peqi'in. Upper Galilee. Israel. Radiocarbon 40(2): 707-7 12.
Sellin, E. ( 1 9 13). Jericho. die Ergebnisse der Ausgrabungen, Hinrichs, Leipzig.
Service, E. R. (1 97 1). Primitive Social Orgonization: An Evoluiionary Perspective, Second edition (first published 1962), Random House. New York.
Shalev, S.. and Northover, J. P. (1987). The Chalcolithic Metal and Metal Working from Shiqmim. In Levy. T. E. (ed.), Shiqmim 1, Vol. 356, B A R International Series, BAR, Oxford. pp. 357-37 1.
S heman. S. J. ( 1 990). QitantzBing Archaeology, Edinburgh University Press, Edinburgh.
Shennan. S. 1. (1989). Cultural Transmission and Culture Change. In Leeuw, S. E., van der. (ed.), What's New? A Closer Look at the Process of innovation, Unwin Hyman, London. pp. 330-346.
Sheman. S. J. (1991). Sorne Current Issues in the Archaeological Identification of Past Peoples. Archaeologia Polona 29: 29-37.
Shipton. G. M. (1938). The Early Pottery of Megiddo. Seasons 1933-1938. Journal of the Palestine Oriental Society 18: 54-56.
Smiley. T. L. (1 955). The Geochronological Approach. In Smiley, T. L. (ed.), Geochronologv.- With Special Reference ro Southwestern United States, Physical Science Bulletin No. 2, University of Arizona, Arizona
Smith. D. G. (1 987). Archueologt*caf Sjutematics and the Analysis of lroquoian Ceramics: -4 Case Study/rom the Crawford Lake Area, Ontario, National Library of Canada, Ottawa.
Smith, M. E. (1992). Braudel's Temporal Rhythm and Chronology Theory in Archaeology. In Knapp, A. B. (ed.), Archueology, Annales, and Erhnohisrory, Cambridge University press, Cambridge, pp. 23-34.
Smith, R. H.? and Hanbury-Tenison, J. (1986). The Pottery Neolithic and Chalcolithic Periods. In McNicol, A., Smith, R. H., Hemessy, B. J., and Potts, T. (eds.), Pella in Jordan 2. Australian National Gallery, Canberra, pp. 17-27.
Sober, E. (1 980). Evolution, Population Thinking, and Essentialism. Philosophy of Science 47: 350-383.
Spaulding, A. C. (1978). Artifact Classes, Association, and Senation. In Dunnell, R. C., and ES. Hall, J. (eds.), Archaeological Essays in Honor of Irving B. Roztse, Mouton, The Hague, pp. 27-40.
Stager. L. E. (1992). The Periodization of Palestine fkom Neolithic Through Early Bronze Times. in Ehrich, R. W. (ed.), Chronologies in Old World Archaeology, third edition, The University of Chicago Press, Chicago, pp. 22-41.
Stein, J. K. (1987). Deposits for Archaeologists. In Schiffer, M. B. (ed.), Advances in Archaeological Method and Theory. Vol. I I , Academic Press, New York, pp. 337- 393.
Stein. J. K. (1990). Archaeological Stratigraphy. In Lasca N. P., and Donahue. J. (eds.), Archaeological Geology of North America, Geological Society of America Centennial Special Volume 4. , pp. 5 13-523.
Stein, J. K. (1992). Interpreting Stratification of a Shell Midden. In Stein. J. K. (ed.), Deciphering a Shell Midden. Academic Press, New York. pp. 7 1-93.
Stekelis. M. (1 967). Traces of Chalcolithic Culture. Eretz-Israel8: 44-88. (Hebrew).
Stoianovich. T. (1 976). French Hisrorical Method: The Annales Paradigm, Corne11 University Press, Ithaca.
Stuiver. M., and Reimer. P. J. (1993). Extended 1% Data Base and Revised CALIB 3.0 I4c Age Calibration Program. Radiocarbon 35(1): 2 15-230.
Sukenik, E. (1 936). Late Chalcolithic Pottery fiom 'Amileh. Palestine Exploration Fund Quarterly Srarement 68: 1 50- 154.
Tainter. J. (1988). The Collapse of Cornplex Socieries, Cambridge University Press, Cambridge.
Taylor, R. E. ( 1 98 7). Radiocarbon Dating: An A rchaeological Perspective, Academic Press, New York.
Taylor, R. E., and Aitken, J. (eds.). (1 997). Chronomefric Dating in Archaeology, Plenum, New York.
Teltser, P. A. (1 995). Culture History, Evolutionary Theory, and Frequency Seriation. In Te 1 tser, P. A. (ed .), Evolzrrionas. A rchaeology: Methodological Issues, University of Arizona Press, Tucson, pp. 5 1-68.
Thompson. T. L. (1979). The Sefrlement of Palestine in the Bronze Age, Verlag, Wiesbaden.
Tomka, S. A.. and Stevenson, M. G. (1993). Understanding Abandonment Processes: Summary and Remaining Concems. In Caneron, C. M., and Tomka, S. A. (eds.), Abandonment of Settle.rtents and Regions, Cambridge University Press, Cambridge, pp. 191-195.
Trigger. B. (1 989). A History ofArchaeological Thozîght, Cambridge University Press, Cambridge.
Triggs, J. R. (1 993). The Seriation of Multilinear Stratigraphie Sequences. In Harris, E. C., Erown. M. R.. and Brown, G. J. (eds.), Principles ofArchaeological Stratigraphy. Academic Press. London. pp. 250-273.
Tzori, N. (1 954). Survey of the Beth-Shan Basin. Btîlletin of the ismel E~ploration Society 18: 78-90.
Tzori. N. (1958). Neolithic and Chalcolithic Sites in the Valley of Beth Shan. Palestine Exploration Qrrarterly 90: 44-5 1 .
Vaax. R.. de (195 1 ). La troisieme campagne de fouilles a Tell el-Far'ah. pres Naplouse - la necropofe. Revue Biblique 58: 566-590.
Vaux, R., de (1952). La quatrieme campagne de fouilles a Tell el-Far'ah, pres Naplouse. Revue Biblique 59: 55 1-583.
Vaux, R., de (1955). Les fouilles de Tell el-Far'ah, pres Naplouse, cinquieme campagne. Rewe Biblique 62: 54 1-589-
Vaux. R., de (1 957). Les fouilles de Tell el-Far'ah, pres Naplouse. sixieme campagne. Revzre Biblique 64: 552-588.
Vau.. R., de (1 961). Les fouilles de Tell el-Far'ah, rapport preliminaire sur les 7eme, 8erne, 9eme campagnes 1958-1960. Revue Biblique 68: 557-592.
Vaux, R., de. (1 970). Palestine dunng the Neolithic and Chalcolithic Periods. Cambridge Ancient History 1. Vol. i, Cambridge. pp. 499-538.
Vaux, R., de. (1971). Palestine in the Early Bronze Age. Cambridge Ancient History I, Vol. ii. . pp. 208-237.
Vaux, R., de, and Steve, A. M. (1947). La première campagne de fouilles a Tell el- Far 'ah, près Naplouse. Revue Biblique 54: 394-43 3.
Vaux, R., de, and Steve, A. M. (1948). La seconde campagne de fouilles a Tell el-Far%.., pres Naplouse. Revue Biblique 55: 544-580.
Vaux, R.. de, and Steve, A. M. (1 919). La deuxieme campagnes de fouilles a Tell el- Far'ah, pres Naplouse - la necropole. Revue Biblique 56: 102- 138.
Vita-Finzi. C. (1978). Recent Alluvial History in the Catchment of the Arabo-Persian Gu1 f. In Brice, W. C . (ed.), The Environmental History ofthe Near and Middle East Since the Last Ice Age, Academic Press, New York, pp. 255-261.
Ward, G. K.. and Wilson, S. R. (1978). Procedures for Comparing and Combining Radiocarbon Age Determinations: A Critique. Archaeornefry 20(1): 19-3 1.
Ward. G. K.. and Wilson. S. R. (1 98 1). Evaluation and CIustering of Radiocarbon Age Determinations: Procedures and Paradigms. Archaeornefry 23(1): 19-39.
Webley, D. (1 969). A Note on the Pedology of Teleilat Ghassul. Levant 1 : 21 -23.
Weinstein. I. M. (1 984a). Radiocarbon Dating in the Southem Levant. Radiocarbon 26: 297-366.
Weinstein, J. M. (1984b). ï h e Signiticance of Tell Areini for Egyptian-Palestinian Relations at the Beginning of the Bronze Age. Bulletin ofthe American Schools of Orienfal Reseurch 256: 6 1-69.
Wiessner. P. (1983). Style and Social Information in Kalahari San Projectile Points. Arnerican Antiquity 49(2): 253-276.
Wiessner, P. (1984). Reconsidering the Behavioral Basis for Style: A Case Study arnong the Kalahari San. Journal of Anthropological Archaeolop 3: 190-234.
Willey. G. R., and Phillips, P. (1 9%). Method and Theory in American Archaeology, University of Chicago Press. Chicago.
Wilson. J. A. (1969a). Egyptian Historical Texts. In Pritchard. J. B. (ed.), Ancient Near eastern Texts Relating to the Old Testament, 3rd edition, Princeton University Press, Princeton, pp, 228-264.
Wilson, J. A. (1 969b). An Egyptian Letter. Ln Pritchard, J. B. (ed.), Ancient Near eastern Texrs Relating to the Old Testament, 3rd edition, Princeton University Press, Princeton. pp. 475-479.
Wilson. J. A. (1969~). Proverbs and Precepts. In Pritchard, J. B. (ed.), Ancient Near eastern Texts Relating to the Old Testament, 3rd edition, Princeton University Press, Princeton, pp. 4 12-430.
Wissler- C. (1 923). Man and Culture, Crowell Co., New York.
Wobst, H. M. (1977). Stylistic Behavior and information Exchange. In Cleland, C. E. (ed.). Papers for rhe Direcror: Research Essays in Honor of James B. Griffin, Antbropolgical Papers 67, Museum of Anthropology, University of Michigan, Ann Arbor, pp. 3 1 7-342.
Wright. G . E. (1 93 7). The Pottery of Palestine ji-om the Earliest Times to the End of the Early Bronze Age, Amencan Schools of Oriental Research, No. 1, Chicago.
Wright, G. E. (1 95 1). An Important Correlation Between the Palestinian and Syrïan C halcolit hic. Bulletin of rhe American Schools of Oriental Research 1 22: 52-5 5.
Wright, G. E. (1958). Tne Problem of the Transition Between the Chalcolithic and Bronze Ages. Eretz-lsrael5 : 3 7-45.
Wright. G. E. (1 961). The Archaeology of Palestine. In Wright, G. E. (ed.). The Bible and fhe Ancient Near Easr, New York. pp. 73-1 12.
Wright, G. E. (1971). The Archaeology of Palestine fiom the Neolithic through the Middle Bronze Age. Journal of the American Orienral Society 9 1 (2): 276-293.
Wright. K. (1 99 1 ). The Origins and Development of Ground Stone Assemblages in Late Pleistocene Southwest Asia. Paléorient 17(1): 19-45.
Yakar, J. (1 989). The so-called Anatolian eiements in the Late Chaicolithic and Early Bronze Age cultures of Palestine: A question of ethnocultural origins. In Miroschedji. P. R. de (ed.), L 'urbanisation de la Palestine à l'âge du Bronze ancien: Bilan et perspectives des recherches acruelles. Vol. 527 (ii), BAR International Series. BAR, Oxford. pp. 34-354.
Yamaguchi, K. (1 99 1). Evenr History Analysis. Applied Social Research Methods Series, Volume 28. Sage Publications, London.
Yassine. K., Ibrahim, M., and Sauer. J. (1988a). The East Jordan Valley S w e y , 1975: Part 1. In Yassine, K. (ed.), The Archaeology of Jordan, Vol. 1, Department of Archaeology, University of Jordan, Amman, pp. 159- 187.
Yassine. K., Ibrahim. M., and Sauer, J. (1988b). The East Jordan Valley Survey, 1975: Part 2. In Yassine, K. (ed.), The Archaeology ofJordan. Vol. 1, Department of Archaeology. University of Jordan, Amman, pp. 189-207.
Yassine, K., Kerestes, T. M., Wood, B. G., and Lundquist, J. M. (1988~). An Archaeological Survey of the Three Resevoir Areas in Northem Jordan. In Yassine, K. (ed.), The Archaeology ofJordan, Vol. 2, Department of Archaeology, University of Jordan. Amman, pp. 209-225.
Yoffee. N. (1979). The Decline and Rise of Mesopotamian Civilization: An Ethnoarchaeological Perspective on the Evolution of Social Cornplexity. Arnerican Antiquify 44(1): 5-35.
Yoffee, N. (1 993). Too Many Chiefs? In Yoffee. N., and Shemtt, A. (eds.), Archeological Theory - WIO Sets the Agenda?, Cambridge University Press, Cambridge, pp. 60-78.
Yoffee, N., and Cowgill. G. (1 988). The Collapse of Ancient States and Civilizations, University of Arizona Press, Tucson.
Zaitschek. D. (1959). Remains of Cultivated Plants from Horvat Beter (Beersheba). 'Atiqot 2: 48-52.
Zaitschek, D. V. (1961). Remains of Cultivated Plants fiom the Caves ofNaha1 Mishmar. Israel Exploration Journal 1 1 : 70-72.
Zeist, W.. van. (1985). Past and Present Environments o f the Jordan Valley. In Hadidi, A. (ed. ), Sf d i e s in the Archaeohgy and History of Jordan II, Routledge & Kegan Paul, London. pp. 199-204.
Zeist. W., van (1988). Some Aspects of Early Neolithic Plant Musbandry in the Near East. Anarolica 15: 49-67.
Zeist, W.. van. and Bottem. S. (1982). Vegetation History of the Eastern Mediterranean and the Near East dunng the last 20000 Years. In Bintliff, J. L., and van Zeist, W. (eds.), Palneoclimates, Palaeoenvironrnents and Human Comrnunities in the Eastern Mediterranean Region in Luter Prehistory, Internat ional Series 1 3 3, BAR, Oxford, pp. 277-32 1 .
Zeist, W.. van. and Woldring, H. (1980). Holocene Vegetation and Clirnate o f Northwestern Syria. Paleohistoria 22: 1 1 1-125.
Zohary, D., and Hopf, M. (1 988). Domestication of Plants in the Old World, Clarendon Press, Oxford.
Zohary, D., and Speigel-Roy, P. (1975). Begimings of Fruit Growing in the Old World. Science 187: 3 19-327.
Zohary, M. (1 973). Geobotanical Foundations in the Middle East. VoI. 1, Gustav Fischer Verlag, Stuttgart.