NASA TECHNICAL MEMORANDUM
THE PLANETS OF THE SOLAR SYSTEM
M. Ya. Marov
79 5NASA TM-88015
Translation of "Planety solnechnoy sistemy," Nauka Press
Moscow, 1986, pp. 1-320 (UDC 523.4)
|NASA-TM-880|5) _BF _LAN_IS C} _HE SOLAR
-_¥SIEM :National aerona_tics aad Space
Administration) _|] _ CSCL 84B
N87-1_148
Unclas
G3/9 1 43667
NATIONAL AERONAUTICS AND SPACE ADMINISTRATION
WASHINGTON, D.C. 20546 NOVEMBER 1986
|. Reoe,t Ne. | Coow,,*_.._.n0 Acc..;on _e.
T2.
_NASA TM-88015 ||
• Tg01o .-4 _b..,I.,tl.
7. ,_,eJ.,(0)
THE PLANETS OF THE SOLAR
SYSTEM
M.Ya. Marov
$. P,,Io,_:.Q O,¢_*a**,o_ H_o _4 A44,*.
Leo Kanner Associates
Redwood City, California 94063
Jg. _10,,--3 AgenCy H_Q _d Addreeo
National Aeronautics and Space Admin-
istration, Washington, D.C. 20546
5TAo4DA_D TtTLE PAGE
_'. J_e(Iplenl'o ([eeelo 0 _e.
19). _opad Oate Nov.
d. P.,ro..¢.g O, ee,,;toe;e,_ Cede
' L Pe_fer.,dne O, e6nlsotioa Repe._e_"_e.
|0. 1red, UAll He.
NASw-4005
I1 Type of _.pe. _d P.,;o4 C...6 g
Translation
14. _rpo,,ora,,: A;,,_cr Co4o
11 Sc;;h_,nt¢, r HoVea
Translation of "Planety solnechnoy sistem," Nauka Press,
Moscow, pp. 1-320 (UDC 523.4)
This book is intended both for the lay person and the would-
be scientist. The planets are discussed with a comparision of
their basic natural features: mechanical characteristics and
parameters of movement, surfaces, inner structure, physical
properties of the atmosphere and meteorology. Als_ general
problems of planetary cosmogony, thermal histor_ ;a_d climatic
evolution are considered briefly. The book is based on
soviet and foreign material, data from spacecraft, Earth
optical and radio astronomical measurements and also data
obtained from theoretical models.
|7. J[oy _e_4, {SCJc(ttO Oy AuthOr(I))
19. _-c.-,, Cle,eIQ. (eQ ,hae.-p_t| I _.
1Unclassified
|B. Dlllrlbul,e. _tote_t
Unclassified-Unlimited
Se_,er Cle.Of.(et f_le peg.)
Unclassified
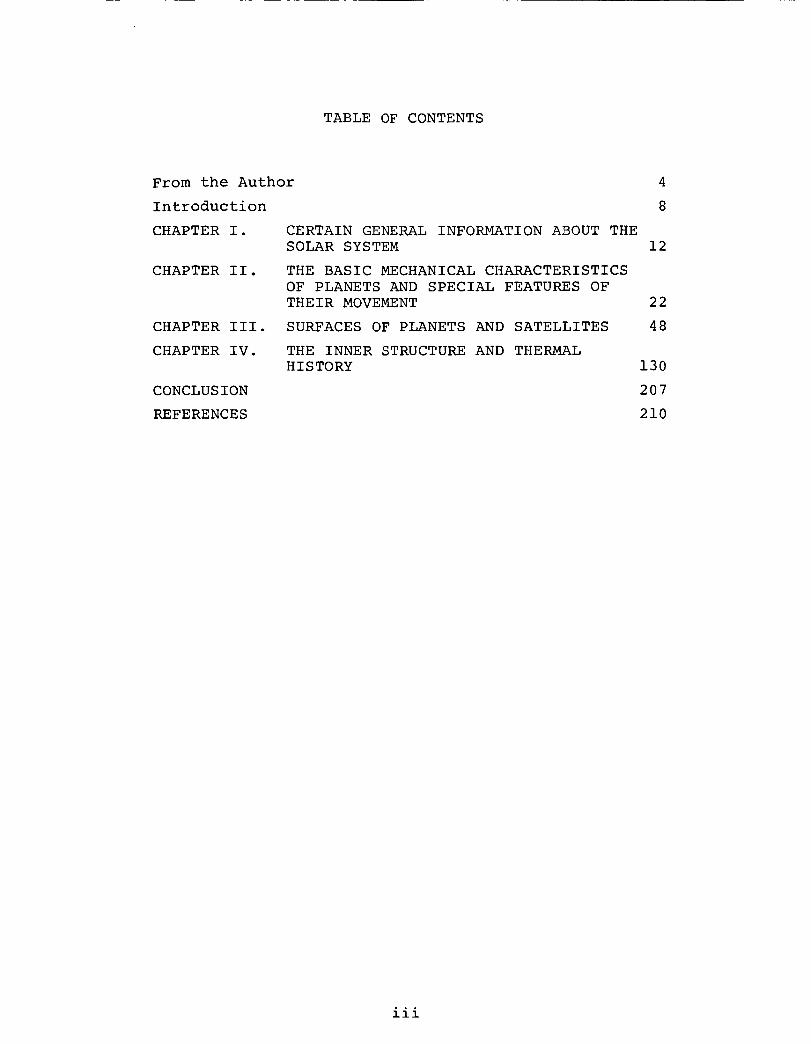
TABLE OF CONTENTS
From the Author
Introduction
CHAPTER I.
CHAPTER II.
CHAPTER III.
CHAPTER IV.
CONCLUSION
REFERENCES
CERTAIN GENERAL INFORMATION ABOUT THE
SOLAR SYSTEM 12
THE BASIC MECHANICAL CHARACTERISTICS
OF PLANETS AND SPECIAL FEATURES OF
THEIR MOVEMENT 22
SURFACES OF PLANETS AND SATELLITES 48
THE INNER STRUCTURE AND THERMAL
HISTORY 130
207
210
iii
From the Author
In deciding to write a popular book, first of all we ask
ourselves the question: to whom is it addressed? Of course, we want
it read by as large a circle of readers as possible. This means the
book must be written simply. However, simplicity must not be
identified with excessive simplification which certainly would not
satisfy the demanding reader. Here the person familiar with any
serious subject (whom the author in his discussion wishes to
attract) is certainly not the same as a simply interested reader.
Therefore, the author rightfully hopes that his efforts will be
multiplied by the patience of a reader trying to become acquaintedwith sections of science of interest to him.
We intend to talk about one of the extremely interesting and
rapidly developing fields of astrophysics -- about studies of planets
of the solar system. In the past decade and a half, this field has
been favorably affected particularly strongly by the newest means and
methods which have been discovered primarily thanks to rocket-space
technology. The flights of spacecraft to Venus, Mars, Mercury,
Jupiter and Saturn have brought unique information about the nature
of these planets, whose volume and importance exceeds the information
obtained in the past century by classical means of astronomy
observations. An approach has been laid out for a comprehensive,
complex study of each of the heavenly bodies closest to us; further
development of methods of technical modeling has been achieved for
processes and phenomena occurring on surfaces, in atmospheres, in the
interiors of planets and in the boundary fields of outer space. This
knowledge assists in the discovery of natural principles in the world
which is fairly limited by the space scale, the world in which we
live, and in the understanding of what has occurred here and in the
past and how it will continue in the future. In this knowledge is the
key to solving fundamental problems of modern natural sciences related
to the origin and evolution of the planetary system.
A comparative study of planets and their satellites -- "moons" --
is of primary significance for understanding the nature of Earth. The
conditions which led to the formation of various natural complexes
including those favoring the generation and development of life on
Earth are still far from clear to us. The search for them assists,
primarily in establishing a range of permissible deviations from
complex interactions for many millions of years as a result of the
ever growing effect of mankind on the environment, outside of whose
limits these deviations could acquire a dangerous and irreversible
character.
Only a limited circle of specialists are familiar with the
significant progress in our knowledge of nature of the planet. The
majority of the readers is familiar only with separate, fragmentary
materials from a few publications in scientific popular journals.
Several books which have appeared in recent years on the history of
discoveries, movement, properties of the planets and other aspects of
planetary astronomy cannot fully fill this gap. Therefore, it seemed
to us useful to discuss all of the most important aspects of modern
4
l DglO p.4 BANK NOT F1LM
planetary research. Here, in distinction from the form of exposition
usually used (sequentially for each of the planets) we have attempted
to look at the planets by comparing their basic natural features in
sections discussing, respectively, the mechanical characteristics and
parameters of movement, surfaces, inner structure, physical properties
of the atmosphere and meteorology. We will also touch on some of the
general problems of planetary cosmogony, thermal history and climatic
evolution.
It seems to us that this type of presentation will be the best
approach for the modern stage of study where the basic thrust is
toward generalization and comparison of information about various
natural complexes on the bodies of the solar system, on the discovery
of their common or unique features and basic differences. In just
this way, we will present the evolutionary approach to the study of
Earth, its nearest environs and the Solar system as a whole, on which
in the future, physicists and astronomers will concentrate their
efforts, devoting themselves to this attractive field of science.
The book is based on a broad amount of material of Soviet and
foreign studies, including the results obtained by spacecraft, Earth
optical and radio astronomical measurements and also data generalized
within the framework of theoretical models. We have included a large
number of illustrations among which photographs of planets occupy a
basic position; some of the most impressive photographs are of planets
_nd _h_ir satellites. The author wishes to express his thanks to
numerous colleagues with whom he has conducted studies and more than
once discussed different problems of physics of the planets. He would
like to take this opportunity to express gratitude to American
scientists G. Mazurskiy, D. Morrison, T. Owen, C. Sagan, B. Smith who
have sent him photographic surveys taken from spacecraft and he is
grateful to the National Aeronautics and Space Administration of the
USA for agreeing to their use. It is his pleasant duty to thank
V. N. Zharkov who read the manuscript and made a number of useful
comments, N. D. Rozman, L. D. Lomakin and I. A. Belousov for their
assistance in preparing the materials for the press. Well, to whom isthis book addressed? We think that it will attract the attention of
those who are interested in the problems of astronomy, geophysics and
space research. The book is fully available to the reader who has a
secondary education. We have attempted to avoid using mathematical
elements and special terminology or give explanations where one has to
know astronomical terms in order to understand them. We would hope
that the book will be read with interest by specialists in other
branches of knowledge, specialists in mixed fields can find in it a
good deal of useful information and possibly, desire to become
acquainted more deeply with some of the individual questions or
subjects as a whole. If these wishes are to some degree met, then we
will be satisfied that our goal has been achieved.
Dealing with such a grandiose subject as the planets of the solar
system, naturally it is impossible to simultaneously discuss in detail
all of its many aspects. In selecting the material, in the specifics
of presentation, in the approach to the subject itself, of course
there are personal interests and tastes of the author involved.
Truly, some will be given a great deal of attention and others, on theother hand, will be omitted. One reader possibly will see this as anadvantage where another will consider the book deficient. We have notattempted to maximally teach the most recent data, because this wouldbe impossible with the overwhelming flow of new information which ischaracteristic for the modern stage of research into the solar system.Therefore, individual results can already be out of date with thepublication of the book. All critical comments and requests about itscontent will be received with thanks; they can be directed to thefollowing address: 117071 Moskva V-71, Leninskiy Prospekt, 15, Chiefeditor's office of physical and mathematical literature, Nauka Press.
September 1980.
The first edition of the book came out five years ago. Sincethen, the science of planets of the solar system has been enriched bynew important results. They particularly pertain to Venus and Saturn.
In 1981, the Soviet automated probes, the Venera-13 and Venera-14for the first time transmitted to Earth color panoramas of the surfaceof Venus and they completed a complex experiment in analyzing theelement composition of Venusian soil. Information on thecharacteristics of the atmosphere and clouds of Venus was_11nn]_m_nf_, in particular information on the content of smallatmospheric components. In 1983-1984, the Venera-15 and Venera-16artificial satellites worked in orbit around the planet for more thana year; they were equipped with radar with lateral view and otherequipment for conducting surveys and studying the physical propertiesof the surface of Venus and also the atmosphere under the clouds. Thehigh-quality images of the surface transmitted significantly expandedconcepts of the geological past and present of Venus, and gave usaccess to a better understanding of ways of its evolution.
in 1980 and 1981, the American Voyager ! and Voyager 2 spacecraftsequentially accomplished flybys in the Saturn system and transmittedto Earth new data on the planet itself, its satellites and rings. Sixnew satellites were discovered for Saturn; the fine structure of ringsand their dynamic properties were studied; images of the icy surfacesof satellites and the morphology of movement in the atmosphere of theplanet were obtained.
In December, 1984, the Vega-i and Vega-2 Soviet automated spaceprobes were launched; their scientific program includes a continuationof the study of Venus using descent vehicles in June 1985 and thestudy from flight trajectory of Halley's Comet with approach to it inMarch 1986. The unique possibility of meeting of a spacecraft withthis remarkable heavenly wanderer (periodically returning to the Sunevery 76 years) and of conducting a number of measurements close toits core is going to be utilized also by western European and Japanesescientists who have launched, respectively, the Giotto and Planeta Acraft.
6

The new results which are well-known today can be studied in the
second edition of this book. Also, certain misprints and imprecisions
were corrected and certain sections were expanded in order to bring
them up to the modern level of knowledge about the bodies of the solar
system. We have attempted here to retain the general style of the
book, retaining the necessary strictness in analysis of factual
material with the simplicity of presenting it. The reader can judge
for himself if we have been successful.
April 1985.
7
Introduction
What we know is of no use,
The unknown only is important
J. W. Goethe, Faust
Glue yourself to a star with a cobweb,
Turn your face to the universe.
N. Zabolotskiy, 1946
Mankind has known about the planets, the "wandering stars" since
ancient times. The miraculous visible movement of five bright stellar
bodies on the nocturnal sky, clearly separated from the other numerous
stars, has long been unexplained; the memory of this remote epoch is
retained in the name "planet" which, in translation from the Greek
means "wandering."
The first attempts to discover certain principles in these
wanderers rested on the development of astronomy and geometry in
ancient Greece and in the Eastern countries -- China, India, Egypt.
They were directly related to the requirements of navigation on the
seas, chronology of the years and creation of a calendar, and also
the formation of the initial concepts about the universe. According
to Aristotle's cosmology (fourth century B.C.), relying on the
planetary theory of Yevdoks Knidskiy developed earlier, the movement of
observed planets was explained as uniform non-axial rotation of (one
relative to the other) concentric hollow spheres on whose surfaces
each planet was attached and at the center, Earth was located. This
theory is the reflection of the basic concepts of Aristotle's
philosophy, which divided all of the world "under the moon on theshell of Earth" into water, air, fire and ether. A much more strict
basis for the geocentric system of the world was found later in the
works of an outstanding ancient Greek astronomer and geographer,
Claudius Ptolemaeus, who published in the second century B.C. his
notable composition entitled "The Great Mathematical Structure of
Astronomy in Thirteen Books" -- Al'magest. Relying on the idea of
another ancient Greek, scientist-geometer, Apollonius Pergius, who
replaced the rotating planetary spheres of Aristotle with circles and
thus put forward the theory of epicycles; Ptolemaeus established the
law of observed movement of the planets making it possible to predict
their positions. In this way, the results of many centuries of
astronomical observations were put forward and systematized into a
whole set of knowledge of this period. And although the geometric
constructions themselves appeared extremely complex, in a natural way
it was related to errors in the initial assumptions about the
geocentricity of the world and Ptolemaeus' work had a large
progressive value. Particularly important was the practical value for
navigation and determining geographical coordinates.
The real scientific basis for modern astronomy was laid aboutfifteen centuries ago by the work of the great Polish scientist,Nicolaus Copernicus (1473-1543). He decisively discarded thegeocentric system of Ptolemaeus and replaced it with a heliocentricsystem of the world, with a Sun at the center and the planets rotatingaround it; this accurately and simply explains their visible movement.The outstanding work by Copernicus published in 1543 and titled"Rotation of Heavenly Spheres" was truly a revolutionary step whichchanged the entire development of the science of astronomy. However,it was many more years before the dogma of the scholastics of theMiddle Ages reflecting church thinking changed and a true scientificworld view was put forward. The astronomical observations ofG. Galileo (1564-1642) using the simplest of telescopes which he hadbuilt, the theories of movement of planets formulated andmathematically proven by J. Kepler (1572-1630), the transfer from akinematic explanation of movement in the solar system to a dynamicexplanation thanks to the discoveries of I. Newton (1643-1727) withhis law of worldwide gravity -- all of this was brilliant confirmationand a true triumph of Copernican science. Moreover, the historicalwork of Copernicus which was forbidden by the Inquisition wasofficially restricted for almost 300 (!) years before it waspublished.
Copernicus' work practically coincided in time with the beginningof the epoch of the great geographical discoveries when concepts aboutthe world expanded at unexpectedly rapid rates beyond the limits ofthe European continent. It is just in this period that the process ofmanufacturing production began; this produced a subsequent intensiveproduction development in a number of western European countries. Thedevelopment of industry produced growing demands for internal andexternal markets, stimulating the outfitting of numerous maritimeexpeditions. Thanks to these expeditions, undertaken by severalgenerations of outstanding fleets, it was finally proven that theEarth is round (remembering that this was shown in studies of thePythagorean school in the sixth century B.C.) and new land and wholecontinents were discovered; the Europeans discovered unique and evenexotic regions and familiarized themselves with the culture ofpopulations of their countries. This turbulent process of discoveryand then mastery of new broad territories actually continued right upto the present century when essentially, on our planet no "whitespots" remained. But modern aviation has decreased the flight timebetween continents to just a few hours.
The beginning of the study and mastery of space which began inOctober 4, 1957, with the launch of the first Soviet artificial Earthsatellite was a tremendous achievement for mankind. Our generationparticipated in this historic achievement. It is difficult tooverestimate its importance for astronomy, for science on Earth, foreveryday economic activity of man, and finally for culture andsociology. Not touching here on the numerous aspects whichundoubtedly are well known to the reader, we mention only thatsatellites and spacecraft for the first time have made it possible tolook at Earth as a planet from space and to begin a study of itsvarious physical characteristics with methods of "reverse astronomy,"
that is, with the assistance of analogues of those tools which are usedby astronomers at observatories when studying the radiation ofplanets, stars and nebulae. Direct study of numerous processes andphenomena earlier inaccessible, occurring in the near environs ofEarth were begun as well as the study of their interaction with theactivity of the Sun and the discovery of certain principles. Finally,
thanks to the flight of spacecraft, it has become possible to make a
comprehensive study of other near heavenly bodies -- the neighbors of
Earth in the solar system. This period of "acquaintance" with our
heavenly neighbors, with their natural features, begun in the 1960's,
can help this be the epoch of great geographical discoveries whose
scale is expanding today far beyond the limits of Earth almost
throughout the entire solar system.
It is completely obvious that space research has not led to
reconsideration of the fundamental concepts based on astronomical
observations -- mechanical characteristics of the planet or laws of
their movement. On the contrary, these characteristics discovered by
classical methods of optical and radio astronomy were brilliantly
confirmed and made more precise in a number of cases. However, the
flights of spacecraft basically provided a new quality in obtaining
information on the physical nature of planets, the special features of
the main active natural mechanisms, -- in a word, where ground means
of observation are not adequately effective or simply do not exist.
Therefore it is possible without exaggeration to say that after a
certain period of relative calm, planetary astronomy has now come intoa period of Great Renaissance. Planets unfamiliar earlier were
discovered; the possibilities and effectiveness of observations grew
immeasurably; their range expanded. The conduct of physical
experiments directly on heavenly bodies became possible, as well as a
detailed geophysical study on Earth, the study of extra-terrestrial
matter in Earth laboratories. Such an encroachment of geophysics into
the traditional spheres of astronomy, significantly more than occurred
earlier, the "accessibility" of the Moon and planets in a natural way
brought this section of astrophysics closer to the complex of sciences
on Earth and this process will undoubtedly continue in the future.
The historical value of this period in the life of mankind can,
to a full degree, be evaluated only by our descendants; truly we can
say that just now we are beginning to fully be able to evaluate the
scientific feats of Copernicus, Galileo and Newton.
Aristotle's cosmology and the studies by Copernicus are separated
from us by almost 20 centuries and the creation of a precise theory of
movement of planets until the beginning of flights of the spacecraft
then took about three centuries. Studies of the solar system have
been continuing for less than three decades and the flow of
discoveries is truly astounding. It is fully probably, however, that
this process will slow down in the future and the beginning of a new
thirty-year period, the renaissance stage of research of distant
environs of the planetary system and a detailed study of the near
environment of Earth basically will be completed. Right now, such
traditional sections of human knowledge as geophysics, geochemistry,
geology, meteorology, to a greater and greater degree will become
10

sections of cosmophysics, cosmochemistry, planetology, physics of theatmospheres of the planets, and this will create new attempts fordeeper and more comprehensive study of our own planet. Recognition ofthe significance of problems in space research of Earth and theplanets which have been presented to mankind in the 20th century isgrowing.
ii
THE PLANETS OF THE SOLAR SYSTEM
M. Ya. Marov
CHAPTERI
CERTAIN GENERAL INFORMATIONABOUT THE SOLAR SYSTEM
As I leave a space and enterthe neglected garden of magnitudes,I cut the imaginary constancy andthe consciouwness of cause and effect.I leaf through your textbook, infinity,without man, without people,Wild leafless healer,A textbook of enormous radicals.
O. Mandel'shtam, 1933
We will begin our discussion of the planets with some of the /14
general characteristics of the solar system whose members also include
other cold bodies -- asteroids, comets, and meteor dust.
The planets are separated from us by tremendous distances, tens
and hundreds of millions of kilometers. In order to receive a radio
signal on Earth from a spacecraft located close to Venus or Mars, even
in the most favorable conditions, one must wait several minutes and
then the radio waves like any other electromagnetic radiation are
propagated at the speed of light! Within the limits of the solar
system as the unit of distance we take the astronomical unit (IAU)
that is, the average distance of the Earth from the Sun comprising
149.6 million km. Light covers this distance in 8 min 19 s. The
average radius of the orbit of the known planet farthest from us,
Pluto, is 40 IAU and in order to reach it, a radio signal sent from
Earth requires five and one half hours.
However, the limits of the solar system are not limited by the
diameter of orbit of Pluto -- indeed, they significantly exceed it.
Starting with purely physical expressions, beyond its external
boundary one could take a distance at which flowing of the plasma
("solar wind") occurs in the interstellar gas continuously flowing
from the Sun and filling all of the near-Sun space. The boundary of
this field is called the heliopause. The problem of infiltration of
solar plasma which has a supersonic speed of interstellar gas
consisting almost entirely of ionized hydrogen at a temperature of /15
Numbers in the margin indicate pagination in the foreign text.
12
=100 K was discussed in detail by Soviet physicist V. B. Baranov andK. V. Krasnobayev. It seemed that for an idealized model of aspherically symmetrical plasma flux, t_is slow_own and formation of ashock wave occurs at distances from 10 and 10_ IAU, depending on theconcentration of rticles assumed for the interstellar hydrogen inlimits 0.1-1 cm-3pa. Moreover, the configuration formed is anasymmetrical result of movement of the Sun at a velocity of about20 km/s relative to the nearest stars (and, correspondingly, of theinterstellar gas) -- this is the well-known movement in the directiontoward the solar apex located in the Hercules constellation. As aresult, in the direction of the vector of velocity of the Sun, theimpact transition occurs close to the cylinder and in the oppositedirection (toward the antiapex), on the other hand, farther from thecenter. Nevertheless, the evaluation made above of the averagecharacteristic dimension of the heliopause remains true.
In other words, a more correct criterion is the boundary on whichthe force of gravity of the Sun is compared with the force of gravityof the stars nearest to us. This criterion leads to an e_aluation ofthe dimensions of the solar system on the order of 1.5"10 J IAU
As huge as these distances seem according to Earth concepts, onthe scale of the universe they are comparatively small. Actually, instellar and galactic astronomy, the measurement units of distance arein light-years and parsecs. The parsec is the distance from which thegreat pole of the Earth orbit is visible at an angle of i' (or inother words, the distance to the stars whose annual parallax equalsi'). Consequently, the distance expressed in parsecs is the inversevalue of the annual parallax; one parsec = 206,265 IAU (radii of theorbits of Earth) which comprises 30.86"1012 km and equals 3.26 light-years. In these units, the diameter of our planet system is a totalof about 0.001 parsecs. Even in relation to the diameter of ourgalaxy (Milky Way) close to 30 kiloparsecs (30,000 parsecs), thiscomprises a total of several hundred million parts; and the N modernastronomy deals with distances of mega and even gigaparsecs±! Thegalaxies closest to us, the large and small Magellan Clouds,55 kparsecs away from us and the famous Andromedes Nebula --0.7 Mparsec from us. Such distances separate us from our farthestgalaxies as are observed now and the light from them was emittedbefore the formation of the Sun -- more than 4.5 billion years ago!
/16
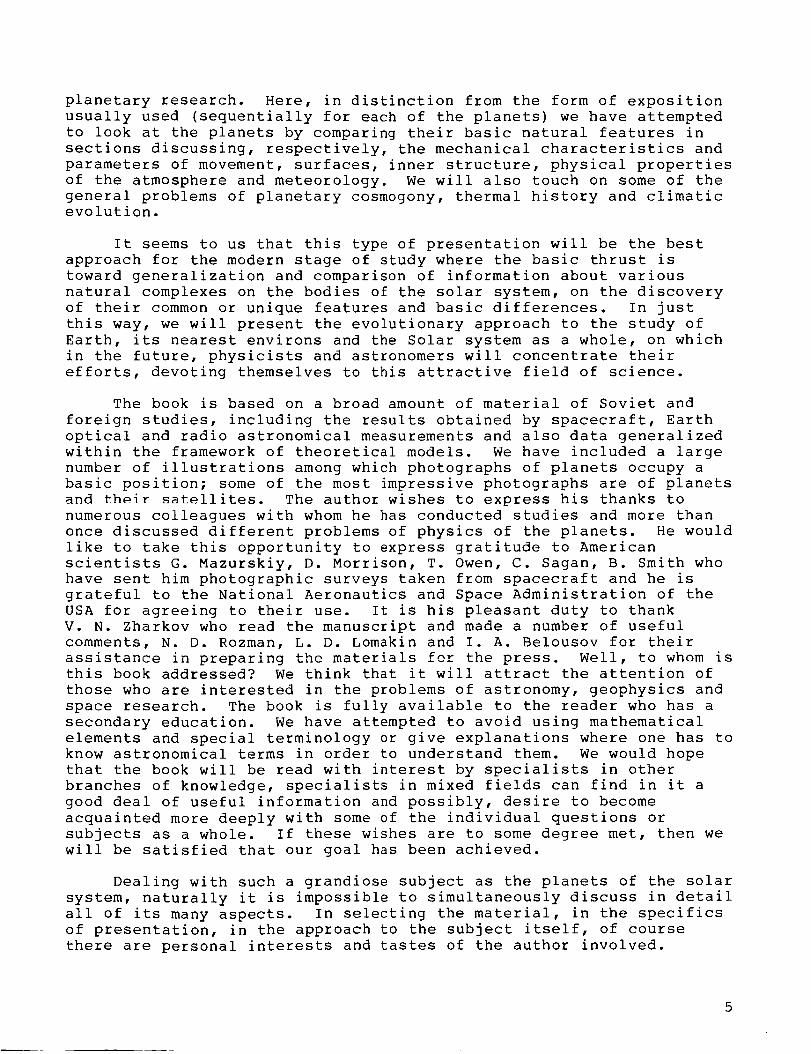
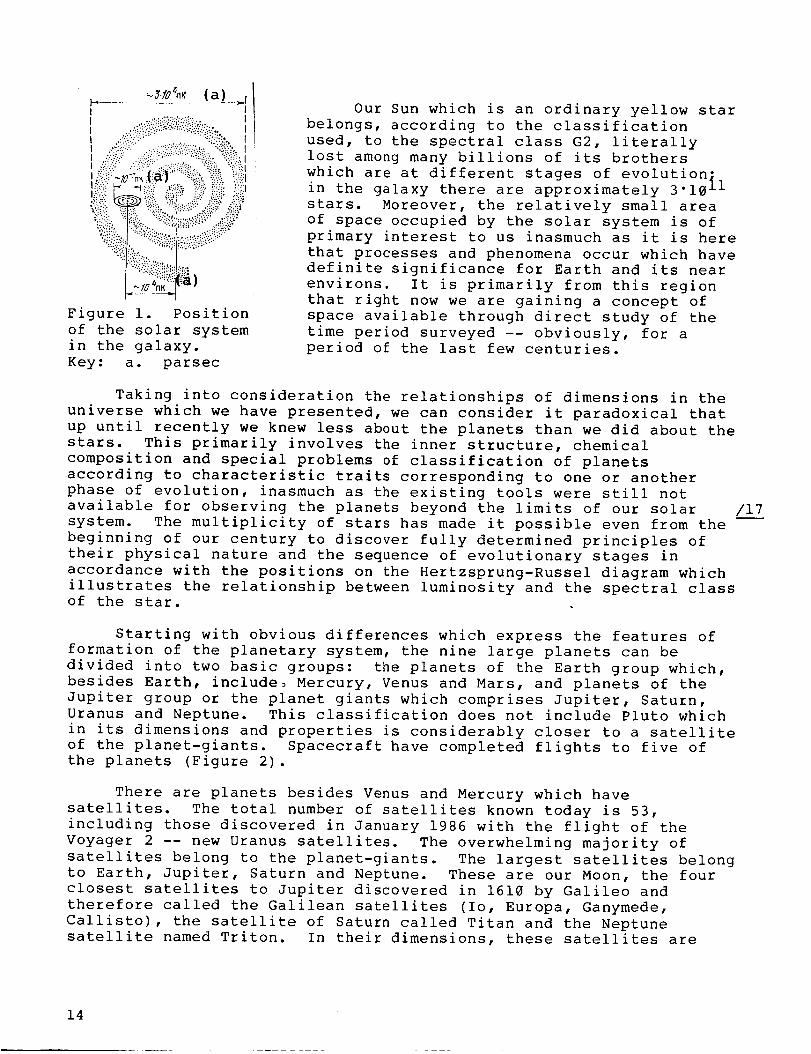
The galaxy has the shape of a gigantic convex lens with thickness
about 4 kparsecs and our solar system is found at a distance of about
10 kparsecs (33,000 light-years) from its center in one of the spiral
sleeves (Figure i). The galaxy rotates and the rate of rotation at
first increases with an increase in distance from the center and then
decreases. The rotation of the Sun around the center of the galaxy
occurs at a velocity of about 240 km/s, so that its full rotation is
completed in approximately 200 million years.
1Megaparsec (i Mparsec)
Gigaparsec (i Gparsec)
= 106 parsec;
= 109 parsec.
13
_Y10%_(a) .,.jI I
. ..';..]'::i":i"_!":_:':;:::"?_;:_:.":.,II":'!".:"...... . "<i!"'.. II
I ,_ -:: .::_i{'!:_:i,ii.':<.!-' %1? II ,::. :d:i!i:;:::_""i .""<!i:.;_."::_!_.I
I:<..::< }:::::i::i ': _-::.i_:':::i!_:!..':it
:i_i_i__;_._:..:_;:.,,.,.,........._.:.:.:.:..,_:,:.,._{P,i.!{_...':.',_{{'ii'.'"'"._':3_':'_"
"£::< ii(7...."::::_:_:!!:iii!,ii!j_
)
Figure i. Position
of the solar system
in the galaxy.
Key: a. parsec
Our Sun which is an ordinary yellow star
belongs, according to the classification
used, to the spectral class G2, literally
lost among many billions of its brothers
which are at different stages of evolut!on-in the galaxy there are approximately 3 10 il
stars. Moreover, the relatively small area
of space occupied by the solar system is of
primary interest to us inasmuch as it is here
that processes and phenomena occur which have
definite significance for Earth and its near
environs. It is primarily from this region
that right now we are gaining a concept of
space available through direct study of the
time period surveyed -- obviously, for a
period of the last few centuries.
Taking into consideration the relationships of dimensions in the
universe which we have presented, we can consider it paradoxical that
up until recently we knew less about the planets than we did about the
stars. This primarily involves the inner structure, chemical
composition and special problems of classification of planets
according to characteristic traits corresponding to one or another
phase of evolution, inasmuch as the existing tools were still not
available for observing the planets beyond the limits of our solar
system. The multiplicity of stars has made it possible even from the
beginning of our century to discover fully determined principles of
their physical nature and the sequence of evolutionary stages in
accordance with the positions on the Hertzsprung-Russel diagram which
illustrates the relationship between luminosity and the spectral classof the star.
/i_!
Starting with obvious differences which express the features of
formation of the planetary system, the nine large planets can be
divided into two basic groups: the planets of the Earth group which,
besides Earth, include, Mercury, Venus and Mars, and planets of the
Jupiter group or the planet giants which comprises Jupiter, Saturn,
Uranus and Neptune. This classification does not include Pluto which
in its dimensions and properties is considerably closer to a satellite
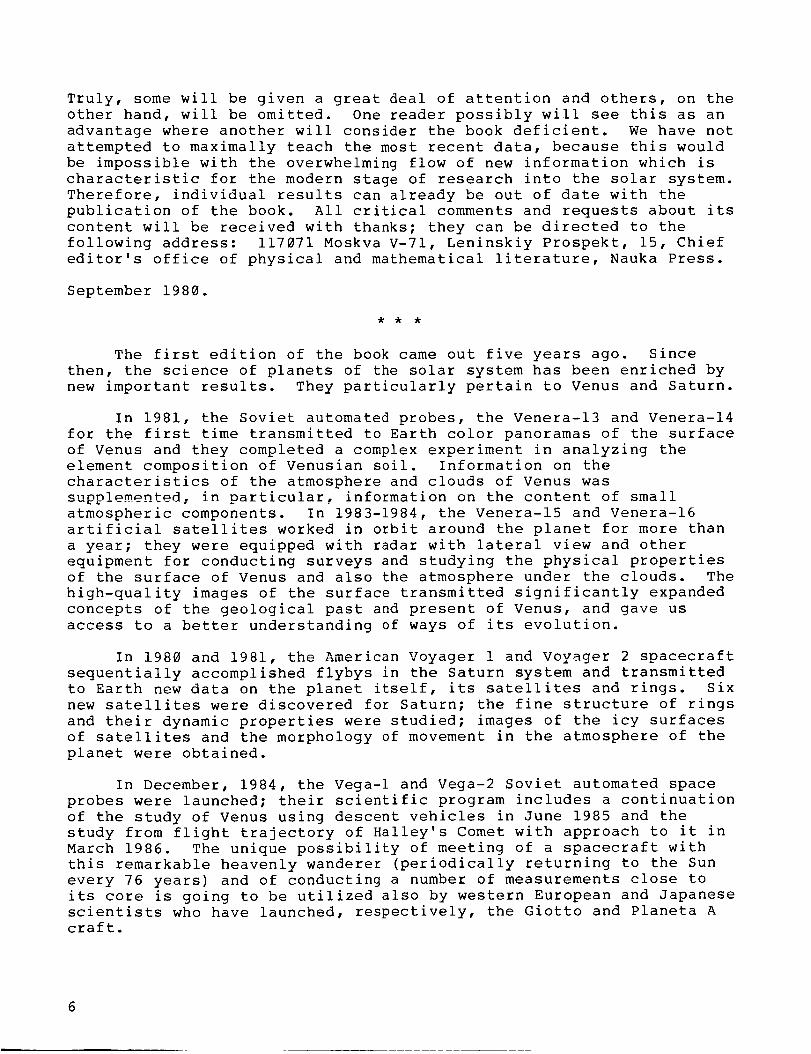
of the planet-giants. Spacecraft have completed flights to five of
the planets (Figure 2).
There are planets besides Venus and Mercury which have
satellites. The total number of satellites known today is 53,
including those discovered in January 1986 with the flight of the
Voyager 2 -- new Uranus satellites. The overwhelming majority of
satellites belong to the planet-giants. The largest satellites belong
to Earth, Jupiter, Saturn and Neptune. These are our Moon, the four
closest satellites to Jupiter discovered in 1610 by Galileo and
therefore called the Galilean satellites (Io, Europa, Ganymede,
Callisto), the satellite of Saturn called Titan and the Neptune
satellite named Triton. In their dimensions, these satellites are
14
ORIGINAL PAGE I_
CIF POOR QUALITY
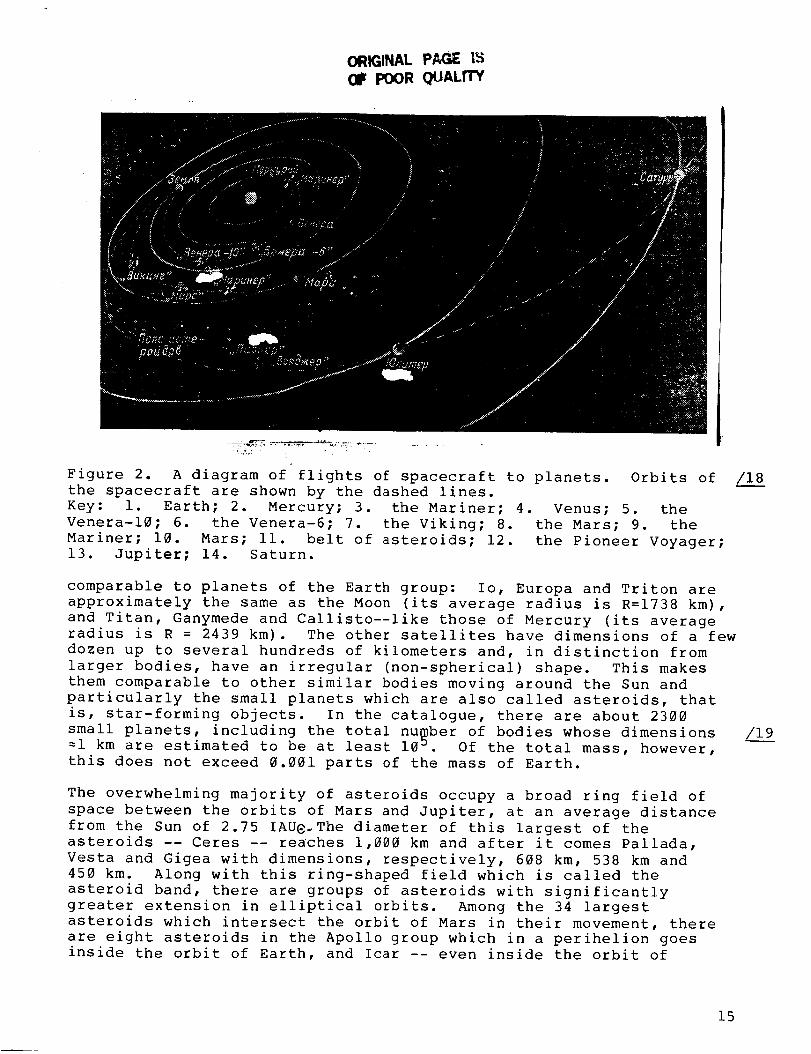
Figure 2. A diagram of flights of spacecraft to planets. Orbits of
the spacecraft are shown by the dashed lines.
Key: i. Earth; 2. Mercury; 3. the Mariner; 4. Venus; 5. the
Venera-10; 6. the Venera-6; 7. the Viking; 8. the Mars; 9. the
Mariner; 10. Mars; ii. belt of asteroids; 12. the Pioneer Voyager;13. Jupiter; 14. Saturn.
comparable to planets of the Earth group: Io, Europa and Triton are
approximately the same as the Moon (its average radius is R=1738 km),
and Titan, Ganymede and Callisto--like those of Mercury (its average
radius is R = 2439 km). The other satellites have dimensions of a few
dozen up to several hundreds of kilometers and, in distinction from
larger bodies, have an irregular (non-spherical) shape. This makes
them comparable to other similar bodies moving around the Sun and
particularly the small planets which are also called asteroids, that
is, star-forming objects. In the catalogue, there are about 2300
small planets, including the total number of bodies whose dimensions
=i km are estimated to be at least 10 _. Of the total mass, however,
this does not exceed 0.001 parts of the mass of Earth.
The overwhelming majority of asteroids occupy a broad ring field of
space between the orbits of Mars and Jupiter, at an average distance
from the Sun of 2.75 IAUe. The diameter of this largest of the
asteroids -- Ceres -- reaches 1,000 km and after it comes Pallada,
Vesta and Gigea with dimensions, respectively, 608 km, 538 km and
450 km. Along with this ring-shaped field which is called the
asteroid band, there are groups of asteroids with significantly
greater extension in elliptical orbits. Among the 34 largest
asteroids which intersect the orbit of Mars in their movement, there
are eight asteroids in the Apollo group which in a perihelion goes
inside the orbit of Earth, and Icar -- even inside the orbit of
/i/9
15
Mercury. If we pay attention to all of the asteroids with dimensions
greater than 1 km, which in their movement intersect the orbits of
Earth and Mars, then their number will reach approximately 10,000. In
turn, in the aphelion, a number of asteroids are removed from the Sun
to a distance exceeding the radius of Jupiter's orbit. Such a
character of movement brings them close to the short-period comets and
gives us the basis for E. Opik's hypothesis that some of the small
planets are remnants (relicts)/of comet nuclei whose gas component has
completely disappeared.
The majority of "tail oddities" -- comets, obviously, which do
not have a direct field, are limited to the heliopause and are located
beyond its limits. Significantly closer to the Sun we find only a few
families of comets; their aphelion lies basically between the orbits
of Jupiter and Neptune. At the present time, elements of orbit of
about 600 comets can be counted among which are short-period (period
of rotation less than 200 years) and long-period (with period mores e time_ the total number of comets is
than 200 years). At the _estimated at a value of 10 -- 1015 . The basic family, as the Dutch
astronomer J. Oort proposed is concentrated in the field of comet
clouds located in the galactic plane at a distance of =105 IAU from
the Sun. This cloud hypothetically formed simultaneously with the
formation of the solar system and its total mass, obviously, does notexceed one mass of Earth.
Other hypotheses exist about the origin of comets which include
one which deserves attention, the "theory of focusing." It is
proposed that in its own movement, the Sun intersects interstellar
gas-dust clouds and individual large "clusters" are focused on the
solar trajectory (the "axis of accretion"). The basis for this
hypothesis is the well-known concentration of perihelions of comet
orbits in the environs of the solar apex and anti-apex. Moreover,
this concentration does not contradict the hypothesis of clouds if one
pays attention to the probable effect of "cracking" of the comet
matter as to interstellar gas. Within the framework of this
hypothesis, focusing explains with more difficulty the predominance of
elliptical and not hyperbolic comet orbits and certain other features
which we will not pause to discuss. Therefore, the hypothesis of a
ring-shaped comet cloud, often called the Oort cloud, is for us morebasic.
Truly one should remember that recently molecular interstellar
clouds were discovered lying close the galactic plain with tremendousmasses, up to 10 v M® (M@ -- mass of the Sun) which could be evidence
of the strong perturbation effect on Oort's cloud when the solar
system with its movement toward the apex passes at distances from it of
less than approximately 10 parasecs. This brought up the possibility
of its prolonged existence, commensurate with the age of the solar
system, at such a great distance from the Sun. Avoiding this
difficulty is possible, however, having assumed that the dimensions of
the _ort cloud is less, that is, it is at a distance on the order of5"10 _ IAU, possibly, even at a distance of 104 IAU, where perturbation
is not so great.
/20
16
An alternative to the cloud of interstellar gas is the hypothesisof the existence on the Sun of a companion in the form of a dwarf starapproximately 9 times the visible stellar value (9m), found in a veryeccentric orbit with maximum distance (at the apastron) up to 2.5light-years and with a period of rotation relative to the Sun of26 million years. It was even given the name Nemezides. If thisobject actually exists, then approaching the Sun (in the periastron)it must strongly perturb the comet cloud, "throwing" millions ofcomets inside the solar system, many of which could intersect, inparticular, with the orbit of Earth. It is interesting here to notethat as paleontologists have observed, the disappearance of certainbiological types on Earth occurred over a period of 26-31 millionyears; it is tempting to relate to the periodicity of the grandioseclimatic changes on Earth due to the sharp increase in dust content asa result of impact with comets. A similar periodicity is detected inthe increased content (up to a magnitude of 2) of the rare element --iridium -- in the surface layers of the crust which also can be due tosuch catastrophes.
In spite of the fact that there are actually sources ofperturbation, for us it is important to understand that under theireffects the comets from the cloud can have orbits in which thedistance to the perihelion is small and pass, in this way, close tothe Sun where it will reach the greatest brightness and one will beable to detect them. A similar example is observed in short-periodcomets with closer aphelions. The extended tail illuminated in solarrays is formed due to a loss of mass by the core of the cometcomprising, according to the generally accepted model now by the well-known American astronomer, F. Whipple, of a "dirty snow," that is,water ice along with frozen dust and larger individual fragments ofrock. The tail is part of the gas-dust atmosphere (this so-calledcomma of the comet occurring as it approaches the Sun), which "isblown" in an antisolar direction under the effect of light pressure.At the same time, the dimensions of the core do not exceed 5-10 kilometers, the developing tails extend for distances of hundredsof thousands and millions of kilometers. The maximum loss of mass dueto one rotation in the brightest comets is estimated at a value of0.2-0.5% (usually less than 0.1%) and therefore often the cometspassing close to the Sun cannot live long. In turn, the disappearanceof gases and dust as a result of sublimation of the comet core (thatis, transfer of matter from a solid state to a vapor, omitting theliquid phase) creates additional perturbations due to the reactiveforce applied on gravitational perturbations of the Sun and planets.All of this leads to the fact that the parameters of comet orbits(eccentrics, accumulation) lie within broad limits. Here difficultiesare involved in predicting the moments of occurrence and observationof these heavenly bodies, the suddenness of their appearance. It isinteresting to note that perturbation in a perihelion at a distance of1-2 IAU imparts a large pulse to the movement of the comet rather thanslowing of the artificial Earth satellite in the perigee of acomparatively close elliptical orbit. Due to this, the apheliondistance changes greatly.
/2_i
/22
17
Some of the comets which appear, having undergone strongperturbations close to the perihelion, even transfer from anelliptical to a hyperbolic orbit and always leave the solar system.
In recent times, the interest in comets has grown considerably,due to the next arrival at the Sun of one of the best known of theperiodic comets -- Halley's Comet. This event occurs once every 76years; the last time was 1910. Spacecraft are being sent to meet thecomet for the first time; this includes the Soviet Vega-i and Vega-2.For successful conduct of these complex experiments with flyby fromthe core at a distance of a total of a few thousand kilometers, it isnecessary to know with high precision the parameters of movement ofthe comet itself; a broad international network of observations hasbeen organized for this purpose and non-gravitation perturbations arebeing calculated theoretically.
Besides the bodies we have considered, in interplanetary spacethere is an even larger quantity of particles of different dimensions,primarily very small, in mass thousands and millions of parts of agram. They are called meteor dust. The formation of these particlesis dues to the fact that, in all probability, collisions of largerbodies (asteroids) and sequential crushing into smaller fragmentsoccurred for the entire length of existence and evolution of the solarsystem. Also, a random breakdown of such bodies under the effect oftemperature deformations or rapid inherent rotation also makes adefinite contribution.
Meteor dust is recorded both as flares and by observing radarreflections from the remaining traces during invasion into the upperatmosphere of Earth and directly into the experiments on high altituderockets of the artificial Earth satellites and interplanetary probes.Their existence involves the well-known phenomena of zodiacal light --a weak diffuse illumination symmetrical relative to the plane ofelliptics. It is observed in the form of cones expanding toward thehorizon soon after the onset of darkness or before dawn and rapidlythey disappear as the angular distance to the Sun increases. Theillumination occurs thanks to scattering of solar light on theparticles of dust caught in near-solar orbit and forming, according toour modern concept, clouds in the shape of ellipsoids, one of whichserves as a focus for the Sun. The content of dust in such a cloud /23
must decrease with an increase in distance from the Sun and from the
plain of the elliptics.
Moreover, a number of additional effects significantly change
this model. This means that for distribution of dust, along with
gravitational forces, there is an effect of the force of light
pressure on the Sun, mechanical breaking and also an electrical charge
acquired by the particles. Under the effect of pressure of solar
radiation, the finest particles of dust are swept out into the
external field of the solar system. The larger particles (in units of
hundreds of microns) are subjected to the so-called Poynting-Robertson
effect whose contribution is comparable to the mechanical braking of
interplanetary gas for particles of even larger dimensions.
Additional braking is created by the formation on the particles of
18
electrical charges and then Coulomb forces occur in the electricalfield and Lorentz forces during their interaction with theinterplanetary magnetic field.
The physical essence of the Poynting-Robertson effect consists ofthe following. A particle absorbs solar photons moving at the speedof light _ radially from the Sun and therefore having a zero moment ofquantity motion relative to it. At the same time, it emits energyuniformly in all directions, that is, isotropically, so that a pulseis partially transmitted by the photon emitted which has a particleitself. As a result of this, the particles in which the vector ofvelocity [ and, consequently, the pulse are directed tangentiallytoward its trajectory; it acquires in the inherent system coordinatesof an additional component v/c caused by light pressure and adirection opposite its movement. In this way, due to the decrease inmoment of the quantity of motion of the particle, a gradual decreaseoccurs in the radius of its orbit and it approaches the Sun as aspiral, that is to say, it "falls into the Sun." In other words, themotion occurs not according to the Kepler ellipse because a non-central force is acting on the particle. It is easy to calculate the"lifetime" of the particle in near-solar orbit if one uses theappropriate simple formula. According to the theory, a sphericalparticle with radius r and density p , primarily being in an almostcircular orbit with r_dius a is incident on the Sun for a timet,= 7"1063rP*a2 years. Consequently, for particles with r=100 _m and@ _3 g/cm , foun_ from the Sun at a distance of a_l IAU, the lifetim_comprises t=3"10 years. At the same time, the particle does not
reach the Sun but evaporates in its environs and goes into the
composition of the solar atmosphere. Obviously, the Poynting-
Robertson effect basically is explained by the actual absence of dust
in the inner fields of the solar system. In actuality, flights of
interplanetary spacecraft do not show any kind of noticeable changes
in its content up to the orbit of Jupiter including (which is
extremely interesting!) the field inside the asteroid band.
Micrometer sensors on the Pioneer and the Voyager hardly detected any
changes in the count rate here, having discovered a small increase in
concentration only in direct proximity to Jupiter itself.
Let us note that separate relatively small fields with increased
concentration of dust material can exist in a system of two attracting
centers (Sun-planet, planet-satellite) at points of relative
equilibrium -- the so-called points of liberation or Lagrange points
named in honor of the remarkable French mathematician, P. Lagrange who
predicted their existence back in the 18th century. The position of
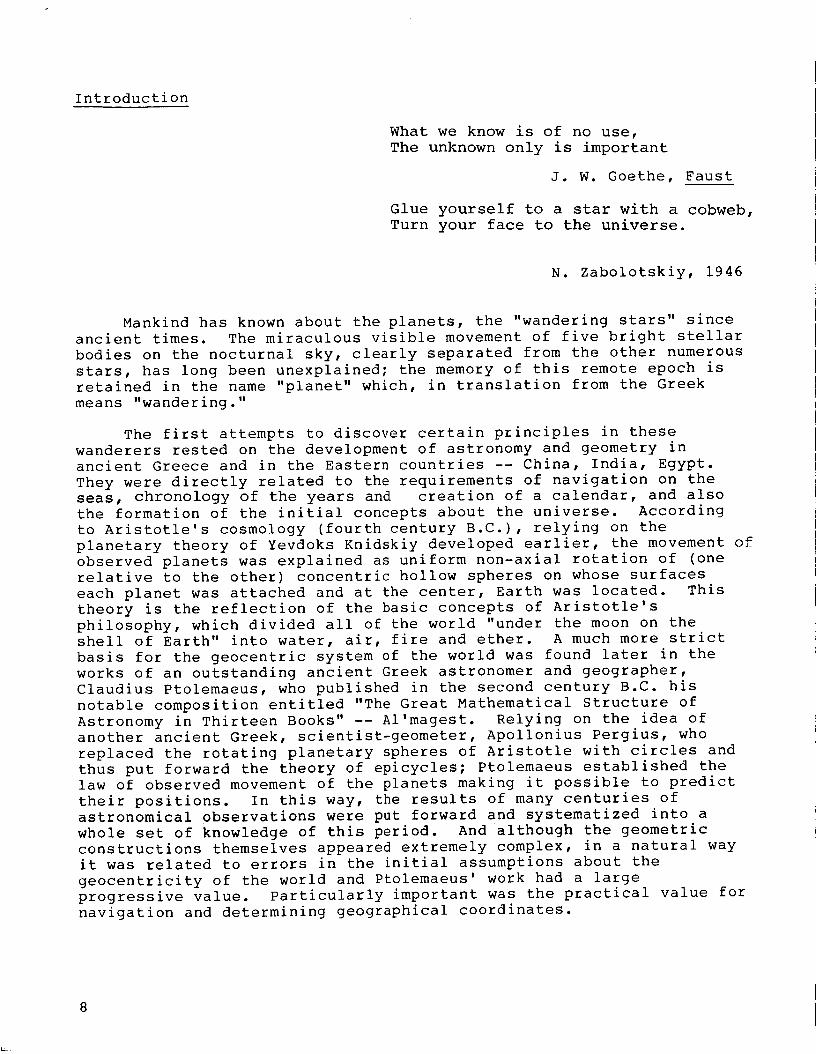
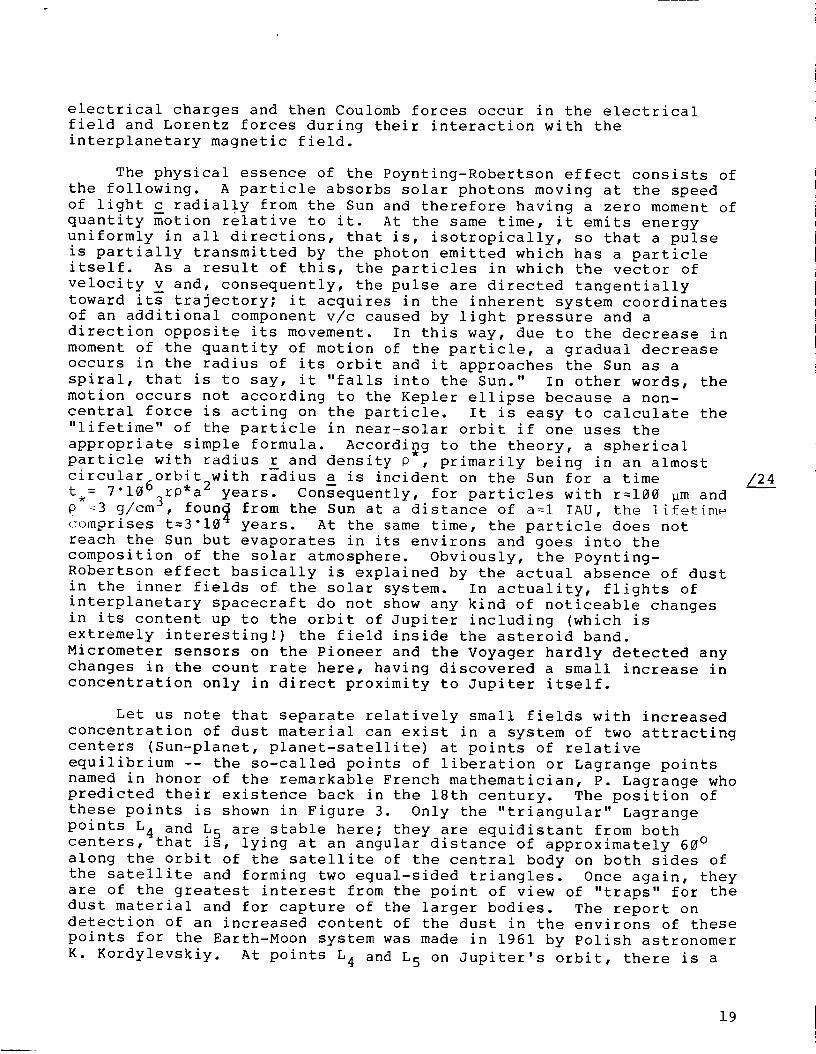
these points is shown in Figure 3. Only the "triangular" Lagrange
points L 4 and _5 are stable here; they are equidistant from both
centers, that zs, lying at an angular distance of approximately 60 °
along the orbit of the satellite of the central body on both sides of
the satellite and forming two equal-sided triangles. Once again, they
are of the greatest interest from the point of view of "traps" for the
dust material and for capture of the larger bodies. The report ondetection of an increased content of the dust in the environs of these
points for the Earth-Moon system was made in 1961 by Polish astronomer
K. Kordylevskiy. At points L 4 and L 5 on Jupiter's orbit, there is a
/24
19
+L_(a)
I -v "../ £ _ \
/ \
t : .(b II It . ....._- ,.;.,7. I
\ /\ /\ /
\ /L3 i
Figure 3. Position
of the Lagrange
points. L] -_ L inthe planet:satellite
system.
Key: a. satellite;
b. planet.
well-known group of asteroids -- the so-called
Trojan group. Small asteroid-like bodies /25
were also detected at the Lagrange points of
two fairly large Saturn satellites -- Tephiyaand Dione.
In the capture zone of Earth, particlesof different mass and dimension are incident.
They practically all must collide with it and
therefore a noticeable concentration of dust
close to Earth cannot occur. This is well
confirmed by a series of experiments on
satellites essentially verifying the earlier
measurements and concepts not confirmed about
the dust band. For most of the particles,
their collision with Earth ends in
evaporation in the surface atmosphere
(basically at altitudes of more than 80-
120 km) but a certain quantity reaches the
surface of Earth in the form of well-known
meteorites. It is completely obvious that
the larger the body the much smaller the
probability of such an event. According to the existing analysis of
the flux of the finest dust particles go Dg to Earth, it is p{imarilyisotropic and comprises in mass about 10 _ g/day, that is, !0 _ g/day
or about 0.1 t/s. The surface of Earth S = 4_R z =5"10 i_ cm z, the
velocity of meteor particles lies in a range 11-72 km/s. Assuming an
average velocity v=30 km/s, we find that the density of the dust
component in near-Earth space comprises
equation io.'gd s I0-" _'CM",P_-" 5.10t8c_12.3-10° CM/(S _" 7,
For comparison, let us point out that the densi_x of the Earthatmosphere at an altitude of 1000 km is P=5"10 -±= g/cm 3, that is, at
least a magnitude of two larger.
The study of meteor bodies is of qreat independent interest, but
with them are directly related general problems of evolution of larger
space objects, in particular, the formation of surface planets andasteroids.
We are talking about particles incident in the zone of capture of
heavenly bodies, whose maximum case is incidence of particles on that
body (or meteoroid on the planet). The dynamics of approach and
collision is considered within the framework of the theory of
elliptical orbit generalized for a hyperbolic orbit. In turn,
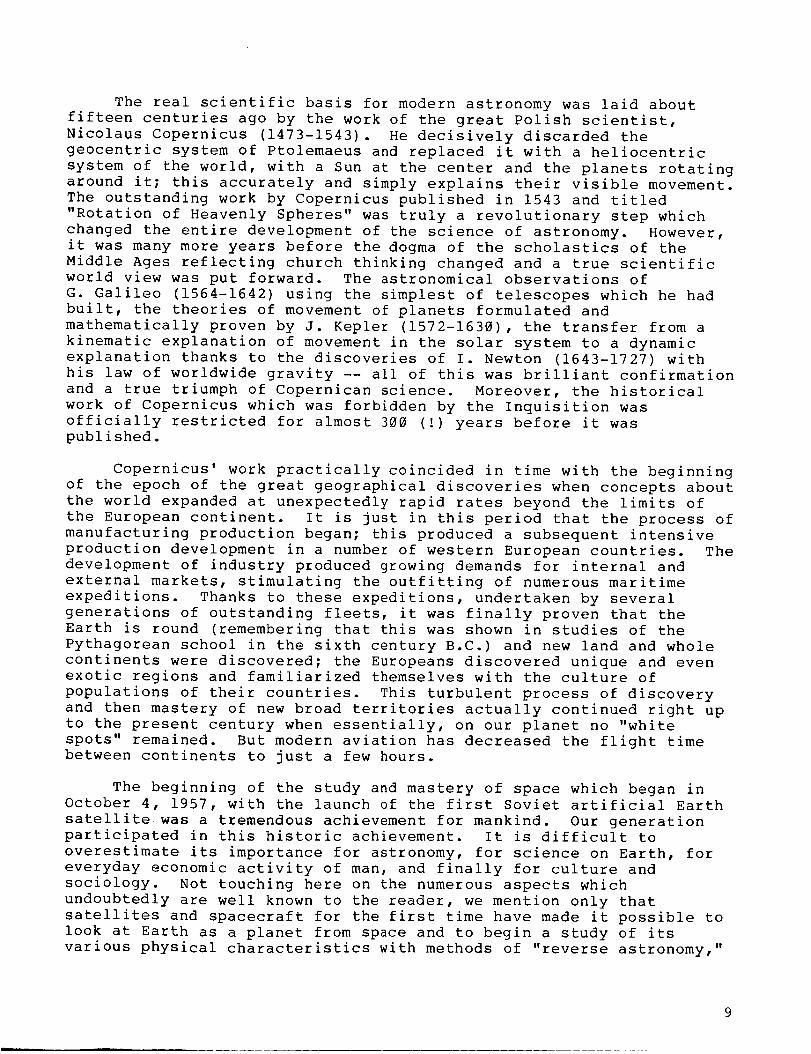
distribution of a number of collisions depending on mass, that is,
fluxes of meteor bodies with different dimensions than mass can be
shown in the form of diagrams as presented in Figure 4. This diagram
is attained on the basis of many years of systematic observations of
meteor bodies on the basis of paleontology data, theoretical
extrapolations, and in recent times -- with the calculation of direct
studies which have become available of the surfaces of planets and
their satellites. It is used not only for evaluation of the fluxes of
20
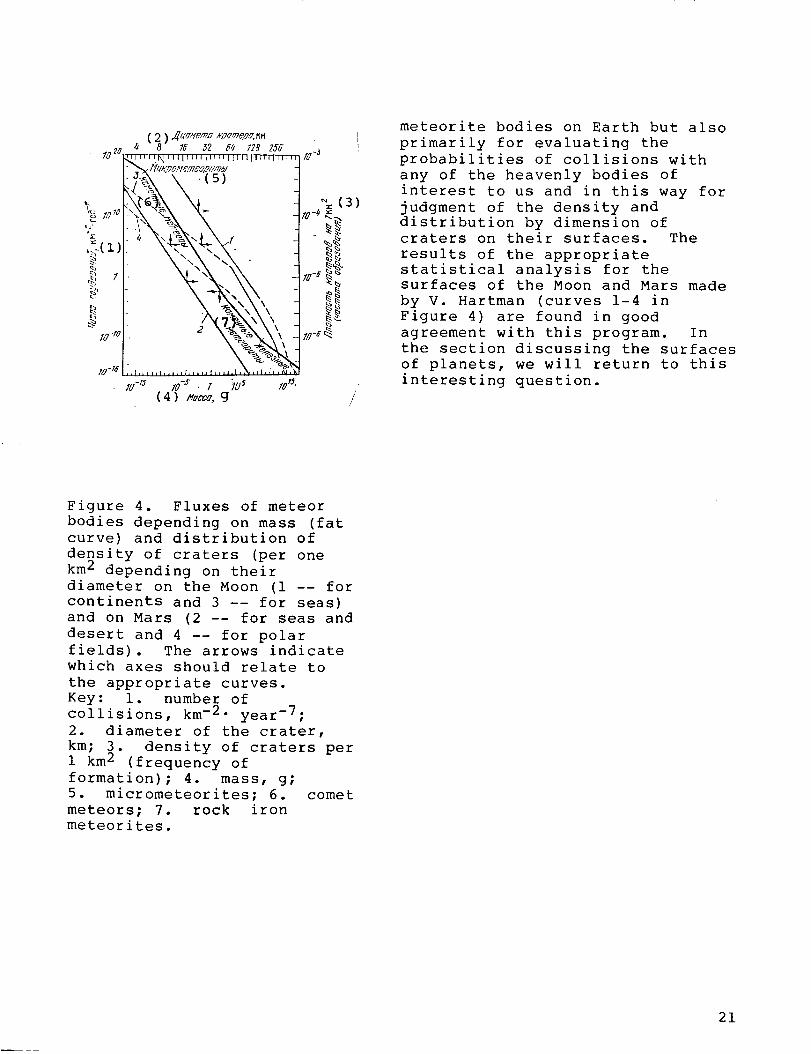
meteorite bodies on Earth but alsoprimarily for evaluating theprobabilities of collisions withany of the heavenly bodies ofinterest to us and in this way forjudgment of the density anddistribution by dimension ofcraters on their surfaces. Theresults of the appropriatestatistical analysis for thesurfaces of the Moon and Mars madeby V. Hartman (curves 1-4 inFigure 4) are found in goodagreement with this program. Inthe section discussing the surfacesof planets, we will return to thisinteresting question.
Figure 4. Fluxes of meteorbodies depending on mass (fatcurve) and distribution ofdensity of craters (per onekm2 depending on theirdiameter on the Moon (i -- forcontinents and 3 -- for seas)and on Mars (2 -- for seas anddesert and 4 -- for polarfields). The arrows indicatewhich axes should relate tothe appropriate curves.Key: i. number ofcollisions, km-2" year-7;2. diameter of the crater,km; 3. density of craters per1 km2 (frequency offormation); 4. mass, g;5. micrometeorites; 6. cometmeteors; 7. rock ironmeteorites.
21
CHAPTERII
THE BASIC MECHANICALCHARACTERISTICSOF PLANETSAND SPECIAL FEATURESOF THEIR MOVEMENT
Nothing in all the universeExists, only their flight,And it carries me far off, impressedFlight of the planet, the Earth, the stars, flight
and stonesAnd my thoughts on life and on death --On two wings, on two waves they float.
Paul Eluar"Repetition," 1922
Let us go now to the basic subject of our discussion about thesolar system -- the large planets. We begin with their mainmechanical characteristics on whose study the basic efforts of many
generations of astronomers have been concentrated. The fundamental
importance is primarily, knowledge of geometric dimensions, mass (and
consequently, average density), the parameters of orbital motion of
the planets and their satellites and the parameters of rotation. The
latter directly involves determination of the figures of the
gravitational body and limits of deviation of its gravitational field
from spherical symmetry. In turn, the knowledge of the shape and
degree of its correspondence to hydrostatic equilibrium is a
determining factor when constructing models of the inner structure of
planets. The set of all of these characteristics among which one
observes a number of important features is given a good deal of
attention quite purposefully: essentially, they all play an important
role in the problem of planetary cosmogony.
Dimensions, Mass, Rotation
Figure 5 shows the position of orbits and relationships of
dimensions of the planets. In the astronomy of planets found inside
the orbit of Earth, that is, close to the Sun, we name the lower and
outside of Earth's orbit -- the upper. Their basic mechanical
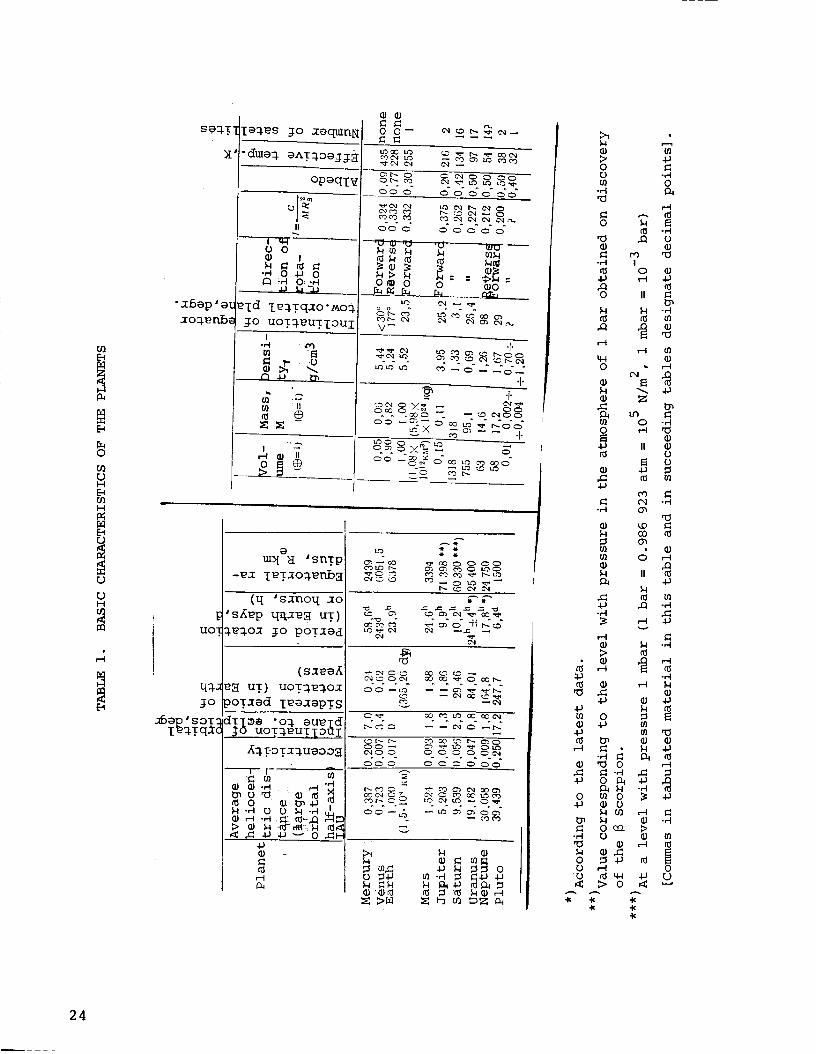
characteristics are shown in Table 1 to which we will refer constantly
in the future. It is apparent from Table 1 that the main difference
among planets of the Earth group and the planet-giants is in their
dimensions, mass and density. The difference in dimensions is about
one-and-one-half magnitudes and in mass -- it reaches almost four
magnitudes. With significantly larger dimensions in mass of the
planet-giants, they have four or five times less density than planets
of the Earth group. This is explained by the differences in the
relationships of the three basic types of matter of the planets --
gases, ice and rock or, as we have already said, mineral rock (among
the most important are iron, silicate and oxides of magnesium,
aluminum, calcium and other metals).
/2_1
/28
22
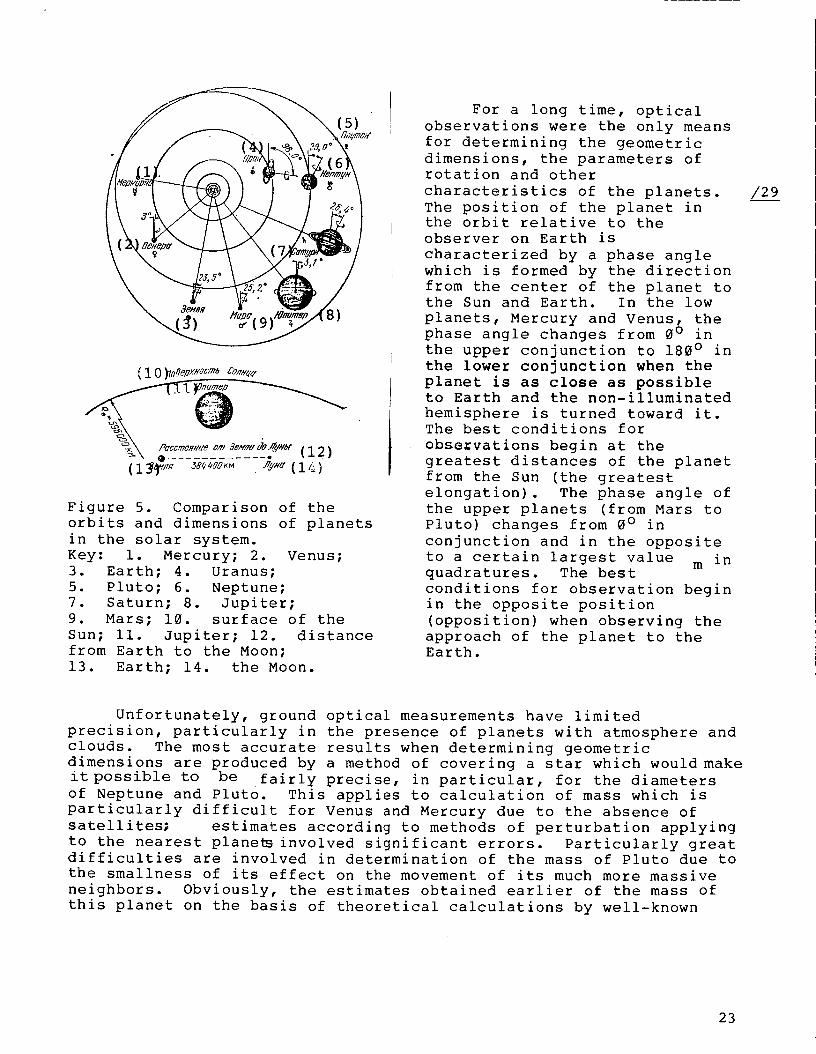
( 12__e _8o_SOKMJ7##_(1/_)
Figure 5. Comparison of theorbits and dimensions of planetsin the solar system.Key: i. Mercury; 2. Venus;3. Earth; 4. Uranus;5. Pluto; 6. Neptune;7. Saturn; 8. Jupiter;9. Mars; 10. surface of theSun; ii. Jupiter; 12. distancefrom Earth to the Moon;13. Earth; 14. the Moon.
For a long time, opticalobservations were the only meansfor determining the geometricdimensions, the parameters ofrotation and othercharacteristics of the planets.The position of the planet inthe orbit relative to theobserver on Earth ischaracterized by a phase anglewhich is formed by the directionfrom the center of the planet tothe Sun and Earth. In the lowplanets, Mercury and Venus, thephase angle changes from 0° inthe upper conjunction to 180° inthe lower conjunction when theplanet is as close as possibleto Earth and the non-illuminatedhemisphere is turned toward it.The best conditions forobservations begin at thegreatest distances of the planetfrom the Sun (the greatestelongation). The phase angle ofthe upper planets (from Mars toPluto) changes from 0° inconjunction and in the oppositeto a certain largest value m inquadratures. The bestconditions for observation beginin the opposite position(opposition) when observing theapproach of the planet to theEarth.
/2_/9
Unfortunately, ground optical measurements have limited
precision, particularly in the presence of planets with atmosphere and
clouds. The most accurate results when determining geometric
dimensions are produced by a method of covering a star which would make
it possible to be fairly precise, in particular, for the diameters
of Neptune and Pluto. This applies to calculation of mass which is
particularly difficult for Venus and Mercury due to the absence of
satellites; estimates according to methods of perturbation applying
to the nearest plane_ involved significant errors. Particularly great
difficulties are involved in determination of the mass of Pluto due to
the smallness of its effect on the movement of its much more massive
neighbors. Obviously, the estimates obtained earlier of the mass of
this planet on the basis of theoretical calculations by well-known
23
0
InoH
I-4
U
OHUl
4
I_%_s _o xaqulnN _ o-
"dm_ aAT. %Da_I,q } m_0
op_qlg I o r-°mdE E
0_0000
EdEd_E
II
o O• I
-,-_ O .,u' O
, .eId I_Tqxo" _o%
Io uoT_uTIoUII•,-I "
'I_
C_ 4J . Im
: II
OOO OOOOO
O_ 0 0 O0N__.N_._........_ ...... L
oo
V--
.[.
uOuD uD CO -- 0 -- --0_
"I"
o_ o X'_ -- oo-
,,. , i
I/Ol:
-_x I_TXo_nbs
(q 'sxnoq xo
'sA_p q_x_ uT)
_ox _o poTxad
% % %%%%%%
#
_._ 00 _D uo oo 00¢q
b_'cO O ----_ 0 --r,-
c_oE o.o ooo_<DO0 O _D O O OO
oO C_ ¢_ _I-- e_ _ _C_ _ C_ _ _oo_
U'D _ C0¢0
o _ _I_
l-I ID,14J _Q4 D
> 4JOO .H
0
0 M
-H Io •
_0 II
u,-i •_ _.4
m o -H
II IDU
.IJ
•H o'_
ul I11
I.-i
o
-,-I 0 _/l
U e.-tO _ 4_ _)
24
astronomers V. Pickering and P. Lowell (averages between masses of
Neptune and Earth) were much too high. The very first datum of
observation which did not permit measuring the disk of Pluto led us to
this same conclusion -- it proved to be less than 0.2", and the mass
considerably smaller than the mass of Earth. This forced us to
reconsider the degree of its perturbation effect on the movement of
Neptune. Therefore, even by 1930, that is, immediately after the
discovery of Pluto by C. Tombaugh at the Lowell Observatory in Flaqstaff,E. Brown pointed out the basic hypothesis that the fact of the
discovery of Pluto itself was not due just to a happy chance. This
opinion was confirmed by a majority of modern astronomers including
D. Cruikshank and his colleagues from the Observatory of Kitt Peak and
the observatory of the University of Hawaii. The values presented inTable 1 of the albedo and the dimensions of Pluto were obtained from
an analysis of the results of their careful spectrometric
observations. /30
The report in July of 1978 about the discovery of a Pluto
satellite in photographs obtained by D. Christie was a sensation;
Christie used a 155-centimeter telescope at the Marine Observatory in
the USA. The resolution on the photographs does not permit
distinguishing the presence of bodies close to Pluto, the bodies
moving with in orbit but an elongated image with a large projection
made it possible. However, an alternative satellite was difficult to
find, because it had the same shape as Pluto itself and recently had
been broken by centrifugal forces. From an analysis, it follows that
the satellite is turning in orbit around Pluto with a period equal to
the period of rotation of the planet itself at a distance of
=17,000 km from it (such is the linear dimension of the image). Thisdistance and estimate of distance to the center of mass of the Pluto-
satellite_sy_tem leads to a value of the mass of the latter on the
order of 1/3_ mass of the planet. This ratio exceeds the ratio of the /31mass of Moon and Earth by almost two (1/81.4) and means that the Pluto
satellite (which has been named Charon) must have a fairly significant
effect on the planet. The existence on Pluto of a satellite,
obviously, found in synchronous orbit (which is a unique example of a
natural synchronous satellite in the solar system) gives us the basis
for talking not about a separate planet but about a close dual system.
In turn, this has made it possible to more precisely determine the
mass and density of Pluto itself (see Table i).
In precision of mass with equatorial radius and average density
of Mercury, Venus, Mars, Jupiter and its Galilean satellites, the
radar measurements and flights of spacecraft have made a decisive
contribution. As a result of analysis of the perturbing effects on
the flight trajectory of a spacecraft or orbit of an artificial
satellite, the planets also have significantly more precise parameters
for their gravitational fields. In the expansion of the gravitational
potential of the planet according to spherical harmonics, several
primary members are determined which characterize the perturbing
effects due to the difference in the field from the central field. At
the same time, significant progress is being achieved in determining
the shape of the planet, the degree of its deviation from the spheroid
25
and a number of dynamic characteristics directly related to theparameters of rotation.
From Table i, it is apparent that with the large mass of aplanet-giant, the smallest periods of rotation occur as a result ofwhich linear velocities on the equator of the visible surface aregreat (12.2 km/s for Jupiter at the same time that on Earth it is0.46 km/s). This is due to the fact that, in particular, there aresignificantly large values of dynamic compression of these planets in
a - bcomparison with planets of the Earth group defined as _ = _-. Hereaa and b are the large and small half-axis of the ellipsoid rotationfor which, in a first approximation, one must satisfy the shape of arotating planet found in a state of hydrostatic equilibrium. In thisway, the value of _ characterizes the distribution of density in itsinterior (for a non-rotating planet it would be sphericallysymmetrical). In turn, the true s_hape of the planet is determined bya geometrical compression in e - a - b, which characterizes the actual
a_blate shape_of the planet determined by the difference in equatoriala and polar b radii. The compression of Jupiter comprises 4400 km atthe same time that for Mars it is about 25 km and for Venus it doesnot exceed a few hundreds of meters. One must emphasize that if forJupiter and Saturn (as results of analysis of measurements oftrajectory of movement close to these planets has indicated recently)e and e agree well with each other, then for the Moon, Venus andMercury e and _ differ considerably. Distribution of the gravitationalpotential energy of a heavenly body or its gravitational potential isrelated to the degree of compression.
Mars is rotating around its own axis almost with the same periodas that of Earth: the Martian days are 41 minutes longer than thoseof Earth (average solar days). And here, Venus and Mercury arerotating extremely slowly and Venus in a direction opposite thedirection of movement for the orbit. From the other planets, asimilar feature is observed only on Uranus, whose axis of rotationlies almost in the plane of its orbit (see Figure 5). In the lowplanets -- Venus and Mercury, there is a shift in phase similar to thephases of the Moon with a period on the average of 584 Earth days forVenus and 116 days for Mercury (synodic period).
/3__!
The problem of determining the periods of rotation of Venus and
Mercury and their rotation around the Sun (incidentally, like a number
of other characteristics of these planets) has a long history. This
involves the fact that the surface of Venus in an optical range is not
visible, but Mercury is very difficult to observe due to the smallness
of its angle of dimensions (changing within limits from 13" to 5") and
the small angles of distance from the Sun not exceeding 28 ° . In just
the two last decades, we have obtained reliable values of these
characteristics by radar study of planets.
Radar measurements of Venus were begun in 1961 simultaneously in
the Soviet Union by a group of workers at the Institute of Radio
26
Engineering and Electronics of the Academy of Sciences USSR under thedirection of V. A. Kotelnikov and in the USA by workers of theMassachusetts Institute of Technology and the California TechnologicalInstitute and in England at the Jodrell Bank Observatory. Duringthese and subsequent experiment_ frequency and time spectra of theradio signal reflected from the planet were measured, the Doppler shiftof its frequency, the intensity of reflected radiation and itsdepolarization and also the propagation time for the signal. On thebasis of measurements of angular velocity and rotation of the planetwhich were made by several methods, elements of its rotation weredetermined.
A large series of experiments made it possible to obtain thevalue of the sidereal period of rotation of Venus which is consideredto be, at the present time, by the International Astronomical Union:243.0+0.1_ earth days (e.d.). Later probing at a wavelength of 39 cmproduced, obviously, a somewhat more precise value of 243.1 earthdays. The data of many years of photographic and radar measurementsof the parameters of rotation of Mercury led, respectively, to valuesof the period 58.644+0.009 earth days and 58.65+0.1 earth days. Froman analysis of the phototelevised images of Mercury published in 1974by the Mariner-10 spacecraft, a period of 58.6461+0.005 earth days wasobtained.
/34
The gaseous shell of Jupiter, Saturn, Uranus and Neptune is inherent
to differential rotation, that is, the change in the period of
rotation with latitude which can involve dynamic processes in the
atmosphere. On Jupiter, the tropical zone of the atmosphere is
rotated more rapidly than the polar by 5 min ii s, that is, the
difference comprises about 1% and on Saturn it reaches almost 5%. For
Jupiter, obviously it is the closest to the true value of the period
corresponding to rotation of its magnetic field and determined by
modulation of intensity and direction of polarization of intrinsic
radio emission of the planet (09h55m29.7s+0.07s). It is considered
that it is best characterized by rotation--of the more viscous regions
of the planet lying below.
In 1977, S. Hayes and M. Belton, and after them a number of other
scientists, put the values of the periods of Uranus and Neptune in
some doubt; these values had been determined in 1912 by well-known
astronomers P. Lowell and V. Slayfer and later by D. Moore and
D. Menzel according to the slope of the Fraunhofer lines in the
spectrum of reflection caused by rotation of the planet. These values
comprised 10.8 hr for Uranus and 15.8 hr for Neptune. Hayes and
Belton concluded that there were considerably larger values of the
periods after having analyzed a large number of intrinsic spectral
measurements at the Kitt Peak Observatory and having reconsidered once
more the series of earlier observations.
The new values appeared close to twice those of the period of
rotation determined earlier for these planets. Later on, however, an
error was detected and the period of rotation of Neptune was decreased
almost to its former value of 15.4+3 hr. Finally, observations made
in 1983 using new high-sensitivity--receivers of radiation (the so-
27
called FZS-detectors) made it possible to obtain, obviously, a moreprecise value for the optical period of Neptune in the middlelatitudes: 17h50m+5m. If we pay attention to the fact that thedynamics of atmospheric circulation on Neptune, probably, is similar
to the dynamics of Jupiter and Saturn, then this value must be close
to the period of rotation for the inner areas of the planet. As to
Uranus, first of all on its disk one cannot successfully detect any
kind of local irregularities and its period of rotation is estimated
still with indeterminancy: 24+4 hr. These latter values are shown in
Table i. This does not exclude the fact that on the differences
obtained not only do method difficulties for conducting such
measurements have an effect but also the actually existing
irregularity of rotation of the visible surface of the planet.
Proposals have been brought out according to which the effect of
differential rotation on Uranus and Neptune can prove to be even more
significant than on Jupiter and Saturn.
/35
Questions of determining the shapes of the planet and degrees of
their difference from the state of hydrostatic equilibrium are closelyrelated to problems of the inner structure and in more detail we will
pause to discuss these questions later. While we only note that the
most interesting feature of the shape is observed on Mars, which has a
northern hemisphere (according to the lines of the large circle
inclined at =35 ° to the equator) that is more oblate than the southern
hemisphere, that is, it differs more noticeably from a spheroid. The
center of the figure is shifted relative to the center of mass by
2.5 km in a direction 98 ° W and 57 ° S. Venus has a lesser asymmetry
in shape. According to the data of radar for wavelength 3.8 cm, the
cross section of the planet in the equatorial plane is approximated by
an ellipse whose difference in half-axis comprises 1.1+0.4 km (for a
comparison let us indicate that for Earth this difference is <0.2 km)
and the center of the figure is shifted relative to the center of mass
by 1.5+0.3 km in the direction to Earth in the epoch of a lower
conjunction.
Due to the spheroidal shape of the planets caused by rotation,
their axis of rotation does not retain its position in space but under
the effect of gravitation perturbations undergoes periodic
oscillations. Here the well-known precession and nutation
oscillations of the Earth's axis are involved imparting to the Moon
and the Sun an equatorial band of Earth's spheroid inclined toward the
plane of Earth's orbit or ecliptics at an angle of 23.5 ° . The
resulting moment of force created strives to turn the equatorial plane
in such a way that it matches the plane of the ecliptics and then the
gravitational effect of the Sun is approximately 2.2 times smaller
than that of the Moon due to its great distance -- almost 400 times.
Inasmuch as the Earth has a large mass and is similar to a gyroscope,
it rapidly rotates and such a turn does not occur but orientation of
the axis of rotation (and this means the axis of the world) in space /3___6changes periodically: it describes around the axis of the ecliptics a
surface of a cone with an angle of solution 23.5 ° (precesses) like the
axis of a gyroscope. Respectively, the North and South Poles of the
world describe the circle on the heavenly sphere. This precession
movement occurs clockwise from east to west (that is, on the side
28
opposite the annual movement of the Sun on the heavenly sphere), at avelocity of 50.3" per year. Therefore, the full rotation around the
360°axis of the ecliptic occurs for 50.3" = 25800 years -- is the periodof precession of the Earth's axis.
It is necessary to add to this that inasmuch as the plane of thelunar orbit is inclined toward the plane of ecliptics on the averageat an angle of 5009 ', it itself precesses around the axis of eclipticswith a period of about 19 years -- this istthe so-called regression ofthe plane of the lunar orbit. Moreover, when the Sun (in March andSeptember) and the Moon twice a month intersects the heavenly equator,their dynamic action on the equatorial band of the Earth's spheroiddoes not create a moment striving to incline the axis of rotation.Altogether, all of these effects lead to a small additionaloscillation (nutation) of the Earth's axis. Therefore, the poles ofthe world at the same time describe around the poles of the eclipticscircles modulated by the frequency of nutation oscillations.
The most characteristic_ result of precession is a change in theposition of stars on the heavenly sphere in the equatorial system ofcoordinates. Thus, for example, at the present time, the North Poleof the world approaches the Polar Star. Angular distance between themcomprises right now 50' and in 2103 years decreases to a minimum valueof 27'. However, even in 3000 years, it increases to =5° and by 4200years the North Pole of the world will be =2° from _ Cepheus.Finally, 13,800 years closer to the North Pole of the world, thebright star (at a distance of =5° ) is Vega (e Lyra). Such a shiftwill be repeated with a period of about 26,000 years but, of course,the angular distances of these stars from the poles of the world willbe somewhat different.
Precession and nutation are the most characteristic and beststudied forms of movement of the Earth's axis. It is proposed alsothat there are other long-period oscillations as a result of the
gravitation perturbations, leading to a change in inclination of the
axis of rotation in space. According to the calculations of Soviet
scientists Sh. G. Sharaf and N. A. Budnikova, for the last 30 million
years, the inclination of the axis of rotation of Earth has changed
approximately from 22.1 ° to 24.6 ° with a period of about 40 and 200
thousand years.
29
The massive Moon satellite has a strong stabilizing effect on theposition of the axis of rotation of Earth. Mars has no similarsatellite and therefore its axis of rotation probably undergoesstronger oscillations relative to the plane of ecliptics. Ascalculations of the American scientist V. Ward have shown, they can be
due to application of three effects: change in the inclination of the
plane of the orbit to the plane of elliptics and the equator to the
plane of the orbit as a result of gravitation perturbations of the
planet-giant and precession of the axis of rotation itself caused by
the effect of moment from the Sun on the asymmetrical shape of the
planet. As a result, the position of the axis of rotation in space
varies with a period of 120,000 years (period of precession) and the
amplitude of oscillation changes with a period of 1.2 million years as
,v V°
I I I I
Op_HA'j M#H, _
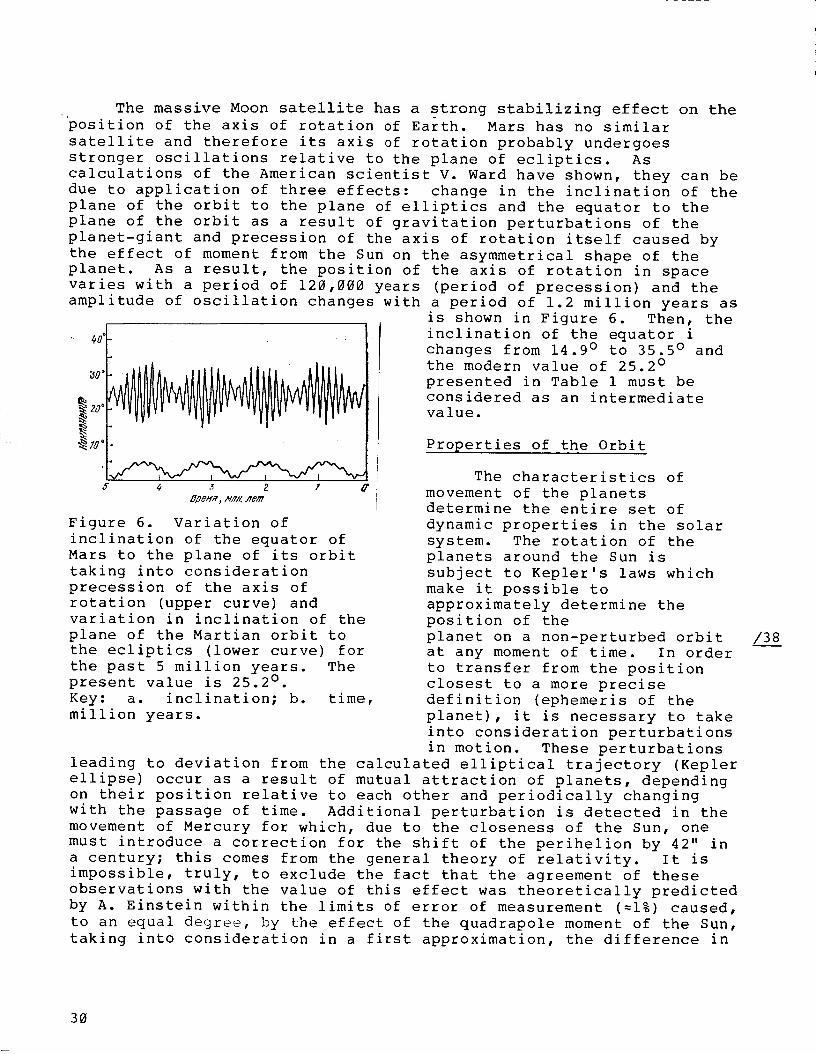
Figure 6. Variation of
inclination of the equator of
Mars to the plane of its orbit
taking into consideration
precession of the axis of
rotation (upper curve) and
variation in inclination of the
plane of the Martian orbit to
the ecliptics (lower curve) for
the past 5 million years. The
present value is 25.2 ° .
Key: a. inclination; b.
million years.
time,
is shown in Figure 6. Then, the
inclination of the equator i
changes from 14.9 ° to 35.5 ° and
the modern value of 25.2 °
presented in Table 1 must be
considered as an intermediate
value.
Properties of the Orbit
The characteristics of
movement of the planetsdetermine the entire set of
dynamic properties in the solar
system. The rotation of the
planets around the Sun is
subject to Kepler's laws which
make it possible to
approximately determine the
position of the
planet on a non-perturbed orbit
at any moment of time. In order
to transfer from the position
closest to a more precise
definition (ephemeris of the
planet), it is necessary to take
into consideration perturbations
in motion. These perturbations
leading to deviation from the calculated elliptical trajectory (Kepler
ellipse) occur as a result of mutual attraction of planets, depending
on their position relative to each other and periodically changing
with the passage of time. Additional perturbation is detected in the
movement of Mercury for which, due to the closeness of the Sun, one
must introduce a correction for the shift of the perihelion by 42" in
a century; this comes from the general theory of relativity. It is
impossible, truly, to exclude the fact that the agreement of these
observations with the value of this effect was theoretically predicted
by A. Einstein within the limits of error of measurement (=1%) caused,
to an equal degree, by the effect of the quadrapole moment of the Sun,
taking into consideration in a first approximation, the difference in
/38
30
the external gravitational potential of the Sun from the Newtonianpotential for an ideal sphere.
The elements of orbit undergo a long-period perturbation whosecharacter is determined by analytical solutions of the equations ofmovement and the theories well known in classical celestial mechanics.They, in particular, include the idea that inasmuch as movement isalmost completely determined by gravitational forces (or, in otherwords, a system in which perturbation movement of the celestial bodyoccurs, is conservative in distinction, for example, from the case ofan artificial satellite on which the resistance of the gas of theupper atmosphere already has an effect), the large half-axes and,consequently, the periods of rotation of planets around the Sun remainunchanged. As to the eccentricities and inclinations, for the upperplanets at the limits of their changes, strong limitations are appliedwhich come from the conditions involving these elements with othercharacteristics of orbital movement.
Certain properties of orbital and rotational movement areevidence of the existence of a number of principles which are a resultof the general distribution of mass in the dynamic system of planetsand satellites. With total mass of the planets comprising in all1/750 of the mass of the Sun, on them about 98% of the total moment ofthe quantity of motion of the solar system is involved. The planetsatellites make an insignificant contribution to this value. All ofthe planets move in a direction coinciding with rotation of the Sun,their orbits have a small inclination toward the plane of the solarequator and small eccentricities (except for Mercury and particularly,Pluto; see Table i).
The presence of even comparatively small elliptical position ofthe orbit causes noticeable seasonal changes, due to the large flow ofenergy from the Sun (insolation) in the perihelion. For Mars, theaxis amounts to about 45% and for Mercury it reaches 200%. However,the main role in seasonal changes is played by inclination of the axisof rotation from the normal toward the plane of the orbit. For Venus,for example, eccentricity and inclination is close to 0 and shift inseasons does not occur; at the same time, for Mars, both factors playa role leading to, besides a clearly expressed seasonal progress, adifferent duration of seasons in the northern and southernhemispheres.
The principle which we know by the name of the Titius-Bode rulesnamed after the law of planetary distances is noted in the position ofthe planets. According to this law, the ratios of the large half-axesof a sequential series of planets, the farther they get from the Sun(n = -® for Mercury, n = 0 for Venus, n = 1 for Earth, etc.)are almostconstant so that a = 0.1" (3"2 n + 4) IAU. This relationship produces,with a value of n = 3, the position of the band of asteroids,obviously, a relict of the stage of accretion in the form of anunshaped planet. At another time, the opposite point of view washeld: certain scientists consider that this was a fragment of aplanet which existed at some time which was named Phaethon. Thishypothesis was brought out for the first time by the German astronomer
/39
31
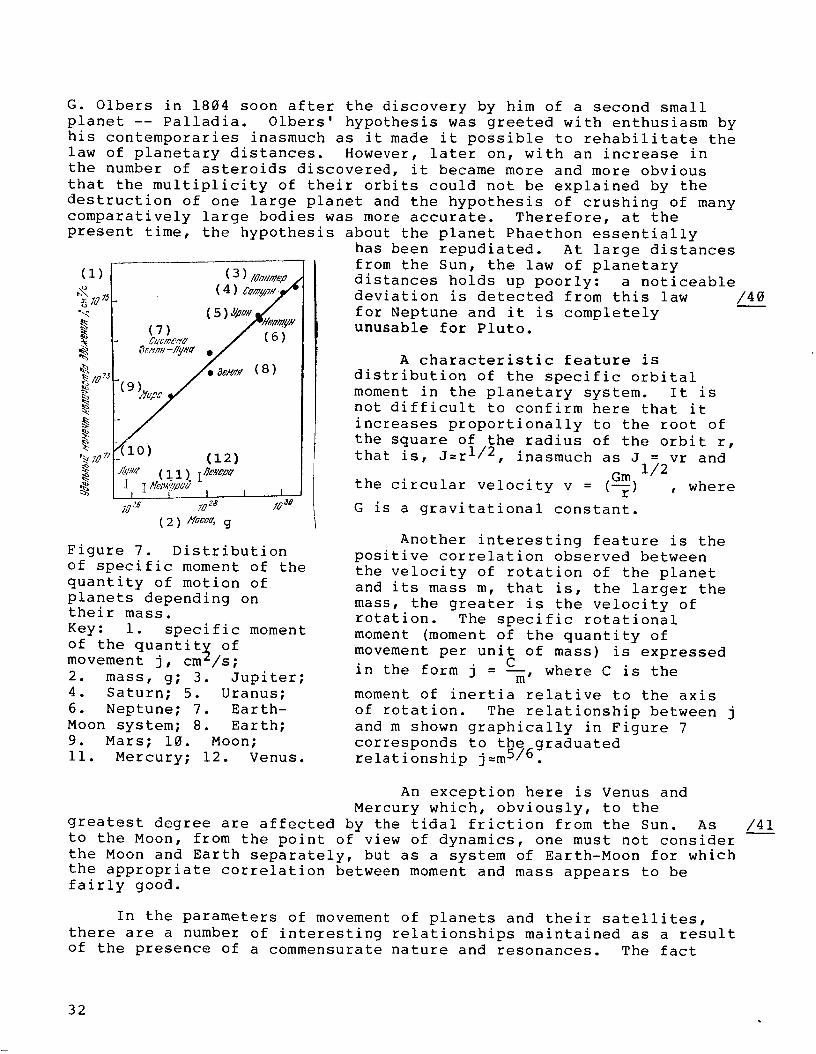
G. Olbers in 1804 soon after the discovery by him of a second smallplanet -- Palladia. Olbers' hypothesis was greeted with enthusiasm byhis contemporaries inasmuch as it made it possible to rehabilitate thelaw of planetary distances. However, later on, with an increase inthe number of asteroids discovered, it became more and more obviousthat the multiplicity of their orbits could not be explained by thedestruction of one large planet and the hypothesis of crushing of manycomparatively large bodies was more accurate. Therefore, at thepresent time, the hypothesis about the planet Phaethon essentially
has been repudiated. At large distancesi
(3 )10nur_ep
(4) _'_i
• 8oH/7_ _o;
(12)
1_exepu
I I I
(1)
_1075.,_,
#,10IJ
(9
lOz_ yOze /0 a°
(2 ) M_ccd,g
Figure 7. Distribution
of specific moment of the
quantity of motion of
planets depending ontheir mass.
Key: i. specific moment
of the quantit_ ofmovement j, cmZ/s;
2. mass, g; 3. Jupiter;
4. Saturn; 5. Uranus;
6. Neptune; 7. Earth-
Moon system; 8. Earth;
9. Mars; 10. Moon;
ii. Mercury; 12. Venus.
from the Sun, the law of planetary
distances holds up poorly: a noticeable
deviation is detected from this law
for Neptune and it is completely
unusable for Pluto.
A characteristic feature is
distribution of the specific orbital
moment in the planetary system. It is
not difficult to confirm here that it
increases proportionally to the root of
the square of the radius of the orbit r,
that is, J=r I/2 inasmuch as J _ vr and' 1/ 2
Gm
the circular velocity v = (--{) , where
G is a gravitational constant.
Another interesting feature is the
positive correlation observed between
the velocity of rotation of the planet
and its mass m, that is, the larger the
mass, the greater is the velocity of
rotation. The specific rotational
moment (moment of the quantity of
movement per unit of mass) is expressedC
in the form j = --_, where C is the
moment of inertia relative to the axis
of rotation. The relationship between j
and m shown graphically in Figure 7
corresponds to the_graduated
relationship j=m b/b.
An exception here is Venus and
Mercury which, obviously, to the
greatest degree are affected by the tidal friction from the Sun. As
to the Moon, from the point of view of dynamics, one must not consider
the Moon and Earth separately, but as a system of Earth-Moon for which
the appropriate correlation between moment and mass appears to be
fairly good.
In the parameters of movement of planets and their satellites,
there are a number of interesting relationships maintained as a result
of the presence of a commensurate nature and resonances. The fact
/40
/4__!
32
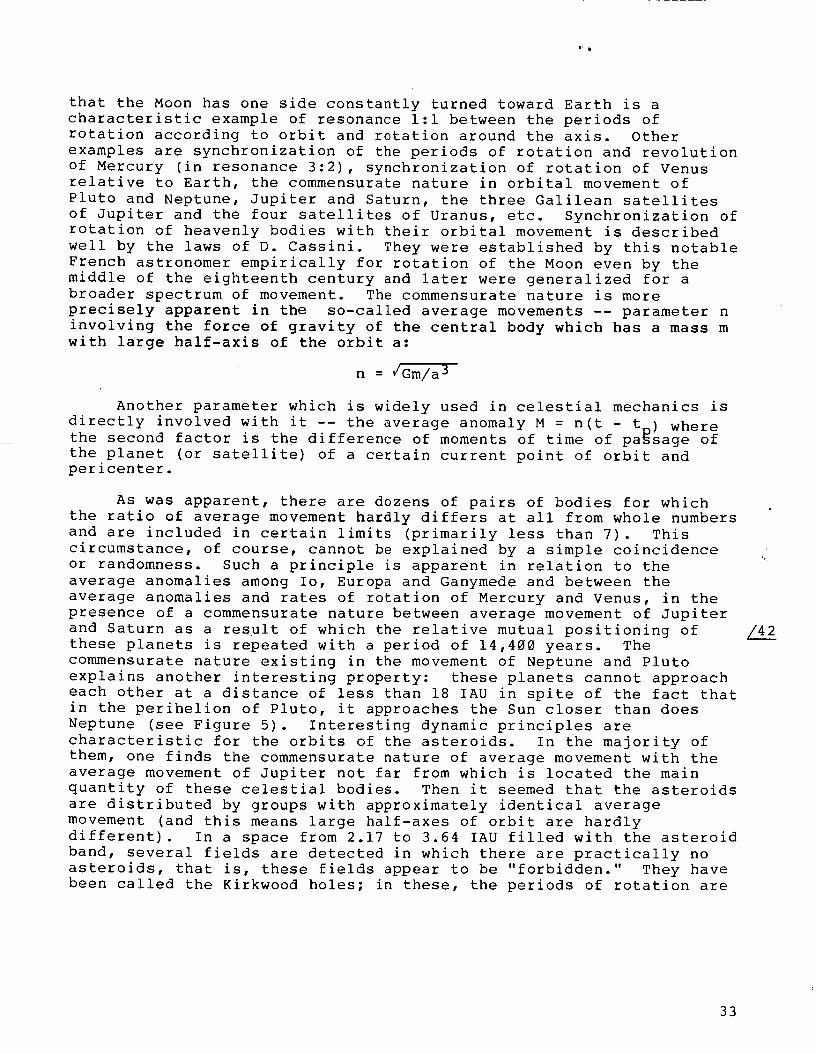
that the Moon has one side constantly turned toward Earth is acharacteristic example of resonance i:i between the periods ofrotation according to orbit and rotation around the axis. Otherexamples are synchronization of the periods of rotation and revolutionof Mercury (in resonance 3:2), synchronization of rotation of Venusrelative to Earth, the commensurate nature in orbital movement ofPluto and Neptune, Jupiter and Saturn, the three Galilean satellitesof Jupiter and the four satellites of Uranus, etc. Synchronization ofrotation of heavenly bodies with their orbital movement is describedwell by the laws of D. Cassini. They were established by this notableFrench astronomer empirically for rotation of the Moon even by themiddle of the eighteenth century and later were generalized for abroader spectrum of movement. The commensurate nature is moreprecisely apparent in the so-called average movements -- parameter ninvolving the force of gravity of the central body which has a mass mwith large half-axis of the orbit a:
n = /Gm/a 3
Another parameter which is widely used in celestial mechanics is
directly involved with it -- the average anomaly M = n(t - tn) wherethe second factor is the difference of moments of time of passage of
the planet (or satellite) of a certain current point of orbit and
pericenter.
As was apparent, there are dozens of pairs of bodies for which
the ratio of average movement hardly differs at all from whole numbers
and are included in certain limits (primarily less than 7). This
circumstance, of course, cannot be explained by a simple coincidence
or randomness• Such a principle is apparent in relation to the
average anomalies among Io, Europa and Ganymede and between the
average anomalies and rates of rotation of Mercury and Venus, in the
presence of a commensurate nature between average movement of Jupiter
and Saturn as a result of which the relative mutual positioning of
these planets is repeated with a period of 14,400 years. The
commensurate nature existing in the movement of Neptune and Pluto
explains another interesting property: these planets cannot approach
each other at a distance of less than 18 IAU in spite of the fact that
in the perihelion of Pluto, it approaches the Sun closer than does
Neptune (see Figure 5). Interesting dynamic principles are
characteristic for the orbits of the asteroids. In the majority of
them, one finds the commensurate nature of average movement with the
average movement of Jupiter not far from which is located the main
quantity of these celestial bodies. Then it seemed that the asteroids
are distributed by groups with approximately identical average
movement (and this means large half-axes of orbit are hardly
different). In a space from 2.17 to 3.64 IAU filled with the asteroid
band, several fields are detected in which there are practically no
asteroids, that is, these fields appear to be "forbidden." They have
been called the Kirkwood holes; in these, the periods of rotation are
/42
33
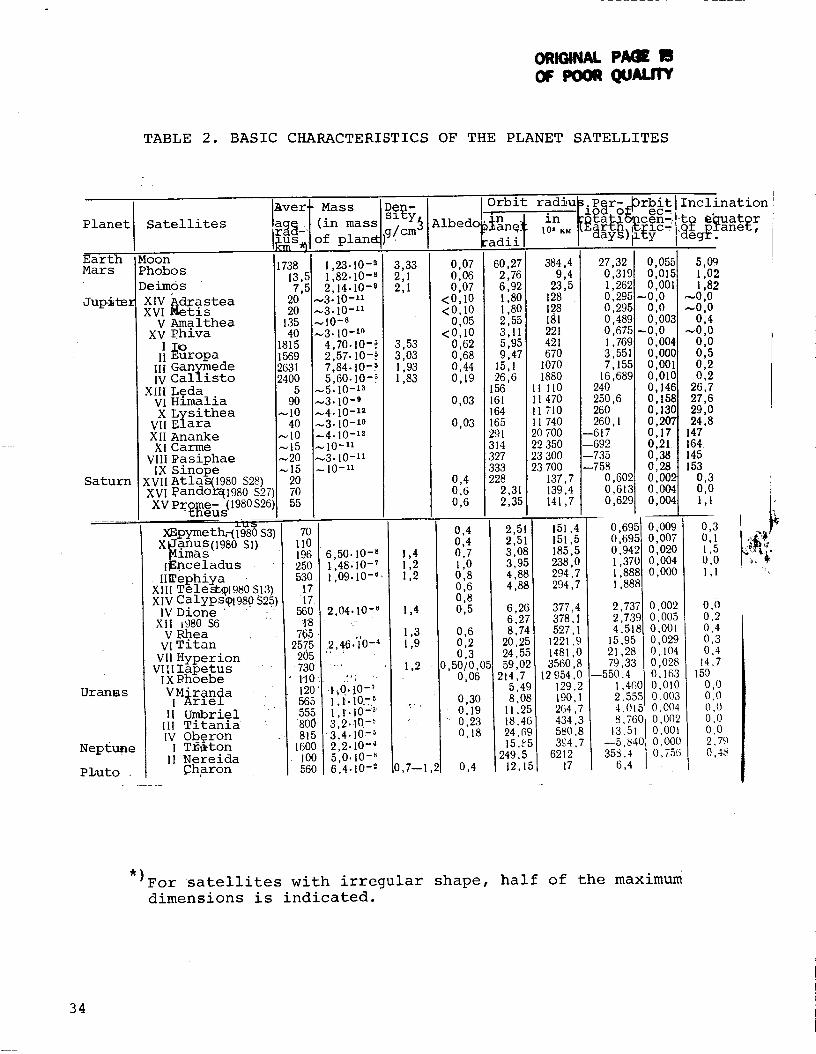
ORIGINAL PA4 SOF POOR QUALrlrY
TABLE 2. BASIC CHARACTERISTICS OF THE PLANET SATELLITES
)lanet Satellites
Moon?arthJars
"up&ha_
,aturn
Phobo s
Deimos
XIV AdrasteaXVl Metis
V AmaltheaXV Phiva
I _.uropaIIIII GanymedeIV Callisto
XIII LedaVI Himalia
X LysitheaVII ElaraXII AnankeXI Carme
VIIIPasiphaeIX Sinope
XVII AtlaF_1980 528)XVI panaor_1980 527)
XV PrOteus(1980 $26)
aver
173813 ,_7,_
2O20
1354O
1815156926312400
590
_1040
_10NI5N20_15
2O7O55
- Mass
(in mass
of planet
1,23.10 -s1,82.10 -s
2,14.10 -9•"-.3. lO-n_3.10 -u._10-8_3.10 -t°
4,70. lO-_2,57, 10-. 57,84.10-. s5,60.10-_
_5.10 -*a_3.10 -9_4.10 -x2--,3.10-Io_4.10-12-..10-n,--3.10 "u
10-11
De -slay&
)g/cm _
3,332,12,1
3,533,03I ,931,83
Orbit rad%u"Per-_0rbitlInclJ-l o o ec- _nl
Albedo_nn_ in :o_a_A_cen--ito e_uator I- I0' KM ,_;__r_t_O,llD_ClC4].QX p/anet, I
kadii| u_ysl _y Iaegr I
0,070,060,07
<0.10<0,10
0,05<0,10
0,620,680,440,19
0,03
0,03
60,272,766,921,801,80
2,553,115,959,47
15,126,6
156161164165291314327333228
2,312,35
384,49,4
23,5128128
221421670
I0701880
11 II011 47011 710I1 740
20 70022 35023 30023 700
137,7139.4141,7
27,32 0,0550,319 0,0151,262 0.0010,295--0,00,295 0,00,489 0,0030,675 --0,01,769 0,0043,551 0,0007,155 0,001
16,689 0,010240 0,146250,6 0,158260 0,130260,1 0,207
--617 0,17--692 0,21--735 0,38--75_ 0,28
0,60_ 0,00_0,613 0,0040,622 0,004
0,40.60,6
5,0_1,0_1,8_
_0,0_0,0
0,4_0,0
0,00,50,20,2
26,727,629,024,8
147164[45153
0,30.01,1
Uranss
Neptune
P]_uto •
x_pymeth_1980 53)anus(1980 Sl)lma s
I_nceladus
II_ephiya •XIIITele_1980 513)XIV Calyps_1980 525)IV Dione "
XII t980 S5V RheaVI Titan
Vll HyperionV! _IlapetusIX Phoebe
VMiran_aI Arle±11 Umbrie 1Ill TitaniaIV OberonI T2_tonII Nereida
_haron
I 70110
[ 196I 250/530
17
| 7;5/ 2575| 205
' / 730|" l lOt 120/ 565
' l 555' / 800
q. 81st 16oo/. 1oo/ 560
6,50.10 -s1,48:10 -71,09.10 -_"
2,04. I0 -8
.? 46/io -_
_,o: _o-'l, l- lO.-. _1,1'. I0-'_:3,2.:1D -_
3,4.10 -_2,2.10 -_5,0.10 -'_6,4.10-" 0,4
151,4151,5185,5238,0294.7294,7
377,4378,1527,1
1221,91481,03560,8
12 954.0129,2190,1264.7434,3580,83_4.7
621217
0.695 I
0,6950,942I, 3701,8881,888
2.7372,7394,518
15,9521,2879,33
--550,41,4(i02,55_4,015!
8,760 I
13,51 1--5,840 I355,4
6,4
);009),007),0203,004),000
3,0023,0050,0010,0290,1040,0280,1630,0100,0030,0040,0020,0010,0000,755
0,30,11,50,01,1
0,00,20,40,30,4
14,7150
0,00,00,00,00,02.790.45
'%,
*)For satellites with irregular shape, half of the maximum
dimensions is indicated.
34
short and the period of rotation of Jupiter and bodies setting behind
it undergo maximum tidal perturbation. Similar principles are
apparent in the structure of Saturn's rings, which we will discuss in
more detail in a later section of Chapter III.
Earth and all of the upper planets have satellites whose names
and basic characteristics are presented in Table 2. From the point of
view of cosmogony, the greatest interest exists in the fact of the
undoubted similarity of satellite systems of planet-giants with the
same planetary system -- Jupiter's system, for example, can be
compared with the solar system. Actually, the ratio of total mass of
satellites to mass of planets corresponds in magnitude to the ratio of
the mass of the planets to the mass of the Sun (=10-3), and the orbits
of the majority of satellites also have small eccentricities and
inclinations; and for their relative position we will use the law of
planetary distances. One should particularly emphasize the study of
the planet-satellite system is extremely important for problems of
long-term evolution of a celestial body, particularly in the case of
interaction involving exchange of energy. Besides the synchronous
rotation of Earth relative to Moon at resonance i:i, similar features
of synchronization (when the rate of rotation is equal to average
movement n in orbit) is detected in the movement of satellites of Mars
-- Phobos and Deimos, the Galilean satellites of Jupiter. Obviously,
they are also characteristic for other satellites of planets, which
are, in this way, one more remarkable property of movement in thesolar system. I
Tidal Interactions
The most accurate explanation of synchronization, smallness ofeccentricities and inclination of orbits and also the existence of
commensurability in the middle movements of the planets and
satellites, at the present time, is obtained starting from the
mechanism of tidal friction. As the basis of this mechanism, we have
the concept of dissipation of energy of gravitation perturbations in
celestial bodies inasmuch as these bodies do not have ideal
elasticity. As the simplest measures of inclination from the ideal
elasticity, we use the so-called dissipative function l/Q,
characterizing damping of any oscillation process and defined as the
portion of mechanical energy which is scattered per oscillation cycle.
The value of Q called the energy or Q factor is used to measure the
quality (resonance properties) of the oscillation system and is
broadly used, for example, in radio engineering for characteristics of
oscillatory circuits. For a contour with inductance L, capacity C, ohmic re-
sistance R: Q= R C' or I/_I/2RC, where _ is the intrinsic frequency of
the circuit. As we see, Q indirectly depends on frequency although
for actual mountain rock, whose properties are determined by the
"mechanical Q factor" of the system, this dependence is not very
strongly apparent. The value of the Q factor is characterized also as
ITable 2 does not include recently discovered new satellites for the
planet Uranus.
35
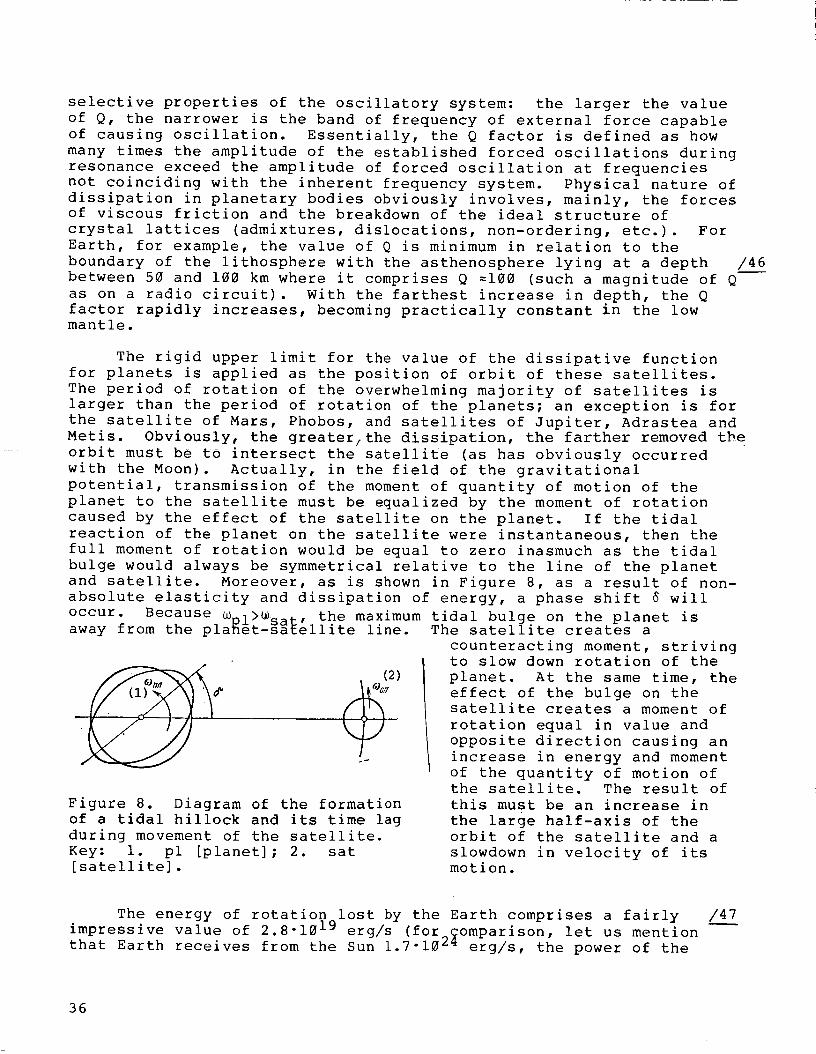
selective properties of the oscillatory system: the larger the valueof Q, the narrower is the band of frequency of external force capableof causing oscillation. Essentially, the Q factor is defined as howmany times the amplitude of the established forced oscillations duringresonance exceed the amplitude of forced oscillation at frequenciesnot coinciding with the inherent frequency system. Physical nature ofdissipation in planetary bodies obviously involves, mainly, the forcesof viscous friction and the breakdown of the ideal structure ofcrystal lattices (admixtures, dislocations, non-ordering, etc.). ForEarth, for example, the value of Q is minimum in relation to theboundary of the lithosphere with the asthenosphere lying at a depth /46
between 50 and 100 km where it comprises Q =100 (such a magnitude of Q--
as on a radio circuit). With the farthest increase in depth, the Q
factor rapidly increases, becoming practically constant in the lowmantle.
The rigid upper limit for the value of the dissipative function
for planets is applied as the position of orbit of these satellites.
The period of rotation of the overwhelming majority of satellites is
larger than the period of rotation of the planets; an exception is for
the satellite of Mars, Phobos, and satellites of Jupiter, Adrastea and
Metis. Obviously, the greater_the dissipation, the farther removed the
orbit must be to intersect the satellite (as has obviously occurred
with the Moon). Actually, in the field of the gravitational
potential, transmission of the moment of quantity of motion of the
planet to the satellite must be equalized by the moment of rotation
caused by the effect of the satellite on the planet. If the tidal
reaction of the planet on the satellite were instantaneous, then the
full moment of rotation would be equal to zero inasmuch as the tidal
bulge would always be symmetrical relative to the line of the planet
and satellite. Moreover, as is shown in Figure 8, as a result of non-
absolute elasticity and dissipation of energy, a phase shift _ will
occur Because _l>_sae, the maximum tidal bulge on the planet isaway from the pla_et-sa_ellite line. The satellite creates a
(2)
Figure 8. Diagram of the formation
of a tidal hillock and its time lag
during movement of the satellite.
Key: i. pl [planet]; 2. sat
[satellite].
counteracting moment, strivingto slow down rotation of the
planet. At the same time, the
effect of the bulge on the
satellite creates a moment of
rotation equal in value and
opposite direction causing an
increase in energy and moment
of the quantity of motion of
the satellite. The result of
this must be an increase in
the large half-axis of the
orbit of the satellite and a
slowdown in velocity of itsmotion.
The energy of rotation lost by the Earth comprises a fairly
impressive value of 2.8-1019 erg/s (for _omparison, let us mention
that Earth receives from the Sun 1.7"10 z_ erg/s, the power of the
/47
36
atmospheric circulation is estimated as approximately 2.4-1022 erg/s,energy generation at the moment of powerful magnetic storms and polarauroras comprises about 1019 erg/s, and the power of the largestmodern electric power plants is <1017 erg/s).
Calculations show that the main part of slowdown of rotation ofEarth comprising about 3.5 ms per hundred years, is caused by oceantides (at the same time the slowdown is less, inasmuch as at the sametime acceleration of rotation occurs by approximately 1.5 ms per onehundred years; its cause is still not clear). A significant portionof energy, obviously, is also dissipated due to the solid-bodyfriction between separate blocks in the crust and mantle of Earth.
According to the measurements of Earth tides, it is found thatslowing down rotation of Earth due to tidal friction corresponds to avalue of Q=I5. Inasmuch as the rate of dissipation of energy isdefined as the average rate of work produced by the Moon on Earth andconsequently, by Earth on the Moon for an oscillatory cycle, it ispossible to obtain an estimate of the effect of tidal friction onevolution of the lunar orbit. Then it seems that due to increments ofenergy of motion, a large half-axis of the lunar orbit is increased byapproximately 3 cm/year, simultaneously insignificantly theeccentricity and inclination of it change. Now, if it is assumed thatthe tidal characteristic which is measured by the function Q wasretained during ancient geological eras in the history of Earth (atleast for the Archean to Aphebian eras) as unchanged, it would bepossible to counter the concept that about 1.5 billion years ago theMoon was located close to Earth and its orbit had a noticeably greaterinclination toward the plane of the Earth's orbit (and Earth days atthat period were almost five hours shorter). Inasmuch as, however,the results of analysis of lunar soil firmly prove the significantlymore ancient age, obviously, the corresponding age of Earth (4, 6billion years), hypotheses about the comparatively "recent" formationof the Moon are excluded. Also, the hypothesis about "mooring" of theMoon to the Earth about 1.5 billion years ago appears hardly probable;therefore, most probably, one can assume that earlier the Earth-Moonsystem (formed as part of a single process) had a significantlysmaller tidal dissipation in comparison with the modern epoch. /48
Thus, under the effect of tidal friction in a rotating planet, an
increase must occur in the large half-axes of the orbit of its
satellites which gradually move farther away from the planet. Due to
gravitation interaction, the moment of quantity of motion is
transmitted from one satellite to another and their period of rotation
becomes mutually related and commensurability of middle movement
occurs. Taking into consideration the relatively close positioning to
its planet of the Jupiter satellites and other satellites of the
planet-giants, evidencing weaker dissipation than for Earth, the lower
limits of the Q factor are estimated for them at a value of =104 (a
tuning fork has such a magnitude for its Q factor). Experimental
confirmation of the important role of the mechanism of tidal friction
comparatively recently was obtained for the Galilean satellites of
Jupiter. Phenomenal effects caused by tidal dissipation were
37
detected, primarily on Io, which we will become more familiar with inChapter III.
The mechanism of synchronization relative to the axis of rotationof the satellite of the planet or the planet itself has a similarnature; this synchronization results in coincidence (orcommensurability) of the average velocity of rotation with averagemotion n. The decrease in angular velocity occurs in this case underthe effect of the righting moment having an effect on the tidal bulgeof the satellite. The righting moment is proportional to the ratio ofdifference of equatorial moments of inertia A and B to the polar C.In a general case, when the satellite is in an elliptical orbit withnoticeable eccentricity, the moment of rotation created by gravitationof its tidal bulge by the planet strives to approach the velocity ofrotation of the satellite for an angular velocity at the pericenter.As rotation slows, the lag time of the bulge along the orbit decreasesand, respectively, transmission of the moment of the quantity ofmotion. At the limit, when the angular velocity of rotation andmovement in orbit are practically equalized, there is no transition ofmoment and only an exchange of tidal energies occurs. It is of someinterest to note that according to an estimate by American scientistS. Peale, the time required for tidal lag of a nonsynchronous rotationand synchronization of it with orbital motion for a satellite of theAmalthea type, in the gravitational field of Jupiter, comprises nomore than 104 years.
Now we turn again to the question of rotation of the two lowerplanets -- Venus and Mercury. We have already talked about the factthat a considerable amount of time and effort is needed primarily withhigh precision which will, in the end, determine their completelyunusual periods of rotation. However, their unusual aspect includesmore than the fact that both these planets rotate extremely slowly.The values obtained are of great interest from the point of view ofthe manifestation of the principles again caused by the mechanism oftidal friction.
The period of rotation of Venus appeared to be very close to theperiod of resonance of rotation of the planet relative to Earth whichequals 243.16 days. Then, in each of the lower (_ = 180 ° ) and upper(_ = 0° ) conjunctions, Venus turns the same side toward Earth. Withthe reverse direction of rotation, this corresponds to duration ofsolar days on Venus of 116.8 Earth days, that is, the Venusian yearcomprises approximately two Venusian solar days.
Resonance rotation of Venus relative to Earth, obviously, iscaused by the effect of gravitational pull of Earth on thenonsymmetrical figure of Venus. However, for stability in the stateof resonancy, it is necessary that the stabilizing moment of Earth T8was greater than the tidal moment of Venus in the gravitational fieldof the Sun TQ. This means that the asymmetry found for the shape ofVenus must be adequate for guaranteeing the difference in moments ofinertia relative to the equatorial axes A and B necessary forcompleting the condition Ts>T®. Moreover, the relative width of theresonance zone on Venus appears to be extremely small, considerably
/49
38
smaller than for the Moon or Mercury. Starting from the generalizedCassini laws, V. V. Beletskiy and S. I. Trushin pointed out that forretaining movement in the limits of the resonant zone in the presenceof periodic solar perturbations, it is necessary to fulfill thecondition B - A _ 2 5"10 -5 An analogous ratio for the Moon has a
C " "
magnitude of =5"10 -4 from which it follows that this condition is very
critical and the phenomenon of resonance rotation of Venus which it is
called lies "on the limit of the possible."
An additional factor facilitating synchronization of rotation of
Venus by Earth can be atmospheric tides. Moreover, the American
scientists T. Gold and S. Soter have also turned their attention to
the possible role of 24-hour variations in pressure and powerful
atmosphere of Venus due to heating by the Sun. Actually, the minimum
pressure and mass occur in the post-meridional field of atmosphere and
the maximum on the pre-meridional. _This distribution of mass creates,
in the gravitational field of the Sun, a moment T'®, proportional to
the period of rotation of the planet and opposite in sign the moment
TO , that is, accelerating its rotation. This decreases the effect of
the slowing tidal moment of the Sun and makes synchronization of Venus
to Earth easier. The precise condition of synchronization acquires,
in this case, the form T_>T®--To. I
The hypothesis about synchronous rotation of Mercury, that is,
about the equality of periods of its rotation and revolution, was put
forward back at the e_d of the last century by the well-known Italian
astronomer D. Schiaparelli about observations of the absence of the
visible mixing of separate spots on the disk of the planet relative to
the terminator and confirmed by a number of later investigations up to
the middle of the 1960's. The precise value found for the period of
rotation does not contradict the confirmation about synchronous
rotation inasmuch as a period of about 88 days is not unique.G. Colombo was the first to direct his attention to the circumstance
that in the case of a non-isotropic moment of inertia, the planets can
have a stable regime and then the period of rotation comprises 2/3 of
the orbital period or 586,461 Earth days. This interesting variation
of resonance, the so-called resonance with spin oscillations, in which
due to tidal interaction of the planet with the Sun, there could have
been a transfer of its angular moment and, respectively, a decrease in
the rate of rotation and "capture" in the existing resonance regime.
A detailed theoretical consideration of this interesting effect was
made in the works of the American scientists G. Colombo and
I. Shapiro, P. Goldreich and S. Peale and the Soviet scientist
V. V. Beletskiy.
It is important to emphasize that for the occurrence on Mercury
of a spin-orbital resonance 3:2 one requires very insignificant
compression of the ellipsoid of inertia in the plane of the equator,
on the order of (B-A)/C>I0 -5. Deviation from the strictly
concentrated distribution of mass close to this plane, possibly, is
due to gravitational anomalies similar to the region on the Moon with
/50
/5!
39
increased concentration of mass. These are called mascons. Thelargest of the hypothetical mascons of Mercury is associated with atremendous (cross section 1300 km) Caloris Basin (also calledthe Sea of Fires) always turned toward the Sun in the perihelion ofthe orbit.
The duration of solar days on Mercury determined by the combinedeffect of rotation and revolution in orbit appears to be equal tothree stellar Mercury days or two Mercury years and comprises 17,594Earth days. It is interesting that due to the large eccentricity oforbit of Mercury, the daily movement of the Sun in the sky of thisplanet is not uniform. It moves more slowly when the planet is foundin the aphelion. In the perihelion, where the angular velocity oforbital movement of the planet exceeds the velocity of its rotation,the daily movement of the Sun (in general occurring from east to west)in a comparatively short period of time becomes fivefold. Thisunusual phenomenon continues for approximately 8 Earth days.
Comparatively recently, American researchers T. van Flendern andR. Harrington have attempted to find an explanation for severalunusual orbits of Mercury and its quasiresonance rotation within theframework of the hypotheses put forward earlier, according to whichMercury at some time was a satellite of Venus, similar to the Moon forEarth. According to the results of modeling on a computer, theauthors have concluded that the situation is possible in which Mercuryfound in primary orbit with average distance =460,000 km from Venusmust_ due t ° tidal interaction, have had its intrinsic rotationgradually slowed down and simultaneously the rotation of Venus broughtup to the inverse. In this dynamic model of Mercury, over a period ofseveral millions of years, one could leave Venus going to theheliocentric orbit from its gravitational field through one of theLagrange points lying on a straight line connecting both centers ofmass inasmuch as the position of the body at these points is unstable(see Figure 3).
There is one more interesting idea also considered by numericalmodeling on a computer by Harrington and van Flendern related to theattempt to explain the orbit of Pluto and its satellite Charon. Backin the 1930's, a proposal was put forward that Pluto is an "escaped"satellite of Neptune which was the result of its close approach toanother satellite Neptune, Triton and therefore the movement of thelatter changed in opposition. The famous American astronomerD. Koype_ having confirmed that the concept of its independentformation as a planet is not compatible with the existing parametersof orbit -- great eccentricity and inclination considered that Plutowas a satellite of the proto-Neptune having left it after completionof the formation of the planet itself. Harrington and van Flendernconsidered several other models according to which the escape tookplace as a result of perturbation which was confirmed by a system ofsatellites of Neptune from an unknown planet with mass on the order of10 masses of Earth. With passage close to Pluto, the planet must haveitself undergone strong perturbation which would throw it to adistance of approximately 50-100 IAU from the Sun where it, possibly,is found right now. Theoretically, this situation is possible and
/52
40
quantitatively its basic realism with the indicated hypotheses isconfirmed by calculations. However, there is no more weighted basisin favor of this interesting idea, primarily, because there are nodata about the existence of a tenth planet in the solar system beyondthe orbit of Pluto. We are talking about "as before," inasmuch as asimilar hypothesis was put forward about 20 years earlier startingfrom the fact of systematically recorded divergencies in the movementof Uranus and Neptune predicted in theory and obtained fromobservations. If such a planet, as was proposed, has a massapproximately equal to the mass of Jupiter and was a distance of60 IAU from the Sun, then it would be observed as an object with noless than a fourteenth stellar magnitude. Nevertheless, the regularsearches with the possibility of discovering even significantly weakerobjects did not produce any kind of results. Moreover, it isimpossible to exclude the fact that this hypothetical near-Plutoplanet X possesses a very low reflective capability (albedo) beingeven farther distant from the Sun and is found in an even more unusualorbit than the orbit proposed with an inclination on the order of120° .
Certain Cosmogonous Results
The principles in the system of planets and satellites considered
by us very definitely indicate a single process for their formation
and makes it possible to put together several concepts of the most
probable means and mechanisms of this process. Modern cosmogonous
theories including two cardinal problems -- the origin of
protoplanetary nebulae and the formation of planets, -- rest both on
the mechanical characteristics of bodies of the solar system and on
new experimental data about the properties of surfaces and the
composition of matter of planets and a comparison with samples of
material of their origin -- the meteorites. Also, the successfully
developed theoretical methods of modeling processes in radiated gas
and cosmic plasma play an important role and, of course, the total
great success of astrophysics and stellar cosmogony.
One of the first serious attempts to explain the basic principles
of the origin of the solar system was undertaken by the important
Soviet geophysicist O. Yu. Shmidt within the framework of his
cosmogonous theory; at the same time, the German scientist
K. Weizsacker was energetically developing this in the 1940's. In
these theories, there was a significant difference from those put
forward in the middle of the seventeenth century by the French thinker
R. Descartes and in the second half of the eighteenth century by the
German philosopher I. Kant and the French mathematician P. Laplace
with concepts about the formation of planets from protoplanetary dust
matter and from gaseous nebulae. These hypotheses are often callednebular from the Latin word nebula.
O. Yu. Shmidt considered the movement of all the planets in a
single direction on a circular orbit lying approximately in a single
plane as the result of a natural statistical averaging of the moment
of quantity of motion of many cold bodies and particles, from whose
combination the planets arose. Their subsequent geological evolution
/53
41
was considered then as the result of separation of radiogenic heatfrom the interior. The law of planetary distance was obtained on thebasis of primary distribution of mass of primary matter at the sametime that Weizsacker defined the scale of turbulence in a gaseous diskwith mass =0.1 mass of the proto-Sun. Both series did not permit,however, explaining the distribution observed at the moment ofquantity of motion in the solar system without involving an artificialhypothesis about the capture by the Sun of interstellar dust clouds(protoplanetary nebulae) which already possess the necessary moment.Although such a capture, in principle, is possible, its probability is /54low which was a vulnerable spot for this theory.
Striving to get around this difficulty, the English
astrophysicist F. Hoyle put forward a hypothesis on the mechanism of
transmission of the solar moment of the pulse of two planets at the
stage of their formation during interaction caused by a strong
magnetic field of the proto-Sun. Such magnetic adhesion
simultaneously must slow down the rotation of the Sun and
redistribution of the moment throughout the entire radius of the
protoplanetary disk was proposed due to turbulent friction. However,
then different perturbations in the plasma were not taken into
consideration which would break down the indicated character of
interaction. Therefore, the practical accomplishment of thismechanism also was somewhat doubtful.
In Hoyle's works, his own expression of the concept of
simultaneous formation of the Sun and a protoplanetary cloud and the
idea of the so-called instability were found; later on this was
intensively developed by the well-known American cosmogonist
A. Cameron and the French astronomer E. Shatsman. The basis of this
is the process of separation of the Sun from the primary cluster of
interstellar matter which has a large moment of quantity of motion as
a result of the collapse of the central cluster due to the occurrence
of instability. The formation of planets occurs as a result of decay
of a thin rotating disk separated from this cluster by the effect of
centrifugal force. Cameron proposes that the primary mass of a
protoplanetary nebula must be on the order of the solar and separation
of matter began at a distance approximately twice exceeding the radius
of orbit of Pluto. Shatsman had both values approximately two
magnitudes smaller, that is, the Sun generated in the beginning
possessed a comparatively small mass and separation of the nebula
occurred in the region of orbit of Mercury.
In Cameron's model, it was proposed that the temperature of the
gaseous disk separated was high, probably higher than 2000 K, but in
the future, after compression stopped, its intense cooling occurred
mainly as a result of radiation. At this initial stage of
condensation, particles of the solid substance were formed and the
nebula was converted to gas and dust. With an increase in luminosity
and the flux of corpuscular radiation of a young Sun, the material
from which the large and small planets had accumulated was partially
swept out. The particularly large loss of matter of the Sun and the
protoplanetary nebula often is related to the period of cooling of the
young stars themselves at the stage of T Taurus when their activity
42
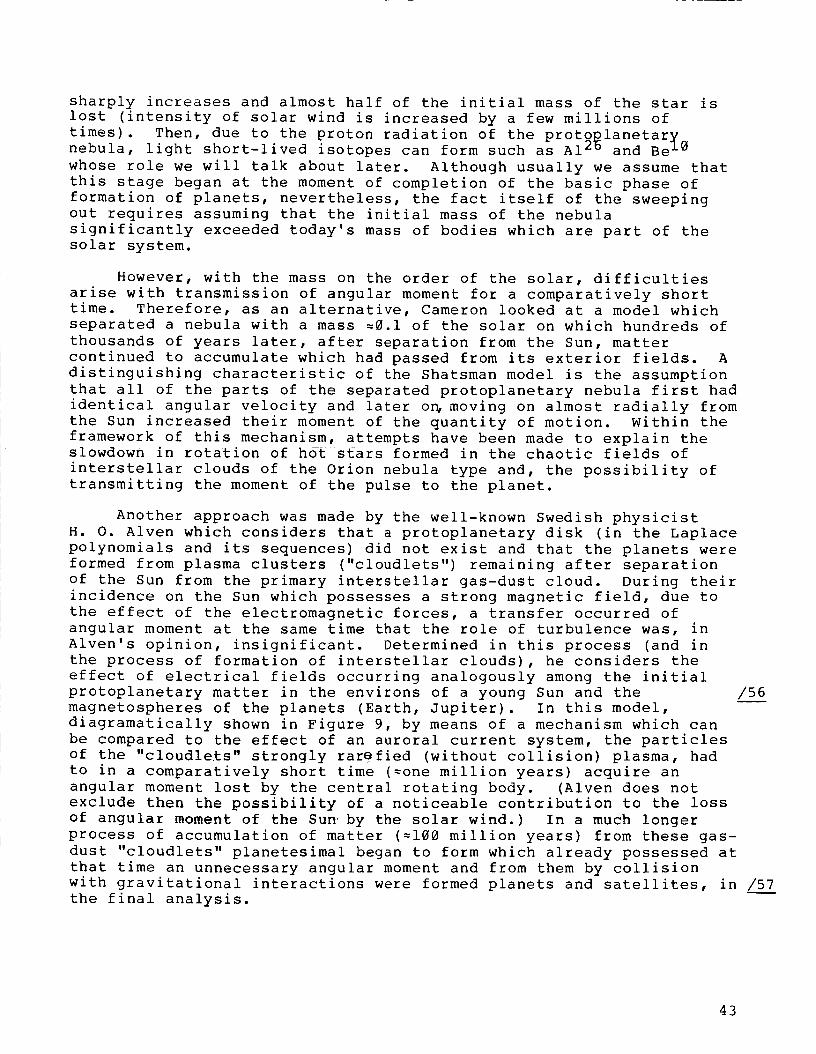
sharply increases and almost half of the initial mass of the star islost (intensity of solar wind is increased by a few millions oftimes). Then, due to the proton radiation of the protoplanetarvnebula, light short-lived isotopes can form such as A125 and Be10whose role we will talk about later. Although usually we assume thatthis stage began at the moment of completion of the basic phase offormation of planets, nevertheless, the fact itself of the sweepingout requires assuming that the initial mass of the nebulasignificantly exceeded today's mass of bodies which are part of thesolar system.
However, with the mass on the order of the solar, difficultiesarise with transmission of angular moment for a comparatively shorttime. Therefore, as an alternative, Cameron looked at a model whichseparated a nebula with a mass =0.1 of the solar on which hundreds ofthousands of years later, after separation from the Sun, mattercontinued to accumulate which had passed from its exterior fields. Adistinguishing characteristic of the Shatsman model is the assumptionthat all of the parts of the separated protoplanetary nebula first hadidentical angular velocity and later o_ moving on almost radially fromthe Sun increased their moment of the quantity of motion. Within theframework of this mechanism, attempts have been made to explain theslowdown in rotation of h0t stars formed in the chaotic fields ofinterstellar clouds of the Orion nebula type and, the possibility oftransmitting the moment of the pulse to the planet.
Another approach was made by the well-known Swedish physicistH. O. Alven which considers that a protoplanetary disk (in the Laplacepolynomials and its sequences) did not exist and that the planets wereformed from plasma clusters ("cloudlets") remaining after separationof the Sun from the primary interstellar gas-dust cloud. During theirincidence on the Sun which possesses a strong magnetic field, due tothe effect of the electromagnetic forces, a transfer occurred ofangular moment at the same time that the role of turbulence was, inAlven's opinion, insignificant. Determined in this process (and inthe process of formation of interstellar clouds), he considers theeffect of electrical fields occurring analogously among the initialprotoplanetary matter in the environs of a young Sun and the /56
magnetospheres of the planets (Earth, Jupiter). In this model,
diagramatically shown in Figure 9, by means of a mechanism which can
be compared to the effect of an auroral current system, the particles
of the "cloudlets" strongly rarefied (without collision) plasma, had
to in a comparatively short time (=one million years) acquire an
angular moment lost by the central rotating body. (Alven does not
exclude then the possibility of a noticeable contribution to the loss
of angular moment of the Sun by the solar wind.) In a much longer
process of accumulation of matter (=100 million years) from these gas-
dust "cloudlets" planetesimal began to form which already possessed at
that time an unnecessary angular moment and from them by collision
with gravitational interactions were formed planets and satellites, in /57the final analysis.
43
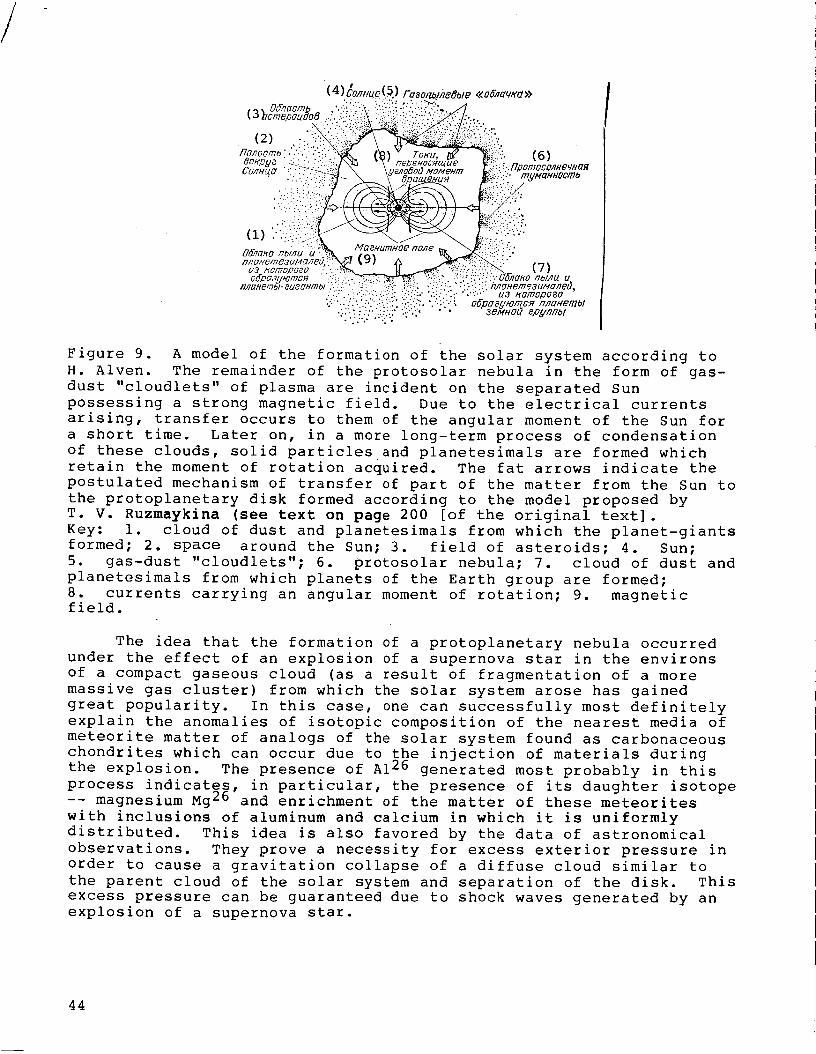
E
( 4 ) ConH_e(.5) Faaor_meS_/e <<:o6"_cwKct>>
.,. OEn_cmb.,::?!//oBoomO6o_B' )• _:" (6)
:.:;?.
nnuHeme3u/4_neO _ _:,__: 5" t -"u3 t<omopoeo __:.><. _•)OETp_3y/orncFI Uh'O nblll/.,/. (I
_/IgHe_Wbl-_/.E_GHrlTOI ;..." " -:::._ 'i:).!;" ;i:?, ,:..: .,. ,'..',k'.nITCfHE_me3uA'/Q'IIeU)
..: ..:.;: ;:...:: 8e,v_/odep,.c,nnt_/
Figure 9. A model of the formation of the solar system according to
H. Alven. The remainder of the protosolar nebula in the form of gas-
dust "cloudlets" of plasma are incident on the separated Sun
possessing a strong magnetic field. Due to the electrical currents
arising, transfer occurs to them of the angular moment of the Sun for
a short time. Later on, in a more long-term process of condensation
of these clouds, solid particles and planetesimals are formed which
retain the moment of rotation acquired. The fat arrows indicate the
postulated mechanism of transfer of part of the matter from the Sun to
the protoplanetary disk formed according to the model proposed by
T. V. Ruzmaykina (see text on page 200 [of the original text].
Key: i. cloud of dust and planetesimals from which the planet-giants
formed; 2. space around the Sun; 3. field of asteroids; 4. Sun;
5. gas-dust "cloudlets"; 6. protosolar nebula; 7. cloud of dust and
planetesimals from which planets of the Earth group are formed;
8. currents carrying an angular moment of rotation; 9. magneticfield.
The idea that the formation of a protoplanetary nebula occurred
under the effect of an explosion of a supernova star in the environs
of a compact gaseous cloud (as a result of fragmentation of a more
massive gas cluster) from which the solar system arose has gained
great popularity. In this case, one can successfully most definitely
explain the anomalies of isotopic composition of the nearest media of
meteorite matter of analogs of the solar system found as carbonaceous
chondrites which can occur due to the injection of materials during
the explosion. The presence of A126 generated most probably in this
process indicates, in particular, the presence of its daughter isotope-- magnesium Mg 26 and enrichment of the matter of these meteorites
with inclusions of aluminum and calcium in which it is uniformly
distributed. This idea is also favored by the data of astronomical
observations. They prove a necessity for excess exterior pressure in
order to cause a gravitation collapse of a diffuse cloud similar to
the parent cloud of the solar system and separation of the disk. This
excess pressure can be guaranteed due to shock waves generated by an
explosion of a supernova star.
44
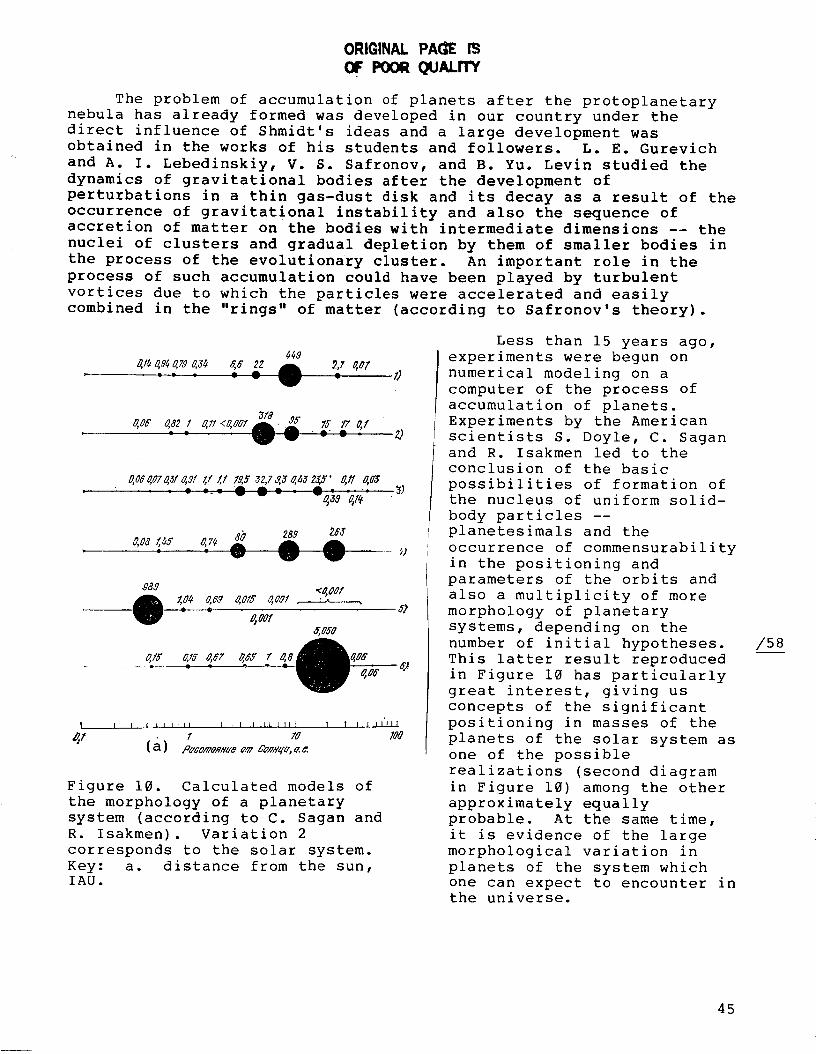
ORIGINAL PAG'_EF3
OF POORQUALITY
The problem of accumulation of planets after the protoplanetary
nebula has already formed was developed in our country under the
direct influence of Shmidt's ideas and a large development was
obtained in the works of his students and followers. L. E. Gurevich
and A. I. Lebedinskiy, V. S. Safronov, and B. Yu. Levin studied the
dynamics of gravitational bodies after the development of
perturbations in a thin gas-dust disk and its decay as a result of the
occurrence of gravitational instability and also the sequence ofaccretion of matter on the bodies with intermediate dimensions -- the
nuclei of clusters and gradual depletion by them of smaller bodies in
the process of the evolutionary cluster. An important role in the
process of such accumulation could have been played by turbulent
vortices due to which the particles were accelerated and easily
combined in the "rings" of matter (according to Safronov's theory).
,1)
3184o_ u,82 I u,11<40ol ,dL _ 15 lz O,f
-- -- Ip, ,w --" • , 27
; -- "- "- = "-= :
8_ 28S 2t,T
08_4o15 4oos. "1._°°1.,
oaool_,oso
I I I I IIIIII I , I I II IIII I I I I nllll
I lO lOO(a) ,o_ o_ co_,_,_.e.
Figure 10. Calculated models of
the morphology of a planetary
system (according to C. Sagan and
R. Isakmen). Variation 2
corresponds to the solar system.
Key: a. distance from the sun,IAU.
Less than 15 years ago,
experiments were begun on
numerical modeling on a
computer of the process of
accumulation of planets.
Experiments by the American
scientists S. Doyle, C. Sagan
and R. Isakmen led to the
conclusion of the basic
possibilities of formation of
the nucleus of uniform solid-
body particles --
planetesimals and the
occurrence of commensurability
in the positioning and
parameters of the orbits and
also a multiplicity of more
morphology of planetary
systems, depending on the
number of initial hypotheses.
This latter result reproduced
in Figure 10 has particularly
great interest, giving us
concepts of the significant
positioning in masses of the
planets of the solar system as
one of the possible
realizations (second diagram
in Figure 10) among the other
approximately equally
probable. At the same time,
it is evidence of the large
morphological variation in
planets of the system which
one can expect to encounter in
the universe.
/58
45
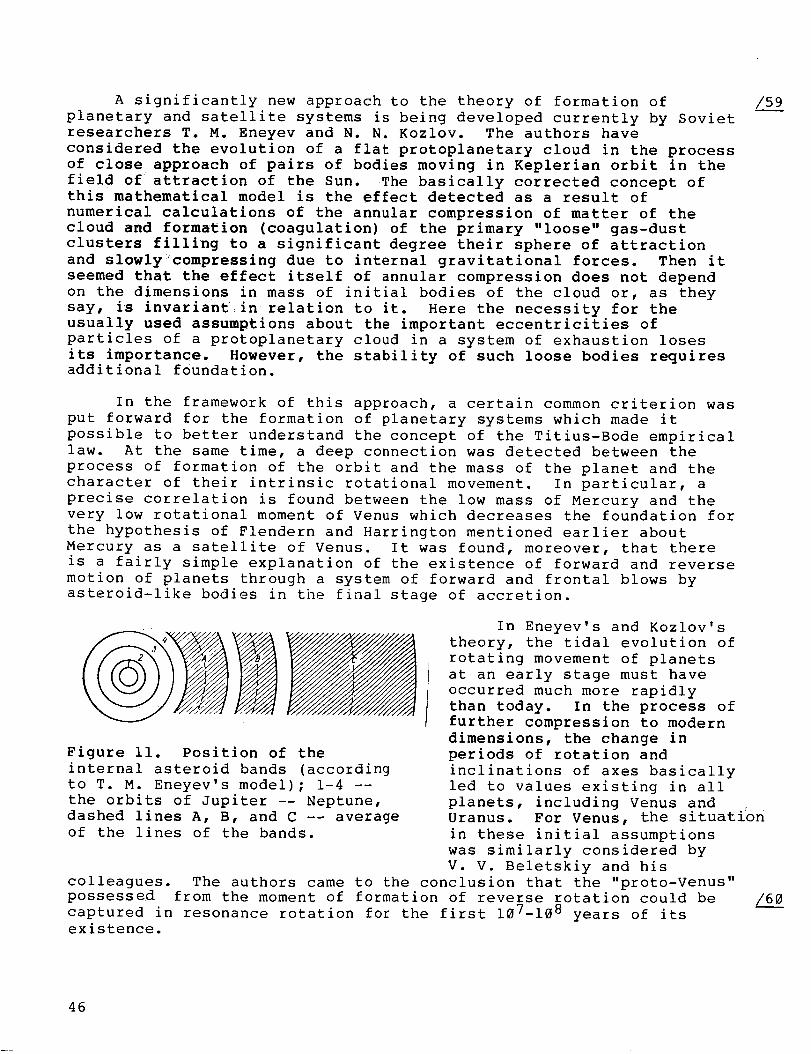
A significantly new approach to the theory of formation ofplanetary and satellite systems is being developed currently by Sovietresearchers T. M. Eneyev and N. N. Kozlov. The authors haveconsidered the evolution of a flat protoplanetary cloud in the processof close approach of pairs of bodies moving in Keplerian orbit in thefield of attraction of the Sun. The basically corrected concept ofthis mathematical model is the effect detected as a result ofnumerical calculations of the annular compression of matter of thecloud and formation (coagulation) of the primary "loose" gas-dustclusters filling to a significant degree their sphere of attractionand slowly:_compressing due to internal gravitational forces. Then itseemed that the effect itself of annular compression does not dependon the dimensions in mass of initial bodies of the cloud or, as theysay, is invariant_in relation to it. Here the necessity for theusually used assumptions about the important eccentricities ofparticles of a protoplanetary cloud in a system of exhaustion losesits importance. However, the stability of such loose bodies requiresadditional foundation.
/s_/9
In the framework of this approach, a certain common criterion was
put forward for the formation of planetary systems which made it
possible to better understand the concept of the Titius-Bode empirical
law. At the same time, a deep connection was detected between the
process of formation of the orbit and the mass of the planet and the
character of their intrinsic rotational movement. In particular, a
precise correlation is found between the low mass of Mercury and the
very low rotational moment of Venus which decreases the foundation for
the hypothesis of Flendern and Harrington mentioned earlier about
Mercury as a satellite of Venus. It was found, moreover, that there
is a fairly simple explanation of the existence of forward and reverse
motion of planets through a system of forward and frontal blows by
asteroid-like bodies in the final stage of accretion.
Figure ii. Position of the
internal asteroid bands (according
to T. M. Eneyev's model); 1-4 --
the orbits of Jupiter -- Neptune,
dashed lines A, B, and C -- average
of the lines of the bands.
In Eneyev's and Kozlov's
theory, the tidal evolution of
rotating movement of planets
at an early stage must have
occurred much more rapidly
than today. In the process of
further compression to modern
dimensions, the change in
periods of rotation and
inclinations of axes basically
led to values existing in all
planets, including Venus and
Uranus. For Venus, the situation
in these initial assumptions
was similarly considered by
V. V. Beletskiy and his
colleagues. The authors came to the conclusion that the "proto-Venus"possessed from the moment of formation of reverse rotation could be
captured in resonance rotation for the first 107-108 years of itsexistence.
46
Under the effect of tidal forces, subsequent evolution occurred in thedirection of slow "upsetting" from reverse rotation to forward;however, for this interval of time, deviation of the axis of rotationfrom the reverse appeared within limits of 2° and later on decreasedeven more. In this way, Venus was successfully captured in aresonance rotation but did not successfully change direction ofrotation. This mechanism is attractive because the capture of Venusin resonance is impossible to explain due to tidal phenomena in theexisting conditions in distinction from situations with the Moon andMercury.
The model of the annular compression leads also to a fairly basichypothesis about formation during evolution of a protoplanetary gas-dust disk in certain accumulation zones of the near-Neptune region ofseveral asteroid bands diagrammatically shown in Figure ii. As aresult of gravitational interaction inside the bands, particularly theasteroids of band A, part of which are incident in the sphere ofeffect of Neptune, a rapid and strong transformation could haveoccurred in their orbits and migration in the field lying inside theorbit of Neptune with subsequent drop in perihelions of these bodiesclose to the Sun right up to regions of the planets of the Earth
group. Such a mechanism which probably acted more effectively during
the first billion years of existence of the solar system makes it
possible to fairly simply explain the peculiarities of the orbit of
Pluto along with its satellites, the orbit of the asteroids in the
Apollo and Trojan groups and also striking of large meteorites on the
surface of planets of the Earth group in the later stages of theirformation.
47
CHAPTERIII
SURFACESOF PLANETSAND SATELLITES
• . . Heavens filled with alder treesThese stars should be laughingThe universe is a deaf place
B. Pz_ternak"Sestra moya --zhizn'" 1917
She has sewn herself a dress of stonePaul Elyuar
"Estestvennyy khod veshchey" 1938
The face of the planet is its surface. The structure forms of /61
the surface, the peculiarities of the terrain, the physical and
chemical properties of individual characteristic regions (provinces as
the geneologists say) contain the most important information about the
present and past of the planet, principles and chronology of events
which formed its modern appearance. Very often the processes
occurring in the remote geological epochs are apparent in one or
another characteristic of the terrain even when the primary structures
themselves appear to be strongly camouflaged by subsequent processes
or to have been subjected to breakdown and drift (denudation)• Much
depends here on the relative role and specific features of the
appearance of internal (endogenic) and external (exogenic) factors in
the formation of the surface structures and the sequence of
stratification of these sedimentary layers• Therefore, besides the
relief, the greatest importance for decoding and reading the "rock
manuscript" essentially are the surfaces of the planets where one can
study and compare the rock components, their element and mineral
composition. Definite information about these properties is carried
by the characteristics of reflection of solar light of the planetary
surface which are compiled with the spectra reflection of Earth
minerals. This method, first used in the 1960's for the Moon, later
on were widespread when studying Mercury and particularly the
asteroids which made it possible to classify them according to
characteristics. At this time, ten classes of asteroids have been
isolated with approximately identical reflective and color propertieswithin the_limits of each class. A number of scientists consider,
truly, that with a calculation of the differences observed in the
spectra of reflection, not gathered into these classes, one can /6___2
isolate 80 different groups.
In distinction from the planets of the Earth group and satellites
of the planet-giants, the planet-giants themselves are massive gas-
liquid bodies and do not have solid surfaces. During observations
from Earth onto the disk of Jupiter, a system of bands is clearly
pronounced with a broad range of colors which have historically given
the zones and bands their names. A detailed stratified structure,
although considerably less pronounced, is apparent on the disk of
Saturn. At the same time, on Uranus and Neptune (appearing green due to
48
the strong absorption of red and yellow beams with methane) no detailsare observed in photographic surveys of these planets received fromhigh-altitude balloons even with resolution up to a quarter of anangular second which comprises approximately a sixteenth part of theangular diameter of Uranus and an eighth part of Neptune. In 1983,however, using the high-sensitivity instruments already mentioned,the PZS-detectors, an image of Neptune was successfully obtained onwhich one could precisely trace separate clouds both in the northernand in the southern hemispheres; a study was begun of the time oftheir life. On the Uranus disk, as before, no irregularities werediscovered.
The sequence of processes of formation of the surfaces of theplanet of the Earth group rises to the completed phase of accretionwhen the flux of asteroid bodies incident on the surface were close todisappearing. In this period, usually there were large partiallymodified craters on the lunar continents similar to the morphology of
craters on Mercury and the more ancient strongly eroded craters on
Mars. Traces of this stage, probably, are retained on Venus; on
Earth, the result of the existence of the hydrosphere and the
biosphere not only of ancient times themselves but also of the more
recent structures, there appear intense erosions or burial under
powerful sedimentary cover. Moreover, the photographs of the surface
of Earth from space have made it possible to distinguish a number of
ring-shaped structures, which are, obviously, traces of impactbombardment.
Unfortunately, of all of the planets, only Earth is still
available for study by all different types of tools which are
available now for geology, geophysics and geochemistry. Moreover,
only about 15-20 years ago, we did not know approximately 2/3 of the
surface of our own planet was covered by water layers of oceans and
seas. Hydroacoustic methods have made it possible to "see" the bottom
of the oceans. Numerous ships equipped with special devices -- echo
sounding which measures depth in the time of propagation of a
reflection from the bottom of the sound signal; the underwater relief
was studied in detail, showing a number of phenomenal structures which
do not have analogs on the Earth's continents. Variation of these
structures is shown in a physiographic map (Figure 12). Primarily,
this includes a system of mid-ocean ridges, a band of deep-water
troughs and island arches, numerous separate underwater mountains andvolcanoes.
/63
The system of mid-ocean ridges which have intensely rugged relief
has a global character. This system is a clearly expressed mobile
band extending along the bed of all oceans for a length of about
64,000 km and partially extending onto the continent. The most
typical middle ridges that the Indian and Atlantic Oceans, whose
individual elevations rise above the ocean bottom by 3.5-4 km. Along
the center of the middle-ocean ridges extend large tectonically active
broken structures -- rift zones which are narrow slots with steep
walls width up to a few dozen kilometers, length from dozens to
hundreds of kilometers and depth 1-4 km. They were framed by mountain
49
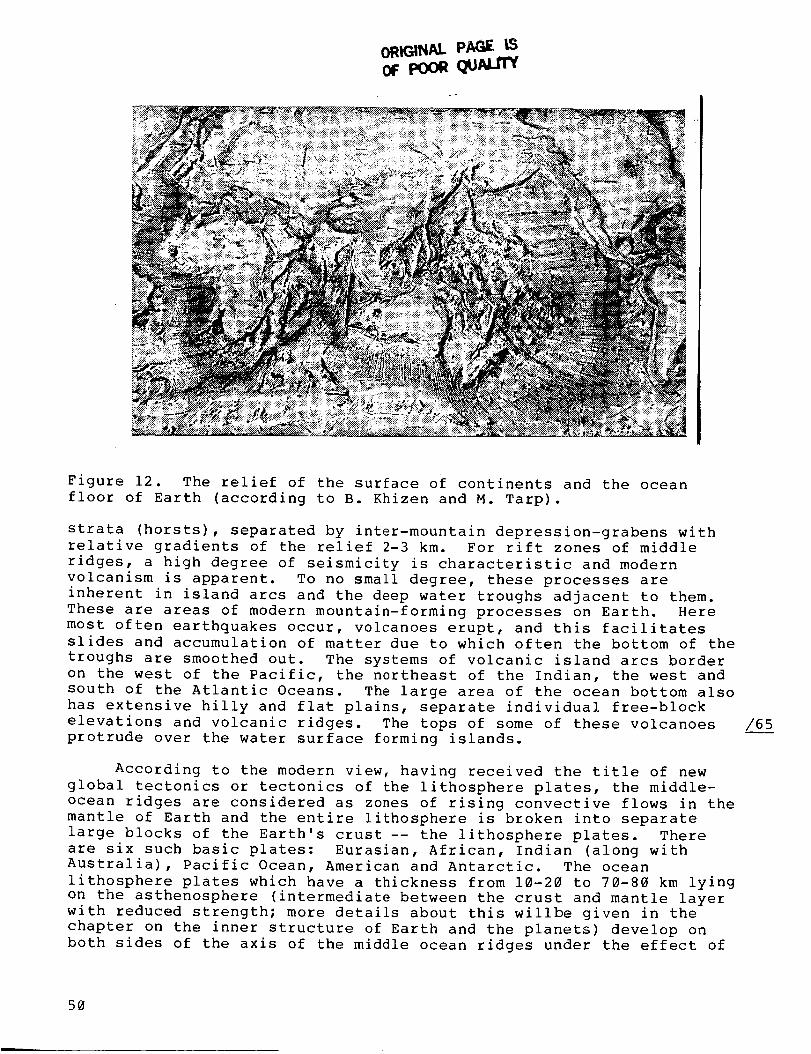
of poor rr't
Figure 12. The relief of the surface of continents and the ocean
floor of Earth (according to B. Khizen and M. Tarp).
strata (horsts), separated by inter-mountain depression-grabens with
relative gradients of the relief 2-3 km. For rift zones of middle
ridges, a high degree of seismicity is characteristic and modern
volcanism is apparent. To no small degree, these processes are
inherent in island arcs and the deep water troughs adjacent to them.
These are areas of modern mountain-forming processes on Earth. Here
most often earthquakes occur, volcanoes erupt, and this facilitates
slides and accumulation of matter due to which often the bottom of the
troughs are smoothed out. The systems of volcanic island arcs border
on the west of the Pacific, the northeast of the Indian, the west and
south of the Atlantic Oceans. The large area of the ocean bottom also
has extensive hilly and flat plains, separate individual free-block
elevations and volcanic ridges. The tops of some of these volcanoes
protrude over the water surface forming islands.
According to the modern view, having received the title of new
global tectonics or tectonics of the lithosphere plates, the middle-
ocean ridges are considered as zones of rising convective flows in the
mantle of Earth and the entire lithosphere is broken into separate
large blocks of the Earth's crust -- the lithosphere plates. There
are six such basic plates: Eurasian, African, Indian (along with
Australia), Pacific Ocean, American and Antarctic. The ocean
lithosphere plates which have a thickness from 10-20 to 70-80 km lying
on the asthenosphere (intermediate between the crust and mantle layer
with reduced strength; more details about this willbe given in the
chapter on the inner structure of Earth and the planets) develop on
both sides of the axis of the middle ocean ridges under the effect of
/6_ s
50
the horizontal component of convective current originating deep in theinterior as a result of dense differentiation of Earth matter in theoxide-iron nucleus and the silicate shell-mantle. The rift zones areformed in areas of movement of the plates where fractures occur alongwhich the hot mantle matter rises upward. With its cooling andcrystallization, a new crust of the oceanic type is formed on theedges of the plate; that is, constantly a process of renewal of thecrust is occurring. In turn, the ocean plates move up (deepen) alongthe edge of the continents or the continental, lithosphere plates onthe boundaries called Zavaritskiy-Ben'of zones going at a slope underthe continent at a depth of a few hundred kilometers. In these zones,(subduction zones) an increase occurs in the new continental crust asa result of upward movement under these plates of the ocean crust andits subsequent floating; island arches occur in areas where the platesslip.
The shift of lithosphere plates along the Earth's surface occursat rates not exceeding 15-18 centimeters per year. However, for thetime characteristic for processes of geological evolution (hundreds ofmillions of years) such shifts can already reach thousands ofkilometers. One can explain the drift of the continents on Earth injust this way.
For studying the relief and physical-chemical properties of thesurface matter of the Earth's continents and the bottom of the oceans,there are practically unlimited possibilities and they can be widelyused everywhere. In truth, the studies are limited to sedimentary,igneous and strongly changing (that is to say, metamorphic) rock ofthe Earth's crust. The_thickness of the sedimentary cover increasesthe farther one gets from the axes of the middle-ocean ridges and inthese same directions, rock deposited which has undergone the leastchanges, the "basalt layer" of the crust increases. The results ofdrilling super deep wells into the oceans from the specially equippedGlomar Challenger ship led to the same conclusion; this was a veryeffective method inasmuch as the ocean crust is significantly thinnerthan the continental crust.
The situation is different on those heavenly bodies in which thesurface matter did not undergo such significant changes as it did onEarth, inasmuch as there were no effective sources for accumulation ofsedimentary rock caused by the presence of a hydrosphere andatmosphere. Primarily this applies to the Moon and Mercury. With thepositioning of the Earth and the Moon comparatively close to eachother, the astronomers quite naturally "took it" that the morphologyof the lunar surface, the relief and many other properties visiblefrom the Earth's hemisphere had been adequately studied in detail.The Moon had become the first object on which the new tool ofplanetary research had been most ably used -- the studies from thespacecraft. For ten years, tremendous effort was made to obtainphotographs of the backside of the Moon before landing the first lunarexpedition. Now, many regions of the surface are being studied indetail (Figure 13) on which the traces of the feet of the cosmonautsand the wheels of the lunokhods remain; many years of study are beingcarried out of different geological structures, the seismic nature of
/66
51
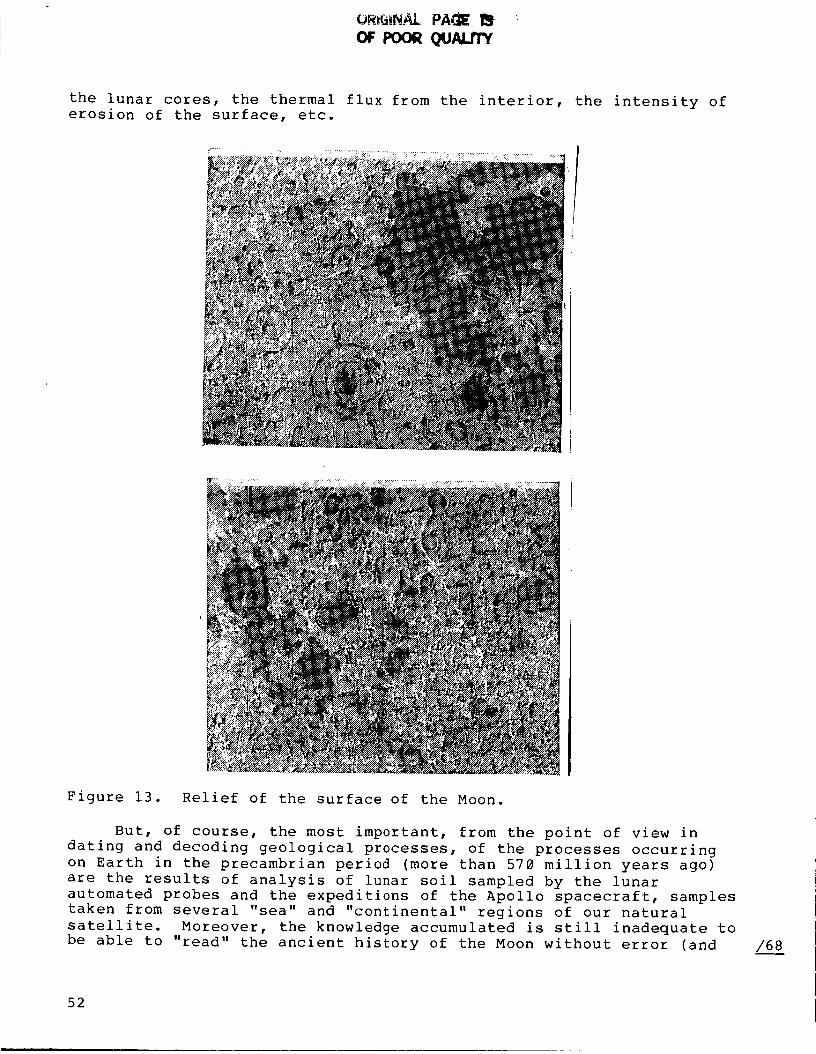
ORi_tN.AL PAdlE i_
OF POOR QqJALRY
the lunar cores, the thermal flux from the interior, the intensity oferosion of the surface, etc.
Figure 13. Relief of the surface of the Moon.
But, of course, the most important, from the point of view in
dating and decoding geological processes, of the processes occurring
on Earth in the precambrian period (more than 570 million years ago)
are the results of analysis of lunar soil sampled by the lunar
automated probes and the expeditions of the Apollo spacecraft, samples
taken from several "sea" and "continental" regions of our natural
satellite. Moreover, the knowledge accumulated is still inadequate to
be able to "read" the ancient history of the Moon without error (and /68
52
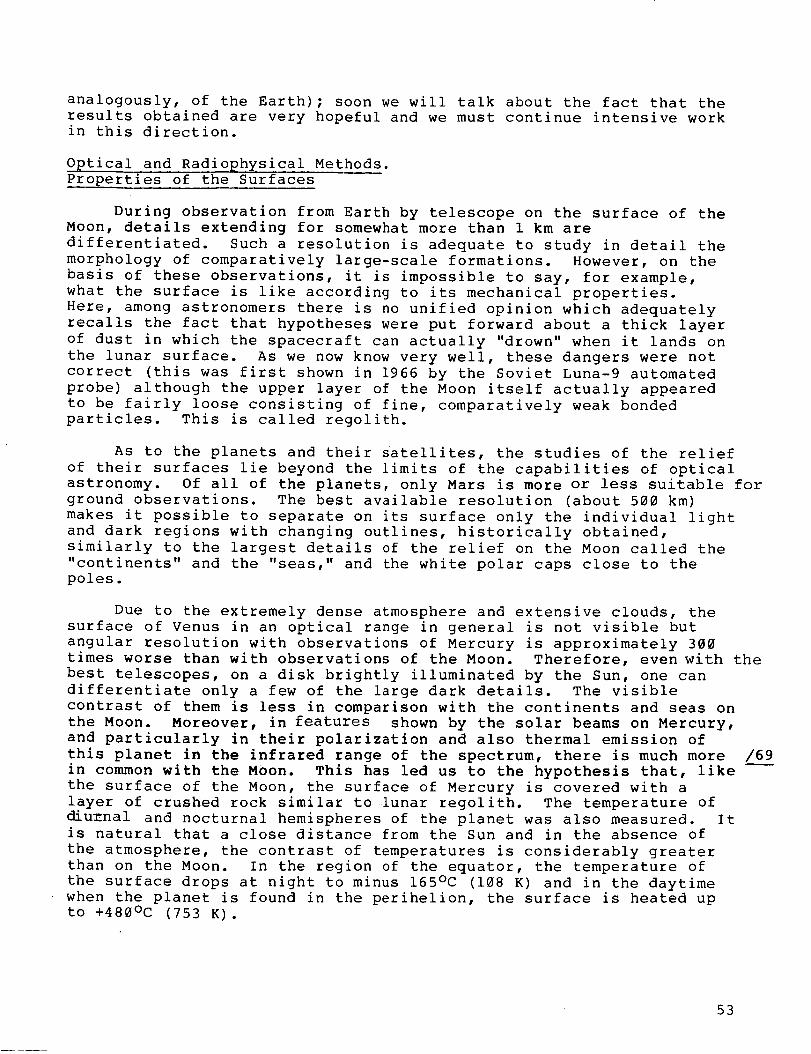
analogously, of the Earth); soon we will talk about the fact that theresults obtained are very hopeful and we must continue intensive workin this direction.
Optical and Radiophysical Methods.
Properties of the Surfaces
During observation from Earth by telescope on the surface of the
Moon, details extending for somewhat more than 1 km are
differentiated. Such a resolution is adequate to study in detail the
morphology of comparatively large-scale formations. However, on the
basis of these observations, it is impossible to say, for example,
what the surface is like according to its mechanical properties.
Here, among astronomers there is no unified opinion which adequately
recalls the fact that hypotheses were put forward about a thick layer
of dust in which the spacecraft can actually "drown" when it lands on
the lunar surface. As we now know very well, these dangers were not
correct (this was first shown in 1966 by the Soviet Luna-9 automated
probe) although the upper layer of the Moon itself actually appeared
to be fairly loose consisting of fine, comparatively weak bonded
particles. This is called regolith.
As to the planets and their satellites, the studies of the relief
of their surfaces lie beyond the limits of the capabilities of optical
astronomy. Of all of the planets, only Mars is more or less suitable for
ground observations. The best available resolution (about 500 km)
makes it possible to separate on its surface only the individual light
and dark regions with changing outlines, historically obtained,
similarly to the largest details of the relief on the Moon called the
"continents" and the "seas," and the white polar caps close to the
poles.
Due to the extremely dense atmosphere and extensive clouds, the
surface of Venus in an optical range in general is not visible but
angular resolution with observations of Mercury is approximately 300
times worse than with observations of the Moon. Therefore, even with the
best telescopes, on a disk brightly illuminated by the Sun, one can
differentiate only a few of the large dark details. The visible
contrast of them is less in comparison with the continents and seas on
the Moon. Moreover, in features shown by the solar beams on Mercury,
and particularly in their polarization and also thermal emission of
this planet in the infrared range of the spectrum, there is much more /69
in common with the Moon. This has led us to the hypothesis that, like
the surface of the Moon, the surface of Mercury is covered with a
layer of crushed rock similar to lunar regolith. The temperature of
diuznal and nocturnal hemispheres of the planet was also measured. It
is natural that a close distance from the Sun and in the absence of
the atmosphere, the contrast of temperatures is considerably greater
than on the Moon. In the region of the equator, the temperature of
the surface drops at night to minus 165°C (108 K) and in the daytime
when the planet is found in the perihelion, the surface is heated up
to +480Oc (753 K).
53
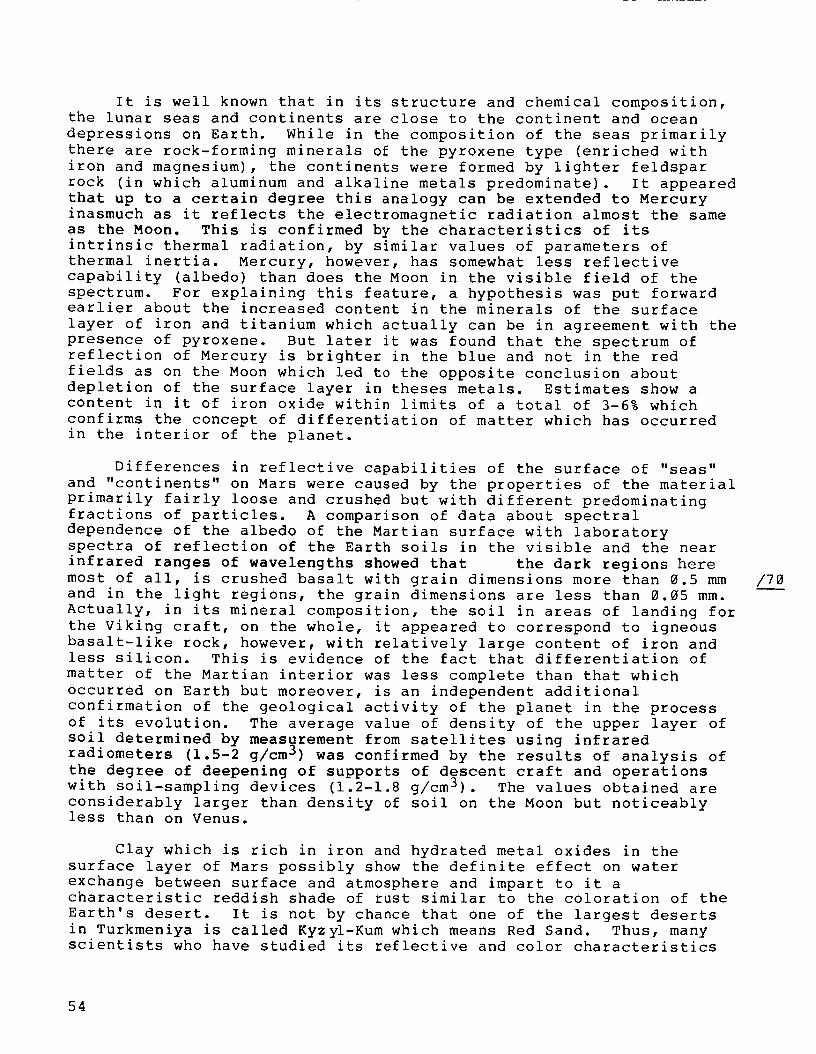
It is well known that in its structure and chemical composition,the lunar seas and continents are close to the continent and oceandepressions on Earth. While in the composition of the seas primarilythere are rock-forming minerals of the pyroxene type (enriched withiron and magnesium), the continents were formed by lighter feldsparrock (in which aluminum and alkaline metals predominate). It appearedthat up to a certain degree this analogy can be extended to Mercuryinasmuch as it reflects the electromagnetic radiation almost the sameas the Moon. This is confirmed by the characteristics of itsintrinsic thermal radiation, by similar values of parameters ofthermal inertia. Mercury, however, has somewhat less reflectivecapability (albedo) than does the Moon in the visible field of thespectrum. For explaining this feature, a hypothesis was put forwardearlier about the increased content in the minerals of the surfacelayer of iron and titanium which actually can be in agreement with thepresence of pyroxene. But later it was found that the spectrum ofreflection of Mercury is brighter in the blue and not in the redfields as on the Moon which led to the opposite conclusion aboutdepletion of the surface layer in theses metals. Estimates show acontent in it of iron oxide within limits of a total of 3-6% whichconfirms the concept of differentiation of matter which has occurredin the interior of the planet.
Differences in reflective capabilities of the surface of "seas"and "continents" on Mars were caused by the properties of the materialprimarily fairly loose and crushed but with different predominatingfractions of particles. A comparison of data about spectraldependence of the albedo of the Martian surface with laboratoryspectra of reflection of the Earth soils in the visible and the nearinfrared ranges of wavelengths showed that the dark regions heremost of all, is crushed basalt with grain dimensions more than 0.5 mmand in the light regions, the grain dimensions are less than 0.05 mm.Actually, in its mineral composition, the soil in areas of landing forthe Viking craft, on the whole, it appeared to correspond to igneousbasalt-like rock, however, with relatively large content of iron andless silicon. This is evidence of the fact that differentiation ofmatter of the Martian interior was less complete than that whichoccurred on Earth but moreover, is an independent additionalconfirmation of the geological activity of the planet in the processof its evolution. The average value of density of the upper layer ofsoil determined by measurement from satellites using infraredradiometers (1.5-2 g/cm 3) was confirmed by the results of analysis ofthe degree of deepening of supports of descent craft and operationswith soil-sampling devices (1.2-1.8 g/cm3). The values obtained areconsiderably larger than density of soil on the Moon but noticeablyless than on Venus.
Clay which is rich in iron and hydrated metal oxides in thesurface layer of Mars possibly show the definite effect on waterexchange between surface and atmosphere and impart to it acharacteristic reddish shade of rust similar to the coloration of theEarth's desert. It is not by chance that one of the largest desertsin Turkmeniya is called Kyz_-Kum which means Red Sand. Thus, manyscientists who have studied its reflective and color characteristics
54
propose that the rust color of Mars is caused by water oxides of iron.
At the same time, the measurements of the element composition on the
Vikings have led us to conclude that the soil is 80%, probably, clay
minerals (montmorillonite and nontronite) and oxides of iron comprised
of about 5% (the remainder -- magnesium sulfate and carbonates). This
soil can be formed as a result of erosion by ultrabasic and magmatic
basic mountain rock (dunite, basalt) in conditions of a dry atmosphere
of a planet practically devoid of oxygen.
The inhabitants of Earth on Mars would be completely unused to
the fact that they would encounter circumstances where the temperature
of its surface undergoes much greater seasonal-daily variations /71
reaching almost 100 K. However, the amplitude of daily variations
rapidly decreases with depth -- approximately by two for each 5 cm so that
at _ a depth of a few dozen centimeters, the variation in temperature
is practically absent. This makes it possible to talk about an
extremely low thermal conductivity of Martian soil (making a definite
contribution to the so-called parameter of thermal inertia obtained
directly from measurement of radiation of the surface in the infrared
and radio ranges) which are important results for planetary
meteorology. We will return to this problem somewhat later.
As we have already mentioned, at the beginning of the 1960's, for
studying periods and directions of rotation of planets and as a result
of the relief and physical properties of their surface, radar began to
be successfully used. For a short period of time, its capability grew
considerably as a result of improvement both of the equipment and of
the measurement methods. For determining the periods of rotation,
results of analysis of the value of shift and expansion of spectral
lines of reflected radiation (echo signal) caused by the Doppler
effect were used and for studying profiles and properties of the
surface, data on the intensity of reflected radiation and the
distribution of intensity according to spectrum were used taking into
consideration the lag time for arrival of signals to the receiving
antenna and the Doppler shift in frequency. Important information on
the microstructure of the surface is given to us also by measurement
data of the degree of polarization of the radio waves reflected by the
planet.
Unfortunately, radar research is more informative for the low-
latitude fields inasmuch as, when transferring to high latitudes, this
means removal from the region closest to Earth (sub-radar) which makes
the greatest contribution to reflection, error in measurement and
ambiguity in their interpretation increases sharply. The working
range of frequencies for ground radar stations determined taking into
consideration minimum absorption in the Earth's atmosphere,
encompasses a broad band of wavelengths from millimeters to meters.
Centimeter waves are primarily used in radar astronomy.
Radar study of the surface of Mars was particularly intense at
the end of the 1960's and the beginning of the 1970's until this
method was practically replaced by the powerful flow of information
from artificial satellites of the planet. The best resolution
available in this period amounted to 8 km in length and about 80 km in
/7_/2
55
width within the limits of a latitude band of +20° on both sides ofthe equator. Significant variations were dete_ted in the Martianrelief reaching altitudes of 14 km on a global scale. In certainsections with tens and hundreds of kilometers, numerous gradations inaltitude were apparent of 1-2 or more kilometers, most of which, asresults of photographing Mars from spacecraft later on proved, werecorrectly associated with craters with cross sections up to 50-100 km.At the same time, the scattering properties of surfaces and angles ofinclination of sections were determined simultaneously; these sectionsare comparable in extent with their wavelength. The larger the anglesare, the greater the roughness of the surface is or, in other words,the more irregular the microrelief. It seems that sections of theMartian surface from which radio waves are reflected, as a whole, arefairly smooth: the root-mean-square values of angles of theirinclination _ lies within limits from 0.5 to 4 ° which is considerably
smaller than on the Moon or Mercury.
The intensity of the signal reflected by the planet depends on
the coefficient of reflection K (expressed in percentage points) with
which physical properties of the surface are directly related
(primarily density of the surface layer at a depth on the order of
several wavelengths of the probe radiation) and the character of the
smooth surfaces of rock. The value of dielectric penetrability c of
the material from which the electromagnetic wave is reflected is
determined by these properties. For different dry land, the rock, in
an experimental way was found as a simple empirical dependence between
dielectric penetrability and density. In this way, measuring _, it is
possible to determine the density of soil p on the planet. This
method was successfully used for the first time when studying the
Moon. The radar study of Mars showed variation in dielectric
penetrability of its surface in broad limits, approximately from 1.5
to 5 which corresponds to a value of density from 1 to 2.5 g/cm 3.
These estimates were confirmed later by measurement using onboard
radiometers in the centimeter range operating on Mars satellites, the
Mars-3 and the Mars-5. The broad range of values obtained evidence of
the change in properties of the Martian surface from hard rock to very
crushed loose rock which as we will see later on actually occurs in
different regions of this planet.
/_7_/3
The power of signals reflected form Mercury is approximately one
to one-and-a-half times less than that from Mars and Venus.
Therefore, for radar research, Mercury is a particularly difficult
planet. Studies of the function of scattering and polarization of
radio emission in the centimeter range of wavelength led us to
conclude that on its surface there are many small irregularities. The
average values of the angle of inclination in several sections of the
equatorial region is estimated to equal approximately 8 ° -- twice as
large as that on Mars. Irregularities of the relief were detected
reached in sections with hundreds of kilometers going 1-3 km in
altitude. According to the value of the coefficient of reflection of
Mercury in the radio range, which appeared to be almost the same as
that on the Moon, an average value of dielectric penetrability was
found, _ = 3 which corresponds to density of the surface layer ofabout 1.4 g-cm -3. This value is intermediate between the dense
56
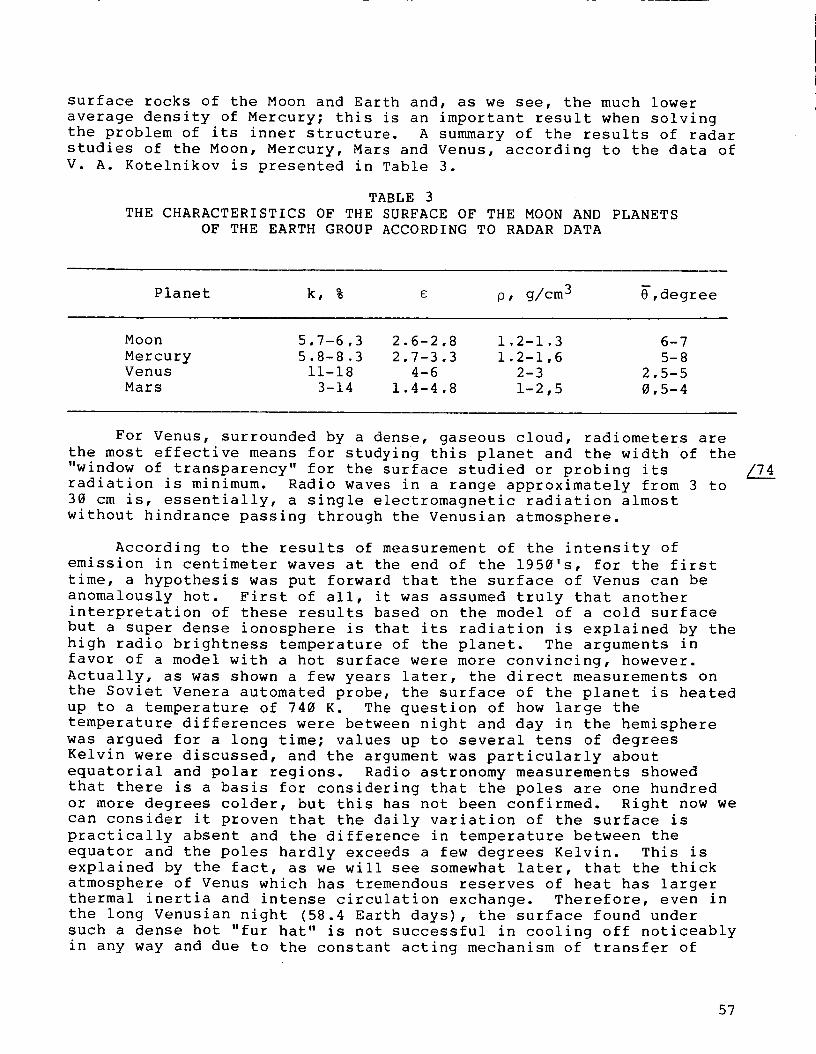
surface rocks of the Moon and Earth and, as we see, the much loweraverage density of Mercury; this is an important result when solvingthe problem of its inner structure. A summary of the results of radarstudies of the Moon, Mercury, Mars and Venus, according to the data ofV. A. Kotelnikov is presented in Table 3.
TABLE 3THE CHARACTERISTICS OF THE SURFACEOF THE MOONAND PLANETS
OF THE EARTH GROUPACCORDINGTO RADARDATA
Planet k, % e p, g/cm 3 8,degree
Moon 5,7-6,3 2.6-2,8 1.2-1.3 6-7Mercury 5.8-8.3 2.7-3.3 1.2-1,6 5-8Venus 11-18 4-6 2-3 2,5-5Mars 3-14 1.4-4.8 1-2,5 0,5-4
For Venus, surrounded by a dense, gaseous cloud, radiometers arethe most effective means for studying this planet and the width of the"window of transparency" for the surface studied or probing itsradiation is minimum. Radio waves in a range approximately from 3 to30 cm is, essentially, a single electromagnetic radiation almostwithout hindrance passing through the Venusian atmosphere.
According to the results of measurement of the intensity ofemission in centimeter waves at the end of the 1950's, for the firsttime, a hypothesis was put forward that the surface of Venus can beanomalously hot. First of all, it was assumed truly that anotherinterpretation of these results based on the model of a cold surfacebut a super dense ionosphere is that its radiation is explained by thehigh radio brightness temperature of the planet. The arguments infavor of a model with a hot surface were more convincing, however.Actually, as was shown a few years later, the direct measurements onthe Soviet Venera automated probe, the surface of the planet is heatedup to a temperature of 740 K. The question of how large thetemperature differences were between night and day in the hemispherewas argued for a long time; values up to several tens of degreesKelvin were discussed, and the argument was particularly aboutequatorial and polar regions. Radio astronomy measurements showedthat there is a basis for considering that the poles are one hundredor more degrees colder, but this has not been confirmed. Right now wecan consider it proven that the daily variation of the surface ispractically absent and the difference in temperature between theequator and the poles hardly exceeds a few degrees Kelvin. This isexplained by the fact, as we will see somewhat later, that the thickatmosphere of Venus which has tremendous reserves of heat has largerthermal inertia and intense circulation exchange. Therefore, even inthe long Venusian night (58.4 Earth days), the surface found undersuch a dense hot "fur hat" is not successful in cooling off noticeablyin any way and due to the constant acting mechanism of transfer of
/7_!
57
atmospheric gas in a meridional direction, a variation occurs oftemperatures between the equator and the poles. The basic reason forthe actually existing temperature differences on the surface is thegradations in altitude related with the relief.
In the centimeter range of radio waves, it is possible not onlyto study the surface but also to "see" it as it looks. For this, ahigh spatial selectivity of the reception antenna on Earth isnecessary. Usually, this is achieved by receiving a reflected signalon two antennas located at a certain distance from each otheroperating according to the principle of a radio interferometer.According to the difference of the phase of the signal received, theposition of each section of the surface relative to a certain averagelevel shape of the planet is measured in sequence. It is obvious thatthe higher the spatial selectivity of the antenna, the higher is theresolution on the surface of the celestial body being studied and,
correspondingly, the higher the quality of the image. With this
method, called a frequency-time selection method, for example, images
were obtained of the Moon which are difficult to distinguish from the
ordinary photographs obtained using ground optical telescopes.
According to the data of numerous radar probes in the band of
Venus near the equator, variations in relief were not as significant
as they are on Mars. Typical gradations of altitude appeared within
limits 2-4 km in sections of length up to 400 km. Moreover, according
to the data of reflection of radio waves, concepts about the
significant irregularity and physical properties of its surfaces have
been merged. More complete data on the reflecting capabilities were
v_Lained at _ne following American stations: Goldstone in California
and Aresibo in Puerto Rico. In Goldstone, reception of reflected
emission was carried out on two antennas with diameters 64 m and 26 m,
spaced at 21.6 km, and in Aresibo, the largest in the world, a 300-
meter antenna was used, installed in a crater of an extinct volcano.
This made it possible to obtain a picture of the reflection
characteristics of the surface in a latitude band ±70 ° and "images" of
several separate sections with cross-sections 1500 km close to the
equator.
The picture of the band near the equator obtained according to
measurements in Goldstone is shown in Figure 14 and a fragment of the
map for high latitudes of the northern hemisphere of Venus, according
to measurements in Aresibo is shown in Figure 15. For the zero
meridian, here, the direction to Earth is selected in the low
conjunction. The ratio of intensities of reflection of the light and
dark regions reaches 20:1. The broadest light bands are approximately
30 ° south and north latitudes (longitude 0 ° and 280 ° ) with cross-
section greater than 1000 km detected even at the very beginning of
radar studies of Venus and designated as _, 8 and 6. One more light
region close to the zero meridian at a latitude of 65°N was named
Maxwell. We see from Figure 14 that an approximately similar lightregion is located somewhat higher in latitude in the longitude region310-340 ° .
/75
/76
58
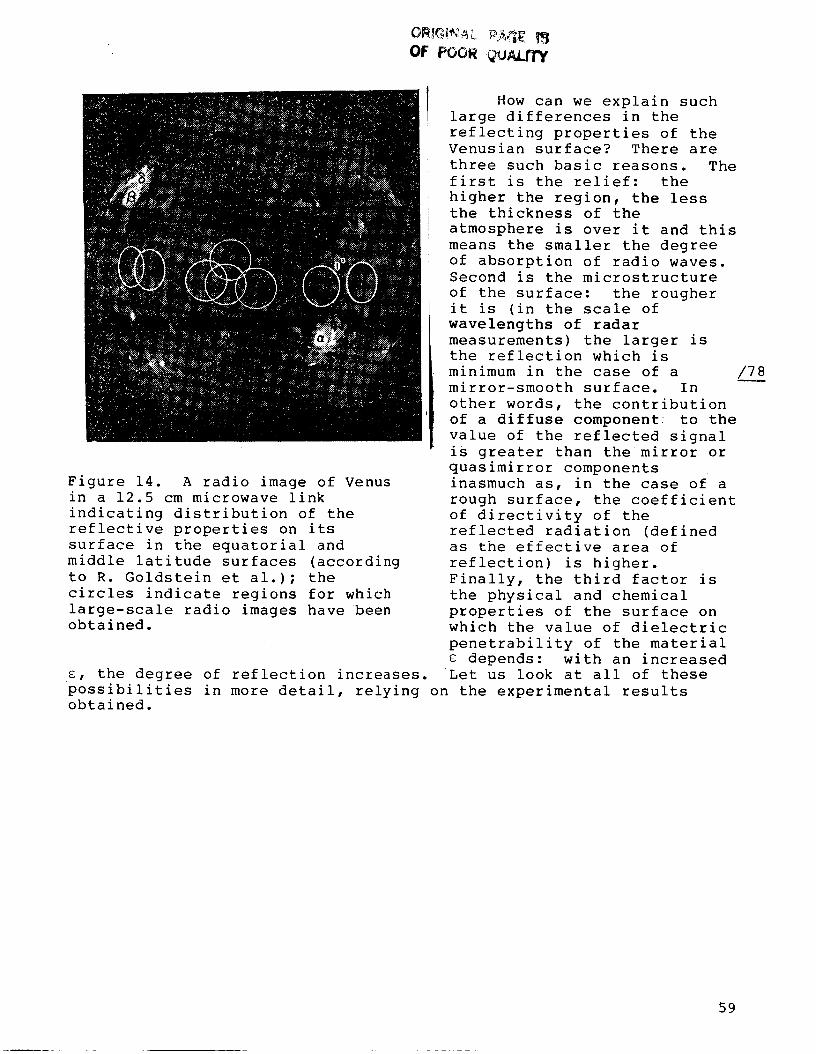
OI_C_*_r_L _.A_ _IOF Poor _U,_L.ITY
Figure 14. A radio image of Venusin a 12.5 cm microwave link
indicating distribution of the
reflective properties on its
surface in the equatorial and
middle latitude surfaces (according
to R. Goldstein et al.); the
circles indicate regions for which
large-scale radio images have beenobtained.
How can we explain such
large differences in the
reflecting properties of theVenusian surface? There are
three such basic reasons. The
first is the relief: the
higher the region, the less
the thickness of the
atmosphere is over it and this
means the smaller the degree
of absorption of radio waves.
Second is the microstructure
of the surface: the rougher
it is (in the scale of
wavelengths of radar
measurements) the larger is
the reflection which is
minimum in the case of a
mirror-smooth surface. In
other words, the contribution
of a diffuse component; to the
value of the reflected signal
is greater than the mirror or
quasimirror components
inasmuch as, in the case of a
rough surface, the coefficient
of directivity of the
reflected radiation (defined
as the effective area of
reflection) is higher.
Finally, the third factor is
the physical and chemical
properties of the surface on
which the value of dielectric
penetrability of the material
depends: with an increased
s, the degree of reflection increases. Let us look at all of these
possibilities in more detail, relying on the experimental resultsobtained.
59
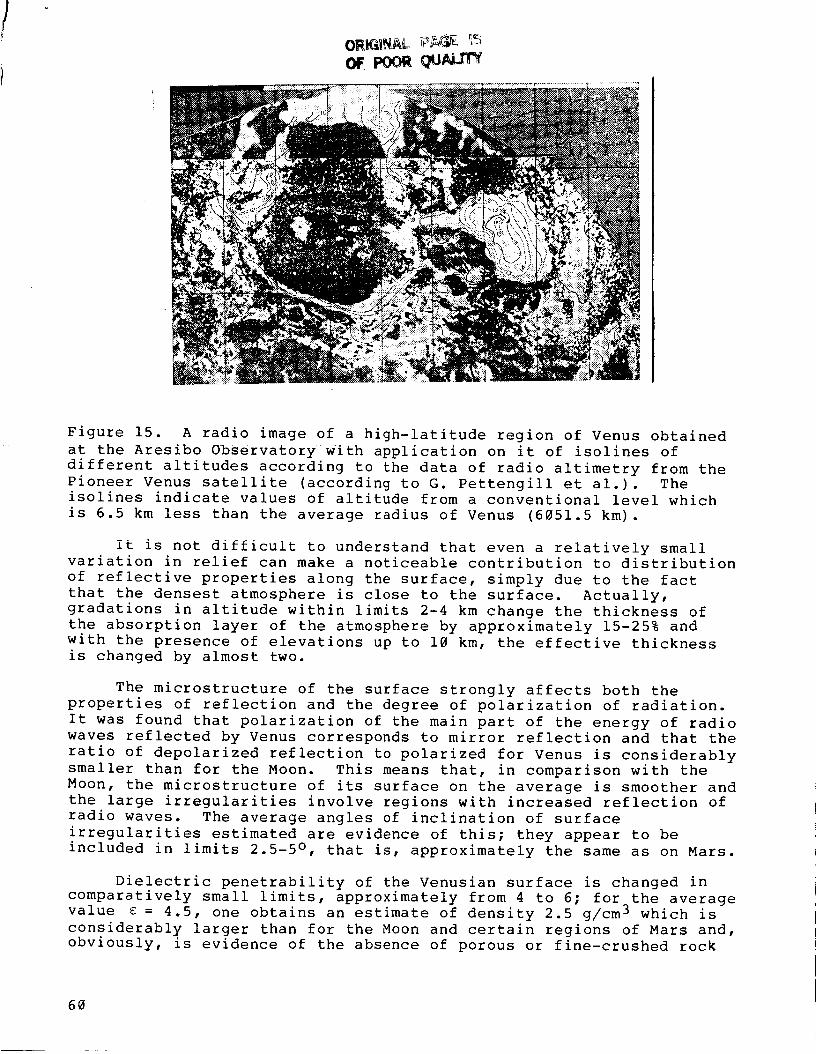
Figure 15. A radio image of a high-latitude region of Venus obtainedat the Aresibo Observatory with application on it of isolines ofdifferent altitudes according to the data of radio altimetry from thePioneer Venus satellite (according to G. Pettengill et al.). Theisolines indicate values of altitude from a conventional level whichis 6.5 km less than the average radius of Venus (6051.5 km).
it is not difficult to understand that even a relatively smallvariation in relief can make a noticeable contribution to distributionof reflective properties along the surface, simply due to the factthat the densest atmosphere is close to the surface. Actually,gradations in altitude within limits 2-4 km change the thickness ofthe absorption layer of the atmosphere by approximately 15-25% andwith the presence of elevations up to 10 km, the effective thicknessis changed by almost two.
The microstructure of the surface strongly affects both theproperties of reflection and the degree of polarization of radiation.It was found that polarization of the main part of the energy of radiowaves reflected by Venus corresponds to mirror reflection and that theratio of depolarized reflection to polarized for Venus is considerablysmaller than for the Moon. This means that, in comparison with theMoon, the microstructure of its surface on the average is smoother andthe large irregularities involve regions with increased reflection ofradio waves. The average angles of inclination of surfaceirregularities estimated are evidence of this; they appear to beincluded in limits 2.5-5 ° , that is, approximately the same as on Mars.
Dielectric penetrability of the Venusian surface is changed incomparatively small limits, approximately from 4 to 6; for the averagevalue _ = 4.5, one obtains an estimate of density 2.5 g/cm 3 which isconsiderably larger than for the Moon and certain regions of Mars and,obviously, is evidence of the absence of porous or fine-crushed rock
60
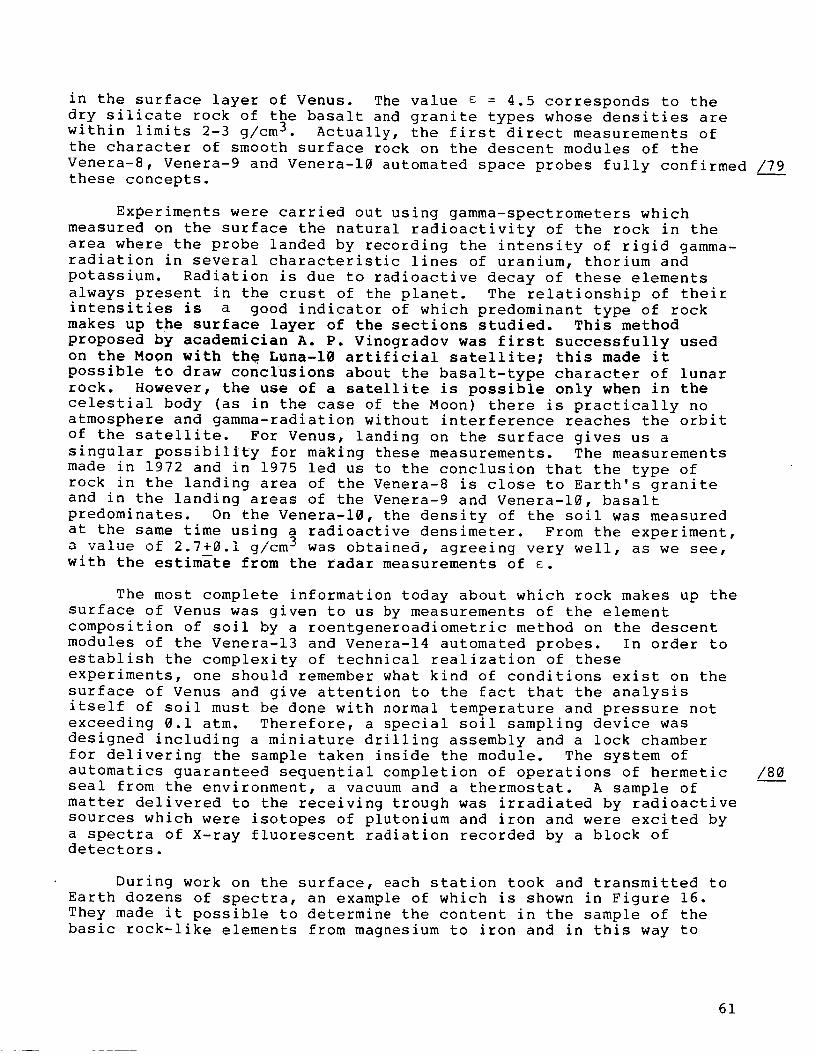
in the surface layer of Venus. The value _ = 4.5 corresponds to thedry silicate rock of the basalt and granite types whose densities arewithin limits 2-3 g/cm 3. Actually, the first direct measurements ofthe character of smooth surface rock on the descent modules of theVenera-8, Venera-9 and Venera-10 automated space probes fully confirmed /7___9
these concepts.
Experiments were carried out using gamma-spectrometers which
measured on the surface the natural radioactivity of the rock in the
area where the probe landed by recording the intensity of rigid gamma-
radiation in several characteristic lines of uranium, thorium and
potassium. Radiation is due to radioactive decay of these elements
always present in the crust of the planet. The relationship of their
intensities is a good indicator of which predominant type of rock
makes up the surface layer of the sections studied. This method
proposed by academician A. P. Vinogradov was first successfully used
on the Moon with th e LUna-10 artificial satellite; this made it
possible to draw conclusions about the basalt-type character of lunar
rock. However, the use of a satellite is possible only when in the
celestial body (as in the case of the Moon) there is practically no
atmosphere and gamma-radiation without interference reaches the orbit
of the satellite. For Venus, landing on the surface gives us a
singular possibility for making these measurements, The measurements
made in 1972 and in 1975 led us to the conclusion that the type of
rock in the landing area of the Venera-8 is close to Earth's granite
and in the landing areas of the Venera-9 and Venera-10, basalt
predominates. On the Venera-10, the density of the soil was measured
at the same time using a radioactive densimeter. From the experiment,
a value of 2.7+0.1 g/cm 3 was obtained, agreeing very well, as we see,
with the estimate from the radar measurements of _.
The most complete information today about which rock makes up the
surface of Venus was given to us by measurements of the element
composition of soil by a roentgeneroadiometric method on the descentmodules of the Venera-13 and Venera-14 automated probes. In order to
establish the complexity of technical realization of these
experiments, one should remember what kind of conditions exist on the
surface of Venus and give attention to the fact that the analysis
itself of soil must be done with normal temperature and pressure not
exceeding 0.1 atm. Therefore, a special soil sampling device was
designed including a miniature drilling assembly and a lock chamber
for delivering the sample taken inside the module. The system of
automatics guaranteed sequential completion of operations of hermetic
seal from the environment, a vacuum and a thermostat. A sample of
matter delivered to the receiving trough was irradiated by radioactive
sources which were isotopes of plutonium and iron and were excited by
a spectra of X-ray fluorescent radiation recorded by a block of
detectors.
/80
During work on the surface, each station took and transmitted to
Earth dozens of spectra, an example of which is shown in Figure 16.
They made it possible to determine the content in the sample of the
basic rock-like elements from magnesium to iron and in this way to
61
identify the samples being studied with well-known Earth rocks whosespectra have been studied well.
Figure 16. Examples ofspectra of roentgenofluo-rescent radiation of samplesof soil obtained on theVenera-13 and Venera-14automated probes. The contentof elements is determinedaccording to intensity ofradiation; their position isindicated by the lines alongthe horizontal axis (accordingto the data of V. L. Barsukov,Yu. A. Surkov and theircoworkers.Key: a. content, productionunit; b. atomic number of theelement.
It seemed that in the landingregion for the Venera-13, the rockwas enriched with potassium and,obviously, did not differ greatlyfrom the rock in the landing areaof the Venera-8 where, according tothe data of measurements of naturalradioactivity, the soil earlier hadbeen found to be approximately thesame anomaly in its content ofpotassium. Moreover, according toits remaining composition, thisrock is not close to granite but tothe potassium alkali basalt of theEarth's crust which is notwidespread, encountered primarilyon ocean islands and in the /81
continental rifts of the
Mediterranean. In distinction from
them, the character of rock in the
region of the Venera-14 landing is
very similar to the rock identified
on the Venera-9 and Venera-10
probes. In composition, they
remind one of the widespread rock
from the ocean crust of Earth --
the so-called toleite basalt
characteristic also for ancient
lava flows on the Moon. Accordingto the results of recent similar
measurements made under the
direction of V. L. Barsukov in the
near-equator regions of Venus on
the Vega-i and Vega-2 probes, on
the surface also a third type of
basalt rock was identified,
obviously, close in its properties
to olivine gabbronorite.
In this way, basalt rock comprising a significant part of the
Earth's crust, obviously, is characteristic for Venus. This leads to
a hypothesis about the closeness of interaction of the continental
crust and the broad flows of basalt on all of the related Earth bodies
-the Moon, Mercury, Mars and Venus. It is possible, however, to think
that the surface of Venus not only in structural-morphological
relationships but also in its chemical composition is more uniform
than Earth. This involves the fact that in conditions of a deficit of
water (see below), the basalt melts which form the crust of the
planet, obviously, did not undergo any kind of significant metamorphic
changes and therefore, in comparison with Earth where the situation
62
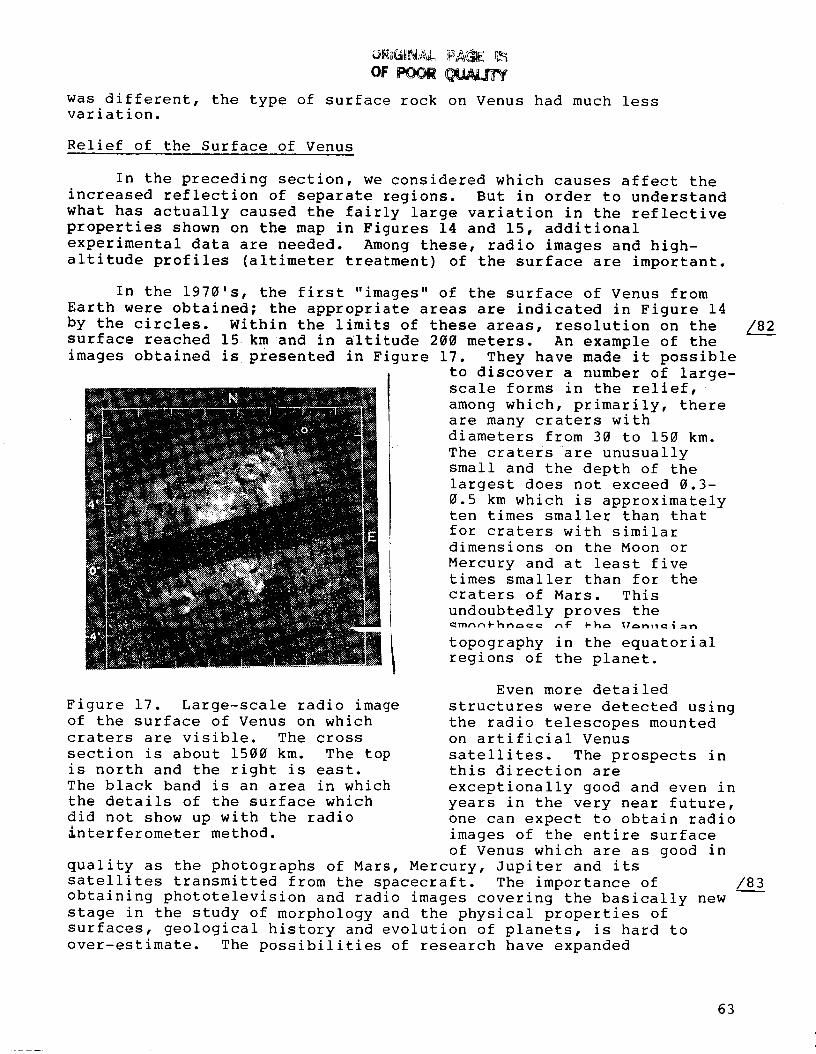
OF POOR
was different, the type of surface rock on Venus had much lessvariation.
Relief of the Surface of Venus
In the preceding section, we considered which causes affect the
increased reflection of separate regions. But in order to understand
what has actually caused the fairly large variation in the reflective
properties shown on the map in Figures 14 and 15, additional
experimental data are needed. Among these, radio images and high-
altitude profiles (altimeter treatment) of the surface are important.
In the 1970's, the first "images" of the surface of Venus from
Earth were obtained; the appropriate areas are indicated in Figure 14
by the circles. Within the limits of these areas, resolution on the
surface reached 15 km and in altitude 200 meters. An example of the
images obtained is presented in Figure 17. They have made it possible
Figure 17. Large-scale radio image
of the surface of Venus on which
craters are visible. The cross
section is about 1500 km. The top
is north and the right is east.
The black band is an area in which
the details of the surface which
did not show up with the radiointerferometer method.
to discover a number of large-
scale forms in the relief,
among which, primarily, there
are many craters with
diameters from 30 to 150 km.
The craters are unusually
small and the depth of the
largest does not exceed 0.3-
0.5 km which is approximatelyten times smaller than that
for craters with similar
dimensions on the Moon or
Mercury and at least five
times smaller than for the
craters of Mars. This
undoubtedly proves the
topography in the equatorial
regions of the planet.
Even more detailed
structures were detected using
the radio telescopes mounted
on artificial Venus
satellites. The prospects inthis direction are
exceptionally good and even in
years in the very near future,
one can expect to obtain radio
images of the entire surface
of Venus which are as good in
quality as the photographs of Mars, Mercury, Jupiter and its
satellites transmitted from the spacecraft. The importance of
obtaining phototelevision and radio images covering the basically new
stage in the study of morphology and the physical properties of
surfaces, geological history and evolution of planets, is hard to
over-estimate. The possibilities of research have expanded
/8_/2
/8__!
63
immeasurably not only thanks to high resolution, hundreds of timesexceeding the best resolution obtained when photographing from Earthbut also thanks to the global encompassing of the entire planet, theaccessibility of areas and polar regions which are unfavorable forone reason or another for ground observations. For example, forVenus, during optical observations or during radar research fromEarth, it is more convenient, as we have already noted, that theperiods of close low conjunction when Venus is turned toward us on oneor the other side. Therefore, its other hemisphere and polar regionsare hardly studied at all. The use of satellites has easily solvedthis problem.
The first experiments on radio mapping were carried out in 1975from the Venera-9 and Venera-10 artificial satellites for which theso-called method of bistatic radar was used. The idea of this methodinvolves the fact that the surface of the planet is irradiated byradio waves from the orbit of the satellite and the radio signalsreflected are received on Earth. Further, as during radar from Earth,according to the difference of time of arrival of signals and thewidth of their spectra, gradients of altitude and the degree ofroughness of the surface can be evaluated with the frequency-timemethod of selection which is already familiar to us (that is, from ananalysis of the dependence of intensity of the reflected signal onfrequency and time) in order to construct a radio image of the regionstudied. Several sections were detected with irregular relief in thesouthern hemisphere of Venus extending in a broad direction forseveral hundreds of km. The altitude gradients in these sectionsreached about 3 km and their surface appeared to be slightly rough,-- 1_most smooth.
A more effective method of radio mapping was used on the American
Pioneer-Venus satellite. Radar is done in this case by the satellite
itself without the participation of ground radio telescopes. The
satellite emits radio waves and receives the reflected signals back
and then the results of radar are transmitted to Earth. The radio
waves from the satellite are emitted along the verticals and at a
certain angle in relation to the section of the surface being studied.-
Probing along the verticals makes it possible according to the time of
lag and intensity of reflected signals to measure the altitude of the
relief and the physical properties of the surface along the flight
path of the satellite (as they say, to conduct altimetry). In turn,
the inclined probing ("lateral view") makes it possible to obtain a
radio image. It is accomplished by the inherent rotation of the
satellite with the antenna mounted on it in such a way that the radio
beam "slides" along the surface on both sides of the plane of the
orbit of the satellite passing through the vertical. The measurements
of time delay and the Doppler shift of frequency of reflected signals
provide the necessary spatial selectivity even with a comparatively
small antenna; however, the quality of the images and the resolution
appear very low (approximately 30-50 km) significantly inferior to
images with resolution of a few kilometers obtained in recent years by
D. Campbell at the Aresibo Observatory. Nevertheless, the results of
the radio altimetry, in combination both with the ground and with the
satellite radio images, significantly clarify the nature of the
/84
64
reflecting properties and features of the relief of many regions ofthe surface of the planet.
A new important step on the path of studying relief and physicalproperties of the surface of Venus was the launch in 1983 of theSoviet Venera-15 and Venera-16 artificial satellites. For studyingradar images of the surface according to the principle of lateralview, on them a much improved piece of equipment was installeddeveloped under the direction of well-known Soviet scientist,A. F. Bogomolov. The subsequent inspection of sections of the surfacealong the orbit in a band about 150 km wide, length up to 8000 km, wasaccomplished at a certain angle relative to the local vertical (withinlimits 10° ) and then not due to rotation of the satellite itself withthe antenna as in the experiment on the Pioneer-Venus satellite, butby electron scanning with a radio beam in a direction perpendicular tothe plane of the orbit. For this purpose, a special antenna withelliptical shape was used with maximum dimension 6 m. The brightnessof the photographic tone on the images was determined by these samethree factors on which intensity of the reflected signals dependduring radar from Earth. Resolution on the terrain reached 1-2 km.At the same time, when using a radio altimeter-profilograph with highprecision, relative gradations in altitude were measured and using theradiometer -- the temperature of the surface. AS a result of inherentrotation of the planet for each subsequent rotation of the satellitenew regions were studied and processing of data on the computer at theInstitute of Radio Engineering and Electronics of the Academy ofSciences, USSR made it possible to "sew" together separate bandsconnecting the transmitted images with relief of the terrain and thethermal physical properties of the surface of Venus.
/85
Located in near-polar orbits with pericenters close to the north pole,
the Venera-15 and Venera-16 satellites, for almost a year of work made
surveys of the northern hemisphere including the polar and middle
latitudes (up to =30 ° ) of an area 100 million km 2 which corresponds to
approximately a quarter of the entire surface of the planet. This
made it possible to study these regions with the greatest amount of
detail, significantly improving our understanding of the special
features of morphology of the relief and its connection with
geological processes, and to begin a compilation of high-quality maps.
How do we look at the planet closest to Earth on the basis of the
information that we have today?
Figure 18 shows a map of the relief of the surface of Venus with
average resolution about 100 km. The light sections are the plains
and the dark are the elevations. It is apparent that almost 90% of
the surface of Venus lies within the limits of +i km from the average
level corresponding to a radius 6051.5 km at the same time that the
greatest elevations occupy an area of less than 8% of the surface. In
this way, as a whole, Venus appeared to be the most spherical of all
the planets with a smooth relief. But still there are some very steep
mountain massifs. On a fragment of surface indicated in Figure 15,
65
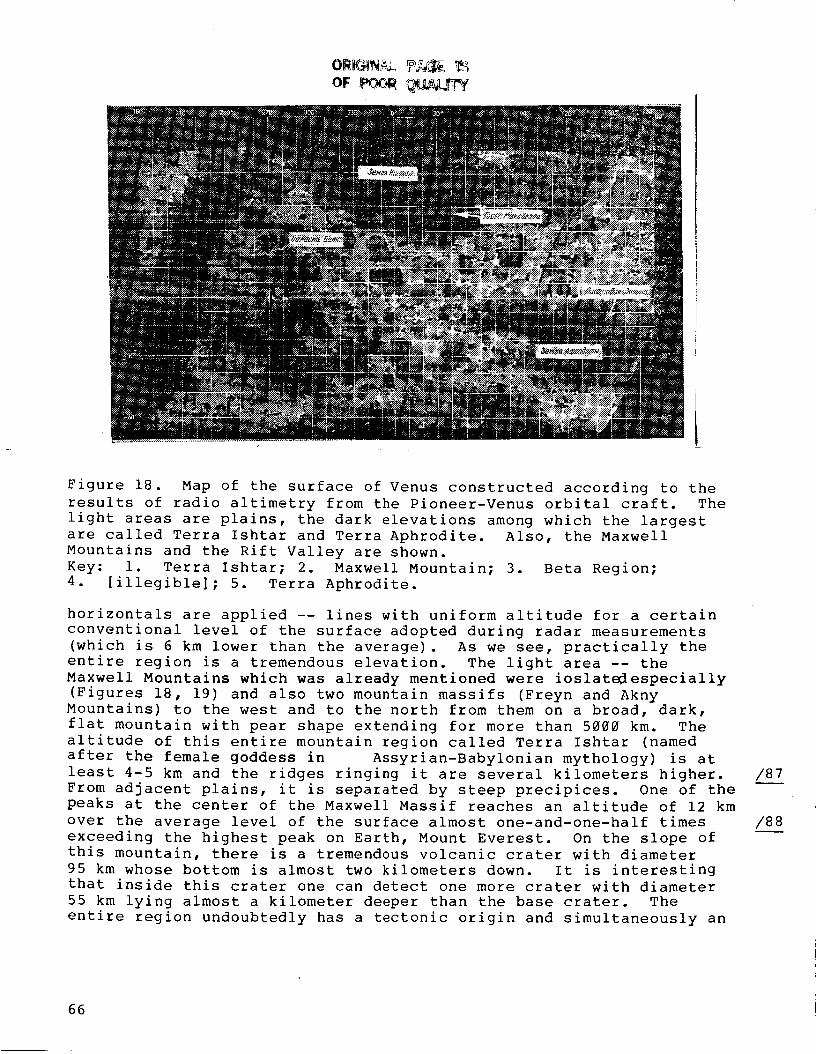
Figure 18. Map of the surface of Venus constructed according to theresults of radio altimetry from the Pioneer-Venus orbital craft. Thelight areas are plains, the dark elevations among which the largestare called Terra Ishtar and Terra Aphrodite. Also, the MaxwellMountains and the Rift Valley are shown.Key: i. Terra Ishtar; 2. Maxwell Mountain; 3. Beta Region;4. [illegible]; 5. Terra Aphrodite.
horizontals are applied -- lines with uniform altitude for a certainconventional level of the surface adopted during radar measurements(which is 6 km lower than the average). As we see, practically theentire region is a tremendous elevation. The light area -- theMaxwell Mountains which was already mentioned were ioslatedespecially(Figures 18, 19) and also two mountain massifs (Freyn and AknyMountains) to the west and to the north from them on a broad, dark,flat mountain with pear shape extending for more than 5000 km. Thealtitude of this entire mountain region called Terra Ishtar (namedafter the female goddess in Assyrian-Babylonian mythology) is atleast 4-5 km and the ridges ringing it are several kilometers higher.From adjacent plains, it is separated by steep precipices. One of thepeaks at the center of the Maxwell Massif reaches an altitude of 12 kmover the average level of the surface almost one-and-one-half timesexceeding the highest peak on Earth, Mount Everest. On the slope ofthis mountain, there is a tremendous volcanic crater with diameter95 km whose bottom is almost two kilometers down. It is interestingthat inside this crater one can detect one more crater with diameter55 km lying almost a kilometer deeper than the base crater. Theentire region undoubtedly has a tectonic origin and simultaneously an
/87
/88
66
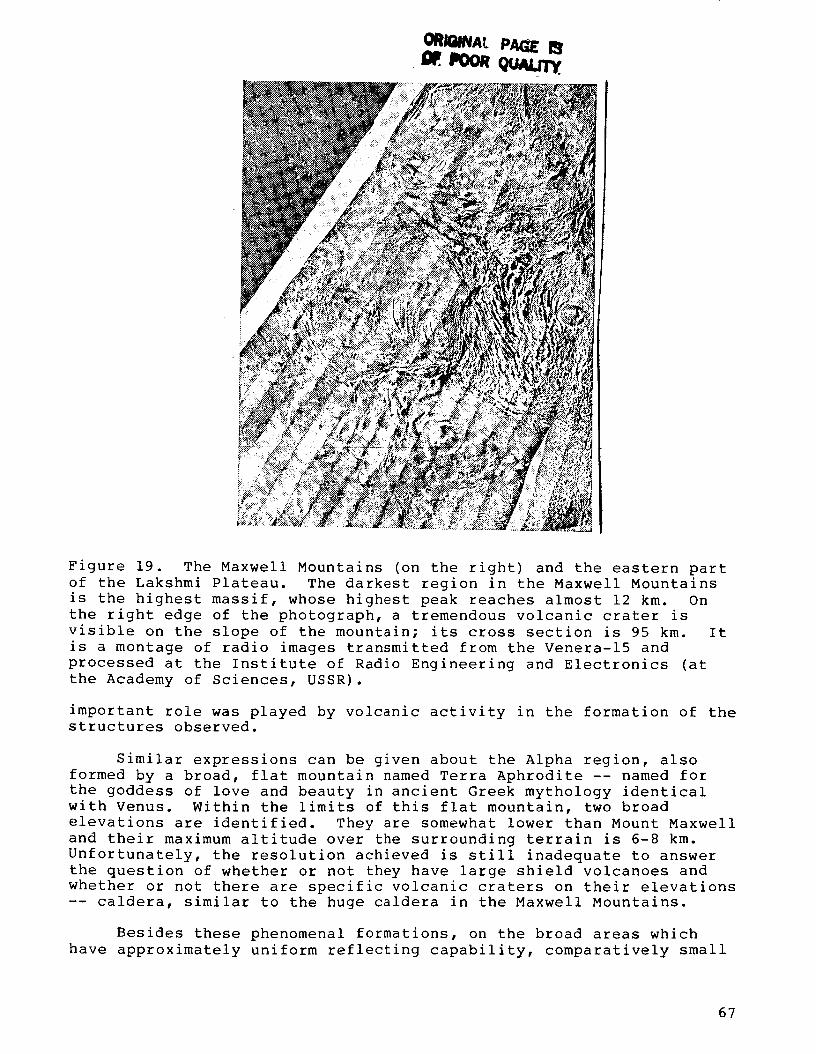
OR/(IWAt. PAGe"
I'ooR Quarry.
Figure 19. The Maxwell Mountains (on the right) and the eastern part
of the Lakshmi Plateau. The darkest region in the Maxwell Mountains
is the highest massif, whose highest peak reaches almost 12 km. On
the right edge of the photograph, a tremendous volcanic crater is
visible on the slope of the mountain; its cross section is 95 km. It
is a montage of radio images transmitted from the Venera-15 and
processed at the Institute of Radio Engineering and Electronics (at
the Academy of Sciences, USSR).
important role was played by volcanic activity in the formation of thestructures observed.
Similar expressions can be given about the Alpha region, also
formed by a broad, flat mountain named Terra Aphrodite -- named for
the goddess of love and beauty in ancient Greek mythology identical
with Venus. Within the limits of this flat mountain, two broad
elevations are identified. They are somewhat lower than Mount Maxwell
and their maximum altitude over the surrounding terrain is 6-8 km.
Unfortunately, the resolution achieved is still inadequate to answer
the question of whether or not they have large shield volcanoes and
whether or not there are specific volcanic craters on their elevations
-- caldera, similar to the huge caldera in the Maxwell Mountains.
Besides these phenomenal formations, on the broad areas which
have approximately uniform reflecting capability, comparatively small
67
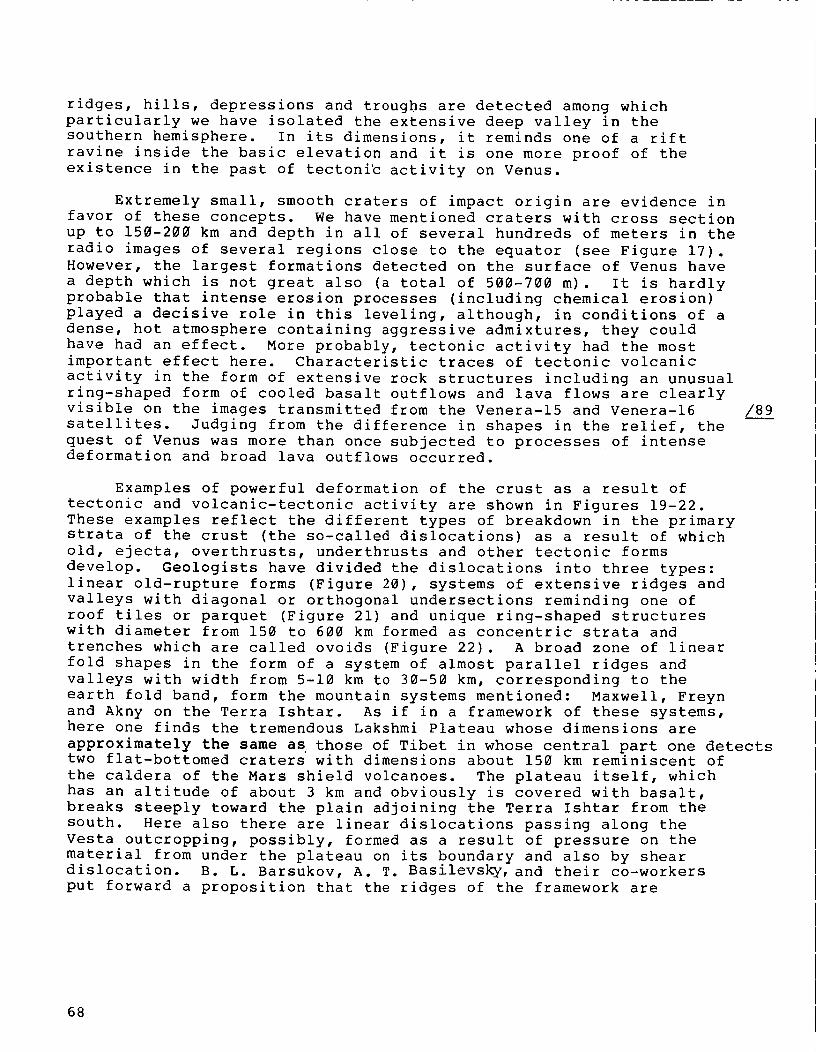
ridges, hills, depressions and troughs are detected among whichparticularly we have isolated the extensive deep valley in thesouthern hemisphere. In its dimensions, it reminds one of a riftravine inside the basic elevation and it is one more proof of theexistence in the past of tectonib activity on Venus.
Extremely small, smooth craters of impact origin are evidence infavor of these concepts. We have mentioned craters with cross section
up to 150-200 km and depth in all of several hundreds of meters in the
radio images of several regions close to the equator (see Figure 17).
However, the largest formations detected on the surface of Venus have
a depth which is not great also (a total of 500-700 m). It is hardly
probable that intense erosion processes (including chemical erosion)
played a decisive role in this leveling, although, in conditions of a
dense, hot atmosphere containing aggressive admixtures, they could
have had an effect. More probably, tectonic activity had the most
important effect here. Characteristic traces of tectonic volcanic
activity in the form of extensive rock structures including an unusual
ring-shaped form of cooled basalt outflows and lava flows are clearly
visible on the images transmitted from the Venera-15 and Venera-16
satellites. Judging from the difference in shapes in the relief, the
quest of Venus was more than once subjected to processes of intense
deformation and broad lava outflows occurred.
/89
Examples of powerful deformation of the crust as a result of
tectonic and volcanic-tectonic activity are shown in Figures 19-22.
These examples reflect the different types of breakdown in the primarystrata of the crust (the so-called dislocations) as a result of which
old, ejecta, overthrusts, underthrusts and other tectonic forms
develop. Geologists have divided the dislocations into three types:
linear old-rupture forms (Figure 20), systems of extensive ridges and
valleys with diagonal or orthogonal undersections reminding one of
roof tiles or parquet (Figure 21) and unique ring-shaped structureswith diameter from 150 to 600 km formed as concentric strata and
trenches which are called ovoids (Figure 22). A broad zone of linear
fold shapes in the form of a system of almost parallel ridges and
valleys with width from 5-10 km to 30-50 km, corresponding to the
earth fold band, form the mountain systems mentioned: Maxwell, Freyn
and Akny on the Terra Ishtar. As if in a framework of these systems,here one finds the tremendous Lakshmi Plateau whose dimensions are
approximately the same as those of Tibet in whose central part one detectstwo flat-bottomed craters with dimensions about 150 km reminiscent of
the caldera of the Mars shield volcanoes. The plateau itself, which
has an altitude of about 3 km and obviously is covered with basalt,
breaks steeply toward the plain adjoining the Terra Ishtar from the
south. Here also there are linear dislocations passing along the
Vesta outcropping, possibly, formed as a result of pressure on the
material from under the plateau on its boundary and also by shear
dislocation. B. L. Barsukov, A. T. Basilevsky, and their co-workers
put forward a proposition that the ridges of the framework are
68
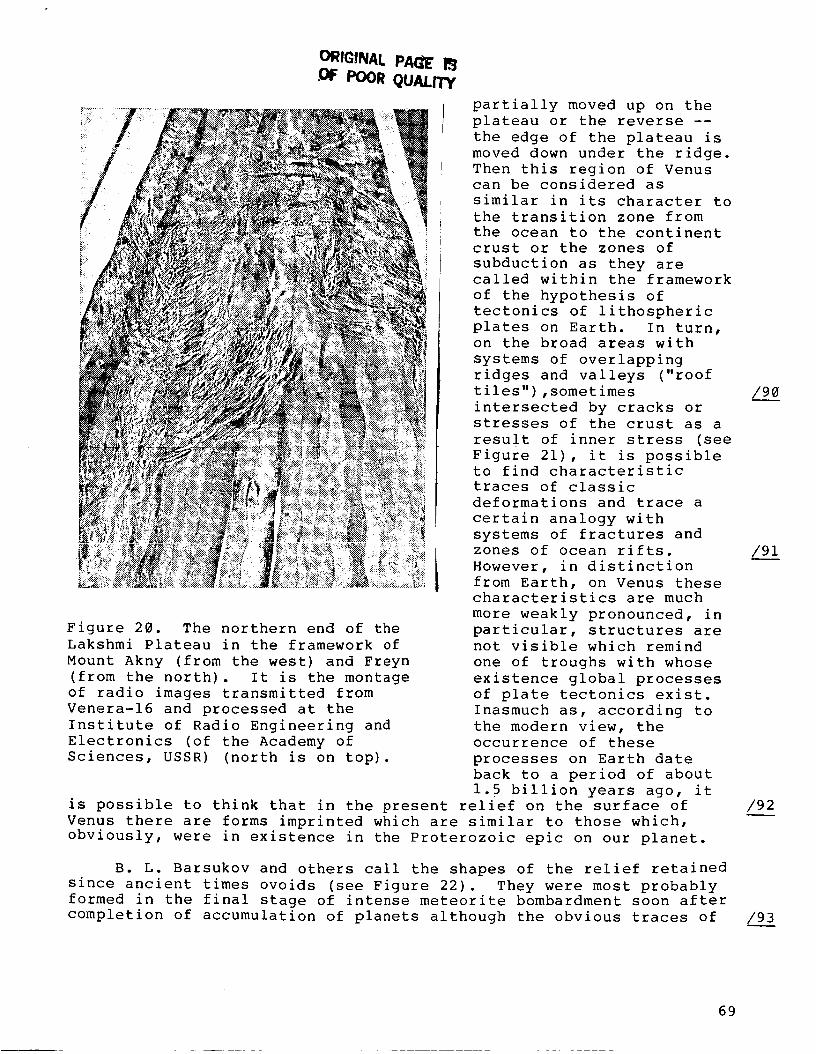
ORIGINAL PAGE.OFPoor QUALITy
Figure 20. The northern end of the
Lakshmi Plateau in the framework of
Mount Akny (from the west) and Freyn
(from the north). It is the montage
of radio images transmitted from
Venera-16 and processed at the
Institute of Radio Engineering and
Electronics (of the Academy of
Sciences, USSR) (north is on top).
partially moved up on the
plateau or the reverse --
the edge of the plateau is
moved down under the ridge.
Then this region of Venuscan be considered as
similar in its character to
the transition zone from
the ocean to the continent
crust or the zones of
subduction as they arecalled within the framework
of the hypothesis of
tectonics of lithospheric
plates on Earth. In turn,on the broad areas with
systems of overlapping
ridges and valleys ("roof
tiles"),sometimes
intersected by cracks or
stresses of the crust as a
result of inner stress (see
Figure 21), it is possibleto find characteristic
traces of classic
deformations and trace a
certain analogy with
systems of fractures and
zones of ocean rifts.
However, in distinction
from Earth, on Venus these
characteristics are much
more weakly pronounced, in
particular, structures are
not visible which remind
one of troughs with whose
existence global processes
of plate tectonics exist.
Inasmuch as, according to
the modern view, the
occurrence of these
processes on Earth date
back to a period of about
1.5 billion years ago, it
is possible to think that in the present relief on the surface of
Venus there are forms imprinted which are similar to those which,
obviously, were in existence in the Proterozoic epic on our planet.
B. L. Barsukov and others call the shapes of the relief retained
since ancient times ovoids (see Figure 22). They were most probably
formed in the final stage of intense meteorite bombardment soon after
completion of accumulation of planets although the obvious traces of
/9__!
/92
/9__!
69
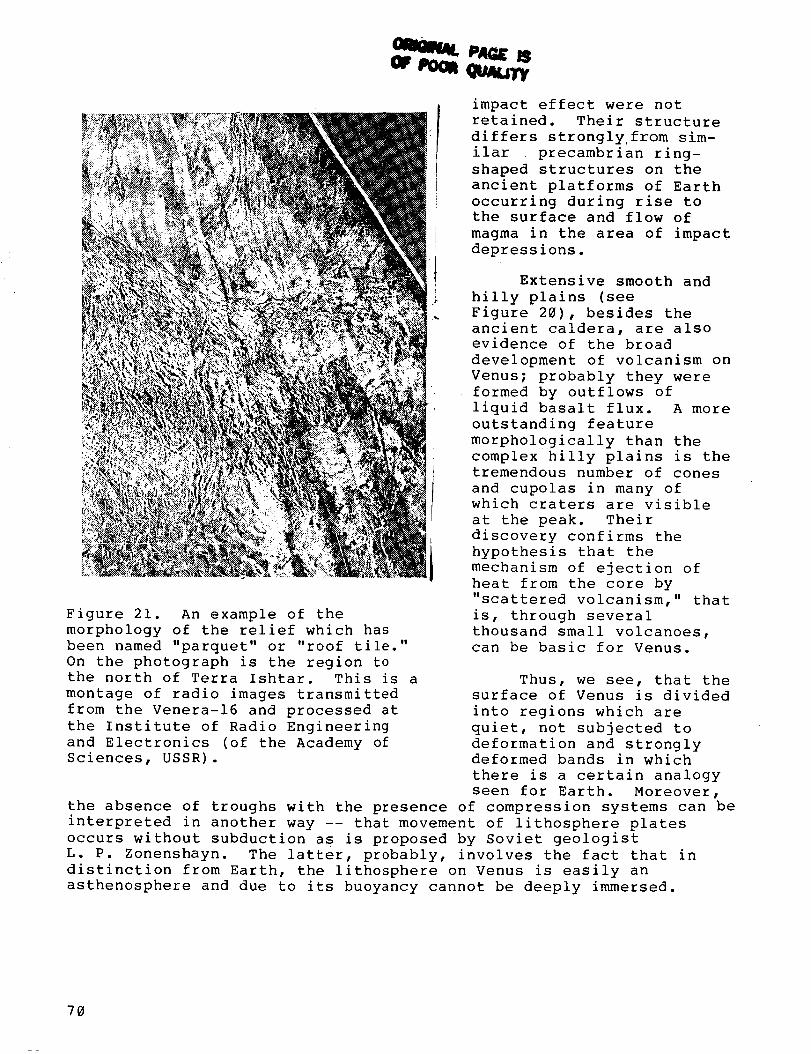
paG£ B
impact effect were not
retained. Their structure
differs strongly from sim-
ilar precambrian ring-
shaped structures on the
ancient platforms of Earth
occurring during rise to
the surface and flow of
magma in the area of impact
depressions.
Figure 21. An example of the
morphology of the relief which has
been named "parquet" or "roof tile."
On the photograph is the region to
the north of Terra Ishtar. This is a
montage of radio images transmitted
from the Venera-16 and processed at
the Institute of Radio Engineering
and Electronics (of the Academy of
Sciences, USSR).
Extensive smooth and
hilly plains (see
Figure 20), besides the
ancient caldera, are also
evidence of the broad
development of volcanism on
Venus; probably they were
formed by outflows of
liquid basalt flux. A more
outstanding feature
morphologically than the
complex hilly plains is the
tremendous number of cones
and cupolas in many of
which craters are visible
at the peak. Their
discovery confirms the
hypothesis that the
mechanism of ejection of
heat from the core by
"scattered volcanism," that
is, through several
thousand small volcanoes,
can be basic for Venus.
Thus, we see, that the
surface of Venus is divided
into regions which are
quiet, not subjected to
deformation and strongly
deformed bands in which
there is a certain analogy
seen for Earth. Moreover,
the absence of troughs with the presence of compression systems can be
interpreted in another way -- that movement of lithosphere plates
occurs without subduction as is proposed by Soviet geologist
L. P. Zonenshayn. The latter, probably, involves the fact that in
distinction from Earth, the lithosphere on Venus is easily an
asthenosphere and due to its buoyancy cannot be deeply immersed.
70
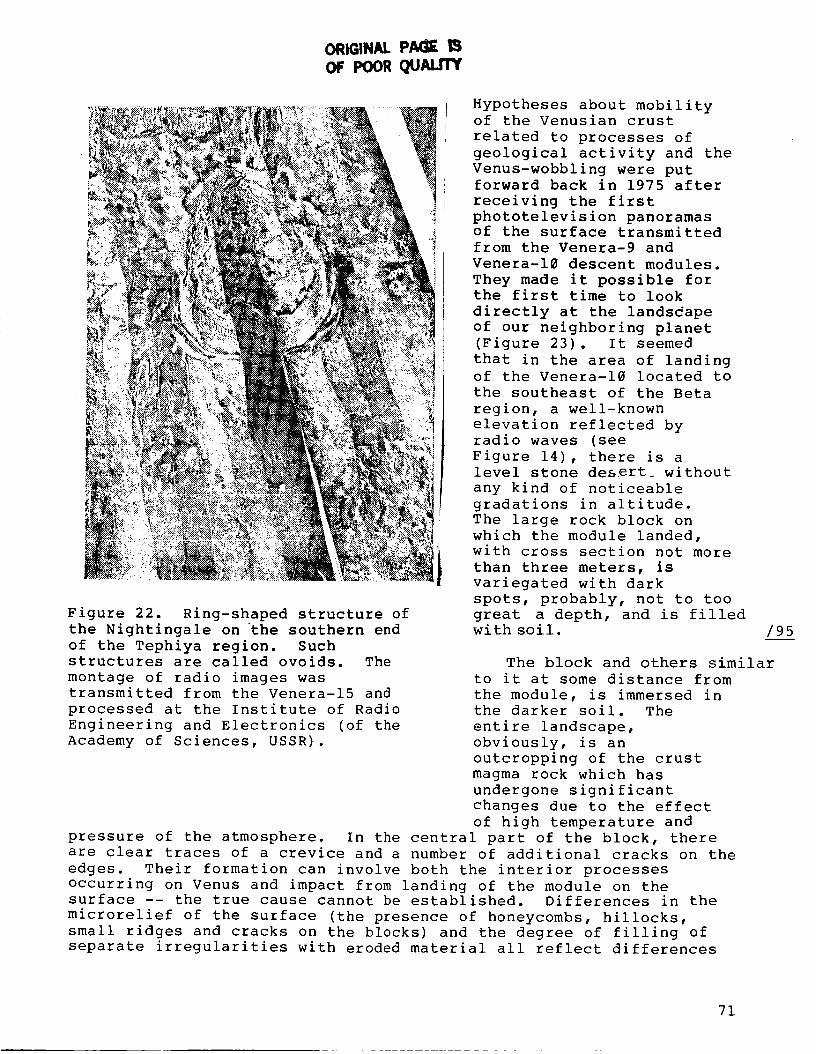
ORIGINAL PA(_
OF POOR QUALITY
Figure 22. Ring-shaped structure of
the Nightingale on the southern end
of the Tephiya region. Suchstructures are called ovoids. The
montage of radio images was
transmitted from the Venera-15 and
processed at the Institute of Radio
Engineering and Electronics (of the
Academy of Sciences, USSR).
Hypotheses about mobilityof the Venusian crust
related to processes of
geological activity and the
Venus-wobbling were put
forward back in 1975 after
receiving the first
phototelevision panoramasof the surface transmitted
from the Venera-9 and
Venera-10 descent modules.
They made it possible for
the first time to look
directly at the landsdape
of our neighboring planet
(Figure 23). It seemed
that in the area of landing
of the Venera-10 located to
the southeast of the Beta
region, a well-known
elevation reflected byradio waves (see
Figure 14), there is a
level stone desert_ without
any kind of noticeable
gradations in altitude.
The large rock block on
which the module landed,
with cross section not more
than three meters, is
variegated with dark
spots, probably, not to too
great a depth, and is filledwith soil. /95
The block and others similar
to it at some distance from
the module, is immersed in
the darker soil. The
entire landscape,
obviously, is an
outcropping of the crust
magma rock which has
undergone significant
changes due to the effect
of high temperature and
pressure of the atmosphere. In the central part of the block, there
are clear traces of a crevice and a number of additional cracks on the
edges. Their formation can involve both the interior processes
occurring on Venus and impact from landing of the module on thesurface -- the true cause cannot be established. Differences in the
microrelief of the surface (the presence of honeycombs, hillocks,
small ridges and cracks on the blocks) and the degree of filling of
separate irregularities with eroded material all reflect differences
71
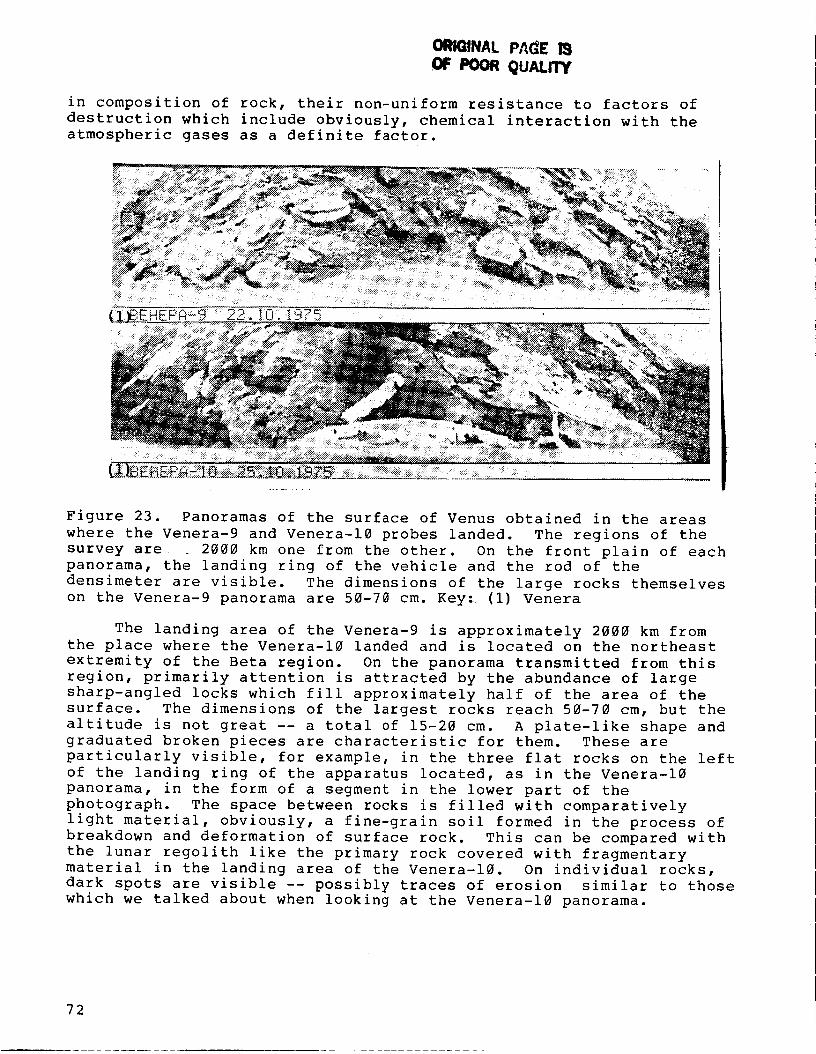
ORIGINAL PP(_E 19
.OF POOR QUALITY
in composition of rock, their non-uniform resistance to factors of
destruction which include obviously, chemical interaction with the
atmospheric gases as a definite factor.
Figure 23. Panoramas of the surface of Venus obtained in the areas
where the Venera-9 and Venera-10 probes landed. The regions of the
survey are 2000 km one from the other. On the front plain of each
panorama, the landing ring of the vehicle and the rod of the
densimeter are visible. The dimensions of the large rocks themselves
on the Venera-9 panorama are 50-70 cm. Key:: (i) Venera
The landing area of the Venera-9 is approximately 2000 km from
the place where the Venera-10 landed and is located on the northeast
extremity of the Beta region. On the panorama transmitted from this
region, primarily attention is attracted by the abundance of large
sharp-angled locks which fill approximately half of the area of the
surface. The dimensions of the largest rocks reach 50-70 cm, but the
altitude is not great -- a total of 15-20 cm. A plate-like shape and
graduated broken pieces are characteristic for them. These are
particularly visible, for example, in the three flat rocks on the left
of the landing ring of the apparatus located, as in the Venera-10
panorama, in the form of a segment in the lower part of the
photograph. The space between rocks is filled with comparatively
light material, obviously, a fine-grain soil formed in the process of
breakdown and deformation of surface rock. This can be compared with
the lunar regolith like the primary rock covered with fragmentary
material in the landing area of the Venera-10. On individual rocks,
dark spots are visible -- possibly traces of erosion similar to those
which we talked about when looking at the Venera-10 panorama.
72
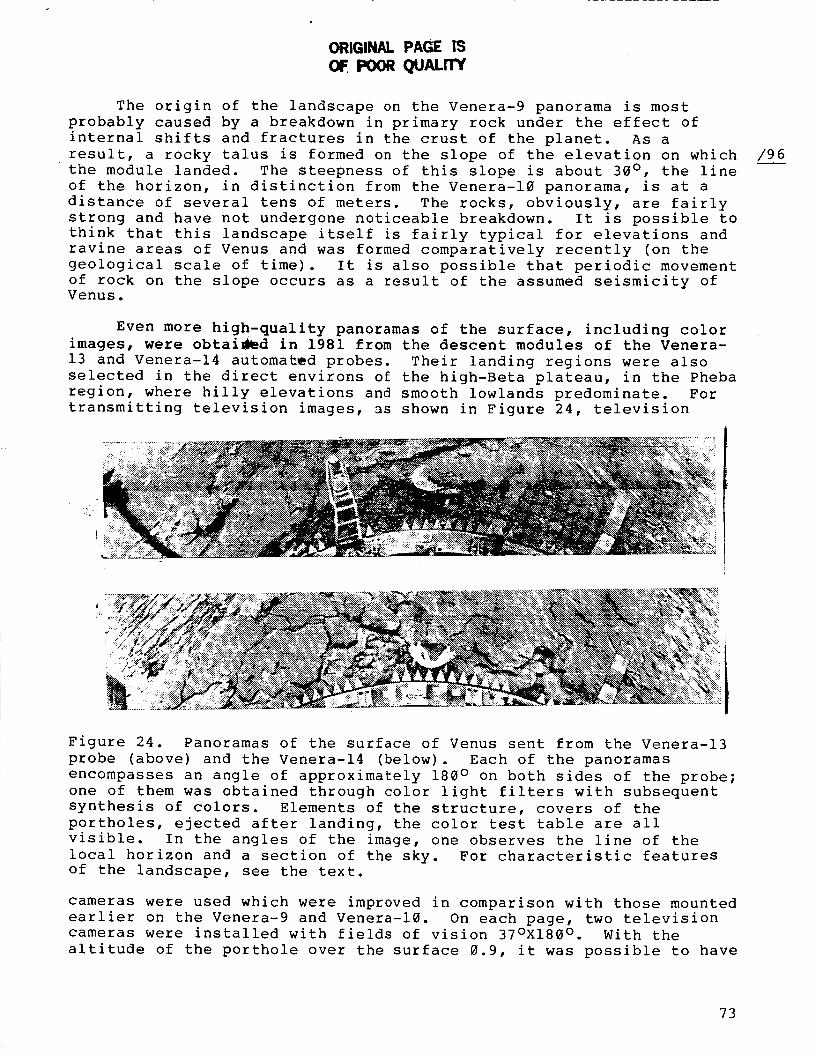
ORIGINAl. PAGE IS
POOR Q4.1ALrl'Y
The origin of the landscape on the Venera-9 panorama is most
probably caused by a breakdown in primary rock under the effect of
internal shifts and fractures in the crust of the planet. As a
result, a rocky talus is formed on the slope of the elevation on which
the module landed. The steepness of this slope is about 30 °, the line
of the horizon, in distinction from the Venera-10 panorama, is at a
distance of several tens of meters. The rocks, obviously, are fairly
strong and have not undergone noticeable breakdown. It is possible to
think that this landscape itself is fairly typical for elevations and
ravine areas of Venus and was formed comparatively recently (on the
geological scale of time). It is also possible that periodic movement
of rock on the slope occurs as a result of the assumed seismicity ofVenus.
Even more high-quality panoramas of the surface, including color
images, were obtai_d in 1981 from the descent modules of the Venera-
13 and Venera-14 automa£_d probes. Their landing regions were also
selected in the direct environs of the high-Beta plateau, in the Pheba
region, where hilly elevations and smooth lowlands predominate. For
transmitting television images, as shown in Figure 24, television
Figure 24. Panoramas of the surface of Venus sent from the Venera-13
probe (above) and the Venera-14 (below). Each of the panoramas
encompasses an angle of approximately 180 ° on both sides of the probe;
one of them was obtained through color light filters with subsequent
synthesis of colors. Elements of the structure, covers of the
portholes, ejected after landing, the color test table are all
visible. In the angles of the image, one observes the line of the
local horizon and a section of the sky. For characteristic featuresof the landscape, see the text.
cameras were used which were improved in comparison with those mounted
earlier on the Venera-9 and Venera-10. On each page, two television
cameras were installed with fields of vision 37°X180 °. With the
altitude of the porthole over the surface 0.9, it was possible to have
73
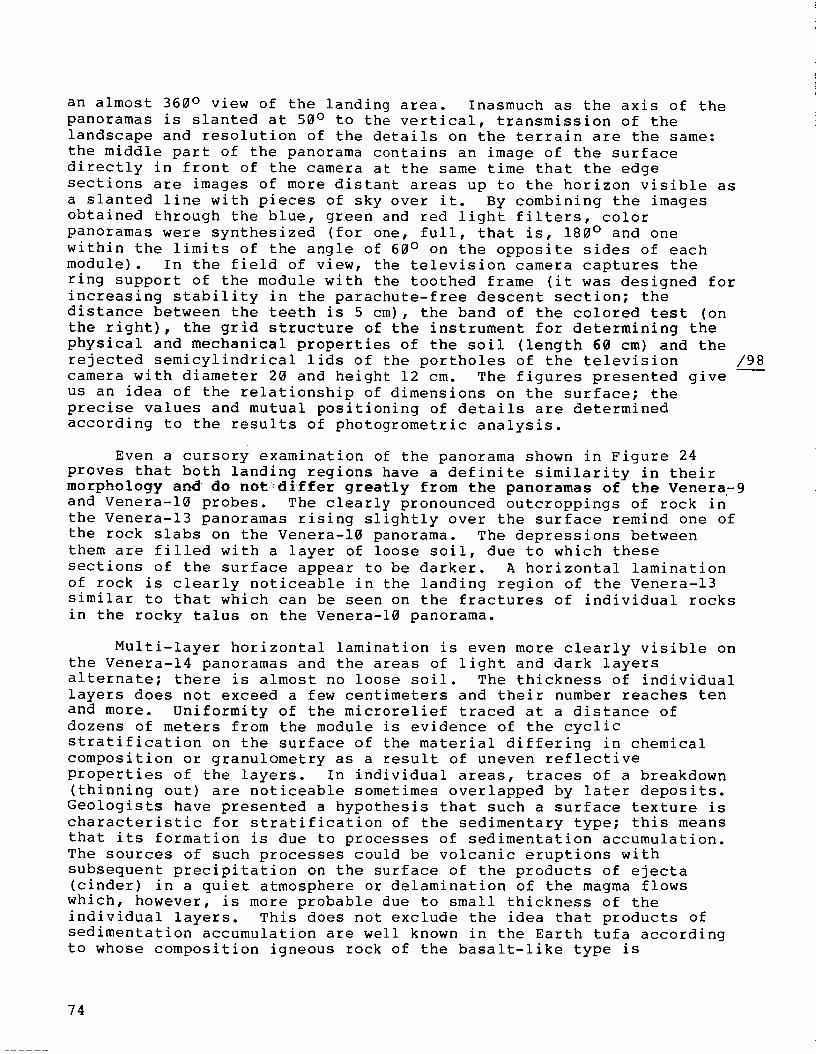
an almost 360 ° view of the landing area. Inasmuch as the axis of the
panoramas is slanted at 50 ° to the vertical, transmission of the
landscape and resolution of the details on the terrain are the same:
the middle part of the panorama contains an image of the surface
directly in front of the camera at the same time that the edge
sections are images of more distant areas up to the horizon visible as
a slanted line with pieces of sky over it. By combining the images
obtained through the blue, green and red light filters, color
panoramas were synthesized (for one, full, that is, 180 ° and one
within the limits of the angle of 60 ° on the opposite sides of each
module). In the field of view, the television camera captures the
ring support of the module with the toothed frame (it was designed for
increasing stability in the parachute-free descent section; the
distance between the teeth is 5 cm), the band of the colored test (on
the right), the grid structure of the instrument for determining the
physical and mechanical properties of the soil (length 60 cm) and the
rejected semicylindrical lids of the portholes of the television
camera with diameter 20 and height 12 cm. The figures presented give
us an idea of the relationship of dimensions on the surface; the
precise values and mutual positioning of details are determined
according to the results of photogrometric analysis.
/98
Even a cursory examination of the panorama shown in Figure 24
proves that both landing regions have a definite similarity in their
morphology and do not_differ greatly from the panoramas of the Venera-9
and Venera-10 probes. The clearly pronounced outcroppings of rock in
the Venera-13 panoramas rising slightly over the surface remind one of
the rock slabs on the Venera-10 panorama. The depressions between
them are filled with a layer of loose soil, due to which these
sections of the surface appear to be darker. A horizontal lamination
of rock is clearly noticeable in the landing region of the Venera-13
similar to that which can be seen on the fractures of individual rocks
in the rocky talus on the Venera-10 panorama.
Multi-layer horizontal lamination is even more clearly visible on
the Venera-14 panoramas and the areas of light and dark layers
alternate; there is almost no loose soil. The thickness of individual
layers does not exceed a few centimeters and their number reaches ten
and more. Uniformity of the microrelief traced at a distance of
dozens of meters from the module is evidence of the cyclic
stratification on the surface of the material differing in chemical
composition or granulQmetry as a result of uneven reflective
properties of the layers. In individual areas, traces of a breakdown
(thinning out) are noticeable sometimes overlapped by later deposits.
Geologists have presented a hypothesis that such a surface texture is
characteristic for stratification of the sedimentary type; this means
that its formation is due to processes of sedimentation accumulation.
The sources of such processes could be volcanic eruptions with
subsequent precipitation on the surface of the products of ejecta
(cinder) in a quiet atmosphere or delamination of the magma flows
which, however, is more probable due to small thickness of the
individual layers. This does not exclude the idea that products of
sedimentation accumulation are well known in the Earth tufa according
to whose composition igneous rock of the basalt-like type is
74
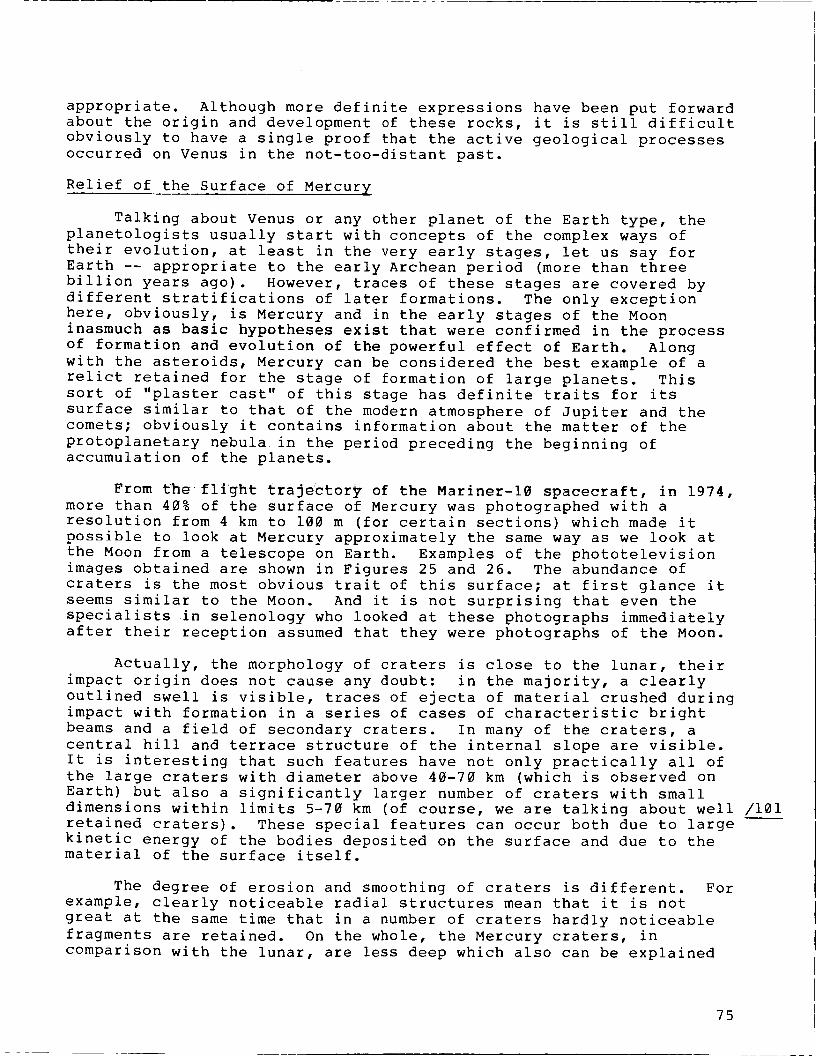
appropriate. Although more definite expressions have been put forwardabout the origin and development of these rocks, it is still difficultobviously to have a single proof that the active geological processesoccurred on Venus in the not-too-distant past.
Relief of the Surface of Mercury
Talking about Venus or any other planet of the Earth type, the
planetologists usually start with concepts of the complex ways of
their evolution, at least in the very early stages, let us say for
Earth -- appropriate to the early Archean period (more than three
billion years ago). However, traces of these stages are covered by
different stratifications of later formations. The only exception
here, obviously, is Mercury and in the early stages of the Moon
inasmuch as basic hypotheses exist that were confirmed in the process
of formation and evolution of the powerful effect of Earth. Along
with the asteroids, Mercury can be considered the best example of a
relict retained for the stage of formation of large planets. This
sort of "plaster cast" of this stage has definite traits for its
surface similar to that of the modern atmosphere of Jupiter and thecomets; obviously it contains information about the matter of the
protoplanetary nebula in the period preceding the beginning of
accumulation of the planets.
From the flight trajectory of the Mariner-10 spacecraft, in 1974,
more than 40% of the surface of Mercury was photographed with a
resolution from 4 km to 100 m (for certain sections) which made it
possible to look at Mercury approximately the same way as we look at
the Moon from a telescope on Earth. Examples of the phototelevision
images obtained are shown in Figures 25 and 26. The abundance of
craters is the most obvious trait of this surface; at first glance it
seems similar to the Moon. And it is not surprising that even the
specialists in selenology who looked at these photographs immediately
after their reception assumed that they were photographs of the Moon.
Actually, the morphology of craters is close to the lunar, their
impact origin does not cause any doubt: in the majority, a clearly
outlined swell is visible, traces of ejecta of material crushed during
impact with formation in a series of cases of characteristic bright
beams and a field of secondary craters. In many of the craters, a
central hill and terrace structure of the internal slope are visible.
It is interesting that such features have not only practically all of
the large craters with diameter above 40-70 km (which is observed on
Earth) but also a significantly larger number of craters with small
dimensions within limits 5-70 km (of course, we are talking about well /101
retained craters). These special features can occur both due to large
kinetic energy of the bodies deposited on the surface and due to thematerial of the surface itself.
The degree of erosion and smoothing of craters is different. For
example, clearly noticeable radial structures mean that it is not
great at the same time that in a number of craters hardly noticeable
fragments are retained. On the whole, the Mercury craters, in
comparison with the lunar, are less deep which also can be explained
75
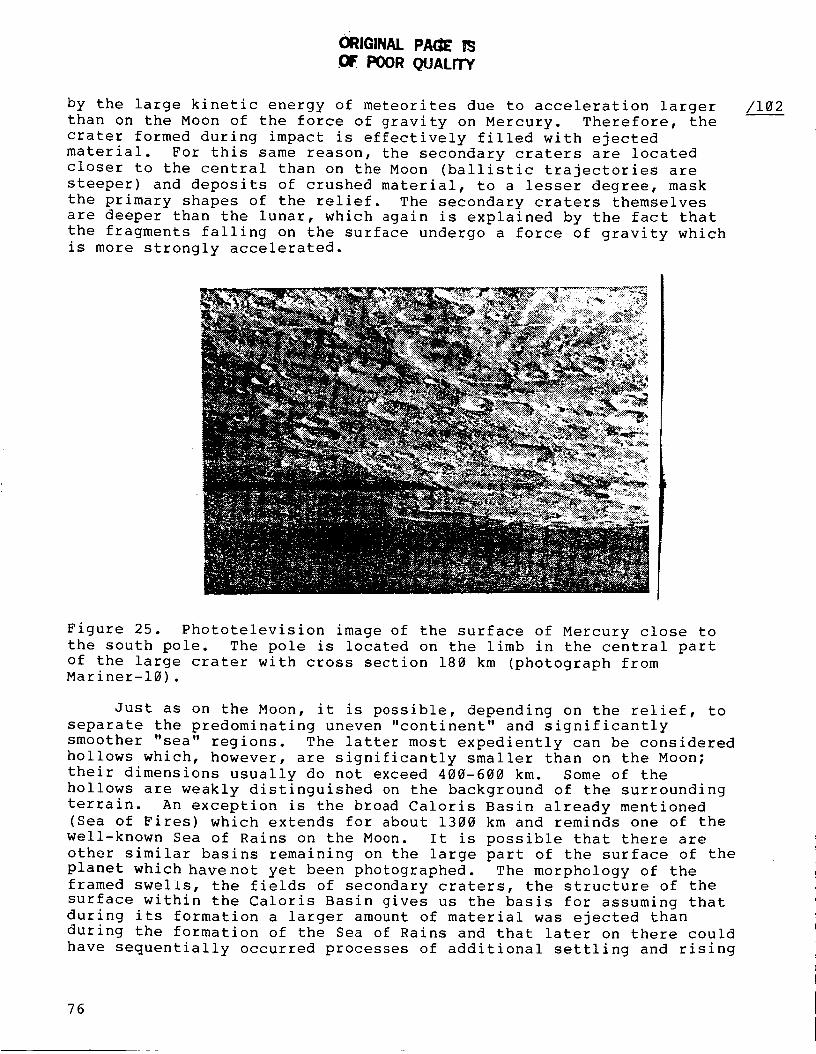
L_
ORIGINAL PA(_ F3
POOR QUALITY
by the large kinetic energy of meteorites due to acceleration larger
than on the Moon of the force of gravity on Mercury. Therefore, the
crater formed during impact is effectively filled with ejected
material. For this same reason, the secondary craters are located
closer to the central than on the Moon (ballistic trajectories are
steeper) and deposits of crushed material, to a lesser degree, mask
the primary shapes of the relief. The secondary craters themselves
are deeper than the lunar, which again is explained by the fact that
the fragments falling on the surface undergo a force of gravity which
is more strongly accelerated.
/102
Figure 25. Phototelevision image of the surface of Mercury close to
the south pole. The pole is located on the limb in the central part
of the large crater with cross section 180 km (photograph fromMariner-10).
Just as on the Moon, it is possible, depending on the relief, to
separate the predominating uneven "continent" and significantly
smoother "sea" regions. The latter most expediently can be considered
hollows which, however, are significantly smaller than on the Moon;
their dimensions usually do not exceed 400-600 km. Some of the
hollows are weakly distinguished on the background of the surrounding
terrain. An exception is the broad Caloris Basin already mentioned
(Sea of Fires) which extends for about 1300 km and reminds one of the
well-known Sea of Rains on the Moon. It is possible that there are
other similar basins remaining on the large part of the surface of the
planet which havenot yet been photographed. The morphology of the
framed swells, the fields of secondary craters, the structure of the
surface within the Caloris Basin gives us the basis for assuming that
during its formation a larger amount of material was ejected than
during the formation of the Sea of Rains and that later on there could
have sequentially occurred processes of additional settling and rising
76
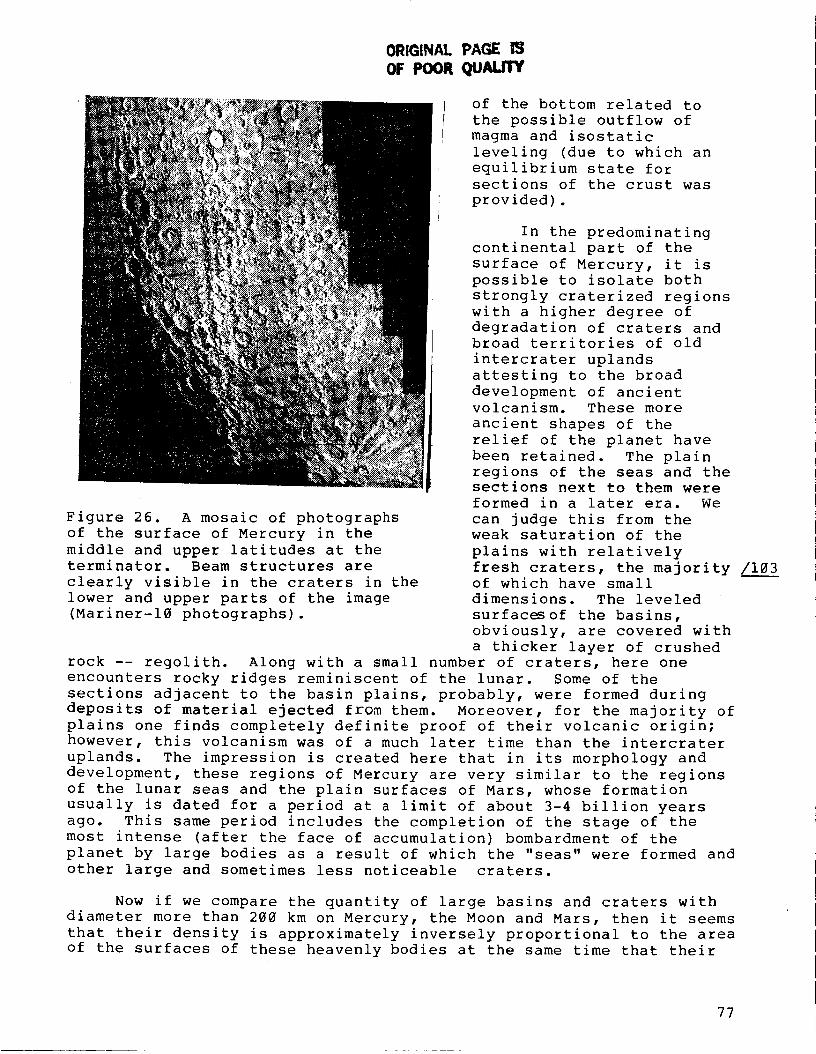
ORIGINAL PAGE FJ
OF POORQU .nY
Figure 26. A mosaic of photographs
of the surface of Mercury in the
middle and upper latitudes at the
terminator. Beam structures are
clearly visible in the craters in the
lower and upper parts of the image
(Mariner-10 photographs).
of the bottom related to
the possible outflow of
magma and isostatic
leveling (due to which an
equilibrium state for
sections of the crust was
i provided).
In the predominating
continental part of the
surface of Mercury, it is
possible to isolate both
strongly craterized regions
with a higher degree of
degradation of craters andbroad territories of old
intercrater uplands
attesting to the broad
development of ancient
volcanism. These more
ancient shapes of the
relief of the planet have
been retained. The plain
regions of the seas and thesections next to them were
formed in a later era. We
can judge this from the
weak saturation of the
plains with relatively
fresh craters, the majority /103of which have small
dimensions. The leveled
surfaces of the basins,
obviously, are covered with
a thicker layer of crushed
rock -- regolith. Along with a small number of craters, here one
encounters rocky ridges reminiscent of the lunar. Some of the
sections adjacent to the basin plains, probably, were formed during
deposits of material ejected from them. Moreover, for the majority of
plains one finds completely definite proof of their volcanic origin;
however, this volcanism was of a much later time than the intercrater
uplands. The impression is created here that in its morphology and
development, these regions of Mercury are very similar to the regions
of the lunar seas and the plain surfaces of Mars, whose formation
usually is dated for a period at a limit of about 3-4 billion years
ago. This same period includes the completion of the stage of the
most intense (after the face of accumulation) bombardment of the
planet by large bodies as a result of which the "seas" were formed and
other large and sometimes less noticeable craters.
Now if we compare the quantity of large basins and craters with
diameter more than 200 km on Mercury, the Moon and Mars, then it seems
that their density is approximately inversely proportional to the area
of the surfaces of these heavenly bodies at the same time that their
77
cross sections differ by a factor of two. It follows from this that
the number of meteorites in the regions of space occupied by these
planets can be approximately identical. Understanding this is not as
simple as one would think at first glance. Usually, we start with the
concepts that the basic regular source of meteorites "postulated" in
the interior regions of the solar system is an asteroid band and the
planets are found at different distances from it. However, if one
pays attention to the fact that besides this basic source there can be
other similar clusters of asteroid bodies beyond the orbit of Pluto
(see Figure ii) also those fulfilling the functions of "suppliers" of
meteorites, the difference in the positioning of planets close to the
Sun becomes insignificant.
This hypothesis seems more probable to us than the one using
similar cases of different "catastrophic" hypotheses. For explaining
the principles observed, the well-known American scientist G. Bezerill
proposed a hypothesis of catastrophic breakdown of the asteroid under
the effect of tidal forces with its passage close to the Earth and
Venus and subsequent fallout of fragments. The fragments then could
have been distributed within the limits of the field of positioning of
the planets of the Earth group approximately uniformly. With all the
external attractiveness of this scenario, it is useful, obviously, to
mention the well-known philosophy-methodology principle according to
which one does not have to invent essentials above the necessary. In
other words, one does not have to use exotic explanations if it is
possible to get along with simpler ones.
Analyzing the basic traits of the surface of Mercury, we turn our
attention both to the many similarities and to the significant
differences with the Moon. An attentive study shows one more
interesting feature shedding light on the history of formation of
planets. We are talking about the characteristic traces of tectonic
activity on a global scale in the form of specific steep scarps, or
slopes -- escarpments. The escarpments have an extent of
approximately 20-500 km and the altitude of the slopes is from a few
hundreds of meters up to 1-2 km. According to its morphology and
geometry of positioning on the surface, they differ from the ordinary
tectonic breaks and ejecta observed on the Moon and Mars and more
rapidly were formed due to thrusts laminated as a result of stress in
the surface layer occurring during compression of Mercury. The
horizontal shift of the swells of certain craters are evidence of this
as is seen, for example, in Figure 27. Here, the escarpment which is
called East, on a section 130 km long intersects two craters. In the
crater with cross section 65 km, located at the center, a shift in the
swell is visible at approximately 10 km which obviously was due to the
decrease in dimensions of the crater with general retention of the
area of the crust of the planet. In the evaluation of the well-known
geologist R. Strom, this contraction comprised about 100,000 km 2 which
is equivalent to a decrease in the radius of Mercury by approximately
1-2 km. These numbers are small if we relate them to the total
surface area or the radius of Mercury; however, the process itself had
tremendous consequences for the formation of the relief.
/104
78
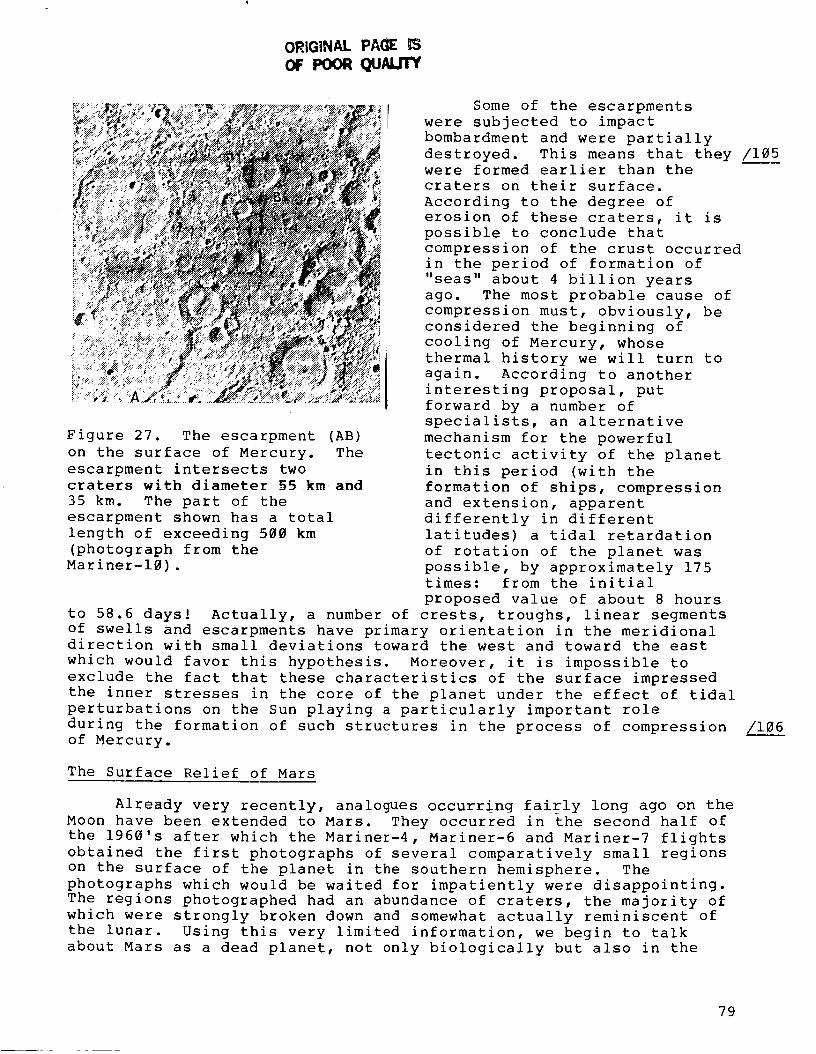
ORIGINAL PA(_E P3
oF Poor qu/crrY
Figure 27. The escarpment (AB)
on the surface of Mercury. The
escarpment intersects twocraters with diameter 55 km and
35 km. The part of the
escarpment shown has a total
length of exceeding 500 km
(photograph from the
Mariner-10).
Some of the escarpments
were subjected to impact
bombardment and were partially
destroyed. This means that they /105were formed earlier than the
craters on their surface.
According to the degree of
erosion of these craters, it is
possible to conclude that
compression of the crust occurred
in the period of formation of
"seas" about 4 billion years
ago. The most probable cause of
compression must, obviously, be
considered the beginning of
cooling of Mercury, whose
thermal history we will turn to
again. According to another
interesting proposal, put
forward by a number of
specialists, an alternative
mechanism for the powerful
tectonic activity of the planet
in this period (with the
formation of ships, compression
and extension, apparent
differently in different
latitudes) a tidal retardation
of rotation of the planet was
possible, by approximately 175
times: from the initial
proposed value of about 8 hours
to 58.6 days! Actually, a number of crests, troughs, linear segments
of swells and escarpments have primary orientation in the meridionaldirection with small deviations toward the west and toward the east
which would favor this hypothesis. Moreover, it is impossible to
exclude the fact that these characteristics of the surface impressed
the inner stresses in the core of the planet under the effect of tidal
perturbations on the Sun playing a particularly important role
during the formation of such structures in the process of compression /106
of Mercury.
The Surface Relief of Mars
Already very recently, analogues occurring fairly long ago on the
Moon have been extended to Mars. They occurred in the second half of
the 1960's after which the Mariner-4, Mariner-6 and Mariner-7 flights
obtained the first photographs of several comparatively small regions
on the surface of the planet in the southern hemisphere. The
photographs which would be waited for impatiently were disappointing.
The regions photographed had an abundance of craters, the majority of
which were strongly broken down and somewhat actually reminiscent of
the lunar. Using this very limited information, we begin to talk
about Mars as a dead planet, not only biologically but also in the
79
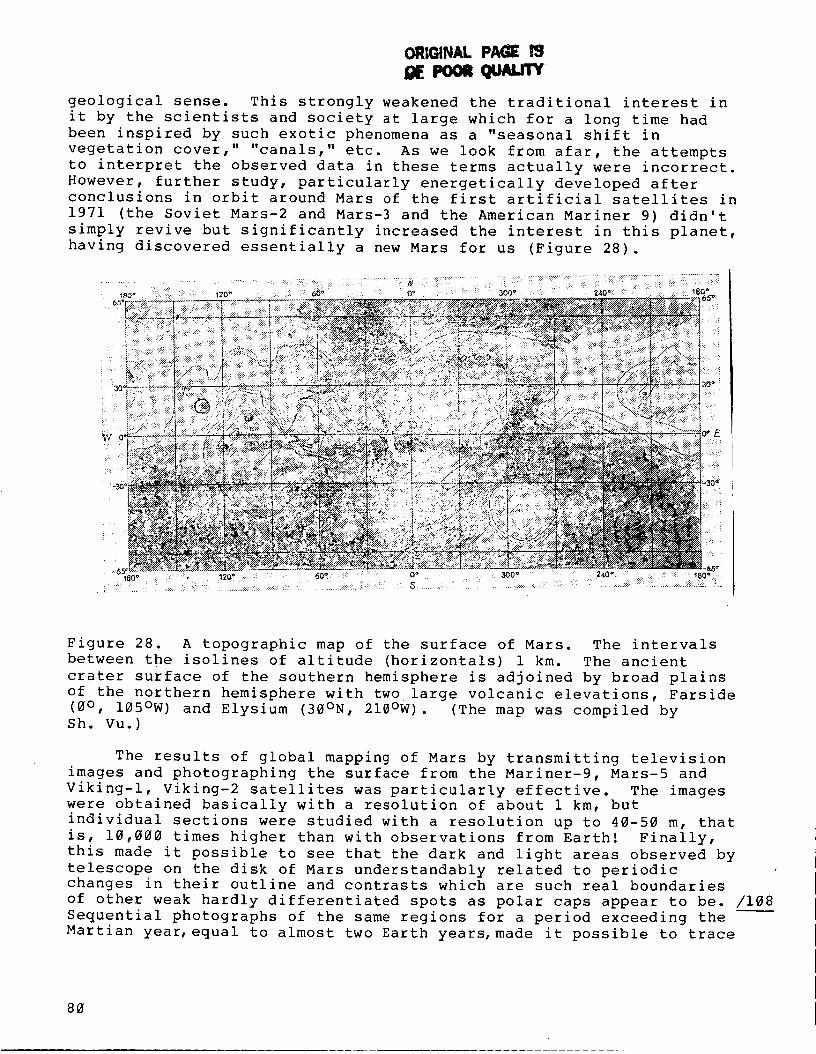
OR|GINAL PA_E
i,oon QU UTY
geological sense. This strongly weakened the traditional interest in
it by the scientists and society at large which for a long time had
been inspired by such exotic phenomena as a "seasonal shift in
vegetation cover," "canals," etc. As we look from afar, the attempts
to interpret the observed data in these terms actually were incorrect.
However, further study, particularly energetically developed after
conclusions in orbit around Mars of the first artificial satellites in
1971 (the Soviet Mars-2 and Mars-3 and the American Mariner 9) didn't
simply revive but significantly increased the interest in this planet,
having discovered essentially a new Mars for us (Figure 28).
Figure 28. A topographic map of the surface of Mars. The intervals
between the isolines of altitude (horizontals) 1 km. The ancient
crater surface of the southern hemisphere is adjoined by broad plains
of the northern hemisphere with two large volcanic elevations, Farside
(0 ° , 105°W) and Elysium (30°N, 210°W). (The map was compiled bySh. Vu.)
The results of global mapping of Mars by transmitting television
images and photographing the surface from the Mariner-9, Mars-5 and
Viking-l, Viking-2 satellites was particularly effective. The images
were obtained basically with a resolution of about 1 km, but
individual sections were studied with a resolution up to 40-50 m, that
is, 10,000 times higher than with observations from Earth! Finally,
this made it possible to see that the dark and light areas observed by
telescope on the disk of Mars understandably related to periodicchanges in their outline and contrasts which are such real boundaries
of other weak hardly differentiated spots as polar caps appear to be. /108
Sequential photographs of the same regions for a period exceeding the
Martian year, equal to almost two Earth years, made it possible to trace
80
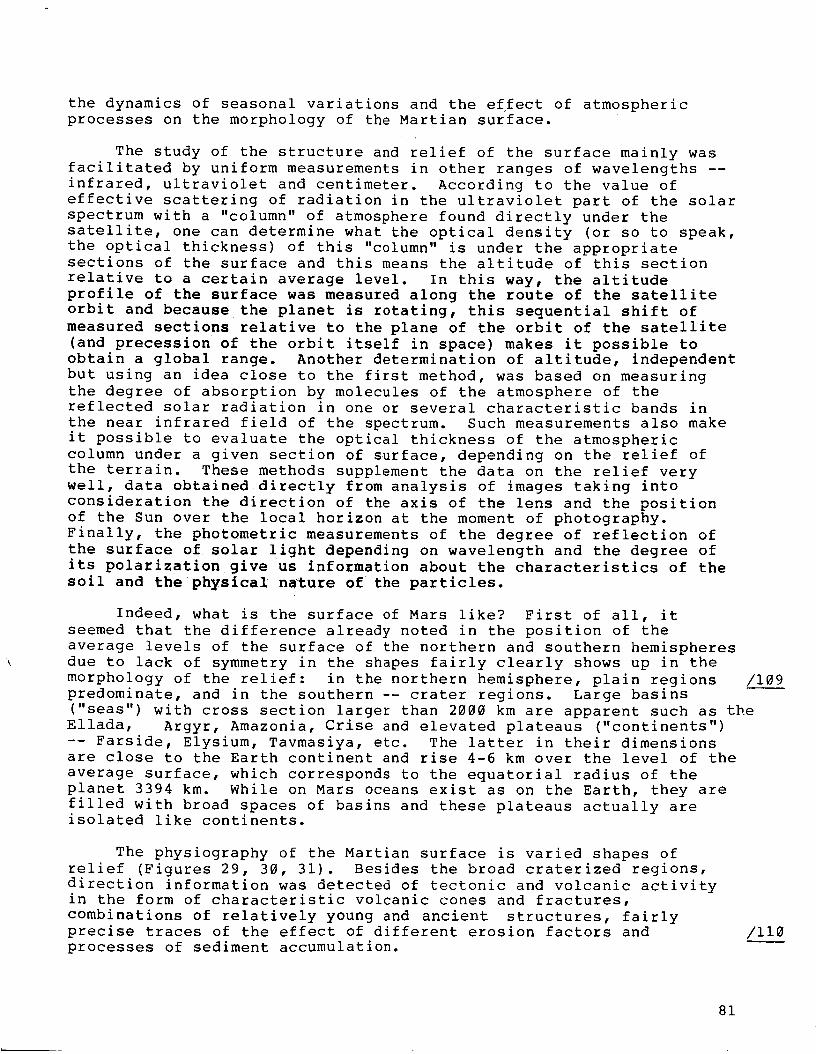
the dynamics of seasonal variations and the effect of atmospheric
processes on the morphology of the Martian surface.
The study of the structure and relief of the surface mainly was
facilitated by uniform measurements in other ranges of wavelengths --
infrared, ultraviolet and centimeter. According to the value of
effective scattering of radiation in the ultraviolet part of the solar
spectrum with a "column" of atmosphere found directly under the
satellite, one can determine what the optical density (or so to speak,
the optical thickness) of this "column" is under the appropriatesections of the surface and this means the altitude of this section
relative to a certain average level. In this way, the altitude
profile of the surface was measured along the route of the satellite
orbit and because the planet is rotating, this sequential shift of
measured sections relative to the plane of the orbit of the satellite
(and precession of the orbit itself in space) makes it possible to
obtain a global range. Another determination of altitude, independent
but using an idea close to the first method, was based on measuring
the degree of absorption by molecules of the atmosphere of the
reflected solar radiation in one or several characteristic bands in
the near infrared field of the spectrum. Such measurements also make
it possible to evaluate the optical thickness of the atmospheric
column under a given section of surface, depending on the relief of
the terrain. These methods supplement the data on the relief very
well, data obtained directly from analysis of images taking into
consideration the direction of the axis of the lens and the position
of the Sun over the local horizon at the moment of photography.
Finally, the photometric measurements of the degree of reflection of
the surface of solar light depending on wavelength and the degree of
its polarization give us information about the characteristics of the
soil and the physical na_ture of the particles.
Indeed, what is the surface of Mars like? First of all, it
seemed that the difference already noted in the position of the
average levels of the surface of the northern and southern hemispheres
due to lack of symmetry in the shapes fairly clearly shows up in the
morphology of the relief: in the northern hemisphere, plain regions
predominate, and in the southern -- crater regions. Large basins
("seas") with cross section larger than 2000 km are apparent such as the
Ellada, Argyr, Amazonia, Crise and elevated plateaus ("continents")
-- Farside, Elysium, Tavmasiya, etc. The latter in their dimensions
are close to the Earth continent and rise 4-6 km over the level of the
average surface, which corresponds to the equatorial radius of the
planet 3394 km. While on Mars oceans exist as on the Earth, they are
filled with broad spaces of basins and these plateaus actually areisolated like continents.
/109
The physiography of the Martian surface is varied shapes of
relief (Figures 29, 30, 31). Besides the broad craterized regions,
direction information was detected of tectonic and volcanic activityin the form of characteristic volcanic cones and fractures,
combinations of relatively young and ancient structures, fairlyprecise traces of the effect of different erosion factors and
processes of sediment accumulation.
/110
81
ORIGINAL PAGE ffj
.OFPOORQUALITY
Figure 29. A section of the
craterized surface of Mars in
the southern hemisphere. In the
center of the Bond Crater with
cross section 100 km, on the
left -- the winding Nirgal
Valley. Photograph from theMars-5.
The overwhelming majority
of craters primarily
concentrated in the middle and
high latitude regions of the
southern hemisphere are of
impact origin with varying
degrees of obliteration or
breakdown due to subsequent
geological processes (in
scientific literature, such
changes in the shape of craters
are called obliterations).
According to the degree of
obliteration, primarily
according to the character of
the breakdown of the edges or
the swells of the slopes, one
can judge the age of the crater
and the intensity of processes
leading to its smoothing out.
On the whole, the craters on
Mars are smaller than on the
Moon or Mercury but
significantly deeper than on
Venus. The outer slopes of the
swells of typical craters have
angles of inclination according
to ratio to the horizon of about
10°; the interior walls are
slanted at 20-25 ° . As a rule,
the bottom of the crater is flat as a result of filling with erodedmaterial.
The predominant shapes of the relief of the northern hemisphere
are directly related to active geological processes. Primarily,
attention is given to the phenomenon of volcanism -- tremendous shield
volcanoes with clearly outlined craters on the apices -- calderas.
Such craters are formed with a partial breakdown of the apex of the
volcanic cone accompanied by strong eruptions. Four volcanoes in the
Farside region are several times larger than those existing on Earth.
The largest volcanic cones are called Mt. Arsiya, Mt. Arkreus,
Mt. Pavonis and Mt. Olympus. They reach 500-600 km at the base,
rising over the surrounding plains 20-21 km. In relation to the
average level of the surface of Mars, the altitude of Arsiya and
Akreus is 27 km and Olympus and Pavonis -- 26 km (Figures 28, 31). It
is hard to visualize not only the altitudes of these mountains but the
diameters of the craters on their summits: about 100 km on Arsiya and
60 km on Olympus. There is not one of the mountain elevations on our
planet which can compare with the dimensions actually. For example,
the largest volcano Mauna Loa in the Hawaiian Islands is approximately
twice as small and in altitude (considering the altitude of the
underwater part, 4.5 km) and in the diameter of the base -- its cross
82
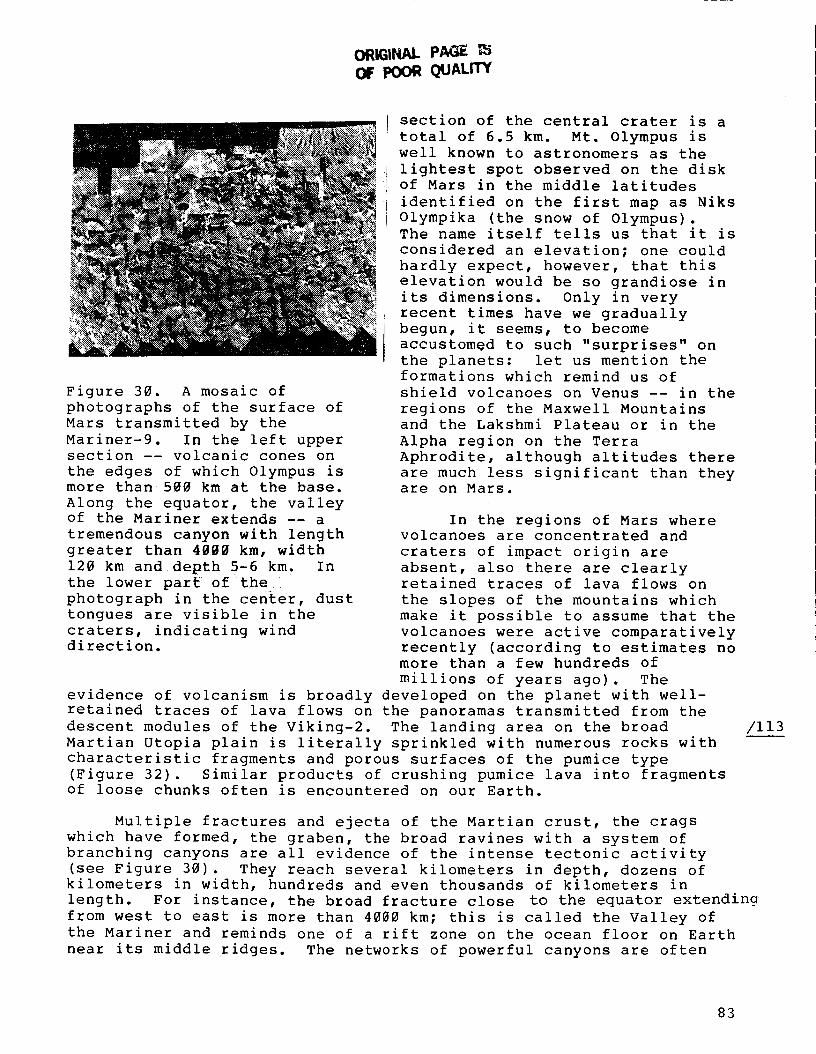
ORi61NAL PAGEOF POOR (_K.IALITY
E
"2N :
Figure 30. A mosaic of
photographs of the surface of
Mars transmitted by the
Mariner-9. In the left upper
section -- volcanic cones on
the edges of which Olympus is
more than 500 km at the base.
Along the equator, the valley
of the Mariner extends -- a
tremendous canyon with length
greater than 4000 km, width
120 km and depth 5-6 km. In
the lower pa_t of the i
photograph in the center, dust
tongues are visible in the
craters, indicating winddirection.
section of the central crater is a
total of 6.5 km. Mt. Olympus is
_ well known to astronomers as the
_!ii!!i;_i_i!! i lightest spot observed on the disk
!' of Mars in the middle latitudes
i identified on the first map as Niks
Olympika (the snow of Olympus).The name itself tells us that it is
considered an elevation; one could
hardly expect, however, that this
elevation would be so grandiose in
its dimensions. Only in very
recent times have we gradually
' _ begun, it seems, to become
accustomed to such "surprises" on
the planets: let us mention the
formations which remind us of
shield volcanoes on Venus -- in the
regions of the Maxwell Mountains
and the Lakshmi Plateau or in the
Alpha region on the Terra
Aphrodite, although altitudes there
are much less significant than theyare on Mars.
In the regions of Mars wherevolcanoes are concentrated and
craters of impact origin are
absent, also there are clearlyretained traces of lava flows on
the slopes of the mountains which
make it possible to assume that the
volcanoes were active comparatively
recently (according to estimates nomore than a few hundreds of
millions of years ago). The
evidence of volcanism is broadly developed on the planet with well-
retained traces of lava flows on the panoramas transmitted from the
descent modules of the Viking-2. The landing area on the broad
Martian Utopia plain is literally sprinkled with numerous rocks with
characteristic fragments and porous surfaces of the pumice type
(Figure 32). Similar products of crushing pumice lava into fragments
of loose chunks often is encountered on our Earth.
/113
Multiple fractures and ejecta of the Martian crust, the crags
which have formed, the graben, the broad ravines with a system of
branching canyons are all evidence of the intense tectonic activity
(see Figure 30). They reach several kilometers in depth, dozens of
kilometers in width, hundreds and even thousands of kilometers in
length. For instance, the broad fracture close to the equator extending
from west to east is more than 4000 km; this is called the Valley of
the Mariner and reminds one of a rift zone on the ocean floor on Earth
near its middle ridges. The networks of powerful canyons are often
83
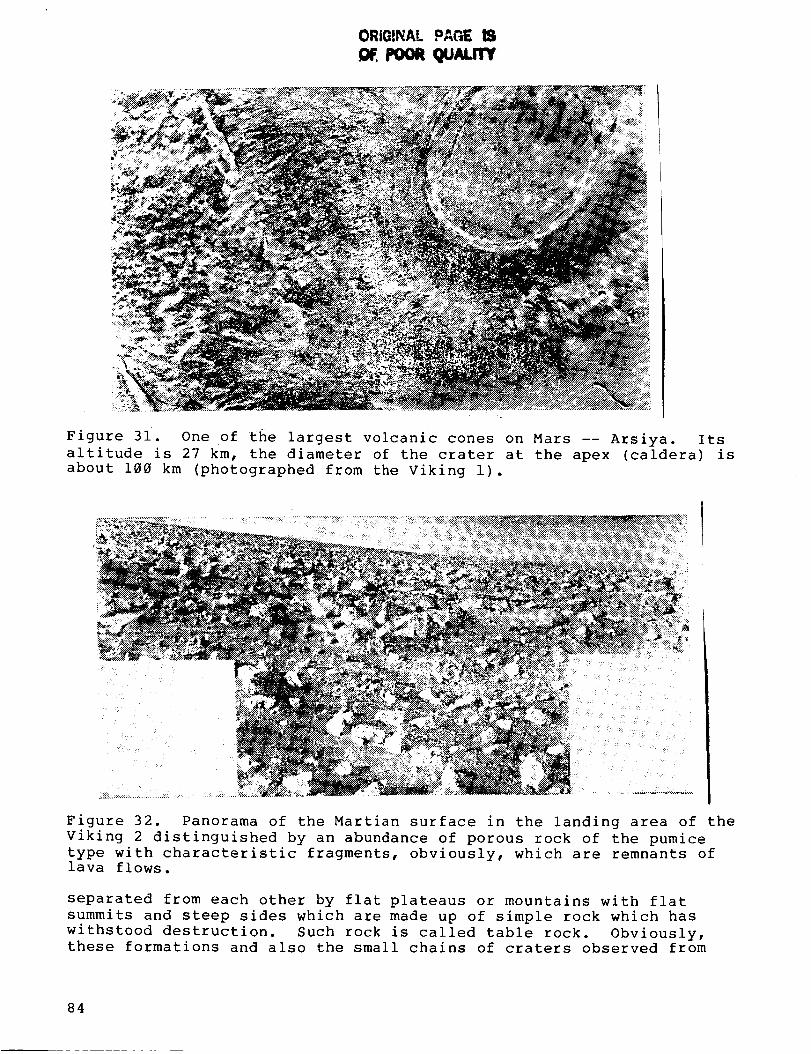
ORIGINAL PAGE IS
POOR ALrrY
Figure 31. One of the largest volcanic cones on Mars -- Arsiya. Its
altitude is 27 km, the diameter of the crater at the apex (caldera) is
about 100 km (photographed from the Viking I).
Figure 32. Panorama of the Martian surface in the landing area of the
Viking 2 distinguished by an abundance of porous rock of the pumice
type with characteristic fragments, obviously, which are remnants oflava flows.
separated from each other by flat plateaus or mountains with flat
summits and steep sides which are made up of simple rock which has
withstood destruction. Such rock is called table rock. Obviously,these formations and also the small chains of craters observed from
84
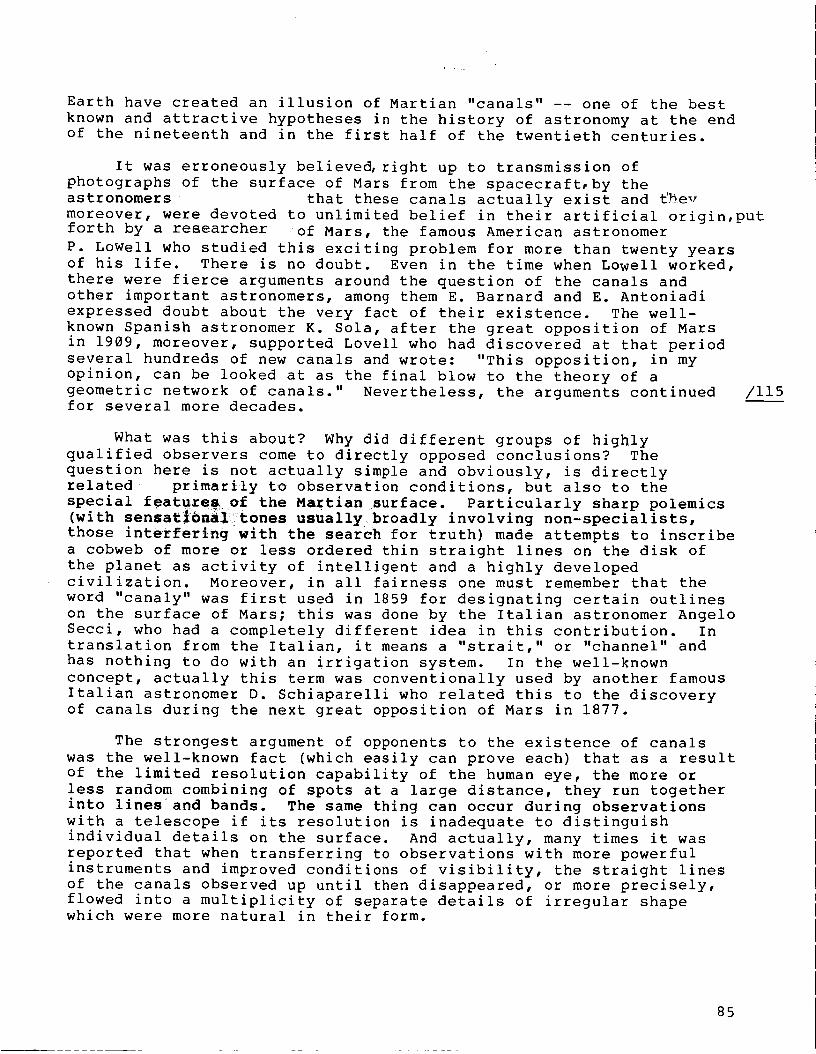
Earth have created an illusion of Martian "canals" -- one of the bestknown and attractive hypotheses in the history of astronomy at the endof the nineteenth and in the first half of the twentieth centuries.
It was erroneously believed, right up to transmission ofphotographs of the surface of Mars from the spacecraft, by theastronomers that these canals actually exist and fbevmoreover, were devoted to unlimited belief in their artificial origin,putforth by a researcher of Mars, the famous American astronomerP. Lowell who studied this exciting problem for more than twenty yearsof his life. There is no doubt. Even in the time when Lowell worked,there were fierce arguments around the question of the canals andother important astronomers, among them E. Barnard and E. Antoniadiexpressed doubt about the very fact of their existence. The well-known Spanish astronomer K. Sola, after the great opposition of Marsin 1909, moreover, supported Lovell who had discovered at that periodseveral hundreds of new canals and wrote: "This opposition, in myopinion, can be looked at as the final blow to the theory of ageometric network of canals." Nevertheless, the arguments continued /115for several more decades.
What was this about? Why did different groups of highly
qualified observers come to directly opposed conclusions? The
question here is not actually simple and obviously, is directly
related primarily to observation conditions, but also to the
special feature8 of the Maxtian surface. Particularly sharp polemics(with senSat_na_l_tones usually broadly involving non-specialists,
those interfering with the search for truth) made attempts to inscribe
a cobweb of more or less ordered thin straight lines on the disk of
the planet as activity of intelligent and a highly developed
civilization. Moreover, in all fairness one must remember that the
word "canaly" was first used in 1859 for designating certain outlines
on the surface of Mars; this was done by the Italian astronomer Angelo
Secci, who had a completely different idea in this contribution. In
translation from the Italian, it means a "strait," or "channel" and
has nothing to do with an irrigation system. In the well-known
concept, actually this term was conventionally used by another famous
Italian astronomer D. Schiaparelli who related this to the discovery
of canals during the next great opposition of Mars in 1877.
The strongest argument of opponents to the existence of canals
was the well-known fact (which easily can prove each) that as a result
of the limited resolution capability of the human eye, the more or
less random combining of spots at a large distance, they run together
into lines and bands. The same thing can occur during observations
with a telescope if its resolution is inadequate to distinguish
individual details on the surface. And actually, many times it was
reported that when transferring to observations with more powerful
instruments and improved conditions of visibility, the straight lines
of the canals observed up until then disappeared, or more precisely,
flowed into a multiplicity of separate details of irregular shapewhich were more natural in their form.
85
Another cause for this was the surface of Mars itself, itsrelief, the presence of extensive cracks, grooves and other
configurations. In truth, attempts to identify the geometric network
of canals which had been observed and described and photographed many
times with the actual morphology of the surface did not lead to the
expected similarity. However, it is impossible to forget that many
configurations on Mars have a regular periodic change and some of them
can have a more stable character. These are caused by the special
features of interaction of the atmosphere with the surface.
We have already talked about the fact that as a result of the
presence of the atmosphere and the significant effectiveness of
erosion on Mars, the craters of meteorite origin are greatly modified.
For this reason, a large quantity of dust-sand material was formed
which was a characteristic mark of the Martian surface. In the
conditions of a water-less medium, this leads to a number of
interesting effects. The shift of dust by wind caused by local
meteorological and global circulation processes on the planet causes
periodic changes in the outlines of the light and dark regions, and
the dark regions are systematically warmer than the light regions by
several Kelvins. In relatively quiet periods, the fine-grain material
basically accumulates in the depressions and with strong winds blows
out of them, forming the characteristic light drifts at the edges of
the craters, oriented in the direction of the wind. This primary
orientation can be retained for a certain period of time also inside
the craters where the large_ particles of sand and dust begin topredominate. _ In the photographs taken with high resolution on the
bottom of such craters, sand dunes are discovered, reminding one of
the barhans of Earth deserts (Figure 33). The traces of the dust
deposits are clearly visible also on panoramas transmitted from the
Crise region where the landing of the Viking 1 was completed
(Figures 34, 35).
The nature of the noticeable "waves of darkness" extending at the
beginning of spring from a latitude of approximately 70 ° to the
equator at a rate of about 5 m/s is related to the transfer of dust
and the dynamics of seasonal changes in the polar caps; the darkening
occurs so that it reaches the equator in less than two Earth months,
covering a distance of more than 4000 km. In the summer, when the cap
is decreased to minimum dimensions, the dark band reaches the latitude
40 ° in the opposite hemisphere and in the fall with the beginning of
an increase in the cap, rapidly moves backward and the "sea" becomes
lighter. In the pertinent theory of Lovell, this was explained as the
spring awakening and the rapid extension of vegetation along the
living arteries -- the canals filled with water with the beginning of
thaw of the polar caps. This in truth grandiose irrigation system of
highly developed Martians naturally was considered as the only
intelligent means to counteract the severe nature of the planet where
the landscape was predominantly desert and water in dry conditions was
less dense than on Earth; the atmosphere rapidly evaporates. The dark
/116
/118
86
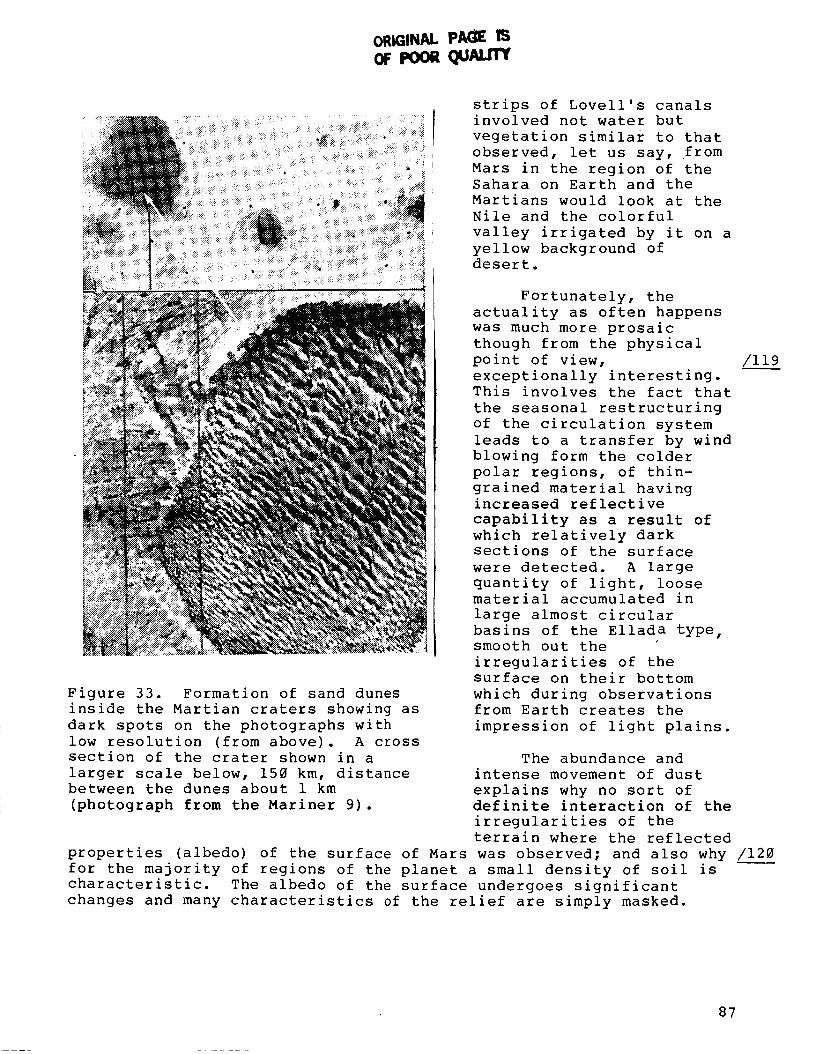
ORIGINAL PAGE ISOF POORQUALr
:: iJl_; :....., _'7_
; :...... : .. _::,<;.×...:;_..
: ..:. :1 .! _.;:: y_,_..: /:_
.).I_
Figure 33. Formation of sand dunes
inside the Martian craters showing as
dark spots on the photographs with
low resolution (from above). A cross
section of the crater shown in a
larger scale below, 150 km, distance
between the dunes about 1 km
(photograph from the Mariner 9).
strips of Lovell's canals
involved not water but
vegetation similar to that
observed, let us say, from
Mars in the region of theSahara on Earth and the
Martians would look at the
Nile and the colorful
valley irrigated by it on a
yellow background ofdesert.
Fortunately, the
actuality as often happens
was much more prosaic
though from the physical
point of view,
exceptionally interesting.
This involves the fact that
the seasonal restructuring
of the circulation system
leads to a transfer by wind
blowing form the colder
polar regions, of thin-
grained material havingincreased reflective
capability as a result of
which relatively dark
sections of the surface
were detected. A large
quantity of light, loosematerial accumulated in
large almost circular
basins of the Ellada type,smooth out the
irregularities of the
surface on their bottom
which during observations
from Earth creates the
impression of light plains.
/119
The abundance and
intense movement of dust
explains why no sort of
definite interaction of the
irregularities of the
terrain where the reflected
properties (albedo) of the surface of Mars was observed; and also why /120
for the majority of regions of the planet a small density of soil is
characteristic. The albedo of the surface undergoes significant
changes and many characteristics of the relief are simply masked.
87
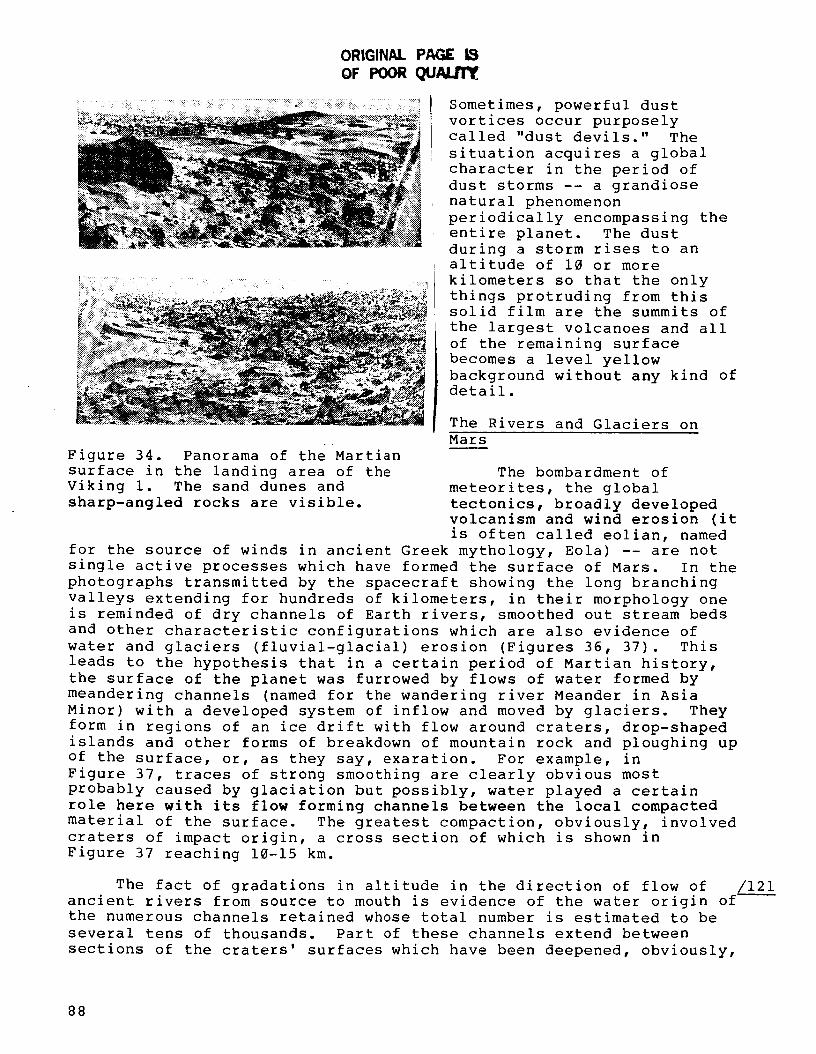
OR|GINAL PAGE !_
OF POORou.=crrt
Figure 34. Panorama of the Martian
surface in the landing area of the
Viking I. The sand dunes and
sharp-angled rocks are visible.
Sometimes, powerful dust
vortices occur purposely
called "dust devils." The
situation acquires a global
character in the period of
dust storms -- a grandiose
natural phenomenon
periodically encompassing the
entire planet. The dust
during a storm rises to an
altitude of 10 or more
kilometers so that the only
things protruding from thissolid film are the summits of
the largest volcanoes and all
of the remaining surface
becomes a level yellow
background without any kind ofdetail.
The Rivers and Glaciers on
Mars
The bombardment of
meteorites, the global
tectonics, broadly developed
volcanism and wind erosion (it
is often called eolian, named
for the source of winds in ancient Greek mythology, Eola) -- are not
single active processes which have formed the surface of Mars. In the
photographs transmitted by the spacecraft showing the long branching
valleys extending for hundreds of kilometers, in their morphology one
is reminded of dry channels of Earth rivers, smoothed out stream beds
and other characteristic configurations which are also evidence of
water and glaciers (fluvial-glacial) erosion (Figures 36, 37). This
leads to the hypothesis that in a certain period of Martian history,
the surface of the planet was furrowed by flows of water formed by
meandering channels (named for the wandering river Meander in Asia
Minor) with a developed system of inflow and moved by glaciers. They
form in regions of an ice drift with flow around craters, drop-shaped
islands and other forms of breakdown of mountain rock and ploughing up
of the surface, or, as they say, exaration. For example, in
Figure 37, traces of strong smoothing are clearly obvious most
probably caused by glaciation but possibly, water played a certain
role here with its flow forming channels between the local compacted
material of the surface. The greatest compaction, obviously, involved
craters of impact origin, a cross section of which is shown in
Figure 37 reaching 10-15 km.
The fact of gradations in altitude in the direction of flow of /121
ancient rivers from source to mouth is evidence of the water origin of_
the numerous channels retained whose total number is estimated to be
several tens of thousands. Part of these channels extend between
sections of the craters' surfaces which have been deepened, obviously,
88
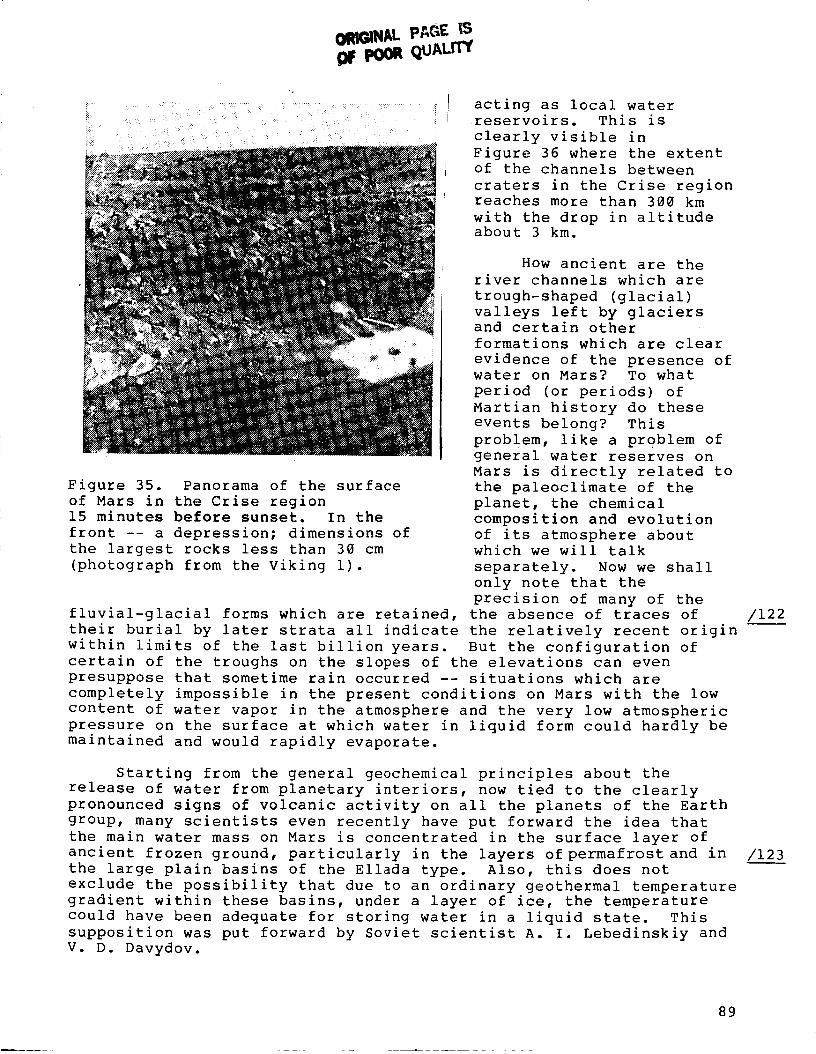
O GINAL pr,GE ISQUALn
acting as local water
reservoirs. This is
clearly visible in
Figure 36 where the extent
of the channels between
craters in the Crise region
reaches more than 300 km
with the drop in altitudeabout 3 km.
Figure 35. Panorama of the surface
of Mars in the Crise region15 minutes before sunset. In the
front -- a depression; dimensions of
the largest rocks less than 30 cm
(photograph from the Viking i).
How ancient are the
river channels which are
trough-shaped (glacial)
valleys left by glaciersand certain other
formations which are clear
evidence of the presence ofwater on Mars? To what
period (or periods) of
Martian history do these
events belong? This
problem, like a problem of
general water reserves on
Mars is directly related to
the paleoclimate of the
planet, the chemical
composition and evolution
of its atmosphere about
which we will talk
separately. Now we shall
only note that the
precision of many of the
fluvial-glacial forms which are retained, the absence of traces of
their burial by later strata all indicate the relatively recent origin
within limits of the last billion years. But the configuration of
certain of the troughs on the slopes of the elevations can even
presuppose that sometime rain occurred -- situations which are
completely impossible in the present conditions on Mars with the low
content of water vapor in the atmosphere and the very low atmospheric
pressure on the surface at which water in liquid form could hardly be
maintained and would rapidly evaporate.
Starting from the general geochemical principles about the
release of water from planetary interiors, now tied to the clearly
pronounced signs of volcanic activity on all the planets of the Earth
group, many scientists even recently have put forward the idea that
the main water mass on Mars is concentrated in the surface layer of
ancient frozen ground, particularly in the layers of permafrost and in
the large plain basins of the Ellada type. Also, this does not
exclude the possibility that due to an ordinary geothermal temperature
gradient within these basins, under a layer of ice, the temperature
could have been adequate for storing water in a liquid state. This
supposition was put forward by Soviet scientist A. I. Lebedinskiy and
V. D. Davydov.
/122
/123
89
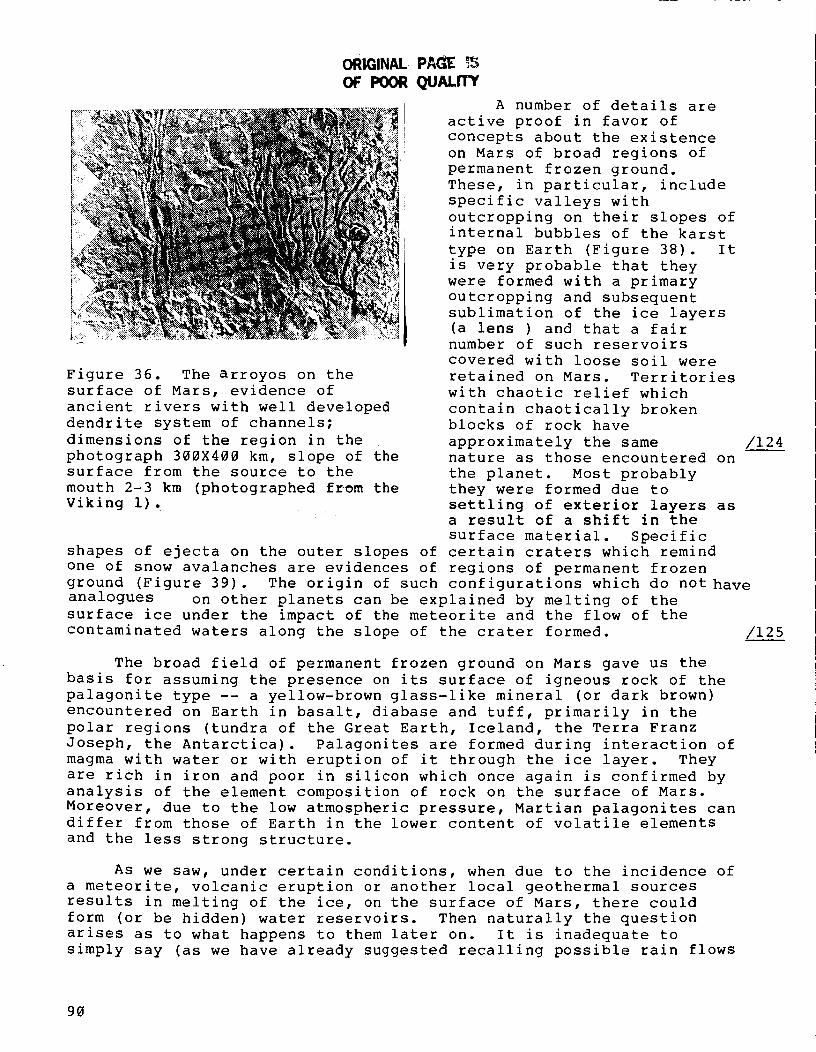
!izl
!i•̧
li!i
ii::¸
ORIGINALOF POOR QUALITY
Figure 36. The arroyos on the
surface of Mars, evidence of
ancient rivers with well developed
dendrite system of channels;
dimensions of the region in the
photograph 300X400 km, slope of thesurface from the source to the
mouth 2-3 km (photographed from the
Viking I).
A number of details are
active proof in favor of
concepts about the existence
on Mars of broad regions of
permanent frozen ground.
These, in particular, include
specific valleys with
outcropping on their slopes of
internal bubbles of the karst
type on Earth (Figure 38). It
is very probable that they
were formed with a primary
outcropping and subsequent
sublimation of the ice layers
(a lens ) and that a fair
number of such reservoirs
covered with loose soil were
retained on Mars. Territories
with chaotic relief which
contain chaotically broken
blocks of rock have
approximately the same
nature as those encountered on
the planet. Most probably
they were formed due to
settling of exterior layers asa result of a shift in the
surface material. Specific
/124
shapes of ejecta on the outer slopes of certain craters which remind
one of snow avalanches are evidences of regions of permanent frozen
ground (Figure 39). The origin of such configurations which do not have
analogues on other planets can be explained by melting of the
surface ice under the impact of the meteorite and the flow of the
contaminated waters along the slope of the crater formed. /125
The broad field of permanent frozen ground on Mars gave us the
basis for assuming the presence on its surface of igneous rock of the
palagonite type -- a yellow-brown glass-like mineral (or dark brown)
encountered on Earth in basalt, diabase and tuff, primarily in the
polar regions (tundra of the Great Earth, Iceland, the Terra Franz
Joseph, the Antarctica). Palagonites are formed during interaction of
magma with water or with eruption of it through the ice layer. They
are rich in iron and poor in silicon which once again is confirmed by
analysis of the element composition of rock on the surface of Mars.
Moreover, due to the low atmospheric pressure, Martian palagonites candiffer from those of Earth in the lower content of volatile elements
and the less strong structure.
As we saw, under certain conditions, when due to the incidence of
a meteorite, volcanic eruption or another local geothermal sources
results in melting of the ice, on the surface of Mars, there could
form (or be hidden) water reservoirs. Then naturally the question
arises as to what happens to them later on. It is inadequate to
simply say (as we have already suggested recalling possible rain flows
90
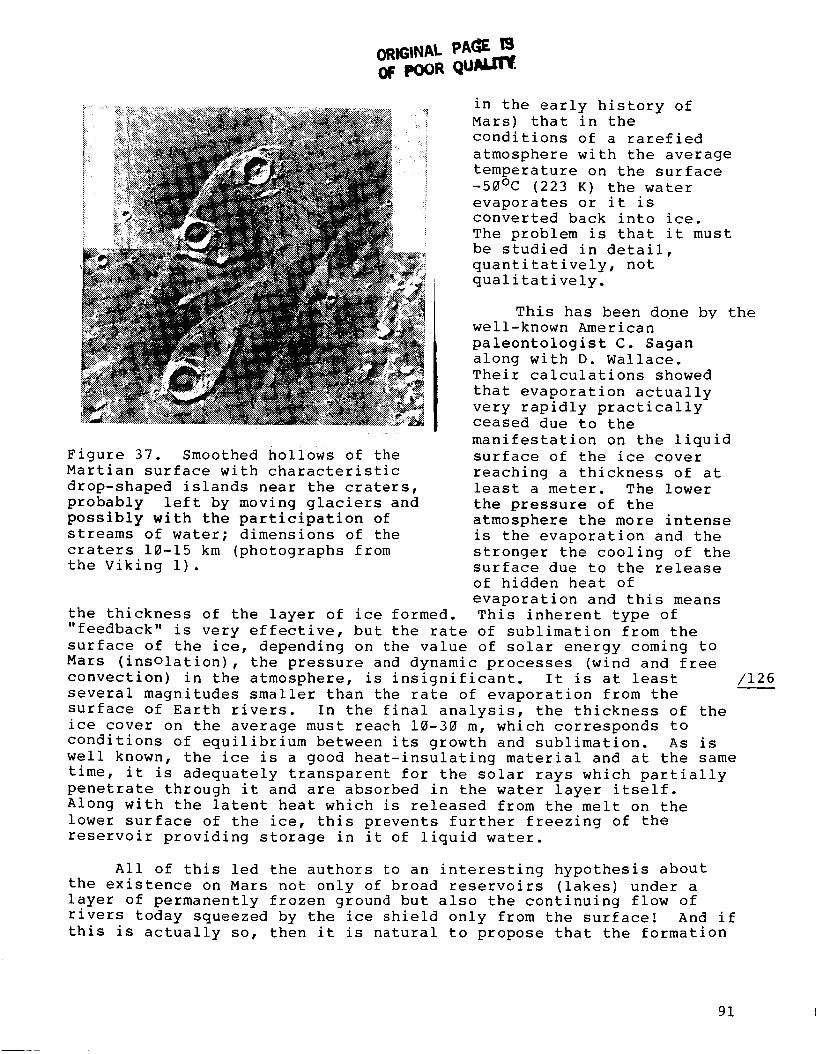
ORmINALpACI#..ISOF QU L .
Figure 37. Smoothed hollows of the
Martian surface with characteristic
drop-shaped islands near the craters,
probably left by moving glaciers and
possibly with the participation of
streams of water; dimensions of the
craters 10-15 km (photographs from
the Viking i).
in the early history of
Mars) that in the
conditions of a rarefied
atmosphere with the average
temperature on the surface
-50°C (223 K) the water
evaporates or it is
converted back into ice.
The problem is that it must
be studied in detail,
quantitatively, not
qualitatively.
This has been done bv the
well-known American
paleontologist C. Sagan
along with D. Wallace.
Their calculations showed
that evaporation actually
very rapidly practically
ceased due to the
manifestation on the liquid
surface of the ice cover
reaching a thickness of at
least a meter. The lower
the pressure of the
atmosphere the more intense
is the evaporation and the
stronger the cooling of the
surface due to the release
of hidden heat of
evaporation and this means
the thickness of the layer of ice formed. This inherent type of
"feedback" is very effective, but the rate of sublimation from the
surface of the ice, depending on the value of solar energy coming to
Mars (insOlation), the pressure and dynamic processes (wind and free
convection) in the atmosphere, is insignificant. It is at least
several magnitudes smaller than the rate of evaporation from the
surface of Earth rivers. In the final analysis, the thickness of the
ice cover on the average must reach 10-30 m, which corresponds to
conditions of equilibrium between its growth and sublimation. As is
/126
well known, the ice is a good heat-insulating material and at the same
time, it is adequately transparent for the solar rays which partially
penetrate through it and are absorbed in the water layer itself.Along with the latent heat which is released from the melt on the
lower surface of the ice, this prevents further freezing of the
reservoir providing storage in it of liquid water.
All of this led the authors to an interesting hypothesis about
the existence on Mars not only of broad reservoirs (lakes) under a
layer of permanently frozen ground but also the continuing flow of
rivers today squeezed by the ice shield only from the surface! And if
this is actually so, then it is natural to propose that the formation
91
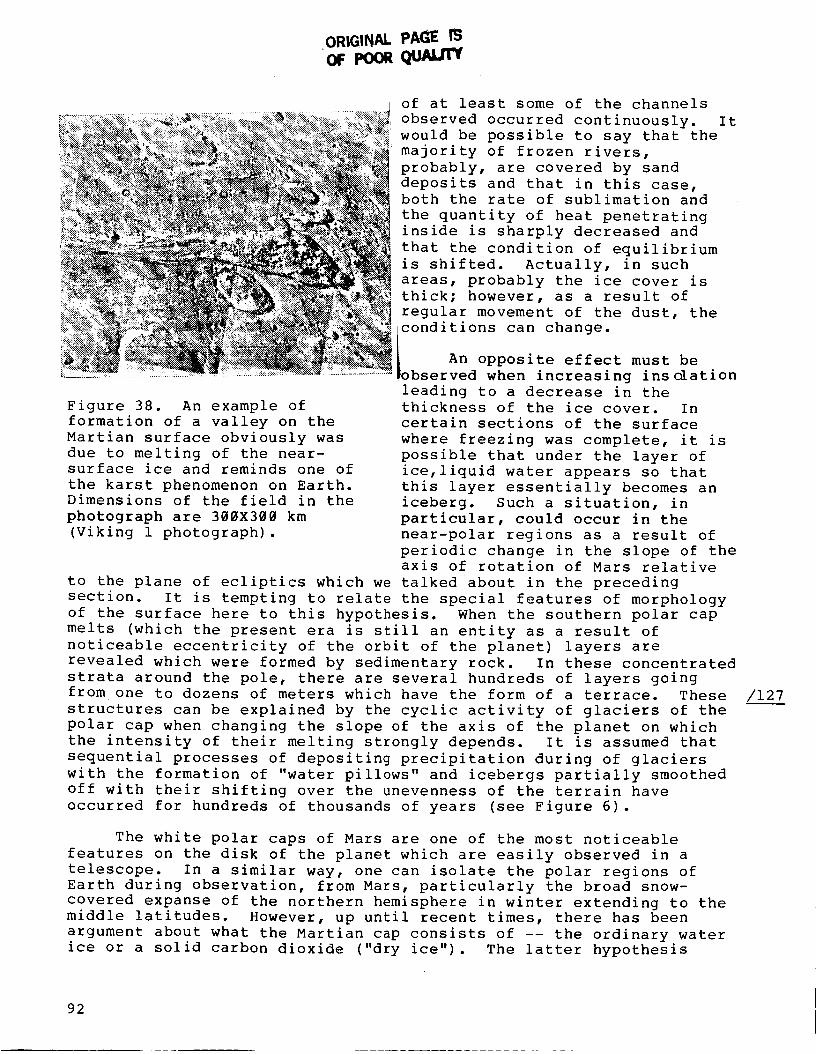
ORiGINAl. PAGE: ISoF POOR
Figure 38. An example of
formation of a valley on the
Martian surface obviously was
due to melting of the near-surface ice and reminds one of
the karst phenomenon on Earth.
Dimensions of the field in the
photograph are 300X300 km
(Viking 1 photograph).
of at least some of the channels
observed occurred continuously. It
would be possible to say that the
majority of frozen rivers,
probably, are covered by sand
deposits and that in this case,
both the rate of sublimation and
the quantity of heat penetrating
inside is sharply decreased and
that the condition of equilibrium
is shifted. Actually, in such
areas, probably the ice cover is
thick; however, as a result of
regular movement of the dust, the
conditions can change.
An opposite effect must beobserved when increasing ins_ation
leading to a decrease in the
thickness of the ice cover. In
certain sections of the surface
where freezing was complete, it is
possible that under the layer of
ice, liquid water appears so that
this layer essentially becomes an
iceberg. Such a situation, in
particular, could occur in the
near-polar regions as a result of
periodic change in the slope of the
axis of rotation of Mars relative
to the plane of ecliptics which we talked about in the preceding
section. It is tempting to relate the special features of morphology
of the surface here to this hypothesis. When the southern polar cap
melts (which the present era is still an entity as a result of
noticeable eccentricity of the orbit of the planet) layers are
revealed which were formed by sedimentary rock. In these concentrated
strata around the pole, there are several hundreds of layers going
from one to dozens of meters which have the form of a terrace. These
structures can be explained by the cyclic activity of glaciers of the
polar cap when changing the slope of the axis of the planet on which
the intensity of their melting strongly depends. It is assumed that
sequential processes of depositing precipitation during of glaciers
with the formation of "water pillows" and icebergs partially smoothed
off with their shifting over the unevenness of the terrain have
occurred for hundreds of thousands of years (see Figure 6).
The white polar caps of Mars are one of the most noticeable
features on the disk of the planet which are easily observed in a
telescope. In a similar way, one can isolate the polar regions of
Earth during observation, from Mars, particularly the broad snow-
covered expanse of the northern hemisphere in winter extending to themiddle latitudes. However, up until recent times, there has been
argument about what the Martian cap consists of -- the ordinary water
ice or a solid carbon dioxide ("dry ice"). The latter hypothesis
/127
92
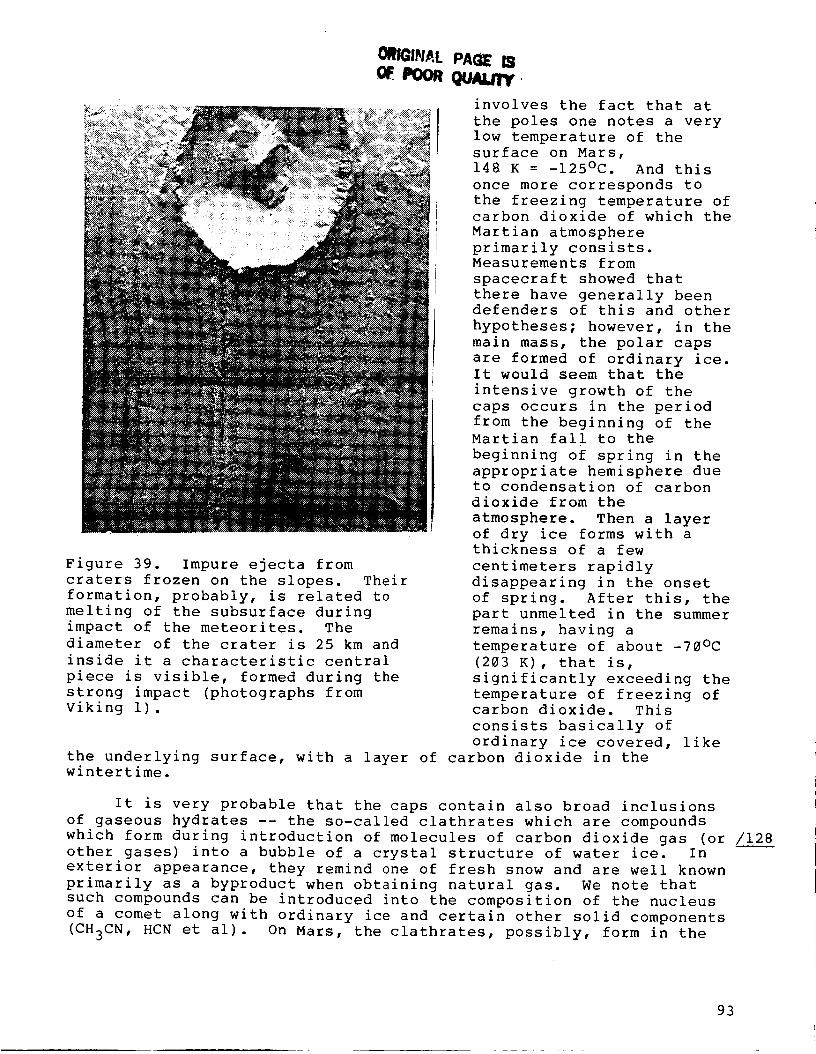
Figure 39. Impure ejecta from
craters frozen on the slopes. Their
formation, probably, is related to
melting of the subsurface during
impact of the meteorites. The
diameter of the crater is 25 km and
inside it a characteristic central
piece is visible, formed during the
strong impact (photographs from
Viking i).
_IN_.L PAGE IS
involves the fact that at
the poles one notes a very
low temperature of the
surface on Mars,
148 K = -125°C. And this
once more corresponds to
the freezing temperature ofcarbon dioxide of which the
Martian atmosphere
primarily consists.Measurements from
spacecraft showed that
there have generally beendefenders of this and other
hypotheses; however, in the
main mass, the polar caps
are formed of ordinary ice.It would seem that the
intensive growth of the
caps occurs in the period
from the beginning of theMartian fall to the
beginning of spring in the
appropriate hemisphere due
to condensation of carbon
dioxide from the
atmosphere. Then a layer
of dry ice forms with athickness of a few
centimeters rapidly
disappearing in the onset
of spring. After this, the
part unmelted in the summer
remains, having a
temperature of about -70°C
(203 K), that is,
significantly exceeding the
temperature of freezing ofcarbon dioxide. This
consists basically of
ordinary ice covered, like
the underlying surface, with a layer of carbon dioxide in thewintertime.
It is very probable that the caps contain also broad inclusions
of gaseous hydrates -- the so-called clathrates which are compounds
which form during introduction of molecules of carbon dioxide gas (or /128
other gases) into a bubble of a crystal structure of water ice. In
exterior appearance, they remind one of fresh snow and are well known
primarily as a byproduct when obtaining natural gas. We note that
such compounds can be introduced into the composition of the nucleus
of a comet along with ordinary ice and certain other solid components
(CH3CN, HCN et al). On Mars, the clathrates, possibly, form in the
93
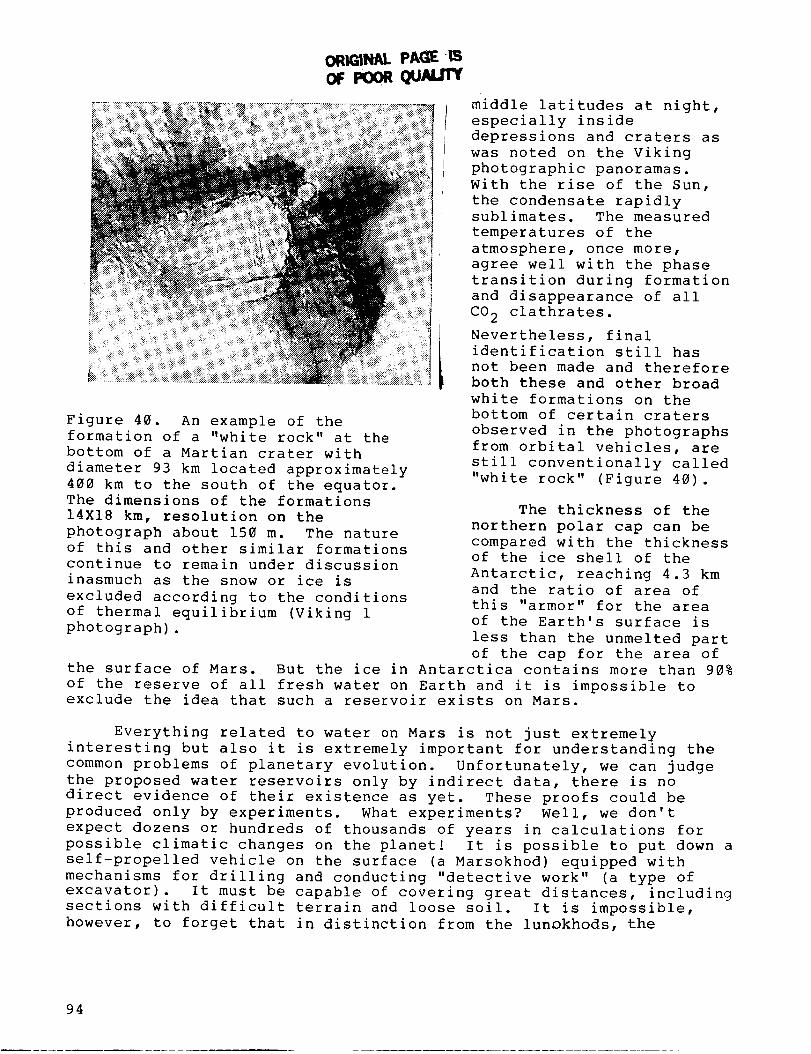
ORIGINAL PAGE ISoF eooe Qu, 'rY
Figure 40. An example of the
formation of a "white rock" at the
bottom of a Martian crater with
diameter 93 km located approximately
400 km to the south of the equator.
The dimensions of the formations
14X18 km, resolution on the
photograph about 150 m. The nature
of this and other similar formations
continue to remain under discussion
inasmuch as the snow or ice is
excluded according to the conditions
of thermal equilibrium (Viking 1
photograph).
middle latitudes at night,
especially inside
depressions and craters as
was noted on the Viking
photographic panoramas.
With the rise of the Sun,
the condensate rapidlysublimates. The measured
temperatures of the
atmosphere, once more,
agree well with the phase
transition during formation
and disappearance of all
CO 2 clathrates.
Nevertheless, final
identification still has
not been made and therefore
both these and other broad
white formations on the
bottom of certain craters
observed in the photographs
from orbital vehicles, are
still conventionally called
"white rock" (Figure 40).
The thickness of the
northern polar cap can be
compared with the thickness
of the ice shell of the
Antarctic, reaching 4.3 km
and the ratio of area of
this "armor" for the area
of the Earth's surface is
less than the unmelted part
of the cap for the area of
the surface of Mars. But the ice in Antarctica contains more than 90%
of the reserve of all fresh water on Earth and it is impossible toexclude the idea that such a reservoir exists on Mars.
Everything related to water on Mars is not just extremely
interesting but also it is extremely important for understanding the
common problems of planetary evolution. Unfortunately, we can judge
the proposed water reservoirs only by indirect data, there is no
direct evidence of their existence as yet. These proofs could be
produced only by experiments. What experiments? Well, we don't
expect dozens or hundreds of thousands of years in calculations for
possible climatic changes on the planet! It is possible to put down a
self-propelled vehicle on the surface (a Marsokhod) equipped with
mechanisms for drilling and conducting "detective work" (a type of
excavator). It must be capable of covering great distances, including
sections with difficult terrain and loose soil. It is impossible,
however, to forget that in distinction from the lunokhods, the
94
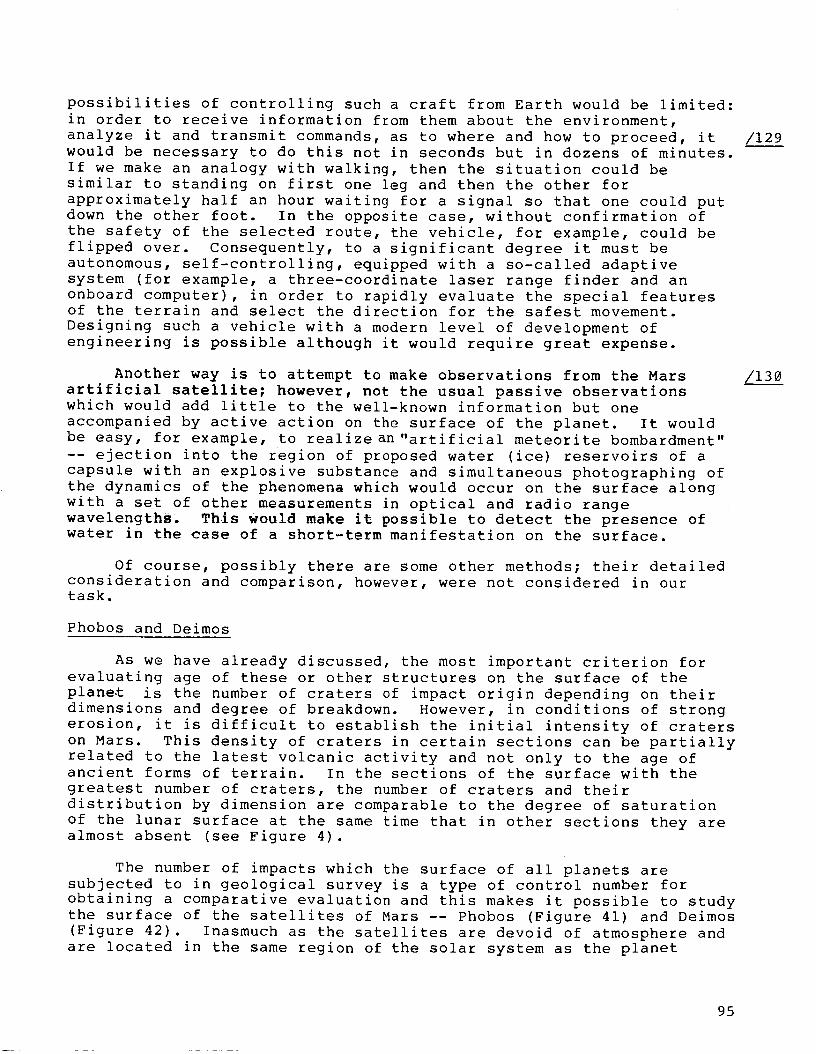
possibilities of controlling such a craft from Earth would be limited:
in order to receive information from them about the environment,
analyze it and transmit commands, as to where and how to proceed, it
would be necessary to do this not in seconds but in dozens of minutes.
If we make an analogy with walking, then the situation could be
similar to standing on first one leg and then the other for
approximately half an hour waiting for a signal so that one could put
down the other foot. In the opposite case, without confirmation of
the safety of the selected route, the vehicle, for example, could be
flipped over. Consequently, to a significant degree it must be
autonomous, self-controlling, equipped with a so-called adaptive
system (for example, a three-coordinate laser range finder and an
onboard computer), in order to rapidly evaluate the special features
of the terrain and select the direction for the safest movement.
Designing such a vehicle with a modern level of development of
engineering is possible although it would require great expense.
Another way is to attempt to make observations from the Mars
artificial satellite; however, not the usual passive observations
which would add little to the well-known information but one
accompanied by active action on the surface of the planet. It would
be easy, for example, to realize an"artificial meteorite bombardment"
-- ejection into the region of proposed water (ice) reservoirs of a
capsule with an explosive substance and simultaneous photographing of
the dynamics of the phenomena which would occur on the surface along
with a set of other measurements in optical and radio range
wavelengths. This would make i£ possible to detect the presence of
water in the case of a short-term manifestation on the surface.
Of course, possibly there are some other methods; their detailed
consideration and comparison, however, were not considered in ourtask.
Phobos and Deimos
As we have already discussed, the most important criterion for
evaluating age of these or other structures on the surface of the
planet is the number of craters of impact origin depending on their
dimensions and degree of breakdown. However, in conditions of strong
erosion, it is difficult to establish the initial intensity of craters
on Mars. This density of craters in certain sections can be partially
related to the latest volcanic activity and not only to the age ofancient forms of terrain. In the sections of the surface with the
greatest number of craters, the number of craters and their
distribution by dimension are comparable to the degree of saturation
of the lunar surface at the same time that in other sections they are
almost absent (see Figure 4).
The number of impacts which the surface of all planets are
subjected to in geological survey is a type of control number for
obtaining a comparative evaluation and this makes it possible to study
the surface of the satellites of Mars -- Phobos (Figure 41) and Deimos
(Figure 42). Inasmuch as the satellites are devoid of atmosphere and
are located in the same region of the solar system as the planet
/129
/130
95
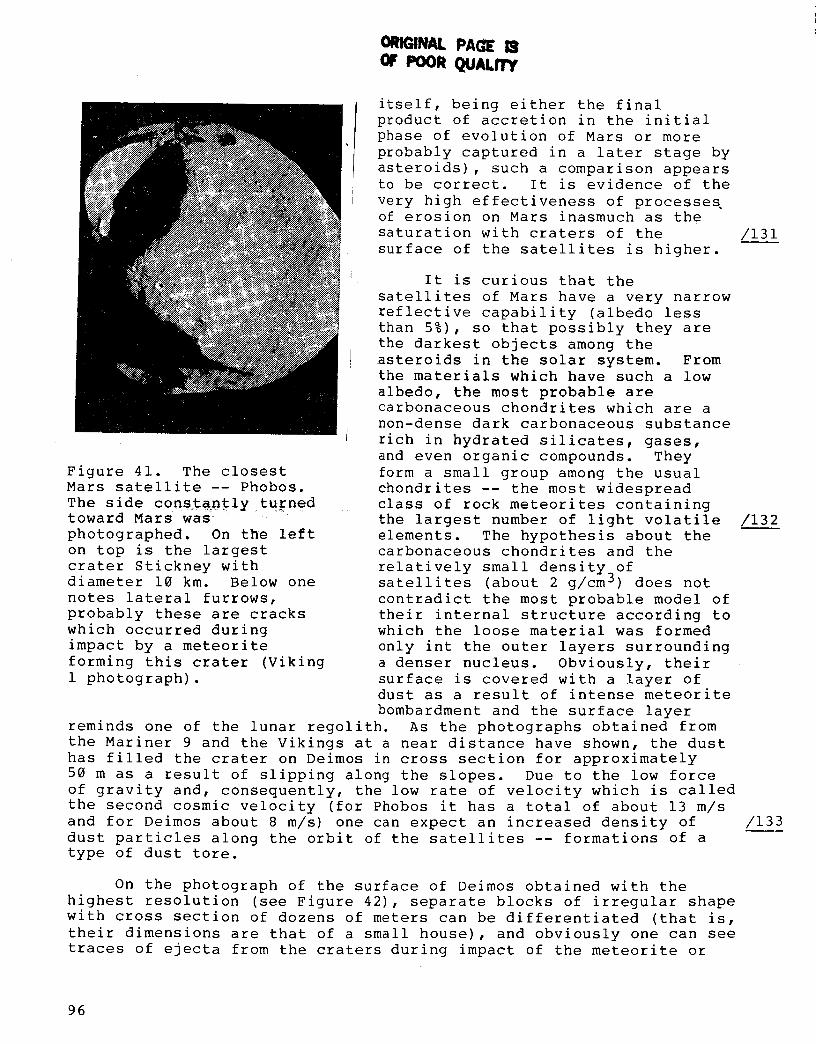
ORIGINAL PAGE 13OF POOR QUALITY
itself, being either the final
product of accretion in the initial
phase of evolution of Mars or more
probably captured in a later stage by
asteroids), such a comparison appearsto be correct. It is evidence of the
very high effectiveness of processes
of erosion on Mars inasmuch as the
saturation with craters of the
surface of the satellites is higher.
Figure 41. The closestMars satellite -- Phobos.
The side constantly turnedtoward Mars was "_
photographed. On the left
on top is the largest
crater Stickney withdiameter 10 km. Below one
notes lateral furrows,
probably these are cracks
which occurred during
impact by a meteorite
forming this crater (Viking
1 photograph).
It is curious that the
satellites of Mars have a very narrow
reflective capability (albedo less
than 5%), so that possibly they are
the darkest objects among the
asteroids in the solar system. From
the materials which have such a low
albedo, the most probable are
carbonaceous chondrites which are a
non-dense dark carbonaceous substance
rich in hydrated silicates, gases,
and even organic compounds. They
form a small group among the usual
chondrites -- the most widespread
class of rock meteorites containing
the largest number of light volatile
elements. The hypothesis about thecarbonaceous chondrites and the
relatively small density of
satellites (about 2 g/cm 3) does not
contradict the most probable model of
their internal structure according towhich the loose material was formed
only int the outer layers surrounding
a denser nucleus. Obviously, their
surface is covered with a layer ofdust as a result of intense meteorite
bombardment and the surface layer
reminds one of the lunar regolith. As the photographs obtained from
the Mariner 9 and the Vikings at a near distance have shown, the dust
has filled the crater on Deimos in cross section for approximately
50 m as a result of slipping along the slopes. Due to the low force
of gravity and, consequently, the low rate of velocity which is called
the second cosmic velocity (for Phobos it has a total of about 13 m/s
and for Deimos about 8 m/s) one can expect an increased density of
dust particles along the orbit of the satellites -- formations of a
type of dust tore.
On the photograph of the surface of Deimos obtained with the
highest resolution (see Figure 42), separate blocks of irregular shape
with cross section of dozens of meters can be differentiated (that is,
their dimensions are that of a small house), and obviously one can see
traces of ejecta from the craters during impact of the meteorite or
/131
/132
/133
96
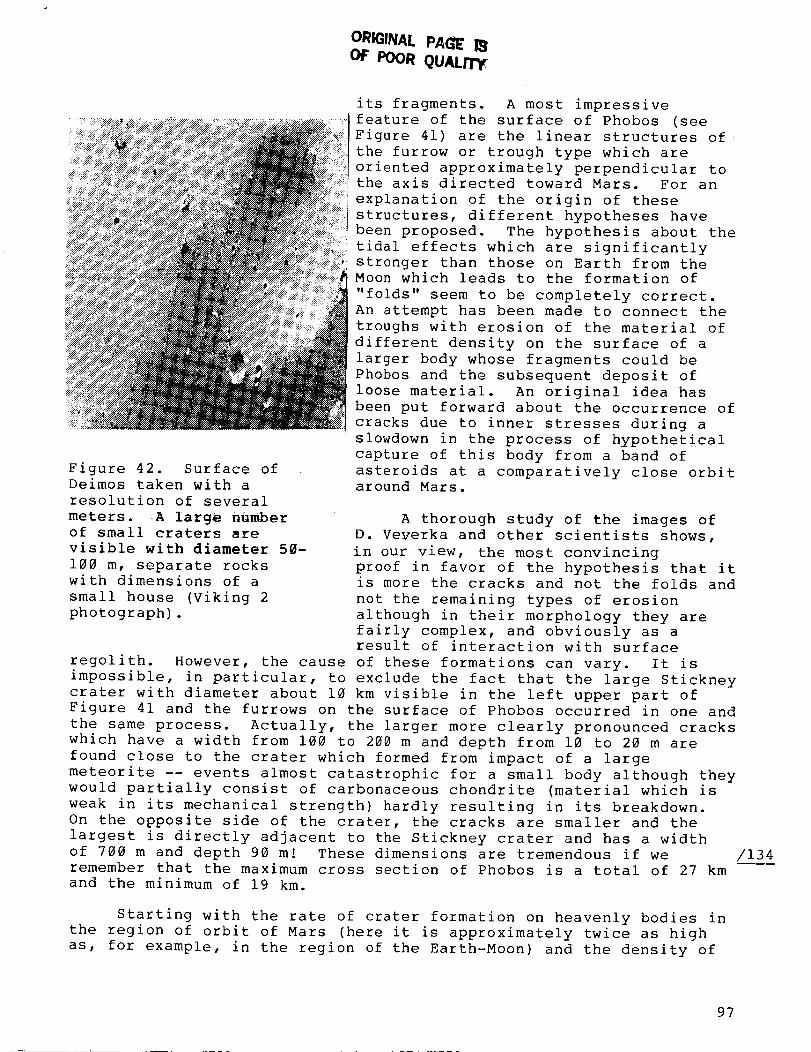
ORIGINAL PAG_ I_OF POOR QUALFrY_
Figure 42. Surface ofDeimos taken with a
resolution of several
meters. A large number
of small craters are
visible with diameter 50-
100 m, separate rocks
with dimensions of a
small house (Viking 2
photograph).
its fragments. A most impressive
feature of the surface of Phobos (see
Figure 41) are the linear structures of
the furrow or trough type which are
oriented approximately perpendicular to
the axis directed toward Mars. For an
explanation of the origin of these
structures, different hypotheses have
been proposed. The hypothesis about the
tidal effects which are significantly
stronger than those on Earth from theMoon which leads to the formation of
"folds" seem to be completely correct.
An attempt has been made to connect the
troughs with erosion of the material of
different density on the surface of a
larger body whose fragments could be
Phobos and the subsequent deposit of
loose material. An original idea has
been put forward about the occurrence of
cracks due to inner stresses during a
slowdown in the process of hypothetical
capture of this body from a band of
asteroids at a comparatively close orbitaround Mars.
A thorough study of the images of
D. Veverka and other scientists shows,
in our view, the most convincing
proof in favor of the hypothesis that it
is more the cracks and not the folds and
not the remaining types of erosion
although in their morphology they are
fairly complex, and obviously as a
result of interaction with surface
regolith. However, the cause of these formations can vary. It is
impossible, in particular, to exclude the fact that the large Stickney
crater with diameter about 10 km visible in the left upper part ofFigure 41 and the furrows on the surface of Phobos occurred in one and
the same process. Actually, the larger more clearly pronounced cracks
which have a width from 100 to 200 m and depth from 10 to 20 m are
found close to the crater which formed from impact of a large
meteorite -- events almost catastrophic for a small body although they
would partially consist of carbonaceous chondrite (material which is
weak in its mechanical strength) hardly resulting in its breakdown.
On the opposite side of the crater, the cracks are smaller and the
largest is directly adjacent to the Stickney crater and has a width
of 700 m and depth 90 m! These dimensions are tremendous if we
remember that the maximum cross section of Phobos is a total of 27 km
and the minimum of 19 km.
/134
Starting with the rate of crater formation on heavenly bodies in
the region of orbit of Mars (here it is approximately twice as high
as, for example, in the region of the Earth-Moon) and the density of
97
craters on Phobos an age of furrows is estimated at 3.4 billion
years. At the very least, it is no less than 1 billion years if one
assumes that for any reason the intensity of bombardment by large
meteorites close to the asteroid band was similarly high. Was this a
singular "almost catastrophic" event in the history of the satellites
on Mars? This we don't know, although it is fully reasonable to
assume that other large catastrophes could have occurred and that the
satellites existing now actually were a fragment of larger related
bodies -- a corrected point of the erosion hypothesis for formation of
linear structures on the surface of Phobos. Truly, the overall
photography from the Vikings did not result in detecting other
"fragments" with dimensions more than approximately 1 km; however, one
must not forget that the area of space covered by the observers was
limited. One would have to consider that for a period of a billion
years complex evolution of their orbits could occur.
Satellites of the Planet Giants and Pluto
Thus, we have become familiar in general terms with the family of
planets close to our heavenly body. Among the other families located
beyond the asteroid band, not one of the four large planets possesses
a solid surface in the ordinary meaning of the word which we have
already mentioned above. As to Pluto, we have seen that it is
impossible in any way to relate it to the large planets either in
dimension or in a number of other characteristics. More likely it
reminds one of a large asteroid (or a system of two asteroids) and
therefore some of the scientists in general are not inclined to count
it as a planet. But the family itself of large planets includes many
solid bodies. These are their satellites encompassing a broad range
of dimensions from those comparable to the planets of the Earth group
to small asteroids (see Table 2).
Unfortunately, the evidence about these bodies based on ground
observations up until recently were very limited. The position was
rarely changed after flights of the Voyager spacecraft through the
Jupiter and Saturn systems. We will discuss these results in more
detail in other sections. Today, first of all, little is known about
the most outer satellites of Jupiter and Saturn which have the
greatest inclination and eccentricities in orbit and also about the
satellites of Uranus and Neptune. Approximately four of the large
family of satellites of Jupiter and also Phoebe -- the Saturn
satellite, are found in very distant orbits, turning around their own
planets not in a forward direction but in a reverse direction.
Already the fact itself definitely indicates that these satellites,
probably, are captured asteroids which have an incorrect shape and
that the basic characteristics of their surfaces have not undergone
noticeable changes after capture (an exception, possibly, is more
intense bombardment when remaining in the environs of a large
gravitational body). At the same time, the nature of other large
satellites particularly close to a planet most often is different,
closely related to the period of formation of the planet itself.
It is possible to propose that with a very low temperature of
condensation in the external regions of the solar system and with
/135
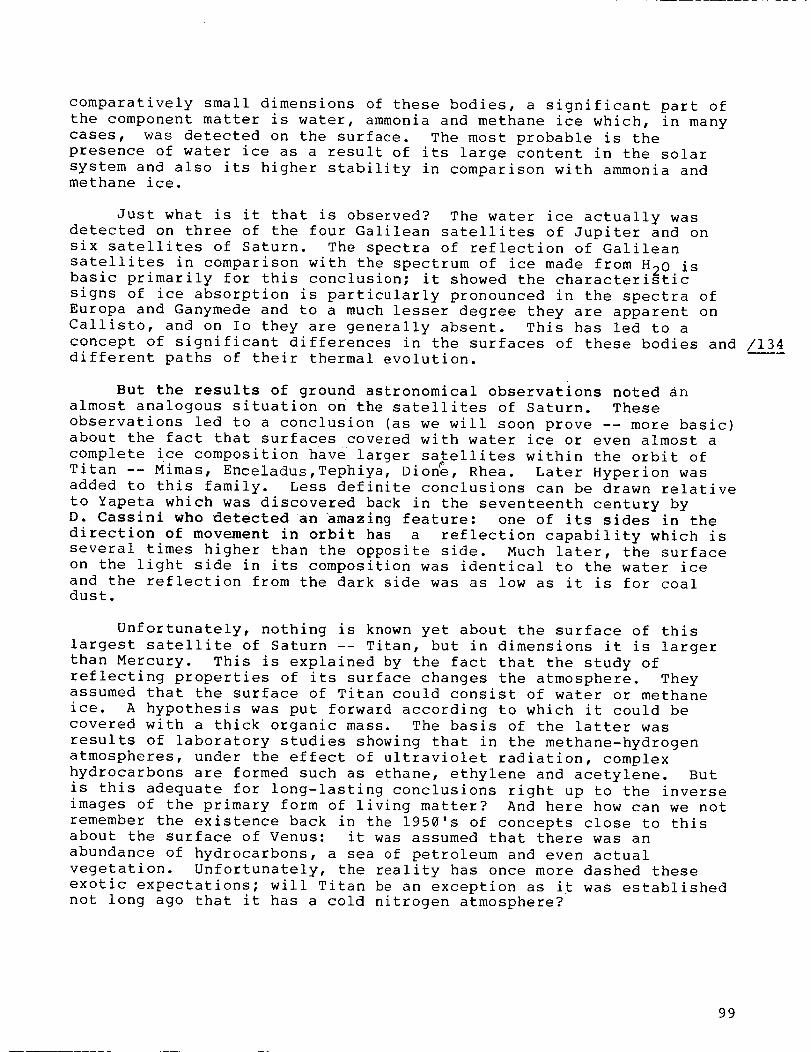
comparatively small dimensions of these bodies, a significant part of
the component matter is water, ammonia and methane ice which, in many
cases, was detected on the surface. The most probable is the
presence of water ice as a result of its large content in the solar
system and also its higher stability in comparison with ammonia andmethane ice.
Just what is it that is observed? The water ice actually was
detected on three of the four Galilean satellites of Jupiter and on
six satellites of Saturn. The spectra of reflection of Galilean
satellites in comparison with the spectrum of ice made from H?O isbasic primarily for this conclusion; it showed the characteristic
signs of ice absorption is particularly pronounced in the spectra of
Europa and Ganymede and to a much lesser degree they are apparent on
Callisto, and on Io they are generally absent. This has led to a
concept of significant differences in the surfaces of these bodies and /134different paths of their thermal evolution.
BUt the results of ground astronomical observations noted an
almost analogous situation on the satellites of Saturn. These
observations led to a conclusion (as we will soon prove -- more basic)
about the fact that surfaces covered with water ice or even almost a
complete ice composition have larger satellites within the orbit of
Titan -- Mimas, Enceladus,Tephiya, Dion_, Rhea. Later Hyperion was
added to this family. Less definite conclusions can be drawn relative
to Yapeta which was discovered back in the seventeenth century by
D. Cassini who detected an amazing feature: one of its sides in the
direction of movement in orbit has a reflection capability which is
several times higher than the opposite side. Much later, the surface
on the light side in its composition was identical to the water ice
and the reflection from the dark side was as low as it is for coaldust.
Unfortunately, nothing is known yet about the surface of this
largest satellite of Saturn -- Titan, but in dimensions it is larger
than Mercury. This is explained by the fact that the study of
reflecting properties of its surface changes the atmosphere. They
assumed that the surface of Titan could consist of water or methane
ice. A hypothesis was put forward according to which it could be
covered with a thick organic mass. The basis of the latter was
results of laboratory studies showing that in the methane-hydrogen
atmospheres, under the effect of ultraviolet radiation, complex
hydrocarbons are formed such as ethane, ethylene and acetylene. But
is this adequate for long-lasting conclusions right up to the inverse
images of the primary form of living matter? And here how can we not
remember the existence back in the 1950's of concepts close to thisabout the surface of Venus: it was assumed that there was an
abundance of hydrocarbons, a sea of petroleum and even actual
vegetation. Unfortunately, the reality has once more dashed these
exotic expectations; will Titan be an exception as it was established
not long ago that it has a cold nitrogen atmosphere?
99
Even at the beginning of the 1980's, thanks to the possibilitiesdiscovered of obtaining high-quality spectra in the near infraredfield using a large infrared telescope on the Mauna Kea Observatory,reliable information was successfully obtained about the satellites ofUranus. The presence of characteristic absorption bands in theinterval of wavelengths 1.5-2.5 km has made it possible for theAmerican astronomers R. Brown and D. Cruikshank to conclude that thesurfaces of Ariel, Titania, Oberon and Umbriel also were made up ofwater ice. Then it was discovered that a purely ice surface existsonly on Ariel at the same time that in the spectra of the others thereare signs of other components partially covered in the ice or mixedwith the ice. Such a component could be silicate rock. On thewhole, we are looking at a certain principle: the farther thesatellite is from the planet, the larger the quantity of admixtures.In character of reflection, the degree of "contamination" of the icesurfaces of the satellites of Uranus on the average is higher than,for example, the surface of Ganymede but lower than the dark side ofYapeta. As to satellites of Neptune, what kind of proof is there ofthe presence of water or condensation of ammonia or methane ice formedat even lower temperatures still unfound. This is a question forfuture studies requiring further improvement in methods andinstruments for conducting these very difficult observations.
In distinction from the satellites of the planet-giants, on Plutothere are identical spectral signs of a methane condensate. Accordingto the results of narrow-band photometery, the ratio of intensity ofreflection in the two spectral fields, in one of which bands ofabsorption of water and ammonia ice are located and then the other --a strong band of absorption of methane ice, prove to equal 1.6. If wetake pure methane ice and take those spectra in the laboratory, thenthe ratio appears only somewhat larger at the same time that for thesatellites of giants with signs of water ice, on the surface thisratio is significantly smaller than i. This fact is a fairly strongargument in favor of the presence of methane. The discovery ofmethane gas on Pluto changes the concepts existing up to recent timesabout its surface formed of rock changing toward more real hypothesesabout the extensive ice layer covering it.
/137
Surfaces of the Galilean Satellites of Jupiter and Amalthea
After the flybys of the Voyager around Jupiter, we found out much /138
that was new and interesting about Galilean satellites of Jupiter.
Finally, it has become possible to see their surfaces (Figure 43).
Three new small satellites were discovered, two of which called
Adrastea and Metis are found closest to the planet (see Table 2) and
consequently, are considered closest to the Amalthea satellite of
Jupiter (Figure 44) shifted to third place and from fifth to eighth inthe Galilean satellites.
100
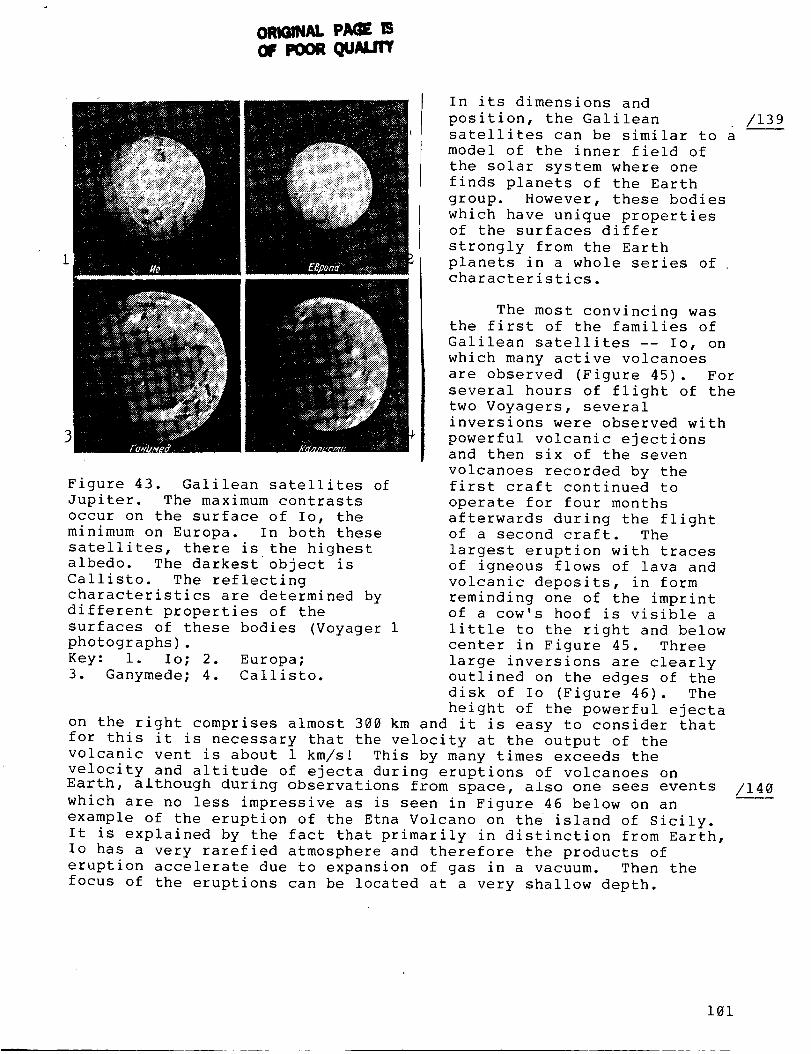
In its dimensions andposition, the Galileansatellites can be similar to amodel of the inner field ofthe solar system where onefinds planets of the Earthgroup. However, these bodieswhich have unique propertiesof the surfaces differstrongly from the Earthplanets in a whole series ofcharacteristics.
Figure 43. Galilean satellites ofJupiter. The maximum contrastsoccur on the surface of Io, theminimum on Europa. In both thesesatellites, there is the highestalbedo. The darkest object isCallisto. The reflectingcharacteristics are determined bydifferent properties of thesurfaces of these bodies (Voyager 1photographs).Key: i. Io; 2. Europa;3. Ganymede; 4. Callisto.
The most convincing wasthe first of the families ofGalilean satellites -- Io, onwhich many active volcanoesare observed (Figure 45). Forseveral hours of flight of thetwo Voyagers, severalinversions were observed withpowerful volcanic ejectionsand then six of the sevenvolcanoes recorded by thefirst craft continued tooperate for four monthsafterwards during the flightof a second craft. Thelargest eruption with tracesof igneous flows of lava andvolcanic deposits, in formreminding one of the imprintof a cow's hoof is visible alittle to the right and belowcenter in Figure 45. Threelarge inversions are clearlyoutlined on the edges of thedisk of Io (Figure 46). Theheight of the powerful ejecta
on the right comprises almost 300 km and it is easy to consider thatfor this it is necessary that the velocity at the output of thevolcanic vent is about 1 km/s! This by many times exceeds thevelocity and altitude of ejecta during eruptions of volcanoes onEarth, although during observations from space, also one sees eventswhich are no less impressive as is seen in Figure 46 below on anexample of the eruption of the Etna Volcano on the island of Sicily.It is explained by the fact that primarily in distinction from Earth,Io has a very rarefied atmosphere and therefore the products oferuption accelerate due to expansion of gas in a vacuum. Then thefocus of the eruptions can be located at a very shallow depth.
/139
/140
101
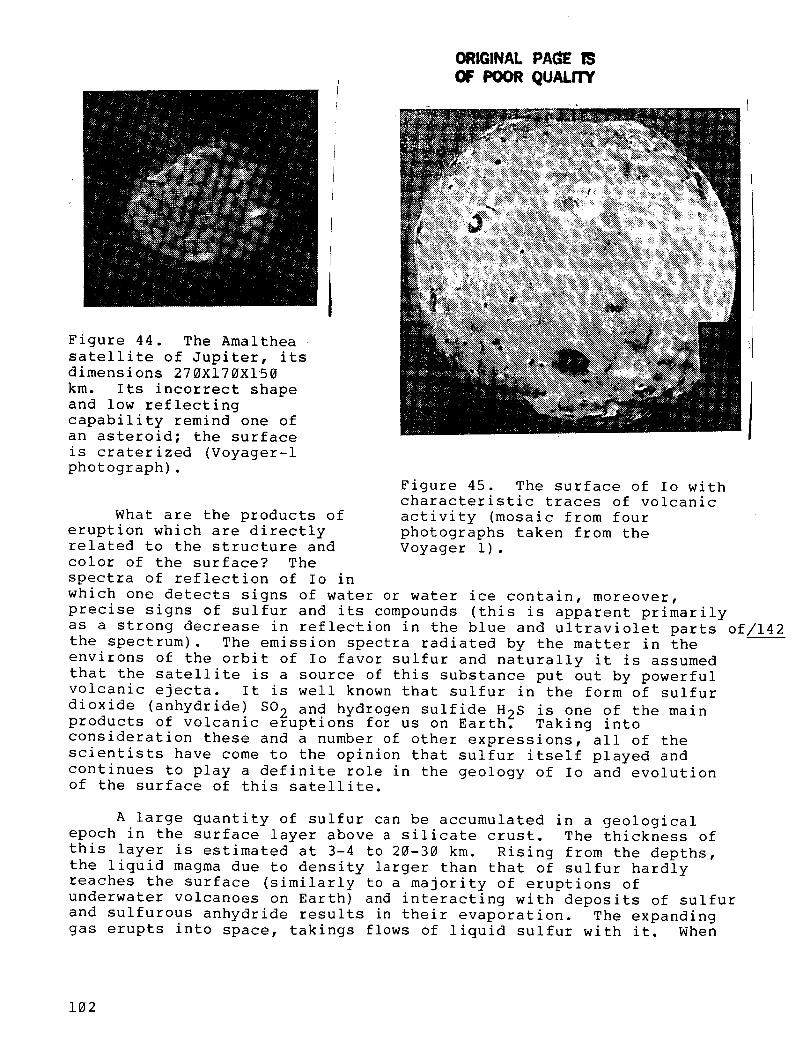
ORIGINAL PAG_
OF POOR QUALITY
Figure 44. The Amalthea
satellite of Jupiter, its
dimensions 270XI70XI50
km. Its incorrect shape
and low reflecting
capability remind one of
an asteroid; the surface
is craterized (Voyager-I
photograph).
Figure 45. The surface of Io with
characteristic traces of volcanic
activity (mosaic from four
photographs taken from the
Voyager i).
What are the products of
eruption which are directlyrelated to the structure and
color of the surface? The
spectra of reflection of Io in
which one detects signs of water or water ice contain, moreover,
precise signs of sulfur and its compounds (this is apparent primarily
as a strong decrease in reflection in the blue and ultraviolet parts of/142
the spectrum). The emission spectra radiated by the matter in the
environs of the orbit of Io favor sulfur and naturally it is assumed
that the satellite is a source of this substance put out by powerful
volcanic ejecta. It is well known that sulfur in the form of sulfur
dioxide (anhydride) SO 2 and hydrogen sulfide H_S is one of the main
products of volcanic eruptions for us on Earth? Taking into
consideration these and a number of other expressions, all of the
scientists have come to the opinion that sulfur itself played and
continues to play a definite role in the geology of Io and evolutionof the surface of this satellite.
A large quantity of sulfur can be accumulated in a geologicalepoch in the surface layer above a silicate crust. The thickness of
this layer is estimated at 3-4 to 20-30 km. Rising from the depths,
the liquid magma due to density larger than that of sulfur hardly
reaches the surface (similarly to a majority of eruptions of
underwater volcanoes on Earth) and interacting with deposits of sulfur
and sulfurous anhydride results in their evaporation. The expanding
gas erupts into space, takings flows of liquid sulfur with it. When
102
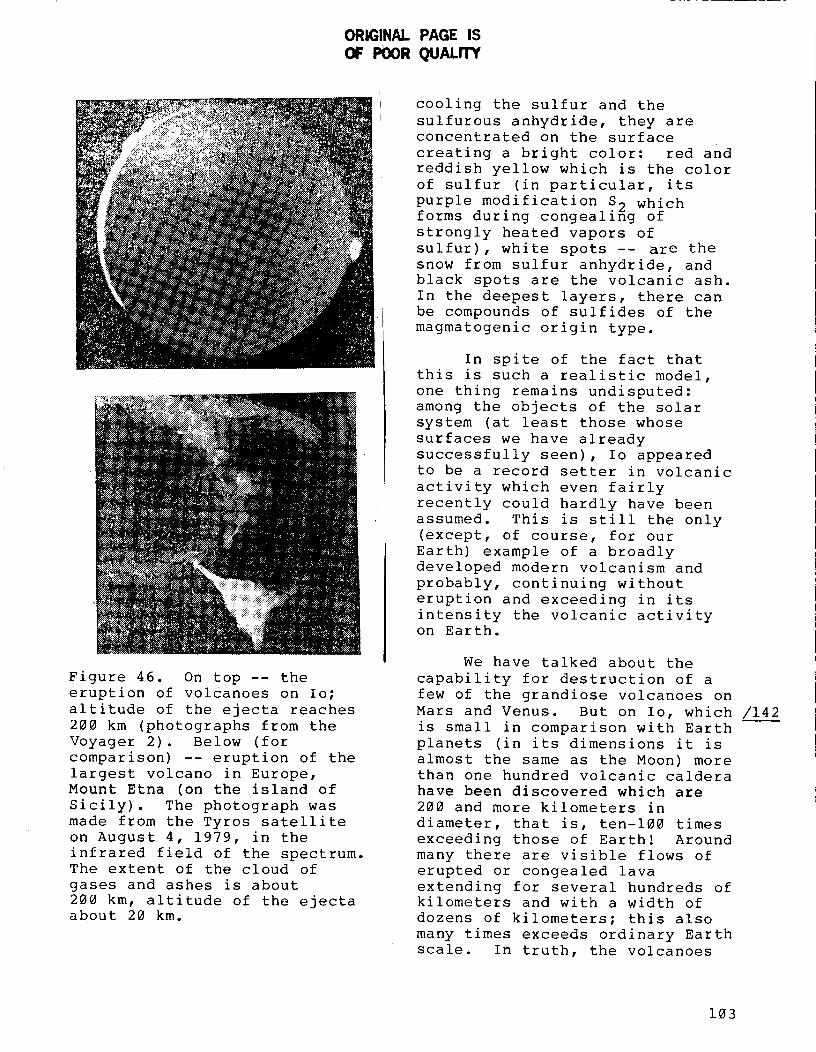
ORIGINAL PAGE IS
OF POOR QUALITY
Figure 46. On top -- the
eruption of volcanoes on Io;
altitude of the ejecta reaches
200 km (photographs from the
Voyager 2). Below (for
comparison) -- eruption of the
largest volcano in Europe,
Mount Etna (on the island of
Sicily). The photograph was
made from the Tyros satellite
on August 4, 1979, in the
infrared field of the spectrum.
The extent of the cloud of
gases and ashes is about
200 km, altitude of the ejectaabout 20 km.
cooling the sulfur and the
sulfurous anhydride, they areconcentrated on the surface
creating a bright color: red and
reddish yellow which is the color
of sulfur (in particular, its
purple modification S 2 whichforms during congealing of
strongly heated vapors of
sulfur), white spots -- are the
snow from sulfur anhydride, and
black spots are the volcanic ash.
In the deepest layers, there can
be compounds of sulfides of the
magmatogenic origin type.
In spite of the fact that
this is such a realistic model,
one thing remains undisputed:
among the objects of the solar
system (at least those whose
surfaces we have already
successfully seen), Io appeared
to be a record setter in volcanic
activity which even fairly
recently could hardly have been
assumed. This is still the only
(except, of course, for our
Earth) example of a broadly
developed modern volcanism and
probably, continuing without
eruption and exceeding in its
intensity the volcanic activityon Earth.
We have talked about the
capability for destruction of a
few of the grandiose volcanoes on
Mars and Venus. But on Io, which /142
is small in comparison with Earth
planets (in its dimensions it is
almost the same as the Moon) more
than one hundred volcanic caldera
have been discovered which are
200 and more kilometers in
diameter, that is, ten-100 times
exceeding those of Earth! Around
many there are visible flows of
erupted or congealed lava
extending for several hundreds of
kilometers and with a width of
dozens of kilometers; this also
many times exceeds ordinary Earth
scale. In truth, the volcanoes
103
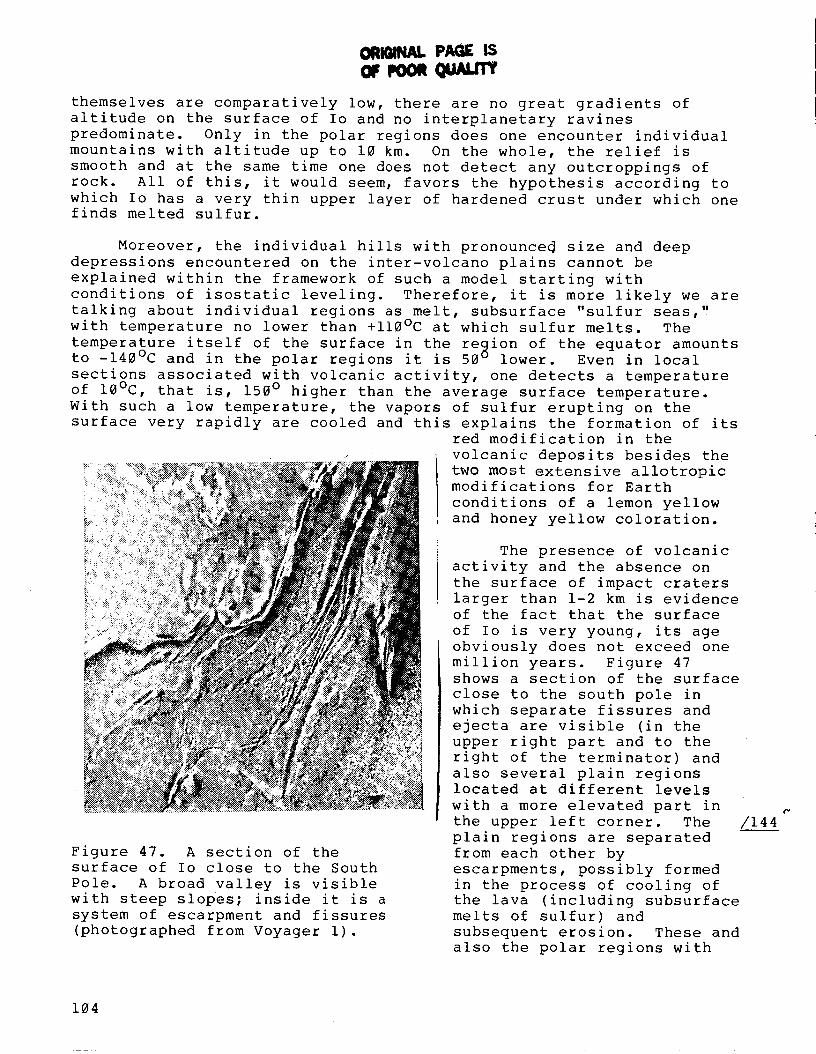
OIl J. PAGE ISoF t oR Cu u1'r
themselves are comparatively low, there are no great gradients of
altitude on the surface of Io and no interplanetary ravines
predominate. Only in the polar regions does one encounter individual
mountains with altitude up to 10 km. On the whole, the relief is
smooth and at the same time one does not detect any outcroppings of
rock. All of this, it would seem, favors the hypothesis according to
which Io has a very thin upper layer of hardened crust under which one
finds melted sulfur.
Moreover, the individual hills with pronounce4 size and deep
depressions encountered on the inter-volcano plains cannot be
explained within the framework of such a model starting with
conditions of isostatic leveling. Therefore, it is more likely we are
talking about individual regions as melt, subsurface "sulfur seas,
with temperature no lower than +i10°C at which sulfur melts. The
temperature itself of the surface in the re_ion of the equator amounts
to -140°C and in the polar regions it is 50 _ lower. Even in local
sections associated with volcanic activity, one detects a temperature
of 10°C, that is, 150 ° higher than the average surface temperature.
With such a low temperature, the vapors of sulfur erupting on the
surface very rapidly are cooled and this explains the formation of itsred modification in the
, volcanic deposits besides the
two most extensive allotropic
modifications for Earth
conditions of a lemon yellow
and honey yellow coloration.
Figure 47. A section of the
surface of Io close to the South
Pole. A broad valley is visible
with steep slopes; inside it is a
system of escarpment and fissures
(photographed from Voyager i).
The presence of volcanic
activity and the absence on
the surface of impact craters
larger than 1-2 km is evidence
of the fact that the surface
of Io is very young, its age
obviously does not exceed one
million years. Figure 47
shows a section of the surface
close to the south pole in
which separate fissures and
ejecta are visible (in the
upper right part and to the
right of the terminator) and
also several plain regions
located at different levels
with a more elevated part in
the upper left corner. The
plain regions are separated
from each other by
escarpments, possibly formed
in the process of cooling of
/144
the lava (including subsurface
melts of sulfur) and
subsequent erosion. These and
also the polar regions with
104
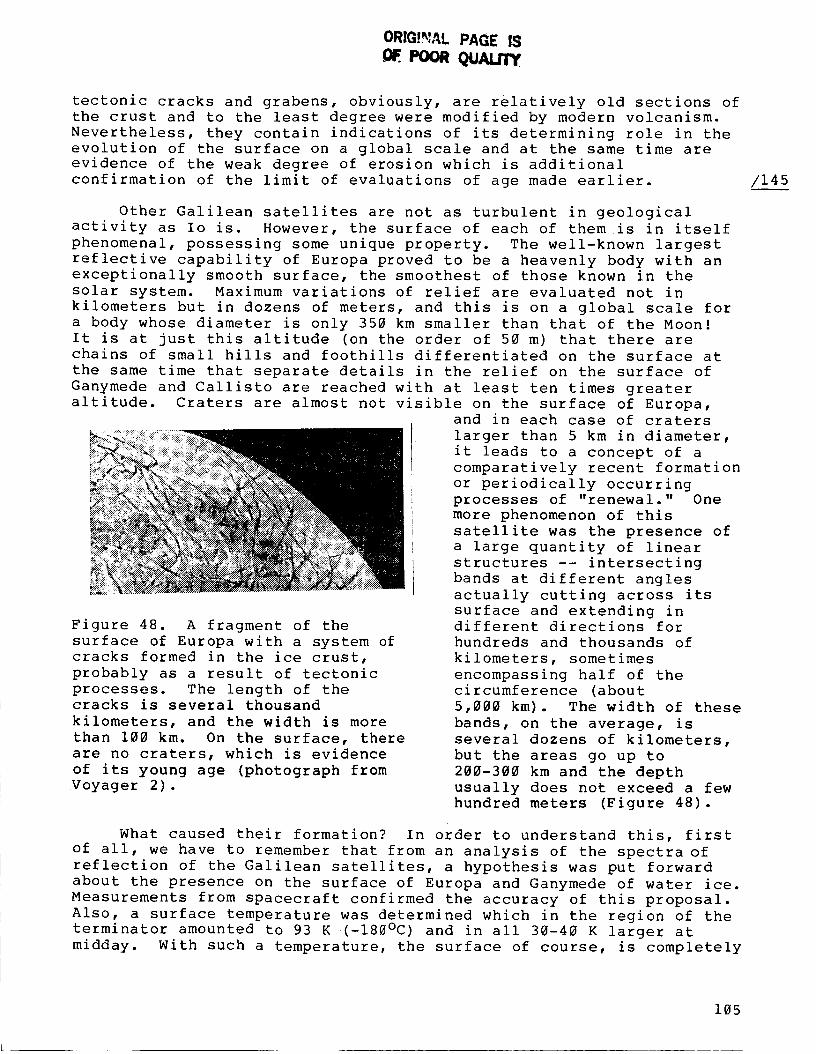
ORIG!.%_L PAGE IS
Poo quALrrY.
tectonic cracks and grabens, obviously, are relatively old sections of
the crust and to the least degree were modified by modern volcanism.
Nevertheless, they contain indications of its determining role in the
evolution of the surface on a global scale and at the same time are
evidence of the weak degree of erosion which is additional
confirmation of the limit of evaluations of age made earlier.
Other Galilean satellites are not as turbulent in geological
activity as Io is. However, the surface of each of them is in itself
phenomenal, possessing some unique property. The well-known largest
reflective capability of Europa proved to be a heavenly body with an
exceptionally smooth surface, the smoothest of those known in the
solar system. Maximum variations of relief are evaluated not in
kilometers but in dozens of meters, and this is on a global scale for
a body whose diameter is only 350 km smaller than that of the Moon!
It is at just this altitude (on the order of 50 m) that there are
chains of small hills and foothills differentiated on the surface at
the same time that separate details in the relief on the surface of
Ganymede and Callisto are reached with at least ten times greater
altitude. Craters are almost not visible on the surface of Europa,
and in each case of craters
N
iii ii!iiii !iii!ili .
Figure 48. A fragment of the
surface of Europa with a system of
cracks formed in the ice crust,
probably as a result of tectonic
processes. The length of thecracks is several thousand
kilometers, and the width is more
than 100 km. On the surface, there
are no craters, which is evidence
of its young age (photograph from
Voyager 2).
larger than 5 km in diameter,
it leads to a concept of a
comparatively recent formation
or periodically occurring
processes of "renewal." One
more phenomenon of this
satellite was the presence of
a large quantity of linear
structures -- intersecting
bands at different angles
actually cutting across its
surface and extending in
different directions for
hundreds and thousands of
kilometers, sometimes
encompassing half of the
circumference (about
5,000 km). The width of these
bands, on the average, is
several dozens of kilometers,
but the areas go up to
200-300 km and the depth
usually does not exceed a few
hundred meters (Figure 48).
What caused their formation? In order to understand this, first
of all, we have to remember that from an analysis of the spectra of
reflection of the Galilean satellites, a hypothesis was put forward
about the presence on the surface of Europa and Ganymede of water ice.
Measurements from spacecraft confirmed the accuracy of this proposal.
Also, a surface temperature was determined which in the region of the
terminator amounted to 93 K (-180°C) and in all 30-40 K larger at
midday. With such a temperature, the surface of course, is completely
/145
105
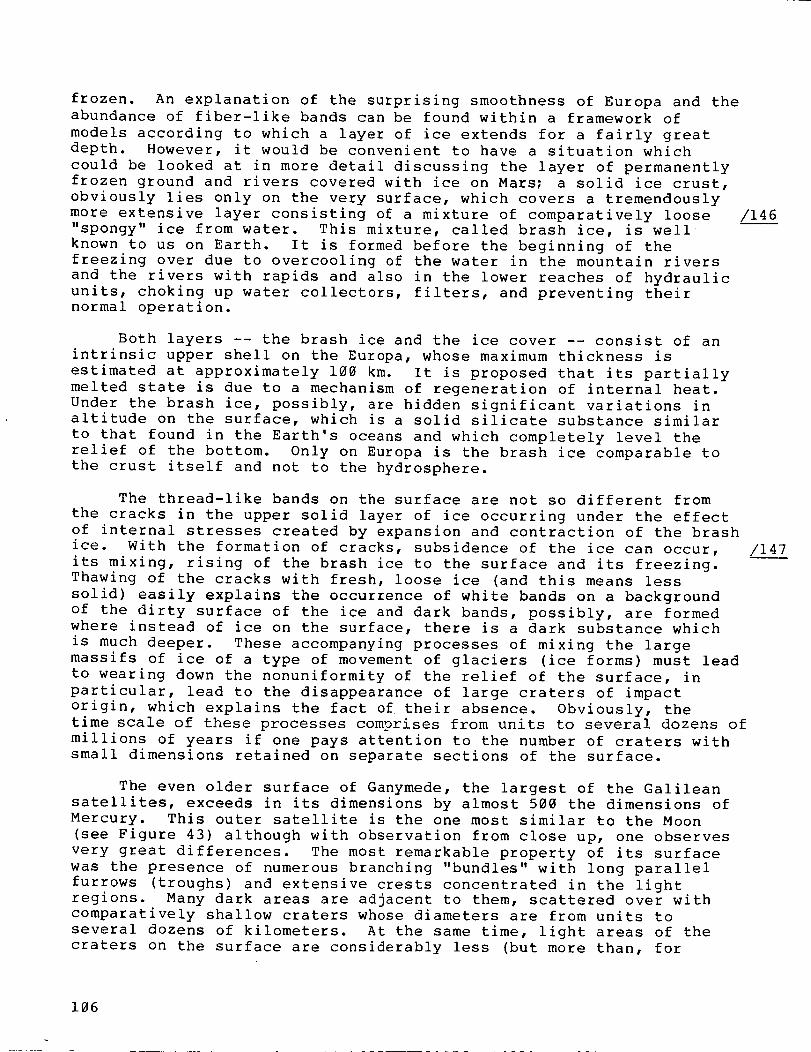
frozen. An explanation of the surprising smoothness of Europa and the
abundance of fiber-like bands can be found within a framework of
models according to which a layer of ice extends for a fairly greatdepth. However, it would be convenient to have a situation which
could be looked at in more detail discussing the layer of permanently
frozen ground and rivers covered with ice on Mars; a solid ice crust,
obviously lies only on the very surface, which covers a tremendously
more extensive layer consisting of a mixture of comparatively loose
"spongy" ice from water. This mixture, called brash ice, is well _
known to us on Earth. It is formed before the beginning of the
freezing over due to overcooling of the water in the mountain rivers
and the rivers with rapids and also in the lower reaches of hydraulic
units, choking up water collectors, filters, and preventing theirnormal operation.
Both layers -- the brash ice and the ice cover -- consist of an
intrinsic upper shell on the Europa, whose maximum thickness is
estimated at approximately 100 km. It is proposed that its partially
melted state is due to a mechanism of regeneration of internal heat.
Under the brash ice, possibly, are hidden significant variations inaltitude on the surface, which is a solid silicate substance similar
to that found in the Earth's oceans and which completely level the
relief of the bottom. Only on Europa is the brash ice comparable to
the crust itself and not to the hydrosphere.
The thread-like bands on the surface are not so different from
the cracks in the upper solid layer of ice occurring under the effect
of internal stresses created by expansion and contraction of the brash
ice. With the formation of cracks, subsidence of the ice can occur,
its mixing, rising of the brash ice to the surface and its freezing.
Thawing of the cracks with fresh, loose ice (and this means less
solid) easily explains the occurrence of white bands on a background
of the dirty surface of the ice and dark bands, possibly, are formed
where instead of ice on the surface, there is a dark substance which
is much deeper. These accompanying processes of mixing the large
massifs of ice of a type of movement of glaciers (ice forms) must lead
to wearing down the nonuniformity of the relief of the surface, in
particular, lead to the disappearance of large craters of impact
origin, which explains the fact of their absence. Obviously, the
time scale of these processes comprises from units to several dozens of
millions of years if one pays attention to the number of craters with
small dimensions retained on separate sections of the surface.
/146
The even older surface of Ganymede, the largest of the Galilean
satellites, exceeds in its dimensions by almost 500 the dimensions of
Mercury. This outer satellite is the one most similar to the Moon
(see Figure 43) although with observation from close up, one observes
very great differences. The most remarkable property of its surface
was the presence of numerous branching "bundles" with long parallel
furrows (troughs) and extensive crests concentrated in the lightregions. Many dark areas are adjacent to them, scattered over with
comparatively shallow craters whose diameters are from units to
several dozens of kilometers. At the same time, light areas of the
craters on the surface are considerably less (but more than, for
/147
106
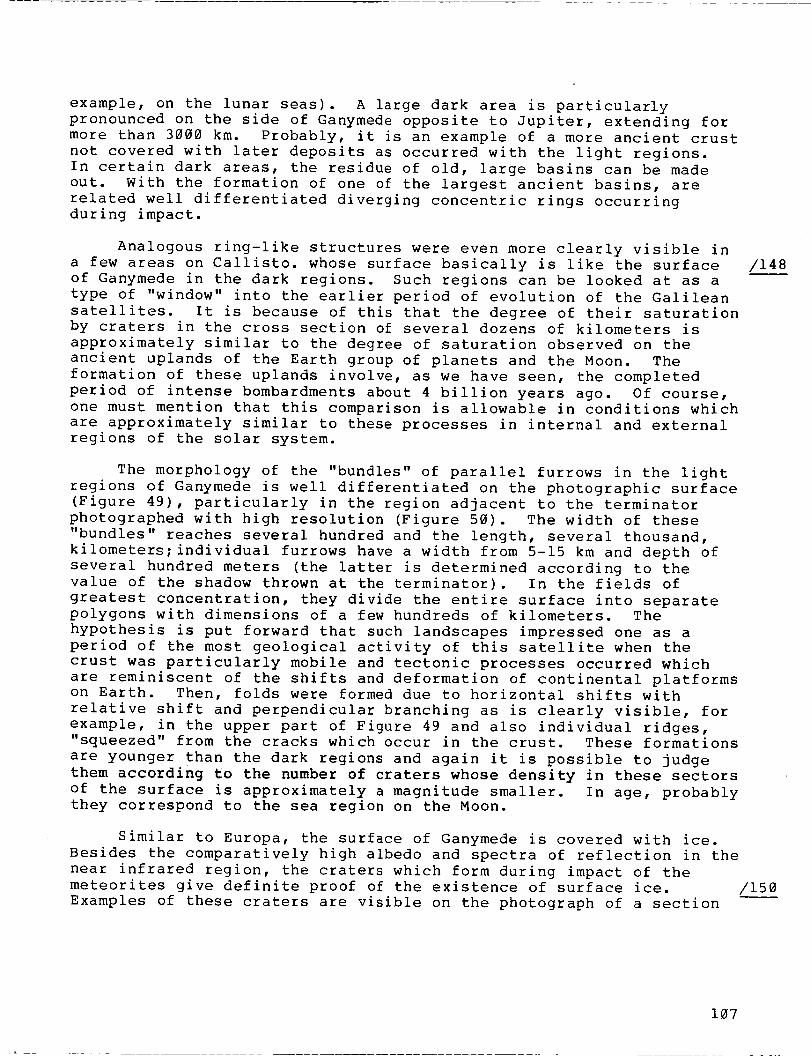
example, on the lunar seas). A large dark area is particularlypronounced on the side of Ganymede opposite to Jupiter, extending formore than 3000 km. Probably, it is an example of a more ancient crustnot covered with later deposits as occurred with the light regions.In certain dark areas, the residue of old, large basins can be madeout. With the formation of one of the largest ancient basins, arerelated well differentiated diverging concentric rings occurringduring impact.
Analogous ring-like structures were even more clearly visible ina few areas on Callisto. whose surface basically is like the surfaceof Ganymede in the dark regions. Such regions can be looked at as atype of "window" into the earlier period of evolution of the Galileansatellites. It is because of this that the degree of their saturationby craters in the cross section of several dozens of kilometers isapproximately similar to the degree of saturation observed on theancient uplands of the Earth group of planets and the Moon. Theformation of these uplands involve, as we have seen, the completedperiod of intense bombardments about 4 billion years ago. Of course,one must mention that this comparison is allowable in conditions whichare approximately similar to these processes in internal and externalregions of the solar system.
/148
The morphology of the "bundles" of parallel furrows in the light
regions of Ganymede is well differentiated on the photographic surface
(Figure 49), particularly in the region adjacent to the terminator
photographed with high resolution (Figure 50). The width of these
"bundles" reaches several hundred and the length, several thousand,
kilometers;individual furrows have a width from 5-15 km and depth of
several hundred meters (the latter is determined according to the
value of the shadow thrown at the terminator). In the fields of
greatest concentration, they divide the entire surface into separatepolygons with dimensions of a few hundreds of kilometers. The
hypothesis is put forward that such landscapes impressed one as a
period of the most geological activity of this satellite when the
crust was particularly mobile and tectonic processes occurred which
are reminiscent of the shifts and deformation of continental platforms
on Earth. Then, folds were formed due to horizontal shifts with
relative shift and perpendicular branching as is clearly visible, for
example, in the upper part of Figure 49 and also individual ridges,"squeezed" from the cracks which occur in the crust. These formations
are younger than the dark regions and again it is possible to judge
them according to the number of craters whose density in these sectors
of the surface is approximately a magnitude smaller. In age, probablythey correspond to the sea region on the Moon.
Similar to Europa, the surface of Ganymede is covered with ice.
Besides the comparatively high albedo and spectra of reflection in the
near infrared region, the craters which form during impact of the
meteorites give definite proof of the existence of surface ice. /150
Examples of these craters are visible on the photograph of a section
107
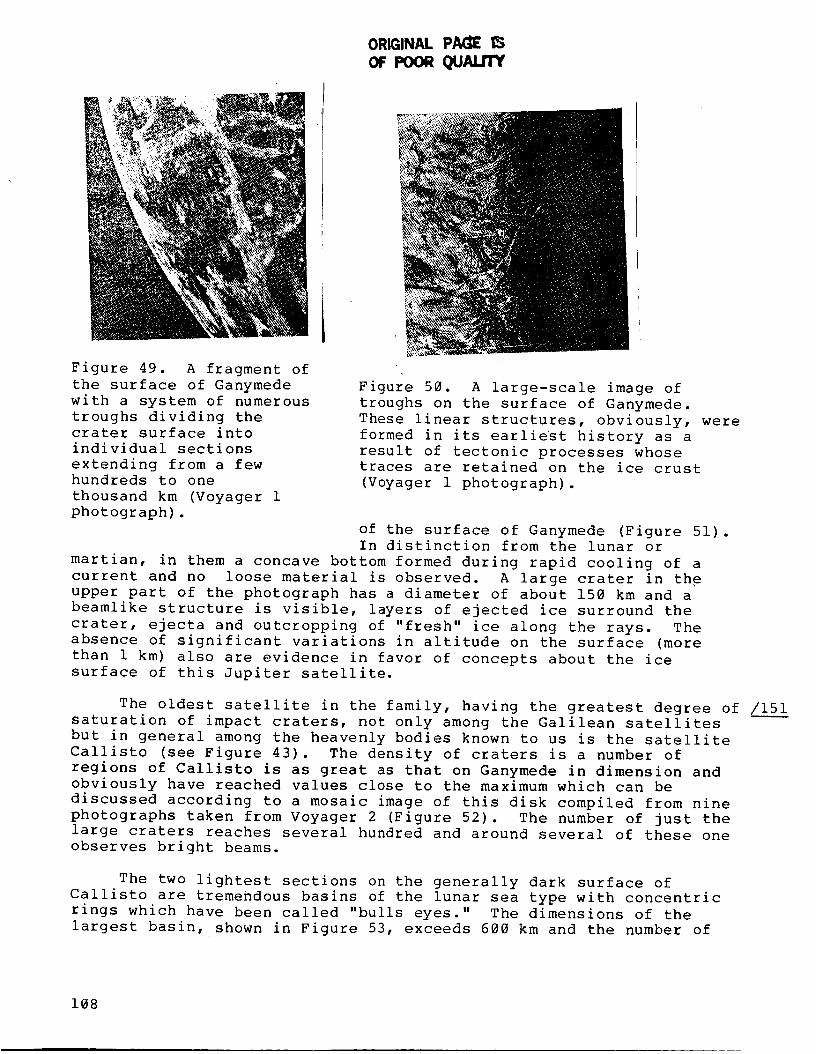
ORIGINAL PAC_
OF FOOe QUALrrY
i:,_:.IN?
Figure 49. A fragment of
the surface of Ganymede
with a system of numerous
troughs dividing the
crater surface into
individual sections
extending from a few
hundreds to one
thousand km (Voyager 1
photograph).
Figure 50. A large-scale image of
troughs on the surface of Ganymede.
These linear structures, obviously, were
formed in its earliest history as a
result of tectonic processes whosetraces are retained on the ice crust
(Voyager 1 photograph).
of the surface of Ganymede (Figure 51).
In distinction from the lunar or
martian, in them a concave bottom formed during rapid cooling of a
current and no loose material is observed. A large crater in the
upper part of the photograph has a diameter of about 150 km and a
beamlike structure is visible, layers of ejected ice surround the
crater, ejecta and outcropping of "fresh" ice along the rays. The
absence of significant variations in altitude on the surface (more
than 1 km) also are evidence in favor of concepts about the ice
surface of this Jupiter satellite.
The oldest satellite in the family, having the greatest degree of /151
saturation of impact craters, not only among the Galilean satellites
but in general among the heavenly bodies known to us is the satellite
Callisto (see Figure 43). The density of craters is a number of
regions of Callisto is as great as that on Ganymede in dimension and
obviously have reached values close to the maximum which can be
discussed according to a mosaic image of this disk compiled from nine
photographs taken from Voyager 2 (Figure 52). The number of just the
large craters reaches several hundred and around several of these one
observes bright beams.
The two lightest sections on the generally dark surface of
Callisto are tremendous basins of the lunar sea type with concentric
rings which have been called "bulls eyes." The dimensions of the
largest basin, shown in Figure 53, exceeds 600 km and the number of
108
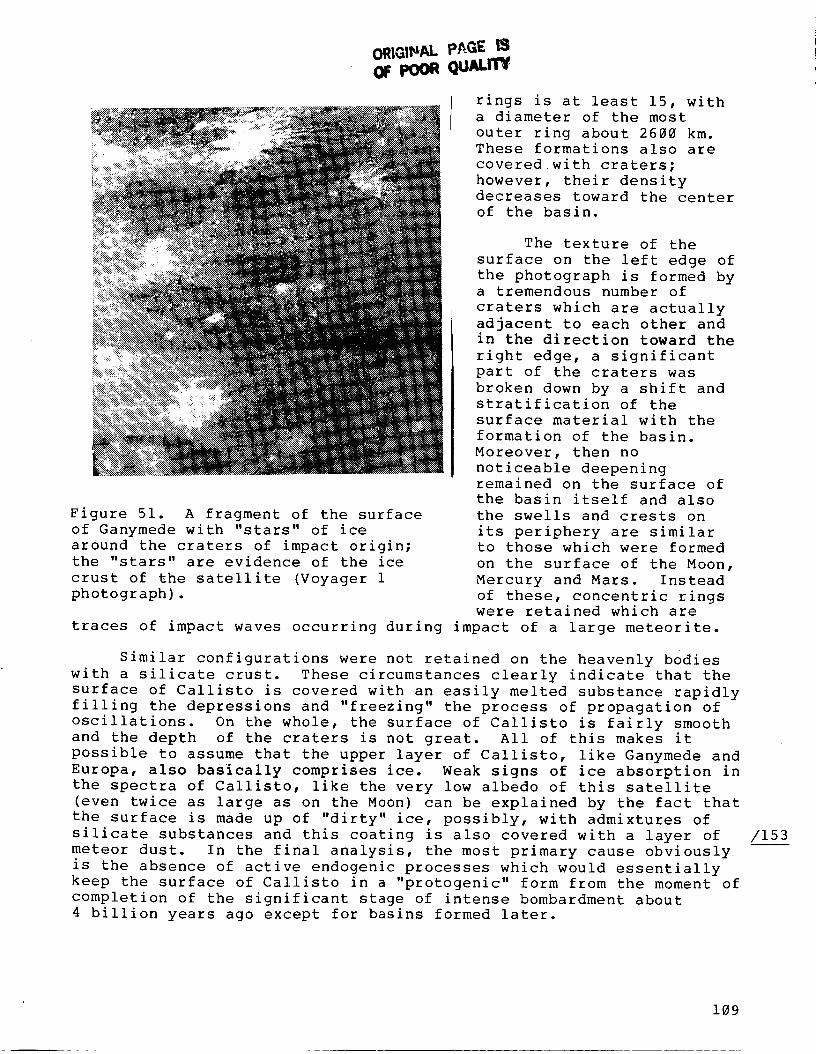
OR|GIHAL p_GE ISOF POORQu,lcrrV
Figure 51. A fragment of the surface
of Ganymede with "stars" of ice
around the craters of impact origin;
the "stars" are evidence of the ice
crust of the satellite (Voyager 1
photograph).
rings is at least 15, with
a diameter of the most
outer ring about 2600 km.These formations also are
covered with craters;
however, their density
decreases toward the center
of the basin.
The texture of the
surface on the left edge of
the photograph is formed bya tremendous number of
craters which are actually
adjacent to each other and
in the direction toward the
right edge, a significant
part of the craters was
broken down by a shift and
stratification of the
surface material with the
formation of the basin.
Moreover, then no
noticeable deepeningremained on the surface of
the basin itself and also
the swells and crests on
its periphery are similar
to those which were formed
on the surface of the Moon,
Mercury and Mars. Instead
of these, concentric ringswere retained which are
traces of impact waves occurring during impact of a large meteorite.
Similar configurations were not retained on the heavenly bodies
with a silicate crust. These circumstances clearly indicate that the
surface of Callisto is covered with an easily melted substance rapidly
filling the depressions and "freezing" the process of propagation of
oscillations. On the whole, the surface of Callisto is fairly smooth
and the depth of the craters is not great. All of this makes it
possible to assume that the upper layer of Callisto, like Ganymede and
Europa, also basically comprises ice. Weak signs of ice absorption in
the spectra of Callisto, like the very low albedo of this satellite
(even twice as large as on the Moon) can be explained by the fact that
the surface is made up of "dirty" ice, possibly, with admixtures of
silicate substances and this coating is also covered with a layer of
meteor dust. In the final analysis, the most primary cause obviously
is the absence of active endogenic processes which would essentially
keep the surface of Callisto in a "protogenic" form from the moment of
completion of the significant stage of intense bombardment about
4 billion years ago except for basins formed later.
/153
109
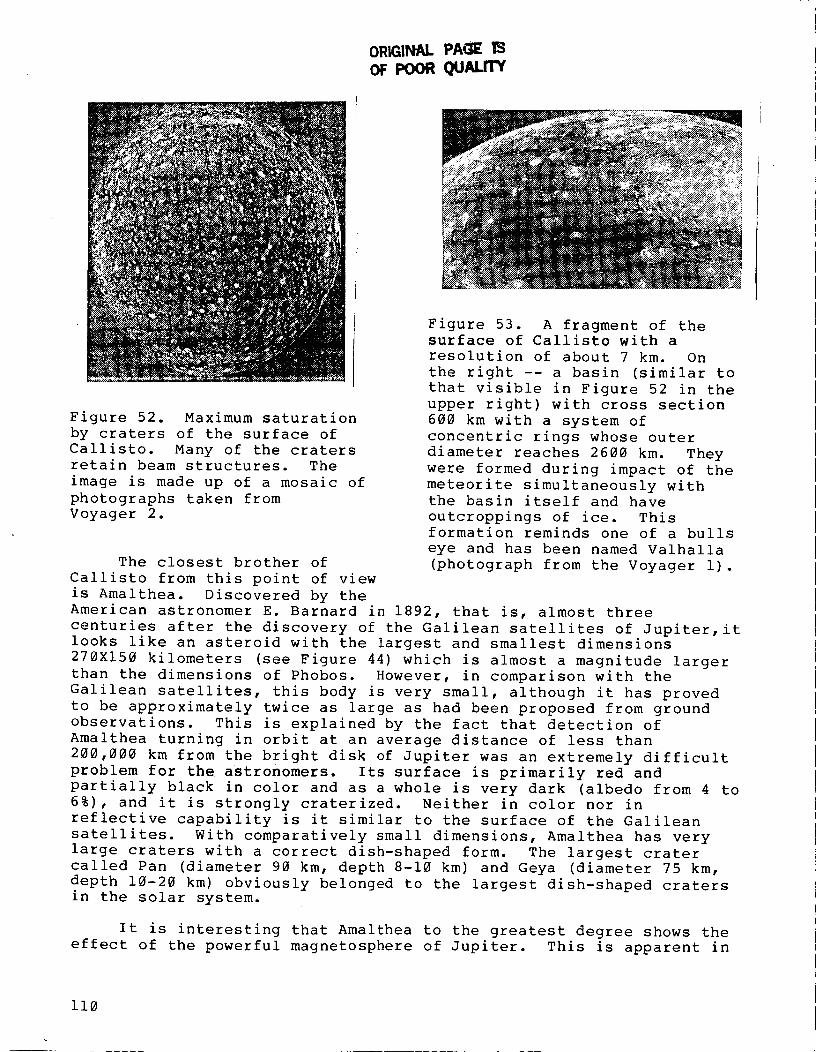
ORIGINAL PAGE ISoF POORqUALrrY
Figure 52. Maximum saturation
by craters of the surface of
Callisto. Many of the cratersretain beam structures. The
image is made up of a mosaic of
photographs taken from
Voyager 2.
Figure 53. A fragment of the
surface of Callisto with a
resolution of about 7 km. On
the right -- a basin (similar to
that visible in Figure 52 in the
upper right) with cross section
600 km with a system of
concentric rings whose outer
diameter reaches 2600 km. They
were formed during impact of the
meteorite simultaneously with
the basin itself and have
outcroppings of ice. Thisformation reminds one of a bulls
eye and has been named Valhalla
(photograph from the Voyager i).The closest brother of
Callisto from this point of view
is Amalthea. Discovered by the
American astronomer E. Barnard in 1892, that is, almost three
centuries after the discovery of the Galilean satellites of Jupiter,it
looks like an asteroid with the largest and smallest dimensions
270X150 kilometers (see Figure 44) which is almost a magnitude larger
than the dimensions of Phobos. However, in comparison with the
Galilean satellites, this body is very small, although it has proved
to be approximately twice as large as had been proposed from ground
observations. This is explained by the fact that detection of
Amalthea turning in orbit at an average distance of less than
200,000 km from the bright disk of Jupiter was an extremely difficult
problem for the astronomers. Its surface is primarily red and
partially black in color and as a whole is very dark (albedo from 4 to
6%), and it is strongly craterized. Neither in color nor in
reflective capability is it similar to the surface of the Galilean
satellites. With comparatively small dimensions, Amalthea has very
large craters with a correct dish-shaped form. The largest crater
called Pan (diameter 90 km, depth 8-10 km) and Geya (diameter 75 km,
depth 10-20 km) obviously belonged to the largest dish-shaped craters
in the solar system.
It is interesting that Amalthea to the greatest degree shows the
effect of the powerful magnetosphere of Jupiter. This is apparent in
110
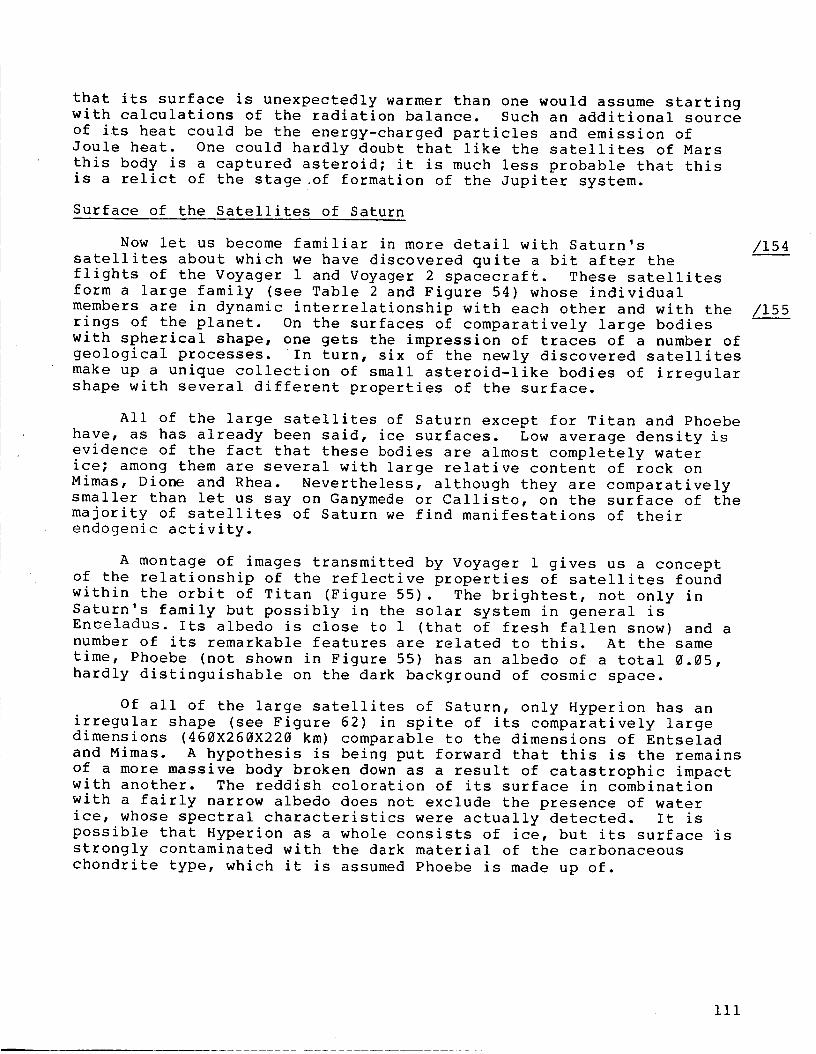
that its surface is unexpectedly warmer than one would assume startingwith calculations of the radiation balance. Such an additional sourceof its heat could be the energy-charged particles and emission of
Joule heat. One could hardly doubt that like the satellites of Mars
this body is a captured asteroid; it is much less probable that this
is a relict of the stage of formation of the Jupiter system.
Surface of the Satellites of Saturn
Now let us become familiar in more detail with Saturn's
satellites about which we have discovered quite a bit after the
flights of the Voyager 1 and Voyager 2 spacecraft. These satellites
form a large family (see Table 2 and Figure 54) whose individual
members are in dynamic interrelationship with each other and with the
rings of the planet. On the surfaces of comparatively large bodies
with spherical shape, one gets the impression of traces of a number of
geological processes. In turn, six of the newly discovered satellites
make up a unique collection of small asteroid-like bodies of irregular
shape with several different properties of the surface.
All of the large satellites of Saturn except for Titan and Phoebe
have, as has already been said, ice surfaces. Low average density is
evidence of the fact that these bodies are almost completely water
ice; among them are several with large relative content of rock on
Mimas, Dione and Rhea. Nevertheless, although they are comparatively
smaller than let us say on Ganymede or Callisto, on the surface of the
majority of satellites of Saturn we find manifestations of their
endogenic activity.
A montage of images transmitted by Voyager 1 gives us a concept
of the relationship of the reflective properties of satellites found
within the orbit of Titan (Figure 55). The brightest, not only in
Saturn's family but possibly in the solar system in general is
En_eladus. Its albedo is close to 1 (that of fresh fallen snow) and a
number of its remarkable features are related to this. At the same
time, Phoebe (not shown in Figure 55) has an albedo of a total 0.05,
hardly distinguishable on the dark background of cosmic space.
Of all of the large satellites of Saturn, only Hyperion has an
irregular shape (see Figure 62) in spite of its comparatively large
dimensions (460X260X220 km) comparable to the dimensions of Entselad
and Mimas. A hypothesis is being put forward that this is the remains
of a more massive body broken down as a result of catastrophic impact
with another. The reddish coloration of its surface in combination
with a fairly narrow albedo does not exclude the presence of water
ice, whose spectral characteristics were actually detected. It is
possible that Hyperion as a whole consists of ice, but its surface is
strongly contaminated with the dark material of the carbonaceous
chondrite type, which it is assumed Phoebe is made up of.
/154
/155
iii
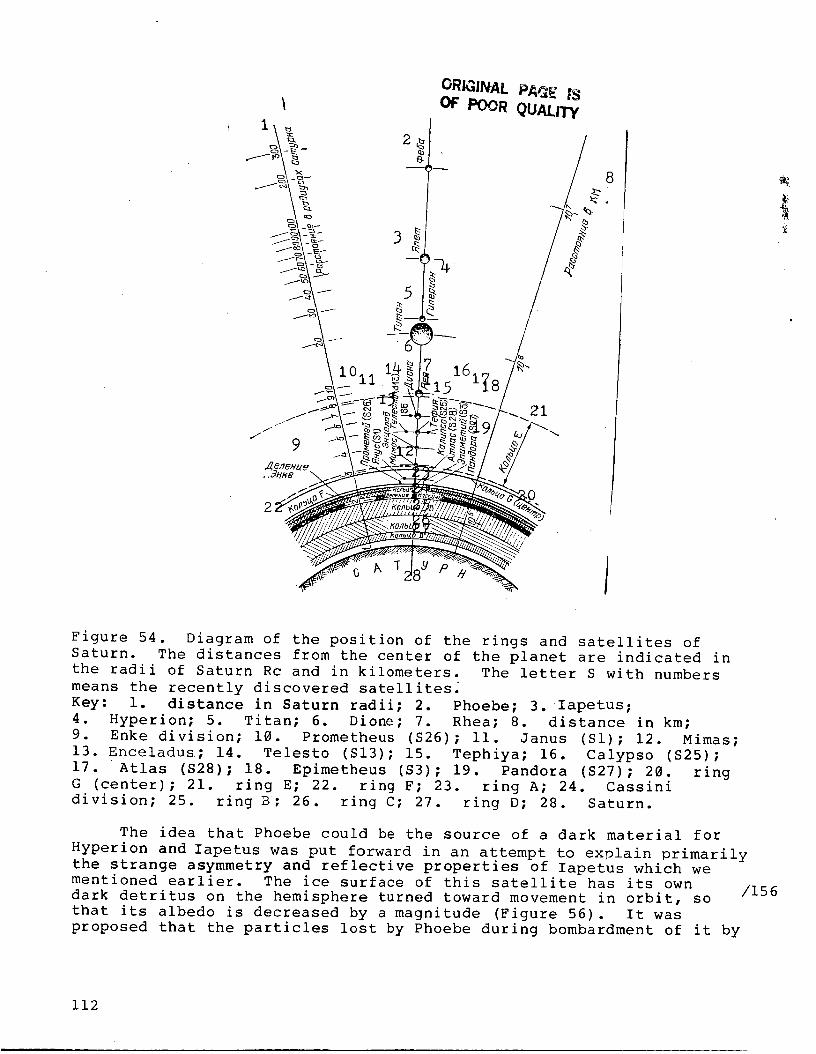
1011 1_
Figure 54. Diagram of the position of the rings and satellites of
Saturn. The distances from the center of the planet are indicated in
the radii of Saturn Rc and in kilometers. The letter S with numbers
means the recently discovered satellites_
Key: i. distance in Saturn radii; 2. Phoebe; 3. Iapetus;
4. Hyperion; 5. Titan; 6. Dione; 7. Rhea; 8. distance in km;
9. Enke division; 10. Prometheus (S26); ii. Janus (Sl); 12. Mimas;
13. Enceladus; 14. Telesto (S13); 15. Tephiya; 16. Calypso (S25);
17. Atlas (S28); 18. Epimetheus (S3); 19. Pandora ($27); 20. ring
G (center); 21. ring E; 22. ring F; 23. ring A; 24. Cassini
division; 25. ring B; 26. ring C; 27. ring D; 28. Saturn.
The idea that Phoebe could be the source of a dark material for
Hyperion and Iapetus was put forward in an attempt to explain primarily
the strange asymmetry and reflective properties of lapetus which we
mentioned earlier. The ice surface of this satellite has its own /156dark detritus on the hemisphere turned toward movement in orbit, so
that its albedo is decreased by a magnitude (Figure 56). It was
proposed that the particles lost by Phoebe during bombardment of it by
112
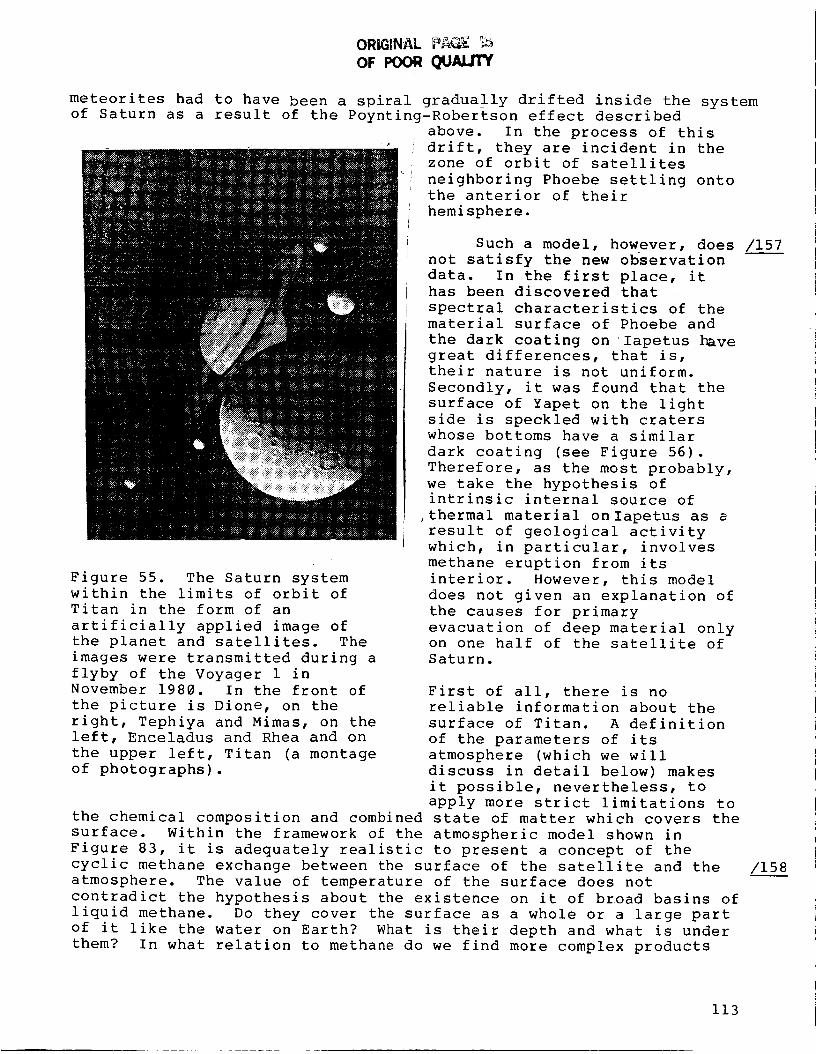
ORiG)NAL PAGE
OF POORQUAUTV
meteorites had to have been a spiral gradually drifted inside the system
of Saturn as a result of the Poynting-Robertson effect described
above. In the process of this
Figure 55. The Saturn system
within the limits of orbit of
Titan in the form of an
artificially applied image of
the planet and satellites. The
images were transmitted during a
flyby of the Voyager 1 in
November 1980. In the front of
the picture is Dione, on the
right, Tephiya and Mimas, on the
left, Enceladus and Rhea and on
the upper left, Titan (a montage
of photographs).
drift, they are incident in thezone of orbit of satellites
neighboring Phoebe settling onto
the anterior of their
hemisphere.
Such a model, however, does /157
not satisfy the new observation
data. In the first place, it
has been discovered that
spectral characteristics of the
material surface of Phoebe and
the dark coating on Iapetus have
great differences, that is,
their nature is not uniform.
Secondly, it was found that the
surface of Yapet on the light
side is speckled with craters
whose bottoms have a similar
dark coating (see Figure 56).
Therefore, as the most probably,
we take the hypothesis ofintrinsic internal source of
,thermal material on Iapetus as a
result of geological activity
which, in particular, involves
methane eruption from its
interior. However, this model
does not given an explanation of
the causes for primary
evacuation of deep material only
on one half of the satellite of
Saturn.
First of all, there is no
reliable information about the
surface of Titan. A definition
of the parameters of its
atmosphere (which we will
discuss in detail below) makes
it possible, nevertheless, to
apply more strict limitations to
the chemical composition and combined state of matter which covers the
surface. Within the framework of the atmospheric model shown in
Figure 83, it is adequately realistic to present a concept of the
cyclic methane exchange between the surface of the satellite and the
atmosphere. The value of temperature of the surface does not
contradict the hypothesis about the existence on it of broad basins of
liquid methane. Do they cover the surface as a whole or a large part
of it like the water on Earth? What is their depth and what is under
them? In what relation to methane do we find more complex products
/158
113
ORIGINAL P_E _S
OF POOR QUALITY
and other (unlimited) hydrocarbons? And finally, how does this
amazing world occur in our solar system, all of these questions we
hope to answer with a future study of Titan.
(
Figure 56. The satellite of Saturn, Iapetus. On the left, a Voyager I
photograph, on the right, Voyager 2 photograph obtained with high
resolution. On both photographs, tremendous differences are clearly
visible in the reflecting properties of the anterior (in the direction
of movement in orbit) and posterior hemispheres. Both hemispheres arestrongly craterized.
The five large satellites within the orbit of Titan have much in
common, but they also have their own specific characteristics. Rhea,
in its dimensions, is close to Iapetus (cross section approximatelvi
1500 km) where at the same time Tephiya and Diona have diameters of
about 1,000 km and Mimas and Enceladus -- a total of 4@@-5@_ km.
Moreover, on Rhea, for example, there are fewer signs of geological
activity than on some of its less massive companions. The surfaces of
all the satellites with the exception of individual regions are
strongly speckled with craters from the smallest to 50 km or larger.
But the density of the number of craters and the distribution of large
and small craters even in the old sections of the surface is not
uniform. This has led to a hypothesis that bombardment of bodies in
the Saturn system occurred in two basic stages separated in time: the
first, very ancient, relating to the period of formation of the planet
and its satellite; the second, a much later one, involving either a
breakdown in one of the early significant satellites and incidents of
its fragments on another body, or with an intense period of comet
activity in the region of the Saturn orbit.
Figure 57 shows the hemispheres of Rhea turned toward the side
opposite the direction of movement in orbit. It is darker than the
opposite and on it light bands are more noticeable. An even more
complex system of bands is observed on the dark (also, the reverse
direction of movement) hemisphere of Diona. Obviously, this is an
outcropping of fresh ice occurring at a comparatively early stage of
internal activity of satellites and not masked by subsequent deposits.
One of the possible scenarios for the formation of these
configurations involves the primary formation of troughs or cracks
along which, later on, in the process degasification of the interior, /160
114
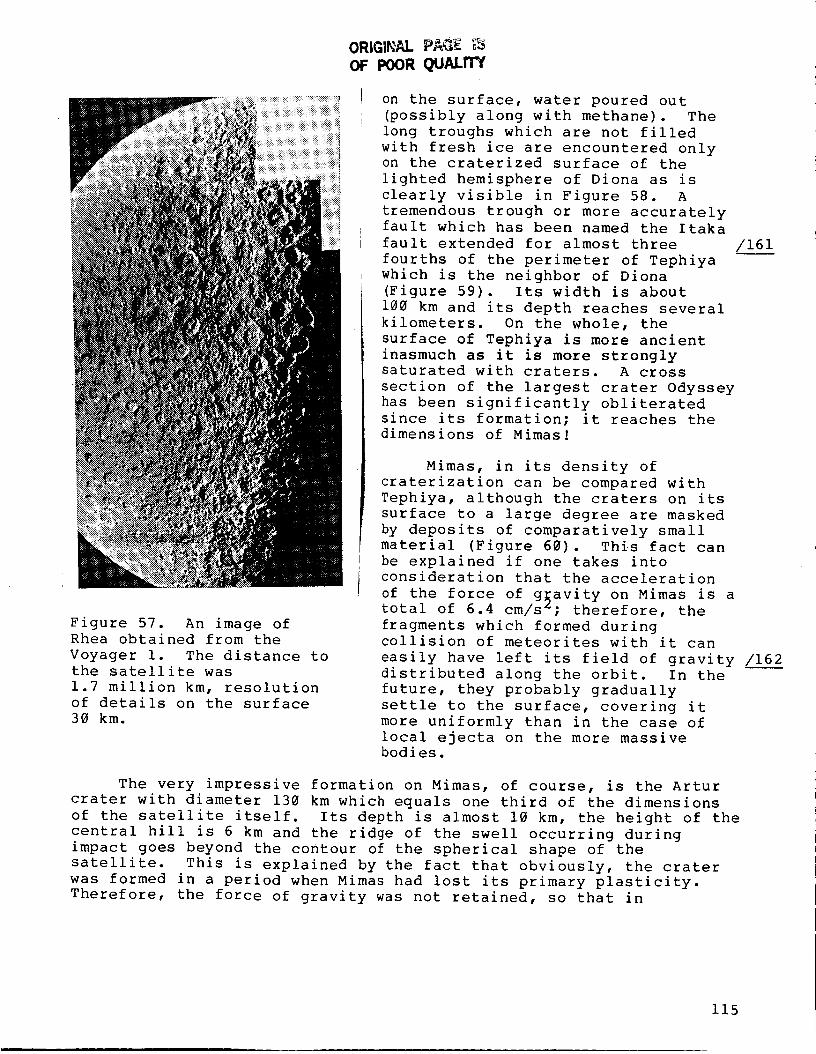
oF POORquALrI
Figure 57. An image of
Rhea obtained from the
Voyager i. The distance tothe satellite was
1.7 million km, resolution
of details on the surface
30 km.
on the surface, water poured out
(possibly along with methane). The
long troughs which are not filled
with fresh ice are encountered only
on the craterized surface of the
lighted hemisphere of Diona as is
clearly visible in Figure 58. A
tremendous trough or more accurately
fault which has been named the Itaka
fault extended for almost three
fourths of the perimeter of Tephiya
which is the neighbor of Diona
(Figure 59). Its width is about
100 km and its depth reaches several
kilometers. On the whole, the
surface of Tephiya is more ancient
inasmuch as it is more strongly
saturated with craters. A cross
section of the largest crater Odyssey
has been significantly obliterated
since its formation; it reaches the
dimensions of Mimas!
/161
Mimas, in its density of
craterization can be compared with
Tephiya, although the craters on its
surface to a large degree are masked
by deposits of comparatively small
material (Figure 60). This fact can
be explained if one takes into
consideration that the acceleration
of the force of g_avity on Mimas is atotal of 6.4 cm/s_; therefore, the
fragments which formed duringcollision of meteorites with it can
easily have left its field of gravity /162
distributed along the orbit. In the
future, they probably gradually
settle to the surface, covering it
more uniformly than in the case of
local ejecta on the more massivebodies.
The very impressive formation on Mimas, of course, is the Artur
crater with diameter 130 km which equals one third of the dimensions
of the satellite itself. Its depth is almost 10 km, the height of the
central hill is 6 km and the ridge of the swell occurring during
impact goes beyond the contour of the spherical shape of the
satellite. This is explained by the fact that obviously, the crater
was formed in a period when Mimas had lost its primary plasticity.
Therefore, the force of gravity was not retained, so that in
115
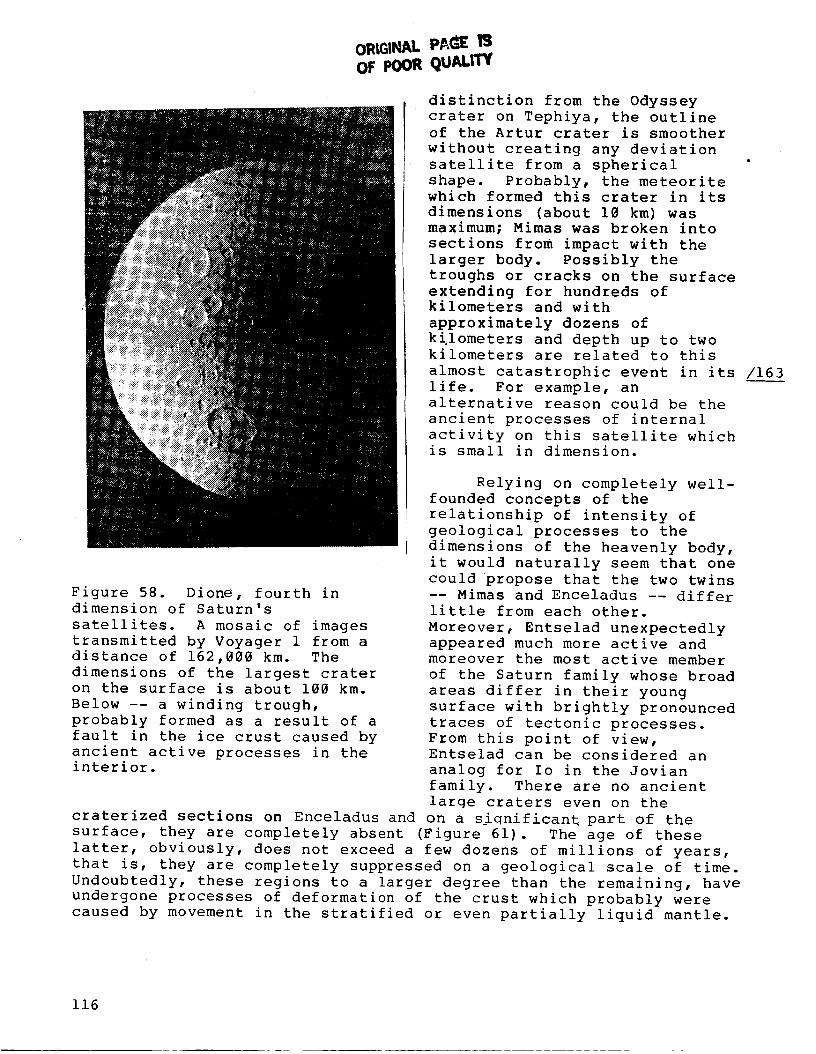
ORIGINAL PD, G'q[ IS
OF POORQuALrrY
distinction from the Odyssey
crater on Tephiya, the outline
of the Artur crater is smoother
without creating any deviation
satellite from a spherical
shape. Probably, the meteorite
which formed this crater in its
dimensions (about 10 km) was
maximum; Mimas was broken into
sections from impact with the
larger body. Possibly the
troughs or cracks on the surface
extending for hundreds ofkilometers and with
approximately dozens of
ki.lometers and depth up to two
kilometers are related to this
almost catastrophic event in its /163
life. For example, an
alternative reason could be the
ancient processes of internal
activity on this satellite which
is small in dimension.
Figure 58. Dione, fourth in
dimension of Saturn's
satellites. A mosaic of images
transmitted by Voyager 1 from a
distance of 162,000 km. The
dimensions of the largest crater
on the surface is about 100 km.
Below -- a winding trough,
probably formed as a result of a
fault in the ice crust caused by
ancient active processes in theinterior.
Relying on completely well-
founded concepts of the
relationship of intensity of
geological processes to the
dimensions of the heavenly body,
it would naturally seem that one
could propose that the two twins
-- Mimas and Enceladus -- differ
little from each other.
Moreover, Entselad unexpectedly
appeared much more active and
moreover the most active member
of the Saturn family whose broad
areas differ in their young
surface with brightly pronounced
traces of tectonic processes.
From this point of view,
Entselad can be considered an
analog for Io in the Jovian
family. There are no ancient
large craters even on the
craterized sections on Enceladus and on a s_qnificant part of the
surface, they are completely absent (Figure 61). The age of these
latter, obviously, does not exceed a few dozens of millions of years,
that is, they are completely suppressed on a geological scale of time.
Undoubtedly, these regions to a larger degree than the remaining, have
undergone processes of deformation of the crust which probably were
caused by movement in the stratified or even partially liquid mantle.
116
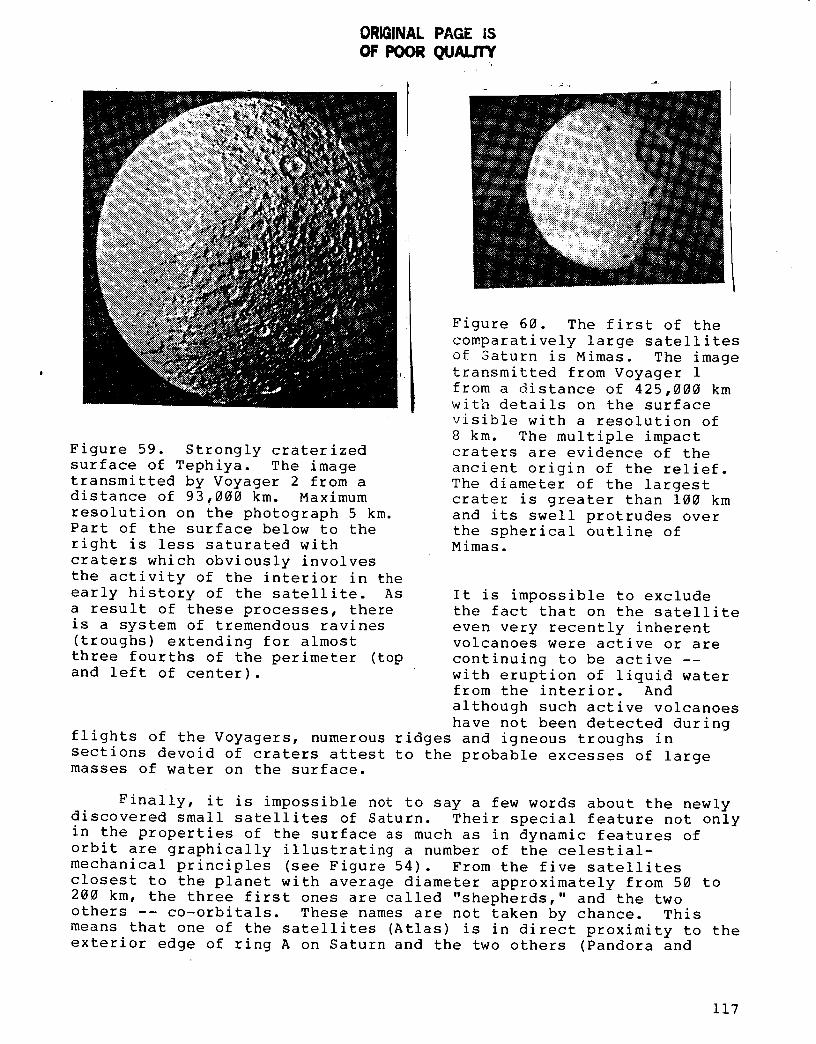
ORIGINAL PAGE iSOF POOR QUAL/rY
Figure 59. Strongly craterized
surface of Tephiya. The image
transmitted by Voyager 2 from a
distance of 93,000 km. Maximum
resolution on the photograph 5 km.
Part of the surface below to the
right is less saturated with
craters which obviously involves
the activity of the interior in the
early history of the satellite. As
a result of these processes, there
is a system of tremendous ravines
(troughs) extending for almost
three fourths of the perimeter (top
and left of center).
Figure 60. The first of the
comparatively large satellites
of Saturn is Mimas. The image
transmitted from Voyager 1
from a distance of 425,000 km
with details on the surface
visible with a resolution of
8 km. The multiple impact
craters are evidence of the
ancient origin of the relief.
The diameter of the largest
crater is greater than 100 km
and its swell protrudes over
the spherical outline of
Mimas.
It is impossible to exclude
the fact that on the satellite
even very recently inherent
volcanoes were active or are
continuing to be active --
with eruption of liquid water
from the interior. And
although such active volcanoes
have not been detected during
flights of the Voyagers, numerous ridges and igneous troughs in
sections devoid of craters attest to the probable excesses of large
masses of water on the surface.
Finally, it is impossible not to say a few words about the newlydiscovered small satellites of Saturn. Their special feature not only
in the properties of the surface as much as in dynamic features of
orbit are graphically illustrating a number of the celestial-
mechanical principles (see Figure 54). From the five satellites
closest to the planet with average diameter approximately from 50 to
200 km, the three first ones are called "shepherds," and the two
others -- co-orbitals. These names are not taken by chance. This
means that one of the satellites (Atlas) is in direct proximity to the
exterior edge of ring A on Saturn and the two others (Pandora and
117
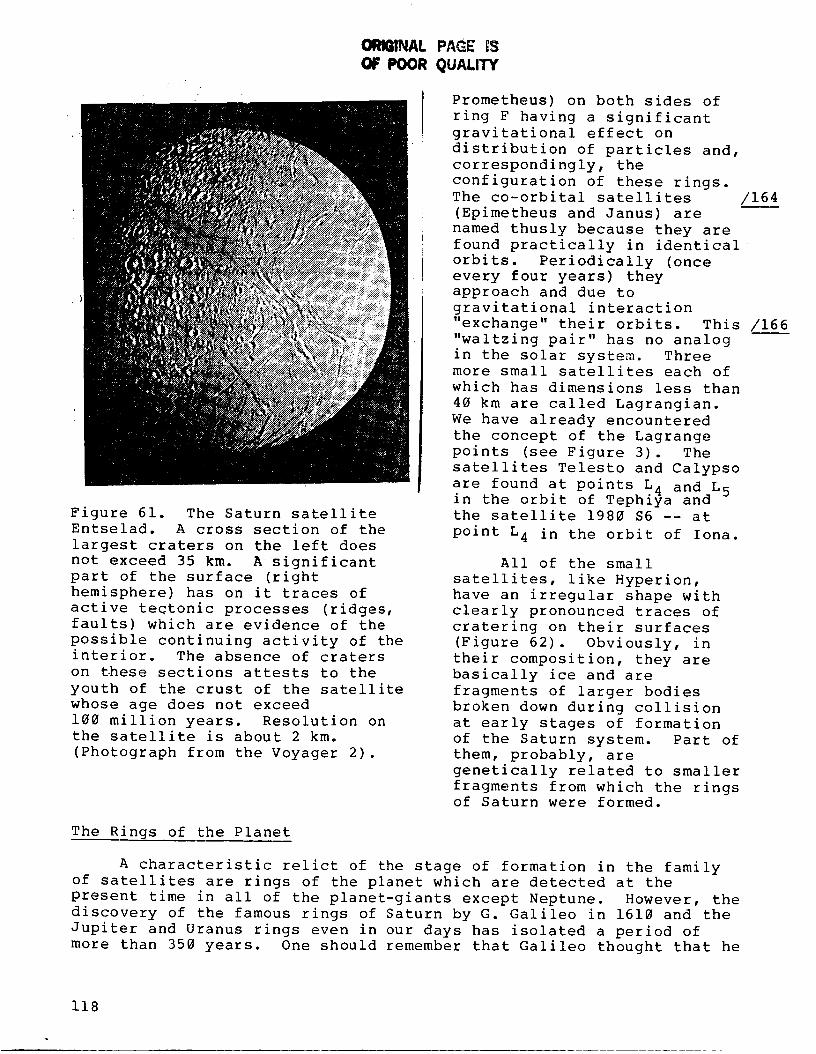
Figure 61. The Saturn satelliteEntselad. A cross section of thelargest craters on the left doesnot exceed 35 km. A significantpart of the surface (righthemisphere) has on it traces ofactive tectonic processes (ridges,faults) which are evidence of thepossible continuing activity of theinterior. The absence of craterson t_ese sections attests to theyouth of the crust of the satellitewhose age does not exceed100 million years. Resolution onthe satellite is about 2 km.(Photograph from the Voyager 2).
ORIGINAL PAGE _S
OF POOR QUALIW
Prometheus) on both sides of
ring F having a significant
gravitational effect on
distribution of particles and,
correspondingly, the
configuration of these rings.
The co-orbital satellites /164
(Epimetheus and Janus) are
named thusly because they are
found practically in identical
orbits. Periodically (once
every four years) they
approach and due to
gravitational interaction
"exchange" their orbits. This /16____6"waltzing pair" has no analog
in the solar system. Three
more small satellites each of
which has dimensions less than
40 km are called Lagrangian.
We have already encountered
the concept of the Lagrange
points (see Figure 3). The
satellites Telesto and Calypso
are found at points L 4 and Lin the orbit of Tephi_a and 5
the satellite 1980 $6 -- at
point L 4 in the orbit of Iona.
All of the small
satellites, like Hyperion,
have an irregular shape with
clearly pronounced traces of
cratering on their surfaces
(Figure 62). Obviously, in
their composition, they are
basically ice and are
fragments of larger bodies
broken down during collision
at early stages of formation
of the Saturn system. Part of
them, probably, are
genetically related to smaller
fragments from which the ringsof Saturn were formed.
The Rings of the Planet
A characteristic relict of the stage of formation in the family
of satellites are rings of the planet which are detected at the
present time in all of the planet-giants except Neptune. However, the
discovery of the famous rings of Saturn by G. Galileo in 1610 and the
Jupiter and Uranus rings even in our days has isolated a period of
more than 350 years. One should remember that Galileo thought that he
118
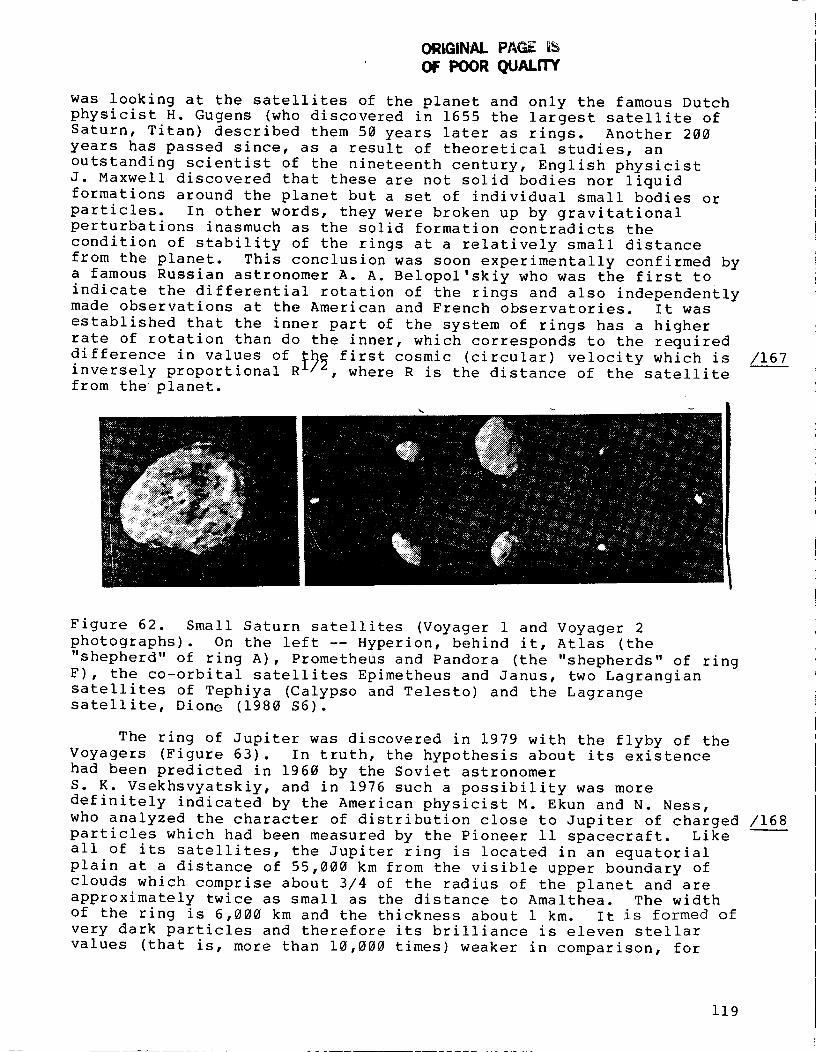
ORIGINAL PAGE t_OF POOR QUALITY
was looking at the satellites of the planet and only the famous Dutch
physicist H. Gugens (who discovered in 1655 the largest satellite of
Saturn, Titan) described them 50 years later as rings. Another 200
years has passed since, as a result of theoretical studies, an
outstanding scientist of the nineteenth century, English physicist
J. Maxwell discovered that these are not solid bodies nor liquid
formations around the planet but a set of individual small bodies or
particles. In other words, they were broken up by gravitational
perturbations inasmuch as the solid formation contradicts the
condition of stability of the rings at a relatively small distance
from the planet. This conclusion was soon experimentally confirmed by
a famous Russian astronomer A. A. Belopol'skiy who was the first to
indicate the differential rotation of the rings and also independentlymade observations at the American and French observatories. It was
established that the inner part of the system of rings has a higher
rate of rotation than do the inner, which corresponds to the required
difference in values of _ first cosmic (circular) velocity which is
inversely proportional R _z_, where R is the distance of the satellite
from the planet.
/167
Figure 62. Small Saturn satellites (Voyager 1 and Voyager 2
photographs). On the left -- Hyperion, behind it, Atlas (the
"shepherd" of ring A), Prometheus and Pandora (the "shepherds" of ring
F), the co-orbital satellites Epimetheus and Janus, two Lagrangian
satellites of Tephiya (Calypso and Telesto) and the Lagrangesatellite, Dione (1980 S6).
The ring of Jupiter was discovered in 1979 with the flyby of the
Voyagers (Figure 63). In truth, the hypothesis about its existence
had been predicted in 1960 by the Soviet astronomer
S. K. Vsekhsvyatskiy, and in 1976 such a possibility was more
definitely indicated by the American physicist M. Ekun and N. Ness,
who analyzed the character of distribution close to Jupiter of charged /168
particles which had been measured by the Pioneer ii spacecraft. Like
all of its satellites, the Jupiter ring is located in an equatorial
plain at a distance of 55,000 km from the visible upper boundary of
clouds which comprise about 3/4 of the radius of the planet and are
approximately twice as small as the distance to Amalthea. The width
of the ring is 6,000 km and the thickness about 1 km. It is formed of
very dark particles and therefore its brilliance is eleven stellar
values (that is, more than 10,000 times) weaker in comparison, for
119
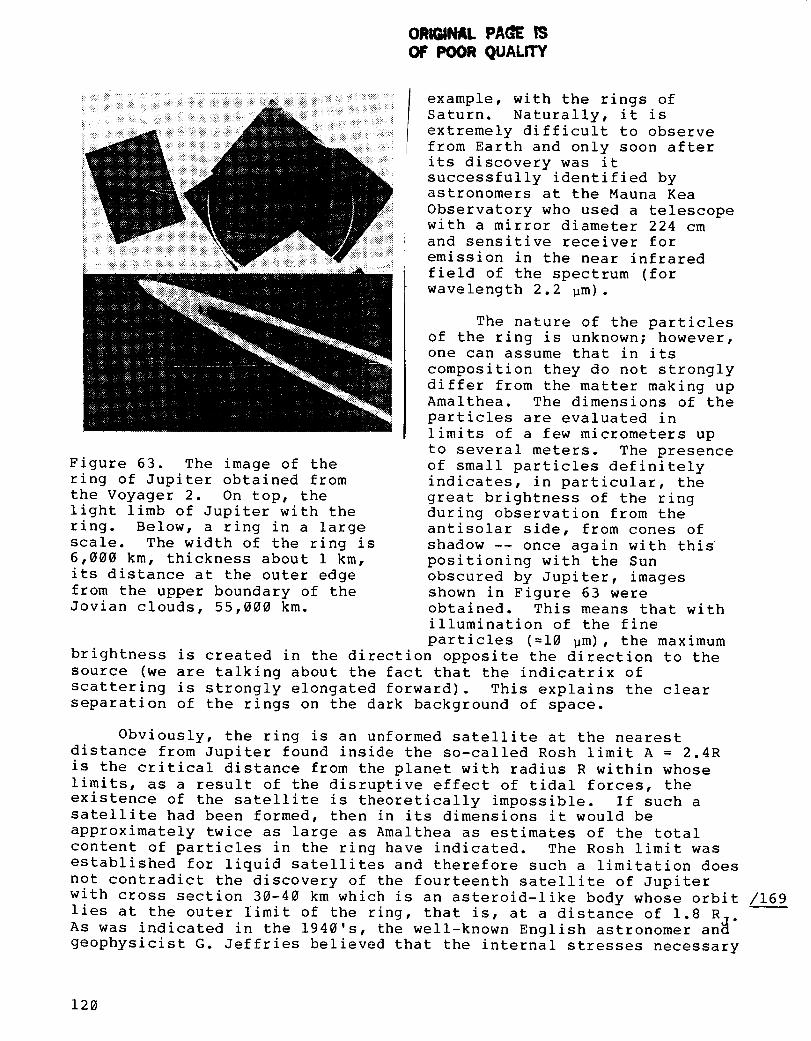
ORWN . PAGE ISOF POOR QUALITY
Figure 63. The image of the
ring of Jupiter obtained from
the Voyager 2. On top, the
light limb of Jupiter with the
ring. Below, a ring in a large
scale. The width of the ring is
6,000 km, thickness about 1 km,
its distance at the outer edge
from the upper boundary of the
Jovian clouds, 55,000 km.
example, with the rings of
Saturn. Naturally, it is
extremely difficult to observe
from Earth and only soon after
its discovery was it
successfully identified by
astronomers at the Mauna Kea
Observatory who used a telescope
with a mirror diameter 224 cm
and sensitive receiver for
emission in the near infrared
field of the spectrum (for
wavelength 2.2 pm).
The nature of the particles
of the ring is unknown; however,
one can assume that in its
composition they do not strongly
differ from the matter making up
Amalthea. The dimensions of the
particles are evaluated in
limits of a few micrometers up
to several meters. The presence
of small particles definitely
indicates, in particular, the
great brightness of the ring
during observation from theantisolar side, from cones of
shadow -- once again with this
positioning with the Sun
obscured by Jupiter, images
shown in Figure 63 were
obtained. This means that with
illumination of the fine
particles (=10 _m), the maximum
brightness is created in the direction opposite the direction to the
source (we are talking about the fact that the indicatrix of
scattering is strongly elongated forward). This explains the clear
separation of the rings on the dark background of space.
Obviously, the ring is an unformed satellite at the nearest
distance from Jupiter found inside the so-called Rosh limit A = 2.4R
is the critical distance from the planet with radius R within whose
limits, as a result of the disruptive effect of tidal forces, the
existence of the satellite is theoretically impossible. If such a
satellite had been formed, then in its dimensions it would be
approximately twice as large as Amalthea as estimates of the total
content of particles in the ring have indicated. The Rosh limit was
established for liquid satellites and therefore such a limitation does
not contradict the discovery of the fourteenth satellite of Jupiter
with cross section 30-40 km which is an asteroid-like body whose orbit /169
lies at the outer limit of the ring, that is, at a distance of 1.8 RAs was indicated in the 1940's, the well-known English astronomer an_"
geophysicist G. Jeffries believed that the internal stresses necessary
120
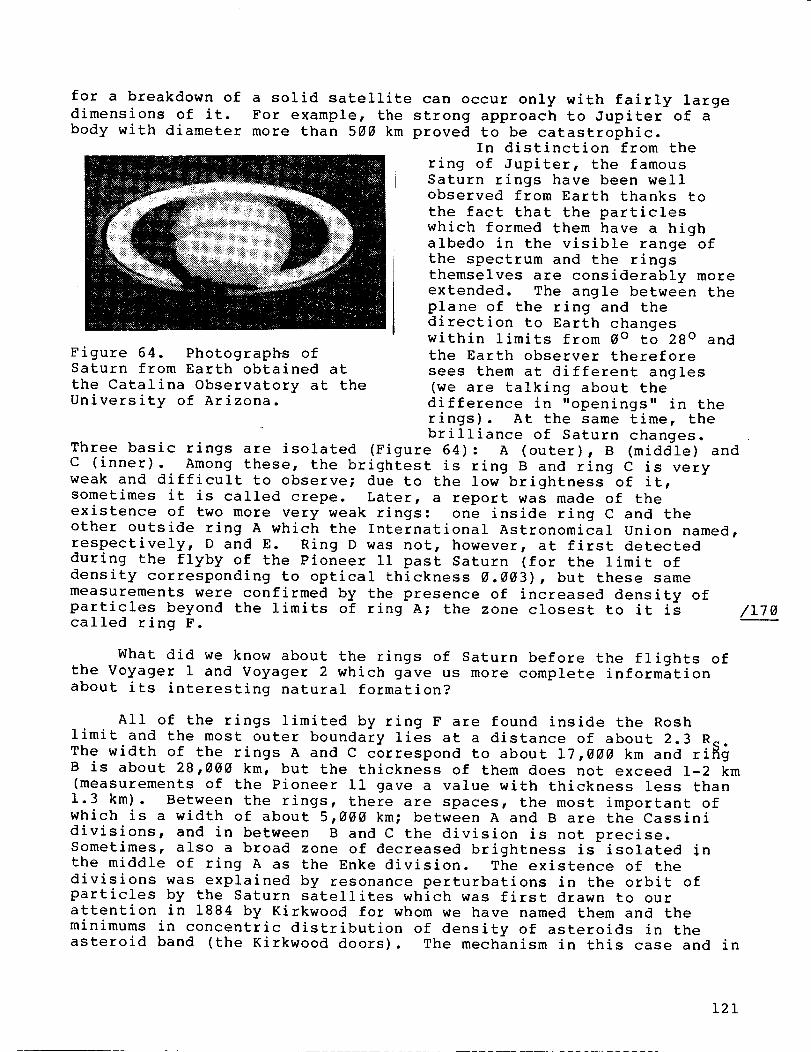
for a breakdown of a solid satellite can occur only with fairly largedimensions of it. For example, the strong approach to Jupiter of abody with diameter more than 500 km proved to be catastrophic.
In distinction from the
ring of Jupiter, the famous
Saturn rings have been well
observed from Earth thanks to
the fact that the particles
which formed them have a high
albedo in the visible range of
the spectrum and the rings
themselves are considerably more
extended. The angle between the
plane of the ring and the
direction to Earth changeswithin limits from 0 ° to 28 ° and
Figure 64. Photographs of the Earth observer therefore
Saturn from Earth obtained at sees them at different angles
the Catalina Observatory at the (we are talking about the
University of Arizona. difference in "openings" in the
rings). At the same time, the
brilliance of Saturn changes.
Three basic rings are isolated (Figure 64): A (outer), B (middle) and
C (inner). Among these, the brightest is ring B and ring C is very
weak and difficult to observe; due to the low brightness of it,
sometimes it is called crepe. Later, a report was made of the
existence of two more very weak rings: one inside ring C and the
other outside ring A which the International Astronomical Union named,
respectively, D and E. Ring D was not, however, at first detected
during the flyby of the Pioneer ii past Saturn (for the limit of
density corresponding to optical thickness 0.003), but these same
measurements were confirmed by the presence of increased density of
particles beyond the limits of ring A; the zone closest to it is
called ring F.
/170
What did we know about the rings of Saturn before the flights of
the Voyager 1 and Voyager 2 which gave us more complete information
about its interesting natural formation?
All of the rings limited by ring F are found inside the Rosh
limit and the most outer boundary lies at a distance of about 2.3 RS-
The width of the rings A and C correspond to about 17,000 km and rlng
B is about 28,000 km, but the thickness of them does not exceed 1-2 km
(measurements of the Pioneer Ii gave a value with thickness less than
1.3 km). Between the rings, there are spaces, the most important of
which is a width of about 5,000 km; between A and B are the Cassini
divisions, and in between B and C the division is not precise.
Sometimes, also a broad zone of decreased brightness is isolated _n
the middle of ring A as the Enke division. The existence of the
divisions was explained by resonance perturbations in the orbit of
particles by the Saturn satellites which was first drawn to our
attention in 1884 by Kirkwood for whom we have named them and the
minimums in concentric distribution of density of asteroids in the
asteroid band (the Kirkwood doors). The mechanism in this case and in
121
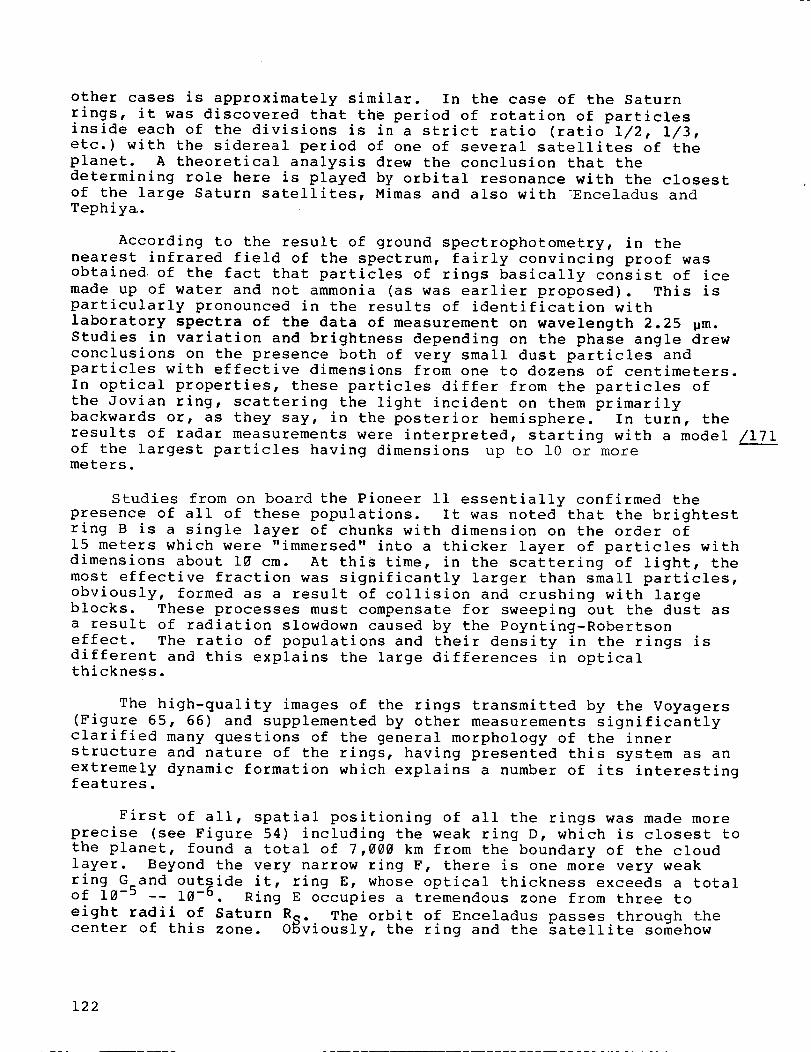
other cases is approximately similar. In the case of the Saturnrings, it was discovered that the period of rotation of particlesinside each of the divisions is in a strict ratio (ratio 1/2, 1/3,etc.) with the sidereal period of one of several satellites of theplanet. A theoretical analysis drew the conclusion that thedetermining role here is played by orbital resonance with the closestof the large Saturn satellites, Mimas and also with -Enceladus andTephiy_.
According to the result of ground spectrophotometry, in thenearest infrared field of the spectrum, fairly convincing proof wasobtained of the fact that particles of rings basically consist of icemade up of water and not ammonia (as was earlier proposed). This isparticularly pronounced in the results of identification withlaboratory spectra of the data of measurement on wavelength 2.25 _m.Studies in variation and brightness depending on the phase angle drewconclusions on the presence both of very small dust particles andparticles with effective dimensions from one to dozens of centimeters.In optical properties, these particles differ from the particles ofthe Jovian ring, scattering the light incident on them primarilybackwards or, as they say, in the posterior hemisphere. In turn, theresults of radar measurements were interpreted, starting with a model /171
of the largest particles having dimensions up to i0 or more
meters.
Studies from on board the Pioneer ii essentially confirmed the
presence of all of these populations. It was noted that the brightest
ring B is a single layer of chunks with dimension on the order of
15 meters which were "immersed" into a thicker layer of particles with
dimensions about 10 cm. At this time, in the scattering of light, the
most effective fraction was significantly larger than small particles,
obviously, formed as a result of collision and crushing with large
blocks. These processes must compensate for sweeping out the dust as
a result of radiation slowdown caused by the Poynting-Robertson
effect. The ratio of populations and their density in the rings is
different and this explains the large differences in optical
thickness.
The high-quality images of the rings transmitted by the Voyagers
(Figure 65, 66) and supplemented by other measurements significantly
clarified many questions of the general morphology of the inner
structure and nature of the rings, having presented this system as an
extremely dynamic formation which explains a number of its interesting
features.
First of all, spatial positioning of all the rings was made more
precise (see Figure 54) including the weak ring D, which is closest to
the planet, found a total of 7,000 km from the boundary of the cloud
layer. Beyond the very narrow ring F, there is one more very weak
ring G and outside it, ring E, whose optical thickness exceeds a total
of 10 -5 -- 10 -6 . Ring E occupies a tremendous zone from three to
eight radii of Saturn R_. The orbit of Enceladus passes through the
center of this zone. O_viously, the ring and the satellite somehow
122
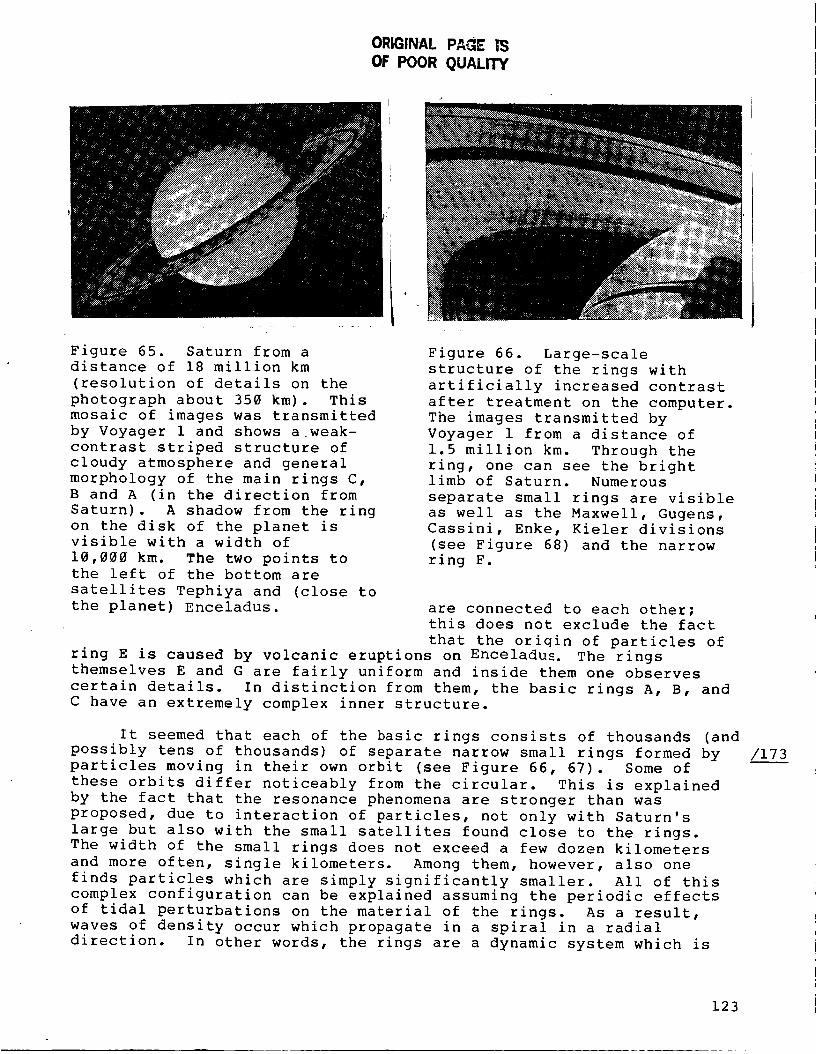
ORIGINAL PAGE _S
OF POOR QUALITY
Figure 65. Saturn from a
distance of 18 million km
(resolution of details on the
photograph about 350 km). This
mosaic of images was transmitted
by Voyager 1 and shows a weak-
contrast striped structure of
cloudy atmosphere and general
morphology of the main rings C,
B and A (in the direction from
Saturn). A shadow from the ring
on the disk of the planet isvisible with a width of
10,000 km. The two points tothe left of the bottom are
satellites Tephiya and (close to
the planet) Enceladus.
Figure 66. Large,scale
structure of the rings with
artificially increased contrast
after treatment on the computer.
The images transmitted by
Voyager 1 from a distance of
1.5 million km. Through the
ring, one can see the bright
limb of Saturn. Numerous
separate small rings are visible
as well as the Maxwell, Gugens,
Cassini, Enke, Kieler divisions
(see Figure 68) and the narrow
ring F.
are connected to each other;this does not exclude the fact
that the origin of particles of
ring E is caused by volcanic eruptions on Enceladus. The rings
themselves E and G are fairly uniform and inside them one observes
certain details. In distinction from them, the basic rings A, B, and
C have an extremely complex inner structure.
It seemed that each of the basic rings consists of thousands (and
possibly tens of thousands) of separate narrow small rings formed by
particles moving in their own orbit (see Figure 66, 67). Some of
these orbits differ noticeably from the circular. This is explained
by the fact that the resonance phenomena are stronger than was
proposed, due to interaction of particles, not only with Saturn's
large but also with the small satellites found close to the rings.
The width of the small rings does not exceed a few dozen kilometers
and more often, single kilometers. Among them, however, also one
finds particles which are simply significantly smaller. All of this
complex configuration can be explained assuming the periodic effects
of tidal perturbations on the material of the rings. As a result,
waves of density occur which propagate in a spiral in a radial
direction. In other words, the rings are a dynamic system which is
/173
123
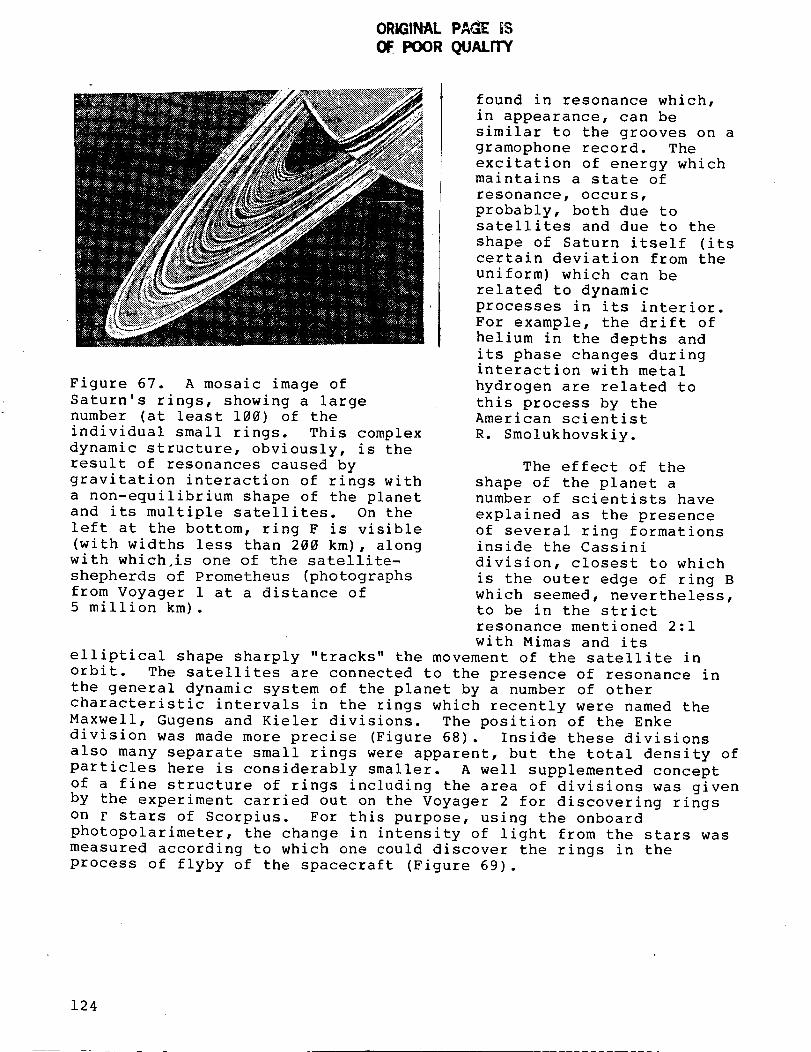
ORIGINAL PAG POORQUALITY
_ . . i :.:i!_ _
Figure 67. A mosaic image of
Saturn's rings, showing a large
number (at least 100) of the
individual small rings. This complex
dynamic structure, obviously, is the
result of resonances caused by
gravitation interaction of rings with
a non-equilibrium shape of the planet
and its multiple satellites. On the
left at the bottom, ring F is visible
(with widths less than 200 km), along
with which,is one of the satellite-
shepherds of Prometheus (photographs
from Voyager 1 at a distance of
5 million km).
found in resonance which,
in appearance, can be
similar to the grooves on a
gramophone record. Theexcitation of energy which
maintains a state of
resonance, occurs,
probably, both due tosatellites and due to the
shape of Saturn itself (its
certain deviation from the
uniform) which can be
related to dynamic
processes in its interior.
For example, the drift of
helium in the depths and
its phase changes during
interaction with metal
hydrogen are related to
this process by the
American scientist
R. Smolukhovskiy.
The effect of the
shape of the planet anumber of scientists have
explained as the presence
of several ring formations
inside the Cassini
division, closest to which
is the outer edge of ring B
which seemed, nevertheless,
to be in the strict
resonance mentioned 2:1
with Mimas and its
elliptical shape sharply "tracks" the movement of the satellite in
orbit. The satellites are connected to the presence of resonance in
the general dynamic system of the planet by a number of other
characteristic intervals in the rings which recently were named the
Maxwell, Gugens and Kieler divisions. The position of the Enke
division was made more precise (Figure 68). Inside these divisions
also many separate small rings were apparent, but the total density of
particles here is considerably smaller. A well supplemented concept
of a fine structure of rings including the area of divisions was given
by the experiment carried out on the Voyager 2 for discovering rings
on F stars of Scorpius. For this purpose, using the onboard
photopolarimeter, the change in intensity of light from the stars was
measured according to which one could discover the rings in the
process of flyby of the spacecraft (Figure 69).
124
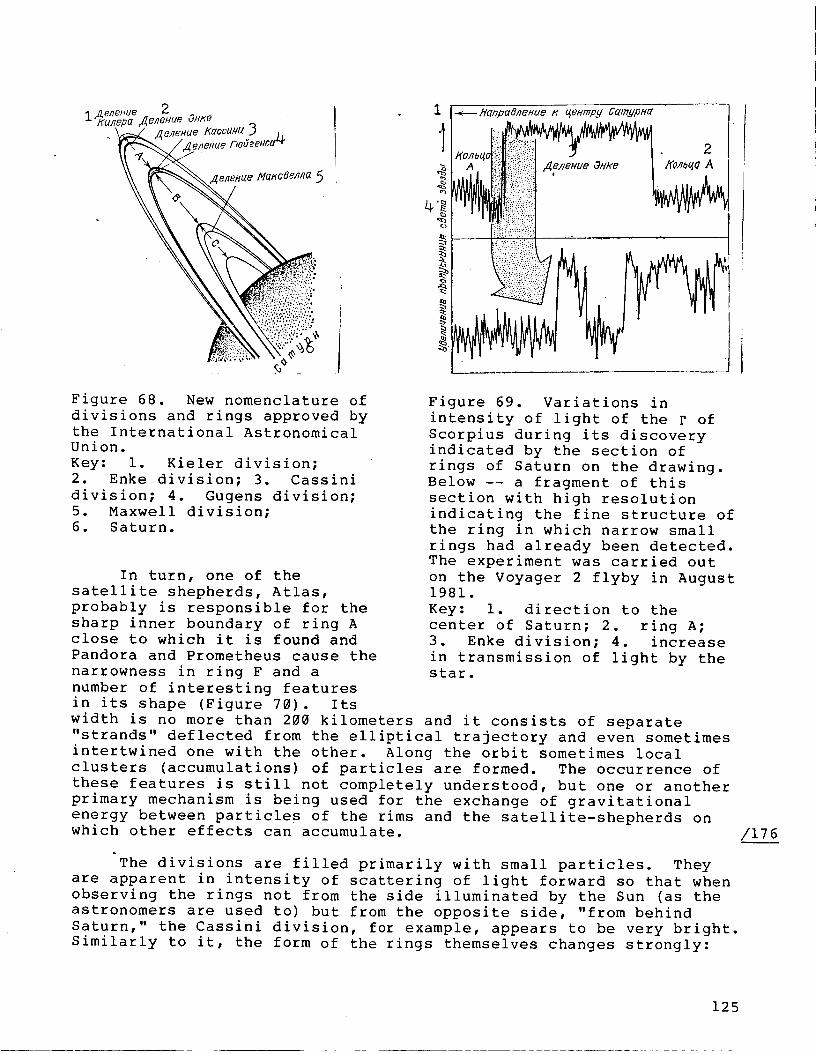
l _u_ep_ _ene.ue a.Ke
, ,<,.• 5:?i'_:5:_'.',:....
Figure 68. New nomenclature of
divisions and rings approved by
the International Astronomical
Union.
Key: i. Kieler division;2. Enke division; 3. Cassini
division; 4. Gugens division;
5. Maxwell division;
6. Saturn.
In turn, one of the
satellite shepherds, Atlas,
probably is responsible for the
sharp inner boundary of ring A
close to which it is found and
Pandora and Prometheus cause the
narrowness in ring F and a
number of interesting features
1 I
I _ H(znpczS/leHue K geHmpy G(zrnypHCl |, I
t
• ..
Figure 69. Variations in
intensity of light of the F of
Scorpius during its discovery
indicated by the section of
rings of Saturn on the drawing.
Below -- a fragment of this
section with high resolution
indicating the fine structure of
the ring in which narrow small
rings had already been detected.
The experiment was carried out
on the Voyager 2 flyby in August
1981.
Key: i. direction to the
center of Saturn; 2. ring A;
3. Enke division; 4. increase
in transmission of light by the
star.
in its shape (Figure 70). Itswidth is no more than 200 kilometers and it consists of separate
"strands" deflected from the elliptical trajectory and even sometimes
intertwined one with the other. Along the orbit sometimes local
clusters (accumulations) of particles are formed. The occurrence of
these features is still not completely understood, but one or another
primary mechanism is being used for the exchange of gravitational
energy between particles of the rims and the satellite-shepherds on
which other effects can accumulate.
"The divisions are filled primarily with small particles. They
are apparent in intensity of scattering of light forward so that when
observing the rings not from the side illuminated by the Sun (as the
astronomers are used to) but from the opposite side, "from behind
Saturn," the Cassini division, for example, appears to be very bright.
Similarly to it, the form of the rings themselves changes strongly:
/176
125
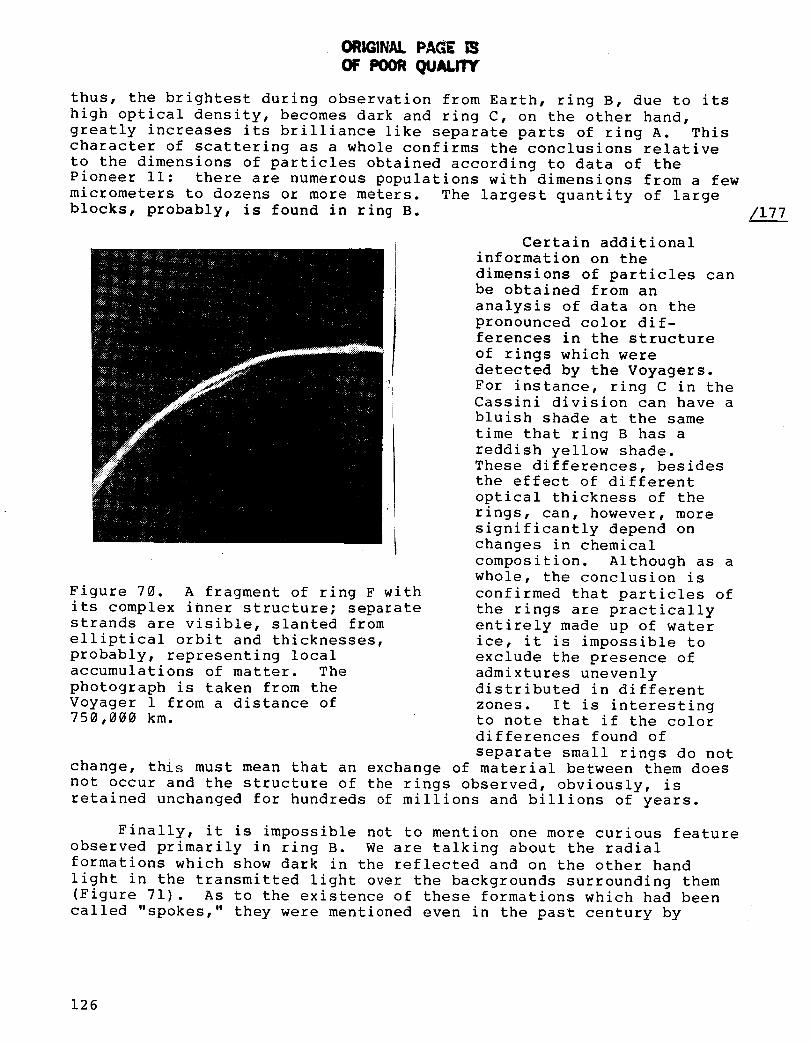
ORIGINN. PAaE
OF POOR QuALrTY
thus, the brightest during observation from Earth, ring B, due to its
high optical density, becomes dark and ring C, on the other hand,
greatly increases its brilliance like separate parts of ring A. This
character of scattering as a whole confirms the conclusions relative
to the dimensions of particles obtained according to data of the
Pioneer ii: there are numerous populations with dimensions from a few
micrometers to dozens or more meters. The largest quantity of large
blocks, probably, is found in ring B.
Figure 70. A fragment of ring F with
its complex inner structure; separate
strands are visible, slanted from
elliptical orbit and thicknesses,
probably, representing local
accumulations of matter. The
photograph is taken from the
Voyager 1 from a distance of
750,000 km.
Certain additional
information on the
dimensions of particles can
be obtained from an
analysis of data on the
pronounced color dif-
ferences in the structure
of rings which were
detected by the Voyagers.
For instance, ring C in theCassini division can have a
bluish shade at the same
time that ring B has a
reddish yellow shade.
These differences, besides
the effect of different
optical thickness of the
rings, can, however, more
significantly depend on
changes in chemical
composition. Although as a
whole, the conclusion is
confirmed that particles of
the rings are practically
entirely made up of water
ice, it is impossible to
exclude the presence of
admixtures unevenly
distributed in different
zones. It is interestingto note that if the color
differences found of
separate small rings do notchange, this must mean that an exchange of material between them does
not occur and the structure of the rings observed, obviously, is
retained unchanged for hundreds of millions and billions of years.
Finally, it is impossible not to mention one more curious feature
observed primarily in ring B. We are talking about the radial
formations which show dark in the reflected and on the other hand
light in the transmitted light over the backgrounds surrounding them
(Figure 71). As to the existence of these formations which had been
called "spokes," they were mentioned even in the past century by
/177
126
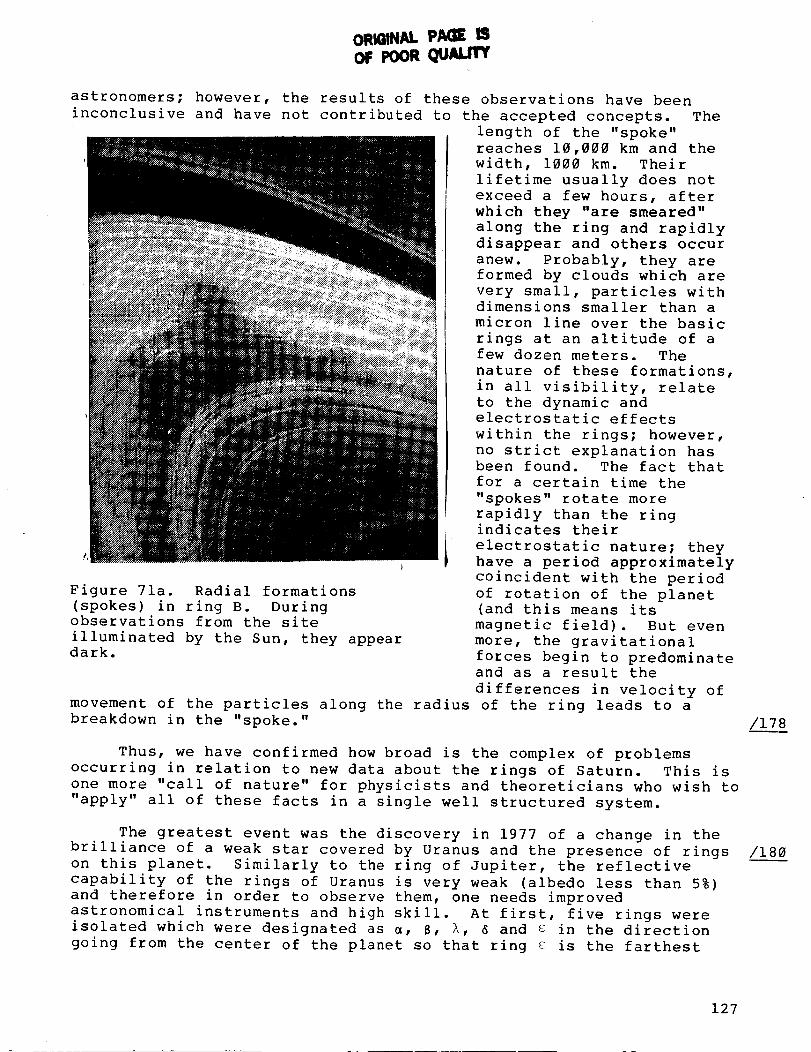
ORIGINAI-p.e E ISOF POORQUAUl
astronomers; however, the results of these observations have been
inconclusive and have not contributed to the accepted concepts. The
length of the "spoke"
reaches 10,000 km and the
width, 1000 km. Their
lifetime usually does not
exceed a few hours, after
which they "are smeared"
along the ring and rapidly
disappear and others occur
anew. Probably, they are
formed by clouds which are
very small, particles withdimensions smaller than a
micron line over the basic
rings at an altitude of a
few dozen meters. The
nature of these formations,
in all visibility, relate
to the dynamic and
electrostatic effects
within the rings; however,
no strict explanation has
been found. The fact that
for a certain time the
"spokes" rotate more
rapidly than the ringindicates their
i electrostatic nature; they, have a period approximately
coincident with the period
of rotation of the planet
(and this means its
magnetic field). But even
more, the gravitational
forces begin to predominateand as a result the
differences in velocity of
movement of the particles along the radius of the ring leads to a
breakdown in the "spoke."
Figure 71a. Radial formations
(spokes) in ring B. Duringobservations from the site
illuminated by the Sun, they appeardark.
Thus, we have confirmed how broad is the complex of problems
occurring in relation to new data about the rings of Saturn. This is
one more "call of nature" for physicists and theoreticians who wish to
"apply" all of these facts in a single well structured system.
The greatest event was the discovery in 1977 of a change in the
brilliance of a weak star covered by Uranus and the presence of rings
on this planet. Similarly to the ring of Jupiter, the reflective
capability of the rings of Uranus is very weak (albedo less than 5%)
and therefore in order to observe them, one needs improved
astronomical instruments and high skill. At first, five rings wereisolated which were designated as _, 8, I, _ and E in the direction
going from the center of the planet so that ring s is the farthest
/178
/180
127
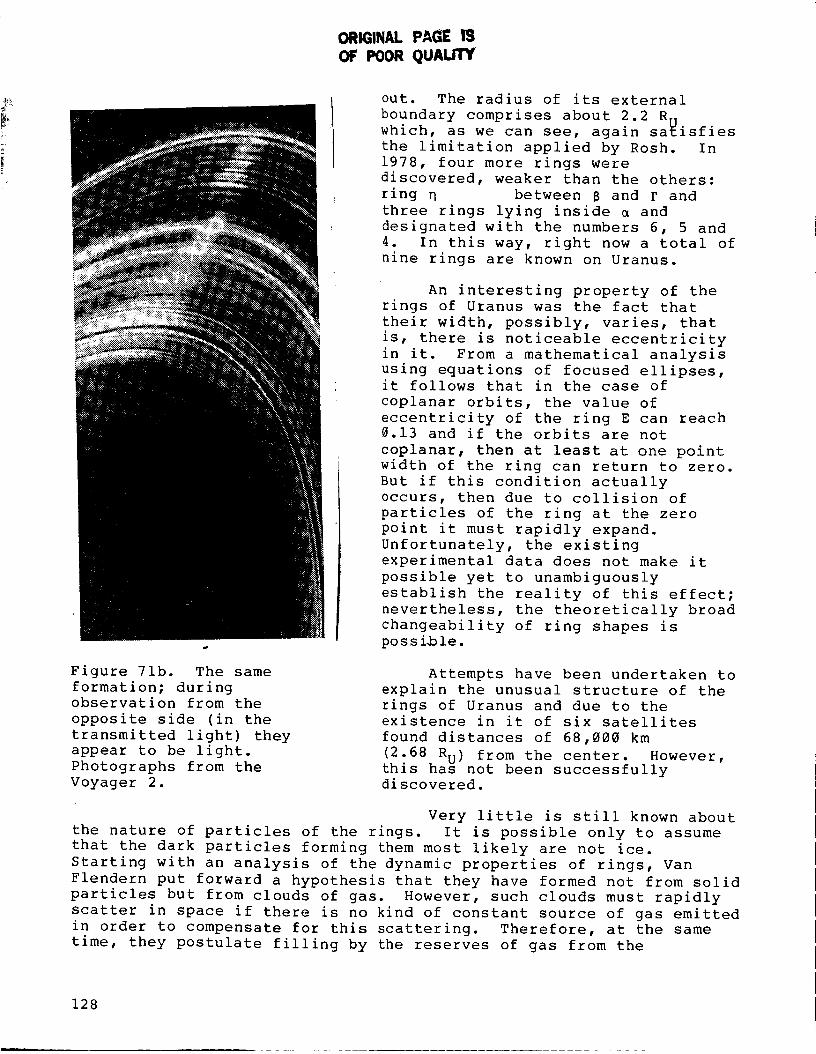
ORIGINAL PAGE
OF POOR QUALITY
out. The radius of its external
boundary comprises about 2.2 R.
which, as we can see, again satisfies
the limitation applied by Rosh. In
1978, four more rings were
discovered, weaker than the others:
ring _ between B and F and
three rings lying inside _ and
designated with the numbers 6, 5 and
4. In this way, right now a total of
nine rings are known on Uranus.
An interesting property of the
rings of Uranus was the fact that
their width, possibly, varies, that
is, there is noticeable eccentricity
in it. From a mathematical analysis
using equations of focused ellipses,
it follows that in the case of
coplanar orbits, the value of
eccentricity of the ring E can reach
0.13 and if the orbits are not
coplanar, then at least at one point
width of the ring can return to zero.
But if this condition actually
occurs, then due to collision of
particles of the ring at the zero
point it must rapidly expand.
Unfortunately, the existing
experimental data does not make it
possible yet to unambiguously
establish the reality of this effect;
nevertheless, the theoretically broad
changeability of ring shapes is
possible.
Figure 71b. The same
formation; duringobservation from the
opposite side (in the
transmitted light) they
appear to be light.
Photographs from the
Voyager 2.
Attempts have been undertaken to
explain the unusual structure of the
rings of Uranus and due to the
existence in it of six satellites
found distances of 68,000 km
(2.68 RU) from the center. However,
this has not been successfullydiscovered.
Very little is still known about
the nature of particles of the rings. It is possible only to assume
that the dark particles forming them most likely are not ice.
Starting with an analysis of the dynamic properties of rings, Van
Flendern put forward a hypothesis that they have formed not from solid
particles but from clouds of gas. However, such clouds must rapidly
scatter in space if there is no kind of constant source of gas emitted
in order to compensate for this scattering. Therefore, at the same
time, they postulate filling by the reserves of gas from the
128
satellites or even the existence of invisible satellites on the orbits /18_____iof the rings, Both these hypotheses seem, in our opinion, fairly
artificial as an exemplary analogous hypothesis explaining the
structure of the rings of Saturn by the presence of asteroid-like
blocks as put forward by V. D. Davydov.
The question continues under discussion as to whether or not
Neptune has rings. Several years ago, the existence of a ring was
reported jointly by the colleagues of American astronomer E. Gaynan
who had observed back at the end of the 1960's a change in brightness
of one of the stars when it was covering Neptune. The measured course
of incidence of brightness was impossible to explain as a satellite
(then the incidence has been stronger and sharper) and therefore a
hypothesis was put forward about rings located very close to the
planet within limits 3600-7900 km from the edge of the disk.
Moreover, another American scientist D. Elliot who had earlier made a
number of observations did not discover rings in the equatorial plane
of Neptune (on the level of intensity of particles corresponding to
obstacle thickness 0.07, that is, higher than the Jupiter rings), but
their existence outside this plane he considers hardly probable basing
his conclusion on the existing examples of the rings of Jupiter,
Saturn and Uranus. One must truly consider that the position itself
of the equator of Neptune is already known fairly precisely (within
the limits of a few degrees). In 1981, a report was put out on the
discovery for Neptune of a third satellite found at a distance close
to the planet. However, it was not a satellite that was observed but
one of the brighter formations of the ring which was found after a new
series of observations in 1984 called aD"arc" or "segments." The
nature of this segmentary structure still remains disputed. Although
the hypothesis itself about the rings (at least such weak rings as
those of Jupiter) began to be more plausible. But in this case, the
theoreticians first of all had to find an explanation for the
phenomenon as to why at a distance of =R N where the arcs of rings were
discovered, that is, beyond the Rosh limit, combining of particles
formed there into a single body did not occur (agglomeration) inasmuch
as here the force of gravity predominates over forces caused by tidal
perturbations in the field of gravity of Neptune.
129
The horsesaid,
looking at a camel:"What kind of a giant mongrel horse are you?"The camel cried:
"Are you actually a horseYou are just
an undeveloped camel."
V. Mayakovskiy"Poems for different tastes"
CHAPTERIVTHE INNER STRUCTUREAND THERMALHISTORY
The development of the modern appearance of planets andsatellites was directly related to processes occurring in theirinteriors and in the final analysis was determined by certain commonprinciples and stages of chemical evolution of planetary matter. Atthe present time, it is difficult to give unambiguous answers toquestions about what the sequence of these stages was. Moreover,already experimental data accumulated which satisfy theoretical modelsmake it possible to put forward a number of basic hypotheses relativeto the geological present and past of the planet and to understand thespecial features of their inner structure.
/182
Consideration of the structure and chemical composition of the
planet-giants brings us to the present stage of formation of the solar
system about 4.6 billion years ago. We will start with the basic
concepts of the fact that the primary composition of matter of a
protoplanetary nebula was the same in all of the fields it occupied
and corresponded to the solar or the cosmic incidence of elements. It
is known that in the incidence of elements, besides small exceptions,
one observes a fully definite principle: with an increase in the
atomic order number it exponentially decreases (down to z = 40) and
for heavier elements the value of incidence is retained almost
constant.
In the composition of matter of the Sun, planets and meteorites,
basic groups of elements have entered formed according to the modern
concepts in galactic nuclear synthesis (nucleo-synthesis) no less
than 10 billion years ago. With the possibility of nucleo-synthesis, /183
right now such processes as occur in the central fields of explosion
during flares of supernova stars and during ejecta of matter from an
unequal layer of neutron stars in close dual systems are involved.
Then, the formation of elements heavier than iron occurs as a result
of capture of neutrons and subsequent 8-decay. The corresponding
concepts are developed by Soviet astrophysicists of the
Ya. B. Zel'dovich school.
In the process of formation of the solar system, possibly,
natural synthesis continued of certain radioactive and stable chemical
130
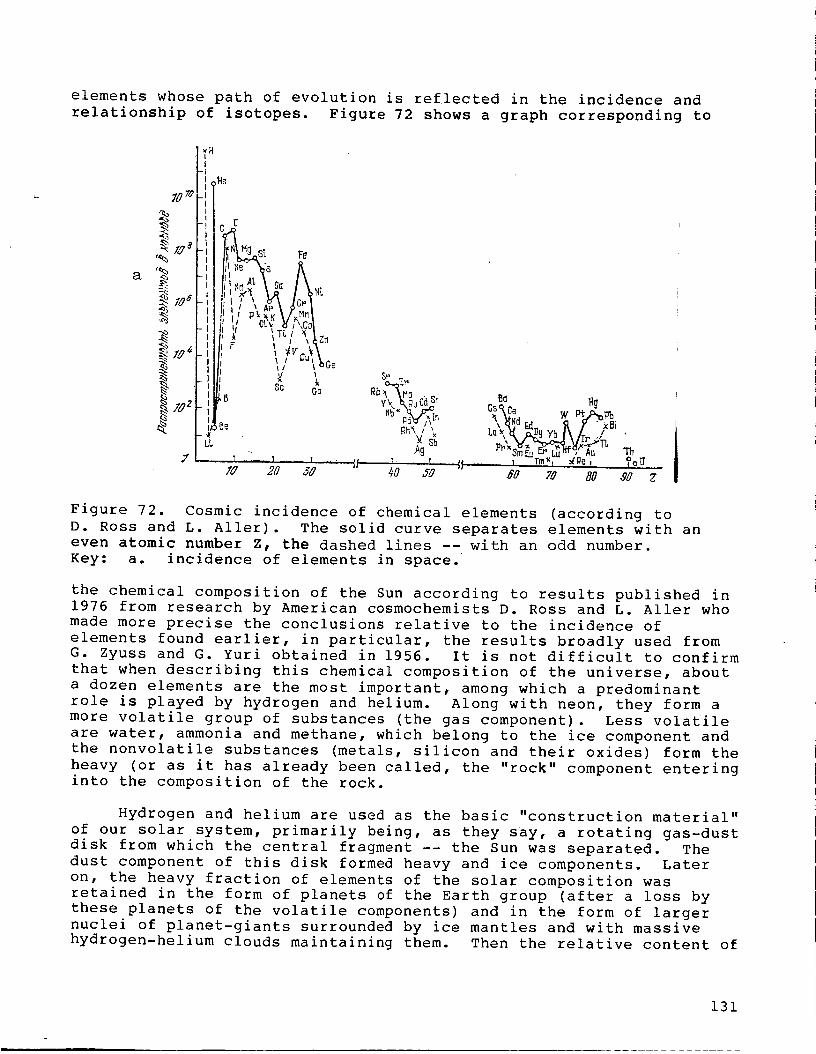
elements whose path of evolution is reflected in the incidence andrelationship of isotopes. Figure 72 shows a graph corresponding to
70 7o
,_ W 8
a
7
_Ht
-I 1%
-_ll! ,/ - _.T_/'_'I
]/1, ¢
i___ .... _ "" tlI0 20 5d
_P 7_
' I f: 1 Tm "/'I _l_e , _oTJ "
_0 ,tO _0 7O 8O ,gO z
Figure 72. Cosmic incidence of chemical elements (according to
D. Ross and L. Aller). The solid curve separates elements with an
even atomic number Z, the dashed lines -- with an odd number.
Key: a. incidence of elements in space.
the chemical composition of the Sun according to results published in
1976 from research by American cosmochemists D. Ross and L. Aller who
made more precise the conclusions relative to the incidence of
elements found earlier, in particular, the results broadly used from
G. Zyuss and G. Yuri obtained in 1956. It is not difficult to confirm
that when describing this chemical composition of the universe, about
a dozen elements are the most important, among which a predominant
role is played by hydrogen and helium. Along with neon, they form a
more volatile group of substances (the gas component). Less volatile
are water, ammonia and methane, which belong to the ice component and
the nonvolatile substances (metals, silicon and their oxides) form the
heavy (or as it has already been called, the "rock" component entering
into the composition of the rock.
Hydrogen and helium are used as the basic "construction material"
of our solar system, primarily being, as they say, a rotating gas-dust
disk from which the central fragment -- the Sun was separated. The
dust component of this disk formed heavy and ice components. Later
on, the heavy fraction of elements of the solar composition was
retained in the form of planets of the Earth group (after a loss by
these planets of the volatile components) and in the form of larger
nuclei of planet-giants surrounded by ice mantles and with massive
hydrogen-helium clouds maintaining them. Then the relative content of
131
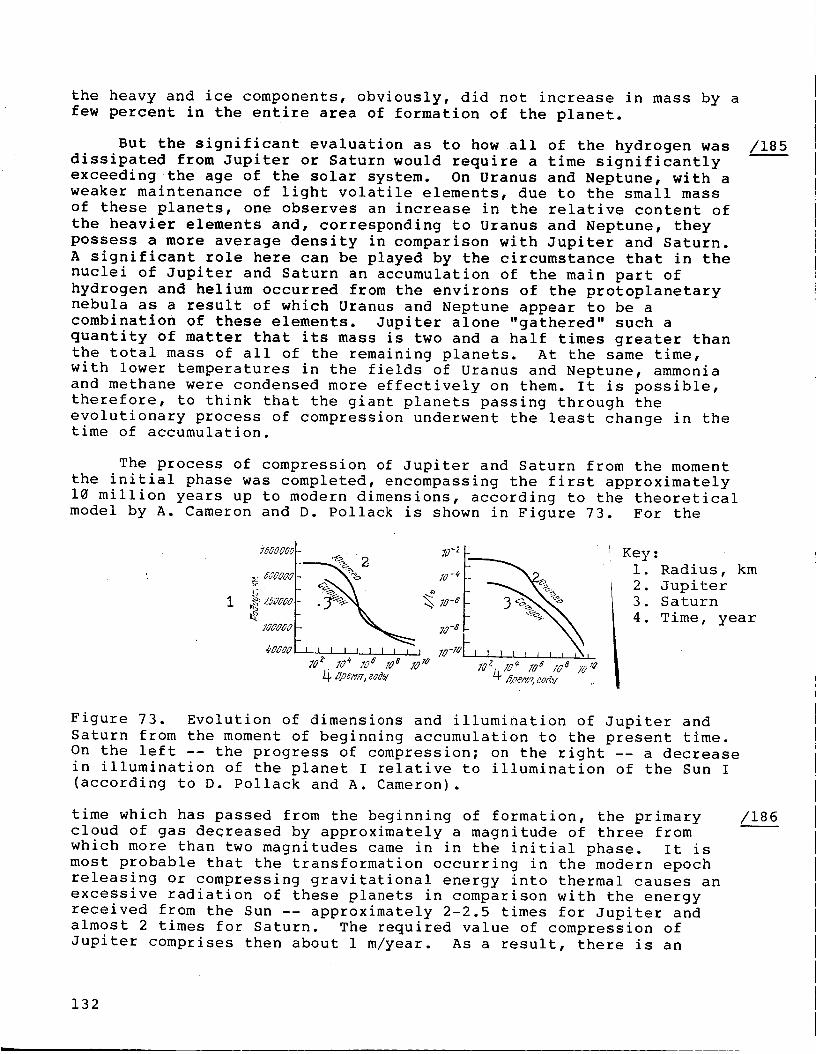
the heavy and ice components, obviously, did not increase in mass by afew percent in the entire area of formation of the planet.
But the significant evaluation as to how all of the hydrogen wasdissipated from Jupiter or Saturn would require a time significantlyexceeding the age of the solar system. On Uranus and Neptune, with a
weaker maintenance of light volatile elements, due to the small mass
of these planets, one observes an increase in the relative content of
the heavier elements and, corresponding to Uranus and Neptune, they
possess a more average density in comparison with Jupiter and Saturn.
A significant role here can be played by the circumstance that in the
nuclei of Jupiter and Saturn an accumulation of the main part of
hydrogen and helium occurred from the environs of the protoplanetary
nebula as a result of which Uranus and Neptune appear to be a
combination of these elements. Jupiter alone "gathered" such a
quantity of matter that its mass is two and a half times greater than
the total mass of all of the remaining planets. At the same time,
with lower temperatures in the fields of Uranus and Neptune, ammonia
and methane were condensed more effectively on them. It is possible,
therefore, to think that the giant planets passing through the
evolutionary process of compression underwent the least change in thetime of accumulation.
The process of compression of Jupiter and Saturn from the moment
the initial phase was completed, encompassing the first approximately
10 million years up to modern dimensions, according to the theoretical
model by A. Cameron and D. Pollack is shown in Figure 73. For the
_00006
5:0000
g
/000:0
_oooo
-- _ 73-8
! i I i I 1 I I I ,t 70-TO/0 2. ZO_ 108 i0_ 10zo
Key:
i. Radius, km
2. Jupiter3. Saturn
4. Time, year
/185
Figure 73. Evolution of dimensions and illumination of Jupiter and
Saturn from the moment of beginning accumulation to the present time.
On the left -- the progress of compression; on the right -- a decrease
in illumination of the planet I relative to illumination of the Sun I
(according to D. Pollack and A. Cameron).
time which has passed from the beginning of formation, the primary
cloud of gas decreased by approximately a magnitude of three from
which more than two magnitudes came in in the initial phase. It is
most probable that the transformation occurring in the modern epoch
releasing or compressing gravitational energy into thermal causes an
excessive radiation of these planets in comparison with the energy
received from the Sun -- approximately 2-2.5 times for Jupiter and
almost 2 times for Saturn. The required value of compression of
Jupiter comprises then about 1 m/year. As a result, there is an
/186
132
increase in measured brightness temperatures over the equilibrium(effective) temperatures calculated from conditions of balance broughtto the planet by solar energy and energy emitted to it in thesurrounding cosmic space.
The calculation mode of changing the value of radiation in theprocess of evolution also is shown in Figure 73, from which it isapparent that at an early stage of formation the illumination ofJupiter could reach tremendous values: about 1% of the illuminationof the Sun! It is possible therefore to think that due to the rapidcompression high temperatures of the interior of these planetsdeveloped and the excess of radiation observed involves not theseparation of gravitational energy, but that continuing from theircooling in the present epoch. From the other hypothetical sources ofenergy, for explaining this phenomenon, there is also interest in thepossibility of heat generation as a result of the continuouslyoccurring transition of molecular hydrogen to metallic or theincidence of helium from a hydrogen-helium solution due to itsimmiscibility with metallic hydrogen, with subsequent drift to thecenter of the planet: as calculations have shown, such chemicaldifferentiation and "outflow" of helium inside from the outermolecular fields are capable, in principle, of providing the requiredvalue of energy generated in the interior. Let us remember that withthis process one can relate such deviations in the shapes of Saturnfrom the equilibrium and the mechanism of pumping energy found inresonance to the dynamic system of the rings.
On the other planets located much closer to the Sun and havingsignificantly less mass, the loss of the volatile elements themselves-- hydrogen and helium and also easily boiling compounds such asmethane, ammonia, water, occurred already in the stage of accretion orsoon after completion of its basic phase. Both the low cosmic /187
velocity and the much higher effective temperatures of which it was
capable were incident inversely proportional to the square of the
distance from the Sun. As was already noted, temperature and pressure
of the solar radiation can noticeably affect the composition itself of
the protoplanetary cloud by fractionation of the primary matter due to
sweeping out of part of the volatile elements from the area of
formation of the Earth planets. Moreover, at great distances where
the giants formed, an additional decrease in temperature (right down
to the temperature of condensation of gases) could have occurred, due
to screening of solar radiation by the dust component of a primary
cloud down to the moment of its disappearance.
Models of Planet-Giants
The mechanical properties considered above of the planets --
mass, dimensions, special features of shape and a rotational movement
-- are the most important consequences for problems of their internal
structure. The distribution of mass in the interior of the planet
determines its gravitational potential and the moment of inertia. The
actual gravitational potential is distinguished from simple Newtonian
potential described as the spherical-symmetrical distribution of
density depending on the radius and can be presented in the form of an
133
expansion according to spherical function. The main member of theseries corresponds to the potential of attraction of the sphere withmass equal to the mass of a planet and members of the second andhigher orders (the so-called zonal and tesseral harmonics) reflect thedetails of its internal structure.
The even and odd harmonics take into consideration, respectively,the deflection and distribution of density from the spherical-symmetrical and the hydrostatically uniform. They are characterizedby multipolar moments Jn determined according to the value ofperturbations of orbit _f natural and artificial satellites and thetrajectory of moment of flight spacecraft. The basic contribution ismade by the first correcting member of the second magnitude,proportional to the quadripolar moment J2 which takes intoconsideration the compression of the planets. Correspondingly, J2defined as J _ C - A has a magnitude of compression _ (all of the
2 MR_
symbols are presented on pages 30-48). The subsequent zonal moments /188
in the body found in hydrostatic equilibrium decreased proportionally--
to the second and subsequent degrees of compression. At a value of
moments higher than J4, the internal layers of the planet are
basically effective, _herefore they speak much less about its internalstructure.
Another important parameter is directly related to the moment J2;it reflects the course of change of density with depth. This
Idimensionless moment of inertia I = -- expressed as the average
M_ 2
moment of inertia in the form _ C + 2A= 3 and the average radius R or
in simplified form, by the moment of inertia relative to the polarC
axis and the equatorial radius RE, that is, I - (see Table i).
In a case where density in the entire thickness is retained as
constant (model of a uniform sphere), I = 0.4. If this density
increases with depth, then I<0.4 then the opposite case I>0.4. For
instance, for Earth, the experimental value I = 0.3315 corresponds to
a significant growth in density toward the center which in actuality
occurs inasmuch as the solid component is basically concentrated inthe nucleus.
The multipolar moments apply limited conditions on the position
of the equipotential (level) surfaces calculated in the theory of the
figure of gravitational bodies and particularly widely used during
calculations of models of the inner structure of giants. In planets
found in a state of hydrostatic equilibrium, the equipotential
surfaces are characterized by uniform values of pressure P, density F,
temperature T and other thermodynamic characteristics of matter. As
to the degree of deviation from hydrostatic equilibrium, it is
possible to judge according to the value of the first odd moment J3-For Earth, it unexpectedly turned out to be fairly large, on the order
134
of the square of compression. This is evidence of the divergence ofthe shape of Earth from equilibrium (for a value on the order of R_2on the surface) and the presence in its interior, besides the radialstresses caused by pressure, of tangential stresses. Their value isseveral magnitudes smaller in comparison with the radial comprising,nevertheless, several dozens of kilograms for each square centimeter.
At the same time, the large planets primarily gas-liquid Jupiter /189
and Saturn, in their composition, are closest to hydrostatic
equilibrium. In their gravitational potential, one does not detect
any kind of noticeable contribution from the moment G 3 according toresults of measurements made on the Pioneer and Voyager spacecraft.
Here excess radiation of energy is indicated as a result of thermal
flow from the interior. A decisive role has to be played here by
convective thermal transfer and not a significantly less effective
mechanism for molecular heat conductivity: it is easily shown that on
the characteristic dimension of the magnitude of the radius of the
planet, the role of its mechanism is negligibly small and can have a
certain contribution in cooling only in the very outer regions. The
basic shift, obviously, occurs within the limits of separate shells
due to differences in density of matter although the precise boundary
of the section between them possibly does not exist. Moreover, on
Jupiter and Saturn, a certain reliable effect of the gradient of
concentration of helium by altitude can be created related to the
mechanism mentioned of its release from the hydrogen-helium solution.
As to the convective activity of the interior, we are also
talking about the presence in Jupiter and Saturn of the appropriate
magnetic fields in whose formation, obviously, not only the central
field but also the shells positioned close to the surface participate.
Along with the theories which have received more recognition of the
planetary magnetic dynamo, as the alternative mechanisms for
generation of a magnetic field, we are looking at movement which
induced precession of the axis of rotation of the planet andexcitation of the thermoelectric electromotive force with convective
transfer onto the boundaries of the field from several different
chemical compositions.
The intensity of the magnetic field of Jupiter at the equator
according to the measurement data from the Pioneer and Voyager
spacecraft comprises 4.2 oersteds (E) which is almost a magnitude
greater than the intensity of the magnetic field of Earth. The
polarity of it is inverse to the polarity of Earth's field, that is,
the northern and southern magnetic poles are found in the same
hemispheres as the corresponding geographic (more precisely Jovian-
graphic) poles and not in the opposite hemispheres as occurs on Earth. /190
The value presented for intensity of the field is related to its basic
dipolar component; along with it, the noticeable components observed
with higher magnitude -- the quadripolar and octipole components whose
relative contribution in value is approximately the same relative to
the contribution of those same components in the geomagnetic field.
The axis of the magnetic dipole of Jupiter does not coincide with the
axis of rotation and the center of the dipole is shifted relative to
the center of the planet into the northern hemisphere. Therefore, on
135
the poles, the intensity of the field varies:comprises 14 E and on the south pole, ii E.
on the north pole, it
The intensity of the magnetic field of Saturn was considerablysmaller and in good agreement with the value indicated by the Sovietscientist Sh. Sh. Dolginov on the basis of the mechanism of generationof a field as a result of precession. According to the data ofmeasurement from the Pioneer ii spacecraft, it comprises on theequator 0.2 E, on the poles 0.56 E; the polarity of the field also isopposite that of Earth and the angle between the axis of the dipoleand the axis of rotation is smaller than 2-3 ° . Data on the presenceof magnetic fields on Uranus and Neptune still have not beenconclusively confirmed.
Significant progress in modeling the structure of giants has beenfacilitated both by the new data of observations and the developmentof the theory of the shape of gravitational bodies and by successes inhigh pressure physics. The latter involves primarily making theequation of state more precise which determines the dependence ofpressure P on density and temperature T, P = P(_, T) for hydrogenand helium and also for heavy and ice components with high pressuresand temperatures inasmuch as the equation of state of real gas isapplicable for calculations only of the most outer fields. Besidesthe fact that the change of pressure of the medium functionallydepends not only on the change in temperature and density, but also onthe concentration of components (which in itself is very complicatedfor a description of its thermodynamic state) a theoreticaldescription of the conditions of formation and stability of phases athigh pressures and temperatures is a complex independent problem.Matter acquires then unusual properties, for example, the transitionof hydrogen into a metallic state. This transition occurs inconditions of very high pressure when the external atomic shells seem"depressurized." The density of the metal hydrogen can be evaluatedroughly assuming that the distance between protons is on the order ofBohr's radius aO = _2/me2 = 0.529 • 10-8 cm (here m and e are the mass /191
and charge of the electron, _ = h/2_, where h is Planck's constant)_
Inasmuch as the mass of a proton mp = 1.67 " 10-24g, we find p=mp/a0=
10 g/cm 3. In this way, this estimate appears almost a magnitude
higher: more strict although not very reliable calculations show
that with pressure 2.6 millions of atmospheres (2.6 megabars, or the
abbreviation Mbar), the metallic hydrogen is found in thermodynamic
equilibrium with molecular hydrogen and its density equals 1.15 g/cm 3.
For transition of helium to a metallized state, one requires a pressure
of about 90 Mbar which is not achieved inside Jupiter. With the
presence of an extensive layer of conducting metal hydrogen, a large
value of magnetic moment is definitely related in this very large
planet of the solar system.
Data on the behavior of matter in extreme conditions are based on
concepts of statistical physics and quantum mechanics. In a very
general case, the thermodynamic state of the liquid and metal
hydrogen, ice and matter of mountain rock at great depths is described
by the equation of state in the so-called Debye approximation with the
136
well-known or additionally calculated relationship to the density ofthe characteristic (Debye) temperature 9. This temperature isexpressed in the form 9 = hv/k, where v is the maximum frequency ofoscillation of atoms of the crystal extending along it in the form ofwaves, each of which can be represented as a quasi-particle -- aquantum of oscillation movement or a phonon. The product ke (k isBoltzmann's constant) characterizes in this case the energy of theshortest wave phonons in matter.
The concept of the phonon makes it possible to study thermal andother properties of solid bodies and matter found in the field ofsuper high pressures using methods of the kinetic theory of gases.During calculations of the deepest layers where temperature reachesdozens and more than thousands of degrees Kelvin, sometimes high-temperature corrections are introduced which take into considerationthe apparent deviation of oscillation of atoms in crystals from aquasiharmonic approximation and also the effect of thermally excitedelectrons of conductivity. In the quasiharmonic approximation, onemore variable is introduced which is extremely important forcalculation of models of the inner structure -- the so-calledGruneisen parameter which characterizes the change of frequency ofoscillation depending on density. Along with the Debye temperature,it fully determines the thermodynamic state of the matter for theappropriate model of a solid body.
/192
Inasmuch as pressure rapidly increases with depth, the hydrogen
and helium making up the inner shells of large planets are found in a
critical state. The critical values of pressure and temperature which
are physical and chemical constants of matter equal for hydrogen,
12.8 atm and 33 K and for helium 2.3 atm and 5 K. For pressure below
critical, the mixture falls into two equilibrium phases -- liquid and
vapor and with pressure higher than critical a continuous transition
of the gaseous phase to liquid occurs, the physical distance between
the phases disappears and the mixture becomes uniform. It is not
difficult to see that the gaseous clouds of these planets must have a
small incidence and these clouds can belong to the atmosphere.
Temperature and pressure determined at levels of atmosphere where
the intrinsic and reflected radiation of the planet form are used as
the necessary boundary conditions and calculations of models of the
inner structure providing initial values for extrapolation of
thermodynamic parameters inside. The lower boundaries of temperatures
in the interiors give extrapolation according to the isotherm (cold
models) and the upper boundaries -- extrapolation according to theadiabatic (hot models). These two models can be considered as maximum
inasmuch as it is difficult to achieve the presence of a super
adiabatic gradient of temperature in conditions which do not prevent
shifting. The most positive result which establishes the probable
range of parameters in the central region leads to adiabatic
extrapolation. Its basis in the assumption, primarily for Jupiter and
Saturn, is strengthened as we have seen by fairly reliably established
facts that both these planets are found in convective equilibrium.
137
The change in thermodynamic and aggregate state by depth makes itpossible to trace the indices of the polytrope and phase diagrams forthe hydrogen-helium solutions determined depending on partial pressureof components and temperature. In the majority of models, theassumption is used that the chemical composition of Jupiter andSaturn correspond to the solar, that is, to the relative content of /193
helium according to a mass of about 20% or one atom of helium to
approximately 20 atoms of hydrogen. The data of measurements of
content of helium and the ratio He/H 2 in the atmosphere of Jupiter andalso the satisfactory agreement obtalned between calculated parameters
of the figure with the observed parameters led up until recently to
the conclusion that this composition actually gives the best results
and the components are heavier than hydrogen and helium, practically
having no effect on the internal structure. Moreover, as later
calculations have shown, the situation obviously is more complex.
With a solar ratio of content of hydrogen and helium, one can assume
the presence on Jupiter of a comparatively large nucleus consisting of
heavy and icy components and also add water to the shell which on
Jupiter, according to estimates is approximately 15 times larger in
comparison with its abundance in the matter of the solar composition(or, in absolute content of =1.8-1029 g which corresponds
approximately to 30 masses of Earth). At the same time, the ratio of
total content of water to the heavy fraction of matter of the nucleus
of Jupiter strongly depends on the initial value adopted of
temperature T0.on a level with pressure at 1 atm from which
extrapolation Is made by depth: with an increase of this temperature,
the mass of excess water increases sharply and the mass of the nucleus
decreases. The abundance presented above of H20 corresponds to the
value T0_190 K which, possibly, is somewhat high. As to Saturn, as wesee from the models, it has a basic mass of water along with methane
and ammonia concentrated in the ice shell directly next to thenucleus.
If these results later on are confirmed, they will have an
important value for the best understanding of the special features of
the early stage of evolution of large planets. They can be looked at
as an indication that at the accretion stage, the mechanism of
separation of phases is in operation which separates water, ammonia
and methane from the heavier fractions and its effectiveness would be
higher the lower the temperature is in the fields of formation of the
planet. Therefore, extensive ice shells were formed on Uranus and
Neptune, on Saturn it remained relatively small and on Jupiter
subjected to a more high-temperature (among the planet-giants) phase
of evolution, was not retained in general transferring to the form of
a mixture in a basically hydrogen-helium solution. These discussions,
of course, have a qualitative character, but unfortunately, right nowwe do not have more reliable data available. /194
Quantitative estimates of the ratio of the content of
concentrated components in the core and the mantle are complicated by
the fact that the mass of the nucleus, generally speaking, hardly
affects the value of gravitational moment with which the results of
the calculations are compared. One must add to this that with the
retained indeterminancy of the equation of state of molecular
138
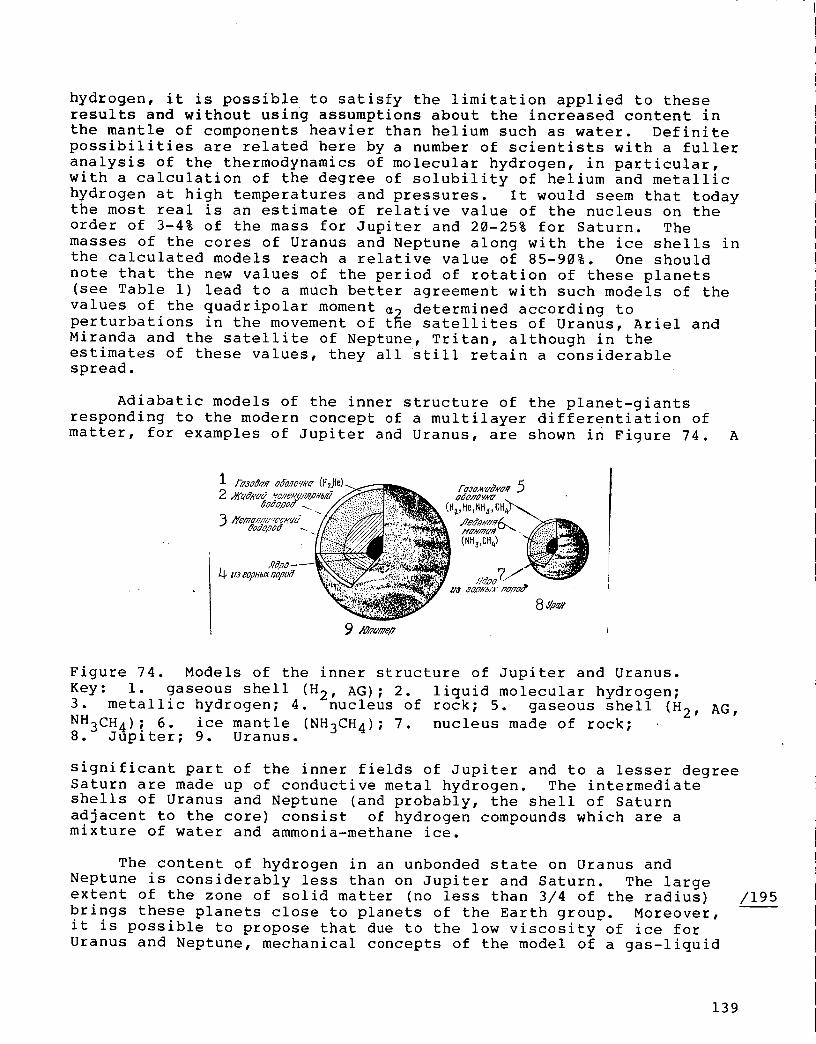
hydrogen, it is possible to satisfy the limitation applied to theseresults and without using assumptions about the increased content inthe mantle of components heavier than heliumsuch as water. Definitepossibilities are related here by a number of scientists with a fulleranalysis of the thermodynamics of molecular hydrogen, in particular,with a calculation of the degree of solubility of helium and metallichydrogen at high temperatures and pressures. It would seem that todaythe most real is an estimate of relative value of the nucleus on theorder of 3-4% of the mass for Jupiter and 20-25% for Saturn. Themasses of the cores of Uranus and Neptune along with the ice shells inthe calculated models reach a relative value of 85-90%. One shouldnote that the new values of the period of rotation of these planets(see Table i) lead to a much better agreement with such models of thevalues of the quadripolar moment _2 determined according toperturbations in the movement of the satellites of Uranus, Ariel andMiranda and the satellite of Neptune, Tritan, although in theestimates of these values, they all still retain a considerablespread.
Adiabatic models of the inner structure of the planet-giantsresponding to the modern concept of a multilayer differentiation ofmatter, for examples of Jupiter and Uranus, are shown in Figure 74. A
• (_z,t_mml_,mi_3"....
(Na_,cNb
_' u_ oo_'_,_ no/_oa_
8 a:a_,
Figure 74. Models of the inner structure of Jupiter and Uranus.
Key: i. gaseous shell (H2, AG); 2. liquid molecular hydrogen;
3. metallic hydrogen; 4. nucleus of rock; 5. gaseous shell (H 2, AG,
NH3CH4); 6. ice mantle (NH3CH4); 7. nucleus made of rock;8. Jupiter; 9. Uranus.
significant part of the inner fields of Jupiter and to a lesser degree
Saturn are made up of conductive metal hydrogen. The intermediate
shells of Uranus and Neptune (and probably, the shell of Saturn
adjacent to the core) consist of hydrogen compounds which are a
mixture of water and ammonia-methane ice.
The content of hydrogen in an unbonded state on Uranus and
Neptune is considerably less than on Jupiter and Saturn. The large
extent of the zone of solid matter (no less than 3/4 of the radius)
brings these planets close to planets of the Earth group. Moreover,
it is possible to propose that due to the low viscosity of ice for
Uranus and Neptune, mechanical concepts of the model of a gas-liquid
/195
139
planet are used found in a state of hydrostatic equilibrium. The mostouter shells located over extensive layers of solid and liquid matterare comparatively thin layers formed basically by gaseous hydrogen andhelium.
In the development of the concept of gas-liquid planet-giants, inthe study of the equation of state of matter at high temperatures andpressure, the theory of figures and calculations of modern models oftheir inner structure has received a significant contribution from theSoviet geophysical school. We will present the values of the basicparameters in the core of planet-giants according to the modeldeveloped by V. N. Zharkov, V. P. Trubitsyn and their coworkers.
The temperature and pressure in the nucleus of Jupiter with theratio He/H is close to that of the solar and appears to equalT=25-103 K and P=80 Mbar, and in the nucleus of Saturn T=20"103 K andP=50 Mbar. The transition of hydrogen to Jupiter in a critical gasphase occurs at a level of =0.98 RU and transition to a metal phase --at the level approximately 0.76 R with pressure P=3 Mbar andtemperature approximately 10,000 _. Obviously, the jump in densitythen does not occur due to lack of continuity of the process ofmetallization in the liquid hydrogen. The metallic shell extends tothe boundary from the nucleus at a level of 0.5 RU. In the model ofSaturn, the metallic hydrogen is formed beginning with a level =0.46 Rand fills the layer approximately to 0.27 R where the nucleus begins.Pressure on the surface of the Jovian nucleus is estimated to equal=45 Mbar and on the surface of the nucleus of Saturn -- about 10 Mbar.The adiabatic models of the inner structure of Uranus and Neptune inwhich the initial state of elements corresponds to cosmic propagation,and relative content of hydrogen and helium remain no more than 5-8%by mass leads to values of temperature and pressure: at the center ofUranus T = (10-12)X103 K and P=5.5-6 Mbar, and at the center ofNeptune T = (12-14)-103 K and P=7-8 Mbar. The boundaries of theirextensive ice shells (cores) begin with a pressure of about 100 kbar.
The Matter of the Planets in the Earth Group and Meteorites
The inner structure of planets of the Earth group, as a result of
any predominant element composition and conditions of formation
differs from the planet-giants by the presence in the entire
thickness of the matter of rock with partially melted mantle and solid
crust on whose surface one can find traces of the geological history
of the planet. The difference in densities of this group of planets
(see Table i) along with the results of modern calculations leads to
concepts of nonuniform chemical composition of primary matter as a
result of fractionation of elements not only in the entire
protoplanetary nebula but also in limits of 1-2 IAU. We are talking
primarily about the metal-silicate fractionation due to the presence
of temperature of condensation of hot gas of solar composition
resulting in nonuniform content of iron and silicon at different
distances from the Sun. Here the supply of diffractionation of iron
and sulfur (more precisely, groups determined by them of the so-called
siderophile and chalcophile elements). Corresponding to the increase
in heliocentric distance, the difference in chemical composition of
/196
140
the primary matter from the composition of iron meteorites has growndue to the large oxidation of iron (with the formation of silicates)and simultaneously the increased content of the sulfide part in it.Here it is possible to consider a certain analog with a degree offractionation of the heavy and ice components depending on thedistance from the Sun: the latter has a lower temperature ofcondensation and therefore comprises the basic portion of mass of thedistant planets themselves and their satellites.
Then, the relatively small quantity of matter of the'protoplanetary nebula from which planets and asteroids in the nearestenvirons of the Sun were formed, in their composition, obviously,corresponded to the composition of meteorites -- namely therefore theywere compared with them speaking of fractionation of primary matter.These space wanderers contain information about the initial stage ofnucleation of the large bodies about 4.6 billion years ago: such isthe age of the overwhelming majority of meteorites which have beenincident on Earth determined according to the isotopic ratio of leadpb207/pb206 and strontium to rubidium Sr87/Rb 87 and at a later timealso the method with greatest precision, according to the ratio ofsamarium and neodymium. Right now there is no doubt that meteoritesformed as a result of crushing at the beginning of larger bodies andtherefore they can be looked at as fragments of asteroids.
It is well known that depending on the ratio of two basic phases-- metallic (iron-nickel) and rock (silicate) -- the meteorites aredivided into three general classes: iron, iron-stone and stone. In
the first of these, a first phase predominates (up to 94%, including
Fe and Ni both in a free and in a bonded state) and in the latter -- a
secondary phase (up to 80%) and in the iron-stone there is
approximately a uniform quantity of iron silicates. Besides these two
basic phases, in each class of meteorites also a sulfide phase or a
troilite phase is present entering the composition of sulfuric iron
(troilite) and a number of other rock-like minerals.
In extent (frequency of incidence) the class of rock meteorites
significantly predominates -- higher than 90% in relative number
whereas the frequency of incidence of iron meteorite does not exceed
6%, the iron-rock is 1.5%. Among rock meteorites in whose composition
mainly there are lithophilic elements forming stable natural compounds
with oxygen (sodium, potassium, magnesium, aluminum, silicon, calcium,
and, of course, oxygen) the main position is occupied by the
chondrites. They were given this name due to the spherical particles
contained in their structure, particles with a diameter on the order
of 1 mm -- chondrules consisting of silicate minerals. Other
meteorites of this class (achondrites) are approximately a magnitude
smaller and in their texture (blurring of boundaries between
chondrules and the matter mixed in) one can assume that during its
formation, they were subjected to a much stronger heating than werethe chondrites.
The content of the richest and most chemically active elements --
hydrogen, carbon, oxygen, magnesium, silicon, sulfur and iron depend
on variations in temperature and pressure in the primary chemically
/197
/198 .
141
uniform protoplanetary disk (Figure 72). With an increase intemperature, the relative content of iron must increase as a result ofloss of silicates and predominance of reducing processes overoxidating processes due to loss of volatile elements. The ordinarychondrites enriched with iron form group H and those poor in iron,group L. Enstatite chondrites consisting basically of a mineral fromthe magnesium silicate family -- enstatite (MgSiO_) and nickel ironpossess the highest degree of reduction; but the _ighest degree ofoxidation belongs to a group of carbonaceous chondrites or group C inwhich almost all of the iron is bonded in magnetite (Fe304) . Thelatter, as was noted, are distinguished also by a very high content ofvolatile elements and are of particular interest.
Actually, if we compare their composition with the combination ofthe incidents of chemical elements according to the curve in Figure72, then it is possible to confirm that it hardly differs at all fromthe composition of the solar matter except for very volatile(ahaophile) elements which include hydrogen, nitrogen and inert gases.This gives us the basis for considering that carbonaceous chondritesare closest to the primary chemical mixture from which later onplanets of the Earth type and asteroids were formed. The meteoritesof this group containing a dark carbonaceous substance, as was alreadynoted, have a very low albedo. The observations indicate that thisalbedo (=5%) has a majority of objects in the asteroid band althoughone would hardly think that their composition is close to that ofcarbonaceous chondrite. More likely, the matter of this compositioncovered only their surface if one takes into consideration thatcarbonaceous chondrites comprise only a small portion among chondritesand meteorites of other classes. Such a hypothesis easilyexplains the reason why only a small number of asteroids, in theirreflective properties, correspond to a composition of the morewidespread iron-rock meteorites. The consideration made convinces usthat chemical classification and the structure of meteorites isdirectly related to their origin. In the first place, the totalgenealogy of meteorites and asteroids makes it possible to proposethat the continental bodies themselves are found in different degreesof evolution, depending on dimensions. If the chondrites originatedfrom comparatively small chemically undifferentiated bodies whichformed by condensation of primary matter at different distances fromthe Sun, then the iron meteorites and achondrites, in all probability,are fragments of larger asteroids whose matter underwent a process ofdifferentiation in their nuclei. A certain part of the ironmeteorites could, however, occur directly as a primary product ofcondensation from the gaseous phase of iron in a protoplanetary nebulawhich the foremost Soviet geochemist A. P. Vinogradov was the first topoint out. Secondly, according to the degree of oxidation of ironcontained in the meteorites, one can judge the conditions ofcondensation, primarily temperature, in different parts of theprotoplanetary nebula. It is posslble to think that the ironmeteorites and enstatite chondrites which differ in a greater degree
in reduction, were formed primarily at high temperature in nearest
distances to the Sun within limits approximately of the orbit of
Mercury at the same time that maximum oxidation of carbonaceous
chondrites occurred at significantly lower temperatures primarily for
/199
142
the orbit of Mars. The overwhelming majority of asteroids in theasteroid band and the nuclei of the planet-giants were formed fromchondrites. The mixture of metal oxides and hydrated silicates makingup the group of carbonaceous chondrites, probably, were in a largeratio in composition of the heavy components of this planet (or as wehave already said, the matter of rock). The conditions ofcondensation predeterminedalso the difference in composition andaverage density of the Earth group of planets and this means thecourse of their subsequent thermal evolution.
One should note that in explaining the path of formation of thematter of chondrites, as the reason for the well-known isotopicanomalies in their composition, there is still no unified opinion. Inparticular, the condensation model does not explain the presence ofgrains of hard-to-melt metals and minerals in the chondrites, whoserelated bodies are found at distances 2-4 IAU from the Sun wheretemperature, probably, did not reach high values. Attempts have beenmade to get around these difficulties, starting with a model ofsequential condensation with movement of matter of the preplanetarynebula from the hot region of the protosun to the periphery of thesolar system. But essentially we are talking about a model ofcompression of solar nebula of subsequent "spreading" of matter fromthe protosun inside the accretion disk as is shown in Figure 9 by thearrows. Such a model was proposed and studied by T. V. Ruzmaykina andlater was considered by P. Kassen and A. Summers and the mechanism ofsequential condensation was developed in part by M. N. Izakov. It isimportant to note that it applies a condition to the maximum value offull rotational moment of the protosolar nebula of no more than=1052 g'cm2"s -I, which, on the whole, can agree with modern cosmogonytheories.
Thus, we see that the basic chemical transformations of primarymatter occurred at relatively high temperatures in the closestenvirons of the Sun. Then the most important role was played by theoxidation-reduction processes at the same time that at great distancesfrom the Sun at low temperatures of reaction, they were slowed downand the composition of primary matter, obviously, remained almostunchanged. In the composition, the high-temperature fraction ofcondensed solid particles from which the planets of the Earth groupwere accumulated, there were radioactive elements which served as asource for subsequent heating. Therefore, it is just on these planetsthat the most grandiose changes occurred in the process of evolutionleading in the end to differentiation of the component matter and theformation of secondary gas shells -- the atmosphere.
Unfortunately, a strict quantitative basis for all these complexprocesses using methods of theoretical modeling is complicated by alack of knowledge of many of the initial conditions of theevolutionary process such as the initial masses and moment of theprotoplanetary nebula, the distribution of temperature andconcentration of the components, the value of pressure at which theprimary condensations of solid bodies occurred, the rate of chemicalreactions and intensity of shifting of matter after completion ofaccumulation, the velocity of degasification from the interior and
/200
143
the effectiveness of bonding of gaseous components with solid matter, /201
etc. Moreover, the study of the inner structure itself of planets in
the Earth group, to a well-known degree, is made easier by the
presence of its own type of standards in the form of Earth and the
Moon for which a powerful method of studying their interiors is
available according to distribution of the rate of propagation of
seismic waves. It produces a change in characteristics of elasticity
with depth and in this way makes it possible to discover the most
characteristic traits of the interior structures of the body
determined by chemical composition of matter, its phase state and the
thermodynamic parameters.
144
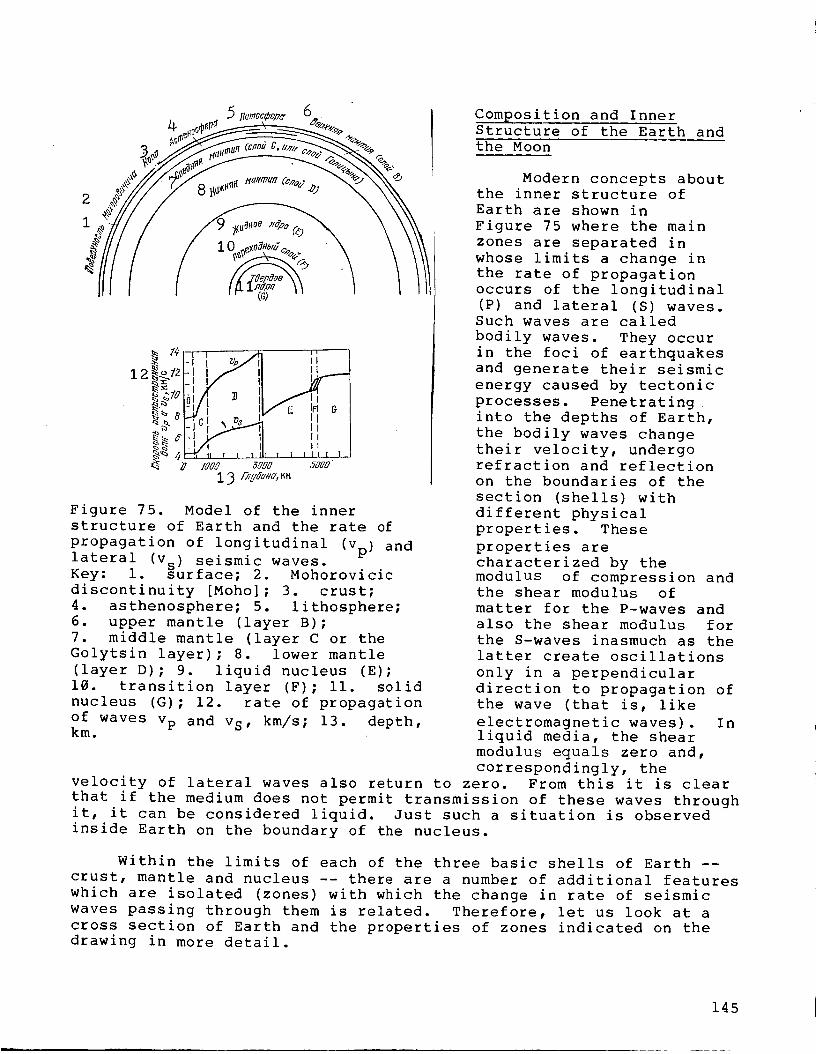
5 nu_oc_ep_ 6 "
_ p.tl__P'_'#.,_"
°(/
I I II
,,,,_- I I II
"-_,1 Ill I l I I [ I I II I [
WOO _000 _00013 DK_ue_'KM
Figure 75. Model of the inner
structure of Earth and the rate of
propagation of longitudinal (Vp) andlateral (Vs) seismic waves.Key: i. surface; 2. Mohorovicic
discontinuity [Moho]; 3. crust;
4. asthenosphere; 5. lithosphere;
6. upper mantle (layer B);
7. middle mantle (layer C or the
Golytsin layer); 8. lower mantle
(layer D); 9. liquid nucleus (E);
10. transition layer (F); ii. solid
nucleus (G); 12. rate of propagation
of waves Vp and v s, km/s; 13. depth,km.
Composition and Inner
Structure of the Earth and
the Moon
Modern concepts aboutthe inner structure of
Earth are shown in
Figure 75 where the main
zones are separated in
whose limits a change in
the rate of propagation
occurs of the longitudinal
(P) and lateral (S) waves.Such waves are called
bodily waves. They occur
in the foci of earthquakes
and generate their seismic
energy caused by tectonic
processes. Penetrating
into the depths of Earth,
the bodily waves change
their velocity, undergo
refraction and reflection
on the boundaries of the
section (shells) with
different physical
properties. These
properties are
characterized by the
modulus of compression andthe shear modulus of
matter for the P-waves and
also the shear modulus for
the S-waves inasmuch as the
latter create oscillations
only in a perpendicular
direction to propagation of
the wave (that is, like
electromagnetic waves). Inliquid media, the shear
modulus equals zero and,
correspondingly, thevelocity of lateral waves also return to zero. From this it is clear
that if the medium does not permit transmission of these waves through
it, it can be considered liquid. Just such a situation is observed
inside Earth on the boundary of the nucleus.
Within the limits of each of the three basic shells of Earth --
crust, mantle and nucleus -- there are a number of additional features
which are isolated (zones) with which the change in rate of seismic
waves passing through them is related. Therefore, let us look at a
cross section of Earth and the properties of zones indicated on thedrawing in more detail.
145
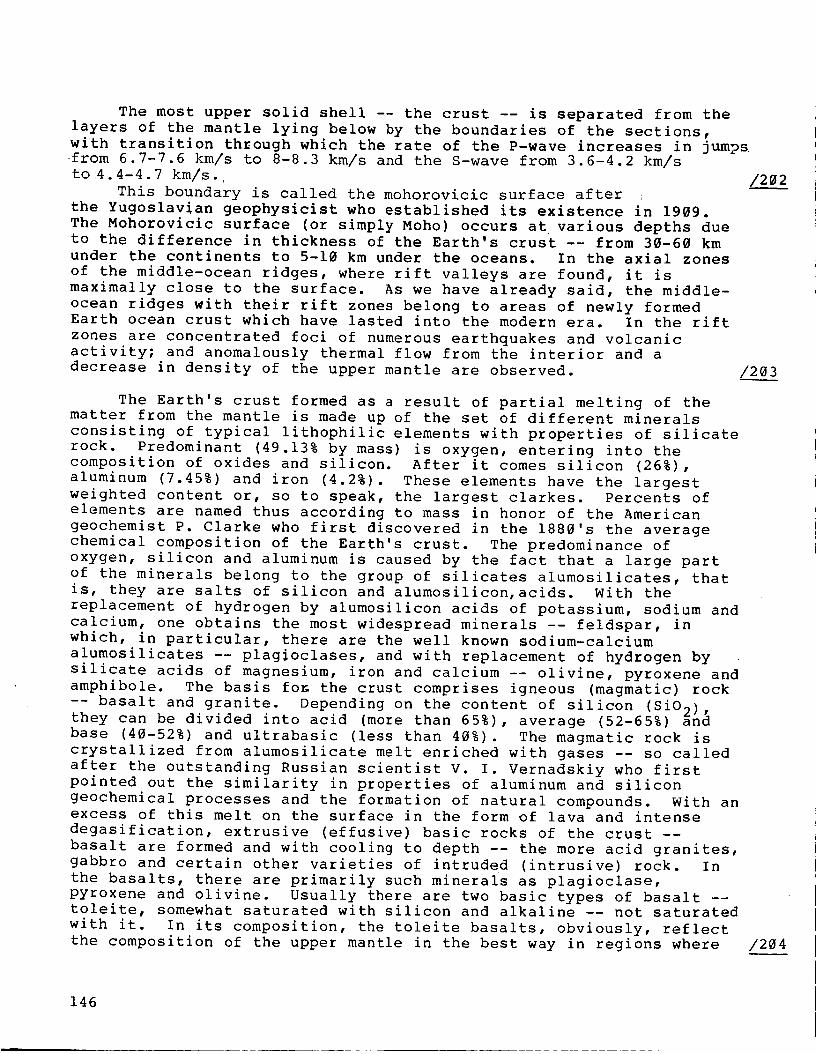
The most upper solid shell -- the crust -- is separated from thelayers of the mantle lying below by the boundaries of the sections,with transition through which the rate of the P-wave increases in jumpsfrom 6.7-7.6 km/s to 8-8.3 km/s and the S-wave from 3.6-4.2 km/s ito14.4-4.7 km/s. /202
This boundary is called the mohorovicic surface after
the Yugoslavian geophysicist who established its existence in 1909.
The Mohorovicic surface (or simply Moho) occurs at various depths due
to the difference in thickness of the Earth's crust -- from 30-60 km
under the continents to 5-10 km under the oceans. In the axial zones
of the middle-ocean ridges, where rift valleys are found, it is
maximally close to the surface. As we have already said, the middle-
ocean ridges with their rift zones belong to areas of newly formedEarth ocean crust which have lasted into the modern era. In the rift
zones are concentrated foci of numerous earthquakes and volcanic
activity; and anomalously thermal flow from the interior and a
decrease in density of the upper mantle are observed. /203
The Earth's crust formed as a result of partial melting of the
matter from the mantle is made up of the set of different minerals
consisting of typical lithophilic elements with properties of silicate
rock. Predominant (49.13% by mass) is oxygen, entering into the
composition of oxides and silicon. After it comes silicon (26%),
aluminum (7.45%) and iron (4.2%). These elements have the largest
weighted content or, so to speak, the largest clarkes. Percents of
elements are named thus according to mass in honor of the American
geochemist P. Clarke who first discovered in the 1880's the average
chemical composition of the Earth's crust. The predominance of
oxygen, silicon and aluminum is caused by the fact that a large part
of the minerals belong to the group of silicates alumosilicates, that
is, they are salts of silicon and alumosilicon, acids. With the
replacement of hydrogen by alumosilicon acids of potassium, sodium and
calcium, one obtains the most widespread minerals -- feldspar, in
which, in particular, there are the well known sodium-calcium
alumosilicates -- plagioclases, and with replacement of hydrogen by
silicate acids of magnesium, iron and calcium -- olivine, pyroxene and
amphibole. The basis fo_ the crust comprises igneous (magmatic) rock
-- basalt and granite. Depending on the content of silicon (SiO2) &they can be divided into acid (more than 65%), average (52-65%) ana
base (40-52%) and ultrabasic (less than 40%). The magmatic rock is
crystallized from alumosilicate melt enriched with gases -- so called
after the outstanding Russian scientist V. I. Vernadskiy who first
pointed out the similarity in properties of aluminum and silicon
geochemical processes and the formation of natural compounds. With an
excess of this melt on the surface in the form of lava and intense
degasification, extrusive (effusive) basic rocks of the crust --
basalt are formed and with cooling to depth -- the more acid granites,
gabbro and certain other varieties of intruded (intrusive) rock. In
the basalts, there are primarily such minerals as plagioclase,
pyroxene and olivine. Usually there are two basic types of basalt --
toleite, somewhat saturated with silicon and alkaline -- not saturated
with it. In its composition, the toleite basalts, obviously, reflect
the composition of the upper mantle in the best way in regions where /204
146
the magmatic activity is apparent. In comparison with basalt, granitecontains more silicon and less iron and magnesium. In theircomposition, feldspar predominates, aqueous alumosilicates (mica) andquartz which is a crystalline modification of (hexagonal and trigonal)silicon.
The intrusive rock partially undergoes change (metamorphosis)under the effect of high temperature and pressure at a depth as aresult of which granites form differing from granites of themetamorphic type of rock such as gneiss and crystalline shale. Theupper part of the crust is a continuous sedimentary layer consistingof products of erosion from intruded and metamorphic rock and alsoredeposition involving the activity of the biosphere (limestone, radiolaurite). The continental crust under a sedimentary layer is dividedinto two parts: the granite layer composed of predominantly graniteand gneiss and a "basalt" layer deposited under it made up, probably,of more basic (containing less SiOo) modifications of metamorphicrock. Under the sedimentary layer o_ the oceans lie basalts whichform a layer up to 2 km in thickness and below that gabbro which hasthe same composition as the basalt but is solidified deeper. Theformation of the crust of the ocean type continues at the presenttime, in the rift zones of the middle-ocean ridges due todifferentiation of mantle matter coming into the'faults.
Under the crust is the upper mantle (zone B). Its upper layerunderlying the crust sometimes is called the substratum. Besides thecrust, it forms a lithosphere -- the most rigid shell of Earth, belowwhich one finds close to the melted layer with decreased strength --the asthenosphere. This is identified partly with the Gutenberg layerin which one notes a noticeable decrease in the velocity of lateralseismic waves. The causes of their slow passage, obviously, are thelarge geothermal gradient in the asthenosphere and the significant (amagnitude of two or three) decrease in viscosity of matter incomparison with the lithosphere. The lower boundary of theasthenosphere lies at a depth of 250-350 km and its upper boundary isthe closest to rising to the surface under the axes of the middle-ocean ridges. With transition to the sea zone called the middlemantle or the Golytsin layer, the velocity of seismic waves increases /205
to a depth of about 1000 km where a boundary of the lower mantle(zone
D') is located and in the lower mantle the increase in velocities
slows down sharply. Between the lower mantle and the core are small
(about 200 km in thickness) transition layer D'' with the additional
small increase in velocity of the P-wave.
The increase in seismic velocity in the C zone is due to phase
transitions resulting from restructuring of minerals in modifications
with denser packing of the atoms. In distinction from the acid and
base rock of the crust, the mantle comprises ultra-base rock
containing the least quantity of silicon dioxide SiO 2 in the form of
minerals and quartz and at the same time a large quantity of magnesium
oxide in the composition of several types of minerals. The main rock-
forming minerals of base and ultra-base rock (basalts, dunites,
gabbro, peridotites, diabases, etc.) are the iron-containing and
magnesium-containing silicates -- olivine and pyroxenes which have,
147
respectively, the formulas (Mg, Fe) SiO4 and (Mg, Fe) SiO 3.Supposedly, the primary mantle of Earth comprises olivine-pyroxenerock (the so-called pyrolite) before differentiation of the componentplanetary matter.
According to the modern concepts supported by laboratory
petrochemical research on minerals with values of the parameters of
the Earth interior, olivines in the upper mantle at the boundary of
the B and C zones (400-420 km) as a result of polymorphous phase
transition deteriorate in the structure of the modified spinel found
in the magnesium edge of the olivine series and having a structure
with dense cubic packing of oxygen ions. This transition explains the
increase at this level of velocities of the P-waves. In turn, the
pyroxenes even at a depth of about 70 km are crystallized into
orthopyroxene and in the presence of aluminum oxide AI_o q (alumina,
corundum) transfer to granite and the quartz -- sequen£i_lly in the
structure of coesite and stishovite -- a mineral which is 62% denser
than ordinary quartz. In the middle mantle, beginning approximately
at a depth of 700 km, it is assumed that there is one more phase
transition from the spinel zone to the zone of perovskite -- a mineral
which has a clearly pronounced cleavage into cubes, that is, a
particularly dense cubic packing. Here the structure of the corundum
can be rearranged into a structure of ilmenite replacing atoms of
aluminum with atoms of iron and titanium. In the uniform D layer,
obviously, there is a whole perovskite zone and the velocity of
seismic waves increases (although with a lesser gradient) only due to
compression of matter under pressure of the layers lying above and anincrease in its density.
In zone E, the velocity of longitudinal waves decrease
approximately by two and the lateral waves do not penetrate completely
through this layer. At the same time, again they are excited in the
central part (zone G) separated from E by the small S layer with!
thickness about 150 km where one notes a small increase in velocity of
the P-waves. These facts give us the basis for identifying the E
layer with the upper liquid nucleus with radius about 3460 km and the
G layer with the internal solid (or more accurately, partially melted)
nucleus with radius 1250 km. The mass of the entire nucleus comprisesabout 30% of the mass of the entire Earth at the same time that the
mass of the inner nucleus is 1.2%. Such a distribution of mass in
Earth as a whole corresponds to calculation models of its interior
constructed taking into consideration the necessity for satisfying
also the value of the dimensionless moment of inertia I we presentedearlier.
In its composition, the Earth nucleus, obviously, is close to the
composition of iron meteorites and was formed by an iron-nickel alloy
called for short "nife" (approximately 89% Fe, 7% Ni, 4% FeS). Up
until recent times, a competitive hypothesis about the iron-nickel
core was the hypothesis of V. P. Lodochinkov and V. Ramzey accordingto which the Earth core can be made up of metalized silicates formed
as a result of base transitions of silicates to a metal state with
pressure on the order of 1 million atm. This hypothesis was not
confirmed, however, in the experiments on impact compression with
/206
148
values of parameters corresponding to the physical condition in thecore.
The iron-nickel composition of the core corresponds to two moreproven hypotheses relative to its formation: by separation from themelt in the process of gravitation differentiation,approximately uniform in composition or due to heterogeneous condensa-tion of solid phases in the protoplanetary cloud. In the first case,the situation reminds one of the well-known process of melting of irQnin blast furnaces: the iron reduced to a metallic state settles tothe bottom, forming a dense liquid phase and the remaining lightersilicates float to the surface in the form of slag. Another approachdeveloped by A. P. Vinogradov agrees better with ideas about themetal-silicate fractionation of primary matter and the formation of adifferent class of meteorites. The main argument here is thecircumstance that with the beginning of condensation of theprotoplanetary cloud from it, in a solid phase, in the first place, anickel iron is separated (temperature 1460 K) and then magnesiumsilicates are formed (forsterite, enstatite) and still later differentlow-temperature condensates (magnetite, troilite, etc.). The metalparticles are significantly more easily combined in compact massesthan the silicate, forming at first a body of meteorite dimensions.Accumulating,they could be the nucleus for future planets. Theportion of high-temperature fraction then must decrease with anincrease in distance from the Sun which, in actuality, is observed forplanets in the Earth group if one remembers the distribution of theiraverage densities. Subsequent stages of evolution in this pageinclude the process of gravitation differentiation of matter with thisdifference, that its role is decreased in the initial separation ofthe material of the core and the shell.
/207
Knowledge of distribution by depth of the velocities of
propagation of seismic waves makes it possible to directly determine
the course of pressure and density and this means, equalizing the
state of matter in the interiors. Two important parameters which
determine the thermodynamic shells of the planets -- the Debye
temperature and the Gruneisen parameter depend as we have seen on
density; these parameters are easier to calculate by using seismic
data. Moreover, it appears comparatively simple to calculate a
physical model of the inner structure of Earth and the basic
thermodynamic coefficients which characterize its structure (heat
capacity, coefficient of heat conductivity, compressibility, etc.).
Calculation of the actual course of temperature allows, however,
noticeable indeterminancies. Experimentally the geothermal gradient
with which the heat flux from the core of Earth is directly related is
found only for the highest layer comprising on the surface of Earth an
average value of 20 k/km with noticeable variations in different
regions. But with depths, the increase in temperature slows down.
The boundary conditions here are real temperatures of melting the
matter -- those mineral associations which we have briefly mentioned
when discussing the model in Figure 75. Therefore, distribution of
temperatures along the curves of melting have their own type of
criteria which determine the position of their lower boundary.
/208
149
Another criterion is the expression that in the liquid coretemperatures must correspond to the adiabatic law. Then thetemperature gradient of the main mechanism of heat transfer isconvection. The convective state of the Earth's core encompassing,obviously, not only the core but also the mantle, right nowessentially is not in question. With the presence of developedconvection in the core obviously a large magnetic moment of Earth canbe explained as a result of the electromagnetic induction in themoving medium. According to the hypothesis of the hydromagneticdynamo already mentioned, it is created by movement of the conductingliquid which leads to self-excitation of the magnetic field in amanner similar to how current generates a magnetic field in thedynamo-machine with self-excitation. Temperature in the central partof Earth comprises according to modern hypotheses, about 6,000 Kpressure 3.65 Mbar and on the boundary of the core with the low mantle4300 K and about 1.4 Mbar.
The data on distribution of velocities of seismic waves in thebody of the Moon were obtained according to results of an 8-year studyof seismographs on its surface which was carried out as part of theautomatic complex equipment at the Alsep left in several regions bythe Apollo expeditions. For this period, 2775 lunar quakes wererecorded with deeply placed foci and a set of other events occurredrelated to impact of meteorites. From the number of lunar quakespresented, about 80 were identified with sources lying at a depth of800-1000 km where it is assumed the zone of partially melted rockbegins. The noticeable periodicity of deep lunar quakes brought tolife a hypothesis about their tidal origins. At this time, the numberof events related to the count of a comparatively shallow positioningof sources, for this period, did not exceed 30. These lunar quakesmost naturally are related to weak tectonic processes on the Moonwhich, in turn, obviously are explained by the extremely slowrelaxation of stresses caused by compression and extension of itsexterior shell.
As to the presence of significant internal stresses of lunarinteriors, there is the fact of large irregularity in the shape of ournatural satellite, established on the basis of a detailed analysisfrom the orbit of the artificial Moon satellites. It seemed that thereal shape of the Moon, close to spherical equilibrium, deviates fromthe dynamic which determines a level surface of its gravitationalpotential (selenoid). Deviation is almost a magnitude larger than onEarth where it is on the order of the square of compression J. Withsmaller acceleration of the force of gravity than on Earth, thisresults in shearing stresses comparable to those on Earth which canmaintain a lunar lithosphere. Another important result obtained fromstudies of the gravitational field of the Moon is determination of itsdimensionless moment of inertia I = 0.391 which, as we see, is veryclose to a value corresponding to the moment of inertia of a uniformsphere. This means that density of the Moon is approximatelyconstant, that is, in distinction from Earth there is no largeconcentration of mass of the center.
/209
150
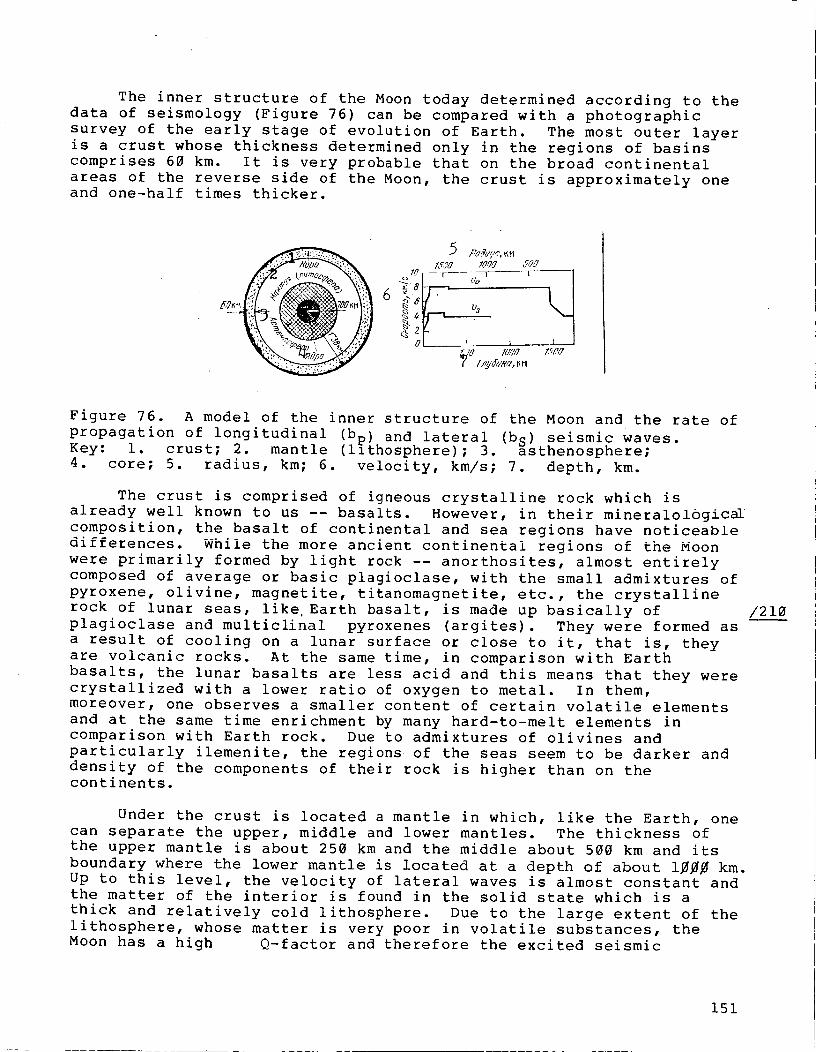
The inner structure of the Moon today determined according to thedata of seismology (Figure 76) can be compared with a photographicsurvey of the early stage of evolution of Earth. The most outer layeris a crust whose thickness determined only in the regions of basinscomprises 60 km. It is very probable that on the broad continentalareas of the reverse side of the Moon, the crust is approximately oneand one-half times thicker.
_GO _' _¢O/y
c.J1_/ I-- I--_ I /
dye.
0 L_.._' 1
_"N 100/7 Z _,¢0
( fky_iitGi_H
Figure 76. A model of the inner structure of the Moon and the rate of
propagation of longitudinal ((blP)t and _a_ra[ (b) seismic waves,Key: i. crust; 2. mantle h h ; 3. Ssthenosphere;
4. core; 5. radius, km; 6. velocity, km/s; 7. depth, km.
The crust is comprised of igneous crystalline rock which is
already well known to us -- basalts. However, in their mineralologic_
composition, the basalt of continental and sea regions have noticeable
differences. While the more ancient continental regions of the Moon
were primarily formed by light rock -- anorthosites, almost entirely
composed of average or basic plagioclase, with the small admixtures of
pyroxene, olivine, magnetite, titanomagnetite, etc., the crystalline
rock of lunar seas, likeEarth basalt, is made up basically of
plagioclase and multiclinal pyroxenes (argites). They were formed as
a result of cooling on a lunar surface or close to it, that is, they
are volcanic rocks. At the same time, in comparison with Earth
basalts, the lunar basalts are less acid and this means that they were
crystallized with a lower ratio of oxygen to metal. In them,
moreover, one observes a smaller content of certain volatile elements
and at the same time enrichment by many hard-to-melt elements in
comparison with Earth rock. Due to admixtures of olivines and
particularly ilemenite, the regions of the seas seem to be darker and
density of the components of their rock is higher than on thecontinents.
Under the crust is located a mantle in which, like the Earth, one
can separate the upper, middle and lower mantles. The thickness of
the upper mantle is about 250 km and the middle about 500 km and its
boundary where the lower mantle is located at a depth of about i_ km.
Up to this level, the velocity of lateral waves is almost constant and
the matter of the interior is found in the solid state which is a
thick and relatively cold lithosphere. Due to the large extent of the
lithosphere, whose matter is very poor in volatile substances, the
Moon has a high Q_factor and therefore the excited seismic
/210
151
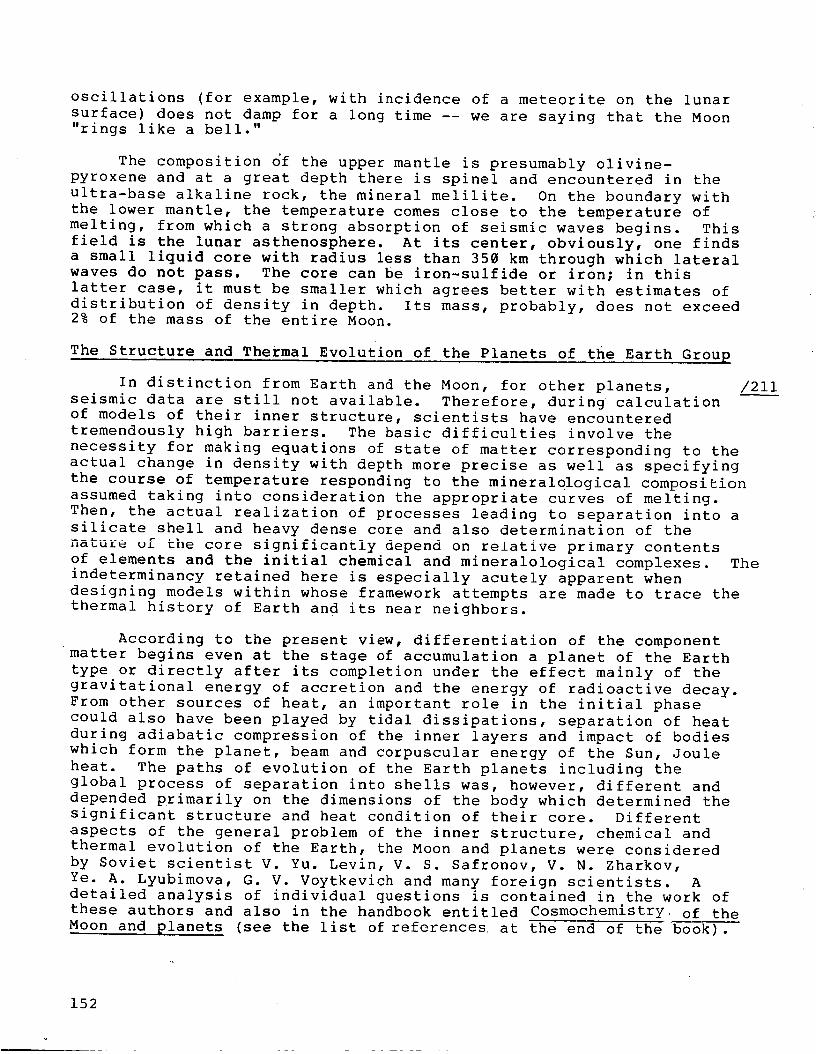
oscillations (for example, with incidence of a meteorite on the lunarsurface) does not damp for a long time -- we are saying that the Moon"rings like a bell."
The composition of the upper mantle is presumably olivine-pyroxene and at a great depth there is spinel and encountered in theultra-base alkaline rock, the mineral melilite. On the boundary withthe lower mantle, the temperature comes close to the temperature ofmelting, from which a strong absorption of seismic waves begins. Thisfield is the lunar asthenosphere. At its center, obviously, one findsa small liquid core with radius less than 350 km through which lateralwaves do not pass. The core can be iron-sulfide or iron; in thislatter case, it must be smaller which agrees better with estimates ofdistribution of density in depth. Its mass, probably, does not exceed2% of the mass of the entire Moon.
The Structure and Thermal Evolution of the Planets of the Earth Group
In distinction from Earth and the Moon, for other planets, /211
seismic data are still not available. Therefore, during calculation
of models of their inner structure, scientists have encountered
tremendously high barriers. The basic difficulties involve the
necessity for making equations of state of matter corresponding to the
actual change in density with depth more precise as well as specifying
the course of temperature responding to the mineralological composition
assumed taking into consideration the appropriate curves of melting.
Then, the actual realization of processes leading to separation into a
silicate shell and heavy dense core and also determination of the
nature _f the core significantly depend on relative primary contents
of elements and the initial chemical and mineralological complexes. The
indeterminancy retained here is especially acutely apparent when
designing models within whose framework attempts are made to trace the
thermal history of Earth and its near neighbors.
According to the present view, differentiation of the component
matter begins even at the stage of accumulation a planet of the Earth
type or directly after its completion under the effect mainly of the
gravitational energy of accretion and the energy of radioactive decay.
From other sources of heat, an important role in the initial phase
could also have been played by tidal dissipations, separation of heat
during adiabatic compression of the inner layers and impact of bodies
which form the planet, beam and corpuscular energy of the Sun, Joule
heat. The paths of evolution of the Earth planets including the
global process of separation into shells was, however, different and
depended primarily on the dimensions of the body which determined the
significant structure and heat condition of their core. Different
aspects of the general problem of the inner structure, chemical and
thermal evolution of the Earth, the Moon and planets were considered
by Soviet scientist V. Yu. Levin, V. S. Safronov, V. N. Zharkov,
Ye. A. Lyubimova, G. V. Voytkevich and many foreign scientists. A
detailed analysis of individual questions is contained in the work ofthese authors and also in the handbook entitled Cosmochemistry_ of the
Moon and planets (see the list of references at the end of the book).
152
The course of evolution is determined by the balance between theintensity of generation of thermal energy (taking into considerationthe heat of melting) and cooling due to convection and heatconductivity. One of the basic sources of energy is radiogenic heatgenerated by lithophilic elements belonging to the group of long-living isotopes of uranium, thorium and potassium: U-238, U-235,Th-232, K-40. When modeling the thermal evolution of the planetusually they begin with the initial content of these elementscorresponding to one or another model of condensation of aprotoplanetary nebula. The most precise quantitative criteria areestablished for Earth,the moon and meteorites for which the ratio ofhard-to-melt lithophilic elements of uranium and thorium areapproximately identical (=3.5) at the same time that in the relativecontent of potassium one observes significant differences Thelargest ratio of K/U (=8"10 _) in carbonaceous chondrites iclose intheir composition, as we have seen, to the average content of elementsfrom the Sun) approximately a magnitude smaller for Earth rock andeven half a magnitude smaller for the rock of the Moon. The latter isin good agreement with the general impoverishment of volatile andchalcophilic elements of the lunar matter delivered to Earth by theLuna automated probes and the Apollo expeditions; this matter, incomposition, was much closer to an achondrite.
At the same time, in it one detects an excess content of uraniumand other hard-to-melt lithophilic elements which is an indication ofthe condensation of matter of the Moon from the high-temperaturefraction of the protoplanetary nebula and acutely poses the questionof the position of formation of the Moon in the solar system. It isjust this circumstance which has brought to life the hypothesis aboutthe initial formation of the Moon within the orbit of Mercury and itstransition due to tidal perturbations occurring then from a moredistant orbit with subsequent attachment to Earth. Although thisscenario is contradicted by the small average density of the Moon,nevertheless, paying attention to the measured value of thermal fluxfrom the lunar interior (taking into consideration its mass), one mustassume that in enrichment by radioactive sources of heat, the matterof the Moon exceeds the matter of Earth. Their content appearsapproximately the same as the content required for a model of thermalevolution of Mercury. As to the other planets, this initial abundanceof long-lived radioactive isotopes for Venus is assumed to be close tothat for Earth and for Mars -- intermediate between Earth andchondrite.
Also, short-lived radioactive isotopes could have played animportant role in the earliest stage of evolution of the primarymatter of Earth and the planets; these isotopes, primarily isotopes ofaluminum AI-26 and also berylium Be-10, iodine 1-129, chlorine CI-36and certain transurani elements -- plutonium Pu-214, curium Cm-247.Inasmuch as, in AI-26 and the majority of other isotopes, the periodof half-decay comprises no more than 1-10 million years, all of theseisotopes can be considered extinct. However, they obviouslyfacilitated rapid heating of condensed large meteor bodies andprotoplanets, strongly accelerate at the beginning of the process oftheir chemical differentiation which, moreover, explains the closeness
/212
/213
153
of ages of meteorites which are different in composition. Indistinction from isotopes of heavy elements which formed due toprocesses of nuclear synthesis, the light isotopes (AI-26, Be-10) aswas noted, obviously are products of explosion of a supernova star orirradiation of the protoplanetary nebula by intense corpuscularradiation of a young Sun. These isotopes occur in insignificantquantity and at the present time, under the effect of solarcorpuscular flux in the material of the surface rock of the Moon andmeteorites and also in the atmosphere of Earth.
Generation of radiogenic heat of long-lived isotopes for theentire history of Earth was put together according to an evaluation ofY. A. Lyubimovoy as 0.9-1038 erg at the same time that the total lossis due to thermal flux (contemporary average value _75 erg'cm-2s -I or1.79"10 -6 cal-cm-2s -I) did not exceed 0.54-1038 erg. However, in theprocess of thermal evolution, the flux could change and therefore weconsider that a more real value for total thermal loss due toradiation in space is almost twice as large. Generation of radiogenicheat of short-lived isotopes was more effective, as was noted at thestage of formation of planetesimals and with small dimensions ofbodies it would have to have been emitted into the surrounding space.In the planet which was formed, the most intense heat generation,obviously, was due to the release of potential energy in the processof gravitation differentiation of the components matter. In a book byA. S. Monin on the history of the Earth (see references), he presentswhat seems to us to be a more real estimate of heat generation withinEarth along with the energy of the gravitation differentiation for4.6 billion years at about 2.5-1038 erg. Consequently, pa_ngattention to this, the heat losses of approximately 1.8"I_ _v erg ofaccumulated heat led to overheating and melting of the Earth interior.Melting was achieved only in the field of the core inasmuch as forfull melting at all levels one would have needed twice as large anamount of energy (about 3.2-1038 erg) and consequently, the Earth didnot pass through such a stage. From this, one can conclude that theaverage by mass initial temperature of the Earth's interior did notexceed 1700 K and at the same time, probably, was 300-400 K lower.
/214
Generation of heat had to coincide with heat exchange and
cooling. As in the giants, the coefficient of heat conductivity of
the exterior shells of the planet of the Earth group is small and
therefore equalizing the temperatures in this way occurs very slowly
and ineffectively. The main mechanism for heat transfer which
determines intensity of cooling of planetary interiors, is convection.
With the presence of a convective shift and outflow of heat from the
depths, the so-called zonal melt is involved (known in technology also
as zonal recrystallization used when refining materials); it was
described in detail by A. P. Vinogradov and his coworkers for the
matter of chondrites appropriate to differentiation of matter of the
Earth's mantle. A mathematical model of the evolution of the zone of
melting in the thermal history of Earth was considered by
A. N. Tikhonov, Ye. A. Lyubimova and V. K. Vlasov with a certain
dependence on time and depth of distribution of thermal sources and
coefficients of heat conductivity. Then, the main accomplishment of
subsequent multiple (up to 18 times) formations of the zone of melt in
154
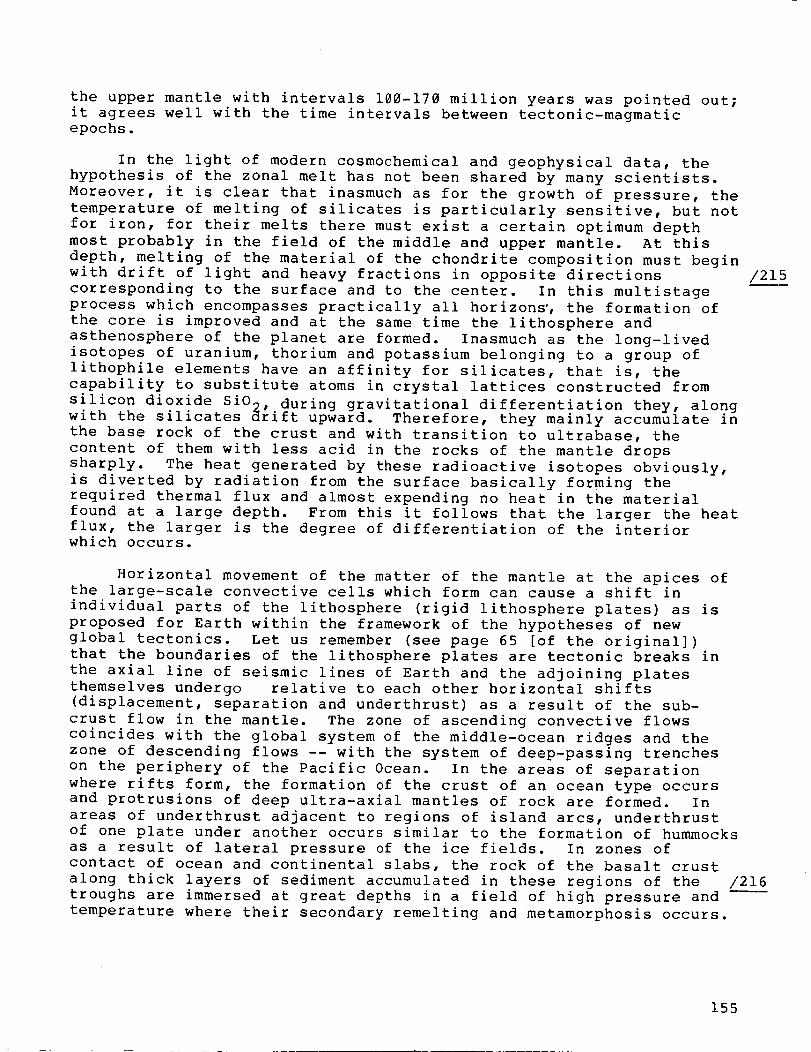
the upper mantle with intervals 100-170 million years was pointed out;it agrees well with the time intervals between tectonic-magmaticepochs.
In the light of modern cosmochemical and geophysical data, thehypothesis of the zonal melt has not been shared by many scientists.Moreover, it is clear that inasmuch as for the growth of pressure, thetemperature of melting of silicates is particularly sensitive, but notfor iron, for their melts there must exist a certain optimum depthmost probably in the field of the middle and upper mantle. At thisdepth, melting of the material of the chondrite composition must beginwith drift of light and heavy fractions in opposite directionscorresponding to the surface and to the center. In this multistageprocess which encompasses practically all horizons', the formation ofthe core is improved and at the same time the lithosphere andasthenosphere of the planet are formed. Inasmuch as the long-livedisotopes of uranium, thorium and potassium belonging to a group oflithophile elements have an affinity for silicates, that is, thecapability to substitute atoms in crystal lattices constructed fromsilicon dioxide SiO2, during gravitational differentiation they, alongwith the silicates drift upward. Therefore, they mainly accumulate inthe base rock of the crust and with transition to ultrabase, thecontent of them with less acid in the rocks of the mantle dropssharply. The heat generated by these radioactive isotopes obviously,is diverted by radiation from the surface basically forming therequired thermal flux and almost expending no heat in the materialfound at a large depth. From this it follows that the larger the heatflux, the larger is the degree of differentiation of the interiorwhich occurs.
/215
Horizontal movement of the matter of the mantle at the apices of
the large-scale convective cells which form can cause a shift in
individual parts of the lithosphere (rigid lithosphere plates) as is
proposed for Earth within the framework of the hypotheses of new
global tectonics. Let us remember (see page 65 [of the original])
that the boundaries of the lithosphere plates are tectonic breaks in
the axial line of seismic lines of Earth and the adjoining plates
themselves undergo relative to each other horizontal shifts
(displacement, separation and underthrust) as a result of the sub-
crust flow in the mantle. The zone of ascending convective flows
coincides with the global system of the middle-ocean ridges and the
zone of descending flows -- with the system of deep-passing trenches
on the periphery of the Pacific Ocean. In the areas of separation
where rifts form, the formation of the crust of an ocean type occurs
and protrusions of deep ultra-axial mantles of rock are formed. In
areas of underthrust adjacent to regions of island arcs, underthrust
of one plate under another occurs similar to the formation of hummocks
as a result of lateral pressure of the ice fields. In zones of
contact of ocean and continental slabs, the rock of the basalt crust
along thick layers of sediment accumulated in these regions of the /216
troughs are immersed at great depths in a field of high pressure and
temperature where their secondary remelting and metamorphosis occurs.
155
As a result, basalt and andecite magma formed during remeltingincrease below the layer of the crust of the continent type. Theseprocesses are related to the formation of rock bands on Earth such asthe Alpine-Himalaya or Euro-Mountains. The approach of the slabs andcollision of dust on these continents resulted in the intensedeformation of the Earth's crust, the formation of tectonic cover andfolding. As to the Moon, Mercury and Mars, these or othercharacteristics of the relief of their surfaces are directly relatedwith the processes of global tectonics of slabs hardly possible but inan equal way it is impossible to fully exclude this hypothesis forcertain stages of thermal evolution.
As we have already noted, the study of problems of thermalevolution causing a vital interest in scientists, in recent years, isbeing stimulated by many special features of the "geologicalchronology imprinting on the surfaces of planets which we havediscussed in the preceding chapter. Along with the more specific dataon thermal sources based on the study of the matter of the Moon andmeteorites, this has resulted in an increase in verification of thecalculated models of the inner structure in remote and modern epochs.The existing approach to the problem is fairly completely expressed inan overview by well-known American scientist M. Toksots andD. Johnston in their collection entitled CosmoChemistry of the Moonand Planets.
Figure 77 shows the curves of thermal generation E calculated by
these authors for the Moon and planets of the Earth group (with the
initial contents of U, Th, K discussed above) per unit of mass of the
planets depending on time t. The change in intensity of thermal
generation is directly related to the evolutionary stage through which
the planet has passed. Their sequence, primarily responding to the
earlier precambrian period in the history of Earth is noticeably
apparent on the Moon in the chronology of lunar rock. These data make
it possible, first of all, to isolate a stage of early volcanism with
evacuation on the surface of the light fraction of the melt and the
formation of a feldspar crust about 4.6 billion years ago which led to
smoothing of residual irregularities in the relief after completion of
accretion and a stage of continuous magma activity between 4.4 and 4.0
billion years ago with the formation of anorthosites enriched with
aluminum and calcium rock. At this same stage, shell rock was formed
-- breccia; partial or complete remelting of the magma rock occurred
during incidents of meteorites and metamorphosis of the ancient crust.
/217
156
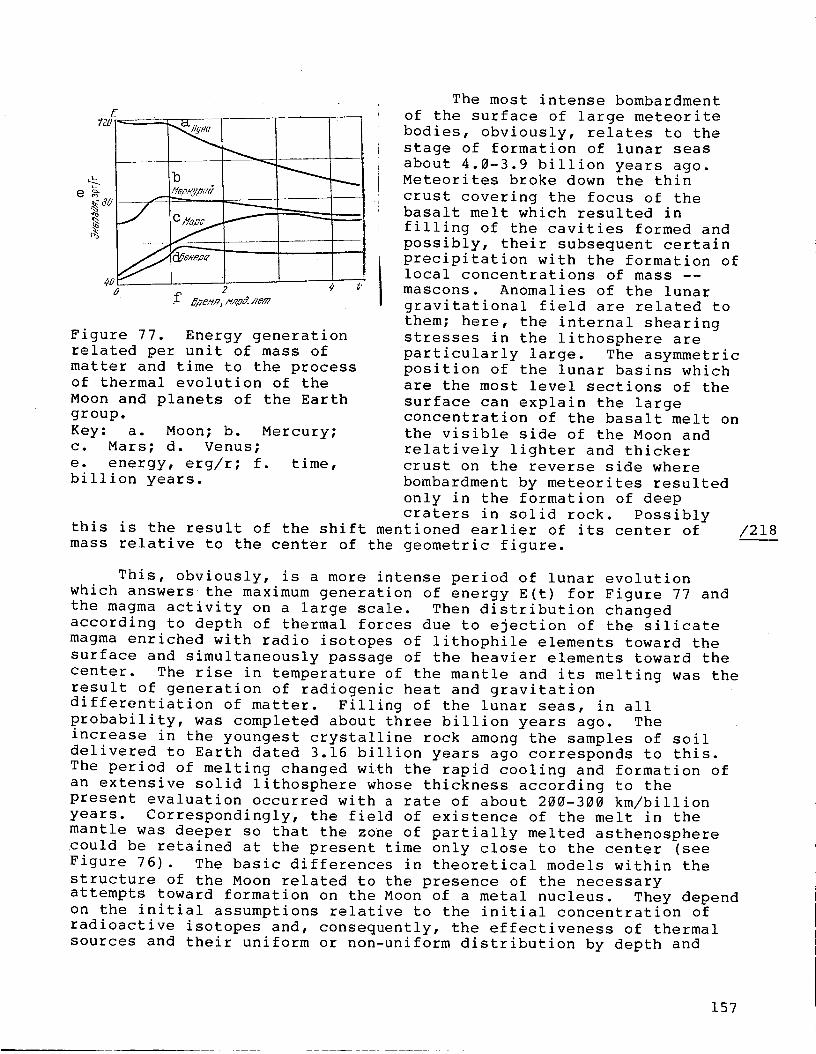
E
_01_ _
b
20 .f #:e/R,M._pdperu
Figure 77. Energy generation
related per unit of mass of
matter and time to the processof thermal evolution of the
Moon and planets of the Earth
group.
Key: a. Moon; b. Mercury;
c. Mars; d. Venus;
e. energy, erg/r; f. time,
billion years.
this is the result of the shift mentioned earlier of its center of
mass relative to the center of the geometric figure.
The most intense bombardment
of the surface of large meteorite
bodies, obviously, relates to the
stage of formation of lunar seas
about 4.0-3.9 billion years ago.Meteorites broke down the thin
crust covering the focus of the
basalt melt which resulted in
filling of the cavities formed and
possibly, their subsequent certain
precipitation with the formation of
local concentrations of mass --
mascons. Anomalies of the lunar
gravitational field are related to
them; here, the internal shearing
stresses in the lithosphere are
particularly large. The asymmetric
position of the lunar basins which
are the most level sections of the
surface can explain the largeconcentration of the basalt melt on
the visible side of the Moon and
relatively lighter and thicker
crust on the reverse side where
bombardment by meteorites resulted
only in the formation of deep
craters in solid rock. Possibly
/218
This, obviously, is a more intense period of lunar evolution
which answers the maximum generation of energy E(t) for Figure 77 and
the magma activity on a large scale. Then distribution changed
according to depth of thermal forces due to ejection of the silicate
magma enriched with radio isotopes of lithophile elements toward the
surface and simultaneously passage of the heavier elements toward the
center. The rise in temperature of the mantle and its melting was the
result of generation of radiogenic heat and gravitation
differentiation of matter. Filling of the lunar seas, in all
probability, was completed about three billion years ago. The
increase in the youngest crystalline rock among the samples of soil
delivered to Earth dated 3.16 billion years ago corresponds to this.
The period of melting changed with the rapid cooling and formation of
an extensive solid lithosphere whose thickness according to the
present evaluation occurred with a rate of about 200-300 km/billionyears. Correspondingly, the field of existence of the melt in the
mantle was deeper so that the zone of partially melted asthenosphere
could be retained at the present time only close to the center (see
Figure 76). The basic differences in theoretical models within the
structure of the Moon related to the presence of the necessary
attempts toward formation on the Moon of a metal nucleus. They depend
on the initial assumptions relative to the initial concentration of
radioactive isotopes and, consequently, the effectiveness of thermal
sources and their uniform or non-uniform distribution by depth and
157
also the role of convection in transfer of heat at an earlier stage ofevolution and the degree of hardening of the core as a result ofcooling of the lunar interior. The temperature in the core depends onits composition and, obviously, is included within limits 1300-1900 K.The lower boundary corresponds to the hypothesis on enrichment byheavy fraction of protomatter of sulfur, primarily in the form ofsulfides and the formation of a nucleus from the eutectics Fe-FeS withmelting temperature (hardly depending on pressure) about 1300 K. Thehypothesis about enrichment of the protomatter of the Moon with lightmetals (Mg, Ca, Na, AI) agrees best with the upper boundary; they comein together with silicon and oxygen in a composition of the mostimportant rock-forming minerals of the base and ultrabase rock --pyroxines and olivines.
/219
The fact of the decrease in content in the Moon of iron and
nickel favors this latter hypothesis; the low average density affects
its determination. A. P. Vinogradov explained this circumstance that
the accretion of the Moon could be depressed by the Earth. Therefore,
both these and dozens of other siderophile elements -- the ordinary
satellites of metallic iron (along with them, the rock existing in
Earth due to closeness in physical and chemical properties) could be
lost even at the early stage and with lower temperature accretions on
the Moon, more intensely accumulate relatively lighter elements.
Nevertheless, within the framework of this hypothesis, one cannot
successfully find an explanation of the obvious enrichment mentioned
of the lunar matter with hard-to-melt lithophile elements in
connection with the fact that the question on the position of
formation of the Moon close to and along with the Earth or far from it
remains open.
A very small and possibly only partially melted core makes it
possible to understand why, in the modern epoch of the Moon, there is
not a magnetic field (upper limit of its intensity does not exceed
1 gamma or one hundred thousandth part of an oersted) and
correspondingly, why the plasma of the solar wind flowing past it does
not undergo excitation. Moreover, the residual magnetization
established of lunar rock hardly explains the directed field duringimpact of meteorites and more likely forces one to assume that either
in some period of its history the Moon had a field of internal origin
(obviously caused by the mechanism of the hydromagnetic dynamo in the
existence of the then melted nucleus), or that the formation of the
Moon occurred in the presence of an external magnetic field with
intensity at least several thousand gamma. The latter assumes,
however, strong limitations on the model of thermal evolution of the
Moon, requiring that the temperature in the mantle always remained
below a certain critical temperature of phase transition in which a
series of physical properties of matter changes (the Curie point)
equal to approximately 100 K.
At a temperature higher than the Curie point, matter containingferromagnetic material loses its magnetic properties. On the basis of
the entire set of existing data, English geophysicist S. Rankori looks /220
at the most probable model according to which at the beginning of its
history the Moon could have possessed a field with intensity on the
158
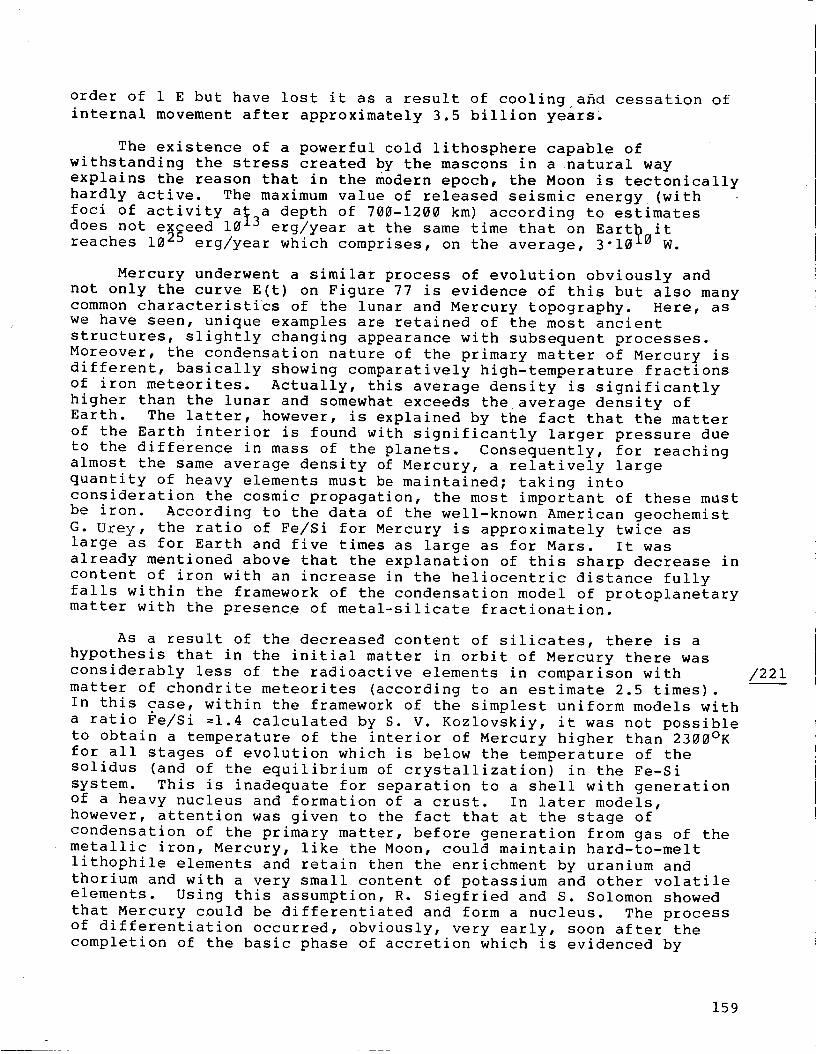
order of 1 E but have lost it as a result of cooling a_d cessation o_internal movement after approximately 3.5 billion years.
The existence of a powerful cold lithosphere capable ofwithstanding the stress created by the mascons in a natural wayexplains the reason that in the modern epoch, the Moon is tectonicallyhardly active. The maximum value of released seismic energy (withfoci of activity a_ a depth of 700-1200 km) according to estimates3does not exceed 10 erg/year at the same time that on Earth itreaches 1025 erg/year which comprises, on the average, 3-1010 W.
Mercury underwent a similar process of evolution obviously andnot only the curve E(t) on Figure 77 is evidence of this but also manycommon characteristics of the lunar and Mercury topography. Here, aswe have seen, unique examples are retained of the most ancientstructures, slightly changing appearance with subsequent processes.Moreover, the condensation nature of the primary matter of Mercury isdifferent, basically showing comparatively high-temperature fractionsof iron meteorites. Actually, this average density is significantlyhigher than the lunar and somewhat exceeds the average density ofEarth. The latter, however, is explained by the fact that the matterof the Earth interior is found with significantly larger pressure dueto the difference in mass of the planets. Consequently, for reachingalmost the same average density of Mercury, a relatively largequantity of heavy elements must be maintained; taking intoconsideration the cosmic propagation, the most important of these mustbe iron. According to the data of the well-known American geochemistG. Urey, the ratio of Fe/Si for Mercury is approximately twice aslarge as for Earth and five times as large as for Mars. It wasalready mentioned above that the explanation of this sharp decrease incontent of iron with an increase in the heliocentric distance fullyfalls within the framework of the condensation model of protoplanetarymatter with the presence of metal-silicate fractionation.
As a result of the decreased content of silicates, there is ahypothesis that in the initial matter in orbit of Mercury there wasconsiderably less of the radioactive elements in comparison withmatter of chondrite meteorites (according to an estimate 2.5 times).In this case, within the framework of the simplest uniform models witha ratio Fe/Si =1.4 calculated by S. V. Kozlovskiy, it was not possibleto obtain a temperature of the interior of Mercury higher than 2300°Kfor all stages of evolution which is below the temperature of thesolidus (and of the equilibrium of crystallization) in the Fe-Sisystem. This is inadequate for separation to a shell with generationof a heavy nucleus and formation of a crust. In later models,however, attention was given to the fact that at the stage ofcondensation of the primary matter, before generation from gas of themetallic iron, Mercury, like the Moon, could maintain hard-to-meltlithophile elements and retain then the enrichment by uranium andthorium and with a very small content of potassium and other volatileelements. Using this assumption, R. Siegfried and S. Solomon showedthat Mercury could be differentiated and form a nucleus. The processof differentiation occurred, obviously, very early, soon after thecompletion of the basic phase of accretion which is evidenced by
/221
159
traces of early volcanism on the Mercury surface. As in the modelscalculated earlier, it was assumed that with further thermal evolutionof the planet high conductivity of the iron was important comprisingabout 70% of its mass. Then it was found that the core of Mercury hadto have hardened approximately 2 billion years ago if one did notassume retention in it of thermal sources right up to the presenttime.
Some scientists have named the continuing decay of potassium assuch a source which simultaneously provides a more rapid formation ofan iron core and melting of the mantle. Calculations showed that forretaining the core in a partially melted state, the present content ofpotassium had to be insignificant, several magnitudes smaller thanmatter of the lunar soil. Drift toward the surface due to processesof shift could be ineffective in redistribution of potassium and morethan this practically not right now in the Mercury crust. Inparticular, this is evidenced by the very low threshold for thecontent in the atmosphere of Mercury of the argon isotope At-40 whichis a product of beta-decay of K-40 in the crust of the planetestablished according to the data of measurement using the ultravioletspectrometer on the Mariner 10 spacecraft. This threshold proved tobe significantly lower than the measured content of argon on the Moonwhere it is absorbed into the soil with low soil temperatures and withthe rise of the Sun, its partial pressure increases by approximately a /222
magnitude. Such an accumulation of argon, obviously, does not occur
on Mercury, which is a serious limitation when evaluating the contentof potassium in the crust but does not contradict the idea of
maintaining it in the interior.
With conditions of retention in the nucleus of this or other
hypothetical thermal sources, one can understand the presence on
Mercury of a significant magnetic field, starting with the concept of
its generation due to the hydromagnetic dynamo. The hypothesis of
residual magnetization is considerably less probable inasmuch as for
Mercury it is even more difficult than for the Moon to assume that the
temperature in its interior did not rise higher than the Curie point.
The magnetic field was recorded by N. Ness and his coworkers with
flight around the planet by the Mariner 10. The intensity of the
basic dipole component of the field at the surface on the equator
comprises 350 gamma, or =1% of the Earth's; the axis of the magnetic
dipole is formed with the axis of the orbit an angle of 12 ° . Plasma
measurements close to Mercury confirm that the field belongs to the
planet itself and is not induced with the flow of solar wind: the
structure of the limited field of space--the magnetosphere and a number of
specific features of streamline flow of the planet with intrinsic
regular field are evidence of this. This includes the presence of a
magnetopause, an impact wave (formed at a distance of =1500 km from
this surface at the same time as during interaction with a very
rarefied atmosphere it would be approximately a magnitude closer) and
a number of effects, which, similarly to Earth, obviously, are caused
by processes of acceleration of captured particles in the field of the
magnetic loop.
160
\'
%_./Z__± _...... _ J
19/fopc
12
Figure 78. A comparison of
models of the inner structure
of planets of the Earth group.Relative dimensions of the
core are indicated in
volumetric percent.
Key: i. upper mantle;
2. Earth; 3. lithosphere;
4. middle mantle; 5. lower
mantle; 6. Moon; 7. litho-
sphere; 8. asthenosphere;
9. core; 10. lower mantle;
ii. upper mantle; 12. litho-
sphere; 13. Venus; 14. as-
thenosphere; 15. lithosphere;
16. Mercury; 17. mantle;
18. lithosphere; 19. Mars.
Thus, independent of the
thermal model used, one can
confirm that Mercury, like the
Moon (although somewhat later)
reached the apex of evolution
in the early stage of its
history and at the presenttime continues to cool. As is
apparent from Figure 78, in
which a model is shown of the
basic shells of the planet,
the iron-nickel core of
Mercury comprises about 3/4 of
its diameter, that is, it is
approximately equal to the
dimensions of the Moon and
most of all is partially
melted. It is surrounded by a
thin mantle, probably,
consisting of magnesiumsilicate rock of the olivine
type and along with the upper
crust layer a solid
lithosphere of Mercury is
formed. Its thickness
increased from =200 km about 3
billion years ago to =500 km
at the present time. The
fairly large intensity of the
lithosphere gives us the basis
for assuming a low level of
modern tectonic activity. It
is possible, however, toassume that as a result of the
longer period of cooling, the
processes of global tectonics
and ancient volcanism
encompassed a larger period of
Mercur_ history than lunar. From this it follows that the age of the
youngest rock 1 on the plain sections of the planet inside the
craters and basins subjected to filling by igneous lava must be
noticeablyless than the minimum age of 3.16 billion years determined for
the rock of the Moon.
/223
The special features of morphology of the relief presented
already for the escarpments discussed earlier in a system of extensive
steep outcroppings with toothed outlines makes it possible to consider
Mercury a planet on which tectonic processes have a unique character.
They were caused by its general global compression and showed,
obviously, the direct result of formation of a large core after
approximately 1.2 -1.5 billion years after accumulation of the planet,
followed by a long period of cooling. The cooling and compression
began soon after completion of the period of intense bombardment of
the surface by large meteorites and continued after formation of
/224
161
broad, flat ravines and basins hindering moreover the appearance ofsurface volcanism. It is possible that in the initial stage of thisprocess tectonic cracks occurred; however, the formation of folded
structures encompassing the entire latter period of thermal evolution
of Mercury were dominant. They are more characteristic for this
planet, in spite of the traces of the extent of the crust of tectonic
origin on the Moon and Mars which have a more average density.
The evolution of Venus, obviously, in its characteristics, is
similar to that of the Earth and also is characterized by
comparatively early differentiation of its interior. Models of the
inner structure are calculated, starting from a composition of
protomatter in orbit of Venus close to Earth with somewhat fewer
admixtures of volatile elements. Correspondingly, one obtains on the
whole a structure similar to that of Earth for the interior of this
planet. The radius of liquid iron of the core is estimated,
approximately like that on Earth, equal to 2900 km if one assumes that
the dimensionless moment of inertia I of Venus is equivalent to that
of Earth. The model in Figure 78 also assumes, similarly to Earth,
the existence of a lithosphere, thickness about 100 km, upper and
lower mantles. Their mineralQlogical composition, obviously, differs
little from the composition of the components of the rock in the
shells of Earth. This confirmation is not contradicted by data
obtained earlier for determining the composition of soil in the
landing areas of the Venera station which discovered rock of basalt
type in the crust close to toleite and potassium alkali basalt. The
results of these measurements are also evidence that on Venus, as a
result of gravitational differentiation of matter, evacuation occurred
in the crust of long-lived isotopes. The calculated value of the
thermal flux from its interior comprises about 100 erg/cm2-s;
approximately such values were recorded on Earth in the fields ofmodern volcanism.
162

[Pages 225-256 were not included for translation.]
163
The existence of carbohydrates led to hypotheses about the
possible abiogenic organic synthesis in the atmosphere of Jupiter
under the effect of solar ultraviolet and high-energy corpuscular
radiation, and also thunder and lightning in clouds occurring thanks
to effective separation of charges in high convection conditions.
C. Sagan and B. Kkhar conducted experiments on modeling such a type of
process, making it possible to obtain a broad class of complex organic
compounds right up to amino acids and to identify their spectral
characteristics in the visible and near infrared areas of wavelengths
with the spectra of Jupiter. It is possible that organic polymers
which have a broad range of colors make a certain contribution to the
coloration of Jupiter. However, here obviously, the basic role is
played here by the amorphous red phosphorus during separation of
phosphate, the hydrogen and ammonia polysulfides and sulfur. They
color the disk of the planet reddish brown and yellow inasmuch as
their basic components are hydrogen and helium and also methane and
ammonia in any phase, remain practically colorless.
The model of the upper part of the Jupiter gas cloud shown in
Figure 80 [Figure 80 was not included for translation] is constructed
according to the data of measurements of temperature using infrared
radiometers and radio-eclipse measurements during flights around
Jupiter by the Pioneer and Voyager spacecraft. The zero altitude
corresponds to a certain randomly selected value on the pressure
scale. A pressure of 1 atm corresponds to a temperature of 170 K.
The tropopause is found at a level with pressure 0.1 atm and temper-
ature 115 K. In the entire troposphere lying below, the altitude
course of temperature can be characterized by the adiabatic gradient
in the hydrogen-helium atmosphere -- about 2 K per kilometer. The
spectrum of Jupiter's radio emission also is evidence of a stable
increase in radio brightness temperature with depth. Above the tropo-
pause is located the field of temperature inversions where the tempera-/258
ture right up to a pressure on the order of 1 mbar gradually increases
to =180 K. This value is retained in the mezosphere which is
characterized by isothermia to a level with pressure approximately
10 -6 atm and above that begins the thermosphere changing to the
exosphere at a temperature of 1250 K.
Figure 80 also shows the proposed structure of clouds of Jupiter.
According to this model, there are three basic layers: the upper
layer at a pressure of about 0.5 atm consisting of crystal ammonia; an
intermediate layer comprising hydrosulfide of ammonia; the lowest
layer -- with pressure of several atmospheres comprising an ordinarywater ice. This model on the whole satisfies the set of existing
experimental data and explains well the characteristic coloration of
zones and bands: the light zones located above in the atmosphere
contained bright white crystals of ammonia and the bands located more
deeply -- the red-brown crystals of ammonium hydrosulfide. In certain
models, starting with the geochemical expressions, it is also possibleto assume the existence of an even lower fourth layer of clouds
consisting of liquid ammonia. Similarly to Earth and Venus, lightning
has been recorded in the atmosphere of Jupiter. Judging from the
light flashes seen on the photographs from the Voyager, the intensity
164
of charges is extremely great. However, it is still unclear to whatdegree these phenomena are related to the clouds inasmuch as theflares are detected at higher altitudes than one would expect.
The effective temperature of Saturn, as the result of the greatdistance from the Sun, is lower than on Jupiter. But as a whole, thestructure of the atmosphere, the profiles of temperature and pressure,the density of the cloud cover are similar to the Jovian although thesurface of the clouds appears more uniform than possibly is explainedby the presence of an extensive super-cloud smoke (see Figures 65 and66). According to the data of radio measurements on the Voyager 2,temperature at the level of pressure of 1.2 atm comprises about 145 Kand slowly decreases with the adiabatic gradient 0.85 K/km. In thetropopause at a pressure of about 0.07 atm, the temperature isapproximately 80 K. The upper boundary of the clouds at the equator,obviously, is located higher than at the poles and their color changesfrom blue-green in the near-polar zone to red-brown, beginning with alatitude of =59° as is seen on the color synthesized imagestransmitted by the equipment of the Voyager (with certainamplification of color contrast). In the middle and lower latitudes,separate bands and zones are clearly differentiated however moreweakly expressed than on Jupiter (see Figure 89 and Figure 94). Thezones, obviously, are located above the bands inasmuch as, asmeasurements have shown using an infrared radiometer, theirtemperature is lower.
In the study of atmospheres and clouds of Jupiter and Saturn, theresults of ground photometric, spectral and polarized observationsmake a great contribution; these are regularly made by groups ofSoviet astronomers direct by V. G. Teyfel, V. P. Dzhapiashvili,A. V. Morozhenko and several groups of foreign scientists. Theseobservations make it possible to study the vertical structure ofclouds, trace their spatial-time variations related to dynamicprocesses in the atmosphere. The interpretation of the spatialfeatures of reflective properties of these planets have made itpossible, in particular, to draw conclusions about the aerosol smokelocated above the main cloud cover and having greatest opticalthickness over the polar regions. Obviously, the darkening of thepolar regions is related to its presence, particularly strong in theultraviolet. However, it is impossible to exclude the fact that adecrease in reflection in the ultraviolet field of the spectrum is dueto the existence above the layer of smoke of absorbing particlessimilar to those which occur in the super-cloud atmosphere of Venus.However, according to measurements on spacecraft, no absorbing agentwas detected. During flight around Saturn, intense ultravioletillumination was recorded due to scattering of atomic hydrogen whosesource possibly can be the rings.
The special features of the atmosphere of Uranus and Neptune areexplained by the even lower effective temperatures and the largeconcentrations of methane and ammonia which have already beenmentioned. Methane plays a particularly significant role. Thespectra of reflection of these planets in the visible field with well-known methane bands of absorption have hardly any differences.
/259
165
Unfortunately, an analysis of the content of this gas and an estimateof pressure and temperature at the level of formation of the bands isextremely complicated by difficulties in determining the equivalentwidths of the lines and the limitation of laboratory data on the CH4bands in a spectral interval shorter than i.I _m where absorption hasa complex character. Therefore, as a standard of comparison usuallyone uses measurements of equivalent widths in the spectra of Jupiterand Saturn where the content of methane is determined more reliablywith an error of no more than =50%. According to these results, atthe level of formation of bands at temperature =90 K on which the CH4lines still remain unsaturated, the ratio of the CH4/Hp mixtureessentially exceeds the solar value and enrichment With carbon reachesapproximately 50 times.
The structure of the atmospheres of Uranus and Neptune,obviously, also differ noticeably from Jupiter and Saturn. Inparticular, their spectra of radio emission are noted here in whichthe significant increase in brightness temperature is not detected infields from 3 to 10 cm as is observed with the rapid increase intemperature from the depth. According to the set of results ofanalysis of spectral observations and calculations of weakeningaccording to altitude of the thermal flux made by R. Danielson, modelsof the atmospheres of these planets were calculated. Then, differenthypotheses relative to the positioning of the effective level ofreflection of solar radiation and the boundaries of the cloud layerwere used here and the behavior of thermodynamic parameters werecontrolled by the course of the curve of pressure of saturation ofmethane vapors. The measured course of brightness temperature closestto reality was explained to be models in which it was permissible tohave the thermal flux variable according to altitude and the presencein the atmosphere of inversion layers. However, we still must expendconsiderable effort so that information on the atmospheres of Uranusand Neptune will be much more definite. Obviously, here a decisiverole is played by the planned flyby close to Uranus of the Voyager 2in 1986.
According to a number of similar characteristics in the spectraof reflection recorded on Earth for Uranus and Neptune, the largestseems to belong to Saturn's satellite -- Titan. Recently, itsatmosphere discovered at the beginning of this century by Spanishastronomer K. Sola has attracted a great deal of attention. In the1940's, the well-known American astronomer D. Koyper confirmed thepresence of atmosphere on Titan having detected bands of absorption ofmethane in its spectrum and later reporting on identification of weakquadripolar lines of molecular hydrogen. But such lines occur due todeformation of molecules with collisions creating their asymmetry anddipolar moment which explains the non-resonant (induced) absorptionproportional to the square of gas pressure. This led to a hypothesisabout the presence on Titan of a fairly dense gaseous cloud.
The results of studying the dependence of the infrared brightnesstemperature on wavelength were first interpreted in such a way that awavelength of 2030 _m corresponding to the expected equilibrium oftemperature of Titan (about 90 K) emits considerably less energy
/260
/261
166
than one finds from the Sun and a maximum of radiation is mixed in themore shortwave part of the spectrum. This phenomenon can also beexplained if again one allows that Titan has a dense atmosphere inwhich the basic non-transparency is created in a range of wavelengthsabout 20 _m. Then the temperature measured on these wavelengths willapply to the emitted layer located at a certain altitude in theatmosphere and temperature on the surface as a result of thegreenhouse effect can reach almost 200 K. In other words, theclimatic conditions on Titan can be looked at as comparativelyfavorable, almost the same as those on Mars!
For a long time, the question of which agent can be responsiblefor this lack of transparency in the atmosphere has been discussed.Methane does not have strong bands of absorption in areas longer than7.7 _m. As to molecular hydrogen, its required quantity here mustcorrespond to pressure on the surface of at least 0.5 atm and hardlythe body of such mass as Titan could maintain so much hydrogen and itsconstant intense supply into the atmosphere is hardly probable. Moreexemplary seems to be the hypothesis that the outgoing radiation isscreened due to induced absorption of molecular hydrogen at a pressureon the order of 1 atm. Such a high pressure can be created, forexample, by neon or nitrogen with relatively small content ofhydrogen. The cosmically propagated neon can be retained from thestage of accumulation and the nitrogen be formed due to photolysis ofammonia.
However, the reality of this hypothesis was greatly reduced afterdoubt was cast on the actual detection of hydrogen in the spectra ofTitan. Therefore, two models have been continued to be looked at:non-dense atmosphere with pressure on the surface =20 mbar and denseatmosphere with pressure on the surface about 1 atm. The mainatmospheric component was considered to be methane. Moreover,basically no exemplary explanation for the possible increase intemperature of the lower atmosphere has been found.
Starting with concepts of the possible formation of hydrocarbonsunder the effect of ultraviolet radiation on the surface or in thelayer of clouds, attempts have been undertaken to explain the natureof the reddish coloration of Titan: its albedo in the red part of thespectrum is as great as that of Mars or Io and, generally speaking,can be caused by the surface or the atmosphere. The presence in thespectrum of fairly blurred, difficult-to-distinguish marks ofabsorption existing, differently from gases, reflected from solidbodies would appear not to exclude such a possibility. However, anumber of special features in the structure of bands of methane andthe results of measurements of the dependence of the degree ofpolarization of the reflected radiation on the phase angle definitelyis evidence that like Jupiter and Saturn, the reflecting material wasmost probably an aerosol concentrated in the clouds.
The results of optical and radio measurements of the parametersof the atmosphere of Titan with flight of the Voyager 1 basicallyclarified all of these questions. It appeared that Titan actually hasa very dense atmosphere with pressure on the surface =1.6 atm and
/262
167
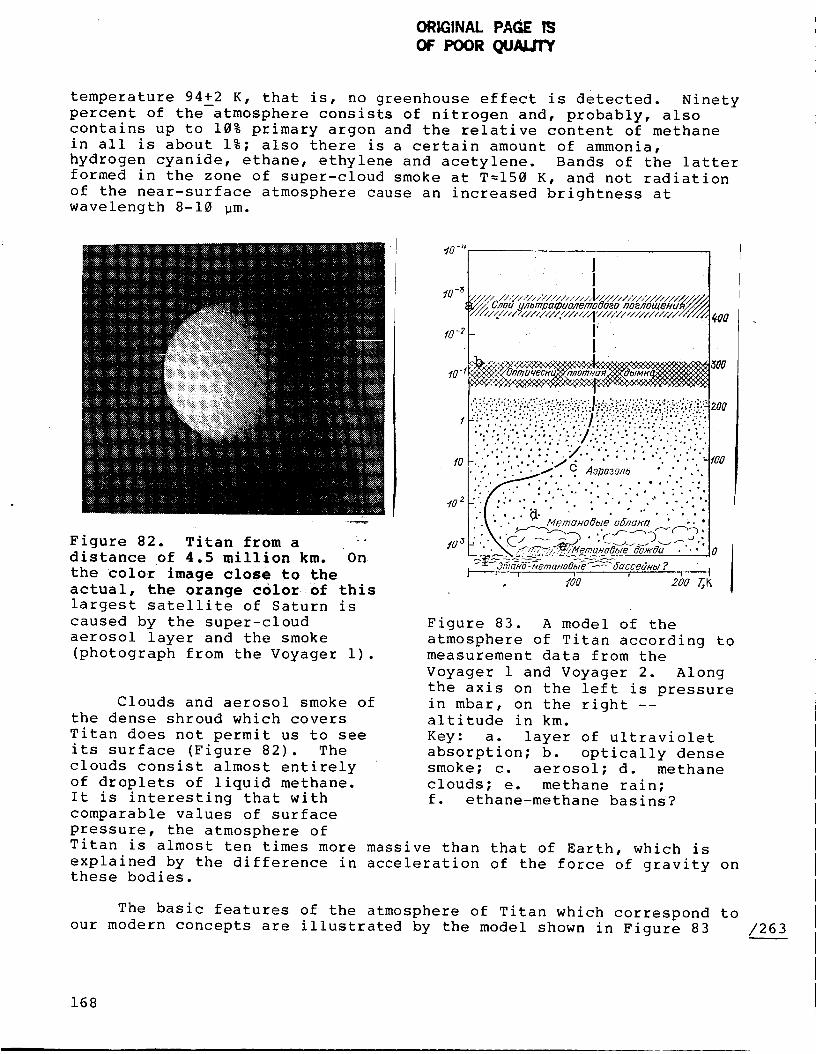
ORLGINAL PAGE !_
OF Poor _lAlal"t,
temperature 94+2_ K, that is, no greenhouse effect is detected. Ninety
percent of the atmosphere consists of nitrogen and, probably, also
contains up to 10% primary argon and the relative content of methane
in all is about 1%; also there is a certain amount of ammonia,
hydrogen cyanide, ethane, ethylene and acetylene. Bands of the latter
formed in the zone of super-cloud smoke at T=150 K, and not radiation
of the near-surface atmosphere cause an increased brightness at
wavelength 8-10 _m.
Figure 82. Titan from a
distance of 4.5 million km. On
the color image close to the
actual, the orange color of this
largest satellite of Saturn is
caused by the super-cloud
aerosol layer and the smoke
(photograph from the Voyager i).
Clouds and aerosol smoke of
the dense shroud which covers
Titan does not permit us to see
its surface (Figure 82). The
clouds consist almost entirely
of droplets of liquid methane.
It is interesting that with
comparable values of surface
pressure, the atmosphere of
!
_a - _ _/////_ //, :1/ /// ////// / / / / /]1/////
_/_,9<___,,_,//,_,,____,,o__,_ _,__9,3'D_,_9,_,_,_,,"S//__oa10-2
10-t
fO
_0 2
- I"I
1:.i.!::_'."..;:._:.-)LT<_:;.i"::.$;?.!:;:i-_::::!::_i_:=.:;.:_;:.::_:;".';._!":;;!;.'.'i;:...";i:!
-_:"_".';":::i_:.::;_:'_:.:"_.;-=.-.L':;:::::!:_;"..i"_;.iT<i._;.;:!.::;:;I";':.:.':;';.¢!:.7""W..;i"_'-_"'-."; : :::"!...:':".'." ,':: "./-: "- ;". :. ;:.":., :'.','L
..... : '.'..:..'..;;_ c; ,;Uo_o,,_ "" ...
• ,(:", _I" :: _1"_ /v/enT, c/Ha_o/e adn_/_c/ ; /__;- °
• .\ _ ',J--_.-._ .-¢_..,--_-,_,_--'-c _,
2o0 r,_
_oo
_oo
• Ioo
Figure 83. A model of the
atmosphere of Titan according tomeasurement data from the
Voyager 1 and Voyager 2. Along
the axis on the left is pressure
in mbar, on the right --altitude in km.
Key: a. layer of ultraviolet
absorption; b. optically dense
smoke; c. aerosol; d. methane
clouds; e. methane rain;
f. ethane-methane basins?
Titan is almost ten times more massive than that of Earth, which is
explained by the difference in acceleration of the force of gravity onthese bodies.
The basic features of the atmosphere of Titan which correspond to
our modern concepts are illustrated by the model shown in Figure 83 /263
168
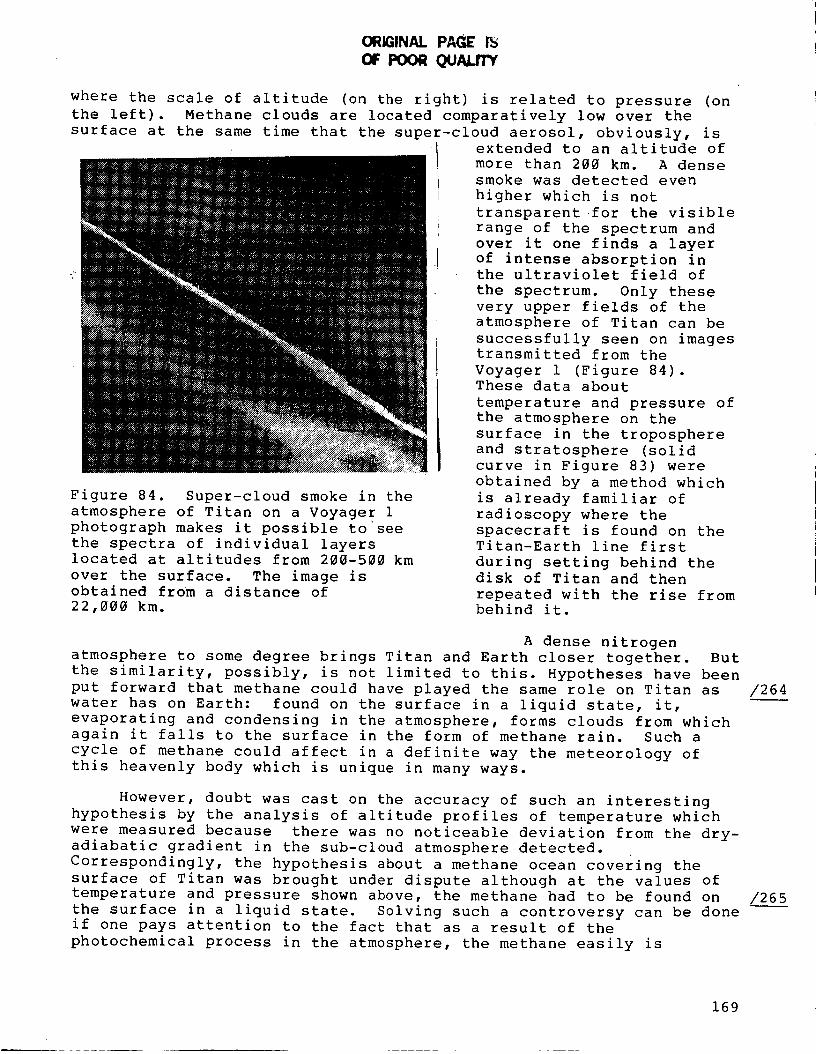
ORIGINAL PAGE !_
OF Poor QUALrW
where the scale of altitude (on the right) is related to pressure (on
the left). Methane clouds are located comparatively low over the
surface at the same time that the super-cloud aerosol, obviously, is
Figure 84. Super-cloud smoke in the
atmosphere of Titan on a Voyager 1photograph makes it possible to see
the spectra of individual layerslocated at altitudes from 200-500 km
over the surface. The image is
obtained from a distance of
22,000 km.
L
extended to an altitude of
more than 200 km. A dense
smoke was detected even
higher which is not
transparent for the visible
range of the spectrum and
over it one finds a layer
of intense absorption inthe ultraviolet field of
the spectrum. Only these
very upper fields of the
atmosphere of Titan can be
successfully seen on imagestransmitted from the
Voyager 1 (Figure 84).These data about
temperature and pressure of
the atmosphere on the
surface in the troposphere
and stratosphere (solid
curve in Figure 83) were
obtained by a method which
is already familiar of
radioscopy where the
spacecraft is found on the
Titan-Earth line first
during setting behind the
disk of Titan and then
repeated with the rise frombehind it.
A dense nitrogen
atmosphere to some degree brings Titan and Earth closer together. But
the similarity, possibly, is not limited to this. Hypotheses have been
put forward that methane could have played the same role on Titan as
water has on Earth: found on the surface in a liquid state, it,
evaporating and condensing in the atmosphere, forms clouds from which
again it falls to the surface in the form of methane rain. Such a
cycle of methane could affect in a definite way the meteorology of
this heavenly body which is unique in many ways.
However, doubt was cast on the accuracy of such an interesting
hypothesis by the analysis of altitude profiles of temperature which
were measured because there was no noticeable deviation from the dry-
adiabatic gradient in the sub-cloud atmosphere detected.
Correspondingly, the hypothesis about a methane ocean covering the
surface of Titan was brought under dispute although at the values of
temperature and pressure shown above, the methane had to be found on
the surface in a liquid state. Solving such a controversy can be done
if one pays attention to the fact that as a result of the
photochemical process in the atmosphere, the methane easily is
/264
/265
169
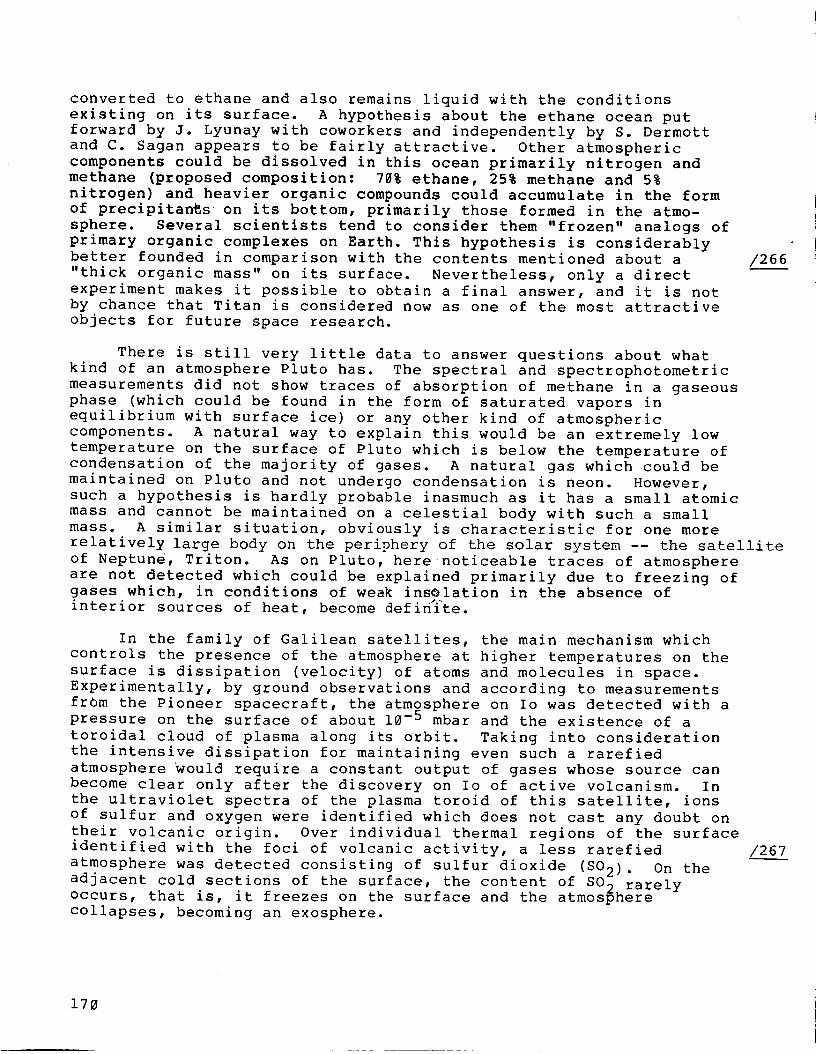
converted to ethane and also remains liquid with the conditionsexisting on its surface. A hypothesis about the ethane ocean putforward by J. Lyunay with coworkers and independently by S. Dermottand C. Sagan appears to be fairly attractive. Other atmosphericcomponents could be dissolved in this ocean primarily nitrogen andmethane (proposed composition: 70% ethane, 25% methane and 5%nitrogen) and heavier organic compounds could accumulate in the formof precipitants • on its bottom, primarily those formed in the atmo-sphere. Several scientists tend to consider them "frozen" analogs ofprimary organic complexes on Earth. This hypothesis is considerablybetter founded in comparison with the contents mentioned about a"thick organic mass" on its surface. Nevertheless, only a directexperiment makes it possible to obtain a final answer, and it is notby chance that Titan is considered now as one of the most attractiveobjects for future space research.
/266
There is still very little data to answer questions about what
kind of an atmosphere Pluto has. The spectral and spectrophotometric
measurements did not show traces of absorption of methane in a gaseous
phase (which could be found in the form of saturated vapors in
equilibrium with surface ice) or any other kind of atmospheric
components. A natural way to explain this would be an extremely low
temperature on the surface of Pluto which is below the temperature of
condensation of the majority of gases. A natural gas which could be
maintained on Pluto and not undergo condensation is neon. However,
such a hypothesis is hardly probable inasmuch as it has a small atomic
mass and cannot be maintained on a celestial body with such a small
mass. A similar situation, obviously is characteristic for one more
relatively large body on the periphery of the solar system -- the satellite
of Neptune, Triton. As on Pluto, here noticeable traces of atmosphere
are not detected which could be explained primarily due to freezing ofgases which, in conditions of weak ins@lation in the absence of
interior sources of heat, become definite.
In the family of Galilean satellites, the main mechanism which
controls the presence of the atmosphere at higher temperatures on the
surface is dissipation (velocity) of atoms and molecules in space.
Experimentally, by ground observations and according to measurements
from the Pioneer spacecraft, the atmosphere on Io was detected with a
pressure on the surface of about 10 -5 mbar and the existence of a
toroidal cloud of plasma along its orbit. Taking into consideration
the intensive dissipation for maintaining even such a rarefied
atmosphere Would require a constant output of gases whose source can
become clear only after the discovery on Io of active volcanism. In
the ultraviolet spectra of the plasma toroid of this satellite, ions
of sulfur and oxygen were identified which does not cast any doubt on
their volcanic origin. Over individual thermal regions of the surface
identified with the foci of volcanic activity, a less rarefied
atmosphere was detected consisting of sulfur dioxide (SO2) " On the
adjacent cold sections of the surface, the content of SO 9 rarely
occurs, that is, it freezes on the surface and the atmosphere
collapses, becoming an exosphere.
/26__3_7
170
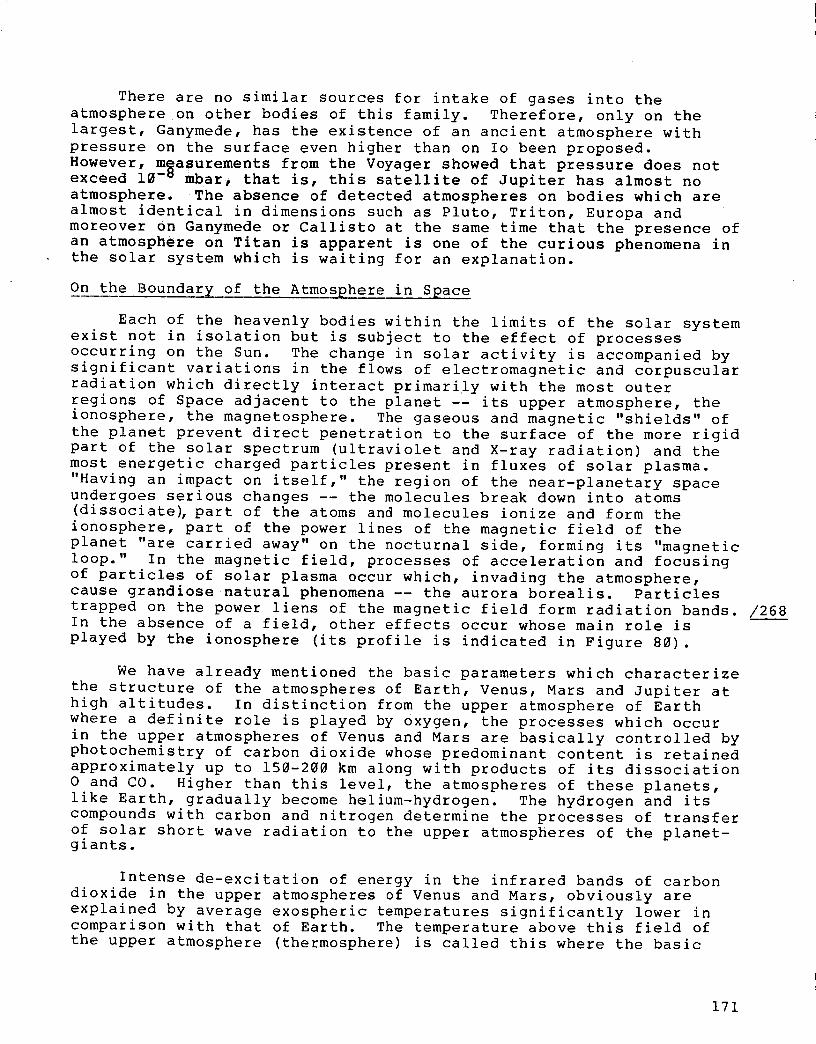
There are no similar sources for intake of gases into theatmosphere on other bodies of this family. Therefore, only on thelargest, Ganymede, has the existence of an ancient atmosphere withpressure on the surface even higher than on Io been proposed.However, m_asurements from the Voyager showed that pressure does notexceed 10 -° mbar, that is, this satellite of Jupiter has almost noatmosphere. The absence of detected atmospheres on bodies which arealmost identical in dimensions such as Pluto, Triton, Europa andmoreover on Ganymede or Callisto at the same time that the presence ofan atmosphere on Titan is apparent is one of the curious phenomena inthe solar system which is waiting for an explanation.
On the Boundary of the Atmosphere in Space
Each of the heavenly bodies within the limits of the solar system
exist not in isolation but is subject to the effect of processes
occurring on the Sun. The change in solar activity is accompanied by
significant variations in the flows of electromagnetic and corpuscular
radiation which directly interact primarily with the most outer
regions of Space adjacent to the planet -- its upper atmosphere, the
ionosphere, the magnetosphere. The gaseous and magnetic "shields" of
the planet prevent direct penetration to the surface of the more rigid
part of the solar spectrum (ultraviolet and X-ray radiation) and the
most energetic charged particles present in fluxes of solar plasma.
"Having an impact on itself," the region of the near-planetary space
undergoes serious changes -- the molecules break down into atoms
(dissociate), part of the atoms and molecules ionize and form the
ionosphere, part of the power lines of the magnetic field of the
planet "are carried away" on the nocturnal side, forming its "magnetic
loop." In the magnetic field, processes of acceleration and focusing
of particles of solar plasma occur which, invading the atmosphere,
cause grandiose natural phenomena -- the aurora borealis. Particles
trapped on the power liens of the magnetic field form radiation bands. /268In the absence of a field, other effects occur whose main role is
played by the ionosphere (its profile is indicated in Figure 80).
We have already mentioned the basic parameters which characterize
the structure of the atmospheres of Earth, Venus, Mars and Jupiter at
high altitudes. In distinction from the upper atmosphere of Earth
where a definite role is played by oxygen, the processes which occur
in the upper atmospheres of Venus and Mars are basically controlled by
photochemistry of carbon dioxide whose predominant content is retained
approximately up to 150-200 km along with products of its dissociation
O and CO. Higher than this level, the atmospheres of these planets,
like Earth, gradually become helium-hydrogen. The hydrogen and its
compounds with carbon and nitrogen determine the processes of transfer
of solar short wave radiation to the upper atmospheres of the planet-giants.
Intense de-excitation of energy in the infrared bands of carbon
dioxide in the upper atmospheres of Venus and Mars, obviously are
explained by average exospheric temperatures significantly lower in
comparison with that of Earth. The temperature above this field of
the upper atmosphere (thermosphere) is called this where the basic
171
influx of energy occurs due to direct absorption by atmosphericmolecules and atoms of solar ultraviolet and X-ray radiation and theprofile of temperature becomes almost isothermal. The exosphere ofEarth begins with altitudes of about 400-500 km from which particleswhich hardly undergo large collisions can without obstacle escape intoouter space. Depending on the time of day and state of solaractivity, the exospheric temperature changes on the average from 500-700 to 1000-1200 K. As to Mars and Venus, their exospherictemperatures do not exceed 200-350 K and the basis of the exospherelies approximately at 200 km lower. Then, in the thermosphere ofVenus, the temperature atnight, as we have already said, drops to100 K -- 80 K below the temperature of the mesopause, usually thecoldest region in a planetary atmosphere. As Soviet scientistV. F. Gordiets and Yu. N. Kulikov have shown, the reason for thisphenomenon can be in addition to the CO2, de-excitation of energy inthe rotational band of water vapor in the infrared region of thespectrum.
Measurements according to method of radio illumination from thespacecraft showed that Venus and Mars have ionospheres; however, theyare less dense than those of Earth and are closely pressed to theplanet. In the ionosphere of Earth, the maximum electronconcentration (up to 10v el/cm 3) is observed at an altitude of about280 km in the daytime -- this is the so-called F2 layer. Less clearlypronounced maximums lie at altitudes of 150-200 _m (F] layer), about110 km (E layer) and 80 km (D layer) where the concen£ratlon of elec-trons is from 105 el/cm 3 in the F1 layer up to 103 el/cm 3 in the Dlayer.
At night, the density of each of these layers is considerablylower. The main ion in the F region is atomic oxygen and molecularions of oxygen, nitrogen and _itrous oxide participate in ionizationof the remaining fields; their role becomes determining for theformation of the D and E layers. Above the F2 layer, the ion andelectron concentration (the ionosphere is quasineutral!) graduallydrop and approximately at an altitude of 1000 km are equalized withthe concentration of neutral gas (basically hydrogen). At the sametime, in all of the underlying atmosphere, the neutral components aredominant; for example, at the altitude of the F ,of ions does not exceed tenths of a percent. T_e the relative contentmost importantdifference in the ionosphere of Mars from the ionosphere of Earth isthe absence in it of a maximum F2 formed in the Earth's ionosphere dueto ions O+ with certain relationships of the processes of ionization,recombination and diffusion. The cause for this difference is thecircumstance that the rate of reaction of recharging of ions O+ withCO2 is considerably greater than with N2 which retains the role of thebasic components of the atmosphere of E_rth up to comparatively highaltitudes. This prevents an accumulation of the O+ ions on Mars belowapproximately 200 km.
The basic maximum of the daytime layer of the Martian ionospherelies at an altitude of 135-140 km and has an electron concentration ofno more than 2-105 el/cm 3, that is, almost a magnitude smaller thanthe concentration in the F2 layer of the ionosphere of Earth. The
/269
172
second maximum is detected at an altitude of about 110 km withelectron concentration 7-104 el/cm 3. The basic component of theMartian ionosphere is the 0+2 which forms as a result of reaction ofovercharging of the ion with carbon dioxide and atomic oxygen. Theionosphere of Venus also is formed basically b[ ions 0+2 withadmixtures 0+ and others; above 200 km, ions O- predominate. Itsdaytime maximum with concentrations (3-5)-105 el/cm _ is located at analtitude of 140 km; the sharp drop in electron concentration isobserved at a level of 250-400 km: here one finds the ionopause --the boundary between the thermal ions of the ionosphere and flows ofhigh-energy particles of solar plasma. On the nocturnal side, anextensive zone is formed up to an altitude above 3000 km with theaverage concentration of electrons less than 103 el/cm 3 and severallocal maximums at altitudes below 150 km where concentrations are 5-10times higher and the basic ion is 0+. The composition and content ofions in the ionospheres of Venus and Mars undergo significantvariations.
/270
A powerful ionosphere whose extent reaches no less than 3000 km
is observed on Jupiter although the maximum electron concentration in
it does not exceed 5-105 el/cm _. According to the data of measurement
on the Voyagers in the morning and evening conditions and with shifts
from the equator to 67 ° in latitude, the maximum electron
concentration and position of the main peak changed, respectively,
from 2.104 el/cm 3 to 5 el/cm 3 and from 700 to 2500 km in altitude
counting from the apex of the clouds. A much weaker ionosphere wasobserved on Saturn with a peak of electron concentration 9"103 el/cm 3
at an altitude of 2800 km counting from the level with pressure =i atm
as measurements indicated in the method of radio illumination from the
Pioneer ii. Measurements close to this value (from 0.6 to
1.7-104 el/cm 3) were found by a similar method in the morning and
post-midday hours during the flight of the Voyager 2.
It is interesting that ionospheres were also detected on two of
the planet's satellites -- the Moon and Io. The weak ionosphere on
the Moon (less than 103 el/cm 3) almost adjoins the surface and
obviously, is created basically by ions of argon. Io, in the emission
ultraviolet spectrum, shows lines identical for ions of sodium and
sulfur. These ions, most probably, are formed under the effect of
impact ionization of atoms by electrons in the powerful radiation
bands of Jupiter.
The problems of physics of the upper atmosphere (planetary
aeronomy) are related in the closest manner to the characteristic
features of interaction of a heavenly body with accumulating flows of
solar plasma. In our ordering of several models, nature allowed a
basic difference which consists primarily of the presence or absence
in the planets of their own magnetic fields and gaseous shell. As we
have seen, among the planets of the Earth group, only Earth has a
significant magnetic field and the other maximum cases the Moon devoid /271
both of a magnetic field and an atmosphere. In turn, the strong
magnetic field of Jupiter which exists, in a number of special
features, is similar to a pulsar -- the source of pulsing radio
173
emission and in it a commonality of physical mechanisms acting in theuniverse is apparent.
We do not have the possibility of devoting a great deal ofattention to these problems inasmuch as their consideration is ofindependent interest far beyond the framework of this book.Therefore, we will only touch on the very general characteristics ofthe special features of space which are formed in the environs ofVenus, Mars and the largest planet of the solar system -- Jupiter.
The formation of a transition zone -- the ionopause from thediurnal side of the planet in a field located beyond the shock wave ataltitudes higher than approximately 300-500 km is the mostcharacteristic feature of interaction of solar plasma with Venus andMars. There are no radiation bands on them. The ionopause is formedin a zone where the pressure of the solar wind (comprising for Venusapproximately one hundred billionth part of a millibar) approximatelyequalizing the pressure of the ionosphere charged particles along withthe pressure of the intrinsic magnetic field of the planet. In anideal model of the ionosphere with infinite conductivity of the flux,induced by the flux of solar wind, flow along the surface of theionopause and the region directly adjacent to it above. Therefore,the resulting induced magnetic field is located outside theionosphere. Obviously, an approximately similar situation is retainedin a more actual case of the ionosphere with finite conductivityinasmuch as the time of magnetic diffusion is considerably larger thanthe time of change of direction of the interplanetary magnetic fieldand diffusion of the latter in an un-perturbed ionosphere isnegligibly small.
At the same time, the picture of interaction is significantlymore complex and has a number of specific characteristics separate forVenus and Mars as was apparent according to the results of plasmaexperiments on artificial satellites of these planets. The complexcharacter of processes in the field of streamlined flow, besides theformation of the intermediate zone identical with the ionopause alsoincluded a sequence of overheating and thermalization of ions, theformation of zones of rarefaction beyond the shock wave and many other /272
special features. In particular, the high temperatures of electrons
and ions in the ionosphere of Venus apply to it -- these are
approximately, respectively, 5000 K and 1000 K, that is, approximately
exceeding by a magnitude the exospheric temperature of this planet.
This is evidence of the ineffectiveness of processes of temperature
relaxation in distinction from the fact that it is observed on Earth
where the temperature of electrons, ions and neutral particles right
up to =500 km do not have great differences. Then, it is surprising
that high values of electron and ion temperatures are retained on the
nocturnal side on a background of neutral temperature of the
cryosphere 100 K. This forces us to look for a mechanism of input of
energy on the nocturnal side of the planet and nocturnal ionization
which, most probably, is related to the intense dynamic exchange and
the processes of electromagnetic interaction.
174
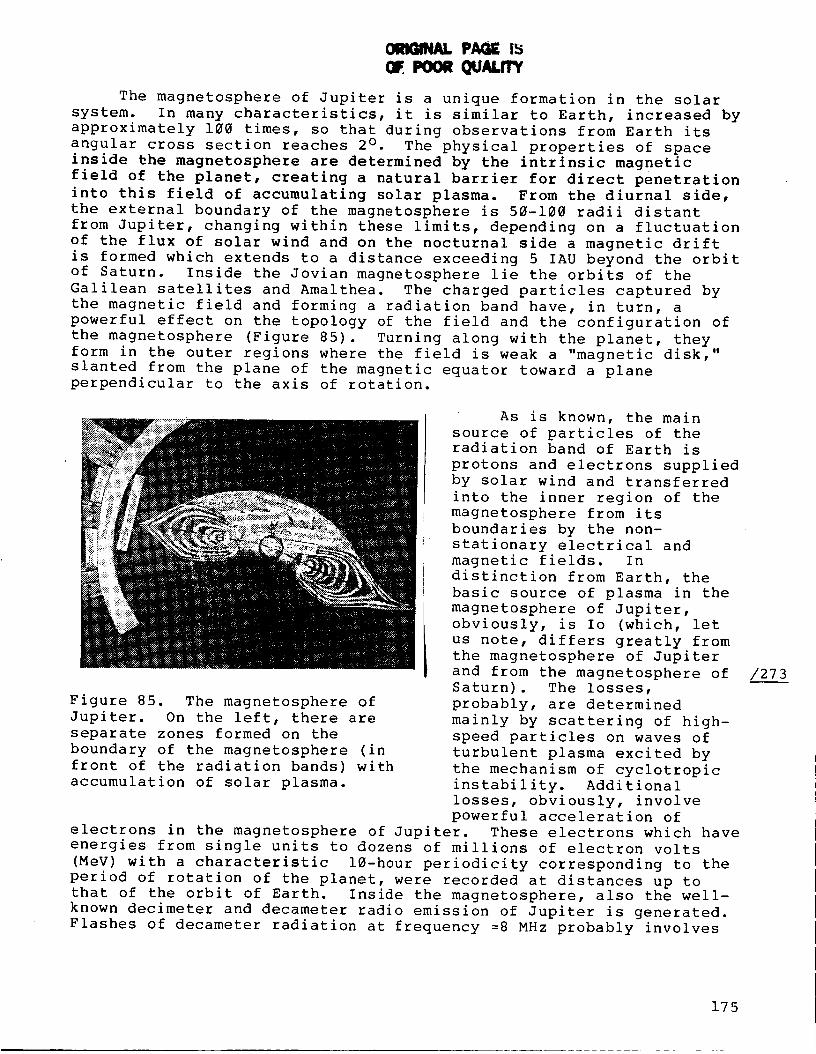
POOR ( JALITV
The magnetosphere of Jupiter is a unique formation in the solar
system. In many characteristics, it is similar to Earth, increased by
approximately 100 times, so that during observations from Earth its
angular cross section reaches 2 ° • The physical properties of space
inside khe magnetosphere are determined by the intrinsic magnetic
field of the planet, creating a natural barrier for direct penetration
into this field of accumulating solar plasma. From the diurnal side,
the external boundary of the magnetosphere is 50-100 radii distant
from Jupiter, changing within these limits, depending on a fluctuation
of the flux of solar wind and on the nocturnal side a magnetic drift
is formed which extends to a distance exceeding 5 IAU beyond the orbit
of Saturn. Inside the Jovian magnetosphere lie the orbits of the
Galilean satellites and Amalthea. The charged particles captured by
the magnetic field and forming a radiation band have, in turn, a
powerful effect on the topology of the field and the configuration of
the magnetosphere (Figure 85). Turning along with the planet, they
form in the outer regions where the field is weak a "magnetic disk,"
slanted from the plane of the magnetic equator toward a plane
perpendicular to the axis of rotation.
Figure 85. The magnetosphere of
Jupiter. On the left, there are
separate zones formed on the
boundary of the magnetosphere (in
front of the radiation bands) with
accumulation of solar plasma.
As is known, the main
source of particles of the
radiation band of Earth is
protons and electrons supplied
by solar wind and transferred
into the inner region of the
magnetosphere from its
boundaries by the non-
stationary electrical and
magnetic fields. In
distinction from Earth, the
basic source of plasma in the
magnetosphere of Jupiter,
obviously, is Io (which, let
us note, differs greatly from
the magnetosphere of Jupiter
and from the magnetosphere of
Saturn). The losses,
probably, are determined
mainly by scattering of high-
speed particles on waves of
turbulent plasma excited by
the mechanism of cyclotropic
instability. Additional
losses, obviously, involve
powerful acceleration of
electrons in the magnetosphere of Jupiter. These electrons which have
energies from single units to dozens of millions of electron volts
(MeV) with a characteristic 10-hour periodicity corresponding to the
period of rotation of the planet, were recorded at distances up tothat of the orbit of Earth. Inside the magnetosphere, also the well-
known decimeter and decameter radio emission of Jupiter is generated.
Flashes of decameter radiation at frequency =8 MHz probably involves
/273
175
plasma instability of the ionosphere or electrical charges in theatmosphere at the same time as decimeter radiation caused by asynchrotropic mechanism; it occurs during movement of the capturedrelativistic electrons with energies =10 MeV between the magneticpoles at dis£ances of =1.5-6 radii of the planet. This radiation ismodulated with a frequency corresponding to the period of rotation ofIo which, probably, is due to interaction with its plasma toroid whichwas formed by ions of sulfur and oxygen and can itself serve as asource of low-frequency radio emission (with wavelength on the orderof a kilometer) recorded by the Voyager craft.
/274
From the toroidal cloud of plasma rotating along the magnetic
field of Jupiter, obviously, another remarkable natural phenomenon isinvolved which is well known to us on Earth -- the aurora borealis.
It was observed in the atmosphere of Jupiter during both flights of
the Voyager spacecraft at altitudes of 700, 1400 and 2300 km from the
visible surface of the boundary of clouds (at the same time that on
Earth the aurora borealis basically occurs at altitudes of 100-
200 km). A study of the results obtained showed an interesting
feature: in the zone of the aurora borealis magnetic power lines are
projected passing through the plasma toroid in the orbit of Io. As a
result, current tubes are formed which connect the two sides of
Jupiter and its near-polar regions. It is assumed that the flows of
electrons and ions coming into the atmosphere along the magnetic power
lines are intensified by powerful electrical fields. The power of the
current flowing inside the current tube is estimated to be on the
order of five million amperes.
In conclusion, let us mention one more interesting feature
discovered in the magnetosphere of the planet. We are talking about
Saturn which has, as we have already noted, a fairly weak magnetic
field in comparison with the magnetic field of Jupiter. Therefore, it
has a more "modest" magnetosphere and a high degree of uniformity of
the magnetic field is apparent in its very symmetrical distribution of
the charged particles in its interior zone at a distance of
approximately ten radii of the planet. The feature which we have
mentioned involves Saturn's rings located inside this zone. It would
appear, as was predicted, there are no charged particles within the
limits of the system of rings. This phenomenon is called the
"guillotine effect," as a result of which a region is formed which has
the least radiation of any region in the solar system. The sweeping
out of particles occurs as a result of their absorption in material of /275
the rings which they encounter during an oscillatory movement between
the hemispheres along the magnetic power lines.
The discovery of this effect by the Pioneer ii flyby has made it
possible, in particular, to put forward a hypothesis about the
existence on Saturn of outer ring E which was previously unknown; it
is located within limits of approximately 8 RS; this was laterconfirmed by studies on the Voyagers (see Figure 54).
176
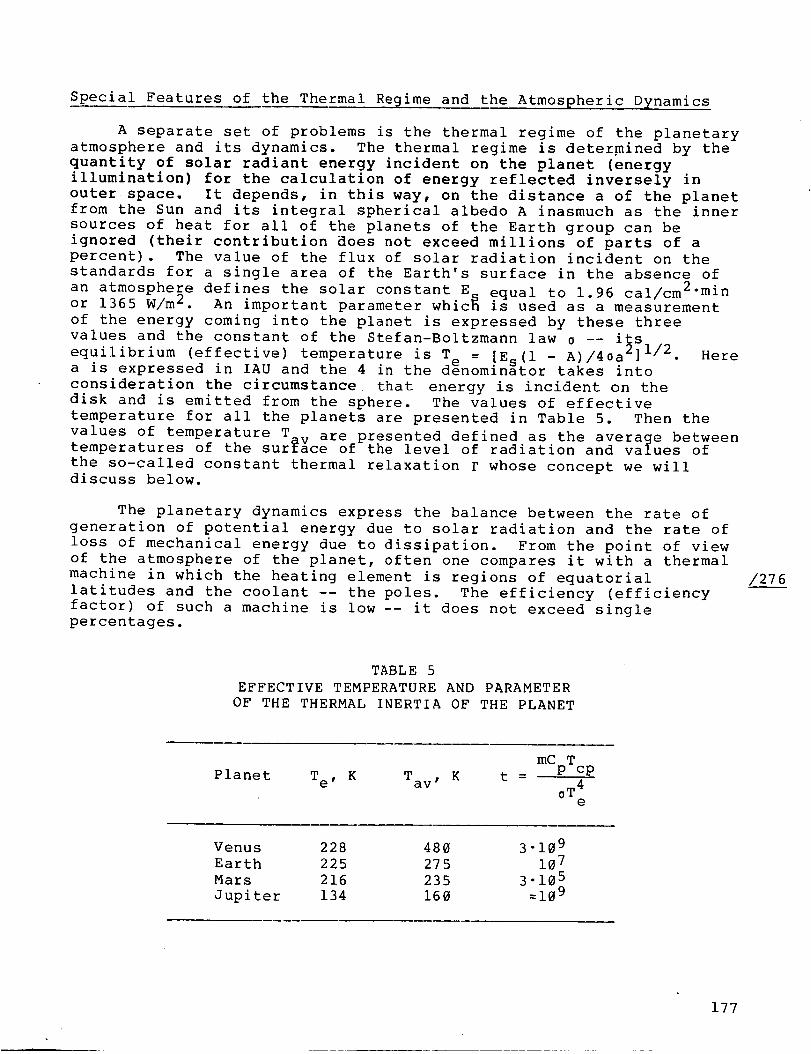
Special Features of the Thermal Regime and the Atmospheric Dynamics
A separate set of problems is the thermal regime of the planetary
atmosphere and its dynamics. The thermal regime is determined by the
quantity of solar radiant energy incident on the planet (energy
illumination) for the calculation of energy reflected inversely in
outer space. It depends, in this way, on the distance a of the planet
from the Sun and its integral spherical albedo A inasmuch as the inner
sources of heat for all of the planets of the Earth group can be
ignored (their contribution does not exceed millions of parts of a
percent). The value of the flux of solar radiation incident on the
standards for a single area of the Earth's surface in the absence of
an atmosphere defines the solar constant E equal to 1.96 cal/cm2"minor 1365 W/m 2. An important parameter whic_ is used as a measurement
of the energy coming into the planet is expressed by these three
values and the constant of the Stefan-Boltzmann law 0 -- i_s . Hereequilibrium (effective) temperature is T e = [Es(l - A)/40a ]1/2a is expressed in IAU and the 4 in the denominator takes into
consideration the circumstance that energy is incident on the
disk and is emitted from the sphere. The values of effective
temperature for all the planets are presented in Table 5. Then the
values of temperature T are presented defined as the average betweentemperatures of the surface of the level of radiation and values of
the so-called constant thermal relaxation r whose concept we willdiscuss below.
The planetary dynamics express the balance between the rate of
generation of potential energy due to solar radiation and the rate of
loss of mechanical energy due to dissipation. From the point of view
of the atmosphere of the planet, often one compares it with a thermal
machine in which the heating element is regions of equatorial
latitudes and the coolant -- the poles. The efficiency (efficiency
factor) of such a machine is low -- it does not exceed singlepercentages.
/276
TABLE 5
EFFECTIVE TEMPERATURE AND PARAMETER
OF THE THERMAL INERTIA OF THE PLANET
Planet T e, K Tav, K t =
mC Tp cp
0T 4e
Venus 228 480 3-109
Earth 225 275 107
Mars 216 235 3-105
Jupiter 134 160 =109
177
Let us make the simplest estimates for the atmosphere of Earthusing the values of the solar constant presented above. The flux ofsolar energy on the surface of Earth is about 4"1013 cal/s or1.7"1017 W. This means that for just one hour the Sun sends to ourplanet =6-1017 kW-hours of energy. In order to best understand howimpressive the value i , _et us say for comparison that for obtainingit one needs to burn 5_10 = tons of oil! The full kinetic energy ofatmospheric movement is retained practically unchanged; it comprisedabout 1021 Joules (about 3-1014 kW-hr) and the rate of _nversion ofpotential energy to kinetic energy is estimated at 2"10 _ kW. Fromthis, we soon see that firstly, the typical time for a conversion ofenergy in the atmosphere of Earth comprises 3"1014 kW-hr/2-1012 kW=150 hours, that is, approximately a week and secondly that theeffiqiency of the atmospheric thermal "machine" is2"10 ±z kW/1.75"1014 kW=l.2%
The source of atmospheric movement on different spatial scales isthe absence of equality between incoming and outgoing energies inspecific sections of the planet with a total strict fulfillment ofconditions of thermal balance on a global scale characterizing theeffective temperature. In other words, the occurrence of horizontaltemperature gradients as a result of differential heating must becompensated by the development of large-scale movement with a broadspectrum of spatial dimensions.
The one system on the planet created due to identicaldistribution of solar heat in space and in time depends also onwhether there is a mechanism of thermal effect with a large or smallperiod of intrinsic rotation of the planet. From this point of view,Earth, Venus, Mars and Jupiter have fully defined similarities anddifferences which are apparent in the specifics of mechanismsresponsible for thermal balance and processes of dynamic exchange onplanetary, meso-scale and local levels.
As a result of thermal expansion caused by the dependence ofdensity of gases both on pressure and on temperature (this property iscalled baroclinicity), it is more strongly heated and this means aless dense air rises upward and a colder and heavier drops downward.Therefore, at first glance it seems obvious that the increments ofpressure occurring due to the difference in insolation and this meansthe horizontal gradients of temperature (baric gradients) must lead toa regular transfer of air masses (and correspondingly, an excess ofheat) from the tropics to the poles. Along the meridian then is formeda gigantic closed convective cell in whose upper part the warm airwill move from equator to pole and along the surface -- the cold airfrom pole to equator. This cell itself is called Hadleyan, named forthe well-known English astronomer D. Hadley who in the first half ofthe eighteenth century put forward and gave a good foundation for thehypothesis that different heating by the Sun of equatorial polarregions must be the basic reason for the general circulation ofEarth's atmosphere. At the same time, such circulation symmetricalrelative to the equator neither in the atmosphere of Earth nor in theatmospheres of other planets has been established. The reason forthis is the presence, due to rotation of the planets, of a strong
/277
178
Coriolis force whose action is analyzed in detail in school textbooksfor physics. In the dynamics of the atmosphere (on Earth and alsoover the ocean), its horizontal component plays a decisive role,thanks to which the air flows deviate from the direction of themovement to the northern hemisphere on the right and in the southernto the left. As a result, the extent of meridional circulation isstrongly limited and Hadley's cell dominates in the Earth's atmosphereonly at the lowest latitudes, approximately up to 30° on both sides of /278
the equator. In the atmosphere of the middle and upper latitudes,
circulation acquires a zonal character, that is, movement occurs along
the parallels. Inasmuch as the primary source of them are gradients
of temperature, the winds themselves are called thermal. In the
troposphere, western winds blow directed from the west to the east at
the same time that in the stratosphere the winds change their
direction: in the wintertime, west winds blow, and in the summer,
east winds, and here one observes velocities up to 50-100 m/s,
When determining the field of winds, a convenient approximation
practically realized in the atmosphere is the concept of geostrophic
flux or geostrophic wind corresponding to the condition where
gradients of horizontal pressure are balanced by the Coriolis forces.
The force of this thermal wind depends on the gradient of pressure and
the direction along the line of equal pressure -- the isobar.
The effect of the Coriolis forces on the shape of movementu
usually is characterized by the Rossby number: Ro = 2L_sin_
where u is the typical horizontal velocity of movement, L is their
characteristic scale, and R is the angular velocity of rotation of the
planet, _ is latitude. In other words, this is a dimensionless
parameter which is the ratio of members related to acceleration (as a
result of the baric gradient) and the Coriolis forces in equations for
conservation of a pulse. This means that the Coriolis forces are
predominant when Ro_l. For example, for Jupiter, with values typicalin the middle latitudes u=100 m/s and on a scale of L=I03 km, this
condition is knowingly fulfilled and the flux has a clearly pronounced
zonal character.
But this system is very idealized. The actual character of
circulation is determined by the accumulation of several types of
movement, whose degree of non-ordering strongly depends on angular
velocity of rotation of the planet. Wave movement develops on the
rotating planet called the Rossby waves. With an increase in angular
velocity and with large gradients of temperature along the meridian,
also the waves become unstable and with their destruction vortices
occur. In the atmosphere of Earth, the dimensions of these vortices
change in broad limits from very fine on the order of millimeters to
several thousands of kilometers in cross section.
/279
Small and average vortices are elements of atmospheric turbulence
and the very largest form well-known fields of low and high pressure
-- cyclones and anticyclones. In the cyclones, circulation of air
occurs around the center of low pressure in the direction
counterclockwise in the northern hemisphere and clockwise in the
179
southern; in the anticyclones, the direction of rotation around thecenter of high pressure is the opposite. Their lifetime in theatmosphere on the average corresponds to an estimate we made earlierof the rate of conversion -- on the order of a week. Instability ofthe Rossby waves related to large-scale systems of weather (or, as wealready have said, the baroclinic instability), the most effectivemechanism is mixing of the atmosphere in a meridional direction,transfer of heat from the equator to the pole and smoothing out of theappropriate differences in temperature on the surface of Earth. Atthe same time, some of the damping excitations transfer kinetic energyto the average zonal flow (mainly existing at high altitudes in thetroposphere of a jet stream) which additionally facilitates thedevelopment of circulation.
In studying the complex structure of circulation in theatmosphere of Earth, the component basis of dynamic meteorology and acertain reliability in prediction of weather retains many unsolvedproblems still. The basic difficulties involve the impossibility ofadequate description of fields of pressure and wind depending on acertain influx of solar heat in the field of temperature andcharacteristics of the underlying surface. Solution by numericalmethods of a system of hydrodynamic equations with limitations ofinitial data about the fields of meteorological elements andunavoidable filtration of a number of harmonic waves in baroclinicmodels does not permit, to a full degree, calculating all of thevarieties of mutually-caused phenomena occurring in the atmosphere.
One runs into even more difficult situations in attempts to havetheoretical modeling of circulation on other planets. The positionhere is exacerbated by the incomparably small volume of experimentaldata and in a number of cases (for example, for Uranus and Neptune)they are completely absent. Nevertheless, in a theoreticaldescription of the principles of movement observed on Mars, Venus, and /280
Jupiter, there is considerable progress. Models which take into
consideration the specifics of conditions on these planets, moreover,
help us to better understand the many characteristic features of the
dynamics of the atmosphere of Earth.
Certain simplified concepts about movement in the planetary
atmospheres can be compared using expressions of similarity and in
complex hydrodynamic problems. This approach was developed in the
1970's by Soviet scientist G. S. Golytsyn. It is based on selection
of criteria of similarity which are a combination of several
dimensional parameters characterizing the mechanical and thermal
properties of the planet and a number of universal constants . The
use of the indicated criteria appropriate to atmospheric and ocean
circulation on Earth have made it possible to reproduce with good
precision the quantitative estimates of the rate of appropriate
movement. Good justification of the values predicting this theory
were also obtained for atmospheres of other planets which were studied
during flights of spacecraft.
In an analysis of the thermal regime of the planetary atmosphere
usually one uses the concept of a constant thermal relaxation T
180
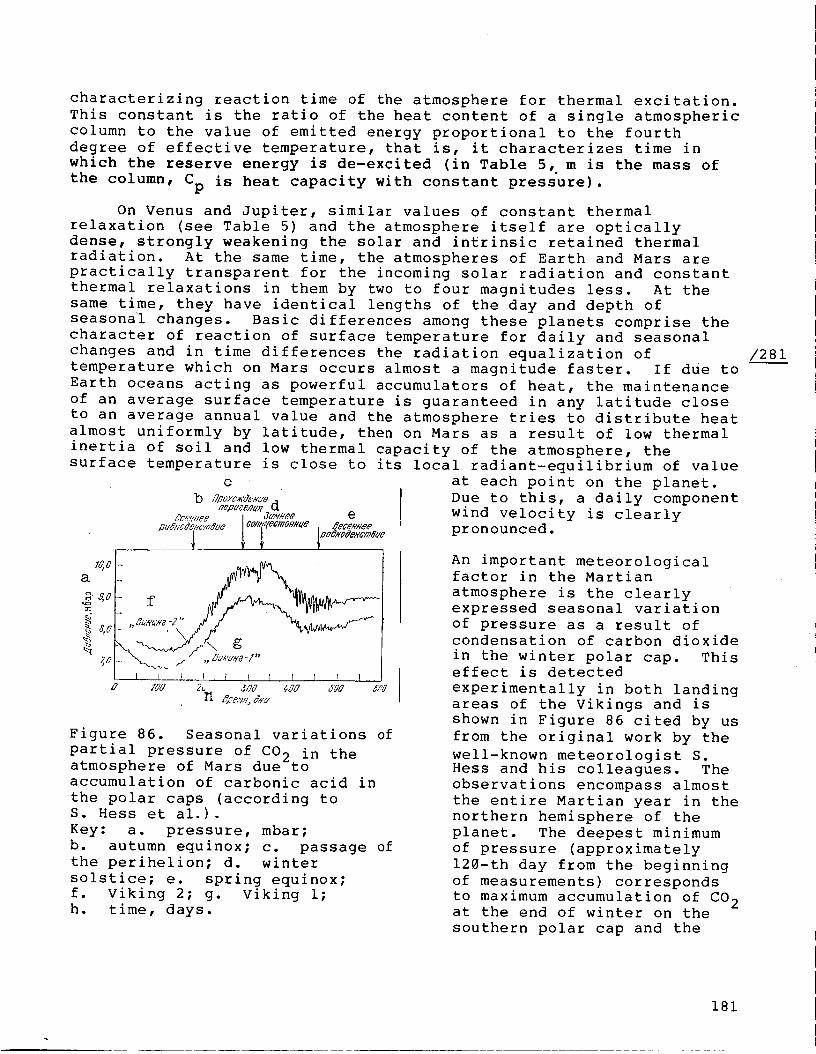
characterizing reaction time of the atmosphere for thermal excitation.This constant is the ratio of the heat content of a single atmosphericcolumn to the value of emitted energy proportional to the fourthdegree of effective temperature, that is, it characterizes time inwhich the reserve energy is de-excited (in Table 5, m is the mass ofthe column, Cp is heat capacity with constant pressure).
On Venus and Jupiter, similar values of constant thermalrelaxation (see Table 5) and the atmosphere itself are opticallydense, strongly weakening the solar and intrinsic retained thermalradiation. At the same time, the atmospheres of Earth and Mars arepractically transparent for the incoming solar radiation and constantthermal relaxations in them by two to four magnitudes less. At thesame time, they have identical lengths of the day and depth ofseasonal changes. Basic differences among these planets comprise thecharacter of reaction of surface temperature for daily and seasonalchanges and in time differences the radiation equalization oftemperature which on Mars occurs almost a magnitude faster. If due toEarth oceans acting as powerful accumulators of heat, the maintenanceof an average surface temperature is guaranteed in any latitude closeto an average annual value and the atmosphere tries to distribute heatalmost uniformly by latitude, then on Mars as a result of low thermalinertia of soil and low thermal capacity of the atmosphere, thesurface temperature is close to its local radiant-equilibrium of value
a
:n.
_ 4o
7,0
0
Figure 86. Seasonal variations of
partial pressure of CO 2 in theatmosphere of Mars due to
accumulation of carbonic acid in
the polar caps (according toS. Hess et al.).
Key: a. pressure, mbar;
b. autumn equinox; c. passage of
the perihelion; d. winter
solstice; e. spring equinox;
f. Viking 2; g. Viking i;
h. time, days.
at each point on the planet.
Due to this, a daily component
wind velocity is clearly
pronounced.
An important meteorologicalfactor in the Martian
atmosphere is the clearly
expressed seasonal variation
of pressure as a result of
condensation of carbon dioxide
in the winter polar cap. Thiseffect is detected
experimentally in both landing
areas of the Vikings and is
shown in Figure 86 cited by us
from the original work by the
well-known meteorologist S.Hess and his colleagues. The
observations encompass almost
the entire Martian year in the
northern hemisphere of the
planet. The deepest minimum
of pressure (approximately
120-th day from the beginning
of measurements) corresponds
to maximum accumulation of CO 2at the end of winter on the
southern polar cap and the
/281
181
other minimum (the 430-th day) -- is freezing on the northern cap.These minimums appear to be close to the autumn and spring equinoxesat the same time that the maximum pressure was observed close to theperihelium during the winter solstice. Restructuring of thecirculation system is related to the general change in pressure andlocal fluctuations indicate a change in the wind regime including theoccurrence of dust storms.
It is interesting to note in this connection a certain analogybetween Mars and Io: the most probable components of its very
-12rarefied atmosphere made up of sulfur dioxide (_10 bar),
obviously, is found in equilibrium with the broad deposits of SO2 onthe surface in the solid phase.
According to the results of measurements of temperature of theatmosphere of Mars in the infrared range, according to the data of theshift in dust on the surface and data of direct measurements fromdescent modules obtained estimates of intensity and the shift in winddirection in different periods of time. In the summer, in tropicallatitudes at altitudes of 15-20 km, western winds predominate withvelocity 30-50 m/s at the same time that in the troposphere on thesurface, the wind direction undergoes strong 24-hour changes and theaverage daily component is small, less than 10 m/s. The highestvelocity (on the order of 70-100 m/s) of wind is achieved duringstrong dust storms, usually coinciding with periods of opposition ofMars. Measurements made during a dust storm in 1971 which lasted forabout four months made it possible to discover a number of interestingfeatures of this unique natural phenomenon which has a globalcharacter. The dark clouds of dust rising up to 10 or more kilometerswere observed on the entire disk completely smoothing out thecontrasts on the surface. A significant darkening of the atmosphereitself was detected and a lower temperature of the surface(inclination of the temperature profile toward the isothermic) as aresult of lack of transparency of the atmosphere for solar radiationwhich was maintained by the dust. The density of dust particles inthe atmosphere with average dimensions 5-10 _m comprised about10-9 g/cm 3. This means that in the atmosphere more than a billiontons of dust were raised whose spectral characteristic in the highcontent (about 50%) of silicon oxide approximately corresponded to the /283
composition of the surface rock. We note that according to the
existing evaluation approximately the same quantity (about 109 t) of
dust annually is ejected into the Earth's atmosphere which with time
can be a serious climatic factor.
Another specific feature of the thermal regime and the
atmospheric movement is characteristic for Venus and Jupiter.
Possessing similar values of time for thermal relaxation, these
planets basically differ in their rate of rotation: Jupiter rotates
almost two and one half times more rapidly and Venus 243 times more
slowly than Earth. Therefore, during the time that on Jupiter zonal
flows are determined very obviously with powerful Coriolis component,
the rotation of Venus, obviously, has little effect on atmospheric
movement. With very great duration of the Venusian days, an important
182
factor which determines the character of circulation can be thedifference of temperatures not only between the equator and poles butalso between the subpolar and antisolar points.
A few more years ago, lively discussions were held about whatmechanism caused in the atmosphere of Venus such a high temperature onits surface. Well Venus receives almost the same amount of energy asEarth in spite of the fact that it is closer to the Sun andillumination of it at this distance almost twice exceeds the solar
constant E S this means that the albedo on Venus also is approximatelytwice as hlgh and therefore the values of unreflected solar radiation
are comparable. We have looked basically at two alternative models:
the greenhouse proposed in 1960 by C. Sagan and the model of deep
circulation proposed in 1966 by two well-known specialists in the
field of physics of the atmosphere and geophysical hydrodynamics,
R. Good and A. Robinson. According to the greenhouse model, a certain
portion of solar radiation penetrates to the surface and is absorbed
by it but radiation of the heated surface occurs on longer (infrared)
waves. This thermal radiation is captured by the atmosphere due to
the presence in it of three-atom molecules of carbon dioxide and water
vapor having in this field of the spectrum strong bands of absorption
and also it is screened by clouds which are not transparent for these
wavelengths. As a result, the surface and the lower atmosphere are
heated and then part of the heat rises upward as a result of
convection. The radiant-convective thermal exchange established on
the verticals corresponds to the measured adiabatic profile of
temperature. Such a model is described similarly abroad by D. Pollack
and in our country by V. S. Avduevskiy, the author and their
colleagues.
/284
The strongest arguments made by critics of the greenhouse model
occurred in the two expressions: first that the clouds of Venus are
very dense and the atmosphere is extremely dusty so that solar light
does not penetrate to the surface and secondly that it is hardly
possible to create the required high lack of transparency for
departing thermal radiation. This resulted in bringing to life a
model of deep circulation whose historical predecessor was the so-
called aeolospheric (or wind) model proposed by E. Epik. Epik
proposed that solar energy is absorbed in the upper regions of the
atmosphere found in convective equilibrium and is transmitted to the
surface of the planet due to friction on it of dust particles during
wind movement. Moreover, even the requirement itself of convective
equilibrium must lead to a transport of absorbed energy to the lower
layers of the atmosphere and the establishment of an adiabatic
temperature profile right up to the surface. From this point of view,
the addition of a complementary heat source due to friction appears
insignificant.
These proposals were taken under consideration by Good and
Robinson. They avoided a number of difficulties which had been
encountered in the aeolospheric model and they developed an original
system of thermal transfer in the deep atmosphere of Venus using an
analogy with ocean circulation on Earth. In this model, solar energy
absorbed on the surface of the boundary of clouds illuminated by the
183
Sun is transferred to the nocturnal side due to large-scale movements.The flow of gas in the region of the antisolar point and the rise inthe region of the subsolar point are caused, respectively, by its
adiabatic heating and cooling. As a result, in the atmosphere, an
adiabatic temperature gradient is established where the atmosphere is
deeper the higher the temperature of the surface is.
Direct measurements of illumination on the Venera stations showed
that a significant portion of solar radiant energy coming to the
planet in actuality passes through the clouds and reaches the surface.
Measurements brought us to the conclusion that in the clouds no more
than half of _he light flux is retained and that the surface absorbs
about 100 W/m E or approximately a sixth of the energy coming to Venus.
Thus, the first serious expression against the greenhouse model
was removed and moreover, one of the chief hypotheses for the model of
deep circulation for absorption of solar radiation on the "apex" of
the clouds was removed. At the same time, a series of calculations
were made in order to analyze the special features of transfer of
thermal radiation in the atmosphere of Venus taking into consideration
the very strong dependence of the structure of the absorption band of
CO 2 and H20 on temperature and pressure. Interesting results wereob£ained _ere by one of the colleagues of the author V. P. Shari. It
seemed that even the atmosphere comprising completely carbon dioxide
with parameters corresponding to the Venusian provides cover of the
main part of the flow of thermal radiation and the addition of water
vapor with relative content a total of several hundredths of a percent
covers it practically completely. Inclusion in the model of strongly
screening clouds consisting of droplets of sulfuric acid increases the
effect even more. Then the outflow of heat from the surface and from
the lower atmosphere appears to be close to the value of the solar
radiation absorbed and agrees well with the values of thermal fluxes
measured on the Pioneer-Venus spacecraft.
With further study of this problem by the author, A. P. Galtsev
and V. P. Shari showed that the contribution of water vapor in the
creation of nontransparency of the atmosphere of Venus required from
the conditions of thermal balance appeared to be most significant
above approximately 20 km. The experimental (taking into
consideration error in measurement) and calculation data on flows of
heat can agree with each other having assumed that relative content of
H20 with decreased altitude drops as indicated by thespectrophotometric measurements on the Venera-ll -- Venera-14. But
inasmuch as, in adiabatic equilibrium of the atmosphere, there exists
a full shift and consequently the ratio of the mixture H20/C02 in thetroposphere must be retained as constant, it is necessary in This case
to assume the existence of a certain mechanism which provides
evacuation of water vapor from the lower atmosphere. The proposal
that it is due to thermal chemical reactions effectively occurring or
temperature higher than approximately 600 K seems, however, to behardly probable.
/285
184
Thus, we can consider it proven that maintenance of a high /286
surface temperature on Venus is responsible for the greenhouse effect._
As to the model of deep circulation, that concept about this mechanism
must be additionally made much more specific.
Very soon after the appearance of this model, it was pointed out
that hypothetical circulation cells encompassing almost half of the
circumference of the planet are not stable. Stable circulation can
develop only when the necessary conditions have been created for the
occurrence of a strong greenhouse effect, that is, when a "super
adiabatic condition" of the initial temperature profile on the surface
occurs. In other words, the stability of large-scale cells is higher
the deeper the solar radiation penetrates into the atmosphere. But it
is just this situation, as we know, that is realized in the atmosphere
of Venus which has led to the convergence of models which previously
appeared to be contradictory.
Thus, there remains no doubt that the main role in the thermal
regime of Venus is played by large-scale dynamics due to which
equilibrium occurs of temperatures between the equator and the poles
between the nocturnal and diurnal hemispheres. Therefore, the
greenhouse effect can be considered as a convenient local
approximation and possibly as a vital source for the mechanism of
planetary circulation on this planet.
Circulation on Venus is traced from the surface of Earth
according to the drift of separate irregularities on the surface of
clouds during observation in the ultraviolet range of the spectrum.
In these irregularities, stable features are retained for a long
period of time (several weeks) among which the Latin letter Y is
particularly characteristic on the side. The shift of cloud
structures of their configurations were studied in detail from on
board the Mariner 10 and Pioneer -- Venus spacecraft which transmitted
a large number of photo-television images of the clouds (Figure 87).
The basic component of movement has an average velocity of about
100 m/s on which other short and long period components and wave
processes are accumulated. This average velocity corresponds to a
four-day period of repetition of individual configurations which have
been called "ultraviolet clouds." They are found at the level of the
upper boundary of the main zone of cloudiness and the sub-cloud smoke
(Figure 80) and are moved with a velocity almost 60 times greater than /288
the velocity of rotation of the surface of the planet itself.
With the descent of the automated Venera stations into the
atmosphere of the planet, measurements of the zonal component of the
wind velocity were made by recording the Doppler shift of frequenciesof the onboard sensors of the descent vehicles.
185
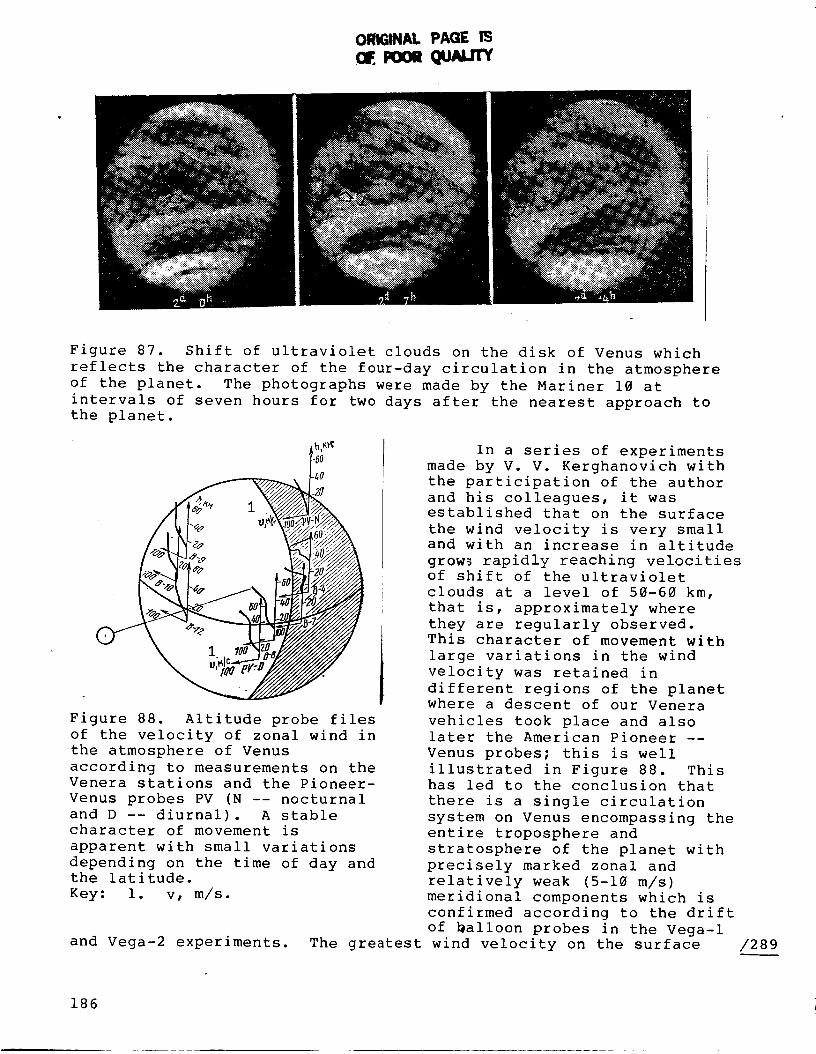
ORIGINAL PAGE iS(]F.eooe Quarry
Figure 87. Shift of ultraviolet clouds on the disk of Venus which
reflects the character of the four-day circulation in the atmosphere
of the planet. The photographs were made by the Mariner 10 at
intervals of seven hours for two days after the nearest approach tothe planet.
60
_0
_L
Figure 88. Altitude probe files
of the velocity of zonal wind in
the atmosphere of Venus
according to measurements on the
Venera stations and the Pioneer-
Venus probes PV (N -- nocturnal
and D -- diurnal). A stable
character of movement is
apparent with small variations
depending on the time of day andthe latitude.
Key: I. v, m/s.
and Vega-2 experiments.
In a series of experiments
made by V. V. Kerghanovich with
the participation of the author
and his colleagues, it was
established that on the surface
the wind velocity is very small
and with an increase in altitude
grow_ rapidly reaching velocities
of shift of the ultraviolet
clouds at a level of 50-60 km,
that is, approximately where
they are regularly observed.This character of movement with
large variations in the wind
velocity was retained in
different regions of the planet
where a descent of our Venera
vehicles took place and also
later the American Pioneer --
Venus probes; this is well
illustrated in Figure 88. This
has led to the conclusion that
there is a single circulation
system on Venus encompassing the
entire troposphere and
stratosphere of the planet with
precisely marked zonal and
relatively weak (5-10 m/s)
meridional components which is
confirmed according to the drift
of balloon probes in the Vega-I
The greatest wind velocity on the surface /289
186
(0.5 -- 1 m/s) was measured by V. S. Avduevskiy with his colleaguesusing the cup-shaped anomometers on the Venera-9 and Venera-10.
The phenomena of four-day circulation is a complex problem andhas not yet ended although many attempts have been made to clarify itwithin the framework of different hydrodynamic models. The mostrealistic for us seems to be the mechanism proposed by R. Thompson inwhich the development of primarily occurring fluctuation instabilityis proposed in the large convective cell of the Galilean type to whichhorizontal perturbation is applied (wind profile). Stability ofcirculation is guaranteed here due to transfer by pumping energy ofconvective movement to the energy of the zonal flux. The principlereality of this mechanism was proven by a series of numericalcalculations made by colleagues of the author V. G. Vasinym. Withinthe framework of this theoretical model, in particular, a_number ofeffects were successfully reproduced which had been observed inexperiments with Mercury enclosed in a container with a toroidal shapeheated from above by a slowly moving gas torch. The latter simulatedthe Sun at the same time that the Mercury which was found in thelimited volume was able in the best manner to model parameters onwhich the dynamics of the atmosphere of Venus depend.
Additional information on the thermal mode and dynamics of sub-cloud atmosphere of Venus were obtained by experiments in the infraredspectrometry accomplished on the Venera-15 and Venera-16 artificialsatellites jointly with scientists in the USSR and the GDR. On eachof the satellites an instrument was installed called a Fourierspectrometer which makes it possibl_ to record, with high resolution,the spectra of outgoing radiation (in a range from 36-6 _m).Analyzing the spectral characteristics of this radiation, it ispossible to establish a profile of temperature over the clouds, toidentify atmospheric components and study variations in the thermalflux in different regions of the planet, that is, study a number ofphysical principles which determine the special features of planetarymeteorology. Significant changes in the altitude of the position ofthe upper boundary of clouds observed on the Pioneer -- Venussatellite were confirmed; here basically outgoing radiation is formedand also a general tendency toward heating of the polar regions incomparison with the middle latitudes. The latter is explained by thedescent of the clouds into the polar zone and, obviously, is explainedby the descending movement at the center of the cyclone vortexexisting here related to the general system of the four-daycirculation on Venus. Using the temperature profiles which have beenestablished, it will be possible from the conditions of geostrophicbalance (thermal wind) to obtain with time a more detailed picture ofhorizontal movement in the atmosphere over the clouds.
Circulation on Jupiter and Saturn
Being at a distance from the Sun of about 5 IAU, Jupiter obtains
only 4% of the flux of solar energy coming into Earth and Saturn even
four times less. The interior flux of heat which we discussed above
is even more effective. From the point of view of atmospheric
dynamics, these planets have a greater similarity as a result of the
/290
187
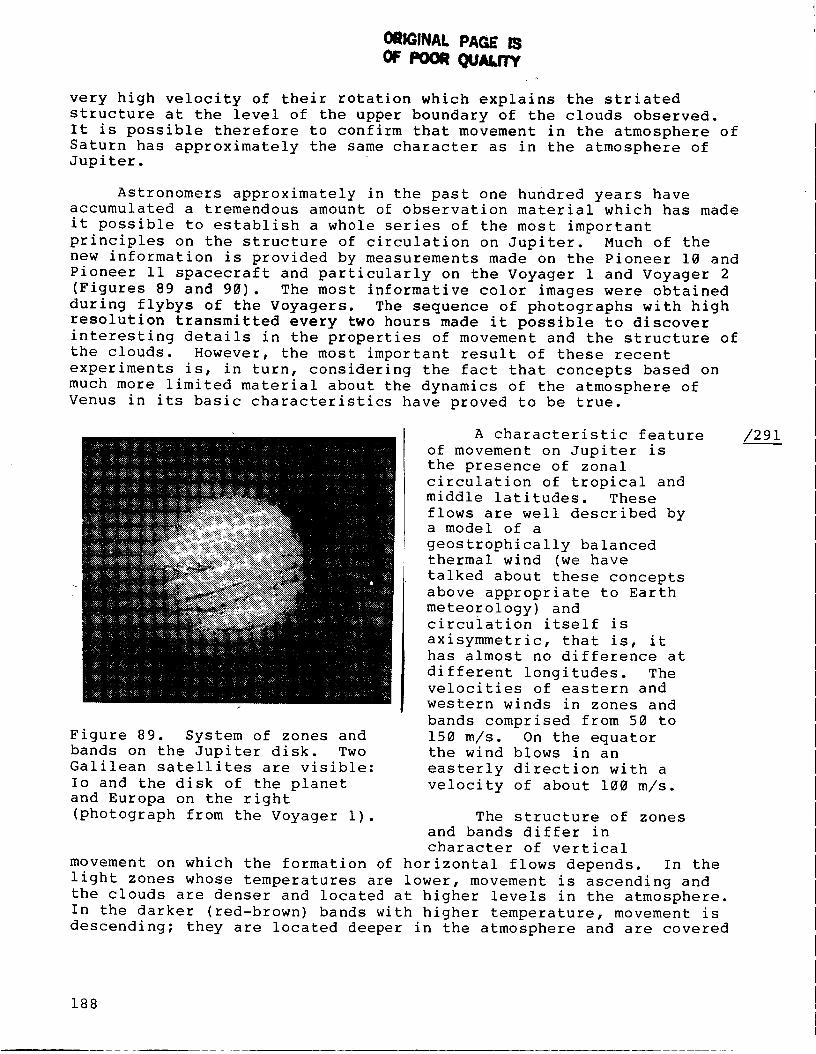
ORIGINAL PAGE IS
0e POOR(: JN..rrY
very high velocity of their rotation which explains the striated
structure at the level of the upper boundary of the clouds observed.
It is possible therefore to confirm that movement in the atmosphere of
Saturn has approximately the same character as in the atmosphere of
Jupiter.
Astronomers approximately in the past one hundred years haveaccumulated a tremendous amount of observation material which has made
it possible to establish a whole series of the most important
principles on the structure of circulation on Jupiter. Much of the
new information is provided by measurements made on the Pioneer 10 and
Pioneer ii spacecraft and particularly on the Voyager 1 and Voyager 2
(Figures 89 and 90). The most informative color images were obtained
during flybys of the Voyagers. The sequence of photographs with high
resolution transmitted every two hours made it possible to discover
interesting details in the properties of movement and the structure of
the clouds. However, the most important result of these recent
experiments is, in turn, considering the fact that concepts based on
much more limited material about the dynamics of the atmosphere of
Venus in its basic characteristics have proved to be true.
Figure 89. System of zones and
bands on the Jupiter disk. TwoGalilean satellites are visible:
Io and the disk of the planet
and Europa on the right
(photograph from the Voyager i).
A characteristic feature
of movement on Jupiter is
the presence of zonal
circulation of tropical and
middle latitudes. These
flows are well described bya model of a
geostrophically balancedthermal wind (we have
talked about these concepts
above appropriate to Earth
meteorology) andcirculation itself is
axisymmetric, that is, it
has almost no difference at
different longitudes. Thevelocities of eastern and
western winds in zones and
bands comprised from 50 to
150 m/s. On the equator
the wind blows in an
easterly direction with a
velocity of about 100 m/s.
The structure of zones
and bands differ in
character of vertical
movement on which the formation of horizontal flows depends. In the
light zones whose temperatures are lower, movement is ascending and
the clouds are denser and located at higher levels in the atmosphere.
In the darker (red-brown) bands with higher temperature, movement is
descending; they are located deeper in the atmosphere and are covered
/291
188
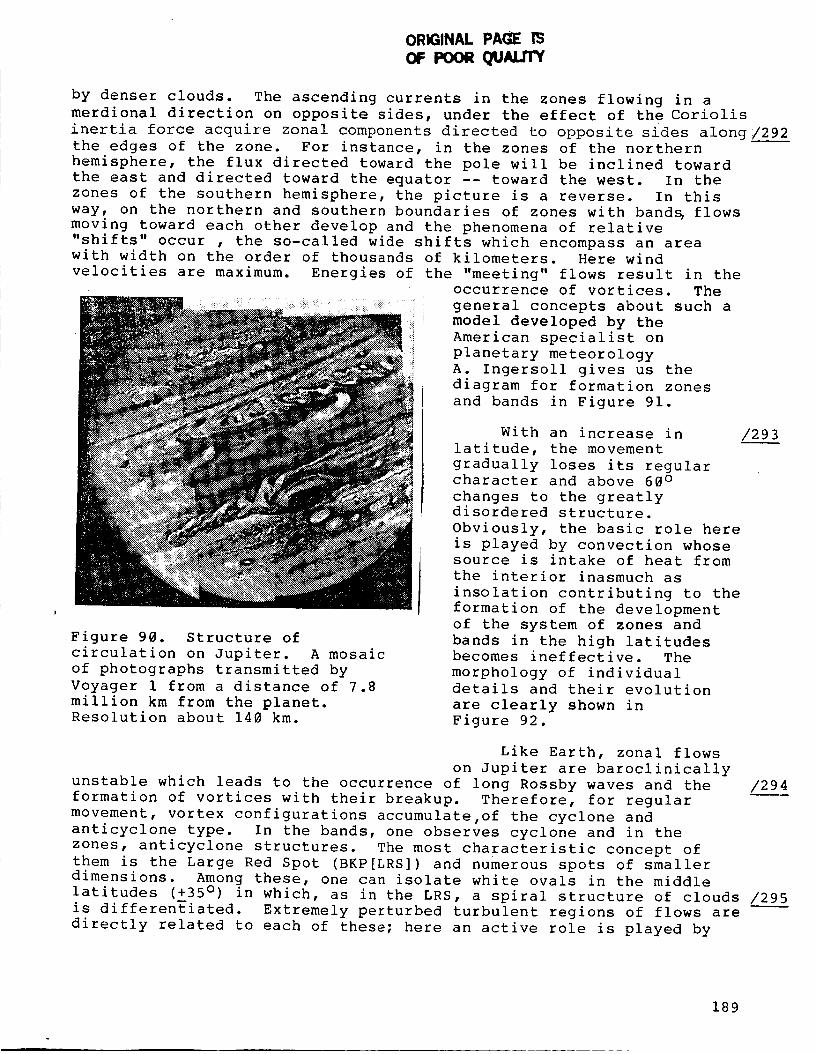
ORIGINAL PAGEoF
by denser clouds. The ascending currents in the zones flowing in a
merdional direction on opposite sides, under the effect of the Coriolis
inertia force acquire zonal components directed to opposite sides along/292
the edges of the zone. For instance, in the zones of the northern
hemisphere, the flux directed toward the pole will be inclined toward
the east and directed toward the equator -- toward the west. In the
zones of the southern hemisphere, the picture is a reverse. In this
way, on the northern and southern boundaries of zones with band_ flows
moving toward each other develop and the phenomena of relative
"shifts" occur _ , the so-called wide shifts which encompass an area
with width on the order of thousands of kilometers. Here wind
velocities are maximum. Energies of the "meeting" flows result in the
Figure 90. Structure of
circulation on Jupiter. A mosaic
of photographs transmitted by
Voyager 1 from a distance of 7.8
million km from the planet.Resolution about 140 km.
occurrence of vortices. The
general concepts about such a
iill model developed by the
American specialist on
planetary meteorology
A. Ingersoll gives us the
diagram for formation zones
and bands in Figure 91.
With an increase in
latitude, the movement
gradually loses its regular
character and above 60 °
changes to the greatly
disordered structure.
Obviously, the basic role here
is played by convection whosesource is intake of heat from
the interior inasmuch as
insolation contributing to the
formation of the development
of the system of zones and
bands in the high latitudes
becomes ineffective. The
morphology of individual
details and their evolution
are clearly shown in
Figure 92.
/293
Like Earth, zonal flows
on Jupiter are baroclinically
unstable which leads to the occurrence of long Rossby waves and the /294
formation of vortices with their breakup. Therefore, for regular
movement, vortex configurations accumulate,of the cyclone and
anticyclone type. In the bands, one observes cyclone and in the
zones, anticyclone structures. The most characteristic concept of
them is the Large Red Spot (BKP[LRS]) and numerous spots of smaller
dimensions Among these, one can isolate white ovals in the middlelatitudes i+35 °) in which, as in the LRS, a spiral structure of clouds /295
is differentiated. Extremely perturbed turbulent regions of flows are
directly related to each of these; here an active role is played by
189
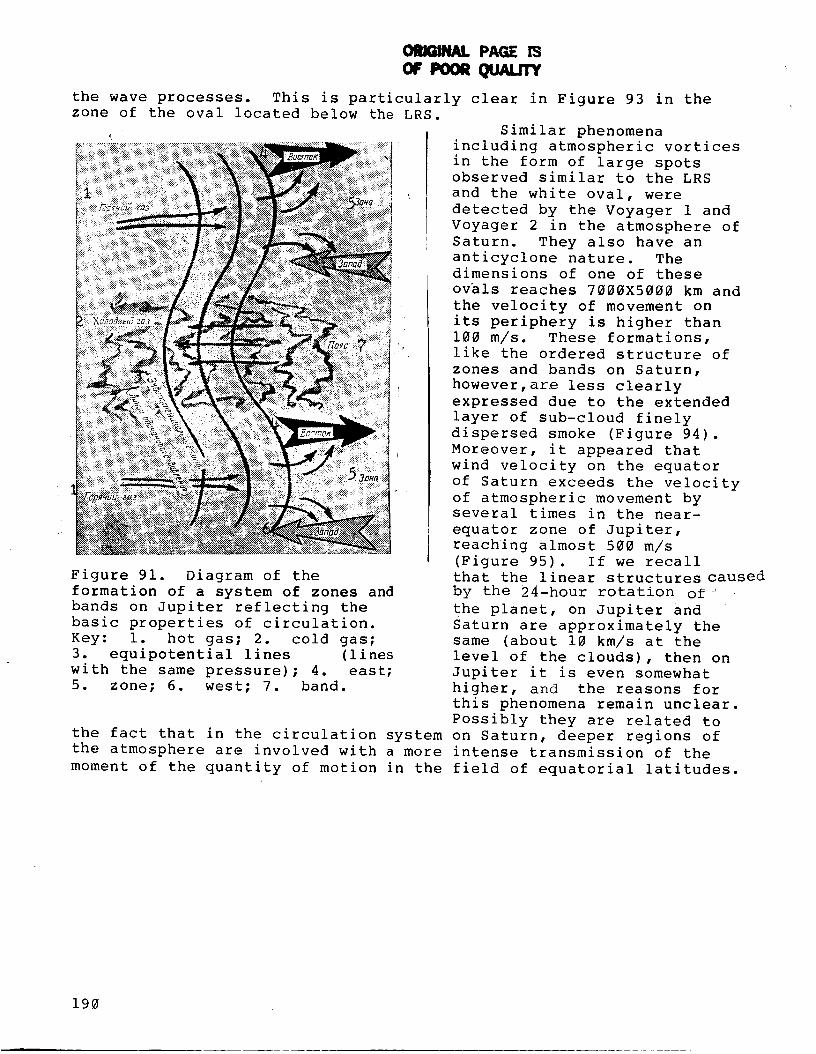
oRmm_ PAGE
murv
the wave processes. This is particularly clear in Figure 93 in thezone of the oval located below the LRS.
Similar phenomena
including atmospheric vortices
in the form of large spotsobserved similar to the LRS
and the white oval, were
detected by the Voyager 1 and
Voyager 2 in the atmosphere of
Saturn. They also have an
anticyclone nature. The
dimensions of one of these
ovals reaches 7000X5000 km and
I the velocity of movement on
its periphery is higher than
100 m/s. These formations,
like the ordered structure of
zones and bands on Saturn,
T however,are less clearly
expressed due to the extended
layer of sub-cloud finely
dispersed smoke (Figure 94).
Moreover, it appeared that
wind velocity on the equator
of Saturn exceeds the velocity
of atmospheric movement byseveral times in the near-
equator zone of Jupiter,
reaching almost 500 m/s
(Figure 95). If we recall
Figure 91. Diagram of the that the linear structures caused
formation of a system of zones and by the 24-hour rotation of
bands on Jupiter reflecting the the planet, on Jupiter and
basic properties of circulation. Saturn are approximately the
Key: i. hot gas; 2. cold gas; same (about 10 km/s at the
3. equipotential lines (lines level of the clouds), then on
with the same pressure); 4. east; Jupiter it is even somewhat
5. zone; 6. west; 7. band. higher, and the reasons for
this phenomena remain unclear.
Possibly they are related to
the fact that in the circulation system on Saturn, deeper regions of
the atmosphere are involved with a more intense transmission of the
moment of the quantity of motion in the field of equatorial latitudes.
190
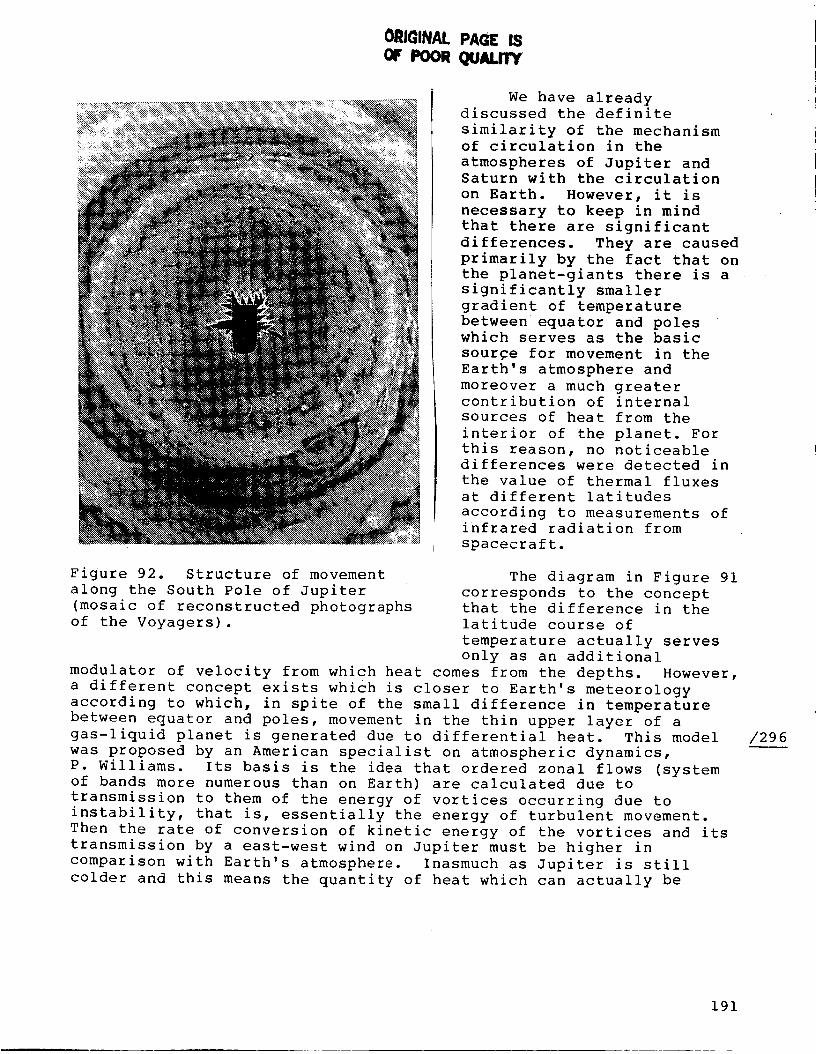
ORI(_INAL PAGE IS
of Poor QU JTy
We have already
discussed the definite
similarity of the mechanism
of circulation in the
atmospheres of Jupiter andSaturn with the circulation
on Earth. However, it is
necessary to keep in mind
that there are significant
differences. They are caused
primarily by the fact that on
the planet-giants there is a
significantly smaller
gradient of temperature
betweenequator and poles
which serves as the basic
sourGe for movement in the
Earth's atmosphere and
moreover a much greatercontribution of internal
sources of heat from the
interior of the planet. For
this reason, no noticeable
differences were detected in
the value of thermal fluxes
at different latitudes
according to measurements of
infrared radiation from
spacecraft.
Figure 92. Structure of movement
along the South Pole of Jupiter
(mosaic of reconstructed photographs
of the Voyagers).
The diagram in Figure 91
corresponds to the concept
that the difference in the
latitude course of
temperature actually serves
only as an additional
modulator of velocity from which heat comes from the depths. However,
a different concept exists which is closer to Earth's meteorology
according to which, in spite of the small difference in temperature
between equator and poles, movement in the thin upper layer of a
gas-liquid planet is generated due to differential heat. This model
was proposed by an American specialist on atmospheric dynamics,
P. Williams. Its basis is the idea that ordered zonal flows (system
of bands more numerous than on Earth) are calculated due to
transmission to them of the energy of vortices occurring due to
instability, that is, essentially the energy of turbulent movement.
Then the rate of conversion of kinetic energy of the vortices and its
transmission by a east-west wind on Jupiter must be higher in
comparison with Earth's atmosphere. Inasmuch as Jupiter is still
colder and this means the quantity of heat which can actually be
/296
191
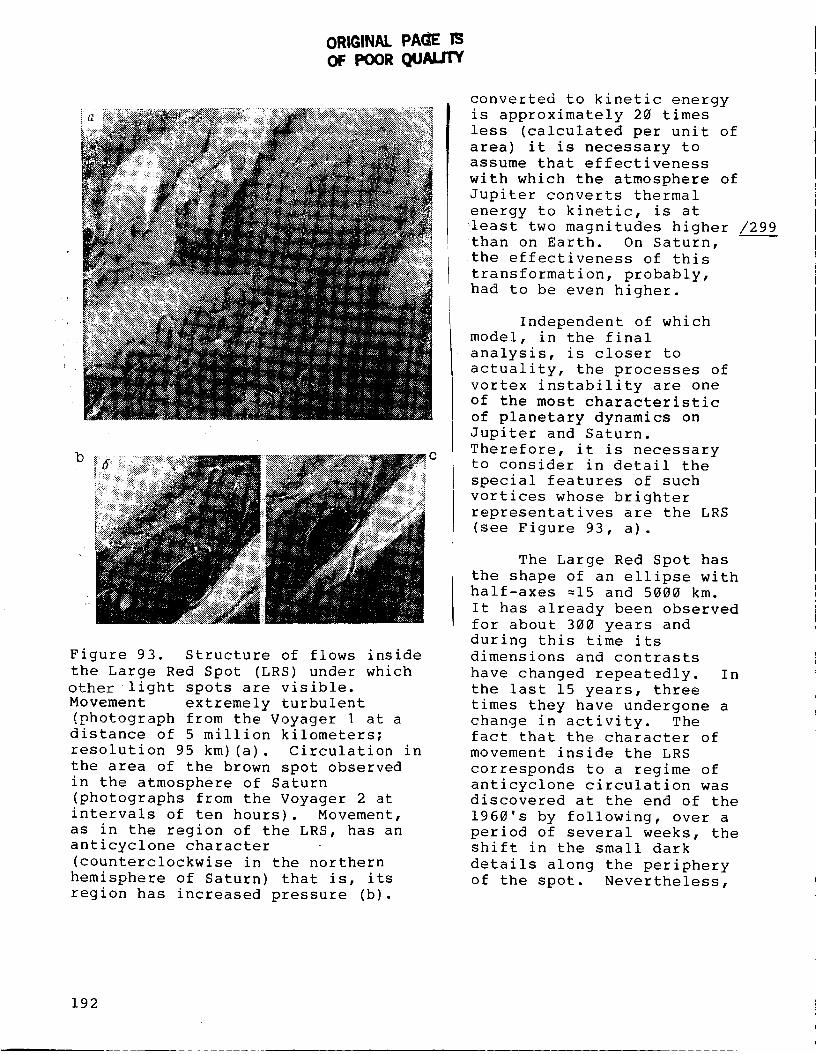
OR Gtt4 PA( r3oF Poor qu, J'rY
b
========================
:::i_: .9:
Figure 93. Structure of flows inside
the Large Red Spot (LRS) under which
other light spots are visible.
Movement extremely turbulent
(photograph from the Voyager I at a
distance of 5 million kilometers;
resolution 95 km) (a). Circulation in
the area of the brown spot observed
in the atmosphere of Saturn
(photographs from the Voyager 2 at
intervals of ten hours). Movement,
as in the region of the LRS, has an
anticyclone character
(counterclockwise in the northern
hemisphere of Saturn) that is, its
region has increased pressure (b).
converted to kinetic energy
is approximately 20 times
less (calculated per unit of
area) it is necessary to
assume that effectiveness
with which the atmosphere of
Jupiter converts thermal
energy to kinetic, is atleast two magnitudes higher /299
than on Earth. On Saturn,
the effectiveness of this
transformation, probably,
had to be even higher.
Independent of which
model, in the final
analysis, is closer to
actuality, the processes of
vortex instability are one
of the most characteristic
of planetary dynamics on
Jupiter and Saturn.
Therefore, it is necessary
to consider in detail the
special features of such
vortices whose brighter
representatives are the LRS
(see Figure 93, a).
The Large Red Spot has
the shape of an ellipse with
half-axes =15 and 5000 km.
It has already been observed
for about 300 years and
during this time its
dimensions and contrasts
have changed repeatedly. In
the last 15 years, three
times they have undergone a
change in activity. The
fact that the character of
movement inside the LRS
corresponds to a regime of
anticyclone circulation wasdiscovered at the end of the
1960's by following, over a
period of several weeks, theshift in the small dark
details along the periphery
of the spot. Nevertheless,
192
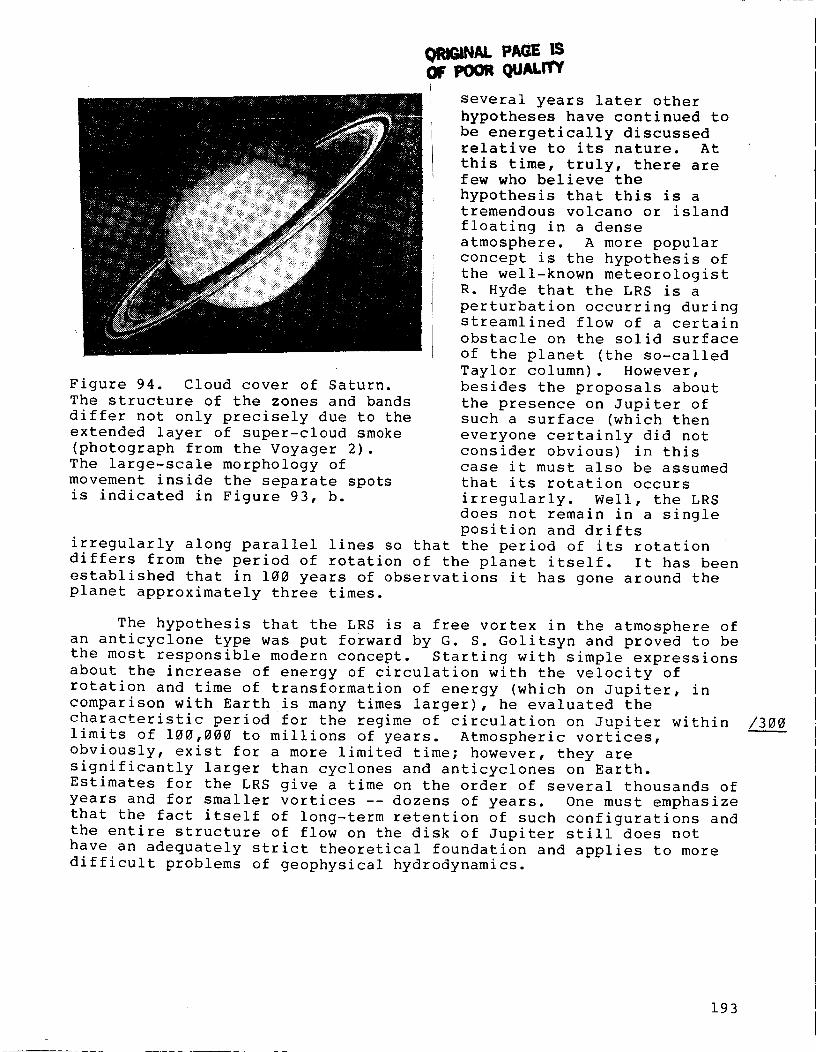
QRIG AL PAGE ISOF POOU
Figure 94. Cloud cover of Saturn.The structure of the zones and bands
differ not only precisely due to the
extended layer of super-cloud smoke
(photograph from the Voyager 2).
The large-scale morphology of
movement inside the separate spots
is indicated in Figure 93, b.
several years later other
hypotheses have continued to
be energetically discussedrelative to its nature. At
this time, truly, there arefew who believe the
hypothesis that this is a
tremendous volcano or island
floating in a dense
atmosphere. A more popular
concept is the hypothesis of
the well-known meteorologist
R. Hyde that the LRS is a
perturbation occurring during
streamlined flow of a certain
obstacle on the solid surface
of the planet (the so-called
Taylor column). However,
besides the proposals about
the presence on Jupiter of
such a surface (which then
everyone certainly did not
consider obvious) in this
case it must also be assumed
that its rotation occurs
irregularly. Well, the LRS
does not remain in a single
position and drifts
irregularly along parallel lines so that the period of its rotation
differs from the period of rotation of the planet itself. It has been
established that in 100 years of observations it has gone around the
planet approximately three times.
The hypothesis that the LRS is a free vortex in the atmosphere of
an anticyclone type was put forward by G. S. Golitsyn and proved to be
the most responsible modern concept. Starting with simple expressions
about the increase of energy of circulation with the velocity of
rotation and time of transformation of energy (which on Jupiter, in
comparison with Earth is many times larger), he evaluated the
characteristic period for the regime of circulation on Jupiter within
limits of 100,000 to millions of years. Atmospheric vortices,
obviously, exist for a more limited time; however, they are
significantly larger than cyclones and anticyclones on Earth.
Estimates for the LRS give a time on the order of several thousands of
years and for smaller vortices -- dozens of years. One must emphasize
that the fact itself of long-term retention of such configurations and
the entire structure of flow on the disk of Jupiter still does not
have an adequately strict theoretical foundation and applies to more
difficult problems of geophysical hydrodynamics.
/300
193
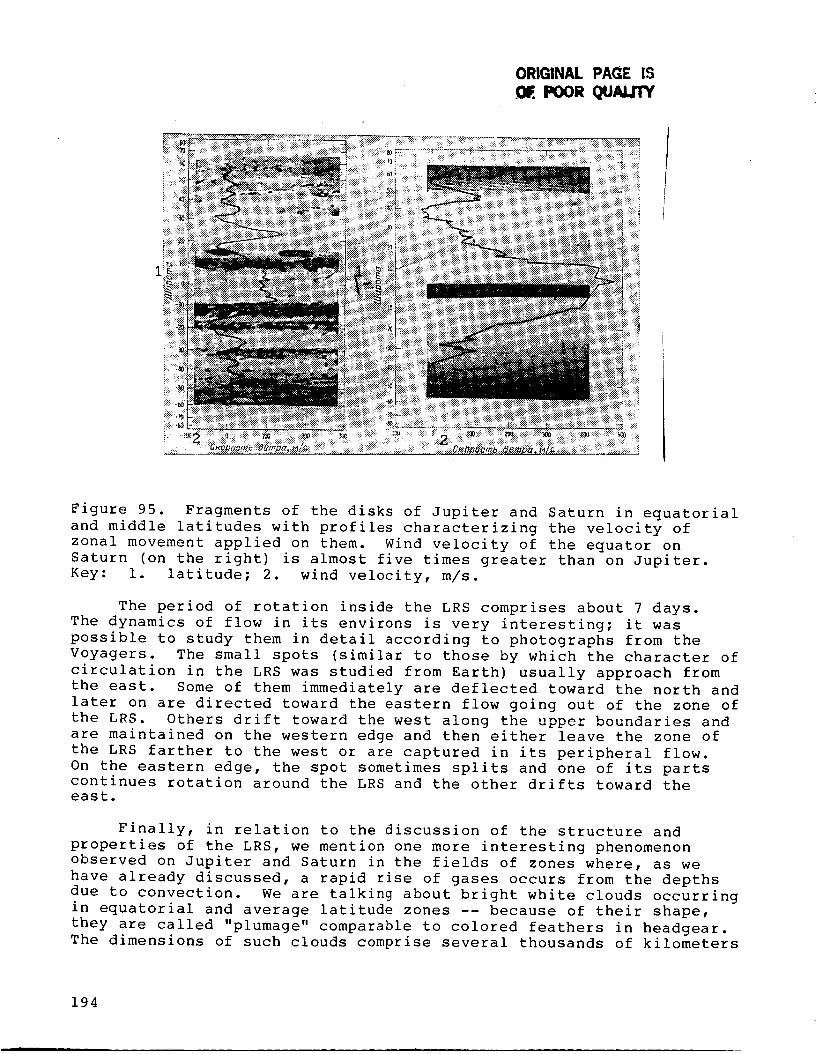
ORIGINAL PAaE IS
POOR QUAUTY
Figure 95. Fragments of the disks of Jupiter and Saturn in equatorial
and middle latitudes with profiles characterizing the velocity of
zonal movement applied on them. Wind velocity of the equator on
Saturn (on the right) is almost five times greater than on Jupiter.
Key: i. latitude; 2. wind velocity, m/s.
The period of rotation inside the LRS comprises about 7 days.
The dynamics of flow in its environs is very interesting; it was
possible to study them in detail according to photographs from the
Voyagers. The small spots (similar to those by which the character of
circulation in the LRS was studied from Earth) usually approach from
the east. Some of them immediately are deflected toward the north and
later on are directed toward the eastern flow going out of the zone of
the LRS. Others drift toward the west along the upper boundaries and
are maintained on the western edge and then either leave the zone of
the LRS farther to the west or are captured in its peripheral flow.
On the eastern edge, the spot sometimes splits and one of its parts
continues rotation around the LRS and the other drifts toward the
east.
Finally, in relation to the discussion of the structure and
properties of the LRS, we mention one more interesting phenomenon
observed on Jupiter and Saturn in the fields of zones where, as we
have already discussed, a rapid rise of gases occurs from the depths
due to convection. We are talking about bright white clouds occurring
in equatorial and average latitude zones -- because of their shape,
they are called "plumage" comparable to colored feathers in headgear.
The dimensions of such clouds comprise several thousands of kilometers
194
and inside have separate elements with cross sections of 100-200 km.In their morphology, they remind one of familiar cumulus cloudsgreatly differing from the diffuse wavy formations on the backgroundaround them and they exist for no more than 100 hours, rapidlydisappearing. Judging according to temperature, these clouds arelocated approximately at the same levels as the cloud structurescomprising warmer material including the apex of the LRS which iscolder than the surface of the band. This fact itself is strangeinasmuch as from the red-brown spots on Jupiter's disks, like theanalogous color of bands, usually fields of descending movement areinvolved located deeper in the atmosphere where the temperature ishigher.
How do we explain this contradiction? Obviously, the mechanismsof formation of "dark" clouds and "plumages" are different. Theoccurrence of the latter, possibly, due to wavy processes (the passageof a "propeller wave") accumulated on the basic zonal flow andamplifying convective activity similar to that observed in tropical
latitudes on Earth. At the same time, the proposal that the presence
of ascending convective movement in the fields of red-brown clouds,
primarily in the zone of the LRS, can prove to be illusory. Seemingly
the results of analysis of the data of the Voyagers which did not
discover a noticeable change in altitude in the structure of flow
within the LRS actually indicate this. This problem directly related
to the origin and evolution of vortices in the atmospheres of Jupiter
and Saturn still need to be solved.
Certain Problems of Climatic Evolution
In the sets of atmospheric parameters averaged for fairly large
space-time intervals, statistical principles are apparent which
determine climate on the planet or in its separate regions. From the
point of view of problems of climate including as the most important
problem a study of paleoclimate and prediction of the future weather
on Earth, primary interest is given to the two neighboring planets --
Venus and Mars. As a corrected concept in the riddle of development
of their climatic evolution, usually one uses the hypothesis we have
already mentioned that gases of solar origin were lost at the stage of
accumulation of the Earth planets and the initial composition of
matter degasified from the interior was approximately the same and
that in the future the decisive effect on the course of evolution was
the distance of the planet from the Sun. These ideas were developed
by A. P. Vinogradov, I. Russel and K. Birch, by D. Pollack and other
scientists.
Of course, from all of the planets of the Earth group, the
greatest interest for climate is caused by Venus. There are two basic
reasons for this. Firstly, as the closest analog to Earth, it is
completely natural to consider it as one of its limiting models and it
can be used in the future as a unique proving ground for experiments
on the active effect on climatic processes on a global scale. In this
way, for studying Venus the problem is immediately involved of a
purely Earth utilitarian one -- finding the limits of regulation in
the nature-climate mechanisms and interrelationships of the
/301
/302
_" _ 195
continuously expanding anthropogenic effects on climate which couldappear to be irreversible. Secondly, it is necessary to understandwhy the two neighboring planets which in the scale of the solar systemare found at not too great a distance from each other and are almostidentical in dimensions appear to be so different from each other.
Most of the problems -- climatic and cosmogenic -- are closelyrelated to each other. They engender a number of key questionsincluding those which we have mentioned as the most important. Weresuch clearly different present-day natural conditions of Earth andVenus caused by the character of fractionation of matter of theprotoplanetary nebulae or the principles of subsequent stages ofevolution caused by different distances of these planets from the Sun?When did the existing climate on Venus appear and was it stable duringthe time comparable to the development of the solar system or didVenus undergo more favorable periods, for example, in those sameepochs when _arth went through the great ice ages? Finally, are theprocesses of volcanic and tectonic activity completed or are they
continuing -- those accompanied by intense degasification and what was
the balance of products of degasification and dissipation of gases
from the atmosphere of Venus in different eras?
For an answer to the questions posed involving the many general
problems of planetary physics, geophysics and climatology, of primary
importance is the multifaceted geology-geochemical studies of Venus
and other planets of the Earth group, the discovery of more
characteristic features in the chemical composition of their
atmosphere and surface rock, the study of mechanisms of the
lithosphere-atmosphere interaction, radiant heat exchange and
atmospheric dynamics. Here, mathematical modeling of complex
planetary processes plays an important role as well as the conduct of /303
numerical experiments on climatic models.
It seems we must recognize that Earth was the "luckiest" because
it was 10-15 million km closer to the Sun (a quarter of the distance
between orbits of Earth and Venus) and otherwise such favorable
climatic conditions could hardly have occurred. Here the following
simplest evaluations are confirmed which agree well with the strictest
theoretical models.
If we assume that the primary albedo of Earth was determined on
the whole by the surface and corresponded to the lunar (~0.07), then
with the present-day level of illumination of the Sun, its effective
temperature is equal to 275 K. At this temperature and with
establishment of a comparatively low pressure (about 5 mbar), our
planet can retain its water whose main mass was condensed in the
atmosphere and dropping on the surface was concentrated in the oceans.
As to carbon dioxide, in conditions of comparatively low temperature
it accumulated in the Earth's hydrosphere and in the carbonates of
sedimentary rock due to bonding with metal oxides making up the
minerals of the ocean crust in the upper mantle and partially in a
biogenic way due to deposits of calciferous skeletons of marine
organisms. The basic non-biogenic process occurs in reactions ofcarbon dioxide dissolved in water with the well-known minerals --
196
olivines (orthosilicates) containing iron and magnesium andplagioclases -- anorthotites (alumosilicates) containing aluminum andcalcium. As a result of these reactions, minerals were formed(aqueous silicates) containing hydroxyl groups (OH) -- serpentine andkaolin. Therefore, the first of the reactions correspondingly iscalled serpentinization and the second -- kaolinization.
b
Here, it is important in general to emphasize the role which,
according to the existing concepts, gets around the reactions of
hydration in low-temperature stages of condensation of protoplanetary
matter. During interaction of olivine-pyroxine groups of minerals
with water vapor, hydrated silicates are formed such as serpentine,
talc, tremolite, which are most widespread in carbonaceous chondrites.
These silicates are the basic latent reservoirs for water subsequentlydriven off from the interior of the planet. What has been said makes
it obvious that it is necessary in this case, for example, for Earth
to look at the origin of its atmosphere and hydrosphere as genetically /304
related, as a single evolutionary process.
Let us turn to our model estimate. The value obtained of
temperature here is increased inasmuch as it does not take into
consideration the fact of the increase of illumination of the Sun
which over a period of =2.3 billion years according to different
estimates spend 35-60% and also the increase of the albedo of Earth
from the beginning of formation of the atmosphere. Modern theories of
stellar evolution have led to the conclusion that after =10 million
years after formation of the Sun, it has undergone the basic sequence
of the Hertzprung-Russell diagram. However, without taking into
consideration the increase in illumination, the average temperature of
the Earth's surface appears below the point of freezing even of ocean
water. But this contradicts the modern geological and paleontological
data according to which primitive photogenic autotrophic organisms
occurred on Earth at least =2.5 billion years ago. This periodincludes the most ancient stromatolites -- the stratified formations
in thick layers of limestone and dolomite formed as a result of the
life activity of bluegreen algae.
The contradiction can be eliminated, assuming that in the early
precambrian Earth atmosphere, besides carbon dioxide and water (and
probably also methane and hydrogen sulfide), there was a relativelysmall quantity of ammonia (on the order of a few ten thousandths of
part of a percent) or that in it a large quantity of hydrogen was
accumulated (on the order of 1 atm). Using any of these hypotheses,
one can elevate the temperature above the freezing point for water due
to the strong greenhouse effect created by these components as was
proposed in the model of C. Sagan and G. Mullen.
For Venus, with this same quantity of the initial albedo, the
equilibrium temperature appears to be at least 325 K which is right up
to a pressure of 0.2 atm above the boiling point for water. In thisway, in order to retain water, Venus would have had to have almost two
magnitudes denser an atmosphere than the initial atmosphere in
comparison with Earth which with identical rates of degasification of
matter of the mantle and dissipation of the atmosphere into the
197
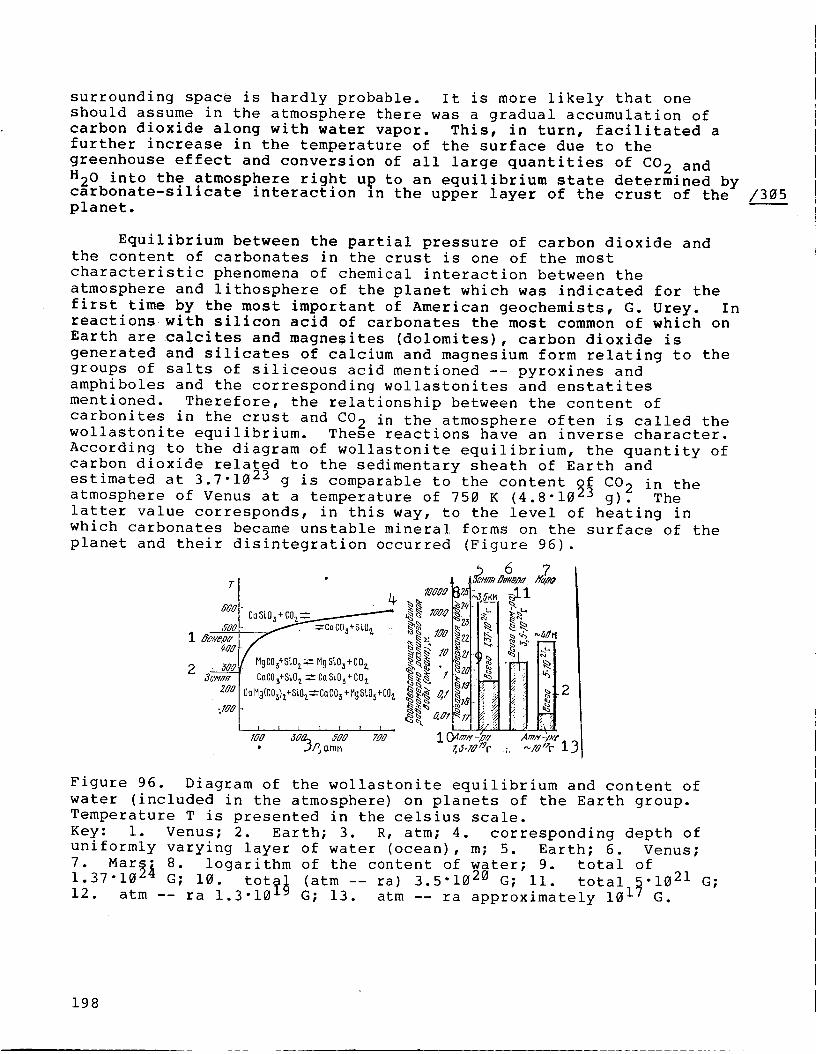
surrounding space is hardly probable• It is more likely that oneshould assume in the atmosphere there was a gradual accumulation ofcarbon dioxide along with water vapor. This, in turn, facilitated afurther increase in the temperature of the surface due to thegreenhouse effect and conversion of all large quantities of CO2 andH_O into the atmosphere right up to an equilibrium state determined byc_rbonate-silicate interaction in the upper layer of the crust of theplanet.
Equilibrium between the partial pressure of carbon dioxide andthe content of carbonates in the crust is one of the mostcharacteristic phenomena of chemical interaction between theatmosphere and lithosphere of the planet which was indicated for thefirst time by the most important of American geochemists, G. Urey. Inreactions with silicon acid of carbonates the most common of which onEarth are _alcites and magnesites (dolomites), carbon dioxide isgenerated and silicates of calcium and magnesium form relating to thegroups of salts of siliceous acid mentioned -- pyroxines andamphiboles and the corresponding wollastonites and enstatitesmentioned. Therefore, the relationship between the content ofcarbonites in the crust and CO2 in the atmosphere often is called thewollastonite equilibrium. These reactions have an inverse character.According to the diagram of wollastonite equilibrium, the quantity ofcarbon dioxide related to the sedimentary sheath of Earth andestimated at 3.7-1023 g is comparable to the content of CO2 in theatmosphere of Venus at a temperature of 750 K (4.8"1023 g). Thelatter value corresponds, in this way, to the level of heating inwhich carbonates became unstable mineral forms on the surface of theplanet and their disintegration occurred (Figure 96)•
6 ?
:•, Ilq lel' t I;12
14
ZJ.m_v _, ~m@ lJ
T
6OO
500
000
200
-/00 -
%<Co01,0_+ C_' _ i
S _Ca CO_+Si,Oz ::
CoCO_+S_,Oz-" Co_0_ + CO_
O_Mg(CO_)_+_tOz_C_CO_+Hg_i.0_+COl.
i i i i f l i
Figure 96. Diagram of the wollastonite equilibrium and content of
water (included in the atmosphere) on planets of the Earth group.
Temperature T is presented in the celsius scale.
Key: i. Venus; 2. Earth; 3. R, atm; 4. corresponding depth of
uniformly varying layer of water (ocean), m; 5. Earth; 6. Venus;
7 Mars; 8. logarithm of the content of water; 9. total ofi[37-102_
tot_ (atm -- ra) 3.5"1020 G; ii. total 9"1021 G;G; 10
12. atm -- ra {.3"10 G; 13. atm -- ra approximately 101 G.
/305
198
It is much more complex to explain the situation with water. /306
When assuming a "geochemical similarity," of the processes of
evolution of planetary interiors and degasification of the volatile
substances, the quantity of water distilled on Venus had to correspond
to the volume o_ the Earth's hydrosph_{e which comprises approximately1370 million km _ or more than 1.37"10 _ g. Moreover, on the surface
of Venus, water is not retained inasmuch as the temperature there is
higher than the critical level equal to 647 K. This statement remains
true for aqueous solutions (brines) for which critical temperature
usually is somewhat higher (=675 -- 700 K). As to the atmosphere,
then one takes into consideration the values put forward earlier,
taking the average content of water _apor as 0.05%, the quantity ofwater appears to be equal to 3.5.102_ _. This significantly exceeds
the content of water in the Earth's atmosphere (=1.3"10 _= g) but by a
magnitude of three and a half is smaller than the reserves of water in
the hydrosphere (see Figure 96).
Of course, then one must keep in mind two additional expressions.
In the first place, similarly to Earth, a certain quantity of water
can be retained in the Venusian crust -- both in the form of
chemically bonded (constituted and crystallized) water of minerals and
in the free (gravitation) water obviously, found in a vapor-like
state. The content of water in the Earth's crust according to
different sources is estimated from 4-5 to 30-50% of the mass of the
hydrosphere from which about 25% is found as the portion of bonded
water. Appropriate to Venus, more probable is the lower of the
indicated limits due to retention of primarily bonded water. For the
possibility of formation of its rock from a moist melt (at 1-1.5% H20
in the initial material) in particular, data of analysis of soil on
the Terra Aphrodite indicates this. Secondly, much water can exist in
the mantle of Venus. We have already discussed the fact that
according to A. P. Vinogradov's hypotheses, only a small portion of
the volatile substances contained or produced in the mantle of Earth
were degasified into the atmosphere and hydrosphere for the entire
geological history of our planet. In particular, the volume of the
hydrosphere according to his estimate does not exceed 7.5% of thetotal reserves of water in the mantle. If this estimate is
approximately true for Venus (with similar character of thermalevolution of both planets), then the potential possibilities of "being
acquired" by the hydrosphere in the case of a change of climate onVenus are retained.
Other processes of climatic evolution, obviously, occurred on
Mars. Its equilibrium of temperature is significantly below zero andthe water distilled _om the interior can be foundon the surface in a
liquid state only with an adequately dense atmosphere thanks to the
greenhouse effect and the increase in temperature. It is difficult to
answer the question of whether water existed on the surface of Mars
only at a certain stage of evolution or whether it appeared regularly
over a long period of time, but its traces remain in the form of
shriveled river channels and glacial scouring (exaration) and are fairly
obvious.
/307
199
In this case, one must add that on the planet at the same time asharp change occurred in climate probably somewhere within the limitsof 1 billion years ago and that up to this moment Mars had passedthrough the apex of its geological evolution and was more similar toEarth. This change could have been due to a sharp decrease in thegeneration of internal heat which is naturally involved in the finalstage of volcanic activity on Mans. But it is impossible to excludethe idea that variations in the Martian climate occurred repeatedlysimilarly to the period of great ice ages on Earth. Hypotheses haveeven been put forward that they occur right now with a period ofseveral hundreds of thousands to millions of years. These hypothesesare based on calculations made earlier of the periodic oscillations ofthe slant of the equator of Mars toward the plane of its orbit as aresult of tidal perturbations of the planet and the Sun andcorrespondingly changes in exposure to the Sun on the poles. Thevariation in inclination of the equator indicated in Figure 6 (uppercurve) corresponds to the change in average annual exposure to the Sunon the poles (ratio of their exposure to the solar constant)approximately by a factor of two from 0.08 to 0.18. A significantlysmaller effect is indicated for the periodic changes in eccentricityof the Martian orbit (within limits from 0.005 to 0.141) as a resultof which exposure of the poles changes by a total of 1-2%. Thecorresponding models were considered by V. Ward, B. Murray and otherscientists. The calculations of C. Sagan, P. Garash and O. Tun led tothe conclusion that due to the change in the inclinationequivalent to oscillation of illumination by the Sun, there could betwo maximum stable states of the atmosphere of Mars: one with such ararefied atmosphere as there is now and the other with an atmospherein density equal to that of Earth. The source of increase in densityby more than 100 times in this model was the pole on whose polar capsfreezing of large quantities of carbon dioxide was proposed. It waspointed out that increased radiation of the poles due to the largeinclination of the axis of rotation in comparison with that of thepresent day (approximately by 4-5 ° ) accompanied by a decrease in theiralbedo, in principle, is capable of creating such an atmosphere and atthe same time lighting up the aqueous ice.
Later measurements made by the Viking, however, did not detectany significant quantity of "dry" ice in the caps in pure form.Obviously, the main mass of degasified carbon dioxide is found in theMartian regolith and also in deposits of finely dispersed dustmaterial around the poles and in the stratified plain regions of thenear-polar latitudes. Particularly large stratification of suchfrozen soil could be expected in the northern polar region due todifferences in exposure by the Sun of the Martian hemispheres: in thenorth, the winter is longer. Nevertheless, in this case, theequilibrium state between the quantity of adsorbed carbon dioxide andits partial pressure in the atmosphere is determined by temperature.Therefore, concepts about the possibility of changing density of theatmosphere depending on the change in inclination of the axis ofrotation as whole remain, obviously, true.
Of course, it would be tempting to believe that to us simply Marswould not seem different with a more favorable climate due to
/308
200
inadequately large inclination of the axis of its rotation in thepresent-day era and that this makes it possible to look at ourdescendants approximately a hundred thousand years later on. However,opposed to this attractive hypothesis is the fact that covered withwater and glacier channels and troughs, obviously, they were formedearlier than the relatively younger craters of impact origin on theirshriveled surface whose age is estimated to be at least dozens ofmillions of years. Therefore, in our opinion, the hypothesis aboutcyclic changes of the level of illumination of the Sun put forward bythe American astrophysicist V. Fowler in connection with attempts toexplain the paradox of the solar neutrino deserves a good deal ofattention. Thus we mention the considerably smaller (approximately by5 times) flux recorded on Earth of the neutrino from the Sun incomparison with their expected output as a result of the reaction ofthermonuclear synthesis, taking into consideration the main mechanismof generation of solar energy. The correlation found for these cyclesrepeating with a periodicity of =108 years with great icing up onEarth in a natural manner could be explained both by periodicoscillations of the Martian climate and possibly significant climaticvariations on other planets.
For discovering the paths of evolution of the atmosphere and theancient climate of Venus and Mars, the results of mass-spectrometricmeasurements in the atmospheres of these planets are very important;they contain small admixtures primarily of inert gases (see Table 4)and ratios of the basic isotopes. As has already been discussed, by acomparison of measured concentrations of inert gases with theirabsolute and relative content in Earth's atmosphere and the gaseousfraction of meteorites, one can judge the degree of their primaryfractionation at the stage of accumulation and passage through thegeological time by the degree of degasification on the planet. Ananalysis of the isotopic composition makes it possible additionally toclarify the degree of degasification and fractionation of volatilesubstances during dissipation of gases from the planetary atmosphere.
On Venus, the ratio of the content of the radiogenic isotope ofargon Ar-40 to the content of the primary isotopes of argon Ar-36 andAr-38 are approximately equal to one at the same time that on Earththis ratio is 300 and on Mars, 3000 times greater. At the same time,the absolute contents of Ar-40 on Earth and Venus are approximatelythe same and on Mars approximately a magnitude smaller. In otherwords, in comparison with the Earth and particularly the Martianatmospheres, the atmosphere of Venus is greatly enriched with primaryisotopes of argon: at this time, both Ar-40 is approximately twice assmall as on Earth and Ar-36 is almost 100 times larger. Also, neon isapproximately a magnitude larger in the Venusian atmosphere althoughisotopic ratios for both planets do not differ greatly. The data onkrypton and xenon is less definite, nevertheless, in these cases theirabsolute content on Venus, obviously, is approximately a magnitudegreater. Let us add to this that if we take the ratios of measuredvolumetric contents of primary argon in the atmosphere per unit ofmass of the stellar body (for Venus, Earth and Mars, they,correspondingly, equal 5"10 -b, 2"10 -_ at 0.5"10 -10 cm3/g) and areapplied on a graph in a logarithmic scale depending on the distance
/309
201
from the Sun; then these ratios appear to be located in approximatelya single straight line. On this same line, certain types of carbonatechondrites of classes C and H are applied (for C3 it is approximately10-6 _m3/_ and for the higher temperature H, on the average,2-10 -o cm_/g).
In this way, we encounter a steady tendency which cannot berandom. An explanation of these facts must be, obviously, finding thematter of the planet and meteorites at different distances from theSun in the condensation sequence of formation which we consideredearlier. In this way, the question of evolution of the atmosphere andclimate blend into a general cosmogonic problem.
It is possible to add that with different effectiveness threebasic mechanisms are active: nonuniform accumulation of planets(heterogenic accretion), nonuniform degree of degasification andfractionation of the primary protoplanetary cloud.
A model of heterogenic accretion was discussed in detail startingwith an analysis of the content of volatile substances in the matterof planets of the Earth group and meteorites by E. Anders and T. Owen.According to their idea, after the formation of the basic mass of theplanet, on the completed stage meteorites fall on it consisting oflater low-temperature condensates containing the main mass of volatilesubstances in them.
As one gets closer to the Sun, the number of strikes mustincrease and this means the difference in positioning of the planetcan play a significant role in the formation of the reserve ofvolatile substances and the degree of subsequent degasification of theplanet, including the surface layer hit by meteorite matter.
The last condensate, in turn, includes carbonaceous chondritesenriched, as was already noted, by hydrated silicates, gases and evenorganic matter. According to content of hydrogen in the chondrites,the C3 group is fairly close to the H group of chondrites. Then,assuming an identity of factors for release of primary isotopes ofargon and hydrogen on Earth and Venus, it is possible in thehypothesis confirmed above to come to the conclusion that there arecomparable quantities of water distilled on the surface of bothplanets in the geological epoch. For Mars, at the same time, it isnecessary to pay attention to its mass, which is approximately 9 timessmaller in comparison with the mass of Earth and Venus.
The degree of degasification of the matter of Venus, obviously,was higher than on Earth. Correspondingly, more Ar-36 was accumulatedinasmuch as degasification of At-40 accumulated gradually on theaverage at a great depth occurs more slowly than its primary isotopesand this means a larger quantity of volatile atmophilic elements wastransferred into the atmosphere of Venus. At the same time, on Marsfor the reserve of volatile matter, probably, is depleted incomparison with the corresponding reserve on Earth and Venus,degasification was less complete so that obviously, it is related to alesser degree of differentiation of Martian matter and the small mass
/310
202
of this planet. Moreover, due to differences in temperatures, theprimary isotopes of argon and other volatile substances must basicallybe found in the Venusian atmosphere in opposition to Mars where they,to a greater degree, were accumulated in solid surface rock.
The expressions presented do not explain fully, however, the dataon the unusually high concentration of primary argon in the atmosphereof Venus where as we see its content in calculation per unit of massof the planet by several times exceeds an analogous content even inthe carbonate chondrites type C30 which are most enriched by thisisotope. Therefore, the principle observed in distribution of inertgases on planets could be, to a certain degree, caused by the third ofthe mechanisms mentioned -- by the difference in the initialrelationship of the elements during formation of the planets. In thiscase, it would be necessary to assume that in the process ofaccumulation, Venus was made up of a preplanetary cloud with greaterprimary isotopes of argon, neon, krypton and groups of other elementsrelated to them, larger than on Earth and Mars, on the other hand witha lesser quantity. Is it possible for such a sharp fractionation ofprimary matter to occur in a comparatively small area of the solarsystem within limits less than 0.8 IAU? It seems to us hardlyprobable and the question still remains open.
But one way or another, we will find completely determinedadditional confirmation of concepts about the decisive role of thepositioning of the Earth planets relative to the Sun in the course oftheir climatic evolution. Otherwise, it is difficult to explain whyVenus has lost such a tremendous mass of water compared with thevolume of Earth oceans and Mars has "conserved" a significantly largeraverage quantity of water on its surface in the form of ice.
The results of analysis of the content of hydrogen in theatmosphere and its heavy isotope of deuterium are evidence of the factthat Venus had a fairly heavy hydrosphere. This analysis presentedaccording to the data of mass-spectrometer measurements on the basisof the Pioneer-Venus probe by T. Donahue et al. led to an importantconclusion: the ratio of deuterium D to hydrogen H in the atmosphereof Venus comprises (1.6+0.2)'10 -2 , that is, is two magnitudes largerthan in the atmosphere _f Earth! Explaining such a high enrichment ofthe Venusian atmosphere with deuterium can be due to the separation ofthese isotopes during thermal outflow of hydrogen from the atmospherewhere it accumulates as a result of evaporation of oceans andsubsequent dissociation of hydrogen vapor by ultraviolet radiation.Then, as we see from theoretical estimates, up until now the relativecontent of hydrogen in the atmosphere is increased by approximately 2%and effectively acts not as a thermal but as a hydrodynamic mechanismof outflow in which fractionation of hydrogen and deuterium does notoccur. This latter idea applies its own type of lower limit to thequantity of water distilled on Venus at the level of approximately ahalf percent of the volume of Earth hydrosphere so that once again themeasured ratio D/H applies. However, it is hardly a real volume ofthe Venusian hydrosphere which would correspond to this low level;with the consideration of the geochemical expressions presented above,
/312
203
it is much more probable that it would be approximately the same as onEarth. But one cannot strictly prove this as yet.
The question of the accumulation in the atmosphere of significantreserves of water capable of creating a powerful phase of thegreenhouse effect still remains open for a loss of water may haveoccurred more or less evenly. We have seen that with the modernconditions, the relative content of vapor of H_O required in theatmosphere of Venus is not low inasmuch as the-screening of thermalradiation almost completely is provided by bands of absorption ofcarbonates due to the modification of their structure at hightemperatures and pressures. From this, however, it does not followthat the basic non-transparency was created due to an accumulation ofCO2 at the earlier stages of evolution. But even in a case where thewater vapor in the atmosphere has not accumulated and its loss wasuniform, one must assume that the flow of molecules of hydrogenrequired for evacuation of the distilled quantity of water from theatmosphere reached a tremendous value -- about 7"1010 cm-2-s -I. Thisis approximately three to four magnitudes higher than the modern rateof dissipation of hydrogen from the atmosphere of Earth and Venus andthe large values in general appear to be unrealistic.
Also it is necessary to indicate by which processes the bondingof a tremendous mass of released oxygen occurred. The atmosphericcomponents, even taking into consideration the chemistry of theclouds, could hardly play a decisive role here. It is hardly probablethat the entire excess of oxygen went into oxidation of carbon due tothe more realistic hypothesis about the primary origin of atmosphericCO2 due to gasification from the interior. As to the dissipation ofoxygen from the atmosphere, here one would require an exospherictemperature higher than 1500 K which is several times greater thanthe modern value and in conditions of intense radiation cooling bymolecules of carbon dioxide could hardly be possible in general. Moreprobably, the oxygen was bonded with surface rocks and this forces usto assume a considerably larger tectonic activity on Venus than onEarth; this would be required for the effective bringing to thesurface from the depths of fresh unoxidized material.
Now if we turn to Mars, the results of the isotope analysis and
the relationship of volatile substances 2 A e_ usthe basis for considering that at some t a o sdenser atmosphere approximately 20 times greater in comparison withthe existing content of carbon dioxide and approximately 10 to 100times greater a content of nitrogen. The latter estimate was made onthe basis of the measured isotope ratio of nitrogen (N-15/N-14) whichappeared to be approximately 75% higher than in the atmosphere ofEarth at the same time that the isotope ratios of other extensivecomponents -- oxygen and carbon -- are retained approximately the sameas on Earth. This leads us to an important conclusion that even inthe most favorable periods, the atmosphere of Mars remained at leastten times less dense than that of Earth and this atmosphere wascapable of creating a noticeable greenhouse effect and retainingliquid water on the surface.
/313
204
The total distilled quantity of water on Mars is estimated at avalue of =5"1021 g which corresponds to the average depth of, a uniformlydiffuse layer on the surface of about 20 m; this is approximately two /314
magnitudes smaller than on Earth but, however, a magnitude larger than
on Venus (see Figure 96). One could expect that almost all of this
mass of distilled water is retained right now on Mars in the near-
surface glaciers and polar caps if one starts with the hypotheses that
the rate of dissipation of atoms of hydrogen for the extent of all
geological history of the planet corresponded to the present day value
of the flow (about 108 cm-2-s-l). In this case, the quantity of water
lost relating to the thickness of the effective layer must not exceed3-5m.
It is interesting to note that besides adsorption on the Martian
regolith and in the stratified near-polar regions, one of the channels
for evacuation of CO 2 from the atmosphere could have been thecompounds of inclusion which we already mentioned -- the clathrate
compounds. It is easy to convince oneself that for the quantity
estimated above of H20 and COp, the molar ratio for the clathrate
compound C02andH_ O to which it corresponds almost coincides with the
lower limit-for gaseous hydrates at normal pressure.
A completely natural question can arise: is it only distance
from the Sun that affects the climate of Mars and what would happen to
it if it were the same dimensions as for instance Earth or Venus? One
can assume that in this case Mars would accumulate and maintain a
significantly larger quantity of volatile substances (which
particularly favors the hypothesis of heterogeneous accretion which we
considered) and as a result of any course of thermal evolution, the
degree of differentiation of the component matter and degasification
would be more complete. Such a Mars, obviously, would possess a
significantly denser atmosphere and a moderate climate. Taking into
consideration the differences presented above in mass and degree of
degasification in comparison with that of Earth, the estimated mass of
distilled water would have to increase by at least 25-30 times which
would make it comparable with the Earth's hydrosphere with a layerwith thickness about 0.5 km.
The composition of the atmosphere of Mars including oxygen,
nitrogen, carbon, a temperature close to the Arctic and Antarctic
regions of Earth and a richness of water in its upper horizons it
would seem, favor the optimistic expectation of observing signs of
life on this planet. Unfortunately, biological experiments with
Martian soil on the descent vehicles of the Viking established this
question as unanswerable or as having more negative than positive
results. Obviously in conditions of effective natural sterilization
due to shortwave ultraviolet radiation penetrating to the surface
(with energy of photons less than 6-7 eV) and the strongly oxidized
medium in the soil obtaining oxidized compounds (peroxides), the
chances of detecting life on Mars were small.
/315
There is a basis for assuming that a number of apparently
positive pieces of information about biological activity in each of
the three types of biological experiments on the Vikings -- gas
205
exchange, decomposition of markings and assimilation of carbon (in thetwo latter cases, using the labeled atoms of carbon C-14) -- areexplained by processes of chemical interaction. In particular, theintense generation of oxygen in the initial phase of the experiment ongas exchange most probably involves an excess of peroxides in the soiland not processes of metabolism. An important argument against thepresence_ of live forms also is the extremely low threshold ofdetection on the surface and in the near-surface layer of organicmolecules (10 -6 by mass according to ratio to the inorganic).Moreover, it is completely possible that the negative result of themission of the Vikings was determined by the inadequate sensitivity ofthe methods used in such modern conditions unfavorable for life on •Mars. It is impossible, of course, to exclude the fact that theseconditions could be considerably more favorable in earlier history ofthe planet or at certain stages of its climatic evolution when on thesurface there was liquid water. Therefore, there was considerableinterest in the attempts to detect the simplest forms of paleologicallife in the Martian soil available by a direct method of analysis inEarth laboratories.
While, there are not any reliable signs of life on Mars to befound of certain planet satellites, primarily on Titan, basically theyare retained although the probability of the existence of life isstill extremely small. If in the future with such hopes finallysettled, then only with great care can the question be posed of whylife occurred and developed intensely only on the planet the thirdfrom the Sun -- the question has not only a natural science value butalso a tremendous philosophical value -- value from the standpoint ofattitude.
206
Can you say who chainedman to the universe?Had love been true in this world,the entire earth would have been motherland,And having a free soul, man would haveequally loved the entire broad world,And not only the earth would have been themotherland but also the stars and planets!
A. K. Tolstoy"Don Juan"
CONCLUSION
The solar system has made available for us unique examples ofintricate natural complexes different from our planet itself. Theirstudy in all interactions and depending on certain factors, thediscovery of the most important criteria and principles of formationof these complexes has led to establishment of comparativeplanetology, on whose successful development, in particular, willdepend the best understanding of the mechanisms as the basis fornature on Earth and its position as a member of the solar system.
The study of the majority of natural processes on examples ofdifferent heavenly bodies provides an unusual scope for the approachand simultaneously makes it possible to examine it in depth. Newexperimental data and the ideas developed from them make it possibleto go beyond the limits of the circle of concepts comprised as aresult of adherence to some particular point of view or model.
All of this leads to recognition of the commonality of nature ofdifferent phenomena. It is adequate to say that the principles ofelement and mineralological composition of matter in planets andmeteorites which have been discovered, the commonality of thecharacter of'thermal evolution, volcanic and tectonic activity andgeological structures on the planets of the Earth group, the discoveryof a deep connection between processes of formation and their masswith the formation of rotational movement, the number of similarfeatures of circulation on Venus and ocean circulation on Earth, theprobable correlation of periods of the ice ages and the climaticevolution on Earth and Mars, etc. As a result, it has actually becomepossible to talk about comparative geology, comparative meteorologyand climatology and on a new basis to present the problem of genesisof heavenly bodies which is directly related to general problems ofnuclear and chemical evolution of matter in the solar system.
For the approaching generations of our epoch, one of the mostimportant accomplishments of mankind from the point of view of thehistorical perspective is our entry into space. The possibility hasbeen shown and the beginning has been made for a long-term period forexpansion of the sphere of habitation beyond the limits imposed by theregion of the solar system -- the Earth planets.
/316
/317
207
What will happen later on? Space expeditions, landing of peopleon planets, their making themselves at home there, the creation oflunar, Martian and other permanent active bases? We believe thatmankind is going into this new stage but, of course, not in thiscentury. Primarily this is because the possibilities of automaticprobes has been far from exhausted and more likely we are continuouslyexpanding them. Another extremely serious reason is that the existingtechnical means are hardly suitable for interplanetary communication-- they are too heavy, cumbersome and inefficient. We need newengines for space rockets -- nuclear, electroreactive, but,unfortunately, they have not been adequately developed and do not havethe necessary thrust. Among other problems, we include the mostimportant which are related to guaranteeing life support and a long-term stay of man in outer space. Finally, one must not forget howmany means are required for organizing such an expedition and moreoverright now there exist a multiplicity of other problems on our planetwhose solution which also requires tremendous expenditure,undoubtedly, have high priority. And must we still talk about thefact that equipping and sending such expeditions must be the result ofthe collective efforts of the developed countries of the world, an actof international cooperation undertaken in the interests of all peopleon Earth in distinction from the existing forces for improvement anddevelopment of weapons which threaten the very existence ofcivilization?
Neighboring us is lifeless limitless space, new regions in theform of other planets and asteroids which with time have become acosmic ocean and will be mastered as the first settlements of the "newlight."
_Todav this can seem to be a fantasy but, undoubtedlvj Drojectsfor changing in a more favorable direction the existing climatic
conditions on Venus and Mars are being developed; settlements will be
created on the Moon and asteroids will begin to be developed. As to
distances, we remember that Christopher Columbus needed 70 days inorder to cross the Atlantic Ocean -- two thirds of the time for a
flight of an automated station to Venus. And similarly to this, right
now overcoming the distance between Europe and America, it can be
measured in hours with the progress in technology we can sharply
decrease the flight time to the other planets. At the same time, the
degree of risk is being decreased; such communication will become
regular and ordinary.
Inevitability of this process is fairly obvious. One must not
forget that the level of development of life on Earth has acquired the
characteristics of technologically developed civilization only in the
last approximately 100 years at the same time that mankind has existed
for hundreds of thousands of years. And with the passage of this very
insignificant period of turbulent development of civilization, we have
begun to perceive the deficiencies in sources of raw materials, energy
resources; problems have arisen of overpopulation in certain regions,
contamination of the environment, etc. Correspondingly, social
problems have been aggravated in conditions of continuously growing
/318
208
rates of scientific and technical progress and economic development.It is undoubtedly true that mankind over a period of three thousandyears will face the necessity for mastering new territories in thenear environment of out star, the maximum use of its energy output,mastering tremendous resource richness of planets and asteroids.
In this way, the purpose of study of planets is not limited andwe have not exhausted the accumulation of knowledge about how ourneighbors in this world are constructed and function and how they haveoccurred and developed. This is one of the sections of fundamentalscience with which very closely the solution of many technical-economic and social problems will be related on the path towardfurther development of civilization.
Man and the modern world (limited in its scale and fairly"brittle" in its adaptive capability) with an ever increasing degreeis familiar with the achievements of the industrial revolution. Aparadoxical situation has arisen: unconsciously finding captivity init, at the same time he loses the capability of being amazed by newscientific and technical achievements perceiving them often as naturaland at the same time stopping imagining the actual prospects andconsequences connected to them. Moreover, striving toward what isnew, hidden and enigmatic is maintained feeding the human fantasy andright now leading to a mystical type of futuristic thinking about themyths of "space pods," "foreign planet humanoids." We hardly need topoint out that these fantasies in themselves don't have the smallestscientific basis and we hope that the content of this book will helpus to better understand the various facets and separate reality fromfantasy.
But then the prospects for transfer of man to a new stage --mastery of the solar system -- undoubtedly is scientific, dictated bythe logic of its preceding development and its further progress and inits grandiose scale its significance can hardly be truly expressed.It would be an achievement if people on the planet Earth, once and forall having ended their conflicts, would combine their forces for afavorable beginning here. Here is the pledge for further forwardmovement of human civilization closely related to the embodiment ofour communist ideals. At the same time, prospects are expanding forestablishment of contacts with other similar civilizations in ourgalaxy and beyond its limits. It has many times increased the"whispers of Earth" as we call the discussion about our beautifulplanet described on special metal records played inside the spacecraftwhich are destined to leave the solar system. And then this will be astory not only about the cradle of civilization but also a form ofexpression of our great compatriot, the founder of cosmonautics,K. E. Tsiolkovskiy, and also a description of our near-Sun space whichis successfully being made into a single large home.
Mankind is truly the master of his star, the master of otherlifeless planets and it is undoubtedly true that the future prospectsare good for acquiring their riches. We are talking about the highevaluation for future generations of today's efforts by ourcontemporaries because these will be the origin of a grandiose path.
/319
209
REFERENCES /320
l •
•
•
•
•
•
•
•
•
10.
ii.
12.
13.
14.
15.
16.
Beletskiy, V. V., Ocherki o dvizhenii kosmicheskikh tel[Notes on
the movement of cosmic bodies], Nauka Press, Moscow, 1972.
Gerels, T., Protozvezdy i planety [Protostars and planets], (intwo parts), Mir Pub1., Moscow, 1982•
Gerels, T., Yupiter [Jupiter], (Parts I, II, III), Mir Publ.,Moscow, 1978-79•
Goldsmith, F. and T. Owen, Poiski zhizni vo Vselennoy [Search forlife in the universe], Mir Publ., Moscow, 1983.
Golitsyn, G. S., Vvedeniye v dinamiku planetnykh atmosfer
[Introduction to the dynamics of planetary atmosphere],
Gidrometeoizdat Publ., Leningrad, 1973.
Goody, R. and Dzh. Walker, Atmosfer__ [Atmospheres], Mir Publ.,Moscow, 1971.
Grebenikov, Ye. A. and Yu. A. Ryabov, Poiski i otkrytiya planet
[Search for and discovery of planets], 2nd ed., Nauka Publ.,Moscow, 1984.
Kaula, U., Vvedeniye v fiziku planet zemnoy grunny [Introduction
to the physics of planets of the Earth group], Mir Publ.,Moscow, 1971.
Keldysh, M. V., editor, Perv[[e panoramy poverkhnosti Vener_ [Thefirst panoramas of the surface of Venus], Moscow, 1979.
Keldysh, M. V. and M. Ya. Marov, Kosmicheskiye issledovaniya[Space research], Nauka Press, Moscow, i981.
Kondrat'ev, K. Ya., Meteorologiya planet [Meterology of theplanets], LGU publication, Leningrad, 1977.
Ksanfomaliti, L. V., Planety, otkrytye zanovo [Planets discovered
anew], Nauka Press, Moscow, 1978.
Kulikov, K. A. and N. S. Sidorenko, Planet Zemlya [Planet Earth],Nauka Press, Moscow, 1977.
Kuz'min, A. D. and M. Ya. Marov, Fizika planety Venera [Physicsof the planet Venus], Nauka Press, Moscow, 1974.
Levin, B. Yu., Proiskhozhdeniye Zemli i planet [Origin of Earth
and the planets], 4th ed., Nauka Press, Moscow, 1964.
Monin, A. S., Istoriya Zemli [History of Earth], Nauka Press,
Leningrad division, Leningrad, 1977.
210
17.
18.
19.
20.
21.
22.
23.
24.
25.
26.
Moroz, V. I., Fizika planety Mars [Physics of the planet Mars],Nauka Press, Moscow, 1978.
Reeves, G., Proiskhozhdeniye Solnechnoy sistemz [Origin of the
solar system], Mir Publ., Moscow, 1976.
Runkorn, S. S. and G. Urey, Editors, Luna [The Moon], Mir Publ.,
Moscow, 1975.
Safronov, V. S., Evolyutsiya doplanetno@o oblaka i obrazovaniyeZemli i planet [Evolution of preplanetary clouds and the
formation of Earth and the planets], Nauka Press, Moscow, 1969.
Shklovskiy, I S , Vselennaya, zhizn'• . , pazum [Universe, life,
intelligence, 5th ed., Nauka Press, Moscow, 1980.
Vinogradov, A. P., Editor, Kosmokhimiya Luny i planet
[Cosmochemistry of the Moon and the planets], Nauka Press,
Moscow, 1975.
Vinogradov, A. P., Vvedeniye v geokhimiyu okeana [Introduction tothe geochemistry of the ocean], Nauka Press, Moscow, 1967.
Voytkevich, G. V., Khimicheskaya evol[utsiya Solnechnoy sistemy[Chemical evolution of the solar system], Nauka Press, Moscow,1979.
Whipple, F., Sem'ya Solntsa [The family of the Sun], Mir Publ.,Moscow, 1984.
Zharkov, V. N., Vnutrenney e stroeniye Zemli i planet [The inner
structure of Earth and the planets], Nauka Press, Moscow, 1978.
211