AN EXPERIMENTAL AND THEORETICAL STUDY OF RADIATIVE EXTINCTION OF DIFFUSION FLAMES FINAL REPORT NASA GRANT # NAG3 - 1460 December, 1995 Prepared by ARVIND ATREYA Department of Mechanical Engineering and Applied Mechanics The University of Michigan, Ann Arbor M[ 48109 - 2125 Telephone. (313) 647 4790; Far." (313) 647 3170 for NASA Microgravity Science & Applications Division NASA Project Monitor: Mr. Kurt R. Sacksteder; Lewis Research Center Combustion Science Program; Program Scientist: Dr. Merrill King

Welcome message from author
This document is posted to help you gain knowledge. Please leave a comment to let me know what you think about it! Share it to your friends and learn new things together.
Transcript
AN EXPERIMENTAL AND THEORETICAL STUDY OF RADIATIVE
EXTINCTION OF DIFFUSION FLAMES
FINAL REPORT
NASA GRANT # NAG3 - 1460
December, 1995
Prepared
by
ARVIND ATREYA
Department of Mechanical Engineering and Applied Mechanics
The University of Michigan, Ann Arbor M[ 48109 - 2125
Telephone. (313) 647 4790; Far." (313) 647 3170
for
NASA Microgravity Science & Applications Division
NASA Project Monitor: Mr. Kurt R. Sacksteder; Lewis Research Center
Combustion Science Program; Program Scientist: Dr. Merrill King

AN EXPERIMENTAL AND THEORETICAL STUDY OF RADIATIVE
EXTINCTION OF DIFFUSION FLAMES
( NASA GRANT#: NAG3-1460)
CONTENTS
EXECUTIVE SUMMARY .......................................
RESEARCH RESULTS .........................................
1
4
1. INTRODUCTION AND OBJECTIVES ................................. 4
2. PREVIOUS RESEARCH ................................. 5
3. EXPERIMENTAL APPARATUS ............................ 610
4. RESEARCH RESULTS ...................................
4.1 Transient Radiative Flames ......................... 10
4.2 Progress on lag Experiments ........................ 12
4.3 Progress on 1-g Experiments ........................ 20
5. REFERENCES ........................................ 22
APPENDICES ................................................ ""
APPENDIX A - "Extinction of a Moving Diffusion Flame in a' Quiescent Microgravlty
Environment due to COJH20/Soot Radiative Heat Losses"
APPENDIX B - "Observations of Methane and EthyleneDiffusion Names Stabilized
Around a Blowing Porous Sphere under Microgravity Conditions"
APPENDIX C - "Radiation from-Unsteady Spherical Diffusion Names in Microgravity"
APPENDIX D - "Radiant Extinction of Gaseous Diffusion Flames"
APPENDIX E - "Effect of Radiative Heat Loss on Diffusion Flames in Quiescent
Microgravity Atmosphere"
APPENDIX F - "A Study of the Effects of Radiation on Transient Extinction of Strained
Diffusion Flames"
APPENDIX G - "Numerical Simulation of Radiative Extinction of Unsteady Strained
Diffusion Flames"
APPENDIX H - "Experiments and Correlations of Soot Formation and Oxidation in
Methane Counterflow Diffusion Flames"
APPENDIX I - "Measurements of Soot Volume Fraction Profiles in Counterflow Diffusion
Flames Using a Transient Thermocouple Response Technique"
APPENDIX J "The Effect of Changes in the Flame Structure on Formation and
Destruction of Soot and NOx in Radiating Diffusion Flames"
APPENDIX K - "The Effect of Water Vapor on Radiative Countefflow Diffusion Flames"
APPENDIX L - "Dynamic Response of Radiating Flamelets Subject to Variable Reactant
Concentrations"
APPENDIX M - "The Effect of Flame Structure on Soot Inception, Growth and Oxidation
in Counterflow Diffusion Flames"
APPENDIX N - "Measurements of OH, CH, C,_ and PAH in Laminar Counterflow
Diffusion Flames"
APPENDIX O - "Transient Response of a Radiating Flamelet to Changes in Global
Stoichiometric Conditions"

EXECUTIVE SUMMARY
The objective of this research was to experimentally and theoretically investigate the
radiation-induced extinction of gaseous diffusion flames in lag. The lag conditions were required
because radiation-induced extinction is generally not possible in 1-g but is highly likely in lag.
In l-g, the flame-generated particulates (e.g. soot) and gaseous combustion products that are
responsible for flame radiation, are swept away from the high temperature reaction zone by the
buoyancy-induced flow and a steady state is developed. In pg, however, the absence of
buoyancy-induced flow which transports the fuel and the oxidizer to the combustion zone and
removes the hot combustion products from it enhances the flame radiation due to: (i) transient
build-up of the combustion products in the flame zone which increases the gas radiation, and (ii)
longer residence time makes conditions appropriate for substantial amounts of soot to form which
is usually responsible for most of the radiative heat loss. Numerical calculations conducted
during the course of this work show that even non-radiative flames continue to become "weaker"
(diminished burning rate per unit flame area) due to reduced rates of convective & diffusive
transport. Thus, it was anticipated that radiative heat loss may eventually extinguish the already
"weak" lag diffusion flame. While this hypothesis appears convincing and our numerical
calculations support it, experiments for a long enough lag time could not be conducted during the
course of this research to provide an experimental proof. Space shuttle experiments on candle
flames [Dietrich, Ross and T'ien, 1995] show that in an infinite ambient atmosphere, the
hemispherical candle flame in lag will burn indefinitely. It was hoped that radiative extinction
can be experimentally shown by the aerodynamically stabilized gaseous diffusion flames where
the fuel supply rate was externally controlled. While substantial progress toward this goal was
made during this project, identifying the experimental conditions for which radiative extinction
occurs, for various fuels, requires further study.
To investigate radiation-induced extinction, spherical geometry was used for the lag
experiments for the following reasons: (i) It reduces the complexity by making the problem one-dimensional. Thus, it is convenient for both experimental measurements and theoretical
modeling. (ii) The spherical diffusion flame completely encloses the soot which is formed on the
fuel rich side of the reaction zone. This increases the importance of flame radiation because now
both soot and gaseous combustion products co-exist inside the high temperature spherical
diffusion flame. It also increases the possibility of radiative extinction due to soot crossing the
high temperature reaction zone. (iii) For small fuel injection velocities, as is usually the case for
a pyrolyzing solid, the diffusion controlled flame in lag around the pyrolyzing solid naturally
develops spherical symmetry. Thus, spherical diffusion flames are of interest to fires in lag and
identifying conditions (ambient atmosphere, fuel flow rate, fuel type, fuel additives, etc.) whereradiation-induced extinction occurs was considered important for spacecraft fire safety.
During the course of this research, it was also found that the absence of buoyant flows
in lag and the resulting long reactant residence times significantly change the thermochemicalenvironment and hence the flame chemistry. Thus, for realistic theoretical models, knowledge
of the formation and oxidation rates of soot and other combustion products in the thermochemical
environment existing under lag conditions was essential. This requires detailed optical and gas
chromatographic measurements that are not easily possible under lag conditions. Thus,
supplementary 1-g experiments with detailed chemical measurements were conducted. The

sphericalburner,however,wasnotsuitablefor thesedetailed1-g experiments due to the complex
buoyancy-induced flow field generated around it. Thus, a one-dimensional counterflow diffusionflame was used. At low strain rates, with the diffusion flame on the fuel side of the stagnation
plane, conditions similar to the pg case are created -- soot is again forced through the high
temperature reaction zone. Furthermore, high concentration of combustion products in the
sooting zone can be easily obtained by adding appropriate amounts of CO2 and H20 to the fuel
and/or the oxidizer streams. These 1-g experiments were used to support the development of
detailed chemistry transient models that include soot formation and oxidation for both pg and 1-g
C ases.
To understand the radiative-extinction process and to explain the experimental results,
transient numerical models for both _g and 1-g cases were developed. These models include
simplified one-step chemistry and gas radiation. Soot formation and oxidation and soot radiation
was included only for the transient 1-g case along with the simplified one-step chemistry. Within
the assumptions, both the pg and 1-g models predicted radiative extinction of diffusion flames
due to gas radiation. While this was very encouraging, detailed chemistry and transport
properties need to be included in these models. This was done only for the 1-g steady-statecounterflow diffusion flame both with & without enhanced H20 concentrations. The 1-g
experiments were particularly important for validating these models because for cases whereflame extinction" does not occur, a steady state is predicted. This steady-state condition was
directly compared with the detailed experimental measurements.
The research conducted during the course of this project was published in the following
articles:
1. Atreya, A., Wichman, I., Guenther, M., Ray, A. and Agrawal, S. "An Experimental and
Theoretical Study of Radiative Extinction of Diffusion Flames," Second International
Microgravity Combustion Workshop, Cleveland, OH, NASA Conference Publication I0113,
September, 1992.
2. Atreya, A. and Agrawal, S. "Effect of Radiative Heat Loss on Diffusion Flames in Quiescent
Microgravity Atmosphere," Annual Conference on Fire Research, NIST, October, 1993.
3. Atreya, A., and Agrawal, S., "Extinction of Moving Diffusion Flames in a Quiescent
Microgravity Environment due to CO_fi-/,_O/Soot Radiative Heat Losses," First ISHMT-ASME
Heat and Mass Transfer Conference, 1994.
4. Atreya, A, Agrawal, S., Sac "ksteder, K., and Baum, H., "Observations of Methane and Ethylene
Diffusion Names Stabilized around a Blowing Porous Sphere under Microgravity Conditions,"
AIAA paper # 94-0572, 1994.
5. Atreya, A., Agrawal, S., Shamim, T., Pickett, K., Sacksteder, K. R. and Baum, H. R. "Radiant
Extinction of Gaseous Diffusion Flames," 3rd International Microgravity Conference, April,
1995.
6. Pickett, K., Atreya, A., Agrawal, S., and Sacksteder, K., "Radiation from Unsteady Spherical
Diffusion Flames in Microgravity," AIAA paper # 95-0148, January 1995.
7. Atreya, A. andAgrawal, S., "Effect of Radiative Heat Loss on Diffusion Flames in Quiescent
Microgravity Atmosphere," Combustion & Flame, (accepted for publication), 1995.
8. Atreya, A., Agrawal, S., Sacksteder, K. R., and Baum, H. R. "Unsteady Gaseous Spherical
Diffusion Flames in Microgravity - Part A: Expansion Rate" being prepared for submission
2

to CombustionandFlame.9. Atreya, A., Agrawal, S., Pickett, K., Sacksteder, K. R., and Baum, t-1. R. "Unsteady Gaseous
Spherical Diffusion Flames in Microgravity - Part B: Radiation, Temperature and Extinction"
being prepared for submission to Combustion and Flame.
10 Shamim, T., and Atreya, A., "A Study of the Effects of Flame Radiation on Transient
Extinction of Strained Diffusion Flames," Joint Technical Meeting of Combustion Institute,
paper: 95S-I04 pp.553, 1995. Currently being prepared for submission to Combustion and
Flame.
11 Shamim, T., and Atreya, A., "Numerical Simulations of Radiative Extinction of Unsteady
Strained Diffusion Flames," Symposium on Fire and Combustion Systems, ASME IMECE,
November, 1995.
12 Atreya, A. and Zhang, C., "Experiments and Correlations of Soot Formation and Oxidation
in Methane Counterflow Diffusion Flames," submitted to International Symposium on
Combustion, Not accepted, currently being revised for submission to Combustion and Flame.
13 Zhang, C. and Atreya, A. "Measurements of Soot Volume Fraction Profiles in Counterflow
Diffusion Flames Using a Transient Thermocouple Response Technique," Submitted to The
International Symposium on Combustion, Not accepted, currently being revised for
submission to Combustion and Flame.
14 Atreya, A., Zhang, C., Kim, H. K., Sham#n, T. and Suh, J. "The Effect of Changes in theFlame Structure on Formation and Destruction of Soot and NOx in Radiating Diffusion
Flames," Accepted for publication in the Twenty-Sixth (International) Symposium on
Combustion, 1996.
15 Shamim, T. and Atreya, A. "Dynamic Response of Radiating Flamelets Subject to Variable
Reactant Concentrations," Proceedings of the Central Section of the Combustion Institute,
1996. The corresponding paper "Transient Response of a Radiating Flamelet to Changes in
Global Stoichiometric Conditions." is being prepared for submission to Combustion and
Flame.
t6 Crompton, T. and Atreya, A. "The Effect of Water on Radiative Laminar HydrocarbonDiffusion Flames - Part A: Experimental Results," being prepared for submission to
Combustion Science and Technology.
17 Suh, J. and Atreya, A. "The Effect of Water on Radiative Laminar Hydrocarbon Diffusion
Flames - Part B: Theoretical Results," being prepared for submission to Combustion Science
and Technology. Also published in the proceedings of the International Conference on Fire
Research and Engineering, Sept, 1995.
18 Suh, J. and Atreya, A., "The Effect of Water Vapor on Radiative Countefflow Diffusion
Flames," Symposium on Fire and Combustion Systems, ASME IMECE, Nov. 1995.
19 Zhang, C, Atreya, A., Kim, H. K., Suh, J. and Shamim, T, "The Effect of Flame Structure on
Soot Inception, Growth and Oxidation in Counterflow Diffusion Flames," Proceedings of the
Central Section of the Combustion Institute, 1996.
20 Zhang, C, Atreya, A., Shamim, T, Kim, H. K. and Suh, J., "Measurements of OH, CH, C,_ andPAH in Laminar Counterflow Diffusion Flames," Proceedings of the Central Section of the
Combustion Institute, 1996.
NOTE: Most of the above papers are presented in the Appendices of this report.

RESEARCH RESULTS
1. INTRODUCTION AND OBJECTIVES
The absence of buoyancy-induced flows in pg and the resulting increase in the reactant
residence time significantly alters the fundamentals of many combustion processes. Substantial
differences between 1-g and pg flames have been reported in experiments on candle flames [1,
2], flame spread over solids [3, 4], droplet combustion [5, 6] and others. These differences are
more basic than just in the visible flame shape. Longer residence times and higher concentration
of combustion products in the flame zone create a thermochemical environment which changes
the flame chemistry and the heat and mass transfer processes. Processes such as flame radiation
(and its interaction with the flame chemistry), that are often ignored under normal gravity,
become very important and sometimes even controlling. This is particularly true for conditions
at extinction of a pg diffusion flame. As an example, consider the droplet buming problem. The
visible flame shape is spherical under pg versus a teardrop shape under 1-g. Since most models
of droplet combustion utilize spherical symmetry, excellent agreement with the experiments is
anticipated. However,/.tg experiments show that a soot shell is formed between the flame and
the evaporating droplet of a sooty fuel [5, 6]. This soot shell alters the heat and mass transfer
between the drop)et and its flame resulting in significant changes in the burning rate and the
propensity for flame extinction.
Under l-g, the buoyancy-generated flow, which may be characterized by the strain rate,
assists the diffusion process to transport the fuel and the oxidizer to the combustion zone and
remove the hot combustion products from it. These are essential functions for the survival of
the flame which needs fuel and oxidizer. Numerical calculations [7] show that even flames with
no heat loss become "weak" (diminished burning rate per unit flame area) in the absence of flow
or zero strain rate. Thus, as the strain rate (or the flow rate) is increased, the diffusion flame
which is "weak" at low strain rates is initially "strengthened" and eventually it may be "blown-
out." The computed flammability boundaries show that such a reversal in material flammability
occurs at strain rates around 5 sec I [8]. Also, model calculations of zero strain rate transient
diffusion flames show that even gas radiation is sufficient to extinguish the flame [7]. Yet, the
literature substantially lacks a systematic study of low strain rate, radiation-induced, extinction
of diffusion flames. Experimentally, this can only be accomplished under microgravity
conditions.
The lack of buoyant flow in/.tg also enhances the flame radiation due to: (i) build-up of
combustion products in the flame zone which increases the gas radiation, and (ii) longer residence
times make conditions appropriate for substantial amounts of soot to form which is usually
responsible for most of the radiative heat loss. Thus, it is anticipated that radiative heat loss may
eventually extinguish the already "weak" pg diffusion flame. While this is a convincing
hypothesis, space shuttle experiments on candle flames show that in an infinite ambient
atmosphere, the hemispherical candle flame in pg will bum indefinitely [1]. It was our goal to
experimentally and theoretically find conditions under which radiative extinction occurs for
aerodynamically stabilized gaseous diffusion flames. Identifying these conditions (ambient
atmosphere, fuel flow rate, fuel type, fuel additives, etc.) is important for spacecraft fire safety.
Thus, the objective of this research was to experimentally and theoretically investigate the
4

radiation-induced extinction of gaseous diffusion flames in pg and determine the effect of flame
radiation on the "weak" I.tg diffusion flame_ Scientifically, this requires understanding the
interaction of flame radiation with flame chemistry.
To exPerimentally investigate radiation-induced extinction, spherical geometry was used for
/_g for the following reasons: (i) It reduces the complexity by making the problem one-dimensional. Thus, it is convenient for both experimental measurements and theoretical
modeling. (ii) The spherical diffusion flame completely encloses the soot which is formed on the
fuel rich side of the reaction zone. This increases the importance of flame radiation because now
both soot and gaseous combustion products co-exist inside the high temperature spherical
diffusion flame. It also increases the possibility of radiative extinction due to soot crossing the
high temperature reaction zone. (iii) For small fuel injection velocities, as is usually the case for
a pyrolyzing solid, the diffusion controlled flame in pg around the pyrolyzing solid naturally
develops spherical symmetry. Thus, spherical diffusion flames are of interest to fires in pg.
To theoretically investigate the radiation-induced extinction limits, knowledge of the rates of
production and destruction of soot and other combustion products in the thermochemicalenvironment existing under/.tg conditions is essential. This requires detailed optical and gas
chromatographic measurements that are not easily possible under pg conditions. Thus,
supplementary 12g experiments with detailed chemical measurements were conducted. The
spherical burner, however, is not suitable for these detailed 1-g experiments due to the complex
buoyancy-induced flow field generated around it. Thus, a one-dimensional counterflow diffusionflame was used. At low strain rates, with the diffusion flame on the fuel side of the stagnation
plane, conditions similar to the pg case are created -- soot is again forced through the high
temperature reaction zone. Furthermore, high concentration of combustion products in the
sooting zone was easily obtained by adding appropriate amounts of CO, and H,O to the fuel
and/or the oxidizer streams. These l-g experiments supported the development of detailed
chemistry transient models for both pg and 1-g cases. Interestingly, understanding the effect of
increased concentration of combustion products on sooting diffusion flames is also important for
several 1-g applications. For example, many furnaces and engines use exhaust gas recirculation
for pollutant control. Similarly, oxidizing soot by forcing it through the reaction zone is anexcellent method of controlling soot emissions, if the flame is not extinguished. The effect of
increased water vapor concentration on sooty diffusion flames is also important for water mist
fire suppression technology. Thus, the fundamental knowledge generated during this research
has wide spread 1-g applications in addition to helping develop a fire safe pg environment.
2. PREVIOUS RESEARCH
An extensive review on pg combustion has recently been published by Law and Faeth [9].
Thus, only relevant aspects are summarized here. In the literature, propagation and extinction
of premixed flames (both under pg and 1-g conditions) has received much more attention thandiffusion flames. Some excellent work on premixed flames may be found in references [9-14].
Relatively fewer studies on mechanisms of diffusion flame extinction are available [8, 15-20].
Of these, even fewer have included flame radiation as the extinction mechanism [19, 20]. This
is not surprising, because under 1-g conditions flame radiation does not extinguish diffusion
flames. Even in very sooty diffusion flames, the excess particulates are simply ejected from the
5

flame tip (where it is locally extinguished)and convectedaway by the buoyant flow field.Typically, in l-g, extinction is caused by high strain rates generated by buoyant or forced flows
and has been a subject of numerous studies (see for e.g., [21]). However, in jag, strain rates are
very low and excess flame-generated particles and products of combustion become efficient
radiators of chemical energy and may cause radiative-extinction. To the best of author's
-knowledge, to-date there is no systematic study of the radiative-extinction hypothesis.; although
numerical models supporting it have recently been presented [7, 22-25]. Much related work in
this area is currently underway by Drs. T. Kashiwagi, H. Baum, J. T'ein, H. Ross, K. Sacksteder,
F. Willams, C. Law, G. M. Faeth, C. Avedisian, S. Bhattacharjee and R. Altenkirch. Their work
is described in Refs. [9, 26-28] and the references cited therein. In summary: Combustion
research prior to this work had focused primarily on problems that may be characterized by
moderate to high strain rates. Combustion products do not accumulate near the reaction zone
at these strain rates and soot is not produced in significant quantities. Thus, flame radiation was
justifiably ignored and few studies that investigate the effect of flame rach'ation on extinction areavailable in the literature. Furthermore, low strain rates available under pg conditions, open
a much less investigated fundamental branch of combustion science, i.e., - understanding the
interaction of flame radiation with flame chemistry in addition to the limit phenomenon of
radiation-induced flame extinction.
Counterflow diffusion flames (used in the 1-g supporting experiments) have been extensively
used in the past to study the extinction phenomena due to high strain rates and inert gas dilution
(Tsuji, Sheshadri, Law and others, see for e.g. [29-31]). However, despite their obvious 1-D
advantages, they have rarely been used to study particulate formation in flames and have never
been used to investigate radiative extinction at low strain rates. The primary reason for this is
that particulate formation is associated with long residence times - or low strain rates - and such
flames are very difficult to stabilize under 1-g conditions. The buoyant high-temperature gases
in the combustion zone alter the flow field until the ideal counterflow ceases to exist. To
overcome the buoyancy effect, flow rates of fuel and oxidizer are increased, which in turn
reduces the residence times and the particulate formation rate. Thus, despite the obvious
advantage of 1-D species and temperature fields, many investigators have been forced to use
more complicated co-flow or Parker-Wolfhard burners to study soot formation rates. We
designed a special low-strain-rate, high-temperature and controlled composition, 1-D counterflow
diffusion flame burner to enable reproducing the thermochemical environment present under t_g
conditions and to measure the thermal, chemical and sooting structure of radiating diffusion
fla rueS.
3. EXPERIMENTAL APPARATUS
Micro_ravity ExperimentsThe gg experiments were conducted in the 2.2 sec drop tower at the NASA Lewis
Research Center. The experimental drop-rig used is shown in Figure i. It consists of a test
chamber, burner, igniter, gas cylinders, solenoid and metering valves, thermocouples with signal
processors, photodiodes with electronics, video camera, computer and batteries to power the
computer and the solenoid valves. The spherical burner (1.9 cm in diameter) was constructed
from a porous ceramic material. Two gas cylinders (150 cc & 500 cc) charged with various
gases between 15 to 45 psig were used to supply the fuel to the porous spherical burner. Typical
6

r I I I t I _ I f I t l t t i I i I i
..j-_Aluminul_ i'rame
'Flaermocouplcs
III
P() fl)ll,'q
Phutocells Ceramicwith circuit 13ut-ner
I lot-wirc
Igniter
Rotafy
Solctmid
'l'ypc S
/i
-'l'ypc K
|!
CIIIIICI'[!
Metering Valves
CxHy Gas
Gas Lines
Signal Conditioning
Battery Battery
Schematic o1:2.2 Second Drop Tower Apparatus

gas flow rates used were in the range of 3-25 cm3/s. Flow rates to the burner were controlled
by a needle valve and a gas solenoid valve was used to open and close the gas line to the burner
upon computer command. An igniter was used to establish a diffusion flame. After ignition the
igniter was quickly retracted from the burner and secured in a catching mechanism by a
computer-controlled rotary solenoid. This was necessary for two reasons (i) The igniter provides
a heat sink and will quench the flame (i.i) Upon impact with the ground (after 2.2 sec) the
vibrating igniter may damage the porous burner.
As shown in the figure, the test chamber has a 5" diameter Lexan window which enables
the camera to photograph the spherical diffusion flame. The flame growth was recorded either
by a 16mm color movie camera or by a color CCD camera which was connected to a video
recorder by a fiber-optic cable during the drop. Since the flow may change with time, it was
calibrated for various settings of the needle valve for all gases. A soap bubble flow meter was
used for this purpose. An in-line pressure transducer was used to obtain the transient flow rates.
Changes in the cylinder pressure during the experiment along with the pressure-flow rate
calibration, provides the transient volumetric flow rates. However, the flow rates during the
experiments were found to be nearly constant.
Ground-Based Counterflow Diffusion Flame Experimen_
The 1-g grouiad-based supporting experiments were performed in the counterflow diffusion
flame apparatus schematically shown in Figure 2 (for further details see Ref.[32-34]). In this
apparatus, an axis-symmetric diffusion flame was stabilized between the two preheated fuel and
oxidizer streams in a specially-constructed ceramic burner. Two streams of gases which can be
electrically preheated impinge against each other to form a stable stagnation plane, which lies
approximately at the center of the burner gap. Upon ignition, a flat axis-symmetric diffusion
flame roughly 8cm in diameter was established above the stagnation plane. All measurements
are taken along the axial streamline. Co-flowing nitrogen was introduced along the outer edge
of the burner to eliminate oxidizer entrainment and to extinguish the flame in the outer jacket.
Methane, ethylene, oxygen, nitrogen, helium and carbon dioxide used during the experiments are
obtained from chemical purity gas cylinders and their flow rates are measured using calibrated
critical flow orifices. Water vapor was generated by passing a stream of inert gas (helium or
nitrogen) through a distilled water saturater maintained at a specified temperature. To determinethe detailed diffusion flame structure, very low strain rates (= 6-8 sec _) were employed in order
to increase the reactant residence time as much as possible and thus obtain a thick reaction zone
convenient for measurements. The inert gases in the fuel and/or oxidizer streams were also
substituted by various amounts of CO_, and H20 to simulate increased concentration of
combustion products in the reaction zone. Experimental measurements consisted of: (i)
temperature prof'fle, (ii) profiles of stable gases, light hydrocarbons (up to benzene) and PAH,
(iii) profiles of laser light scattering, extinction, and fluorescence across the flame, (iv) Laser
induced fluorescence for OH profile measurements, and (v) spatially resolved spectral radiative
emission profiles.
As shown in the figure, is a beam of argon-ion laser operating at 350/514/1090nm. This
beam was modulated by a mechanical chopper and then directed by a collimating lens to the
center of the burner. This beam was used for classical light scattering and extinction
measurements. A photomultiplier tube and a photodiode were used to detect the scattered and
8
0
0

transmitted signals respectively. These signals are processed by a lock-in amplifier interfaced
with a microcomputer. The extinction coefficient was experimentally corrected for gas absorption
by subtracting the extinction coefficient of a reference flame. This reference flame is carefully
chosen by slightly reducing the fuel and the oxidizer concentrations such that soot scattering isreduced to less than 0.5% of the original flame. Emission from soot particles was not observed
from this blue-yellow "scattering limit" flame. Laser-induced broadband fluorescence (LIF)
measurement were made by operating the laser at 350/488nm and detecting the fluorescence
intensity at 514_+10nm. This signal was taken proportional to the PAIl concentration. In the
subsequent data reduction, the soot aerosol was assumed monodispersed with a complexrefractive index of 1.57-0.56i. OH measurements were made by using a pulsed UV laser to
excite the molecules and detecting the fluorescence by an ICCD spectrograph. This spectrograph
was also used to make spatially'resolved measurements of radiative emission.
Temperatures were measured by 0.076mm diameter Pt/Pt-10%Rh thermocouples. The
thermocouples were coated with SiO, to prevent possible catalytic reactions on the platinum
surface. They were traversed across the flame in the direction of decreasing temperature at a rate
fast enough to avoid soot deposition and slow enough to obtain negligible transient corrections.
For radiation corrections, separate experiments were performed to determine the emissivity of the
SiO,_ coating as a function of temperature. The maximum radiation correction was found to be
150K. The terrlperature measurements were repeatable to within _+25K. Chemical species
concentrations in the flame were obtained by an uncooled quartz microprobe and a gas
chromatograph. A 70 _rn sampling probe was used for most of the analysis except for the
heavily sooting flame where a larger (90 pm) probe was used. This probe was positioned radially
along the streamlines to minimize the flow disturbance. Concentrations of stable gases (Hz, CO2,
O,, N,., CH4, CO and H,O), light hydrocarbons (up to C6) and PAH were measured. This datawas reduced via. a model to obtain the production and destruction rates of various species.
4. RESEARCH RESULTS
As discussed above, radiation-induced extinction was investigated in _g using spherical
diffusion flames and the supporting l-g experiments were conducted using counterflow diffusion
flames. The purpose of the supporting l-g experiments was to quantity the detailed thermal,
chemical and sooting structure of low strain rate radiative diffusion flames in the thermochemical
environment encountered under/.tg conditions. The data from l-g experiments was needed for
the development of detailed chemistry transient models for both /ag and l-g cases. In this
section, first a theoretical formulation for transient radiative diffusion flames is discussed to show
the relationship between l-g and/ag parts of the study. Next, progress on the/_g experiments is
described followed by the progress on the 1-g experiments. Several papers have been published
during the course of this research. These are presented in the Appendices.
4.1 Transient Radiative Diffusion Flames
Since we are interested in radiative-extinction and the processes that induce it, the theoretical
formulation must be transient. Also, eventually detailed chemistry and transport properties must
be included to better understand the interaction between radiation and chemistry that leads to the
limit phenomenon of radiative extinction. To this end, we are linking the Sandia Chemkin code
10
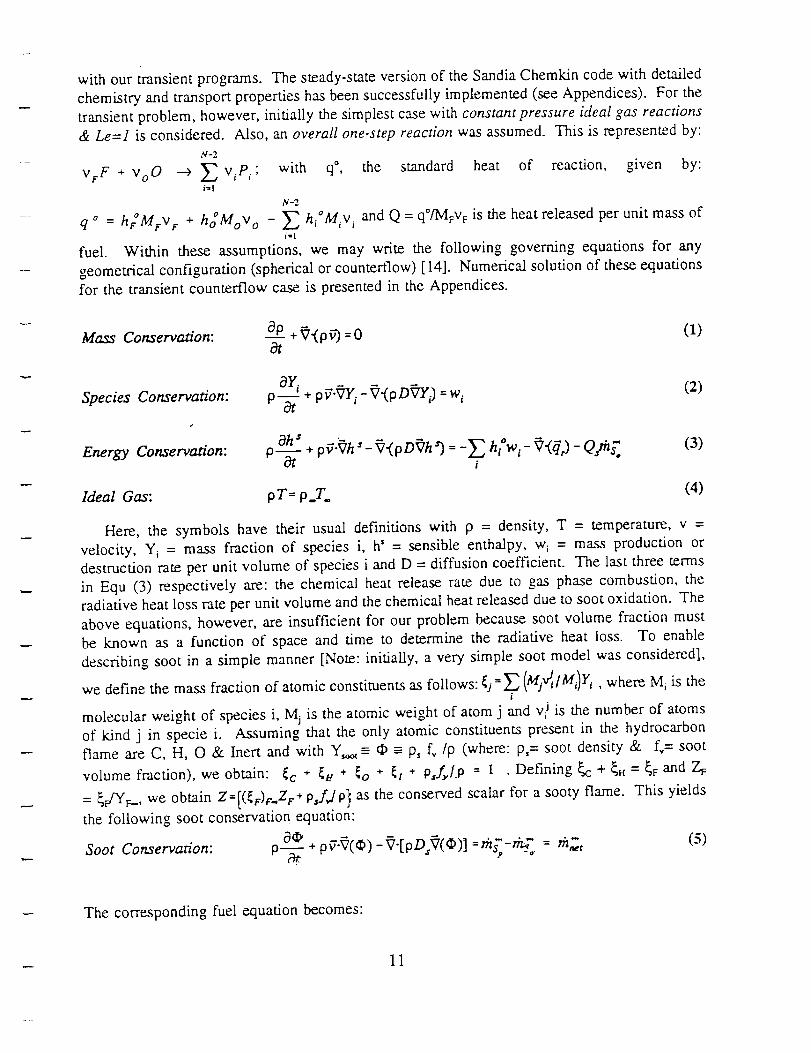
with our transient programs. The steady-state version of the Sandia Chemkin code with detailed
chemistry and transport properties has been successfully implemented (see Appendices). For the
transient problem, however, initially the simplest case with constant pressure ideal gas reactions
& Le=l is considered. Also, an overall one-step reaction was assumed. This is represented by:
N-2
VF F + Vo 0 ..._) _ v_pi; with q°, the standard heat of reaction, given by:isl
N-2
q o = hTMrvr + hoMoVo _ _, hi°M_vi and Q = q°/MFvF is the heat released per unit mass of
fuel. Within these assumptions, we may write the following governing equations for any
geometrical configuration (spherical or counter'flow) [ 14]. Numerical solution of these equations
for the transient counterflow case is presented in the Appendices.
Mass Conservation:
Species Conservation:oY,
+ _(2)
Energy Conservation:Oh s
. rZ<pD h'): h,°w,-i
Ideal Gas: p T= p T.
(3)
(4)
Here, the symbols have their usual definitions with p = density, T = temperature, v =
velocity, Y_ = mass fraction of species i, h' = sensible enthalpy, w_ = mass production or
destruction rate per unit volume of species i and D = diffusion coefficient. The last three terms
in Equ (3) respectively are: the chemical heat release rate due to gas phase combustion, the
radiative heat loss rate per unit volume and the chemical heat released due to soot oxidation. The
above equations, however, are insufficient for our problem because soot volume fraction must
be "known as a function of space and time to determine the radiative heat loss. To enable
describing soot in a simple manner [Note: initially, a very simple soot model was considered],
we define the mass fraction of atomic constituents as follows: ¢/=_ (Mj_/M_)Yt, where M i is thei
molecular weight of species i, Mj is the atomic weight of atom j and v_ is the number of atoms
of kind j in specie i. Assuming that the only atomic constituents present in the hydrocarbon
flame are C, H, 0 & Inert and with Y,_- • =--p, fv/P (where: ps= soot density & t;= soot
volume fraction), we obtain: (c + _ + (o + _t * PJfl-P = 1 . Defining _ + _ = %F and Z F
= _t_t'F_, we obtain Z=[(_v)r.Zp+ p,f,/P} as the conserved scalar for a sooty flame. This yields
the following soot conservation equation:
Soot Conservation: p-_-- + 9_'V(_) -V-[pD_V(_)] :rh_-r/__'_ = rh_t (5)
The corresponding fuel equation becomes:
11

Fuel Conservation: (6)
The oxygen conservation equation for Zo defined as 7,0 = _Yo- is obtained as:
Oxygen Conservation:OZ o
p _ + p _'V(Z o) - V-[p D (7(Zo) ] = 0 (7)
Under conditions of small soot loading, the soot terms in the energy and the fuel conservation
equations (3) & (6), may be ignored. Thus, Equ.(6) may be considered homogeneous to a good
approximation and becomes similar to Equ. (7). Thus, _ calculated from the soot equation can
be used to determine the radiative heat loss term in the energy equation.
The above formulation requires a description of soot formation (the) and oxidation (th_o)
terms. To experimentally determine these terms, measurements of soot volume fraction, soot
number density, temperature, velocity and species profiles were needed. These measurements
were not possible under/ag conditions. Thus, a supporting 1-g experiment that can determine
these terms in an enhanced combustion products environment (simulated _g) was used. The most
convenient 1-g experimental configuration is one that simplifies the above PDE's to ODE's. One
such flame configuration is the counterflow diffusion flame which was used to determinerh_
andthj" o. [The counterflow diffusion flame apparatus used for these experiments had the
following additional advantages: (i) Its special construction enabled obtaining strain rates as low
as 6 sec _. This increases the reactant residence time and yields a thick reaction zone convenient
for determining the detailed thermal, chemical and sooting structure of the diffusion flame. (ii)
The reactants were preheated and the desired mixture with combustion products was created to
match the pg thermochemical environment. (iii) The optical and gas chromatographic equipment
was used to make spatially resolved profile measurements of: temperature; stable gases; light
hydrocarbons (up to benzene); PAIl; laser light scattering and extinction for soot; laser induced
fluorescence for OH & PAH; and spectral radiative emission. These flame structure
measurements are presented in the Appendices and were used for developing detailed chemistry
models for 1-g and I.tg cases. (iv) Some flames were also established on the fuel side of the
stagnation plane. This enables soot to oxidize as it approaches the reaction zone and makes the
flames very radiative.]
4.2 Progress on lag Experiments
(A spherical diffusion flame supported by a low heat capacity porous gas burner)
Significant progress has been made on both experimental and theoretical parts of the pg
research despite the fact that radiative extinction could not be experimentally proven due to short
pg times. The accomplishments are briefly summarized below and the papers are presented in
the Appendices:
12

1. Atreya, A, Agrawal, S., Sacksteder, K., and Baum, [-1., "Observations of Methane and Ethylene
Diffusion Flames Stabilized around a Blowing Porous Sphere under Microgravity Conditions,"
AIAA paper # 94-0572, 1994. APPENDIX B
2. Pickett, K., Atreya, A., Agrawal, S., and Sacksteder, K., "Radiation from Unsteady Spherical
Diffusion Flames in Microgravity," AIAA paper # 95-0148, January 1995. APPENDIX C
3. Atreya, A., Agrawal, S., Shamim, T., Pickett, K., Sacksteder, K. R. and Baum, H. R. "Radiant
Extinction of Gaseous Diffusion Flames," 3rd International Microgravity Conference, April,1995. APPENDIX D
4. Atreya, A., Agrawal, S., Sac'ksteder, K. R., and Baurn, H. R. "Unsteady Gaseous Spherical
Diffusion Flames in Microgravity - Part A: Expansion Rate" being prepared for submissionto Combustion and Flame.
5. Atreya, A., Agrawal, S., Pickett, K., Sacksteder, K. R., and Baum, H. R. "Unsteady Gaseous
Spherical Diffusion Flames in Microgravity - Part B: Radiation, Temperature and Extinction"
being prepared for submission to Combustion and Flame.
The above experimental and theoretical work is briefly described below:
ktg Experimental Work: The lag experiments were conducted in the 2.2 sec drop tower at the
NASA Lewis Research Center. A low heat capacity porous spherical burner was used to produce
an aerodynamically stabilized gaseous spherical diffusion flame [It is important to note that such
flames are very difficult to obtain even in lag and considerable time and effort was devoted
toward obtaining these flames]. Several lag experiments under ambient pressure and oxygen
concentration conditions, were performed with methane (less sooty), ethylene (sooty), and
acetylene (very sooty) for flow rates ranging from 4 to 28 cm3/s. Two ignition methods were
used for these experiments: (i) The burner was ignited in 1-g with the desired fuel flow rate and
the package was dropped within one second after ignition. This method is suitable only for very
low flow rates. (ii) The burner was ignited in 1-g with the lowest possible flow rate (-2.5 cm3/s)
to make a very small flame and create the smallest possible disturbance. The flow was then
switched to the desired flow rate in lag just after the commencement of the drop. However, in
all the experiments with different fuels and flow rates, radiative extinction was not observed. It
appears that longer lag time may be required. The following measurements were made during
the lag experiments:
1. The flame radius was measured from photographs taken by a color CCD camera. Image
processing was used to determine both the flame radius and the relative image intensity.
A typical sequence of photographs is shown in Appendices B & C.
2. The flame radiation was measured by three photodiodes with different spectral
absorptivities. The first photodiode essentially measures the blue & green radiation, the
second photodiode captures the yellow, red & near infra-red radiation, and the third
photodiode is for infra-red radiation from 0.8 to 1.8 grn. Results of these measurements
are presented in Appendices C & D.
3. Theflame temperature was measured by two S-type thermocouples and the sphere surface
temperature was measured by a K-type thermocouple. In both cases 0.003" diameter wire
was used. The measured temperatures were later corrected for time response and
radiation. The temperature results are also presented in Appendices C & D.
13
It wasinterestingto note thatfor all fuels (methane,ethyleneandacetylene),initially theflame is blue (non-sooty) but becomesbright yellow (sooty) under_g conditions (see theprogressiveflame growth for methanein AppendixB). Later,as the ktg time progresses, the
flame grows in size and becomes orange and less luminous and the soot luminosity seems to
disappear. A possible explanation for this observed behavior is suggested by the theoreticalcalculations of Refs. [7, 24 & Appendix El. As can be seen from Fig. 6 of Appendix E, the soot
volume fraction first quickly increases and later decreases as the local concentration of
combustion products increases. Essentially, further soot formation is inhibited by the increasein the local concentration of the combustion products and soot oxidation is enhanced [Refs. 32-
35]. Also, the high temperature reaction zone moves away from the existing soot leaving behind
a relatively cold (non-luminous) soot shell (soot-shell was visible for ethylene flames). Thus, at
the onset of lag conditions, initially a lot of soot is formed in the vicinity of the flame front
resulting in bright yellow emission. As the flame grows, several events reduce the flame
luminosity: (i) The high concentration of combustion products left behind by the flame front
inhibits the formation of new soot and promotes soot oxidation. (ii) The primary reaction zone,
seeking oxygen, moves away from the soot region and the soot is pushed toward cooler regions
by thermophoresis. Both these effects increase the distance between the soot layer and thereaction zone. (iii) The dilution and radiative heat losses caused by the increase in the
concentration of the combustion products reduces the flame temperature which in tum reduces
the soot formatitn rate and the flame luminosity.
It was further observed that, for the same fuel flow rate, methane flames eventually
become blue (non-sooty) in approximately one second, ethylene flames became blue toward the
end of the pg time (i.e. -2 sec) while acetylene flames remained luminous yellow throughout the
2.2 sec pg time (although the intensity was significantly reduced as seen by the photodiode
measurements in Figure 2). This is because of the higher sooting tendency of acetylene which
enables soot formation to persist for a longer time. Thus, acetylene soot remains closer to the
high temperature reaction zone for a longer time making the average soot temperature higher andthe distance between the soot and the reaction layers smaller. Eventually, as is evident from
Figure 2, even the acetylene flames will become blue in pg. From Figure 2 we note that the
peak infrared, visible and UV radiation intensities occur at about 0.1 sec which almost
corresponds to the location of the f'trst thermocouple whose output is plotted in Figures 3 & 4
as Tgas(1). From the temperature measurements presented in Figures 3 & 4, we note that: (i)
The flame radiation significantly reduces the flame temperature (compare the peaks of the second
thermocouple [Tgas(2)] with those of the first [Tgas(1)] for both ethylene and acetylene) by
approximately 300K for ethylene and 5OOK for acetylene. (In fact, the acetylene flame seems to
be close to extinction at this instant.) (i_i) The temperature of the acetylene flame is about 200K
lower than the ethylene flame at the first thermocouple location. (iii) The final gas temperature
is also about 100K lower for the acetylene flame, which is consistent with larger radiative heat
loss. Thus, it seems that a higher fuel flow rate and/or a sootier fuel and/or an enhanced CO2
& H,_O atmosphere will radiatively extinguish the flame.
The data from the photodiodes was further reduced to obtain the total soot mass and the
average temperature of the soot layer. This is plotted in Figures 5 & 6. These figures show that
the average acetylene soot shell temperature is higher than the average ethylene soot shell
temperature. The total soot mass produced by acetylene peaks at 0.2 seconds which corresponds
14

Flame Radius for Methane
iI i
Iacident Radiatioa Me._ure.d by PbotodiodesAce..tytcaeExperimeat #'76
2OO•_._.= F.,_,_.,_ _--__7_ / Y _ i
g150 ............ =. -_[ ....... g
s 1oo // _
2 2 .... 1
.... 1 .............. 00 0..5 I I_5
TIME (se.c)
Figure 1
2OOO
_d
E-'' 1500 -Ou
P.
"_ lOOO
io50(1 ....
o
0.g
=_
._0.6
0
OA
F-
O!
02 0.01 0.02 0.1 0.2 I
Time (see)
Figure 2
K
Tern: _eram_s for Ethyteae [expt-# 93, 95, 96]
_%,-a_,, #'_ ,_,,,- ,_,.: t !-. Tpa(1
-- --4-.c--- -- -- -J .... -._ --T_(4 )#MI,_-- I_0
i i i " ;
_ i...... - ..... "_:-
! : i
0_5 1 1.5 2
TIME (sec)
Fi_oure 3Soot Mass & T_rh_ramre for Ethylene:
I • i - 1500r : : : ._'_..... :.... _ t-_%--:,_.: : __: .... ,_....
, _. *, , ot •
/ : "'" '.." " ".'.oet ...... _-- -- --'_- g-,'_-,_l._ #'- "-_r -_ --.-_--_
, ._'/" .L,-'_ :." .'.. '....... : . _ ¢-';_---v_ --- -- .
•,. -_.,,g,_,,_- 300
_:. .... ',.... :- : - .,._..,.,_ , ,
0 _ , _ , -- s,,_.-_ 00 0.2 0.4 0.6 0._
TIME (sec)
Figure 5
Tcmpcmtm'_ for Ace.tyleac {aXle# 73, 75, 76]_/X)0
_d
fu
¢)
OO
o
=.1000
LD
0.g
_=
0.6
o0.4
=1
0
F.02.
- - 4_- - -- -/ .... _ _4)_--
r', t I ., :--I iX\ 1 i-'_m_
_-._ i .... "--'_'--'--T--"
i i -''",'--_ ..... :'-"
_-2
500 .... ; .... ; .... i . :
0 0.5 1 I..5 2
TIME (se_)
FLoure 4Soot Mass & Tcm1_raazr_ for Acetylene
I i i _ i
I i I I
"i._d I /I I I
_._.__,=,____-_ .... ._........
...... i _ I _1
i i i i
..... !...... _....... !....... +--'--.--I
._* ..., ,- . ..-.. - _......._'_;. .,_ _..: ..--.= _._;_,:'-_.'-_ ....
I I I I •
,-_....-'r_-. ....... _.....
0 0.7. 0.4 0.6 O.g
TIME (sec')
Figure 6
2OOO
1500
1000
5OO
1500
1200
900 =
!
"6o

to the peak of the first thermocouple [Tgas(1)], explaining the large drop in temperature. Also,
the acetylene soot shell is cooling more slowly than the ethylene soot shell which is consistent
with the above discussion regarding the photographic observations. Thus, for ethylene the
reaction layer is moving away faster from the soot layer than for acetylene. This is also
consistent with the fact that ethylene soot mass becomes nearly constant but the acetylene soot
mass reduces due to oxidation. Finally, the rate of increase in the total soot mass (i.e. the soot
production rate) should be related to the sooting tendency of a given fuel. This corresponds to
the slope of the soot mass curves in Figures 5 & 6. Clearly, the slope for acetylene is higher.
Figure 1 shows the measured and calculated flame radius for methane flames plotted
against/ag time. Two sets of data are shown: (i) low flow rate flames where the flame was
ignited in 1-g and the package was dropped, and (ii) high fuel flow rate flames that were ignited
in/_g. This data was obtained both by visually measuring the radius of the outer faint blue flame
region from the photographs, and by using video image processing and defining the radius by a
threshold intensity. The two methods of determining the flame radius were within the
experimental scatter. Since, methane is the least radiative flame, it is expected that a model with
only gas radiation (i.e. without soot radiation) may compare favorably. Model calculations are
also shown in Figure 1 (these will be discussed later). The flame radius measurements show a
substantial change in the growth rate from initially being roughly proportional to tm- to eventually
(after radiative heat loss) being proportional to t _/5.
9g Modeling Work: As a first step, it was of interest to see if the transient expansion of/.tg
spherical diffusion flames could be predicted without including soot and flame radiation and inthe limit of infinite reaction rates. This simple model was very informative and was presented
in Ref.[36] & NASA Technical Memorandum 106766. Thus, our more recent work with asecond order overall finite rate reaction and gas radiation is described here. The gas radiation
model and other reaction rate constants used were identical to those described in Appendix A &
E. Equations (1) through (4) for the I-D spherical case were numerically solved assuming Le
=1 and p2D = constant. Boundary conditions at R = _ were:2
at R=Ri: T=T; Yr=l; Yo=0; Ye=0; and Fuel injection rate = _r(t) =4=R_ (pv)_&
where l:q. was taken as 0.15 cm, and as R - =: T=T.; Yv=0; Yo=Yo..; Ye=Ye,. Also, initial
spatial distribution of temperature and species based on infinite reaction rate solution was
assumed.
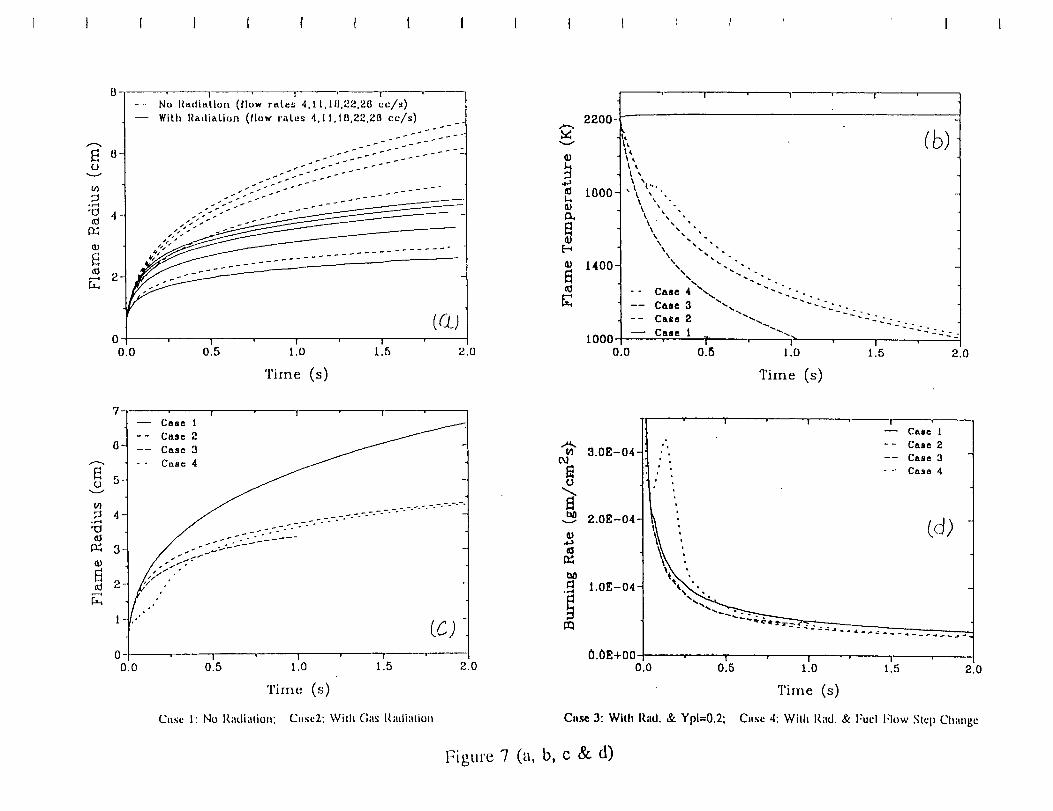
Model calculations for four cases are shown in Figures 7, 8 and 9. The four cases were:
(i) Case I - No flame radiation & fuel flow rate = 22 cm3/s of methane; (ii) Case 2 - same as
case 1 but with gas radiation; (iii) Case 3 - same as case 2 but with increased ambient product
concentration, Yp_= 0.2 instead of zero; (iv) Case 4 - same as case 2 but with a step change in
fuel flow rate from 2 cm3/s until flame radius of 1.3 cm and 22 cm3/s thereafter. Figure 7a
shows several calculated flame radii for different fuel flow rates t'or both with and without flame
radiation. Clearly, the flame radius increases with the fuel flow rate and decreases substantially
due to gas radiation. Essentially, as the gas inside the spherical flame looses heat via radiation,
its temperature fails and its density increases. Thus, the spherical flame collapses as is evident
from Figures 8 and 9 which are time sequences of gas density and velocity. Figure 9 actually
shows that there is a reversal in the gas velocities near the flame zone due to the collapsing
16
I I I I i I I I I I I I I I ' I I
¢..)v
4
o
°*'-4
tO
tO
0
0.0
I I ' I f--
-- No Radiation (flow rates 4.11,ifl,22.28cc/s)
-- With RadiaLion (/low raLes 4.11,113.22.28 co/s)
._--:::::j:--..::::/:7/:-:::::;:.....
..;:-22--'" _ ........
(cz)I ! I
0.5 1.0 1.5 2.0
Tirne (s)
7",
5
°
4-
3-
2-
1-
0-0.0
I I I
-- Case 1-- Case 2
-S---------------------
, _°*
I I w I
0.5 1.0 1.5
Time (s)
Case 1" No Radiation; Case2: With Gas I_,adiation
2.0
u
t0
2200-
1800-
L400-
I000
0.0
! I
l\
t •
• x •
_--- Case 4 "•'..,,.-- Case 3
cb)
-- Cue 2
Case 1
--.. "" J-JJjjzc_..
":,-,72,.7,. 7
0.5 1.0 1.5 2.0
Time (s)
¢q
o
3.0E-O4
2.0E-O4
Time (s)
Case 3: With Rad. & Ypl=0.2; C.se 4: With Rad. & Fuel Flow Stc 1) Change
F'igure 7 (a, b, c & d)

{ I I I I i I I I l I { I I i r } I i
oo
tm
.,--4_q
©A
1.2E- 03 -
1.0E-03.
B.0E-04-
8.0E-04
4.0E-04-
2.0E-04-
O.OE+00-0
, ) , ../.-I f, , ' r--
: // /:/: /:::/:I: I
: :/:/
\',', ,i , /
\?.-..,:/L=.25s
I I
2 4
Radial DisLance (crn)
-- Case 4
-- Case 3-- Case 2-- Case 1
(Q.)
10
oo
g}
o
1.2E-03
1.0E-03
8.0E-04
8.0E-04
4.0E-04
2.0E-04
0.0E+00
, _ ' I ' /_.-I .... .L.... !..../ -/"-" ..........
k I "/ "/'( / '/':, :.',' / :b)
• _{ ::":
L=ls -- Case 2
-- CA.e i1 !
Radial DisLance (cm)
oo
.iJ
l.fiE-03
1.0E-03-
8.0E-04 •
8.OE-O4
4.0E-04
2.0E-04
O.Og4-O0
' " I ' I / .':4_..__ _.L .____ ._'__ .I
/:: Ibt I' i In I' i I
I' a I'._ i, , I.?, : : ,' /
,_ %% /, I /
t=.5s - -
I ! |
0 2 4 8
Radial DisLance (cm)
(¢)
Case 4Case 3
Case 2
Case 1| *--
8
C.sc I: No Radi;ition; C.._e2: With Gas Radiation
i.2Z-03
I.OE-03
uo 0.0E-04
t_"--" 8.0E-04
4.0E-04.
2.0E-04
0.0E+O0
1o o lo
' '_' ' ' I ' I I '
-y, .;-...............,s
l ,/,L ,o
4, ,s
o#
:'--.--" (d>
L,=I.Ss -- Case 2
-- Case 11 ' " I ' I I
2 4 6 8
Radial DisLance (era)
Case 3: With Rad.& YpI=0.2; C_,se 4: With Rad.& I:ucl l:low Step Change
Figure 8 (a, b, c & d)

I I I I I I I I I I i I i : I I
5
0
p., 3
0
0
©> 1
-1
5m
o
p_ 3-.,-I
oocD
P" 1
-1
l=.2fis -- Ca_e I
-- Case 2
_ -- Ca_e 4
.."., (o_)Iii I II I i I
\1
%{ ,,' /#{', /#
,,,,'_,
I I I I
3 5 7 9
Radial Distance (cm)
o
..,.4
ooo
>-
7
3-
-1
I "" I '--1 I
L= ls -- Ca_e 1
-- Case 2
-- Cas_ 3
"" Case 4
, (b)
I ' I" I
i 3 5 7 0
Radial Distance (cm)
" I I I I 1l=.5s -- Cale-- Case 2
.
't, "; --:'"
"::_..L: i v
I 1 1 I
3 5 7 0
Radial Distance (era)
Case 1: No Radiation; Case2: With Radiation
7ff , I I I
L=1.5: -- C_se i
-- Case 2
"" Case 4
I/1
._ 3
00
i,I-.i
-1. , , ' ? , ,I I " ' I
3 5 7 0
Radial Dislance (era)
.C.as¢ 3: With Rad. & YpI=0.2; Case 4: With Rad. & l"ucl Flow Step Cll;lllge
Figure 9 (a, b, c & d)

spherical flame. However, the net flame radius still increases, albeit slowly. Figure 7b shows
that for Case 3 the flame temperature falls below 1000K within I second. Thus, radiative
extinction is possible for certain atmospheres. Also, as seen from Figure 7d, the burning rate perunit area decreases as the flame expands and radiation contributes to decrease it further.
4.3 Progress on 1-g Experiments
(An axis-symmetric low strain rate counterflow diffusion flame)
Significant progress has been made on both experimental and theoretical parts of the 1-gwhich may be briefly summarized as follows:
a) Theoretical modeling of zero strain rate transient diffusion flame with radiation (Ref. 7).
• Atreya, A., and Agrawal, S., "Extinction of Moving Diffusion Flames in a Quiescent
Microgravity Environment due to COrff'l,.O/Soot Radiative Heat Losses," First ISHMT-
ASME Heat and Mass Transfer Conference, 1994. (Appendix A)
• Atreya, A. and Agrawal, S., "Effect of Radiative Heat Loss on Diffusion Flames in
Quiescent Microgravity Atmosphere," Combustion & Flame, (accepted for publication),1995. (Appendix E)
b) Theoretical rffodeling of finite strain rate transient counterflow diffusion flame with radiation
(Refs. 24, 25).
° Shamim, T., and Atreya, A., "A Study of the Effects of Flame Radiation on Transient
Extinction of Strained Diffusion Flames," Joint Technical Meeting of Combustion
Institute, paper:. 95S-I04 pp.553, 1995. Currently being prepared for submission toCombustion and Flame. (Appendix F)
• Shamim, T., andAtreya, A., "Numerical Simulations of Radiative Extinction of Unsteady
Strained Diffusion Flames," Symposium on Fire and Combustion Systems, ASMEIMECE, November, 1995. (Appendix G)
• Sham&n, T. andAtreya, A. "Dynamic Response of Radiating Flamelets Subject to Variable
Reactant Concentrations," Proceedings of the Central Secdon of the Combustion Institute,
1996. The corresponding paper "Transient Response of a Radiating Flamelet to Changes
in Global Stoichiometric Conditions." is being prepared for submission to Combustion and
Flame. (Appendix L & O)
c) Experimental work on counterflow diffusion flames to determine the soot formation and
oxidation rates (Refs. 32, 33).
• Atreya, A. and Zhang, C., "Experiments and Correlations of Soot Formation and
Oxidation in Methane Counterflow Diffusion Flames," submitted to International
Symposium on Combustion, Not accepted, currently being revised for submission to
Combustion and Flame. (Appendix H)
• Zhang, C. and Atreya, A. "Measurements of Soot Volume Fraction Profiles in
Counterflow Diffusion Flames Using a Transient Thermocouple Response Technique,"
Submitted to The International Symposium on Combustion, Not accepted, currently being
revised for submission to Combustion and Flame. (Appendix I)
° Atreya, A., Zhang, C., Kim, H. K., Shamim, T. and Suh, J. "The Effect of Changes in the
Flame Structure on Formation and Destruction of Soot and NOx in Radiating Diffusion
2O

Flames," Accepted for publication in the Twenty-Sixth (International) Symposium on
Combustion, 1996. (Appendix J)
Zhang, C, Atreya, A., Kim, H. K., Suh, J. and Shamim, T, "The Effect of Flame Structure
on Soot Inception, Growth and Oxidation in Counterflow Diffusion Flames," Proceedings
of the Central Section of the Combustion Institute, 1996. (Appendix M)
Zhang, C, Atreya, A., Shamim, T, Kim, H. K. and Suh, J., "Measurements of OH, CH, C2
and PAIl in Laminar Counterflow Diffusion Flames," Proceedings of the Central Section
of the Combustion Institute, 1996. (Appendix N)
d) Detailed chemistry simulation of the effect of enhanced water vapor concentration onradiative countefflow diffusion flames.
• Crompton, T. and Atreya, A. "The Effect of Water on Radiative Laminar Hydrocarbon
Diffusion Flames - Part A: Experimental Results," being prepared for submission to
Combustion Science and Technology.
• Suh, J. and Atreya, A. "The Effect of Water on Radiative Laminar Hydrocarbon Diffusion
Flames - Part B: Theoretical Results," being prepared for submission to Combustion
Science and Technology. Also published in the proceedings of the International
Conference on Fire Research and Engineering, Sept, 1995.
• Suh, J. and Atreya, A., "The Effect of Water Vapor on Radiative Counterflow Diffusion
Flames,"'Symposium on Fire and Combustion Systems, ASME IMECE, Nov. 1995.
(Appendix K)
Experiments on counterflow diffusion flames were conducted to determine the soot
particle formation and oxidation rates. This geometry was adopted for the ground-based
experiments and modeling because it provides a constant strain rate flow field which is one-
dimensional in temperature and species concentrations. The strain rate is directly related to the
imposed flow velocity and the one-dimensionality of this flame simplifies experimental
measurements and analysis. As noted earlier in Section 4.1, this is the simplest flame for
experimentally determining the RHS of Equ. (5). Two types of counterflow diffusion flames are
being investigated: (i) A low-strain-rate diffusion flame which lies on the oxidizer side of the
stagnation plane. Here, all the soot produced is convected away from the flame toward the
stagnation plane. Thus, soot formation is the dominant process. (2) A low-strain-rate diffusion
flame which lies on the fuel side of the stagnation plane. Here, all the soot produced is
convected into the diffusion flame. This enhances flame radiation as the soot is oxidized. The
second configuration is especially relevant to the pg experiments. The experimental results for
the flame on the oxidizer side of the stagnation plane are described in Ref. [32] and a soot
formation model developed based on these results is being prepared for publication (Ref. [33]).
To theoretically investigate the extinction limits of diffusion flames, first a simple case
of zero strain rate one-dimensional diffusion flame with flame radiation was examined [Ref. 7].
Next strained diffusion flame calculations with flame radiation were conducted. These are
presented in the Appendices. As a first step, constant properties, one-step irreversible reaction
and unity Lewis number were assumed. The equations were numerically integrated to examinethe conditions under which radiation-induced extinction occurs. The soot formation and oxidation
rates were obtained from the counterflow diffusion flame experiments. Surprisingly, calculations
show that extinction occurs due to gas radiation as in the spherical diffusion flame case.
21

R E F E R E N C E So
1. Dietrich, D. L., Ross, H. D. and T'ien, J. S. "Candle Flames in Microgravity," Third Microgravity Combustion
Workshop, Cleveland, Ohio, April, 1995.2. Ross, H. D., Sotos, R. G. and T'ien, J. S., Combustion Science and Technology, Vol. 75, pp. 155-160, 1991.
3. T'ien, J. S., Sacksteder, K. R., Ferkul, P. V. and Gray'son, G. D. "Combustion of Solid Fuels in very Low Speed
Oxygen Streams," Second International Microgravity Combustion Workshop," NASA Conference Publication,
1992.4. Ferkul, P., V., "A Model of Concurrent Flow Flame Spread Over a Thin Solid Fuel," NASA Contractor ReEg.._
191111, 1993.5. Avedisian, C., T. "Multicomponent Droplet Combustion and Soot Formation in Microgravity," Third
Microgravity Combustion Workshop, Cleveland, Ohio, April, 1995.6. Jackson, G., S., Avedisian, C., T. and Yang, J., C., Int..._=.J_.Heat Mass Transfer., Vol.35, No. 8, pp. 2017-2033,
1992.7. Atreya, A. and Agrawal, S., "Effect of Radiative Heat Loss on Diffusion Flames in Quiescent Microgravity
Atmosphere," Combustion & Flame, (accep/ed for publication), 1995.
8. T'ien, J. S., Combustion and Flame_ Voi. 80, pp. 355-357, 1990.
9. Law, C. K. and Faeth, G. M., Prog. Energy Combust. Sci., Vol. 20, t994, pp. 65-116.-10. Buckmaster, J., Gessman, R., and Ronney, P., Twenty-Fourth (International) Symposium on Combustion, The
Combustion Institute, 1992.
11;. Ronney, P.D., and Waclunan, H.Y., "Effect of Gravity on Laminar Premixed Gas Combustion I: Fl ability
Limits and Burning Velocities," Comb. & Flame,62,pp.107-119(1985).
12. Ronney, P.D., "t_ffect of Gravity on Laminar Premixed Gas Combustion II: Ignition and Extinction Phenomena,"
Comb. & Flame,62,pp.121- 133(1985).
13. Ronaey, P.D., "On the Mechanisms of Flame Propagation Limits and Extinguishment Processes at Microgravity,"
22nd Symposiumfint'l) on Combustion, The Combustion Institute, Pittsburgh, 1989.14. Williams, F.A., Combustion Theory., Benjamin/Cummings Publishing Co., 2nd Ed.(1985).
15. Fendell, F.E., J. Fluid Mech.,21,pp. 281-303 (1965).
16. Linan, A., Acta Astronautic.a, Vol. 1, pp. 1007-1039, 1974.
17. Linm_ A. and Crespo, A., Combustion Science and Technoloov, Vol. 14, pp. 95-117,1976.18. T'ien, J.S., "Diffusion Flame Extinction at Small Stretch Rate: the Mechanism of Radiative Heat Loss," Comb.&
65, pp.31-34(1986).19. Sohrab, S.H., Linan, A., and Williatns, F.A., "Asymptotic Theory of Diffusion Flame Extinction with Radiant
Heat Loss from the Flame Zone," Comb_____=Sci__.=Tech._27,pp. 143-1.54(1982).
20. Chat, B. H., Law, C. K. and T'ien, J. S., Twenty-Third (Internation,'d) Symposium on Combustion, The
Combustion Institute, pp. 523-531, 1990.21. Seshadri, K. and Williams, F. A.,_Intl. J. Heat Mass Transfer 21,251 (1978).
22. Chat, B. H., Law, C. K., 1993, "Asymptotic Theory of Flame Extinction with Surface Radiation," Combustion
& Flame, Vol. 92, pp. 1-24.
23. Kaplan, C. R., Baek, S. W., Oran, E. S., and Ellzey, J. L, "Dynamics of a Strongly Radiating Unsteady EthyleneJet Diffusion Flame," Combustion & Flame, Vol. 96, pp. 1-21, 1994.
24. Shamirn, T., and Atreya, A., "A Study of the Effects of Radiation on Transient Extinction of Strained Diffusion
Flames," Joint Technical Meeting of Combustion Institute, paper 95S-104 pp. 553-558, 1995.
25. Shamim, T., and Atreya, A., "Numerical Simulations of Radiative Extinction of Unsteady Strained Diffusion
Flames," Symposium on Fire and Combustion Systems, ASME EMECE Conference, 1995.
26. Ross, H. D., Proceedings of the Third International Microgravity Combustion Workshop," NASA Conference
Publication., Cleveland, April 1995.27. Ross, H. D., Proceedings of the Second Inter_mtional Microgravity Combustion Workshop," NASA Conference
Publication_ Cleveland, 1992.28. Microgravity Science and Applications, Program Tasks and Bibliography for 1992, NASA Technical
Memorandum 4469, March, 1993.29. Ishizuka, S., and Tsuji, H., "An Experimental Study of the Effect of Inert Gases on Extinction of Laminar
Diffusion Flames,"18th Symposium _ on Combustion, The Combustion Institute, Pittsburgh
22
pp.695-703(1981).
30. lshizuka, S., Miyasaka, K., and Law, C.K., "Effects of Heat Loss, Preferential Diffusion, and Flame Stretch onFlame-Front Instability and Extinction of Propane-Air Mixtures," Comb.& Flam._._e45,pp. 293-308(1982).
31. Tsuji, H., "Counterflow Diffusion Flames," Prog. Energy & Comb. Sci.,8,93 (1982).
32. Zhang, C., Atreya, A. and Lee, K., Twenty-Fourth (-International) S.v'mposium on Combustion, The Combustion
Institute, pp. 1049-1057, 1992.
33. Atreya, A. and Zhang, C., "A Global Model of Soot Formation derived from Experiments on Methane
Counterflow Diffusion Flames," in preparation for submission to Combustion and Flame.
34. Atreya, A., "Formation and Oxidation of Soot in Diffusion Flames," Annual Technical Re op.9._%GRI-91/0196, Gas
Research Institute, November, 1991.
35. Atreya, A., Kim, H. K., Zlmng, C., Agrawal, A., Suh, J., Serauskas, R. V. and Kezerle, J., "Measurements and
Modeling of Soot. NOx and Trace Organic Compounds in Radiating Flamelets," International Gas Research
Conference, 1995.
36. Atreya, A, Agrawal, S., Sacksteder, K., and Baum, H., "Observations of Methane and Ethylene Diffusion FlamesStabilized around a Blowing Porous Sphere under Microgravity Conditions," AIAA paper # 94-0572, January
1994.
37. Pickett, K., Atreya, A., Agrawal, S., and Sacksteder, K., "Radiation from Unsteady Spherical Diffusion Flames
in Microgravity," AIAA paper # 95-0148, January 1995.
23

APPENDIX A
Extinction of a Moving Diffusion Flame in a Quiescent
Microgravity Environment due to CO2/H20/SootRadiative Heat Losses
First ISHMT-ASME Heat Transfer Conference paper
By
A. Atreya and S. Agrawal
EXTINCTION OF A MOVING DIFFUSION FLAME IN A QUIESCENT MICROGRAVITY
ENVIRONMENT DUE TO CO2/H20/SOOT RADIATIVE HEAT LOSSES
Arvind Atreya and Sanjay Agrawal
Combustion and Heat Transfer Laboratory
Department of Mechanical Engineering and Applied MechanicsThe University of Michigan
Ann Arbor, MI 48109
Corresponding Author
Prof. Arvind Atreya
Department of Mechanical Engineering and Applied Mechanics
The University of MichiganAnn Arbor, MI 48109
Phone: (313)-747-4790
Fax : (313)-747-3170
Submitted to the First ISHMT-ASME Heat and Mass Transfer Conference,
January 5-7, 1994, Bombay, India

EXTINCTION OF A MOVING DIFFUSION FLAME IN A QUIESCENT
MICROGRAVITY ATMOSPHERE DUE TO COz/HzO/SOOT
RADIATIVE HEAT LOSSES
ARVLND ATREYA AND SANJAY AGRAWAL
Combustion and Heat Transfer Laboratory
Department of Mechanical Engineering and Applied Mechanics
The University of Michigan
Ann Arbor, MI 48109-2125
ABSTRACT
In this paper we present the results of a theoretical calculation for radiation-induced
extinction of a. one-dimensional unsteady diffusion flame in a quiescent microgravity
environment. The model formulation includes both gas and soot radiation. Soot volume fraction
is not a priori assumed, instead it is produced and oxidized according to temperature and species
dependent formation and oxidation rates. Thus, soot volume fraction and the resulting flame
radiation varies with space and rime. Three cases are considered (i) a non-radiating flame, (ii)
a scarcely sooty flame, and (iii) a very. sooty flame. For a non-radiating flame, the maximum
flame temperature remains constant _i'd it d,,oes not extinguish. However, the reaction ratedecreases as t making the flame "weaker. For radiating flames, the flame temperature
decreases due to radiative heat loss for both cases resulting in extinction. The decrease in the
reaction rate for radiating flames is also much faster than t_'. Surprisingly, gas radiation has a
larger effect on the flame temperature in this configuration. This is because combustion products
accumulate in the high temperature reaction zone. This accumulation of combustion products
also reduces the soot concentration via oxidation by OH radicals. At early times, before a
significant increase in the concentration of combustion products, large amount of soot is formed
and radiation from soot is also very large. However, this radiative heat loss does not cause a
local depression in the temperature profile because it is offset by the heat release due to sootoxidation. These results are consistent with the experiments and provide considerable insight into
radiative cooling of sooty flames. This work clearly shows that radiative-extinction of diffusion
flames can occur in a micro_avity environment.
LNTRODUCTION
The absence of buoyancy-induced flows in a micro_avity environment and the resulting
increase in the reactant residence time significantly alters the fundamentals of many combustion
processes. Substantial differences between normal _avity and microgravity_ flames have been
reported during droplet combustion 1, flame spread over solids 2, candle flames 3 and others. Thesedifferences are more basic than just in the visible flame shape. Longer residence time and higher

concentrationof combustionproductscreatea thermochemicalenvironmentwhich changestheflame chemistry. Processessuchas sootformation andoxidation andensuingflame radiation,whichareoftenignoredundernormal_avity, becomevery.importantandsometimescontrolling.As anexample,considerthedropletburningproblem. Thevisible flameshapeis sphericalundermicrogavity versusa teardropshapeundernormal gavity. Since most models of dropletcombustionutilize sphericalsymmetry,excellent ag-reementwith experimentsis anticipated.However,microgravity experimentsshowthat a sootshell is formedbetweentheflameand theevaporatingdropletof a sooty fuelt. This sootshell altersthe heatandmasstransferbetweenthe droplet andits flameresulting in significantchangesin the burningrate and thepropensityfor flame extinction. This changein thenatureof the processseemsto haveoccurredbecauseof two reasons:(i) soot formed could not be swept out of the flame due to the absenceofbuoyantflows, and (ii) soot formation wasenhanceddueto an increasein theresidencetime.
Recently,somevery interestingobservationsof candleflamesundervariousatmospheresin microgravityhavebeenreported3. It wasfoundthatfor the sameatmosphere,theburningrateperunit wick surfaceareaandtheflame temperaturewereconsiderablyreducedin microgravityascomparedwith normalgravity. Also, theflame(sphericalin micro_avity) wasmuchthickerand further removedfrom the wick. It thus appearsthat the flame becomes"weaker" inmicrogravity due.to the absenceof buoyancygeneratedflow which servesto transport theoxidizer to thecombustionzoneandremovethehot combustionproductsfrom it. The buoyantflow, whichmay be characterized by the strain rate, assists the diffusion process to execute these
essential functions for the survival of the flame. Thus, the diffusion flame is "weak" at very low
strain rates and as the strain rate increases the flame is initially "strengthened" and eventually it
may be "blown out." The computed flammability boundaries 4 show that such a reversal in
material flammability occurs at strain rates around 5 sec t.
The above experimental observations suggest that flame radiation will substantially
influence diffusion flames under microgavity conditions, particularly the conditions at extinction.
This is because, flame radiation at very low or zero strain rates is enhanced due to: (i) high
concentration of combustion products in the flame zone which increases the gas radiation, and
(ii) tow strain rates provide sufficient residence time for substantial amounts of soot to form
which is usually responsible for most of the radiative heat loss. This radiative heat loss may
extinguish the already "weak" diffusion flame. Thus, the objective of this work is to theoretically
investigate the reason why the diffusion flame becomes "weak" under micro_avity conditionsand determine the effect of flame radiation on this "weak" diffusion flame. This will lead to
radiation-induced extinction limits. This work is important for spacecraft fire safety.
TIrE MODEL PROBLEM
We note that the problem at hand is inherently transient and to study the effect of flame
radiation we must focus on the reaction zone. Also, since the reaction zone is usually thin
compared with other characteristic dimensions of the flame, its basic structure is essentially
independent of the flame shape. Thus, we consider a simple model problem consisting of an
unsteady one-dimensional diffusion flame (with flame radiation) initiated at the interface of two
quiescent half spaces of fuel and oxidizer at time t--O. Zero gravity, constant properties, one-step

irreversible reaction and unity Lewis number are assumed. A novel feature of the formulation
presented below is that soot volume fraction is not a priori specified to determine the ensuing
flame radiation. Instead, soot is produced and oxidized according to the temperature and species
concentration dependent formation and oxidation rates. Thus, the soot volume fraction and its
location within the flame evolve as a function of space and time. The soot formation and
oxidation rates used here are obtained from the counterflow diffusion flame experiments and
models of Refs. 5 and 6. A large activation energy asymptotic analysis of this problem without
flame radiation may be found in Ref. 7. A schematic of the physical problem along with the
imposed boundary conditions is presented in Figure 1 and the corresponding equations are:
Continuity:
a_p_ + a(pv) = oat Ox
(I)
where p is the density, t the time and v
the velocity normal to the fuel-oxidizer
interface induced by volumetric
expansion.
Species Conservation."
OXIDIZER
N.tEL
O t'.0;,x >0a O t>0; x--
Yo-Yo.; Yp-o; T-Te.
-0
0 t-O;,x<O& 0 t>_x ---
Y_-Y_..; Yo"O; T-To..
Figure 1 • Schematic of the Model Problem
P--at + pv Ox - pD - wg- ( rh"'-'"')s; ms o (2)
a% aYo a(aYo)(3)
P 07 + pv Ox - -O-x_ -O--x) + (l+v)%(4)
Symbols used in the above equations are defined in the nomenclature. The reaction rate,
wg, is modelled by a second order Arrhenius expression. Preexponential factor and the activationener=_y are chosen for methane undergoing a one-step irreversible reaction F* vo- (: *v) p; where v
is the mass-based stoichiometric coefficient. Fuel depleted as a result of soot formation, though
usually small, is also included in the model via the term (&;;" - m;,;' ), which is zero whennegative.

Energy Conservation.
aT + pv OT _ a [k aTl rh" -m_ ) V'Qr8-7 / + Q w + Qs ( ' " ' - (5)
In this equation, the source terms include heat released by the primary reaction and soot
oxidation and heat lost via flame radiation. The soot oxidation term is clearly zero when
negative. Emission approximation is used to describe the radiative heat flux from the flame.
Thus, V'Qr = 4oT '4 (a_+a_,) where, a_, and a;, are Planck mean absorption coefficients for
combustion products (co 2 , ,v2o ) and soot respectively. Planck mean absorption coefficients for
combustion products were obtained from Ref. 8 and for soot we have useda;,= zl. 06 f.,T cm _obtained from Ref. 9.
Soot Conservation:
8_ + P v 6_ _ (rhs_,-rhea' ) whet e, ¢= f'p sax ' p(6)
Here, both production and oxidative desmacfion of soot are considered, but soot diffusion is
ignored. A simplified equation for the net soot production rate (production - oxidation) is taken
from Refs. 6 & 7. Also, average number density is used to avoid including the soot nucleation
rate equation. The net mass production rate of soot per unit volume is thus described by:
rhs_'-ffli'o': ApfZv/3 (_F--_O) exp (-Es/RT) , where _i-i--! _ Y!
In this equation, the combined atomic mass fraction of carbon and hydrogen is taken to represent
the hydrocarbon fuel according to [,,=[c.[_, where the subscripts F, C & H denote fuel, carbon
and hydrogen respectively. Finally, the boundary conditions, as depicted in Figure 1, are: Yo =
Yo**, T= T**, YF = O at t=O, x > 0 & at t > O, x ---> _andY F = YF**, Yo = O, T= T** at t = O,x< O& art> O,x--e-oo.
The incompressible form of the above equations is obtained by using Howarth
transformation z =[ P (x', _) dx _, where x = 0 defines the location of the material surface that.io P°
coincides at t = 0 with the original fuel-oxidizer interface. As a result of this choice, v = 0 at
x = 0. Assuming p2D=p2.D, and defining the reaction rate as wg = A_p2Y,,Yoexp(-E_/Rr) weobtain:

aY_ a2Y_ _ w_at - D® az 2 p
_,
- A;f_/3 (_F--{&o)ex!p(-EJRT)(8)
a Yo a2Yo
at az 2- v pAgY_Yoexp (-Eg/RT)
(9)
aY_ _ m.--at az _ + (1 +v ) pAgYFYoexp (-Eg/RT)
(i0)
"-a-V+ -40T 4apg
pc_(Ii)
- AP_ :z/3 ((F-3[o) exp (-Es/RT) (12)where; a t .---_- _v
SOLUTION:
Analytical Solution
For infinitely fast gas-phase reactions and no flame radiation a simple, well known,
analytical solution is obtained.
Tl- 13.,_{3__, 2 2(13)
Here, [3 = YF " Yo Iv and [3 = YF + CpT/Qg are the Schvab-Zeldovich variables. The flame lies
at the location n:_ = i/(l+vYr./:,'o.). Thus, for unity equivalence ratio (E=I) based on free
stream concentrations, the flame lies at z = 0. For non-unity equivalence ratios [fuel rich (E>I)
or fuel lean (E<I) conditions] the flame will travel as ",/t in either direction. "This is evident from
='q$.Equ. (13) by simply substituting "q The three possible cases are plotted in Fig. 2 formethane. The constants used ar o: for Qe=4"7465 J/gm of fuel, cp-- 1.3 j/grrLg,
i".=295 K , v=4 , p =!.16×!0-3 gm/cm_ ,and/9.=0.226 cmZ/sec. The flRme conditions are:
(a) Yo.=0.5, Y_.=0.125. (b) Yo.=0.5, Yr. =0.0625. (c) Yo.=0.25, y_.=0.125. _"ca_(b)
the flame travels towards the fuel side because of excess oxygen (Fig. 2b). Similarly, for case
(c) it travels towards the oxygen side because of excess fuel (Fig. 2c). However, for case (a) the
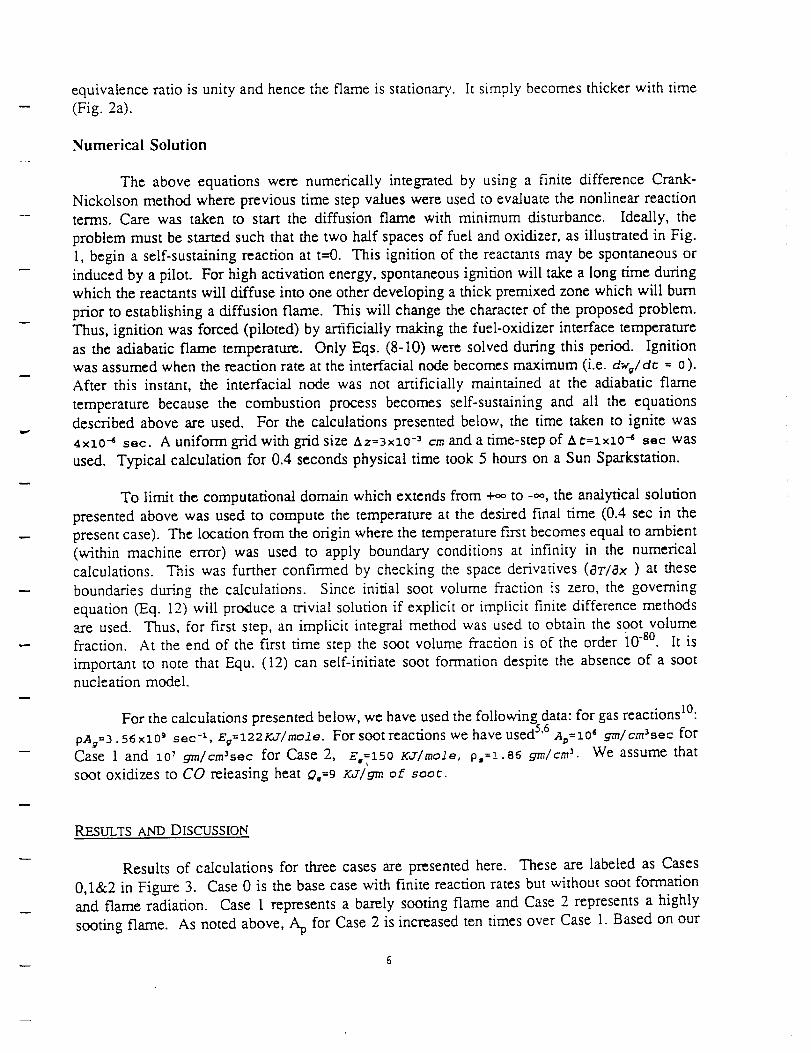
equivalenceratio is unity and hence the flame is stationary. It simply becomes thicker with time
(Fig. 2a).
Numerical Solution
The above equations were numerically integrated by using a finite difference Crank-
Nickolson method where previous time step values were used to evaluate the nonlinear reactionterms. Care was taken to start the diffusion flame with minimum disturbance. Ideally, the
problem must be started such that the two half spaces of fuel and oxidizer, as illustrated in Fig.
1, begin a self-sustaining reaction at t--0. This ignition of the reactants may be spontaneous or
induced by a pilot. For high activation energy, spontaneous ignition will take a long time during
which the reactants will diffuse into one other developing a thick premixed zone which will burn
prior to establishing a diffusion flame. This will change the character of the proposed problem.
Thus, ignition was forced (piloted) by artificially making the fuel-oxidizer interface temperature
as the adiabatic flame temperature. Only Eqs. (8-10) were solved during this period. Ignition
was assumed when the reaction rate at the interracial node becomes maximum (i.e. dwg/d_ = 0).
After this instant, the interfacial node was not artificially maintained at the adiabatic flame
temperature because the combustion process becomes self-sustaining and all the equations
described above are used. For the calculations presented below, the time taken to ignite was
4x:tO' sec. A uniform grid with grid size Az=3xlo -_ cm and a time-step of ac=lxlo "4 see was
used. Typical calculation for 0.4 seconds physical time took 5 hours on a Sun Sparkstation.
To limit the computational domain which extends from +co to _oo, the analytical solution
presented above was used to compute the temperature at the desired final time (0.4 sec in the
present case). The location from the origin where the temperature first becomes equal to ambient
(within machine error) was used to apply boundary conditions at infinity in the numerical
calculations. This was further confirmed by checking the space derivatives (OrlOx) at these
boundaries during the calculations. Since initial soot volume fraction is zero, the governing
equation (Eq. 12) will produce a trivial solution if explicit or implicit finite difference methods
are used. Thus, for first step, an implicit integal method was used to obtain the soot volumefraction. At the end of the fu-st time step the soot volume fraction is of the order i0 -8°. It is
important to note that Equ. (12) can self-initiate soot formation despite the absence of a soot
nucleation model.
For the calculations presented below, we have used the following data: for gas reactionsl°:
pAr=3.56 ×10 9 see -l, E_=122KJ/mole. For soot reactions we have used 5'6 A;_=10 _ gm/cm_sec for
Case 1 and lo' gm/cm3sec for Case 2, E,_!50 KJ/mole, p,=!. 86 gm/cm 3. We assume that
soot oxidizes to CO releasing heat Q,=9 _cJ/gm of soot.
RF_SULTS AND DISCUSSION
Results of calculations for three cases are presented here. These are labeled as Cases
0,1&2 in Figure 3. Case 0 is the base case with finite reaction rates but without soot formation
and flame radiation. Case 1 represents a barely sooting flame and Case 2 represents a highly
sooting flame. As noted above, Ap for Case 2 is increased ten times over Case 1. Based on our
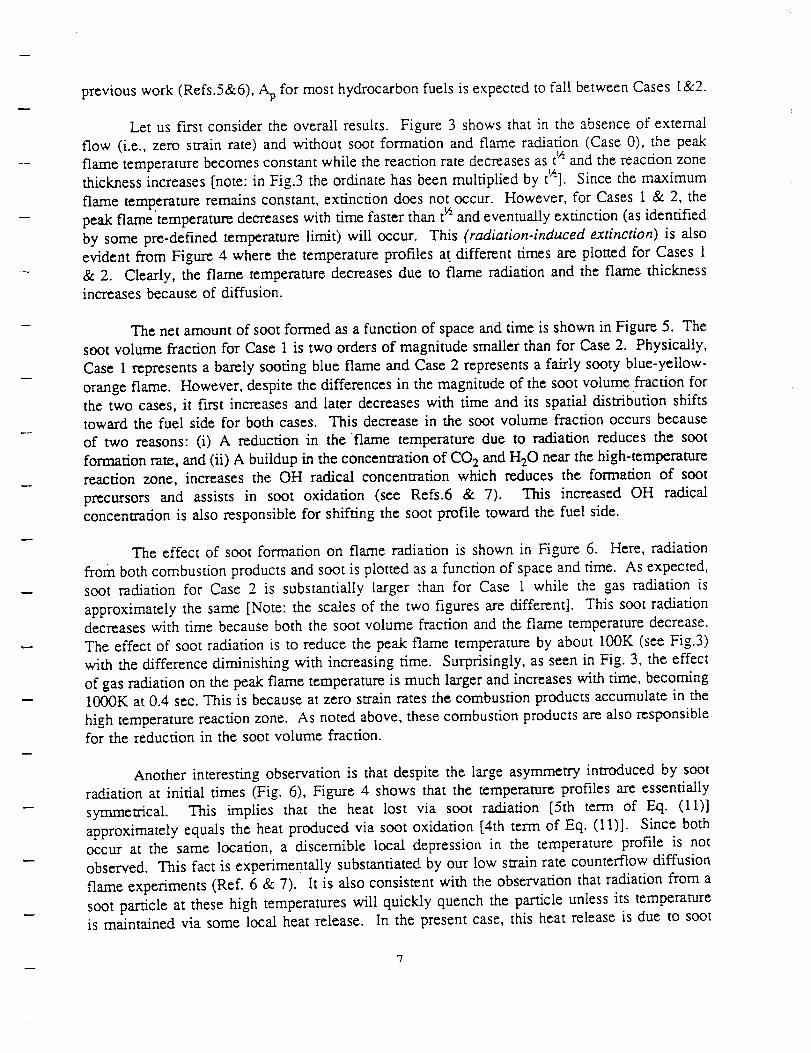
previous work (Refs.5&6), Ap for most hydrocarbon fuels is expected to fall between Cases l&2.
Let us first consider the overall results. Figure 3 shows that in the absence of external
flow (i.e., zero strain rate) and without soot formation and flame radiation (Case 0), the peak
flame temperature becomes constant while the reaction rate decreases as t'A and the reaction zone
thickness increases [note: in Fig.3 the ordinate has been multiplied by t'A]. Since the maximum
flame temperature remains constant, extinction does not occur. However, for Cases 1 & 2, the
peak flame'temperature decreases with time faster than t'/i and eventually extinction (as identified
by some pre-defined temperature limit) will occur. This (radiation-induced extinction) is also
evident from Figure 4 where the temperature profiles at different times are plotted for Cases 1
& 2. Clearly, the flame temperature decreases due to flame radiation and the flame thickness
increases because of diffusion.
The net amount of soot formed as a function of space and time is shown in Figure 5. The
soot volume fraction for Case 1 is two orders of magnitude smaller than for Case 2. Physically,
Case 1 represents a barely sooting blue flame and Case 2 represents a fairly sooty blue-yellow-
orange flame. However, despite the differences in the magnitude of the soot volume fraction for
the two cases, it f'_'st increases and later decreases with time and its spatial distribution shifts
toward the fuel side for both cases. This decrease in the soot volume fraction occurs because
of two reasons: (i) A reduction in the flame temperature due to radiation reduces the soot
formation rate, and (ii) A buildup in the concentration of CO 2 and H20 near the high-temperature
reaction zone, increases the OH radical concentration which reduces the formation of soot
precursors and assists in soot oxidation (see Refs.6 & 7). This increased OH radical
concentration is also responsible for shifting the soot profile toward the fuel side.
The effect of soot formation on flame radiation is shown in Figure 6. Here, radiation
from both combustion products and soot is plotted as a function of space and time. As expected,
soot radiation for Case 2 is substantially larger than for Case 1 while the gas radiation is
approximately the same [Note: the scales of the two figures are different]. This soot radiationdecreases with time because both the soot volume fraction and the flame temperature decrease.
The effect of soot radiation is to reduce the peak flame temperature by about 100K (see Fig.3)
with the difference diminishing with increasing time. Surprisingly, as seen in Fig. 3, the effect
of gas radiation on the peak flame temperature is much larger and increases with time, becoming1000K at 0.4 sec. This is because at zero strain rates the combustion products accumulate in the
high temperature reaction zone. As noted above, these combustion products are also responsiblefor the reduction in the soot volume fraction.
Another interesting observation is that despite the large asymmetry introduced by soot
radiation at initial times (Fig. 6), Figure 4 shows that the temperature profiles are essentially
symmetrical. This implies that the heat lost via soot radiation [5th term of Eq. (11)]
approximately equals the heat produced via soot oxidation [4th term of Eq. (11)]. Since bothoccur at the same location, a discernible local depression in the temperature profile is not
observed. This fact is experimentally substantiated by our low strain rate counterflow diffusion
flame experiments (Ref. 6 & 7). It is also consistent with the observation that radiation from a
soot particle at these high temperatures will quickly quench the particle unless its temperatureis maintained via some local heat release. In the present case, this heat release is due to soot

oxidation. Thus,a portion of thefuel thatis convertedinto sootoxidizesat a locationdifferentfrom themain reactionzoneandnearlyall theheatreleasedduringthis processis radiatedaway.The remainingfuel is oxidized at the mainreactionzoneresultingin a lower heatreleaseandhencea reducedpeakflame temperature.This is the justification for including the last term inEq.(8) andthe4th termin Eq. (11). Thesetermsaccountfor fuel consumptionandheatreleaseddueto net soot formation (or oxidation) andprovide valuablenew insight into the mechanismof radiativecooling of sooty flames.
The aboveconclusionis alsoclear from Figure7 which showsthe spatialdistribution ofsootand temperaturefor Cases1 & 2 at 0.2 secondsafter ignition. Note that while the peaktemperatureis about75K lower for Case2, theprofile is nearlysymmetricalaboutthe origin forbothcasesdespitethesharp& narrowsootpeakson thefuel side. Also notethat themagnitudeof the sootpeak(sootpeakfor Case2 is abouttwo ordersof magnitudelargerthan for Case1)hada negligibleeffecton the symmetryof thetemperatureprofile. Figure7 is alsoqualitativelyvery similar to our low strain ratecounterflowdiffusion flameexperimentalmeasurements.
Finally, wenotethatemissionapproximationwasusedin theflameradiationformulation.Sincethereactionzonethicknessis of theorderof a few centimeters,self-absorptionof radiationmay becomeimportantand in somecasesit may alter theextinction limit.
CONCLUS IONS:
This paper presents the results of a theoretical calculation for radiation-induced extinction
of a one-dimensional unsteady diffusion flame in a quiescent microgravity environment. The
model formulation includes both gas and soot radiation. Soot volume fraction is not a priori
assumed, instead it is produced and oxidized according to temperature and species dependent
formation and oxidation rates. Thus, soot volume fraction and the resulting flame radiation varies
with space and time. Three cases are considered (i) a non-radiating flame, (ii) a scarcely sooty
flame, and (iii) a very sooty flame. For a non-radiating flame, the maximum flame temperatureremains constant and it does not extinguish. However, the reaction rate decreases as t'_ making
the flame "weaker." For radiating flames, the flame temperature decreases due to radiative heat
loss for both cases resulting in extinction. The decrease in the reaction rate for radiating flames
is also much faster than t _. Surprisingly, gas radiation has a larger effect on the flame
temperature in this configuration. This is because combustion products accumulate in the high
temperature reaction zone. This accumulation of combustion products also reduces the sootconcentration via oxidation by OH radicals. At early times, before a significant increase in the
concentration of combustion products, large amount of soot is formed and radiation from soot
is also very large. However, this radiative heat loss does not cause a local depression in the
temperature profile because it is offset by the heat release due to soot oxidation. These results
are consistent with the experiments and provide considerable insight into radiative cooling of
sooty flames. This work clearly shows that radiative-extinction of diffusion flames can occur in
a rnicrogravity environment. In the present model self-absorption of the radiation was neglected
which in some' cases may alter the extinction limits because of relatively thick reaction zone
[O(cms)] . Further work is required.
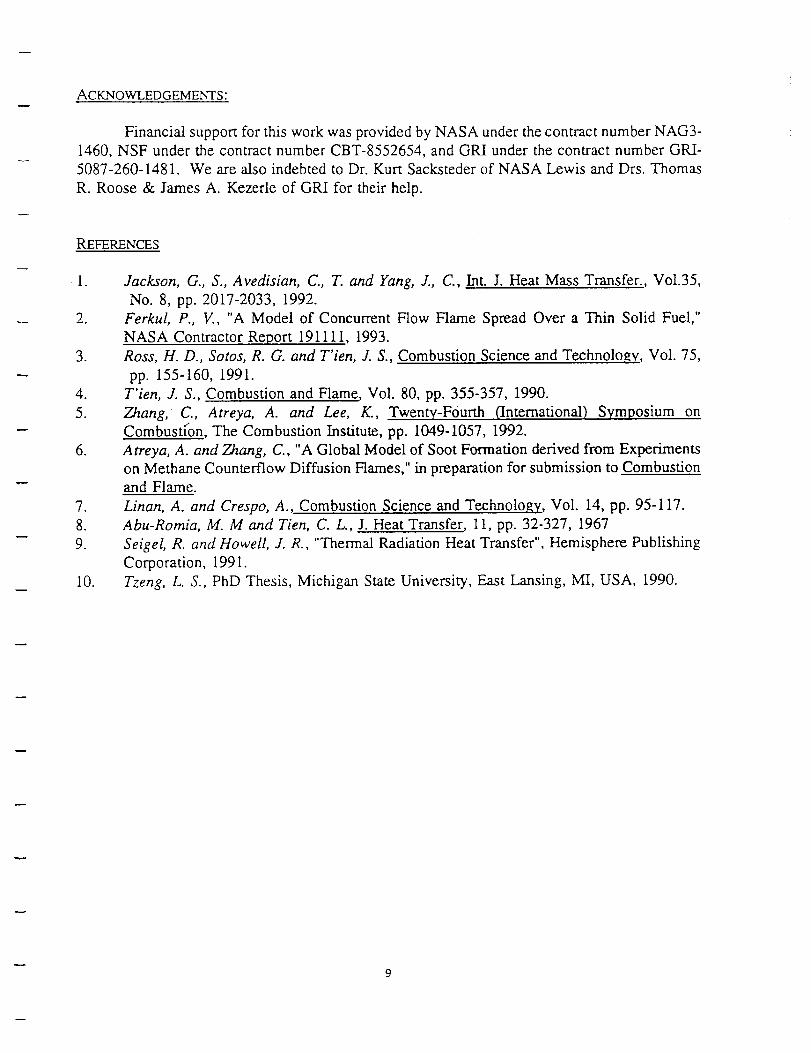
ACKNOWLEDGEMENTS:
Financial support for this work was provided by NASA under the contract number NAG3-
1460, NSF under the contract number CBT-8552654, and GRI under the contract number GRI-
5087-260-1481. We are also indebted to Dr. Kurt Sacksteder of NASA Lewis and Drs. Thomas
R. Roose & James A. Kezerle of GRI for their help.
REFERENCES
.
.
3.
4.
5.
6.
.
8.
9.
10.
Jackson, G., S., Avedisian, C., T. and Yang, J., C., Int. J. Heat Mass Transfer., Vol.35,
No. 8, pp. 2017-2033, 1992.
Ferkul, P., V., "A Model of Concurrent Flow Flame Spread Over a Thin Solid Fuel,"
NASA Contractor Report 191111, 1993.
Ross, H. D., Sotos, R. G. and T'ien, J. S., Combustion Science and Technology, Vol. 75,
pp. 155-160, 1991.
T'ien, J. S., Combustion and Flame, Vol. 80, pp. 355-357, 1990.
Zhang, C., Atreya, A. and Lee, K., Twenty-F0urth (International) Symposium on
Combusffon, The Combustion Institute, pp. 1049-1057, 1992.
Atreya, A. and Zhang, C., "A Global Model of Soot Formation derived from Experiments
on Methane Counterflow Diffusion Flames," in preparation for submission to Combustion
and Flame.
Linan, A. and Crespo, A., Combustion Science and Technology, Vol. 14, pp. 95-117.
Abu-Romia, M. M and Tien, C. L., J. Heat Transfer, 11, pp. 32-327, 1967
Seigel, R. and Howell, J. R., "Thermal Radiation Heat Transfer", Hemisphere Publishing
Corporation, 1991.
Tzeng, L. S., PhD Thesis, Michigan State University, East Lansing, MI, USA, 1990.

NOMENCLATURE
a Planck mean absorption coefficient
A Frequency Factor
C; Speci fi c hea C
D Diffusion Coefficient
E AcCivasion Energy
fv Sooc volume fraction
k Thermal conduccivicy
m_" SooC surface growth rare
_h_" SOOC oxidation race
M ACumic weight
Dr Radiative heac flux
Q Hear of combustion per unic mass
C Time
T Tempera Cure
v Veloci Cy
w Reaction race
W Molecular weight
x Distance
Y Mass fraction
z Densi Cy distorted coordina Ce
GREEK
Thermal diffusivi ty
Schvab-Zeldovich variable
Mass based sroic._iomecric coefficient; number of moles
Soot mass fraction
Densi ry
variable defined in Eq. (7)
Subscripts
F
g
o
P
s
am
Fuel
Gas
Oxygen
Products ( H=O,
Soo C
Free s rream
C02 )
i0

FIGURE CAPTIONS
Figure 1: Schematic of the Model Problem
Figure 2: Analytical solution. Temperature distribution as a function of distance for various
equivalence ratios. (a) Equivalence ratio (E) is unity (b) E < 1 (c) E > 1.
Figure 3: Maximum reaction rate and temperature as a function of time. Note that reaction
rate is multiplied with tu.
Figure 4: Numerical solution. Temperature distribution as a function of distance at various
instants. (a) Case 1, less sooty flame, (b) Case 2, very sooty flame.
Figure 5: Soot volume fraction as a function of distance at various instants. (a) Case 1, less
sooty flame, (b) Case 2, very sooty flame.
Figure 6: Radiative Heat Loss as a function of distance at various instants. (a) Case 1, less
sooty flame, (b) Case 2, very sooty flame.
Fi_are 7: Soot volume fraction and Temperature distribution at t = 0.2 seconds. (a) Case 1,
legs sooty flame, (b) Case 2, very sooty flame.
ll
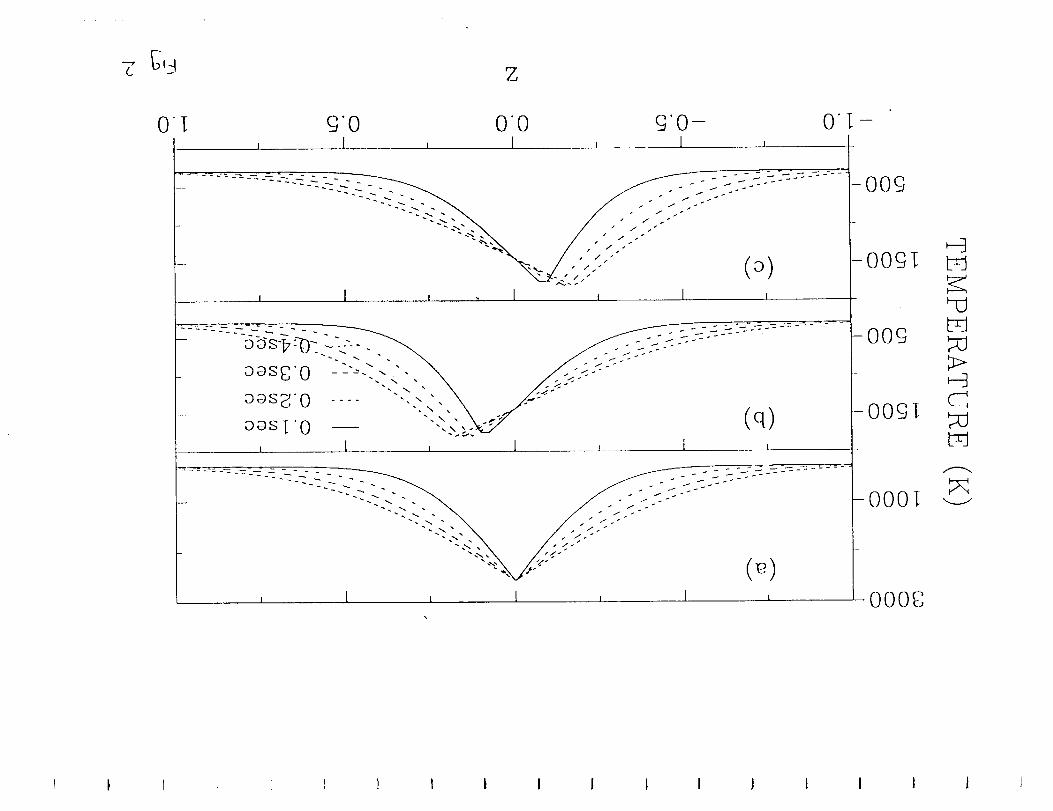
Z
0]: 9"0 00 9"0- 0[-, I I 1 , 1
/.2.; (o)I I J . I , I I
_--'-_-----_---:--:_--_-:-_:-:_:::\;.;;:;...."........_.::;;i;;-:-i-;;;;:-;;::;...-----
I I i I 1 I
OO9
-009I
OOg
009[
-000[
O00g
I I '. ! ! I I i I I I I I 1 I I 1 I

1 ( f I _ I 1 I I I I _ t 1 I I i
©
0Q
4E+05
3E+05-
2E+05
1 E+05
0 E -t- 00
0.0
f
\
%,
I ' I " 1
"'" _222-2-22-u2-2_u._..__
CASE0
CASE1
CASE2
_ L-L'L-L-L.-____z._z_z..... z___z____ -
\
\
.... - - - ££z-: .......
_ I ' I ' I ' 0
0.1 0.2 0.3 0.4
-2000
1500
1000
50O
E-,
r_
E-_
'['IME (see)
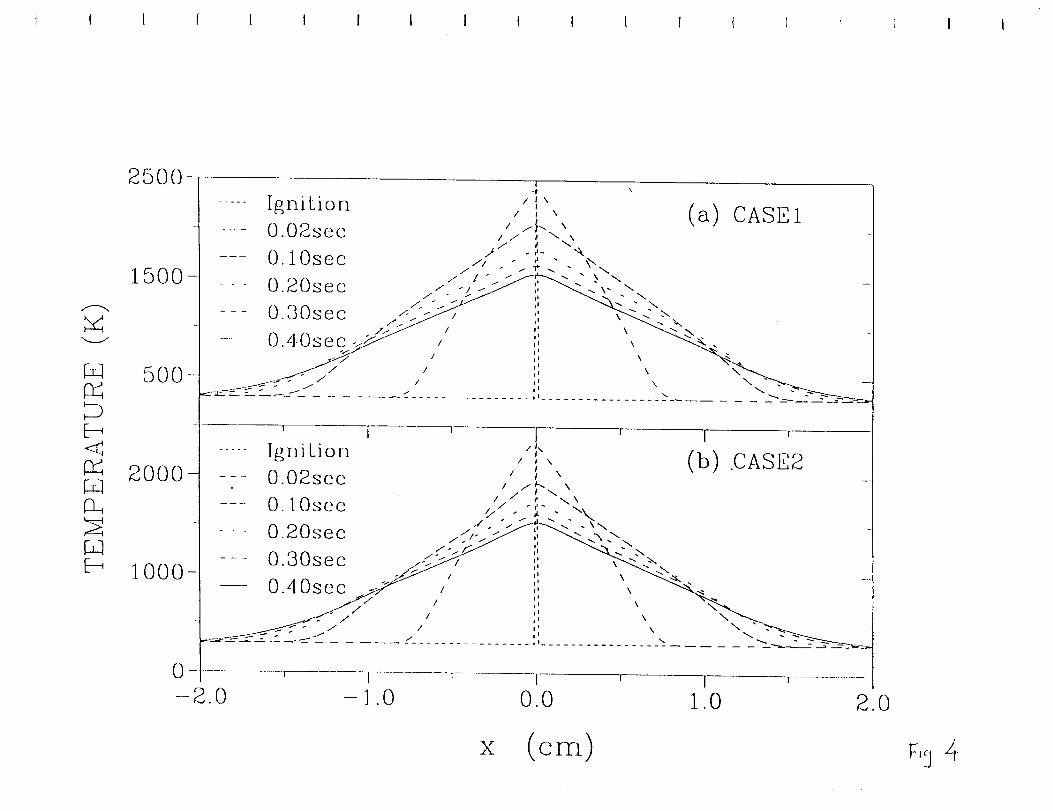
I I I I I I I I I I I I I { I i ! I I
kd
kq
E_<
_qF_
kq
2500
1500
5OO
2000
1000
I
..... Igni Lion ,' ! ',O.O£sec ,, ..!.\, (a) CASE1
// . t \\.._
O.lOsec - ,_"- .,-,
--- O.20sec .-"-/-"jPf::_"_" ." ,-" \./ - // ;, _<.. ..
--- o 3Osec _;_ ii _'?£P-__
--- u.4usec_ / ii '/./ / ',, \ \"_
- / i I "_. "_
' I r I ' I r
X (CKI)

! I I i I I I I I I I I 1 I
>
0
£D<O<
0|-....
E--,00Or)
3.5g--08
2.5g-08
1.5g OB
5.0E-09
3. OE- 06
i
2.0E-06
1.0E-06
O.Ogsec
O.06sec
O.lOsec
0.20sec
x (crn)
CASE1
CASE;g
0.00

1 I I I I I I ! I I I I I _ i I t
OE+O0
- 1 E-I- 04
EDQ.
(:d
L>I
-2E-t-04
Og+O0
-2E+04
-4E+04
-6E+04
I
II
I II I
- 8E-t-04 , i , i '-1.0 -0.5 0.0 0.5
0.40see
0.30see
0.20sec
O.]Osec
O.06sec
O.02sec
r
.0
x (ore)

0_0p..
I
LQ (D _0
00
f
00t40
I
0I
j ' t ' ICO CO 0"_ C.D0 0 0 0
I I I I_ r-..=-I r-_..=.l
LD t.O 0 L.Q
Od _ t_O
0
0
0
02
n;
0
>4
,q-.
o--I,O..C
APPENDIX B
Observations of Methane and Ethylene Diffusion Flames
Stabilized Around a Blowing Porous Sphere
under Microgravity Conditions
32nd Aerospace Sciences Meeting (AIAA 94-0572) paper
By
Atreya, A, Agrawal, S., Sacksteder, K., and Baum, H.

]
1
1
1
1
AIAA 94-O572
Observations of Methane and EthyleneDiffusion Flames Stabilized Around a
Blowing Porous Sphere underMicrogravity Conditions
1
1
!
A. Atreya: and S. AgrawalDepartment of Mechanicaland Applied MechanicsThe University of MichiganAnn Arbor, M! 48109-2125
Engineering
]
]
]
]
]
K. R. Sacksteder
Microgravity Combustion ResearchNASA Lewis Research Center
Cleveland, OH 44135
H. R. BaumNational Institute of Standards
Gaithersburg, MD 20899
and Technology
32nd Aerospace Sciences
Meeting & Exhibit
January 10-13, 1994 / Reno, NV
-For i:_rmission to ¢_p/or rlpubllsh, con1:_ct th_ An_rican Inst_tulo of Ai_onau_|c= and A_rof_autlcs
_70 L'Enfant Pmmenld4, S.W., Walhincjl:an, D.C. 21:)024

OBSERVATIONS OF ME-IH._NE AND ETHYLENE DD-FUSION FLAI_ES STABILIZED
AROUND A BLOWING POROUS SPHERE U'NDER MICROGRAVITY CONDITIONS
Arvind Atreya and Sanjay Agrawal
Combustion and Heat Transfer Laboratory.
Department of Mechanical Engineering and Applied Mechanics
The University of Michigan. Ann Arbor. MI 48109-2125
Kurt R. Sacksteder
Microgravity Combustion ResearchNASA Lewis Research Center
Cleveland. OH 44135
Howard R. Baum
National Institute of Standards and Technology
Gaithersburg, MD 20899
Abstract
This paper "presents the experimental and
theoretical results for expanding methane and ethylene
diffusion flames in microgravity. A small porous sphere
made from a low-density and Iow-imat-ca0acity insulating
material was used to uniformly supply fuel at a constant
rate to the expanding diffusion flame. A theoretical
model which includes soot and gas radiation is formulated
but only the problem pertaining to the transient expansionof the flame is solved by assuming constant pressure
infinitel.v fast one-step ideal gas reacdon and unity. Lewis
number. This is a l-u'st step toward quantifying the effect
of soot and gas radiation on these flames. The
theoretically calculated expansion rate is in good
agreement with the experimental results. Both
experimental and theoredca.I results show that as the flameradius incrr.ase:s, the flame expansion process becomesdiffusion controlled and the flame radius grows as ,,/t
Theoretical calculations also show that for a constant fuel
mass injection rate a quasi-steady state is developed in the
region surmtmded by the flame and the mass flow ram at
any location reside this region equals the mass injection
rate.
I. Introduction
The absence of buoyancy-induced flows in a
microgradty environment and the resulting increase in thereactant rmidence time significandy alters the
fundamentals of many combustion processes. Substantial
differences between normal gravity and microgravity
flames have been r_-q:)orted during droplet combustion[l],
flame spread over solids[2,3], candle flames{4] and others.These differences are more basic tha.n just in the visible
flame shape. Longer residence time and higher
concentration of combustion products create a
thermochemical end.ronment which changes the flame
chemistry. Processes such as soot formation and
oxidation and ensuing flame radiation, which are often
ignored under normal gravity, become very important and
sometimes controlling. As an example, consider the
droplet burning problem. The visible flame sdaape is
spherical under microgravity versus a teardrop shapeunder normal gravity. Since most models of droplet
combustion utilize spherical symmetry, excellent
agreement with experiments is anddpated. However,
microgravity experiments show that a soot shell is formed
between the flame and the evaporating droplet of a sooty
fuel{l]. This soot shell a.lte'rs the heat and mass transfer
between the droplet and its flame resulting in significant
changes in the burning rate and the propensity, for flame
extinction. This change in the nature of the processseems to have occurred because of two reasons: (i) The
soot formed could not be swept out of the flame due to
the absence of buoyant flows. Instead, it was forced to go
throughthe high temperature reaction zone increasing theradiative heat losses, and (ii) soot formation was enhanced
due to an increase in the reactant residence time.
Recendy, some very interesting observations of
candle flames under various atmospheres in microgravity
have been reported[4]. It was found that for the same
atmosphere, the burning rate per unit wick suit'ace area
and the flame temperature were considerably reduced in
microgravity as compared with normal gravity. Also, the
flame (spherical in microgravity) was much thicker andfurther removed from the wick. It thus appears that the
flame becomes "weaker" in microgravity due to the
absence of buoyancy generated flow which serves to
transport the oxidizer to the combustion zone and removethe hot combustion products from it. The buoyant flow,
which may be characmriz_d by the strain rate, assists the
diffusion process to execute these essential functions for

thesurvivalof theflame.Thus.thediffusionflameis"weak"at very.low stratarata andas thestrainramincreasesthe flame is initially "strengthened"andeventuallyit may be "blown-out." The comput:dflammabilityboundaries[5]showthatsuchareversalinmaterialflammabilityoccursatstrainrotesaround5sec_.Modelcalculationstbr a zerostrainramI-D diffusion
tlame show that even gas radiation is sufficient to
extinguish the tlame{6].
The above observations suggest that flame
radiation will substantmUy influence diffusion flames
under microgravity conditions, particularly the condiuons
at extinction. This is because, flame radiation at very low
or zero strain mte, s is enhanced due to: (i) high
concentration of combustion products in the flame zone
which increases the gas radiation, and (ii') low strain rates
provide sufficient residence time for substantial amounts
of St'xR tO lOr'm which is usually responsible /'or most of
the radiative hcat loss. It is ,-mt.icipamd that this radiative
heat loss may extinguish the ,'d.ready "week" diffusiontla.me.
To investigate the possibility of radiation-induced
cxtincdon limits under microgravity conditions, spherical
geometry, is chosen. This is convenient for both
experiments and theoretical modeling. In this work. a
porous spherical burner is used to produce spherical
diffusion flames in fag. Experiments conducted with this
burner on methane (less sooty) and ethylene (sooty)diffusion i'la.mes are described in the next section. A
genera/ theoretical model for transient radiative diffusion
flames is then formLtlamd and calculations are presented
for the transient expansion of the spherical diffusion
flame. These calculations are compared with the
cxpermaental measurements in the discussion section.
This v,'ork is me first necessary, step toward investigating
radiative-extinction of spherical diffusion flames.
I[. Exoeri.ment,'d Ar_params and Results
The _tg experiments were conducted in the 2.2
sac drop tower at _e NASA Lewis Research Center. The
experimental drop-rig used is schematically shown inColor Plate 1. It consists of a test chamber, burner.
ignit,._, gas cylinder, solenoid valve, camera, computer
and batteries to power the computer and the solenoid
valves. The spherical burner (1.9 cm in diameter) is
constructed from a low density, and low heat capacity
porous ceramic mat_al. A 150 cc gas cylinder at
approximately 46.5 psig is used to supply the fuel to the
porous spherical bur'ner. Typical gas flow rotes used werein the range of 3-15 cm_/s. Flow rams to me burner are
conu-otled by a n__,_,dle valve and a gas solenoid valve is
used to open and close the gas line to the burner upon
computer command. An igniter is used to establish a
diffusion tla.me. After ignition the igniter is quickly
retracted from the burner and secured in a catctl_g
mecganism by a computer-controlled rotary, solenoid.
This was necessary for two reasons li) The igniter
provides a heat sink and will quench the tlame (ii) Upon
impact with the gound {after 2.2 sec) the vibrating igniter
may damage the porous burner.
As shown in the Color Plate I. the test chamber
has a 5" diameter Lexan window which enables the
camera to photograph the spherical diffusion tlame. The
tlame growth can be recorded either by a [6ram color
movie camera or by a color CCD camera which is
connected to a video recorder by a fiber-optic cable
during the drop. Since the fuel flow may change with
time, it had to be calibrated for various settings of theneedle v,-dve for both methane and ethylene. A so_hubble flow meter was used to c:'dibmte Lhe flow for
various constant ga.s cylinder pressures. Consta,nt
pressures were obtained by connecting the cylinder to the
main 200 lb gas cylinder using a quick-disconnect...\n
in-line pressure transducer was used to obtain the transient
flow rotes. Changes in the cylinder pressure during the
experiment along with the pressure-flow rate __alibradon.
provides the transient volumetric flow rates. These are
shown plotted in Figure 1.
r-
r. Ig J
° T.......................... ............E
o.o _.4 o.e :.2 t." 2.o
TLme (see}
Figure I: Volume/low razes versus time.
In Figure 1. the letters "M" and "E" represent
methane and ethylene respectively and the letters "L'.
"M" and "H" represent low, medium and high flow rotes.
Thus. MM implies medium flow rate of methane. Notethat low flow rote for methane is nearly equal to the
medium flow rote of ethylene. For these experiments, the
gas velocity at the burner wall was between 0.25-tc-m/see.
The porous spherical burner produced a nearly
spherical diffusion flame in microgravity. Some observed
2

Pictureof the nficrograviW sphericaldiffusionflame apparatus
Computer
•---_/_//_.////Y////A
Elec_iczlconnections
Viewing window
Test Chamber
t_Lll-Ilffl[
_ Rotary
Solenoid valve
Needle valve
solenoid
Schematic of the microgravity sphericaldiSffusion flame appaxatus
COLOR PLATE 1

dismfbance.s are attributed to slow large-scale all mouon
inside the test chamber. Several microgravity experiments
were pcKonned under ambient pressure and oxygenconcentration conditions tbr different flow rotes of
methane and ethylene {as shown in Fig. 1). Methane was
chosen to represent a non-sooty fuel and ethylene was
chosen to represent a moderately sooty fuel. In these
experiments, ignition was always initiated ha 1-g just prior
to the drop. The package was typically dropped within
one second after ignition. The primary, reason tbr not
igniting in lag was the loss of ume in heating the i_iter
wire and in stabilizing the flame after the inidal ignition
disturbances. Some photographs from these experimentswe shown in the Color Plate 2.
The tlame radius measured from such
photographs along with the model predicdons (to be
discussed later) are shown in Fig. 2. As expected, for the
s:u'ne flow rates it wa,_ tbund that ethylene tlames were
much sootier and smaller. Immediately after dropping the
pack,age, the tlame shape changed from a teardrop shape
(see Color Plate 2) t6 a spherical shape (,although it was
not always completely spherical, probably because of slow
large-scale air mouon persisting inside the test chamber).
The photographs shown in the Color Plate 2 are formedium flow rates of methane and low flow rotes of
ethylene. For the data presented in Fig. 2, an average
tlame radius dete-rmined from the photographs was used.
v
.<
'...d
2 o
-2 •
=- Theorv£" .-''"
i
@
3 o
2
g."
F_._el flow ra'.e 4 crn3/s . ,, .._,-" _-- "t-eJ ema/s" . - -,, . - -,
-- .... qItem s "" ---_
II
)
Rad.ium of tda,_ but'ta._ O.gScr= ]Fuel tlow rate 3 cm3/s
4 cm3/s _ _J
Theory . • •
.-f..-c* _"•v • • • * 1
ETHYLENE _ I
0.0 ols 1'.o l'.s
(see)
Figure 2: Flame radius versus time
t
2.0
[t is interesting to note that for both medmne and
ethylene fsee the progressive flame growth in Color Plate
2). initially and in 1-g (e.g. photographs 'e' & 'F) the
flame is nearly blue (non-sooty) but becomes bright
yellow tsooty) immediately a.fter the onset of lag
conditions. Later. as the _ag time progresses, the flame
grows in size and becomes orange and less luminous and
the soot seems to disappear. A possible explanation tbr
this observed behavior is suggested by the theoreticalcalculations of Ref. 6. The soot volume fraction first
quickly increases and later ff,."creases as the localconcentration of combustion products increases.
Essentially, further soot formation is inhibited by theincrease in the local concentration of the combustion
products [Ref.7,8] and soot oxidation is enhanced. Thus,
at the onset of lag conditions, initially a lot of soot is
formed in the vicinity of the flame front (the outer faint
blue envelope) resulting in bright yellow emission. As
the flame grows, several events reduce the flame
luminosity: (i) The soot is pushed toward cooler regions
by thermophoresis. [n fact. tbr sootier fuels this leads to
the formation of a soot shell. (ii) The high concentration
of combustion products left behind by the flame front
inhibits soot formation and promotes soot oxidation. (iii)
"l'he dilution and radiative heat. losses caused by the
increase in the concentration of combustion products
reduces the flame temperature which in turn reduces the
soot formation ram and the flame luminosity.
Figure 2 shows the average measured flame
radius for methane and ethylene lag diffusion flames
plott_ against dine. This is the radius of the outer faint
blue region of the flame as measured from the
photographs. To a good approximation this may Ix:considered as the flame front location. Thus. as a f'n'st
step. it will be interesting and important to determine it
the transient expansion of the lag spherical diffusion flame
can be theoretica, tJy predicted without considering sootformation and oxidation kinetics and flame radiation.
III. Model Formulation
As noted above, the spherical diffusion flames
ale expanding and changing their luminosity with time.
Thus, the general theoretical formulation must be transientand must include flame radiation. For the simplest case
of constant pressure Meal gas reactions with Le=/. we
may wrim the following governing equations for any
gemnetrical configuration (spherical or countenlow
geometry):
Mass Conservation:
(l)(3p+v-('p v-)=0"U
4

(a) (b)
i-g flame 0 0667sec
into_tg
Co) (d)
0.3333sec 0.6667sec
into _tg into tag
MEITqANE FLAME, FUEL FLOW RATE 8 cm 3/sex:
(e)
1-g flame 0.0667sec
into _tg
(g) Ca)
0.1667sec 0.5667sec
into _g into _g
(i) (9
1.233sec 1.667sec
inlo _g into _tg
ETHYLENE FLAME, FUEL FLOW RATE 3 cm 3[sec COLOR PLATE 2

Energy Conservation:
Oh ' ¢.Vh V .(p D 7h ')pT.p '-
---_ h,°m_- 0,,,_fi - v .q,
Constant Pressure Meal Gas:
(2)
(3)
pT=p_T_ ur ph " =con.st.
t{ere, the symbols have their usual defmidons
with p = density, T = temperature, v = velocity, Y_ =
mass fraction of species i, h' = sensible enthalpy. % :
,nass production or destruction rate per unit volume of
species i and D = diffusion coefficient. The last three
terms in Equ (2) respectively are: the chemical heat
rcle&se rate due to gas plmse combustion, chemical heatreleased due to soot oxidation and the radiative heat loss
rate per unit volume. The above equations, however, are
insufticient for out'problem because the soot volumefracdon must be known as a function of space and time
to determine the radiative heat loss. To enable describing
soot volume fraction in a simple manner, we define themass fraction of atomic constituents ,as follows:
qj: 2 (M/v_i / Mi)Yi ' where M_is the molecular weigbti
of species i. M1 is the atomic weigbt of atom j and v,'isthe number of atoms of kind j in specie i. Assuming that
the only atomic constituents present in the bydr_arbon(tame are C. H. O & Inert and with Y,,_ _ • - p, f. lp
(where: p,= soot densi.ty & f. = soot volume fraction).
.r.._ ._ +pf/p = twe obtain: _c. ":.u o t ,
Defining _ + _ = _._ and _ = _ fY__ and Zo =
we ot,, n as meconserved scalar for a sooty flame. This yields the
following soot. fuel and oxidizer conservation equationsin terms of their scalar variables:
Soot Conservation:
p _ +p 9".V(¢) -_'@ D V(¢)I_t
:m?-,_ : rm:,
(4)
Fuel Conservation:
aZ_p _._2" + p ¢.v (Z,) -'7 <p D V(Z_)]
0t
l . m2,
----T2(5)
Oxygen Conservation:
p ¢.V(Z,_ - vg.[p D _r(Zo)] : 0OC
(6)
Under condidons or"small soot loading, the soot
terms in the fuel and energy conservation equations can
be ignored except when studying radiative extinction.
Thus. Equ (5) may be considered homogeneous to a good
approximation. Also. as a first crude approximation, the
heat lost by flame radiation may be subtracted from theheat of combustion in the form of a radiative fraction.
Thus. the energy equation ('Equ(2)) can also be made
homogeneous if written in terms of the total enthalpy [h
= _ Y, (hi° + h,')l. This approach may be adequate for
calculating the observed expansion rate of the spherical
diffusion flames, but it is completely inadequate for
predicting radiative extinction, llowever, the great
mathematical advantage of this approach is that it makes
Eqs. (2.4.5. & 6) identical and onty one conserved scalar
equation need be considered. As a first step, it is or
interest to see how well the transient expansion of the lag
spi_erical diffusion flames be predicted without rigorously
considering soot and gas radiation. This will also help in
quantifying the effect of soot and gas radiation by
comparison with more detailed calculations. Re-writing
the above equations in spherical coordinates, we get:
Mass Conservation:
ap.t a,,_tr-pv) =0dt r : dr
(7)
Fuel Conservation."
,_z az t a(. _az
P.-.,-- - r ,---F_ir-p u--_ )= 0 f8)
The_ two equations along with the ideal gas law
at constant pr_sure. Equ.(3). are sufficient to describe the
transient growth of non-radiative spherical diffusion
flames and are expected io approximate this growth in the
presence of flame radiation. It is also assumed that a fast
one-step over'all reaction occurs at the flame s_. Ibis
N-2
is represented by: vFF ÷ VoO "--'> Z viPi; withi-I
q° as the standard heat of reaction and Q = q°/Mrv F the
heat released per unit mass of fuel. Clearly.N-2
O O
q o = hE Mrve + hoMoVo _ __, hi°Mivi. Thei-I
corresponding initial and tx_undary conditions for a sphere
of radius "R' blowing fuel gases at a rate /Q'(t)are
discussed below and illustrated in Figure 3.
6

...:
/ /""............ '''i
f'
Y..ff, Z, z.z¢ .....z<z_
V_l_ ,- _ _ ..-'"]1:,I/_',,, _t/_..-' Z-Z,:
F(_,uee 3." Schematic of the Model Problem
Continuity, fuel mass fraction _md
conservation at the _iurface of the sphere yield:energy
M(t) , _ (9a)
•_ --tP v;._,
'_(¢)ry laYr]
Y') ---P° ),,
(9b)
(h_'-,,;)_,,¢ah. (9c)
Here. Y__ & h'_ are the fuel mass fraction and enthalpy
of the incoming fuel stream and Y_ and h' R are the
corresponding values at the outer sunace of the sphere.
The ambient values of fuel and oxidizer ent/m.lpies are
taken to be equal i.e. h__ = hi_ = h_,. and Z_-I &
p_po for ambient conditions on the fuel side and 7_,---0&
p_o for ambient conditions on the oxidizer side. Now,
for high fuel injection rams, YF- " Y_ ; b' = b'_ and
Z R = I and the corresponding diffusion terms in Equs. 9b
& 9c become zero. For a given mass injection rate [
iGi (t) ]' these conditions are also satisfied as R--+0. Thus.
for a point fuel source, the boundary conditions at the
source are simplified. Other initial and boundary
conditions are: At t--0. Z(r,0); p(r,0) & v(r,0) are me
spatial distributions corresponding to the flame at t=0. as
sbown in Figure 3. Also, at the flame surface [r=r._t)]
Z=Z¢=(I. + Yr_MoVolYo Mrvr) "t. and as r.-_o.
Z-+0; v--+0 & h'-+h'_. All other variables can be easily
obtained in terms of Z by utilizing the tinear reLadonsbipsbetween Lhe conserved scalars [Ref.10]. For constant
pressure ideal gas reactions ttaese linear relationshipsyield:
For R <_r < ff (t):
' 1-'P :p.Ii+(l-z)QYrZ
t h '(I -Z ) /k -- _ J
(10)
M(t) D ap
4rcrZp, p dr
÷,Vf(t) QZ.,( (ZR-Z)
k - (l-z)
These equations, along with Equ. (8). arc
sufficient to provide all the distributions in the region
between the porous sphere and the flame. In Equ. (11).
the first term on the rigbt hand side repots the
injection velocity and the second term accounts for the
increase in the velocity, due to the de_rease in density.
The third term is identically zero if the distribution of Y_
within the porous sphere if<R) is identical to that in the
gas i.e. Y,. = YF_(Z-Z¢)/(1 -Z) • Note at r=-R. YF
= Ym and Z = Z_. Mso note that the third term becomes
zero for high injection velocities and small "R' since
Z_--_I & Yw_Y¢_. In F_.qu.(11). 13and (_p /Or) can
be expressed entirely in terms of Z through Equ. (I0).
Thus. Equ. (8) along with the appropriate boundary.conditions ks sufficient to determine Z(r.t).
at the yZa_e s._face r'='/O:
At the flame surface, the Z_'j = Z (') = Z: and all
its derivatives are continuous. Here. '2 represents the
fuel side and '+' represents the air side. Also, T(r:', t) =
T(U, t) = Tr; p(r,', t) = p(r[, t) = t9¢and v(r¢', t) = v(rf.
t) = % Other jump conditions at the flame surface are
obtained from species and energy balances as follows
(assuming Le = I & D = D_ ):
,t,,.,,=
J,,.,- ,:
In terms of 7-. both Equs. (12) & (13) are
identically satisfied if the ftr_t derivatives of Z are equalat the flame surface. Thus, for the solution of F_,qu.(8) in
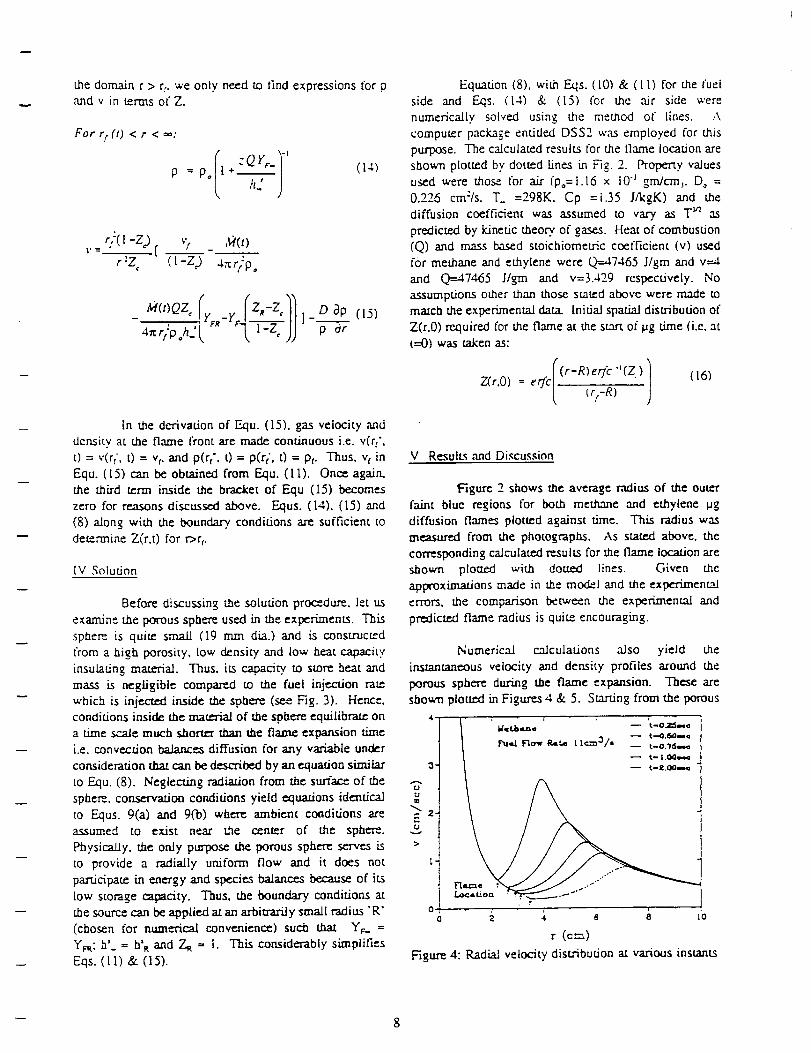
the domain r > r:. we only need to lind expressions for p,and v in terms of Z.
For r:(t) < r <=:
I -(2r,_p =po l+m
h. j
(14)
r::(t -2:)_[ _) _ ,_(0
r:Z (L-Z) J,_r/po
- 4rcr/p,h_, l r,- e--LI-T-_, II] -'-'_'_-
In the derivation of Equ. (15). gas velocity and
density at the flame front are made continuous i.e. v(q',
t) = v(rf', t) = yr. and p(q'. 0 = p(q', 0 = P_. Thus. vf in
Equ. (15) can be obtained from Equ. (11). Once again.
the third term inside the bracket of Equ (15) becomes
zero for reasons discussed above. F_,qus. (14). (15) and
(8) along with the boundary, conditions are sufficient to
determine Z(r.t) for r->rf.
IV Soludon
Before discussing the solution procedure, let us
examine r.be porous sphere used in the experiments. This
sphere is quite small (19 mm dia.) and is constructed
from a high porosity, low density and low heat capacity
insulating material. Thus. its capacity, to store beat and
mass is negligible compared to the fuel injection rate
which is injected inside the sphere (see Fig. 3). Hence.
conditions inside the material of the sphere equilibrate on
a time scale much shorter than me flame expansion time
i.e. convection bahances diffusion for any variable under
consideration that can be described by an equation similar
to Equ. (8). Neglecting radiation from the surface of the
sphere, conservati(m conditions yield equations identical
to Equs. 9(a) and 909) where ambient conditions are
assumed to exist near the center of the sphere.
PhysicaLly, the only purpose the porous sphere serves is
to provide a radially uniform flow and it does not
participate in energy and species balances because of its
tow storage capacity. Thus. the boundary conditions at
the source can be applied at an arbitrarily small radius "R"(chosen for numerical convenience) such thal Y_ =
Y_; b'_ = h' R and Z_ = 1. This considerably simplifies
Eqs. (11) & (15).
Equation (8). with Eqs. (L0) & (It) for the fuelside and Eqs. (t-,t) & (15) for the air side were
numerically solved using the method of lines. A
computer package entided DSS2 was employed for this
purpose. The calculated results for the tlame location are
shown plotted bv dotted lines in Fig. 2. Property values
used were those for air (Po=t.t6 × 10 j grn/c'm_. Do =
0.226 cm:/s. T. =298K. Cp =1.35 //kgK) and the
diffusion coefficient was assumed to vary as T 3n as
predicted by kinetic theory, of gases. Heat of combustion
(Q) and mass based stoichiometric coefficient (v) used
for methane and ethylene were Q---47465 J/gm and v--,¢
and Q---47465 I/gin and v=3.429 respectively. No
assumptions other than those stated above were made to
match the experimental data. Initial spatial distribution of
Z(r.0) required for the flame at the start of _tg time (i.e. at
t=O) was taken as:
. :(r-R)eff'c "LfZ)Z(r,O) = er]ct. (16)
L
V Results ,and Discussion
Figure 2 shows the average radius of the outer
faint blue regions for both methane and ethylene pg
diffusion flames plotted against time. This radius was
measured from the photographs. As stated above, the
corresponding calculated results for the flame location are
shown plotmd with dottex:l lines. Given the
aplxoximations made in the mod_l and the experimental
errors, _e comparison between the experimental and
predicted flame radius is quite encouraging.
Numerical calculations also yield the
instantaneous velocity and density profiles around the
porous sphere du.nng me flame expansion. These are
shown plotted in Figures 4 & 5. Starting from the porous
| - _ t..._.6,@_
f'ut,,d _,:,_ Rabe L tcznJ/= ?._,,,,.at-O
| _ _,- l.Q_g,*,,o
3' __ -- t-_,o_._
&
t"
0
r (_=)
Figure 4: Radial velocity distribution at various instants
-- 8
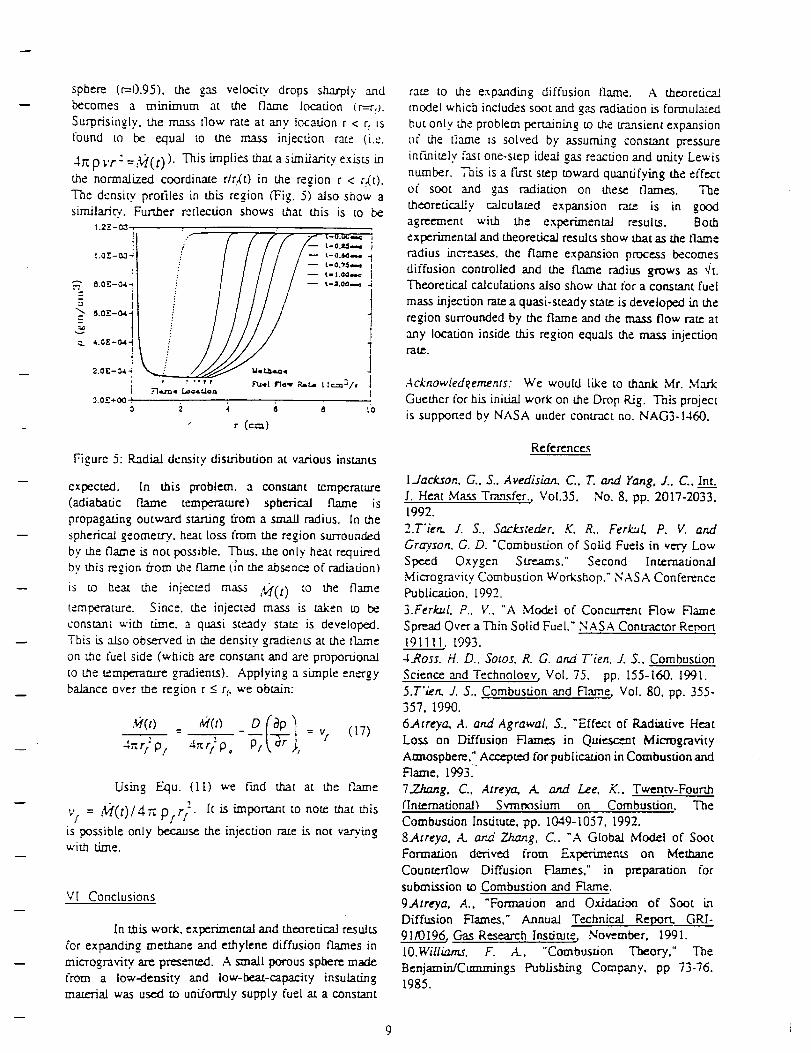
sphere (r=0.951. the gas velocity drops sharply and
becomes a minimum at the flame location (r=rg.Surprisingly. the mass flow rate at any location r < r, is
found to be equal to the mass injection rate (i.e.
4r_ p vr : =),;/(t) )' This implies that a similarity exists in
the normalized coordinate r/r.dt) in the region r < r,(t).
The density profiles in this region (Fig. 5) also show a
similarity. Further retlection shows that this is to be1.2Z-IX3
I.QZ-00-t -- t - o.M.,_,
i t-O.?$._-- I;. [ .Oel_.c
5
,N4.01[:-O4-
2.0£-0a.- NgLII,La4
_ "_ Fuql Irlo_ R_tA t Zc.._'t/f.--[,,a-m,, La_,*ao*a
_.O.T.+ O0 F
Figure 5: Radial density distribution at various instants
expected. In dais problem, a constant temperature
(adiabatic flame temperature) spherical flame is
propagating outward stamng fi'om a small radius. In the
spherical geometry,, heat loss from the region surrounded
by the flame is not possible. Thus, the only heat requiredby this region _om the flame (i'n the absence of radiation)
is to heat me injected mass _!J/'(/) to the flame
temperature. Since. the injected mass is taken to be
constant with time. a quasi steady state is developed.
This is also observed in the density gradients at the tlm'ne
on the fuel side (which are constant and are proportional
to the temperature gradients). Applying a simple energy
balance over the region r _<rr, we obtain:
M(t) = M(t) _ D 0(_)------v-- 4rcr/ 9/(Or), = vl (17)4_ r/p/ po
Using Equ. (Ii) we Fred that at the flame
v/ = ,Q(t)/47z p/rf-. It is important to note that this
is possible only because the injection rate is not varyingwith time.
V[ Conclusions
In this work. experimental and theoreticalresults
for ex[mnding methane and ethylene diffusion flames in
microgravity are presented. A small porous sphere made
from a low-density and Iow-tw..a.t-capacity insulating
material was used to uniformly supply fuel at a constant
ratz to the expanding diffusion flame. A theoretical
model which includes soot and gas radiation is formulated
but only the problem pertaining to the transient expansion
of the tlame is solved by assuming constant pressure
infinitely fast one-step ideal gas reaction and unity Lewis
number. "finis is a first step toward quantifying the effect
of soot and gas radiation on these tlames. The
theoretically calculated expansion rate is in goodagreement with the experimental results. Both
experimental and theoretical results show that as the flame
radius incre.a.ses, the flame expansion process becomes
diffusion controlled and the flame radius grows as '4't.Theoretical calculations also show that for a constant fuel
mass injection rate a quasi-steady state is developed in the
region surrounded by the flame and the _ flow rate at
any location inside this region equals the mass injectionrate.
,4cknowled_ements: We would like to thank Mr. Mark
Guether for his initial work on the Drop RAg. This projectis supported by NASA under contract no. NAG3-1460.
References
IJackson. G., S., Avedisian. C..T. and Yang, J.. C..Int__.=
1. Heat Mass Transfer., Vol.35, No. 8. pp. 2017-2033,1992.
2.T'ien. J. S., Sacksteder, K. R., Ferk.uL P. V. and
Grayson. G. D. "Combustion of Solid Fuels in very Low
Speed Oxygen Streams." Second International
Microgravity Combustion Workshops NASA ConferencePublication. t992.
3.Ferk.ul, P.. V., "A Model of Concurrent Flow Flame
Spread Over a Thin Solid Fuel." NASA Contractor Rer'_on
191111, 1.993.
4_Ross, H. D.. Sotos. R. G. atzd T'ien, J. S., Combustion
Science and Technology, Vol. 75. pp. 155-160. 1991.
5.T'Mn, Y. S.. Combustion and Name, Vol. 80. pp. 355-357, 1990.
6Atreya. A. and Agrawal, S.. "Effect of Radiative Heat
Loss on Diffusion Flames in Quiescent Microgravity
Amaosphem.". Accepted for publication in Combustion andFlame, 1993.
7.Zhang, C., Atreyck A_ and Lee, K.. Twenty-Fourth
(Intemational_ Svrnposium on Combustion. The
Combustion Institute. pp. 1.049-1057. 1992.
8,Atreya. A. and Zhang. C,, "A Global Model of Soot
Formation derived from Experiments on Methane
Counterflow Diffusion Flames." in preparation forsubmission to Combustion and Flame.
9Atreya. A.. "Formation and Oxidation of Soot in
Diffusion Flames," Annual Technical Report. GRI-
91/0196, Gas Research Institute, November. 1991.tO.Williams. F. A_ . "Combustion Theory." The
Benjamin/Cummings Publishing Company. pp 73-76.1985.
APPENDIX C
Radiati9n from Unsteady Spherical Diffusion Flames inMicrogravity
33nd Aerospace Sciences Meeting (AZAA 95-0148) paper
By
Pickett, K., Atreya, A., Agrawal, S., and Sacksteder, K. R.

n F_
AIAA 95-0148
Radiation From Unsteady SphericalDiffusion Flames in Microgravity
K. Pickett, A. Atreya and S. AgrawalDepartment of Mechanical Engineeringand Applied MechanicsThe University of MichiganAnn Arbor, MI 48109-2125
K. R. Sacksteder
Microgravity Combustion ResearchNASA Lewis Research Center
Cleveland, OH 44135
]
]
]
-I
33rd Aerospace SciencesMeeting and Exhibit
i January 9-12, 1995 / Reno, NV
;or permission to copy or republish, contact the American Institute of Aeronautics and Astronautics
70 L'Enfant Promenade, S.W., Washington, D.C. 20024
RADIATION FROM UNSTEADY SPHERICAL DIFFUSION FLAMES IN MICROGRAVITY
Kent Pickett, Arvind Atreya and Sanjay Agrawal
Combustion and Heat Transfer Laboratory
Department of Mechanical Engineering and Applied Mechanics
The University of Michigan. Ann Arbor, MI 48109-2125
Kurt R. Sacksteder
Microgravity Combustion ResearchNASA Lewis Research Center
Cleveland, OH 44135
Abstract
This paper presents the experimental results
of flame temperature and radiation for expanding
spherical diffusion flames in microgravity. A small
porous sphere mad6 from a low-density and low-
heat-capacity insulating material was used to
uniformly supply fuel, at a nearly constant rate, to
the expanding spherical diffusion flame. Three
gaseous fuels methane, ethylene and acetylene wereused with fuel flow rates ranging from 12 to 28
ml/sec. Time histories of the radius of the spherical
diffusion flame, its temperature and the radiation
emitted by it were measured. The objective is to
quantify the effect of soot and gas radiation on these
diffusion flames. The experimental results show thatas the flame radius increases, the flame expansion
process becomes diffusion controlled and the flameradius grows roughly as ",]t. While previoustheoretical calculations for non-radiative flames show
that for a constant fuel mass injection rate a quasi-
steady state is developed inside the region
surrounded by the flame, current experimental resultsshow a substantial reduction in the temperature and
flame luminosity with time.
I. Introduction
The absence of buoyancy-induced flows in
a microgravity environment and the resulting
increase in the reactant residence time significantly
alters the fundamentals of many combustion
processes. Substantial differences between normal
gravity and microgravity flames have been reported
during droplet combustion[l], flame spread over
solids[2,3], candle flames[4] and others. Thesedifferences are more basic than just in the visible
flame shape. Longer residence time and higher
concentration of combustion products create a
thermochemical environment which changes the
flame chemistry. Processes such as soot formation
and oxidation and ensuing flame radiation, which are
often ignored under normal gravity, become very
important and sometimes controlling. As anexample, consider the droplet burning problem. The
visible flame shape is spherical under microgravity
versus a teardrop shape under normal gravity. Since
most models of droplet combustion utilize spherical
symmetry, excellent agreement with experiments is
anticipated. However, microgravity experimentsshow that a soot shell is formed between the flame
and the evaporating droplet of a sooty fuel[l ]. Thissoot shell alters the heat and mass transfer between
the droplet and its flame resulting in significant
changes in the burning rate and the propensity forflame extinction. This change in the nature of the
process seems to have occurred because of tworeasons: (i) The soot formed could not be swept out
of the flame due to the absence of buoyant flows.
Instead, it was forced to go through the high
temperature reaction zone increasing the radiativeheat losses, and (ii) soot formation was enhanced
due to an increase in the reactant residence time.
Recently, some very interesting observationsof candle flames under various atmospheres in
microgravity have been reported[4]. It was found
that for the same atmosphere, the burning rate perunit wick surface area and the flame temperature
were considerably reduced in microgravity as
compared with normal gravity. Also, the flame
(spherical in microgravity) was much thicker andfurther removed from the wick. It thus appears that
the flame becomes "weaker" in microgravity due to
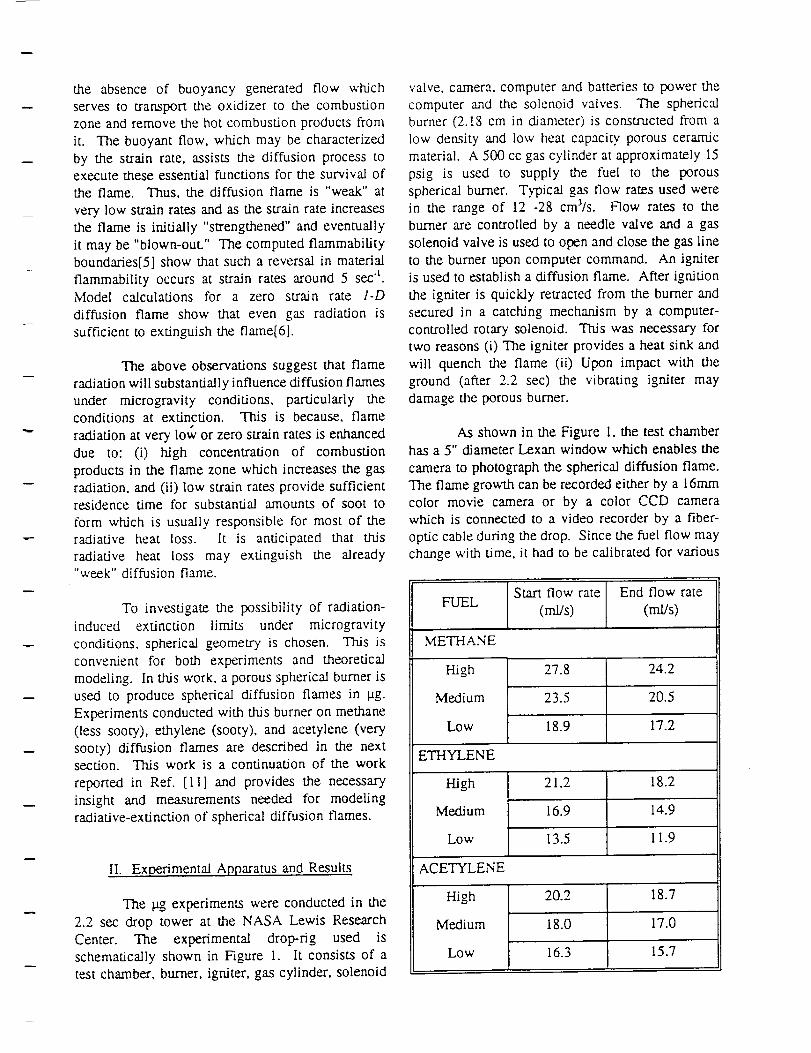
the absenceof buoyancygeneratedflow whichservesto transportthe oxidizerto the combustionzoneandremovethehotcombustionproductsfromit. Thebuoyantflow, whichmaybecharacterizedby the strainrate,assiststhe diffusionprocesstoexecutetheseessentialfunctionsfor thesurvivaloftheflame. Thus,thediffusion flame is "weak" at
very low strain rates and as the strain rate increasesthe flame is initially "strengthened" and eventually
it may be "blown-out." The computed flammability
boundaries[5] show that such a reversal in material
flammability occurs at strain rates around 5 sec t.Model calculations for a zero strain rate 1-D
diffusion flame show that even gas radiation is
sufficient to extinguish the flame[6].
The above observations suggest that flame
radiation will substantially influence diffusion flames
under microgravity conditions, particularly theconditions at extinction. This is because, flame
radiation at very low or zero strain rates is enhanced
due to: (i) high concentration of combustion
products in the flame zone which increases the gasradiation, and (ii) low strain rates provide sufficientresidence time for substantial amounts of soot to
form which is usually responsible for most of theradiative heat loss. It is anticipated that tl-fis
radiative heat loss may extinguish the already"week" diffusion flame.
To investigate the possibility of radiation-
induced extinction limits under mJcrogravity
conditions, spherical geometry is chosen. This isconvenient for both experiments and theoretical
modeling. In this work, a porous spherical burner is
used to produce spherical diffusion flames in gg.
Experiments conducted with this burner on methane
(less sooty), ethylene (sooty), and acetylene (very
sooty) diffusion flames are described in the nextsection. This work is a continuation of the work
reported in Ref. [11] and provides the necessary
insight and measurements needed for modelingradiative-extinction of spherical diffusion flames.
II. Experimental Apparatus and Results
The lag experiments were conducted in the
2.2 sec drop tower at the NASA Lewis Research
Center. The experimental drop-rig used is
schematically shown in Figure I. It consists of a
test chamber, burner, igniter, gas cylinder, solenoid
valve, camera, computer and batteries to power the
computer and the solenoid valves. The sphericalburner (2.18 cm in diameter) is constructed from a
low density and low heat capacity, porous ceramic
material. A 500 cc gas cylinder at approximately 15
psig is used to supply the fuel to the porous
spherical burner. Typical gas flow rates used were
in the range of 12 -28 cm3/s. Flow rates to the
burner are controlled by a needle valve and a gas
solenoid valve is used to open and close the gas line
to the burner upon computer command. An igniter
is used to establish a diffusion flame. After ignition
the igniter is quickly retracted from the burner andsecured in a catching mechanism by a computer-
controlled rotary solenoid. This was necessary for
two reasons (i) The igniter provides a heat sink and
will quench the flame (ii) Upon impact with the
ground (after 2.2 sec) the vibrating igniter maydamage the porous burner.
As shown in the Figure 1. the test chamberhas a 5" diameter Lexan window which enables the
camera to photograph the spherical diffusion flame.
The flame growth can be recorded either by a 16ram
color movie camera or by a color CCD camerawhich is connected to a video recorder by a fiber-
optic cable during the drop. Since the fuel flow maychange with time, it had to be calibrated for various
Start flow rate End flow rateFUEL
(mr/s) (mr/s)
METHANE
27.8 24.2High
Medium
Low
23.5
18.9
20.5
17.2
ETHYLENE
High
Medium
Low
ACETYLENE
21.2
16.9
13.5
High
Medium
Low
20.2
18.0
16.3
18.2
14.9
11.9
18.7
17.0
15.7

"-_ 4'
cJv
AIurmnumFr'am_
C?[indricaJ Test Chamber
"I_ncrmocouples
P°r°us l I
Phoioc_lls Ccra_cl Ty!:< S
u, lth cin:ua( burner //
I F[G"".esval,,.¢aI_
II
m
I Ta_'tle_e "SBC
Data Acqcusiuon System
Obsc_
/ Mc_nng Valves \
i
Signal Conditioning
•,,-,¢v5¢_ ,--.%PI%' ",,_P,",",',,",'
Figure 1 Schematic of Experimental Drop-rig
t
c,Q
o uet.hQne
8 a8
o
,', Xl4_a
C3 u,e_um
0 Lo_, i
Time (see)
i
o
o
Time (see)
Fig 2(a) Methane Flame Fig 2(c) Acetylene Flame
cJ
_n 4,-=
:3-
I ,
aa 6
@
o L_yI_
0 i_,r
0.8-
0.(5
0.2- 1
ON I 00lJO O'_O o'?o OIQO _ " i 0 I e_O I.SO _.?0 I'_0
WaveLength ,CU._ )
"_ 0.4-<:
Fig 2(b) Hame
Ethylene Ha_me
radius as a function of time; Fig 3: Calibration curves for photodiodes
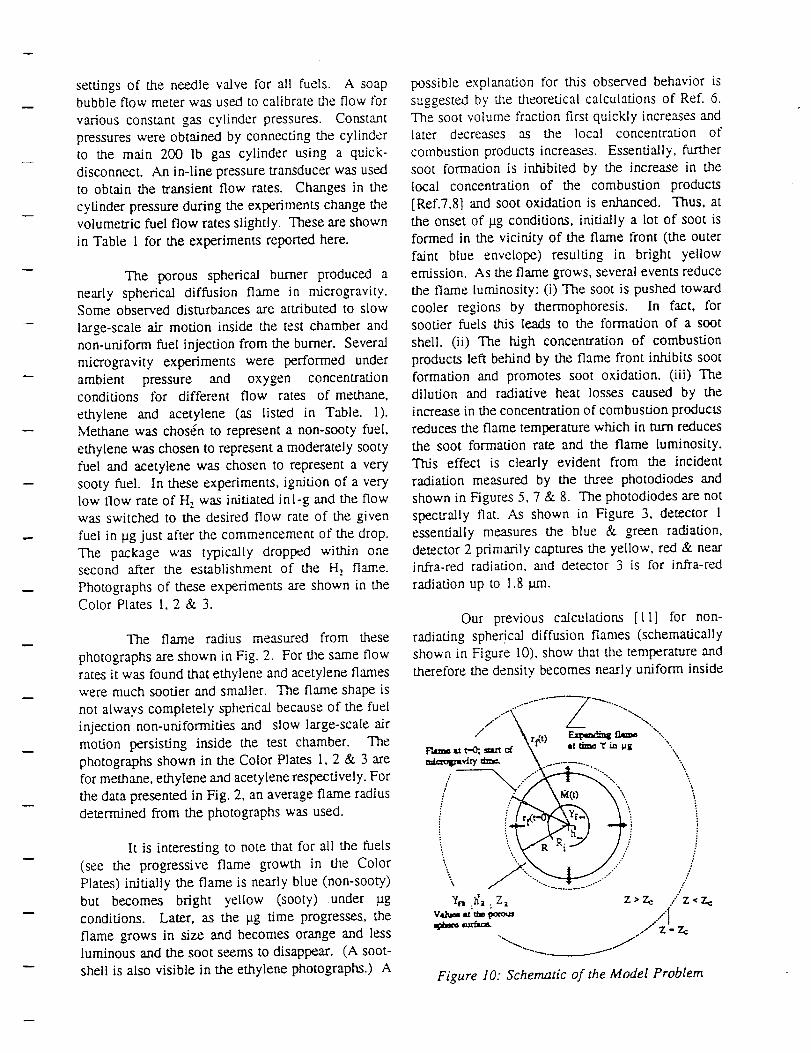
settingsof theneedlevalvefor all fuels. A soapbubbleflow meterwasusedto calibratetheflow forvariousconstantgascylinderpressures.Constantpressureswereobtainedbyconnectingthecylinderto the main 200 lb gascylinderusing a quick-disconnect.Anin-linepressuretransducerwasusedto obtainthetransientflow rates. Changesin thecylinderpressureduring the experiments change the
volumetric fuel flow rates slightly. These are shown
in Table 1 for the experiments reported here.
The porous spherical burner produced a
nearly spherical diffusion flame in microgravity.Some observed disturbances are attributed to slow
large-scale air motion inside the test chamber and
non-uniform fuel injection from the burner. Several
microgravity experiments were performed under
ambient pressure and oxygen concentrationconditions for different flow rates of methane,
ethylene and acetylene (as listed in Table. 1).
blethane was chosdn to represent a non-sooty fuel,
ethylene was chosen to represent a moderately sootyfuel and acetylene was chosen to represent a very
sooty fuel. In these experiments, ignition of a very
low flow rate of H: was initiated inl-g and the flowwas switched to the desired flow rate of the given
fuel in lag just after the commencement of the drop.
The package was typically dropped within onesecond after the establishment of the H, flame.
Photographs of these experiments are shown in theColor Plates 1, 2 & 3.
The flame radius measured from these
photographs are shown in Fig. 2. For the same flowrates it was found that ethylene and acetylene flameswere much sootier and smaller. The flame shape is
not always completely spherical because of the fuel
injection non-uniformities and slow large-scale air
motion persisting inside the test chamber. The
photographs shown in the Color Plates 1, 2 & 3 are
for methane, ethylene and acetylene respectively. For
the data presented in Fig. 2, an average flame radius
determined from the photographs was used.
It is interesting to note that for all the fuels
(see the progressive flame growth in the Color
Plates) initially the flame is nearly blue (non-sooty)
but becomes bright yellow (sooty)under lagconditions. Later, as the lag time progresses, the
flame grows in size and becomes orange and less
luminous and the soot seems to disappear. (A soot-shell is also visible in the ethylene photographs.) A
possible explanation for this observed behavior is
suggested by the theoretical calculations of Ref. (5.
The soot volume fraction first quickly increases andlater decreases as the local concentration of
combustion products increases. Essentially, furthersoot formation is inhibited by the increase in the
local concentration of the combustion products
[Ref.7,8] and soot oxidation is enhanced. Thus, at
the onset of tag conditions, initially a lot of soot is
formed in the vicinity of the flame front (the outer
faint blue envelope) resulting in bright yellow
emission. As the flame grows, several events reduce
the flame luminosity: (i) The soot is pushed toward
cooler regions by thermophoresis. In fact, forsootier fuels this leads to the formation of a soot
shell. (ii) The high concentration of combustion
products left behind by the flame front inhibits soot
formation and promotes soot oxidation. (iii) Thedilution and radiative heat losses caused by the
increase in the concentration of combustion products
reduces the flame temperature which in turn reduces
the soot formation rate and the flame luminosity.
This effect is clearly evident from the incident
radiation measured by the three photodiodes and
shown in Figures 5, 7 & 8. The photodiodes are not
spectraily flat. As shown in Figure 3, detector 1
essentially measures the blue & green radiation,
detector 2 primarily captures the yellow, red & nearinfra-red radiation, and detector 3 is for infra-red
radiation up to 1.8 grn.
Our previous calculations [11] for non-
radiating sphen.'cal diffusion flames (schematically
shown in Figure 10), show that the temperature and
therefore the density becomes nearly uniform inside
\
/
/
..//z<z_
Figure 10: Schematic of the Model Problem
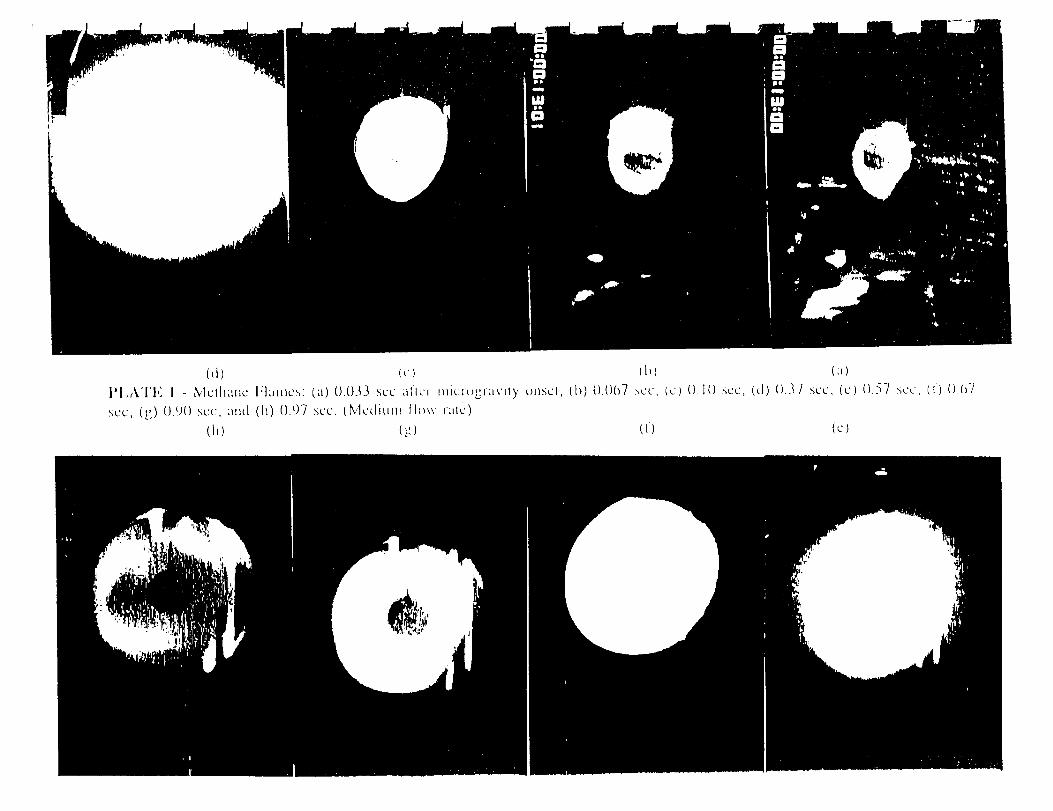
(d) (_-) (b) (;k)
i_'I_A'I'I_ 1 - /'v'l_tllat_ l'ialt_c_: {a) C).C)33 s_.'c ;_ltL', ,l_*,._rL_r:,','ity _.m:-;ct, (b) 0.C)67 >,c__,to) ()I{) _.'c, (el) ().3Y sL',._,Co) C)..'$7_c__. (l) ().(_V
_cc, (_;) 0.9() s_,._, :uld (h) ().t)? scc. cMcdiu,ll t1_,,_. ,:lt_.')
(h) (g) (1) (c;
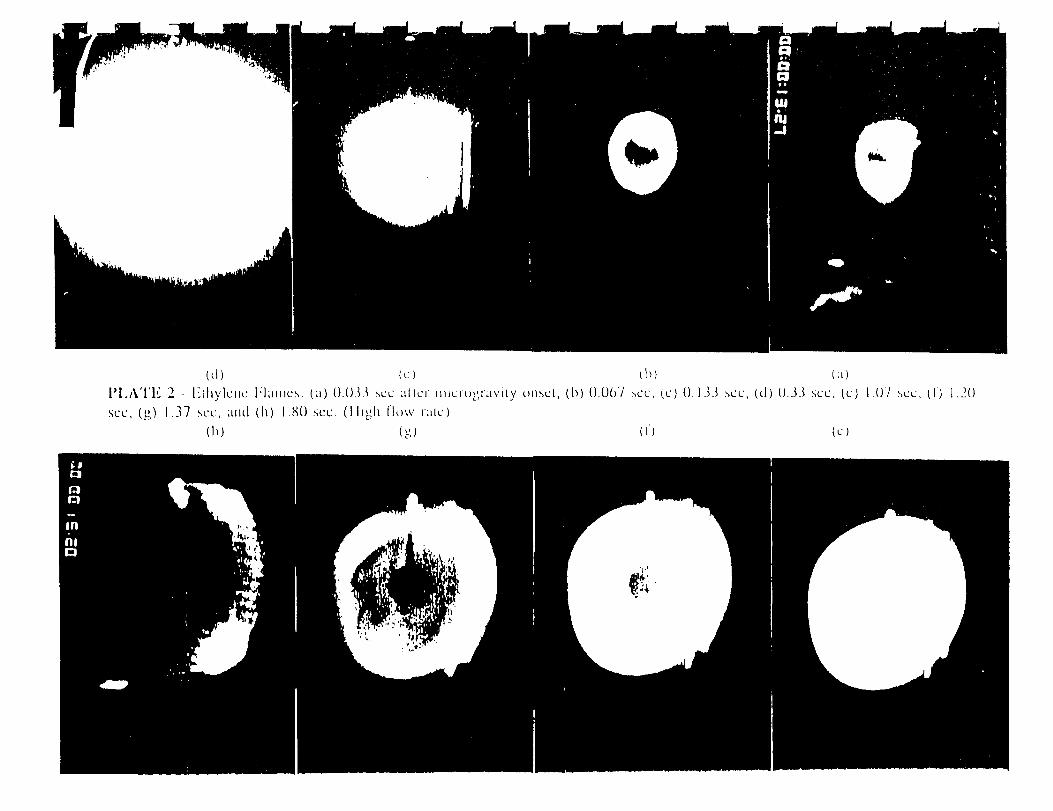
(d) Ic) tl>) C;t)I'I,ATI':" 2 - litllylunu l:l;+inlc:-;: Ca) 0.033 _,c,.: ;tttuF t+li,+:_,.)gt;+L,,'ityt+:,t+sct,Cb)().0(+/7 nee. i<.:+)().133 _cc, (d)t].33 sue, (c) I ()-] _cu, (i) 1.2()
suc, (g) 1.37 sue, .and (It) 1.80 suc. (lligh Ilc, w i;ttc)
(11) g) Cl) to)

(d) (c) (h) (a)
I'I_A'I'I_ 3 - Ace(ylclle Flames: (a) 0.033 see allcr Inicrogravily onset, (b) ().067 ._ec, (c) 0.10 s¢c, (d) 0.20 s_'c, (L:) 0.37 _cc, (f) 0.50see, (g) 1.90 ._cc, and (h) 2.13 scc. (iligh II¢_w ralc)
(h) (g) (f) Co)

i r
.... 3.0¢m Qwty froro _lnP.er
120<3 2.'lcm +,qr_y Prom ce=_er
A'..p/_4rs aurf4al
_" Looo-_ ..' ...............
?. .-= e00
_oo •
0 1 2
Time (sec)
(a) Low Flow Rate
v,
1300-
• --- 3.0<=121 _lWe!r fl"on= c_nter
-- 2,3c_ 4wly _'_;"o c_ntcr
• • At _pb+re _aa_II00-
700-
500_._ /
.,.3C0 " " ..................................
i i
Time (sec)
0.014-
t-' 0.012-
0.010-
0_, _ 0.008-
_ o.oo_
_ 0.004'
"0
"_ O.OOZ.
0.000
.... L
t 2
Ti_me (sec)
(a) Detector I
+..*ife,,,¢,,_
_o ,, ,++.,,+0
+1,.,,¢_ 4.
0,"
.... f.
-- II
-- H
i i
Time (sec)
(b) Medium Flow Rate (b) Detector 2
1200"
"_ IO00-
= eoo-
eoo-
400-
200
0
--- 3.0_=1 m_7 Pr_l= e.+ll_,ir
c_n er
.:
Ttme (see)
e+ 20"
-- L
-- M
\! 2
T'.me(_ec)
(c) High Flow Rate
Fig 4: Flame Temperatures for Methane
(c) Detector 3
Fig 5: Incidence radiation detected by photodiodes

1200-
lO00-v
= 600-
800-
_.,,
400_
200
.... 30¢_ a_s T _'o_ c_nrter
2.3¢=_ tlrm 7 f_'om cl=ter
• • At ipb_rq eurfao¢
i iTime (sec)
(a) Low Flow Rate
1200"
I000-
600-
E 600-
400-
200
.... 3.o©m ,vl), fror_ ©eGLar
-- 2,'1¢=_ _,qrly f'_nl c_:itGr
• - At _r_'eurfeaq
¢. "'°-......,.
Time (see)
_-" o.o16]E
4e,-- 0.012-_
"_. o.oos-
o.oo4-_J
0,000
(a) Detector 1
r.
.o s..,
_2
0
.... L
Time (sec)
--- L
• B
I 2
T'me (sec)
(b) Medium Flow Rate (b) Detector 2
1200-
_" 1000-
_00_
600-
E-
400-
"'- 3.0C=_ a_rs 7 rl'or_ c_Gr.4r
_.3¢m 4srs 7 from osn_r
.°
200
Time (sec)
120"
o,.--_ 0 80-
40-
.=¢Jt-
C
o i i
rlme (see)
L
: ..
(c) High Flow Rate
Fig 6: Flame Temperatures for Ethylene
(c) Detector 3
Fig 7: Incidence radiation detected by photodiodes

r
.... 2.QCEI1 i_!r :ro_ cel_Ler
1200 2.3cm Q,,r_y from oeD.L_r
At Irph4_r,i ¢u_a=4
v_" I°°° I /."................................:j -....o_ .................;,.. :.
8oo-i /_00
4O0 "•.
• -.o ...................................
2001
0 I 2
Time (see)
(a) Low Flow Rate
1300
1 ,T.00 -
v
,, "?00
b.
300 ] "'"
0
.... 2.G¢_Q mink? r_ol_l c_Qtar
-- 2.3_-m 4,mh? rrorri clo_er
• • At mph.r,i Amrf6o_
!t
T_me (see)
0.05-
,_. O.04-
v
o O,03-
"dlU
_ .O
0.o t..-,o
0.00 L
"--" L
-- U
"" H
Time (see)
(a) Detector l
3O
E
v
=_ zo,
a_
"-- L
-- M
Ttme (sec)
(b) Medium Flow Rate (b) Detector 2
1300 i
!/1__..... .°_.."
_00_-f//.. .....................................
300 _ , ,
v
E
0 I 2
Tlm_ (sec)
_'_ 150-
_ 120.
_O
e,
_ 40-
-- L
\ • - H
"rim. (,-:)
(c) High Flow rate
Fig 8: Flame Temperatures for Acetylene
(c) Detector 3
Fig 9: Incidence radiation detected by photodiodes
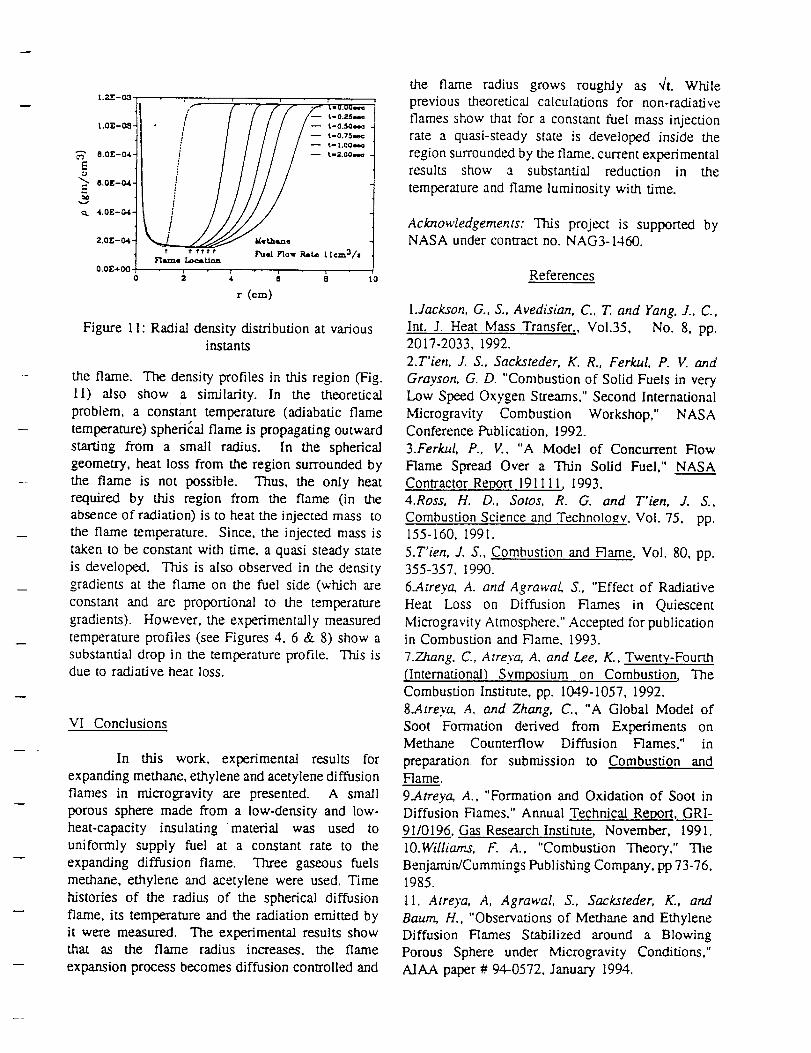
1.21g-Oa
I.OE-OS-
_" 8.0E-O4-
E
" 8.0E-O._-
_, 4.0E-04
2.0E-0.4.
O.OE+O0
t
I I I i i i- t-o.5o,.,_i r / / / / -,.-o.-,,,_i I / / / -- t-l.o,,.,..
Nqth,ane
' ' f'' _ Fuel Flow Ra_ 1 lcm'_/sFl_e Loc_ l.lcm
r (_m)
Figure 11: Radial density distribution at variousinstants
the flame. The density profiles in this region (Fig.11) also show a similarity. In the theoretical
problem, a constant temperature (adiabatic flame
temperature) spherical flame is propagating outward
starting from a small radius. In the spherical
geometry, heat loss from the region surrounded by
the flame is not possible. Thus, the only heat
required by this region from the flame (in the
absence of radiation) is to heat the injected mass to
the flame temperature. Since, the injected mass is
taken to be constant with time, a quasi steady state
is developed. This is also observed in the density
gradients at the flame on the fuel side (which are
constant and are proportional to the temperature
gradients). However, the experimentally measured
temperature profiles (see Figures 4, 6 & 8) show a
substantial drop in the temperature profile. This isclue to radiative heat loss.
VI Conclusions
In this work, experimental results for
expanding methane, ethylene and acetylene diffusion
flames in microgravity are presented. A small
porous sphere made from a low-density and low-
heat-capacity insulating material was used to
uniformly supply fuel at a constant rate to the
expanding diffusion flame. Three gaseous fuels
methane, ethylene and acetylene were used. Time
histories of the radius of the spherical diffusion
flame, its temperature and the radiation emitted by
it were measured. The experimental results showthat as the flame radius increases, the flame
expansion process becomes diffusion controlled and
the flame radius grows roughly as _/t. Whileprevious theoretical calculations for non-radiative
flames show that for a constant fuel mass injection
rate a quasi-steady state is developed inside the
region surrounded by the flame, current experimentalresults show a substantial reduction in the
temperature and flame luminosity with time.
Acknowledgements: This project is supported byNASA under contract no. NAG3-1460.
References
l.Jackson, G., S., Avedisian, C., T. and Yang, J., C,
Int. J. Heat Mass Transfer., Vol.35, No. 8, pp.2017-2033, 1992.
2.T'ien, .I.S., Sacksteder, K. R., Ferkul, P. V. and
Grayson, G. D. "Combustion of Solid Fuels in very
Low Speed Oxygen Streams," Second International
Microgravity Combustion Workshop," NASAConference Publication, 1992.
3.Ferkul, P., V., "A Model of Concurrent Flow
Flame Spread Over a Thin Solid Fuel," NASA
Contractor Report 191111, 1993.
4.Ross, H. D., Sotos, R. G. and T'ien, .I.S.,
Combustion Science and Technology Vol. 75, pp.155-160, 1991.
5.T'ien, .I.S., Combustion and Flame, Vol. 80, pp.355-357, 1990.
6.Atreya, A. and Agrawal, S., "Effect of Radiative
Heat Loss on Diffusion Flames in Quiescent
Microgravity Atmosphere," Accepted for publicationin Combustion and Flame, 1993.
7.Zhang, C., Atreya, A. and Lee, K., Twenty-Fourth
(International) Symposium on Combustion, The
Combustion Institute, pp. 1049-1057, 1992.
8.Atreya, A. and Zhang, C., "A Global Model of
Soot Formation derived from Experiments onMethane Counterflow Diffusion Flames," in
preparation for submission to Combustion andFlame.
9.Atreya, A., "Formation and Oxidation of Soot in
Diffusion Flames," Annual Technical Report, GRI-
91__/0196, Gas Research Institute, November, 1991.
lO.Williams, F. A., "Combustion Theory," The
Benjamin/Cummings Publishing Company, pp 73-76,1985.
11. Atreya, A, Agrawal, S., Sacksteder, K., and
Baum, H., "Observations of Methane and Ethylene
Diffusion Flames Stabilized around a Blowing
Porous Sphere under Microgravity Conditions,"
AIAA paper # 94-0572, January 1994.

APPENDIX D
Radiant Extinction of Gaseous Diffusion Flames
3rd International Microgravity Conference, April, 1995 paper
By
Atreya, A., Agrawal, S., Shamim, T., Pickett, K., Sacksteder, K.R. and Baum, H. R.

RADIANT EXTINCTION OF GASEOUS DIFFUSION FLAMES
Arvind Atreya, Sanjay Agrawal, Tariq Shamim & Kent Pickett
University of Michigan; Ann Arbor, MI 48109
Kurt R. Sacksteder
NASA Lewis Research Center; Cleveland, OH 44135
Howard R. Baum
NIST, Gaithersburg, MD 20899
INTRODUCTION
The absence of buoyancy-induced flows in micr%_-avity sigmificantly alters the fundamentals of
many combustion processes. Substantial differences between normal-gravity and microgravity flames have
been reported during droplet combustion[l], flame spread over solids[2,3], candle flames[4] and others.
These differences are more basic than just in the visible flame shape. Longer residence time and higher
concentration of combustion products create a thermochemical environment which changes the flame
chemistry. Processes such as flame radiation, that are often ignored under normal _avity, become very
important and sometimes even controlling. This is particularly true for conditions at extinction of a pgdiffusion flame.
Under normal-gravity, the buoyant flow, which may be characterized by the strain rate, assists the
diffusion process to transport the fuel & oxidizer to the combustion zone and remove the hot combustion
products from it. These are essential functions for the survival of the flame which needs fuel & oxidizer.
Thus, as the strain rate is increased, the diffusion flame which is "weak" (reduced burning rate per unit
flame area) at low strain rates is initially "strengthened" and eventually it may be "blown-out." Most of
the previous research on diffusion flame extinction has been conducted at the high strain rate "blow-off'
limit. The literature substantially lacks information on low strain rate, radiation-induced, extinction of
diffusion flames. At the low strain rates encountered in tag, flame radiation is enhanced due to: (i) build-up
of combustion products in the flame zone which increases the gas radiation, and (ii) low strain rates
provide sufficient residence time for substantial amounts of soot to form which further increases the flameradiation. It is expected that this radiative heat loss will extinguish the already "weak" diffusion flame
under certain conditions. Identifying these conditions (ambient atmosphere, fuel flow rate, fuel type, etc.)
is important for spacecraft fire safety. Thus, the objective of this research is to experimentally and
theoretically investigate the radiation-induced extinction of diffusion flames in pg and determine the effect
of flame radiation on the "weak"/.tg diffusion flame.
RESEARCH APPROACH
To investigate radiation-induced extinction, spherical and counterflow geometries are chosen for
pg & 1-g respectively for the following reasons: Under/ag conditions, a spherical burner is used to

produceasphericaldiffusionflame.Thisforcesthecombustionproducts(includingsootwhichis formedonthefuel sideof thediffusionflame)intothehightemperaturereactionzoneandmaycauseradiative-extinctionundersuitableconditions.Undernormal-gravityconditions,however,thebuoyancy-inducedflow field aroundthesphericalburneris complexandunsuitablefor studyingflameextinction.Thus,aone-dimensionalcounterflowdiffusionflameis chosenfor 1-g experiments and modeling. At low strain
rates, with the diffusion flame on the fuel side of the stagnation plane, conditions similar to the lag case
are created -- the soot is again forced through the high temperature reaction zone. The 1-g experiments
are primarily used to determine the rates of formation and oxidation of soot in the thermochemical
environment present under lag conditions. These rates are necessary for modeling purposes. Transientnumerical models for both lag and 1-g cases are being developed to provide a theoretical basis for the
experiments. These models include soot formation and oxidation and flame radiation and will help
quantify the low-strain-rate radiation-affected diffusion flame extinction limits.
RESULTS
Significant progress has been made on both experimental and theoretical parts of this research. This
may be summarized as follows:
1) Experimental and theoretical work on determining the expansion rate of the lag spherical diffusion
flame. Preliminary results were presented at the ALAA conference (Ref. 5).2) Theoretical modeling of zero strain rate transient diffusion flame with radiation (Ref. 6).
3) Experimental and theoretical work for determining the radiation from the lag spherical diffusionflame. Preliminary results were presented at the kJAA conference (Ref. 7).
4) Theoretical modeling of finite strain rate transient counterflow diffusion flame with radiation (Ref
8).
5) Experimental work on counterflow diffusion flames to determine the soot formation and oxidation
rates (Ref. 9).
The above experimental and theoretical work is briefly summarized in the remainder of this section.
Experimental Work: The lag experiments were conducted in the 2.2 sec drop tower at the NASA LewisResearch Center and the counterflow diffusion flame experiments (not described here) were performed at
UM. For the lag experiments, a porous spherical burner was used to produce nearly spherical diffusion
flames. Several experiments, under ambient pressure and oxygen concentration conditions, were performedwith methane (less sooty), ethylene (sooty), and acetylene (very sooty) for flow rates ranging from 4 to
28 cm3/s. These fuel flow rates were set by a needle valve and a solenoid valve was used to open and
close the gas line to the burner upon computer command. Two ignition methods were used for these
experiments: (i) The burner was ignited in 1-g with the desired fuel flow rate and the package was
dropped within one second after ignition. (ii) The burner was ignited in 1-g with a very low flow rate of
H,. and the flow was switched to the desired flow rate of the given fuel in lag just after the commencement
of the drop. Following measurements were made during the lag experiments:
i) The flame radius was measured from photographs taken by a color CCD camera. Image
processing was used to determine both the flame radius and the relative image intensity. Sample
photographs are shown in Photos E1 to E3 for ethylene and AI to A3 for acetylene.ii) Theflame radiation was measured by the three photodiodes with different spectral absorptivities.
The first photodiode essentially measures the blue & green radiation, the second photodiode
captures the yellow, red & near infra-red radiation, and the third photodiode is for infra-red
radiation from 0.8 to 1.8 jam.
iii) The flame temperature was measured by two S-type thermocouples and the sphere surface
temperature was measured by a K-type thermocouple. In both cases 0.003" diameter wire wasused. The measured temperatures were later corrected for time response and radiation.

It is interestingto notethatfor bothethyleneandacetylene(seetheprovessiveflamegrowthin theColor Photos)initially the flame is blue (non-sooty)but becomesbright yellow (sooty)under lagconditions.Later,asthe_g time progresses,the flamegrowsin sizeandbecomesorangeand lessluminousandthesootluminosityseemsto disappear.A possibleexplanationfor thisobservedbehaviorissuggestedbythetheoreticalcalculationsof Ref.6& 8. Thesootvolumefractionfirst quicklyincreasesandlaterdecreasesasthelocalconcentrationof combustionproductsincreases.Essentially,furthersootformationis inhibitedby theincreasein the localconcentrationof thecombustionproductsandsootoxidationisenhanced[Ref.9,10].Also,thehightemperaturereactionzonemovesawayfromthealreadypresentsootleavingbehindarelativelycold(non-luminous)sootshell. (A soot-shellisclearlyvisibleintheethylenePhotoE2.) Thus,attheonsetof lagconditions,initiallya lot of sootis formedin thevicinityof theflamefront (theouterfaintblueenvelopein thephotographs)resultingin brightyellowemission.Astheflame_ows,severaleventsreducetheflameluminosity:(i) Thehighconcentrationof combustionproductsleft behindby theflamefrontinhibitstheformationof newsootandpromotessootoxidation.(ii) Theprimaryreactionzone,seekingoxygen,movesawayfromthesootregionandthesootispushedtowardcoolerregionsbythermophoresis.Boththeseeffectsincreasethedistancebetweenthesootlayerand the reactionzone. (iii) The dilution and radiativeheat lossescausedby the increasein theconcentrationof thecombustionproductsreducestheflametemperaturewhich in turnreducesthesootformationrateandtheflameluminosity.
Uponfurthero_servation,wenotethattheethyleneflamesbecomebluetowardtheendof the/_gtimewhiletheacetyleneflamesremainluminousyellow(althoughtheintensityissignificantlyreducedasseenbythephotodiodemeasurementsin Figure2). Thisisbecauseofthehighersootingtendencyof acetylenewhichenablessootformationtopersistfor a longertime. Thus,acetylenesootremainscloserto thehightemperaturereactionzonefor a longertimemakingtheaveragesoottemperaturehigherandthedistancebetweenthesootandthe reactionlayerssmaller. Eventually,as is evidentfrom Figure2, eventheacetyleneflameswill becomeblueinpg. FromFigure2 wenotethatthepeakradiationintensityoccursat about2.5cm flameradiuswhichcorrespondsto a time of about0.2 seconds.This is almostthelocationof the first thermocouplewhoseoutputis plottedin Figures3 & 4 as Tgas(1). From thetemperaturemeasurementspresentedin Figures3 & 4, wenotethat:(i) Theflameradiationsignificantlyreducestheflametemperature(comparethepeaksof thesecondthermocouplewith thoseof thefirst forbothfuels)by approximately300Kfor ethyleneand5OOKfor acetylene.(In fact, theacetyleneflameseemsto beon thethresholdof extinctionat thisinstant.)(ii) Thetemperatureof theacetyleneflameisabout2OOKlowerthantheethyleneflameatthefirstthermocouplelocation.(iii) Thefinalgastemperatureis alsoabout100Klowerfor theacetyleneflame,whichis consistentwith largerradiativeheatloss.
The datafrom thephotodiodesis furtherreducedto obtainthe totalsootmassandthe averagetemperatureof thesootlayer. This is plottedin Figures5 & 6. Thesefiguresshowthattheaverageacetylenesootlayertemperatureishigherthantheaverageethylenesootlayertemperature.Thetotalsootmassproducedbyacetylenepeaksat0.2secondswhichcorrespondstothepeakof thefirst thermocouple,explainingthelargedropin temperature.Also, the acetylene soot layer is cooling more slowly than the
ethylene soot layer which is consistent with the above discussion regarding the photographic observations.
Thus, for ethylene the reaction layer is moving away faster from the soot layer than in the case of
acetylene. This is also consistent with the fact that ethylene soot mass becomes nearly constant but theacetylene soot mass reduces due to oxidation. Finally, the rate of increase in the total soot mass (i.e. the
soot production rate) should be related to the sooting tendency of a given fuel. This corresponds to the
slope of the soot mass curve in Figures 5 & 6. Clearly, the slope for acetylene is higher.
The flame radius measurements, presented in Figure 1, show a substantial change in the growth rate
from initially being roughly proportional to tm to eventually (after significant radiative heat loss) being

proportionalto t_/_.In Ref. 5, wehaddevelopedamodelfor theexpansionrateof non-radiatingflameswhich is currently beingmodified to includetheeffectsof radiantheatloss.
Theoretical Work: Due to lack of space, only ourmost recent theoretical work is summarized here. In
this work, to quantify the low-strain-rate radiation-
induced diffusion flame extinction limits, a
computational model has been developed for anunsteady counterflow diffusion flame. So far, only the
radiative heat loss from combustion products (CO 2 and
H,_O) have been considered in the formulation. The
computations show a significant reduction in the flame
temperature due to radiation. The adjacent figure
1,11_1,
2,L_II
'zr_l
=
_ J
'?? ..... i
_w*_,_TSt 10.0 _'" " " ........ ";
-- _'rll,_, 0_0 a, 0.a -..-- gmN_ o._ & I.O "'-. r
r0.1 OJ 0.3 O.4 Q.$ 0,1 O? 0.1 O.D 1
Reduction in Maximum Flame Temperature withRadiation (T,=295K, YF,=0.125, Yo.,=0.5)
shows the time variations of the maximum flame temperature for various values of the strain rates. This
plot shows that for flames with strain rates less than 1 st, the effect of gas radiation is sufficient to cause
extinction. These results agree with our earlier study [6] at zero strain rate where gas radiation was also
found to be sufficient to cause extinction. Clearly, additional radiation due to soot will extinguish the
flames at higher strain rates.
Acknowledgements: This project is supported by NASA under contract no. NAG3-1460.
REFERENCES
1. Jackson, G., S., Avedisian, C., T. and Yang, J., C., Int. J. Heat Mass Transfer., Vol.35, No. 8, pp.
2017-2033, 1992.
2. T'ien, J. S., Sacksteder, K. R., Ferkul, P. V. and Grayson, G. D. "Combustion of Solid Fuels in very
Low Speed Oxygen Streams," Second International Microgravity Combustion Workshop," NASAConference Publication, 1992.
3. Ferkul, P., V., "A Model of Concurrent Flow Flame Spread Over a Thin Solid Fuel," NASA Contractor
Report 19111 I, 1993.4. Ross, H. D., Sotos, R. G. and T'ien, J. S., Combustion Science and Technolo__y, Vol. 75, pp. 155-160,1991.
5. Atreya, A, Agrawal, S., Sacksteder, K., and Baum, H., "Observations of Methane and Ethylene DiffusionFlames Stabilized around a Blowing Porous Sphere under Microgravity Conditions," AIAA paper # 94-
0572, January 1994.
6. Atreya, A. and Agrawal, S., "Effect of Radiative Heat Loss on Diffusion Flames in Quiescent
Microgravity Atmosphere," Accepted for publication in Combustion and Flame, 1993.7. Pickett, K., Atreya, A., Agrawal, S., and Sacksteder, K., "Radiation from Unsteady Spherical Diffusion
Flames in Microgravity," AIAA paper # 95-0148, January 1995.
8. Shamim. T., and Atreya, A. "A Study of the Effects of Radiation on Transient Extinction of StrainedDiffusion Flames," Central States Combustion Institute Meeting, 1995.
9. Atreya, A. and Zhang, C., "A Global Model of Soot Formation derived from Experiments on Methane
Counterflow Diffusion Flames," in preparation for submission to Combustion and Flame.
10. Zhang, C., Atreya, A. and Lee, K., Twenty-Fourth (International) Symposium on Combustion, The
Combustion Institute, pp. 1049-1057, 1992.
11. Atreya, A., "Formation and Oxidation of Soot in Diffusion Flames," Annual Technical _ GRI-
91/0196, Gas Research Institute, November, 1991.
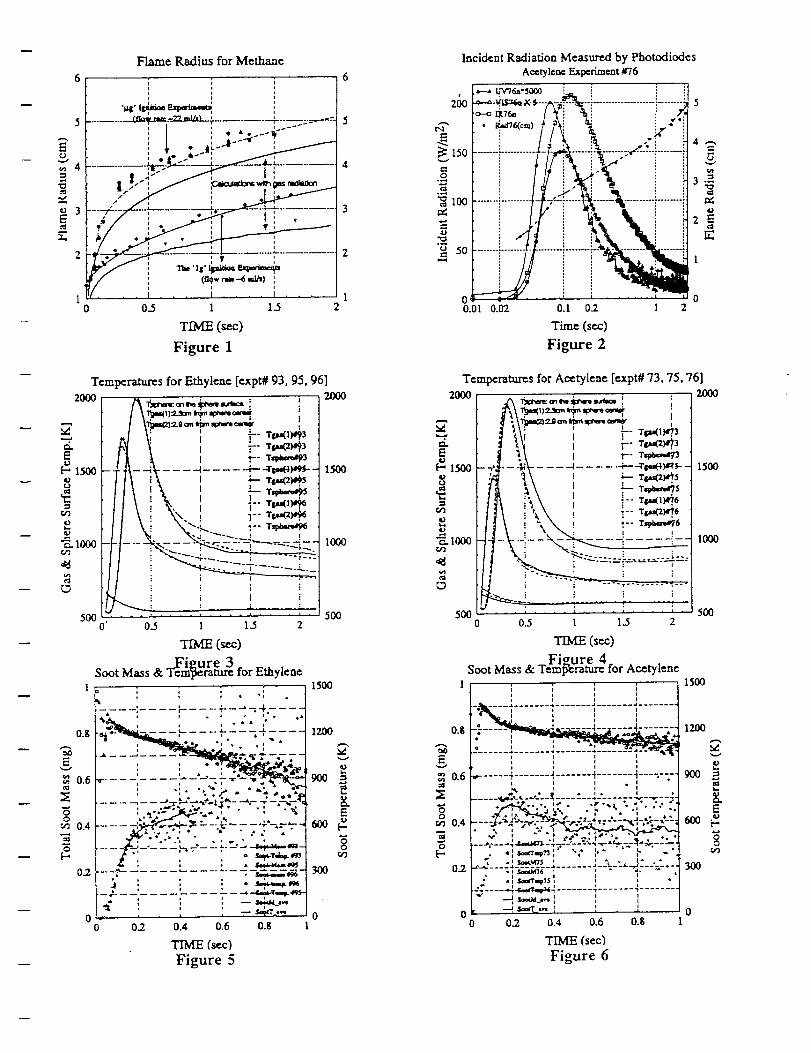
Flame Radius for Methane
6 6 Acetylene Experiment #76
! ! i _-. ffv-7_-_ooo _ , i
•+,,',_,-_-_---:' i 2_ _-,_+',+,._-._-__--_...................i.........
t........--_-_:I ,_..+ t'°'°l'_-:-'--'-_.... _ "_'/[_i _, ._
i 3 -+ 3 100 .......... "_ ................
2 ..... 2 _ 50 ......
0 0-5 I 1.5 2 0.01 0.02 0.I 0.2 1
TIME (see) Time (sex:)
Figure 1 Figure 2
Incident Radiation Measured by Photodiodes
5
3:+:
1
0
T_m
2OO0
d.
_1500CJ
o
5000'
0.$
0.6
o0.4
o
O.2
00
eratu_s for Ethylene [expt# 93, 95, 96]2000
.@,,a'_._ ,, _,_ ,,_,,= ', '.
I I,J \i _ r "¢_'m3
-I_-_V---_ .... ,_i---_-- 15oo
I \ i "_, , _--'r_,_I \ ! \\. _ !-vv._,_.I \_ \2"_ :-- T.p_...._+- .- "----- - .... =_'---_=--_ --: - - 11300
i ..... "T ..... _. '-L.
l i I i
'" ! _ -- ; ' 5000.5 I 1.5 2
(sex:)
__Fieure 3Soot Mass & lem}Seram_ for Ethylene, ; ,, - 1500
, ,, , • ., ._----1-. _ ---F--'-; 4.----
"-.%_ __. : ___:_=_: ...._°+e, ", • ., " "
.__ :___ +-__. _ _-.- :-
'r .... ' .... '-_ --"-"-" '-'-"r+"':"_
, ",- :./ . 2_, .'_...... ..,_ _ ..-+:r t-.'_.,,,.I ._+--- .._- ..,, _ &_--,
l _ .+ .*1 ° "+: . • _ •....m _ .,, .,-- ', o _++++.+
i-;_+ i " 7--;-_ -_-
0.2 0.4 0.6 0.8
TIME (see)
Figure 5
1200
,J
9OO
E
gr,o
0.8
0.6
om 0.4
0
O.2
Temperatures for Acetylene [expt# 73, 75, 76]
_" / _ _._ I v" v,..c_3 /[ _[ I. [ I 1-" Tg_,e.e_3 1I---_,_-- 4._- - -- -a .... .-4---v_4_s- -I 15oo
° Ill _\ ', -,.,+--_:,m [t it ','_ \ _ i" t_-o_+ /
UJ_L _ +, J+,+ _- .... -+..... __ ,+
5O0 5OO0 0..5 I 1.5 2
(s_)
Figure 4Soot Mass & Temperamr_ for Acetylene
1 ; i '. i 1500l I l II ! I I
.....__- - -_llt,.,tII ....... .,tIt....... .tIll....... "_lll........
............ 4 ...... • ........ 1200• I ao _ _a
I l I I+ , , ,..... +....... _....... _.......... . .... 900.... I "
..... +.+%_--'-'--Z .... -".... - .......... "4o+_.,_* o,., i," . .r.,+. " _'. "- •I __"- ",_', ": ."I _
• • _v'_#_*_.t__J__ J-_"-x'-'-k--__,::-t-., ,_-._-'__o
_'-+-T_-..-]
_---='-_- I....... I--=-- I---_- fl 3001 1
._" I i l _i .......
0L" __.-t t. i. I 00 0.2 0.4 0.6 0.8 1
TIME (sec)
Figure 6

APPENDIX E
Effect of Radiative Heat Loss on Diffusion Flames in/
Quiescent Microgravity Atmosphere
Combustion and Flame paper
By
Atreya, A. and Agrawal, S.
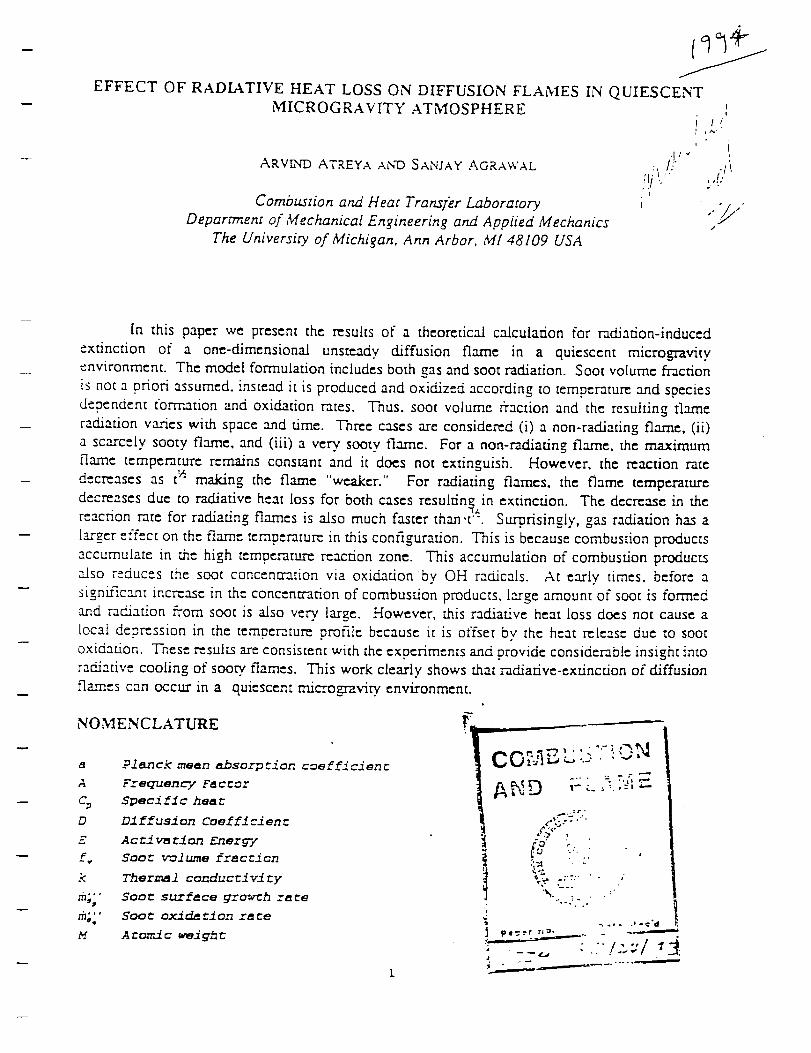
EFFECT OF RADIATIVE HEAT LOSS ON DIFFUSION FLAMES IN QUIESCENTMICROGRAVITY ATMOSPHERE
ARV_q'D ATREYA AND SANJAY AGRAWAL :, /i,l-' +
;!/".I
Combustion and Hear Transfer Laboratory
Department of Mechanical Engineering and Applied Mechanics
The University of Michigan, Ann Arbor, M/48109 USA
II
i t,
if,t
iso_ •
In this paper we present the results of a theoretical calculation for radiation-induced
extinction of a one-dimensional unsteady diffusion flame in a quiescent microgravity
environment. The model formulation includes both gas and soot radiation. Soot volume fraction
is not a uriori assumed, instead it is produced and oxidized according to temperature and species
dependent formation and oxidation rates. Thus. soot volume fraction and the resulting flame
radiation varies with space and time. Three cases are considered (i) a non-radiating flame, (ii)
a scarcely sooty flame, and (iii) a very. sooty flame. For a non-radiating flame, the maximum
flame temperature remains constant and it does not extinguish. However, the reaction rate
decreases as t '_ making the flame "weaker." For radiating flames, the flame temperature
decreases due to radiative heat loss for both cases resulting in extinction. The decrease in the
reaction rate for radiating flames is also much faster than "t:". Surprisingly, gas radiation has a
larger effect on the fla.me temperature in this configuration. This is because combustion products
accumulate in the high temperature reaction zone. This accumulation of combustion products
also reduces the soot concentration via oxidation by OH radicals. At early times, before a
significant increase in the concentration of combustion products, large amount of soot is formed
and radSation from sop( is a/so very. large. However, this radiative heat loss does not cause a
local depression in the temperature profile because it is offset by the heat retease due to soot
oxidation. These results are consistent with the experiments and nrovide considerable insight into
radiative cooling of sooty flames. This work clearly shows that rackiative-extincrion of diffusion
flames can occur in a quiescent microgr-avity environment.
NOMENCLATURE
a Planck mean absorption cuefficienr
A Frequency Factor
C; Speci fl c hea r
D 121 ffusi on Cueffl ci en r
E Acrivmricn Energy
f_ Soot volume fraction
k Thermal conducrivi _y
m_;' soot surface growth rare
ril_;' Soot oxidation rare
M AC_nzic w_ighr
4-- i'_%
;.2CO?,,1EL;:- ! N
,i" . o °'.¢ G-
,¢4" ,. -: . .
i "_...
• ."!
/
_.,. .i_C" d
pe=:r
' :" I i- ""12.;.' ¢

QC
T
'Z
;V
W
x
z
Greek
a
v
P
Radiative bean flux
,_.eec cf cbmbuscion ;_er unic mass
Time
Tempera cur e
Vel oci Cy
Reaccion ra co
Molecular weight
Dis can ce
Mass fracriQn
Densicy distorted cGordina ce
Thermal diffusivi cF
Schvab- Ze l dGvi ch variable
Mass based scoichiomecric cmefficienc; number of moles
SGoc mass fraction
Densl c_
Variable defined in E_. _7)
Subscripts
F Fuel
g Gas
o Oxygen
? .=:educes (.u.:O,
s See c
o. Free scream
CO: )
INTRODUCTION
The absence of buoyancy-induced flows in a micrograviry environment and the msulLing
increase in the reactant residence Lime signixScanfly alters the fundamentals of many combustion
processes. Substantial differences between normal gravity and microgravity flames have been
reported during droplet combustion[ 1], flame spread over solids [2], candle flames [3] and others.
These differences are more basic than just in the visible flame shape. Longer residence dine and
higher concentration of combustion products create a thermochemical environment which changes
the flame chemistry. Processes such as soot formation and oxidation and ensuing flame radiation,
which am often ignored under normal gravity, become very important and sometimes conrroUing.
As an example, consider the droplet burning problem. The visible flame shape is spherical under
microgravity versus a teardrop shape under normal gravity. Since most models of droplet
combusdon utilize spherical symmetry, ex_ttent ag'mement with experiments is anticipated.
However, microgravity experiments show that a soot shell is formed between the flame and the
evaporating droplet of a sooty fuel [1]. This soot shell alters the heat and mass transfer between
the droplet and its flame resulting in significant changes in the burning rate and the propensity
for flame extinction. This change in the nanu-'e of the pmce.ss seems to have occu.r_d bex:ause
of two reasons: (i) soot formed could not be swept our of the flame due to the absen_ of
2
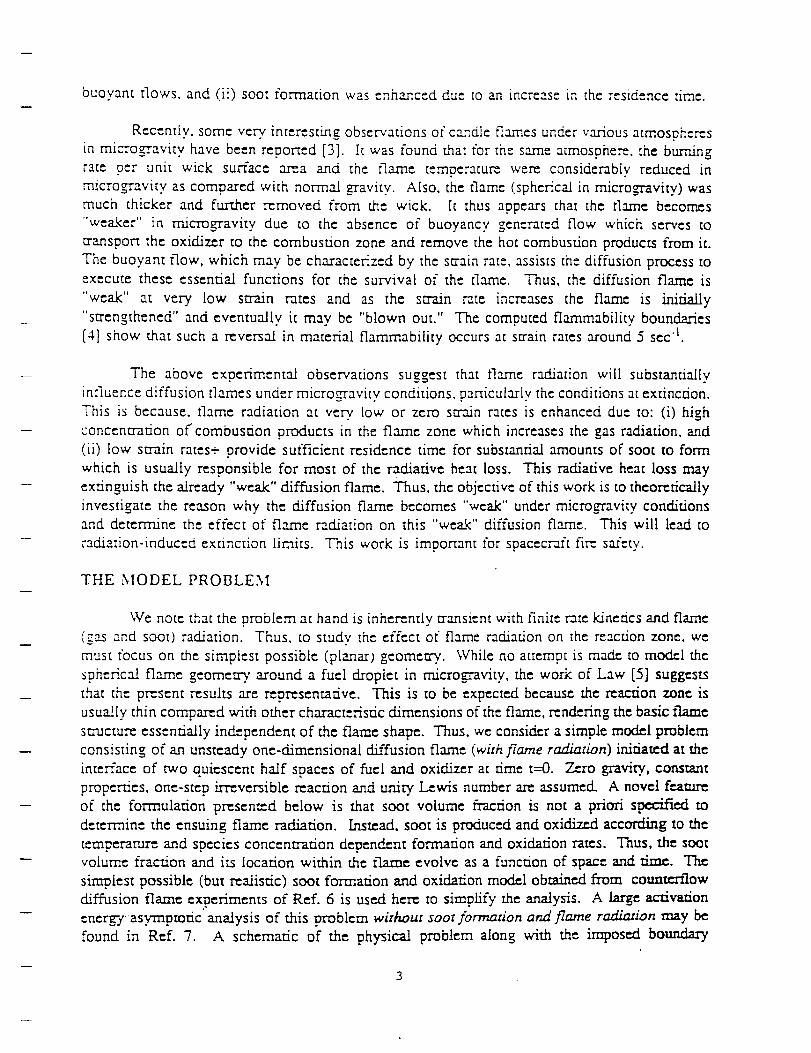
buoyant flows, and Oi) soot formation was enhanced due to an increase in the residence time.
Recently, some very. interesting observations of candle flames under various atmosahems
in microg-raviw have been reported [3]. It was found that for the s_,_ne atmosphere, the burning
rate per unit wick surface ar'_a and the flame temperature were considerably reduced, in
micro_avity as compared with normal _avity. Also, the flame (spherical in microgravity) was
much thicker and further removed from the wick. [t thus appears that the flame becomes
"weaker" in micrOgTavity duc to the absence of buoyancy generated flow which serves to
transport the oxidizer to the combustion zone and remove the hot combustion products from it.
-fine buoyant flow, which may be characterized by the strain rate, assists the diffusion process toexecute these essential functions for the survival of the flame. Thus, the diffusion flame is
"weak" at very low strain rates and as the strain rate increases the flame is initially
"strengthened" and eventually it may be "blown out." The computed flammability boundaries
[4.1 show that such a reversal in material flammability occurs at strain rates around 5 sec "t.
The above experimental observations suggest that flame radiation will substantially
infiuence diffusion flames under micro_avity conditions, particularly the conditions at extinction.
This is because, flame radiation at very low or zero strain rates is enhanced due to: (i) high
concentration of'combustion products in the flame zone which increases the gas radiation, and
(ii) low strain rates+ provide sufficient residence time for substantial amounts of soot to form
which is usually responsible for most of the radiative heat loss. This radiative heat loss may
extinguish the already "weak" diffusion flame. Thus, the objective of this work is to theoretically
investigate the reason why the diffusion flame becomes "weak" under microgravity conditions
and determine the effect of flame radiation on this "weak" diffusion flame. This will led to
radiation-induced extinction limits. This work is important for spacecraft fie sMety.
THE MODEL PROBLEM
We note that the problem at hand is inherently transient with finite rate k.inerics and flame
(g_ and soot) radiation. Thus, to study the effect of flame radiation on the reaction zone. we
must focus on the simplest possible (planar) geomeuy. While no attemnt is made to model the
spherical flame geometry around a fuel droplet in microm-avity, the work of Law [5] suggests
that the present results are representative. This is to be expecwed because the reaction zone is
usually thin compared with other characteristic dimensions of the flame, rendering the basic flame
structure essentially independent of the flame shape. Thus. we consider a simple mod_l problem
consisting of an unsteady one-dimensional diffusion flame (with flame radiation) iniriamd at the
interface of two quiescent half spaces of fuel and oxidizer at time t--0. Zero gravity, constant
properties, one-stop irreversible reaction and unity Lewis number am assumed. A novel feam.m
of the formulation presente.d below is that soot volume fraction is not a priori specified to
determine the ensuing flame radiation. Insmad, soot is produced and oxidized according m the
temperature and species concentration dependent formation and oxidation rams. Thus, the soot
volume fraction and its location within the flame evolve as a function of space and time. The
simnlest possible (but realistic) soot formation and oxidation model obtained frnm cotmmrflow
diffusion flame experiments of Ref. 6 is used here to simplify the analysis. A large am:ivation
energy asymptotic analysis of this problem without soot formazion and flame radiation may be
found in Ref. 7. A schematic of the physical problem along with the imposed boundary

• ,.\ "\
conditions is presented in Flgn, re\l and the corresponding equations are:\ \"
Confinui_:
a_p_ + a(pv) = o (_)@c ax
whe_ p is the density, t _he time and v the velocity normal to the fuel-oxidizer interface induced
by vo[umemc expansion.
Species Conservation."
aro aro a( _aro_• -- ", dd 'ee,)'>a: +p" - <",: "== (2)
a_,o aYo a (p=0Yo]P-_ " Pv-_x - _xt -_-x) - ,,w
(3)
aY, ar, a ( ar_ (4)
Symbols used in the above equations are defined in the nomenclature. The reaction ram.
w. ismode|led by a second order Arrhenius expression. _-eextJonentialfaclorand the activation
energy arechosen formethane undergoing a one-stepirreversiblereactions_.vo- (!-v)P; where v
isthe mass-based stoichiometriccoefficient.Fuel depleted as a resultof soot formation,though
usually small, is aJso included in the model via the term (.5_. - .,_;.}, which is zero when
negative.
Energy Conservation:
(5)
In this equation, be source terms includ_ heat released by the primary reaction and soot
oxidation and heat lost via flame radiation. The soot oxidation term is clearly ze.ro when
negative. Emission approximation is used to describe the radiative heat flux from the flame.
Thus, V_, : car' (e_-e_,) where, a_z e=d e_, are Planck mean absorption coefficients for
combusnon products (co_, a'._o) and soot respectively. Planck mean absorption coefficients for
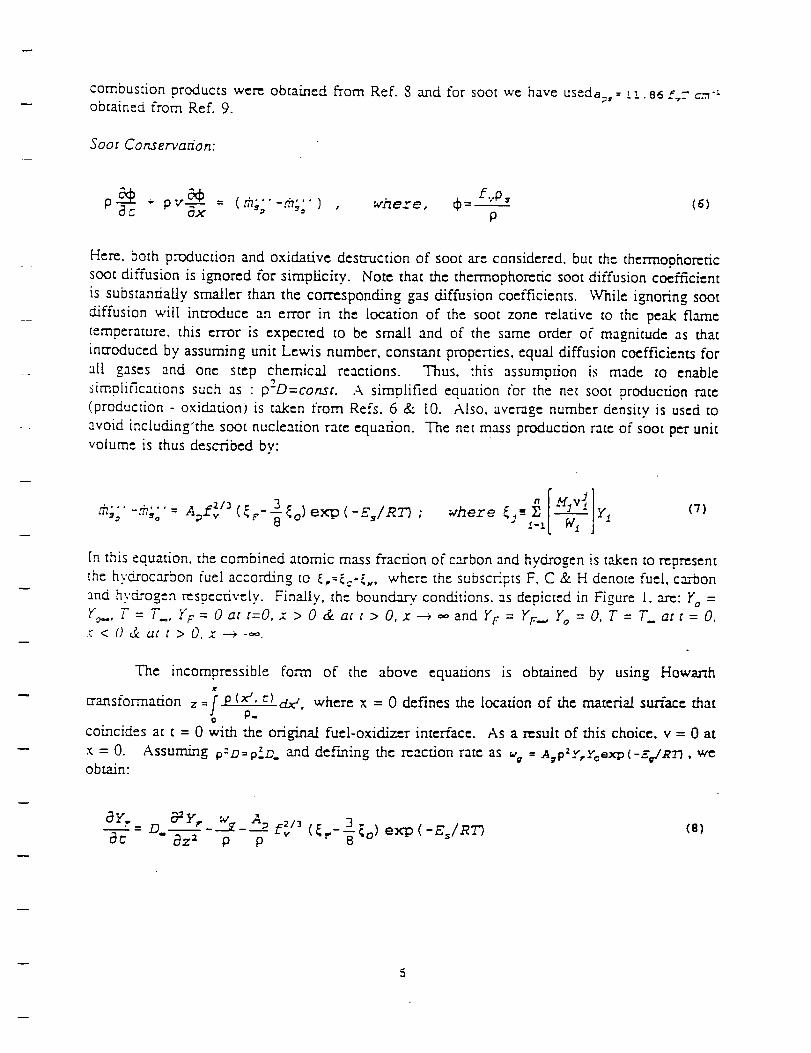
combustion products were obtained from Ref. 8 a_nd for soot we have us,,da;,_obtained from P,ef. 9.
Soot Co ru_erva_'on:
= _-!. 86 f.,T cm "_
v c3_ ''"-"" ) where, r_= f.,p_,p _- p _ = (m,, re,o" , P(6)
Here, both p:x:x:iucdon and oxidative destruction of soot are considered, but the thermoohoretic
soot diffusion is ignored for simplicky. Note that the thermophoreric soot diffusion coefficient
is substantially smaller than the corresponding gas diffusion coefficients. While ignoring soot
diffusion will introduce an error in the location of the soot zone relative to the peak flame
temperature, this error is expected to be small and of the same order of magnitude as that
introduced by assuming unit Lewis number, constant properties, equal diffusion coefficients for
at[ gases and one step chemical reactions. Thus. this assumption is made to enable
simplifications such as : p2D=consn A simplified equation for the net soot production ram
(production - oxidation) is taken from Refs. 6 8,: i0. Also, average number density is used to
avoid including'the soot nucleation rate equation. The net mass production rate of soot per unit
volume is thus described by:
m%..... -.'n,o'" = -;--_'aF2/3 (_'-_(°)exD(-E_'/RZ3"_8 ,-,.,[-d] Y,(7)
[n this equation, the combined atomic mass fraction of carbon and hydrogen is taken to represent
:he hydrocarbon fuel according to ,_,={c-_,,, where the subscripts F, C & H denote fuel, carbon
and hydrogen respectively. Finally, the boundary conditions, as depicted in Figure 1. are: Yo =
_'o-, T = 7"_, YF= O at t=O, x > 0 & ate > O,.r. ---+ ,,,,and Y7 = F/r_, Yo = O. T= T_ ar t = O.< O& act> O,x---+-_,.
The incompressible form of the above equations is obtained by using How&nh
z =? P (xa' _) d..v', where x = 0 defines the location of the material sm'face thattransformation,/ P.O
coincides at t = 0 with the original fuel-oxidizer interface. As a result of this choice, v = 0 at
x = 0. Assuming p=n=pZn, and deeming the reaction rate as % = A_I_'y,.Zaex._(-EJR_, weobtain:
0Y.
0c a2Y, ___x_ A_2,,,2/3 (__- 3-_°)8expaz a p P -_
(8)

-_ = D.----az 2vpA_Y_, o_xp. (-EJR.-.) (9)
a Y, 82Yp
ac - D. az 2 ÷ (i÷v)pA_Y._Yoex p(-EjRT)(!o)
az 2 pc:, q: p pcp(ii)
where; 80# _ A= FZ/3 (_ 3
SOLUTION
Analytical Solution
For infinitely fast gas-phase reactions and no flame radiation, a simple, well known.analydcal solution is obtained.
= -- = ---erfc (13)n 13.-t3__ 2 2
Here. _ = FF " YO/v and _ = }'F + CpT/Q_ are the Scflvab-Zeldovich variables. The flame liesat the location net = z/(z*vz,,/:%j. "F_us, for unity equivalence rado (Eel) based on free
stream concentrations, the flame lies at z = 0. For non-uniw equivalence ratios [fuel rich (E>I)
or fuel lean (E<I) condidonsl the flame will travel as _/t in either direction. This is evident from
Ee_---4%_ by simply substituting 1"I = rl ft. The three, possible cases _ plotted in Fig. 2 for
methane. The constants used are [1 1]: forQ_r=4746S J/gm of fuel
c==!.3 J/gmr, 7".=295:<,v -4,, O.=l.16x!o-3 g.m/cma ;and B.--0.226 cma/seg. "lq_fhlrl_
c.o n d i t io n s a r e : (a) Yo.=0.5, Ym,.=O.125, (b) Yc.=0.5, Ym..=O.0625.
(c) Yo.:0.25, i',,.:0.125.For case (b) the flame travelstowards the fuel side because of
excess oxygen (Fig. 2b). Similarly, for case (c) it travels towards the oxygen side because of
excess fuel (Fig. 2c). However, for case (a) the equivalence ratio is unity and hence the flame
is stationary. It simply becomes thicker with time (Fig. 2a).
Numerical Solution
The above equations were numerically integrated by using a finite difference Crank-

Nicko[sonmethodwhereprevioustime stetJvalueswereusedto evaluatethe nonlinearreactionterms.Care was taken to start the diffusion flame with minimum disturbance.. [deally, theproblemmust bestared suchthat thetwo ha.Ifspacesof fuel andoxidizer, asillustratedin Fig.1,beDn a self-sustainingreactionat t=0. This ignition of thereactantsmay bespontaneousorinducedbv a pilot. For high activation ener=_, spontaneous ignition will take a tong time during
which the reactants will diffuse into one other developing a thick premixed zone which will burn
prior to establishing a diffusion flame. This will change the character of the.proposed problem.
Thus,_ was forced (piloted) by artificially making the fuel-oxidizer interface temperature-a'g-the adiabanc'FTtame _._8-.-_) were solved during this period. Ignition
was assumed when the reaction rate at the inteffaciai node becomes maximum (i.e. d%/dr = 0).
After this instant, the inteffacial node was not artificially maintained at the adiabatic flame
temperature because the combustion process becomes self-sustaining and all the equations
described above are used. For the calculations presented below, the time taken to ignite was
_xZO "_ sic. A uniform grid with grid size t,z=3xZO-j ca anda time-step of _c=ixlO -4 se._ was
used. Typical calculation for 0.4 seconds physical time took 5 hours on a Sun Spark.smtion.
To limit the computational domain which extends from .+.o, to -=, the analytical solution
presented above was used to compute the temperature at the desired final time t0.4 s_'l_ in the
- present case). Th{: location from the origin where the temperature first becomes equal to ambient
(within machine error) was used to apply boundary, conditions at infinity in the numerical
calculations. This was further confirmed by checking the space derivatives (ar/ox) at these
_ _es_during the calculations. Since initial soot volume fraction is zero, the governing
equation q'f.d2) will produce a trivial solution if explicit or implicit finite difference methods
are used. Thus, for first step, an implicit integral method was used _o obtain the soot volume
-- fraction. At the end of the first rime step the soot volume fraction is of the order 10".°. It is
imoonant to not= that Equ-:.--.(b2) can self-initiate soot formation despite the absence of a sootnucleation model. '_" 5"
*
For the calculation___s presented below, we have used the following data: for gas reactions
-- [[l]: pA_r=3.56x__sec "_, E¢=!.22Kd'/mole. For soot reactions we have used[6,10]• I _ ")_=_o 9"m/':mJse.c f O r C a s e l a n d !o' gnT/cmas;_ f o r C a s e _ ,
-'__,=z5o :':J/maIe, p,=Z.B6 gm/c= _. We assume _at soot oxic_s to CO releasing heat
_ -I ,--0"_7K-9;,_jlgm o_e s,,o_.
RESULTS AND DISCUSSION
Results of calculations for three cases are presented here. These are labeled as Cases
0,1&2 in taSg_3. Case 0 is the base case wi_ finite reax:tion rates but without soot formation
and flame ra_on. Case i represents a barely sooting flame and Case 2 represents a highly
sooting flame, As noted above, Ap for Case 2 is increased ten times over Case I. Based on our
previous work CRefs.6&10), Ap for most hydrocarbon fuels is expected to fall between Casesi&2.
Let us f_st consider the overallresults. Figure 3 shows that in. the absence of external
flow (i.e., 7.,-'m strainrate) and without soot formation and flame radiation (Case 0), the peak
flame temperatm'e becomes constant while the reaction ram decreases as t 'a and the reaction zone
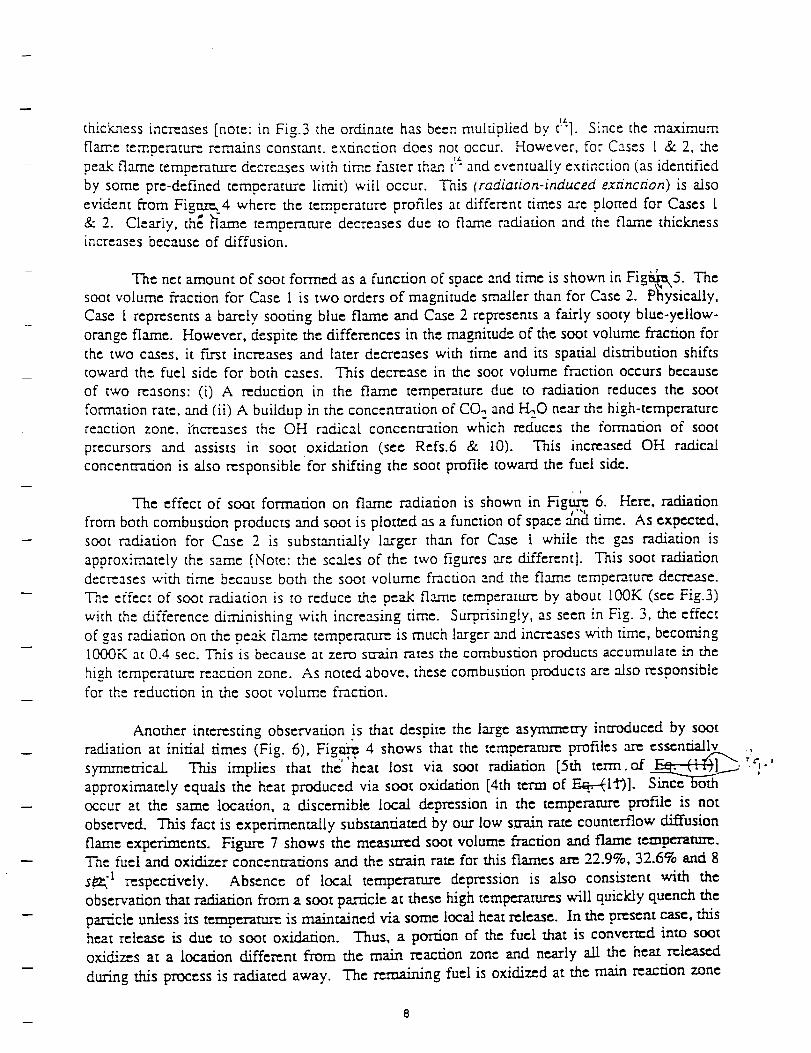
thickness increases [note: in Fig.3 the ordinate has been multiplied by t!_']. Since the maximum
flame temoeramre remains constant, extinction does not occur. However, for Cases I & 2, _e
peak flame temperam.re decreases with time faster than tt_-and eventually extinction (as identified
by some pre-defined mmperamre limit) will occur. This (radiation-induced extinction) is also
evident from Figm_,_4 where the temperature profiles at different times are plormd for Cases l
& 2. Clearly, the }'lame temperature decreases due to flame radiation and the flame thicknessincreasesbecause of diffusion.
The net amount of sootformed as a function of space and time isshown inFig'_'a_5.Thesoot volume fractionfor Case I istwo ordersof magnitude smaller than for Case 2. P_ysically,
Case I representsa bar_ly sooting blue flame and Case 2 representsa fairlysooty blue-yellow-
orange flame. However, despim the differencesin the magnimd_ of the soot volume fractionfor
the two cases,itFrostincreasesand lamr decreases with lime and itsspatialdistributionshifts
toward the fuel side for both cases. This decrease in abe soot volume fractionoccurs because
of two reasons: (i) A reduction in the flame temperature due to radiationreduces the sool
formationrate,and (it)A buildup in the concentrationof CO. and I-LO near the high-temperature
reaction zone. Fncreases the OH radical concentration which reduces the formation of soot
precursors and assists in soot oxidation (see Refs.6 & 10). This increased OH radical
concentration is also responsible for shifting the soot profile toward the fuel side.
• L
The effectof soot formation on flame radiationisshown in Fig,u_,,6. Here, radiation
from both combustion products and soot isplotmd as a functionof space and time. As cxpex:md,
soot radiationfor Case 2 is substantiallylarger than for Case i while the gas radiationis
approximately the same [Note: :he scales of the two figures are differem). This soot radiation
decreases with time because both the soot volume fraction and the flame temperature decrease.
The effect of soot radiation is to reduce the peak flame mmperam.re by abom 100K (see t::ig.3)
with the difference diminishing with incre_ing time. Surprisingly, as seen in Fig. 3, the effect
of gas radiation on the peak flame mmperamre is much larger and increases with lime, becoming
1000K at 0.4 sec. This is because at zero strain rates the combusHon products accumulate in the
high temperamz: reaction zone. As nomd above, these combustion products are also responsible
for the reduction in the soot volume fraction.
AnoLher interesting observation is that despite the large asymmetry introduced by soot
radiation at initial times (Fig. 6), Fig_(_ ,¢ shows that the temperature profiles are essentially
symmetrical. This implies that the"l_eat lost via soot radiation [5th term.of _ " ,
approximately equals the heat produced via soot oxidation [4th term of F.,q-_ll0]. Since both
occur at the same location, a discernible local depression in the mmperamre profile is nor
observed. This fact is experimentally subsm.nriamd by oar low s.wa.in rate counterflow diffusion
flame experiments. Figu.re 7 shows the measu._d soot volume fraction and flame tempc_tu_.The fuel and oxidizer concentrations and the strain ram for this flames a._ 22.9%, 32.6% and 8
s_, "l respectively. Absence of local temperature depression is also consistent with the
observation that radi2fion from a soot particle at these high temperatures will quickly quench the
particle unless its temperam__ is maintained via some local heat release. In the present case, this
heat release is due to soot oxidation. Thus, a portion of the fuel that is convermd into soot
oxidizes at a location different from the main reaction zone and nearly all the heat released
during this process is radiated away. The remaining fuel is oxidized at the main reaction zone
.?
rc t ,0
8
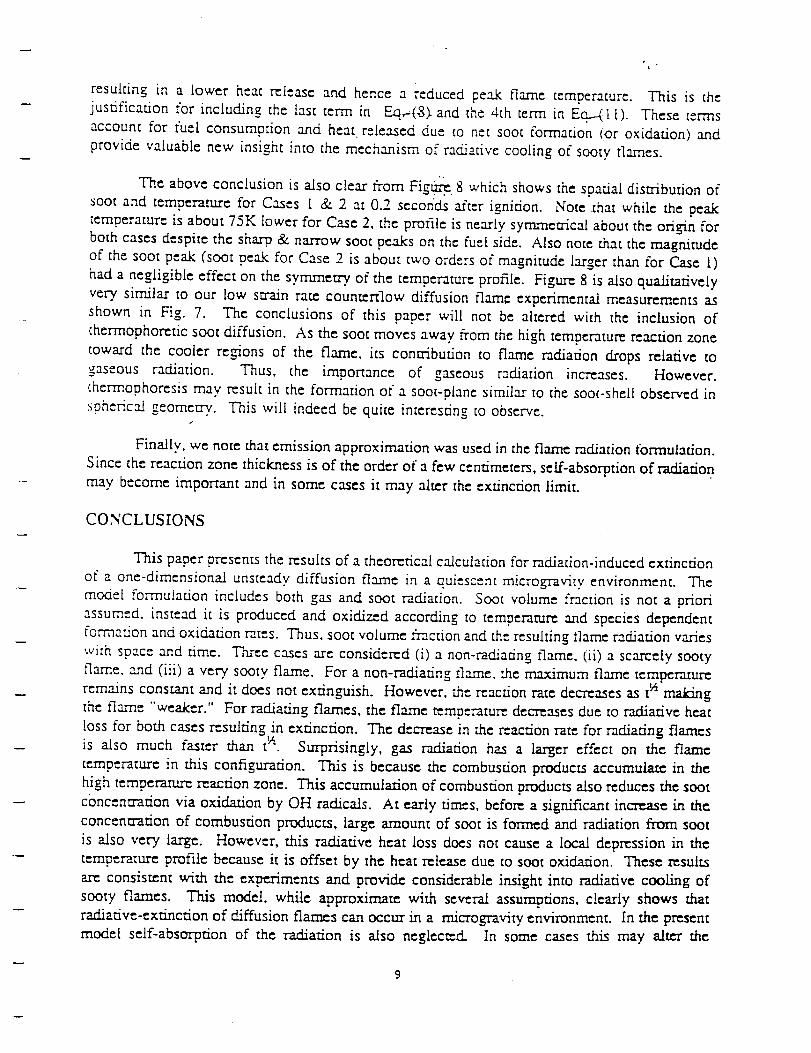
ft °
resuking in a lower heat r_lease and hence a reduced peak flame temperature. This is thejustification for including the last term in Eq._(8). and the 4th term in Ec:--(I [). These terms
account for fuel consumption and heat. released due co net soot format.ion (or oxidahon) and
provide valuable new insight into the mechanism of" radiative cooling of" sooty flames.
The above conclusion is also clear from Fig.u_.. 8 which shows the spatial distribution of"
soot and temperature for Cases 1 & 2 at 0.2 seconds after ignition. Note that while the oea_k:
temperature is about 75K tower for Case 2, the profile is nearly symmen'ical about the origin for
both cases despite the sharp, & narrow soot peaks on the fuel side. Also note that the magnitude
of the soot peak (soot peak for Case 2 is about two orders o¢ magnitude larger than for Case 1)
had a negligible effect on the symmetry o¢ the temperature profile. Figure 8 is also qualitatively
very similar to our low strain ram countertlow diffusion flam_ experimental measurements as
shown in Fig. 7. The conclusions of this paper will not be altered with the inclusion of
chermophoretic soot diffusion. As the soot moves away from the high temperature reaction zone
toward the cooler regions of the flame, its contribution :o flame radiation drops relative to
gaseous radiation. Thus, the importance of gaseous radiation increases. However.
chermophoresis may msuk in the formation of a soot-plane similar to the soot-shell observed in
spherical geometry.. This will indeed be quite interesr/ng to observe.
Finally, we note that emission approximation was used in the flame radiation tbrmuladon.
Since the reaction zone thickness is of the order of a few centimeters, serf-absorption of radiation
may become imponam and in some cases it may alter the extinction limit.
CONCLUSIONS
This paper presents the results of a theoretical calculation for radiation-induced extinction
of a one-dimensional unsteady diffusion flame in a quiescent microgravity environment. The
moclei formulation includes both gas and soot radiation. Soot volume traction is not a oriori
assumed, instead it is produced and oxidized according to temperature and species de_ndent
formation and oxidation rates. "i-bus. soot volume fraction and the resulting tlame radiation varies
with space and time. Three cases are considered (i) a non-radiating flame, (it) a scarcely sooty
flame, and (iii) a very sooty flame. For a non-radiating flame, the maximum flame temperature
remains constant and it does not extinguish. However, the reaction rate decreases as t '_ making
the flame "weaker." For radiating flames, the flame temperature decreases due to radiative heat
loss for both cases resulting in extinction. The decrease in the reaction rate for radiating flames
is also much faster than t''i. Surprisingly, gas radiation has a larger effect on the flame
mmpera_ure in this configuration. This is because the combustion products accumulate in the
high temperamr_ reaction zone. This accumulation of combustion products also reduces the soot
cbncenr,-arion via oxidation by OH radicals. At early times, before a significant increase in th_
concentration of combustion products, large amount of soot is formed anti radiation from soot
is also very large. However, this radiative heat loss does not cause a local depression in the
temperature profile because it is offset by the heat release due to soot oxidation. These results
are consistent with the experiments and provide considerable insight into radiative cooling of
sooty flames. This model, while approximate with several assumptions, clearly shows that
rackiative-extinction of diffusion flames can occur in a microgravity environment. In the present
model self-absorption of the radiation is also neglected_ In some cases this may alter the

extinction limits because of the development of a thick reaction zone.
ACKNOWLEDGEMENTS
Financial support for this work was provided by NASA under the contrac: number NAG3-
[460. NSF under the contract number CBT-8552654, and GR[ under the contract number GRI-
5087-260-148t. We are also indebted to Dr. Kurt Sacksteder of NASA Lewis and Dr. Jim
Kezerie of GRI for their help. Ma'. Anjan Ray helped in conducting the experiments.
REFERENCES
°
"9
,
4
5.
6.
°
8.
9.
tO.
tl.
Jackson, G., S., Avedisian, C., T. and Yang, J., C., Int. J. Heat Mass Transfer.,
35(8):2017-2033 (1992).
Ferkul, P., V., A Model of Concurrent Flow Flame Spread Over a Thin Solid Fuel, NASA
Contractor Report [91111, 1993.
Ross. H. D.. Sotos. R. G. and T'ien, J. S., Comb. Sci. Tech.. 75:[55-160 (1991)
T'ien..L S.. Combust. Flame, 80:355-357 (1990).
Law, C.K t, Combust. Flame. 24:89-98(1975).
Zhang, C., Atreya, A. and Lee, K.. Twenty-Fourth (International) Symposium on
Combustion, The Combustion Institute, 1992, pp. 1049-1057.
Linan. A. and Crespo, A., Comb. Sci. Tech., 14:95-I 17 (1976).
Abu-Romia, M. M and Tien, C. L., J. Heat Transfer, 11:32-327 (1967).
Seige[, R. and Howell, I. R., Thermal Radiation Heat Transfer. Hemisohere Publishing
Corporation. [991.
Atreya, A. and Zhang, C.. "A Global Model of Soot Formation derived from Experiments
on Methane Countefflow Diffusion FIa_mes." in preparation for submission to Combustion
and F !arne.
Tzeng, L. S., "I"neoretical Investigation of Piloted Ignition of Wood. PhD Thesis, Dept.
Mech. Engg., Michigan State University, East Lansing, MI. USA. [990.
l0
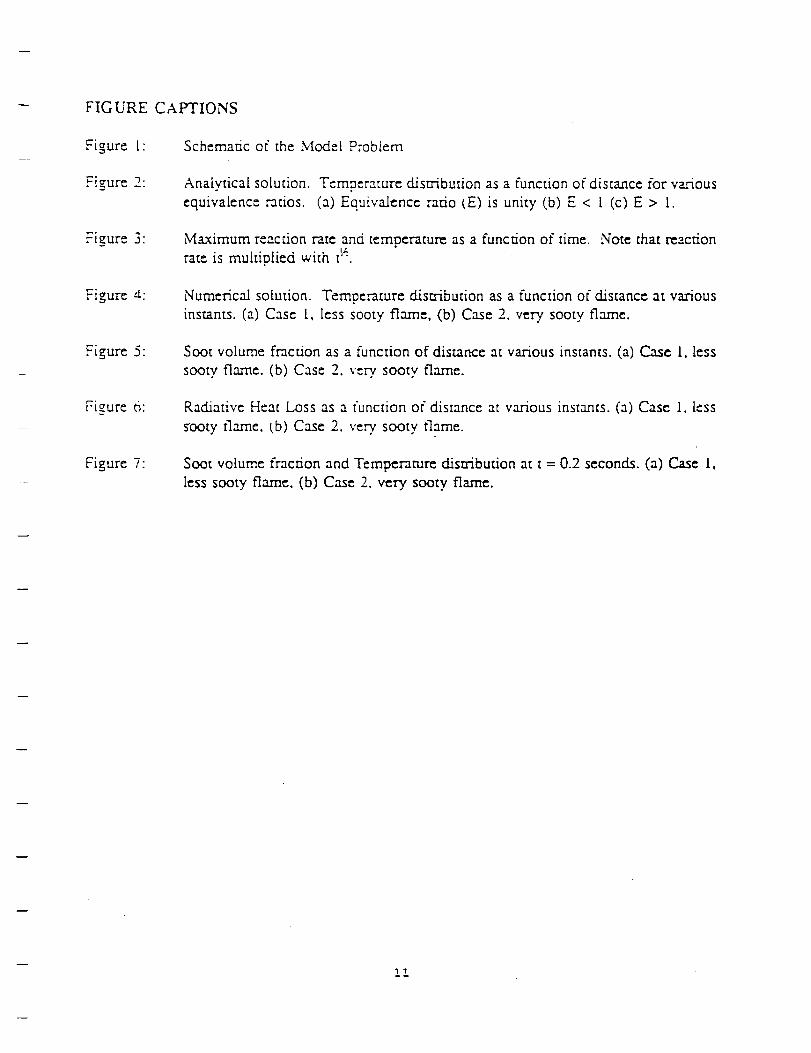
FIGURE CAPTIONS
Figure [' Schematic of the Model Problem
Figure 2: Analytical solution. Temperature distribution as a function of distance for various
equivalence ratios. (a) Equivalence ratio (E) is unity (b) E < I (c) E > 1.
_-:gur, 3" Maximum reaction rate and temperature as a function of time. Note that reactionI,z.
rate is multiplied with t".
Figure ,.,t: Numerical solution. Temperature distribution as a function of distance at various
instants. (a) Case l, less sooty flame, (b) Case 2, very. sooty flame.
Figure 5" Soot volume fraction as a function of distance at various instants. (a) Case 1, less
sooty flame. (b) Case 2. very sooty flame.
F-igure _: Radiative Heat Loss as a function of distance at various instants. (a) Case I, less
sooty flame, (b) Case 2. very sooty flame.
Figure 7: Soot volume fraction and Temperature distribution at t = 0.2 seconds. (a) Case 1,
less sooty flame, (b) Case 2, very sooty flame.
l:

OXIDIZER
FUEL
Inid_ Interface @ t=0 x=O •
@ t=O;x >0& @ t >0;x- =
%= %., YF=o; T=TF.
@ t = 0;x<0& @ t >0;x--"
YF=YF®; Yo=O; T=To..
Figure l : Schematic of the Model Problem
12

ET
I < 3 (_) I > S (q) A_lun s! (3) ouu.I _nU_l_A.mb 3 (n) "sou_ ._nuntnA!nb_
snout^ Jo7 _nu'ms.rpJo uo.nnunj _ sn uonnq_s.rp _m_dm_ L -uonnlos T_nPXl_UV :_ _rn_=!__
Z
O'I g'o 0"0 g'O- 0"I-
-oog
-00gI
-oog
-OOgl
0001
O00C
.--=
E=j
_O
>
L-=j
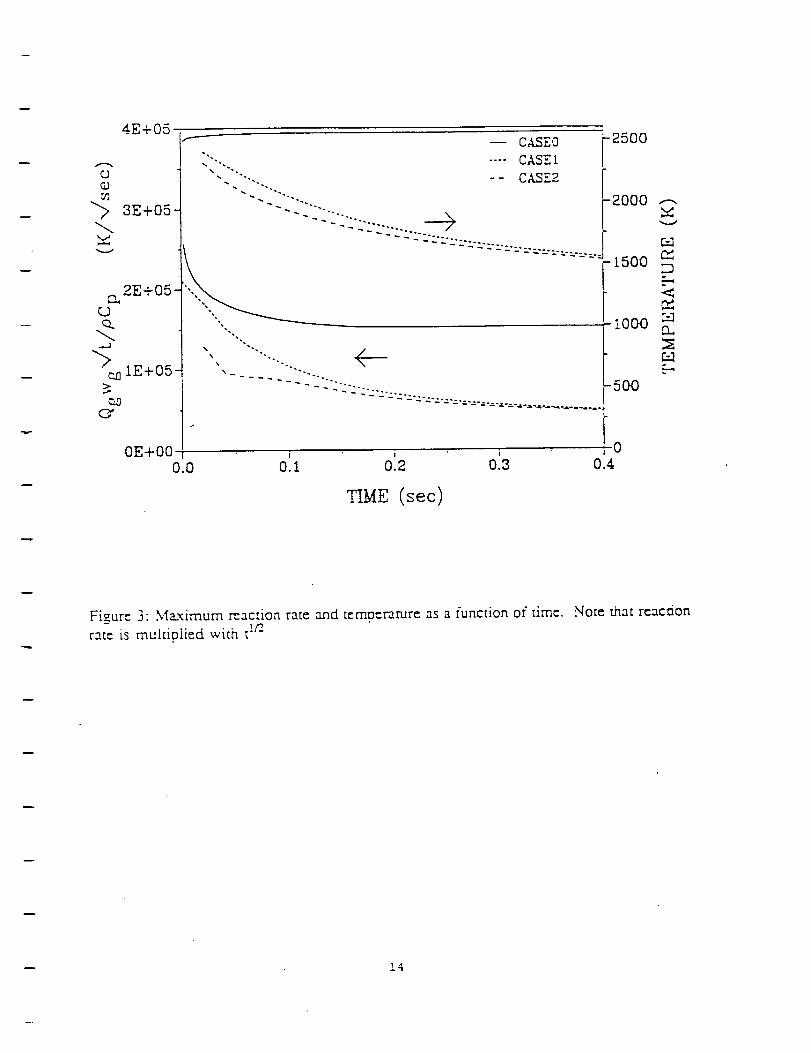
4E+05
3E+05
25OO
0
OI .1 0'.2 o13 0.4
TIME (sec)
Figure 3: Maximum _acdon ra[e and [empcramre as a function of dine.race is mukiolied with ttn
Note that rencdon
14
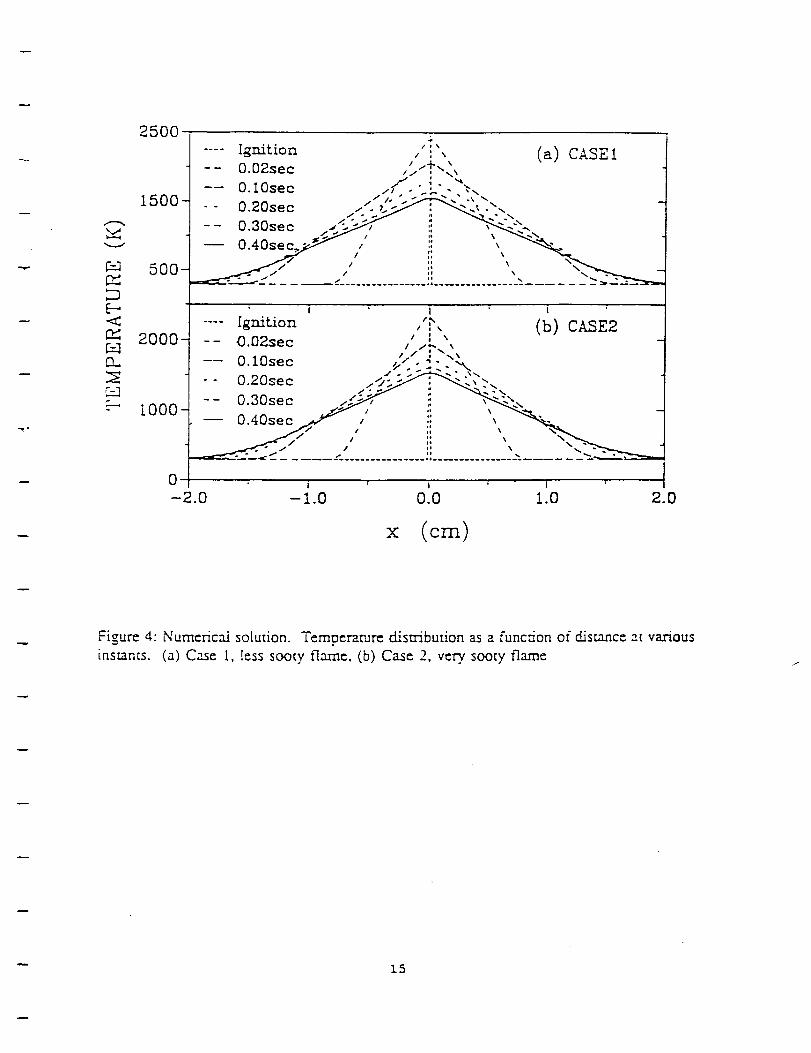
-F-=..]12:::
E-<
-r.:..]o._,
2500
1500
500-
2000-
i000-
0
i %
.... Ignition ,': , (a) CASE1-- O,02sec ,' ,..-I-..',
,., ,.,., .,-" ,. :._'..., --..° " u.,_usec .." . 1. -_..-/ ; '-._.,t . x
i i ' I
.... Ignition ,'_, (b) CASE2
-- O.02sec ,, ..:... ,,/ / i -_\--- O.lOsec ,.,-" . -,- . x,,.
,. ,.,,., v'. ;."..-C'-<-- 3-.- - u.,-usec /-2;,>./- : "._;._ .'-,_
--0.30see ,,_ _ __-- , - , --.4
' i _ I i
-2.0 -i.0 0.0 1.0 2.0
Figure 4: Numerical solution. Temperature distribution as a funcdon of cLismnce at various
Ensmnts. (a) C_e t, tess sooty flame. (b) Case 2, very. sooty flame
15

3.5E-08->
2.5E-08XG
9- I.SE-OS-Q_<C:; 5.0E-09"
3.0E-06-
o 2.0E-06->
p
0 1.OE-060or]
O.OE+O0--i
-- O.02sec
-- O.06sec
-- O.lOsec
-- 0.20sec
.... 0.30sec-- 0.40sec
i
--- O.02sec
- - O.06sec
-- O.lOsec
- - 0.20sec
.... 0.30sec
-- 0.40sec z', _ _ /,,.... .. _ _/ ,
"" • /\\ ',
t i
).75 -0.50 -0.25
,-\ (a) ClSEI -/ \.,
/ ,'\ ,/
/ , ,_I
/ ,,'" L...._,_ _ ,
mi I
,., (b) CASE2 -J
e
-I\ , /%/, \ , I \
/ , \ / \
/ , ,/ \/ , t 4
' ttII\
, \
0.00
Figure 5: Soot volume fraction as a funcdon of distance ac various instants. (a) Case t, less
sooty flame, (b) Case 2, very sooty flame
!6

OE+O0
- !E+04
cu<_)
e. -2E+04-
O" OE+O0
I-2E+04-
-4E+04-
-6E+04-
(a) CASEI ""% "" "'" -" /"" -- 040see''.X- "--" i/."
\" -. -"/ --- 0.30sec
\. ,'/ -- 0.20sec\'- /
-- O.IOsec\ /- - O.OSsec
O.02sec=.
(b) CASE2 /l,
,LlIi
IIk
-- 0.40sec
.... 0.30sec
- - 0.20sec
-- O.lOsec
- - O.OOsec
-- O.OEsec-8E+04 _ ' I ,
-1.0 -0.5 0.0 0.5 1.0
X (cm)
Fizure o: Radiative heat loss as a funcuon of distance ac various insmn[s. (a) Case I, less
sooty t-lame, (b) Case 2, very. sooty t'lame
17
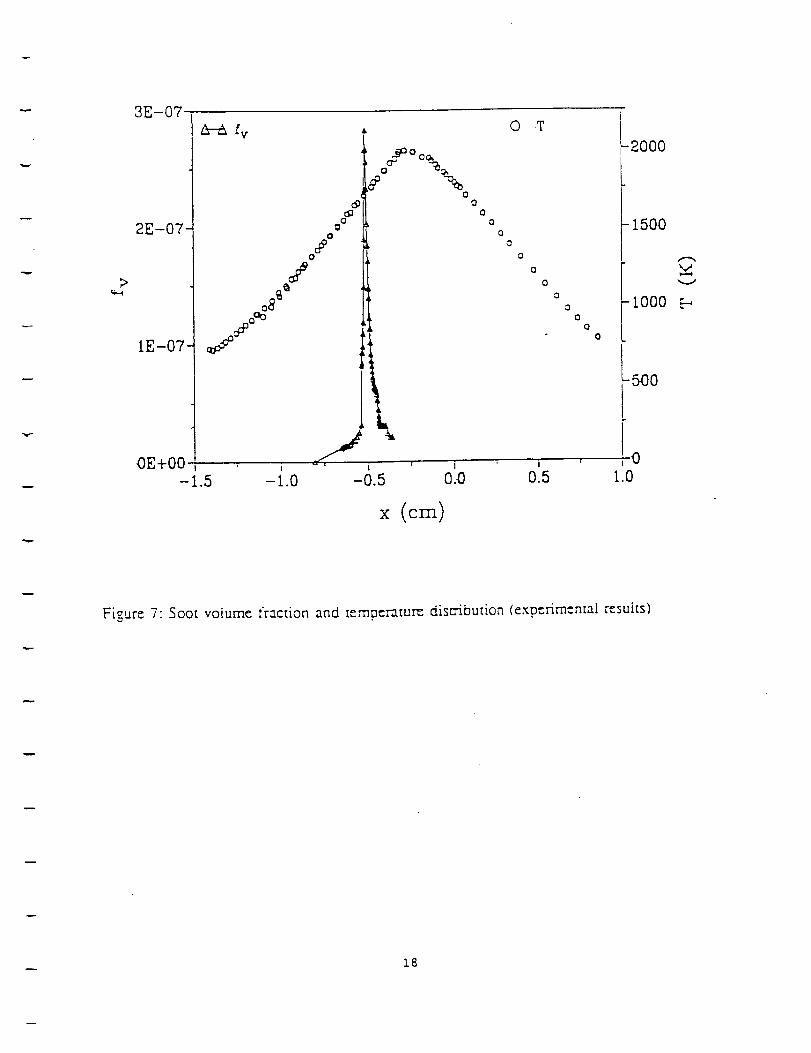
3E-07
>
2E-07
1E-07-
fv A
o "_
0
2 °0
0
0
8 joo I
c_ _° i!
I 1
-i.0 -0.5
© T
0
0
0
0
0
0
O
OE+O0 , , , , 0
- 1.5 O.O 0.5 1.0
-2000
-1500
i000
-5OO
Figure 7: Soot volume fracdon and _mn_r_tum disu-ibudon (exp_rim_nEal msutts)
18
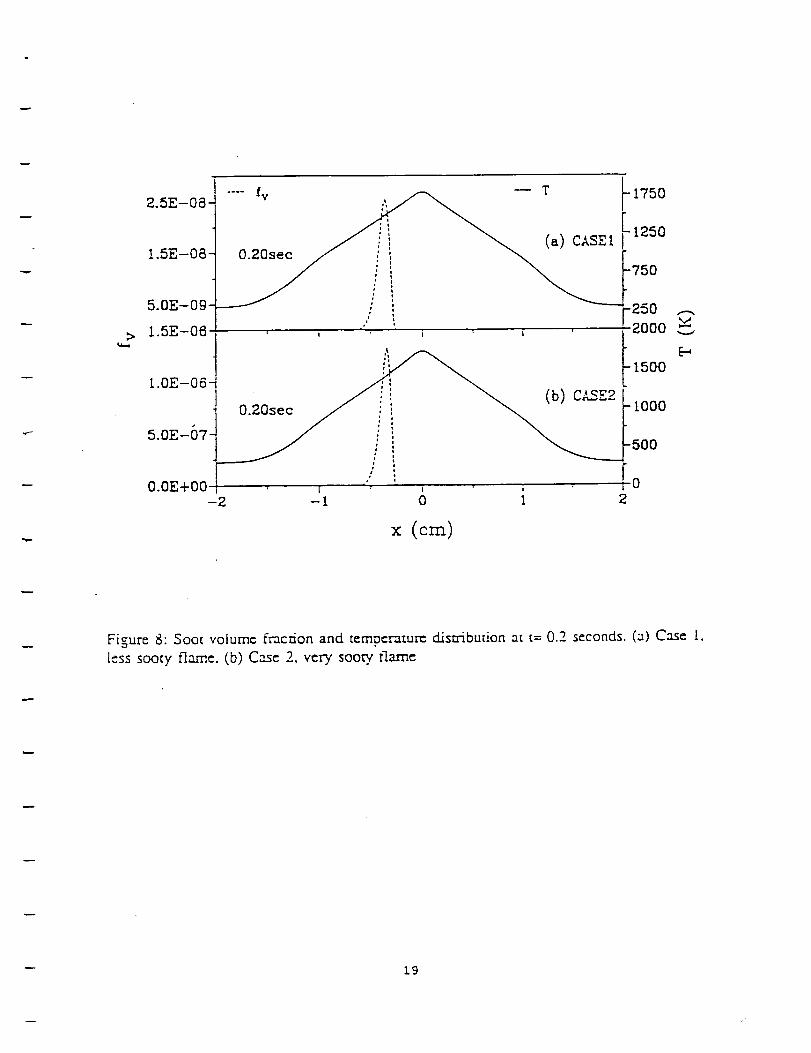
>
2.5E-08-
1.5E-08-
5.OE-09-
1.5E-06
1.OE-06
5.0E-67
soa
u.u._,-i'-uu ' I '-2 -I (3 I
T 1750
i _ [ 1250
. : 250 _,, i '" k ' i ' 2000
1500
-I000
-500
!o2
x
Figure 8: Soot volume frncrion and temocram_ distribution at t= 0.2 seconds. (a) Case |.
less sooty flame. (b) Case 2, very sooty, flame
19


APPENDIX F
A Study 9f the Effects of Radiation on Transient Extinctionof Strained Diffusion Flames
Joint Technical Meeting of Combustion Institute paper, 1995
By
Shamim, T. and Atreya, A.

Central & Western States/Mexican National Combustion Institute Meeting, May 1995
A Study of the Effects of Radiation on Transient Extinction of
Strained Diffusion Flames
TARIQ SHAMIM AND ARVIND ATREYA
Combustion and Heat Transfer Laboratory
Department of Mechanical Engineering and Applied Mechanics
The University of Michigan, Ann Arbor, MI 48109-2125
Numerical simulations of transient counterflow diffusion flames were conducted to quantify the
low-strain-rate radiation-affected diffusion flame extinction limits. Such limits are important for
spacecrafi fire safety. The ratfl'ative effects.from combustion products (CO_ and H20) were considered
in the formulation. Employing the Numerical Method of Lines, the governing equations were spatially
discretized by using a 4th order central chfference formula and temporally integrated by using an
implicit backward th'fferentiation formula (BDF). Results show a significant reduction in the flame
temperature due to radiation. For flames subjected to small strain rates, this reduction in temperature
was found to be sufficient to cause extinction. For methane flame, the extinction occurs for strain ratesless than I s"1, and the extinguishment time (disappearance of flame chemiluminescence = 1550 K) for
most of these strain rates was found to be less than 1 secoru£ A flammabiIity map was plotted to show
the maximum flame temperature as a function of the strain rate and the time of radiation induced
extinction. Results were compared with an earlier study at zero strain rate and were found to be in
excellent agreement.
NOMENCLATURE
a_A
cp
Di
h
h°t.i
MW
Le
P
R
T
t
v
Yi
E
lqX.
v
Planck mean absorption coefficient
Pre-exponential factor
constant pressure specific heat of the mixture
coefficient of diffusivity of species i
enthalpy
enthalpy of formation of species i
average molecular weight
Lewis number
pressureradiant heat loss
heat of reaction
universal gas constant
temperaturetime
axial velocity
mass fraction of species i
strain rate
similarity wansformafion variable
thermal conductivity of the mixture
dynamic viscosity of the mixturemass based stoichiometric ratio

P¢3
mass density
Stefan-Bokzman constant
similaritytransformationvariable
mass rate of production of species i
INTRODUCTION
This study was motivated by a need toquantify the low-strain-rate radiation-affected flammability limits.
Flammability limits are of practical interest specially in connection with fa'e safety because mixtures
outside the limits of flammability can be handled without concern of ignition. For this reason, extensive
tabulations of limits of flammability as limits of composition or pressure have been prepared, tu
However, there are very few studies on radiation-affected flammability limits and diffusion flame
extinction limits.
One reason for such a lack of literature is that measurements have indicated that radiant losses
from the gas are relatively insignificant for small-scale lab experiments since under normal gravity
conditions the excess particulates are simply ejected from the flame tip by the buoyant flow field. But
radiant emission may have significant influence on conditions at extinction for larger scales because of
the presence of a large number of soot particles and under microgravity conditions because of very low
strain rates.Bonne ml was the first one who analyzed the problem of diffusion flame extinction with flame
radiation. Using the results of a simulated experimental study, he showed that the radiative
extinguishment occurs in a zero gravity environment. The existence of a radiative extinction limit at
small strain rates was first numerically determined by T'ien/3k He plotted a flammability map showing
the extinction boundaries consisting of blowoff and radiation branches. However, he onty considered
the radiative heat losses from the fuel surface and neglected gas-phase radiation and absorption.
The radiative effects from soot, CO 2 and H20 were considered by Kaplan et al.,t41 in their recent
study to investigate the effects of radiation transport on the development, structure and dynamics of the
flame. Recently, Atreya and Agrawal t_ numerically demonstrated the occurrence of radiative-extinction
of a one-dimensional unsteady diffusion flame in a quiescent microgravity environment.
FORNII_ATION OF THE PHYSICAL PROBLEM
General Governing Eauations
A schematic of a counterflow diffusion flame stabi2izcd
near the stagnation plane of two laminar flows is shown
in Figure 1. In this figure, r and z denote the
independent spatial coordinates in the tangential and the
axial directions respectively. Using the assumptions of
axisymmetric, unity Lewis number, negligible body
forces, negligible viscous dissipation, and negligible
Dufour effect, the resulting conservation equations of
mass, momentum, energy and species may be simplified
to the following form:
/__Figure 1 Schematic of counterflow diffusion flame

aP +2p¢,+ (8._L_-0
÷ - _ p DIP P
along with the equation of state: p Ip-
The symbols used in the above equations are def'med in tim nomenclature. Note that in the present form
the equations do not depend on the radial direction. In this study, the radiative heat flux is modelled
by using the emission approximation, i.e., QR = 4 c_T 4 (a_o: + a_z:o); where, _ is the Stefan-Boltzman
constant, and ap.co: and a_.o am Planck mean absorption coefficients for CO2 and H=O respectively.
These absorption coefficients were taken from Ref. [6].
Reaction Scheme
The present problem was solved by considering a single step overall reaction which may be
written as follows:
IF] + v [Oz] (l+v) [P]
Here, v is the mass-based stoichiometric coefficient. Using second order Arrhenins kinetics, the reaction
rate was defined as co = A p2 Yv Yo exp(-F__fR "I"). The reaction rates for fuel, oxidizer, and product
may then be written as co_ = -co; c_ = -vco; and a_ = (l+v)co. The values of the pre-exponential factor
A, the activation energy E_ for a methane flame and the other properties were obtained from Ref. [5].
Initial and Boundary Conditions
A solution of these equations requires the specification of some initial and boundary conditions
which are given as foUowing:
Initial Conditions:
_(z,O) = _,o(Z)h(z,0) = h,,(z) or T(z,0) = To(Z)
Yi(z,O) = Yi.o(Z) [ n conditions or (n-l) conditions + p(z,O) ]
Here subscript 'o' represents the specified initial function.
Boundary Conditions:The origin of our coordinate system was defined at the stagnation plane.

v(=,,t) = 1
h(oo, 0 = h_
[or T(oo,t) = T,,v
Yi(_,t) = Y,_
v(0,t) = 0
V(-_,t) = (p../p_)_
h(-oo, t) = h,o.
T(-*o,t) = T_0,,]Yi('_, t) = Ylo-
The strain rote a, which is a parameter, must also be specified.
SOLUTION PROCEDURE
The governing equations form a set of nonlinear, coupled and highly stiff partial differential equations.
A closed form solution of these equations is very difficult to obtain. Hence, in the present study, the
equations were solved numerically. The numerical scheme used is called the Numerical Method of Lines
(NMOL). In this method, the equations are fast discretized by applying a standard finite difference
scheme in the spatial direction which transforms PDEs into ODEs. The resulting ODEs in time are then
solved by using a time integrator such as Rtmge Kutta, implicit Adams method, implicit backward
differentiation formulas for stiff problems.
In the present study, a 4th order 5-point central difference formula was used to spatially discretize
the equations and an implicit backward differentiation formula (BDF) was used to integrate in the
temporal direction. Ahn order to carry out the numerical integration, infinity was approximated by a finite
length of the order of the length scale of the problem (i.e., 0Die) a ). This was confirmed by checking
the gradients of all the variables which must vanish at the boundaries.
RESULTS AND DISCUSSION
Figures 2-4 show the results for unity equivalence ratio with T_=295K, Yr...--0.125, Yo__--'0.5 and strain
rate E=0.5 s "t. These results were obtained by dividing the computational domain into 1001 spatial nodes
(i.e., the size of spatial node was 0.05 mm). ALl the profiles shown are at time t= 0.001, 0.01, 0.1, 0.5,
and 0.7 second. For these results, constant %, equal diffusion coefficients for all gases and p-'D=constantwere used.
The temperature profiles show a decrease in the maximum flame temperature due to gas radiation.
The effect of gas radiation was found to be sufficient to cause extinguishment (defined as disappearance
of chemiluminescence =1550 K) in approximately 0.5 second. However, the effect of radiation was
found to decrease with an increase in strain rote. Figure 5 shows the steady state temperature pmf'tles
for the cases with and without radiation effects for _=10.0 s". The results show that the gas radiation
reduces the maximum flame temperature by 175 K without causing any extinguishment.
Figure 6 shows the time variations of maximum flame temperature for various values of strain
rates. The plot shows that for flames with strain rates less than 1 s"1, the effect of gas radiation is
sufficient to cause extinction.
The results were compared with an earlier study m at zero strain rate. Figure 7 shows a
comparison of temperature profiles at time t---0.31 s in density distorted coordinates. Both the results
were found to be in very good agreement. A small difference at the peak temperature may be attributed
to the fact that in Ref. [5], the variation of molecular weight in the calculation of density was not
considered.
CONCLUSIONS
A computational model has been developed for an unsteady counterflow diffusion flame to quantify the

low-strain-rateradiation-affecteddiffusionflameextinctionlimits. Theradiativeeffectsfrom combustionproducts(CO2and H20) were consideredin the formulation. A significant reduction in the flame
temperature due to radiation was found to occur. This reduction in temperature increases with a decreasein strain rate and was found to be sufficient to cause extinction at low strain rates. For a methane flame,
the extinction occurs for strain rates less than 1 s"z. A flammability map was plotted to show the
maximum flame temperature as a function of the strain rate and the time of radiation induced extinction.
Results were compared with an earlier study at zero strain rate and were found to be in excellent
agreement. In the present model, the soot radiation, detailed chemistry and non-unity Lewis number
were not considered.
ACKNOWLEDGMENT
Financial support for this work was provided by NASA (under the grant number NAG3-1460) and GRI
(under the grant number 5093-260-2780).
REFERENCES
.
2.
3.
4.
5.
6.
F. A_ Williams, Combustion Theory, Benjamin/Cummings Publishing Co. 2nd Ed. (1985).
U. Bonne, Comb. & Flame, 16, 147 (1971).
J. S. T'ien, Comb. & F/ame, 65, 31 (1986).
C. R. Kaplan, S. W. Baek, E. S. Oran, and J. L. EUzey, Comb. & F/ame, 96, 1 (1994).
A_ Atreya and S. Agrawal, Comb. & Flame, (accepted for publication) (1993).M. M. Abu-Romia and C. L. Tien, J. of Heat Trans., Nov, 321 (1967).
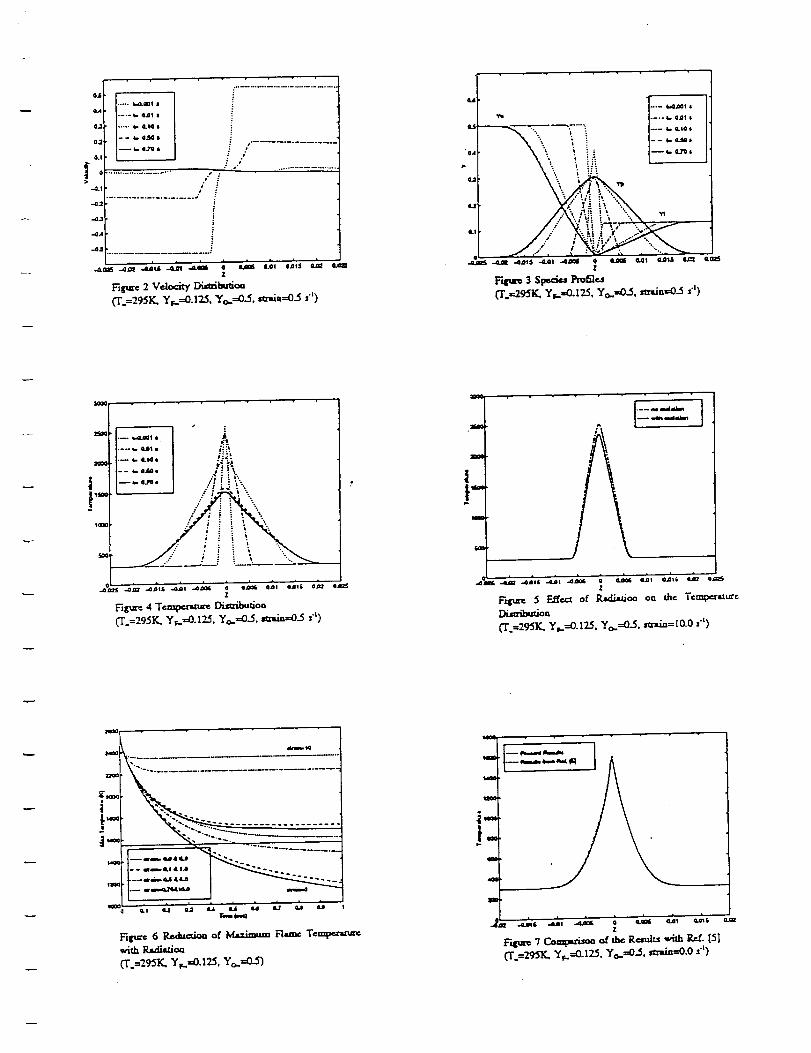
o.q
0.4
0,1
0.,2
0.1
J-.-. _.4.W! II
.... _, 4J1 |
..... Pm LSa •
--_m a.TQ e•; o...............
: o"
.o ;
;/i
-o.: i
o i L_ i * i , i._ -L£EZ -LLO_6 4.01 -LL 4 (L_ L_I I,OIS a_ZZ
_Iurc :2Vclock7 l_aib_oa_.=2_ ¥_=0.12-% ¥o.=0_, m-_=O__ s"K)
2saa
ii _.
.-:_
e'. *'°
--_ a.._, ..'" ] " t"
t ° ".. ".
m l
Z
Fi_'_ 4 T_p_t_tu_ _dom(T =295K, y_.=0.125, y_.=O..5, _l_m=0.5 s"_)
Q._.c
i
'l:l_l
,_,m= Sd
.o llii(L| 4 |.i_
,i, mb 4gl & 4LO
_pcc 6 P,r,ducc_n of IVf_knum Fizmc T,:_with l_.sdiz_o_
--- 4.dl.OQl il
--_7,. ,_ : --- 4= CLIO*
'_ ,_ : -- *=o._,
I-
o_
% ,_ :... : Yf
• ?; s _ _,."
Fq_n 3 Sp_=i_aPmfi]_a(T._295K. Yr..=O.l_5, Yo. =03. sc_n=:_3 _")
m
|*&m
F_c 5 E,ffc_ of R_o_ oo _hc Tcmp_,u._c
0" =29_K, %_.=0.1%%%o,.=0-,<,s._iu= I0.0 s"_)
w
m
.i
-- (_Mm_ M_idho
Z
APPENDIX G
Numerical Simulation of Radiative Extinction of Unsteady" Strained Diffusion Flames
Symposium on Fire and Combustion Systems, ASME IMECE
paper, 1995
By
Shamim, T. and Atreya, A.

Symposium on Fire and Combustion Systems, ASME IMECE, 1995 ,i
NUMERICAL SIMULATIONS OF RADIATIVE EXTINCTION OF UNSTEADY,
STRAINED DIFFUSION FLAMES
Tariq Shamim and Arvind Atreya
Department of Mechanical Engineering and Applied Mechanics
The University of Michigan
Ann Arbor, Michigan
ABSTRACT
In an attempt to fill the existing gap in the literature, time-
dependent numerical simulations of axisymmeuSc counterflow
diffusion flames were conducted to quantify the low-strain-rate
radiation-affected flammability limits. Such limits are important
for spacecraft fire safety. At low strain rates, there is an
enhancement of flame radiation due to increased accumulation of
combustion products in the flame zone and an increased rate of
soot formation. Hence radiative extinction becomes significantly
more important.
The model formulation includes the radiative effects from both
soot and combustion products (CO: and H_O) as weil as soot
formatton and oxidation. Employing the Numerical Method of
Lines. the governing equations were spatially discretized by using
a 4th order central difference formula and temporally integrated
by using an implicit backward differentiation formula (BDF').
Both non-sooty and sooty flames were considered. Results show
a significant reduction in the flame temperature due to radiation.
The radiation from combustion products was found to play a
dominant role. For flames subjected to small strain rates, the
radiation-induced reduction in temperature was found to be
sufficient to cause extinction. For methane flame, the extinction
occurs for strain rates less than 1 s 4. and the extinguishment time
(disappearance of flame chemiluminescence ", 1550 K (Bonne.
1971)) for most of these strain rates was found to be less than 1
second. A flammability map is presented to show the maximum
flame temperature as a function of the strain rate and the time of
radiation induced extinction.
INTRODUCTION
The objective of this study is to invesdgate the effects of
radiative heat losses from soot and combustion products (CO z and
H_.O). This work will lead to the quantification of low-strain-rate
radiation-affected diffusion flame extinction limits. Such limits
are important for spacecraft fire safety. Although. there has been
a growing recognition of the importance of radiadve heat losses
from flame (Chao and Law. 1993 and Kaplan et al.. 1994). there
still exists a v_t gap in the literature.
One reason for such a lack of literature is that measurements
have indicated that radiant losses from the gas are relatively
insignificant for small-scale lab experiments since under normal
gravity conditions the excess particulates are simply ej_ted from
the flame rip by the buoyant flow field. But radiant emission may
have significant influence on conditions at extinction for larger
scales because of the presence of a large number of soot particles
and under microgravity conditions because of very low strain
rates. At low strain rates, there is an enhancement of flame
radiation due to increased accumulation of combustion products
in the flame zone and an increased rate of soot formation. Hence
radiative extinction become_ significantly more important.
Bonne (1971) was the first one who analyzed the problem of
diffusion flame extinction with flame radiation. Using the results
of a simulated experimental study, he showed that the radiative
extinguishment occurs in a zero gravity environment. The
existence of a radiative extinction limit at small strain rates was
first numerically determined by T'ien (1986). He plotted a
flammability map showing the extinction boundaries consisting of
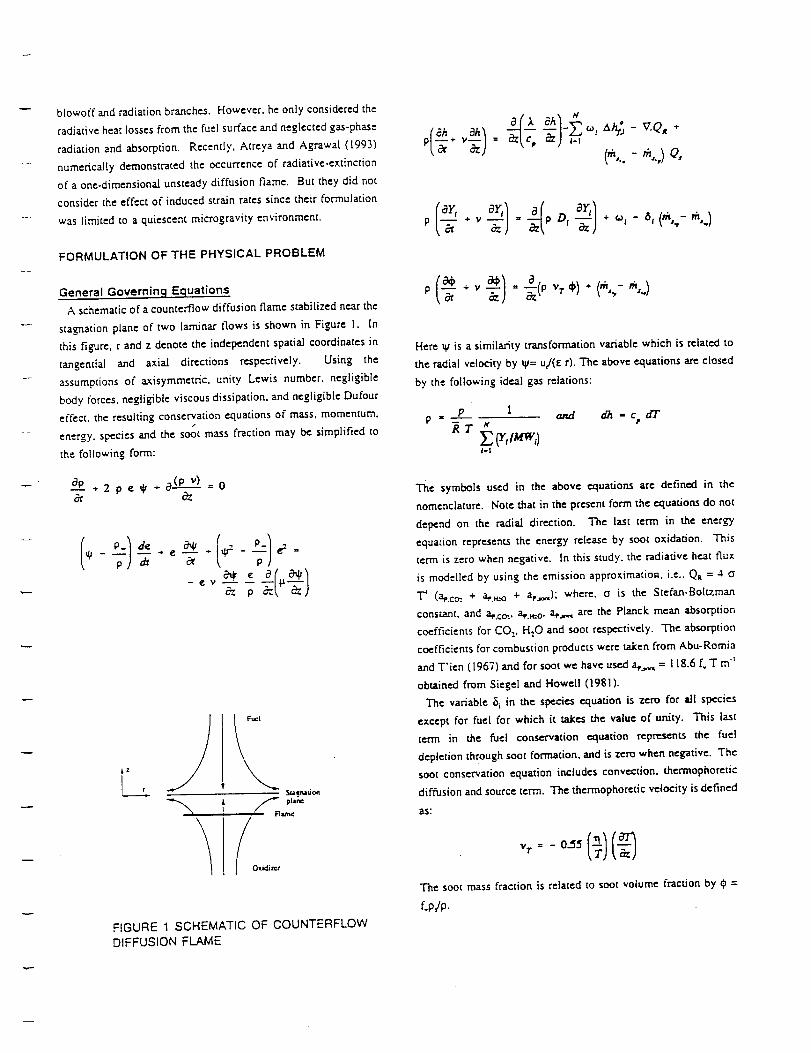
blowoff and radiation branches. However. he only considered the
radiative heat losses from the fuel surface and neglected gas-phase
radiation and absorption. Recently, Atreya and Agrawal (1993)
numericaJ[y demonstrated the occurrence of radiative-extinction
of a one-dimensional unsteady diffusion flame. But they did not
consider the effect of induced strain rates since their formulation
was limited to a quiescent microgravity environment.
FORMULATION OF THE PHYSICAL PROBLEM
General Governing Equations
A schematic of a counterflow diffusion flame stabilized near the
stagnation plane of two laminar flows is shown in Figure I. [n
this figure, r and z denote the independent spatial coordinates in
tangential and axial directions respectively. Using the
assumptions o( axisymmetdc, unity Lewis number, negligible
body forces, negligible viscous dissipation, and negligible Dufour
effect, the resulting conservation equations of mass. momentum.
energy, species and the soot mass fraction may be simplified ro
the following form:
a--tP÷ 2 p e ,1,÷ a (p v___.))= o& &
-ev _ c& p
S_a¢_aUon
S pla_¢
, , FIa.m¢
f OtidJz_$
FIGURE 1 SCHEMATIC OF COUNTERFLOW
DIFFUSION FLAME
(m,..-m,.,)o,
p ÷ ,, p D, • - ,.,..)
p * ,, = ", ,¢,)-(,%- m..)
Here _/is a similarity transformation variable which is related to
the radial velocity by q1= u/(E r). The above equations are closed
by the following ideal gas relations:
P = p I and _ -c d'/"
I-1
The symbols used in the above ,:_luadonsare defined in the
nomenclature. Note that in the present form the equations do not
depend on the radial direction. The [a.st term in the energy
equation represcnL_ the energy release by soot oxidation. This
term is zero when negative. In this study, the radiative heat flux
is modelled by using the emission approximatiom i.e.. Q_ = 4
T_ (_.co:. + a_._--o + ap.,_); where, o is the Stefan-Bolczman
constant, and _.co-., a1'.a:o, a_,,,_ are the P[anck mean absorption
coefficients for CO,, H_O and soot respectively. The absorption
coefficients for combustion products were taken from Abu-Romia
and T'ien (1967) and for soot we have used al,.,,,,, = I Ig.6 f, Tm"
obtained from Siegel and Howell (1981).
The variable _i in the species equation is zero for all species
except for fuel for which it takes the value of unity. This last
term in the fuel conservation equation represents the fuel
depletion through soot formation, and is zero when negative. The
soot conservation equation includes convection, thermophoredc
diffusion and source term. The thermophoretic vetocity is defined
as:
The soot mass fraction is related to soot volume fraction by ¢ =
LP/P.
Soot Production Model
The source term in the soot conservation equation, i.e., (m,.o -
rr_.o), is represented by a model developed by Zhang et al., (1992)
and Atreya and Zhang (1995) and may be described as following:
,,. a',I
In this simplified model, the soot nucleation rate equation is
avoided by the use of an average number density. The value of
the pre-exponential factor for soot reaction Ap, the soot activation
energy E,. the energy released during soot oxidation Q, and the
soot particle density p, were taken to be 10 t° kg/m:.s. 150
kJ/mole. 9xl& k.J/kg and 1.86x1_ kg/m _ respectively (Zhang et
al.. 1992 and Atreya and Zhang. 1995).
Reaction Scheme
The present problem was solved by considering a single step
overall reaction which may be written as fotlows:
[F] + v [0:] (l+v) [P]
Here. v is the mass-based stoichiometric coefficient. Using
second order Arrhenius kinetics, the reaction rate was defined as
03 = A p" YF Yo exp('Ea/'R T'). The reaction rates for fuel,
oxidizer, and product may then be written as 6% = -co: 030 = -v03;
and _ = (1+v)03. For the calculations presented here. the values
of various constants and properties ,.,,'ere obtained from Atreya and
Agrawa[ (1993).
Initial and Boundary Conditions
A solution of these equations requires the specification of some
initial and boundary conditions which are given as following:
lnith_l Conditions:
_(z.0) = _,(z)
h(z.0) = ho(Z) or T(z.0) : To(z)
Y,(z.0) = Y,..(z) [ n conditions or (n-l) conditions + p(z.0) ]
o(z.O) = Oo(Z)
Here subscript 'o' represents the specified initial function.
Boundary Conditions:
The origin of our coordinate system was defined at the
stagnation plane.
_(**,t) = 1 _K-**,t) = (PJP-)'_
h(**,t) = b.,, h(-,,*,t) = h_,.,
[or T(*.*,t) = T,,, T(-,_,t) = To,, ]
Y_(**,t) = Y,_ Y,(-**,t) = Y,,
v(0,t) = 0
The strain rate _. which is a parameter, must also be specified.
SOLUTION PROCEDURE
The governing equations form a set of nonlinear, coupled and
highly stiff partial differential equations. A closed form solution
of these equations is very difficult to obtain. Hence. in the
present study, the equations were solved numerically. The
numerical scheme used is called the Numerical Method of Lines
(NMOL). In this method, the equations are first discretized by
applying a standard finite difference scheme in the spatial
direction which transforms PDEs into ODEs. The resulting ODEs
in time are then solved by using a time integrator such as Runge
Kutta. implicit Adams method, implicit backward differentiation
formulas for stiff problems.
[n the present study, a 4th order 5-point central difference
formula was used to spatially discretize the equations and an
implicit backward differentiation formula (BDF) was used to
integrate in the temporal direction. [n order to carry out the
numerical integration, infinity was approximated by a finite length
of the order of the length scale of the problem (i.e.. (DIE) _ ).
This was confirmed by checking the gradients of all the variables
which must vanish at the boundaries.
RESULTS ANI) DISCUSSION
Figures 2-...t show the results for unity global equivalence ratio
with T_=295K. Yr.._--O.125, Yo._--0-5 and strain rate _:---'0.1 s _,
These results were obtained by dividing the computational domain
into 1001 spatial nodes (i.e.. the size of spatial node was 0.05
ram). All the profiles shown are at time t= 0.001.0.01.0.1.0.3.
and 0.'4 second. For these results, constant c_,. equal diffusion
coefficients for all gases and p2D---constant were used.
The temperature profiles show a decrease in the maximum flame
temperature due to gas radiation. The effect of gas radiation was
found to be sufficient to cause extinguishment (defined as
disappearance of chemiluminescence-1550 K (Borme. 1971)) in
approximately 0.3 second. However, the effect of radiation was
found to decrease with an increase in strain rate. Figure 5 shows
the steady state temperature profites for the cases with and
without radiation effects for _= 10.0 s "t. The results show that the
radiation reduces the maximum flame temperature by 250 K
without causing extinction.
Figure 6 shows the development of soot volume fraction profiles
at various time intervals for strain rate of 0.1 s "l. This figure
shows that the soot volume fraction initially increases, reaching
a maximum value in approximately 0.04 s and then starts

decreasing.Thefigurealsoshowsashiftofsootformationzonetowardsthefuelside.Thedecreaseinthesootformationisdueto:(i)areductionintheflametemperatureasaresultofradiation:
- (ii)theconvectionofsoot to lower temperature zones: and (iii) an
increased rate of soot oxidation. The convection of the soot
volume is mainly due to expansion waves generated at the initial
-- stage of ignition (see Figure 2). This convection effect is further
assisted by the following two factors: (i) the spread of products of
combustion with time increases the OH radical concentration.
- which in turn increases the soot oxidation in the high temperature
zone and thus shifts the soot formation towards low temperature
zone: and (ii) the thermophoretic diffusion of soot particle. "me
latter effect, however, is not very dominant. The convection of
soot volume fraction is opposed by the _traln induced flow. This
opposing effect becomes important at higher strain rates. Results
-- at higher strain rates show a considerable decrease in the soot
volume fractions with soot formation in the higher temperature
zones. i
- Figure 7 shows the time variations of maximum flame
temperature for various values of straJn rates. The plot shows that
for flames with strain rates less than l sa, the effect of radiation
is sufficient to cause extinction. These results show similar trends
as those obtained in our previous study (Shamim and Atreya,
1995). which included the effect of gas radiation only. The effect
of soot radiation was obtained by comparing the cases with and
without soot radiation. The difference in peak temperatures for
these two cases as a function of strain rate at time t=0.05 s is
plotted in Figure 8. The figure shows a decrease in the effect of
soot radiation with an increase in strain rates. This decrease is
due to a decrease in the soot volume fractions at higher strain
rates. However. since the radiative losses from combustion
products decrease at a faster rate with strain rates, the contribution
of soot radiation becomes more significant at higher strain rates.
CONCLUSIONS
[n order to quantify the low-strain-rate radiation-affected
diffusion flame extinction limits, the effects of radiative heat
losses on an unsteady counterflow diffusion flame were
numerically investigated. The model formulation includes the
radiative effects from both soot and combustion products (CO:
and H,O) as well as soot formation and oxidation. Both non-
sooty and sooty flames were considered. Results show a
significant reduction in the flame temperature due to radiation.
This reduction in temperature increases with a decrease in strain
rate. The radiation from combustion products was found to play
a dominant role. specially at low strain rates. For flames
subjected to tow strain rates, the radiation-induced reduction in
temperature was found to be sufficient to cause extincdon. For
methane flame, the extinction occurs for strain rates less than 1
s*. and the extinguishment time (disappearance of flame
chemiluminescence - 1550 K) for most of these strain races was
found to be less than I second. A flammability map is presented
to show the maximum flame temperature as a function of the
strain rate and the time of radiation induced extinction. In the
present model, detailed chemistry and non-unity Lewis number
were not considered.
ACKNOWLEDGMENT
Financial support for this work was provided by NASA (under
the grant number NAG3-1460) and GRI (under the grant number
5093-260-2780).
NOMENCLATURE
aJi
a_
A
AW
Cp
Di
E,
fv
h
h°tj
MW
Le
P
Q,
Q,R
T
t
Ut
v
v T
Yi
8,
E
q
X
V
number of atoms of kind "j" in species "i"
Planck mean absorption coefficient
pre-exponential factor
atomic weight
constant pressure specific heat of the mixture
coefficient of diffusivity of species i
soot activation energy
soot volume fracuon
enthalpy
enthalpy of formation of species i
soot production rate
soot oxidation rate
average molecular weight
Lewis number
pressure
radiant heat loss
heat of reaction for soot oxidation
universal gas constant
temperature
time
radial velocity
axial velocity
thermopheretic velocity
mass fraction of species i
variable defined in the species equation
strain rate
kinematic viscosity of the mixture
thermal conductivity of the mixture
dynamic viscosity of the mixture
mass based stoichiometric ratio
variable defined in the soot model

P(3
mass density
Stefan-Boltzman constant
sootmass fraction
simila.dty transformation vadabIe
mass rate of production of species i
- REFERENCES
Abu-Romia. M. M.. and T'ien. C. L., 1967, "Appropriate Mean
Absorption Coefficients for Infrared Radiation of Gases." Jourrm[
of Heat Trarfffer, Vo[. 11, pp. 321-327.
Atr_ya, A. and Agrawal. S.. 1993. "Effect of Radiative Heat
Loss on Diffusion Flames in Quiescent Microgravity
Atmosphere." Combustion & Flame, (accepted for publication).
Atreya, A.. and Zhang, C.. 1995, "A Global Model of Soot
Formation Derived from Experiments on Methane Countertqow
Diffusion Flames." Combustion & Flame. (tO be submitted) .
Borme. U.. 1971. "Radiative Extinguishment of Diffusion Flames
at Z_ro Gravity." Combustion & Flame, Vol. 16. pp. 147-159.
Chao. B. H.. Law. C. K.,'1993, "Asymptotic Theory of Flame
Extinction with Surface Radiation." Combustion & Flame. Vol.
92. pp. 1-24.
' Kaplart. C. R.. Back. S. W.. Oran, E. S.. and Ellzey, J. L. 1994.
"Dynamics of a Strongty Radiating Unst,"_dy Ethylene Jet
Diffusion Flame." Combustion & Flame. Vol. 96. pp. 1-21.
Shamim. T.. and Atreya, A., 1995, "A Study of the Effects of
Radiation on Transient Extinction of Strained Diffusion Flames,"
Join_ Technicc( Meeting of Combustion Irtstitute. paper 95S-104
pp. 553-558.
Siegel. R.. and Howell. J. R.. 198[. Thermal Radiation H¢at
Trar.sfer. Hemisphere Publishing Corp.. Washington, D.C.. 2nd
ed.
T'ien. J. S.. 1986. "Diffusion Flame Extinction at Small Stretch
Rates: The Mechanism of Radiative Loss," Combustion & Flamt.
Vol. 65, pp. 31-34.
Zhang. C.. Atreya, A.. and Lee, K.. 1992. "Sooting Structure of
Methane CoLmterflow Diffusion Flames with Preheated Reactants
"" and Dilution by Products of Combustion." Twenry-Four:h
([nt_rnation.al) Symposium on Combustion. The Combustion
[nstimte, pp. 1049-1057.
.. b,,_.:l=l i
•=cll I .... Cl....
..... _. O.tO 4
I--=.o.--OF" ................ °
!f...................................2 =J I
°- ..................
.... - ......... L
I tJ0
Z(¢_I
FIGURE 2 VELOCITY DISTRIBUTION
_T.=295K, YF.=0.125, Yo..=0.5, STRAIN---O'I s'Z)
" ,. [L2=::
g {_1
FIGURE 3 SPECIES PROFILES
(T.--295K, YF.=0.125, Yo- =0-5, STRAIN=0.1 s")
=_- - - " *-=" vf i'_
FIGURE 4 TEMPERATURE DISTRIBUTION
(T_=295K, YF.=0.125, Yo- ---0"5, STRAIN=0.1 s")

I
-Z -t_$ °t -0.$ ¢ 0.$ t I.S Z 2.S
FIGURE 5 RADIATION EFFECT ON TEMP
(T =295K, Y_ =0.125,Yo.=0.5, STRAIN=10 s "z)
|,a
1_cm
la_LI a_ a.J eL4 _J Od •.t ol •.s
r_(,i
FIGURE 7 REDUCTION OF MAXIMUM FLAME
TEMPERATURE WITH RADIATION
(T =295K. YF =0.125, Yo.=0.5)
• la 4
l,$
i|!
I
-- _ o._ A ¢1.1
- * *., _,OI • •.3
• -*., a.¢w & a.,L
i., a*_'l & O-S
0._ a.4 0.$ 0._
FIGURE 6 PROFILES OF SOOT VOLUME
FRACTION
('i" =295K, Y_ --0.125, Yo =0.5, STRAIN=0.1 s "t)
z 3 • s • t • • ta
FIGURE 8 EFFECT OF SOOT RADIATION ON
THE PEAK TEMPERATURE
(T_=295K, YF =0.125, Yo =0.5, TIME---0.05 s)
APPENDIX H
Experiments and Correlations of Soot Formation andOxidation in Methane Counterflow Diffusion Flames
Combustion Symposium paper
By
Atreya, A. and C. Zhang

Experiments and Correlations of Soot Formation and Oxidation in
Methane Counterflow Diffusion Flames
A. Atreya and C. Zhang
Combustion and Heat Transfer Laboratory
Department of Mechanical Engineering and Applied Mechanics
The University of Michigan
Ann Arbor, Michigan 48109-2125USA
Telephone: (313) 647 4790
Fax: (313) 647 3170
e-mail: aatreya @ engin.umich.edu
A Global Model of Soot Formation Derived from Experiments
on .Methane Counterflow Diffusion Flames
A. Atreya and C. Zhang
Combustion/Heat Transfer Laboratory
Department of Mechanical Engineering ana Applied Mechanics
The University of Michigan
Ann Arbor, MI 48109
ABSTI_,.-X CT
This I_'tpcr presents a simpie model of soot formation in fuel-rich counterflow diffusion flames.
it is derived and tested on extensive measurements of temperature, chemical species, soot volume
frzctiun und particle number density in flames. In order to shed light on a global approach of soot
modetin,_, and thereby to admit applications of turbulent flames. Parameters critical to turbulent
diffusiun tlames, such as preheated reactants and dilution by primary products of combustion, were
systematically varied in our exaeriments. It was proposed that the soot ff,:-mation in a countertlow
diffusion flame be modeled bv three Arrhenius type reaction equations and one molecular particle
coagualation equation (soot nucleation; soot coagulation, soot surface grovcth and soot oxidation)
_,_h c_.:;s_mts derived from measurements. The proposed model accounts for the effect of CO, and
H,0 u,_ _oot reduction by using a mixture fraction variable ?roportional to the unoxidized carbon
a:om c,_nccntration. Soot nucieation rate expression was derived from the homogeneous nucleation
_.izeo_ :rod soot formation rate was assumed proportionai "o the soot surface area and the local
unoxidized carbon atom concentration. This model, along with SA_NDIA 0PPDLF code, was
ir',corDorated into a computation scheme. Comparison of model prediction with our experiments
iCH, _l:tme) and with those in the literature (C,.H6 flameJ were made and show qualitative
::_ree:,,,cnts. This work has suggested a global approach toward soot modeling aimed for turbulent
dir_siun tlarfie calculations.

1. Introduction
The process of soot tbrmation is of considerable interest to combustion science because it controls
the combustion efficiency, thermal radiation and smoke emission from practical combustion
systems. Turbulent diffusion flames used in these systems are known to locally consists of laminar
diffusion t]amelets [I] and they are often modeled using the flamelet concept [2,3]. Thus, to both
understand and model soot formation in turbulent diffusion flames, it is essential to quantify, soot
formation in a single diffusion flamelet.
During the past several ,,'ears, there have been many attempts of modeling soot formation.
Generaily. these efforts fail in two different approaches: reaction chemistry, based model and global
scheme based model. Frenldach and coworkers [4-7] are using the most detailed chemistry schemeI
which includes reactions up to large PAH. Similar but simpler approaches were adopted by
Lindsdedt [8] and Hall [9] to reduce the complexity by introducing acetylene and benzene as a
critical species in soot modeling. On the other hand, Kenned?' et al [10], Kent et al [11 ] and Stewart
et al [12] are using a global species (i.e., fuel mixture fraction) to model soot formation.
While considerable progress has been made, adequately but reasonably simplified chemical
schemes which accounts for complicated chemical and transport processes in diffusion flames are
iackin,_, Thus, a simpler description of the sooting process which is derived from and backed by
ex-tensive experimental measurements seems essential to the success of soot modeling. The present
work attempts to explore this unique approach: experiment-based soot modeling. We developed a
simple bu_ comprehensive soo_ formation model based on exxensive flame structure measure-ments
conducted under different thermochemical environments (i.e. for different degree of reactant preheat
and dilution by products of combustion). This work, along with other efforts in the literature, are
im_o_ant toward the development of a soot model used for turbulent flame application.
2. Experiment and Computation

I. apparatusand measurements
The experimental apparatus used is described in detail elsewhere [13]iBrietly, a especially
constructed ceramic burner with preheating capability is used to establish a tlat axisymmetric
countenlow diffusion flame approximately 8cm in diameter. The flow rates of fuel and oxidizer
streams are determined with critical flow orifices. All the measurements are pertbrmed along the
axial stream line and one-dimensionality of the flame is con_firmed by examining the temperature
profile 'along the radial direction. Temperature is measured using a Pt/Pt- 10%Rh (wire diameter 76
.urn) thermocouple coated with SiO, and is corrected for radiation. Gas compositions are measured
by a direct-sampling quartz microprobe and a gas chromatograph. The local soot diameters, number
densities and volume fractions are determined by extinction and scattering of a beam from an
Argon-ion laser operating at 514.5nm. The soot aerosol is assumed monodispersed with a refractive
index or" 1.57-0.56i. Visible laser induced fluorescence (VISLIF)distribution was conducted by
exciting the flame at 488nm and detecting at 514" 10nm. The location of the stagnation plane was
also determined by particle track photography.
The experimental conditions that were used are summarized in Table 1, which shows the fuel and
o.'ddizer tlow rates and concentrations, the burner preheating temperatures and the various amounts
of CO. and H,O that were added to alter the chemical environment of the flame while keeping the
thermai environment un-chan_ed. Also shown in Table ! are two flames bv Axelbaum and
Vandersburger [14 ,15], these two flames were used to mrther test our soot model. In our
experiments, we used very.' low strain rates to expand the scot formation zone for accurate snatial
measurement.
Detailed temperature, gas species concentrations, PAH and soot profiles were measured for ail the
flames iisted in Table 1. These measured profiles provided the basis for the development ofthe soot
model To enable comparing the sooting structure of various flames, a non-dimensional axial
coordinate Zn was employed (Za=(Z-Zs)/(Zt-Zs), where Z is the vertical distance t'rom the bottom

surface of the burner and Zs and Zt are the locations of the stagnation _[ane and the peak flame
temperature respectively).
H. computation
To ensure the validity of the developed soot model and to compare the soot predictions with the
experiments, a detailed reaction mechanism-GRJ_\flZCH, alon_ with the code OPPDIF developed
by S_\'DIA [16], was implemented in the present work. The program was run using the specified
experimental boundary conditions. It contains 177 elementary reactions and 34 species. The
governing equation and solution techniques can be found in Kee [17]. The computation provided
chemical and thermal structures of relative flames, which ',,,ere subsequently compared with the
measurements. Conserved scalers (see definitions later) were thus computed and used for the
developed soot model to predict soot formation under the relative flame conditions.
Ill.sooting flame structure
Temner_mre. velocity and soeci_.S
Figure l shows the measured and computed temperature and velocity profiles for three flames
(BA, BB and BC). Figure 2 shov,'s the measured and computed species profiles (BC). The velocity
profiles inside these sooting flames could not be measured because of the presence of soot particles,
which would affect LDV. Tiros. they ,.,,'ere calculated bv specifi,'ing the measured boundary
conditions and by using the measured temperature and species profiles. Properties of the
multi-component mixture ,.,,ere obtained as a function of temperature from the NASA code [18].
The I-D continuity and momentum equations employed aiong with the appropriate boundary
conditions may be found in Ret'. [19]. The calculated velocity profiles were checked by using the
measured locations of the sta_ation plane. They matched wit_Mn the experimental error of±0.2mm.
In these [igures, computatio:_ results using S._N'DIA code were also included. It was found that the
velocity in the reaction zone _0 _Z.._ 1) and hence the residence time measured from the flame front
'.,,.as e_sentially the same for all the flames. However. the :!ame visible thickness (Z, -Z,) varied

from O to 8ram. Chemical soecies profile in Figure 2 has shown overall agreement between the
measurements and computations in chemical structure.
Soot rmrxicle profiles
The measured soot volume fractions and particle number densities are shown in Figure 3 along
with computed OH profiles. While the data tor other flames could not be presented here, these
results are representative. The number density curves in Fibre .3 show that the location where the
first nuclei appear (inception Iocation) changes considerably with the flame conditions listed in
Table I (Zn varies from 0.4 to 0.85). The corresponding soot volume fractions peak values also
decrease v, ith the shift: in the inception location. From Figure i, one finds that the temperature at the
inception location varies From i400K to 1750K. Thus, it is not possible to conclude that inception/
occurs at a specified temperature. However, OH profiles (see Figure 3) indicated that an quicker
decay of OH from the flame resulted earlier inception (BC)..--klso, in our experiments, it was ".'ound
that an increase in the concentrations of CO2 and HaO shifts the inception location away from the
flame toward the rule side. Thus, one might conclude the critical role played by OH in soot
formation, which is critical in modeling the nucleation site o/sooting.
Fi_mare4 shows a comparison or'soot volume fraction and number density profiles for the BC flame
with ti_ose available in the iiterature. Due to the low strain rates employed in our flames, the
residence time (-400ms) is much larger than the literature flame data. Thus, the flight time t was
normalized by the maximum residence time to make the results of different flame conditions
comparable (tmax, the maximum flight time from the flame, was 18ms for A_xetbaum's flame, 16ms
l"or V,mdsburger's flame and 96ms for Santoro's flame [20]). It is seen that our results flame are
similar to those measured in the cylindrical forward-stagnation counter-flow diffusion flames
(Vandsburger et al, 1984 and .-kxetbaum 1988), but the values are slightly lower. This may be due
to the diIt'erence in fuel concentration and the flame temperature. However, the fact that the two
proril_.._ are similar implies that the effect of higher strain rates used by Axelbaum et al. and
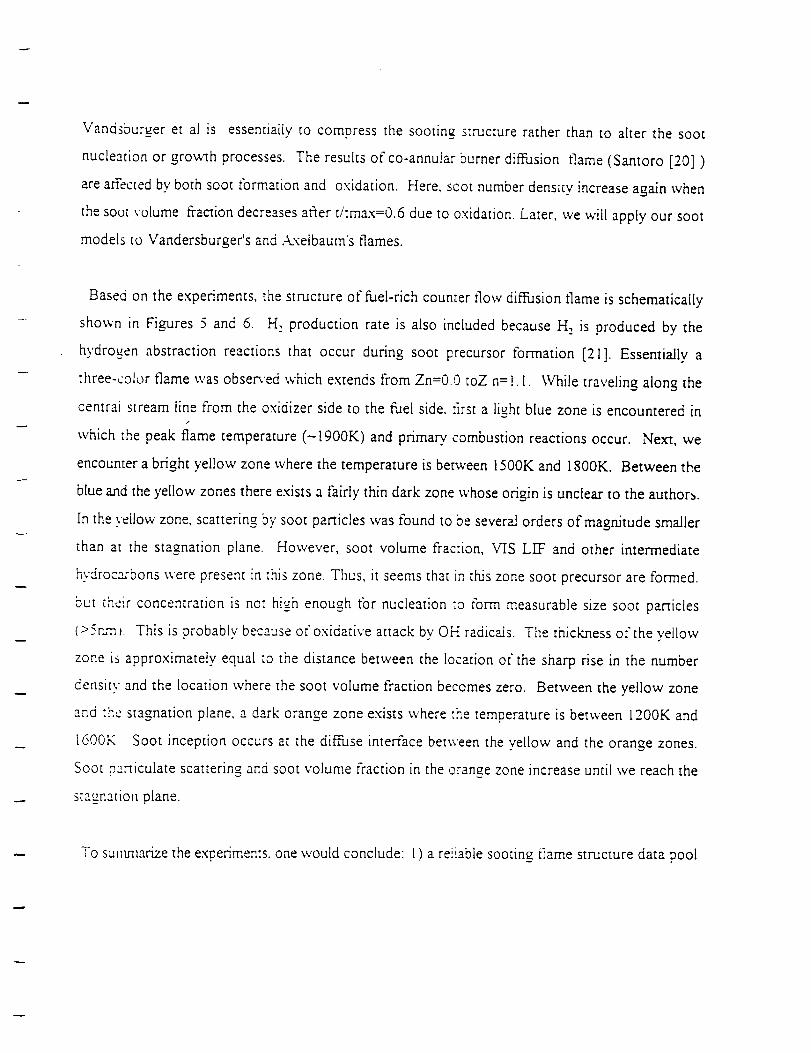
Vandsburgeret al is essentiallyto compressthe sootingstructurerather than to alter the soot
nucleationor growth processes.Theresultsof co-annularburnerdiffusion flame(Santoro[20] )
areaffectedbybothsoot tbrmation and oxidation. Here, soot number density increase again when
the soot volume fraction decreases after t/tmax=0.6 due to oxidation. Later. we will apply our soot
models to Vandersburger's and Axetbaum's flames.
Based on the experiments, the structure of fuel-rich counter flow diffusion flame is schematically
sho',vn in Figures 5 and 6. H: production rate is also included because H, is produced by the
hydrogen abstraction reactions that occur during soot precursor formation [21]. Essentially a
three-color flame was observed which extends from Zn=0.0 toZ n = !. I. While traveling along the
centrai stream line from the oxidizer side to the fuel side, first a light blue zone is encountered in/
which the peak flame temperature (-1900K) and primary, combustion reactions occur. Next, we
encounter a bright yellow zone where the temperature is between 1500K and 1800K. Between the
blue and the yellow zones there e.'dsts a fairly thin dark zone ,,,,'hose origin is unclear to the author_.
In the vellow zone, scattering by soot particles was found to be several orders ofmagrtitude smaller
than at the stagnation plane. However, soot volume fraction, \rIS L_ and other intermediate
n,,droca_'bons ',,,ere present in this zone. Thus, it seems that in this zone soot precursor are formed.
but their concentration is no: high enough _'br nucleation "o form measurable size soot panicles
(>5rum_. This is probably because of oxidative attack by OH radicals. The thickness of the yellow
zone is approximately equal _o the distance between the location of the sharp rise in the number
densit,." and the location where the soot volume fraction becomes zero. Between the yellow zone
and the stagnation plane, a dark orange zone exists where the temperature is betv,'een 1200K and
I600K Soot inception occurs at the diffuse interface between the yellow and the orange zones.
Soot p:miculate scattering and soot volume fraction in the orange zone increase until we reach the
stagnation plane.
To suummrize the experiments, one would conclude: 1) a reiiable sooting _iame structure data pool

,.,,'ase_tabtished,which revealthe basicsootingprocessesundervariouscondition. This is very
cmciatto sootmodeling;and 2)whileit still awaits detailedflamestructurestudyto clarify,theOH
and ot_erkey radicals'role in soot formation (this work in currently underway in our lab), it is
phenonmtogically clear that a critical species (or trace species) with enough concentration is
essential I'or soot inception to occur. Our experiments reveaied that the concentration of this trace
species may increase with (i) increase in the flame temperature; (ii) decrease in oxygen containing
species that may, in turn, increase the OH radical concentration; and (iii) increase in the fuel
concentration.
Thus r!w. different approaches have been explored to model the inception species. (e.g., Large
PAH. F::mclach[4,7], C,H_, and Csh_, Lindstedt[8], Gore [9], or arbitrarily assigned, Kennedy[10]).p
Nevertheless, a universally applicable scheme that can quanti-tatively explain all e.',dsting
experiments is still lacking. In this work, we attempt to model the inception (nucleation) and growth
specie,, _,.ith a simple but experimen-tally based global species (the conse_'ed scaler).
Soot model
In th.,: model presented here. the conserved scaler formuiation has been used to enable easy
application to turbulent diffusion t'iames. By defining the atomic mass fraction of atom j as:
,, 1
,.,,i_ere :\I _,nd y_ denote the motecuIar ,.,,'eight and mass fraction of species i, 5,'I_denotes the atomic
,.veigh_ or atom j and ,.,_J denotes the number of atoms of i in species i, t'or an arbitrary control
voIume in the reaction zone we obtain:
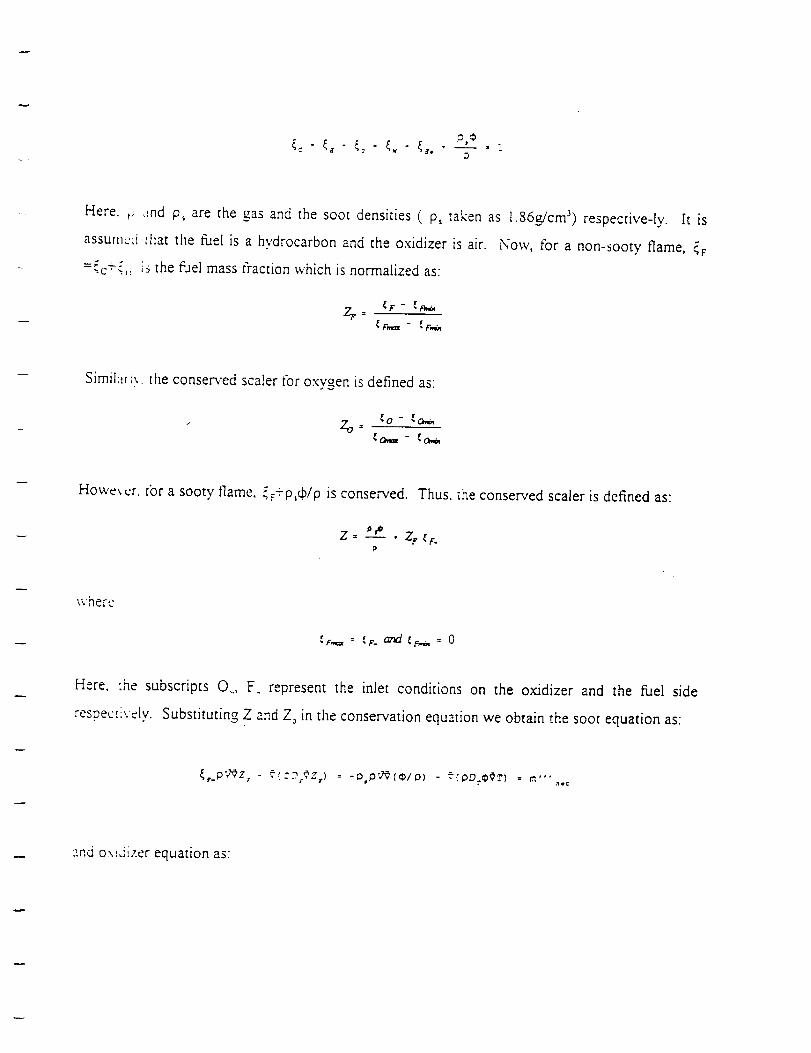
D
Here. 1; ,rod p_ are the gas and the soot densities ( p, taken as 1.86_cm 3) respective-ly. It is
assumed Ihat the fuel is a hydrocarbon and the oxidizer is air. Now, tbr a non-sooty flame, _
=_,c"-_:_: is the fuel mass traction which is normalized as:
Z_.z = _p - _a,,.
Simil:_fi_. the conserved scaler for oxygen is defined as:
. Zo _ _o- _o,.,
Howe_..r. tbr a sooty flame.._F+p,¢/p is conserved. Thus. _he conserved scaler is defined as:
z= _'* . zr _r.
where
Here, :he subscripts 0., F represent the inlet conditions on the oxidizer and the fuel side
respec,.i,, ely. Substituting Z and Zo in the conservation equation we obtain the soot equation as:
_,.p';gZz - %'22;¢Z,}.. : -0 DVg(_/D) - =.,:_)D.$OTI. = m'"._.:
and o\LJizer equation as:

p F_Zo - (z(pDofTZ_)= 0
where. ::f"_, is the net soot nroduction rate.
While: there were various sheme to define a trace species for soot inception and growth.
Fundaw_..ntal questions still remains. Thus, we introduce a hypothesis tbr describing soot formation
and oxiJa_ion:
/=e/(C H ...) => _, _xx. a_z_O, OH: or 0,.) - pm,_:u.
Here, :hel represents unspecified hydrocarbons, fuel fragments and pyrolysis products which are
containcJ in Z_ and the o:,ddizer represents oxygen or radical species that are contained in Z o. Now,
to quaf:ci[V m'"_:,, first, it is essential to develop a model for the nucleation rate as a function of the
thermo,:hemical environment and account for the changes that occur in the panicle number density
due to ,:o:t,_,ulation. Then, the soot mass added by surface growth and reduced by oxidation can be
calcuI::tcd.
N,'ttC[L,7.,:,,)_t:
[n ti:c ,. _.!!ow and orange zones of a sooty flame, the concentration of soot precursors and growth
species _large PA.Hs, C2H2 and other intermediate hydrocarbons) increases toward the stagnation
plane. These molecular precursors are of the order of several hundred :,-%M-Uand may contain
bet_vc_-:_ 20 to 50 carbon atoms [22]. As the PAR concentration increases and the temperature
decrea_,¢s toward the stagnation plane, attractive Van der Waals forces between these molecules
result i:_ the formation of molecular clusters (The Van der Waals forces for large precursor
molecules are substantial and their sticking coefficient is nea.riv unity [22]). [n accordance with the
ctassica! homogeneous nucleation theory, it may be assumed that a critical size of these clusters
leads !_ c_aFticle inception. It is suggested [22] that the incipient soot particle diameter is about 2nm

(-200¢_A.\IU)and that the averagesizeof condensingprecursorsis between200 to 400 ._MU.
Thus..:dusterof about6 to 8 largeprecursormoleculesisrequiredto form soot nuclei.
Under _upersaturated conditions, the rate at which critical size nuclei are tbrmed by condensation
ofmoiccules can be determined from the homogeneous nucleation theory. [23] as:
) -_dt
where. , . is the diameter of the critical size panicle, g* [s the number of large molecules required
to tbnu :t critical size, PL is the partial pressure of precursors, and S--p]p_, is the saturation ratio (p,/
is the p::r-tial pressure of precursor under saturated conditions). Also, k,a and T are the Boltzmann's
constant, d_e surface tension of'the liquid and the absolute temperature respectively. Hence, S must
be gre:::_-r than unity for nucleation to occur.
Assuming o, g'_, d_. to be constants, we obtain the nucleation rate as:
l_._.a = (Pl)_.! "/'T/'t_D2 . P..,f ".:2
wilere, p is the total pressure and pip (= Zl ) is the mole fraction of condensing molecules. Also,
P' _/'[' I T,
where. _x.l-Iv is the heat at vaporization of the condensed molecules and Tb is the absolute
:emnerature when the saturation pressure equals the total pressure. Since. p, <<p • Tb >>T. Thus,
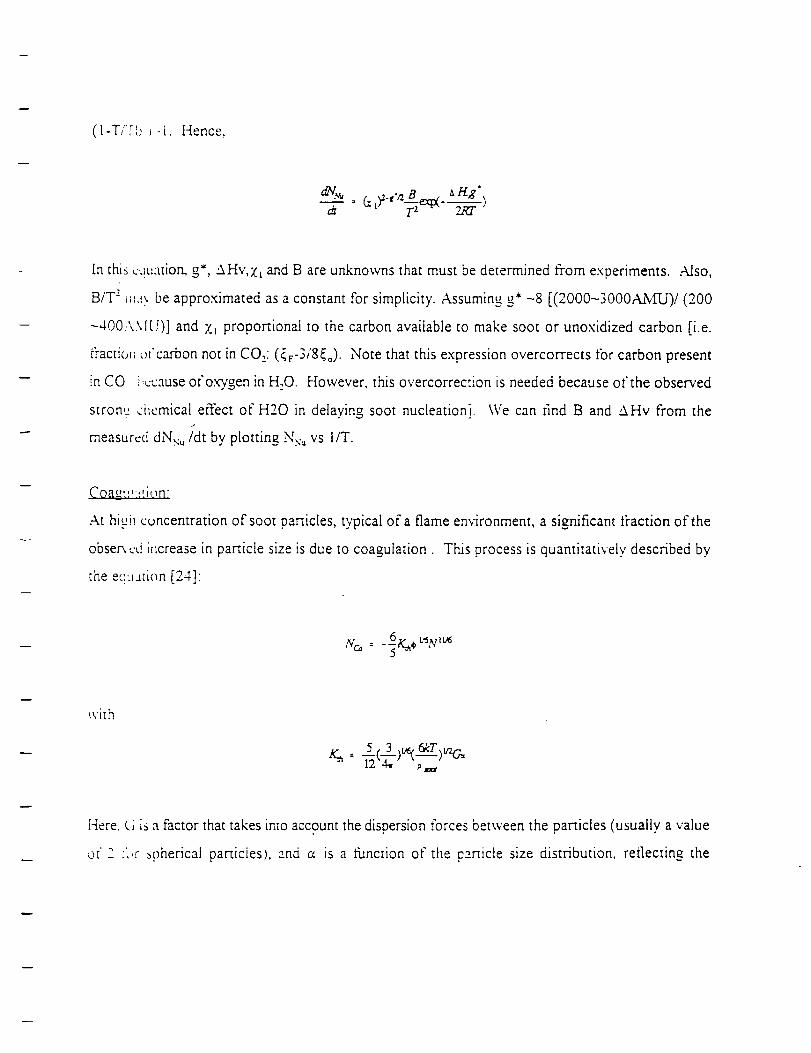
(1-T/TI, ; -l. Hence,
,
In this _.-!u,ttiorL, g*, '_XHv,z_ and B are unknowns that must be determined from experiments. Also,
B/T 2 _L;_ be approximated as a constant for simplicity. Assuming g* -8 [(2000-3000Az\fL,T)/(200
-400..\.\115)] and Z_ proportional to the carbon available to make soot or unoxidized carbon [i.e.
fracti(m _)fcarbon not in CO:: (_F-3/8_o). Note that this expression overcorTects tbr carbon present
in CO i,ccause ofox-ygen in H,O. However, this overcorrection is needed because of the observed
stronL, cilemical effect of H20 in delaying soot nucteationi. We can find B and AHv from the
measured dNx,,/dr by plotting Nx_ vs liT.
Coag,:!:,J.iorll
At hi,_,il concentration of soot particles, typical of a flame environment, a significant fraction of the
obser',_..,! increase in particle size is due to coagulation. This process is quantitatively described by
the ec:u._tion [24]:
6K__ L_ClW
with
12 4- p._
Here. L} is a factor that takes into account the dispersion forces between the panicles (usually a value
or2 :',,F _phecical particles), and c_ is a thnction of the ezrticle size distribution, reflecting the

variati_,r_in collision rateswith differentparticlesizes.For a monodispersedsystem_ takesthe
valuec,f 4_2. Thus,the generationrateof sootparticlesis abalancebetweenthenucleationrate
andtta.-coagulationrate:
,v. = - ,%
Surface, (_rowth:
Most ,,t'lhe soot in a flame is produced by surface growth. In the global model presented here, we
assume it:at the soot formation rate is proportional to the sur:'ace area of the soot particles [23] and
the local hydrocarbon concentration assumed proportional to the available carbon (E,_:-3/8_o). This
leads _,, the following Anhen.ius equation:
3 o_V_, _e -z_"
This co:ration was derived bv assuming the soot aerosol to _.e monodispersed.
O'<ida!_,m
[n thes_ flame, O: is not present on the fuel side and the flow is such that the soot particle are
convec,cd to the stagnation e[ane. Thus. oxidation may occur only by OH radicals whose
concen:radon is increased with _mcrease in the tocal CO, and H,O concentrations. As noted earlier,
this proc_.-ss occurs in the vei[ow zone and significantly a_ects the concentration or" intermediate
hvdroc:L_bons that lead to prec_sor tbrmation and eventually :o soot formation. While considerable
_rogre:s ins been made toward developing a fundamental understanding of processes leading to soot
incee_a:n [24] and a model ef soot inception has recently appeared in the literature [4-7], further

work i, _eededto explain,for example,the effect of CO, andH,O. In the conserved scaler
formui.,,tion presented here, the details of this zone are by passed by using ({t.-_3/8(o) in both
nucleatiofl and surface growth expressions. Hence, for these tlames oxidation need not be
consid_,r_..d. However, for a typical flamelet in a turbulent flame it is necessary to include soot
oxida:ion Thus, for the sake of completeness, soot oxidation rate may be expressed as:
m-,. - &_,.Z/V_¢me'E'ar
The c, ,:_:mts A o and E o may be obtained from the literature [25].
In o_,_cr to experimentally determine the corresponding constants, calculations have been carried
out fo: .:Jl the flames listed in Table 1. The overall formation rates for soot volume fraction and soot
particle _umber density were obtained from the global conservation equations which for the
countc.:tlow diffusion flame become:
and
, _c 7) . (,%) --N_ : ,v._- ,%
Here. :he thermophoretic veiocitv v-r was calculated from the expression:
vr = - 0.£_Z.drTa_

To c\_crimentally determine the model constants (A and E.R), measured number densities (which
exist _,,_i., Ibr the orange zone) and soot voIume fractions profiles were used alonu with the above
tour e-_::t_ions (soot growth, soot oxidation, soot nucleation and soot panicle coagulation) to yield
formmi,,f_ and nucieation rates. These rates were then normalized according to the relative models.
These :_.,.-utts are plotted in Figures 7 and 8 defined as:
%/(N , (¢p - _¢o_p, _.d N_;/(¢p- ¢&.2
Based on the experimentally determined constants (Ap and Ep/R and An and En/R for soot
forma_iou and nucleation respectively), the proposed model were finalized and were also plotted
alon¢.z, :_ ith error margins in these figures.
From these two fi_gures, one could make the following observations: 1) While there is considerable
scatter. ,a Nch was mainly due to differentiation of measured profile data, the trend of soot formation
and nucleation rates follow the proposed model; 2) It may be necessary, to include a factor in the
model. ,.,.hich reflects more accurate effect of OH. and 3) Nevertheless, it is possible to model the
comp!icaled soot formation processes in a counterflow diffusion flame with the above three
.-\rrer,..L.cs type equations and one molecular coagulation equation.
.\lodet test
To c:¢=ble validation and _Jnher refinement of the proposed model, a two-step computation
scheme..,, hich incorporates the soot model. ,,,,'as developed. Step 1, SANDIA code OPPDIF was
used to compute flame structures with imposed experimental boundary conditions and temperature
profile..:, This computation would produce the conse_,ed scaier profile for each of the considered
:!ame case. Step 2, a set of ODE equations along with our soot model were numerically solved. The
,:om_;u:_:d soot number density and soot volume fraction protiles were thus compared with
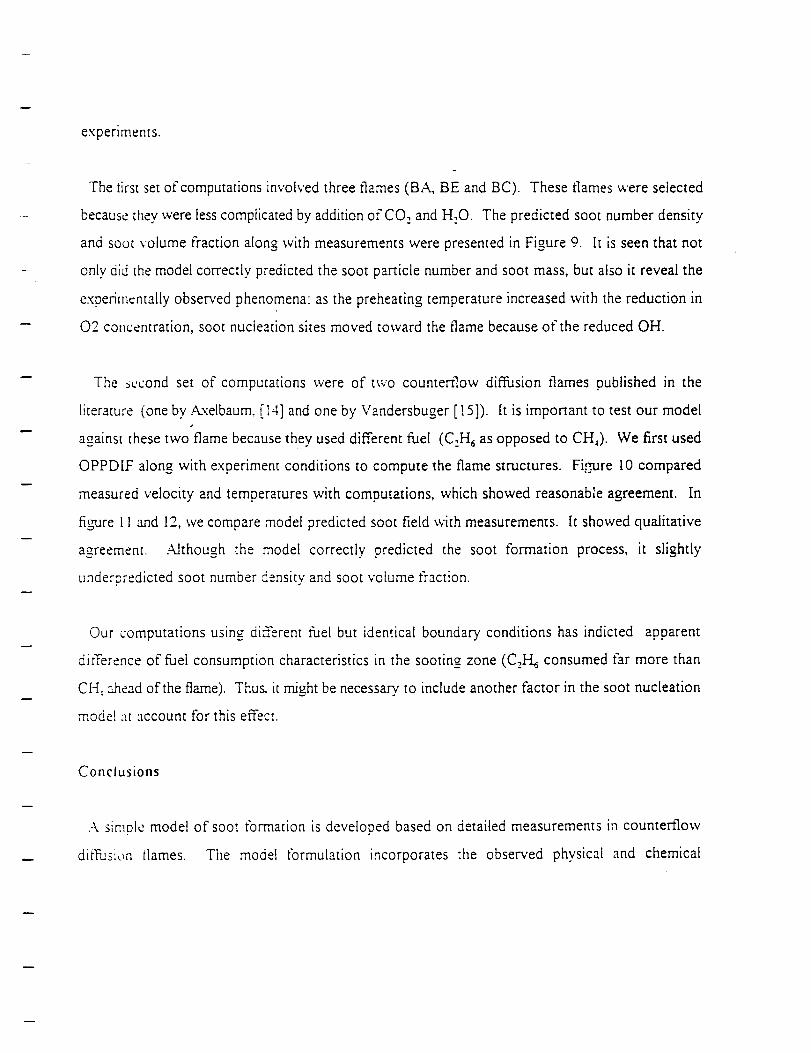
experiments.
The first set of computations involved three flames (BA, BE and BC). These flames were selected
because they were less complicated by addition of CO, and H,O. The predicted soot number density
and soot volume fraction along with measurements were presented in Figure 9. It is seen that not
only did the model correctly predicted the soot particle number and soot mass, but also it reveal the
experimentally observed phenomena: as the preheating temperature increased with the reduction in
02 concentration, soot nucleation sites moved toward the flame because of the reduced OH.
The s,..cond set of computations were of two counterflow diffusion flames published in the
literature (one bv Axelbaum, [ 14] and one by Vandersbuger [! 5]). It is important to test our modelI
against these two flame because they used different fuel (C:H_ as opposed to CH4). We first used
OPPDIF along with experiment conditions to compute the flame structures. Fi._mare 10 compared
measured velocity and temperatures with computations, which showed reasonable agreement. In
figaare 11 and 12, we compare model predicted soot field with measurements. It showed qualitative
agreement. .--klthough the model correctly predicted the soot formation process, it slightly
undernredicted soot number density and soot volume fraction.
Our computations using different fuel but identical boundary conditions has indicted apparent
difference of fuel consumption characteristics in the sooting zone (C21"J-_consumed far more than
Ct-[_ ahead of the flame). Thus. it might be necessary to include another factor in the soot nucleation
model :It 'account for this effect.
Conclusions
.-k sinmle model of soot tonnation is devetooed based on detailed measurements in counterflow
diffusion tlames. The model tbrmulation incorporates the observed physical and chemical

phenomenapertainingto • (i) Nucleation:which occursin the orangezone of the three-color
(blue-_cilow-orange)flame structure and is modeled in accordancewith the homogeneous
nucleationtheo_'; (ii) Coaguiation;whichsignificantlyinfluencesthenumberdensityin theorange
zone..-\theoreticalexpressionfor this is takenfrom theliterature:and(iii) Su_acegrowth;which
is takeuproportionalto thesootsun'aceareaandthelocalunoxidizedcarbonconcentration.This
model is intentionallycastin termsof mixture fractionvariablessuchthat it canbeeasilyapplied
to turbulentdiffusionflamecaicuIations.[t hasbeenextensivelytestedagainstexperimentswhere
thethen-nochemicalenvironmentof the flamewaschangedbychangingthepreheatingtemperature
andb.vintroducingCO2andHao.
The agreementof soot predictionusingthe modelwith experimentswas very encouraging.
However.manyissuesremainwhichrequireattention. Especially,how to accountfor OH effect
, whichhasbeenexperimentallyprovedto becrucialin sootformation, and how to account for fuel
structure effect. These are precisely the on-going effort in our work. Nevertheless. this work has
shed li,,h[ on a unique approach in soot modeling: experimentally based soot model.
Ackno_ ledgements
Z:J.s _, .r,, _ :_s supported b.v the Gas Research institute under contract number G R! 50S7-160-1-/,8 [ and tccbmical du'ection
: [Dr.,; .i ', Kczerie and T. R. Roose and by National Science Foundation t:.':der contract number NSF CI3T-$55265". The
:-:.st at',:x:r _sould also like to thar£_: ?:otbssor G. F. Career and Drs F. E. Fende[l and H. R. Baum tbr their interests in this
_'udv al_a _cvcral helpful discussioi_.s.
REFERENCES
I. Career. G. F., Fendell. F. E. and Marble. F. E.: J. App. ,\Iath 28(3), 463 (1974)
Z. Pe',crs. N.: Prog. Energy Comb. Sci. 10, 319 (!984)
3. Baum. H. R., Rehm, R. G. and Gore, J. P.: 23th Symposium (international) on Combustion, The
Combt:stion Institute, ( 1990/
4. Frenklach,M., Clary,D. W., Cardiner,W.C., andStein.S.E. (1985),20thSymposium([ntl) on
Combustion,TheCombustionInstitute,pp.887-90l
5. Frenktach,M., andWarnatz,J. (1987),Combust.Sci.Tech.,51,265
6. Frenklach, M, (1988). 22nd Symposium (Intl) on Combustion. The Combustion Institute,
p1075
7. Frenllach, _I. and Wang, H. (1990), 23rd Symposium (Intl) on Combustion, The Combustion
Institute. p1559
8. Fairweather, M., Jones, W.P. and Lindstedt, R.P., (1992)., Combust. Flame 89, 45
9. Hall. R.J., Smooke, M.D. and Colket, M.B., (1994) submitted to Combust Sci and Tech
[0. Kennedy, I.M., Kollmann. W., and Chen, J., (1990) Combust. Flame 81,73
I I. Honnery, D.R., Tappe, M. and Kent, J.H., (1992), Combust Sci and Tech., 83,305
12. Stewart, C.D_, Syed, K.J. and Moss, J.B., (1991) Combust Sci and Tech, 75,211
13. Z h:.mg. C., Atreya, A. and [.ee, K. (1992) 24th Symposium (International) on Combustion, The
Combustion Institute, pp 1049- !057
14. Vandsburger, U., Kennedy, I. M. and Glassman, I. Twentieth Symposium (Internationai) on
Combustion, p. 1105, The Combustion Institute, (1984)
!5..--k.xdbaum. R. L., Flower. W. L. and Law, C. K.: Comb. Sci. and Tech. 61, 51 (1988)
',,5. K_e. R.J., Rupley, F.M. and _liller, J.A., (1989) S,,-MNDIA report
:7 K_. R. J., Miller, J.A., Evans, G.H. and Dixon-Lewis. G., (1988) 22rid Symposium (Interna-
:ionail ,on Combustion, The Combustion Institute, pp 1479-t494
!3. Gu_don, S. and Mcbride, B. J. NASA SP-273 (1970)
i9 Smooke, M.D., Seshadd.K.. and Purl, I.K.: Comb. & Flame 73. p.45 (I988)
20. Sa_toro, R.J., Miller, J. H.: Langmuir 3,244 (1987)
-' I. S:l_vth, K. C., Tjossem, P. J. H., Hamins, A. and Miller. J. H. Comb. & Flame 79, 366 (1990)
_ H::r;is, S.J., and Weiner. A.M., (1988) 22nd Symposium (Interna-tional) on Combustion, The
Combu,,tion Institute, p333
"3. F:-iedt:tnder, S. K. Smoke. Dust and Haze, Wiley, (1977"1

24.Havnes,B.S.,andWagner,H. G., (1981)Progressin EnergyandComb.Sci,7,229
25.Nauie,J. and Strickland-Constable, R. F.: Fifth Conference on Carbon, I54, (1962)

Preheating Temperature
(K)
300
300
300
3OO
300
900
900
9OO
900
900
I200
1200
1200
Fuel
Composition
65%CH,-35%N:
65%CH,+IS%N:+I2%
CO,+8%He
65°/KTH,+2 t %CO;+ 14%He
65q_,K2H,+31.4%N:+3.6%
H,O
65%CH:35%N:
65%CH,-35%N_
65°/_H,+I5%N:+I2%
COz+g%Hg
65°/d:2 H.+21%CO:+14%He
65_H,+35%N:
65°_K2H,-35%N:
65%CH,_35%N:
65_CH.-217_20:+14%He
55%CH._31.4%N:-,-3.6%
H:O
Oxidiz.-'.r, Composition
16_:-R4%He
[6%O:-84%He
16_0:-84%He
16%O:-84%He
16°/_:+g0.4%He-
3.6%H:O
11%O:-$9%N:
11%O:-89%N:
ll_f_D:-g9%N:
11%O:-69%N:-12%CO:-8%He
11%O:-54%N:-21%CO:-I4%He
9.7%O:-_ 3%N:
Remarks
L'i'rdSwork. BA Ha.me
This work. IA flame
"Fnis work. MA flame
This work. WA.F flame
TY,/swork. WAO flame
Trds work. BB flame
This work. IBF flame
This work. MBF flame
Tb.is work. IBO flame
"F_,Jswork. M BO fl_ne
Ti',.is work. BC flame
9.77_3:-9.13%N:
9.7%O:-_,'2 3%N:
"Vn.(swork. MCF flame
300 100%C:H, 2 l*,I£):-'_%N= A.'<etbaum et al
300 [ 00%C:[ [, l 8",_):- :i27 aN t Vandersburger ¢t al
T'nis work. WCF flame
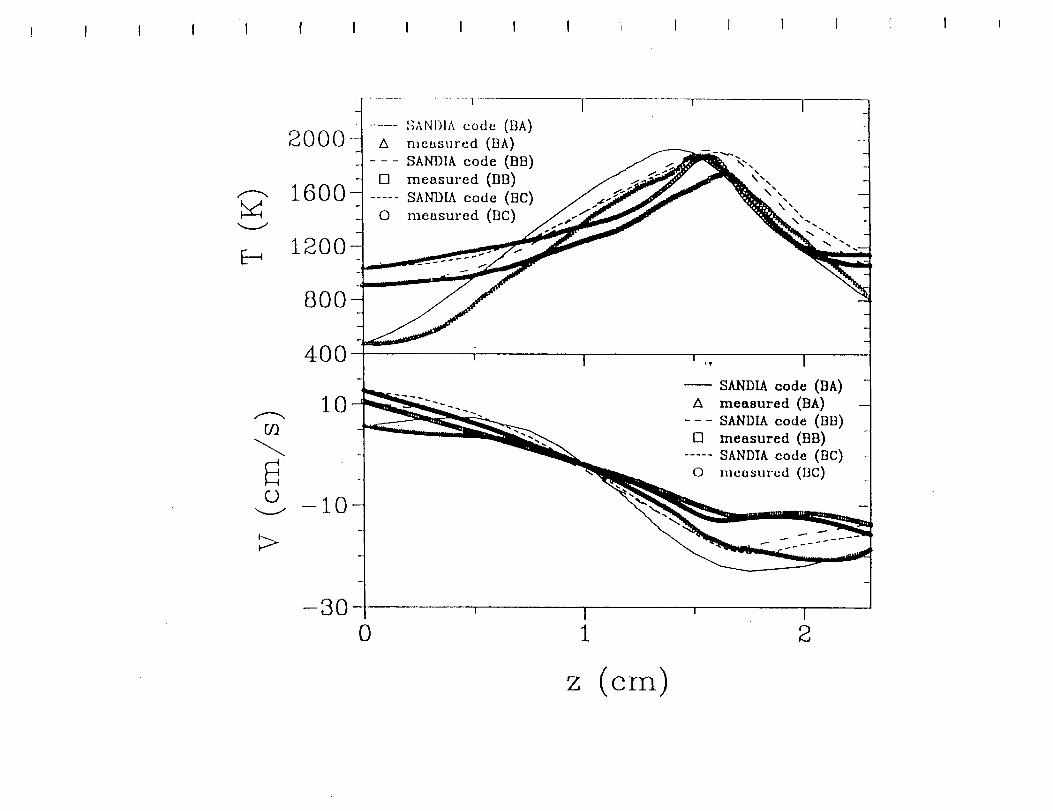
) I I I I I I 1 I I I 1 I I I I { 1
E-_
2000• A n,easured (BA)
_ SANDIA code (BB)
1600 [] me.sured (Bin..... SANDIA code (BC)
O measured (BC)
1200-
800-
4O0
,_. 10
-.1
-10
' I ',, I J
--- SANDIA code (BA)
.... A measured (BA) --
- SANDIA code (BB)
__ [] me.-_ured(riB) -..... SANDIA code (BC) -
_i ncnsurcd (BC) -
, I ' I
0 1 2
z (cm)

LO0
_ 80
',,,j
"'-:, 60
_ 40
_ 20 t0
_._ o-
-- 4-
U 2_
C_: 0
-1.5
_, l o:;"_" ,, _0_1-- -=';-" ,,,o_6o o _ o _o _
. ;< %,,L, u o \/ _ , "
_ - -o_@@@eee _.. [] ----
,'/ O_ _iO '\
--- - -=--" ..... =£- _== _ _z==_-¢¢¢-¢_- .... -v __"-ID , _ I
I
-O.5 0.5 1.5
Z n
.... SANDIA Code
CH 4
@ 02x5
N 2
O H20xl0
± C0 2
C0
O H 2
.... SANDIA Code

0
_jZ
00G]
>
<
i0_ 'I02_
!0-_ (9 bb
l0 -2_ 0 bc
10_ i 0 bc _ -_1011 : _9
lO_Oj
I!I]9_
t_0-7--£
l0-8j-
(9 bb ; e o
• baI
-4
I
I l I i { , ,
'0 ' ' ' _ ' _100 O 0 0 0 0 0(_[__
• • O0 '
• ba
• --=
0 be • -_I i l I [ i
10-_
Z n
(gn= 1,flame
I l I 1 ,
10 o
location)

lO_J.
!1
lo'J1
i10oJ.
vv _ _v _
j_ra A Ct_c_ a°a o ao
@@oQQee@ @ @ • • • • @0
A
A
1011
:O:o-
l
l
i
il
10 _
l
]A
A
0
Z_ V V
_!_ v v_ vvv
@e @ @ @ • @ @ @I_
' l
l io0.0 0.2 0.4 0'.6 0.8 !
Normalized flight time(t/tmax)
(tma x" maximum residence tll-i-le)
V ¢(Santoro)
A _(Axelbaum)
[] _(Vandsburger)
• _(BC, this work)
V N(Santoro)
A N(Axelbaum)
[] N(Vandsburger)
• N(BC, this work)

!
Probe Memsurcment (GC mad T)
Scattering Detector
Absorption Detector
°..•°-_
..- Oxidizer/
"'" J ) I ) )
...." ) !I I I Rl_ __ _o_)[ ::_ / Yellow (LIF but no scattering)
I__=_--'- '- Orange (soot gmwr.h)
I
........................Siii_aifii/_e .............................. z
J/< j" \"., \ r
"-...
. ..-'"
Fuel• .............'"'-'- ............................... -"
Flame Structure (close-up)

I I I I I I I I I I [ I I r i r I I
A
ox
0
COv -..3
u Z
3_V-13 .41-1SIA NIIAI E)NINqJ_LVOS IOOS NIIAI
.O00I
-OOgI
0008
NOIIVNDVIS
,-]
-<;1-,-4
El3
A
i--,_°
fl_
V

o
0
o
©
©©
10-2_ .... 1 .... 1 .... I .... I .....
10___j ........
I0-' x ac ° -Z. _-_-P. .
104- A BB 25% Error barSOOT MODEL
X WAFI0-_-
[] WAO
+ LAi 0 BA
I0 -I_ i .... , .... _ .... l .... J ....0.60 0.65 0.70 0.75 0.80 0.85
IO00/T (K -1)

I I I I I I I I [ I I f t I r I l
Soot Nucleation Rate (#/cm3s)
oo0
P_I
0
0
!
I
mW o I
WI
I
I
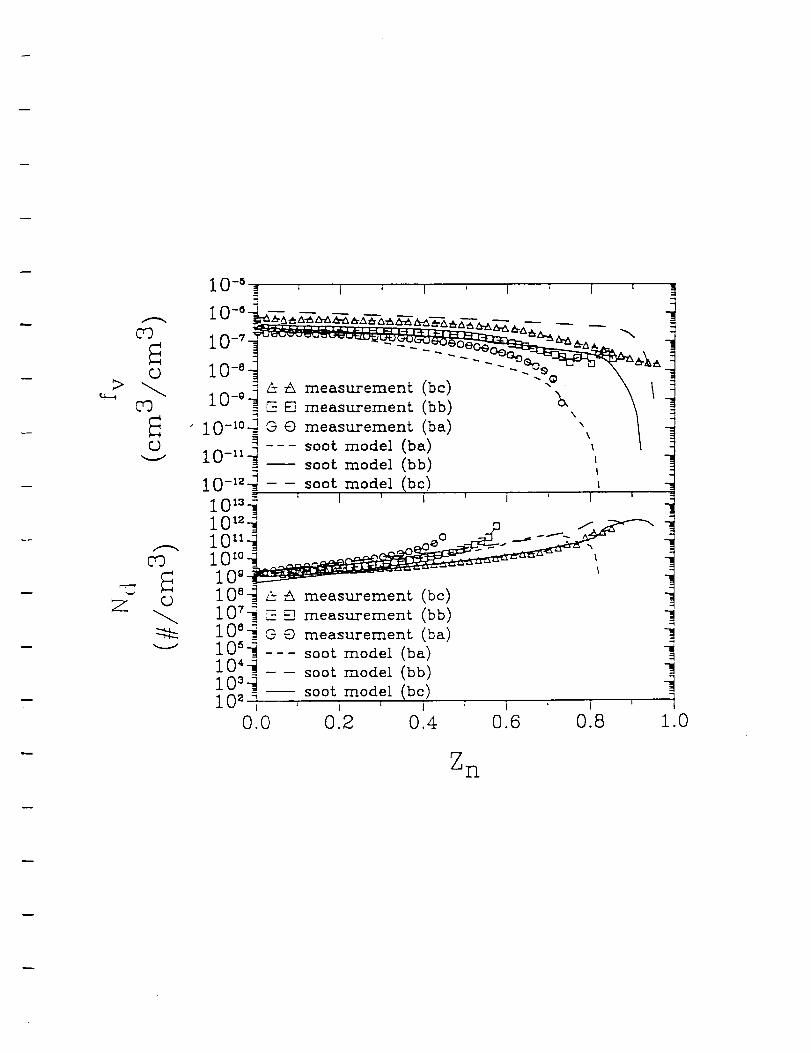
i0 -_ ' i '
_-_ lO-g_ _ [] measurement b _'\
•iO-,0__o e measurement(b_) \ 1C) --- soot model (ba) _ l
_jZ
cO
o
=!soot model (bb)
lO-IZ_ - _ soot model (bc) l
i01___ ' l ' , ' i ' J '
i01_i /
Oi°_i0 _i0 8_ a% A measurement (bc)
i07-_C=_ measurement (bb)
i0 _-_ e o measurement (ba)
I 0 _ soot model (ba)
I00 __3 s°°t m°del(bb)4
10 z _ soot model (bc)' i ' I ' I i ' 7
0.0 0.2 0.4 0.6 0.8 1.0
Z n

h_
q,,!..)
O-.-,
(DE--,
09
rO
:::>
0
I
]
0.0 0.2 0.4
Distance
0.6 0.8 1.0 1.2
from the burner
1.4 1.6

CO
©
Z
1012i--
1011
101°
I0 _
i08-_
lOI 1
I ' I '[] Vandersburger (100Z'C2H418Z0282ZN2)
computation for Vandersburger's flame
[][]
[] []
[][]
0
I
' i ' I ' I '
1 2 3 4
Distance from the flame (ram)
CO
z
1
i013_
1012_
1011 7
i °'°_r"_ _I0 °
lOS i10 _ I ' I
0 10
A Axelbaum (100ZC2H421Z 279ZN2)
computation for Axelbaum's flame
A A
' I i i
20 30
Time from the flame (ms)
!1
40

APPENDIX I
Measurements of Soot Volume Fraction Profiles in
Counterflow Diffusion Flames Using a Transient
Thermocouple Response Technique
Combustion Symposium paper
By
C. Zhang and Atreya, A.

Measurements of Soot Volume Fraction Profiles in Counterflow Diffusion
Flames Using a Transient Thermocouple Response Technique
C. Zhang and A. Atreya
Combustion and Heat Transfer Laboratory
Department of Mechanical Engineering and Applied Mechanics
The University of Michigan
Ann Arbor, Michigan 48109
USA
Telephone: (313) 76-37471
Fax: (313) 74-73170
- e-mail: [email protected]
e-mail: [email protected]
paper lengthtext:
equations:
figures:table:
author_' preference
presentation:
area:
3353 words
7
9
1
oral
Laminar Flames. Soot and PAH
1996.1.15

Measurements of Soot Volume Fraction Profiles in Counterflow Diffusion
Flames Using a Transient Thermocouple Response Technique
C. Zhang and A. AtreyaCombustion and Hear Transfer Labora_or3.'
Department of Mechanical Engineering and Applied MechanicsThe Universi_. of Michigan
Ann Arbor, Michigan 48109USA
ABSTRACT
In this study, the previous work of Rosner et al t'3 is extended by a simple mathematical model. This
nev,' model facilitates determining the profiles of soot volume fraction from measurements of the
bead radius and the transient temperature of a soot deposited therrnocouple. To demonstrate the
feasibility of the developed technique, experiments were performed on a low strain-rate counterflow
diffusion flame burner for methane and ethylene flames. Transient temperatures were measured by
a PrYPt-10%P-,,h fine-wire thermocouple whose bead size was determined by a microscope. These
measurements in conjunction with the model yielded the profiles of soot volume fraction. I.n
addition, the in-situ laser scatterinffextinction measurements and the flame spectroscopic analysis
were conducted to confirm the thermocouple results. Excellent agreement was found between the
tv,o measurement techniques. From this study, it was also found that: (i) Soot deposits on the
therrnocoupte can cause a "dent" in the temperature profile near the flame on the fuel side. This
phenomenon persists in veliow flames even to the extent ',,,'here absorption and scattering by soot isne__li_ible (scattering-limit flame), which seems to support the concept of "transparent particles"
recently proposed by D'Anna and D'Alessio': and (ii) The magnitude of the observed temperature
"dent" [s c_roportionat to the soot loading of different flames. In particular, this "temperature dent"
in sootin,z flames is caused by the combined effect of two competing mechanisms: soot deposition
due to thermophoresis and soot oxidation due to OH attack on soot deposits.
D_'TRODUCTIOh"
The difficulties of making thermocouple temperature measurements in sooting flames are well
documented _36. The thermal radiation from the junction of a thermocoupie to the surroundings
forces the bead surface temperature to fall significantly below that of the adjacent gases. Such a
negative temperature .gradient will, in turn, drive the surrounding soot onto the thermocouple probe
due to thermophoresis. Consequently, a layer of soot develops, which completely shields the bead
of thermocouple from the ambient gas. This further reduces the bead temperature as the result of
enhanced radiative heat loss due to (i) the higher emissivity of soot; and (if) the continuous increase
in the bead size because of soot deposition (see Fig. 1).
1
While the soot deposition complicates the temperature measurements in sooty flames, the transient
response of the thermocouple can be exploited to find the soot deposition rates, and these deposition
rates can subsequenti,,' be related to local soot loading. Thus, with the aid of an appropriate model,
local soot volume tractions can be determined from simple transient temperature measurements.
This technique wilt be vet), valuable under circumstances where expensive and cumbersome lasero
diagnostics can not be afforded, such as in microgravity experiments.
Soot deposition has been of interest in many practical combustion systems. Previous work _'3'7's-'°
have already identified thermophoresis (which is essentially soot particulatestransporting "down"
a temperature gradient) as the dominant transfer process leading to soot deposition. A recent study
by Rosner et al2 fu_her concludes that thermophoretic proper-ties of soot were essentially insensitive
to aggregate size and morpholog_y. Despite the progress made in these work, the emphasis has been

to investigatethemechanismaYndtherateof sootdepositionontoanisothermalsurface(combustors,
enginewallsor cold platesfor collectingsootsamplesfrom flames). In the presentstudy, we
endeavoredto extendthe previouswork of Rosneret al_3by developinga simplemathematical
model that facilitatesdeterminingthe profilesof soot volumefraction in a sootingflameusing
transientthermocoupleresponsemeasurements.In addition,we appliedthe developedtechnique
to exploit fi.irtherthe effectof thermophoresisundervariousflameconditions,i.e., from a purely
blueflame(non-sooty)to ayeUow-orangeflame(verysooty). Experimentswereperformedon fuel-
rich methane and ethylene counterflow diffusion flames. Transient temperatures inside the sooting
zone were measured by a Pt/'Pt-10%Rh fine-wire thermocouple (wire diameter-0.2mm) where the
bead size was determined by a microscope. Detailed soot volume fraction profiles were deduced
from the measured thermocouple bead size as well as the transient temperature history using the
model developed. These results were confirmed by the in-situ laser diagnostics and the flame
spectroscopic analysis,
THEORETICAL
Based on the preceding discussions, a simple analysis of soot deposition onto a thermocouple bead
is perfonned by assuming that:
(1) The thermocouple bead is simply a sphere and the soot deposition process is spherically
symmetric_
(2) Soot panicles are spherical droplets with monodispersed distribution;
(3) The emissivity of soot is unity (e_=I);
(4) The ambient gas surrounding the therrnocoup[e is locally isothermal and homogeneous

and falls in the low Reynolds number flow regime, thus the Nusselt number, is6:
hD
k
(5) The conversion efficiency of surface collision is 100%, i.e., the panicles that collide with
the bead ofthermocouple are completely absorbed into the soot layer.
(6) Local thermodynamic properties are constant for the thermocouple bead, soot deposits
and gases;
(7) The thermocouple bead and the soot deposit layer have negligible thermal "inertia",
i.e., the thermocouple instantaneously assumes the steady state temperature for a given bead
/
size; and
(8) Heat transfer proceeds as the radiative heat loss from the "soot-coated" bead to the
ambient th.rough a layer of non-attenuating "thin gas" and as the convective heat gain from
the ambient gases to the bead.
With these assumptions, we can derive the following equations:
Conse_ation of soot mass:
where the therrnophoretic mass flux can be expressed asS:
(1)
3pf_ (_dr/ (2)J = -- r d,)
8
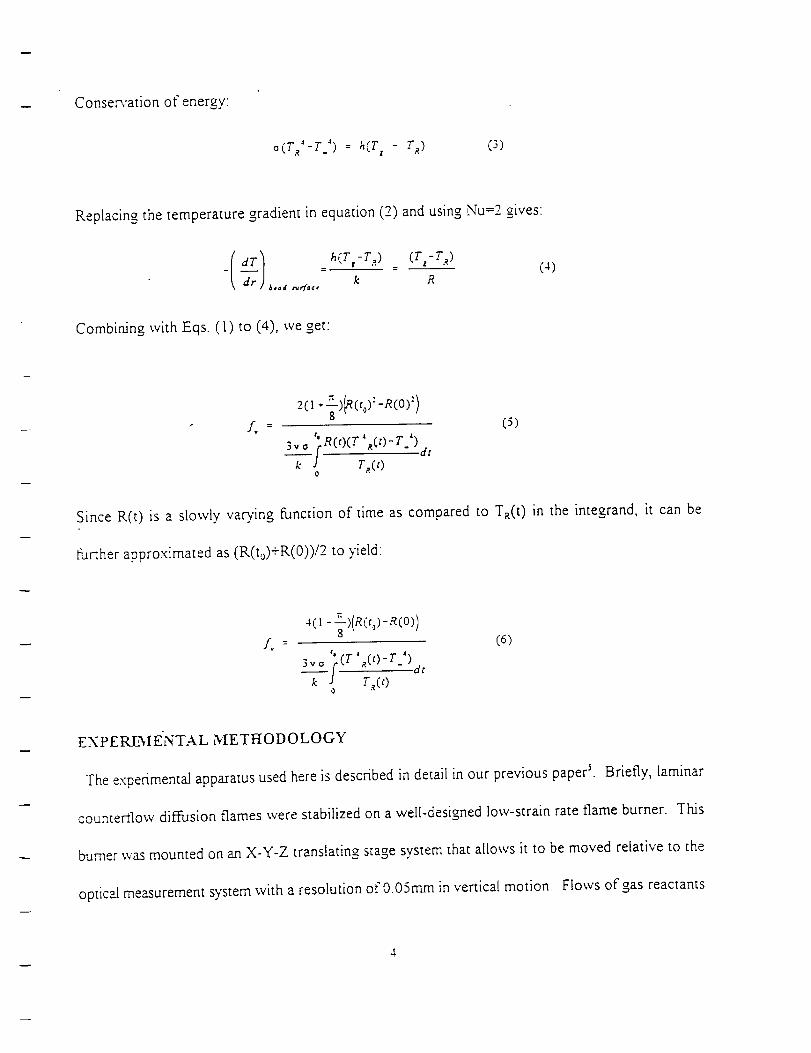
Conse_'ation of energy:
o(T '-T _) = h(T, - T_) (3)
Replacing the temperature gradient in equation (2) and using Nu=2 gives:
dT) h(Tr-Ta) (Tt = T.:_)(4)
Combining with Eqs. (1) to (4), we get:
2(1 _-_-)(R(to):-a(o):)L : (5)
fQ 4 4
3vo fR(t)(Z ,_(t)-T ).dr
r c,>
Since R(t) is a slowly varying function of time as compared to Ta(t) in the integrand,
fur:her approximated as (R(to)+R(0))/2 to yield:
it can be
4(1- f)(R((_)-R(0))A : (6)
" (T* (t_-T %
3vo f_- _,,-, - "dr
k J T_(t)
EXPEREMENTAL METt_ODOLOGY
The experimental apparatus used here is described in detail in our previous paperk Briefly, laminar
counterflow diffusion flames were stabilized on a well-designed low-strain rate flame burner. This
burner ,.,,as mounted on an X-Y-Z translating stage system that allows it to be moved relative to the
optical measurement system with a resolution of 0.05mm in vertical motion. Flows of gas reactants
were measured with critical orifice flow meters.
summarized in Table I.
Flames selected for the present study were
Temperature measurements were made using a Pt/Pt-[0%Rh thermocouple with a wire diameter
of 0.2 mm. The junction of the thermocouple was formed by butting Pt and Ptl0%Rh wires together
and coated ,_ith SiO, to prevent catalytic reaction. The thermocouple probe was made in a triangular
confi_ration to minimize the heat conduction loss and was supported by a ceramic tube. For each
experiment, the thermocouple bead size was measured two times under the microscope, prior to and
after the soot deposition. The entire thermocouple assembly was mounted on a translating stage
/
whose position was recorded by the computer data-acquisition unit along with the thermocouple
temperature data.
:-x_sidefrom thermocouple measurements, soot was also measured independently using the standard
[iL,__ktscattering and extinction techniques. A schematic illustration of the optical apparatus and the
burner is shown in Fig.2. Here a 5W Ion laser operating at 355nm, 488nm, 514nm and 1090nm lines
was used. The laser beam was modulated using a mechanical chopper to allow for synchronized
detection of the transmitted and the scattered light signal at the angles of 0 ° and 900 with respect to
the incident beam. Additionally, flame emission spectroscopic analysis was conducted using the
spectrograph and the ICCD detection system for studying the oxidation of soot deposits by OH
at-tack. Emitted light from the flame was collected at 135 o with respect to the incident beam by the
detection optical tiber. The spatially resolved measurements of flame emission at 306.4nm were
made to determine the OH distribution in the flame. However, in this work, these laser diagnostics

were used only for comparison purposes because the quantity of interests is the measurement of soot
using thermocouple response technique.
RESULTS
A _'pical plot of the instantaneous change in the thermocouple bead temperature in response to the
process of soot deposition and soot oxidation (burn-up) is shown in Fig.3. This was obtained by
quickly inserting a "clean" thermocoupie into the sooting zone (to detect soot deposition) and by
inserting a "soot-coated" therrnocouple into the oxidizing OH zone (to detect soot bum-up).
Obviously, these two opposite processes were captured in the transient profiles of thermocouple
response. As is seen in Fig.3, soot particles continuously built up on the bead surface, forcing the
thermocouple temperature to drop throughout the sampling period. This process of soot deposition
was sustained by the negative temperature gradient between the bead and the adjacent gases as a
result of the continuous radiative "cooling". In contrast, soot oxidation occurred much fast. Wit_n
appro.'dmately 20 seconds, soot deposits burned out completely and the thermocouple temperature
was stabilized at 1920K.
In order to apply the developed model to the actual soot measurements, we carefully selected two
well-defined counterfiow diffusion flames suitable for probe measurement. Figs.4 and 5 illustrate
the sooting structure of the ethylene flame (a similar structure was also observed for the methane
flame). Sandia burner code 9 (OPPD12), which was modified to include gas radiation with boundary
corrections, was used to compute for the flame structure. Soot measurements were performed for
comparison with the subsequent measurements the using thermocoup[e response techniques. As
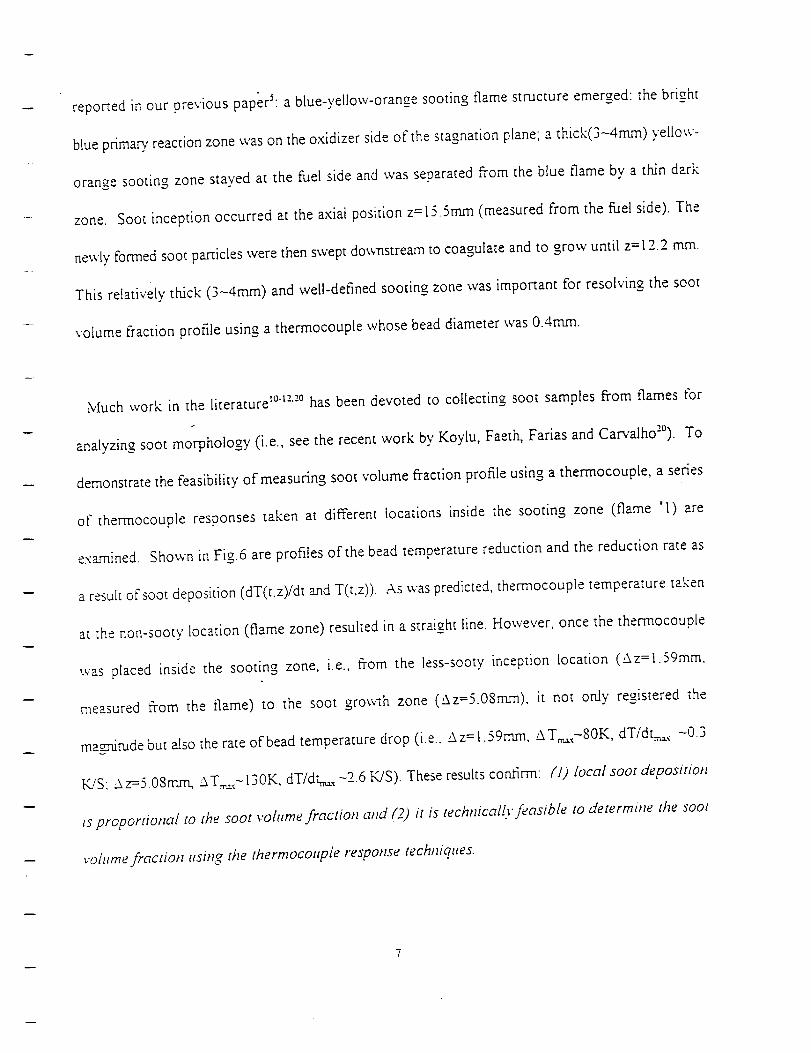
reportedin our previouspaperS:a blue-yellow-orangesootingflamestructureemerged: the bright
blue primary, reaction zone was on the oxidizer side of the stagnation plane; a thick(3-4mm) yellow-
orange sooting zone staved at the fuel side and was separated from the blue flame by a thin dark
zone. Soot inception occurred at the axial position z=[5.Smm (measured from the fuel side). The
newty formed soot particles were then swept downstream to coagulate and to grow until z=12.2 mm.
This reIative[y thick (3-4mm) and well-defined sooting zone was important for resolving the soot
volume fraction profile using a thermocoupie whose bead diameter was 0.4mm.
Much work in the literature ..... has been devoted to collecting soot samples from flames for
analyzing soot morphology (i.e., see the recent work bv Koylu, Faeth, Farias and Ca_'alho2°). To
demonstrate the feasibility of measuring soot volume fraction profile using a thermocouple, a series
of thermocouple responses taken at different locations inside the sooting zone (flame =l) are
examined. Shov,n in Fig.6 are profiles of the bead temperature reduction and the reduction rate as
a result of soot deposition (dT(t,z)/dt and T(t,z))..,-ks was predicted, thermocouple temperature taken
at the non-sooty location (flame zone) resulted in a straight line. However, once the thervnocouple
was placed inside the sooting zone, i.e., from the less-sooty inception rotation (_z=l.59mm,
measured from the flame) to the soot growth zone (,Sz=5.08mm), it not only registered the
magnitude but also the rate of bead temperature drop (i.e.. ,._Xz=t.59mm, ,ST_,-80K, dT/dt_, -0.3
K/S: _z=5 08turn, _T._._-I30K dT/dt_..,._ -2.6 K/S). These results confirm: H) local soot deposition
is proportional to the soot vohtrne fraction and (2) it is technicall.v feasible to determine rite soot
vohcme fraction using the thermocouple response techniques.

Measurements of soot volume fraction using thermocouple response techniques were conducted
in two fuel-rich counterflow diffusion flames (flame :l and flame :2). Eq.(6) was used to determine
the soot volume fraction profiles from the measured thennocouple bead size along with the transient
temperature data. Results of these measurements and the profiles of"soot-coated" bead size are
shown in Fig.7. As is seen, the ethylene flame produced 10 times more soot as compared with the
methane flame. Correspondingly, the maximum bead size (soot coated) at the highest soot loading
location was 4.5 times that of the "clean" bead while for methane flame it was only about 50%
increase in the bead size. ,_so included in this figure are the soot measurements using in-situ laser
scattering and extinction techniques. Despite a relatively lower spacial resolution of thermocouple
measurement (which was about 0.4ram in the present experiment) as compared to a much higher
resolution of optical method (which was 0.05mm), a good agreement was clearly found in soot
measurements between these two techniques, which demonstrated the feasibility of the developed
new technique. From the figure, it also seems that the thermocouple measurements overestimate
soot volume fraction in the heavv sooting zone. Three factors may have contributed to this
discrepanc.v: (i) The thermophoretic velocity equation (Eq(2)), which was used to derive the soot
surface flux. could become less vigorous in the final stage of soot growth where soot can appear as
ag_omerates; (ii) The constant property assumption (assumption (6)) ; and (iii) The approx.imadon
and the quasi-steady assumption used in deriving Eq.(6), which may also over-simplif3" the process
in a heavy sooting zone. Therefore, it will benefit if a simple method could be introduced to measure
the R(t) in "real time", which wilt thus enable removing several assumptions made in the present
analysis.

DISCUSSION
The temperature "dent" phenomenon
It has long been "known in the literature that temperature profiles normal to a flame can display
a "dent" (slope discontinuiW). In the past, two hypotheses were introduced to explain the observed
phenomenon: (i) the effect of endothermic methane pyrolysis x3 and (ii) the effect of exothermic
recombination of radicals onto the platinum thermocouple surface t'. The second hypothesis deserved
more attention here because the phenomenon of temperature "dent" occurred exclusively in those
experiments where a thermocouple was used. Similar phenomena were not reported in numerical
studies even with a full methane reaction mechanism. In line with the present work, we postulate
1
that the observed "dent" phenomenon, at least in sooting flames, can be attributed to two competing
mechanisms: soot deposition on the thermocoup[e due to the effect of thermophoresis and soot
oxidation due to the effect of OH at-tack on soot deposits. The physics behind the phenomenon can
direction ofo,. oerceived as follows: when a thermocouple travels across a sooting zone in the
increasing gas temperature (i.e., from "cold" zone to "hot" zone, which favors thermophoresis), the
local gas temperature is always higher than that of the bead at each instant. Consequently', soot
accumulates on the thermocouple bead thereby reducing the bead temperature. This process can
continue until the thermocouple is brought in contact with the high temperature OH pool, where
soot deposits burn out (oxidize) via the heterogeneous reaction iS:
C .... -H(s) - OH - products (7).
The depletion of the soot layer previously deposited on the thermocouple immediately reduces the
radiative loss thereby brining up the bead temperature. The combined effect of these two processes
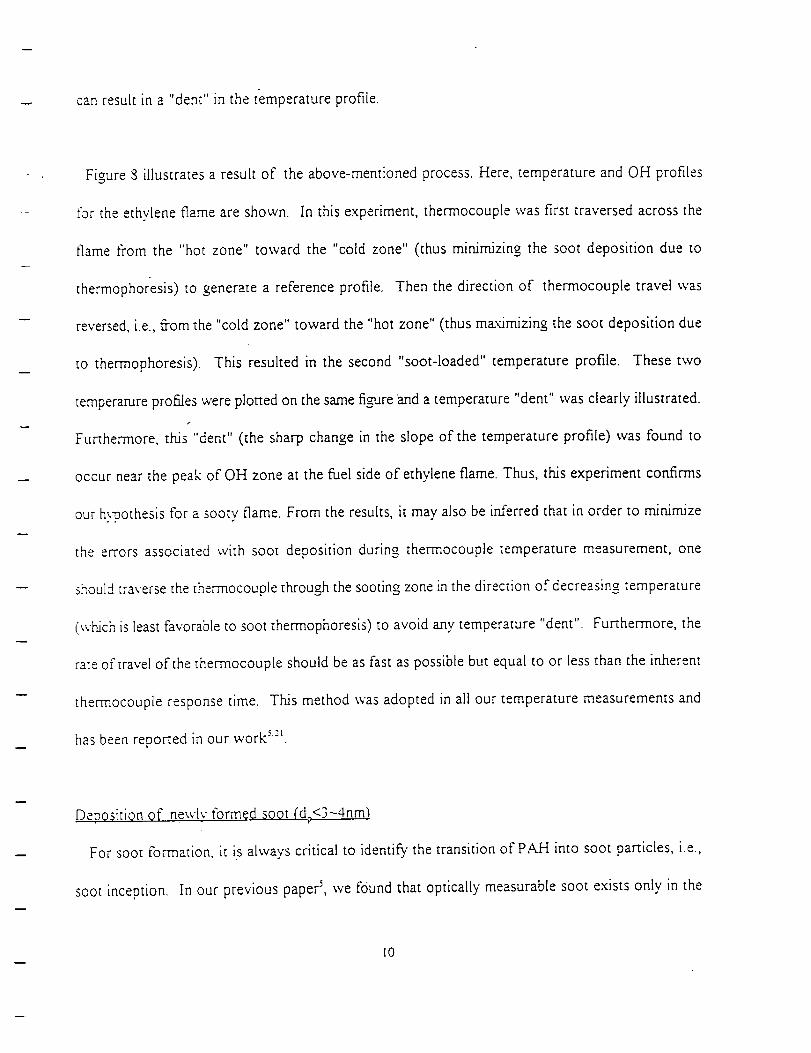
canresultin a "dent" in the temperatureprofile.
Figure8 illustratesa result of the above-mentionedprocess.Here,temperatureandOH profiles
for theethyleneflameareshown, i'n this experiment, thermocouple was first traversed across the
flame from the "hot zone" toward the "cold zone" (thus minimizing the soot deposition due to
thermophoresis) to generate a reference profile. Then the direction of thermocouple travel was
reversed, i.e., from the "cold zone" toward the "hot zone" (thus maximizing the soot deposition due
to thermophoresis). This resulted in the second "soot-loaded" temperature profile. These two
temperature profiles were plotted on the same figure and a temperature "dent" was clearly illustrated.
Furthermore, this "dent" (the sharp change in the slope of the temperature profile) was found to
occur near the peak of OH zone at the fuel side of ethylene flame. Thus, this experiment confirms
our h._pothesis for a sooty flame. From the results, it may also be in_t_rred that in order to minimize
the errors associated with soot deposition during thermocouple temperature measurement, one
should traverse the thermocouple through the sooting zone in the direction of decreasing temperature
(which is least favorable to soot thermophoresis) to avoid anv temperature "dent". Furthermore, the
rate of travel of the thermocoup[e should be as fast as possible but equal to or less than the inherent
thermocouple response time. This method was adopted in all our temperature measurements and
has been reported in our work _:_.
Dep0si[ion of newly formed SOOt (dp<3-4nm)
For soot formation, it is always critical to identify the transition of PAH into soot particles, i.e.,
soot inception. In our previous paper 5, we found that optically measurable soot exists only in the
I0
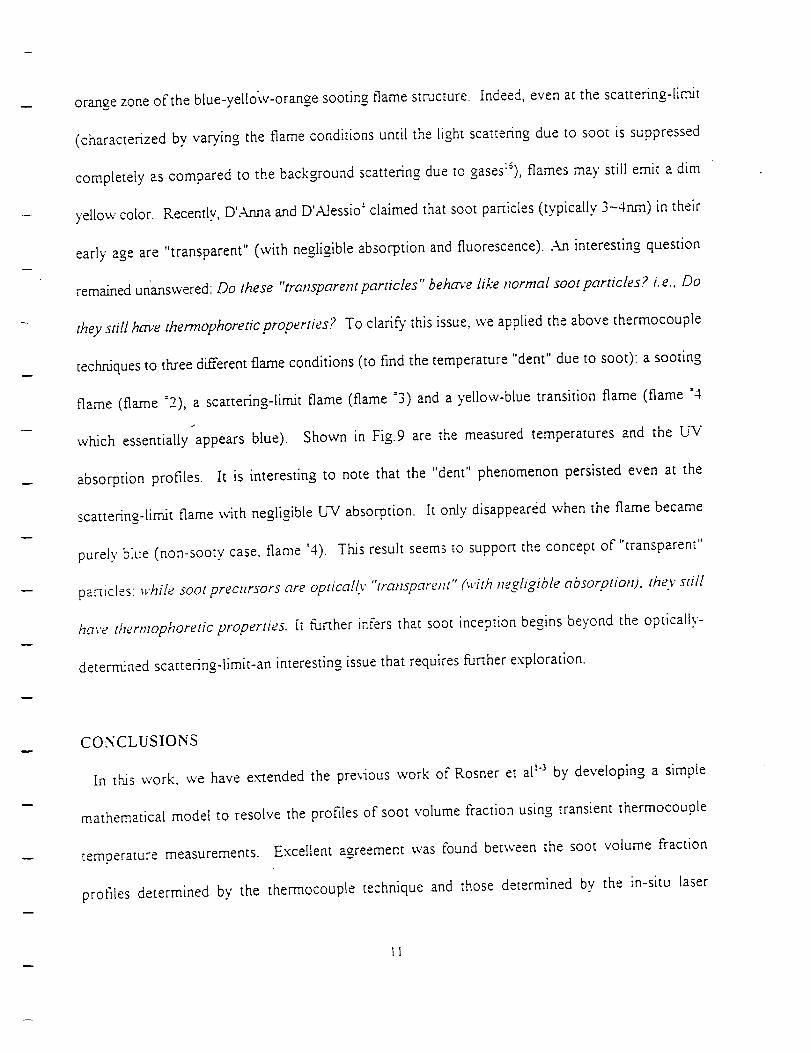
orangezoneof theblue-yello'w-orangesootingflamestructure.Indeed,evenatthe scattering-limit
(characterizedby varyingthe flameconditionsuntil the light scatteringdueto soot is suppressed
completelyascomparedto thebackgroundscatteringdueto gases:Z),flamesmaystill emit adim
yellowcolor. Recently,D'AnnaandD'A.lessio"claimedthatsootpanicles(typically3-4nm) in their
earlyageare "transparent"(with negligibleabsorptionandfluorescence).A.ninterestingquestion
remainedunanswered:Do these "transparem particles" behave like normal soot particles? i.e., Do
they still have therrnophoreticproperties? To clarify' this issue, we applied the above thermocouple
techniques to three different flame conditions (to find the temperature "dent" due to soot): a sooting
flame (flame -2), a scattering-limit flame (flame "3) and a yellow-blue transition flame (flame "4
which essentially appears blue). Shown in Fig.9 are the measured temperatures and the UV
absorption profiles. It is interesting to note that the "dent" phenomenon persisted even at the
scattering-limit flame with negligible LVv' absorption. It only disappeared when the flame became
purely biue (non-sooty case, flame :4). This result seems to support the concept of "transparent"
panicles: while soot precursors are optically "transparent" (with negligible absorption), they still
have thermophoretic properties. It further infers that soot inception begins beyond the optically-
determined scattering-limit-an interesting issue that requires further exploration.
CONCLUSIOnS
[n this work, we have e,'ctended the previous work of Rasher et al _'_ by developing a simple
mathematical model to resolve the profiles of soot volume fraction using transient thermocouple
temperature measurements. Excellent agreement was found between the soot volume fraction
profiles determined by the thermocoup[e technique and those determined by the in-situ laser
II
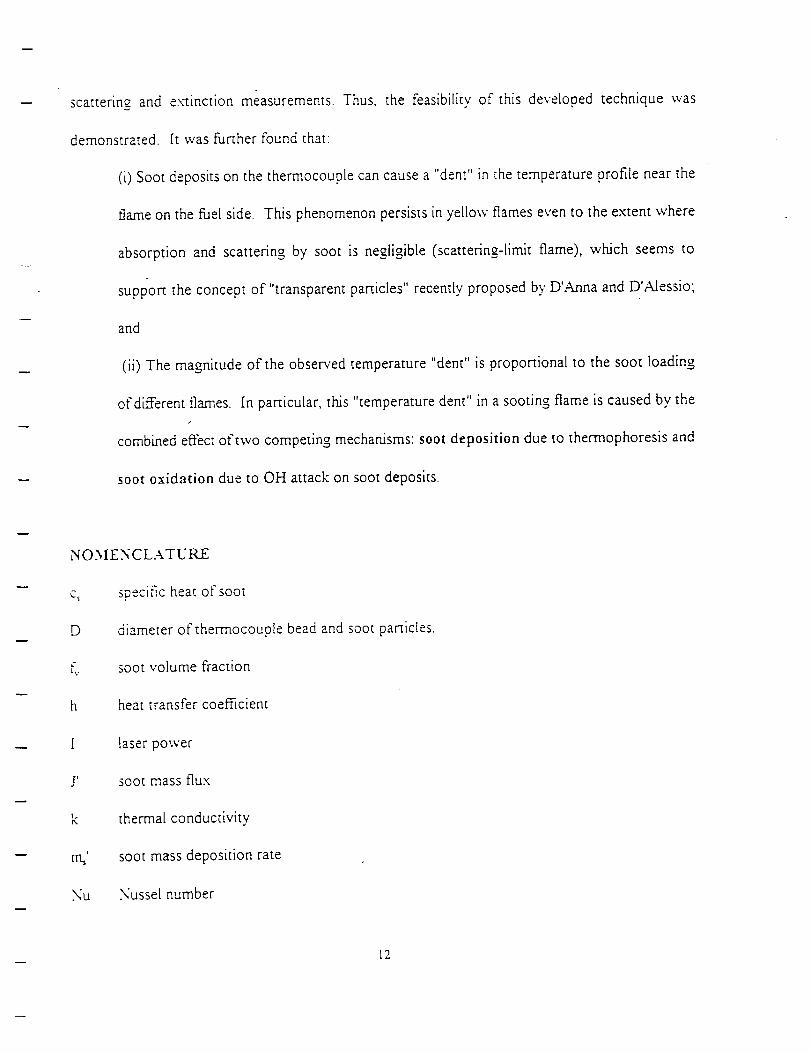
scatteringand e.\"tinctionmeasurements.Thus, the feasibilityof this developedtechnique was
demonstrated. It was further found that:
(i) Soot deposits on the thermocouple can cause a "dent" in the temperature profile near the
flame on the fuel side. This phenomenon persists in yellow flames even to the extent where
absorption and scattering by soot is negligible (scattering-limit flame), which seems to
support the concept of "transparent particles" recently proposed by D'Anna and D'Alessio;
and
(ii) The magnitude of the observed temperature "dent" is proportional to the soot loading
of different flames. [n particular, this "temperature dent" in a sooting flame is caused by the
combined effect of two competing mechanisms: soot deposition due to thermophoresis and
soot oxidation due to OH attack on soot deposits.
NOMENCLATURE
C_
D
g-
.L_,,
h
[
j,
k
n'h'
.",,'u
specific heat of soot
diameter ofthermocouple bead and soot particles.
soot volume fraction
heat transfer coefficient
laser power
soot mass flux
themaa[ conductivity
soot mass deposition rate
.X,ussel number
12

r
R
Re
T.
T_
T._
T
Z
radial coordinate
radius of'the thecrnocoup[e bead
Raynold number
ambient temperature
local gas temperature
ther_nocouple bead temperature
temperature
a_'dal coordinate
Greek letters
emissivity
u viscosity
p gas density
v '_nematic viscosity
a Stefan Boltzmann constant
ACKNOWLEDGEMENTS
This work was supported by GPd under the contract number GR_[ 508%260-1481 and the technica[
direction ofDrs. J.A. Kezerle and R.V. Serauskas; by NASA under the grant number NAG3-1460
and by NSF under the grant number CBT-8552654.
13
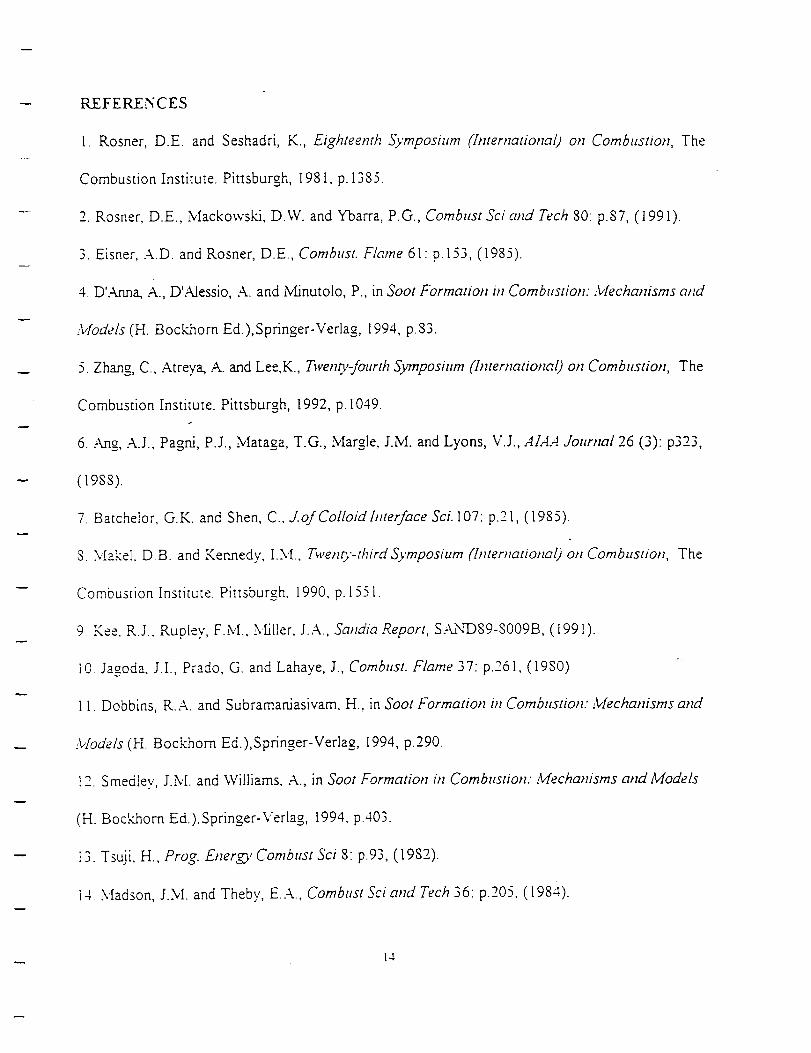
REFERENCES
1. Rosner, D.E. and Seshadri, K., Eighteenth Symposium (International) on Combustion, The
Combustion Institute. Pittsburgh, 1981, p. 1385.
2. Rosner, D.E., Mackowski, D.W. and Ybarra, P.G., Comhust Sci and Tech 80: p.87, (1991).
3. Eisner, A.D. and Rosner, D.E., Combust. Flame 6l: p.153, (1985).
4. D'Anna, A., D'Alessio, A. and _finutolo, P., in Soot Formation in Combustion: Mechanisms attd
Models (H. Bockhorn Ed.),Springer-Verlag, 1994, p.83.
5. Zhang, C., Atreya, A. and Lee,K., Twetm,-fottrth Symposium (Intert_ational) on Combustion, The
Combustion Institute. Pittsburgh, 1992, p. 1049.
6. A.ng, A.J., Pagni, P.J., Mataga, T.G., Margle, J.M. and Lyons, V.J., AIAA Journal 26 (3): p323,
(1988).
7. Batchelor, G.K. and Shen, C., 2.ofColloidhuerface Sci. 107: p.21, (1985).
:3..Makel. D.B. and Kennedy, I.M., Twenr2,'-third Symposium (InternazionaO on Combustion, The
Combustion Institute. Pittsburgh, 1990, p. 155I.
9 Kee. R.J., Rupley, F.M., ,.Miller, J.A., Sanda Report, S.A2,4"D89-8009B, (1991).
10. Jagoda, J.I., Prado, G. and Lahaye, J., Comhust. Flame 37: p.261, (1980)
t 1. Dobbins, R.A. and Subramardasivam, H., in Soot Formation m Combustion." Mechanisms and
Models (H. Bockhorn Ed.),Springer-Verlag, 1994, p.290.
12. Smedley, J.M. and Williams, A., in Soot Formation in Combustion: Mechanisms and Models
(H. Bockhom Ed.),Springer-Verlag, 1994, p.403.
13. Tsuji, H., Prog. Energ3' Cornbust Sci 8: p.93, (1982).
14. Madson, J.M. and Theby, E.A., Cornhust Sci and Tech 36: p.205, (1984).
14

[5. Frenklach, M. and Wang, H., Twen_.'-third Symposium (Tntertlatiop_al) o_1 Combustiot_, The
Combustion Institute. Pittsburgh, 1990, p. 1559
16. Du, D.X., .--k.xe[baum, R.L. and Law, C.K., Combst Flame 102: p. tl, (1995).
17. Rosner.D.E., Tratzsport processes m chemically reaction flow systems, Buttep, vor-th-Heinemann,
Stoneham, NL.-k, 1990.
18. Heitor, NI.V. and Moreira, L.N., Prog. Energy Combttst Sci 19: p.259, (1993).
19. Friderlander, S.K., Smoke, Dust and Haze, Wiley Interscience, New York, 1977.
20. Koylu, U.O., Faeth_ G.M., Farias, T.L. and Carvalho, M.G., Combust. FlamelO0: p.621, (1995).
2l. Atreva, A., Zhang, C., Kim. H.K., Shamin, T. and Sub, J., submitted for Twenty-sixth Symposium
(International) ott Combustion, The Combustion Institute. Pittsburgh, 1996.
FIGURE CAPTION
Table 1 Flame conditions.
Figure 1 Sketch of the soot deposition process.
Fiaure 2 Schematic illustration of the burner and the apparatus.
Figure 3 Thermocouple response to the process of (i) soot deposition and (ii) soot burn-up
(o:ddation) for the ethylene flame. Note that soot oxidation completes less than 20s.
In contrast, soot deposition proceeds continuously.
Figure 4 Profiles of measured temperature (corrected for thermocouple radiation), computed
temperature and velocity for the ethylene counterflow diffusion flame. Sooting zone
,,,,as at the fuel side of the flame.
Profiles of measured soot volume fraction, number density and panicle size usingFigure 5
t5

Figure 6
Figure 7
Figure 8
Figure 9
°
laser scattering and extinction techniques, assuming Rayleigh scatterer model with
monodispersed distribution. This well-defined and relatively thick (-3.Smm) sooting
zone ensured the feasibility of therrnocoup[e probe measurement.
Profiles of the transient therrnocouple bead temperature reduction T(t,z) and the rate
of temperature drop dT(t,z)/dt at different locations of sooting zone. In this figure,
the location of therrnocouple was measured relative to the flame (maximum
temperature).
Measurements of soot volume fraction using the thermocouple technique. Shown
are the soot volume fraction and the size of "soot-coated" thermocouple bead. Also
/
included are the soot measurements using laser scattering and e_inction technique.
Effect of the soot deposition and the soot bum-up (oxidation) on profiles of measured
temperature. The temperatures were obtained by traversing the thermocouple across
the sooting zone in two directions (F-O: from the soot peak position toward the flame
to maximize soot deposition: O-F: from the flame toward the soot peak location to
minimize soot deposition). Shown also are the measured and computed OH profiles.
Note that the location of the "dent" in temperature profile is coincident with the OH
peak.
Effect of soot loading on the temperature profiles. Shown are the measurements of
temperature (left.), using the same technique as in Fig.8 and the UV absorption (right,
the laser was operated at 355nm). They are for three different flames (from top to
bottom): Blue flame (no soot); Scattenng limit flame (negligible soot par-tide
scattering) and Sooty flame.
16

TABLE 1
Flame Conditions
Flame # Reactants
Composition
84%0,
16%He
28.9%CH_
71.1%He
42.6%0,
57.4%N,
22.8%CH_
77.2%He
42.6%0,
57.4%N,
15.3%CH_
84.7%He
Flow Rates
(cold, cmJ/s)
12t.0
194.1
171.3
66.2
231.0
66.2
210.4
66.2
Flame Temp.
(uncorrected)
1776
1864
1834
1703
Obse_'ations
sOOt zone_
3.5ram
soot zone
.yellow orange
SOOt zone_
3mm
soot zone
yellow orange
negli_ble
scattering
inceptiondim-yellow
non-soot3."
blue
Max. Soot
Loading
1.534x10 "_
1.OlOxlO';
none
none
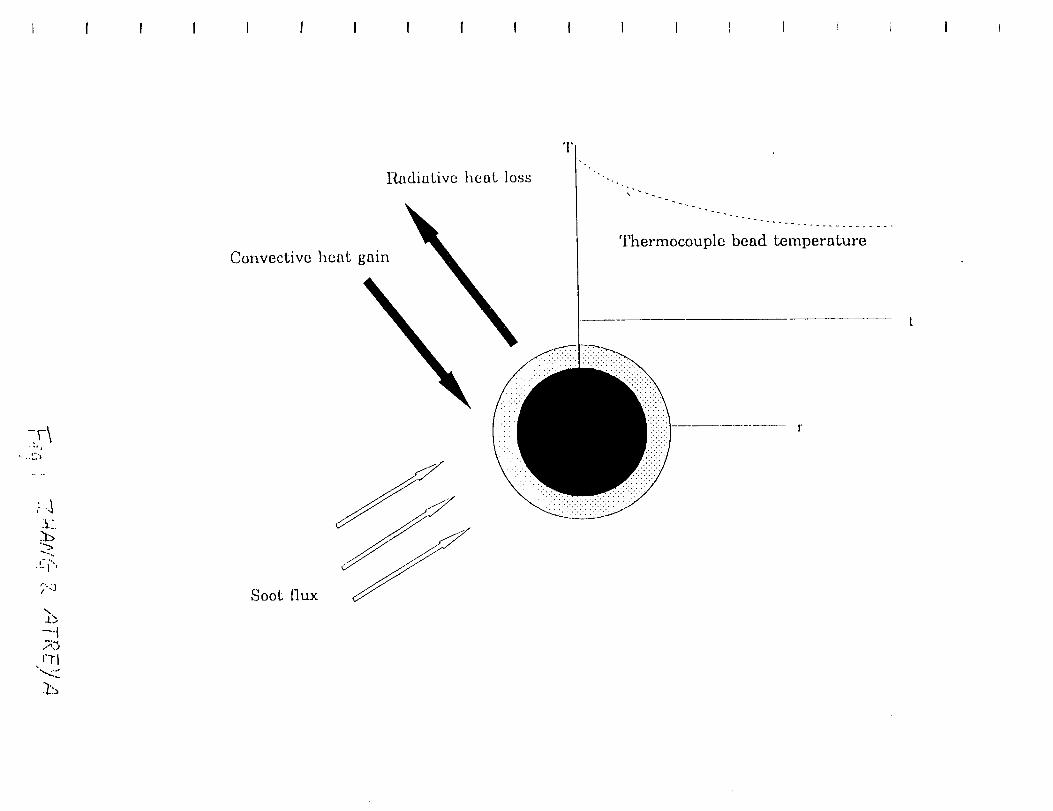
t I 1 I I I I I I I I I I I I _ i I t
7v\.o%
-.. '--'1
""2_
ci,,
• cT1"<5
.'t'_
Radiative heat loss
Convective heat gain
Soot flux
J
T
Thermocouple bead temperatm'e

I I I I I I I ! I I I I t I I i t I
-13
[-q7I:::
&3
,.rrl
Mirror Collimating Lens Focusing Lens . :
iBURNER :: :..... .... . '. .... ..
Chopper
Focusing Lens
Polarizer
NB Filter
l:-z_-[l00
DC Power
Integrator Photodiode
Imaging Lens
Optical Fiber
._. Spectrograph Lock-in Amplifier
__ ICeD Camera
Lock-in Amplifier
I
I ]

• i- • • -
• •
• •
• •• •• • 3
• •• •
• •
. • g• •
• !__ • •
7T • •
__ _ • •
--_ _ • •m •
C 3 • •
:,T. "L • • _
_ • •.__ .__ • •
"_ _-- m ql . _ -----'
• •
_ mm-_ -_ • •
D m O
mmm ,m
0 _ m m "° .-°
®
- - -7_t,!_ ::7
72.

I I I I I I I I I I I I I I I I
-T1
L_
t-q
[-_
3OO0 I I I I I I I I I
2500
T (Computed)
T (Measured)
V (Computed)_OT, : ! : .:
\
F+I ..... . 0+I
0.0 3.0 6.0 9.0 12.0 15.0 18.0 21.0 24.0 27.0
Distance from the fuel side (mm)
5O
40
3O
20 _-_
0
-10
-20
-3030.0

\
"-'. 7
.0
m
-%O
®
DJ
K,
L_
©
p..
l('o - --
-- - Tb._.;,(C77 _.• j;
k

I I I I i I I I I I I I I I i' i I I
. ...._
ub-'-t
-.<
03
'-o
'-o
0.0-
-0.5-
-1.0-
-1.5-
-2.0-
-2.5-
' I ' 1 '
/
1800-
• t400-%
_ t200-ooo
rOOD"
I I
Flame
"_---_-.___
1.59ram from file flame
3.81ram from the flatne"0 _l'}_O_.-Si.l-o - 0 -¢) -0.0.0 _ts.4:_ .._ .U_ l__i_ _i__0 _0._
5.08ram from the flame
000' , ,0 200 400
flame
5.08ram from Lhe
1.59mm from Lhe1
200
flame
flame1 I
400
Time (s)
600
600

I I I I I I I I I I I I I I I f i 1 I
-Z3
_4
0.r--t
©_5
©
0
00
CO
i0-_ I
10-4--
1 0 -5-
10 -0
10-7
-i
10-_-
10 -°-1
0
O
[]
NN
' I
opkical (flame 2) _"°1thermophorekic (flame 2) ,.o
opLical (flame 1) ,, ,.0,._ O.fl-"
thermophoretie (flame 1)_ ::]!IJ0
Y 0.£-
0
In
_ _11_ _ 0.1-
O_
I1_ 1
1 .IL _B
ooooooooo0oooooooooo8oooo • -. -..\o o
1'8 I'6
%i
Io
I
.q
--2;
' I ' I
13 15
DisLance from Lhe fuel side

I I I t I I I I ! I I I I I i _ I I
oO
t-4
2000
1800
1600
1400
1200
i000
[]
-6
' I '
TTOH (measured)
OH (computed)
I o
•no
I ' I ' I
I
Distance from the flame (ram)
.8000
7500
_7000
_ 6500
6O00
5500
_5000
4500
4000
3500
• 3000
2500
2000
- 1500
1000
5OO
04
v
0
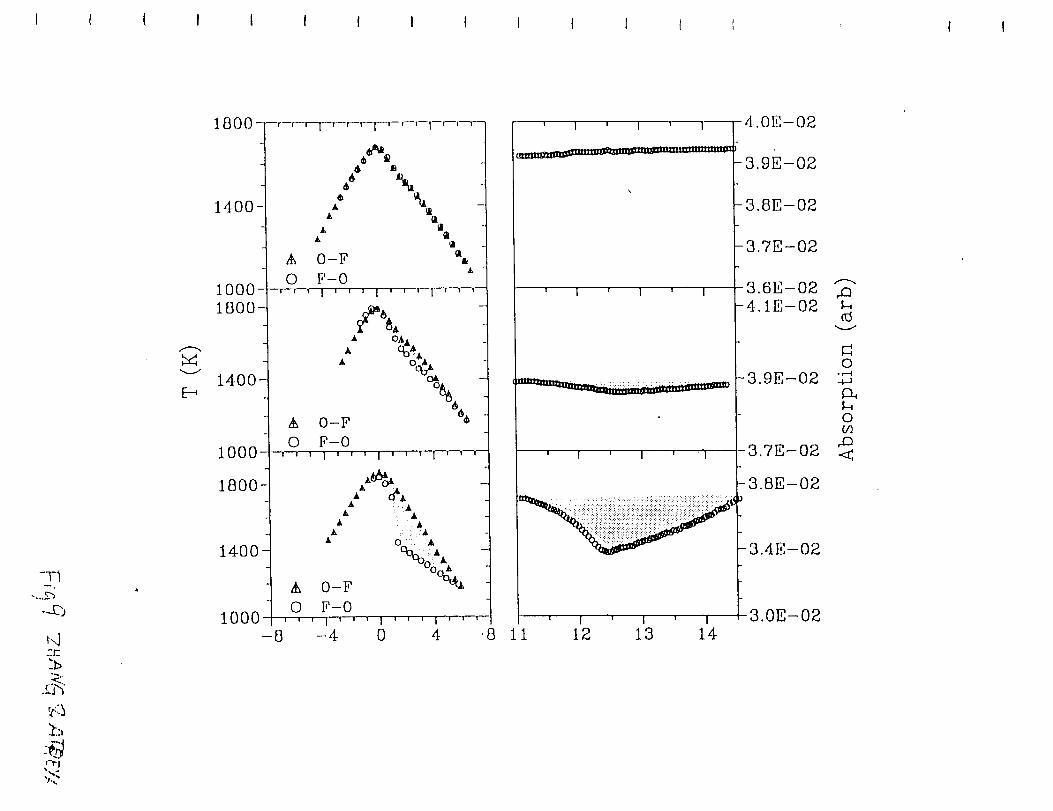
I I I I I I I I I I I I I < _ I I
-7-1
.-..._
:b_..,"
h,
,--,.f,,_
b_
1 8 0 0 _ "--[--[-l_--r--FTr--r---r--l--'--'--l---
14-00
1000-
1800-
0i i I
, %. %
AA
(IA _i "
O-F an
F-O1 '" ' 1 ' ' ' I ' ' '-
AA **
%,O-F
0 F-O
1400
1000 ,,, i''' I,', I ' ' '
1800_ t #_o,A i! •
A 0 , :&
t %%>
,I_ 0-F
10001 o F-O1 1 ! I i ! !
-8 -4I I 1 i I 1 i
0 4 8 11
' I ' I ' I
' I ' I ' 1
-4.0E-02
3.9E-02
-3.8E-02
-3.7E-02
3.6E-02-4.1E-02
£:)
_J
1 " I ' 112 13 14
3.0E-02
0
_ ..... _........ 3.9E-02 "_
' I °' l ' I ' l 3.7E-02 <

APPENDIX J
The EffecI of Changes in the Flame Structure on Formation
and Destruction of Soot and NO x in RadiatingDiffusion Flames
Combustion Symposium paper
By
Atreya, A., Zhang, C., Kim, H. K., Shamim, T. and Sub, J.

The Effect of Changes in the Flame Structure on the Formation and
Destruction of Soot and NOx in Radiating Diffusion Flames
A. ATREYA*, C. ZHANO, H. K. KIM, T. SHAMIM _ J. SUH
Combustion and Heat Transfer Laboratory
Department of Mechanical Engineering and Applied Mechanics
The University of Michigan
Ann Arbor, MI 48109-2125
USA
Telephone: (313) 747 4790
Fax: (313) 747 3170
e-mail: [email protected]
* Corr_ponding author
1996.1.15

The Effect of Changes in the Flame Structure on the Formation and
Destruction of Soot and NOx in Radiating Diffusion Flames
A. ATREYA, C. ZHANG, H. K. KIM, T. SHAMI_ & J. SUH
Combustion and Heat Transfer Laboratory
Department of Mechanical Engineering and Applied Mechanics
The University of MichiganAnn Arbor, MI 48109-2125
ABSTRACT
In this study, soot and NOx production in four counterflow diffusion flames with different
flame structures is examined both experimentally and theoretically. The distance between the
maximum temperature zone and the stagnation plane is progressively changed by changing theinlet fuel and oxidizer concentrations, thus shifting the flame location from the oxidizer-side to
the fuel-side of the stagnation plane. One flame located at the stagnation plane is also examined.
Detailed chemical, thermal and optical measurements are made to experimentally quantify the
flame structure and supporting numerical calculations with detailed chemistry are also performed
by specifying the boundary conditions used in the experiments. Results show that as the radical-
rich, high-temperature reaction zone is pushed into the sooting zone, several changes occur in the
flame structure and appearance. These are: (i) The flames become very bright due to enhanced
soot-zone temperature. This can cause significant reduction in NO formation due to increased
flame radiation. (.ii) OH concentration is reduced from superequilibrium levels due to soot and
soot-precursor oxidation in addition to CO and H 2 oxidation. (iii) Soot-precursor oxidation
significantly affects soot nucleation on the oxidizer side, while soot nucleation on the fuel side
seems to be related to C,2H_ concentration. (iv) Soot interacts with NO formation through the
major radical species produced in the primary reaction zone. It also appears that Fenimore NO
initiation mechanism becomes more important when N: is added to the fuel side due to higher
N: concentrations in the CH zone.

INTRODUCTION
The production of soot and NOx in combustionprocessesis of considerablepractical
interestbecauseof the needfor controllingpollutantformation. Industrialfurnacesthatemploy
non-premixednaturalgasburnersuseseveralmethodsof reducingNOx. Thesearebasedupon
decreasingthegastemperatureand/orcontrollingthecombustionprocessvia stagedintroduction
of fuel or air. Bowman' andSarofimandFlagan2presentexcellentreviewsof theseNOx control
strategiesand their underlyingchemicalmechanisms.Onemethodof reducingthe combustion
gas temperature,and hencethe NOx production rate, is via enhancedflame radiation3. For
industrialfurnaces,this methodhasadditionaladvantagesbecauseradiationis theprimary mode
of energy transfer in thesesystems. Thus, increasingthe flame radiation also increasesthe
efficiency of energytransferto the objectsin the furnace,and hencethe furnaceproductivity.
Enhancedflame radiationcanbeaccomplishedby increasingthesootproductionrate in
sucha way that it is completely oxidized beforeleaving the flame zone. Thus, an important
questionis - how should the non-premixed flames be configured to increase flame radiation,
reduce NO x and oxich'ze all the soot and hydrocarbons produced in the process? In search of
such flame configurations, a detailed experimental and theoretical study on a basic unit of a
turbulent diffusion flame (a radiating laminar flamelet) was conducted. The objective was to
explore the interrelationships between soot, NO,x, transport processes and flame radiation.
Experimentally, methane counterflow diffusion flames (CFDF) were used to represent these
flamelets and their thermal, chemical and radiation structure was measured and modeled.
Clearly, if soot can be forced into the high temperature reaction zone, then flame radiation
will be enhanced and soot and other hydrocarbons will be simultaneously oxidized. Our previous
experimental work 4 shows that this can be accomplished by bringing the CFDF to the fuel side

of the stagnationplane (SP). To realizesuchflame configurations,we notethat: (i) In CFDFs
all particulatematter (suchassoot) is essentiallyconvectedtowardthe SP. Thus, bringing the
soot zonecloserto the reactionzoneimpliesbringingthepeaktemperatureregioncloserto the
SP.(ii) The locationof theSPis determinedby momentumbalanceandthelocationof theflame
is determinedby stoichiometry. In an idealdiffusion flame, fuel and oxidizer diffuse into the
flame in stoichiometricproportions. Thus, by adjusting the diffusive mass flux of fuel and
oxidizer, flame location can be altered relative to the SP. While the diffusive mass flux can be
changed by changing the 'pD' product, the most convenient method is to adjust the inlet fuel and
oxidizer mass fractions. To examine the benefits of changing the flame location relative to the
SP, comparisons of the detailed flame structure measurements and calculations are needed for
flames on the fuel side, on the oxidizer side and at the stagnation plane. While there have been
several previous experimental and theoretical studies of CFDF structure _s), they have been
limited to normal flames that lie on the oxygen side of the SP. Recently, Du and Axelbaum 9
have investigated limiting strain rates for soot suppression in CFDFs as a function of the
stoichiometric mixture fraction and numerically examined the structure of two flames on the fuel
and the oxidizer side of the SP. Similar studies in coflow flames have also been recently
presented by Sugiyama _° and Faeth and coworkers _. However, flame structure measurements
and comparisons for sooting flames are not available in the literature. This study provides such
measurements and comparisons and investigates the effect of changes in the flame structure on
formation and destruction of soot and NOx.
EXPERIMENTAL METHODS
The experiments were conducted in a unique high temperature, low strain rate CFDF
burner. Various diffusion flame conditions were obtained by changing the inlet fuel & oxidizer
- 2

concentrationsand flow rates. Low strain ratesweremaintainedto facilitate measurementsof
the flame structure. All measurementswere made along the axial streamline of a flat
axisymmetricdiffusion flame roughly 8 cm in diameter. Onedimensionalityof scalarvariables
in the flame was confirmed bY radial temperaturemeasurements. All gasesused in'the
experimentswereobtainedfrom chemicalpurity gascylindersandtheir flow ratesweremeasured
usingcalibratedcritical flow orifices. The completeexperimentalapparatusincludingtheoptical
andthe gaschromatographysetup is describedin detailelsewhere7.
Thesootvolumefractionandthenumberdensityweremeasuredby usinganAr-ion laser.
The soot aerosolwas assumedmonodispersedwith a complexrefractive index of 1.57-0.56i.
Thesemeasurementswerehighly repeatable(within +_3%).OH concentrationwasmeasuredby
lasersaturatedfluorescence1"-'_3.The relative OH measurementswerecalibratedusing detailed
chemistrycalculationsfor a non-sooty(blue)methaneflame. OH measurementswererepeatable
to within ±10%.
Other chemical specieswere measuredby gaschromatographs.A quartz microprobe
(-100pro dia.) was used for extracting the gas sample from the flame. The gas sample was then
distributed via heated lines and valves to the GCs and the NOx analyzer. Gasses measured were:
CO, CO,_, H,_O, H,_, CH4, He, 02, and N2; light hydrocarbons from Ct to C_; & PAils up to Cxs.
The GC and NOx measurements were accurate to within ±.5%, except for H,_O which had
variations larger than ±10%.
Temperatures in the flame were measured by a Pt/Pt- 10%Rh thermocouple (0.125mm wire
diameter). The thermocouple was coated with Si02 to prevent possible catalytic reactions on the
platinum surface. It was traversed across the flame in the direction of decreasing temperature
at a rate fast enough to avoid soot deposition and slow enough to obtain negligible transient

corrections.Thesetemperaturemeasurementswereestimatedto beaccurateto within +_30Kafter
radiation corrections. However, therepeatabilitywaswithin _10K.
The experimentalflame conditionsusedfor the measurementsare summarizedin Table
I. Theseflamesweremeasuredthreetimeson separatedaysto checkfor overall repeatability.
This wasfound to bewithin the repeatabilityof the individual measurements.Table I alsolists
themeasuredlocationsof thepeakflame temperature(andits value)andthelocationsof theSP.
Note that very low strainrate flames (6-9sec_;definedashalf the velocity gradientat the SP)
were usedto facilitate flame structuremeasurements.In flames 1 and 2, N2 was used as the
diluent for O_, whereas in flames 3 and 4, N 2 was used as the diluent for CH4. This was done
to simulate the effect of fuel side N2 on NO formation. Helium was used as the other diluent
to help experimentally stabilize these low strain rate flames. Flame 1 was a very sooty flame
located significantly on the air side of the SP, whereas, flame 4 was on the fuel side. The
mixture fraction 'Z' listed in the table was calculated as the sum of elemental carbon and
hydrogen mass fractions _4.
NUMERICAL CALCULATIONS
To better understand the experimental results, numerical calculations with detailed
chemistry were performed by specifying the experimental boundary conditions listed in Table I.
Experimental burner separation of 29ram was used and the measured boundary temperatures and
species mass fluxes were specified as boundary conditions. Like the experiments, the model
considers a steady axisymmetric CFDF established between impinging fuel and oxidizer streams.
The governing equations for the conservation of mass, momentum, species and energy were
solved in the boundary layer form assuming potential flow at the boundary 6. GRIMECH 2.11
mechanism (276 reaction equations and 50 species) with realistic multicomponent transport was
4
usedin thenumericalmodel. The numericalcodeusedin this work wasprovidedby A. E. Lutz
andR. J.Kee_5.Thecalculationsweredoneusingthemeasuredtemperatureprof'flesto eliminate
uncertaintiescausedby theflameradiationmodel. Somecalculationswerealsodoneby solving
the energyequationwithout theradiativeheatlosstermto evaluatethe effectof flameradiation
on NOx production.
RESULTS AND DISCUSSION
Detailedflame structuremeasurementsandcalculationsfor thefour flamesarepresented
in this section. Figure 1showsthe measuredtemperatureandthemeasuredandcalculatedNO
and OH concentrationsfor the low strain rate(-6sec"_)blue referenceflame. This flame was
chosento representa typical non-sootyblueflamestudiedin the literature5"6with the hopethat
the kinetics employed will adequately represent the flame chemistry. The relative OH
fluorescence measurements were calibrated using these calculations. The measured and
calculated NO results show good agreement, except on the fuel side. The discrepancy on the fuel
side appears to be due to the chemical mechanism employed. In sum, this figure represents the
expected level of agreement between the measured and calculated NO & OH concentrations.
Any significant differences between measurements and calculations for sooting flames could then
be attributed to the difference between assumed and real chemistry.
Figures 2, 3, 4 and 5 show flame structure measurements and calculations for the four
flames listed in Table I. The upper graph in these figures shows the NOx structure. It contains
data for mole fractions of burner inlet species, temperature and NO concentrations. The bottom
graph in these figures shows the sooting structure. Measured soot volume fraction & number
density are plotted along with the measured and calculated H,_, CO, and OH concentrations. Ha
and CO were chosen because they are the primary species oxidized by OH. The locations of the
maximumflame temperature(Tmax) andSParemarkedonall the graphs.Themixture fraction
'Z' is also plotted to enableconversionfrom physicaldistanceto mixture fraction coordinate.
Individual aspectsof this dataarecomparedanddiscussedbelow.
Maior Chemical Species:
The calculated and measured burner inlet species profiles, presented in the upper graphs
of Figures 2-5, show good agreement for all four flames. Since the calculations were done by
using measured temperatures and experimental boundary conditions, the differences between
measured and calculated CO, H,, OH and NO profiles may be attributed to the soot formation
and oxidation process which is not represented in the chemical mechanism employed. It is
expected that the.relative rates of soot formation and oxidation will change significantly with the
position of the flame relative to the SP. In earlier work 9, similar calculations with C-2 chemistry
were used to infer soot nucleation propensity. While Faeth et al's ** have correlated measured
soot nucleation rates with C_H a concentration. Thus, C.2H,- was chosen for comparison between
measurements and calculations. These comparisons are presented in Figure 6 for all four flames.
Since the C2H,_ measurements in the sooting region (which is expected to have the maximum
concentration) could not be obtained due to probe clogging difficulties, comparisons with the
acetylene concentration on the fuel side (before the sooting region) are meaningful. In this
region, flames l&2 show reasonable agreement, whereas, predictions for flames 3&4 are off by
an order of magnitude. Likewise, CO and H: measurements (Figures 2-5) also show
disagreement. Measured CO and H z are higher than calculated for flames l&2 and lower than
calculated for flames 3&4. Note that flames 1&2 were on the oxidizer side, flame 3 was very
slightly on the fuel side and flame 4 was substantially on the fuel side. While the reasons for
this discrepancy are unclear, it seems to be related to the soot formation and oxidation process
6

which changessignificantly with the locationof theflamerelativeto theSP. Theseresultshows
that it is difficult to infer sootingtendenciesof diffusion flameswith C-2 chemistry.
Soofino_, Structure:
As these flames were moved closer to the SP, visibly they become very different. Flame
1 had a thick dull-yellow-orange sooting zone, whereas, flames 2, 3 and 4 were very bright
yellow with narrow sooting zones. The thickness of the sooting zone can be inferred from
Figures 2-5 and the brightness from the average temperature of the sooting zone. Since soot is
primarily convected toward the SP, the higher is the temperature at the SP, the brighter the flame
becomes. Measured temperatures at SP, listed in Table I, show that this difference can be as
large as 800K, r0aking a significant difference in flame radiation. Essentially, as the distance
between the flame and SP is changed, soot is constrained between the OH oxidizing zone and
the location on the fuel side that satisfies appropriate conditions for soot nucleation. These
conditions are not uniquely identified by temperature alone. The temperatures at zero f,, & N on
the fuel side vary from 1250K for flame 1 to 1750K for flame 2 to 1600K for flame 3 to 1800K
for flame 4.
These flames have very different sooting structures. In flame 1, soot volume fraction (Iv)
monotonically increases toward SP and the number density (N) monotonically decrease.s. In
flame 2, while f,, monotonically increases toward SP, N first increases and then decreases,
• indicating that soot nucleation is severely affected by the presence of OH. For flames 3 and 4,
both f,, & N first increase and then decrease and unlike flames 1 & 2 maximum fv does not occur
at the SP. Interestingly, while the maximum value of fv is about the same in flames 1 & 2, the
maximum N in flame 2 is about 3 times larger. While the maximum value of N correlates with
the measured _H,. concentration (not the calculated C.z_H2), the maximum value of f, does not

correlatewith the C__Hzconcentration. Flame3 showsthe largestf, probably becauseof the
increasedresidencetime in the acetylenerich zone,beingcloseto the stagnationplane.
The most interestingaspectof theseflamesis that asthe radicalrich zone(identified by
peaktemperature& OH concentration)is pushedinto thesootzone,largediscrepanciesbetween
themeasuredandcalculatedOH concentrationoccur. For flame 1,measuredandcalculatedOH
showsgoodagreementand OH is essentiallybeingusedto oxidizeCO and H,.. As evidenced
by monotonicallyincreasingN, thereseemsto be little soot oxidation. OH, however, does s_m
to control the soot inception location. This behavior is very different in flames 2 & 3. A
considerable reduction in the measured OH occurs signifying that soot competes for OH along
with CO and Hz.. This is evident from the sharp decrease in N on the oxidizer side. Similar
conclusions were obtained by Santoro _6in coaxial flames, however, a corresponding increase in
the CO concentration is not observed in the present flames. In flame 4, soot and OH co-exist
perhaps due to larger velocities that carry the soot particles into the OH zone. Also, less
reduction in the OH concentration occurs due to lower fy and N. From these results it appears
that OH plays a significant role in determining the soot inception location on the oxidizer side.
As noted earlier, the soot inception location on the fuel side seems to be controlled by the C__H,_
concentration.
NO Structure:
Figures 2-5 show the measured and calculated NO for the four flames. Figures 2-3
correspond to the flames where Nz was added to 02, whereas, Figures 4-5 correspond to the
flames where N,_ was added to CH4. However, for flames l&2, the energy equation was also
solved without the radiative heat loss term to determine the effect of flame radiation on NO
production. There was approximately a 100K increase in the maximum flame temperature for
8
theadiabaticcalculationswhichsignificantlyincreasedtheNO concentration(differencebetween
NOA& NOr in figures2&3). While thisdifferencecanbedirectlyattributedto theradiativeheat
loss,measuredNO is still lower thanNOr by 70ppmfor flarnel andby 40ppmfor flame2. Yet,
a goodcomparisonwasobtainedfor theblueflame. A possibleexplanationis the effect of soot
on the major radical speciesproducedin the primaryreactionzoneand their subsequenteffect
on NO production. In flame2, theOH concentrationwassignificantly reduceddueto soot/soot-
precursor oxidation. Thus, the O-atom concentrationwill also be reducedsince, at least
approximately,partial equilibrium may beassumed17.Thus,evenif significant contribution to
N-atomscomes from the Fenimore initiation reaction18(CH+N.,=HCN+N),the corresponding
contributionfrom theZeldovichinitiation reaction(O+N2=N+NO)isreduced.Anotherpossibility
is that the 40ppm differencefor flame2 is dueto low N, concentrationin the primary reaction
zone. Calculations show that N: concentrationdifference is responsiblefor giving peak
NOr=75ppm for flame2 and peak NO'r=145ppmfor flamel despite about 100K higher
temperaturefor flame2. Thus, it appearsthat the 70 & 40ppmreductionin NO in flames l&2
respectivelyis due to soot-NOinteractionsthroughtheradicalsin the primary reactionzone.
Figures4-5showmeasuredandcalculatedNOfor flames3&4. Theseflamesshowmuch
higherNO concentrationdespitelowerpeakflame temperaturesthanflame2. Thus,it seemsthat
the NO formation mechanismhaschanged.While peakvalue of flame3 NO is about 50ppm
lower thancalculations,flame4showsgoodagreement.However,a substantialdifferenceexists
on thefuel sidefor both flames. Sincethisdifferenceis similar to the blueflame, it cannot be
attributedto thepresenceof soot. Two questionsarise:(i) Why is NO somuchhigher in flames
3&4? (ii) What are the possiblemechanisms?We first note thatin flames3&4 N_.was added
to CH,, making higherconcentrationof N,% availablein the fuel rich region. Thus, Fenimore
9

initiation mechanismis likely to becomemoreeffective. To checkthis hypothesis,calculated
N, HCN, CH & O concentrationsare plotted in figure 7 for all four flames [Note: these
calculationsdo not contain the effect of soot]. The calculatedpeak NO concentrationsare
directly related to the calculatedN-atom concentrationsanda direct correspondencebetween
CH&N-atom peaksandOH&O-atom profiles exists. While CH-peakfor flame2 is higher than
flamel, N-peakis lower dueto lower N,_%at theCH-peak(-7% N,_for flame2and-35% N,.for
flame1). For flames3&4, CH-peaksbecomeshorterandbroaderastheflamemovesto thefuel
side. However, the N-atompeaksarenot substantiallyaffecteddue to higherN2%at the CH-
peak(-40%). SincelargeNO is producedby theFenimoremechanismin flames3&4,theeffect
of sootis masked.There is, however,a largediscrepancybetweenthemeasuredandcalculated
OH concentrationsfor flame3that makesasubstantialdifferencein themeasuredandcalculated
NO concentrations.For flame4, the differencein OH is lessanda correspondingdifferencein
NO is also seen. Although morework is needed,it appearsthat: (i) soot hasa largeinfluence
on NO throughthe radical pool in thereactionzone,and(i.i) theFenimoremechanismbecomes
muchmore importantwhen Nz is added to the fuel side due to higher N_ concentrations. Thus,
the relative importance of the Z.eldovich mechanism shifts as N, is shifted from the O,. side to
the fuel side.
CONCLUSIONS
In this work, soot and NO production in four diffusion flames with different structures
was examined both experimentally and theoretically. The distance between the primary reaction
zone and the stagnation plane was progressively changed to bring the flames from the oxidizer-
side to the fuel-side including one flame located at the stagnation plane. Although more work
is needed to understand the soot and NO structure of these flames, following may be concluded:
l0

1) C-2 chemistrydoesnot adequatelydescribethe minor speciesandradicalconcentrations
in sooting flames. 2) As the radical-rich, high-temperaturereactionzone is pushedinto the
sooting zone, the flames becomevery bright due to enhancedsoot-zonetemperature.3) OH
concentrationis significantly reduceddueto sootandsoot-precursoroxidationin additionto CO
and Hz oxidation.4) The presenceof OH significantly affectssootnucleationon the oxidizer
side, while soot nucleationon the fuel side seemsto be related to C:_H2 concentration.5)
Significant reductionin NO formation occursdue to reductionin flame temperaturecausedby
flame radiation. 6) It seemsthat soot interactswith NO formation throughthe major radical
speciesproducedin the primary reactionzone.7) It appearsthatFenimoremechanismbecomes
more important when N,_ is added to the fuel side due to higher N 2 concentrations in the CH-
zone. The relative importance of the Zeldovich mechanism shifts as N,. is shifted from the 02
side to the fuel side.
ACKNO_,VLEDGMENTS
This work was supported by GRI under the contract number GRI 5087-260-1481 and the
technical direction of Drs. R. V. Serauskas and J. A. Kezerle; by NSF under the grant number
CBT 8552654 and by NASA under the grant number NAG3-1460.
11

REFERENCES
I. Bowman,C. T. , Twenty-Fourth Symposium 'International) on Combustion, The Combustion
Institute, Pittsburgh, p. 859-878, 1992.
2. Sarof'un, A. F. and Flagan, R. C., Prog. Energy Combust. Sci., Vol. 2, p. 1-25, 1976.
3. Turns, S. R. and Myhr, F. H., Combustion and Flame, 87, p. 319-335, 1991.
4. Atreya, A., Wichman, I., Guenther, M., Ray, A. and Agrawal, S., Second International
Microgravity Workshop, NASA Lewis Research Center, Cleveland OH, 1992.
5. Tsuji, H., Prog. Energy Combust. Sci., V. 8, p. 93, 1982.
6. Smooke, M. D., Seshadri, K., and Purl, I.K.: Comb. & Flame 73, 45 1988.
7. Zhang, C., Atreya, A. and Lee, K. Twenty-Fourth Symposium (International) on Combustion,
The Combustion Institute, Pittsburgh, p. 1049, 1992.
8. Axelbaum, R. L., Flower, W. L. and Law, C. K_, Combust. Sci. Technol. V. 39, p. 263, 1984.
9. Du, J. and Axelbaum, R. L., Combustion and FLame, 100, p. 367-375, 1995.
I0. Sugiyama, G., Twenty-Fifth Symposium (International) on Combustion, The Combustion
Institute, Pittsburgh, p. 601, 1994.
11. Sunderland, P. B., Koylu, U. O. and Faeth, G. M. Combustion and FLame, 100, p. 310, 1995.
12. Reisel, J. R., Carter, C. D., Laurendeau, N. M., Drake, M. C., Combust. Sci. Technol. V.
91, p. 271-295, 1993.
13. Carter, C. D., King, G. B. and Laurendeau, N. M. AppL Opt., V. 31, p. 1511, 1992.
14. Peters, N., Twenty-First Symposium (International) on Combustion, The Combustion
Institute, Pittsburgh, p. 1231-1250, 1986.
15. A. E. Lutz, and R. J. Kee, Personal Communications.
16. Puri, R., Santoro, R. J. and Smyth, K. C., Comb. & Flame 97, 125, 1994.
12

17. Smyth, K. C., and Tjossem, P. J. H., Twenty-Third Symposium (International)
Combustion, The Combustion Institute, Pittsburgh, p. 1829-1837, 1990.
18. Drake, M. C. and Blint, R. J., Comb. & Flame 83, 185, 1991.
on
13
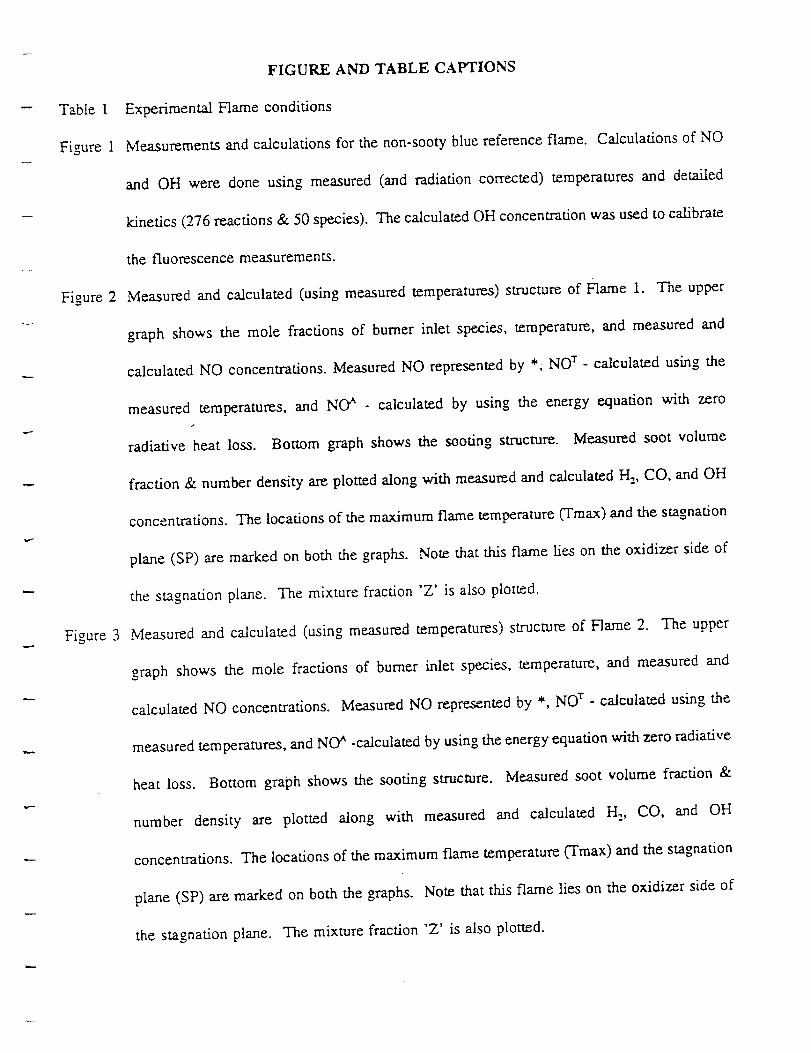
Table 1
Figure 1
FIGURE AND TABLE CAPTIONS
ExperimentalFlameconditions
Measurementsand calculationsfor thenon-s0otybluereferenceflame. Calculationsof NO
and OH were done using measured (and radiation corrected) temperatures and detailed
kinetics (276 reactions & 50 species). The calculated OH concentration was used to calibrate
the fluorescence measurements.
Figure 2 Measured and calculated (using measured temperatures) structure of Flame 1.The upper
Figure 3
graph shows the mole fractions of burner inlet species, temperature, and measured and
calculated NO concentrations. Measured NO represented by *, NO r - calculated using the
measured temperatures, and NCY' - calculated by using the energy equation with zero
radiative heat loss. Bottom graph shows the sooting structure. Measured soot volume
fraction & number density are plotted along with measured and calculated Ha, CO, and OH
concentrations. The locations of the maximum flame temperature (Tmax) and the stagnation
plane (SP) axe marked on both the graphs. Note that this flame lies on the oxidizer side of
the stagnation plane. The mixture fraction 'Z' is also plotted.
Measured and calculated (using measured temperatures) structure of Flame 2. The upper
graph shows the mole fractions of burner inlet species, temperature, and measured and
calculated NO concentrations. Measured NO represented by *, NO r - calculated using the
measured temperatures, and NC_ -calculated by using the energy equation with zero radiative
heat loss. Bottom gra_)h shows the sooting structure. Measured soot volume fraction &
number density axe plotted along with measured and calculated H,_, CO, and OH
concentrations. The locations of the maximum flame temperature (Tmax) and the stagnation
plane (SP) axe marked on both the graphs. Note that this flame lies on the oxidizer side of
the stagnation plane. The mixture fraction "Z' is also plotted.

Figure 4
Figfire 5
Figure6
Figure7
Measuredand calculated(usingmeasuredtemperatures)structureof Flame 3. The upper
graph shows the mole fractions of burner inlet species, temperature, and measured and
calculated NO concentrations. The bottom graph shows the sooting structure. Measured soot
volume fraction & number density are plotted along with measured and calculated H,, CO,
and OH concentrations. The locations of the maximum flame temperature (Tmax) and the
stagnation plane (SP) are marked on both graphs. Note that this flame lies at the stagnation
plane within measurement accuracy. The mixture fraction 'Z' is also plotted.
Measured and calculated (using measured temperatures) structure of Flame 4. The upper
graph shows the mole fractions of burner inlet species, temperature, and measured and
calculated NO concentrations. The bottom graph shows the sooting structure. Measured soot
volume fraction & number density are plotted along with measured and calculated H2, CO,
and OH concentrations. The locations of the maximum flame temperature (Tmax) and the
stagnation plane (SP) are marked on both graphs. Note that this flame lies on the fuel side
of the stagnation plane. The mixture fraction "Z' is also plotted.
Calculated and measured' concentrations of Acetylene for all four flames. Lines
calculations; Symbols - measurements.
Calculated mole fractions of 0 & N atoms and CH and HCN radicals in the four flames.
Solid lines in the upper graph represent CH for the four flames (F1 - F4), whereas, the solid
lines in the bottom graph represent N atoms. These calculations were done using measured
temperatures and GRIMECH211.

Table I - Experimental Flame Conditions
Fla.rne
Number
Fuel
1
Inlet
Species
Con.(%)
CH4 28.86
He 71.14
Burner Inlet
Conditions
Vel. Temp
(crrds) (K)
11.01 544
N, 57.40Oxy 4.96 636
02 42.60
He 84.50Fuel 15.23 684
CH, 15.502
N, 18.23Oxy 5.42 710
O, 81.77
N, 74.95Fuel - 7.88 672
CH_ 25.053
4.9.3_Oxy - 10.09 694
He 56.46
CH, 21.23Fuel 7.78 652
N, 78.774
He 47.82Oxy 9.31 670
O, 52.18
Strain
Rate
(1/sex)
[½Velocit
y gradient
@ S.P.]
5.82
8.27
9.03
8.49
Distance from
the fuel side
(mm)
S.P. Tmax
cr) (T)
12.2 19.5
(1272) (2126)
K K
12.2 15.5
(1791)i (2212)K K
14.5 14.0
(2155) (2198)
K K
15.5 12.0
(1980) (2201)
K K
Comments
&
Visual
Observat-
ions
(Mix.Fra.)
Very
sooty
Hame on
02 side
(Z=0.129)
Bright
Flame on
O., side
(Z=0.297)
Bright
Flame at
the
stagnation
plane
(Z=0.48)
BrightFlame on
the fuel
side
(Z=0.584)

I I I I I I I I I I I I I r : I I I l
OH mole fraction & NO%o o 0 o
o 0 0 0
] u , u , I, w , u I i | u
Temperature (K)
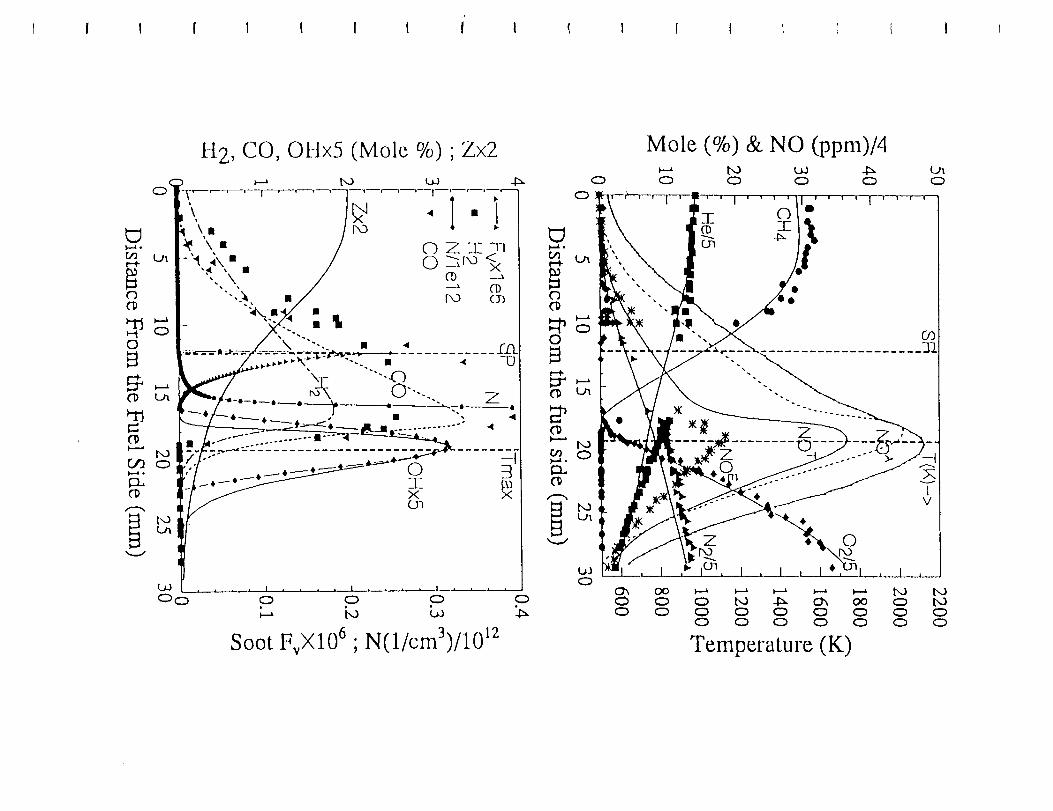
H 2, CO, OHx5 (Mole, %) ;Zx2
0
0
o
_Jj,,._ °
0
t_o
Mole (%) & NO (ppm)/4t,o _ 4x
0 ED 0 0
PO
00
0 0 NI _ Clx oo0 0 0 0 0 0
0 0 0 0 0
Temperature (K)
o
bo t,o0 bo0 00 0

I I I ! I ! ! t I 1 I _ ! I 1 ( I 1 I
H 2, CO, OHx5 (Mole %); Zx2
0 0 0
FvX106; N(1/cm3)/4xl 012
t_O
O
Mole (%) & NO (ppm)/3tO t._ -Ix
0 0 0 0t.A0
PO
o000
0 tO ._ ox o0 c_0 0 0 0 0 0 00 0 0 0 0 0 0
Temperature (K)
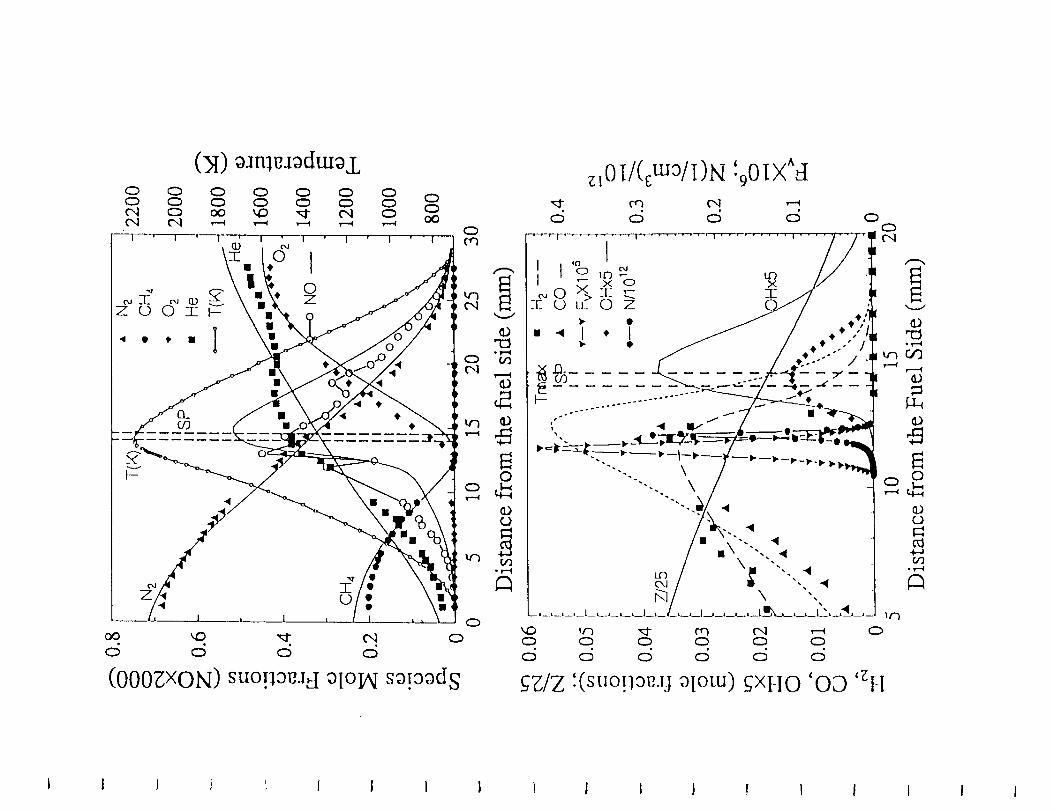
0 00 0c'q C_eq eq
0 0 0 0 0 00 0 0 0 0 0oO _ "_ Cq 0 oO
P I0Z
0
cq .__
0
C_
°_
0
0
(O00ZxON) suo!lae.ld o[OIAlsa!oads
_OI/(_ma/I)N '.90IX^£
,:5 c5 c5
/
I 1 I } 1 I i I i I l t } + I I I l I
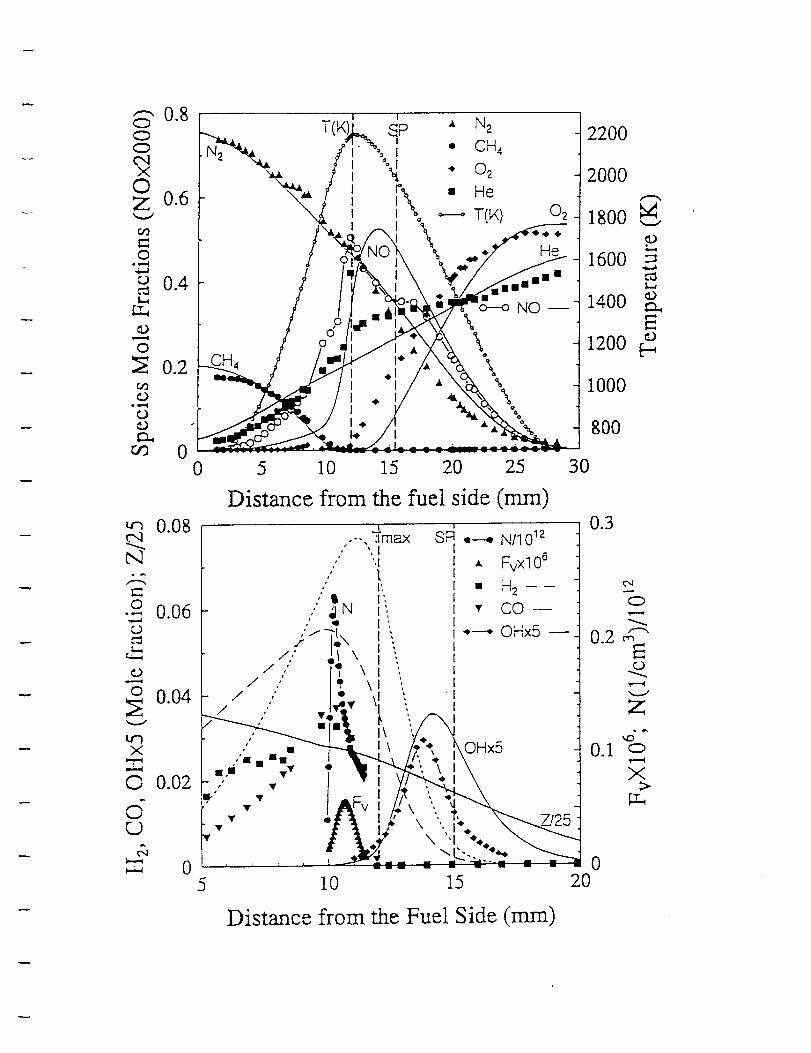
o
0.60.4
0.2
o
0.08
N
-_'_'-0.06
0.04
(_ 0.02
o0
X_ I a% _ T(K) 02
/ ,-_,-_. ,.._'. 8-o NO --
/ Z l""i_ \t /.'._kY.i"7X\ \
0
2200
2000
1800 _"
1600
1400
1200
1000
800
5 10 15 20 25 30
Distance from the fuel side (mm), 0.3!
..--.]max SF=I e--o NIl012
.' ',{ • Fvx106•" I', m H 2
,'$ I',,'" _IN t! v CO---
£_ _1,, I ', .*---_ OHx5•,," le" I ',
/.,' _1 k ',/.' I_ X ",
/ ,,' i • \_ '/ ,' • I
/ ,,, _ [_v \1
•'--¢'---_'1":, '_ "-'\]\o,,_...- c-'-1-_-b, / H×_
"P'" "'" I * I• _vi/_ "
,- ;r_ j._'
o
0.2
.T
o._x>
05 10 15 20
Distance from the Fuel Side (mm)

12000
6000
©
4000
C)2000
00
flame 1
flame2
flame3
flame4
Flame4
il •
5
• I
f
10 15
Distance from the fuel side (mm)
2O
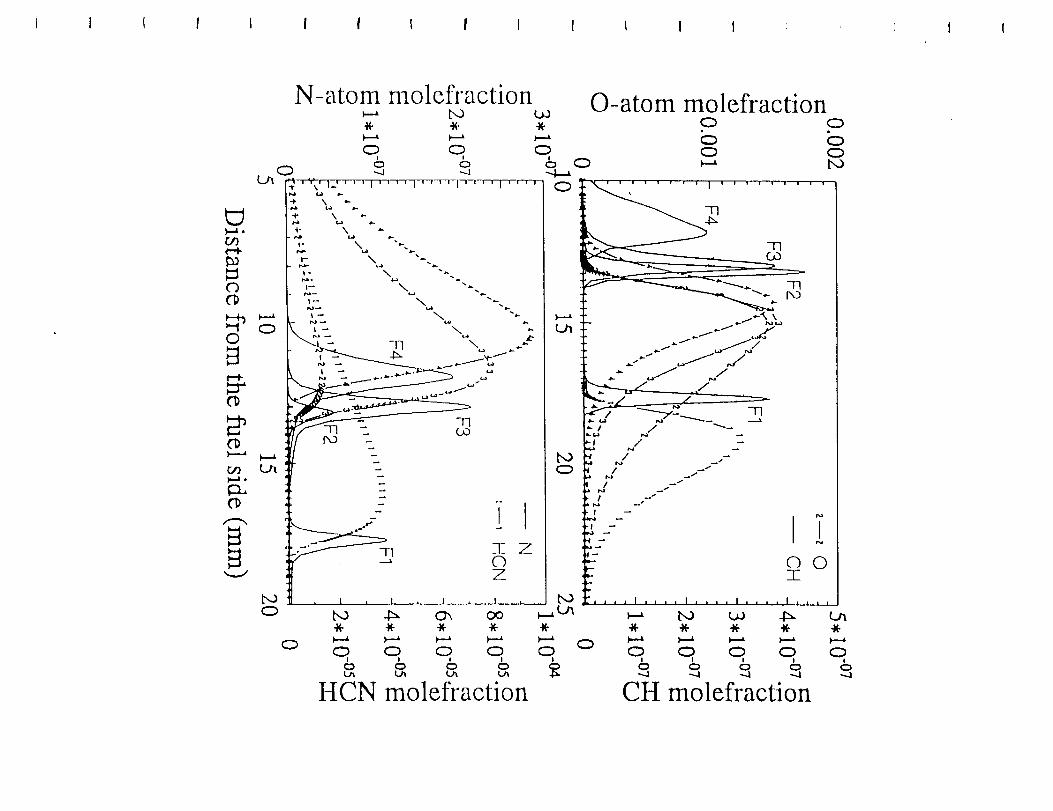
I I I ! I I I I I I I I I 1 ' ; ' I I
l,-a0
0
t,,a
N-at0m m01efracti0nt',O ¢.0
b--.t I,---a l,--a
o Q oo(_ -.4 -4
-_ a,-
e4
"T-__ -Ix j,,---"-
['o _.
.. TII Z0Z
cb
O:
t'O0
, I , I , I , I ,
ba 4:x _ ¢x_ _., toa
0 0 0 0 0I I t I I
0 0 0 0
HCN molefracti0n
O-atom m01efraction0 o
00 0
0 _ l',o
..... "
l'o
___ -nZJ J _-_
-- IT-
'---- o 0T
o o, o o o0 0 0 O° 0
CH molefracti0n
APPENDIX K
The Effect of Water Vapor on Radiative CounterflowDiffusion Flames
Symposium on Fire and Combustion Systems, ASME IMECE
paper, 1995
By
Suh, J. and Atreya, A.
Symposium on Fire and Combustion Systems, ASME IMECE, 1995
THE EFFECT OF WATER VAPOR ON RADIATIVE COUNTERFLOWDIFFUSION FLAMES
Jaeil Sub and Arvind Atreya
Department of Mechanical Engineering and Applied Mechanics
The University of Michigan
Ann Arbor, MI
ABSTRACT
The chemical and physical effects of water vapor on the structureof counter_low diffusion flames is investigated both experimen-
tally and theoretically. The experimental flame structure measure-
ments consist of profiles of temperature which are used for
computation with detailed C z chemistry. This enables describingthe flame radiative heat losses more accurately. The flame struc-
ture results show that OH radical concentration increases as the
water vapor concentration is increased. This increases the flame
temperature and the CO-, production rate and decreases the CO
h production rate. Additional computauons performed for strainedradiative counterflow diffusion flames with and without gas radia-
tion show that at low strain rate. gas radiation is important for
reducing the peak flame temperature, while it has a negligible
effect at high strain rates. Increase in water vapor substitution
increases the radiation effect of the water inside the flame at low
strain rates.
INTRODUCTION
Water has been, and is, the most important fire suppression
agent. Currendy, even though we have several other effective
chemical fire suppression agents, water is the most prevalent and
the only agent for large fires because of its easy accessibility.
Water is also non-toxic and is supposed to behave as an inert in a
fire. Many other chemical fire suppression agents are known to
produce toxic compounds that restricts their usage. However. a
large amount of water that is typically used to suppress a fire
causes severe water damage which sometimes exceeds the fire
damage. To limit the water damage and to minimize the water
usage, it is important to understand the mechanisms of fire sup-
m pression by water. Recendy, there is considerable enthusiasm to
use water mist as a replacement for halons. This also requires the
knowledge of adequate amount of water to efficiently suppress the
fire in the gas phase. Thus, there is a need to quantify the effect of
water vapor on flames. Even though water has been used as a sup-
pression agent for a long dine, the exact mechanisms of fire sup-
pression by water are not well understood.
Water is known to have two physical effects: (i) cooling of the
burning solid by water evaporation and (ii') smothering caused by
dilution of the oxidizer and/or the fuel by water vapor. These
effects lead to fire suppression when water is applied to the fire.
Furthermore. increase of the amount of the water inside of the
flame can increase the flame radiation and reduce the flame tem-
perature. However. in addition to these effects, another effect of
water that is not well known was observed in our laboratory. This
effect is the enhancement of chemical reactions inside the flames
by water vapor. Transient experimental results (Crompton, [995)
show an increase in the flame temperature. CO 2 production rate
and O 2 depletion rate and a decrease in the CO and soot production
rate with water substitution (fuel and oxidizer concentrations were
held constant). Furthermore. these results are different from CO-,
substitution which reduced the flame t_mperatures and suppressed
the fire. Thus, water substitution experiments suggest that the
chemical reactions inside the flames are enhanced by water vapor.
Similar results for premixed flames have been reported earlier by
Muller-Dethlefs and Scblader (1976).
In this paper, detailed structure of counterfiow diffusion flames
with water vapor is measured and calculated to investigate how the
reactions occurring inside the flame are enhanced. The counter-
flow flame configuration was chosen because it represents the
local behavior of large turbulent diffusion flames typical of fires.
Measured temperature profiles were used for calculation to
describe the radiation heat losses from the flame more accurately
and the calculations were performed with the full C 2 mechanism.
In addition to these, more computations were performed using the
energy equation for various strain rates. Two different calcula-
tions, with and without gas radiation were conducted for each

I _ Z,V
FUEL IT 1_'r'u
z= L
BurnerGap Spignati° n
A OXIDIZER
1FIGURE 1. SCHEMATIC OF THE COUNTERFLOW DIFFUSION FLAME APPARATUS
strain rate and for each water vapor substitution.
/
FLAME TEMPERATURE MEASUREMENTS
The counterflow diffusion flame apparatus was used for flame
temperature measurement. Schematic of this apparatus is shown in
Figure [. The gap between the fuel side and the oxidizer side was26ram and the radius of fuel and oxidizer exit was 38.1 mm and
63.5mm respectively. The flow rate of fuel with diluent (nitrogen)
through the fuel exit was 2 liter-per-minute, while that of the oxi-
dizer with two different diluents (nitrogen and argon) was 8 liter-
per-minute. The input concentration on the fuel side was 75% CH.,
and 25% N, and it was maintained constant for various water sub-
"" sutution to the oxidizer side flow. The input concentration on the
o:ddizer side was changed as water vapor was substituted, holding
the molar concentration of O-, constant at 20"70. To maintain the
same flow field and the same heat capacity of the oxidizer flow. a
mixture of water vapor and argon was substituted for nitrogen.
This maintained the same molar flow rate and roughly the same
specific heat. Therefore, the amount of oxygen which flowed into
the flame was the same for all the experiments ( I0, 20.30 and 40%
of water vapor substitutions). The flame temperature profile was
measured with a coated S-type thermocoupte (platinum and plati-
num with 10% rhodium). Silicone dioxide (Sift_) coating was used
to prevent catalytic reactions.
Governint_ Eouations
For steady state laminar stagnation point flow in cylindrical coor-
dinates, the mass and the momentum conservation equations are
expressed as follows:
Mass
_(pur)+_(pvr) =0
Momentum
_u Ou Op O f Ou_
-. pv-+- :PUor Oz ar
(1)
(2)
Introducing a new function, qs. to normalize the r-direction veloc-
ity. u. refer to Smooke et al. (1987).
U
= -- (3)U
where u is the free stream tangential velocity at the edge ofw
boundary layer, u = ar, where a is the strain rate.
Assuming the transverse velocity, v. density, p. and species Yk to
be functions of z-direction only, the following system of boundary
layer equations are obtained:
COMPUTATIONAL METHOD
Numerical modeling of the chemical process is performed using
the Sand2a ChemMn-based opposed flow diffusion flame code (Kee
and Miller. 1992). The flame is modeled as a steady state axis-
symmetric opposed flow diffusion flame using the experimentally
measured center line temperature profile. Pressure is assumed to
be constant at 1 atm. The reaction mechanism for methane is the
C_ - mechanism which consists of 177 chemical reactions with 32
species. More chemical reactions will be added later to account for
chemical enhancement due to soot disappearance.
Mass conservation equation
d---(pv)+2ap_ = 0dZ
Momentum equation
=0
(4)
(5)
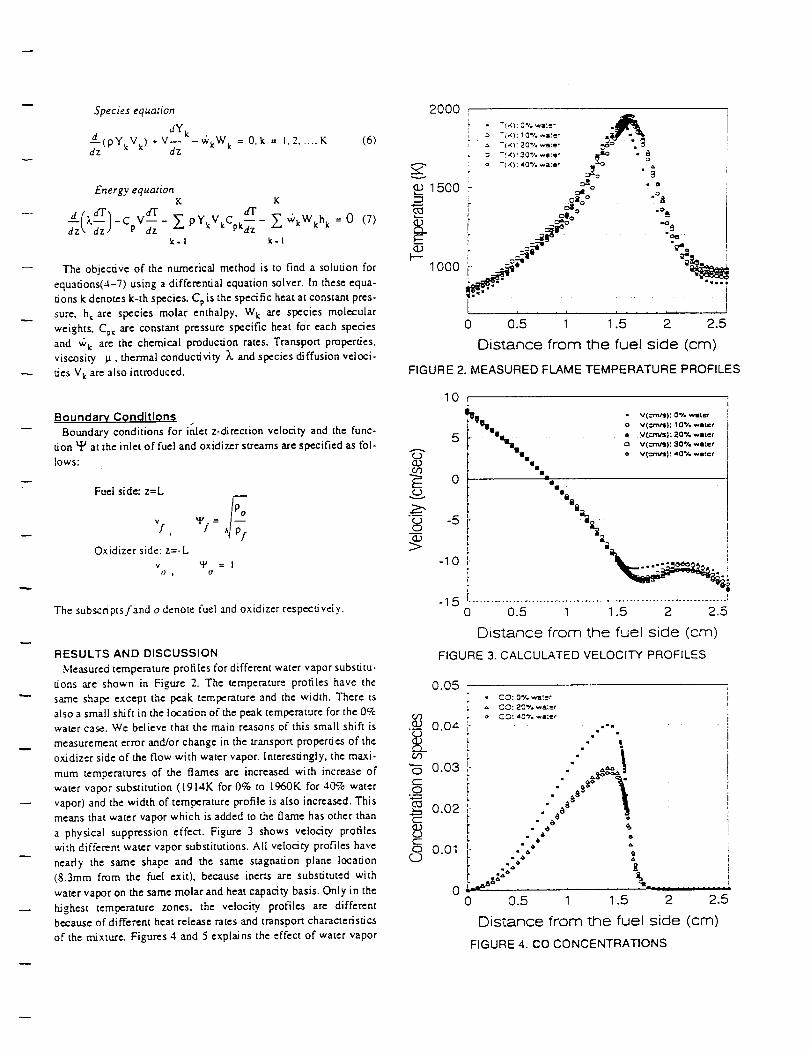
Species equation
i(PYkVk) + vd---Yk- _'kWk=dz 0. k= 1,2 ..... K(6)
Energy equationK K
X -cp dz ._, PYkV_Cpk_- S'. '_kWkhk = 0k-I k.l
(7)
The objective of the numerical method is to find a solution for
equations(4-7) using a differential equation solver. In these equa-
tions k denotes k-th species. Cp is the specific heat at constant pres-
sure, hk are species molar enthalpy, W k are species molecular
weights. Cp_ are constant pressure specific heat for each species
and ',bk are the chemical production rates. Transport properties,
viscosity IJ-, thermal conductivity k and species diffusion veloci-
ties V k are also introduced.
Boundary Condition._Boundary conditions for inlet z-direction velocity and the func-
tion ufl at the inlet of fuel and oxidizer streams are specified as fol-
lows:
Fuel side: z=L
"i--
Oxidizer side: z=-L
v u_ = I
o i o
The subscripts f and o denote fuel and oxidizer respectively.
RESULTS AND DISCUSSION
Measured temperature profiles for different water vapor substitu-
tions are shown in Figure 2. The temperature profiles have the
same shape except the peak temperature and the width. There is
also a small shift in the location of the peak temperature for the 0%
water case. We believe that the main reasons of this small shift is
measurement error and/or change in the transport properties of the
oxidizer side of the flow with water vapor. Interestingly, the maxi-
mum temperatures of the flames are increased with increase of
water vapor substitution (1914K for 0% to 1960K for 40% water
vapor) and the width of temperature profile is also increased. This
means that water vapor which is added to the flame has other than
a physical suppression effect. Figure 3 shows velocity profiles
with different water vapor substitutions. All velocity profiles have
nearly the same shape and the same stagnation plane location
(8.3mm from the fisel exit), because inerts are substituted with
water vapor on the same molar and heat capacity basis. Only in the
highest temperature zones, the velocity profiles are different
because of different heat release rates and transport characteristics
of the mixture. Figures 4 and 5 explains the effect of water vapor
2000_
L -ix_: :% ,,,a:-." .'a_ ]L o -(Z): 10% _a:er i
I _ T(;4): 20% _,.,._:er ,_' "__ • !
EL = v(_):30%.a:er :_ a_? " oa io 7{ wE):40% _ll[Ir
v i "" i_1500 [- o_ °
1 000 _
, , L , , ,
0 0.5 1 1.5 2 2.5
Distance from the fuel side (cm)
FIGURE 2. MEASURED FLAME TEMPERATURE PROFILES
10,
¢J0.)
oooJ
>
-5 kEI
-lO i-
-15
IIIIiiiio
• V(.,_:'ntS): 0°/o w'llt_e
o V(_-'¢$}: 10°/, wlltee
a _4(f.rNl}: 20% WiltCf
= V(m'n/SI: :30"/. water •
o V(m'n/s): 40"/. wmtce
mmi@B@._
i ...................................................................... 1
0 0.5 1 1.5 2 2.5
Distance from the fuel side (cm)
FIGURE 3. CALCULATED VELOCITY PROFILES
O.O5 r
(./3
OO
oc-o
.m
C13
c-(I)c.Jco
CD
0.04
0.03
0.02
0.01
0
- CO: O'/. ,,,,lit .":CO: 2Q'/. _a:-_rr
o CO: 40°;° _,ll:er
i.'m. '
i" a*
r . •
.¢6 g
_....4° %,.0 0.5 1 1.5 2 2.5
Distance from the fuel side (cm)
FIGURE 4. CO CONCENTRATIONS

onthereaction of CO and CO-). The concentration of CO 2 is grad-ually increased with increase of water vapor addidon while the
concentrationof CO is decreased.The mainreactionfor CO: pro-ductionwith CO is as follows:
CO + OH = CO-,+ H
Therefore. {.heincrease of CO_, with decrease of CO means that the
active OH radical from water vapor which is produced in the high
temperature flame zone enhances the reaction of CO to CO+. Fig-ure 6 shows the differences in the OH radical concentrations with
and without water vapor addition. From Figure 6, it is clear that the
__ presence of water vapor in the flame increases the OH concentra-
tion.
In Figure 7, calculated temperatures using the energy equation
with and without gas radiation are plotted. These calculations were
-- done using the same input boundary conditions as the experiment
for [0% war,-r substitution case and are compared with the experi-
mentally measured temperature. Figure 8 shows similar results for
40% water substitution case. Gas radiation from CH 4. 02, N 2. CO,
CO: and H20 species in the flame was included in the calcula-
tions. These results (for [0% and 40% cases) show that locations
of the reaction zones (maximum temperature point) are well
w matched for the experiment and computations. However, the over-
all temperature profile for the radiation compensated case agrees
better with the experimental result than with the adiabatic case.
Especially for 40% water vapor substitution case (Figure 8). the
-- radiation compensated computation result is almost the same as the
experimental result. The reason is that sooty flames were used for
the experiments and when the amount of water vapor substitution
was increased, the decease of the soot volume fraction was visu-
ally observed. Therefore. in the 10% water vapor subsutution case.
a fair amount of soot. which was not considered in these calcula-
tions, was present and made the difference between the experimen-
tal and the calculated results. In the 40% case, however, much less
soot was present, thus gas radiation compensated calculation result
a_s well with the experimental result. Figure 9 shows the calcu-
lated adiabatic flame temperature profiles with various strain rates
-- for the 10% water vapor substitution case. whereas, Figure I0
shows similar results for the 40% water vapor substitution case.
Figure 11 shows the calculated radiation compensated flame tern-
_ perature profiles with various strain rates for the 10% water vapor
substitution case while Figure 12 shows those for the 40% water
vapor substitution case. In Figures 9 to 12, the lowest strain rate
corresponds to the experimental case. As the strain rate is
increased., the temperature profile becomes narrow and the loca-
tion of the maximum temperature moves toward the fuel side for
both adiabatic and radiation compensated cases. However. in the
adiabatic calculation case. the maximum temperature drops when
strain rate is increased while in the radiation compensated calcula-
tion case. the maximum temperature is increased up to certain
point and then decreased. This result is valid for both 10% and
40% water vapor substitution cases and is mainly due to the radia-
tion from water and other gases. In the low strain field, the flame is
wider than that in the high strain field as indicated by the wider
temperature profile. Thus, the gas radiation in the flame becomes
an important factor to reduce the peak flame temperature in the
low strain field. This effect is reduced when the strain rate is
increased, i.e.. a thin flame sheet can not emit much gas radiation.
0.08t.,O
(D0<:2..)Q_o_ 0.06
oc-o--"O04_ .t-.-
c- 0.02o<..3
• COt: 0% _eter
a CO,: 20°Io wster
o CO:); 40% wa:er
i
i
oA •
r _*."
or.o_ " tx
<),.% • ,0
o_
°'_ +o
• ,0,
"0
":
J
o
,"_:ta,,_-
0 0.5 1 1.5 2 2.5
Distance from the fuel side (cm)
FIGURE 5. CO 2 CONCENTRATIONS
0.006 r
._ 0.005
o_L0.004
o¢--.o 0.003O3
c 0.002
o0.001
0
• OH: 0% _{m"L
. a OH: 20% _o OH: 40% _ 8ao
o
i "[ .F _
(
L A
C
i"
0 0.5 1 1.5 2 2.5
Distance from the fuel side (cm)
FtGURE 6. OH CONCENTRATION
2500 L
..-..2000",,d
_1500N_
)--'1000
500
FIGURE 7.
t /
fi °L
I ." m m o o m .[ - xoo° o •
i °o-.- J
I........... ,........... •........... +.......... : .......... .=.
0 0.5 1 1.5 2 2.5
Distance from the fuel side (cm)TEMPERATURE PROFILES FOR DIFFERENT
CALCULATIONS (10% WATER CASE)
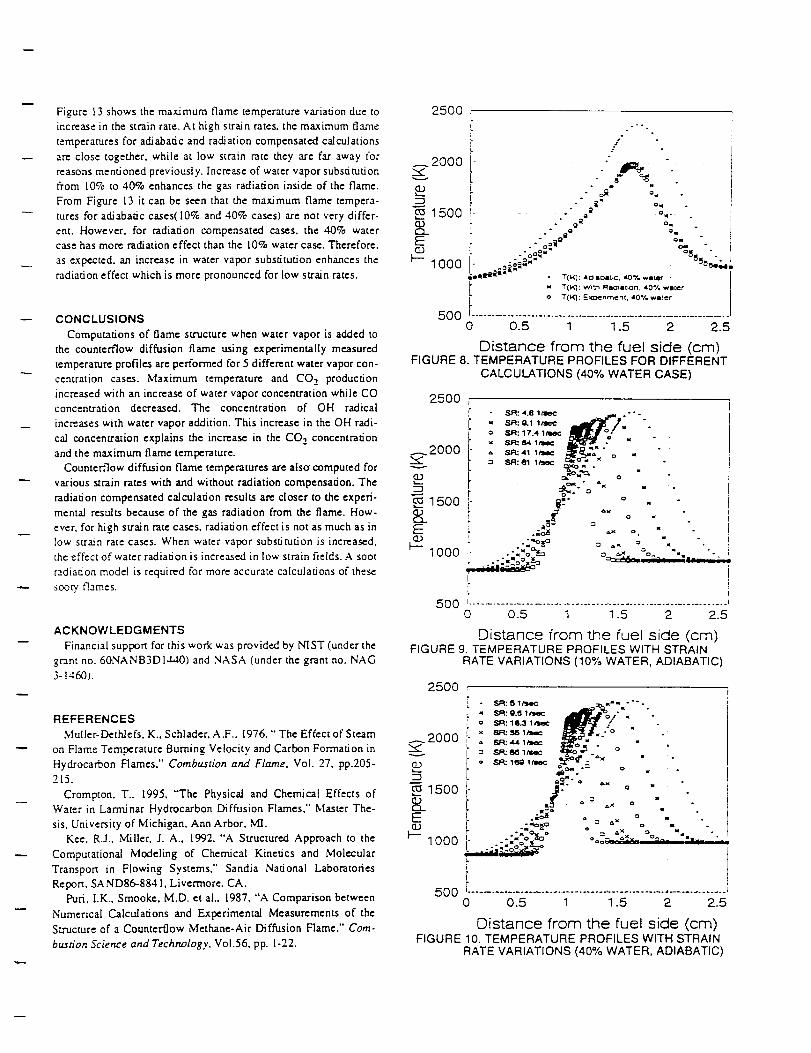
Figure 13 shows the maximum flame temperature variation due to
increase in the strain rate. At high strain rates, the maximum flame
temperatures for adiabatic and radiation compensated calculations
are close together, while at low strain rate they are far away for
reasons mentioned previously. Increase of water vapor substitution
from 10% to 40% enhances the gas radiation inside of the flame.
From Figure 13 it can be seen that the maximum flame tempera-
tures for adiabatic cases(10% and 40% cases) are not very differ-
ent. However, for radiation compensated cases, the 40% watercase has more radiation effect than the 10% water case. Therefore.
as expected, an increase in water vapor substitution enhances the
radiation effect which is more pronounced for low strain rates.
CONCLUSIONS
Computations of flame structure when water vapor is added to
the counterflow diffusion flame using experimentally measured
temperature profiles are performed for 5 different water vapor con-
centration cases. Maximum temperature and CO 2 production
increased with an increase of water vapor concentration while CO
concentration decreased. The concentration of OH radical
increases with water vapor addition. This increase in the OH radi-
cal concentration explains the increase in the CO 2 concentration
and the maximum flame temperature.
Counterflow diffusion flame temperatures are also computed for
various strain rates with and without radiation compensation. The
radiation compensated calculation results are closerto the experi-
mental results because of the gas radiation from the flame. How-
ever, for high strain rate cases, radiation effect is not as much as in
Iow strain rate cases. When water vapor substitution is increased,
the effect of water radiation is increased in low strain fields. A soot
radiation model is required for more accurate calculations of these
sooty flames.
ACKNOWLEDGMENTS
Financial support for this work was provided by NIST (under the
grant no. 60NANB3DI440) and NASA (under the grant no. NAG
3-1460).
REFERENCES
Muller-Dethlefs, K., Schlader, A.F.. 1976, '" The Effect of Steam
on Flame Temperature Burning Velocity and Carbon Formation in
Hydrocarbon Flames," Combustion and Flame, Vol. 27, pp.205-
215.
Crompton. T., 1995, "The Physical and Chemical Effects of
Water in Larminar Hydrocarbon Diffusion Flames," Master The-
sis, University of Michigan, Ann Arbor, MI.
Kee, R.J., Miller, J. A., 1992, "'A Structured Approach to the
Computational Modeling of Chemical Kinetics and Molecular
Transport in Flowing Systems," Sandia National Laboratories
Report. SAND86.-8841, Livermore, CA.
Puff, I.K., Smooke, M.D. et al., 1987, "A Comparison between
Numerical Calculations and Experimental Measurements of the
Structure of a Counterflow Methane-Air Diffusion Flame,'" Corn-
bastion Science and Technology, Vol.56, pp. 1-22.
2500,
_2000x
_ 1500
E
_-IGO0
500
FIGURE 8.
[I
tI
L
.--°°
/
Oil
.°" a ;_= o,,.
L .° Q
i . -'o =_aa o.
i. . .ooo .- °o_l__ m I
!- -,mlll'_Im_'" - Y(I<]: AC_e01t,¢. 40% wetm"
f • Tt_: wl_-i t.._ll:ll[_0,,.1. 40"/. wilier"
0 0.5 1 1.5 2 2.5
Distance from the fuel side (cm)TEMPERATURE PROFILES FOR DIFFERENT
CALCULATIONS (40% WATER CASE)
2500
_2000,,<
1500
E
F--tO00
SR: 4.8 I_ _ -'-
• .SR: ;1.1 1/'_C .._'_ ]_* °
o SR: 17.4 1/'J_¢
x SR: _ I_IC .x . •
a ,SIR; 4,1 1P_= o
= SR:el 1/'Jet
o -
_:- o .
° °-o •°_ e.x o •
t ." N O :1¢
T
i"
M
o • -
500 _..............................................................0 0.5 1 1.5 2 2.5
Distance from the fuel side (cm)FIGURE 9. TEMPERATURE PROFILES WITH STRAIN
RATE VARIATIONS (10% WATER, ADIABATIC)
25OO L
_20002_
1500
t"--1000
l - ,S_: 51_4¢ .--_._:_==%t" "" "
t:SR: 111.3 lCN<
I. : SFt _51_:
i ':, .SFt:I_QI/I_C
/ .._-.=oO_,%2 ,,
500' .........................................................'0 0.5 1 1.5 2 2.5
Distance from the fuel side (cm)FIGURE 10. TEMPERATURE PROFILES WITH STRAIN
RATE VARIATIONS (40% WATER, ADIABATIC)

2500,
_2000v
1500
E
_--1000
,r SR: 4...K llSt_:
[ ! ,SFt; 6.9 llSe¢
r o SR.' 17.2 1/'Jet I_l_ 'P'__
I "
°° o •) ,.i • _x
t I(°" := o "
;.,,_I =_ °o_ "__-_"'- ,
Lr
500 ...............................................................0 0.5 1 1.5 2 2.5
Distance from the fuel side (cm)FIGURE 11. TEMPERATURE PROFILES WITH STRAIN
RATE VARIATIONS (10% WATER, RADIATION)
25OO
A2000
v
1500&E
1000
_R: 4.5 1
S_: 9.2 1/'_1_ -_
o S.q: le 1/sac _r_j_.=_,,x 81=1:_,,I..4 1/=_C
= SR:_S 1_ -
o S.'=I: 8_,.3 1/_,: o. -
o _: 1_1/le¢ '_ =, " N
=-'! ° "
I_ _." 0:3 O '¢
2.'-" o = o "
500 '- ........................................... • ....................
0 0.5 1 1.5 2 2.5
Distance from the fuel side (cm)FIGURE 12. TEMPERATURE PROFILES WITH STRAIN
RATE VARIATIONS (40% WATER. RADIATION)
24001r .o-,.i.o=, =,._:._ : _-. j
2300 _"!. I
2200
00 ............ ;............. ;.......... , ............ _............
_000 _ - :- ........:.... .... .....................lg00 I
0 0.05 0.1 0.15 0.2 0.25
1/Strain Rate (sec)FIGURE 13. MAXIMUM FLAME TEMPERATURES
WITH STRAIN RATE VARIATIONS
APPENDIX L
Dynamic Response of Radiating Flamelets Subject to VariableReactant Concentrations
Proceedings of the Central States Combustion Institute
Meeting, 1996
By
Shamim, T. and Atreya, A.

Dynamic Response of Radiating Ftamelets Subject to Variable
Reactant Concentrations
Tariq Shamim and Arvind Atreya"
Combustion and Heat Transfer Laboratory
Department of Mechanical Engineering and Applied Mechanics
The University of Michigan, Ann Arbor, N_I 48109-2125
The effects of reactant (fuel�oxidizer) concentradon fluctu.ations on radiating flamelets using a numerical
investigation are reported in this article. The fLame response to sinusoi-#-_! variations about a mean value
of reactant concentration for various values of strain rates is examine_ This work will aid in the better
understanding of turbulent combustion. The rr..diative effects from combustion produc:s (CO z and H:O)are also included b_ the formulation. The mzr.rimum flan, e temperature, heat release rate and the radiative
heat loss are used to describe the flame response. The results show that flame responds to fluctuations
with a time delay. The effect of the frequency of fluctuation is found to be more important than its
amplitude. Low frequency fluctuations bring about a significant flame response causing extinction at
large strain rates for high fluctuation amplitudes. At high frequencies relative to the strain rate, rapidconcentration fluctuations are distributed close!y in space. These are neutralized by the resulting large
diff_Lsion gradients. Thus the fiame becomes relatively insensitive to fluctuations. The induced fluctuations
were found lo have more prominent effect on radiation than on the heat release.
Introduction
An investigation of transient effects on flamelet combus-tion is useful for better understanding of turbulent combus-
tion. The flametet concept, which was proposed by Carrier
e; al., [1} and later developed by Peters [2], provides aconvenient mechanism to include detailed chemical kinetics
into the calculations of turbulent flames. The idea is based
on the translation of physical coordinates to a coordinate
s/stem where the mixture fraction is one of the independentv2;iabIes. One can then express all therrnochemical
v_-iables as unique functions of two variables, the mixture
fra:tion and its dissipation rate by assuming that the
changes of therTnochemical variables are dominant in the
direction perpendicular to the surface of constant mixture
f:acdon [3]. These unique functions have been called "state
relationships" [4]. Consequently, the flamelet model can be
incorporated into existing turbulent combustion model
provided these state relationships are known.A basic assumption of these flamelet models is that the
locai structure of the reaction zone may be represented by an
e_semble of quasi-steady state strained laminar flameeIements which are stretched and convected by the turbulent
flow [5]. The validity of this assumption has, however,
been questioned in many recent studies by shorting that non-
s_eady effects are of considerable importance [5-7]. Conse-
quently, there has been a uowing interest in the study of
time dependent effects on flamelet combustion {3, 6-13].However, most of these studies are limited to the effects of
time varying strain rate ,_,'ith the exception of the limited
study by Clarke and Stegasa [14} and Egolfopoulos [15] onconcentration fluctuations. Furthermore, the effects of
radiative heat losses are not considered by any of these
studies with the exception of Egolfopoulos [12].
-The present study is an attempt to fill this existing gap in
the literature. We investigate the effects of reactant concen-tration fluctuations on radiating ftzmelets in this article. The
flame response to sinusoida[ v__-iations about a mean valueof reactant concentration for v_,'-ious values of strain rates is
examined.
Mathematical Formulation
General Govemin_ EquationsA schematic of a counterflow diffusion flame stabilized
near the stagnation plane of two laminar flows is shown in
Figure 1. In ;dais figure, r anct z denote the independent
spatial coordinates in tangential and axial directions respec-tively. Using the assumptions of axisymmetric, unity Lewis
number, negligible body forces, negligible viscous dissipa-
tion, and negligible Dufour effect, the resulting conser,'a-
tion equations of mass. momentum, energy and species may
"Corresponding authorProceedings of the 1996 Technical Meeting of the Central States Section of the Combustion Institute

,----L
\ HaL,._<
I
Figure I Schematic of Countedlow Diffusion Flame
be simplified to the following form:
<3__p_ 2 p _ _ - a (p "---_)= o
'+' '"1 ,{o '"/-o,P[7; " :T: o, o-7.j
Here _t is a similarity transformation variable which isrela_ed to the radial velocity by qs= u/(_ r). The above
equations _re closed by the following ideal gas relations:
P = _P I ar.d dh = c dT.V ,7
Rr Ei,I
The symbols used in the above equations are defined
elsewhere [16]. Note that in the present form the equations
do no_ depend on the radial direction. In this study, theradiative heat flux is modeled by using the emission approx-
imation, i.e., Q._ = 4 o "I" (a..co., + &Ho ): where, o is the
Stefan-Boltzmann constant, and ap.co:., _.,_:o are the Planck
mean absorption coefficients for CO: and H,O respectively.
The absorption coefficients for combustion produc:s ,,,,'eretaken from Ref. C17].
Reaction Scheme
The present problem was solved by considering a single
step overall reacdon which may be wriuen as follows:IF] + v [0:] ---"(l+v)[Pl
Here.v isthemass-basedstoichiometriccoefficient.Using
second order Arrhenius "kinetics, the reaction rate v.._
defined as co = A p: YF Yo exp(-E_/R T). The reaction rates
for fuel. oxidizer, and product may then be written as to F=
-co; coo = -vco; and _ = (l+v)co. For the calculations
presented here, the values of various constants and proper-ties were obtained from Ref. [16].
Initial and Boundary Conditions
A solution of these equations requires the specification of"
some initial and boundary conditions which are liven as
following:Initial Conditions:
_(z,O) = %(z)h(z.O) = ho(Z) or T(z.O) = T,(z)
Yi(z.O) = YLo(z) [n conditions or (n-1) conditions + p(z.O)]
_(z,O) = @o(Z)Here subscript 'o' represents the initial steady state solution.
Boundary Conditions:The origin of our coordinate system v-as defined at the
stagnation plane._(=,.t) = 1 th(-=.t) = (pJp_)_
h(=>.t)= h,_ h(-*_.t) = h,o.
{or T(=,,t) = T,, T(-**.t)= T,<,..]
Yi(='or) = YL,_ Yi("'*'t) = Yia,.,-.
v(0,t) = 0The strain rate a. which is a parameter, must also be speci-
fied. The reactant concentration is varied by multiplying the
boundary value of either fuel or oxidizer concentradon b.v
(1.+A'sin (2 r: f t)).
Solution Procedure
The governing equations form a set of nonlinear, coupled
and highly stiff partial differential equations. These equa-tions were solved numerically using the Numerical Method
of Lines (N'MOL). A 4th order 3-point central difference
formula was used to spatially discredze the equations and _,a
implicit backwzrd differentiation formula (BDF) was used
to integrate in the temporal direction. In order to car'ry out
the numerical integration, infinity was approximated by a
finite length of the order of the length scale of the problem
(i.e., (D/E) _ ). This was confirmed by checking the _aai -ents of all the variables which must vanish at the boundaries.

ResultsandDiscussionThenarameter values used in the present calculations are
T. = 295 K. E/RTo = ;_9.50, pre-exponential constant A =
9.52 x 10⁹ (mJ/kg.s), QHv = 47.465 x 10⁶ J/kg, Yr-- = 0.125,
and Yo.-. = 0.5. The resuLts were obtained by assuming
const_t specific heat. equal diffusion coe_qcient for all
gases and p:D = constant. Results shown in this paper ageonly for fuel concentration fluctuations but are applicable toboth reactants (fuel and oxidizer) since similar findings are
obtained for oxidizer fluctuations. Figures 2-5 show theresults for strain rate of 10 s"t and sinusoidal variation in fuel
concentration of 50% amplitude and 1 Hz frequency.
2 $,,.'_
x
=
y
It;r._
I
-2
, t \
s t %
, .s L
i
/ i ¸
J .:
r
I ..... 1.05
I °.- I. 0.2 i
-t -..aS 0 0A
Fi_. 2 Temoerature Profiles
(._"np = 50%, Freq = i Hz, Strain Rate = 10 s"_)
Figure 2 shows temperature profiles at various timeinter.'als. The figure shows that the flame which wa_
initially stabilized at the stagnation plane (at 0) begins tomove towa.rds the oxidizer side due to an increase in the fuel
concentration. After reaching a maximum value, the
temperature starts decreasing corresponding to a decrease infuel concentration and the flame moves back towards the
stag"nation plane. [t crosses the stagnation plane andcontinues to move towards the fuel side till reaching a
minimum temperature. The flame then keeps oscillating
back _nd forth across the stagnation plane between these two
temt)erature limits, which are very close to the steady state
values corresponding to the maximum and minimum fuelconcentrations. These results show that the flame tempera-
ture is substantially affected by fuel concentration fluctua-
tions.
St t0 °r
:4_
; ' \ .0.t .b
I
._ '
1
o'-
I
", (_)
Fig. 3 Radiation Profiles(Amp = 50%. Freq = I Hz. Strain Rate = 10 s"*)
Similar trends age observed for the gas radiation profiles.
Figure 3 shows that the m_ximum gaseous radiation per unitvolume is increased by 30% corresponding to an increase in
the flame temperature and radiating combustion products
caused by an increase in the fuel concentration and is
decreased by 55% corresponding to a decrease in the flame
temperature and radiating combustion products.
In Figure 4. the maximum flame temperature, which is a
good indicator of the flame response to the induced fluctua-tions, is sho_'n as a function of fluctuation time period. The
fi=m.treshows that the flame responds to fluctuations sinusoi-
dally with a time delay. This delay or phase lag is due to
slow n'anspon processes (convection & diffusion) which are
responsible for _-ansmitting infonnation from nozzle to thereaction zone. The fla_,"neresponse also shows a slight
2
"_ _"ac(2
0 g._ I 2 2_
Fig. 4 Maximum Temperature Variations(Amp = 50%, Freq = I Hz, Strain Rate = L0 s"_)

asymmetry _'ith respect to the initial maximum temperature,
i.e., the mean maximum flame temperature around which the
flame temperature oscillates shifts to a lower value.
-": / _ ' i / /
"L I / I
,.,. I;ir
! 1@j i I,J Z Z.J ]
Fig. 5 Variations in Heat Release Rate
(Amp = 50%, Freq = l Hz. Strain Rate = t0 s")
Other indicators of the flame response, such as the heat
release rate (or fuel mass burning rate) and the radiative
fraction (defined as the ratio of the total heat radiated to the
total amount of heat _eleased), show similar trends (Figures
5,6). The increase or decrease in the heat release is due to
a corresponding increase or decrease in the fuel burning rate
caused by variations in the fuel concentrations. The radia-
tive fraction profile indicates that the fuel concentration
fluctuations have more significant effect on radiation th_.n on
the z.mount of heat released. Note that the radiative fraction
u.'ould remain constant if the radiation fluctuated propomon-
ally to the heat release rate. At the limiting values of _-el
con:entr_tions, the change in the total radiation from its
mean value is roughly twice more than that in the heat
release.
Effect of Fluctuation Amplitude
Figure 7 shows that the va:iadons in the maximum flame
_! /.-/'
7-_:._.i" ,_
, !!;
.? "\ ./ _,,_" ,f
t _ ::
!j '
Fig. 7 Variations in Max Flame Temperature for Different
Amplitudes (Freq = 1 Hz. Strain Rate = 5 s "t)
temperature a.s induced by different amplitudes of fuel conc-
entration fluctuations. For these results the induced fre-
quency and strain rate were set at 1 Hz and 5 s "t respectively.
The results show that: i) the amplitude of fluctuations has no
effect on the time delay in the flame response; it) the mean
maximum temperature around which the flame temperature
oscillates decreases with an increase in the fluctuation
amplitude; and iii) the amplitude of the flame response
increases almost linearly with an increase in the induced
fluctuation amplitude. The last conclusion can be drawn
more clearly from Figure 8. In this figure, the maximum
temperature fluctuations (normalized with the steady state
temperature) are plotted as a function of the induced fluctu-
ations (normalized wSth the steady state fuel concentration).
tt can be inferred that for larger strain rates at high fiuctua-
lion amplitude the extinction will occur.
Effect of Fluctuation Frec_uencv
In Figure 9. the variations in the maximum flame tempera-
ture are plotted as a function of time for different frequen-
cies. All these results are for flames subjected to fuel
_'_ _ / \
Fi_.. 6 Variations in Radiative Fraction
(Amp = 50%, Freq = I Hz, Strain Rate = tO s")
: I
] tJ !
o_;
t
Fig. 8 Effect of Fluctuation Amplitude on Max Flame
Temperature (Freq = I Hz, Strain Rate = 5 s "_)
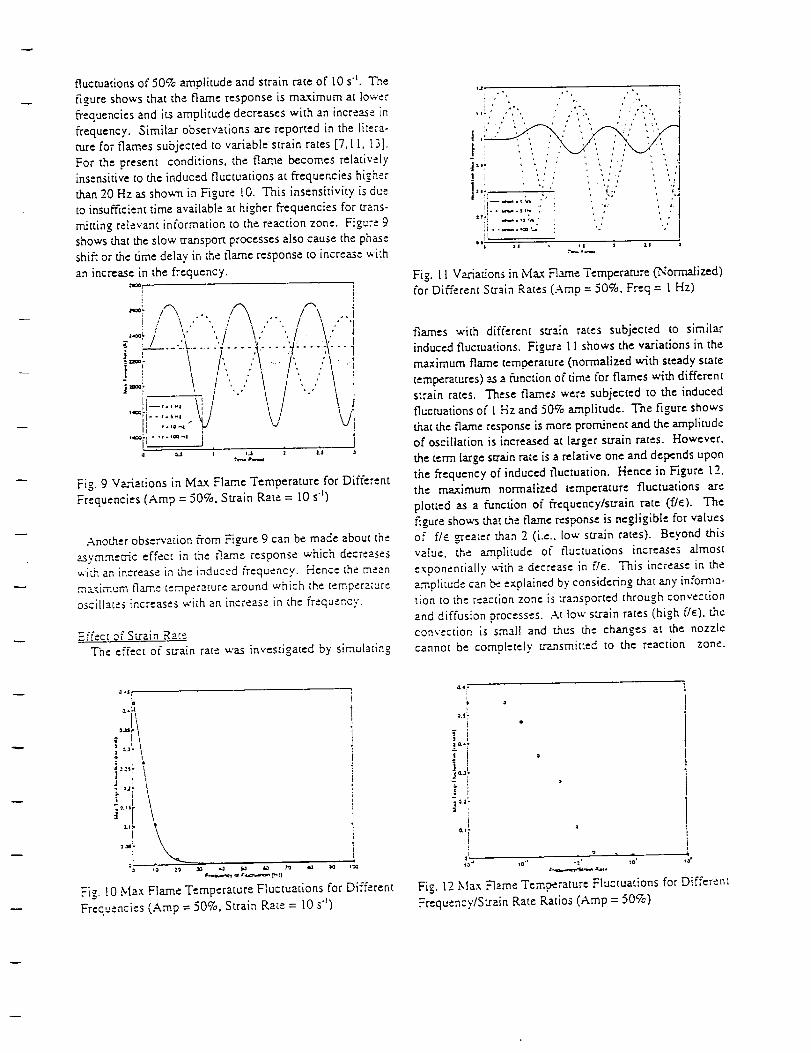
fluctuations of 50% amplitude and strain rate of tO s"t. The
figure shows that the flame response is maximum at lower
frequencies and its amplitude decreases with an increase in
frequency. Similar observations are reported in the litera-ture for flames subjected to variable strain rates [7, [ I, 13],
For the present conditions, the flame becomes relatively[nsensitive to the induced fluctuations at frequencies higher
than 20 Hz as shov,'n in Figure 10. This insensitivity is due
to insufficient time available at higher frequencies for trans-
mitting relevant information to the reaction zone. Figure 9shows that the slow transport processes also cause the phase
shift or the time delay in the flame response to increase with
an increase in the frequency.:",rA,_ l
: !
:" ,'-'x -, ,/"k i \ ..i !' \ .' ', ,' ", ,"", t ., .' 'i
,._,' '," ',f \." './ \.' I- " / "L ./ ,, .t. _' ,
;............. T .... :_.".... "t";Y 1] ' ' '' ' 1i='r ! t, ..! /,,..v
a l.l I t.i i 2.1 •
Fig. 9 Variations in Max Flame Temperature for Different
Frequencies (Amp = 50%, Strain Rate = 10 s"t)
Another observation from Figure 9 can be made about the
asymmeu-ic effect in the flame response which decreaseswid-, an increase in the induced frequency. Hence the mean
m_ximum flame temperature around which the temperatureoscillates increases with an increase in the frequency.
Effect of Strain Race"Fne effect of strain rate was investigated by simulating
J
J,,._ ... , •.... .,..,.
tI...... ,-..' : '-' iI
iti 11 I i 1 li i
Fig. l I Variations in Ma._: Flame Temperature (Normalized)for Different Strain Rates (Amp = 50%, Freq = t Hz)
flames with different strain rates subjected to similar
induced fluctuations. Figure 11 shows the variations in the
maximum flame temperature (normalized with steady state
temperatures) as a function of time for flames with differentstrain rates. These flames were subjected to the induced
fluctuations of I Hz and 50% amplitude. The figure shows
that the flame response is more prominent and the amplitudeof oscillation is increased at larger strain rates. However.
the term large strain rate is a relative one and depends upon
the frequency of induced fluctuation. Hence in Figure 12.the maximum normalized temperature fluctuations are
plotted as a function of frequency/strain rate (f/e). Thefigure shows that the flame response is negligible for values
of fie _eater r,han 2 (i.e.. low strain rates). Beyond this
value, the amplitude of fluctuations increases almost
exponentially with a decrease in f/c. This increase in the
z.mplitude can be explained by considering that any informa-tion to the reaction zone is transported through convection
and diffusion processes. At low strain rates (high f/_), theconvection is small and thus the changes at the nozzle
cannot be completely r,"znsmkted to the reaction zone.
°"_ i
= t
]°'[ \:tl_
I
Fig. l0 Max Flame Temperature Fluctuations for Different
Frequencies (Amp = 50%, Strain Rate = 10 s"t)
T!!_.,r
!°7
Ia,f
I
Fig. 12 Max Flame Temperature Fluctuations for Different
Frequency/Strain Rate Ratios (Amp = 50%)

Hencetheflameresponseissmall.Asthestrainrateisincreased(fieisdecreased),theconvectionpartincreases,therebytransportingmoreinformationandhencetheflameresponseis increased.Beyondcertainstrainrate(fie0.05),theinformationpropagatesinstantaneouslyandtheinstantaneousflametemperatureagreesverycloselytothesteadystatetemperaturevaluesat thecorrespondingfuelconcentration.
FigureI I alsoshowsthat:i) theincreaseinthestrainrateincreasestheasymmetry,intheflameresponse;andii) forafixedfrequency,thephaseshift in theflameresponsedecreaseswithanincreasein thestrainrate.Thislaterbehaviormayalsobeexplainedbasedonthepreviouslydescribedargumentabouttheroleof theslowconvectionratesatlowstrainrates.Otherresults(notshownhere),however,revealthatif theratiof/¢ is keptconstant,anincreasein thestrainrateincreasesthephaselag. Thismeansthattheincreaseintheinformationtransportthroughconvectionprocessesbyincreasingstrainrateissmallerthantheincreaseinfluctuationsatthenozzlebyacorrespondingincreaseinthefrequency.
ConclusionsInthisarticle,wehaveinvestigatedthedynamicresponse
ofradiatingflameletsubjectedtovariablereactantconcent-rations,usingnumericalsimulations.Thereactantconcentr-ationwasvariedsinusoidallyandanumberofflameswithdifferentstrainrateswereexamined.The maximum flame
temperature, heat release rate and the radiative heat loss
were used to describe the flame response. The results led to
the following conclusions:
i) The flame responds sinusoidally with a phaseshift to the sinusoida[ induced reactant fluctua-
tions.
ii) Low frequency fluctuations bring about a signi-
ficant flame response causing a possible extinction
at large strain rates.iii) The ratio of frequency over strain rate (f/e) may
be used to predict the flame response to the in-duced rezc _tz.ntfluctuations. The flame response is
instantaneous for f/¢ _ 0.05 and its amplitude
decreases exponentially for 0.05 :; fie :; 2, beyondwhich the flame becomes insensitive to fluctua-
tions. Hence the transient effects must be consid-
ered in the flamelet modeling for the critical range
0.05 _ fl_ _ 2.
iv) The effect of the frequency of induced fluctua-
tion is more important than its amplitude.v) The induced fluctuations have more prominenteffect on radiation than on the heat release.
(under the grant number NAG3-1460) and GRI (under the
grant number 5093-260-2780).
References
I. Carrier. G. F.. Fendell. F. E.. and Marble. F. E.,
SIAM J. Appl. Math., 28. 463 (1975).
2. Peters, N., Prog. Energy. Combusr. Sc., 10, 319(198Z).
3. Chen,/. Y.,Kaiser, T., and Kollmann, W.. Comb.
Sc. Tech., 92, 313 (1993).
4. Faeth, G. M.. and Samuetson, G. S.. Prog. Energy.Combusr Sc., 12, 305 (1986).
5. Howarth, D. C., Drake, M. C.. Pope, S. B.. andBlint, R. J., Twenty-Second Symposium (Inter
national) on Combustion. The Combustion Insti-
tute, Pittsburgh, 1988 (1988).
6. Barlow, R. S., and Chen, ,1..Y.. Twent)'-Fo,,rrh
Symposium (International) on Combustion. The
Combustion Institute, Pittsburgh. 231 (1992).7. Ghoniem, A. F., Soteriou. M. C., Kino, O. M., and
Cetegen, B., Twenty.Fourth Symposium. (International) on Combustion. Th_ Combustion Insti-
tute, Pittsburgh, 223 (1992).8. Baum, H. R., Rehm. R. G., and Gore, J. P., Twenty-
Third Symposium (International) on Combustiot,.
The Combustion Institute, Pittsburgh, 715 (1990).9. Rutland, C. J., and Fer-ziger, J. H., Comb. So. Tech.
73, 305 (I 990).[0. Stahl, G., and Warnara., J., Comb. & Flame 85, 2S5
(1991).[ I. Darabiha. N., Comb. Sc. Tech. 86. 163 (1992).
12. Egolfopoulos, F. N.. Twenty-Fifth Symposium(International) on Combustion. The Combustion
Institute. Pittsburgh. 1375 (199.1').13. Ira, H. G.. Law. C. K., Kim. J. S.. and Williams. F.
A., Comb. & Flame. 100, 21 (1995).
l& Clarke, J. F., and Stegan, G. R., J. FluidMec&.3-l.
343 (1968).
15. Egolfopoulos, F. N.. E_stern States Section /Combustion Institute Fall Technical Meeting 1993.
Princeton. NJ, 275 (1993).
16. Shamim, T., and Atreya, A., Proc. of the AS.agE
Hear Transfer Division, ASM_ Int'l Cong. & Exp.,San Francisco, CA. HTD Vol. 317-2, 69 (1995).
17. Abu-Romia. M. M.. and Tien. C. L., J. of Hear
Trans., Nov, 321 (1967).
Ackno,,vledgment
Financial support for this work was provided by NASA

APPENDIX M
The Effect of Flame Structure on Soot Inception, Growth andOxidation in Counterflow Diffusion Flames
Proceedings of the Central States Combustion Institute
Meeting, 1996
By
Zhang, C, Atreya, A., Kim, H. K., Suh, J. and Shamim, T.
The Effect of Flame Structure on Soot Inception, Growth and Oxidation in
Counterflow Diffusion Flames
C. Zhang, A. Atreya _, H.K.K.im, J'. Suh and T. Sha.mLm
Combustion and Heat Transfer Laboratory
Department of Mechanical Engineering and Applied Mechanics
The University of Michigan
Ann Arbor, Michigan 48109
ABSTRACT
This poper presenLs an experqmental investigation into the effect of flame stmtcture on soot inception,
growth and oxidation. The experiments were conducted in a low strain rate counterflow burner with
the diffusion flame location progressively shifted, via fuel dilution and/or oxygen enrichment, from
the oxidizer side to the fuel side of the stagnation plane. Quantitative chemical and physical
measurements of temoerature, OH, CH, soot, molar gas species and intermediate h3"drocarbon3 Ct"C_
were perfo_led to spatially resolve the sooting structure of four carefully designed sooting flame
configuration3: Flame l: a basic soot formation case: Flame 11: a partially-affected soot formation
case, where the flame is pushed closer to the stagnation plane: Flame Ill: a combined soot
formatiotv'oxidation case, where the flame resides at the stagttation plane: and Flame IV: a soot
oxidation case, where the flame is on the fuel side of the stagnation plane. From this work, it may be
concluded: (l) diffusion flame structure is important in soot inception, growth and destruction,
because it is the local conditions (_.e., hydrocarbon concentrations, rich or lean, temperature, etc) that
deterrnipte the inception and growth of soot: and ('2_) transport of the incipient soot is crucial because
it can either enhance soot growt]_ or lead to soot destruction.
1. Introduction
L'_j_fion of a gas feet jet into a cornbus_or that contains
o._idizer is a common practice i_ many indusu-ial furnaces.
Research progress in th2s front can be.found in a recent
[ORC proceedmgs (DoIenc, t995). Theoretically, the
combustion process involves two gas streams (feel and
o.'dd_) that react near the interface upon mixing. At
di.ff_ent stages from the point of jet irfifiation, flame can be
tocatty feel-rich or fuel-lean, depending on the associated
equivalence ratios. Co_quenfly, combustion can produce
different amount of pollutants (soot. NO etc). Thus, an
tmdersmnding of the eff_t of flame configurations on soot
formation and destruction is of significance not only for
practical bu.,-ner design but also for pollutant modeling ('Du
and A.xelbau_m. 1995, Su_vama. 1995).
In tb.Js work, we are pr;.marily concerned with the influence
of flame structure on soot inception, growth and destruction
C orre.s_nding author?toe.dings of the 1996 Technical M_ting of the Central States Section of the Combustion hastirute
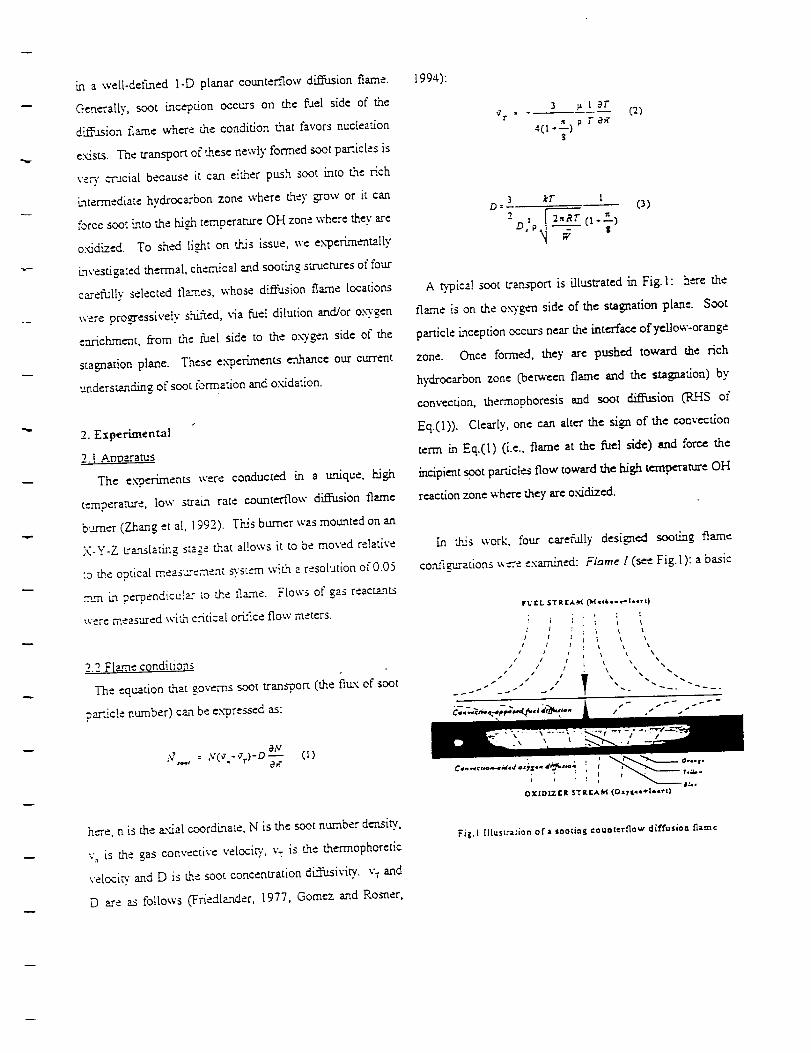
in a well-defined l-D planar counterfiow di/_asion flame.
C_neral[y, soot inception occurs on the fuel side of the
dLffusion flame where the condition that favors nucleation
e.'dsts. The transport of tb.ese newly formed soot particles is
yen' crucial because it can either push soot into the rich
intermediate hydrocarbon zone where they grow or it can
force soot L-,to the ki_ temperature OH zone where the)' are
o.,6dized. To shed li_t on this issue, we experimentally
investigated thermal, chemical and sooting structures of four
carefully selected flames, whose diffusion flame locations
were pro_essiveiy shifted, via fuel dilution and/or oxygen
e,xficb.mem, from the fuel side to the ox3"gen side of the
stagnation plane. These experiments enhance our current
_dersta'16ing of soot formation and oxidation.
2. Experimenlal
2. ] Anoaratus
The experiments were conducted in a unique, high
temperature, low strain rate cot.mterflow diffusion flame
burner (Z.hang et aI, 1992). Tkis burner was mounted on an
X-Y-Z traristating sta_e that allows it to be moved relaive
to the optical meast:.-ement _scem wiuh a resolution of 0.05
.'7._min perp, endicu[ar to the flame. Flows of gas reac_'ats
were measured x_,i_ critical or'ff_ce flow meters.
2.2 Flame conditions
The equ.ation that governs soot u-an_ort (the flux of soot
pzrtic[e number) can be ex.'pressed as:
j , : .V(_r.¢r)-D a:v (I)
here, n is the axial coordinate, N is the soot number density,
1.', is u_.e gas convective velociw, vr is the thermophoretic
velocib" and D is the soot concentration diffusiviw, v-r and
D are as tbttows (Friedtander, 1977, Gomez and Ro_er,
1994):
3 _i l OT
40-_) p r a,r$
(2)
D--Z _r 1
,,P _ 8V¢
(3)
A typical soot trar,_"port is illustrated in Fig. 1: h:re the
flame is on the oxTgen side of the stagnation plane. Soot
particte inception occurs near the interface ofyeUow-orange
zone. Once formed, they are pushed toward the rich
hydrocarbon zone Coetween flame and the stagnation) by
convection, thermophoresis and soot _h.tsion (P,.HS of
Eq.(1)). Clearly, one can alter the sign of the eow,'ection
term in Eq.(l) (i.e., flame at the fuel side) and force the
incipient soot pm-dctes flow toward the kig.h temperanlre OH
reaction zone wh_e they are o.xid.ized.
ha thds work, four carefiAly designed sooting flame
co_l_-aions w_e examined: Flame I (see Fig.l): a basic
iTl_lr I., STiirb.,14 ('_(,**,l,..t.-,.|.,_tt)
I
I I ', *, *.
/
Fig.l illustration of a looting, ¢otmt_:rllo'.v dif-fusio_a flame

soot formation case, where the flame was on the oxidizer
side of the stagnation plane with a thick (3---gram) scot
grow_ zone; Flame If: a partially-affected soot formation
case, where the flame was pushed closer to the stagnation
plane, resulting in a much narrower (-..O.8mm) soot _ow-d-t
zone; Flame Hi: a combined soot formation/oxidation case,
where the p_mar'y reaction zone of the flame resided at the
stamnation plane. The convection term of soot trm'_-port in
eq. (I) changed sign. Thermophoresis and diffusion pushed
the newiy formed soot particles toward the hydrocarbon
zone where they will grow and convection pushed the soot
particles into the OH radical zone where they are o.,ddized;
and Flame iV: a soot o.,ddation case, ,,,,'here the flame was on
the fuel side of the stagnation plane. Here, gas convection
is expected to dominate, forcing thesoot particles into the
radical-rich flame zone where signi.ticant soot oxidation
occurs. In addition, a reference flame (blue flame) was also
established. The selected flame conditions are summarized
in Table I. The stagnation planes of these flames were
confirmed by flow ,Asualization using Titanium iso-
propox.ide (Ti(OC_H_),) and were also confirmed by
ntamevical computations using measured temperatures.
Table IFlame Conditions
FL# R:act_nts
28.9%CH_+71. l%He
42.6%O:+57.4%N:
2 l 5.5%CH,+84.5%He
81.8%O:+l 8.2%N:
3 25%CH,+75%N:
43.5%O:+56.5%He
4 21.2%CH,+78.S%N:
52.2%O:+47.8%He
Ref 15.3%CH,+S4.7%He
I 42.6%O,+57.4%N.
v
(,'m/s)
10.1
4.5
13.7
5.2
6.67
9.04
7.1
9.4
tl.2
4.01
T
562
649
691
764
637
699
local
OxT"
side
Oxy
side
on
S.P.
669 Fuel
676 side
509 Ox'y
573 side •
2.3 Measurement techniques
Temperature measur:ments v,'_e made using a Pt/Pt-
10%P& _ermecouple ``_i,.h-,wire diameter of 0.2 ram. The
junction of the _ermocoupte ,.,,'as formed by butt-welding Pt
and Ptl0%R.h _ires together and coating them with SiO: to
prevent catat',-dc reaction. The thermocouple probe was
made in a tria.n_lar confimaradon to minimize wire heat
conduction loss and ',,,'as _pported by a ceramic tube. The
entire thermocouple assembly was mounted on a translating
stage whose position was recorded by the computer data-
acquisition unitalong with the thermocouple temperature
data.
A 5W A.r-ion taser operating at 355 rim, 365nm and 514rim
lines was used for broadband LIt: excitation of PM-I and for
scatterin_ex-tinction me_'-_.rement of soot This laser beam
was modulated by a mechanical chopper to allow for
sTnchronized detection of the signal. The _tted laser
beam was first colLected by an integrating sphere and then
measured by the photodiode to minimize possible light
deflection due to the d---=_ity _adients in flames. The
scat,feted li_t by soot pm"ticles £nd the induced broadband
P'AH fluorescence were collected by a focusing tens, at 90 _
_ith rebec: to tine incid_t beam. through a band filter mud
detected by a photomulfiplier tube. OH, CH and C, emission
spectra were collected by a 6:1 imaging optics inio an
optical fiber coupled Oriel 257 spectrograph (20Ohm
-800mm) at 135_ relative to the incident beam. To ensure
the spacia[ resolution of emission m_ements, a thin
line(--O.O6rm'a) measuring volume in the flame was achieved
by placing a 10-.urn slit in front of the optical fiber (nominal
diameter of" 200.urn). The spectrograph then directed the
dispersed specm,.a"n (gratings: 6001/ram, 120OI/mm and 2400
l/re.m) onto a three-s:.age exiled, gated-ICCD camera. For
OH laser induced fluorescence measurement, a Nd:YAG
pumped tunable dye las_ was frequency, doubled to produce

0.5mJ,282.5nm,7ns-pulses.TheexcitedOH LITwas
_'picallysampled_itha lOOnsgate_idth.200inte_ationswereusedtomm'ximizeS/'Nratio.In thesemeasurements,boththe CW andthe pulsedlaserbeamswere:h'stcollimatedandthenfocusedby a 300ram UV coated lens
intothe burner, which gave m appro,'ximate focal did_meter
of O.O4mm.
Chemical _ecies were measured by gas chromatogaphs
(GC). An tmcooled quar-_ microprobe (-100,urn) was used
for extracting the gas saraples from the flame. The saraple
_ithdrawn was located by positioning the microprobe
relative to the burner port. The probe was also aligned
radially along the streamline to minimize disturbance. The
multicomponent sample was ex'a'acted and distributeA, via
a heated vacuum sample line to four GCs for analysis. Gases
measured were: CO, CO:, H:O, H:, CH,, He, O: and N:;
light hydrocarbons from Ct to C,; and PAN up to Ct,.
3. Results and Discussion
Countefftow diffusion flame structure
ha Figs.2 _d 3, dTe measured temperature, che.'Tucal
_ies and CH and OH radical profiles are present_ for a
blue flmme (C:, PAN mud soot were not tbund). "INs flmme
served as a reference tbr the counterflow d_tsion flame
structure (the blue flame was used because it posed least
uncertain'q," in modeling and chemical measurements). Also
tins flame was at the th.resho[d of blue-yellow transition- a
slight increase in thel conce'ntration would lead to a yellow-
.-mission flame. A similar sa-ucmre (r, v, major species Ct
--C 3 intermediate hydrocarbons but without radicals) was
r_orted in Tsuji's e_iy work on fo_vard stagnant point
flow countenlow diffusion fla:'ne (Tsuji et al, 1969, 1971 ).
Here, the measured temperature has been corrected for
radiation. OH peaked v.ith the diffusion flame temperature,
" o._-t _ +'_ t. 7 c--7oz / _",.'4_..1_-_d,_ .iS.._.... _2 _'oo_._n _ _io_ .a_i - _'-_-_,¢_ ,_,
o 2!__--N_, _8°° "_I-- _ = ----: _4000
o.0_ . .
. i-: z _, _3500 02---0zj_--3:o r3OO0 o°,,-4 cH=tooo _. ._-zsoo"_
Jl;: ,.ooo-1E-C2 _ ,, N, * "_-!,500
u .'--tooo -_,/'- l, T
o>0o! ..-,7, .,ooo0 10 20 30
Distancefrom the fuel side (ram)
Fig.2 Flame structure I('blue flame)
while CH was slightly off to the fuel side. Both CO and H:
showed a sharp decrease near the flame on the fuel side
where CH e.'dsted. This portion marked the welt-kmown
water-gas ski_ reaction with s'_'ong emission at blue
wavelength: (Gaydon, 1974). These two speci_ ,,,,'ere
consumed in the primary reaction zone that produced
combustion products H:O and CO.. Similar to Tsuji's result,
water profile appeared broader but had a larger error in GC
meas_e_[.
[ntermedia:e hvd.rocarbons (C:-42_) were sho_,'n in Fig.3.
j _,'-D C'2H _ _ ' ' '
BOO ¢2H4 /_
_- 2o:
16 r----iC_H 4 tm. -- C*]H_
I2_ _ ¢sHtz
"1":J4
4 5 8 10 12 14 15
Distance from the fuel side (ram)
Fig.3 Flame structure H (blue flame)
: Blue emission was attributed to either CO combustion or
CH emission in the past.

At1intermediatehydrocarbonsdemonstratedsimilarprofiles
and peaked atappro.ximate[ythesame locationon thefuel
sideoftheflame. C: _-pecies(C:I-{_and C:H,) e.,dstedina
broader zone (g=7-16ram) while species of C3 and above
e_sted us. a relatively sin--rower zone (Z=lO-16mm)..And
the ma_mirude of theses species demonstrated the fol[o_g
trend, indicating a build-up of PAH:
C: . C, > C5 =.d C, (4)
Similar intermediate hydrocarbon poor su-ucture were found
for flames I-IV.
Effect of flmme structure on soot formation and oxidation
In Fig.4, OH and soot volume fraction profiles are
presented for flames {to IV. Clearly, for the fuel-rich case -
flame on the oxygen side, once soot inception occurs, it is
pushed away from the OH zone. (here, the gas convection,
the thermophoresis and the soot diffusion all drive soot
particles away from the flame toward the fuel side). Thus,
there is [i_[e soot oxidation, resulting in a simRle branch of
soot volume fracdon profile. It is interesting that flame I[
yielded higher soot volvzme fraction de_ite its lower _el
conc_-mtrafion at the fuel inlet port. This is probably because
of the higher temperature to accelerate soot formation.
_--_-_v. L .... i -a'°E-°2
-_ i" : __" : 2.0E-02
0 2-"- 07" ' _ _ ""
',.q, e.,-._ ¢u... I .OE-02
i Y_ _'_.°°" "_'-- o-"*ooo---oo ' _' " ' " '' _T--'O_
n,,_, ] tt_=, _ _],
| I; \_ =...,, 2E-o2 _
i ,If A\ . o
OE+O0 , _ • _ "' , 'L0 t2 t._ ts _s z'o zz
Distance from the fuel side (ram)
Fig.4 Effect of OH on soot inception and _ovc&
Flames III and [V showed very different soot formation
picture. Agak'_, soot inception occurred on the fuel side of
the flame but very close to the OH reaction zone. However,
due to the reversed gas convection, which is the dominant
term in Eq. (1), the newly formed soot particles were forced
to pass throu_'a high temperature OH zone where the
o.,ddation occurred, resulting in a double branched soot
profile. For /.lame 1II, since the flame r_ided at the
stagnation plane (v.,=O), convection was less dominant than
in flame IV, hence the peak soot volume fi'action (--4xlO "_)
was still higher due to its high temperature. In flame IV, the
convective term was dominant leaving line time for soot
gro_xh. It seems that soot was o.,ddized immediately after
the inception (see Fig.4).
Effect of local eouivalenc_ ratio on soot
Soot formation in premixed flaraes is directly related to the
C/O ratio. In the counterflow diffusion flames, however,
local C/O ratio varies from zero to infinite. Thus, the flame
structure plays an important role. As is seen above, flames
I-IV have di.ff_ent peak soot volume fractions, which are
not proportional to their inlet rue[ concentrations, i.e., flame
III produced about 8 times soot higher than flame IV even
though its rue[ concentrations was only slighdy higher. This
5---07 } ..... , , , ' _ , _2E-041- CHIOH
4E--0"7] O'O =ooL ",ua "_ IE-04
3E-07- _ _ _.E-05 _
. _ _ , . _ OE*O0
" . _ , "--8E-05
_4E-05_---o_'_._\_o_ oo_'- - , . . [o--.+oo
Distance from the fuel side (ram)
Fig.5 Eff_t o[ local condition (Ct-I/OH) on soot

"_1¢"
, , I
O-e ceK4C,t. 4) -i
t_oo. =_-'_ceH_(n '_) _../_T 2z_c_-_ cz_ga ,) I.'" i / "'-. ]"....r (;l 4) i /I -
=o--'<"" ,q/t i-`'°°f i,,.
_°°4 ." v<'°-_
"°°i ""
DistAnce from the fuel side (in.m)
Fig.6 Effect of local conditions (T, C:H:, C_I--I_)on soot
suggests that it is the local conditions that determine the
peak volume fraction. To fi.u-ther discuss ",his issue, the local
ratio of CH/OH is shown in Fig.5 along with the soot
volume fraction. In all cases, the magnitude of peak CH/OH
ratio appears to corre_ond to that of the soot volume
fi'action profile, which shows the follov,'ing trend (local soot
and CH/OH ratio):
CH$00f , --'.
OHflame !l.r> flarnl II > flami 1"> flare* I;" (5)
Simal_ trend can be obserwed in intermediate hydrocarbon
profiles, i.e., Fig.6 shows that flames [II and IV had _4,milar
temperature field, but the former flame had higher inter-
meediate hydrocarbons as seen from ace_'[ene and benzene,
consequently, it generated more soot.
4. Conclusions
From this work, it may be concluded: (1) diffusion flame
sm.,etvxe is important in soot inception, _owth and
des-'a-uction, because it is the local conditions (i.e.,
hydrocarbon concentrations, rich or lean, temperate, etc)
that determine the inception and grov,_ of soot, and (2)
trar,_."portof the incipient soot is crucial because it caneither
,-m2_ancesoot gowth or lead to soot destruction.
Acknowledgement
This work was supported by GRI under the contract number
OR1 5087-260-1481 and the t_,k._cal dirt',ion ofDrs. J'.A.
Kezerle and R.V. Serauskas; by NASA under the re'ant
number NAG3-1460 and by NSF under the grant number
CBT-8552654.
References
I. Dolenc, D.A. ed, Proceedings of the I.nt_-r'national Gas
Research Conference, Cannes, France 1995
2. Du, J. and A.xelbaum, R.L., Combustion andFlgme I00:
367-375 (1995)
3. Sugiyama, G., Twenty-Fifth Symposium ('International) on
Combustion, The Combustion Ins'dtute, 1994, p.601
4. Zhang,C., Atreya, A. and L_,K., Twenty-fourth Syrup.
(Into on Combustion, The Combustion Institute, Pittsburgh,
1992, p.1049
5. Friedlander, S.K., Smoke, Dust andHaze, Wiley, (1977)
6. Gomez, S. and Ro-,-ner, D., Combust Sci and Tech 84:
o.335 (1993)
7. Tsuji, H. and Yamaoka, I., Twelfth Syrup. (Into on
Combustion, The Combustion Institute, Pittsbtu-g.k, 1968,
9.997
8. Tsuji, H. and Ym"aaoka, I., Thirteenth Syrup. (Into on
Combustion, The Combustion I..nstimte, Pittsburgh, 1970,
p.723
9. Gaydon, A.G., The Spectroscopy of Flames, Chapmen
and Hall, London, 1974

APPENDIX N
Measurements of OH, CH, C2 and PAH in LaminarCounterflow Diffusion Flames
Proceedings of the Central States Combustion Institute
Meeting, 1996
By
Zhang, C, Atreya, A., Shamim, T., Kim, H. K., and Suh, J.

Measurements of Ot t, CH, C2 and PAIl in Laminar CounterflowDiffusion Flames
C. Zhang, A. Atreya:,T. Shamim, H.K. Kim and J.Suh
Combustion and Heat TransferLaboratory
Department of Mechanical Engineering and Applied MechanicsThe University of Michigan
Ann Arbor, Michigan 48109
ABSTRACT
In this work, in-situ laser diagnostic methods, flame emission spectroscot_' and laser-induced
fluorescence, were employed for concentration measurements of four species: OH, CH, C7 and P.4H,
in sooting laminar counterflow diffusion flames. Spatially resolved flame emission spectroscopic"
measurements were performed for OH, Ctt and C_ using a 6:1 imaging optic.s, an optical fiber
coupled specrrograph (spectral range of 2OOnm--8OOnnO and a gated-ICCD detector. Emission from
the 306.4nm band of O[-[: the 431.5nm band of CH and the 516.5 nm- 595.87nm Swan band,stem
of C: were ,_easured. Broadband UV fluorescenae (attributed to P.4.H) was measured by exciting the
flame with a CW laser operating at 355nm and 365nm and detecting the fluorescence signal at
452.5-27.5nm. Also, fluorescence from OH was excited at 282.5nm by a Nd:T.4G pumped tunable
d),e laser and detected at bands front 307nm to 318nm. These measurements help identify the
progression of the sooting process from the parent fuel to increasing l)' comple.x species and finally
to soot portic[es.
1. Introduction
Flarne _ecies, such as OH, CH, C. and PAr-t, are important
to combustion and soot chemistry. OH has been identified
as a dominant o.'ddizer of soot particles (Neoh et al 1984);
CH, on the other hand, has been implicated in the ineeptiort
stage of soot formafioa through the chemi-ionization
reaction of m'ound state CH with O and the reactioa of
electronically excited EH with C:H: (Calcote, 1981); and
b,zth C. and p.ad--I are kmo_'a to play an important role in soot
nucleation (Gaydon, 1974; Fren.klach et al, 1990). Thus,
non-intrusive and spatially resolved measurements of these
_ecies wilt help understand and model of soot formation
and o.,ddation in hydroca.,-bon _ion flames.
In premixed hydrocarbon flames, emission _-pecr.,nam fi'om
OH, CH and C. are prominent (Gaydon, 1974). The well-
known C-. bands, centered at 515nm m'een line, were first
mapped in 1857 by Sv,'an. The visible flame spectrum
generally e:,ah.ibits a strong violet-degraded band in the blue
near 431.5nm due to CH and several bands in the ultra-
•¢io[et ranges due to OH (the strongest is found at 306.4nm).
Never'daetess, emission spe:-troseopy has, in the past, been
used primarily for detecting the overall presence of a
particular radicals in flames. Because it is a "Line of sight"
measurement. It had been w_y difftcult to resolve the
t Corresponding authorproceedings of the 1996 Technical Meeting of the Central States Section of the Combustion Institute

0.08
0
2200
2000
1800 _"
1600 _=
1400E
1200 _
1000
800
5 10 15 20 25
Distance from the fuel side (mm)
3O
0.3
Distance from the Fuel Side (mm)
v','q .--. I-imax S ,,,--. NIl012
• ', t Fvx106-- / !•.._ 0.06 .',aN, ,,.... ,, CO--- o
/ _-11,. I ', .,.--- OHx5 -- 0.2 _--" Io " I ',/." .'_.\i"
/" I, \i ',,-_.
:_o.o4 , . ,;.. ,, ,, _"
o.o2L,,: '- 1" t '_ I1_ \ I 4
_-_ 0 ' ' ' ' -- = =-'-='"= = = "5 10 15 20
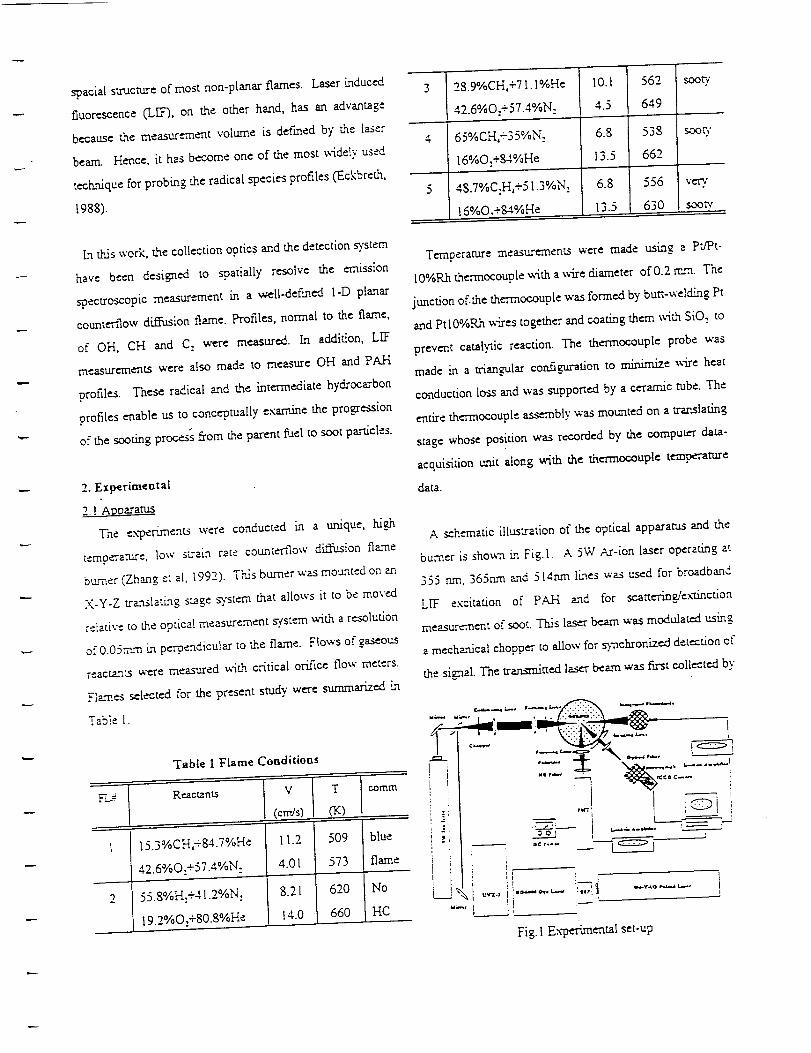
spacial structure of most non-p[anar flames. Laser induced
fluorescence ('LEF), on Oe other hand, has an advantage
because the measurement volume is defined by the laser
beam. Hence, it has become one of the most widely used
techrdque for probing the radical species profiles (Eckbreth,
1988).
28.9%CH,+71. l%He
42.6%0:+57.4%N:
4 65%CH,+35%N:
16%O:+84%He
sooty
45.7%C:H,+51.3%N: very
16%O.+$4%He soow
In this work, the collection optics and the detection system
have been designed to spatially resolve the emission
spectroscopic measurement in a well-defined 1-D planar
counterflow diffusion flame. Profiles, normal to the flame,
of OH, CI--[ and C: were measured. In addition, LIF
measurements were also made to measure OH and PAH
profiles. These radical and the intermediate hydrocarbon
profiles enable us to conceptually examine the progression
of the sooting proce_ from the parent fuel to soot particles.
2. Experimental
2.1 Apoarams_
The experknents were conducted in a unique, b.i_
temperature, low su-aka rate counter'flow dLffa_ion flame
burner (Zhang et aL 1992). This burner was mounted on
X-Y-Z translating stage system that allows it to be moved
re[alive to the optica! measurement system with a resolution
of O.05mm m perpendicular to the flame. Flows of gaseous
reactants were measured with critical orifice flow meters.
Temperature measurements were made using a Pt/Pt-
10%Rh thermocouple with a ,,,,'irediameter of O.2 ram. The
junction of.the thermocoupte was formed by butt-welding Pt
and Ptl0%Rh wires together and coating them v,'ith SiO: to
prevent catalytic reaction. The thermocouple probe was
made in a trimly.liar configuration to minimize ,.,,"ire heat
conduction loss and was supported by a ceramic robe. The
entire therrnocoupte assembly was mounted on a translating
stage whose position was recorded by the computer data-
acquimtion unit along with the thermocouple temperature
data.
A schematic illustration of the optical apparatus and the
burner is sho_,'n kn Fig. I. A 5W A.r-ion laser operard.ng at
355 run, 365nm ,qd 514nm Ikrtes was used for broadband
LEF excitation of PAI-[ and for scatterin_ex'tinction
measurement of soot. This laser beam was modulated using
a mechan.ical chopper to allow for synchronized deletion of
the signal. The tran..x,,-nirted laser beam was first colt_ted by
Flames selected for the present study were summarized in
Table 1 Flame Conditions -_- _ x, 0_.,,,,-,
l 5 3%CH,+84.7%He ...... ____'_
42 6%O.+57.4%N, 4.0l 573 flame i
• . __ __ i _ '.
55.8%H:+41.Z%N: , 8.2[ 620 No L__] _,,_-, I I'*''''''" !:'-_"_] ........
660 HC "-" _ :19_%0.+80.8%He I 14.0
._ . __
Fig. 1 Experimental set-up

aninte_ati.ngsphere and then measured by the photodiode
to _e possible light deflection due to the dens_D"
grad[eats in flames. The scattered light by soot and the
induced broadband P._ fluorescence were collected by a
focusing lens, at 900 with respect to the incident beara,
through a band filter and detected by a photomuttiplier tube.
While OH, CH and C. emission spectrum was collected by
a 6:1 imaging optics into an optical fiber coupled Oriel 257
spectrograph (200nm-SOOn-m) at 135°. To ensure the spacial
resolution of emission measurement, a thin line (--O.06mm)
measuring volume was achieved by placing a lO-pm slit in
front of the optical fiber (nominal diameter of 200pro). The
spectrograph then directed the dispersed spectrum (gratings
: 600Vmm, 1200Vmm mad 24001/ram) onto a three-stage
cooled, gated-ICCD camera. For OH L_ measurements, a
Nd:YAG pumped tunable dye laser was frequency doubled
to produce 0.SmJ, 282.5nm, 7ns-pulses. The excited OH LIF
was typically sampled with a lOOns gate width_ 200
integrations were used to maximize the S/N ratio. In these
measurements, both the CW and the pulsed laser beams
were fu'st collimated and fi[tered and then focused by a
300_m UV coated lens into the bu._.er yieldLng an
appro._ma_e focal diameter of0.04rrun.
22 Emission and L[F detection schemes
O__SH
The spontaneousemission bands of OH are due to a :E-:_
trznsitioas. These bands are degraded to the red and show
an open rotational free structure, tn this work, the most
prominent (0,0) band of OH at 306Anm was measured to
.',ield the OH profile across the flame. In addition, LEa from
OH was excited with the pulsed laser beam tuned near
2S3,-tm and detected 1_'om 307m'a to 31 Sam (which covered
(0,0) and (1, l ) bands).
L)
1800
1000-
800 -
600 -
400-
200 -
0 '
200
C:q 308.SnmCbl 43 l'$nrn
Weve[ength (rim)
Swan syltem(-550nm)
lifo _o aoo
Fig.2 Emission spectrum of OH, CH and C:
c_E
Despite its relative low concentration, CH emission at 431.5
nm is very. strong in flames, which is due to (O,0) band of:A
-:I7 transition v,ith a fairly open rotational structure. This
band was me.as'ured to yield CH profile.
_C:
The weIl-k3iown Swan system consists of a number of
bands each with a sharp edge or head on one side and all
shaded off"or degraded the same way. These bands are due
to h"I- _rl trzr,-,-ition. In this work, Swan bands at 512.9nm
to 595,9rzm w_e measured to yield C.. A "q,-picalemission
spectrum of OH, CH and C_ is given in Fig.2.
The UV induced broadband visible fluorescence is
attributed to PAH (Smyth et al, 1985; Bcrerta et al, 1985).
in tb.2s work. the broadband PAH fiuoresc, ence wm excited
with a CW laser operating at 355nm and 365nm tines and
then detected at e,52.5-'-27.Snm. According to Beretta, PAH
fluorescing in this band window may include the follou,'ing
species: Fluoranthene, ff,enzperylene, Perylene, Coronene
andAnthcnthrene.
2.3 Calibration:
Radical concentratio_ from the measured emission and
:calibration were only made for OH and CH.

LL:canberelatedtomeasuredintensity',I. and[athrough
equations (Gaydon, 1974 and Eckbreth, 1988):
R r I[xl = t - c.7t, (t)
• P Arl.pt
here A is the Boltmm_n distribution relation (generally,
flame deviates from the equilibrium condition, see Smyth,
et al., 1990). Likewise, for LIF we have:
r o.$
ix| -- ¢o,se (-L_I r °'5 I-A-_=ctrO'J'r,t (2)P,•I E:l
The Sandia National Laboratories computer code OPPD[F
and CHE_WKIN-II (Kee, et al. 1989) were extended to
include gas radiation and were used for base flame
modeling. The present GRIMECH-I mechara-'m is regarded
as quite adequate for a blue methane flame (flame# 1, which
was not complicated by measured C3 and higher species or
soot). Tiffs confidence was based upon comparisons of
measured and computed temperature and major chemical
_ecies. The computed pe£< concentrations of OH and CH
were used to place the measured OH and CH for the blue
flm'ne on the absolute basis. The constants C, and C, were
&ca derived to calibrate other flames for OH and CH.
3. Results and Discussion
Comoarison of measured OH with model eomoutation.
In Fig.3, the measured and computed OH profiles (flame
#2 and flame#3) are compared. Here, the solid lines are
computed OH profiles and the dashed line is the OH profile
of flame#3 obtained by LIF. Good agreement was achieved
g" I-[ • •bew,'een measurements oL O using emission _ectroscopv
and usLng the L_. For the hydrogen flame (flame#2), the
computed OH is in close agreeraent with measurement
except that the computed profile is broader. In contrast, the
computed OH for the soot'/" flame (flame#3) exhibited a
relatively larger error in peak mole fraction, which was due
primarily to the fact that flame computations currendy lack
the capability" of handling the rich-combustion and the soot
chemistry. These results show that emission spectroscopy
can, indeed, be used for resolving prominent radical profiles
of OH, CH and C,.
_:_p,A.H and _ootin_ structure_
FigA illustrates the sooting structure of flame#3 with
relative concenn'ations of radicals like OH. CH. C. and
important soot precursor _ecies of PAH (radicals v-ere
obtained by using emission spectroscopy and PAid was
obtained by using broadband fluorescence measurement).
Basically, a blue-yellow-orange sooting flame structure is
seen: the bright blue reaction zone, which is characterized
by CH emission, was on the oxidizer side of the stagnation
plane; CH peaked on the fuel side slightly away from the
flame; A relatively thick (-3ram) yellow-orange zone,
where si_e.ant C: was present, was located on the fuel
side of the flame and was separated from the blue zone by
a very" thin dark zone. Soot inception seemed to actually
occur at the location where C. reached its peak and ,.,.'here
PAH profile began to rise. The incipient soot particles were
then swept do_-ast,'eam (toward the fuel side) due to the
convection and due to the thermophoretic d_ion. Along
its path, soot par'dcles grew through coagulation and surface
growth. This process ceased at the stafmation plane. With
zo'7[
-- tO"'
"_ 10"
°i0 lO-'
: 1U
-- IO--
0
I0"
$
* °" i_"•tAM _i
: %! ' ..
l
l'a
Dis_.ance from the fuel ',,ide (rnrn)
IO"
i
10 o
:r1;
t
2:5
_.o
a
o
oo';
Fig.4 Sooting structure as charact_'zrized by OH, CH, C.and PA_H

',t,,."
neglioble soot mass di_ion and weak thermophoredc
diffusion, very little soot was present beyond the stagnation
plane de_ite a simLficant amount of PAH. Tiffs
emphasizes that little nucleation occurs at or below the
stagnation plane and the process is predominantly soot
_o_-r.i'_ controlled.
In limht of"the sooting processes in premixed flames where
the primary fuel breaks down and then builds up to soot in
the post flame zone. The above observation may lead to a
similar conceptual ",4sualization of the main sooting
processes in a fuel-rich counterflow diffusion flame:
(i) D_ion and convection of radicals such as OH, 0 and
H into the fi.lel-rich reactant flow _. resulting in chain-
reactions leading to the formation of unsaturated compounds
such as acevlene anc[ larger unstable molecules,
(ii) Breakdown of some of the larger molecules, or reactions
v,ith radicals like H and CH, to produce C: species,
(iii) Continued gro_vth or" =saturated compounds to form
_ng-structured benzene and large PAH:
(iv) Under certain conditions, nucleation of some PAH into
mcipL-n: soot panicles occurs; _,nd
(v) L_. accorda,ace _ith the increase in PA.H concentration.
soot po,-ticies undergo a series of chemical surface react{on,
by absorbing _ecies like aceD'len¢, and physical reaction
like coagulation_
(vi) Ln the current flame configuration, soot was ew--ntually
try-ported radially out by convection at the stagnation
plane, leaving only little soot that diffused below the
sm_ation plane. Wiffle PAH continued to di.ff-use towards
the fuel side.
) in _'_¢oresent work, the primer-/fuel diffused against the gasconv_tion into the flame front which lied at the oxygen side of
the st2goation plane
Fig.5 Effect of 0H, C. and T on soot
_C:,PAH and soot loading
As discussed above, C: and PAH are ,epresentative of
fuel-rich sootJ.ng flame, althoumh the defiliite rote or" these
_ecies under different flame conditions is yet to be
elucidated, tn Figs. 5 and 6, we further examine the effect
of PAH and C. on soot loadings in two flames (flam_..'-..-¢and
5). These txvo flames had similar thermal and flow field
sm.tcture (see Fig.5) with a slighdy Iffgher flmme temperature
for the methane flame. Since both flames _ the same
amount of o_dixer (16%O:, 13.Scm/s ), they had ahnost
same o.'ddizer concentrations. Nevertheless, the ethylene
flame was s_n to produce more C. and CH. In Fig.6, note
that there is 50 _-nes more C:, 2 times more PAH mad 10
times more soot in the ethylene flame. Even though tiffs
2Q
"i4 "
A to t2 t4 tS 18
DisLance from _he fuel side (ram)
Fig.6 Effect of C, and PAH on soot
il" 10 _
lq.
__ I0"" o'l
?
fi. tO _
2O

comparison may not be conclusive in a quantitative sense,
the result is consistent _'_th the above discussion: Wen
similar thermal and flow structure of r,vo flames, more the
available carbon, more the soqt is produced.
4. C6nelusions
Despite the current progress, flame emission spectroscopy
has remained a lesser-used tecbaxique for radical profile
measurements. In this work, we successfully applied the
flame emission spectroscopy to resolve OH, CH and C,
profiles in a well-defined I-D diffusion flame. This, ha
conjunction with LIF measurements and the numerical
flame computation, enables us to examine the sooting
smacvare ofcounterflow diffusion flames as characteriz_ by
OH, CH, C, and PAH.i
From dais work, it may be concluded that, similar to
premixed flames, sooting path can be derived for diffusion
flames: (i) Di.ff_ion and convection of flame produced
radicals into rue[ stream to tbrm unsaturated hydrocarbon
compounds;(ii) Breakdown of large molecules to ','ield
c_obon radicals and P,-LH; (iii) Nucleation o_"PAN to form
incipien_ soot; and (iv) Soot grow via surface reaction and
coa i._'u[ation.
Ackno,,_'ledgeme nt
To.is work was supporied by GP,.I ,under the contract number
GR._ 3087-260-1-_81 and the tec,hzi.ical direction of Drs. J.A.
Kezerle and R.V. Serauskas, by NASA under the grant
nu.mber NAG3-1460 and by N'SF under the grant number
CBT-8552654.
References
1. Neoh, K.G., Howard, LB. and Sarofim, A.F., Twentieth
Syrup. (Into or, Combustion, The Combustion hnstitute,
Pittsb_gi'l, 1984,p.95 i
2. Ca[cote, H.F., Comb. & Flame "")" "_15, (198l)
3. Gaydon, A.G., The Spectroscopy of Flames, Chapman
and Halt, London, [ 974
4. Eckbre_, A.C., Laser Diagnostics for Combustion
Temperature and Species, Abacus Press, 1988
5.Freri.ldach, M. and Wang,H, Twen.tv-thirdSymp. (Into on
Combustion, "Fae Combustion Institute, Pittsburgh. 1990,
p1559
5. Zhang,C., Atreya, A. and Lee,.K., Twen.ty-foureh Syrup.
(Into on Combustion, The Comb_tion Institute, Pittsburgh,
1992, p. 1049
6. Sm.,,zh, K.C., Miller, J.H., Dor'ffnan, R.C., Mallard, W.G.,
Santoro, R.J., Comb. & Flame 62:p.157, (1985)
7. Beretta, F., Ci.qcotti, V., D'aiession, A. and Merino, P.,
Comb. & Flame 61:p.2l I, (1985)
8. Kee,R.J., Ruptey,F.M., Miller, J.M., Sandia Report,
SANDSg-8009B, (1991 )
9. Smyth, K.C., Tjossem, J.FL, Applied Ptg'sics B 50:p.499,
099O)

APPENDIX 0
Transient Response of a Radiating Flamelet to Changes inGlobal Stoichiometric Conditions
For Submission to Combustion and Flame, 1996
By
Shamim, T. and Atreya, A.

Transient Response of a Radiating Flamelet to Changes in GlobalStoichiometric Conditions
T. Shamtm and A. Atreya
Combustion and Heat Transfer Laboratory
Deoartment of Mechanical Engineering and Applied Mechanics
The University of Michigan. Ann Arbor. 5[[ 48109-2125
Corresponding Author
Prof. A. Atreya
Combustion and Heat Transfer Laboratory.
Denartment of Mechanical Engineering and Applied *iechamcs
The University of Michigan
Ann Arbor. NI[ 48109-2125
Phone: 1313) 6.47-4790
Fax :(313) 647-3170
emaii: [email protected]
Transient Response of a Radiating Flamelet to Changes in GlobalStoichiometric Conditions
T. Shamim and A. Atreya
Combustion and Heat Transfer Laboratory
Department of Mechanical Engineering and Applied Mechanics
The University of Michigan, Ann Arbor, MI 48109-2125
AbsrtactThe effects of changes in global stoichiometric conditions by varying reactant (fuel/oxidizer)
concentrations on radiating flamelets using a numerical investigation are reported in this article. The
flame response to both step and sinusoidal variations about a mean value of reactant concentration forvarious values of strain rates is examined. This work will aid in the better understanding of turbulent
combustion. The radiative effects from combustion products (CO 2 and H20) are also included in the
formulation. The maximum flame temperature, heat release rate and the radiative heat loss are used to
describe the flame response. The results show that the flame responds to fluctuations with a time delay.
The effect of the frequency of fluctuation is found to be more important than its amplitude. Low
frequency fluctuations bring about a significant flame response causing extinction at large strain rates
for high fluctuation amplitudes. At high frequencies relative to the strain rate, rapid concentrationfluctuations are distributed closely in space. These are neutralized by the resulting large diffusion
gradients. Thus the flame becomes relatively insensitive to fluctuations. The ratio of frequency over
strain rate is identified to predict the flame response to the induced reactant fluctuations. The induced
fluctuations were found to have more prominent effect on radiation than on the heat release.
Nomenclature
ap
A
cp
Di
h
h°f.i
MW
Le
P
QHv
R
T
t
v
Yi
Planck mean absorption coefficient
Pre-exponential factor
constant pressure specific heat of the mixturecoefficient of diffusivity of species i
enthalpy
enthalpy of formation of species i
average molecular weightLewis number
pressureradiant heat loss
heat of reaction
universal gas constant
temperaturetime
axial velocity
mass fraction of species i
strain rate
similarity transformation variable

v
Pa
thermal conductivity of the mixture
dynamic viscosity of the mixturemass based stoichiometric ratio
mass density
Stefan-Boltzmann constant
similarity transformation variable
mass rate of production of species i
Introduction
An investigation of transient effects on flamelet combustion is useful for better understanding of
turbulent combustion. The flamelet concept, which was proposed by Carrier et al., [1] and later
developed by Peters [2], provides a convenient mechanism to include detailed chemical kinetics into thecalculations of turbulent flames. The idea is based on the translation of physical coordinates to a
coordinate system where the mixture fraction is one of the independent variables. One can then expressall thermochemical variables as unique functions of two variables, the mixture fraction and its
dissipation rate by assuming that the changes of thermochemical variables are dominant in the direction
perpendicular to the surface of constant mixture fraction [3]. These unique functions have been called
"state relationships" [4]. Consequently, the flamelet model can be incorporated into existing turbulent
combustion moddl provided these state relationships are known.
A basic assumption of these flamelet models is that the local structure of the reaction zone may be
represented by an ensemble of quasi-steady state strained laminar flame elements which are stretched
and convected by the turbulent flow [5]. The validity of this assumption has, however, been questioned
in many recent studies by showing that non-steady effects are of considerable importance [5-7].
Consequently, there has been a _owing interest in the study of time dependent effects on flamelet
combustion [3, 6-13]. However, most of these studies are limited to the effects of time varying strain
rate. which is only one of three important parameters that need to be matched in order for the structure
of turbulent flamelet to correspond to the structure of the laminar diffusion flame [14]. The effect of the
other two parameters, reactant concentration and reactant temperature fluctuations, has not been
investigated with the exception of the limited study by Clarke and Stegan [15] (on concentration
fluctuations) and Egolfopoulos [15] (on concentration and temperature fluctuations). Furthermore, the
effects of radiative heat losses are not considered by any of these studies with the exception of
Egolfopoulos [ 12].The present study is an attempt to fill this existing gap in the literature. We investigate the effects of
reactant concentration fluctuations on radiating flamelets in this article. It is interesting to note that
velocity fluctuations, which receive such a wide attention in the recent combustion literature, have a
relatively smaller effect on the flame through changes in the flow field and subsequent small changes
in the concentration profiles in the reaction zone [ 17]. The concentration fluctuations, on the other hand,
are expected to bring about a more prominent effect on the flame through changes in the equivalenceratio. Such fluctuations are also important in practical combustors which are subjected to various
unsteady fluctuations and turbulence. The flame response to step and sinusoidal variations about a mean
value of reactant concent-ration for various values of strain rates is examined.
Mathematical Formulation
General Governing Equations
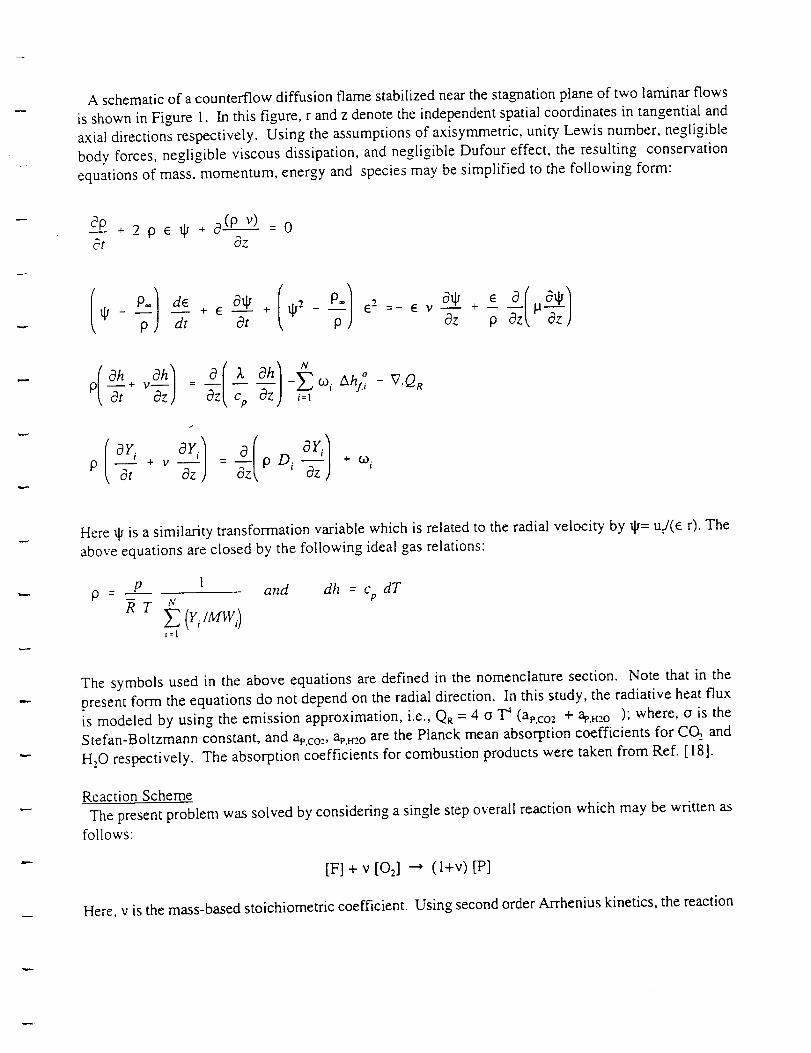
A schematic of a counterflow diffusion flame stabilized near the stagnation plane of two laminar flows
is shown in Figure 1. In this figure, r and z denote the independent spatial coordinates in tangential and
axial directions respectively. Using the assumptions of axisymmetric, unity Lewis number, negligible
body forces, negligible viscous dissipation, and negligible Dufour effect, the resulting conservation
equations of mass, momentum, energy and species may be simplified to the following form:
dp . 2 p e qs * 0 -(p v) _ 0& Oz
ql - dedt ÷ e c3tlso--T+ _2 _ 6"-=-e v c3z p Oz la
I vahla( No o, T..j : c Tz -Foo, Ah .°.,- v.Q,i
OY i OY i = 0T p D i + 60.
Here qs is a similarity transformation variable which is related to the radial velocity by qs= u/(e r). The
above equations are closed by the following ideal gas relations:
= p 1 and dh = c- N P
Rr iMW )i=1
dT
The symbols used in the above equations are defined in the nomenclature section. Note that in the
present form the equations do not depend on the radial direction. In this study, the radiative heat flux
is modeled by using the emission approximation, i.e., QR = 4 o "I_ (ap.co, + _mo ); where, o is the
Stefan-Boltzmann constant, and ap.co:, ap.mo are the Planck mean absorption coefficients for CO, and
H,O respectively. The absorption coefficients for combustion products were taken from Ref. [18].
Reaction Scheme
The present problem was solved by considering a sin_e step overall reaction which may be written as
follows:
[F] + v [02] "-'+ (l+v) [P]
Here, v is the mass-based stoichiometric coefficient. Using second order Arrhenius kinetics, the reaction

rate was defined as co = A p-"YF Yo exp(-ER/R T). The reaction rates for fuel, oxidizer, and product may
then be written as coF = -co; coo = -vco; and cop= (l+v)co. For the calculations presented here, the values
of various constants and properties were obtained from Ref. [ 19].
Initial and Boundary Conditions
A solution of these equations requires the specification of some initial and boundary conditions which
are given as following:
Initial Conditions:
qJ(z,O) = qSo(Z)h(z,O) = ho(Z) or T(z,O) = To(Z)
Yi(z,O) = Yi.o(Z) [n conditions or (n-l) conditions + p(z,O)]
¢(z,0) = Co(z)Here subscript 'o' represents the initial steady state solution.
Boundary Conditions."
The origin of our coordinate system was defined at the stagnation plane.
qj(oo t) = ! qj(-oo,t) = (p.,/p_)"_
h(==,t)= hup h(-_,t)= h,o,_
[or T(_,t) = T,_ T(-=,t) = Tiow ]
Yi(_, t) = Yi.up Yi(-_°, t) = Yuow
v(0,t) = 0
The strain rate e, which is a parameter, must also be specified. The reactant concentration is varied by
multiplying the boundary value of either fuel or oxidizer concentration by (l+A*sin (2 _ f t)) for
sinusoidal variations and by using a Heaviside function for step changes.
Solution Procedure
The governing equations form a set of nonlinear, coupled and highly stiff partial differential equations.
These equations were solved numerically using the Numerical Method of Lines (NMOL). A 4th order
3-point central difference formula was used to spatially discretize the equations and an implicit backward
differentiation formula (BDF) was used to integrate in the temporal direction. In order to carry out the
numerical inte_ation, infinity was approximated by a finite len_ of the order of the length scale of the
problem (i.e., (D/e) _ ). This was confirmed by checking the gradients of all the variables which must
vanish at the boundaries. For the calculations presented here, a uniform grid with grid size Az = 1.6x 10"
cm and a variable time step of the order of 1 gsec was used. The grid sensitivity was checked by
reducing the grid size by half and the results were found to be unaltered.
Results and Discussion
The parameter values used in the present calculations are T, = 295 K, E/RT® = 49.50, pre-exponential
constant A = 9.52 x 10⁹ (m3/kg.s), Qm, = 47.465 x lC_ J/kg, Y_ = 0.125, and Yo-- = 0.5. The results
were obtained by assuming constant specific heat, equal diffusion coefficient for all gases and pZD =
constant. Results shown in this paper are only for fuel concentration fluctuations but are applicable to
both reactants (fuel and oxidizer) since similar findings are obtained for oxidizer fluctuations.

Flame Response to Sinusoidal Variations in Reactant Concentrations
Figures 2-4 show the results for strain rate of 10 s _ and sinusoidal variation in fuel concentration of
50% amplitude and 1 Hz frequency. Figure 2a shows temperature and velocity profiles at various time
intervals. The figure shows that the flame which was initially stabilized at the stagnation plane (at 0)
begins to move towards the oxidizer side due to an increase in the fuel concentration. After reaching
a maximum value, the temperature starts decreasing corresponding to a decrease in the fuel concentration
and the flame moves back towards the stagnation plane. It crosses the stagnation plane and continues
to move towards the fuel side till reaching a minimum temperature. The flame then keeps oscillating
back and forth across the stagnation plane between these two temperature limits, which are very close
to the steady state values corresponding to the maximum and minimum fuel concentrations. These
results show that the flame temperature is substantially affected by fuel concentration fluctuations.
Similar trends are observed for the gas radiation profiles. Figure 2b shows that the maximum gaseous
radiation per unit volume is increased by 30% corresponding to an increase in the flame temperature and
radiating combustion products caused by an increase in the fuel concentration and is decreased by 55%
corresponding to a decrease in the flame temperature and radiating combustion products.
In Figure 3a, the maximum flame temperature, which is a good indicator of the flame response to
induced fluctuations, is shown as a function of fluctuation time period. The figure shows that the flame
responds to fluctuations sinusoidally with a time delay. This delay or phase lag is due to slow transport
processes (convection & diffusion) which are responsible for transmitting information from nozzle to
the reaction zone. The flame response also shows a slight asymmetry with respect to the initial
maximum temperature, i.e., the mean maximum flame temperature around which the flame temperature
oscillates shifts to a lower value.
Other indicators of the flame response, such as the heat release rate (or fuel mass burning rate) and the
radiative fraction (defined as the ratio of the total heat radiated to the total amount of heat released),
show similar trends (Figure 3b). The increase or decrease in the heat release is due to a corresponding
increase or decrease in the fuel burning rate caused by variations in fuel concentrations. The radiative
fraction profile indicates that the fuel concentration fluctuations have more sig-nificant effect on radiationthan on the amount of heat released. Note that the radiative fraction would remain constant if the
radiation fluctuated proportionally to the heat release rate. At the limiting values of fuel concentrations,
the change in the total radiation from its mean value is roughly twice more than that in the heat release.
Effect of Fluctuation Amplitude
Figure 4a shows the variation in the maximum flame temperature as induced by different amplitudes
of fuel concentration fluctuations. For these results the induced frequency and strain rate were set at 1
Hz and 10 s_ respectively. The results show that: i) the amplitude of fluctuations has no substantial
effect on the time delay (phase lag) in the flame response. The phase lag is found to decrease by only
50 with an increase in the amplitude from 10% to 50%; ii) the mean maximum temperature around which
the flame temperature oscillates decreases with an increase in the fluctuation amplitude; and iii) the
amplitude of the flame response increases almost linearly with an increase in the induced fluctuation
amplitude. The last conclusion can be drawn more clearly from Figure 4b. In this figure, the maximum
temperature fluctuations (normalized with the steady state temperature) are plotted as a function of the
induced fluctuations (normalized with the steady state fuel concentration). It can be inferred that for
larger strain rates at high fluctuation amplitude the extinction will occur.

Effect of Fluctuation Frequency
In Figure 5a, the variation in the maximum flame temperature are plotted as a function of time period
for different frequencies. All these results are for flames subjected to fuel fluctuations of 50% amplitude
and strain rate of 10 s t. The figure shows that the flame response is maximum at lower frequencies and
its amplitude decreases with an increase in frequency. Similar observations are reported in the literature
for flames subjected to variable strain rates [7,11,13]. For the present conditions, the flame becomes
relatively insensitive to the induced fluctuations at frequencies higher than 20 Hz as shown in Figure 5b.
This insensitivity is due to insufficient time available at higher frequencies for transmitting relevant
information to the reaction zone. Figure 5a shows that the slow transport processes also cause the phase
shift or the time delay in the flame response to increase with an increase in the frequency.
Another observation from Figure 5a can be made about the asymmetric effect in the flame response
which decreases with an increase in the induced frequency. Hence, the mean maximum flame
temperature around which the temperature oscillates increases with an increase in the frequency.
Effect of Strain Rate
The effect of strain rate was investigated by simulating flames with different strain rates subjected to
similar induced fluctuations. Figure 6a shows the variation in the maximum flame temperature
(normalized with steady state temperatures) as a function of time for flames with different strain rates.
These flames were subjected to the induced fluctuations of 1 Hz and 50% amplitude. The figure shows
that the flame response is more prominent and the amplitude of oscillation is increased at larger strain
rates. However, the term large strain rate is a relative one and depends upon the frequency of induced
fluctuation. Hence, in Figure 6b, the maximum normalized temperature fluctuations are plotted as a
function of frequency/strain rate (fie). The figure shows that the flame response is negligible for values
of f/e _eater than 2 (i.e., low strain rates). Beyond this value, the amplitude of fluctuations increases
almost exponentially with a decrease in f/_. This increase in the amplitude can be explained by
considering that any information to the reaction zone is transported through convection and diffusion
processes. At low strain rates (high fie), the convection is small and thus the changes at the nozzle
cannot be completely transmitted to the reaction zone. Hence, the flame response is small. As the strain
rate is increased (fie is decreased), the convection part increases, thereby transporting more information.
Consequently, the flame response is increased. Beyond certain strain rate (fie < 0.05), the information
propagates instantaneously and the instantaneous flame temperature agrees very closely to the steady
state temperature values at the corresponding fuel concentration.
Figure 6b also shows that: i) the increase in the strain rate increases the asymmetry in the flame
response; and ii) for a fixed frequency, the phase shift in the flame response decreases with an increase
in the strain rate. This latter behavior may be explained based on the previously described argument
about the role of the slow convection rates at low strain rates. Other results (not shown here), however,
reveal that if the ratio f/e is kept constant, an increase in the strain rate increases the phase lag. This
means that the increase in the information transport through convection processes by increasing strain
rate is smaller than the increase in fluctuations at the nozzle by a corresponding increase in the
frequency.
Flame Response to Step Changes in Reactant Concentrations
Effect of Step Size (Amplitude)

Figure 7a shows the variation in the maximum flame temperature as a function of time to both positive
and negative changes in the fuel concentrations for different step sizes (amplitudes). For all these flames
the strain rate was kept constant at 10 s t. The results reveal that: i) as expected, the flame response
increases with an increase in the step size; ii) the flame responds with a time delay to a step change and
this delay slightly decreases with an increase in the step size; and iii) the effect of a negative step (a
decrease in the fuel concentration) is more substantial on the flame than that of a positive step (an
increase in the fuel concentration) of similar size.
The time taken by the flame to reach the steady state for different step sizes is shown in Figure 7b.
Here, the steady state is defined as the condition when the maximum flame temperature attains 99% of
the total change in temperature. The figure shows that, for a similar change in temperature, the flame
reaches steady state more rapidly for positive step sizes. Furthermore, the steady state time increases
with a decrease in the positive step size whereas the trend is opposite for negative step sizes. It should
be mentioned here that a negative step change in fuel concentration moves the flame towards the
oxidizer side and a positive step towards the fuel side of the stagnation plane. Hence, the figure shows
that the nearer the flame to the reactant side which is subjected to a step change, the more rapidly the
flame reaches the steady state.
Effect of Strain RateThe effect of strain rate on the flame response to step changes in fuel concentrations is similar to that
caused by sinusoidal variations in fuel concentrations. Figure 8a displays the maximum flame
temperature (normalized with the steady state temperature) profiles for different strain rates. All these
flames were subject to a 50% increase in the fuel concentration. These results depict that the higher the
strain rate, the _eater the flame response. Furthermore, with an increase in the strain rate, the time delay
in the flame response decreases and the steady state condition is reached more rapidly (as shown in
Figure 8b). The physical reasoning of this behavior is same as described in the earlier section, i.e., the
increased role of convection at higher strain rates.
Conclusions
In this article, we have investigated the dynamic response of radiating flamelet subjected to variable
reactant concentrations, using numerical simulations. The reactant concentration was varied both
sinusoidally and with a step function. A number of flames with different strain rates were examined.
The maximum flame temperature, heat release rate and the radiative heat loss were used to describe the
flame response. The results led to the following conclusions:
i) The flame responds sinusoidally with a phase shift to the sinusoidal induced reactant
fluctuations.
ii) Low frequency fluctuations bring about a significant flame response causing a possible
extinction at large strain rates. The effect of the frequency is more important than its amplitude.
iii) The ratio of frequency over strain rate (fie) may be used to predict the flame response to the
induced reactant fluctuations. The flame response is instantaneous for f/c g 0.05 and its
amplitude decreases exponentially for 0.05 g f/e < 2, beyond which the flame becomesinsensitive to fluctuations. Hence, the transient effects must be considered in the flamelet
modeling for the critical range 0.05 < f/e < 2.
iv) The induced fluctuations have more prominent effect on radiation than on the heat release.
v) The flame responds to a step change with a time delay. With an increase in the step size, the

responseincreasesandthe initial timedelaydecreases.vi) Forastepchange,thesteadystatetimedependsuponthefinal locationof theflameandthestrainrate;thenearertheflametothereactantsidewhich issubjectedto achangeandhigherthestrainrate,themorerapidly theflamereachesthesteadystate.
AcknowledgmentFinancialsupportfor thisworkwasprovidedbyNASA (underthe_ant numberNAG3-1460)andGRI
(underthegrantnumber5093-260-2780).
References
1. Carrier, G. F., Fendell, F. E., and Marble, F. E., SIAMJ. Appl. Math., 28:463 (1975).
2. Peters, N., Prog. Energy. Combust. Sc., 10:319 (1984).
3. Chen, J. Y.,Kaiser, T., and Kollmann, W., Comb. Sc. Tech., 92:313 (1993).
4. Faeth, G. M., and Samuetson, G. S., Prog. Energy. Combust. Sc., 12:305 (1986).
5. Howarth, D. C., Drake, M. C., Pope, S. B., and Blint, R. J., Twenty-Second Symposium (Inter-
national) on Combustion. The Combustion Institute, Pittsburgh, 1988 (1988).
6. Barlow, R. S., and Chen, J. Y., Twenty-Fourth Symposium (International) on Combustion. The
Combusti9n Institute, Pittsburgh, 231 (1992).
7. Ghoniem, A. F., Soteriou, M. C., Kino, O. M., and Cetegen, B., Twenty-Fourth Symposium
(International) on Combustion. The Combustion Institute, Pittsburgh, 223 (1992).
8. Baum, H. R., Rehm, R. G., and Gore, J. P., Twenty-Third Symposium (International) on
Combustion. The Combustion Institute, Pittsburgh, 715 (1990).
9. Rutland, C. J., and Ferziger, J. H., Comb. Sc. Tech. 73:305 (1990).
10. Stahl, G., and Wamatz, J., Comb. & Flame 85:285 (1991).
11. Darabiha, N., Comb. Sc. Tech. 86:163 (1992).
12. Egolfopoulos, F. N., Twen_'-Fifth Symposium (International) on Combustion. The Combustion
Institute, Pittsburgh, 1375 ( 1994)i
13. Ira, H. G., Law, C. K., Kim, J. S., and Williams, F. A., Comb. & Flame, 100:21 (1995).
14. Cuenot, B., and Poinsot, T., Twenty-Fifth Symposium (International) on Combustion. The
Combustion Institute, Pittsburgh, 1383 (1994).
15. Clarke, J. F., and Stegan, G. R., J. Fluid Mech., 34:343 (1968).
16. Egolfopoulos, F. N., Eastern States Section / Combustion Institute Fall Technical Meeting 1993,
Princeton, NJ, 275 (1993).
17. Egolfopoulos, F. N., Twenty-Fifth Symposium (International) on Combustion. The Combustion
Institute, Pittsburgh, 1365 (1994).
18. Abu-Romia, M. M., and Tien, C. L., J. of Heat Trans., Nov:321 (1967).
19. Shamim, T., and Atreya, A., Proc. of the ASME Heat Transfer Division, ASME Int'l Cong. &
Exp., San Francisco, CA, HTD Vol. 317-2:69 (1995).

Figure Captions
Figure 1
Figure 2
Schematic of counterflow flame
Flame subjected to sinusoidal variations in fuel concentrations: a) Temperature and
velocity profiles; b) Radiation profiles (Amplitude = 50%, Frequency = 1Hz, Strain
rate = 10 sL)
Figure 3 Flame response to the induced sinusoidal fluctuations: a) Variations in maximum
flame temperature; b) Variations in heat release rate and radiative fraction (Amplitude
= 50%, Frequency = 1Hz, Strain rate = I0 s"L)
Figure 4 Effect of fluctuation amplitude: a) Variations in maximum flame temperature
(Amplitude = 50%, Frequency = 1Hz, Strain rate = 10 sL); b) Normalized maximum
temperature fluctuations
Figure 5 Effect of fluctuation frequency: a) Variations in maximum flame temperature;
b) Normalized maximum temperature fluctuations (Amplitude = 50%, Strain rate =
IOs "L)
Figure 6 Effect of strain rate: a) Variations in normalized maximum flame temperature
(Amplitude = 50%, Frequency = 1Hz); b) Normalized maximum temperature
fluctuations for different frequency/strain rate ratios (Amplitude = 50%)
Figure 7 Effect of step size on the flame response to step changes: a) Variations in maximum
flame temperature; b) Steady state times for different step sizes (Strain rate = 10 s _)
Figure 8 Effect of strain rate on the flame response to step changes: a) Variations innormalized maximum flame temperature; b) Steady state times for different strain
rates (Step size (amplitude) = 50%)

I I I i _ I I (
N
,"'1
©
N
/
_jJJ/

I 1 I I I I 1 I f I I ( I I t 1 ! I I
3v
0
Temperature (%
O 0 O 0 0 O 0
Velocity (cm/s)
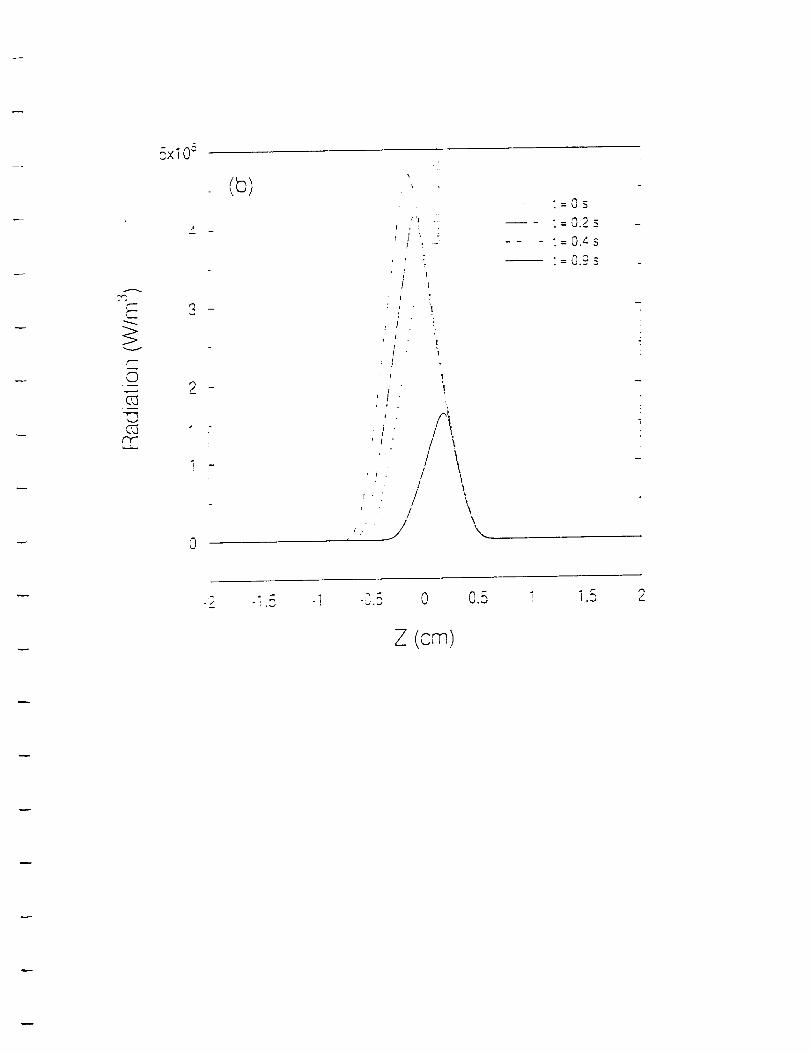
A
V
©
f-y--
_x10 _
w
_
1 --
(b)
/'I -.
s i
P "1
i :!
f ,
i !I i "
- /i• 0
/,!. /
/o
/
!
"=OS
:=O.2s
_ _ _ -=O.Zs
"-0.gs
X\\L.
t
i
4 "m -! 0
Z (cm)
0.5 i i ...,_ 2
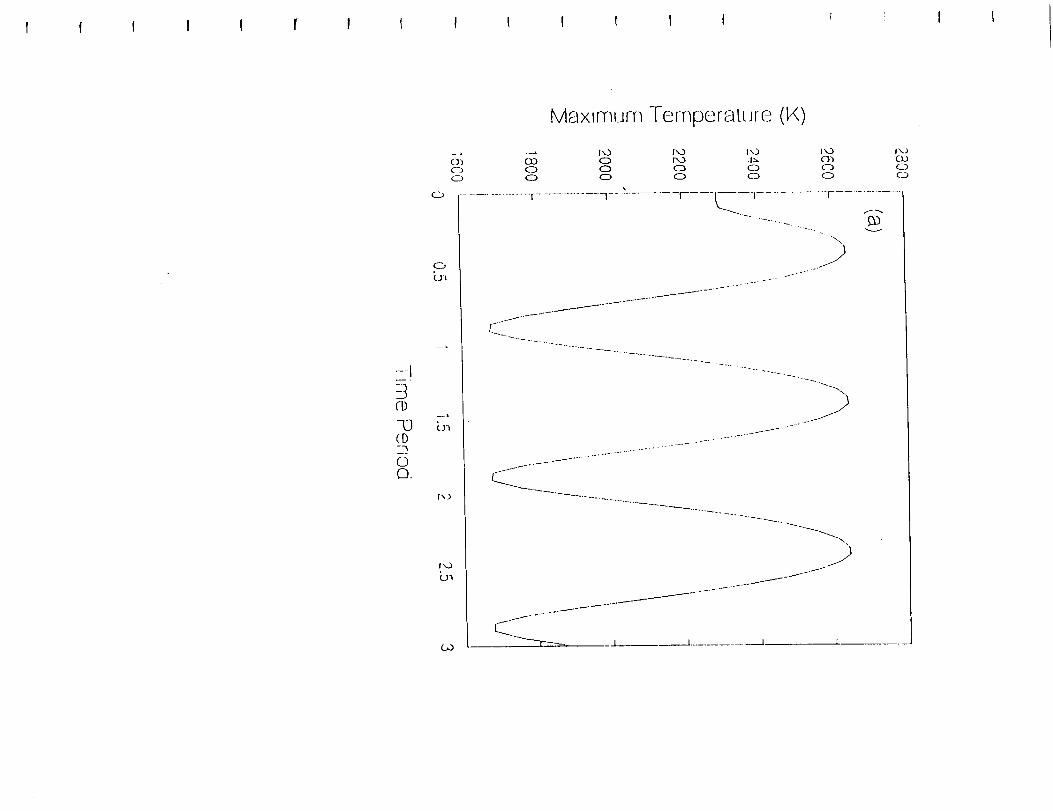
I t I I I ! ! I I [ I I ] I _ I I
---l
-3(D
-L3(-D
0O_
o
o
I,,.3
bl
Maximun_ Temperature (K)
--* ---'. l",3 P'.-) I',..),£T) 03 0 r'o .1"_0 0 0 0 00 0 0 0 0
........... I ................. 7 -- -'t-........ -T
ix..)o)ocb
c_oo
. l ............. F ...........
.....ilbv
..,_J
.._._.__I
I , L ......

--t
(D
0
ob_
|\)
f
p,,,.)
,j
Heat Release (W/rn')
i
C.-) (L)
---,,,I oo
I I_ .......... I i I I ....... _ _ I ........... I....... I ......... I ......
" '-?T ' ..... .----
\
.r,.s_-- _
tOx
o
I Z-'"Z-- Z ........ _._ -.
[I
I
O C_ 0 0 0 0 O 0 C) 0 Oo b b ..........
O) ""4 CD ,tO _ --" mO LO -1_ U1 O)
Radiative Fraction

( I I I { I t I t
-I
-[3(D
0Q_
MaxlmLJrn Temperature (14)
o
o
oo
I........... ,. I
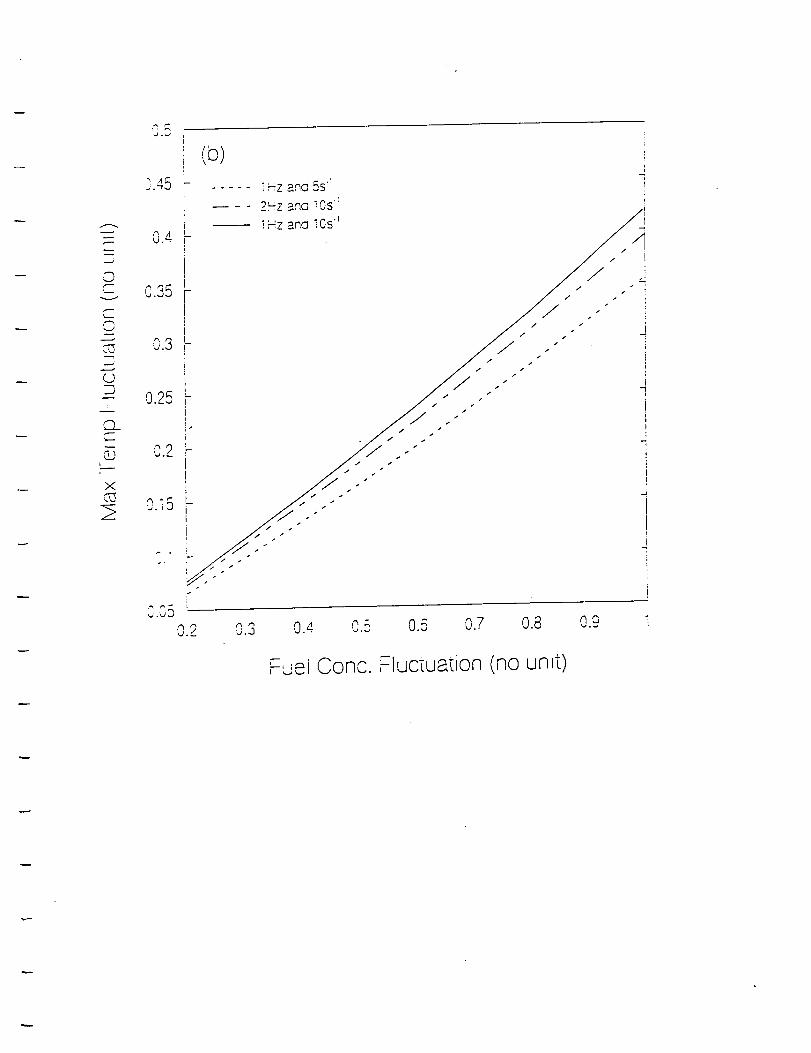
__J
f--.
,.,--
©
"-"1_J
CL<©
i
X
{b) ii
_._:D _ ..... i_Z _na 5S "i '.
2:-zaria los: .iT i
0.4F .4
/ ,-" i,._-/..-" ,
o.3_ /f//..-' i
0.25 """ i
c.2< ,,_'.,"" i
n15 L .,,5," ." i"" I /'_ ." t
I //.- Ii S'."
7. _- //s .'''s
Fuel Conc. Fluctuation (no unit)
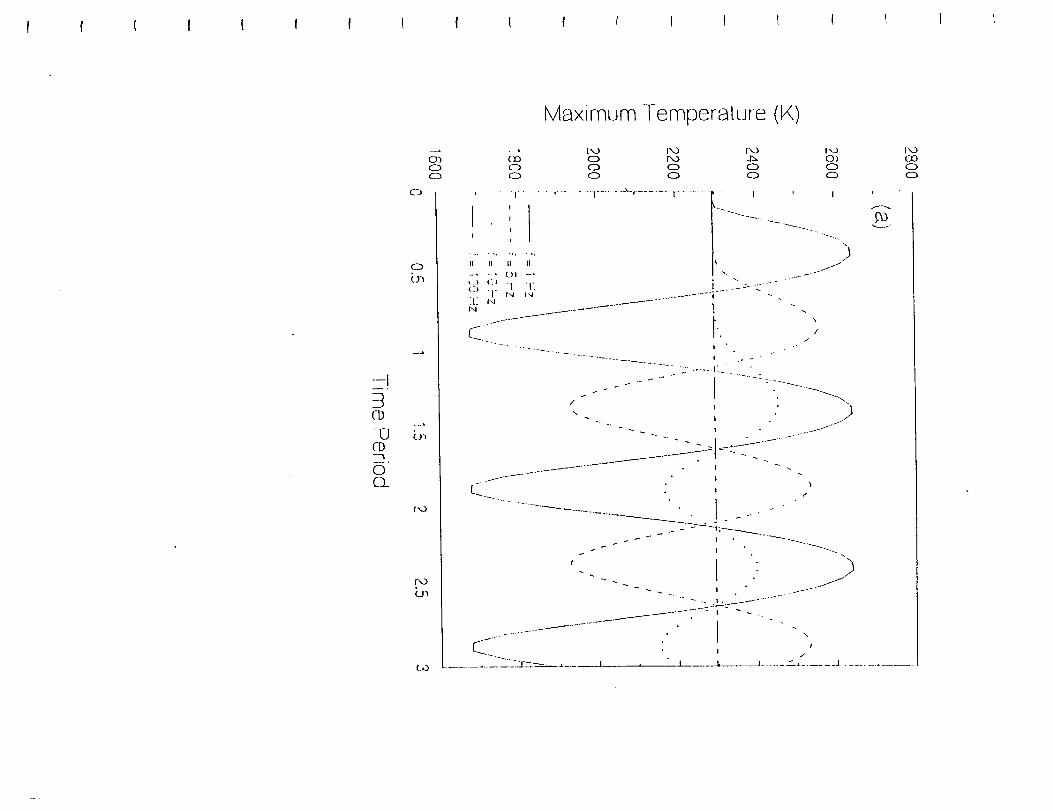
I I i I _ i I I I I I I I f I I I I I
--I
-3ID
-0[I.)
OC'X
oo
o
o
i ,,..)
bl
Maximum Temperature (K)
i
II
-.. ,,. -,, .,,
11 II II II
.... U I -"
c) _i_ "l" "1"[c.i) [l" t_ J:L[ NN
/
.... I',O _ r',..) f_.l09 o r,,o .l',_ O)o o o o oo o o o o
" i .... , ........ I ....... _-_....... i ............... i , i
)
• ..2..... _ ......
t "/"o/
I
.......... 2._ ..,._ i- - -
I
/
¢
I
.L ....
I".bO_O0
, I...... "_ ..... ] .............
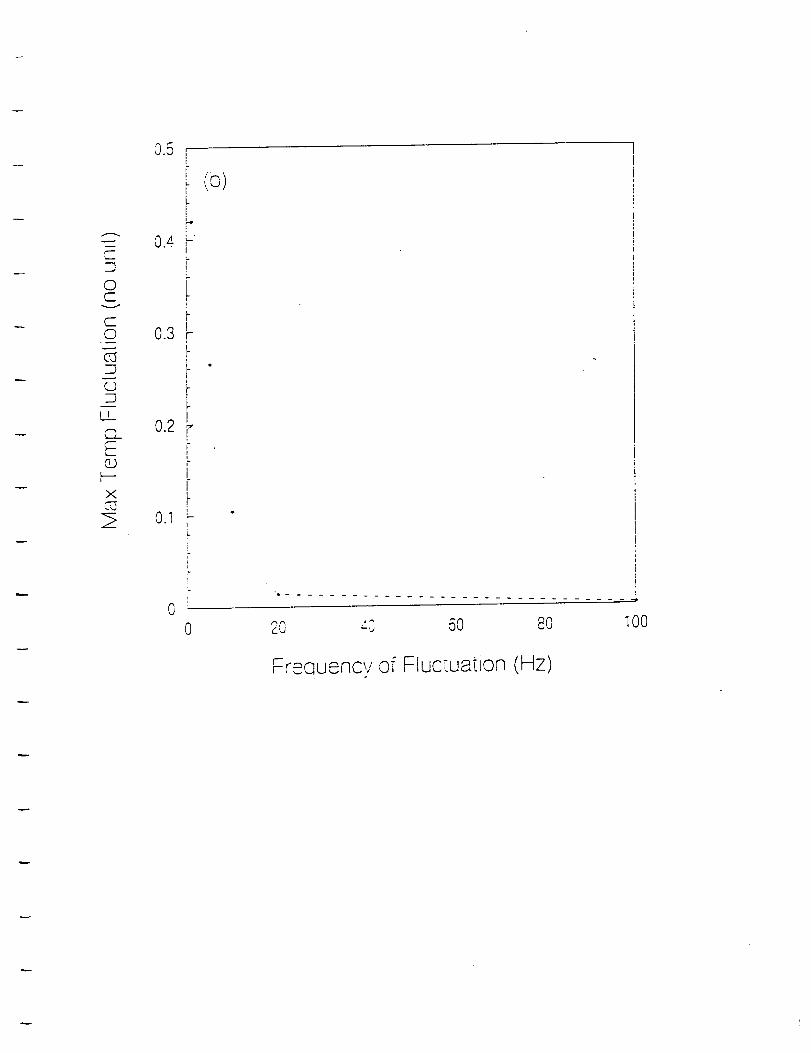
©c-
c-O
tJ
LL
©
X
0.5
0.4
0.3
0.2
0.l
i- •lib,
FI
r
h
!,r-
i"
ii-
t-ir
i
1.
t
o ............................... -,P
'_" 5O 8O IO0z'_ --_.J
Frequency of Fluc_uation (Hz)

! I ( i I I I I ( I I I I I I I I I i
Normalized Max Temperature
--I
CD
73(I)
0CL
0
0
In,.)
1",3
C31
o,)
0
b_
:1 .-..:: .- ...... I ..... I ....

I l I ! I ! I I ,I I I I ! 1 I I f I
Max-rernp t-luctuaLic)rl (no Lit/It)
'l-I
(1.)
c-(1)
C_
O0
p,._
.T..O[,.\_q--I
Cb
0
i,J
(L)
0
__b
0
.... i,o ca _ b, b>
- -I ...... _ .......... I ....... _'_----'q ........ ' .......... ! ......... t .......... I .... _" ........
0-
4.
I
..... , ....... I ......... • ........ -J ...... J----.._ .......... J ....... _..... , .. -J ....... J .......

,<V
GD
q5
d_D0__E
F-
-
t'_ ¢-,,_.cOO
2400 ,
2200 :-
2000" :,-°.
(a)/
/
,/
/
/ J: /
i i
\ .......
• t'"
\
_ _ _ --- • _.__ _ "
i 800 _mo = _0% "
Amo=20% ,,N
Ams=30% \
Ams=50%
!500 ..................................................................................0 0.! 0.2 0.3 0.4 0.5
Time (s)

A
CO
EF-
_9u..5
, (b)J_-_ -
i
0.24 _T
0.235 _-
- 0.23 --
0.225 -
0.2210
• _os:[ive
• ,',4 _,'_ _ t.I ve
Step S:,ze (Amp itude
4O
(%)
it
i
J
i
J
i
i-I
I
4
i
4i"I.
"i
4
i
5O

©
05
©O_E©
r---
x
-O©
>--
OZ
1.1_ L
1.1 :-
L
1.05 '-
/
/
F _
0.02 _,.1 0.2
Time (s)
- i
//
/!
/'
/
//
/
//
J s[ra_n = 1 s4 -.
s_ra_n= 5 sT
s,:ra_n= i0 s1 t• i
s.ra_n = t00 s"
1 2

Cm,
),--
9,'q
t2_ m
i
/
0.5 -
0
0.01
(b)
0.02
//
/'
/i/
//
0.1 0.2
1/Strain Rate (s _)
._ o
i
t
z
I
.2'1
Related Documents