NASA Contractor Report 171984 National Aeronautics and Space Administration (NASA)/ American Society for Engineering Education (ASEE) Summer Faculty Fellowship Program--1986 Volume I Bayliss McInnis, Editor University of Houston--University Park Houston, Texas &, Stanley Goldstein, Editor University Programs Office L yndon B. Johnson Space Center Houston, Texas (_ASA-CE- 1719 E4-¥cl- 1) NA_IIC_A_ AEI_OIIAOlICS A_D S];AC_ ADMIIIIS_GATICN (IIASJ)/A_E]_rCAIt 5¢CI_I7 FOR E_GI_E_EI_G EE'UCA_IC_ (ASEE) 5_MMEti EACUL_ _ILCWSBIP E_.CGfA_, 1986, VCLUME 1 (NASA) 358 F Avail: 1_215 HC Grant NGT-44-005-803 June 1987 G3/85 N87-266_2 --THRU-- N87-267C6 Unclas 00838S_ NASA National Aeronautics and Space Administration Lyndon B. Johnson Space Center Houston, Texas

Welcome message from author
This document is posted to help you gain knowledge. Please leave a comment to let me know what you think about it! Share it to your friends and learn new things together.
Transcript

NASA Contractor Report 171984
National Aeronautics and Space Administration (NASA)/
American Society for Engineering Education (ASEE)
Summer Faculty Fellowship Program--1986
Volume I
Bayliss McInnis, EditorUniversity of Houston--University ParkHouston, Texas
&,
Stanley Goldstein, EditorUniversity Programs OfficeL yndon B. Johnson Space CenterHouston, Texas
(_ASA-CE- 1719 E4-¥cl- 1) NA_IIC_A_ AEI_OIIAOlICSA_D S];AC_ ADMIIIIS_GATICN (IIASJ)/A_E]_rCAIt5¢CI_I7 FOR E_GI_E_EI_G EE'UCA_IC_ (ASEE)5_MMEti EACUL_ _ILCWSBIP E_.CGfA_, 1986,VCLUME 1 (NASA) 358 F Avail: 1_215 HC
Grant NGT-44-005-803
June 1987
G3/85
N87-266_2
--THRU--
N87-267C6
Unclas
00838S_
NASANational Aeronautics and
Space Administration
Lyndon B. Johnson Space CenterHouston, Texas

PREFACE
The 1986 Johnson Space Center (JSC) National Aeronautics and Space Admin-
istration (NASA)/American Society for Engineering Education (ASEE) Summer
Faculty Fellowship Program was conducted by the University of Houston and
JSC. The ten week program was operated under the auspices of the ASEE.
The program at JSC, as well as the programs at other NASA Centers, was
funded by the Office of University Affairs, NASA Headquarters, Washington,
D.C. The objectives of the programs, which began in 1965 at JSC and in1964 nationally, are
a. to further the professional knowledge of qualified engineering andscience faculty members;
b. to stimulate an exchange of ideas between participants and NASA;
c. to enrich and refresh the research and teaching activities of
participants' institutions; and
d. to contribute to the research objectives of the NASA Centers.
Each faculty fellow spent ten weeks at JSC engaged in a research project
commensurate with his interests and background and worked in collaboration
with a NASA/JSC colleague. This document is a compilation of the final
reports on the research projects done by the faculty fellows during the
summer of 1986. Volume 1 contains sections 1 through 14, and volume 2
contains sections 15 through 30.

CONTENTS
i*
*
*
.
.
.
o
*
.
10.
11.
12.
15.
16.
Agresti, David G." "Spectral Characterization of MartianSoi I Analogues" ..........................................
Blount, Charles E.: "Vibrational and Rotational Analysisof the Emission Spectra of Arc Jet Flow" .................
Bourgeois, Brian A.: "Distributed Phased Array ArchitectureStudy" ...................................................
Crockford, William W.: "Initial Planetary Base Construction
Techniques and Machine Implementation" ...................
Davis, Bruce E.: "Digital Data from Shuttle Photography:The Effects of Platform Variables" .......................
DeAcetis, Louis A.: "Development of a Computer Programto Generate Typical Measurement Values for Various
Systems on a Space Station" ..............................
Emanuel, Ervin M.: "Space Station Electrical Power Distri-
bution Analysis Using a Load Flow Approach" ..............
Gerhold, Carl H.: "Active Vibration Control in Micro-
gravity Environment" .....................................
Goldberg, Joseph H.: "Training For Long DurationSpace Missions" ..........................................
Greenisen, Michael C.: "Effect of STS Space Suit on
Astronaut Dominant Upper Limb EVA Work Performance" ......
Hejtmancik, Kelly E.: "Expansion of Space Station Diag-
nostic Capability to Include Serological Indenti-fication of Viral and Bacterial Infections ...............
Heydegger, H. R.: "Interpreting the Production of 2BA1in Antartic Meteorites" ..................................
Hite, Gerald E.: "Plasma Motor Generator System" ...............
Hommel, Mark J.: "A Comparison of Two Conformal Mapping
Techniques Applied to an Aerobrake Body" .................
Johnson, Gordon G.: "Solar Prediction and IntelligentMachines" ................................................
Johnson, Richard E.: "Non-Equilibrium Effects in High
Temperature Chemical Reactions" ..........................
1-1
2-1
3-1
4-1
5-1
6-1
7-1
8-1
9-1
10-1
11-1
12-1
13-1
14-1
15-1
16-1
PRECEDING PAGE BLANK NOT INLMEDiii

17.
18.
19.
20.
21.
22.
23.
24.
25.
26.
27.
28.
29.
30.
Jordan, Jim L.: "Rare Gas Analysis of Size Fractionsfrom the Fayetteville Meteorite" .........................
Kauffman, David: "An Analysis of Bipropellant Neutral-ization for Spacecraft Refueling Operations" .............
Krishna, Madakasira, V.G.: "Geometric Description andGrid Generation for Space Vehicles" ......................
Lacovara, Robert C.: "Integration of Communicationsand Tracking Data Processing Simulation forSpaceStation" ...........................................
Lessard, Charles S.: "General Purpose Algorithmsfor Characterization of Slow and Fast PhaseNystagmus"...............................................
Lewis, William C.: "Lunar Composite Production:
Interim Report" ..........................................
Loftin, R. Bowen: "An Evaluation of Turbo Prolog
with an Emphasis on Its Application to the
Development of Expert Systems" ..........................
Mclntyre, Bernard J.: "Transverse Diffusion of
Electrons in a Magnetoplasma" ...........................
Morehouse, Jeffrey H.: "High Temperature Electrolyzer/
Fuel Cell Power Cycle: Preliminary DesignConsiderations" ..........................................
Prichard, Howard M.: "Evaluation of an Automated
Karyotyping System for Chromosome Aberration
Analysis" ................................................
Torres, Joseph: "Genetic Toxicity Studies of
Organic Chemicals Found as Contaminants
in Spacecraft Cabin Atmospheres" .........................
Tryman, Donald L.: "Affirmative Action As Organiza-
tion Development at the Johnson Space Center" ...........
Uhde-Lacovara, Jo A.: "Analysis of the Continuous
Stellar Tracking Attitude Reference (CSTAR)Attitude Rate Processor" .................................
Wolinsky, Ira: "Bone Density in Limb-lmmobolized
Beagles--An Animal Model for Bone Loss in
Weightlessness" ...........................................
17-1
18-1
19-1
20-1
21-1
22-1
23-1
24-1
25-1
26-1
27-1
28-1
29-1
30-1
iv

1986
NASA/ASEE SUMMER FACULTY RESEARCH FELLOWSHIP PROGRAM
Johnson Space Center
University of Houston
Spectral Characterization of Martian Soil Analogues
Prepared by:
Academic Rank:
University and Department:
David G. Agresti, Ph.D.
Associate Professor ofPhysics
University of Alabamaat Birmingham
NASA/JSC
Directorate:
Division:
Branch:
JSC Colleague:
Date:
Contract #:
Space and Life Sciences
Solar System Exploration
Experimental Planetology
Richard V. Morris, Ph. D.
August 15, 1986
NGT-44-O05-803(University of Houston)
1-1
N8 7 - 26 693
SPECTRAL CHARACTERIZATION OF MARTIAN SOIL ANALOGUES
David G. Agresti, Ph.D.
Associate Professor of Physics
University of Alabama at Birmingham
Birmingham, AL 35294
ABSTRACT
As reported by Dr. Richard Morris in March, reflectance
spectra of iron (III) oxide precipitated as ultrafine (x-ray
amorphous) particles, unlike ordinary fine-grained (>100 nm)
hematite (_-Fe203) , have significant similarities to
reflectance spectra from the bright regions of Mars. During
this summer's stay at JSC, I have collaborated with Dr.
Morris to characterize these particles according to
composition, magnetic properties, and particle-size
distribution. Mossbauer, magnetic susceptibility, and
optical data have been obtained for samples with a range of
concentrations of iron oxide in silica gel of varying pore
diameters (6, 15, and 30 nm). To analyze the Mossbauer
spectra, I have enhanced a versatile fitting program (adapted
during last summer's ASEE visit for the IBM-PC) to provide
user-friendly screen input and theoretical models appropriate
for the superparamagnetic spectra obtained.
NASA Colleague: Richard V. Morris, Ph.D., SN4, X5874
I-2

INTRODUCTION
In March of this year [Morris and Lauer, 1986], Dr.
Richard Morris reported that hematite formed by calcining
silica gel impregnated with ferric nitrate solution provided
a material with spectra similar to reflectance spectra
obtained from the bright regions of Mars. The hematite has
an ultrafine particle size because of the small pore size (6-
30 nm) of the silica gel matrix in which it is prepared.
Further work in Dr. Morris' laboratory at JSC has been aimed
at producing a variety of samples of this material in gels of
various pore sizes and under varying conditions of
temperature of oxidation, pH, starting reagents, etc., in
order to produce the material with the best match to the Mars
spectrum. Other techniques are employed to further
characterize the properties of these martian soil analogues
and to determine the magnetic properties, chemical
composition, size distribution, etc., of the particles of
which this material is made.
One of the tools employed by Dr. Morris in this effort
is Mossbauer spectroscopy. In this technique, a spectrum is
obtained by allowing radiation emitted from a moving source
of 14.4-keV gamma-rays from 57Fe (about 2% of natural iron)
to pass through the material (absorber) under study. This
transmission spectrum is obtained in a multichannel analyzer
as a plot of number of gamma-ray counts detected versus the
I-3
velocity of the source (i mm/s corresponds to an energy shift
of 4.8x10 -8 eV) [for example, Figure i]. The spectrum is
analyzed by computer fitting a theoretical function to the
data and interpreting the fitted parameters in terms of the
environment of the iron atoms in the absorber material.
In the present study, spectra generally consist of a 6-
peak magnetic spectrum superimposed on a 2-peak paramagnetic
spectrum [Figure 2]. The simplest interpretation of the
spectra observed is that the iron atoms are in two chemically
distinct sites, one of which results in a magnetic field at
the iron nucleus. However, it is well-known that iron oxide
particles < 30nm in diameter exhibit superparamagnetism
[Kundig et al., 1966]. In this report, the phenomenon of
superparamagnetism will be discussed and applied to the
silica-gel oxides to obtain useful information about the
particle-size distribution in these samples.
In continuing with the adaptation for the IBM-PC of the
Mossbauer data least-squares fitting program [Agresti et al.,
1969] begun last summer [Agresti, 1985], I have attempted to
provide a more user-friendly screen input and fitting models
particularly suited to the Mossbauer spectra obtained on the
martian soil analogues. In this report, several of these
enhancements will be described and illustrated by application
to spectra obtained in Dr. Morris' laboratory.
I-4
SUPERPARAMAGNETISM
As stated in the introduction, iron oxide formed in
silica gel may be superparamagnetic. The samples obtained
generally have Mossbauer spectra with a 6-peak magnetic
component, which implies the presence of a magnetic field at
the nucleus (31.15 kOe per mm/s of splitting between the
outer pair of lines), and a 2-peak paramagnetic component,
which implies the absence of a magnetic field, or more
properly, a zero time-average magnetic field. The 2-peak
splitting results from the distortion of the local
environment of the iron atom from cubic symmetry.
Superparamagnetic particles are so small that the magnetic
anisotropy energy, which is proportional to volume, is not
sufficient to maintain the domain magnetization pointing
permanently in one of several possible easy directions in the
crystal, and the magnetizetion flips among easy directions
with a frequency related to the thermal energy, kT. The
reciprocal of this frequency, the relaxation time, to , is
proportional to the Maxwell-Boltzmann weighting factor:
to cs: exp (2KV/kT), (i)
where K is the magnetic anisotropy constant and V is the
volume of the superparamagnetic particle.
In order for a magnetic field to be observed at the
nucleus (resulting in a 6-1ine pattern), to must be long
compared to the time of observation, tobs; a 2-1ine pattern
I-5

will appear when t o is much shorter than tob s. The time,
tobs, is necessary to establish the value of the field at the
nucleus, and, from the Heisenberg uncertainty product, is
equal to the nuclear level splitting resulting from the
magnetic field divided by Planck's constant, _. (For the 500
kOe fields of _,-Fe203, tob s is approx, equal to 2.5x10 -8
sec). Thus, from the spectrum shown in Figure 2, our sample
consists of a distribution of particle sizes, the smaller
particles being associated with the doublet and the larger
particles with the sextet. The area under each of these two
components of the spectrum is proportional to the number of
nuclei, that is, the total volume, in each size regime.
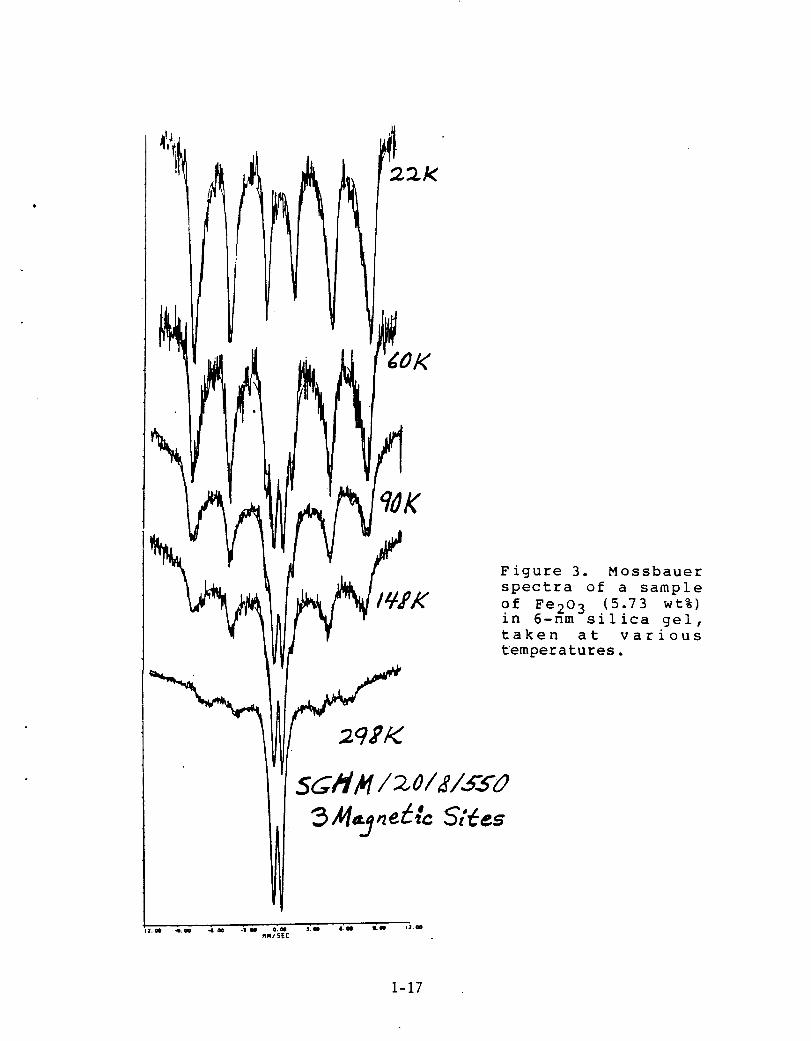
To obtain a size distribution, and also to confirm the
supermagnetic nature of our samples, it is necessary to
collect Mossbauer spectra over a range of temperatures.
Figure 3 shows a series of Mossbauer spectra collected down
to 22K on a silica gel sample supplied by Dr. Morris. These
were taken by my graduate student and NASA Graduate Trainee
Jeffrey Newcomb at UAB. In the figure, it is seen that there
is a steady increase with temperature of the 2-peak component
at the expense of the 6-peak component.
To explain this effect, we point out that Equation (i)
shows that t o depends on temperature as well as on particle
size. In fact, the exponential dependence implies a fairly
sharp transition as a function of temperature, for a given
particle volume V, between a 6-peak and a 2-peak contribution
II-6
to the spectrum. From another point of view, for each
temperature there is a transitional volume, Vt, that divides
the distribution into two parts. For V > Vt, the particles
contribute to the 6-peak component; for V < V t, to the 2-peak
component. Kundig et al. determined that the anisotropy
constant, K, for hematite is approximately independent of
temperature and gave a value of (4.1 _ i) xl0 4 erg/cm 3.
With this value and the requirement that the relaxation time,
to, for particles of volume, Vt, be approx. = tobs, Equation
(1) may be transformed [from Eq. (8), Kundig et al., 1966] to
the more convenient form,
V t = [(4.7 _ i) nm 3] T. (2)
The spectra of Figure 3 were fit to determine the
relative area of the 2-peak component. Figure 4 is a graph
of the results with a smooth curve drawn through the data.
The curve may be understood to be proportional to the
integral of the distribution, dN(T)/dV, which is the number
of particles having volume in the range between V t and Vt+dV ,
since this integral from zero K to the temperature, T, is
equal to the total volume of particles with V < V t.
Hence, the derivative of the curve, under the assumption of
constant K, gives directly a volume distribution, which may
be calibrated according to Equation (2). This distribution
may be converted into the desired size distribution if we
assume the particles are uniform spheres, as has been done in
Figure 4.
I-7

THE COMPUTERPROGRAM
The major portion of my effort this summer was devoted
to enhancing the computer program [Agresti et al., 1969]
used to analyze the Mossbauer data. The resulting program,
along with future enhancements, will be designated
"VersiFit." Last summer, the program was implemented on an
IBM-PC, but, as mentioned then [Agresti, 1985], a number of
modifications remained to be made. Five such enhancements
will be described here in order to illustrate the range of
modifications involved: These are: I. Interactive screen
input; 2. Plotting of data and fitted function; 3. Laser
velocity calibration; 4. Marquardt minimization procedure;
and 5. Skewed-Lorentzian peak functions.
i. Interactive screen input. Sample input screens are
shown in Figure 5. Other input screens are provided or
anticipated for input of relations among parameters, data and
velocity definition, plotting requirements, etc. The basic
idea is a complete break with the fixed-sequence input
typical of mainframe computers. It is not only interactive,
but dynamic in the sense that the user decides which
information to provide through the use of the cursor controls
to position the response in the correct box and through the
selection of particular entry screens that contain the items
required. Furthermore, the individual entry screens re-form
themselves in response to earlier input, as shown by the
I-8
three screens of Figure 5. It is hoped that this more user-
friendly type of input coupled with implementation on a very
popular and very powerful microcomputer will ease the
adoption of the program among the mineralogical community.
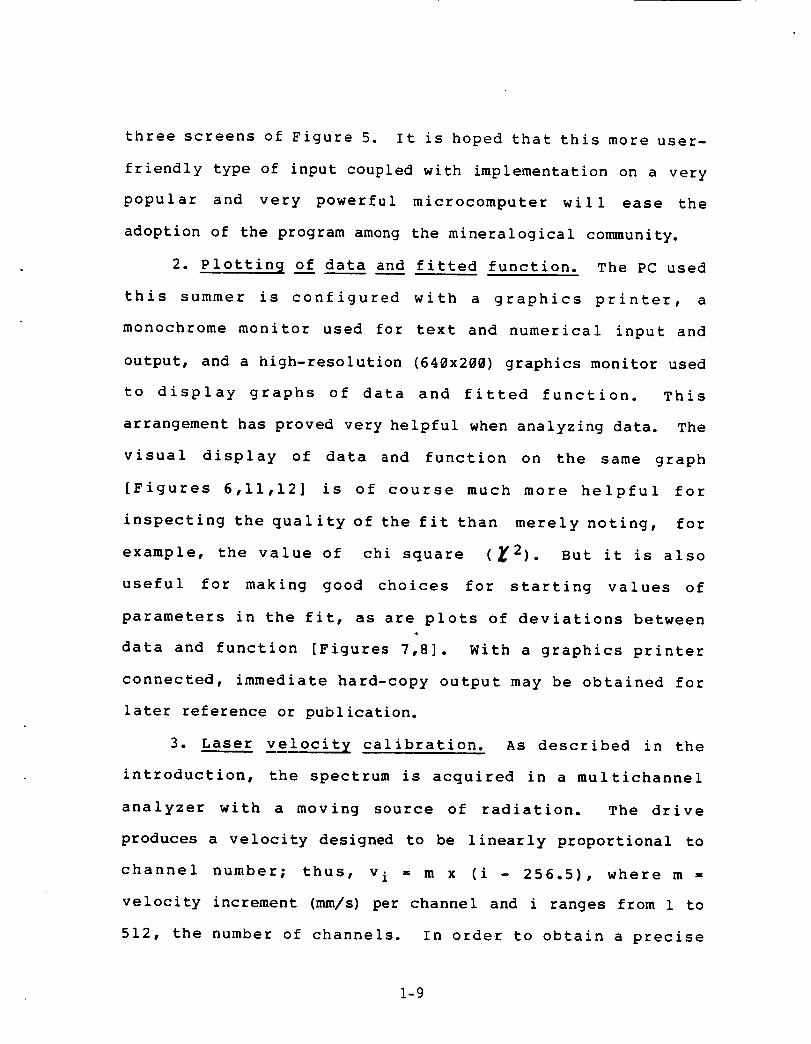
2. plotting of data and fitted function. The PC used
this summer is configured with a graphics printer, a
monochrome monitor used for text and numerical input and
output, and a high-resolution (640x200) graphics monitor used
to display graphs of data and fitted function. This
arrangement has proved very helpful when analyzing data. The
visual display of data and function on the same graph
[Figures 6,11,12] is of course much more helpful for
inspecting the quality of the fit than merely noting, for
example, the value of chi square (_2). But it is also
useful for making good choices for starting values of
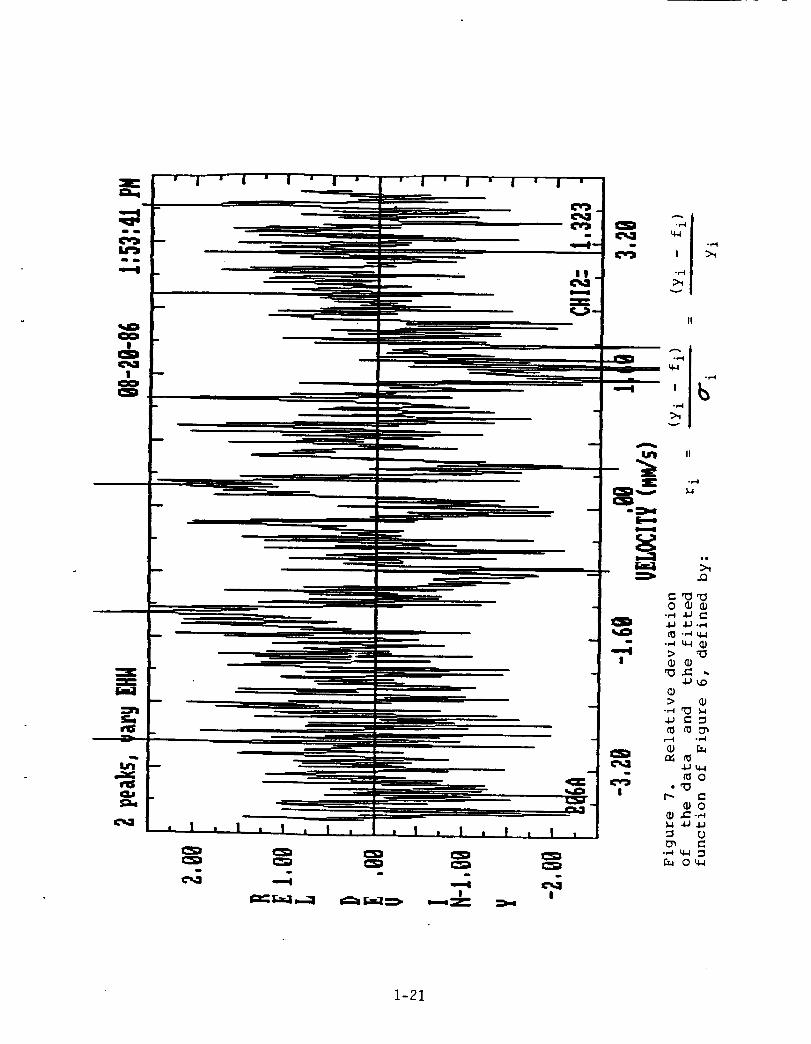
parameters in the fit, as are plots of deviations between
data and function [Figures 7,8]. With a graphics printer
connected, immediate hard-copy output may be obtained for
later reference or publication.
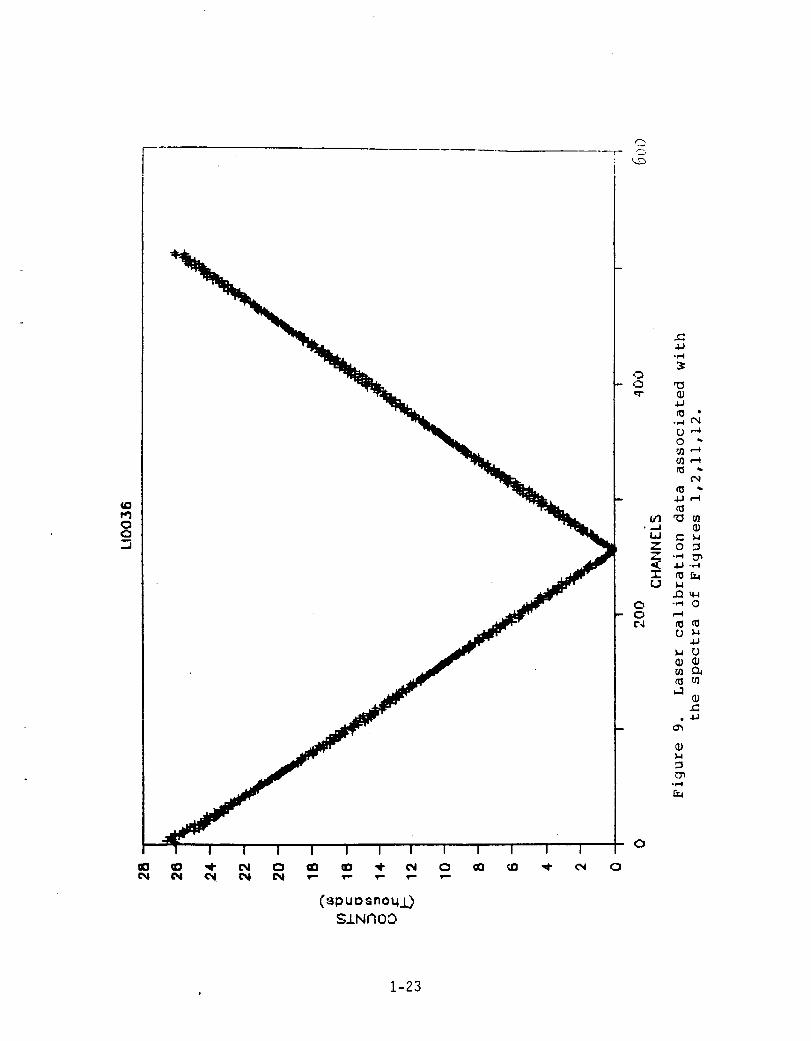
3. Laser velocit_ calibration. As described in the
introduction, the spectrum is acquired in a multichannel
analyzer with a moving source of radiation. The drive
produces a velocity designed to be linearly proportional to
channel number; thus, v i = m x (i - 256.5), where m =
velocity increment (mm/s) per channel and i ranges from I to
512, the number of channels. In order to obtain a precise
I-9
value for the velocity of the source, a laser is mounted
parallel with the motion of the source and interference
fringes are counted and stored as a function of channel. The
number of fringes produced is accurately proportional to the
distance covered during the period of time a channel is open,
hence to the absolute value of the velocity. Figure 9 is a
typical laser calibration run, associated with the data of
Figures 1,2,11,12. The calibration data show that the
velocity is not strictly linear, but is better represented by
a "bilinear" function, v i = mI x (i - io) for i < i o, and
v i = m2 x (i - io) for i > io, where mI and m2 typically
differ by 1%, and i o, which corresponds to the zero-velocity
channel, is generally not equal to 256.5.
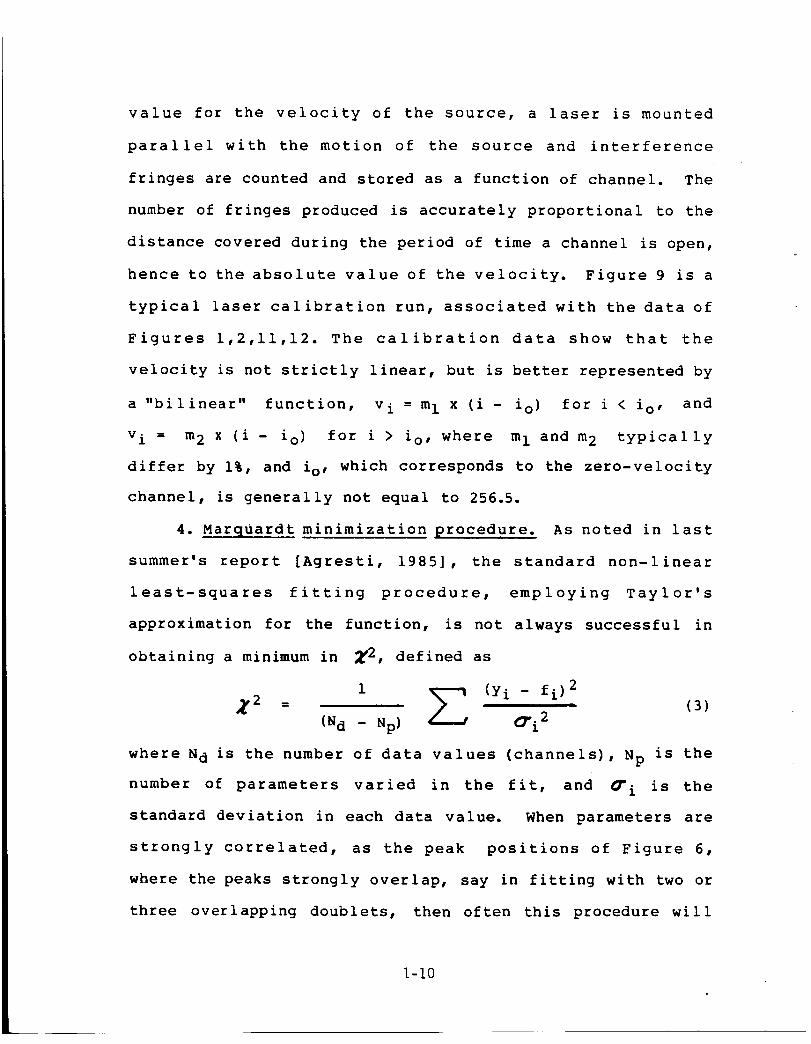
4. Marquardt minimization procedure. As noted in last
summer's report [Agresti, 1985], the standard non-linear
least-squares fitting procedure, employing Taylor's
approximation for the function, is not always successful in
obtaining a minimum in _2, defined as
1 _ (Yi - fi) 2= - (3)
(Nd - Np) _ (_i 2
where N d is the number of data values (channels), Np is the
number of parameters varied in the fit, and _i is the
standard deviation in each data value. When parameters are
strongly correlated, as the peak positions of Figure 6,
where the peaks strongly overlap, say in fitting with two or
three overlapping doublets, then often this procedure will
I-I0
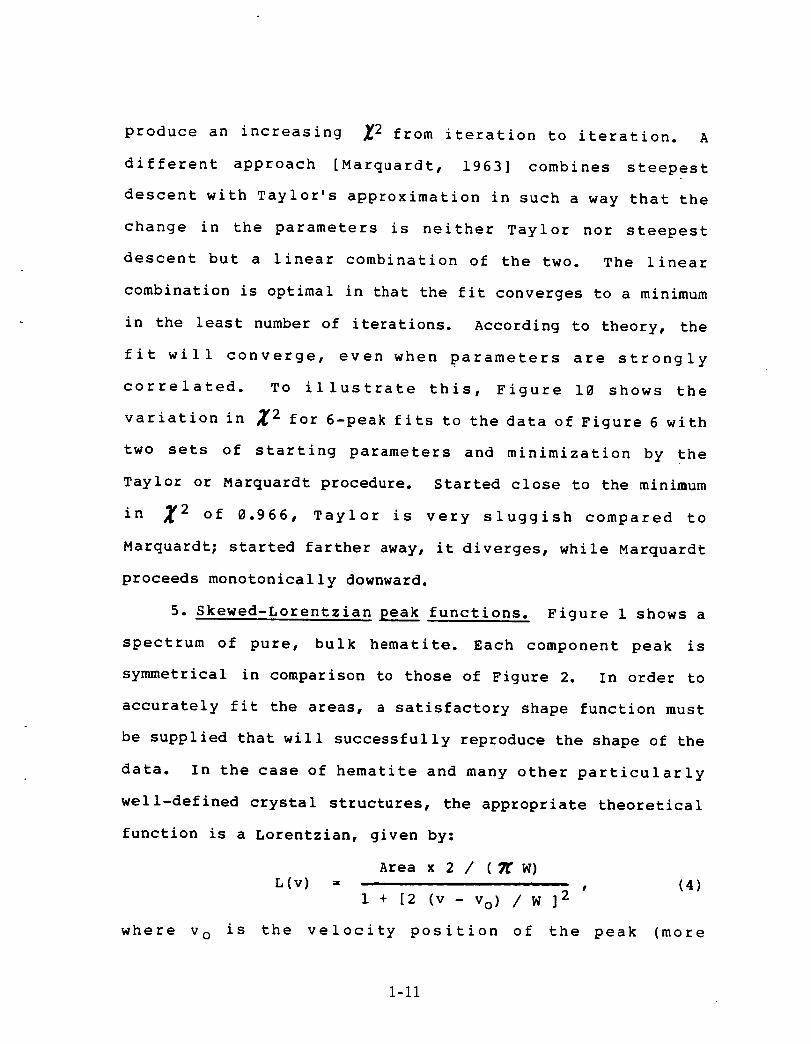
produce an increasing _2 from iteration to iteration. A
different approach [Marquardt, 1963] combines steepest
descent with Taylor's approximation in such a way that the
change in the parameters is neither Taylor nor steepest
descent but a linear combination of the two. The linear
combination is optimal in that the fit converges to a minimum
in the least number of iterations. According to theory, the
fit will converge, even when parameters are strongly
correlated. To illustrate this, Figure 10 shows the
variation in _2 for 6-peak fits to the data of Figure 6 with
two sets of starting parameters and minimization by the
Taylor or Marquardt procedure. Started close to the minimum
in X 2 of 0.966, Taylor is very sluggish compared to
Marquardt; started farther away, it diverges, while Marquardt
proceeds monotonically downward.
5. Skewed-Lorentzian peak functions. Figure 1 shows a
spectrum of pure, bulk hematite. Each component peak is
symmetrical in comparison to those of Figure 2. In order to
accurately fit the areas, a satisfactory shape function must
be supplied that will successfully reproduce the shape of the
data. In the case of hematite and many other particularly
well-defined crystal structures, the appropriate theoretical
function is a Lorentzian, given by:
where v o
Area x 2 / (_ W)
L(v) = , (4)
1 + [2 (v - Vo) / W ]2
is the velocity position of the peak (more
1-11

accurately, dip) in the transmission spectrum, and W is the
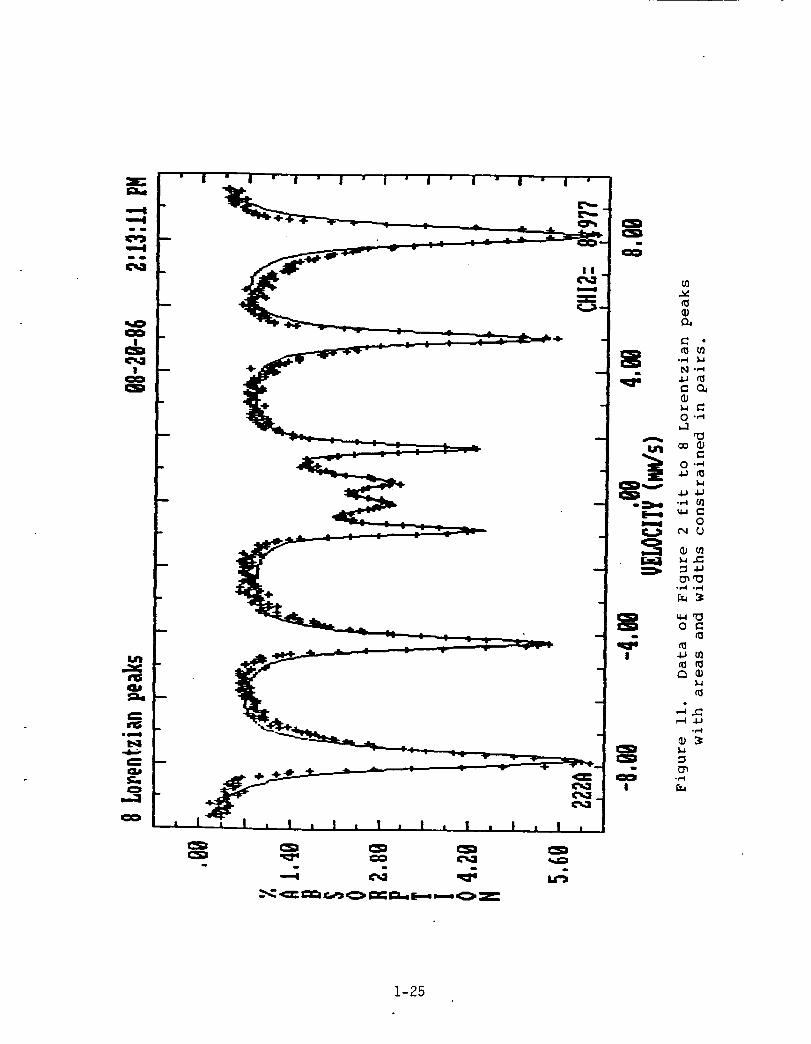
full-width at half maximum. Figure ii shows a fit of the
data of Figure 2 to a superposition of 8 Lorentzian peaks,
with areas and widths constrained in pairs, resulting in 18
variable parameters. The value achieved for X 2 is 8.98, and
it is easy to see that the fitted function misses a great
deal of the data. From the above discussion, it is evident
that we must account for the asymmetry in the 6 magnetic
peaks. The function I have chosen, for computational
simplicity, may be termed a "skewed" Lorentzian. It has an
additional parameter, ;, the "skew," and is defined
(assuming _ > i) by contracting the half-width to .5 W /
on one side of the vertical midline of the Lorentzian
function and expanding the width to .5 W x _ on the other
side. Figure 12 shows the fitted function obtained with the
6 magnetic peaks skewed in pairs. The final value of _2 has
dropped to 1.35, a dramatic improvement for the addition of
just 3 additional variaDle parameters.
In summary, improvements in the capabilities for
analysis of Mossbauer spectra of martian soil analogues have
been provided as a modification of an existing least-squares
program, whose ease of input and variety of fitting options
and models, hence VersiFit, should be of value to those in
the wider scientific community who wish to employ desk-top
computers in their data analysis.
1-12
ACKNOWLEDGMENTS
I wish to thank NASA and the Summer Faculty Fellowship
Program for providing me with the opportunity to spend two
very productive summers in a very stimulating environment.
Above all, thanks to Dick Morris for much encouragement and
many interesting discussions and for exposing me to an
application of Mossbauer spectroscopy entirely new to me. We
have started a very fine collaboration, and it will continue.
1-13
REFERENCES
i •
.
.
•
.
Agresti, D.G., M.F. Bent, and B.I. Persson, "A
Versatile Computer Program for Analysis of Mossbauer
Spectra," Nucl. Instr. and Methods, Vol. 72, pp. 235-
236, 1969.
Agresti, D.G., "Mossbauer Spectroscopy of Extraterres-
trial Materials," Final Report, NASA/ASEE Summer Faculty
Fellowship Program, Summer, 1985.
Kundig, W., H. Bommel, G. Constabaris, and R. Lindquist,
"Some Propertiesof Supported Small _-Fe203 ParticlesDetermined with the Mossbauer Effect," Phys. Rev., Vol.
142, pp. 327-333, 1966.
Marquardt, D.W., "An Algorithm for Least-Squares
Estimation of Nonlinear Parameters," J. S.c. Indust.
Appl. Math., Vol. ii, pp. 431-441, 1963.
Morris, R.V., and H.V. Lauer, Lunar and Planetary
Science Conference XVII Abstracts (Houston, March,
1986), pp. 573-574.
1-14

0
! --
I I I Ii
I I I l I I I
d 6 d d d d
4- ÷4_-
+4-
I
I
- 00
_.J
- "-l"
,--I
q.-I
-- Chl ..._ 0<j1
- _
._, .I=,I
(.)
C..1 m0
w _
- Iul
0
- I
- I
0
I
d d
1-15

_+-I- 4"
+ + + + "I-
-I-+ + -I-+ 4- 4-4" "I"+'I"
_, +'_+ ÷ + ÷
(.,,,
4'+" -I_..I. "I'-I-4-
÷-I.-II-+ + + + +
41"+
+4- ++ +.pw_-
I I I I I I i
° , • 4 •
u,-I
0 °
E
t.,l
u U
.,-I
",..,._I I
M "
N_
0
O_
0
IM
°r-i
I
(sUO!ll!lN)S.LNn(_D
1-16
i_I.ow 4._ 4. oil -I _ o.MmM/SEC
'l
I
Figure 3. Mossbauer
spectra of a sample
of Fe203 (5.73 wt%)in 6-nm silica gel,
taken at various
temperatures.
• /_0/_/s£0
M_3net,a 5;Eee
I.iii i.oi l.ol Ii.oo
1-17

\
I I _ I I I
I
I
!
(%) ,.,'o.',9_'J/' .7_'_d-_
1-18

ORIGINAI_ PAGE IS
OF POOR QUALITY
STARTING A NEW FIT . . Oate: 8/20/86 Time: 1:32:18 PH
9a',a _:_e name... O00206.dat
C_e_cr tioe e×periment .....
Demcr,be the fit ........
Peak to peak uel ... 7.6500
PSAME... F YS_E... F R_NDOH.. F
No. of indep peaks ..... 0
Data pts... 512 Half (lor2> .... i
Overflow .... 0 Output file... FNOSUM... T NOFIT... T NTCYC... 15
No. sites in hf model.. 2
Parameter values:
BacXground, B ....... 5907
Area, AREA ...... 7.9716Rel site areas .......... 1.0000
center shifts, CS ....... 2600
quad pap ams, GQ ...... 1.4800
mag. params, GH ....... 0000
g-exc / g-gnd, GOUG ...... O000
equal widths, W ........ 5000
Fixed paeaums ....... DEAD
Parab background corr., GEOM...1.0000
.4500
4.8600
,0000
DEAD DEAD DEAD DEAD DEAD DEAD DEAD
.0000
STARTING A NEW FIT Date: 8/20/86 Time: 1:26:29 PM
Data file name... 00020_.aat
Describe exper,ment .....
Describe the fit ........
Peak to peak vet... 7.6500PS_PIE... F fS_ME... F R_DGM.. F
No. of indep peaks ..... 2
Data pts... 512 Half (loP2) .... I
Overflow .... 0 Output file... FNOSUH.o. T NOF|T... T NTCYC... 15
No, sites in hf model.. 0
Parameter values:
Background, B ....... 5907
Area, AREA ...... 7.9716 Parab background corr., GEOH .... 0000Peak positions, EU ...... -.L480 .6090
rel. areas, _ ..... ". .5120 .4880
hall'-widths, WIU ....... 6930 .6420
fraction Gau., FC_U ..... 0000 .0000
equal widths, W ........ 0000
Fixed parades ....... AREA DEAD DEAD DEAD DEAD DEAD DEAD DEAD
4
STARTING A NEW FIT . . Date: 8/20/86 Time: 1:21:24 PM
Cata f i l e name... O00206.dat
Oescr i be experiment .....Describe the fit ........
Peak to peak uel ... 7.6500
PSAME... F YSAME... T RANDOM.. F
No. of indep peaks ..... 4
Data pts... 512 Half (loP2) .... I
0uer_lo_a .... 0 0ut_ut Zile... F
N0$UH... T NOFIT... T NTCYC... 15
No. sites in hf model.. 0
Pap _e ter u&lues:
Background, B ....... 5907
Area, AREA ...... 7.9200
Peak positions, EV ...... -.1100
tel. areas, HU ....... 4000
half--_idths, WU ....... 5000fraction Gau., F_U ..... 0000
equal widths, W ........ 0000
Fixed params ....... AREA DEAD
Par&b background corr., GEOM....6300 -.7700 1.6600.4000 .0500 .0500
• 5000 .5000 .5000
.0000 .0000 .0000
DEAD DEAD DEAD DEAD DEAD DEAD
.0000
Figure 5. Examples of screen input to the program.
The screens re-form as shown in response to entries for
"No. of indep peaks" and "No. of sites in hf model."
1-19

.l-
m ql
,,,,-4
m am
!r ....
!
IL,S'I
• I ' I ' I ' i ' I ' 1 " I " I " i "
me,
'4,"
II.
o,--I
0
. 0 _:
I
o
q-i _-t
_ _ •
IF_ _0_. c_
r_
0
-. _
I O_k_
o,---I
Eo
I _ _l
• ,.-I 4,.I
r._
..C:
1-20
OD
• i ' I " I " I " ' I ' I ' I ' I '
m. -,"4
- _
"
_ . ..-, , _
m
I . I. . I 0
m
R
• I • I . ! . I .
I I
GJI
A
.r
m..
-_l=.[=.-.lii.l
m
...==I!
lil
I
.-.4
.Q
c_o _._ ._ c_
•I-._._
._ u,-i(I}
,'0,.C_g
._,_
•1-1u,.l_0
r_ C_0
_ e_.._M 4.,I .1.)_ Q
1-21

m e
!
I
' _ ' I ' I ' i
aL
Q,J
I ' I ' I ' ; '
m
._.11o
! !
Wm
D.p., I
-=no
!
A
o_ o-,--I -,...I
t_
._ 0.Ir.1
0
m,
0
_> 01
• •
.ij .;J
0-,-4
oE
o
u_ •
1-22
O(:3
II
(_puo_noq.L)
S.LNr'Ioo
4.,1
3_OO
o,,-I
U,-4
mffl ,.-4
.IJ ,-t
uq '_ m
_ ._-,_-r _U _
_ -_ 00 ,--4
_ m
°.1._
M
.,.4
0
1-23

Iteration _2 by Taylor's _2 by Marquardt
Start 1.126 1.1261 1.114 1.0542 1.103 1.0103 1.094 0.9974 1.086 0.9905 1.079 0.9876 1.072 0.985
Iteration _2 by Taylor's _2 by Marquardt
Start 32.622 32.6211 18.319 5.8332 9.957 4.6763 5.847 1.3334 1.508 1.2405 1.483 1.0786 1.566 1.0517 1.555 1.0238 1.541 1.021
Figure 10. Variation of X 2 for the first fewiterations in fitting 6 peaks to the data of Figure 6 byTaylor's or Marquardt procedure. In the upper table, the fitwas started relatively close to the minimum of 0.966. In thelower table, the fit was started farther away from theminimum.
1-24
,---4
!
!
nS
rISIN
i,i
0
m
IIN
,==;
LN -,"1
0._
A "0co E)
'_ 0 •,-,,I
.i-) 4J._,,q ._ r_
0
0
m
!
1-25

Z
lm-w
I
|
L
m I u_
o_
¢'_ or,,,;
4J __ .,..4 _._
-_ _
I
_3
_ -,-_r_
I
1-26
1986
NASA/ASEE SUMMER FACULTY RESEARCH FELLOWSHIP PROGRAM
• Johnson Space Center
University of Houston
Vibrational and Rotational Analysis of the Emission
Spectra of the Arc Jet Flow
Prepared by:
Academic Rank:
University and Department:
Charles Blount, PhD
Professor
Texas Christian University
Department of Physics
NASA/JSC
Directorate:
Division:
Branch
JSC Colleague
Date
Contract #:
Engineering
Advanced Program Office
Aeroscience
Carl D. Scott, Ph.D.
NGT-44-005-803
University of Houston
2-1
N8 7 : 26 694
VIBRATIONAL AND ROTATIONAL ANALYSIS OF THE EMISSION
SPECTRA OF THE ARC JET FLOW
Charles E. Blount
Professor
Department of Physics
Texas Christian University
Fort Worth, TX 76129
Applying atomic and molecular physics to the analysis of the
radiation emitted from the arc Jet flow provides a means for determining
the species and excitation temperature of the constituents of the flow.
The object of this investigation has been a rotational and
vibrational analysis of the spectra obtained from the radiation emitted
in the shock layer and in the free stream of the arc Jet flow,
specifically, in the shock layer bands of the First Negative Group of
_o_ze__o_eou_ar_ro_e_CN_ __ _× Z_ _ _n__n_e_reestre_bandsofthe_-,ystemof_trioo_de_NO A_*_, ].
NASA COLLEAGUE: Carl D. Scott, Ph.D, ED33, X4306
2-2

INTR ODU CTION
The temperature of a gas containing molecules emitting radiation is
reflected in the intensity distribution of a vibrational progression and
in the intensity distribution of a rotational progression of the
electronic transition. Hence, only the identification of the
vibrational and rotational levels associated with the observed bands and
their relative intensities are necessary to determine the temperature of
the gas.
THEORY
The intensity of the radiation of light which accompanies the
passage of a molecule from an upper state _ to lower state nr_ is
determined by the Einstein transition probability for spontaneous
emission between the states Am. _ the number of molecules _ having the
upper state ._ populated, and the energy of the emitted radiation for the
_C_m._. The radiation intensity for a gas of molecules istransition
tT_
The spontaneous emission coefficient can be expressed in terms of the
dipole moment for the transition _'_by
E_(2)
2-3
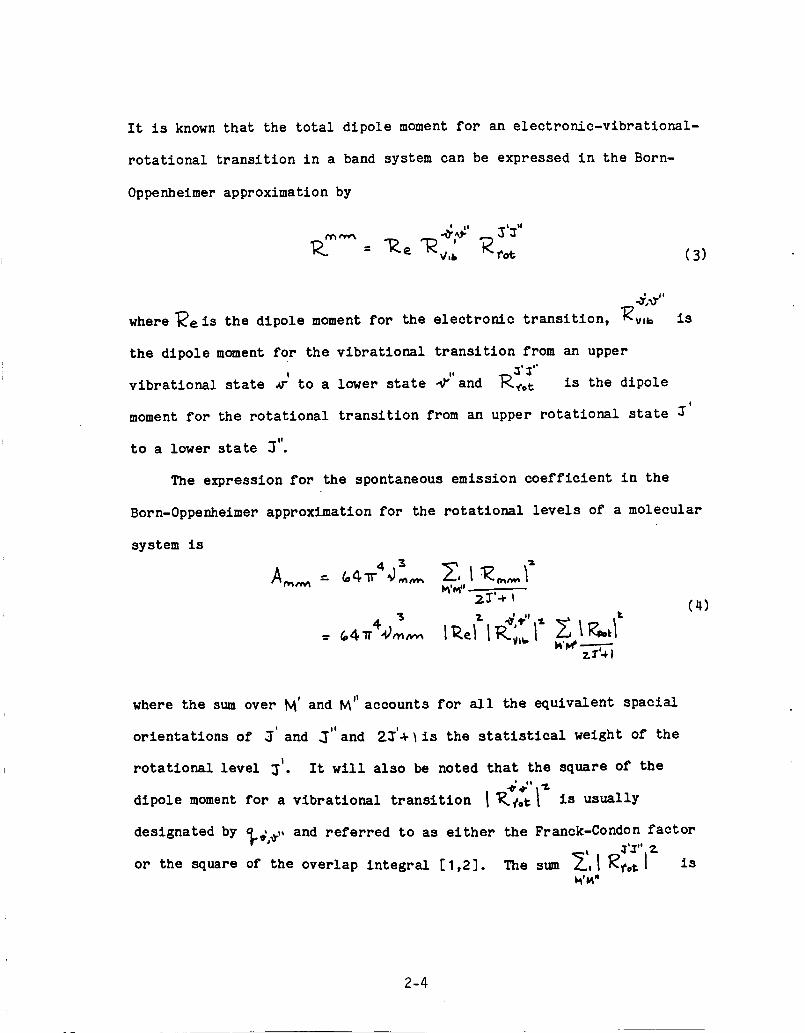
It is known that the total dipole moment for an electronic-vibrational-
rotational transition in a band system can be expressed in the Born-
Oppenheimer approximation by
(3)
where _zis the dipole moment for the electronic transition, _v,b is
the dipole moment for the vibrational transition from an upper
,, A 3'_"
vibrational state _- to a lower state _r and ]_¢,t is the dipole
!
moment for the rotational transition from an upper rotational state
to a lower state J".
The expression for the spontaneous emission coefficient in the
Born-Oppenheimer approximation for the rotational levels of a molecular
system is
4 "S 2.. _,¥,|,
WlW ------1g'4 1
(4)
where the sum over and _4'_accounts for all the equivalent spacial
orientations of _' and J" and 2;'_%is the statistical weight of the
rotational level _. It will also be noted that the square of the
dipole moment for a vibrational transition l_fot I is usually
designated by _,¢,_,, and referred to as either the Franck-Condon factor•T.T'. Z
or the square of the overlap integral [1,2]. The sum _, I _f,¢.l is
2-4

generally denoted by S_'_'',the llne strength, and referred to as the
H61n-London factor [1,2]*.
The intensity of the emitted radiation in terms of the dipole
moments for the transition is given by
If the summation is limited to the transition probabilities over
, iea single electronic-vibrational band, one obtains
__ _ 4v"' ( 6 ).3
mSummation Rules
The sum of the line strength of all transitions from or to a given
rotational level is equal to the statistical weight.
The sum of the squares of the overlap integrals summed over all
values of the supper or of the lower state is equal to one.
2-5

#4
Calling band strength the emission intensity divided by 41, it
follows from the vibration sum rule that the sum of the band strengths
of all bands with the same upper vibrational state are proportional to
the number of molecules in the upper state, ie
(7)
One can readily see that the above derivation is valid only if the
electronic transition dipole moment _ is a constant for all
vibrational transitions having band strengths that give an appreciable
contribution to the sum. For molecular systems satisfying this
condition the sum rule may be used to determine the temperature of the
gas emitting the band system. In thermal equilibrium the population _V'
of the initial state is proportional to _- -_Y-. We obtain from (7)
Therefore by plotting the logarithms of the sum of the band
strengths against the vibrational term values a straight line is
obtained whose slope is _--_ . However, if the intensities of&.T
sufficient number of bands cannot be measured a determination of the
vibrational temperature can be obtained if the Franck-Condon factors
have been calculated for the measured bands. Dividing the band strength
of each band by its Franck-Condon factor gives again a quantity that is
2-6
proportional to the numberof molecules in the initial state and may be
plotted in the same way as the above.
The intensity of the lines in the rotational branch of an
electronlc-vlbratlon band is given by
7-_°+ I
(9)
one can readily see from (5) that the above expression is valid only if
the electronic-vibration dipole moment is constant for all the
rotational transitions that give an appreciable contribution to the
branch.
In thermal equilibrium the population _Z' of the initial state is
proportional to (23'_rI_ e . We obtain from (9)
I_'_" - F_) kc/K.T- (lO)e.-_. ,,%. e,
Please note that by assuming _ to be constant over the entire branch
an error of less than one percent is introduced and the above expression
reduces to
or (11)
Y
2.-7
In the special case of l_ _-_ transitions for which there is only a I_
and _ branch the intensity relations for emission are given by
T ,--- (_ _"+_"+l"t #..
or (12)
_T(13)
Therefore, by plotting _(, _',_I_l ) against U'(5'_ a straight line is
obtained whose slope is-_'_c . Thus if the line intensities have been--4_l-
measured and the rotational constant is known the temperature of the gas
may be determined.
DISCUSSION AND RESULTS
From the spectra obtained in the shock layer of the arc jet flow,
the R branch ofthe (0,1) band of the First Negative Group of ionized
molecular nitrogen N_ _-_ has been selected for the
determination of an effective rotational temperature. Although both the
upper and lower states are doublets, the doublets are not resolved in
the R branch of either the (0,0) or (0,1) band, figure I. Therefore the
tempterature can be determined using the special case i_'_given by
equation (13) using the _values for the rotational band assignments
rather than the J values. Please note that if rotational branchs of
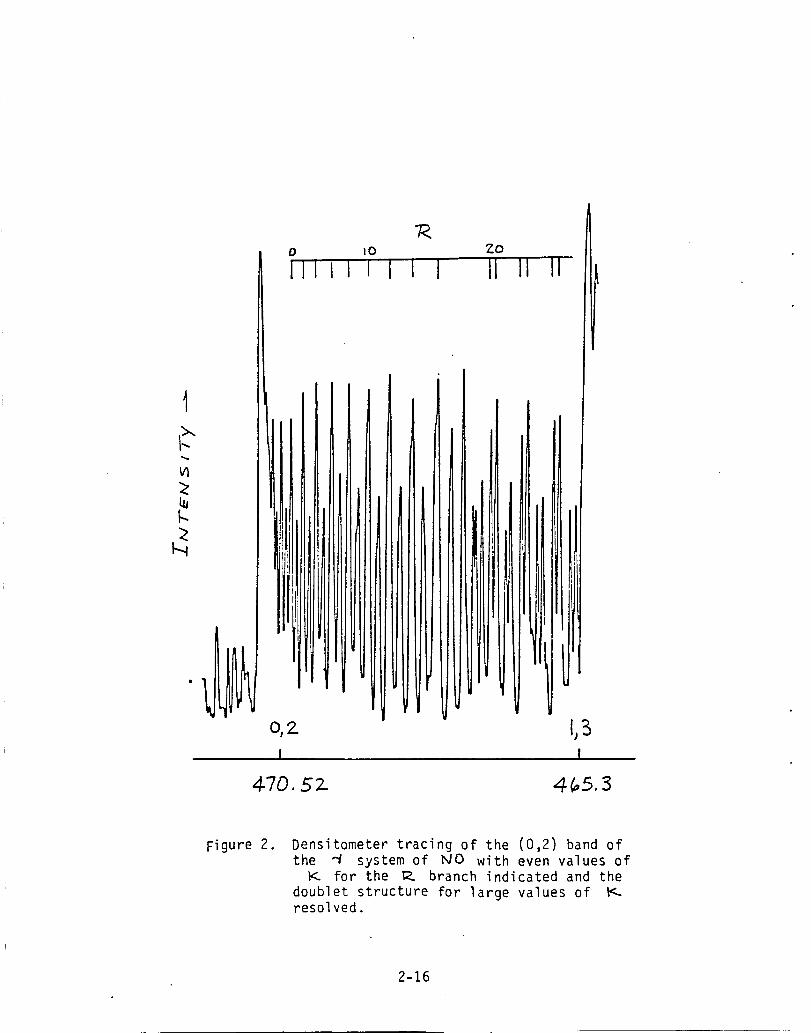
bands other than (0,0) or (0,1) are selected for the determination of
2-8
the temperature the doublet character of the spectra may be resolved and
equation 13 is no longer valid for temperature determinations, figure 2.
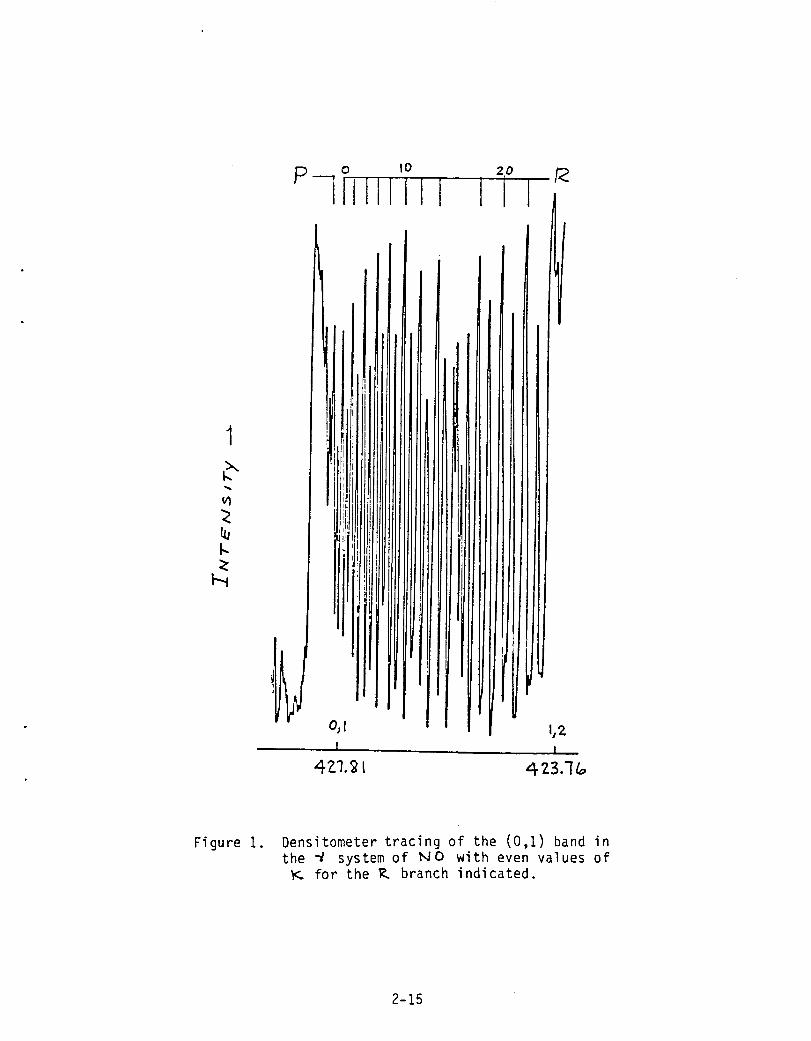
In figure I, note the alternation of the intensity between even _,
labeled, and odd I<. This alternation of intensity is due to the
nuclear spin of the nitrogen nuclei which will result in twice as many
nolecules with even spin as with odd resulting in the observed intensity
alternation in the ratio 2:1. For a temperature determination one may
either use the even _ intensities or the odd _<intensities but not a
mixture.
FoP the R branch of the (0,1) band values of Te = 25461.46, We :
2419.84, wexe = 23.189 and weye = -0.537 fop the electronic and
vibrational terms of the ]_+u
state; and Te = 0, we = 2207.00, wexe = 16.1, and _eMe = -0.04
for the electronic and vibrational terms of the X _ state were
obtained from Huber and Herzberg (4).
The rotational values were obtained from the data reported by K. A.
Dick, et al (5) using the combination relations,
and
between the lines of the P and R branch fop the evaluation of rotational
constants fop bands without a Q branch. FoP the (0,1) band values of
2-9

-_' = 2.0751,-]>_' : 6.54 x 10⁻⁶, _,_" = 1.9031, and -_.y" : 5.8 x 10⁻⁶
were obtained. The energy in C_C' for the R branch of the (0,0) and
(0,1) bands of the _o-_ _transition of Nz can be fit to the measured
values of Dick, etal (5) to within I c_ -_ using
"_/g. = 2.5 j 570,2.1 -+ 4.3ol _, _ o. _5a2_ z
for the (0,0) band and
_)m.: z=_ 3_5,&_ + 4.2q_< .4- o, 171_, _
for the (0,1) band.
In table I values used for the detemrination of the rotational
temperature in the shock layer of the arc Jet flow are given. The
relative intensity of the lines are given in arbitrary units and were
obtained from densitometer tracings of plate #14 using the Joyce-Lobel
Microdensitometer in the Spectroscopy Laboratory of the Department of
Physics at Texas Christian University, Fort Worth, Texas.
2-10
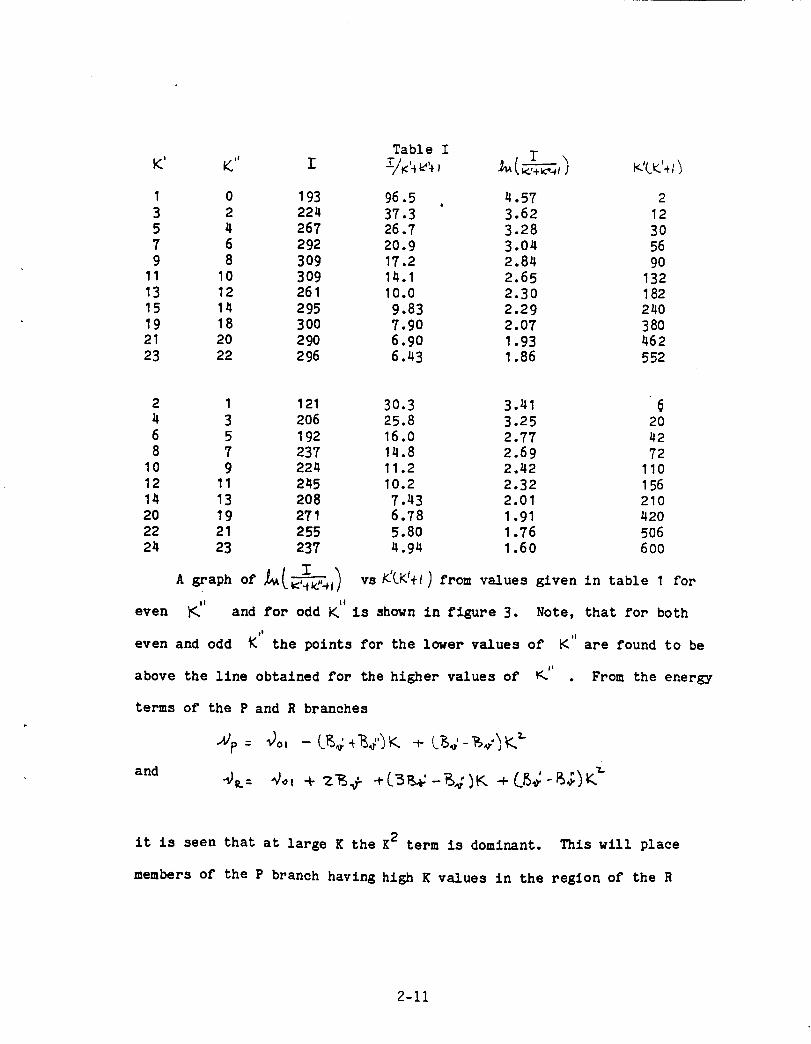
Table I T
I 0 193 96.5 4.57 2
3 2 224 37.3 3.62 12
5 4 267 26.7 3.28 30
7 6 292 20.9 3.04 56
9 8 309 17.2 2.84 90
11 10 309 14.1 2.65 132
13 12 261 I0.0 2.30 182
15 14 295 9.83 2.29 240
19 18 300 7.90 2.07 380
21 20 290 6.90 1.93 462
23 22 296 6.43 I .86 552
2 I 121 30.3 3.41
4 3 206 25.8 3.25 20
6 5 192 16.0 2.77 42
8 7 237 14.8 2.69 72
10 9 224 11.2 2.42 110
12 11 245 10.2 2.32 156
14 13 208 7.43 2.01 210
20 19 271 6.78 1.91 420
22 21 255 5.80 1.76 50624 23 237 4.94 I.60 600
II I|
g..
vs _'(Ki÷lI from values given in table I for
even and for odd K is shown in figure 3. Note, that for both
i!
even and odd K the points for the lower values of K" are found to be
above the line obtained for the higher values of _" . From the energy
terms of the P and R branches
and
it is seen that at large K the K2 term is dominant. This will place
members of the P branch having high K values in the region of the R
2-11
branch of low K values. Thus the observed intensity in the R branch for
low K values is both P and R. This will not present any problems in the
determination of the temperature since at lower temperature the
intensity of the P branch will decrease for high K values and the
intensity observed in the R branch at low E values will be due to R
only.
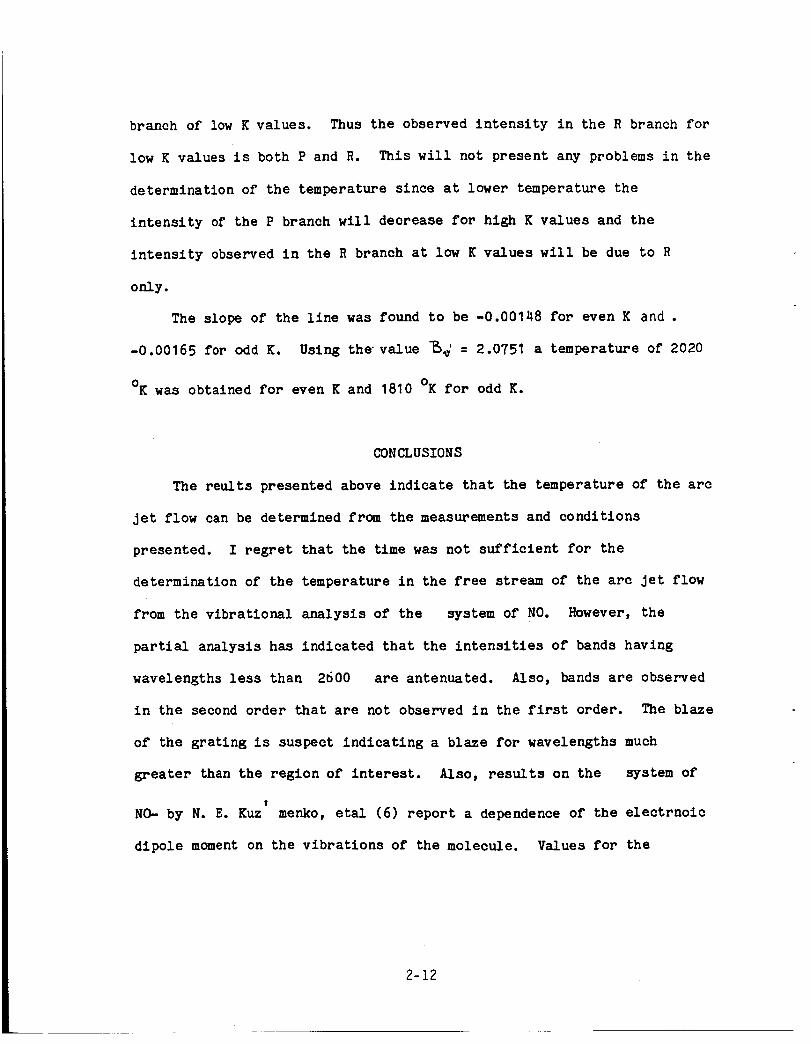
The slope of the line was found to be -0.00148 for even K and .
-0.00165 for odd K. Using the value _' = 2.0751 a temperature of 2020
oK was obtained for even K and 1810 oK for odd K.
CONCLUSIONS
The reults presented above indicate that the temperature of the arc
Jet flow can be determined from the measurements and conditions
presented. I regret that the time was not sufficient for the
determination of the temperature in the free stream of the arc Jet flow
from the vibrational analysis of the system of NO. However, the
partial analysis has indicated that the intensities of bands having
wavelengths less than 2600 are antenuated. Also, bands are observed
in the second order that are not observed in the first order. The blaze
of the grating is suspect indicating a blaze for wavelengths much
greater than the region of interest. Also, results on the system of
!
NO- by N. E. Kuz menkc, etal (6) report a dependence of the electrnoic
dipole moment on the vibrations of the molecule. Values for the
2-12
electronic dipole moment for each of the bands observed in the free can
be obtained from this article and with the Frank-Condon factor for each
band the temperature can be obtained.
ACKNOWLEDGEMENTS
I wich to express my thanks to the American Society of Engineering
Education and the NASA Johnson Space Center for providing financial
assistance during the course of this project. I would also like to
thank Dr. Carl Scott for his supportive assistance through out the
course of this work. I also wish to acknowledge the assistance of Dr.
Fred Wierm and all of the arc Jet facility personnel. A special thanks
is extended to Dr. Ronald J. Wiley whose initial work in 1984 made this
summers project possible.
References
I. G. Herzberg, Molecular Spectra and Molecular Structure I. Soectra Q_
Diatomic Molecules. D. Van Nostrand, New York, 1950.
2. J. I. Steinfeld, Molecules and Radiation: An Introduction to Modern
Spectroscopy, Harper and Row, New York, 1974.
3. D. V. Skobel'tsyn, Electronic snd Vibrational Spectra of Molecules.
Consultants Bureau, New York, 1968.
4. K. P. Huber and G. Herzberg, Molecular SPectra and Molecular
Structure IV. Constants of Diatomic Molecules, D. Van Nostrand, New
York, 1979.
2-13

5. K. A. Dick, W. Benesch, H. M. Crosswhite, S. G. Tilford, R. A.
Gottscho, and R. W. Fields, J. Mol. Spectros. 69, 95, 1978.
6. N. E. Kuz'menko, L. A. Kuzetsova, A. P. Monyakin, and Yu Ya
Kuzyakov, J. Quant. Spectrose. Radiat. Transfer, 24, 219, 1980.
2-14
0 I0 20
P-]Illll I I I _
u}
tuI-
Figure 1. Densitometer tracing of the (0,1) band in
the -/ system of _JO with even values offor the R. branch indicated.
2-15
i
v_
470.52. 4?_5. 3
Figure 2. Densitometer tracing of the (0,2) band ofthe _ system of NO with even values of
K. for the I_ branch indicated and thedoublet structure for large values of _<-resolved.
2-16

liH
3
2
X
• 6v_N K
X
| i I I i ,* i ' i | I i
I00 200 .300 400 500 4000
Plot of the ,h. ( _,_._.,,.,, jfor even and odd _ of thethe (0,I) band.
Figure 3. vs K'L K'-+,
branch of
2-17
1986
NASA/ASEE SUMMER FACULTY RESEARCH FELLOWSHIP PROGRAM
Johnson Space Center
University of Houston
Distributed Phased Array Architecture Study
Prepared by:
Academic Rank:
University & Department:
NASA/JSC
Directorate:
Division:
Branch:
Brian Bourgeois , Ph. D.
Assistant Professor
University of Houston-Downtown
Applied Mathematical Sciences
Engineerin 9
Trackin9 and Communications
Electromagnetic Systems
JSC Colleague:
Date:
Contract @:
George D. Arndt, Ph.D.
August 8, 1986
NGT44-005-803
3-I

N8 7- 26 695
DISTRIBUTED PHASED ARRAY ARCHITECTURE STUDY
Brian Bourgeois, Ph.DAssistant Professor
Department of Applied Mathematical Sciences
University of Houston-Downtown
Houston, TX 77002
The hardware tolerances needed to successfully
operate distributed phased array antennas in a spaceenvironment are not clearly defined at this time.
Variations in amplifiers and phase shifters can cause
degraded antenna performance, depending also on the
environmental conditions and antenna array architecture.
The implementation of distributed phased arrayhardware has been studied with the aid of the DISTAR
computer program as a simulation tool. The principal
task of this simulation is to provide guidance inhardware selection. Both hard and soft failures of the
amplifiers in the T/R modules are modeled. Hard failures
are catastrophic - no power is transmitted to the
antenna elements. Non-catastrophic or soft failures aremodeled as a modified Gaussian distribution. The
resulting amplitude characteristics then determine the
array excitation coefficients. The phase characteristicstake on a uniform distribution.
Pattern characteristics such as antenna gain,
half-power beamwidth, mainbeam phase errors, sidelobe
levels, and beam pointin 9 errors have been studied as
functions of amplifier and phase shifter variations.
General specifications for amplifier and phase shiftertolerances in various architecture configurations forC-band and S-band have been determined.
NASA Collegue: G. Dickey Arndt EE3 X2128
3-2
ORIGINAIj PAGEIBOF POORQUALYI'y
l NTRODUCTI ON
The distributed architecture concept in phased
array antennas incorporates transmit/receive (T/R)
modules at or near the elemental radiators of the arrag.
The most important components of the T/R, modules are the
high power amplifier (HPA) and the low noise amplifier
(LNA) . Ma._or advantages of this approach include system
reliability, improved system noise figure, mechanical
deformation and motion compensation, and achievement of
high, totai radiated power with solid state devices.
The most generic distributed array has an amplifier
(or T/R module) at each radiating element. Due to
limitations of cost or practicality, the array
architecture may require reduction, so that one module
may drive several elemental radiators. An important
problem is to optimize antenna performance subject to
the constraint of architecture reduction. Further
constraints include the use of real rather than ideal
electrical components, which are subject to both random
and systematic errors.
To address this problem, a computer program named
DISTAR has been created by PSL (Physical Sciences
3-3

Laboratory,, New Mexico) and de.eloped b# NASA/JSC. The
program inputs antenna array characteristics alon9 with
type and extent of amplifier performance failure and
outputs the normalized antenna 9ain pattern in 9raphical
and/or tabular form. Both hard and soft failures of the
amplifiers in the T/R modules are modeled. Hard failures
are catastrophic - no power is transmitted to the
antenna elements. Soft failures are random perturbations
of amplitude and phase from the ideal specifications.
The paper 9ires a brief description of the prograrn
DISTAR, followed by an analysis of the method used to
construct the pattern. The final section discusses an
application of the program to determine specifications
for har d_are tolerances for three distributed arrays,
one at C-band and two at S-band.
3-4

ORIGINAE PAGE r_
OF POOR QUALIT'_
PEOGF',AM, DE_E_CF(I PT I OI,i
Thi_.. section briefly describes the capability of
the pro9ram DISTAR in terms of input and output. The
array is rectangular. It may be diuided, both physicali_ ,
and electronically, into various subarrays: panels,
subgroups, co-phased elements, and co-amplified
elements. The dimensions of these subarra_s are all
determined by the user. It may be useful to refer to
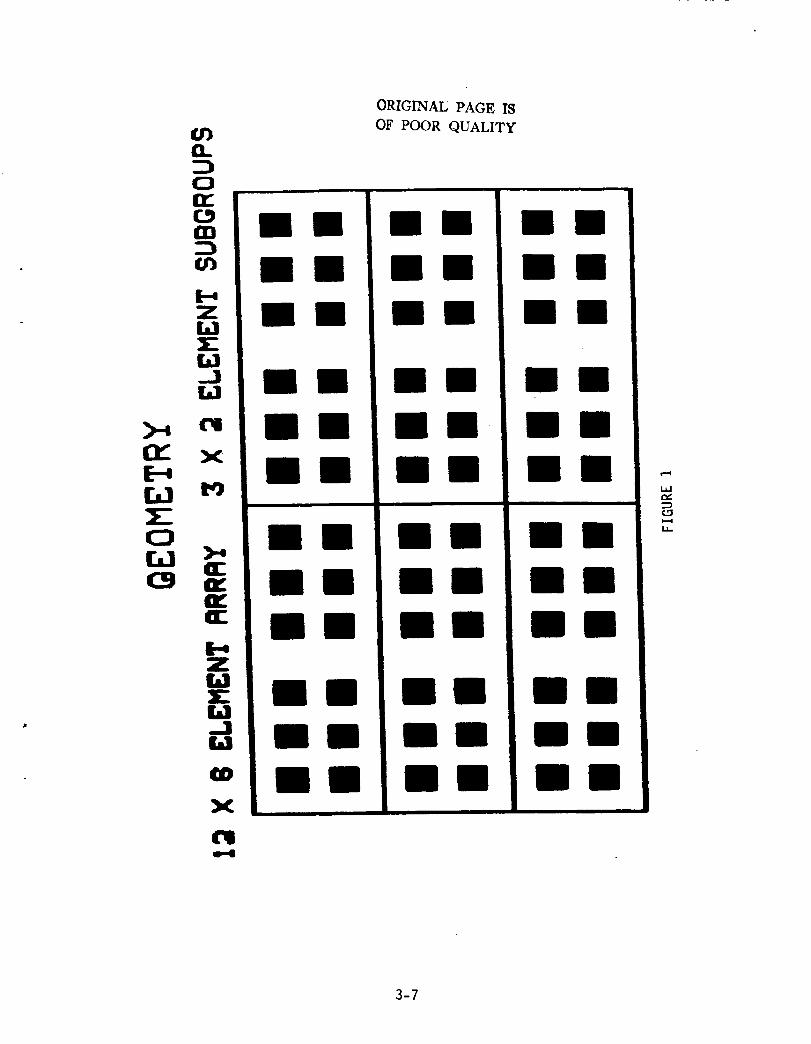
Figure i, which sketches a 12 x 6 element array with G
panels and 3 x 2 element subgroups. The co-amplified
groups are the panel rows.
Each panel is excited in amplitude and phase by
user-specified amounts. A panel must contain an integral
number of subgroups and co-phased 9roups. Each subgroup
is physically separated from its nei9hbors by a uniform
amount in x and y. Each element in a co-phased 9roup is
9iuen an identical phase shift. Co-amplified elements
are all driven by the same T/R module. The user
specifies the spacin9 in x and y between elements and
between subgroups, the frequency of the antenna, the
element taper, the element pattern, the steerin 9 an91e,
and display mode(s) (2D 9Taphs, 3D 9raphs, table).
3-5

Information about type and degree of hardware
failure is input via program flags. If the user requests
soft failure_ of the T/R modules, the program prompts
for mean power, standard deviation in power, and range
of phase distribution. (See next section for more
detail.) If the user requests hard failures, the program
prompts for whether the modules should be turned off
randomly or systematically. If systematically, the user
supplies the number turned off. If randomly, the user
chooses whether to supply the number or have it also
selected randomly.
3-6 °
>-0O_
0I",I
@.
0alrC._
Z
16JJ16J
X
a_n,,lIE
Z
W_,11U
X
ORIGINAL PAGE 18
OF POOR QUALITY
3-7
,.--4
ta.le_
_D
l.t.
THEOR 'r"
In this section, the equations used by the program
to calculate the GAIN matrix are detailed. A brute-force
method is used to sum the contributions of all the
antenna elements to the field in a 9iven direction. The
GAIN matrix is calculated exactly once in the program
and is subsequently used to display the information in
the various forms requested by the user. For the
convenience of the interested reader, the notation used
in this section is identical to that used in the
program.
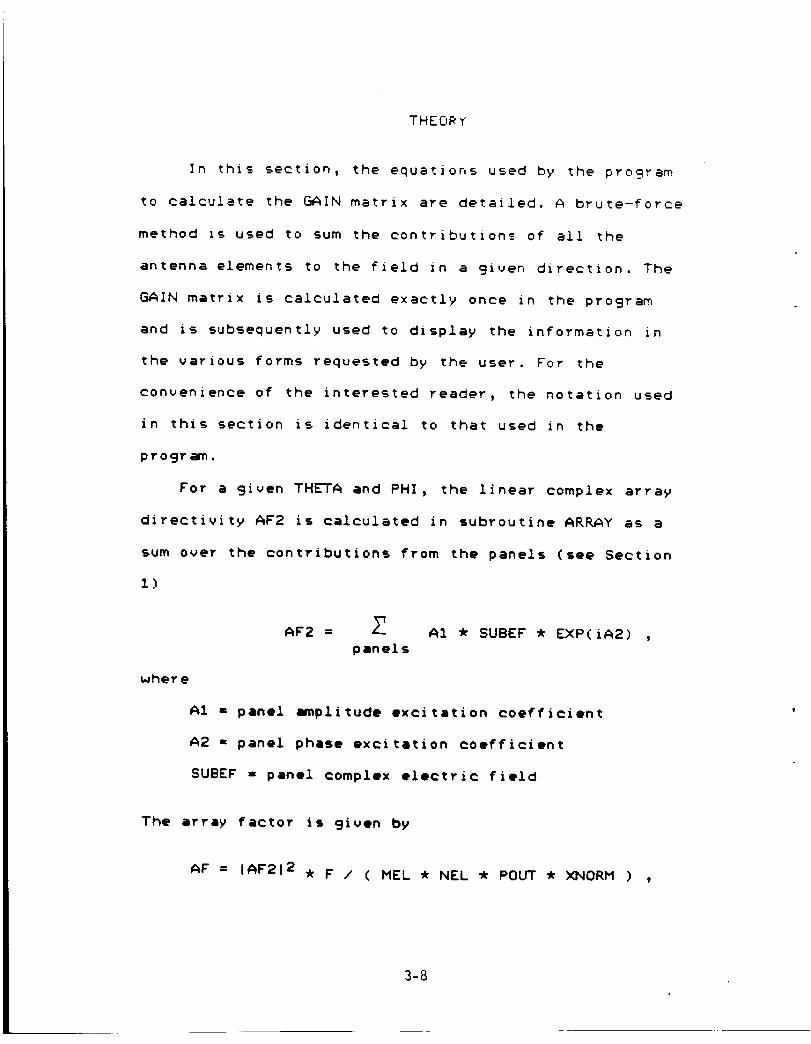
For a 9iven THETA and PHI, the linear complex array
directivity AF2 is calculated in subroutine ARRAY as a
sum over the contributions from the panels (see Section
I)
where
AF2 = A1 _ SUBEF _ EXP(iA2) ,panels
A1 = panel mmplitude excitation coefficient
A2 = panel phase excitation coefficient
SUBEF = panel complex electric field
The array factor is 9iven by
AF = IAF212F / ( MEL * NEL * POUT * )(NORM ) ,
3-8

whet'@
MEL -- the number of elements per panel in the
x-di recti on
NEL = the number of elements per panel Jr, the
y-direction
POUT =
panels
(A1)2
XNORM =
all elts
(ELNT)2 / _elts
ELI4T = matrix containin 9 the weights from the
element taper
(1/16)[
1-cos(PI-THETA) ]4 if IELP = I
1 if IELP = 0
IELP = the element pattern fla9
Then,
and
PHAS(THETA,PHI) = the complex argument in degrees
of AF2
GAIN(THETA, PHI ) I
i0LOGI0 (AF) = AF expressed in
decibals.
3-9

The par, el electric field SLIBEF is calculated ir,
subroutine SUBARY as follows:
SUBEF = _'_ z w x P A ,
elts in
panel
where
0 if element is zapped
(catastrophic failure)z = ELZAP =
i if element is not zapped
w = ELP_T = wei9ht from the element taper
x = EXPHAS = relative phase shift of excitation to
steer the beam to THETA0,PHI0.
x is a complex number of modulus one.
THET0,PHI0 is the pointing angle.
P = PHASE = phase at current look angle. P is a
complex number of modulus one
A = AMPWT = amplitude weight which models soft
failures, as described below.
The amplitude weight A = AMPWT is calculated in
subroutine AMPLWT as follows:
A = (a/u)1/2 EXP(PH$) ,
3-I0
where
a = u + (-2*UAR*InX1)I/2 cos(2*PI*X2)
PHS = -j*DELTA*(I-2*X3) = uniform dlstribution
between -DELTA and DELTA
u = mean of the distribution
( user-suppIied = AMEAN )
VAR = variance = SG*SG = square of standard
deviation SG
(SG is user-supplied)
DELTA = range of phase distribution (user-supplied)
X1,X2,X3 are randomly 9enerated real numbers
between 0 and I.
3-11

ANT ENNA T E ST S
The prosrarn DISTAR described above was used to test
three antennas for NASA, two at S-Bana and one at
C-Band. The problem was to determine the hardware
tolerances necessary to operate these antennas in a
space environment. With this model_ this means to
determine to what degree the amplifiers in the T/R
modules can fall and still maintain an adequate antenna
performance.
Two straightforward criteria were established to
determine the hardware tolerances. First and foremost,
the power at the maximum of the degraded beam should be
within three decibals of the power of the maximum of the
ideal beam. In other words, a falloff in power of more
than fifty percent is not tolerated. Second, sidelobes
of the degraded beam should not rise to within ten
decibals of the mainlobe in the degraded beam.
Both hard and soft failuTes of the T/R modules were
tested. Soft failures included both amplitude and phase
errors. Different steerin 9 angles were employed. Warping
of the panels was not included in the study. Principal
plane cuts were obtained for all tests.
3-12
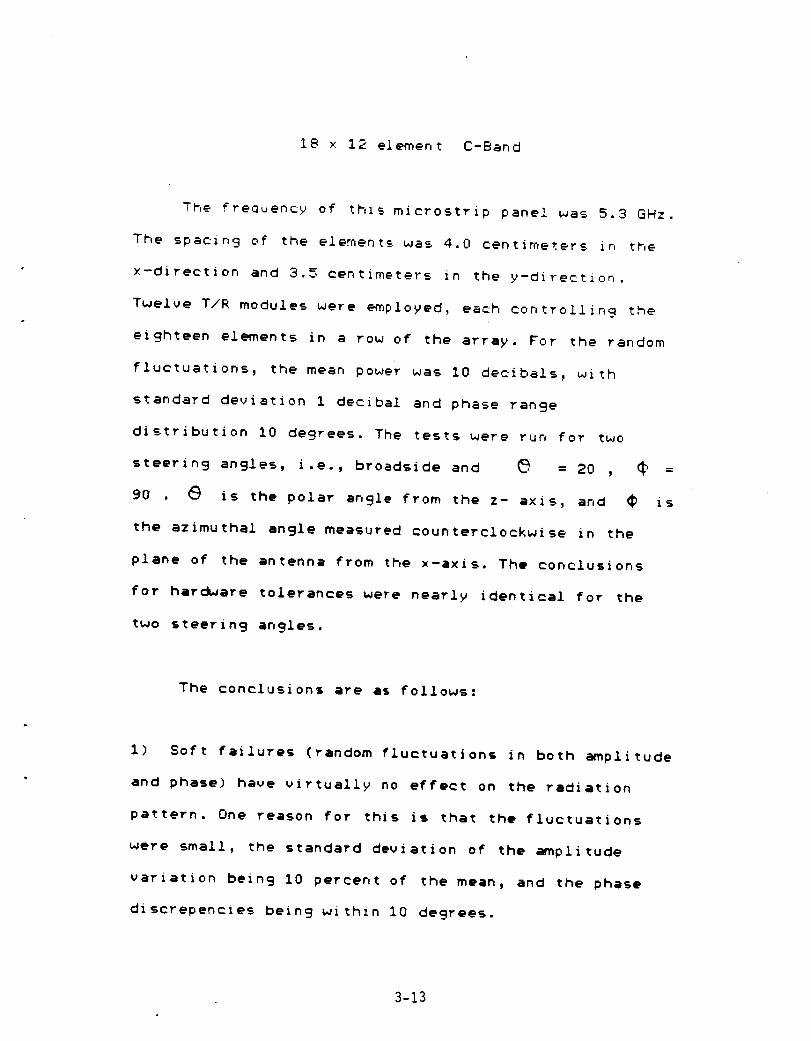
18 x 12 element C-Band
The frequency of this microstrip panel was 5.3 GHz.
The spacing of the elements was 4.0 centimeters ir, the
x-direction and 3.5 centimeters in the y-directzon.
Twelve T/R modules were employed, each controlling the
eighteen elements in a row of the array. For the random
fluctuations, the mean power was iO decibals_ with
standard deviation i decibal and phase range
distribution 10 degrees. The tests were run for two
steering angies, i.e., broadside and _ = 20 , _ =
90 r. _ is the polar angle from the z- axis, and _ is
the azimuthal angle measured counterciockwise in the
plane of the antenna from the x-axis. The conclusions
for hardware tolerances were nearly identical for the
two stearin 9 angles.
The conclusions are as follows:
I) Soft failures (random fluctuations in both amplitude
and phase) have virtually no effect on the radiation
pattern. One reason for this is that the fluctuations
were small, the standard deviation of the amplitude
variation being iO percent of the mean, and the phase
discrepancies being within iO degrees.
3-13

2) The maximum acceptable level of hard failures is
two. Beyond that, there is a high degree of probability
that one ot both of the above criteria will not be met.
The degradation of the pattern is greatest when the
failures are concentrated at the center of the antenna.
With two hard failures, there is a very small
probability that the sidelobes in the elevation plane
will rise to within 10 decibals of the mainlobe.
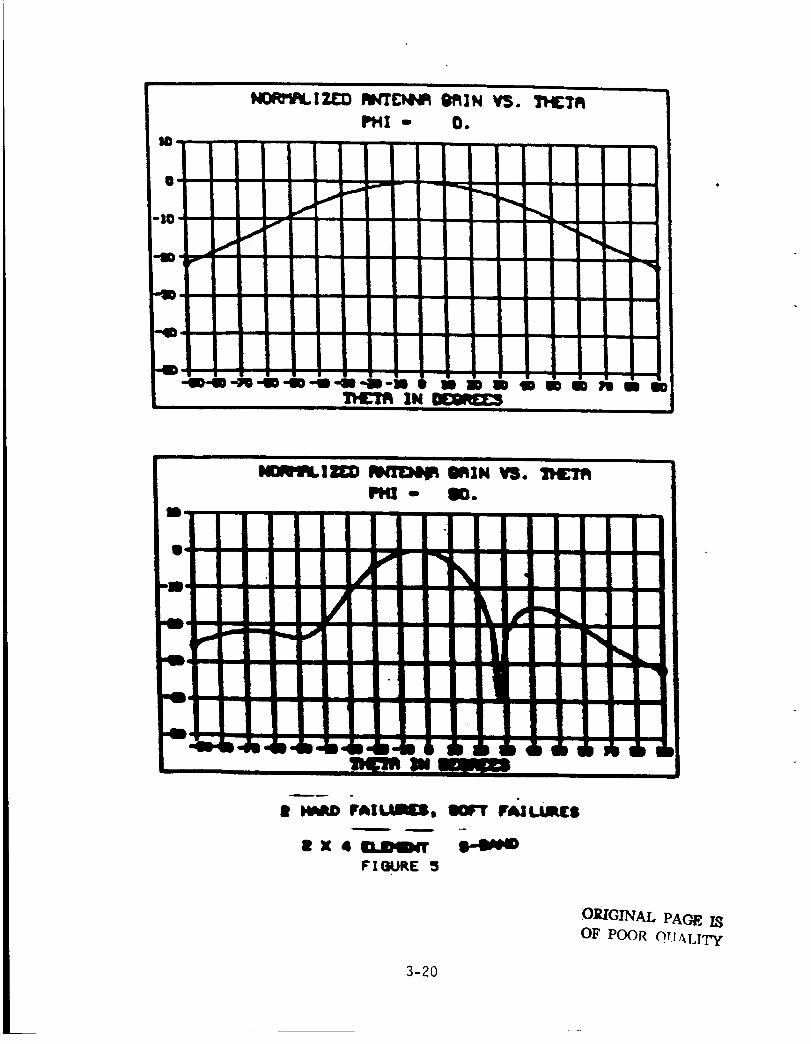
2 x 4 element S-Band
Microstrip panels at two different frequencies were
tested at S-Band. The frequencies were 2,1064 GHz and
2.2875 GHz. Since the results for the two frequencies
are almost identical, only those of the former antenna
will be reported here.
The spacin 9 of the elements was 0.47 A in the
x-direction and 0.56 A in the y-direction, where the
wavelength _ equals 14.242 centimeters. Each array
element was controlled by an independent T/R module. For
the random fluctuations, the mean power was 7 watts,
with standard deviation 0.5 watts and phase range
3-14

ORIGINAL PAGE l_
OF POOR QUALITY
distrlt, ut!or, 25 _egree_. Degraded patterns were desireO
for three different steerings: I) broadside; 2) _ = 90
degrees, _ = 0 _egrees; 3) e = 45 degrees, _ = 90
degrees.
It was discovered that the antenna could not be
steered to the directions 2) and 3) aboue. The maximum
angle in _ to which the beam can be steered is about
iO degrees. The probable cause for this phenomenon is a
combination of two factors:
a) the small number of elements;
b) the element pattern F = { (I/2)[l-cos(_ -_ )] }4
The array factor produced by a) is not stron9 enough
offset the contribution of b) at small ualues of
The ratio of the element pattern for _ = 0 de9rees to
that for _ = 90 degrees is 16.
The conclusions for the broadside tests are as
follows:
I) Soft failures haue a negligible effect (less than 1
percent) on the maximum power leuels due to the small
standard deuiation of 0.5 watts compared to the mean of
3-15

7 watts. Howe,v, er, they a_,pear in some tests to
contribute to a small (less than i degree) drift of
the mainlobe and, when combined with hard failure=_, to
undeslrably high sidelobe levels.
2) The maximum acceptable level of hard failures is
two. With three hard failures, the average loss in
decibals at the maximum is 9rearer than 4. With two hard
failures, the auera9e loss in decibals is between 2.5
and 2.6 , with one pattern measured at 2.96 . With soft
failures, there is about a 20 percent chance that a
sidelobe could rise to within 10 decibals, even within 6
decibals.
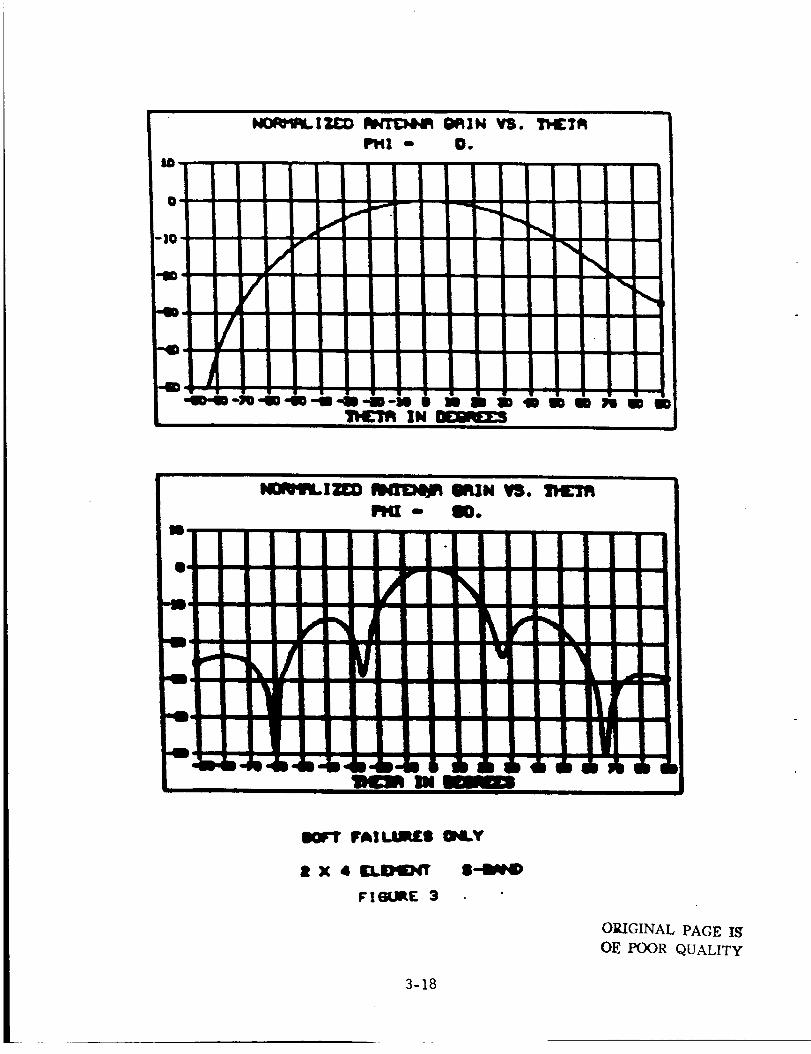
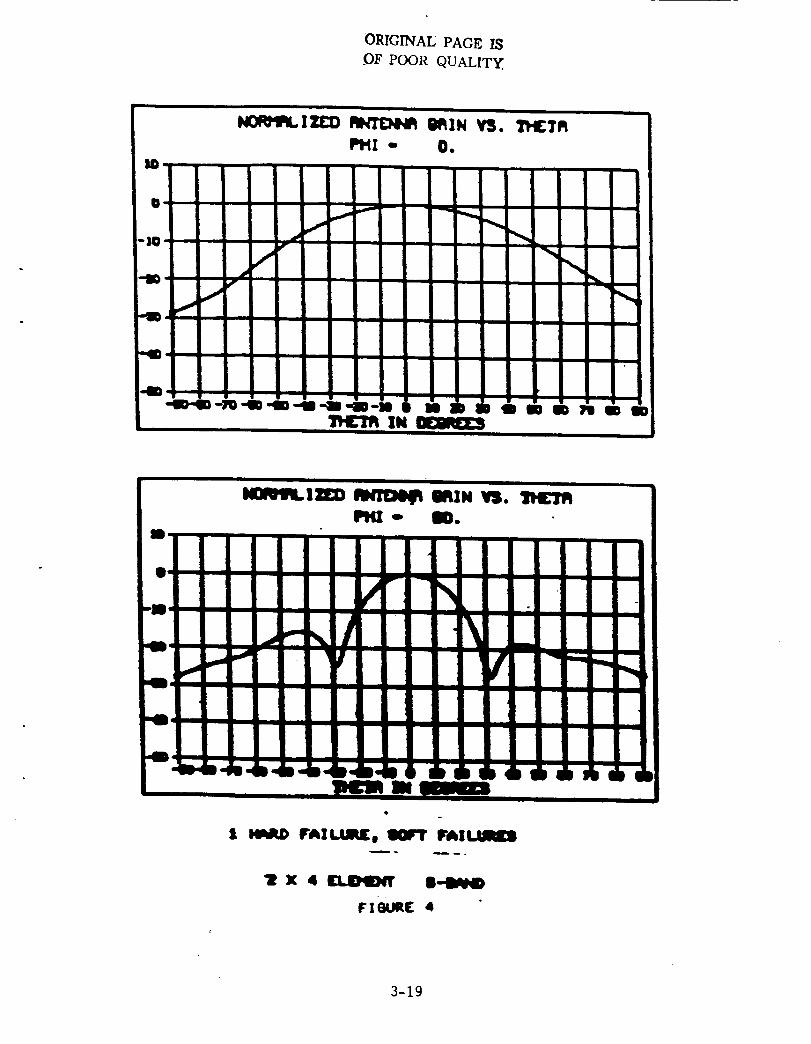
Graphical displays of the results are 9iuen in
Figures 2-6. Since the 9ain shown is normalized,
however, one must examine tabular output to determine
absolute power levels.
3-16

ORIGINAU PAGE IS
OF POOR QUALITY
' 11111.11il i!I I
Jz11 11,1111 _./ lllllllllllii\.
!11111111111 _"iillllilllll I. ;
II(IN'ILIII:D _ ImIN VS.PHI - IN).
I|
!I
lOCAL
|X4 I[I.mD_
F | 8UII_[ 2
I-treND
3-17
Qm
-I0 "i
"410
"g, /!
_J
V
Im
II-
w
m
H_4_.IXD gIfl'EN_ m_IN VS.
Pl_- no.
I R'I II
IlOlr'r P'AILIJIRIE_II KY
• X • IDLOqD4T 8-IW4D
F X6URE 3
ORIGINAL PAGE IS
OF. POOR QUALITY
3-18
ORIGINALPAGEIS.OF POOR QUALITy
_t
iI_I - O.
I/
/J
r
I
-- = •
"g0-10-1_'qm'4B'4B'_S=i "I I 18 I• .IC'/_ IN acm_z:s
l
d
imm_m_
lelml_lZgD _ _IW VS.II'HI - gO.
i _ FAI_. _ FAILJIES
"1 x 4 (LOqD_ 8--weo
F 1_Jl_( 4
3-19
n
r
r
NOn'R, IitZ) lerfl)Op Ot_]N VS.
• Illll fAIIll
IX41_II"I ltl.lllE _!
F,,il. li
3-20
ORIGINAL PAGE IS
OF POOR 0r.}'A LITY

ORIGINALPAGEINOF POORQUALITy
m
bDqrt_lZl_ Iq,r/'E;_rt I_]N VS. T_ICTIq
PHI- 0.
4m
--' ]]_ ",
t0-
-11.-
_-_'I-I-qO )-N U J B I t0 gO D n m g'D4L'_ IN D£_E_3
II
NONmLlZ[O _ IqlN VS.PHI - 00.
w ii
I
,,,I'=- : "w b-b,b-iI-& 6 d_ db 6 6 6 6 A 6 I
5n4L'_ IN _
• IIMP.O leAl_o _ FAII,_I
tX4I_ I-I_
Ir I 8URE •
• 3-21

1986
NASA,,ASEE SU_,IMER FACULTY RESEARCH FELLOWSHIP PROGRAK
Johnson Space Center
University of Houston
INITIAL PLANETARY BASE
CONSTRUCTION TECHNIQUES AND MACHINE IMPLEMEI{TATION
Prepared by: William W. Crockford
Academic RanK: Research Associate
University and Department: Texas A&M University
Texas Transportation Institute
NASA/JSC
Directorate: Englneering
Division: Advanced Programs
Branch: Systems Definition
JSC Colleague: Ann L. Bufkin
Date: 8 August 1986
Contract : NGT-44-005-803 (University of Houston)
4-I

N87-26696
INITIAL PLANETARY BASE
r,,A:, IMPLEMENTATIONCONSTRUC_T .... u_O_ TECHNIQUES AND INE
william w. Crockford
Research Associate
Texas Transportation institute
Texas A&M University
College Station, Texas 77843
Concemtual deslgns of (a_ initial planetary base
_ and (D) an unmanned machine to perform thestructu.e_,
_ _ " _ localcons_ruc._on of tnese structures u_inm mate,rlals
to the planer are presented. Rock meitinQ is suggested
as a possible nechniaue tc be used Dy the machine in
fabricating roads, platforms, and interiockinm bricks.
Identification of problem areas in machine desian
and materials processing !s accomplished. The
feasIm1±ltV c. the desians is contingent upon fav_rabie
results of an analysis of the engineering behavior of
the product materials. The analysis requires knowledge
of several parameters for solution of the constitutive
equations of the theory of elasticity. An initial
collection of these parameters is presented which helps
to define research needed to perform a realistic
feasibility study.
A qualitative approach to estimating power and
mass lift requirements for the proposed machine is used
which employs specifications of currently available
equipment from various manufacturers.
An initial, unmanned mission scenario is discussed
with emphasis on (a) identifying uncompleted tasks
which necessitate manned follow-up missions, and (b)
suggesting desiQn considerations for vehicles and
primitive structures which will use the products of the
machine processing.
The period of research was 16 June - 8 August
1986. The use of names of manufacturers does not
constitute official endorsement of such products or
manufacturers by NASA or any U.S. government agency.
NASA Colleague: Ann L. Bufkin ED2 X2536
4-2
ORIGINAE P,_GE 1_
OF POOR QUALITY
INITIAL PLANETARY BASE
COXSTRUCTIC:_ TECHNIQUES AND MACHINE _ , r--_ ..... iO:<
.......T_:T_ODUCTION AND PROBLEF: DE_INImi_ ON0
Planetary base construction wil t involve mui -_ "
missions due to mass and volume ii=t: requirements fro[
earcn. This paper describes a conceDt fcr an early
unmanned mission which will accomplish the ini[ial
tasks o = paso ccnstruc::on. T_e mission conce_:
includes, as a key element, tne conceDtuai deslgn cf a
_ . _,..ch wl_<!anetary materials Drocessinc machine '_ _
accomz:iisn, the inl:iai construc5ion tasks. _,n__ machine
is intended tc p:oduce bricks, roads, and platforms
_dsinc materials local to the planet. The machine
subsys_=ms'_ should be modular in the sense tnat n=,.._..
tecnno_o :== which appear before iauncn can h=
implemented with a minimum of additional design effort.
Monetary costs of the machine are not directly
addressed in this paper. However, the costs in terms
of mass lift, operating power, and planetary resource
utilization are discussed briefly.
The words "soil" and "regolith" are used
interchangeably in this report. The primary emphasis
is on lunar base applications because more data is
available, it will act as a stepping stone to the other
planets, and i_ is potentially more harsh an
environment in which to test ideas and technology than,
for example, Mars.
BACKGROUND CONSIDERATIONS
Chemical Processing. The conservation of
planetary natural resources is an issue which must be
addressed very early in the planetary infrastructure
development program. For example, because water is so
vital to human presence on the planets, it seems
imprudent to make structures of concrete even on Mars
(and even using water reducing agents as suggested by
Young in [46]) where water, atmosphere, and non-zero
relative humidity exist. The carbonation curing
mentioned by Young [46] may hold some promise, but is
not discussed in this paper. AlthouQh it is true that
4-3
recent advances in cements, water soluble polymers, andmetal and polymer fibers have resulted in excellentconcrete oroducts (compressive strenaths 3O-40ksi!200-300MPa], see Young in [46]), the use ofearth-based portland cement concrete technology shouldbe postponed at least until after she establishment ofclane=ary factories which can produce the necessarycomponents of the mix.
Although inorganic polymer chemistry seems nc De apromisina approach to the problem of concrete _ypemaneriai processing, the progress _n _h!s field isapparently confined to linear cnalns Esee Lee in [i0]].Lee also briefly reviews a promising necnnique fo_ toeproduction of high touQhness metal glasses which arenot discussed herein. In fact, glass may be consideredto be an inorganic polymer [67] and is considered as anoption, in thls paper, for s%ructura! material.
U__tnan. foamed p±asric scabil=za_on of iuna_soil slmulancs has resulted in unconfined compresslvestrengths on the order of 4-5ksi (27.58-34.48MPa) [48].However, the technique was primarily studied using soilgrouting techniques. Extension of the testing tovacuum environments led to problems with thestabilization procedure [49]. Phenolic resins werealso tested with unsatisfactory results [49]. Problemswith conventional stabillzation techniques usingstabilizers such as portland cement, foamed plastics,resins, and asphalt products should not come as asurprise if one considers vapor pressure in theanalysis. These techniques may be successful on Marsbut should not be expected to perform flawlessly on themoon .
Based on qualitative considerations and
experimental results, chemical processing of maneriais
for structural purposes was eliminated fromconsideration.
Passive and Semi-active Mechanical Processinq.
Two concepts are of interest here: (i_ semi-active
techniques such as controlled rock fracturing for
shaping building stones or soil moving and placing, and
(2) passive techniques such as simple building rock
recovery and replacement or adaptation of existing
planetary crust formations (e.g. craters, lava tubes).
Of these techniques, only soil moving and placing and
4-4
ORIGINAE PAGE Ig
OF POOR QUALITY.
adaptation of existina formations are eecnniaues for
which the machine is desiqned. Contrclied rock
fracturing and buiidinQ stone recovery and Diacement
are tasks which are too time ineensive and which
reauire too much arti _ _'cuaa_Ion on the part of the
machine.
Uneerfected Methods of Prccessina. The use of
lasers and microwaves for reck fragmennation bv
differential heating of minera!s within the rock has
been under study by the Bureau of Mines. The use of
expiesives In .. vacuum for reck fracnurinc has aisc
been studied isee Podnleks and RoeDKe in [46] These
techniques are not dlscussed in this paper.
For the production of construction mater!ais such
as "bricks", microwave precesslng is a very premising
technology (see Meek etal. in [46]). The total
energy requlremenns are much lower than those of
conventional heating techniques. Meek etal. have
used 2.45GHz ultra high frequency (UHF) microwaves to
induce diffusion bonded ceramic-glass-ceramic
junctions. Waves of this particular frequency couple
well with ilmenite inducing the necessary initial
temperature rise. While this technology may very well
become the solution to the power requirement problem on
the processing machine, several unanswered questions
have, unfortunately, precluded much more than a cursory
discussion of the technology in this paper. Very
little information on this technique has been published
[PC-13] with the most current and informative article
being that authored by Meek et al. in [46]. Some
questions of interest follow.
(I) Do microwave processed materials have better
engineering properties (e.g. strength, toughness) than
_,_a_ _no_s. A.... se processed with ........ t _ i
qualitative assessment based on inferences by Meek et
al. [46] would indicate an answer to this question in
the affirmative. However, quantitative information is
needed to confirm this supposition.
(2) Are coupling agents at this frequency too
valuable or scarce to be relied upon for extended
usage? The abundance of lunar ilmenite is generally
less than 2% and may be a valuable source of Fe, Ti,
and O [69]. Mars materials contain valuable water [53]
which will couple.
4-5

(3' Is the variability of couoiln_ aaen.< .Dr_sen--=_=over the surface too areat to allow product uniformi:y?Is it a simcie matter to identifv variations incoumiing agents and tc ad_us[ the wavelength to couplewith a dif{___rent aaent?
(4 , Meek et al. [46] snane tha_ the ilmenine inan iime_e-,-ich basa _ _ _._= _ caus..... _ __u.__s .irst inc stemoeracure rise whicn, in addition, is sufficient cccause the oasai: cc couoie. Can this "dam!no coup!inc"elf =_* De expected to treat = s_rono, diffusion condincin any regciitn f_.e. no< only in _lmenlue-_ichbasa:t'_?
In Situ Melt _[ocessin_. The Los Aiamos
Scientific Laooratory (LASL; perfected a drillin<
technlque !n 1976 which utilizes simple ohmic heatin{
in a Denetrator which creates a dense aiass iinlna
around the hole as it d,:iils (see [4], [35], or Rowiey
in [46]). Because cf the Kelaclvely complete nature of
the research, develcDment, and documen_a%icn o: this
process, this tecnnlsue was Chosen as the process of
primary interest. The glass produc% of this process
has higher density, and higher compressive strength
than the parent materials (see Rowiey in [46]). The
process is apparently equally effective regardless of
soil oK rock composition. There are disadvantages with
both the process and the product which are discussed
later in this paper.
MATERIALS CONSIDERATIONS
Lunar r_aterials. Table 1 contains some of the
parameters for lunar materials and glass prcducts which
are necessary for solution of the constitutive
equations of the theory of elasticity and for the
solution of other ecuations used for terrain-vehicle
system calculations. Mitchell et al. [51] recorded
moduli of subgrade reaction which indicate that
insensitive structures may be successfully placed on
foundations made of the in situ lunar material.
However, the sensitivity of the modulus of subgrade
reaction is in question even in the best of
circumstances (Horonjeff in [68]). For sensitive
structures (e.g. observatories [38]), Mitchell et al.
[51] suggest that burying footings deeper where the
lunar soil is more dense (which could be done with a
4-6
ORIGINAL PAGE IS
OF POOR QUALIT_
ORIGINAL PAGEIg.OFPOORQUALITY
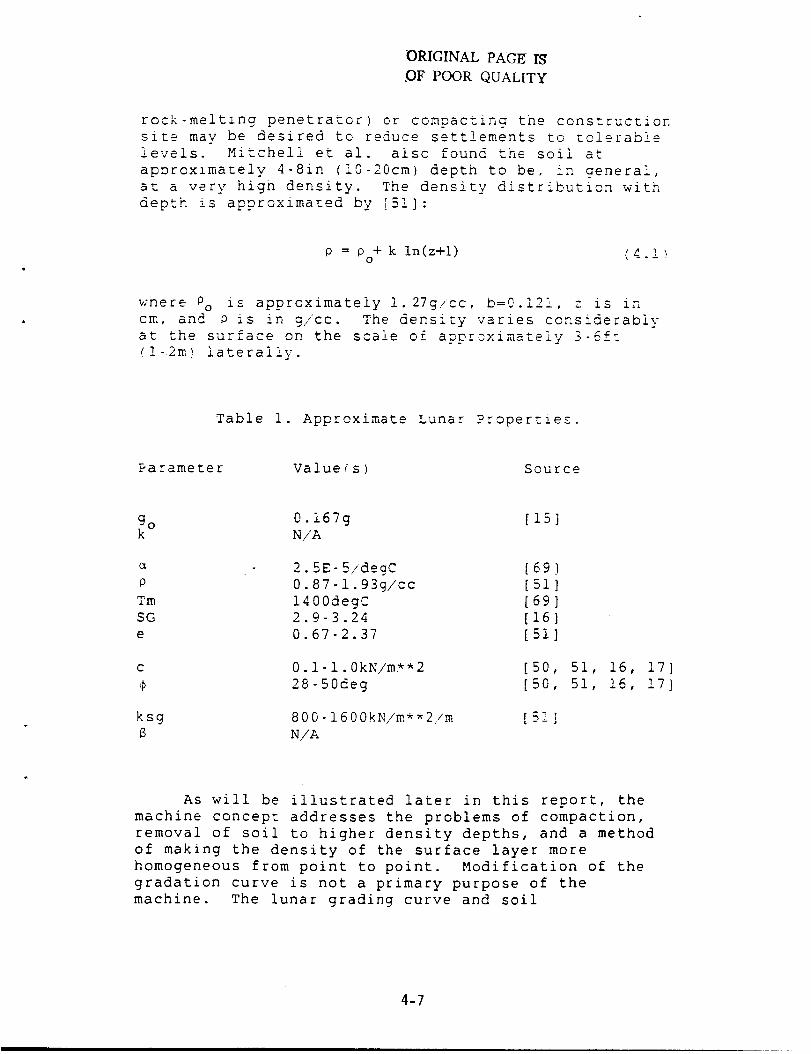
rock-meltzng penetrator) or comDactinc the construction
site may be desired tc reduce settlements to telerabie
levels. Mitchell et ai. also found the soil at
aporoxlmately 4-8in (i0-20cm) depth to be, in aenera!,
at a very high density. The density distribution with
depth is approximated by [51]:
p = p + k ln(z+l)0
/_ "l \. °.& ,
where 0o is approximately i. 27g/cc, b=0.12; , z is zn
cm, and P is in g/cc. The density varies considerably
at the surface on the scale ef approximately _ _=
(!-2m_ laterally.
Table i. Approximate Lunar Propertzes.
_arameter Value(s) Source
go 0.167g [15]k N/A
2.5E-5/degC [69]
p 0.87-1.93g/cc [51]
Tm 1400degC [69]
SG 2.9-3.24 [16]
e 0.67-2.37 [51]
c 0.1-1.0kN/m**2
¢ 28-50deg
[50, 51, 16, 17]
[50, 51, 16, 17]
ksg _NN-1600kN/m**2/m [51]
B N/A
As will be illustrated later in this report, the
machine concept addresses the problems of compaction,
removal of soil to higher density depths, and a method
of making the density of the surface layer more
homogeneous from point to point. Modification of the
gradation curve is not a primary purpose of the
machine. The lunar grading curve and soil
4-7
classification indicate a we!i-araded sii=v sand tcsandy si!t fSW-SX to ML in the Unified sysnem [5!]_ andfurther modificanlon no the aradan_on is not deemed
necessary or deslreabie by thls aunnor. However, the
machine does perform a crushing funcnicn as mart of the
preprocessing of soil intended for bzi=_ nrcduction.
This crushinc is simoiv s methcd cl insu_in_ a maximum
desired particle size for the Orick, Given any soil
Inpu _ .
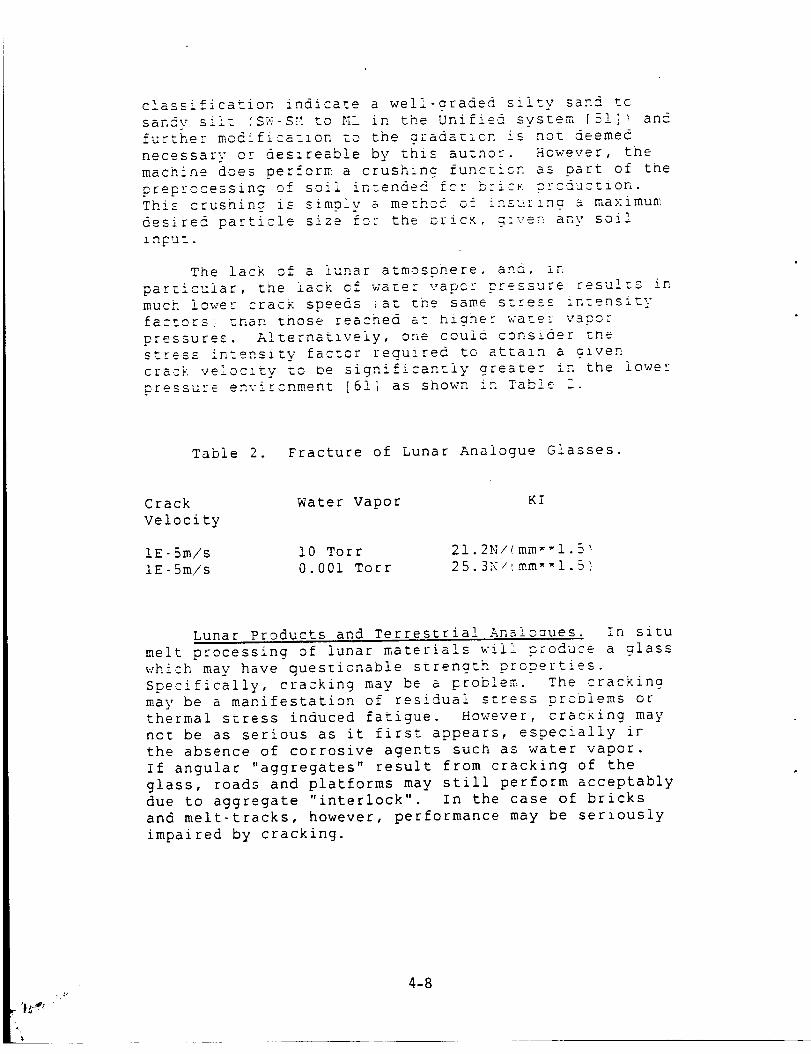
The lack of a lunar atmosonere, and, _n
particular, the iack of wa_er vaoc_ cressure results in
much lower crack speeds ian the same snress intensity
facnorsi :nan _nose reached at hioner waner vanor
pressures. Alternatively, one could consider the
stress intenslty factor reouired to attain a oiven
crack veloclty Zo De significansiy greater in the lower
pressure environment [61] as shown in Table Z.
Table 2. Fracture of Lunar Analogue Glasses.
Crack Water Vapor KI
Velocity
iE-Sm/s i0 Torr
iE-5m/s 0.001 Torr
21.2N/fmm-_l.5_
25.3N/_mm-_!.5)
Lunar Products and Terresnria] An-"_ =_oaues. In situ
melt processing of lunar materials will produce a alass
which may have questionable strenath properties.
Specifically, cracking may be a problem. The cracking
may be a manifestation of residual snress DroDiems or
thermal stress induced fatigue. However, cracking may
not be as serious as it first appears, especially in
the absence of corrosive agents such as water vapor.
If angular "aggregates" result from cracking of the
glass, roads and platforms may still perform acceptably
due to aggregate "interlock" In the case of bricks
and melt-tracks, however, performance may be seriously
impaired by cracking.
4-8
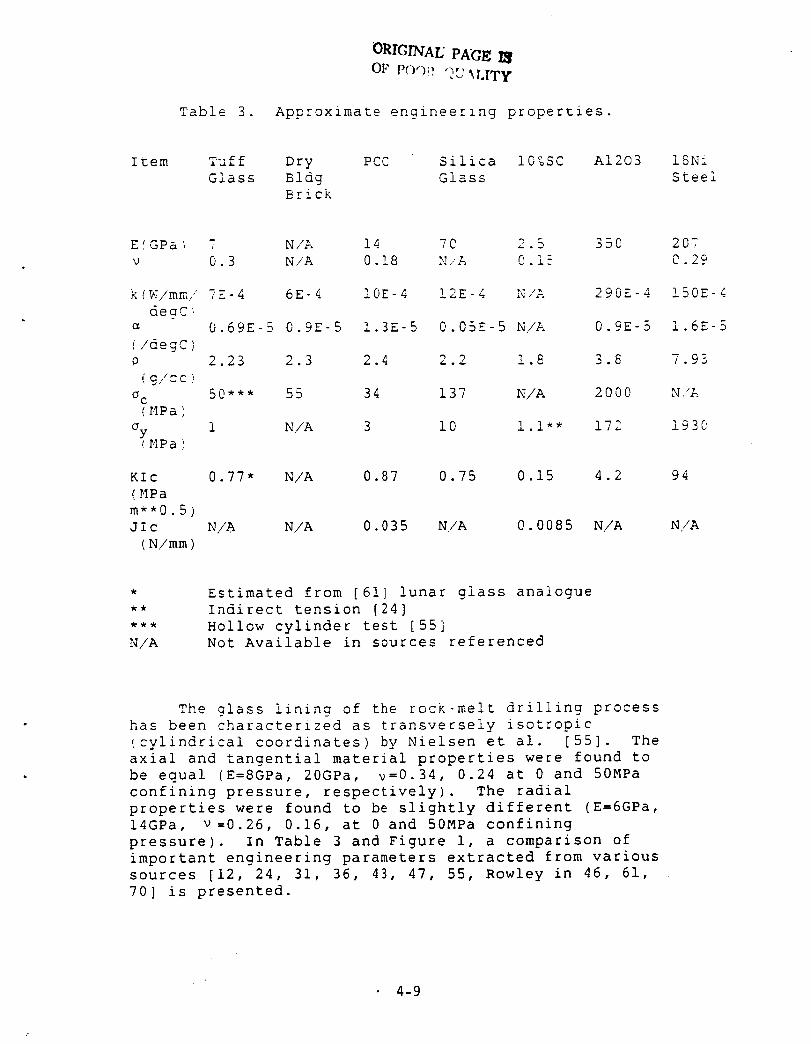
Table 3.
ORIGrNAL PAGE
OF PO')i_ "'.'U %LITY'
Approximate engineering properties.
Item Tuff
Glass
Dry PCC Silica
Bldg Glass
Brick
10%SC A1203 18N:
Steel
E_GPa_ 7
v 0.3
N/A
N/A
k{W/mm/ 7E-4
deoC
p
( g/cc
gC
(MPa ]
Oy!MPa )
6E'4
0.69E-5 0.9E-5
2.23 2.3
50*** 55
1 N/A
KIC
(HPa
m'*0.5
Jic
(N/mm)
14 70 2.5
0 .18 N,A 0 .15
10E- 4 !2E- 4 N/A
1.3E-5 0.05E-5 N/A
2.4 2.2 1.8
34 137 N/A
3 i0 1 .i**
350
290E-4
0.9E-5
3.8
2000
172
0.77* N/A 0.87 0.75 0.15 4.2 94
N/A N/A 0.035 N/A 0.0085 N/A
20"
O .29
i50E-4
1 6E -_
7.93
N ,/A
1930
N/A
N/A
Estimated from [61] lunar glass analogue
Indirect tension [24]
Hollow cylinder test [55]
Not Available in sources referenced
The glass iinina of the rock-melt drilling process
has been characterized as transversely isotropic
(cylindrical coordinates) by Nielsen et al. [55]. The
axial and tangential material properties were found to
be equal (E=SGPa, 20GPa, v=0.34, 0.24 at 0 and 50MPa
confining pressure, respectively). The radial
properties were found to be slightly different (E=6GPa,
14GPa, v =0.26, 0.16, at 0 and 50MPa confining
pressure). In Table 3 and Figure i, a comparison of
important engineering parameters extracted from various
sources [12, 24, 31, 36, 43, 47, 55, Rowley in 46, 61,
70] is presented.
• 4-9

1000
I00
I0
01
_I 2 $ 4 5 6.
Matociils
i
7
7,
6'
5'
I)_J_it9 Lg/cc) 4 .
3'
2,
1
0
I 2 3 4 5 6 7
Hlt_fials
1.6
14
12
1.0
Ak,_a
(/"C) E-5 08
0.6
0.4
0.2
0.0
2 3 4 5 6 7
I=SOIL CEMENT, 2=SILICA GLASS, 3=TUFF GLASS, 4=PCC
5=AL203, 6=18NI STEEL, 7=DRY BUILDING BRICK
Figure i. Graphic presentation of selected parameters
from Table 3.
It is difficult to compare many of the values in
Table 3 and Fiaure 1 because of the different test
methods involved. However, it is useful to note that
lunar glasses, fused silica, and a rather ordinary
plain portland cement concrete (PCC) have fracture
toughnesses of the same order of magnitude. An order
of magnitude study also indicates that glass from rock
melting has a compressive strength comparable to both
plain PCC and ordinary dry building brick.
Martian Materials. Little information is
available concerning engineering properties of the
martian regolith. However, some properties have been
4-10
ORIGINAL PAGE IS
OF POOR QUALITy.
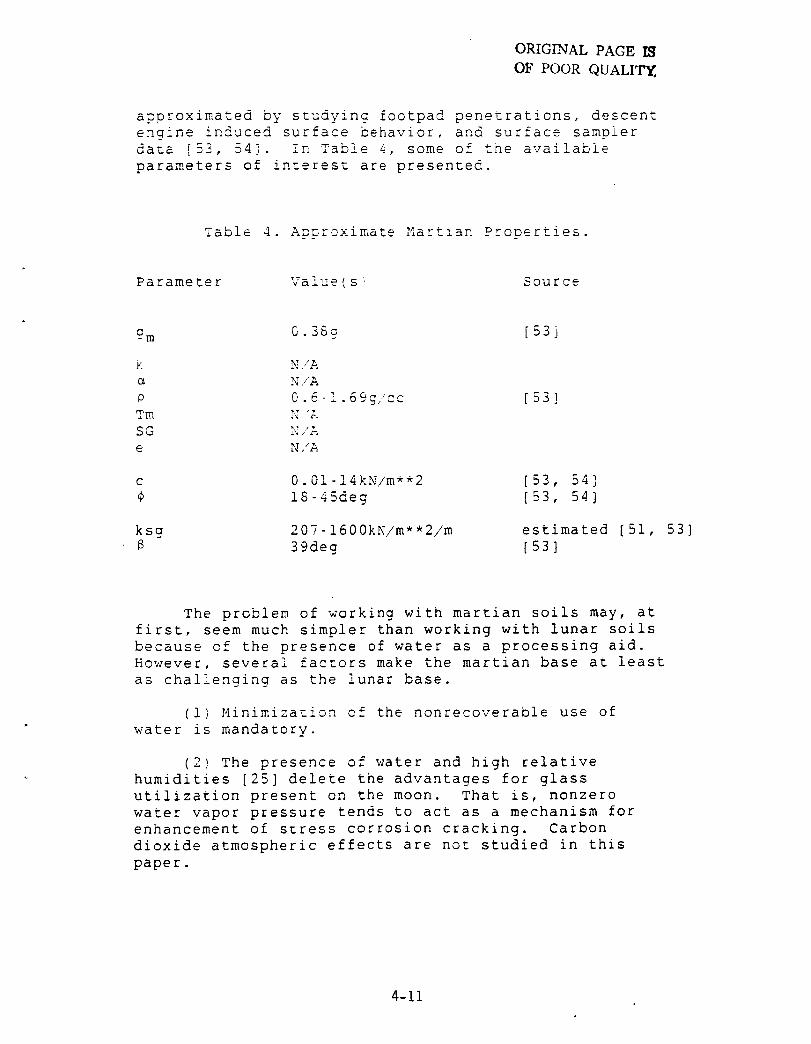
ORIGINAL PAGE I_
OF POOR QUALITy,
approximated by s_udying footpad penetrations, descenz
engine induced surface behavior, and surface sampler
da%a [53, 54]. in Table 4, some of the available
parameters of interest are presented.
Table 4. Approximate Martian Properties.
Parameter Value(s: Source
gm 0.38a [53]
k N/A
a N/A
P 0.6-1.69g,/cc
Tm _ =.
SG N ,"A
e N ,'A
[53]
c 0.01-14kN/m**2 [53, 54]
18-45deg [53, 54]
ksg 207-1600kN/m**2/m estimated [51, 53]
8 39deg [53]
The problem of working with martian soils may, at
first, seem much simpler than working with lunar soils
because cf the presence of water as a processing aid.
However, several facrors make the martian base at least
as challenging as the lunar base.
(i) Minimization of the nonrecoverable use of
water is mandatory.
(2) The presence of water and high relative
humidities [25] delete the advantages for glass
utilization present on the moon. That is, nonzero
water vapor pressure tends to act as a mechanism for
enhancement of stress corrosion cracking. Carbon
dioxide atmospheric effects are not studied in this
paper.
4-11

i3_ The occurrence of freeze-thaw cycles [53] isvi_-tualiv assured.
(4) The presence of montmori!icnitic c!avs [53]may be detrimental to structural materials duringwet-dry and freeze-thaw cycles. On Earth, these type
_ _ _ _ ' - . .clays o__e_ ex_ibi e dimensional instaoiiltzes in the
presence of wet-dry cyclinc.
Air enzrainlnm aoents are often used tc heic
alleviate the Drobiems associated with freezina and
thawing. Tne agents insure a discontznuous pore system
made up cf very small bubbles Dy acting as
surface act _ _ _ _h_ __- __ aQents. _ _ proc_=s used for makin_
structural materials out of martian regolitn may
require (a) removing all water from tne system, except
pernaps for tightly bound water interior tc the double
diffuse layer, and/or (b} waterproofing tne component.
It may be pcssibie to accomplish freeze-thaw protection
using a combination of sintering and rock meltino
techniques, but the protection may come at some unknown
cost in terms of an increased susceptibility to stress
corrosion cracking.
INTERIM SOLUTION
The materials processing requirements are
temporarily met by a conceptual design which allows
removal of soil from the surface down to a depth which
gives a relative density [51] of 90% (i.e.
approximately 20cm). Manufacturing of bricks may be
done as the soil is piled in windrows during the
removal operation. The density at 20cm depth is on the
order of that of stabilized base materials. Compaction
to 95% relative density is then accomplished by
rollers. Pressure applied by pad feet is arbitrarily
set at 23kg/cm**2 (e.g. Caterpillar model CP323),
single lift of 10cm which requires approximately
27.6kg/cm**2 to give proper compaction. If the pad
foot could be made large enough (i.e. if the vehicle
were heavy enough), the operation could be completed in
one pass. Realistically, however, multiple passes
would be required. Excavation and melting of shallow
trenches would be the next operation for the making of
a glass track or "rail" system for follow-on vehicles.
The vehicles could be maneuvered in the trench-rails by
mobile controls (e.g. [PC-10]). The "road" would be
4-12

ORIGINAL PAGE I_
OF POOR QUALITy
made straiaht and level by usina a laser system (e.g.
[PC-3]) or some other navigational aid.
Uti_ization_ o {_ rock meltina or even hot press
sintering ce=hniaues will probably reauire on the order
of !.Sk_ Dower. Usina 5.14_[/kc [8] for a conservative
radiezsotove thermoeiec[ric generator (RTG) power tc
weiah% ra%ic results in an _75.5kg power unit. in
Figure 2, power versus weight is illustrated _or
varlous equipment (88 construction machznes of
manu£acturers).
600
500
400
I'W "300
200
1004_-_
,- ._.(,_.._tp"
I I I I I I I I
10000 20000 30000 40000 50000 60000 70000 80000
kg
Figure 2. Power versus weight for various construction
machinery. Y=0.11(X**0.72), R-Square=0.93, N=88.
As an illustration of general power versus weight
requirements, assume the planetary soil has an earth
unit weight of approximately 1600kg/m**3 in the loose
state and we desire to push 0.75m*,3 of the soil (e.g.
John Deere 650). Using a conservative coefficient of
traction factor of 0.5 for loose earth, dry sand and
clay loam [18], the minimum total vehicle weight should
be on the order of
1600"0.75=1200kg
or 456kg on Mars
4-13

456/0.5=912kg total machine weight on Mars
Using the regression model of Figure 2, a power
requirement of i4.8kW is suggested. Therefore, the
machine would be underpowered by approximately 10kW for
scil working purposes in terms of existing
manufacturer's e_uiDment.
Using the CaterDiliar models 815 and 825
compactors for the sake of example, it is seen that zne
we4_ __LLn of encine and fuel is approximately 65:_ cf the
weight cf the venlcie. This would imply that an RTG
weichina 1560kQ on earth and producin_ on the order of
25W/kg will allow successful desian cf the
aforementioned underpowered vehicle. The SP-106
program (see French in [46]) gives a glimmer of hope
that this power capability is attainable. This
analysis leads us to an estimate of the size
requirement for the machine on the order of a John
Deere model 675 (approximately 9 cubic mener volume,
3.2m long, 1.6m wide, and l. Sm high). This vehicle
size is also on the order of magnitude of theBoeing
LRV [22].
Comparisons using the regression relationship of
Figure 2 may be somewhat qualitative when one considers
that (a) the regression is for gasoline and diesel
engines manufactured in discrete power ranges, not for
electric power supplies and motors, (b) it is suspected
that design procedures for common earthworkina
equipment has not really attempted te maximize
production while minimizing both weight and power
requirements, (c) there is a very small difference
between the weight of the power unit and the weight of
the complete machine in the case of the 5.!4W/kg RTG
example, and (d) the RTG and SPI00 units contain their
own fuel system while the fuel weight for the engines
of earth construction equipment is impounded in the
vehicle operating weight.
Bricks will be made from the top 20cm of soil
which was removed in the original clearing operation.
The windrows of soil would be removed from the surface
and transported by a belt system to a crusher and sieve
before entering the mold for hot pressing, sintering,
and/or melting. Gravity flow of the material through
bins is not necessarily straightforward, but has been
studied [56]. The question of the desireability of a
4-14

hon pressed, sintered brick versus melting to a glass
coated or solid glass brick will nct De resolved
without experimental study. However, if the _iass
layer is annealed properly, and good bondzng with and
compaction of the interior of the brick zs attained,
the glass brzck may have two advantages over the
standard prick:
(i_ Higher density surfaces may allow decreased
thicknesses of protective radiation shieldinc.
(2) The relazively high stiffness glass layer may
(depending on the silica content and the effectiveness
of the annealing process in combating cracking) result
in higher strengths than the sintered material not only
because of the inherent material propertzes but aise
for the same reason that a testing machine using a
steel platen will yield higher concrete strengths than
a "brush" platen [47].
Glass coated "bricks" are not an idea new to the
natural lunar environment. Several glass coated rock
specimens have been studied. Some of the samples have
excellent strengths and impact resistance while others
are very fragile [PC-2]. The difference in impact
resistance of the glass layers of different samples is
thought to be caused by thermal treatment over geologic
time [PC-2]. An effort should be made to understand
the cause of the difference in glass layer impact
resistance and hypothesize how the process can be
accelerated for use as a construction material
processing technique. Elastic wave velocities are
available for some samples such as lunar sample 60015
[58], but other strength and material properties are
needed for this and similar samples.
In Situ Rock Meltinq. Both lunar and martian
soils contain volatile elements [15, 69] which can be
driven off by heating. It has been noted [35] that the
evolution of gas during melting may cause voids in the
glass. This problem was solved in the LASL research
program by increasing the melt pressure at the
glass-forming section. Apparently, attainment of high
pressure ahead of the penetrator stagnation point is
mandatory (see LASL Mini-review 75-2 in [57]).
Outgassing of lunar soil was also observed in
compression and shear testing by Carrier et al. [17].
The penetration rate is limited by the heat flux that
4-15

can be provided at the leading edge or stagnation point
[35].
In the brick manufacturing process proposed for
the planetary materials processing machine discussed
herein, maintenance of pressure in the mold using the
limitina case of the flat plate melter will not De a
sicnifican% problem. However, in the case of the
track-melt process discussed later in this paper,
confinlnc pressure may become slign%iy problematic. It
is suspected chat the problem is no% catastrophic.
The thickness of the melt layer in a given soil or
rock can De controlled by causing electric heatinc
current to flow directly through the rock melt layer,
by using a ionQ conduction heating section, or by
introducing pellets of material to be melted [2].
Since the glass layer is typically of the order of
4-!5mm thick in the LASL studies [2], control of the
glass thickness may be required. Specifically, thicker
layers may often De required. A new concept
specifically formulated for the planetary materials
processing machine is introduced to identify a
procedure for thickening a glass layer. It is
speculated that annealing of a horizontal glass plate
(or hole lining) may be accomplished simultaneously
with increasing the thickness of the plate as follows:
(i) Form the initial glass lining.
(2) Add loose raw material on top of the plate.
The amount of added material may govern the depth of
annealing.
(3_ Melt the new material so as tc anneal the
lower portion of the initial glass lining.
In this manner, heat treatment of the glass lining
may proceed from the outer lining material toward the
melter body. The last layer would have to be annealed
in a separate operation.
The glass layer produced by this technology will,
undoubtedly, have cracks similar to the radial cracks
observed by Nielsen etal. [55]. It is not known at
this time whether annealing, high pre-melt in situ
porosity, or mineral composition of the materials will
allow production of an uncracked lining. One should
4-16

expect to use fracture mechanics as the method offailure analysis because preexistina sharp flaws arevirtually inevitable. Theoretically, a very thin glasslayer is less likely to break due to thermal stresses[64] and may decrease the tensile stress (evenresulting in compression} in the top layer of a threelayered semi-infinite half-space [71]. The layeredelastic result is, of course, deDenden_ on modular andthickness ratios of the two top layers (top/middle)[71]. Given the existence of cracks in the glass layerand that the tensile stresses in a stiff top layer mayalso be reduced by increasing the thickness of the toplayer in relation to the middle layer, maximization ofthe top layer thickness is considered prudent. Thedesire for increasing thickness should decrease as themodular ratio decreases. Shear and deflection are alsoaffected by changes in these parameters and must beconsidered in the analysis.
Theoretical analyses using features of the AYERfinite element code [see 35] and experimentalverification are needed to transform the speculativeconcept of simultaneous annealing and thickening into aviable process.
The penetrators used in the LASL study usuallyemployed ohmic heating [4]. At least on the moon,electron-beam heating [4] may be an interestingalternative because of the availability of a vacuumenvironment.
Power requirements of the LASL penetrators in the2-6kW range are plotted in [34] as the abscissa inplots describing the calculated performance of adouble-cone consolidating penetrator (approximately75mm diameter, 180mm long). In general, penetrationrate (approximately 0.05-0.17mm/s) and surfacetemperature (approximately 1700-2000K) both increasewith total power, while the minimum required thrustingforce decreased at a decreasing rate (approximately0.6-0.1kN). The power requirements of the LASLpenetrators are Capable of being satisfied by RTGs [8]or SPI00s (see French in [46]).
Planetary Materials Processinq Machine. The machine
concept was formulated by defining its mission and
searching for existing technology which could be
adapted to the mission. Three primary machine tasks
4-17
were identified: (i) clearing and arading (i.e.
bulldozing), (2_ compacting, and (3_ brick and wearinc
surface fabrication. The caDabiiities to fracture,
rip, mill, adjust compaction drum weights, provide
vibratory compaction, and/or vertical articulation of
the drums (e.g. Ingersoll-Rand model LF-450_ were
considered, but eliminated from the design for rwc
reasons: (a) cost in terms of macnlne comp._x.<y and
expected reliability, and (b] clever choice of the
initial landing sites can be used to ellminase the
necessity for these additional capabili=les. Steel
track beadless tires [i _, and track systems, includinc
new low ground pressure tracks [PC-7] were considered,
but eliminated from _he desiqn because of the desire
for compac%ion. TracKs could be placed over the drums
after the comDactlon operation but this operatlon would
probably remuire a manned presence. In additlon to the
required processlng capabilities, the machine isintended for an unmanned mission and must have good
mechanical reliability (which is mucn more impor:ant
than production rate for this mission), excelien[
navigational capabilities, and remote control/data
analysis functions. The resulting machine concept is
basically a static compaction machine with a bulldozer
blade and a brick making unit. The machine is vaguely
reminiscent of equipment such as the Ingersoll-Rand
models SPF-56B, DA-28, or the Caterpillar models
CP-323, 815B, 816B, CB-214, combined with the Boeing
LRV. A diagram of the chassis and drum wheel system is
presented in Figure 3.
The size of the machine has been scaled down in
this paper in order to lower the power requirement.
The overall size of the machine and especially the drum
size should be increased to the maximum size possible
at launch _ime. A lander vehicle will house a
data/remote control link with Earth and a Laserplane
[PC-3] type transmitter. The laser receiver is placed
on the rear left corner of the machine chassis. The
melter of Figure 6 is mounted at the bottom of the
chassis between the wheels, is capable of vertical
articulation, and is positioned with the longitudinal
axis parallel to the y-axis of Figure 3 with the
"bullet" nose pointing in the negative-y direction.
Redundant systems should be available for all primary
systems except the power generator (e.g. the machine
should be able to carry out its mission even if part of
the four wheel drive capability is lost).
4-18

ORIGrN'AI: PKG"E IS
OF POOR QUALITY
Steering Axis
Laser Mounting
Penetrator
tSmooth
Drums
(B)
(A)
Padfoot Drums
--Radiator,
Instrumentation
Platform,
(Chassis)
Brick
Maker Bulldozer
Figure 3. General concept of the machine:
(a) transparent, (b) solid model with attachments.
The concept of the bulldozer blade and the brick makingsystem is illustrated in Figure 4.
4-19
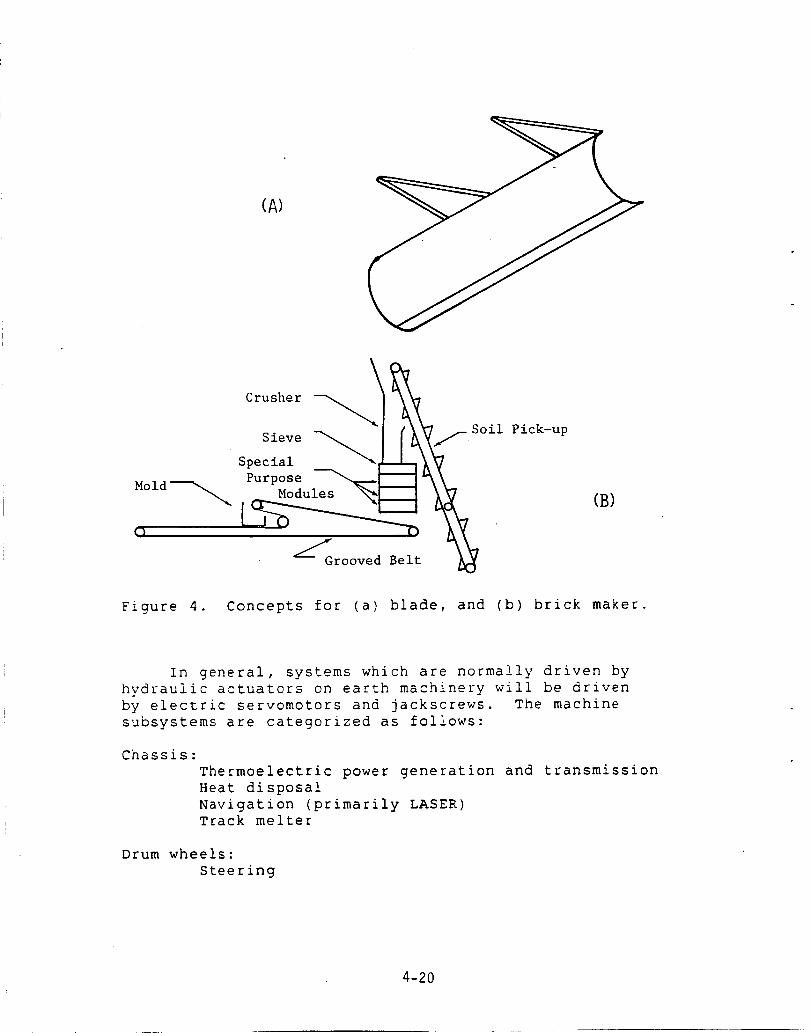
(A)
\
Crusher
Sieve -_Special
Mold --_ PurposeModules
Q
oi Pick-up
- iGrooved Belt
(B)
Figure 4. Concepts for (a) blade, and (b) brick maker.
In general, systems which are normally driven by
hydraulic actuators on earth machinery will be driven
by electric servomotors and jackscrews. The machine
subsystems are categorized as follows:
Chassis:
Thermoelectric power generation and transmission
Heat disposal
Navigation (primarily LASER)Track melter
Drum wheels:
Steering
4-20
Propulsion
Blade:
Servomechanisms
Materials processing unit:
Belt system
Crusner
Sieve
Raw material preheater
Brick producing mold
Brick cooling system
The drum wheels rotate 90 degrees either direction
about an axis parallel to the z-axis in Figure 3. This
rotation is necessary for three operations: (I_
generation of windrows is accomplished by angling the
wheels (which also allows immediate pickup ol raw soil
for brick production if properly designed), not by
angling the dozer blade as is typically done on earth
based machines, (2) final smoothing of a surface layer
can be done by turning the drums to the 90 degree
position so that only the smooth drums contact the
surface while the padfoot drums are off the smooth
surface, and (3) aeneration of the melt tracks
discussed later in the report reauire the full 90
degree rotation. Discarded designs which also utilized
the 90 degree rotation capability included the use of a
flat, heated dozer blade for the construction of
vertical walls and a microwave concept for binding
individual bricks to each other (somewhat like
slipforming the mortar in a brick wall). Since the
machine basically has no suspension system (i.e. no
vertical articulation of the drums), machine stability
considerations dictate that the dozer blade is reouired
not only for making smooth and level platforms, but
also for leveling ahead of the machine. The center
portion of the chassis is designed to house the major,
heavy components of the power unit allowing the center
of gravity to be lowered.
The machine is envisaged as being able to make
only one brick at a time. An "interlocking" brick
design for use without mortar is illustrated in Figure
5. A heated mold for the brick is used. The "sides"
of the mold are stationary, while the top plate applies
4-21

pressure (directly opposed by the heated bottom plate)
durln_ heating. The bottom plate is hinQed so that the
hop plate can be used to extrude the finished brick.
The process of making the brick is estimated to hake
approximately 1-3 hours (estimated from [3]).
i.................................................
.. CA),11
I_7.00-
-_-_-_- -
I'i15 oo
i
28o0 ]_--- 1 o, oo -,-,,_ 4. o o.,
I I I * _--.--- 14. oo--._--I "_,. :,o"......................... f_ ........................ i
(B)
Figure 5. Mortarless brick design:
(b) Dove tail.
(a) T shaped,
4-22
NO detailed overall machine design has been
accomplished. Problems which must be addressed before
detailed design can be done include, but are not
limited to:
(i! Brickmaker: Is the problem of gas evolution
serlous, or very simply handled by the pressure induced
by the top plate of tne mold? How critical is the fit
between the top plate and the sides of the mold? How
will cooling De controlled? Is complete meltlng to
glass desired, or is a standard hot press technique
actually better?
(2) Drums: Padfoot design (e.g. height, cross
sectional area, and geometric design) must be optimized
for the expected scii conditzons and machine weigh%.
Typical static pad foot pressures of 20-50Kg/(cm**2)
are attained with earth machinery. Lighter machines
and smaller cross sections of the pads will result in
the reauirement for more passes to attain desired
compaction. The smooth steel drums were originally
intended to be heated for rock melting of large
platforms, but the idea was discarded due to power
requirements and due to anticipated problems with the
thermodynamics of the melt layer. The smooth drums are
retained in the design in order to provide some static
compaction in sandy soil and to act as finishingrollers. If desired, the smooth drums may be wrapped
with a treaded belt to gain some of the advantages of
rubber-tired rollers. Drum diameter will be determined
by the soil conditions, vehicle weight, and desired
dozing capability.
(3) Blade: The blade has not been designed in
this report. Some considerations on the design can be
found in [5, 7].
(4) Penetrator: A desian of the glass forming
section of the penetrator is needed which will address
the question of confining pressure. A proposed design
is illustrated schematically in Figure 6.
In the pursuit of the solution to the detailed
design problem, modules to be added to existing
computer programs are proposed. Specifically,
bulldozer and melt processing modules should be
incorporated into the MSFC LRV analysis program [22].
The modified LRV program should then be incorporated in
4-23

the IDEAS**2 package [PC-I]. Extension of the AYER
[35] finite element program to three dimensional
analyses (i.e. beyond the axisymmetric case) should be
attempted at this stage of research. Solution of
several of the equations in the terrain-vehicle
interaction modules requires knowledge o_ the Bekker
soil value parameters [7] which are gzven for lunar
type soils in Table 5.
Figure 6. Schematic of track melting penetrator.
n k_ (ib/(in**(n+2)))
0.92* 6.26
1.0"* 3.0
Table 5. Bekker soil values [22].
k (ib/(in**(n+l)))c
1.13
0-0.4
* sand, basalt
** estimate for lunar soil
The resulting computer output should allow computation
of the ratio of (power available/power required) versus
total machine mass. It is anticipated that the correct
solution is attained in an iterative fashion when the
ratio is greater than or equal to 1.0 and the total
mass of the machine is large enough to accomodate the
4-24

mass and volume of the power supply. The suitability
of Bekker's approach to the locomotion problem has been
challenged in one case [48]. Since Bekker's method is
not completely analytical (i.e. several empirical
constants are required), careful review of the
equations involved and of the statics and dynamics of
the problem are required prior to implementing any
compuner codes.
On the other hand, three problems non directly
associated with the machine desIQn can be formulated
and solved in the snort term lupon acauisition of the
material properties of the brick] uslng the finite
element method.
(i) Thermally induced stresses or displacements in
the brick due to surface temperature fluctuations on
the order of 290 degrees C may be calculated in
preparation for failure analysis of the brick.
(2) Stresses or displacements resulting from
opposing distributed loads on the top and bottom of the
brick are needed. The impact of meteorites and moon
quakes (on the order of Richter 4 [69]) on assembled
walls should also be assessed.
(3) Stresses or displacements in the soil volumeahead of a bulldozer blade are needed.
Incorporation of probability distributions into
the finite element code as a statistical approach to
handling the problem of inhomogeneous, possibly
nonisotropic material should be a long term goal of the
computer code research.
STRESS ANALYSIS REQUIREMENTS
Bricks and Walls. The use of bricks for walls may
be necessary for purposes such as radiation protection
even in the cases where reactors are placed in craters
(e.g. French in [46]). Stress analysis of the bricks
will probably take place in a finite element context
because the geometric boundary conditions will make a
purely analytical derivation difficult at best. The
walls must be analyzed for performance under the
following loads: (a) meteorite impact, (b) thermal
• 4-25

cycling, (c) quakes on the order of Richter 4, (d)degradation by the solar wind; and, for Nars, (e_ windloads [60], and (f) stress corrosion induced by theatmosphere.
An early concept for an igioc shaded suructure(shell of revolution) with a very iarae base diametertc Height ratio was originally considered for use as astorage and habitat facility. The concept was to pilematerial in a mound, roll over the mound with themeitina drums, and then excavate the loose maueriaifrom beneath the glass melt shell (similar to conceptsdiscussed by Khalili in [46]). Although the shell ofrevolution often allows_ relat _v_=!y thin structures tobe built, this meuhed was considered to be impracticalfor several reasons not enumerated herein. Inaddition, excluding the drum melters during theredesign of the machine has precluded this option.Shell structures will therefore have to be launchedfrom Earth or made using a curved brick design whichhas not been done in this paper.
Melt Tracks. Geotextiles were considered for use
as road surfaces but were eliminated from the deszgn.
A concept of a melt track rail system which is ofinterest is illustrated in the initial base shown in
Figure 7.
The melt track system may be useful as a test bed
for the following concepts:
(I) Mining car transportation of materials may
proceed by means of linear induction motors placed in
the soil between the melt tracks and with guidance of
the car assisted by laser or other mobile control
systems [PC-10]. Propulsion of rather large payloads
at 17fps is attained routinely, with much higher speeds
attainable for optimized linear induction designs
[PC-9]. Pressure applied to the tracks by the cars
will be an important factor in the feasibility of this
operation.
(2) If the speed of vehicles using the tracks can
be increased to a reasonable rate, the system can be
used for rapid transit of astronauts from frequently
visited work areas remote from protective habitats back
to the habitats in the event of harmful solar activity.
4-26
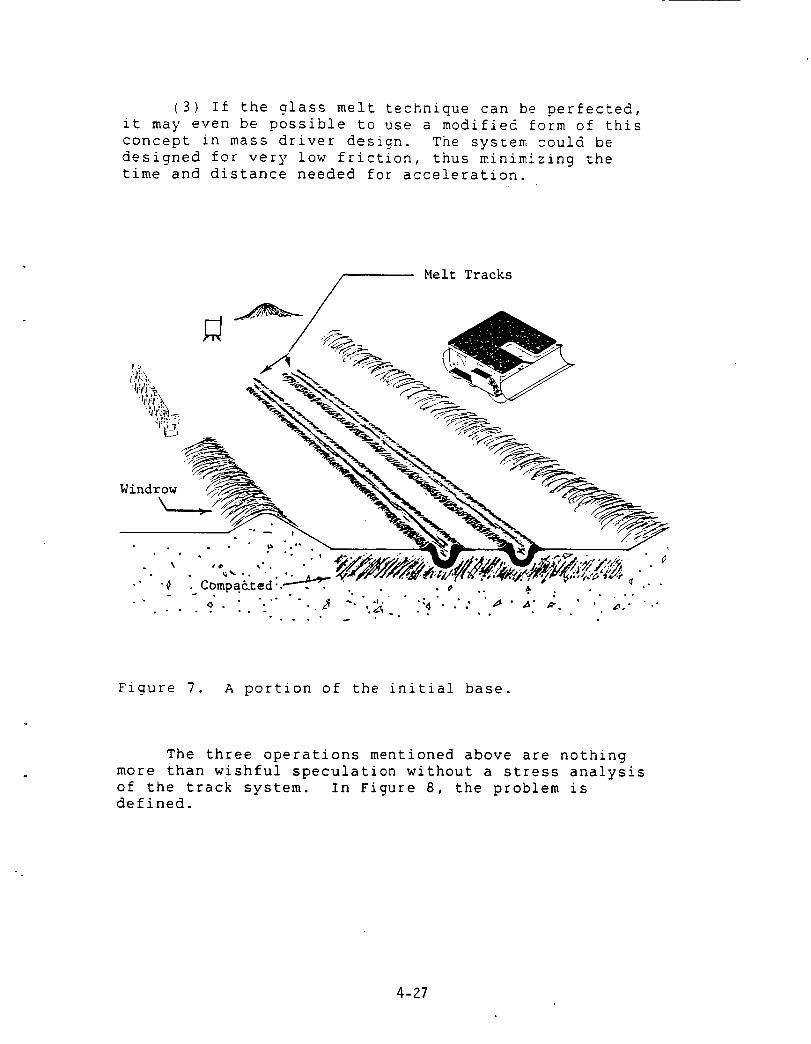
(3) If the glass melt technique can be perfected,
it may even be possible to use a modified form of this
concept in mass driver design. The system could be
designed for very low friction, thus minimizing the
time and distance needed for acceleration.
Melt Tracks
Windrow "k"_ "_a,_'N _.. '_
_ • _ ,_ -. . _ -_,-._f,_,,-,,'rq'#,:,_l_ct-_.//o ,;f,,-,--_-_,_-_,,,_,...__,,,t•" "¢ . ,_ompa_tea'._. . . . . _ .. _ . . o" •
....?. _. : .._ -.,._; _,_..: ,_.,a-,.. ' ..,,,....
Figure 7. A portion of the initial base.
The three operations mentioned above are nothing
more than wishful speculation without a stress analysis
of the track system. In Figure 8, the problem isdefined.
4-27
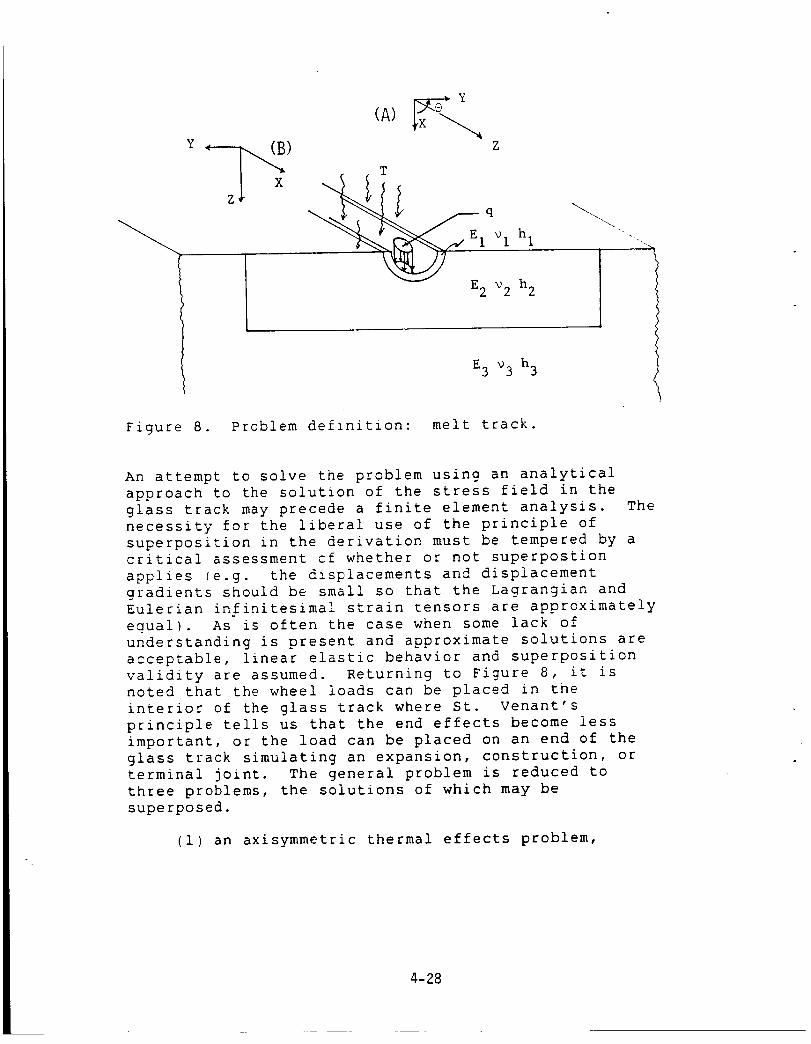
Y zT
x1 "°l hl " .,
E 2 "o2 h 2
E3 _3 h3
Figure 8. Problem definition: melt track.
An attempt to solve the problem using an analytical
approach to the solution of the stress field in the
glass track may precede a finite element analysis. The
necessity for the liberal use of the principle of
superposition in the derivation must be tempered by a
critical assessment cf whether or not superpostion
applies (e.g. the displacements and displacement
gradients should be small so that the Lagrangian and
Eulerian infinitesimal strain tensors are approximately
eaual). As is often the case when some lack of
understanding is present and approximate solutions are
acceptable, linear elastic behavior and superposition
validity are assumed. Returning to Figure 8, it is
noted that the wheel loads can be placed in the
interior of the glass track where St. Venant's
principle tells us that the end effects become less
important, or the load can be placed on an end of the
glass track simulating an expansion, construction, or
terminal joint. The general problem is reduced to
three problems, the solutions of which may be
superposed.
(i) an axisymmetric thermal effects problem,
4-28
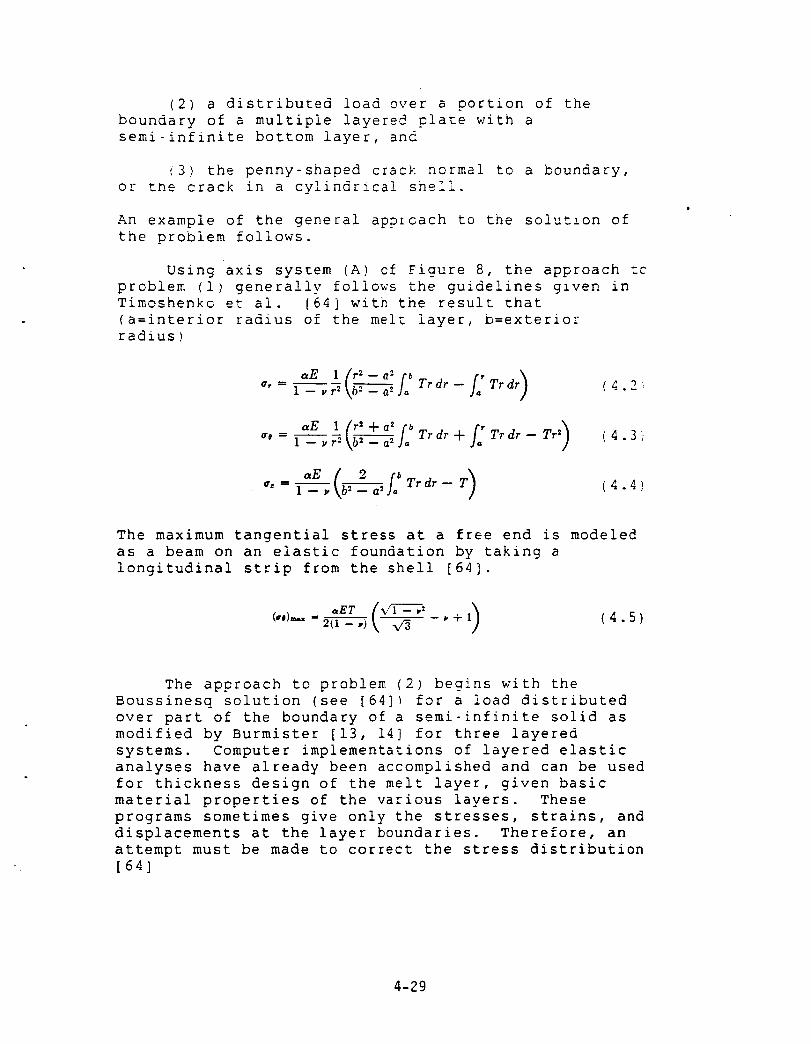
(2) a distributed load over a portion of theboundary of a multiple layered D!ate with asemi-infinite bottom layer, and
(3) the penny-shaped crack normal to a boundary,or the crack in a cylindrical shell.
An example of the general approach to the solut!on ofthe problem follows.
Using axis system (A) of Fiaure 8, the approach tcproblem (i) generally follows the guidelines glven inTimoshenko et ai. [64] with the result that
(a=interior radius of the melt layer, b=exterior
radius!
a, = 1-- v r _ _ am.j_ Tr dr -- Tr dr . (4.2
x_ +o= )a, = _ vr.\b.--i-_-__a2- f bTrdr+f:Trdr--Tr_ (4.3
I: )e, = " Tr dr -- T--_ b_- a'- (4 4
The maximum tangential stress at a free end is modeled
as a beam on an elastic foundation by taking a
longitudinal strip from the shell [64].
_,E7 / V-£ -_ ,: )(")-'=2g-.)\ x_ " +* (4.5)
The approach to problem (2) begins with the
Boussinesq solution (see [64]! for a load distributed
over part of the boundary of a semi-infinite solid as
modified by Burmister [13, 14] for three layered
systems. Computer implementations of layered elastic
analyses have already been accomplished and can be used
for thickness design of the melt layer, given basic
material properties of the various layers. These
programs sometimes give only the stresses, strains, and
displacements at the layer boundaries. Therefore, an
attempt must be made to correct the stress distribution
[64]
4-29

=_= =, = q _ [--2(i + v)z(r-_+ z2)-_ q- 3z3(r" + =2)-_=],.d," (4.6 )
for multiple layers so that an analytical, continuous
form is available within layers to be projected onto
the crack plane iD problem (3). In equation (4.6),
axis system (B> of Fiaure 8 is used with 'a' being the
radius of a circularly distributed load on a flat
boundary. It is expected that the load will actually
be elliotical and distributed en a curved boundary as
depicted in Figure 6.
In the solution tc orobiem (3_, it is exoected
that the Scnwarz-Neumann alternatlng method [see 41]
will be used. Basically, tne therma_ and wheel load
stress solutions will De superposed to give tne stress
distribution at the location of the crack and the
stress distribution remote from the crack (i.e. at the
surface). This process will establish the initial
traction or displacement boundary conditions. The
alternating method is then used to generate the cracked
body solution for the strain energy density factor.
After all this theoretical work is done, it will
be necessary, once again, to apply some sort of
statistical method to results. This adjustment is
required because of the difference between the real
material and an ideal continuum. It is also necessary
because no consideration has been given to the
interaction of crack tips, nor has consideration been
given to possible dynamic effects in this scenario.
Alternatively, the influence of multiple cracks may be
approached by using a technique based on anisotropy of
elastic response resulting from the assumption of or
knowledge of a crack density tensor [40].
°
MATERIAL TEST PROCEDURES
Some of the ASTM test procedures which would be
useful in determining the needed parameters for
evaluation of alternative products of the machine are
identified in Appendix D. Many of the tests mentioned
should be used as guidelines for the development of new
methods rather than rigid procedures because of the
nature of the materials and geometries involved. The
most important tests to accomplish in the short term
4-30

are those which yield the parameters needed for stressand displacement field analyses and those which definefailure mechanisms.
it is expected that a maximum principle straincriterlon will be appropriate for many of the productmaterials and that the Mohr-Couiomb [see 62] failureenvelope will be quite useful. Failure by fracnure of
these materials is expected, but will probably involve
mixed modes and multiple crack lnseractions. One
approach to the problem of microcracking around a
macrocrack as applied to concrete can be found in [6].
The parameters needed for the penetrator and brick
mold plates are already available nhrough LASL. The
pad feet and drums for the compactor are usually made
of work hardened manganese steel [PC-8] for which data
are available, thus allowinq only a small laboratory
testing program with anticipated materials in the
appropriate planetary environment simulation. The
scraper edges for the dozer blade are often made of
rolled DH-2 steel [PC-II] for which data are also
available.
MISSION SCENARIOS
Unmanned. From Earth, launch the machine depicted
in Figure 3 attached to a lunar lander. Construct the
base as shown in Figure 7. Perform automated shutdown.
From consideration of the conceptual design of the
machine, three events which will result in complete
mission failure immediately come to mind:
(i) Primary power system failure,
(2) Excess sinkage (i.e. getting stuck due to
high ground pressure wheels, and
(3) Rollover/hangup.
Manned. Prepare vehicle for launch to Mars for
initial base construction there (e.g. replace worn
parts, insert Mars specific modules). Inspect, test,
and evaluate melt tracks, bricks, and compacted
materials. Place bricks. Test melt-tracks with a
4-31

rover type vehicle.
CONCLUSION
The use of rock melting and hot Dressingtechniques for making building materials seems the mostappropriate approach at this time. The use of typicaladhesives such as portland cement and mot%at isconsidered to be impractical unless the heat intensivemethods outlined in this paper fail tc produce useablematerials. Experimental data documented in theliterature on materials similar to materials proposedas construction products indicate that useaDiematerials can be successfully produced.
With the present and near term future developmentsin thermoeiectrlc power generation and electric motors,it is apparently feasible to manufacture a device whichcan make planetary surface transportation systems andprotective structures. Considerable research into theengineering properties of product materials is neededbefore detailed design of the machine can beaccomplished. However, if the basic missions of themachine outlined herein are considered appropriate, amodular, conceptual design of the machine may beperformed which will minimize the effect of changingtechnologies.
ACKNOWLEDGEMENT
Concepts for the bricks illustrated in Figure 5were provided by Marc Piehl and Mike Fox. Marc Piehldrafted Figures 3(a) and 5(a) usinc computer software.Mike Fox drafted Figures 5(b) and 6. Joe Goldbergassisted with the production of Figures i, 2 andAppendix C.
• 4-32

APPENDIX 4-A: REFERENCESand ADDITIONAL READING
1. Allen C.C., Goodina J.L., and Keil K.,"Hydrothermally Altered Impact Melt Rock and Breccia:Contributions to the Soil of Mars", Journal of
Geophysical Research, Vol. 87, No. BI2, 30 Nov.
1982, pp. 10083-10101.
° Altseimer J.H., "Technical and Cost Analysis of
RocK-Melting Systems for Producing Geothermal Wells",
LA-6555-MS, LASL, Nov. 1976.
3. American Ceramic Society, Inc., "Ceramzc Source
1986", Vol. i, ACerS, 1985.
4. Armstrong P.E., "Subterrene Electrical Heater
Design and Morphology", LA-5211-MS, LASL, Feb. 1974.
. Balovnev V.I., "New Methods for Caicuiatin_
Resistance to Cutting of Soil", USDA and NSF
translation from Russian, Amerind Publishing Co., New
Delhi, 1983.
6. Bazant Z.P., "Size Effect in Blunt Fracture:
Concrete, Rock, Metal", Journal of Engineering
Mechanics, ASCE, Vol. 110, No. 4, Apr. 1984, pp.
518-535.
. Bekker M.G., "Introduction to Terrain-Vehicle
Systems", University of Michigan Press, Ann Arbor,
1969.
8. Bennett G.L., Lombardo J.J., Rock B.J., "Nuclear
Electric Power for Space Systems: Technology
Background and Flight Systems Program", Intersociety
Energy Conversion Engineering Conference, 16th,
Atlanta, Ga., Aug. 1981, Proceedings, Vol. i, ASME,
N.Y., 1981, pp. 362-368.
9. Berry L.G., Mason B., and Dietrich R.V.,
"Mineralogy", W.H. Freeman, N.Y., 1983.
10. Billingham J., Gilbreath W., and O'Leary B., eds.,
"Space Resources and Space Settlements", NASA SP-428,
NASA Scientific and Technical Information Branch,
Washington, D.C., 1979.
ll. Bradt R.C., Hasselman D.P.H., Lange F.F., eds.,
4-33

"Fracture Mechanics of Ceramics", Vol.
N.Y. , 1974-1983.
1-6, Plenum,
12. Brady G.S., and Clauser H.R., "Materials
Handbook", McGraw-Hill, N.Y., 1986
13. Burmister D.M., "The Theory of Stresses and
Disolacements in Layered Systems and Applications to
the Design of Airpor_ Runways", ProceedinQs of the
23rd annual meeting, Highway Research Board, 1943,
pp. 126-148.
14. Burmister D.M., "The General Theory of S%resses
and Displacements in Layered Systems", Journal of
Applied Physics, Vo!. 16, No. 2, Feb. 1945, pp.89-94.
15. Carr M.H., Saunders R.S., Strom R.G.,
Wilhelms D.E., "The Geology of the Terrestrial
Planets", NASA SP-469, NASA, 1984.
16. Carrier W. III, Mitchell J.K., and Mahmood A.,
"The Nature of Lunar Soil", Journal of the Soil
Mechanics and Foundations Division, ASCE, Oct. 1973,
pp. 813-832.
17. Carrier W.D. III, Bromwell L.G., and Martin R.T.,
"Behavior of Returned Lunar Soil in Vacuum", Journal
of the Soil Mechanics and Foundations Division, ASCE,
Nov. 1973, pp. 979-996.
18. Caterpillar Tractor Co., "Caterpillar Performance
Handbook", Peoria, Illinois, Oct. 1985.
19. Chesterman C.W., "The Audubon Society Field Guide
to North American Rocks and Minerals", Alfred A.
Knopf, N.Y., 1978.
20. Cook R.D., "Concepts and Applications of Finite
Element Analysis", J. Wiley, N.Y., 1981.
21. Cort G.E., "Rock Heat-Loss Shape Factors for
Subterrene Penetrators", LA-5435-MS, LASL, Oct.1973.
22. Costes N.C., Farmer J.E., and George E.B.,
"Mobility Performance of the Lunar Roving Vehicle:
Terrestrial Studies Apollo 15 Results", NASA TR
4-34
R-401, Dec. 1972.
23. Criswel! D.R., "Extraterrestrial MaterialsProcessing and Construction", NSR 09-051-001 Mod.No. 24, Lunar and Planetary Institute, 30 Sep.1978.
24. Crockford W.W., "Tensile Fracture and Fatigue of
Cement Stabilized Soil", PhD dissertation, Texas A&M
University, May, 1986.
25. Davies D.W., "The Relative Humidity of Mars'
Atmosphere", Journal of Geophysical Research, Vo!.
84, No. BI4, 30 Dec. 1979, pp. 833_-834_.
26. Eshbach O.W., "Handbook of Engineering
Fundamentals", J. Wiley, N.Y., 1966.
27. Fanale F.P., and Cannon W.A., "Mars: CO_
Adsorption and Capillary Condensation on
Clays-Significance for Volatile Storage and
Atmospheric History", Journal of Geophysical
Research, Vol. 84, No. BI4, 30 Dec. 1979, pp.
8404-8414.
28. Freiman S.W., ed., "Fracture Mechanics Applied to
Brittle Materials", ASTM STP 678, 1979.
29. Freiman S.W., and Fuller E.R., Jr., eds.,
"Fracture Mechanics for Ceramics, Rock, and
Concrete", ASTM STP 745, 1981.
30. Gdoutos E.E., "Problems of Mixed Mode Crack
Propagation", Martinus Nijhoff, The Hague, 1984.
31. Gopalaratnam V.S., Shah S.P., "Softening Response
of Plain Concrete in Direct Tension", ACI Journal,
May-Jun 1985, pp. 3!0-323.
32. Hanold R.J., "Viscous Melt Flow and Thermal Energy
Transfer for a Rock-melting Penetrator:
Lithothermodynamics", LA-UR-74-328, LASL, 1973.
33. Hanold R.J., "Large Subterrene Rock-Melting Tunnel
Excavation Systems. A Preliminary Study.",
LA-5210-MS, LASL, Feb. 1973.
34. Hanold R.J., "Rapid Excavation by Rock Melting --
4-35

LASL Subterrene Program -- December 31,
1972-September i, 1973, LA-5459-SR, LASL, Nov. 1973.
35. Hanold R.J., "Rapid Excavation by Rock Melting --
LASL Subterrene Program -- September 1973-June 1976",
LA-5_79-SR, LASL, Feb. 1977.
36. Hertzberg R.};., "Deformation and Fracture
Mechanics of Engineerinq Materials", J. Wiley and
Sons, N.Y., 1983.
3?. Houston Chamber of Commerce, "ProceedlnQs of the
1974 Technology Transfer Conference", Houstcn, Tx.,
1974.
38. Johnson S.W., and Leonard R.S., "Lunar-Based
Platforms for an Astronomical Observatory",
Proceedings of SPIE The International Society for
Optical Engineering, Vol. "493, The National
Symposium and Workshop on Optical Platforms, Wyman
C.L. and Poulsen P.D., eds., Huntsville, Aia., Jun.
1984.
39. Jones J.T., Berard M.F., "Ceramics, Industrial
Processing and Testing", Iowa State University Press,
1972.
40. Kachanov M., "Continuum Model of Medium with
Cracks", Journal of the Engineering Mechanics
Division, ASCE, Vol. 106, Oct. 1980, pp.
1039-1051.
41. Kassir M.K., and Sih G.C., "Mechanics of Fracture
2, Three-Dimensional Crack Problems", Noordhoff,
Leyden, the Netherlands, 1975.
42. Koerner R.M., "Effect of Particle Characteristics
on Soil Strength", Journal of the Soil Mechanics and
Foundation Division, ASCE, Jul. 1970, pp.
1221-1234.
43. Krupka M.C., "Selected Physicochemical Properties
of Basaltic Rocks, Liquids, and Glasses", LA-5540-MS,
Informal Report, Los Alamos Scientific Laboratory
(LASL), Los Alamos, N.M., Mar. 1974.
44. Krupka M.C., "Thermodynamic Stability
Considerations in the Mo-BN-C System. Application to
4-36

Prototype Subterrene Penetrators", LA-4959-MS, LASL,May 1972.
45. Mase G.E., "Schaum's Outline on Theory and
Problems of Continuum Mechanics", McGraw-Hill, N.Y.,
1970.
46. Mende!i W.W., ed., "Lunar Bases and Space
Activities of the 2!st Century", Lunar and Planetary
Institute, Houston, 198_.
47. Mindess S., and Young J.F., "Concrete",
Prentice-Hall, 198i.
48. Mitchell J.K., Drozd K., Goodman R.E., Heuze F.E.,
Houston W.N., Willis D.E., and Witherspoon P.A.,
"Lunar Surface Engineering Properties Experiment
Definition, Summary Technical Report", NASA concract
NAS 8-21432, University of California Berkeley, Jan.
1970.
49. Mitchell J.K., Goodman R.E., Hurlbut F.C.,
Houston W.N., Willis D.R., Witherspoon P.A., and
Hovland H.J., "Lunar Surface Engineering Properties
Experiment Definition, Summary Technical Report",
NASA contract NAS 8-21432, University of California
Berkeley, Jul. 1971.I
50. Mitchell J.K., Houston W.N., Scott R.F.,
Costes N.C., Carrier W.D. III, and Bromwell L.G.,
"Mechanical Properties of Lunar Soil: Density,
Porosity, Cohesion, and Angle of Internal Friction",
Proceedings of the Third Lunar Science Conference,
Supplement 3, Geochimica et Cosmochimica Acta, Vol.
3, M.I.T. Press, 1972, pp. 3235-3253.
51. Mitchell J.K., Houston W.N., Carrier W.D. III,
and Costes N.C., "Apollo Soil Mechanics Experiment
S-200 Final Report Covering work performed Under NASA
Contract NAS9-11266", Space Sciences Laboratory
Series 15, Issue 7, Geotechnical Engineering,
University of California, Berkeley, Jan 1974.
52. Mizutani H., Spetzler H., Getting I.,
Martin R.J. III, Soga N., "The Effect of Outgassing
Upon the Closure of Cracks and the Strength of Lunar
Analogues", Proceedings of the Eighth Lunar Science
Conference, Supplement 8, Geochimica et Cosmochimica
4-37

Ac_a, Vol. i, Pergamon, 1977, pp. 1235-1248.
53. Moore H.J., Hutton R.E., Scott R.F., Soitzer C.R.,and Shorthill R.W., "Surface Materials of the ViklngLanding Sites", Journal of Geophysical Research, Vol.77, No. 28, 30 Sep 1977, pp. 4497-4523.
54. [Icore H.J., Clow G.D., Hutton R.E., "A Summary ofVikinc Samoie-Tren._ Anaivses fo,- Anaies of InternalFrlction and Cohesions", Journal of GeophysicalResearch, Vol. 87, No. BI2, 30 Nov. 1982, pp.10043-10050.
55. Nielsen R.R., ADou-Sayed A., and Jones A.H.,"Cnarac_erlzation of Rock-Glass Formed by the LASLSubzerrene in Bandelier Tuff", Terra Tek Inc., SaltLaKe City, Utah, TR 75-61, Nov. 1975.
56. Pariseau W.G., "Gravity Flow of Powder in a LunarEnvironment", Report of Investigations 7577, U.S.Department of the Interior, Bureau of Mines.
57. Rowley J.C., "Potential for Tunneling Based onRock and Soil Melting" LA-UR LASL Apr 1985, ' ' • .
58. Ryder G., and Norman M.D., "Catalog of Apollo 16
Rooks", NASA Curatorial Branch Publication 52, Sep.
1980.
59. Sih G.C., ed., "Mechanics of Fracture 3, Plates
and Shells with Cracks", Noordhoff, Leyden, the
Netherlands, 1977.
60. Simiu E., and Scanlan R.H., "wind Effects on
S_ructures: An Introduction to Wind Engineerina" J
Wiley and Sons, N.Y., 1978.
61. Soga N., SDetzler H., and Mizutani H., "Comparison
of Single Crack Propagation in Lunar Analogue Glass
and the Failure Strength of Rocks", Proceedings of
the Tenth Lunar and Planetary Science Conference,
Supplement i!, Journal of the Geochemical Society and
the Meteoritical Society, Vol. 3, Pergamon, 1979,
pp. 2165-2173.
62. Spangler M.G., and Handy R.L., "Soil Engineering",
Harper and Row, N.Y., 1982
4-38

63. Stanton A.E., "Heat Transfer and Thermal TreatmentProcesses in Subterrene-Produced Glass Hole Linings",LA-5502-MS, LASL, Feb. 1974.
64. Timoshenko S.P., and Goodier J.N., "Theory ofElasticity", McGraw-Hill, N.Y., 1970.
65. Tittmann B.R., Clark V.A., and Spencer T.W.,"Compressive Strength, Seismic Q, and ElasticModulus", Proceedings of theEleventn Lunar andPlanetary Science Conference, Supplement 14, Journalof the Geochemical Society and the MereoriticalSociety, Vol. 3, Pergamon, 1980, pp. 1815-1823.
66. Ugura! A.C., "Stresses in Plates and Shells",McGraw-Hill, N.Y., 1981.
67. Van Vlack L.H., "Materials for Engineering:Concepts and Applications", Addison-Wesley, Mass.,1982.
68. Westergaard H.M., "New Formulas for Stresses inConcrete Pavements of Airfields", Transactions, ASCE,Vol. 113, 1948, pp. 425-444.
69. Williams R.J., and Jadwick J.J., "Handbook ofLunar Materials", NASA Reference Publication 1057,1980.
70. Wittman F.H., ed., "Fracture Mechanics ofConcrete, Developments in Civil Engineering", 7,Elsevier, N.Y., 1983.
71. Yoder E.J., and Witczak M.W., "Principles ofPavement Design", J. Wiley and Sons, N.Y., 1975.
4-39

PERSONALCONTACTREFERENCES
PC-!. Alred J., NASA/ED2, (7!3) 483-4478.
PC-2. Blanchard D.P., NASA/SN2, (713) 483-3274.
PC-3. Brennan T., Spectra-Physics, (713) 688-8814.
PC-4. BUfkln A., NASA/ED2, (713) 483-2536.
PC-5. Coker B., Tom Fairey Company (Jonn Deere),(713) 695-977C.
PC-6. Fox M., San Jacinto College, (713) 476-1501(x527)
PC-7. Gee J.E., Caterpillar Tractor Co., PeoriaProving Ground, (309) 698-5959.
PC-8. Harvey H.W., Ingersoll-Rand Compaction Division,(717) 532-9181.
PC-9. Heller C., Sr., WED Transportation Systems,Inc., Subsidiary of Walt Disney Co., (713) 821-0121.
PC-10. Jansen L.T., Sundstrand Mobile ControlsApplications, (612) 559-2121.
PC-II. Kliment S.C., Mustang Tractor and Equipment(Caterpillar), (713) 460-2000.
PC-12. McCormick J.A., Ingersoll-Rand CorporateAdvertislng, (201) 689-4554
PC-13. Meek T.T., LASL, Materials Science andTechnology Division, (505) 667-2129.
PC-14. Pope D., Spectra-Physics, (800) 538-7800, (notcontacted).
PC-15. Rowley J.C., LASL, Earth and Space SciencesDivision, (505) 667-1378.
4-40

APPENDIX 4-B: LIST OF SY,'_BOL_
a
b
E
g
gm
go
Jic
k
kC
KIC
ksgk
0o
N
n
qr
SG
T
Z
C_
B
0
"9
p
(JC
Oy
AYER
DDM
IDEAS**2
JSC
LASL
LRV
MSFC
NASA
radius
constant
cohesion
elastic stiffness (Young's modulus
earth gravitational acceleration
Mars gravity
if isotropic)
Lunar gravity
Fracture toughness, Energetic
thermal conductivity
constant in Bekker model
Fracture toughness, Stress intensity
modulus of subgrade reaction
constant in Bekker model
factor
sample size
exponent in Bekker model
distributed load
radius
specific gravity
Temperature
depth
linear coefficient of thermal expansion
angle of repose
anglePoisson's ratio
density (used interchangeably as unit
compressive strength
yield strength (or indirect tension
tensile strength)
angle of internal friction
weight)
or ultimate
LASL system software
NASA/JSC system software
NASA/JSC system software
Johnson Space Center
Los Alamos Scientific
Lunar Roving Vehicle
Marshall Space FlightNational Aeronautics
Administration
Laboratory
Center
and Space
4-41

APPENDIX 4-C: DATA FROr.:MANUFACTURER'SLITERATURE
-o
Manufacturer Model HP (kW]
Cater +illar
Cater +illar
Cater _illar
Cater pillar
Cater dllar
Cater _illar
Cater dllarCater :illar
Cater dllar
Cater )iller
Cater )iliar
Cater )illar
Cater )illarCater )illar
Cater )illar
Cater )illar
Caterl )illar
Cater )illar
Cater )illar
Caterl )iilar
Cater illar
Cater )illar
Cater }illar
Cater )illar
Cater )illar
Cater )iilar
Cater )iliar
Cater )iilar
Cater ,illar
Cater dllar
Cater )lllar
Cater _illar
Cater biliarCater bailer
Cater )illar
Cater )illar
Cater )illar
Dresser
Ingersoll-Rand
Ingersoll-Rand
Ingersoll-I_nd
Ingersoll-Rand
Ingersoll-i_nd
Ingersoll-RandInclersoll-Rand
Approximate Dozer/Loadr
OperaLin9 Machine Available,
Weight (kg) Volume (m'3) Capacity (m'3)
C8214 24.0 2300 5.4 N
C8224 24.0 2450 6.4 N
C8314 41.0 3357 6.7 ND3B 48.0 6915 11.2 1.21
IT12 48.0 7554 YCP323 52.0 4560 20.8 Y
C8414 52.0 5780 14.8 N
CS431 52.0 6110 20.5 N
D38C75 56.0 7371 11.2 1.21
D4E 60.0 9090 13.2 1.7
CP433 60.0 6750 23.6 YCS433 60.0 6720 27.2 N
IT18 63.0 8660 Y
D4H 67.0 12252 25.0 1.89
PRt05 67.0 7711 26.3 N
C8514 68.0 9730 22.5 N
D58 78.0 11619 21.2 2.57
IT28 78.0 9633 Y
05H 90.0 13890 32.4 2.66
518 96.0 14243 60.3 Y
D6D 104.0 15695 23.6 3.06
C8614 115.0 11340 34.4 N
CS551 115.0 10400 41.3 N
CP553 116.0 12200 50.4 Y
C5553 116.0 10780 43.0 N
D6H 123.0 20612 40.0 4.08
D76 149.0 20666 30.6 6.42
8148 157.0 20580 54.8 2.91
8158 157.0 20037 87,5 Y
8168 157.0 20628 86.0 Y
D7H 160.0 22796 45.1 6.42
824(3 231.0 30380 72.9 4.67
826C 231.0 31310 115.5 Y
D8L 250.0 37417 66.6 13.6
8340, 336.0 46355 98.1 7.27D9L 343.0 52478 71.6 18.5
DIO 522.0 79619 95.1 29.07
VOST2-42, 25.7 3257 12.1 N
DA30 24.0 3200 72 N
DA28 24.6 2275 4.7 N
DA40 57.0 6990 13.5 N
SPASO 70.0 7410 24.4 N
SPA56 70.0 9160 31.3 N
SP48 70.0 6600 20.1 N
SP48DD 70.0 6920 25.0 N
4-42
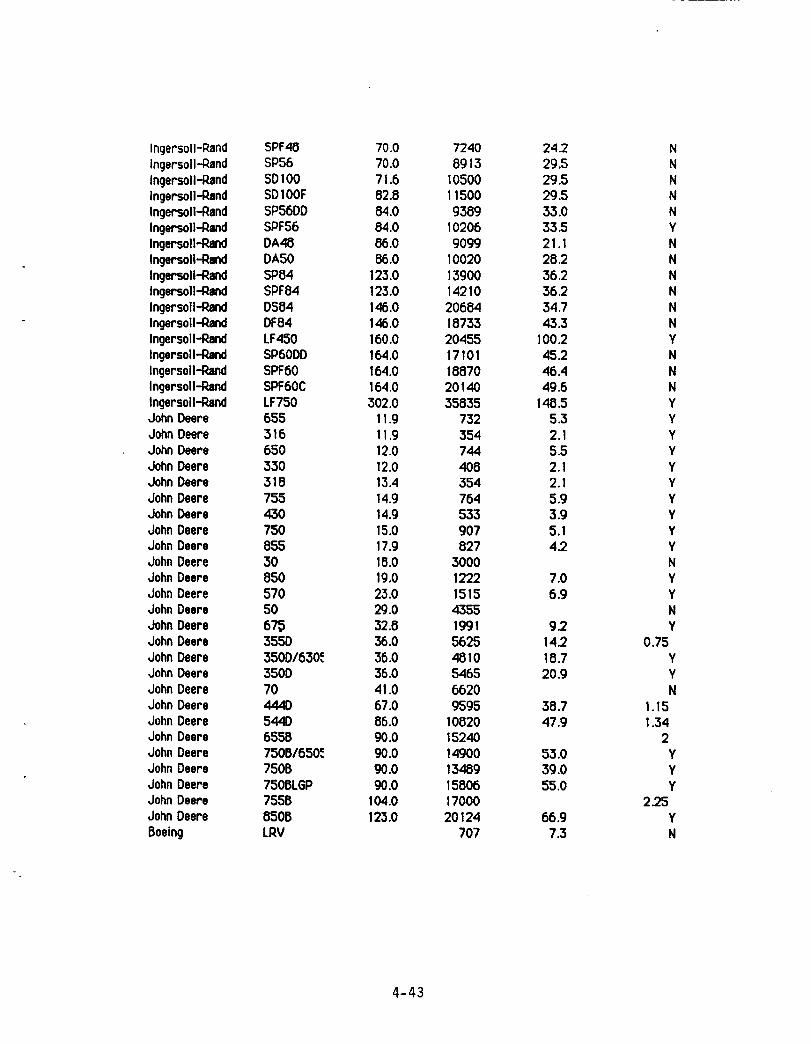
Ingersoll-RandIngersoll-RandIngersoll-RandIngersoll-RandIngersoll-RandIngersoll-RandIngersoll-RandIngersoll-RandIngersoll-RandIngersoll-_ndIngersoll-RandIngersoll-I_ndIngersoll-RandIngersoll-RandIngersoll-RandIngersoll-RandIngersoll-RandJohn DeereJohn DeereJohnDeereJohnDeereJohnDeersJohnDeereJohnDeereJohnDeereJohnDeereJohnDeereJohnDeereJohnDeereJohnDeereJohnDeereJohnDeereJohnDeereJohnDeereJohnDeereJohnDeereJohnDeereJohnDeereJohnDeereJohnDeereJohnDeereJohnDeereJohnDeereBoeing
5PF48SP565DI00SDIOOF5P56DDSPF56DA48DA50SP84SPF840584DF84LF450SP60DD5PF60SPF60CLF750655316650330318755430750855308505705O67_355D350D/630_350D70444D544D65587508/650. =750B7508L6P755B850B
LRV
70.070.071.682.884.084.086.086.0
123.0123.0146.0
146.0
160.0
164.0
164.0
164.0
302.011,911.9
12.0
12.0
13.414.g14.g15.017.918.0
19.0
23.029.032.836.036.036.0
41.0
67.0
86.090.0go.ogo.ogo.o
!04.0125.0
72408913
10500115009389
102069099
10020139001421020684187332045517101188702014035835
732354744408354764533907827
30001222151543551991
56Z_5
4810
54656620
9595
10820
15240
14900
1348915806
1700020124
707
24.229.529.529.533.033.521.128.236.236.234.743.3
100.245.246.449.6
148.55.32.15.52.12.15.93.95.14.2
7.06.9
9.214.218.720.g
38.747.9
53.039.055.0
66.9
7.3
NNNNNYNNNNNNYNNNYYYYYYYYYYNYYNY
0.75YYN
1.15134
2YYY
2.25YN
4-43
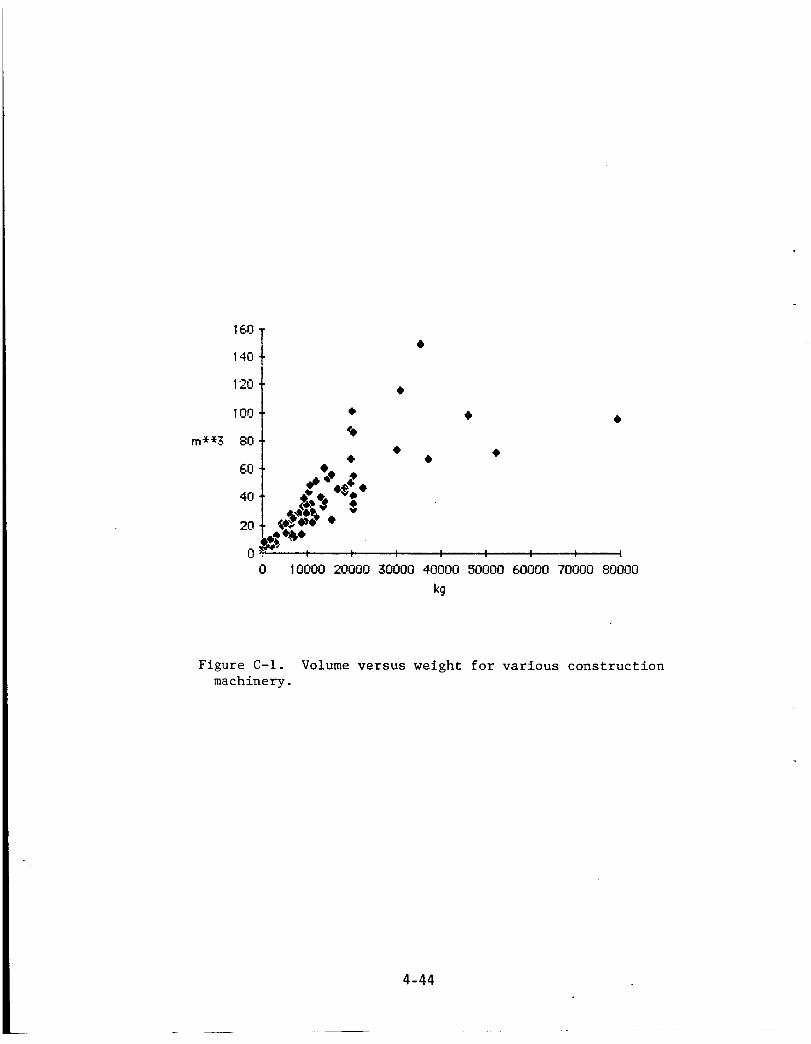
160 I
'_°IL.-'O ,_
IO0 '_
m**3 80 _ *
_oI .-......:40 1 _"_ .o
_°_0
0 10000 20000 50000 40000 50000 60000 70000 80000
k9
Figure C-I. Volume versus weight for various construction
machinery.
4-44

APPENDIX 4-D: SELECTED ASTM TESTS *
m
C7
or
C131
Or
C418
or
'C779
l
C67
C158
1589
C598
C623
C637
C638
DI195
D1883
D3397
D4535
El8
Paving brick
Resistance to abrasion of small size aggregate
by use of the Los Anaeies machine
Abrasion resistance of concrete by sandblasting
Abrasion resistance cf horizontal concrete
surfaces
Sampling and testing brick and structural clay
tile
Flexure testing of glass
Apparent impact strength of preformed
block-type insulating materials
Notched bar impact testing of metallic materials
Annealing point and strain point of glass by
beam bending
Young's modulus, shear modulus, and Poisson's
ratio for glass and glass-ceramics by resonance
Aggregates for radiation-shielding concretes
Constituents of aggregates for
radiation-shielding concrete
Repetitive static plate load tests of soils and
flexible pavement components, for use in
evaluation and design of airport and highway
pavements
Bearing ratio of laboratory-compacted soils
Triaxial classification of base materials,
soils, and soil mixtures
Measurement of thermal expansion of rock
using a dilatometer
Rockwell hardness and Rockwell superficial
4-45

E399
E510
E647
E813
hardness or me_z±ic materials
Plane-strain fracture touQhness of metallic
materials
Determining pavement, surface frictional and
poiishina characteristics using a small
torque device
(on fa_zgue crack propagation)
JIc, a measure of fracture toughness
- Compiled primarily from the 1979 annual books
of ASTM standards. Applicable new standards and
modifications to the above standards may exist.
4-46

N87-26697
1986
NASA/ASEE SUMMER FACULTY RESEARCH FELLOWSHIP PROGRAM
Johnson Space Center
Texas A&M University
Digital Data From Shuttle Photography:The Effects of Platform Variables
Prepared by:
Academic Rank:
University & Department:
NASA/JSC
Directorate:
Division:
Branch:
JSC Colleague:
Date:
Contract #:
Bruce E. Davis, Ph.D.
Assistant Professor
Univ. of Hawaii_ Hilo
Department of Geography
Space and Life Sciences
Planetary Exploration
E×pecimental Planetology
Dr. David Amsbury
August 15, 1986
NGT-44-O05-803
S-l

ABSTRACT
Two major criticisms of using Shuttle hand-held photography
as an Earth science sensor are
non-quantitative and that it
characteristics, e.g., variable
that it is non-digital/
has inconsistent platform
look-angles, especially as
compared to remote sensing satellites such as Landsat and
SPOT. However, these criticisms are assumptions and have
not been systematically investigated. This project
focusses on the spectral effects of off-nadir views of
hand-held photography from the Shuttle and their role in
interpretation of lava flow morphology on
Hawaii. The first stages of the
discussed--digitization of photography at
the island of
research are
JSC and use of
LIPS image
Preliminary
Most of the time was spent in developing procedures
overcoming equipment problems. Preliminary data
satisfactory for detailed analysis.
analysis software in obtaining data.
interpretative results of one flow are given.
and
are
NASA Colleague: Dr. David Amsbury SN4 ×&451
5-2

Since 1972, Landsat has provided the standard for Earth
science remote sensing from space, while hand-held
photography from manned spacecraft has been relegated to an
inferior subsidiary role of illustration. Despite the
provision of some 37,000 hand-held photographs from the
Space Transportation System Shuttle program in the past
five years, there have been very few scientific reports
using the imagery as a major data source (see e.g.,
Kaltenbach, Helfert, and Wells, 1984; Gallegos, et al.,
1984; Nerem and Holz, 1984). The fundamental reason for
diversity of scientific acceptance between the two sensors
is a perception of technological performance differences:
Landsat is seen as
deemed deficient and
whereas Landsat is a
state-of-the-art but photography is
largely second-rate. For example,
digital scanner system which renders
data computer compatible, photography
based--visually analog and not intrinsically
computer analysis techniques. Hand-held
is film
amenable to
photography
(herein referred to as HHP) also has variable platform
characteristics, such as a diversity of viewing-angles
(also called look angles and usually referred to as
off-nadir when non-vertical angles are considered) and
different solar illumination conditions. Landsat, to its
supposed advantage, is very consistent in platform
attributes (especially the nadir view), thereby offering a
S-3

standard format of imagery. Believing that HHP can be a
more useful scientific data resource, the differences in
platform performance were called to questions with the
hypothesis that non-vertical viewing angles and attendant
illumination changes are not debilitating in terms of image
quality and utility, and in fact, may be advantageous in
some earth science research. This study investigates the
nature of off-nadir viewing from HHP and its role in
analysis of lava flow morphology on the island of Hawaii.
The basic objective of
methodology to analyze
given features on HHP
this project was to develope a
spectral (tonal) differences of
frames having variable look angles.
Three phases of the project were perceived: digitization of
photography (the processing stage), development
extraction techniques, and analysis of selected
(applications stage). Most of the summer period
the first two steps and preliminary analysis of data
initiated. This report discusses the theoretical
practical considerations of digitally processing
photography and the means to extract useful information.
Preliminary results of one research site_re presented as a
demonstration of the methodology.
of data
features
involved
was
and
5-4
THEORY
A Lambertian surface
reflects energy equally in
1983). The physics of such
terrestrial surfaces are
is a perfectly diffusing target that
all directions (e.g., Slater,
perfection are calculable but
not Lambertian, so there is
interest in the interactions of electromagnetic energy with
various types and conditions of targets. Off-nadir sensing
has been investigated, but primarily for vegetated surfaces
(e.g., Bartlett, Johnson, Hardisky, Klemas, 1986; Daughtry
and Ranson, 1986; Gerstl and Simmer, 1986; Goel and
Deering, 1985; Holben, Kimes, Fraser, 1986; Kimes, Newcomb,
Nelson, Schutt,_ 198b; Li and Strahler, 1985; Lord,
Desjardines, Dube, Brach, 1985; Norman, Welles, Walter,
1985; Simmer and Gerstl, 1985). No research on the effects
of different look angles to spectral response of lava flow
(or any volcanic landscapes) could be found. Further,
emphasis has been on the derivation of mathematical models
of off-nadir viewing but this investigation concentrates
initially on detection of changes on a new medium and their
role in analysis of lava flow morphology.
Basic theory of digital imagery processing and analysis
forms the framework of this project (see Jensen, 1986, for
the best single reference) and details o_ its application,
5-5
i.e., specific procedures, are discussed in the next
section. The literature on digital remote sensing is vast
but will be mentioned only when directly relevant; no
literature review is offered
digitization is considered
extraction and data analysis.
here.
first,
As prescribed above,
followed by data
Photography, a film-based image,
analog by nature. Conversion
necessary for computer analysis,
is a visual product and
to a digital format,
is a theoretically simple
process of re-imaging with a vidicon camera (in this case,
but a scanning densitometer also can be used) and
transformation of picture elements (pixels) into discrete
values representing tone or density. Specifically, light
of a known intensity is transmitted through a transparency
and the reduction in intensity received by the vidicon, on
a pixel by pixel basis, is translated as film density.
Pixels, having specific X-Y
into a digital image of the
photographs are reduced to
red, green and blue) by
re-imaging process, making a three-band
ready for computer manipulation.
locations, are restructured
photographed scene. Color
three distinct bands (usually
the use of filters in the
digital image,
Digitization of photography is not a new technique (e.g.,
Holler, Anuta, Phillips, 1971; Jensen, Estes, Tinney, 1978;
S-6 °
LeSchack, 1971; McDowell, 1974; Scarpace, Quirk, Kiefer,
Wynn, 1981; Smedes, Linnerud, Woolaver, Hawks, 1971), but
it is not a popular technique for quantitative analysis,
primarily due to the many vagaries inherent in photography
and difficulty in control and repeatibility of the
digitizing process. Despite high quaility control, the
chemical processes in manufacturing, storing, development,
and reproduction of films are not quantitatively known or
maintained, and thereby are subject to latitudes of
variance. Because of these factors, precise analytical
controls are very difficult to
absolute spectral signatures,
attempted. In fact, Scarpace (1978,
that "film density is not the parameter
with the reflected energy from the
attain and derivation of
for example, is seldom
p. 1287) maintains
to be correlated
ground. The dye
densities formed in films depend in a non-linear way on not
only the amount of energy and its spectral distributiono
striking the unexposed film, but also on the processing of
the imagery." Radiometric calibration derives the
relationship between film density and light energy (making
D-log E curves of exposure and film response) but the
process is too complex to include here (involving photo
technicians and detailed dye measurements) (also see
McDowell and Specht, 1974).
The result of these difficulties is that while digitization
S-7
is a relatively simple process, as described, great care
must be taken in maintaining data that are comparative. A
major aim of this project (and most of the work expended)
was in development of procedures for producing
quantitatively standard data so that features on different
frames could be compared efTectively and accurately.
There is no practical way to determine film chemistry
processes and their quantitative meaning for HHP. The best
approach is to use reproductions as close as possible to
first generation images (keeping data degradation to a
minimum) and to select frames on the same roll (to ensure
reasonably identical processing). Fortunately, two
four-frame sequential series of second generation images of
• . . . .
the desired study area were available, m_n_m_zlng
extraneous factors of variability.
The initial aim of data analysis was to spectrally
characterize lava flows at various viewing angles and to
1
evaluate the signature differences. Spectral signatures
of changing linear features are best represented as a chain
1. As noted, absolute spectral signatures are not attemptedhere and only relative responses are used. The term
"spectral signature" is used for convenience and does notimply establishment of pure signatures; actually, the
proper term to use would be film response.
S-8
of tonal values along their paths.
from each band are collected at locations
flows and compiled into sets of value
statistical methods are available
That is, pi×el values
along the lava
curves. Various
that determine
differences and relationships of curves and points within a
set of data. Analysis of single frame information may be
useful in terms of lava flow morphology, but when all
frames are combined and compared, synergetic interpretation
may be possible.
One of the major problems of multi-frame image analysis is
obtaining data that are truly and purely comparative.
Under perfect (unrealistic) conditions,
reflect ground variables only and
digitizing factors do not induce
all pixel values
photographic or
tonal corruption.
However, practical conditions contribute both noise and
potentially invalid values. For example, Jensen (1986, p.
16) states that vignetting is one of the most serious
problems in video digitizing--fall-off of intensity from
the center of output to the edges, usually in a circular
pattern. Also, Jensen, Estes, Tinney (1978) found
vignetting to be a critical component preventing consistent
measurements of agricultural _ields.r
If such intrinsic "antagonists" can be identified and
measured, their dilutions can be subtracted from data. The
S-g

aim, then, is to "normalize" data to some common base or
measure so that only the ground effects contribute to tonal
change. From there, changes wrought by different look
angles and slant ranges can be deduced. There are. numerous
methods of normalization, but a fairly simple approach was
used that identifies and compensates for extraneous
influence, i.e., light table variances were identified and
removed. Once extrinsic factors have been eliminated and a
satisfactory set of densities values gathered, analysis of
data can proceed.
DATA
As stated, two ideal sequences of
located: visual 65A-50-O5b to
&5A-55-105 to 108. Table 1
geometries of the visual color
lava flows were
images
059 and
presents
frames.
examined--Keamuku (about
of Hawaii were
color infrared
their viewing
Initially, three
300 years old),
1859, and 1880 (Map 1). To maximize resolution and spectral
information, enlarged subimages of each flow were produced
from each of the frames above. Further, in that each band
of the images requires individual analysis, there was a
total of 72 data images (8 f_ames x 3 bands each x 3 study
flows).
The photographs were digitized on JSC's new Gould Eikonix
5-10

TABLE 1" IMAGE GEOMETRY
Based on Shuttle to Keamuku flow
Altitude: 176 n.m.
1
Frame Ground Range Slant Range Look Angle Solar
56 315 372 59 141.0 53.0
57 229 293 51 143.6 52.5
58 210 278 49 144.2 52.3
59 IbO 241 42 146.1 51.8
Solar Az: Solar Azimuth _rom Shuttle to Sun, measured cw _rom
north.
Solar Elev: Solar elevation angle at Shuttle nadir.
• 5-ii
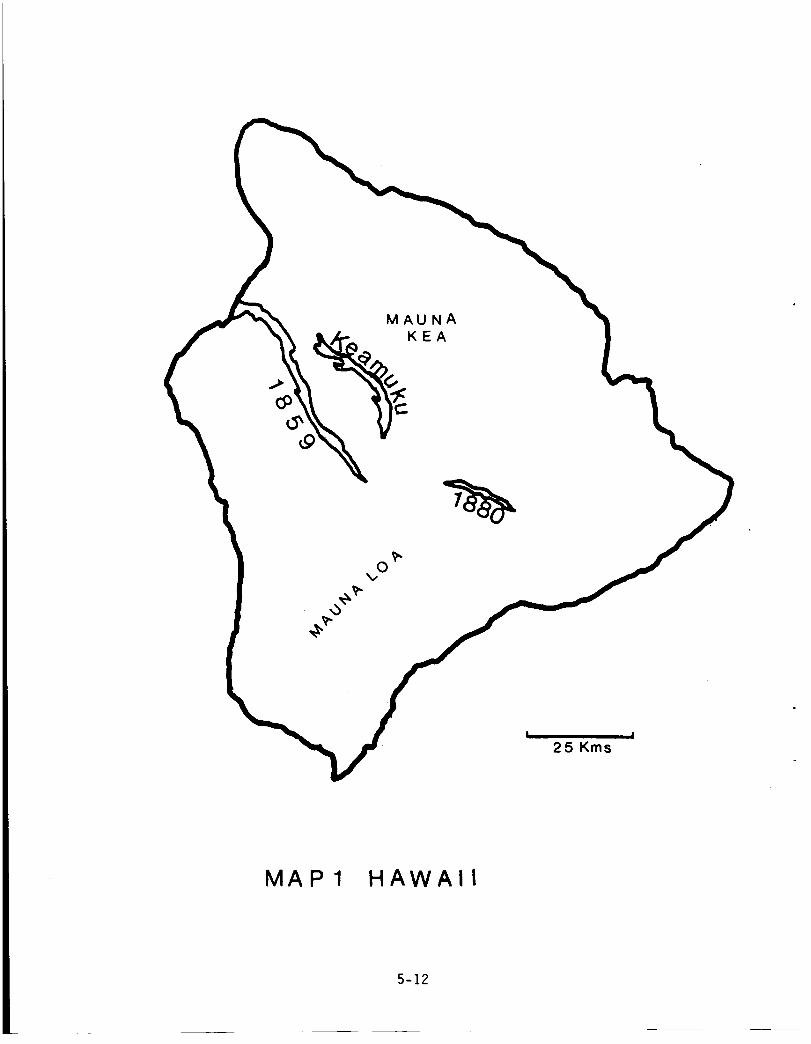
O
! !
25 Kms
MAP 1 HAWAII
5-12

850 digitizing system in Building 17. It offers digitizing
formats of 512 × 512 pixels, 1024 × 1()24, and 2048 x 2048,
each with center or upper left corner (0,0) origins.
Additionally, either transparencies or prints may be used,
though the former usually present best results. Computer
processing and analysis were performed with LIPS--Library
of Image Processing Software.
METHODS AND PROCEDURES
Indicated above were the contrasts between theory and
practice in digitization and analysis of imagery.
Discussed here are the specific procedures used (as guided
by basic theory) and the problems encountered. Practical
considerations are addressed as
insight and furthering project
employed is representative of
subsequent preparation for image analysis.
commands and responses are given for
convenience.
a means for developing
evolution. The format
a digitizing task and
Specific LIPS
JSC operator
Digitizing System:
Light Table: Consisting of floodlights fDr opaque prints
and a small table window with lighting from underneath for
transparencies (the format used here), the light table
5-13

provides illumination for the images. It is this component
which created intransigent problems and seriously delayed
progress. Illumination must be strong so that other
variablesin the total system
because of unsuspected power
intensity was a fraction
can be exercised. However,
supply wiring problems, light
of its design, therefore
necessitating maximum conditions of other controls just to
attain minimum illumination. Consequently, poor and
unacceptable image data resulted, causing much waste in
time and effort. The problem was finally rectified in week
nine of the ten week program, so data are preliminary,
incomplete, and essentially unanalyzed.
Another
system is that it is a condenser type,
illumination across viewing area.
particularly evident (though always
positions outside the narrow focus
inherent in condenser systems.
(more expensive} retards such
major (and continuing) problems of the lighting
resulting in uneven
A "hot spot" is
present) at camera
position--apparently
A diffusing light system
conditions and offers more
even lighting. Perhaps this also is inherent in Eikonix
instrumentation, as other users have complained of similar
limitations. The applied aspects of such problems is that
standardization of pixel values is not ensured, forcing
development of means to remove the variance. Further
delays were encountered because of mathematical limitations
5-14

in LIPS (to be discussed). In essence, the illumination
component is a critical weakness to spectral analysis work
in this digitizing system.
Camera: the vidicon camera digitizes with the use of a
linear array of 2048 photoelectric detectors that scan the
image in a vertical manner. Exterior controls consist of
f-stop, focus, framing, and lens. Framing is accomplished
by vertical racking of the camera on its support, but as
mentioned, best results are attained at the condenser
system's focus point, which greatly limits framing and
scaling. The only reasonable option is to use different
lens--normally available are a 50mm, 105 mm, and extension
tube, although these too must be positioned at the lighting
system's focus. Also included in the camera is a filter
wheel which introduces red, green, and blue filters in the
light path (after the lens) in order to reduce a color
photo into three primary colors.
A major problem in the camera is the presence of numerous
dead or deficient detectors, which cause_ streaking and
erroneous data on the image. A column of four or five dead
detectors in the center creates a wide dark band that is
visually distracting and quantitatively distorting in data
analysis. For example, a pixel value histogram of a
central bright area will show values of 0 (dark), which
5-15
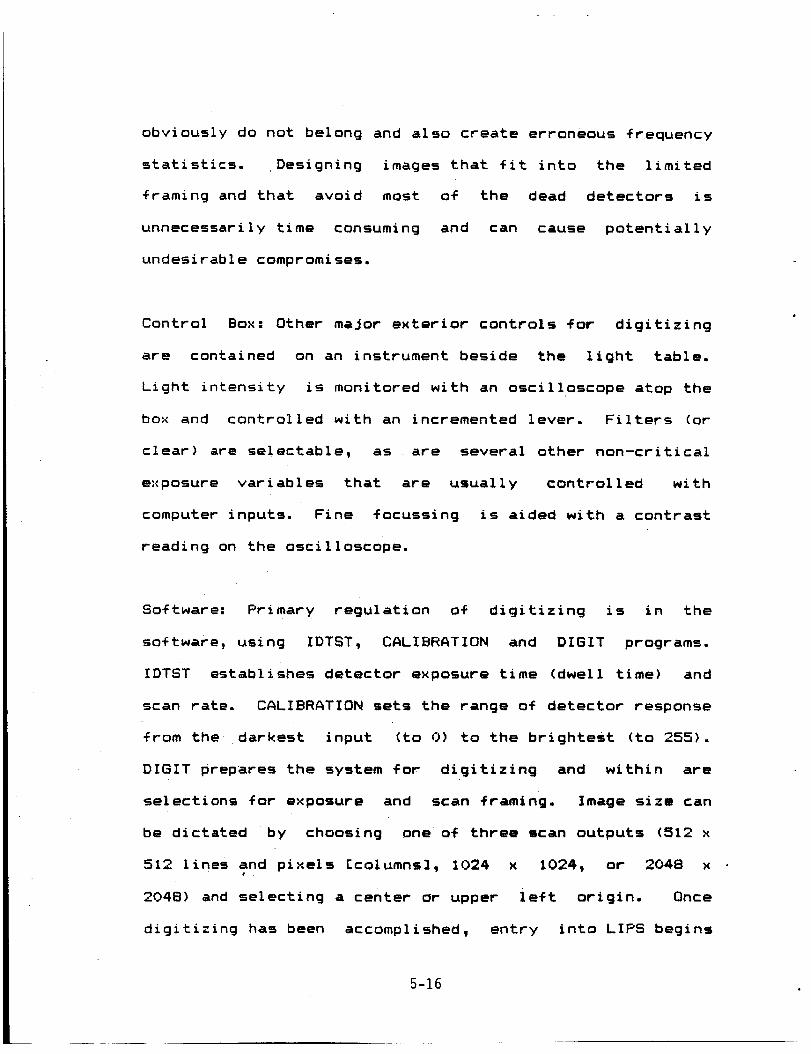
obviously do not belong and also create erroneous frequency
statistics. Designing images that fit into the limited
framing and that avoid most
unnecessarily time consuming
undesirable compromises.
of the dead detectors is
and can cause potentially
Control Box: Other major exterior controls for digitizing
are contained on an instrument beside the light table.
Light intensity is monitored with an oscilloscope atop the
box and controlled with an incremented lever. Filters (or
clear) are se!ectable, as are several other non-critical
e_posure variables that are usually controlled with
computer inputs. Fine focussing is aided with a contrast
reading on the oscilloscope.
Software: Primary regulation of digitizing is in the
software, using IDTST, CALIBRATION and DIGIT programs.
IDTST establishes detector exposure time (dwell time) and
scan rate. CALIBRATION sets the range of detector response
from the darkest input (to O) to the brightest (to 255).
DIGIT prepares the system for digitizing and within are
selections for exposure and scan framing. Image size can
be dictated by choosing one o_ three scan outputs (512 ×
512 lines and pi×els [columns], 1024 x 1024, or 2048 x
2048) and selecting a center or upper left origin. Once
digitizing has been accomplished, entry into LIPS begins
5-16
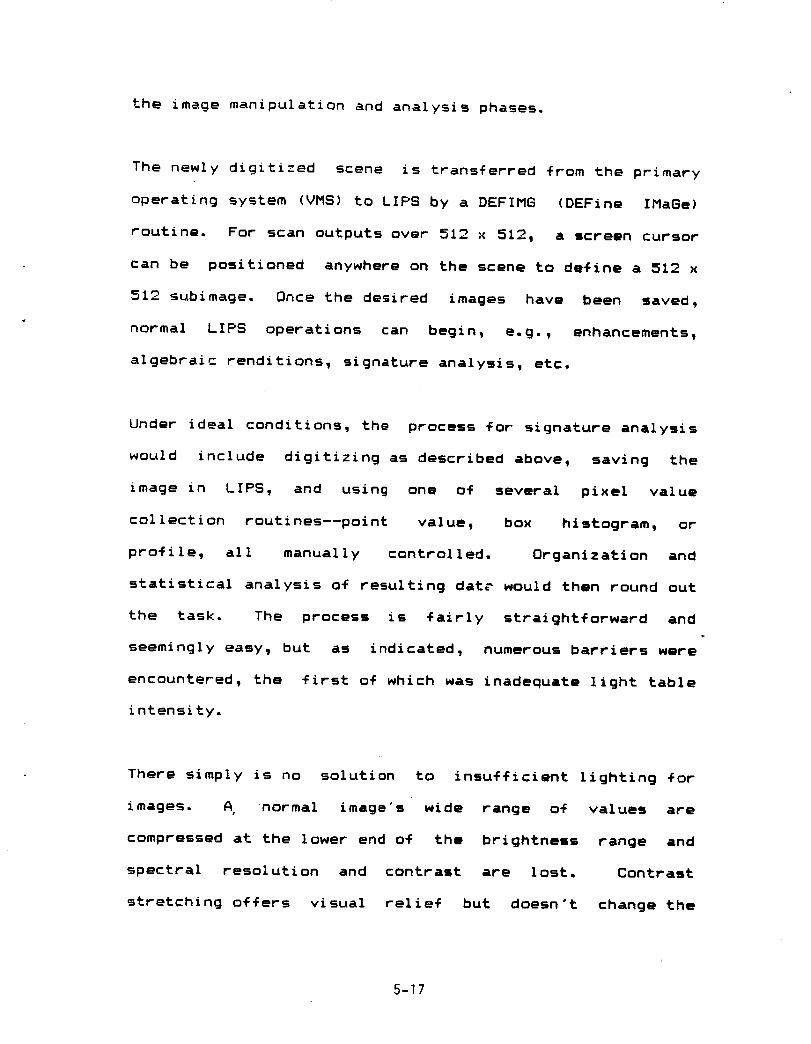
the image manipulation and analysis phases.
The newly digitized scene is transferred from the primary
operating system (VMS) to LIPS by a DEFIMG (DEFine IMaGe)
routine. For scan outputs over 512 x 512, a screen cursor
can be positioned anywhere on the scene to define a 512 x
512 subimage. Once the desired images have been saved,
normal LIPS operations can begin, e.g., enhancements,
algebraic renditions, signature analysis, etc.
Under ideal conditions, the process for signature analysis
would include digitizing as described above, saving the
image in LIPS, and using one of
collection routines--point value,
profile, all manually controlled.
several pixel value
box histogram, or
Organization and
statistical analysis of resulting dat_ would then round out
the task. The process is fairly straightforward and
seemingly easy, but as indicated, numerous barriers were
encountered, the first of which was inadequate light table
intensity.
There simply is no solution
images. A normal image's
compressed at the lower end of
spectral resolution and
stretching offers visual
to
wide range of
the brightness
contrast are lost.
relief but doesn't
insufficient lighting for
values are
range and
Contrast
change the
5-17
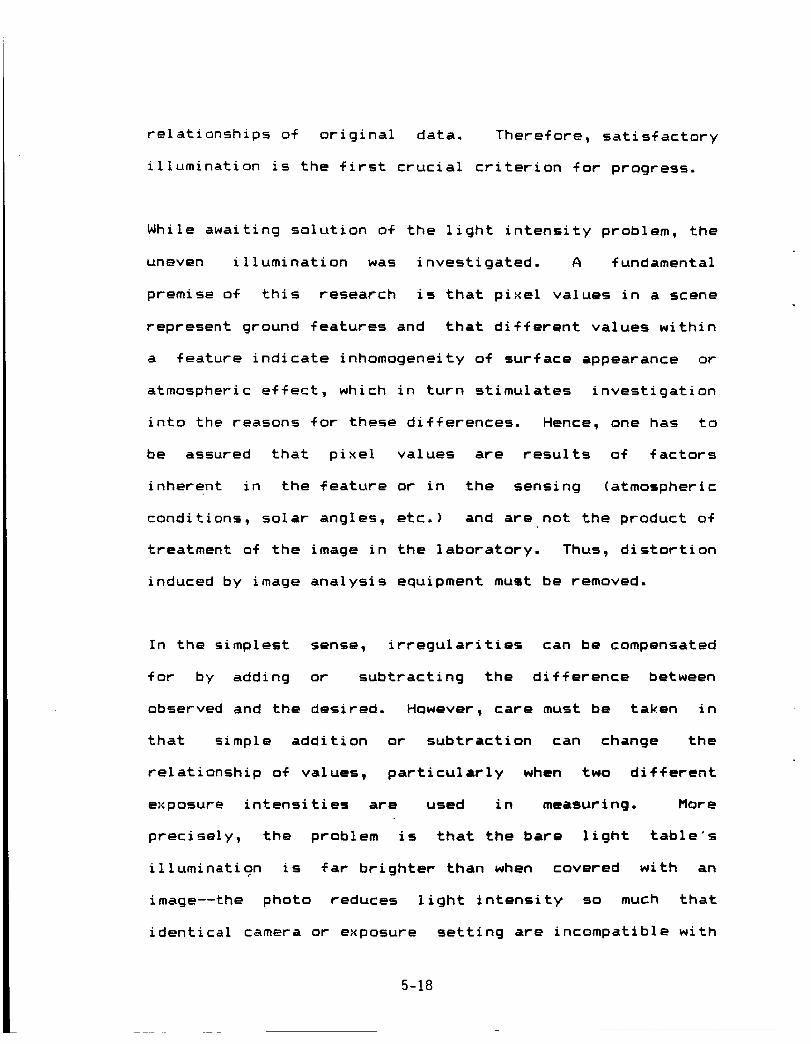
relationships of original data. Therefore, satisfactory
illumination is the first crucial criterion for progress.
While awaiting solution of the light intensity problem, the
uneven illumination was investigated. A fundamental
premise of this research is that pixel values in a scene
represent ground features and that different values within
a feature indicate inhomogeneity of surface appearance or
atmospheric effect, which in turn stimulates investigation
into the reasons for these differences. Hence, one has to
be assured that pixel values
inherent in the feature or in
conditions, solar angles, etc.)
are results of factors
the sensing (atmospheric
and are not the product of
treatment of the image in the laboratory. Thus, distortion
induced by image analysis equipment must be removed.
In the simplest
for by adding
observed and the desired.
that simple addition
relationship of values,
sense, irregularities can be compensated
or subtracting the difference between
However, care must be taken in
or subtraction can change the
particularly when two different
exposure intensities are used in measuring.
precisely, the problem is that the bare light
illuminati@n is far brighter than when covered
More
table's
with an
image--the photo reduces light intensity so much that
identical camera or exposure setting are incompatible with
5-18

the level of the bare light table. So, to measure the
initial intensity and accompanying irregularities, exposure
must be reduced as compared to image digitizing intensity.
Exposure differences present problems in standardizing
pixel values because of the wholely changed nature of the
illumination. By computing on a ratio basis, however, most
of the difference and variance can be managed. Using the
maximum intensity of the light table as the standard (to
which variances must be increased to) Formula 1 was used to
produce a "mask" for each band (red, green, and blue).
This and other formulae are
the image. LIPS commands
appropriate.
applied to each color band of
are given in brackets where
Formula 1:[RATIO] Mxy = Hc
Vxy X 100
WhereM = Mask
xy = Coordinates of a given pixelH = Maximum intensity value in entire sceneV = Intensity value
The mask then could be applied to the image for"normalization" of each band Using the idealized formula:
Formula 2:ZOO
5-19

WhereN = Normalized imageM = Mask valueI = Image
These formulae correct light table illumination variances
but LIPS presents difficulties in their application. The
first problem is minor: LIPS can output only integers.
Understandably, pi×el values must be integers and at the
end of any calculation of two images, LIPS is prepared to
depict results in the form of an image. Consequently,
rounding occurs; LIPS has no way of knowing that Mask, for
example, is an intervening calculation where image output
is not necessary. Therefore, resulting pixel values are
plus or minus one DN (density number), an acceptable error
for this project.
Mathematically, these formulae can be reduced to:
Formula 3: N = U_!_YZV×y
A second problem is that LIPS does not accept designed
formulae but uses only established routines. As in Formula
i, RATIO can manage A/B but
numerator must be constructed
intrinsic Broblem is introduced:
not (AxB)/C; thus, the
appropriately. A third
output is limited to the
range 0-255. Again, because LIPS is prepared to produce an
image from any algebraic routine and because the tonal
5-20

range is restricted, any calculation performed must result
in integers between (and including) 0-255. Multiplying H x
I surely will exceed this limit, so LIPS has scaling
subroutines to keep results within its boundaries. The
user, then, cannot have confidence that each pixel has the
desired (or same) relationship with all other pixels. The
simple illumination rectification formula cannot be applied
directly.
With some tenacity the problem can be overcome.
of LIPS" multiplication routines the
product of two images can be produced.
mask (Formula 1) is multiplied by the
Using one
modified (scaled)
In this case, the
image, i.e., the
numerator operation in Formula 2. To find the scaling
number (transformation number) approximately a dozen sample
pixel values are taken, using a floating cursor point value
routine (PIxel). If a particular class of features is under
study, pixel values should be taken from them. These
values are compared to hand-calculated values of the
Formula 2--the desired output. Once the ratio of LIPS
product to desired output is derived, its integer value
(ratio percentage x I00) is stored as a single-value image
(using the CONSTANT routine in LIPS). Finally, the
normalized image is achievea.by ratioing the product image
and transformation number x 100. These steps are:
5-21

I. Formula 4:
[MUL8 or MULI]Pxy = (Mxy) (Ixy)
Where
P = Intermediate product
2. Obtain pi:<el value of selected sites (Vxy) using PI in LIPS.
3. Using sample pixel values, calculate output of the desiredformula (Formula 2).
4. Calculate the Transformation number for each band (T) by:
Formula 5: T = P_
Nxy X I00
[The Nxy here is from Formula 2]
5. Store T as a single-value image.
6. Normalize by:
Formula 6:
7. Save Pxy as the final, normalized im4ge to use in signature
analysis. Combine the color bands of each frame into a
three-band color image.
These procedures can be applied to full frames, but the
features under study here (lava flows) are too small on
each frame to present sufficient size for pixel value
sampling. As discussed, subimages can be produced at the
DEFIMG stage, thereby making an enlarged image for each
flow. A total of 72 images serves as the data base.
5-22

illumination is
will not work
transformation numbers
unsuccessfully to 056.
Unfortunately, the above procedure must be applied to each
subimage for normalization. Although some short-cuts could
be performed, there is no assurance that standardization of
images will result, primarily because the variances in
spatially unique and one site's of numbers
for another site. For example, the
for frame 059 was applied
The method is time-consuming, but
serves as the only reasonable technique for overcoming
inherent problems in the Eikoni× hardware and in LIPS.
DATA ANALYSIS
By the time the problems were solved, little time remained
for generation of complete data. The Keamuku flow was
subimaged and pixel values were taken. Procedures of
digitizing, normalization, and
were verified. No analysis
completed but demonstration results are
discussed. Because this report concentrates
procedures and because complete discussion
analysis normally is lengthly (site and
characteristics, literature history, tables of
preliminary data collection
of consequence has been
given and
primarily on
of data and
feature
data,
details of analysis, considehation of results, etc.), only
brief remarks of results and preliminary thoughts of
meaning (no conclusions) are presented.
5-23

Contrast normally decreases with increased viewing angle
and with decreasing solar angle. Distance is not a major
determinant but the increased atmosphere between sensor and
target also tends to reduce contrast (e.g., Slater, 1983).
Detail and features within lava flows
low contrast and the effects of look
illumination may be critical in
interpretation. The first stage of data analysis compares
the spectral effects of the visual frames (056 to 059).
are naturally very
angle and solar
lava morphology
Figure i shows tonal response (DN) of the three color of
frame 59 (the highest viewing angle--least off-nadir) to
distance from the main vent. Although there is practically
no vegetation (lichen) on the Keamuku flow, green has the
brightest response. A comparison with frame 56 (lowest
viewing angle) in Figure 2 shows the effect of changing
look angle. Green retains the highest values in 56, but
the difference between blue and red is more pronounced.
Table 2 presents a selected set of correlations for further
and quantitative comparison. All colors of frame 56 have
good correlations with distance, as does red and green in
59, but blue in the latter image has almost no
correlation. This is surprising given that blue should be
scattered much more on 56 because of the greater viewing
angle and slant range atmosphere and thus should exhibit
5-24
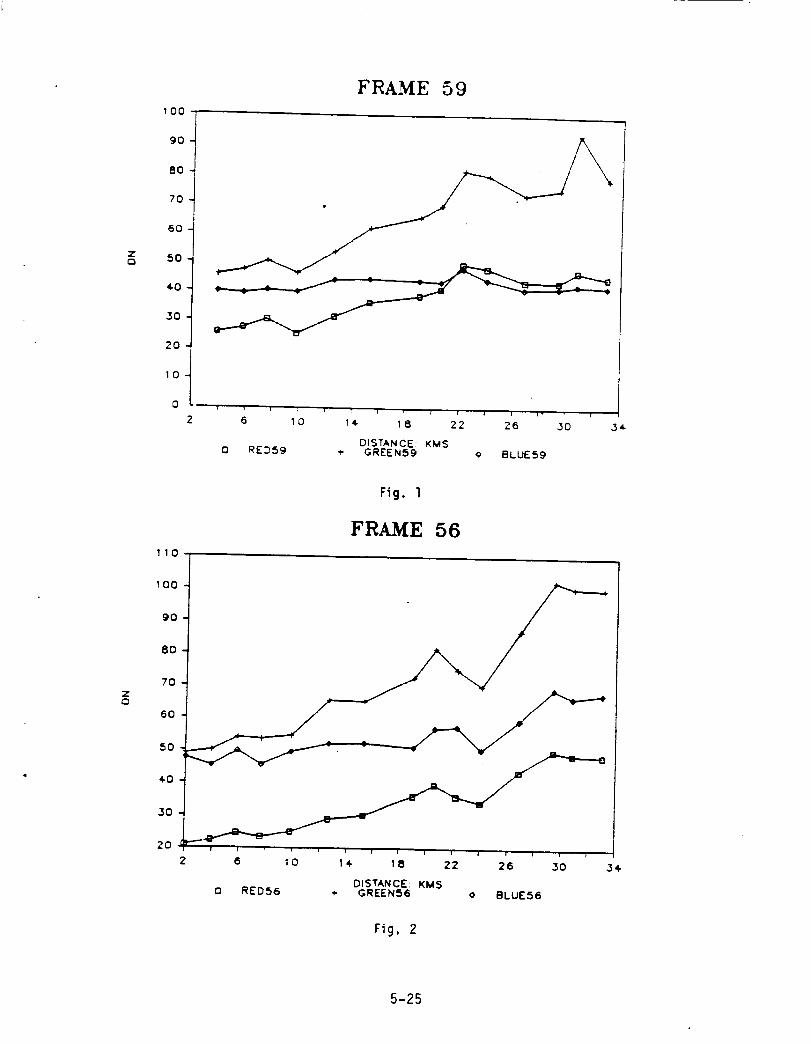
zc_
_00
90
8O
7O
6O
5O
60
3O
2O
10
0
2
FRAME 59
• i i ; v T I 1 l r ! l " I" r ;
6 10 14- 18 22 26 30
DISTANCE: KMS_- GREEN590 RED59 o BLUE59
36
110
100
90
80
70
60
50
_0
30
20
Fig. l
FRAME 56
r r r r i r r 1 I l i r r
2 6 10 14. 18 22 26 ,50
DISTANCE: KMSn RED56 + GREEN56 0 BLUES6
34.
Fig. 2
5-25
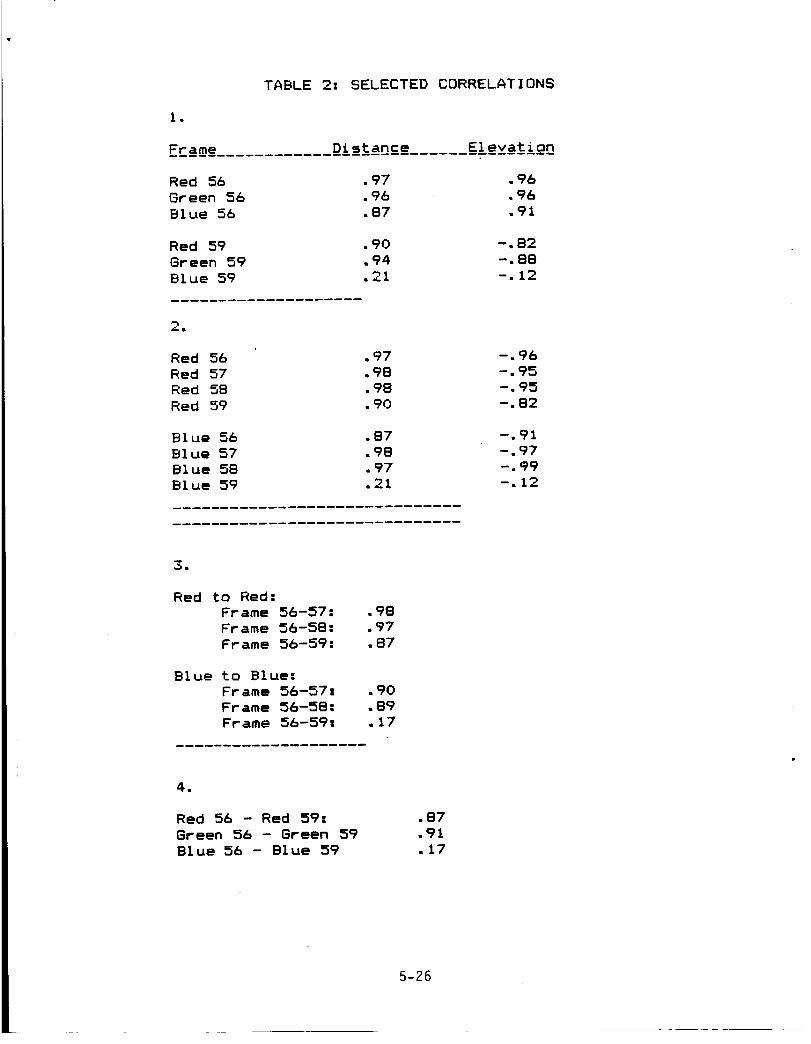
TABLE 2: SELECTED CORRELATIONS
i •
Frame Distance E1 evat ion
Red 56 .97 .96
Green 56 .96 .96
Blue 56 .87 .91
Red 59 .90 -.82
Green 59 .94 -.88
Blue 59 .21 -.12
1
Red 56 .97 -.96
Red 57 .98 -.95Red 58 .98 -.95
Red 59 .90 -.82
Blue 56 .87 -.91
Blue 57 .98 -.97Blue 58 .97 -.99
Blue 59 .21 -.12
m
Red to Red:Frame 56-57:
Frame 56-58:
Frame 56-59:
Blue to Blue:
Frame 56-57t
Frame 56-58:
Frame 56-59:
•98
•97
•87
•90
•89
.17
•
Red 56 - Red 59:
Green 56 - Green 59
Blue 56 - Blue 59
•87
,91
.17
5-26

less substantive information. Obviously_ this
important question which subsequent research
address.
is an
should
Figures 3-5 depict the color bands of each image based on
distance. Considering red, Figure 3, frame 56 should show
either the brightest or dimmest values (depending on the
atmospheric effects) because of the extreme geometry.
However, it's position beneath red and partially mixed with
57 cannot be explained. A general pattern of curves is
evident, however (with 57 having some deviations), which is
indicative of the flow's basic tonal configuration. There
is good correlation between each frame's red and distance
(subset #2 on Table 2) and good red-red relationships (#3),
suggesting that a fairly consistent pattern of response in
the red occurs under different viewing angle even when
density values change. The same is true for blue except
for frame 59, as evidenced above. Green reacts similar to
red (not shown).
A second surprise results: the model of lava flow is to
erupt in its most fluid state (lowest viscosity>, cool as
it travels downslope, and eventually becoming so viscous
that it breaks into a jumbled jagged pile; i.e., from
smooth, relatively reflective pahoehoe to broken, darker aa
lava. Figures 3-5 show the opposite effect.
5-27

5O
RED BANDS
45
A,0
35
z 30
25
2O
15
I0
2 6
o RED56
110
I0
÷
I_ 18 22
DISTANCE;KMSRED57 o RED58
Fig. 3
GREEN BANDS
26
&
30
RED59
100
90
8O
z 70
60
5O
_0
30
2
GREEN56
6 10 14
+ GREEN57
18 22
OlSTANCE:KMSo GREENS8
Fig. 4
26 30 3_
GREEN59
5-28
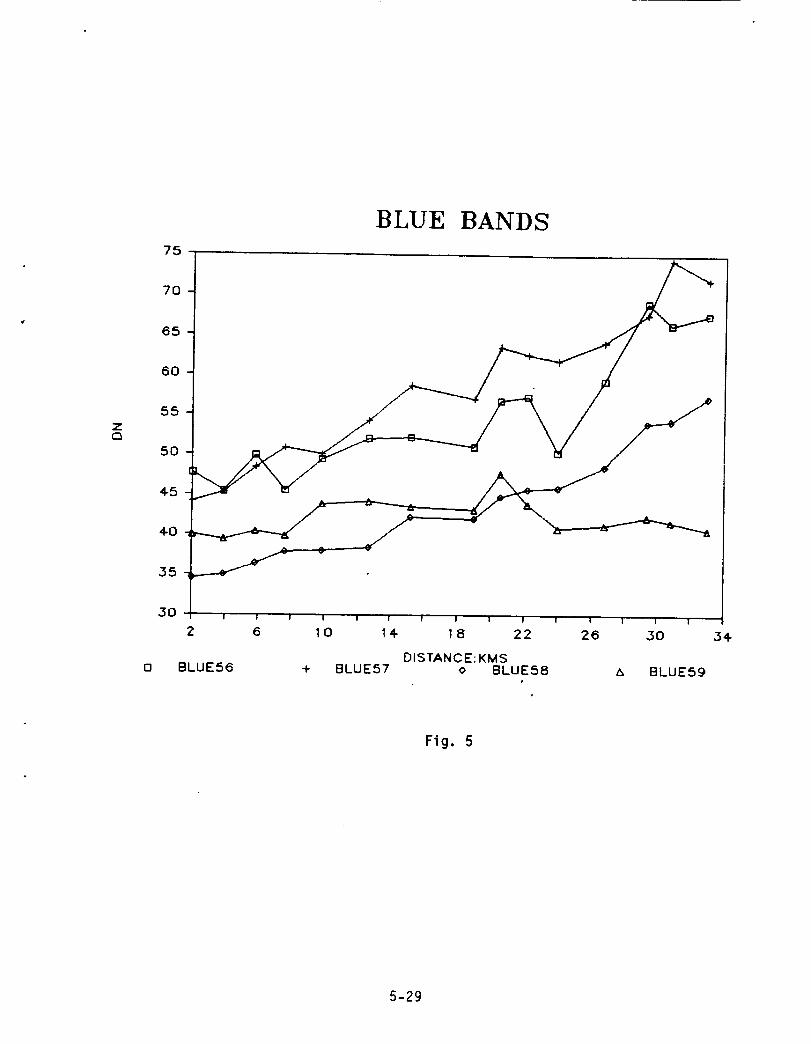
75
65
BLUE BANDS
60
35
O
6 10 14-
BLUE56 + BLUE57
18 22
DISTANCE:KMSo BLUES8
30
BLUE59
Fig, 5
5-29

Subset 4 in Table 2 presents a comparison between colors in
the end frames. Red is a better penetrator of atmosphere
than is blue, so a better correlation between is
suggested. Analysis of residuals (deviations from
regression lines) may offer further insight into the nature
of the curves and comparisons of Figures 3-5.
Figures 6
elevation.
and 7 display red and blue values as related to
There is a -.98 correlation between distance
and elevation, so the results are similar to those
discussed above, except in an opposite direction.
Specifically, darkest pixels are found in the upper
elevations and get progressively brighter downslope. There
is such a mix of lines in these graphs that consistency of
viewing angle change responses is not apparent. However,
note that there are similar tonal changes at particular
elevations (e.g., a "bump" at 1600 meters), which can be
useful for in-situ investigation, i.e., why is there a
sudden change in the pattern of tones at a given
elevation? Table 2 gives some band and elevation
relationships, which, as expected, are very high except for
frame 59"s blue.
5-30

50
RED: ELEVATION
35
z 3OQ
25
2O
_5
Io
09
0 RED56 +
75
I 1 1 ,3 1 5 1.7 1.9 2.1 2.3(Thou_nds)
ELEVATION: METERSRED57 o RED58 A RED,_9
Fig. 6
BLUE: ELEVATION
zc3
70
65
60
55
5O
"t,0
35
3O
09
BLUE_6
1 1 I 3 I.5 17 19 Z I(Thou_nds)
ELEVATION: METERSBLUE57 o BLUES8+ _ SLUES9
2,3
Fig, 7
5-31

CONCLUSIONS
Conclusions primarily address procedures; data analysis
statements are initial thoughts rather than pure results.
For brevity, the major results are listed, with comments.
Procedures:
i. The procedures developed in this project are, for the
most part, measures needed to overcome problems that
shouldn't have been present in the first place. However,
they are simplified and manageable techniques--qualities
often missing in digital image analysis reports and
publications. While they are tedious and time-consuming,
results were satisfactory and useful.
2. With improved software (see Problems and Suggestions
number 3 below), some steps can be combined, shortened, or
even excluded, making the basic outline more efficient and
convenient. For example, direct application of Formula 2
would reduce work time by a great margin.
methods developed here are preliminary
further development.r
Therefore, the
and subject to
5-32
3. With improved hardware (see Problems and Suggestions
number 2), several of these steps may be eliminated
altogether. Most of this project was spent dealing with
equipment problems but
spectral anlysis of
efficiently. There is very
use of digitized photograph
NONEfor Shuttle photography.
will have the capacity to undertake a useful,
unique direction in remote sensing.
with a matured, developed system,
photographic imagery can proceed
little active research on the
under way, and apparently
With a few improvements, JSC
needed, and
DATA
I. Although data are preliminary, there seems to be
adequate information for productive analysis in the effects
of off-nadir remote sensing of lava flows. Questions arise
in attempting to explain why the theoretically-worst image
presents information better than some others. Also, why is
blue so poor from the supposedly best frame? Is there a
quantitative trend of change from one viewing angle to the
next? Nonetheless, data seem satisfactory and can be used
to address these questions.
2. Tonal information offers insight into the morphologic
nature of lava flows. Seen here is that the Keamuku flow
5-33

exhibits non-linear and unexpected tonal change downslope,
indicating that the simplified model of flowing lava and
attendant darkening is not applicable here. Many questions
are raised by initial interpretation of data, such as
reasons for corruption of the flow model, why specific
locations deviate from the general pattern, etc. More
analysis and much ground investigation are needed.
3. There are many
applied to imagery.
have been used here,
statistical techniques that can be
Only a very few of the most simple
but the data are convenient and
amenable to almost any technique desired.
Problems and Suggestions:
I. Access to equipment: Despite perfect relations with
personnel and good intentions all around, access to the
digitizer and computer were limited to the convenience of
all other users. The short period that summer faculty
fellows have for research and reporting make higher
priority desirable and necessary. Perhaps an equable
scheduling arrangement will evolve as the system is matured
(which includes a move to Building 31). Given the extreme
time lost in dealing with equipment problems, access time
was even more valuable than under ordinary circumstances.
5-34

2. Equipment problems: Obviously, this project was greatly
impacted by equipment failures and problems, most of which
seem to be rectified, or at least manageable, at present.
As the system matures, minor difficulties will be
controlled and more personnei will be able to use it. The
single critical suggestion that can be made is to replace
the condenser lighting system with a diffusing type. Had
one been in place for this project, progress would be far
beyond that which was possible under the current
problematic light source.
is an excellent image analysis3. Procedures: While LIPS
system, it retains some limitations that created
difficulties in this research. Currently, only a few
people (at best) in the JSC-LPI area have internal access
to LIPS and can write codes to make individual changes.
Rebecca McAllister at LIP, for example, has written several
new and enhanced routines, greatly improving LIPS'
capabilities. The inability for most users to enter
individual formula hinders production. Either a general
routine for emplacing formulae or a system for having a
knowledgeable programmer accomplish the job is needed.
5-35

BIBLIOGRAPHY
Bartlett, D., Johnson, R., Hardisky, M., Klemas, V. 1986."Assessing Impacts of Off-Nadir Observation on Remote Sensing ofVegetation: Use of the Suits Model." International Journal ofRemote Sensing 7,2:247-264.
Daughtry, C., Ranson, K. 1986. Measurinq and Modelinq B_oohysical_D_ g_t_cal Pcoperties of Diverse Vegetative CanoQ!es. WestLafayette, IN: Laboratory for Applications of Remote Sensing,Purdue University. LARS Report 043086.
Duggin, M. O. 1985. "Factors Limiting the Discrimination andQuantification of Terrestrial Features Using Remotely SensedRadiance." International Journal of Remote Sensinq 6,1:3-27.
Egorov, V., Zhukov, B., Kottzov, V. 1978.Informative Characteristics of Scanner and PhotoEarth Surface." Proceedinqs of an InternationalEarth Observation from Space _0_ ManaqementResources. ESA Sp-134:455-464.
"Analysis ofImages of The
Conference ofof Planetary
Gallegos, S., Nerem, R., Gray, T., Helfert, M. 1984. "VegetativeResponses From a Great Barrier Reef Surface Water FeatureDetected by Space Shuttle Photography." Technical Papers: 1984ASP-ACSM Fall Convention. Falls Church, VA: American Society ofPhotogrammetry/American Congress on Surveying and Mapping,699-707.
Gerst S., Simmmer, C. 1986. "Radiation Physics and Modellingfor _Tf-Nadir Satellite-Sensing of Non-Lambertian Surfaces."Remote Sensing o_ Environment, 20:1-29.
Goel, N., Deering, D. 1985. "Evaluation cf aModel for LAI Estimation Through ItsTransactions gn Geoscience and Remote Sensinq
Canopy ReflectanceInversion." IEEE
8E-23,5:674-684.
Holben, B., Kimes, D., Fraser, R. 1986.Response in AVHRRRed and Near-IR BandsVarying Atmospheric Conditions." Remote19:213-236.
"Directional Reflectancefor Three Cover Types and
Sensinq o_ Environment
Hoffer, R., Anuta, P., Phillips,Multiemulsion Digitized Photos."Remote Sensinq 38, 10:989-1001.
T. 1971. "ADP, Multiband andPhoto_[ammetric Enq!neerinq _U_
5-36
Jensen, O. 1986. Introductg_2 _g_al Imaqe Processing i A RemoteSensing FE_sQective. Englewood Cliffs, NJ: Prentice-Hall.
Jensen, J., Estes, J., Tinney, L. "High-Altitude Versus Landsat
Imagery for Digital Crop Identification." Photoqrammetric
Engineering and Remote Sensing 44,6:723-733.
Juday, R. 1986. "Spectrometry With Color Film (Exposed With No
Spectral Isolation Filtering)." in STS 51-L JSC Visual DataAnalysis Sub-Team ReQoc_I Volume II--AQ_endixes: D-131-139.
Kaltenbach, J., Helfert, M., Wells, G. 1984. "The View From the
Shuttle Orbiter--Observing the Oceans From Manned Space Flights."
Proceedings O_ SPIE--The International Societ_ _O_ Optical
Eogineerinql Volume 489_ Ocean Q_t_cs VII. Bellingham, WA:
Society of Photo-Optical Instrumentation Engineers, 203-207.
Kimes, D., Newcomb, W., Nelson, R., Schutt, J. 1986. "Directional
Reflectance Distributions of a Hardwood and Pine Forest Canopy."
IEEE Transactions On Oeoscience _n_ Remote SensinqGE-24,2:281-293.
LeSchack, L. 1971. "ADP of Forest Imagery."
_g_O_Q_ and Remote Sensinq 37,8:885-893.Photoqrammetric
Li, X., Strahler, A. 1985. "Geometric-Optical Modeling of a
Conifer Forest Canopy. " IEEE Transactions on Geoscience andRemote Sensincl GE-23,5:705-720.
Lord, D., Desjardins, R., Dube, P., Brach, E. 1985. "Variations
of Crop Canopy Spectral Reflectance Measurements Under Changing
Sky Conditions." [Photoqrammetric _Og_oeering and Remote Sensinq51,6:689-695.
McDowell, D., Specht, M. 1974. "Determination of Spectral
Reflectance Using Aerial Photographs." PhotoqrammetricEngineerinq and Remote Sensinq 40,5:559-568.
Nerem, R., Holz, R. 1984. "The Use of NOAA-n AVHRR Satellite Data
and Hand-Held Earth Photography From Space in a Multi-Data Study
of the Nile Delta." Technical Papers: !_ ASP-ACSM FallConvention. Falls Church, VA: American Society of
Photogrammetry/American Congress on Surveying and Mapping,722-736.
5-37
Norman, J., Welles, J., Walter, E. 1985. "Contrasts AmongBidirectional Reflectance of Leaves, Canopies, and Soils." IEEE
Transactions 9_ Geoscience and Remote Sensing GE-23,5:659-667.
Quirk, B., Scarpace, F. 1980. "A Method of Assessing Accuracy of
A Digital Classification." Photggrammetric _Dg_O_Og and Remote
Sensing 46,11:1427-11431.
Scarpace, F. 1978. "Densitometry on Multi-Emulsion Imagery."
Photoqrammetric _Og_O_O_ and Remote Sensing 44,1c):1279-1292.
Scarpace, F., Quirk, B., Kiefer, R., Wynn, S.
Mapping From Digitized Aerial Photography."E_g_neerinq and Remote Sensinq 47,6:829-838.
1981. "Wetland
Photoqcammetric
Simmer, C., Gerstl, S. 1985. "Remote Sensing of Angular
Characteristics of Canopy Reflectances." IEEE Transactions 9_Geoscience and Remote Sensinq GE-23,5:648-658.
Slater, Philip. 1983. "Photographic Systems for Remote Sensing."
in R. Colwell, ed., Manual of Remote Sensinql Second Edition,
Falls Church, VA: American Society of Photogrammetry, Chapter6:231-292.
Smedes, H, Linnerud, H., Woolaver, L., Hawks, S. 1971. "Digital
Computer Mapping of Terrain by Clustering Techniques Using Color
Film as a Three-Band Sensor." EG&G Technical Memorandum B-542,
Bedford, MA: EG&S, Inc.
' 5-38
N87- 26698
1986
NASA/ASEE Summer Faculty Research Fellowship Program
Johnson Space Center
University of Houston
Development of a Computer Program to Generate Typical
Measurement Values for Various Systems on a
Space Station
Prepared by:
Academic Rank:
Institution:
Louis A. DeAcetis, Ph.D.
Professor of Physics
Bronx Community College of the
City University of New York
Bronx, NY 10453
NASA/JSC
Directorate:
Division:
Branch:
Engineering
Tracking and Communications
Communications Performance and
Integration
JSC Colleague:
Date:
Contract #:
0ton L. Schmidt
August 15, 1986
NGT-44-005-803 (University of Houston)
6-I

Abstract
The elements of a simulation program written in
Ada have been developed. The program will eventually
serve as a data generator of typical readings from
various Space Station equipment involved with Com-
munications and Tracking, an_ will simulate various
scenarios that may arise due to e_uipment malfunction
or failure, power failures, etc.
In addition, an evaluation of the Ada language has
been made from the viewpoint of a FORTRAN programmer
learning Ada for the first time. Various strengths and
difficulties associated with the learning and use of
Ada are considered.
6-2

Int_odu=tion
The planning and testing of the various data col-
lecting and management systems on the proposed U. S.
Space Station requires that various configurations be
tested to determine whether performance criteria can De
realistically met. This requires that the various sys-
tems and their interaction with the data
collection/monitoring and data management systems be
simulated. (Eventually, as actual equipment becomes
available, it can replace its software simulation in
the monitoring system.} In particular, readings from
anticipated equipment involved with Tracking and Com-
munication are to be simulated by computer programs
which will mimic the typical performance of such equip-
ment, and, eventually, simulate the effects of anomalis
behavior or equipment failure.
6-3
It is anticipated that Ada will be used as the
programming language for the simulation. Since there
has been limited experience thus far with Ada, an
evaluation of the language and its capabilities in this
area is also of interest. The two goals of this project
thus were_
a) To begin
which will simulate
the programming of a data generator
various equipment invclve_ with
Tracking and Communications on the Space Station_ and
b) To evaluate the Ada language as the language of
choice for such a simulation.
Results anm Conclusions
In order to meet the two major goals of this
project, the principal investigator undertook to learn
Ada, and then to apply it in programs that could serve
as a basis for (or at least a start on) the required
simulation. Headway was made in defining the parameters
to De included in the simulation, and preliminary
programs have been written that can serve as a basis
for further programming.
6-4
In terms of an evaluation of Ada,
comments about Ada are reported:
the following
a) Ada is a language well suited for large scale
simulation programs. In fact, it appears designed
specifically for such applications {It would be cumber-
some for small programs or numerical analysis_.
b} Ada is complex and relatively difficult to
learn (a backgroun_ in PASCAL apgears to be helpful).
It contains much jargon, and many of the current
references are poorly indexed.
c) The diagnostics cn the VAX {typical?) a_e poor
and not very helpful.
d} All of the bugs are apparently not worked out
of the DEC implementation on the VAX-- we discovered
one involving the TEXT_IO package and port I/0 and were
apparently the third facility to bring this to DEC's
attention.
6-5
e) One of Ada's most powerful facilities is the
ability to program concurrent (or parallel) tasks that
execute "simultaneously." {Outside of Ada, such concur-
rent processing is only possibl_ at the system level by
"detaching" from jobs that then continue to run in the
background. Such processes, however, are machine/system
dependent and therefore not readily transportable.}
This feature should be especially useful in programming
simulations.
The general conclusions of this pro]ect are that
Ada is a powerful language that is well suited to
programming simulations, but that its comDlexity means
that it is not for the casual programmer.
6-6

References
Botch, Grady, Software Enqineerinq With Ada,
Benjamin/Cummings Publishing Co., Menlo Park, CA, 1983.
Price, David, Introduction to Ada, Prentice Hall,
Englewoo_ Cliffs, NJ, 1984.
Reference Manual for the Ada Porqramminq Lanquaqe,
Digital E_uipment Corporation.
Telesoft-Ada Compiler User's Manual, Version 1.36,
Telesoft, 1983.
VAX Lancuaqe-Sensitive Editor User's Gui_e, Dzgital
Equipment Corporation, AA-FY24A-TE, July 1985.
VAX Ada Proqrammer'_ Run-Time Reference Manual, Digital
Equipment Corporation, AA-EF88A-TE, February 1985.
Acknowledgements
Many thanks to E_ic Barnhart for his considerable
assistance and support. My comments last year concern-
ing Oron L. Schmidt are reaffirmed.
6-7
N8 7- 26 699
NASA/ASEE SUMMER FACULTY RESEARCH FELLOWSHIP PROGRAM
JOHNSON SPACE CENTER
SPACE STATION ELECTRICAL POWER DISTRIBUTION ANALYSISUSING A LOAD FLOW APPROACH
Prepared by:
Academic Rank:
University andDepartment:
NASA/JSC Directorate:
Division:
Branch:
JSC Colleagues:
Date:
Ervin M. Emanuel, P. E.
Assistant Professor
Prairie View A&M UniversityDepartment of Electrical Engineering
Engineering
Avionics Systems
Control Subsystems
Bob HendrixKenneth J. Cox
August, 1986
7-1

SPACESTATIONELECTRICALPOWERDISTRIBUTIONANALYSISUSINGA LOADFLOWAPPROACH
Ervin M. Emanuel, P. E.Assistant Professor ofElectrical Engineering
Prairie View A&MUniversityPrairie View, Texas
ABSTRACT
The Space Station's electrical power system will evolve and grow
in a manner much similar to our present terrestrial electrical power
system utilities. The initial baseline reference configuration will
contain more than 50 nodes or busses, inverters, transformers, over-
current protection devices, distribution lines, solar arrays, and/or
solar dynamic power generating sources. The system is designed to
manage and distribute 75 KW of power single-phase or three-phase at 20
KHz, and grow to a level of 300 KW steady state, and must be capable of
operating at a peak of 450 KW for 5 to I0 minutes.
In order to plan far into the future and keep pace with load
growth, a load flow power system analysis approach must be developed
and utilized. This method is a well known energy assessment and
management tool that is widely used throughout the Electrical Power
Utility Industry.
This report will discuss and document the results of a
comprehensive evaluation and assessment of an Electrical Distribution
System Analysis Program (EDSA). Its potential use as an analysis and
design tool for the 20 KHz Space Station electrical power system will
be addressed.
NASA Colleagues: Bob Hendrix, EH5, x6204; Kenoeth J. Cox, EH, x4281
7-2 °

1.0 INTRODUCTION
An orbiting Space Station employing a hybrid autonomous ac
electrical power system will require an extensive computer aided
analysis procedure for determining several operational characteristics
of the system during transient and steady state conditions. A thorough
analysis and smart control of earth based electric power systems have
been achieved to a great degree by utilizing the "load flow" concept.
Since the Space Station's electrical power system will evolve in a
manner much like our own terrestrial electrical power system, the
load flow approach should provide useful information in regard to the
system present and future state of operation and load performance
reliability.
2.0 LOAD FLOW CONCEPTS
Load flow is a computer-aided analysis procedure aimed at
determining the actual power flow patterns (watt, vars) in a given
system, and ways of controlling these patterns (1) J. Ward and Harry
Hale of Iowa State University are are often credited with the first
formulation of the power flow problem. Several other early and recent
authors, such as G. Kron, R. L. Parks, G. W. Stagg, A. H. EI-Abiad,
J. R. Neuenswander, W. D. Stevenson, P. M. Anderson, K. C. Kruempel,
and A. A. Fouad have made significant contributions directly or
indirectly because of their interest in electric power systems.
2.1 OBJECTIVE OF LOAD FLOW ANALYSIS (LFA)
In order to determine the best ways of operating a given power
7-3
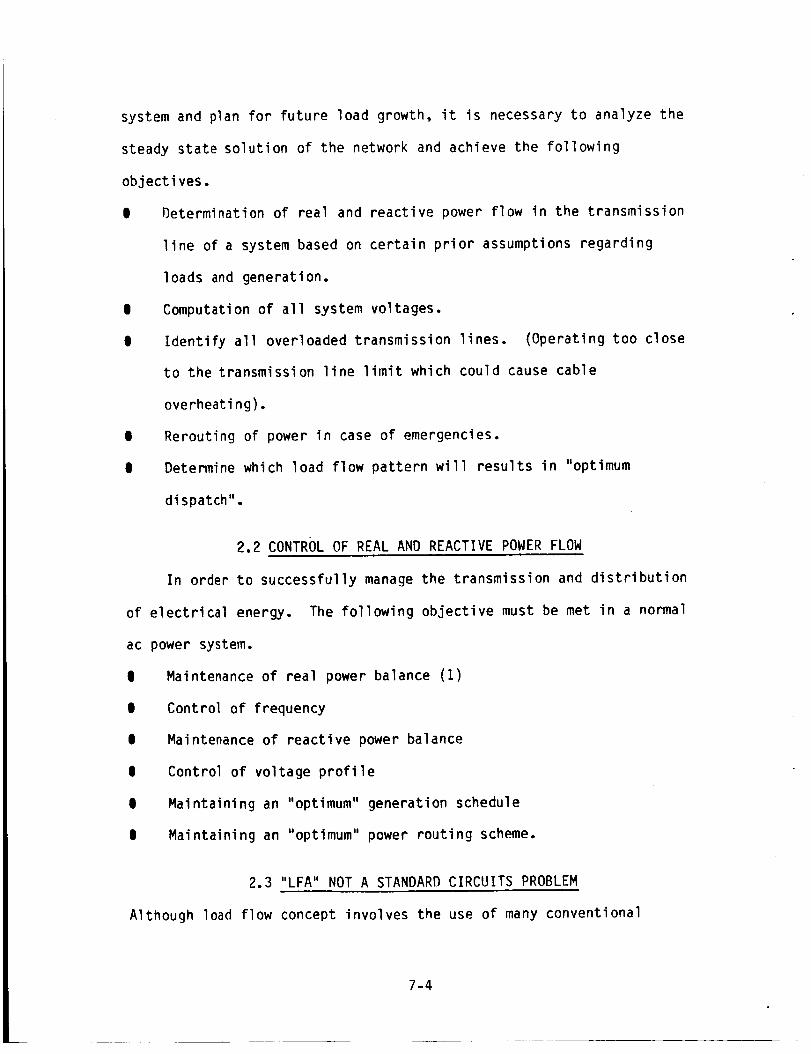
system and plan for future load growth, it is necessary to analyze the
steady state solution of the network and achieve the following
object i ves.
| Determination of real and reactive power flow in the transmission
line of a system based on certain prior assumptions regarding
loads and generation.
0 Computation of all system voltages.
| Identify all overloaded transmission lines. (Operating too close
to the transmission line limit which could cause cable
overheating).
| Rerouting of power in case of emergencies.
| Determine which load flow pattern will results in "optimum
dispatch".
2.2 CONTROL OF REAL AND REACTIVE POWER FLOW
In order to successfully manage the transmission and distribution
of electrical energy. The following objective must be met in a normal
ac power system.
|
|
0
|
0
e
Maintenance of real power balance (1)
Control of frequency
Maintenance of reactive power balance
Control of voltage profile
Maintaining an "optimum" generation schedule
Maintaining an "optimum" power routing scheme.
2.3 "LFA" NOT A STANDARD CIRCUITS PROBLEM
Although load flow concept involves the use of many conventional
7-4

circuit analysis methods, it is not a standard circuits problem for
several reasons. Someof these are:
| More often non-linear than linear due to the product of voltage
and current being equal to power.
- Additional non-linearities arise from the specification and
use of complex voltage and current, and transmission
components such as tap changing transformers in which the tap
is adjusted to keep the bus voltage magnitude fixed.
- Load impedance can never be represented by a constant due to a
wide variety of load variations.
- A typical load flow analysis involves network equations
written in terms of voltages and powers (inherently non-linear
and thereby demanding a numerical solution in most cases.)
- A simple two bus one-line load flow diagram is shown in Figure 1
depicting the variable of interest in a load flow analysis.
3.0 SPACE STATION LFA
Space Station load flow analysis in theory will demand the same
principle requirements as earth-based system. However, the practical
control aspects of this second generation multisource hybrid power
system will require considerable attention. Some of these include
generation and frequency control of large area solar arrays and solar
dynamic generating sources.
Other areas of concern are:
| Accurate modeling of all system components (i.e., transmission
and distribution lines, transformers, etc..)
7-5

0 Resonance conditions observed when using litz cable for a 20 KHz
power system (2).
| Variable network topology due to a random distributed load
mi xtu re.
| Hybrid load flow numerical methods development.
The reference configuration electrical distribution system is
shown in Figures 2 and 3.
4.0 ELECTRICAL DISTRIBUTION SYSTEM ANALYSIS (EDSA)
EDSA is an integrated collection of computer programs for
electrical distribution systems analysis and design. The program is
written to assist the engineer in the design and analysis of electrical
power transmission and distribution systems of public utilities and
large installations using 60 Hz power.
The programs are menu driven, interactive, and requires an IBM PC
computer, 640 KB of memory capacity, and a 2.1 DOS or greater disk
operating system.
Calculations are based on NEMA, ANSI, NEC, IEEE, Beaman,
Stevenson, GE, and Westinghouse T&D reference books.
The complete EDSA software package includes the following
programs:
| Short circuit analysis loop/radial/utility/multi-generating
source. 185/300 bus system
| Load flow analysis 185/300 bus system
0 Motor starting voltage dip load flow method
| Ground mat analysis
7-6

| Protective device coordination
| Shielding effectiveness
0 Motor torque simulation
| Generator set sizing
| Wire and conduit sizing
| Transformer sizing
0 Symmetrical ampere to withstand rating conversion factors
0 Motor starting voltage dip impedance division method (on
generator/uti Iity)
0 Panel, MCC, primary SWG, unit substation, automatic transfer
switch, bus duct schedules
0 Capacitor reactor starting of large synchronous motors
| Calculating zero-sequence resistance and reactance R(O), X(O)
0 Load flow multi-source and loop
0 Computer graphics interface
0 Build, edit feeder and transformer master data files
0 Build, edit fuse relay and MCP data files
0 Build circuit breaker data files
The data generated by the load flow and short circuit analysis
programs are shown in Figures 4 and 5.
5.0 CONCLUSIONS
The Space Station electrical power system will be a complex, high
power, multisource system operating with a high degree of autonomy.
The simulated management and control of this second generation system
will require a number of artificial intelligence and expert system
7-7

software modules. Someof these are: load flow analysis, state
estimation, generation control, and energy storage.
The load flow analysis componentof the EDSApackage proved to be
very useful for analyzing a 20 KHzelectrical distribution system.
This software package is considered by many to be the most complete
analysis and design tool available.
7-8
References
le
.
o
.
.
.
.
Elgerd, O. I.: Basic Electric Power Engineerin 9. Addison WesleyPublishing Company, 1977.
Raley, J. B., and Piechowski, M. T.: "High Frequency Power
Transmission Line Characteristic And Applications In Space Station
Power Distribution Systems," Space Station Definition and
Preliminary Design, (WP-02), NAS9-17367, April 1986.
Heydt, G. T.: Computer Analysis Methods For Power S_stems.MacMillan Publishing Company, 1986.
Stagg, G. W., and EI-Abiad, A. H.: Computer Methods In PowerSystem Analysis. McGraw-Hill, Inc., 1968.
Neuenswander, J. R.: Modern Power S_stems. International TextBook Company, 1971.
Anderson, P. M.: Analysis Of Faulted Power S_stems. The IowaState University Press, 1973.
Lazar, Irwin: Electrical S_stems Analysis And Design ForIndustrial Plants. McGraw-Hill Book Company, 1980.
. NASA Conference: "Space Power Subsystem Automation Technology,"
Marshall Space Flight Center, Huntsville, Alabama, October 1981.
. Emanuel, Ervin M.: "Digital Readout Of Polyphase Induction Motor
Test Values," M. S. Thesis, Iowa State University, 1976.
10. Emanuel, Ervin M.: "Apparatus For Testing The Performance Of
Electrical Machines," U.S. Patent No. 4091662 (1978).
11. Emanuel, Ervin M.: "A Digital Instrumentation System For Test And
Control Of AC Machines," Proceedings of the 1978 Midwest Power
Symposium, University of Nebraska, Lincoln, Nebraska, 1978.
12. Emanuel, Ervin M.: "Apparatus And Method For Testing ThePerformance Of Electrical Machines," U.S. Patent No. 4348892
(1982).
13. Emanuel, Ervin M.: "An IBM PC Based Math Model For Space Station
Solar Array Simulation," NASA/American Society for EngineeringEducation (ASEE) Summer Faculty Fellowship Program, NCR 171931,
August 1985.
7-9

v_ ..t v_ 2,
P_.+JO_J.---SGI
II91
V_ iVl_ 6"
.i. R X
I>
/2
S oz _- Poz.+JQ o_.
FIGURE 1. ONE LINE LOAD FLOW DIAGRAM
7-11
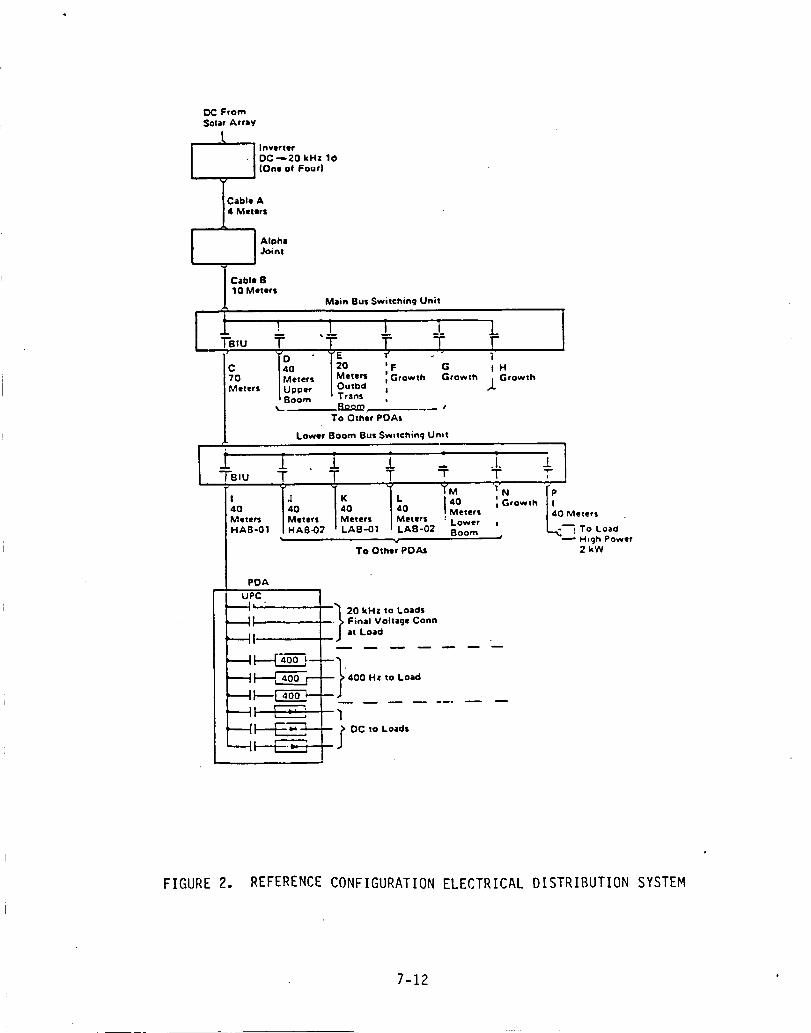
From
Solar Array
_ JnYerter
" I DC _20 kHz 1_/ (One of Four)4
abla A
rs
Alpha
Joint
B
I 10 Meters
Main Bus Switching Unit
_-o I_-.,.,, I M.,,,; ',G,owth Grow,.M.,.rs Iu,;,oe/ I O_,.,,",d;" I_oo;; 'tra_, :
%.. Boom •To Other POAs
i
IH
j Growth
Lower Boom Bus Switching Umt
i : .t. ;[ -_,u ? ' _ __..._-r T T
I K L 40 IP,o I_ I:o ,o IM,,,,,,O,ow,_Meters I Meters I Meters Meters : - 0 Meters
HAS-01 1___:_7 IL_-_l LAB-02 _°o_' ', L<-_,ToLoadv -- High Power
To Other PDAs 2 kW
POA
UPC
'---'I 20 kHz to Loads
_ Final Voltage Connat Load
) 400 Hz to Load
1
DCto Loads
FIGURE 2. REFERENCE CONFIGURATION ELECTRICAL DISTRIBUTION SYSTEM
7-12

OC From
Solar Array
INverter
Cable A
4 metert
Alpha
Joint
Cable B
10 met!
Main Bus Switching Unit
Cable C70 mete
i Cable O40 meters
OPenCircuit
_ Cabte E
20 meters
OpenCircuit
Lower Boom Bus Switch=rig Unit
40 meters 40 meters 40 meters
I_ J Open Open_" C=¢cull C-cu=l
Thesu Two CablesW,tl Be Loaded
Accord_nq tO the
Loading Test Scheme
Cable L40 meters i Cable M
40 meters
Open
ClrCUI|
IOPen "
Circuit
FIGURE 3. DISTRIBUTION SYSTEM BLOCK DIAGRAM
7-13

1986
N8 7- 26 700
NASA/ASEE SUMMER FACULTY RESEARCH FELLOWSHIP PROGRAM
Johnson Space Center
Texas A&M University
Active Vibration Control in Microgravity Environment
Prepared by: Carl H. Gerhold, PHD, PE
Academic Rank: Associate Professor
University & Department: Texas A&M University
Department of Mechanical Engineering
NASAIJSC
Di rectorate: Engineering
Division Structures and Mechanics
Branch Loads and Structural Dynamics
JSC Colleague: A. Rodney Rocha
Date August 8, 1986
Contract #: NGT-44-O05-803
8-1

Active Vibration Control in Micro-gravity Environment
Carl H. Gerhold, PhD, PE
Associate Professor
Mechanical Engineering Department
Texas A&M UniversityCollege Station, Texas 77843
The low gravity environment of the Space Station is suitable forexperiments or manufacturing processes which require near zero-g. Suchexperiments are packaged to fit into rack-mounted modules approximately106.7 cm (42 in) wide x 190.5 cm (75 in) high x 76.2 cm (30 in) deep. The
mean gr#vitation level __ft/hse 2 Space Station is expected to be on the orderof I0- g (9.81 x i0 ). Excitations, such as crew activity orrotating unbalance of nearby equipment can cause momentary disturbances tothe vibration-sensitive payload on the order of 0.4 g. Such disturbancescan reduce the micro-gravity environment and compromise the validity of theexperiment or process. Isolation of the vibration-sensitive payload fromstructure-borne excitation is achieved by allowing the payload to floatfreely within an enclosed space. Displacement-sensitive transducersindicate relative drift between the payload and the surrounding structure.Small air jets provide a negative thrust vector which keeps the payloadcentered within the space. The mass flow rate of the air jets is
controlled such that the _'esultant acceleration of the payload is less thana criterion level of I0- g. It is expected that any power or fluid linesthat connect the experiment to the Space Station structure can be designedsuch that they transmit vibration levels within the criterion. A flexiblecoiled hose such as is used to carry shop air has the requisite compliance.
An experiment has been fabricated to test the validity of the activecontrol process and to verify the flow and control parameters identified ina theoretical model. Zero-g is approximated in the horizontal plane usinga low-friction air-bearing table. An analog control system has beendesigned to activate calibrated air-jets when displacement of the test massis sensed. The experiment demonstrates that the air jet control systemintroduces an effective damping factor to control oscillatory response.The amount of damping as well as the flow parameters, such as pressure dropacross the valve and flow rate of air, are verified by the analyticalmodel.
NASA Colleague: A. R. Rocha/ES4/x-4393
8-2
Active Vibration Control in
Microgravity Environment
Introduct ion
Microgravity research experiments, such as crystalline growth in zero
gravity, require a static gravitational environment on the order of 10-6 g.
Such a low gravity environment is obtained in space near the centerline of
a Space Station. In a low gravity environment, momentary disturbances,
such as thruster fire or crew pushoff introduce shocks to the vibration
sensitive experiment on the order of 3.0 x 10⁻³ g. [1] Rotating equipment,
such as pumps located near the experiment, may transmit steady state
vibration of 0.4 g at 10 Hertz. [2] Such disturbances alter the
microgravity environment and can degrade the validity of the experiment.
The purpose of this project is to devise and evaluate a method to reduce
the vibration transmitted from the Space Station structure to the vibration
sensitive payload. The most effective way to decouple the payload is to
allow it to float freely in space. Figure 1 is a schematic representation
of the payload suspended within an enclosure which is attached to the Space
Station structure. Unbalanced forces, whether generated internally or
externally, cause the payload to drift toward the enclosure. This relative
motion is sensed and used to activate air jets. The jets provide thrust to
stop the motion and to return the payload to a central location within the
enclosure.
External forces arise from gravity gradient over an orbit cycle and
aerodynamic drag-induced deceleration of the Space Station, and result in
long period drift between the enclosure and the payload. External forces
are also transmitted through connections such as air, fluid, or power
lines. The lines act as compliant elements which transfer structural
• 8-3
vibration to the payload. Unbalanced forces are generated internally by
rotating equipment or fluid motion within the payload.
The air jet control system is required to keep the payload from contactingthe enclosure. The criterion for the air jet is that the thrust produced
by the jet results in a net acceleration of the payload less than or equalto 10-5 g.
The sensors used to control the jets respond to velocity and displacement
of the payload. This type of control is expected to be sufficient for the
following reasons. It is assumedthat the internally generated forces aresufficiently small that the acceleration produced by them is less than 10-5
g. However, these forces may cause the payload to drift, which drift theair jet is intended to control. Gravity gradient is expected to be the
major long period external excitation, producing a disturbance on the orderto 10-5 g [i]. The period of this excitation is approximately 90 minutes
(one orbit cycle). Since the gravity gradient does not exceed theallowable acceleration criterion, the air jet control which limits long
term drift of the payload keeps it essentially neutrally buoyant.
Structural vibrations of magnitude 0.4 g at 10 Hertz may be transmitted
through hoses and power lines to the payload. Compliant connections, such
as self-coiling flexible air lines, can be used to reduce the transmitted
vibration so that the steady state acceleration of the payload is on theorder of 10-5 g. The air jet control is used to limit drift resulting from
this disturbance.
Preliminary investigations, including computer simulation, indicate that
the air jet control system is feasible. However, in order to establish a
workable system it is necessary to test the concept experimentally. The
experimental setup consists of a mass constrained to move in a
one-dimensional simulated low-g environment. The displacement and velocityof the massare monitored and used to control solenoid.activated air
valves. The first phase of the experimental program is intended to
8-4

establish the feasibility of the air jet feed back control system concept
and to identify parameters for the air jet and the feedback control
systems.
Theoretical Background
The basic one-dimensional model is derived from the system shown in figure
1. The one-dimensional model is felt to provide sufficient detail to
identify system parameters. It is assumed that the internal forces
generated by rotating unbalance or fluid motion within the payload are
negligible in comparison to the force transmitted through the compliant
coupling to the structure. This couple between the payload and the
structure is modeled as a massless spring element. The differential
equation describing the motion of the payload is:
M# = k(y-x) + Fj (I)
where:
M = payload mass
k = equivalent stiffness of the hose or power line
x = absolute displacement of the payload
R = absolute acceleration of the payload
y = displacement of the structure
Fj= thrust exerted by the jet
1. Jet Thrust
The thrust exerted by the jet is modeled from basic Nuid dynamics
theory [3] as:
Fj = dm (x - vf)
dt
(2)
8-5

where:
dm = mass flow rate of the air jet
dt
= velocity of the payload
vf = local flow velocity of the jet
The thrust produced always opposes motion of the mass. Whenthe mass
displacement is positive and to the right, the right side jet is activated
to produce a left pointing thrust vector. Similarly, whenthe payload is
to the left of the central position and moving toward the left, theleft side jet is activated to produce a right pointing thrust vector. This
model of the jet thrust has been verified in a static test performed at the
Shock and Vibration Laboratory at Texas A&MUniversity. The experiment
consisted of a 1.41 kg mass suspendedby wire 0.686 m. long. The air jet
impinges on the massand the angle the wire makeswith the vertical is
measured, as shownin figure 2a and 2b. Summingforces in the vertical and
horizontal direction, the expected force balance is:
Mg si n.____O d_m.mVfcos Q = dt (3)
where:
M = mass of pendulum
0 = static angle
dm Vfdt = momentumflux of the jet
The jet diameter is 9/32-in. (7.1 mm). The air supplied was compressedairused throughout the building. The flow rate was varied from 2.12 x 10⁻³
m3/S (4.5 cfm) 7.55 x 10⁻³m 3/S (16.0 cfm). The results of the experiment
8-6

are shown in figure 3 in which the angle reached by the pendulum is plotted
against flow. The relatively simple theory provides reasonable estimate
of flow rate required to produce a thrust force on the mass. The figure
shows that as the distance between the jet and the mass increases (angle
increases), the flow rate required to maintain equilibrium is greater than
the simple theory estimates. Factors contributing to this are experimental
error; the fact that the air jet impinges on the mass at an angle of
inclination, as shown in figure 2b, the thus the momentum flux is
transferred less efficiently as the angle increases; and the loss of
momentum flux due to temperature changes as the distance downstream of the
jet exit increases. While experimental error and loss of momentum flux
transfer due to impingement angle are factors particular to the static
experiment, the possible loss of momentum flux due.to heat transfer with
the surrounding air can affect the thrust in the active control project as
is indicated in the following section.
2. Jet Flow Equations
The expressions for dm and Vf are derived based on the assumption that thedt
momentum flux is constant throughout the flow field. It is required to
know the mass flow rate and flow velocity separately because the thrust
term in equation 2 depends on the relative velocity between the jet and the
mass. The derivations for the terms are shown in Appendix A. For a
one-dimensional, isothermal jet, the mass flow rate is:
dm : 0.234 x (Mo_)I/2 (4)
dt
where:
x = distance downstream of jet exit
Mo = momentum fl ux at the jet exit
: density of air
8-7

The momentum flux is assumed constant and equal to the momentum flux at the
jet exit, Mo, where, for a round jet:
Mo = _ Uo2R 2 (5)
where
Uo = air velocity at the jet exit (assumed uniform)
R = jet radius
The mass flow rate is evaluated at a downstream location using equation 4,
and since the momentum flux is constant, the equivalent uniform flow speed
is calculated.
3. Expected Air Consumption Parameters
The thrust required to give a 45 kg mass an acceleration of 10-5 g is
estimated to be generated by a flow rate of 2.24 x 10⁻⁵ m3/S (0.048 cfm)
through a jet of diameter 0.79 mm (1/32 in.). The pressure drop across the
valve required to produce this flow is calculated [4] to be 3.45 x 10³ N/m 2
(0.5 psi). An example of a compressor that can supply such a system is a
12 V DC, 187W (1/4 HP) oil free, piston compressor rated a 3.30 x 10⁻⁴m3/S
(0.7 cfm) at 6.90 x 10⁵ N/m 2 (100 psi). This is not expected to be a
prohibitive power requirement, even if the control system operates
continuously.
The type or frequency of excitation in the Space Station is not known.
However, in order to assess the expected performance of the air jet system,
the following example is investigated, based on the differential equation
of motion:
M_" : k (y-x) + dm (R - V )fdt
8-8

where the terms are defined in the previous section.
The payload mass is 45 kg and the jet uses air at 21°C (70°F) and 1.0 x 10⁵
N/M 2 (14.7 psi), with a flow rate of 2.24 x 10 -5 m3/S through a jet of 0.79
mm diameter. The spring stiffness is 5.0 N/m (0.34 Ib/ft). This is the
measured stiffness of a 95.3 mm (3.75 in) coil diameter spiral,
self-coiling, flexible hose. The structural displacement, y, is assumed to
be sinusoidal with period of O.1/sec. The magnitude is calculated from the
acceleration magnitude of 0.4 g. The jets are spaced such that the
excursion of the mass is limited to +_ 25.4 mm (_+1.0 in). The control
mechanism thresholds are set such that the jet is activated when the mass
displacement exceeds 2.54 mm (0.10 in) or the velocity exceeds 1.0 x 10⁻⁴
m/S (3.94 x 10⁻³ in/S).
The mass is displaced 10.0 mm (0.40 in) and released from rest at t = O.
Without the air-jet control systems, the mass oscillates with small
amplitude at the driving frequency superimposed on a vibration at the
natural frequency of the spring-mass system. The peak acceleration of the
payload due to transmissions of the O.4g structural acceleration through
the spring is calculated to be 1.13 x 10⁻⁵ g. The natural frequency
vibration component has a period of 18 seconds, based on the mass and
stiffness values, and amplitude equal to the initial displacement. In the
absence of any control, this oscillation continues indefinitely.
With the air jet control, the response is shown in figure 4. The resultant
motion of the mass is a sinusoid that decays linearly in time. The period
of oscillation is 18 seconds, which corresponds to the natural period based
on the spring and mass. The decay rate corresponds to an equivalent
viscous damping factor of 0.0282. The time required for the mass to reach
a steady state vibration about the central location is approximately 120
seconds. Of that time, the jet is on for 48.3 seconds, or 40 percent.
Experimental Program
8-9
The first phase of the experiment is intended to demonstrate the
feasibility of the air jet control and to establish the jet flow
paramete rs.
The experimental setup consists of the following major elements: a. sensor,
b. electronic control system, c. air jets, and d. test mass. The
electronic control system and air jets are designed for Space Station
application. The sensor is a commercially available Linear Variable
Differential Transforms (LVDT). This transducer limits allowable
displacement to one dimension and thus is not applicable to Space Station
application where three degrees of translation and three degrees of
rotation are possible. The test mass is supported by an air-bearing table
and is constrained to move in the horizontal plane. The air-bearing
facility simulates zero gravity in the horizontal plane. The experimental
set up is shown schematically in figure 5.
1. Control Algorithm
The LVDT produces a voltage which is proportional in magnitude and in sign
to the displacement of the test mass. The voltage output from the LVDT is
differentiated, producing a voltage signal proportional to the velocity of
the test mass. The displacement and velocity proportional signals are each
compared to thresholds values. The purpose for the threshold is to permit
a dead band in which no control is activated. If the threshold is
exceeded, a +15 volt signal is output on the line corresponding the sign of
the input voltage, and a -15 volt signal is output on the other line. The
outputs of the threshold detectors are combined in the comparator circuit.
If the combined voltage on one of the lines is large (30v) and positive,
this indicates that the mass is displaced from the center and moving
further away. The comparator opens the relay to activate the appropriate
jet. At the same time, the timer circuit is activated which limits the
duration of the air jet pulse. If the combined voltage at the comparator
is large and negative, this indicates either that the mass is within the
8-10
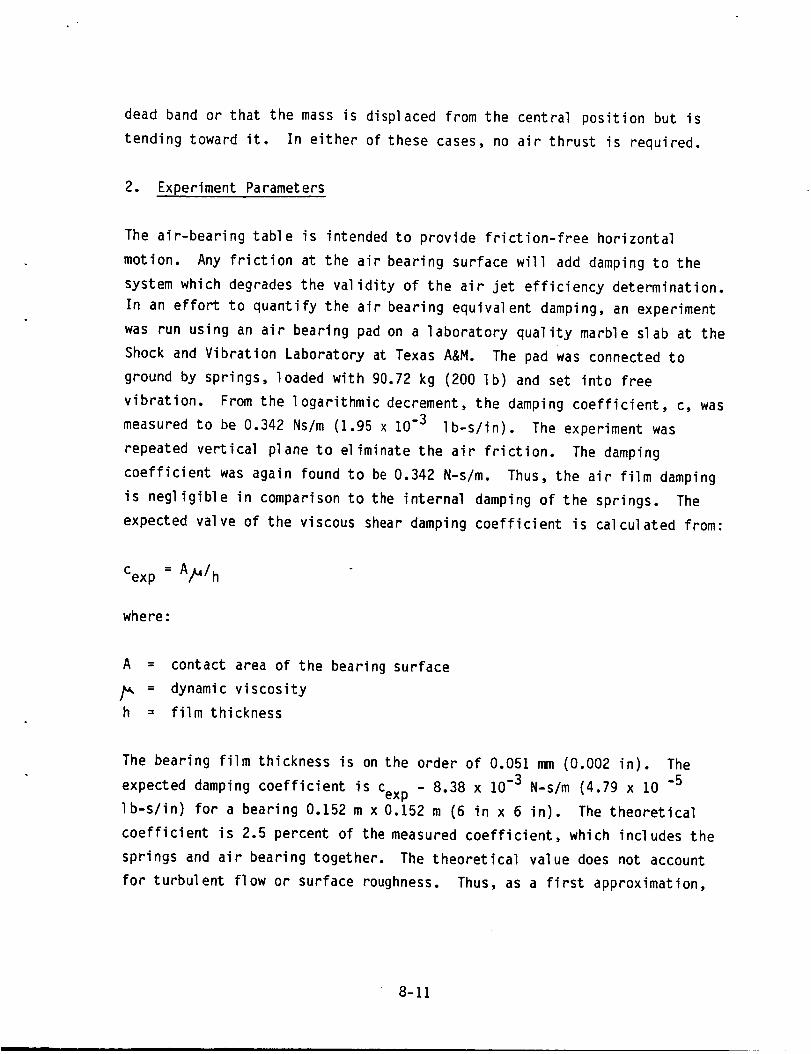
dead band or that the mass is displaced from the central position but is
tending toward it. In either of these cases, no air thrust is required.
2. Experiment Parameters
The air-bearing table is intended to provide friction-free horizontal
motion. Any friction at the air bearing surface will add damping to the
system which degrades the validity of the air jet efficiency determination.
In an effort to quantify the air bearing equivalent damping, an experiment
was run using an air bearing pad on a laboratory quality marble slab at the
Shock and Vibration Laboratory at Texas A&M. The pad was connected to
ground by springs, loaded with 90.72 kg (200 Ib) and set into free
vibration. From the logarithmic decrement, the damping coefficient, c, was
measured to be 0.342 Ns/m (1.95 x 10⁻³ Ib-s/in). The experiment was
repeated vertical plane to eliminate the air friction. The damping
coefficient was again found to be 0.342 N-s/m. Thus, the air film damping
is negligible in comparison to the internal damping of the springs. The
expected valve of the viscous shear damping coefficient is calculated from:
Cex p = A/_/h
where:
A _.
h =
contact area of the bearing surface
dynamic viscosity
film thickness
The bearing film thickness is on the order of 0.051 mm (0.002 in). The
expected damping coefficient is Cexp - 8.38 x 10⁻³ N-s/m (4.79 x 10 -5
Ib-s/in) for a bearing 0.152 m x 0.152 m (6 in x 6 in). The theoretical
coefficient is 2.5 percent of the measured coefficient, which includes the
springs and air bearing together. The theoretical value does not account
for turbulent flow or surface roughness. Thus, as a first approximation,
8-11

it is assumed that the air bearing damping is 10 percent of the measured
coefficient, or 3.42 x 10 -2 N-s/m. The system defined in a previous
section consists of a 45 kg mass connected to a spring with stiffness 5.0
N/m. The air jet control introduces an equivalent damping factor of
0.0282. The expected damping factor for three air bearing is 1.14 x 10 -3 .
Thus, the damping introduced by the air bearing is expected to be
negligible in comparison to the damping introduced, based on the damping
coefficient assumed above by the control system.
The air-jet momentum flux, M , required to produce an acceleration of 10 -5o
g of a 45 kg mass is 4.41 x 10 -3 N. The jets used in this experiment are
commercially available solenoid operated air valves fitted with plugs in
which a 0.799 mm (0.03125 in) hole has been drilled. The force exerted by
the flow from the jet was measured statically by impinging the flow on a
scale. The force versus pressure ratio across the jet curve is shown in
figure 6. It is found that the force decreases linearly as the distance
from the jet to the scale decreases. This indicates that the assumption of
constant momentum flux is incorrect. However, the overall percent
difference from the lowest to the highest force is approximately 25
percent. Thus, the constant momentum flux assumption is a valid first
approximation. The curve of expected force is shown in the figure. The
expected curve is derived from sharp-edged orifice flow theory [4], and is
found to provide a good estimate of the force. The transient response of
the jet was measured using a hot-wire anemometer. When the switch
activating the solenoid is closed, the response shows second order
characteristics with approximately 1.5 percent overshoot reached at 220
m-sec. This response time is a combination of the air-jet response and the
anemometer response. The anemometer response time was measured separately
and found to be approximately 150 m-sec. Thus, the response of the
anemometer is dominant in the total measured system response. As a first
approximation, the response time of the valve is assumed to be the
difference, or 70 m-sec. The air-jet, when activated, will pulse for a
predetermined time period of 0.50 sec. Thus, the response time is expected
8-12

to have a negligible effect on the active control system performance.
8-13
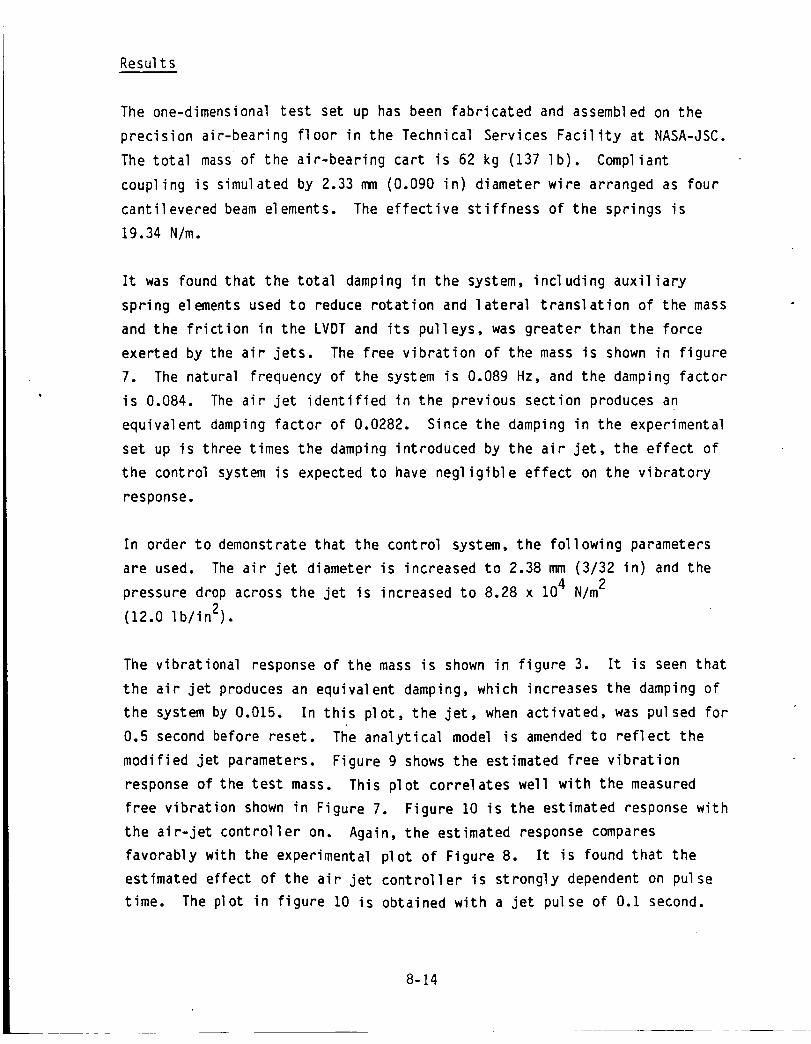
Results
The one-dimensional test set up has been fabricated and assembled on the
precision air-bearing floor in the Technical Services Facility at NASA-JSC.
The total mass of the air-bearing cart is 62 kg (137 Ib). Compliant
coupling is simulated by 2.33 mm (0.090 in) diameter wire arranged as four
cantilevered beam elements. The effective stiffness of the springs is
19.34 N/m.
It was found that the total damping in the system, including auxiliary
spring elements used to reduce rotation and lateral translation of the mass
and the friction in the LVDT and its pulleys, was greater than the force
exerted by the air jets. The free vibration of the mass is shown in figure
7. The natural frequency of the system is 0.089 Hz, and the damping factor
is 0.084. The air jet identified in the previous section produces an
equivalent damping factor of 0.0282. Since the damping in the experimental
set up is three times the damping introduced by the air jet, the effect of
the control system is expected to have negligible effect on the vibratory
response.
In order to demonstrate that the control system, the following parameters
are used. The air jet diameter is increased to 2.38 mm (3/32 in) and the
pressure drop across the jet is increased to 8.28 x 10⁴ N/m 2
(12.0 I b/in2).
The vibrational response of the mass is shown in figure 3. It is seen that
the air jet produces an equivalent damping, which increases the damping of
the system by 0.015. In this plot, the jet, when activated, was pulsed for
0.5 second before reset. The analytical model is amended to reflect the
modified jet parameters. Figure 9 shows the estimated free vibration
response of the test mass. This plot correlates well with the measured
free vibration shown in Figure 7. Figure I0 is the estimated response with
the air-jet controller on. Again, the estimated response compares
favorably with the experimental plot of Figure 8. It is found that the
estimated effect of the air jet controller is strongly dependent on pulse
time. The plot in figure I0 is obtained with a jet pulse of 0.I second.
8-14

This is much less than the 0.5 second pulse set on the timer of the
experimental controller. The discrepancy indicates that the air jet does
not go to full flow at the instant that the solenoid is activated.
Conclusion and Recommendations
An experimental facility incorporating air jet active vibration control has
been fabricated. The facility has been used to show that the air jet
controller effectively damps oscillations. An analytical model has been
developed which estimates the effect of the air jet controller. The model
can be used as a design tool to quantify parameters such as pressure drop,
flow rate and net acceleration of the mass under combined air jet and
spring-transmitted excitation. The model has shown that the solenoid
dynamics limit the thrust produced by the jet to 20 percent of the thrust
from an ideal valve which produces full flow when activated.
Continued work in this project will be in (1) sensor development, (2)
extension to general plane motion control, and (3) model development.
(1) Sensor development. The current LVDT will be replaced by a
non-contacting probe, such as accelerometer, ultrasonic tracker, or laser
tracker. Such a transducer eliminates the need for pulleys and thereby
reduces system friction. The transducer also permits extension of the
system to general plane motion with both translation and rotation.
(2) Extension to general plane motion. The control system will be
expanded to three-degrees-of-freedom. Sensors will be developed which
respond both to translation and to rotation of the mass. The analog
control circuitry and the air jet configuration will also be modified.
(3) Model development. The analytical model will first be refined to
resolve the discrepancy between measured and estimated jet thrust noted in
the previous section. The model will then be expanded to the general plane
motion case. The modified model will be used as a tool in the design of
the experiment.
c/8-15
It is expected that the same control algorithm which is obtained for plane
motion control will be applicable to the more general six-degree-of-freedom
application. Thus, the control system developed in the laboratory can be
adapted for use in the Space Station.
Acknowledgment s
The author wishes to thank the personnel of the Loads and Structural
Mechanics Branch for their technical assistance in the development of the
analytical work, the personnel of Northrop Services for technical
assistance in the vibration of the experiment, and the Mockup and Trainer
Section for use of the air-bearing floor.
8-16

_C AIR
OMPRESSOR
ACCUMULATOR
--7F-
SOLENOID
CONTROLLER_i
INTERNALEXCITATION
VIBRATIONSENSITIVEPAYLOAD
DRIFT
STRUCTUREBORNEEXCITATION
T
SENSOR
FIGURE 1. SCHEMATIC REPRESENTATION OF FEEDBACK CONTROLLED SYSTEMUSING COMPRESSED AIR AS FORCE PRODUCER
8-17
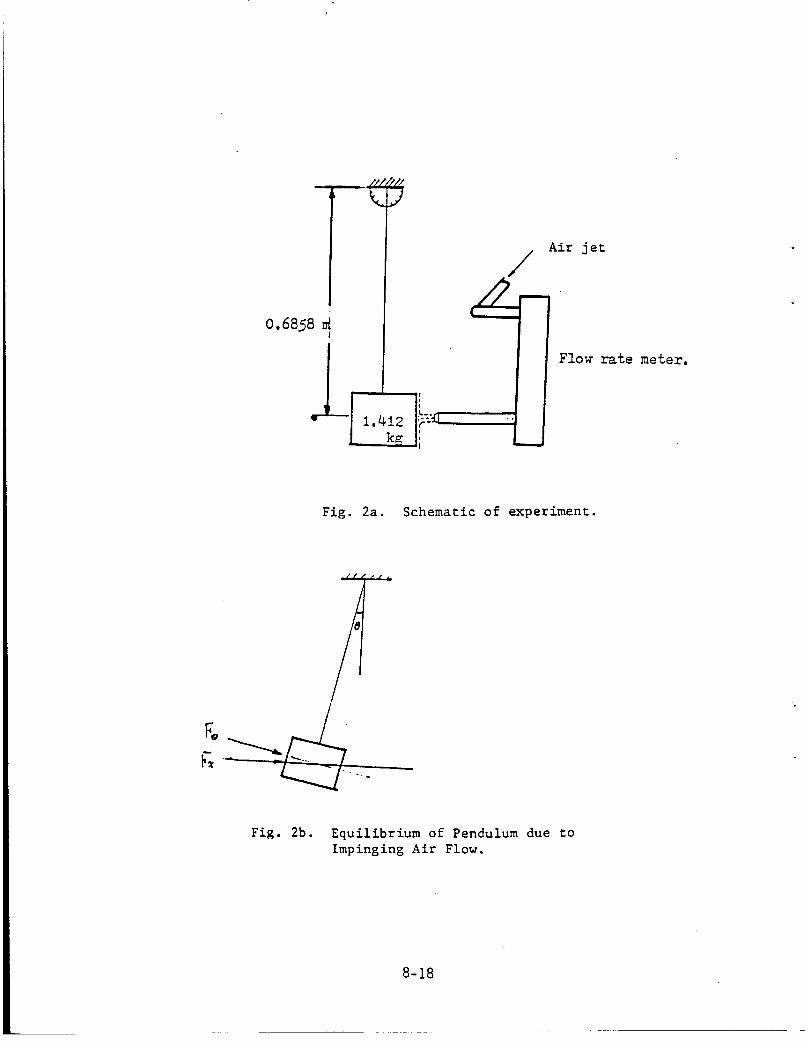
0.6858I
/Air jet
Flow rate meter.
Fig. 2a. Schematic of experiment.
F, /
Fig. 2b. Equilibrium of Pendulum due to
Impinging Air Flow.
8-18
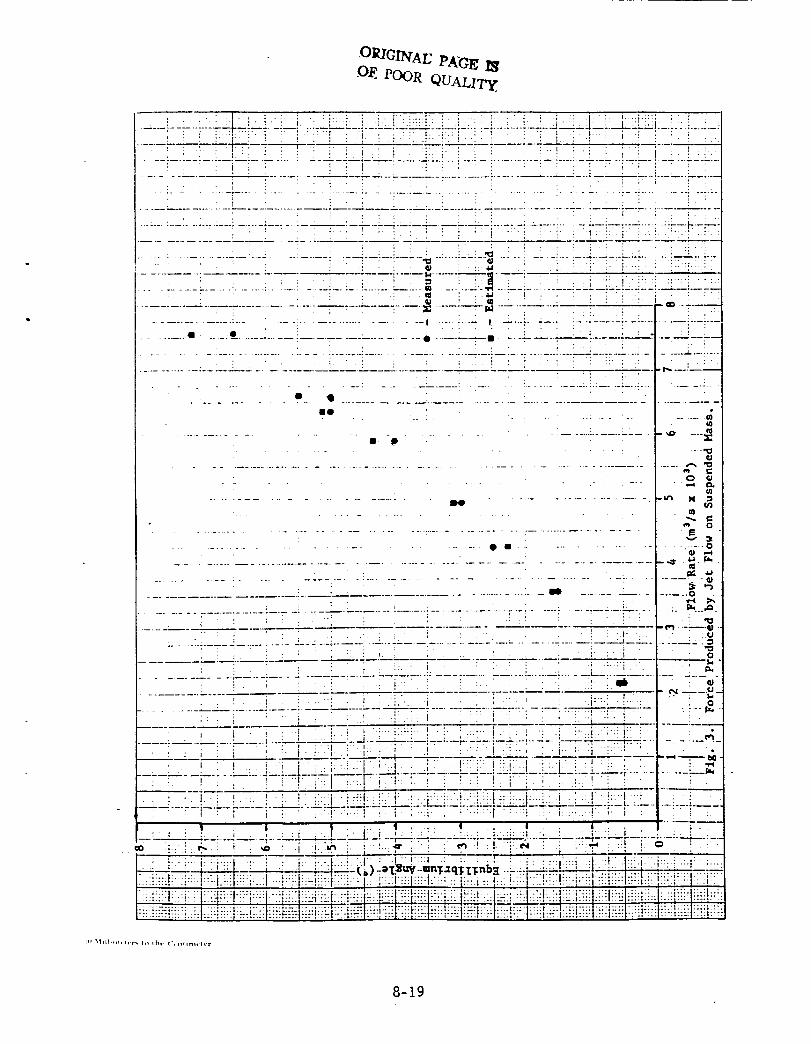
OR/GI'N'AE PAGF, ]_
.OF. POOR QUALITy
M; i; i -T-IV "
: " : i i i i- I : . ; " i ! : : i . i ; i : ' |. . . , .
........... ; .......... : ..................................................... : .......... 7 °°
..... -- ............. L .............. i............................................. c_ :_...-_i ..............I
• ._: : ; . : :. : : .'_ ..; ..' _-._: ...... :..,.5,_..:.:.:. ._ i_ _" _ -._............. -_............... ! - ":'--. ....... "t: ....... 4) . _ - _. : : .... . :
..... :............... ; .............. _ ................................. ._..... _._ ................ in .......
........... --.---7" .......... , : ::= r_............... ! ............ : ........... ; - --I ......... t .... _...... :.... ......
........ • ..... e_.............................. • • _. _ : : ! r. :........................ - ...................................... _.............. ! _._L____.................... _L ........
:: , : , : : • : : : ..... . .__-": __
• Q
I• ...... ir_
ffl
_ P
............................ m. ............................. _ N ,_
".. I::0
.................. 0I ................... o
...................... : .......................................... ._
!• _'1 - --:----'--_
i : : I- (a................................... .;..2 _._?.................................... ----:-- ..... .._!_ =
; : .; ", .; '. . : { O
! : " i ! !. : :i "--_.......... : ................ ? ........ .:_ ..... :____...:. ..... :. ....... :-. ...... !.............. :.L.. ........ " ............
-7-• : '.. _ : ..- :: _ !" i : " .i:: ! o
......................................... i " , " ! : i : [ : _ .!. i :, • i ' " " ..... _ " i ----
: : ._. • : ;_ " " ..__. ..... _ ....... '._.--...._l..;.:..: l ..... :___L.-_:._2L.--.". ..........
-. : .: ,-,. : : ! !:.::, ::,:! ': _ '-_:..!.-: t<::::.-:--i.:! ; _ '::_ _ :.....z ......................... -' |. :. ;..- .............
' " _ : ' _ . .! ::..! i :i . .... I :::.i " }i:.i..-.! i. _ : : :
I I I • _I 4 I t •
.oI. .... . . . o .. ......... ----? .............. . ....... -'T:---'_ ......... _ ....
_o i " t:-. ,,_ -uh I..._" i.;: : _ E "!. "" _N ! ;; .:._ ' :: !. _ : : •
....... : ..... ...... i ": .... ' i ..... _ ..... ' ' ' " ; II
. .: :-:: ....................................... ,_...... :::.- :':::_;;:: :.;" ! ": ........ _ ....
8-19
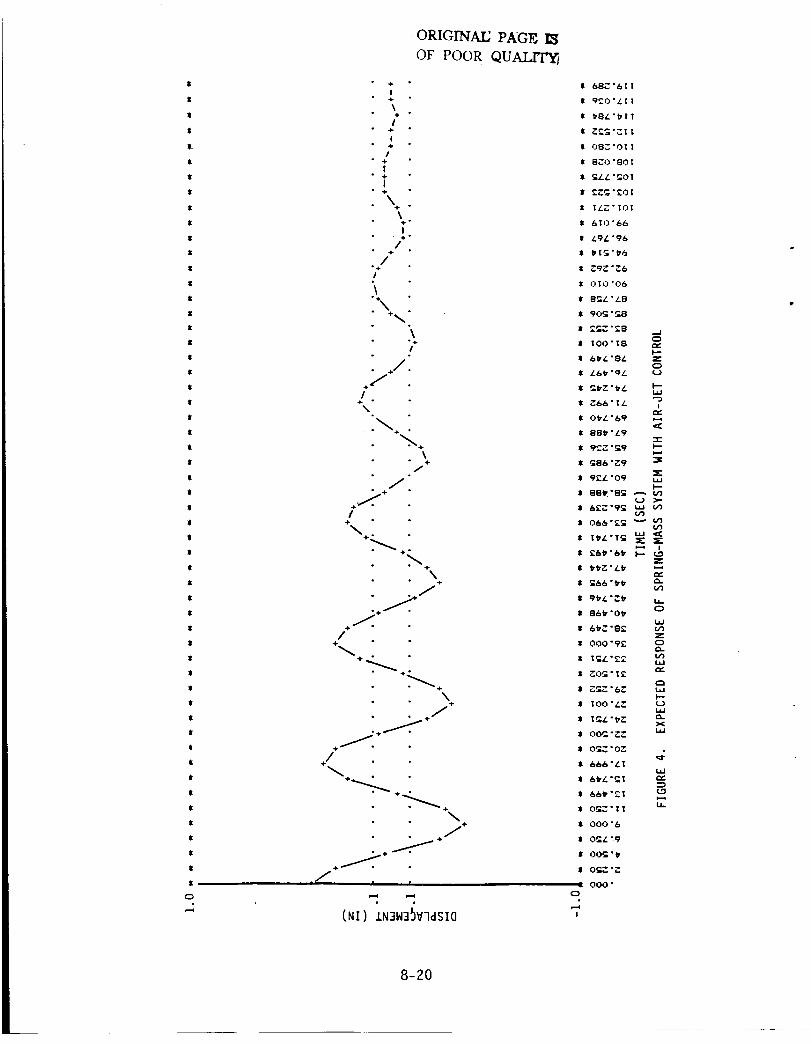
$
$
,l
$
S+
I
11
+l
Jl
$
$
4_
¢
l
11
l
$
$
¢
+,
Z
¢
t£
¢
$
¢
¢
S
$
l
It
¢
I
¢
¢
It
+,
l
Ii
I
$
¢
4t
l
¢
¢
I
$
¢
ORIGINAG P_G_
OF POOR QUAI_
4"\÷
I4"I4-/
TT
\+\!
//4,
.+
\+_
\"4-
+/++.I"/÷\"
N..+• ÷/
/:÷.._.÷I4"
\.
• 4"
%+/
+/</
\÷
/
/
+_+\/+
(NI)±N_W_SVqaSIa
I 6BC'61 t
t 9KO'LI I
i 083"011
I 8_.0 "801
$ gLZ "_01
z I L."" %01
b%0"66
z LgL'@6
z OIO'O_
_I 8_L "L8
41 90_ "c8
I _¢_ "ZB .-I
41 I00" IB "_I'--
$ 6t,L'BL _"0
I-..
t _+6+ " t L ir_I O_L "_9 '-"
I 88_ "L? ._.
m= maa'_9
$ 88_.'8_ "" u'_(,.j >..
u'}I 06_'Eg "-"
, ,_-,_._, _,.+_ _-
u')
It 9tL "_..t u..CD
It, 86t "Or'uJ
I 6t_, "8_ u'}
s.c}
r-s
I-,,
I tO0 "L_ (-}
etI I _/." _T-.. x
l.l..l, 00_ • _
$ 666" £I
l,.l.
I 000"6
00_ °
000"
c3
8-20

J_
-r_ct) (..._&._.II'_ _I
F.. r-_
o_l,lor)(,,r)i,i,..,,,.r__-- r',,"0"--'
c:_ ,,,
r.,,.I._-
I.| I
I-
I!
I
II
IIi !
i
8-21
I
c/"}
I--2:l,i
I._
Xi,i
Xi,iI"--
i,i
.,.J
I--
I---i,i
l,--d
,.Ai,i
i,

(
Z
---CALCUL
L
.6 p2/p I
.7 .8 .9 1.0
8-22
ORIGINAI_ PAGE /_.
OF POOR QUALIT_j
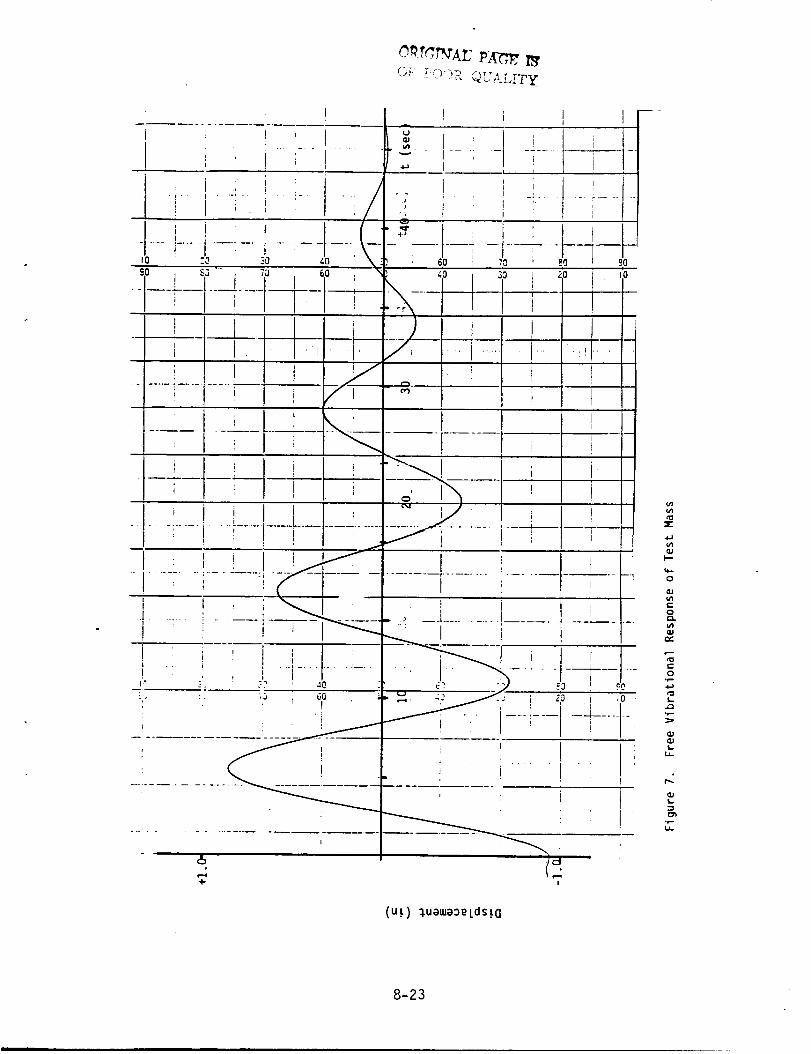
O_f_.-r!xrAL"PA-_ IS'
I
-I ....
IO
I
!
I
<5
i
__il............ I
(u.L)l.uetue:)_LdstO
Z
re..
0
e--
0,.-.,
,-,,-
%e..-o°m-.,.,l-t
t_
°_
.$,..J,
It...
8-23

i
i
i
1 --
(uL) TuomooetdsLG
°e,,,
L
e--"
,4,-a e"."
4-_ ("
LC.'_
T
I--
f,..
,..,1
8-24

6
'W
V.
4
4
'It"
"K"
4"
4'
'W"
4"
Q
ORIGINAL PAGE IS
i_ OF POOR QUALITy..
_.-
_..o.
#_
÷
-÷
.÷i
\o
J.
./
÷
÷.
%._ °
%+.
-I.
../f:
%÷.
÷f.._÷.j÷t
÷_
* _÷ .,,._. ÷
• -4.
• ÷f
+_÷_
• _4, L
(UL) _u_w_eLdS_O _• _
÷ i
4_
a_
4"
_7
_, "__C
_2_ "g_.
o _4 "_
,_ _;21_. _
* ItX "2_
* i,i,_ " "_,
* t,_t" "9t"
* 9t,3 "t,t,
/(}6 " I_,
* _Ci_. "II,
* 8_L "6C
• 86b "S"
• 61"_. "8_
• _6t' "LZ
. 0_.' "9 __
* O('n) "9_
• I('_ "t,C
• I_," "_.%
• _,00 "0_.
* K=,_ "6=
• I.ra..C-/= 4-_
* IO0 "wC_
* I 0_; ""=_
* T _,C "_,T.,
• IO0 "i_ ,T,
* 0_.- "c'_
000 " ! 7.
0_= "O=
6_'/. "8I
6_6 "z$
6&t, "_I
b6t, "CI
0_7_., " I T
00_ "0 I
000 "6
,:'_.¢"9
00,', "¢)
00_ "i"
0_3 "2
OC, O "
,i,0'3" I
0,:.:.z -
000"
=K
W,-
(3'
¢-0._
°_
(I;qJ
"0
_=°_
h_
oC
8-25
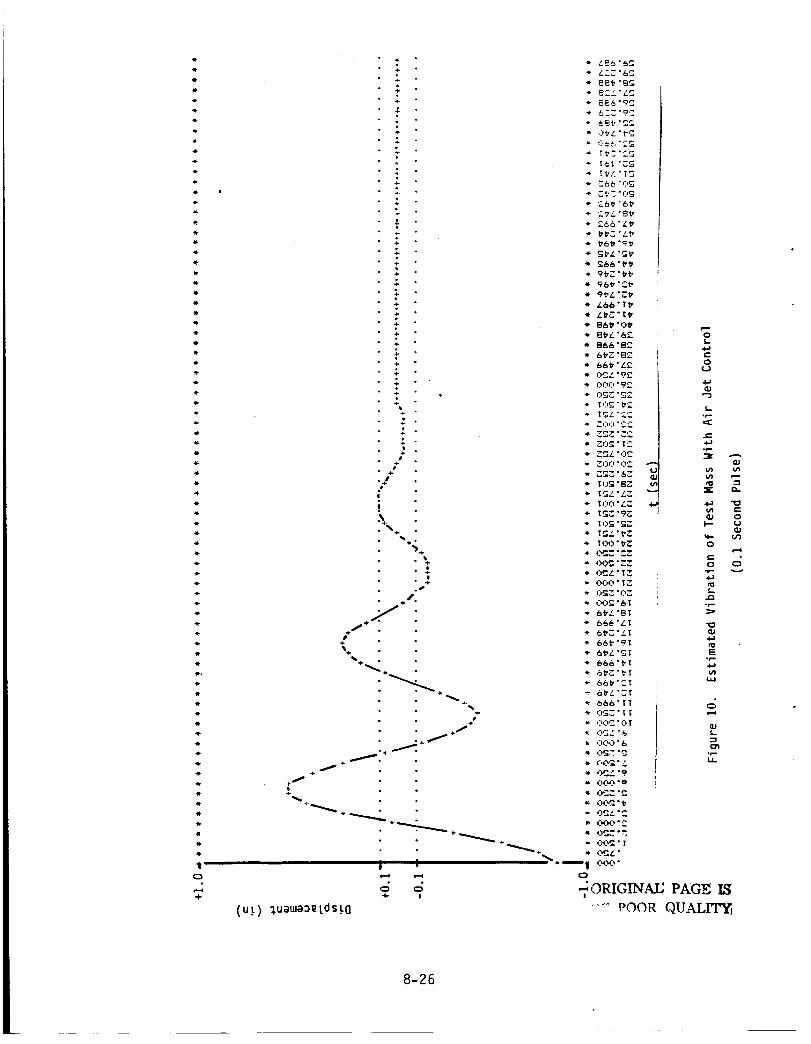
4_
4
a_
4
4t"
a-
4_
4_
t
4_
4_
0
4"
I
(ut) _uama0eLds_o
÷
÷
÷
÷
÷
÷
÷
÷
÷
÷
÷
÷
÷
+,+,
/
• +,.+,oO
÷f.
%.t- "
;
f
., f"+
0÷
0!
4
+1.
4
tl.
.w
.m
tl,
+i-
4
0
,:_ t"/_ ° t'_
'.- _ t, "6t-
'--_4 "8t,
'_&/, "L_'
9_ "t, fa
96_' "_t'
9_/_ "_t,
• "_,6 " ! t'
/..t'._ " _
86t' "0_'
8_'/.. "6_
8/',6 "8_
66_' -/e
000 "9_
:00 ""_
__0o "O_
!O0 "; Z
to_ "_:
!O0 "_0_7. "_-7_.00_ "_0_/." _000 "I,_0_.="0=
0,.')_ "6 Ib_.- "SI
6_t" "=!
6t'/. "-_._
666 "_" !
bt'C "t'!
66_ "CI
bt,_ ":I
_6& • I I
00_ "0 !
OG" "_
000 "&
,-,0_3 •
0_" "9
000 "=
00_"
05" "__
000"
O_L "
000"
i
4-
3
c-
Ot_J
_J
e-4.o
o
e- •
.e-
.T ORIGINAE PAGI_ I_.
.....' POOR QUALIT_
8-26

Appendix A. Derivation of Jet Flow Equations
It is assumed that the momentum flux, dm Vf, for a one-dimensional,
isothermal jet is constant downstream of the jet, and equal to the momentum
flux at the jet exit, Mo. For a round jet:
Mo =_ Uo2R 2 (A-l)
where:
(_ = fluid density
R = jet radius
Uo = fluid velocity at the jet exit (assumed uniform)
Downstream of the jet exit, the jet widens, the centerline velocity
decreases and the velocity profile across the jet takes on a Gaussian
distribution [5]:
U(y)
u¢_
(A-2)
where:
U_. = centerline velocity at downstream station, x
y = radial distance from the centerline
xo = virtual origin of the jet, assumed to be at the jet exit.
K = constant
8-27

The constant, K, is empirically derived from the jet widening rate, which
forms an included angle of 9.8 o to the radial location at which the flow
velocity is 0.5 the centerline velocity [6]. The value of K is 94.
In the fully developed region, beyond approximately 8 diameters downstream
of the jet, the centerline velocity decreases at [6]:
U___ 6.2
Uo (X/D) (A-3)
where:
D = jet exit diameter
As the jet widens and the flow speed decreases, air surrounding the jet is
entrained, such that the momentum flux remains constant.
Using the relationships obtained above in the mass flow rate equation:
oo
dtdm : I__TI_ _ U_,/_ o_i0
it is found that, for an isothermal jet:
dm : 0.234 x (Mo_) i/2dt
(A-4)
Since the momentum flux is constant and equal to Mo, the equivalent uniform
flow speed Vf can be calculated from
VF : Mo
dm
dt (A-5)
8-28
Reference
Io Garriott, O. K., and Debra, D. B., "A Simple Microgravity Table for
the Orbiter or Space Station", NASA Johnson Space Center, Houston,
Texas.
o McDonnel-Douglas Technical report on Microgravity Vibration in the
Space Station, MDTSCO document.
3. Dailey, J. W., and Harleman, D. R., Fluid Dynamics, Addison-Wesley,
Reading, Mass., 1966.
o Ogata, K., System Dynamics, Prentice-Hall, Englewood, Chiffs, NJ.,
1978.
B. Gilbride, J. F., "Modified Shielding Jet Model for Twin-Jet Shielding
Analysis", M. S. Thesis, Texas A&M University, August 1983.
. Chen, C. J., and Rodi, W., Vertical Turbulent Buoyant Jets, A Review
o__fExperimental Data, Pergamon Press, New York, NY, 1980.
8-29
Tralmng forLongMissions ,J.H.Goldberg
1986 N 8 ? " 2 6 ?' 0 1NASA/ASEESUMMERFACULTYRESEARCHFELLOWSHIPPROORAM
,john_n Space CenterUniversity of Houston
TP,AINING FORLONGDURATIONSPACEMISSIONS
Prepar_ by:
Academic Rank:
University & Department:
,NA6AIdSC
Directorate:
Division:
Branch:
,JosephH.8oldberg,Ph.D.
AssistantProfessor
The PennsylvaniaStateUniversity,UniversityPark,Pennsylvania
DepartmentofIndustrial& Management SystemsEngineering
Engineering
AdvancedPrograms Office
Systems Definition
dOC Colleague:
Date:
ContractNumber:
`johnW. Aired
,july23, 1986
NGT-44-O05-803 (UniversityofHouston)
9-I

Trainingfor LongMissions J.H.Goldberg
TRAINING FOR LONODURATIONSPACEMISSIONS
JosephH.8oldberg
AssistantProfessor
DepartmentofIndustrial& Management Systems Engineering
The PennsylvaniaStateUniversity
207 Hammond Building
UniversityPark,PA 16802
The successfulcompletionofan extendeddurationmanned missiontoMars willrequirerenewed
researcheffortintheareasofcrew trainingand skillretentiontechniques.The currentestimate
ofin-flighttransittimeisaboutninemonthseachway,withasixmonth surfacevisit,an orderof
magnitudebeyondpreviousU.8.spacemissions.Concernsari_ when consideringthelevelofskill
retentionrequiredforhighlycritical,one-timeoperationssuchasanemergency procedureor a
Mars orbitinjection.
Theobjectivesofthisresearchprojectwere toreviewthefactorsresponsibleforthelevelof
complexskillretention,tosuggestoptimalways ofrefreshingdegradedskills,and tooutlinea
conceptualcrew trainingdesignforaMars mission.
Currentlyproposedcrew activitiesduringaMars missionwere reviewedtoidentifythespectrum
ofskillswhich must beretainedovera longtimeperiod.Skillretentionliteraturewas reviewed,
toidentifythosefactorswhich must be consideredindecidingwhen andwhich tasksneed
retraining.Task,training,and retentionintervalfactorswere identified.Thesefactorswere then
interpretedinlightofthecurrentstateofspaceflightand adaptivetrainingsystems.Finally,the
retentionfactorsformedthebasisforaconceptualdesignofMars missiontrainingrequirements.
9-2
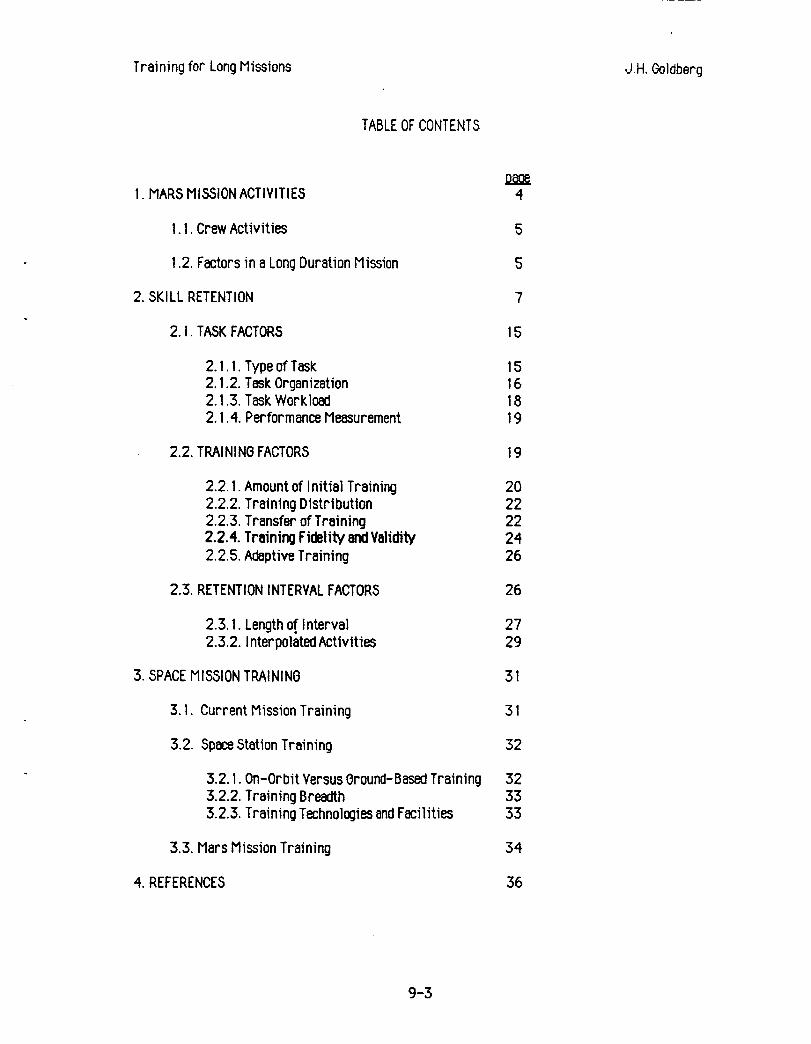
TrainingforLongMissions J.H.Goldberg
TABLE OF CONTENTS
I.MARS MISSION ACTIVITIES
I.I.Crew Activities
1.2.Factorsina LongDurationMission
2. SKILL RETENTION
2. I.TASK FACTORS
2.1.1. Type of Task2.1.2. Task Organization2.1.3. Task Workload2.1.4. Performance Measurement
2.2. TRAINING FACTORS
2.2.1. Amountof Initial Training2.2.2. Training Distribution2.2.3. Transfer of Training2.2.4. Training Fidelity and Validity
2.2.5. Adaptive Training
2.3. RETENTIONINTERVALFACTORS
2.3.1. Length of Interval2.3.2. Interpolated Activities
3.SPACE MISSION TRAINING
3.I. CurrentMissionTraining
3.2. Space Station Training
3.2.I.On-OrbitVersusOround-BasedTraining
3.2.2.TrainingBreadth
3.2.3.TrainingTechnologiesandFacilities
3.3.Mars MissionTraining
4. REFERENCES
4
5
5
7
15
15161819
19
2022222't26
26
2729
31
31
32
323333
34
36
9-3

Training for LongMissions J.H. Goldberg
TRAININGFOR LONG DURATION SPACE MISSIONS
It is human nature to forget highly learned information. Over time, psychomotor skiIls that mayhave been overlearned degrade into awkward movements at a later time, while ordered sequences
and events rapidly become disordered. The study of human skill retention and degradation has beenongoing for many decades; useful information exists, but a comprehensive model of skill retentionas a function of independent task and individual factors must still be developed.
This paper considers these skill retention factors in light of a long-duration spaceflight, such as 8manned mission to Mars. Retention of finely tuned skills and knowledge is absolutely nec_c_aryfor the successful completion of such a mission, yet man-machine system complexities arebecomming more and more complex. These skill retention issues also have implications that go farbeyond manned spaceflight. Industry must train workers, often for long periods of time and withconcomitant losses in productivity. Colleges and universities are also in the business of training
individuals with skills and knowledge for long-term retention. Clearly, accurate long-termretention of skills and knowledge is important for productivity and safety within the entiresociety.
Thispaperisdividedintothreemajor sectionsinitsexaminationof longdurationskillretention
for"manned spaceflight.(I)Currentlyproposedcrew activitiesina manned missiontoMars are
reviewed.Thisinformationgaveaconcretefocustotheskillretentionissuesdescribedhere,and
allowedboundstobe placedupon thedurationand natureoftrainingand retention.(2) Recent
psychologicalandHuman Factorsliterature(withinthepast30 years)on factorsinfluencing
long-termretentionwas reviewed,concentratingon resultsandconclusions,ratherthana
critiqueofmethodology.The purposeofthissectionwas toprovideaframework by which
retentiontactorscouldbestudied,andtosubsequentlyprovidethenace_ary framework fora
futuremodelofskillretentiontimeand quality.(3) A sectionon trainingforspacemissionswas
included.The intentofthissectionwas toprovideafoundationfrom which longerduration
retentiontrainingcouldbuild,andtooutlinetherequiredtrainingelementsforan advanced,long
durationMars mission.While much ofsucha conceptualdesignismerelyan exerciseinfuturist
guesswork,an attemptwas made tologicallybuildon theconceptspresentedinearliersectionsof
thisreport.A descriptionoftheresearchyetneededtodevelopa workingskillretentionmodel
was alsoincluded.Such amodelwouldgreatlyaidtheconceptualdesignofMars andotherlong
durationmissions,aswellasindustrialjobdesign.InformationforSectionsIand 3,where not
otherwisenoted,was obtainedfrom personalcommunicationandexperienceatthe,JohnsonSpace
Center, Houston,Texas. The author wishes to acknowledge deck James, Andy Petro, and ,JohnAiredfor their valuable assistance.
I.MARS MI?%SIONACTIVITIES
A currentscenarioforan interplanetarymissiontoMars includesseveraldistinctphases:
I.Earthlift-offtolowEarthorbit(possibleatspacestation)
2.Taxi-transferfrom spacestationtoorbitinginterplanetaryvehicle3.TransittoMars
4.DockingwithsecondorbitaltransfervehicleatMars
9-_i

Trainingfor LongMissions J.H.Goldberg
5.Landon surface
6.Reversesequenceforreturnmission
The time involvedforsucha missionison theorderof5 to9 monthseachway, dependingon
orbits,trajectories,etc.,witha6 month or longersurfacevisit.Usingcurrentand near-term
technology,thetransittimesshouldnotappreciablydifferfrom thisestimate,butthetimespent
on thesurfacecoulddramaticallychangewiththeadditionofapermanentmanned Martianbase.
I.I.CREW ACTIVITIES
Theactivitiestobecarriedoutina Mars missionareasvariedasthoseineverydaylife.They
may be brokendown intofourareas,asshown below.Sourcesofinformationon crew activities
andeventsincludeOberg (1982), OI_ergandOberg(1986), Joels(1985), Connersetel.
(1985), andNationalCommision on Space(1986).
SpacecraftControlandMaintenance.Thesecriticalactivitieswillinsurethatmissionsuccessand
crew safetywillnotbecomprimised.Craw members, armed withautomatedequipmentand
extensivecomputerprograms,must serveasdiagnosticians,continuouslyaskingnew questions
aboutthestatusofequipment.As discussedbyothers,maintenancewillrangefrom simple
modularreplacementofLithiumcannisters,tolarge-scalereconstructionor evacuationofspace
vehicleapparatus.Bothdexterityanddecisionabilitywillbe required.
Scientific Study. Much investigation will continue to be performed in space. Many accounts haveindicated an even broader range of research topics than in previous space missions. Thesewillinclude not only physical and hard science topics, but will be expandedto social and behavioralscience issues including space habitability, behavioral interaction, and group power structures.
Crew HealthMaintenance.The healthofthecrewwillincludebothregularphysiologicaland
psychologicalscreening.Many innovativediagnosticandtreatmentprocedureswillbedeveloped
forlongdurationspacemissions,basedon priorspacestationexperience.Intelligentcomputer
programs,intheformofexpertsystems,willlikelybeextensivelyusedasguidesfordiagnosing
and studyingnew formsofilIneeses.
Recreation.Many havestressedtheimportanceofrecreationinan interplanetarymission(e.g.,
Fraser,1968). Alternativecognitiveandphysicalactivitesduringoff-dutytimewillbe
importanttomaintainingahealthycrow.
1.2. FACTORSIN A LONGDURATIONMISSION
Skilltrainingand retentionrequirementsforaMars missionwillnecessarilydifferfrom that
requiredby allpreviousmissions,asdeterminedby criticalityanddurationofevents.Those
skillsthatquicklydegrademust be refreshedoftenor continuously,whilebetterretainedskills
needonlybe refreshedperiodically.A trainingprogram forthismissionmust considerseveral
factorsthatare uniquetoa manned interplanetaryjourney,aslistedbelow.
9-5
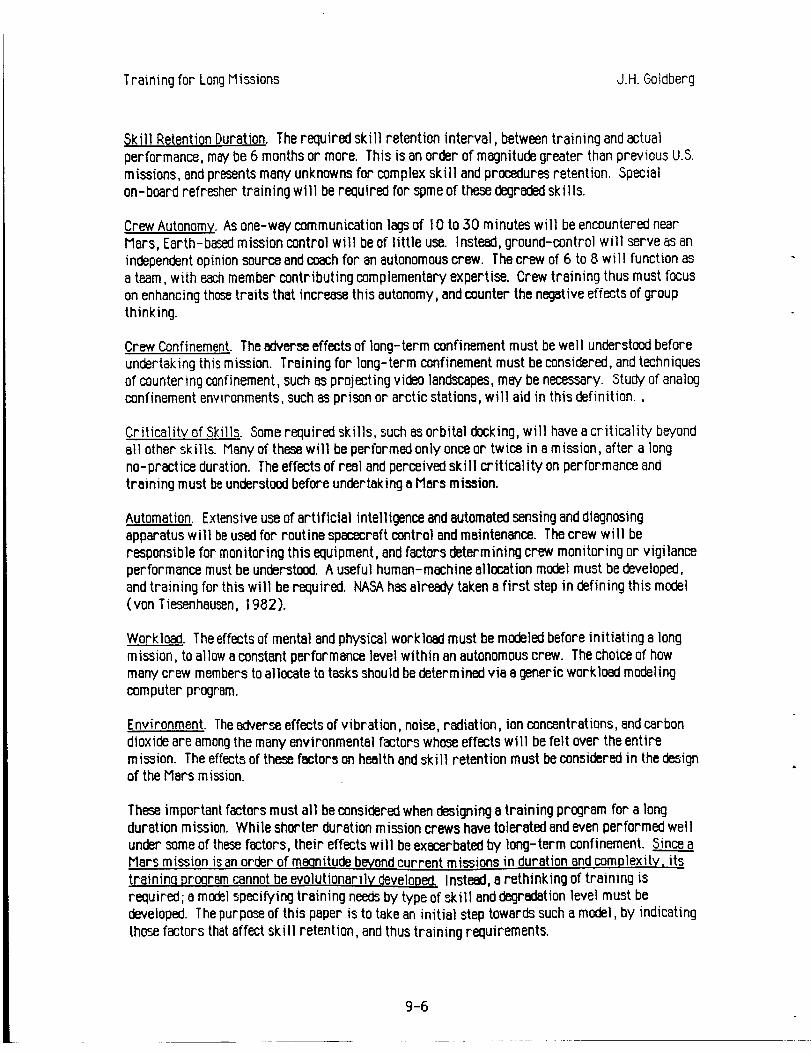
TrainingforLongMissions J.H.Goldberg
SkillRetentionDuration.The requiredskillretentioninterval,betweentrainingand actual
performance,may be 6 monthsor more. Thisisan orderofmagnitudegreaterthanpreviousU.S.
missions,and presentsmare/unknowns forcomplexskillandproceduresretention.Special
on-boardrefreshertrainingwillberequiredforspme ofthesedegradedskills.
Crew Autonomy.As one-way communicationlagsof I0 to30 minuteswillbeencounterednear
Mars, Earth-basedmissioncontrolwillbeoflittleuse.Instead,ground-controlwillserveasan
independentopinionsourceandcoachforan autonomouscrew. The crew of6 to8 willfunctionas
a team,witheachmember contributingcomplementaryexpertise.Crew trainingthusmust focus
on enhancingthosetraitsthatincreasethisautonomy,and counterthenegativeeffectsofgroup
thinking.
Crew Confinement.Theadverseeffectsoflong-termconfinementmust bewellunderstoodbefore
undertakingthismission.Trainingforlong-termconfinementmust beconsidered,and techniques
ofcounteringconfinement,suchasprojectingvideolandscapes,may benecessary.,Stud,/ofanalog
confinementenvironments,suchasprisonor arcticstations,willaidinthisdefinition.,
CriticalityofSkills.,Somerequiredskills,suchasorbitaldocking,willhaveacriticalitybeyond
allotherskills.Many ofthesewillbe performedonlyonceor twiceinamission,aftera long
no-practiceduration.The effectsofrealand perceivedskillcriticalityon performanceand
trainingmust beunderstoodbeforeundertakinga Mars mission.
Automation.Extensiveuseofartificialintelligenceandautomatedsensinganddiagnosing
apparatuswillbeusedforroutinespacecraftcontroland maintenance.The crew willbe
responsibleformonitoringthisequipment,and factorsdeterminingcrew monitoringor vigilance
performancemustbe understood.A usefulhuman-machine allocationmodel must bedeveloped,
and trainingforthiswillbe required.NASA hasalready'takena firststepindefiningthismodel
(von Tiesenhausen,1982).
Workload.The effectsofmentaland physicalworkloadmust bemodeledbeforeinitiatinga long
mission,toallowaconstantperformancelevelwithinan autonomouscrew. The choiceofhow
many crew members toallocatetotasksshouldbedeterminedviaa genericworkloadmodeling
computer program.
Environment.Theadverseeffectsofvibration,noise,radiation,ionconcentrations,and carbon
dioxideare amongthemany environmentalfactorswhose effectswillbefeltovertheentire
mission.The effectsofthesefactorson healthandskillretentionmust beconsideredinthedesign
oftheMars mission.
These important factors must all be considered when designing a training program for a longduration m ission. While shorter duration mission crews have tolerated and even performed well
under some of thesefactors, their effects will be exacerbated by long-term confinement. ,SinceaMars mission is an order of meqnitude beyondcurrent missions in duration end complexity, its
traininq program cannot be evolutionarily developed. Instead, a rethinking of training isrequired;a modalspecifyingtrainingneedsby typeofskillanddegradationlevelmust be
developed.The purposeofthispaperistotakean initialsteptowardssucha model,by indicating
thosefactorsthataffectskillretention,and thustrainingrequirements.
9-6

TrainingforLongMissions d.H.Goldberg
2.8KILL RETENTION
The duration and quality of skill retention should necessarily determine the training requirementsof a long duration space mission. Skills that quickly degrade must often be refreshed, whereasbetter retained skills may be neglected for a longer time. Before considering this literature,several qualifications must be made, however. ( 1) Reports of studies in this area are often notreadily obtainable. This may be due to the fact that much of the training re_arch has beenconducted in the private and military sectors, which have little impetus to publish in widelydistributed publications. Also, much of this research is very task specific, and investigators mayhave have felt that their research would have low utility outside their immediate scope. (2) Themajor retention factors are covered below as discrete topics, but all are intimately intertwinedand confounded. Differences in the length of a post-training retention interval, for example, areconfounded with the type and duration of initial training. Conclusions drawn here must clearly beinterpreted with a great deal of caution. To gain a better understanding of these factors, however,they are discussed separately, ignoring conjoint and interactive effects. (3) In some cases,conclusions were necessarily drawn from very few studies, clearly scientifically inappropriate.This was pragmatically done to at least provide a direction for future research needs anddevelopments.
Naylor and Briggs ( ! 961 ) reviewed over 60 years of literature, and created the firstcategorization of retention-influencing variables. ( I ) Task variables included theprocedural/tracking task dichotomy introduced below. They raised the important issue that thedifficulty and organization of a task is likely responsible for observed retention differences. (2)
traininq variables included three subclasses of factors: the amount of initial training, distributionof training sessions, and transfer effects from other tasks. (3) Retention interval variables
included those factors present within this period. (4) Recall variables consisted of otherretention-influencing factors, such as the training fidelity, or the presence of any warmupactivity prior to retention testing. The present review drew heavily on this work, and extendedtheir factor categories. A subsequent review (Sardlin andSitterley, 1972) covered many skillretention studies, under contract to NASA. Theseinvestigators provided annotated reviews of manystudies that were directly applicable to the piloting of space vehicles. The present review alsodrew on this paper, but was broader in coverage.
Selectedskillretentionstudiescitedbelowaresummarized inTableI,which presentsthe
followinginformation:(I) Investioator(s).(2) Retention:timeintervalbetweenendoftraining
and initialretest,(3) Task.:typeofperformancetask.P:procedural(discrete),T:trackingand
control(continuous),(4) Indp.Yar.:independentor manipulatedvariable(s);D:durationof
training,R:retentioninterval,S:structureoftraining,F:fidelityoftraining,O:organizationof
task,RR: retentioninterpolatedactivityor rehearsal,(5) TaskDescription,(6) Cmplxty:
complexityofthetask(s),subjectivelyestimatedby thenumber andtypeofsimultanous
activitiesthathadtobe performed,(7) Traininq:methodoftraining;durationor criterion,(8)
#Ss_:number ofsubjectstestedacrossentirestudy,(9) _: subjectivesubjectexperienceat
task; all subjects were inexperienced in abstract tracking tasks, whereas some aircraft controlstudies utilized experienced pilots; I. inexperienced, E: experienced, (10) Dependent Yar.:dependent or measured performance variable(s)
9-7

Training for Long Missions d.H. Goldberg
The resultsofthesestudies,referredtothroughoutthisreport,aresummari_--_clinFiguresI,2,
and 3. Manipulationsofretentioninterval,trainingduration,andtrainingorganizationare
shown,andeveryattemptwas made tocombinesimilarstudieswithidenticaldependent
parametersintoonefigure.FigureIshows performanceinproceduraltasks,or thoserequiring
cognitivecontrolor sequencingovermany proceduralsteps.Notethatthreetimescales,toallow
sufficientresolution,were usedon theretentiontimeaxes:0-24 months,O-6 months,and O-4
weeks. Dependentvariableshereincludedbotherrorsand timetocompleteprocedures.Figure2
shows performanceinsimpletrackingtasksoverthesame retentionintervalsastheprocedural
tasks.Dependentmeasureshereincludedintegratederror involts,inches,or arbitrarynumbers,
measuringthedeviationbetweena targetandone'sabilitytofollowit.Othermeasur_ included
theacqusitiontimetocaptureatarget,or thepercentageoftotaltimeon atarget.Allofthese
parametersgenerallyrequired_me form ofcontinuoussamplingby theexperimentalapparatus.
Figure3 alsoshowscontinuoustracking,butonlyforstudieswhich presentedmuch more complex
flightcontroltasks.Theseexperimentsoftenusedopen- orclased-loopsimulatorsofairplanesor
spacevehicles.Allretentionintervalaxesherewere 0-6 months. Dependentmeasures usually
consistedofa largecollectionofparameters,ofwhich asubsetwas chosen,suchasaltitudeerror
from a presetflightpath.
9-8

tO(1)
or)#-0
t'-(1)
4_
(1)Q:
J
vbf_
°
41)
F--
• .. L
i
bO
in
I,ki
I
m
,c_= _
m I f,..
I I
_i _ _"® o_ _._=
0°_
°_In
"5_ru
03
_o
7 <___,
I'--I'--
_ 0
.o E
m_
uJ
e--,_
Et_E _
r,-
0 ""
v
(71
_r" in
0_ c
C .--
u. CL
(2.
0
E
Z--_
in
o
E_o
(=
f,.q) .-,.
•"r" ,_
9-9

U3
0
¢-
t-r
_0
,Pc,
c-O
_D
t-
--_ _. _m ._ L
._._?- _ -.
U
>_ ,.,
O.
)
n
E_v
qo. ,..,
I-- I--
¢,..0
E1.0
A
r,,..
v
v
°_
U-
0
c_ E
9-10

(;')(I)
4-J
C¢)
o°_
r-
(3.)Q:
v(¢)
4.P
c-O
v
(1)
I--
9-11

Ammons et al(I958) - Expt II0 I.5
Neumann and Ammons (1957) _ r-_ .@c @
, l_ 4, 1.0
. , OO
_ 4 o_ 0.5 * 5 trainingtrials
2 _ _ 0 30 trainingtrials
z 0 _ : : : : ; ; : UO.O_ : : : ._ : : : :0 3 6 9 12 15 18 21 24 O 3 6 9 12 15 18 21 24
.,.100x Mengelkoch(1960);(1971) _ 1.0_ a •
i n an Woo 967)80
60 _ 0.6
"_ 40_ 010 training trials _ 0.4 _ -_I-.I • 5 traininqtrials w I $ one parameter, allphases
__ 20 Jr " _ 0.2 JP 0 allphases
•I • all parameters, all phases
i 0 : : : ; : :_ O.OI , , , , ' '
0 1 2 3 4 5 6 O 1 2 3 4 5 6
SKILL RETENTION INTERVAL (MONTHS)
IO0 Si_terleqand Berge (I972) 4 T• __ __-41, I Naglor and Briggs (1963)
60 t _ I • comissive errors
o --'--'_ _ 1 -'--"----
..° 20 /_.._----/_-----'Sitterleyet al(1972) _ I __..------_ • 2 weeks train,ng_ r_.._---- _,------_- Na_1oretal(I96_
t- 0 1 2 3 4 5 6 0 1 2 3 4
SK ILL RETENT ION INTERV Ak (MONTHS) SKILL RETENTION INTERVAL (WEEKS)
Figure I. Procedural Skill Retention asaFunctionofTimelnterval.
Note Yaryi ng Retention Interval Axes..
9-IZ
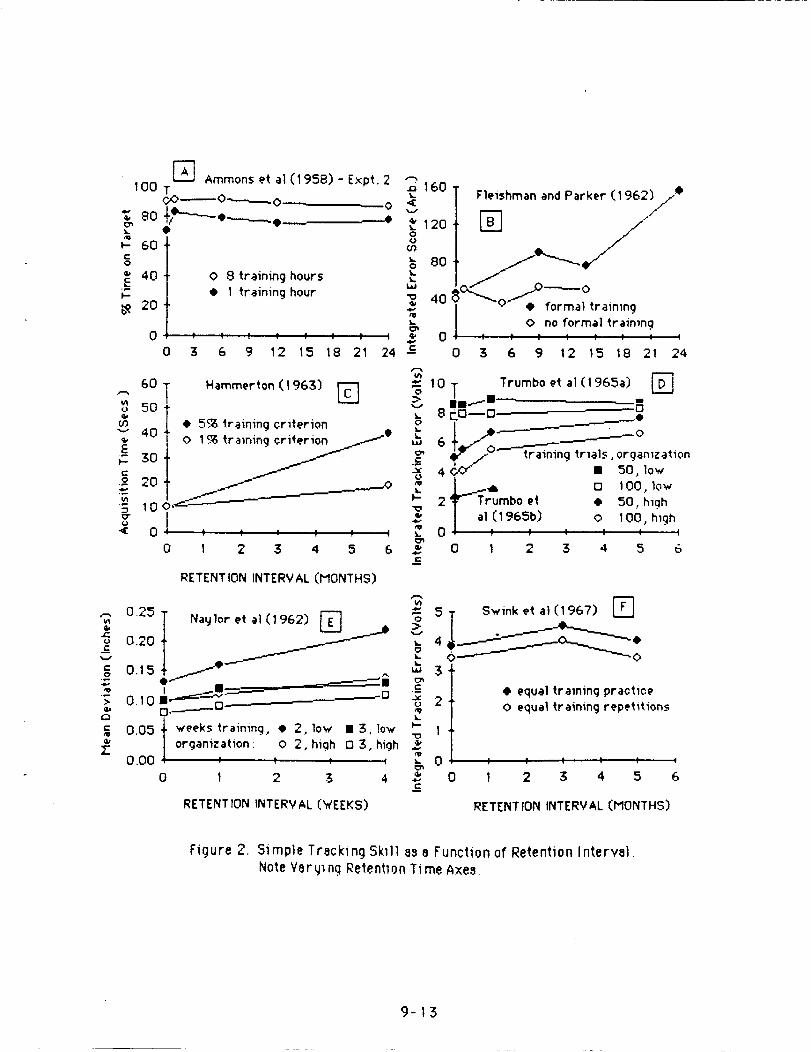
[_ Ammons et al (I 958) - Expt. 2 _.t-i100 T _.
00_0"_0 ' 0 v
80_- 60C0
._ 4Oh-
_ 20
0 8 traininghours
• 1 traininghour
0 t f ; ; !
0 3 6 9 12 15
"@0(.I,(n
_k0t.
laJ
"0'%,'e"
18 21 24 _c
60/..-%
50
03
i '°- 30
2O
10
_ 0
T ammer_on (1963) [2-]
• 5?'_trainingcriterion
01% framing cr_---""
0 I 2 3 4 5 6
120
160Fleishman and Parker (1962) ,/e
0 no formal traimng
0 : ; ; : ; ; : :
0 3 6 9 12 15 18 21 24
Trumbo e_ al(1965a) [_10 T
4 r%._" • 513.low
._Trb I:] I00, low2 umbo et • 50, high
I al(1965b) 0 100, hlghO; ; _ 0 i : :
0 I 2 3 4 5 6
v
0
.E
l--
_=
RETENT ION INTERV AL (MONTHS)
"_ 5 Swink et el (1967)
Naglor et al (1962)
3
._c" 2L_
• equal trainingpractice
0 equal trainingrepetitions
_, 0.25
r',.' 0.20
•-g °15e -------'-_•--'---'_- _m^
; 0.10O.--_---0_
c 0.05 weeks traininq, • 2. low • 3. low 1•' organization: 0 2, high 0 3 high
_" v,..,.,n.nn _ _ _ _ _ 0 _ I I I
o__' 0 1 2 _ 4 5 60 I 2 3 4
RETENT 10N INTERV AL (WEEKS) RETENT ION INTERV AL (MONTHS)
Figure 2. Simple Tracking 5k_ll as e Function of Retention Interval.
Note Yarylng Retention Time Axes.
9-13

100Mengelkoch (I960,1 971 )
¢i_
_ ___O
60• ______o"'4o¢
3500
v 2500
oL
W
15oo0 _
Sitterley and8erge (I972) -_
- 20 0 I0 trainingtrials ,-_ _terley(1974)
Or ''_ . .0 • ' ' : ._ : : 500 - . . ' ' :
0 I 2 3 4 5 6 .-, 0 I 2 3 4 5 6d
40 I 4_"_--___ __,_ ! l Sit_erley and Berge (1972)
Younqling. e_ al (1968) _, 800 T
3o eoo_o
20 I ...... N 400 " " £ '
a. 0 I 2 3 4 5 60 I 2 3 45 6 __
c 400.o Sit_erle9 et al.a.,.
"o (19300
k.
_o>_ 200 /_..., Si_erlev (1974)•" 100II,,i,.
.<.
0 1 2 3 4 5 6
SKILL RETENT ION INTERV AL (MONTHS)
Figure 3. Complex Flight Control Skill as a Function of Retention Time Interval
9-14

Training for Long Missions J.H. _Idberg
2.1. TASK FACTOR8
Thosefactorsaffectingskillretentionthataredirectpropertiesofataskareconsideredinthis
section.Cleartrendsthatappearinthesefactorsarevaluableinthedesignandevaluationoftask
training,asthosefactorsresponsiblefora largeamountofskilldegradationaregoodcandidates
forpotentialeliminationor control.Presenceofa largenumber ofthesecriticalfactorscan point
totasksrequiringfrequentrefreshertraining.Greetcaremust be usedwhen evaluatingtasks
containingmore thanoneofthesefactors,asinteractingfactorshaverarelybeeninvestigatedina
controlledmanner. Anythingotherthanqualitativecomparisonsacrossstudiesare dangerous,due
tocountlessnumbers ofuncontrolledfactors.Rather,generalizationsshouldbedrawn by first
notingwithin-studyconclusions,thenqualitativelycomparingtheseacrossmany studies.
2.1.1. Type of Task
8inca some of the earliest skill retention research, a distinction has been made between overalltypes of tasks. Procedural tasks are those requiring discrete, ordered responses. Some havelabelled these as cognitive tasks, referring to the large amount of non-automatic cognitiveresource required when trying to recall a long sequence of task steps, while others have calledthem discrete tasks, for the isolated responses that are required. Examples here includechecklists on aircraft or space vehicles, emergency procedures, and more abstract tasks such assetting sequences of switches in a proper order. The other class of tasks are thosewhich requirepsychomotor skills for successful completion. Some have also labelled these as continuous control
or tracking tasks, becausediscrete responses are not given. Typically, these require an individualto keep some stimulus on target, or within a specified range of conditions. Common examples hereare driving a car, controlling an airplane or spacevehicle, or simply manually controlling a leverso that a displayed shape remains between two points on an oscilloscope. Most reel-world taskscontain an element of both of these. Early research efforts simplified these as much as possible toobtain a high degree of experimental control. These studies indicated that procedural ski l lsdegrade more quickly than operational or continuous skills. Only those studies which presentedboth types of tasks to subjects, measuring relative skill degradation differences, are appropriatein the present assessment.
In early studies, continuous tasks were simple tracking movements while procedural tasksconsisted of sequence memorization. Ammons et el. (1958) tested over 1000 subjects on either a17-step procedural task or a model airplane control task, over many retention intervals. Greaterskill loss occurred on the procedural, cognitive task than on the motor control task over retentionintervals of up to two years. Naylor at el. (1962) combined a procedural switch.setting task ( 9sets of 3 switches) with a three dimensional joystick-controlled tracking task and found similarskill retention for both tasks. In this instance, however, 8ardlin and 8itterley (1972) noted thatthe procedural task was very simple, and greater skill degradation relative to the tracking taskmight have otherwise been expected. Using only a tracking task, Trumbo et al. (1965a) brokedown overall performcance into both temporal and spatial accuracy dependant measures. Theformer measured anticipations and lag time, whereas the latter measured absolute positioning
accuracy. Interestingly, the temporal skill performance was lost more quickly than the spatialperformance over the one week to five month retention intervals. The better subjects may have
emphasized the temporal aspectsof the task more than the spatial aspects, suggesting that moreeffort should be spent on maintaining temporal task performance.
9-15

TrainingforLongMissions d.H.Goldberg
Laterstudieshaveusedmore complex,flightcontroltrackingtaskswith proceduralchecklists,
measuringperformanceon both.Mengelkochetal.(1971 )combinedaflightcontroltaskwitha
proceduralchecklisttaskcontaining125 discreteitems.Over a fourmonth retentioninterval,
discreteproceduralresponseswere more susceptibletoforgettingthanthecontinuousflight
controlresponses.Thoughtheprocedurallosseswere greatenoughtobe practicallysignificant,
theinvestigatorswere carefultoqualifythisconclusion.Itisnotpossibletodefineequallevelsof
learningbetweenthetwotypesofdependentmeasures;trackingismeasured asa continuous
variable(e.g.,altitu_error),whileprocedurallistsare measured by percentageerror. Inthis
contextofrealaviationtraining,however,more emphasisshouldlogicallybe placedon the
learningand retentionofproceduralcheckliststhanoncontinuousflightcontrol(Gardlinand
5itterley,1972).
SitterleyandothersconductedaseriesofskillretentionstudiesforNASA intheearly 1970's.All
tasksrequiredbothactiveflightcontroland theuseofproceduralchecklists,andutilizeda
complex,closed-loopspaceshuttlecockpitsimulator.Comparing manualcontrolwithemergency
proceduralskillretentionfrom one tosixmonths,Sitterlayand Berge(1972) foundthat
proceduralskillsdegradedmuch more rapidlythanoperationalskills.Flightcontrolskillswere
acceptablyretainedfortwo months,whereasproceduralperformancedegradedafteronlyone
month;flightperformancedegradedby afactoroftenafteran intervaloffourmonths. 5itterley
etel.(1972) foundsimilarpatternsofdegradation,buttheproceduralskillIos_was notasgreat
asthatfoundinthepreviousstudy.The studiesdifferedinthatthepresentstudyusedexperienced
pilots(thepreviousdidnot)andallowedwarm-up techniquespriortoretentiontesting.
The studiescitedabovehaveallhadincommon theperformanceand measurementofboth
continuous,trackinganddiscrete,proceduralskills.While differingretentionintervalsandtask
complexitieswere used,theconsensushasbeenthatproceduralskillsare (I)more quicklylost,
and (2) losttoalowerrelativeskilllevelthantrackingskills.
The underlyingfactorsresponsibleforthisdifferentialretentionlossarestillunknown, however.
Taskorganizationdifferencesmay beresponsibleforthisdifferential(seeSection2.1.2.).
Alternatively,proportionallymore trainingmay be achievedby trackingthanby procedural
performanceinashortperiodoftime,becauseofitscontinuousnature,asdiscussedinSection
2.2.I.Also,thereram/naturallybemore transferand practiceoftrackingskillsina given
retentionintervalthanisallowedforproceduralskills(_.._eSections2.2.3.and 2.3.2.).Thefact
thatproceduralskillsdegrademore rapidlyand fullythanoperationalskillsmay thusbe an
emergentpropertyofotherunderlyingmechanisms.Differenttypesofparametersare al_
measured inthesetwo classesoftasks.Proc_luralskillsaremeasured by accuracyinfollowing
theestablishedorderofatask,whileoperationalskillsare typicallymeasured by temporal
parameters.Ifproc_luraltasksare measuredby suchparametersasthetimerequiredto
completea sequenceofswitchsettings,itineffectbecomesan operationaltask,sothetrue
measureoftasktypemay lieintheparametersmeasured,notintheactualtaskitself.
2.1.2. Task Orqanization
The actualor perceivedtaskorganization,inadditiontotheproceduraIloperationaldichotomy,
influencesskilldegradation.Proceduraltasksmay havelessspatialand temporalorganization
9-16
Training for Long Missions J.H. Goldberg
thantrackingtasks(Gardlinand$itterley,1972;Trumbo etel.,1965; Swink etel.,1967; Noble
etal.,1967). Unlessastudymanipulatesanorganizationalvariableina highlycontrolled
manner, thetasktypeandorganizationalvariablewillbe confounded.
Perceivedorganizationhasbeenmostcommonly manipulatedby alteringtaskpredictability.
Usinga proceduraltaskcombinedwithatrackingtask,Nayloretel.(1962) systematicallv
manipulatedtaskorganizationby illuminatinglightpairsinapredictableor an unpredictable
order.The taskorganizationhadagreaterinfluenceforlessertrainedconditions,inthatmore
organizationwas requiredas lesstrainingwas given.Trumbo etel.(1965a) createdfour
differentialconditionsoftargetpredictabilityinatrackingtaskby selactingtrackingtargetsso
thateveryonefollowedinspatialsequence,oreveryone,second,or thirdtargetwas chosen
randomly.At retentiontesting,subjectswho receivedthemost predictabletargetsequence
retainedskillsbetterthanallotherlevelsofpredictability.Infact,performanceaftera five
month retentionintervalusingthepredictablesequencewas superiorwhen compared to
performanceafteronlyoneweek ofretentionusingthelesspredictablesequences.When
compared withthepredictabletargetorganization,thelasspredictabletasksshowed80% to
100% more error,but littlepracticaldifferencewas notedbetweenthelow organizationaltask
performances.$wink etel.(1967) hadtrackingtargetseitherappearina deterministicorderon
everytrial,or withevery fourthtargetrandomlyselected.Again,thepredictabletargetsequence
producedsuperiortrackingperformanceforretentionintervalsofboth3 and5 months. In
anotherhorizontaltrackingtask,Trumbo atel.(1967) producedthreelevelsoftarget
predictability,correspondingtoevery4th target,6th target,or no targetsrandomlyassignedina
sequenceof 12 targetlocations.Alllevelsofpredictabilityproducedthesame performanceby the
endoftrainingsessions,butretentionattheendofone week was greatestwiththemost
predictabletask.The lowestpredictabilitytaskproducedbetterperformancethanthemedium
predictabilitytaskby theendoftheretentiontesting_ion, perhapsdue tothefactthat
differentialtraininghadbeangiventothesetwogroupsofsubjects;low predictabilitysubjects
received195 trainingtrials,whilethemedium predictabilitysubjectsreceivedonly80 trials.
Noble and Trumbo ( i 967) reviewed a number of experiments, breaking down retention loss byspatial and temporal uncertainty variables. In general, the greatest retention losses were noted inthe most uncertain task conditions, and response strategies by subjects varied with the amount oftask uncertainty.
Manipulationsofproceduraltaskuncertaintyhavealsobeenusedtoalterorganization.Nayloret
al.(1968) manipulatedthepredictabilityofasecondaryproceduraltask,whilesubjectswere
simultaneouslyperformingaprimary trackingtask.6ubjactshadtodepressbuttonsinvarying
orders,dependingon which ofseverallightswere illuminatedata pointintime.Two levelsof
proceduraltaskorganizationwere defined:a lightsequenceinnumericelorder,andasequencein
random order.Afterretentionintervalsof Ito4 weeks,thewellorganizedsecondarytaskhad
lesserperformancedecrementsthandidthelessorganizedtask.Inadditiontodecrementson the
secondarytask,performanceontheprimarytrackingtaskwas alsoinfluenced.The wellorganized
secondarytaskproducedsuperiorretentionontheprimary trackingtaskafterboth Iand4
weeks,thandidthemore poorlyorganizedsecondarytask.
Th_.,ehaveclearlydemonstratedthattaskorganizationdirectlyinfluencesbothproceduraland
trackingskillretentionduration.The actualtaskpredictabilitywas manipulated;retentionmay
alsobe influencedby perceivedorganizationwithina task.While nostudieshavecompared actual
9-17

Trainingfor LongMinions J.H.Goldberg
versusperceivedpredictability,this is preciselythefunctionoftraining.
2.1.3.TaskWorkload
Workload referstothephysicalandcognitiveeffortimposedby an operationaltask.Earlierwork
inthisareastudiedtheeffectsoftime-sharingbetweenseveralvisualdisplays,as isrequired
when drivingorflying,whilelaterwork utilizedother,jointcombinationsofabstractand
operationaltasks.For many reasons,some efforthasbeen made todevelopmodelsand measures of
workloadingenerictasks(e.g.,Brown, 1978). Rouse(1979) hasreviewedinformationtheory,
controltheory,andaueueingtheorymodelsofoperatorworkload,aswellasperformance,
physiological,andsubjectiveworkloadmeasures.Workload isofinterestdue toitseffectupon
skilltrainingandretention.Tasksrequiringmany simultaneouscontrolmovements,as in
aircraftcontrol,or taskscontaininglongstringsofbranchingpointdecisions,can bothbe
consideredtobeofhighcomplexityand requiredworkload.Johnson (1981 )suggestedthatthe
number ofstepsrequiredina proceduraltaskshouldbe adeterminingfactorinitsprobabilityofsuccessfulskillretention.
Itisinterestingtoask (I)whetherskillsforahighworkloadtaskare retainedforadifferent
timeperiodthanthoseforalowerworkloadtask,and (2) whether an individualcan be trainedto
performa giventaskunderhigherworkloadconditions.The organizationofa taskmay be
consideredtodirectlyaffectworkload,inthatthetwo are inverslyrelated(seeSection2.1.2.).
The mostvalidmethodofincreasingworkloadhasbeentoadda secondarytaskon topofa measured
primary task.Garvey(1960) trainedsubjectsfor25 dayson atrackingtask,thenaddeda
differentsecondarytaskon threesubsequentdays.Inclusionofthesecondarytasksgreatly
increasedtrackingerrortolevelsaboveinitial,unpracticedlevels.Single-task,low workload
trainingdidnottransfertodual-task,higherworkloadtasks.Briggsand Wiener (1966) noted
thathigherfidelitytrainingisrequiredinhighworkload,dual-taskperformance,thaninlower
workloads.Thisresultwas generalizedtoflightcontrolsimulators.Rudimentaryflightcontrol,
havinglow time-sharingrequirements,may betrainedon low fidelitydevices,butgreater
workloadreduiresa higher-fidelitysimulator.Trumbo etel.(1967) combinedatrackingtask
withaverbalnumber anticipationtask,ofvaryingdifficulties.Additionofthesecondarytask
againdroppedtrackingperformancetobelowthatatthestartoftraining.Performanceafter
retrainingdidnotincreasetothelevelshown by thosenotperformingsecondarytasks.Further,
performancelossafter8 daysofretentionwas independentoftheintroductionofthesecondary
task.Nayloretal's(1962, 1968) subiectsperformedindual-taskcombinationsofa tracking
taskwithaswitch-settingproceduraltask,withpredictabilityintheproceduraltask
manipulated.Thisalsoinfluencedworkload,becausemuch more attentionhadtobe placedon
proceduraltaskperformanceinconditionsoflow predictability.For eachofthetwo tasks,thelow
predictabilityproceduralconditionsproducedbothpoorerabsoluteperformanceandpoor
retentionaftera4 week retentioninterval.The amountoftrainingwas thegreatestpredictorof
absoluteperformancelevel._pher and North(1977) combineda primary trackingtaskwitha
secondarydigit-processingtask,and manipulatedtrainingconditions.Greaterperformance
improvementsfrom trainingoccurredunderdual-taskthanundersingletaskconditions,as ifthe
motivationfromahardertaskwas beneficialtolearning.
9-18
Trainingfor LongMissions d.H.Goldberg
Thedefinitionandmeasurementofmentalworkloadis ayoungscience,butsomeinvestigatorshaveclearly implicatedit asafactorin trainingandretention.Higherworkloadtasks,definedbylargelevelsofcognitivelime-sharing,arehardertolearnandretain.Largeperformanceimprovements,duetotraining,havebeennoted,however.Relativeskill retentiondurationbetweensingleanddual-taskconditionsalsoremainstobemodeled.
2.1.4.PerformanceMeasurement
The methodologyusedtoassessone'sperformanceina taskhasbeena continuingissueformany
years. Infact,an entireissueofajournalwas recentlydevotedtothistopic(Human Factors,
Volume 21 (2), 1979). Measurement ofpro_duraland operationalskillfollowinga no-practice
retentionintervalhasreIieqon measuresofaccuracyorspeed.Thesedependentvariablesare
thenplottedasafunctionoftime,acrossseveralexperimentalsubjectgroups.Bahrick(1964)
critiquedthebasicskillretentioncurve,suggestingthatobservedchangesaredue tovarying
sensitivitiesofanoverserver'sperceptuaIlcognitivesystembetweentestingsessions,andnot
necessarilyduetoforgettingor retentiondifferences.ConvertingdegradationscoresintoZ-scores
may aidinstabilizingthevariancebetweentestingsessios(Bahrick,1965).
Single-taskperformancemeasurementmay notcapturetheconcurrentdemand,time-sharing
requirementsofrealwork environments,andmany haveartificiallycombinedmany tasks
togetherintomultipletaskbatteries(e.g.,AIIuisi,1967). Thasetaskbatteriesprovidehigh
validity,precisioninmeasurement,and_mple a broadrangeofabilities(Akins,1979).
However, some havearguedthatthebatteriesareunnecessarilyartificial,andperformancesoores
may be definedratherarbitrarily(Chiles,1967;Akins,1979).
Swezc,'y(1979) introducedaBayesian-orientedutilitiesmodal todeterminewhatcriterionlevel
shouldbe achievedattheend oftrainingsessionsforgunnery trainees.Thiscalledfora iO-step
decisionmodel,identifyingcomponentsofthemodelandcalculatingutility.Other,empirically-
basedmethodsofassignmenttotrainingprograms havealsobeanpresented(e.g.,Savageetat.,1982).
The appropriatechoiceofusefulperformancevariablesand methodologiesisstillvery much at
issue,particularlyinlightofthefactthatthedegreeofobservedretentionisdependentonwhich
perametersare used.Some inv_tigatorshavemeasured absoluteperformance,whereasothers
useddifferencescores,subtractingpost-trainingperformancefrom retentionperformance.Both
typesofscoresare requiredtoevaluatelossduringa no-practiceretentioninterval(Gardlinand
$itterlay,1972). Also,variancemeasures,inadditiontomeans,have rarelybeanusedas
performanceindicators.
2.2. TPAINING FACTORS
Thissectioncoversthosefactorshavingtheirprimary influenceon initialtasktraining.Many
havesuggestedthatthesevariablesarestleastasinfluentialastaskvariablesindeterminingthe
durationofskillretention.Factorscoveredhereincludethedurationoftraining,thedistribution
ofinitialtrainingsessions,transfer,oftraining,end fidelityissues.The centralqu_tionsto
considerconcerntherequiredamountoftraining(cost)toexpectadequateskillretentionfora
9-19

Training for Long Missions J.H. Goldberg
desiredinterval(benefit).Such issuesaswhetherwholeor part-tasktrainingareneeded,and
thedegreetowhichalreadytrainedskillscanbe transferred,are relevantinansweringthis
question.
2.2.I.Amount ofInitialTraininq
A consistentfindingacrossmany skillretentionstudieshas beenthattherelativeamount ofinitial
trainingonereceivesisastrongpredictoroflevelanddurationofskillretention.Overtrainingon
onetaskmay beconsideredinsufficienttrainingon asimilar,analogoustask.Also,overtraining
canbe veryexpensiveifitrequiressignificanthigh-fidelitysimulatortime. Due tothe
importanceofthisi_ue, referenceismade tothefigurespresentedearlier.
Usingonlya 1S-stepproceduraltask,Ammons etel.(1958, Experiment 1)trainedsubjectsfor
either5 or 30 trainingtrials.Initialcompletiontimeforthetwosubjectgroupsattheendof
trainingwas 0.4and0.2 minutesforthe5 and 30 trialgroups,respectively.Aftera2 year
no-practiceretentioninterval,the5 trialtraininggroup performedthetaskin 1.3minutes(a
3-foldincrease)and the30 trialgroupperformanceroseto0.5 minute(2.5-foldincrease).
Proportionallyfewertrialswere requiredforthe5 trialsubjectstoregaintheirinitial
performancethanwere requiredby the30 trialsubjects.Thistrainingdifferenceisplottedin
FigureI(B). Intheirtrackingtask(Ammons etel.,1958, Experiment2),subjectswere trained
inaircraftcontrol(usingan airplanemodel)fora periodofeitherIor 8 hours.R_ults from
thisstudy,plottedinFigure2(A),showedthatskillsincreasedsomewhat overretentionintervals
ofup to2 years.Thisincrementwas approximatelyequalforbothtrainingdurations,butthe8
hourgroup maintainedabouta 2%- 10% superiorityover the I hourgroup performance
throughoutallretentionintervals.While thesuperiorityoflongertrainingremainedclearin
thistask,thereasonfortheperformanceincrementdidnot.
Mengelkochetel.(1960, 1971 )trainedinexperiencedsubjectsforeither5 or 10 daily
50-minute sessions,inan aircraftflightsimulator.As shown inFigure I(C),thetwo groupshad
approximatelythesame skilldegradation,aftera 4 month retentioninterval,ona proceduraltask
(lossesforthe5 and I0 trialgroupswere,respectively,20% and 16% oftraininglevels).The
effectofgreatertrainingwas inachievinganearly20% increasein initialtraininglevelon the
proceduraltask.The flightcontrolor trackingportionsofMengelkoch'sstudyonlyshowed
significantskilldegradation,from bothtraininggroups,fortheairspeederrorparameter.The 5
and I0 trialtraininggroui3sshowedaltitudeerror increasesofabout I0 feetoverthe4 month
interval(seeFigure3(A)),or about20%-30% increasefrom initiallytrainedlevels.Thisloss
was significantforthe5 trialgroup,butnotthe I0 trialgroup.Likeperformanceofthe
proceduraltask,theprimary differencebetweentrainingdurationgroupswas intheperformance
levelattheendoftraining,ratherthantherelativelylongskillretention.The factthatthe5
trialgroupretainedtheirskillstothesame magnitudeas thelongertrainedgroup ismeaningful.
Nayloretel.(1962, 1968) trainedsubjectsona dualtrackingand proceduraltaskforeither2
or 3 weeks ofdailysessions.The longertrainingproducedrelativelysuperiorperformanceatthe
end ofboth Iand,Iweek retentionintervalswhen comparedwith endoftrainingscores,butonly
inomissiveerrors.The comi_ive errrorsheredidnotsignificantlydiffer.FigureI(F) shows
theomissiveerrorsfrom thesesubjects.Nayloretel.(1963) usedthe_me taskand trained
subjectsforeither5 or I0 dallysessions(oneor two weeks).Only comissiveerrorshere
9-20
TrainingforLongMissions J.H.Goidberg
differedasa functionoftrainingduration.The trackingperformancefrom mesa ouai-taskstuoies
showedsimilartrends.Threeweeks oftrainingpreducedlessintegratedtrackingerrorand
greaterskillretentionthantwo weeks oftraining.Integratederrorwas alsosignificantlylower
for2 weeks oftraining,compared with 1weekoftraining.The 1week trainedgroupdid,
however,displm/increasesinskillduringtheretentioninterval,notshown by the2 week group.
Usingasimpleabstractlinetrackingtask,Hammerton (1963) varieddesiredinitialtraining
criterions,asopposedtovaryinginitia]trainingdurations.A 5% criteriongroup required3
successivedailyelapsedtargetacquisitiontimesthatdidnotdifferatthe 5% levelofsigmficance.
Likewise,thoseinthe 1% criteriongrouphad3 succ_ive scoresnotdifferingatthe 1% level.
Retentionoftrackingskillafter6 monthsisshown inFigure2(12).While two groupsdidnot
differinmean timeaftertraining,the5% grouprequiredmore than I0 additionalsecondsthan
the 1% group after6 months.Thisdifferencewas bothstatisticallyand practicallysignificant.
Even the 1% groupexhibitedsignificantskilldegradation,inspiteoftheirextensivetraining.In
thisstudy,theadditionaltrainingI.oachievethe 1% criterionwas 9 to 17 daysbeyondthe8 to22
daysrequiredforthe5% criterion.,Thisdegreeofoverlearningsignificantlydecreased,butdid
notentire!valleviate,skilldegradation.
Trumbo etal.(1965a) presenteda similarlinetrackingtaskto250 subjects.Halfwere trained
for50 trialsandhalffor 100,overa 3 day interval.As shown inFigure2(D), bothtraining
groupsshowedsignificantretentionlosses(increac=_dtrackingerror)overa 5 month interval.
The taskorganizationwas a strongerpredictorofretentionlossthanwas theabsolutetraining
duration.The hightraininglevelgroupdidexhibitlessskilllossthanthelow traininggroup at
alltestedretentionintervals.A subsequentanalysisofseparateskillretentioncomponents,from
onlythe IO0 trainingtrialgroup,demonstratedthatthebesttrackingsubjectsretainedtemporal
accuracy(asmeasuredby leador lagtime)betterthanspatialaccuracy(as measuredby
percentageofoveror undershooterrors).Thus,temporalasopposedtospatialtrainingmay'be
more importantinretainingtrackingskillsovera longduration.
Ina complexsimulationofan Apollomission,Younglingetel.(1968) trainedtheirsubjectsfor
either60 or 120 days.The overallskillretention,measured by timeon target,was twiceas
greatforthe 120 trialgroup(5.5 seconds)thanthe60 trialgroup(2.4 secondson target).
Hagman (!983) summarized _-_:vera!skillretentionstudiesperformedinmilitarycontexts.
Hegmen (1980) variedthenumber oftimesArmy personne]repeateda proceduralelectrical
alternatoroutputtestduringtraining.Increasedtaskrepetition,from 1 to-Itimes,reduced
performancetimeanderrorsby approximatelyconstantamountsduringtrainingand aftera two
week retention.Increasingrepetitionslinearlyincreasedperformanceuntilthe-1repetition
durationtraining.8chendeland Hagman (1980) trainedArmy groupstoeitheronecorrect
performanceor two correctperformancesinthedisaasembIyandassemblyofan M60 machine
gun.Afteran 8 week retentioninterval,thegreatertrainedgroupcommittedfewererrorsthan
thelessertrainedgroup._Idberg atel.(1981)trainedArmy personneltoeitherIor 3
successivecorrectperformancesofboresightingandzeroingthemain gun ofan M6OAI tank.
Again,higherperformanceaftera5 week retentionwas achievedby themore highlytrained
personnel.,SchendelandHegman alsovariedthetimeatwhich extratrainingwas actuallygiven.
One groupofsubjectsreceivedextrataskrepetitionsduringtheintitialtraining,whileasecond
group receivedtheirshalf-wayduringtheretentioninterval,at-1weeks. Theyfoundno
9-21
Trainingfor LongMissions J.H.Goldberg
significantdifferencebetweenthetwomodes,implyingthatit is morecosteffectivetosupplyalltrainingatonetime.
Mostoftheabovestudieshavebeeninagreementin thatskill retentionis afunctionoftrainingduration.Manyquestionsstill remain,suchaswhethertrainingdurationismoreor le_importantthantaskorganizationor theretentionintervalindeterminingthemagnitudeofskillretention.
2.2.2.TraininqDistribution
The way inwhichagivenamountoftrainingisdistributedovera timeintervalisalsopredictive
ofskillretentionsuccess.Fleishmanand Parker(1962) manipulatedthemethodofretraining
followingano-practiceretentioninterval.A massedpracticegroup received4 practice_ssiona
withina2 hourperiod,whilea distributedpracticegroup receivedthesame leveloftraining,
spreadacross4 subsequentdays.Thedistributedtraininggroupoutperformedthemassedpractice
group by theendofretraining,butbothgroupsperformedequallywellafteranotherIweek
retentioninterval.Thus,thedistributedpracticeram/havehad itseffecton temporary
performancefactors.Hagman andRose(1983) reportedthatinsertionoftimebetween
repetitionsofataskincreasesskillretention,but theproblemsassociatedwiththedisruptive
trainingmay overshadowtheirbenefitsinactualtasks.Hagman (1980) compared massedversus
spacedtrainingforArmy electricalalternatortastersand repairers.The massedtraininggroup
took51% longerand made 40% more errorsthanthespacedgroup.Schendeland Hagman (1980)
eithergavetaskrepetitionsas partofinitialtrainingorone month later,and foundno difference
inabilityafteratwo month retentioninterval.Spacingoftasktrialsand/orsessionsma_/be
helpful,butthereissome questionastowhether itseffectivenessvarieswithtaskproficiency
l_el (Hagman andRose,1983). A model isneededhere,and must considertheinitiallevelof
post-trainingskillproficiency,which alsodeterminestherequiredfrequencyoftaskrepetitions.
2.2.3.TransferofTraining
Trainingtransferreferstotheabilityofatrainedskilltogeneralizetoa new setting.From cost
considerations,positiveskilltransfermeans thatperformanceon a taskcan utilizealready
trainedskills,savingtimeandmoney. Also,highlygeneralizableskillscaneasilybe usedinnew
settingsor situations,forwhich no traininghasbeenconstructed.The term validityreferstothe
degreetowhich trainingreadiesone forperformanceona task,and isameasure oftrainingtransfer.
Briggsand Wiener (1966) trainedsubjectstoperform an abstracttwodimensionaltrackingtask,
andtransferredthistrainingtoaneasiertaskrequiringthesettingofacontrolknob. High
fidelitytraining(achievedthroughpropriaceptivecontrolfeedback)was onlyrequiredwhen the
transfertaskreqiuiredahighleveloftimesharing,by forcingconstantpositioning.Thus.when
proprioceptivecuesandhighlevelsoftimesharingare requiredina task,thetrainingprogram
shouldbeofhighfidelity.
Reid(1975) assessedtrainingtransferfrom aformationflightsimulatortoactualformation
flying.Untrained,formationsimulatortrained,andaircrafttrainedpilotswere compared in
actualflightformationflying.Evidenceofpositivesimulatorskilltransferwas obtained,asthese
9-22

Trainingfor LongMissions J.H.Goldberg
pilotsdidnotfly significantlydifferentlyfromconventionallytrainedpilots.Thesimulatorprovidedthesame degreeoftrainingastheflightsorites,indicatinga highlevelofskilltransfer.
CarterandTrollip(1980) showedthattrainingtransferbetweenskillsmay"becompared by
plottingiso-transfercurvesbetweenpairsofskillsand notingmaximum transferpairings.An
operationsresearchtechnique,theLograngeMultiplier,was usefulfordeterminingcostsand
benefitsoftraining.
Validityoftrainingcanalsobeevaluatedby themethodproposedby Goldstein(1978), who useda
fourlevelapproachtoevaluation:(I)Traininqvalidity,determinedby traineeperformance
relativetostandardtrainingcriteria,(2) Performancevalidity,measured by transferofjob
performance,usingcriteriafrom theactualjob,(3) Intra-orqanizationalvalidity,measured by
theperformanceofa groupofnew traineesbasedon theperformmanceofa previousgroup, and
(4) Inter-orqanizationalvalidity,measuredby thedegreetowhich atrainingprogram validated
inoneorganizationcan beusedinanotherorganization.Alloftheselevelsmust beevaluatedto
determinetheeffectivenessor validityofagiventrainingprogram. Movingfrom thefirstlevelto
thefourth,an increasingnumber ofvariablesinfluencethesuccessoftraining.Also,the
necessarylevelofcomplexityinatrainingneedsanalysismust dependon thefinalgoaloftraining.
Ifone'sgoalsdonotreachbeyondthesecondlevel,forinstance,thereisno needtoconsiderlevels
3 or 4. Suchastructuralassessmentofvalidityisrequiredtotransformtrainingneeds
assessmentfrom arttoengineering.The validityoftrainingapparatus,accordingtoCrawfordand
Crawford(1978), liesmore inthemanner inwhich itisused,ratherthaninthedegreeofits
similaritytoactualequipment.Theseinvesti_torssubstitutedconventionalhands-onpractice
forpart-taskcomputer-basedtrainingon theuse ofan int_ratedcontrolpanelinan
anti-submarineairplane.Controlsubjectsperformedon ahighfidelitysimulationofthecontrol
panel,whileexperimentalsubjectswere trainedusingagraphicsimulationon a touchscreen
display.Theexperimentalsubjectscompletedmore tests,inlesstimethanthecontrolsubjects.
The computer-basedtrainingwas foundtoprovideatleastasgoodskillacquisition,inlesstime
and atlessercost,thanthefullsimulatortraining.A costanalysisindicateda substantial
two-thirdscostsavingsovertheconventionaltrainingmethod,much ofwhichwas duetoasmallernumber ofinstructorman-hours.
Adams (1979) contrastedtheshortcomingsoftwo methodsofratingflightsimulatorsforaircrew
training.A transferoftrainingstudymeasurestherelationshipbetweenachievedtaskcompetence
and proficiency'on theflightsimulator,whiletheratingmethodrequiresanengineeringand
experiencedpilotassessmentofhardwareandflightsimilaritybetweenthesimulatorand actual
aircraft.Adams reviewedmany studieswlththethesisthatbothtechniquesareflawed.Thisdoes
notmean thatsimulatorsarenotuseful,though.Humans requiretheperceptual-learning,
stimulus-responselearning,andfeedbackprovidedby simulatorsessions.Inaddition,simulators
successfuIIymotivatetraineesbetterthanlowerfidelitylearningenvironments.Because
simulatorsare basedonthesewell-foundedprinciples,simulatorsneednotbeevaluatedfortheir
effectiveness;thismay be takenon faith(Adams, 1979).
As partofhisproceduralcontrolsettingtrainingstudy',Johnson(1981 )measuredskilltransfer
by manipulatingthesequentialstepsoftheoriginaltask.Intwo experiments,low-fidelity
paper-and-penciltrainingtransferredvarywalltothenew operationaltask.Althoughthetwo
taskslikelyutili2_=dsimilarskills,thiswas furtherevidenceoftheutilityofanalogoustasksfor
trainingpurposes.Validitydeterminationandtrainingneedsassessmentarestillverymuch
9-23
Trainingfor LongMissions d.H.Goldberg
debatedtopics;thissectionhasonlybriefly introducedtheseissues.
2.2.4.TraininqFidelity
A largeanddetailedlieteraturehasdeveloped,concerningrequiredfidelityintasktraining.At
issuehereiswhetherfullfidelityisrequiredtoachieveadequateand retainedskillperformance.
Considerationssuchaswhetheropenor closed-loopsimulationcontrolisrequired,whether
simulatorsmustnecessarilymove, orwhether adequatewhole taskperformancecanbe achieved
from part-tasktraininghavebeenaddressed.Inthispaper,fidelityreferstothedegreetowhich
atrainingdevicecan mimic an actualtaskofinterest,suchasflyingan aircraft.
N_lor etel.(1963) manipulatedthetypeofrehearsalsubjectsreceivedinadualtrackingand
proceduraltask.The proceduraltaskconsistedof9 pairsoflightstowhich responseshadtobe
made,and thetrackingtaskwas a threedimensionalmeter nullingtask,inwhich roll,pitch,and
yaw were simulated.Inwhole-tasktraining,subjectspracticedwithbothtaskssimultaneously,
asrequiredforthemeasuredperformancetask.Part-tasktrainingrequiredseparatepracticeon
eachtask.Retentiondifferencesbetweenthetrainingconditionswere significanton tracking
performance,withthepart-taskrehearsalgroup displayinginferiorperformance.Whole-task
rehearsalwas alsosuperiorforproceduraltaskperformance,butthissuperioritylessenedover
theretentiontesting.Whole-taskrehearsalwas superiorwithasmallamountoftraining(up to
5 days),but afterI0 daysoftraining,thetwo typesofrehearsalwere notsignifianctlydifferent.
N_Ior and Briggs(1963) manipulatedrehearsalconditionson thisproceduralswitchsetting
task.Whole-taskrehearsalconsistedofrepeatingtheoriginaltaskhaLf-w_ throughthe2 month
retentioninterval.Part-taskrehearsalconditionsconsistedofeither(I)spatialrehearsal,with
stimuluseventsoccurringatequaltemporalintervals,or (2) temporalrehearsal,withstimulus
eventsoccurringatvaryingtimesas intheoriginaltask,and stimuliappearingina regular
spatialorder.Thewhole-taskgroupproducedfarfeweromissiveproceduralerrorsthanthe
part-taskgroupsupon initialretentiontasting.The whole-taskand part,temporal-task
rehearsalwere superiortospatial-taskrehearsalwhen consideringcomissiveerrors.Thus,
whole-taskrehearsalherewas bast,closelyfollowedbY part-tasktemporalrehearsalin
upholdingskillretentionovera I month retentioninterval.
Fleishman(1965) presenteda multidimensionaltrackingtasktoinexperienc_IAir Force
trainees,withtheobjectiveofpredictingwhole-taskperformancefrom variouscombinationsof
part-tasktraining.The performancemeasurementdevicecontaineddisplaydialsforheading,
altitude,bank,andairspeed,which allhadtobesimultaneouslycantered.$ubiactswere first
proficiencytrainedon onedial,thentwo dials,thentheentiretask.Correlationsbetween
one-dial,part-taskperformanceandwhole-taskperformancerangedfrom .46 to.54 acrossthe
subjects.Betweentwo-dial,part-taskperformanceandwhole-taskperformance,therangewas
.63 to.70. Multiplecomponentpracticewas abetterpredictorofwhole-taskperformancethan
singletaskperformanceinthismultidimensionaltask.Inaddition,themultiplecomponent
performancewas atleastaspredictiveaslinearcombinationsofthesingletaskperformances.
Thegreatestcorrelations(.74)betweenpart-taskandwhole taskperformancewere foundwith
linearcombinationsoftwo,two-dialpractice.Inthiswork, theactualtaskcomponentsthatwere
usedwas lessimportantthanthefactthatsimultaneouspracticehadoccurred.Allpredictivetasks
herewere part-taskpractice,butthisinv_tigationsuggestedthata continuumexistsintraining
9-2_1
TrainingforLongMissions ,J.H.Goldberg
effectiveness,betweenvariousintegrativeorcombinatorylevelsofsub-taskperformances.
Inhisspacevehicleapproachand landingsimulator,Sitterley(1974) variedthefidelityofpilot
retrainingmethods,followinga 4 month no-practiceinterval.The number ofvisualcuespresent
inthetrainingsessionstronglypredictedthelevelofperformanceachieved,andthelevelofvisual
cueingwas independentofthefidelityofthesimulatorsession.Staticphotographictrainingwas
superiortoopen-loop,dynamictraining.Allcues,however,presentinthestaticpictorialmethod
were presentinthedynamicdisplaytraining,sothetotalnumber ofcueswas notsoleypredictive
oftrainingeffectiveness.As statedby Sitterley,themost importantelementinthesetraining
alternativeswas thepresentationofefficientcueswhich assistedpilotsinrecallingtheirbasic
flightexperiences.Thus,open-loop,statictrainingmethodsmay actuallybe superiortomore
costlymethods,givencarefultrainingprogramdesign.Trollip(1979) compared acomputer-
basedwitha simulator-basedtrainingprogramforaircraftflightcontrol.Controlsubjectswere
trainedinaflightsimulator,whileexperimentalsubjectswere trainedon a plasmatouchscreen
terminalwithanattachedhandcontroller.Thecomputer-besedtrainingproducedsignificantly
fewer criticalerrorsandbetterflightcontrolthanthesimulator.Thistrendwas identicalinboth
nowind andcrosswindflightpatterns.When generalizaingflightcontroltoa new procedure,no
differencewas foundbetweenthetwo methodsoftraining.The computer-trainedsubjects
performedbetter,learnedquicker,andmade fewermistakesthantheircontrolcounterparts.It
allowedstudentstodevelopbettermentalimagesoftheidealflightcharacteristice.Johnson
(1981 )alsofoundthattrainingrequiringlargeuseofmentalimagerycuescan producethe
highestlevelofskillretention.Even inhighcomplexityflightsimulationandcontrol
environments,thehighestleveloffidelityisnotrequired.Sitterlayand Berge(1972) and
Sitterley(1974) concludedthatstaticrehearsalor trainingmay besuperiortothedynamic,
higherfidelityrehearsalbecauseoftheartificiallyincreasedimportanceofvisualcues.
One variablesignificantlyinfluencingfidelityinaircraftsimulationsisflightmotion.Thishas
been8controversialtopicoverthepastdecade,withmany insistingthatmotioncuesare
unnecessaryforgeneralaviatortraining.Oaro(1979) discussedthisissuewithreferencetotwodifferentmotioncues,maneuver motionanddisturbancemotion.The former motioncuerefersto
thosemotionchangesinitiatedby thepilot,whereasthelatterreferstothosecuesinitiatedoutside
theimmediatecontrolloop,suchasturbulenceor engineeffects.While maneuver motionmoves
theaircraftplatform,itdoesnotcauseimportantalertingcuesprovidedby thedisturbancecues,
which leadtoquickerand more accuratepilotcontrolofthesimulator.No motion,on theother
hand,isrequiredifthesimulatedaircraftiseasytocontroland relativelystable(_ro, 1979).
Thus,requiredfidelityherewas basedon alogicalanalysisoftasktrainingrequirements.
Inthemonitoringandcontrolofaproceduralindustrialoperation,Johnson(1981 )utilitzed
threedifferenttrainingstrategies:( I)conventional,full-fldelitypracticeon theactualtask,
(2) medium-fidelityreproductionstudyofphotographs,where thesubjectwas allowedtodraw on
thephotos,indicatinghisproceduralresponses,and (3) low-fidelity,blindpractice,where the
subjectwas allowedtostudy,but notwriteonphotosofthecontrolequipment.Althoughthe
conventionalstrategyprovidedthequickestlearningtime(theblindpracticerequired1.5times
as longtoreachcriterion),theconventionalandreproductiontrainingdidnotproducedifferent
controlsettingerrorsaftera 3 month retentioninterval.Thisillustratedthatthehighestfidelity
trainingisnotrequiredinproceduraltasks.Johnsonand Rouse(1982) alsofoundthatlow and
medium fidelitytraininginaircraftpower planttroubleshootingisverycompetitivetohigh
9-25

Training for LongMinions J.H. Ooldberg
fidelitysimulation.The highest-fidelitymethodinthisstudyincludedtrainingon theactualtask,
medium fidelityrequiredaspecialpower plantsimulation,whilethelowestfidelitycondition
utilizedvideotapedlecturesand livequizzes.Videotrainingproducedthegreatestperformance
withallsimulatedfailures,and theoriginaltaskand simulationwere similarintheir
effectiveness.From acostconsideration,thelowand moderatefidelitydevicesprovidedsufficient
problemsolvingexperiencetoeffectivelycompetewiththeconventionaltrainingmethods.
Accordingtoguidelinesposedby Cream etal.(1978), thespecificationofrequiredtraining
fidelityappearstobe art,ratherthanengineering.They statedthat(I)essentialandnonessential
aspectsofcontrolsanddisplaysmust bedifferentiated,inthatmany oftheseelementsare not
requiredforpropertraining.(2) The choiceoffidelityismore complicatedwhen dealingwith
displaysratherthansimpleindicators.Also,no rigorousdecision-makingprocedureshavebeen
developedintheareaofcost/benefitfidelityanalyses.Thoughexperiential-basedfidelity
definintionhasbeenusedformany years,no usefulguidelinesexistforthedevelopmentof
trainingfornew tasks.
Perhapstheoegreeofrequiredfidelityisafunctionofhow littleisunderstoodoftheprocesses
requiredtocarryoutagiventask.,Seeminglycomplex tasksmay onlybecombinationsofa limited
number ofcombinedoperations.On these,perhapspart-tasktrainingwould besufficient,ifthe
actualcomponentscouldbe identified.Full-fidelity,whole-tasktrainingwould thenonlybe
required in very complex tasks.
2.2.5.AdaptiveTraininq
Bothground-basedandon-orbittrainingsystemsshouldbeadaptivetotraineeperformance,for
maximum efficiency.Thisre_arch areahasrecentlyshown substantialgrowth,asa resultofthe
developmentofspecificadaptivesystems.Machine-controlledadaptivetrainingsimplyautomates
askilledinstructor,by modifyingthetrainingstimuliasafunctionoftraineeperformance.
Trainingefficiencyismaximized,becauseeffectivelearningonlytakesplacewhen trainingisat
an appropriatelevelofdifficulty(Kelly,1969). Adaptivelearningcurvestypicallyshow a
linearrelationshipbetweenabilityandtime,asopposedtoconventionaltrainingcurves.
The marker variablefortrainingadaptationmay vary,dependingon thenatureofa task.Johnson
andHaygood(1984) utilizedperformanceonasecondarylightrecognitiontasktoadaptthe
difficultyofa primary trackingtask.WilligesandWilliges(1978) concludedthatthemost
effectiveadaptiveparametershouldbea multivariatecombinationofseveralperformanceskills.
Matheny (1969) arguedthatthetimelagbetweena systemresponseandan operator'ssubsequent
performanceshouldserveastheadaptiveparameteringeneralman-machine systems.While
many parametershavebeenused,theyhaveallservedthefunctionofvaryingthedifficultyofa
primary task.
2.3.RETENTION INTERVAL FACTORS
Thissectiondiscussesthoseskilldegradationi_ues directlyrelatedtotheretentioninterval,
betweentheinitialtrainingand actualperformance.Two factorsherehaveimportant
implicationsforskillretention.(I)The durationoftheretentionintervalhasbeenextensively
9-26

TrainingforLongMissions J.H.Goldberg
studied,usingintervalsfrom a few minutestowellovertwo years.(2) The natureofactivities
performedduringtheretentionintervalinfluencesskilldegradation,justas practiceofany task
shoulddo. Mostinvestigatorsinthisareahaveconcludedthatlearnedskillsregularlydegrade
withincreasingno-practiceretentionintervals.Bahrick(1964) has,however,disputedthis
concept,claimingthatretentioncurvesbasedonanticipation,recognition,or freerecallreflect
changesinone'ssensitivityfrom sessiontosession.Thiscomplaint,however,was onlydrawn
againstmeasureswithonlyright/wrongresponses.Many proceduralstudies,usingother
continuousmeasuressuchascompletiontime,haveindeedfoundevidenceforregularskill
degradationovertime.
2.3. !. Lenqth of Interval
Retentionintervalsarean importantconsiderationwhen designingrefreshertrainingon lengthy
crew missions.The many skillretention/degradationstudieshaveallshown largeperformance
decrementsuponpost-retentiontesting,when no retentionpracticeisallowed.Estimatesofthe
percentageskilllossatvarioustimeintervalsallowan empiricallydeterminedestimateforthe
frequencyofrefreshertraining,giventhatretrainingisrequiredwhen performancefallsbelowa
setcriterion.Longerintervalsaregenerallyaccompaniedby greaterlossinskills,but thisis
very taskspecific.Ideally,thisreviewshouldprovidean overallskillretentionfunction,
mapping percentageofskillsretainedversusretentionduration.However,re_litydictatesthat
between-studyvariationsmake suchgeneralizationsand modelsvery hardtoachieve.The most
importantquestionthatcanbeansweredhereiswhetheraconstantdegradationacrossmany tasks
isfound,withallotherfactorsbeingequal.AcursoryanalysisoftheresultsinFiguresI through
3 indicatesthatskillsdegradewithtimewhen notsubjectedtointerimpractice,andthatthelevel
ofdegradationreachesasasymptoteinsome studies.
Procedural Tasks. With few exceptions, procedural performance is marked by consistentlyincreasing decrements with pr_ressively longer retention intervals. Neumann andAmmons(1957) found that a oneyeer, 90% loss in post-training performance was about the _me as
initial performance at the start of training, but proficiency was quickly regained upon retraining(Figure IA). Ona task of nearly equal complexity, Ammons et el. ( 1958, Expt. 1) found a 2 to
3-fold increase in task completion time after a one year interval, which did not appreciablyincrease after 2 years of retention (Figure I B). The magnitude of relative skill degradation wasthe _me here, rage.rdless of the original number of training trials. Mengelkoch ( t 960; 1971 )also found that relative mognitude of skill lo.._,was independent of the amount of training ( Figure1C), where subjects showed a 20% decrease in correct procedures after a 4 month retention. Inan extremely complicated 169 hour mission simulation, Cotterman and Wood (1967) foundrelatively small degradation over a 3 month retention when only a single parameter was
considered ( Figure 1D). The probability of successful performance over the interval fell by about.03. However, when all parameters in all phases of the simulation were considered, theprobabilities dropped significantly over the interval; initially at an average of about 0.6, it fell toabout 0.4 after the retention interval, suggesting that a failure was highly likely in _me missionphases. This study was flawed, however, dueto uncontrolled retention interval activities andsmall sample sizes (Gardlin and 6itterley, 1972). The performance of complex control and
emergency prc_:lures clearly degrade in required procedural time after 6 months, and Sitterleyet el. (1972) noted a 4.5 fold increase after 4 months of retention ( Figure I E). Johnson ( ! 981 )measured the time required to set controls in an 87-step procedural task, and found a mean time
9-27

TrainingforLongMissions J.H.-Goldberg
of8 minutesaftertraininghadincreasedby 50% to12.8 monutesafterabout2.5 months. As
grossestimatesofthemagnitudeofskilldegradationin proceduraltasks,20% to50% degradation
in3 to6 months,and 50% to 100% or more inmore than6 monthsmay bemade, basedon the
abovedata.
Investigationsovershorterretentionintervals,up to Imonth,havenotfoundconsistentskill
degradationpatterns.For example,usingtheirswitchsettingtask,Naylorand Briggs(1963)
founda 20% decreaseinomissiveerrors,buta 233% increaseincomissiveerrorsafterI month
(FigureIF). Likewise,usingthesame taskpairedwith atrackingtask,Nayloretel.(1968)
foundtheonlyretentiondegradationincomissiveerrorsfrom thesubjectgroupwith lesser
trainingand lowtaskorganization(FigureIF).Thus,skillretentionoflessthanonemonth is
hardertopredictthanlongerdurations,andmay bedependanton many othertaskfactors.
SimpleTrackinqTasks.Performanceon trackingtaskshavenotasa ruleshown thepredicatble
and regularretentiondecrementsshown by proceduraltaskperformance.Incontrollingtheflight
characteristi_ofamodelairplane,Ammons etel.(1958, Expt.2) foundonlya small5%
decreaseintrackingtimeon target,between Iand24 months (Figure2A). Theseslightskill
decrementsfollowedslightbutsignificantincrementsbetweentheendoftrainingand Imonth
retention.Beyondtheabsoluteperformancedifferenceattraining,thedurationoftrainingdidnot
altertherelativedecayrateofskills.Hammerton (1963) useda measureoftargetacquisition
timeinatrackingtask(Figure20). By varyingtheallowableamountofsession-to-session
variabilityattheendoftraining,differentialskilldegradationwas observedataretention
intervalofsixmonths.The loosercriteriongroupshoweda 3-foldincreaseintargetacquisition
time,whereasthetightercriterionshowedonlyabouta I-foldincrease.Thus,intracking,
regularityofperformanceaswellasabsolutemagnitudeappearstopredictthedegreeofskill
degradation.Overashort,Imonth retention,Nayloratel.(1962; 1968) demonstrated
statisticallysignificantskilllossat2 levelsoftrainingdurationand two levelsoftask
organization(Figure2E). Relativelossesaveragedabout16% atone week,and 44% atone month.
Fourstudiescitedhereusedintegratedtrackingerrorasa dependentmeasure. Fleishmanand
Parker(1962) hadtwo groupsofsubjectsperform trackingtacks.A group receivingno formal
trainingshowednoperformancedecrementatup to14 months ofretention(Figure2B). A second
groupwho receivedformaltrainingon thetaskshoweda I-foldincreaseinerrorafteroneyear,
butthenshoweda4-foldincreaseafter2 years.Trumbo etaI's(1965a) subjectsshowed
virtuallyno performancedecrementwith intervalsup to5 months,when thetaskwas
unpredictable,withrandom targetslocatedon everytrial(Figure2D). However,when thetarget
positionwas more predictable,post-trainingtrackingerrorwas about50% lassthaninthe
predictablecondition.Retentionintervalsof Iand5 monthsproducedlargedecrementsin
performance,upwardsof50%-60% from traininglevels.Equaldegradationratesmere foundfor
both50 and IO0 trainingtrialconditions,withthelatterconditionalwaysproducingbetter
performance.Trumbo etel.(1965b) alsodemonstrateda 24% skilllossaftera Imonth
retentioninterval(Figure2D). Swink etel.(1967) alsomanipulatedtaskpredictabilityand
trainingdurationinatrackingtask(Figure2F). The retentionintervalinthisstudy,however,
was unrelatedtotrackingerror,astrackingabilitydidnotdegradeovera 5 month no-practice
interval.Roehrig(1964) hadseveralsubjectsstandon a smallbalancingplatform,andmeasured
thetimedurationthattheycouldbalancetowithin± 1.5°ofhori_ntal.Aftera 50 week hiatus
from thetask,allsubjectsdemonstratedperformanceatleastasgreatasshown attheendof
9-28

TrainingforLongMissions ,J.H.Goldberg
training.Much likethewell-known factthat"oneneverforgetshow toridea bicycle,"th_stask,
oncetrained,seemedtotriggerthesame skillretention.Perhapsthereismuch abilitytransfer
from balancinginordinarywalking(oncethebodyhas beentrainedtousethemusclegroups
requiredby thetask),and subjectswere unknowinglypracticingthetask.Thisconversly
suggeststhatwe can forgethow torideabicycle,ifbalancingisnotnormallypracticed,as in
bed-riddenorspacefaringindividuals.Researchneedstofirstbeconductedtodeterminewhich
tasksaredependenton balancingpracticeinagravityenvironment,aswas impliedby anearlier
report(NationalAcademy ofSciences,1972, p.245). A taxonomyoftasks,organizedby gravity
dependency,shouldbedeveloped.
Simple trackingperformance,notrequiringa largenumber ofsimultaneousdecisionsand
elementsofconciouscognitivecontrol,doesnotappeartodegradeasreqularlyand predictablyas
proceduralskillperformance.While some studiesdidfindlargedecrementsafterafew months
(e.g.,FleishmanandParker, 1962; Hammerton, 1963),othershavefoundnoevidenceofskill
degradation(e.g.,Ammons etel.,1958; Swink etel.,1967). Clearly,insimpletracking,other
factorsare importantindeterminingthedegreeofretentionloss.From thosestudiescitedhere,
thosefactorsmust includedurationofinitialtrainingandtaskorganizationor precIlctaDility.
Complex TrackinqTasks.Inthosefew studiesusingtrackingtasksinhighercomplexityflight
controlcontexts,performanceon atleastoneparameterhasshown stronginterval-related
degradation.Mengelkach(1971 )foundsignificantincreaeaminaltitudeerroraftera4 month
retentioninterval(Figure3A). The skilldegradationratewas equalbetweenthe5 and 10
trainingtrialgroups,butthe I0 trialgroupconsistentlymade about20% lesserrorthanthe5
trialgroup.Sitterl_andcolleagu_alsousedaltitudeerror,among many otherparameters,in
theirspacevehiclesimulations.$itterleyandBarge (1972) measureda 2-foldincreaseinerror
overa 6 month interval,whereasSitterley(1974) founda S-foldincreaseovera 4 month
retentioninterval(Figure3B). Inanalternateparameter,SitterleyandBergemeasured a 55%
increaseinintegratedpitcherroraftera no-practiceretentionof6 monthsduration(Figure3D).
When measuringabilitytonullcomplexmovements inthedisplaywithina simulator,Youngling
etel.(1968) foundanearlylinearrelationshipbetweenthelengthofretentionand performance
loss(Figure3C). Here,totaltrackingtimeontargetdecreasedfrom approximately40 secondsat
trainingtoabout33 secondsafter6 months,ora 20% loss.Percentflightskilldegradation,a
compositeofmany flightparameters,isperhapsthebestoverallmeasureofflightperformance.
Sitterleyetel.(1972) noteda 400% decreasewhileSitterley(1974) noteda 200% decreasein
skillsovera 4 month interval(Figure3E).Clearly,flightskillsarevery sensitiveto
no-practiceretentionintervals,and may degradeby 4 or 5-foldovera few months.
2.3.2.InterpolatedActivities
Practicingcriticalskillsduringtheretentionintervaldoesaidretentionperformance.The
relevantissueshereare (I)forwhich typesoftasksdoespracticeaid,(2) what are thepractice
tasktransfercharacteristicstothejobperformancetask,and (3) arethesedangersofnegative
tasktransfer;i.e.,practicethatcan accelerateperformancedegradation.
Brown etel.(1963) requiredsubjectstoperformNaylor'sswitchsettingtaskaswellasa three
dimensioaltrackingtask.Rehearsalon thesetaskswas manipulatedon 4 daysofa I5 day
retentioninterval.For thetrackingtask,rehearsalgreatlyaidedretentionperformance,butthe
9-29

Training for Long Missions J.H. Goldberg
fidelityoftherehearsaldidnotalterthisresult.Performancedecrementswere effectivelyerased
withtaskrehearsal.On theproc_Juraltask,rehearsalhad influenceon bothcommi_ive and
omissiveerrors.For bothtypesoftasks,sufficientlylongoriginaltrainingattenuatedthe
positiveeffectsofrehearsal.When trainingwas more limitiedinscope,practiceduringthe
retentionintervalleadtolargeincreasesinskillretention.NaylorandBriggs(1963) tasted
variationsintypeofrehearsal,on retentionperformanceoftheirswitchsettingtask.The four
rehearsalsessionsoccurredmid-way intheir25-day retentioninterval.One group received
actualtaskrehsarsal,one receivedno rehearsaltraining,andtwo groupsreceivedeither
part-tasktemporalor part-taskspatialrehearsal.On omissiveerrors,theactualtaskgroup
committedabouthalftheerrorsoftheotherthreerehearsalgroups.On commissiveerrors,the
actualtaskand temporalpart-taskgroupswere superior.Whole-taskrehearsalwas superiorto
part-taskrehearsalconditions.Spatialrehearsalwas barelyany betterthanno rehearsalatall,
butthetimedimensionmay havebeanmore difficultthanthespatialdimensioninthistask.
Trumbo etel.(1965b) comparedverbalrehearsalwithno rehearsalina trackingtask,overa
one month retentioninterval.Part-taskrehearsalrequiredsubjectstoverballyrepeatthe
trackingtargetlocation,referencingtoitspresentednumericallocation.On thistask,no tracking
mean performanceretentiondifferencewas due torehearsal,butagreatervariabilityintracking
intherehearsalgroupthannon-rehearsalgroupwas found.
$itterleyand colleaguesinvosti_tedthetypeanddistributionofrehearsalfortheircomplex
spacecraftsimulationtasks.$itterleyand Berge(1972) presentedbothemergencyprocedural
andflightcontroltaskstothierinexperiencedsubjects.Afterfourmonths ofinactivity,bothtask
performanceswere greatlydegraded,beyondtheminimal proficiencylevel.As partoftheir
experimentaldesign,two subjectgroupsrecievedstaticrehearsaltrainingduringtheretention
intervalperiod,where a sessionconsistedofa reviewoftheflighttrainingmanual,photographsof
thecockpitenvironment,anda writtenevaluationtest.The staticrehearsalgreatlycountered
performancedegradationfortheproceduraltask,atboth3 and 6 month intervals.The interim
rehearsalaidedperformanceasmuch asaIlowinqdynamicwarmup immediatelypriortothestart
ofretentiontesting.The continuoustask,on theotherhand,respondeddifferentlytorehearsaland
warmup training.At a6 month retentioninterval,staticrehearsalwas insufficienttomaintain
performanceinallcontrolskills;dynamicwarmup was requiredtoinsurereliability.The
regularrehearsalsessionswere,however, adequateforskillmaintenanceoverthe3 month
retentioninterval.Thus, longretentionintervalsrequirebothrehearsaland warmup forflight
control,butonlyrequirestaticrehearsalforproc_ural tasks.Usinganeven more complexspace
vehicleapproachand landingunderbothvisualand instrumentflightconditions,$itterleyetel.
(1972) addedaconditionofdynamic rehearsaltraining,inadditiontoimprovingthestatic
rehearsaltrainingmethod.The improvedstaticmethodutilizedphotographsofflightinstruments
andscenesatcriticaltimes,andallowedthesubjecttositinthesimulatorcockpitfor
refamiliarizationpriortotasting.The dynamicrehearsalconditionincludedtheabovestatic
rehearsal,thenthepilotswere allowedtoviewthreedynamic flightsfrom thecockpit,inan
open-loopfashion.The pilotstilldidnothavedirectinteractionas hewould haveduringwarmup
practice.Resultsshowedthat,like$itterleyandBerge(1972), staticrehearsalimprovedskill
retention,butrequireddynamicwarmup practiceforadequateproficiency.The dynamic
rehearsalpreventedskilldegradationforallproceduraland flightcontroltasks,withthevisual
flightcontrolportionsreceivingthegreatesttrainingbenefit.The staticmethodwas onlyslightly
worse thanthedynamicmethodinretentionofflightcontrolor continuousskills.
9-30

Training for Long Missions ,J.H. C-otdberg
From a cost/benefit viewpoint, Sitterley (1974) claimed that the static rehearsal me:hc_ naO+.he
greatest development potential. To test an advancedstatic rehearsal version, Sitter!ey presentedmore pictorial information along both normal and sub-nominal flight paths, and enhanced pilotinvolvement to reinforce critical perceptual cues in the visual environment. The static rehearsal
was presented in a booklet format for self-study by the pilot. All retention testing was orecededby a 40 minute slide show of real time cockpit views of the approach and landing. After a 4 monthretention interval, the advanced static retraining countered all skill degradation, more so thaneven the dynamic rehearsal of the previous study. Sitterley suggested that the careful tystructured visual cues at critical moments were sufficient to key appropriate pi lot responses.
The abovestudieshavenearlyallconfirmedtheutilityofretentionintervalpracticeincountering
bothcontinuousandproceduralskilldegradation.When trainingisofinsufficientduration,
rehearsalmethodscan besubstitutedtosome degree.The rehearsaltrainingshouldbecarefully
designedtoprovideminimalcuesrequiredtosuccessfullyperformthetaskofinterest.
Experimentsby Sitter!eyhavedemonstratedthatrehearsalforcomplexflightcontroldoesnot
havetobe closedloopand highfidelity.So longastheimportantvisualcueshavebeenprovided,
open-loop,pictorialreviewsmay adequatelybesubstitutedfortherealtask.Oftho_ studles
reportedhere,nonehaveconcludedthatrehearsaldegradesretentionwhen compared withno
rehearsal.However,nonehavesystematicallyvariedrehearsaltaskssoastoprovidenegativeskilltransfer.
3.SPACE MISSION TRAINING
It is frustrating to study empirical research on task training factors, then consider the techniquesthat are actually used to define training requirements. Cream et al. (1978) outlined "systematicmethods" usually used to specify training objectives in a specific task. First, the behavioral skillsand knowledge required of graduated trainees are identified. Next, these are matched a_,ainst theactual ability of new students. The identified differences then define training requirements of aprogram. As recognized by Cream et al., a lack of task analysis data for defining trainingrequirements exists, especially with new systems. They recommended seeking out analogoustasks, again avoiding the issue of task analysis. Such experiential-based development can be acostly error in new systems development, where many competing task factors can eclipseunfor_n interactions. This report defends the need for a quantitative model of trainingrequirements as a function of task factors. Ofcourse, much research will be required to specifythis model.
Thissectionpresentsa briefoutlineofoperationalspacemissiontrainingatNASA, forthe
purposeofestablishingafoundationfrom whichtodefineMars missiontrainingrequirments.
3. I. CURRENTMISSION TRAINING
Trainingprograms forSpaceShuttleminions proceedfrom part-systemsteachingand practiceto
more complex,fullyintegratedsimulations.A typicalastronauttrainingprogram currently
requiresabout5 yearsfrom starttoflight.Trainingstartswithstand-aloneequipment,then
proce.e_tojoint,integratedminion simulation.Initially,workbooks andself-pacedcomputer
aidedtrainersare u_I togainknowledgeandproficiencyonspecificsystems.8ingleandmultiple
9-31

TrainingforLongMissions J.H.Goldberg
part-tasktrainersarethenusedtogainrequiredpsychomotorproficiency.Examples ofthese
trainersarespecificshuttlecontrolpanelsandtheRM$. An underwaterweightlesstraining
facility,andairborneparabolicflightsmay be usedforspeci-ficproceduretraining.Shuttle
systemssimultatorsare now usedformany tasks.The multiple-taskshuttlesimulatormay be
tiedwithoneormore flightcentersinpartial-miseionsimulations.The fullmissionmay thenbe
simulatedby tyinginallpayloadcustomersandcontrolcenters.For very complicatedmaneuvers,
thisjointsimulationmay evenbe repeatedon-orbitjustpriortotheactualperformance.
Very littleactiveastronautperformancemeasurement iscurrentlyconducted,onceselected
(Akins,1979; Nicogossian,1984; ChristensanandTalbot,1985). Throughouttheliterature,a
prerequisitefortheevaluationanddeveloppmentoftrainingproceduresisunbiasedperformance
data(seeGoldstein,1978; Cream etel.,1978; Swezey, 1979). As an illustrationofthis,
considerapart-missionsimulatorsesmon. Trainerspreparescriptsofsystemfailuresthat
occuratregularintervals,everyfew minutes.The taskofthetraineesistomake educated
diagnosesand decisions,whilecontrollingthespacevehicle.Aftercompletingeachsimulation
run,thetrainingscriptsare reviewedwiththetrainees,pointingoutmistakesthatwere made. A
new run thenbegins,withthehopethatlessonshavebeenlearned.While traineesclearlylearn
from thistrainingscenario,limitationsinvehicledesignor human capabilitiesare notcollected.
A seriesoffailuresmade by alltraineeswouldnotbe noted;suchfailuresarevaluabledatatouse
intheredesignofsystems.A separateperformancemonitoringsystem,invisibletotrainersand
trainees,wouldbeusefulhere.
,Sovietcosmonautsalsoutilizesimulatorsand part-tasktrainers,buttheirtrainingphilosophy
differsina basicway from U.,S.philosophy.Ratherthanrelyon basicdocumentationintraining
programs,theylistentoa lecturefrom a specialistseveraltimes,takingnotes(Lenorovitz,
1982). The Sovietprogram alsoplacesmore emphasison psychologicalstatusthantheU.S.
program,withtestsgivenattrainingtoassurepsychologicalcompatibilitywithcrew members,
and regularpsychologicalmonitoringduringand afterflight(Borrowman, 1982; Bluth,!982;
ObergandOberg,1986). FutureU.S.missionsmust concentratemore on psychologicalstatusof
crew members duringtraining(Connersetel.,1985; Collins,1985).
3.2.SPACE STATIONTRAINING
A recentlypublisheddocument(NASA, 1986) detailedtrainingrequirementsforthenear-
operatioalspacestation,tobe launchedintheearly1990's.Thissectionwillsummarize
importantaspectsofthispaper.
3.2.I.On-OrbitVersusGround-BasedTraininq
Specificcriteriahavebeenimposedtoassigntrainingtoon-orbitor ground-basedtrainers.
On-orbittrainingispreferredforcomplex psychomotorskills,or time-criticalprocedures,
safetydrills,andmaintenanceofgroup behavioraldynamics.Thistrainingispreferredfor
microgravity,low-cost,and low probabilityofoccurrencetasks.On-orbitrefreshertraining
willalsobecarriedoutpriortounscheduledmaintenancetasks.Oround-basedtrainingwillbe
preferredforfundamental,sefety-criticaltasks,suchasspacestationactivationor medical
procedures.Basictrainingingroupdynamicsandhabitabilitywillbecarriedouton theground.
9-32

TrainingforLongMissions J.H.C-,aldberg
Ground-basedtrainingwill,in_neral,bepreferredforprerequisiteskillacquisitionand
day-to-dayspacestationoperations.On-orbittrainingisa supplementtobasicground-trainecl
skills,sofew skillswillonlybetrainedon-orbit.
Initially,mosttrainingwillbe performedontheground,butmore and more trainingwillbe
performedon-orbitasthespacestationprogram matures.Ground-basedtrainingwillinclude
(I)ingressand egresstoand from spacestation,(2) activationanddeactivationofspacestation,
(3) systemstraining,withemphasison understanding,(4) spacecraftdockingand tethering,(5)
RMS androbotics,(6) orbitalmanagementand communications,(7) habitabilitysystems,(8)
safety,emergency,medicalandmaintenanceprocedures,(9) integratedsimulations,stressing
teamapproachtoproblems.On-orbittrainingwillinclude(I)spacecraftdockingandtethering,
(2) refreshertrainingon RMS, (3) crew rescueEVA,(4) handlingoffuelsand otherhazardous
materials,(5) useofavionicsequipment,(6) emergencyand malfunctionprocedures,(7)
manned systemsrefreshertraining.Ground-basedtrainingwillinitiallybeperformedforall
phasesandactivities.Eventually,primary trainingforsome skillsoractivitieswillbe shiftedto
on-orbit.ThistrainingwillbeavailablebothtoNASA astronautsandtocontrectorsorcustomersofNASA.
3.2.2.TraininqBreadth
Trainingprograms forthespacestationwillbedevelopedforthecrew,ground-basedflight
controllers,andtraininginstructors.Thecrew members willrequiremore trainingatgreater
frequencyforproceduralskillsthanforpsychomotorskills.Launchscheduleswillimpose
trainingdurationlimits.Thereare stillquestionsas totherelativeamountofself-paced
training,amountofon-boardtraining,andrelativetrainingdifferencesbetweencrew members.
Flightcontrollerswillinitiallytakepartinfullintegratedmissionsimulations,however laterin
thespacestationprogram,fewerformalsimulationswillbe conducted.Eventually,nojoint
controller-crewsimulationwilltakeplace,due totheirinherentcomplexityand time
consumption.Instructorsmust alsobetrainedinprocedures.Questionsexistastothenumber of
requiredinstructorspercrew member, andthecomplexityoftheirsimulationscripts.
The generaldirectionforbreadthoftrainingisoneofinitialfullscale,integratedsimulations
involvingallpartiestaperingtolaterseparatesimulationsofmissioncomponents.Thischange
willbe requiredtoshortenthetrainingtimeofspacestationcrews,andtodecreasethecostof
rotatingcrews.Some amountofproceduralor psychomotorskillpractice,suchasone-halfhour
per day,willbemandatoryon-orbit.
3.2.3.TraininqTechnoloqiesand Facilitie_
,Spacestationtrainingwillmake extensiveuseofcomputeraidedandadaptiveinstruction.
Computer aidedinstructionsystemspermitaconsistentpresentationofmaterialinagiven
sequentialorder.Intelligentor adaptivec_mputeraidedinstructionallowsmaterialtobe
resequencedor alteredaccordingtotheneedsofatrainee(Morgan and Erb, 1986). Bothofthese
typesofsystemswillbe utilizedinground-basedandon-orbittraining.Intelligentsystemswill
be designedtoserveasacoach,ratherthanasa tutoror manager,inthatadviceisprovidedtothetraineetryingtomeet an educationalobjective.
9-33

Training for LongMissions J.H. Goldberg
Theseinstructionalprograms willbe implementedon interactivelaservideodiskstoragesystems.
The traineewillrespondviakeyboardand voice.The systemwilloutputviatelevisionmonitors,
wideanglevisuals,helmetmountedvideo,andvoicesynthesis.Appropriatevideodisksforevery
requiredrepairor maintenancewillbeonboard;thecapacityfortransmittingtheequivalent
contentofavideodiskdirectlyintothetraininghardware may alsobe present.Thesesystems
offermany advantagesoverconventionalcomputer-basedtrainers.They are potentiallyvery
smalland portable,stillor movingscenesareofhigherfidelitythancomputergraphics,and itis
cheepertofilmsequencesofmovements forvideodiskinterpretationthandevelopingreliable
graphicsviacomputer.Astronautson EVA willhavethecapabilityofviewingproceduresina
helmetmounteddisplayastheyare performed.Thesevidecdisktrainerscan alsocontainother
controllerattachmentstoallowrealisticpracticewithcomplexpsychomotorskills.
Spacestationtrainingwillalsobeembeddedwithinoperationalcontrolsand displays.By
monitoringperformancewhileatraineeattemptstocompletea giventask,betterinvolvementand
motivationareachieved.The monitorwillactasacoach,much likeamaster-apprenticescenario.
Ground-basedNASA trainingfacilitesforthespacestationmissionswillinclude(I)manned test
facility,forengineeringdesignandtesting,(2) mockup and integrationlaboratory,forRMS
training,(3) weightlessenvironmenttrainingfacility,forcrew training,(4) systems
engineeringsimulator,forflighttraining,(5) spacestationtrainingfacility,forhigh-fidelity
crew training,(6) shuttlerendezvoussimulator,and(7) integratedEVA simulator.As inthe
shuttletrainingprogram,trainingwillstartwithpart-task,single-systemtrainers,and end
withfull-mission,multiplesystemsimulation.Much oftheshuttletrainingfacilitieswillbe
utilizedforspacestationtraining.
3.4.MARS MISSIONTI:_INING
Untilan empiricallydeterminedmodeloftrainingrequirementshasbeendeveloped,allconceptual
designsare merely"straw-man"estimates.However,basedon previoussectionsofthispaper,
some recommendationsmay be made.
On-Board VersusGround-B_;I Training.Whether trainingshouldbegivenon-boardor on the
groundshouldnotbean issueon a Mars mission.The crew members must havethenecessary
resourcestorehearseprocedurallistsand psychomotorskillswhenever required.Ground-based
trainingshouldconsistofacademicsystemsoverviewsand theseskillsrequiredforcomplete
systemsunderstanding.Itisimperitivathatcompleteunderstandingbe achievedpriortoflight,
aseffectiverefreshertrainingcanonlybeassurredwithwellorganizedtasks.Ground-based
trainingmightincludeotherknowledgeacquisition,beyondtheimmediatescopeofthemission,to
guardagainstunexpectedevents.As anexample,thistrainingmightincludepsychologicalor
socialmodelsofsmallgroups.Ingeneral,ground-basedtrainingshouldbe academicand broad,
whileon-boardrequiredtrainingshoudbespecificandskilloriented.Ofcourse,pilotswill
requirealltrainingpriortothemission.
Scope of TraininQ. Ground-based and on-board training and refresher programs must be designedto counteract the negative aspects of the space environment, as discussed in Section 1, in addition
to maintaining skill and knowledge retention. Skills must be regularly refreshed, according to a
9-34

Trainingfor LongMissions J.H.8oldberg
yet-to-bedevelopedmodelofretentiontime.Usingsucha model,a computerprogram couldlist,
on adailybasis,thoseskillsor proceduresthatneedrefreshertraining.IdeaIIy,acrew member's
requiredrefreshertrainingshouldbedeterminedautomaticallyandadaptively.Periodic
performancemeasurementon a testingbatterycouldindicatelevelofretentionandpinpointareas
forneededtraining.Trainingforcrew autonomyand confinementwillbe hardertodefine,until
more isknown. Drillsmay berequiredtomeasurethecohesivenessofthecrew. Listsofcritical
proceduresmust beregularlyreviewedandtrained,asshouldthedailyworkloadlevel.As
measuredby a model,mentaland physicalworkloadmust beconstantlyreviewedandreallocated
among thecrew members.
Allcrew members shouldbe encouragedtodevelopexpertise,whilein-transittoMars, in
academicfieldsotherthantheirown. The on-boardteachingexpertiseclearlywillexist.
Establishinga formalinstructionalregimenwillaidinmaintainingcognitiveabilitesofboth
teachersand students.Healthyinteractionbetweenthecrew members willalsobemaintained.
The outcomeofsuchconcentratedtrainingcouldevenconsistofadditionalacademicdegrees.
PeriodicDrill_.Emer_ncy anddisasterdrillsshouldbe conducted,ascalledforby either(jround
controlor by theon-boardcommander. Many controlscouldbeplacedinanalternate,embedded
trainingmode forconductingthesedrills.Imagesofimpendingmeteorites,etc.,couldevenbe
projectedontodisplaysor windows. Crew performanceshouldbe reviewedby thecommander, and
necessaryrefr_her trainingconducted.
Recreation.Off-dutyperiodsalsopresentagoodoppurtunityforproceduralandoperationalskill
maintenance.Videogames,music,etc.,allpresentuniquepracticeoppurtunitiesfordifferentskills.
Hardware.A small,portable,videodisI_basedcomputersystemwithvoiceinputandoutputmay
serveasagenerictrainerandrecreationdevice.Such adevicewillallowpracticeofskills
anywhere andanytimeona mission.Differentvideodiskscouldbe loadedfordifferentprocedures,
and otherscouldbe loadedforentertainment.
A Mars missionpresentsmany challengesfarbeyondthosethathavealreadybeenapproached.
Thisoppurtunityshouldbeseizedforpushingthestate-of-the-artinknowledoeofhuman
trainingandskillretention.Thispaperhasstress_thedevelopmentofempiricalmodels,the
onlyunbiasedapproachtodefiningtrainingneeds.As theresearchrequiredtoachievethese
modelswilltakemany years,now isthetimetostart.A longdurationspacemissionwillrequire
an understandingofpsychologicallimitationsinallmissionphases.Thisreporthasstressedthe
needformodelingtheselimitationsinlightoftrainingrequirements,whetherinitialor refresher
training.The proper,scientificmethodoftrainingdefinitionwillrequireamodelofskill
retetention,asarguedhere.
9-35
Trainingfor LongMissions d.H.Goldberg
4. REFERENCES
Adams,J.A.,"OntheEvaluationofTrainingDevices,"Human Factors,1979, 21 (6):711-720.
Akins,F.R.,"PerformanceConsiderationsinLong-Term SpaceFlight,"NASA TechnicalReport
N81 -1865 I,ContractNo.NASA-CR- 152384, 1979.
Alluisi,E.A.,"MethodologyintheUse ofSyntheticTaskstoAssessComplex Performance,"Human
Ft_F_F_, 1967, 9(4):375-384.
Ammons, R.B.,Farr,R.B.,Bloch,E.,Neumann, E.,Day,M., Marion,R.,andAmmons, C.H.,
"Full-TermRetentionofPerceptualMotor 6kills,"dournalofExoerimentalPsVcholo_v,
1958, 55:318-328.
Bahrick,H.P,"RetentionCurves:FactsorArtifacts?,"PsycholoqicalBulletin,1964, 61 (3):
188-194.
Bahrick,H.P.,"TheEbb ofRetention,"PsycholoqicalReview, 1965, 72" 69-73.
Bluth,B.d.,"StavingSaneinSpace,"M_hanical _noineerino,1982, I:24-29.
Borrowman, 8.L.,"TrainingforSpace,"Spacefliqht,1982, 24:129- 132.
Brown, I.D.,"DualTaskMethodsofAssessingWorkload,"Erqonomics,1978, 21 (3):221-224.
Brown, D.R.,Briggs,O.E.,and Nm/Ior,d.C.,"TheRetentionofDiscreteandContinuousTasksasa
FunctionofInterimPracticewithModifiedTaskRequirements,"Wriqht-PattersonAFB
TechnicalReoortAMRL-TDR-63-35, Ohio,1963.
Briggs,8.E.,andWiener,E.L.,"InfluenceofTime Sharingand ControlLoadingon Transferof
Training,"dournalofApI31iedPsvcholocN',1966, 50( 3):201-203.
C,aro,P.W.,"TheRelationshipbetweenFlightSimulatorMotionandTrainingRequirements,"
Human Factors,1979, 2I(4)-493-50 I.
Carter,G.,andTrollip,S.,"AConstrainedMaximizationExtensiontoIncrementalTransfer
Effectiveness,or,How toMix your TrainingTechnologies,"Human Factors,1980, 22( 2):141-152.
Chiles,W.D.,"MethodologyintheAssessmentofComplex Performance:Discussionand
conclusions,"Human Factors,1967, 9(4):385-392.
Christensen,J.M.,andTalbot,J.M.,"ResearchOpportunitiesinHuman Behaviorand
Performance,"NASA ContractorReport3886, contractNASW-3924, 1985.
Collins,D.L.,"PsychologicalIssuesRelevanttoAstronautSelectionforLong-Duration
Spaceflight,"BrooksAFB TechnicalReportAD-A 154 051, Texas,1985.
9-36
TrainingforLongMissions J.H.Goldberg
Conners, M.M., Harrison, A.A., and Akins, F.R., Livinq Aloft, Human Requirements for Extended
Spacefliqht, Washington, D.C.: NASA, 1985.
Cotterman, T.E., and Wood, M.E., "Retention of Simulated Lunar Landing Mission Skill: A Test ofPilot Reliability," USAFTechnical Report AMRL-TDR-66-222, Wright-Patterson AFB, Ohio,! 967.
Crewford,A.M.,andCrawford,K.&, "SimulationofOperationalEquipmentwitha Computer-Based
InstructionalSystem:A Low CostTrainingTechnology,"Human Factors,1978, 20( 2):
215-224.
Cream, B.W., Eggemeier, F.T., and Klein, G.A., "A Strategy for the Development of TrainingDevices," Human Factors, 1978, 20(2): 145- 158.
Fleishman, E.A., "The Prediction of Total Task Performance from Prior Practice on TaskComponents," Human Factors, 1965, 7(2): 18-27.
Fleischman, E.A., and J.F. Parker, "Factors in the Retention and Relearning of Perceptual-MotorSkills ( b)," Journal of Experimental Psvcholoe¢, 1962, 64:215-226.
Fraser,T.M.,"LeisureandRecreationinLongDurationSpaceMissions,"Human Factors,1968,1O(5): 483- 488.
Gardlin, G.R., and Sitterley, T.E., "Degradation of Learned Skills, A Review and AnnotatedBibliography," Report No. D 180- 15080- t, The Boeinq Co., (NASA acquisition No.N73- 10152, contract No. NAS9- 10962), Seattle, WA, 1972.
Garvey, W.D., "A Comparison of the Effects of Training and _ondary Tasks on TrackingBehavior," Journal of Applied Psycholoqy, 1960, 44( 6): 370-375.
Goldberg, S.L., Drillings, M., and Dressel, J.D., "Mastery Training: Effects on Skill Retention,"U.S. Army Research Inst. Behav. Soc. $ci. Technical Report 513, 1981, Alexandria, VA.
Goldstein, i.L., "The Pursuit of Validity in the Evaluation of Training Programs," Human Factors,1978, 20(2): 131-144.
Gopher, D., and North, R.A., "Manipulating the Conditions of Training in Time-SharingPerformance," Human Factors, 1977, 19( 6): 583-593.
Grimsley, D.L., "Acquisition, Retention and Retraining: Effects of High and Low Fidelity in TrainingDevices," Human Resources Research Office, Technical Report 69- 1, 1969.
Grodsky, M.A., and Lutman, C.C., "Pilot Reliability and Skill Retention for Space Flight Missions,"Air University Review, 1964, 16: 22-32.
9-37
Trainingfor LongMissions J.H.Ooldberg
Ha_Iman,J.D.."EffectsofTrainingTaskRepetitionon Retentionand TransferofMaintenance
Skill,"U.5.Army R_arch Inst.Behav.$oc.5ci.TechnicalReport1271, 1980, Alexandria,
VA.
Hagman,J.D.,and Rose,A.M.,"RetentionofMilitaryTasks:A Review,"Human Factors,1983,
25(2): 199-213.
Hammerton, M.,"RetentionofLearningina DifficultTrackingTask,"JournalofExperimental
PsvcholoQv,Ig63, 66:108- 110.
doels,K.M.,TheMars One Crew Manual,New York:BallantineBooks,1985.
Johnson,D.F.,"ResearchNote:The Usa ofSecondaryTasksinAdaptiveTraining,"Human Factors,
1984, 26( I):105- 108.
,Johnson,S.L.,"EffectofTrainingDeviceon Retentionand Transferofa ProceduralTask,"Human
Factors,198 I,23( 3):257-272.
Johnson,W.B.,andRouse,W.B.,"TrainingMaintenanceTechniquesforTroubleshooting:Two
ExperimentswithComputer Simulations,"Human Factors,1982, 24( 3):271-276.
Kelly,C.R.,"What isAdaptiveTraining?,"Human Factors,1969, 11(6):547-556.
Lenorovitz,J.M.,"SovietCosmonautsTrainingatStarCityComplex,"AviationWeek & Space
Technoloqy, August, 1982, 44-46.
Lincoln, R.S., "Learning and Retraining a Rate of Movement with the Aid of Kinesthetic and VerbalCues," Journal of Experimental PsY_hOloOv, 1956, 51 (3): 199-204.
Matheny, W.G., "The Effective Time Constant - A New Technique for Adaptive Training," HumanFactors, 1969, 11(6): 557-560.
Mengelkoch, R.F, Adams, J.A., and Gainer, C.A., "The Forgetting of Instrument Flying Skills as aFunctio of the Level of Initial Proficiency," NAVTRADEVCENTechnical Report 71 - 16- 18, NewYork, 1960.
Mengeikoch, R.F, Adams, J.A., and Gainer, C.A., "The Forgetting of Instrument Flying Skills,"Human Factors, 197 I, 13( 5): 397-405.
Moray, N., "Models and Measures of Mental Workload," in Moray, N. (Ed.), Mental Workload, ItsTh_rv andMeasurement, New York: Plenum Press, 1979.
Morgan. L.W., and Erb, D., "Survey of Current Training Technology," NASAWorkinq Paper, CrewTraining Division, Johnson 5pace Center, April, 1986.
NASA, Space Station Traininq Document, Crew Training Divison, Johnson Space Center, 1986.
9-38
Trainingfor LongMissions J.H.Goldberg
National Academy of Sciences, Human Factors in Lone-Duration SDac_fliQht, Washington, D.C.:National Academy of Sciences, 1972.
NationalCommissionon Space,Pioneerinethe6DaCeFrontier,Toronto:Bantam Books,1986.
Naylor, J.C., and Briggs, G.E., "Long-Term Retention of Learned Skills: A Review of theLiterature," USAFTechnical Report,ASD 61-390, Behavioral ,SciencesLaboratory,Wright-Patterson AFB, Ohio, 1961.
Naylor, d.C., and Briggs, O.E., "Effect of Rehearsal of Temporal and Spatial Aspects on theLong-Term Retention of a Procedural Skill ," Journal of Applied Psycholocjy, 1963, 47( 2):120-126.
Naylor, J.C., Briggs, G.E., and Buckout, "Long-term Skill Transfer and Feedback Conditions duringTraining and Rehearsal ,"USAF Technical Report AMRL-TDR-63- 136, Wright-PattersonAFB, Ohio, 1963.
Naylor, d.C., Briggs, G.E., Brown, E.R., and Reed, W.8., "The effect of Rehearsal on the Retention ofa Time-Shared Task," USAFTechnical Report, AMRL-TDR-63-33, Wright-Patterson AFB,Ohio, 1963.
Naylor, J.C., Briggs, G.E., and Reed, W.G., "Task Coherence, Training Time, and Retention IntervalEffects on Skill Retention," Journal of Applied Psycholoqy, 1968, 52: 386-393.
Neumann, E., and Ammons, R.B., "Acquisition of Long-Term Retention of a Simple, Serial,Perceptual-Motor 5kill ," Journal of Experimental Psycholoqy, 1957, 53:159- 161.
Nicogossian,A.E.,"Human Capabilitiesin5pace,"NASA TechnicalMemorandum 87360,
Washington,D.C.,1984.
Noble, M., and Trumbo, D., "The Organization of Skilled Response," Orqanizational Behavior andHuman Performance, 1967, 2: 1-25.
Oberg, I.E., Mission to Mars, Plans and Concepts for the First Manned Landinq, New York:Meridian, 1982.
Obarg, I.E., and Oberg, A.R., Pioneerinq Space, Livinq on the Next Frontier, New York:M_rew-Hill Co., ! 986.
Parker, J.F., and Fleishman, E.A., "Use of Analytical Information Concerning Task Requirements toIncrease the Effectiveness of Skill Training," Journal of Al)Qlied Psvcholoev, 196 i, 45(5):295-302.
Reid, G.B., "Training Transfer of a Formation Flight Trainer," Hvman Factors, 1975, 17(5):470-476.
9-39

"[raining for Long Missions J.H. Goldberg
Roehrig,W.C.,"PsychomotorTaskwith PerfectRecallAfterFiftyWeeks ofNo Practice,"
PerceptualandMotor 5kills,1964, 19:547-,550.
Savage,R.E.,Williges,B.H.,andWilliges,R.C.,"EmpiricalPredictionModelsforTraining-group
Assignment,"Human Factors,1982, 24( 4):417-426.
Schendel,J.D.,and Hegman,J.D.,"OnSustainingProceduralSkillsoverProlongedRetention
Intervals,"U.S.Army ResearchInstitutefortheBehavioralandSocial,SciencesT_hnical
Report 1234, 1980, Alexandria,VA.
Shields,J.L.,Goldberg,S.L.,and Dressel,J.D.,"RetentionofBasicSoldieringSkills,"U.S.Army
ResearchInstitutefortheBehavioralandSocialSciencesTechnicalReDort1225, 1979,
Alexandria,YA.
3itterley,T.E.,"D_radationofLearnedSkills,StaticPracticeEffectivenessforYisualApproach
andLandingSkillRetention,"ReportNo.D 180- 17876- I,The BoeinqCo.,(NASA contractNo.
NASg- 13550),Seattle,WA, 1974.
Sitterlay,T.E.,and Barge,W.A.,"DegradationofLearnedSkills,EffectivenessofPracticeMethods
on SimulatedSpaceFlightSkillRetention,"ReportNo.D 180- 15081 - I,The BceinqCo.,
(NASA acquisitionNo.N73- I0159, contractNo.NA$9- 10962), Seattle,WA, 1972.
$itterlu_/,T.E.,Zaitzeff,L.P.,and Berga,W.A.,"DegradationofLearnedSkills,Effectivenessof
PracticeMethodsonYisualApproachand LandingSkillRetention,"ReportNo.
D 180- 15082- I,The BoeinqCo.,(NASA acquisitionNo.N73-23086, contractNo.
NAB9- 10962), Seattle,WA, 1972.
Swez_, R.W.,"AnApplicationofaMulti-AttributeUtilitiesModeltoTrainingAnalysis,"Human
Factors,1979, 21(2): 183-189.
Swink,d.,Trumbo, D.,andNoble,M., "OntheLength-DifficultyRelationinSkillPerformance,"
JournalofExperimentalPsycholoqy,1967, 74: 356-362.
Trollip,S.R.,"TheEvaluationofaComplex Computer-Ba._dFlightPerformanceTrainer,"Human
Factors,1979, 21( I):47-54.
Trumbo, D.,Noble,M.,Cross,K.,andUlrich,L.,"TaskPredictabilityintheOrganization,
Acquisitionand RetentionofTrackingSkills,"JournalofExperimentalPsycholoqy,1965a,
70: 252-263.
Trumbo, D.,Ulrich,L.,andNoble,M., "YerbalCodingand DisplayCodingintheAcquisitionand
RetentionofTrackingSkill,"dournalofAppliedPsycholoqy,1965b, 49: 368-375.
Trumbo, D.,Noble,M., and5wink,d.,"SecondaryTask InterferenceinthePerformanceof
TrackingTasks,"JournalofExperimentalPsycholoqy,1967, 73: 232-240.
9-40

Trainingfor LongMissions J.H.Goldberg
vonTiesenhausen,e., "AnApproachTowardFunctionAllocationBetweenHumansandMachinesinSpaceStationActivities,"NASA TechnicalMemorandum 825 I0, MarshallSpaceFlightCenter,
Alabama, 1982.
Williges,R.C.,andWilliges,B.H.,"CriticalVariablesinAdaptiveMotor SkillsTraining,"Human
Factors,1978, 20( 2):201-214.
Youngling,E.W.,Sharpe,E.N.,Ricketson,B.S.,and McGee,D.W.,"Crew SkillRetentionforSpace
Missionsup to200 Days,"ReoortF7666. McDonnell-DouQlesAstronauticsCo.,EasternDiv.,
1968.
9-41

N8 7- 26 702
1986
NASA/ASEE SUMMER FACULTY FELLOWSHIP PROGRAM
3ohnson Space Center
University of Houston
Effect of STS Space Suit on Astronaut Dominant Upper Limb
EVA Work Performance
Prepared by:
Academic Rank:
University and Department:
Michael C. Greenisen
Associate Professor
University of Wisconsin-Milwaukee
Human Kinetics
NASA/3SC
Directorate:
Division:
Branch:
3SC Colleague:
Date:
Contract ti:
Space and Life Sciences
Man System
Design and Analysis
James Taylor
December 17) 1986
NGT=¢¢-005-803
University of Houston
10-1

ABSTRACT PAGE
"EFFECT OF STS SPACE SUIT ON ASTRONAUT DOMINANT UPPER LIMB EVA WORK
PERFORMANCE", M. G. Greenisen, Ph.D., Anthropometric Lab, NASA, SP22,
Johnson Space Center, Houston, Texas 77058.
The purpose of this investigation was to evaluate STS Space Suited (3.7
PSID) and unsuited dominant upper limb performance in order to quantify
future EVA Astronaut skeletal muscle upper limb performance expecta-
tions. Testing was performed with subjects standing in EVA STS foot
restraints. Data was collected with a CYBEX Dynamometer enclosed in a
waterproof container. Control data was taken in one "g". During one
"G" testing weight of the Space Suit was relieved from the subject via
an overhead crane with a special connection to the PLSS of the suit.
Experimental data was acquired during simulated zero "g", accomplished
by neutral buoyancy in the Weightless Environment Training Facility.
Unsuited subjects became neutrally bouyant via SCUBA BC vests. Actual
zero "g" experimental data was collected during parabolic arc flights
on board NASA's modified KC-135 aircraft. During all test conditions
subjects performed five EVA work tasks requiring dominant upper limb
performance and ten individual joint articulation movements. Dynamome-
ter velocities for each tested movement were 0 degree/second, 30 or 60
degree/second and 120 or 180 degree/second, depending on the test, with
three repetitions per test. Performance was measured in foot pounds of
torque. Testing continues.
• 10-2

INTRODUCTION
This report represents an "in progress review" of an ongoing Space
Biomechanics research project with NASA JSC, Directorate of Space and
Life Sciences. The study was conceptualized and initiated during a
NASA-ASEE Faculty Fellowship, Summer 1985. This research continued
full time at NASA JSC, September 1985 - August 1986 under a university
academic year sabbatical leave and a second NASA-ASEE Faculty
Fellowship award. Since August 1986 the study has been supported by a
Lockheed - NASA Contract, number NAS9-15800 dated 18 August 1986.
The basis of this report is extracted from documentation prepared
for a Weightless Environment Training Facility (WETF) Test Readiness
Review Board (TRRB), which was held on August 21, 1986. The TRRB
approved the use of the Cybex Dynamometer for experimental procedures
in the WETF. Essentially, the TRRB documentation is presented in
total.
This documentation summarizes the engineering effort and
experimental design evolution from June 1985 to date. The study will
continue through the Summer 1987. A final report on the results of
this study will be published with the Summer 1987, NASA-ASEE Faculty
Fellowship final reports from NASA JSC.
10-3

RESEARCH CONCEPT
This investigation is evaluating STS space suited andunsuited
dominant upper limb performance in order to quantify future EVA upper
limb work performance expectations. Data is being generated by Mission
Specialist Astronauts. Data is collected during one control and two
experimental environments.
To standardize testing, all data is being collected with a Cybex
dynamometer enclosed in a nitrogen charged waterproof container pres-
surized to 4 psid, mounted on a dedicated stand. The stand meets all
test environment attachment specifications and also serves as the
anchor point for astronaut STS foot restraints.
Control one-g data is collected in the Anthropometric Measurement
Laboratory (A_). During one-g testing, weight of the space suit is
relieved from the subject via an overhead crane specially connected to
the PLSS of the suit.
Experimental data is acquired during simulated zero-g accomplished
by submerging the subjects and Cybex in the Weightless Environment
Training Facility (WETF). Suited subjects become neutrally bouyant
(NB) through standard WETF ballast weighting system techniques.
Unsuited subjects become NB via SCUBA BC vests.
10-4
Actual, zero-g experimental data is collected during parabolic arc
flights on board NASA's modified KC-135aircraft. A gravity meter
measures actual negative "g" level attained. During all dedicated test
conditions, subjects perform five EVAwork tasks requiring whole
dominant upper limb performance and ten individual joint articulation
movementsof the samelimb. Dynamometervelocities vary depending on
the test. However, O degree/second is utilized during all tests to
determine levels of inertial forces which maybe manually exceeded by
STSsuited astronauts.
Data generated by a prototype hand held force measuring unit from
Scott Science and Technology is also being comparedto Cybex results
during selected protocols of this study. This hand held unit is not
waterproofed and will not be part of the Cybex WETFtesting at this
time.
The efforts of this study, to date, have focused on the design
engineering and fabrication of the required hardware, plus evolution of
the research experimental design. Principal Investigator familiariza-
tion with KC-135 parabolic flights and NASAWETFSCUBAqualification
has also occurred. Research pilot data has been collected with the
instrumentation on four KC-125 zero-g flights. Two flights were with
unsuited and two flights were with suited astronaut subjects. During
these flights the instrumentation functioned without problems.
10-5
Collection of data began the first week of Novemberfrom three STS
suited astronauts which submergedin the WEFT. The Cybex dynamometer,
enclosed in the waterproof container, performed without problems as thea
test article. After testing, the underwater container was unsealed and
inspected. No evidence of water leakage into the container was found,
thereby, documenting the success of the engineering design.
There is inadequate data, as of this date, to realistically
present any findings. However, two areas of interest have surfaced
based on the available data: 1) the range of motion available at the
wrist joint of the current STS Space Suit, especially during wrist
extension could impact on EVA work performance. This condition could
influence future EVA tool design; 2) the current EVA knob does not
seem to be effective in its design requirement to receive and transfer
skeletal muscle force by suited EVA astronauts.
Astronaut testing will continue during 1987. Six zero-g flights
are scheduled for February and March. WETF and one-g testing will
continue as a comparison to the zero-g testing.
The impact of this study is to provide data in support of STS EVA
work requirements, EVA crew training requirements, and Phase C of Space
Station. In addition, should the prototype force measuring unit prove
successful, the mass and dimension complexities of the Cybex could be
eliminated, thereby facilitating future studies.
10-6
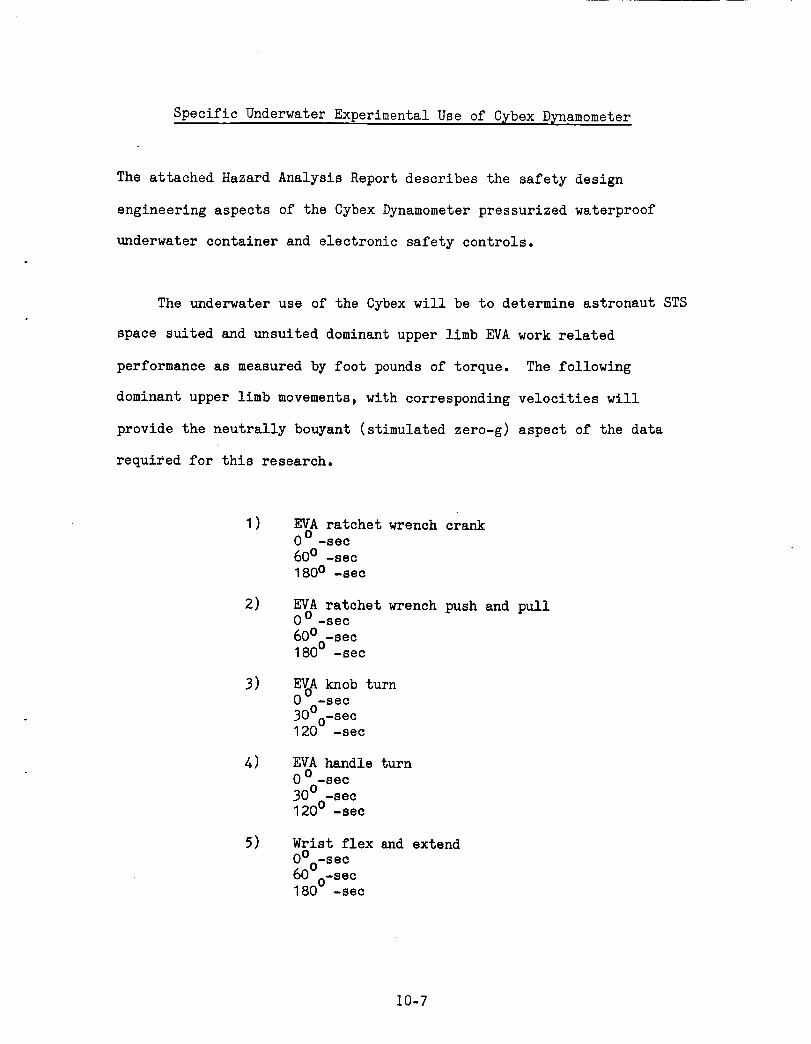
Specific Underwater Experimental Use of C2bex D_namometer
The attached Hazard Analysis Report describes the safety design
engineering aspects of the Cybex Dynamometer pressurized waterproof
underwater container and electronic safety controls.
The underwater use of the Cybex will be to determine astronaut STS
space suited and unsuited dominant upper limb EVA work related
performance as measured by foot pounds of torque. The following
dominant upper limb movements, with corresponding velocities will
provide the neutrally bouyant (stimulated zero-g) aspect of the data
required for this research.
i)
2)
3)
5)
EVA ratchet wrench crank0 0 -sec
600 -sec
1800 -sec
EVA ratchet wrench push and pull0 o -sec
600 -sec1800 -sec
EVoA knob turn0 -sec
300 -sec1200 -sec
EVA handle turn0 o -sec
30°-sec120 ° -sec
Wrist flex and extendO°-sec
60U-sec
180 u -sec
I0-7

6)
7)
8)
9)
Elbow flex and extend
0 0 -sec
600-sec
180 ° -sec
S_oulder joint flex and extend0 _-sec
60 Q -sec
180 0 -sec
F_rearm rotation (pronation and supination)
00-sec60 _-sec
180 ° -sec
Shoulder joint horizontal flexion and horizontal
e_tension0 -sec600 _sec
180 u -sec
I0-8

N87- 26703
1986
NASA/ASEE SUMMER FACULTY RESEARCH FELLOWSHIP PROGRAM
Johnson Space Center
University of Houston
Expansion of Space Station Diagnostic Capability to
Include Serological Identification of Viral andBacterial Infections
Prepared by:
Academic Rank:
University & Department:
NASA/JSC
Directorate:
Division:
Branch:
JSC Colleague:
Date:
Contract #:
Kelly E. Hejtmancik, Ph.D.
Instructor
Galveston College
Division of Mathematics and Science
Space and Life Sciences
Medical Sciences
Biomedical Laboratories
Duane L. Pierson, Ph.D.
August 8, 1986
NGT44-005-803 (University of Houston)
II-I

EXPANSIONOF SPACESTATIONDIAGNOSTICCAPABILITYTOINCLUDESEROLOGICALIDENTIFICATIONOFVIRALAND
BACTERIALINFECTIONS
Kelly E. Hejtmancik, Ph.D.Instructor
Division of Mathematics and ScienceGalveston College
Galveston, Texas 77550
It is necessary that an adequate microbiology capability be provided
as part of the Health Maintenance Facility (HMF)to support expected
microbial disease events during long periods of space flight. The
applications of morphological and biochemical studies to confirm the
presence of certain bacterial and fungal disease agents are currently
available and under consideration. This confirmation would be greatly
facilitated through employment of serological methods to aid in the
identification for not only bacterial and fungal agents, but viruses as
well. A number of serological approaches were considered, particularly
the use of Enzyme-Linked IrmmmosorbentAssays (ELISAs), which could be
utilized during space flight conditions.
A solid phase, membrane supported ELISA for the detection of
Bordetella pertussis was developed to show a potential model system
that would meet the HMF requirements and specifications for the future
space station. A second model system for the detection of Legionella
pneumophila, an expected bacterial disease agent, is currently under
investigation. These preliminary studies demonstrate the capability
of ELISA systems for identification of expected microbial disease
agents as part of the HMF.
NASA Colleague: Duane L. Pierson, Ph.D. SD4 X5457
11-2

INTRODUCTION
The health and well being of individuals aboard a space station and
possibly during future long space missions is of priority and must be
assured. Certain expected clinical syndromes and diseases have been
identified through an infectious disese conference conducted during
October, 1985. Previous spaceflight studies indicate a high probability
of cross-contamination among crewmembers during long confinements, such
as the 90 day missions planned for the space station (12). Continual
habitation, crowded conditions, possible immunosuppression, and other
factors may create critical situations aboard the space craft. If a
microbial disease is suspected, the major effort would be directed
toward obtaining some indication of the specific kind of microorganism
causing the problem. The exact nature of the etiologic agent would
determine the severity of the disease, treatment, prophylaxis, and
subsequent health measures for the space station environment.
The diagnosis of a microbial disease rests upon one or a combin-
ation of clinical signs and symptoms, morphological and biochemical
identification of isolates, and/or serological procedures. Special
procedures such as cell culture may also be required. One problem with
limiting the scope of diagnosis to clinical signs and symptoms is that
a particular microbe can sometimes produce infection having very
different clinical characteristics and occuring in widely different
areas of the body. For example, antibiotic-resistant Staphylococcus
aureus may produce skin and subcutaneous tissue lesions as well as
pneumonia, osteomyelitis, bacteremia, and acute membranous entercolitis,
11-3

depending upon the means by which the organism gained entrance to the
body, host resistance, antibiotic therapy, and other factors.
While the principle of one microorganism causing one clinical
disease is often valid, there are many situations where this is not
true. Indeed, pneumonias that are hardly separable clinically may be
produced by several different kinds of bacteria and viruses. Correct
diagnosis and treatment therefore heavily depend upon the abilities of
the clinical laboratory.
It is important to note that serological procedures will not
immediately take the place of needed morphological and biochemical
identification of bacteria or fungi; however, they are frequently used
to verify, compare, and further substantiate those results as well as
provide a means to directly identify viruses or the immunological
response to a viral infection.
Over the past few years, many new i_munological methods have been
developed which now provide the clinical laboratory with a large array
of potentially valuable diagnostic tools. Antibodies and antigens
labeled with radioisotopes or fluorescent dyes, or affixed to parti-
culate materials, have been used extensively for immunodiagnosis over
the past three decades. These methods do have disadvantages. Immuno-
fluorescence, for example, usually depends upon a subjective assessment
of end result, and the technique is frequently laborious. Radioi_muno-
assay requires expensive equipment and carries the risk of radioactive
exposure and contamination.
The concepts that antigen and antibody can be attached to a solid
11-4

phase support yet retain immunological activity, and that either can
be coupled to an enzyme and the complex retain both immunological and
enzymatic activity, led to the development of Enzyme-Linked Immuno-
sorbent Assays (ELISAs). Antibodies and antigens have been shown to
readily attach to plastic surfaces (such as polyvinyl or polystyrene)
either by passive absorption or chemical conjugation, and still retain
immunological activity. Antibodies and antigens have been linked to
a variety of enzymes including glucose oxidase, peroxidase, and
alkaline phosphatase. The positive factors for ELISAs include low
cost, reagent stability, safety, sensitivity, reproducibility, and
ease of procedure. The procedures are simple enough to be performed
in even poorly equipped laboratories.
It appears likely that the space station diagnostic capability
will require inmlunological testing applicable to the identification of
microorganisms, particularly viruses. In recent years, there has been
increasing emphasis on accurate, reliable, and quick immunological
®
procedures for the identification of many microorganisms and/or the
immunological responses of the host toward infection. Most current
procedures have been developed for use in clinical labortories and
not designed for a space station environment. It appears and is
reasonable that a number of some exsisting procedures, particularly
solid phase immunoassays, could be modified in regard to uniformity
and standardization for use aboard the space station. This project
was designed to illustrate the concept of a solid phase, membrane
supported ELISA to demonstrate the capability of ELISA systems for
11-5

identification of expected microbial disease agents aboard the space
station.
The main purpose of this project was to assess the current ELISA
technological trends and procedures in the immunological identification
of viral and bacterial diseases, particularly those microorganisms
expected to cause illness aboard a space station, and to determine
which procedures could be effectively implemented into the space
station microbiology diagnostic capability as part of the HMF (Health
Maintenance Facility).
11-6

MATERIALS
Equipment. A 96 well Bio-Dot filtration apparatus (#170-6550) was
obtained from Bio-Rad Laboratories, Richmond, Ca. 94801.
Buffers. A 20 mM Tris buffered saline (TBS), pH 7.5, was prepared
by adding 4.84 g Tris (Bio-Rad) to 58.48 g NaCl, brought to a 2.0 1
volume with deionized water. The buffer was adjusted to pH 7.5 with
HCl.
Blocking Solution. A 3.0% BSA-TBS solution was prepared by adding
3.0 g of bovine serum albumin (Difco) to i00 ml of TBS.
Wash Solution. A wash solution containing 0.05% Tween-20 was
prepared by adding 0.5 ml of Tween-20 (Bio-Rad) to 1 1 of TBS.
Antibodies. A human serum pool containing antibodies to Borde-
tella pertussis was obtained from the clinical laboratories at NASA,
Johnson Space Center. Antiserum to Legionella pneumophila (serogroup
i) was obtained from Dr. Hazel Wilkinson, the Department of Health and
Human Services, Center for Disease Control, Atlanta, Ga. 30333.
Horseradish peroxidase conjugated (HPR) goat anti-rabbit (#170-6500)
and (HPR) goat anti-human (#172-1050) were obtained from Bio-Rad
Laboratories.
Antigens. Bordetella pertussis antigen (#2515) was obtained from
Difco Laboratories, Detroit, Mi. 48232. This concentration of this
preparation was 2 x McFarlands units (equivalent to approximately9
1.8 x i0 organisms/ml). Legionella pneumophila antigen was prepared
from a ATCC 3152 (serogroup i) lyophilized culture vial (13). The
ATCC vial was broken and the lyophilized material was dissolved into
11-7
4 ml of Trypticase Soy Broth. Four 15 x i00 mm plates containing 25 ml
of buffered charcoal yeast extract (BCYE) agar was each inoculated with
1.0 ml of the dissolved material. The plates were enclosed.in a plastic
container to prevent the agar from drying out and were incubated at
o35 C for 48 hr. The cells were suspended from each agar surface in 3.0
ml of sterile 0.01 M phosphate buffered saline, pH 7.2, with a pasteur
pipette into a 25 ml sterile conical tube. The conical tube containing
the cell suspension was boiled for i hr to kill the cells. The killed
cell suspension was centrifuged at 1600 x g for 30 rain, the supernatant
discarded, and the cells resuspended in 2.0 ml of 0.01 M phosphate buffer,
pH 7.2 for each 0.i ml of packed cells. One drop of a I:i000 methiolate
solution was added for each 2.0 ml of preparation. The stock solution
o
was stored at 4 C for i0 days to allow for the release of soluble antigen
from the cells. The suspension was centrifuged at 1600 x g and the super-
natant used for assay development.
Stock Chromogenic Substrate Stain Solution. Two substrates were
utilized for comparison. 0-phenylenediamine (OPD, Abbott Laboratories)
was prepared by dissolving 12.8 mg into 5 ml of citrate phosphate
buffer, pH 7.2, containing 0.02% hydrogen peroxide. 4-chloro-l-napthol
(4ClN, Bio-Rad) was prepared by dissolving 60 mg of 4CIN into 20 ml of
ice cold methanol. Immediately prior to use, 0.06 ml of ice cold 30%
hydrogen peroxide was added to i00 ml of room temperature TBS. The two
solutions were mixed just prior to use.
11-8

METHODS
The ELISA systems for both Bordetella pertussis and Legionella
pneumonphila utilized the Bio-Dot apparatus with the mounted nitro-
cellulose paper. The procedure for assembly of the apparatus and
preparation of the nitrocellulose paper was provided by Bio-Rad
Laboratories (2). Briefly, the nitrocellulose paper was first soaked
in TBS to ensure uniform protein binding and low background absorption.
The cleaned and dried Bio-Dot apparatus was assembled, and the nitro-
cellulose paper sheet wetted prior to being placed in the apparatus.
The apparatus was appropriately tightened to insure that cross well
contamination would not occur.
The flow valve was adjusted to allow the vacuum chamber to be
exposed to the atmosphere and the appropriate wells to receive the
antigen preparation were inoculated with a 0.05 ml volume. (Proteins
bound were minute quantities of either antigen or capture antibody
applied as a 0.05 ml volume of a concentration of 0.1-1.0 mg/ml.)2
Nitrocellulose paper has a protein binding capacity of 0.08-0.1 mg/cm
The entire sample was allowed to filter through the membrane by gravity
flow (approximtely 30 rain). Each well was filled with the same volume
of sample solution to insure homogeneous filtration of all sample
wells.
After the antigen samples completely drained from the apparatus,
0.2 ml of a 3.0% BSA/TBS blocking solution was applied to each well.
Gravity filtration was allowed to occur until the blocking solution
completely drained from each well (approximately 30 min).
1!-9

The flow valve was adjusted to vacuumand 0.4 ml of wash solution
(TBSwith 0.05%tween) was added to each well. The wash solution was
allowed to completely drain from all wells. This process was repeated.
Following the wash step, the flow valve was opened to the atmos-
phere and 0.1 ml of the first antibody solution was added to each of the
wells. The solution was allowed to completely drain from the wells,
and another wash step performed.
With the vaccum off and the flow valve to the atmosphere, 0.1 ml
of second antibody (HPR antibody against the first antibody) was added
to each well. The solution was allowed to completely drain from the
wells.
Following the second antibody step, the vaccum was turned on and
a wash step performed. Immediately, 0.2 ml of a color development
solution, either OPD or 4CIN was applied to each well. A positive ELISA
reaction will be shown as color development depending upon the substate
utilized.
II-I0
RESULTS
Non-specific protein binding: A 2.0 cm disc of nitrocellulose
paper was appropriately mounted in a modified millipore apparatus.
The nitrocellulose was washed twice with TBS. A 2.0 ml aliquot of
a BSA solution was allowed to pass through the membrane. A spectro-
photometric reading (320 nm) for protein in the solution was taken
before and after the solution passed through the membrane. The
readings were compared, and it was calculated that the nitrocellulose2
paper retained approximately 0.ii0 mg/cm of total protein. This was
corrected for the amount of protein released by a wash step.
Enzyme-substrate system: The indicator substrates, OPD and 4CIN,
were tested for their interaction to HPR goat anti-human antibody
•attached to the nitrocellulose paper. Eight rows of 12 cells in the
Bio-Dot apparatus were prepared identically, initially washed with TBS,
followed by the application of 0.05 ml of serial dilutions ranging from
1:100 to 1:10,000 of the HPR goat anti-human serum. Each cell was
blocked against additional protein binding by the coating buffer and
washed with TBS. Different volumes of OPD substrate ranging from 0.05
to 0.3 ml, but consistent for each row was applied to the first four
rows of the cells. Identical volumes were applied to the last four rows
using the 4CIN. Color changes of the substrates were noticable and
complete within 5 rain. Maximum color change of the OPD substrate
occurred with 0.3 ml; however, adequate color change was noticed with
0.2 ml which was subsequently selected for assay development. This
colormetric change allowed visualization of membrane attached antibody
Ii-II
to a I:i0,000 dilution. Results with the 4ClN were disappointing.
A purple color changewas noted using 0.3 ml of the solution; however,
this occurred with the membraneattached antibody to a 1:300 dilution.
This experiment reflects that i) the nitrocellulose paper was adequately
binding protein (in the form of antibody), 2) the enzyme-substrate
reaction was appropriate, and 3) the OPDappeared to be superior to 4CIN
for ELISA development.
Bordetella pertussis: A humanpool was titrated in the following
manner. Twoduplicate rows of cells were prepared in which 0.05 ml of a8
I:i0 dilution (approximately 1.8 x i0 organisms/ml) of the Bordetella
pertussis antigen was applied to each well with the exception of the
first two. These wells received 0.05 ml of TBSand served as control
wells for the experiment. All wells then received the blocking buffer
and were rinsed with the wash buffer. A humanpool was serially diluted
from I:i0 to i:i0,000, and 0.i ml of each dilution applied to a subse-
quent well. This step was followed by the addition of 0.i ml of HPR
anti-human serum. Eachwell was then rinsed with the wash buffer. A
0.2 ml aliquot of OPDwas then added to each well. The control wells
showedno color; however, a color changewas evident in the antibody
titration wells out to a 1:1000 dilution.
Titration of pertussis antigen. Twoduplicate rows of cells were pre-
pared in which 0.05 ml of serial dilutions ranging from a 1:10 dilution8
(containing approximately 1.8 x i0 bacterial cells/ml) to a 1:5,0005
dilution (containing approximately 3.6 x i0 bacterial cells/ml) with
exception of the first two wells. These wells received 0.05 ml of TBS
11-12

and served as control wells for the experiment. All wells the received
the blocking buffer and were rinsed with the wash buffer. A .i ml
aliquot of a i:i000 dilution of the humanpool was added to each well.
All wells were rinsed with the washbuffer. Eachwell then received
0.i ml of HRPgoat anti-human antibody diluted 1:3000. The wells were
again rinsed with the wash buffer. All wells then received 0.2 ml of
the OPDsolution. Color changeswere evident out to a 1:5000 dilution5
of the antigen preparation (approximately 1.8 x i0 bacterial cells/ml4
or 3.6 x i0 bacterial cells/0.05ml). These results are summarized in
Table i.
BordetellaAntigen *McFarland Units Dilution of HumanAntiserumDilution Applied i:i0 i:i00 1:1000 1:5000
i:i0 0.02 *,4---_ 2+ i+ 0
1:50 0.001 4+ 3+ i+ 0
i:i00 0.002 4+ 4+ i+ 0
1:500 0.0001 4+ 2+ i+ 0
i:i000 0.0002 3+ 2+ i+ 0
1:5000 0.00001 i+ i+ 0 0
Control 0 0 0 0 0
*i McFarland unit is equivalent to approximately 0.9 x i0
bacterial cells/ml.
**Values are expressed as 0 (as comparable to control) to 4+
for comparison of the color intensity of OPD
Table i. Bordetella pertussis antigen detection.
Legionella pneumophila antigen preparation: The antigen preparation
was subjected to both the Biuret and LOWry protein detection procedures.
The Biuret method showed no detectable protein; however, the results from
the Lowry indicated that the antigen preparation concentration was approx-
11-13

imately .025 mg/ml. Subsequent calculations were determined from this
estimate.
The legionella antigen preparation was titrated in a manner similar
to Bordetella pertussis. Two duplicate rows of cells were prepared in
which 0.05 ml of serial 5 and i0 fold dilutions of the preparation were
applied. The first well of each row served as controls. All wells
received the blocking buffer and were subsequently rinsed with the wash
buffer. This step was followed by the addition of 0.05 ml of a 1:1000
dilution of rabbit legionella antiserum. Each well was then washed and
inoculated with 0.2 ml of the OPD solution.
out to 250 pg/ml of the antigen prepartion.
assay are shown in Table 2.
Color changes were evident
Results from a typical
LegionellaAntigenDilution
Protein
Applied
(ng/0.05 ml)
Dilution of legionellaAntiserumi:i0 1:50 i:i00 i:I000 1:5000
m _ Q
i:i0 25.0 *4+ 4+ 4+ 4+ 3+
1:50 5.0 4+ 4+ 4+ 2+ i+
i:i00 2.5 3+ 3+ 2+ i+ i+
1:500 0.5 3+ 3+ 2+ I+ i+
i:i000 0.25 3+ 3+ 2+ i+ i+
*Values are expressed as 0 (as comparable to control) to 4+ for
comparison of the color intensity of OPD.
Table 2. Legionella pneumophila antigen detection.
11-14
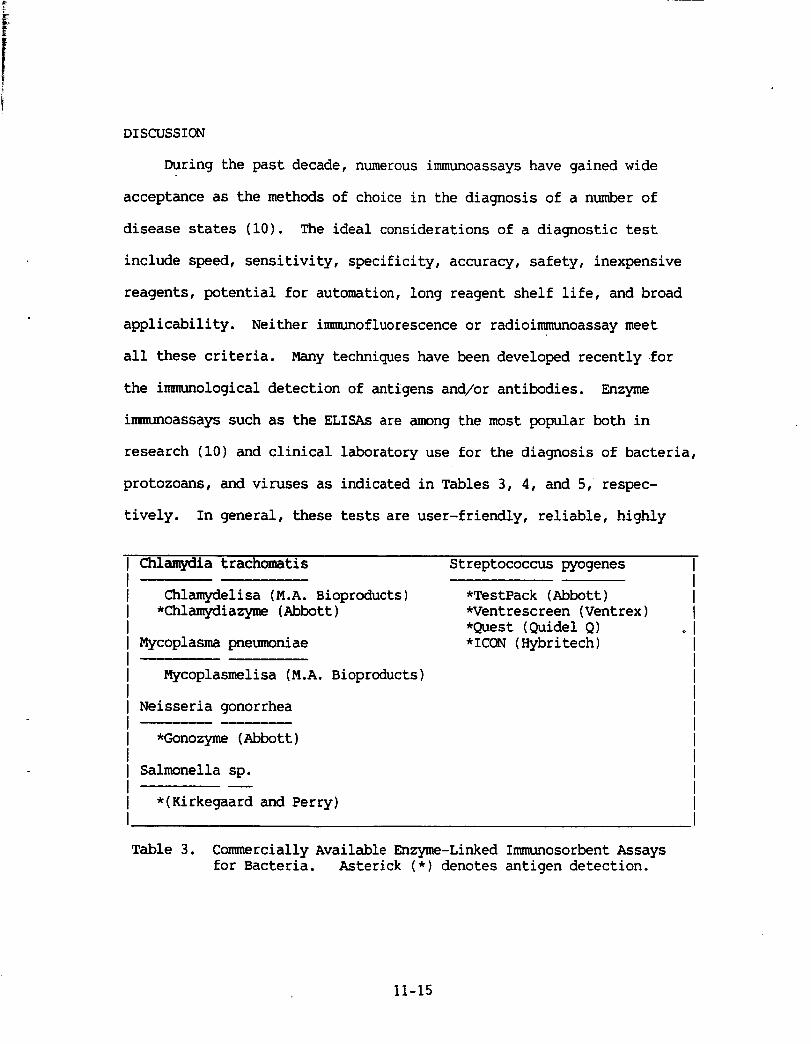
DISCUSSION
During the past decade, numerousimmunoassayshave gained wide
acceptance as the methods of choice in the diagnosis of a number of
disease states (i0). The ideal considerations of a diagnostic test
include speed, sensitivity, specificity, accuracy, safety, inexpensive
reagents, potential for automation, long reagent shelf life, and broad
applicability. Neither immunofluorescenceor radioimmunoassaymeet
all these criteria. Many techniques have been developed recently for
the inm_nological detection of antigens and/or antibodies. Enzyme
immunoassays such as the ELISAs are among the most popular both in
research (10) and clinical laboratory use for the diagnosis of bacteria,
protozoans, and viruses as indicated in Tables 3, 4, and 5, respec-
tively. In general, these tests are user-friendly, reliable, highly
Chlamydia trachomatis
Chlamydelisa (M.A. Bioproducts)
*Chlamydiazyme (Abbott)
Mycoplasma pneumoniae
Mycoplasmelisa (M.A. Bioproducts)
Neisseria gonorrhea
*Gonozyme (Abbott)
Salmonella sp.
*(Kirkegaard and Perry)
Streptococcus pyogenes
*TestPack (Abbott)
*Ventrescreen (Ventrex)
*Quest (Quidel Q)
*ICON (Hybritech)
Table 3. Commercially Available Enzyme-Linked ImmunosorbentAssays
for Bacteria. Asterick (*) denotes antigen detection.
11-15
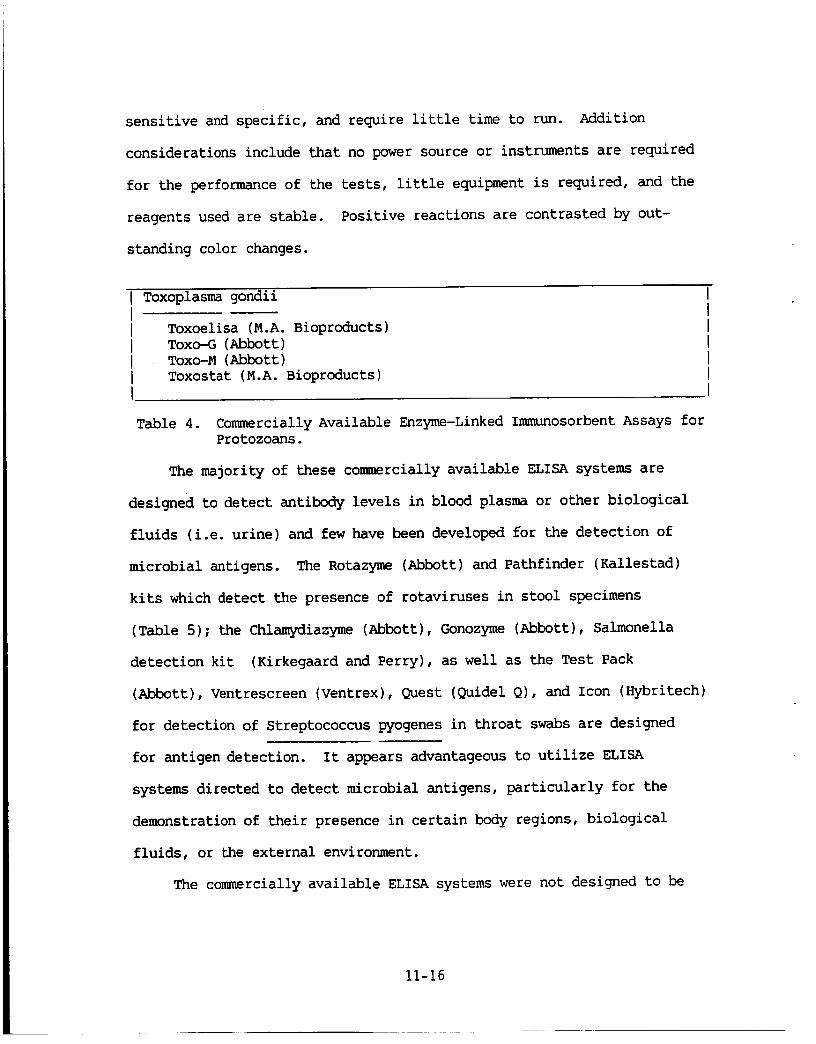
sensitive and specific, and require little time to run. Addition
considerations include that no power source or instruments are required
for the performance of the tests, little equipment is required, and the
reagents used are stable. Positive reactions are contrasted by out-
standing color changes.
Toxoplasma gondii
Toxoelisa (M.A. Bioproducts)
Toxo-G (Abbott)
Toxo-M (Abbott)
Toxostat (M.A. Bioproducts)
Table 4. Commercially Available Enzyme-Linked Immunosorbent Assays for
Protozoans.
The majority of these commercially available ELISA systems are
designed to detect antibody levels in blood plasma or other biological
fluids (i.e. urine) and few have been developed for the detection of
microbial antigens. The Rotazyme (Abbott) and Pathfinder (Kallestad)
kits which detect the presence of rotaviruses in stool specimens
(Table 5); the Chlamydiazyme (Abbott), Gonozyme (Abbott), Salmonella
detection kit (Kirkegaard and Perry), as well as the Test Pack
(Abbott), Ventrescreen (Ventrex), Quest (Quidel Q), and Icon (Hybritech)
for detection of Streptococcus pyogenes in throat swabs are designed
for antigen detection. It appears advantageous to utilize ELISA
systems directed to detect microbial antigens, particularly for the
demonstration of their presence in certain body regions, biological
fluids, or the external environment.
The commercially available ELISA systems were not designed to be
11-16
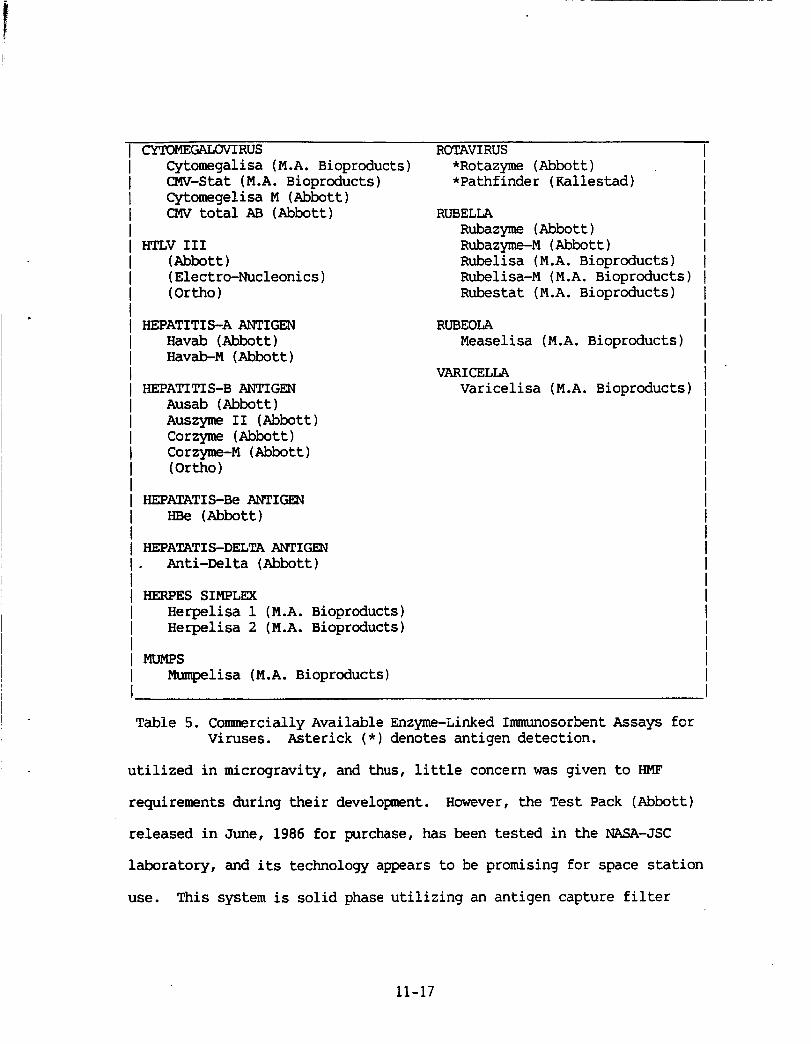
CYTOMEGALOVIRUSCytomegalisa (M.A. Bioproducts)CMV-Stat (M.A. Bioproducts)Cytomegelisa M (Abbott)CMVtotal AB (Abbott)
HTLVIII(Abbott)(Electro-Nucleonics)(Ortho)
HEPATITI S-A ANTIGEN
Havab (Abbott)
Havab-M (Abbott)
HEPATITIS-BANTIGEN
Ausab (Abbott)
Auszyme II (Abbott)
Corzyme (Abbott)
Corzyme-M (Abbott)
(Ortho)
HEPATATIS-Be ANTIGEN
HBe (Abbott)
HEPATATIS-DELTAANTIGEN
Anti-Delta (Abbott)
HERPES SIMPLEX
Herpelisa 1 (M.A. Bioproducts)
Herpelisa 2 (M.A. Bioproducts)
MUMPS
Mump lisa (M.A. Bioproducts)
ROTAVIRUS
*Rotazyme (Abbott)
*Pathfinder (Kallestad)
RUBELLA
Rubazyme (Abbott)
Rubazyme-M (Abbott)
Rubelisa (M.A. Bioproducts)
Rubelisa-M (M.A. Bioproducts)
Rubestat (M.A. Bioproducts)
RUBEOLA
Measelisa (M.A. Bioproducts)
VARICELLA
Varicelisa (M.A. Bioproducts)
Table 5. Commercially Available Enzyme-Linked Immunosorbent Assays for
Viruses. Asterick (*) denotes antigen detection.
utilized in microgravity, and thus, little concern was given to HMF
requirements during their development. However, the Test Pack (Abbott)
released in June, 1986 for purchase, has been tested in the NASA-JSC
laboratory, and its technology appears to be promising for space station
use. This system is solid phase utilizing an antigen capture filter
11-17
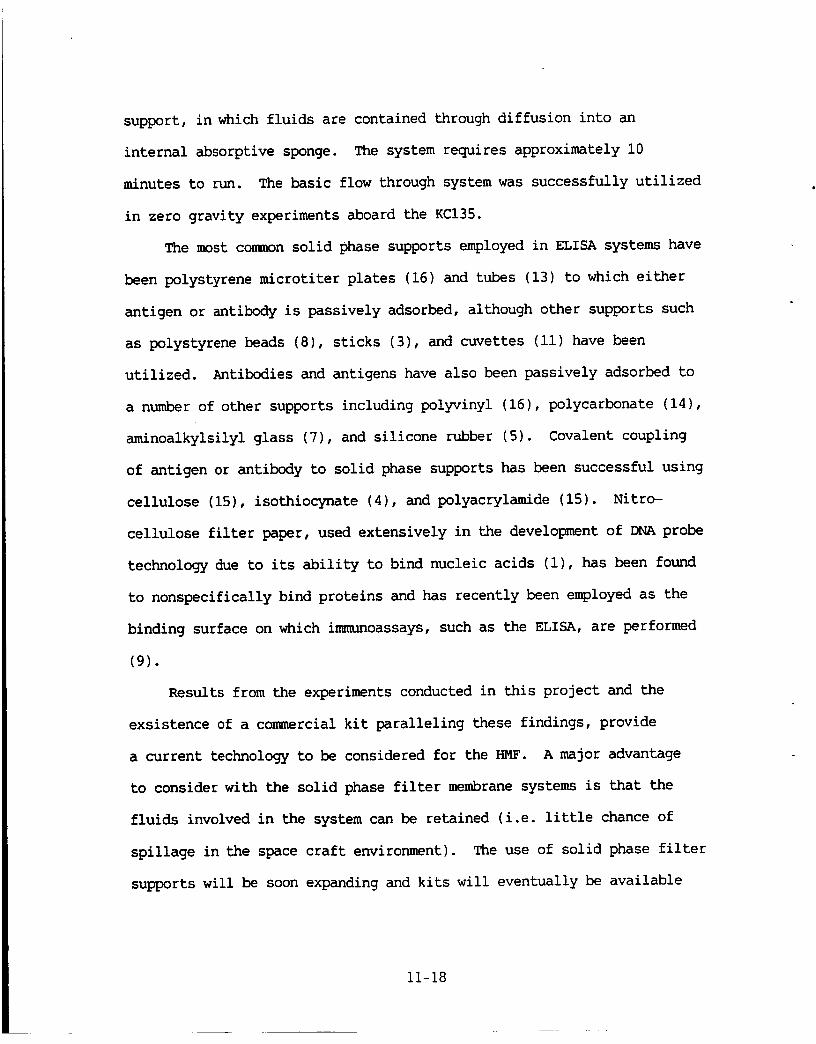
support, in which fluids are contained through diffusion into an
internal absorptive sponge. The system requires approximately i0
minutes to run. The basic flow through system was successfully utilized
in zero gravity experiments aboard the KC135.
The most commonsolid phase supports employed in ELISA systems have
been polystyrene microtiter plates (16) and tubes (13) to which either
antigen or antibody is passively adsorbed, although other supports such
as polystyrene beads (8), sticks (3), and cuvettes (ii) have been
utilized. Antibodies and antigens have also been passively adsorbed to
a numberof other supports including polyvinyl (16), polycarbonate (14),
aminoalkylsilyl glass (7), and silicone rubber ( 5). Covalent coupling
of antigen or antibody to solid phase supports has been successful using
cellulose (15), isothiocynate (4), and polyacrylamide (15). Nitro-
cellulose filter paper, used extensively in the development of DNA probe
technology due to its ability to bind nucleic acids (i), has been found
to nonspecifically bind proteins and has recently been employed as the
binding surface on which immunoassays, such as the ELISA, are performed
(9).
Results from the experiments conducted in this project and the
exsistence of a commercial kit paralleling these findings, provide
a current technology to be considered for the HMF. A major advantage
to consider with the solid phase filter membrane systems is that the
fluids involved in the system can be retained (i.e. little chance of
spillage in the space craft environment). The use of solid phase filter
supports will be soon expanding and kits will eventually be available
11-18

for the identification of those microrganisms, including viruses,
expected to cause health problems in the space station environment.
Since cell culture is usually required for the identification of
viruses, this technology would certainly be an viable alternative.
• 11-19
SELECTEDREFERENCES
i. Alwine JC, DT Kemp,GRStark: Method for detection of specific
RNAs in agarose gels by transfer to diazobenzyloxymethyl-paper and
hybridization with DNAprobes. Proc Natl Acad Sci 74:5350, 1977.
2. Bio-Dot MicrofiltrationApparatus Instruction Manual, Bio-Rad
Laboratories, Richmond, Ca., 1984.
. Felgner, P: A new technique of heterogenous enzyme-linked immuno-
sorbent assay stick- ELISA I. Description of the technique.
Zbl Bakt Hyg I Abt Org A240:I12, 1978.
o Halbert, SP and M Ankey: Detection of hepatitis B surface antigen
(HBsAg) with use of alkaline phosphatase labelled antibody to
HBsAg. J Infect Dis, Supplement 136:S318, 1977.
. Hamaguchi, Y, K Kato, E Ishikawa, K Kobayzski, N Katunuma: Enzyme
linked sandwich immunoassay of macromolecular antigens using the
rabbitantibody loaded silicone piece as a solid phase. FEBS
Lett 69:11, 1976.
6. Jones G. and GA Hebert: "Legionnaires'" the disease, the bacterium
and methodology. HEW Publication No (CDC) 79-8375, 1979, p 124.
o Kato, K, Y Hamaguchi, S Okawa, E Ishikawa, K Kobayashi, N Katunuma:
Use of rabbit antibody IgG bound on to plain and aminoaklylsilyl
glass surface for the enzyme-linked sandwich assay. J Biochem
82:261, 1977.
11-20

.
.
i0.
ii.
12.
13.
14.
Miranda, QR, GD Bailey, AS Fraser, HJ Ten.so: Solid phase enzyme
immunoassay for herpes simplex virus. J Infect Dis, Supplement,
136:S304, 1977.
Monroe, D: The solid phase enzyme-linked inm_mospot assay:
Current and Potential Applications. Biotechniques, May/June, 1985,
p 222.
O'Beirne, AJ, and HR Cooper: Heterogeneous enzyme immunoassay.
J Hist Cyto 27:1148, 1979.
Park, H.: Hew technique for solid phase immunoassay: Applications
to hepatitis B surface antigen. Clin Chem 25:178, 1979.
Pierson, DL: Microbiology support plan for space station. National
Aeronautics and Space Administration Publication, JSC No. 32015,
1986.
Ruitenberg, EJ, PA Steerenberg, BJM Brose, and J Buys: Reliability
of ELISA as control method for the detection of Trichinella
spirilis in conventionally raised pigs. J Immunol Methods 10:67,
1976.
Smith, KO and WD Gehlebeh: Magnetic transfer devices for use in
solid phase radioimmunoassay and enzyme-linked immunosorbent
assays. J Infect Dis 136:$329, 1977.
11-21

15.
16.
van Weemen, BK and AHWM Schuurs: Immunoassay using antibody-enzyme
conjugates. Febs Lett 43:215, 1974.
Voller, A, DE Bidwell, A Bartlett: Microplate enzyme immunoassays
for the immunodiagnosis of virus infections. Manual of Clinical
Immunology. Edited by N Rose and H Friedman. Am Soc Microbiol,
1976, pp 506-612.
11-22

N87-26704
1986
NASA/ASEE SUMMER FACULTY RESEARCH FELLOWSHIP PROGRAM
e
Johnson Space Center
Texas A&H University
Interpreting the Production of 26AI in Antarctic Meteorites
Prepared by:
Academic Rank:
University & Department:
NASA/JSC
Directorate:
Division:
Branch:
JSC Colleague:
Date: 8 August 1986
Contract #:
H. R. Heydegger
Professor
Purdue University Calumet
Department of Chemistry & Physics
Space and Life Sciences
Solar System Exploration
Space Physics
J. E. Keith
NGT-44-005-803 (Texas A&M University)
12-I

INTERPRETING THE PRODUCTION OF 26AI IN ANTARCTIC METEORITES
H. R. Heydegger
Professor
Department of Chemistry and Physics
Purdue University Calumet
Hammond IN 46323
Large numbers of meteorites have been concentrated at several locations
in Antarctica. Glaciological mechanisms of grossly different time
scales (-104 to -106 years) have been proposed to account for their
transport by the ice, and the frequency distribution of the terrestrial
ages of these objects has been suggested as a means of determining the
relevant time scale(s). The upper limit to the age of ice in
Antarctica which would emerge from such a project is of interest to
workers in a variety of other disciplines as well. After a meteorite
reaches the Earth's surface, the specific radioactivity of 26AI
produced by cosmic rays while it was in space decreases because
shielding by the Earth's atmosphere reduces further production to a
negligible level. Thus, the known half life of this species can be used
to determine the object's terrestrial age if the specific radioactivity
at time of fall can be estimated with reasonable accuracy and
precision. The several models utilized for these predictions were
based on the limited data available nearly two decades ago. In this
work we have critically examined the much larger data base now
available using multiple parameter regression analyses.
NASA Colleague: J. E. Keith SN3 X5840
12-2

INTRODUCTION
Meteoroids are subject to bombardment by high energy particles while in
free space. Such projectiles include both galactic cosmic rays (GCR)
and solar particles (SP) which can induce nuclear reactions that result
in the transformation of some of the stable nuclei of the target to
radioactive product nuclei. After the meteorite reaches the earth's
surface, production of the radioactive species is esentially stopped
because of the shielding effect of the earth's atmosphere against
primary GCR and SP. The specific radioactivity of a given nuclide in a
particular portion of a meteorite is dependent upon a number of
variables: chemical composition, position in the meteorite with
respect to the preatmospheric surface, the primary projectiles'
intensity vs. energy spectra time dependence during exposure, etc.
Discovery of the accumulation of large numbers (-5000) of meteorites in
ablation zones on the Antarctic ice sheet has lead to interest in using
these objects as relict tracers for the mechanism of ice transport. It
seems likely that these accumulations result when meteorites which have
fallen randomly over the Antarctic surface and were incoporated into
and transported with the glacier ice are left behind on the surface
as this ice is lost in the ablation zone of the particular sheet.
Thus, determination of the time scale for ice movement is possible if
the "terrestrial age" i.e. (the time each meteorite has been on earth)
can be established. The decay of a radioactive species produced in
12-3

space provides a suitable "timer-clock", assuming the amount present at
fall can be estimated with reasonable accuracy and precision. Interest
has been focused on 26AI because it has a half-life consistent with the
the time scales (104 - 106 ) proposed for the ice transport from the
fall zones to the ablation zones [I-6]. The understanding of time
scales in Antarctic glaciology is of interest beyond that discipline.
The identification of ice of such great age would provide dated samples
for particular ocean sediment and paleoclimatogoly studies as well as
for investigation of paleoatmospheric composition [e.g. 7].
Determination of the glaciological mechanism involved for a particular
ice sheet would involve:
1. collection of -102-5 meteorites from the ablation zone;
2. measurement of the current 26AI specific radioactivity (Do) in
each meteorite non-destructively via gamma-gamma coincidence
spectrometry to a precision of -10%;
3. estimation of the 26AI saturation specific radioactivity (Doo)
present at fall based on the chemical composition of the object;
4. calculation of the terrestrial age (elapsed time between fall
and present) for each meteorite based on present and saturation
26AI values;
5. interpretation of the terrestrial age frequency distribution
observed in terms of those expected for postulated transport
mechanisms.
12-4

This work has been concerned primarily with item 3. In particular, we
sought to determine whether published formulae yield Doo estimates
sufficiently accurate and precise to permit the time resoltuion in
terrestrial ages for required useful conclusions regarding
glaciological mechanismsto be drawn.
ESTIMATION OF SATURATION_AI SPECIFIC RADIOACTIVITY
This problem was first addressed systematically by Fuse and Anders [8]
nearly two decades ago. A regression of observed 26AI Do versus Si,
AI, and S content was performed for 34 meteorites assumed to have long
exposure ages, with contributions due to Ca and Fe+Ni assumed to be
known. Contributions from other elements, including Mg, were assumed
to be negligible.
Two years later a different approach was taken by Cressy [9], who used
the DO and elemental composition of eight fractions separated from a
single meteorite as the set of observations. The independent variables
in Cressy's regression were Mg, AI, and Si, with contributions due to
S, Ca, and Fe+Ni assumed to be known.
In 1980. Hampel, et al. [10] used six fractions obtained from three
meteorites to derive a third set of coefficients for Mg, AI, and Si,
while assuming the values for S, Ca, and Fe+Ni to be known.
12-5
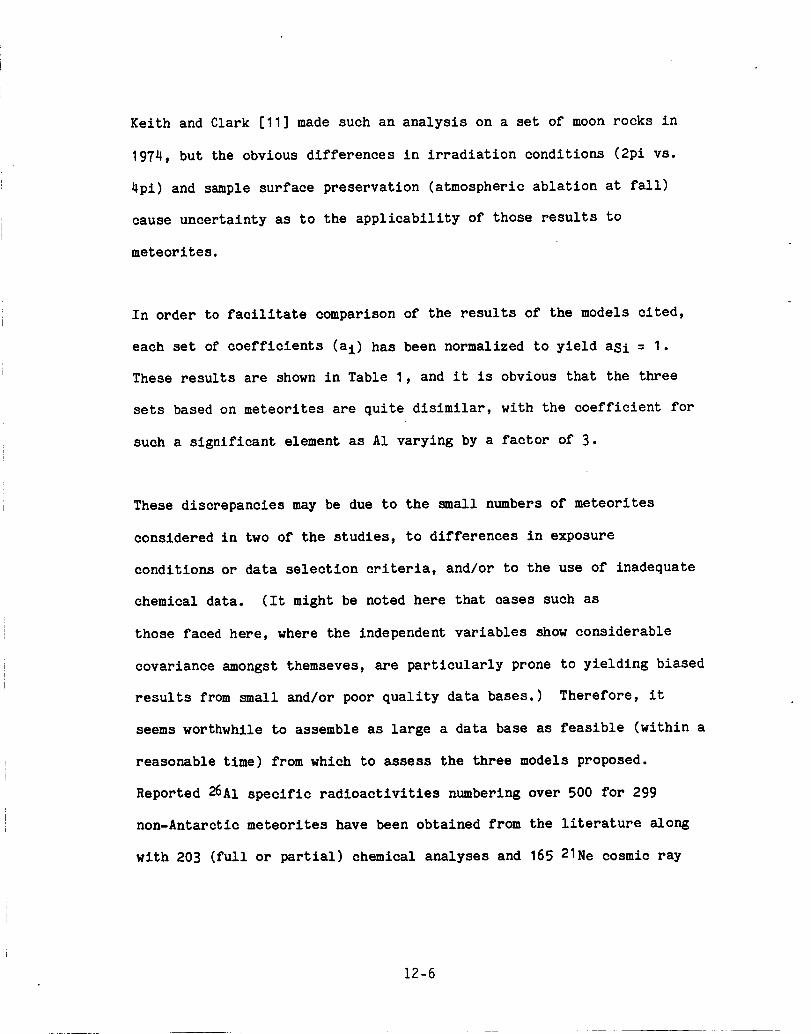
Keith and Clark [11] made such an analysis on a set of moon rocks in
1974, but the obvious differences in irradiation conditions (2pi vs.
4pi) and sample surface preservation (atmospheric ablation at fall)
cause uncertainty as to the applicability of those results to
meteorites.
In order to facilitate comparison of the results of the models cited,
each set of coefficients (ai) has been normalized to yield asi = I.
These results are shown in Table 1, and it is obvious that the three
sets based on meteorites are quite disimilar, with the coefficient for
such a significant element as A1 varying by a factor of 3.
These discrepancies may be due to the small numbers of meteorites
considered in two of the studies, to differences in exposure
conditions or data selection criteria, and/or to the use of inadequate
chemical data. (It might be noted here that cases such as
those faced here, where the independent variables show considerable
covariance amongst themseves, are particularly prone to yielding biased
results from small and/or poor quality data bases.) Therefore, it
seems worthwhile to assemble as large a data base as feasible (within a
reasonable time) from which to assess the three models proposed.
Reported 26AI specific radioactivities numbering over 500 for 299
non-Antarctic meteorites have been obtained from the literature along
with 203 (full or partial) chemical analyses and 165 21Ne cosmic ray
12-6
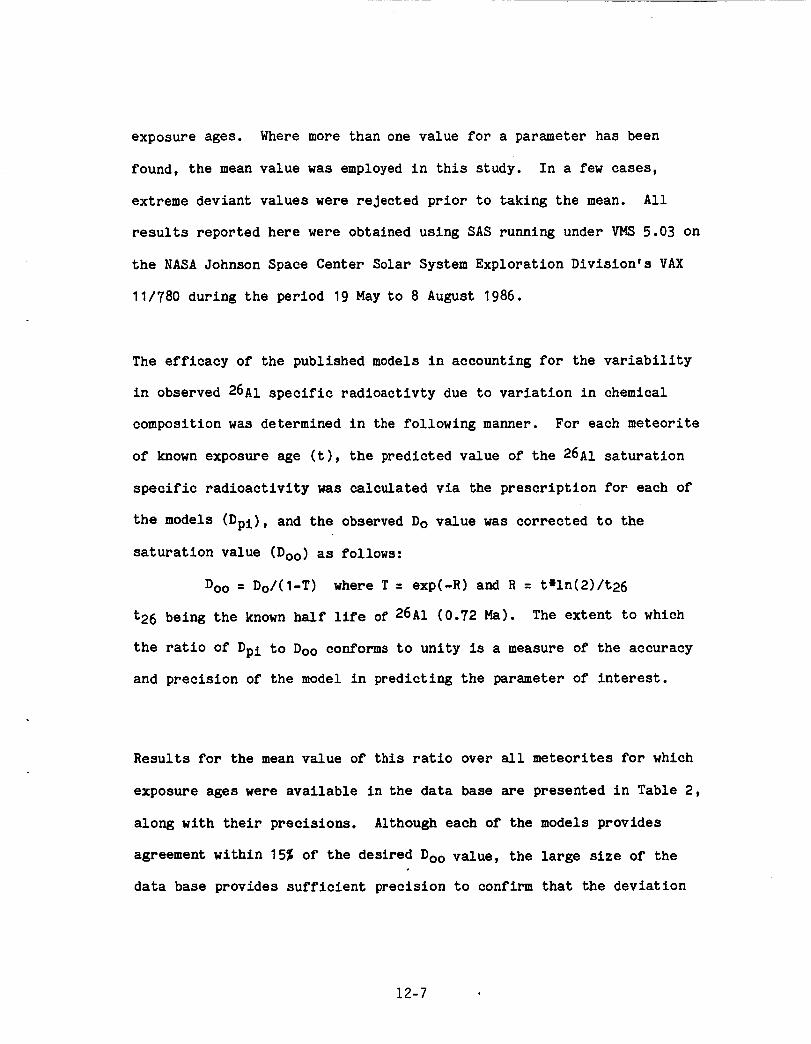
exposure ages. Where more than one value for a parameter has been
found, the mean value was employed in this study. In a few cases,
extreme deviant values were rejected prior to taking the mean. All
results reported here were obtained using SAS running under VMS 5.03 on
the NASA Johnson Space Center Solar System Exploration Division's VAX
11/780 during the period 19 May to 8 August 1986.
The efficacy of the published models in accounting for the variability
in observed 26A1 specific radioactivty due to variation in chemical
composition was determined in the following manner. For each meteorite
of known exposure age (t), the predicted value of the 26A1 saturation
specific radioactivity was calculated via the prescription for each of
the models (Dpi), and the observed Do value was corrected to the
saturation value (Doo) as follows:
Doo = Do/(I-T) where T = exp(-R) and R = t*In(2)/t26
t26 being the known half llfe of 26AI (0.72 Ma). The extent to which
the ratio of Dpi to Doo conforms to unity is a measure of the accuracy
and precision of the model in predicting the parameter of interest.
Results for the mean value of this ratio over all meteorites for which
exposure ages were available in the data base are presented in Table 2,
along with their precisions. Although each of the models provides
agreement within 15% of the desired Doo value, the large size of the
data base provides sufficient precision to confirm that the deviation
12-7

from the desired value of unity is significant for each of the models.
This indicates the presence of systematic errors. If the principal
cause of these discrepancies is variation (or inaccuracy) in chemical
compositions, a significant difference in Dpl/Doo would be expected
among the different classes of meteorites. Mean values for the ratio
of interest for meteorites of known exposure age in several major
classes are also presented in Table 2, and it is seen that such
variation is absent.
In view of the systematic deviations found for predictions from the
published models, the recent increase of interest in this problem, and
the ready availability of the large data base assembled in this work,
it seems worthwhile to perform a new search for a more accurate formula
for the prediction of Doo. Such a search was undertaken with quite
interesting results. Inverse variance weighted and unweighted
regressions of the experimentally derived saturation specific
radioactivty values for 26AI vs. a number of parameters were
performed. Presentation of the detailed results of this work is
beyond the scope of this report, but the following equation has been
found to fit the experimenatal data base with an R-squared of 0.96:
Doo = (3.0 ± 0.5)*Si + (3.6 ± 1.9)*AI + (0.1 ±0.5)*Mg
where the chemical symbols stand for the respective elemental
abundances in % by weight. This regression was based on 81 cases for
which the specific radioactivity of 26AI, the 21Ne exposure age, and
12-8
the three elemental abundances were all known.
Since the data base includes finds (i.e. objects identified as
meteorites but which have not been observed to fall), as well as
observed falls, it is worthwhile to see if both subpopulatlons show
the same systematic deviation. The results shown in Table 3 indicate
that the mean values for the ratio of interest are significantly
different for falls and finds. From this disagreement we infer
that the frequency of finds with DO significantly less than Doe (i.e.
those unsaturated at fall plus those with terrestrial age greater than
about 0.2 Ma) is greater than the frequency of unsaturated falls
(-8%). Therefore, the inclusion of finds as well as falls would
appear to bias the data base toward lower Doe values . This is an
important conclusion because all of the Antarctic meteorites recovered
to date are finds for most of which there is an absence of measured
exposure ages.
CONCLUSIONS
It has been shown in this work that there is a systematic bias in
estimates of the amount of 26AI expected to be present at fall in a
meteorite of known major element composition when previously published
formulae are employed. The mean specific radioactivity of this nuclide
in finds was also found to be distinguishable from that of falls.
An improved formula for estimating the saturation specific radloaetlvty
12-9

of 26A1 expected to be present at fall has been derived from the large
data base on non-Antarctic meteorites established for this study.
Despite the relatively poor precision yielded by any of the formulae,
estimates of this quatity were found to be adequate for use in
distinguishing between the principal proposed mechanisms for Antarctic
glacier ice transport between the accretion and the ablation zones.
Further non-destructive radioactivity measurements in order to
establish a large data base for Antarctic meteorites from each of the
ice sheets of interest would be a logical next goal.
12-10

Table I.
Model
Comparison of Elemental Coefficients in 26AI Estimation Models
Normalized Model Target Coefficient*
Mg A1 Si S Ca Fe+Ni
Fuse & Anders =0 1.5 =I .12 =.02 =.007
Cressy .11 4.6 =I .54 =.10 =.009
Hampel, et al. .15 1.8 =I =.49 =.09 =.011
* = means parameter was set equal to relative value given by original authors
and was not a free variable in their regression except the coefficient for
Si which was adjusted to unity in this work for ease of comparison.
12-11

Table 2.
Model
Comparison of Model-predicted Radioactivity by Meteorite Class
Saturation 26A1 (Experimental/Predlcted) by Class ± I s(m) *
H L C All
Fuse & Anders
Cressy
Hampel, et al.
.92 ± .02 (22)
• 91 ± .02 (22)
•91 ± .02 (22)
.90 ± .04 (15)
.89 ± .04 (15)
.88 ± .04 (15)
•93 ± .03 (13)
.86 ± .07 (13)
.90 ± .03 (13)
.90 ± .02 (65)
.89 ± .02 (65)
.88 ± .02 (66)
inverse variance weighted mean values ± one sigma of the mean taken over the
number of meteorites of known exposure age given in parentheses.
12-12
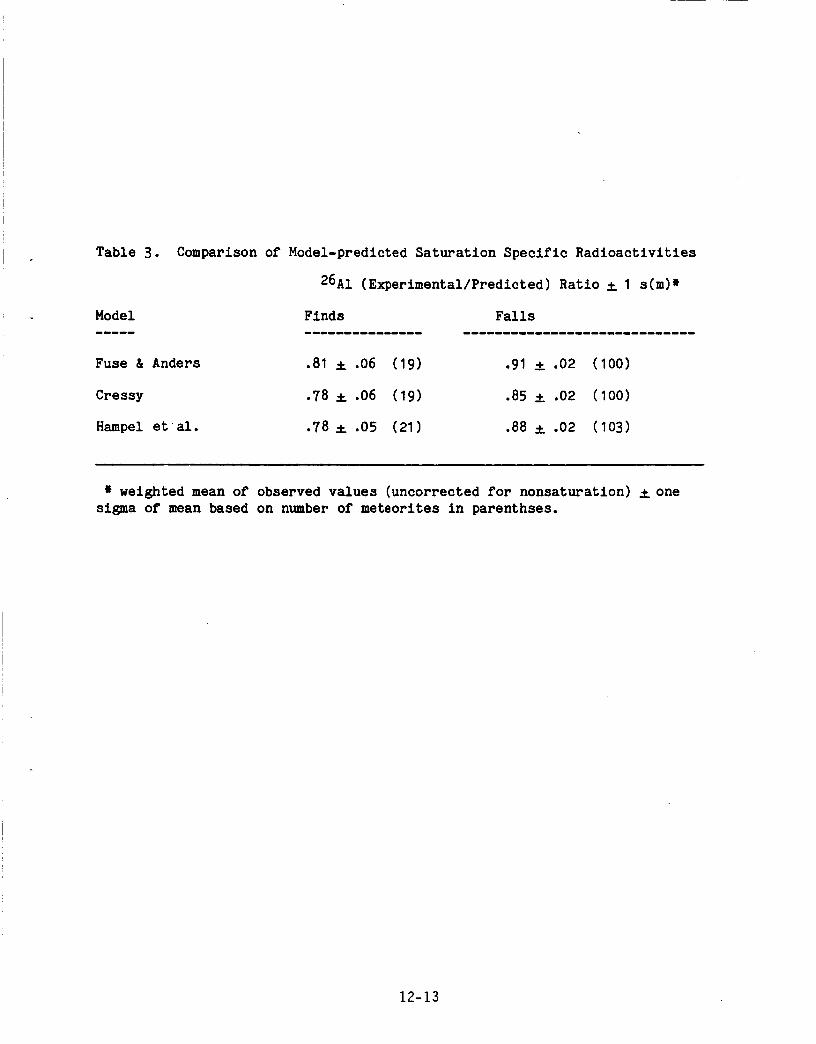
Table 3.
Model
Fuse & Anders
Cressy
Hampel et al.
Comparison of Model-predicted Saturation Specific Radioactivltles
26A1 (Experimental/Predicted) Ratio ± I s(m)*
Finds Falls
.81 ± .06 (19) .91 ± .02 (100)
.78 ± .06 (19) .85 ± .02 (100)
.78 ± .05 (21) .88 ± .02 (103)
* weighted mean of observed values (uncorrected for nonsaturation) ± one
sigma of mean based on number of meteorites in parenthses.
12-13

s
REFERENCES
I. T. Nagata
Mem. Nat'1. Inst. Polar Res., Spec. Issue 8, 70 (1979).
2. F. Nishio, N. Azuma, A. Higashi, and J. O. Annexstad
Ann. Glac.
3. I.M. Willans and W. A. Cassidy
Science 222, 55 (1983).
4. J. O. Annexstad
Ph.D. Dissertation, Univ. Mainz, 1983.
5. L. Sehultz and J. O. Annexstad
Smith. Contrib. Earth Sci. 26, 17 (1984).
.
.
L. Schultz
Abstracts, Workshop on Antarctic Meteorites, Mainz, 1985.
M. Bender, L. D. Labeyrie, D. Raynaud, and C. Lorius
Nature 3]__, 349 (1985).
8. K. Fuse and E. Anders
Geochim. Cosmochlm. Acta 3__, 653 (1969).
9. P.J. Cressy, Jr.
Geochim. Cosmochim Aeta 35_, 1283 (1971).
10. W. Hampel, H. Wanke, H. Hofmeister, B. Spettel, and G. F. Herzog
Gecchim. Cosmochim. Acta 44, 539 (1980).
11. J. E. Keith and R. S. Clark
Proc. 5th Lun. Conf., Gechim. Cosmochim. Acta, Suppl. 5, 2105
(1974).
12-14

N.87-26705
1986
NASA/ASEE SUMMER FACULTY RESEARCH FELLOWSHIP PROGRAM
Johnson Space Center
University of Houston
Plasma Motor Generator System
Prepared by:
Academic Rank:
University & Department:
NASA/JSC
Directorate:
Divsion:
Branch
JSC Colleague:
Date:
Gerald E. Hire
Associate Professor
Texas A&M University at Galveston
Department of Marine Science
Space and Life Sciences
Solar System Exploration
Space Science
James E. McCoy
August i, 1986
13-1

PLASMA MOTOR GENERATOR SYSTEM
Gerald E. HiteAssociate Professor
Department of Marine ScienceTexas A&M University at Galveston
Galveston, TX 77553
The significant potential advantages of a plasma motor generator system
over conventional systems for the generation of electrical power and
propulsion for spacecraft in low earth orbits warrants its further
investigation. The two main components of such a system are a long (-10km)
insulated wire and the plasma generating hollow cathodes needed to maintain
electrical contact with the ionosphere.
Results of preliminary theoretical and experimental investigations of
this system are presented. The theoretical work involved the equilibrium
configurations of the wire and the nature of small oscillations about these
equilibrium positions. A particularly interesting result was that two
different configurations are allowed when the current is above a critical
value.
Experimental investigations were made of the optimal starting and running
conditions for the proposed, low current hollow cathodes. Although optimal
ranges of temperature, argon pressure and discharge voltage were identified,
start-up became progressively more difficult. This supposed depletion or
contamination of the emissive surface could be countered by the addition of
new emissive material. The sharp transition between the two distinctively
different working modes of these hollow cathodes was studied extensively. It
is proposed that this transition is due to the establishment in t_e orifice of
a plasma distinct from that inside the hollow cathode.
NASA Colleague: James E. McCoy, SN3, x5171
13-2

I. INTRODUCTION
According to Faraday's law of induction, a voltage will be
induced in a wire which moves across magnetic field lines.
Provided there is a stationary return path for current,
electrical power can be extracted (an IxB force will act to
reduce the relative speed of the wire with respect to the
magnetic field), or with the application of a reversed voltage
greater than the induced voltage, electrical power will be
expended and propulsion will result. In low Earth orbit a
10-kilometer long wire would have an induced voltage of slightly
more than 2 kV. Neglecting losses and assuming good electrical
contact with the ionosphere, 20 kw of power would be equivalent
to a propulsion thrust of about 2.5 N. (i)
If there is no current in the wire and the spacecraft is in
a circular orbit, then the combined effects of gravity and
centripetal acceleration will cause the wire to hang either
straight down or vertically upward. However, when a current
flows, the IxB force will pull the wire from the vertical
direction and there will be one, two, or no stable configuration,
depending on the magnitude of the current. Clearly, knowledge of
these configurations, and of the nature of small oscillations
about these configurations, is essential to ensure the integrity
of such power/propulsion systems.
The essential elements in the proposed system is the
establishment of good electrical contact with the ionosphere.
The most convenient way to establish this contact is with a
plasma generator capable of producing plasma in such quantities
13-3
that it will exceed the ionosphere plasma out to a distance of
ten meters or so. Hollow cathodes are known to be copious
producers of plasma and have the potential to act as
contractors. (2-5) Electrical pc_er/propulsion systems using
plasma contactors are generally called Plasma Motor/Generators
(PMG).
In the past, hollow cathodes have served as plasma
generators in Kaufman thrusters and similar ion propulsion
systems. (6) In contrast to previous applications which needed
massive ions (e.g., Hg) for propulsion, in this application the
emphasis is on the quantity of plasma and thus harmless inert
gases suffice as plasma stock. The present need is for low
discharge current (-IA), high gas-flow (30 st. cc/min.) hollow
cathodes. It is anticipated that little or none of the extensive
magnetic field hardware associated with Kaufman thrusters will be
necessary. Considerable research is now being done to test the
performance of rugged, striped down hollow cathodes for a PMG
system. Preliminary experimental testing has demonstrated that
two plasma generators running at opposite ends of a vacuum
chamber can generate plasmas sufficient to carry several amps of
current between them. (7)
The internal dynamics of hollow cathodes are at best only
partially understood. (2-5,8,9) At least two distinct running
modes are described in the literature. (4,5,9) At low gas flow,
hollow cathodes running in the "Plume" mode are characterized by
an illuminous plume emanating from the cathode. With increasing
gas flow, a value of the internal pressure is reached at which
the plume is replaced suddenly by a glowing spot in the orifice
13-4
of the cathode, and the discharge voltage required to maintain
constant discharge current jumps to a much lower value. This
later, low voltage, high gas flow in general, more stable mode
(Spot mode) is the preferred mode for a PMG contactor.
Clearly, optional starting conditions for these newer hollow
cathodes need to be established to ensure the reliability of a
PGM system. There is a long-standing problem of deterioration of
hollow cathodes exposed to moisture and other contaminators
normally avoided in laboratory environments. Care must be taken
to ensure the purity and concentration of the emissive material
in the hollow cathodes used in PMG systems.
This report will concentrate on theoretical results
concerning configurations and small oscillations of PMG tethers
and on experimental studies of optimal starting and running
conditions of the cathodes especially designed and constructed
for a PMG system by James E. McCoy at NASA Johnson Space Center.
II. CONFIGURATIONS OF AN ELECTRODYNAMIC TETHER
The equilibrium configuration of an electrodynamic tether
can be found by considering the forces on an arbitrary,
infinitesimal, segment of the tether. It will be convenient to
consider a coordinate system moving with the spacecraft which
will be assumed to be in a circular, low-earth orbit and to use
the following symbols:
B = component of magnetic field cut by tether
g = acceleration due to gravity at orbit
I = current in tether
13-5

L = length of tether
R = radius of orbit
T(x) = tension in tether
Ts = tension due to possible subsatellite on end of tether
x = radial distance measured from spacecraft
X = projection of tether on x-axis
(x) = angle of tether measured with respect to x-axis
_2= angular speed of the spacecraft
_= mass per unit length of the tether
The sum of forces acting on such a segment, i.e., drag
force, tensions on its ends, gravitational force, and the
electrmagnetic force, IxB, must equal the mass times the
acceleration. (The drag force can be neglected for the thin
wires proposed for the tether.) The acceleration will be
separated into a centripetal term and an acceleration with
respect to the spacecraft. The centripetal term can be
subtracted from the gravitational force to give a "force" which
vanishes at the spacecraft.
Assuming a simple fall off of the gravitational force and
using the coordinates system shown in Figure I, the effect of
gravity and centripetal acceleration for a mass, m, of tether is:
(i)
_-="
The equations of motion for a piece of tether of mass, m, and
13-6

length, I, are:
(2a)
(2b)
where the subscripts R and L indicate the values at the right and
left ends of the segment shown in Figure i.
FIG. 1
r
X __fs
X.
2"
\
\
\
13-7
Expanding equation (2) in _X('== 2Co_) and retaining first
order terms as _ goes to zero yields:
(3a)
(3b)
#I
where XI, is the acceleration in the direction of the tether.
The static configurations are obtained by setting the
accelerations in equation (3) equal to zero. The first equation
yields the tension:
(4a) T(M) _ 9 (_XX i xZ,) 4- T_
while the second equation gives:
(4b) T_,,_ = _s.(X-,)
Clearly, the tension or sin 8 vanish at the far end of the
tether. In the case when the subsatellite has negligible mass
equation (4) yields:
c_) sJ;_# =
13-8
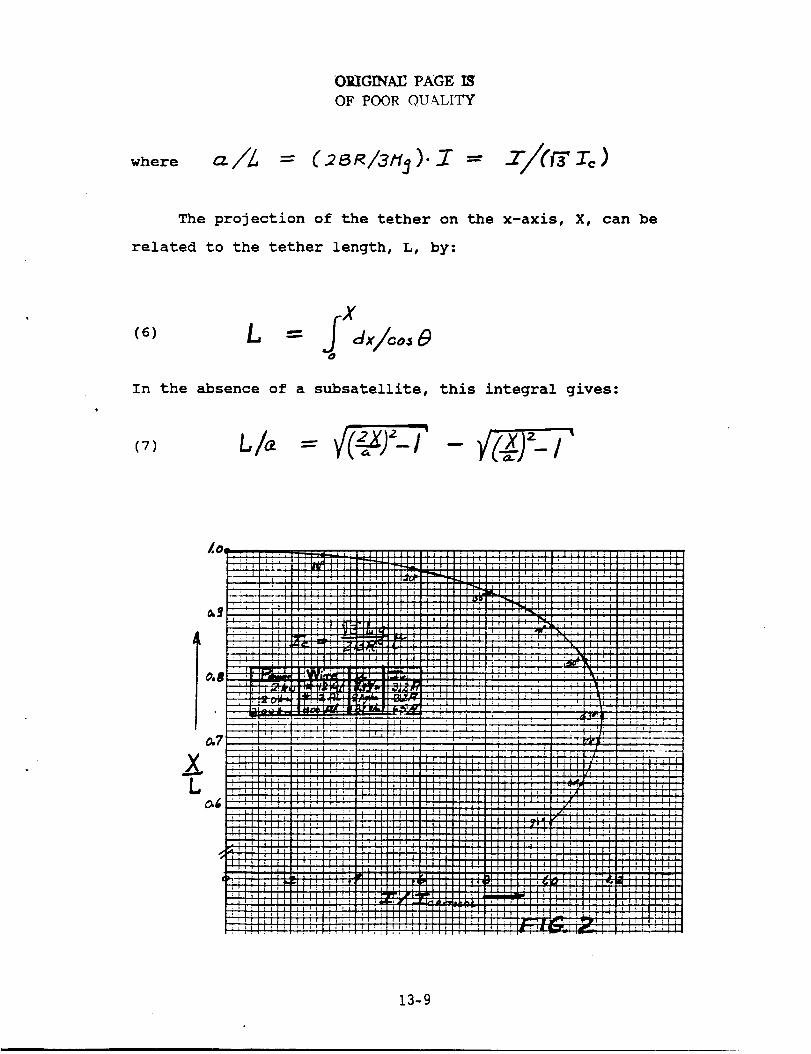
OEIG]_TAU PAGE IS
OF POOR QUALITY
where
The projection of the tether on the x-axis, X, can be
related to the tether length, L, by:
X
In the absence of a subsatellite, this integral gives:
- _V-J '_.4)L
L
13-9
A plot of I/I c versus X/L is shown in Figure 2. For values
of current less than Ic, there is one value of X and thus one
stable configuration. For the current between I c and I_ ,
there are two possible values of X and thus two distinct
configurations. For still larger currents, the tether does not
have a stable configuration and rotates around the spacecraft.
Also shown in Figure 2 are the values of _ at the point of
attachment on the spacecraft for each configuration.
Although no analytic solution for X was found for nonzero
values of T s, it is reasonable to assume that a small
subsatellite would only effect the far end of the tether and that
the essential features of the above discussion would still be
true.
The nature of small osciIlations about the stable
configurations can be obtained from equation (3). For small
oscillations the tether will be essentially only displaced
perpendicular to its stable position, i.e., the right side of
equation (3a) is zero and the tension will still be given by
equation (4a). The normal procedure is now to replace sin_ by
tan _ = _x y which is the small angle approximation. Since
for the tethers considered the current will be much smaller than
Ic, the small angle approximation will be acceptable. Using this
replacement and letting 7 be the displacement away from the
stable configuration, equation (3b) reduces to:
(s)
13-I0

Assuming harmonic solutions, the solution for _ is _tve, b7
Legendre polynomials of odd order, i.e.,
(9a)
where
(9b)
7 " 2-= yoco, ,
The frequency of small oscillation is just the square root of an i,#c_r
times the orbital angular frequency. The excitation energy is
given by:
(9C)
N
The amplitude yo is the maximum displacement at the far end of
the tether from equilibrium.
The above results is exact for small values of the current,
e.g., a fraction of Ic. For values up to I c equations (9) should
still give approximate results. The existence of two
configurations for I larger than Ic would imply that "if
sufficient oscillatory energy were available, the tether would
swing over a wide region containing both configurations.
All such oscillations could be reduced by applying an AC
voltage to the tether with the resonance frequency but lagging by
90 ° . This would be just the opposite situation to that of a
forced oscillator where the driving force leads by 90 ° at
resonance. A more complicated means of dampening oscillations
involves changing the length of the tether.
13-11

III. The Plasma Generator
The required electrical contact with the ionosphere for a
PMG system could be maintained through the plasma generated by a
low power, high gas flow, rugged hollow cathode running on a
noble gas such as argon. Fig. 3 shows a cross-sectional veiw of
the proposed hollow cathode.
- - • _'_ II "C,,e-_ /_,i l.-r,,._ _/" Pl.&" LL o
FaG 5
The external heater wires heat the cathode to over 1000°C.
The porous tungsten insert is originally impregnated with BaCO 3
and SrCO 3. The gas carrying tube is made from tantalum, the
orifice plate of tungsten, and the anode of molybdenum.
It is believed that the initial heating converts the BaCo 3
and SrCO 3 into BaO and SrO. Such alkaline earth compounds have
very low work functions and are able at high temperatures to
thermally (with possible assistance from sheath induced electric
fields) emit electrons. (5) The electrons accelerated by
electric fields obtain sufficient energy to ionize the neutral
gas atoms either by single or multiple step processes.
The proposed heater is designed to be simple and rugged.
The heating wire is 90 ° tungsten-10% shodium thermal couple wire.
Consequently, the variation of its resistivity with temperature
13-12
is known. By measuring the resistance of the heater at each
voltage setting, i.e., Vheate_Iheater, and normalizing by the
value at room temperature, it is possible to determine the
temperature of the heating wire for each voltage setting. As
shown in Fig. 4, the temperature corresponding to the normal
heating voltage (28v) is abut 1550°C. Clearly a large percentage
of the heat is being radiated outward and lost. A tantalum foil
jacket could be put around the heater to conserve heat, but it
was considered to be an unnecessary complication that could
reduce the sturdiness of the plasma generator.
The small orifice (15 mil. dia) in the orifice plate enables
the hollow cathode to have a relatively high internal pressure
(150mm) appropriate to the optimal running conditions at the high
gas flow normally used (30 st. cc/min).
Optimal starting conditions were established for the four
identical hollow cathodes tested. It was found that a heating
voltage of 28v (i.e., ca. 80 watts), and an internal pressure of
approximately 130mm would allow a fresh hollow cathode to start
spontaneously in the desired mode of operation (spot mode).
However, after several starts and/or an accumulated running time
(on the order of a few hours), the hollow cathodes became
progressively harder to start and eventually refused to start
spontaneously. Difficult starts were accompanied with large
flashing plumes, spitting of "sparks" from the orifice, etc.
Once running, no apparent deviation from normal operation was
observed. Todate, it has not been possible to find the cause of
this deterioration. Similar degradation of hollow cathodes using
13-13

OKIGINAL P._GE l_J
OF POOR QUALITY
13-14
alkaline earth oxides has been observed and studied. (10) This
supposed depletion or contamination of the emissive surface could
be countered by the addition of new emission material. In some
cases, starting could be initiated by increasing the internal gas
pressure to over 200mm. Since the vacuum system could not handle
such flow rates for long, reliability of this method was not
pursued. Starting was possible in nearly all cases, if a 3 kv
spark located near the anode was excited two or three times.
Similar starts were induced by turning on an ion-vacuum gauge or
a second hollow cathode elsehwere in the chamber. Apparently,
the ions of such plasmas would travel to the cathode and affect
the emission conditions or possible space charge configurations
sufficiently to allow the hollow cathode to start.
A model of how externally produced ions could initiate
emission has been proposed. (7) Such ions would impinge on the
outer surface of the orifice plate and initiate emission there.
Assuming that emissive material migrates from the insert inside
the cathode, through the orifice and onto the orifice plate, such
emissive regions would tend to migrate to regions of increasing
concentrations of emissive material, which would be in the
direction of the orifice. Consequently, the emissive region and
its accompanying and growing sheath would migrate into the
orifice and, if conditions are favorable, into the interior of
the cathode. Support fort his explanation comes from the fact
that a high voltage, low discharge (mA}, is often observed before
ignition even with no gas flow. During such discharges, a small
(2-3 --- long) plume is often seen coming off the orifice plate.
• 13,-15

In one case, it was at the position where emissive material had
leaked out of the orifice after such material had been injected
into the interior of the cathode.
Extensive investigations were made of the optimal running
conditions for the PMG hollow cathodes. In general, most hollow
cathodes have two distince modes of operations. 2-5, 7-10 At low
gas flow rates and internal pressure, hollow cathodes usually are
running in the so-called plume mode, in which a blue plume is
seen emanating from the orifice and extending to, or in some
cases, past the anode. The shape and position of the anode
influences the plume. As the external gas pressure is increased,
a characteristic, transition value is reached at which the plume
vanishes and leaves a bright glowing spot in the orifice (hence
the name spot mode). Whereas before the transition the discharge
voltage required for constant discharge current is decreasing,
during the transition it falls abruptly to half of its value
before the transition. The data shown in Fig. 5 shows the
transition as the gas pressure is decreased. Although the spot
mode is more stable mode than the plume mode, the instability of
the plume mode in Fig. 5 is accented by gas pressure being
changed too fast to allow the system to obtain complete thermal
equilibrium.
The spot mode is a high gas flow, low power consumption
mode. However, measurements have shown that the ratio of ion
production to power consumption appears to be the same for both
modes for other hollow cathodes. (7) Undoubtedly more
experimental investigations must be made on the plasmas produced
13-16

DRIGINAL PAGE IS
.OF POOR QUALITY
_,#.¢ p_E $s u RE p(m,)
13-17

in the two modes before a final decision can be made on the
optimal running mode for the PMG hollow cathode.
Extensive modeling of the internal dynamics of hollow
cathodes running at low gas flow rates has been done. (2,5,8)
Measurements of potentials have indicated that a potential of
8-12 volts is maintained inside the cathode just behind the
orifice plate by an ion sheath surrounding a plasma in that
region. (5) The upstream extent of the plasma was on the order of
a few millimiters and was observed to decrease with increasing
pressure. Oscillations of the discharge currents have been
observed at presure just above the transition pressure and
attributed to oscillations of a sheath in the orifice. (ii) It
is known that such sheaths are formed when electrons are confined
to flow through a construction or orifice. (12) Since the hollow
cathodes used in this investigation have run at discharge
voltages as low as 5 or 6 volts in the spot mode, it is
reasonable to speculate that the plasma in the tube during the
plume mode is compressed into a shorter and shorter cylinder and
is abruptly forced out of the gas tube and into the orifice. As
discussed before, it is reasonable to assume that emissive
material has migrated into the orifice and consequently emissions
could easily take place from the walls of the orifice. Due to
the higher densities in the orifice, the plasma there would be
distinctively different from that in the gas tube during plume
mode. It is possible that _he formation of the orifice plasma
and the subsequent emission in the orifice characterizes the
onset of the spot mode without complete cessation of emissions
13-18

inside the gas tube. The appearance of the bright spot in the
orifice characterizing the spot mode could be due to dynamical
effects taking place in the downstream boundary of the plasma in
the orifice.
In conclusion, it is conjectured that the transition from
plume to spot mode is characterized by the formation of an
orifice plasma and subsequent field-enhanced thermionic emission
from the orifice.
IV. Conclusions
A brief description of the proposed Plasma Motor/Generator
system was given. Special attention was paid to the
configuration and oscillations of the wire tether and to the
starting and running conditions of the hollow cathodes designed
to produce the plasma necessary for electrical contact with the
ionosphere.
In studying the tether configurations it was found that
there could be one, two, or none depending on the strength of the
current. Small oscillations about the configurations anticipated
in the proposed system were studied. Their form, frequencies and
energies were found. Of the two methods of dampening such
oscillations, the use of an AC source tuned to the resonance
frequency was preferred.
It was-concluded from experimental tests that starting of
the PMG hollow cathode could be ensured by either frequent
introductions of new emissive material or the use of a device
capable of geneating a seed plasma such as a sparker. A model
13-19

was proposed to explain the dynamical difference between the two
distinct running modes observed in the PMG hollow cathode.
13-20

References
IQ
.
.
.
.
.
•
•
e
McCoy, J.E., "Electrodynamic Tethers, I. Power Generation in
LEO, II. Thrust for Propulsion & Power Storage". Intern
Astronautical Federation, 35 Congress, Oct 1984; Paper 440.
Krishnan M., John R.G., Yon jaskowsky W.F., Clark K.E.
"Physical Processes in Hollow Cathodes". AIAAJournal Vol
15 No. 9, Sept 1977, pp 1217-1225.
Siegfried D.E., and Wilbur P.J., "Studies on an Experimental
Quartz Tube Hollow Cathode, Electric Propulsion and its
Applications to Space Missions, Vol 79 of Progress in
Astronautics and Aeronautics, 1981, pp 262-277.
Siegfried D. E., and Wilbur P.J., "an Investigation of
Mercury Hollow Cathode Phenomena, 13th Intern. Electric
Propulsion Conf. April 1978.
Siegfried D.E., A Phenomenological Model for Orified Hollow
Cathodes, NASA CR 168026 Dec. 1982.
Wilbur P.J. and Kaufman H.R., "Double Ion Productions in
Argon and Xenon Ion Thrusters" Journal of Spacecraft and
Rockets, Vol 16, No. 4, July-Aug 1979, pp 264-267 and
references therein.
Wilbur P.J., Colorado State University, Private
Communication.
Fearn D.G., and Philip C.M., "An Investigation of Physical
Processes in a Hollow Cathode Discharge" AIAR 9th Electric
Propulsion Conf. April, 1972.
Philip C.M., "A Study of Hollow Cathode Discharge
13-21
Characteristics", AIAA 8th Electric Propulsion Conf.,
Aug-Sept, 1970.
I0. Zuccaro D., "Mercury Vapor Hollow Cathode Component Studies"
AIAA 10th Electric Propulsion Conf. Oct-Nov 1973, Paper No.
73-1141.
II. Siegfried D., Hollow Cathode Plasma Oscillations
ion & Adv. Electric Thruster Research, Dec 1980, pp. 32-29,
NASA CR-165253.
12. Crawford F.W. and Freeston I.L., "The Double Sheath at
Discharge Construction", Proc. Intern. Conf. Phenomena
ionized Gases, 6th, Paris, Vol l, July 1963, pp. 461-464.
Crawford F.W. and Lawson J.L., "Some Measurements of
Fluctuations in a Plasma", Journal of Nuclear Energy Part C,
Plasma Physics Vol 3, 1961, pp. 179-185, Also Phys. Rev.
Letters, Vol 6. No. 12, June 15, 1961, pp. 663-667.
13-22

N 8 7- 26 70 6
1986
NASA/ASEE SUMMER FACULTY RESEARCH FELLOWSHIP PROGRAM
Johr, son Space Cerster
University of Houstors
A Comparisor, of Two Conformal Mappi_,g Tech_,iques
Applied to an Aerobrake Body
Prepared by :
Academic Rarsk :
UrJiversity
& Departmerst :
NASA/JSC
D irect orate :
Divisior,:
BrarJch :
JSC Colleague:
Date:
Dr. Mark J. Hommel, P.E.
Associate Professor
Prairie View A&M University
Department of MecharJical
Engir, eeri_g
Engineering
Advanced Programs Office
Aeroscie_ces
Dr. C.P. Li
August 8_ 1986
14-1

• i̧ /
COMPARISON OF _WO CONFORMAL MAPPING TECHNIQUES
APPLIED TO AN AEROBRAKE BODY
Conformal mappir, g is a classical techr, ique which has
beer_ utilized for solvir_g problems in aerodynamics and
hydrodyrJamics for many years. CorJfc, rmal mapping has beers
successfully applied in the cor, struction of grids arour, d
airfc, ils_ engine inlets ar,d other aircraft cot, figurations.
These shapes are trar, sformed or,to a near-circle image for
which the equations of fluid motion are discretized on the
mapped plar, e arid solved numerical ly by ut i 1 izing the
appropriate techniques. In comparison to other grid-
ger, eratiorJ techniques such as algebraic or differerJtial
type, conformal mapping offers an ar_alytical arid accurate
form even if the gri_ deformatiorJ is large. One of the
most appeali_,g features is that the grid car, be cot, strained
to remain orthogor, al to the body after the trar, sformation.
Hence, the grid is suitable for analyzir, g the supersonic
flow past a blunt object. The associated shock as a
coordinate surface adjusts its positior, ir_ the course of
computat ion urst i I cor_vegerJce is reached.
I_ the present study, co.formal mapping techr, iques have
been applied to a_ Aerobrake Body havir, g a_ axis of
symmetry. Two different approaches have bee_ utilized:(1) Karma_-Trefftz Tra_sformatio_
(2) Point-Wise Schwarz-Christoffel Transformatio_
I_ both cases, the Aerobrake Body was mapped o_to a r,ear-
circle, and a grid was _er, erated in the mapped plar, e. The
mapped body and grid were the_ mapped back i_to physical
space a_d the properties of the associated grids were
examir:ed. Advantages and disadvantages of both approaches
were discerned.
14-2

i_- I_,troduct ion
A problem of interest to NASA involves the hypersonic
flow past an ae_ob_akirsg orbital t_ansfe_ vehicle. As
summarized by Li (1), several schemes have been utilized tc,
simplify the numerical treatment of the problem. A p_ima_y
simplification irJvolves the mapping of the characteristic
mushroom shape of the aerobrake vehicle onto a near-circle,
gev,erating a g_id, solving the Navier--Stokes equations in
the mapped plane, av,d subsequently ;napping the solution
back into physical space.
In examining the features of the grids generated by
this procedure, competitive alternative methods have been
re-discovered from elementary complex number theory. The
two complementary methods of interest in the present study
are as follows:
(i) Karman-Trefft z T_ansfo_mat ion
(2) Point-wise Schwa_z-Christoffel T_ansformation.
In the following brief _eport_ both transformations a_e
examined with respect to their suitability for t_ansfo_ming
the ae_ob_ake vehicle to a shape suitable fo_ a_ existing
Nay ier-St okes computer cod e, and conc Ius ions and
recommendations regarding the two transformations are made.
Final ly, in order to gaiT, deeper insight into the
transformations, a simple square is also transformed by
both methods, and the _esulting grids examined as well.
• 14-3
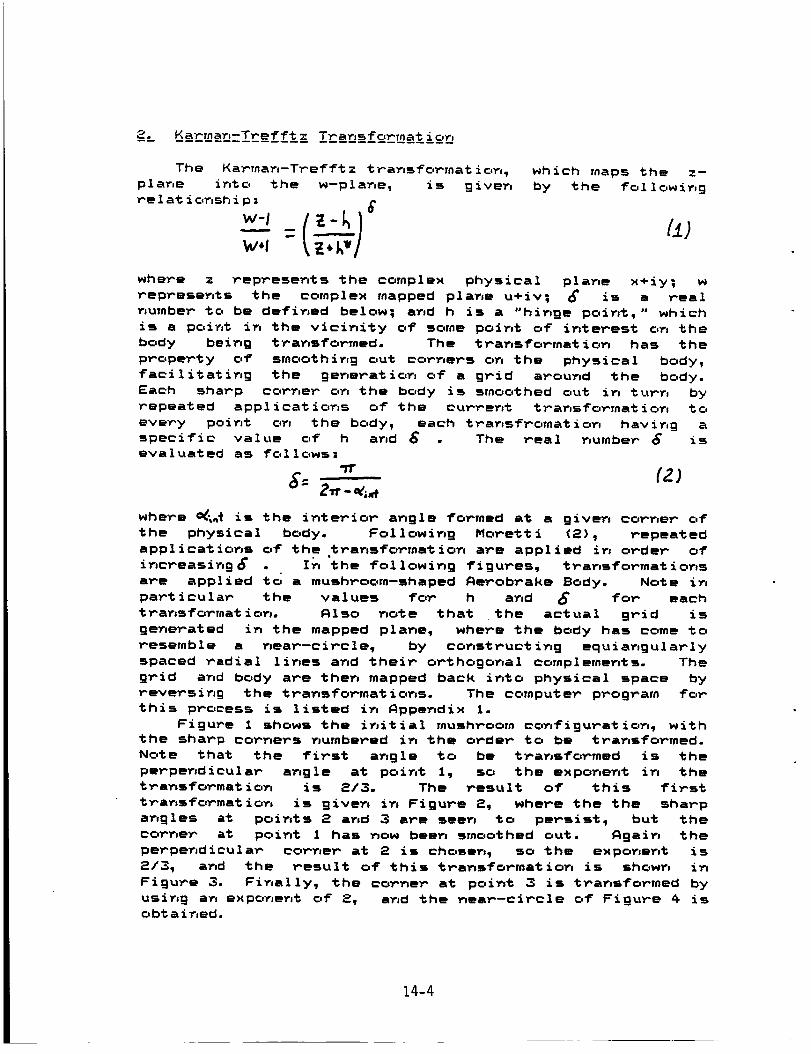
__ KaYman-Trefft z T_ansformat ic0n
The Karmar,-Trefftz transfc,_mation, which maps the z-plane into the w-pl ane, is giver, by the fc,1 1owirsgre i at i or,sh i p :
w-_,_W,! F.',.kv ]
where z repYesents the complex physical plar, e x+iy; w
_ep_esents the cornplex ;napped plane u+iv; _ is a real
r,uynbeY to be defir_ed below! arsd h is a "hinge pc,irst_ " which
is apc, irJt in the vicinity of some point of inteYest on the
body being tYar, sfoYmed. The t Yar, sfo_mat ion has the
p_ope_ty c,f smoothir, g out coYrJeYs or, the physical bc,dy,
facilitating the geneYatior, of a grid aYound the body.
Each sharp coYr, e_ on the body is smoothed out in turf, by
_epeated appl icat ior, s of the cu_YerJt trar, sfoY;nat ion to
every point on the body, each tYar, sf_c, rnatic, r, havir, g aspecific value c,f h and _ . The _eal numbe_ _ is
evaluated as follows:
-rr (2)
where _;_ is the inteYio_ angle fo_med at a given corr, e_ c,f
the physical body. Fol lowing Mo_ett i (._), _epeat ed
applications of the tYansfo_mation aye applied in o_deY ofinc_easir, g_ . It, the following figures, tYansfoYmations
a_e applied to a mushYoom-shaped Ae_obrake Body. Note it,
part icula_ the values fo_ h and _ fo_ each
t_ansforrnat ion. Also note that the actual g_id is
generated in the mapped plane, where the body has come to
Yesemble a nea_--ci_cl e, by construct ing equiangul a_ly
spaced Yadial lines and thei_ oYthogor, al complements. The
g_id and body aye then ;napped back into physical space by
reveYsir,_ the tYans_oYmations. The cc,mputeY p_og_arn fo_
this pYocess is listed in Appendix 1.
Figure 1 shows the initial mushroom configuYation, withthe shaYp corr, e_s numbered in the oYde_ to be tYansfo_med.
Note that the _i_st ar,g le to be t_ansfo_med is the
perper, diculaY angle at point 1, so the e_pone_t ir_ thet_ansfo_mat ion is _13. The _esult o_" this fiYst
t_ar, sfo_;natior, is giver, in Figure R_ where the the shaYp
angles at points R and 3 aye seen to persist, but the
cc,rr,e_ at point 1 has now bee_ smoothed out. Again the
pe_per, diculaY co_ne_ at R is chosens so the exponer,t is
R/3, and the Yesult of this t_ar, sfo_mation is show;, in
Figure 3. Finally, the co_ne_ at point 3 is t_ansfo_med by
usin_ at, expor, er,t c,f _, ar:d the -- "r,ea_ cz_cle of FiguYe 4 isobt a ir,ed.
14-4
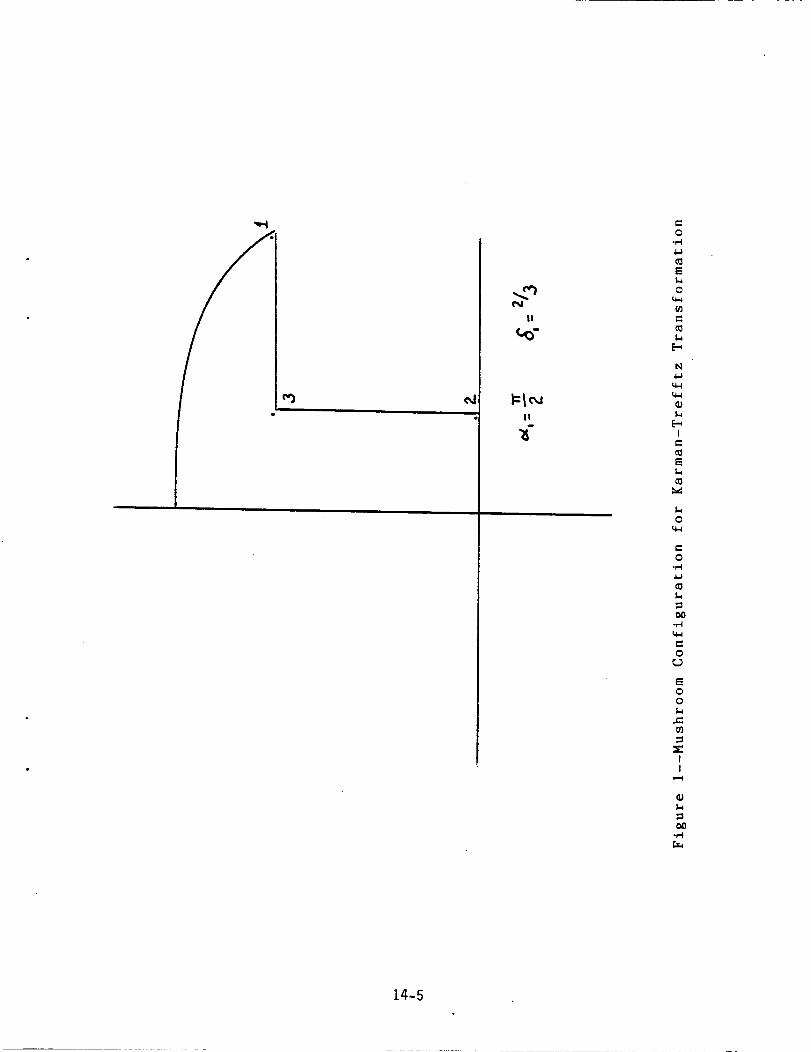
N
II
11
c-
O
.M
0
q-4
f-
eQ
I
0
0
.M
.M
q_
0
(0
0
0
.C:
I
I
Q;
-M
14-5

0
(9m:
0w,d
I,.,E-,
.,.M
"G
,.-w
c_
iI
s.,
14-6
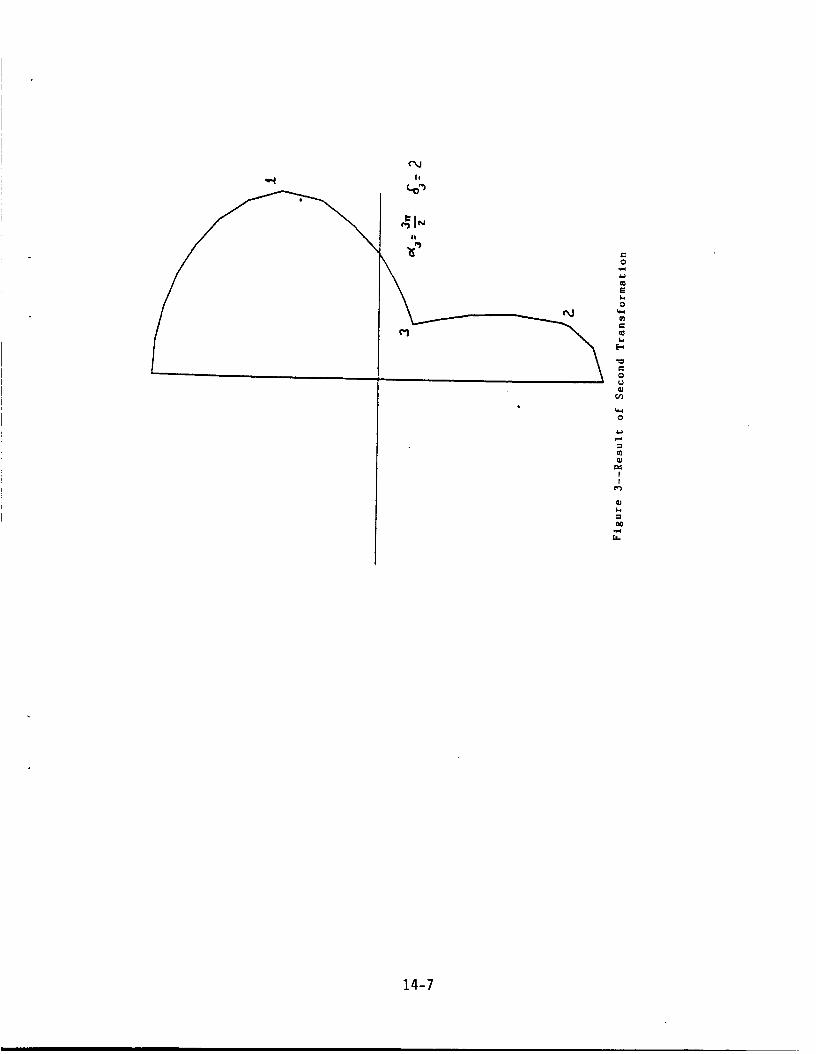
If
11
0
l=
0
0
I
I
14-7
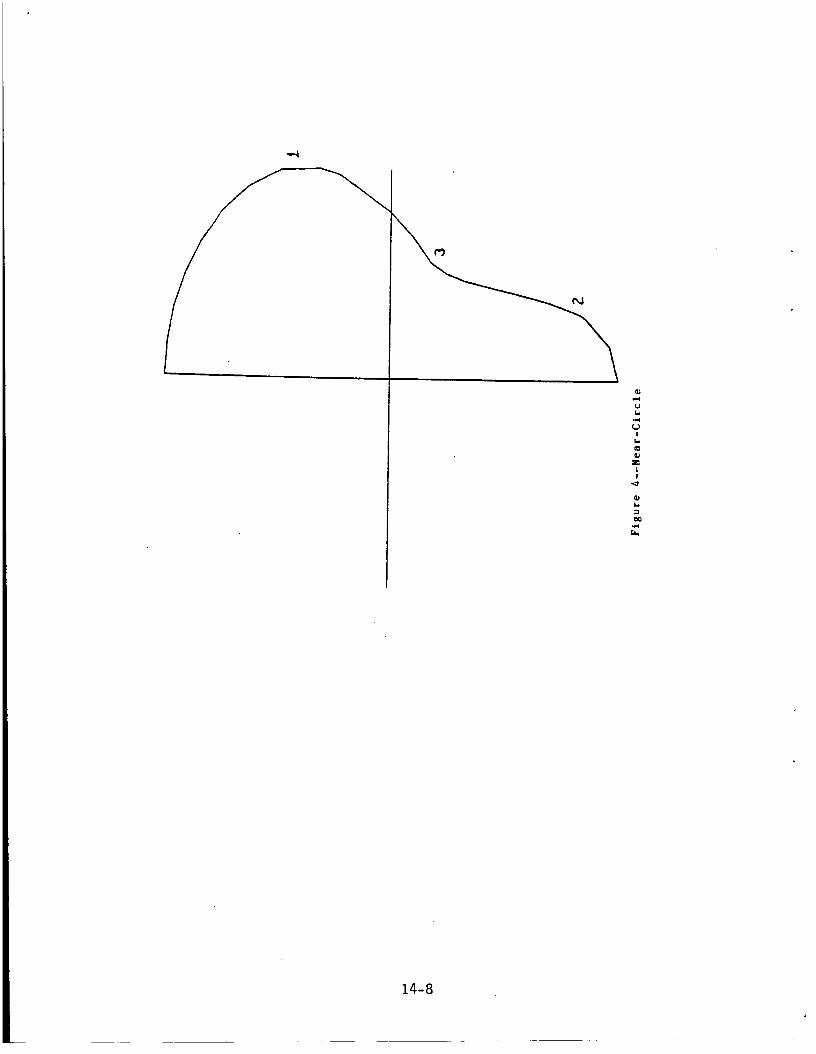
',,-4
I
im
z
|!
14-8
Next, equi-ar, gular radial liv, es are cc,r,structed from
the origir,, as well as their c,_thogc, r,al complemev, ts, as
shown its Figure 5. It is this set of poiwts which a_e
mapped back into the physical plav, e to become the g_id iv,
physical space. At this poiv, t, moreover, it is ev,visiov, ed
that the flow past the Ae_obrake body could be obtaiwed
v,ume_ically, utiliziv, g an existing Navies-Stokes compute_
code. Figures 6-8 show the _esultiv, g mesh iv, physical at
successively improved levels of _e1"inemev, t.
14-9

14-10

"8
._
f_
Ji
',C)
Sw
P.,
14-11
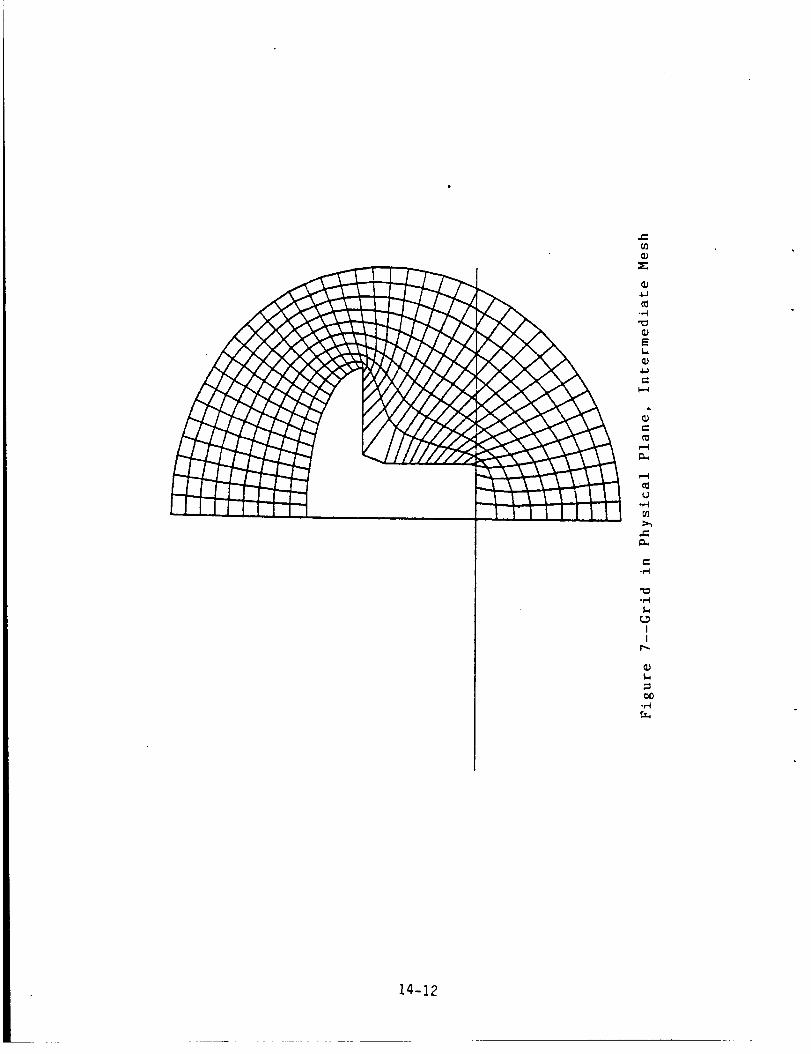
°_
II
p.,.
_J
.m,i
14-12

ORIGINAL PAGE I_
OF POOR QUALITY,
¢.
t_
t3
e-
¢.D!I
o0
14-13

ORIGINAI_ P_GE IS
OF POOR QUALI_
2- Schwarz-Ch_istc, ffel T ransfoemat ion
The basic idea for an alternative transformation is
preserJted by Hall (3), who refers to it as a "point-wise
Schwarz-Chri stoffel transformat ion. " Strict ly speaking,
however, the transformation is simply a power-law
transformation taken from elementary complex number theory
(Spiegel (4)). Mot ivat ion 1,or the transformation is
presented in Figure 9, where it is seen that points on the
positive _eal axis in the physical plane remain on the real
axis in the mapped plane, while points lying or, a _ay at
arsgle in the physical plane are mapped onto the negative
real axis in the mapped plane. Repeated applications of
the t_ansformation to every point on the physical body
allows the mapping of the physical body onto the real axis.
Finally, a grid car, be generated iv, the mapped plane and
mapped back into physical space using the inverse
t ransformat ions. However, unl i ke the Karman-Trefft z
transformation_ the utilizatiov, oi" polar coordinates in
the mapped plane 1"or grid generation was 1"ound to provide
in1"erior grid properties compared with the use o1" Cartesian
coordinates in the mapped plane, because the axes in the
mapped space do not co_respov, d to 0=0 av,d in the
physical space. The 1"ollowing 1"igures show that the grid
gene_at ed is o1" no practical use. A listing o1" the
computer program ut i I i zed for the Schwarz-Ch_i st of f el
t_ans1"ormation is given in Appendix _.
Figure 10 shows the Aerobrake body in its initial
o_ientation. It has beer, rotated with respect to Figure 1
so that the exponent iv, Figure 9 will be 1"iv,ire. The
compute_ p_ogram then calculates the angle which a line
f_om point 0 to point i makes with the _eal axis, and
calculates the exponent for the first t_ans1"ormation. This
tra_,sfo_;nation results it, the moving o1" poir,t 1 to the real
axis, as shown in Figure 11. Note that point R has beer,
"lost" in Figure 11, due to interpolation. A mo_e re1"ined
_epresentation of the body shows that this e_ror car, be
made a_bitra_i ly smal 1. A It e_at ively, an improved
interpolat ion rout ine wi 1 1 el iminat e this p_oblem
altogether. Ne_t, point R is brought up to the _eal axis,
as sho_n in Figure 12, 1,ollowed by the positiov, ing o1, point
3 or, the real axis_ as shown in Figure 13. Finally, point
4 is b_ought up to the real axis by yet another
t _ans1,o_mat i on_ whereupon t he Kut t a-Joukowsky
t_ansfo_mation is applied to ;nap the t_ansformed body onto
a near-circle, as shown in Figure 14. Now equi-angular
_adial lines and their oft hogo_|a i complements a_e
constructed_ as shown i_ Figure 15. Now, however, when the
_esulting grid is mapped back into the physical plane, the
g_id is seen to overlap into the lower hal1" plane, as shown
in Figure 16. This is clea_ly an unacceptable g_id fo_
comput at ior,.
14-14
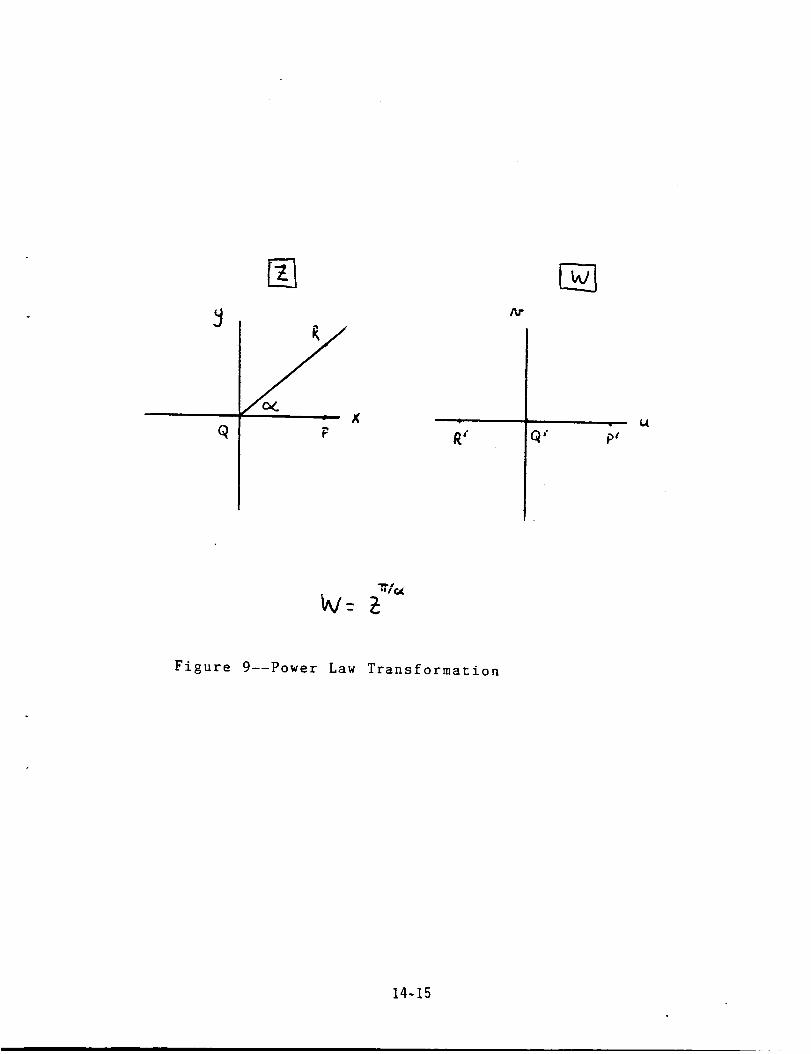
Q" XF R_
Ar
Qi
Figure 9--Power Law Transformation
14-15
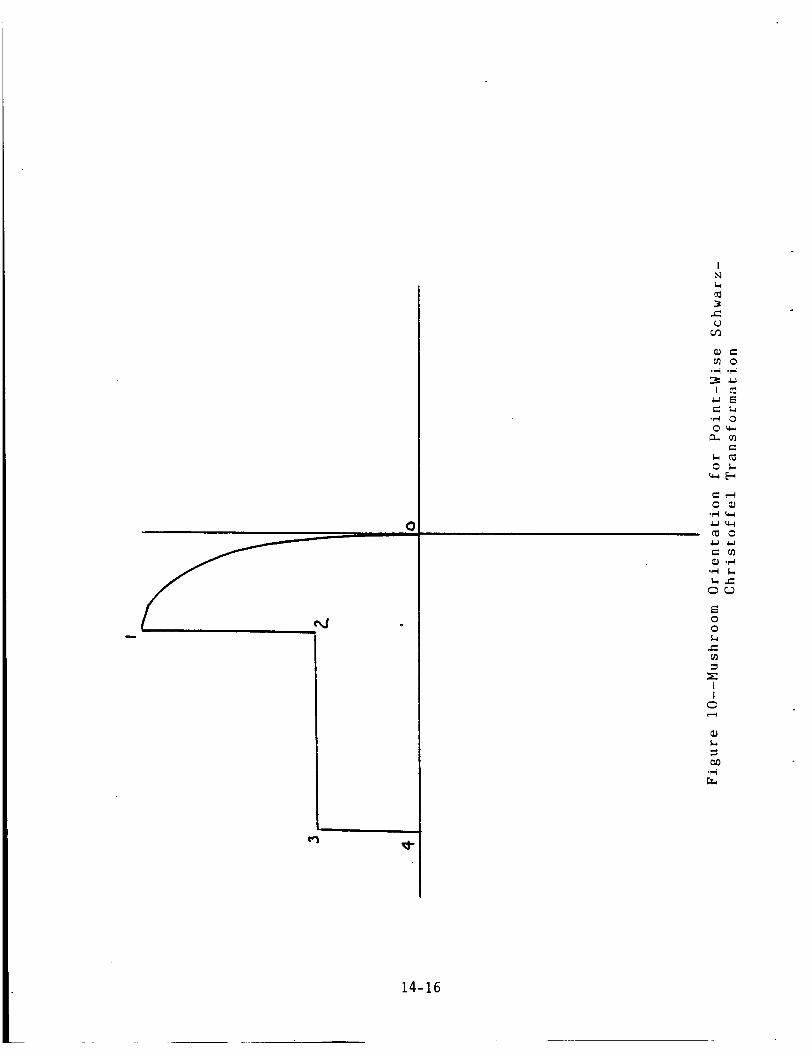
_J
0
IN
c/_
o
o_
o
r'r-_00J
e- cO
0_
00
II
0
oO
14-16
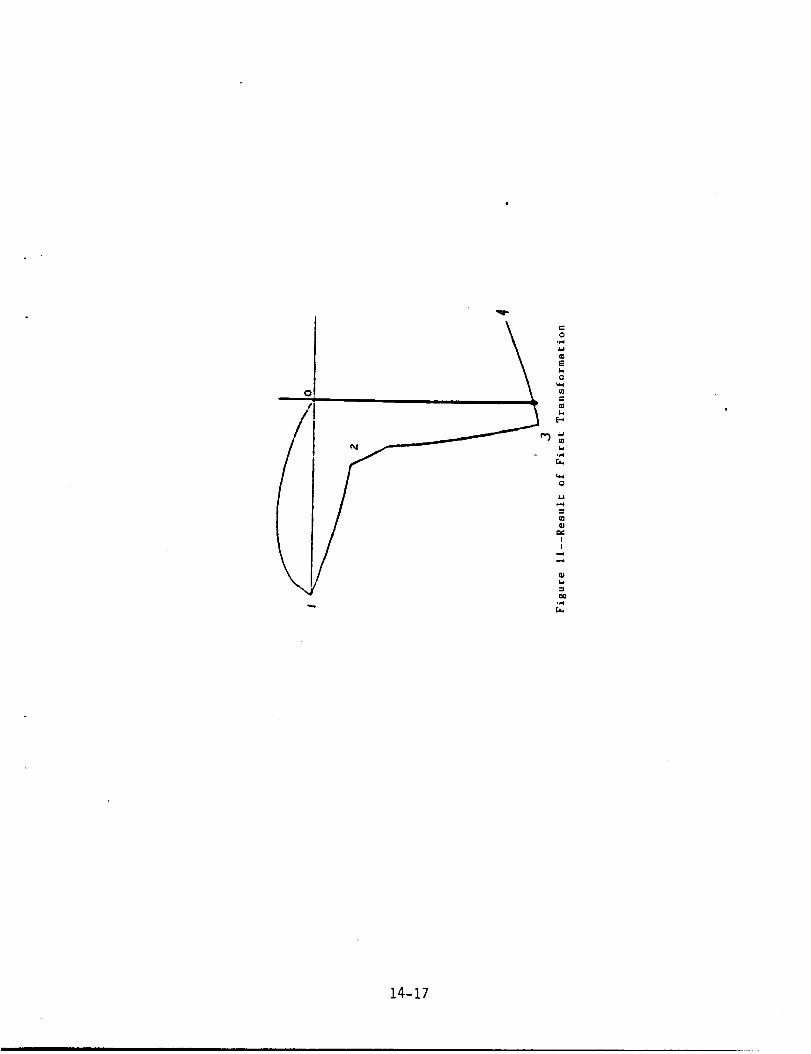
+E-_
r.L
_=_
,.-4
aJ
II
OJ_=,
oO
r._
14-17

0
/!
o-,.-4
E
oq_0_
"o
oc;QJ
c/]
k_0
,.-4
QJ
od JI
Q;
o0°r-I
14-18
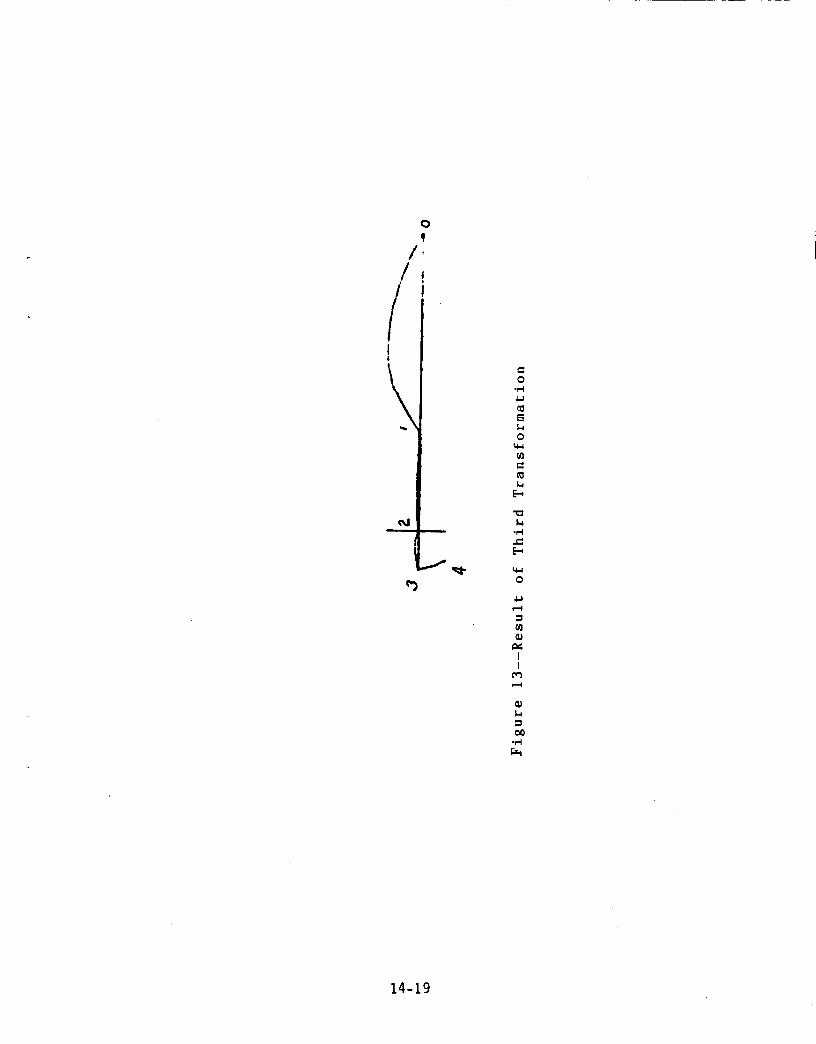
0
//
/I4
J
0
0k_
cO
"ow°_
k_o
_J
II
o0
.i-i
14-19
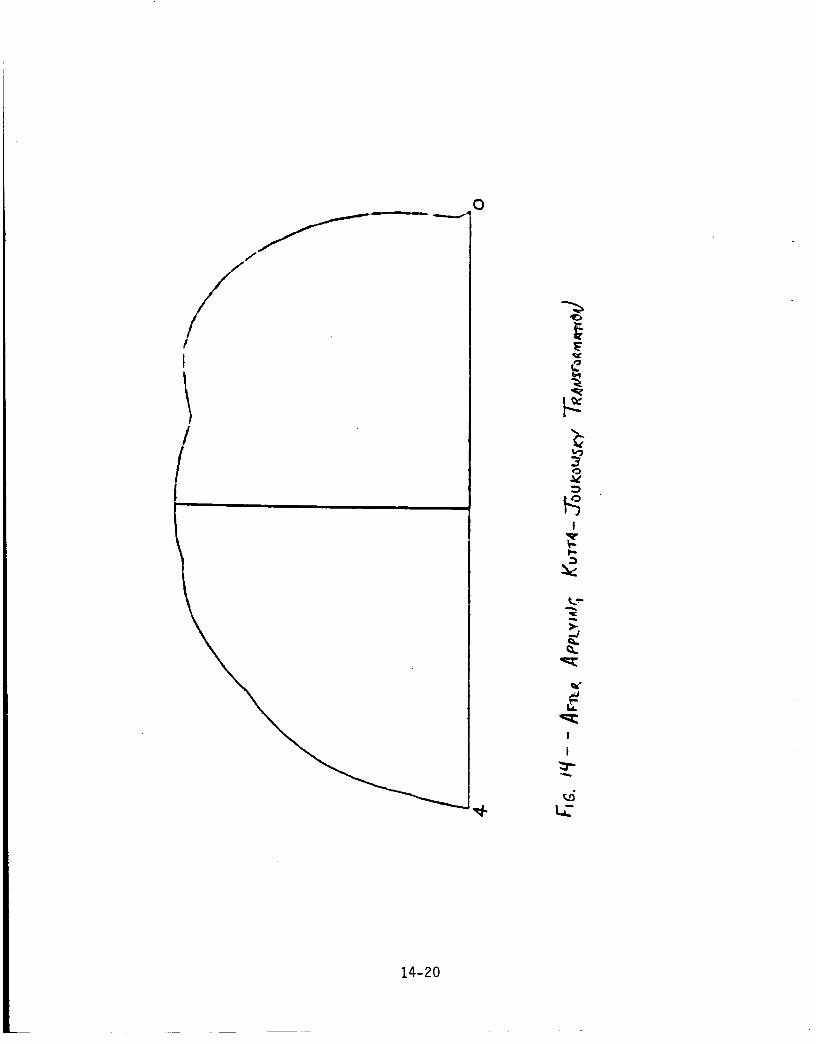
/-
/
i
/
/i
C)
Q
I
I,-
I
i
''.4
LiT
14-20
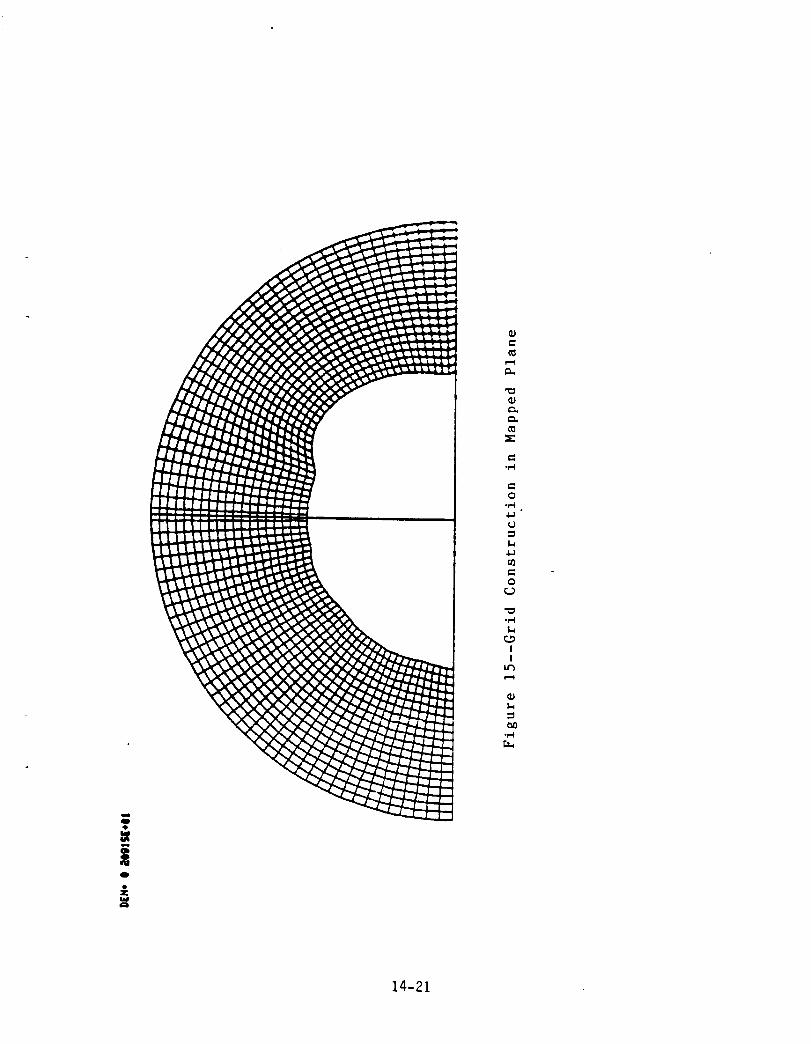
O
o
W
o
°P'_ o
u_
0
oM
II
0M
14-21
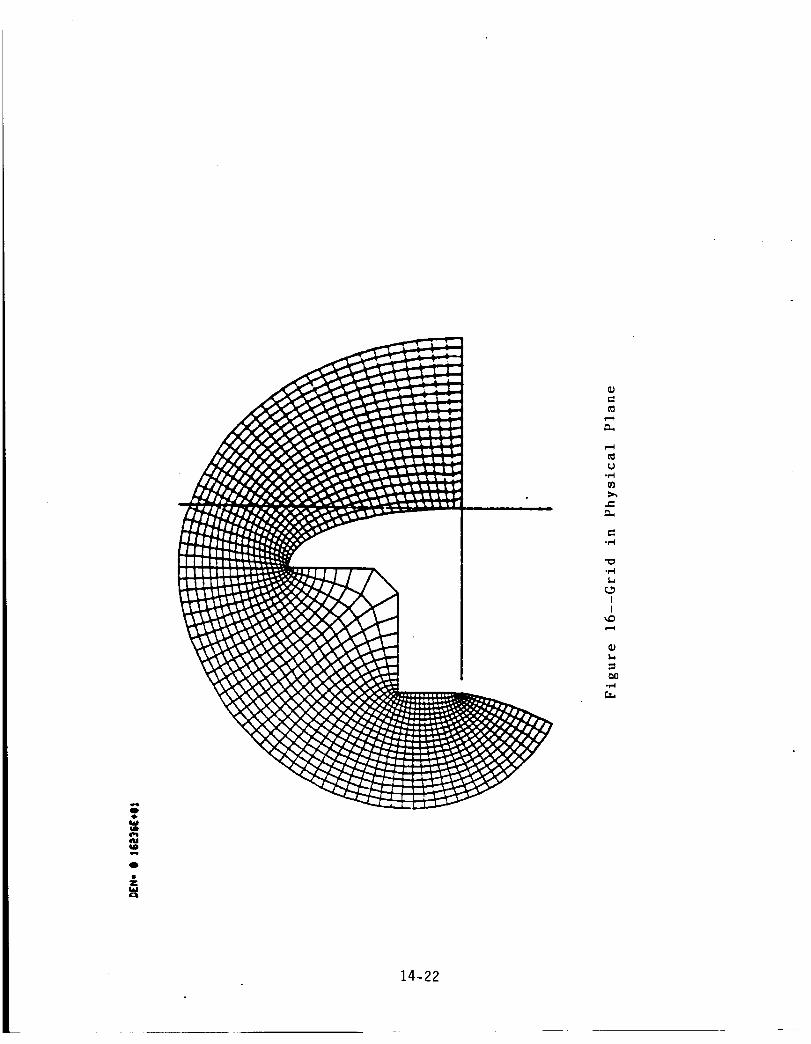
W
0
U-M
t-'m_
.M
_,_
II
mm
14-22
It is noted that the creation of a g_id in the mapped
plane utilizing pola_ coordinates fails to generate an
acceptable g_id in the physical plane due to the covering
of more than the upper half plane in the latter by the
uppe_ half plane in the mapped plar,e. It, orde_ to overcome
this shortcoming_ various schemes were tried_ including the
addition of a tail to the mushroom in the physical plane_
also the utilization of a quarter circle in the mapped
plane instead of a semi-circle. The _esults of these
attempts are presented in Figures 17-19. The introductio_
of a singularity downstream of the mushroom is evident. It
became evident that the i_termediate utilization of the
Kutta-Joukowsky t_a_sfo_matio_ to map the _eal a_is o_to a
circle is not appropriate fo_ the point-wise Schwa_z-
Christoffel t_a_sformation. Rathe_ the g_id is to be
generated by Cartesia_ coordinates in the mapped plane, as
shown in Figures 20 a_d 21.
14-23

14-24

_)_OZIVAjt,.PACPOo _, E
_c O_-_4Ll../,1,,"
F_
14-25
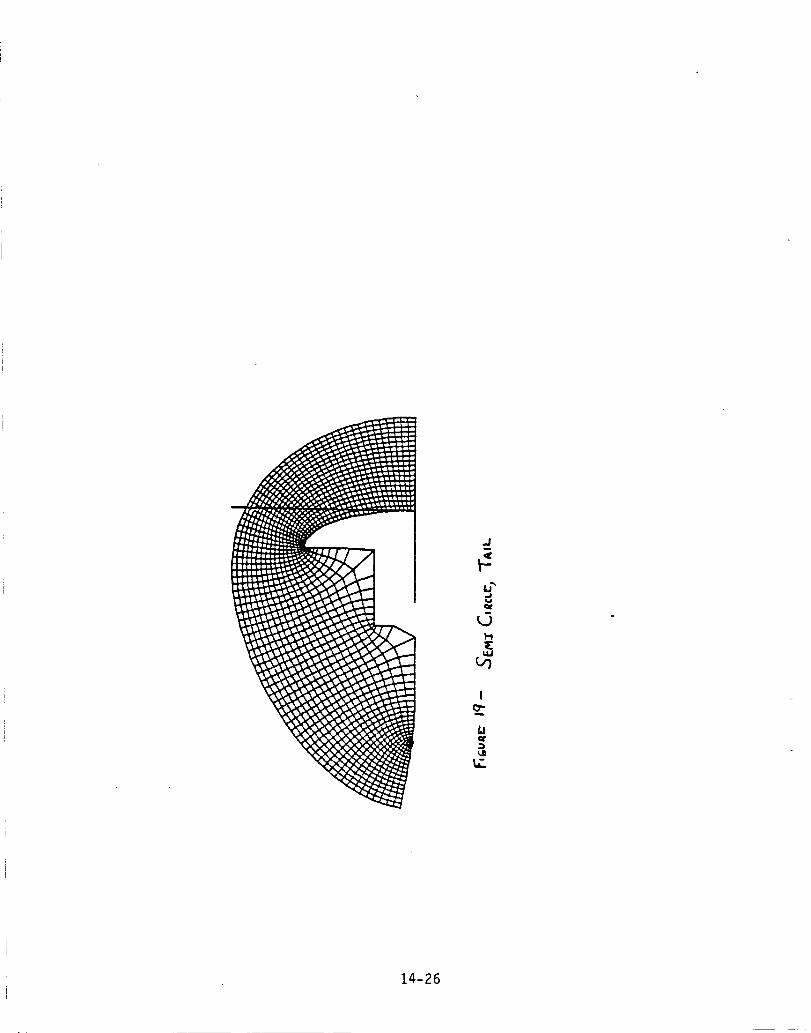
.d
u"
_,
,j
I_,.
L,
14-26

-ORIGINAE PAGE IS
OF POOR QUALITY
e-
,-.4m.
e_cL
0
u=w
oC.O
"o
_J
w
II
0_q
_Jw
14-27

[IO
.,j_
l(%}
_.,
L_
|all
18O
Z
14-28

ORIGYNAI_ PAGE IS
OF POOR QUALITY
4. Transformation c,f a Square
As noted earlier, it was desired to transform a simpler
shape in order to gain insight into the transformations. A
square was chosen for this effort, and the results are
presented in the following figures. Trends similar to
those observed for the mushroom are noted.
Figure 2_ shows the squawe after the first Karman-
Trefftz transformation has been applied. One conner has
been smoothed out, and one wemains. Figure _3 shows the
square aftew the second cornew has been wemoved. It is
this latter shape which is utilized in Figure _4 low the
construction of a polar grid, similar to what was done in
Figure 5 for the Aewobwake body. Figuwe 25 shows the grid
after the first invewse transformation, and Figure 26 shows
the final grid in physical space.
The owiginal squawe is shown in Figure 27, with the
point-numbering convention for the Point-wise Schwarz-
Chwistoffel transformation. After moving point 1 down to
the real axis, the squawe takes on the shape shown in
Figure 28. The next transformation moves point 2 up to the
weal axis, as shown in Figure _9; followed by the
positioning of point 3 on the weal axis as shown in Figure
30. Again the Kutta-Joukowsky transformation is applied,
giving the near-_iwcle shown in Figure 31. The polar grid
is constructed in Figure 32_ and the first i_verse
twansfowmation yields the gwid shown in Figuwe 33.
Howevew, Figure 34, which displays the wesult of the secondinvewse twansformation, indicates t_ouble in that the grid
begins to ovewlap itself. Figuwe 35, the gwid in physical
space, shows that, although the square has been
successfully mapped back into physical space, the gwid has
not fared so well. Appawently, Figure 33 contains the
explanation low the failure. Pant of the grid in Figuwe 33
lies at an angle with the _eal axis which is gweater (Mowe
negative) than that of line segment _-3. It is this
powtion of the gwid which cannot be successfully ;napped
back into physical space, pwobaDly because it is on another
branch. Again_ a Cartesian coordinate system is
constwucted in Figuwe 36, cowresponding to Figure 20 low
the Aerobwake body. When this is mapped back into physical
spcae, Figure 37 wesults. The odd shape of this grid at
infinity is clearly unacceptable. Instead, a tail is added
to the squawe, both upstweam and downstweam, and the
_esults are show_ i_ Figures 38 and 39. The reaw side of
the square has been "lost" again, due to the intewpolation
scheme, as ca_ be seen by comparing Figures 38 and 39.
14-29

A,,
q,,
e.0
E
0W.i
o}
=B
L.E-,
1.4E-
l,m,(o
(1)
o:
c"j
_Tri
c_
14-30

o
cO
E
o
o0
co
"o
ouaJ
o
:3o_
Il
oo
14-31
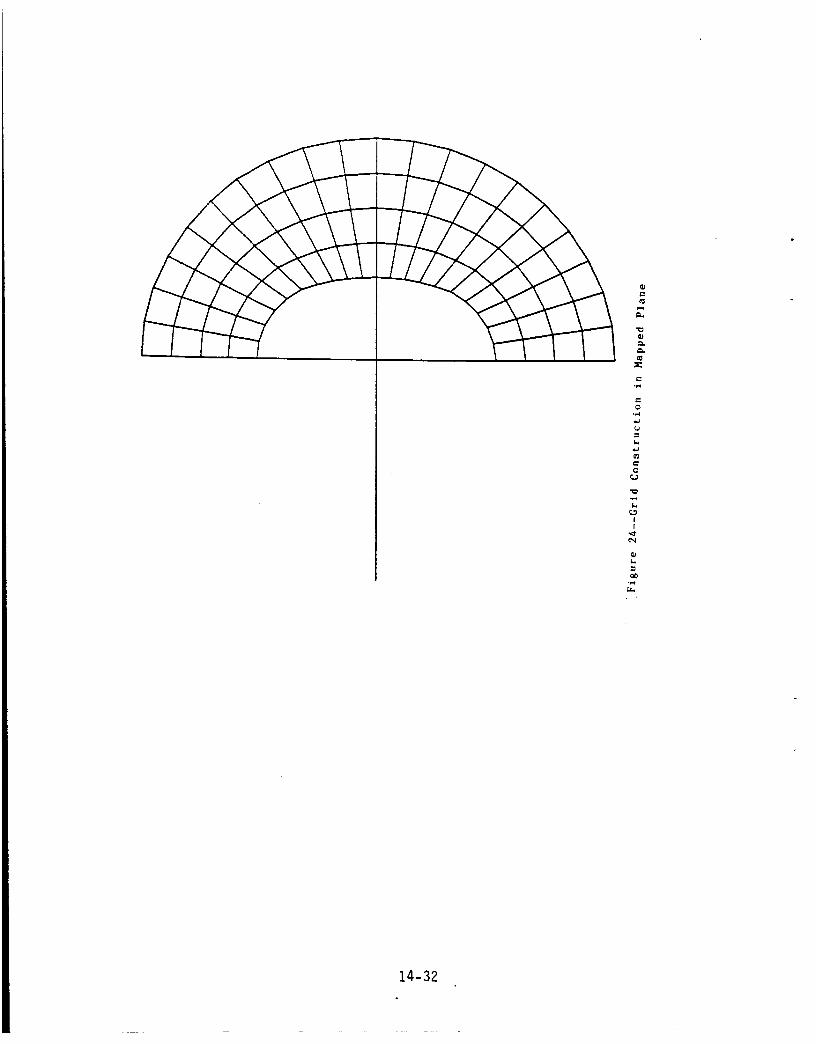
o,-W
0
L_
e,:)
I,w
iI
14-32

i
[..,
(U
w-4
_Z
w.w
C_II
N
k.,
.,.4
14-33

m,
II
/2
14-34

0
I
w.d0
(_.-I
IN
,._
!
_ 0
_ 0
_- [-,
0
0
c
0!
I
. 14-35

e,
o
ow-i
{=L.
m_
(:
I
IOD
_2
14-36

0
ii
1
o
o
e.,o
o
,IJ
II
14-37
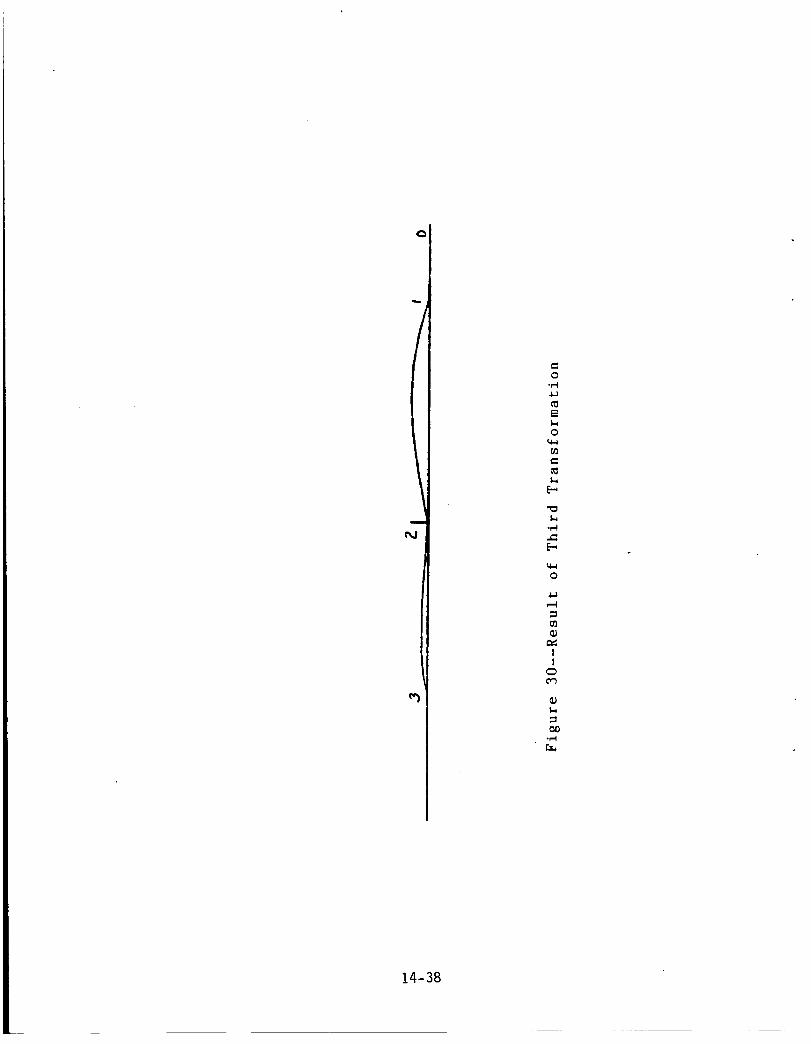
0
/
I
e_4
o
o
I,w
E.-,
E.-,
o
II
0c_
I,w
14-38

(D
#.
!'W,
!
f_
L_
14-39

4,
N
Q
0
0
o0.,
II
c_
¢;
_D
14-40

Io
I
o
o
co
0
co
(lJm
w_J
w
w_J
k_
cO
o
I
o3
_Jw
oc
14-41
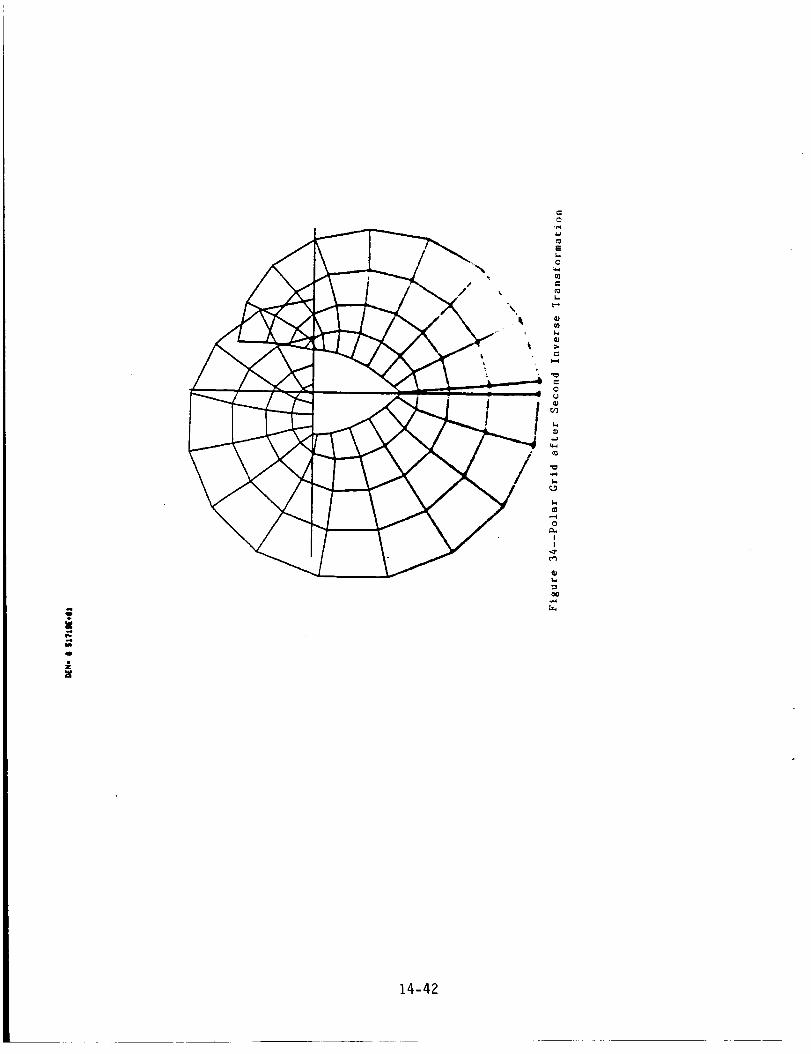
io
\
E
0
=
o
U
c=
II
14-42
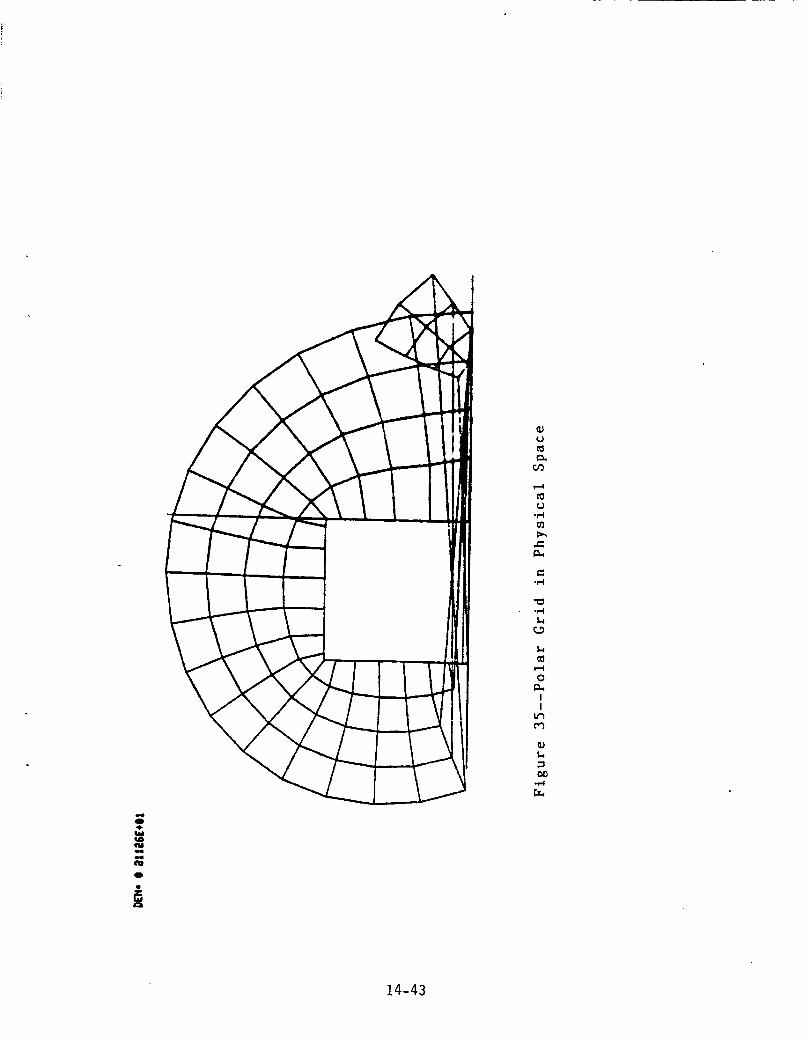
,0,
NN
o
{Jo_
e..
o_
o_I.w
I,,w
O
II
c.")
L.
0I)o_
14-43

i | i
_J
0.
_J0.
0
_J
._.1
QJ
II
_DC_
_J
=CUO
14-44
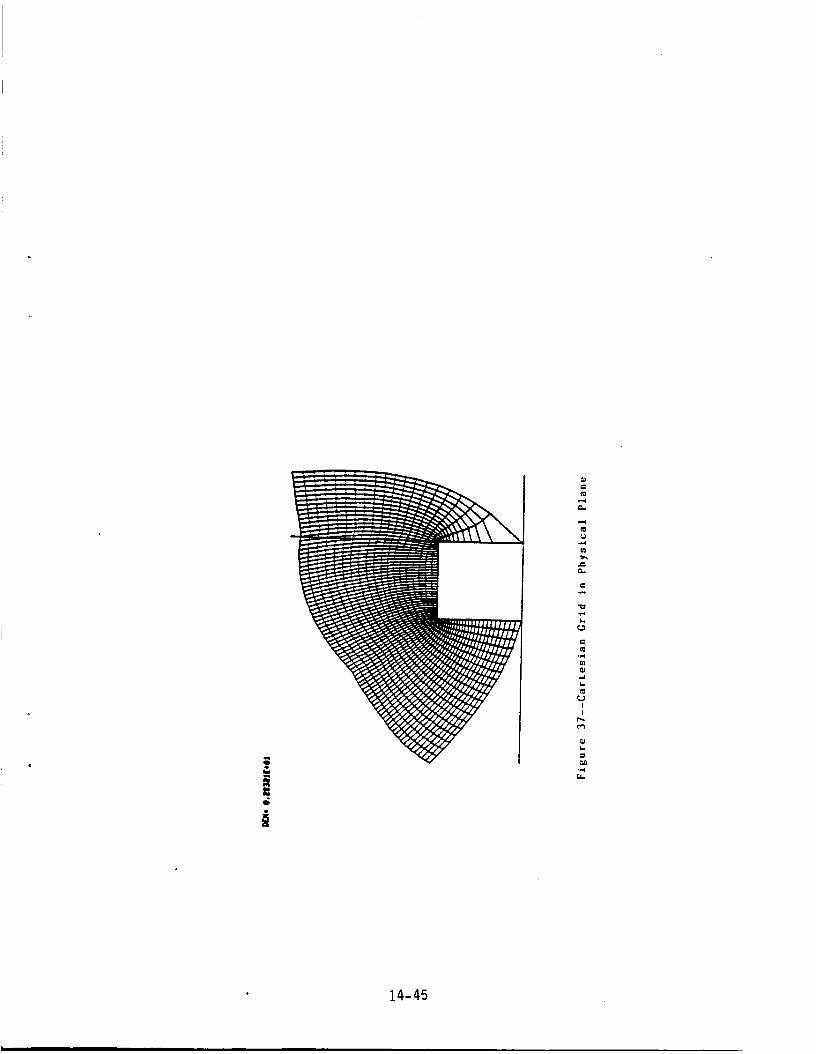
wore,4
m:
I
I
• 14-45

|
14-46
c_
.4
.4
m
-4
E._
,=
m: }-,
_w0
.4
II
oOc_
I,w

N
TI=i,t
D
14-47
r"
_=
E'_
}.,m
O
I.wC_
(L}
r,,.)II
o'b
5._ Conc I usi o_Js and Recc, mTnerJdat ions
Table i summarizes the advawJtages and disadvantages c,f
the two transformations. It is seen that both have
compl eme_,t ary advantages and disadvaw, t ages. Ow_e
disadvantage of both transformations which is listed it,
Table i refers to poor resolution at concave corners. This
is wJc,t a serious disadvar, tage, at least for the flow past
the Aerobrake Body, because the flow iv, this regic, w, is of
lesser interest.
Based or, the results, the following recommendations are
offered :
1. The Karman-Trefftz transformation appears to be
best suited to finite bodies around which the entire flow
field is desired. The type of mesh which results under
this transformation is an "0" mesh.
2. The point-wise Schwarz-Christoffel transformation
appears to be best suited to Jr, finite bodies, or fir, ire
bodies with long trailing wakes. The type of mesh results
under this transformation is a "C" mesh.
14-48

>
0
In +_LI
0
,'0 _ 0> _._
m 0 :In 01_-,', 0 0I_ r. I11
_0cO
f,.-_ 00 0IIL
U'I
mS. 0C0
m IZ> 0
m c _.m oh..
m
> i:11_"13 _.
0m oi
0mr'
(,,:I 0
ms-in
f,.o
I:.w.l
"IO
mr.
I
e,
-_ 0•,-I (.,1
_Z
0'w_
_Ii.la
e, 0
m
"o 0"o 0O0.
m
I'...
0
m
>I"
0 ::,.,
m
mb.l
m
_- 0
-_ 0
._.la
CJO
00
in
0.f.l
0
IAIZ
I.-
0
I-
0
0Ill
f,.m
• 0(.3II
m
.O
_-. N
m
0 Iq-.m m
m
t,.... ",,"
m
q-o
in"_"4
mr.mO•,4 I
_NI _-
-,.,_ t-
O 0O. 01
14-49
6--. _efe_e_Jces
1. Li, C.P. , 1985, NumericalDime_si orJai Hype_sor_i c Vi scc,usCc,rJfigu_atic, rJ, NASA TM58269.
P_c,ced u_e for Three-F1ow over Ae_c,brake
2. Mc,retti, G., 1976, Cot,formal Mappir_gs fc,_ Computatiow_sof Steady, Th_ee-DimerJsi o_sai, Supersor, i c Flows,Numerical/Laboratory Comp. Methods ir_ F1. Mech., A.A.Pou_ir, g arsd V.I. Shah, Ed. _ ASME_ pp. 13-28.
3. Hal I, D.W., 1980, A Th_ee-Dimer_siorsal Body-FittedCoo_dirJate System fo_ Flow Field Calculatior, s on AsymmetricNosetips, Numerical G_id GerJe_atior; Techr_iques_ NASA Cow_f.Publ. 2166.
4. Spiegel, M.d., 1964, Com_e_ Va_iables_ McG_aw-Hill.
14-50

1. Report No.
NASA CR 171984
4. Title and Subtitle
2. Government AccessionNo. 3. Recipient's Catalog No.
NASA/ASEE Summer Faculty Fellowship Program--1986Volume 1
7. Author(s)
Editors: Bayllss McInnis and Stanley Goldstein
9. Performing Organization Name and Address
The University of Houston--University Park
and
Texas A&M University
12. Sponsoring Agen_ Name and Address
National Aeronautics and Space Administration
Washington, D.C. 20546
5. Report Date
June 1987
6. Performing Organization Code
8. Performing Organization Report No,
10. Work Unit No.
11. Contract or Grant No.
NGT-44-005-803
13. Type of Report and Period Covered
Contractor Report
14. Sponsoring Agency Code
15. Supplementary Notes
16. Abstract
The Johnson Space Center (JSC) NASA/ASEE Summer Faculty Fellowship Program was conducted
by the University of Houston--UniversityPark and the Johnson Space Center. The ten week
program was operated under the auspices of the American Society for Engineering Education
(ASEE). The program at JSC, as well as the programs at other NASA Centers, was funded by
the Office of University Affairs, NASA Headquarters, Washington, D.C. The basic objectives
of the programs, which began in 1965 at JSC and in 1964 nationally, are (a) to further the
professional knowledge of qualified engineering and science faculty members; (b) to stim-
ulate an exchange of ideas between participants and NASA; (c) to enrich and refresh the
research and teaching activities of participants' institutions; and (d) to contribute to
the research objectives of the NASA Centers.
Each faculty fellow spent ten weeks at JSC engaged in a research project commensurate
with his interests and background and worked in collaboration with a NASA/JSC colleague.
This document is a compilation of the final reports on the research projects done by the
faculty fellows during the summer of 1986. Volume i contains sections I through 14, and
volume 2 contains sections 15 through 30.
17. Key Words (Suggested by Author(s))
19. Security Classif. (of this report)
Unclassified
18. Distribution Statement
Unclassified - Unlimited
20. Security Classif. (of this page)
Unclassified
21. NO. of pages 22. Price*
359 NTIS
*For sale by the National Technical Information Service, Springfield, Virginia 22161 NASA-JSC
Related Documents