II - AD-A239 844 _____AADC-8 wAGARD 4 mADVISORY GROUP FOR AEROSPACE RESEARCH & DEVELOPMENT 7 RUE ANCELLE 92200 NEUILLY SUR SEINE FRANCE AGARD CONFERENCE PROCEEDINGS 480 Low Temperature Environment Operations of Turboengines (Design and User's Problems) Fonctionnement des Turbor6acteurs en Environnement Basse Temp6rature (Problmes Poses aux Concepteurs et aux Utilisateurs) 4- NORTH ATLANTIC TREATY ORGANIZATION Distribution and Availability on Rck Cover

Welcome message from author
This document is posted to help you gain knowledge. Please leave a comment to let me know what you think about it! Share it to your friends and learn new things together.
Transcript

II - AD-A239 844 _____AADC-8
wAGARD4 mADVISORY GROUP FOR AEROSPACE RESEARCH & DEVELOPMENT
7 RUE ANCELLE 92200 NEUILLY SUR SEINE FRANCE
AGARD CONFERENCE PROCEEDINGS 480
Low Temperature EnvironmentOperations of Turboengines(Design and User's Problems)Fonctionnement des Turbor6acteurs enEnvironnement Basse Temp6rature(Problmes Poses aux Concepteurset aux Utilisateurs)
4- NORTH ATLANTIC TREATY ORGANIZATION
Distribution and Availability on Rck Cover

AGARD-CP-480
ADVISORY GROUP FOR AEROSPACE RESEARCH & 0EVELOPMEN4T7 RUE ,NCELLE 92200 NEUILLY SUR SEINE FRAN,.'E
AGARD CONFERENCE PROCEEDINGS 480
Low Temperature EnvironircntOperations of Turboengines". -(Design and User's Problems)Fonctionnement des Turbor6acteurs enEnvironnement Basse Temperature(ProbIlmnes Poges aux Concepteurs - ... .et aux Utilisateurs)
Papers presented at the Propukion and Energetics Fanel 76th Symposiumheld in Brussels, Belgium, Sth-12th October 1990.
"- _ _ North Atlantic Treaty OrganizationOrganisation du 7rait6 de 'Atlantique Nord
VI91 u O' 991-08951

BestAVailable
copy

The Mission of AGARD
According to its Charter, the mission of AGARD is to bring together the leading personalities of the NATO nations in the fieldsof science and technology relating to aerospace for the following purposes:
- Recommending effective ways for the member nations to use their research and development capabilities for thecommon benefit of the NATO community;
- Providing scientific and technical advice and assistance :o the Military Committee in the field of aerospace research and
development (with particular regaid to its military application);
- Continuously stimulating advances in tie aerospace siLiences relevant to strengthening the common defence posture;
- Improving the co-operation among member nations in aerospace research and development;
- Exchange of scientific and technical information;
- Providing assistance to member nations for the purpose of increasing their scientific and technical potential;
- P.endenng scientific and technical assistance, as requested, to other NATO bodies and to member nations in connectionwith research and development problems in the aerospace field.
The highest authority within AGARD is the National Delegates Board consisting of officially appointed senior representativesfrom each member nation. The mission of AGARD is earned out through the Panels which are composed of experts appointedby the National Delegates, the Consultant and Exchange Programme and the Aerospace Applications Studies Programme Theresults of AGARD work are reported to the member nations and the NATO Authorities through the AGARD series ofpublications of which this is one.
Participation in AGARD activities is by invitation only and is normally limited to citizens of the NATO nations
The content of this publication has been reproduceddirectly from material supplied by AGARD or the authors
Published May 1991
Copyright 0 AGARD 1991All Rights Reserved
ISBN 92-835-0618-9
NitPrinted bySpeciahsed Printing Services Limited40 Chigwell Lane, Loughton, Essex IGIO 3TZ
"lllji --'- m .~ m~m ,wm .mmm ~ mw ... ii. .

Recent Publications ofthe Propulsion and Energetics Panel
CONFERENCE PROCEEDINGS (CP)
Viscous Effects in TurbomachinesAGARD CP 351, September 1983
Auxiliary Power SystemsAGARD CP 352, September 1983
Combustion Problems in Turbine EnginesAGARD CP 353, January 1984
Hazard Studies for Solid Propellant Rocket MotorsAGARD CP 367, September 1984
Engine Cyclic Durability by Analysis and TestingAGARD CP 368, September 1984
Gears and Power Transmission Systems for Helicopters and TurbopropsAGARD CP 369, January 1985
Heat Transfer and Cooling in Gas TurbinesAGARD CP 390, September 1985
Smokeless PropellantsAGARD CP 391, January 1986
Interior Ballistics of GunsAGARD CP 392, January 1986
Advanced Instrumentation for Aero Engine ComponentsAGARD CP 399, November 1986
Engine Response to Distorted Inflow ConditionsAGARD CP 400, March 1987
¢ Transonic and Supersonic Phenomena in Turbomachines, AGARD CP 40 1, March 198 "
Advanced Technology for Aero Engine ComponentsAGARD CP 421, September 1987
Combustion and Fuels in Gas Turbine EnginesAGARD CP 422, June 1988Engine Condition Monitoring - Technology and Experience
AGARD CP 448, October 1988
Application of Advanced Material for Turbomachinery and Rocket PropulsionAGARD CP 449, March 1989
Combustion Instabilities in Liquid-Fuelled Propulsion SystemsAGARD CP 450, April 1989
Aircraft Fire SafetyAGARD CP 467, October 1989
Unsteady Aerodynamic Phenomena in TurbomachinesAGARD CP 468, February 1990
Secondary Flows in TurbomachinesAGARD CP 469, Fcbrury 1990
Hypersonic Combined Cycle ProptislonAGARD CP 479, December 1990
Low Temperature Environment Operations of Turboengines (Design and User's Problems)AGARD CP 480, May 1991
.Iftl

ADVISORY REPORTS (AR)
Through Flow Calculatlons in Axial Turbomachines (Results of Working Group 12)AGARD AR 175, October 1981
Alternative Jet Engine Fuels (Results of Working Group 13)AGARD AR 181, Vol.1 and Vol.2, July 1982
Suitable Averaging Techniques in Non-Uniform Internal Flows (Results of Working Group 14)AGARD AR 182 (in English and French), June/August 1983
Producibility and Cost Studies of Aviation Kerosines (Results of Working Group 16)AGARD AR 227, June 1985
Performance of Rocket Motors with Metallized Propellants (Results of Working Group 17)AGARD AR 230, September 1986
Recommended Practices for Measurement of Gas Path Presqures and Temperatures for Performance Assessment ofAircraft Turbine Engines and Components (Results of Working Group 19)AGARD AR '.45, June 1990
TLe Uniform Engine Test Programme (Results of Working Group 15)AGARD AR 248, February 1990
Test Cases for Computation of Interna! lows in Aero Engine Components (Results of Working Group 18)AGARD AR 275, July 1990
LECTURE SERIES (LS)
Operation and Performance Measurement of Engines in Sea Level Test FacilitiesAGARD LS 132, April 1984
Ramjet and Ramrocket Propulsion Systems for MissilesAGARD LS 136, September 1984
3-D Computation Terhuiques Applied to Internal Flows in Propulsion SystemsAGARD LS 140, June 1985
Engine Airframe Integration for RotorcraftAGARD LS 148, June 1986
Design Methods Used in Solid Rocket MotorsAGARD LS 150, April 1987AGARD LS 150 (Revised), April 1988
Blading Design for Axial TurbomachinesAGARD LS 167, June 1989
Comparative Engine Performance MeasurementsAGARD LS 169, May 1990
AGARDOGRAPHS (AG)
Manual for Aeroelasticity In TurbomachinesAGARD AG 298/1, March 1987AGARD AG 298/2, June 1988
Measurement Uncertainty within the Uniform Engine Test ProgrammeAGARD AG 307, May 1989
Hazard Studies for Solid Propellant Rocket MotorsAGARD AG 316, September 1990
REPORTS (R)
Application of Modified Loss and Deviation Correlations to Transonic Axial Compressors£ AGARD R 745. November 1987
Rotorcraft Drivetrain Life Safety and ReliabilityAGARD R 775, June 1990
II iv '

Theme
The low temperature environment and its impact on aircraft propulsion reliability continues to be of major concern to militalyand commercial aviation. The Propulsion and Energetics Panel and Flight Mechanics Panel have sponsored Specialists'Meetings and Symposia in the past directed at problems and challenges concemning cold weather operation This Symposiumon Low Temperature Environment Operations of Turbo-Engines is particularly relevant now because in recent years engineand component design technology advancement permits better accommcdation of cold weather variables in enginedevelopment and anti-icing design considerations.
This Symposium will address engine design and user's problems as well as new testing technologies. The Symposiumencompasses four ve3sions:
- Session I deals with user's requirements and operational experience.
- Stssion 11 addresses engine starting conditions, improvements in engine performance and reliability due to electronicensgine control, life cycle management, and specific examiples of anti-icing design methods and results.
- Session III addresses fuels ,ind lubricants and their performa-ce at low temperature.
Icing conditions, analytical prediction models, testing technology, and recent test results are included in Session IV
In sumnmary, this Symposium ties together the requireaents and operational community and the engine design and testingcommunity while presenting a balanced analytical and empinical view of the state-of-the-art.
Theme
L'environnement basse temprdrature et son impact sur la fiabilitd des syst~mes de propulsion des aeronefs reste l'une desprioccupations majeures de la communaut6 de l'aviation civile et militaire.
Dans le pass6. les; Panels AGARD de propulsion et d'Energ~tique et de la M~canique du Vol ont organis6 des riunrons despecialistes et des symposia sur les problmes poses et les diifis souleves par Ie fonictionnemnent des moteurs d'avion par tempsfroid.
Ce symposium sur le fonctionnement des ttirbordacteurs en environnement basse tenipdrature est particulierement pertinenteaujord'hui puisque les progris realises r~cemment dans les technologies de conception des moteurs et des composants ontpermis une meilleure prise en compte des variables Wies au temps froid dans le d~veloppement des reacteurs et la conceptiondes syst~mes d'antigivrage.
Le symposium examinera les probl~mes rencontr~s par lea concepteurs et lea utilisateurs des turbor~acteurs, ainsi que leanouvelles technologies d'essai. 11 eat organis6 en quatre sessions:
- La Session I porte sur les besoins des utilisateurs et l'exp~nence opirationnelle.
-- La Session 11 conceme lea conditions de mise en route des r~acteurs, lea ameliorations apport~es aux performances ct ii Iafiabilit6 des moteurs gifice Ia regulation 6lectronique r&acteur ct it la gestion de Ia dur~e d'utilisation, et propose quelquesexemples spdcifiques de m~thodes et de r~sultats dans Ie domaine de la conception des syst~rnes d'antigivragc.
-La Session III examine lea carburants; et les lubrifiants et leurs performances basse tcmp~rature.
- La Session IV traite des conditions de givrage, lea mod~les pridictifs analytiques, lea technologies d'essai et pr~sente desr~sultats d'essais ricents.
Er risumd, cc symposium a pour objet de riunir Ia communautd des exigences op~rationnelles et celle de l'rtude et des essais
des r~acteL'rs, en pr~sentant unc synth~se r6quilibr~e, ii Ia fois analytique et empinque, de N'tat de l'art dans cc domaine.
Propulsion and Energetics Panel
Chairmar': M. i'Ing Princ. de lArmement Ph.Ramette Deputy Chairman: Prof. Dr A. UgerSocidt6 Europienne de Proulsion Middle East Technical University24, rue Salomon de Rothsenld ODTUbP 303 - 92156 Suresnes Cedex Makina Mulh B61lmuFrance Ankara, Turkey
PROGRAMME COMMITTEE
Mr William W.Wagner (Chairman) Ing. de lArmement Christophe MeyerTechnical Director (Code TD) Service Technique des ProgrammesNaval Ar Propulsion Center Afronabtiques(Code PE 3). P.O Box 7176 4. avenue de la Porte d'IssyTrenton, New lersey 0862R-0176 00460 ArmesUnited Stales France
Dr Robert C.Bill Mr Manuel Mulero ValenzuelaChief, Engine & Transmissici Div Departamento de Motopropulsion yUS Army Propulsion Directorate Energia, (INTA)(AVSCOM) Mail Stop 77-12 Crta. Torrejon a Ajalvir, Km. 421000 Brookpark Road 28850 Torrejon de Ardoz, MadridCleveland, Ohio 44135 SpainUnited States Mi Don M.Rudnitski
Major Ibrahim Corbacioglu Head, Engine LaboratoryI NCI hava lknial Ve Bakin Division of Mechanical Engiiei ingMerkezi K ligi National Research Council of CanadaEskisehir Ottawa, Ontario K IA OR6Turkey Canada
Professor Dr Dietmar K Hennecke Mr David J WayFachgebiet Flugantriebe PN2 DivisionTechnische Hochschule Darinstadt Propulsion DepartmentPetersenstrasse 30 Royal Aerospace Establishment (Pyestock)61(0 Darmstadt FarnboroughGermany Hants GU 14 OLS
Professor Rene Jacques United Kingdom
Ecole Royale Militaire30, avenue de la Renaissance1040 BruxellesBelgium
HOST NATION COORDINATOR
Major L Gabriel
PANEL EXECUTIVE
Mr Gerhard Gruber
Mail from Europe: Mail from US and Canada:AGARD-OTAN AGARD-NATOAttn- PEP Attn: PEP7 rue Ancelle APO New York 0977792200 Neuilly sur SeineFrance
Telephone: 33 (1) 4738-5785 Telex: 610176 (France) Telefax: 33 (1) 4738-5799
ACKNOWLEDGEMENT
The Propulsion and Energetics Panel wishes to express its thanks to the National Authorities from Belgium for the invitation tohold this meeting in Brussels, and for the facilities and personnel which make the meeting possible.
vi
Contents
Paige
Recent Publications of PEP ill
ThemefIThime v
Propulsion and Energetics Panel Ai
Reference
SESSION I - COLD WEATHER OPERATIONAL EXPERIENCEAND REQUIREMENTS
Low Temperatu~re Environment Operation of Turbo Engines - IA Military Operator's Experience and Requirements
b~y M.Summerton
Canadian Forces Cold Weather Experience in the Maintenance and Operation .1 2Figher Engines
by C.Ouellette
Analyse des Problkmes de Demnarrage par Temps Froid avec 3les Turbomoteurs d'Hilicoptere de Type ASTAZOU
par W.Pieters
Avions d'Affaires Mystere-FALCON - 4Experience Operationelle par Temps Froid -
par C.Domenc
Vulnerability of a Small Powerplant to Wet Snow Conditions; - 5by R.Meijn
Cice-Tolerant1Engine Inlet Screens for CHI 13/1 13A Search and Rescue Helicopters. 6by R.Jones and W.ALucier
SESSION II - SYSTEM DESIGN CONSIDERATIONS
Cold tarting Snall Gas furbines'--/An~verview 7by C.Rodgers -
Cold Start Optimization on a Military Jet Engine 8by H.Gruber
-Cold Weatherjjiiition Characteristics of Advanced~mall 9)6t.,ruitine,eombustioi~gystems,
by SSampath and I.Critchlcy
"Cold WetherJt Ewfgine Starting Strategies Made 10Possible by Efigine Dgifil 0ontrol$ystems. -
by R.C.Wibbeisman
ColdSfart h~vestigation of an APU with Aninular Combustor and Fuel/Vaporizers. 1by K.H.Collini N
,(11-~
Reference
Control System Design Considerations for Starting Turbo-Engines 12during Cold Weather Operation
by R.Pollak
Cold Start Development of Modern Small Gas Turbine Engines at PWC 13by D.Breitman aaid F.Yeung
Design Considerations based upon Low Temperature Starting Tests 14on Military Aircraft Turbo-Engines
by H.-F.Feig
Climatic Considerations in the Life Cycle Management of the CF-18 Engine 15by R.W.Cue and D.F.Muir
Application of a Water Droplet Trajectory Prediction Code to the Design 16of Inlet Particle Separator Anti-Icing Systems
by D.LMann and S.C.Tan
Captation de Glace sur une Aube de Prerotetion d'Entrke d'Air 17par R.Hen y et D.Guffond
Development of an Anti-Icing System for the T800-LHT-800 Turboshaft Engine 18by G.V.Bianchini
Engine Icing Criticality Assessment 19by E.Brook
Ice Ingestion Experience on a Small Turboprop Engine 20by L.W.Blair, R.L.Miler and D.J.Tapparo
SESSION III - FUEL EFFECTS AND LUBRICANTS BEHAVIOUR
Fuels and Oils as Factors in the Operation of Aero Gas Turbine Engines 21at Low Temperatures
by G.L.Batchelor
The Effect of~tel,Properties and Atomization on ow Temperature Ignition 22in das irbine)9mbustors
by D.W.Naegeli, L.G.Dodgg and C.A.Moses
,Givrage des Circuits de Carburant des Turboreacteurs 23par F.Garnier
The Influence of Fuel Characteristics on,4 eterogeneous I/iame Pi'opagation 24
by M.F.Bardon, J.E.D.Gauthier and V.K.Rao
The Development of a Computational Model to Predict Low Temperature 25Fuel Flow Phenomena
by R.A.Kamin, CJ.Nowack and B.A.Olnstead
Paper 26 rithdrawn
SESSION IV - ICING CONDITIONS AND TESTING
Paper 27 withdrawn
Environmental Icing Testing Lt the Naval Air Propulsion Center 28by W.H.Reardon and VJ.Trugho
Vill
Reference
Icing Research Related b., Engine Icing Characteristics 29by S.J.Riley
Modelisatlon Numirlque de r'Fvolution d'un Nuage de Gouttelettes .t'Eau 30en Surfusion dans un Caissoa Givrant
par P.Creismeas et J.Courquct
Icing Test Capabilities for Aircraft Propulsion Systems at the 31Arnold Engineering Development Center
by C.S.Bartiett, J.R.Moore, N.S.Wcinberg and T.D.Gazretsoi
Icing Test Programmes and Techniques 32by E.Carr and D.Woodhouse
A Documentation g Vertical and Horizontal Alrcraft'Soundings 33ottingelevant)oudphysical PYranieters
by H.-E.Hoffinann
Developments inlcng Testevhniques for Aerospace Applications 34in the RAE Pyestock Altitude Test Facility,
by M.Hoimes, V.E.W.Garratt and R.G.T.Drage
Entrke d'Air d'HkIicoptires: Protection pour le Vol en Conditions 35Neigeuses ou Givrantes
par M~e la Servette et P.Cabnt
ix

~1-1
LOW TOMPDATUR ENVIIONMEN OPIRATIQI OF TURBO ENGINES- A MILITARY OPERATOR'S PERIEINCE AND REQUIRMOM
byLieutenant Colonel M Swnerton CEng MRAeS REME
School of Aeronautical Engineering
Army Air Corps CentreMiddle WailopStockbridge
Hampshire S02U 8DY
SUMMARY manufacture. Above all, aircraft should be as4 reliable and maintenance-free as possible, but
The United Kingdom's commitment to NATO includes where maintenance Is unavoidable, it should bethe regular use of Royal Marine and Army helicop- capable of being completed in the shortestters in low temperature conditions. This paper possible time, -iith the minimum quantitiesspecifically addresses the operation of the of tools and equipment. To understand why,Westland LYNX helicopter with its Rolls Royce consider how our Royal Marine squadron operates inGEM engines during winter deployments in Norway Norway.where the near-arctic conditions present certainoperating and working difficulties. Operating Conditions. Initially, the Marines
operato from ships, flying off pitching decksThis paper considers these difficulties both regul~rly doused with cold sea-spray. Havinggenerally, from a human and physical point of view, lan~ed all of their vehicles, equipment andand then more specifically with regard tv the supplies, the road parties deploy inland toengines themselves. Finally, it concludes with a several different field locations, sometimes infew areas for improvement, with the emphasis on wooded areas, and sometimes in and around villagesreliability, ease of maintenance, and effective or towns. Once in position they are joined by
development and testing before entry into service, their aircraft, which tend to end up in deep,fresh snow. unlike the vehicles which are normally
INTRODUCTION sited on, ar close to, cleared tracks and roads.
The aim of this paper is to help set the Once inland, away from the moderating influence ofscene, as a prelude to more detailed and esoteric the relatively warm sea, and perhaps well abovediscussion of low temperature engine problems. sea level, they experience a variety of weatherThe paper has been kept deliberately short and conditions including:essentially practical, and does not seek toinvestigate and solve the relatively few problems a. Day-time temperatures in the region -10that the British Army experiences, to -15-C.
b. Cold soak night-time temperatures down toThe paper deals exclusively with helicopter -30C.operations, conducted from field locations with- c. Driving snow which drifts and builds upout the benefit of hangarage. on flat surfaces.
d. Cloud, mist and -ain.BACKGROUND e. Freezing fog and freezing rain.,
f. Wind.
The British Army has some 360 aircraft, the
majority of which are LYNX and GAZELLE helicop- The Practical Difficulties. Operax.ng in theters based in the United Kingdom and West Germany. above conditions, there are many practical diffi-This fleet includes a squadron of aircraft which culties. Keeping warm becomes a major preoccu-are operated by the Royal Marines who are a part pation, especially if there is any wind, whereof the Royal Navy. only a moderate breeze can reduce a temperature of
-7-C down to -240C. At such temperatures, thereThis Royal Marine squadron, together with an is a progressively worsening risk of frostbite,Army flight of six GAZELLES, deploys from which at the lower end can result in flesh freez-January to March e .:h year to Norway where they ing within a minute. Such a threat requiresparticipate in NATO exercises. engineers to work in pairs on a buddy-buddy
system, to monitor each other for any signs ofThese deployments constitute the majority of our frostbite or cold exposure. Low temperatures cancold weather experience but we also get a also cause instant adhesion of bare skin to verycertain amount from our aircraft based in West cold surfaces, and cold burns. At temperaturesGermany, though the conditions there rarely as 'mild' as -lO
0C, bare metal contact is quite
approach the severity of Norway. Neither of painful.these areas compare with places like Canada andthe arctic regions, however, but with winter In such conditions, effective protective clothingtemperatures ranging from +5 to -30*C, with freez- is absolutely essential, but unfortunately, aing rain, snow and ice, the climatic conditions are glove that is warm is guaranteed to be totallyconsidered more than representative of the unsuitable for detailed technical work such asproblems. adjusting engine controls and wire-locking
components.THE NATURE OF WINTER OPERATIONS
The obvious answer to the problem is to move theWhen considering low temperature operations, it is aircraft under cover whenever you need to carryimportant for those associated with the specifics- out significant work, but this can only be done iftion nnd design of aircraft, to =d tnd the thcrc arc zultable large b cild ,lue to tneessential practical natuie of such operations. It landing site, and where the route to the buildingsis important because winter conditions present is sufficiently flat, and clear of snow and ice.problems which are unique and which tend to aggra- In practice, the work involved in getting an
vate any fundamental weaknesses of design and aircraft under cover, is not normally
I01-

41-2
justifiable, but it can be done if the need is The aat of having to rig up the heat source andgreat enough. the time it takes, however,, is unacceptable.
The alternative is to leave the aircraft where Cold soak can also lead to the freezing and stiff-it ia and rig a shelter over the area being worked ness of engine controls, especially teleflexon, and apply local heat. This still requires controls which may have got moisture inside them.considerable effort, however, and it creates a hugethermal signature which could badly comprimise aunit't location. Starting. Successful starting is almost
exclusively a function of adequate levels ofBesides personal protection, there is also a need electrical power. If we have well-charged air-to protect the aircraft, with covers. However,, the craft batteries or we use an external DC supply,act of fitting the covers can represent quite a then we find the GEM engine relatively easy todifficult task in itself, especially if they happen start. Tf, however,, electrica) power is low thento be covered in snow and ice from previous use. we experience:The problem is compounded by the need to applycamouflage nettinr and by deep snow, where the a. Stagnation/failure to start.aircraft will settle on its skis at one height,but all ground activity is conducted 30 to 40 cems b. Excessive light-up times, (30-50 secslower, rather than 22 secs).
Other practical problems also present themselves: C. Wet starts and excessive turbine temp-eratures.
1. It is difficult getting tools andequipment out to the aircraft, especially Operating from woods, in deep snow, and probablyin a full tactical setting where they will be scattered over a wide area, arranging externalwidely dispersed around a location. power from either a vehicle or a ground rig can at
best be unacceptably slow and inconvenient, and atb. If tools and equipment are dropped in worst, impossible. Our aircraft may also bethe snow they can be very difficult to find. operating totally remote from such support. We
therefore prefer to use internal battery power asc. Before working on the aircraft you the norm. However, after overnight exposure tohave to remove portions of the camouflage temperatures of -10*C and below, or a 24 hour soakand protective covers, at even miide temperatures, we find that many of
our batreries have only marginal power for suc-d. When you climb onto an aircraft you cessful starting. The only solution in this casemust be careful to remove all snow and ice s to anticipate conditions and remove the batteryfrom your boots,, otherwise you can slip very to a warm area, but this in turn can impose aeasily. technical burden that is even worse than the u_"
of external power.e. Protective hoods tend to restrict p-ri-pheral vision and hearing, making you more The problem of low battery power is almost cer-prone to dropping tools and banging your head tainly aggravated by increased engine turningon aircraft structure. Likewise, the wearing resistanc-. We always check our engines for freeof NBC equipment is especially limiting, rotation in case of any technical failure, or in
case of any water having run-back into the enginef. When carrying out technical work you and freezing in contact with rotating assemblies.have to leave your gloves off most of the In spite of the use of lower viscocity oil, how-time and you therefore need frequent warming- ever, it is noticeable that engine resistance isup. Job times are often doubled or trebled, greater in comparis-n with temparate operation.
ENGINE PROBLEMS In our experience the only other factor thataffects engine starting, is fuel volatility.
With the exception of the pcints which are con- Given the choice we would use F40 AVTAG which hassidered below, the operation of our GEM engines in a flash point of only -40oC, but we are normallycold weather present relatively few problems. From supplied with F34 AVTUR which has a much higherthe flying point-of-view, once the engines are flash point of +380C. At the other end of thestarted and are stabilised at correct temperatures scale we would prefer not to use the navy's F44and pressures, then the only subsequent concern is AVCAT which has an even hipher flash point, forfor the adherence to snow and ice limitations. shipborne safety. Subjrttively, we would say that
there is a 5eC difference in the ambient tempera-From the engineering point-of-view, the picture is ture at which AVTUR will successfully start snequally good: if you compare defect rates, spares engine, compared with AVCAT, (ie. a particularusage, and data from engine health monitoring sys- marginal engine and battery combination mighttems, then there is no detectable difference manage a AVCAT start at -5*C, whereas AVTUR couldbetween cold and temperate engine operation. manage it at -10-C).
Of far greater concern is fundamental engine reli- In all cases of difficult ;tarting, slightability and maintainability, because, as illustra- advancement of the engine speed select leverted above, any technical work that has to be beyond toe 'Ground Idle' gate normally helps,, butcarried out on an aircraft, in cold conditions,, is T6 limits need careful monitoring.extremely difficult.
Snow and Ice The most significant limitation onHaving put the subject in its correct context, let the use of helicopters Its cold weather is theus now consider the problems that we do have. hazard caused by snow and ice. In our Ministry of
Dre se"-, Ose vurzous climatic conditions in wnicnCold Soak. When an aircraft has been cold-soaked our aircraft may be required to operate, arebelow -26*C, we have to heat the engines and gear- defined in DEFENCE STANDARD 00-970.box to bring the main rotor gearbox sump tempera- These standards manJatorily require operation in
ture back to -26*C before we can attempt a start.
J I

1-3
temperatures down to .26-C and no damage from cold engines, to minimise the amount of work thatsoak down to -40 *C. On the icing side, the stan- has to be carried out in- low temperaturedard defines nine different conditions that on conditions.aircraft ma be required to operate in. Theseconditions can be summarised as: b. Lower cold-start limits to avoid any
necessity for having to pre-heat engines anda. Clear air ice. gearboxes.
b. Mixed snow and ice. c. Better batteries that ere less prone tolosing their charge, or an alternative detign
c. Falling snow, of autonomous starting system which is lessdependent on battery condition.
d. Re-circulating snow (caused by hoveringin ground effect). d. In conjunction wizh the above, even more
dependable starting.e. Freezing fog.
e. Fully integrated airframe and engine in-f. Freezing rain/drizzle, take design to provide full airframe,
transmission and engine protection from snow,In practice, we find that unless the weather is slush and ice.almost clear blue skies, then we are greatly limi-ted in when we can fly. These limitations are due f. More thorough specification, developmentto: and cold weather testing before delivery to
service.a. A general lack of visibility.
The state-of-the-art on helicopters mpy still notb. Ice accretion on zotors which destroys allow us to achieve, sufficiently economically,lift and causes severe vibration, the level of snow and ice performance to which we
would ideally aspire, but what is quite clear toc. General ice accretion on the airframe us, is that between our ministry and industry, wewhich, for example, might break off and dam- must specify and actually achieve, realisticage a tail rotor, or enter an engine as a requirements that sensibly reflect the operationalforeign object. need. In the meantime, in the context of both
temperate and cold weather operations, we mustd. Ice accretion on or around engine in- continue to strive to make our aircraft andtakes, res&ricting air flow,, or threatening engines as reliable and maintainable as possible.ingestion.
e. Snow and slush deposits whi_h threaten Discussioningestion.
We are advised that an crdinar -sized snowball is P.W. Wagner, US Navy
capable of flaming-out a GEM engine, and that a Please address starting limitations concernng lubricants or15cc lump of ice can cause serious damage to the viscosity problems at low temperature.engine's axial flow, LP compressor. Which problems effect engines or power drive system
components9
The impression that we have gained, as opera-
tors, erroneously or not, is that we specify Author.mandatory temperature requirements, but we do
not appear to specify and achieve particular We have no lubncant problem with the GEM engine in coldsnow and ice requirements. As a consequence', weather. Oil temperatures and pressures have to bewhen we conduct our cold weather testing, to monitored during start-up, aid they take longer to stabilize,establish in-service operating limits, we end but this does not cause any problemsup having to restrict the aircraft's opera- We do not change engine oil when operating at lowtion to what we find, rather than just cun-firming what the designer has achieved in temperatures but we do change transmission oil to a lowersatisfaction of a contract specification. viscosity type
A check of serviceability statistics reveals no detectableIn the case of the LYNX, this has resulted in difference between temperate and cold weather operations.us having spent many years tryirg to developa satisfactory snow and ice guard, capable ofextending the aircraft's snow and ice clear- 2. W. Wagner, US Navyanccs to reasonably acceptable operational Please identify the engine design problems which thislimits. This has now been achieved. Fromthis experience we would note the extent to assemblage of design and manufacturing community couldwhich the engine designer is very much depen- addressdant on the aircraft designer, to achieve aiatisfactory intake design, and further, we Author.would observe that an aircraft's snow and ice Fundamental reliability is the most imoortant requirementclearance is only as good as its worst both in temperate and in cold weather conditionsfeature. We hope that both our ministry and
industry have learnt the appropriate lessons. A properly integrated airframe and engine inlet design is ofequal importance, but whether you start with the
CONCLUSIONS assumption, of an ice-tolerant engine or not is a question ofphilosophy. If you have a robust, ice tolerant engine. then the
LYNX/GEM combination, we would like to see integration of the engine into the airframe is not as critical,
the fellowing general improvements: and the protec-tion afforded to the engine can be reduced.Neither of our two mair helicopters have fundamental
a. Even more reliable and maintainable engine design problems viz-a-viz cold weather operation
-4
2-1
LOW TEMPERATURE ENVIRONMENT OPERATIONS OF TURBO ENGINES
by
Lt Christian OuelletteMechanical and Propulsion Engineering Officer
Base Aircraft Maintenance Engineering OrganizationCanadian Forces Base Cold Lake
Medley, AlbertaCanada
INTRODUCTION OPERATIONAL ROLEGood morning Ladies and Gentlemen, Bonjour Madames Our Air Fowe utilizes the CF-5 Freedom Fighter as ouret Messieurs, my name is Lt Christian Oucllette and I am "Basic Fighter Pilot Trainer". We operate about 40 CF-5here representing the Operational and Maintenance aircraft out of 419 Sqn at CFB Cold Lake. The nucleus ofcommunity of the Canadian Armed Forces, and more our air defence posture is out front line Fighter andspecifically the branch of Air Command. I am the Interceptor, the CF-18 Hornet. A total of 125 CF-18s areMechanical and Propulsion Engineering Officer at spread amongst 8 squadrons, located in Baden-Soelligen-Canadian Forces Base Cold Lake, situated in the Central Germany, Bagotville-Quebec and Cold Lake-Alberta.Eastern portion of the province of Alberta. Our operational commitments are as follows:
It is my distinct pleasure to share with you some of our (a) Basic Fighter Pilot Training at 419 Sqn on the CF-5.experiences it: the maintenance and operation of Turbo and at 410 Sqn on the CF-5Engines under cold weather conditions.Canada is a vast country, bordered by two oceans and the (b) NORAD peacetime alert role and wartime deployment
arctic circle. Our Armed Forces, with its varied capabilty;commitments of Peacekeeping, the North Atlantic Treaty (c) Air to Air Intercept;Organization (NATO) and the North Am.,can A rDefence (NORAD) plan, have the unenviable task of (d) Air Superiority and NATO traiing; and
patrolling and protecting the vast reaches 6f the North (e) Air to Air/Air to Ground peacetime traning.American Northern Region. At CFB Cold Lake. our 3 CF- 18 Squadrons combined, overNever a dull moment it seems. From the time we first turn the winter months of November to Febrnary, fly an averageover an aircraft at dawn, our missions vary from hunting of 860 sorties per month. 419 Sqn alone, with the CF-5.down the odd arctic Bear-H, to escorting MIG-29s who averages 490 sorties per month during the cold weatherhave a tendency to wander and lose their way. season.
This morning's preseptation will cover the following areas-
(a) The climate conditions which we are faced with inCanada; MAINTENANCE PROBLEMS AND PRACTICES
(b) a summary of our operational role and commitments; Severe weather conditions pose a series of the challenging
(c) a brief look at some maintenance problems and problems to the maintenance community. The types of
practices associated with the cold weather obstacles encountered are as follows:
environment; (a) Personnel Protection Against Cold
(d) the "Hung Start" problem associated with CF-18, When servicing/starting aircraft in extreme conditions,safety of personnel is first and foremost. CrewGE-F404, engine; and members must protect themselves from the bitter
(c) a quick review on the status of the infamous temperatures by adding layer upon layer of clothing,J-85-CAN-15 compressor stall problem. making it difficult at times to perform routine servicing
tasks;CLIMATIC CONDITIONSCanadian s orces Base Cold Lake, appropriately named, is (b) Power Take-Off Shaft Shearinglocaed lon th 54h pralel. he ollwin isa gaphSpecial precautions must be observed on engineslocated along the 54th parallel. The following is a graph which drive exterior gearboxes (such as the accessorydepicting the temperature norms of the area over a 12 month drive xteior g exte(suc athe c e. prio. Athogh or MAN empratre lw i ony aout drive system on the CF-5). In extreme cold weather theperiod. Although our MEAN tempetature low is only about oil in the gearbox gels and the drive shaft will shear on-18 deg C, we face ARCTIC type conditions for over 35% engine start Usual precautions as follows:of the November to February time frame. Wind chill factorsreach in excess of 1625 Watts per square meter, a point at (i) motor the engine prior to starting;which exposed flesh freezes. (ii) apply heat (portable heater) to the gearbox;
Inuvik, situated above the 68th parallel, is one of our four (iii) run engine for minimum time before applyinga~~~~o .lad ,hn genratrs hpaumepson f umain Forward Operating Locations (FOLs). Weather toads ongenerators, pumpsconditions dunng the winter months are generally bitter, (c) Hydraulic Seal Leakscompounded further by constant prevailing winds from the Hydraulic system "0" rings on cold soaked equipmentEast, driving temperatures down into extreme lows. The will tend to leak. The normal cure is to let the systemoutside temperature (excluding the wind chill factor) is warm up at idle, eliminating the leaks once the systembelow -20 deg C for over 150 days per year. warms up.

2-2
(d) Fire Extinguishers The folloing traces back the history of the stall problem,When the temperature drops to -40 deg C and below, outlining lessons learned, along with our present status:fire extinguishers may not work as advertised(particularly CO2 extinguishers) for they do not Feb 75 Invcstgation by NRC showed that engine anti-icegenerate enough pressure to adequately push out the increased the stall margin.extinguishant. At Cold Lake we have specialextinguishers which we have identified by a broad blue Nov 76 The interrelationships between RPM and EGiband on the case cutback, and T2 sensor outputs were discussed
The pctential problem that incorrect T2 sensing(e) Fluid Servicing Carts could adversely affect stall characteristics was
Servicing carts containing fluids may cause identified.contamination problems. Carts are generally stored inthe hangar at a temperature of 70 deg F While hangar Mar 78 Flight tests concluded and recommended adoor. are often opencd several times per day, the modification to activate anti-ice concurrent withtemperature quickly drops to that of the outdoors, the Afterburner.During cold weather, the temperature of the cart shell(always metal) can be subject to temperature Jan 79 A temperature soaking procedure to preventfluctuations of up to 100 deg F This causes compressor stalls at very cold temepratures, mainlycondensation within the cart and contaminates both during ground runs, was recommended andthe cart and the system replenished by that cart. In the implemented at 419 Squadron, until the Gas-FilledCF-5 world we get frequent complaints from SPAR, T2 sensor mod was installed.one of our 3rd line maintenance contractors, aboutwater contamination in the CF-5 Accessory Drive May 82 Underwent flight testing of a modified T2 sensingSystem. The only solution to this problem is to check system, with a recommendation for relocation ofthe carts daily for water contamination, and drain the Resistance Temperature Detector (RTD) andwater when found adjustment of the MFCU to start RPM cutback at
(f) Starting Problems -15 deg C.In general the gas turbine engine starts easier undercold weather conditions, however some problems do Nov 82 Testing of the automatic engine anti-ice
occur Failures to start can usually be attributed to engagement system, whereby anti-ice is selected
either improper ignitor plugdepth, burned out plugs or for 10 seconds following A/B initiation. Aircraft
wetting of the plug (caused by introducing fuel into the were modified and a reduction in stall numbers was
engine before firing the plug). recorded.
(g) Overpower/Stalls Oct 84 MFCUs were biased by +30 deg F to compensateAll gas turbine engines develop greater power in cold for inaccurate T2 sensing. Technique wastemperatures, thereby becoming more prone to stall, somewhat effective in reducing stalls.While stall prevention measures will vary according tothe equipment, general rules such as "No Erratic Oct 87 Modification CF-055, Gas Filled T2 sensor wasOperation or Sudden Power Changes" will generally implemented.apply.
!!UNG START PROBLEM/F404-GE-,400 ENGINE PRESENT STATUSThe CF-18, F404 Engine is experiencing periodic Hung Installed: - auto engine anti-ice engagement systemStart and Roll Back problems during cold weather - GFT2 sensor/modified T5 amplifieroperations. As recently as last spring, while on deployment - various AOI and unit flying orderto Inuvik, up to 6 hung starts per day were expenenced, in anaverage temperature environment of -42 deg C. Present changes
operating instructions call for motoring of the engine for 2 Modifications - automatic takeoff doors: automaticallyminutes pnortostart. Ifa hung start is experievced, there ar- underway open for flight below M - 045a series of checks to be earned out, verifying integrity to -- P3 lag tube: damps out rapidelectrical connections, density settings etc. If no fault found, fluctuations of the P3 tap, which is anmotor engine for an additional 2 minutes and repeat input to the MFCUprocedure until start occurs. If after repeated tries, the hung ?lojected - the definition of the true icing limits forstart persists, remove and replace Main Fuel Control. The the aircraft, and the correct RPMsituation in Inuvik often requires in excess of 15 minutes of cutback schedule
engine cranking and throttle movement to achieve engine - considering a new replacement T5start. amplifier
Given the critical nature of operations at Forward OperatingLocations, delayed aircraft starts are totally unacceptable.Further investig: ion into the Main Fuel Control start PRESENT STALL RATE SITUATIONschedule is requited and has been recommended. The following is a graph depicting the J-85 Stall rate, per
CF-5/J-85-CAN-15 COMPRESSOR STALL HISTORY 1000 hrs, over a 3 year average. I he total number of stalls
Since the introduction into service of the CF-5 in the 1960s, per year have gone from:
the problem of sudden compressor stalling has plagued the 1987-76fleet. This phenomenon was first identified during cold 1988-- 53weather evaluations of the aircraft in the late 1960s, and 1889 - 36continues to be a problem to this day. 1990 - even less
i4

2-3
Discussion 4. P. Sabli, GEACWhat is the normal start-up procedure that permits plug
I. R, E. Smith, Sverdrup wetting?
What were the fixes applied to make the tire extinguisher Author:units effective at low temperatures? Our present start-up procedure for the CF-5 is as follows
- motor engineq to 14.5%Auho:- engage ignitionAuthor:
The fire extinguishers acquired for cold weather conditionsare still C02 types, but with a greater built-in discharge - advanced power lever, introduce fuel.
pressure. How th'is accomplished, I am not certain. Our wet start problem is not caused by an erroieo.s startHowever, we have identified these extinguishers with a wide procedure, but rather by pilot error in selecting power leverblue band to ensure we do not use them in temperature too early. PILOT error will conii.oe to be a problem,conditions above -26 C ambient, therefore perhaps the issue of a safeguard against accidental! wetting can be addressed.
2. W. Alwang, Pratt and Whitney
What was the nature ef the T2 sensing problem and how was How is failure to spark detected?it corrected?
Author:Author: We rely on the inabilty of the engine to fire-up as anThe T2 sensor was formally located near the under surface indicator.of the aircraft where air is collected by two scoops, one for
V each engine, and is ducted to the MFCVs. The problem was 5. C. Rodgers, Sundstrand Poser Systemsthat the total temperature of the sample air picked up by the Do all CAF aircraft fly from prepared bases?scoops was not representative for CIT, hence EGT and Do you provide portable heating for aircraft flying fromengine cutback were noch occurring on schedule, increasing unprepared forward bases?the stall margin.The RTD sensor was relocated to an area in the engine bay Author:where a representative value of CIT could be obtained. Our fleet of CF-18 is based at prepared main operatingFurther sensing errors continued, so MFCV was biased to bases (FOLs) where we make use of facilities on site, whichcorrect, and some improvement was seen. in the most cases are inadequate, in other words, storageEventually the introduction of a gas-filled sensor eliminated facilities for beth aircraft and equipment are in short supply.the sensing error and was successful in reducing the stall Although portable heat is available at FULs, i.e. Hermanrate. Nelson's, conditions generally render them little or no use.
Heating is generally used for personal rather than A/C. We3. R. Toogood, Pratt and Whitney Canada prefer to conduct starting operations with cold soaked A/C,You have spoken at some length on the CFT stall problem. avoiding the problems of expansion and contractionHave you experienced any significant cold weather associated with introducing heat in severe conditions.problems as yet with the CF 18 aircraft?~6. W. Wagner, US Navy
Author. You referred to hung starts at extreme low tempeiaturesOur experience with the CF18 in cold weather is that the with CF 18 aircraft. Would today's full authority digitalaircraft performs better. Our only complaint is with the electronic controls elimate this problem?
t, scheduling of the MFCV during cold weather start-up. Ourhung-start problem is critical during certain operations, and Comment by R. Wibblsman, GE:is considered totally unacceptable. This issue is apparently The floor indicated it would correct the situation, and thebeing addressed during paper 10. problem will be addressed in detail in paper 10 tomorrow,
I
I
1[- ~ -- -

3-1
ANALYSE DES PROBLEMES DR DENA RRA GE PAR TEMPS FPtOID AVEC LIS TURWOMOTEURS D' NELICOPTXRIDR TYPE ASTAEOU.
parLieutenant Ir. W. PIETERS
Offr Maint255 Cie Maint d' Aviation Ldg~re
Flugplatz RutzweilerhofButzweilerstrasse
5000 KOLN 30RFA
RESUME
Pendant lea pdriodes d' hivar assez s6v~res au dibut den ann~es 80, 11 arm6e beigea connu de conhiddrables problbues de d6marrage sur sea hdlicoptbres de type ALOUETTEdquipds de turbomoteurs ASTAZOU.
La rapport reprend lee m~thodes de d6tection des ph6nombnes employdes par leautilisateurs, lea actions immddiatas prises au sein de 1V arude et lea solutionsAlabor6es en collaboration avec lea constructeurs ainsi que leura consdquencesbudgtaires.
SUMMARY
During the heavy winter perioda in the beginning of the 80th, the Belgian army had
considerable starting problema on his helicopters ALOUETTE equiped with ASTAZOJ turboThe papers discuss the different detection methods of the phenomena employed by thecolaboatin wth heconstructors as well as their budgettary consequences.
NOMENCLATURE
255: Abr6viation utilisd dana le texte, indiquant la 255 Compagnie Maintenance etD~p8t d' Aviation Ldgbre, faisant 1' entretien des hdlicoptbres de la Forcererrestre de 1' armie beige.
T4: Tempdrature & la sortie de la turbine.P2: Pression A la sortie du compreaseur.RO: R6vision g~ndrale, allouant un nouveau potential au turbomotaur.VNIP: Visite Non Interruptive de Potentiel, Ie potential du moteur reste Ie miea aprbs
son passage en usine.FB: Francs Edlges.IT: Instruction Technique.FF: Francs Frangais (avec 1 FF=6,5 FB),
1. INTRODUCTPION.
a. Situation de 1V arude belge.
L' aricda beige, stationn6e partiellement en Allasagne de 11 Ouest at en Belgique,utilise des hdlicoptires pour rdpondra A sea fonctions lui impoudes dana Ie cadre desconventions de 1' OTAN.Ainsi ella dispose actuellesent de (Situation cl8turde Ie 01 Jan90):
-FORCE TERRESTRE: 56 hdl-lcopt~raa ALOUETTE II, dont 16 avec motaur ARTOUSTE at 40 avecmoteur A8TAZOU.En utilisation depuis 1958, ila ont des missions d'observation at da liaison.Notons qua 1' arade a conclu rdcement uncontrat pour 1V achat de 46 hdlicopt~rea AGUSTA 109 dont 28 recevrontuna mission antichar ot 18 auront une mission d' observation st doaliaixon.Leur livraison at prdvue dOs is mois de juin 1991.Unetrentaine (32) d' ALOUBTTBS II resteront quand-mime en service commahdlicopthre de liaison , main uniquement en version ASTAZOU.
-FORCE AERIEk4NE: 5 hdlicopt~ras SHAKING prdvus spdcialesent pour des opdrations desauvetage en mar.
-FORCE MAVALE: 3 hdlicoptires de type ALOUETrE III, avec des missions de sauvetage en
-GENDARMERIE: 3 h4licoptbres de type PUMA.
Los hilicoptbres de la Force Terreatre feront 1V objet de cat expood.Ils sontutilisds dana des conditions climatiques tris varides, allant d' un climat maritimemoddre en Belgique & un climat continental pius vera 1' Est.En principe loa conditionsclimatiques sont assez favorables point de vue tempdrature , avec une humidit&
3-2
relativement dlevde.Normalement, on no connalt gubro do problbmes dus & des tempdraturesextrimement basses. Cependant, lea anndes S0 ont dt6 marqudea par une succession dequeiques pdriodes d' hiver tris sdvbros ainsi que queiques p~riodes nettement plusmoddrdes.Pendant ces p~riodes d, hiver s6v&res, des probl~moa se sont manifost~s.
b.Poaition du problase.
Pendant les pdriodes d, hiver au cours des anndes 80, 1' armde beige a connu doconsiddrables problirees do d~marrage sur see hdlicoptbres do typo ALOUET25 II pourvu doturbomoteurs do type ASTAZOU II A2.
L' oxposd reprendra toutos les phases du problAme, do s ddtection jusqu' auxsolutions dlabordes ainsi quo sea consdquences budgdtaires.
2. THEORIN RLEMEIITAIRX DR LA PHASE DR DENARRAGE DES MOTHURS ASTAZOtI.
Le circuit do dimarrago s compose do 4 parties (annexe A)
-la micropompe (1)-Is robinet 4 voies (2)-Ia prise d' air du carter turbine (3)-lea allumeurs-torches (4)
Le fonctionnement est 10 auivant.DA-s la mise en marche, la micropompe aspire lecarburant et en premibre phase purge son circuit.Quand la pression a' 4slive, 1ecarburant eat refould vera le robinet 4 voies qui contient une bille.La pression ducarburant repousse Ia bl aur son sibgo et ouvre ainsi Ia voie vera lee allumeurs-torches en bouchant la sortie du kdroshne vera la prise d' air P2 qui eat une prise d,air totale A la sortie du compresseur centrifuge.Le kdrosbne eat injectd dana la chasabredo combustion et onflammd par lea allumeurs- torches.
Une fois quo 11 allumage eat rdalisd, la micropompe eat coupde automatiquement; lapression carburant retombe A zdro et "a bills du robinet 4 vois eat soulevde do sonsibge car d, un c~t6 elhe oat soumiso & la preasion totale P2 et de 11 autre c~td elleregoit la pression statique regnant au niveau des allumeurs-torchee laquelle eat plusbaase.Ce courant d' air st~che lea tuyauteries et 6vite 1' encrassage des allumeurs-torches par carbonisation du kdrosbne.
3. LA SURCHAUFFE AU DEI4ARRAGE.
a.Tempdrature iddale do ddearrage.
Le constructeur a ddfini dana son manuel do vol une tempdrature iddahe do ddmarrageT4 de 450 OC pour moteur froid at do 550 0C pour motour chaud; on considire qu, unmoteur eat chaud quand la T4 rdsiduelle eat do plus de 100 OC et do momns do 150 OC.Enrospectant ces plages do tempdraturo bora du ddmarrage, 1e bon fonctionnoment duturbomoteur no devrait pas Atre probldmatique.
b.Surchauffe au ddmarrago.
Dana son manuel d' entretien 6dition Dic 1987, le conatructeur a, d' une monibreeapirique, donn6 des tempdratures do aurchauffe au ddmarrage.Ce sont des tempdraturos &no pas ddpaaser lora du ddmarrage sous peinb d, ondoasagement do Ia turbine.Voici leacontr~les qul il a prdvu:
81 T4 >750 OC pondant t > 5 eec: Le moteur doit retourner en usine pour rdviaion.
S1 T4 > 750 OC pendant t <5 sec: Le motour peut 8tro maintenu en service aprdsOU T4 > 700 0 C mais < 750 *,' certains contrdles apdcifiques & ho 255.
La tazepdrature do surchauffo ddper.d principalemont do l& matibre do constructiondes aubes des diaques do turbine.
c.Loa causes do surchauffe au ddmarrage.
Pour nos hdlicoptbres, quolquos causes "classiques" do surchauffe au ddrnarrago sontconnues.
(1). line tension do batterie trop foible provoque une tensior primaire et socondaire d,allamage trop basse.L' allumage oat retardd tandis qu' un excbs do carburant a'accumule dana 10 carter turbine.Ce surplus do carburant a' enflamme d' une manidrebrutale bora do 1' allumage, il en rdsulte une tempdrature do ddmarragp excessive.
(2). U'n fonctionnement ddficient du robinet 4 voies.La bille se trouvont dana 1s corpsdu roblinst paut se )bloquer eL p~rdre son 6tanchditd par 10 givre ou par 1lencraaaement.Ainsi, du carburant envoy6 par 1a micropompe pout entrer dans bechambre do combustion aussi bien par la prise d' air P2 quo par lea ollumeure-torches.X1 en rdsulte un apport excesaif do carburant par la prise do pression quiaboutit & us.'urchalaffe au ddmarrage, bra do so miss & Leu.
(3). En dehora do ces causes primaires, ii existe quelquoe causes secondaires do.surchauffe au ddmarrage, notammont:

3.3
-La prisence di' eau dans Ie carburant.L' Administration Fdddrale do 11 Aviation indiquequl une concentration de 30 ppm peut; ftre dangereuse car shle pout provoquer le blocagedui robinet 4 voles lors dui refroidissement du earburant.-Le bypass de ha pompe de carburant mal r~gld pourrait provaquer une pression decarburant trop &levde.-Un siauvais fonctionnement du r~gulateur barostatiqus qui pqrset la rigulation dui ddbitcarburant en fonction de 1' altitude.-One pression micropompe trop dlevde.-One entrde 41 air obstnu~e, mime partiellement.
4. LES SURCHAUFFES AU DEMARRAGE DAMS LES ESCADRILLES .ANALYSE DES INCIDENTS ST
ACCIDENTS.
a.Les p~riodes d' hiver 1982/83 jusque 1984/85.
L' annexe B reprdsente un dtat r6capitulatif des incidents et accidents pourlesquels un avis technique a dt6 dtabli par la 255 pendAnt la pdriode 1982-1994.Sur untotal de 70 hdlicopt~res, on compte 23 accidents/incidents dont 5 dus aux surchauffes auddmarrage.Deux de ces incidents dtaient causds par un erreur de pilotage; les troisautres avalent une cause purement technique: le gel dui robinet 4 voies par tempsfroid.Le coft d' une r6vision qgdrale s' d6ve & environ un million de FB (prix 85 nonactualisd) sans compter 1.' immobilisation de 1' hdlicoptire, lea frais de dipannagedventuels, le main d' oeuvre.... 11 va de soi que des incidents successifa, coma us sosant produits au d~but 1985, sont trig lourds & supportor.Non seulement, UlS consommententre 15 et 20 % du budget prdvu pour 1' ann~e, mais ils ont dgalement une Influencedirecte sur la disponibilitt des machines et sur le planning des heures de vol.
b.Analyse des problimes.
Les problbmes de surchauffe au dimarrage dtaient relativement bien connus.De tempsen temps, des surchauffes se produisaient suite & mne mauvaise manipulation du piloteou & un d~fau' technique.Les deux cas mentionnds en 1982 en sant Ia preuve.La 255 avaitd' ailleurs dij& ddit6 depuis 1e mois de juin 1978 une instruction technique pourattirer 1' attention dii pilots sur ce phdnom~ne.Ces instructions techniques dmises parla ?55, qui, en mati&re de sdcuritd de vol, priment sur tout autre document (sans Atreen contradiction avec cehui-ci naturellement), traitent des probl~mes spdcifiquesrencontrds Bur nos LI,~icopt~res.
L' IT II B4 n0 3 en qi'estion parlait de Ia tempdrature iddale de dimarrage, commedifini ci-dessus et indiquait les causes possibles de son ddpassement.En ce qui concernslea temp~ratures maximalea autorisdes au ddsarrage, elle rdf~rait simplement au manuelde vol.Cette IT de,'ait 6tre portdfe & la connaissance des pilotes r6gulibrement et pourmarguer son importance, des briefings spdciaux 6taient donzids systdmatiquement.
Lea trois incidents de ddbut 1985 dtaient considdrds comae mne suite plus ou momnsaldatoire dont la cause prdsumde dtait le givrage de 1.' eau dc' condensation dane lerobinet 4 voies.C' eat pourquoi que le commandement Bs limitait a envoyer queiques notesde rappel de 1' IT traitL-nt dui vol en atmosphbre neigeuse et givrante.On imposaitdgalement la miss en place des housses de protection d~s 1' arr~t de la maLhinle.Lesmesures prises paraissaient addquates car au cours de 1' annde, il ne se produisait plusde surchauffe.
c.La piriode d' hiver 1985-1986.
Pendant la p~riods d' hiver 1985-1986 quatre aurchauffes au d~marrage asproduisaient dana in ddlai de trois senaines (annexe C).C' dtait in ddsastre, deuxmoteurs devaicnt sub-.r une RG, lei deux autres devaient subir mne VNIP.Les frais der~paration s' dlevaient A environ 7,5 millions de FB.Les causes des incidents Etaient achaque fois soit un robinet 4 voies gelE, joit une battense trop fa'.ble, soit unecombinaison dLs deux facteurs.Le ndsultat Etait catastrophique car il ne reatait plus
*aucun moteur de rdserve pour le ddpannage des machines immobilisdes.
*d.Analyse des probl~mes.
Au d~but de 1' hiver des briefings spdciaux avaient encore 6t6 donnds sur leprobl~ms de surchaiiff, am d~marrage; la rdaction des autoritds ne se fainait pas
kattendre.Des sanctions pdcuniaires pour le reaponsable de 1' incident farent propgs~s etla 255 f~t incitike h siortir des nouvelles IT; mais le premier pas envers la solution duiproblbms Etait la mise sur pied d' une commission d' enquAte pour traiter le probl~msdans sa globalitE,Dbut mai 1986, la commission d' enquAte sortait sea rdsultats.
Coma premibre cause principals des problimes, ha com.ssion indiquait la faiblecharge de la battense, elle proposait alora de faire part icu i~rement attention auvoltage et aux tests de batterie pendant lea piriodes d' hiver.Elle proposait dgalementde faire remplacer la gdndratrice DYNASTAR par une gdn~ratrice A courant de chargementsup~nieur et de aire constnuire. en collaboration avec he constnucteur, in circuit deprotection pour couper automatiquesent ha sdquence de ddmarrage si la tension battensedescendait en dessous dii scull dangereux de 14 Volt.[
Cosine deuxibme cause principale, le bon fonctionnement du robinet 4 voies Etaitmien question.La commission propoaait de chercher mne solution en collaboration avec leIconstnucteur om bien en d~plagant le robinet 4 voles ou bien en plagant in syst~ms doprdchauf fags dii robinet 4 voies.Elle proposait Egalement de faire la assure dii degrihygrom~trique dui carburant en d~but d' hiver.
3-4
On cft qui concerne le problbme de la batterie, il avait ddjh 604 remarqud au debut1985, suite & une consosamation anorm&le d' 616ments do baLcarie qua ce.les-ci dtaientsouvent insuffisamment chargdes et qua la m~thode de charge at de d~charge parimpulsions pouvait Atre amdliorda.Ce problbme a, aggravait en hiver car Is batterieperdait de sa capacitd.Sur base de cos arguments, Is ddcision dtait prise de former learesponsables de Ia charge des batteries diractoment en usine chez !a firme VARTA at d'Atre beaucoup plus s56re lore du contr8le des dldmdnts.Les frais de remplacement desdliments batterie pour Ia p~riode 1985/87 s' dlevait & 5,5 millions de FB.Bn outre, denouveaux chargeurs de batterie dtaient acquis pour une valour tocale do 600.000 EB.Laproposition do placer un circuit de coupure du dimarrage coupl4 A is tension batterie n'dtait pas dtudid.
Les dtfectuositds constatdes aui niveau du robinet 4 voies dtaiont doublaa.Lemauvais fonctionnement provenait d' un encrassage de Ia bille suite aux diffdrentsd6marrages, provoqu,,nt une augmentation dvolutive des T4.Le deuxiame phdnomane sofaisait sentir en hiver, par temps froid at degrd hygromdtrique 61avd, par le blocage durobinet suite aui gel des vapours do condensation.
Pour readdier & ces problimes, una nouvelle version d' une IT II Bi no SA sortaitaui mois do novembre 1985, aprbs contact tdl6phoniqie avec la firms TURB0OI4CA.L' ITrendait obligatoiro la mise en place des cuiffas do protection 8*)r un Sol couvert donoigo at lore d' une tomp6rature do momns de 5 Oc.Elle imposait dgalemsnt au pilots derefaira une miss en marche du motour apris son arrAt jusqul A une ld6re augmentation doT4, car cotta opdration gmiLAettait de remplir le robinet 4 voies de kdrosbne et 4'dviter le gel de celui-ci.glle prdvoyait dgalement 10 nettoyaga at 10 s~ghage du filtroat du tuysu P2 ainsi qua la bl at son siL~ge du robinot 4 voies & chaque visitsmultiple do 25 hauras.
Les trois incidents du ddbut do 1986 prouvaiont qua los actions antreprises nesuffisaient pas enrora,cl ost pourquoi en mars at an novembre 1986 paraissaient dosnouvelles versions des IT 11 B4 no 3 contonant des prescriptions plus clairos atsimplifidos quant aux tempdraturas do ddcimions sinai quo lea actions h prendre par lepilots at lea mdcaniciens en cas do tempdratura ou tension anormales.
La modification du robinet 4 voles dtait do la compdtence do Ia firma TURBOMECA.Lespropositions do Is 255 6taiant tin r6chauffement du robinat 4 voies par voio 6loctrique,une solution toute simple at efficace, at dventuallemont una modification du systimolui-MGMe.L& modification ant in propoade par la firma 6tait le diplacement du robinat 4vcies (plus pr~s du motour, donc avoc moins do risques do gel) at une protectioncalorifique des tuyauteries 4u robinot 4 voies.La modification coatait environ 7000 Fpar turbine avec un ddlai do livraison da 8 mois.Quolques moteurs ont subi cottamodification.
e.La pdriode d' hiver 1986-1987.
Suita & 1' 6tude fait en 1985 at 1986, on pouvait esp~rer una natto amidliorationdes problimes poi'r 1l hiver suivant.Bn of fet, deux surchauffes au d6marrage dtaientremarqudos mais la ddgats causes & 10 turbina Ataient n6gli, aables grace h do bonnasrdactions des pilotos.Le fait quo le probl&mo itait bien connu at qruo des itesuressuffisantes dtaient prises, avait portd sea fruits.
5. CONCLUSIONS GSNNRALIS.
La problima de surchauffe au ddmsrrago 6tait dQ & deux phdnombnes tout A faitind6pendants.D' abord il y avait dos causes puromant techniques comma la d6faillance dola battario at du robinet 4 voias, qui ont Std rdsolues d' une manubre satisfaigantamais pas tout At fait complite.En affot, lea solutions difinitivos, A savoir un circuitdlectriquo do coupure du ddmarrage an fonction do la tension battarieasinsi qu' unsyst~me do prdchauffage du robinat 4 voies n' oat pas dt& retenues.En outra, le risqued' erreur do manipulation (factour humain) a dtd r6duit & un minimum par unosensibilisation at tine instruction addquate.
Satin ii no faut pas non plus exagdrar 1s phdnom~na car dapuis 1987 ii n' y a plusjamais oti do problbmes do aurchauffe au dimarrage due aui tamps froid, d' un c8td parcoquo des conditions axtrises de tempdrature sont dovanues assaz rares dans nos r~gions,paut-Atra, comma prdtondent las "'varts" & cause d' ur r~chauffosant de IS terra pareffet de serre mais surtout parco qua los pilotos sont bien conscionts du ph6nom~ne aten cas do situation anormale , uls ont & leur disposition des instructions simples etclaires.
RFPISNCES
l.Manual d' Entretien at Manual do Vol S.A. 3180 ALOUETTE ASTAZOU,SUD AVIATPION, Sociit6Nationasa do Constructions Adronautiques,PARIS,FRANCS.2.Documeitts classifi6s do la 255 Compagnio Maintenance at Odp8t d' Aviation Ldg&ro.

3-5
-CARUiURANT tJEt)AIR
Annexe A: CIRCUIT V8~ CARBURA1NT DR DEMAIIRAGE
Nom'bre dI h~liccpt~res: 70Nombre total d' incidents: 23Noznbre total de surchauffes: 5
Date cause prdsum~e Prix Rdparation (FB)
1.3 Fey 82 Non application des procddures 827.600 (R.G)17 Nov 82 Non application des procddures 1.254.800 (RG)14 Jan 86 Bille robinet 4 voies gel~e 691.63704 Jan 85 Biills robinet 4 voies gel~e 1.015.500 (VNIP)14 Jan 85 Bille robinet 4 voies gelde 1.019.250
Anneue B:ACCIDENTS/INCXDENTS DR LA PERIODE 1982-1!85
Date: 05 Fey 86Appareil:A 81GTN no 500 A 1322:30 hrCellule: 3539:20 hrIncidcnt:l surchauffe de 750 OC d' environ 2 secDonndes supplementaires:
Lieu: vocelsangL' h6licoptire 6tait stationn6 sans ses housses 'le Protection sur unemplacement en".aigd.lors du passage d' une autre machine, cette neige a pu S,&lever du so-., entrer Ie moteur et sa accumuler dana le circuit d'Ialimentation jusqu' au robinet 4 vo~es.En plus, la proc~iure de remiss enmarche aprba arr~t n' a pas dtd exdcutde.
Prix de rdparation:219.784 FF'.
Snzz baife n2
Date: 11 Fey 86Appareil:A 42GTM n0 678 h 813:40 hrCellUle: 4612:35 hrTncident:1 surchauffe de 700 00, apr~s coupure d~p'arrage & 590 00Donndes supplementaires:
Lieu:flcrzbruc'. (AIX,Ddmarrage aprba une ventilation trop longue dI environ 15 sec, ce qui estnocif pour Ie d4marreur,le relais dimarreur et la batterie.
cause prdsum~e:Gel du robinet 4 voies bien qua Ia machine ne stationna que 5 minutesdans une tempdrature ldgbrement ndgativc.Prix de rdparation:150.656 FF', soit Ie prix de 11 expertise car la turbine n' a pas 6tdendommagde.

3-6
Surchauffa nO 3
Date: 25 Fey 86Appareil:A 78GTM n0 551 & 1361:55 hrCollule: 3570:40 hrIncIdent: Deux d~marrages suc'~essifs anormaux de 630 OC, suivi d' une surchauffe de 750
OC pendant 1 sec.Le 19 Fdv 86 une premibre surchauffe de 730 OC pendant 1 secavait d6j& eu lieu.
Donndes stpplementaires:La tempdrature extdrieure etait de -5 OC.Un 'contr8le le lendemain indiquaitque Ie robinet 4 voies dtait bloqud par le gel.
cause prdsumde:Gel du robinet 4 voies et suite aux tentatives successives de d~marrage,un affaiblissement de la batterie.Prix de rdparation:171.549 FF plus remplacement de la DYNASTAR et le relais d~marreursuite au refroidissement insuffisant entre les d~marrages.
AnrhauffenO
Date: 25 Fey 86Appareil:A 93GTM no 376 A U473:35 hrCellule: 4505:40 hrIncident:l surchauffe de 800 OC pendant 1 sec.Caujse prdsumde:R~action retardive do la part du pilote pour arr~ter la phase ded~isarrage, la batterie ne poseddant pas Ie voltage minimum n~cessaire pour effectuer unddm&rrage correct.Lieu:Ecole d' Aviation Ldg~re & BRASSCHAAT.Prix de rdparation:229.178 FF
Amnexe C:ACCIDENTS/INCIDENTS DO LA PBRIODS D' HIVER 1985-1986
Date: 13 Jan 87Appareil:A 95GTH n0 718Incident: Lors d' tne premibre mise en route, la temp6rature de 700 OC a dt atteinte,
lors du deuxi~me ddmarrage, elhs dtait de 600 OC.Le robinet 4 voies a dtdpr~chauff6 par un "crimp games heater" emprunt4 aux paracommandos.Apr~s cetteop~ration, un ddmarrage normal dtait possible.
Donndes supplementaires:Lieu: Schaf fan'rempdrature extdrieure:-17 O0
GrAce & une intervention correcte du pilote, la turbine n' a subi aticun ddgat.
Surchauffe nO 2
Date: 15 Jan 87Appareil:A 79Incident: A Cologneun d6marrage au moyon d' tin groupe a dtd rdalisd apr~s prdchauff age
du robinet 4 voiss A 1' air ctaud.Apr~s tin vol d' environ 3 heures, Ia turbinea dtd coup6e et remise en route immddiate,jisqu' & tine augmentation de T4 de300 OC.Les housses de protection ont 6td mises en place aussit8t.Aprks 25minutes, tin nouveau d~marrage &. 6t6 tentd salon la procedure normals durantlaqual tine montde anormale de T4 jusque 600 0C a dtd remarqud.Aprbsprichauffage du robinet 4 voies,un ddmarrage normal a Pu avoir lieu.
Donndes supplementaires:Lieu: SoestTemp~rature:-11 OC et vent d' Bat assez fort et froid.
Annexe D:ACCIDENT/IkICIDC'NT5 DS~ LA PERIMD' HIVER 1986-1987
4-!
AVIONS D'AFFAIRES MYSTERE-FALCON
EXPERIENCE OPERATIONNELLE PAR TEMPS FROID
C. DOMENCResponsable Propulsion
DASSAULT- AVIATIONBoite Postale n' 24
33701 MERIGNAC CEDEX - FRANCE
- MMILLE DES AVIONS MYSTERE-FALCON
Breve prdscntation des diff~rents modeles, de leur domaine de vol, des caractdristiques dc leurs moteurs,
des systces dc demarrage.
-EXPERIENCE DU DEMARRAQE PAR TEMPS FROID
Campagne d'essais jusqu'A - 40TC dans; le cadre de la certification, comportecnt des syst~mes dedernarrage dlectrique A bass(, temptdrature, proc6durcs opdrationnelles correspondantcs.
Domaine de d6marragc en vol.
-EXPERIENCE EN CONDITIONS GIVRANTES
Mrve description des systemes de protection comie le givre, prdI~vements d'air moteur, niCthode de
certification, experience en service.

4-2
Depuis la certification en 1965 du MYSTERE-FALCON 20, Ia Socidtd DASSAULT a prodoit plus de 1000 avions
d'affaires A ridaction qui ont accumuld 5 millions d'heurc-s de vol en service.t ~Cottefamille d'avions compronxd los bi-ridactcurs de type FALCON 20 et FALCON 10, ainsi quo lcs tri-.-actcnrs de
typeFALCN 50et FLCON900.Actuellemnt sculs lcs tri-ridacteurs sont crn production., mais on nouveau bi-rdacteur, le FALCON 2000, ost en cours
de d~veloppcmtent pour comph~tcr la gamine.
A. - Caractdristiques pcjngicl.
Type Nbre de passgcrs Moteur Rayon d'acion Mach Maximum Atitude
(avec irdscrves Nt3AA-It5
R) Maxinium
FALCON 20 8/10 2 GENERAL ELEMCTR 1400Nat 085/088 42000 ft
CF 700
DERIVES DU
FALCON 20:
tF200/F200 8/to 2 GARIU5rFrI-'3 2200 Nat 0865 42000 ft
P20.5' 8/to 2 GARRUtT 2200 Nmn 08s/0 88 42000 ft
W'E 73-2A
FALCON 5O 8/14 3 GARRUtT 3200 Nin 086 49000 ft
'E 731-3
FALCON 900 8/19 3 GARRUtT 3900 Ni 0.87 51000 ft
WEti731-SAR
Re-motorisation des NO0 en Service.
Tous cos avions dtaient de technologie trts modorne ao nmonment do leor certification tant en cc qoi concorno los
syst~mes, dont los motoors, quo I'adrodynamiquo ct la structure.
En raison de leurs performances ils sont tous enti~rement dquipds do commandos do vol servo-ccmmanddos. C'idtaitone premiere poor un avion civil bors deo a certification do FALCON 20, Ct cola a contribud A l'agr~mont particulior
do pilotage do ces avions oi~antmoment appr~cid.
L'optimisation des voiluros par le calcol a commenc6 avoc le FALCON 10 ot a 616r compl~tement rdalis6o poor Ie
FALCON 50 et le FALCON 900 dont la voiluro est optitnisdo on r6gimc suporcritiqoc. Tous c0$ avions (tnt dos
dispositifs hypersustentatours do bord d'attaquc et do bord do fuite des voiluros pour pormettro l'emploi do pistos
coortes utilisdcs par I'amiation d'affaircs.

4-3
Les formes arri~rcs dc fuselage ont W~u particuli~rezncnt etudides sur les tri-r6acteurs FALCON 50 et 900 pour
r~duire la trainde cn croisiarc.
Lcs voilures sent A structure inttdgrale sur tous les mod~Ics. Un FALCON 10 est en service depuis quclques -inndes
avec une voilure A caisson en composite carbonc. Les matdriaux composites sont utilis~s sur le. FALCON 50 et
surtout sur le FALCON 900.
B. - Domaine de vol typiu
A titre d'exemple on trouvcra ci-apr~s le domaine d'emploi du FALCON 900 en tempdraturc/altitude, avet la zone
de d~collage effectivement ddmontrde jusqu*A 14000 ft (LA PAZ) et le domaine de rallumage en vol garanti jusqu'A
30 000 ft
C. -Motur
Avion Moteur Dicollage Croisi~rc Observations40000 ft M - .8
Pose rFaux de 'Faux de Cs (lb/lb/br)lb compression dilution (non installie)
M.0 CF 700 4300/4500 1 6.-S 2 0967 Pan arnrerF200 AMF 5200 j 21 2.9 080 Triple corpsPlo TEE 731.2 3230 j 13 27 081 Fan avant avec rdcteurP50 TEE 731-3 3700 14 7 I 28 0814 ran avant avecr iductcar
P900 11mi 731-SAR 4500 j 14.7 36 0.759 Fan avant avec riducteur__________ _________ jet tuy~re A mlangeur
-Remarques g6ndrales sur ces moteurs:
N le CF700 dtait le premier petit rtdacteur A double flux. Une roue tutbine/fan dtait rajoutde derriere ung~nerateur type 0J610. Pr~figuration des UDF actuels de GENERAL ELECTRIC.
4 I'ATF3 est le seul petit rdacteur double flux, triple corps, avee le corps haute pression juxtapose dI I'arri~re
d'un double corps fan/basse pression.
a les TEE 731 ont Ld(6 les premiers rdacleurs utilisant une regulation dlectronique.
a les taux de dilution modd&6s permetient de limiter le diam~tre du moteur A des valeurs compatibles avecun montage sur le fuselage arritre.
-Caractdristiques. de ecs moteurs Iifees au d6marrage, en particulier A basse tempdrature

4-4
0 Pointe du couple rdsistant, A - 40*F (-40*C).
CF 70) ATF3 731-5AR
Vitesac prise ddmarrcur (tours/minutes) 850 M2X 1350
Couple r6sistant (L[B.FI') 65 40 35
Puissance m~canique correspondante (WVatts) 1 7800 6777 6710
Ccs puissances sont compatibles avec un syst~me de ddmarragc 6lectrique, Lc CF700, malgrd ion faible taux de
compression, est plus exdgeant car le compresseur dans son entier est entraind Par le d~marreur, alors quc seul lecompresseur HP (centrifuge) de faible inertie ct do taux de comprcassion nioddrd (2 A 2.5) est entrain6 sur I'ATF3(M3) et sur Ic 731 (N2).
On peut noter que sur lc TFE 731 le fan est coupl6 au compresseur BP par un r6ducteur qui n6cessite une quantitd
d'huilc augment6e, d'ob un impact sur le couple rdsistant, mais momns fort que si le di~marreur devait entrainer
l'ensemble.
w Les dispositifs de gdomdtrie variable d'entrdc d'air (CF 700, ATF3) et les vannes de ddcharge aident
diminuer le couple resistant au d~marrage.
0 La r6gulation 6lectroniquc des ATF3 et TFE 731 dose le dc~bit carburant au d6marrage en fonction de Ia
tempdrature ambiante. Un enrichissernent autematique est prdvu au-dcssous d'une tempdrature interturbine de
400TF. Une commande manuelle permettant de maintenir l'enrichissenient au-delA de 400*F pour Ics d~marrages Aibasse tempdrature cat montde sur Ics FALCON 10 et 50.
x La charge des accessoires avion est faible. 11 nWa pas dt n~cessaire d'utiliser un by-pass des pompes
hydrauliques. La gdn6ratrice 6lectrique sert de ds~marreur et ne retrouve sa fonction g6ndration qu'apras Ia fin du
d6marrage. Seion Ics eas, il pout etre necessaire dc temporiser Ia misc en ligne de Ia gdnidratrice pour laisser Ie
moteur accdl6rcr entre I? fInm do ]a sdquence de demarrage et Ic ralen'i.
D. - Svst Me de demarrage
- Sur ccs avions de bilan dlectrique moddrd, I'analysc A montr6 que Ie meilleur compromis en poids et en prix tait
d'utiliser une gendration 6lectrique en courant continu 28 volts, Ia gendratrice servant aussi de d~marreur.
Pour pcrmettre le demarrage autonome des moteurs, deux batteries (Nickel-Cadmium) sont necessaire.
Les g6n6ratrices (une par moteur) utilisdes sur Ics FALCON ont une puissance dc 9 Kw (sauf FALCON 200: 10.5
Kw), les batteries sont de 36 Ah sur Ics FALCON 20 et. 200, de 23 Ab sur les autres modls.
IMM I
4.5
*Le couplage des batteries en sdrie ou en parall~le au cours du ddmarrage est choisi scion leur rdsistance interne dcfagon A maintenir une tension satisfia.A' aux bornes du d~marrcur jusqu'a une tempdrature ambiante assez basse:
*S6rie uniqucmcnt sur Ic FALCON 20 CF700.*Parall~le ou sdrie (A basse temperature, stir selection dui pilote) sur les FALCON 10, 50 et 200.
*Parall~Ie uniquement sur le FALCON 900.*Une assistance par la gendratrice dc l'APU, ou par celle d'un moteur d~ja ddmarr6 est possible sur Ica;
FALCON.
-L'tat de charge des batteries et leur temperature sont des param~tres essentiels du demarrage A bassetemperature.
3. - EXPERIENCE DU DEMARRACJE PAR TEMPS FROID
3.1. - FALCON 20 - CF70
-Une campagne a eu lieu en FINIANDE et NOR VEGE en 1966 jusqu'A momns 28*C.
*Apr&s exposition d'une nuit sans protection particuli~re, lea d~marrages se font correctement avec lea
batteries de 36 Ah en seric.Le seul ennui rencontr6 eat l'obturation d'une tuyauteric de regulation, modifide ultdrieurement par
GENERAL ELECTRIC.
3.2. - FALCON 10 TFE 731-2
- Deux campagnes d'esaaia ont eti lieu la premiere en 1974 en ISLANDE et aui CANADA (FROBISH-ERBAY) jusqu'A - 30'C, Ia deuxi~me en 1975 au CANADA (FROBISHER BAY et YELLOW KNIFE) jusqu'A-45*C.
-La procddure de d~marrage ati-dessous de 5'C conaiste A coupler lea batteries en aerie pour d~marrer lepremier moteur et en parall~le pour d6ntarrer le second
M Demarrage sans protection particulitre des batteries ou des moteura apr~s u- sdjour prolong6 auifroid.
.Avec des batteries de 23 Ahi le premier moteur d6marre juaqu'A - 10*C/-15*C. Avec des batteries de36 Ah cette limite passe A - 25*C/- 30'C: tn demarrage marginal A -30*C a durde 65 secondes avec allumageau bout de 45 secondes et ITT' maximum 820'C pour une limite de 860*C.
.e second moteur ddmarre dana tous les ess, apr~s tin sejour prolong6 entre
- V0C et - 40*C.
.Le premier moteur a pu 6tre ddmarr6, avec les batteries de 23 Ali, apr~s un adjour de 4 licurcs A.-30'C, apras deux tentatives infructueuses qui avaient rechauff6 lea batteries de - 10*C A OiC et diminud lapounte initiale de courant de 1000 A/12.SV A 825A/I1.5V.
Itt

4-6
W Ddmarrage du premier moteur avec syst~mes de r~chauffage branchids sur des panneaux
d'alimentation ext6rieure.Richauffage des batteries par couverture electrique chauffante CSA 120V/80W.
Apr~s tine nuit et tine matinde passees A - 40*C/- 43CC, la tempdrature des batteries se maintient A50C et le moteur demarre. La temperature de I'huile dtait de - 43*C.
Le d~marrage eat difficile le fan tourne lentement, on considre qu'au-delA de - 35'C it vaut nieux rechauffer
le moteur.Rdchauffagc des moteurs par ventilateur CTC 120V/850W.
L'instaflation de ce ventilateur dans I'entr6e d'air avec les caches entrde d'air et tuyauterie normaux ou avec
une couverture molletonn~e A trois 6paisseurs isolantes enveloppant toute la nacelle a permis de ramener la
tempdrature d'huile respectivement de - 43*C A - 270C et A - 18*C. La couverture permet de gagner 10 A 20*Csans vent, 20 A 30*C avec tin writ de 10 Kts.
La d6marrage a Wt facile.
-Durant ces essais, des anomalies de fonctionnement des calculateurs dlectroniques du moteur lars de la
chute de tension en idbut de d~marrage ont amend le motoriste i modifier cette version initiate des
calculateurs.
Avec des batteries de 23 Ah, la chute de tension initiate batteries en sdrie, si tea batteries ne sont pasrechatiffees, peut amener une insuffisance momentande de l'allumage et tin passage en mode manuel du
calculateur moteur Tout rentre dans l'ordre quand le ddmarreur prend de ]a vitesse cc qui s'accompagned'une augmentation de sa force contre-electromotrice, d'oii une remont6e de la tension et tine batsse du
courant d~bitd par des batteries.
La pression d'huule, moteur non r~chauffd, peut atteindre 80 A 100 psi et demande 4 A 5 minutes avant derevenir dans la plage habituelle infdrieure A 55 psi.
- tin indicateur N2 qui se btoquait au froid a 0t6 modifid.
3.3. - FALCON 50 TFE 731-3
-Des essais ont eti lieu en FINLANDE, puis au CANADA (FROBISHER BAY - FORT CHURCHILL -CAMBRIDGE BAY) en 1980 jusqu'A - 39*C.
-Les moteurs et les batteries sont tr~s proches de ceux du FALCON 10, Ia gdneratrice/demarreur eat d'unmod~le different, l'APU qui n'existe pas sur FALCON 10 est optionnel stir FALCON 50.
-La premiere serie d'essais en FINLANDE a montr6 la ndcessite de r~chauffer les batteries ati-dessous de -10*C/ - 15*C cc qui est homogene ati FALCON 10.
Les couvertures chauffantes de 80W du FALCON 10 se sont avdres insuffisantes, des couvertures mietixadaptees de 120W et 150W ont et essaydes ati CANADA. I b 150 W, trap puissantes, donnaient deselevations de temperature des batteries excessives (65,1 7("C). Las couvertures de 120W ont et retenucs
(6chauffement de 55*C) avec, dans Ic kit grand froid .X duit des essais, tine coupure de r~chauffage A tine
temperature batterie de 25'C.
4-7
L'APU et les moteurs doivent Etre rdchauffes au-dessous de -35-C. Le fan ne peut Etre tourn6 A la main
sans r6chauffage A - 350C.L'APU est r6chauff6 par un ventilateur de 850 W plac6 dans l'entrdc d'air, obturateurs d'entrde d'air et
tuyfre en place.Los moteurs ont dte rehauffes soit par deax ventilateurs (entree d'air et tuy~re) de 850W, soit par un
prdl~vement d'air branch6 sur Pavion qui suppose I'APU ou un moteur en fonctionnement. Le r6chauffage dumoteur permet ]a rotation du fan, mais l'huile contenue dans le relais d'accessoires reste A la temp-rature
* ambiante.
-Un d~marrage apres 31-30 A - 27*C sans aucun r~chauffage a W.t essayd. Les batteries etaient A -15*C, l'huilemoteur A - 17'C/ - 230C, le caisson APU A - 14*C.
Aprts un dtmarrage correct de I'APU sa gendratrice est coupee pour simuler I'avion sans APU. Deux essaisdce d6marrage d'un moteur batteries en s~rie sont interrompus par le pilote A cause de la perte d'indicationN2 (tension trop faible). La troisi&,ie tentative, batteries en parallele est normale, les batteries 6tant
maintenant a + I5*C.
-Avec les batteries rdchauffees et une ambiance de - 31.5*C (temperature d'huile - 31*C) le demarrage est
possible batteries en parale ou en sdrie, mais dure 40 sec avec IT717 = 660*C en parallele, pour 26.5 see ct
ITT = 475*C en serie.Si I'assistance d'une gendratrice moteur ou APU est utilisc celle-ci fournit environ 30% du courant soit 460
Amp.
- Avec les batteries et les moteurs rechauffes (temperature inferieure A - 35*C) Ic premier nioteur estdemarrd batteries en serie, les autres batteries en parallale avec assistance 6ventuelle des generatriccs.
A - 390C, batteries A + 280C, huile A - 35*C (relais d'accessoires) le moteur demarre en 21 see,
ITT = 550*C.
- Des essais conparatifs d'huiie MOBIL JET JI et EXXON 2380 nWont montre aucune difference perceptibledes caractdristiques de demarrage maigre leurs viscosites differentes.Un contacteur electrique du circuit de demarrage a dQ 8tre rdchauffc-.
3.4. - FALCON 900 - TFE 731-5AR
-Des ressais ont eu lieu en 1986 ct 1987 A FROBISHER BAY jusqu'A - 39*C.
-Cci avion est proche du FALCON 50, les moteurs ont un peu plus d'huile, PAPU dtant de base sur cetavion le c-ouplage des batteries est uniquement parall~le et I'assistance au d~marrage par le g~nk ratrice de
l'APU est ;ystdmatique.
-Un essai a montre qu'il etait pomoibir de demarrer sans assistance et sans rechauffage apres 12H passees
entre -15*C et -19*C.
L ie reehauffage des batteries par les m~mes couvertures de 120W que sur le FALCON 50 A des
teiratures inferieures A - 15TC a Wt utilise (hors l'essai ci-dessus)Le rdchauffage des moteurs au-dessous de - 35'C, au lieu d'utiliser les ventilateurs de 85OW a Wt fait A partir
de groupes de piste permettant de souffler de P'air chaud sur les zones A rechauffer, en particulier sur lescharni~res des capots; avant d'ouvrir ceux-ci pour r~chauffer le r~servoir d'huile ci le relais d'accessoircs ce
qui n'Ctait pas fait sur le FALCON 50. Un brassage du fan a la main d'une quinzainc de tours assure sonUcbiocagc
4-8
Le r6chuE iffage de l'APU, quand ii est lubrifid par de I'huile type I (ESSO 2381), n'est en principe pasndessaire. Mais le temps de ddmarrage observd conduit & recommandcr le rdcbauffage A tempdrature
infdrieure A - 35*C.
-Pour couvrir le cas de panne de I'APU, un moteur a 6t6 demarrd sans assistance A - 39*C, batteries & +30'C, apres un r6chauffage de 15 minutes (T huile = 35*C). Le d6marrage est long (1 minute 48 secondes)
sans surchauffe (I1T = 548'C), c'est un cas marginal.Avec assistance, le temps de demarrage est d'une trcntaine de secondes.
3.5. - FALCON 200 - ATF3
*Unt; campagne d'essais a eu lieu en 1982 A YELLOW KNIFE jusqu'A - 48*C.
*Par rapport aux TFE 731 dquipant les FALCON 10, 50 et 900, l'ATV3 n'a pas de r~ductcur de fan ce qui est
un peu favorable.
L'avion ..st dquip6 de batteries de 36 Ah (37 Kg contre 25 Kg pour la batterie de 23 Ah). Leur rdsistance
interne plus faible donne momns de chute de tension initiate que les batteries de 23 Ab.
*Sans protection particuliere it a dt6 possible de d6marrer jusqu'A - 25*C.
-Avec rdchauffage des batteries (tenip~rature infdrieure A - 30*C) par les couvertures de 120W, il a dtd
possible de ddmarrer A des temp6ratures de I'ordre de - 45*C sans r~chauffer Ie moteur, apres avoir tournd Iefan & Ia main. Quelques stagnations de r6gime entre Ia fin de demarrage et Ie ralenti, rattrapables enavan~ant Ia commande de gaz ont 6t6 observdes et corrigdes par le inotoriste dans une version ult6rieure du
calculateur.
3.6. - RESUME DES PROCEDURES DE DEMARRAGE PAR TEMPS FROMD
- Pour les FALCON dquipds de moteurs GARRETIT TFE 731 oti ATF3 il est recommandd de tourn--r Ie fan
A Ia main avant un d6marrage A temp6rature n6gative.
- Jusqu'A - 10*C/- 15*C (batteries de 23 Ab) ou - 25*C (batteries de 36 Ab) aucun rdchauffage n'est
n~cessaire, le demarrage autonome est possible en s~lectionnant le d~marrage LOW TEMP, batteries en
sdrie, pour le premier moteur (sauf FALCON 900 ---- > assistance APU).Pour une exposition prolong6e au-dessous de ces tempdratures, it faudra prdvoir un r~chauffage des batteries.
*Au-ciessous de - 35'C il faudra 6galement rechauffer le r6acteur (mod~le TFE731) et I'APU de pr~fdrenceavec un groupe de piste (air chaud).
*Le deuxiame rdacteur d6marre toujours batteries en parallele, le troisieme 6galement.
-Une pression d'huile forte peut 6tre atteinte, en particulier s'il n'y a pas eu de rdchauffage du relaisd'accessoires.
Les carburants utilisds au CANADA dtaient du JET Al ou du JET' B.
-Le dispositif d'enrichissement manuel, peu utilisC sur les FlO et F50 n'a pas 6t0 reconduit sur Ie F900.

4.9
3.7. - DOMAINE DE DEMARRAGE EN VOL
L Ie domaine d'altitude ddmontre sur les FALCON 20,10,50 et 900 est 0 -30000 ft et 0-35000 ft sur leFALCON 200. En cas de panne du calculateur 6lectronique l'altitude es* limitde A 20 000 ft pour 6viter les
surchauffes (debit carburant plus fort),
L Ie domainc vitesse/rdgime de demarrage en moulinet est ou non d6fini. C'est l'intdrdt du d~marrage
6lectrique que d'etre disponible a tout instant et pratiquement inddpcndamment des conditions
d'altitude/vitesse, une consigne, du genre N2 < 15% :-utiliser le d~marreur, peut suffire.
4. - EXPERIENCE EN CONDITIONS GIVRANTES
4.1. - DESCPTION SOMMAIRE DES SYSTEMES D'ANTIGIVRAGE
-Tous lea FALCON sont dquip6s de circuits d'anti-givrage par air chaud prdlev6 stir lea rdacteura. Its
protgent l'intdgralite des bords d'attaque des voilures, ain'i que les entrdes d'air des r6acteurs.
-La zone rdchauffee de l'entrde d'air vanie selon l'application:
FALCON 20) CF 700. Entree d'air a double conduit (un pour le compresseur etun pour le fan
arri~e). Rechauffage des lIvres entree commune et entree compresseur, de mfits atructuraux du conduit de
fan, du fond de ce conduit.
*FALCON 10, TFE 731. Recliauffage des ltvres et d'une portion aval du canal d'entrde d'air.
*FALCON 200 (ATF3), 50,900,20-5 (TFE 731). Rechauffage des levres uniquernent.
*Moteur central FALCON 50 et 900: en plus des levres, rechauffage des 180* superieurs du conduit
en S.
-La technologie des dcbangeurs de chaleur eat la suivante
*Pour le bord d'attaque (bees mubiles) des voilures F20/FIO/F50900, l'air chaud distribu6 par un
tube perfor6 circule dans des canaux usins dans la paroi externe et refermeds par une paroi interne.
*Pour lea l~vres d'entrde d'air, it y a eu evolution : double peau (comme. pour les voilures) sur la
nacelle CF 700, simple caisson de bord d'attaque avec .. tribution d'air par tube "piccolo" sur lea autres
nacelles, dvacuation par une double peau rdchauffant un morcau du canal d'entree d'air sur Ic FALCON 10,
dvacuation directe sur lea autres avions.
Pour les conduits en S des moteurs centraux F50 et F900, canaux en OMEGA rapportes.
-Les prelevementa d'air (avec moteurs GARRETT') consistent en un medlange BP + HP pour lea voilures et
conduits en S, en HP pur pour lea Ievres d'entrees d'air. Des vannes rdgulatrices de pression sont
generalement utilisees pour moduler Ie debit preleve en foriction du regime r6acteur.
Par exeniple pour un FALCON 900, en montee, on preleve environ 1% de HP pour les lWres d'entrees d'air
et 7% de medlange HP + BP pour les voilures et le co Lduit en S.
4-10
E Lcs moteurs eux-mdmes ont, ou non, un syst~nie d'antigivrage. Le CF700 ct les TFE731-2 ct -3 initiaux (F20
FI Nacc50es dossiers dqupd calu e vene cid iton ~vant et (GUM A r:hufg Fe 731.2/Pl cm r Oe r uCI70FF0) esu sinr ellintucls e oialain oric en soflri egv CErSCA ncle
CF700/F20, 731.2leone dace apain cta 731.3/F50),n m eue n scmpicrcs d pirea earsec den
teprauesola e ole extrapolation aux limites d oan , vol en cniin givrae nature].es. nto arclu e
NaDees:ai doerse de service etrde de coandtiosgivrapunt (GRUM AN fats 73-/1 -a deRd e u OHRsd
certification soit en soufflerie de givrage pour l'installation motrice, soit en vol pour la voilure
-Hors panne de vanne de prdl~vement, aucun cas de protection insuffisante n's Wc rapportd
-Des pr6cautions d'emploi en jour chaud et en condition statique sont ndcessaires, en particulier pour 6viterla surchauffe des bords d'attaque de voilure.

4-11
MYSTERE-FALCON 900
DOMAINE DE RALLUMAGE EN VOL
00 5 0 2 C 8 0
ATTDEMAIE EPRAURE E! LTID
-- 7-0-- 15 200 - 25- 3C.- - -0- - -
ISA
- -N-
30- % - -- -N
10--- - -- -
DEC OLLAGE liTAT ERRISSACF
-80 .80 -40 -20 0 20 40
Tompirsture statiqu. (10

4-12
/ -)
o - I-
U- V
0 -.,o_ ..--
0
I

I1RI AITY OF A SM POKRPLANTTO WIT S CONDITIONS
by
R. MeijnManager Environmental Control and
Ice Protection Systems
FOUM Aircraft B.V.P.O. Box 7600
1117 Z3 Schi1*Ol-OoatThe lst~rlmA@
.. .. E INTAKE UP LEADING 106t HEATING STRIP MY1
Several temporary flame-out incidents were INTAKE LIP NNER 2 ~ ' HETNGSRHIVATR
experienced in descent through light icingconditions and precipitation during regularscheduled flights.Previously, both engine and aircraft had beenqualified against FAR 33/JAR 9 and FAR/JAR 25including tunnel-testing and natural icing trials.Test-flights in natural icing conditions with videoobservation of the interior of the air intakerevealed ice accretion at the interface betweenengine-casing and intake-duct in mixed conditionsof cloud, snow, hail and rain while the aircraft ITAKE L 8 (AkE R AP'
exterior remained free of ice.Extensive ground testing of the engine indicated FLEAL SEAL
less tolerance to ice ingestion than had beendemonstrated in engine certification test8.Powerplant ice protection was enhanced byadditional anti-icing of the engine flexible seal Figure la : Cross-sectional view of uct (split-up)by bleed air. and bifurcation (detail).This paper discusses factors influencing unexpectedice formation and associated uncertainties in the The leading edge is continuously heated andqualification process of a small turboprop temperature controlled, originally between 40 'Cpowerplant. and 50 *C.
The group of continuously heated elements alsocomprises strips at either side of the gap; a strip
1. Description of jgWrlant ice Just below the cavity of the seal of the intake anda strip on the adaptor flange.
The aircraft is a twin-engined turboprop, designed Associated power-density is 12,5 W/In2.
for operation in icing conditions to FAR/JAR 25,Appendix C. Figure lb shows the heater sections for theThe engine is a three-shaft turbo-prop in the 2000 original duty-cycle down to -7,5 *C.horsepower-class with a maximum pressure-ratio of15,2 (max cruise).The composite propeller is driven by the two-stagefree turbine through a reduction gear-box.
The engine air intake is excentric and is providedwith a by-pass channel for foreign objectseparation.The engine has fleible mounting and consequently aflexible element is required between engine-casingand intake duct.
A 0,2 inch (5 m) gap with recessed compressionseal (silicone elastoser) is located between a
light alloy adaptor flange on the engine and aflange an the composite duct.Figure la gives a cross-section of theconstruction.The abovementioned gap runs across areas of water &or snow impingemept.
The compoiite air intake is de-iced by anelectro-thermal system, utilizing semi-conductor Te-7s'-
switching. w1: '7 E3i0 SEC 1 3 MIN
heated: the propeller blades and spinner, the inner 0 2.8 SEC 1,Ilip 1 and 2 surfaces, the duct floor and the duct *l2 SEC 16 MIN
side-walls. a Cn amurwus aO-so'The control of cyclically heated elements isdependent on outside air temperature.The power-density for the cyclically heated parts Figure lb : Engine air intake de-icingis 12,5 W/in2. configuration.

I'
3-2
Powerplant de-icing is governed by two (LH/RH) 3. Operational irnidentDe-icing Control Units, which monitor various inputand output parameters and are capable of detecting During the winter of 1988 with more than 30partial system malfunction. aircraft in service and about 50.000 hours of
flight accumulated, siveral occurences werereported of a sudden " Morary loss of torque.
2. ai In general, the so-called flame-out incidentsoccurred under the following conditions:
The engine was qualified to FAR 33 and JAR R. - flight-phase: descent, power 10 to 35% torqueFAR 33 addresses: water cloud icing conditions por - IOAT -2 to +3 *CAppendix C of FAR 25 and ice ingestion, in - altitude 8.000 to 14.000 ftparticular ice from the air intake, a 1 inch - IAS 160 to 180 ktshailstone and water, 4% of the engine core maseflow Analyzing a total of 6 confirmed occurrences theby weight. following common factors were recognized:
- incidents occurred at relatively lowIce ingestion tests at sea-level with a typical air Power settingsintake system yielded a maximum ice volume and - together with the altitude effect, this meantshape that could be ingested without damage to the that engine maseflow was lowengine compressor; an asoociated limit for ice - powerplant ice protection system had beeningestion was declared in engine certification activated prior to the incident, together withdocuments. continuous ignitionSince mechanical damage was considered the limiting - prior to each incident the aircraft hadfactor, most tests had been conducted at relatively encountered light icing conditions, while in mosthigh engine speeds, i.e. high engine power- cases rain was reported by the flight-crew and insettings, some cases snowOperational limits for ice ingestion associated - however, no or little ice was seen on thewith fleame-out were not defined, as by tradition airframeflame-out was s''osed to be covered by sea-level - in each case ambient temperatures were nearwater ingestion tests, freezing level
The powerplant was certified to FAR 25 and JAR 25. The abovementioned sudden losses of engine powerFAR 9 25.1093 spzecifies water cloud icing were characterized by a drop in torque to zeroconditions per Atppendix C and "snow, both falling percent, followed by a drop in gas temperature.and blowing"; however, temperature, density, Next, when gaegenerator speed had dropped to thewater/ice ratio and crystal structure are undefined level where relight is possible, power restored(ref.: AC 20-73 and FAA ADS-4). automatically.In the absence of definition, test-facilities and The aircraft did not leave its intended flight-pathtest-traditions in Europe, the paragraph addressing and flight safety was not impaired.snow has been deleted from JAR § 25.1093.ACJ § 25.1093(b) recommends water cloud conditions Previously, there had been several exposures toat altitude for qualification of the powerplant. severe water cloud icing conditions in which the
powerplant ice protection system performed asFor previous applications of the engine, the designed and engine operation remained undisturbed.powerplant had been subjected to icing tests in asea-level tunnel-facility. In response to the first incidents opLrationalConsequently, for subject derivative engine this restrictions were imposed, mainly addressing powertradition was followed with Liquid Water Content as a means of increasing engine tolerance to iceadjusted for the difference in airspeed. ingestion.The majority of the tests, including ice shedding However, the power needed to obtain the intendedafter delayed activation of the de-icing system, benefit was too high for regular operations,were performed at high power-settings, representing especially descent.prolonged conditions of ice encounters.Note that ACJ 0 25.1093(b), 2.4.3, 2.4.5 and 2.4.7 Evidently, an unknown phenomenon, not experiencedsuggest ice shedding at high engine power. during qualification testing, had to be identifiedAt idle power-settings satisfactory ice protection before an effective solution could be defined.capabilities were easily demonstrated sinceelectrical de-icing is independent on engine-speed.
4.- Plight-test,,' engine water injettonn
In addition to abovementioned ice-tunnel tusting afully-instrumented prototype-aircraft was subjected Following aforementioned incidents, investigationsto dry air tests and natural icing trials, were initiated to retrieve the cause of the power-Dry air tests comprised a wide range of interruptions.testconditions, including (simulated) failure A first series of flight-tests was conducted toconditions. analyse the engine tolerance at altitude to suddenFlight-tests in natural atmospheric icing water ingestion.conditions were executed to verify powerplant ice Water was used, because it could easily be injectedprotection system effectiveness, especially in repeatedly into the engine compressor inrelation with system delayed activation, ice well-defined quantities at known rates.accumulation on unprotected areas and aircraftflight handling characteristics. The aircraft installation consisted of a largeContinuous maximum icing conditions were found; hydraulic cylinder; total volume of water to besubsequent encounters with de-activated ice injected ranged up to 0.53 US gal (2 litres)protection system resulted in ice build-up that maximum at a flow-rate of sore than 0.53 US gal/swould have accumulated in intermittent maximum (maximum).icing conditions.During flight-tests no anomalies occurred; not even More than 150 water injections were performed inwhen the engine ingested about 0.5 inch (13 mm) of various configurations at altitudes between 5.000ice accumulated on the intake-lip, and 18.000 feet altitude at differentIt was concluded that the powerplant ice protection power-settings (torque); a total of 73 flame-outssystem performed satisfactorily, were induced.
mmmm ia m •m l Jmm m m~~v MIm

5-3
Boundaries for flame-out were established at With video observation in natural snow conditionsseveral anti-surge bleed (Handling Bleed) significant ice accumulation was found in the areamasaflows; it appeared that more bleed increased of the adaptor flange.the engine's tolerance to water ingestion. The unheated slot into which a considerable portionHowever, from the testresults it was concluded that of ice keyed, formed a comfortable point offlame-out behaviour was rather different from that attachment for preoipitation which otherwise wouldreported in the incidents, which therefore remained have been repelled from adjacent continuouslyunexplained, heated strips.
Ice lodged in the cavity of the seal and bridgedLater, comparative water and ice ingestion tests across the continuously heated strips to thewere conducted on a sea-level teetbed. cyclically heated side-wall.Ice appeared to be much more critical rekarding Complete shedding was inhibited by the ice beingeffect on engine behaviour, also on a basis of mass keyed; Vigure 5b gives an impression of the way icetimes enthalpy. mushroomed in the seal gap.
From the tests it was concluded that the flame-out EN5INEincidents were unlikely to have been caused by GOTRIP (ADAPTOR A
ingestion of rain or water accumulated in the ADAPTOR-FLANGE
engine air intake. ALHowever, it was recognized that tolerance to wateringestion reduced considerably with increasingaltitude independent of power-setting; restorationwas achieved by alteration of anti-surge bleedvalve control. HEA"ING-STRIPIOUCT)The tolerance to water ingestion increasedsignificantly with 8% Handling Bleed.Finally, it was concluded that engine behaviourwith sudden water injection and increased IC SIDE-WALL CYCLICALLY HEATEOanti-surge bleed had no relation to that with iceingestion (at sea-level); consequently, further iceingestion tests were required.
Figure 5b Principle of ice accretion in the sealcavity.
5. Fllht-teata. video observatin iMla. the AirIntake Ice secreted until aerodynamic forces prevailed
over the adhesive forces between ice and duct wallAs a result of the incidents, the engine air inlet and the strength of the foundation provided by thede-icing system was re-evaluated to observe ice unheated slot.build-up and shedding characteristics inside the Periodic shedding was frequently observed; theduct in natural icing conditions, central part disappeared in the by-pss dcot,Ice accretion was recorded using three miniature whilst the remainder was sometimes ingested by thecolour video cameras mounted at different positions engine.in the air intake of a prototype aircraft. This mechanism appeared to be dependent on the
dimensions of the accumulated ice, whereas alsoThe fields of view were chosen as follows: power-setting appeared to influence patterns of ice1. rear of air intake duct including the shedding; Figure 5c shows the location of ice
bifurcation and the lower half of the engine accumulation and the direction of shedding.inlet interface
2. floor of the intake duct3. top (ceiling) of the intake duct and forward VERY LIGHT RUNBACK ACCRETION
part of the engine inlet casing
Figure 5a shows the positions of the cameras in theintake duct.
tN~tNE
INL(" BY-PASS STICKING AREAGOES OP OR DOWNDEPZNOING ON THICKNESS
~ j~~~ JiziBY -PASS DUCT
VIEWED FROM CAMERA ON INLET LIP
Figure 5a : Positions and fields of view of cameras Figure 5c : Location of ice accumulation andmounted in the air intake duct. shedding pattern.
Initially, exploratory flights were conducted in Apart from the seal area, ice accumulated on theatmospheric conditions of opportunity, including: (lefthand) rear side-wall (influence oflight cloud icing conditions, snow, hail and rain. propeller-swirl) where it secreted between theAs a result of these video-observations it emerged heating-cycles to such an extent that it sometimesthat significant ice accumulation developed at the resisted complete shedding.
Further flight-tests were performed with only one In general, the observed ice accumulation in thevideo camera mounted on the intake lip, viewing the ares where it could potentially enter the enginerear of the intake duct. under critical conditions was estimated to have a '
volume of 5 to 6 ins (82 to 98 cam).
' !
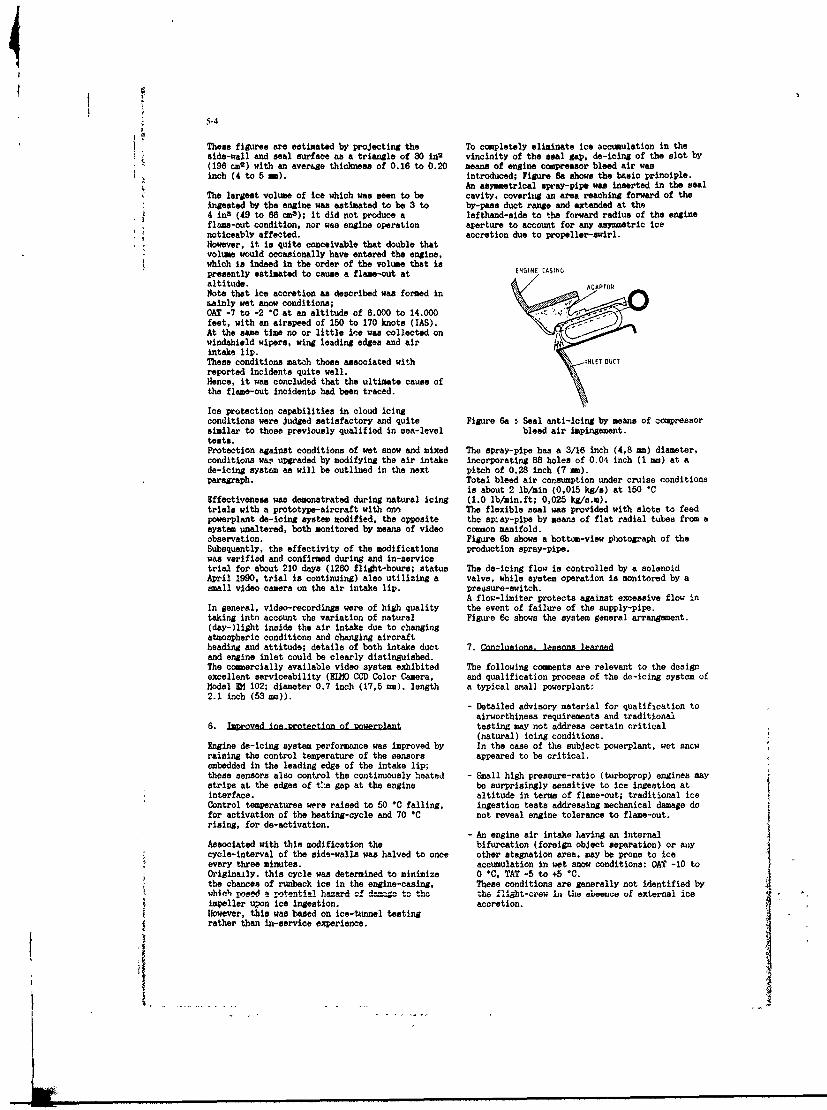
I
: 5-4
These fistt'ee are estimated by projecting the To completely eliminate ice accumulation in thea ide-wall and seal surface as a triangle of 30 in2 vincinity of the seal gap, de-icing of the slot by(196 cat) with an aversge thicknes of 0.16 to 0.20 means of engine compresor bleed air wasinch (4 to 5 mm). introduced; Figur-e So shows the basic principle.
. An asymmetrical spray-pip* was inserted in the sealThe largest volume of ice which was seen to be cavity. covering an area reaching forward of the
Irested by the engine was estimated to be 3 to by-pass duct re and extended at the4 in s (49 to 68 cm3); it did not produce a lefthand-eide to the forward radius of the engineflame-out condition, nor was engine operatin aperture to account for any asymmetric icenoticeably affected. accretion due to propeller-swirl.However, it in quite conceivable that double thatvolume would occasionally have entered the engine,which to indeed in the order of the volume that ispresently estimated to cause a flame-out at ENGINE CA SING
Note that ice accretion an described was formed inD ainly wet snow conditions;
AT -7 to -2 "C at an altitude of 6.000 to 14.000 - -
feet, with an airspeed of 150 to 170 knots (IAS).At the same time no or little ice was collected onwindshield wipers, wing leading edges and airintake lip.These conditions match those associated with INLET OUCTreported incidents quite well.Hence, it was concluded that the ultimate cause ofthe flame-out incidents had been traced.
Ice protection capabilities in cloud icingconditions were Judged satisfactory and quite Figure 6a Seal anti-icing by means of compressorsimilar to those previously qualified in sea-level bleed air impingement.tests.Protection against conditions of wet snow and mixed The spray-pipe has a 3/16 inch (4,8 mm) diameter,conditions war upgraded by modifying the air intake incorporating 88 holes of 0.04 inch (1 mm) at ade-icina system as will be outlined in the next pitch of 0.28 inch (7 m).paragraph. Total bleed air consumption under cruise ronditions
is about 2 lb/min (0,015 kg/s) at 150 *CEffectiveness was demonstrated during natural icing (1.0 lb/min.ft; 0,025 kg/s.m).trials with a prototype-aircraft with on, The flexible seal was provided with slots to feedpowerplant de-icing system modified, the opposite the sp:ay-pipe by means of flat radial tubes from asystem unaltered, both monitored by means of video common manifold.observation. Figure Sb shows a bottom-view photograph of theSubequently, the effectivity of the modifications production spray-pipe.was verified and confirmed during and in-servicetrial for about 210 days (1260 flight-hours; status The do-icing flow is controlled by a solenoidApril 1990, trial is continuing) also utilizing a valve, while system operation is monitored by asmall video camera on the air intake lip. preesure-switch.
A flow-limiter protects against excessive flow inIn general, video-recordings were of high quality the event of failure of the supply-pipe.taking into account The variation of natural Figure 6c shows the system general arrangement.(day-)light inside the air intake due to changingatmospheric conditions and changing aircraftheading and attitude; details of both intake duct 7. onnihmonA. leasona learndand engine inlet could be clearly distinguished.The commercially available video system exhibited The following comments are relevant to the designexcellent serviceability (EIM CCD Color Camera, and qualification process of the de-icing system ofModel EM 102; diameter 0.7 inch (17,5 em), length a typical swall powerplant:.2.1 inch (53 mm)).
- Detailed advisory material for qualification toairworthiness requirements and traditional
6. Imprnved ice protertion of owerrlant testing may not address certain critical(natural) icing conditions.
Engine de-icing system performance was improved by In the case of the subject powerplant, wet sncwraising the control temperature of the sensors appeared to be critical.embedded in the leading edge of the intake lip;these sensors also control the continuously heated - Small high pressure-ratio (turboprop) engines maystrips at the edges of the gap at the engine be surprisingly sensitive to ice ingestion atinterface, altitude in terms of flame-out; traditional iceControl temperatures were raised to 50 *C falling, ingestion tests addressing mechanical damage dofor activation of the heating-cycle and 70 IC not reveal engine tolerance to flame-out.rising, for de-activation.
- An engine air intake having an internalAssociated with this modification the bifurcation (foreign object separation) or aniycycle-interval of the side-walls was halved to once other stagnation area, may be prone to iceevery three minutes. accumulation in wet snow conditions: OAT -10 toOriginally, this cycle was determined to minimize 0 1C, TAT -5 to +5 *C.the chances of runback ice in the engine-casing, These conditions are generally not identified bywhiel pmed a potential hs n.rd of da=-c to tho the flight-craw in the 06vence of external ice
impeller upon ice ingestion, accretion.However, this was based on ice-tunnel testingrather than in-service experience.

~55
In addition, ice build-up in wet snow conditions - finally, it is concluded that comerciallyappears t- be different from that in cloud icing available mJrsiature video systems are quiteconditions, which are subject of traditional suitable for observation of ice accretion insidequalification tests. an engine air intake during flight in natural
icing conditions.- sudden water ingestion tests at altitude are Performance in test-aircraft as well an in an
unlikely to produce the effects of ice ingestion; operational trial was excellent.these tests are no substitute
A psanm~tS"w"
figure 6b Spray-pipe mounted on adapter-flange.
S U - FF c VA LV El e
Figure 8c General errm.nement of bleed air supply to spray-pipe.

45-b
Discussion addition, the engine tested at NRC was basically a gasgenerator and only airspeed was varied to account fordifferent flight conditions. In-flight video observations of
1. W. Grabe, NRC Ottawa the flow pattern inside the air intake duct indicated that, forOnly light icing conditions were noted by pilots prior to instance, propeller swirl significantly influences the locationflameouts, yet this problem was not encountered under of stagnation areas.heavy icing conditions at NRC. How come?While problems were caused by wet snow, supercooled 2. R. Toogood, Pratt and Whitney Canadawater icing at NRC should show the weak areas at the intake Would you care to comment on the differences in inletsplit. Why did it not do it
9 prototype coiafigurations used in the ice tunnel and that ofthe initial production configuration?
Author: Would you agree that an important conclusion of this studyAt the moment of the power interruptions, the crew is that discontinuities in :urface ice protection should bereported to encounter light cloud icing conditions. However, avoided at critical impingement locations?prior to the flame-outs, the aircraft had during a certaintime-interval been exposed to what can best be Author: The differences between the prototypecharacterized as mixed conditions of (wet) snow and configuration last tested in the icing tunnel and the initial(supercooled) water droplets. The conditions tested at NRC production configuration of the intake duct basically involveduring qualification only addressed cloud icing conditions (software) changes to the controller. However, these areat sea-level in accordance with the requirements as laid subordinate to the introduction of spray pipe, which is thedown in IAR/FAR (ACI) 25, It appeared that engine result of testing in naturai icing conditions rather than icetolerance to ice ingestion at altitude when being exposed to tunnel tests,natural icing conditions (wet snow) may be quite different. One of the conclusions of the paper and the presentation isFirst of all, conditions tested at NRC /IM and CM) may not indeed that discontinuities in stagnation areas which are
be that severe as the mixed conditions experienced in exposed to impingement of precipitation involves a highnatural precipitation conditions (i.e. wet snow, hail, rain). In design risk.
tF
l w m m m n

6-1
ICE TOLERANT ENGINE INLET SCREENS FOR CH1I3/II3ASEARCH AND RESCUE HELICOPTERS
by
R.BJonesSenior Project EngineerBoeing Canada Arnprior
W.A.LucierManager Engieenng
Boeing Canada AmpriorBaskin Drive East
Arnpnor, Ontario KFS 3MICanada
SUMMARY regimes In icing conditions though, the CHII3/113Ascreens had exhibited a tendency to become congested
The Canadian Forces CHI 13/113A Search and Rescue with ice, and consequently the screens have to beHelicopters occasionally encounter unavoidable icing removed for winter operations. The unprotectedconditions in their operating environment. The engines are exposed to increased risk of FOD dunngoriginal engine inlet safeguards were not designed for, operations in this period.nor capable of sustained operations in icingenvironments, necessitating removal of the inlet The CHI13/113A Helicopters are rated at a maximumscreens in these conditions. This arrangement resulted all up weight of 21,400 pounds, and are powered byin unacceptable risk of foreign object damage to the twin General Electric T58-8F engines. The engineengine, and compromised operational safety. features a 10 stage axial in-line compressor, and
variable inlet guide vanes to ensure efficient and stallIce tolerant inlet screens have been developed as a free operation. The military power rating for eachremedy to this problem. The flat faced, inverted cone engine is 1350 shaft horsepower. At normal SARscreens with a bypass opening accommodate operating weights and full fuel, the aircraft lacksprogressive ice congestion during the various single engine capai-!,ty with the present poweroperational modes with minimal engine performance available. Canadian Forcet, ,::,-rience has shown thatdegradation. Comprehensive testing has confirmed the the inlet guide vanes and first stage compressor bink..capability to operate in simulated severe icing of the T58 engine are particularly vulnei able to FODconditions for a minimum of thirty minutes, meeting in the absence of protective screensthe objective "get oul. of trouble" capability.O erational experience and testing has substantiated The inlet configuration for the CHI 13 helicopterimproved tolerance to the full range of meteorological consists of a straight cylindrical duct. Thisconditions for the fleet of CH 113 Helicopters. arrangement, with minimal obstruction, is kiown to
offer virtually undistorted inlet flow and the recoveryActivity is continuing to equip the remaining CHI 13A of a large percentage of the ram air effect, althoughHelicopters with the ice tolerant engine inlet screens. offering little protection from sand and small particleOther international operators of the Boeing Helicopters debris. Electrical resistance heating and engine bleedModel 107 Type helicopters have expressed interest in air are employed to prevent ice build-up. The onginalthe developments achieved, and independent particle separator system used with the CHI 13Aevaluations are under way. variant provided improved resistance to debris
damage, at the expense of a somewhat obstructedinlet. This latter arrangement also provided heating tobreeze surfaces, although operational experience and
1.0 INTRODUCTION testing has shown that ice could develop at the
Small gas turbine engines geneially lack the tolerance separator in some conditions '.
to foreign object damage (FOD) and ice ingestion Several factors have contributed to the need forproblems afforded to large turbofan powerplants in improvements to the engine inlet protection systemscommercial jetliners. As such, in'-t screens and for the CHI 13/113A. The very nature of search andparticle separators are employed as protection to the rescue (SAR) operations, particularly in light ofvulnt.ra'ile compressor blades in many helicopters and Canada's geography and environment, places a highsmaller fixed wing aircraft. The Canadian Forces demand on availability and reliability. SAR missionsCHI 13/113A Search and Rescue Helicopters, are moqt often conducted in costai or m=untainousdeivatives of thc Boeing Helicopters 107 series regions and frequently in adverse weather conditions. 'tandem rotor helicopter, were originally equipped with Although the aireraft was not designed, nor authori7edconical wire mesh screens to minimize FOD problems for flight into icing conditions, tolera'ce tefor its two internally mounted engines. The CHI 13A unexpected, unavoidable icing condition13, jr marginathelicopter also employed a particle separator. These conditions is highly desirable in the SAR role andsystems proved to be effective at minimizing engine particularly for a "get out of trouble" capability. Thedamage due to foreign debris under most operating consequences of an chorted mission or a forced

6-2
landing could be serious due to both the role and a similar way to a mountain rescue involving altitudeenvironment served by the CHI 13/113A. change on the West coast, and it is the variability of
conditions: wet snow, dry snow, cold weather icing,The limitations in single engine performance provides warm weather icing and perhaps most worrisome,further impetus for enhanced protection against FOD freezing rain that presents the real flight problem.and ice ingestion problems, underscoring the need for Trying to predict the onset and effect of potential icingfull time safeguards for the engine. The loss of a conditions can be humbling even when thesingle engine is considered a critical emergency for consequences are less severe, such as when operatingthe CHI 13/113A. The risk of dual engine failure can a personal automobile. It is not unusual to observebe significant in some circumstances of foreign debris trees and fences glazed with freezing rain, and yet noingestion, particularly during any in-flight ice shedding accumulation will form on the windshield.or severe inlet congestion due to ice or wet snow. Mysteriously, in what would seem to be comparable
conditions to the casual observer, keeping even aAlthough the possibility of developing a modified inlet heated windshield clear of ice build-up will be aduct system was initially considered, this option was virtually impossible task.dismissed in favour of an ice tolerant inlet screen duelargely to the limitations inherent to the internal The rate of Ling on the different surfaces is importantmounting of the engines. The problem addressed in for the type of screen considered and this introduces athe current work was therefore to develop a FOD ice further parameter i.e. the local air flow. A lessonscreen to be installed externally in front of the straight learned at the start of testing invalidated an assumptionduct. This approach was expected to yield a passive that the blade downwash air travelled directlydevice to be employed in all seasons with minimal downwards in ground effect hover and ground run. Itchange to the existing engine inlet and duct was found that the cross flow caused by the blade dragconfiguration. was very significant, especially for the ice accretion
rate from the side of the engine inlet.
2.0 ICING CONDITIONS Earlier work with an ice detector installed on thehelicopter did not yield successful results, leading to
The logical start to an analysis of the rate of ice thz removal of the detector. It was possible that itaccretion is the definition of the icing conditions, and would mislead the air crew, especially as to the typeherein lies an intensive challenge due to the variability of icing. The two basic types of ice formationof these conditions. While modelling the ice accretion experienced during tests were clear glaze ice and rimerate for one particular set of parameters may be ice (milky white). The glaze ice varied from hard toachievable, the certification requirement and the real soft, which introduced the danger of it breaking off,world icing conditions are subject to a broad range of but the rime ice was always hard. This was ofviriation in the contributing factors, including: particular influence in the final detail design whichatmospheric parameters, surface properties, and had to be refined because of the type of build-up onengine operating condition and flight parameters. different parts of the screen. The same also applied to
the snow conditions: the wet snow often produced aParticularly difficult to define is the starting point, i.e. soft glaze ice which could easily break off and enterthe icing cloud and the snow cloud. The Coalescence the engine.Theory model for precipitation gives a mechanism ofrain drop growth in warm cloud, whereas the The certification requirements, as defined inWegener-Bergtiron-Findeisen theory gives a cold cloud Airworthiness Regulations FAR 25 (which is notmodel in which ,xupercooled water droplets and ice strictly applicable for military helicopters), do notcoexist, but coalescence takes place in such a cloud as completely clarify the icing conditions and accretionwell ". These two models are not mutually exclusive rates to be considered for the design case '. Thenor contradictory, therefore the liquid/solid water certification requirements also provide little guidancecontent is yet another variable. As well as this, the with respect to the failure criterion for different flightdependence of the type of icing cloud or snow conditions. There are obviously two extreme cases:conditions on the suspended atmospheric particles adds flame out due to air starvation and engine failure duemore to the complex picture. Thi? is also influenced to FOD resulting from an ingested ice piece. In eitherin ground effect hover with recirculating snow and ice case for the CHI 13/113A, a single engine failureladen air, resulting in a localized whiteout. would result in degraded performance and a mission
abort. In the case of a dual engine failure, anThe problem of variability of atmospheric conditions autorotation to the ground or sea surface would befor the Search and Rescue role for this helicopter in necessary unless power can be recovered. The regimeCanada is aggravated by seasonal and geographical of flight and the local terrain or sea state would playrealities. Canada has long coast lines on both the an important role in the safe execution of theAtlantic and Pacific Oceans. and a vast interior autorotative landing and survival. It would certanyspeckled by an array of freshwater lakes that are be desirable to work towards some irtermediate !failureamong the world's iargest and most numerous. This, criterion, such as 70% screen blockage, versus thewmbined with our ranges of terrain and latitude, extremes raised with their inherent loss of affectedcontributes to EL full spectrum of icing conditions that engine power.may be encountered. A rescue on the East coast farout into the shipping lanes can face weather changes in
i I

6-3
As a result of the difficulties in rigorously modelling removed and replaced with a straight heated duct,the range in ice accretion rate, it was determined that comparable to the CHI 13 configuration. This newtesting and closely monitored prototype installations duct provided a improved heating capacity versus thewould most effectively cover this aspect of the prior arrangement, and commonality for anydevelopment. Icing simulations were conducted at the subsequent modifications evolving from the presentNational Research Council Canada (NRC) Ottawa test investigation addressing the inlet screen icing problem.rig facilities. No testing was done with artificial snowas previous studies reported unreliable results, and it A Boeing Helicopters proposal to the Swedish Armedwas felt that natural snow, whether wet or dry, would Forces in 1974, and work done by Kawasaki Heavyyield more credible testing '. Design features Industries, describes a heated wire mesh screen similar;nfluenced by the icing conditions would call upon the in geometry to the original conical screen. Thistest findings, as well as past experience in similar solution was burdened with prohibitively highdevelopments, such as that for the CH147 Chinook. manufacturing costs per screen on small production
runs combined with excessive electrical powerrequirements: approximately 15 KW per screen to
3.0 OPTIONS TO REMEDY THE ICING anti-ice 40 per cent of the screen surface underPROBLEM extreme icing conditions for short periods (up to 15
minutes), and 5 KW continuous under moderate icingSeveral candidate solutions to the CHI 13/113A engine conditions. These factors negated the feasibility of ainlet icing problems were considered. The number of heated variant of the conical screen.potential remedies evaluated was reflective of thedifficulty in fully defining the scope of the designparameters, as raised in the preceding discussion onicing conditions. The parameters considered in the A "dog house" type of protective inlet cover has beenevaluation of the candidates included: developed and used successfully by Columbia
Helicopters. The simple arrangement is based on thea) icing performance concept of an enclosed space with a small entranceb) suitability for year round FOD parallel to the incoming air stream. Dry air can be
protection, drawn in, leaving the moisture laden air and anyc) inlet flow distortion, suspended FOD particles to rush past. This conceptd) aerodynamic drag penalty, and was also studied by Kawasaki Heavy Industries frome) electrical power demand. 1971 to 1981 for the 107 Type helicopter. The
concept was dismissed because of potential for iceThe solu" :- commonly employed for inlet protection accretion and ingestion in severe icing conditions.has ger tally been integrated into the duct, such as an The Columbia experience however, has proved moreS-duct, a vortex generator bank, or an axisymmetric positive and the dog house configuration remains induct with swirl vanes '. These and any similar service on their fleet of 107 Type helicopters.solutions demanding extensive modification to theengine inlet duct configuration were immediately A variation of this concept is a pane' )r screen cone indiscounted due to physical space restrictions and front of the intake inlets pointing into the air stream soprogram constraints. It should be noted that these that the air has to go around the corner lip to enter thecriteria dismissed several possiblm solutions that could engine. This concept was not studied in detail due tobe of merit in other applications. Only solutions its similarity to the original cone and because of theexternal to the inlet duct were considered further in anticipated penalty in summer with the absence ofthe current investigation. FOD protection.
First among solutions considered were modificationsto, or enhanced variants of, the original conical screenarrangement. This system had proven to be effectiveat preventing FOD ingestion in most environments,but operational experience and NRC ice test rig resultsconfirmed its vulnerability to ice congestion. The testrsults suggested that in some conditions, sufficient icebuild-up could occur within a few minutes to cause theengine to flame out. The aircraft operatinginstructions reflected this limitation by directing thatthe screens be removed in possible icing conditions.With these screens removed the engines were open toIce/FOD ingestion, and engine damage occurred inthis configuration.
It was suspected that the original particle separatorutilized on the CHI 13A w.s also responsible for anumber engine failures caused by liberated icedeveloped at the separator. Testing in the NRC icerig verified this possibility; the particle separator was
1I
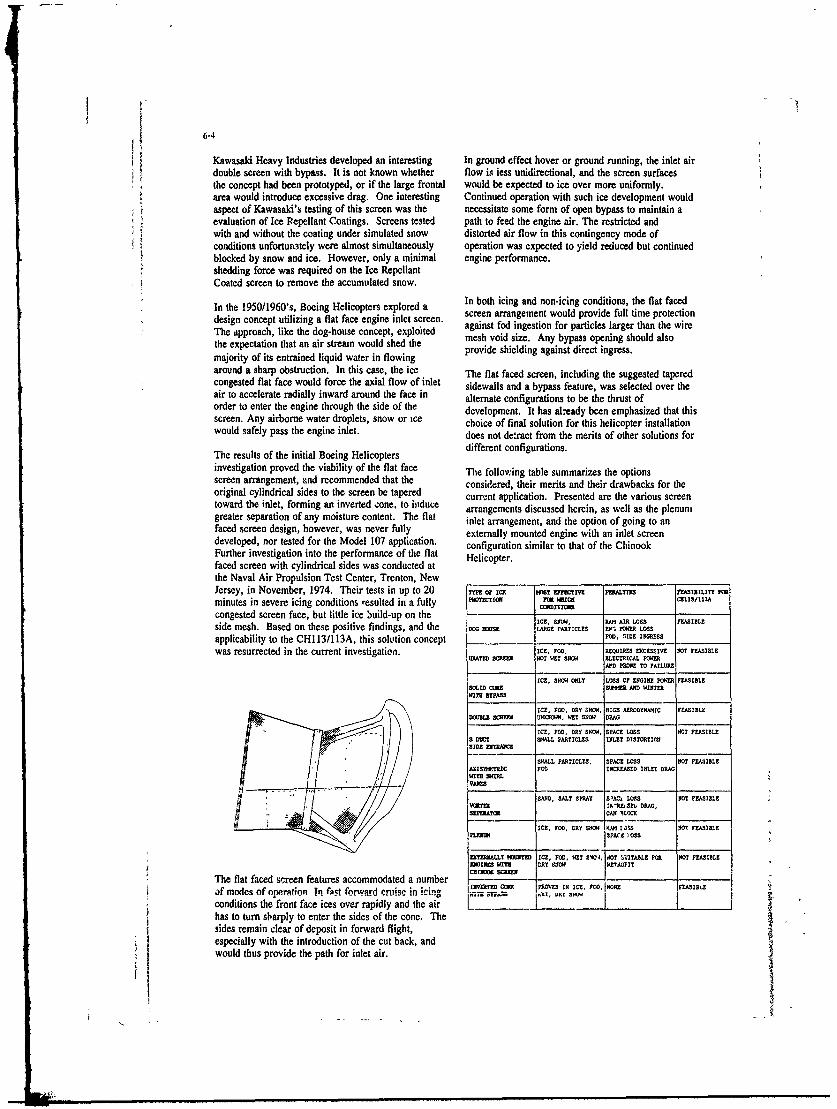
6-4
Kawasald Heavy Industries developed an interesting In ground effect hover or ground running, the inlet airdouble screen with bypass. It is not known whether flow is less unidirectional, and the screen surfacesthe concept had been prototyped, or if the large frontal would be expected to ice over more uniformly.area would introduce excessive drag. One interesting Continued operation with such ice development wouldaspect of Kawasaki's testing of this screen was the necessitate some form of open bypass to maintain aevaluation of [ce Repellant Coatings. Screens tested path to feed the engine air. The restricted andwith and without the coating under simulated snow distorted air flow in this contingency mode ofconditions unforturitely were almost simultaneously operation was expected to yield reduced but continuedblocked by snow and ice. However, only a minimal engine performance.shedding force was required on the Ice RepellantCoated screen to remove the accumulated snow.
In the 1950/1960', Boeing Helicopters explored a In both icing and non-icing conditions, the flat faceddIn ne pt 1950/1960iing Hfliotefa e ileoree, screen arrangement would provide full time protectiondesign concept utilizing a flat face engine inlet screen. against fodl ingestion for particles larger than the wireThe approach, like the dog-house concept, exploited mes vod izetAn bypass eig sh alsothe expectation that an air stream would shed the mesh void size. Any bypass opening should also
majority of its entrained liquid water in flowing
around a sharp obstruction. In this case, the ice The flat faced screen, including the suggested taperedcongested flat face would force the axial flow of inlet sidewalls and a bypass feature, was selected over theair to accelerate radially inward around the face in alternate configurations to be the thrust oforder to enter the engine through the side of the development. It has already been emphasized that thisscreen. Any airborne water droplets, snow or ice choice of final solution for this helicopter installationwould safely pass the engine inlet, does not detract from the merits of other solutions for
The results of the initial Boeing Helicopters different configurations.
investigation proved the viability of the flat face The following table summarizes the optionsscreen arrangement, and recommended that the considered, their merits and their drawbacks for theoriginal cylindrical sides to the screen be tapered curr'.nt application. Presented are the various screentoward the inlet, forming an inverted ,zone, to induce arrangements discussed herein, as well as the plenumgreater separation of any moisture content. The flat inlet arrangement, and the option of going to anfaced screen design, however, was never fully externally mounted engine with an inlet screendeveloped, nor tested for the Model 107 application, configuration similar to that of the ChinookFurther investigation into the performance of the flat Helicopter.faced screen with cylindrical sides was conducted atthe Naval Air Propulsion Test Center, Trenton, NewJersey, in November, 1974. Their tests in up to 20 TPo Ie KT Tmmv PENALIES FEArILITY Rminutes in severe icing conditions resulted in a fully PTECTIO FOR mc 13/113A
ONDITIONSB
congested screen face, but little ice build-up on the - IE S R AIR LOSS FEASIBLEside mesh. Based on these positive findings, and the DOLARGE PARTICLES POWE LOSS
applicability to the CHI 13/113A, this solution concept POD. SIDE INGRESS
was resurrected in the current investigation. CER, FU, RIEQURES SI SE N FEASIBLEIMTDSRE OT WET SNOW ELECTRICAL POWER
AD PRIE TO FAILURE
ICE, SGOW ONLY LOSS OF EIGINE PWER FEASIBLE5OLID CONE SINNH AND WINTERwie BYPASS
ICE, POD, DRY SNOW, HIGH AERODYNAMIC FEASIBLEDOUBLE SCREN UNKNOWN, WET SNO DRAG
ICE, POD, DRY SNOW, SPACE LOSS l0T FEASIBLES DuT SMALL PARTICLES INLET DISTORTION
E SMALL PARTICLE . SPACE L 3 PO0 FEASI LEAxSDIewC PEG INCREASED INLET DRASWITH SWIRLVANES
SAND, SALT SPRAYS D'AC LOSS NOT FEASIBLEVORZXIWKNLSMl ERAS,
SEPZIAICK CAR 4LCC
ICE, PED, DRY DHRMI 4 11 NOT FEASIBLEPIZIIJ J PAC4 551S
ERAMLLY MOUNTED ICE, POD, WET S140. 190 5UITASLE FOR NOT FEASIBLEEINES WITH RY SW ROPI?
The flat faced screen features accommodated a number ...... I N"D
if modes of operaion Sn faet forward s,;o ; '. 0 IN Iw s , POD, IAoE rSSZ
_I In 615 fowrdcconditions the front face ices over rapidly and the air _
has to turn sharply to enter the sides of the cone. Thesides remain clear of deposit in forward flight,especially with the introduction of the cut back, andwould thus provide the path for inlet air.
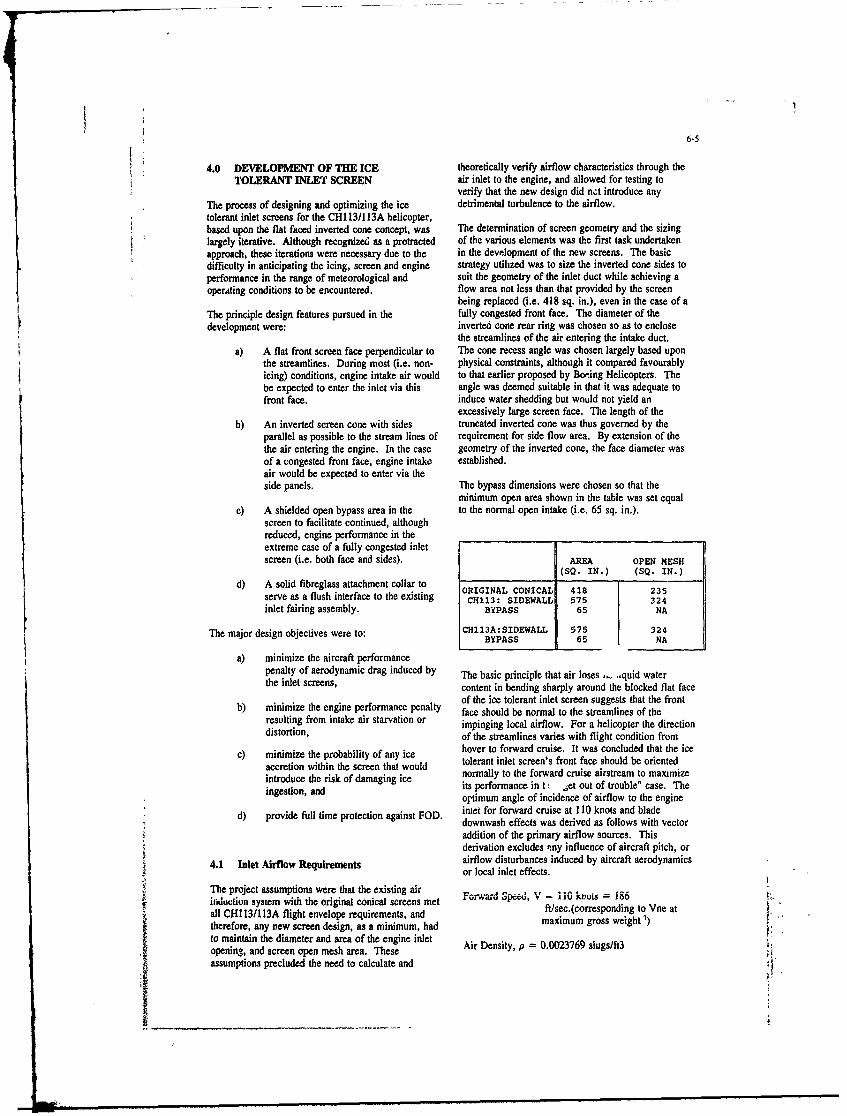
6-5
4.0 DEVELOPMENT OF THE ICE theoretically verify airflow characteristics through theILERANT INLET SCREEN air inlet to the engine, and allowed for testing to
verify that the new design did n,;t introduce anyThe process of designing and optimizing the ice detrimental turbulence to the airflow.tolerant inlet screens for the CHI 13/113A helicopter,based upon the flat faced inverted cone concept, was The determination of screen geometry and the sizinglargely iterative. Although recognized as a protracted of the various elements was the first task undertakenapproach, these iterations were necessary due to the in the development of the new screens. The basicdifficulty in anticipating the icing, screen and engine strategy utilized was to size the inverted cone sides toperformance in the range of meteorological and suit the geometry of the inlet duct while achieving aoperating conditions to be encountered. flow area not less than that provided by the screen
being replaced (i.e. 418 sq. in), even in the case of aThe principle design features pursued in the fully congested front face. The diameter of thedevelopment were: inverted cone rear ring was chosen so as to enclose
the streamlines of the air entering the intake duct.a) A flat front screen face perpendicular to The cone recess angle was chosen largely based upon
the streamlines. During most (i.e. non- physical constraints, although it compared favourablyicing) conditions, engine intake air would to that earlier proposed by Boeing Helicopters. Thebe expected to enter the inlet via this angle was deemed suitable in that it was adequate tofront face. induce water shedding but would not yield an
excessively large screen face. The length of theb) An inverted screen cone with sides truncated inverted cone was thus governed by the
parallel as possible to the stream lines of requirement for side flow area. By extension of thethe air entering the engine. In the case geometry of the inverted cone, the face diameter wasof a congested front face, engine intake established.air would be expected to enter via theside panels. The bypass dimensions were chosen so that the
minimum open area shown in the table was set equalc) A shielded open bypass area in the to the normal open intake (i.e. 65 sq. in.).
screen to facilitate continued, althoughreduced, engine performance in theextreme case of a fully congested inletscreen (i.e. both face and sides). AREA OPEN MESH
(SQ. IN.) (SQ. IN.)d) A solid fibreglass attachment collar to ORIGINAL CONICAL 418 235
serve as a flush interface to the existing CH113: SIDEWALL 575 324inlet fairing assembly. BYPASS 65 NA
The major design objectives were to: CH113A:SIDEWALL 575 324BYPASS 65 NA
a) minimize the aircraft performancepenalty of aerodynamic drag induced by The basic principle that air loses . ...quid waterthe inlet screens, content in bending sharply around the blocked flat face
of the ice tolerant inlet screen suggests that the frontb) minimize the engine performance penalty face should be normal to the streamlines of the
resulting from intake air starvation or impinging local airflow. For a helicopter the directiondistortion, of the streamlines varies with flight condition from
c) minimize the probability of any ice hover to forward cruise. It was concluded that the ice
accretion within the screen that would tolerant inlet screen's front face should be oriented
introduce the risk of damaging ice normally to the forward cruise airstream to maximize
ingestion, and its performance in t. jet out of trouble" case. Theoptimum angle of incidence of airflow to the engine
efull time protection against FeD. inet for forward cruise at 110 knots and bladeddownwash effects was derived as follows with vector
addition of the primary airflow sources. Thisderivation excludes finy influence of aircraft pitch, or
4.1 Inlet Aidrflow Requirements airflow disturbances induced by aircraft aerodynamicsor local inlet effects.
The project assumptions were that the existing airiikluctiun system with the original conical screens met For .ard Speed, V - 110 luts = 186ft/sec. (corresponding to Vne aall CHI 13/113A flight envelope requirements, and maxiecm(orr eight at therefore, any new screen design, as a minimum, had maximum gross weight )to maintain the diameter and area of the engine inlet A t . s
opening, and screen open mesh area. Theseassumptions precluded the need to calculate and
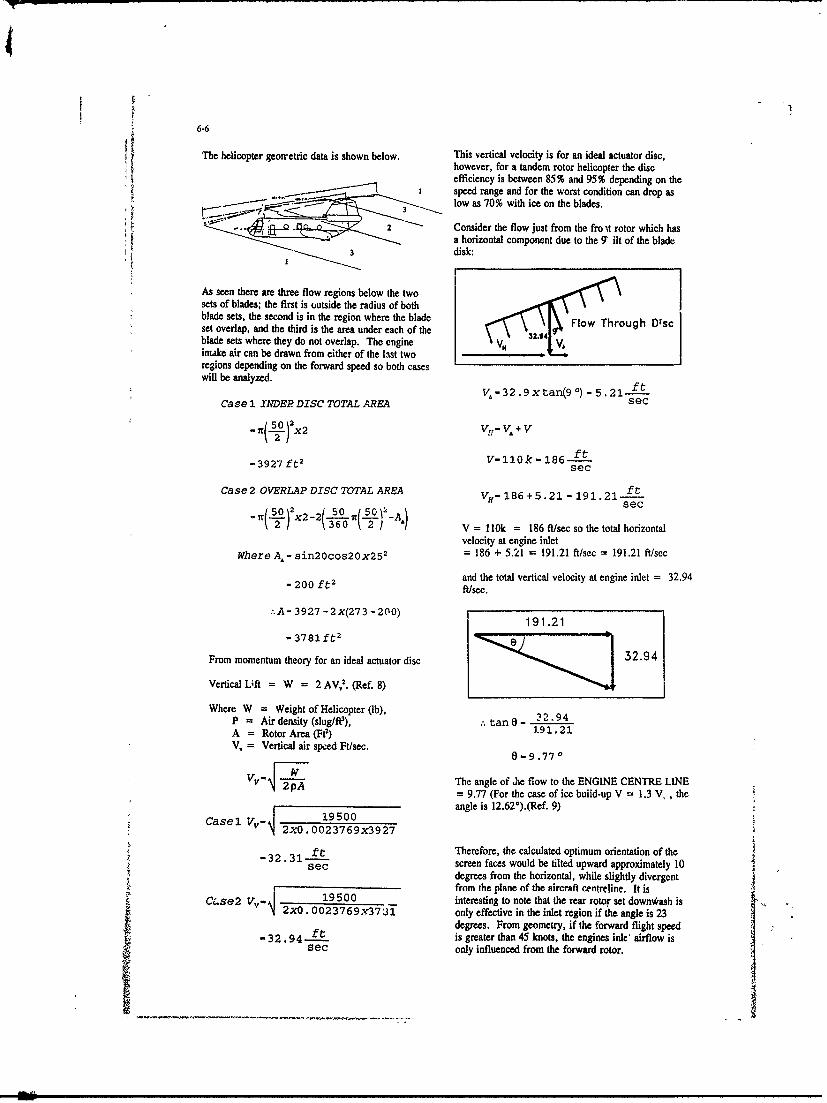
6-6
The helicopter georretric data is shown below. This vertical velocity is for an ideal actuator disc,however, for a tandem rotor helicopter the discefficiency is between 85% and 95% depending on the
. .speed range and for the worst condition can drop asF . .. /Fr--- - - .low as 70% with ice on the blades.
2 Consider the flow just from the fro ,t rotor which hasa horizontal component due to the 9 ilt of the blade
3 disk:
As seen there are three flow regions below the twosets of blades; the first is outside the radius of bothblade sets, the second is in the region where the blade Flow Through Discset overlap, and the third is the area under each of theblade sets where they do not overlap. The engine V,intake air can be drawn from either of the last tworegions depending on the forward speed so both caseswill be analyzed. VA3 2 .9Oxtan(9 ). 5.1-
Case 1 INDEP DISC TOTAL AREA sec
- I(50o) 22 11- V+
-3927ft 2 V-l10k-186 ftsec
Case2 OVERLAP DISC TOTAL AREA VH- 186 +5.21 - 191.21 ftsec
Tr- 50 2x2-2 n( 51 -Al2 (360 2 / A) V = 110k = 186 ft/sec so the total horizontal
velocity at engine inletWhere A,-sin20cos20x252 = 186 + 5.21 = 191.21 ft/sec = 191.21 ft/sec
and the total vertical velocity at engine inlet = 32.94- 200 ft 2
fMsec.
.. A- 3927 -2x(273 -200) 191.21
- 3781ft 2 E
From momentum theory for an ideal actuator disc 32.94
Vertical Uft = W = 2 AV12. (Ref. 8)
Where W = Weight of Helicopter (b),P = Air density (slug/f), .. tan0 - 22.94A = Rotor Area (Ft) 191.21V, = Vertical air speed Ft/sec. 0-9 770
TpA The angle of he flow to the ENGINE CENTRE LINE= 9.77 (For the case of ice buiid-up V = 1.3 V, , the
angle is 12.62°).(Ref. 9)Case1Vv-q 19500Casel Vv 2xO.0023769x3927
f.t Therefore, the calculated optimum orientation of thesec screen faces would be tilted upward approximately 10
degrees from the horizontal, while slightly divergent1900from the plane of the aircraft ctntreline. it isCse2 19500 interesting to note that the rear rotor set down*ash is2x0.0023769x3731 only effective in the inlet region if the angle is 23
degrees. From geometry, if the forward flight speed-32.94 - t is greater than 45 knots, the engines inle' airflow is
sec only influenced from the forward rotor.

6-7
The inverted front cone dimensions and the optimum Another interesting aspect in the design analysis wasangle corresponding to cruise conditions enabled the the determination of the structural contribution of thelocation of the left front cone to be centred just in screen mesh, whose stress/strair relationship wasfront of the intake face, However, when integrating found by test to be inherently non-linear.the front cone to the attachment collar, the desiredangle of incidence could not be maintained for theright hand screen due to interference with the 4.3 Prototype Developmentsynchronizing shaft cover (tunnel) in front of the righthand intake. An inclination angle of 17 degrees was The earliest prototype developed was modular inthe minimum allowable for the given screen concept. This design was applied to the CHI13A,dimensions at the right hand side. This physical whose inlet configuration differed slightly from that ofconstraint superseded the optimum calculated the CHI 13. Unlike subsequent models, the bypassorientation. This angle of incidence would be aligned feature was not integrated into the side of the screen.to the expected inlet air flow at a forward cruise speed An optional bypass was achieved with interchangeableof 64 knots. front faces - one flush face providing no bypass (i.e.
suitable during non-icing seasons), and one faceTufting tests conducted by AETE during the incorporating a forward bypass.certification phase of the final screen configurationsubstantiated the adequacy of the orientation for the Testing plans for this first design were comprised ofscreens, engine test cell work, intended to observe the flow
distortions and engine performance at various stages ofThe above geometric constraints were employed as blockage, and icing tests. Due to program constraints,design objectives in the manufacture of the first difficulties in emulating the aircraft inlet, and testprototype screen, and in fact remained fixed facility problems; the findings of the engine tests withthroughout the development and final design. CAD the first prototype were inconclusive.facilities were employed and very effective atimplementing these critical geometric parameters in The simulated icing test plan was comprised of 28preparing the engineering drawings for the designs sorties for a total of 14.1 flying hours. The results ofcompleted. these icing trials suggested that the flush faced screen
did not provide a sufficient time margin in icing toenable the pilot to recover safely before engine flame-
4.2 Structural Considerations out due to blockage. Ice build-up was also found tooccur in the yet unchanged particle separator duct,
The basic materials selected for the build of the which led to a engine FOD incident. This arisingprototype remained unchanged throughout the contributed to the deciion to eliminate the particledevelopment. The screen mesh for the various inlet separator for the CHI 13A helicopters.areas was type 304 stainless steel wire with 1/4 x 1/4inch mesh. The underlying structure was This arrangement was abandoned in favour of an aftmanufactured of welded type 321 stainless tube, plate bypass system for subsequent designs.and sheet. The attachment collar was fabricated witha fibreglass - vinyl ester composite moulded toconform with the inlet fairing of the helicopter. Thesupporting structure and aft most edge of the screen The bypass location chosen in the next iteration was atmesh were embedded in the moulded collar during the the top aft area between the front cone rear small ringmanufacture. These materials enabled the designs to and the collar of the engine inlet screen. The bypassmeet the various structural requirements including opening was covered by a piece o screen resulting instatic strength, resistance to impact, and resistance to a shape like the open gill of a fish. This piece ofvibration induced fatigue, screen, referred to as the "ear", was designed to
provide shielding Pgainst direct ingress from the frontThis mention of structural requirements introduces a while introducing minimal frontal aerodynamic drag.very interesting aspect of the design ". The impact This configuration was subject to extensive ice rig andload ease for the front face of the screen, and engine test cell qualifications, as detailed in Section 5.consequently for the supporting structure right back toth: support collar, was influenced by competingrequirements. In order to reduce the impact load 4.4 Final Design Configurationcase, the structure needed to bi, flexible to absorb theenergy of impact. However, the structure also had to The final design configuration also utilized an aftbe sufficiently strong to transmit the load developed bypass, but with the opening situated at the outboardwithout failure. The design of the structure with side of the screen. The prototype of this configurationsufficient strength and flexibility to reduce the impact was subject to an extended flight test program,load resulted in a narrow window tor structural detailed below, betore fitment to the CHI 13 fleet.design. The loading on the front face was derived by Minor refinements were accomplished based upon thean iterative assumed load/deflection/resultant load results of testing and operational experience with thecalculation. This converged to the final impact load prototype. This "fine tuning" of the screens was agiven by the rigid object strike to the front face. critical phase in the development. Sites of localizedI i'

6-8
ice accretion were eliminated by contouring air flows, being imposed by the progressive increase in inlet areasoae elements were strengthened, a localized heating restriction on the prototype screen design. Inproblem was remedied, and a removable bypass screen addition, it was desired to determine whether use ofinsert was developed to discourage bird nesting. the new inlet configuration would produce
unacceptable inlet conditions which could affect the5.0 QUALIFICATION TESTING condition of the engine.
The importance of the testing aspect of the To fulfill the objective of the engine test cell trials, thedevelopment of the ice tolerant inlet screen has been following test points were defined as part of the finalstressed through out this paper. The team for the test plan:various qualification tests of the final conflguratinnwas comprised of representatives from the Canadian a) Perform two initial standard performanceForces National Defence Headquarters (NDHQ), the runs to establish base line data and verifyAerospace Engineering Test Establishment (AETE), repeatability of data;the Naticnal Research Council (NRC) and Boeing.The availability of the unique NRC ice test rig and the b) Create various air intake flow restrictionstechnical support of the ice rig staff was crucial to the to simulate progressive screen blockagedevelopment and certification. The use of the due to icini;Standard Ae-n engine test cell and the support fromStandard Aero made the engine testing possible. c) Test with the fairing without particle
separator ar.d with the existing CHI 13'fairing for performance comparison;
5.1 Tufting Test d) Conduct standard engine performanceruns between main configuration change.;
A tufting flight test was conducted by AETE in to verify base line data repeatability;Ottawa to provide suitable airflow visualizationthroughout the CHI13A operating speed range for e) Perform a one hour endurance run withconfirmation of the optimum inlet screen angle. The "optimum" air inlet blockage. Thetest comprised two sorties for a total of 8.4 flying optimally blocked screen configurationhours with a test helicopter and a pheto chase aircraft. involved 100% blockage of the top andSix inch long tufts were affixed to the test aircraft's front of the screen and 75% blockag- ofskin spaced every 4 inches for 7 ft along the top of the the bottom of the screen with the bypassaircraft in front of both engine inlets ad along the aft area open. This configuration providedpylon within 3 feet of the engine inlets. In addition, a an element of swirl in the inlet flowhoop positioned 32 inches in front of the engine inlets conditions creating the wcrse inletallowed the attachment of three 12-inch long tufts condition.floating freely in the airstream for the purpose ofindicating the direction of the airflow entering theengines.
f Perform "slam" accelerations as well as"load chops" and "load bursts" with thescreen totally blocked to demonstrate the
The behaviour of the tufts was filmed from the photo engine's ability to neither stall nor surgechase helicopter. The film of these flights was with the screens completely iced.difficult to analyze and showed rapid oscillation of thetufts, especially on the long tuft located to give the g) Monitor engine vibration levelsangle of ai, flow at the engine inlet. The estimated throughout the test as an indication ofaverage air flow angles were observed to be inlet flow distortion caused by theapproximately 10 degrees for the left hand screen, and various degrees of screen blockage.15 degrees for the right hand screen. These figures,although subject to wide scatter in the test results (i.e. In summary, the engine cell performance tests+/- 8 degrees), substantiated the calculated screen indicated a two percent (2%) power loss with frontorientations, face completely blocked and 75% of sidewalls
blocked. Thirty-seven percent (37%) power loss withboth front face and sidewalls completely blocked -
5.2 Engine Test Cell Qualifications engine air entering solely through bypass opening. Inthe unlikely situation where such extreme inlet screen
The ice tolerant inlet screens incorporating the aft top blockage might be experienced for both engines, thereb.pS feature wore tested in December 1986 at the wuuld be sufficient power remaining (i.e. 1700 HP)Standard Aero engine test cell with a production for cruise. During the tests the engine did not stall or(T58-8F) engine. The main objective for testing the surg- during all "slam accelerations", "load chops",prototype screen and new fairing configuration in a and 'load bursts".test cell environment was to determine whether or notany detrimental effects on engine performance were
~~
lan • u mwmm._Li -.. i mm~ _ jIm m

6-9
The results of this testing verified that the installed nozzles below the mid-mast position and the helicopterengine performance matched that of thme original inlet positioned approximately 100 feet away from andconfiguration. The inlet distortion was monitored by facing the array of spray nozzles. For in groundrecording the vibration of the first set of compressor effect (IGE) hover the nozzle array was raisedblades using the zoom feature of a spectrum analyzer, completely to the top of the mast, however, for theand no adverse effects were noted in testing with the tandem rotor helicopter a wind velocity of at leastnew induction system. The conclusions drawn at the 15.5 to 24.9 miles per hour was required to obtain aend of this test phase were that the ice tolerant inlet good cloud coverage.screens and the new H46 inlet system performedsatisfactorily. Even with all of the screen blocked and The conclusion from this testing was that the prototypethe bypass partially blocked, engine performance was inlet screen allowed sufficient airflow for normalacceptable. The design was subsequently approved for operation of the engines for up to 30 minutes at flightflight testing by Boeing and NDHQ technical idle under severe simulated icing conditions. Thereauthorities, was evidence of ice on the front of the struts which
indicates that some of the air entering the front faceFinally, based on the analysis of the engine test cell exits through the bypass which is a very desirabletrials, the proposed inlet screen design was approved, feature, however, this was not confirmed. It waswith respect to the propulsion system, for use during concluded that the bypass must be moved more to theactual icing trials. It was recommended to proceed side and that all struts in the bypass area must bewith flight trials, relocated. It was recommended that further testing be
conducted to investigate the capability of a modifiedCHI 13/113A helicopter to operate in all types of snow
5.3 Simulated Icing Trials conditions and in visible moisture in the range of320F to 39'F.
The Icing Spray Rig of the Low TemperatureLaboratory of the Division of Mechanical The recommended modification: were embodied onEngineering, NRC, was employed for the simulation the subsequent prototype, and the qualifications, withof icing environments. The rig, located in Ottawa, these revisions, resumed in genuine meteorologicalconsists of an array of 161 steam atomizing water conditions versus the simulated environments.nozzles producing an icing cloud 16.4 feet deep and75.5 feet wide. The array can be rotated about asingle supporting mast 75.5 feet high to take 5.4 Performance flight test.advantage of wind direction. Liquid water content(LWC) can be varied over the range of 2.0 x l0r' to Performance tests were conducted by AETE and 4241.5 x 10' slugs per cubic foot (slug/f) and drplet Squadron personnel March 1987. The tests were tosizes ranging from 1.2 to 2.4 thousandths of an inch determine and quantify any significant degradation independing on temperature and wind velocity, engine performance with the prototype bypass iceThe second stage of testing in the NRC ice rig with tolerant inlet screen and modified H-46E air inductionthe ice tolerant inlet screen and top aft bypass was the system installed. The tests comprised seven sorties formost crucial part of the test program. Basically, the a total of 2.2 hours of ground testing and 7.3 hours ofperformance objective was for 30 minutes of operation flight testing.in severe icing conditions. The thrust of this testingwas ice accretion, and no rigorous measure of any In summary, the helicopter's performance with theengine performance degradation was conducted at this protective inlet screens installed was acceptable.test phase.
AETE was tasked to evaluate the ice tolerant inletscreen and develop the icing trial methodology. This 5.5 Rain/Snow Flight Trials.methodology was based on knowledge from previousice testing and a logical choice of cloud conditions. Results of the icing trials were sufficiently promisingThe FAR 25 stratiform cloud case was chosen rather to warrant further investigation of the capabilities ofthan the cumuliform because this case is related to a the prototype screens ". AETE was tasked to developlarger horizontal extent (10.8 miles) of cloud giving the test program and perform the flight testing. Testsmore accretion time. Similarly the choice of droplet were conducted to investigate different types ofsize of 1.2 thousandths of an inch, which was accretion on the test aircraft and on the prototype icesuggested by NRC personnel to represent a good tolerant inlet screens in the following threeaverage value for FAR testing, was considered meteorological conditions n ii:prudent. These decisions enabled the test method tobecome simply a matter of controlling the accretion of a) cold rain in the range of 32°F to 39°Fice as a function of the LWC and exposure time The. OAT:maximum LWC available from the rig, corresponding b) wet snow in the range of 26.6°F toto the selected test parameters, was chosen. The 35.5°F OAT; andavailable range of LWC was from 3.9 x 10' to 1.4 x c. dry snow in the range of 15.8°F to10' slug/tW. With the helicopter in the ground the 28.4 0 F.best icing cloud coverage was obta,..ied at winds of Iapproximately 10 miles per hour, with the spray

6-1
Ground idle, (IGE) hover and low speed forwardt flight tests were conducted at CFB Gander in cold FEATUM TESTING
rain, wet snow, and dry snow conditions. Cold rain Front Cone Proved by extensive
tests were conducted only at flight idle and no testing.
accretion of ice was observed. The worst cases in wet Bypass Area Final design same areaand dry snow were experienced during the 30 minute as screen tested in
IGE hover flights. Unlike the original CHI13/1l3A engine Cell.inlet screens, the prototype CHI 13/113A ice tolerant Frontal Drag & Performance flight
inlet screen, now equipped with the outboard rear Engine Performance test.
bypass, was capable of operating during t.se trials in Engine Inlet Tested in engine cell.visible moisture below 39°F OAT. Distortion CHl13A No anomnlies reported
during ground andflight testing.
The results of the flight tests with the side bypass Engine Inlet No anomalies reportedwee summarized as follows: Fleet fitment of the side Distortion CH113 during ground and
bypass ice tolerant inlet screens was recommended flight testing.
with the following refinements incorporated inproduction versions:
Sufficient testing has been completed at the NRC ice
a) The fibreglass attachment collar was to rig, the engine test cell and during free flight in icingbe extended in the area beneath the left and snow conditions to establish both the airworthinesshand ice tolerant inlet screen assembly to and effectivity of the ice/FOD deflector installation oncover the exposed heated surfaces of the the CHI 13/113A.engine air inlet fairing assembly in thisarea. 6.0 OPERA'IIONAL EXPERIENCE
b) All surfaces of the fibreglass attachment The CHI 13 fleet of 6 aircraft has been flying with the
collar extending inside the ice tolerant ice tolerant inlet screens for over a year with noinlet screen assembly were to be trimmed engine inlet icing or ic, FOD related problemsand all acute corners were to be reported. It has been difficult to ascertain the extentsmoothed out to reduce the collection of of any ice development on the new screens in normalsnow or ice. use. The engine inlets are not visible to aircrew in
flight, and any accretion would be expected to melt
c) An additional 1 inch of the lower during post landing operations and shutdown. The
quadrant of the mesh screen was to be positive performance of the new ice tolerant inlet
embedded in the fibreglass attachment screens has contributed to improved pilot confidencecollar to delay ice accretion inside the in the aircraft capability, particularly in adversemesh screen. weather conditions.
These modifications to the screen assemblies further The first CHI13A s.eiicopter modified has also been
reduced or eliminated their susceptibility to the flying for a year with the screens installed with no
formation of ice inside the screen assembly. The two reported operational problems.
sets of CH113 prototype ice tolerant inlet screens wereflown in normal operations for the duration of the One set of screens has also been supplied to Kawasal
icing season. The screen performance was acceptable. Heavy Indurtries for evaluation by the Japanese Self
No eztgine performance degradation was reported. Defence Forces. To date, there has been no feedback
Therefore, the commitment was made to proceed with regarding any operational performance results.
the CHI 13 fleet fitment of production inlet screens.
7.0 CONCLUSIONS
5.6 Qualification Summay An ice tolerant engine inlet screen has been developed
The following chart summarizes the ice tolerant inlet to provide protection against foreign object damage
screen project with respect to the method used to and resistance to inlet congestion. Ie design features
achieve non-turbulent engine inlet airflow, minimum a flat mesh face, an inverted conical side and a
degradation in engine performance and minimum shielded bypass opxcning. The findings of a
cdrag. comprehensive test program proved that the screensaerodynamic dwould provide a minimum of thirty minutes of
operation in severe icing conditions, and satisfactoryperformance in wet snow or dry. snow.
These positive results have led to an improvedtolerance to unexpected and unavoidable icingconditions for the engines of the CHI113/113A Searchand Rescue Helicopter fleet, and improved aircrewconfidence in the aircraft's reliability in inclementweather.
6-11
During engine cell tests for the ice tolerant inlet 11. AETE PROJECT REPORT 87/30,screen, a unique method of monitoring any influence *CHI 13/113A ENGINE INLET ICE FODof detrimental inlet flow distortion was derived. This SCREEN FOLLOW-ON TESTING", 9 AUGtechnique employed a spectrum analyzer to record the 1988.vibrational characteristics at the blade passingfrequency for the compressor first stage. The result 12. AGARD-AR-223, Advisory Report,Rotorcrftwas . relatively simple and real-time verification of Icing- Progres- and Potential,Sept 1986.any undesirable compressor blade excitation whenoperating in the presence of the various inlet 13. FAA Advisory Circular No. 29-02configurations. Change,Certification for Transport Category of
Rotorcraft, May 1985.
8.0 ACKNOWLEDGEMENT
We would like to thank The National Research DiscussionCouncil, Department of Mechanical Engineering for I. H. Saravanamuttoo, Carleton Universitysponsorship in publishing this work. In addition, we Was this system designed to allow flight in known icingacknowledge the support of the individuals and conditions or to permit continued flight if unexpected icingorganizations contributing to the design and tests was encountered?conducted, specifically the Canadian Forces ProjectOfficers, the Aerospace Engineering Test Author:Establishment, the staff of the National Research The system was designed and tested to permit continuedCouncil Ice Rig facility, and the stff of the Standard flight if icing is encountered in flight and no attempt wasAero Engine Test Cell. made to certify the helicopter for deliberate flight into icing.
Essentially this is a get out of trouble capability. There maybe a next stage in the project for continued icing certification
9.0 REFERENCES together with the re-introduction of blade de-icing.
1. AETE PROJECT REPORT 85/52, 2. W. Grabe, NRC Ottawa"CHIl3/113A Helicopter Engine Inlet Ice FOD Anti-icing screens have been around for a long time, egScreens", 17 NOV 1987. Sikorski gave a paper on it at a NAPTC conference some 20
years ago. What is different about this screen? How is its2. AET'; PROJECT REPORT 79/55,Leigh MK design special?
12A Ice Detector Trials on CHI13AHelioptr, Cld akeAlbrta,22 ec 180. Author:Helicopter, Cold Lake, Alberta, 22 Dec 1980. Yes, there are other good screens in service: the sister
tandem rotor helicopter the Chin )ok has externallyVincent J. Shaefer, John A. Day. A Field mounted engines and conical screen, with a removableGuide to the Atmosphere 1981. bypass screen which is effective in icing and is a good jfod"
screen. The design in this paper is special only because of its4 FAR 25 Airworthiness Standards, Appendix geometrical shape which was developed to be ice-tolerant
C,1974. and the concept originated from studies 20 years ago Theside bypass and the cutback on the cone sides produce the
5. X. De la Servette and P. Cabrit. Helicopter Air unique multi-mode operation for cruize and hover.Intake Protection Systems, AGARD LectureSeries 148 1986.
6. J.Ballard, Impact of IPS and IRS configurationson engine installation design,AGARD LectureSeries 148 1986.
7. CFTO C-12-1 13-000/MB-000 AircraftOperating Instructions CHI 13/113A.1987-08-31.
8. E.L.HOUGHTON AND A.G.BROCK,Aerodynamics for EngineeringStudents, 1960.
9. BOEING ARNPRIOR ENGINEERINGREPORT DE-89-091 Rev. B, AerodynamicRoporl 27 Jun 1990.
10. BOEING ARNPRIOR ENGINEERINGREPORT DE-89-025, "STRESS REPORT",27 FEB 1989.
7-1
COLD STARTING SMALL GAS TURBINFS - AN OVERVIEW(Ddmarragc Temps Froid des Petites Turbines s Gaz)
by
C.RodgersChief Concept Design
Sundstrand Power Systems4400 Ruffin Road
San Diego, California 92123United States
ABSTRACT
The requirements to operate aircraft gas turbines over a large range of environmental conditions proveparticularly demanding to the systems designer, especially when rapid starting of a cold engine is stipulatedat sub-zero ambient temperatures. As a consequence the occurrence of cold climatic extremes are dis-cussed and a trend is observed toward designing aircraft for specific areas and deployment, rather thanworldwide usage.
Cold engine cranking torque characteristics are oasically controlled by the lubricant viscous drag in themechanical drive train and accessories. To further complicate matters, this viscous drag is dependent uponthe magnitude of the applied start torque. Either actual viscous drag test data or realistic methods of pre-dicting engine cold cranking torque levels with high lubricant viscosity may be required before definitivestarter specifications can be issued. Experience with start systems for small gas turbine Auxiliary PowerUnits (APU's) has shown that the total weight required for successful rapid starting at -54*F can approachthe weight of the APU powerhead itself. As a consequence, most cold start requirements are relaxed to-400 C or higher.
Briefly addressed, but of critical importance, is the role of the combustion designer who provides a keyinput in designing and developing a combustor capable of rapid consistent light-off over a wide operatingrange at the earliest possible speed, thereby permitting the transition from negative (cranking) to positiveengine assist during start.
Methods of reducing APU viscous drag and start energy requirements that deserve future study are theall electric gearbox-less APU, and the possibility of a self-start pulse combustor concept.
ABREGE
Les demandes d'utilisation des turbines d'avion dans une gamme 6tendue de conditions d'environment s'averent de plusen plus 6xigentes pour le concepteur des syitimes; ceci est sp6cialement le cas du dniarrage rapde d'un moteur froid partemperatures tr~s basses La probabilit , de rencontrer des conditiors trts froides doit &tre discute, on observe tine tendancea concevoir des avions pour des r6gions specifiques ct des conditions particulires, plu*6t que pour tne utiliationuniverselle.
Les couples charact~ristiques d'entrainement d'un moteur froid d6oendent 6ssentiellement de ]a train6e visqueuse deI'huile dans les boites d'entrainement et les bni~es accesssoires. La que ,ion se complique un peu du fail que la train~evisqueuse dipend de la grandeur du couple de demarrage appliqu6 A rant d'ecrire les specifications dfinitlives dudrmarieur, il faut soit des rdsultats d'essai mesurant la trainee visqueuse r~elle, soit des methodes realistes de pr6e ision descouples d'entrainement du moteur froid. L'expenences a montr6 que pour le dmarrage de petits-APV, la masse totalenecessaire pour r6ussir un d6marrage i -54'C pouvait approcher Ia masse du generateur de puissance lui-m~me Enconsequence, la plupart des exigences de d6marrage temps froid se limitent A des temperatures superieures ou 6gales a-40"C.
Nous mentionnerons bn~vement nais en soulignant son importane le role du concepteur du syst me de combustion;celui-ci apporte une contnbution decisive en concevant et developpant une chambre de combustion capable d'allumagerapides dans n domai:.e d'utilisation tr, .tendu, d .tes,,- de rctatzo. I, phus b p.... b..; cc: p -1 I- pas..rapidement d'un couple resistif 5 un couple moteur pendant le demarrage. Parmi celles qui m6ritent des 6tudes plusapprofondies, les solutions permettant de rduire Ia trainee visqueuse d'un APU ct les besoins en 6nergic 61lcinque sontIAPU tout-6lectrique sans boite d'entrainement et le concept possible d'une turbine volume quasi-constant..1 S

7-2
II
NOMENCLATURE
Area Reference AreaAMAD Aircraft Mounted Accessory DriveATS Air Turbine StarterATSM Air Turbine Staiter Motor
APU Auxiliary Power UnitD DiameterECS Environmental Control SystemEGT Exhaust Gas TemperatureEPU Emergency Power UnitF Axial Load
JFS Jet Fuel StarterJP Jet PetroleumHP HorsepowerIp Polar Moment of InertiaKPa Kilo PascalME. Main EngineN Rotational SpeedPASS Pneumatic Air Start SystemP PressureQ Oil FlowSLS Sea Level StandardTIT Turbine Inlet TemperatureT TorqueVSCF Variable Speed Constant FrequencyVLSI Very Large Scale IntegrationU Tip SpeedVret Combustor Reference VelocityW AIRFLOWVo Isentropic Spuuting VelocityA' Viscosityp Density
SUBSCRIPTS
b Burner

47-3
1.0 Introduction 2.0 Cold Weather Extremes
Cold weather and cold envirrnmental starting The design of cold weather start systems forof aircraft main propulsion engi-. s represents a aircraft gas turbines is critically dependent uponsignificant design burden for self-sullicient fighter the design specification, specifically, the low :em-ai'craft operation from unimproved forward bases. perature extreme soak condition. Low temperatureAlthough military and cotr mercial aircraft typically extremes for world%;de usage (excludng the air,operate from permanent bases with both personnel land and ice shelf areas south of 60 degrees) areand equipment preheating capabilities, emergency shown on Figure 1, and set forth in MIL-in-flight power outage may require start up of the STD-210B and in the revised updated versionaircraft secondary power system after extensive MIL-STD-210C. Both standards do not give defi-soaking at -57
0 C conditions. nite limits, but they offer design criteria and start-
The many elements of the start systemn and the ing points for engineering analyses to determine
synergistic effect of cold weather are often difficult design criteria
to accurately predict A conserv.dve cold start The detailed requirement values used in MIL-analysis may present ant unpalatable system weight STD-210B represent risk values. It would oftenpenalty. A more palatable analysis can mature to be cost prohibitive and/or technologically impossi-prove disastrous when in'to the final qualification ble to design military equipment to operate any-stage. In retrospect, lessons learned would deem where in the world under the most extreme envi-improved definition of the synergistic effects of fuel ronmental -tresses for all but a certain small per-and lubricant viscosity effects, thermal soaking, and cent of the time. Tae design criteria for operationstransient performance during preliminary design. It in MIL-STD-2lOB are based where possible, onis the intent of this presentation to briefly expose hourly data from the most extreme month andmost of the known pitfalls in cold weather starting, area in the world. From hourly data it is possiblesuch that the designer is provoked and appreciative to determine the total number of hours a givenof the task involved, value of a climatic element is equaled or surpassed.
In preparation for addressing the cold weather If a value of a climatic extreme occurs (or is sur-
problem. a review of climatic weather extremes and passed) in about 7 hourly observations in the 7-4probearevious ewol stt clti isatheretred. a hour observations of a 31-day month, then thisprevious cold start tecnnology is presented. value occurs roughly 1 percent of the time. The
risk values pertaining to low temperature are asfollows:
Low Temperature Risk Values
Risk Value 1% 10% 12% 50%Temperature (*C) -61 -54 -51 -46 -.40
SeeCo ld E I .. .. . ----. .-- ...
FT-T -7--
Figure 1. Climatic Extremes
I.[f
7-4
The one percent extreme is used as the design F-15 was most likely the first aircraft to be quali-criteria for all climatic elements except low tern- fied at -40 0 C. Many of the justifications used toperature and rainfall rate. The 20 percent extreme relax the cold temperature requirement for theis used for low temperature. F-15 pertain to most or all of the other aircraft as
NATO has adopted a Standard Agreement well.which covers climatic environmental conditions af- The feasibility of starting an aircraft at -51 OCfecting the design of material for use by NATO was considered poor using the technology availableforces operating in a ground role. This doctiment, and the expense requiree to obtain -51°C capabil-STANAG No. 2831,, is similar to MIL-STD-210C. ity %as considered unrealistic Batteries were con-sidered to be unacceptable for use below zero de-
Five categories pertain to cold weather and acelisted in the following table. Where a range of grees. Hydraulic start systems were also limited intemperature is given, it reflects the high and low cold weather due to poor viscosity characteristicsseverae duivn at 24ure eriodtis the highand while increased volume would provide the nec-temperatures occur pe vu are for essary energy, the weight penalty was unacceptable.Ztemperature occurs. These values are for Lack of full human functionality at -40°C andoperational conditions corresponding to the values lower was used as justification, and the standardgiven in MIL-STD-210C which serve as starting itself was often deemed to be unrealistic.points for engineering analyses.foi vcs ofr thgineer es climticateThe results of the Reference 1 survey are sum-
The five locations of these climatic categories marized as follows:are:
; Mild Cold - Areas which experience mildly 1. MIL-STD-210B is an interpretable docu-ment which offers guidelines that allow sig.
low temperatures such as the coastal areas nficant devance from the intended designof Western Europe under prevailing mari- criteriatime influence, Southeast Australia and theLowlands of New Zealand. 2 MIL-STD-210C will make no attempt at
0 Intermediate Cold - Areas which expert- setting any design criteria,nce moderately low temperatures such as 3. The U.S. Air Force sets cold weather re-Central Europe including South Scandina- quirements on a system-by-system basis.via, Japan and South Eastern Canada 4. Start systems appear to be a limiting factor
9 Cold - Colder areas which include North- with cost and space/weight penalties beingern Norway, Prairie Provinces of Canada, main drivers. Start system technology hasTibet and parts of Siberia but excludes not kept pace with other areas.those areas detailed in the two colder cate- 5 The designing trend leans toward aircraftgories for use in specific areas rather than for use
0 Severe Cold - The coldest areas of the worldwide.North American Continent.
* Extreme Cold - The coldest areas of It was emphasized that MIL-STD-210 was an
Greenland and Siberia attempt to apply the lessons learned in World WarII to future aircraft designs. Future systems must
The values listed in STANAG 2831 represent not be designed for the conditions they experiencein peacetime, but for the conditions that they may
the air temperature, which, on average, was at- encounter in the advent of war.tamed or exceeded for all but approximately lper-cent of a month during the coldest month of theyear. 3.0 Review Of Previous Start Technology
A detiiled evaluation of MIL-STD-210B, Extensive design data and design techniques for-210C and STANAG 2831, plus cold weather aircraft gas turbine engine start systems have beenstarting specification requirements for USAF air- published by the Society of Automotive Engine ,,craft was made in Reference 1. (SAE) Starter Committee AE6, most notable of
The A-10, F-15 and F-16 aircraft are all which are listed in References 2 through 8 Thequalified to -40*C. The minimum ground opera- SAE Starter committee was first formed in 1962,tion temperature specifications for the C-17 and and meets biannually to formulate standards forthe B-lB are -40FC and -34"C respectively. The aircraft engine starting systems.
Cold Temperature Extremes for NATO Operational Conditions
Lowest RecordedCategory Temperature Temperature
Mild Cold oC -6 to -19 -24
Intermediate Cold 0C -21 to -31 -42
Cold 0C -37 to -46 -56
Severe Cold 0C Constant -51 ---
Extreme Cold 0C C(nmien- 57 -7 !
I.-t
a w wm , w w mw, m n • m u muwmw , I,

7-5
References 9 and 10, Starting Systems Tech- 2. Pneumatic Link - With small integral bleednology, SAE special publications SP 598 1984, and or load compressor auxiliary power unitsSP 678 1986 provide latest design data for most (Figure 5), either mounted on-board, oraircraft start'system components, including gas tur- from external ground carts.bine auxiliary power units, emergency power units 3. Electrical - From aircraft batteries, on-(EPUs), air turbine starters (ATS), and air turbine board APU, or ground power supplies.starter motors (ATSM), and hydraulic and electricstarters. 4. Hydraulic - From on-board APU or
The author and his affiliation (References 11 - ground hydraulic chart.16) have devoted efforts toward the optimization of 5 Windmill - With possible assist from APU.
the start systems for both prime propulsion engines 6. Cartridge - Solid propellant breech firingand small auxiliary power units Previous start pa- into the high temperature air turbine starterpers published by the author are found in Refer-ences 11 - 16, and were motivated by a primary or direct rotor impingementgoal to improve start system reliability, particularlyfor self-sufficient jet fuel starters (JFS), which mayprovide the only means of aircraft dispatch. 2.0-
4.0 Starting Methods Constant Turbine iest Temp
A frequently used method of starting aircraft _.__ - -
prime mropulsion gas turbine engines is by means pof a small auxiliary power unit providing com- "pressed (bleed) air to an accessory drive gearbox- ' "mounted air turbine starter. This AFU may be 36 . .. -carried on-board or mounted externally on ground a 000o isupport equipment. The majority of these APU'sdeliver a bleed pressure ratio of approximately 4.0 i .•at standard day conditions, as constrained by oil 00.0auto-ignition temperature limits no higher than ,40"250*C for mostly comnercial aircraft applications NThe general effects of ambient temperature and 120m Raltitude on small gab turbine performance at rated 0 610oUconditions are shown in Figure 2. The basic po,'er -60 -40 -20 0 20 40 60lapse rate towards lower power on hot days is dic- APU Air Inlet Temp Ctated by the decrease of cycle efficiency with tur-bine inlet temperature (T.I.T.) to ambient tem-perature ratio, air density with hot days decreasingoutput power, and cold days increasing output Figure 2. Typical Power Lapse Rate Singlepower. The temperature and altitude lapse rates Shaft Radial Gas Turbineshown are typical of single-shaft APUs with cen-trifugal compressors operating at rated TIT andconstant rotational speed. Slightly different hotdsy power lapse rates may be exhibited with van-abie speed operation. Note that the power lapserate change with ambient temperature may be ap- L a'trrtg "
E31E a~ cll ridge
T 2Main EngineHP ( SLS
HPSLS
WindmillIt is observed in Figure 2 that rated output
power decreases about 30 percent f:om SL 15'Cto SL 52 0C conditions. Normally APU's are sized Electricto mec, full aircraft secondary power requiiementsat critical iot day conditions, and are therefore PTOcapable at delivering access power at cooler ambi- Hydraulicent temperatures, as dependent upon load changewith a- bient temperature. Usually, 90 percent of AM .D.APU operating rime is spent at ambient tempera- Itun.s below 35'C and therfore exposure to maxi- Ground Cwtmum TIT's may be limited. 4-,APU
Six common methods of starting aircraft prime ne (Hot Gaspropulsion gas turbine engines shown in Figure 3 Mechanical LA.J Source)~~are: i
I Mechanical Link - With small gas turbinejet fuel starters of the two-shaft power tur-bine or m -nole-- -i- .0, tLWOu Ceierieiconfiguration, (Figure 4) Figure 3. Engine Start Methods L02-3
Ik
,I
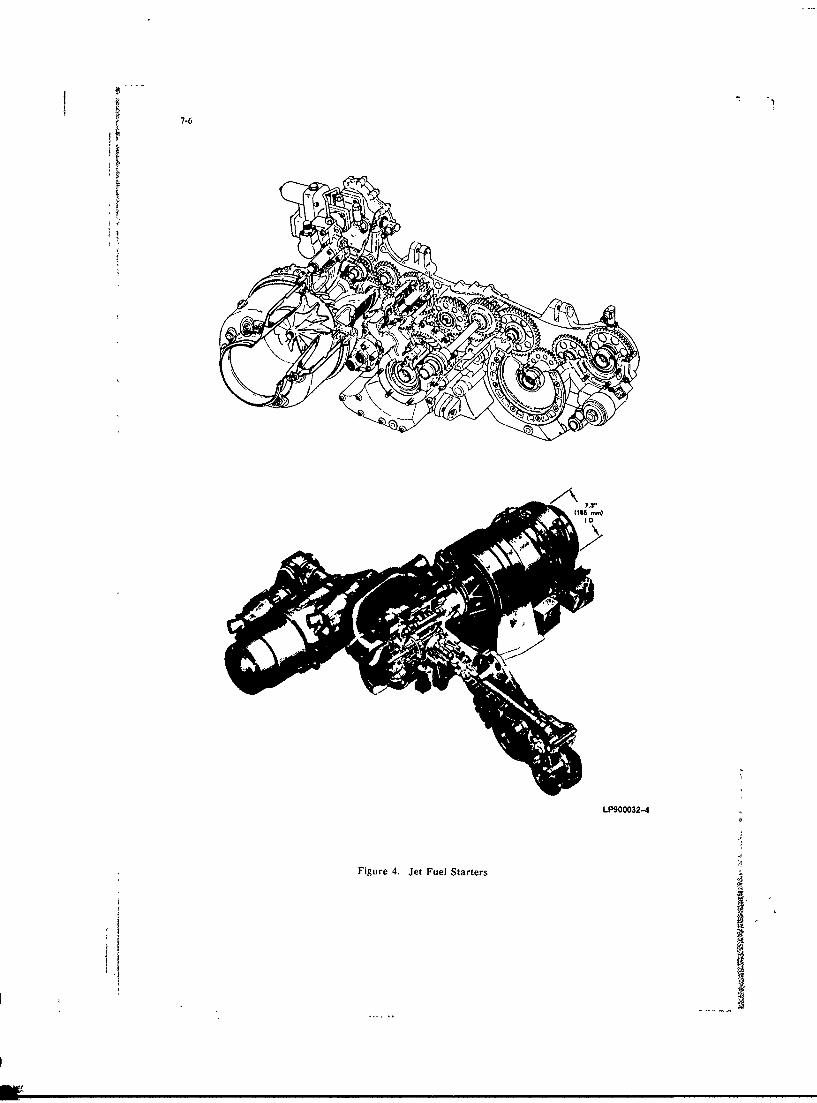
7-6
LP900032-4
Figure 4. Jet Fuel Starters
.I

7-7
Figure 5. Pneumatic APUS
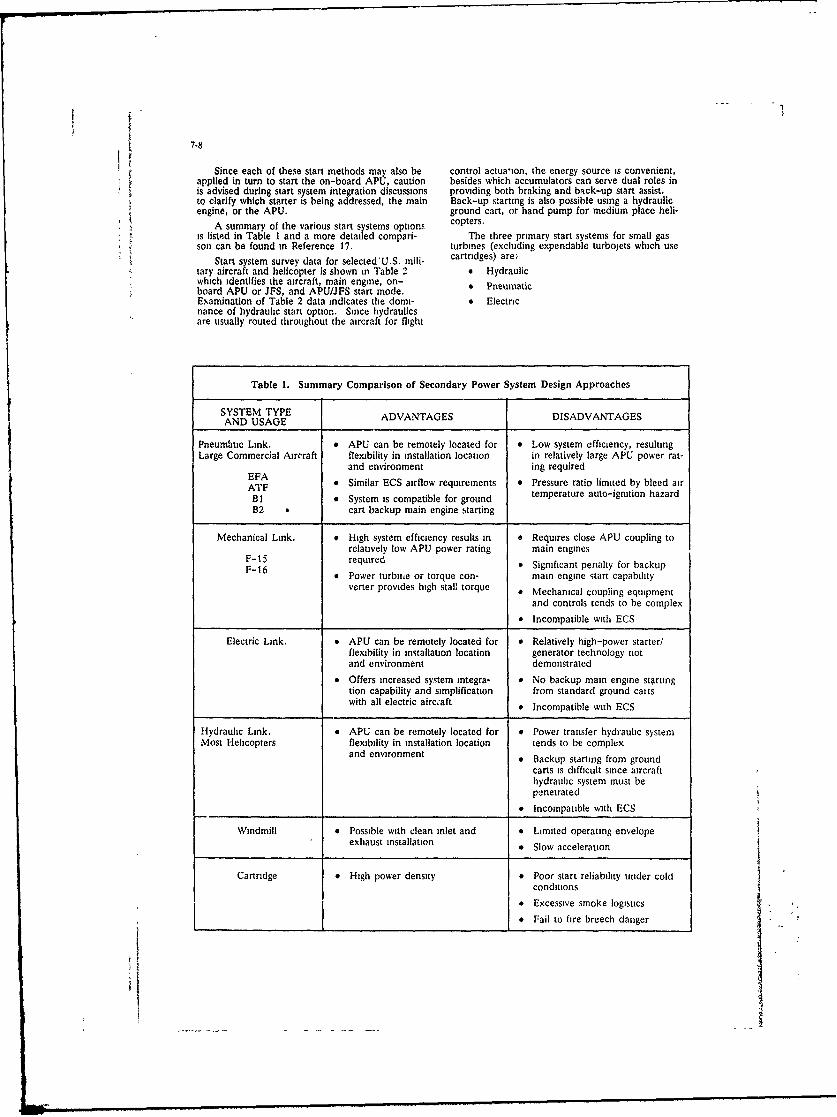
7-8
Since each of these start methods may also be control actua'ion, the energy source is convenient,applied in turn to start the on-board APU, caution besides which accumulators can serve dual roles inis advised during start system integration discussions providing both braking and back-up start assist.to clarify which starter is being addressed, the main Back-up starting is also possible using a hydraulicengine, or the APU. ground cart, or hand pump for medium place heli-
A summary of the various start systems options copters.is listed in Table I and a more detailed compari- The three primary start systems for small gasson can be found in Reference 17. turbines (excluding expendable turbojets which use
Start system survey data for selected'U.S. mili- cartridges) are:tary aircraft and helicopter is shown in Table 2 0 Hydraulicwhich identifies the aircraft, main engine, on-board APU or JFS, and APU/JFS start mode. * PneumaticExamination of Table 2 data indicates the domi- * Electricnance of hydraulic start option. Since hydraulicsare usually routed throughout the aircraft for flight
Table 1. Summary Comparison of Secondary Power System Design Approaches
SYSTEM TYPEAND USAGE ADVANTAGES DISADVANTAGES
Pneumitic Link. APU can be remotely located for * Low system efficiency, resultingLarge Commercial Aircraft flexibility in installation location in relatively large APU power rat-
and environment ing requiredEFAATF * Similar ECS airflow requirements 9 Pressure ratio limited by bleed airBI System is compatible for ground temperature auto-ignition hazardB2 * cart backup main engine starting
Mechanical Link. o High system efficiency results in a Requires close APU coupling torelatively low APU power rating main engines
F-16 required e Significant penalty for backupF Power turbiie or torque con- main engine start capability
verter provides high stall torque * Mechanical coupling equipment
and controls tends to be complex
* Incompatible with ECS
Electric Link. e APU can be remotely located for * Relatively high-power starter/flexibility in installation location generator technology notand environment demonstrated
9 Offers increased system integra- e No backup main engine startingtion capability and simplification from standard ground caitswith all electric airc:aft * Incompatible with ECS
Hydraulic Link. a APU can be remotely located for * Power transfer hydraulic systemMost Helicopters flexibility in installation location tends to be complex
and environment * Backup starting from groundcarts is difficult since aircrafthydraulic system must bepenetrated
* Incompatible with ECS
Windmill o Possible with clean inlet and e Limited operating envelopeexhaust installation o Slow acceleration
Cartridge o High power density e Poor start reliability under coldconditions
• Excessive smoke logistics
* Fail to fire breech danger
Iij, ........ -..... ...I.

7-9
Table 2. Starting Data - U. S. Military Aircraft
AIRCRAFT F-15 F-16 F-18 B-1 KC-135 C-141 Black Hawk AH-64
Main EngineModel F-100 F-100 GE404 F-100 CFM56 TF33 T700 T700
lp lb.ft.sec 2 3 2 3 2 2.65 5.92 5.92 8.9 0.11 0 11
Core N krpm 13.5 13.5 14.5 14.5 14.5 9 0 43 43
lpN2 XIO-6 583 583 557 1244 1244 720 203 203
GTCP GTCP GTCP GTCP
Model JFSI90 T62JFS 36-200 165-9 T40LC 85-106 T4o 36-150
Ip lb ft sec 2 0054 .0032 0071 022 0045 .026 0031 .0068
N krpm 65 61.6 62 38 0 64 3 41 61 6 62
IpN2 X10 - 6 22.8 12.1 27 3 31 8 18 6 75 6 11.8 26.1
Approx Weight lb 100 84 160 230 190 320 96 100
ATART SYSTEM
Type Hydraulic Hydraulic Hydraulic Hydraulic Hydraulic Hydraulic Hydraulic Hydrauhz
Weight lb 75 47 51 110 63 119 56 46
Low Temp °C -40'C -401C -40°C -29°C -400C 0 -40°C -320C
Starter Displacement 0.3 0.42 0 37 0.60 0.65 0 37 0.68 0.365in3/rev
Accumulator 2x2,5 2x200 290 1200 500 2x400 200 299Volume in3
Approx System _j 50 51 110 61 119 62 40Weighz lb

7-10
4.1 APU Hydraulic Start 4.3 APU Electric StartUntil recently, most quick start military gas tur- Increased avionics, electrical systems, and
bine APU installations used hydraulic start systems, power levels has created renewed interest in theas oppbsed to electric systems. The reasons full electrical aircraft. Advanced VSCF type gen-stemmed from compatibility with the aircraft hy- erators, capable of operation as starters are beingdraulic system, and cold weather starting. Electri- studied for both large prime propulsion and APUcal systems usually require battery electrolyte heat- gas turbines. Switched reluctance starter-genera-ing at temperatures below -28 'C, but can be tors have also been identified as a potential futurestarted at lower temperatures with battery shorting, technology approach. These starter-generatorsif time is not critical. Hydraulic start systems are generally operate at 150 percent of rated powermainly in use for sub-Arctic environments, but during a start to meet the engine start torque re-nevertheles., are also prone to increasing fluid vis- quirements, and may also require a dual ratio gear-cosity pressure drops effects, and thus reduced box. None of them have yet demonstrated satis-starter output torque. Hydraulic start system sizing factory starts in an actual aircraft. Battery chargefor -54°C conditions, in particular, require large considerations under cold weather conditions ashydraulic accumulator volumes and therefore pe- typified in Figure 7 is a fundamental constraint.nalize aircraft gross take-off weight. As with bat- Reference 19 describes a battery shorting techniqueteries, APU preheating may be necessary. used to make successful -54 0 C start with a small
The effect of soaked temperature conditions on gas turbine. The engine ECU incorporated athe performance of a typical hydraulic starter using "WINTER" mode which initiated a pre-program inMIL-H-83232 fluid is shown in Figure 6 For the microprocessor to periodically connect and dis-temper e lissh on -40 C theiue 6 of connect the battery from the starter windings intemperatures less than accordance with a progamed sequence of on/offMIL-H-5606 fluid is recommended. cycles, causing the battery to be warmed internally
from its own cell resistance
100 - - _
5.0 Engine Starting Characteristics
15-135T It is difficult to estimate with any reasonable80 -- -_- * _ accuracy the starting characteristics of small gas
turbines because of the synergistic nature of theproblem Engine starting characteristics are influ-
-54*c enced (among other intangibles) by:Z: 60Lu - Temperature and altitude
S* Initial engine design selectionF- 40 - MIL-H-83232 Fluid 0 Engine performance
0 Engine fuel control schedulingMechanical features and associated viscous
20 drag0 20 40 60 80 100
% Max Speed 0 Acceleration rate• Starter selection and torque characteristics
Figure 6. Typical Hydraulic Starter Performance100
4.2 APU Pneumatic Start 90
High pressure pneumatic air start systems 80(PASS) (see Reference 17 and 18) are being pro- 70posed and used to circumvent the low temperature 60problems of the electric and hydraulic approaches.Stored air in high pressure bottles is expanded Iacross an air motor attached to the APU gearboxor directly impinged on the turbine rotor. Current o 40system pressure levels are 1,000 psig, with higher 3OLlevels, 4,000 psig, being considered to reduce stor- 0age volume. Further air storage volume reduction 20- - .. --is possible with development of small high pressurefuel rich air/JP combustors capable of heating the 10cold expanding air (sometimes at -73*C or lower) 0to 900°C. The cryogenic temperatures experi- 0 50 100 150 200 250 300enced with PASS components and prolonged high Discharge Currentpressure recharge compressor times offer challengesto match the high start reliability standards of hy- 09M2-7draulic starters.
Figure 7. Typical Battery Characteristics
1I
. 1 ! !

7-11
Due to the complex interrelation of these fac- During the initial start phase (below approxi-tors, engine starting characteristics are realistically mately 20 percent design speed), the aerodynamiconly obtained by actual test under controlled con- and viscous drags at normal ambient temperaturesditions with a specific start system. Although ex- may be relatively small in relation to the basictrapolaton of these characteristics to other operat- starter applied torque. In such cases, the starter
* ing conditions and start systems without actual test applied torque is approximtely equal to the basicis not recommended, it is often necessary. flywheel acceleration torque as determined from
The three major torques during engine accel- the rotating assembly inera and acceleration.
eration shown in Figure 8 are: Under these conditions, examination of severalsmall gas turbines with different start systems has* Unfired cranking torque shown that the starting difficulty (or amount of
* Viscous torque starting energy required) can be correlated with theproduct of the rotating assembly polar moment of
* Fired torque inertia and the square of the rotational speed,IpN2 .
Since the start system weight is a function ofso visous-9 the stored starting energy, general trends have been
S .. established for start system weight as a funcuon ofIpN2 as shown in Figure 9. These trends are use-
_ _ Sful in early engine design to indicate the potential0 20 40 60s o 10o effect of compressor and turbine geometry and de-
sign speed upon start system weight for equal starttimes at normal ambient conditions. Both APU
- o Regmand main engine (core) IpN 2, data are shown onso- Figure 9 for a wider correlation base of gas turbine
Iengine types. The use of the core inertia and-0 ---- rd o cclertiUn speed is a fundamental correlating parameter for
_1 ___ -turbofans, particularly with the trend to higher by-pass ratios and three spool configurations.
Figure 8. Idealized Engine TorqueCharacteristics
Kg m2 rpm2
101 2rM 101
1000
500
- ,100kg
: ~~~S -0 400C-..'
00 *
t
10
10 7 5 10 8 5 log 5 10
I, N 2 Ib ft s e c 2 rp m 2 ,P 00 .0.2 .S
A Figure 9. Start System Weight Correlation

7-12
A review of the hypothetical starting times fora typical main propulsion engine using a pneumaticlink start system comprising a small APU, ducting,and air turbine starter was described in Reference Bro Trine
15, where relative sea level start times for the ide- 06,alized case with only aerodynamic and no viscousdrag effects considered showed. 0.-- -Turbine-
UO Brake0 05 05 1.0 1.5
Ambient *C Relative Time % I0 5 -Revere
15 100 RotatingCompressor
34 130 10
-54 63 Compressor
The longer main engine start time for the SL Figure 10. Four Quadrant Turbine Operations130*F is typical of pneumatic link systems, andconsequently often sired the APU. The computedreduced start time at -541C is purely hypotheticaland contrary to normal sub-zero trends, where Analysis of low speed unfired cranking torquesviscous drag becomes dominant and causes relative for small gas turbine APUs indicates that the ap-start time to increase substantially above that of SL proximate magnitude of the net aerodynamic150C. These start times refle:t the basic power cianking torque conservatively relates to that of thelapse rate of the smaller gas turbine APU with out- torque required to drive the compressor (only)put power increasing significantly at lower ambient For fixed compressor geometry and zero bleedtemperatures. Both the main engine and APU, conditions this can be simply expressed as:are, however, impacted adversely by cold weatherdrag effects
At -540C ambient conditions, hydraulic startsystems weight for small APUs may approach thatof the APU power plant itself, forcing the APU Aerodynamidesigner to scrutinize all possib'e sources of reduc-ing rotor inertias. Such scrutiny is common practice Compressor Design HP x 5250 2Design Nin turbocharger design, for example, where fast C%accelerations are required for response and smokeabatement. Rotor blade number and disk configu- Design Speed rpm (__100rations are whittled to the minimum is necessaryfor structural integrity at design or overspeed con-ditions. The APU engine turbine blade numbertradeoff is extremely weight effective, and turbineefficiencies of up to three percentage points may In effect, this presumes the turbine operatesbe sacrificed for non-continuous duty operation, near runaway conditions producing no expansion
torque and requiring minimal input.5.1 Unfired Cranking Aerodynamic cranking torque, is best deter-
Engine performance behavior during the initial mined from actual torque measurements, but maycranking phase, prior to light off, are often pre- be derived from APU speed deceleration tracesdicted using steady state compressor, combustor after a cold unfired starter crank.and turbine component characteristics, yet it is wellknown that the transient and steady-state compo- 5.2 Viscous Dragnent performances may be diflerent. For example,the first start of a gas turbine normally requires a The mechanical features of the engine starterlonger time than subsequent starts. drive train and support bearings are possibly the
most dominant single factor controlling cranking atDifficulties encountered i computing low speed sub-zero ambient tenperatures. Inadequate clear-
ances and dissimilar metal contraction rates have* Accurate low speed characteristics been known for example to cause interference
definition of the compressor, combustor binding preventing starting High oil viscosityand turbine, throughout the train and bearings increases dragOperation of the turbine near or beyond torque by an order of magnitude. Parasitic losses
in the oil and fuel pumps increase also with therunaway" conditions, as illustrated in change in viscosity.
Figure 10
* I

7-13
At normal ambient temperatures, the mecham- 0.cal losses in the drive train, bearings, and accesso- HP loss/bearing = 0.80 (ItQ)ries are on the order of 1 to 4 percent of the de-sign power rating dependent upon train reductionratio, type, number of bearings, and accessories. This relationship is shown plotted on Figure 11.
Additional parasitic losses may stem from engine During preliminary engine design, a mechanicaldriven equipment such as cooling fans, generators design configuration is selected after many designand hydraulic pumps. Miniature gas turbines (less iterations to best compromise all the design criteriathan 20 hp) tend to exhibit higher mechanical and constraints. The creative designer will gener-losses on the order of one-tenth of rated power, ate an efficient design in which mechanical lossessince it is not always cost effective to scale engine are minimized to avoid impacting such factors asdriven accessories, especially when ultra high rota- cost, performance and oil cooler requirements.tional speeds are employed. Although these mechanical losses at normal ambi-
High speed rolling element bearing losses for ent temperatures and design speed may be smallsmall gas turbines can be estimated using the data (2-5 percent) and seemingly negligible relative toof Reference 20 approximated to give: the aerodynamic drag, oil viscous shearing at start
initiation results in larger mechanical than aerody-namic drag.
The T-47 gas turbine APU (Figure 5) gearboxwas subjected to extensive cold crank tests during
HP losslbearing = 0.20 (gQ)0 initial development. The effect of oil sump tem-perature on its cranking torque at 15 percent speed
D6 2 + .0002D tN 0 5 F is shown in Figure 12.t *The cranking torque ratio shown is that com-
posing mechanical drag from the starter drive trainvia the main reduction gear bearings, accessories,and aerodynamic drag. Total mechanical losses atdesign speed for this engine were approximatelyfour percent of the total engine output. Light air-craft type oils, MIL-7808 and MIL-23699 were
Where the bearing bore, diameter D is given in used but nevertheless cranking torque increased bymm, and the viscosity ;. is in centistokes. For light a factor of 4.0 at -54*C with higher oil viscosity.axial loads the power loss is dominated by viscous Cranking tests results with the gearbox deprimedshearing, and with typical "DN" values of 2 x 10⁶, are also included and indicate up to a 20 percentcan be further approximated to yield. reduction drag.
Lltre/Mln1.0 5.0 10.05 I , -' 6 00Conrad Type Ball Bearing
4 MIL-L-7808 OilDN= 2X10⁶ -40C
3- Light Loading N
0
X 1.0
S0.51 ,.,.0.1 0.5 1.0 5.0 10.0
Oil Flow GPM0B900032-11
Figure 11. Bearing Losses

7-14
a Applications of external starting torque di-C rect to the high speed shaft itself, with un-
-50 -25 0 25 coupling of all but necessary viscous para-4 1 0sitic shear sources.
15% pd * Advancement in applied tribolo y to reduceviscous shear effects in gas turbine acces-
3- MIL-7808 Primed sory and maii shaft componunts.0
3 -- - MIL-7808 Deprimed
-ML-23699 Primed
I __I
-4 -.-- Z - Oil MIL-L-7808-50 0 50 100Oil Sump Temperature *F Excludes Hydraulic Pumps, Generators, Fans
LPIOVO2m' _ 54 C (-65F)- 0.8... Single Shaft
Figure 12. Effect of Oil Sump Temperature Constant Speed APtJon Cranking Torque 4 Kgm
, -32I 0.4
Examination of the apparent oil viscosity vari- 0ation (based on ambient temperature) and the in- 2-crease in cranking torque indicated a relationship- -similar to that presented in Reference 21 basedupon cold starting of diesel and automotive engines .where: -
1 * 100 2 0S.L. 151C Rated Power
Cranking Torque
Cranking Torque Reference Figure 13. Typical APU Breakaway Torques
The reference conditions define the cranking 5.3 Fired Accelerationtorque and apparent oil viscosity at design ambient. The transition from unfired cranking torqueThe exponent n varies from 0.2 to 0.3. This rela- resisting acceleration, to fired torque assisting accel-tion.hip may he applied to project mechanical drag eration, occurs upon ignition and combustor lightat sub-zero ambient conditions providing: off with fuel burn scheduled by the engine control
o Mechanical drag at the reference condition unit (ECU). The synergestic starting effects culmi-is known to be reasonably accurate by esti- nate during this transition phase. With instantane-mation or direct measurements. ous thermal and fluid response this transition would
hypothetically materialize by a vertical shift fromo Aerodynamic torque is assumed negligible unfired to fired torque levels at constant speed. In
in the range of 0 to 15 percent speed. practice the transition takes a finite speed intervalas dictated by the system response.
In the event that a reference torque conditionis unavailable, the represtntative breakaway torques Thermal transient response effects become(torque at zero speed) in Figure 13 may be used in even more significant during fast accelerations.a first cut start analysis. Higher breakaway torques Substantial increases have been observed in tran-at -54*C have been experienced resulting in stored sient fuel flow demands for small gas turbines at
ystart system weights that can approach the the author's affiliation, directly relating to heatenergy art sysem weight tat The ame the losses to the "cold" castings and flame quenchingdry APU powerhead weight itself. The same APUs effects on combustion efficiency. Heat exchangedwhen employed as a starter for larger prime pro- e turbinepulsion gas turbines are burdened with the incom- gas turbine engines are notorious in this respect aspatibility of starter torque output dep-ndent upon the large mass of the heat exchanger acts as ther-the square of air density (Figure 2), yet main en- mal reservoir absorbing heat during start and dissi-gine cranking torque is basically dependent upon pating heat (with possible bearing soakback prob-lubricant viscosity. Fortunately, a main engine re- lems) on shutdown.start at altitude occurs with the lubricant already The p.ienomena of increased viscous drag withpreheated. Aftudc and sub-zcro starting ,ondi- higher appiied starter torque and taster accelera-tions, however, will continue to require excessively tions is discussed in Reference 14. The effect isheavy start systems until viscous shear losses can be related to the increase in oil viscosity under highreduced by either, pressure shear rates

7-15
Cold starting characteristics of a load compres- The static pressure at the exhaust must neversor type APU are shown on Figure 14 at S.L. be greater than the static pressure at the inlet when-40°C conditions, 'vith 0.95 and 0.68 cu. in. hy- a start is attempted since this can result in flame-draulic start motors. Acceleration fuel scheduling back out of the APU inlet. Although high inletof the ECT tcoping type was the same for both. ram recovery can increase APU power, it increasesIncreasing the start stall torque by approximately velocities through the combustor and may interfere50% (0.95 cu. in. motor) increases the initial en- with APU starts, which is discussed in the next sec-gine resisting torque by a similar perrentage. The tion. Starting above the tropopause with low pres-increase of APU resisting torque with acceleration sures and temperatures results in compressor opera-rate complicates start system optimization and start- tion at lower Reynolds numbers and higher relativeer selection and necessitates experimental determi- Mach numbers which can reduce surge margin.nation of its magnitude. The EGT topping fuel Advanced ECU's are now capable of identifyingschedule eventually produces the same APU assist- surge and responding by re-metering the start fueling torque characteristics after acceleration past schedule to avoid surge confrontation.starter cut-out.
Small gas turbines are particularly sensitive to 6.0 Combustor Design Considerationstip clearance effects since clearance gap to bladeheight ratios tend to be larger than those of larger The previous effects are relatively small whengas turbines. In most instances, the minimum en- compared with the transient behavior of the com-gine operating clearances are established by tran- bustor. Transient combustor efficiencies as low assient engine tests to determine limiting rub clear- 20 percent have been experienced for small shortances gaps. Some tuning can be accomplished by reverse flow annular combustors on cold starts fol-matching thermal responses of the rotors and sta- lowing ignition and light-off, as indicated on Figuretionary shrouds and by appropriate material selec- 15.tion. Computation of engine transient performanceusing steady-state component performance charac-teristics does entail small errors due to the effect of _transient clearance effects on both component effi- 9 Translentciency and pressure flow characteristics. -
60 -- -7
SL -40*C 60
Z- I I iDome Height 2.6 cm
it Starter Torque141.42 20 -1aStr
010 0. .140 20 40 60 80 100 120S APUI I Percent Design N L.POOO3
>E 2 1'Torque 0__~" ''J/It,2,
-,"" - li I - Figure 15. Transient Burner Efficiencies
-0.a95 i I e Of primary importance to increasing engine0.95 In/ Rev Motor acceleration assisting torque is early ignition and
0 -. 0.68 In2/ Rev Motor good fuel atomization, which affects the transitionfrom engine resisting to positive acceleration torque
LPIOL.14 characteistc. A major constraint for reliable earlyignition under a wide range of operating conditionsis in the design of the fuel injection (atomization)
Figure 14. Effect of Higher Starter Torques system.
All these transient effects can be simulatedwith sophisticated analytical models, but the acid
5.4 In-Flight APU Starting test is start demonstration under exposed cold soakconditions.In-flight starting of the APU after cold soakcniht sarti n of theA afteThe capability to fill the fuel manifold faster,,ombined with higher ignition spark rate, and im-
Y The inlet and exhaust duct pressure proved start nozzle fuel atomization, is required torecovery or loss, provide an earlier transition from unfired cranking
. Aircraft location of the inlet and exhaust, to positive engine assist torque. Under Arctic con-ditions, high fuel viscosity and poor fuel atomiza-
a Gearbox breakaway torque after cold soak, tion ma) cause a delayed light-off, which com-bined with higher viscous parasitic drag can resultSConosmbustr characteristics under ram in an aborted or hung tart.
conditioins.

7-16
Low combustor reference velocities and load- The typical effect of engine speed and flightings are preferred for reliable ignition (especially at Mach number on unfired combustor reference ve-altitude), fuel air ratio stability limits, and low com- locity is sho'" in Figure 17. Higher Mach num-bustor pattern factors. Combustor reference veloc- bers, or more specifically, engine inlet/exit pressureity is defined as: ratios, increase the reference velocities and eventu-
ally may cause blow-out upon ignition attempts.
Vref = Wb/(A ref P) Annulusfl'ozzl Area Ratio. 10
where W b = Combustor airflow 1 1.1 1
Af = Combustor reference area I0 I Ram 4 10
= Combustion gas density 30 - PruesurePVWe ROO i
fps W m150
The combustor reference area is typically cal- 5culated from the mean diameter and chamber 01dome height since most gas turbine combustors are -of the reverse flow or axial through-flow types. 0 13 20 30 40 s0Combustor maximum diameter becomes governed % Design Speedby the necessity to minimize frontal area compat-ible with that of the compressor and or turbine,The only remaining "free" combustor sizing van- Figure 17. Typical Effect of Ram Pressureables are usually dome height and length. Choice Ratio on Vrefof length (volume) influences the combustor heatrelease rate and loading, which are additional im-portant combustor design criteria. Note that under ram conditions, flow is being
rammed through the engine at zero speed and mayactually decrease slightly as the engine initiallybreaks away and ptcks up speed, as dependentupon the turbine flow characteristics at low pres-
Combustor Loading = Wb 1r(Pb) 1 Vol eTb/540) sure ratios and speeds.Combustor reference velocities are determined
also by the ratio of the combu-tor reference areato the turbine nozzle area. Thus, for a given com-bustor area, higher engine pressure ratios with cor-responding smaller turbine nozzle areas provide
Lower combustor reference velocities permit lower combustor reference velocitieswider fuel/air ratio limits during start in the mannershown in Figure 16, and therefore tend to promote As mentioned previously, good fuel atomizationimproved fuel atomization and blow out limits tn- is critical for small gas turbines. In this respectder high altitude operation Figure 18 shows the result of tests on a series of
swirl pr-ssure azomizers, of differing sizes appropri-ate to 200 hp APU, using two different fuels of 4and 25 centistokes viscosity. Using 4 centistokes is
- v appropriate to typical JP-4, at an ambient ofSea hLie -40°C A viscosity of 25 centistokes is appropriate
- -High Altitude to a heavy diesel oil near its cloud point, and rep-
resents a worst case, appropriate, for example, toAir Force ground carts burning diesel fuels. The
- - r/Sec 10two curves define the fuel pressure required for.10 1adequate atomization and any chosen fuel flow,
Fuel when using a 0.8 Joule ignition system. The scaleFuel c effects of swirl pressure atomization is clearly
"-KT" 1shown by the impossibility of providing adequate"$ 0fuel atomization for fueling rates of 5 and I Kg/hr
.01 - oi less, for viscosities of 25 and 4 centistokes re-/ spectively as, at such fuel flows, the fuel pressure
0 -- "Lear, required is infinite. On the other hand, fuel flows0much above 15 kg/hr show little effect of fuel vis-
.001 - cosity, and fuel pressure required for adequate fuel0 10 20 30 40 atomization is modest at about 35 psi Thus, a
very significant difference in flane performanceV ref (fps) using swirl pressure atomizers, as between large and
U10=2.19 small gas turbines, exists. This focuscs, in thesmall gas turbine, more strongly than in the largeturbine, on those fuel properties affecting fuel at-
Figure 16. Tyoical Small Burner Ignition Limits omization. with emphasis primarily on fuel viqertyand, to a smaller degree, on surface tension.
! i

V7-17
7.0 Control System
Kgfnr Once combustion is accomplished, the magni-5__ s 10 is tude of engine assisting torque is governed by:
- Engine performance and temperature and2000 30 temperature limitations.
4CS CS 200h APIJ * Compressor surge margin.
* Fuel control scheduling.P Parasitic applied torqueb.
- Transient thermal mass affects.
Larger, higher pressure ratio gas turbines usecomplex controls systems to skirt the compressorsurge line and accelerate within predefined me-
100 chanical operational limitations. Smaller, low-costAPUs have, until recently, used simplified "openloop" type acceleration control systems.
The advent of electronic controls for small gasturbines has permitted the utilization of closed loop
0 ~ accelerau . fuel control scheduling where fuel may11 JO 3o 40 be topped as a function of a single or multiple con-
FueI Flow (PPI') trol variable.LOom.,0 Most recent APUs provide higher starting
torques by metering fuel close to the design tran-Figure 18. Minimum Fuel Pressure for sient T.I.T. limitations. T)pically, two fast re-
Good Atomization sponse thermocouples are l.ositioned in the exhaustto measure exhaust gas temperature (EG) whichis a speed dependept indicator of T.I.T. TwoEGT thermocouple outputs are normally averagedFuel atomization effects are dominant on igni- to provide the control input signal. However, if
tion as the fuel evaporation rate is inversely pro- there is a disagreement of a predetermined differ-portionate to the square of the fuel droplet size. ential between the two readings, the lower one isFuel volatility has a secondary important influence, disregarded and the higher of the two is used forbut hydrogen content and end boiling point have, control. If, by certain predetermined criteria, nei-in t.omparison, little influence. This is well illus- ther probe is providing valid data, then a shutdowntrated in the small Gemini APU (Figure 19) where is initiated.unusually excellent ignition is obtained, with veryviscous non-volatile diesel fuels, in the extreme A comparison of APU starting torques withconditions of Arctic operation, by use of extremely open loop and EGT topping control systems isfine atomization from a novel rotating cup fuel in- shown on Figure 20. Torques at low-end speedjector. remain essentially unchanged, being established by
light-off ,peed and viscous effects. Above 32 per-In addition, fuel viscosity has a further impor- cent speed, the EGT topping control exhibitstant influence on ignition since the fuel spray angle higher torques than open loop control, until at 80is significantly reduced with viscous fuels. With percent speed, accelerating torque is approximatelythis reduction, the fuel spray may not be in correct doubled, providing faster start time.relationship to the ignitor spark and ignitior, willnot occur. A sepatate start injector makes it easierto take acount of this, so that in the worst case,most viscous fuels such as JP-5 having up to 16.5centistokes viscosity at -40 0C, and No. 2 dieselhaving up to 25 centistokes viscosity at -12'C, canbe ignited.

7-18
LP900032-19
Figure 19. 10 K" Turboalternator

7-19
8.2 Hot Gas Vane Motor
2 The inability of most current front-line militaryaircraft to provide self-sufficient starting at -34'Cconditions has prompted the USAF to sponsor the
Speed development of a high torque, high power density0 ' 1 "Hot Gas Vane Motor" program described in Ref-
0 20 40 60 80 100 erence 23. he concept is to provide the hot mo-- i tot (Figure 21) as a F-16 aircraft retrofit Arctic
start kit, for the existing hydraulic start motor (Fig-2 ,,ure 3). Demonstration starts have been completed
S. - .using both hydrazine and air/JP gas generators, anddevelopment is continuing with a flight weight unit
4 -for eventual overall installation. Small high pres-osure air/JP gas generators as depicted in Figure 22
have found several recent applications in high en-
6 -- OpenLoopergy start and emergency power systemr6 --- ope n oo
- Egt Topping Axial
Cross-Section
0LPSO032-20
Figure 20. Effect of Closed Loop Control
8.0 Alternate ApproachesIt has been shown that the critical phases in
cold weather starting are fuel atomization and igni-tion, plus the transition from unfired to firedtorques as dependent upon viscous drag and engine Exhaust Portingthermal response. Alternate starting methods cur-rently under study and development to improveconditions are described as follows.
8.1 "All-Electric" APUThe development of a small "Gemini" Turboal-
ternator APU is described in Reference 22 wherethe gas turbine directly drove a high speed solidLundell alternator at 93,500 rpm. Several acces-sory drive systems were studied, but cost and reli-ability considerations finally constraiaed the con-figuration to tlat shown in Figure 15, with a con-ventional reduction gearbox arrangement and lowerspeed accessories. Inlet Porting
The increasing demand for electrical secondary LP900032-21power and dramatic electronic power conditioningcomponent technology advances are requiring areappraisal of the Turboalternator concept, without Figure 21. Hot Gas Vane Motora gearbox, where in the alternator could also beused as a starter. The accessory fuel pump, oilpump, etc., would be driven electrically from theconditioned alternator output. Viscous drag duiingcold starting could be significantly reduced in thisarrangement. A disadvantage of this approach isthat the alternator inertia may be similar in magni-tude to the gas turbine rotating assembly thus pro-longing the start time, and the requirement for bat-tcry preheating under Arctic conditions.
The replacement of metallic components in thesmall Gemini gas turbines by the ceramic compo-nents is described in Reference 16. The replace-ment permitted the demonstration of an extremelyfast start of 2 1/2 seconds duration from zero to100 percent rated speed.
10 ae
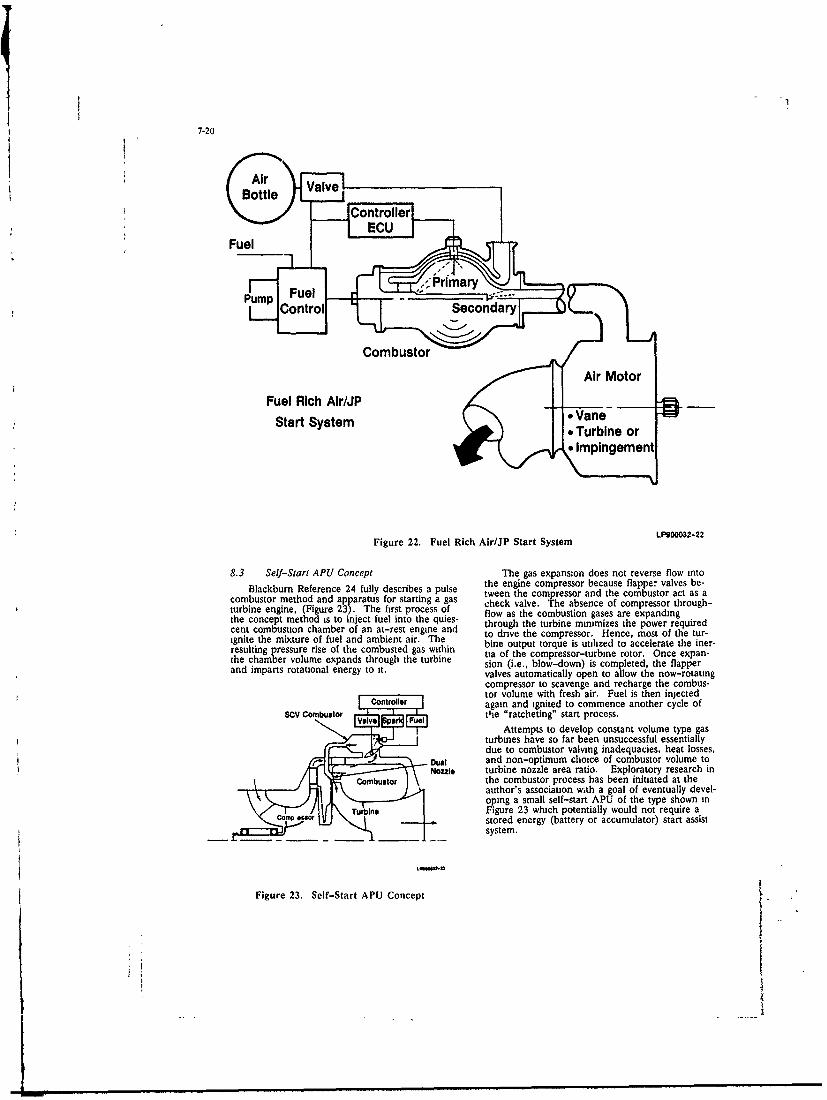
7-20
Bottle av
Fuel Fut Controller mr
8 f trl Secona se
Combustor af Air Motor
Fuel Rich Air/JP AM.Start System Vane-
t Turbine or
Figure 22. Fuel Rich Air/JP Start SystemLP0322
8.3 Self-Start APU Concept The gas expansion does not reverse flow inoBlacbur Reerene 2 fuly escrbesa plse the engine compressor because flapper valves be-Blacbur Reerene 2 fuly escrbesa plse tween the compressor and the combustor act as acom bustor m ethod and apparatus for starting a gas ch k va e. T e bs n e o c mp s or t ou -
turbne eine m i e t ioThe ir es o flow as the combustion gases are expandingthe concept method is to inject fuel into the quies- through the turbine minimizes the power requiredcent combustion chamber of an at-rest engine and to dnve the compressor. Hence, most of the tur-ignite the mixture of fuel and ambient air. The bine output torque is utilized to accelerate the iner-resulting pressure rise of the combusted gas within tia of the compressor-turbine rotor. Once expan-the chamber volume expands through the turbine sion (i.e., blow-down) is completed, the flapperand imparts rotational energy to it. valves automatically open to allow the now-rotating
compressor to scavenge and recharge the combus-tor volume with fresh air. Fuel is then injected
Sn e again and ignited to commence another cycle ofSCV Combuutor the "ratcheting" start process.Attempts to develop constant volume type gas
turbines have so far been unsuccessful essentiallydue to combustor valving inadequacies, heat losses,
Dual and non-optimum choice of combustor volume toNozzl, turbine nozzle area ratio. Exploratory research in
Combustor the combustor process has been initiated at theauthor's association with a goal of eventually devel-oping a small self-start APU of the type shown inFigure 23 which potentially would not require astored energy (battery or accumulator) start assistsystem.
Figure 23. Self-Start APU Concept
7-21
8.4 High Altitude, High Speed Start High energy starters and sophisticated elec-Withtronic controls may not have as much immediateWith the use of significantly high starter torque payback as simply reducing the rotating assembly
input it is possible to accelerate the engine to near inertia. Advanced material development however,,full (100 percent) speed where the combustor inlet can be equally expensive and time consumng.pressure and temperature are substantially higher Thus, all options should be examined iii detail,than the ambient conditions, as dependent upon including the all e!ectr;c gearbox-less APU withcompressor design pressure ratio. Combustor load- switched reluctance high speed generator.ing is also reduced and fuel requirements increasedmaking combustor and fuel spray conditions more The requirements to operate aircraft gas tur-ideal for light-off and operation. bines over a large range of environmental condi-
tions prove particularly demanding to the designer,eOften specialized start injectors are a require- especially when rapid starting of a cold engine is
ment for high altitude igition, i.e., a means of stipulated at sub-zero ambient temperatures.fuel atomnization specific to high altitude low speedign!tion. By means of high speed ignition such Cold engine cranking torque characteristics arecomplexity is eliminated. The difficulty with the basically controlled by the lubricant viscous drag inhigh speed light-off concept is the high starter the mechanical drive train and accessories. Totorque requirement, even though the unfired win- further complicate matters, this viscous drag is de-dage torque is reduced at altitude. Two potential pendent upon the magnitude of the applied startmethods of providing the required high starter torque. Either actual viscous drag test data or re-torque are: alistic methods of predicting engine cold cranking
torque levels with high lubricant viscosity may beHydraulic starter motor with increased ac- required before definitive starter specifications cancumulator volume and capabdity to operate be issued. Experience with start systems for smallat up to 150 percent overspeed, gas turbine APUs had shown that the total weight
" Hot gas generator driving a vane starter required for successful rapid starting at -54'C canmotor or direct impingement on the rotat- approach the weight of the APU powerhead itself.ing assembly (Figure 22). It is evident that starting torque characteristics
of small gas turbines are a Unction of many interAdditionally, the use of variable compressor dependent criteria and thus, quite synergistic In-
inlet guide vanes can help reduce high unfired win- deed, isolation of the individual cause and effect ofdage torque. many of the criteria involved may be intangible
In summary, a high altitude start method is Nevertheless, an effort has been made to describefeasible where the engine light-off is scheduled to these criteria and their apparent effects which maytake place at about 80-100 nercent rated speed, prove sufficiently intriguing to simulate renewedrather than the conventional practice of about interest in the development of improved starting5-40 percent speed. prediction procedures.
Hopefully, the considerations presented will be9.0 Conclusions employed by the gas turbine mechanical or systems
engineer to more realistically appraise the complexSpecific power levels of gas turbines continue starting problem issue, and may serve to make him
to increase paced by continuing advancements in more cognizant of the effects of engine parasitickey technologies such as aerothermodynamics, viscous drag sources on starting during the criticalcomputational fluid mechanics, and high tempera- engine preliminary design phase. Briefly ad-ture materials. Power sections consequently con- dressed, but of critical importance, is the role oftinue to dimmish in size and increase in speed for the combustion designer who provides a key inputa given power rating. Associated technology devel- in designing and developing a combustor capable ofopments in engine driven mechanical equipment rapid consistent light-offs over a wide operatingsuch as reduction gearboxes, generators and hy- range at the earliest possible speed thereby permit-dratilic pumps proceed at a more modest rate ting the transition from negative (cranking) to posi-This technological disparity precipitates dispropor- tive engine assist during start.tionate sizing of the engine powerhead and drivenequipment, spawning increased viscous drag and Methods of reducing APU viscous drag andpotentially reduced cold start reliability, start energy requirements that deserve future study
are the all electric gearbox-less APU, and possibil-Increased viscous effects are mitigated to some ity of the self-start pulse combustor concept.
degree by advanced engine ECUs with inherentcapability to tailor the starting sequence for all en-v- onments. The nemesis of the advanced ECU is 10.0 ACKNOWLEDGMENTSfixed cost which can represent more than half the The author would like to acknowledge the ef-cost of an advanced small APU. Implementing forts of the following people in preparation andVLSI technology will serve to deter disproportion- editing of the manuscript. Jack Shekelton,ate cost trends and should be pursued to realize Mcchele Wilson, Patti McNally and Trudy Lentz,cost effective advanced digitally controled APUs. and to Sundstrand Power Systems for publication
authority, and the combined efforts of the SAEStarting Committee in their continuing function toimprove aircraft gas turbine starting technology.
S 1

7-22
REFERENCES Discussion1. AIR 78 1A - Auxiliary Power Sources for 1. H. Saravanamuttoo, Carleton University
Aerospace Applications. What difficulty do you have in obtaining realistic
2. AIR 781 - Guide for Determining Engine compressor data at very low speeds, say 30-40% of design?Starter Drive Torque Requirements Compressor characteristics are very seldom available below
3. ARP 906A - Glossary, Aircraft Engine 50%, a typical idlc spccd.Starting and Auxiliary Power Author'
4. AIR 944A - Pneumatic Ground Power - Referencc to Figures 2 and 12 show that viscous powerSupplies for Starting Aircraft losses increase more rapidly than thermo-dynamic
5. ARP 949A - Turbine Engine Starting System powe'. increase, with decreasing ambient temperatures.Design Requirements - We test our compressors to as low as 20% speed. I am
6. AIR 1174 REV A - Index of Starting System not knowledgeable of low speed efficiency levels ofSpecitications and Requirements larger more sophisticated multible-spool axial
7. AIR 1467 REV A - Gas Energy Limited Start- compressors.ing Systems - Removal of misfired cartndges is indeed a dangerous
8. MIL-STD-210B - Military Standard Climatic task.Extremes for Military Equipment
9. SAE SP-398 - "Starting SystemsTechnology." 1984. 2. P Sabla, MGR CAD GEAC
Why in figure 9 does weight go up by the factor 5 (data10. SAE SP-678 - "Starting Systems points) for the same energy level. Is this driven by design
Technology 1J." 1986. requirements or by external requirements?
11. Rodgers, C., "Starting Torque Characteristicsof Small Gas Turbines and APUs," ASME Author79-GT-95. 1979. The weight factor (see Figure 9) is actually less than two, and
12 Rodgers, C., "Impingement Starting and results from the correlation of many different APU andPower Boosting of Small Gas Turbines." main engine configurations produce a relatively wideASME 84-GT-188. 1984 correlationband.
13. Rodgers, C., "Secondary Power Unit Optionsfor Advanced Fighter Aircraft." 3. R. Wibbelsman, GEAIAA-85-1280. 1985 The moment of inertia depends very much on the design of
14. Rodgers. C., "Fast Start APU Technology" the engine and is also a function of the mission of the aircraft.
SAE 86-1712/SP-679. 1986. At high Mach engines the rotor is stronger and heavier and
15. Rodgers, C., "Pneumatic Link Secondary impacts on the torque.
Power Systems for Military Aircraft" SAE88-1499. 1988.
16. Rodgers, C., Bornemisza, T., "Faz StartCeramic APU" SAE 89-2254. 1989.
17 Rhoden, J. A., "Modern TechnologySecondary Power Systems for Next GenerationMilitary Aircraft." SAE 84-1606. 1984.
18. Gazzera, R. W., "Advanced Pneumatic StartSystems for APUs." SAE 36-1713 1986.
19. Drury, E.A., "Low Temperature Startng ofthe V1 Battle Tank." ASME 82-Gt-190,1982.
20. Trippett, R.J., "A High Speed RollingElement .,earing Loss Investigation"Trans ASME Vol. 100 Jan. 1978.
21. Meyer, W.E., DeCarolis, J.J., Stanley, R.L.,"Engine Cranking at Arctic Temperatures,"Society of Automotive Engineers Transactions,Vol. 63, 1955,, Pg. 515.
22. Rodgers, C., "Performance Development His-tory - 10 KW Tutboalternator", SAE 740849.1974.
23. Dusenberry, G., Carlson, D., "Development ofa Hot Gase Vane Motor for Aircraft StartingSystemns." SAE 8.61714. 196.
24. Blackburn, R., Moulten, J., "Semi ConstantVolume Pulse Combustor for Gas TurbineStarting". AIAA 89-2449

COLD START OPTIMIZATIONON A MILITARY JET ENGINE
byH. Gruber
Hans-Sachs-Str. 16b8038 Gr6benzell
Germany
n cooler 8na'e &7 Cr = Water C -. II. NTRO TION -- ( ow
Cold-start testing at temperatures of oh )approximately minus 40'C (233 K) wasperformed on 2 RB 199 engines at aWest German altitude test facility.
The engines were of the same build T.°4s5 ,------ a,standard with exception of the seal 4100081
configuration (labyrinth or brush), V~and running times.CT
One part of the test was performed Engne Exhaust tube -
with F34 fuel, the other with F40.
The
F facilities 2: Cooling-Air Flow infaciltiesTest Cell
* test methods* and test results
will be presented in this report. After the air had passed through thecompressor, the temperature was redu-ced tn approximately 40C by awater-air cooler. The cooling-air tem-
2. TESE FACILITIES perature was then reduced by another65C to minus 25"C by an additional
The general layout of the altitude downstream brine cooler before enter-test cell in which the test series ing a cooling turbine, which thenwere performed is shown in figurI.1. lowered the temperature to the levelThe engine test set-up was largely required for test-cell induction, inidentical to that of sea level test this case minus 40C to minus 45C.configurations. The induction air temperature remained
at this level from starting to idlespeed. To maintain this, it was ne-cessary to bypass a certain amount ofair in relation to the specific engineoperating conditions.
Up to idle speed, pressure in front ofand behind the engine was ap-proximately 100 kPa. A movable damperinstalled behind the engine preventedthe rotation of the engine spools dur-ing the cooling phase. Additionally,the high-pressure spool was blocked byinternal resistance from theSlave-Loading-System. The inter-mediate-pressure spool would not turnwhen both high and low-pressure spoolswere static.
Fiue ,Altitude Test FacilityAn additional locking pin was in-
stalled radially to block the tan,thereby preventing the low-pressure
The induction air path through the spool from rotating when the dampertest facility and test cell is de- was opened.scribed in figurL2.
A steel pipe holding 3pproximately 25
liters of fuel was installed in thetest cell directly ahead of the fuelbacking pump. This portion of fuelvery quickly reached the requiredminus 40C during the test cell cool-ing phase.
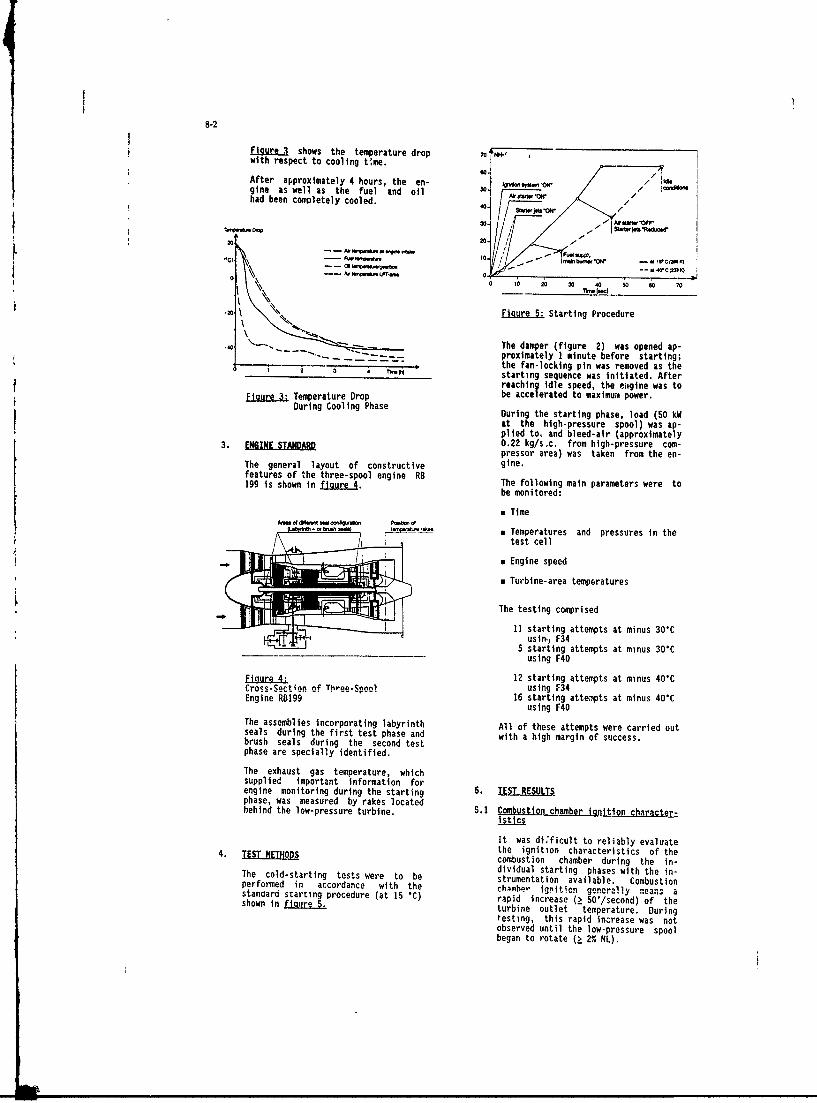
8-2
Figre, shows the temperature drop 7,0 -with respect to cooling time.
After approximately 4 hours, the en- /Igine as well as the fuel and oil 0. 0 tVW.* - / Ihad been completely cooled.
40.
r0.- D" 20if *&o2020
AMi V- - -
0i 0 20 2 40 2 0 0
oo 'o ;o
2 F\iue 5: Starting Procedure
40 \ The damper (figure 2) was opened ap-proximately I minute before starting;
7 2the fan-locking pin was removed as theS 2 3 4 TV" starting sequence was initiated. Afterreaching idle speed, the eagine was to
Figure 3: Temperature Drop be accelerated to maximum power.During Cooling Phase During the starting phase, load (50 kW
at the high-pressure spool) was ap-plied to, and bleed-air (approximately3. ENGINE STANDA 0.22 kg/s.c. from high-pressure com-pressor area) was taken from the en-
The general layout of constructive gine.features of the three-spool engine RBS199 is shown in .f_ The following main parameters were to
be monitored:
v Time
a Temperatures and pressures in thetest cell
x Engine speed
v Turbine-area temperatures
The testing comprised
11 starting attempts at minus 30Cusinj F34
5 starting attempts at minus 30"Cusing F40
F12 starting attempts at minus 40CCross-Section of ThreeSpool using F34Engine RB199 16 starting attempts at minus 40C
using F40The assemblies incorporating labyrinth All of these attempts were carried outseals during the first test phase and with a high margin of success.brush seals during the second testphase are specially identified.
The exhaust gas temperature, whichsupplied important information forengine monitoring during the starting 5. TEST ESULTDphase, was measured by rakes locatedbehind the low-pressure turbine. 5.1 Combustion chamber lqnltion characr-
It was di~ficult to reliably evaluatethe ignition characteristics of the4. TEST jOPS combustion chamber during the in-dividual starting phases with the In-The cold-starting tests were to be strumentatlon available. Combustion
performed in accordance with the chlmber igrit!on generily means astanoard starting procedure (at 15 CQ rapid increase ( 50'/second) of theshown In figre5i turbine outlet temperature. During
testing, this rapid increase was notobserved until the low-pressure spoolbegan to rotate (a 2% NL).
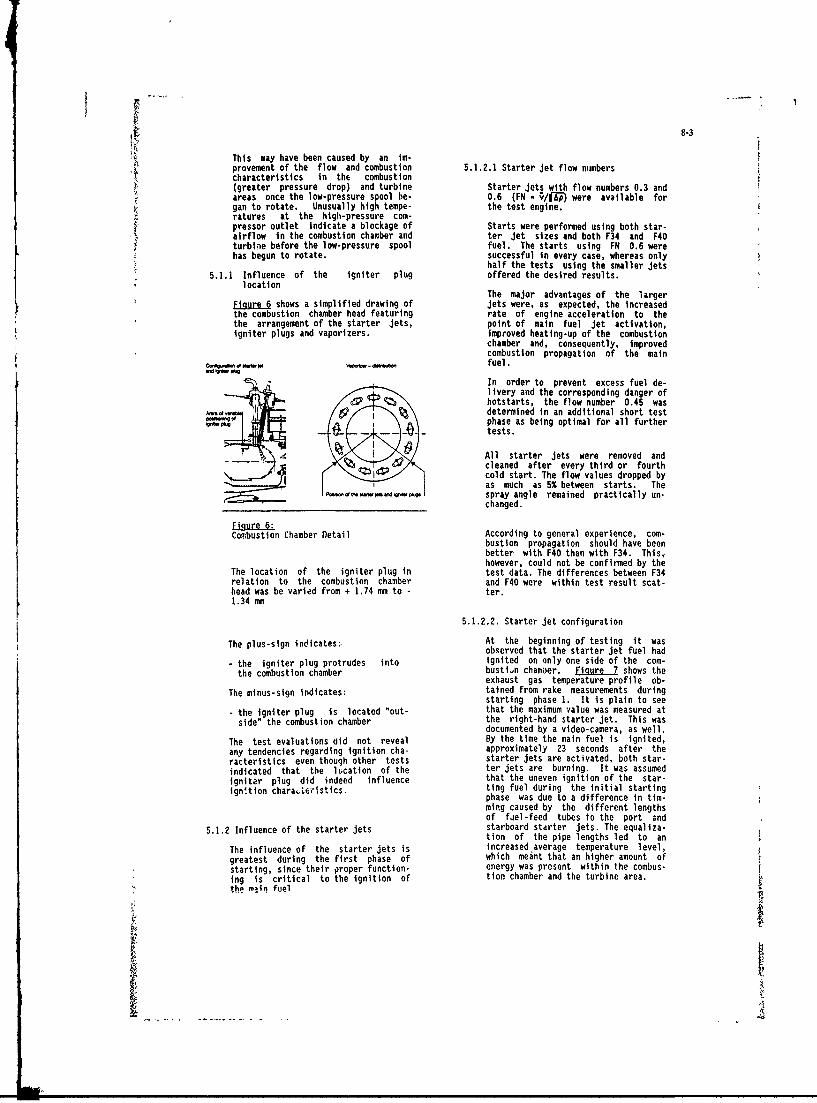
8-3
This may have been caused by an im-provement of the flow and combustion 5.1.2.1 Starter jet flow numberscharacteristics in the combustion(greater pressure drop) and turbine Starter jets with flow numbers 0.3 andareas once the low-pressure spool be- 0.6 (FN - /(Ap) were available forgan to rotate. Unusually high tempe- the test engine.ratures at the high-pressure com-pressor outlet indicate a blockage of Starts were performed using both star-airflow in the combustion chamber and ter jet sizes and both F34 and F40turbine before the low-pressure spool fuel. The starts using FN 0.6 werehas begun to rotate. successful in every case, whereas only
half the tests using the smaller jets5.1.1 Influence of the igniter plug offered the desired results.
locationThe major advantages of the larger
Figure 6 shows a simplified drawing of jets were, as expected, the increasedthe combustion chamber head featuring rate of engine acceleration to thethe arrangement of the starter jets, point of main fuel jet activation,igniter plugs and vaporizers. improved heating-up of the combustion
chamber and, consequently, improvedcombustion propagation of the main
fuel.
In order to prevent excess fuel de-livery and the corresponding danger ofhotstarts, the flow number 0.45 was
-,, determined in an additional short testphase as being optimal for all further
- -e tests.
All starter jets were removed andcleaned after every third or fourthI 4P cold start. The flow values dropped by
as much as 5% between starts. Thespray angle remained practically un-changed.
ELFgrCombustion Chamber Detail According to general experience, com-
bustion propagation should have beenbetter with F40 than with F34. This,,however, could not be confirmed by the
The location of the igniter plug in test data. The differences between F34relation to the combustion chamber and F40 were within test result scat-head was be varied from + 1.74 mm to - ter.1.34 nmn
5.1.2.2. Starter jet configuration
The plus-sign indicates:, At the beginning of testing it wasobserved that the starter jet fuel had
- the igniter plug protrudes into ignited on only one side of the com-the combustion chamber busti~n chamuer. Figure 7 shows the
exhaust gas temperature profile ob-The minus-sign indicates: tained from rake measurements during
starting phase 1. It is plain to see
- the igniter plug is located "out- that the maximum value was measured atside" the combustion chamber the right-hand starter jet. This was
documented by a video-camera, as well.The test evaluations did not reveal By the time the main fuel is ignited,
any tendencies regarding ignition cha- approximately 23 seconds after the
racteristics even thouqh other tests starter jets are activated, both star-indicated that the lication of the ter jets are burning. It was assumed
igniter plug did indeed influence that the uneven ignition of the star-igntion charaLeristics. ting fuel during the initial startingphase was due to a difference in tim-
ming caused by the different lengthsof fiel-feed tubes to the port and
5.1.2 Influence of the starter jets starboard stdrter jets. The equaliza-tion of the pipe lengths led to an
The influence of the starter jets is increased average temperature level,greatest during the first phase of which meant that an higher amount ofstarting, since their proper function- energy was present within the combus-lng is critical to the ignition of tion chamber and the turbine area.the main fuel
NI
) •

8-4
This required that the main fuel feed13- _be activated at a certain point in20. time rather than at a specific engine
,.25 speed. The point at which the mainfuel Jets were activated correspondsto 12 - 15% high-pressure spool speed
at minus 30"C and minus 40'C. Duringambient starts (engine-intake tempe-rature - 15C) 19 - 23% high-pressurespool speed was reached, compared to25% during hotstarts (engine-intaketemperature - 50*C).
sWOIA
5.3 IrMLM rAtJil
Exhaust Gas Temperature Distri- Figre shows the torque profiles forbution During Cold-Starting cold-starting of the test engines with
different seal configurations.
It is suspected that the starter jetfeed lines contained residual fuel To ..--vapors, whose effect on fuel delivery .increases with an increase in fuel 6-line length. "Wet cranks", performed IA- _. _ _prior to the starting tests would su- / -rely have helped preclude any such 40 .difficulties. ' "'--
The exhaust gas temperature, which is _a primary factor in evaluating theeffect of pipe-length equalization, 0subsequently showed a greater rate ofincrease during the starting tests o *---that followed. -? b- 1
-'0 - - _
5.2 StartinQ orocedure optimization Ltq.._Torque During Cold-Starting
The starting procedures for cold -
starting were substantially modifiedcompared to the sequence at 15 'C (fi-gure 5). It must be taken into consideration
that the engine equipped with theDuring starting at minus 30% and brush seals had been operated for ap-minus 40C, a sufficient high-pressure proximately 180 hours prior tospool speed (19-23%) could not be cold-start testing and could thereforereached with normal starter jet assi- not be representative of a new brush-stance alone. It would have been help- seal equipped engine.ful to keep the starter jets activatedfor a longer period of timc to augment The comparison between the differentthe thermal energy available in the engine builds showed that:combustion chamber, thereby improvingthe conditions for the ignition of the a the differences in the resistancemain fuel. This, however, would have curves for both engines were small.resulted in a very short overlap ofstarter engagement and main fuel jet a the low-pressure spool breakaway ofactivation. Experience shows that a the brush seal engine was not affec-long period of starter engagement with ted by engine intake temperaturethe combustion chamber "lit" or par- between minus 30'C and minus 40"C.tially "lit" is required for success- The low-pressure spool breakaway oc-ful cold-starting. This could be ac- curred at approximately 19% high -complished by varying the starter en- pressure spool speed, which isgagement time in relation to engine slightly higher than that of theintake temperature, as is the case engine equipped with labyrinthwith other engines, seals. It appears that the labyrinth
configuration was indeed affected by
The following starting sequence was engine-intake temperature.found to be optimal for the test engi-ne: It is assumed that the friction of thecold brush seals was lower than that of
starter jet open:, after 2 to 5 seconds the cold labyrinth seals. This may bemain jets open : atter 20 + 5 seconds due Lu tue relatively long running timeof the brush seal engine and the factthat the brush seal pins did Pot comeinto contact with any rotating parts atthese low temperatures.
6. C0NCt sjON Discussion -
These results dre based on tests with 1. C. Moses, Southwest Research Institutetwo engines of different seal configura- You stated that there was very little difference in the startingtion and with different running times. characteristics of the two fuels. Was this also true when youThey are certainly useful as a basis forgeneral assertions concerning the be- used the smaller fuel nozzles?haviour of those engines; they do not,however, allow any final conclusions te Author:be drawn. Further extensive testing The situation was comparable with both flow nozzle smzeswould be necessary.
2. P. Sabla, GEAEThe following points of interest. rele- Was the milet air dry? How was the moisture removed'"vant to the RB199 engine cold-starting were noted; Author-
v The differences between the igni- The inlet air was not dried We ran all the tests with
tion propagation properties of fuels unconditioned air, that means with normal ambientF34 and 4O were within the measure- conditions.ment scatter.
3. D. Hennecke, Technische Hochschule Darmstadt
m The starting characteristics of Do your test cell arrangement and your test procedure
the engines equipped with brush and ensure that you have steady-state temperature conditionslabyrinth seals differed only when you start the engine?slightly. The relatively long run-ning time of the engine equipped Author:with brush seals prior to testing Figure 3 of my report shows the temperature drop withmust be taken into account. respect to cooling time During this phase a low amount of
wol air was passing through the engine although the dampern The configuration and size of the was filled behind the engine. The spools did not rotate The
starter jets is of fundamental s i- temperature level in and around the engine was controlledgnificance to the ignition propaga-tion in the combustion chamber and, all the time by temperature probes. After approximately 4
subsequently, to the success of the hours, the engine as well as tle fuel and oil had been cooledstarting process. down to the required -40 C.
a The optimization of tie starting 4. C. Rodgers, Sundstrand Power Systemsprocess entails changing from an Was ignition of the starter jets programmed at 5% n?engine-speed-determined main fuel Did a revision of the cold start fuel schedule requiresupply activation point to a time- reprogrammingof the ECU?determined point.
Author.v A further, marked improvement in The ignition of the starter jets was initiated at 5% n by the
starting characteristics may be ach- engiednver.ieved by generally changing to an enedriverintal!e temperature-related-starter- The tests were not performed wih a DECU, but theengagement sequence, as is the case expenencegainedduringthetestslateronwasintroducedinwith a number of other engines, fuel scheduling of another engine programme
2I
'!I

9-1
COLD WEATHER IGNITION CHARACTERISTICSOF ADVANCED SMALL GAS TURBINE
COMBUSTION SYSTEMS
I. Critchley, P. Sampath, F. ShumPratt & Whitney Canada Inc., 6375 Dixie Rd.,
Mississauga, Ontario, Canada L5T 2E7
SUM 4ARY friction in bearings and gears, accessory
loads and lubricant viscosity effects, tendLow temperature and high altitude to increase the initial drag at lowstarting requirements of present day small temperature as seen In Figure 1. Loweraero-gas turbine engines are discussed from battery voltages during cold soaK/altitudethe viewpoint of their influence on the operations and the higher drag thereforedesign of the combustors and ignition tend to reduce engine cranking speeds andsystems. Use of electric starters, common air flows during start-up and hence reducein small engines, creates particular the combustor air pressure drop availableSchallenges to starting especially under for atomization and mixing within thecold soak sea level and altitude start up combustor.
Lconditions.FlRot - YPICAL eTARTMN TONGQUE REQUIREMENTS
The main factors in combustion systemdesign affecting starting performance areSdiscussed; including combustor sizing, fuel t.,w ."T Aplacement, fuel atomization, fuF
scheduling and igniter selection.Experience of Pratt and Whitney Canada(P&WC) with small engines for diffcrent " C TM M
applications are also covered.
Low emission requirements may#adversely affect starting performance, ....necessitating use of elaborate Nfuel/ignition systems, some recentdevelopments are described.
Nomenclature . .
A P - Pressure dropSMO - Sauter Mean DiameterTo - Ambient temperatureT3 - Combustor air Inlet temp'rature Adding to these difficulties is theT5 High pressure turbine exit t.mperature increased viscosity of the fuel at lowTTL - Time to lght temperatures which will result in a moreTa - Air temperature coarsely atomised fuel spray and hence beTf - Fuel temperature more difficult to light. Low pressures and
temperatures adversely affect both theINTRODUCTION initial ignition process and the subsequent
flame propagation because of slowThe ability of an aircraft g~s turbine evaporation and reaction rates. Even after
to light-up and accelerate easily and a stable flame has been established itsreliably is of crucial importance both for efficiency and therefore the ability of theground and altitude starts. The engine to accelerate are significantlyachievement of this goal under adverse lowered under extreme conditions of lowconditions of low soaking tcnperatures, or temperature and pressure. Reduction of theat low temperature and pressure during combustion efficiency occurs at a time whenaltitude operations, imposes severe increased engine drag necessitates moreconstraints on the combustion system. energy from the combustion system.Typical cold start requirements for smallaircraft gas turbines would be for air All these factors combine to increasetemperatures down to 220K and with fuel the difficulty of starting under adverseviscosities up to 12 centistokes. Altitude conditions and can result in the inabilityrelighting capability is needed typically to light, accelerate or lead to torchingup to 11,000 meters for main power plants and consequently turbine damage which mayand in excess of 12,500 meters for the new not be inmediately apparent. Othergeneration of Auxilliary Power Units (APU), possibilities art hung starts or extremelywhich may be required to start and rapidly long times to light and idle. Solutions to. generate emergency power after cold soaking these problems Impose restraints on theat high altitude, combustion system and increase the
cOMplexity of the fuel and igrition)all aircraft gas turbines are systems. This is particularly undesirable
typically equipped with electric starters, on small aero gas turbines where thesethe starting torque being set to be greater systems can be a significant contributionthan the maximum drag torque during to the total engine cost and weight.
cranking conditions. However all the majordrag sources; compressor aerodynamic load, Advanced engines with their demand forwindage in compressor & turbine discs, lower specific fuel consumption and
m*

9-2
specific weight operate at higher engine FIG 3:FUELINJECTORMOUNTINGARRANGEMENTS
pressure ratios and turbine inlett(nperatures. These requirements havedriven combustor designs to be more compact ,----_ --__
for durability, to have lower combustorpressure drop for performance and tooperate with leaner primary zones for smokeand emissions control. All theserequirements have made the problem ofdesigning for cold and nigh altitudestarting more challenging than ever before.
DESIGN CONSIDERATIONS ......
The f'rst requirement of the -;.combustor is good ignition performance,necessitating a combustion system with .... *....
adequate fuel atomization, optimum fuelplacement and a reliable cnd effectiveignition system. However, thn combustorprimary zone must be sized with suffi ientvolume for reasonable air loadings [1j. Thecombustor primary zone flow structure and considerations. The number selected willfuel - air ratio must be set to achieve influence combustor exit temperaturerapid Ignition and subsequent flame distribution as well as ignition andstabilization and propagation around the starting performance. Engine manufacturerscombustor annulus. A recirculating primary generally use empirical correlationszone flow is commonly used. The structure developed to suit their own combustionof the recirculating flow will vary with systems. Figure 4 shows the minimumdifferent designs and wy be driven by ignition fuel flow for an airblast fuelswirling air through the fuel nozzles or. injector system with different numbers ofas is more common in small engines, a fuel injectors; the minimum ignition fuelsingle toroidal vortex, Figure 2, driven by flow required decreases with increasingwall cooling flows around the front end of number of fuel iniectors.combustor. The fuel nozzles are positionedto spray the fuel into the combustor so as Primary zone fuel air ratio control isto maximize the residence time of the fuel an important aspect of combustor designin the primary zone. The nozzles may be affecting ignition, combustion efficiencymounted radially spraying upstream or and emissions performance. One of theaxially through the dome of the combustor means of reducing emissions is to designor tangentially as shown in Figure 3. the primary zone to be fuel lean, however,FIG2. TYPICALCOMBUST1ON SYSTEMSFORGASTURBINEGENINES a rich primary zone is usually required for
good ignition and flame stability.Elimination of local fuel rich pockets inthe primary zone will reduce smoke but may
S.NO.I". 0AL TORTEXI O.MUIOW $WIRLEIMAt-LZIO OMUTR adversely impact ignition, Figure 5.In most cases detailed combustor holepattern development and fuel sprayoptimization are necessary to meet both
cold ignition and emissions requirements.
OF FUEL INJECTORS
....... . .M.LA FUlL INJCTO
The igniters (usually 2 to provide ! 3 ,o.-,redundancy) are positioned in a fuel rich *,, -t.,*FotQregion of the primary zone. However, care Smust be taken to prevent excessive fuel I
wetting which can lead to premature igniter ,1
failure or spark quenching. 'o2
Circumferential positioning of the igniters 9will depend on the degree and direction ofany residual swirl from the diffuser airoutlet which may be present in the primary .om vw ,zone and the trajectory of the fuel spray.In practice, igniter position and FUEL DELIVERY SYSTEMpenetration are determined by developmenttesting. Optimum penetration will be a The fuel system design. including fuelcompromise between Improving ignition and injector, manifold and scheduling plays anexcessive igniter tip temperatures as important role in cold ignitionpenetration increases. performance. Good atomization is crucial
for good ignition. Figure 6 shows aThe number of fuel injectors is comparison of droplet size between pressure -
generally selected as a compromise to and airblast atomizers, showing thesatisfy both combustor performance superior performance of airblast injectorsrequirements and cost and weight except under starting conditions.

9-3
FG5:.ATOiW ETWEMINUM K OFUEL LOW will light but fail to accelerate. In thisAMoNoCUUSml o case, the primary fuel injectors may have
low combustion efficiency under adverseconditions. If the engine then fails to
develop sufficient air pressure for thefuelcontrol to schedule an increase in fuel
PUNK IA~AT ,WACQoW flow, the secondary fuel injectors may not21*7K have su'ficitnt fuel pressure for good
o.b atomiza.ion. This can be overcome byto,.. o increasing the starting fuel flow as shownin Figure 8. The engine hangs just below260K with the lowest starting fuel flow;increasing starting fuel flow eliminateshanging and the engine always acceleratesat temperatures above its lighting limit.However, this Is not always a viable
*solution since over-fuelling can lead toexcessive exhaust temperatures during
,* .*S,ooo light-up. The hanging can also be"" "", eliminated by use of a sinele manifold
(unstaged) system, Figure 9. However, sucha system usually has a fairly high ambient
Pressure Atomizers temperature ignition limit, although thiscan be lowered by Increasing the starting
Pressure atomizers have been used fuel flow.successfully for many years on gas turbine
V engines. However, on engines with a high Fl 1: VARIATION OF PEAK TEMPERATUREturn-down ratio (ratio of maximum to ouPNG STARTING WrI
F minimum fuel flow), low fuel pressure and NUMBER OF PRIMARY FUEL INJECTORSthus poor atomization will result at thestarting conditions. This problem can beovercome to some extent by staging of thefuel whereby soe fuel injectors near the 160oigniters receive fuel at a higher pressurewhich will improve their ignition 2
performance. Staging is achieved by use of ', Ia flow divider valve which may be single ormulti-port providing several levels of ,oostaging to aid a gradual flame propagation.
no 0: COMPARISON OF AY ATER MEAN DIAMETERS FORPRESSURE JET AND PURE ABLAST ATOMIZERS t
* fAOT *OOQ
IIM ,,4I*AV FUNL "Iftlit
SUESEONE At
*. FIG S: EFFECT OF STARTING FUEL FLOWON HANDING
8-ATI codWS PUL PORA
*Nain CONDITION
" Staging of the fuel can result Intorching or flame propagation ,0difficulties. Correct proportioning of the .E ,,G STTU
fuel to the various stages is required toprevent long manifold fill-up times withconsequent fuel dribbling and pooling whichcan lead to torching during starts. Recent I
4 PT6 engines use a 2 stage system withprimary and secondary fuel injectors.Figure 7 shows how the peak transientcombustor exit temperature can be reducedby optimizing the number of primary and 1o,
secondary fuel injectors. An optimum fuelflow split between stages exists when tne -temperature peaks associated with the lightup of each stage are equalized and neither 1°1predominates. In this case this was - ----achieved with 10 primary injectors. .0 21; io ITO oo *TO $10
Engine hanging can also occur as ML AWA " AA R
XI
a result of fuel staging where the engine

9-4
An alternate approach to improve P&WC has succ'ssfully demonstrated ignitionstarting performance and to eliminate with airblast fuel injectors at combustorhanging is use duplex fuel injectors, pressure drops down to 38 mm of water atFigure 9; lighting should not be a prublem ftel and air temperatures of 230K.although the limit was not established inthis testing. However. the complexity of Piloted fuel systems are used toduplex Injectors and the need to maintain enhance startirg and to alleviate torchirgadequate fuel passage sizes limits their from overfuelling at low temperature anduse to low turndown ratio applications, pressure condltions. Piloted systems
usua!ly employ a hybrid fuel nozzle or a
FIG; :COMPARISON OF STAGEDANuNSTAGED torch igniter. A torch iqniter consists ofFUELcLOWON HANGING a Combined igniter and pressure jet
. .~atomizer. Problems of coking and biockagecan be minimized by mounting the atomizerin a relatively cool region or by purging.Application of torch igniters is mostcom on on vaporizing fuel systems but hasbeen used in some airblast applications.
Hybrid fuel injectors consist of aw, .4-1 vk" 0, pressure atomizing primary and an airblast
secondary nozzle. Fuel is introduced tnthe primary fuel circuit first for initial
* light-up and subsequent propagation to theOVOCX -0.41 \.remaining airblast fuel injectors. Figure
10 shows a comparison of minimum ignitionfuel flow for a pure airblast and a hybridairblast system at cold conditions. For
... ..... the hybrid system, the minimum ignitionUALO STA IT- ULu 6O
O' SV tV" O ~ fuel flow is independent of combustorpressure drop. With the pure airblastsystem, time-to-light is governed by the
S--manifold fill-up time and the achievementof favourable conditions at the igniter.
U----W-- 3y*T~v This can result in much slower ignitionL,_____,___ ,________ with possible pre-ignition fuel
0. Is o *2 ; accunmulation and torching at ignition.P' .- D A.t11*e ,LUAuKIW) With the hybrid system, ignition can be
achieved at extremely low combustor airAirblast Atomizers pressure drops and with a much quicker.i..tAtm r time-to-light. Ignition .s usually
Advanced gas turbine engines with instantaneous and a controlled light-aroundtheir requirements for better spray quality without any torching is achieved.and longer life generally use airblast fuelinjectors. This type of injector is FIG 1 STARTING CHARACIERISTICS OF APT$ ENGINEWITII VAPORIZING AND PRESSUREparticularly suited to small engines since ATOM ING FUEL SYSTEMSfuel passages can be larger than for
pressure atomizers which are prone toblockage in small engines. As a result ofthe dependeace on air pressure drop acrossthe combustor for atomization, dropletsizes are usually coarse at startingconditions, particularly at lowtemperatures when the fuel is more viscousand cranking speeds are low. For small gasturbine engines, under extreme conditions, ... .... , ,the combustor air pressure drop could be aslow as 25 m of water. Development ofairblast fuel injec'ors for small engineshas concentrated on improving atomizationat these low pressure drops. Testing at
FIG 10 COMPARION OF IGNTION PERFORMANCE BETWEENHYBRIO AND PURE ARBI.AST SYSTEMS
lr
0"l AMlLAITA AIR LAI'
Vaporizing fuel Systems are widelyused in small gas turbine engines; this
-'--: : : type of system requires the use of anexternal flame source likea torch igniterfor lighting. Once developed, lightingperformance is governed by thetoh
V.. torc
I'mut DRO ,-igniter and is very Similar to Pressure.oATI, atomizing Systems as shown In Figure 11.
However, problems may occur with flame

9-5
propagation around the combustor depending detrimental to igniter durability. Figureon vapcrizer design and spacing. Slow 13. The final choice will be the minimumflame propagation may cause unburned fuel energy to meet cold and altitude ignitionto accumulate during start-up and can lead requirements so as to maximize igniterto high exhaust temperatures, Figure 11 anJ life.long starting times.
FiG13 EFFECT OF NITION ENERGY ON IGNITION PERFORMANC'FUEL MANIFOLD AND CONTROLS AND IGNITER DURABIUTY
Fuel manifold design plays a role inthe success of the starting system. Asmall diameter manifold can give excessive tQ ta ......line pressure losses which can ultirpately I t SECaffect the combustor outlet temperaturedistribution. A large diameter manifoldwill require a long filling time leading todribbling and torching. It is necessary to ofind a compromise between these two 4-requirements. Spiking the initial fuelflow can reduce the manifold filling timeand the tu.rching tendency, a solution whichhas become more viable with the advent ofelectronic fuel controls. The accuratefuel scheduling off any required engine e
I. operating p-rdmeter provided by electroniccontrols is also of great benefit to go%., AO Sf1 , O . ,P ,)starting performance since it is possfleto operate with a smali margin betweensub-idle surge and the acceleration demand. Alternate means of ignition have
also been used or are under study. The1 Air assist systems use high pressure concept of plasma jet ignition has beenair which can be introduced into the fuel studied by vacious researchers [2]. In thismanifold to aerate the fuel thereby type of ignitEr, Figure 14, the arc doesassisting atomiz tion durinp light-ups. not occur at tie tip of the igniter but isThis kind of system has been used for heavy confined in a small cavity. The gases (andfuels in industrial applications, liquid fuel) in the cavity are heated by
the arc and a pressure rise results. TheIGNITION SYSTEM pressure is allowed to exhaust through an
orifice resulting in a jet of energeticMost small gas turbine engines use plasma which is propelled into the
ignition system energies in the range 1 to combustor. The concept was developed for4 joules. Both low tension (L.T.) automotive applications but can offersemi-conductor (approx. 4kV) and high advantages to gas turbine designs since ittension air gao (typically 24 kV) systems will illow the spark kernel to be projectedare employed. For a given output energy, away from combustor wat, cooling flows intoboth systems give similar ignition that part of the primry zone most amenable9o prformance :.s shown in Figure 12. Air to Ignition. The p. inciple can be appliedcooling to the Igniter can also affect to both high tension and low tensionIgnition performance. In this case, Figure 3ystems.12, the provision of air cooling aidedignition which suggests that rich Emergency power units for specialconditions prevailed near the igniters. applications can have a requirement forIgniter cooling air Is not always very fast light-up ano acceleration dt verybeneficial to starting and the effect high altitudes. A one second time-to-lightdepends on the envirnnment adjacent to the at altitudes up to 15,000 meters wit:i pureigniter. airblast fuel injectors has been
demonstrated by use of oxygen injection atFI12' EFFECTOFIGNITERTYPESONINITION the fuel injectors.
The recent development of solid stateFUEL T $44% LT exciters has improved the efficiency of
the energy transfer process so tiat a givenenergy can be d' ivered at the igniter tip
-. with a smaller, lighter, cheaper exciter.o This type of device can also offer improvedocontrol of spark rate which can be
i....._. ,0.,. maintained Independently of input voltage.Z Unoo. . - -f :t .... and ambieat temperature. This Is+ -E particularly impoi cant for continuou3
ignitioni app'Ications where a low spark* rate is desirable. Future developments
could allow the adjustment of spark rate or* energy to suit ambient or engine condition,
....... diagnostic capability will also be2 - ,, ,available to warn operator, of impending
co~uI?0$ *mtsm~ ONO, Ignition syeste failurc.
the most dominant effect on ignition 'EL EFFECTSI performance is the energy supplied at theigriter tip, increasing energy level wil* Small LAs turbines, even for aeroimprove ignition Performalice but w I1 be applications, '-ve to operate with a wide
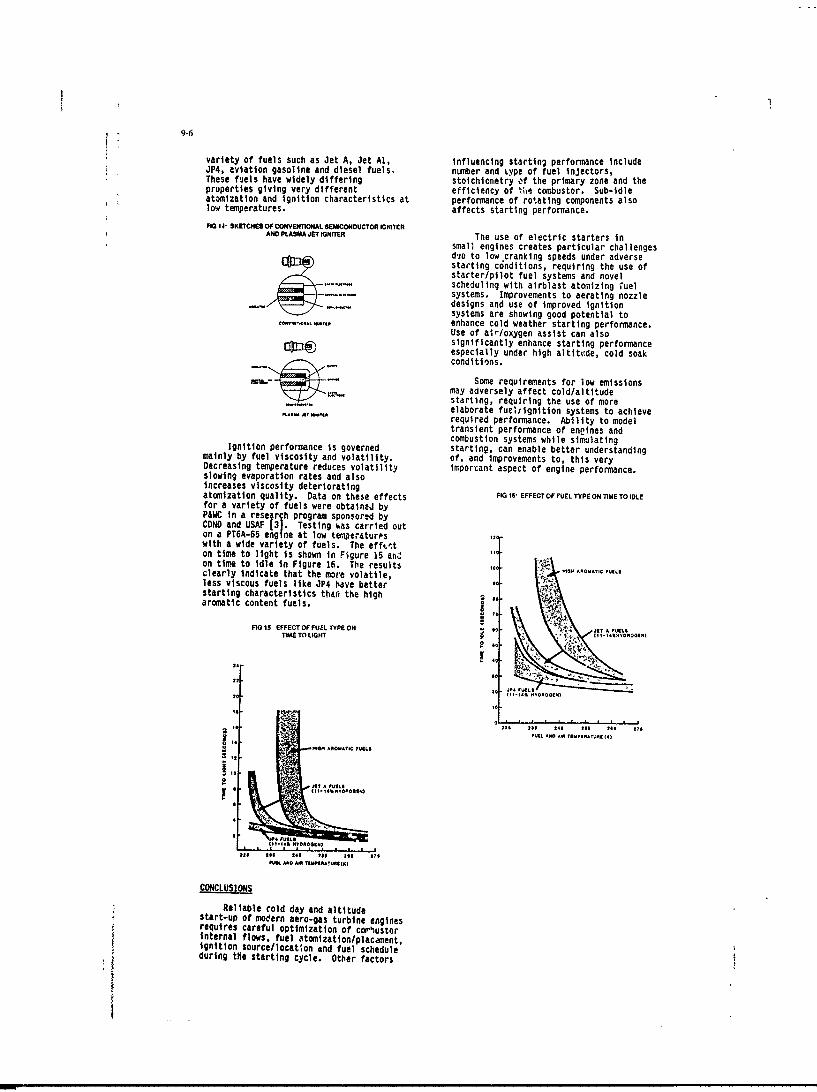
9-6
variety of fuels such as Jet A, Jet Al, influencing startin2 performance IncludeJP4, aviation gasoline and diesel fuels. number and type of fuel injectors.These fuels have widely differing stoichionetry of the primary zone and theproperties giving very different efficiency of the combustor. Sub-idleatomization and ignition characteristics at performance of rotating components alsolow temperatures. affects starting performance.
FIG 14' SKETCHES OF CONVENTIONAL $EMICODUCTOR IGNITERAND PI.ASMAJETIGNITER The use of electric starters in
small engines creates particular challengesdue to low.cranking speeds under adversestarting conditions, requiring the use ofstarter/pilot fuel systems and novelscheduling with airblast atomizing fuelsystems. Improvements to aerating nozzledesigns and use of improved ignitionsystems are showing good potential to, ,---,,-,,,enhance cold weather starting performance.Use of air/oxygen assist can alsosignificantly enhance starting performanceespecially under high altittde, cold soakconditions.
Some requirements for low emissionsW_ may adversely affect cold/altitude
starting, requiring the use of moreelaborate fueyiignition systems to achieverequired performance. Ability to modeltransient performance of eneines andcombustion systems while simulating
Ignition performance is governed starting, can enable better understandingmainly by fuel viscosity and volatility, of, and improvements to, this veryDecreasing temperature reduces volatility important aspect of engine performance.slowing evaporation rates and alsoincreases viscosity deterioratingatomization quality. Data on these effects FI16 EFFEC OFFUELTYPEONTIMETOIDLEfor a variety of fuels were obtaineJ byP&WC In a research program sponsored byCDND and USAF [31. Testing was carried outon a PT6A-65 engine at low temperatureswith a wide variety of fuels. The efftrton time to light is shown in Figure 15 andon time to Idle in Figure 16. The results ,o Rclearly indicate that the more volatile,less viscous fuels like JP4 have better 2
starting characteristics than the high ,0aromatic content fuels. "
FIG15 EFFECT OF FUEL TYPE OH 'IT A 05ALsTIME TO LIGHT { 1-14t000R00I0(
4o 5 2 02F 2 0 2 1 1•
120
22a .2 2 222 2222 2(2
210 25.1 0 4 124 0 1 | 7
° [~~~F. AA A T:ARIT (
CONCLUSIONS
~Reliable rold day and altitude! start-up of modern aero-gas turbine engines
requires careful optimization of col'"ustortinternal flows, fuel .tomtzationlplacment,
( igntion source/locatlon end fuel schedule! during the starting cycle. Other factors

~9-7
REFERENCES:
1. Lefebvre, A.H., "Gas Turbine Combustion", McGraw-Hill Book Co.
2. Zhang, J.X., Clements, R.X., Smy, P.R., 'An Experimental Investigation ofthe Effect of a Plasma Jet on a Freely Expanding Methane-Air Flame",Combustion & Flame, 50, (1983).
3. Gratton, M., Critchley, I., and Sampath, P., "Alternate Fuels CombustionResearch", AFWAL-TR-84-2042, July 1984.
j Discussion
1. C. Scott Bartlett, SverdrupIs consi ,ration given to use of gaseous fuel injection or a
igaseous fuelled pilot torch for cold start assistancc9
Is the primary reason that gaseous fuels are not used due tothe complexity of the additional systems required?
Author.The questioner is nght. Although the benefit of gaseous fuelsfor ignition is well known for static applications it wouldnormally not be considered for commercil aero-applications due to the complexity and logistics of providingand refuelling such a system.Howeser the idea could be considered for military
applications to aid, for example, relighting at very highaltitutes. In fact work has been carried out at Pratt andW"V hitney Canada using oxygen injection through igniters andfuel mjectuf,, which demonstrated a significant extension ofthe relight envelope to high altitudes
2. D. Hennecke, Technisehe Hochschule DarmstadtIf I understand correctly you emphasized the importance ofsmoke emission during start-up. Is this not unimportantcompared to smoke emission at full power conditions9
Author:During my presentation I was referring to high poweremissions Therefore I would agree to this comment.
{IIiiR
J,

10-1
MDE POSSMBE BY EGNE DIGI'ThL OWNDmL SYS1M2S
RCZ WIBEl&WSeior Staff Engneer
GnrlElectric Owpony Peebles Tbet Operation1200 Jaybird Rad
L Peebles, Chio 45660
The subject of automated and adaptive jet engine starting strategy is acoplicated1 subject inzvolving man intricate sets of ooflicting req~dreeients,both from the stat-'o-int of the engine envirnmenal situation as well as theengine health situation. In the past, many design xrnpronisee had to be madewhich resulted in limaiting Lie engii~s ability to achieve loot startingsuccess, particlarly in the "off design" regions. 'lbs advent of thecomputing power of digital cotrols now, ake it poesible to achieve a majorstep forward in the cotrol systerm ability to cop with the multiplicity ofsituations cofronting the engine starting system designer.
'There are many different strategies thnat could he employed. Ihis paperpresents the one used by the GE and OmN Oomercial Family of large highbypass ratio turbofan engines. Numercus variatiaws of this basic coceptcouild be employed.
It is hoped that this paper will promote a new vision of what is possible toachieve in the way of-
- Soluticns to the present design dilemas facing the enginedesigner.
- Better reliability at the snvixrrental extreias.- Mo~re reliable starting~ of deteriorated engines.- Mo~re reliable starting urder extreme emergency situations.- M~ake starting mure certain under adverse battle dmage situation.
we have just begun to scratch the surface. ret us now -antnue to exploitthis concept on the next generation of jet engines.
Table of m fl
1.0 Introduction
1.1 Basis of This Paper1.2 General operation1.3 Manual versus Automatic
2.*0 overview of System aid Its Response to Unu~sual Events
2.1 Grcwirx Start Sequence2.:2 Air Start Sequence2.3 Arctic Weathner Design Considrations
3.0 Stall Sensing aid Resequencing
3.1 Ground Start Stall Sensing3.2 Air Start Stall Sensing3.3 Resecussing Due to Stall
3.4 Adaptive Strategy for Engines with Repeated carculd StartStall History
4.0 Light Off Sensing and 1iesegmwniml
4.1 Light Of f Sensing4.2 Ground a-tart Light Off Resequenizing4.3 Arctic Graini Starting Asseq.aencingI;4.4 Air Start Light off Reseqencing
5 .0 n- S F- ars
5.1 FA1IC Approach5.2 Normal Grcurd Start Strategy5.3 Arctic Grourd Start Strategy5.4 Air Start Strategy
6.0 Starter Usage Strategy During Air Starting
10-2
1.0
Full 14. .hority Digital ontrol Systems are caning into wide use in the largecommercial jet engine industry, and are starting to appear in the militaryengine market. Same of these engines aploy automratic start oequencefeatures, which siuply automate the omwenticnal hydro-madinical onttrolocept, %ihile others take advantage of the oeuting po-e of the digital
approach and incorporate adaptive eiqpert system features. The CFNE andGeneral Electric large commercial engines, suc as the CM56-5 and CF6-ifall into this later category.
qbis approach is largely being driven by econoic - uideratiais because inworld-wide operation, aircraft using theeeninee commonly lard inrelatively unsupported airports. Under those circumtances, if the enginewill not start the passengers ant be unloaded, overniht hotelacocodatiuis and seal~s provided, while another aircrf is ferried in. Allof which entail considerable expense and customer dissatisfaction.
Many engines are basically capable of being started under adversecircustace, but are inhibited by the inherent limitations of the fuelonetrol schedules, i.e., not custanized to those specific unuxsual enginehealth circumstances. The adaptive system employed on the modern GE enginesassure that the engines will start (with same sacrifice in start time) ifthey ar inherently capable of being started.
Thew adaptive features emxployed effectively customize the fuel and ignitionschedules and sequences so as to match the specif ics of a particular engineproblem. The design concept was inteded to aflw the aircraft to remain inservice u-til it coujld be scheduled into an overhaul facility where theabnormality could be corrected.
7hese samr caxrapts/features also sake the control more adaptable to airstartsituations, and sor inportantly (from the standpoint of this discussion)make the control adaptive to the arctic engine starting environment. All ofthis was accomplished with sesors previously applied for other reason~s.
11 asis of this a
Engine starting systemu are specifically custcmized to thecharacteristics of each engine. Different CFXI and GE engines employsaamt diffesrent strategies. This paper represents 1 omposite of tiedifferent approadies and is riot intended to represent any one specificapplication.
Furthermore, the systes currently in use represent the current phase ofthe evoluticnary nature of this concept. Sane of the approachesdiscussed are rot currntly in use as they are daemed "Inct required" atthis tire, but have been tried/developed, and are known to work, if sorequired, in response to a specific set of circumtances associated witha particular engine.
1.2 Gerisral Operation
The FAE autoated start sequence integrates and automates all of theelements of the start sequence in respnse to a singlea comanad from the
1. Initiates Starter2iot Initiates Ignition 0oncrrently moitors
4. unsOf Ignition tation.5. FMen off Starter37. Program The Appropriate Start Bleed
1.3 Manua versus &etcmtic
The aircraft system allows for bach manuial and automatic start mode. inthe manual soda the pilot imst sequence a mober of swj tches, levers,etc., aid monitor for proper system operation. This sets up thepossibility of pilot error by not segaencing the srtAm properly when inthe manual mode, or inproparly seqmencin when in the autamatic soda.Madi of the FD) logic involves the proper sequncing aid appropriateaction to inappropriate pilot anipulation of the thirottle, aircraft fuelshuto4ff lever, etc.

10-3
1. 3. 1 This Paper conentrates on the unique features appropriate for startingengines under enviro-suital and health oditians which Presenteddifficult design ontflicts/tradeoffs associated with conventionalhydro-medianical control systens.
The system is intended to be adaptive to varicus uraal or special situationswjhich are norrally not encoutered, but if experieced, usually result in anaborted start. It is the intent of these features of the GE FAE) system tocircumvent the ahrmality and still promhce a successful start, although at asmall sacrifice to start time.
2.1 Generl Descriction Of Grotnd Start system eir
The followjing presents an overview of the seqence of events and adaptivestrategy employed. Details of this logic are described later in this paper.
Pihen a start is initiated the following sequence of events is follow~ed:
1. Starter Initiated
2. Ignition Activated At Apprc~riate RPM (before fuel admission)
3. Low Starter Assist Check
- System Checks For Miniis Starter Assist just prior to fueladmission
4. Fuel initiated At Desired Firing REIM
5. Check For Lightoff
- Resequence Fuel and Ignition IfLightoff Is Not Detected
6. Check For Stall After Lightoff (sand throughout start)
- Reseqaence If Stall Detected
7. check For Fan Rotation Before Reaching Idle
8. Check For Starter Air Pressure Interniptii-.
- Warn of pssible high speed starter re-enggemnt.
9. Starter Shutoff and Ignition Of f at Predetermined RPM.
10. Store In 1emsory Any orrective Action
-If Correction Required On Succssive Series Of Starts,Paasiter Settings And Initiate Following Starts UsingStored Experience
2.2 General Description of Aerial Restart Myts euec
The air restart mod is similar to the groard start mode, but is differentin several aspects of its qperation.
2.2.1 Starter:
Different esof operation are eallced, ie., with or without starterassist, depending Won ore windmilling rpm and other factors ie., suchas:
a. Flight ocnritionb. PM stable or spooling donc. Starter crash re-e~ment Prevention (inter-ock) if required by
starter amafaoturer.
2.2.2 19ni~ki LiLIaivn PojiL:
Ignition is Initiated at any rpmu if the start is a wixxdilling start,but delayed until a predetermined minin- rpm is achieved if assist iseuployed.

10-4
2.0 W OM AM S YOID p T na RMI OMI[O tmL iTS (onmt'd)
2.2.3 Fuel Initiation Point:
FUel is initiatod at any winmilling RPM if the start does not employthe starter, but is delayed until a mma firing RPH is ad ieved ifthe starter ir to be employed. In either case, fuel is never initiateduntil the ignitl-si is initiated.
2.2.4 Light off detectoVreseqenc and stall detectic/resequencing canbe different from grun coraticn
2.2.5 Autamatic fuel sutoff philosop.y, in the case of light off failure,and stall recovery sequencing can be different in the air versus on theground dependlng upon the airplane manufacturers preference.
2.3 Arctic _ Wahe Desig i9diderat
The arctic ground starting sequence of events is the same as the normalground starting sequence, but cdmdy some of the design cnsiderations ofair starting as wall as grond starting.
2.3.1 Both occur at cold ambient temperatures conditions, ie., -40 to -600F.
- Greird starting cmn occur with both cold and warm fuel depenisngu the cold soak time. Air starting rarely encounters extremelycold fuel due to elevated oil cooler temperatures
- This means that fuel viscosity can vary over a wide range andccnseqently the comsstion effects can vary over a 50% to 100%range
- Engines can have radically different thermal cmditions dependingupon t'me since shutdown and windmilling time since shutdown.
2.3.2 The followI table shows the varity of conditions that could exist atan engine inlet tezperatUle of -65-F:
FEL T.WP. AIR MP. METAL TEMP. START SIUATTON
(Very Cold -65°F Very Cold old StartMod. Warm -65°F Very Cold Refuel With Warm Fuel
J After Cbid SoakGimxAn Start
(Cold -650 F Warm Restart After Aborted StartMod. -650 F Warm Restart After Refueling
Air Start Warm -65 0 Mod. Werm Spool Down Retari:MWd.(ld -65°F Mod. Cold Extended Windailling
2.3.3 Fnine Thermodynamic duracteristirs Scale as classical ; and6 factors, with ombustion efficiently being aproxmately
98%. But, under arctic conditions, cmbustin characteristics canvary dramatically as a function of fuel viscosity aid its effect onfuel nozzle spray pattern. This means that:
- Lightoff fuel re*drunta can change by 50-100%.- After lightoff combustion efficiesncy can vary by 30%.
2.3.4 on same engines capreseor stall can vary as a function ofc asor metal teperature history.
2.3.5 Oil viscosity increases engine medhnical drag, and disappears as afunction of total 1utWer of revolutlun. This oil "isoous drag isnot prevent cing air starting, but the effects of airrxaft powerextraction drag can be substantial during air starting particularlyat low orine inlet pressure flight on)tics.
3.1 Stall SUli..w
Start range stall is semed by several mens depending upon thestall signature chracteristics of the specific eline anddspuriq upon the operating enirament (grzod versu in-flight).

10-5
3.1.1 Ground Start Stall Senir
Ground Start Stall Sensing omprises two isdeperdent ensingsysteai, A iVM1/14 and a "sliding" EFr limit.
3.1.1.1 The Aa , sys senses a suden decrease in core corrected rpmacceleration rate and osres it to a stall reference schedule asa function of corrected core speed.
Cagin Stall ReferenceChange in ScheduleCoreAcceleration Starter Cut OutRate
X . Idle Governing
ircraft HorsepowerX-', Extraction
Corrected Core Speed
a. Since engine acceleration torque is a "corrected" parameter, theA 0/1h is biased as a " function of engine inletpressure.
b. The key to this concept is tu obtain an RPM versus time signalwhose noise content is sufficiently low so that a good first andsecond derivative can be obtained.
In this respect, "many have tried but few have suceded". TheGE FADEC euploys a very sophisticated mathematical approach tosignal acquisition and processing which makes such an approachpossible.
c. This approach is applicable if the characteristic of the stallreaction signal is sufficiently strong so as to distinguishbetween the other events which also produce similar signals,i.e.,
Starter QatoutAircraft Accessory Ioad ApplicationIdle RPM Governor Action
d. This concept can detect stall within 0.5 sec. of its occurrenceand thus quickly prevent the adverse stress/overtemperatureommonly associated with stall.
3.1.1.2 EGT versus core speed as a stall sensing signal.
Th sstalso senses. corrected D cr/) cars;it to aschedule of stall BHr versus corrected[ oe RPM /(Referred to as the "Sliding imT" limit).
a. This schedule is designed to be higher than that expected duringnormal starting, but well belMow the tarperature associated witha "hot start".
b. The ) factor autcmatically bias the schedule for hot aid coldday erircmntal cnditicns.
c. This reference schedule is further biased to acccimt for anyresidual = caused b previous engine history.
Corrected Hot Start Limit EGT "Sliding Limit"
ExhaustGas Temp.
FCorrected Core Speed

IO*10-6
3.0 M= MM AM ZC9W= fQoMt14
3.1.1.3 Other alternative approades to stall sensing uihich consist ufcrzbinations of parameters could be employed during ground and/orair starting oonditions where engine ildisycrasies preclude thesole use of the A W/O or the sliding K12 limit approad. ForExmle:
- Moderately hot Er and very slow aoeleration rate.
- Low aoceleration rate, moderate BOT, and elevated fuelscheduling.
3.2 Air Start Stall Sensing
Air Start Stall Sensing is acccplished differently, depending uponthe nature of the stall pinch point.
3.2.1 Lightoff Stall
During air starting lightoff stall, the core REM can continue toincrease due to wirdmilllng assist or due to starter assist.Because of the altitude effect on acceleration rate, the stallsignature can be very low thus rendering the A tl/d sensorimpractical. Likewise, the Sliding Ear, reference scedule(reference paragraph 3.1.1.2) can be relatively low due to theeffects of BT/O at the cold ambient tempoerature associated withhigh altitude, low aircraft machine operation. Mu the slidingB2T limit my also be an inadequate stall indicator.
3.2.1.1 The high residual BGT immediately following an in-flight flameout,coupled with the low E21 reference from the sliding IOT limit, cansometimes produce an erroneous irdication of stall. In that casethe added intelligence produced by abrmaly low core acoelerationrate can provide the intelligence required to discern in-flightcoopressor stall.
3.2.2 "After Light-Off" Type Stall
Th swng of stall after light-off can be acox-p1ished by sensingA as per paragraph 3.1.1.
However, in flight, this is ocuplicated when aircraft powerextraction is applied because aircraft power extraction has a muchstrcnger impact on core acceleration at attitude than it does atSIB.
If such is the case, the concept of the sliding B=T limit, biasedby the residual BO, and couled with low core acceleration rate,is an apriopriate indication of stall.
3.3 Sall FAooWVr i
3.3.1 Ground Starting Stall Recovery Seq.encing
If a ground start stall is encuntered, the following sequence is
esployed:
" Interrupt the fuel for a short du"ation in order to break thestall. Conti ue to apply ignition and starter assist. ore rpmmy either ontinue to aooelerate, hang up or deceleratedepending upon the relatawbfip between tufired engine pmintorque are starter tor"u.
o Lowr the WF/PS300 fuel scdule a pre-determined amount.
o To-initiate fuel flow and monitor for light-off:

10-7
3.3 Btall NEaavOr ffemmir tcotdl
3.3.1 GcniStarting stall Recovery Seum m (oot'd)
o If the rpm is above norml starter cut out, adhere to thestarter crash engagement liits, is., do niot re-engage thestarter if FEM> 20%, but allow engine to coast down to the safestarter re-egagunent RPM4. Then initiate Fuiel Flow
o After light off is sensed, again moniitor for stall.
o If stall is again sensed, interrupt the fuel and further lowerthe fuel schedule.
o If required, repeat the stall recvery sequence for apre-deterelned maximumnuzirter of fuel decrements. If stallpersists, abort the start. The pilot can then re-initiate thestar~t seunc.
3.3.1.1 Anti RPM hang-up due to decresented fuel schedule
If stall free acceleration is eventually achieved, engineacceleration with the (stall free) decremnted fuel schedule -an bpslugish, particularly in the region above starter cut out rpmi, orabove aircraft load application rpm. If this ocurs, the anti-hangup feature is activated which then slowly retuzrns the fuel scheduleto its original value.
3.3.1.2 The combination of the stall decrement strategy and the anti-hangup strategy have the effect of rerograrming the fuel schedule soas to "skirt around" en unusual stall "bUrket".
3.3.2 Airstart Stall Recvery Sequnz
The airstart stall reciry sequence employed can differ due topreference of the airfrae re mifacturer.
"oOne aircraft yanufacturer does not automatically resequerice forany reason.
- heir Basic Flight Safety Eilosqiiy Is:
-If a stall is sensed, it is so annunsciated to the pilot andrequires Pilot dotIOn to reseageece the system.
-No adaptive fuel reduction features are euployed, but fuelenridiant for lean fuel rpo hang-up is available.
" Another aircraft anufacturer does euplay resequencing featuresdue to their philosophy to "Make the System Fully Automatic" andconsistent with ground operation.
3.3.2.1 Operational COflicting Requirement
The following operational situations can be enommtered during airstarting.
Very High Any Stall Resequence
Moderate Moderate No StallI Not Reuired
Intermediate Low ~ Stall Paseque me
LWLOW Lean Fangup Raise Fuel Schedule

10-8
3.0 POLL PR M M 3 (cont'd)
3.3.2.2 Air start stall recovery sequencing strategy eoployed by P7DOis:
After 1st Stall Interrupt fuel, lower fuel schedule
After 2rid Stall Repeat first resequen-(with additional fuel reductioa)
After 3rd Stall Repeat 3rd stall reseqence(no additional fuel reduction)
Successive Stalls ontinue to resequenoe per 2id stall
3.3.2.3 Anti-hanMu feature in conJunction with stall resenuenCinct
If the fuel decrement successfully clears the stall, andsubsequent lean RM4 hang-up is enountered, the fuel schedule isslowly increased until such point where sufficient accel rate isestablished.
3.4 Adptive Stratev For gines With A Reveated Gxrond Start Stall
Depending up the preference of the airplane manufacturer,adaptive features can be added which shortens the number ofreseguencin events required for each start. This feature isintrded for use in comexciX aircraft until the aircraft can bescheduled into an appropriate overhaul station.
Each tie an engine is required to be resequenced due to stall, the
FARC Logic.
a. Determines the ixzber of resequence tries raquired for success.
b. Stores this in memory.
c. M'en a subsequent *tart is initiated the nmber of tries isrecalled and then a pre-proranmed decision is made about thefuel schedule decrement to start out with.
4.0 Moro 83
4.1 Lioht Off SensiM
Several means of sensing lightoff have been employed and aresomewhat different between the two "GV' engine programs.
4.1.1 Sense a sudden, almost instantamns increase in engineaoceleration rate.
- Since a sudden, almost instantaneous increase in qoineacceleration rate occurs at lightoff, the same a MA/ signalused in stall sensing can be employed. Mis -. ept isapplicable to both ground and air starting which both produceapwcodmtely the same signal level.
4.1.2 Sense a significant and sudden increase in Mr1.
- Sene a mxe junp in 021 above the residual Wr level. Thesystem theretore determines the residual EMT at the initiation ofthe start sequence and then loks for significant EOT increasesabove the residual value.

_ _ _ 10-9
The GE omercial engine. mlyda giio orefrbtexcoitors and ignitor.
o Normally, for longevity raosonyn iitrfires.uingiven start. The sse lentsteo-tradintrpiafter each succeful start.
o After the fuel is initiated, the light off detector circuitmonitors for light-off.
- If light-off is not detected within a predetermined time, thesysteml shuts of'. the fuel1, motors the engine then fires bothignitors.
- The system then eiiitsfeanmoiosorlg-O.
o If failure to detect W/0 is again enutered, the fuel of f,motor , and fuel on sequesoe Is repeated (usig both ignitors).
Tis" se~ is repeated several times dependiing upon airplanemanufacturer preference) after which the syrten declares a "falsestart" ad the start terninated.
o Because lcnger than normal l.ight of f delays can routinely occrduring air starting ard during arctic starting, aditional "timeto light of f" is all(-;ad unier these circumstances.
4.2.1.1 The GE Commercial engines do not require aditional light of f fuelflow to compensate for light of f failure. However, otheralternatives ould easily te applied depending upon, the specificlight off characteristics:
-Additional light of f fueal flow coulld he employed on eachsuccessive start by:
a. Additional incraasntal step in minimum fuel f lowb. Time ramp increase minitm fuel flow after each WO0
res~lx.
4,5 Cold grtxid Startlr iaht Off 1Bes&Rmen,
o 1Eperienoe to date on bath cxsmercial engines has shown that theelevated fuel associated with the normal W'/PIPi schedulingalong with the increased allowable light of f delay time isadequate i.'hen used with the resequenoe described in paragraph4.2.1.
o Mome sophisticated logic circuits employ'ing ircrental increasesin light of f fuel are programmed into FALVZ for future use, butare disarmed at this tima. It required at a future date thesestrategies could he easil1y activated.
~CArStArtiL9t Of f &9AXM91
Light off resequencing can differ between engine prograsm due toair start light Of f characteiristic differences
o Currently neither VE engires emloy any adaptive air start lightoff features.
- Since air startiiM can be an anegncy situation~, both ignitOrsare immediately employed.
t- Because of the wircdmilling airflow, effect, no fuel purging isrequired.
- if light off is not detected within 20 secondsa, light offfailure is annunciated ard the system relies on pilot action to
resequenoe.

t0-a)
it4.0 Q99MI~ BDUD# fomtcfl
4.4.*1 Other adaptive features that could be stoloyed
At extreme flight coniitions, air start light of f can, on someengines, invulve design conflicts between the requviments forelevated light of f fuel flow and the subsequent lower fuel requireddue to the cmiPressor stall characteristics that develop afterflame propagation. Ths ability to detect light off within 0.5seconds (by the use of the delta aoceleratiai rate sensor, makespossible the resequencirq strategy wichd tmw~rarily raie lightof f fuel flow until light of f is sensed, but then rapidly restoresnormal min fuel flow.
5.0 JE d13 ~iIn the past, the design of fuel scheduling associated with hydro-madianic-Alcontrol systems has been a ccspromise between different cmnflictinlgciraumstanoe because
W PP5 3 versus Il#was used as the fuel hdieWliV aiprimary stall avoidance parameter.
Since Wf/P 3 is not a direct sensor of omprressor stall, it issubject to other influences.
- Omdosticti efficiency variations3 due to fuel viscosity, altitudepressure, engine metal tae~erature, etc.
- Varying compressor stall characteristics produced by enginethermal history scenarios.
- Thermodynaic cycle va-iatioie due to ram pressure ratio effects(i.e., during air starting).
unusual oeadbinations of thesg situations can occur at ocid airtemperatiires, je., below -20-F ambient. (reference. Paragraph2.3.2).
Thus, scheduling W,/Pas a ftunction of core rpm and engine inlettereraureis ns~ilcentcontrol intelligence to do the optimm
job that is possible with digital controls.
5.1 BOXDE General Anod
The crzipting and scheduling flexibility of the FADEC now makes itpossible to do a better job of bringing all of these elementstogether. Thus prcAmting a better more reliable system concept, asfollows:
I. Design for the normal (or routine) Aituation encountered duringoperation in the three major environmients.
- Normal Ground Start- Arctic Ground Start- Air Starting
2.* Use special override features under non-normal ciromsences.3. WI*e appropriate, or tihere design conflicts still exists, or where
stall risk still exists, use the stall sensing/resequencing, orfailed lightoff resequencing and anti-hang up features to overridethe fuel schdulding features.
Thus, the fuel systas becomes very faciving by adopting the philosophyuZ scheduling the prime parameter, k .asing it for additionalcircumstances, and then if all else fails, using the lightof f/stallresequencing as a final authority override.
51 tall tratsov (nonral ambient teii ranoe)
1 . Use conventional W~/'3* fuel schedule oupied with a fixedminimum fuel flow as the primary lightoff fuel criteria and duringthe in4 tiz. r-4 region.
2. Above tisT P.R4 use acleration rate vesu corrected core spee as,the prime mode.3. lvdethes acee a rat eimedUm with the Wr/FS tC verses
tc40 sceue designed primarily as a stall protectioncircuit.
4 Deinthe topng&hedule per 60OF day and use normal S A'S ofactorm to crsuiensate for ambient pressure aid terperature
variations.

10-11
5.0 MUgMU SaI ymFT (Rt8
5.2 gncd Stall st = fnomal a bient tM rN=) (cnt'dI
Bias this WP 3 schedule downard to oupe ate for srK-normal effects of
- Some engines have a depressed compresor stall line when the engine isat an intermediately thermal conditions (is., not cold, not hot, but
5. am) .
l 5.3 Arctic Ground Start Strateav
5.3.1 Design the stall protection portion of the fuel scheduling circuithigher at very cold tamratuure days, i.e., arctic oonditions based onthe poor cxzstion efficiency, associated with cold ambient and coldfuel. Assume the engine is thermally stable at cold soak conditions.
Arctic Acceleration ruelT erature Schedule
Corrected
WF/PS3 Ambient Temperature>OF
Corrected Core Speed
5.3.2 Provide an additional bias over-ride features so that the base scheduleis modified downward to acount for the residual engine therval effectsof recent engine running such as:
- Increased combustion efficiency associated with warm fuel produced bya residual of warm oil in the oil cooler.
- Engine Thermal History
The signeis associated with establishin tha engine thermal condition andoil temperature, and/or fuel temperature are available from other portionsof the FAIC system.
5.3.3 Increased lightoff fuel flows are usually required, and are subject tothe same variety of environmental and operational cortiderationsdefined in paragrap 5.0. The det/ils of these requirements areexpected to be a function of the specific engine fuel injection syster.design.
a. The GE FAMC system have beer. ieasful with the increasedlightoff fuel flow produ)ed by the raised W/P, Oh"scedule.However, other engines my need additional 6scensoly circoits.(reference. paragraph 5.3.2).
b. These compensating circuits can take various forms.
- Raise minimum fuel flow as a function of fuel temperture, oilcooler temperatures or other indication of fuel viscosity.
-Ramp increase minimum fuel flow as a function of time (only withvery cold fuel conditions).m- ap increase, or tire step increase the sin. fuel flow butaimmediately redca it to a ieaer level (i.e., within 1/4 - 1/2
second after lightoff so as to be commnsurate with stall-freeoperation.
c. There are a variety of other schemes that could be employed dependingupon the specific idiosyncrasies _f the engine design.
L
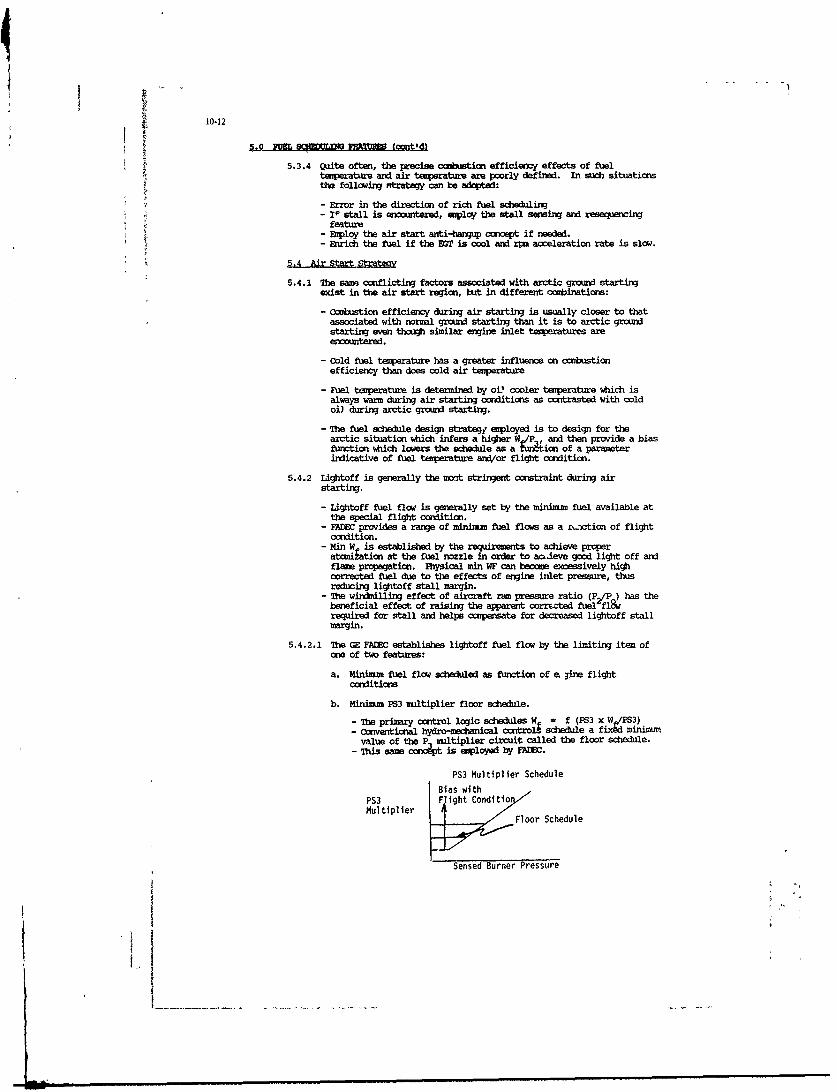
10-12
5z %mu
5.3.4 Quite often, the precise omixisticn efficiency effects of fueltemperature and air temperature are poorly defined. in such situationsthe folloig strategy can be adopted:
- Err=r in the direction of rich fuel schduling- IIP stall is encounered, iniploy the stall sensing and resequencing
feature- Employ the air start anti-hangup concept if needed.- Enrich the fuel if the m~r is cool and rpa acceleration rate is slow.
5.4 Air SatSr~
5.4.1 The same coflicting factors associated with arctic ground startingexist in the air start region, but in different osrainaticais;
- Ombusticn efficiency during air starting is usually closer to thatassociated with normal ground starting than it is to arctic groundstarting even though similar engine inlet temperatures areencontered.
- Qild fuel terperature has a greater influence on ccsbistionefficiency than does cold air terperature
- Fuiel temperature is determined by oi' coler teaperature which isalways wars during air starting onditions as cotrasted with coldoil during arctic ground starting.
- The fuel schedule design strategy esploye1 is to design for thearctic situation wh.tich infers a highe W/P,, and then provide a biasfunction which lowers the schedule as a runtion of a parameterindicative of fuel temperature and/or flight condition.
5.4.2 Lightoff is generally the aont stringent constraint during airstarting.
- Lightoff fuel flow is generally set by the minimum fuel available atthe special flight condition.
- FAMC provides a range of sminim=m fuel flows as a ±,-cticn of flightondition.
- Min W is established by the requiresents to acieve properatcnihatio at the fuel nozzle in order to ac..eve good light off andf lame propagation. Physical sin WF can become excessively highcorrected fuel due to the effects of engine inlet pressure, thusreducing lightoff stall margin.
- The wintmilling effect of aircraft ram pressure ratio (P2 /P ) has thebeneficial effect of raising the apparent corrczted fuel fl&reqired for stall and helps compensate for decreased lightoff stallmargin.
5.4.2.1 The GE FAL8Z establishes lightoff fuel flow by the limiting item ofone of two features:
a. Minimum fuel flow scheduled as fution of a ;ine flightconditions
b. Minim=s PS3 multiplier floor schedule.
- The primary control logic scedules W = f (PS3 x WdP3)- Conventional hydro-mechanical cratol~ schedule a fixed minimr
value of the P multiplier circuit called the floor schedule.- 'flds sae 47c~t is employed by F711C.
PS3 Multiplier Schedule
Bias withPS3 I Flight Conditlo
Multilier Floor Schedule
SneBunr Pressure
iW-13
5L~PUL ~LN~P~10M toCnt'd)
- C provides the capability to wanirWate the EoOr slh deand thus lightoff Diel flow. T1n GE crat&rcial eninescurrently do not roirxe a bias ot the Zloor schedule, LutFADEc is capable of doing no, if ro,,dxed in otherapplications.
5.4.3 The correct fuel flow W, /IS0" reqir d hea=ue U lightoffatomization cnsideratiom (lim prkOagtion) may bt: exesslva afterlightoff due to stall consideraticns. Because of the availability ofthe extremely rapid action light-off sensor, it is =jrible to rapidlyreduce lightoff fuel flow after lightoff but W-we stall is developed.1his feature is not currently employeif, tt avadluble for activation,if required by a specific engi",
5.4.4 Slow acceleration or ' RM hangup" can ocur in the air start region dueto two factors:
1. Inadequate fuel because of:
- Aircraft powez extraction effects- In-exact knowletge of the rsered fuel which can occur at flight
extremes ar4'or obscureonitions.
2. Ompressor stall
5.4.5 Anti-hang up strategy
5.4.5.1 If slow aoceleration is er *~n;-ered, featr-- can be ewsloyed thatdetermine awther the slow acceleratico is u tW ialpluate Diflflow or coapressor stall.
5.4.5.2 If the slow acceleration is produced by low fu.l flJ, theanti-harup circuit slowly irs oses fuel flow, overriding the otherfuel ccq0taticns, until a minism cor FRM aocel rate is produced.
5.4.5.3 If the rpm hangup is cascd by socapdor stall, the adaptive stallrecovery strategy is activated.
N=: This feature has the potential for siqaificantly increasii- theunassisted portion of the air stvt envelope.
h.0 1tM ar uW.tat&W R.wiiu Air Atsjg
Air starting is ustally livided L-to two regions: W~Ad/ling and starcerassisted.
o Starter assist is req.tred ihen widmsillinj rpm is less than 10-20%depening upon the engine. If wirdaillin RIM is low, the starter isactivated twediately, hit igniti'n and fuel are delayed until the engineacclerates to a safer firxin RW-
o If wirdmilling RM is greater than 20%, atarter assist is not ecployed.
o The situotion is further omplicated by the engins state snd the starter*enqy ,supy avAllability when the start is initiated
- 7he starbix nay or my ?tot be x railable depetiling uxm the status of itsenergy )~pply. -
- te engin can Lv wir milliq, /tabilized) or spooling dam depending howsoon after dutdoa& that the start i Initiated.
eIn ither .ose, nillin verimx r,=l down rtart, the FA= logicdoes not apply sta,,tar assi t ,nlesR the rpm is below the safe starter
engageswzt PM.

10-14
TUs cuthor wihes to Gcknwleeqe the assietanoe of Mr. Daniel J. ranlell for hiscrf lxtLn to the "'.at of the art" of establlniai the mathematical approach
Yedre to determi the secod tie derivatiana of engine rpm and to Mr. RcertL. Mayer, who applied tta basic ocxspt to the CF6-80C2 egine, creating severalof the strategies c :ie-bed herein, and who is Ey co-inventorc of the patent forthis prodhct. In ad1itin the asuthor wishes to adrwsedg the effort. of r-vinH. Yast, Jn S. Smith., Scxott P. Jolliffee and Tft V. Ny who have worked to refinethe initial ocnoept into an operational prodLut.
1. - &ngine inlet total tmqxratioe (°F) divids b, st.r SIS t as rature
(519)
2. f Fxqa inot presm:r (PSIA) divided by atar ard SIS pressure (14.7)
3. Nz Core Rfl
4. I /. Corrected ore RE4
5. d Core RPM axeleration rte (RiWSBC)
6.- Ch-rge in core aaczaleraticms rate
7.A' Corrected dange of core aceerati. rate
8. IC? Wwust gas teiperature9. Wo2 Fuel claw
10. PS- oaspressor discharge pressure
ii.l4/hDF~9ICtr.l ao.lerat3.oi fuel sciedule p.-.ter
Discussion 20% speed, and within some tenth of a second we knowwhether we had a minimum acceleration rate If not and if asubsequent stall is encountered we stop the start and fix the
1. 1. Kurzke, MTU APU.How long does it take to modify a control schedule gettingall signatures? 3. H. Saravanamuttoo, Carleton University
You mentioned the need to airstart after extensive time ofAuthor: windmilling, following the shut-down of a second erngme.Development units are done immediately under control of Could you please elaborate on the type of aeroplanes andthe engineering manual application Productions units can the cause of incidents?modify only quality control, with all of the delays associated.
Author.On commercial aircraft which employ 2, 3, 4 engines, a
2. C. Rodgers, Sundstrand Power Systems flame-out in flight may occur for a wide range of factors. AllWhat cases of failed starts did you have? of them include engine maintenance cost considerations.
Thus an engine could be shut down early in the flight forAuthors: precautional reasons. If em additional engine is shut downNone, but we had some hardware problems, not very many later in the flight, particularly for more serious reasons, itconsidering 600-700 starts a day. We still use the APU and may be desirable that the initial engine may have to beconsequently had no battery power problems. We fired at restarted after extended windmilling conditions
ilI-I
4
COLD START INVESTIGATION OF AN APU WITH
ANNULAR COMBUSTOR AND FUEL VAPORIZERS
by
K.H. CollinThermodynamics and Performance Department
K. Piel
ConsultantKHD Luftfahrttechnik GmbHD 6370 Oberursel, Germany
Summarv
The paper deals with the combustor of the APU for the "Tornado" fighter aircraft. Asth!s APU has to cope with the narrow space in the fuselage it must be of small size. Alannular combustor is favourable as it is short and can be integrated Into the envelopeof the outer diameter. The fuel vaporizer system is chosen because of its great advanta-
gel with combustion.
The paper describes the ignition process which is difficult as no fuel is acLuatly va-porized when the start is initiated. Theoretical background and experimental steps of adevelopment programme are reported. The result was perfect starting of this system downto -40 *C and a very high "First Start Reliability" which merns no false start leadingto several start procedures.
1. Introduction
An APU (Auxiliary Power Unit) is installed in ar aircraft to provide secondary energyfor one or more of the following tasks.
On ground an APU has to deliver shaft energy for electrical generators, for hydraulicand feel systems. In addition it has to deliver bleed air for starting the mainengine as well as for air-conditioning.
As soon as the aircraft is airborne some APU's have to be able to work as standbyemergency power sources.
With the initiation of the landing procedure the APU may again - with some applica-tions in case of emergency it has to - take over all secondary energy in order to re-lieve the main engine of secondar loads.
Several facts have influence on the operation of an APU. The main aspects are:
Design of the APU
- Design of the secondary power system of the aircraft
- Operational requirements for the APU
- Requirements for special types of fuel and oil
Influence of ambient climate conditions and altitude.
Regarding low temperature environment conditions we have to consider two phases ofoperation of a4 APU
- Starting the APU even at extreme low temperature conditions
- Running the APU U
____________
4
11-2
During the Prototype-Testing of this aircraft,thc first phase - starting the APU at lowtemperature conditions - showed that sometimes two or three start attemps had to le con-
ducted before a successful start was reached. For Production aircraft this was contrary
to the user's requirements which stipulated:
- high start reliability which meant no false starts leading to several start pro-cedures: "First start reliability".
- no special preparations before starting like
pre-cranking of the rotorpre-heatfng of the oil
pre-pressurization of fuel
- short starting and run up time
Fsr the second phase - running the APU at low temperatures after successful startingno problems have been experienced: as the air intake of the APU T 312 is located under
the body of the "Tornado" aircraft and the opening with the hydraulic operated flap is
showing to the ground, there is no danger with ingestion of hail and only small amountsof rain and snow enter the APU. Experience has proved perfect running of the APU. There-fore this Paper deals with the development and experience connected with the first phaseof APU operation, i.e. starting at low temperature environments.
2. Auxiliary Power Unit (APU) T 312
2.1 General Description of the APU
The requirements of the secondary power system of the aircraft,which are Important fordefining start and operation of the APU are:
- small size ard weight of the APU
- limited battery capacity in the aircraft
- short starting time for immediate aircraft start
- high starting reliability: "First start reliability"
- same types of fuel and oil as for the aircraft
- immediate delivery of oil with high pressure to a dry friction clutch connecting APU
and the gearbox of the aircraft
- no in flight operation required.
For ground operation such as pre- and aft-flight check of the aircraft systems, forstand-by and for starting the main engines via a hydraulic torque converter, the APUdelivers the necessary energy as mechanical shaft power. This is transmitted into thegearbox by the clutch which will be automatically engaged as soon as the APU has nearlyreached Its 100 % speed after start up. To compliment these design features the APUT 312 has been defined as a single shaft gas turbine engine. Besides other characteris-
tics, for example the constant output speed, such a single shaft APU has the great ad-
vantage of low weight and small size.
Fig.l shows a cross-section with the main components: A two stage axial-radial com-pressor, reverse flow annular combustor, two stage turbine, exhaust duct aid a planetarytype gearing which reduces the output speed to 8.000 rpm. The APU has its own oil pumps,which deliver oil for lubricating the bearings and gearing as well as supply high pres-sate ull to Eie clutch. The oil reservoir is in the aircraft mounted gearbox to which
the APU is connected. The fuel supply Is controlled by a hydraulic governor. The star-ting sequence as well as overload and overspeed protection are achieved by an ir igratedElectronic Control Unit.
I _
________

11-3
Dimensions of the APU are: Overall length is 510 mm, including all accessories thediameter is 380 iMn. The rated shaftpcwer is 105 kW for continuous running with a 10 %short time contingency power. The ratio of rated power to weight Is 2.7. [1)
2.2 Description of the Combustor Des.gn
As the combustor of the APU is of great importance to the starting procedure, it will bedepicted here in more detail. The combustor, see Fig.3 , is of the reverse flow type.This type allows short engine dimensions.For small gasturbines like the APU T 312 anevenly spray pattern of the fuel cannot be reached with atomizer nozzles since a consi-derable amount of fuel will be spilled onto the walls of the combustor. Fan sprayers asthey were ased with some gasturbines may be one solution. At a number of other gastur-bine manufacturers greater experience, however, were gained with vaporizer nozzles. The-refore this type of fuel injection was chosen.
Advantages of vaporizer nozzles:
- low fuel pressure system
- excellent combustion because of pre-vaporization of fuel in the vaporizer canes byheat transfer from the primary zone in the combustor
- good maintainability
- low cost
A serious disadvantage, however, exists:
- bad starting at low temperatures and in altitude. The reason for this is poor or evenno fuel vaporization at these conditions.
As can be seen in Fig. 2 the dome of the reverse flow annular combustor carries 12vaporizer nozzles and 3 starter nozzles in 4oo, 800 and 1200 position. The compressoroutlet air enters the cqmbustor through bores directly. For fili cooling of the walls anair-layer is directed through rows of small holes combined with deflector rings . Afteran elbow bend of 180 0 the stream of hot gasses leaves the combustor and enters into thefirst turbine nozzle. Fuel is injected into the 12 vaporizer nozzles through thin pipes.During the starting period of the APU ignition is initiated by three ignition nozzles,i.e. one torch igniter 1- 1200 position and two stabilizer nozzles in 400 and 800 posi-tlion.
A torch igniter is shown in Fig.4.It consists of an atomizing swirl type spray nozzlecombined with an electrical high energy spark plug. An oval shielding tube reachesthrough the turbine housing into the wall of the combustor. The ignition spray nozzleand the igniter plug are assembled on the shieldlng. A stabilizer nozzle consists of anatomizing swirl type spray nozzle only and is shown in Fig.5. The design is similar tothe torch igniter.
3. Theoretical Analysis of Starting
3.1 Balance of Torques
The cold starting condition depend upon the "balance of energies" which prevails duringthe starting phases.
The balance of torques Is described as:
Driving Torques - Drag Torques = Aceeleration Torque
In Fig. b ana 7 toe torques on the turbine shaft ,ersus turb ne spccd arc sh.own for thcearly design of the APU with only one ignition nozzle, i.e. a torch igniter at 800 posi-
lion.
451
~11-4
Curve : torque of starter motor
Curve 2 : turbine torque
Curve 3: acceleration torque
Curve 2 is the combination of all drag torques and - after the combustor has lightedthe sustaining torque of the turbine wheels. The acceleration torque, curve 3 reveals agreat difference between normal temperatures, +15 0C and lower ones, e.g. -2C *C. At+15 °C ambient temperatures there is sufficient surplus torque for acceleration
(0.8 Nm). At -26 0C this surplus torque is already very little (0.1 Nm), At temperatures
below -26 OC there Ill be no acceleration torque, that means a "hanging start".
The elements wh1ch Influence the balance of the torques are following:
Driving Torques
- Starter motor
This torque is dependent on the size of the starter motor and capacity and charge ofthe battery which is aboard the aircraft. Both the!r sizes, I.e. of starter andbattery, are limited by the overall design and weight limits.
- Combustion of fuel
Tests have shown that a completely "lighted up" combustor will result in a sufficientenergy release. However with decreasing temperatures light up procedures of the com-
bustor becomes more and more difficult.
Drag Torques
- Ventilation of compressor and turbineThese losses cannot be reduced once the basic design has been frozen. All the worse,with decreasing temperatures the ventilation losses of the compressor Increasesbecause of higher density and mass flow of the air due to the laws of similarity( N / T ) and (m T /P).
- Bearings
These losses can definitely be reduced by use of ball and roller bearings i'stead ofsleeve bearings. In the APU all bearings with the exception of pump bearing', are ballor roller bearings,compared with sleeve bearings their losses raise with increasingviscosity less.
- Sealings
It was already the intention with the basic design to minimize losses by use of laby-rinth-sealings wherever possible. With decreasing temperatures, however, a certainshrinking as well as in other places rubber sealings has befn considered.
- GearsHere the losses are negligible, with lower temperature they may Inerease a littlebecause of the oil viscosity.
- Fuel pump
With the choice of vaporizer nozzles a low 9ressure fuel system already results inrather small losses.Even for spray nozzles like the igniter and staullizer nozzles the pressure need notbe higher, especially as the flow range is limited to the starting phase. Thevaporizer system including the igniter and ntabilizer nozzles requires only 15 barpressure compared with approximately 60 bar for a fully swirl type system.
Oil pumpsHere the viscosity influence is significant. The losies are proportional to thedelivery pressure which increases when flow resistance raises with higher viscosity.
Therefore deloading the pressure oil puips would be helpful.
I

11-5
3.2 Combustion Techniques
3.2.1 General TheoriesDuring the start - especially at low tempertures - the sustaining torque of the com-
bustion energy plays the important roll. The aim must be an immediate ignition and ahigh efficiency of the combustor.
The ignition of combustors with a vaporizer system is initiated by a torch igniterand sometimes stabilizer nozzles. Combustion efficiency of this type of combustor isinfluenced by the quality of atomization.
Another influence is the type of fuel. As soon as the torch igniter and stabilizernozzles are burning the vaporizer nozzles should also start burning. Below a certaintemperature the heat for evaporation has to be induced by the torch igniter and
stabilizer nozzles.
Another influence of th° ambient temperqture in connection with the fuel/air ratio ofthe APU is shown in Fig.8.The turbine speed represents the amount of air deliveredfrom the compressor. Here again the inflammability of fuel depends on the torch Igni-
ter and stabilizer nozzles.
3.2.2 Combustion Techniques of APU T 312
Applying the general principles of the ignition theorie- to the APU T 312 it can be saidthat reliable starting at low temperatures requires early ignition of all three igniternozzles to warm up the vaporizer nozzles and inflame there as much fuel as posbible. Theenvelope which allows combustion, however, is limited by local conditions of lean orrich fuel/air ratio. The total fuel flow to the ignition and vaporizer nozzles Is sche-duled by the fuel control dependent on the CDP (compressor discharge pressure), Thisfuel flow is shown In Fig. 9. It can be seen that at a CDP up to 1.5 bar a constant
quantity uf 24 1/hr is scheduled. It shall be noted, that an engine speed is assigned tothe compressor discharge pressure 1.5 bar, which depends on the compressor inlet tempe-rature and corresponds to the following values:
Compressor inlet temperature T0 ['C) -26 +25Engine speed N [%] 44 51
The scheduled fuel of 24 1/hr is split by means of a flow/ pressure livider within thefuel control unit into 14 1/hr to the ignition nozzles and 10 1/hr to the vaporizernozzles. Furthermore it has been found by testing that some of the fuel injected throughthe ignition nozzles is sprayed on the walls of the combustor as can be seen fromFig.10. Calculations have been performed to find out the fuel/air ratio. Only those in-let openings In the combustor which are in the spray area contribute air to the fuel of
the ignition nozzles. This air together with the fuel results in a local fuel/air ratio,w'iich is dependent on turbine rotor speed. These ratios have been eslculated as well as
the fuel/air ratio in the vaporizer nozzles. Results are represented in Fig.ll. Curve"Al reflects the conditions in the vaporizer nozzles, but this curve does not apply tothe first phase of the starting cycle, because the fuel is not vaporized yet. Curves "B"and "C" are related to the ignition fuel nozzles. It shall be noticed, that withinsufficient fuel/air mixture, caused by wetting of the combustor walls, the combustiblerange is reduced by leaning-out.
In summary it can be said that for suceessful starting it is necessary to reduce thedrag torques and to increase the driving torques: Therefore two tasks have to be solvedto guarantee at low tempertures reliable starting of this APU with the vaporizer systemin the combustor:- Improvement of good and complete light up of the combustor during the early starting
phase.
- Delcading the pressure oil pump as long as possible but safeguarding lubrication to
the ;earings.

11-6
Some essential markings have been entered in Fig.l1.
1) Range, in which the maximum fuel pressure at the ignition ,el nozzles and the nomi-
nal fuel flow is reached,
2) Maximum cranking speed witsiout ignition
3) Stitching to fuel control algorithm and end of range in whch fuel qunntity is con-
stant
4) Shut down of ignition fuel nozzles
5) Combustion range to be expected at homogeneous fuel/air mixture.
6) Cut out of starter motor and electrical ignition
It can be seen from Fig.ll that exceeding a certain speed without a pilot flame has beenignited (because of late fuel supply etc.) the fuel/air mixture fails to be ignited due
to leaniiig-out. So it shall be considered as essential, that either
- the maximum fuel presssure for the ignition nozzles will be reached at low speed, or
- the local fuel/air ratio of the ignition nozzle at 1200 position will be increased.
4. Test Results
The tests had to cover the whole operational range of the APU, which are:
Ambient temperatures -40 IC up to +52 *C, Fuel temperatures -40 IC up to *70 *C(in some cases up to+90 *C)
Type of fuel: AVTUR (Kerosine type, Jet A-I, F 35)AVTAO (Wide range, JP 4, F 40)
Type of oil: Synthetic lubricating oil, 5 eSt, MIL-L-23699
Main emphasis had been given to testing the starting ability at low temperature environ-ment conditions. As an APU cannot get any easment preceding a start -e.g. pre-cranking-
test conditions had to be assessed as realistic as possible. This meant for each startat low temperature that the APU had to be soaked long enough these ended up in tather
long cold-soaking-periods, at -40 OC, this were 3 hrs minimum.
On the other hand all design changes or changes in adjustments, e.g. change of fuelsetting, had also to be tested at high temperature environment to ensure that no
detrimental effect could occur. As an example: influence of different fuel settings in
regard to compressor surge or stall.
Besides the above mentioned limitations, for all test proceduies and subsequent designchanges the basis was defined by the analysis as explained in the preceding chapters.
Low parastic losses, i.e. low drag torques during start up.
Optimization of the combustor, i.e. correct fuel/air ratio for igniter and vaporizer
nozzles
In order to give a condensed information two test configurations in the sequence of de-velopment will be presented together with their design status.
1. First experimental design with only one igniter nozzle
2. Production standard design with three igniter nozzles

11-7
4.1 Optimization of Drag Torques
It %as alr-, y reported in chapter 3.1 that there could not be a reduction of the drag
torques.Ex,.pt the oil pump torque could be reduced by deloading the oil pressure.
According to the system specification the APU had to delivwr an oil flow with a pressure
30 bar In ordcr to serve the pressure for the clutch.This clutch is necessary because a
single shaft APU cannot be loaded during the start.
The viscosity of the specified type of oil, MIL-L-23699, increases by a factor of 150when the temperature decreases from +15 *C to -40 *C. As a result of this the dragincreases.Fig.12 displays the rotor diag lines for both temperatures. The performance ofthe electric starter motor is nearly constant over this temperature range resulting insteady-state cranking speeds of 3 % at -40 IC and 20 % at .15 0C. Due to the APU control
system the fuel does not begin to flow before 8% speed is reached. Therefore adoitional
steps had to be take;n to safeguard APU light up with temperatures down to -40 *C. -estshad shown that the oil pressure of 30 bar already builds up at 2 % speed,because the
pipes had to till up. Therefore a device was developed to deload the pump during thestarting phase, still ensuring full pressure in time for clutch engagement. During the
whole procedure, however, a level of pressure is maintained in order to guarantee thelubrication of tne APU. With the modified oil system the oil pump is deloaded during the
starting phase by a valve which is electrically switched to "load conditions" at 48 %APU speed. The result will be a greater acceleration torque on the turbine shaft as is
shown in Fig.13 (comparison with Fig. 7). With earlier and complete light up of tile
combustor the ascending part of curve 2 (Turbine Torque) shifts to the left, curve 2a.The acceleratin torque, curve 3 raises to 3a. With this a reliable start and shorterstarting time will be reached.
4.2 Optimization of the Combustor
It was explained that reliable starting at low temperatures requires early - i.e. at lowAPU speed - ignition of all three igniter nozzles. These will then warm up the vaporizernozzle and inflame the fuel.
Most aggravated conditions wern chosen for the tests in order to cover all environmentaland operational conditions.
-,for cold and normal temperatures lowest battery charge,1 Volt/35 Amps,i.e. min power
supply to the starter motor,
for high temperature max. battery charge,l Volt/70 Amps.
Fuel pressure head 0,019 bar representing lowest level in aircraft tank.
Fuel typeJet A-I for cold and normal temperatures
JP4 for high temperatures.
These fuels were selected for the different temperature ranges because of the data ofvolatility and vapor-pressure. The underlined values in the following table indicate the
most adverse properties:
Begin of volatility vapor pressure
Jet A-1 +1781 0,04 bar
JP 4 + 661 0,64 bar
iI
I []I I I I I III l I I II |I IP 7 I II Il I I I I " i Ii

11-8
Jet A-I has worse condition for starting the engine at cold ambient temperature because
there is a large difference in fuel and volatility temperature. JP4 is critcal at high
ambient temperature becaise vapour pressure is in the same order of suction pressure of
the fuel pump.
For some tests 6 thermocouple-probes had been lastalled in the combustor as is shown in
Fig.14. With this arrangement the light up sequence in the combustor could be well
assessed.
Test I
Test conditions:
Ignition: only torch igniter at 800 positionAmbient Temperature: -40 0C, 3 hrs soaked
Fuel: Jet A-I
Battery: min charge
The test traces, Fif.15 show temperatu-es of the 6 probes TCO1 6 and their position inthe combustor, average exhaust gas temperature TE and turbine speed N.
Discussion of test result.
The turbine speed raises very slowly: after 25 seconds the speed is only 22 %, althoughTE is already 900 *C. The temperature Indications of the six probes, however, show theactual situation within the combustor. Initial ignition Is after 1.5 seconds. Looking at
the positions of the torch igniter 800 and the six probes (below right in Fig.15) we see
that probes 1, 2 and 3 indicate inmediate increase, I and 3 stagnate, 2 and 6 climbfurtheron. For probe 1 there is no full inflamation, because the spray angle of the 800
nozzle is too narrow: the vaporizer is not heated up enough.
Probes 1, 3, 4 and 5 are very slow, slowest Is 5: it does not reach a temperature in-
crease of 100 'C before 38.5 seconds. This figure has been taken as an indicator:Ignition Delay Time 1000: IDT 100 = 38.5 seconds.The explanation for the increase of TEafter 25 seconds can also be clearly explained: fuel is not burning within the combustor
but is atomized lateron by turbine disks and burns in tie exhaust duct where TE probesare positioned. The analysis of this test showed that the initial flame of 800 torch
igniter did not heat up the far off side (3, 4, 5) of the combustor, air/fuel ratio of
lomogenous mixture was very lean. Therefore first start reliability was poor. Once the
combustion chamber had warmed up with the first start, the second or third start was
25 seconds.
The conclusion of this test was:
Thie igniter nozzles-instead of one equally spaced at 400, 800, 1200 with the torchigniter at 120 position because of maintenance reasons
Test 2
Test conditions:
Ignition: 3 starter nozzles
Ambient Temperature: +10 0C
Fuel : Jet A-I
Battery : min charge
This test series was now conducted under normal ambient temperaturcs to find out the
effect of the three Igniter noztles.

11-9
The test traces Fig.16 shbw the temperature indications of the six probes (notedifferent positioning compared with test l!). The delay time of probe 5:IDT 100 = I seconds.
The start up time of 24.5 seconds as well as "First Start Reliability" was stillmarginal.
D The analysis of this test showed that the air/fuel ratio of the igniter nozzles were notsufficient. Therefore a rather wide test series for optimizing these conditions wereperformed. The result was:
- Increase of the fuel flow to the igniter nozzles
Change of arrangement of the spray nozzle and the igniter plug of the 1200 torchigniter.
The design features were already shown in Fig.4.
Test 3
Test conditions:
Ignition: S starter nozzles, optimized flow and optimized arrangement
Ambient Temperature: +15 *CFuel : Jet A-IBattery: min charge
The test traces Fig.17 show mt,,h faster ignition and complete light up of the combustor.The delay time, probe 6, is IDT 100 = 6 seconds, start up time is 12.5 seconds. A veryimportant characteristic of this optimized design was, that also at max. dry crankingspeed (20 %) ignition was possible.
With this configuration (Test 3 cild and hot chamber tests were performed. Since thesetests were "Official Qualification Tests" the APUs were not equipped with the six probesin the combustor. Therefore only the general results can be reported.
Test 4
Test Conditions
Ambient Temp. Fuel Battery Start time to
charge 100% speedTest 4.1 -40 *C Jet A-1 mill 24 secondsTest 4.2 -70 'C JP 4 max 12 seconds
Test 4.2 was necessary to proof successful operation at high tempertures. All test re-* suits of the complete programe are compiled in Fig.18.Flrst start reliability including
all endurance tests wds in the range of 98 %. This was achieved mainly to the fact thateven with late fuel supply, e.g. because of air bubbles in fuel supply line,thc ignitionat max. dry cranking speed was suceessful. With n3rmal fuel conditions the specifiedmax start up time of 30 seconds was also achieved.
5. Conclusion
A combustor with a fuel vaporizer system cannot be started without an auxiliary ignitionsystem because there is jo vaporization during the starting phase. With the APU for the
"Tornado" fighter aircraft a programme was initiated for a thorough improvement of thestart capability at low temperature environment. Theoretical analysis combined with a
test programme resulted in successful starts of the APU down to -40 *C. Besides this theuser's requirements for "First Start Reliability" could be met.
References
[11 K Piel: Experience with the KHD APU T312 for a modern Figbter Aircraft,
AGARD Conference Proceedings No.324 Engine Handling.
1- - -- - * -
-A

11-17
Fig.1 APU T312 Cross section
TORCH IGNITER 120-
/ VAPOURIZER* -~ NOZZLE
STABILIZER NZL 0NOZZLE 800 NOZL 4"
Fig.2 Dome of combustor[
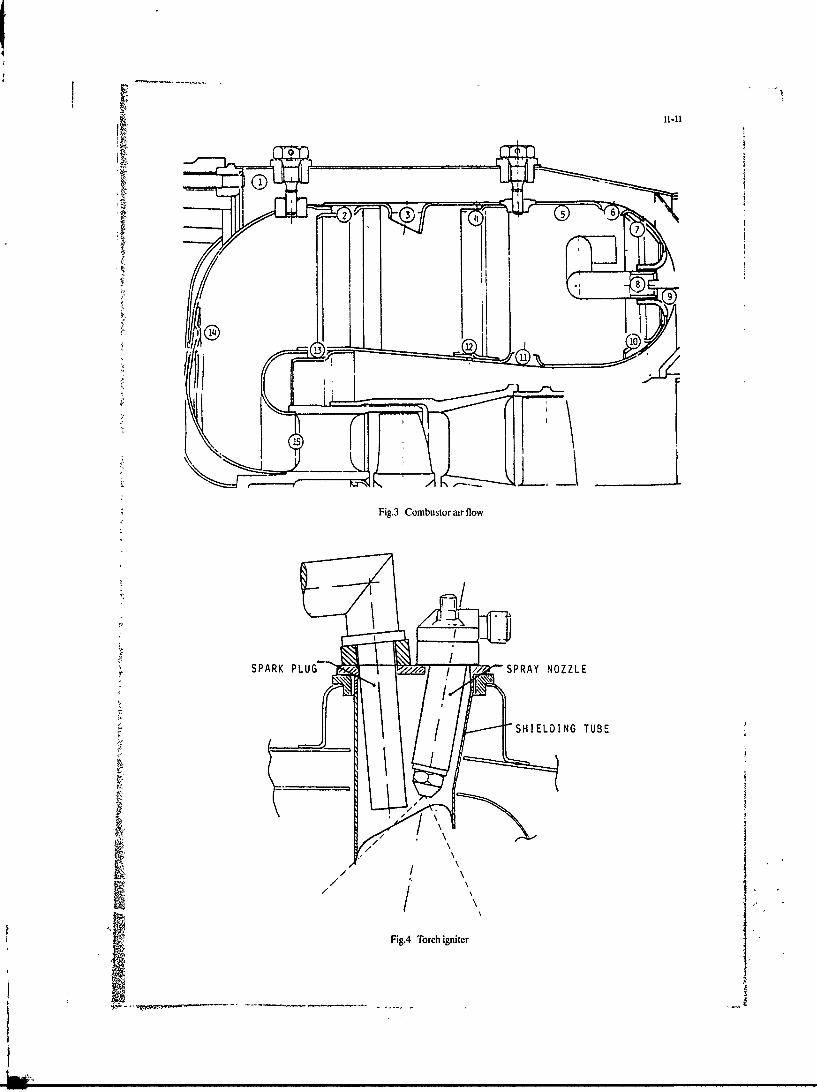
13g. Cobsoarfo
SPARK PLUG - I / SPRAY NOZZLE
\ ~ SHIELDING TUBE
11_
Fi. oc gie
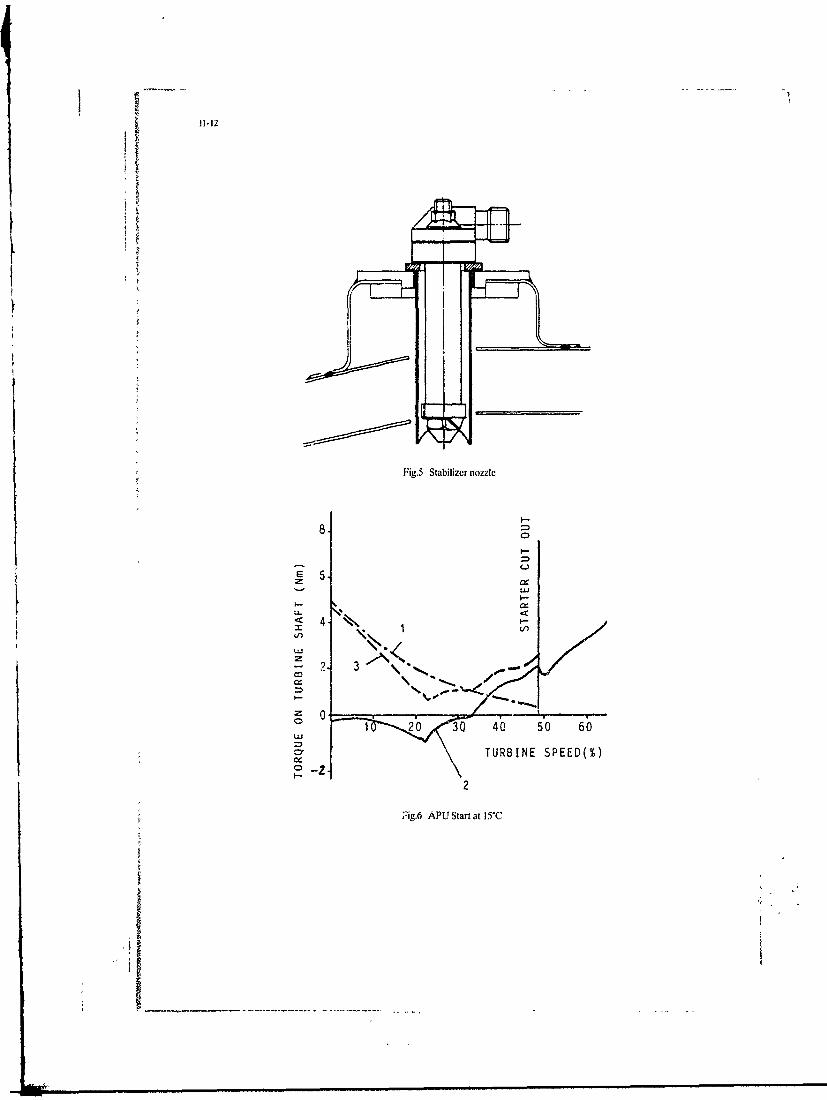
11-12
41-
Fig.5 Stabilizer nozzle
4 -.
U-1
2 3C\$.%
zo
1 20 30 40 50 60w&
7 TURBINE SPEED(%
2
Fig.6 APU Start at 15*C

11-13
6.-
E 8.
Y 0.
-2
-22
Fig.7 APU Start at -26C(-
AMBIENT TEMPERATURE
T < 5-
~ 3 COMBUSTION RANGE AT23 (K
HOMOGENEOUS 23K'J- 2] FUEL/AIR MIXTURE /
0 10 20 30 43 50 60 70 80
TURBINE SPEED (
Fig.8 Fuel/air ratio at the 4vaporizer nozzles

11-14 9
80-
S 70--
5- - -----
40
f 30,
10.--
0 1 ?2 3 fj 5Cow~essor Discharlge Pressure, (bar)
Fig.9 Fuel control schedule
OBSTRUCTION
STABILIZER NOZZLE 8 oSAIIE OZE4
Fig.10 Dome of combustor spray area of5 ignition nozzle 1200
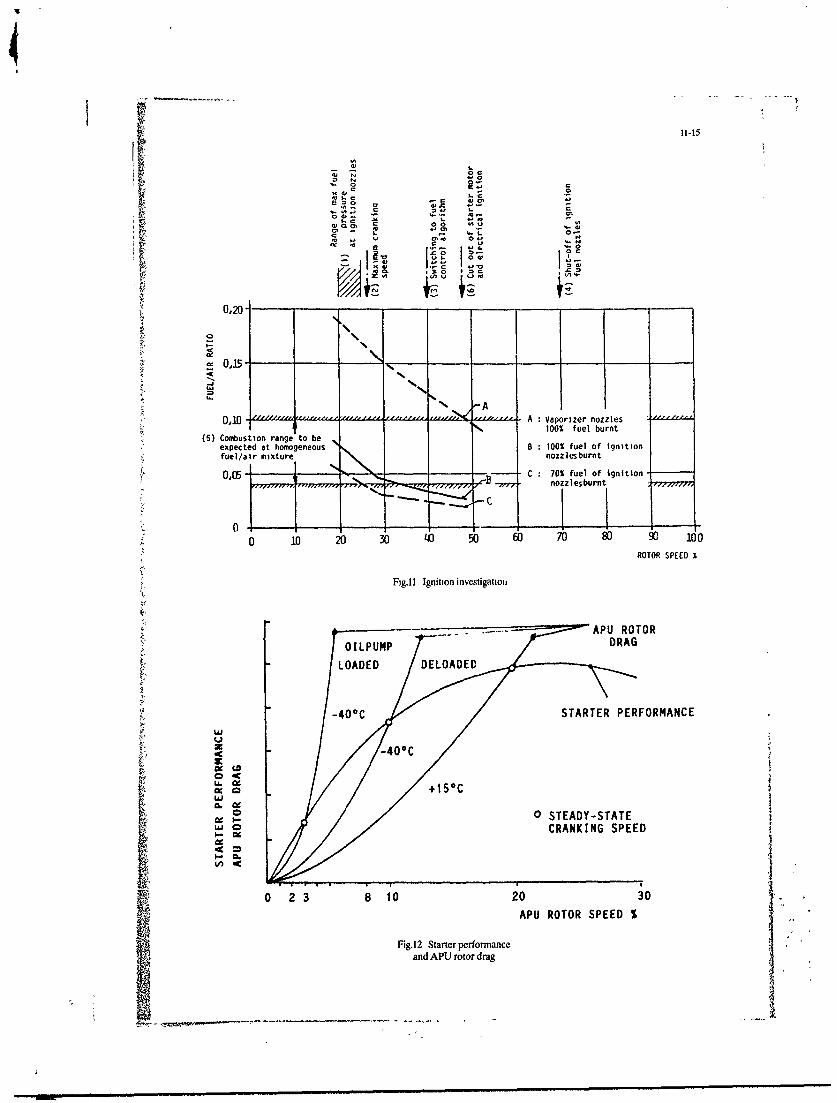
41-1
- L
Q .C 00
4.L 1- 04!
L. 0'' w
~A 0~ 3'
0,20
2! 0,15 ~-K
0,10 2au L&uL A Vaporizer nozzles100% fuel burnt
(5) Combustion range to beexpected at homogeneous no1001 fulofntiofuel/air mixture nzlsun
O~fE j IC 0%fuel of ignition
Fig.1i Ignition investigatiosRTRSPE ozlsun
APU ROTOR
-400CSTARTER PERFORMANCE
X 40Z
0 STEADY-STATECRANKING SPEED
0 2 3 8 10 20 30APU ROTOR SPEED %
Fig.12 Starter performanceand APU rotor drag

11-16
Vt)2 0a
Cr N-(X o,
10 i 3 -- ' 40 b 6 7
-2 V22aa TURBINESEE %
0 -
4i.1 Combstowisizhroope
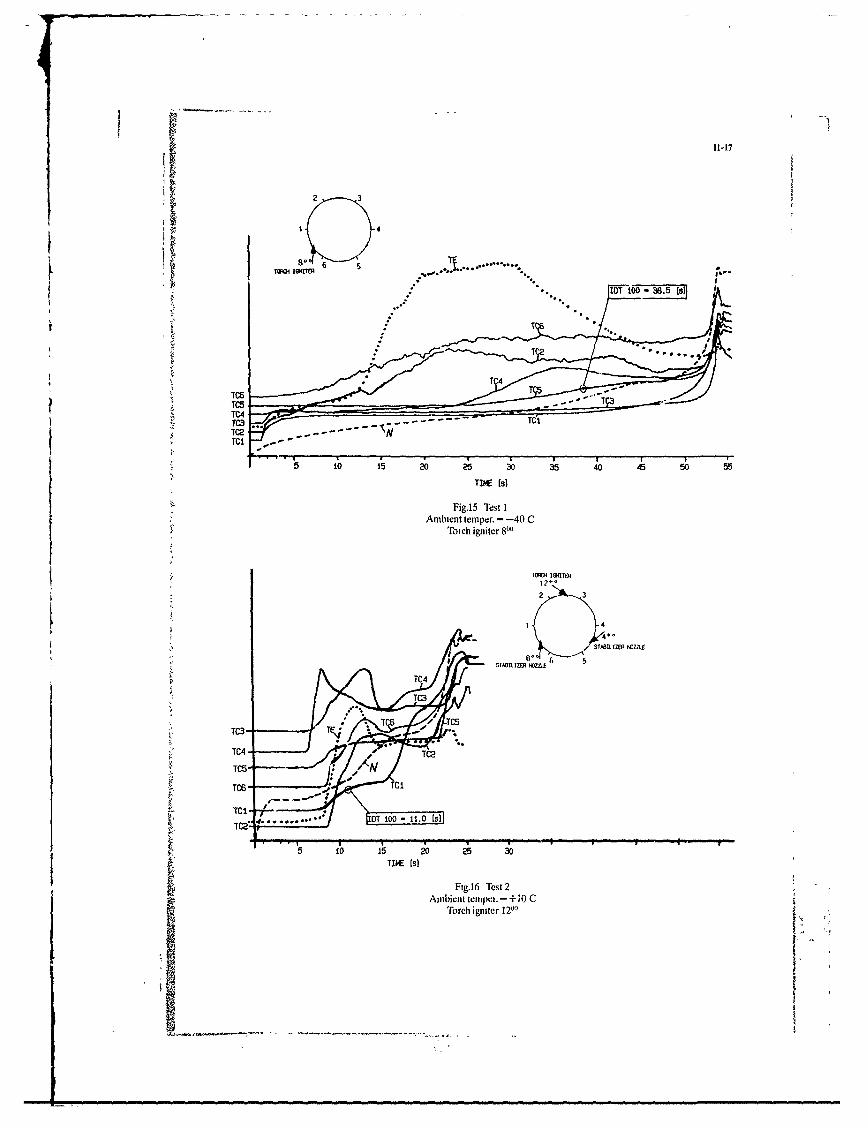
11-17
2 3
1 4
Fig.15D TIt
2O 3
1 5 45
5 ;0 ;5 20 25 3
TTIME (s)
Ambient tenp.-+ 140 CTorch igniiter 8I2~'
7G'CHIGNI-

mTO
tiI
TUMO 1GNZWIN12-
____ ___2 3
T1 44oo
STABUZEJ NCZA.F
STABILIZIPZfl 605
TC4 -
TC3- TT10Ta2
5 0 15 LIo 25 3
TIME (s)
Fig.17 Test 3Ambient temper - +15 C
Torch igmter 12'"
90]
~so.70- -TEST 4.2
L.1
= 60-
50-
w 40-
" 30"
c 20- TEST 3x 10,4C
0
-10
-20
-30. 4.1
-40,
8 10 12 14 16 18 20 22 24 26 28 30 32 34
START TIME (s)I Fig.18 Start time vs temperature
Ii ------ ~-- - -

12-1
CONTROL SYSTEM DESIGN CONSIDERATIONS FOR STARTINGTURBO-ENGINES DURING COLD WEATHER OPERATION
.BYROBERT R. POLLAK
DEVELOPMENT ENGINEERPRATT & WHITNEY
GOVERNMENT ENGINE BUSINESSP. 0. BOX 109600
WEST PALM BEACH, FLORIDA 33410-9600U.S.A.
ABZTRACT WF/PT2: Ratio of Combustor Fuel Flow to Engine
Starting turbo-engines at climatic extremes has Inlet Pressure, Mass Flow/Absolutealways presented challenges to the systems engineer. Pressure
The wide range of both ambient and engine Internal FTIT: Fan Turbine Inlet Temperaturet' temperatures experienced by many influential
variables Increase the complexity of the startup 1B: Combustion Efficiency Within Main Engineprocess both on the ground and in the air. The Burnercontent of this paper provides the current status ofadvanced control methods designed specifically to FADEC: Full Authority Digital Electronic Control
address combustor Ignition and quick, stall-free TQ/8i: Corrected Torqueacceleration to Idle. Sensitivity of combustor ignitionlimits to cold conditions as well as fuel types has TOtot: Engine Total Aerodynamic Torquebeen accommodated by both the combustor fueldelivery system and control system design. Specific TOpwa: Engine Internal Parasitic Torque
attention is also given to starting at cold altitude T Engine Torque Available for Accelerationconditions with extremely hot as well as extremelycold internal engine temperatures. Successfully TO.t: Airframe Torque Extracted from Enginemeeting these requirements has been accomplishedby designing the control system to automatically TOstarter: Starter Cranking Torquemonitor external influential variables as well as enginef.TQ~ccel: Requested Acceleration Torqueinternal parameters both prior to and during the actual (Request)startup cycle and using these data to continuouslyadjust fuel scheduling to obtain optimum startup TO 0cc.,: Actual Acceleration Torque Sensedcharacteristics. (Actual) By the Control
LIST OF SYMBOLS i Polar Moment of Inertia
N2: High Compressor Rotor Speed, Revolutions Fuels: JP-4, Equivalent to NATO F-40per minute JP-8, Equivalent to NATO F-34, F-35
JP-5, Equivalent to NATO F-44PT,- Engine Inlet Face Absolute Total Pressure
TT2: Engine Inlet Face Absolute Total INTRODUCTIObITemperature
The process of Ignition that occurs during coldRatio of Engine !nlet Face Absolute Total weather conditions within a Turbo-Engine has alwaysTemperature to Sea Level Standard Day presented a challenge to the combustor designer andTemperature systems engineer. The multitude of variables that
influence the initialon of combustion under theseTO: Torque conditions have certainly been encountered by
8: Ratio of PT2 to Sea Level Standard anyone given the challenge to assure ease andAbsolute Pressure consistency of starting,
N2C2: Corrected High Compressor Rotor Speed, Surveying any fuel properties refererice manualN2Z//-2 = quickly shows that the vapor pressure of the fuel
drops dramatically as fuel temperatures approachWP/PB: Ratio of Combustor Fuel Flow to Combustor sub-zero conditions while viscosity similarly increases.
Pressure, Mass Flow/Absolute Pressure With the high viscosity levels encountered, the
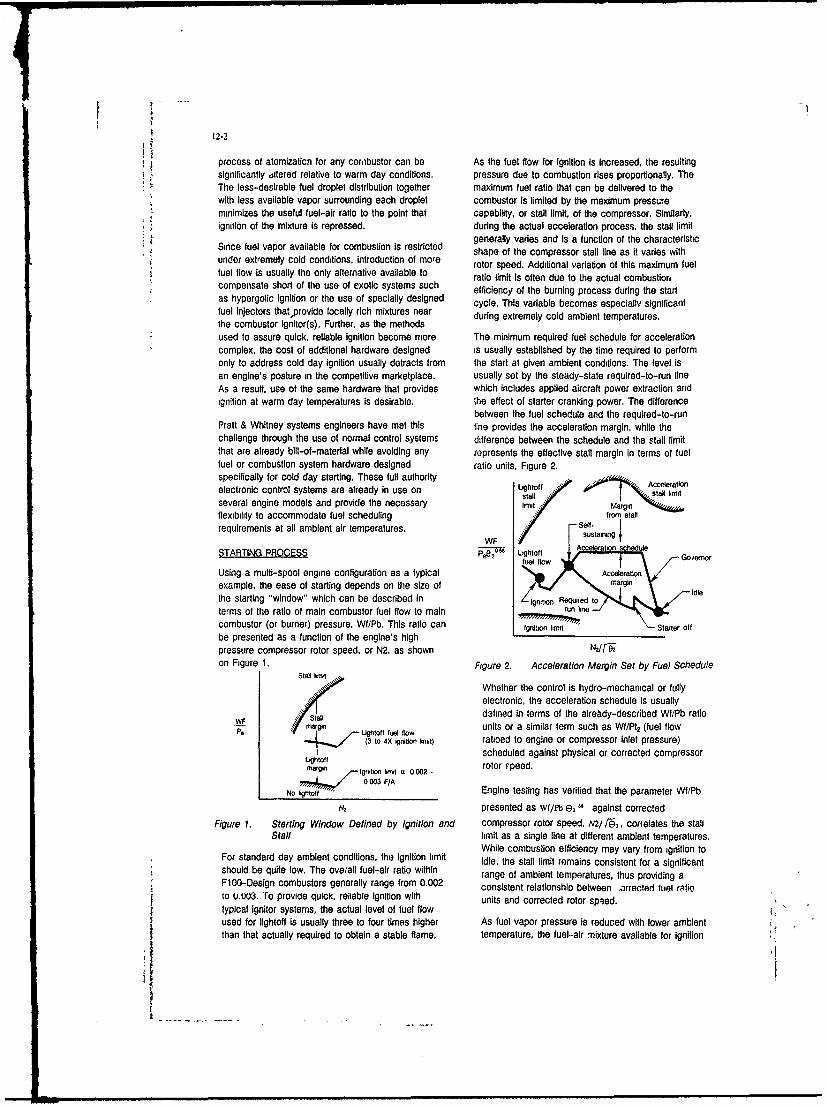
12-2
process of atomizaticn for any cormbustor can be As the fuel flow for Ignition Is Increased, the resultingsignificantly dltered relative to warm day conditions, pressure due to combustion rises proportionally. TheThe less-desirable fuel droplet distribution together maximum fuel ratio that can be delivered to thewith less available vapor surrounding each droplet combustor is limited by the maximum pressureminimizes the useful fuel-air ratio to the point that capability, or stall limit, of the compressor. Similarly,Ignition of the mixture is repressed. during the actual acceleration process, the stall limit
generally varies and Is a function of the characteristicSince fuel vapor available for combustion is restricted shape of the compressor stall line as it varies withunder extremely cold conditions, introduction of more rotor speed. Additional variation of this maximum fuelfuel flow is usually the only alternative available to ratio limit is often due to the actual combustioncompensate short of the use of exotic systems such efficiency of the burning process during the startas hypergolic ignition or the use of specially designed cycle. This variable becomes especially significantfuel injectors thatprovide locally rich mixtures near during extremely cold ambient temperatures.the combustor ignitor(s). Further, as the methodsused to assure quick, reliable ignition become more The minimum required fuel schedule for accelerationcomplex, the cost of additional hardware designed is usually established by the time required to performonly to address cold day ignition usually detracts from the start at given ambient conditions. The level isan engine's posture in the competitive marketplace. usually set by the steady-state required-to-run lineAs a result, use of the same hardware that provides which includes applied aircraft power extraction andignition at warm day temperatures is desirable. the effect of starter cranking power. The difference
between the fuel schedule and the required-to-runPratt & Whitney systems engineers have met this line provides the acceleration margin, while thechallenge through the use of normal control systems difference between the schedule and the stall limitthat are already bill-of-material while avoiding any represents the effective stall margin in terms of fuelfuel or combustion system hardware designed ratio units, Figure 2.specifically for cold day starting. These full authority Acelerationelectronic control systems are already In use on Littolt A eatl onmt
stalltlli tseveral engine models and provide the necessary hrm , Marginflexibility to accommodate fuel scheduling from stalrequirements at all ambient air temperatures. Sl I
STARTING PROCESS K Ughtoff Acceleration schedule
Using a multi-spool engine configuration as a typical Acceerationexample, the ease of starting depends on the size of margin Ilthe starting "window" which can be described in gnil n Required toterms of the ratio of main combustor fuel flow to maincombustor (or burner) pressure, Wf/Pb. This ratio canIgntion imit offbe presented as a function of the engine's highpressure compressor rotor speed, or N2, as shown N2/i
on Figure 1. Figure 2. Acceleration Margin Set by Fuel Schedule
Whether the control is hydro-mechanical or fullyelectronic, the acceleration schedule Is usually
wF ./stg defined in terms of the already-described Wf/Pb ratio-m- . argin L f units or a similar term such as Wf/Pt2 (fuel flow
(3 to 4X ignition limt) ratioed to engine or compressor inlet pressure)scheduled against physical or corrected compressorLgrtotrr peed.
margin lgrvt limit u 0 002 -
0 003 F/ANo Vtolf" Engine testing has verified that the parameter Wf/Pb
Nz presented as wf/Pb e 2 against corrected
Figure 1. Starting Window Defined by Ignition and compressor rotor speed, N2/1J ,, correlates the stallStall limit as a single line at different ambient temperatures.
While combustion efficiency may vary from ignition toFor standard day ambient conditions, the ignition limit idle, the stall limit remains consistent for a significantshould be quite low. The oveall fuel-air ratio within range of ambient temperatures, thus providing aF100-Design combustors generally range from 0.002 consistent relationshio between )rrerted fuel ratioto u.uu3. To provide quick, reliable Ignition with units and corrected rotor speed.typical ignitor systems, the actual level of fuel flowused for lightoff is usually three to four times higher As fuel vapor pressure is reduced with lower ambientthan that actually required to obtain a stable flame, temperature, the fuel-air mixture available for ignition

41
12-3
likewise drops. Consequently, more fuel is required to temperatures, the design task Is to provide requiredprovide sufficient vapor for ignition. The characteristic fuel flow to Initiate a timely lightoff. In the usual case,is manifested as an increase of required fuel ratio the fuel flow adequate for warm day Ignition is too lowunits as shown on Figure 3. The amount of increase for extreme cold day operation. The generalfor a given temperature level Is, of course, a function technique Includes a bias with engine Inlet sensedof the fundamental ignition characteristics of the temperature. Tt2, or an equivalent compressor inlet
combustor design. Test data under controlled temperaiure behind the fan or low compressor. In anyconditions have Indicated that the rain cf Increase of case, as the temperature drops, the fuel schedule Isignition limit Is a function of the level of the warm day adjusted to provide lightoff flow commensurate withignition. If the limit Is low, the rate of Increase of the the ambient temperature as shown In Figure 5.limit with temperature reduction Is likewise low. Characteristics for a
typical lightoff rotor speed- Cold iueralua
- --"" * Viscous u vapor pletaif Stall limitUghtotf fuel
WF schedule requires___ knits p.OM temperature BIAS
rotor spett
3~~~fe flow,.. Tymc Uit
----- *- Visa ko vapor "mint Cold Standard ot
__ F -60 0 60 120
N21(_0" (-C) (-51) (-18) (16) (49)
Figure 3. Lightoff Window Influenced by Fuel Ambient temperatureCharacteristics Figure 5. Temperature Bias Used to Optimize i.ghtoff
Depending on the specific design of the combustor,combustion efficiency can drop off significantly at As mentioned previously, combustion efficiency can
sub-zero temperatures. As a result, the amount of drop significantly as ambient temperature drops. This
fuel required to drive the compressor into stall is especially true at low rotor speeds just after Ignition
likewise increases. If this characte'istic is such that during which low vapor pressure and high viscosity
the stall limit Increases to a greater level than the still exist. This low combustion efficiency minimizes
ignition limit, a useful start window will remain. If the energy available for acceleration such that a higher
increase of the ignition limit Is larger than the stall level of fuel flow is required to meet required-to-run
limit, it Is conceivable that the two will Intersect, thus operation. Although difficult to measure or calculate,
relegating the engine to an unstartable condition, available heat from combustion is dissipated into the
Figure 4. This condition, of course, requires a fuel surrounding metal thus contributing to the low
nozzle or combustor redesign, cr a compressor with effective efficiancy. As such, the fuel schedules at
increased stall margin to provide a useful operational low rotor speeds must be Increased a proportionate
window, amount to maintain acceleration margin. Figure 6.
Typical ightoft rotor speed
Fuel required for ignitwin stit
iniates stall at lightof
PeWs ' ncrease due to low WF
w Inii i High ignition limit NOre fUe'
ILow acceete r-W
*F .60 0 60 120 ncrease hftl(c) (51) (18) (16) 1491 Lowii
A ib"ilnt temperature
Fioure 4. Lightoff Window Varies with Design and Figure 6. Combustion Efficiency Drives AccelerationTemperature Requirements
As the rotor proceeds toward idle, the internal
conditions of the engine are rapidly heated to theAssuming that a useful starting window exists at all point that the combustion process becomes more

12-4
efficient. Further, less heat Is dissipated to internal has been successfully demonstrated at ambientparts thus releasing more energy for acceleration, temperatures as low as -40* F (* C) wih both JP-4Consequently, as rotor speed approaches Idle, the and JP-8 fuels.initla!fy high fuel schedule required to maintaindsrbeacceleratian Is no longer necessary. Whenever a start is attempted during a hat-frandesirable acondition (an engine with residual heat) the warn',Similarly, the amount of fuel required to stal likewise FTIT provides the control with the capability todiminishes due to the process of increasing Internal schedule a lower value of lightoff fuel flow totemperatures and Increased combustion efficiency. As compensate for the higher combustion efficiency thata result of the lower required-to-run line end stall prevails at these conditions even though ambient airlimit, the resulting schedule can be lowered while still temperature Is cold. This feature therefore, providesmeeting acceleration requirements, and must be optimum Ignition capability at sub-zero airloweed to avoid stalling the compressor. temperatures while assuring maximum compressor
stali margin when engine internal temperatures areThe rate of combustion efficiency change during the war
warm.acceleration to Idle is a reasonably consistentprocess at cold temperatures as long as the engine Additional Iightoff protection Is included to addressinternal temperature during any given start is initially low-grade fuel which may further degrade Ignitionthe same Difficulty c.an arise It the combustion capability via extra-low vapor pressure or highefficiency at low rotor speeds is significantly different viscosity. The control monitors the time after fuel Isfrom one start to another at a given ambient 'ntroduced to the fuel manifold and senses whethertemperature. That Is, for a cold-soaked engine or ignition has taken place. If ignition has not taken"cold-iron" engine, the efficiency Is low, but, for an place within the prescribed time period which includesengine still hot after normal shutdown, or "hot-iron". expected time to fill and light, the control begins tothe efficiency Is high. Should available compressor increase fuel flow in an attempt to establish anstall margin be sufficiently high to accommodate acceptable ignition fuel-air ratio, Figure 8. Athese differences, no difficuitles will occur. However, reasonable limit Is included for obvious safetymany high periormance compressors may have reasons.limited margin to accept these differences, This is L~htof not Maximum kmt fortrue for fighioff fuel flow requirements as well as the tte sety reaso sacceleration schedule. pscried tie
ADAPTIVE CONTROL
The now-common Full Authority Digital Electronic flow - ful fow -
Control (FADEC) used on high-technology engines at pph
Pratt & Whitney utilizes internal core engine TN0Ita Rampp rotieed totemoerature to schedule lightoff fuel flow to obtain advance estaish better FIAsuccessful Ignition during cold day operation with both"cold-iron" and "hot-iron' engine conditions. Shown Ti-on Figure 7 is a typical lightoff fuel schedule for anopaa~oal ngie. ue flo Isschduld wthFigure 8. Addiftlanai Lightoff Protection Provided forop•rational engine. Fuel flow Is scheduled with Low-Grade Fuelscontrol-sensed Fan Turbine Inlet Temperature. orFTIT. During warm day iperation the fuel is As shown in Figure 6, the level of fuel schedulescheduled at ielatively "low" values which provides required to accelerate can be significantly hlghG, atquick lightoff capability while maintaining adequate cold temperatures during low speed operation due tostall margin. As ambient terrperatur6 and likewise iow combustion efficiency. Since this process is moreFTIT drop, the scheduled fuel flow is increased to physical 9ther than aerodynamic, and the physicalcompensate for the more dfficult ignition process of combustion can change depending on thecharacteristics discussed previously. This technique grade or type of fuel, designing the fuel flow schedule
for the acceleration to idle can often be a hit or miss500 process. The design Is further complicated since
warm engines must also be started at coldtemperature, which will also alter the amount of fuel
UA required to maintain a desired level of acceleration.The FADEC has completely eliminated the need for
second-guessing continually changing variablesduring the starting process.
F .l-oo 0 1oo 200 300 1600 1601 170D IWO ACCELERATION PROCESSC( 71) (48) (38) (03) 114W) (18 871 (8 ") (M 831
tan 1 tet utt etn e The concept of describing turbo-engine starting
Figure 7. Lightoff Fuel Flow Set by Engine Internal characteristics in terms of acceleration torque of theTemperature high compressor rotor has been fundamental for
t'

12-5
years. It accurately describes the power of the engineat a specific speed and relates directly to the ,. . t
aerodynamic capability of compressor and turbine a~ ~ ~~i ' , vF/Acharacteristics. 8131111IA
compwOor AThe relative relationship of acceleration torque tocompressor operation Is shown on Figure 9. The iavelof torque available for acceleration is proporticna! tothe compressor operating line and the temperaturegenerated within the combustor to provide turbine coreressor ctd fWitow
power. The resulting airflow, pressure, andtemperature together with the compress or and turbine --
efficiency characteristics provide the net excess () ,," Margon fromstall WMtpower for acceleration. As speed increases, airflow
and compressor pressure capability increase, and the A Typ ,temperature required to reach this pressure likewise Acceleration Torque levels at SCtnedletorque compressor 8increases, thus increasing net power. stal tor ..S '-" SIC -...
I I I
c ro llum C Corrected rotor speed
m OA Figure 10. Acceleration Limlts Defined by Compressor
Ar) St all
-UtoffNet accerati T0/6
Cornpressor oorrected aitflow Total torque (for saa iee. STO day)
A LUghtoff Fe..() Fire out Fire ' onTO
0- B
Acceleration I C Weretorque T i • torque - acceleration torque * parascs
i.-I I -",.. .TO--,0 _ TO., + TOam_
) . Fritin purngs. widae etcC Corrected rotor speed
Figure 11. Internal Influences Incorporated WithinCorrected rotor speed Control Schedules
Figure 9. Compressor Fire-on Line Relates to corrected high compresscr rotor speed, N2C2, andAcceleration Rate represents total engine power which includes net
measurable acceleration torque and that absorbed. For any given rotor speed, fuel flow can, of course, internally within the engine for friction, pumps.
be increased to the point that the compressor will windage, etc. This relationship has workedstall, as shown on Figure 10. At this point on the successfully at ambient temperatures ranging fromcomprassor map, there is a corresponding point of -40 F (°C) to over 125 F (52°).maximum acceleration torque that represents in
physical terms the aerodynamic capacity of the To construct the physical acceleration characteristicsengine. These relationships circumvent any variations of the engine, the Tq/8 schedule is uncorrected byof combustor efficiency due to fuel grade or internal the following relationships:engine temperatures, such as a hot engine starting ona -old day. N2 - N2C2 l,,
Tq-Tq/8 - 8The FADEC on Pratt & Whitney's F100 family ofengines has boon using this technique successfully As part of the overall acceleration rate of the engine.for years. The actual allowable level of acceleration the starter cranking characteristics are alsotorque for any engine model is programmed into the programmed as a function of ambient temperaturecontro as Torque/6 ana represents me maximum and pressure altitude (elevation) to represent thedesirable aerodynamic torque available for a start at starter's contribution to acceleration. Further, thea given temperature, such as that shown on Figure aircraft accessory loads extracted from the engine11. Corrected torque In terms of Tqo8 Is used against are also Included as shown on Figure 12. The
t- * - - -

12-6
combination of these three major variables comprises closed-loop function descilbed mathematically withinthe torque available for acceleration and becomes the the programming of the FADEC.' This capability Is
actual requested parameter that continuously changes useful when different types of fuel are used, such aswith ambient temperature ,ad ores.sure conditions. JP-4 and JP-5, espccially when fuel type adjustment
ster ouMW on the fuel control is not available. While the fuelAircrt -e& scheduling used for the two starts will be different, the
Net" , w'Jrg acceleration rates will be virtually identical togetheri sts- off with Identical compressor stall margin consumption.
AlrtTO -ft Consequently, as ambient temperature decreases tosVf-~t~~ -0f sub-zero levels, engine acceleration Is not altered
Efrom the desired, automatically-programmed values.t re t Ma"Ifue Since fuel flow is continuously-adjusted rather than
aCetIon pre-programmed, the control system adjusts fuel flowto meet the desired start characteristics as Influentialvariables change.
N LMTIC DEMONSIRjTOS~N,Figure 12. External Influences Dehne Net Acceleration As mentioned above, all of the F100 family of engines
Capability currently In production Incorporate the closed-loop
control mode which has eliminated the difficulties
The control calculates the desired net acceleration normally encountered during sub-zero starting. Thistorque from these three variables (including engine was successfully demonstrated during climatic testing
parasitic drag) on a continuing basis as a function of of an F100-PW-220 in the Climatic Hangar at Elgin
N2, Figure 13. Rate of change of N2 with time is Air Force Base in Florida. The entire aircraft was
sensed by the control and converted to a torque installed within the hangar and tested under
value by way of compressor/turbine moment of teiperature extremes of -101F to - 401: using JP-4Inertia. This actual torque is compared to the and JP-8 fuels, Each cold test was preceded by at
requested value to provide an error which Is used to least a 10 hour soak at the specified temperature.
set the value of fuel flow increase via a gain. The Tie soak time was begun after critical aircraft
end result Is a control system that delivers only the gearbox and engine oil temperatures had reached
fuel flow required to produce the desired aerodynamic ambient temperature. The resulting start times are
acceleration of an engine rather than scheduling fuel shown on Figure 14 which demonstrate that the
flow on an open-loop basis and obtaining an potential sta; time of an engine is actually faster
acceleration rate that can vary slgnifcantly with instead of becoming longer as ambient temperature is
uncontrollable influential variables. With the exception lowered.
of the Initial portion of the start during which theengine is accelerating on open-loop igniti'n fuel flow, 1. United States Patent No. 4,274,255 and Foreign
the acceleration times to Idle are virtually identical for Patents, R. R. Pollak, "Control For Startup of a Gasall engines. Any fuel control hardwaru tolerances are Turbine Engine," Assignee: United Technologies
automatically eliminated since fuel flow is a Corporation. Hartford Conn.
8
NS - ~ z TO/, To.,
En or Fuel flow
+ (Re(uest)A-N2 _,H TOW
T. - TOM .,
Figure 13. Starting Components Assembled to Control Fuel Flow
- :.:: .......
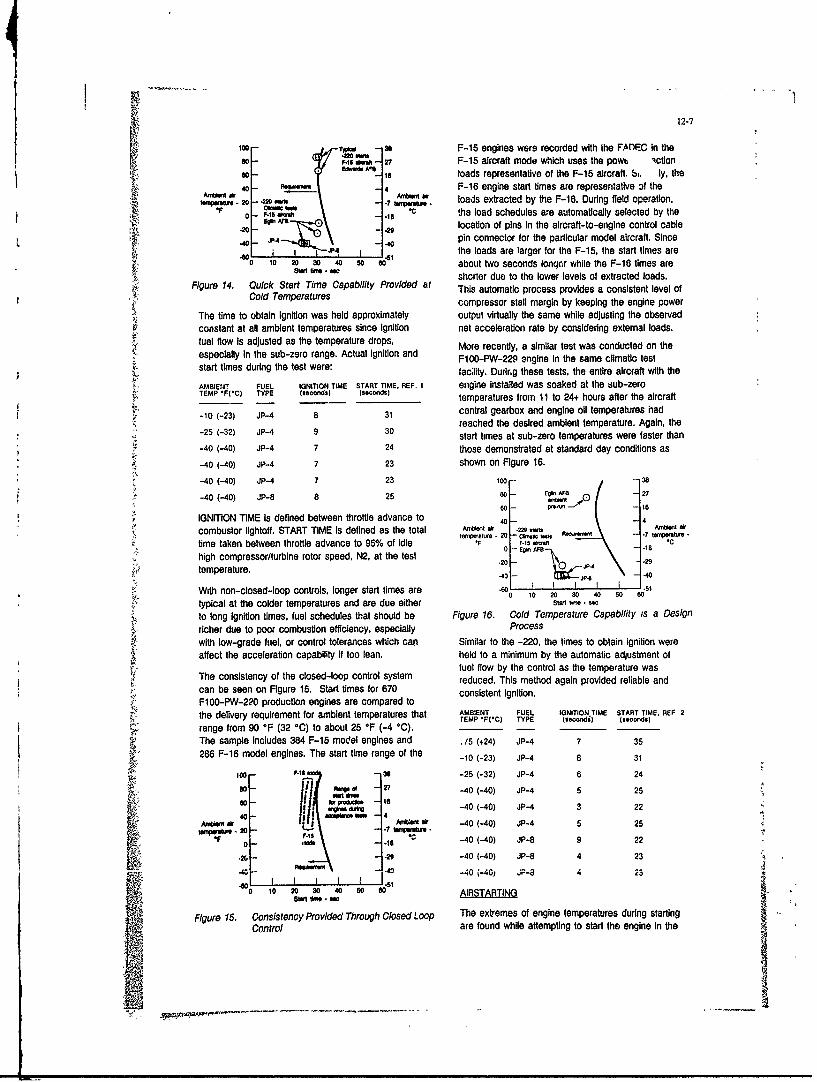
12-7
10o -, F-15 engines were recorded with the FADEC in the110 - .I5 ftA-2 F-15 aircraft mode w.hich uses the powt iction
so 1, loads representative of the F-15 aircraft. S. ly, the40 - 4 F-16 engine start times are representative of the
S2 - @w " loads extracted by the F-16. During field operation,,F od --- the load schedules ae automatically selected by the
2M location of pins In the aircraft-to-engine control cable
-4 .-- pin connector for the particular model aircraft. Since
o60 the loads are larger for the F-15, the start times areVo 1 o 2 s0 4o sos about two seconds longor while the F-16 times are
shorter due to the lower levels of extracted loads.- Figure 14. Quick Start Time Capability Provided at This automatic process provides a consistent level of
Cold Temperatures compressor stall margin by keeping the engine power
The time to obtain Ignition was held approximately output virtually the same while adjusting the observedconstant at all ambient temperatures since Ignition net acceleration rate by considering external loads.fuel flow Is adjusted as the temperature drops, More recently, a similar test was conducted on theespecially in the sub-zero range. Actual ignition and Fo-Pn-22 engine in the same climatic testF0P2start times during the test were:s d tfac;lty. During these tests, the entire aircraft with the
AMBIENT FUEL IGNITION TIME START TIME. REF. I engine installed was soaked at the sub-zeroTEMP *F(°C) TYPE Iseconds ) secon~ds temperatures from II to 24+ hours after the aircraft
-10 (-231 JP-4 a 31 central gearbox and engine oil temperatures hadreached the desired ambient temperature. Again, the
-25 (-32) JP-4 9 30 start times at sub-zero temperatures were faster than
-40 (-40) JP-4 7 24 those demonstrated at standard day conditions as
-40 (-40) JP-4 7 23 shown on Figure 16.
-40 (-40) JP-4 7 23 100 - - 38
-40 (-40) JP-8 8 25 so - Egin AFS - 27
IGNITION TIME is defined between throttle advance to 40 - 4combustor Iightoff. START TIME is defined as the total a, s Qa
time taken between throttle advance to 95% of idle " 0 F-15 I 18
high compressor/turbine rotor speed, N2, at the test .20 " - .29
temperature. .4D -- ,0+ -40
With non-closed-loop controls, longer start times are t0 20 30 4 50 o
typical at the colder temperatures and are due either star t,, oto long Ignition times, fuel schedules that should be Figure 16. Cold Temperature Capability is a Design
richer due to poor combustion efficiency, especially Process
with low-grade fuel, or control tolerances which can Similar to the -220. the times to obtain ignition wereaffect the acceleration capability If too lean. held to a minimum by the automatic adjustment ofTe cfuel flow by the control as the temperature was
consistency reduced. This method again provided reliable andcan be seen on Figure 15. Start times for 670 consistent ignition.F100-PW-220 production engines are compared tothe delivery requirement for ambient temperatures that AMBIENT FUEL IGNiTIONTIME START TIME. REF 2
range from 90 *F (32 °C) to about 25 °F (-4 °C). E
The sample Includes 384 F-15 model engines and ./5 (+24) JP-4 7 35
286 F-16 model engines. The start time range of the -10 (-23) JP-4 8 31
1OD F-I 30 -25 (-32) JP-4 6 24
Do Rs of - 27 -40 (-40) JP-4 5 25
Or" 1A -40 (-40) JP-4 3 2240 usin s - 4 "
Ambtet ATr -40 (-40) JP-4 5 25i. .-20 - L_; .r
-i Ic -40 (-40) JP-8 9 22
.2f -, -. 29 -40 (-40) JP-8 4 23
-40 (-40) JF_8 4 23200 30 .0 O "
0 10 20 30 40 50 go ~ AIRSTARTINGSin ino -sw
Figure 15. Consistency Provided Through Closed Loop The extremes of engine temperatures during startingControl are found while attempting to start the engine In the

12-8
air. Depending on the requirements specified by the significantly longer and converts into lost altitude for acustomer, procedures can be significantly different single engine application. Obviously, If the shutdownfrom one application to another. event occurs at a low altitude, recovery time Is, critical.In multi-engine aircraft applications, the classical
windmill airstart may be tne desired procedure since, The same technique used during ground starts thatfor the most part, the time factor for restarting the delineates cold vs hot engine conditions is used inengine may not be critical. Further. dpssigning for a the air Fuel flows for Ignition are shown on Figure 18single procedure offers simplicity and minimizes as a typical schedule that accommodates hot enginedevelopment costs. conditions at altitude. The schedule uses FTIT as the
engine temperature parameter to delineate internalIn such cases, the engine Is usually In a cold gaspath conditions prior to start initiation. Note that atcondition due to the relativety long engine-out time at thupesclofemrarsulfosaethe upper scale of temperatures, fuel flows aresub-zero engine inlet temperatures. Under these scheduled lean to provide stall-free ignition, ,hile atconditions, fuel flows to obtain quick, consistent the colder, sub-zero temperatures that representIgn!tion together with a fuel schedule to provide windmill conditions, high fuel flows similar to grcundadequate acceleration can be designed without too starting on cold days are used, Th! -nethod ofmuch difficulty. In some cases a single fuel flow for scheduling fuel flows provides the capability of startinglightoff together with a single acceleration schedule, under any set of engine conditions from colde.g. WI/Pb, can suffice for all windmill airstart grequremnts Asmenione abveat oldwindmills to extremely hot, quick restarts.requirements. As mentioned above, at cold
temperatures, starting requirements may be met onlyby rich fuel flow scheduling for both ignition andacceleration. As such, the predescribed procedure - -must be adhered to in detail to restart the engine _ _ _ _during an In-flight shutdown. Should the engine be [--
hot, however, the windmill-designed fuel schedulingwill usually be too rich and precipitate compressor
stalls. I. .
Requirements for today's generation of military fighter T o 0 2W M 1 Iwo ,700aircraft usually require the engine to be started shortly FM ho* I. ( rw W -,,°'o 5 7,after the shutdown. Under many conditions for Figure 18. Engine Gaspath Temperature Provides Full
starting, the internally-measured gaspath temperature Lightoff Capablitymay be 1300 °F (700 °C) or more at the time arestart is desired. Airstarts attempted under these hot The fuel required during acceleration with a hot
conditions with fuel scheduling designed to produce engine Is likewise reduced from that of a windmill. If a
acceptable windmill recoveries usually stall the schedule is designed to provide stall-free accelerationcompressor. It Is clear, then, an alternative approach with a hot engine, It is likely to be Insufficient tois desirable. orovide acceleration while in a windmill condition. This
is especially true with more viscous fuels such asDuring combat when a military alrcraft engine is shut JP-8 or JP-5.down for any reason, survivability requirements Using the same closed-loop control techniques duringdemand obtaining operational thrust as soon as airstartirg as is used during ground starting, both hotpossib a. This requirement is certainly amplified In the and cold engine restart capatilitles are achievable.case o.1 a single engine aircraft application whether in An acceleration characteristic that Is acceptable forcombat or not. A typical comparison of restart times restarting hot engines is available for windmill as well.for a windmi.ll and a quic!l restart, or spooldown With the Ignition fuel flow design to provide quickrestart, is shown on FRiuc 17 ThA amount or time lightoff at any temperature, both spooldown andrequired to perform a windmill start is ,.Yays windmill restarts er, always available to the customer
for any application without concern for unique,mandatory procedures.
A&F/ If the acceleration torque schedules are designed forthe hot engine condition, the pre-programmed safe
N ,acceleration rates and necessary fuel flows will bedelivered to the control to provide successful restartsfor both temperature conditions, and with known,repealable start timo at a giean fiighit condition.
The accuracy of the closed-loop control provides notFigre7. podow r,1 only consistent airstart characteristics, but a larger
Figure 17. Spooldown Reduces Engine-Out Time airstart envelope. This Includes hot as well as coldt,
/.,
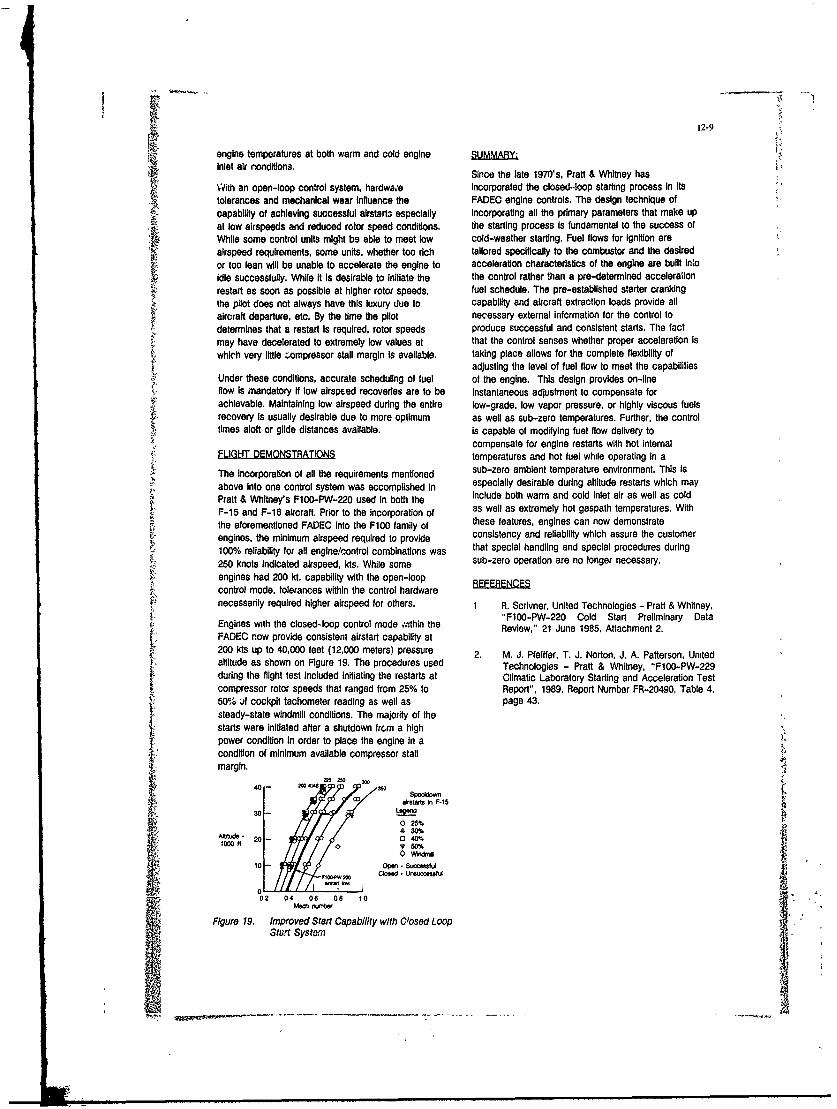
12-9
engine temperatures at both warm and cold engine S MARYInlet air nonditions.t
Since the late 1970's, Pratt & Whitney hasWith an open-loop control system, hardwae incorporated the closed-loop starting process In itstolerances and mechanical wear Influence the FADEC engine controls. The design technique of
P4 capability of achieving successful airstarta especially incorporating all the primary parameters that make upat low airspeeds and reduced rotor speed conditions, the starting process Is fundamental to the success ofWhile some control units might be able to meet low cold-weather starting. Fuel flows for Ignition areairspeed requirements, some units, whether too rich tailored specifically to the combustor and the desiredor too lean will be unable to accelerate the engine to acceleration characteristics of the engine are built intoidle successfully. While it Is desirable to Initiate the the control rather than a pre-determined accelerationrestart as soon as possible at higher rotor speeds, fuel schedule. The pre-established starter crankingthe pilot does not always have this luxury due to capability and aircraft extraction loads provide allaircraft departure, etc. By the time the pilot necessary external information for the control todetermines that a restart Is required, rotor speeds produce successful and consistent starts. The factmay have decelerated to extremely low values at that the control senses whether proper acceleration Iswhich very little ,ompressor stall margin Is available, taking place allows for the complete flexibility of
adjusting the level of fuel flow to meet the capabilitiesUnder these conditions, accurate scheduling of fuel of the engine. This design provides on-lineflow Is mandatory if low airspeed recoveries are to be instantaneous adjustment to compensate forachievable. Maintaining low airspeed during the entire low-grade. low vapor pressure, or highly viscous fuelsrecovery Is usually desirable due to more optimum as well as sub-zero temperatures. Further, the controltimes aloft or glide distances available. Is capable of modifying fuel flow delivery to
compensate for engine restarts with hot internalFLIGHT DEMONSTRATIONS temperatures and hot fuel while operating in aThe incorporation of all the requirements mentioned sub-zero ambient temperature environment. This Isabove Into one control system was accomplished in especially desirable during altitude restarts which mayPratt & Whitney's F100-PW-220 used in both the include both warm and cold inlet air as well as cold
F-15 and F-16 aircraft, Prior to the incorporation of as well as extremely hot gaspath temperatures. Withthe aforementioned FADEC Into the F100 family of these features, engines can now demonstrateengines, the minimum airspeed required to provide consistency and reliability which assure the customer100% reliability for all engine/control combinations was that special handling and special procedures during
250 knots indicated airspeed, kts. While some sub-zero operation are no longer necessary.V- engines had 200 kt. capability with the open-loop
control mode, tolerances within the control hardwarenecessarily required higher airspeed for others. 1 R. Scrivner, United Technologies - Pratt & Whitney,
"F100-PW-220 Cold Start Preliminary DataEngines with the closed-loop control mode ivithin the Review," 21 June 1985, Attachment 2.FADEC now provide consistent airstart capability at200 kts up to 40,000 feet (12.000 meters) pressure 2. M. J. Pfeiffer, T. J. Norton, J. A. Patterson, Unitedaltitude as shown on Figure 19. The procedures used Technologies - Pratt & Whitney, "F100-PW-229during the flight test Included initiating the restarts at Climatic Laboratory Starting and Acceleration Testcompressor rotor speeds that ranged from 25% to Report", 1989, Report Number FR-20490, Table 4,50% f cockpit tachometer reading as well as page 43.steady-state windmill conditions. The majority of thestarts were initiated after a shutdown from a highpower condition In order to place the engine in acondition of minimum available compressor stallmargin.
2520 2%
0AM " 20 - o 0o 40%,o
10 - Open -I I so&I
cI/ Clow - unsuetu
02 04 06 08 10
Figure 19. Improved Start Capability with Closed Loopstar Systemn

12 -10
Discussion Author:While power extraction does vary from one engine toanother in multiple engine aircraft, the load characteristic
1. K. Piel, BMW-RR Aeroengines programmed into the control represents the worst caseWith reference to figure 19 of the paper, what is the figure of conditions. In that way, actually applied loads will always besteady-state windmill conditions? equal to or less than those used in the control. As such,
compressor stall margin is always maintained at theminimum design value or more, thus maximizing reliability.
Author:The windmill limit is defined as the airspeed required to 3. W. Bouwman, Netherlands MODobtain an N2-rpm of 11.4% Thch speed. This is defined as Is the worst case also used concerning TQ because of nothe guarantee rpm required to perform a windmill airstart. temperature dependence occurring?In most cases starts can and have been performed at lowerrpm. Author:
No temperature bias is included because the effect of coldtemperature is less significant for larger engines than in
2. R. Wibbelsman, GE smaller size engines, such as those used for helicopters.A/C TP, loads can vary dependent on A/C load However, should a situation exist that the parasitics aredistnbution. This makes rate control schemes more difficult, significant at colder temperatures, the variation of theHow do you handle this? characteristic can easily be programmed into the FADEC.
i. .
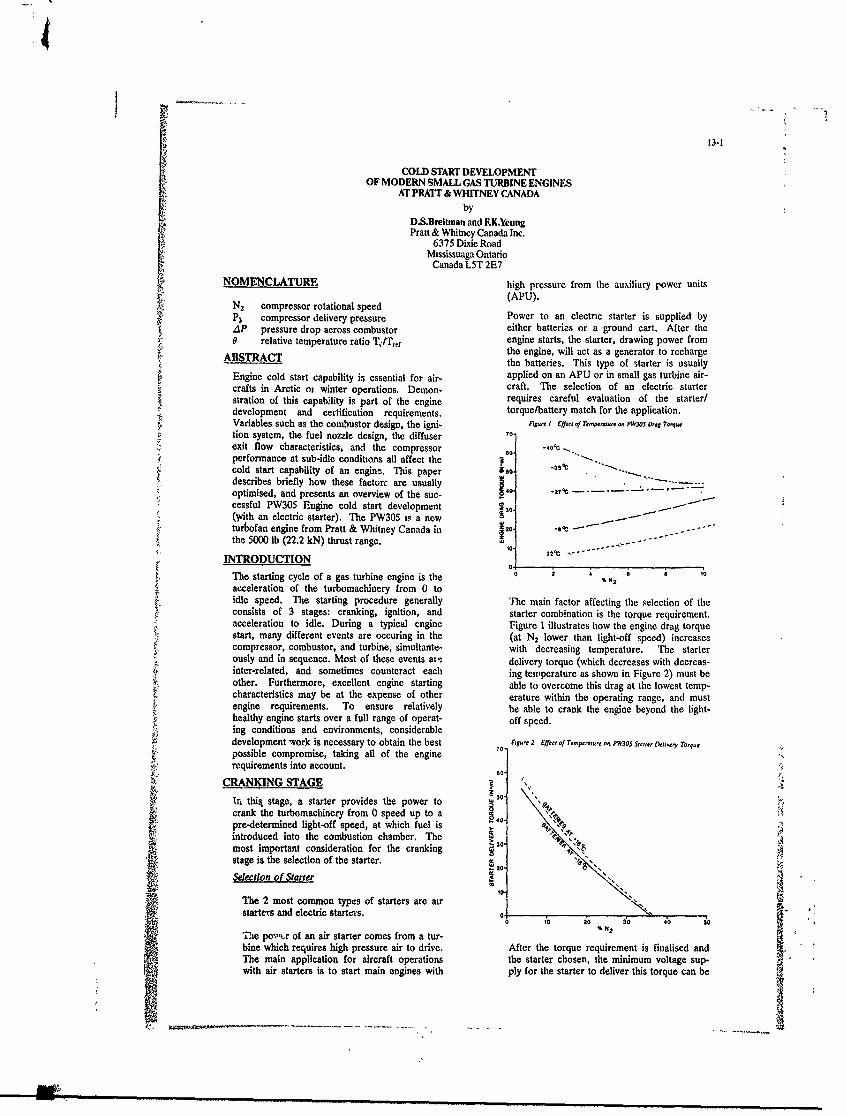
'4
13-1
COLD START DEVELOPMENTOF MODERN SMALL GAS TURBINE ENGINES
AT PRATT & WHITNEY CANADAby
D.S.Breltman and F.K.YeungPratt & Whitney Canada Inc.
6375 Dixie RoadMississuaga Ontario
Canada LST 2E7NOMENCLATURE high pressure from the auxiliary power units
(APU).N2 compressor rotational speedP3 compressor delivery pressure Power to an electric starter is supplied byzIP pressure drop across combustor either batteries or a ground cart. After the0 relative temperature ratio T /Tr, engine starts, the starter, drawing power from
s i ithe engine, will act as a generator to rechargeABSRACT the batteries. This type of starter is usually
eold sapplied on an APU or in small gas turbine air-crafts in Arctic oi winter operations. Demon- craft. The selection of an electric starterstration of this capability is part of the engine requires careful evaluation of the starter/development and certification requirements, torque/battery match for the application.Variables such as the combustor design, the igni- F1s I Cffr of ,, rpwfo D.9 TrorqN.tion system, the fuel nozzle design, the diffuser 70
exit flow characteristics, and the compressor 60 -,performance at sub-idle conditions all affect the a " .
cold start capability of an engina. This paper 5 -s* "describes briefly how these factorc are usually I .... ...optimised, and presents an overview of the suc--"cessful PW305 Engine cold start development 3--
(Vi th an electric starter). The PW305 is a newturbofan engine from Pratt & Whitney Canada in 20 - -gthe 5000 lb (22.2 kN) thrust range. 0 --------.
INTRODUCTION 0..
The starting cycle of a gas turbine engine is the N N,
acceleration of the turbomachinery from 0 toidle speed. The starting procedure generally The main factor affecting the selection of theconsists of 3 stages: cranking, ignition, and starter combination is the torque requirement.acceleration to idle. During a typical engine Figure 1 illustrates how the engine drag torquestart, many different events are occuring in the (at N2 lower than light-off speed) increasescompressor, combustor, and turbine, simultante- with decreasing temperature. The starterously and in sequence. Most of these events ai ' delivery torque (which decreases with decreas-inter-related, and sometimes counteract each ing temperature as shown in Figure 2) must beother. Furthermore, excellent engine starting able to overcome this drag at the lowest temp-characteristics may be at the expense of other erature within the operating range, and mustengine requirements. To ensure relatively be able to crank the engine beyond the light-healthy engine starts over a full range of operat- off speed.ing conditions and environments, considerabledevelopment work is necessary to obtain the best Au,, 2 Effect of Tempeture oo PW303 Start hery Toquepossible compromise, taking all of the enginerequirements into account.
CRANKING STAGETa this stage, a starter provides the power tocrank the turbomachinery from 0 speed up to apre-determined light-off speed, at which fuel is,introduced into the combustion chamber. The 30-kmost important consideration for the cranking -,
stage is the selection of the starter. ' .,
Selection of Starte0t0oThe 2 most common types of starters are air
starters and electric starters. 0! 0 2 N 30
"TAe pov'r of an air starter comes from a tur-bine which requires high pressure air to drive. After the torque requirement is finalised andThe main application for aircraft operations the starter chosen, the minimum voltage sup-with air starters is to start main engines with ply for the starter to deliver this torque can be

13-2
determined from the starter characteristics, not properly atomised because of the low fuelThe batteries must be able to provide this nec- flow. At combustor AP beyond the stability lim-
essary voltage, it the air velocity may be too high for ignition, orfor any initial flame to stabilise. The preference
During development of a typical PWC fan is a wide ignition range, which can provide ade-engine, the power supply was the electrical quate margin to ensure smooth and fast ignitionsimulation of the batteries at the lowest oper- during every start. Obviously, the local flow con-
ating temperature. Only when all parameters ditions at the igniters and fuel nozzles are impor-
affecting starting had been optimised were the tant factors affecting ignition. The optimum
actual batteries tested to confirm the devel- combustor and fuel injector configuration, taking
oped data. all the engine requirements into consideration,must be determined experimentally during devel-opment. The other factors the also affect igni-
IGNITION STAGE tion are:
During cranking, as the engine reaches the light- l)operating temperaturesoff speed, fuel is introduced into the combustion 2) altitudechamber and ignition occurs. Fast ignition is 3)ignition fuel flowdesirable in order to avoid fuel pooling at the 4) ignition systembottom and unburnt fuel accumulation in the 5)fuel nozzle and igniter locationsdown-stream turbine stages. Hence a long time 6)selection of the light-off speedto light will, very likely, cause torching and dam-age to the turbine. Operating temperatures
Prior to full engine starting tests, the ignition Figure 4 illustrates how the ignition range is
range (ie. optimum fuel/air ratios for ignition) of affected with decreasing temperature. At low-
the combustion system has to be determined er temperatures increasing fuel viscosity
thr ugh-out the operating range of the engine, adversely affects fuel atomisation. To com-
including the lowest operating temperature and pensate, higher fuel flow is necessary to
the most advcrse altitude relight conditions. A ensure successful ignition.
graphical representation of the ignition range isgiven in Figure 3. The upper limit is the fuel-rich
r'-,, 4 Effect of TemPe.a1,,e onM PW3OS lgotna R-g,
401Figure 3" Typical PW305 Ignition Range
4.0• ' o 0-
- TO-400 -- l3.)"to, °.,w- 0 $OND$
\ NO LIGHT 9 20 o - 2,ec
3.o- RIC LIN
- --- ------
2.5- , "
0 20 S00 7i5 14o0
OMU/ co&usOR a (NItt2U1- 2.0./
1.5-
Altitude
0.5COMB0TOR 1A0 200 250 At altitude, a stalled engine will windmill
because of the aircraft's forward speed. This
will cause a Ligh pressure drop ( dP ) acrossthe combtstor. At higher combustor LP's the
limit above which the fuel/air ratio is too high stability limit for ignition is reduced (see Fig-for combustion to occur, or that any initial flame ure 5). A wide ignition stability range iswill be extinguished by fuel. The lower limit io essential at altitude where fast relights arethe fuel-lean limit, below which, either the fuel/ expected over a range of aircraft speeds (ie.air ratio is too low for combustion, or the fuel is windmilling and thus combustor AP).
.- - -'-

13-3
Agure5 rffec of AIntude on PW30 Ignition Range achieved mostly at the expense of igniter dur-3.0- ability. Therefore, the selected igniter box
should have the minimum output energy levelS25 and/or pulse rate required to achieve a re-
o.s- \\ . sonable ignition range at the lowest tempera-\\ ' ture and the highest altitude in the operating
'20 \ >200 envelope.3: M RANGE
,S _ lOR00m RANGE . )Figue6 effect of Exdter Box EneVgy on PY 305 Ignitlon Range ot Attitude
0.3.0-
COMBUSTOR AP 20 \
' 20,
Ignit ion fuel flow 1 5 -The main concern in the fuel system design is ofast ignition and light-around. This is essential
to provide a good circumferential temperaturedistribution following ignition, in order to 0.a 0 S00 100 15;0 200avoid a non-uniform back pressure onto the CO B S O APo (oN IMo 2'compressor, which can force it into stall. COMBUSTOI AP tN/m
2)
After the ignition range is determined for thevarious operating conditions, the starting fuel Although there are usually 2 igniters on anflow for each condition can be selected in con- ergine, regulations specify that the enginejunction with the combustor AP (which is must be able to relight at altitude with I igni-determined by the light-off speed). Bee" tcr only.of the narrower ignition range at cold tenatures and at altitude, the control on the acku- Ate!//oZle and igniter locationsracy of the fuel flow is just as important as theactual amount itself. Otherwise a long time to The locations of the fuel nozzles and the igni-light will result. ters can significantly affect the ignition range
and are determined in relationship to the com-The ignition fuel flow normally consists of a bustor. In additon to ignition, the other con-pre-determined amount of "pilot' fuel (from buster nddtntiniintoteonp siderations are combustion efficiency, combu-the pressure atomisers) and "main' fuel (from stor exit temperature profiles, combustion~~~~the air-blast nozzles), flov, ing simultanteously, ytmdrbltmitanbltisalto
SThis is to facilitate a fast light-around to and access. After their axial locations are
poueauniform temperature for reasonsciteduicte preious secpturi frneaon fixed, the circumferential locations of the pilotcite inthe revous ectonnozzles and igniters have to be decided care-
,Ignition system fly
A pilot nozzle and an igniter must be in theThe ignition system consists of an electrical same proximity for ignition. Two of each arepower supply, an exciter box, and usually 2 required for redundancy. The 2 pilot nozzlesigniters. The electrical power supply comes may be side-by-side, or they may be separated,from the batteries. The main criteria for igni- depending on the following:ter selection are durability, low loss (i.e., the
ability to transmit the energy from the exciter l)air-flow around the fuel nozzle/igniterbox to the igniter tip efficiently), and compat- region, including tbt air swirlability with the combustor. 2)fuel manifold connections, including the
position(s) of the fuel supplyThe choice of exciter boxes is dependent on 3)the intendeu circumferential fuel flow distri-the output energy level and the pulse rate. butionFigure 6 is an illustration that the higher this 4)the intended directions of flame propagationenergy level and/or pulse rate is, the wider the after ignitionignition range becomes. The energy level is amore dominant factor. This is very beneficial Selection of light-offspeedfor low temperature ignition and atitude
relight. However, this performance is The selection of the light-off speed is depen-
V
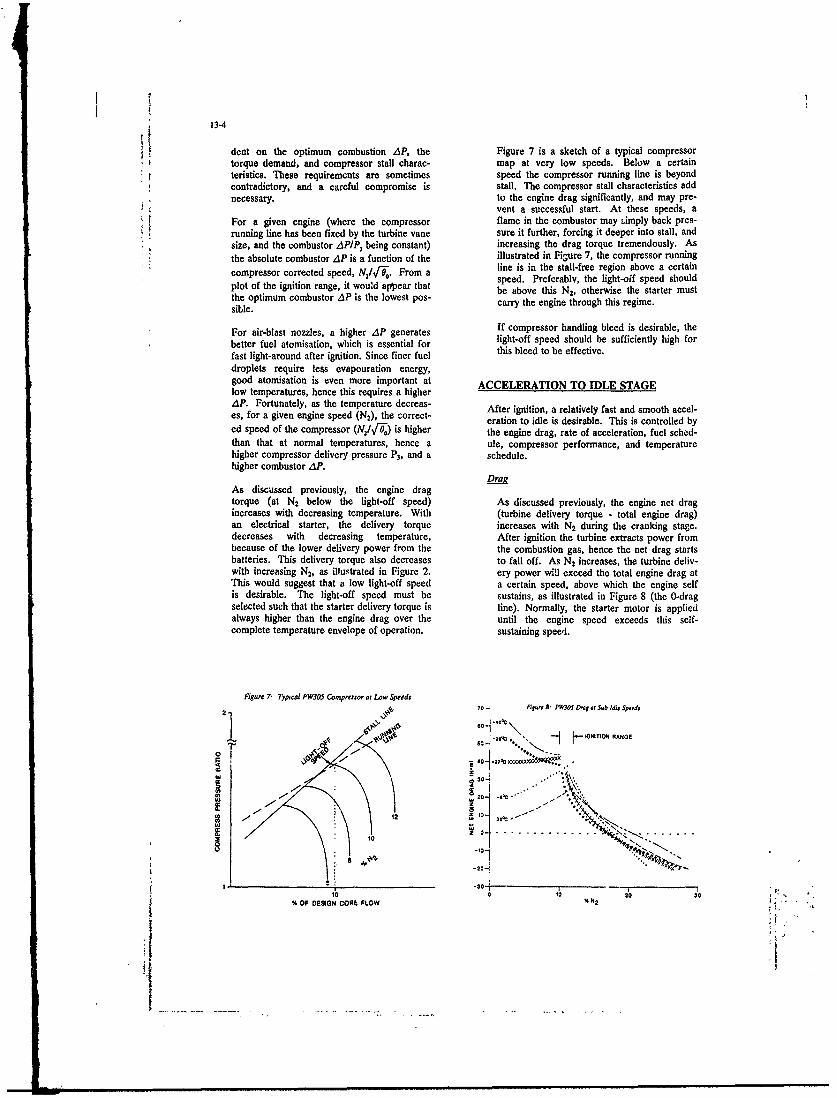
13-4
dent on the optimum combustion AP, the Figure 7 is a sketch of a typical compressortorque demand, and compressor stall charac- map at very low speeds. Below a certainteristics. These requirements are sometimes speed the compressor running line is beyondcontradictory, and a careful compromise is stall. The compressor stall characteristics addnecessary. to the engine drag significantly, and may pre-
vent a successful start. At these speeds, aFor a given engine (where the compressor flame in the combustor may imply back pres-running line has been fixed by the turbine vane sure it further, forcing it deeper into stall, andsize, and the combustor API' , being constant) increasing the drag torque tremendously. As
the absolute combustor AP is a function of the illustrated in Figure 7, the compressor running
compressor corrected speed, N2/I OJ. From a line is in the stall-free region above a certainspeed. Preferably, the light-off speed should
plot of the ignition range, it would appear that be above this N2, otherwise the starter mustthe optimum combustor zP is the lowest pos- carry the engine through this regime.sible.
For air-blast nozzles, a higher AP generates If compressor handling bleed is desirable, the
better fuel atomisation, which is essential for light-off speed should be sufficiently high for
fast light-around after ignition. Since finer fuel this bleed to be effective.
droplets require less evapouration energy,good atomisation is even more important at ACCELERATION TO IDLE STAGElow temperatures, hence this requires a higherAP. Fortunately, as the temperature decreas- After ignition, a relatively fast and smooth accel-es, for a given engine speed (N2), the correct- eration to idle is desirable. This is controlled byed speed of the compressor (N:I/Fo) is higher the engine drag, rate of acceleration, fuel schcd-than that at normal temperatures, hence a ule, compressor performance, and temperaturehigher compressor delivery pressure P3, and a schedule.higher combustor AP.
DragAs discussed previously, the engine dragtorque (at N2 below the light-off speed) As discussed previously, the engine net dragincreases with decreasing temperature. With (turbine delivery torque - total engine drag)an electrical starter, the delivery torque increases with N2 during the cranking stage.decreases with decreasing temperature, After ignition the turbine extracts power frombecause of the lower delivery power from the the combustion gas, hence the net drag startsbatteries. This delivery torque also decreases to fall off. As N, increases, the turbine deliv-with increasing N2, as illustrated in Figure 2. ery power wi!l exceed the total engine drag atThis would suggest that a low light-off speed a certain speed, above which the engine selfis desirable. The light-off speed must be sustains, as illustrated in Figure 8 (the 0-dragselected such that the starter delivery torque is line). Normally, the starter motor is appliedalways higher than the engine drag over the until the engine speed exceeds this self-complete temperature envelope of operation. sustaining speed.
Figure 7- Typial PW305 Compressor at Low Speeds2 4? 701 igure t PW
0$ as Sub Idle Speeds
1040
-27
220-
7 a -.2k ..25- ..
| ' 10) 0 10 210 310 , .
% OF DESON CORE FLOW %N2
m mmmmmmwm , mm m m w ]m
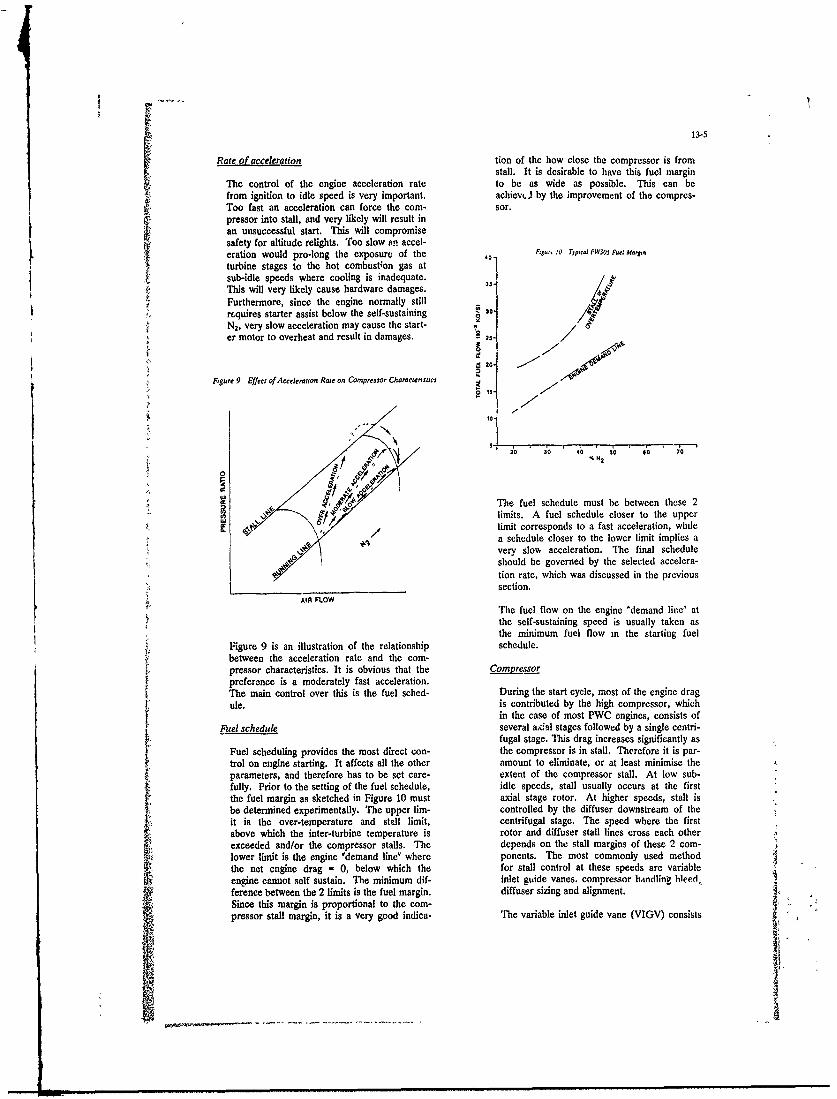
13-5
Rate of acceleration tion of the how close the compressor is fromstall. It is desirable to have this fuel margin
The control of the engine acceleration rate to be as wide as possible. This can befrom ignition to idle speed is very important. achievc,. by the improvement of the compres-Too fast an acceleration can force the corn- sor.pressor into stall, and very likely will result inan unsuccessful start. This will compromisesafety for altitude relights. Too slow on accel-eration would pro-long the exposure of the F0 g. 10 TypI PW3J3 Fetj Md,gturbine stages to the hot combuston gas at
sub-idle speeds where cooling is inadequate.This will very likely cause hardware damages. /.Furthermore, since the engine normally stillrquires starter assist below the self-sustaining .N2, very slow acceleration may cause the start- oer motor to overheat and result in damages. - 25- /Y
0.
Figure 9 Effect of Acceleranon Rate on Compressor Charactenstics
0 .
20 30o 40 so s'o 70NN 25 35 45 55 65"74,/
. ,_ ~fio " Te fuel schedule must be between these 2
W T fl h l u b e e h limits. A fuel schedule closer to the upper,, limit corresponds to a fast acceleration, while
a schedule closer to the lower limit implies avery slow acceleration. The final scheduleshould be governed by the selected accelera-tion rate, which was discussed in the previoussection.
AIR FLOWThe fuel flow on the engine 'demand line" atthe self-sustaining speed is usually taken asthe minimum fuel flow in the starting fuel
Figure 9 is an illustration of the relationship schedule.between the acceleration rate and the com-pressor characteristics. It is obvious that the Com sressorpreference is a moderately fast acceleration.The main control over this is the fuel sched- During the start cycle, most of the engine dragule. is contributed by the high compressor, which
in the case of most PWC engines, consists ofFuel schedule several ax-al stages followed by a single centri-
fugal stage. This drag increases significantly asFuel scheduling provides the most direct con- the compressor is in stall, Therefore it is par-trol on engine starting. It affects all the other amount to eliminate, or at least minimise theparameters, and therefore has to be set care- extent of the compressor stall. At low sub-fully. Prior to the setting of the fuel schedule, idle speeds, stall usually occurs at the firstthe fuel margin as sketched in Figure 10 must axial stage rotor. At higher speeds, stall isbe determined experimentally. The upper lim- controlled by the diffuser downstream of theit is the over-temperature and stall limit, centrifugal stage. The speed where the firstabove which the inter-turbine temperature is rotor and diffuser stall lines cross each otherexceeded and/or the compressor stalls. The depends on the stall margins of these 2 com-lower limit is the engine 'demand line' where ponents. The most commonly used methodthe net engine drag - 0, below which the for stall control at these speeds are variableengine cannot self sustain. The minimum dif- inlet guide vanes. compressor handlin, hleed,ference between the 2 limits is the fuel margin, diffuser sizing and alignment.Since this margin is proportional to the com-
pressor stall margin, it is a very good indica- The variable inlet guide vane (VIGV) consists

13-6
of airfoils set at certain angles upstream of 'he compressor stall. If the 'fuel margin' (dis-
high compressor. Its function is to introduce cussed in the 'Fuel Schedule' section) is very
swirl into the air flow, which delays compres- narrow, a carefully controlled temperature
sor stall at very low *ub-idle speeds. In our schedule can be used to 'navigate' through the
experience, the VIGV alone may not be ade- awkward speed range. This temperaturequate. It :a usually employed in conjunction schedule is usually determined experimentallywith compressor handling bleed at sub-idle during development, and Figure 12 is an illus-
speeds. tration of several schedules that were evaluat-ed during the PW305 development. For amodem PWC fan engine, the start cycle is
The handling bleed is air taken off the com- controlled by a sophisticated electronic enginepresers gas path through bleed slots. The control system (EEC) to follow a temperaturebleed serves as an air flow sink that helps schedule.increase the air flow through the first stages ofthe compressor, and pulls it away from stall.Figure 11 is an illustration how bleed affectsthe compressor stall margin, as indicated bythe fuel margin. For this bleed to be effective, t o-e 12 PWOS Sttog later Turbune Temperaure (74$) Schedule,
the light-off speed should be sufficiently high, - -such that the compressor pressure ranuo at the 09.slot is adequate for air to be bled off. 09 /
// /------
Fngoe 11 Effect ciodletj Bleed-ot PWJOS COMPtstot S11l Malt,,,0/
40-,
35-
- 030; s. 20 0 N, so
7 7"" - -- OTHER CONSIDERATIONS
.......... During PW305 development ,ll the above
parameters were optimised, and successful startsat low temperatures were demonstrated. More
tests were conducted in search of improvements,partly to demonstrate safety, and partly to deter-mine ultimate limits.
F N2 1)More tests at extrmme temperatures, evenbelow the operating range, with alternativefuels and oils. The purpose of this was to
Ile diffuser throat sizing, while having a sig- determine whether the engine starting per-nificint effect on the sub-idle stall margin, has formance could be improved further with Iow-an even greater effect on performance and er viscosity fuel and/or oil.stall margin at full speeds. Since this geom-etry cannot 1,e varied as readily as the VIGV 2)Starts conducted with deteriorated batteries toand the handling bleed, it is decided usually determine the worst conditions these compo-with more consideration given to the full nents could be operated at, without compro-speed performance and stall margin. mising safety.
Temperature schedule 3)Starts demonstrated in the test facilities withwater saturated fuel at the worst icing condi-
To avoid damages to the turbine stages, inter- tions.turbine temperature limit schedule for sub-idlespeeds must be determined. This temperature 4)Alttude relights at extended operating enve-schedule depends mainly on the amount of lope demonstrated in the test facilities. Thiscooling available for the turbine stages. At was later confirmed in flight tests.any given speed, this temperature should besufficiently high for the turbine to extract 5)Successful altitude relights with single igniterenough power for reasonably fast acceleration, and single pilot nozzle beyond the operatingyet low enough to avoid turbine hardware envelcpe demonstrated in the test facilities,damages and/or over-acceleration causiug and later confirmed in flight tests.
-4i°! 13-7
6)Starts with deteriorated engine to simulate the Discussion
hardware conditions after an extended periodof operation. 1. C. Meyer, French MOD
Quelles sont les possibilas en cas de redenarrage avort6sur PW 305? Y-a-t-il des procedures en des precautionsparticulires?
-2 ONCLUDING REMARKS Author:The starting sequence for the PW 305 both on the ground
This has beer a brief description on the major and in the air is as follows.parameters affecting starting, the problems thatusually arise, and the techniques applied during (i) Continuous ignition selected onthe developmont of the PW3OS Engine to over- (ii) Thrust lever angle (TLA) selected to idle position
come these problems systematically. Part of this (iii) Starter motor switch on
experience may be readily applied to other small As the engine accelerates through 10% N2 (high pressuregas turbine engines with an electric starter, rotational speed), the electronic engine controlIlowever, each engine is designed for its own automatically introduces fuel. Since the igniters are alreadyunique application, and hence some of the prob- on, ignition takes place and the control accelerates thelems may require considerations on an individual engine to idle.basis. In the event of an aborted start, at altitude, windmillng will
scavenge pooled fuel and the process (i-ifi) is repeated. Onthe ground a motonng cycle must be earned out to ensurescavenging of excess fuel. Then the start procedure isrepeated.
ACKNOWLEDGEMENT This procedure is repeated until a start is successful or it isfelt that further investigation of the situation is necessary
The authors would like to thank Pratt & Whit- (burnt out igniter plugs, plugged fuel nozzles., etc)ney Canada Inc. for the permission to publishthis data, and to express special appreciation to 2. P. Sabla, GEAEMr. Alan Wheatley (of the PWC Coinblistion Curve nr. 3 shows delta p off by a factor of 10?Dept.) and the test crew at the NationalResearch Council for their support during the Author:cold start development. This is in fact incorrect, scale should read 0-2500.
[-i
4F
14-1
Design Considerationsbased upon
Low Temperature Starting Tests on MilitaryAircraft Turbo Engines
byH.-F. Feig
Wehrtechnische Dienstetelle fur Luftfahrzeuge (WTD 61)Flugplatz, 8072 Manching, Germany
SUMMARY
Test experience on engine low temperature starting was obtained in the course of
multinational and national trials to assess weapon system performance.
The objective of the trials was to recommend a clearance for the weapon system.
In order to carry out these tests adequately the operational role of the weapon*2 system had to be considered and the operational limits of the engines and associated
systems had to be known.
Parameters influencing low temperature start capabilities were reviewed andexperience gained from the tests was discussed.
1. INTRODUCTION
Engine start is an Interaction of various systems. Consequently, not only theengine has to be considered - of equal importance are the starting system and thecapability of monitoring the start pe=cess.
~The evidence that the solution provided by the contractor complied with therequirements of the Services had to be demonstrated by official tests.
Conclusions resulting from these tests are summarized in a recommendation statingthe extent to which the weapon system can be operated by the Services.
The assessment of low temperature start performance represents a specific andvery important field In the overall testing of the weapon system, since lowtemperature engine starting has a considerable effect on the value of the weaponsystem.
a) The objective of the low temperature engine start test has to be an assessment ofwhether the technical solution meets the requirements of the Services. Thisofficial task can be defined in more detail as follows:
- checking of the engine and engine starting system standards with regard to
performance and characteristics required by the specifications
- checking the validity and applicability of the operating instructions
- assessment of the weapon system start up activity from the military operationalpoint of view
- gathering of Information for checking and validating the national weapon systemand engine documentation
- recommending a clearance for Service use.
b) The mission for which the weapon system was designed together with resultingperformance aspects must be considered with regard to their Influence on the testprogramme.
In order to meet operational requirements, each weapon system design - Includingengine design and starting system design - comprises many technical featureswhich together contribute to a satisfactory weapon system operation. Knowledge ofthis features is required for the assessment of low temperature engine startcapabilities. This information has to be obtained from specifications and designdocuments and from development test experience available from airframe, engineand system manufacturers.
c) Operational limits, which must not be exceeded, togehter with proper Interactionof the systems Involved, form the technical basis for the assessment of the testresults.
:1K

4
14-2
2., MILITARY SYSTEMS ENVIRONMENTAL REQUIREMENTS
During the weapon system definition phase environmental requirements andsystem capabilities were established.,
Guidelines for the selection of requirements and the scope of testingnecessary are provided by:
- NATO STANDARDISATION AGREEMENTS (STANAG)- MILITARY STANDARDS- MILITARY SPECIFICATIONS
List 1 shows an abstract of current documentation relevant to definitionand evaluation of system capabilities.
3. TEST ENVIRONMENT
3.1 CLIMATIC CHAMBER TESTTNG
In order to achieve Independence from natural meteorological influences,environment simulation is used. In many cases the environmental systemsof test chambers are not capable of delivering the airflow demand of theengine.Therefore, during start up, outside air is mixed Into the test chamber.In general, outside air has a higher temperature and a higher totalamount of humidity than the air of the test chamber. This results in adirect fall out of humidity and rapid Ice build up on the cold soakedtest object.It must be ensured that the free water content of the air and the Iceaccretion does not result in any interference with the test objective.
3.2 TESTING IN NATURAL ENVIRONMENT
Complete weapon system testing In a natural environment is the approachdesired, sometimes, however, it is the reliability of the weatherforecast that is tested!
As shown In Fig: 1, a typical temperature survey of a 94-hour cold starttest conducted at WTD 61 airfield during winter 1985 is provided.The lowest temperature reached was -211C and the highest temperatureobserved -91C. Fluctuation of temperature is remarkable in the course ofa day.
In order to give an impression of the cool down capability of the naturalenvironment, the frequency distribution of the teiperature survey isshown in Fig: 2. The reference soak temperature achieved on aircraftduring this test was -141C.
3.3 COLD SOAK EFFECTIVENESS
A so called "Pull Cold Soak" Is only completed when all systems affectedduring the test are cooled down to the same level of temperature.Bec.ause of the unequal mass concentration on weapon systems long soakperiods were required in order to obtain a balanced temperature.A proper test instrumentation must be Installed In order to measuresystem temperatures.
4. INFLUENCES IN ENGINE COLD START CAPABILITIES
4.1 VISCOUS SHEAR EFFECTS
One of the main influences aggravating engine cold start up are viscousshear effects depending on-
4.1.1 TYPE OF OIL
Modern engines and weapon system designs demand sufficient lubricity andthermal stability under bigh operating temperaturc .
14-3
The following oils are used in modern German mil~tary systems:
0 - 160 according to UK-SpecificatlonDERD 2497/3
and
0 - 156 according to NIL-L-23699 C Amd 1 orDERD 2499/1 Amd 2
These oils are of the 5,5 mms/s Viscosity Class at 100"C.As expressed in Ref: 1, the viscosity of the above mentioned oilsIncreases by a factor of 150 when the temperature is lowered from +15*Cto -40"C. This increase in viscosity is the main driver in system dragIncrease.
The use of oils with a lower base viscosity,which are more suitable forcold operations, is discarded due to the climatic conditions prevalent inCentral Europe and because of logistic reasons as:
- restrictions in oil types- abandonment of oil changing activities necessary for a very shortperiod of the year only.
4.1.2 SYSTEM DESIGN
Geartrains and bearings cause the highest portion in start up drag.
A reduction can be achieved by:
4.1.2.1 SEPARATION:
Reducing the number of components operated during cold start up by:
- multi-spool engine design- use of clutches and freewheels.
4.1.2.2 DELOADING:
- Engine oil pump deloading during start phase- Accessory hydraulic pump deloading during start phaae
4.1.2.3 MINIMIZATION OF GEARTRAIN LOSSES BY
- stacked design of accessories such as fuel and oilpumps- avoidance of niches and depots where oil can behidden
- dry sump oil system design and shielding of the geartrain in order toreduce churning losses.
4.1.2.4 ROTOR DRAG REDUCTION
Appropriate clearances/materlal contraction rates need to bc provided inorder to avoid brushing or blocking of the rotor.In order to reduce the rotational moment of inertia, separation has to beconsidered by:
- multi-spool engine design- use of clutches and freewheels.
In order to reduce the torque demand of the compressor, deloading by uneof Inlet guide vanes/bleed valves should be considered.
4.2 FUEL AND AIR MANAGEMENT
%latching of all components under consideration of various Influences mustbe ensured In order to enable a reliable light up of the engine,As effects are analysed In detail In Ref: 2, Ref: 3 and Ref: 4,indication of the main subjects is considered to be sufficient in thispaper.
4t

~14-4
4.2.1 TYPE OF FUEL
Introduction of the fuel Nato Code P3413PS) with a flamepoint of at least+381C and a destillatlon range of 1301C to 300C as a basic engine fuelfor German Forces instead of Nato Code F40 (JP4) with a flamepoint ofbelow - 20"C and a destillation range of 5O*C to 250"C (Wide cut)aggravated the engine demands in low temperature starting.
4.2.2 SYSTEM DESIGN
Capabilities of cold start up are mainly influenced by
- compressor delivery characteristic- combustor design*- fuel vapouriser-/atomiser- apabilities- number and position of starter jets- start up and acceleration fuel control schedule- number and position of ignitor plugs- ignition energy provided by a ,oaked andloaded battery as power sourc'.
4.3 STARTER ASSISTANCE AND ENGINE RESISTANCE/ASSISTANCE
fhe most important aim of the overall process called engine start Is toenable a reliable and a stable circumferential light up of the combustionchamber.Ref: 5 describes an annular combustion chamber with a wide fuel/airflowoperational range of 10 to 40% of engine speed, for example.
The start window of each Individual engine needs to be met by tailoringthe engine starter characteristic.Fig: 3 shows a typical engine resistance/assistance characteristic with astarter characteristic and Fig: 4 typical different engineresistance/assistance characteristics of various engines in coldoperation.Increasing engine speed leads to higher torque demand on the engine up tothe light up point when combustion takes place and turbine energy startsto assist the engine run up. At higher speed the resistance reaches zeroand a positive torque of the engine commences. The typical speed-torquerelation of an engine starter is a decendIng, linear slope with maximumtorque at zero speed. These characteristics are well known from turbinesand some types of electrical motors.
Starter size and characteristic must meet the requirements made by:
- maximum drag torque of the engine- maximum drag torque of the accessories- start assistance of the engine- load characteristics of the accessories when hydraulic pumps andgenerators are getting on line
- rotational moment of inertia of the engine- rotational moment of inertia of the accessories.
On the basis of the knowledge of the resistance/assistance characteristicand the sum of the rotational moments of all components related to oneshaft (for example the power take off shaft), the required starterassistance can be calculated in order to meet the weapon systemrequirements.Dependent on weapon system task and environmental range,, different startsystems are in use.,
4.3.1 DIRECT MECHANICAL SYSTEMS
Main engine starts are carried out via one or two shaft APUs, reductiondrives, and on some weapon systems by torque convertors.
Decause the APU power output characteristic is dependent on air densityand fuel control characteristic, power output In cold environmentincreases and Is therefore able to cope with the higher demand of powerrequired.

14-5
4.3.2 PNEUMATIC SYSTEMS
4.3.2.1 PRESSURE BOTTLE OPERATED
Provision is made for Impingement operation of the turbine or of thecompressor wheel, or a separate starter motor is provided.These are the systems often used for small engines. Low temperatureperformance can only be ensured, when especially extreme care is taken ofthe water extraction system of the bottle filling compressor.The operating media air is stored under high pressure. Rapid expansionwill not be followed by the humid portion of the air. The resulting freewater can freeze and can create trouble In pressure control valves,control valves and nozzles.
4.3.2.2 APU OR GROUND CART OPERATED
The power available Is substituted by the characteristic mentioned inPara 4.3.1 and an advantage in respect of less run up drag in comparisonto direct mechanical drive systems due to the almost gearless design Isprovided.
4.3.2.3 ELECTRICALLY OPERATED
The ain power source is the aircraft battery. Because of the decreasingpower output in a cold environment, battery-powered systems can onlyfulfil the system requirements when the battery is properly sized andservice usage allowance and charge factor are taken into consideration. Acommon factor for service usage allowance Is 0.8 and for charge 0,9. Inother words, 0,8 times 0,9 - 0,72 , which means a battery of 72%capacity shall be considered for sizing and demonstrating systemperformance.
Because of the limited power available, battery powered starting systems
are commonly used only up to the 1800 KW/15 k Newton engine power class.
4.3.2.4 HYDRAULICALLY OPERATED
A high amount of energy can be stored In hydraulic accumulators andrecalled even In extreme cold environment. The special effort required Isnormally applied only when appropriate utility systems are already onboard and extreme environmental conditions have to be met.
5, ENGINGE STARTING SYSTEM PERFORMANCE ASSESSMENTS
5.1 PNEUMATICALLY AND ELECTRICALLY POWERED
As an denotation of different engine start system capabilities, therespective speed ratios, each calculated from dry crank speed achieved atISA temperature divided by dry crank speed achieved at -151C, are shownIn Fig: 5.
The WILLIAMS WR 2-6 engine Is equipped with a pneumatic starting system.
The KHD T312 and LARZAC 04 engines are equipped with a battery poweredelectrical starting system.
5.2 DIRECT MECHANICALLY POWERED
As shown in Fig: 6 and already described In Ref: 6, the TORNADO aircrafIs equipped with a mechanical secondary power system. For enginestarting, APU or main engine power Is used to operate a torque converter,the turbine section of which is connected to the main engine power takeoff shaft. Cold temperature testing revealed a temperature dependency ofthe torque output as shown in Fig: 7.
The warming up behaviour was Investigated. Fig: 8 shows the warming upcurve for the left hand and right hand gearbox of the secondary powersystem respectively. Temperature Increase at the end of the curve wascaused by torque converter operation.The different warming up behaviour of the gearboxes is mainly cat,ed bythe Integrated oil system of the right hand geairbox and the APU :nen hotreturn oil flow of the APU shortens system warm up.Xt was deterainded from test results that In order to fulfil main engineassistance demand, an oil temperature of at least +30*C was required.
,A . .. -,

14-6
A warming up procedure was created and recommended to the Services.
The influence of viscosity in torque converter output torque waseliminated in the meantime by modification action mainly by Improving thesuction conditions of the scavange oil pump.
6. ENGINE PROTECTION DURING START UP
As much as engine resistance increases and starter assistance is degradedin cold environment, engine assistance has to take over a higher portionIn order to accelerate the engine properly up to idle speed according tothe system requirements. That will result in a higher thermal loadingduring the start phase.In order to protect the engine from thermal overloading specialarrangements were built in.
Typical differences in speed and temperature during start up of an engineunder ISA and cild conditions are shown In Fig: 9 and Fig: 10.
The protection system has to cope with this wide range of engineparameters.In order to safeguard the engine start under extreme environmentalconditions, the following measures were created:
6.1 SCOPE OF PROTECTION
6.1.1 PROTECTION AGAINST TOO LOW STARTER ASSISTANCE
Too low starter assistance can be caused by seizure Inside thetransmission train or degradation of the power source, as:
- exhausted battery- exhausted accumulators or air pressure bottles- flow starvation of the power transmission media,
6.1.2 PROTECTION AGAIN'ST "NO LIGHT UP"
Achieved by minimization of fuel Injected In order to avoidovertemperature and to save starter system energy.
6.1.3 PROTECTION AGAINST HUNGSTART
A hugstart is caused mainly by incomplete light up of the combustionchambLr or low starter assistance.
6.1.4 PROTECTION AGAINST OVERTEMPERATURE
The necessity has already been mentioned in Para 6.
6.1.5 PROTECTION AGAINST INCORRECT RESTARTING
Proper starter engagement and sufficient drainage time have to be ensuredfor consecutive engine starts.
6.2 APPLICATION OF ENGINE PROTECTION SYSTEMS
6.2.1 FIRST GENERATION OF ENGINE PROTECTION DURING START
Manual protection Is given for early developed systems. Speed andtemperature gauges have to be observed by the operating personellaccording to the operating instructions, and high pressure fuel cockopening/closing and starter shut off have to be initiated manually.Because of the slow beginning and very dynamic behtviour at the end, theoutcome of the start, especially in cold operatioi., depens to a greatextent on the skill of the operators.
6.2.2 SECOND GENERATION OF ENGINE PROTECTION DURING START
Combined, automatic and manual protection Is provtded.
Engine start up operation within the limits is enabled by the use of somethreshold values functioning as watchdogs and the assistance of theoperator.
Electronic Control Units of discre-e or integrated technology wore used.

14-7
Some typical threshold values which are logically combined in theElectronic Control Units are explained below:
6.2.2.1 PROTECTION AGAINST TOO LOW STARTER ASSISTANCE
This protection is provided by speed observation at the end of thestarter only acceleration prior to Initial ignition of the engine.Because of the low acceleration customary in cold environment, thethreshold value has to be tailored to these conditions.
For example:
6 seconds after start initiation the engine speed must to be equal orgreater than 8%.
6.2.2.2 PROTECTION AGAINST "NO LIGHT UP"
Such protection is provided by temperature or speed observation of theengine.
6.2.2.2.1 TEMPERATURE OBSERVATION
A temperature threshold value Indicates the begin of the light up of thecombustion chamber.
For example:
12 seconds after start Initiation the exhaust gas temperature must beequal or greater than 150*C.,
6.2.2.2.2 SPEED OBSERVATION
A speed threshold value Indicates the begin of the light up of thecombustion chamber.
For example:
15 seconds after start initiation the engine speed must be equal orgreater than 25%.
6.2.2.3 PROTECTION AGAINST HUNGSTART
This protection is provided by engine accelerat' -nr speed observation.
6.2.2.3.1 ACCELERATION OBSERVATION
An acceleration threshold value indicates a minimum acceleration.
For example:
20 seconds after start initiation and up to Idle speed the accelerationof the engine must be equal or greater than 0,5% per second.
6.2.2.3.2 SPEED OBSERVATION
A speed threshold value indicates the acceleration above a typicalhungstart area.
For example:
20 seconds after start Initiation the engine speed must be equal orgreater than 40%.Im I|.

14-8
6.2.7.4 PROTECTION AGAINST OVERTEMPERATURE
As shown in Fig: 10 the temperature level Is much higher during coldstart up of an engine than during all other starts. Because of the verydynamic nature of the engine parameters during the start up, anovertemperature protection has to be provided.In order to meet stringent acceleration requiromaits, metering of thefuel is scheduled accordingly. This results in a iapid Increase of thegas temperature during start up to a high level.
6.2.2.4.1 PROTECTION AGAINST OVERTEMPERATURE BY TEMPERATURE JBSERVATION
6.2.2 4.1.1 TEMPERATURE LIMIT
A temperature threshold value allowing a safe operating range for startup.
For example:
Engine exhaust terperature must be less than 800*C.
6.2.2 4.1.2 TEMPERATURE/TIME LIMIT
A temperature versus time threshold value Is built InFor example:
Excursions of the exhaust gas temperature up to llOO'C are allowed for 2seconds duration.
6.2.2.4.2 PROTECTION AGAINST OVERTEMPERATURE BY ACTIVE CONTROL
6.2.2.4.2.1 BY TEMPERATURE OBSERVATION
The fuel scheduled to the engine is uneffected up to the maximum allowedgas temperature. When the gas temperature threshold Is reached, thisresults in fuel bypassing In order to limit the gas temperature to themaximum allowed.Because of the lower portion of fuel metered to the engine, accelerationis decreased.
6.2.2.4.2.2 TEMPERATURE OR ACCELERATION CLOSED LOOP CONTROL
An exhaust gas temperature or acceleration schedule versus engine speedIs provided.The fuel is metered according to this schedule dependent on theenvironmental conditions.This method demands the greatest effort, ensuring in this way mostcareful treatment of the engine during starting operation.
6.2.2.5 PROTECTION AGAINST INCORRECT RESTARTING
Threshold values for recycling of a start are built In.
For example:
- For a restart engine speed must be less than 2%.- For a restart temperature must be less than 150C.- Intervals between successive starts must be greater than 2 minutes.
6.2.3 THIRD GENERATION OF ENGINE PROTECTION DURING START
Fully automatic control Is provided. %fter Initiation of the stbrtsequence by the operater or programmed start up, observation andprotection were performed automatically.
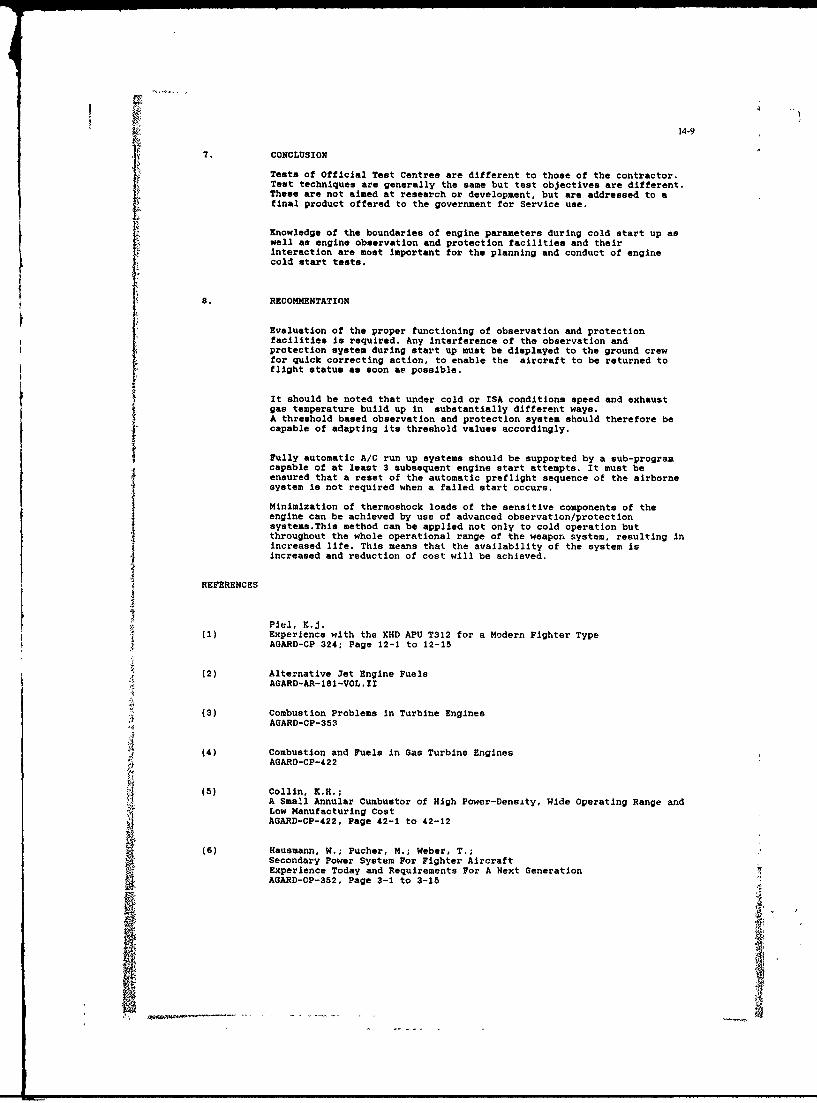
14-9
7. CONCLUSION
Tests of Official Test Centres are different to those of the contractor.Test techniques are generally the same but test objectives are different.These are not aimed at research or development, but are addressed to afinal product offered to the government for Service use.
Knowledge of the boundaries of engine parameters during cold start up aswell as engine observation and protection facilities and theirInteraction are most important for the planning and conduct of enginecold start tests.
8. RECOMMENTATION
Evaluation of the proper functioning of observation and protectionfacilities Is required. Any interference of the observation andprotection system during start up must be displayed to the ground crewfor quick correcting action, to enable the aircraft to be returned toflight status as soon as possible.
It should be noted that under cold or ISA conditions speed and exhaustgas temperature build up in substantially different ways.A threshold based observation and protection system should therefore becapable of adapting its threshold values accordingly.
Fully automatic A/C run up systems should be supported by a sub-programcapable of at least 3 subsequent engine start attempts. It must beensured that a reset of the automatic preflight sequence of the airbornesystem is not required when a failed start occurs.
Minimization of thermoshock loads of the sensitive components of theengine can be achieved by use of advanced observation/protectionsystems.This method can be applied not only to cold operation butthroughout the whole operational range of the weaporn system, resulting inincreased life. This means that the availability of the system isincreased and reduction of cost will be achieved.
REFERENCES
Piel, X.J.(1) Experience with the KHD APU T312 for a Modern Fighter Type
AGARD-CP 324; Page 12-1 to 12-15
(2) Alternative Jet Engine FuelsAOARD-AR-181-VOL.II
(3) Combustion Problems In Turbine EnginesAGARD-CP-353
(4) Combustion and Fuels In Gas Turbine EnginesAGARD-CP-422
(5) Collin, K.H.;A Smafl Annular Cumbustor of High Power-Density, Wide Operating Range andLow Manufacturing CostAGARD-CP-422, Page 42-1 to 42-12
(6) Hausmann, W.; Pucher, M.; Weber, T.;Secondary Power System For Fighter AircraftExperience Today and Requirements For A Next GenerationAGARD-CP-352, Page 3-1 to 3-15 U

14-10
LIST I
DOCUMENTAT.0N TO DEFINE AND EVALUATE SYSTEM CAPABILITIES
STANAG 2895 Extreme Climatic Conditions and Derived Conditions For Use InDefining Design/Test Climatic Conditions For NATO ForcesMateriel
STANAG 3518 Environmental Test Methods for Aircraft Equipment andAssociated Ground Equipment
MIL-STD-210 Climatic Extremes for Military Equipment
MIL-STD-810 Environmental Test Methods And Engineering Guidelines
MIL-E-5007 Engines, Aircraft, Turbojet and Turbofan, GeneralSpecification for
MIL-A-87229 Auxiliary Power System, Airborne
MIL-P-85573 Power Unit, Aircraft, Auxiliary, Gas Turbine, GeneralSpeciflaction for.

14-11
TEMPERATURE IC!0
i -160
-20
HOURS
FIGURE 1 94 HOUR COLD SOAK TESTMANCHING AIRFIELD 11-15.01.1985
TIME (H)20
15-
0-9 -10 -11 -12 -13 -14 -16 -16 -17 -18 -19 -20 -21
TEMPERATURE [C]
FIGURE 2 TEMIPERATURE FREQUENZCY DISTRIB.UTION
w-

14-12
ASSISTANCE
RESISTANCE ENGINE SPEED
-~STARTER CHARACTER. --4- ENG.CHAR.ISA
FTGURE 3 TYPICAL ENGINE RESISTANCE/ASSISTANCEAND STARTER CHARACTERISTIC
ASSISTANCE
RESISTANCE ENGINE SPEED
-ENG.CHAR.COLO -4- ENG.CHAR COLD - ENG.CHAR COLD
FIGURE 4 TYPICAL ENGINE RESISTANCE/ASSISTANCHCHARACTERISTIC OF DIFFERENT ENGINEDESTGNF IN COLD OPERATION

14-13
CRANCSPEEO RATIO
0le
0.6
0,4...... ......
WILLIAMS WR 2-6 KHD T312 EM LARZAC 04
FIGURE 5 CRANKSPEED RATIO ISA/-15'C
IDG mc
IP
IHP
SECONDARY POWER SYSTEMOF TORADO ARCRAF

T
14-14
TORQUE
HP-SPOOL [RPM]
MODIFIED / WARMED UP -4- UNMODIFIED
FIGURE 7 TORQUE CONVERTER CHARACTERISTIC
TEMPERATURE (Cl
40 F -
30O202
-10
-20r
TIME
- /H Gearbox 4 R/H Gearbox
FIGURE 8 GEARBOX WARMING UP CURVE

14-15
SPEED
TIME
ISA -4- COLD
FIGURE 9 TYPICAL ENGINE STARTSPEED RELATION
TEMPERATURE
TIME
ISA -4-- COLD
FIGURE 10 TYPICAL ENGINE STARTTEMPERATURE RELATION
Lil

Discussion Author:Adequate configuration control has to be obtained, The.1. C. Meyer, French MC D minimum performance is specified and has to beUri probl~me qui se fair gi~nsralemeot en essais de demonstrated. Performance of items of series productionqualification est celui dc la dispersion des performances has to include the production 5catter and has to be above theentre mat~nels d'une maine serie. Prennez vous en coinpte minimum specified. For demonstrating systemcet aspect pour la qualification des capacitds d- de0 5 rrage i performance, for example the battery, the minimumbasse temp~rature? performance required is used.

15-1
CLIMATIC CONSIDERATIONS IN THE LIFE CYCLEMANAGEMENT OF THE CF-18 ENGINE
by
Capt. R.W. CueCanadian Forces
National Defence HeadquartersOttawa, Canada, KIA OK2
Attn: DFTEM 6-3-2
D.E. MuirGasTOPS Ltd.
l011 Polytek StreetOttawa, Canada, K1J 9J3
The Canadian ForceE have developed an Engine Parts Life Tracking System (EPLTS) todefine the scheduled maintenance requirement of CF-18 aircraft engine components. Up to64 components are tracked by this system, 26 of which are life limited on tha basis ofeight different Life Usage Indices defined by the engine manufacturer and evaluatedduring each operational mission by the aircraft's Inflight Engine Condition MonitoringSystem. Data on the rates of component life consumption collected by the EPLTS during afull 12 month time span have been analyzed. The manner and extent to which seasonaleffects might influence these life consumption rates and hence the life cycle managementof the engine are presented and discussed.
NOMENCLATURE
ADF - Aircraft Data File N2 - Compressor Rotor Fpeed
CFB - Canadian Forces Base N2F - Full N2 cycles
CR - Count Rate N2P - Partial N2 Cycles
EFTC - Equivalent Full Thermal Cycles 0CM - On-Condition Maintenance
EPLTS - Engine Parts Life Tracking P3F - Full PS3 CyclesSystem
EOT - Engine Operating Time P3P - Partial PS3 Cycles
ELCF - Equivalent Low Cycle Fatigue PS3 - Compressor Delivery Static Pressure
HPC - High Pressure ,jmpressor PLA - Power Lever Angle
HPT - High Pressure Turbine RS - Relative Severity
IECMS - Inflight Engine Condition SRF - Stress Rupture FactorMonitoring System
IRP - Intermediate Rate4 Power TAMP - Time at Maximum Power
LCF - Low Cycle Fatigue TMT - Turbine Metal Temperature
LCMM - Life Cycle Maintenance Manager T1 - Engine Inlet Temperature
LUI - Life Usage Index tR - Time to Crccp Ruptura
LPT - Low Pressure Turbine Ec - Creep Strain
MDRM - Maintenance Data Recorder de,/dt - Creep Strain Ratemagazine
MOB - Main Operating Base
15-2
INTRODUCTION
The air element of the Canadian Forces operates 124 CF-18 fighter aircraft fromMain Operating Bases located at Cold Lake, Alberta; Bagotville, Quebec; and Baden-Seellingen, West Germany. The operational role of the CF-18 requires that it operateout of bases in various geographical and climatic areas. For the CF-18's Canadiansovereignty and North American Air Defence (NORAD) role, the aircraft operates from farnorth deployments at Inuvik, Yellowknife, Rankin Inlet and Iqaluit, North WestTerritories to training deployments at various bases in the southern U.S. The CanadianForces' NATO commitment has the CF-18 operating out of the European theater. This putsthe CF-18 in an operating environment which ranges from the very cold weather in the farnorth, to the moderate climate of Europe, to the extreme heats of the southern U.S.
The acquisition of the CF-18 bv ..he Canadian Forces has also resulted in a newapproach to fighter engine maintenan a. Whereas previous engines were overhauled on afixed time interval basis, the General Electric F404-GE-400 engine is for the most partmaintained on an "on-condition" basis. In particular, the life usage of critical compo-nents within the engine is continuously evaluated by the aircraft's Inflight EngineCondition Monitoring System (IECMS). A ground-based Engine Parts Life Tracking System(EPLTS) has been developed by the Canadian Forces to record the accumulated life usage,configuration status and maintenance history of these components. The EPLTS also isused to forecast the fallout or removal time for each lifed component based on histori-cal life usage accumulation rates.
This paper describes the CF-18 IECMS and EPLTS and examines the effects that clima-tic variations can have on the rates of F404 component life usage accumulation. Theinfluence of these effects on the life cycle management of the engine are also dis-cussed.
BAhCKROLNIM
The CF-18 aircraft is powered by two General Electric F404-GE-400 engines, a lowbypass, twin-spool turbofan fan engine i,ith mixed flow exhaust and afterburning. TheF404 is the first engine in the Canadian Forces to be maintained under a formal On-Condition Maintenance (OCM) program. Under this program, engine components are replacedor repaired based upon their condition. For the replacement of life limited parts,"scheduled" maintenance is mandatory when the life limit is reached. For the remainingcomponents, "unscheduled" maintenance is performed when an in-service problem hasoccurred cr when degradation is observed. The OCM maintenance concept thereforerequires that an engine condition monitoring capability be developed to monitor andpredict component life usage rates and to provide early warning of progressive enginedeterioration.
To meet these requirements, each CF-18 is equipped with a fully integrated InflightEngine Condition Monitoring System which automatically records data on engine lifeusage, limit exceedances and take-off periormance for post-flight analysis. The IECMSlogic was developed by General Electric and is implemented as software on one of twoaircraft Mission Computers. As the aircraft performs each mission, engine life usage iscontinuously calculated by the IECMS using eight different Life Usage Indices (LUIs)related to the low cycle fatigue, thermal fatigue and creep damage expArienced by theengine components. As such, these LUIs provide a basis for establishing individualcomponent life limits, rather than the general and more conservative life limits appliedto older engines. Table 1 presents a brief description of the CF-18 sngine LUIs.
In addition to various other aircraft mission data, the running sums of each LUIare stored in the Mission Computer memory and are recorded twice per flight to a remov-able Maintenance Data Recorder Magazine (MDRM). The gathering and processing of MDRMdata is accomplished by a network of ground-based processors as illustrated in Figure 1.Each squadron is equipped with a Ground Data Station which stores a copy of the MDRMcontents in an Aircraft Data File (ADF), erases the tape for return to service andprovides hzrd copy reports of specific data records. The ADFs are automatically trans-ferred from each squadron to a central Base Computing Facility and eventually archivedADF for the EPLTS and other engine application programs.
The Engine Parts Life Tracking System is an application program deviloped by theCanadian Forces to process and analyze IECMS life usage data and to aid the maintenancedecision making process of retiring critical engine components from service before theyfail. The EPLTS is a computerized database system which includes a suite of computerprograms for: automated usage data entry, interactive entry of maintenance data, vali-dation of maintenance data by configuration and compatibility checks, and interactivedata retrieval for reporting purpoaes. The piaary component ot the EPLTS is its data-base, which contains the component part numbers, serial numbers, their relationship toother components and the life usage status of each part. The system tracks by serialnumber the location and current accumulated LUIs of 24 life-limited and 40 logisticallycritical components of each F404-GE-400 engine.
,
! !
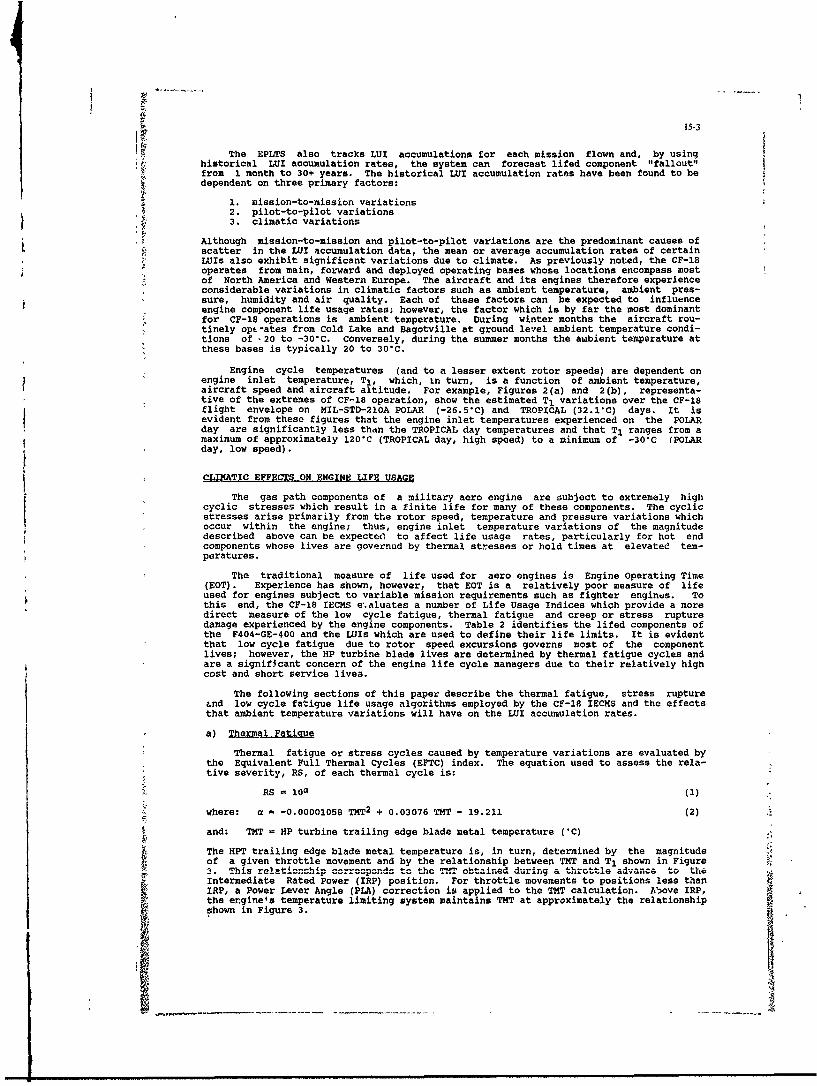
15-3
The EPLTS also tracks LUI accumulations for each mission flown and, by usinghistorical LUI accumulation rates, the system can forecast lifed component "fallout"from 1 month to 30+ years. The historical LUI accumulation rates have been found to bedependent on three primary factors:
1. mission-to-mission variations2. pilot-to-pilot variations3. climatic variations
* Although mission-to-mission and pilot-to-pilot variations are the predominant causes of' scatter in the LUI accumulation data, the mean or average accumulation rates of certain
LUIs also exhibit significant variations due to climate. As previously noted, the CF-18operates from main, forward and deployed operating bases whose locations encompass mostof North America and Western Europe. The aircraft and its engines therefore experienceconsiderable variations in climatic factors such as ambient temperature, ambient pres-sure, humidity and air quality. Each of these factors can be expected to influenceengine component life usage rates; however, the factor which is by far the most dominantfor CF-18 operations is ambient temperature. During winter months the aircraft rou-tinely opf-ates from Cold Lake and Bagotville at ground level ambient temperature condi-tions of -20 to -301C. Conversely, during the summer months the ambient temperature atthese bases is typically 20 to 301C.
Engine cycle temperatures (and to a lesser extent rotor speeds) are dependent onengine inlet temperature, TI, which, in turn, is a function of ambient temperature,aircraft speed and aircraft altitude. For example, Figures 2(a) and 2(b), representa-tive of the extremes of CF-18 operation, show the estimated T1 variations over the CF-18flight envelope on MIL-STD-210A POLAR (-26.5"C) and TROPICAL (32.1"C) days. It isevident from these figures that the engine inlet temperatures experienced on the POLARday are significantly less than the TROPICAL day temperatures and that T1 ranges from amaximum of approximately 120"C (TROPICAL day, high speed) to a minimum of -30"C (POLARday, low speed).
SCNATIC EFFECTS ON ENGINE LIFE USAGE
The gas path components of a military aero engine are subject to extremely highcyclic stresses which result in a finite life for many of these components. The cyclicstresses arise primarily from the rotor speed, temperature and pressure variations whichoccur within the engine; thus, engine inlet temperature variations of the magnitudedescribed above can be expected to affect life usage rates, particularly for hot endcomponents whose lives are governed by thermal stresses or hold times at elevated tem-peratures.
The traditional measure of life used for aero engines is Engine Operating Time(EOT). Experience has shown, however, that EOT is a relatively poor measure of lifeused for engines subject to variable mission requirements such as fighter engines. Tothis end, the CF-18 IECMS e'.aluates a number of Life Usage Indices which provide a moredirect measure of the low cycle fatigue, thermal fatigue and creep or stress rupturedamage experienced by the engine components. Table 2 identifies the lifed components ofthe F404-GE-400 and the LUIs which are used to define their life limits. It is evidentthat low cycle fatigue due to rotor speed excursions governs most of the componentlives; however, the HP turbine blade lives are determined by thermal fatigue cycles andare a signif3cant concern of the engine life cycle managers due to their relatively highcost and short service lives.
The following sections of this paper describe the thermal fatigue, stress rupture&nd low cycle fatigue life usage algorithms employed by the CF-18 IECMS and the effectsthat ambient temperature variations will have on the LUI accumulation rates.
a) Thermal Fatigue
Thermal fatigue or stress cycles caused by temperature variations are evaluated bythe Equivalent Full Thermal Cycles (EFTC) index. The equation used to assess the rela-tive severity, RS, of each thermal cycle is:
RS -10a (1)
where: a - -0.00001058 TMT2 + 0.03076 TNT - 19.211 (2)
and: TMT = HP turbine trailing edge blade metal temperature ('C)
The HPT trailing edge blade metal temperature is, in turn, determined by the magnitudeof a given throttle movement and by the relationship between TMT and T1 shown in Figure3. Thsrelatinship corrcspond to the T1T obtained during a throttle advance to theIntermediate Rated Power (IRP) positio n. For throttle movements to positions less thanIRP, a Power Lever Angle (PLA) correction is applied to the TMT calculation. A'bove IRP,the engine's temperature limiting system maintains TNT at approximately the relationshipshown in Figure 3.

15-4
Table 3 summarizes the relative severity of the HPT thermal cycles as predicted byequations (1) and (2). The extreme sensitivity of the EFTC counts to TNT is clearlyevident. For example, a cycle to TNT - 960"C is over 20 times more severe than a cycleto 840"C. Figures 4 and 5 present the variations of TMr' and EFTC counts with maximumPLA for a single throttle excursion at an altitude of 20,000 ft. and Mech number of 0.8on both POLAR and TROPICAL days. it is evident from these figures that. throttle excur-sions at the warm inlet conditions result in iigher blade metal temperatures and sig-nificantly more EF'C counts than on colder days (in this case, by a faotor of over 3:1).The sensitivity of EFTC counts to the magnitude of the throttle movenent is also appar-ent. The number of counts rises sharply to a maximum or limiting value at approximatelythe IRP throttle position. Beyond this position, hot end temperatures ore limited bythe engine control system as previously noted.
It is evident from Figure 3 that, if the engine's temperature limiting system isfunctioning properly, the maximuA number of EFTC counts for a single throttle excursionis obtained at a T1 of approximately 761C and a TNT of 9461C. From equations (1) and(2), this maximum value is 2.6 counts. considering that the averace number of EFTCcounts for a given mission is roughly 20 and that the maximum number of EFTC counts permission can be as high as 150-200, it is evident that the number of throttle excursionsis the primary determinant of the EFTC accumulation rates.
b) Stress Ruture
Turbine stress rupture or creep damage is caused by prolonged operations at ele-vated cycle temperatures. Creep damage is generally measured by the accumulated ortime-integrated creep strain, cc:
C = f(dec/dt)dt (3)
where the creep strain rate, dec/dt, is assumed constant for a given temperature andstress level. Additionally, the time to creep rupture, tp, is related to the strainrate by:
dec/dt = I/tR (4)
The IECMS Stress Rupture Factor (SRF) algorithm evaluates a count rate, CR, whichis proportional to the creep strain rate using the following dquations:
CR = ea (5)
where: a = -0.0000321 TMT2 + 0.1038 TMT - 78.13 (6)
As in the case of the EFTC counts previously described, the stress rupture count rate isa function of the HP turbine blade trailing edge metal temperature which, in turn, isdetermined by throttle position, engine inlet temperature and altitude. An additionalcorrection is applied to the TMT calculation for SRF if the engine exhaust gas tempera-ture exceeds a reference value.
Table 4 gives the variation of stress rupture count rate with TMT as predicted bytequations (5 and (6). It is evident from this table that the SRC rate is also ex-tremely sensitive to turbine blade metal temperature and is therefore likely to beaffected by ambient temperature variations. For instance, Figure 4 indicates that thevalue of TMT will vary botween 885'C and 925"C from a POLAR to TROPICAL day at PLA =Intermediate, altitude = 20,000 ft. and Mach No. = 0.8. This would result in the SRCrate on a TROPICAL day being over 6 times the POLAR day rate at these flight condi-tions.
c) Low Cycle Fatigue
The CF-18 IECMS evaluates full and partial coinpressor rotor speed, N2 , cycles toassess the low cycle fatigue (LCF) accumulations for many of the engine's rotatingcomponents. The full and partial cycles are defined as follows;
N2 Full (N2F) Cycle: 59-92-59% N2N2 Partial CN2P) Cycle: 76-92-76% N2
where N2 = 59% corresponds to the Ground Idle speed of the engine. The N2F and N2Pcounts are combined by the Engine Parts Life Tracking System to give an Equivalent LCFcount;
ELCF = N2F + K • N2P (7)
where K varies for different components.
The expresaion for ELCF given in equation (7) appears to be based on a linear LCFdamage law, where the value of K is a weighting factor used to assess the damage of apartial cycle relative to a full cycle. Furthermore, since only compressor speed isused to assess LCF, it is implicitly assumed that the fan rotor speed is proportional toN2 and that the effects of temperature on LCF damage to both the high and low pressureturbines is also proportional N2.
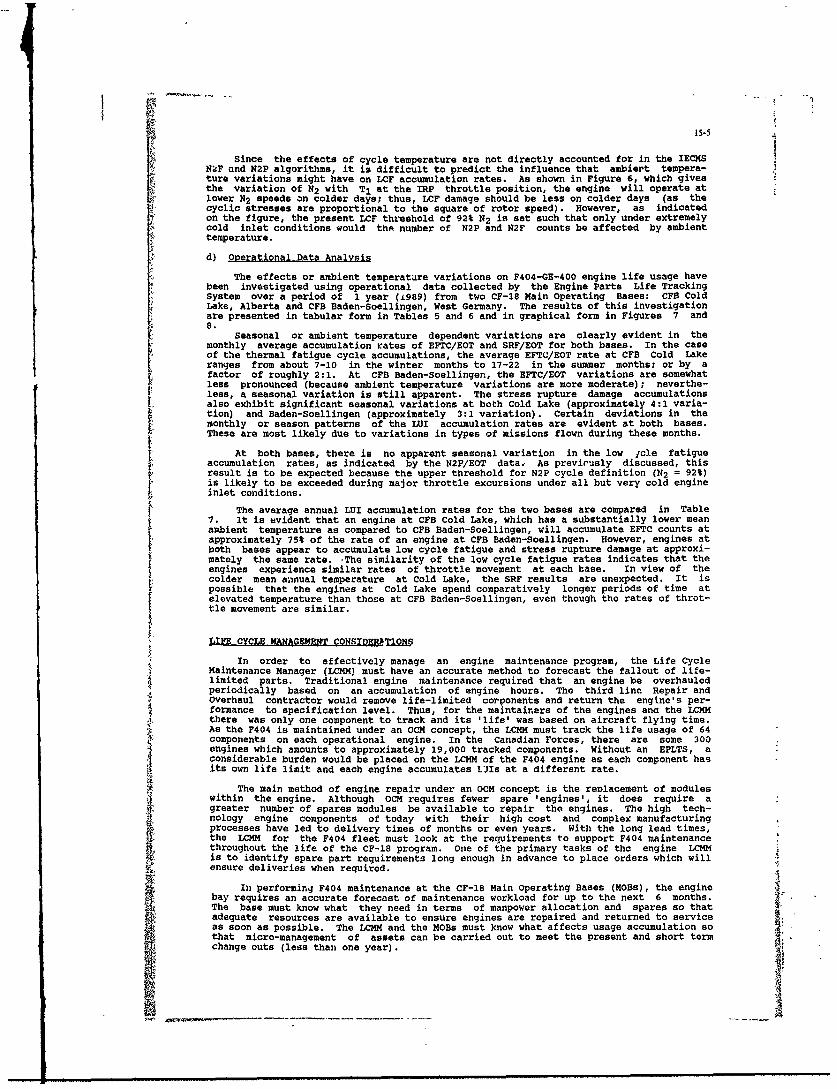
15-5Since the effects of cycle temperature are not directly accounted for in the IECMS
NkF and N2P algorithms, it is difficult to predict the influence that ambiert tempera-ture variations might have on LCF accumulation rates. As shown in Figure 6, which givesthe variation of N2 with T1 at the IRP throttle position, the engine will operate atlower N2 speeds on colder days; thus, LCF damage should be less on colder days (as thecyclic stresses are proportional to the square of rotor speed). However, as indicatedon the figure, the present LCF threshold of 92% N2 is set such that only under extremelycold inlet conditions would the number of N2P and N2F counts be affected by ambienttemperature.
d) oerational Data Analysis
The effects or ambient temperature variations on F404-GE-400 engine life usage havebeen investigated using operational data collected by the Engine Parts Life TrackingSystem over a period of 1 year (±989) from two CF-18 Main Operating Bases: CFB ColdLake, Alberta and CFB Baden-Soellingen, West Germany. The results of this investigationare presented in tabular form in Tables 5 and 6 and in graphical form in Figures 7 and8.
Seasonal or ambient temperature dependent variations are clearly evident in themonthly average accumulation rates of EFTC/EOT and SRF/EOT for both bases. In the caseof the thermal fatigue cycle accumulations, the average EFTC/EOT rate at CFB Cold Lakeranges from about 7-10 in the winter months to 17-22 in the summer months; or by afactor of roughly 2:1. At CFB Baden-Soellingen, the EFTC/EOT variations are somewhatless pronounced (because ambient temperature variations are more moderate); neverthe-less, a seasonal variation is still apparent. The stress rupture damage accumulationsalso exhibit significant seasonal variations at both Cold Lake (approximately 4:1 varia-tion) and Baden-Soellingen (approximately 3:1 variation). Certain deviations in themonthly or season patterns of the LIUI accumulation rates are evident at both bases.These are most likely due to variations in types of missions flown during these months.
At both bases, there is no apparent seasonal variation in the low Icle fatigueaccumulation rates, as indicated by the N2P/EOT data, As previously discussed, thisresult is to be expected because the upper threshold for N2P cycle definition (N2 = 92%)is likely to be exceeded during major throttle excursions under all but very cold engineinlet conditions.
The average annual LUI accumulation rates for the two bases are compared in Table7. it is evident that an engine at CFB Cold Lake, which has a substantially lower meanambient temperature as compared to CFB Baden-Soellingen, will accumulate EFTC counts atapproximately 75% of the rate of an engine at CFB Baden-Soellingen. However, engines atboth bases appear to accumulate low cycle fatigue and stress rupture damage at approxi-mately the same rate. -The similarity of the low cycle fatigue rates indicates that theengines experience similar rates of throttle movement at each base. In view of thecolder mean annual temperature at Cold Lake, the SRF results are unexpected. It ispossible that the engines at Cold Lake spend comparatively longer periods of time atelevated temperature than those at CFB Baden-Soellingen, even though the rates of throt-tle movement are similar.
LIFE CYCLE MAAGEN CONSIDER TI
In order to effectively manage an engine maintenance program, the Life CycleMaintenance Manager (LCMM) must have an accurate method to forecast the fallout of life-limited parts. Traditional engine maintenance required that an engine be overhauledperiodically based on an accumulation of engine hours. The third line Repair andOverhaul contractor would remove life-limited corponents and return the engine's per-formance to specification level. Thus, for the maintainers of the engines and the LCMMthere was only one component to track and its 'life' was based on aircraft flying time.As the F404 is maintained under an OCM concept, the LCMM must track the life usage of 64components on each operational engine. In the Canadian Forces, there are some 300engines which amounts to approximately 19,000 tracked components. Without an EPLTS, aconsiderable burden would be placed on the LCMM of the F404 engine as each component hasits own life limit and each engine accumulates LUIs at a different rate.
The main method of engine repair under an OCM concept is the replacement of moduleswithin the engine. Although OCM requires fewer spare 'engines', it does require agreater number of spares modules be available to repair the engines. The high tech-nology engine components of today with their high cost and complex manufacturingprocesses have led to delivery times of months or even years. With the long lead times,the LCMM for the F404 fleet must look at the requirements to support F404 maintenancethroughout the life of the CF-18 program. One of the primary tasks of the engine LCMMis to identify spare part requirements long enough in advance to place orders which willensure deliveries when required.
In performing F404 maintenance at the CF-18 Main Operating Bases (MOBs), the enginebay requires an accurate forecast of maintenance workload for up to the next 6 months.The base must know what they need in terms of manpower allocation and spares so thatadequate resources are available to ensure engines are repaired and returned to serviceas soon as possible. The LCMM and the MOBs must know what affects usage accumulation sothat micro-management of assets can be carried out to meet the present and short termchange outs (less than one year).
__ _ _ __ _:

15-6
There are presently no components on the F404 which are life-limited in terms ofSRF counts; as such, the only component fallouts which are affected by ambient tempera-ture variations are the High Pressure Turbine blades (lifed by EFTCs). If a base uses amean annual EFTC rate to project their fallout during the warm months, the blades willbe time expired earlier than forecasted. For the MOB, this covld mean an additionalrotor change out per month. If the MOB doesn't have the spares or the manpower avail-able, delays repairing the engines are encountered. The effect on forecasting isopposite when using the mean annual EFTC rate during the cold months. In this case aforecast could show one more rotor change out per month than would actually occur.Although the reduced workload does not impact operations, it does tie up valuableresources which could be used elsewhere.
Over a period of approximately 1 to 2 years, seasonal variations in the LUI accumu-lation rates are no longer apparent in the long term life usage rates for a given base;therefore, for long term planning at a particular base, climatic effects are minimal.However, since aircraft are not routinely rotated from base to base, fleetwide planningfor the procurement of long lead time spares must take into account the base to basevariations in EFTC accumulation rates due to mean annual ambient temperature differ-ences.
MCOLUSION
The predominant climatic factor affecting the life usage of CF-18 engine componentsis the variation of ambient temperatures resulting from aircraft operations ranging fromthe extremes of hot and cold weather experienced in North America to the relativelymoderate climate of Europe. The influence of ambient temperature variations on CF-18engine life usage has been investigated by examining the sensitivity of the life usagealgorithms employed by the aircraft Inflight Engine Condition Monitoring System toengine inlet temperature variations and by the analysis of operational data collected bythe Ck-18 Engine Parts Life Tracking System. The results of these investigations indi-cate the following:
1. Seasonal variations in ambient temperature have a significant effect on the meanmonthly accumulation rates of the IECMS thermal fatigue and stress rupture lifeusage indices. These variations arise from the extreme sensitivity of the IECMSEFTC and SRF algorithms to engine inlet temperature.
2. Ambient temperature variations have little or no effect on the mean monthly accumu-lation rates of low cycle fatigue counts. The full and partial N2 cycles computedby the IECMS do not directly assess the effects of cycle temperature levels on thelow cycle fatigue of engine components. Furthermore, the upper threshold for theN2F and N2P cycle definitions is set at an N2 level which is likely to be exceededduring a major throttle excursion under most engine inlet conditions.,
3. Significant variations in the mean annual rates of thrmal fatigue cycle accumula-tion can be found between operating bases with significant variations in meanannual temperatures.
In the life cycle management of the F404 engine, the LCMM must take into accountthe effects of climatic conditions on LUI accumulation rates in order to ensure theaccuracy of maintenance forecasts. If there is no significant variation between basesin the mean annual ambient temperatuze, then the long term management of the enginefleet is not adversely affected by seasonal changes in LUI rates. In the month to monthmanagement of the F404 fleet, the LCMM and the personnel at the MOBs must take intoaccount the effects of seasonal mean ambient temperature variations on the LUI accumula-tion rates in order to ensure that micro-management of assets can be carried out to meetthe immediate and short term maintenance requirements.
The conclusions of this paper are based on life usage algorithms developed byGeneral Electric. Although the derivation of these algorithms is proprietary informa-tion to General Electric and specific to the F404-GE-400 engine, it is evident thatother engines will also experience thermal fatigue, creep and possibly low cycle fatiguedrage rates which are also sensitive to ambient temperature variations. It is impor-ta.t therefore that the maintenance managers of these engines take into considerationthese climatic effects when forecasting maintenance requirements.
LII
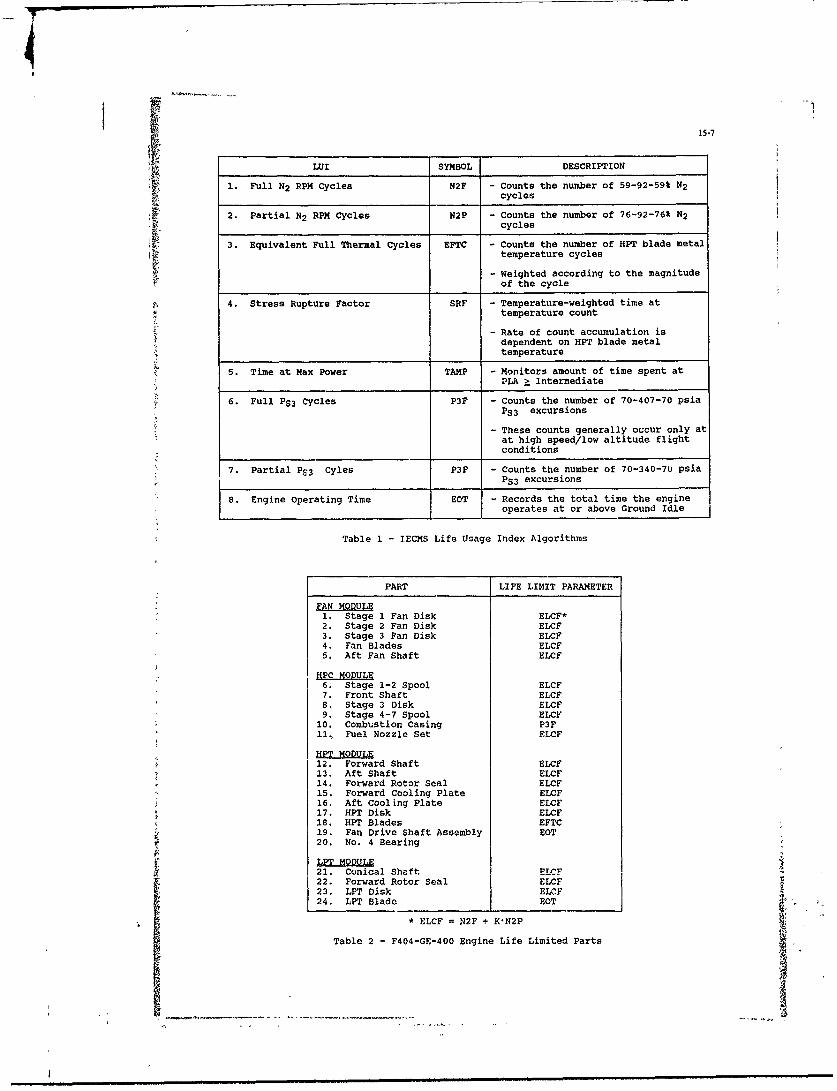
' 15-7
LUI SYMBOL DESCRIPTION
i. Full N2 RPM Cycles N2F - Counts the number of 59-92-59% N2cycles
2. Partial N2 RPM Cycles N2P - Counts the number of 76-92-76 N2cycles
3. Equivalent Full Thermal Cycles EFTC - Counts the number of HPT blade metaltemperature cycles
- Weighted according to the magnitudeof the cycle
4. Stress Rupture Factor SRF - Temperature-weighted time at"temperature count
- Rate of count accumulation isdependent on HPT blade metaltemperature
5. Time at Max Power TAMP - Monitors amount of time spent atPL t Intermediate
6. Full PS3 Cycles P3F - Counts the number of 70-407-70 psiaPS3 excursions
These counts generally occur only atat high speed/low altitude flightconditions
7. Partial PS3 Cyles P3P - Counts the number of 70-340-70 psiaPS3 excursions
8. Engine Operating Time EOT - Records the total time the engineoperates at or above Ground Idle
Table 1 - IECMS Life Usage Index Algorithms
PART LIFE LIMIT PARAMETER
FAN MODULE1. Stage 1 Fan Disk ELCF*2. Stage 2 Fan Disk ELCF3. Stage 3 Fan Disk ELCF4. Fan Blades ELCF5. Aft Fan Shaft ELCF
HPC MODULE6. Stage 1-2 Spool ELCF7. Front Shaft ELCF8, Stage 3 Disk ELCF9. Stage 4-7 Spool ELCF
10. Combustion Casing P3F11, Fuel Nozzle Set ELCF
HPT MODULE12. Forward Shaft ELCF13. Aft Shaft ELCF14. Forward Rotor Seal ELCF15. Forward Cooling Plate ELCF16. Aft Coollng Plate ELCF17. HPT Disk ELCF18. HPT Blades EFTC19. Fan Drive Shaft Assembly EOT
20. No. 4 Bearing
LPT MODULE21. Conical Shaft2. Forward Rotor Seal ELCF
23. LPT Disk ELCF24. LPT Blade EOT
*ELCF =N2F + K*N2P
Table 2 - F404-GE-400 Engine Life Limited Parts
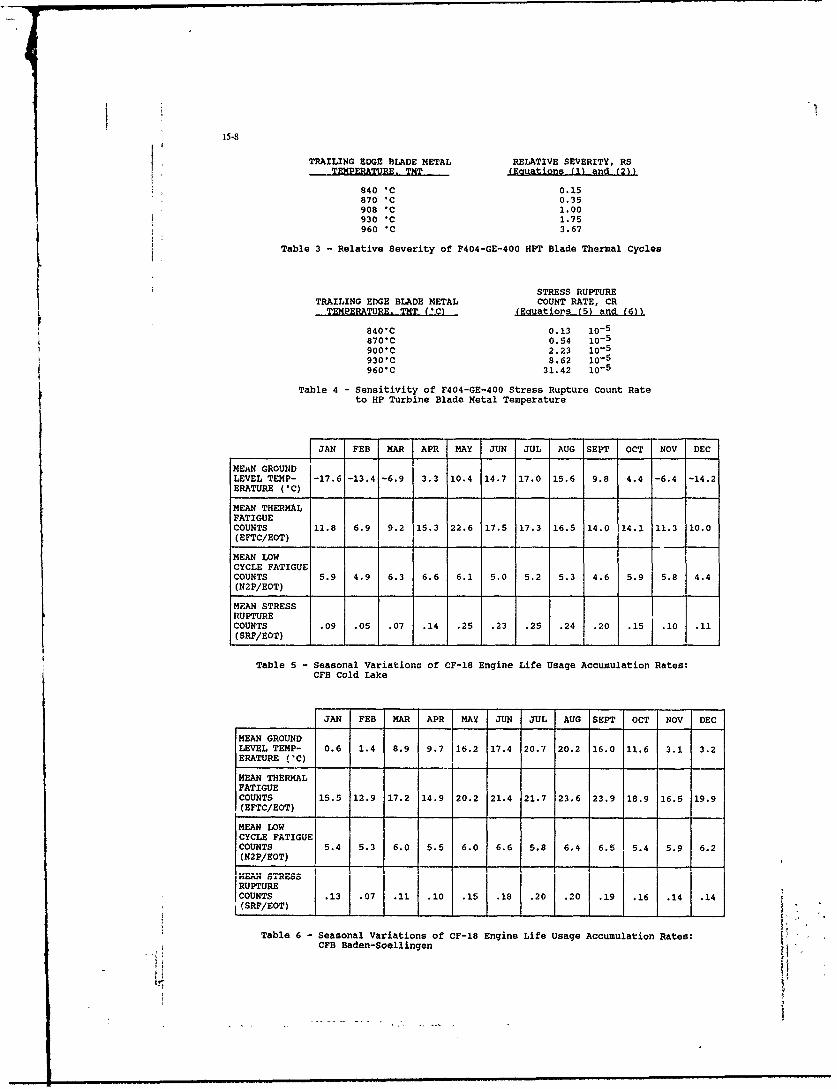
15-8
TRAILING EDGE BLADE METAL RELATIVE SEVERITY, RSTEMPERATURE. TNT (Equations (1) and (2))
840 *C 0.15870 'C 0.35908 *C 1.00930 "C 1.75960 *C 3.67
Table 3 - Relative Severity of F404-GE-400 HPT Blade Thermal Cycles
STRESS RUPTURETRAILING EDGE BLADE METAL COUNT RATE, CR
TEMPERATURE. TMT (*C) (Eauatio s (5) and (6))
840*C 0.13 10-5
870°C 0.54 10-5
900°C 2.23 10- 5
930*C 8.62 10- 5
960*C 31.42 10-5
Table 4 - Sensitivity of F404-GE-400 Stress Rupture Count Rateto HP Turbine Blade Metal Temperature
JAN FEB MAR APR MAY JUN JUL AUG SEPT OCT NOV DEC
MEAN GROUNDLEVEL TEMP- -17.6 -13.4 -6.9 3.3 10.4 14.7 17.0 15.6 9.8 4.4 -6.4 -14.2ERATURE ('C)
MEAN THERMALFATIGUECOUNTS 11.8 6.9 9.2 15.3 22.6 17.5 17.3 16.5 14.0 14.1 11.3 10.0(EFTC/EOT)
MEAN LOWCYCLE FATIGUECOUNTS 5.9 4.9 6.3 6.6 6.1 5.0 5.2 5.3 4.6 5.9 5.8 4.4(N2P/EOT)
MEAN STRESSRUPTURECOUNTS .09 .05 .07 .14 .25 .23 .25 .24 .20 .15 .10 .11(SRF/EOT)
Table 5 - Seasonal Variations of CF-18 Engine Life Usage Accumulation Rates:CFB Cold Lake
JAN FEB MAR APR MAY JUN JUL AUG SEPT OCT NOV DEC
MEAN GROUNDLEVEL TEMP- 0.6 1.4 8.9 9.7 16.2 17.4 20.7 20.2 16.0 11.6 3.1 3.2ERATURE ('C)
MEAN THERMALFATIGUECOUNTS 15.5 12.9 17.2 14.9 20.2 21.4 21.7 23.6 23.9 18.9 16.5 19.9(EFTC/EOT)
MEAN LOWCYCLE FATIGUECOUNTS 5.4 5.3 6.0 5.5 6.0 6.6 5.8 6A 6.5 5.4 5.9 6.2(N2P/EOT)
NE STRESSRUPTURECOUNTS .13 .07 .11 .10 .15 .18 .20 .20 .19 .16 .14 .14, (SRF/EOT)
Table 6 - Seasonal Variations of CF-18 Engine Life Usage Accumulation Rates:CFB Baden-Soellingen
- t

15.9
CFB COLD LAKE CFB BADEN-SOELLINGEN
MEAN GROUND LEVEL TEMPERATURE ('C, 1.4 10.8
MEAN EFTC/EOT 14.3 19.0
MEAN N2P/EOT 5.6 5.9
MEAN SRF/EOT 0.16 0.15
Table 7 - Average Annual CF-18 Engine Life Usage Accumulation Rates
STAIIN STII04 FUST
DATA FM AA IE
Figure - CF-18 Ground Data Processing
mwaw m w • •mmbmm~m~w ~ WN U m www mu ~ wmmml__ ,
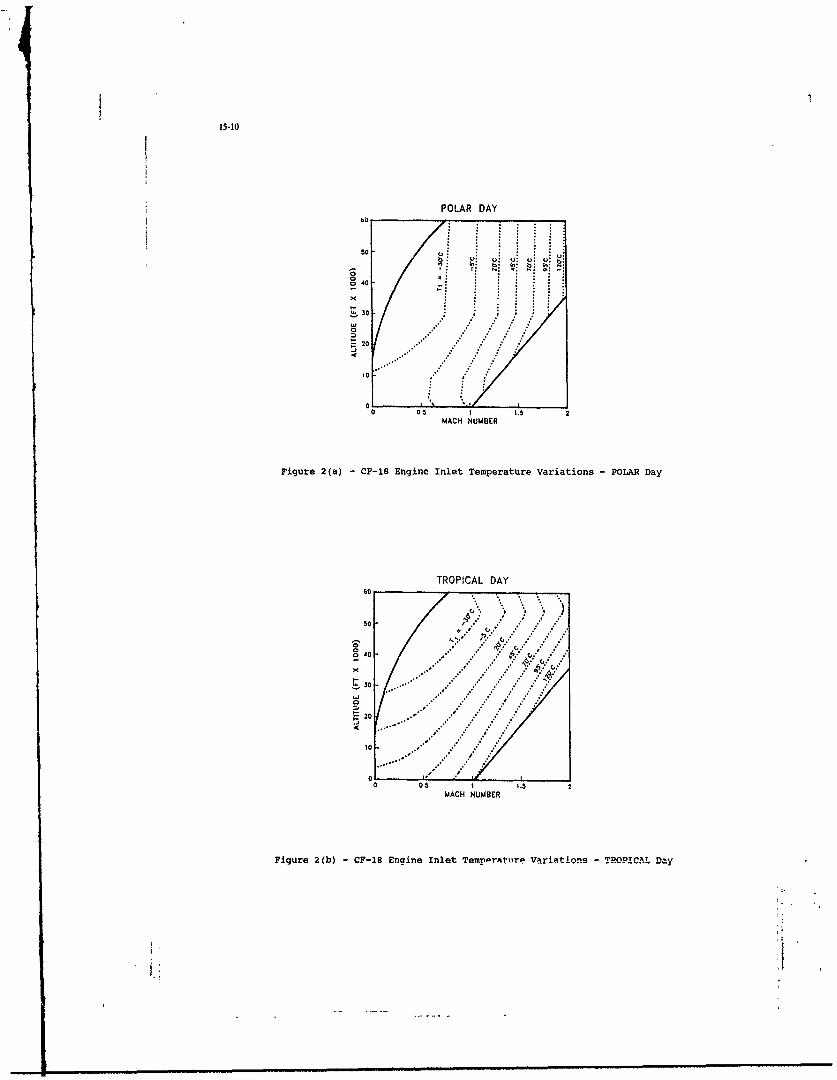
15-10
POLAR DAY
50
0
10
01
0 05 1 1.5 2
MACH NUMBER
Figure 2(a) -CF-18 Engine Inlet Temperature Variations -POLAR Day
TROPICAL DAYso
50
0
o (
20
0
10
0 05 1 1.5 2MACH NUMBER
Figure 2(b) -CF-18 Engine Inlet Temperature Variations -TROPICAL Day
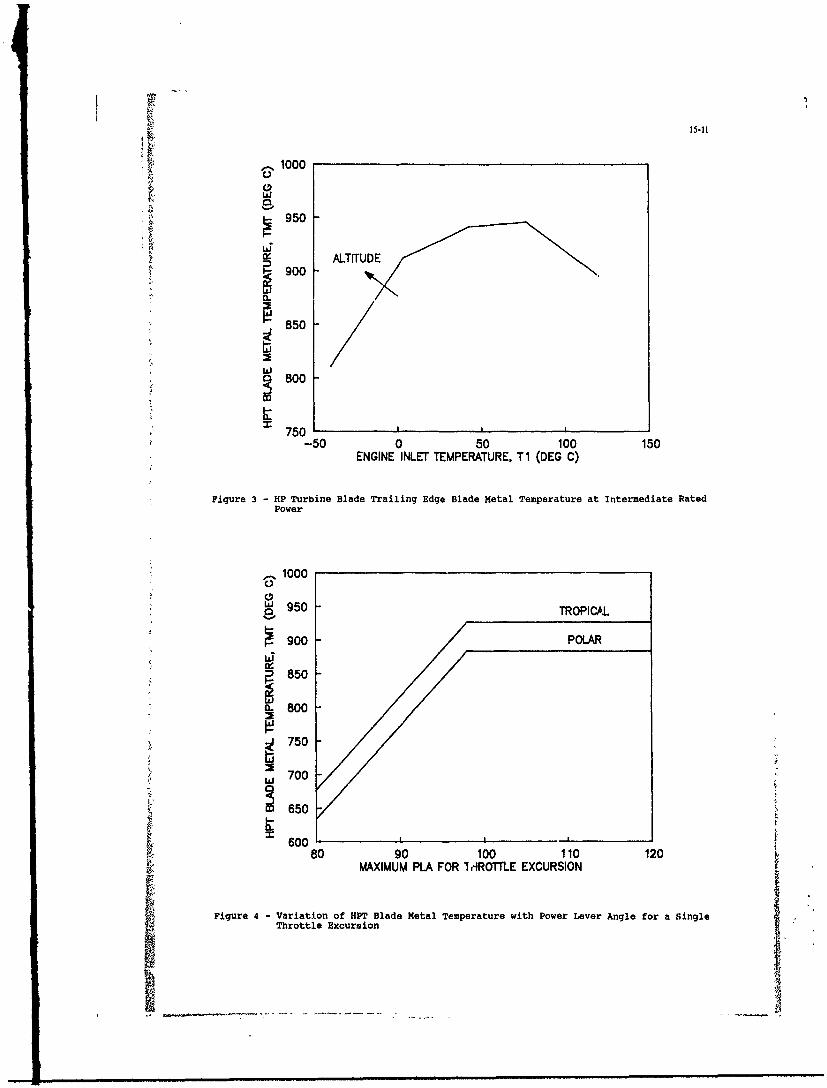
it .1000
0
i~950
850
W 800
X 7501-50 0 50 100 150
ENGINE INLET TEMPERATURE, Ti (DEG C)
Figure 3 -HP Turbine Blade Trailing Edge Blade Metal Temperature at Intermediate RatedPower
S1000
S950 -TROPICAL.
900 POA
850
~800
; 750
W 700
650
X 600
k6080 90 100 110 120MAXIMUM PLA FOR ledROTTLE EXCURSION
Fiue4 Variation of HPT Blade Metal Temperature with Power Lever Angle for a SingleFiue4-Throttle Excursion
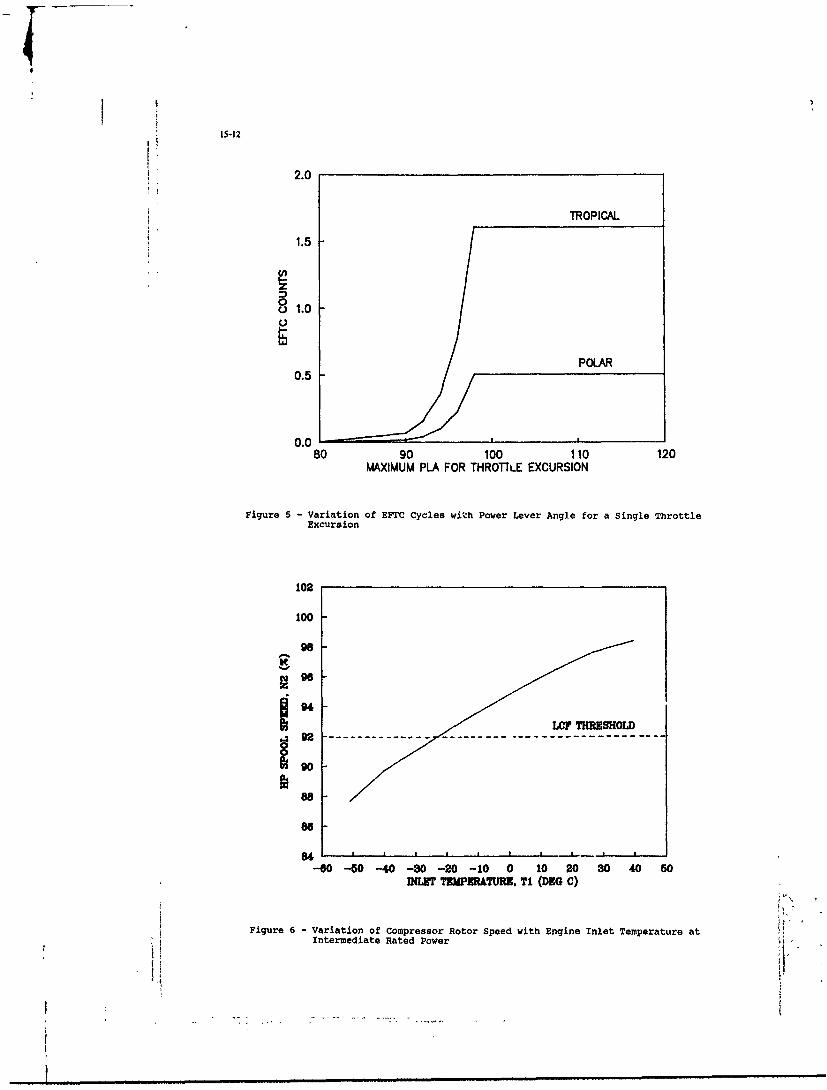
2.0
TROPICAL
1.5
C1.0
POLAR0.5
-
0.080 90 100 110 120
MAXIMUM PLA FOR THROTTLE EXCURSION
Figure 5 - Variation of EFTC Cycles with Power Lever Angle for a single ThrottleExcursion
102
100
98
~96
~92 - - - - - - - - -
,go
88
--60 -50 -40 -30 -20 -10 0 10 20 30 40 50DIMI TEMPXUTURN. TI (DHG C)
Figure 6 -Variation of compressor Rotor Speed with Engine Inlet Temperature atIntermediate Rated Power
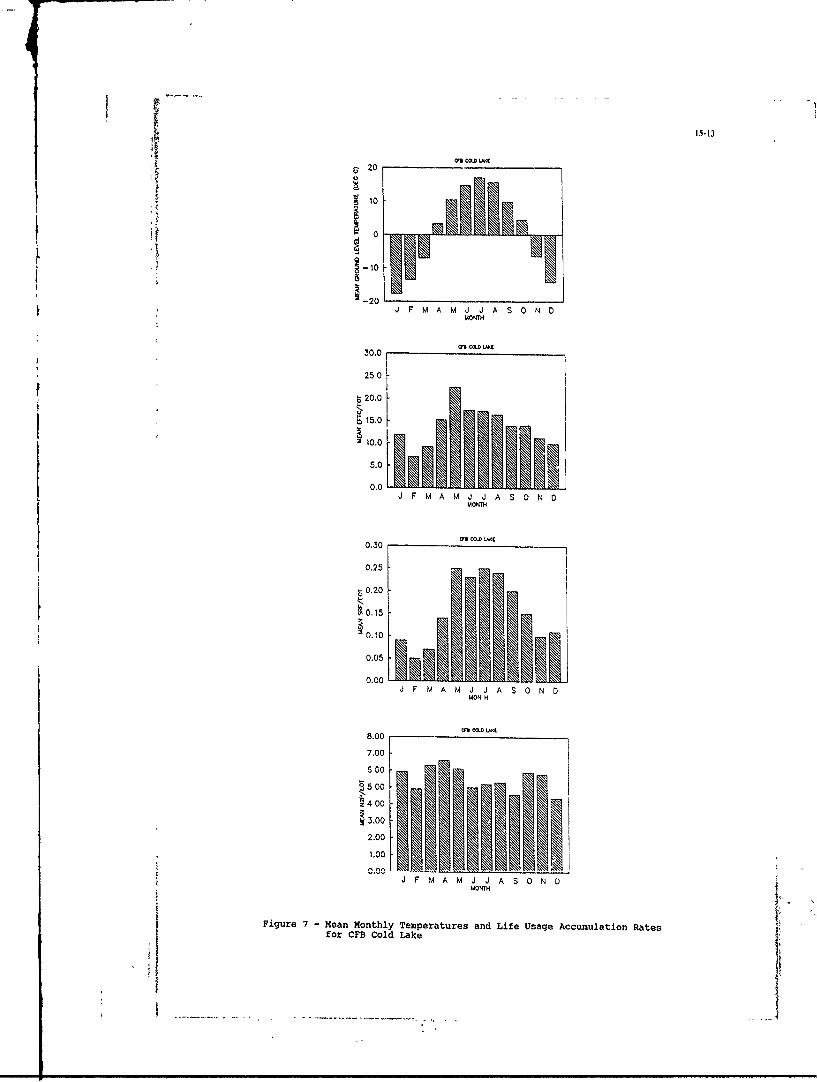
15-13
20 C"t C". LME
10
t 0
I10-2020 J F M A M J .J A S 0 N 0
MONTH
" CO" LAME30.0
25 0
20.0915.0
'10.0
5.0
0.0J F M A M J J A S 0 N 0
MONTH
CF c LME0.30
0.25
0.20
N0.15
20.10
0.05
0.00J F M A M J J A S 0 N D
MON H
I" WEa
8.00
7.00
6 00
500
400
3.00
2.00
1.00
J F M A M J J A S N DMONTH
Figure 7 -Mean Monthly Temperatures and Life Usage Accumulation Ratesfor CFB Cold Lake

15-14 p5
200
15.0
910.0
05.0
00
300 ,.c" -
25 0
10.0
50
MOT
8 400
300
2 00
1.00
0.00
0 30
0 025
.020
0.-15
0 10
0.05
0.00
~MONTH
Figure 8 -Mean Monathl.y Temperaktures and Life Usage Accumulation Ratesfor CFB Baden-Soellingen

i 15 -15
Discussion1. F. Kuiper, MOD Netherlands uses historical engine usage data for an individual base. ForThe Canadian forces calculate their short term forecast per fleet planning purposes, EPLTS uses average data for thebase. How is the forc.asting performed for long term fleet. It depends on the magnitude of the accumulation rateforecasts for the whole fleet? Also average LUTs per base or difference. If one date is different by a factor of 1.1/1, thenaverages over the entire fleet, an average between the two should be sufficient for long
term planing. If the difference is by a factor of 2 or 3/1, thenAuthor: long term forecast should be done separately (usingFor short term and long term forecasting at a base, EPLTS individual base rates) and then added together.
I.

16-1
i i APPLICATION OF A WATER DROPLET TRAJECTORY PREDICTION CODETO' "EDESIGN OF INLET PARTICLE SEPARATOR ANTI-ICING SYSTEMS
by
D.L.Mann* and Dr S.C.Tan"*Rolls-Royce plc, Leavesden, Watford WD2 7BZ, United Kingdom
*Cranfield Institute of Technology. Cranfield, Bedford, United Kingdom
ABSTRACT engine and scavenge paths (Figure 1). Interms of theengir.e power performance
Over the past five years a dust penalty associated with the fitting of anparticle trajectory code has been jointly IPS, the necessary heating energy input maydeveloped by Rolls-Royce and Cranfield. The be 80% higher than for a conventionalpaper describes recent work on the code to intake duct.include an ice accretion prediction modelsuitable for use as a design aid for a wide Development of an anti-icing system forvariety of gas turbine engine inlets, but such an intake by conventional 'cut andparticularly for particle separator try' methods is expensive, time consuminggeometries. The calculation of the local and will always tend to lead to a designheat transfer coefficient is seen to be which is energy inefficient in achievingcritical to the success of the ice its required performance. Energy efficiencyaccretion prediction. The paper describes here applies to whatever the chosenthe incorporation of a suitable model and anti-icing mechanism is, whether that be byshows that a series of validation tests, a hot gas engine bleed or by somecarried out on a full scale rig, have electrical means. Current state of the artsatisfactorily verified the code. A second IPS technology gives an anti-icing heatingseries of validation experiments, carried requirement which represents a notout in an icing facility, further shows the insignificant engine power penalty.prediction model to be appropriate. This paper describes the development of
a predictive anti-icing system design codeaimed specifically at reducing the expense
NOMENCLATURE and time of development by 'cut and try'methods and, from a power penalty point of
D Drag coefficient view, to reduce current level heatingrp,O ,zp Particle's cylindrical requirements by 50%.P PcoordinateV9,VP Gas and particle velocity The foundation of the ice accretion
vectors prediction model has been softwareVg V q Component gas velocities in developed during the course of theVr9'Veg'V the cylindrical coordinate generation of a particle separator design
system system (Reference 2,3). The principleVrI.ePVq~ Component particle velocities components of the model are a Navier-Stokes
in the cylindrical coordinate flow solver, the Moore Elliptic Flowsystem Programe (MEFP) (Reference 4), and the
pp, p, Particle and gas densities joint Rolls-Royce/Cranfield developedparticle trajectory prediction proc-am(Reference 5).
INTRODUCTION Validation of the prediction code to
The susceptibility of rotorcraft to ice date has comprised two series of rig testsaccretion problems in icing conditions has carried out on a full scale IPS. The firstbeen observed almost since the aircraft set of experiments were aimed specificallytype first appeared. Rotor blades have been at measuring local heat transfercited as the prime area of concern and much coefficients along the gas passage of theactivity has been initiated to investigate IPS and hence validating the calculationthe icing phenomena in this area. In method derived during the cour3e of theparticular, the need for suitable work, and the second took place in a
predictive tools to ease the burden of Rolls-Royce icing facility and was aimed at
necessary design, development and validation of the water dropletcertification testing efforts has produced traiectory/ice-accreticn calculationa number of prediction models, an excellent methods.review of which f contained in Referencei.
THEORtETICAL MODELIn comparison to the rotor icing
problem, the problems of the rotorcraft Flow-field Predictionengine manufacturer may appear to berelatively minor, but with the simultan3ous MEFP has firmly established itself attrends towards more aerodynamically the core of the particle separator designefficient (and therefore more damage prone) package used at Rolls-Royce on the basis ofturbomachinery and the fitting of inertial the accuracy of its predictions and its
Fz ....... inc .......... aarts IS, the... uuer c.p.d, effici~ncy. ThG coc i:job of engineering a suitable powerplant described in Reference 4 and its use withinanti-icing system is becoming more the particle separator design role isdifficult. The ad'ent of the IPS makes described in Reference 3.anti-icing more difficult due to the factthat internal surface area must inherently The IPS under consideration during theincreaso as the incoming flow is first course of the work described here, being aforced to travel over d bend and is then direct engine mounted device, is nearbi-furrated as the flow is split into axi-symmet:ic in form and hence in order to

16-2
reduce computation time MEFP was run in its droplet size over a wide range of values2D form. Grid generation was fully within the code, for the purposes of thisautomated and a typical calculation grid study a size distribution was usedcomprised around 4000 node points as shown comparable with that measured on icingin Figure 2. tests carried out to UK Def Stan engine
certification requirements (Reference 11),that is, with a mean droplet size of 20microns.
Water Droplet Trajectory Prediction
The particle equations of motion werederived by assuming the drag force to be HEAT TRANSFER COEFFICIENT (HTC) MEASUREMENTthe only force of interaction. This TESTSassumption is valid if particle density ismore than three times greater than that of Experimental Set-Upthe surrounding fluid medium (Reference 6).In cylindrical co-ordinatLs, these The experimrntal set-up for the HTCequations may be written as follows:- measurement tests is illustrated in Figure
3. The rig consists of three detachablesections:-
- G(Vr9 - -P) + r,0. () 1. An upstream section which consists ofat an intake nozzle, followed by a diffuser
er with an adapter flange at one end.tp G(Ve - rp - 2ipip (2) 2. The test sect-on which consists of the
at IPS inner and outer wall assembly. The two
are connected to the upstream section by a
zG(V - - V clamp at the flange.
at 3. The downstream seution which consislsof the scroll and splitter lip assembly,
where G is the force of interaction - followed by the scavenge and mainline pipe.The scavenge pipe is joined to the mainlinepipe just upstream of the suction fan. AG ( -throttle valve is located on the mainline
G 9 D - l V)I pipe and an ISA 1932 nozzle (for flow4p P metering) is set in the scavenge pipe.
The centrifugal and coriolisacceleration terms are represented by the The downstream section was mounted as a
end terms on the right hand side of permanent feature of thp whole rig. Theequations (1) and (2) respectively. The detachable upst est sections
force of interaction depends on the allowed film prG- 'stuck' to the
relative velocity between the particle and inner and outer walls .h considerablethe gas flow, and particle size, shape and ease.density. The drag coefficient, C', isobtained from the standard drag curve forspherical particles. The trajectory of aparticle is calculated by a numerical AERODYNAMIC MEASUREMENTsolution of the three equations of motionobtained through the Kutta-Felhberg method Wall static pressure tappings were(Reference 7). placed along the inner and outer walls of
the IPS in positions as shown in Figure 4.The IPS inlet fiow rate was monitored byfour wall static pressure tappings spaced
ICE ACCRETION MODEL radially in the inlet nozzle. The scavengeflowrate was metered by an ISA 1932 nozzle.
The ice accretion model chosen as most All of the pressure tappings were connectedsuitable for this study has been that to a scanivalve and recorded with a Druckdeveloped by Cansdale and Gent (Refirence manometer.8). The method is based on the solution ofa set of heat balance equations (kineticheating, convective cooling, etc.) and isused to calculate the rate of ice growth. HOT FILM PROBESThe water flux distribution is calculatedby collecting droplets in a series of The hot film probes specified for the'compartments' located along the IPS wall 1"cal heat transfer measurements weresurfaces. In the model, it has been assumed manufactured in Denmark by DISA and were ofthat water droplets do not rebound upon the 'glue-on' type (ref: 55R47). Theseinpact, however, previous experience in probes are more normally used for skinicing tests has shown that significant friction measurements. The probe consistsbounce can occur under certain conditions, of a polymid foil substrate (16 x 8mm) onwhen sufficient impact energy exists to which a thin nickel film (0.9 x 0.1 x(Reference 9). It is intended that 0.001mm) is depcsited. The film ends areexperiments to investigate water droplet joined to two nickel/silver plates oi torestitution ratios wiil be carried out in which a pair of copper wires (0.1mmthe near future to overcome this potential diameter) are soldered. The resistance ofshortfall. the probe wire usually varies from 10.0 to
18.0 ohms and lead (copper wire) resistanceThe calculation is primarily dependent is usually about 0.2 Ohms.
on the local heat transfer coefficient(HTC). The method of Jayatilleke (Reference In order to minimise IPS wall heat10) has been selected as most suitable to conduction effects, the appropriate wallsthis application, of the IFS had shallow channels cut into
the sheetmetal, these channels were thenWhilst it is possible to vary water filled with a low conductivity material and
16-3
the hot film probes attached, by means of from:-double-sided tape, so as to sit flush withthe IPS wall.
Q I2R - I2R(no flow)
Therefore, the HTC, h, is given by theHEAT TRANSFER MEASUREMENTS formula:-
Copper wires from the probe were h - Q/(Aeff(T. - T,))soldered to 5m length cable and pluggeddirectly into a constant temperature where Aeff is the effective heating area ofanemometer. The operation of the anemometer the probe and T , T are sensor and airis based on the operation of a Whetstone temperatures respectively. The effectivebridge with an amplifier which feeds heating area parameter will be furtherunbalanced signals (caused by the current discussed in a later section.changes in the sensor) to the sensor inorder to maintain a constant wiretemperazure. A combination of two types ofanemometer were used:- RESULTS AND DISCUSSION
i) 55M system consisting of 55M01 and Figure 5 shows a plot of the predicted55M10 units, velocity vectors in the IPS produced by the
NEFP code. The predicted flow recirculation.i) 56C system consisting of 56C01 and in region A and the stagnation and56C17 units, separation in region B have been previously
seen during flow visualisation tests andThe construction in both systems are are hence true phenomena. The wall static
similar but the M-type is more expensive pressure readings for the IPS design pointand normally used for high performance flow are shown in Figure 6 alongside themeaurements. corresponding MEFP prediction. The pressure
values have been non-dimensionalisedThe heat transfer measurements were against atmospheric pressure. Agreement is
carried out with 6 probes connected to 4 seen to be very good.M-type and 2 C-type anemometers. The outputfrom the anemometers were connected to an The comparison between measured avJRMS digital voltmeter via a 55D65 scanner. predicted HTC at the wall locations shownThe probe wire temperature is set from the in Figure 4 is plotted in Figure 7.required overheat ratio, a, which is Predicted HTC's come from the Jayatillekedefined as: model. The results for the inner wall
(Figure 7a) shows good agreement except ina - (Rh - R,)/Rc the region of re-circulatir flow, A, where
the measured HTC was higher. Thiswhere R5 and R are the hot and cold sensor difference is to be expected because theresistances respectively. The sensor turbulence in a re-circulating flow regionresistance, R is then calculated from usually serves to enhance heat transfer
rates (Reference 10, 13).R m R20 (1 + a20 (T - 20)) The comparison between experimental and
where R is the sensor resistance at predicted values on the outer wall (Figure20.Odeg , a,
2 is the temperature 7b) also show good agreement except around
coefficient of resistance at 20degC and T the stagnation region, B, just after theis the required sensor temperature. Hence maximum diameter point. Again, separationthe hot resistance can be calculated as is thought to increase the effective heatfollows:- transfer in this region.
Rh - (1 + a)R20 + Rcable + RL)
where Rcable and R. are the cable and leadresistances. EFFECTIVE HEATING AREA
The overheat ratio was set and the Te average effective heating area ofThe vereat ati wa setandthe 0.3mm employed in the calculation of theanemometers were balanced after the probes local HTC was found by curve fitting of thehad been glued onto the IPS wall. Figure 4zhows the location of the probes on the experimental data. This would give antest section. A staggered arrangement was effective width of the sensor wire asadopted in order to avoid disturbances in 0.33mm instead of the actual value ofthe flow caused by the wires (and heat in 0.1mm, assuming that the heat is conductedthe upstream probe from affecting into a rectangular area. This, however, isthewstream probe fabout three times the geometrical area ofdownstream probes. the sensof wire, which has an actual area
of 0.09mm . Many researchers (Reference 14,15, 16) have encountered the uncertainty of
CALCULATION OF THE LOCAL HTC the effective heating area because itdepends on the amount of heat conductedinto the substrate materials and theTho current, I passing through the immediate flow over the sensor. It is
probe is calculated from Reference 12 as generally recognised as a difficult andtime consuring problem, and almost--- ---- c --- dctcrmlnc I- -ractlo Au- to
I - V/(Rt + R + Rcable) the small component sizes involved.
where V is voltage, R ard Rcable are Previously, it has been concluded only thatresistances of the sensor and cable, Rt is the effective heating area is greater thanthe anemometer top resistance, which is the geometrical area.given as 50 and 20 Ohmi for the N- and C- Defining a factor, Fa, as the Latio oftype systems respectively. The heat the effective heating area over the actualtransfer to the flow, Q, is calculated geometric area then the work of the above

16-4
previous investigators has shown that Fa is RESULTS AND DISCUSSIONgreater than unity; thus setting a lowerbound value for the factor. Figure 9 shows predicted water droplet
trajectories within the IPS for the testIn an attampt to try and locate an conditions. The distribution of droplets at
upper bound to the factor, a model of the the inlet was assumed to be uniform fromsensor using a conventional heat transfer hub to shroud with 155 droplets beingcode was constructed. The effects of heat launched for each water droplet size. Aconvection and radiation were ignored and range of water droplet sizes, compliantconduction was assumed to be steady state, with the required 20 micron mean diameter,The non-linear thermal properties of the based on a previously measuredKapton material were accounted for. By characteristic was used. in all, themaking these assumptions, a high limit on analysis comprises some 1240 dropletthe effective heating area was able to be trajectories. Further assumptions made werecalcultted. This value was found to be that the droplets do not bcunce and that0.43mm and so (Pa)max becomes:- they do not coalesce.,
(Fa)max - 0.43/0.09 - 4.78 Figure 10 illustrates the resultingpredicted ice accretions on the IPS walls
and so, Fa may be said to lie in the (shown dashed) alongside the measuredrange:- accretions. The three areas of actual
accretion; inlet hub front face, outer wall1.0 < Fa 4.78 and splitter lip top surface have all been
picked up by the prediction model andCurve fitting of the experimental data generally speaking the agreement in ice
gave a value of Fa of 0.3/0.09 - 3.33, shapes is good throughout the IPS.which is consistent with the stated band ofvalid values. The main area of discrepancy occurs at
the splitter lip accretion where theIt is intended that the analysis using prediction shows a pronounced 'hill' of ice
the heat transfer code will be extended in at the splitter lip stagnation pointthe near future to include the effects of whereas the tests showed a flat covering ofconvection and radiation and hence allow ice. The difference is believed, in part,for a more precise 3ustification for the to be due to the fact that the actual IPSuse of the 3.33 value used in the splitter flow - where the flow is turnedexperimental curve fitting exercise. 180 degrees into the scroll collector
system (Figure 1) - was not simulated inthe model. It should be stated, though,that if anything, the experimental results
ICING TUNNEL TESTS at the splitter lip was a surprise in thatother tests on different splitter lip
Experimental Set-Up shapes have produced the predicted 'hill'of ice at the stagnation point.
During the course of IPS certificationtesting taking place at the icing facility Overall, the results would appear toat Rolls-Royce, Hucknall, it was possible indicate that the theoretical model is anto carry out a short series of icing tests appropriate one.with an unheated IPS in order to obtainvalidation data for the water droplettrajectory prediction part of the iceaccretion model. CONCLUSIONS
The Hucknall facility set up is The method of heat transfer measurementillustrated in Figure 8, which shows the using hot film sensors has beenset-up for the IPS work. The facility is a successfully applied to a helicopter enginere-circulating, blowing one in which the iPS intake and has validated a viscous flowtest section is held within a closed cell. prediction code and the Jayatilleke HTCThe IS was full scale and operated at its model. Discrepancies in areas ofdesign point flow conditions. The required re-circulating flow were as expected andflow split into 'engine" and 'scavenge' have been explained. Tests on an unheatedlines was achieved using a valve at the Ips in an icing facility have successfullydischarge from the engine section. validated the water droplet trajectorySuper-cooled water droplets were produced model incorporated into the code.from a spray grid upstream of the IPS inletand droplet size was calibrated to complywit,. the UK Def Stan (Reference 11) 20micron mean diameter. The nozzle FUTURE WORKarrangement to achieve an even distributionof droplets was carrled out by trial and At the time of writing, the IPS iceerror. accretion studies are on-going. The next
stage of work involves the development andThe tests were run at -10degC witi a validation of a model to predict the heat
water droplet concentration of 0.6g/m . The inputs required through a geometry toduration of the trial was established by prevent the foration of ice. Thetrial and error to give a satisfactorily validation exercise will be done through ameasurable ice accretion whilst n-t second series of icing tunnel tests, thissignificantly altering the flow field time employing a heated IPS model. It iswithin the IPS. A maximum permitted ice hoped, subsequently, to design and test aaccreticn depth of 6mm was chosen and this full IPS anti-icing system in order toresulted in a test duration of around 10 demonstrate the stated desirp tn reA,i' cemin,-tes, heating requirements over current levels by
50%. With the available evidence, there isno reason to believe that this objectivewill not be met.

16-5
REFERENCES 15. Hodson, H.P., 'Boundary LayerTransition and Separation Nearing theLeading Edge of a High Speed Turbine. AGARD, 'Rotorcraft icing - Progress Blade, ASME 29th International Gas
and Potential', AGARD Advisory ReportNo. 223, September 1986. Turbine Conference and Exhibition,
Amsterdam, Paper no. 84-GT-179, June2. Tan, S.C., Elder, R.L., Mann, D.L., 1984.
T h r . . S u d f P r i l 1 6 . M c C r o s k e y , W .J ., D u r b i n , E .J ., F l o w* Thorn R.I., 'Study of ParticleTrajectories in a Gas Turbizne Intake', 1. cle WJha Durbsn easure'FlowNinth International Symposium on Air Angle and Shear Stress MeasurementsBreathing Engines, Athens, September Using Heated Films and Wires', ASME1989. Paper 71-WA/FE-17, July 1971.
3. Mann, D.L., Tan, S.C., 'A Theoretical ACKNOWLEDGEMENTSApproach to Particle Separator The authors would like to express theirDesign', Ninth International Symposium Thks to s atuolls-oyce andon Air Breathing Engines, Athens, thanks to colleagues at Rolls-Royce andonpteAir Beatn nCranfield for the invaluable assistance andSeptember 1.989. advice given during the course of this
4. Moore, J.G., 'An Elliptic Calculation work. Special mention must go to Joan Moorefor her advice on the use of MEP. Finally,Procedure for 3D Viscous Flow', AGARD thanks are also offered to Rolls-Royce plcLecture Series No. 140; 3D Computation and the UK MOD, the two sponsors of thisTechniques Applied to Internal Flows work.in Propulsion Systems, June 1985.
5. Tan, S.C., 'A Study of ParticleTrajectories in a Gas Turbine Intake',PhD Thesis, Cranfield Institute ofTechnology, Cranfield, Beds, UK, 1988.
6. Rudinger, G., 'Flow of Solid Particlesin Gas', AGARD - AG-222, October 1976.
7. Ledermann, W., 'Handbook of ApplicableMathematics, Volume III, John Wiley &Sons.
8. Cansdale, J.T., Gent, R.W., 'IceAccretion on Aerofoils inTwo-dimensional Compressible Flow - ATheoretical Model', RAE TechnicalReport 82128, 1983.
9. Parker, G.J., Bruen, E., 'TheCollision of Drops with Dry and WetSurfaces in an Air Atmosphere', Proc.Inst. Mech. Eng. (London), 184(1969-1970), Pt.3G(III), pp57-63.
10. Jayatilleke, C.L.V., 'The Influence ofPrandtl Number and Surface Roughnesson the Resistanci of the LaminarSub-layer to Momentum and HeatTransfer' Progress in Heat and MassTransfer, Volume 1, Pergammon Press.
11. UK Military Icing Specification, DEFStan 00971.
12. DISA, 'Type 55M10, !nstruction Manual,DISA 55M System witn 55M10 CTAStandard Bridge', DISA Elektronic A/S.DK-2740.
13. Gooray, A.M., Watkins, C.B., Aung, W.,"Numerical Calculation of TurbulentHeat Transfer Downstream of a RearwardFacing Step', Proc. of the 2ndConference on Numerical Methods inLaminar and Turbulent Flow, Venice,Italy, July 1981.
14. Matthews, J., 'The Theory andApplication of Heated Films for theMeasurement of Skin Friction', PhDThesis, Cranfield Institute ofTechnology, Cranfield, Beds, September1985.
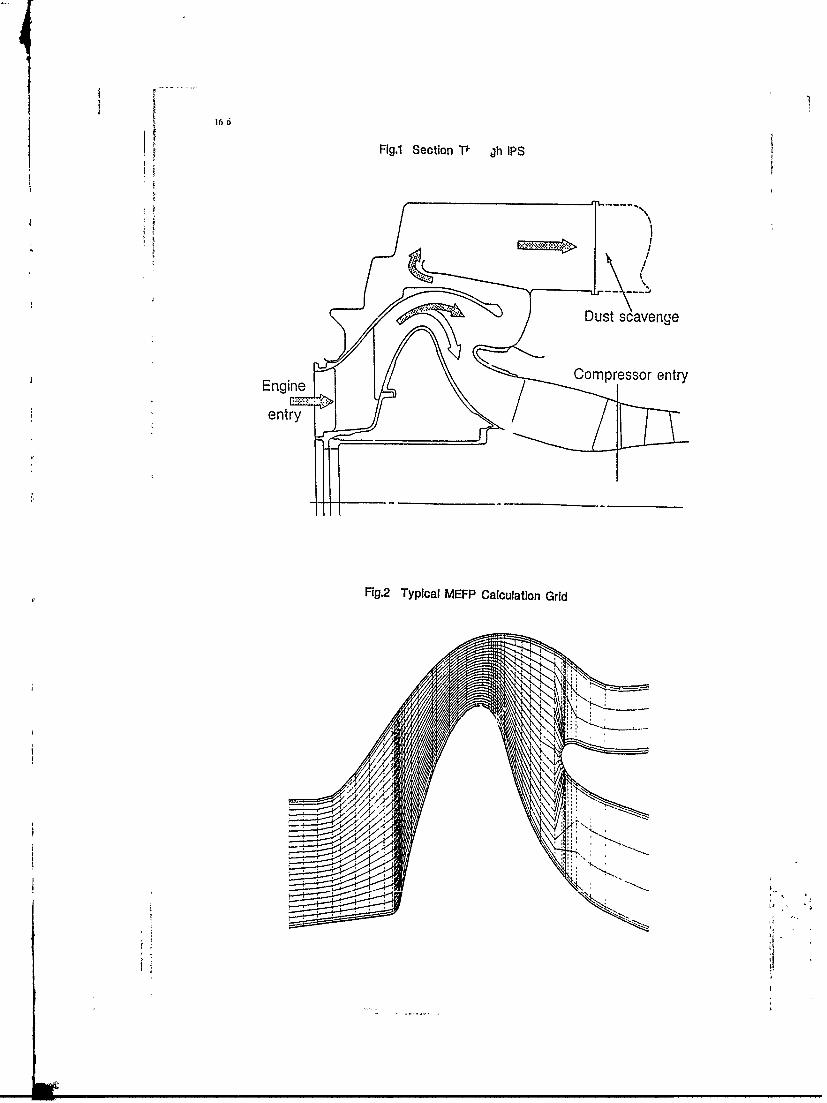
K 1 6Fig.1 Section TP gh IPS
Dust scavenge
EngineCompressor entry
Fig.2 Typical MEFP Calculation Grid

f1
16-7
Fig.3 HTC Measurement Rig Set-up
orif iceScavenge plate
DirnL 1
Inlet Engine outtefly valvesTeat section
Fig.4 Static Pressure Tapping and Hot Fiim Probe Positions
F tatictaingsaHat-film poe
j~

16-8
VFlg.5 MEFP Predicted Velocity vector plot
Fig.6 Measured Versus MEFP Predicted Wall Static Pressures
0
095-
E0 925
09: ne a
208765
08
00 0.2/005 0075 01 0.125 015 0.175 012 0225 0 25 0 27; 0rO3
Distance along walt surtace

16-9
FIg.7 Measured and Predicted Local Heat Transfer Coefficients
a) INNER WALL Iv~-In b) OUTER WALL800-60
700- 70D0
600- 600 V
400' 71400
200 203
100- 100-
00 005 0.1 015 02 00 005 01 015 02 025
Fig.B Hucknall Icing Facility
IS In ICING TUNNEL
DIAGRAMMATIC LAYOUT
TRICHLORETHYLENEI- TANKS
KENTCONTROLLER
-SUNVIC' TRIC.BELLMOUTII - FLOW RECULATOR 3-LOUVRE VALVE
FOR FINE TRIMIIINGOF FLOW
CONTROL CLOSED CELLVALVE
IICAT CXCIIANCERI ~ FAN
/ SRAY TEMPERIATURE 7 5 NP
NOT AIR INPUT BOSE FANTIO TEST -jMODELS DRAIN
VALVE
.54

16-10
Fig.9 Predicted Water Droplet Trajectories
X1o-2.92
2.G9.
2.45.
2.21
1.9 8.
.- 1
0.0
AXIAL DISTANCE (mm)
Fig.1O Predicted Versus Measured Ice Accretions
Predicted
Measured

16-11
Discussion Aithor.At each of the heat transfer probe positions, the
1. D. Breitman, Pratt and Whitney Canada experimental data capture technique comprised a half hour
What is the IPS bypass ratio? 1;robe stabilisation period followed by a 30 minute test
Do you analyse particle trajectories that are not parallel to period, during which time readings were recorded on circathe engine centrcline? How sensitive is your design to this? 20 occasions. Thus, a data point on figure 7 describes a
mean of the 20 readings taken at a position.
Author: Ice accretion tests were run with the IPS operating at
At its design point, the IPS of the RTM 322 passes a flow approximately 75 % design point flows, air temperature was
equivalent to around 18% of the core flow through the -10 C and water droplet concentration 0.6 g/m3 Water
scavenge system. droplet size was set according to UK Def Stan requirements.
A comprehensive run of the trajectory code will consider a The coalescing of water droplets which initiated runback is
wide range of inlet particle velocities, both in terms of something which is not currently modelled by the code.
directior and speed. This has found to be important m Arg with water droplets break-up (pre and post impact)
replicating experimental data obtained from a cloud-fed and bounce restitution ratios, this is an aspect which is to be
inlet, the subject of experimental activities in the near future,
Initial particle directions significantly different from that aimed at generating a programmable model. The motion of
parallel to the engine axis, do exhibit a trend to be less well single water droplets along the surface is something which
separated on the RTM 322 IPS. However, for inlet the code is already capable of handling.trajectories representative of a cloud-fed dust this effect hasbeen seen to be marginal.
2. G. Bianchini, Allison 5. E Siegmund, Fokker AircraftHave you validated your predictions with only one Is it the intention to make a fully evaporative anti-icingconfiguration of inlet particle separators9 Do you feel that system or will the required power be such reduced that only
the model is flexible -nough to be used with other water runs back into the separator?configuration IPS?Are there any future plans to validate the model with Autho.different configurations of IPS9 Design philosophy, given to current certification
requirements, is to prevent any ice formation on gas passageAuthor: surfaces leading into the engine core passage. The liquidThe ability of MEEP to calculate heat transfer coefficients water generated from such a system has not been seen tohas been validated, within Rolls Royce, foradiverse range of create a runback problem on the RTM 322 IPS.engine components. The trajectory code validations have Other designs may not exhibit such a characteristic and sooccurred over a range of RTM 322 IPS geometry standards care must be taken to ensure that the engine is tolerant to theonly. A more generalized validation exercise is about to take ingestion of potential large quantities of water, and that theplace during the heated rig tests, where a range of IPS geometry provides the maximum possible watergeometries will be evaluated separation efficiency. In the second case this may be
The design system is considered to be appropriate to the full achieved by suitable wall profiling in conjunction with otherrange of IPS geometries, both axisymmetric and meansasymmetric, being considered for the next generation of IPStechnology
3. C. Scott Bartlett, Sverdrup Technology 6. R. Toogood, Pratt and Whitney CanadaThe droplet trajectory and impingement prediction (figure Could you please elaborate if your accretion analysis9) shows no droplet impingement on the splitter plate, incorporates a twie-stepping or is it a simple impingementhowever the following figure (10) shows a prediction of ice location prediction?accumulation Would you please comment on this apparent Are you considering a building and a sudden process of icediscrepancy? or do you require completely clean surfaces in the RTM 322
fPS?Author:Unfortunately, the trajectory prediction done to produce Author:figure 10 did not generate a trajectory plot The trajectories The current accretion model is not time-stepping An abilitypresented in figure 9 are from an earlier run, performed on to be able to predict ice accretions while continuouslyan IPS geometry different to that later used on the trajectory accounting for changes being made to HTCs and the flowvalidation tests. field is not appropriate for the design of anti-icing systems
where the objective is to keep surfaces free from ice, as on4. A. Sutton, BAe the RTM 32 Looking longer term, where controlledHow many data points were collected for the determination shedding devices may become available, then a time-of heat transfer coefficients? stepping code would have to be considered.What were the conditions of the ice accretion validation Apologies for the short fall, but the main point of figure 9test? was merely to highlight that such plots are produceable andShould the impact of water droplet model take into account to graphically illustrate the large number of trajectoriesthe runback of the water wnici is not frozen? which are invoived in a calcuiation.
m ,1I

17-1
CAPTATION DE GLACE SUR UNE AUBE DE PREROTATION D'ENTREE DAIRPar
R. HENRY et D. GUFFOND0. N. E. R. A, Direction des Etudes de Synth~se
29, Avenue de Ia Division Leclerc92320 CHATILLON, France
RESUMEtridimensionnel axisym~trique, type Euler compressible[2] calcule le champ a~radynaniique dans un dtage
Lorsque les moteurs fonctionnent au ralenti, la complet (aubage fixe et mobile). Dans notre cas, seulesprotection des aubes directrices de prdrotation contre les les donn6es clans l'aubage fixe sont n6cessaires.effets du givre est rendue ddlicate en raison du calage L'&coulement amont ne poss~de pas de composante deimportant des aubes et de la faible dnergie disponible. giration. Utilisant la sym~trie de r6volution, le champLa connaissance de la sdvdritd du givrage clans ces est determind entre deux aubes voisines, clans un rep~reconfigurations ainsi que la masse de glace susceptible (R, Z, 8) (Figure 1).de se deposer est nkcessaire pour optimiser la repartitionet l'intensit6 du flux de chaleur utilis6 pour laprotection des aubes. La modelisation des trajectoires Rt Zdes gouttes d eau surfondues, rdalis~e d'abord clans unechamp axisyin~trique bidimensionnel, puis sur unenappe de courant b poxinit6 de l'aube, permet decalculer l'dtendue et l'intensit6 de la captation. Un bilanthermodynamidque sur la paroi de l'aube permet enf ind'6valuer la forme du givre d~posd.
INTRODUCTION
Un des moyens de prot~ger les aubes de pr~rotation rig. 1: Ecoulement entre deux aubes choix du repixed'entr~e drair des moteurs contre le givrage consiste lesr~chauffer par de l'air prdlev6 en sortie du compresseurcentrifuge (jusqu'A 1,7 % du debit). Cet air chaud circule Le calcul tridimensionnel des trajectoires de gouttes estA l'intdrieur des aubes. Lorsque le moteur fonictionne au tr~s coftteux en temps de calcul et nest pas justifid ici.ralenti, la quanfit6 de chaleur et la tempdrature sont plus En effet, on peut distinguer deux zones distinctes clansfaibles et donc la protection momns zfficace sur certaines 1'6coulement: la zone situ~e en amont de l'aubage, nevparties des aubes. perturbee par la presence des aubes, et la zone mouiII:,PtL'dtude de ces ph6nom~nes par la seule voie les aubes. Dans Ia premiere, on peut consid6rerexp~rinientale 6tant tr~s ondreuse, il est int~ressant de I'co'jlement bidimensionnel axisymdtrique clans le plansimuler numdriquement ]a formation de givie sur ces; (Z,R) clans une coupe d'angle 0 constante (figure 2a).aubes af in de dt~term-iner M'tendue du dep6t, son Dans la deuxi~me, 1I6coulement peut atre Otudi6 sur uneintensit6 et sa forme, sans apport de chaleur, clans un nappe de courant clans le plan (Z,R*9) clans une coupepremider temps. de rayon R (Figure 2b). Les faibles valeurs de laLa chaine num~rique de calcul bidimensionnel de forme troisi~me composante des vitesses clans chacun des casde givre sur profil, developp~e I'O.N.E.R.A [1] est justifitent cette approche.adapt~e et appliqu~e ce cas. Elie est compos~e de 3parties distinctes: un calcul a~rodynamique donnant lechamp de vitesse et pression autour de l'obstacle, uncalcul de trajectoires de gouttes d'eau dens l'Moulementaboutissant au coefficient local de captation quicaract~rise l~tendue du givrage et, enfin, un bilanthermodynamique h la paroi fournissant M'paisseur et Iafoi me du depot.
L'application de ces diff~rents calculs la captation surune, aube est pr~sentde clans ce papier ainsi qu'un iexemple de r6sultat obtenu.4
C' ITAn?, r flAt ,TL
I- Champ a~rodvnmiu Fig. 2a Maillage dans le plan (ZR) d e mddian.
La simulation num~rique de 1'6coulement clans un 6tage Les r~sultats du code adrodynamique sont done exploit~scle l'Energ~tique A I'O.N.E.R.A. En particulier, un code chaque zone de l'Moulement ainsi definie.

17-2
j, ig.4 Approximation au bord d'attaqueFig. 2b Maillage de proximitl dans le pl an (ZR* e)au niveau :du pied d'aube, dui rayon moyen, de la t~ted'aube. 2 - ("alcul des traiectnlreq des gouttes d'eau
Les figures 3a et 3b montrent le champ dec vitesse dans oainPdraeces deux plans ddnommds "canal" et "profit - aubie", Les 6quations de lMoulement diphasique sontsituds chacun dans une coupe m~diane dans Ia 3P appliqu~es avec: les hypoth~ses suivantes :dimension. On peut noter que les lignes de courant SOnt - l'koulement nWest pas modifi6 par Ia prdsence destr~s peu devides par les aubes. Le choix du iaillage gouttes (foible nombre).conduit une imprecision de calcul au niveau du bord les gouttes sont parfaitement sph~riquesd'attaque de laube :en effet, un "becquet" doit atre - I goutte W'est soumidse qu'A Ia force de trainee.ajout6 Ak lavant du profit (Figure 4). C'est un des Le bilan de force appliqu6 A une goutte s'kcrit:incotivdnients de ce code.
d
avec: Fg - force de train6eMg. maese dec Ia goutte
______________________________Vg.- vitesse de la gouttet= temps
______________________________En exprimant Iat force de trainee en foniction du____________________________________coefficient dec train~,e, (1) s'6crit:
------- d~g pA rCt (2)(k 4 pgRg
avec : pa - masse volumnique dec I'airPg= masse volumnique dec la goutte
Fig. 3a champ de vilesse dans le plan "canal" Vr - Va-Vg(7,RJ) a 0 mL'dian Rg -rayon de ta goutte
Ct= f(Re) Coefficient dec trainbo fonction dunombre de Reynolds de Ia goutte
Le calcul des trajectoires est effectu6 de mani~reexplicite [1]: Apart~deIa vitesse de a goutte Al'instant t, on calcule l'acc6l~ration (2) et en Iasupposant constant pendant dt, on intagre (2) et dt~uitIa vitesse dec Ia goutte A linstant t+dt ainsi que sa
____________________________________position jusqu'I l'impact sur l'obstacle.
Les figures 5a et 5b montrent les trajectoires dans Ics__________________________deux plans d~finis pr~c~demment : dans le plan
'1canal", le calcul met en 6vidence un I6ger resserrementdes trajectoires ; dans le plan "profil-aubie", situ6 dansune opem&!iane d-- rayon, Ics gowteS, ont pCU
Fig.3b ham de itese ans e pan profl-aibedevi~es et suivent les lignes dec courant. La zoneFig 3bchap d viess das lpla "pofi-aue"d'impact s'~tend l'intrados jusqd'au bord de fuite.(7,R 9) d R m6.dian

17-3
Adds
- -~2Fig. 6: Coefficier: local de captation
La courbe reprdsentant la posiuon A l'origine enfoniction de l'abscisse curviligne d'impact par rapport aupied de pale est report6e sur ]~a Figure 7, pour un
Fig. Sa .Resserrement des trajectoires dans le plan nomnbre de trajectoi as variant de 10 4 30."canal", Mach amont= 0,33. Diam*Jre median =20 pin
La ddriv~e de cette foinctiop donne les valeurs; de O3c auxdiff~rents points drimpact. Une fonction de cubic-spleeninterpole les valeurs en fonction du rayon et calculeen particulier le facteur de surconcentration aux rayons
- - ~ correspondants aux diftents plans de coupe du calculdans le plan "prof il-aube" (Figure 8).
____________________________En raison de l'interpolation de la ddrivde, les valeursvarient en fonction du nomnbre de trajectoires choisi.Cependant, les oscillations sont gomnm~es pour un
------- calcul effectu6 avec: la valeur mnoyenne de 15trajectoires, courainmnent utilis~e. On constate que lacaptation est nulle au niveau du pied de l'aube, ainsi
Fig. Sb Trajectoires autour de I'aube. Rayon median. qu'au somnmet et que les valeurs d~croissent, pour desrayons croissants.
D'une rnani~re g~ndrale, le coefficient local de 3-1Zcaptition, not6 P3, est le rapport, en suivart ur, tube decourait defini par deux trajectoires vcisines, de la M0I
densir6 de flux massique d'eau mni impactant localement, , M01IIXl a densit6 de flux massique rencontr~e par une si~rface ]
perpendiculaire I'coulenient l'infini amront nil.(Fig. 6).
n(3) W2
Fzg.7: Positions initiate des gouttes d l'origine enEn 6crivant la conservatio,i du debit mnassique entre fonction de leur position d'itnpact sur le bord d'attaquedeux trajectoires voisines, (3) s'6crit dans un plan: dans le plan "canal'.
ds (4) -- --
avec: ye, ordonn~e deIa goutte hl';-fini amor't, 0,r-
s-abscisse curviligne de l'impact sur le --
profil. c--
On obtient donc A~ en calculant Ia d~rivAe de la tonction 8(Creliant, pour chaque goutte, l'ordonn~e.' lnfmni amnnt /hsa position d'imnpact sur Ie profil.
LU calcul de trajectoires dai s le plan "canal" periet 11 2,donc le calcu! d'un piemnier coefficient local de captation if-P~C bur le bord d attaque de I'a'mbe, en fonction . ra,, on. n"'c C-MCaract4-risant leffet de resserrement des gouttes 1-ur 01-40
aresur crofii 'gi fi dotl e un coueffcir de Fig. 8 Coefficients locaux ae ,urconcent ration Pc dartssupdrieures A 1. le plan "canal". Influence du nombre de trajectoires.
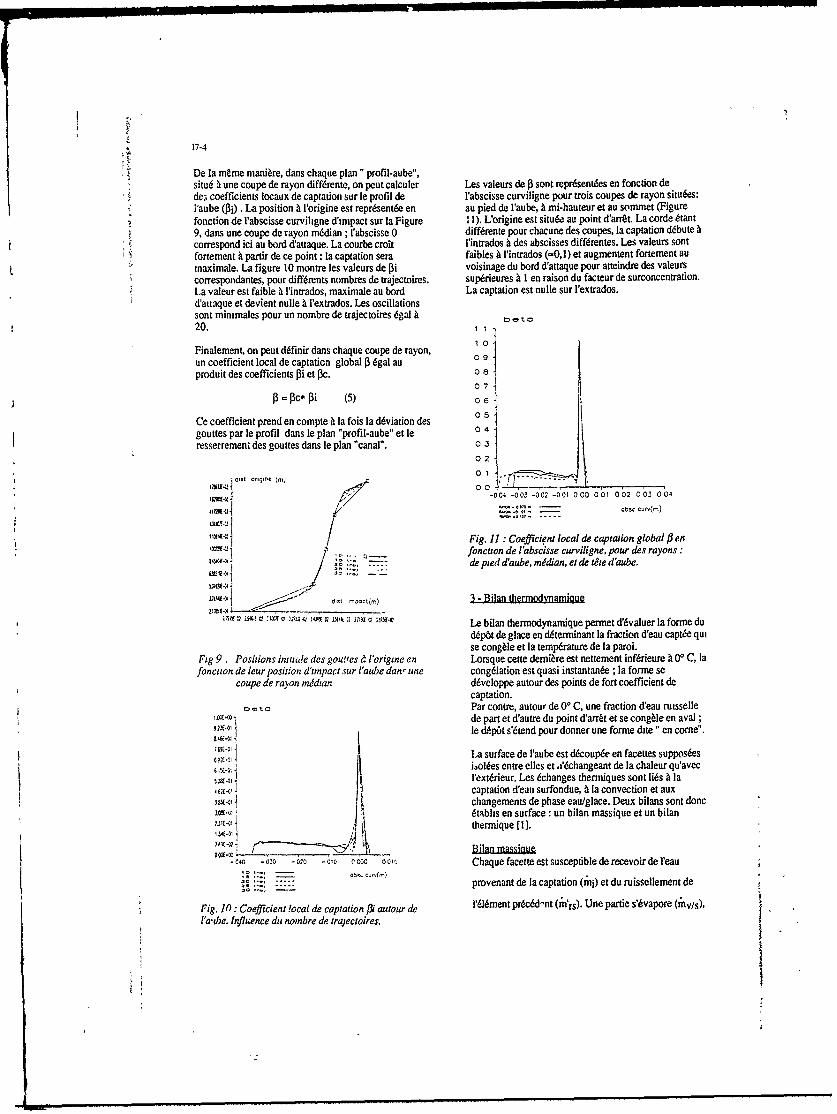
17-4
De la meme mani~e, dans chaque plan" profil-aube",situ6 i une coupe de rayon diff~rente, on peut calculer Les valeurs de j3sent repr~sent~es en fonction dede; coefficients locaux de captation sur le promi de l'abscisse curviligne pour trois coupes de rayon situ~es:laube (Pij) .La position A l'origine est repr~sent~e en au pied de l'aube, A mi-hauteur et au soninet (Figurefonction de l'abscisse curviligne d'impact sur la Figure 11). L'origine est situ&- au point d'arret. La corde t6tant9, dans une coupe de rayon m~dian ; 'abscisse 0 diff~rente pour chacune des coupes, la captation debutecorrespond ici au bord d'attaque. La courbe croit l'intrados des abscisses diff~rentes. Les valeurs sentfortement A partir de ce point : la captation sera faibles A l'intrados (-0,l1) et augmentent fortement aurnaximale. La figure 10 montre les valeurs de Pi voisinage du bard d'attaque pour atteindre des valeurscorrespondantes, pour diffdrents nombres de trajectoires. sup~rieures A 1 en raison du facteur de surconcentration.La valeur est faible It l'intrados, maximale au bord La captation est nulle sur l'extrados.d'attaque et devient nulle At I'extrados. Les oscillationssont minimales pour un nombre de trajectoires 6gal at t e20. i
1 0Finalement, on peut definir dans chaque coupe de rayon,un coefficient local de caption global 13 6gal au3produit des coefficients fOi et N3. 0 8
0 7
P - PC* Pi (5) 061
Ce coefficient prend en compte It la fois la deviation des 05gouttes par le profil dans le plan "profil-aube" et le 0 4resserrement des gouttes dan~s le plan "canal". 0 3
00g0 0l 3 1)
-0 04 -.003 -0 02 -0 01 0060 001 0062 0 0300
16(6- ~Obscc4~m
Fig. 11 : Coefficient local de capta: ion global P enfoncuion de l'abscisse curviligne, pour des rayons:
IN3( de pied d'aube, mdian, ei de O~e d'aube.
3241410~, 4~~3(fl~)3 - Bilan thermodvnmiu
M333Q 2144.3 C203 :2733 3460 Q %,, 0 309 2 38333( Le bilan thernodynamidque permet d'dvaluer la forine du
d~p6t de glace en determainant la fraction d'eau capt~e quise cong~le et la temp~rature de la paroi.
Fig 9 . Positions initude des gou!'es t! l'origine en Lorsque cette demi~e est nettement inf~rieure At 00 C, lafonciton de leur position d'zmpact sur l'aube dan, une congelation est quasi instantan~e ;Ia formne se
coupe de rayon ,nddan developpe autour des points de fort coefficient decaptation.Par contre, autour de 00 C, une fraction d'eau ruisselle
0312.01de part et d'autre du point d'arrk et se cong~Ie en avalle depOt s'&end pour donner une formne dite " en come!'.
L.a surface de l'aubc est decoup&e en facettes suppos~es69x-.J i~es entre elles et .i'changeant de la chaleur qu'avec
1- Iextdrieur. Les 6changes theriniques sont lids At laJ~2, captation deati surfondue, It la convection et aux
changements de phase eaulglace. Deux bilans sont done33340. tablis en surface : un bilan massique et un bilan
C40 -01 -00 -10 co 0011Chaque facette est susceptible de recevoir de Imea
42....,provenant de la captation ('ii) et du ruissellement de
Fig. Y() :Coefficient local de captation fli autour de l'6lment pr&6d&nt (mn'rs). Une partie s'~vapore (rinv/s),l'a'cbe. Influ~ence du nombre de trajectoires.
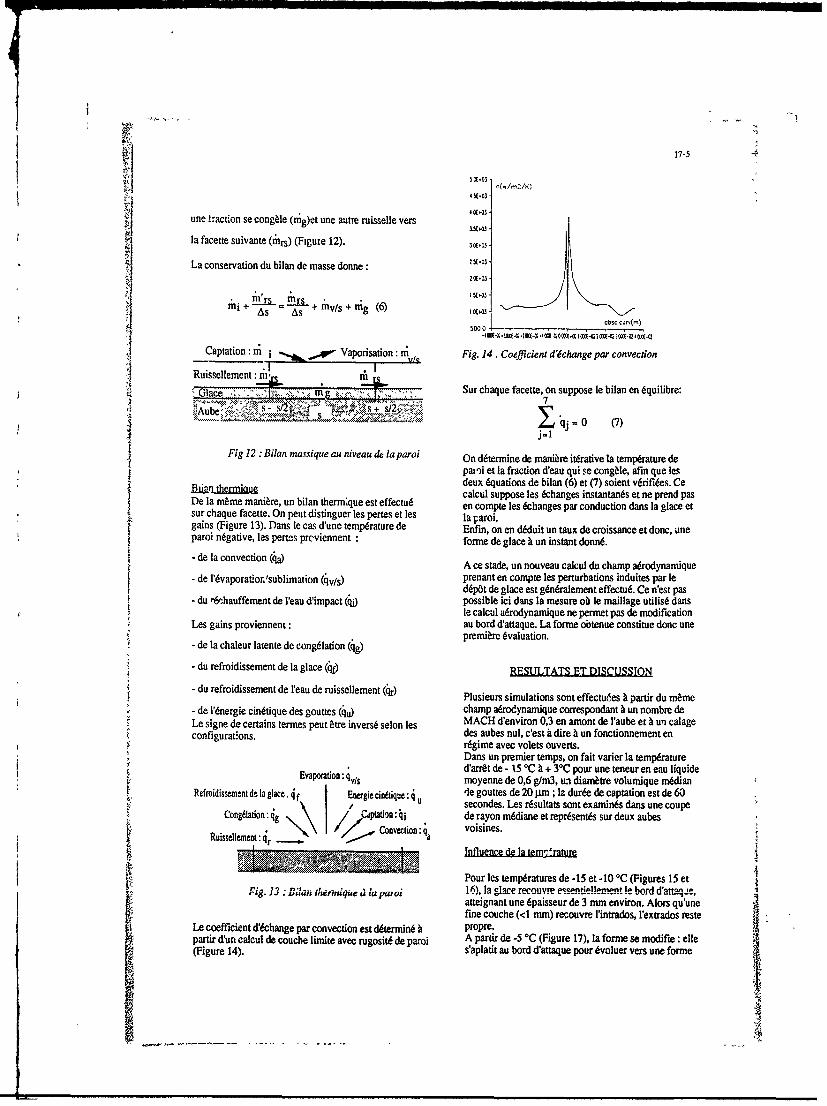
17-5 -4
4 5E+03
une tracton se cong~le (ig)et une autre ruisselle vers;4E0ISE .03
la facette suivante (inrs) (Figure 12). 3E0
La conservation du bilan de masse donne:2E020.+03
mrsr I 5E.03
As As fvSiginj+ = + (6) 5000 es .. m
400.M- I0in C050 ,Iw4014* 30NNI 0*2X.
Captation: ini i -,6 ,P Vaporisation: in, Fig. 14. Coefficen d'4change par convection
Ruisselleinent: in in~'~m .~. Sur chaque facette, on suppose le bilan en dquifibre:
Xq3=0 (7)j-1jFig 12 :Bilan massique au niveau dt la paroi On d~terinine de rnani~re it~rative la temperature de
pai')i et ]a fraction d'eau qui se cong~le, afmn que lesBii^. theriguedeux 6luations de bilan (6) et (7) sojent v~rifi~es. Cefl1LiJht~f1W1 ~calcul suppose les 6changes instantan~s et ne prend pas
De ]a marme inani~re, un bilan therinque est effectu6 en compte les kchanges par conduction dans la glace etsur chaque facette. On peut distinguer les pertes et les la paroi.gains (Figure 13). Dans le cas d'une tenspfature de Enfi, on en d~luit un taux de croissance et donc, uneprinegative, les perte-s prcvienneitfomdglcA nisatdn6
deparonvcto fo6ad)lae~u nsatdna- deIa onvetio ( ~A ce stade, un nouveau calcul du champ adrodynarnique
-de l'6vaporarior~sublimation 6/ prenant en compte les perturbations induites par ledep~t de glace est g~n~ralement effectu6. Ce West pas
-du 6rohauffemnent de l'eau dinipact (bu possible ici dans la mesure o6 le inaillage utilisd dansle calcul a~rodynamique ne perinet pas de modification
Les gains proviennant: au bord d'attaque. La formne ootenue constitue donc une
-de la chaleur latente de cong~Iation (jg)P auain
du refroidissement de la glace (q)RESULTATS ET DISCUSSION
- durefoidsseiantde eau e rissllemnt ~r)Plusieurs simulations sont effectu~es b partir du mnme-de l'dnergie cin~tique des gouttes (41) champ a~rodynainique correspondant A un nombre de
Le signe de cartains tarmas peut atre invers6 selon les MACH d'environ 0,3 en amont de l'aube at A u'n calageconfigurat-ons. des aubes nul, c'est a dire A un fonctionnemnent en
r~gime avac volets ouverts.Dans un premier temps, on fait varier la tenpA-awurad'arrat de - 15 *C A + 30C pour une tenaur en eau liquideEvaporation: q is V mayenne de 0,6 g/in3, ui diain~ra volumnique median
Refroidissement dt 13 glace. 4if Enezgiecindtiquo: d 'e gouttes de 20 jim ; I& dur~e de captation est de 60Congeation I /sacondes. Les r6sultats sont examines dans une coupeU oiain g Cdptdon: i de rayon m&Iiane at reprsent~s sur daux aubas
. /<.rj~.Convection: la voisinas.Ruissellement: q
.... .. ..... nfluence dela tem 'rature
Pour las temp6ratures de -15 et -10 *C (Figures 15 etPig X'"an 1, u ~' 16). la glace recouvre essentialemnt le bord d'attaq-le,
atteignant une 6paisseur de 3 mmu environ. Alors qu'unefine couche (<1 mmn) recouvre l'intrados, I'extrados resta
Le coefficient dfchange par convection est determin6 h propre.partir dun calcul de coucha limifte avec rugosit6 depao A partir de -5 OC (Figure 17), la forin se inadifie :alle(Figure 14). s'aplatit au bord drattaque pour dvaluer vets une farme

17-6
"en come" 0 *C (Figure 18). Le point d'arrat nestplus recouvert mais I'eau se cong~1e de part et d'autre.La largeur de la forme atteint 7 mm. Elie reste confin~eautour du bard d'attaque.
La glace est encore pr~sente pour des temp&aturesd'arret 16g&ement positives car les temp~ratures sonttoujours negatives A lintrados et lextrados (Figure 19et 20). Une 6paisseur relativement importante subsisteau debut de l'extrados et 1'eau ruisselant sur lintrados secongWl plus loin vers le bord de fuite.En r~sum6, on constate une dvolution importante desformes avec la tempdravim.
Fig. 18: - 60 s de captation - lwc 0,6 g~m3-diiv=20gm - tar=0 TC- Rayon m~dian -
Fig. 15: - 60 s de captation - Iwc = 0,6 gIMi C-dmv =2Opin- tar = -is IC -Rayon midian m
Fig. 19: -60 s de capta: ion - iwe - 0.6 g~m3-dmv -20 pin- tar- + 2 IC -Rayon mi'dian
Fig. 16: -60 s de captation - lwc -0.6 ghn3 LZ-dmv 20 pmn - tar -10 OC - Rayon mddan
Fig 20. -60 s de captation - Iwe = 0 .6 gfm3-dmv = 2Opmn - tar = + 3 IC -Payon mdldian
Tnfluence de la section de Ilaube
Le code pernet d'effectuer Itcs calculs de forme danschacune des 15 c.-upes de rayon d~finies dans le codea~redynamnIque, du pied daube A la tate. D'une mani~egdn~rale, le calcul de trajectoires a montrd qu'aucurenouttenimpactait sur les extrdinaits ;les limites de lazorne captation sont donc situ~es en retrait denviron 4min par rapport au. sorrmet et t la base. Entrc cer, dc~ax
L.L2Jlimites, la comparaison des formes pour trois coupesU1iff~rentes ne rdv~1e pas de diffdrence notable (Figure -
Fig. 17: -60 s de captation - lwc =0,6 g~m3 21). La forine n'6volue que tr~s peu avec le rayon de-dmv 20 gmn- tar 5 -s '-Rayon m#.dian - l'aube.

17-7
avec le rayon: l'6paisseur eat identique de la base ausommet de l'aube.Linfluence du calage des aubes n'a Pu 6tre dtudi~.e car samodification n~cessite un nouveau calcula~rodynam-ique A partir de nouvelles donn~es de profil.Selon lexemple trait6 ici, l'application de cette chaine
-Pied d'aube -~ de calcul A une configu- -~on de fort calage (60)permettra. une meilleure localisation des dep6ts de givre.
CDONmLISLa chalne num~rique de calcul de forme de givre sur
-Rayon m6dian - profil d6veloppde I O.N.E.R.A a 6t6 modifide etadaptde au cas de captation sur un aubage de pr~rotationdentr~e d'ali de moteur. Le champ adrodynamiquetridimensionnel est exploit6 successivement dans lesdeux plans perpendiculaires (ZR) et (ZOe) afin dedeterminer les coefficients locaux de captation dans cesdeux dimensions. Un bilan thermodynamique estensuite effectud dans une section de l'aube et la forme de
-Tte d'aube - glace 6valu~e.
Une simulation eat effectu~e dans une configuration deFig. 21: - 60 s de captation - Iwc 0,6 g/m3 calage nul (vclets ouverta). En gdn~ral, la zone de- dmv - 20,pm - tar 5 S C - captation maximale eat situ~e autour du bord dattaque
dont il conviendra donc de priviI~gier la protection.Influence de la teneur en ean ui L'intrados eat recouvert d'une midnce couche de glace,et de ja taille des goutes aiors que l'extrados n'est pas atteint.
Une simulation 0 OC avec une teneur en eau liquide de Las quantizs apparaissent inauffisantes pour conduire AI g/m3 montre, comnme on pouvait s'y attendre, que la une obstruction par recouvrement de plusieurs aubes;quantit6 de glace est plus importante que dans le cas tt voisinpq. Toutefois, on retrouve Il6volution classique0,6 gIm3. Par contre, la forme reste inchang~e (Figure des fornes qui tendent k s61argir lorsque la temp~rature22). La s~v~rit6 du givrage augmente avec la teneur en augmente et avoisine 0 *C. La role prdponderant de laeau liquide. Linfluence de la taille des gouttes se r6v0le temprature eat ici confinii6.ndgligeable.Ceci est en contradiction avec les r6sultatsobtenus sur profit d'avion mais sexplique par les fortes La s-.mulaton de configurations diftentes, envaleurs du coefficient dinertie en raison des tr~s fables particulier avec un calage important peut etre realisdedimensions de l'aube. avec; ce code. Elie permettra de mieux apprehender les
probl~mes de protection contre le givrage rencontr~sdans ces conditions.
REEENCES
[I] D.GUFFOND O.N.E.R.A - FranceCaptation de glace par une surface nonprot~g~e au cours d'un vol en conditionsgivrantes. Recherches et dtablissement d'unem~thode de calcul - 1981 - R T n* 3/5146 SY
Fig. 22- 60 s de capta lion - lwc - 1 g~nm3 [2] J. P VEUILLOT et G. MEAUZE O.N.E.R.A-dv -20,pm - tar - 0 "IC - Rayon midian - A 3D Euler Method for Internal Transonic
Flows Computation With a Multi-DomainE~i r~sum6, !'application du code A une configuration Approach AGARD/PEP - Lacture Series n*pr~cise et une dude non exhaustive de param~tres 140, Paris, 13 - 14 Juin 1985mettent en 6vidence Ia presence de givre,essentiellement autour du bord d'attaque. Pour un [3] L. BRUNETchamp de vitesse identique, !a prdpond~rance du Conception et discussion dun mod~le dennr mn Lme lemp%,ratoirp rnni 4 " 1-e:e1ele ft Ormationdu givrc sur des obstaclca vanies.largement sur la forrue du dep6t de glace dana une 1985. -Thse de doctorat - Universit6 desection donn&e. Par contre, Ia forme paralt peu 6voluer CLERMONT 2 - France

17-8
Discussion 3. A. Sutton, BAeIs there any possibility of using this code on rotor blades aswell as on stator vanes?
1. K. Broichhausen, MTUMy question is also directed to the authors of paper 16. Both Author:codes, the Moore code and the Veuillot code, work either No, this code cannot be used on rotor blades. In this case,with cusps or have some problems in the stagnation zone. the problem is a really 3-D flow field code one. DropletOn the other hand, the icing effects are concentrated near trajectory codes are not developed with effect of giratior.the leading edge. Could you please comment on this?
4. E. Brook, Rolls RoyceAuthor: Does the code re-calculate the flow field to take account ofThat is the problem of the flow field calculation. These the accretion?codes were not developed for this application. The mainpurpose of the codes is to know the flow field at the exit of a Author:stage. ONERA/energetic direction is developing a new code No, in this application the flow field is not re-calculated. Thewith a mesh. I will take this problem into account, approximations at the leading edge do not permit it. The
final ice shape is not important. The masn question is todetermine the areas of accretion.
2. S. Riley, Rolls RoyceHow does the heat transfer coefficient at the ice surface 5. P Sabla, GEACwarm transiently and how is the time stepping achiexed9 What inclement weather corrosion does 0.6 g/m 3 drop
represent9
Author.The transfer coefficient is calculated with an integral Author'boundary layer code. The calculation is done on the blade These conditions represent the standard conditions of LWCroughness and introduced by an equivalent sand height and DVM by FAR 25 law (Appendix C). Other conditionsroughness. Transition appears with a critical Reynolds can be simulated. Accretion increase with the LUC, butnumber. The boundary layer is not re-calculated. The there is a weak effect oftheDMV because of the value ofthecalculations are steady, and we calculate an ice growth rate. inertial coefficient.
..
-t

18-
DEVELOPMENT OF AN ANTI-ICING SYSTEM FORTHE TSO-LHT-800 TURBOSHAFT ENGINE
byGary V. Bianchini
Allison Gas Turbine Division, General Motors CorporationP.O. Box 420
Indianapolis, Ipdiana USA 46206-0420
ABSTRACT partnerships through the Preliminary Flight Rating (PFR)phase with competitive procurement from the winning
The T800-LHT.800 is a modern technology 1200 hp partners following the Qualification Testing (QT) phase.(900 kW) class turboshaft engine developed for the U.S.Army's LH helicopter and various civil applications. One Following the PFR contract award, the Light Heli-of its significant features is an integral inlet particle copter Turbine Engine Company (LHTEC), a partnershipseparator (IPS). The presence of an IPS significantly between Allison Gas Turbine Division of General Motorscomplicates development of an anti-icing system for Corporation and Garrett Engine Division of Allied Signal/protection against the hazards associated with ice forma- Signal Aerospace Company, began a 3-year developmenttion during operation r environmental icing conditions, program competition. LHTEC won the downselect and is
Characteristically, inlet particle separators expose currently in the QT phase of the program. Following the
large areas to the incoming 'ir, with the potential for completion of QT, scheduled for 1991, Allison and
widespread impingement of rupercooled cloud droplets Garrett will compete for the T800 Government procure-and resulting accretion of ice. Thermal anti-icing of such mert. Both LHTEC partners will, however, be awarded aan inlet system, with the limited amount of compressor minimum order in each production lot to ensure theirbleed air available, presented a significant design chal- continued competitiveness.lenge, which has been addressed through three designiterations, an engine test involving a thermal survey of the In parallel with the LH application engine develop-protected surfaces, and an engine test in environmental ment, other engine applications have been explored.icing conditions. A second thermal survey test and a final Commercial ventures including T800 installation in anenvironmental icing test, wnich will satisfy military and Agusta A 129 and Westland Lynx arm currently beingcivil certification requirements, will be run on the pursued. In conjunction with the U.S. Coast Guard, theresulting system late in 1990. Army has issued a T800 contract modification providing
The anti-icing system that has evolved from this for a proof of concept flight demonstration for an Aero-series of designs and tests is simple and light weight. spatiale HH65 aircraft re-engineo with T800 propulsionimposes a performance penalty of less than 5% in powe: units.and specific fuel consumption, and prntects againstharmful formatiors of ice throughout the envelope ENGINE DESCRIPTIONdefined by the Military and the Federal Aviation Admini-stration (FAA). In addition, the system provides protec- The T800-LHT-800 engine is . 1200 hp (900 kW):ion for the vulnerable surfaces of the IPS scavenge class, modular design, 310 pound (141 kg), turboshaftsystem so that separation capability is available to aid in engine. The engine's core consists of a dual-stagepreventing core ingestion of ice shed by the air vehicle, centrifugal compressor, an annular flow combustor, two-
stage gas generator turbine, air cooled with the exceptionThis paper describes the T800 engine, discusses the of the second-stage blade, and a two-stage front drive
anti-icing system requirements, design evolution, and o t he nge a d aily-sge forve
validation testing, and presents the final anti-icing system power turbine. The engine was initially designed for t
configuration resulting from the development effort. U.S. Army which required a high level of maintainabilityand battle field hazard :esistance. The engine features a
PROGRAM DESCRIPTION dual channel full authority digital electronic control,which utilizes a Mil Standard 1553 bus. Other outstandirg
The TS00-LHT-800 engine is under development for features of the engine include attitude capability to 120the U.S. Army's LH helicopter and has significant poten- degrees noseup, 90 degrees nosedown, and 45 degree roll;tial for commercial application. The Army's development 6 minutes loss of oil capability; and an engine-mountedprogram was structured as an effort for two competing IPS. The engine is shown in Figure 1.

18-2
INLET PARTICLE SEPARATOR The IPS system is illustrated in Figure 2.
The engine IPS consists of an inner dome, which The [PS has been developed from detailed flowforms the inner flow path, and the IPS casing assembly, analysis and over 100 hours of both aerodynamic andwhich forms the outer flow path and also contains the sand ingestion rig testing. The IPS system sand ingestionflow splitter, scavenge vanes, and scavenge scroll. An separation efficiency has been demonstrated on both theengine-mounted blower, which is driven by the accessory rig and engine to be 86% with AC coarse and 96% withgearbox, pulls air through the IPS system to create the Mil-C Spec sand. Additionally, foreign object damageaerodynamic separation. The flow path of the IPS forms a (FOD) ingestion tolerance, by either separation or foreign'Y' with one leg leading to the inlet of the compressor object retention, has been demonstrated on the rig.and the second leg connecting to the IPS scavengesystem. This flow path shape coupled with the aerody- Although the IPS system has a demonstrated highnamic separation helps protect the engine core from separation efficiency, the large surface area, inherent toforeign object ingestion. Foreign material in the engine IPS design, results in the potential of widespread super-inlet is separated and pulled through the IPS and dis- cooled water impingement on the flow-path surface, andcharged overboard. The IPS creates a large surface area the subsequent ice accretion while operating ini environ-exposed to incoming airflow, which is a characteristic of mental icing conditions. This, coupled with the budgetingparticle separating systems. The scavenge vanes and the of anti-icing energy source to reduce performance impact,scroll account for a significant portion of the surface area. created a significant anti-icing system design challenge.
ANTI-ICING SYSTEM REQUIREMENTS
The engine anti-icing system was designed to satisfyboth the Military and FAA anti-icing requirements. TheT800 Engine System Specification (military) require-ments state that the engine's anti-icing system shallprevent ice accretion on all core flow-path surfaces of thefront frame and all flow path surfaces of the inner dome.On the IPS casing assembly, all the flow-path surfacesupstream of the scavenge vanes 20% chord point (Figure3) must te ice free, except light frosting will be allowedon the outer shroud upstream of its point of maximumdiameter. These areas are shown in Figure 3. Addition-ally, ice accretion or shedding on surfaces other than the
Figure 1. T800-LHT-800 turboshaft engine. described areas shall not: cause damage to any enginecomponents, cause IPS scavenge flow degradation greaterthan 10% at 10 minutes in the icing condition, causeairflow disturbances that axcite harmonic compressor
/ / / frequencies, cause secondary damage due to reduced/ CW k,/ clearances between rotating and stationary components,
/ C / result in stall or surge, adversely affect the power setting
parameters, or cause engine flameout.
..- '-. [ The engine pertormance loss associated with operat-vwwo,\ V e ing in icing conditions with the anti-icing activated cannot
Fbw exceed 5% loss in delivered power available at all condi-$Pfto \ Se tions above Maximum Continuous power and 5%
sfl -increase in SFC at all conditions above 50% Maximum-ron f: /v Continuous power. Engine transient response must besturm demonstrated to be within specification limits while
operating in icing conditions.Coreifl w The icing conditions that are required to be tested by
the Engine System Specification represent a ground fogTE9O 2186 point (at idle only), a 230 F (-5° C) condition, and a -40 F
(-15" C) condition. Water content, drop diameters, andexposure times at each of these conditions are shown in
Figure 2. Inlet particle separator system. Table 1.

18-3
-- -. minute, immediately followed by anti-ice actuation. TheLight frosting allwed engine anti-ice system is manually activated, so this
requirement simulate,; the probable delay in anti-icingR Iesystem actuation since an encounter with an icing
-condition may not be immediately recognized by a pilot.
20 fchordSpoint (se vane Table 2. FAA icing test points.
T crosssection)
Cod 3
Engine inlet total temp-- -4 +23 +29Airflow 'F ('C) (-20) (-5 (-2)
20% of chord paintTE90-2187 Mean effecive drop
idiameter--microns 15 25 40
Liquid water content --g/m' 1.0 2.0 0.6
IPS scavenge vane cross-sectionExposure time -- minutes 10 10 30
Figure 3. Required ice free surfaces.The military requirements preclude the use of engine
oil as the primary anti-icing energy source. During theicing test, it is required that the engine inlet oil tempera- The FAA, similar to the military, requires the engineture be maintained at or below the minimum oil thermo- operate in the particular icing condition with anti-icestat setting. Also, the ground fog icing condition (Table 1, actuated for 10 minutes, except the FAA also requires thatcondition 3) must be run with the engine inlet oil tempera- the engine continue to run in the icing conditions until anyture maintained at or below the engine inlet air tempera- ice accretion has stabilized. This is a significant require-ture, 230 F (-5 C), for a 60 minute duration of cloud ment for enzines with inlet particle separators, since iceexposure. These requirements ensure that any oil heat formation in the IPS scavenge flow path is allowable, andtransfer effects are minimized, due to the large surface area inherent to an IPS, almost
unavoidable.Table 1. Military .cing test points.
Other requirements, not specifically documented inCondition the specification, are self imposed to ensure the anti-icing
2 a system is reliable, simple, light weight, maintainable, andEngine inlet total temp-- -4 +23 +23 easily producible.
'F ('C) (-20) (-5) (-5)
INITIAL ANTI-ICING SYSTEM DESIGN AP-Mean effective drop PROACH AND RATIONALE FOR REDESIGN
diameter--microns 20 20 30Several anti-icing concepts were evaluated. The
Liquid water content-- selection criteria of the anti-icing system included consid-g/m 1.0 2.0 0.4 eration of satisfying the Military Specification and FAA
requirements, cost, weight, reliability, maintainability,Exposure time -- minutes 10 10 60 and producibility.
The FAA imposes anti-ice system requirements very The initial anti-icing system concept was to anti-icesimilar to the military, with some exceptions. The icing only the inner dome and front frame flow path. Using thistest conditions specified, as shown in Table 2, differ from criteria, several schemes were proposed and evaluated,the test conditions specified by the military. This is insig- including compressor discharge air anti-icing, engine oilnificant to the design criteria because the anti-icing anti-icing, and compressor interstage anti-icing, the onesystem is designed to prohibit ice accretion during any chosen for the T800.icing ccndition enco,!ntered within the engine operating 7and icing envelopes, shown in Figures 4 and 5. During the engine dcvelopment program, the IPS
splitter nose was extended to increase sand separationThe FAA also requires that the engine operate in an efficiency (Figure 6). This resulted in the nc w, actively
icing environment without anti-icing activated for I anti-ice the flow splitter, iistead of relying solely on heatI

18-4
NOSU ureate it x 1000Akkud@~ M4 l0eI to 6 71 km 22,00 1t) 0; 5 0 is 20tMAXrf Mn V* Cx 4AM 198 kM (6,490 M) .6 0 1 43
I IHoWZonal exlerd32 2 k. (20 m)t-------- 0 ov 320
RIO 60 25
213 I I08 1 1 -1Mea cp(e32dTmeter rrvons 2 1
046
TE90.2188Figure 4. Continuous icing envelope.
P.rsn.,teal~nde fI 1l00
0 20 25 300
Merdan dnre d~arrter -nmnn -1040
02 6 8 61
Figure 4. Cr oentminu icing conditions.
conduction from the front frame. Since this forced an anti- power turbine support for wheel cooling. This is sche-icing systPm redesign, and in order to further reduce risk, matcally shown in Figure 8. This concept was rejectedit was decided to also actively antd-ice the IPS outcr flow because at several flight conditions the flow circuitpath and the scavenge vanes. The anti-iced engine flow pressure drop reduce I1 power turbine coolin~g airflowpaths of the initial design and the redesign are compared excessively. Also, the size and weight of the plumbingand illustrated in Figure 6. resulted in weight and maintainability penalties.
Using the redesign concept, four an-icing schemes The third concept evaluated was a compressor inter-were evaluated. An air and electrical system (Figure 7) stage dual pass system. The andi-ice air would be deliv-was studied. The air would andicle the IPS flow splitter, ered from compressor interstage to the front frame struts.front frame, and inner dome, and electrical heaters would The air would then pass through the struts and to the,and-ice the IS outer flow path and scavenge vane leading edge of the inner dome. Then it would flow aftleading edges. The electrial heater power could be al6ng the inner dome flow path surface, then through theprovided by the engine driven PMA, which would require IPS flow splitter, outer flow path, and scavenge vanes.a 50% increase in output capability. This scheme was This concept as shown in Figure 9, was rejected becauserejected due to cost, weight, and maintainability concerns, a significant increase in strut and inner dome passage areawould be required to accommodate the increased total
The second concept consisted of integrating the low. This would impose cost and weight penalties.power turbine buffer air with the anti-ice system. Bufferair is supplied from compressor interstage to the rear The fourth concept investigated, shown in Figure 10,suppo.," to cool the power turbine w.hee.This n1-iing was chos~n foi the PFR uiifiguraton of the T800. it is aconcept would use compressor interstage air to andi-ice compressor interstage split flow system. The anti-icing airthe inner dome and IS flow splitter, flow path, and s delivered from compressor interstage to the front frame.scavenge vanes. The portion of the air used in the IS The air then passe. -ward thru five tunnels in the frontwould exit the IPS casing assembly then be routed to the frame to the struts. The airflow splits at this poinL Part of
30 hOOMI ~erg4 82km (
2 S L ~ 4 " t o C O M
wtxI;
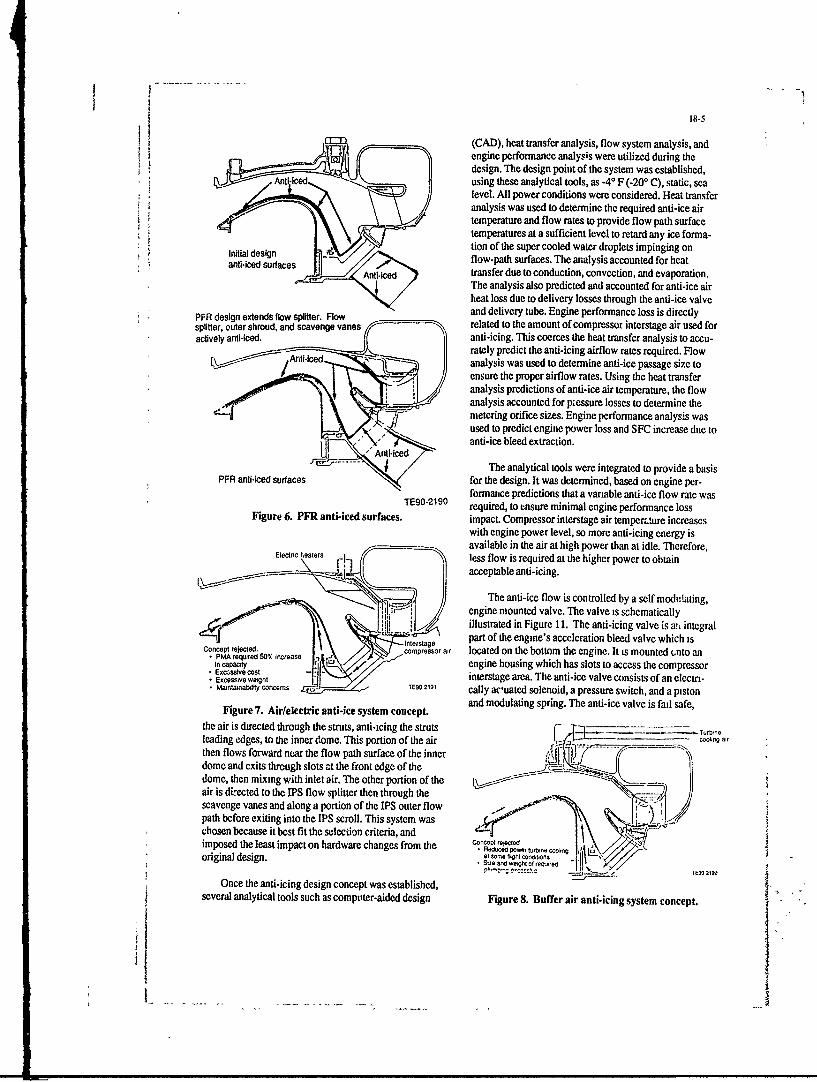
1 18-5
Ii (CAD), heat transfer analysis, flow system analysis, andengine performance analysis were utilized during thedesign. The design point of the system was established,
• " , dusing these analytical tools, as -40 F (-200 C), static, sealevel. All power conditions were considered. Heat transferanalysis was used to determine the required anti-ice airtemperature and flow rates to provide flow path surfacetemperatures at a sufficient level to retard any ice forma-
ntdgtion of the super cooled water droplets impinging oninitial design flow-path surfaces. The analysis accounted for heatAnti-iced transfer due to conduction, convection, and evaporation.
The analysis also predicted and accounted for anti-ice airheat loss due to delivery losses through the anti-ice valve
PFR design extends flow splitter. Flow and delivery tube. Engine performance loss is directlysplitter, outer shroud, and scavenge vanes - related to the amount of compressor interstage air used foractively anti-iced. anti-icing. This coerces the heat transfer analysis to accu-
rately predict the anti-icing airflow rates required. FlowA c analysis was used to determine anti-ice passage size to
ensure the proper airflow rates. Using the heat transferanalysis predictions of anti-ice air temperature, the flowanalysis accounted for piessure losses to determine themetering orifice sizes. Engine performance analysis wasused to predict engine power loss and SFC increase due toanti-ice bleed extraction.
-- The analytical tools were integrated to provide a basisPFR anti-iced surfaces for the design. It was determined, based on engine per-
formance predictions that a variable anti-ice flow rate wasTE90-2190 required, to ensure minimal engine performance loss
Figure 6. PFR anti-iced surfaces, impact. Compressor interstage air temperLture increaseswith engine power level, so more anti-icing energy isavailable in the air at high power than at idle. Therefore,
"ectnc heaters less flow is required at the higher power to obtainacceptable anti-icing.
The anti-ice flow is controlled by a self modulating,engine mounted valve. The valve is schematicallyillustrated in Figure 11. The anti-icing valve is at, integralpart of the engine's acceleration bleed valve which isConcep r.., .compressor awr located on the bottom the engine. It is mounted Gnto an
CocPt rejced SM, Increase- tetae profteegnsaclrtinbedvvewchsin ca"c s engine housing which has slots to access the compressorEceOIsvOe weight interstage area. The anti-ice valve consists of an electn-MainaitycE9 2 9 ally ac'uated solenoid, a pressure switch, and a piston
and modulating spring. The anti-ice valve is fail safe,Figure 7. Air/electric anti-ice system concept.
the air is directed through the struts, anti-icing the struts F rb- Trnneleading edges, to the inner dome. This portion of the air Ao~o ,g Allthen flows forward near the flow path surface of the innerdome and exits through slots at the front edge of the J. _ ..dome, then mixing with inlet air. The other portion of theair is directed to the IPS flow splitter then through thescavenge vanes and along a portion of the IPS outer flow .path before exiting into the IPS scroll. This system waschosen because it best fit the selection criteria, andimposed the least impact on hardware changes from the C ,r .,ektedod 'logn.4tik-
original design. at Some t ,t Cor4Vtn
Once the anti-icing design concept was established, I .
several analytical tools such as computer-aided design Figure 8. Buffer air anti-icing system concept.

18-6
1lower pressure of compressor interstage air and a spring
A e causing the valve t close, disallowing airflow throughthe valve. When anti-ice is selected on, the solenoid s un-
Tpowered and blocks compressor discharge air fromentering the piston. olis, in turn, allows compressorinterstag air pressure to act against the spring and
emodulate the valve. Compessor interstage air pressure,Concept rejecta similar to temperature, decreases as engine power level
Excessive nuease h stt ci and decreases. The lower interstge pressure results inInner dome passage a ed o t i increasing valve area, as seen in Figure 11. A er
v Cost InTrease s o a g ti switch senses pressure in the andice flow circuit andetprovides a cockpit indication of anu-ie actuation.
' INITIAL THERMAL SURVEY TEST AND PRE-
LIMINARY ENVIRONMENTAL ICING TEST
The anti-ice system design was supported withseveral analytical tools-, however, due to the complexity
JT of the flow circuit and heat transfer effects, and todemonstrate the system az, required by specification,hardware flow tests and t~o test programs were per-
formed.
TE90-2193 The flow tests were designed to verify the part fabri-Figure 9. Dual pass antiFice system concept g cation and design integrity by ensuring that the engine
requiring power to actuate the solenoid and turn anti-ice hardware was capable of flowing the design flow rates.off. When anfi-ice is selected off, the solenoid becomes Flow tests were run on the anti icing valve, the innerpowered and allows compressor discharge air to enter the dome, the front frame, the IPS casing assembly, and thevalve's piston. The pressure of the air acts against the entire assembled anti-icing circuit.
Inlet particle separator
Froont Frame
i~~ Fiur 10 aF 5ofgrto ani-cigsyte.
Inedm

18-7I,.
Compressor dischargepressure (P3)
ABV solenoid ABV solenoid A id A! solenoid
F..... A switch
;G'Ne Ambient' Ambiendtmie
Compressor interstage
Anti-ice~flowCustomer i 9bleed port Ambient All solenoids are deenergl;edA c TE90-2195
Figure 11. Anti-ice valve schematic. Anti-ice valve
The first test program run was an anti-ice thermal fold in the front frame, - suiting i lower temperatures ofsurvey. Thermocouples were installed at various circum- the anti-icing air in both the front frame, inner dome, andferential and axial locations of all anti-iced surfaces, the IPS casing flow .ircjut.Figure 12 illustrates the location of thermocouple place-ment. The thermocouples were imbedded in the flow-path Heat transfer analysis, used to model the test data andsurface to reduce convection errors and provide a true provide possible solutions, focused in the aft manifoldsurface temperature. The engine was then run throughout area. As the air enters the aft manifold from the deliverythe power range with dry inlet air at 23* F (-5' C) and -4' tube, it is forced to flow circumferentially in one directionF (-200 C), since these are demonstration points required by a blockage wall in the manifold (Figure 10, Section A-by the specification. Early in the test it was found that the A), thus ensuring that the air is distributed evenly. Theanti-ice flow rate was lower than predicted values. The analysis verified that removal of the blockage could resultvalve was modified to obtain higher flow rates and thus in less temperature drop. Furthermore if the wall had aprovide meaningful temperature data. properly sized opening, acceptable flow , inbution could
occur. Later in the engine developi ',, . , , prior toThe temperature data revealed that the surface tem- the QT phase, the front frame wa; r," igned and tht aft
peratures were lower than expected, as shown in Figures manifold was completely eliminated. This will be13 and 14. Review of the test data showed a significant discussed, in detail, in a later section.temperature drop, about 1000 F (56° C) more thanexpected, from the anti-icing valve inlet to the aft mani- The temperature data from the the most severe condi-
tion, -40 F (-200 C) inlet temperature, revealed that all- surface temperatures were above freezing except for theS/ IPS outer flow path and the leading and trailing edges of
Ithe scavenge vanes.
I ~ The thermal data provided a preliminary evaluationof the anti-icing system effectiveness, however a prelimi-
Inary icing test was required to determine "low-path-/ response to icing conditions and to further ,,aluate engine
performance loss due to anti-icing operation. The test unitwas configured as a gas generator, (power turbineremoved), during the icing test in order ., Lmplify thetest equipment adaptation of the icing spray systemthrough elimination of the load absorption system. Thisdid no compromie 11-c tet cbjectivcs because the entire
M Air temperature TE90 2196metal temperature anti-icing system was intact. Engine performance during.Static pressure these icing runs was synthesized baser on actual perform-
Figure 12. PFR anti-ice thermal survey ance data from this same engine prior to removal of theinstrumentation, power turbine.

18-8
T800 engine 1808 BU4 Metal temperature
-50C (230F) amb 25% MCP Metal temperature
- (38) 100
,'* ,/(32) 90' / A.(
(27 80I
(21) 70
(16 60
(10) 50
(4) 40
(-1) 30
IPS Scavenge Frontshoud vane Nose fmme Inlet strut Inner dome
A A A A -1A A
Figure 13. PFR thermal survey data; 23T, 25% MCP. TE90-2197
The test stand wi .oo.werted ft, -m'. altitude test required a sophisticated deicing and defogging system.facility to a, ,.!ng Si;.1,-. "n test s;,,Ad for this test. Additionally, the borescopes and support equipment wereSpraying Systems I '4J- 1A nozzles were used to produce mounted to the engine and had to survive the engine andthe water spray. The variable conditions were set by icing environment.changing the nozzle water flow rate and the atomizing airpressure. Each test condition (cloud liquid water content Additional documentation of flow-path surfaces wasand droplet diameter) also required that the number of obtained with videotaped borescope inspections immedi-spray nozzles be varied because of the limited operating ately following the icing runs and still photographs of therange of water flow and atomizing air pressure of each engine inlet. Cold airflow was maintained during thesenozzle. The uniformity of the icing spray, which if not post-test inspections to prevent any ice melUng for the
correct could significantly bias test results, was estab- duration of the inspections (usually 20 minute duration).lished by collecting ice on a screen located at the end ofthe engine supply air dut. After nozzle radial location The simulated icing conditions that the engine waswas varied to optimize spray uniformity, the spray system exposed to conformed to the Military requirements de-was calibrated using laser probes. The calibration not only lineated by Table 1. They were:identified the required water flow and air pressure setpoints for each operating condition, but also established (1) 230 F (-50 C) inlet temperature, 2.0 g/m" liquid watersensitivity to variations of these parameters. content, 20 micron drop diameter
(2) -40 F (-200 C) inlet temperature, 1.0 g/ml liquid waterInternal on-line video recording of a front frartie strut, content, 20 micron drop diameter
the IPS flow splitter, and an IPS scavenge vane was (3) 230 F (-50 C) inlet temperature, 0.4 g/m1 liquid waterprovided from borescopes mounted in the IPS casing content, 30 micron drop diameter, idle onlyassembly. This on-line monitoring was used as a diagnos-tic tool and as a safety feature, to ensure engine damag. The test points run during :he icing test were exten-due to ice build up and shedding was avoided during the sive. Power points from iule to maximum power were runtest. The borescope system was designed and imple- with simulated conditions (1) and (2). The engine wasmented due to the inability to visually inspect and expo . the iing canditon fora 10minut duration.document the 'Y' shaped engine inlet flow path, as can be After 5 minutes of exposure a rapid acceleration to 2seen in Figure 2. The video rronitoring system designi maximum followed by a rapid deceleration to the testcriteria were very demanding. The borescopes tips were point was run to demonstrate transient response. Immedi-installed flush with the engire flow-path surface and ately following the full 10 minute exposure period, the
.. ...
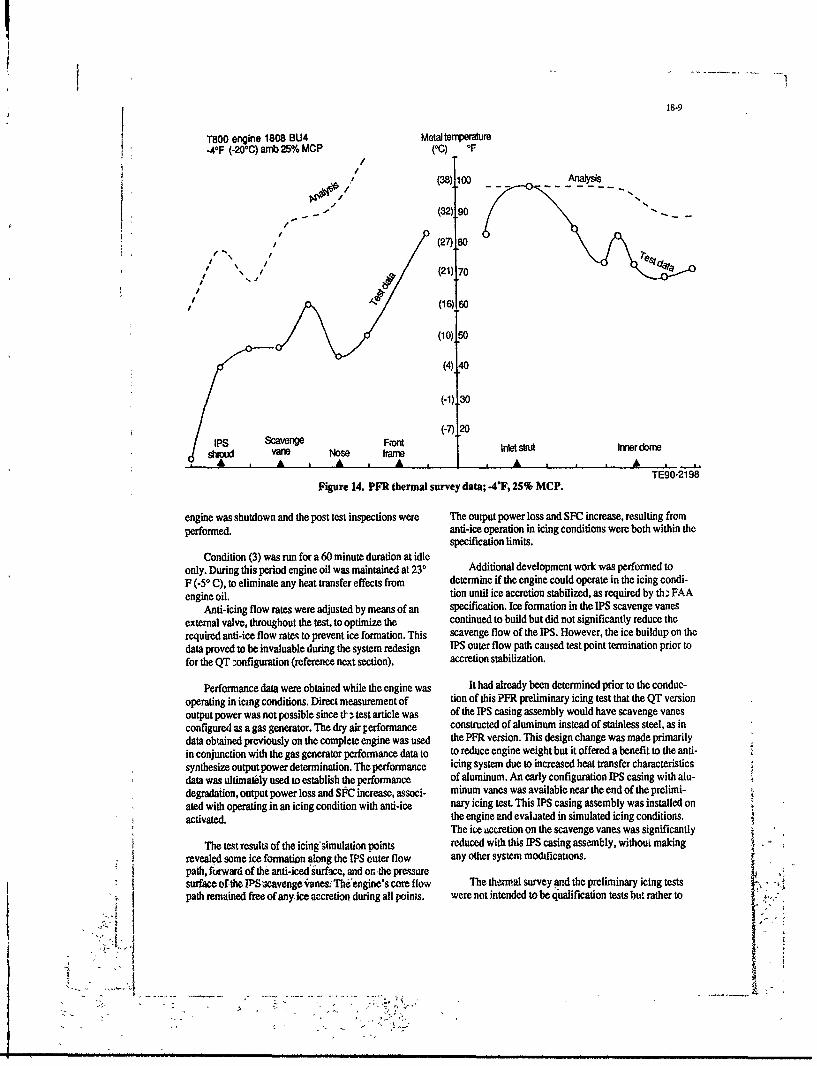
18-9
T800 engine 1808 BU4 Metal temp)erature-4-F (.20t) an 25% MCP (00) OF
/
, (38)100 Analysis
- - - - (32)'90 --/ ( 27) a
I /
S , / (21)70
(16) 60
(10) 50
(4) 40
(-1)30
(-7) 20
Nose frame Inlet s"bt Inner domeA A A . . A *. A TE90-2198
Figure 14. PFR thermal survey data; -4F, 25% MCP.
engine was shutdown and the post test inspections were The output power loss and SFC increase, resulting fromperformed. anti-ice operation in icing conditions were both within the
specification limits.
Condition (3) was run for a 60 minute duration at idleonly. During this period engine oil was maintained at 23* Additional development work was performed toF (-50 C), to eliminate any heat transfer effects from determine if the engine could operate in the icing condi-engine oil. tion until ice accretion stabilized, as required by th:" FAA
Anti-icing flow rates were adjusted by means of an specification. Ice formation in the IPS scavenge vanesexternal valve, throughout the test, to optimize the continued to build but did not significantly reduce therequired anti-ice flow rates to prevent ice formation. This scavenge flow of the IPS. However, the ice buildup on thedata proved to be invaluable during the system redesign IPS outer flow path caused test point termination prior tofor the QT onfiguration (reference next section). accretion stabilization.
Performance data were obtained while the engine was It had already been determined prior to the conduc-operating in icing conditions. Direct measurement of tion of this PFR preliminary icing test that the QT versionoutput power was not possible since t- , test article was of the IPS casing assembly would have scavenge vanesconfigured as a gas generator. The dry air performance constructed of aluminum instead of stainless steel, as indata obtained previously on the complete engine was used the PFR version. This design change was made primarilyin conjunction with the gas generator performance data to to reduce engine weight but it offered a benefit to the anti-synthesize output power determination. The performance icing system due to increased heat transfer characteristicsdata was ultimately used to establish the performance of aluminum. An early configuration IPS casing with alu-degradation, output power loss and SFC increase, associ- minum vanes was available near the end of the prelimi-ated with operating in an icing condition with anti-ice nary icing test. This IPS casing assembly was installed onactivated, the engine nd evalaated in simulated icing conditions.
The ice accretion on the scavenge vanes was significantlyThe test results of the icing'simulation points reduced with this IPS casing assembly, without making
revealed some ice formation along the IPS outer flow any other system modifications.path, furward of the anti-icedsurface, and or.the pressuresurface ofthe JPSxcavengevanes.'Thl'engine's core flow The thermal survey and the preliminary icing testspath remained free of any ice accretion during all points, were not intended to be qualification tests but rather to
t

18-10
identify areas of the anti-icing system that needed further above that required to inhibit ice accretion. Ihis coup" denhancement. Both of these tests were very effective in with the icing problems in the IPS outer flow path andproviding this data. scavenge vane areas led logically to a retistribution of the
anti-ice flow rate splits. It was, imperative to maintain theANTI-ICING SYSTEM REDESIGN BASED ON same level of total anti-icing flow rate tc znsure minimalTEST RESULTS engine performance loss penalties. Therefore, the flowrate
in the front frame/inner dom" anti-ice flow circtit wasFollowing completion of the engine PFR develop- reduced 10% by decreasnb the .Yze of the inner dome
ment program, LHTEC was awarded the follow-on anti-icing inlet holes, which meter the flow. 'The rrdistn.contract for QT development (and engine production). bution, coupled with 5!ight modificauons to inti- ice flowSeveral engine hardware redesigns were initiated to orifices and passages in the IPS casing ws~sembly, in-address problems encountered in the PFP. phase as well as creased the anti-icing flow to the IPS by )0%, thus -heto enhance engine reliability, producif-u:ity, and decrease overall anti-ice flow rate was unchaug d.weight and cost. Part of this redesign was focused on theand -icing system. The test results from the anti-ice In addition to the increase in anti-icing flow to the.thermal survey and the preliminary icing test were very IPS flow splitcr and IPES cavenge area, other IPS casingvaluable in highlighting the areas of the anti-icing system assembly changes were also implementewd. The anti-icingthat required design changes. The original anti-icing flow circuit on the outer flow path was extended forward,concept of the compressor interstzge dual bypass system as shown in Figure 16. This change addressed the outerwas maintained; however, the anti-ice flow circuit was shroud ice formation problem encountered In the icingmodified to increase the anti-icing system effectiveness, test. The anti-ice holes in the scavenge vanes were
modified to provide more uniform heat transfer to theThe front frame was modified significantly by relo- vane surface. As planned near the end of the PFR phase,
cating the oil supply and scavenge passages. This change the vane material wab changed from steel to aluminum towas made primarily due to a compressor modification, reduce weight. This incre.,ed the heat trsfer charawer-however it allowed beneficial rerouting of the anti-ice istics of the vanes.airflow. As discussed previously, the anti-ice air tempera-ture decreased significantly in the aft tunnel of the front The anti-icing valve was redesigned to provide theframe anti-icing air manifold. Relocating the oil tubes anti-ice flow rate changes aetermined from the prelimi-allowed this manifold to be eliminated, thus theoretically nary icing test. As pa-t of the initial development test thereducing a large portion of the 1000 F (560 C) temperature anti-ice flowrates were controlled with an external valvedrop. With the new design, schematically shown in Figure to provide variability not 9vailable in the engine v.lve.15, the anti-ice air enters the front frame from the delivery This flow data defined the design flow rates for the QTtube and flows directly to the forward manifold. anti-icing valve.
Both the PFR thermal survey temperature data andthe preliminary icing test verified that the inner dome andfront frame strut surface temperatures were at a level well
foFrom frame PFRntlrn s - ,3ten.
Arrdced v.W, we ex1tinded forward
o' an sast r (,c/-~~ Aft mndold shmf rate. ~
e o dFigure 16. outer flow path tl-ing design ": "
AnNeie OT anf zec aslWl
Figure IS. QT anti-icing system.-1ne

18-11
The modifications made to the engine anti-icing tavirtually eliminate any blockage since the leads will becircuit addressed all of the concerns resulting from the routed through some of the anti-icing flow passages. Inthermal survey and icing test. These changes did not order to allow access, the thermocouples located on theimpose major setbacks to engine hardware fabrication 1PS1 scavenge vanes are installed during the basic IPSschedules because they were coordinated with hardware casing fabrication process.changes which enhanced the other features of the engine(reliability, cost, weight, producibility). The modifica- Thermocouples will also be located near the shroudtions, made on the basis of the development data, pro- of the IPS scavenge vanes. The purpose of this instrumen-vided a high degree of assurance that the effectiveness of tation is to ensure that the epoxy used during the IPSthe anti-icing system would be increased to a level that casing manufacturing process remains below the allow-both the Military and the FAA certification tests could be able temperature limit during the hot day anti-ice failedsuccessfully completed, including the extended exposure condition.requirement of the FAA.
The engine will be operated throughout the powerrange with dry air (no icing cloud) at each of the follow-
VALIDATION OF REDESIGN BY THERMAL SUR- ing conditions; 590F (150 C), 40*F (4.4*C), -4°F (-200C),VEY TEST and 131'F (55*C). Each of these conditions will be run
with and without anti-ice actuated and with customerThe QT anti-icing system will be validated with bleed extraction. The source of the customer bleed air,
hardware flow tests and a second thermal survey of the like the anti-ice air source, is compressor interstage. Bleedprotected surfaces, scheduled to be performed in 1990. extraction provides a more challenging condition for anti-
icing system operation, due to the increase in temperatureThe anti-icing circuits of the redesigned inner dome, and pressure loss occurring when a higher flow rate is
front frame, and IPS casing assembly, and anti-icing valve delivered.will be flowed to verify design flow capacity. The partswill then be instrumented to allow anti-icing air tempera- Following the completion of the dry air runs, theture and flow path surface temperature measurement 40*F (4.4*C) inlet temperature run will be repeated whileduring engine calibrations, which will be run with simulating an icing cloud at the engine inlet. The 40*Fvariable inlet temperatures. (4.40C) inlet temperature was chosen to eliminate the
complex test equipment provisions required to prevent iceInstrumentation during the thermal survey test will be formation in water supply lines and the spray nozzles that
very similar to that used during the PFR development would occur with below freezing inlet temperatures.phase thermal test, except for slight changes to thermo-couple location based on experience and design differ- The purpose of this water injection test is to provideences. Figure 17 illustrates the location of the instrumen- data so the heat transfer analysis model can be furthertation. As before, the thermocouple sensing tips will be enhanced, and then extrapolated, to provide confidence inimbedded in the surface to provide a true surface tempera- actual icing conditions. Slight variations between the PFRture indication unaffected by convection. The size of the thermal survey test results and the PFR preliminary icingthermocouple wire used during this test will be minimized test results occurred because the location of the icing
cloud water droplets on engine flow-path surfaces couldnot be accurately predicted. The water significantlyaffects the heat transfer characteristics of the surface,therefore determining its location and quantity becomes acritical part of the analysis. Predicting the location of thewater droplets is challenging due to the complex engineairflow and aerodynamic separation.
Surface temperature variations between the dry airrun and the simulated icing cloud run will provide thetemperature data required to accurately predict the
N Air o Ca t.mporatur,* locatior and quantity of the water droplets on flow-path* Mot ,mraur°" surfaces. Following this, the heat transfer model can be
S"OO 220, used with a high level of confidence to predict surfacetemperatures during icing condition operation.
The thermal survey test is intended to provide data sothat the hcat transfer model can be enhanced. Ultimately,
Figure 17. QT thermal survey instrumentation. the thermal survey testing will provide a high level of
I"ii
_ _

418-12
confidence that the anti-icing system can provide accept- incoming area and provide potential for ice accretion.able engine icing protection throughout the icing envelope This challenge was met by designing and developing anprior to running the final environmental icing test. anti-icing system that exceeds all military and FAA re-
quirements.FINAL ENVIRONMENTAL ICING TEST
The anti-icing system design evolved from the initialThe QT environmental icing test will take place late concept to the final configuration through the use of
in 1990 at the Naval Air Propulsion Center (NAPC) in analytical tools, a thermal survey test, and n environ-Trenton, New Jersey. The te t will be identical to the mental icing test. It has undergone three design iterations,icing test performed in the PFR phase except the test which were integrated with other modifications as thearticle will be configured as an engine instead of a gas engine matured, so as to reduce schedule and cost impacLgenerator. The system utilizes compressor interstage ar as the
energy source and delivers the air through a dual bypioNAPC has performed several icing tests on various arrangement. The airflow rate is regulated by a self modu-
engines, including the Aittson T406. NAPC's facility, lating valve to prevent excess air delivery at higher engine
equipment availability, and experienced personnel made powers and thereby minimize performance loss associated
their test sae very attractive. LHTEC has the capabilities with the use of the anti-icing system.
to perform the test but the cost associated with a one time Effectiveness of the system has been repeatedly~~~~setup were not an acceptable option to the NAtPC test site. Efetvnsofheytmhabenrptdydemonstrated with analytical and actual test results duringvarious test programs. Final verification of the system
The preliminary work completed on the engine's will result from a second thermal survey. Military andanti-icing system provides LHTEC with onfidence that FAA flight certification of the system will be obtainedthe engine will successfully complete the icing test. It is through a final environmental icing acceptance test at theplanned that the testing completed at NAPC will be ap- Naval Air Propulsion Center in Trenton, New Jersey,proved by the U.S. Army as completion of the required scheduled to be performed late in 1990.demonstration of the anti-icing system. LHTEC will alsobuild on the test program to include additional test points The anti-icing system is effective, meeting all re-that will satisfy the FAA requirements. quirements. It is light weight, low cos, reliable, easily
maintained, and provides the pilot with engine icingSUMMARY protection by activation of a single switch. The anti-icing
system development, as well as the T800 engine develop-The T800-LHT-800 engine anti-icing requirements ment, represents many thousands of hours of dedicated
imposed a design challenge due to the presence of an work from LHTEC personnel to providing a state-of-the-integral inlet particle separator (IPS). Characteristically, art helicopter engine that meets or exceeds all require-inlet particle separator systems expose a large areas to ments and design goals.
i4 S
-,.I7}

18 3
Discussion Author:Yes, the laser probes measured both particle sizedistribution and density distribution The probes used were
1. R. Wlhbelsman, GE called a Fowaro scattering spectrometer probe (FSSP) andHave you checked the surge margin under the conditions of an optical array probe (OAP). These probes areanti-icing or STD inlet temperature? commercially available.
Author:The engine surge margin has been completely characterized 5. D. Mann, Rolls Royceunder all operating conditions, including operation with Have you nade any separation efficiency measurements onanti-ice on. water droplets?
How impoprtant do you believe is the water/ice separation2. R. Toogood, Pratt and Whitney Canada efficiency to the configuration of the anti-icing system?What is the IPS bypas ;/core airflow raio)
Have you determined that the change from steel to Author:alummium for the IPS turbo shafts will maintain adequate We have not made water droplet separation efficiencyerosion capability? measurements.Did you consider an IPS desig,, which did not include I believe that water separation efficiency is very critical toturning vanes in the scavenge duct9 the anti-icing system. I do not think that increased water
separation efficiency is critical to anti-icing system design,Author:but rather, identifying the location of the water droplets isThe IPS scavenge flow is in excess of 20% of the engine inlet the crtical aspect relating to anti-icig design.flow.
tWe have run the IPS with aluminim scavenge vanes on the
sand ingestion rig to evaluate erosion of the aluminium. Theresult of this test showed no significant erosion. 6. W Rearson, Naval Air Propulsion CenterTo thebest of knowledge, adesgn without turningvanes was Besides PFR icing, the engine was configured as a gas
not considered, generator. How was the performance deteriorationdetermined in this configuration
"9
3. A. Spirkel, MTUi
How much anti-icing air flow is used at high power ratings9 Author:Prior to the removal of the power turbine (configuration of
Author:. gas generator) the engine performa~ice was characterized.
Approximately 2.5 % of the engine core flow is the quantity Power turbine inlet total pressure and inlet temperature wasof anti-icing air used at idle, about half of this amount at measured during this When the engine was run as a gasmaximum power generator, the powei turbine inlet pressure measurement
and power turbine inlet temperature measurement were4. W. Alwang, Pratt and Whitney used to compare the complete engine data. Therefore, gasDid the laser probe measure both particle size distribution generator performance loss was determined by analyzing
and density distribution? and comparing the gas generator and complete engineWas it a commercially available probe9 performance data.
I
ft
i ms i l 1 -- l .... l _ m I l -- L [ I l s llI1 ll ~ ill l ll = l l lW 44
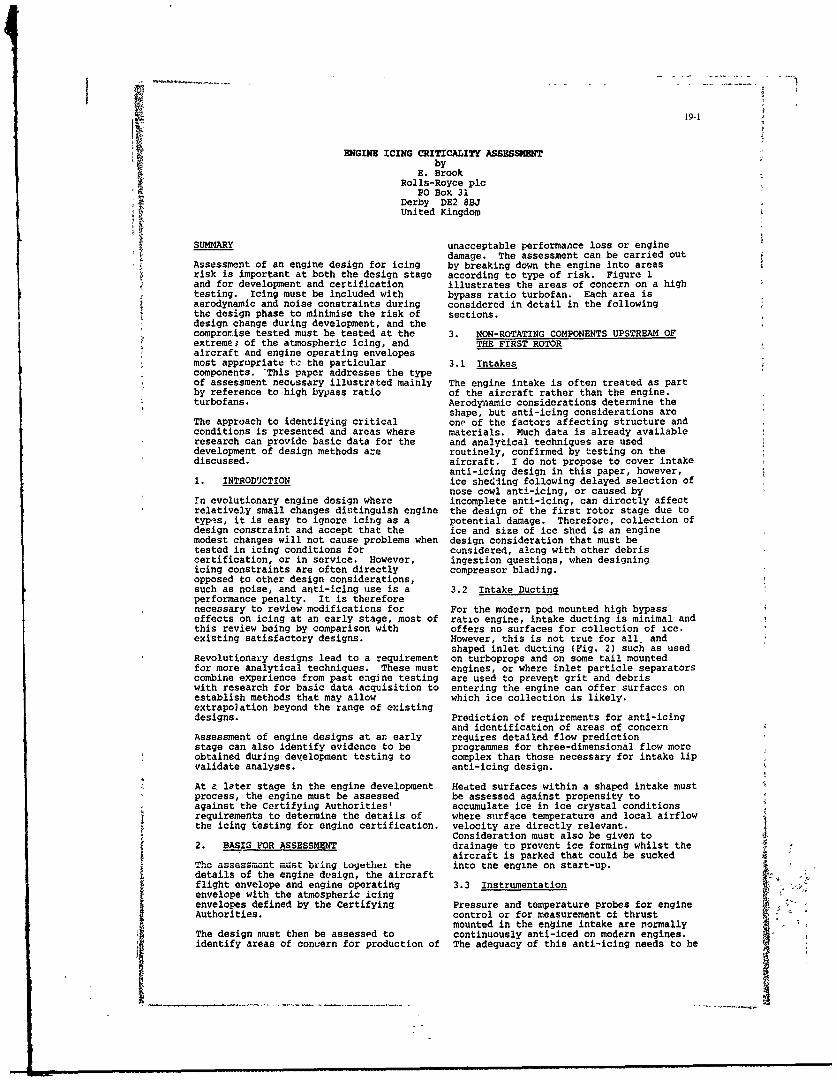
19-1
ENGINE ICING CRITICALITY ASSESSMNTby
E. BrookRolls-Royce plc
PO Box 31Derby DE2 8BJUnited Kingdom
SUMMARY unacceptable performance loss or engineAaidamage. The assessment can be carried outAssessment of an engine design for icing by breaking down the engine into areasrisk is important at both the design stage according to type of risk. Figure 1and for development and certification illustrates the areas of concern on a hightesting. Icing must be included with bypass ratio turbofan. Each area isaerodynamic and noise constraints during considered in detail in the followingthe design phase to minimise the risk of sections.design change during development, and thecompromise tested must be tested at the 3. NON-ROTATING COMPONENTS UPSTREAM OFextreme, of the atmospheric icing, and THE FIRST ROTORaircraft and engine operating envelopesmost appropriate t. the particular 3.1 Intakescomponents. 'This paper addresses the typeof assessment nectssary illustrated mainly The engine intake is often treated as partby reference to high bypass ratio of the aircraft rather than the engine.turbofans. Aerodynamic considerations determine the
shape, but anti-icing considerations areThe approach to identifying critical one of the factors affecting structure andconditions is presented and areas where materials. Much data is already availableresearch can provide basic data for the and analytical techniques are useddevelopment of design methods are routinely, confirmed by testing on thediscussed. aircraft. I do not propose to cover intake
anti-icing design in this paper, however,1. INTRODUCTION ice shedling following delayed selection of
nose cowl anti-icing, or caused byrn evolutionary engine design where incomplete anti-icing, can directly affectrelatively small changes distinguish engine the design of the first rotor stage due totypes, it is easy to ignore icing as a potential damage. Therefore, collection ofdesign constraint and accept that the ice and size of ice shed is an enginemodest changes will not cause problems when design consideration that must betested in icing conditions for considered, along with other debriscertification, or in service. However, ingestion questions, when designingicing constraints are often directly compressor bladJng.opposed to other design considerations,such as noise, and anti-icing use is a 3.2 Intake Ductingperformance penalty. It is thereforenecessary to review modifications for For the modern pod mounted high bypasseffects on icing at an early stage, most of ratio engine, intake ducting is minimal andthis review being by comparison with offers no surfaces for collection of ice.existing satisfactory designs. However, this is not true for all. and
shaped inlet ducting (Fig. 2) such as usedRevolutionary designs lead to a requirement on turboprops and on some tail mountedfor more analytical techniques. These must engines, or where inlet particle separatorscombine experience from past engine testing are used to prevent grit and debriswith research for basic data acquisition to entering the engine can offer surfaces onestablish methods that may allow which ice collection is likely.extrapolation beyond the range of existingdesigns. Prediction of requirements for anti-icing
and identification of areas of concernAssessment of engine designs at an early requires detailed flow predictionstage can also identify evidence to be programmes for three-dimensional flow moreobtained during development testing to complex than those necessary for intake lipvalidate analyses, anti-icing design.
At a later stage in the engine development Hedted surfaces within a shaped intake mustprocess, the engine must be assessed be assessed against propensity toagainst the Certifying Authorities' accumulate ice in ice crystal conditionsrequirements to determine the details of where surface temperature and local airflowthe icing testing for engine certification. velocity are directly relevant.
Consideration must also be given to2. BASIS FOR ASSESSMENT drainage to prevent ice forming whilst the
aircraft is parked that could be suckedThe assessmont must bringq ogethex the into tne engine on start-up.details of the engine design, the aircraftflight envelope and engine operating 3.3 Instrumentationenvelope with the atmospheric icingenvelopes defined by the Certifying Pressure and temperature probes for engineAuthorities. control or for measurement of thrust
mounted in the engine intake are normallyThe design must then be assessed to continuously anti-iced on modern engines.identify areas of conuern for production of The adequacy of this anti-icing needs to be

19-2
addressed on the engine as local flow least partly, the rctating nose cone oreffects can prodnce areas of enriched water spinner. With no anti-icing ice miustcontent within the intake, although accumulate on this and the low ceatrifugaldetailed testing of the isolated probe in forces acting close to the engineicing conditions will have been carried out centre-line may allow an excessiveby the supplier. Prediction of water accumulation before melting ordroplet behaviour arcund the intake lip can out-of-balance forces cause shedding.be used to assess the acceptability of theprobe immersion. There are two approaches to nose cone
design; either accept the shape determinedModein temperature and pressure probes are by compressor intake flow design and designusually electrically anti-iced to minimise an anti-icing system adequate to preventtheir performance penalty. For these th ice build-up, or determine the shape ofcritical icing conditio:,s are likely to .e nose cone that minimises ice build-up andmaximum engine power conditions at minimum ensure that this is established as thealtitude and either at minimum temperatures, basis for design. Departures from thisif heat removal is dominated by the ideal design, which may still not requireairflow, or at about O'C total inlet any deliberpte anti-icing, can then betemperature, where water input is maximum assessed provided data on ice catch and icedue to the nature of the atmospheric icing shedding is available, similar to that usedeni-lopes, if heat removal is dominated by on fan blades discussed in Section 4.2.the zrquirement to evaporate thesuper, oled water drop lets caught by the If the methods to assess the design are notprobe s rfaces. available, specific testing of a new design
may be necessary once criteria torOn some older engines hot air anti-iced acceptability, e.g., maximum ice build-upprobes are used and critical conditions in weight or thickness, have beenthen depend on the hot air supply. established. As a last resort, engine
testing in icing conditions will establishThe design of the prone anti-icing system the acceptability of a particular design,should be such as to prevent any ice at a cost.forming on the probe either by heating thewhole probe body, or by providing full The critical conditions for ice build-up onevaporation of all water caught by the a spinner are likely to be extendedprobe on the critical areas. Probe designs exposure at minimum temperature conditionsthat are not fully anti-iced must be such as occur during hold as this producesassessed against the damage that could be the strongest ice bonding, and is thereforecaused by shedding of the maxim-,an sire of likely to accumulate more ice than higherice particle, liquid water contents at higher
temperatures which will shed earlier.3.4 Inlet Guide Vanes and Nose Cones
For aircraft that normally cruise at lowerFigure 3 illustrates an engine with altitudes, within the continuous maximumnon-rotating engine hardware immediately icing envelopes, higher engine powers mayupstream of the first rotor stage. This give rise to a worse situation due to thetype of hardware must be anti-iced, and higher energy imparted to the shed ice.because of the danger of damage caused byice shedding and the distortion caused by A further aspect to be considered inblockage the inlet guide vanes at least spinner designs is the possibility ofshould be continuously anti-iced. Critical asymmetric ice accumulation. Uneven gapsconditions will depend on the type of around fairings can give rise to iceanti-icing used, whether it is independent accumulations sufficient to giveof engine power, like electrical heating, or unacceptable out-of-balance and, hence.dependent such as the use of engine oil or engine vibration. Spinner drainage musthot air. also be addressed for the same reasons.
4. THE FIRST RMOR STAGE 4.2 The Fan
All surfaces ahead of the first rotor stage Ice cannot be prevented from accumulatingare potential sources of ice debris that on the fan blades, the first rotating stagecould damage the aerofoils or casing in a high bypass ratio engine. Assessmentlinings of the first, and subsequent, of an engine design, the , tore, reduces torotating stages. This type of damage can prediction of the quantity of ice that willbe minimised by appropriate application of accumulate before sheddiig, how this iceanti-icing or de-icing, i.e. prevention of will shed, where the ice debris will go andice accumulation or removal of ice before how to prevent this ice debris causingan unacceptable quantity has accumulated, damage.Once into the rotating stages it becomesvirtually impossible to provide anti-icing Current fan designs are unlikely to sufferand it is, therefore, necessary to appraise from unacceptable performance loss due tothe design for its propensity to accumulate flow passage blockage by ice, but it cannotice and the likely consequences of the be ignored for revolutionary designs ifaccumulation. It is then necessary to blade spacing is significantly reduced,determine how this ice will shed and especially at the Llade root whereconsidAr the desin of the surfaces against distortion generated Would directly affoctwhich it will impact. the core engine.
4.1 The Nose Cone Ice accumulation on fan blades is afunction of the fan blade relative air
There Is one further part that it may be temperatures. This leads to a maximmpossible, and desirable to anti-ice at radius above which ice cannot adhere for a
.1
N • • mm m Mmmmmm~m~mm~mmmm ms m ., m~mmmm~mm~~mmm m mwm m mm mm mmmmmmm mm ~ M I

~19-3
given set of ambient conditions and of excessive quantities of ice can causerotational speed, and a gradation in ice surge or flame-out as well as damage tobond strength to the blade surface rotor and stator blades or rotor pathdecreasing as radius increases, liners.
' This bond strength is an important Methods to predict ice accumulation and
parameter if analysis techniques are to be shedding from stator vane sets based on iceestablished to predict ice shedding from catch and bond strength data may befan blades, and also nose cones or any possible, although prediction of theother surface. aerodynamic forces responsible for
shedding, given the highlyThe energy of the ice debris can then be three-dimensional form of the flow,considered for design of the fan track especially after ice has started'toliner and casing panels downstream, and accumulate and is causing local blockageprediction of worst case scenarios for dependent on ice shape, is extremelyengine icing testing for certification. difficult, It is also necessary toFor example, is the maximum accumulation of consider the interaction between ice onice occurring during excended exposure at adjacent vanes as ize structures bridginglow power conditions likely to produce more between vanes are strong and do not rely ondamage than the limited accumulation at bcnd strength to the individual vanes tohigh power conditions where much of the fan prevent shedding, but require a failureblade wi'l be ice fiee? For the low power within the ice structure.conaition ice shedding during engineacceleration must also be considered. Stator vane spacings that permit ice to
bridge between "anes, given the icingIn most current high bypass ratio engine conditions that actually occur within thedesigns it is not possible for ice shed engine, and realistic exposure times arefrom the fan blades to enter the core unlikely to be acceptable due to blockage,engine. Reduction in fan blade trailing and hence compressor inlet distortionedge to core engine inlet spacing maypermit ice to shed into the core engine. Empirical data is needed to permitThis could cause core engine damage, or assessment of the propensity fvrpower loss due to compressor surge or unacceptable ice accumulation on statorflame-out. Methods to predict ice vane sets as a function of vane spacing,trajectory once released from the blade stagger angle and temperature, as reducedsurface are, therefore, necessary for spacings are often favoured for noisedesign assessment, reduction reasons.
5. ENGINE COMPONENTS DOWNSTREAM OF THE Temperature is an important parameter asFIRST ROTOR STAGE the ice form and quantity is dependent on
the temperature of formation. IcingThe assessment of the components downstream conditions giving worst Dlockage need to beof the first rotor stage in icing identified for certification testing.conditions is zundamentally different from Highest air temperatures give the least
* components considered in Sections 3 and 4 aerodynamic ice forms, but also the weakestas the temperature and pressure rise ice a compromise temperature must,through the first, and subsequent, therefore, be identified.compressor stage alters the envelope oficing conditions. Engine power becomes a Ice catch on surfaces is also important inmajor factor in the exposure of components identifying realistic airflow waterto icing. At high engine powers in flight contents to be considered once the fanambient conditions with supercooled water blades have removed a proportion of thedroplets present may never exist combined atmospheric liquid water content.with temperatures downstream of the first
* rotor sta~e at which ice can accumulate. 5.2 Fan Bypass Stream Outlet Guide Vanes
Ice catch or the fan blades and nose cone Ice accumulation on fan outlet guide vanesis also an important parameter in follows the same basic rules as that onpredicting the liquid water contents in the engine section stators but is usually lessair:low that must be considered, critical as spacings are usually wider andTher-fore, it is not usually necessary to there are no components downstream that cananti-ice components downstream of the first be affected by either the blockagerotor stage, and it is often impossible to generated distrption or the ice that isprovide anti-icing on the aerodynamically shed. However, excessive blockage can givedetermined components due to their size or rise to pressure loss through the outletthe problems of supply of hot air or guide vanes or loss in aerodynamicelectrical power. efficiency leading to excessive swirl in
the bypass stream airflow, giving reducedHowever, tere are a rumbor of areas of engine thrust if not compensated for by theparticular concern that should be engine control system.considered at the design phase andaddressed during engine certification icing An assessment of the envelope of enginetesting. thrust, aircraft operating conditions and
atmospheric conditions in which icing can5.1 Engine Section Stators occur downstream of the first rotor stage
is, therefore, important.The engine section stators are the firstset of components within the core engine. 5.3 Intercompressor DuctingIce accumlatior on these can cause coreengine inlet blockage, leading to Intercompressor ducting usually has a verydistortion and compressor surge. Shedding limited envelope when icing may occur
depending on the number of stages in the
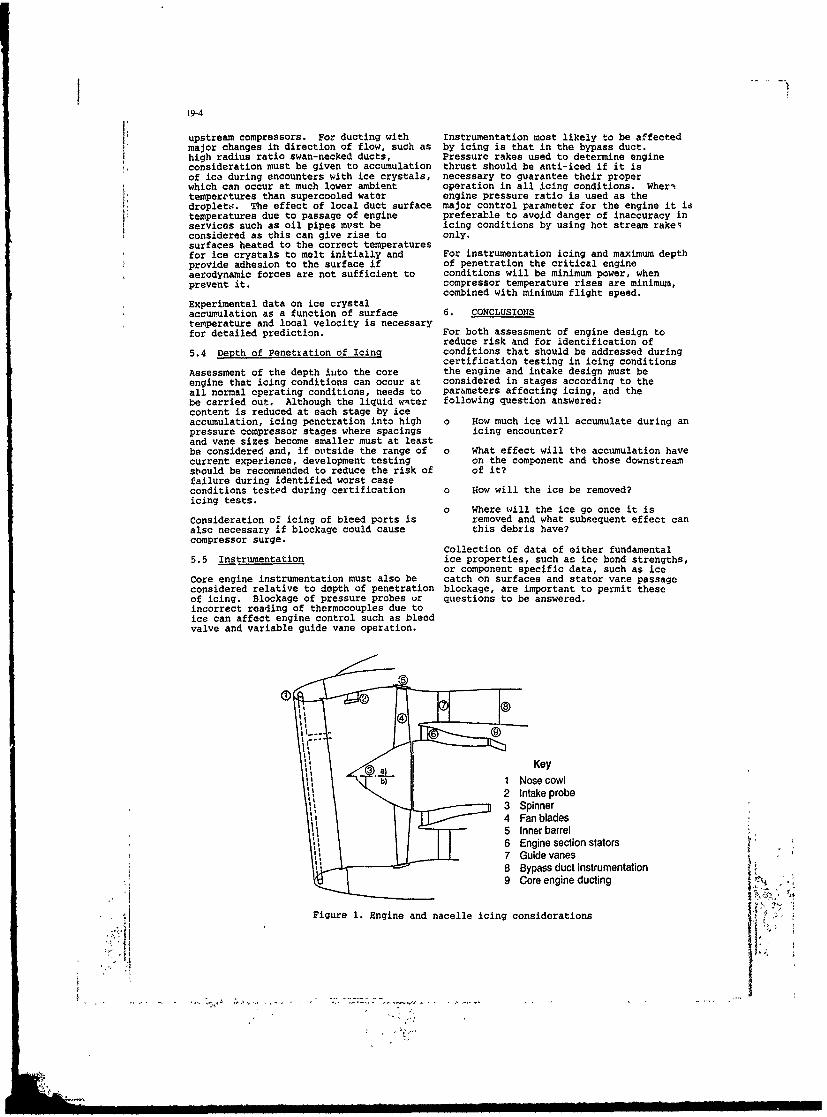
19-4
lI upstream compressors. For ducting with Instrumentation most likely to be affectedmajor changes in direction of flow, such as by icing is that in the bypass duct.high radius ratio swan-necked ducts, Pressure rakes used to determine engineconsideration must be given to accumulation thrust should be anti-iced if it isof ica during encounters with ice crystals, necessary to guarantee their properwhich can occur at much lower ambient operation in all icing conditions. Wher%temperetures than supercooled water engine pressure ratio is used as thedroplets. The effect of local duct surface major control parameter for the engine it istemperatures due to passage of engine preferable to avoid danger of inaccuracy inservices such as oil pipes mu'st be icing conditions by using hot stream rakeqconsidered as this can give rise to only.surfaces heated to the correct temperaturesfor ice crystals to melt initially and For instrumentation icing and maximum depthprovide adhesion to the surface if of penetration the critical engineaerodynamic forces are not sufficient to conditions will be minimum power, whenprevent it. compressor temperature rises are minimum,
combined with minimum flight speed.Experimental data on ice crystalaccumulation as a function of surface 6. CONCLUSIONStemperature and local velocity is necessaryfor detailed prediction. For both assessment of engine design to
reduce risk and for identification of5.4 Depth of Penetiation of Icing conditions that should be addressed during
certification testing in icing conditionsAssessment of the depth i,,to the core the engine and intake design must beengine that icing conditions can occur at considered in stages accordinq to theall normal operating conditions, needs to parbmeters affecting icing, and thebe carried out. Although the liquid water following question answered:content is reduced at each stage by iceaccumulation, icing penetration into high 0 How much ice will accumulate during anpressure compressor stages where spacings icing encounter?and vane sizes become smaller must at leastbe considered and, if outside the range of o What effect will the accumulation havecurrent experience, development testing on the component and those downstreamsbould be recommended to reduce the risk of of it?failure during identified worst caseconditions tested during certification o How will the ice be removed?icing tests.
o Where will the ice go once it isConsideration o! icing of bleed ports is removed and what subsequent effect canalso necessary if blockage could cause this debris have?compressor surge. Collection of data of either fundamental5.5 Instrumentation ice properties, such as ice bond strengths,
or component specific data, such as iceCore engine instrumentation must also be catch on surfaces and stator vane passageconsidered relative to depth of penetration blockage, are important to permit theseof icing. Blockage of pressure probes ur questions to be answered.incorrect reading of thermocouples due toice can affect engine control such as bleedvalve and variable guide vane operation.
KeyIb) I q I Nose cowl
2 Intake probeI I3 Spinner
4 Fan blades5 Inner barrel6 Engine section stators7 Guide vanes8 Bypass duct instrumentation9 Core engine ducting,
Figure 1. Engine and nacelle icing considerationsP ael cn
p
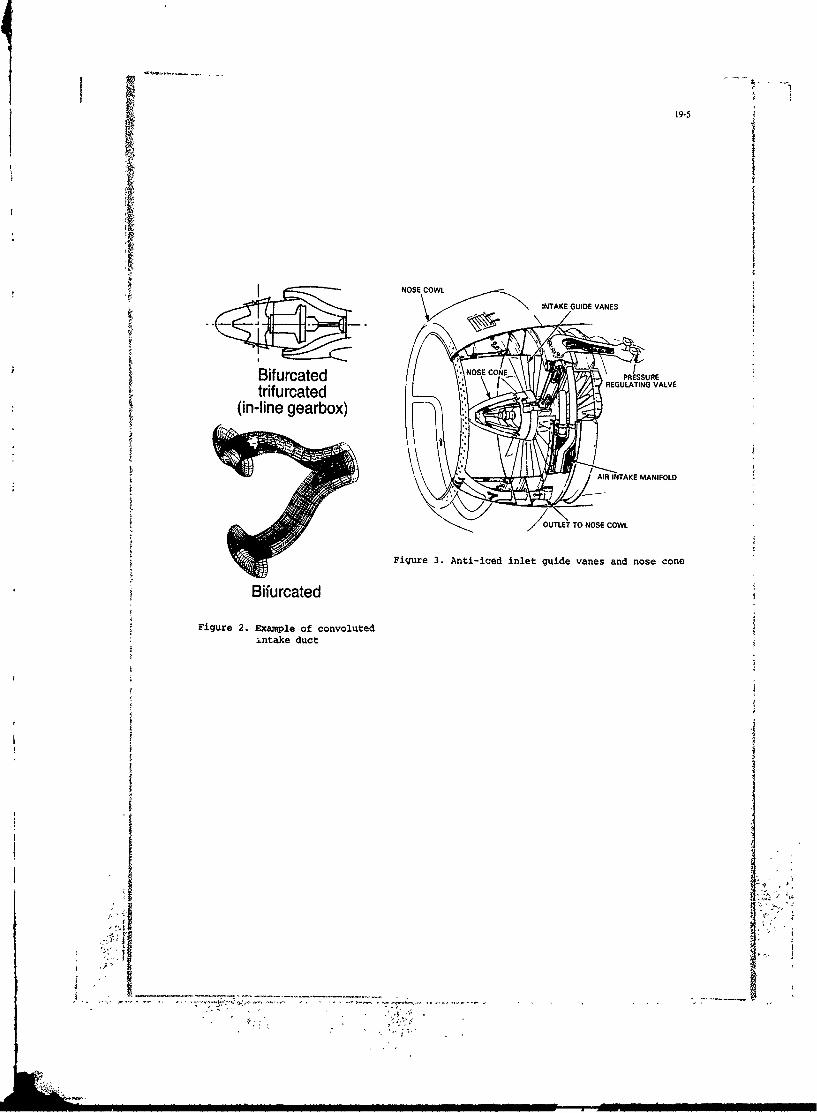
ii 19-5
NOSE COWL
INTAKE GUIDE VANES
BifuratedREGULATING VAL.VEtrifurcated
(in-line gearbox)
AIR INTAKE MANIFOLD
ODUTLET TO NOSE COWL
Figure 3. Anti-iced inlet guide vanes and nose cone
Bifurcated
Figure 2. Example of convolutedintake duct

19-6
Discussion except indirectly through the charge in the engne as the iceaccumulates. It should be noted that :o loss in thrust occursas the ice accumulates since the engine is usually controlled
1. M. Holmes, RAE to an overall pressure ratio which means a directTo what extent are altitude test facilities used by Rolls Royce measuremeit of engine thrust.for icing qualification tests compared with flight tests behindan aircraft carrying water droplet spray equipment?
4. D. Way, RAEAuthor Which of the icing problems that you have decribed is mostRR use altitude test facillities for engine icing tests troublesome, in the sense that it is least amenable toextensively and consider an altitude test facility the best way protection or experimental model testing early in the engineof performing engine icing tests. Aircraft icing tests are only development programme?contemplated where problems occur during flight testing orwhere the certifying authorities of the airframe constrictor Author:insist. However, in the future, the limited size of the altitude The worst problem recently has been icing of engine sectiontest tacililties available may force a change as engine size stators. Engine section stator designs have been givingincreases, reduced gaps and increased blade numbers for noise
reasons, and ice building on these can lead to problems due2. W. Grabe, NRC Ottawa to the pressure loss through the blockage, or flow distortion.Have you estimated energy requirements for anti-or de-icing or ice shedding i,ito the core. This can produce compressorthe Contrafan nacelle lip on account of its larger diameter? stall or surge and combustion extinction. Without testing ofSuggested is not to reject the cyclic de-icing which is done the full engine the interaction between core inlet icing andnow quite successfully, providing accretions are not allowed the operation of the core compressor is very difficult toto grow too large? predict, especially as problems are likely to occur at descent
idle powers.Author: If problems occur during engine testing the only solution isEngines like the contrafan, which has both a large diameter to apply some restrictions on engine operation in icingfan cowl and a gas generator cowl ahead of the aft mounted conditions which is undesirable.fan, plus struts and inlet guide vanes which requireprotection from icing, puts a demand on core compressorblade flow for full anti-icing which is unacceptable. I do not 5. M. Holmes, RAEknow the exact numbers but they are such that the bleed You suggested that your icing assessment and predictiondemand would give an unacceptable effect on gas generator methods were aimed at minimizing or even eliminating theoperation. The same applies to many of the designs need for expensive testing. Do you believe you will evercurrently being proposed for ultra-high bypass ratio reach that goal, and what evidence have you obtained so farengines, and alternatively anti-or de-icing of engine inlets which gives you (and the airworthiness authorities) suchmust be considered, such as electro-impulse de-icing. confidence?Hov.ever, any de-icing method gives an additional problemin that the engine must then be proved to be capable of Author:accepting the regular inputs of the ice debris generated. This The assessment and prediction methods have arrived atshould not be an insuperable problem but it increases the eliminating expensive testing, but they have also arrived aterosion problems already generated by rain and hail. ensuring that the testing earned out is the most effective one.
Having identified areas of risk relative to operation in icing3. A. Sutton, BAe this is accepted by the airworthiness authorities already asWhat amount of blockage have you found with ice accretion evidence in adjusting test conditions or eliminating teston the fan blades? requirements. Theevidence of the success of the approach is
in the excellent operation record of Rolls Royce engines inAuthor: service both in term of safety and in-service behaviour withWe have not measured the ice blockage on the fan blades icing.
Vi
Iii V.

20-1
iIIII
ICE INGESTION EXPERIENCE ON A SMALLI TURBOPROP ENGINE
L.W. Blair, R.L. Miller, D.J. TapparoGeneral Electric Aircraft Engines
1000 Western Avenue, Lynn, Massachusetts 01910
IntAuction The compressor operates behind an integral inertialparticle separator (IPS). The separator system, shown in
Premise Figures I-IA and I-1B, is integrated into the power unit oilModem high technology turbine aircraft engines often cooling system and provides airflow to cool the electronic
employ high rotor speed compressors with thin advanced engine control. Originally designed as a sand separator forblading designs to achieve better performance. The engine the military helicopter environment, the system incorpo-designer is faced with a tradeoff between optimum com-pressor performance and on-wing durability. During the TO FXHAUST EJECTORengine/ aircraft development stage, certain assumptions are CSCROLL DISCHARGE
made regarding the icing environment and the testing CONAMIAEDrequired to confirm compatibility with it. Often the true COMPRESsoaINLETimpact of the design trade-off is not realized until the en-gine is exposed to its service environment.
Despite successful engine test cell and aircraft natural eA~ ARicing certification tests, in 1984 General Electric Aircraft CONTAMNATEDI SCROLL CASEEngines Company began to experience an unacceptable I'-E AIRq XMAINFRAE
level of foreign object damage (FOD) caused by ingested r SCROLL V4ES n)ice with its CT7-5/-7 family of turboprop engines. INLET FRAME
FRAME AFTFORWARD STRUTS (S)
PSTRUTS (a)
The purpose of this paper is:(1) to address the issue of Stage I compressor rotor Figure I-lA Engine Inlet Flow Diagram
blade ice FOD in the C",7 engine,(2) to explain the methods and techniques used in as-
sessing the icing environment, _ _____.- A
(3) to explain the lessons learned from test and analy- (TOMCTORsis, and
(4) to define the final resolution of the compressormaintenance problem which simultaneously created accel- .ET [erated performance deterioration for the engine.
IThe paper is divided into two parts, the first dezling I IF Ewith the airframe icing environment and its impact on the M , 3TrMengine inlet system, and the second concentrating on t('e 4,W Fasdesign improvement and durability testing of the Stage 1 7 nVCASNcompressor blade. Igure
ARFigure I-B Inlet Frame, Mainframe, IGV Casing Assembly
rated swirl A.d deswirl vanes to optimize efficiency. It hasBasicEngineDesign since been changed from a swirl coacept to a straight axial
The (27 turboprop engine is a free-turbine modular bypass to reduce pressure loss and improve performance.design derivative of the 7700 turboshaft engine. It employs , a five-stage variable stator axial and single stage centrifugal Inlet and Installed Icing Eg irnnietcompressor with a combined pressure ratio of 18:1. Tae airframe-provided inlet design is a conventional
S-duct with a throat area optimized to aircraft specifica-tions. An inlet protection device (IPD) is incorporated tomeet bird ingestion certification requirements.I-tI
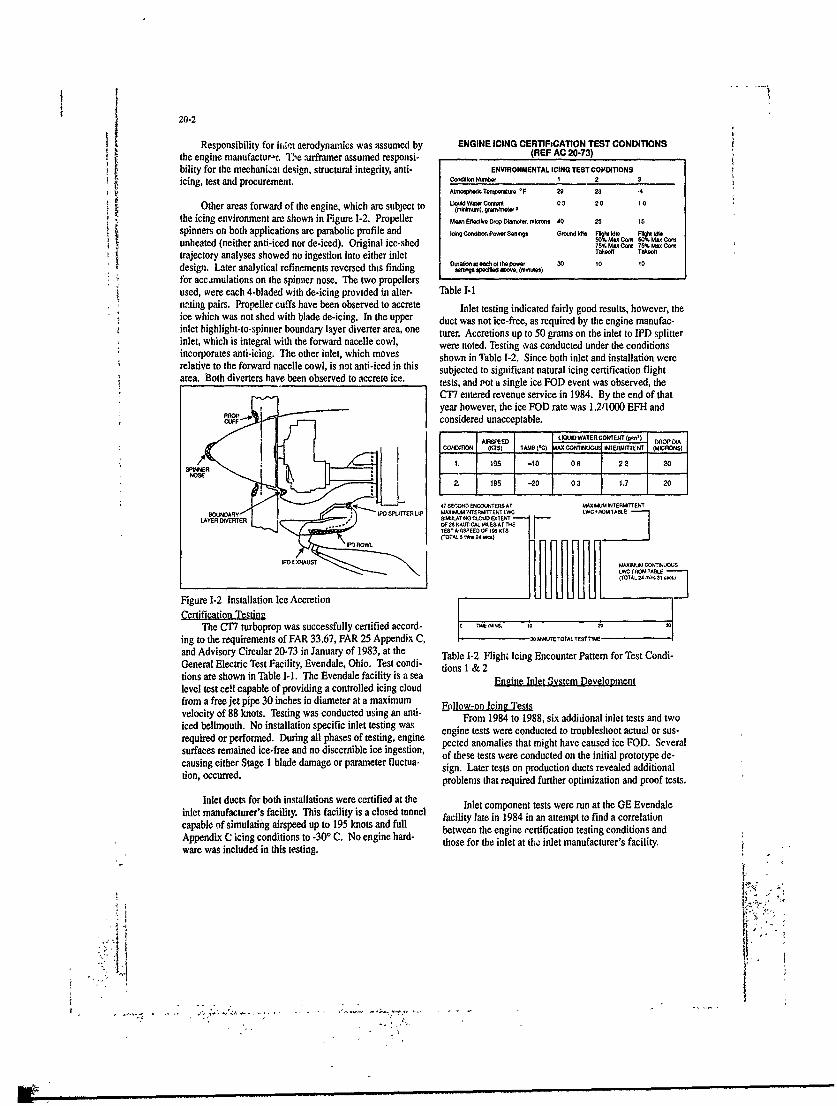
20-2
Responsibility for ih:et aerodynamics was assumed by ENGINE ICING CERTIFICATION TEST CONDITIONSthe engine manufactur-r. T.e atrframer assumed responsi- (REF AC 20-73)bility for the mechanizat design, structural integrity, anti- ENVIRONMENTAL ICING TEST COIADITIONSicing, test and procurement. co,,d,, NwRw 1 2 3
A2nospdhcTwnauwo *F 29 23 .4
Other areas forward of the engine, which are subject to all COMM 03 20 10
the icing environment are shown in Figure 1-2. Propeller Menr , 0196.,61,om 40 25 15spinners on both applications are parabolic profile and C dP ow w S awns G i M C C.
unheated (neither anti-iced nor de-iced). Original ice-shed 75% Ma Coo 75% M& Comtrajectory analyses showed no ingestion into either inlet T~,, Takw"O
Dwadn a "chol ho p 3 10 10design. Later analytical refinements reversed this finding so" so 10 mo
for accimulations on the spinner nose. The two propellersused, were each 4-bladed with de-icing provided in alter- Table I-1nating pairs. Propeller cuffs have been observed to accrete Inlet testing indicated fairly good results, however, theice which was not shed with blade de-icing. In the upper duct was not ice-free, as required by the engine manufac-inlet highlight-to-spinner boundary layer diverter area, one turer. Accretions up to 50 grams on the inlet to IPD splitterinlet, which is integral with the forward nacelle cowl, were noted. Testing %vas conducted under the conditionsincorporates anti-icing. The other inlet, which moves shown in Table 1-2. Since both inlet and installation wererelative to the forward nacelle cowl, is not anti-iced in this subjected to significant natural icing certification flightarea. Both diverters have been observed to accrete ice. tests, and Pot a single ice FOD event was observed, the1CT7 entered revenue service in 1984. By the end of that
year however, the ice FOD rate was 1.2/1000 EFH andconsidered unacceptable.
ND ARSPWED AXUvWEacONTIT(9) DIOP DIA
cotNON (KTS) TAMB (C) WXCOIrT aINERlNT (MICRONS)
1 ME; I. 19s -10 0 22 20
2. 195 -20 03 1.7 20
47 SEOOND ENCOUNTERS AT MAXRJJIM VNTERMWENTBODAAy M PUTTE MJR P S JW.LAT WTEMUENTWLWC LWC FROMIABLE
LArE ISWTWO 3 COUD ETENTOF 26 NAUTiCAL MILESAT THETESTAIASUEE0 OF 195 415
(TOTAL 24 rr r 214 TA
1P0 EXHAUST
Figure 1-2 Installation Ice AccretionCertification Testino
The CT7 turboprop was successfully certified accord- C .o 26 1
ing to the requirements of FAR 33.67, FAR 25 Appendix C, .3OIMITTOTAL rSTIMEand Advisory Circular 20-73 in January of 1983, at the Table 1-2 Flight Icing Encounter Pattern for Test Condi-General Electric Test Facility, Evendale, Ohio. Test condi- tions I & 2tions are shown in Table I-1. The Evendale facility is a sea Engine Inlet System Develoomentlevel test ce!l capable of providing a controlled icing cloudfrom a free jet pipe 30 inches in diameter at a maximum Fl -on Icing Testsvelocity of 88 knots. Testing was conducted using an anti- rom
icedbelmouh. o intalatin seciic ilettesingwasFrom 1984 to 1988, six additonal inlet tests and twoiced bellmouth. No installation specific inlet testing was engine tests were conducted to troubleshoot actual or sus-required or performed. During all phases of testing, engine pected anomalies that might have caused ice FOD. Severalsurfaces remained ice-free and no discernible ice ingestion, of these tests were conducted on the initial prototype de-causing either Stage I blade damage or parameter fluctua- sign. Later tests on production ducts revealed additionaltion, occurred. problems that required further optimization and proof tests.
Inlet ducts for both installations were certified at the Inlet component tests were run at the GE Evendaleinlet manufacturer's facility. This facility is a closed tunnel facilit late in 1984 in an attempt to find a correlationcapable of simulating airspeed up to 195 knots and full betwey te in 94iian teting coditionApenixC cig oniton o 3Q C N egie ar- between the engine certification testing conditions andAppendix C icing conditions to -30 C. No engine hard- those for the inlet at th, inlet manufacturer's facility.ware was included in this testing.
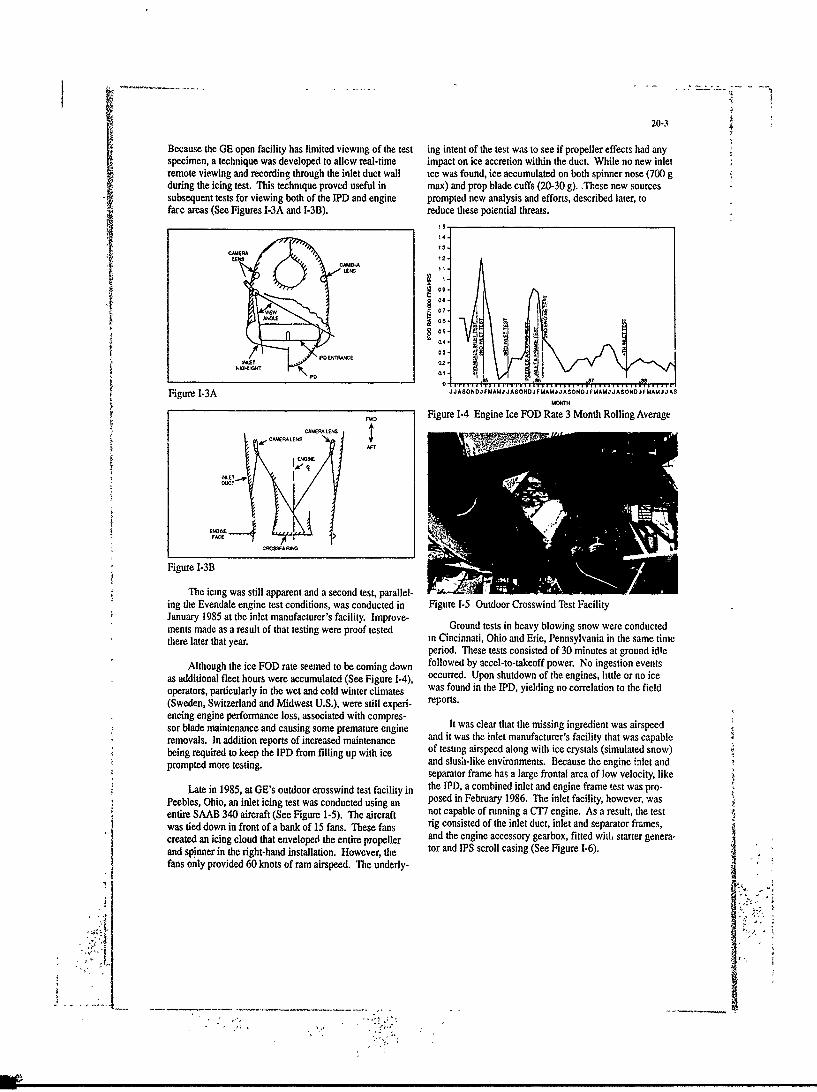
20-3
Because the GE open facility has limited viewing of the test ing intent of the test was to see if propeller effects had any 2specimen, a technique was developed to allow real-time impact on ice accretion within the duct. While no new inletremote viewing and recording through the inlet duct wall ice was found, ice accumulated on both spinner nose (700 g
face areas (See Figures I-3A and I-3B). reduce these potential threats.
14 .
143
0't
CMERA
0.2
Figure I3A JAODFAJAODFAJAOOFAJAOOFA3A
Figure I-3B
The icing was still apparent and a second test, parallel- 2
ing the Evendale engine test conditions, was conducted in Figure 1-5 Outdoor Crosswind Test FacilityJanuary 1985 at the inlet manufacturer's facility. Improve- Grudtssihevblwnsow eecnutdm ents m ade as a result of that testing w ere proof tested r u d essi h av bl w n s ow e e c n u t dthere later that yer in Cincinnati, Ohio and Erie, Pennsylvania in the same time
period. These tests consisted of 30 minutes at ground idleAlthough the ice FOD rate seemed to be coming down followed by accel-to-takeoff power. No ingestion events
as additional fleet hours were accumulated (See Figure 1-4), occurred. Upon shutdown of the engines, little or no iceoperators, particularly in the wet and cold winter climates was found in the IPD, yielding no correlation to the field(Sweden, Switzerland and Midwest U.S.), were still experi- reports.encing engine performance loss, associated with compres-sor blade maintenance and causing some premature engine It was clear that the missing ingredient was airspeedremovals. In addition reports of increased maintenance and it was the inlet manufacturer's facility that was capablebeing required to keep the IPD from filling up with ice of testing airspeed along with ice crystals (simulated snow)prompted more testing. and slush-like environments. Because the engine inlet and
separator frame has a large frontal area of low velocity, likeLate in 1985, at GE's outdoor crosswind test facility in the IPD, a combined inlet and engine frame test was pro-
Peebles, Ohio, an inlet icing test was conducted using an posed in February 1986. The inlet facility, however, wasentire SAAB 340 aircraft (See Figure 1-5). The aircraft not capable of running a C'T7 engitie. As a result, the testwas tied down in front of a bank of 15 fans. These fans ng consisted of the inlet duct, inlet and separator frames,created an icing cloud that enveloped the entire propeller and the engine accessory gearbox, fitted witi, starter genera-
and spinner in the right-hand installation. However, the tor and IPS scroll casing (See Figure I-6).
fans only provided 60 knots of ram airspeed. The underly-I
EQ"
''
Vew.

20-4
Other Approaches to Ice FOD ReductionTurboprbp spinner icing experience was reviewed and
a conical spinner design war service evaluated in an effortto reduce accretions and thereby alter trajectories. Therehad been success in the past on turbofan applications forsuch designs; Figure 1-7 depicts the turbofan test resultsupon which the turboprop service evaluation was based.The results of this survey yielded no improvement. Spinner.oating experience was examined with no obvious benefituncovered. A program to anti-ice the spinner nose wascarefully reviewed, however, a shortfall of aircraft electrical
"-*.... .. .... power eventually ruled out such a program, as well as any. . .. potential for increased de-icing of propeller blades/cuffs.
Figure 1-6 Inlet/Frame Test Setup
Externally heated oil was supplied to the gear- box and ,NTOIKETcirculated by motoring on the starter generator. Thts pro- COIA St[vided engine frame antt-icing for those surfaces normally cOToM
protected by oil temperature. Hot air was generated exter-nally to anti-ice, those engine surfaces which rely on bleed -
"-
air. Skin temperatures obtained from a simultaneous engine Relative Ice Accreton
anti-icing test at Evendale were maintained to simulate anti- o g &.o
iced engine heat rejection. S L S-3'C, 2gm/m 3(>t 1 00 055000 M 25 MACH -15"C 2 2 gm/mn, 20/a 43 07
In addition to the ice crystal and mixed conditions, the
standard test liquid water content (LWC) was factored up. 5000 M 25 MACH -20'C 1.7 gm/m, 20g. 30 05
This accounted for the additional water impingement cre- Figure 1-7 Spinne. Ice Elimination/Reductionated by the aircraft normal cruise speed of 260 knots vs thetunnel maximum speed of 195 knots. Three things were Si. ultaneous to these source reduction/eliminationlearned: (1) the engine frames did not ice or pack slush, (2) efforts, GE embarked on an extensive program to evaluatethe IPD required additional flow-through ventilation to and improve the effectiveness of the engine separatorreduce packing of slush and aerodynamically assure that the system for target size pieces of ice. Trajectory analyses,slush would not enter the engine, and (3) the factored LWC using the standard axi-symmetric model of the separator,put additional load on the inlet anti-icing system requiring were conducted for varying degrees of adverse particlefurther improvements. One of these improvements was a preconditioning imposed by the turboprop S-duct. Baselineheated IPD exhaust chute. cases were correlated with factory test results for 3 gram
pieces of ice (.75 inch dia).D_,-,i. ::.. 'ove-mentioned second engine test at
Evendale, this time with aircraft inlet installed, a single Several flowpath modifications were analyzed forFOD event was observed. Using the inlet video cameras, efficiency improvement and the most promising was se-the event was traced to ice build-up inside the inlet tern- lected for model testing (See Figures I-8A through I-8D).perature sensor duct, from runback along the inlet frame. Modified inlet and separator hardware model testing wasAs the ice built up in the sensor duct, it gradually was conducted in the GE Lynn component facility, using separa-sucked out by the compressor. A reworkable fix, demon- tor scavenge flows confirmed from flight test measure-strated latei in this test, was implemented immediately ments. The mixed test results (see Figure 1-9) showed noacross the fleet and in production. ronsistent net improvement in ice protection. It was con-
cluded that the range of inlet duct exit trajectories is tooAs duct improvements were gradually incorporated broad to achieve substantial IPS performance gains within
into the fleet the ice FOD rate stabilized at about 0.2/1000 the confines of a compatible installation. While gains mayEFH. This; however, was still an unacceptable perform- be realized for a given preconditioned trajectory, a compa-ance and maintenance penalty for the small commercial rable loss is likely for another trajectory of equal probabil-operator. As a ,'sult, a target goal of .075/1000 EFH was ity. While inlet separators are effective in minimizing theestablished, While further inlet improvements continued to number of damaging objects reaching the compressor, theybe addressed, the possibilities of ice FOD coming from ad- are at best statistical devices which cannot be 100 percentditional sources, and measures needed to deal with these effective. When faced with a steady input of instantaneouspossibilities, were explored, damage-producing objects (as opposed to a time dependant
, • K
- .---------- ---. - -------

20-5
,. 11101 -1
O~~pocefiP LSPPOO
IPS FLOW - % Wc-t
igr 1 -Figure 1-9 Separation Efficiencies with Production Inlet
Figure 1-8A erosion process), separation efficiency improvements naybe misleading. At this point, attention wis turnc' to tie
_._- .. __ + .Stage I compressor blades themselves.
Engine Inlet System Development Conclusions1)To ensure a consistency in the application of icing
test requirements, the aircraft inlet and engine should betested together in the most severe environment available.
IThis environment should include ice crystals and mixedconditions.
2)Successful operation in natural icing tests may notbe sufficient to preclude in service icing problems.
3)Follow-up icing testing of the final Production inlet_design is required to ensure proper implementation of
prototype test results.
Figure I-SB 4)Dunng the initial installation design phase, thecomplete inlet/propellei/spinner icing environment shouldbe asseszed as a system to ensure optimum distribution of
j anti-icing energy.Part I
Ice FODResistant Comressor Blade Dev.!oJment
- -~-Stage 1 Compressor Blade ClippingEvein with improved inlet ducts, the ice FOD rate
requiring maintenance action for CT7-5 powered aircraftwas about .20/1000 EFH; still beyond customer expecta-tions, the FOD appeared as a curled stage I blade tip as
LLUE shown in Figure 11-1, and it caused an audible compressorwhine and loss in engine temperature margin. The mainte-nance action required removal of an axial compressorcasing half for access to the damaged stage I compressor
Figure I-8C blade(s); clipping the deformed blade material and a similarportion from an opposite blade to maintain rotor balance,
id - I L and hand benching a leading edge on the clipped airfoils.
/V
Figure I-8D Figure 11-1
-- C
'I

20-6
This action eliminated the compressor whine but did not causing erratic flight and inconsistent impact areas. The icefully restore the engine's original performance level be- balls were targetted to pass cleanly between the IGV's andcause the material removal adversely impacted compressor impact tho blades as close as possible to the tip withoutefficiency and airflow, contacting the shroud. A speed trap measured the object
velocity just before entering the inlet casing. The largest,=5.U-!2 ice chunk would be the circumferential space between the
A key part of developing a more rugged compressor inlet guide vanes (about 1-inch at the casing) and wouldblide was to determine the degree of the ice FOD which permit an 8 gram sphere to pass through when the vanescould result in Stage I blade damage. A rig was designed were fully open (i.e., axial at casing O.D.).with a row of inlet guide vanes (IGV) ahead of the Stage 1blisk driven by a high speed spindle at engine speeds (See The test events were recorded with a high speed cam-Figure 11-3). Due to the possibility of FOD wedging action era system at 22,000 frames/second. This provided insightbetween the blade and casing, a shroud over the blades was on the impact phenomenon and verified the impact area ofused to simulate the casing. A pneumatic gun was used to the objects. High speed video (2500 frames/second), whichpropel the FOD objects at various velocities up to 400 ft/ had the advantage of instant replay to monitor testing, wassee (120 m/see). The ice FOD tests however, were con- used to verify the impact area and ice velocity. The testducted at 85 - 90 ft/sec (27 m/sec), the highest possible speed was 42,000 RPM, a typical altitude cruise speed atvelocities determined for ingested ice objects released which most ice FOD events occur.during flight. It is possible that ice chunks impacting on theinlet S-duct could enter the compressor inlet at slower Resultsspeeds, but the impact of these objects was considered less The initial blisk testing was done on a CT7-5 blade. Itsevere than the test simulation. The approximate ice veloc- was found that a 2.8 gram ice object caused initial bending,ity was calculated by equating the acceleration of a spheri- and a 4.5 gram ice object caused a single event blade tipcal ice mass to the drag of free stream flow using a drag curl similar to field damage (See Figure 11-1). Smallercoefficient of 0.55. Figure 11-2 shows the calculated veloc- ,hunks of ice (i.e. 3 grams) can cause a blade curl fromity at the Stage 1 blade as a function of ice ball size. successive hits. Successive hits occur on a particular blade
because it is bent forward of the plane of the other blades.The ice objects used for the test were spherical in The testing also determined the vulnerability of a blade
shape because the initial small right cylinders tumbled, which is adjacent to a clipped blade. A clipped blade al-lows more ice penetration prior to impact by the adjacentblade. This causes full tip curls from smaller ice objects.1- ..- - -: - , - This correlated with field observations where compressors
& , - + - - - - - with clipped blades had higher rates of maintenance actionafter the first clip. The high speed photography also re-
. .1.. i- vealed that a large ice object can impact and bend a blade- " on its initial hit and then, due to a heavier impact on the
7 -protruding blade, cause a full curl on the next revolution.-" '-+ -+'-Large ice chunks (5 to 8 grams) were also fired at the pitch' L secions causing minor bulging. This was not typical of ob-:1 - - served field damage. Therefore, it was concluded that the.. -damaging ice objects were traveling along the outer casingrXWG ") wall and impacting in the blade tip area.
Figure 11-2 Ice Ball Parameters at IGV Inlet A sample of operator ice FOD data was evaluated todetermine the extent and frequency of the blade curls (SeeFigure 11-4). The data included the bend radius, since it isthe amount of material removed prior to benching a new
/SJcm- t leading edge radius. About 75% of the events required aclip of 0.3 inches along the blade tip chcd and 0.8 inches
I- I --- C down the leading edge.
It was judged that a cutback of .25 inches along the tipIH and .65 inches down the leading edge along with a reshape.of the leading edge to improve the aerodynamics would
eliminate most of the problem associated with tip curls.-.. Furthermore, a swept leading edge would present a more
aerodynamic shape to minimize performance loss. ThisI-- was called the "smart clip" (See Figure 11-5) and is subject
Figure 11-3 Component Test Setup of a pending patent application. This "smart clip" was
• ,ff

20-7
TABLE 11-1 TEST RIG ICEBALL FOD SUMMARYObject which
Blisk Object which Causes ExtensiveConfiguration Iniates Damage Damager LrlCT7-5A grams grams
Baseline 2.8 4.5.12 Cutback >4 5.18 Cutback 6 >6.25 Cutback >8 >8
Baseline CT7-5A 1.5 2.8next to Field Clip
cr7-5A .25 Cutback 65 >6.5next to Field Clip
CDN7-9 Cutback >8 >8_UTAK____N_ I- -INCHE
Figure 11-4 Operator Ice FOD Data Rotor Speed 42,000 rpmIce Ball Velocity 85 ft/sec
evaluated in the test rig in steps of .12, .18, and .25 inches Impact Area @ Blade Tip
of tip cutback. The test results in Table II-1 show that the Initial blade cutbacks were- carried out at the opera-.25 inch cutback eliminates any damage that could be tor's shop or during on-wing maintenance that requiredcaused by an 8 gram iceball passing between the inlet ?"ide access to the compressor. After the "smart" blade cutback,vanes at 85 ft/sec. Although these larger objects travel virtually all ice FOD problems were liminated with thatmore slowly when accelerating in an engine inlet, these engkne. As the field engine population increased in cutbacktests were conservative because they held velocity constant compliance, corresponding reductions in maintenanceat the upper limit of smaller objects. action occurred (See Figure 11-6). As of December 1989,
he rate has been reduced by over 30 times to less than.005/l10O EFH with 98% compliance. The performanceeffect of the "smart clip" has been small particularly when
CUTBACK .25 INCHES caiied out with other compressor refurbishment which, inALONG CHORD 'itselt, offsets the cutback Stage 1 blade performance loss.
too* 10
0.20 s0
S0.111 TOW 50 FOO 7
0.,:
'A A0
010 401
0.0 <0.AOo0
i . 0s
Figure 11-5 "Smart Clip" Stage 1 Blisk Figure 11-6 CT7-5 Turboprop Ice FOD Reduction From"Smart Clip" Compliance
A significant reduction in the baseline blisk damageresistance was observed for a blade positioned next to aclipped blade. The results show that the initial damage speed films was done to understand whether blade leadingthreshold was reduced by objects from 2.8 to 1.5 grams. ee ticnss oe bk geer wastinfluentialainThis is also where major curl damage was reduced by i g cees stanp of emt clp ladl.objects from 4.5 to 2.8 grams. Also, the .25 inch cttback improving ice FOD resistanze of the "smar clip" Wade.showed initial damage occurring at 6.5 grams weight, Blade leading edge shapes of the test hardware were photo-sweeas ainifomly damagecuarkrig a abo grams (S graphed, measured and correlated with the test results. Thiswheease a. ufollow-on investigation which included tests of swept back
blades with thin leading edges showed that good correlation
could be obtained between damage resistance and thicknessmeasured .04 inches back from the leading edge at a loca-tion 0.5 inches down from the blade tip. Figure 11-7 is aplot of ice ball size and leading edge thickness showing a
:1

20-8
lint, of demarcation between damaged and undamaged This investigation has demonstrated the importance ofairfoils. For this plot, damage was assumed to be any de- leading edge thickness in pieventing ice damage to blades.tectable plastic deformation of the blade leading edge. This It allows the engineer to design the best aerodynamic bladeplot points out the sensitivity of the damage resistance to configuration including leading edge contour and assureblade leading edge thickness, good ice damage capability by conrolling the leading edge
I I I I I thickness. This assumes that the remainder of the airfoilsrlao~s 1has sufficient strength to accelerate the ingested ice par-
TPTAPE, ticles up to wheel speed without deformation.
0 I MAG I / Ice FOD-Resistant Compressor Blade Development
/--l)Blade leading edge thickness is the most important- I 0o parameter for resisting ice FOD damage.
5! 0j j 2)A full tip curl can be caaised by a single large ice- 0 Iobject, or by a succession of smaller objects which, ini-
- tially, only partially deform the airfoil.I I k wI, ii 3)Airfoils which protrude forward of the plane of the
-- 1 other blades are likely to be hit repeatedly and more se-e 9 10 1 1 1 2 verely. Similarly, airfoils following more deeply cutback
E 74rH.ESS (04W CHORD, 3 5 RADIUS) - tA REFhEME blades are more vulnerable to damage caused by deeper iceFigure 11-7 FOD Resistance Correlates Well With L.E. penetration prior to impact.Thickness 4)lncreased ice velocity and size increase blade dam-
The blade leading edge thickness is felt to be critical age. However, larger particles accelerate slower and havesince damage is initiated at this location. More dramatic lower velocity at blade impactblade curling occurs later due to t!, increased exposure of 5)As a rule to durability, the stage I compressor blades
the blade because of the forward deformation of the leading should be capable of withstanding impact from any piece of
edge. The high speed films show the ice ball is shattered by ice that can pass between the inlet guide vanes.
the initial blade impact which cau-;es a significant load on 6)Cutback modification to the leading edge of the
the leading edge. However, blade curling is caused by the CT7-5 Stage I blade has an ice FOD resistance that will
high loads imposed on the blade as it accelerates the in- eliminate most field damage.gested mass of ice up to wheel speed. The measurementlocation of .04 inches from the leading edge is somewhatarbitrary but does provide a quantitative measure of thelead edge bluntness where the initial ice impact occurs.Figure 11-8 shows enlargements of the leading edge shapeof two airfoils and how the relative thickness at .04 inchescharacterizes the leading edge shape. Velocities of the iceball and blade are such that the ice is ingested at a rate ofapproximately .07 inches per blade at 80 feet per second.This adds further justification to a thickness measurementnear the leading edge.
BLUNT SHARP
BLADE BLADE10 04 INCHESFROM L E
Figure 11-8 Thickness at 0.04 Inches From L.E. Character-izes L.E. Bluntness
- '

20-9
Discussion 3. R. Jones, Boeing Arnprior CanadaWhat is the mechazasm by which the cut back on the leadingedge of the blades prevent fod from one inch pieces of ice?
1. H. Saravanamuttoo, Carleton UniversityCould you please indicate how many compressor blades Author:were subject to damage in a typical FOD incident, and could The cut back increases the leading edge thickness resultingyou give some quantitative idea of the penalties in in a stronger blade. Figure 11-7 illustrates that only modestcompressor efficiency or engine temperature margin? increases in thickness are required.
Author: 4. M. Holmes, RAEMost ice-fod events involved a single blade which resulted in What lessons were learnec as a result of the CT7-5 ice fodan audible whine from the compressor and a 5- 10 degree C problems in service on repeat of qualification of futureshift upward in T5 temperature at constant torque. The engines?repair, which clipped off the bent blade material and asimilar amount from the opposite blade, costs about 1 point Author-in compressor efficiency and about 6 C in temperature First, compressors should be capable of handling ice objectsmargin, large enough to pass cleanly between the inlet guide vanes.
Se.ond, ice accretion in the inlet system must be negiegible2. D. Mann, Rolls ROyce or limited to sizes easily handled by the compressor blades.Did you at any stage operate your trajectory code in a This issue of qualification (certification) often focusses onreverse mode, in an attempt to assess where the FO culd the safety of flight issue which was not the problem for CT7.have come from, upstream of the damaged parts of the Our problem was unscheduled maintenance from ice-fodcompressor blades? and I do not think these kinds of issues are easilyIt appears from figure 1-8A that during the course of demonstrated in an engine qualification programme.assessment of different designs, no consideration of changesto the splitter lip was made, despite the fact that this is anarea which has a significant effect on separation efficiency. 5. C. Scott Bartlett, Sverdrup TechnologiesCould you comment on this? Would you please comment on considerations given to the
type of the ice used during your ice ingestion tests and if youAuthor. feel there is a difference in damage due to ingestion atThis is an interesting suggestion but we did not evaluate this different types of of ice?approach. We suspect the ice objects are much slower thanthe air stream and they tend to slide along the outside walls. Author:The tests with cameras viewing the inlet duct demonstrated We felt that ice near freezing would be less brittle and maythis behaviour. cause larger energy transfer to the blade because it is lessSplitter lip changes were to extensive for consideration as a likely to scatter upon impact. Therefore, we allowed the icefield fix. Major redesign certification programmes would be to warm up slightly before test so that there was some liquidneeded to implement those kind of changes. on the surface of the iceball.
ii

21-1
FUELS AND OILS AS FACTORS IN THE OPE.1ATIONOF AERO GAS TURBINE ENGINES AT LOW TEMPERATURES
byG L Batchelor
Eng 2aProcurement Executive, Ministry of Defence
St Giles Court, 1-13 bt GLes High StreetLondon WC2H 8LD
United Kingdom
Two factors -trongly influence the low temperature behaviour ofaero gas turbine fuels and oils. TI-ey are Viscosity, and Stateor phase change - i.e. whether the material is liquid or solid.In fact the question is whether solids are, or are not, presentbecause, although the whole -nay cease to flow at somedesignated temperature, the lighter components of hydrocarbon
and other o.,ganic mixtures are likely to be liquids under allnatural circ' tances. Terms such as Freezing Point, PourPoint, and the like, will be familiar enough. This presentationexamines the eiemical and physical realities underlying suchparameters and considers their impact on aero gas turbineengine performance. For the purposes of this paper fuels andoils will be treated quite oeparately.
Part I: FUELS
FUEL TYPES impact. They are water itself, and thefuel system icing inhibitor (FSII) added to
A:1 ordinary aviation turbine fuels arr all military fuels to combat any free watervariants of kerosine. The Wide-Cut fuel forming in those aircraft not equipped withF-40, or JP4, is kerosine plus naphtha. engine fuel filter heaters.The current European Theatre primary fuel Water is present in solution in all fuelF-34, or JP-8, is Kerosine per se. The at equilibrium concentrations of the ordernaval High Flash fuel F-44, or JP-5, is a tens of parts per million. FSII is addedslightly higher boiling kerosine cut which at tenths of a percent by volume.can, on occasion, satisfy either F-34 or The water occurring naturally should notF-44 requirements. Such differences may be be confused with that which may arisemanifest in fuel low temperature behaviour. through contamination of the fuel supply.
The latter is a logistic concern not to beaddressed here.
FUEL COMPOSITION
From the low temperature performance FUEL COMPOSITION EFFECTS
aspect there is need to take account onlyof those organic compound classes present (A) Phase Changein "bulk" proportions; i.e. whose percent-.,ge contribution will be at least five, and WATER. Apart from the fact that itswill likely be numbered in tens. Namely:- equilibrium solubility varies marginally
with hydrocarbon class, water will behavePa"affins (normal and iso) almost independently of fuel type. When in
solution, water is .o problem. But it ib aNaphthenes (or cyclo paraffins) low temperature performance issue due to
the simple natural fact that from about 0OCAromatics (single ring) and on downwaros the dissolved water wil
crystallise out as ice. Although thatbut only such members of each class as are process is virtually complete at -300C, the ° ":allowed by the boiling range of any given ice crystals tend to remain in suspension.fuel, Those which do reach the tank walls form an
ice film and are thereby inactivated untilTwo trace components have significant that film melts. Aiother wholly natural
4 - - - - - ,- - -

21-2
source of water is precipitation out of the the fuel will be wholly liquid in terms ofaircraft fuel tank ullage air. its hydrocarbon make up.
The function of the FSII is that of an FLOW POINT Flow Point addresses the"anti-freeze" which so modifies water:fuel threshold of flow. Under the title "Pourpartitioning as to obviate the blockage of Point", it is a common enough parameter forengine filters by ice. Therc is a popular oils and diesel fuels. In the context ofmisconception that FSII operates on the jet fuel it has specific meaningFreezing Point (see below) of the fuel When fuel temperature continues to fallitself. IT DOES NOT. below the Freezing Point, more and more
hy~irocarbons crystallise out until a pointSo much for water, is reached at which the solids form a
stable matrix. Precisely at that point theHYDROCARBONS Generally speaking, the still liquid components remain fully mobile
heavier members of a given series can be but very soon thereafter even they becomeregarded as being dissolved in the lighter entrapped in the growing matrix, and theones. Certainly it is the heaviest which fuel then becomes a de facto solid, "crystallise first on cooling. Adding to The jet fuel criterion of flow concernsthe lighter end of a fuel cut (if that be the ability of the crystal matrix toan option) allows greater flexibility at collapse at its unsupported edges under itsthe other end. This is well demonstrated own weight such that the two phase mushby wide-cut fuel which has a Freezing Point can still flow of its own volition to the
10 degrees or more below that of a kerosine aircraft tank backing pump; thereafter, anybut has the higher final boiling point, mechanical work on the fuel ensures that
Straight chain normal paraffins are the the phase balance cannot again worsen.really "waxy" types which most readily and Flow Point has attracted attention 'romdistinctly crystallise out. The phenomenon time to time (chiefly at times of perceivedbecomes increasingly less definitive as the fuel shortage) but has yet to attain pract-molecular pattern compacts through ical significance.branched structures to saturated rings. Without there having been cause for full
There are also inter-specie effects, consensus on the issue, Flow Point has thusNormal fuels being always comprised of far been defined in terms of recoverable
mixtures, the low temperature behaviour of fuel under designated test conditions.any particular fuel will be a function ofthe balance of its components. A mixture VISCOSITY In an aviation fuel contextof two fuels of differing composition will the parameter is the kinematic variety.not necessarily average the properties ofthe two individuals. This is not apractical concern except for the rare event MEASUREMENTof both being at the specification margins.
FREEZING POINT Determination entails(B) Viscosity cooling a fuel sample in glass apparatus at
a controlled rate to just beyond the pointSo long as they remain wholly liquid, of hydrocarbon crystal formation. Normally
most fuels are fully Newtonian in their this is readily distinguishable from theflow. That is true for the more paraffinic ice crystal haze mentioned above. The fuelexamples even to below their Freezing is then allowed to warm until the lastPoints. But this is open to some question hydrocarbon crystal melts. This procedurewith the extremely cyclo-paraffinic types is repeated until the temperaturos ofyielded by modern hydrocracking processes appearance and disappearance differ b;, no
a point to which I shall return later, more than some prescribed amount.With normally paraffinic fuels all is
straightforward and operator experience is
THE FUEL PARAMETERS not critical. When, as with some of thenewer cyclo-paraffinic fuel varieties, the
FREEZING POINT Best known of all the transition points are difficult to observe,fuel low temperature parameters, Freezing and temperature differentials cannot bePoint addresses the transition between a met, subjectivity increases markedly.fuel being wholly liquid and there beingsolid hydrocarbons presr-t. Thermodynamics ALTERNATIVES TO FREEZING POINT Thedictate that both the -st appearance of fact that Freezing Point determination iscrystals on cooling, a J their final dis- labour intensive, coupled with the fact ofappearance upon warming, shall take place its increasing element of subjectivity, hasat different temperatures. The definition driven a search for automation. Any auto-of Freezing Point centres on disappearance; matic equipment capable of truly replic-it mak th l .we.t te.per..ture at whih ating the Freczing IPoint has thus fat
I i
21-3
proven to be extremely sophisticated. But parameter viability) is far from beingthere are now several simpler, portable, valid.devices capable of indicating the FreezingPoint, or something closely related to it. (B) Viscosity
The importance of these does not lie intheir specification potential but in the Because it is a design criterion thatpossibilities they offer for greater oper- fuel viscosity shall not exceed 12 cSt atatlonal flexibility. At present, although any functional point in the engine system,Freezing Points are frequently well within the parameter is not generally seen as aspecification, the absence of an actual performance or operational considerationvalue at the point of refuelling means that other than when the aforesaid criterion is,aircraft flight plan must presume a value for some reason, not met. Certainly thereat the specification limit. A "plane-side" have been spectacular instances of startingFreezing Point capability would be a difficulties with kerosine fuels underconsiderable operational boon. unusually cold conditions.
Certain hydromechanical devices apart,FLOW POINT The only test method thus viscosity at the burner spray or atomiser
far formally published is that developed by is the main concern.the UK Institute of Petroleum in the late1950s when it was thought that there mightbe insufficient fuel of low enough Freezing SPECIFICATIONPoint to meet the requirements of the thendawning inter-continental commercial jet It is quite usual to think of fuels inaircraft traf=ic. It entails a vertically terms of their specified Fieezing Points:cylindrical test vessel at whose bottom end vizis a conical valve capable of sudden
* release such as to allow the fuel to flow - -40 [0C] for Jet-A; -47 for Jet-Alif it can, and JP-8; -58 [- ?"FJ for JP-4: etc.
However, the purpose of this short sectionOPERATIONAL and PERFORMANCE IMPACT is to briefly review the manner in which
specifications address the low temperature(A) Phase Change requirements.
FREEZING POINT The parameter is often (A) Phase Changeseen as being an airframe concern inasmuchthat any resultant constraints applied to FREEZING POINT Although its definitionaircraft routeing arise essentially out of is centred on crystal disappearance, thethe relationship between meteorologically latter is only the Indirect basis of limitsprojected fuel tank temperatures and set by fuel specifications.understood fuel Freezing Points. The reality is best illustrated by the
outcome of the lengthy ASTM debate whichBut, in the final analysis, it all comes attended the lowering of the Jet-Al limit
back to the engine. There seems to be a from -500C to -470C in response to the fueluniversally accepted stipulation to the supply crises of the late 1970s After dueeffect that fuel shall be delivered by the consideration of data from the airlines andairframe to the engine three degrees above from Boeing's studies of its 747 aircraft,the Freezing Point - the latter again taken the consensus finally settled at minus 47as being at the specification limit, on the basis that ...
Such a rule presumably purports to The best overall number for in-flightensure single phase flow regardless of the minimum fuel temperature was -430C.precision of the Freezing Point test method ADD the 30 margin for the engine.employed (of which aspect more anon). ADD 1 more for good measure!
FLOW POINT The parameter, as it has so It might appear, in the light of thefar has been defined, is perhaps a little data entailed, that there is over-cautionpessimistic in that vibration, coupled with here. But, the data is only as good as theattitudinal g forces, will very probably measurements made in those aircraft tankskeep a crystal matrix unstable below the wherein measurement was possible.temperature indicated by static laboratorytesting. Caution is not wisplaced. The protagonistsHowever, the blithe assumption that of specification change are usually lookingordinary aircraft might somehow be able to only at the fuel aide of the equation. Oneutilize semi-frozen fuel (thus giving the hears tell of "difficulty" in getting fuel
!1
21-4
out of wing tip tanks in cases where the Again I sub-divide into already notedoperators have sailed close to the Freezing categories; but I discount Flow Point asPoint wind. even a medium term recourse.
FOR SO LONG AS AERO GAS TURBINE FUEL FREEZING POINT This is certainly a simpleSYSTEMS ARE TO BE DESIGNED FOR SINGLE and convenient parameter but must wePHASE HYDROCARBON FLOW ONLY, THEN SO remain forever locked-in to the concept ofLONG WILL FREEZING POINT REMAIN THE KEY nil solid hydrocarbons? Cannot engineFUEL LOW TEMPERATURE PARAMETER. systems handle just a few?
Admittedly that begs the question ofFLOW POINT There is little that can be defining a "few" but let fuel specification
said, in a specification context, of a fuel writers worry on that score for the moment.parameter that has yet to be specified. From a hardware aspect the solution to
such a problem may already be to hand. It(B) Viscosity may simply be a matter of the batting order
for the fuel system's components. Are theyAlthough the 12 cSt hardware limit is always in optimum sequence? Once an engine
independent of temperature, a specification is running heat is plentiful. Indeed, amust stipulate a temperature of testing. current concern is the limiting capacity of
This will preferably be some cc-ivenient fuel as a heat sink.laboratory norm. For aviation kerosine If the heat exchanger can be as far up-that turns out to be -200C whereat an 8 cSt stream as possible, then only at start-upmaximum satisfies the operational need. would there be need for auxiliary energy to
Wide-cut fuel is, by its very nature, raise the incoming fuel through a probablywell inside the viscosity mark; but, even very small temperature increment.were that not so, its volatility would putroutine measurement beyond reach. Test methods coming under the heading
ALTERNATIVES TO FREEZING POINT may welloffer a route to definition of acceptable
HARDWARE DESIGN IMPLICATIONS solid hydrocarbon levels - tney may evenhave on-line potential.
(A) Airframe
The aircraft fuel system must respect FRESH STUDYFlow Point in order to deliver fuel at all,and respect Freezing Point in order to VISCOSITY may be deserving of detaileddeliver fuel of acceptable quality, reappraisal in the aero engine context.
Warming a just flowing fuel mush to anengine-acceptable condition has to entail Hitherto, we have been accustomed toaircraft fuel tank heating .. with the fuels whose flow has remained consistentlynecessary heat deriving ultimately from the Newtonian albeit that their Freezing Pointsengine, have been relatively high. Now we see
Boeing, and others, have carried out hydro-cracked fuels whose Freezing Points,numerous paper studies - often with seeming though hard to measure, are very low.enthusiasm. But the outcome, be it initial Is enough known about these liquids atinstallation or retrofit, always carries so those temperatures? Might their reluctancemany, and such varied, penalties that I am to crystallise be accompanied by some formforced to the view that such action would of nucleation in solution? Do perceivedbe set in train only by the most traumatic viscosity temperature relationships holdof fuel eventualities. for them? Above all, how might any such
aberrant behaviour impact on combustor(B) Engine performance?
On the engine side, there are far less In recommending this as an area ripetraumatic options which can, and perhaps for study I would point out that, toshould, be looked at in the shorter term as be mean- ingful, such studies woulda safeguard against any future fuel supply entail the most careful fueleventualities. modelling.
-~'-~-

21-5
PART II: ENGINE OILS
Aviation fuels come directly from naturally available resources.They are subjected only to the minimum of processing and/oradditive treatment essential to ensure specification compliance.The oil situation is very different. Petroleum based mineralgas turbine oils today form a minority category; they will notbe addressed here. The majority of current oils are 'synthetic"in that their primary constituents are synthesised from rawmaterials of animal or vegatable origin. Such oils are in factdesigned with specific user engine types view. Their successfulmanufacture is as much an an art as it is s science.
OIL TYPES with shorter chain acids - principallyesters based on..
Aero gas turbine synthetic oils aremostly categorised by notional viscosities (2) Tri-methylol-propane (TMP)at 400C .. viz:
, or,
3 cSt eg.. Nato 0-148, or 0-150
(3) Penta-erythritol (PE)5 cSt eg .. Nato 0-156, or 0-160
The two last named allow a measure of7JcSt eg.. Nato 0149 product tailoring through variation of the
esterifying acid or acid mix.Multiple designations under a single
category arise out of differing nationalqualification processes or out of differing ADDITIVESperformance levels (0-160 has a higher loadbearing capability than 0-156). These regulate thermal and oxidative
There is no specific categorisation with stability, load bearing capability, hydro-respect to low temperature performance. It lytic stability, corrosivity, foaming, andis, of course, easier to achieve a desired so forth, but not, it should be noted, lowlow temperature capability with a thinner temperature performance per se.oil. Oil viscosity is as much an engine The low temperature concern is thatdesign parameter as it is an oil one albeit additives, particularly any which happen tothat some engines can use oils of differing be at the threshold of true solution, mightviscosities. precipitate irreversibly - especially when
exposed to prolonged soak.This is as much a problem between oils
OIL COMPOSITION as it is one within an oil.
A synthetic aero gas turbine oil isusually chazacterized by the type of ester PHASE SEPARATION and VISCOSITYmaking up the bulk of oil volume andthereby giving the product its underlying That final comment re additives saidfluidity and elasto-hydrodynamic quality, virtually all that there is to tell about
To this base will be added various low temperature phase separation in oils.additives whose purpQse(s) will be toconfer, or enhance, specific properties of VISCOSITY is the key. And .he key is tothe finished lubricant. engine starting.
I exclude from this discussion circum-ESTERS are the reaction products of stances in which aircraft heating, or other
alcohols and organic acids. They can be external aids to starting, are a recognisedlooked upon as falling into three classes:- part of an operational scenario.
Given such exclusion, interest centres(1) (The first on the scene] Long chain on starting torque engendered by the oil.acids coupled with relatively simpler That will be primarily an engine designalcohols ., generally termed di-basic acid parameter but consequential oil design will
esters - eg di-octyl sebacate, or its depend --also on the lower operating temp-azeleic or adipic counterparts. erature envisaged for the user aircraft.
Such limits typically vary between -25CThereafter come complex alcohols coupled and -54,C.
g .
] i I : ... .. . ..
21-6
The real problem with attaining approp- At the type approval stage it is usualriate low temperature viscosity is that of also to confirm low temperature hrmo-matching this particular need with the geneity empirically in the laboratory.parallel one of having sufficient viscosityat normal running temperatures.
In fact, as a dominant factor, the oil OIL PRODUCTIONlow temperature requirement has but briefduration. Once the engine is tip and The raw naterials for synthetic aerorunning, oil quickly takes on the crucial engine oils derive from natural renewabler6le of a heat transfer medium. resources. They are, therefore, subject to
climatic and other environmental vagaries.Moreover, aviation is only a minor user
OIL COMPOSITION EFS'ECTS of thcm and in no position to dictate theshape of the market in any fundamental way.
It is not really realistic to set out to As a consequence, oil suppliers preferexamine composition as an option vis-a-vis to have a range of optional compositionsoil low temperature performance. Such are approved for any product, albeit that somethe conflicts with the high temperature options may be superior others in the finalimperatives, and such is the increasing analysis.weight given to the latter, that there islittle option other than compromise at thelow end. ENGINE DESIGN and OPERATIONAL
Certain advanced engine systems (using CONSIDERATIONSspecialised lubricants) have resorted tooil dilution .. itself a fairly venerable In the matter of oil superiority theredodge in the piston engine world! Others very definitely are "Horses for Courses".allow for higher than normal viscosity (at Not all oils perform equally well in alllow temperature) in relatively conventional the engines for which they are notionallyoil types, suited.
A sometimes necessary reverse comprom- Different engines do not rank the sameise (from a lubricant design standpoint) is oils in a single order. Indeed, differentconstraint on additive addition where an parts of the same engine may rank a givenotherwise optimum treatment level might oil set differently. And this even moreresult in unacceptable low temperature true when the ranking is done with regardcharacteristics, to differing oil performance parameters.
It is a not unreasonable generalisation There is, therefore, a need perhaps toto state that , for any given oil type, rank the parameters. We might observe atwhilst it may be possible to move the range once that the exigencies of aircraft perf-band of high to low temperature capability ormance seem already to have ranked the oilup or down the temperature scale, it is high temperaturo requirement above the low.very difficult to widen that band.
That being so, there is need to examine thelow temperature requirement itself.
SPECIFICATION and MEASUREMENT After start-up it involves a very smallpart of the fight envelope other than for
The only quantified oil low temperature those APUs and other accessories which mayparameters are Viscosity and Pour Point. be exposed to static cold soak on long
flights; they might be allowed to windmill,VISCOSITY is measured in the conven- or be started-up periodically, Io maintain
tional manner. Specification limits have their readiness.generally been predicated to a functional Furthermore, low temperature startingkinematic viscosity of 13,000 cSt at -40 0C. occupies only a small par of the totatHowever, as implied above, high temperature operational envelope; one ponders theperformance demands are forcing a re-think extent to which it should be allowed toand numbers such as 14,000 cSt at -200C are predicate overall oil design?being mooted for some impending aircraftprojects.
FUTURE OIL DEVELOPMENTSPOUR POINT is an empirical observation
of the limiting temperature at which an oil The viability of alternative "chemis-just flows of its own volition. The spec- tries" for the lubrication of aeroification limit is usually -60 0C. It is a gas turbines in the broad inventorybatch quality control and is also used in is a subject of current and on-goingscreening now products. interesL and review.
, . ?[.
it
,, - - wt ,t , :

21-7
iscussion 3. F. Gamier, SNECMAPour les turbor~acteurs, on a parl, aujourd'hui des huiles de I3 et 5 cst, 5 jusqu'iA -40 C, au dessous mais on parle aussi
1. P Sable, GEAE maintenant de plus en plus de nouvelles hulles de 4 est. QueShould surface tension be considered as a controllablc si aient les avantages de ces nouvelles huiles par raport auxparameter to enhance the atomization at low temperatures? autres, auront-elles les memes comportements?
Author:An additive approach would be viewed with caution as itcarried unacceptable ! .nalties in other directions. The Author:desirable first step is a deeper understanding of the These standard viscosity classifications are predicated to
relationship between physical effects, such as atomization +40 C. I doubt that a 4 cst oil would necessarily offerand fuel composition. improved low temperature performance above 5 cst unless
2. M. Holmes, RAE specifically designed with such an end in view.
What is the fuel property that most limits the lowtemperature operation of turbo engines? Is this a seriouslimitation and, if so, does your organization have any 4. D. Way, RAEprogrammes to find a solution? At long distance aircraft, the ranges are becoming longer
Author: and longer, and the danger of the fuel coming to lower
At the moment freezing point, in the future perhaps also temperature increases. Is this a concern?
viscosity, as the aircraft criteria are presently defined, areabsolute limitations (go/no go). The fuel man can offer littleservice. Any solution open to him must necessarily limit fuel Author:availability or increased fuel price or both. Limits can be It does on transatlantic flight with slower aircraft.aftered only with the consent of the aircraft design side. The With nc, mal aircraft, it is somewhat compensated byfuel side does attempt to maintain a data base for current aerodynamic heating. The problem increases with tip tanksand foreseeable fuels. Perhaps that needs to be reconsidered with a smaller volume to surface ratio and a thin skin. Forwith design options for the eventuality of a fuel availability extremely long distances there m,:st be a compromiseshortfall. between the commercial and the technical interest.
Ci
!4
t -
22-1R
THE EFFECT OF FUEL PROPERTIES AND ATOMIZATION ON LOWTEMPERATURE IGNITION IN GAS TURBINE COMBUSTORS
byD.W. Naegeli, L.G. Dodge and C.A. Moses
Southwest Research Institute6220 Culebra Road
San Antonio, Texas 78228U.S.A.
ABSTRACT INTRODUCTION
Experiments were conducted in a T63 engine The fuel quality/availability ratio has becomecombustor to gain a better understanding of the complex in recent years because of the uncer-role played by volatility and atomization in low tainty in the supply of petroleum. Alternatives,temperature ignition. Eight test fuels were used, such as synfuels, tend to have different boilingsome of which were specially blended to vary ei- point distributions and increased viscosities whenther viscosity or volatility while holding the compared with their petroleum equivalents. Thisother constant. Six atomizers were used to vary trend toward reduced volatility and increased vis-the fuel spray charactc tics, and average drop cosity could cause degradation of low tempera-sizes, represented by Sauter mean diameter ture ignition, altitude relight, and flame stabiliza-(SMD), were measured. Air temperatures were don in gas turbine engines.varied from 239 to 310K. Ignition comparisonswere made by the minimum fuel-air ratios neces- Several aspects of the ignition process in gas tur-sary to achieve ignition. Significant results in- bine engines are not clearly understood. Combus-eluded: 1) viscosity, which determined atomiza- tor rig tests have been effectively used to demon-tion characteristics, was more important than strate the effects of varying fuel properties onvolatility in the ignition process; 2) ignition de- ignition and flame stabilization.' 1 ) Analyticalpended more on achieving a critical drop size models have been developed to correlate(I2
than on reaching the lean-limit fuel-air ratio; and data from several combustors. However, the mod-3) fuel temperature was found to be more impor- eling efforts have been seriously hindered by thetant than air temperature for low-temperature ig- absence of information on the effects of fuel vol-nition, an effect due principally to viscosity and atility, and atomization.atomization rather than evaporation. A practicalimplication is that fuel heating would give a It has been foundQ$) that ignition models aremuch greater improvement in cold-start perfor- quite sensitive to the drop-size distribution in themance than heating the combustor inlet air. fuel spray, characterized by the Sauter mean di-
ameter (SMD), but this sensitivity has not beenNOMENCLATURE properly measured in the combustor data avail-
able to date. Previous studies (13-15) have em-Vf reference velocity ployed correlations that were based on measure-F/A fuel-air ratio ments of SMD in spr-..ys from atomizers thatSMD Sauter mean diameter, micrometers were similar, but rst sensitive to the subtle dif-
kinematic viscosity, eSt ferences in the design of the actual fuel atomiz-surface tension, dynes/em ers used in gas turbine combustors. The purpose
FN flow number, kg/s -4a of the present study was to provide a clearer def-inition of which fuel property, viscosity or vola.
wf coefficienttof g/s t~flity, plays the more important role in the igni-R2 coefficient of determinationtion process.
Rosin-Rammler Parameters for:cumulative volume fraction of spray XPERIMENTAL FACILITIES AND
D droplet diameter METHODSX droplet size parameterN width of distribution General Description - This work was per- ii
formed in the combustor facility of the Belvoir

22-2
Fuels and Lubr-.ants Research Facility (BFLRF) the radiation sensor used to detect the onset of aat Southwest Research Instute (SwRI). The visible flame in the ignition measurements.combustor facility was specially designed tostudy fuel-related problems in the operation of The T63 combustor employs an igniter that pro-gas turbine engines. The air supply system pro- duces sparks at a rate of 8 per second with ener-vides a clean, smooth flow of air to the combus- gies of about 0.87 joules, and a dual-orifice pres-tion test cell with mass flow- rates up to 1.1 sure-swirl atomizer. The primary orifice is usedkg/s, pressure to 1620 kPa (16 atm), and temper- principally for the atomization of fuel in the igni-atures from 239K (-30 0F) to 1089K (1500 0F) tion process. The secondary orifice supplies the(unvitiated). For cold start ignition tests, the com- bulk of the fuel but does not engage until thebustor inlet air is cooled by injecting liquid nitro- fuel flow rate is above that required for ignition.gen and gaseous oxygen through a manifold To further examine the effects of atomization onplaced upstream of the combustor. This system ignition, an adapter was constructed to allow useis capable of lowering the temperature of the of single-orifice, Delavan pressure-swirl atomiz-burner inlet air supply to -34 0C (-30F) for the ers with flow capacities ranging from approxi-mass flow rates (0.09 to 0.27 kg/s or 0.2 to 0.6 mately 15 to 30 liters/hr (4 to 8 gal./hr) at a dif-Ibis) used in the T63 combustor ignition tests. ferential fuel pressure of 689 kPa (100 psid).Turbine flowmeters and strain-gage pressuretransducers are used to measure flow properties Test Fuels - The test fuels described in TABLE
of the air and fuel. Thermocouples are refer- I were chosen for the ignition study because of
enced to a 338.5K (150.0F) oven. Data reduc-tion may be performed on-line with test summa- TABLE 1. Fuel Propertiesries available immediately; these summaries Specific Vis Surfaceprovide average flow data as well as standard de- Fuel Fuel Gravity at at Tension m
No. Description Gravi15.6* atD * at 250C Bi fviations (typically less than 1 percent of average o.Derito1.615"C St) (dyeser) Bilofvalue) of inlet temperature and pressure, exhaust 1 JP-8 0.8236 2.51 27.18 169.4
temperature, flow rates of fuel and air, emissions 2 JP-4 07519 1.22 24.29 98.0data, and combustion efficiencies. Further detail 3 JP-5 1 0.8080 3.48 27.02 189.2on the facilities and procedures described below NDF/25% 0.8265 3.61 27.01 112.2may be found in Reference 19. 4 Gasoline I I
5 NDF/70% 0.7839 1.32 24.01 36.1T63 Combustor Rig - The combustor used in Gasolinethis study was fabricated from T63 engine hard- 6 NDF 0.8484 7.85 28.79 209.9ware. This combustor has been used in previous 7 Methanol 0.7913 1.03 22.44 65.0programs to study the fuel effects on ignition, 8 Gasoline 0.7555 0.90 21.89 16.6combustion stability, combustion efficiency, ex-haust pattern factor, radiation, a:d smoke. Figure their broad range of viscosities, and volatilities.1 is a schematic of the combus'or rig showing To independently study the effects of viscositythe locations of the fuel atomize, igniter, and and volatility on the ignition process, Fuel 4
Rwas blended with a viscosity equal to that ofSENSOR JP-5 and a front end boiling point distribution
similar to JP-4. Fuel 5 was blended with a vis-cosity equal to that of JP-4 and a front end boil-
ang point distribution similar to gasoline. Theviscosi.ics of gasoline and methanol are essen-tially the sa. e, but their 10 percent boil-off tem-
FUEL p eratures and heats of vaporization are very dis-P " :" ""-similar.
Droplet Size Measurement - Atomization is acrucial factor in the ignition of fuel sprays ingas turbine engines. Ignition failure occurs withdiminished atomization quality because of tht de-
BURNCR creased fuel surface area available for evapora-COM4BUSTOR CM tion and the increased spark energy required for
Figre .T63coustor droplet evaporation. For a given engine design: Figure 1. T63 combustor

22-3
poor atomization is caused, for the most part, by The Delavan atomizers were single-orifice pres-increased fuel viscosity; consequently, higher vis- sure-swirl (simplex) nozzles differing only incosity fuels and lower fuel temperatures lead to flow rate capacity. Compared to the standardhigher fuel/air ratio requirements for ignition. It T63 atomizer, the droplet-size measurements inis a general rule that when fuel viscosities ex- sprays from the Delavan atomizers were rela-ceed 12 cSt combined with lower burner inlet tively straight forward.air temperatures, the probability of ignition ingas turbine engines is greatly reduced at any The test fluids and test conditions used in the at-fuel-air ratio, omization measurements are given in TABLE 3.
To better understand the ignition test results in Table 3. Test Fluids for T63 Jgnition/Atomiza-the T63 combustor, droplet-size measurements tion Study to Generate the Correlation of Sauterwere made on hollow cone sprays produced by Mean Diameter (SMD) with Fuel Properties andthe atomizers described in TABLE 2. Flow Conditions
Kinematic Surface Density atTstTep Viscosity Tension
Table 2. Fuel Atomizers Fluid Tst at Test at Test Test(K) Temp ep
Flow Capacity* Flow Coe Temp Temp (gimL)Description @ 689 kPa Number* Angle (cSt) (dynes/acm)
(g/s) (kg/s-'Pa) (degrees) JP-4 298 0.85 23.9 0.746
Factory T63 JP-5 298 2.02 26.6 0.801Dual Orifice 5.93** 7.14 x 10⁻⁶ NDF 298 3.77 28.4 0.841
Pressure SwirlHMGO 298 9.8 31.1 0.868
Delavan Simplex 3.18 3.83 x 10.6 90Pressure Swirl 274 29 33.3 0.884
Delavan Simplex 4.01 4.83 x 10.6 90Pressure Swirl
Delavan Smplex 5.13 6.18 x 10.6 90 The first three of these fluids, JP-4, JP-5, andPressure Swirl NDF are test fuels described in TABLE 1;
Delavan Simplex 5.88 7.08 X 10.6 90 HMGO is a heavy marine gas oil selected be-Pressure Swirl cause of its relatively high viscosity. The flow
Delavan Simplex 7.00 8.43 x 10.6 90 rates ranged from 1 to 7 g/s depending on the at-Pressure Swirl _omizer and fuel combination examined.
Capacity and flow number for JP-5**Primary nozzle on! Drop-size data were obtained with a Malvem
Model 2200 particle sizer based on the diffrac-tion angle produced by drops when illuminated
The standard T63 atomizer is a dual-orifice noz- by a collimated beam of mono-chromatic, coher-zle that uses a flow divider valve internal to the ent light from a HeNe laser. A 300-mm focalnozzle body to determine the fuel flow split be- length ff7.3 lens was used to collect the scat-tween the primary and secondary nozzles. At tered light. The laser beam diameter was 9 mmlow flow rates, such as those used in ignition, with a Gaussian intensity distribution truncatedthe valve completely restricts the flow of fuel at the edge by the 9-mm aperture. Data were re-through the secondary nozzle. As a result, the corded at an axial distance of 38.1 mm (1.5 in.)droplet-size measurements were made only on downstream of the nozzle tip.sprays originating from the primary nozzle.
Two procedures were necessary to ensure theThe standard T63 atomizer is also equipped with proper calibration of the particle sizing instru-passages to carry burner inlet air through the ment. The drop-size distribution is computednozzle to prevent deposit buildup on the nozzle from the relative scattered light intensity mea-face exposed to combustion gases. However, the sured at different scattering angles by a set ofairflow was also found to affect atomization 30 annular ring photodiodes.and, therefore, had to be accounted for in thedroplet-size measurement. To simulate this air- For an ideal optical and electronic system andflow, a special manifold was designed to allow uniform responsivity between photadiodes, thethe separate flows of fuel and air through the at- signal intensity may be used to compute theomizer drop-size distribution without resorting to exter-
X11

22-4
nal calibration standards. Tests at this labora- clusions are drawn concerning the relative rolestory have shown that the nonidealities of the sys- of atomization and evaporation on low tempera-tern are negligible except for the detector ture ignition in gas turbine engines and the po-responsivities that must be determined for each tential use of fuel heating as an effective startinginstrument,in order to get accurate results. The aid.first procedure(20) was used specifically to as-sure proper calibration of the particle sizing in- Droplet-Size Results - Ignition in gas turbine en-strument. gines is strongly dependent on fuel atomization
because it is the droplet size that determines theThe second, procedure (21) was necessary to cor- rate of fuel vaporization. The Sauter mean diame-rect for multiple light scattering off droplets in ter (SMD) of the spray at the spark-gap dependsvery dense fuel sprays obtained at the higher on the atomizer, fuel properties, and the flowfuel flow rates. This procedure was used in only conditions within the combustor. The SMD'sa few instances to correct the data recorded were measured in fuel sprays produced by thewhen dense sprays were encountered. standard T63 dual-orifice pressure-swirl atomizer
and five Delavan simplex atomizers at severalAll tests were performed at atmospheric condi- flow rates using five test fluids (see TABLE 3).tions in a test chamber of square cross-section The measurements were made along the center-30 cm on a side and 76 cm long, with air line of the spray about 38 mrn from the nozzlepulled through the chamber at a velocity of tip. The SMD obtained by this approach was anabout 2.1 m/s by an explosion-proof exhaust fan. average through the spray centerline; no accountA set of twisted metal screens in the exhaust was taken of the radial drop-size distribution induct removed the fuel mist from the air before the spray. Figure 2 shows the effect of the fuelexhausting to the atmosphere so
All spray data were reduced assuming a Rosin-Rammler drop-size distribution, which is speci-fled by two parameters X and N, defined by,
R = exp(-(D/X)N) (1)1W
where R is the cumulative volume (or mass) Ifraction of the spray contained in drops whosediameters are larger than D; X is a size parame- 114 Toter and N indicates the width of the distribution. V ILarge values of N imply narrow distributions NO. INDICATE NOMtEand vice versa. Fuel sprays wcre characterized CAPACITY (GAL/IR) 7by an "average" size based on the volume-area AT Ia P510
mean diameter, more commonly called the Sau- 4ter mean diameter (SMD), which may be com-puted from the Rosin-Rammler parameters. (22) . 1 0
FUEL MASS FLOW, oil
RESULTS AND DISCUSSION Figure 2. Effect of fuel flow rate and atomizercapacity on SMD for JP-5 fuel
The purpose of this study was to gain a more flow rate on the SMD for all the atomizers ex-basic understanding of the ignition process in amined. Clearly, the results show that ine capac-gas turbine combustors. The results of this work ity of the atomizer has a significant effect onare presented as two parts. The first part de- the flow rate required to achieve a desiredscribes the droplet-size measurements in the SMD. It is found that for a given fuel flow rate,sprays of the'six atomizers used in the ignition the measured SMD decreases in almost directmeasurementsand the correlation of SMD's with proportion as the capacity (or flow number) ofatomizer flow conditions and fuel properties. In the atomizer is reduced.the second part, the actual ignition measure-ments are presented; also, the effects of combus- The break in the curves at low fuel flow ratestor flow Ctiiditions, fuel properties, and SMD's shown in Fig. 2 is probably due to the Weberon the limifirg fuel-air ratio are examined. Con- number effect observed by Simmons and Har-

22-5
ding.(23) The Weber number, We,, is the ratio of zles producing larger drop sizes at equivalent
inertial forces to the surface tension forces. The conditions. The average drop size as repre-SMD is much more dependent- on flow rate sented by the Sauter mean diameter (SMD)when We < 1, i.e., at lower flow rates. could be correlated with the fuel nozzle capacity
(flow number), the fuel flow rate, and the fuelThis effect was not important in the present viscosity and surface tension as follows:study because the minimum fuel flow rates forignition always occurred at We < 1. SMD = 4.052 FN'lS8~t0 212o0 457wf'l 16 (2)
Figure 3 shows the effect of fuel type on the In correlating the SMD data from the T63 atom-. .. ...... izer, it was necessary to account for the airflow
directed across the nozzle face used to reduce+carbon deposition, This airflow was considered
(21c) \because it had a significant effect on the atom-izatior process. The ignition tests in the T63combustor were performed at three airflows, 91,
"teJ HUGO 182. and 273 g/s. SMD's were measured withJP4 x air pressure drops across the T63 nozzle corre-
sponding to combustor airflows of 91 and 273INI g/s; the atomization at the intermediate airflow
I was assumed to be an average of the two ex-tremes.The SMD correlation at the 91 g/s air-flow condition for the T63 atomizer was,
NI" 0.9 -1.2SMD = 112.61.399wf 1.21 (3)
ot. . . and at the 273 gfs airflow condition,FUEL MAUS FLOW, gis0
Figure 3. Effect of fuel flow rate and fuel type on SMD = 99.71.t0 334wfl'09 (4)SMD produced by the standard T63 atomizer
Equations 2 through 4 were used to calculateSMD's measured in sprays produced by the T63 SMD's of fuel sprays at the ignition limits andatomizer. The results show that fuel properties to ascertain the effects of atomization on the ig-have a significant effect on the SMD/mass flow nition process in the T63 gas turbine combustor.rate correlations. The fuel effect is most pro-nounced for HMGO at ambient temperature and Low temperature ignition experiments were274K. Otherwise, the JP-4, JP-5, and NDF fuels conducted at several operating conditions in atested in the high mass flow rate regime (We > T63 combustor rig; TABLE 4 shows the range1) gave very similar SMD's. Basically, the ef- of test conditions used. To simulate a sea-levelfects on SMD's measured in sprays from the start, pressures were kept close to one atmo-Delavan simplex atomizers were similar to those sphere. Burner inlet temperatures were variedfound for the T63 atomizer. However, the fuel from ambient to -340C (-29.20F). The mass floweffects on SMD appeared to be more pro- rate of air was varied to change the reference ye-nounced in sprays produced by the Delavan at- locity in the combustor. Fuel temperature wasomizers. This fuel effect was especially apparent varied in order to examine the effects of viscos-among the JP-4, JP-5, and NDF fuel sprays gen- ity, surface tension, and the SMD of the sprayerated at the higher mass flow rates that wereused in the actual ignition studies. Considering Table 4. Combustor Operatingthe fuel properties in TABLE 3, it is apparent Conditions for Ignitionthat the relatively high SMD's determined for Pressure kPa 103 to 124I-MGO are most probably attributed to increased 'sueka03t12
viscosity. Burne Inlet Temperature, C 25, 10, 0, -24, -34Fuel Tcmperairc, 0 C 0 to 30
Atomization Correlations -The five Delavan Mass Flow Rate of Air, kg/s 0.09, 0.18. 0.27
simplex atomizers with different flow capacities Reference Velocity, ni/s 5, 11, 16performed similarly, with the larger capacity noz-r

22-6
on the limiting fuel-air ratio for ignition. Fuel fuel evaporates more rapidly. As a result, thetemperature was varied both as a result of the minimum fuel-air ratio for ignition is expectedvariation of inlet temperature, and independently to decrease as the SMD of the fuel spray is low-of inlet temperature by using an ice bath. Fuel ered.temperature was monitored by a thermocouple in-serted into the fuel line and located at the en- The fuel effects on the minimum fuel-air ratio
trance to the atomizer. for ignition are very apparent in Fig. 4 Fuelssuch as NDF with high viscosity and low volatil-
The ignition limits of the test fuels were mea- ity require a higher minimum fuel-air ratio forsured in terms of the overall fuel-air ratio re- ignition than the more volatile and less viscousquired to achieve ignition at a given set of oper- fuels such as JP-4. Fuels with similar viscosi-ating conditions. These tests were performed by ties such as JP-8, JP-5, and NDF/25-percent gas-first establishing the desired air flow conditions oline have similar minimum fuel-air ratios for ig-in the combustor. The igniter was turned on, and nition. It is important to note that Fuel 4,the fuel flow was started at a flow rate below NDF/25-percent gasoline, was blended with thethe ignition limit. The fuel flow was gradually same viscosity as JP-5, but with a front-end vola-increased, using a motorized valve until ignition tility (TIe%) similar to JP-4. Fuel 5, NDF/70 per-occurred. At the point of ignition, the motor turn- cent gasoline, was blended with the same viscos-ing the fuel valve was stopped, and the mini- ity as JP-4, but similar front-end volatility tomum fuel flow rate for ignition was recorded. gasoline. By inspection of Fig. 4 it is apparent
that Fuel 4, NDF/25-percent gasoline, has a mini-Most of the ignition measurements were made mum fuel-air ratio for ignition similar to JP-5.on Fuels 1 through 6 in TABLE 1. Limited data Also, Fuel 5, NDF/70-percent gasoline, has awere obtained on methanol and gasoline. Figure minimum fuel-air ratio for ignition similar to4 shows the effect of reference velocity on the JP-4. The gasoline data are not presented, but its
.0.3 minimum fuel-air ratio, in fact, falls significantlybelow that of JP-4. These results show that
.025 fuels of equal viscosity require similar mini-mum fuel-air ratios for ignition, and that viscos-
02 - ity appears to be more signyfcant than volatil-3O I. N ity in the ignition process.
2 .015- Figures 5 and 6 show correlations of the mini-
mum fuel-air ratio for ignition with viscosity005
-0- T63 ATOMIZER0 -018 C DELAVAN ATOMIZER 0
.L_ _. . , . 0 R' 0790 2 4 6 6 10 12 14 16 18
REFERENCE VELOCITY (m/s) 0 0 0
Figure 4. Effect of reference velocity and fuel typeon minimum fuel-air ratio for ignition with the 0
.0 -
standard T63 atomizer z .01 A A
minimum fuel-air ratios for ignition of Fuels 1 006 A
through 6 at a fuel and burner inlet temperaturesof 300K using the standard T63 dual-orifice at- 002
omizer. Similar results were obtained using the 0 1 2 3 , aDelavan simplex atomizers. It was found that KINEMATIC VISCOSITY, cSt
the minimum fuel-air ratio for ignition decreased Figure 5. Correlation of minimum fuel-air ratioas the reference velocity was raised. This de- for ignition with viscosity for the standard T63crease is explained in part by the fact that the atomizer and the 15 liter/hr Delavan simplexmass flow rate of fuel delivered to the atomizer atomizermust increase to maintain the fuel-air ratio when and 10 percent boil-off temperature, respectively.the-mass flow rate ot air through the combustor These data were obtained with the standard T63is raised. When the fuel flow rate is increased, dual orifice atomizer and the 15 liter/hr Delavanthe SMD of the fuel spray decreases and the atomizer.The results clearly show that the mini-
.11
I, . . . .. . .. ... .' , " " " '.. .. ..1" " ".: ..... .. . . .
- A llmml lma mm l ~~ m l m ~

22-7
-o0- 63 ATOMIZER IIf indeed a critical SMD is the important criteriaDELAVAN ATOMIER • 0
.0a0 for ignition, then it should be relatively indepen-
,.o / 04 dent of the flow number of the atomizer. Figure
.01'4 'O 0= .8 shows the dependence of the SMD at the mini-
140 -O-V, : 5M/2
0' 0 120
.006 V 6[ 21000
.Io2
250 30D 350 400 450 500
10 PERCENT BOIL-OFF TEMPERATUREFigure 6. Correlation of minimum fuel-air ratio , 60
for ignition with volatility (10 percent pt) for the ..standard T63 atomizer and the 15 liter/hr Delavan 40_osimplex atomizer 3 4 5 6 7 a 9
FLOW NUMBER (kg/s. Pa"2 ) x 106
mum fuel-air ratio correlates more favorably Figure 8. Effect of atomizer flow number on thewith viscosity than front-end volatility. SMD at minimum fuel-air ratio for ignition of
JP-5; data obtained at reference velocities of 5, 11,The effects of atomization on the minimum fuel- and 16 m/sair ratio for ignition have been apparent in theresults discussed above. Figure 7 shows the ef- mum fuel-air ratio for ignition versus the atom-fect of atomizer flow number on the minimum izer flow number for JP-5 fuel at three referencefuel-air ratio for ignition. The data were mea- velocities. The SMD's were calculated fromsured using JP-5, a burner inlet temperature of Eqns. 2 through 4. At the 5 m/s condition in300K, and reference velocities of 5, 11, and 16 Fig. 8, the SMD's ranged from 99 to 122, a fac-m/s. The six points on each line represent the tor of 1.2 whl, in Fig. 7, the corresponding fuel-six atomizers examined. If ignition depended ai ratio at ig a varied by a factor of 2.6only on achieving a critical fuel-air ratio, there over the range ur flow numbers. At 11 m/s andwould be little or no dependence on atomizer 16 m/s, the respective SMD's ranged from 56 toflow number.The fact that the minimum fuel-air 88, a factor of 1.6, and 43 to 69, a factor of 1.6ratio for ignition increases with atomizer flow whereas the corresponding fuel-air ratios at igni-number means that the average drop size of the tion varied by 3.2 and 2.7.spray must be less than some critical value if ig-nition is to be successful. For the higher capac- bne r tue on ignitio heburner inlet air temperature on ignition has beenity atomizers, this critical SMD is reached at ahigher fuel flow rate than for the lower capacity difficult to discern because of the effect of fuelatomizers. temperature. In the present study, the effect of
fuel temperature was accounted for in the viscos-
.025 -0- V, - S ,,/, ity and surface tension terms of the SMD corre--0- , 0 lations. Figures 9 and 10 show the effect of
.02 A , burner inlet air temperature on the requiredSMD at the minimum fuel-air ratio for ignition.These data were obtained with test fuels listed
.15 in TABLE I using the respective T63 dual ori-Z .fice and 15 liter/hr Delavan simplex atomizers0 with a reference velocity through the combustor
01 0 A of 11 mis. The trend lines through the data indi-
cate that smaller SMD's are necessary for igni-005 tion when air temperatures are reduced. The
3 4 5 6 7 a 9 SMD's required for the more volatile fuels suchr'LOWI NUMBERg (k9/s.Pa!/') 10'8
FLOWI4UMER (g/s.Po! 2 ) x10'as JP.4 appear to vary more strongly with air
Figure 7. Effect of atomizer flow number on the temperature than the less volatile fuels like JP-8and JP-5. In fact, the SMD's required for theminimum fuel-air ratio for ignition, JP-5 fuel; less volatile fuels are relatively independent of
data obtained at reference velocities of 5, 11, and16 m/s
Ki 4

22-8 air temperature, and also because smaller drops
0,JP8 will be more easily carried to the igniter by the0 P4E a JS. , airflow and will evaporate more readily.
2 0 75X1401'. 25% Got +0.9 * 3t NDF. 70X Cot
A41 r ° To reduce the SMD of the spray, it is necessary
"45 * .. o " only to heat the fuel to reduce the viscosity.This can be seen in Eqns. 2, 3 and 4. Figure
S35 11 shows the effects of fuel temperature on vis--cosity for several aviation ft In Fig. 10,
5 25 - the ignition cl,3racteristics at an air temperature
4 of 273K (0°C) for JP-8 can be improved to that03 15
I ' .I . . at 305K (320C) by reducing the SMD by the220 230 240 250 260 270 20 290 300 310 ratio of the minimum SMD requirement orAIR TEMPERATURE (K) about 8 percent. Using Eqn. 3, this would mean
Figure 9. Effect of inlet air temperature and fuel a viscosity reduction of abou 3 this w omtype on SD required for Ignition using standard aiscosIit reducion oe vosty 3percent. From
T63 atomizer and reference velocity of 11 m/s Fig1. reducin he viscosity from 2.5 cSt to1.7 c~ ol enheating the fuel. from O0Cto 180C. This concept would be expected to be
" 0 JP4 applicable to full scale engines starting in coldo 90 o& J5 , air, but in general the amount of heating would
2 0 75%1401'. 25X Got# * 30 o D 1. 7o Co, be different for each engine design. For new air-
80 0 .1' craft, a fuel tank heater would greatly improve
70 0 the staring characteristics of cold weather air-I craft. To avoid the cost of retrofitting existing
60 -- ' aircraft, perhaps loading the aircraft with-warm" ftel, e.g., room temperature, 250C, just
2E 50 prior to starting would suffice; for quick re-
4 sponse time though, a small heater in the fuel0a40
240 250 260 270 280 290 300 310 tank that the engine draws from would be better.AIR TEMPERATURE (K) It should also be noted that these results refer
Figure 10. Effect of Inlet air temperature and fuel only to combustor ignition; there may be other
type on SMD required for ignition using 15 low temperature effects on engine and gear boxliter/hr Delavan simplex atomizer and reference lubricants that further inhibit engine starting.velocity of 11 mis a, ... "
the bumer inlet temperature. It is also important 'ooWto note that the NDF/25-percent gasoline fuel 1o0 SRblend which had a viscosity close to JP-5, but a 4 .
volatility similar to JP-4, seemed to require 30
SMD's for ignition nearer to that required by JP- .20o5, JP-8 and NDF. These observations tend to ,0 "A!
favor fuel viscosity over volatility and suggest 12 . .
that fuel vaporization depends, for the most part, 90
on droplet size. 806O
It should be noted that during engine start up, +there is very little compression of the air so thatthe burner inlet air temperature is essentially the ,0ambient temperature. Thus the significance of Tem rfure, VC
these results is that at lower temperatures, Figure 11. Typical dependencies of viscosity onchanges in the air temperature will not have a temperature for aircraft fuels 3significant effect on the ignition characteristicsof low-volatility fuels such 0s WJ-8 and JP-5. It CONCLUSIONSis more important to reduce the SMD of thefuel spray. This is because the evaporation of Extensive experiments were carried out in a T63 7
the fuel is caused by the spark energy, not the gas turbine combustor to determine which fuel
LI1,4
, ,',m In nm Ji l m Ilt~ll ll~lm llm l~mI Jllllmmllml •I llll I IN I /lllIlill I lll mm N Im ...

22-9 t
property, viscosity or volatility, is the most criti- ESL-TR-80-46 (November 1980).cal in low temperature ignition in gas turbine en-gines, 7. Reider, S.B., Vogel, R.E. and Weaver, W.E.,
"Effect of Fuel Composition on Navy AircraftIgnition depended more strongly on achieving a Engine Hot Section Components," Report No.critical average drop size (SMD) than on reach- DDAEDR11135 (September 1982).ing the lean-limit fuel-air ratio. Fuel viscosity,which determines atomization characteristics, 8. Beal, G.W., "Effect of Fuel Composition onwas found to be more important than volatility Navy Aircraft Engine Hot Section Components,"in the ignition process' The importance of viscos- Report No. PWA/GPD/FR-16456 (August 1982).ity was particularly apparent in the less volatilefuels such as JP-5 or JP-8. Volatility effedts 9. Rutter, S.D., "Effect of Fuel Composition onwere most apparent in JP-4 and fuels containing T53L13B Hot Section Components," Report No.gasoline. Low temperature ignition performance D12-6-032-83 (March 1983).appeared to depend more so on the effect offuel temperature, i.e., the fuel viscosity, rather 10. Rutter, S.D., "Effects of Fuel Compositionthan the burner inlet air temperature. This obser- on Navy Aircraft Engine Hot Section Compo-
vation has the important practical implication nents, Lot If-Component Test," G.E. draft report
that heating the fuel or using ' lower viscosity prepared under Contract No. N00140-79-C-0483.fuel would be a much more efficient way to im-fuoelwldmbeatuchre fiientn weayi t - 11. Ball, I., Graham, M., Robinson, K., Davis,prove low-temperature ignition than heating the N., "T76 Alternative Fuels Final Report,' Garrett
inlet air, a guideline particularly suited to com- Turbine Engine Company, Report No. 214744
bustors employing pressure-swirl atomizers for (u gust 1983).igniion.(August 1983).
ignition.
12. Ballal, D.R. and Lefebvre, A.H., "A Gen-REFERENCES eral Model of Spark Ignition for Gaseous and
Liquid Fuel-Air Mixtures," 18th Symposium In-1. Moses, C.A., "Studies of Fuel Volatility Ef- ternational) on Combustion, The Combustion In-fects on Turbine Combustor Performance," Pre- stitute, Pittsburgh, pp. 1737-46 (1981).sented at the 1975 Joint Central/Western StatesSection Spring Meeting of the Combustion Insti- 13. Peters, J.E. and Mellor, A.M., "A Spark Ig-tute, San Antonio, Texas. nition Model for Liquid Fuel Sprays Applied to
Gas Turbine Engines," Journal of Energy, 6 (4),
Character Effects on FlOI Engine Combustion p. 272 (1982).
System," Final Technical Report AFAPL-TR-79- 14. Peters, J.E. and Mellor, A.H., "Characteris-1018, CEEDO-TR-79-07 (June 1979). tic Time Ignition Model Extended to an Annular
Gas Turbine Combustor," Journal of Energy, 63. Vogel, R.E. and D.L. Troth, "Fuel Character (6), p. 439 (1982).Effects on Current High Pressure Ratio, Can-type Turbine Combustion Systems," Final Techni- 15. P%ters, J.E. and Mellor, A.H., "An Ignitioncal Report AFAPL-TR-79-2072, ESL-TR-79-29 Model for Quiescent Fuel Sprays," Combustion(April 1980). and Flame, (38), p. 65 (1980).
4. Oiler, T.L., et al., "Fuel Mainbumer/Turbine 16. Derr, W.S. and Mellor, A.H, "CharacteristicEffects," Final Technizal Report AFWAL-TR-81- Times for Lean Blowoff in Turbine Combus- t2100 (May 1982). tors," Presented at the Fall Meeting of the West-
em States Section/rhe Combustion Institute5. Gleason, C.C., et al., "Evaluation of Fuel (1986).Character Effects on J79 Engine CombustionSystem," Final Technical Report AFAPL-TR-79- 17. Naegeli, D.W., Moses, C.A., and Melior,2015, CEEDO-TR-79-06 (June 1979). A.H., "Preliminary Correlation of Fuel Effects
on Ignitability for Gas Turbine Engines," ASME6. Gleason, C.C., et al, "Evaluation of Fuel 83-JPGC-GT-8.
Character Effects on J79 Smokeless Combu~tor," 'Final Technical Report AFWAL-TR-80-2092, 18. Moses, C.A., et al., "An Alternate Test Pro- '
1S
ijl,--

t1
22-10
cedure to Qualify Fuels for Navy Atrcraf,, Phase Messrs. R.C. Haufler and M.G. Ryan conducted11 Final Report, Appendix D. Ignition and Alti- the experimental measurements. Ms. S.J. Hoovertude Relight;" SwRI-5932-3, NAPC-PE-145C and Ms. L.A. Pierce performed the manuscript(August 1984). preparation with the editorial assistance of Mr.
J.W. Pryor and Ms. C.G. Wallace. Mr. S.L Lestz19. Naegeli, D.W., Dodge, L.G. and Moses, provided assistance in contract managementC.A., "Effects of Fuel Properties and Atomiza-tion on Ignition in a T63 Gas Turbine Combus-tor," Interim Report BFLRF No. 235, December Discussion1987.
20. Dodge, L.G., "Calibration of the Malvem 1. R. Pollak, Pratt and WhitneyParticle Sizer," Applied Optics, 23, p. 2415 Have you examined the/effect of small quantifies of lower(1984). viscosity/higher volatility fuels, say JP5, mixed into more
viscous/low volatility fuels, say JP4, to obtain better ignitioncharactertics at cold temperatures?
21. Felton, P.G., Hamidi, A.A., and Algal, A.K., Author"Multiple Scattering Effects on Particle Sizing We have conducted experiments such as this several timesby Laser Diffraction," Report No. 413HIC (Au- over the years including the results reported here where twogust 1984). of the test fuels were blends of gasoline in diesel fuel to tailor
the viscosity and volatility properties. In earliest studies (at22. Allen, T., Particle Size Measurement, 3rd ambient air temperatures) we used blends of pentane withEd. Chapman and Hall, New York, p. 139 both Jet-A and diesel fuel. In all cases, the addition of the
lighter materials improved the ignition characteristics of the(1981). combustor. We have not, however, conducted a thorough
study of the type you mentioned in the sense of developing a23. Simmons, H.C. and Harding, C.F., "Some fuel sensitivity model fur low-temperature ignition. 'TheEffects of Using Water as a Test Fluid in Fuel significance of the more recent studies, of which the workNozzle Spray Analysis," ASME 80-GT-90 reported here was a part, is that we can now do these(1980). combustor experiments at low temperatures and make
detailed measurements of atomization, air-fuel ratio and24. Handbook of Aviation Fuel Properties, CRC velocities at the spark gap, and spark energy to isolate the
Document No. 50, p. 34, Coordinating Research fuel variables.
Council, Atlanta, Georgia (1983). 2. P. Kotslopoylos, Hellenic Air Force AcademyI would like to know if you have any comments to makeabout the effect of the change of fuel composition, forinstance from JP4 to JP8, on the hot engine components as a
ACKNOWLEDGEMENTS result of the change of the viscosity - provided that the massflow rate is kept constant by adjusting the fuel controlsystem.
This work was performed by the Belvoir Fuels Have you observed any phenomena like carbon particlead Lubricants Research Facility (BFLRF) located formation at the hot parts etc?
at Southwest Research Institute (SwRI), San An- Author:tonio, Texas under Contract Nos. DAAK70-85-C- Fuel effects on hot-section durability are due to increases in0007 and DAAK70-87-0043 with the U.S. Army the flame radiation or changes in Mtpc.a: R Chitributions,Belvoir Research, Development and Engineering i.e. hot streaks. The major differences between JP4 and JfPowhich could came there problems are lower hydrogenCenter (Belvoir RDE Center). Funding was pro- content and higher viscosity. Lower hydrogene contentvided by the Naval Air Propulsion Center increases the soot formation and flame radiation in the(NAPC) through a Military Interdepartmental piim9,- -one leading to higher liner temperatures. This sootPurchase Requisition, and aiso in part with can also deposit on the liner surfaces ot atomizer face andfunds from the SwRI Fuels and Lubricants Re- disturb the flow pattern leading to hot spots. Highersearch Division. viscosity means larger drops in the fuels spray and could
mean inadequate air-fuel mixing or even impingement onthe liner. Such problems are generally eliminated in thedesign of the combu.tor and most combustors are designed
Mr. PA, Karpovich was the principal NAPC to operate satisfactorily on both fuels; however, it is possiblestaff member providing Program direction. Mr. that in an older, perhaps marginally designed combustor, aF.W. Schaekel of Belvoir RDE Center (STRBE- change from JP4 to JP8 could result in inadequate air-fuelVP) served as the Contracting Officer's represen- mixing and/or create an increase in deposit formation in
isolated areas and lead to durability problems. In thetative; and Mr.-M.E. LePeraj Chief of Fuels and combustor studies conducted by the US Air Force, thereLubricants Research Division (STRBE-VF), were no hot section durability problems identified due to a ij served as the project technical monitor. change from JP4 to JP8.
ir ii lalal I i i ol •a m ll ~ ml m~ a l l lll l m l m .. t .. .. ..

23-1
GIVRAGR DES CIRCUrTS DR CAREIIRAMI! DES TUfl(OtEA1EBS
Francis GAIUIIERXngfinieur expert en systims dhuile
SNECKAI Direction techniqueCentre d'essais de Villaroche77550 noIssy-CL ynAK (FRANCE)
RESU1U
Suir lea avions civils, il W'est pas de pratique courante dtajouter d'additif aanti-givre dans le carburant. Il slensuit aux tr~s basses temp6ratures des risques ded~osde givre dans certains composants des circuits moteur A partir de Ileauin6luctablement contenue dans le carburant.
Ce pbfinornbne de givrage peut affecter tous lea moteurs A la fois au moment dud6collage, entralner des perturbations importantes touchant leur pilotabilit6, pouvantd~m aller jusqu'& leur extinction.
Pour 6viter le givrage, la solution Ia plus simple eat de r6chauffer stiff isammentle carburant avant son entr6e dana les composants aensibles pour qu'il soit toujours Atemprature positive; la difficult6 6tant de connaitre avic suffisamment de pr~cisionla quantit6 de calories disponibles sur le circuit d'huile dans les conditions extremesfroides des le d6but des 6tudes de d6veloppement d'un nouveau noteur.
Noua avons done 6t6 amen~s & d6velopper, mettre au point et valider un modklemath6matique capable de determiner lea 6quilibres thermiques huile/carburant dana toutle domains d'exploitation du moteur.
tiA partir des analyses effectu6e grce Ace mole, il a 6t6 possible de d6finiruesolution simple qui, sans rien changer Al'6quilibre ducircuit d'huile, a permis
Au cours de et expose, nous d6crivons ce mod~le, lea principales analyseseffectu6es, l'installation d'essai et lea r6sultats obtenus en conditions extremes degivrage qui montrent que la solution retenue avec r6chauffeur huile-carburant desservom6canismes permet un fonctionnement correct jusquIA - 45 *C au lieu de - 30 OCpour des conditions identiquea sur le circuit d'huile.
PREANBILE
Le carburant consomm6 par lea moteurs dun avion eat atock6 dana un ayatbme der6servoirs situ6s dana lea ailes et Ia partie centrale du fuselage de l'avion. Apr~s tinsystems de transferts entre reservoirs, il eat pomp6 dana une "nourrice" et achemin6vera lea moteurs. Pour des raisons de s~curit6, pollution de l'environnement enparticulier, ce carburant eat tr&s souvent stock6 stir lea a6roporta dana des cuves nonenterr~es. En cons6quence, par temps froid, on peut conaid6rer qua le carburant pomp6
*vera le moteur eat A Ia temp6rature ambiante qui peut atteindre, dana certains pays,des valeurs excessivenent basses. Malgr6 toutes lea pr6cautions prises par leacompagnies p6trollArea qui assurent l'avitaillement des avions, de l'eau petit subsisterdana le carburant sous forme dissoute et libre.
Aux temp~ratures n~gatives, lleau libre se trouve en suspension soua forme demicro-paillettes de glace gui aeront pomp6es avec le carburant. Ces cristaux de glacepeuvent obturer lea circuits carburant: lea filtres, mais aussi et aurcout lea syst~mesdrigulation gui dosent le carburant A injecter dana Ia chambre de combustion ou qui
commandent la position des vannes de d6charge et des stators a calage variable. 11 pe.ut'lenauivre'de graves perturbations pouvant affecter la pilotabilitk du moteur etconduire, A la limits, A l'extinction des moteurs. Des moteurs, en effet, car 1,'ph~nom&ne de givrage peut lea affecter tous A Ia fois puisque la cause eat com~aune.
Si on montro par lea calculs que la condition la plus critique eat cealea du r6gimede d~collag&, on comprend alorsa gravit6 de situation qua petit engendrt~z le ph~nom~nede givrage des circuits carburant.a Si en exploitation militaire, le prc~IVme eat r~solupar lladJoriction au carburant de produits anti-givre, cette pratique :i'exiateg6n6rilement pa en exploitation commerciale. 11 revient donc aui mc'~oriste Ia charge ded6finir et d'installer stir le moteur un syst&me permettant dl6vitu r le ph6nombne de
givrage ou, pour le momns, d'6viter sea cons6quences.

212Nous vous proposons au cours de cet expos6 de presenter
En lin partie- lee diverses solutions qui avaient 6t6 imaginees lors de la conception du-CFIE56 et plu~s particulibrement celle qui a 6t6 retenue-lee analyses et les calculs qui ant permis d'aboutir A ce choix
En 2i' partie- lee moyens d'essais mis en oeuvre- lee essais de validation effectu6s au bane de simulation
En 3w partie-une actualisation
1- LB CIRCUIT CARBURANT DR BASE
11 comprend, pour ce qui nous intdrese- les r6servoirs de carburant (partie avion)-la pompe basso pression du moteur (pompe B.P.)
- un filtre qui protage ia pompe haute pression A engrenage (pomps H.P.)- la r6gulation du moteur- la chambre de combustion avec ses injecteurs- un 6changeur de chaleur destin6 A ref roidir l'huile de lubrification dumoteur
2 - ELMENTS DU CIRCUIT POUVAIT E~h AFFECTES PAR LE GIVRAGE
En conditions givrantes, les cristaux de glace v6hiculeis par le carburant peuventaffecter ls fonctionnement de certains: organes du circuit carburant.
2-1 ECHANGEUR UILhE CARBURAST
Bien que i'huiie du moteur soit chaude, ler, tubesi et les plaques frontales del'6changeur peuvent fitre A temp6rature n6gative, favorisant l'accrochage eti'accumuiation des cristaux de glace. Ii vs slensuivre une diminution de issection libre pour le passage du carburant et conadautivement une augmentation dela perte de charge de l'6changeur; Ia limits 6tant 1' obstruction totale. A partird'une certaine valeur, le clapet de d6rivation va slouvrir, pouvant A is limited6river tout le carburant. La r~duction du d~bit carburant dans is matrice conduitA une augmentati~on de is temp6rature de l'huile, des plaques frontales et destubes. Le d6givrage de Is matrice vs slop6rsr progressivement jusqu'& refermeturedu clapet. Ce phenombne d'ouverture fermeture peut s'up~rer piusieurs fois maissans jamais perturber r6ellement ls fonctionnement correct du moteur, si leasystbmes en avai peuvent accepter du givre, bien sOr.
2.2 FILTE
Lea premieres manifestations du ph6nomdne de givrage se produisent Sur lefiitre A carburant & cause des termpdratures de paroi plus basses dune part et dessections de passage unitaires plus faibles d'autre part. Dans lea as decolmatage extreme par ls givre, is moteur pout btre amen6 A fonctionner cispetouvert, clest A dire sans filtration, pendant une dur6e importante du vol; iemoteur foncticonnant n~anmoins correctement, seule is dur6e de vie de is pompe H.P.risque d'8tre affectee.
2.3 RBGULk1TBUR
Les servom6canismes du r6gulateur gui dosent ls carburant et fixent Japosition des syst~mes & g~om6trie variable (VSV et VBV) constituent Is partie dumoteur gui peut entralner des cons6quences graves en cas de givxage. En effet, lecolmatage de ass organes peut conduire A des perturbations importantes Sur isfonctionne~oeit du moteur: d6lai d'obtention important voire non obtention du tauxde pouss~e atfich6 par is pilots A Is manette des gaz; ass perturbations pouvantaller jusgu'& lextinction du moteur, situation particulibrement grave puisque,coxmme nous al~ons ls voir, Is condition is plus critique se situe A pleinspuissance du miteur, c'sst A dire au regime de d#.collage et de mont6s donc & tr~sbase altitude. Lee analyses ont done pcrt6 plus particulierement eur cette partiedu circuit carb~rant.
3 ri RLBSgPwitW~s
Les r~glements dei-andent qus is moteur soit capable de fonctionner correctement fKdand tout ls domains d'itilisation pour loque! ii est concu avec du carburantinitialement satur6 d'eau A 27 0C (80 0 F) et syant au momns 0,75 cm3 d'eau libre ajout~epar US gallon do carburant (200PP4) et ref roidi jusgul& ia condition ls plus critique
du point do vue givrags pouvant etre rencontr~e en exploitation.

23-
En l'absence dadditifs anti-givre ajout6s au carburant au de syst~mes capablosd'enlever tous les cristaux de glace pouvant Atre contenus dans le carburant, laiir pmi~re solution qui viont & l'esprit est de r~chauffer suffisamment les circuitspour quo, dans la condition de vol la plus s~vbre, los pi~ces et le carburant lui-mamesoient & temp6rature positive. En off et, il ne suff it pas que le fluide salt Atemp~rature positive pour 6viter tout problbme U64 au givrage lea cristaux de glacequi nWont pas eu Ie temps de fondre peuvent adh~rer aux pibces &temp6rature n~ga~iveet abturer les circuits; la temp~rature des pi~ces d~pendant do~s 6changes thermiquesavec le carburant d'une part et avec l'air do l'environnement, (nacelle) d'autre part.11 oat Clair quo I& condition la plus critique se rencontrera lora do fonctionnemontsaux tomp~raturos los plus bassos sp6cifi~es.
Les 6tudes ant port6 plus particulibrement sur lea cas do vol suivants:- d~collage, maxi cantinu et maxi mont6e en ISA -124 0F (Tamb=-540C)- maxi mont6e et maxi continu dopuis 1e sal jusqu'A une altitude do
35000 ft on atmosph~re extr~me froido.
Pour mener A bion ces 6tudes, un madile de calcul comportant plusieurs modules a6t6 cr44 ot valid6 sur des r6sultats d'essais provenant des matours en d~veloppement.
Le modble complet comprend los madules siiivants
- le "module technalogie"l dana lequel sont intraduites tautes les donn~esg6om~triques permttant do d~crire 10 matour
*g~om~trie des roulements, des pignons*surfaces d'4change des onceintes-huile*d6finition g6om~trique des joints A labyrinthe*description des rotors susceptibles d'entrainer do l'air ou do l'huile onrotationdiam~tre et longuour des tuyauteries*circulation des fluides au sein du matour*liaisons m~caniques entre le moteu'r propremont dit et s05 6quipements
- 10 "module thrmodpnamiqlue" permttant d'introduire les donn~es du cycl~epour los point qolon dtSire calculer
*vitesse de rotation des carps*temp~ratures, pressians et d~bits A des paints caract~ristiques des fluxprimaires et secondaires
- le "module circuit d'huile", 10 plus important, contient los m~thodes docalcul. Clest lui qui calcule la puissance calarifique recuoillie par l'huilequ'il d~livre sous la forme d'une courbe
- 1e "module circuit carburant", il contiont ls technologie et los m~thodes docalcul propres au circuit carburant. C'est lui qui calcule l'4quilibre etd6livre les temp~ratures
- le "module 6changour" fait l'intorf ace entre lea modules "circuit huile"et "circuit carburant" et contiont los champs d'efficacit6 des 6changeurspravenant d'essais ou d'analyses; c'est a dire l'efficacit4 thermique enfanction des d~bits et des temp~ratures
4.1 DETERMNINATIONI DR LA PUISSANCE CALORIFIQIJE DISPORIBLE DANS L'HUILE PAR LE14MELK "CIRCUIT D'HUILB"
Pour une condition do vol et un fonctionnement moteur donn6, la puissancecalorifique Wh rojet~e par le moteur sur 1e circuit d'huile no d~pend plus quo dola Temp~rature d'Huile A l'Rntr~e du Mateur. Le rble du module "circuit d'huile"eat danc do d~terminor los courbos Whl = f (THEM) pour tous los cas do vol 6tudi~s.La puissance tatale recueillie par l'huilo oat la somme de toutos los puissances6l6mentaires rejet~es par los camposants du moteur en contact avoc l'huile. Cespuissancos sont calcul~es analytiquement et non pas par une identification avec desr~sultats obtenus sur 1e motour lui-m~me.
Ello provionnent- des roulements dos lignus d'arbres; c'ost la plus grando partenviron 60% au plein gaz, jusqu'& 90% au ralenti.
- des pignons et engrenages- des 6changes do chalour ontre les onceintes-huile et leurenvirannoment tconvectian + rayonnement + conduction au travers dessupports do palior)
- do l'air deoprossurisation introduit dana lea onceintes a~u travers desjoints A lab;yrinthes
- des centrifugations d'buile cr66es par lea rotors cantenus dana leaenceintes
- des puissancos m~caniquos n6cessaires A l'ontrainemont on rotation dugroupe do lubrification (circuit ferm4)
- du frottemont do l'air aur les parties taurnantos situ~es dana lea
enceintes friction sur 10 voile des engrenagos, friction entro rotor
23-4
et stator dans lea labyrinthes,- des 6changes de chaleur, principalement par convection, entre lea6quipements et l'air nacelle :r~servoir d'huile, boite d'engrenages,tuyauteries, pompes A huile, .
- des 6changes de chaleur par convection et rayonnement entre lestuyauteries dans la travers6e des parties chaudes du moteur
Cemdue le bras dopiu, copreevro 40lg d'6criture en
4.2.DERKNINATION Dli NIVEAU D' HOUILIMB THMMRNIU RWI'RE L HUILR ST LE CARBURAN!PAR E MULSCIRUITCARBURANT"
La puissance calorifique recueillie par l'huile eat transmise au carburantpar les 6changeurs de chaleur. Selon leur efficacit6 thermique, cette transmissionse fera A des niveaux plus ou momns 6lev6a sur chacun des circuits
* efficacit6 6lev6e -niveau bas sur l'huileV- niveau 61ev6 sur le carburant
* efficacitd faible -niveau 61ev6 sur l1huile-niveau bas sur le carburant
Comme le module pr6c6dent, ce module comporte un sous-programme permettant decalculer lea puissances calorifiques gdn~r6es au sein du circuit carburantlui-m~me par les pompes basse pression et haute pression, la recirculation decarburant dana la boucle par ddgradation de l'dnergie de pression, las diversespertes de charge jusqu'aux injecteurs. Par ailleurs, il prend en compte lea6changes thermiques entre las composants du circuit et l'air nacelle.
Enf in, comme nous l'avons d~jh vu, ii d6termine l'dquilibre par applicationdu premier principe de lai thermodynamique.
4.3 VALIDATION DUi NOOLE
Avant dlentreprendre des calculs pour d6terminer lea temp6raturesz susceptibles d'&tre atteintes en extreme froid, il convient de valider los
rdsultats produits par le mod~le compos6 des deux principaux modules d~crits plushaut, dans un domaino de fonctionnement explor6 en ossai le plus large possible,de fagon A faire varier tous los param~tres influents sur une plage la plus largepossible. car, il eat bion dvident quo si les conditions do basses temp6raturespouvent 6tre reproduites en esaai partiel sur le circuit carburant, elles nepeuvent 1'8tre aur un moteur complet en fonctionnement, particulibrement au rdgimedu plein gaz.
4.3.1 IWDULI CIRCUIT W'HUILE
Pour ce faire, bora du d6veloppement du CFM56-2, lea circuits d'huile et decarburant du moteur 004 ont 6t6 fortoment instrumentds et un programme dlessai
$ spficifique a 6t6 r6alia6.
Un im~nagement des circuits au niveau des 6changeurs de chalour a 6t6ndcesaaits de fagon A explorer une plage de temp6rature d'huile plus large quecelle rencontr&3 normalement au banc aol:
*adjonction sur le circuit dhuile d'4changeurs suppl6mentaires huile/eauet huile/azote liquide do fagon A abaisser ia temp6rature d'huile Al'entrde du moteur aussi pr&s que possible des tempdratures pr~calculdospar le modbllo ra dun fonctionnement atabilis6 au aol sur avion enextrame froid.*adjonction d'un syst~me de vannage, sur le circuit de mani~re A d6river de1'4changeur tout ou partie de l'huile de mani~re A obtenir destemp6raturea d'huile 6levdes.
Cos easais ont permia d'obtonir un nombre important de rdsultats couvranttolwes lea vitesses de rotation posaibles sur une plage de temp6ratures dhuile A1'3ntr~e du moteur variant de 20 A 120 *C. Lleffet des pr~l~vements d'air etmdcanique a 6galemert Wt quantifi4.
C'est i partir de ces champs de valeurs que le "module circuit dhuile" a 6t6v6rifi6 et valid6. 11 eat bien 6vident quo de nombreuses retouches ont dQ 8treeffectu~es.
En particulier, il a'eat avdr6 que lea puissances calorifiques obtenues surmoteur aux faibles temphratures d'huile itaient plus faibles que celles obtenuespar le calcul; ceci provenant principalement du choix des'~- exoat ur be teimede viscosit6 dans la m~thode utilia6e irsitialement pour le calcul des puissancescalorifiques g6n6r~es par lea roulements.
D'autre part, des am6nagements ont dQ fitre apport6s en ce qui concerne lad~termination des puissances calorifiques g~n6r6es par barattage de 1' huile danalea enceintes confin~es ou l'effet de la pression dana ces mgmes enceintes ef fet

IF 23-5du frottement de 1'air sur lea rotors. Une boite d'engrenages fonctionnant avecune preasion interne de 1,5 bar absolu dissipera plus de puissance gu'& 0,5 barabsolu.
L'affet des ventilations externes au moteur a dOI 6galement 8tre affin6 pourtenir compte de Ilenvironnement :moteur au banc sol sans nacelle ou moteuravionn6 avec des nacelles de types de ventilation diff~rents.
Les corrfilationa calculs/easais obtenues in fine sont les suivantes*au banc aol sur le rsoteur 004/4La comparaison des puissances met en 6vidence l'excellent accordcalculs-essais pour tout le champ r6gimes-temp6ratures explor6 aubanc. L16cart guadratique moyen eat de 6 % ce qui se traduirait auaol par un 6cart maximum de 2 Cc sur le niveau d'6quilibre destemp~ratures
*en vol* sur banc volant "Caravelle". Moteur 006/2.* sur avion YCl5 avec le moteur 003/2.
Le but de ces recoupements 6tait de a'asaurer gue lea effets demoteur, d'altitude et de ventilation nacelle (effet du mach de vol)6taient correctement restitu6s.
4.3.2 1MDULE "RCHWIGEJRS DR CHlALEIR"
Dana a version finale, ont 6t6 introduita dana ce module lea r6sultatsd'essai obtenus au banc partiel, par simulation des conditions r6elles detemp6ratures d'huile et de carburant A l'entr6e des 6changeurs pour respecter leaeffets de REYNOLDS, d16paisseur de couche limite ..
4.3.3 MODULE "CIRCUIT CARBURANT"
Le m~me proces.sus gue 4.3.2 a 6t6 appliqu6, clest A dire des champs deperformances provenant des essais partiels r~alis~s sur lea pompes H.P. et B.P. etle circuit carburant au complet mais d6pourvu de calories provenant du moteur ettranamises par lea 6changeurs.
4.3.4 MODLS OPLET
Chague module ayant 6t6 pr6alablement test6 et valid6 96par~ment, il nepouvait subsiater que des probl~mes d'interface entre lea modules; c'eat A diredes probl~mes d16criture informatique mais nullement de simulation rsath6matiquedes syst~mes ou des ph6nom~nes physiques.
La pr6cision finale, en terme de temp~rature eat meilleure que 6 0 C.
A la suite de quoi le mod&le a 6t6 d6clar6 valid6 et applicable & lad6termination des temp6ratures d'6quilibre en particulier en extr~me f raid.
5 -SPECIFICATIONS
Un moteur d'avion doit ftre capable de fonctionner correctement sur une plage tras6tendue de tcmp~rature ambiante :depuis - 55 OC jusquI& + 55 OC environ au aol; lecarburant, comme nous l'avons vu, 6tant 6galement suppos6 6tre & cette temp~rature Al'entr~e du moteur. on congoit que lea syat~mea de refroidissesent d'huile/r~chauff agede carburant ne pourront 6tre qu'un compromis pour satisfaire lea valeurs destemp~ratures limites souhait~es sur chacun des circuits. D'oO la n6cesait6 de sp6cifierces valeura, gui peuvent r6aulter pour certaines des propri~t~s physiques des fluideset pour d'autres de congid~rations fonctionnelles inhdrentes au moteur lui-m~meexp6rience acquiae, easais paztiels, analyses ...
11 eat ainsi apparu ncessaire apr~s analyse
que le d6bit de carburant qui traverse lea asservissements soit r~chauff suffisamment de manibre gue la temp6rature du fluide soit toujours sup~rieure& 100C et non pas 0 cc af in de tenir compte des effets de convection autourdu r~gulateur d'une part et d16changea thermigues A lint~rieur du r6gulateurentre le carburant principal froid (< 0 ~C) et le carburant chaud desasservissements d'autre part (cas du r~chauff age du d6bit dlasservissement)
que lea temp6ratures extr~mes pouvant 8tre atteintes sur lea circuits d'huilerestent h l'int~rieur des limites acquises par l'exp6rience, tant & froid qu&Achaud; ce qui a pour effet, dana lea cas qui noua int6resaent, de limiter lepr6lavement de puissance sur le cicut d'huil1c
gue lea temp6raturea maximales dans le circuit carburant reatent, en atmosph~rechaude, inf6rieures & certaines valeurs pour 6viter tout probl~me de cavitationdes pompes, de "vapor-lock" ou de cok~faction.
En Par ailleura, il tait demand6 que lea circuits soient lea plus simples poasibles.En artculeril tai coseil6d'6viter tout sytm evanne hrotiueu
command6 par calculateur. En un mot, 6viter toute g6om6trie variable.

23-6
6 - ETERNINATION DES TEMPERATURRS D 'EOUILIBE EN CONDITIONS EXTREMES FROIDES
Le mod~le 6tabli et valide comme nous itavons vu, va nous permettre maintenant desimuler les conditions extr~mes froides en introduisant dans le "module thermo-dynamiquel" les conditions aux limites representatives des cas que V'on veut 6tudier;4 valeurs d~termin6es en amont par un autre mod~le.
Dans les conditions de temp6ratures au sol ISA - 124 OF (Tamb= - 54 00) et nombrede Mach de vol severe du point de vue ventilation autour du moteur, la puissancecalorifique recueillie par le circuit d'huile du moteur d6pend du niveaux de pouss6edemand6 par le pilote. Vest cette puissance qui va d'abord eitre utilisee pourrechauffer le carburant etlsp~cs a elle es raut .le ne dupenupasu
d6j& souligrA au paragraphe 4.1. Elle ne sera donc calculde qu'une seule fois par le"module huile"; ce qui a lavantage d16viter des it6rations entre ce module et le"module carburant' et d'accroitre Ia vitesse de calcul.
6.1 RQUILIBRE OBTENU SUR I.E CIRCUIT DR EASE (SAKS RECHAUFFEUR)
Ce circuit eat le plus simple. H6las, slil eat satisfaisant dans Ia plupartdes cam, il ne lest pas A froid. La tempdrature de 10 00 minimum A lentree desservom~canismes eat loin de6tre satisfaite.
duDans la condition de decollage extr~me froid (Tanib= - 54 OC), la temp6raturedfluide A l'entr~e des servom~canismes attein. 0 OC pour une temp6rature du
carburant de - 30 oC A l'entr6e du moteur. Pour satisfaire la condition des+ 10 00, il ne faudrait pas que la temp6rature du carburant pomp6 soit inferieureA - 15 00. Ceci montre tout simplement l'incapacit& du moteur A rechauffersuffisamment tout le carburant qulil consomme, Le6nergie calorifigue provenant ducircuit d'huile et du circuit carburant (laminages, rezdelnent des pompes) nepermet d'6chauffer toute la masse consomm~e que de 25 IC A 30 OC(- 15 OC -- > + 10 00 et -30 0 -- > 0 O0); la diff~rence de 5 00 provenant de lapente negative de la puissance calorifique delivree par le moteur en fonction duniveau degquilibre THEM.
Pour satisfaire la condition des 10 0C, il faudrait apporter au carburantconsomm6 environ 3 fois plus de puissance gue le moteur nen dispose. Leasolutions consistant A apporter ce manque de chaleur par des systemes 6lectriquesou par prelevement dair chaud sur le compresseur (6changeur air/huile ouair/carburant) ont 6t6 envisagees, 6tudi6es, puis abandonn6es pour des raisonsdiverses: complexit6, s~curit6, fiabilit&, masse, performance du moteur, etc...
Des corsi~crations precedentes, il ressort que la voie & suivre pour protdgerle circtuit carburant contre le givrage, en utilisant la seule puissance thermiquediaponLble sur le circuit d'huile, eat la suivante:
*r~chauffer suffisaranent le debit carburant gui traverse les asservissementsdu regulateur (debit 4 fois plus faible gue celui consomme) de manibre & ceque la temperature du fluide soit sup~rieute & 10 00
*completer le ref roidissement de i1huile jusgu'aux niveaux de temp~raturedesires par un refroidisseur adapte situe en lieu et place de celui guiexiste dans le circuit de basedemontrer par des essais partiels oi~a la partie du regulateur nonsuffisainment rechauf fee eat capable de fonctionner correctement pendant destemps tres longs en condition givrante
Clest cette solution qui a 6te egalement utilisee avec succ&s par notrepartenaire GENERAL ELECTRIC sur sea moteura CF6-50 et CF6-80.
6.*2 RODILIBRE OBT1ENU SUR L.E CIRCUIT AVEC UN RECHAUFFEUR DES SERV014ECANIISMES
Tout dabord, de trbs nombreux calculs ont ete necessaires pour definir lemeilleur couple (refroidisseur dhuile , rechauffeur des servom~canismes) du pointde vue de leurs efficacites respectives, et du choix de leur emplacement dana leacircuits. Mais aussi pour slassurer que, dana tous lea domaines dexploitationpossibles du moteur, lea tempratures d'huile et de carburant ne depassaient paslea limites fixees : effet des regimes de rotation, de 1altitude, des conditionsambiantes, froides mais aussi chaudes, des diverses phases de vol, desprelbvements, de le6tat du moteur et de sea eguipements (influence du debitd'huile delivr6 par la pompe d'alimentatior., dune erreur sur llestimation de lapuissance rejet~e sur l'huile, du debit dasservissement, de la nature des fluidesutilis~s :huile type I ou type 11, carburant JETA, JP4, etc ... ). i
Hormis pour la temperature du carburant A lentr~e des servomecanismes, cetteoptimisation a pzrmiz dc rondra le niveau g~kz6ie1 d 6quilibre pratiguementinsensible & !a presence ou non du rechauffeur des servom6canismes. West AL diregue la presence du r6chauffeur nabaisse et ne6chauffe gue de 1 A 2 00 le niveaudes tosperatures dhuile et do carburant A 1 injection dana la chambre decombustion.
23-7
Les 6volutions des temp6ratures calcul6es en fonction de la temp~rature ducarburant TCa A llentr~e du moteur font apparaltre
un classement des temp6ratures inverse de celui do l'6nergie calorifiquerecueillie par le circuit d'huile. Ceci provient du fait que, dans lacondition d6collago par exemple, le d6bit carburant consomm6 a relativementplus augment6 que l'6nergie recueillie par l'huile ;plus le taux depouss6e du moteur est 61ev4, plus les niveaux d'6quilibre thermique descircuits sont basen extrfime froid un rehaussement de la temperature du carburant desservom~canismes de 25 OC par rapport A celle & l'entr6e du r~gulateur et unniveau d'6quilibre qui se situe autour de 10 1C. Rappelons quen l'absencede rdchauffeur de carburant des servoin6canismes, la temp~rature A llentrdede ceux-ci serait celle A l'entr6e du r6gulateur.
7- CONCLUSION DES RTUDES
Les nombreuses analyses effectu6es ont montr6 gulen condition extreme froide, lecircuit d'huile du moteur nest pas capable de r~chauffer tout soul la totalit6 ducarburant consomm6 jusqu'A un niveau de temp6rature tel que toute cause de givragepuisse 8tre 6vitde sur la totalit6 des 6quipements mouill6s par le carburant.
Si pour certains, le givrage ne peut entrainer que des dysfonctionnements locauxn'affectant pas la marche normale du moteur, pour le r6gulateur et ses asservissements,on pout fitre confront6 A des ennuis graves affectant la pilotabilit6 m8me du moteur,pouvant aller A la limite jusqu'A son extinction par mauvais dosage du carburant oumauvais contr~le de la position des stators variables. La recherche d'une sol.utionsimple nous a conduit A r~chauffer s6par6ment les servom~canismes, partie la plussensible, jusqu'& un niveau de tempratures 6vitant tout risque do givrage et lecircuit principal du r~gulateur jusqu'au maximum possible autoris6 par le circuitd'huile du moteur; la temp6rature dans le r6gulateur restant cependant fortementn6gative en extrfime froid.
Le domaine de fonctionnement correct de ce concept ne pouvalt qulatre explor6 etvalid6 par des essais partiels reproduisant le plus fidblement possible les conditionsde givrage susceptibles d'&tre rencontr6es en exploitation. Csest l'objet de ladeuxibme partie.
24110 M-APT-MIE - LEM-S MESAIS-- 014ODIIC
Les essais de simulation ont 6t6 effectu6s au Centre d'Essais des Propulseurs(CEPr) de SACLAY (FRAN~CE), centre disposant do moyens dlessai et d'investigation tr~simportants mis A la disposition des constructcurs de moteurs a6ronautiques mais aussides avionneurs, en particulier pour ce qui concerne les simulations de vol en altitude.
1 - GENERALITES SUR LES CONDITIONS DE SIMULATION
Des analyses pr6sent6es en premibre partie, il ressort que les conditions ded6collage sont les plus critiques et couvrent par leur s6v~rit6 tous les autres cas devol possibles. En cons6quence, nous nous sommes attach6s & faire subir au circuitcarburant complet les conditions quil pourrait 8tre & mgme de rencontrer sur aviondans des conditions de temp6ratures extremes :D&co11age z= 0, M-- 0.6, ISA= - 124 -F.
1.1 TENSRlE EN EAUl
Nous avons d~jA vu que les r&glements demandent que la teneur en eau libre nesoit pas inf6rieure A 200 PPM au cours des essais; le carburant A 27 0C ayant 6t6pr~alablement satur6 en eau dissoute. Ce qui, compte tenu des courbes desolubilit6 de l'eau dans le earburant, conduit & un rapport en masse de 0.0078 %d'eau dissoute dans le carburant, soit environ 100 PPM en volume.
Dans la r6alit6 sur avion, cette eau dissoute pout se lib~rer totalementgrace A l'abaissement de la pression avec l'altitude. En d~finitive, le carburantpeut contenir, A la limite, jusqu'& 300 PPM dleau libre :cas d'un avion longcourrier d6collant d'un pays chaud et humide (zones 6quatoriales) et contraint dored6coller en fin do mission suite & un atterrissage avort6. En cons6quence,l'ensemble des essais a 6t6 ef fectu6 avec une quantit6 dleau en volume 6quivalentea 300 PPM au momns dleau libre.1.*2 PUISSANCE CAORE&
Un parambtre trbs important A simuler eat la loi de puissance calorifia'ietransf~r6e par l.es 6change,,rs, du circuit d'huile moteur au circuit carburant: loiqui nWest pas constante mois, comme nous l'avons vui on premi~re partie,d6croissante quand la temp6rature d'huile A l'alimentaticn du moteur augmente. Led~bit d'huile 6tant constant et fix&, le plus simple 6tait de restituer par unsyst~me do r~gulation la diff6rence do temp~rature (sortie moteur -entr~e moteur)en fonction de la temp~rature entr~e moteur.
23-8
1. 3 wIONEM
on sleat efforc6 da recr~er autour des 6quipementa, lea conditionsa6rothermiques lea plus d6favorables suaceptibles d'8tre rencontr~es stir avionrespect de la temp6rature anibiante et du coefficient d'6change par convection. Ce
lk qui a n6cessit6 dlinstallet tous lea mat6riels en essai dans une enceinteclimatique calorifug6e.
1.*4 TWEIRNIWRB CARBURtAM
De fagon A d6terminer lea limitos de fonctionnement correct des systarnes,des
essais de 5 en 5 degr6s ont 6t6 of fectu6s depuis - 25 0C jusque vers - 50 1C,
1.5 DURES DR CHAQUE PHlASE D'ESSAIS
La majorit6 des essais a 6t6 effectu6e pendant des dur~es continues de 60 et90 minutes en conditions extr~mes de givrage.
1.6 CONhFIGURATIONS
2 configurations ont 6t6 test6es- sans r6chauffeur des servom~canismes- avec r6chauffeur des servomdcanismes
1.7 FLUIDES
*CARBUR.AN4T
Pour tous lea essais, le carburant utilis6 6tait du TR-0 (JET Al) sansadditif anti glace. Il r6pondait A la norme AIR 3405/C.
*HUILE
LI'hule utilis~e sur le circuit des 6changeurs Atait de l'huile synth6tiquer6pondant aux exigences de la norme AIR 3514 (type I).
2 -NATMiUKS Eff ESSAI
La configuration d'essai 6tait en tout point identique ati montage des circuitscarburant et huile du moteur (6quipements, diamatres de canalisation, bouclesd'asservissement... ). Les 6carts par rapport aux mod~les d6finitifs ne portaient questir l'aspect physique ext~rieur, dtis aux modes de fabrication, mais ne remettaient pasen question leur fonction. Par ailleurs, les liaisons m~caniques et hydrauliques6taient identiques A celles utilis6es sur moteur.
3 - INSTALLATION D'ESSAI
La d6finition, la r6alisation et la mise ati point de cette installation ont 6t6effectu~es par le CEPr de SACLAY stir la base des sp~cifications d'essai 6mises par laSNECH.A.
Elle se composait des parties principales suivantes" un circuit carburant" tin circuit d'huile" tin circuit d'air r~gul6" tine enceinte climatique" tin dispositif dlentrainement m~canique
3.*1 LE CIRCUIT CAIWURAMT
Parmi lea diff6rentes proc~dures dlessais de givrage appliqu~es aui CEPr suxlea circuits de carburant et leur composants , c&est celle du t"refroidissementpr~alable et d'ingestion d'eau proportionnelle" gui a 6t6 retenue, car elle permetde r6aliser des dosages pr~cis et des essais de longue dtir6e :,pltis de 9 hetiresdana notre cas.
ioans ce type dlessais, une des difficult6s vient du fait que le d6bit d'eau Ainjecter dana le carburant eat souvent faible :quelques litres par hetire.
En consequence, on cr6e 2 circuits
" Le circuit principal constitu6 d'un r6servoir de grande capacitecontenant le carburant n6cessaire A l'ex6cution de llessai, refroidi &la temp6rature demand~e et envoy6 vera lea mat6riels A tester.
" Un circuit secondaire comportant tin rdservoir dleau at tin reservoir deca0.buiant. 11 perme. d'ub~ezir tin mC-lange eaui carburant & iatempiratire ainbiante. Ce rn6lange eat introduit dana le circuitprincipal par tin injecteur qui d6livre tin d6bit correspondent a leaconcentration aotihait~e.4

23-9
Cinq fonctions doivent btre assur~es
* r~serve de carburant f raid et sec* injection d'eau* r~cup~ration du carburant contamin6 par l'eau* ringage des circuits au carburant sec* s6chage du carburant
D carburant desa rOIDblEnt: "s~ch6" per un filtre coalesceur ti
stock6 dans deux r6servoirs de 4,5 mn3 chacun, cossiuniquant en leur point baa. Lorsde la pr6paration du carburant f raid, uls ftaiont raccord6s wii circuit fern4,auccessivement sur deux refroidisseurs:
* l'un utilis6 pour ref roldir jusqul& - 35 OC, constitu6 par un groupe motocompresseur & fr6on capable de compensor un apport thermique de 75 kwA -35 OC.
* l'autre, utilis4 pour descendre au dessous de - 35 OC, constitu6 par uneinstallation A 6vaporation dsazote liquide, capable de compenser un apportthermique de 10 kcw aux plus basses temp6ratures des essais.
Ce carburant froid et sec filtr6 & 50 Mi, 6tait achemin6 aux inat6riela enessai par une pompe capable de 5 in3/h sous 2,5 bars relatifa; la pression et led6bit 6tant rhglables par un syst~mo do vannage.
3.1.2 INJECTION D'EAU
Le in6lange, & raison de 20 % doeau at 80 % de carburant, 6tait pr6par6autosatiquement par pompage, filtration, et r6glage des d6bits dana deuxr~servoirs & teinp~rature ainbiante -
" un r6servoir d'eau d6min6ralis6e de 0,1 in3
" un r~servoir de carburant do 0,4 in3
Aprbs r~gulation et inesure du d6bit, la partie de ce m6lange correspondant Ala concentration recherch~e eat injezt~e dana la veine de carburart froid;,l'oxc6dent dtant ronvoy6 dana un r6servoir de r~cup~ration de 0,5 in
3.
LinJectour, souinis ext6rieurement aux basses temp6ratuxes du carburantf raid, 6tait pourvu d'un dispositif de r6chauff age & huile chaude pour 6viter laformation de glace et l'obstruction. A Ilendroit de l1injection, la veine 6taittransparonte pour permettre de regarder l'6tat de l'injecteur lui-n&in sais aussila formnation des paillettos de glace dana 1e courant f raid. La pulv6risation deproduits anti-givre sur la paroi externe de la veine 6tait fr6quente pourarn6liorer la visualisation.
3.1.*3 RECUPERATION DU CARBURANT COPTAmIN PA L EAU
A la sortie du circuit carburant inoteur en essai, le carburant f raid, chargede particules de glace, 6tait dirig6 vera un r6servoir d'une capacit6 de 11 in3
pour stockago temporaire avant traitement.
3.1.*4 RINCAGE DES CIRCUITS AU CARBURN SEC
Juste apr6i, chaque phase dlessai en conditions givrantes, lea circuits enessai 6taient aliment~s avec du carburant sec A temp6rature ambiante provenantdun reservoir de 0,72 in
3. Apr6S chaque passage dana le circuit du Inoteur, le
carburant 6tait d~charg6 de son eau. par passage dana le filtre coaloscour avantde rotourner au r6servoir.
3.1.5 SECHAGE DU CARBURANT D'ESSAI
De mgme quo pr6c6denanent pour le ringage des circuits, l'op~ration des~chage du carburant avait lieu aprbs chaque sai.
Elle a'effectuait en 2 phases" Preiire phaseF-chauff age du carburant stock6 dana le r~servoir de 11 in
3 par circulationen circuit ferm6.
" Deuxi~nie phaseTransvasement du carburant du r~servoir de 11 m3 dana lea deux r6servoirsde 4,5 im3 apr~s passage au travers du filtre coalescour charg6 do s6parerl'oau libre du carburant. Des analyses effectu6es suivant la rn6thode deKARL-FISCHER A l'aval du filtre coalesceur perrnettaient de contraler lateneur r6siduelle en eau libre. Elle se situait aux environs do 80 PPM.
3.2 LE CIRCUIT D'HUILE .Ainsi que nous lavons ddjA signal6 au paragraphe 1.2, ce circuit 6tait
charg6 de restituer oxactement lea conditions des transferts de chaleur du circuit
d'huile moteur vera le circuit carburant.

23.-10
Il se composait des principaux 6l6ments suivanta
* Un circuit comprenant :un r~servoir, un vase d'expansion, une pompe decirculation.
* Un dispositif de chauff age de l'huile.* Un circuit vhhiculant 11ul chaude vers les 6changeurs du circuitcarburant en essai comprenant :une pompe volum6trique, un systbme de
vannae por egiueleo doi teplaure & air due soe (tnhermo-su
1e plus fin de simuer u meux pr4voion do la uispsance drnre fau 1caburanstahuil par 'A du:i 'nclaai 6et a egved
* chnepnciple de 4n oter de rhgutatne lcue doer~ tepaturedue&rversi d'haneurt donc la puissance tansf6rucrrnaait d 0k 61+82)*t in el6nmleciutprnpa de r~gulation decte temphrature.Apri n soad (teroi
d o~uplti) cotaitu parcntiv du ase de foctionetep diul4 tayopte t
en c lu, concne ls mes dieu r6ction de puissdane l'huilc e a
carundiat 1ion mej de fesinaitigue sormte ompesser .e gPS3" ae16uateur 6taitncal pa une btere deuao 2e boutchute dei compr&a200
bars dipa6 cane dirut dpteniul 200 -~uato 40 bars.m~rtre aOct ruair d6tendu alim~entai u ruateu de presionnmt permttan la custemnt
etlemp maintie d2 maprino 63 da vachlur f epran Ae prorame duessais. M5
en e neledergaincmeat les phnmesd jtom epusse filre s hagerae
ler6gulatur i maer6 ptair ns btll d un cauion cliaiqu & exclusi200dur moturpe haue dcun tnent esr 200.V - C du vbandrcs.nee
stto vairabledu comesseur H.P. guia6eai de pitusi a lexterieur du caisson.
Ctte ncint e laonfecionn A la vlaeu die pane irolrantmen dlamedever
Wetaitl rfide paru apiorateumr &aoto liquidmes almentpre uns r6avirs et
le homogtur li6 de, em6atedns'ecie tait intl6dnncisnciassue, pA un entlaurbrassatu contiueementraine;n daiessVB.et auurie deuipemnts desi
a vrialesi de la mpsture a.P li 6netstsAlt6rieur du caisson.6atasu~ a
'uCrture etclanfermeture d'unee6lectrovandeassantu sl'aintatin lie deN2rltiud t comandie pa prt duA sode deqid tprature t parun r6saerord
Lle dispositf deteratemt du aglaeu eeite ssme 6tait compos6pr u peiaer
- usn oteultiuellmn & coant lati vitesse var ds qibledne puissncresnomtinae de 195l oW, apae d'uavin ies aiaed 00C/m
La un ultiplice ate dovte de rapportiu au caisdson yat ame derluvrurifitio fetur dn lrdorte airat aoupl6atclu du Nriquid t mae Apri ur.sned ep~auee ~u ~uae
Lealiientation duetanmn droulteur et de rslg os ies dome rotat comaienpa
-su~ a un ~rteur 4iuecurante statiu A tristrialepisac
-istumttinpierti de vificeder aptout 1momn de esnsaist eoditondo simul ation et d onier1 comporemn de sri mat aels&. d
L'a alimentatdiun d~nuntotn d et leu~ raede s vtiess iuade urio ecrnt
tae mltran en detes rele copreen e.atre
-omi lesa 6ts e cur d'a inecte d'hes essais, lessbepret
-ion lea prls imos dnjectosri op .. etHPetscsri
r~chauffeur
23-11
- les pertes de charge du filtre carburant, des 6changeurs- lea temp~ratures de fluide
*carburant :entr6e pompe B.P., entr6e et sortie 6changeurs, sortier6gulateur
* huile :entr6e du r~chauffeur de c*rburant, sortie du refroidisseurd'huile*1* A l'int6rieur du caisson climatique
les temp6ratures de masse :pompe carburant, r6gulateur, 6changeurs.
5 PROCEDURES D'RSSAXi-Des proc~dures de mise en route, d'arr~t et de reconditionnement de 1isaltoavaient 6t6 6tablies et affin6es lors des essais pr6liminaires qui sl6taient d~roul6sdu 26 OCTOBRE au 21 DECEMBRE 1977 pour optimiser et figer les nombreuses manipulationsaf in de rendre les divers essais parfaitement comparatifs entre-eux.
6 - CITUBS DR REIISSITE
Ces essais gui 6taient effectu6s dans le cadre de la certification du moteur
-de d6montrer gue le circuit carburant 6tait capable de fonctionner sansinterruption
-de r~guler correctemenz le debit carburant dans les conditions de givragesuaceptibles d'6tre rencontr~es dana le domaine de vol pr~vu
-de d~terminer la dur~e pendant laquelle ces fonctions 6taient assur~escorrectement.
En cons6quence, le comportement du circuit carburant devait 6tre analys6, enr~gime permanent, en terme de la stabilit6 de certains param~tres de r6gulationen particulier
*d~bit carburant inject6*position des vannes de d~charge (VBV) et des stators variables (VSV),
paraznbtres gui servaient de r6f~rence pour justifier la r6ussite de llessai et laconformit6 des circuits vis A via des r~glements.
Bien que nintervenant pas directement sur le fonctionnement du moteur lui-mame,le comportement de l16changeur principal et du r~chauffeur 6tait notd pour chaque pointd'essai, tant du point de vue thermique gu'hydraulique.
7 -RESULTATS DES ESSAIS ET ANALYSE
7.1 CONFIGURATION SANS RECHAUFFEUR DR CARBURANT DES SERVCIECANISMES
Le montage 6tait donc celui du circuit carburant de base comprenantessentiellement en suivant le sens de 1'6coulement:
*la pompe basse pression recevant le carburant froid A la tempdrature TCa et Ala pression PCa1 '6changeur huile/carburant
*le filtre A carburant*la pompe haute pression*le r6gulateur et sea servom~canismes*le circuit dinjection*la boucle de recirculation
4 essais ont 6t6 effectu6s en condition d6collage avec des temp6ratures decarburant A ]entr6e de la pompe basse pression suivantes - 25 OC, - 30 OC,-3-. 1C, - 40 OC pendant des durdes de 35 min pour lea deux premi~res tempdratureset 60 min pour lea deux autres.
Comportement. des circuits
Deux comportementa sont apparus suivant la temp~rature do carburant Al'entr6e des 6quipements:I*temp~rature sup~rieure A 0 OC MTa 2: - 30 1C) .tous lea circuits fonction-nalent correctement, lea paraxn~tres restaient stables au niveau des valeursinitialestemn6ratures n6gatv2 & Intr~e des 6ouipements (TCa < -30 OC) .:le filtre A
iaruatetaitgle premier' 6uipornent & subir lea effets du givrage. La pertede charge de l'616ment filtrant comrnengant A croitre 1 h 2 minutes apros led~but de llessai d'inJection d'eau et le colmatage tot-al entrainant l'ouverturedu by-pass, intervenant aprbs 8 & 10 minutes. A noter cependant, gue plus latomp6rature 6tait basse, plus l'augmentation de la perte de charge dtait lente.Caci piul a!axpllquor r a cossa I ct !a ctutr e!adaa cccristaux mous s'agglutinant plus facilement gqie des cristaux durs.
En ce gui concerne 1'injection du d6bit carburant dana la chambre et lessyst~mes d'aaservissement (VBV, VSV), on notait un fnctionnement correctpendant au momns huit minutes. Au del&, apparaissaie.it des variations de d6bitdu carburant inject6 de 1 10 % environ autour de la aleur norninale, pouvantdevenir au bout d'une dizaine de minutes suffisamment significatives pour
affecter le fonctionnement du moteur. Lea cristaux s'accumulant, il s'ensuivait

23-12
des instabilit~s de plus en plus importantes affectant les pressionsd'asservissement des stators variables (VSV) et des vannes de d6charge (VBV).Par exemple, l'essai A - 40 OC a 6t6 arrfit6 38 minutes apr~s l'injection dleau:la variation des param~tres 6tait telle qu'il n'6tait plus possible d'exploiterlea enregistrements. Des battements de 40 bars ont 6t6 relev6s sur la pressiond'injection du carburant dans la chambre. A noter gue dans tous les cas,ld6changeur principal a toujours fonctionn4 correctement, sa perte de chargen'ayant d'ailleurs gue tr&s peu vari6 + 15 % au maximum.
Ces essais ont montr6 clairement gue la pilotabilit6 du moteur est affect~etrbs rapidement d~s lors que les temp6ratures du carburant A l'entr~e durhgulateur et des servom6canismes deviennent n6gatives.
7.2 CONFIGURAWION AVEC RECHiAIFFEUR DES SERVCMBCANINS
Dana cette configuration, un 6changeur de chaleur r~chauffe le carburant dessyWtwicz d'asservissement prdlev6 A la sortie de la poape HP et dont le d6bit eatenviron 1/4 du d6bit consomm6; ce r6chauff age 6cant effectu6 par la totalit6 du d6bitd'huile A la temp6rature de sortie du moteur. Pour le reste, le circuit eat le m8me que13 circuit de base. 4 essais ont 6galement 6t6 effectuds en condition d~collage, soitpour des temp6ratures de - 25 CC, - 30 OC, - 35 OC, - 45 OC et des dur6es de 90minutes.
Camporteient des circuits
Mise A part l'ouverture du clapet de d6rivation du filtre pour les points A-30 CC, - 35 OC, - 45 IC, guelgues minutes aprbs linjection. d'eau, ce guitraduit un comportement identique A 7.1, lea syst~mes de r6gulation sont peuaffect6s par le pr~sence de glace dana le carburant. Le d6bit carburant injectd etla position des servom~canismes (VBV + VSV) sont rest~s stables pendant les 90minutes de l'essai, except6 pour TCa =-45 OC ott A 88 minutes exactement unaccroissement de 10 % du d~bit carburant inject6 eat apparu. Puis le d~bit eatrest6 stable & sa nouvelle valeur jusqu'& la 94 e1 minute, moment oi eat apparuun deuxi~me accroiasement de pr~s de 40 %; lsessai ayant 6t6 arr~t6 A la 96minute par suite de ld6puisement de la r~serve destin6 A Ileasai.
Ceci montre que
*des temps de fonctionnement forts longs peuvent 8tre n~cessaires avant quen'apparaissent lea premiers symptdmes dus au givrage et qulil convient, encons6guence d'&tre prudent en la mati~re quant aux extrapolations.
-le syst~me propoad a sea limites com"me nous le pensions au coura del'analyse puisgue le carburant le long iu circuit d'injection eat toujourarest6 & temp6rature n6gative.
A noter guen ce gui concerne l'6changeur principal, il a 6t6 relev6 descolmatages de la matrice, conduisant A l'ouverture du clapet de d6rivation, puia Ad~colmatage pour TCa = -.45 CC comme attendu par l'analyae, suite au r6chauff agedes plaques frontales par l'huile. Mais ce d6colmatage ne s'est pas produit & destemperatures momns froides; ce gui traduit encore l'effet de la structure de laglace aur lea ph6nombnes d'agglutination des cristaux et dobatruction guia 'ensuivent.
Pendant toute la durde de ces easais, lea pertes de charge du r6chauf four ducarburant des servomdcanismes sont rest~es stables aux valeurs d'originetraduisant gu'il nly a jamais eu d'accumulation de glace; lea temp~raturea deparoi 6tant toujours & ternp6rature positive.
8 -CONCLUSION DES ESSAIS
Lrjs principaux enseignements (ou confirmations) gui d6coulent des easais effectudsen conditions givrantes du 18 Janvier au 30 Mars 1978, sur des circuits carburanttypiques de la farnille des moteurs C?11 6, tcnctionnant avec du carburant contenant del'eau dana lea proportions d6finies par l.ee reglements, soit 300 PPM en volume (300 A380 PPM bora des essais), sont lea suivants
* Le fonctionnement correct eat assur6 sans rebtriction de dur~e due & lapresence de Ileau, dbs lora gue l~a temp6rature du carburant A 1entr6e dur6gulateur eat sup~rieure A 0 CC, ceci malgx6 le colmatage 6ventuel du filtreprincipal.
* Pour des ternp6ratures de carburant inf6rieures A 0 CC au r6grulateur, lefrrcLionreieeiL correct du circuit carburant na pu 6tre assurd Clue pendant dEsdurdes limit6es dent lea valcurs d6pendent des niveaux de temp~rature Al'entr6e de la pompe BP et 6galement du taux de pouss~e d6livr6 par le moteur.
* Le premier phhnom&ne anormal rencontr6 aprbs 8 A 10 minutes de fonctionnementeat une variation p6riodigue du d6bit carburant, d6livr6 A la chambre, autour
de a valeur nominale, ce ph6nombne restant stable dans le temps.
23-13
*Le deuxi~me ph6norn~ne est une obstruction du circuit des servom6canismes du
r~gulateur conduisant A une d6rive des param~tres essentiels au fonctionnementdu moteur :position des vannes de d6charge et des stators variables, conitr~ledu d6bit carburant consomm6 ; ce second ph6nornbne apparaissait 10 & 35 minutesapr~s fonctionnement en conditions givrantes.I Cette limite de fonctionnement correct, sans limitation d'aucune sorte sur les
conditions moteur, est atteinte avec le circuit do base du CFM56, non 6quip6 der6chauffeur du carburant des servom6canismes, lorsque la temp6rature du carburant al'entr6e de ls pompe BP descend A - 30 OC.
Cetts limits est repouss6e & - 45 OC par l'adjonction dun petit 6changeurhuile/carburant dont le r~le est de r6chauffor le carburant qui circule dans lesservom6canismes plus sensibles aux effets du gi,.raqe que le circuit principal dur6gulateur; Ia puissance calorifique extraite du circuit d'huile 6tant sensiblement lamfine dans les deux cas.
Ainsi que nous l'avons d6ji vu, des fonctionnements au dessous de - 30 OC sansr~chauffeur conduiraient assez rapidement A une impilotabilit6 du moteur; de maine, dansles m6mes conditions moteur, des fonctionnements au dessous de - 45 OC conduiraient auxm~mes anomalies avec des circuits 6quip6s de r6chauffeur, et des systames annexessersient n6cessaires pour "descendre" plus baa. Cependant, jusqu'& ce jour, aucunavionneur, aucune compagnie a~rienne nWest demandeur, une temp6rature de - 45 0Cn'6tant vraisemblsblement pas &~ pratigue courante I
341-- 3PA~IE - CT ALIS'IIOM
Les 6tudes pr6sent~es pr~c~demment datent de 1'6pogue de la d6finition et dud~veloppement des premiErs CFM56. Elles sont donc vieilles de 15 ans aujourd'hui. Lesessais d6crits en deuxiame partie datent de 1977-1978.
Qu'en est-il aujourd'hui?
* les systbmes d6finis A l'6poque se sont-ile r6vd14s satisfaisant au cours decop Presque 10 ann6es d'exploitation des CFM456 ?
* Quelues sent les tendances actuelles ?
1 EXPERIENCE A -1SH
1.*1 EN ESSAI E' VRAIR GRANDEUR SUR AVION
Au d6but de Ilutilisation des 'CFM56-2B s'ur les avions ravitailleurs KCl3SR,l'USAF a effectu6 a EGLIN (FLORIDE) des essis climatigues sur un avion 6guip6 deses 4 CFM56-2B. L'avion etait install6 dans un hangar A l'int6rieur luquel istenip~rature avait 6t6 abaisse et maintenue A des niveaux compris entre - 29et - 51 *C, pendant des dur~es suffisamment longues, de fagon que l'ensembleavion + moteurs sit eu is temps de se mettre A la temp6rature ambiants du hangar.
Tous lea essais effectu6s montrarent un fonctionnement correct des moteurslore des d~marrages et des guelgues minutes effectuaes au ralenti; les dur6es defonctionnement ne pouvant gu'atre courtes puisgue l'6jection des gaz se faisaitdans le hangar. on ne connait pas la quantit6 dleau gus pouvait contenir lecarburant.
Cet essai eat relat6 car clest le soul cas, A notre connaissance, oL) desCFM.56 ont fonctionn6 A si basse temp6rature au. sol.
1.2 EN EXPLOITATION
Contrairernent A ce gus V'on peut penser, il nWest pas aiS6 pour un motoristsde connaitre guelles ont 6t6 lea conditions les plus savares gus ss moteurs ontpu rencontrer en exploitation ... tout du mains guand ils ont fonctionn6 sansfaire parler d'eux I
Apr~s 20 millions d'heurea de vol cumul6es par tous les moteurs, nous n'avonsjamais eu de plaintes cc'ncernan; un moteur gui aurait eu des troubles de 1fonctionnement suite A un givrage prasum6 du circuit carburant; certains de cesmoteure op6rant pourtant en zones r6put6es tras froides L. certaines p~riodes del'aain6e ou ayant rencontr6 en altitude des couches plus froides gus lea - 56,5 -Cde l'atmosphbre standard valables au dessus de 11 km.
Mais il faut dire aussi gue du carburant A - 45 OC au aol doit 6tre fort peufr6guent et gu'en vol, il faudrait voler plus de 5,5 heures A M = 0.8, au r6gimede d~collace en ISA - 15 OC (Tamb =-71 OC) et avec 30., PPM d'eau dans lecarburant pour gulil y ait une probabilit4 gue lea premiers signes de givrageapparaissent (cf 2m partie). On peut donc en conclure gus ls solution couvrantdes conditions jusgu'A- 45 'C st satisfaisante.
23-14
2 - NOUVEAUX COCcEPTS DR CIRCUIT CARWURAiST
Sur certains Inoteurs, pour azn6liorer la consommation sp6cifique du moteurinstail6, le ref roidiasement du circuit d'huile des alternateura de l'avion eat assur6par le circuit carburant. Ce concept permet d'6viter l'6changeur situ6 derribre lasoufflante, 6changeur voluminoux gui cr6c dos portes do chargo at des h6tdrog6n61tds ded6bit dans l'6coulement secondaire; ce gui se paie par une surconsommation.
Sur lea CFM56-5A qui propulsent les AIRBUS A320, un echangeur huile-IOG/carburantcat install6 dans la boucle carburant du moteur.
tine vanne thermo-commandee associee A un circuit de retour carburant auxreservoirs de l'avion permet d'obtenir un debit de refroidissement sup6rieur au debitde carburant consomm6 par le moteur, particulierement aux baa regimes pour lesguels laconaommation eat inauffisante pour assurer le refroidiasement at du moteur et de sonaltornateur avion sans entralner des sur-temp~ratures aur lea circuits. Aux rdgimoa ded6collago, cette vanno eat en position formee pour des questions do a6curit6 mais aussiparce que la consommation 6lev6e le permet, mgme aux conditions lea plus chaudes.
La puissance calorifigue, gui provient du refroidissement d'un alternateurd6livrant une puissance dlectrigue de 60 kVa, repr6sento environ is moiti6 de cellegeneree au plein gaz par Is circuit de lubrification d'un CFM56.
l'alternsteur eat slors un merveilleux rdchauffeur de carburant ... tout du momnspopr lea conditions froides. Dana lea m~mes conditions gue cellos des ossais d6critsaen2 '1 partie, le r6chauff age de la totalit6 du d6bit consomm6 eat de l'ordre do 10 *Cau r~gime de d6collage en ISA - 124 OF (Tamb = - 54 OC). Ce gui signifie gue sansrdchauf four des servomecanismes lea phenombnes do givrage ne so manifestersient guevera - 40 OC et vera - 55 OC avec un rdchauffeur des servomdcanismes.
Par ailiours, si i'cn tient compte que is consommation ap~cifigue des moteursd'aujourd'hui eat plus faible gue coux congus ii y a 15 ans, on eat en droit de penserA is suppression du rdchauffeur des servom~caniamea.
La seule difficult6 eat que si une panne intervient sur ialternateur et gue 1ePilate soit contraint de le d~brayer m6caniquement, on ne saurait plus tenir que- 30 OC environ puisgue ion eat ramen6 au circuit de base .. pour loguel ii avaitfallu un rochauffeur. Soules des 6tudea fines permttont de statuer.
3'OUVE U. NOORLE MAI AI QUES
AU f ii des anndea, le modeo ddcrit en premiere partie a eu piusieurs descendants.
D'abord pour satisa ire is demande des avionneura (BOEING, AIRBUS INDUSTRIE) guiavaient beanin de modeles math6matiguea motour pour:
" aideLr A Is certification de i'aeronef (extrapolation sux conditions chaudes otfro..ies)
" mie'A.' restituer dana lea siroulateurs do vol lea indications pilotes provenantdes circuits huile et carburant.
Mais aussi pour nous, af in de mieux approcher is rdsiit6 des phdnorn&nes physiques.Le modble, gui au d6part no calculsit quo des tempdratures en r~gime stationnaire, a puaaaez rapidement offectuer des caiculsaen regime thermigue inatationnaire.
Aujotlrd'hui, pour lea 6tudes sur CFM56-5C destin6 A liavion A340, 10 modele oatcapable do calculer les tomp~raturos des circuits huile/carburant du moteur mais aussidu circuit d'huiie do lalternateur 10 long d'uno mission complete, tout en dvaiuant istomp6rsture du carburant d~livr6 par l'avion aux motoura, avec et sans recirculation docarburant dana ces rdservoirs. En un mot, is simulation oat compiate.
Ainsi, on pout suivro par le calcul 1' evolution des temp6ratures du carburant lorado ,-~l en conditions extr~mes froides au nivoau do l'entrde du rdgulateur at desser'-omecanismes, comparer lea ialeurs mais aussi lea dur6es par rapport aux essais decercification d6crits en 21" partie ot d6terminer lea marges do a6curit6 on terme degivrage.
Los etudes effectu~os avec do teis modbies pormettent d'optimiser encore plusfinoment lea solutions technologiguos et conduisent a des gains en masse et on coat.
4-PIEGES A GIVRE
Nous avons r6solu lea problbmes do givrage des circuits carburant nioteur gui sosent poada & nous en r~chauffar~t suffisamment 1e carburant pour faire fondre los
cristaux do glace. Mais nous ne serions pas complets si nous no parlions pas dessyst&mes bases sur is captation des cristaux. Do tels systemes sent utilises avecsuccbs sur certaina moteurs d'helicoptbres tols quo 10 "MAKILA" gui 6quipe le S3A331
Conane les essais llont montr6 (cf 2m" partie) 10 plus simple des syatbmea passifspourrait &tre un filtre A carburant. Mais pour assurer des dur6es do fonctionnomentsuffisaranent longues, l'oncornbremont risguoerait d'6tre prohibitif car la forme plisado
slavire ihadiquate, la glace faisant des ponteta entre lea plis; tris rapidement lej
filtre ne travaille plus que sur sa pfrliph6rie.
En consfquence, lea syatbmes sent plus com~liquils et ressemblent plut~t, pour
certains, A un 6changeur de ~chaleui sans ubes, dana lequel ne aubsiatent que leschicanes. La captation so faisant d'abord sur les preires chicanes, puis sur ladeuxi&me et ainai de suite. Ces systbmes simples dana leur principe, demandent unelongue mise au point faite A base dlessais pour diterminer l'agencement interno quico-nfirent llautonomip it riua longue.
Si cis zsytbime sont,;s6dilisants dana leur Principe puisqu'ils ne nicesaitent pasd'6nergie,,ils dt.cependint quelguier inconvinienta
- leur autonomie 6xt limicne- lea dibitsade;carburant A traitor doivent rester faibles aous peine
d'eicobtaent'importar~t- lat captatioii'peut ne pas 8tre total'.- enf in, 1*'arit du moteur, il faul. digivrer le systime ot drainer l'eau de
fusion de lagl4ace.
Tous 668 inconv6nients font on'e aie tels dispositifs sont difficilement utilisablesaur lea turboriacteurs des avions ,jommerciaux.
5 - COINCLUSIUI
Pour lea moteurs de la clasae des 100 kNewtons de poussike et au del&, il semblequa la meilleurs solution, pour 6viter lea conlsiquencea dues au givrage, soit celle guiconaista A richauffer suffisammant la partie du carburant qui circule dana lea organeslea plus sensibles par un petit richauffaur huila/carburant.
L'inergie diaponible sur le circuit d'huile doit permattre de couvrir de favonsatiafaisante lea conditions lea plus sivires. Sur lea moteurs trhs ricents, comptetenu de l'axnilioration de leur consoimmation spicifique, des vitesses de rotation deplus en plus 6levies, de l'environnement de plus en plus chaud autour des encaintespaliers de par l'augmentation des taux de compreaaion, voire de la prise en charge durefroidissement des alternateurs par le circuit carburant moteur, un "circuit Ga base"conaistant A ricliauffer tout le dibit consommi pourrait Citre envisageable juaquIA destempiraturea de - 40 OC environ.
L'expirience montre que, pour 6viter lea phinomines de givrage, il suff it que latempirature du carburant A l'entrie des organes aensibles soit tr~s ligirement auGassua du point de congilation de l'aau; lea criataux de glace ayant peu d'inertiatherinique d'une part, 6tant donn6 leur f~iible masse, et. G'autre part, la tempiraturede,paau des circuits en contact avec le carburant 6tant trbs proche de la temp6raturedu fluida en raison du rapport des ccifficients G'ichange entre le carburant et l'airqui environne leas 6quipements.
Nianmoina, si, au sein G'un mfime dquipement aensible, une circulation de carburantfroid jouxte une circulation Ge carburant chaud, lea coefficients d1ichange parconvection risquant d'fitre du mime ordre de grandeur, une analyse thermique devra 8treaft ectuie pour slassurer que la tempirature des parois nWest pas n6gative sur lecircuit chaud.
Cependant, 6tant donn6 lea situations extrimement graves que peut entrainer legivrage des circuits Ge carburant, des essais racriant au plus pris lea conditions defonctionnement sur moteur en situation extrime de givrage Goivent 6tre effectuis surlea circuits de ia difinition finale pendant des dur6es suffisamnent longues pours'affranchir de tout risque.
DiscussionAuthor:
1. R. Jacques, Ecole Royale Militafre Pour une condition de fonctioimcmcent donnie, la courbeLa puissance calorifique degagia est uniquement fonction de est unique la puissance clorifique recuejillie par l'uile nela ternpirature d'entrer de I'uile. M'y a tsil des lors anciens depend plus en fait qur de la viscosit6 de I'huile, soit de laautre parametre que la viscosit6 d'huile fonction de la. tempirature pour une huile donn~e, ce qui 6tait le cas danstempirature, qui influence ce transfert de chaleur? I'exposi.

23-16
Fig. I STOCKAGE TYPE DU CARBU RANTEN EXPLOITATION CIVILE
NOURRICECUVE DE STOCKAGEA6rlennes (civil) ou
INTERNEEnterries (militaire)
Fig. 2 SYSTEME CARBU RANT DE BASETEXTE : paragraphe 1
1&re partie
_____________________PANTIE AVIOI PANTIE MOTEUR
AMLA EGUL A I CU
POMPE DECAVA6F AVION VERS LE ULAUMTU
OMA
ECAGU
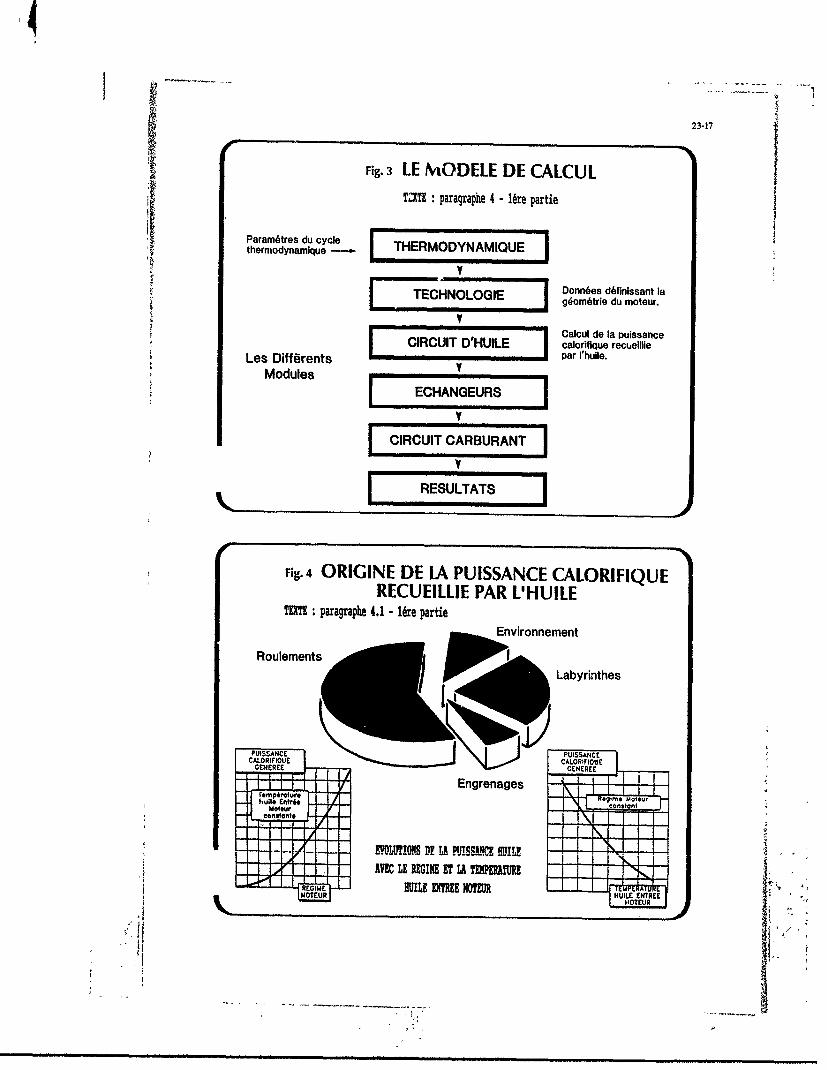
Fig. 3 LE NiODELE DE CALCUL231JTZXTE : paragraphe 4 -16re partiej
Param6tres du cycle THROYAQUthermodynamnique THRODNIIU
F TEC"ONOOGIEDonn6es d~finissant laTECH gdam6trie du moteur.
Calcul de la puissanceI CIRCUIT D'HUILE calorifique recueillieLes Diffdrents pa 'hie
Modules I ECHANGELJRS
CIRCUIT CARBURANTIyI RESULTATS
Fig. 40RIGINE DE [A PUISSANCE CALORIFIQUERECUEILIIE PAR L'HUILE
TEXTE : paragraphe 4.1 - lire partieEnvironnement
Roulements
ft Labyrinthes
PU~~ISSANCECAOrE
CENEREE EREI I- Engrenages -4 -C 1R
W.uII Enfri.-
I 1AC
REOTE'U HULNNRE TU ULE ENTREEMOTEUR 'TEUR
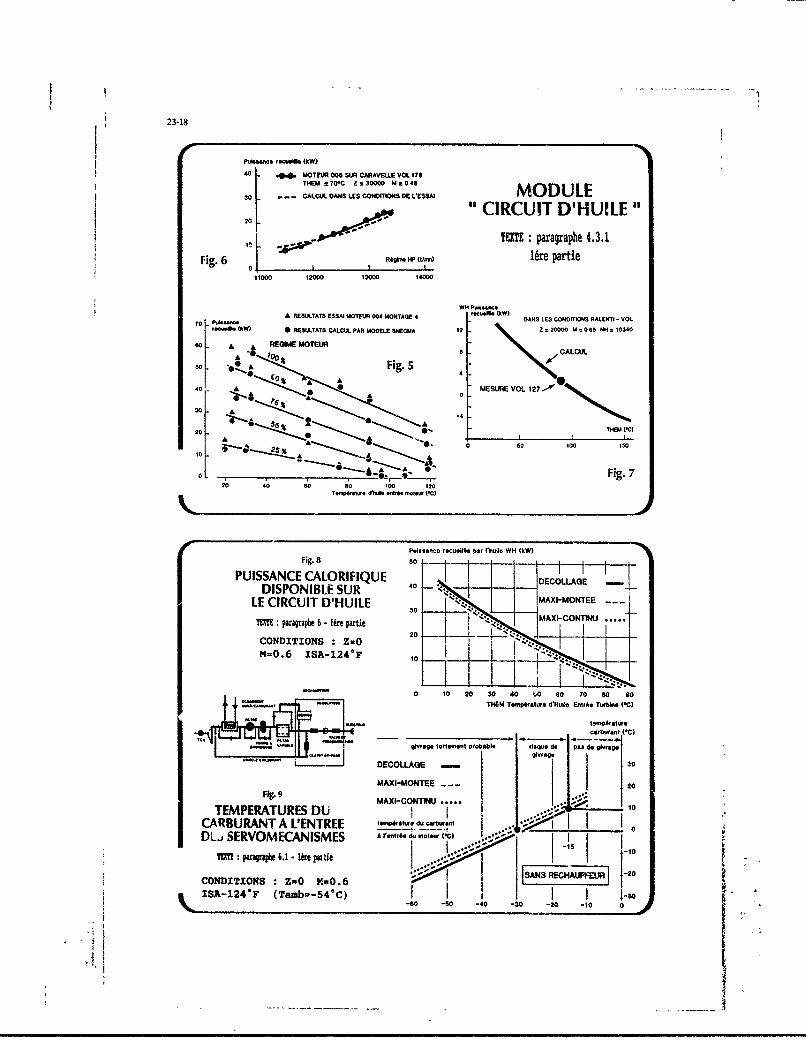
23-18
40 . 4. MOTEU30 00G8)44CARAVELL8VOL 178THEM 270-C Z=30000 .046
30 - CAL::L DAMS US CONDITION4S DE LES8AI MODULECIRCUIT D'HUILE
20 TEXTE :paragraphe 4.3.1
Fig. 6 160 HP 01M lere partie11000 12000 13000 14000
7 O ARES)LTAT3 E83.4 MOTEN4 004 MONTAGE 4 .1Mbo NW) DAMS LES CONDI1TIONS RALENTI - VOL.14.Mb 01W) 0 RE0CLTATS CALCIXI PAR MOCELE SMEOMA 12 -Z . 20000 M 0065 N14 10340
60 A .4 REOWI MOTEUR0 200
A 'Oo-_ ALU
so. ., Fig. 5 Al
0 A , A 4
ALA
20. A
200 THEM (-C)
A..... 0 0 00 100 0
Fig. 8 5PUISSANCE CALORIFIQUE 4 EOLG jDISPONIBLE SUR 4 .OCLAE -
LE CIRCUIT D'HUILE .. *MAXIMONTEE - - -
EM:paragraph 6 - Ifte partie 2
CONDITIONS :Z..O
M-0.6 ISA-124*F
0 10 20 30 40 w0 E0 T0 80 s0THEM Tormpratur. d'Huft EntrA. Turbbw PC)
W f m f h = .. ngivrage foflament probablo rlsque do Pas do ginrag_H=~L....J DECOLLAGE
'30
F~.9MA.XI-MONTEE -I -2Fig 9MAXI-COmnTNJ
TEMPERATURES DU Ij1CARBURANT A LIENTREE ±' . ______DLa SERVOMECANISMES, A r~r6 Ii m (C
1 I..* -0
1Utl: pugap* 6.1 - Ie pz1e
CONDITIONS :Z..O M-0.6 SAN REHUU -20ISA-124-F (Taub=--54-C) I -30
-6 -0 40 -0 -20 -10 0

23-19
1g.10 TEMPERATURES DU CARBU RANTA L'ENTREE DES SERVOS ET DU REGULATEUR
CONDITIONS :Z=O M=0.6 ISA-124OF (Tanib=-540C)
tempbrature* carburant (4C)
DECOLLAGE IMAXI-MONTEE - - - I...z 30-
MAX[ICQNTINU ..... 2
-20. TEM T paragraphe 6.2
-30 ler partie
-70 -M 5 4 3 -20 -10 0
INJECTION WAFig. 11CUVE 4,W VE45 n FILTRE RG
DE GIVRAGE
50e pmaCFie
L j.

* 23-20
A H, LT TR
Fig. 12 66
DISPOSITIF DES ESSAIS ~ EI6TE
INJECTION D'EAU AMER
1.061 9AC GULATEUR
TXE:paragraphe 312DWE~24me partie
gNJECTEUR tOEGIVRE
CNRCUrT DE -
CAR BURANTFROED
QUITE~tEOISPOSITIF Of CHAUrFA&C
CUVf --- CUSS REGULATION4.3 s . I.CUIT C44ARW T CF 5
Fig. 13 .r'I O'OSSEUR
7060
DISPOSITIF DES ESSAIS 2A
DE GIVRAGE
RINCAGE DES CIRCUITS + HIs0
TMXT: paragraphe 3.1.442&e partie GARNSEC FILTRE
IS"

23-21
flUTE +CU~T
Fig. 14
DISPOSITIF DES ESSAISDE GIVRAGE c
"SECHAGE" DUCARBURANT D'ESSAI
TMXT : paragraphe 3. 1. 5 A ILTEC
RESERV01R. I im3
AUA.ttIAIPE
Fig. 15S$ISTANCE Of CHAUFFAGE
A I 35 1 PIll O CNIRCULATION
p OU CHUFAG ,
DISPOSITIF DES ESSAISLTDE GIVRAGE MANOE I
CIP D'ALIMENTATIOA
CIRCUIT D'HUILE ET tACOLI
DE REGULATION AMEOS 0A TOE E7 CHANGIUR
DE TEMPERATURE IIE' PRINCIPA
REGULAT ION PRINCIPALS
2&e parie TOEI*
SN TRAIITOIN 0 S 1OSaL0
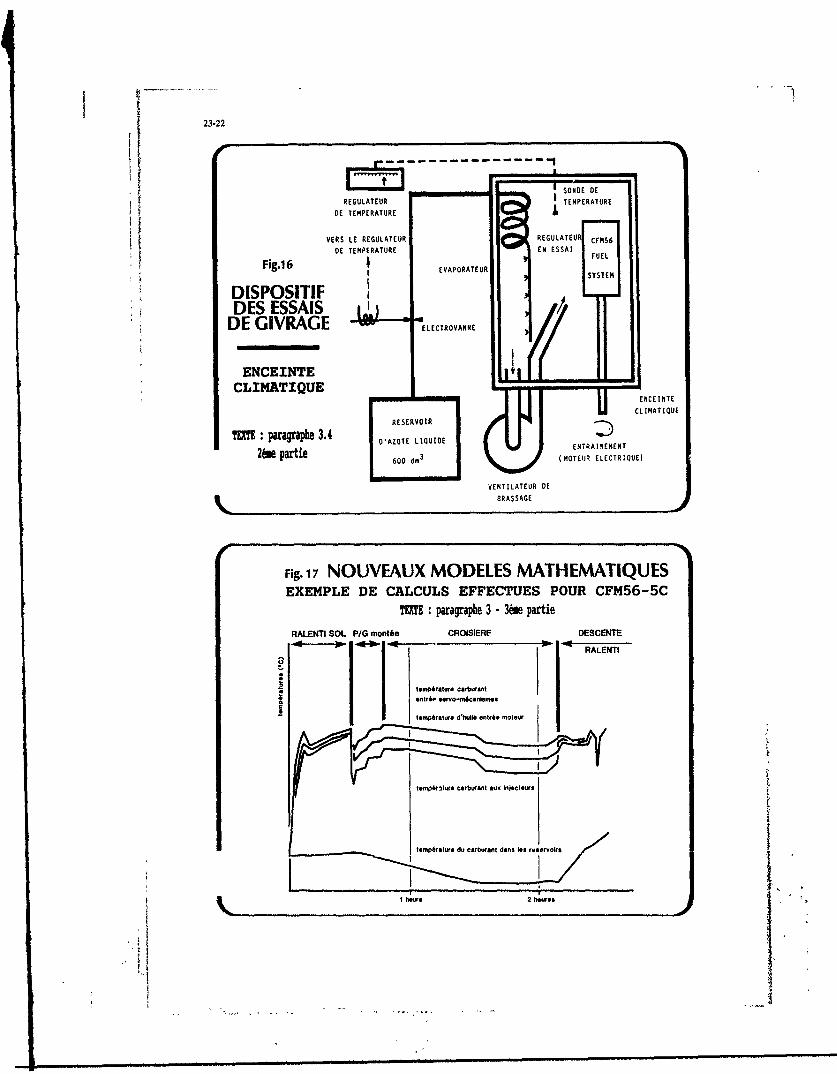
23-22
REGULATE JRTEPRUEDE TE14PERATURE
Fi.16E VAPOR ATE URf
DISPOSITIF
DE GIVRAGE J EETOAN
ENCEINTECLIMATIQUE
TETE: aagaps AZOTE LtQUIDE ETANMNHes partie60 m MTU LCRQE
BRAS SAGE
Fig. 17 NOUVEAUX MODELES MATHEMATIQUESEXEMPLE DE CALCULS EFFECTUES POUR CFM56-5C
TMXT : paragraphe 3 - 3&e patie
RALENTI SOL PIG montbe CROISIERE DESCENTE
lp RALENTI
tomprature carbiwant
a *ontr6o ..wvo-m~canism~s
temp6ratw~e dtoWlaentr6e moteuf
P;.. ~ 2 hwos.
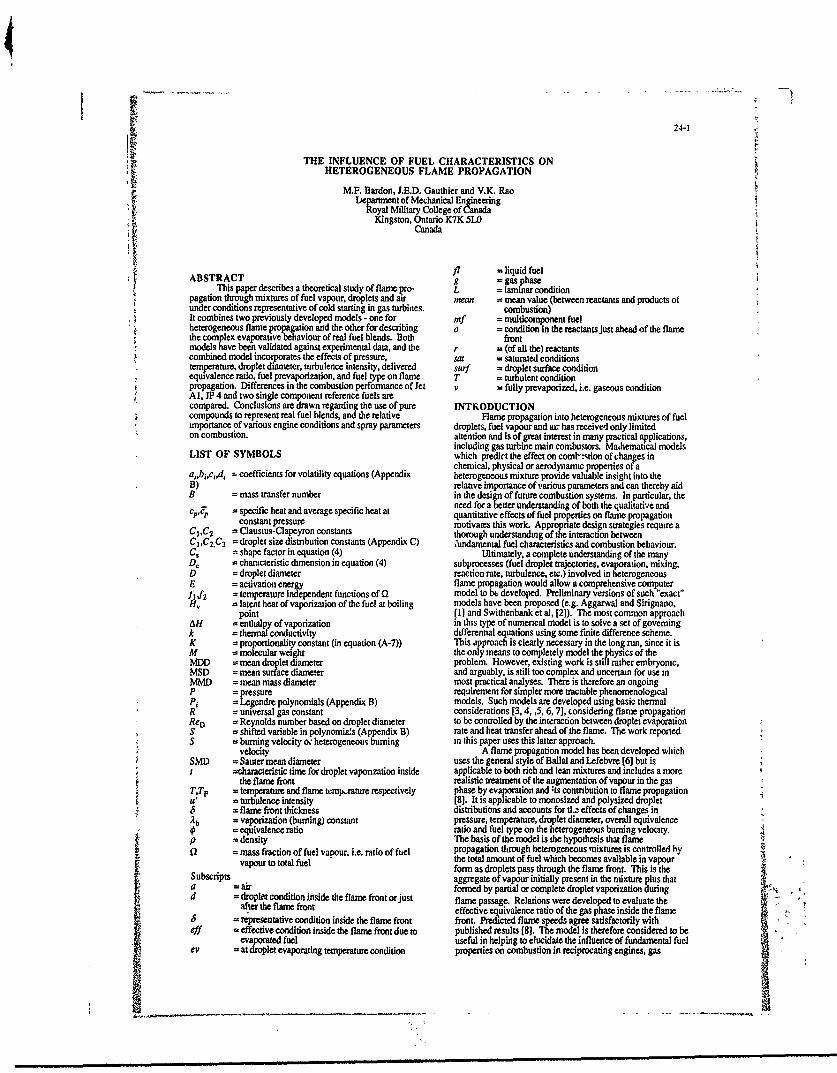
24-I
THE INFLUENCE OF FUEL CHARACTERISTICS ONHETEROGENEOUS FLAME PROPAGATION
M.F. Bardon, J.E.D. Gauthier and V.K. RaoDeparment of Mechanical Engineering
Royal Military College of CanadaKingston, Ontario K7K 51.0
Canada
A fi = liquid fuelABSTRACT g = gas phase
This paper describes a theoretical study of flame pro- L = laminar conditionpagation through mixtures of fuel vapour, droplets and air mean = mean value (between reactants and products ofunder conditions representative of cold starting in gas turbines. combustion)It combines two previously developed models - one for mf = multicomponent fuelheterogeneous flame propagation and the other for describing o = condition in the reactants just ahead of the flamethe complex evaporative behaviour of real fuel blends. Both frontmodels have been validated against experimental data, and the r = (of all the) reactantscombined model incorporates the effects of pressure, sat = saturated conditionstemperature, droplet diameter, turbulence intensity, delivered surf = droplet surface conditionequivalence ratio, fuel prevaporization, and fuel type on flame T = turbulent conditionpropagation. Differences in the combustion performance of Jet v = fully prevaporized, i.e. gaseous conditionAl, JP 4 and two single component reference fuels arecompared. Conclusions are drawn regarding the use of pure INTRODUCTIONcompounds to represent real fuel blends, and the relative Flame propagation into heterogeneous mixtures of fuelimportance of various engine conditions and spray parameters droplets, fuel vapour and ar has received only limitedon combustion. attention and is of great interest in many practical applications,
including gas turbine main combustors. Mahematical modelsLIST OF SYMBOLS which predict the effect on comnstion ofchanges in
chemical, physical or aerodynamic properties of aas,bi,,d --- coefficients for volatility equations (Appendix heterogeneous mixture provide valuable insight into theB) relative importance of various parameters and can thereby aidB -mass transfer number in the design of future combustion systems. In particular, the
need for a better understanding of both the qualitative andc, = specific heat and average specific heat at quantitative effects of fuel properties on flame propagation
constant pressure motivates this work. Appropriate design strategies require aC 2 - Clausius-Clapeyron constants thorough understanding of ie interaction betweenC1 ,C2 .C3 = droplet size distribution constants (Appendix C) ;undamental fuel characteristics and combustion behaviour.C, = shape factor in equation (4) Ultimately, a complete understanding of the many
= characteristic dimension in equation (4) subprocesses (fuel droplet trajectories, evaporation, mixing,D = droplet diameter reaction rate, turbulence, etc.) involved in heterogeneousE = activation energy flame propagation would allow a comprehensive computerfA f 2 = temperature independent functions of Q model to bt developed. Preliminary versions of such "exact"H = latent heat of vaporization of the fuel at boiling models have been proposed (e.g. Aggarwal and Sirignano,
point [1] and Swithenbank et al, [2]). The most common approachAH = entlialpy of vaporization in this type of numerical model is to solve a set of governingk = thermal conductivity differential equations using some finite difference scheme.K = proportionality constant (in equation (A-7)) This approach is clearly necessary in the long run, since it isM = molecular weight the only means to completely model the physics of theMDI) - mean droplet diameter problem. However, existing work is still rather embryonic,MSD = mean surface diameter and arguably, is still too complex and uncertan for use inMMD - mean mass diameter most practical analyses. There is therefore an ongoingP = pressure requirement for simpler more tractable phenomenologicalPi = Legendre polynomials (Appendix B) models. Such models are developed using basic thermalR -universal gas constant considerations [3, 4, ,5, 6, 7], considering flame propagationRe0 - Reynolds number based on droplet diameter to be controlled by the interaction between droplet evaporationS = shifted variable in polynomia.s (Appendix B) rate and heat transfer ahead of the flame. The work reportedS = burning velocity o: heterogeneous burning in this paper uses this latter approach.
velocity A flame propagation model has been developed whichSMD Sauter mean diameter uses the general style of Ballal and Lefebvre [6] but irt =characteristic time for droplet vaporization inside applicable to both rich and lean mixtures and includes a more
the flame front realistic treatment of the augmentation of vapour in the gasT,TF = temperature and flame tcmp..rature respectively phase by evaporation and its conmbution to flame propagationu = turbulence intensity [8]. It is applicable to monosized and polysized droplet5 = flame front thickness distributions and accounts for tl.z effects of changes inAb = vaporization (burning) constant pressure, temperature, droplet diameter, overall equivalence
= equivalence ratio ratio and fuel type on the heterogeneous burning velocity,p = density The basis of the model is the hypothesis that flame
= mass fraction of fuel vapour. i.e. ratio of fuel propagation through heterogeneous mixtures is controlled hyQapourto total fuel the total amount of fuel which becomes available in vapourform as droplets pass through the flame front. This is the
Subscripts aggregate of vapour initially present in the mixture plus thata =air formed by partial orcomplete droplet vaporization duringd = droplet condition inside the flame front or just flame passage. Relations were developed to evaluate theafter the flame front effective equivalence ratio of the gas phase inside the flame
S , representative condition inside the flame front front. Predicted flame speeds agree satisfactorily witheff = effective condition inside the flame front due to published results [8]. The model is therefore considered to be
evaporated fuel useful in helping to elucidate the influence of fundamental fuelev = at droplet evaporating temperature condition properties on combustion in reciprocating engines, gas
.5 _ 1

II
24-2
turbines and other devices employing fuel sprays. A summary of the details of the model is included asIn its initial form, the model, like other existing flame Appendix A. Figure 2 shows a comparison between the
propagation models, was limited to single component fuels or predictions of the model for - o-octane, a single componentat best, rather unrealistic binary mixtures. On the other hand, fuel, and measured flame speeds. The agreement isreal fuels are composed of hundreds of components. This considered to be satisfactory. The trends predicted by themakes their volatility behaviour quite complex. Unlike a model have also shown to be correct under a wide range ofsingle component fuel, the vapour pressure of a mixture other conditions. [8]depends not only upon its temperature but also upon howmuch has already evaporated. For example, the vapour 45 - 60 pm, [6pressure of JP-4 decreases by an order of magnitude as it j
evaporates at constant temperature. Light volatile components 0 100 gm, 16]i I 40 0 150 pur, (6)
is still liquid, but less volatile compounds remain behind, and 0the vapour pressure drops continuously as evaporation 35proceeds.
Recent work by two of the present authors 30[9,10,11,12] has resulted in the development of simplemathematical models for multicomponent hydrocarbon fuels.These allow real fuel volatility variations to be predicted with 0 25 60 pm theoryreasonable accuracy and the computational procedures are 10simple enough to be included as suhcomponents of larger 20 -analyses.
The aim of the work presented in this paper was to 15 - 3 13 0incorporate the multicomponent fuel equations into theheterogeneous flame propagation computational procedures, 10then use the refined model to investigate the effect that these 0real fuel characteristics would have on flame propagationcompared to single component idealizations. Of particular 5interest are the effects of real fuel properties on combustionbehaviour during cold starting and idling in a gas turbine. 0
0 0.2 0.4 0.6 0.8HETEROGENEOUS FLAME PROPAGATION VAPOUR FRACTION C1MODEL
Consider a reference frame fixed with rT.pect to a Figure 2. Comparison of Predicted and Measured Laminarplane flame of thickness 8 into which a heteregeneous mixture Flame Speed for Iso-Octane Sprays [8]flows at velocity S, as shown in Figure 1. The heterogeneousburning velocity is assumed to be equal to that of a MULTICOMPONENT FUEL VOLATILITY MODELhomogeneous mixture of equivalence ratio equal to that of the The simplest functional relationship for the vapourtotal gaseous mixture available for chemical reaction inside the prcssure of a pure component is the Clausius-Clapeyronflame front. To apply this model, it is therefore necessary to equation:calculate the effective equivalence ratio of the gas phase 0including both the vapour initially present, plus the fuel wwieh Psit = C I exp(-C2 / T) (1)vaporizes from the droplets passing through the flame front. where:The heterogeneous burning velocity is then equal to the Psat = equilibrium saturation pressureburning velocity of a homogeneous air/fuel mixture having T = absolute temperaturethis overall equivalence ratio. C1, C2 , constants for a given pure substance
The basis of the method outlined in references [9] -[121 is the assumption that real multicomponent behaviour can
! be described by treating C and C2 as functions of the extentSof vaporization, defined by the vapour fraction f2. This latteris the mass fraction of fuel in the form of vapour,oO 0 0 Q = mass of fuel in the vapourphase (2)
total fuel masso 0 0
0 0The basic vapour pressure equation of the multicomponento 0 0 fuel is therefore written as
777777,77/, 77777773 1/777/7777777" Pmfsat = ft exp(-f 2/T) (3)
wherefj andf 2 are temperature independent functions ofi1Figure 1: Diagram of plane flame front propagation alone, for any particular fuel. The technique uses the ASTM
distillation data [13] and specific gravity to predict theThe principal assumptions inherent in the calculation variations off, andf 2 as well as those of the mean vapour
procedures used in the model are as follows: phase molecular weight M,,f and enthalpy of vaporizationAH with the vapour fraction 'b. The relationship between
a) Transient droplet heat-up is not included - the quasi-steady each of these four quantities and the vapour fraction istreatment of the well-known "d2 law" is used; expressed by a polynomial equation. Appendix B gives
further details.b) individual droplet envelope flames or relay transfer are not Fig-ire 3 shows a comparison between vapour
explicitly included. in effect, all mixing and non-uniform prcssurcs predictcd by their d s d those measuredflame spread effects are lumped by the averaging inherent experimentally for JP-4. The results are satisfactory; thein the concept of effective equivalence ratio; volatility model is therefore considered adequate for use in
analysing real fuel twhaviour in combustion systems.c) buoyancy and droplet acceleration through die flame zone In this study, the turbulent burning velocity was deter-
are neglected; mi-,ed for a wide variety of conditions using different fuels.Results for the case of very rich cold starting conditions in
d) turbulene effects ae accounted for using empirically spark ignition engine have been reported elsewhere (14]. Inderived relations, this paper, the model is used to study conditions relevant to
,old starting of gas turbines. The fuels studied are JP-4, JETA 1, and two single component reference fuels, n-nonane and
l l ll l J ! I I i I ll i l l Hi N N he # II ill 1 [ ! i m i [ I l [I l
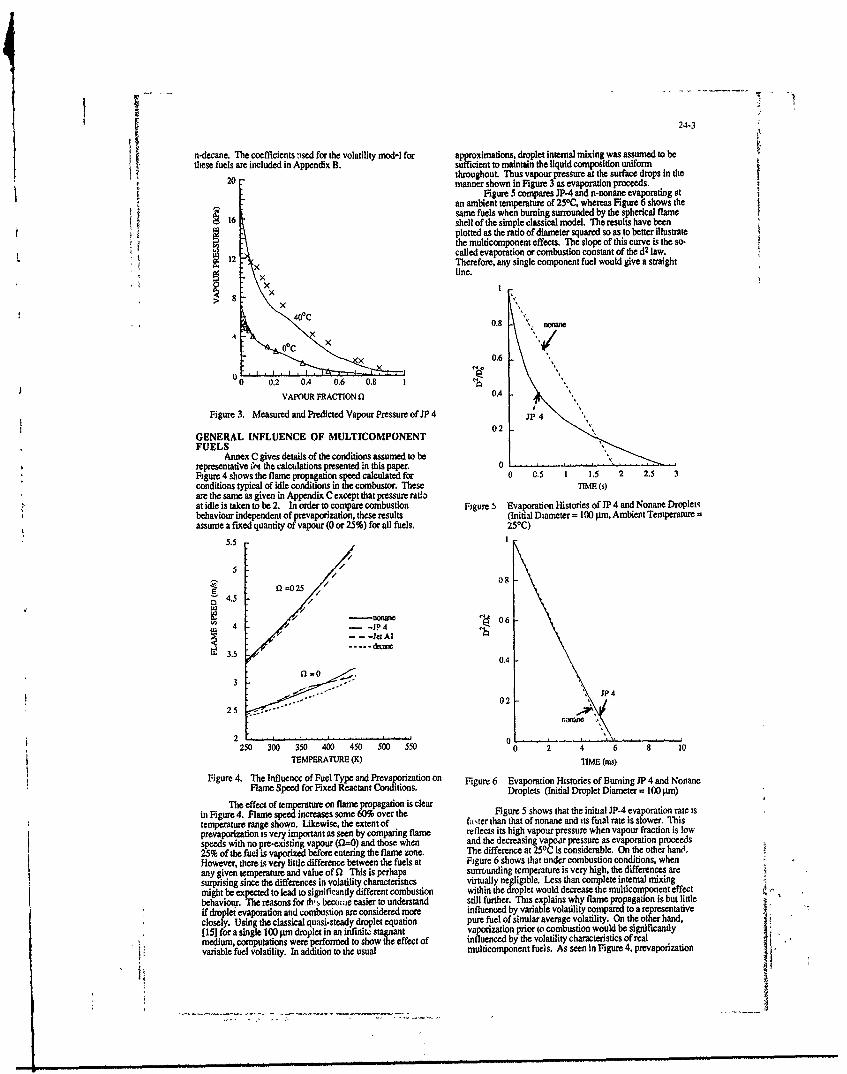
24-3
n-decane. The coefficients ,sed for the volatility modI for appoximations, droplet internal mixing was assumed to bethese~~~~~~~~~ fesaeilueinApniB.sficient to maintain the liquid composition uniform
20 throughout, Thus vapour pressure at the surface drops in the20 manner shown in Figure 3 as evaporation proceeds.
Figure 5 compares JP-4 and n-nonane evaporating at
an ambient temperature of 250C, whereas Figure 6 shows thesame fuels when burning surrounded by the spherical flame
16 shell of the simple classical model. The results have been
plotted as the ratio of diameter squared so as to better illustratethe multicomponent effects. The slope of this curve is the so-called evaporation or combustion constant of the d2 law.
L 12 ~Therefore, any single component fuel would give a straight
X< line.
> 8
,00C
X 0.6OC0
0 0.2 0.4 0.6 0.8 1
VAPOUR FRACTION 0 0.4
Figure 3. Measured and Predicted Vapour Pressure of JP 4 4,
02GENERAL INFLUENCE OF MULTICOMPONENTFUELS
Annex C gives details of the conditions assumed to berepresentative ;nt the calculations presented in this paper. 0figure 4 shows the flame propagation speed calculated for 0 C.5 1 1.5 2 2.5 3conditions typical of idle conditions in the combustor. These TM. (s)are the same as given in Appendix C except that pressure ratioat idle is taken to be 2. In order to compare combustion Figure 5 Evaporation Histories of JP 4 and Nonane Dropletsbehaviour independent ofprevaporization, these results (Initial Diameter= 100 jlm, Ambient Temperature fassume a fixed quantity of vapour (0 or 25%) for all fuels. 250C)
5.5 1//5 /
/ 08Cal _-0 V25
4.5
/ 11-5O =ei 064 -JP 4
- - -et Al3.3 dm
0.4
Q =0.' ."'"" P4
0225
nonane
2 ... 0 1 .-- .-.250 300 350 400 450 500 550 0 2 4 6 8 10
TEMPERATURE (K) TIME (ins)
Figure4. The Influencc of Fuel Type and Preva rization on Figure 6 Evaporation Histories of Burning JP 4 and Nonane
Flame Speed for Fixed Reactant Conditions. Droplets (Initial Droplet Diameter = 100 pm)
The effect of temperature on flame propagation is clearin Figure 4. Flame speed increases some 60% over the Figure 5 shows that the initial JP-4 evaporation rate is
temperature range shown. Likewise, the extent of faster than that of nonane and its final rate is slower. This
prevaporization is very important as seen by comparing flame reflects its high vapour pressure when vapour fraction is lowspeeds with no pre-existing vapour ("-0) and those when and the decreasing vapoir pressure as evaporation proceeds
25% of the fuel is vaporized before entering the flame zone. The difference at 250C is considerable. On the other han, .
However, there L; very little difference between the fuels at Figure 6 shows that under combustion conditions, whenany given temperature and value of fl This is perhaps surrounding temperature is very high, the differences are
surprising since the differences in volatility characterisucs virtually negligible. Less than complete internal mixingmight be expected to lead to signiif-cantly different combustion within the droplet would decrease the multicomponent effectbehaviour. The reasons for th', beconie easier to understand still further. This explains why flame propagation is but littleif droplet evaporation and combustion are considered more influenced by variable volatility compared to a representativeclosely. Using the classical quasi-steady droplet equation pure fuel of similar average volatility. On the other hand,
(15] for a single 100 tW droplet in an infnit. stagnant vaporization prior to combustion would be significantly
medium, computations were performed to show the effect of influenced by the volatility characteristics of realvariable fuel volatility. In addition to the usual multicomponent fuels. As seen in Figure 4, prevaporization
w ~ mlmmmm tm am tummmi ammw 1 J• ..

24-4
exerts a very significant influence oil flame propagation. It ishere rather than in the combustion itself that the effects are 400
Theimporalt conclusion is thus that it is in the conditions Ileading up to combustion that differences in fuel 350characteristics are significant for middle distillates such as the tdecanefuels studied heme. The similarity of the flame speeds for thedifferent fuels seen in Figure 4 is thus due o the fact that
prevapotization was taken to be the same f, all fuels.1250 nonaneRESULTS FOR GAS TURBINE STARTING
CONDITIONSAppendix C lists the conditions taken to be.
representative of the combustor under cold startingconditions. Dropliets are injected at an Ldtial diameter. 150 Ji' 4partially evaporate during a short period before entering thecombustion zone and then bum at % rate determined by, /among other things, the reduced droplet size and the vapour t00present due to prevaporization.
The model predicts flame speed. The question is then 50 Jet At_ - I \ .how to relate this to the starting performance of a real engine.The models developed here could be used as subcomponents 0of larger cold starting models of varying degrees of 0 . 5 2 .5... . 5 .complexity. For purposes of comparison in this paper,a 05 t 1.5 2 2.5 3 3.5 4simple and accepted means of relating fundamental flame P RATIOspeed to some recognized operational parameter was needed.For this purpose, the blow-out velocity was selected becausethe e is a straighforward way of relating it to flame speed Figure 8 Effect of Fuel Type and Pressure Ratio on Blow-OutVelocity (Initial Diameter = 100 pm, Ambientwithout entraining other moot considerations which would Temperature = 20C)cloud the issue. The relation of Ballal and Lefebvre [161 wasused: In addition to the obvious major impact of pressure
ratio (hence cranking speeo) on combustion, there are severalUao CCSL(4) other noteworthy observations which can be made from thisas figure. The first striking feature is how different the single
comolnent fuels behave compared to the real blends. It isIn order to ensure that the model gave physically clear that, under some conditions at least, the use of pure
realistic predictions of blow-out velocity, comparisons with compounds to represent JP-4 or Jet-A l leads to verypublished experimental data werc made. Figure 7 shows a unrepresentative results. The disparity can be attributed to thecomparison between the measured blow-out velocity of different prevaporization occurring with the fuels during thenonane as presented by DeZubay [17] and the predictions of flight of the droplets from injector to flame zone. The poorthe model. These values are for complete prevaporization, simulation of the real fuels by pure compounds of similarand are seen to agree satisfactorily. No data were found in the overall properties is in marked contrast to the earlieropen literature to permit a direct comparison for a observation that, all other conditions incudigheterogeneous case, but the present model compares RpYxniza ' being equal, flame propagation is viniallyfavourably to the theoretical prediction of Ballal and Lefebvre identical for all four fuels.[16]. In fact, the model presented here offers an advantage A second observation from Figure 8 is that there is aover that of Ballal and Lefebvre in that it correctly predicts the maximum blow-out velocity occurring at some pressure ratio.well-known observation that droplets below a certain size Further increases in pressure ratio (and thus in chamber temp-behave as if the fuel were completely evaporated. Having erature) reduce blow-out speed. This is due to the rich overallvalidated the model to the extent possible, it was then used to mixture (equivalerce ratio of 3.3) and relatively small dropletinvestigate the relative importance of various parameters, size (100 gim) used in these calculations. For such
conditions, excessie pressure rise results in a chamber250 temperature so high that evaporation to local values well
beyond soichiometiic occurs and the flame is slowed orextinguished altogetier. The practical likelihood of such an
102 kPa occurrence seems small under cold starting conditions, butdesigners might need to take the possibility into account whensystems designed for good cold starting are started at warmambient temperatures with high cranking speeds and better
050 atomization.A final observation from Figure 8 is that the
differences between JP-4 and JETAl are insignificant in the100 range of pressure ratios up to the peaks. These latter are
a0 slightly different and occur at somewhat different pressure0 IF- * ratios, but are again close enough that differences are, " probably not of great practical significance. This apparent
indifference to the volatility advantage of the wide-cut JP-4* can probably be attributed to the combination of favourable
0 0.5 .... ...... ,........... spray size, very rich mixture and high ambient temperature0.5 l 1.5' 2 (201C) used in this particular calculation. Under cold starting
FUEL-AIR EQUIVALENCE RATIO conditions, coarser sprays and lower volatility wouldaccentuate the differences between wide-cut and high fl-h
figure 7 Comparison of Blow-Out Velocity Predictions with point fuels, leading to significantly better vaporization withData of DeZubay [171 the latter.
Figure 9 represents similar conditions to those ofFigure 8, except that ldropet size is assumed to be 350 gm
Figure 8 shows the blow-out velocity for the assumed instead of 100 pm ambient temperature is reduced tocold starting conditions listed in Appendix C. The effect of a -40
0C. It again shows that the pure fuels are poor represen-higher pressure ratio is to increase combustion chamber tatives for the blends; however, this time, there are no peaks
temperature, with concomitant effects upon evaporation and within this range of pressure ratio. For these less favourableflame speed. conditions, the JP-4 shows its better volatility, for a given

24-5
7 is quite substantial.Figure 12 shows the importance of the droplet size
distribution on blow-out velocity. The spray having the greatestrange of sizes, and hence many small droplets, shows the highest
6 blow-out velociv at low tempertures. By comparison, asnonosized spray has greatly inferior performance. The effectagain, is due to the change m prevaporization. A relatively small
JP4 .tAI mass fraction of small droplets can markedly improve5 evaporation rate.
120
- 4
21 1.5 2 2.5 3 3.5
PRESSURE RATIO 80
Figure 9 Effect of Fuel Type and Pressure Ratio on Blow-OutVelocity (Initial Diameter = 350 pin, AmbientTemperature = -40
0C) 70 -
blow-out velocity (i.e. a given combustion performance) thepressure ratio must be higher for the lower volatility JET A. 'etThis would correspond to somewhat poorer cold starting and 60
idling performanc in the case of a real engine. -40 -30 -20 -10 0 10 20 30 40In view of the unsuitability of the single component fuels AMBIENT TEMPERATURE (
0C)
to adequately represent the real fuel blends when vaporization isinvolved, the remaining discussion will concentrate on the two Figure II Effect of Ambient Temperature on Optimum Dropletreal fuels. Figure 10 shows the effect of temperature and mean Si/zdroplet size (SMD) on combustion performbnrce. The particularconditions used in the calculation again lead to curves which 120show peak combustion performance at some optimum meandroplet size. Lower ambient temperature decreases blow-outvelocity substantially, and also requires smaller droplets to attain pIam Bbest results. At a mean diameter of 125 pmi, blow-out velocity at 0oo
200C is some 60% higher than at 00 C. In reality, droplet sizetwould be expected to become coarser at lower temperatures dueto increased liquid viscosity, aggravating the disparity still 80 polydisperse Afurther. /too
100 60
80 40,I'
60 26o s l nionosaze
I \\ -TAMB =OC 0 ... .. .
' -- -TAMB +20C -40 -30 -20 -10 0 10 20 30 40
SAMBIENT TEMPERATURE CC)
20 1 Figurel2 Effect of Droplet Size Distribution on Jet A1I - Combustion (SMD=100 pm)
0 60260 310 CONCLUSIONS
60 The flame propagation model with multicomponent fuelSAUTER MEAN DIAMETER OF DROPLETS (Jl) properties accounted for can shed uqrfid light on crm.
Figure 10 Effect of Temperature and Droplet Size on Jet Al bustion behaviour. A simple example has beenCombustion presented hem; but the multicomponent fuel model and
Figure I shows the change in optimum droplet size as the flame propagation model could also be utilized
ambient temperature is varied. The advantage of JP-4 at low idividualyorin combintion as components of more
temperatures is clear in that droplets need not be as small as for complex gas turbine combustion analyses. ForJet A1. However, the difference is not great for the rather short instaoc, they couldbe usedtohelp evaluate theevaporation time arbitrarily selected for these calculations. The evaporation occurng from individual droplets and totwo curves cross at higher tenperature because JP-4 droplets calculate the combusuon rat at different locations withinevaporate too quickly for the rich local equivalence ratio used for the combustor.
the calculations. For either fuel, the effect of ambient temperature

24-6
2. Single component idealizations are quite satisfactory for 15. Kanury, A.M., Introduction to Combustion Phenomena,many combustion and flame tion calculations; Gordon and Breach, New York, 1977.however, when prevaporzaton is im such as 16. Ballal, D.R. and Lefebvre, A.H., "Some Fundamentalun'c~r cold starting conditions, a fuel behaviour Is Aspects of Flame Stabilization," Fifth International
dly 1td b sige co nent ap tions. Symposium on Airbreathing Engines, Feb. 1981.Multico.'woent volatili behaviour cn crtically 17. DeZubay, E.A., "Characteristics of Disk-Controlledinfluence the conditions ldng up to xmbustin Flamie," Aero. Digest, Vol.6 1, Nor.V, Jul. 1950, pp 94-
3. The extent of prevaporization con exert a dominant effect 96,102-104.on flame propagaron; therefore accurate representation 18. Williams, F.A., Combustion Theory, 2nd ed.,of this process is essential to any model. Benjamin/Cummitings Menlo Park, California, 1985.Multicomponent effects must be accounted for. 19. Hubbard, G.L., Denny, V.E. and Mills, A.F., "Droplet
4. For the partcular conditions studied here, the Evaporation: Effects of Trnsients and Variabledifference~s between JP-4 and Jet A1I ame relatively Properties," IntJ.Heat Mass Transfer, Vol. 18, 1975.
slight. However, detailed modeingofparticularcasts pp.1003-1008.would be expected to show much greater impact of the 20. Gordon, S. and McBride, B.J., "Computer Program formore volatile JP-4. The equations pre.ented here for Calculation of Complex Chemical Equilibriumvapour pressit cwt readily be used for such studies. Compositions, Rocket Performance, Incident and
5. The effect of mean droplet size, size distribution, Reflected Shocks, and Chapinan-Jouget Detonations,"cranking speed (via pressure ratio), ambient temperature NASA, SP-273, March 1976.and fuel type have been studied for an arbitrary set of 21. Fenn, J.B. and Calcote, H.F., "Activation Energies inconditions intended to represent cold starting in a gs High Temperature Combustion," Fourth Symp. (Int.)turbine. Particular conclusions relevant to this case have Combust., Williams and Wilkins, Baltimore, 1953,been drawn and may offer some qualitative guidance. p.231-239.However, actual behaviour is very sensitive to the 22. Gauthier, J.E.D., Flame Propagation in Mixtures of Fuelvalues of parameters assumed (eg. turbulence intensity). Droplets, Fuel Vapour andAir, thesis submitted to the
Sresults should therefore be considered as merely Royal Military College of Canada, Kingston, Ontarioan illustration of the type of computations which can be 1980.a
performed with the flame propagation and volatility 23. Raju, M.S. and Sirignano, W.A., "Multicomponentmodels. Spray Computations in a Modified Centerbody
Combustor," J.Prop.and Power, Vol.6, No.2, March-REFERENCES April, 1990.
24. Lefebvre, A.H., Gas Turbine Combustion, McGraw-1. Aggarwal, S.K. and Sirignano, W.A., "Numerical Hill, New York, 1983.
Modeling of One-Dimensional Enclosed Homogeneous 25. Andrews, G.E., Bradley, D. and Lwakabamba, S.B.,and Heterogeneous Deflagrations," ComputFlulds, 'Turbulence and Turbulent Flame Propagation - AVol.12, No.2, 1984, pp.145-158. Critical Appraisal," Combust Flame, Vol.24, 1975,
2. Swithenbank, J., Turan, A., Felton, P.O., "Three- pp.2 85-304
Diretsional Two-Phase Mathematical Modelling of GasTurbine Comb'jstors," Gas Turbine Combustor DesignProblems, Lefebvre, A.H., ed., Hemisphere, APPENDIX AWashington, D.C.,, 1980, pp.249-314 .
3. Polymempoulous, C.E., "Flame Propagation in Aerosols FLAME PROPAGATION MODELof Fuel Droplets,Fuel Vapor and Air,"Combust.Scl.Technol., Vol.9, 1974, pp.197-207. A.1 Overall Model
4. Polymeropoulos, C.E., "Flame Propagation in Aerosols Since the amount of fuel vapour in the fresh mixture isof Fuel Droplets, Fuel Vapor and Air," known, the main task is to find a procedure to calculate theCombust.SciLTechnol., Vol.40, 1984, pp.2 17-232 , amount of fuel which vaporizes from the liquid droplets
5. Mizutani, Y. and Ogasawara, M., "Laminar Flame passing through the flame front. The time t for any mixture toPropagation in Droplet Suspension of Liquid Fuel," pass through the flame front is given by the ratio of the flameIntJ.Heat Mass Transfer, Vol.8, 1965, pp.921-935 front thickness to the burning velocity:
6. Ballal, D.R. and Lefebvre, A.H., "Flame Propagation inHeterogeneous Mixtures of Fuel Droplets, Fuel Vapor 8end Air," Eighteenth Symp. (Int.) Combust., The t - (A-1)Combustion Institute, Pittsburgh, 1981, pp.321-328.
7. Myers, G.D. and Lefebvre, A.H., "Flame Propagation in As stated above, the droplet diameter Dd, while passingHeterogeneous Mixtures of Fuel Dre-s and Air," through the flame front, decreases according to the "d2 law"Combust.Flame, Vol.66, 1986, pp. 193-210.
8. Gauthier, J.E.D. and Bardon, M.F., "Laminar FlamePropagation in Mixtures of Fuel Droplets, Fuel Vapour D2 D - 4t (A-2)and Air," JJnst.of Energy, Vo.LXII, No.451, Jun1989, pp.83-88. Under steady conditions, thc rate of heat transfer to the
9. Bardon, M.F. and Rao, V.K., "Calculation of Gasoline reactants foi th e is balanced by the rate of heat
Volatility," Jlnst.ofEnergy, Vol.57, 1984, pp.343-348. liberation in the flame (15,18]. From this, an expression can10. Rao, V.K. and Bardon, M.F., "Estimating the Molecular be found [81 to derive the effective equivalence ratio available
Weight of Petroleum Fractions," Ind.Eng.Chem., in the flame front. This is simply the sum of original fuelProcess Des.Dev., Vol.27, No.2, April 1985. vapour present plus that produced by the partial evaporation
11. Bardon, M.F., Rao, V.K, Vaivads, R. and Evans, occurring as droplets pass through the flame front.MJ.B., "Measured and Predicted Effect of the Extent ofthe Evaporation on Gasoline Vapour Pressure'" JJnst'°f of-3)Energy, Vol.65, No.441, December 1986. 04 = or (
12. Bardon, M.P., Nicks, O.W.. Rao, V.K. and Vavads, (A-3)R., "A Vapour Pressure Model for Methanol/GasoliteM85 Blends," SAE Paper #870366 presented at the in accodajice wdith ic ixk t hypothesis, the heterogeneousInternational Congress and Exhibition, Detroit, Feb.23- buining velocity is equal to that of a homogeneous mixture of27, 1987.
13. "Distillation of gasolne, naptha, kerosine and similar equivalence ratio equal to 0,, Note that the laminar4 esgatrneum ducts'" Test D86, American Society fer heterogeneous burning velocity SL is a function of #, but
14. Bird, M.F,, Gauthier, J.E.D. and Rao, V.K., "Flame that #,,is itself a function of SL via equation (A-3). ThisPropagattowi Cirough Sprays of Multi-Com ent Fuel," open form solution mens that the value of SL (hence ofJ.Inst.Energy, Vol.XIil, No.405, Jun 1990, pp.53-60. m; i 'must be found using an iterative method.

24-7
Gas phase properties are calculated using conventional APPENDIX Bmixture procedures and component properties. Thecalculatica of specific heat as functions of temperature is done FUEL VOLATILITY MODELwith third degree polynomials. Following the approach usedby other workers [4,6], the representative gas properties In the present program, the functionsfi andf 2 ininside the flame front are assumed to be those of air at the equation (3) were deri',ed in accordance with an improvedarithmetic mean of the reactant and flame temperatures. The version of the procedure described in references [9]-[121.mean specific heat of the gas phase in the reactants is also The functionsflf2 and Mm and AH are expressed byapproximated by the value at the arithmetic mean of the shifted Legendre polynomia:reactants and flame temperature.
The 13 rule of Hubbard and Mills [ 191 is used to ft = +a 2P2 + +arP1calculate the appropriate reference temperature for singledroplet evaporation. The flame temperature is taken as theadiabatic flame temperature calculated using the NASA f2
= btPj + b2P2 + "" + b P. (B-1)
Chemical Equilibrium program [20].
A.2 Burning Constant Ab Mmf.=C1P1+C 2 P2 +
The burning constant for use in the "d2
law" is found AH = d1 Pt + d2P2 +
from The degrees of the least-squares polynomials required to
8k,4.tn(l+B) adequately approximate the functions flf2, M,,. and AH;Lb = (A-4) vary from case to case; they are determined largely by the
pftCpa, shape of the ASTM distillation curve of the fuel. A curvewhose slope changes considerably as the distillation
where the droplet transfer number is approximated by: progresses, results in functions that require a larger number ofterms in the polynomial approximations, particularly the two
cpaT,,ean- Tfunctionsf, andf 2. In the present case, a fourth-orderB = - (A-5) polynomial was used to represent the functions for. The first
H, + cpfT 3 - Tfl) five Legendre polynomials are:
The droplet surface temperature is assumed equal to the P =Iboiling temperature of the liquid at the instantaneous value of P2 = SfQ. The effect of turbulence on droplet evaporation rate is P3 = (3S1 - 1)/2accounted for using a conventional correlation of the form P4 (3- 3)2P4 = (5S 3 " 3S)/2 (B-2)
Abr = AbL( 1 + 0.3ReB-5) (A-6) Ps = (35S4 - 3052 +3)/8
where the Reynolds number is based on droplet diameter and where S = I - 2C2turbulence intensity. Reference [8] provides further details aswell as a description of how droplet size distribution is Tables B-1 and B-2 give the values of the coefficients usedaccounted for. for JP-4 and Jet A l respectively.
A.3 Homogeneous Burning Velocity Table B-I: JP-4 Coefficients for use with Equation (B-I)
A.3.1 Laminar I'"1 f2 I Mmf All
The calculation of the laminar homogeneous burning 29160E+07 .43807E+04 .11030E+03 .36421E+05
velocity S, is done using the modified Semenov equation 2 -.53703E+06 -.69283E+03 -.14869E+02 ..57603E+04T .14320E+06 I .107331+03 I -.12463E+00 I .89241E+03
[211: 4 -.35832E+05 -.24750E+02 -.4558713401 -.20586E+03
K -2T( - 49269E+05 -.79834E+02 -.91133E+00 -.66367E+03T -T ' (7)Values in this table give pressure in kPa and enthalpy in
(Tp -TQ? J/mol.
The value of K is calculated using the known conditions ofmaximum homogeneous laminar burning velocity at normal Table B-2: Jet A l Coefficients for use with Equation (B- 1)
ambient conditions. The effects of temperature and pressure
method proposed by Gauthier and Bardon [8] to evaluate the - .36596E+07 .52342E+04 .17337E+03 .43518E+05exponents. T_ -.50351E+06 -A5246E+03 -.14785E+02 -.3761611+04
7- .14903E+05 I-.24603E+02 -.105242+01 1-.20456E+03 IA.3.2 Turbulent 14 .8803E+04 .12795E+02 -.857622+00 .106402+03
Reference [22] describes the technique used to 7 -.27068E+05 -.29642F+02 -.10516E+01 -.24662E+03compute turbulent burning velocir; given the laminar flame
Sspeed. The equation used was of the form:saoFor the single component fuels, the Clausius-Clapeyron
Si, = SL, + CT U (A-8) Equation (1) was used
where CT= 0.453 + 4.467
(1+u'ISL,) (9abl. D-3. Coefficients for Equzatro, (1) foi Puic Fuelb
This latter equation is based on empirical data for Cl C2turbulent combustion under conditions similar to those in gasn e l E5turbines [221. n-nonane 1.573E+08 5166.5
n-decane 1.5672E+08 5455.54
[|
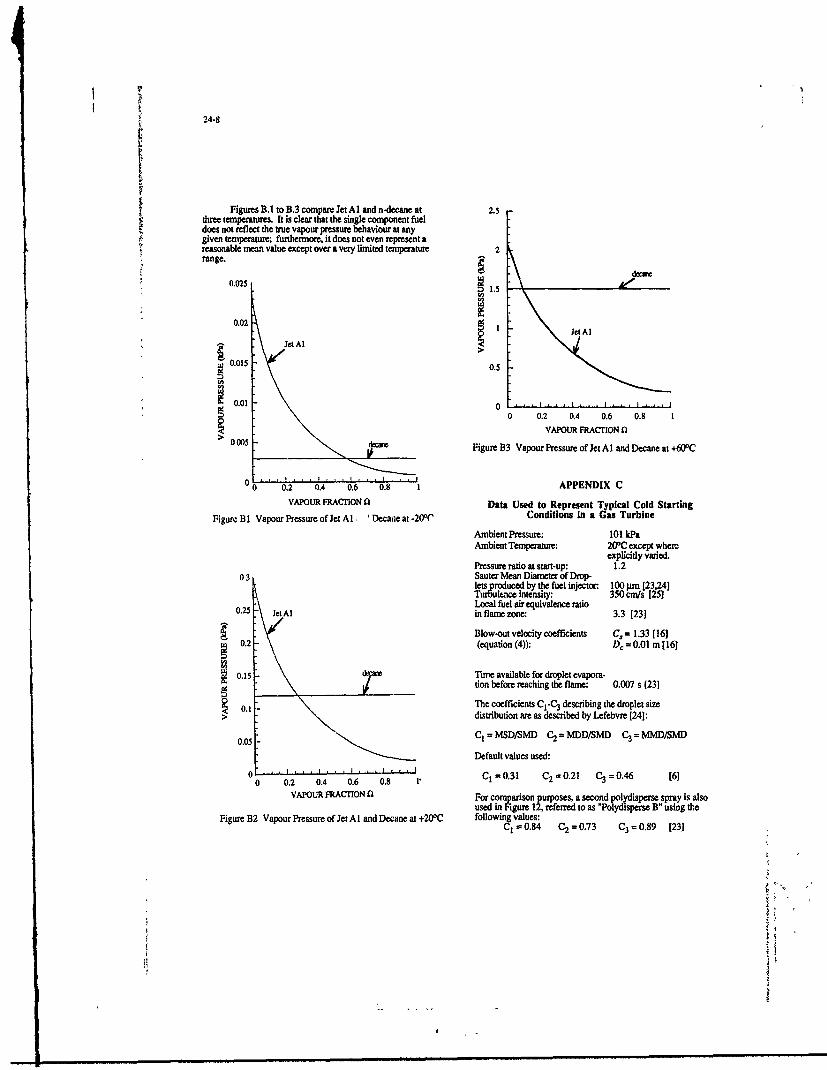
24-8
Figuires B.1 toB.3 corrpare Jet A I nd n-decane at 2.5three temperatures. It is clear that the single component fueldoes not reflect the true vapour pressure behaviour at anygiven temperawre; furthermore, it does not even represent areasonable mean value except over a very limited temperature 2range.
0.025 1.5
0.02
Jet At
0.015 0.5
0.01 __________________
0 0.2 0.4 0.6 0.8 1VAPOUR FRAM~ON fi
>0005 Figure B3 Vapour Pressure of Jet AlI and Decane at +W0C
0 0-. 2 0O. 4 0.6 0.8. APPENDIX C
VAPOUR FRACTON fl Data Used to Represent Typical Cold Starting
FigumcB I Vapour Pressure of Jet Al. 'Decaieat .200C Conditions in a Gas Turbine
Ambient Pressure: 101 kPaAmbient Temperature: 200C except wherc
explicitly varied.Pressure ratio at start-up: 1.2
03 Sauter Mean Diameter of Drop-lets produced by the fuel injector: 100 prn [23,24]Turbulence intensity: 350 cni/s 1251Local fuel air equivalence ratio
0.25 JetAl in flame zone: 3.3 [23]
Blow-out velocity coefficients C, = 1.33 [1610.2 (equation (4)): D, = 0.01 in[ 16]
o.15 Time available for droplet evapom-don before reaching the flame: 0.007 s 23]
0.1 The coefficients C1-C3 describing the droplet sire> distribution are as described by Lefebvre [24]:
0.05C, = MSD/SMD C2 =MDD/SMD C3 = MMD/SMD0.05 -Default values used:
0 0.2 0.4 0.6 0.8 r-C 03 3 0 2 3 04 6
VAPOUR FRACTON 0 For comparison purposes, a second polydispers spray is alsoused in Figure 12 referred to as "Polydisperse B" using te
Figure B2 Vapour Pressure of Jet AlI and Decane at +200C2 following values:C1 0.84 C2 0.73 C3 =0.89 [23]
24-9
Discussion Author:Our work so far has been exclusively on the case of dropletswhich are well mixed internally. This is due to the use ofequilibrium vapor pressure, and implies that droplet
1. C. Moses, Southwest Research Institute evaporation and diffusion outwards is slow with respect toThere are two major theories in the mechanism of droplet internal diffusion This is one of the two limiting cases, theevaporation with multicomponent fuels. At one extreme, the other being the case with no internal mixing or onici-skininterior of the drop is well mixed. This allows for light evaporation. The latter is more nearly the case for heavy
components to be continuously brought to the surface, and viscous fuels and very short residence times. The case in thethus the fuel effectively destills as you have discussed. At the cold combustor is probably closer to the equilibrium limitother extreme, there is no mixing and the droplet evaporates but we have not verified it experimentally. For the presentmuch as an onion skin with all components, light and heavy, circumstances many of the conclusions would in any case beeffectively evaporating at the same time. Have you unchanged. The relatively similar performance of JP4 andinvestigated these two possibilities to see which provides the JET A I for example, would be unaffected by which limitingbetter agreement? model we used in the calculations presented here.
r
" 7
1I
HI /I /IN H~i l l l l l/l l / l/ / uia----
25-1
THE DEVELOPMENT OF A COMPUTATIONAL MODEL TO PREDICT LOW TEMPERATUREFUEL FLOW PHENOMENA
R. A Kamin and C. J. NowackNaval Air Propulsion Center
Trenton, NJ 08628 USA
B. A. OlmsteadBoeing Military AirplanesSeattle, Wa 98124 USt.
SUMMARY
Fuel availability studies indicated that the relaxation of the F-44 freeze pointspecification could greatly increase tha yield of F-44 per barrel of crude. A thoroughanalysis was initiated to ensure that the higher f-eeze point fuel would not form solidwax prucipitates during low temperature operations that could impact aircraft missionperformance. In order to evaluate the effects of a potential change in the freeze pointspecification over the entire inventory of United States Naval aircraft, a generalthree dimensional computational fluid dynamics code, PHOENICS 84, was modified for use.Inputs into the code include tank geometry (cylindrical, rectangular or body fitted),mission profilE (outside air temperaturis or altitude, airspeed and time on station),and fuel properties (specific heat, thermal conductivity, viscosity, freeze point,etc.). Outputs from Ghe model include fuel cooldown and holdup 'unpumpable frozen fuel)as a function of time and position in the tank. The accuracy of +"e code was verifiedby experimental data obtained during flight and simulator testin, if instrumentedtanks.
NOMENCLATURE
A AreaC Numerical ConstantC1 Empirioal Turbulence Model CoefficientC 2 Empirical Turbulence Model CoefficientC 3 Empirical Turbulence Model CoefficientC Specific HeatCP Empirical Turbulence Model Coefficientg Acceleration of Gravityh Sensible HeatH Enthalpyi,j,k Subscripts Denoting Cartesian Coordinate DirectionsK Turbulent Kinetic CnergyK' PermeabilityL Total Latent HeatP Pressureq" Numerical ConstantRet Turbulent Reynolds Number (X2p/ge)S8 Biayancy Source TermSL Latent Heat Source TermS Darcy Source Termt TimeT Temperatureu Velocity VectorU Cartesian Space VelocityI,v,w Velocity In x,y,z Directionsx,y,z Cartesian Space Coordinatesa Coefficient of Thermal Expansion2 Rate of Turbulent Ainatic Energy
Porosityx Thermal Conductivity
a t Turbulent Prandtl Numberax Prandtl-Schmidt NumbLr for Turbulent Dissipation Rateo Prandtl-Schmidt humbir for Turbulent Kinetic Energy9 Dynamic ViscosityPt Turbulent Viscosity pK2'1,
Kinematic Viscosity
8 Angular CoordInate

25-2
INTRODUCTION
F-44, due to its unique requirements of a high flash point (600C/140"F) and lowfreeze point (-46°C/-5l'F), is a specialty product which accounts for only a small
kfraction, less than 1%,. of total refinery production. Therefore, to make the productionof F-44 profitable to the refinery, it is produced at a premium cost to the UnitedStates Navy. In addition, the increasing commercial demand for the refinery distillatestream combined with the iicreased use of heavier, high sulfur, lower yielding crudescreates the potential for shortfalls in the production of F-44 The U.S. Navy, inresponse to these potential fuel shortages, has given a high priprity to investigating
Kmethods of increasing the availability of F-44. Various studies .'have shown that thetwo most critical properties affecting the yield of F-44 per barrel of crude are theflash point and the freeze point. Since the flash point specification is set more as ashipboard safety than an aviation requirement and cannot be lowered, the relaxation ofthe freeze point specification is the most logical and cost effective method toincreasing F-44 yield By relaxing the current -46"C(-51'F) freeze point specification
*to the commercill Jet A specification of -40'C(-40°F), it is possible to obtain a 10%* to 75% increase-, depending on crude source, in the maximum theoretical yield of F-44
per barrel of crude.
However, before the specification change can be made, its potential impact onaircraft performance must be evaluated. This investigation is necessary because of theconcern that the higher freeze point fuel may form solid wax precipitates duringextreme low temperature operationa. The' precipitates may cause plugging of filters orblockage of fuel tank transfer lines that could severely restrict flow to the engine.
The ideal method for assessing the impact of higher freeze point fuels would be tomeasure the fuel temperatures within the tank of each aircraft during extreme lowtemperature operations. This, however, would have required an extensive number of teststhat would be extremely costly and time consuming Therefore, the only practical costeffective method by which to approach this problem was to develop a mathematicalcomputer model, verified by experimental results, to predict fuel temperature andholdup (portion of unusable fuel due to freezing) during a mission
MODEL DEVELOPMENT
The turbulent, unsteady boundary conditions and the extremely high Rayleigh numbers(lOA encountered during a flight make the modeling of fuel cooldown and holdup wit ina tank a difficult and complex analytical problem. Although a one dimensional model
has been developed to predict fuel temperatures in thin wing tanks, many aircraft fueltanks must be modeled in two or three dimensions in order to give accurate resultsPrior to initiating the development of the two and three dimensional model, aliterature search was performed to determine if any existing multidimensionalcomputational fluid dynamics(CFD) codes were available that could be modified to handlethis problem After an extensive review of CFD codes, the general purpose PHOENICS 84(Parabolic, Hyperbolic or Elliptical Numerical-Integration Code Series) code wasdetermined as the best available code to solve this problem. The PHOENICS 84 code is acentralized, versatile system capable of performing a large number of fluid-flow, heattransfer and chemical reaction calculations simultaneously
4. The code consists of an
inaccessible proprietary core program, called Earth, which contains the theoretical,problem solving algorithms The Earth code obtains the specific information necessaryto define and solve each problem from two user accessible programs, called Satelliteand Ground respectively.
An extensive effort was initiated to develop the specific user input routines forSatellite and Ground that would be necessary to allow the source code, Earth, to bothaccurately and cost effectively predict fuel temperature and holdup Majoi areas ofdevelopment included 1. Optimum grid selection for both rectangular and cylindricalgeometries, 2. Turbulence modeling, 3. Phase change modeling, and 4. Expert systemdevelopment
Grid Selection
The optimum computational grids were developed based on the criteria that theyproduce well-converged, stable and accurate solutions at as low a computational cost aspossible For both rectangular and cylindrical geometries, the grids developed weref-nely divided at the walls and the bottom of the tank where the steepest temperaturegradients occur and became increasingly coarser as they approached the center of thetank. The computational coats were further reduced for the two dimensional simulationsby assuming symmetry within the tank, i.e. at the vertical centerline 3v /Me 0 andaT/d9 0 0, and only modeling half the tank This assumption, which cut thecomputational time in half, was verified by experimental testing to bq accurate$.Finally, a grid refinement sensitivity study was performed to determine tne molt costeffective grids, Figure 1, which would give accurate, well-converged solutions
Turbulence Model
The convective flow in aircraft fuel tanks, caused by the temperature gradientbetween the bulk fuel and outside air temperature, hai been calculated to be in thetransitional or turbulent regime, Rayleigh number >10 The failure to account for theincreased mixing of the fuel due to these convective flows could cause significant
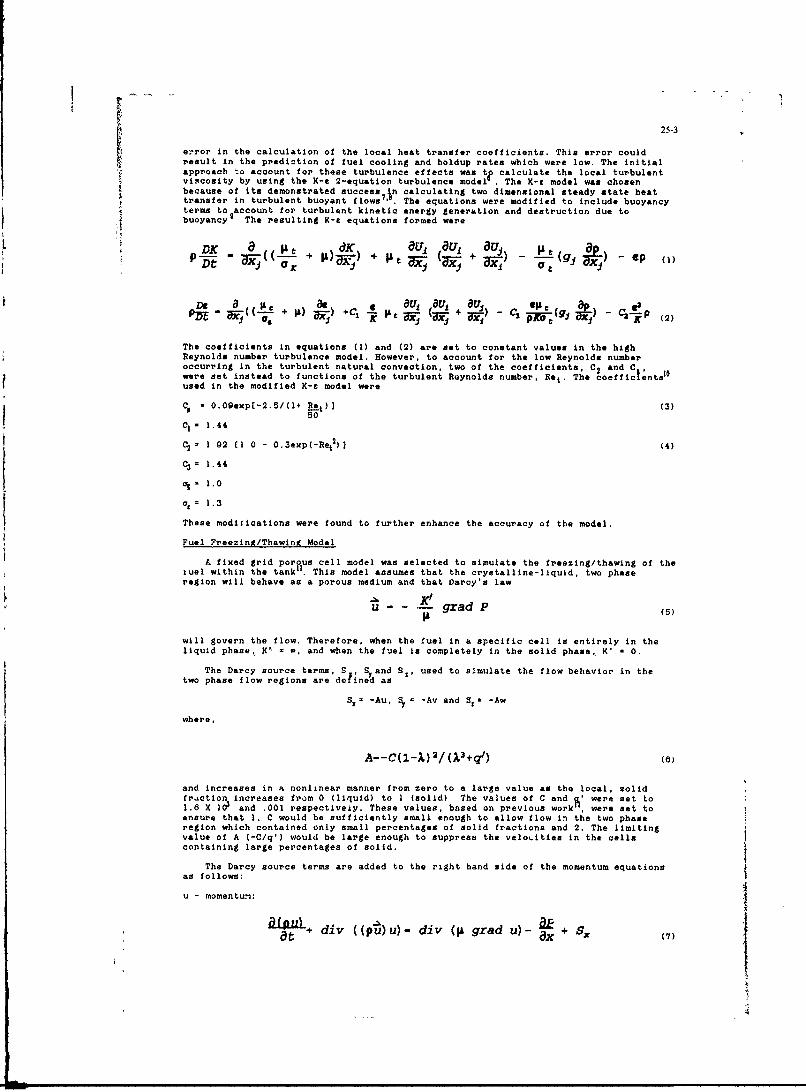
25-3
eror in the calculation of the local heat transfer coefficients. This error couldresult in the prediction of fuel cooling and holdup rates which were low. The initialapproach to account for these turbulence effects was te calculate the local turbulentviscosity by using the K-a 2-equation turbulence model . The K-e model was chosenbecause of its demonstrated success in calculating two dimensional steady state heattransfer in turbulent buoyant flows
7 . The equations were modified to include buoyancy
terms to account for turbulent kinetic energy generation and destruction due tobuoyancy The resulting X-e equations formed were
DK t. JK au a1 u,OT (0t (gj m
The coefficients in equations (l) and (2) are set to constant values in the highReynolds number turbulence model. However, to account for the low Reynolds numberoccurring in the turbulent natural convection, two of the coefficients, C2 and C,were set instead to functions of the turbulent Reynolds number, Ret. The coefficlents
10
used in the modified K-s model were
= O9exp[-2.5/(l+ Ret)] (3)
aC[l 0 - 0.3exp(-Ret2)(4)
C 2 =)
=1.44
1.0
:1.3
These modfications were found to further enhance the accuracy of the model.
Fuel Freezin*/Thawing Model
P fixed grid porus cell model was selected to simulate the freezing/thawing of thezuel within the tank
. This model assumes that the crystalline-liquid, two phase
region will behave as a porous medium and that Darcy's law
u - --- gradp (5
will govern the flow. Therefore, when the fuel in a specific cell is entirely in theliquid phase,. K = e, and when the fuel is completely in the solid phase,, K' * 0.
The a e terms,S,9 and Sz, used to simulate the flow behavior in thetwo phase flow regions are delinedas
SC -Au, -S -Av and Se) -Aw
where,
A--C(1-A)2 / (X3+q)(
and increases in a nonlinear manner from zero to a large value as the local, solidfraction increases from 0 (liquid) to 1 (solid) The values of C and (' were set to
1.6 K l0 and .001 respectiveiy. These values, based on previous work'*, were set toensure that 1. C would be sufficiently small enough to allow flow in the two phaseregion which contained only small percentages of solid fractions and 2. The limitingvalue of A (-C/q') would be large enough to suppress the velo~ities in the cellscontaining large percentages of solid.
The Darcy source terms are added to the right hand side of the momentum equations
- te div ((p )u))-grad u- + (5)
it%

25-4
V - momentum:
diz ( (pu) v) - di v (it grad v) -L + Sy +So 8at +a
w - momentum:
at+div ((P-U*)w)- div (pt grad w)- az+ S.+ S3 9
where u - U i + V + Wk
In the totally liquid cell. these source terms equal zero and, therefore, make nocontribution As a greater portion of the cell becomes solid, the size of the sourceterms increases until it becomes very large and suppresses all the velocities.
Another essential portion of the freezing model for convection/diffusion heattransfer phase change io the energy equation. This equation includes the latent heatsource term, SL' as follows:
at + div (Pth)- dIv adh - SL (10)
In this model the phase change is accomplished through enthalpy, defined as the sum ofsensible and latent heats
H-h+AH (11)
The main advantage of this method is that there are no explicit heat transferconditions to be satisfied as the phase change occurs, and the tracking of the phasechange is therefore not required. With this method, the source term in the energyequation becomes
SL at + grad (pUAH) (12)
For a mixture of a large number of different components, as is found in aviation fuel,AH is a function of temperature
|3 constrained by the limits of
O AHSL
where L, the total latent heat, is defined below the freeze point as
L-f C (T) dt (13)
Although this temperature dependence is nonlinear, a simplified linear relationship wasused as a first approximation. Therefore, at any temperature. the value of AH has thefollowing physical interpretation
Liquid fraction AH/LSolid fraction I - AH/L
Additional details on solving the phase change equations using the PHOENICS 84 code arereported in reference 11
A 2-D simulation with and without the use of the fuel freezing model was performedto determine the effects of the freezing model on the prediction of fuel temperatures.The results showed that the use of the model had little or no effect on the bulk fueltemperatures predicted However, the simulation using the fuel freezing model predictedtemperatures for the fuel located in the bottom of the tank 1*C to 3C (2*F to 6F)lower than the simulation not using the model. Upon comparison with the experimentalresults, Figure 2, the temperatures predicted by the simulation using the fuel freezingmodel..agreed more closely than those predicted by the simulation that did not use themodel".
The most important piece of data needed to determine whether a higher freeze pointaviation fuel can be used is fuel holdup. However, this property is extremely difficultto model accurately The difficulty in this prediction is due to a number of reasons.First, small differences in temperature acund the freeze point can result in a large
i2
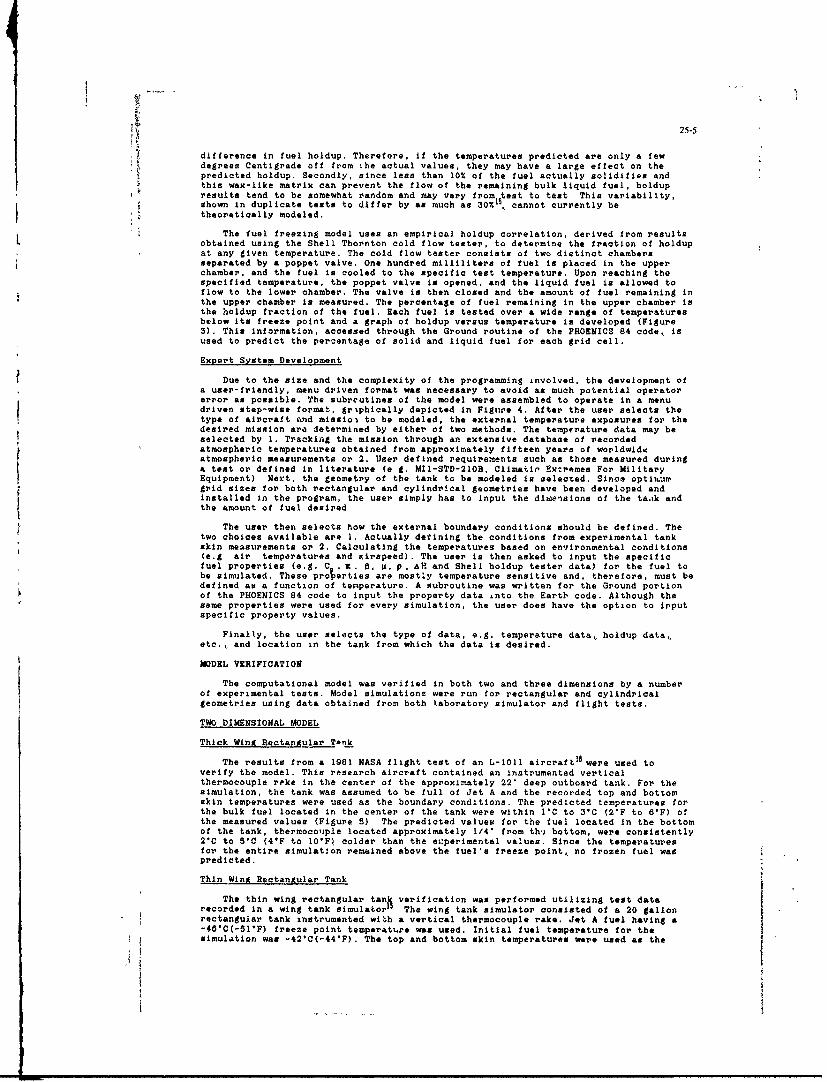
25-5
difference in fuel holdup. Therefore, if the temperatures predicted are only a fewdegrees Centigrade off from the actual values, they may have a large effect on thepredicted holdup. Secondly, since less than 10% of the fuel actually solidifies andthis wax-like matrix can prevent the flow of the remaining bulk liquid fuel, holdupresults tend to be somewhat random and may vary from test to test This variability,shown in duplicate tests to differ by as much as 30%
1, cannot currently be
theoretically modeled.
The fuel freezing model uses an empirical holdup correlation, derived from resultsobtained using the Shell Thornton cold flow tester, to determine the fraction of holdupat any given temperature. The cold flow tester consists of two distinct chambersseparated by a poppet valve. One hundred milliliters of fuel is placed in the upperchamber, and the fuel is cooled to the specific test temperature. Upon reaching thespecified temperature, the poppet valve is opened, and the liquid fuel is allowed toflow to the lower chamber. The valve is then closed and the amount of fuel remaining inthe upper chamber is measured. The percentage of fuel remaining in the upper chamber isthe holdup fraction of the fuel. Each fuel is tested over a wide range of temperaturesbelow its freeze point and a graph of holdup versus temperature is developed (Figure3). This information, accessed through the Ground routine of the PHOENICS 84 code, isused to predict the percentage of solid and liquid fuel for each grid cell.
Expert System Development
Due to the size and the complexity of the programming involved, the development ofa user-friendly, menu driven format was necessary to avoid as much potential operatorerror as possible. The subroutines of the model were assembled to operate in a menudriven step-wise format, gr~phically depicted in Figure 4. After the user selects thetype of aircraft and missioi to be modeled, the external temperature exposures for thedesired mission are determined by either of two methods. The tempfrature data may beseleoted by 1. Tracking the mission through an extensive database of recordedatmospheric temperatures obtained from approximately fifteen years of worldwideatmospheric measurements or 2. User defined requirements such as those measured duringa test or defined in literature (e g. MII-STD-210B, Climati Extremes For MilitaryEquipment) Next, the geometry of the tank to be modeled is selected. Since optitgrid sizes for both rectangular and cylindrical geometries have been developed and
installed in the program, the user simply has to Input the dibiensions of the ta, k andthe amount of fuel desired
The user then selects how the external boundary conditions should be defined. Thetwo choices available are 1. Actually defining the conditions from experimental tankskin measurements or 2. Calculating the temperatures based on environmental conditions(e.g air temperatures and airspeed). The user is then asked to input the specificfuel properties (e.g. C K. B, p p, AH and Shell holdup tester data) for the fuel tobe simulated. These pro~erties are mostly temperature sensitive and, therefore, must bedefined as a function of temperature. A subroutine was written for the Ground portionof the PHOENICS 84 code to input the property data ,nto the Eartb code. Although thesame properties were used for every simulation, the user does have the option to irputspecific property values.
Finally, the user selects the type of data, e.g. temperature data, holdup data,etc., and location in the tank from which the data is desired.
MODEL VERIFICATION
The computational model was verified in both two and three dimensions by a numberof experimental tests. Model simulations were run for rectangular and cylindricalgeometries using data obtained from both laboratory simulator and flight tests.
TWO DIMENSIONAL MODEL
Thick Wing Rectangular TAnk
The results from a 1981 NASA flight test of an L-lOll aircraft were used toverify the model. This research aircraft contained an inotrumented verticalthermocouple rpke In the center of the approximately 22' deep outboard tank. For thesimulation, the tank was assumed to be full of Jet A and the recorded top and bottomskin temperatures were used as the boundary conditions. The predicted temperatures forthe bulk fuel located In the center of the tank were within 'C to 31C (2"F to 6'F) ofthe measured values (Figure 5) The predicted values for the fuel located in the bottomof the tank, thermocouple located approximately 1/4' from th'. bottom, were consistently2°C to S8C (41F to 10'F colder than the e.:perimental values. Since the temperaturesfor the entire simulation remained above the fuel's freeze point, no frozen fuel waspredicted.
Thin Wing Rectangular Tank
The thin wing rectangular tan verification was performed utilizing test datarecorded in a wing tank simulator
' The wing tank simulator consisted of a 20 gallon
rectangular tank instrumented wibh a vertical thermocouple rake. Jet A fuel having a-48°C(-5l'F) freeze point temperature was used. Initial fuel temperature for thesimulation was -42'C(-44'F). The top and bottom skin temperatures were used as the

i25-6
boundary test conditions and held at approximately -50"C(-58"F) for the entire 280minute test.
The predicted temptratures for the bulk fuel were within approximately I'C(2'F) ofthe experimental results tFigure 8). However, the predicted value of 30% fuel hidupdid not agree with the 70% holdup value that was measured experimentally. Potentialreasons for the large difference between the calculated and measured values werediscussed In a prior section.
Cylindrical Geometry
The cylindrical geometry model was verified using the experimental resultt obtainedin a NAPC wind tunnel test of an instrumented 150 gallon FPU-3A external tank
7. The
tank, Figure 7, contained two rakes of thermocouples, one placod in the front (Station32) and the other in the rear (Station 108) of the tank. The tank containedapproximately 122.5 gallons of JP-5 leaving approximately 2.5 inches of ullage space atthe top. Two separate simulations were performed. The first simulation utilized themeasured wall temperatures recorded during the test as the boundary conditions, whilethe second calculated the tank wall temperatures from the external air temperatures andvelocities measured during the test.
The predicted temperatures for the calculated wall temperature boundary conditionca ,e showed excellent agreement (Figure 8) with the experimental results measured bythe thermocouple located in the center of the tank (bulk fuel) . The predictedtemperatures for the measured wall temperature boundary condition case, however, wereapproximately 31C to 5°C (6°F to 10'F) cooler than the bulk fuel. This may beattibuted to the fact that temperature measurements were taken at only four points onthe tank's skin (at 0, 90, 180, 270 degree intervals) and the remaining temperaturesalong the circumference of the skin were determined by linear interpolation If theinterpolated temperatures were in error then the boundary conditions used in thesimulation would be in error, thereby causing the difference in the predicted bulk fueltemperatures. However, the measured wall temperature boundary condition simul%tionpredicted fuel temperatures for the fuel located .25 inches from the bottom of the tankin excellent agreement wit' the experimental values, while the calculated walltemperature boundary condition case je.icted values approximately 2'C to SC (4F to10"F) above the experimental results (Figure 9).
The holdup measured upon draining the tank at the completion of the test was 15%.This compared to the predicted values of 11% for the measured wall temperature boundarycondition case and 5% for the calculated wall temperature boundary condition case.Considering the inherent uncertainty in both the measurement and calculation of holdup,the agreement between the calculated value obtained in the simulation using themeasured wall temperatures as the boundary condition and the actual holdup value wasquite good.
THREE DIMENSIONAL MODEL
Flight Test
A flight test of the 150 gallon inst.'umented FPU-3A tank mounted on an A-6 aircraftwas used to verify the model The 3D model was needed for this simulation because theinclination of the tank during flight caused the formation of three dimensionaltemperature gradients which could not be accounted for by two dimensional modeling 'hetank skin temperatures measured during the flight were used as the boundary conditionsfor the simulation. The tank contained 125 gallons of F-44 and had an initial fueltemperature of 1lC(52°F)
The predicted temperatures for the fuei located at the bottom of the tank wereapproximately 2"C to 'C (4'F to 10'F) above the measured temperatures for the frontthermocouple and P'C to 31C (2'F to 5*F) below the measurements taken at the rear ofthe tank (Fioure 10). However, the ability of the 3-D model to accurately predict thetemperature difference between the front and the rear of the tank demonstrated itsimportance in accurately modeling actual fuel behavior occurring during low temperaturemissions.
CONCLUSION
The model was demonstrated to accurately predict, in both two and thre dimensions,fuel temperature profiles at temperatures both above and below the fuel's freeze point.This model, verified for both rectangular and cylindrical geometries, is capable ofpredicting fuel cooling for any anticipated aircraft mission. In addition, the modelcan also be used, with minor modifications, to predict the heating of the fuel withinthe tank, making it a valuable tool in investigating fuel behavior during supersonicflight.
Although the accuracy of the fuel holdup prediction was not as good as that of fueltemperature, general approximations were able to be made. This prediction was based onan empirical correlation derived from Shell Thornton Cold Flow Tester data becauseholdup was shown to be a somewhat random phenomena containing an inherent degree of
extremely important piece of information,, additional simulator studies are being

25-7
performed to develop the improved empirical correlations needed to w the model tomake better holdup calculations.
The model is currently being used to predict the effects of higher freeze pointfuels on naval aircraft mission performance. The results of this study will be used todetermine if the F-44 freeze point specification can be safely relaxed to thecommercial Jet A specification, thereby increasing the potential yield of F-44 perbarrel of crude.
REFERENCES
1. Lieberman, W., and Taylor, W.F., *Effect of Refinery Variables on the Propertiesand Composition of JP-5," RL.2PE80, June 1980
2. Varga, G.M., Lieberman, W., and Avella Jr., A.J., 'The Effects of Crude Oil andProcessing on JP-5 Composition and Properties', NAPC-PE-121C, July 1985.
3. McConnell, P.M., Desmarais, L.A., and Tolle, F.F.C, 'Heat Transfer in Airplane FuelTanks at Low Temperatures,' ASME paper 83-HT-102.
4. Spalding, D.B., 'A General Purpose Computer Program for Multi-Dimensional One andTwo Phase Flow, "iathematics and Computers in Simulations, North Holland Press,Vol XXIII, 1981.
S. McConnell, P.M., *Development and Use of a Fuel Tank Fluids CharacteristicsMathematics Model - Phase I,* NAPC-PE-142C, January 1987.
6. Launder, B.E. and Spalding, D.B., 'The Numerical Computation of Tu7-bulent Flows,*Computer Methods in Applied Mechanics and Engineering. Vol 3, 1974, pp. 269-289.
7. Markatos, N C. and Pericleous, K A., 'Laminar and Turbulent Natural Convection InAn Enclosed Cavity,' International Journal of Heat and Mass Transfer, Vol. 27,,No. 5, 1984, pp 755-772.
8. Humphrey, J.A.C., Sherman, F S and To, W.N Simulation of BuoyantTurbulent Flow,' SAND8S-8180, August 1985.
9. Rodi,W., Turbulence Models and Their Applications In Hydraulics - AState-of-the-Art, Institut Fur Hydromechanik, 2nd Ed, February 1984, pp. 27-31.
10. Olmstead, B.A. and Kamin, R A., 'Numerical Analysis of Turbulent Natural Convectionin Airplane Fuel Tanks,' To be published.
11. Vollar, V. and Prakash, P., 'A Fixed Grid Numerical Methodology For Phase ChangeProblem Involving Mushy Region and Convection In the Melt',, PDR/CHAM/NA9, July1988.
12. Domanus, H.M and Sha, W.T., 'Solidification with Natural Convection,' April 198813. Mehta, H.K., and Armstrong, R.S , 'Detailed Studies of A,;iation Fuel Flowability,'
NASA CR-174938, June 1985.14. McConnell, P.M., 'Development and Use of a Fuel Tanks Fluids Characteristics
Mathematics Model, NAPC-PE-177C, October 198815. Desmarais, L A., and Tolle, F.F.,, 'Fuel Freeze Point Investigations,'
AFWAL-TR-84-2409, July 1984.16. Svehla, R., 'In Flight Atmospheric and Fuel Tank Temperature Measurements, NASA
Conference Publication CP2307, 1984.17. Kamin, R.A. and McConnell, P.M., 'Impact of Higher Freeze Point Fuels on Naval
Aircraft Operations,' ASME paper 86-GT-262, June 1986.
ACKNOWLEDGMRNT
This program was sponsored by the Energy and Natural Resources Office of the UnitedStates Office of Naval Research.
The authors wish to acknowledge P.M. McConnell and A.F. Grenich of Boeing MilitaryAirplanes and L.L Byrd of the Naval Weapons Center for their support and efforts inthis program.
iI
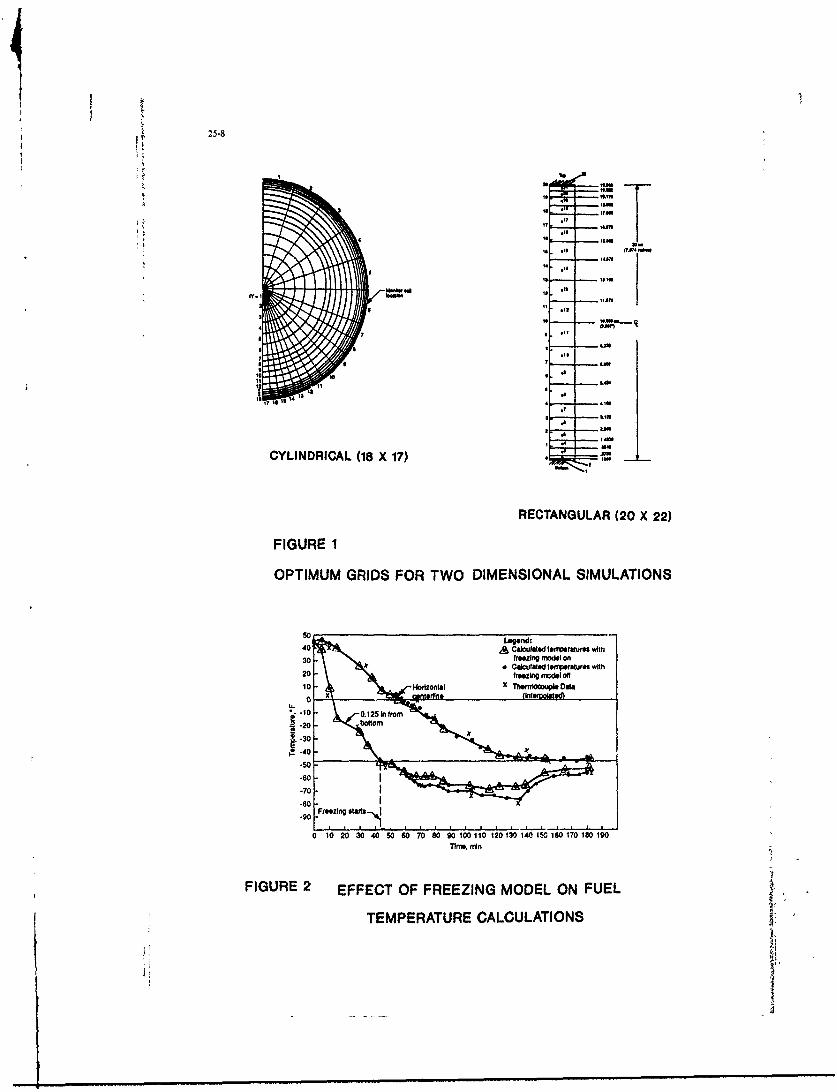
25-8
as..
ass.
am
&an
aLm
I'm
CYIDIA (1aX17
CYLINDRICALLA (18 X 172)7
FIGURE 1
OPTIMUM GRIDS FOR TWO DIMENSIONAL SIMULATIONS
soLo"
0 10 20ezn 30o 4on 07 09 001010101018 6 7 9
x %62c me. ni n
FIUE2 EFC.FFEZN OE NFETEPEATR CALCULATIONS fr
'20 1
-30s
.601

25-9
M 48
ToUrtue-
FIUR
FUE HODPCREBSDO HL TONO ETRDT
-Us MIL 21- Tale
Selet Airplneyp
r-te yTematur W alaaeits
*Uee MIL av-ilTable
tnpuit TIme Varyin 'Boundary Conditiona"'SpecIfy tank skin~ temperatures If available'SpecIfy external heat transfer coefficlent and recovery
temperature profile
Input Fuel Propertlee-Initil conditiona-Temperature dependent fuel propertiee-Freezing properties
PHOENICS84
OUTPUT
*Qo40k "~k printout4 :Plots cf temperature profiles'Plots of frozen fuel regiona
-Calculation of total amount of hold-up vs. timeiIUP 4FLOW DIAGRAM ON APPROACH TO USE COMPUTER MODEL

25-10
80
+ Taal d taso0 0 Calculated
s0
-20 b bottom-0
-40 I I I I I I I I I I I
0 10 20 30 40 50 60 70 80 90 100 110 120 130 140 150 160
lime, mi
FIGURE 5
COMPARISON OF CALCULATED AND MEASUREDFUEL TEMPERATURES FOR THICKWING RECTANGULAR TANK TEST
-42 - -Initial trnp -43.6 T Leen:
-44 0 Cl led (tank center) 100
.52 -70
.64 .50$'F 0
-440
-48 ,, -s o Ccule od up0
-62 -Measured top and bottom. 4 -( tb o u n d a r y ) t er r t u r e s h o ld -u p -. ., _ 1 - 3 0
20
10
.70 f I I I 1 0
0 40 sO 120 160 200 240 280
Time, min
FIGURE 6COMPARISON OF CALCULATED AND MEASURED
FUEL TEMPERATURES FOR THIN WINGRECTANGULAR TANK TEST

StT 7TA Ift
otooso 31A ISM AM[" 5OO0
a stoRut
fOOW~tO OOt
ttSMARpI TO TNT C . .
3I1S .1411NTO : ., I "1 1 .
DalEN 0000 A 6, 1
S05 A MTO 41 401 00 ili0 4t OS. #1I40) TT Tons STAIO 3TS STt,
-3;%, 1, 1 500005 3!. . S t, TWt 1tE 234 1 T 001, 4-st -40 sk 59.
0.01t21. S~TIMAR4 ~TO S a55 0 At041S4 .0 Xe 0 5
-I-, TIO I , : I s: '1" 0.
150 STAN UTA op
FIGURE 7TOTOt t10GALLON FPU-3A INSTRUMENTEDFUEL TANK
10 - Predicion based on spcified wall tonvor~tsresLl. Prediction based on heat transfer boundary
condition
.80
.g0
70 -
0 10 20 30 410 50 60 70 80 90 100 110 120 130 140 150 160 170 180 190Tfim..o non
FIGURE 8COMPARISON OF CALCULATED AND MEASURED
BULK FUEL TEMPERATURES FOR FPU-3AWIND TUNNEL TEST

25-12
so40 Ia4 , * 8 3 2 7 tea t d a ta3020 - Calculated (BC - wail ltfp)
t0 Calculated (SC. H T DOaik*M + axioms) tamip)
.20
0 a-30
40-.50 - ~~.. . ...... .
*60 - -.- 5-
-70 * ........ ...
.80
-90
0 10 230 'W40 60 70 0 90 100 110 120 130 140 150160 170 180 190
"fle. nfi
FIGURE 9COMPARISON OF CALCULATED AND MEASUREDFUEL TEMPERATURES (BOTTOM OF THE TANK)
FOR FPU-3A WIND TUNNEL TEST
60.0 -60 060.0 Legend:
600 Legend:,
40.0 0 aa40.0 0Dt
20.0 .- 200
00
0.0 0.0EE
-20.0 -l -20.o
-40.0 -40 0
-60 0 1 1 ... 1 1 -60.0 '00 60.0 120.0 180.0 240.0 00 60.0 120.0 1800 240.0
Time, mirt Time, mn
STATION 32 STATION 108
FIGURE 10
COMPARISON OF THREE DIMENSIONALMODEL CALCULATED FUEL TEMPERATURES
WITH VALUES MEASURED DURINGFPU-3A FLIGHT TEST
i>
$ m wm w

KZ
25-13
Discussion 3. R. Jacques, Ecole Royale MilitaireYour calculations arc done for a steady flight and giventemsperature gradients in the fuel tank. Does air turbulenceor aircraft manoeuvrig (roll or steep hWink angles) not
1. C. Scott Bartlett, Sserdrup Technologies disturb completely the temperature distribution in the tank?Do you foresee any instances where the additional cost of a3-D solution over a 2-D one will be justified Author:
Although tank vibtation, air turbulence and flightAuthor: manoeuvres will cause fuel sloshing and movement in theThe 3-D model, although much more costly to operate, tank. previous work performed by the Boeing airplaneother than the 2-D model would be justified if the benefits of company has shown that these effects are relatively minorits results would be of a higher value than the associated and have little effect on the fuel cooling profiles or hold-upcosts of the model within the tank.
4. L. Richards, BAeWere you able to check that the position at the four hold-upwas in agreement with the predicted position?
2. D. Henneeke, Technische Hochschule DarmstadtHow did )ou determine the internal heat transfer Authorcoefficients for the wind tunnel and flight conditions? No, because the cylindiical tank sas bill-of-material
hardware Access to view the internal freezing patterns wasAuthor: impossible However, the total amount of fuel hold-up,The external heat transfer coefficients were calculated by unpumpable frozen fuel, was measured during wind tunnelthe computer model using a general flat plate correlation testing and compared to predicted results The work is goingAdditional information regarding the specifics of the on in the NAPClow temperature fuel flow facility, which hascorrrition can be found in reference 5 of the paper optical access to deterninn the frozen fuel locations
I
II
4
28-1
INVIRONMENTAL ICING TESTING AT THE NAVAL AIR PROPULSION CENTERby
William H. Reardon and Vito J. TruglioNaval Air Propulsion Center
P. O. Box 7178Trenton, New Jer ey 08828-0176
U.S.A.
A comprehensive Environmental Icing Simulation System has been developed by theNaval Air Propulsion Center. This system has accommodated the testing of dusted andfree stream mounted engines and free stream mounted aircraft inlets.
Three areas are discussed in detail in this paper:1. Navy specification icing test procedures, success criteria and rationale for the
requf,.ements:2. The overall capabilities of the NAPC icing facilities in terms of critical icing
cloud parameters such as liquid water content, mean effective droplet diameter,humidity and inlet air temperature; and how the icing environment is established,calibrated prior to test and verified during testing along with historical experienceand lessons learned;
3. NAPC test experience in Navy qualification programs for the T405, T700 and F404,as well as demonstration and development test programs performed with the TOMAHAWKCruise Missile inlet and the F-14A aircraft inlet duct.
Navy Specification Reauirements
The Navy Ceneral Specifications MIL-E-005007E (turbofan/turbojet)and MIL-E-008593E(turboshaft/ urboprop) (reference 1) are the baseline documents from which Navy enginemodel zpe, fications are built. They require that turbine engine anti-icing systemsallow the engine to operate satisfactorily under the meteorological conditions asdefined in Table I, with not more than 5.0% total lose in thrust or shaft horsepoder(SHP) available and no more than 5.0% total increase in specific fuel consumption (SFC)at all operating conditions above 50% maximum continuous power (MCP) setting. Foroperation at less than 50% MCP, 95% of the desired power above 50% MCP must be obtainedwithin specification acceleration times. No permanent performance deterioration ispermitted after the meteorological conditions have been removed.The engine anti-icingsystem must also prevent accumulation of ice on any engine part exposed to the gas pathwhile operating in icing conditions.The total loss in performance of 5% includes theeffect of operation in the icing environment plus the effects of operation of theengine anti-icing system. The baseline for determining engine performance loss isestablished by operating the engine with no customer bleed air or power extractionunder the inlet temperature conditions of Table I with air between 80 - 100% relativehumidity (RH) and zero liquid water content (LWC) Delivered power losses and fuelconsumption increases are determined by comparison of engine performance when operatingin the icing conditions defined in Table I with the baseline values. The test consistsof two parts:
a. Part A contains two runs at each if six power settings unde- the threeconditions of Table I, Part 1. At each power setting the engine is op.rated for aminimum of 10 minutes. During rach period the engine is rapidly accelerated tointermediate power to demonstrate transient response.
b. Part B contains a one-hour run at idle, followed by an acceleration tomaximum power, under the conditions of Table I, Part 2.
Rationale for Specification Requirements (Reference 2)
Generally, some form of anti-icing system is incorporated into the engine design toprovide warm compressor bleed air to thcse surfaces susceptible to ice build up.Shedding of ice into the gas path can result in f;5meout, stall, surge, and enginefailure. Ice build up that chokes off the engine Inlet can result in performancedeterioration and/or turbine overtemperature due to air starvation, and controlschedule changes caused by engine sensor malfunction due to icing.
MfasmRi'ement nl nf fOrMAn"0 degradation in intended to be based on power loss at Aparticular throttle setting. This has also been interpreted to mean that the 5% powerloss should be based on the intermediate power level setting, because this is thehighest available power condition Another interpretation is commonly used in theturboshaft engine community, where most of the engines tested are operating on anexternal torque limiter at the Table I cnld inlet conditions. This interpretationcontends that shaft power which degrades with the initiation of anti-icing and theicing cloud can usually be recovered by increasing the throttle (power lever,collective pitch, etc ) until a temperature, torque, fuel flow or speed limiter isreached. This is justified since power is recovered if power is still available,, up to
28-2
operational limiters, with the protection against excessive degrlddtion reflected inthe associated values of SFC. One assumption here is that the correlation betweencalculated and measured turbine temperature does not shift during test. Deviations inthe 5% ;,ower loss requirement have been granted in the past, based on the engine bleedrequirements necessary to prevent ice accumulation. The transient power requirementsfor power levels belcw 50% MCP were incorporated to confirm that and power loss at lowpower is not only recoverable, but does not prevent the engine from accelerating tohigh power levels. Transient performance within 125% of specification allowabletransient times for power changes is required while operating in the icing environment.
Part I testing is performed to determine the engine anti-icing capability throughoutits entire ope-ating range The specification icing test requirements which werederived from N-tional Advisory Committee on Aeronautics (NACA) Technical Notes 1855 and2569 are base,' on data gathered from stratiform clouds (usually prevalent at3,000-(,000 fvirt) which have a low to moderate LWC, and cumuliform clouds which occurfr, 4,000-24,100 feet and have a moderate to high LWC. In the case of stratiformclouds, depicted in Figure IA, the levels of LWC in the cloud form are normally lessthan the I gram per cubic meter (gm/m3) test requirement, while icing encounters incumuliform cI:.uds (Figure 1B) tend to be relat,vely short in duration (approximately Iminute) The icing test conditions of the specification are fairly consistent with theencounters in cumuliform clouds, but the engine is required to operate there for a muchgreater period of time. Although conservative, the Navy specifioation test requirementseems to adequately verify an engines anti-icing system capability, as serviceexperience shows a relatively good record with a low number of icing incidents relatedto the engine anti-icil.g system.
Part II testing of one hour at ground idle in the Table I, Part 2 icing environmentis very similar to the Federal Aviation Regulations (FAR) Part 33.88, Category B testrequizement for civil certification which requires a similar condition run for 30minutes. It is intended to simulate engine operatiou, on the ground, in a freezing rainor icing environment while waiting for takeoff clearance. The ensuing acceleration tomaximum power simulates the takeoff roll.
Earlier versions of the .,evy specification required altitude in addition to sealevel icing tests. Altitude tests were deleted from the specification in part due tothe high cost associated with performance of this test in an altitude chamber.Technically, the sea level icing conditions represent the most severe requirements forthe engine anti-icing system. This was Justified by comparing various engineanti-icing system energy outputs, to icing cloud energy input, at combinations ofengine power level, end inlet flight and meteorological conditions. Low engine power,low Mach number, cold inlet conditions (idle, static) produce the lowest compressorbleed anti-icing system energy. Sea level iving conditions provide the highest enginebutal maseflow yielding greater total liquid flow. Combining high liquid flow with
.Loger dwell times encountered at low airspeed, the gi-eatest difference in ene-gy ormost severe requirement for the engine anti-icing system is created.
Allison used specification sea level icing tests in the development of the model 501and 250 engines baued on studies made using data from flight tests at 3,700 o 19,000feet. During the FAA Aircraft Icing Symposium of April 1989, A'lison indicated that ananti-icing system designed to meet the military specification requirements at sea levelwould result in a configuration which was satisfactory at altitude, and in themeteorological conditiong encountered in flight operations (reference 3). Lt the samesymposium, airline operational experience in icing conditions showed that the mostpctentially serious icing pi.oblem in the Jet engine airplane was engine icing on theground, standing in line, waiting for take off clearance. In addition, experienceshowed that jets had somewhat less of a problem once airborne, as the high rate ofclimb allowved them to exit the icing environment quickly (reference 4). It should berecognized thAt icing conditions can be encountered at high altitudes, althoughencounters sbove 22,000 feet are rare.
Tet Facilities
Engine icing tests have been conducted at NAPO for the paqt 30 years During thisperiod the facilities which have been de~eloped to perform these tests have grown innumber as has the expertise to provide a reliable environmentul icing system fortesting engines.
There are four small engine test cells which have sea level as vell a. altitudecapability. The maximum total airflow for icing tests in these cells is 50poundu/second (lb/sec). There are 5 large engine cells, 2 sea level and 3 altitude,with a maximum air flow of 300 lb/sec. As inentione , altitude icing requirements havenot bee" part of the Navy military specification in recent years; bowaver, altitude ricing tests have been performed at NAPC in the past. NAPC icing test history includes:(1) Turbojets; J02, J19, (2) Turbofans; Te41, TF30, TF34, F404, (3) Turboshsfts: T55,T700, T58,, T406 and (4) the F107 engine/TOMAHAWK Cruise Missile inlet combination andLhe F-14A aircraft inlet. Currently, -ling calibration J-stallations are beingprepared for the T800,, FIfO and F412 engtn.t.
There ara two basic icing inlet configurations utilized at NAPC which Are depictedA in Figure 2 ©he direct connect and free jet. Large engin.= with mas flows greater

28-3
than 40 lb/soc are directly connected and small engines with mass flows less than 40lb/sea are generally configured as a free jet. The F-14A inlet test required a freeJet configuration despite requiring mass flows greater than 300 lb/sec.
Cloud Simulation
Simulation of cloud conditions is accomplished with a spray system consisting ofhorizontally mounted bars shown in Figure 3. Each bar has openings which accept eithera plug or nozzle, allowing for pattern adjustment. Metered and controlled air andwater to the nozzles is introduced into individual manifolds to which each spray bar isconnected.
The nozzle, an aspirating type similar to a design developed by the NationalAviation and Space Administration (NASA) is shown isometrically in Figure 4. Water isforced through a hypodermic size tube and aspirated at its exit by mixing with apressur4zed air source. Liquid water droplets are generated when the mixture exits anorifice. The air is heated to prevent icing of the nozzles. Flow of both water andair are remotely controlled, independently, which provides for the setting of LWC anddrop diameter. In the direct coianect configuration, nozzle water and air flow mt-,t beadjusted as engine air flow changes. In the free Jet configuration, a constant ductairflow can be maintained, therefore a constart nozzle setting can be held for a givenLWC and drop diameter regardless of engine power changes. The nozzle water is potablewater which is demineralized and filtered. Nozzle air is also filtered as well asdried. It is important to minimize the entrained particulates which can seed thesupercooled liquid water droplets causing them to freeze and form ice crystals.Saturation of inlet air is accomplished independently by injecting steam through anozzle located in a plenum upstream of the water spray system.
Calibration Techniques
Full scale calibrations are conducted prior to Icing tests primarily because ofvariations that exist from test to test, such as engine air flow range and inletconfiguration differences, test cell dissimilarities Lr modified icing requirements.Figure 5 shows the typical inlet arrangements for a full scale calibration :nd enginetest.
The primary objective of a calibration is t( set up the entire icing simulationinstallation without the test article. Generation of LWC and drop diameter areverified quantitatively and qualitatively as required by the specification prior to theactual test. Inlet air temperature is measured using thermocouples located upstream ofthe spray bars Pressure is measured with a steam-heated free stream total pressurerake and wall static taps in the duct down stream of the spray bars. Generally thisprobe is only used during calibrations. it is correlated with a total pressure probelocated up stream of the spray bars for setting flow cotditir~ns during test. In th2direct connect arrangement there is a reducer duct which can be heated to prevent icebuild up, however nozzle patterns are adjusted to mirimize the amount of accretion onthe reducer surface. Humidity is measured during bot% the calibration and test with athermally-cycled photocell type dew point sensor Saturation is verified visually.Droplet size is controlled by proportioning measured water flow and air flow to thenozzles. During pro test calibrations this relationship is confirmed using a forwardscattering spectrometer probe (FSSP) which is traversed across the exit of the inletduct where the test article interface would be located. This probe is a laser opticalinstrument which measures and counts droplets according tr. the amount of energyscattered when the droplets pass through a focal point in the laser beam. LWC isgenerated by introducing a metered amount of water flow proportioned to a given amountof measured inlet air flow. A single rotatJ 4 cylinder introduced into the duct nearits exit provides an independent means to me-sure and calculate LWC which can becompared to the metered quantity. The cylinder is housed outside the duct in asupercooled chamber. It is remotely !mmersed tn the air stream for a set time intervaland retr~icted back into the chamber. The ice weight is ueasured after the cylinder isremoved from the chamber. From the ice weight, exposure time and duct velocity, LWCcan be calculated and compared to the metered qtantity using the following equation(reference 5):
V V + r* +rlWhere! = Specific Volume of Ic:
- Catch Efficiency of CylinderT Exposure TimeW - Weight of Ice
I= Length of CylinderP Radius of Cylinder
T.his cylinder is used both during calibrations and tests to verify that the dropletsare supercooled liquid and that evaporation or crystallization has nit occurred. Icedistribution is checked during calibrations by positioning a 2 iich by 2 inch meshscrean at the test article inlet plane. The ice accretion is measured and the nozzlepattern adjusted as required.
II
28-4
CaDabilities
The icing capabilities at NAPC can best be summarized as shown in Figures 8A and OB.Total inlet temperature and LWC are shown an a function of inlet airflow. The minimumtemperature obtainable is -50OF at 40 lb/sec and +32
0F at 310 lb/sec. The icing cloud
simulation capacity is comprised of two envelopes which differentiate between free jetand direct connect LWC capacities. Nozzle water and air flow limitations are theconstraining parameters that establish the LWC and droplet diameter boundaries.
NAPC RxoerLenco
Producing a consistent icing cloud simulation in terms of LWC and droplet diameteris the most important consideration in the development of an environmental simulationsystem for the performance of icing tests. This is due to the fact that the stabilityof the water droplets produced for such a system is highly sensitive to thesurroundings The supercooled droplets are susceptible to evaporation when the inletair is not saturated and freeze-out (ice crystallization) when particulates arepresent Furthermore there are uncertainties involved with any method available tomeasure and validate LWC rendering it difficult to detect freeze-out or evaporation.
Considerable efforr has bee, made at NAPC to provide the best possible icingsimulation system (reference 8). To minimize freeze-out the nozzle water supply isdemineralized and filterod to one macron. Nozzle air is also filtered and dried.Inlet air is not filtered; however, there have been tests in the past substantiatingthat the amount of particulates in the supply are minimal.
There have been many attempts made to measure LWC accurately. Currently the FSSPhas been used to accurately count and measure droplet diameter reliably. Also in orderto increase its usefulnqss, a program was developed to calculate LWC from droplet countdata acquired. dowever, the calculations have proven to be unrepeatable andunreliable. A maJor shortcoming is that the probe can not distingih discretelybetween water droplets and ice crystals.
The method found to be most reliable in terms of verifying LWC has been the singlerotating cylinder. There are inaccuracies inherent in this method but it is the onlyway presently known where freeze-out can be detected since frozen droplets will notaccrete on the cylirder. In the near term, efforts are on-going to investigate thefeasibilit; of an r-lternative to the FSSP, the phase/doppler particle analyzer. Thisis a non-intrusive instrument which is c&pable of measuring droplet size and velocitythrough a volume defined by the intersection of two laser beams The probe couldpossibly be installed external to the inlet, thereby allowing for use during enginetesting However, it is not anticipated that freeze-out detection could be possibleusing this instrument.
NAPC Icing Test Experienqo
1. T408-AD-400 Turboshaft Engine
The Allison Gas Turbines Div'sion (AGTD) T406-AD-400 turboshaft engine, designed topower the V-22 Tiltrotor aircraft, was tested to the Allison Model Specification 937Environmental Icing Test requirements during its Low ProductioA Qualification (LPQ)phase. Model Specification 937 was derived from Ail-E-8593E and was approved by theNavy. It contains success criteria of no more than 5% SHP loss and 8.5% SFC increasein the icing environment.
In the first test attempt (reference 7), the engine anti-icing system was found tobe deficient at low power conditions: At Table I, Part 1 condition; -4
0F, lgm/m3,
below approx 50% MCP (1100 pound-feet (lb-ft)) unacceptable 4ce formed on the engine
inlet guide vanes (IOV's). At Table I, Part 1 condition; +230F, 2gm/m3, unauceptableice formed on the IOV's below approximately 400 lb-ft torque. At the Table I, Part 2condition, the lowest torque at which the engine had adequate anti-icing capability fora one hour period of operation was 450 lb ft. Below that, unacceptable ice formed onthe IGV's The engine did however, meet performance degradation requirements of 5% SHYand 6.5% SFC when measured at constant Power Demand Signal (PDS).
Allison in-house investigation of the engine anti-icing system post test (reference8:, revealed that the engine IGV anti icing airflow supply was deficient. This flow issupplied via external plumbing from the fourteenth stage compressor discharge to theengine inlet housing, where it is internally manifolded to the individual guilJe vanesthrough vane tip ports. Flow checks by Allison confirmed that only 1/2 the design flowrate was passing through the vanes. In addition several areas of system overboardleakage were identified at anti-icing supply tube to engine case mating points and faround guide vane bushings. Heat transfer modeling with these inputs predicted localareas of the IGV at the hub and bladA tip whlch could be zucaptiic tZ 1cing. Th'imresults were consistent with the ice accretions seen during t'he initial test at NAPC,where on videG monitors the ice eccretions were seen accumulating from the hub areaoutward radiall, along the leading edge of the IGV's.
A retest of the T406-AD-400 was performed with a modified IGV anti-iclng flow

28-5
scheme, incorporating reworked IOV hub and tip exit holes and better sealing of theanti-icing flow path. In the retest, the engine anti-icing system prevented iceaccumulation in the engine gas path at all three specification icing conditions. Lossesin shaft horsepower related to operation of the anti-icing system in the icingenvironment exceeded the specification limit of 5% at the +23°F and -4
0F meteorological
conditions of Table I when compared at constant power demand signal (PDS), constant gasgenerator speed (NO) or constant measured gas temperature (MOT) above 50% MCP. In allcases, at and above 50% MCP, power loss was recoverable throughout the range ofenvironmental icing test conditions with an increase in PDS while remaining withinengine temperature and speed limits. This was attributable to engine torque limitingbeing in effect. The V-22 propeller gearbox torque limit is 2150 pound-feet, which isbelow the engine maximum power output capability at the Table I test conditions. Theincreases in 6FC in the icing environment when compared at constant SHP were within theModel Spec 937 l!mit of 6.5% at all conditions. For this test program the NAPCrecommendation was to accept the engine as having met the icing requirements of ModelSpec 937 for the V-22 installation. This would require granting a waiver for SHP lossassociated with operation of the engine qnti-icing system in the icing environment.Presented in Tables IIA and 1iB, is the T406-AD-400 engine performance as r-un in theretest of the environmental icing teat.
2. T700-OE-700 Turboshaft Engine (reference 9)
The anti-icing system of the T700-OE-700 engine contains an integral inlet particleseparator (IPS), which adds extensive flowpath surfaces beyond conventional engineconfigurations. Anti-icing of the T700 IPS, IOV's and engine front frame isaccomplished with a combined system of continuous hot engine oil and modulated axial
s compressor bleed air A valve Varies the blse air with corrected compressor speed
through a variable compressor vane actuator linkage
Testing was conducted in a freestream environment with a specially fabricated enginebellmouth and bulletnose assembly. The bellmouth and bulletnose were designed to beanti-iced by a facility hot air supply. In addition, engine power absorption wasaccomplished by means of a high speed waterbrake enclosed in the bulletnose.
No ice ac=umulations were observed on the engine inlet surfaces (IOV's. struts,front frame) during the testing. Post test observations revealed that s.nall amounts ofice had accumulated on the inside diameter of the IPS scroll cover assembly. Thisserved to explain light puffs of smoke which were observed exiting the IPS blowerduring icing testing. This ice did not damage the IPS blower. Engine performancechanges due to the operation of the anti-icing system and operation in the icingenvironment are shown in Tables liA and IIIB. The T700-GE-700 Engine ModolSpecification DARCOM-CP-2222-02000C which is an Army approved derivative of MIL-3-008593E, allowed up to 9% SHP lose and 7% increase in SFC under Table I conditions.Where levels of SHP exceeded these values during test, it was shown that up tointermediate rated power (IRP), a percentage of the lost power was recoverable. Yortesting at the -4
0F icing conditions, additional power los was observed once the icing
spray was introduced, which was greater than the loae seen with only engine arti-icingsystems on. These power losses were suspect due to inconsistency with the +23
0F
results. Cycle analysis and other OE turboshaft engine icing test experience indicatedthat losses in performance at icing temperatures for wet operation should be no worsethan for dry operation. The T408 test showed a similar inconsistency at the -4
0F icing
conditions. One explanation could be the difference in the energy required to vaporizethe super cooled droplets at -40F versus the energy required to vaporize the dropletsat +23
0F, combined with the difference in the axial location in the compressor where
that change of state occurs, could effect overall engine performance dependisg on thecontribution of each stage of compression to the overall efficiency of the compressor.
Transient performance between ground idle and IRP with customer bleed and anti-icingactivated showed no indications of stall or instability. Standard procedure fordocumenting transient times in a turboshaft installation with a free turbine, where awaterbrake is used for power absorption, is based on the change in gas generator speed(NO) equivalent to that required to achieve 95% of the overall power change. Thismethod most nearly reflects the transient response capability of the engine independentof the power absorber inertia and dynamics. The NO speed associated with the startingand finishing points of the transient excursion are defined by steady state operationat these points.
3. ?404-01-400 Turbofan Engine (reference 10)
The P404-GE-400 Engine Environmental IcinS Test was conducted at NAPC in accordancewith GE Model Specification CP45KO006, which allowed losses cf up to 10% In thrust andup to a 10% increase in SFC while operating in the icing environment. The testrequirements were modified by the Navy to expedite the program. Only tha flight idJeand IRP ower settings wer& ratainod Tt wee felt that if the engine coldsatisfactorily anti-ice at these conditions, it could anti-ice at any power in between.
The installation was a direct connect inlet arrangement, where -uhe 60-inch diameterfacility air supply duct trAnsitioned to 28-inch diameter at the engine inlet. Thetransition section was Jacketed so it could be heated to prevent ice formation on theinternal surfaces. The initial setup contained a labyrinth seal to allow a floating
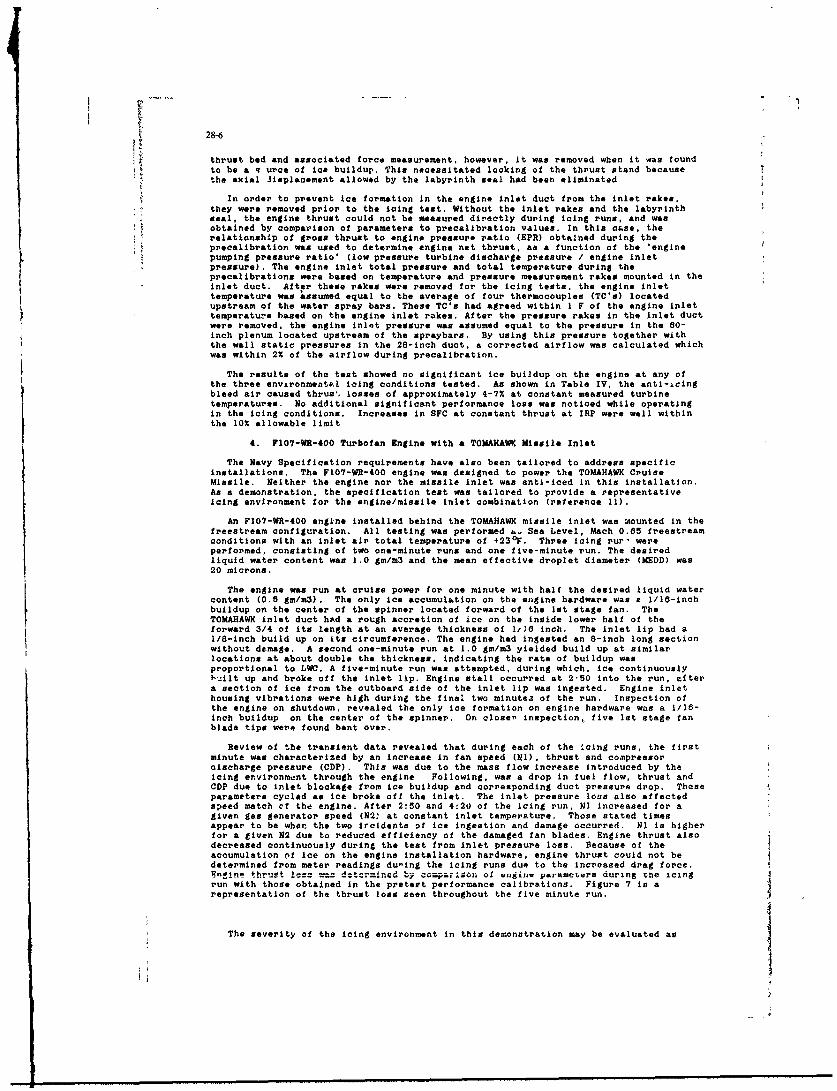
28-6
,:Z thrust bed and associated force measurement, however, it was removed when it was foundto be a q urce of ice buildup. This necessitated locking of the thrust stand becausethe axial Iisplacement allowed by the labyrinth seal had been eliminated
In order to prevent ice formation in the engine inlet duct from the inlet rakes,they were removed prior to the icing test. Without the inlet rakes and the labyrinthseal, the engine thrust could not be measured directly during icing runs, and wasobtained by comparison of parameters to precalibration values. In this case, therelationship of gross thrust to engine pressure ratio (EPR) obtained during theprecalibration was used to determine engine net thrust, as a function of the *enginepumping pressure ratio' (low pressure turbine discharge pressure / engine inletpressure). The engine inlet total pressure and total temperature during theprecalibrations were based on temperature and pressure measurement rakes mounted in theinlet duct. After these rakes were removed for the icing tests, the engine inlettemperature was assumed equal to the average of four thermocouples (TC's) locatedupstream of the water spray bars. These TC's had agreed within 1 F of the engine inlettemperature based on the engine inlet rakes. After the pressure rakes in the inlet ductwere removed, the engine inlet pressure was assumed equal to the pressure in the 00-inch plenum located upstream of the spraybars. By using this pressure together withthe wall static pressures in the 28-inch duct, a corrected airflow was calculated whichwas within 2% of the airflow during precalibration.
The results of the test showed no significant ice buildup on the engine at any ofthe three environments.l icing conditions tested. As shown in Table IV, the anti-icingbleed air caused thruam
, losses of approximately 4-7% at constant measured turbine
temperatures. No additional significant performance loss was noticed while operatingin the icing conditions. Increases in SFC at constant thrust at IRP were well withinthe 10% allowable limit
4. F107-WR-400 Turbofan Engine with a TOMAHAWK Missile Inlet
The Navy Specification requirements have also been tailored to address specificinstallations. The F1O7-WR-400 engine was designed to power the TOMAHAWK CruiseMissile. Neither the engine nor the missile inlet was anti-iced in this installation.As a demonstration, the specification test was tailored to provide a representativeicing environment for the engine/missile inlet combination (reference 11).
An F1O7-WR-400 engine installed behind the TOMAHAWK missile inlet was mounted in thefreestream configuration. All testing was performed i, Sea Level, Mach 0.65 freestreamconditions with an inlet alr total temperature of +23
0F. Three icing rurt were
performed, consisting of two one-minute runs and one five-minute run. The desiredliquid water content was 1.0 gm/m3 and the mean effective droplet diameter (MEDD) was20 microns.
The engine was run at cruise power for one minute with half the desired liquid watercontent (0.5 gm/m3). The only ice accumulation on the engine hardware was s 1/10-inchbuildup on the center of the spinner located forward of the 1st stage fan. TheTOMAHAWK inlet duct had a rough accretion of ice on the inside lower half of theforward 3/4 of its length at an average thickness of 1/0 inch. The inlet lip had a1/8-inch build up on its circumference. The engine had ingested an 8-inch long sectionwithout dtmage. A second one-minute run at 1.0 gm/m3 yielded build up at similarlocations at about double the thickness, indicating the rate of buildup wasproportional to LWC. A five-minute run was attempted, during which, ice continuously1-_ilt up and broke off the inlet lip. Engine stall occurred at 2.50 into the run, eftera section of ice from the outboard side of the inlet lip was ingested. Engine inlethousing vibrations were high during the final two minutesa of the run. Inspection ofthe engine on shutdown, revealed the only ice formation on engine hardware was a 1/16-inch buildup on the center of the spinner. On closer inspection, five let stage fanblade tips were found bent over.
Review of the transient data revealed that during each of the icing runs, the firstminute was characterized by an increase in fan speed (NI), thrust and compressoroischarge pressure (CDP). This was due to the mass flow increase introduced by theicing environment through the engine Following, was a drop in fuel flow, thrust andCDP due to inlet blockage from ice buildup and corresponding duct pressure drop. Theseparameters cycled as ice broke off the inlet. The inlet pressure lose also affectedspeed match cf the engine. After 2:50 and 4:2U of the icing run, Ni increased for agiven gas generator speed (N2! at constant inlet temperature. Those stated timesappear to be when the two ircidents of ice ingestion and damage occurred. NI is higherfor a given N2 due to reduced efficiency of the damaged fan blades. Engine thrust alsodecreased continuously during the test from inlet pressure loss. Because of theaccumulation (,f ice on the engine installation hardware, engine thrust could not bedetermined from meter readings during the icing runs due to the Increased drag force.Fnfine thutlz wz dccrin_ by-- cpr igon ol ,isalim pazremoters during tte icingrun with those obtained in the pretert performance calibrations. Figure 7 is arepresentation of the thrust loss seen throughout the five minute run.
The severity of the icing environment in this demonetration may be evaluated as
I

28-7
follows: The missile traveling at Mach 0.65 will ttavel about 7.5 miles in one miniite.To maintain the missile inlet below freezing (+23
0P) at Mach 0.65 flight condition, the
equivalent ambient temperature is -150F. Cumuliform clouds at -15OF do not exist below
12,000 feet altitude. In addition, this cloud form is typically leass than an averageof 3 miles long if its LWC Is 1 gm/m3. Which would relate to a cloud dwell time forthe missile of less than 30 seconds Stratiform clouds exist at very low altitudes andat -15
0F, their LWC is typically less than 0.2 gm/m3. Stratiform clouds with this LWC
have an average horizontal extent of 20 miles which would equate to approximately 3minutes duration in that environment.
5. F-14A Aircraft Inlet Icing Test
In another developmental effort, NAPC utilized the specification icing conditions toinvestigate a fleet problem encountered by the F-14A aircraft The program wasinitiated because of several reports of F-14A aircraft engines experiencing foreignobject damage (FOD) from ice ingestion (reference 12). From information availableafter one of these icing incidents, the aircraft had been operating for approximately30 minutes in what was perceived as icing conditions at 8,000-10,000 feet at 250 knots(0.4Mn). Th,: aircraft descended and made a normal carrier approach and landing. F-14A
engine icing FOD was reported to have occurred in some incidents during the carrierapproach and in others on carrier arrestment. Ice was found on the rear wall of thebleed/bypass cavity in an F-14A aircraft that did not experience ice damage.
Prior to the NAPC test there had been essentially no previous testing conducted todetermine how the bleed/bypass system functions in flight. Questions regarding thepercentago of total inlet duct airflow that is bled, and whether the bleed/bypass
*system functions as an auxiliary inlet in flight were unanswered. Grumman AircraftCorp. estimated that approximately 10% of the air entering the inlet duct exits throughthe bleed/bypass door.
The F14-A aircraft engine inlet duct (Figure 8) is a variable geometry inlet used todecelerate free stream air in flight to provide even subsonic airflow to the enginethroughout the aircraft flight envelope. The inlet has a two dimensional, four-shock,external compression system with horizontally oriented ramps. It has a three degreeinitial fixed ramp and three automatically controlled variable compression ramps whichare programmed to vary with Mach number. The compression ramp boundary layer is blethrough a throat bleed slot and dumped overboard through the bleed/bypass door.
The objective of this program was to attempt to duplicate the ice formations thathad been observed in flight aircraft and recnmmend possible solutions to the icingproblem. The program was later expanded to include actual testing of the proposedheating blanket fixes. With limited facilities available for the icing installation,the test was run at sea level and reduced Mach number conditions Due to airflowlimitations, air was permitted to flow into and across the top and bottom of the inletduct only Air was allowed to flow across the top of the inlet duct in er a+tempt tosimul.ate the inflight airflow conditions around the bleed/bypass door, which affectsthe airflow rate and direction of airflow through the bleed /bypass cavity. Simulatingthe airflow patterns in and around the F-13A inlet duct in the area of the bleed/bypasssystem is critical, since the rate and pattern of ice accretion in that area isdependent on this airflow pattern. A controlling faftor in the ice build up in thebleed/bypass system cavity and on tis leading edge of the #3 ramp is the amount of airthat is bled by the bleed/bypass system; the ice build up is directly related to thisairflow rote. Conditioned plant air was allowed to flow over the bottom of the duct toprevent distortion of the airflow to the engine from the inlet lower lip. Testing wasconducted using plant air and a TF30-P-408 engine as a 'workhorse pump* behind theinlet in an attempt to create a realistic simulation of the airflow patterns of theinleb duct.
The port engine inlet duct from an F-14A aircraft was installed in the test cell andpartially inserted into a 72-inch diameter plant facility duct Aluminum closure platesinstalled between the facility duct and the F-14A duct were used to block airflow pastthe sides of the inlet. Aerodynamic surveys showed that the bleed/bypass functionedsolely as a bleed for testing with the ramps in the stowed position. The bleed/bypasssystem with the Numoer (M)1 and #2 ramps lowered functioned as a bleed for the lowerengine power settings, but as engine power increased, the bleed/bypass airflowdecreased until the flow reversed. After the point of flow reversal was reached, theblecd/bypass functioned as an auxiliary inlet.
At the icing condition of +230F inlet temperature, 2 gm/m3 LWC and 15 microns
droplet diameter, with the e1 and #2 ramps stowed (low Mach condition), heavy iceaccumulated on the 03 ramp leading edge and the inlet duct tie rod. Testing with therampe lowered (high Mach condition), showed essentially no ice formation in thebleed/bypass cavity. Some ice formed on the lower corner of the 83 ramp leading edgean lu~ (wisiine ins path~ exposed) surisce. ism both, caeo ti,rz wars a.i.U MIgJ131f cantice build up on the lower lip of the F-14A inlet Testing was then performed with theramps in the stowed position to determine where shed ice from the 43 ramp leading edgewould collect. After achieving the ice buildup, the facility air was warmed rapidly,after which the engine was shut down. Examination of video tape of this event showedthat #3 ramp leading edge ice had broken away and lodged in the cavity above the 83
ramp. Mso found in the cavity was ice which had accumulated on the hydraulic ramp
28-8
actuator.
This test demonstrated that the ice found in the bleed/bypass cavity of flightaircraft was most likely caused by ice breaking from the #3 ramp leading edge. Thelarge amounts of ice reported in the bleed/bypass cavity of flight aircraft could bethe result of flying through a series of icing and Pon-icing conditions, whereby icemay repeatedly form on the *3 ramp and break off collecting in the bleed/bypass cavity.This theory is supported by some of the icing incidents reported which stated that theice found in the bleed/bypass cavity appeared to be composed of several layers.
References:
1. Naval Air Propulslon Center, Military Specifications Mil-E-008593A,15 Oct 1975 and Mil-E-005007E, Apr 1983.
2. Naval Al- Propulsion Center, NAPC-E-79003B/l, Mil-E-005007DRequirements Rationale, 10 Feb 1931.
3. G. Bianchini, Allison Division of General Motors,'Small Gas Turbine engines andInlet Icing Protection', Aircraft Icing Protection Symposium, FAA, April 1969.
4. P.A. Soderl nd, Northwest Airlines, 'Airline Operational Experience in IcingEnvironmont, Aircraft Icing Protection Symposium, FAA, April 1969.
5 C. K. Rush and R. L. Wardlaw, National Aeronautical Establishment Canada Report,,'Icing Measurements With a Single Rotating Cylinder', LR-206,1957.
6. V. J. Truglio, Navai Air Propulsion Center, NAPTC-OP-94, *Sea Level Icing RigCalibrations for Small Engine Tests,* October 1976.
7. Allison Gas Turbines Division, T406-AD-400 Quarterly Progress Report, 27 April 1989.
8. W. H. Reardon, Naval Air Propulsion Center, NAPC Ltr Ser PE21/E419, T40-AD-400Environmental Icing Test Results, 2 June 1Q89.
9 S. H. Green, General Electric Co., Report R76AEG031, T700-GE-700 EngineQualification-Anti-icing Test, 30 April 1976.
10. R. R. Thaler, Naval Air Propulsion Center, NAPC-LR-78-23, F07-WR-400 Ice Ingestionand Icing Environment Tests of 15 Nov 1978, PE62:RRT'cja, Sep E850, 30 Nov 1978.
11. R. L. Magnussen and K. P. Halbert, General Electric Co., Report R79AEG1026,F404-GE-400 Qualification Test Phase - Environmental Icing Test, Oct 1979
12. M. K. Fall, Naval Air Propulsirn Center, NAPC-PE-83, Icing Tests of the F-14AAircraft Engine Inlet Duct and Evaluation of Proposed Icing Fixes, Jan 1983.
, I,
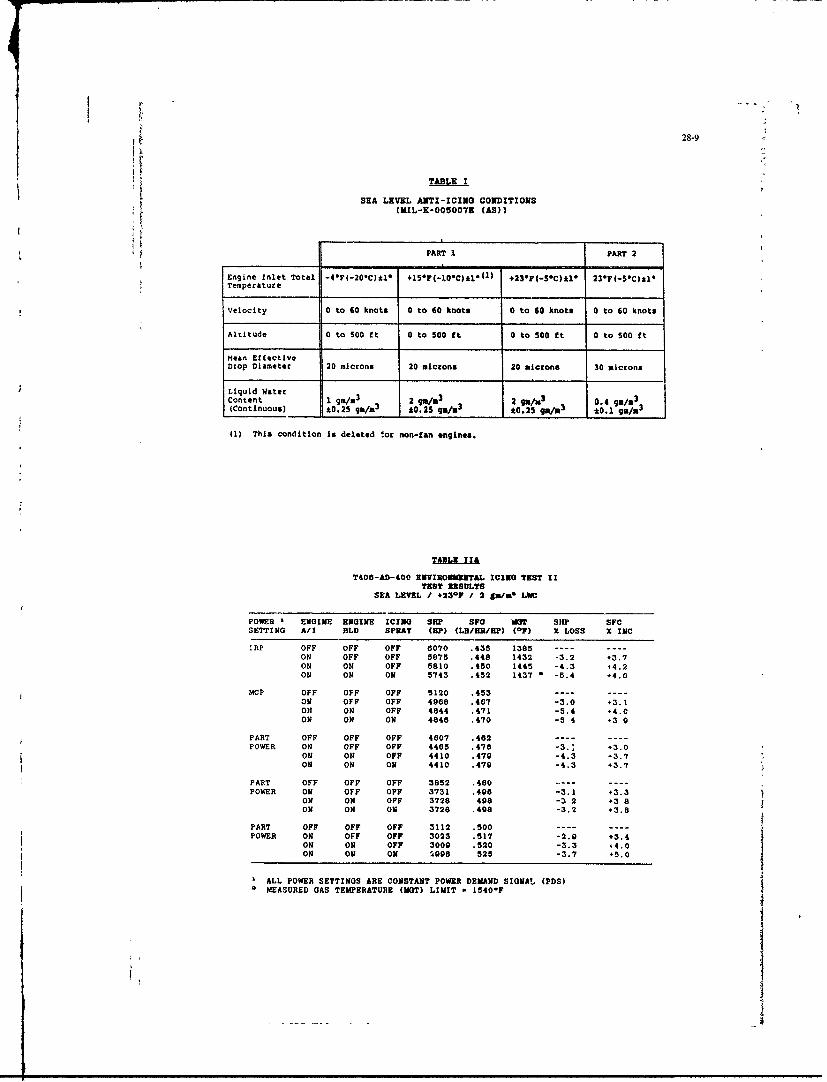
28-9
TABLE I
SEA LEVEL ANTI-ICING CONDITIONS(MIL-E-O050079 (AS))
PART I PART 2
Engine Inlet Total -4*P(-20*C)t1e
+l57(-10-C),l*(1
) +23F(.S*C)&I* 23*F(-5C)l*1Temperature
Velocity 0 to 60 knots 0 to 60 knots 0 to 60 knots 0 to 60 knots
Altitude 0 to 500 ft 0 to 500 ft 0 to 500 ft 0 to 500 ft
Mean EffectiveDrop Diameter 20 microns 20 microns 20 microns 30 microns
Liquid WaterContent 1 gm/m
3 2 gm/s
3 2 gao/
3 0.4 gm/0 3
(Continuous) *0.25 / 0.25 gm/a 3 10.25 g"/in *0.1 gm/s 3
(1) This condition Is deleted !or non-fan engines.
TABLE ZIA
T408-AD-400 ENIIRONMUNTAL ICING TEST IITEST USULTB
SEA LEVEL / +23°F / 2 Sm/mis LWC
POWER * ENGINE ENGINE ICING SN? SIC T SHP SFCSETTING A/I BLD SPRAY (HP) (LB/HR/fP) (0F) Z LOSS I INC
IP OFF OFF OFF 8070 .435 1385 .... ....ON OFF OFF 5875 .448 1432 -3.2 +3.7ON ON OFF 5810 .450 1445 -4.3 +4.2ON ON ON 5743 .452 1437 - -5.4 -4.0
MCP OFF OFF OFF 5120 .453 .... ....ON OFF OFF 4968 .407 -3.0 +3.1ON ON OFF 4844 .471 -5.4 +4.CON ON ON 4846 .470 -5 4 +3 9
PART OFF OFF OFF 4607 .482 .... ....POWER ON OFF OFF 4405 .470 -3.' -3.0
ON ON OFF 4410 .479 -4.3 *3.7ON ON ON 4410 .479 -4.3 :3.7
PART OFF OFF OFF 3852 .480POWER ON OFF OFF 3731 .498 -3.1 .3.3
ON ON OFF 3728 498 -3 2 +3 8ON ON ON 3728 .498 -3.2 -3.8
PART OFF OFF OFF 3112 .500 ----POWER ON OFF OFF 3023 .517 -2.0 *3.4
ON ON OFF 3009 .520 -3.3 .4.0ON ON ON 1998 525 -3.7 +5.0
ALL POWER SETTINGS ARE CONSTANT POWER DEMAND SIGNAL (PUS)MEASURED GAS TEMPERATURE (HOT) LIMIT 1540oF I

28-10
TALI
T408-AD-400 ENYIRONMEETAL IOIG TEST I
TEST RESULTSSEA LEVEL / -4-F / I g1m LUC
POWER ENGINE ENGINE ICING SHP ISFC HOT SHP SFcSETTING A/I BLD SPRAY (HP) (LB/HR/HP) (IF) Z LOSS x IN
IRP OFF OFF OFF 0070 .429 1335 ----ON OFF OFF 5778 .444 1376 -4.8 .3.5ON ON OFF 5742 .447 1385 -5.4 *4.2ON ON ON 5513 .453 :372 -9.1 +5.6
MaP OIF OFF OFF 5237 .449 ----
ON OFF OFF 5059 .484 -3.4 +3.3ON ON OFF 5003 .467 -4.5 +4.0ON ON ON 4780 .475 -8.7 +5 8
PART OFF OFF OFF 4852 .454POWER ON OFF OFF 4535 .487 -2.5 +2.9
ON ON OFF 4473 .470 -3.8 +3.5ON ON ON 4353 .477 -8.4 +5.1
PART OFF OFF OFF 4188 .483 .... ....
POWER ON OFF OFF 4103 .47a -2.1 +2.8ON ON OFF 4045 .478 -3.4 +3.2ON ON ON 3947 .483 -5.8 +4 3
PART OFF OFF OFF 3885 .485 .... ....
POWER ON OFF OFF 3807 .498 -I.8 +2.7ON ON OFF 3559 .500 -2.9 +3.1ON ON ON 3482 .503 -5.0 +3.7
ALL POWER SETTINGS ARE CONSTANT POWER DEMAND SIGNAL (PDS)= MEASURED GAS TEMPERATURE (MGN' LIMIT - 1540*F
TABlLIXXA
T700-GE-700 ENVIRONENTAL ICING TESTTEST RESULTS
(G.E. RT6EG031)SEA LEVEL / +23-F / 2 gale LWC
CUSTOMER BLEED = 0%
r - AS RUN DATA
POWER A/I ICING T4.5H SHP SFC SHP SEP SFCRATING VALVE SPRAY (IF) (HP) (LB/NR/HP) LOSS X LOSS % INC
IRP OFF OFF 1544 1550 .487 .... .... ....CN OFF 1544 1410 .508 140 9.0 4.3ON ON 1544 1410 .508 140 9.0 3.9
MCp OFF OFF 1432 1380 .491 .... .... ....ON OFF 1432 1168 .525 212 15.4 8.0ON ON 1432 1188 .525 212 15.4 6.9
PART OFF OFF 1350 1200 .501 ....POWER ON OFF 1355 1200 .521 4.0
ON ON 1445 1200 .521 4.0
PART OFF OFF 1269 1000 .526 ........POWER ON OFF 1377 1000 .551 4.7
ON ON 1377 1000 .551 4.7
PART OFF OFF 1197 800 .572 ........ON: 0??cp 1315 =0 ;.,.9
ON ON 1310 800 .800 4.9
PART OFF OFF 1130 800 .640 ........P0WR ON OFF 1251 00 .087 7.3
ON ON 1233 600 .687 7.3
"ii
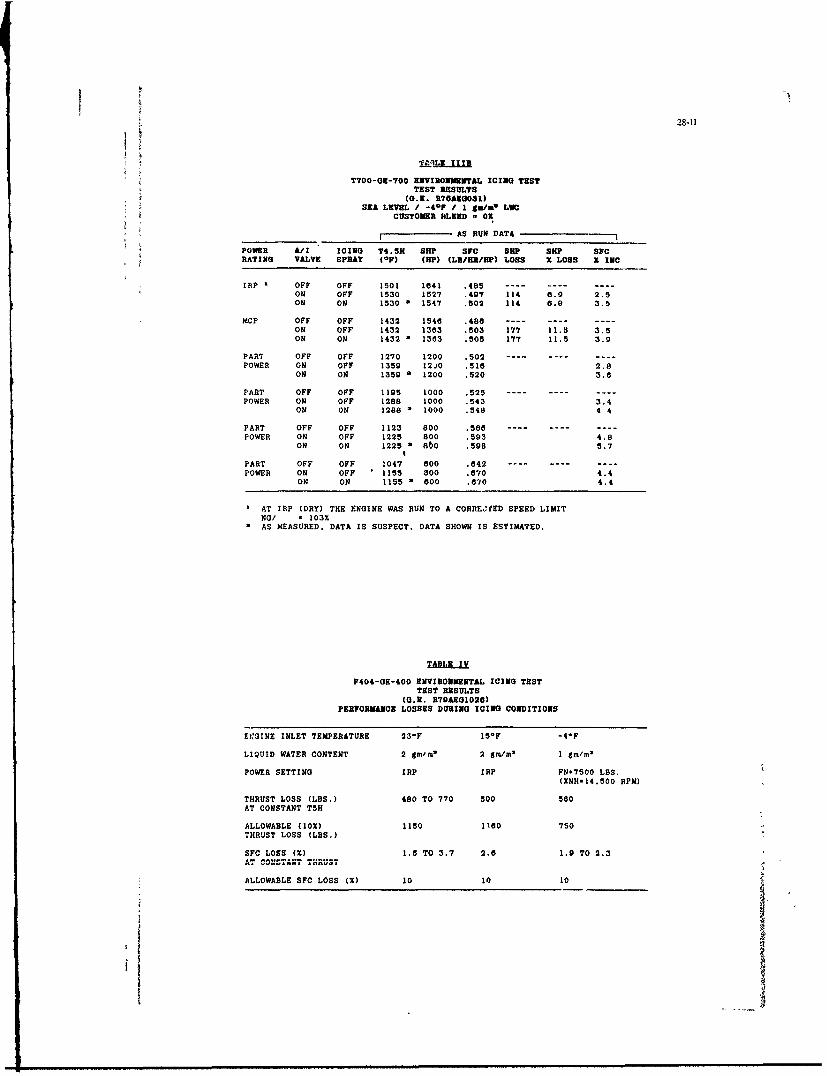
28-11
T700-GE-700 ENVIRONMENTAL ICING TESTTEST RESULTS
(G.E. R70AEG031)SEA LEVEL / -41F / I gn/m LWC
CUSTOMER BLEED - 0E
AS RUN DATA
POWER A/I ICING T4.5 SHP Syc SEP SHP SFCRATING VALVE SPRAY (oF) (HP) (LB/ER/HIP) LOSS % LOSS X INC
IRP OFF OFF 1501 1041 .485 .... .... ....ON OFF 1530 1527 .497 114 0.9 2.5ON ON 1530 - 1547 .502 114 8.9 3.5
MCP OFF OFF 1432 1548 .480 .... .... ....ON OFF 1432 1353 .503 177 11.5 3.5ON ON 1432 - 1303 .505 177 11.5 3.9
PART OFF OFF 1270 1200 .502 .... .... ....POWER ON OFF 1359 12jO .510 2.8
ON ON 1359 1200 .520 3.0
PART OFF OFF 1195 1000 .525 .... .... ....POWER ON OFF 1288 1000 .543 3.4
ON ON 1288 * 1000 .548 4 4
PART OFF OFF 1123 800 .586 .... .... ....POWER ON OFF 1225 800 .503 4.8
ON ON 1225 * 860 .598 5.7
PART OFF OFF 1047 0OO .042 .... .... ....POWER ON OFF * 1155 00 .070 4.4
ON ON 1155 00 .070 4.4
AT IRP (DRY) THE ENGINE WAS RUN TO A CORRECTED SPEED LIMITNo/ - 103%AS MEASURED. DATA IS SUSPECT. DATA SHOWN IS ESTIMATED.
F404-GE-400 ENVIRONMENTAL ICING TESTTEST RESULTS
(G.E. R79AEG102)PERFORMANCE LOSSES DURING ICING CONDITIONS
EVGINE INLET TEMPERATURE 23-F 15*F -4*F
LIQUID WATER CONTENT 2 gm/lm 2 gm/ml I gm/m3
POWER SETTING IRP IRP FN-7500 LBS.(XNH-14,500 RPM)
THRUST LOSS (LBS.) 480 TO 770 500 580AT CONSTANT T5H
ALLOWABLE (10%) 1150 ll0 750THRUST LOSS (LBS.)
SFC LOSS (%) 1.5 TO 3.7 2.0 1.9 TO 2.3AT COUSTAN-T THRUST ,
ALLOWABLE SFC LOSS %) 10 10 10
. . ..

28-12
ALTITUDE: SEA LEVEL TO 22,000 FEFTMAXIMUM VERTICAL EXTFNT: 6500 FEETHORIZONTAL EXTENT: 20 MILES +40
ENIVELOPE OF' ICING
ZI~j WAE 6Tm 3TEUIPERATURFS
___! .- .20 -
0.C (+32-F) AMBIENTS0.6- -10U (1F +102
:'00.t1212
0.2C -- -20___
.X iXl 20 25 30 25 U0 is 2
MEDIAN DROPLET DXAI4CTXR MICRONS GFOPOTENTIAL ALTITUDIE -FEET X 10-3
FIGURE IA :')Fimuous MAximum-icINo CONDITIONS(MIL-E-005007E (AS); MIL-E-008593E (AS); FAR 25, APP. C)
+40 ENVELOiE OF ICING TEMPEATXXE'
ALTITUDE. 4,000 TO 22,000 FEET ----------------- --- POSSIBLE EXTENT OF LIMITS
30LIQUID WAE, OTOT *~-
10UC (-14:F))H
-0,C 1-40 F;
I~I-
-00
~5 c0 ,~- 5 - 20 30 40 50 401 1____0 10 20 30 40
MEDIAN DROPLET DIAM4ETER - MICRONS GEOPOTENTIAL ALTITUDE - FE,;T N10-3
FIGURE IB INTERMITTENT MAXIMUM ICING CONDITIONSCMIL-E-005007E (AS); MIL-E-008593E (AS); FAR 25. APP. C)
FIGURE 1: ICING CLOUDS

28-13
45" DIA. IZ
FREE JET
60"10 DIA
DIRECT CONNECT
FIGURE 2: ICING INLET CONFIGURATIONSSPRAY NOZZLE3 1O0 PLUGSI AE
- -- -DRAIN
iAIR
FIGURE 3: ICING SPRAY BAR SCHEMATIC

28-14
FIGURE 4: ICING SPRAY BAR AND NOZZLE
TEMPERATURE DEW POINT SENSOR /DISTRIBUTION
PRESSUE RAK SCREEN
PRESSURE - HEATED REDUCER '-RETRACTABLE SINGLESPRAY BARS ROTATING CYLINDER
HUMIDIFICATION CALIBRATION
C-TV AND/OR
HI SPEED MOVIE CAMERA
x1TEST ARPLEXIGLAS DUCT
FIGURE 5:TYPICAL CALIBRATION/TEST ARRANGEMENTS

28-15
+30- -
* Lu
Lu
-5 -io
0 100 200 300
INLET AIR FLOW lib/suci
aINLET TEMPERATURE CAPACITY
Mean Effective Drop(12-45) (19-45)0 Diameter Range (microns)
5.0- -r I _ _ _ __ _ _
4.-
LARGE'a9143. ENGINES6," 1-4 (20-45)U 2.0Sml
Eng.
=- 1.0 1 12-25) (12-40)
-J 0.0- ___
0 100 200 300
INLET AIR FLOW (b1/88Cd
b. ICING CLOUD SIMULATION CAPACITY
FIGURE 6: NAPC ICING CAPABILITIES
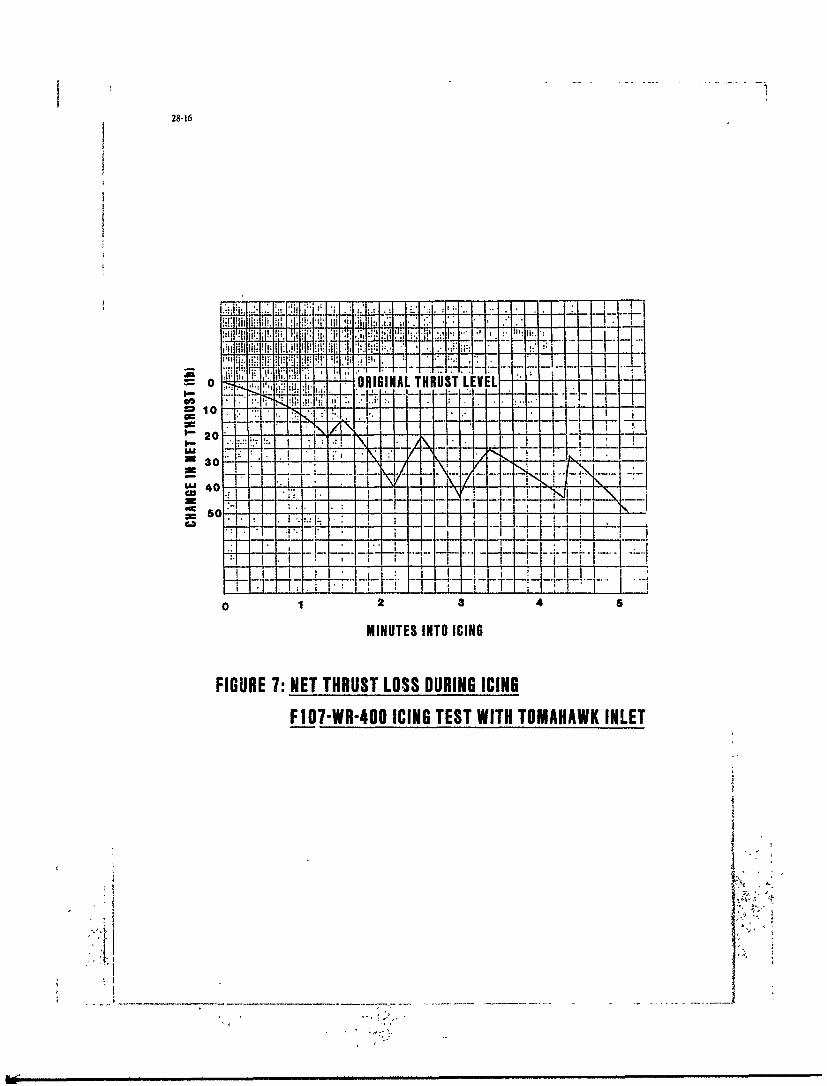
28-16
o ORIGINAL THRUST LEVEL - - -
-I ill
30 --- i
0 12 3 4
MINUTES INTO ICING
FIGURE 7: NET THRUST LOSS DURING ICINGF107-WR-400 ICING TEST WITH TOMAHAWK INLET

BLEED/BYPASS DOOR
NiO. 2 RAMP NO. 3 RAMP
RAMPS LOWERED IHIGH MACH CONDITION',
BSkEED/BYPASS DOOP
NO. 2 RAMP NO. 3 RAMP
RAMPS STOWED (LOW MACH CONDITION)
BLEED/BYPASS DOOR
NO. 3 RAMP BJXEDI'YASS DOOR~
FIGURE 8: F14A AIRCRAFT ENGINE INLET DUCT

28-18
Discuss ion both a traversing pitot and static pressure probe andanemometers as well as a profile pressure rake 1-2diameters upstream of the engine interface plane to quantify
1. G. Bianchini, Allison Gas Turbine the aerodynamic flow field fidelity during the calibrationsDuring the T 700 icing test, you used a heated bullet noseconnected to the engine inlet. Have you performed any 4. M. Holmes, RAEevaluation to investigate the heat conduction effects of the Does your organisation advise on anti-icing methods as wellbullet nose on the engine anti-iced surfaces? as performing icing evaluation tests?How do you control humidity? Please comment on any Have you any evidence which shows that ice accretion onproblems encountered with the humidity control system. engines/rigs measured in ground-based facilities agrees with
flight behaviour?Author:Prior to the T 700 icing test an extensive icing consideration Author:was performed with the facility, whenever there were The Naval Air Propulsion Center serves the US navaltemperature profiles at the plane of the engine inlet. No heat aviator through the Naval Air Systems Command. Wetransfer calculations were performed to determine provide the navy with technical advice pertaining to allconduction heating. However, during the total engine and component systems. Examination of engine anti-environmental icing test, a sinular facility heated inlet icing systems represents one facet of the support.system was used. During this test, the FAA ice ingestion The F 14 A inlet cone test was an example of a fleet problemcondition was performed at both specification kind which was effectively simulated in our icing facility.conditions, throughout the engine power range. This test However, we normally test according to the requirements ofrequired the operation of the engine anti-icing system for the military specification as highlighted in the paper.one minute to determine the worst accretion. The facilitysystem was on for the entire test period. The results showthat ice accreted on the engine gas path surface uniformly. 5. V. Garratt, RAEFrom these results we concluded that the facility system had Is the median droplet size mentioned the same as the meanno adverse effect on the meteorological conditions exposed effective diameter also mentioned? If it is so, how is itto the engine, defined 9
Steam was the medium used to humidify the air supply. It What is the droplet size spectrum about the median?was controlled via a close loop electro/pneumatic controlsystem which used line pressure as a feedback signal. AuthorProblems encountered with the control of humidity had For all intents and purposes the median droplet diameter isessentially been related to consistency of the of the the same as the mean effective droplet diameter becausethermally heated photo cell sensors' ability to provide generally the distnbution obtained from the FSSP laseraccurate point temperature measurements, probe is a normal one. However, it is the mean that is
calculated. The probe counts the droplets in 3 pm diameter2. W. Alwang, Pratt and Whitney increments and the diameters averaged.How did you calibrate the collection efficiency of the For a 20 lum average droplet diameter, the droplet measuredrotating cylinder? ranged from 3-50 lm.
Author: 6. P. Derouet, SNECMAReference 5 of this paper is a report in which NAPC Est-ce que les appareils que vous utilisez aujourd'hui pourmeasured LWC using a single rotating cylinder. In this report mesurer et rigler les parameter de guirage (diam6tre goutte,there is a plot of collection efficiency versus velocity for quantit6 d'eau) donnent les mimes risultats que aux utilisesaverage drop diameters and given cylinder diameters. The dans les anndes 1950 pour 6tablir les normes des nuagesaverage drop diameter is determined from the FSSP laser guirants?probe applied to this plot along with measured ductvelocities to determine the collection efficiency. The piobe which is used by NAPC today to measure the
icing parameters of droplet size 2nd relative moisture3. C. Scott Bartlett, Sverdrup Technologies content is designed to be an airborne cloud measurementWould you please comment on the work performed to instrument. The results which have been gained from thisensure that the aerodynamic flow field fidelity is maintained probe through in-flight measurements are representative offor your subsonic free jet test installations? the engine requirements for specification of intermittent and
continuous maximum icing conditions Airborne test resultsAuthor: for droplet diameters show that they are within the averageFor the subsonic frec jet icing installations, NAPC had used level of data scatter
if -
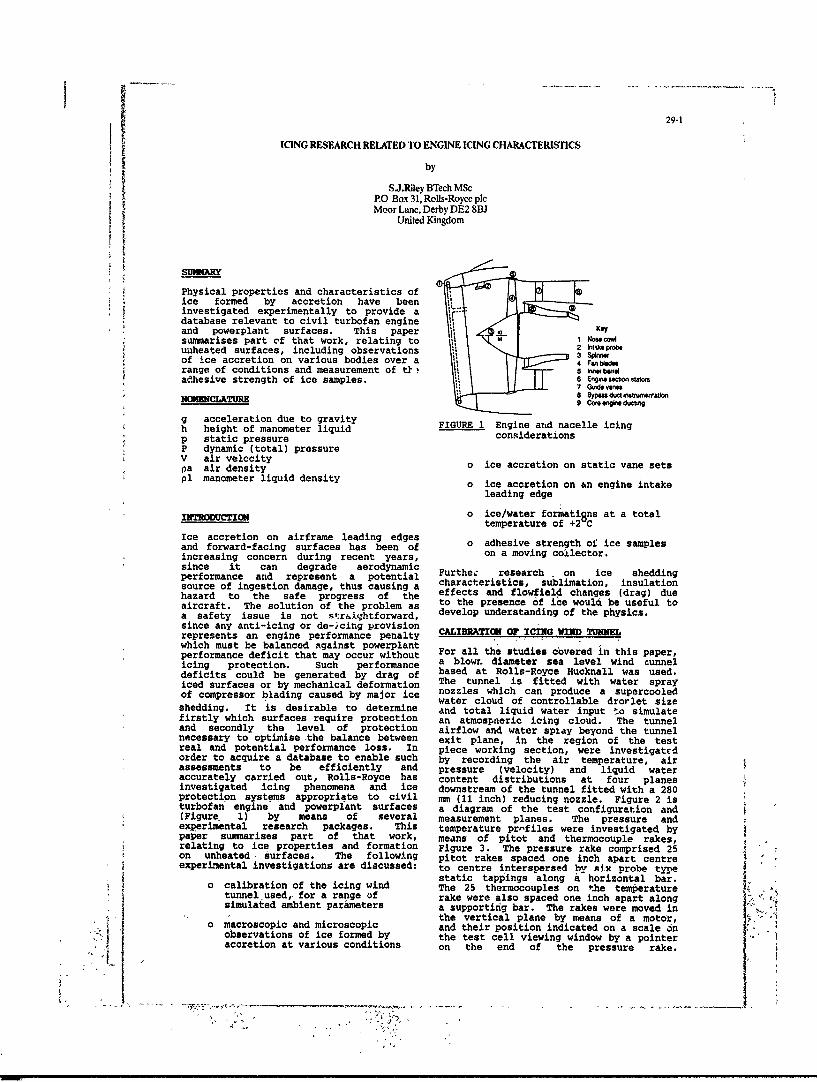
29-1
I ICING RESEARCH RELATED TO ENGINE ICING CHARACTERISTICS
by
SJ.R1ley BTech MScP.O Box 31, Rofs-Royce plcMoor Lane, Derby DE2 8BJ
United Kingdom
Physical properties and characteristics ofice formed by accretion have beeninvestigated experimentally to provide adatabase relevant to civil turbofan engineand powerplant surfaces. This paper 1. ILsummarises part of that work, relating to 4 1 NowcoMuiheated surfaces, including observations 2 mtk poeof ice accretion on various bodies over a 4 range of conditions and measurement of tl 5 WW bareladhesive strength of ice samples. 6 Engine secon sators
7 Gurde vanesmc8 Bypass du nsu~mtion
g acceleration due to gravityg accelerationnduettogravity FIGURE 1 Engine anid nacelle icingh height of manometer liquid cniealnp static pressure considerationsP dynamic (total) pressureV air velocitypa air density o ice accretion on static vane sets
pl manometer liquid density o ice accretion on an engine intake
leading edge
DCTION o ice/water formati8 ns at a totaltemperature of +2 CIce accretion on airframe leading edgesand forward-facing surfaces has been of o adhesive strength of ice samplesincreasing concern during recent years, on a moving collector.since it can degrade aerodynamicperformance and represent a potential Furthec research on ice sheddingsource of ingestion damage, thus causing a characteristics, sublimation, insulationhazard to the safe progress of the effects and flowfield changes (drag) dueaircraft. The solution of the problem as to the presence of ice would be useful toa safety issue is not stralightforward, develop understanding of the physics.since any anti-icing or de-icing provisionrepresents an engine performance penalty CALIBIATI OF ICING WID TMUELwhich must be balanced against powerplantperformance deficit that may occur without For all the studies covered in this paper,icing protection. Such performance a blowr. diameter sea level wind cunneldeficits could be generated by drag of based at Rolls-Royce Hucknall was used.iced surfaces or by mechanical deformation The tunnel is fitted with water sprayof compressor blading caused by major ice nozzles which can produce a supercooled
water cloud of controllable drorlet sizeshedding. It is desirable to determine and total liquid water input to simulatefirstly which surfaces require protection an atmospneric icing cloud. The tunneland secondly the level of protection airflow and water spiay beyond the tunnelnecessary to optimise -the balance between exit plane, in the region of the testreal and potential performance loss. In piece working section, were investigatedorder to acquire a database to enable such by recording the air temperature, airassessments to be efficiently and pressure (velocity) and liquid wateraccurately carried out, Rolls-Royce has content distributions at four planesinvestigated icing phenomena and ice downstream of the tunnel fitted with a 280protection systems appropriate to civil mm (11 inch) reducing nozzle. Figure 2 isturbofan engine and powerplant surfaces a diagram of the test configuration and(Figure 1) by means of several measurement planes. The pressure andexperimental research packages. This temperature prnfiles were investigated bypaper summarises part of that work, means of pitot and thermocouple rakes,relating to ice properties and formation Figure 3. The pressure rake comprised 25on unheated- surfaces. The following pitot rakes spaced one inch apart centreexperimental investigations are discussed: to centre interspersed by six probe type
oiistatic tappIngs along a horizontal bar.o calibration of the icing wind The 25 thermocouples on the temperature
tunnel used, for a range of rake were also spaced one inch apart along A -
simulated ambient parameters a supporting bar. The rakes were moved inthe vertical plane by means of a motor,
o macroscopic and microscopic and their position indicated on a scale onobservations of ice formed by the test cell viewing window by a pointeraccretion at various conditions on the end of the pressure rake.
m i l m mm mm mJ mmmm m m mt m m I I-

29-2
mA~O LIQUI (PA-Ts EC kOA-tfPw .
AIR5'G~~'
ATMAM '-JATP. Qph
WATrT SPRWAP _
FIGURE 2 Icing tunnel calibrdtion measurement planes
effect of varying ambient conditions.Repeatability was good in the highvelocity core. The outermost temperaturesvaried with time according to test cellconditions, but variation during a givenscan was negligible. Sufficient time wasallowed for stabilisation at each testpoint.
A contour plotting program was used toplot results as contour maps for each testcondition at each measurement plane.Figure 4 sh8ws the resultant pressurecontours at 0 C in terms of pressure heads(inches of water) to 12 inches either sideof the centreline. The geometric centre-point of the tunnel is marked +. Thepressures plotted on Figure 4 are zelatedto velocities via a simplified Bernoulli'sequation:-
P - p = 1/2 pa V2
and P - p = pl g hhence V = 2 Pl g h
pa
Figure 5 shows sample temperature contoursin degrees centigrade to 12 inches eitherside of the centreline. Inspection of
FIGURE 3 Instruidentation rakes mounted Figures 4 and 5 shows that the flowdownstream of wind tunnel remains in a core formation up to at least
1.2 m from the nozzle exit plane, and thetemperature of this core flow appruaches
Readings were taken at one inch intervals the nominal air temperature. The size offrom below the tunnel upwardi to avoid the core diminishes with downstreamback-lash in the traverse screw thread and distance. The circular nature of theadvancing mechanism.The vertical extent of pressure contours indicates that the flowmeasurements was chosen to encompass produced is axisymmetric, but the flow issignificant pressure and temperature distributed about a point offset from thegradients, with outermost readings geometric centrepoint. This is due to theapproaching ambient confditions in the test proximity of the test cell wall (to thecell. left, of plots Figures 4 and 5 as viewed)
and floor. Calculations suggest that theReadings were taken at nominal air actual velocity of the core flow exceedsvelocities.of 61 and 122 m/s (200 and 400 the nominal tunnel velocity. As distancefps),at the four measurement planes gor from the exit plane increases the size ofto tufil air. tempratures of 0 C this 'high velocity' core diminishes. For5 c and -30C (pressure readings were a given nominal velocity, the local air - ,
taken at'oC only snce tfi diffrences velocity more than 150 mm (6 inches)onlsegVe it plane A fok 0C and -15 C were radially from the centre of flow is notneggibi.4, Sample rake positions were significantly changed , with downstream Areteited at inteivals to check distance, i.e. velocity and temperature 'epimental repeatability and note the gradients are greatest near to the nozzle.
'' ! .:

PLAN4E A PLANE B MLANE C PLANE D
V =1 lm/s
V=122 rn/
FIGURE 4 Pressure profiles
PLANE A PLANE A PLANE C PLANE CV 61'm/s 1l22 m/s V Elm/s rn2-/s
T 0o
T lC
T =-300C
FIGURE 5 Temperature profiles
Research was carried out in the Hucknall which shed more easily and was generallyfacility to determine the effects 8 f more opaque. The contact area with thecertain variables on ice accreted at -10'C grid was less for the higher speed and theon a steel tubing grid. Air velocities classic forward-facing horned formation
tunnel exit plane. For corresponding test apparent with increased water input.
tunel irseedprducd mre ritleice acreton, ad Bgur 7 shows the
test conditions.

29-4
2%- ~m, 6Iii{0 4agi 2C~je.61m/aq Sgph, .2" 1
2gph, 2(.am, i22m/s 4&91, 29pmn, 122ut/s 8Mh, 20pm, 122m/s
4gph, . 2(~im, 61mls 4QAh,20psn, 61m/s
Figutre 6 lee accretions on grid aftor 5 minute&s at -.100C
4 gph, 20w um 8gph, 20Opm 4 gph, 20 um 8 gph, 20 um61 rn/s 122 rn/s
4 gph, >2011m 4 gph, <20 pm 4 gph, >20 pm 4 gph, <20 pm61 rn/s 122 rn/s
FIGURE 7 Profiles of grid ice accretions after 5 minutes at -100 C
As wiater input increased, i.e. simulate was more opaque and featured a reducedted -1act arca n eti 1fna orecloud liquid wvater content increased, the andato. h icee fmed ontedaorountn The aicete iceme inrese the
amountiof a cHoeer, ac nreducto ed collection grid waa removed and weighedpioortoni-al. H,,iver a edutio in after each test, and it was found that forliquid' water content associated with an a given total water input, a lower waterincrased expsure time to he iing flow rate resulted in a greater quantity
condition had a similar effect to of ice due to the different transportation:1 ~increasing velocity in that the resultant adha rnfrpeoeaa h ufcice was more brittle, shed more easily, of the accreting ice.

29-D
Experimental evidence showed that a collecting surface and surroundings, andreductibn in water 'drojlet size had a any external forces prevailing. Thesimilar effect on'°ice type as an increase variables contributing to a given icinginairspeed or redu dtion in liquid water condition include air temperature (staticcontent, producing more brittle, opaque and total), air velocity, cloud liquidice which shed more easily. water content, water droplet size and
distribution, cloud extent (time in icing)Ice formed at different temperatures and altitude. The pertinent collectingdisplays different characteristics. There stirface characteristics may be consideredare two categories of ice normally quoted; to be rotational speed, heat input, shape,rime ice and glaze ice. Rime ice forms at material and surface finish. As anlow temperatures, is smooth, opaque and initial step towards understanding thetends to follow the 2shape of the surface physics and mechanics of the afore-on which it is building. Glaze ice forms mentioned phenomena, ice was formed on a
at temperatures approachinq 0 C, is stainless steel collector mounted down-clearer and comprises forward facing stream of the Rolls-Royce Hucknall 15 inch'feathers' of ice which give the classic icing wind tunnel for a range ofhorned shape. In the case of a point airspeeds, air temperatures, liquid waterattachment this type of ice 'forms a contents and droplet sizes. The samplesrosette growing forwards and sideways. were observed manually, photographed inExamination of results discussed above close-up using a Hasselblad camera plusshows a tendency towards glaze ice bellows, and photographed through acharacteristics rather than rime for an microscope using a Leitz camera attachmentincrease in airspeed, reduction in droplet plus light box.size or reduction in liquid'water content.At the intermediate test total air The collector was cleaned prior to eachtemperature of -10.C, it will be noted test, and the tunnel run prior to thethat either type of ice or a combination introduction of supercooled water to allowmay form, dependant upon ambient temperature and airspeed to stabilise.conditions. Glaze ice is generally a Ice was collected for one minute at eachgreater problem in respect of aero-engine test condition. Samples wAre collectedintakes since cloud liquid water content over ranges of airspeed 30 to 122 m/s (100is greater at higher temperatures and the to 400 fps), total air temperatures 0 toglaze ice shape will'have a larger effect -300C and water flow from 2.5 to 10.1 g/son drag and damage potential if the ice is (2 to 8 gph). Most tests were at areleased. However, glaze ice tends to be nominal water droplet size of 201im, butmore brittle with a smaller contact area some tests were repeated at smaller andand is more readily shed. The only larger droplet sizes.deviation from transition between rime andglaze ice noticed during the experimental Following manual and close-up photographicinvestigations was an increase in opacity observation, each sample was removed forrather than an increase in clarity. The microscopic observation at 100 timesphysical formation characteristics magnification. It was not possible todistingu.shing the two ice types are as make microgcopic observations of icefollows: the major influencing factor is formed at 0 C due to rapid melting. Thethe freezing fraction; the proportion of wind tunnel was completely run down tothe impinging supercooled water droplets avoid vibration which could be transmittedwhich freeze instantaneously on impact. to the microscope. There would have beenFor pure rime ice the freezing fraction is little advantage in setting the microscope1.0, the resultant ice being opaque. At arrangement up in the test cell, since thelow freezing fractions there is some water main contributory factor to increasedflow along the surface prior to freezing, melting was the light source, andforming clear glaze ice. The post-impact condensation would have been a problem.
water flux gives rise to the horned or Sample close-up photographs are given asrosette type groyith of glaze ice. The Figures 8 and 9.associated increased .zontal area and i
cenficient distributions escalates the Figures 10 and 11 show microscopic photo-
deviation from the original collector graphs corresponding ro Figures 8 and 9.
shape. As temperature increased, the surfaceThe size and location of a test piece structure of *he ice became more uniform.should be chosen to lie within the No indication of the infrastructure couldrasobl b hon tor e fowitHi e, be gained due partly to melting and partlyreasonably uniform core flow. However, to inadequate magnification. Surfacethe presence of a model will deviate the observations only could be male withflow thus effectively increasing-the size c y a aie
of thia core, and heat transfer phenomena quipment available.at thi, ridel surface will influence the increases, water droplet Reynolds number
and inertia parameter (Bowden') increases.viscousheal atingr These changes h&e opposing effects on
isos• g collection efficiency, limiting the net
MA OPIC AMD KICROSCOPIC OSERVATICNS effect on ice accretion. From results itwas seen 'that as airspeed increased theice became more opaque'and brittle. This
The :appearance, net quantity,' shape, observation was consistent with those madedigribui, relative locatioi physical during the calibration research describedpr6petesand h6dding propejisity of ice earlier. As water input increased the i'
amount of accreted ice increasedformed' by accretion are' 'a function of proportionately. However, as previousamb1e't.' conditions at: 'the time of research
H formati6fi, chaiacteriitics of the 'has shown, a reduction in liquid
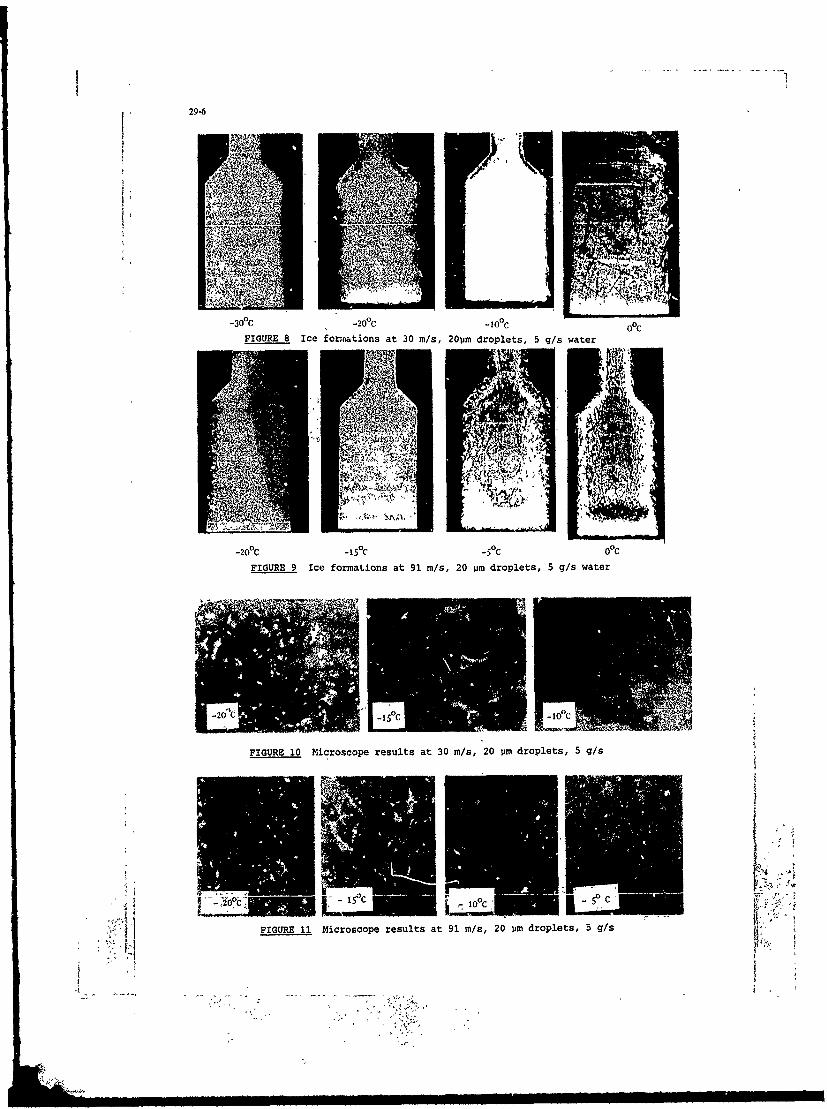
29-6
-30PC -20PC -10C O~CFIGURE 8 ice form~ations at 30 m/s, 20pjm droplets, 5 g/s water
-200C -150C -50C OOC
FIGURE 9 ice formations at 91 m/s, 20 Um droplets, 5 gls water
FIGURE 10 Microscope results at 30 m/s, 20 pm droplets, 5 g/s
FIGURE 11 Microscope results at 91 m/s, 20 pm droplets, 5 g/s

~I
29-7
wa~er conte;t asociated with increased vanes was contained in wooden ducting withexposure tc give an equivalent total water a perspex viewing panel. The vanes wereinput had a s1milar uffeet ,, increasing of constant profile, representing approx-velocity in that the resu- ,nt ice was imately the mid section of typical inletmore brittle, more easily shed, more guide vanes. The trailing edge of eachopaque and features a reduced co.,tact area vane was thickened to enable fitment ofand better defined horned formation. For locating pins. Tests were conducted:a given total water input, reduced liquidwater content resulted in a greater (A) with the 25 mm vane set in-linequantity of ice. similarly, a given at 00 vane incidence• quantity of water input at a higher
velocity gave a greater ice accretion; (B) with all vane sets at 230 to (A)this was also an effective reduction in and 0 vane incidence,liquid water content since volumetric flow to simulate fan swirlthrough the wind tunnel was increased.Water droplet size affected ice collection (C) as configuration (L) wth theefficiency (quantity) and the type of ice 38 mm vanes skewed ±20.formed, although the effect was ruch lessthan that of other parameters. At low air Prior to icing tests, the velocitytemperatures, rime ice is gormed and at profiles upstream of the vane sets weretemperatures approaching 0 C glaze ice checked using a traversing pitot rakeforms. The horned formation is less comprising 27 tappings connected to waterapparent for a flat collector, peripheral manometers. The profiles were found to beice growth providing the best indicator, uniform over the majority of the testResults clearly showed the transition from section, with negligible wall effects.rime to glaze ice characteristics as The rake was removed during icing teststemperature increased. At intermediate and replaced by a sealing plug in thetemperatures, either type of ice or a ducting lower wal., Pre-test ice distri-combination formed on the unheated bution checks indicated satisfactory watercollector. Examination of experimental (ice) distributions, even with one sprayresults also showed that the tendency nozzle operating only for low water inputtowards rime or glaze-type ice is affected conditions. Each test build was alsoby airspeed, droplet size and liquid water checked for leaks. The tunnel aircontent. Microscopic observations temperature was allowed to stabilise atindicated an associated surface area and the desired velocity before supercooledroughness change consistent with the water was introduced at each testforegoing discussion, i.e. as temperature condition. Results were recorded atincreases freezing fraction is reduced and one-minute intervals or as appropriate viathe droplets spread laterally on impact static pressure tappings connected tobefore freezing, giving the more open water or mercury manometers according totexture. the magnitude of pressure drops across the
model. Still 1hotographs were takenThese investigations concluded that: remotely during each test and video
monitoring was used, selected tests being" The physical and mechanical recorded. Times of major ice sheds were
properties of ice formed by noted.accretion are a function offormation conditions. Tests were 30 minutes long unless either
ice blockage rendered it impossible to" The effects of altitude, maintain conditions or an ice accretion
rotational speed, vibration, and shedding cycle had been established.heat input, material type and The highest scheduled airspeed of 137 m/ssurface finish may also (450 fps) could not be achieved due toinfluence ice properties, andthese phenomena should be blockage by the vanes themselves, and 119investigated. m/s (392 fps) was used as the practical
maximum. For most builds temperatures ofo Alternative techniques for -15wC, -60e and -20 C at 61 m/s (200 fps)
microscopic observations and 913 m/s (300 fps) air velocity andshould be investigated. 0.15g/m and 0.3 g/m liquid water content
were tested, although intermediateICE ACCRMOK ON STATIC VANE SETS temperatures, the higher velocity and a
wider rangi of liquid water content (0.1Excessive core engine blockage due to to 0.6 g/m ) were tested for 25 mm and 38icing of engine section stators can be mm angled vane sets. The swivellAng vanesdetrimental to engine performance, giving were tested at incidences of -20 0almosta reduced flow area, increased pressure parallel t8 the cairflow), -10, 0
losG and consequent power loss and must be (datum), 10 and 20 . The latter causedavoided. However, it ib desirable to maximum blockage by the vanes, limitingmaximise the number of fan outlet guide achievable tunnel air velocity. In allvanes and compressor inlet quide vanes for tests the nominal water droplet size wasoptimised noise suppression. Therefore 20Um.model static vane sets of 19.1, 25.4, 38.1and 55.9 mm (0.75, 1.0, 1.5 and 2.2 in) To make comparisons easier, results havespacing were subjected to icinq conditions been plotted non-dimensionally in the formin the Hucknall 15 inch icing wind tunnelto investigate the phenomena involved. NONDIMP = AP - APo where AP = measuredThe effects of fan swirl and relative 6PO pressure drop
swirl and relatiand APo = initial APangle of the vanes to the flow were alsoinvestigated. Each set of stainless steel
'1 T'77- -7

29-8
Figure 12 shows results at 0.3 g/m3 for from which it had been shed and ana.l spacings angled to the flow and Figure adjacent vane, providing a further13 shows results for in-line and accretion surface to exacerbate theswivelling vane sets. build-up. Initial pressure drop acrossrl the vane sets varied considerably withObservations showed that ice formed at vane spacing and angle relative to the-2 C grew forwards and laterally (glaze airflow, but it mtst Le assuned that thisice) and as temperature of formation 'blockage' lue to the vanes is acceptablereduced, frontal area reduced (rime-type for the particular application. In manyice). In general AP increased with tests, for closely spaced vanes and lowtemperature, reflecting the different ice temperatures, the pressure drop across thetypes, but blockage was not necessarily vane set decreased slightly beforegreater at higher temperatures since increasing. This was apparently due toshedding propensity also increased. For slight streamlining of the blade, causedsimilar reasons it did not necessarily by the initial (rime) ice formation. Fromfollow that an increase in airspeed (and inspection of Figure 12 it may be seen
associated increase in water input for a that blockages of 19 mm, 25 nun and 38 mmgiven liquid water content) caused spaced vanes were of the same order andincreased blockage. Having noted that that 56 mm vanes were much lessshedding was a major contributory factor susceptible to blockage. From ain net ice accretion/blockage, shed ice comparison of Figures 12 and 13, nomust pass between the blades to be conclusion can be drawn concerning thecompletely removed. For closely spaced benefit or olnerwise of the presence ofvanes, ice often wedged between the vane swirl due to the fan. Figure 13 shows
that the amount of skew on the vanes
no -^JV3 4 C - - 1me f.m .t 3 V-4. .2 .- 1 3 V-
55.9 mm spacing 38.1 mm spacing
No . -. f-. .CW.. 3,,1 -3 C
M 1 3 C30% 1. - on
0~1 .3 V-4 -In C9 30 V. J V"2 * 2
712It Is -
T,VE m, T't[
25.4 mm spacing 19.1 mm spacing
FIGURE 12 Non-dimensionalised pressures for angled vane sets
'9 1- N - - Oft .92MJ V-
X0 VL J V-3. n .. ft "4.31/4
"a / 2 2 1 . " 2X0 I -M I 4/. .li " I
IN 0...g.9.9 .0 1/-% .1 d" C/ .223
29
94 9
Is A Is 36 S9 2 97 9 ' '~ 2 9 2
TWE E .
25.4~9. mm spacingwvelin
FIGJR 12 Non-dimensionalised presues fornle andsien vane sets

29-9affected blockage greatly. This wasbecause oblique vanes relative to the
airflow themselves represent a largeblockage, so additional blockage due '-o
, ice is low as a percentage of the initialvalue. in all cases it was noted that iceon the leading edges tended to 'shield'pressure surfaces, and any ice locatedthere shed and uid not rebuild unless theleading edge ice shed. This is notapparent of fan blades, where the relativepressure surface area is large, leadingedges thin and the blades are presentedobliquely to the flow at their hubs. Thepressure levels at which shedding occurredincreased throughout a given test. Thisis thought to be due to initial sheds FIGURE 14 Typical runback iceremoving the weaker ice, leaving the Fstronger ice as a base for new accretion. ICE/WAT0R FORMATIONS AT +2°COnce the initial more frequent sheddingwas complete, the shedding appeared to The purpose of these tests was to observeoccur in a cyclic fashion unless build-up the interactive phenomena of ice and waterwas such that the ice could not shed on a typical turbofan intake surface andbecause it had nowhere to move to, e.g. to determine the effect of controlledice bridging adjacent vanes formed a firm parameter changes on iSe formation. Ataccretion base and blocked the corres- mperatures around 0 C there is anponding passageway. .itermediate situation whereby both iceThe investigations concluded that: and running water exist on the surface.TPrediction of the physics, mechanics and
hydrodynamics of this phase is a compli-o closely spaced vanes are more cated heat and mass transfer balance.prone to blockage, and icebridging, but initial pressure A full-scale two-dimensional section of adrops were similar. typ.-cal aero engine intake was mounted
downstream of the Rolls-Royce Hucknall 15Blockage is highly dependant on inch icing wind tunnel and enclosed inshedding propensity. At ducting, the walls of which were shaped toconditions tested, significant simulated the airflow distribution for ablockages occurred, typical descent flight condition. The
model wns fitted with a mock-up section ofo Vane angle relative to the flow anti-icing system, comprising a length ofwas significant mainly 'piccolo' pipe featuring three rows ofdue to initial AP. Fan swirl had holes such that air jets impinged on theno quantifiable effect, intake model internal surfacS. A tunnel
total air temperature of +2 C and waterThe data acquired must be considered in droplet volume median diameter of 20pmconjunction with icing tolerance were used throughout testing. Ice andcharacteristics of a particular engine, water formations and behaviour on thee.g. surge margin, impact resistance, intake section highlight rsgion and inneringestion capability (damage potential) surface were observed for a range oZand detail geometry. tunnel air velocities of 26 to 82 m/s (50
to 160 kts) and water flows of 1.9 to 10.1ICE ACCRETI0N ON ENGINE INLETS g/s (1.5 to 8 gph) with no internalairflow. Selected tests were repeated
Limited sea level testing has been carried with aMbient air fed to the model anti-out on unheated full-scale two-dimensional icing system. Still photographs and videoturbofan inlet section models to check were used to record observations. Thewater (ice) catch prior to anti-icing spread of test conditions was intended tosystem tests. The ice formed displayed cover the range from full evaporation tocharacter'stics consistent with those total phase change in the intake highlightdiscussed earlier, and ice shape ayd region within the limits of the plant andquantity were consistent with Bowden . aircraft operating ambient conditions toIce formations were also similar to those which the test points corresponded.noted during observations of ice accreted Velocity was allowed to stabilise and soakin flight for delayed selection of nose down so the entir% model an0 the airCoil anti-icing. Some photographs of inside it were at +2 C prior to each test.runback ice (unevaporated water running After the water flow was introdced, theback from a heated surface and freezing on test duration was such that conditionsa downstream unheated surface) in the were stable.icing tunnel and in flight. This ice Generally, flowing water on the cowltakes the form of rivulets due to surface surface tended to limit ice formation. Attenion effpets. Figthe lowest velocity of 26 m/s virtually notypical example. ice formed, at 64 m/s ice build up was
observed, less so at higher water flows,at 82 m/s no more ice built ur for a givenwater flow and at 103 m/s the ice quantitywas rcdcd. Thc ad on of air into L'emock-up anti-icing system at 11 to 13 Cdid not change the water flow patterns,but ice accretion was severely limited
.- 't. *_ _ I
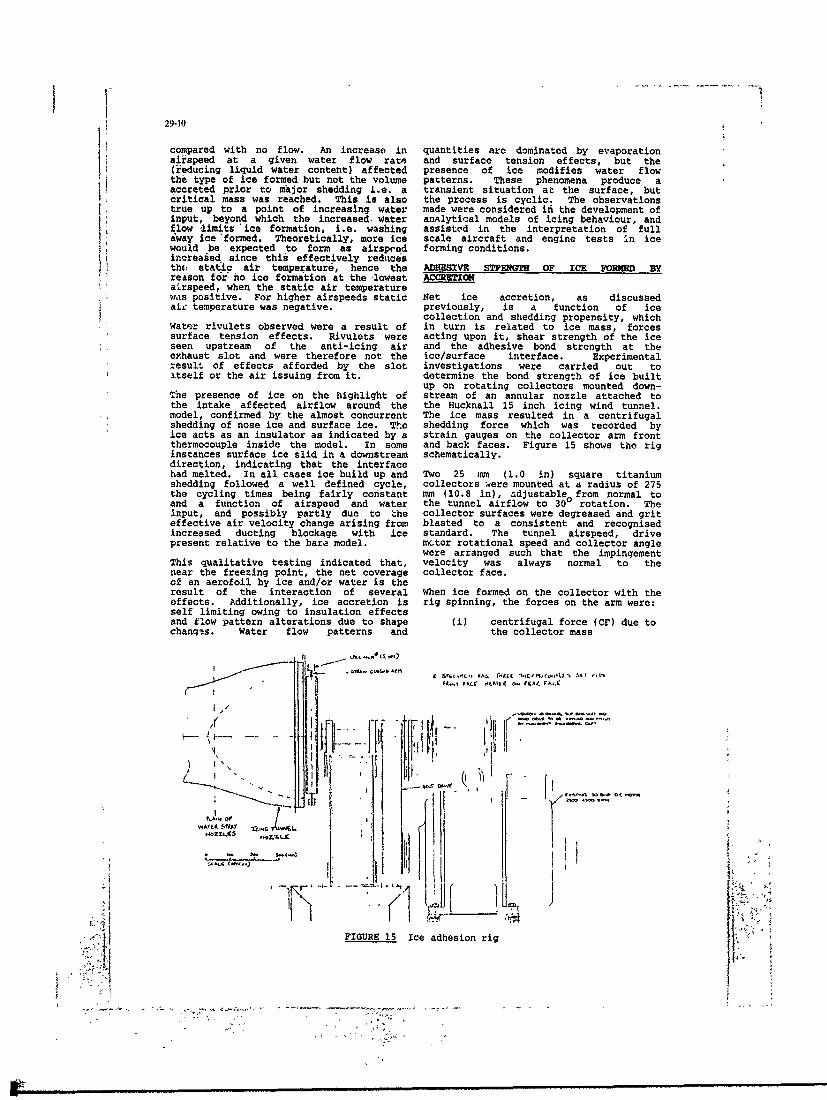
29-10
compared with no flow. An increase in quantities are dominated by evaporationairspeed at a given water flow rate and surface tension effects, but the(reducing liquid water content) affected presence of ice modifies water flowthe type of ice formed but not the volume patterns. These phenomena produce aaccreted prior to major shedding i.e. a transient situation at the surface, butcritical mass was reached. This is also the process is cyclic. The observationstrue up to a point of increasing water made were considered ifi the development ofinput, beyond which the increased water analytical models of icing behaviour, andflow -limits 'ice formation, i.e. washing assisted in the interpretation of fullaway ice 'formed. Theoretically, more ice scale aircraft and engine tests in icewould be expected to form as airspred forming conditions.inoreased since this effectively reditcesth static air temperature, hence the AD SIVR STPRNGTH OF ICE FORM BYreason f6r'.ho ice formation at the lowest ACCRITIOairspeed, when the static air temperaturewas positive. For higher airspeeds static Net ice accretion, as discussedaie temperature was negative, previously, is a function of ice
collection and shedding propensity, whichWater rivulets observed were a result of in turn is related to ice mass, forcessurface tension effects. Rivulets were acting upon it, shear strength of the iceseen upstream of the anti-icing air and tho adhesive bond strength at theexhaust slot and were therefore not the ice/surface interface. Experimentalresult of effects afforded by the slot investigations were carried out toitself or the air issuing from it. determine the bond strength of ice built
up on rotating collectors mounted down-The presence of ice on the highlight of stream of an annular nozzle attached tothe intake affected airflow around the the Hucknall 15 inch icing wind tunnel.model, confirmed by the almost concurrent The ice mass resulted in a centrifugalshedding of nose ice and surface ice. The shedding force which was recorded byice acts as an insulator as indicated by a strain gauges on the collector arm frontthermocouple inside the model. In some and back faces. Figure 15 shows the riginstances surface ice slid in a downstream schematically.direction, indicating that the interfacehad melted. In all cases ice build up and Two 25 mm (1.0 in) square titaniumshedding followed a well defined cycle, collectors were mounted at a radius of 275the cycling times being fairly constant mm (10.8 in), adjustable from normal toand a function of airspeed and water the tunnel airflow to 300 rotation. Theinput, and possibly partly due to the collector surfaces were degreased and griteffective air velocity change arising from blasted to a consistent and recognisedincreased ducting blockage with ice standard. The tunnel airspeed, drivepresent relative to the bare model. mctor rotational speed and collector angle
were arranged such that the impingementThis qualitative testing indicated that, velocity was always normal to thenear the freezing point, the net coverage collector face.of an aerofoil by ice and/or water is theresult of the interaction of several When ice formed on the collector with theeffects. Additionally, ice accretion is rig spinning, the forces on the arm were:self limiting owing to insulation effectsand flow pattern alterations due to shape (i) centrifugal force (Cr) due tochanges. Water flow patterns and the collector mass
19- . S- . .A... ,a... ICA. i ,
'40 7.LL(s El
FIGURE.15 Ice adhesion rig

29-11
(ii) centrifugal force due to the greased) and coatings (PTFE and GRP).ice mass After the first ice shed of a given test,
(iii) moment due to the collector/ the surface nature of the base on whichice CF offset from the arm subsequent ice built would not be ascentreline pre-test, so most tests comprised more
(iv) moment due to aerodynamic than one shed, until ice shed from theforces on the collector tunnel walls affected the results.(probably small compared with(i) to (iii)). Numerical values of average and maximum
cosshear strength were calculated from strainThis combination of forces resulted in a gauge readings. Figure 16 3hows thesenet tensile force on the forward face of results against temperature for the bulkthe collector and a compressive force on of tests. The mean values shown may bethe rear fece. When ice shed, the lower than the true mear in some casesresolved force was reduced and the owing to the inclitcion of results fromresultant change in strain was used to partial ice sheds not recognised as such.calculate the force which caused the The maximum shear strength values areshedding and hence the shear strength of dependant on the number of tests at athe bond and ice. It should be noted that condition.results would be affected to some degreeby the presence of the strain gauges it has been suggested that, because thethemselves. The strain gauge data and centre of mass of the ice sample wasthermocouple readings were continuously offset from the shear face, the ice wouldmonitored via a U/V chart recorder. A tend to peel rather than shed in pureslip ring unit was used to transmit shear. This was limited by not allowingmeasurements from the rotating shaft to the ice sample thickness to exceed 12 mmthe recorder. Stobe-triggered video (0.5 in), but there is no evidence tocameras were used for observation of the support or dismiss the hypothesis that theicing process, and a still camera was used shedding mechanism was either entirelyto record the condition of the ice peeling or initiated by peeling.fracture surface immediately aftershedding. The size and shape of the ice collectors
were not representative of a fan bladePre-test checks on velocity (pressure) and section or other rotating enginewater distributions showed that velocity component. There are two scaling effects;was even over the area swept by the firstly the aerodynamic forces increase ascollectors, and water distribution was the .ize of the accretion surface iseven after modifications to the grid. A reduced owing to the relative proportionsdeflector plate was added to avoid ice of the ice and 'clean' surrounding surfaceaccretion on the arms and bridging to and secondly ice gains strength fromprovide possible strengthening. A large adjacent ice. The shape of the surfacenumber of tests were carried out at each affects the aerodynamic characteristicscondition to establish statistical and ice collection efficiency.credibility because of high scatter due tovariations in accretion and shedding times The mechanism by which ice sheds(and hence ice mass) and experimental (adhesive/cohesive failure) is determinederrors, although accretion and shedding by the fracture mechanics involved, and nowere essenti~lly cyclic. Most tests were attempt was made to study the nature offor 1.0 g/'. liquid water content, 201im the adhesive bond between the ice and thedroplets and a clean surface with impinge- metal surface. It was noted, however,ment velocities normal to the collectors that failure tended to be cohesive, i.e.of 61 to 213 m/s (200 to 700 fps) and failure occurred within the ice, at lower
* tempratures of -2 to -200C (note that for total air temperatures. At highera 30 collector angle the normal impinge- temperatures adhesive failure occurred,ment velocities were twice the tunnel i.e. the bond between the ice and theairspeeds). Additional tests were carried metal surface was broken. The transitionout to investigate the effect of liquid occurred between -6 and -10 C airwater content (0.5 to 2.5 g/m ), droplet temperature, which also corresponds withsize (15 to 30wm), impingement angle (30 the transition betweeit rime and glaze ice.and 35 ), surface preparation (clean and The ice type and failure mechanism did not
I-
Average shear strength. Maximum shear ctrength.
FIGURE 16 Adhesive strength results t1 -

29-12
appear to significantly affect results o The research summarised in this paperexcept that an increase in gradient of the has provided a significint quantity ofstrength-temperature curves was noticeable data which has lImproved knowledge andat lower temperatures. Figure 16 indi- understanding of phenomena associatedcates that shear strength increased as air with ice formed by accretion.temperature at formation reduced, approxi-mately linearly. The impact speed had a o Further investigations are required insignificant effect on shear strength, order to provide a more comprehensivehigher accretion velocities producing understanding of the physics involved.lower strength ice, probably due toincreased aerodynamic forces, reduced o The data available has been used in thecapability for trapped air to escape, design, development and in-serviceincreased droplet spread prior to freezing phases of turbofan installations.and changes in water flow characteristicsat the ice surface. A reduction in REFERMCIESdroplet diameter apparently increasedshear strength, which is in opposition to 1 Bowden et al 'Engineering summary ofthe findings of calibration tests airframe icing technicaldescribed earlier. This has been data', TR ADS-4, Marchattributed to the flat collector versus 1964.the smaller contact area grid. A 5change in impingement angle did not have Discussionany quantifiable effect on shear strength,but this is a relatively small change. A 1.V.Truglio, NavalAirPrpulsionCenter'greased' surface gave lower adhesion. APTFE coating reduced shear strength and Regarding your icing test rig, is there any compensationGRP reduced it further. Liquid water necessary in the generation of liquid droplets due to whatcontent variation had no significant seems like relatively short time between the nozzles andeffect on strength. tunnel exit plane? Also is there any consideration to
The results of investigations were used to humidity effects?validate a fan blade ice accretion and Author:shedding model. For predictive purposes, Investigations (theoretical and experimental) were cardedthe averaged data showed that strength out to determine a minimum distance downstream of thedecreases with total air Smperatureincrease at a rate of -30 kN/m C and the spray grid. A model had to be placed to ensure that themaximum 2ear strength falls at a rate of droplets were as required. A limitation is the physical length-85 kN/m C. of the test cell, but the rig is being refitted with this criterion
a% a design feature.fImidity has been measured but is not a problem due to thetunnel configuration, with heat exchangers drained
The following conclusions may be drawn upstream of the control room and the fact that the entirefrom the work covered, room soaks down to the test temperature.
ii 0
30-1
XODELISATION )NXRIQUE DR L'ZVOLUTION D'UN NUAGE DRGOUTTELITTES DORAU IN BUION DAMS UN CAISSON GIVRAIIT
CREISHEAS paul et COUR14UET JoelD.G.A. O.N.E.R.A./C.E.R.T.C.E.Pr. Saclay 2 Avenue Edouard BELIN b.p. 402591481 ORSAY-CEDEX 31055 TOULOUSE-CEDEX
UI~D Dans un caisson de givrage,Depuis peu, Is C.E.Pr. a l'injection se fait en prdmdlange
developpd pour ses bosoins et en amont de la maquette dans und'dssais en givrage un outil de soucis d'homogdnditi.Cependant, !acalcul qui lui pormet de prdd,-e distance s~parant la naissance dul'4volution de goutelsftes d'e.~u nuage et l'impact sur is maquettoen surfusion dane un dcoulement 6tant de l'ordre de 4 A 5 m, iid'air froid. peut se produire une modification
du D.V.14. du nuage par effet
(Moddlisridicti et Auise d
industriel. douinPr faire, iideviant n~cessaire de moddliser is
Af in de confronter esplus coaplhtement possible leardsultats numdriquesons pa changes thsrmiques entre la phaseM.A.GI.C. avec de u assr liquids et is phase gazeuse, enphysiques, une analyse a dt6 mende peate opelhgo~rsen prenant pour r6fdrence desrdsultats de granulomdtrie sur un Le cods num6rique M.A.GI.C.spray de gouttelettes dans uns (Moddlisation et Analyse dusoufflerie do laboratoirs. Glvrags en Caisson) a tit:-or
dans ce but au C.E.Pr..Le r~sultat de laEtndnnele
confrontation s'est av~rd tr~s nEttdndes ips u leasati sfaisant.inettdsqipet u le
diffdrents coefficients d'dchangeARM,=liquide/vapeur, ii s'est avdr6
n~cessaire do confronter lesSince a few time C.E.Pr. has r~sultats numdriques h desdeveloped a computation tool rdsultats exp~rimentaux.
for its own icing tests needs. A nte cnasac, iThis tool allowed the n'existe pas dans is litt~rature
prediction of supercooled droplets de rdsultats do mesursevolution in a cold air flow. exp~rimentaux d' 6volution de
diaa&tre do gouttelettes d'eauThis program is named faisant intervenir l'hygromdtrie.
M.A.GI.C. and has qualities of Cette constatation nous astability ans adaptability amen6 h concevoir un montageexpected fcr an induatrial expdrimental et. & rdaliser uneprogram. s~rie de assures portant sur le
spectre do diaabtre d'un nuage etIn oder to compare numerical sur ls diambtre volumique mddian.
results from H.A.GI.C. to physicalmeasurements, an analysis based on Loa rdsultats do cez mesuresgranulometry mesurement ont pu 6tre directement compards &concerning droplets inside a ceux du calculs nuadriques dulaboratory wind tunnel Is codes M.A.GI.C., 0*t la comparaisonperformed. slsst avdr6 trhs satisfaisante.
The iasults of the comparison Apr~s avoir prdsentd lesare ver' acceptable. principales caractdristicrues du
cods M.A.GI.C.,nous con~frontons1-I~RODUTIONlos risultats de calcul sur la
miss en vitesse do gouttelettes &Lora do is certification qusiques idsultats issus de laadronautique de matdriels volants bibliographie.en vol givrant siaul6, ii eatindispensable do respecter les Dana Is paragraphs suivant,normes do simulations 6dit4cs par nous introduinons l'environnementl'organisme certificateur [1]. exp6rimental gui a permis les
assures, et nous coaparons ces
C~qs nornes permettent do rdsultats A ceux de M.A.GX.C..4' calculer 2~s diffdrents parametresnicessaires & l'sx~cution dewossais do givrage (2], et. en dl ti! M jjj & j4particulier is diambl-.re volumique Cisn
:jmddianduunuage grant.
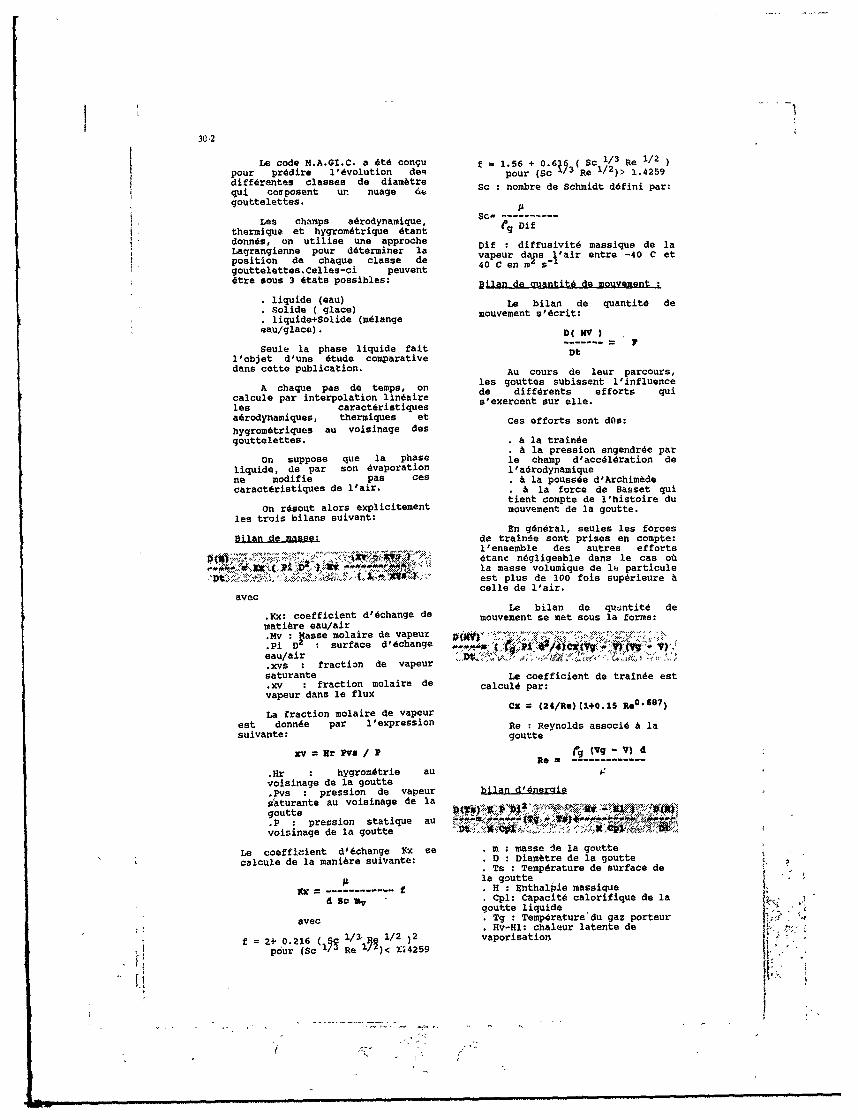
30-2
Le code H.A.GI.C. a 6td coflqu f 1.56 + 0.6w(S 1/3 Re 1/2pour prddire l'6volution deq pour (Sc 1/3(Re 1/2)> 1.4259diffdrentes classes de diamatre
gui orpment uz- nuae ~Sc :nombre de Schmidt d6fini per:
gouttelettes.
Les champs adrodynamique, C------
thermigue et hygromdtrique dtant egDifdonn6s, on utilise tine approche Df:dfuii4ssiu eiLagrangienne pour d~terminer lais:dffsvt asiu el
position de chague clasme e vapeur da-km J'air eritre, -40 C etgouttelettes.Celles-ci peuvent40Ce B
6tre sous 3 dtats possibles: Bilan do qupntitj do mouvement
liqolids (egac) Le bilan de, guantitd desliud+s ( lace)(~a mouvement s'4crit:
eati/glace). D( KV)
Soule la phase liquids fait---l'objet d'une 6tude comparative Otdans cette publication. Au cours de leur parcours,
A chquepas e tmpsles gouttem subissent l'influenceA heu pm detmponl de diffdrents efforts gui
caicule par interpolation linaireles caract~ristiques s'exercent sur shle.
adrodynamiques, theraiques et Ces efforts sont dfle:hygromdtriques au voisinags desgouttelettes. la i traine
a pression engendr6e par
On suppose gus ls phase ls champ d'accdl6ration deliquids, do par son dvaporation l'adrodynamiquene modifie pae cem a poussde d'Archimbdecaractdrietiquem de l'air. & la force do Basset gui
tient compte de, 1'histoire duOn rdsout alars explicitement, mouvemsn. de la goutte.
les trois bilans suivant:En gdndral, seules les forces
Bilan de mase: de traindesmont prises en compte:l'ensemble des autres efforts
An" 6tane nagligeable dans Ie cam oftla masse volumique de li, particule
*~D1%~~. ~est plus de 100 fois supdrieure &aveccells de l'air.
.Kx:coeficent 16cang deLe bilan de qutintitd de
.Kx:br oeff/icin 'chne mouvement me met sous is forms:
.Mv : asse molaire, de vapeur VOMP Dr : surface d16changeeau/air V?.xvs : fraction de vapeursaturants Le coefficient de trainde est.xv :fraction molaire de calculd par:vapeur dane le flux
La fraction molaire de vaeur C 2/e(+.5R067
est donn~e par l1expressionlR enlsasc6aisuivnts:goutte
xv U r Pvs / P Re=fg (Vg -V) d
.Hr : hygromdtrie suvoisinage de is goutte.Pvs : pression de vapeur bilan d'4nerciesa'turants su voisinage de la,
.P :pression statigue auso ...
voisinage de ia goutte
Le coefficient d'6change 1Xx me *m : wasse Is is gouttecalcule de is manibre suivanto: .D : Diaabtre de, la goutte
*Tms Temp6rature de surface deha goutte msiu
NX f~ ~~ H : Ehthal~l msse u
d So av - .Cpl: Capacitd calorifigue de isgoutte liquide
1/2 fly-Hig: chp~aeurhened[avec g: mprtr'du gaz porteur
f 2+ 0.216 ( c R 2vaporisationpour (Sc / Re 1 < :;4259

LUCOIX..I..Nous prdsentons dana les
figure 3-2-2 et 3-2-3 une
3-. .ain u oefiiet ecomparaison entre ia mise entrat~ X.A.GI.C., avec celles donndes par
viese dnes gotes7)cs aUne expression generals du e ~deca(]
coefficient de train~e peut se Les conditions initiales sontmettre sous in forme (2]: presentes dana le tableau
Cx-f(Re,We,Sc,Pr,B) siat
Re : nombre de reynolds gui vtaed 'icaract6rise le regime de la (rn/a)e 1001goutte. -------
We : nombre de Weber gui identifie vitss intill'influence de in deformation dedeguts(/) 0la goutte.
On observe qus l'allure desBe et Pr :respectivement nombre courben eat conasrvde, mainde Schmidt et nombre de Prandt qui M.A '1I.C. a tendance & souscaractdrias lea echnnges massiques eatimer nettement la mise enpar convection ou diffusion, ainsi vitesso des gouttes par rapportque lea dchanges thermigues au aux rdaultata de (7].voisinage de la gouttelette, danais film de vapeur gui l'entoure. Ii xeste deiicat d'avancer
une c'use, la loi de mine enB : nombre de Spald~ing gui vitskis ues goutten dana (7]caracteriae i'intensite du flux n'etant paa prdcise.nassigue.
La discussion prdcedenteCompte tenu de in difficult6 sst portdes aur des resultats de
de trouver de telles correlations, calculs: la reference (9] va nounon suppose gue Cx=f(Re), et maigr6 permettre une comparaison avec descette simplification, de mesures expdrimentals parnombreuses lois existent (3], (4), andmometrie laser.(5], (6].
Lea conditions initales sontNoun en donnons guelgue les suivantes:
examples:
Cx = 24/Re loi do Stokes vitesas de i'nir
din- (24/Re) (l+R*2/3/E) (5] (/)4
vitesse initialsCz = (28/Re0*8 5)+0.48 (6] des gouttes (n/n) 0
Cx = 24/Re pour Re <0.48 [6] temperature deCX = 27/RUoo8.21? [0.481781 (6] l'air ( X ) ambdX = .271 Re pour Re > 78 --------- --
(6]taille des 38.8gouttes---
CZ = 0.32 + 24/Re + 4.4/ Re [3] ( Um 48.8
K.A..0X.C. 58.8Cx = (24/Re) (1+0.lI5R* 0 '6 S7
-------------
Len differentes formulation Noun prdsentons leamontreprssntea ous orme decomparaisons entre i'experience et
courbes aur la figure 3-2-1. Is caicul par M.A.GI.C. sur leafigures 3-2-4 pour chague dinm~tre
On constate ina bonne de goutte dnonce dana in tableauconcordance existant entre lea ci-dessus.courbes, exception faite de cells .correspondant & in ioi di Stokes, La conparainon slavbregui Be detache nettement den satinfainante, l'allure denautres et gui noun entime in force courbes obtenues par le caiculde trainde. suit assez bien lea rdnultats
3-2 confrontation wyec e dosrmet~x* raulatsGe n bbligrabieCependant, on notern gus dana
cc cas M.A.GI.C. a une tendanceaN..oun avons s6iectionnd deux surestimer I& mine en vitesse des
publications [7],[9] qui nouspermettent de nituer len rdsultats gutlte a aprobtenus par M.A.GI.C. pr apotI'expdrience.& des rdsuitats de caicuin et &den r~sUltats de mesure. 33snho
La ioi de caicul do in

30-4
trainde arodynamique des gouttes 1e spray ont termind leur rdgimoutilisde dans M4.A. GI. C. nous de miss en vitesse.permet de soutenir line comparaisonavec des rdsultats issus de *Une deuxibme mesure demesure [9] granulomdtrie est rdalisde & une
distance suffisante pour qu'il yMais cette confrontation ait dvolution notable du diambtre
semble montrcr que l'on peut des gouttes, mais que I'effet deslattendre A une surestimation de la pesanteur puisse Atre c'rnsiddrdla miss en vitesse des comme ndgligeablc.gouttelettes de la part de
4-CHM.A.GION 4-1-1CYconditionsZ
GOUTTEETTZ8,les conditionsj sarodynamique montkL~gjjt2 ju!jj~gen~l~ 4erdsumaes deais 1e tableau ci-amr. "'2. LUMdessous.
Pour disposer d'un outil -------------numdrique capable de prddire I vitesme do 1 13.5 1l'6volution des diffdrentes I 1'4coulement I Iclasses de diambtres de gouttes I i/s IccosLosant un nuago, il est----------------------------- In~cessaire de forsiuler une I hygromdtrie 1 33 Imiddlisation des dchanges %I& Itheriiues ontre lea phases 1 38.2 1liquides et gazeuses gui moit I------------------------satisfaisanto. I taux I
1do turbulence I1L'&volution du diambtre d'une I %I
gouttelette com~osant ls nuage est I ------------------------fonction de nombreux facteurs.Nous I distance I Ipouvons citer par exemple, la Ide l'injecteur 1tempdrature do la gouttelotte, I ncells du fluide porteur ou encore I memure 1 1 0.25 Ila quantitd do vapour d'eau dans I mesure 2 I 1.95l'4coulenent, quantitd gui est 1mesurde par l'hygrosiatrio. -------------
L'expdrience qualitative Les mesurem ont eu lieu dansacquise au C.E.Pr. dans les bancs la soufflerie S2 de l'I.A.T. do Stde simulation do vols givrant a CYR gui nWest pas dquip~e d'untendance A montrer quo sur les sysmtie de contrdle dodistances d'utilisation du nuage l'hygrom~trie.givrant, ( 4 A 5 in), l'hygromatriea une influence pr~ponddrante sur Il 5'51Isuit quo 1'hygrom~triel'4vaporation des gouttes. mesurds est cells gui a dtfi
imposdes par los conditionsNotre recherche dans la mdtdorologiques pendant touts la
littdrature pour collector des durde do la campagno do mesurem.rdsultats do momuros portant surl'6volution do diambtres do 4-1-3 Conditio dfinpoctiongouttes en fonction do ot granulomitri A $gab o1'hygroinatrie s'est avdzd vaine. z--0.25
Uno campagno do inesurss a Los spray mur lequol a L~ddonc dtA rdalisee a l'I.A.T. do St rdalisde los mesurom doCYR, sous contrat C.E.Pr. [10), granulomdtrie a dtd obtonu Adont l'un des buts dtait de mettre l'aide d'un injocteur pnoumatiqueen Avidence l'aspect dchange du C.E.Pr. (10] ot figurs 4-1-3-1.thoninique gouttelettos/air parl'intermddiare de' iesures Les mesures de granulondtrie
granuozdtrques.proprement dites - r~partitiongrnuo~tiue.massique des goutelettos en
Af in de mettrs enI dvidence classes de diam~tres et Diambtrecot aspect transfert thoniniqus Volumique !44dian - mont issues do
sans que d'mutre param~tres inemures par "k.IALVERN't .
viennent perturbar lee inesures,celle-ci ont dtd rdalisdes dans Les diffdrents D.V.II. me3urdsle. conditions suivantes: dans le nuage sont rdaiisds par
variation de la porte do charge du*LG champ de vitamins do la circuit d'air d'llicntation dG
phase gazsuge a dt6 choisi l'injecteur pnoumatique.uniforms et trbm pau turbulent.
Le tableau suivant rdsune les*Une premi~rs inssure do diffdrentes valeurs do la perts do
granulomatrie est rdalisde A une charge - IS P - et les D.V.M.distance do l'injecteur corrospondant.pneuinatique ou les gouttes formantDuatots acapgod
Duran toue la ampane d

30-5
mesure, le debit d'eau de classes do diambtre sup~rieur &50l'injecteur est constant A une pUm.valeur de 4 1/h, valour quicorrespond & un point de 4-3-2 cosnazaison ostrIIfonctionnement. courant en essai de ].VM
givrage.Les rdsultats sont portds surla figure 4-3-2-1
Icharge II On note une bonneI ( Bar ) I ( AM ) I coiencidenco pour des D.V.M.
I------------------Isupdrieur & 20 pm.-- 0.67 - - -I - 17.72 -- I-----------------------I En revanche M.A.GI.C. semble1 0.46 1 23.68 I sous estimer Il'volution des trbs
SI faibles D.V.M..-- 0.29 -- - -I- -31-.32- -
---------------------
Du point do vue expdrimental,Ces quatre valeurs de D.V.M. Ia mesure de l'hygromdtrie restA
couvrent la gamme do diambtres gui toujours sousise h une grandseat demandds en essi de givrage incertitude.
C'est pourquoi i1 nous a paru4-2 Conditions 4M ellolul pour interressant d'6valuer, d'une
ISAIR19Afaqon puremont numdriqueIlinfluence do ce parambtro sur
Les conditions a~rodynasziques l'&volation du D.V.M. d'un spray.prises pour M.A.GI.C sont cellos Los conditions du paragraphsreproduites mu cours de la 4-2 ont dt6 reprises & l'exceptioncampagno do mesure dane la de 1'hygromdtrio.soufflerie do l'I.A.T. (10].
Les rdsultats sont pr4sentdsis on suppose qu'a l'abscisse do sur los courbes de ls figure 4-4-1la prsmibre mesuro de pour los valeurs d'hygrosatrie
granumomdtrio ( X-0.25 Tq ) ,105 suivantes :20%, 30%, 40%, 50%,gouttelettes ont fini lour phase 60%.do miss en vitesse: oncons6quencs, is vitesse initials Cola souligno l'importance dedes gouttelottes dane M.A.GI.C. l'hygromdtrie dane is pr6dictionest cells do l'adrodynamique. do l'6volution d'un nuago givrant.
Los conditions adrodynamiquos Cs phd,iombne Lestsont prises conetantos au cours du particulibrement. sensible dens 1stemps & une valour do 37%. cas do faibles D.V.H..
La rapartition massique enclasse do diambtros correspond&coils meeurdo dens Is souffleries L'ensemble des lois&. l'abscisse x-0.25 m, at st d'4changes thormiquos etdonnde dans los tab]-)aux de la dynamiqubs do M.A.GI.C. permetfigure 4-2-1. d'obtonir sur des m~langes eau/air
1-29 fgio sul& des r~sultats r~alises.
L~lL1WLfALors de campagno docertification do satdrial
La confrontation des mesures adronautique en Vol simuld:,t du calcul so fait pour une givrant, 1e C.E.Pr. est tenu deabscissa do x-1.95 m. respecter des conditions da D.V.M.
Hous prdsentonis une synth~se do pius en pius pr~cises
portant d'uns part eur une Ii est ddsormaie possible,&comparaison dm5s3es pax classes et I'aide do M.A.GI.C. d'4"aiuerd'autre pert sur 1e comportemont. l'&cart do D.V.M. entreglobal du spray, idontif id par son 1i'njsction ot is maquotte en
D..1. ssai, donc d'apportsrd'4ventuolles corrections cur lee
4-3-1 9sparaison lassel oar parambtrs 11injection pourclASS*Sobtenir 10 D.V.M. nominal
Nous presentons sur lee D'autrs part, par cottofigures 4-3-1-1 & 4-3-1-4 uno prcL lgagen, i scomparaison graphique ontre lee envi agrang enn~e ie etrdsultats expdrimentauc at I cosp% rtement dynamique descalcul.*e ssv~aebo d ~emnr ldit-Arsntes classes de gouttes au
On cn~tas ue grndsvoisinago d'un obstacle.cth~rence entro calcul et Cl emt ddaur Iexpdrience.Copendant, M.A.GI.C. Co.. l persetat dvaur 1a
fsous estime l'&volution desOVM ~l ipa~at sr

V
30-7
w
1.00
S0.75
i{ 0.50
0.25
.000. 050. 100. 150. 200,.250. 300. 35
ABSCISSE EN mm
fio3--
figlure. 3-2-2 at 3-2-3: Riseon vito... pour don goUtte. dodiaM&trO 5, 10, 2), 50, 100,500 ;Lm.
C5 2
0<
00
0
0t 0r 0 0 0 * +
S/W N3 3SS3J.IA
lol doemine en viteusecom;raion exp6rience [9) / alciul
d gnu
acbh *ia d'un injeoteur pneumatique
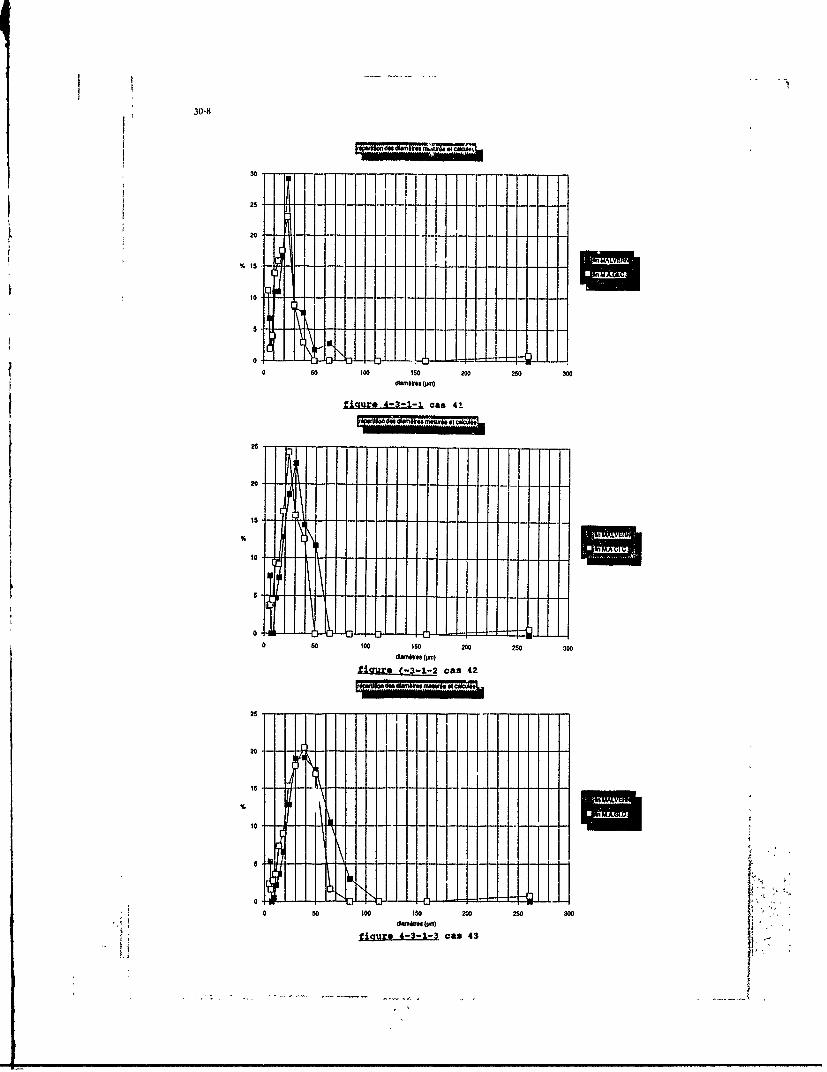
30-8
30
25
t 20
% 15
10
00 so 100 ISO 200 220 300
fiSMX* 4-3-1-1 --Cag 4!
20
10
%
figre -3-.-cas 42
25
10O1
X10
0 50 too Iso 20 200 300
fIcur 4-3-1-3 cas 43 ~-

30-9
25
Is P N IIIi1 ~
0.
0 50 too I so 200 250 300d an,10s p1 )
fLgure A-3-1-4 CaS 44
tableau 4-3-2.1
Pnfluence do I'hygrom6trlo sur Is diamifo
353 hg.20%
Q,.M, 25 [ hg - 30%
20 *hg 40%
i hg - 50%10
0.1 02 0.2 0.3 0.3 0.4 04 05 05 0.6 0.6 07 -hg -60%
5 5 5 5 5 5
Doate do cham A I' nlctour
figure 4-4-1
i i

30-10
30-10 2. T. Sutton, BAe
D.Jiscussion Is there any typical explanation in your table 4.3.2.1 why theerror is least at a medium diameter?
1. M. Mulero, INTADid you compare the results of your model with other Author.models for similar application? I cannot give you a very cleir answer. There are two
possibilities. First, small diameter droplets do not evaporateAuthor: but behave like solids. MAGIC would assume that they do'Ilypical for the MAGIC code is the use of hygromatic evaporate. Second, I do not know what the validity andparameters. In the literature we did not find any code of this precision of the measurements cone by Moven with smallkind. MVDs was.
II

31-1
ICING TEST CAPABILITIES FOR AIRCRAFT PROPULSION SYSTEMSAT THE ARNOLD ENGINEERING DEVELOPMENT CENTER
C. Scott Bartlett, J. Richird Moore, and Norman S. W)inbergSverdrup Techhilogy, Inc., AED.' Gro,-
I" andTed D. Garretson, U. S. Air Force
Arnold Engineering Development CenterArnold Ai Force Base, TN 37389 (USA)
SUMMARY clouds of supercooled water o,'oplets. Ice accre-tion on these surfaces always results in a degra-
Icing test capabilities for full-scale turbine dation of performance and operational safety.engine propulsion systems have been developed Icing tests can be conducted in an altitude facilityin the Engine Test Facility (ETF) at the Arnold and cover a wide range of Mach numbers,Engineering Development Center (AEDC). The pressure altitudes, and inlet conditions withoutcurrent capability to simulate natural in-flight icing regard to the prevailing outside weather condi-environments includes knowledge and control of tions. Further, the variables which define an icingthe principal factors that govern the mechanics cloud can be accurately controlled and monitoredand thermodynamics of icing, namely, water during tests in altitude test facilities. The use ofdroplet size distribution, liquid water content, the altitude icing test facility has become ancloud temperature, pressure, and propulsion acceptable approach for evaluation and quali-system airflow rates. The AEDC facilities provide fication of aerospace systems for flight into icingthe capability to conduct evaluation tests in either conditions. Icing test facilities have beenthe direct-connect or fPee-let mode. developed at the AEDC/ETF which provide the
capability to simulate icing environments for aThe methods and hardware used to inject wide range of aircraft propulsion systems and
liquid spray into a cold airstream to simulate in- components.flight icing conditions are discussed. The spraymanifold systems and spray injection nozzles INTRODUCTIONcurrently in use at AEDC are described. Themethods used to operate and control the cloud Aircraft engine icing tEaz facilities have beengeneration systems are given. Pulsed-laser and developed at AEDC/ETF to simulate naturalpinhole viewing techniques used to view rotating atmnspheric icing conditions. The facilities haveengine hardware in freeze-frame, and low-light been used to conduct icing tests for military andcameras coupled with fiber-optics used to pene- commercial and domestic and internationaltrate to the inner recess of inlet system to customers. The current capability to provide icingobserve real-time transient icing processes on environments for engine testing includes thesurfaces susceptible to icing are described. Test krfowledge and control of the principal factors thatexperiences in both direct and free-jet connect govern the mechanics and thermodynamics oficing testing are addressed. icing, namely, water droplet size distribution, liquid
water content, cloud temperature, humidity,Recent ice accretion scaling techniques and pressure, and airflow. The AEDC acilities provide
test reiults, and developments and observations the capability of simulating the free-stream icingin clou:l liquid water content and droplet sizing are conditions in either the free-jet or direct-connectbneily discussed. Uses of real-time ice accretion testing modes as illustrated in Figs. 1 and 2.deteclors for facility calibration and test article ice respectively. The direct-cornect testing mode isaccretion rate monitoring are addressed. typically used to conduct engine icing tests. The
free-jet testing mode is used to conduct engine,BACKGROUND inlet/engine combination, component, sensor, and
external surface (wing, empanage, etc.) icingThe formation of ice on aircraft propulsion tests.
system surfaces occurs during flight through
The research reported herein was performed by the Arnold Engineering Development Center(AEDC), Air Force Systems Command. Work and analysis for this research were done by personnelof the Air-Force and personnel of Sverdrup Technology, Inc.,'AEDC Group, operating contractor of theAEDC propulsion test facilities. Further reproduction is authorized to satisfy needs of the U. S.Government.

31-2
SPRAYBARS (CONFIGURATION 1, FIG. 7,t "HEATED TOTAL-TEMPERATURE ANDTOTAL.PRESSURE PROBES
7 BELI.MOUTH -THRUST STAND
AIRFLOW - .TOIENTERING 0 --. " FACILITYE.EIG ,,-•J/ .-- EXHAUSTERS
PLENUM P IIASTRU. ENGINE IN. .. T - - " TURBINE ENGINE INSTALLATION\ ,,, "LABYRIT SEAL
ENGINE INLET DUCT ,- TEST CELL (4 9-P. DIAMETER)FLOW STRAIGHTENER -- HOLOCURAM SYSTEM FOR WATER DROPLET SIZE DETERMINATION
Fig. 1. A direct-connect propulsion engine altitude icing test cell configuration.
HOLOGRAM SYSTEM FOR WATERAIR ATOMIZING WATER SPRAY DROPLET SIZE DETERMINATION 7NOZZLE (CONFIGURATION 2, FIG. 7)7 ,/ -TEST ART!CLE /-TEST CELL
/ FREE-JET NOZZLE /I (3.75-m DIAMETER)/ (2.1-m DIAMETER)/i / ,,.,
il,,,, IV '' ., FLOW/ ..#- T AlT7 l lEXHAUST.RS
INLET DUT / FREE-JET NOZZLE EXIT1.8-m ' /FREE-JET NOZZLE INSERTDIAMETER) '-HEATED 1OTAL-TEMPERATURE AND TOTAL-PRESSURE PROBES
Fig. 2. A free-jet propulsion engine altitude icing test cell configuration.
The natural icing conditions that are typically tions that have been used for the purpose ofsimulated during testing are well known and testing turbojet and turbofan engines for militarydocumented in the "Airworthiness Standards," applications are given in Table 1, Ref. 2.Ref. 1. A summary of the icing conditions is pre-sented graphically in Fig. 3. These airworthiness The icing conditions that exist 'it the enginestandards pertain specifically to ic;ng on external face during actual flight are seldom identical toaerodynamic surfaces and not to engine perform- thobe that exist in the freestream. The air enteringance under icing conditions. Standard icing condi-
1. PRESSURE ALTITUDE RANGE, SEA L'EL TO 6,100 mSURCE OF DATA 2. MAIXIMUM VERTICAL EXTENT, 2,000 m
-3 NACA IN23. HORIZONTAL EXTENT, STANDARD DISTANCE OF 12km-6 0.9 ... '.." '_9 -e .8' SOURCE OF DATA
-12 0. - __.NAA TN 1_55" -5,~ (lASS II.M INTERMITTENT MAXIMUM
-18 0.5 -.0. AIR TEMPERATURE, -
.-20__.3
-27 [ T -0-,'o. = I
-3 SR AT 2x 10 4_0 Is 20 25 30 35 40 45PRESSURE ALTITUDE, m x I Os MEAN EFFECTIVE DROP DIAMETER, m '-C
a. Ambient temperature versus b. Liquid water content versus mean effectiveambient pressure, stratitorm drop diameter, stratiform clouds
clouds Fig. 3. Cloud icing conditions (from Ref. 1).
... .. .

31-3
o , [ NOTE: DASHED LINE INDICTES OT SDASHEXTEND O LINE IT I. PRESSURE ALTITUDE RANGE, 1,200 to 6,700
POSSIBLE ETOF MIS 2. HORIZONTAL EXTENT, STANDARD OF 4.8 kmNACA N 2T 3 0 SMR.E OE DATA
;i - 10 ,NACA TN 1855
;5/ 0 NOTE. DASHED LINES INDICATEX! 20 POSSIBLE EXTENT OF LIMITS'
8 1.5-A IR TEMPERATURE,_ OC-
-30 " ' 'i' " 1.0
20-40 -4~6 8 10 15 20 25 30 35 40 45 50
PRESSURE ALTITUDE, m x 103 MEAN EFFECTIVE DROP DIAMETER, im
c. Ambient temperature versus ambient d. Liquid water content versus mean effectivqpressure, cumuliform clouds drop diameter, cumuliform clouds
Fig. 3. Concluded.
Table 1. Icing Conditions Specififed in the Military Specificationsfor Turbojet and Turbofan Testing (MIL.E-5007D)
1. Sea-Level Anti-Icing Conditions
Attribute Condition I Condition II
Liquid Water Content 1 gm/inm 3 2 gm/m3Atmospheric Air Temperature - 20°C (- 4°F) - S°C (+ 23°F)Flight Velocity Static StaticAltitude Sea Level Sea LevelMean Effective Drop Diameter 15 pm 25 pm
I1. Altitude Anti-Icing Condtions
Attribute Condition I Condition 11
Liquid Water Content 0.5 gm/m3 0.5 gm/m3Atmospheric Air Temperature - 20*C (- 4°F) - 20°C (- 4°F)Flight Velocity (Mach No.) 0.32 0.71Altitutde 6,100 m (20,000 ft) 6.100 m (20,000 ft)Mean Effectiva Drop Diameter 15 pm 15 Jim
the inlet/engine has generally either been liquid water content required to simulate differentaccelerated or decelerated from freestream inlet capture ratios can be estimated (Ref. 4). Aaccording to the flight and inlet Mach number typical plot of the required direct-connect enginematch or capture, as illustrated in Fig. 4, Ref. 3. face liquid water content ratio to the free streamThe level of airflow acceleration or deceleration is liquid water content is shown in Fig. 5 (Ref. 5).a function of the inlet capture ratio as determinedfrom both the flight Mach number and the inlet FACILITY PERFORMANCE CAPABILITIESMach number. Therefore, the inlet/engine icingconditions can be quite different from the free- The facility performance capabilities currentlystream conditions. For free-jet icing testing, the available for icing environment simulation arefree-stream stagnation conditions can be set in summarized in Fig. 6. The meteorological icingthe plenum chamber and the cloud will adjust conditions, Fig. 3, are completely within the direct-itself to enter the propulsion system in a manner connect testing capabilities of the AEDC/ETF forclosely duplicating natural flight. In the direct- engines requiring up to approximately 340 kg/secconnect mode of testina, the proper stagnation maximum sea-level airflow. Engines requiring sea-conditions must be set to account for any losses level airflows greater than 340 kg/sec can bein the installed configuration, and the liquid water tested at increasingly higher altitudes. Many icingcontent must be adjusted according to the inlet problems occur at reduced power settings, hencecapture condition to be simulated. The change in meaningful icing tests can be conducted on
'1.

31-4
9 - MABHMIER 1o0A (lCoss SECTION AREA
FREE STREAM CONDITIONS LWC IID WATER CONTENT MAXIMUM CONTINUOUS INLET PRESSUREM., A., LWK,, FAN BLADES',
COMPRE SSOR SLADES liOS - .- -- AECIE.F F CELL
.AEDCIETF J CELL
COMPRESSOR FACE CONDITIONS - - --- AEOCIETF - AND 0 CELLS-StREAM TUBE ENCLOSING M(, A1, LWC(FTIE AIRFLOW INGESTED, BY THE EqkiNEITEEIN/ -MINIMUM EXHAUST PRESSURE
a. Inlet Mach number less than flight Mach 10 E/H P
number, LWCoo < LWCCF
FREE-STREAM CONDITIONS
M., A., LWC. IAN SLATESCOMPRESSOR BLADES 0
I STREAM TUBE o 10 300 500 700NCLOSING THE AIRFLOW, ko/SEC-- FLOW INGESTED"
BY THE ENGINE CORPOOR FA a. Air supply and exhauster capability.- COMPRESSOR FACE CONDITIONSM", Akf, LWC(F .....- AEDC/ETF - T CELL
b. Inlet Mach number greater than flight Mach r 40 - AED/ETF -J CELL
number, LWCCF < LWCoo , MINIMUM CONTINUOUS
Fig. 4. Schematic showing possible stream tube INLET TEMPERATURE
configure' n for turbof3n icing condi- Rtions (from Ret. 3). -404-- MINIMUM iNLET TEMPERATURE
WITH 5-PERCENT LIQUID AIR INJECTIONSUBSCRIPTS: CF- COMPRESSOR FACE -0I
co - FREESTREAM 0 IO0 300 500 700I 1.6 McF = 0.25, IDLE AIRFLOW, kg/SE(
1.4 POWER b. Estimated inlet air temperature capability
1.2 MCI = 0.50, MILITARY Fig. 6. Facility performance capability.POWER
1.0 Spray nozzle manifolds are used to providethe water droplets for the icing cloud. Typical
0.8 DROPLET DIAMETER (MASS spray manifolds used at AEDC/ETF are shown in0.6 MEDIAN) - 20 um Fig. 7. The water spray nozzles are commercially
,- available, two-fluid atomizers. AEDC currently has0.4 an inventory of ten different air atomizing spray
0 0.2 0.4 0.6 0.8 1.0 nozzles, each offering a unique range of dropletFUGHT MACH NUMBER M. size and water flow rate. The number and position
of the spray nozzles can be varied within theFig. 5. Compressor liquid water content manifold to provide a uniform icing spray distri-
loading factor for two compressor bution at the test section. As illustrated in Figs. 1face Mach numbers. and 2, the icing spray manifold is typically located
in the test cell plenum ;hamber upstream of theengines with maximum airflow requirements test section. This a~'angement allows the spray
greater than the facility capability. As indicated in manion Th e ,rty t allows t sprayFig. 6, the low-temperature portion of the manifold the flexihlity to be adapted to different
meteorological conditions can be achieved with propulsion sy.',m installations without major
the addition of liquid air to the inlet air; however, modificatior, . Both the air and demineralized
this technique Itas not been required at AEDC for water, delivered through an all stainless steelplumbing, pump, and storage system, and furnished
icing tests. The facility performance capablities to the spray manifold, are filtered and heated tofor free-jet testing are identical to those shown in temperatures near 10000 to prevent freezing inFig. 6. However, the size of the engines that canbe tested in a free-jet - mode is significantly the spray nozzles during testing (Ref. 6).reduced since substantial airflow must spill The liquid water content of the cloud repre-around the engine to ensure adequate flight flow-field simulation. The future addition of an icingthe amount iquid waer n the atmo-fied smultao, Te ftue aditon f a icng sphere and is typically expressed in terms of
capability to the new ETF C-side test cells, with gra s ypiaater se i ter of
* larger conditioned airflow cppacity, will expand the grams of liquid water-per cubic meter of air. TheAEDC icing test capability, liquid water content of clouds varies greatly with
-' cloud type and atmospheric conditions. The
ZAV

31-5
OILLMOUTH f9,MIER NOZZLE PLUG LOCATIONSPRAY NOZZLE MP I -I - SPRAYBAR STRUT (TYP)
SPAYW BA, r .,-.-- i / SUPPORT
SPRAY NOZZLE LOCA ION CONFIGURATION 2CONFIGURATION 1
Fig. 7. Water spray manifold systems.droplet size spectrum is generally characterized The amount of spray water injected into theby the droplet mass median diameter. The mass flow field to obtain the specified liquid watermedian diameter represents the droplet size for content is analytically determined. The liquid waterwhich half of the total water mass is contained content is specified as a test condition and theabove and below that diameter. The liquid water amount of water evaporated as the cloud travelscontent and droplet size are controlled by varying from injection to the test section of the test cell isthe water flow rate and atomizing air pressure to determined analytically from a mathematical modelthe spray manifold. The size and number of the (Ref. 3). By measuring the airflow and injectedspray nozzles selected can be tailored to a water flow rate precisely, the desired liquid waterparticular engine installation. Liquid water contents content at the test section is accurately set andup to above 3.9 grams per cubic meter have been maintained.obtained at AEDC with spray nozzles calibratedfor mass median droplet diameter from 15 to 35 The uniformity of the icing cloud is gauged formicrons, demonstrating the ability to cover a each unique installation by evaluating thebroad range of expected natural icing conditions. uniformity of ice accreted on a calibration grid
positioned in the test section prior to test articleAn extensive computationdi fluid dynamics installation. This time-honored technique has been
(CFD) capability exists at AEDC/ETF (Ref. 7). A automated at AEDC by application of piezo-full three-dimensional Navier-Stokes flow-field electric transducers operating in the ultrasonicsolver is used to evaluate the aerodynamic fidelity frequency range (Rel 8). An array of theof icing test installations, and i's use is especially "ultrasonic" transducers is integrated into aimportant to ensure the natural flight flow field is calibration grid, and the thickness of ice accretedadequately simulated during free-iet icing tests. A on the transducer is calculated from the signalfull three-dimensional, two-phase ii'. code is received by a dedicated signal processing systemavailable to help predict droplet trajectories during remotely located from the test cell. Thisicing testing. This code is used in spray nozzle automation of the calibration grid technique forpositioning to ensure the most uniform spray cloud uniformly assessment greatly reduces timecloud possible is available during testing, expended for icing test preparation.
Icing Test Techniques at AEDC/ETF The spray nozzles used in the spray manifoldsystem are calibrated to determire the water
The technique used at AEDC/ETF to produce droplet size production and the controi parametersan icing cloud is to inject a continuous stream of necessary to obtain the specified droplet size. Thewater droplets into a cold airstream directed at the calibration data are obtained in the ADC/ETFengine. Injection of the water spray is accom- icing research test cell, RID. Researchers cu!!ctplished in the low-velocity region of the test cell droplet size and size spectrum data with a laser-upstream of the iestceil bellmuuth. The injected based imaging technique. Calibration datawater droplets ire accelerated to near the air currently exist for ten different air atomizing sprayspeed by aerodynamic forces, and through heat nozzles capable of meeting a wide range ofand mass transfer, the droplets reach the air specified conditions.temperature in a supercooled liquid state (Ref. 3).
-. ---- ,. .. ... ....
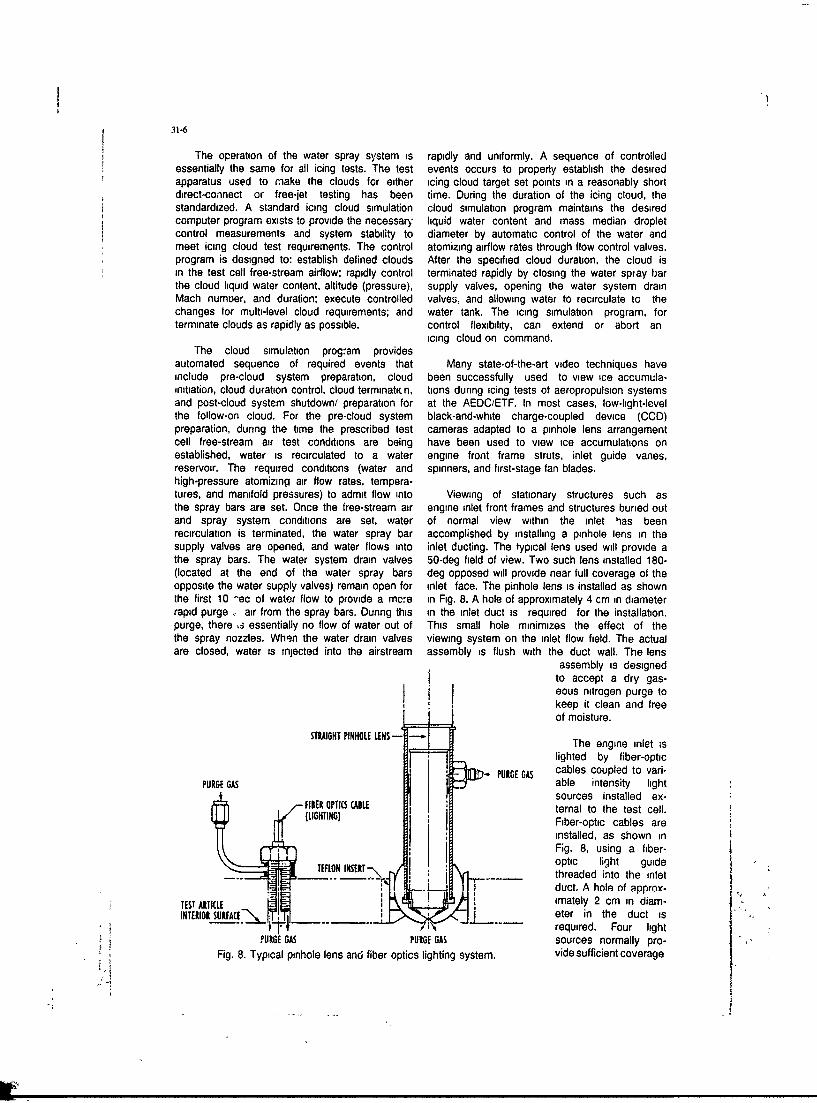
31-6
The operation of the water spray system is rapidly and uniformly. A sequence of controlledessentially the same for all icing tests. The test events occurs to properly establish the desiredapparatus used to make the clouds for either icing cloud target set points in a reasonably shortdirect-connect or free-jet testing has been time. During the duration of the icing cloud, thestandardized. A standard icing cloud simulation cloud simulation program maintains the desiredcomputer program exists to provide the necessary liquid water content and mass median dropletcontrol measurements and system stability to diameter by automatic control of the water andmeet icing cloud test requirements. The control atomizing airflow rates through flow control valves.program is designed to: establish defined clouds After the specified cloud duration, the cloud isin the test cell free-stream airflow; rapidly control terminated rapidly by closing the water spray barthe cloud liquid water content, altitude (pressure), supply valves, opening the water system drainMach numoer, and duration; execute controlled valves, and allowing water to recirculate to thechanges tor multi-level cloud requirements; and water tank. The icing simulation program, forterminate clouds as rapidly as possible. control flexibility, can extend or abort an
icing cloud on command.The cloud simulation program provides
automated sequence of required events that Many state-of-the-art video techniques haveinclude pre-cloud system preparation, cloud been successfully used to view ice accumula-initiation, cloud duration control, cloud terminaticn, tions during icing tests of aeropropulsion systemsand post-cloud system shutdown/ preparation for at the AEDC/ETF. In most cases, low-light-levelthe follow-on cloud. For the pre-cloud system black-and-white charge-coupled device (CCD)preparation, during the time the prescribed test cameras adapted to a pinhole lens arrangementcell free-stream air test conditions are being have been used to view ice accumulations onestablished, water is recirculated to a water engine front frame struts, inlet guide vanes,reservoir. The required conditions (water and spinners, and first-stage fan blades.high-pressure atomizing air flow rates, tempera-tures, and manifold pressures) to admit flow into Viewing of stationary structures such asthe spray bars are set. Once the free-stream air engine inlet front frames and structures buried outand spray system conditions are set, water of normal view within the inlet has beenrecirculation is terminated, the water spray bar accomplished by installing a pinhole lens in thesupply valves are opened, and water flows into inlet ducting. The typical lens used will provide athe spray bars. The water system drain valves 50-deg field of view. Two such lens installed 180-(located at the end of the water spray bars deg opposed will provide near full coverage of theopposite the water supply valves) remain open for inlet face. The pinhole lens is installed as shownthe first 10 -ec of water flow to provide a mc.e in Fig. 8. A hole of approximately 4 cm in diameterrapid purge , air from the spray bars. During this in the inlet duct is required for the installation.purge, there ,s essentially no flow of water out of This small hole minimizes the effect of thethe spray nozzles. Wh,3n the water drain valves viewing system on the inlet flow field. The actualare closed, water is injected into the airstream assembly is flush with the duct wall. The lens
assembly is designedto accept a dry gas-
I eous nitrogen purge tokeep it clean and freeof moisture.
STRAIGHT PINHOLE LENS- The engine inlet is
lighted by fiber-optic
- PURGE GAS cables coupled to vari-PURGE GAS able intensity light
sources installed ex-FIBER OPTICS CABLE ternal to the test cell.
Fiber-optic cables areinstalled, as shown in
., " F;g . 8, using a fiber-optic light guideTEFLON INSERP\ threaded into the inlet
. I duct. A hnle of approy-TEST R11(L , imately 2 cm in diam- -INTERIOR SURFACE- eter in the duct is
I" - I required. Four light
PURGE GAS PURGE GAS sources normally pro-Fig. 8. Typical pinhole lens and fiber optics lighting system. vide sufficient coverage

31-7
for inlet ducts in the 1-m-diam class. The variable conducted at AEDC to provide the technologyintensity light source is useful in adjusting the light advancements necessary to improve the ability tolevel for maximum performance from the low-light- perform aerospace propulsion system icing tests.level cameras. A dry gaseous nitrogen purge As a part of the icing test technology developmentkeeps the optics clean and moisture free. program, an icing research test cell was con-
structed in 1975. The cell, Test Cell R-1D, wasSuccessful viewing of ice accumulation on modified in 1986 to provide a larger free-jet nozzle
rtting fan blades has been accomplished by area. The cell can be used in either a 30.5-cm orusing a laser system as a light source (Fig. 9). 46-cm-diam free-jet mode. The test cell, alsoLaser light is routed to the engine inlet through a capable of direct-connect icing testing, matchessingle coherent fiber-optic cable which can be many of the features of the larger AEDC icing testattached to the inlet duct in the same manner as cells and provides a capability to simulate icingdescnbed above. Coherent fibers are used to environments similar to the larger test cells.minimize the light loss within the cable itself. Thefiber-optic cable ends in a lens assembly designed The ultrasonic ice thickness measurementto spread the beam to the proper dimensions at technique is one of the recent developmentsthe inlet face. The laser light system provides a resulting from the continuing icing test techniquefrequency-controlled light source which can be technology development program at AEDC. Othersynchronized with the rotational speed of the fan current areas under technology developmentto provide stop-action viewing of ice accumulation include ice scaling methods, real-time nonintrusiveand evidence of shedding on individual fan blades. cloud liquid water content uniformity measure-With proper camera alignment, focusing, and ment, and icing cloud simulation requirements.careful mismatch of light source and fan speedsynchronization, views through the rotating fan The work in icing scaling is being conducted,blades to the accumulations on the stator in concert with other U.S Government agencies,assemblies just downstream of the fan have been to ease the restrictive nature of the scaling lawsobtained. currently used at AEDC. Figure 10 illustrates
successful scaling results obtained at AEDC (Ref.FLOW STRAIGHTENERS -VIDEO CAMERA 9).
/ SPRAYBAS CAMERA FIELDBELL OJYH O VIEW The cloud liquid water content uniformity
measurement effort is aimed at developingLASER LIGHT electro-optical d:agnostics to replace the piezo-
FLOW d ILWMINATION electric transducer-equipped calibration grids. Thecurrent approach under consideration is to use a
TUBINE ENGINE fluorescent dye in the water, excite the dropletsIG/ tNSTALLATION with a light source, and correlate the liquid water
eSTROBED USER, FREQUENCY cuntent uniformity with the uniformity of theAND DURATION CONTROLLED intensity of light scattered by the water droplets.
Fig. 9. Typical strobed laser viewing system The work in icing cloud simulation is directedschematic. towards gaining an undarstanding of the influence
The piezo-electric ultrasonic M-'--ice thickness transducers men- FULL-SCALE GLAZE ICE MIXED, RIME.lioned earlier can be flush AIRFOIL CONDITIONS FUL-CALE ,GLAZE, IEmounted to provide an Ice AIREOIL CONDITIONSaccretion thickness measuring 8.3 CM 6.1 (Msystem for many test articles. Themeasuring system provides theL Icap3bility to measure ice thick- 3 C-4 -5.8CM-ness and growth rate in near realtime. A hot wax technique is 1/3.S(ALEroutinely used to produce wax AIRFOIL ACRLEmolds to document complete ice 2.3 CM A 8OIaccretion shape and surface I1.8.MI
characteristics. This documen-taton is benficia: for post-test 1t.analysis of the ice accretions. r-l. -Cmi C
A continuing icing test tech- Fig. 10. Ice shape scaling results, test article size, fullnology development program is and 1/3-scale (from Ref. 9).

31-8
of icing parameter uncertainties in the validity of The AEDC/ETF icing test facilities allow test,icing test results. The efforts to date are reported evaluation, and qualification of full flight systemsin Ref. 10. The work indicates which icing condi- as well as subsystems or components. The capa-tion uncertainties are most influential in altering bility to expose subsystems or components totest results. A typical result of the work, shown in icing conditions is particularly important in theFig. 11, illustrates the impact of droplet sizing system design process, since it allows designuncertainty on ice accretion test results. concepts to be evaluated prior to committing
resources to full system development. The AEDCo.1 icing research test cell (R-1D) described earlier is
particularly well suited for subsystem orcomponent design evaluation. Because of its
00 '-small size, it can be operated more economicallySrCd - 0.0% E 0 022 DATA IROM NAO T 803556 than the larger test cells. Once component or
0i subsystem icing evaluations are complete,AEDC/ETF icing facilities are capable of
006 Q2,21.0 (HORDAIRFOIL t'onducting full-scale engine/inlet compatibilityANGLE Of ATTACK - 4* icing tests.AMIINT TEMPERATURE . -IOCMASS MEDIAN DROPLET OIAM:TER - 20 ,m
S04 LIU.IM WATER CONTENT - 13 Vdms Altitude test facilities such as those at AEDCVELOCITY - So rnSEC offer a safe and economical method for environ-TEST 1 4DURTIO -480 SEC mental icing testing. In these facilities, control
"GUM IM11.-000802 -0 over the pertinent flow variables such as tempera-02 .J i ture, pressure, liquid water content, droplet size,
m 20 ± 5 ASSUMED UNCERTAINTY and Mach number can readily be achieved. Theicing clouds produced in the icing test cells
[ 20 3 closely simulate those found in nature. Many30S MN Dsuccessful icing evaluations have been conducted
at AEDC, and an experience base exists to con-Fig. 11. Effect of uncertainty of mass median duct accurate and closely controlled icing tests.
droplet diameter on the iced airfoildrag coefficient uncertainty. REFERENCES
SUMMARY 1. "Airworthiness Standards: Transport Category
The icing test capabilities available at Airplanes: Appendix C." Federal Aviation
AEDC/ETF have been successfully used during Regulations, Part 25, Federal Aviation
the evaluation of many aircraft propulsion systems Administration.and components. Many tests have been con-ducted in both the free-jet and direct-connect test 2. Military Specifications for Turbojet and
modes. The testing has been conducted for inlet Turbofan Testing. MIL-E-5007D, 1973,systems, engines, and external flow surfaces suchas full-scale cockpit, empamage, and wing sec- 3. Willbanks, C. E. and Schulz, R. J., "Analyticaltions. Icing evaluations have been conducted at Study of Icing Simulation for Turbine EnginesAEDC during various stages of aircraft propulsion in Altitude Test Cells." AEDC-TR-73-144 (AD-system developmental programs over a wide 770069), November 1973.range of conditions as shown below: 4. Pfeifer, G. D. ano Maier, G. P., "Engineering
* Free jet Summary of Power Plant Icing Technical
- Bell helicopter inlet/engine Range Tested at Data.' FAA-RD-77-76, July 1977.
-ALCM AEDC 5. Bartlett, C. S., "Icing Scaling Considerations- GLCM Mach: 0.1 - 0.8 for Aircraft Engine Testing." AIAA-88-0202,- Various full scale inlets Alt: SL -* 9 km January 1988.- Inlet guide vane sectors Temp: -29 - 50C-Icing sensors Size: 0.5 - 2.4 m 6. Marek, C. J. and Bartlett, C. S., "Stability
-Full scale components diam Relationship for Water Droplet Crystallizationwith the NASA Lewis Icing Spray Nozzle."
* Direct Connect DM: 15 -4 35 iim AIAA-88-0289, January 1986.-F110 LWC: 0.2 - 3.9-F101 gm/im3 7. Phares, W. J., Cooper, G. K., Swafford, T.- TF39 W., and Jones, R. R., "Application of Compu-S- F109 tational Fluid Dynamics to Test Facility and
F19i

31-9
Expe~iment Design." AIAA-86-1733, June 3. V. Garratt, RAE
1986. Do you apply any corrections for the modification of a) theILWC, and b) the droplet spectrum by impingement of the
Time droplets on the bell mouth entry? The larger droplets wille r nt ue tend to hit and coalesce. The incidents of these larger
Ultrasonict ofIeGrwhDuigSimulated droplets would slig'htly affect the ice accretion.
and Natural Icing Conditions Using Ultrasonic drpeswudlihyafetheeearton
Pulse-Echo Techniques." AIAA-86-0910Author:
Ruff, G. A.,, "Analysis and Verification of the During the test cell preparations for icing testing, efforts are
Icing Scaling Equatons, Volume 1." AEDC-TR- taken to position the water spray nozzles so that85-30 (AD-A162226), November 1985. impingement of water on the bell mouth is eliminated. There
are two reasons for it. One is the unknown effectimpingement would have on the liquid water content and
Bartlett, C. S. Effect droplet diameter spectrum. The other is that dropletof Experimental Uncertainties on Icing Test impingement might form ice accretions on the bell mouthResults." AIAA-90-0665. that are potentially damaging io the the test article. Since the
amount of impingement and its effect on !iquid watercontent and droplet diameter spectrum are unknown and
Discussion efforts are taken to eliminate droplet impingement, nocorrections are applied during testing.
1. W. Grabe, NRC OttawaTo what atomizer air pr,,,ssure do you work? 4. K. Piel, BMW - RR AeroenginesHow do you determine atomizer air temperatures ard water Are there any results available of comparisons betweentemperatures required? testing at AECD and actual aircraft icing conditions, e.g. on
Author: slave engines etc?
We do not currently have a water spray injection systemnecessary to conduct icing tests in the largest of the Author:propulsion test cells at AECD, the Cl and the C2 Comparisons between icing tests results obtained in ground(Aeropropulsion System Test Facility, ASIT) test cells, test facililties -id results obtained in other ground testSome planning has already been done in consideration of facilities or results obtained in natural or artificial flight haveadding an icing test capability to these test cells. The facility been carried out. The comparisons range from closeis designed to test the air breathing systems capable of agreement to poor to unacceptable agreement. Thegenerating 90.000+ pounds of thrust. The ability to test agreement issue is a continuing problem within the icingspecific engines at specific icing conditions would require an community ad is currently best explained as a result ofanalysis and a feasibility assessment uncertainty associated with the absolute values of the icing
2. M. Holmes, RAE conditions. There are no published comparisons between
Have you any experiemce of conducting icing tests in the AEDC ,.ad flight icing tests.
ASTF at Tullahoma and if these facilities have the capabilityto test the new generation of civil fan engines, producing up 5. P. Derouet, SNECMAto 90.000 lb thrust at take off, which demand a very high air At the station of the spray bars, the water is heated to 100 C.flow at low altitude conditions? Taking into account the distance between spray bars and the
Author: test engine, do you think that the droplets have sufficienttime to reach the temperature of the air flow? Have you done
The water spray nozzles at AEDC are operated at typical calculations?atomizing air pressures of 100 and up to 150 psia. Studieshave been conducted to determine the lower level oftemperature of the atomizing air necessary to prevent Author:freezing of the droplet as they exit the spray nozzle. These The spray droplets do have sufficient time to reach thermalstudies are documented and referenced (ref 6, Marek and equilibrium with the air. Calculations are carried out forBartlett) in the paper. Typically at AEDC, the water is each icing test installation to ensure that there is sufficientheated to about 180-200 F. This is as warm as we can droplet residence time. Details of the calculation procedurecomfortably heat the water to prevent boiling in the spray and mathematical model are described in a report b) Schulzsystem and yet keep the spray nozzles warm enough to and Willbanks, ref. 3 of this paper.prevent ice deposits from forming at the water discharge.
tII
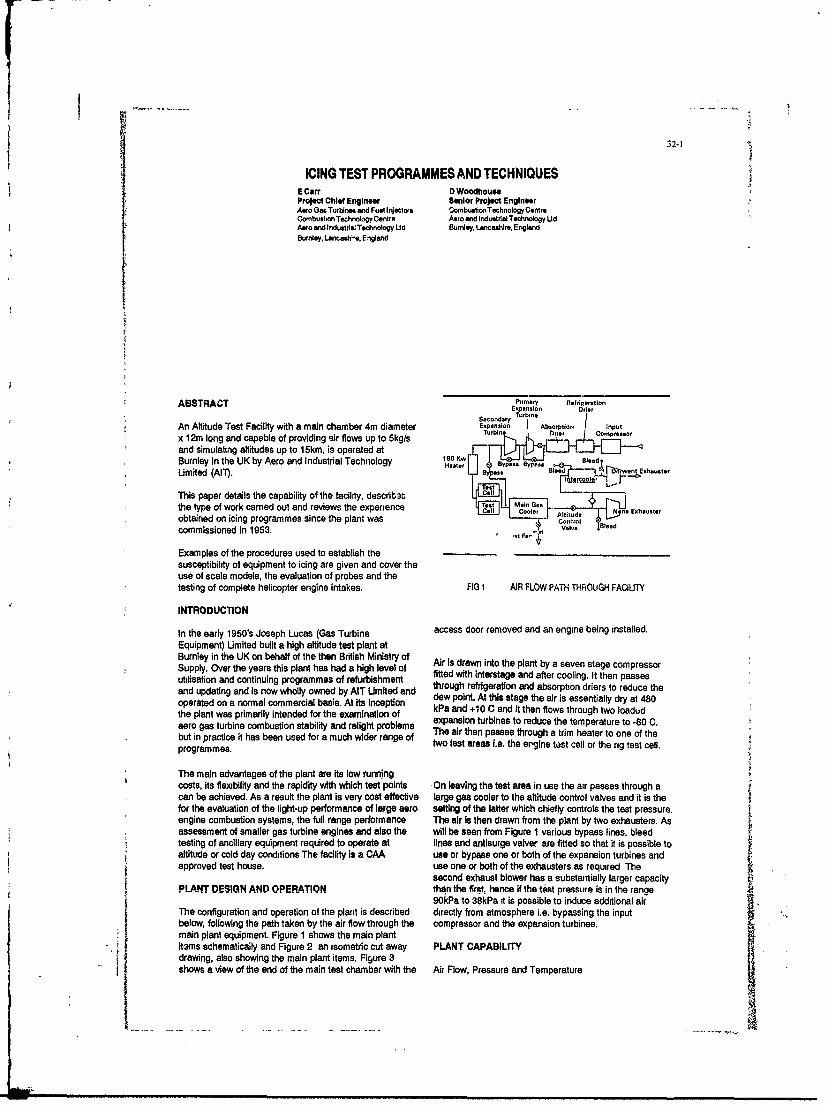
32-1
ICING TEST PROGRAMMES AND TECHNIQUESE Carr D WoodhoueeProject Chief Engineer Senior Project EngineerAeo Gat Turbines aid Fuel Ineclors SombustionTechnology CentreCombusetonTechnology Centre Aero and Indutrial Technology UdAero and industril Technology ltd Burnley, Lancashire, EnglandBurnley, Loncaah'e, England
ABSTRACT Pa-ry AelriqertlonABTATExpansion Wrsecondary Turbi.n
An Attitude Test Facility with a main chamber 4m diameter Expansion Absoption . Inpntx 12m long and capable of providing sir flows up to 5kg/s Tuit-n- l_ Co, ^ o
and simulating altitudes up to 15km, is operated atBurnley in the UK by Aero and Industrial Technology 180 Kw BloodHeater 9 a Bysaep. - xhausterLimited (All). .
eatThis paper details the capability of the facility, describ3c elthe type of work carried out and reviews the experience Tne Main
Cal C t Altitude N = Exhauster
obtained on icing programmes since the plant was co , 5lO dcommissioned in 1953. F-' Volvo
Examples of the procedures used to establish thesusceptibility of equipment to icing are given and cover theuse of scale models, the evaluation of probes and thetesting of complete helicopter engine intakes. FIG 1 AIR FLOW PATH THROUGH FACILITY
INTRODUCTION
In the early 1950's Joseph Lucas (Gas Turbine access door removed and an engine being installed.
Equipment) Limited built a high altitude test plant atBurnly in the UK on behalf of the then British Ministry of Air is drawn into the plant by a seven stage compressorSupply. Over the years this plant has had a high level ofutilisation and continuing programmes of refurbishment fitted with interstage and after cooling. It then passesand updating and is now wholly owned by AIT Limited and through refrigeration and absorption driers to reduce thedew point. At this stage the air is essentially dry at 480operated on a normal commerciai basis. At Its Inception kPa and +10 C and It then flows through two loadidthe plant was primarily intended for the examination of kpand tr0 red ce the thr u e to oa 0 Caero gas turbine combustion stability and relight problems expansion turbines to reduce the temperature to -80 C.
The air then passes through a trim heater to one of thebut in practice it has been used for a much wider range of two test areas i.e. the egine tst cell or the rig test cell.programmes.
The main advantages of the plant are Its low runningcosts, its flexibility and the rapidity with which test points On leaving the test area In use the air passes through acan be achieved, As a result the plant is very cost effective large gas cooler to the altitude control valves and it is thefor the evaluation of the light-up performance of large aero setting of the latter which chiefly controls the test pressure.engine combustion systems, the full range performance The air Is then drawn from the plant by two exhausters. Asassessment of smaller gas turbine engines and also the will be seen from Figure 1 various bypass lines, bleedtesting of ancillary equipment required to operate at lines and antisurge valver are fitted so that it is possible toaltitude or cold day conditions The facility is a CAA use or bypass one or both of the expansion turbines andapproved test house. use one or both of the exhausters as required The
second exhaust blower has a substantially larger capacityPLANT DESIGN AND OPERATION than the first hence if the test pressure is in the range
90kPa to 38kPa it is possible to induce additional airThe configuration and operation of the plant is described directly from atmosphere i.e. bypassing the inputbelow, following the path taken by the air flow through the compressor and the expansion turbines.main plant equipment. Figure 1 shows the main plantit.ems schematically and Figure 2 an isometric cut away PLANT CAPABILITYdrawing, also showing the main plant items. Figure 3Sshows a view of the end of the main test chamber with the Air Flow, Pressure and Temperature

32-2
I2
1 Combustion test chamber. 1
2 Control panel.3 Oil eliminator.4 Dehydrators.6 Extra air dryer.6 Water cooling towers.7 Air inlet filter. 98 Turbo compressor.9 Second extraction blower.
10 First extraction blower.11 Extraction blower intercooler.12 Refrigeration dryer.13 Main gas coole'.14 Diffuser.15 Engine test chamber.
FIG2 'CUT AWAY VIEW SHOWING MAIN PLANT COMPONENTS
F
SFIG 3 INSTALLAION OF ENGINE INTO TEST CELL
,!IIf
1
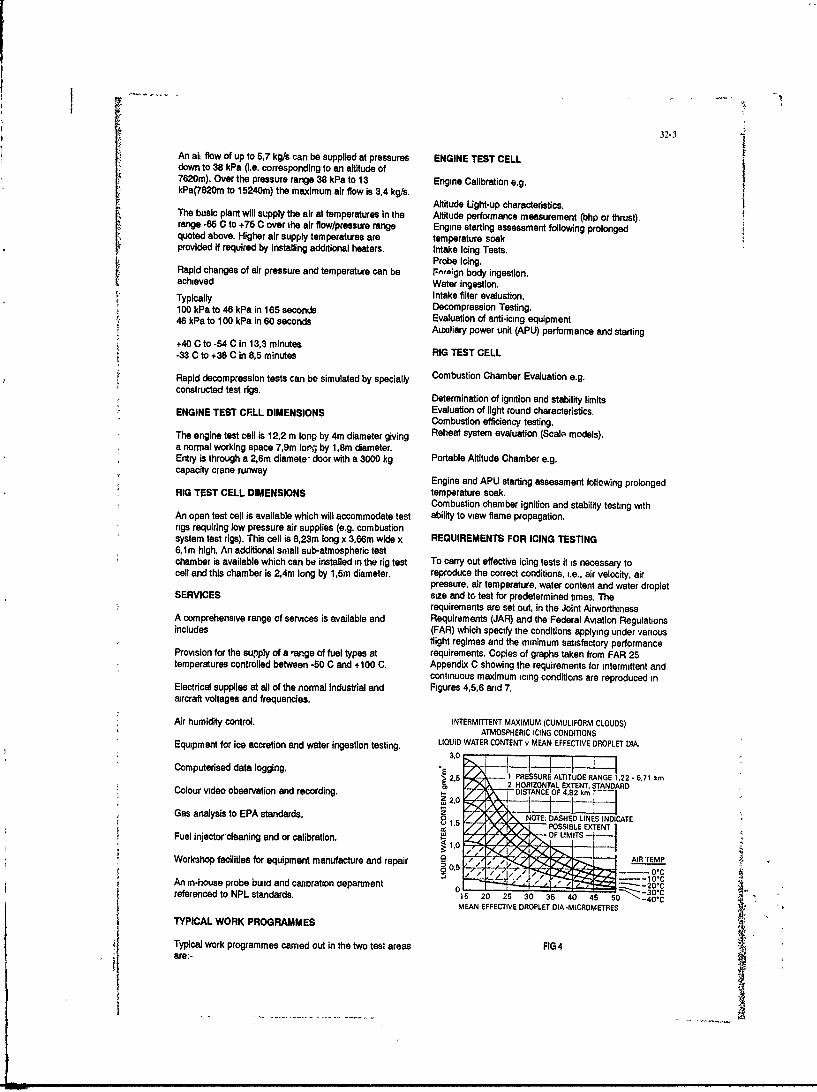
32-3
An ah flow of up to 5,7 kg/s can be supplied at pressures ENGINE TEST CELLdown to 38 kPa (i.e. corresponding to an attitude of7620m). Over the pressure range 38 kPa to 13 Engine Calibration e.g.kPa(7620m to 15240m) the maximum air flow is 3,4 kg/s.
Attitude Ught-up characteristics.The basic plant will supply the air at temperatures in the Altitude performance measurement (bhp or thrust).range -65 C to +75 C over the air flow/pressure range Engine starting assessment following prolonged
quoted above. Higher air supply temperatures are temperature soakprovided it required by installing additional heaters. Intake Icing Tests.
Probe Icing.Rapid changes of air pressure and temperature can be Fwign body ingestion.achieved Water ingestion.Typically Intake filter evaluation.100 kPa to 46 kPa in 165 seconds Decompression Testing.46 kPa to 100 kPa in 60 seconds Evaluation of anticig equipment
Auxiliary power unit (APU) performance and starting+40 C to -54 C in 13,3 minutes
t -33 C to +38 C in 8,6 minutes RIG TEST CELL
Rapid decompression tests can be simulated by specially Combustion Chamber Evaluation e.g.constructed test rigs. Determination of ignition and stability limitsENGINE TEST CF.LL DIMENSIONS Evaluation of light round characteristics.
Combustion efficiency testing.
The engine test cell is 12,2 m long by 4m diameter giving Reheat system evaluation (Scalo models).a normal working space 7,9m lorng by 1,8m diameter.Entry is through a 2,6m diamete; door with a 3000 kg Portable Altitude Chamber e.g.capacity crane runway Engine and APU starting assessment following prolonged
RIG TEST CELL DIMENSIONS temperature soak.Combustion chamber ignition and stability testing with
An open test cell is available which will accommodate test ability to view flame propagation.rigs requiring low pressure air supplies (e.g. combustionsystem test rigs). This cell is 8,23m long x 3,66m wide x REQUIREMENTS FOR ICING TESING6,1 m high. An additional small sub-atmospheric testchamber is available which can be installed in the rig test To carry out effective icing tests it is necessary tocell and this chamber is 2,4m long by 1,5m diameter, reproduce the correct conditions, i.e., air velocity, air
pressure, air temperature, water content and water dropletSERVICES size and to test for predetermined times. The
requirements are set out, in the Joint AirworthinessA comprehensive range of services is available and Requirements (JAR) and the Federal Aviation Regulationsincludes (FAR) which specify the conditions applying under various
flight regimes and the minimum satisfactory performanceProvision for the supply of a range of fuel types at requirements. Copies of graphs taken from FAR 25temperatures controlled between -50 C and +100 C. Appendix C showing the requirements for intermittent and
continuous maximum icing conditions are reproduced inElectrical supplies at all of the normal Industrial and Figures 4,5,6 and 7.aircraft voltages and frequencies.
Air humidity control. INTERMITTENT MAXIMUM (CUMULIFORM CLOUDS)ATMOSPHERIC ICING CONDITIONS
Equipment for ice accretion and water ingestion testing. LIQUID WATER CONTENT v MEAN EFFECTIVE DROPLET DIA.3.0
Computerised data logging. " 1 E ITUDE RANGE 1,22-671 km2 HORIZONTAL EXTENT, STANDARD
Colour video observation and recording. DISTANCE OP 4.82rn
Gas analysis to EPA standards. z NOTE: DASHED LINES INDICATE8 i'. POSSIBLE EXTENT 1
cc - - -OF LIMITSFuel injector-cleaning and or calibration. 1
W~kk iir~i . , /AIR TEMPWorkshop facilities for equipment manufacture and repair 0 . --5_.. 0 5 : C-J ___1 _ Cw
An in-house probe buidc and calibration department - _ , "referenced to NPL standards. 10 20 25 30 35 40 5 50 -4o1c
15 4 45 40*CMEAN EFFECTIVE DROPLET DIA-MICROMETRES
TYPICAL WORK PROGRAMMES
Typical work programmes carried out in the two test areas FIG 4 mare:-

32-4
CONTINUOUS MAXIMUM (STRATIFORM CLOUDS) In addition there can be a requirerment for testing to
ATMOSPHERIC ICING CONDITIONS establish the effect of Ice formations becoming dislodged.LIQUID WATER CONTENT v MAEAN EFFECTIVE DROPLET DIA. This can be determined by either allowing the ice to form
09 and shed by the process applyin3 In service or by forming0:8 1 PRESSURE LTIiTUDE RANGE. S L.-6,71 km blocks of ice In refrigerators and Injecting pieces of ao.s 2. MAXIMUM VERTICAL EXTENT; 2,0 Wm known size into the item to be tested. Hailstones can also0,7 3. HORIZONTAL EXTENT. STANDARD0.6 ISTANCE; 32.2 km - be produced and injected into the test item by means of a
°'°" specially designed gun.
3AIR TEMPERATUR0:2 - . OC0C
0o -OC ICING TEST EQUIPMENT
AJ15 20 25 30 35 40- - 30°C The parameters specific to or of particular importance
MEAN EFFECTIVE DROPLET DIA - MICROMETRES when conducting icing tests are air humidity, water droplet
size and air/water approach conditionsFIG5
It is esiential that the humidity of the air supplied is closelycontrolld, if it is too low any ice formation can be ablated
INTERMITTENT MAXIMUM (CUMULIFORM CLOUDS) and if It is too high additional ice will form It is normalATMOSPHERIC ICING CONDITIONS practice to control the humidity in the range 90% to 100%.
AMPiENT TEMPERATURE v PRESSURE ALTITUDE In the AIT plant the required humidity is obtained by
+ r -"neeing steam into the upstream air supply ducting.
0 NOTEI~2II The required water droplet size is obtained by injectingDASHED LINES water through air blast atomisers into the air fed to the test
-5 - 7 -- INDICATE POSSIBLE - equipment. Seven atomiser nozzles are available (see-/ EXTENT OF LIMITS Figure 8) and all of the nozzles or a selected few can be-10 i - used as required. It is possible to control the water flow to
-- 15each nozzle separately and to adjust the atomising air2quality of atomisation. Until recently the droplet size
UJ 20 J -Iachieved was established using an oiled slide technique7-25 - .-- for the measurement and counting of the droplets.
Recently Laser Equipment (Malvern Type 2600C) has
30 been installed for water droplet measurement. This\ equipment determines the droplet size by establising the
-35 extent of the light scattered from a laser light beam.
-40 -0 1 2 3 4 5 6 7 8 9
PRESSURE ALTITUDE km
FIG 6
CONTINUOUS MAXIMUM (STRATIFORM CLOUDS)
ATMOSPHERIC ICING CONDITIONSAMBIENT TEMPERATURE v PRESSURE ALT.
+5 -
0
-
Z-20 -
@-2 - /- /1
-30U 1 2 3 4 5 6 7
PRESSURE ALTITUDE km FIG 8 WATER SPRAY INJECTORS
FIG 7

32-5
The correct air flow conditions at approach to ttequipment on test aeobtained by using specially shaped METERED EINI;AP
and sized ducts and controlling the flow and condition of TO- "AUSrPLAT
the air supplied from the main plant. The final check KE COLLECTN S -STEM
before commencing a new test programme is tsually to fita gid Into the air/water supply duct immediately upstream T.E PLAE ATWO4C f .*of the eq uip m e nt o n test a nd to che ck that the req uired ice SA P t S /CONDUC ED_ PMU T .E .O
(b) THE GAUZE TTEDO MR WTE TT
distribution is obtained L.e. .ther uniform or biased as IMTSTO SIMULA'[ CORRCTrequired.DUTSRONIGNAK FRWARD VELCITY
SSPRAWMAST SYSTEM TO G1 NEWATICING TECHNIQUES
!tflosfrom the foregoing that the techniques for icing ASAFERTCOOLEQWATER " Ttesting are as follows:-1. Build a suitable tet configuration
- P FROM COD PLANT
2. Set up the required operating conditions. HUM*" 95-100% .
3. Test for the time required to prove compliance with thespecification whilst observing any ice build and takingmeasurements to determine any change of air flow or FIG 9 TYPICAL CONFIGURATION FOR INTAKE ICING
pressure loss. TESTS
4 Shut down quickly following the test and record theextent of any ice formed. TTU ,E
ICING TEST PROGRAMMES tLM TOEUS.E KA A
Exam ples of the icing test programmes carried out are , . .. .,
SEAED D EALE ITAK TIPE
given in the following subsections. o, ,,
ANOJ[TL 0 N
Tests have been carried out to determine if ice formed and -- R EENSERO
THEOTE INTAKE TESIN
I.C. VMNTMUM TANO NG I LAE
became dislodged in a helicopter engine intake TheALRDY9 UCCI
programme was carried out in two parts (a) using the ....... FITTED.intake alone and (b) with the intake feeding an operating
FIG 10 TYPICAL CONFIGURATION FOR ENGINE AND
SEAINTAKE
ICING TESTS
in the first series of tests it was possible to explore a wide --range of conditions without risk of damaging the engine '
and also with the facility to collect and examine any iceobtained In the second series of tests it was possible to Zconfirm that a satisfactory configuration had beenobtained and to prove that it fdlfinled the type test
requirements.
intake tasting and Figure 10 shows the arrangement used
for engine testing with the orrect aircraft intake fitted. The ,Sprovided specifically for the test programme to achieve the ~
In fiseres ofth test igs wasrpossibe tor suplr aden ....
correA velocity conditions at approach to the intake, (b)the facility for catching any ice becoming detached duringthe tet on theintake only, (c) design features permittingquick access to the pats subject to icing and observationof ice build.up during testing
Figill e ho.w i iri on a wLt, mesh grid fitte aco~ =ns~rrcraft intake to check the water distr bution. n th s caseihe ghest water concentration was required towards theutboard side of the passage and it was confirmed by thetest. Figure 12 shows icing on the outer lip of the same
pircraft intake after the subsequent performance test w th hF G 11 DISTRIBUTION TESTthe intake grid removed.
the cestoteprssbjc oIigan bevto

4 zi
FIG 12 INTAKE ICING TEST
Figure 13 shows in more detail the ducting used on anaircraft Intake to achieve ihe required air flow conditions ~ -
and permit observation of ice build-up.
PROBES
The probes subdivide into two catagories, fixed items anditems required to move under operating conditions. FIG 14 DROPLET SIING PROBE ICING TEST
With the former all that is required is to ensure that thecorrect flow conditions are achieved, check the readingobtained from the probe and record the extent of iceaccretion. With the latter it Is also necessary to prove thatthe actuation mechanism still operates under maximumice conditions.
Figure 14 shows ice accretions on a droplet sizing probeevaluated in the AIT test chamber and Figure 15 shows nflight refuelling probe which was required to extend when"iced-up".
DEVELOPMENT OF HEATED MATS
Another agspec qftho *or programme has been thedevelopment of heated anti-icing mats. In this case it ispossible to determlire thl minimum heat input required for ,variio's sectons 6 the heating mat by separatelyi .
controlling the heat input to sections of the mat. Theresuits of the development programme are then normally i1"confirmed by tests on the production version
i'

32-7
ENGINE INTAKE DUST SEPARATORS SCALE MODELS
When flown under dusty conditions helicopter engines are As stated earlier one of the main advantages of the facilityfitted with separators at the engine inlet and it Is is its relatively low operating cost. The lower cost resultsnecessary to prove that they do not block with Ice. Again party from the smaller size and air flows of the facility and tthe approach adopted is to manufacture ducting to give of course this can be In some cases a restricting factor.the required approach conditions, bearing in mind anypitch or yaw requirements, to test as demanded by the One way to overcome this problem is to use scale modelsJAR etc and measure any change of performance and and this approach has proved very successful in researchmake a detailed record of the ice formed. and development programmes. The use of hart linear
scale models with appropriate changes to operatingOne configuration used for helicopter engine separator conditions where necessary, can reduce the required airassessment is shown in Figure 16 and a photograph of mass flow by a factor of four thus bringing manythe ice build-up is shown in Figure 17. programmes within the scope of the facility.
Figure 18 shows a 50% scale model of an aircraft intake.As the equipment was used for a research/developmentexercise it was also made with adjustable or replaceable
M D MINE AIR FLOW components.TO EXHAUST PLANT
cOND,tOEO N AR SUMTY
FIG 16 PARTICLE SEPARATOR, TYPICALCONFIGURATION
FIG 18 INSTALLATION OF A HALF UNEAR SCALEMODEL INTAKE
CONCLUDING REMARKS
The Facility is eminently suitable for either development orcertification testing of equipment which requires air flowsof 5,7 kg/s or less.
It is possible to simulate accurately the conditionsspecified in the FAR and JAR and to quickly obtain repeattests to either evaluate development modifications orIcheck performance repeatability.
FIG 17 PARTICLE SEPARATOR ICING TEST
Nm
Sllf... . .. . .. .. .. . . .. . ... .... ... .... ...

32-8
Discussion systems. 'Iests carried out by AIT confirm that the laser
technique indicates smal!er droplet diameters than the oiled1. S. Riley, Rolls Royce slide method. Calibrations in the altitude test facility atThe maximum airspeed of your tunnel as a relatively large Bus nley showed reasonable correlation with the data givenfacility is low. There are many small high speed facilities by R. G. Keller of the General Electric Company, publishedavailable. Are there plans to increase its capacity? in AGARD CP 236, i.e. a spray measured at a volume
median diameter of 25 Ism by the oil slide technique wasAuthor: shown to have a median diameter of approximately 15 pm byThe procedure normally adopted in the AIT altitude test the laser technique.facility is to install air supply ducts sized to give the approach It follows that larger water droplets are being used than wasvelocity required for the system being evaluated. The main the case pnor to adoption of the laser system for sprayplant limitation is therefore the maximum airflow capability. characterisation. The accuracy of the oiled slide technique isWhilst there have been several studies into the feasibility of open to question because of the intrusive nature of the testincreasing the plant capabililty, to date they have all being and the sensitivity of the result to the characteristics of therejected as they would all have negated the main advantage oil used on the slides. Therefore, since first the laserof the present facility, namely, the relatively low operating technique is considered to be more accurate and second thecost. There is, of course, an ongoing programme for test obtained with the larger droplets would be more ratherupdating the instrumentation and control systems available than less strngent and third as our enquiries showed that thein the facility, majority of the test facilities in the Western world had
already adopted the laser system, it was decided to change to2. E. Brook, Rolls Royce this technique. It is apparent that the test conditionsYou have recently changed from measunng water droplet specified by the various authorities for icing certificationdistributions by oil slides to a laser technique. Have the calibration, should be re-defined using modern laserappearant calibration of your spray nozzle charged? systems.Could you comment on the charge seen, as the certificationicing envelopes used by the authorities are based onmeasurements carried out before modem laser techniques 3. H. Hoffmann, DLRwere available? Your instrument for the measurement of particle size
scattering, is it an own development or the FSSP of PMS?Author:We had substantial reservations concerning the change to Author:the laser technique and only decided to recommend the No, this is the Malvern equipment. It is commerciallychange to customers after a protracted evaluation of the two available.
iI
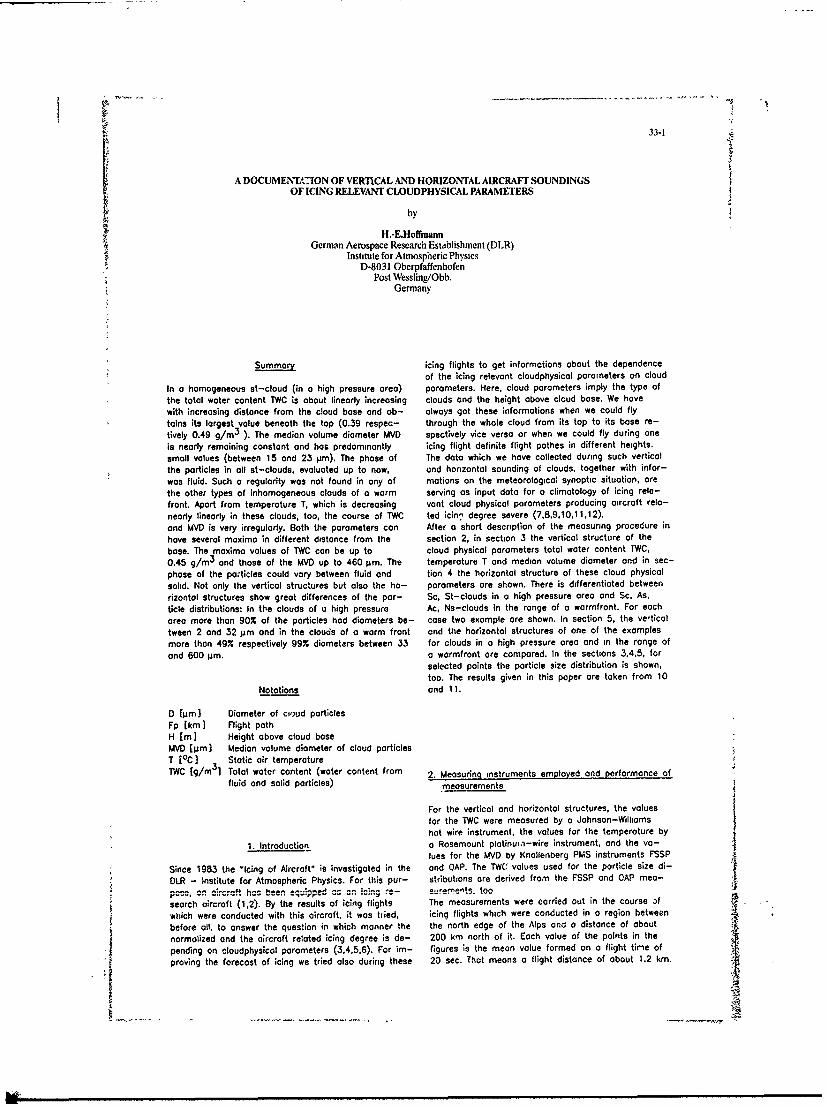
33-1
A DOCUMENT1,ION OF VERTICAL AND HORIZONTAL AIRCRAFT SOUNDINGS
OF ICING RELEVANT CLOUDPHYSICAL PARAMETERS
by
H.-E.Hoffmann
German Aerospace Research Estibiishment (DLR)Institute for Atmospiheric Physics
D-8031 OberpfaffenhofenPost Wessling/Obb.
Germany
Summary icing flights to get informotions about the dependenceof the icing relevant cloudphysical parameters on cloud
In a homogeneous st-cloud (in a high pressure area) parameters. Here, cloud parameters imply the type ofthe total water content TWC is about linearly increasing clouds and the height above cloud base. We havewith increasing distance from the cloud base and ob- always got these informations when we could flytoins its largest value beneath the top (0.39 respec- through the whole cloud from its top to its base re-
tively 0.49 g/m3 ). The median volume diameter MVD spectively vice versa or when we could fly during one
is nearly remaining constant and has predominantly icing flight definite flight pothes in different heights.small values (between 15 and 23 pm). The phase of The data which we have collected during such vertical
the particles in oll st-clouds, evaluated up to now, and horizontal sounding of clouds, together with infor-was fluid. Such a regularity was not found in any of motions on the meteorological synoptic situation, ore
the other types of inhomogeneous clouds of a worm serving as input data for a climatology of icing rele-front. Apart from temperature T, which is decreasing vant cloud physical parameters producing aircraft rela-nearly linearly in these clouds, too, the course of TWC ted icin degree severe (7,8,9,10,11,12).and MVD is very irregularly. Both the parameters con After a short description of the measuring procedure inhave several maxima in different distance from the section 2, in section 3 the vertical structure of the
base. The maxima values of TWC con be up to cloud physical parameters total water content TWC,0.45 g/m
3 and those of the MVD up to 460 pm. The temperature T and median volume diameter and in sec-
phase of the paticles could vary between fluid and tion 4 the horizontal structure of these cloud physicalsolid. Not only the vertical structures but also the ho- parameters ore shown. There is differentiated between
rizontol structures show great differences of the par- Sc, St-clouds in a high pressure area and Sc. As,ticle distributions: In the clouds of a high pressure Ac, Ns-clouds in the range of a wormfront. For each
area more than 90% of the particles had diameters be- case two example ore shown. In section 5, the vetical
tween 2 and 32 pm and in the clouds of a warm front and the horizontal structures of one of the examplesmore than 49% respectively 99% diameters between 33 for clouds in a high pressure area and in the range ofand 600 pm. a wormfront ore compared. In the sections 3,4,5, for
selected points the particle size distribution is shown,too. The results given in this paper ore taken from 10
Notations and 11.
D (pm] Diameter of cioud particlesFp (km] Flight pathH [m] Height above cloud baseMVD (pm] Median volume diameter of cloud particlesT [°C] Static air temperatureTWC [g/m 3 ] Total water content (water content from 2. Measuring instruments employed and performance of
fluid and solid particles) measurements
For the vertical and horizontal structures, the valuesfor the TWC were measured by a Johnson-Williamshot wire instrument, the values for the temperature by
1. Introduction a Rosemount platinura -wire instrument, and the va-lues for the MVD by Knollenberg PMS instruments FSSP
Since 1983 the 'Icing of Aircraft" is investigated in the and OAP. The TWC' values used for the particle size di-
DLR - Institute for Atmospheric Physics. For this pur- stributions are derived from the FSSP and CAP ieD-S ............. equpped c -
search aircraft (1,2). By the results of icing flights The measurements were carried out in the course of
which were conducted with this aircraft, it was tiied, icing flights which were conducted in a region between
before all, to answer the question in which manner the the north edge of the Alps ona a distance of about
normalized and the aircraft related icing degree is de- 200 km north of it. Each value of the points in the
pending on cloudphysicol parameters (3,4,5,6). For im- figures is the mean value formed on a flight tirme off proving the forecast of icing we tried also during these 20 sec. That means a flight distance of about 1.2 km.
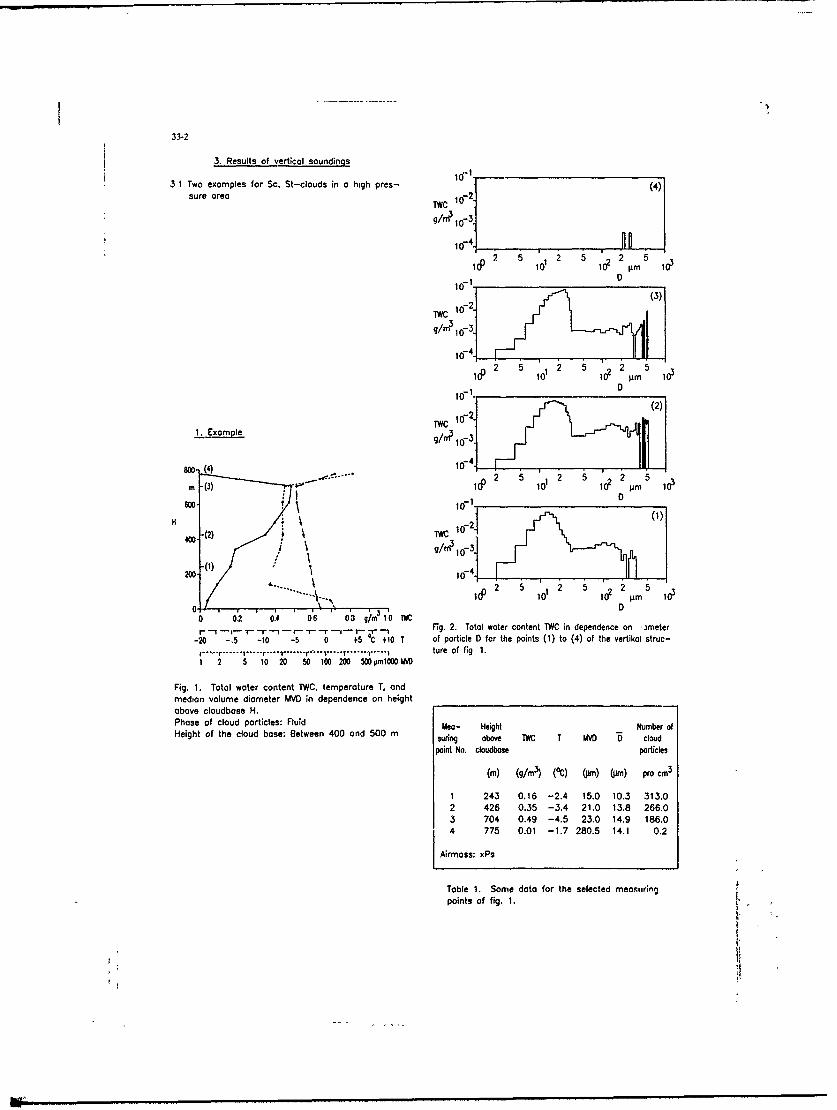
33-2
3. Results of vertical soundings
3 1 Two examples for Sc. St-clouds in o high pres- {(4)sure area }W 62
1 2 5 1 2 5 i?2 Pt5
1071 D
oo2 5 102 5 i?2 Pn5
(2)
(4)c 10-41
2 5) 2 5 5 2 5mc -()Id 0 10? PM 16
-21 (1)-(2) T WC 04003
/g / m 3 6 3 1
1 2 5 ~ 2 5 2 5V.. to 10 11? pmn 10
0' 1 00 0.2 0.4 06 003 g/rns 10 TWC Fi.2Toawaecotn Windpdneon mtr_r-.,- -r -- r- 'r -T __. I -., - -. , Fi.2_oIwtrcnet1VCi eedec n~e-20 -5 -10 -5 0 +5 C+10 T af particle D for the points (1) to (4) of the vertical struc-
i- - .... i.... .. i-* ,, ..I ........ ....Iture ofFigi1.I 2 5 10 20 50 100 200 500 imlt00l iD
Fig. 1. Total water content TWC. temperature T. andmedian volume diameter MVD in dependence on height ________________________above cloudboee H.Phase of cloud particles: Fluid Ma- Height Number ofHeight of the cloud base: Between 400 and 500 m Suring above i'K T lMiD D cloud
point No. claudbase particles
(in) (g/n) (,C) (Um) (Uim) pro cm3
1 243 0.16 -2.4 15.0 10.3 313.02 426 0.35 -3.4 21.0 13.8 266.03 704 0.49 -4.5 23.0 14.9 186.04 775 0.01 -1.7 280.5 14.1 0.2
Airmoss: xPs
Table 1. Some data for the selected measuringpoints of fig. 1.
31

2. Example 10-1 -_______________
9/.400. (2) : W o 2 3
22 5 5 2 5iHd 1 1 10 102 Pm 1
-15 -10 -5 0 +5 C+0 C2
... d.1' 2 5 10 2 5 10 2 Pm 5 100
of paricl 0- f-r the po-t (1) to (4) "-I the veia struc60 lure of0 -ig 35,rTT 02
40 ( 5 /0 2 D ID2D 50ii~w g. 03
medea- Helgme Numbete MV ndpneneo1egt(suigabove loCdI I H. 10) cloud1
Phs poin No.u partidlos: plurticles0egh 02 th lu o204 06 08 gun 102 (1)
(in) 1gm) 0) p)(3) pr.m
-2 -1 -2 5 0 55C+O
Fig. ~ ~ ~~ Fg 4. Total water content TC tepiatr deedec and 4d33 0.1a1.e6.7 674 r0
Phaf patil Diu parices Flui pons()t 4 f h etclsrcOn the same flghfa fig. 3,.u bu 7m aeIIn
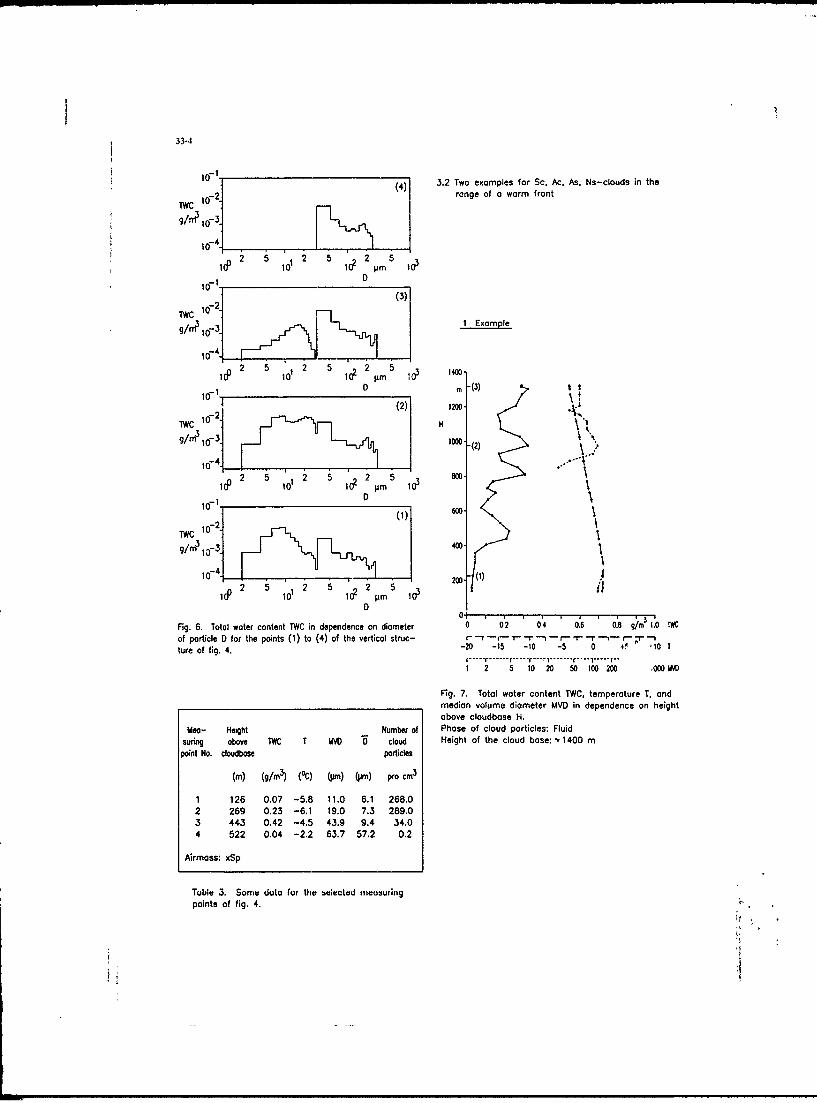
33-4
10-I (4) .3.2 Two examples for Sc. Ac. As. Ns-clouds in the
1-C range of a warm frontTWC 12
104
10(2 5 10 i2 5 1022 5
i07 1 1 0D2 p
TWC 1072_
g/n -31 1 Example
1 4io744
2 5 2 5 2 5ld OI lO2 pm 10 ,0
(2) 1200 AS
. .....(2)
10 2 5 2 5 8 0
10-1. o0
1g), 00
g/rr 4 5 ~2001 2 5 51 2 5 1o 2Jm5
0Of
Fig. 6. Total water content TWC in dependence on diameter 0 02 04 0.6 0.8 a/m.TWCof particle D for the points (1) to (4) of the vertical struc- r-'-r-I- T- -r -- r- = -r -n- r- -r-ture of fig. 4. -20 -15 -10 -5 0 +F '10 T
.................. r- .-. . .. ' , ... ,1 2 5 10 20 50 100 200 M000Vii
Fig. 7. Total water content TlC, temperature T, andmedian volume diameter MVD in dependence on heightabove cloudbose H.
Meo- Height Number of Phase of cloud particles: Fluidsuring above TIC T l&VD cloud Height of the cloud base: 1400 m
point No. cloudbose particles
(m) (g/m3) (,C) (UJm) (pro) pro cm
3
1 126 0.07 -5.8 11.0 6.1 268.02 269 0.23 -6.1 19.0 7.3 289.03 443 0.42 -4.5 43.9 9.4 34.04 522 0.04 -2.2 63.7 57.2 0.2
Airmass: xSp
Table 3. Some data (or the sciecied meutsuringpoints of fig. 4.
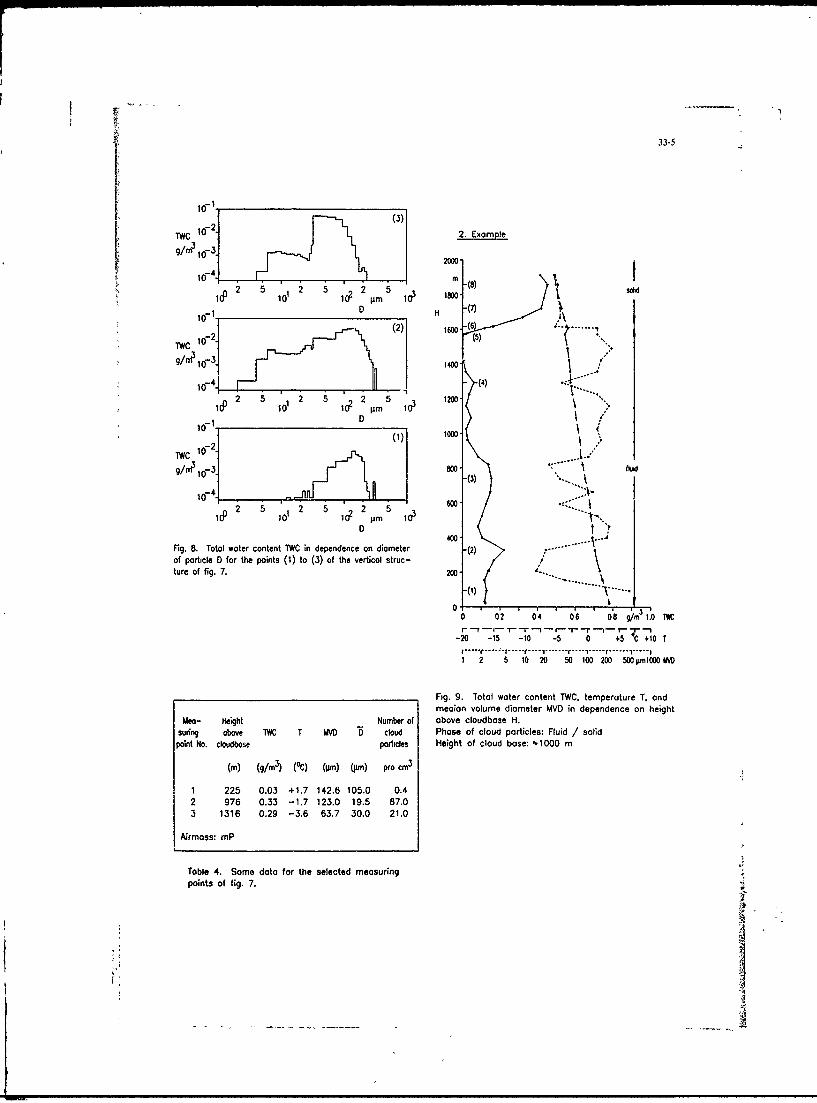
1O~1.3(3)
io2. 2. Example
g/rn 1 0 -32000
2 52 5 2 5 (8)100 id 12 Pm 10 19DO oi
iwc io.2l(2) 160 (
g/ni3 16-3] 40
107 1 (4
10 2 5 12 5 10 2Pm5 13 10
8W 1 .Tol wae cotn TW in d enec on da ee
Iig (2)60
of particle 0 for the points (1) to (3) of the vertical struc-ture of fig. 7. 200
(1)
o 02 04 06 08 jm3 10 W
-20 -15 -10 -5 0 +5 C0 +10T
........................................ ... ,r*, ................1 2 5 10 20 50 100 200 500pilOOOlVO
Fig. 9. Total water content TWC. temperature T, andmealon volume diameter MVD in dependence on height
Usa- Height Number of above cloudbase H.Swing above TWC T MV D cloud Phase of cloud particles: Fluid /solid
point No. cloudbose particles Height of cloud base: f1000 m
(in) (9/A3 (0c) (0rn) (jim) pro cm,
1 225 0.03 +1.7 142.6 105.0 0.42 976 0.33 -1.7 123.0 19.5 87.03 1316 0.29 -3.6 63.7 30.0 21.0
Airmoss: mP
Table 4. Some data for the selected measuringpoints of fig. 7.

33-6
TWC I0" 2
10- 3
.
2 5 °2 5 to 2 5
1 m 10-1 0
(8) 1(3)TWC 1 0 -
107 .10 10-3] 1,o0 .,! ,o-fl .too 2 5 i2 5 2 5 2 5 i 2 5 2 P
1o1 p02Dm 3 10 0 1
1. . . 71) (2)
S g/M io0j V2 5 22 pm 510 100 2 5 10 2 5 102
2 pm 5 10
0 o10 _ , 0
(6) 1(1)TWC
1072 _ TWC O-2 _
9/u 3 16-3 g/m,1031o-44 _ . .1,,,to41,/ . .2d) 0 2 5 102 2 52 5 2 52m 1 '0 i g 1112 0
1^-u 100 0
(5) Fig. 10. Total water content TWC in dependence on diameter
0- 2 of particle D for the points (1) to (8) of the vertical struc-9/m,103 ture of fig 9.
04-_ , ,~
2 5 ° 2 5 1022 5101 pm 103
0Meo- Height Number of
suring obove TWC T MVO D cloudpoint No. cloudbose particles
(m) (g/m3) (°C) (Jim) (pmi) pro cm3
1 93 0.13 +2.9 461).0 37.4 2.02 327 0.22 +1 1 21.5 18.2 44.03 738 0.15 -0.3 j6.t 34.5 16.04 1291 0.06 -2.7 39.5 22.3 30.05 1570 0.01 -3.6 142.6 94.9 0.96 1615 0.16 -3.3 30.5 171 1407 1721 0.42 -4.2 36.5 39.5 12.08 1858 0.45 -5.1 33.5 35.5 16.0
Airmoss: mb
Table 5. Some data for the selected measuring
points of fig. 9.
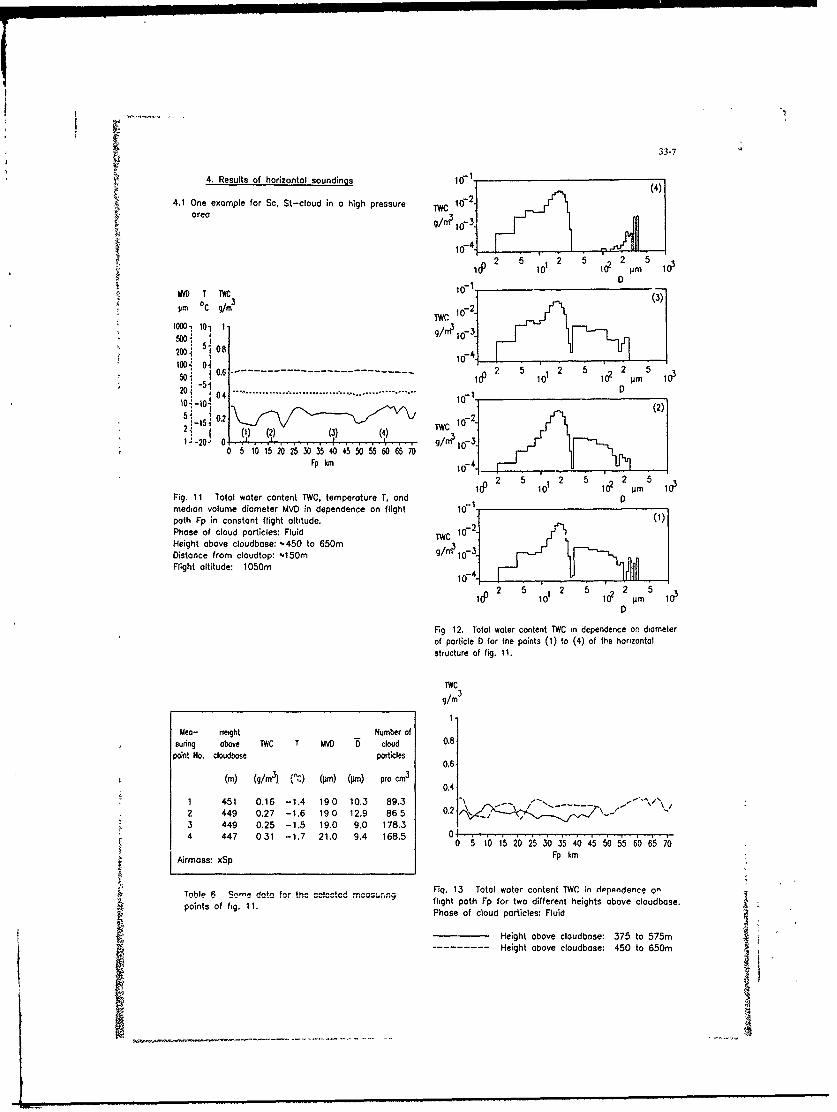
33-7
4. Results of horizontal soundings 16-1-
4.1 One example for Sc, St-cloud in a high pressure TWC i2area gn1
to2 5 10 2 5 S c 2 Jim 5 10D
Psi 0C q/m 3
1000' 10 1g/m 1073_500 -
100 2 2 5 20122pm
20,
(I) ()2)
2 55 2 5 22 502~d 0 pm....... ...... *.. ........2i.11 ToaTaeWonetTCCepeaueT n
path ~F kip in7 cosat4lgtatiue1
Phase of cloud particles: Fluid TIwC102Height above cloudbase: .450 to 650m g~ .~__________________
Distance from cloudtop: N150m 10 CFlight altitude: 1050m 1ff4
2: M 5 111
1002 10 2 c12 pm5 0
ig 12. Total water content TWC in dependence or. diameterof particle D for the paints (1) to (4) of the horizontalstructure at fig. 11.
NWC
Meo- neight - Number of 0.suring above TWC T MVD 0 cloud 0.
point No. cloudbase particles 0.
(in) (g/m), " ) (pm) (pin) poc 0A41 1 0.16 -1.4 190 10.3 89.3 -.
2 449 0.27 -1.6 190 12.9 865 0.2 \
3 449 0.25 -1.5 19.0 9.0 178.34 447 031 -1.7 21.0 9.4 168.5 0 5101205 'A4450556657[Airmoss: xSp Fp km
T~b~ So'e,4n,,;'. '. 'c~Fig. 13 Total water content TWC in diPpAnijence on
poins offig.flight path Fp for two different heights above cloudbose.ponso i.11. Phase af cloud particles: Fluid
Height above cloudbose: 375 to 575m- -- -- --- Height above cloudbase: 450 to 65Dm

33-8
T MVD T COC PMr 0C 9/-110.0 1000; 10 2 ,51• I
-20. ... ...... 200 0 8
-0. 10i01:-15- : 1 -02 ----2o0 0..4. ............ . .. . .....
05 10 15 20 25 30 35 40 4550 55 60 65 70 0 5 10 5 20 25 30 i 40 45 50 5Fp km Fp km
Fig. 14. Temperature T in dependence on flight path Fig. 16. Total water content TWC. temperature T, and
Fp for two different heights above cloudbose. median volume diameter MVD in dependence on flight
Phase of cloud particles: Fluid path Fp in constant flight altitude but deeper pene-
tration into the cloud, caused by continuous ascent ofHeight above clcudbose: 375 to 575m the cloud surface in flight direction
----- Height above cloudbose: 450 to 650m Phase of cloud particles FluidFlight altitude: 111 5mHeight above cloudbose: ?Distance from cloudtop:
"
4 2 One example for Sc, Ac, As. Ns-cloud in the
range of a worm front
MVD WI1 TWIC
pm pm 0C g/m
1000 l000, 101 1
500 50W200 2M0 50.8
100 100" 0 " "-- --- ... , -- - -- --
50- 501 062o .... .. 2oi-,5 "..." ii. :,to.. -°5°20 -- - - ------- -- - ----- - -- 20 j 0410 10, -10155 0.22 2i 1 (2) 4
11 - I . 20 0 -0 5 10 15 20 25 30 35 404550556065 70 0 10 20 30 40 50 60 70 80 90
Fp kin Fp km
Fig. 15. Median volume diameter MVD in dependence Fig. 17. Totai water content TWC, temperature T, and
on flight path Fp for two dilferent heights above median volume diameter MVD in dependence on flight
cloudbase. path Fp.
Phase of cloud particles: MIid Phase of cloud particles: FluidHeight above cloudbase: k 435m
Height above cloudbase: 375 to 575m Distance from cloudtop: ?----- Height above cloudbose: 450 to 650m Flight altitude: 1835m
!I......
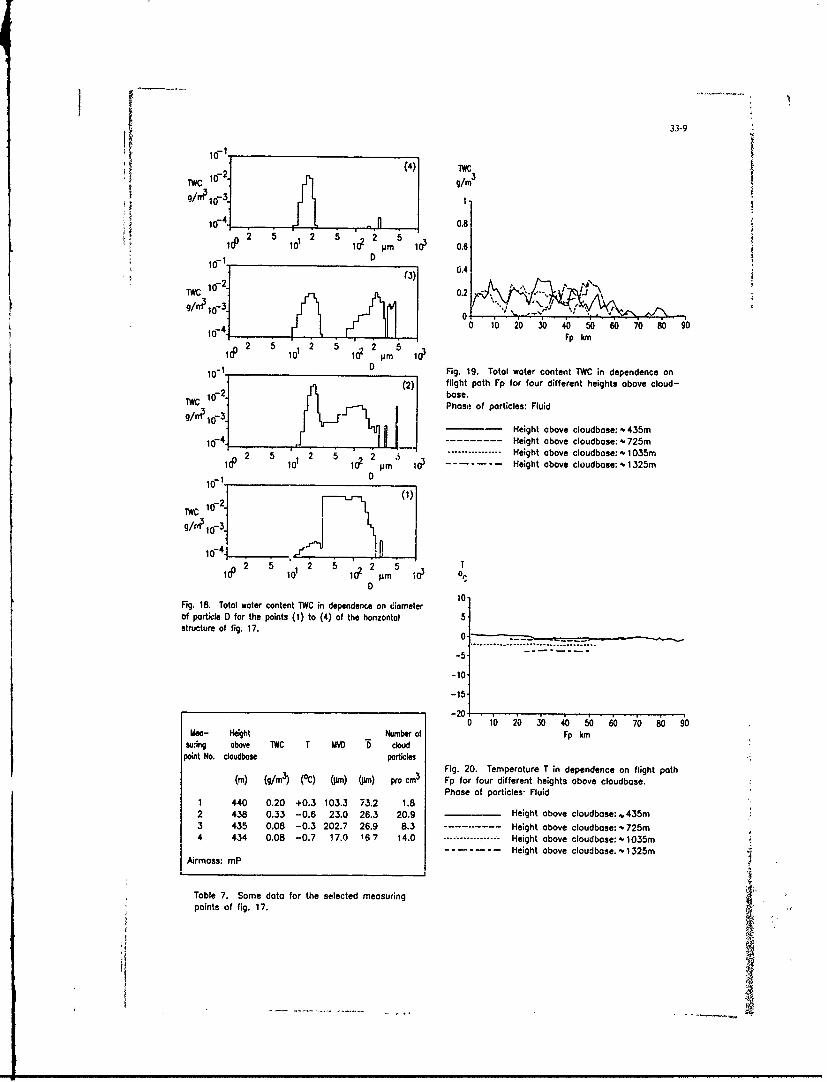
33-9
.fl 0.822 5 2 5
loI ~ ~ IAN-, l 3 ~T10 0.6
10-41 0 10 20 30 40 50 60 70 80 90100 2 5 101 2 5 402 PFp k5n
lOp 12103
10-1. D Fig. 19. Total water content TWC in dependence on(2) flight path Fp for four different heights above cloud-
16-2 base.TWC Poeof particles: Fluid
__________________________________________ IHeight above cloudbase: 435m----- Height above cloudbose: 725m
20522 5 2 3 .............. Height above cloudbase: 1035m101 0 m 1 3 P 1--- Height above cloudbose: 1325m
I-1. 0 1
10_
TWC 1-2_ (
16-4[ 4"- -- ,-'--
1d0 2 5 °2 5 2 5 Ttoic m 03 o
D10
Fig. 18. Total water content TWC in dependence on diameterof particle D for the points (1) to (4) of the honzontol 5structure of fig. 17.
0 ......
*............ .... .... .............-5
-10
-15
-20 .. . , A , , ,0 10 0 0 4 0 s 0 6 0 io 8 0 9 0
Mea- Height Number of Fp kmsuing above TWC T MVD D cloud
point No. cloudbose particlesFig. 20. Temperature T in dependence on flight path
(m) (g/m (0C) (mn) (Pm) pro Cm Fp for four different heights above cloudbose.Phase of particles, Fluid
1 440 0.20 +0.3 103.3 73.2 1.82 438 0.33 -0.6 23.0 26.3 20.9 Height above cloudbose: . 435m3 435 0.08 -0.3 202.7 26.9 8.3 ........... Height above cloudbose: f,725m4 434 0.08 -0.7 17,0 '6 7 14.0 .......... - -Height above cloudbase: , 1035m
- - - - - - - Height above cloudbose. 1325mAirmass: mP
Table 7. Some data for the selected measuringpoints of fig. 17.

33-10
5. Comparison between representative results of cloudsin a high pressure area and clouds in the ranaw ofa worm front
5.1 Comparison between results of vertical soundings
UO
1000.500200 2D*
5020180
52 1600.-
0 110 20 h 4b 50 60 70 80D 0Pp ki 1400
Fig. 21. Median volume diameter MVD in dependence 1200-on flig h path Fp for f Ar different heights abovecloudboa3e.2Phase )f particles: Fluid ID
Height above cloudbase: ft435m---------Height above cloudbase: ft 725m 800...... .... Height above cloudbase: 1035m
- - - - - - -- Height above claudbase: 1325m J00
400-K
200.
0 5-- - -- -0 02 04 06 0 6 g/m 10 WC
Fig. 22. Total water content TWC in dependence onheight above cloudbase H in a high pressure area andin the range of a warmfront.Phase of cloud particles: Fluid - respectivelyfluid /solid
In a high pressure areaIn the ange, of a wormfront
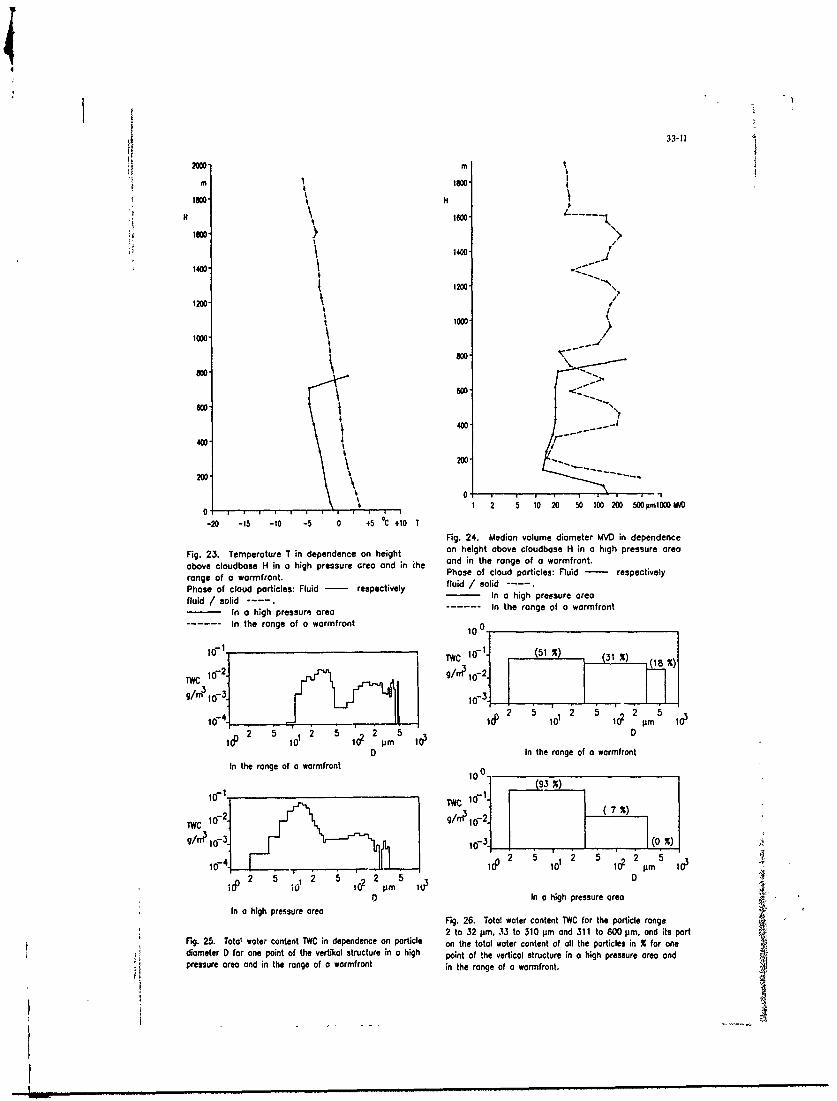
H H 33-11
2000-
1800
1400 40 -
1200
1200'10
600.
8000
400 Itd -
200' 200
00
-20 -15 -10 -5 0 +5 0 1 lFig. 24. Median volume diameter MVD in dependence
Fig. 23. Temperature T in dependence on height on height above cloudbase H in o high pressure areaabove cloudbase H in a high pressure area and in the and in the rang. of a warmfront,range of a wormfront. Phase of cloud particles: Fluid - respectivelyPhase of cloud particles: Fluid - respectively fluid / solidfluid / solid -- In a high pressure area
In a high pressure area ---- In the range of a warmfrontIn the range of a warmnfront 100___oo-______________
10-171. (1 r
TWC o g/r , 2
I 2 5 10 12 5 o 2 Pm 2 11 0 1 2
D In the range of a wormfrontIn the range of a warmfront 100 (9 X)
g/r/d-2 (72))2/r - 5 ,4 2 5 2)5
Icr 1 10 to, Pm2 5 ~ 2 5 92 5 D
i(P10IC? Pm 1Ur0 In a high pressure area
In a high pressure areaFig. 26. Total water content TWC for the particle range2 to 32 pm, 33 to 310 pmn and 311 to 600 pm, and its part
Fig. 25. Totat water content TWC in dependence on particle on the total water content of all the particles in X for onediameter 0 for one paint of the vertikal structure in a high point of the vertical structure in a high pressure area andpressure area and in the range of a warmfront in the range of a warmirant.

33-12
5.2 Comparison between results of horizontal soundings
MVDPM
1000 15001-
TWC 32001
10-
0.61 2.
0.41 0 10 20 30 40 50 60 70 80 9
0.21 ij' \J\,/ Fp km
121 . \ ~.-- . Fig. 29. Median volume diameter MVD in dependence0 10 20 30 40 50 60 70 80 90 on flight path Fp in constant flight altitude in a high
Fp km pressure area and in the range of a wormfrant.Phase of particles: Fluid
Fig. 27. Total water content TWC in dependence on - In a high pressure areaflight path Fp, in constant flight altitude in a high --- -- --- In the range of a warmfrontpressure area and in the range of a warmfront.Phase of particles: Fluid
In a high pressure area- -- -- --- In the range of a warmfront
TWC 12
T]
10 1dP 2 10 4 0 i
- In the range of a wormfront
-5 1
-102
-15 TW
-201 _______________________ 10o73
0 110 20 30 4b 50 60 70 6D 90
iP2 510 2 5102 2 r 5 i
Fig, 28. Temperature Tin dependence on flight path 0Fp in constant flight altitude in a high pressure area In a high pressure areaand in the range of a warmfircnt.Phase of particles: Fluid Fig. 30. Total water content 1YIC in dependence on particle
diameter D for one point of the horizontal structure in aIn a high pressure areahihpesraraadithrngof wmrn.
- -- -- --- In the range of a warmfronthihpesraraadnterngofawmrn.
41

K 33-13
Median volume diameter MVD of clouds 3f a high pres-sure area had predominontly small values (between 11
100 and 23 pm). Only close to cloud base respectivelyT 1o (99 -) cloSeto cloud top it could ge, larger values (see
10-1 Fig. 1,3.4.24).TWC 1Up to 9CS of the TWC was formed by particles with
g/m310-2. diameter between 2 and 32 pm (see Fig. 2,5,6,25,26).1 I (1%) MVD of clouds in the range of a worm front was
(0 %) strongly fluctuating between small and large values.
2 5 2 5 2 5 The maximum values were between 100 and 460 pm00 10 pm 10c (see Fig. 7,9.24). Up to 50% of the TWC was formed
D by particles with diameter between 33 and 600 pm
In the range of a wcrmfront (see Fig. 8,10,25,26).
0 The phase of the particles in clouds of a high pres-10 sure area was always fluid (see Fig. 1.3,4).
-1 (93 %) The ohose of the particles in clouds in the ronge of aTWC 1 ", worm front could vary between fluid and solid (see
1 0 2) Fig. 9).
3 (0 %)1C 2 5 t1 2 5 402 P 5
p0 10D
In a high pressure area
Fig. 31. Total water content TWC for the particle range2 to 32 pm, 33 to 310 pm and 311 to 600 pm, and its part Results ascertained from the horizontal soundinq.s.on the totnl water content of oil the particles in % of one TWC in the clouds of a high pressure area was varying
point of the horizontal structure in a high pressure area and between values of 0.17 and 0.31 g/m 3 on a flight
in the range of a wormfront. path of 70km (see Fig. 11,13,z). In the clouds in therange of a worm front the values of TWC were varyingbetween 0 and 0.32 g/m 3
on j flight path of 90 km(see Fig. 17,19.27).In o speziol case, when the cloud surface was ascen-ding in flight direction the TWC in the clouds of a highpressure area - when flying in constant altitude - wasincreasing respectively decreasing in dependence onflight path length (see Fig. 16). Because of ascendingsurface of cloud - in spite of constant flight altitude -
6. Discussion of the results the airplane hod flown deeper and deeper into thecloud. Before Fp: 30km the airplane was above the
The results discussed in this paper were ascertained on maximum TWC (see Fig. 1), on Fp: 30km the airplaneicing flights in winter months in altitudes up to,4000m was in the maximum TWC and behind Fp: 30kn thein a region between the north edge of the AJps and a airplane wos below the maximum TWC.distance of -200 km in the north of it.
T in the clouds of a high pressure area and in theResults ascertained from the vertical soundinqs range of a worm front was constant in constantTotal water content TWC of clouds of a high pressure heights above cloud base (see Fig. 11,14,20,28).area was about linearly growing with growing distance Only in a special case, when the cloud surface was as-from cloud base. Its maximum was located directly be- cending in flight direction T was decreasing when flyinglow the cloud top and attained values between 0.40 in a constant altitude (see Fig. 16).and 0.50 g/m 3
(see Fig. 1,3,4,22).TWC of clouds in the range of a worm front was stron- MVD of the clouds of a high pressure kept constant ongly fluctuating between cloud base and cloud top and small values (N 20 pm) (see Fig. 11,29). Up to 93% of thod maximum values in different heights . The moxi- the TWC was formed by particles between 2 and 32 pmmum values were between 0.20 and 0.45 g/m3 (see (see Fig. 30,31).Fig. 7,9,22). MVD of the clouds in the range of a worm front was
strongly fluctuating between small and forge values.Temperature T in clouds of a high pressure area was The maximum values were between 100 and 200 pmdecreasing linearly with increasing distance from (see Fig. 17,21,29).cloud bose. Only ieor the buze or near the top. up to 997 of the TWC was formed by particles withT could increase (see Fig. 1,3,4,23). diameters between 33 and 310 pm (see Fig. 18,30,31).T in cluods in the range of a worm front was decrea-sing with increasing distance from cloud base (see The phase of the particles, on the flights discussedFig. 7.9,23). here, was always fluid.

~33-14References rameters on Horizontal Soundings of Strotiform Clouds.
(DLR - Report in preparation)1. Hoffmann, H.-E.; Demmel, J.: First Stage of Equip-ping a Type Do 28 as a Research Aircraft for Icing, 12. Hoffmann, H.-E.: A Climotologiy for Cloud Physicaland First Research Results. ESA-TT-855, 1984. Parameters Causing Aircraft Related Icing Degree Severe.
(DLR - Report in preparation)2. Hoffmann, H.-E.; Demmel, J.: DFVLR's ResearchAircraft Do 28, D-IFMP, and its Measuring Equipment.ESA-TT--972, 1986.
3. Forecasters' Giude on Aircraft Icing. Air Weather DiscussionService, AWS/TR-80/001, 1980.
1. M. Holmes, RAE4. Hoffmann, H.-E.; Roth, R.; Dernmel, J.: Stondardi- As a result of your investigations, do you believe that thezed Ice Accretion Thickness as a Function of Cloud FAA standard clouds are still representative of what occursPhysics Parameters. ESA-'T-1080, 1988. in the real environment?
5. Hoffmann, H.-E.: Icing Degree Moderate to Severe: Author-If and Where in Clouds. ICAS Proceedings, Jerusalem The FAA standards for icing clouds are not representativeAugust 28 - September 2, 1988. for the real atmosphere.
6. Hoffmann, H.-E.: The Analysis of Three Icing Flights 2. R. Toogood, Pratt and Whitney Canadawitn Various Ice Accretion Structures when Reaching You mentioned that your measurements indicate vananceIcing Degree Severe ICAS Proceedings. Stockholm Sep- with the FAA 25, App C atmosphenc conditions. Wouldtember 9-14, 1990. you agree then that your measurements are also at variance
with the JAR atmosperic definitions?7. Roach, W.T.; Forrester. D.A.: Crewe, M.E., Watt, K.F Are the results of your research being coordinated with theAn Icing Climatology for Helicopters. Special Investi- new effort in the United States to re-examune the definitiongation Memorandum 12, Meteorologocol Office, Brock- of the icing atmosphere?nell, 1984.
Author:8. Hoffmann, H.-E.; Roth, R.: Cloudphysical Porame- Our measurements are at variance wtth the FAA and alsoters in Dependence on Height Above Cloud Base in with the JAR atmospheric icing conditions.Different Clouds. Meteorol Atmos. Phys. 41, 247-254, After each yearly DLR Icing Flight Season we are sending1989. special lists .ith our icing results to the University of Dayton
respectively !o the Naval Research Lab. in Washington.9. Hoffmann, H.-E.: The Horizontal and Vertical Struc- They are collectiig new icing data in a contract from FAA totures of Cloud Physical Parameters. 5th WMO Scientific re-examine thedefinitions of the icing atmosphere.Conference on Weather Modification and Applied CloudPhysics, Reijing, China, 8-12 May 1989, WMP Report 3. V. Garratt, RAENo. 12. l am not sure how you differentiate between solid and liquid
particles.10. Hoffmann, H.-E.; Demmel. J.; Horst, H.; Label, H.:
A Documentation of Icing-Relevant Cloud Physical Po- Author:roreters on Vert;col Soundings of Strotiform Clouds. This is our most important problem. We apply two solutions-DLR - Mitt. 90-07, 1990. (An ESA-Tronslation in pre- At first observations by the pilots or flight engineers,poartion). secondly with a back scatter device to determine the
normalized visibility. fhe results of both are only qualitative.11. Hoffmann, H.-E.; Demmel, J.; Horst, H.; Stingl, J.. Thepercentagebetweensolidandliquidparticlescannotbe
Documentation of Icing-Relevant Cloud Physical Po- determined
34-1
DEVELOPMENTS IN ICING TEST TECHNIQUES FOR AEROSPACE APPLICATIONSIN THE RAE PYESTOCK ALTITUDE TEST FACILITY
M Holmes, V E W Garratt, R G T DragePropulsion Department, Royal Aerospace Establishment
Pyestock, Hants. GU14 OLS, England
ABSTRACT equipment is a continuing process andsignificant improvements have recently
The altitude test facilities at RAE been introduced. These are centred on onePyestock are used in support of clearance of the most important elements of theof aero-engines, intakes and helicopter whole process, the simulation of therotors to operate under severe icing defined cloud.conditions. An important aspect of thework is the simulation of the wet icing Some icing clouds consist of a mixture ofcloud in terms of water concentration, supercooled water droplets and particlesmean droplet size and spectrum. Water of dry ice and completely differentspray rakes or booms have been developed techniques are used for producing thesefor this activity and individual nozzles two components of the cloud. Ice parti-calibrated in a purpose built wind tunnel. cles are produced by milling chips offA laser particle sizer has been used to prepared ice blocks and introducing themcalibrate typical spray nozzles and into the main air flow upstream of theattempts made to establish a traceable liquid water injection point. However,standard. Although this paper mainly customers seldom specify a requirement fordeals with the development of cloud dry ice and the subject has therefore notsimulation, it also includes a short attracted quite the same developmentdescription of the facilities and the effcrt as the production of watercapability for monitoring ice formation droplets. It is thus not given muchand shedding. prominence in this paper. Water droplets
are produced using ., array of spray1 INTRODUCTION nozzles placed in the cold inlet air
stream. The droplets rapidly lose heat toSafe operation of civil and military their cold surroundings to become super-aircraft and helicopters in weather cooled, as in the natural cloud, retainingconditions which can cause ice build-up on their liquid state until impact with anengine intalces, engine fan, compressor and object triggers solidification.helicopter rotor bladeb is a prime concernof the air worthiness authorities. Apart from the difficulty of producing aRegulations have therefore been produced consistent uniformly distributed sprayin Europe and the USA which identify the pattern across the duct, which may be uptest conditions with which aerospace to 2.6m in diameter, there is the problemvehicles in ground-based facilities must of measuring the droplet size distributioncomply before clearance to fly in icing itself. Although this should ideally beconditions is given. The advantages of done whilst the test is in progress, thegaining test evidence on ground-based practice at RAE has been to calibrateacilities prior to flight testing Is that individual nozzles in a controlledthey can provide specified, consistent and environment in a low speed wind tunnelrepeatable test conditions irrespective of especially adapted for this purpose. Athe prevailing weather. They also permit laser particle sizer has been used to goodthe use of non-flightworthy test vehicles, effect in this work.all of which contribute towards aconsiderable reduction in time and cost to This paper begins by reviewing the icingobtain clearance for flight in ice-forming certification regulations, noting anyconditions. differences between the various regulatory
authorities and the effect this can haveSuch cesit facillties exist at the Royal on setting up test conditions. The testAerospace Este',lishment, England, in the facilities at Pyestock are then describedform of two of the altitude test cells at together with a brief description of thePyestock. These were primarily intended capability for monitoring ice formationfor steady-state and transient performance and shedding. Finally, the development ofevaluation of air breathing missile and water spray rake is discussed, withaero engines, but a capability for icing particular attention paid to thetests was recognised and incorporated at calibration of spray nozzles and thethe design stage. Although there has been development of special equipment for thatlong experience of icing tests extending purpose.over twenty year-, development oftechniques, instrumentation and monitoring

34-2
2 REVIEW OF ICING REGULATIONS of actual meteorological data by theNational Advisory Comnittee in Aeronautics
Icing tests at Pyestock form part of an (NACA) contained in Refs, 6,7 and 8. Refoverall icing certification programme 6 gives two sets of curves depicting cloudagreed between the manufacturer and one or liquid water content (LWC) versus meanmore of the three regulatory authorities effective droplet diameter or volumeempowered to grant the relevant median diameter, (VMD), over an ambientoperational clearance for aerospace temperature range of 0°C to -30°C forvehicles manufactured and/or tested in the continuous maximum icing and O°C to -40"CUnited Kingdom (UK). These authorities foe intermittent maximum icing. Ref 7are:- gives two curves of LWC factor versus
cloud horizontal extent to allow for(a) The UK Ministry of Defence duration of flight in icing conditions andProcurement Executive (MOD(PE)) which Ref 8 is the source for plots of ambientdeals with military equipmet coveicd by temperature versus pressure altitude.the appropriate Defence Standard (Ref 1).
The spectrum of droplet sizes to be(b) The British Civil Aviation employed for demonstrating compliance withAuthority (CAA) which administers the icing regulations is not strictly defined.Joint (European) Aircraft Requirements Probably because it would be very(JAR) applicable to modern transport difficult, if not impossible, to simulateaircraft and propulsion systems (Ref 2 and the range of sizes which occur in real3) and also the old British Civil Aircraft clouds. The droplet spectra tabled in DefRequirements which still apply to types Stan 00-970 and AC 20-73 all plot asoriginally certified to these regulations. normal distributions and are aimed at the
theoretical assessment of the icing hazard(c) The Department of Transportation of in terms of water catch rate (20 micronthe United States of America (USA) Federal droplets) and water impingement limitsAviation Administration which issues (50 micron droplets).Federal Aviation Regulations (FAR) (Ref 4)and associated Advisory Circulars which At Pyestock, the practical operatingare applicable to UK manufactured conditions recommended for the air blastaerospace equipment which is required to spray nozzles are those which produce aoperate in America. near normal size/volume distribution; that
is, as far as possible, bimodalThe nature of the regulations, which distributions are avoided as givingapplies to all authorities, demands that unrepresentative icing conditions.clearance to operate in icing conditionsis dependant on a three-part assessment. In general, the icing test requirementsThe first requirement is for an in-depth for the civil aircraft authorities quotedtheoretical analysis of the susceptible ,iow very close agreement and it wouldicing areas on the flight vehicle at the appear that there is a gradual convergencemost severe atmospheric conditions which towards a common policy covering allmay produce ice accretion and their affect aspects of clearance to operate in naturalon the vehicle as a whole. This is icing conditions.followed, wherever posssible, by full-scale rig tests at these critizal condi- The main differences at the moment lie intions and, finally, flight tests are the requirements for the simulatedperformed in real icing environments. The conditions for testing rotorcraft andtotal programme should be agreed between those for testing turbine engines. Ir thethe aerospace manufacturer and the airwor- former, the CAA has reduced the severitythiness authorities, but the demonstration of the icing atmosphere below 3000 m fromof satisfactory operation under simulated that quoted in Refs 3 to 6. In theconditions is the sole responsibility of latter, whereas the CAA/JAR requiresthe manufacturer under the scrutiny of the simulated altitudes, forward speeds andappropriat- authority's officials or their engine powers for the flight regime underdelegates. scrutiny, the FAA states that compliance
with regulations can be adequatelyAll three regulatory authorities refer to demonstrated over a range of engine powersthe same two standard wet icing at ground level static conditions but withatmospheres detailed in Refs 5 to 8. considerably increased liquid waterThese are the Maximum Continuous icing concentrations.conditions relating to long tracts ofstratiform cloud and the Maximum 3 DESCRIPTION OF ICING FACILITIESIntermittent icing typical of short spancumuliform cloud, illustrated in Fig 1. The altitude test facilities at Pyestock,Both are bused on a statistical treatment pictured from overhead in Fig 2, consist
4i
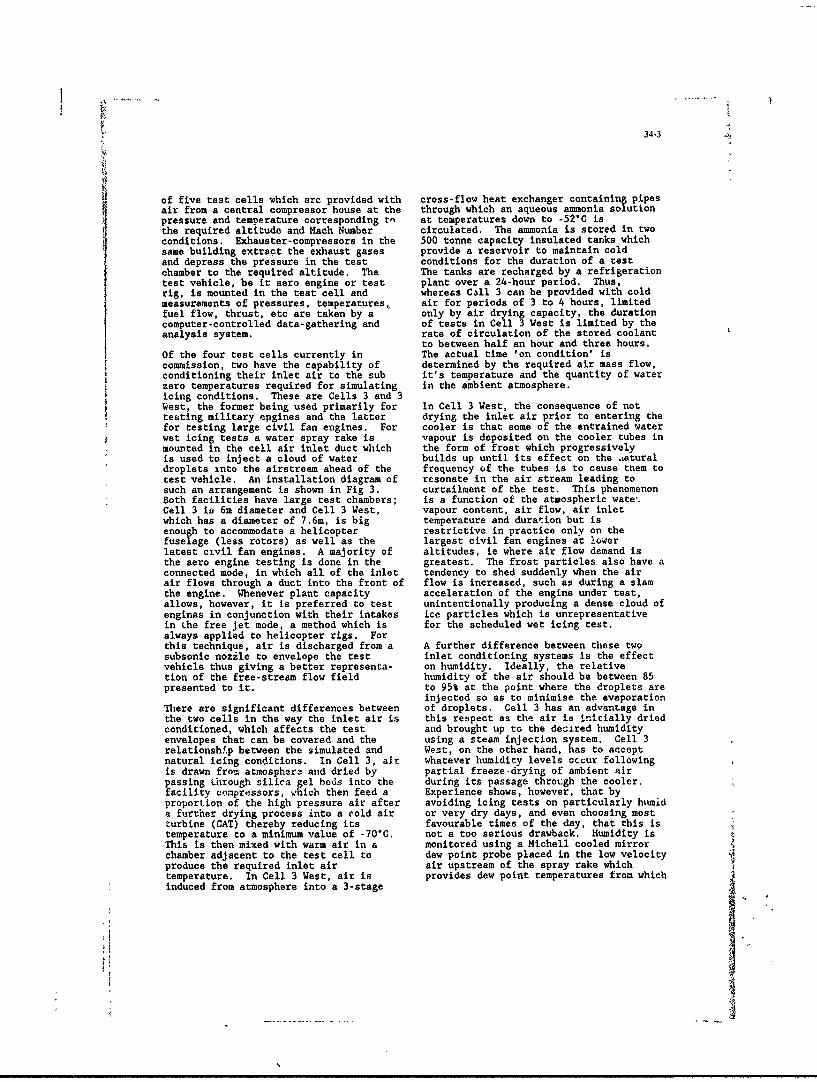
34-3
of five test cells which arc provided with cross-flow heat exchanger containing pipesair from a central compressor house at the through which an aqueous ammonia solutionpressure and temperature corresponding to at temperatures down to -52"C isthe required altitude and Mach Number circulated. The ammonia is stored in twoconditions. Exhauster-compressors in the 500 tonne capacity insulated tanks whichsame building extract the exhaust gases provide a reservoir to maintain coldand depress the pressure in the test conditions for the duration of a testchamber to the required altitude. The The tanks are recharged by a refrigerationtest vehicle, be it aero engine or test plant over a 24-hour period. Thus,rig, is mounted in the test cell and whereas Call 3 can be provided with coldmeasurements of pressures, temperatures, air for periods of 3 to 4 hours, limitedfuel flow, thrust, etc are taken by a only by air drying capacity, the durationcomputer-controlled data-gathering and of tests in Cell 3 West is limited by theanalysis system. rate of circulation of the stored coolant
to between half an hour and three hours.Of the four test cells currently in The actual time 'on condition' iscommission, two have the capability of determined by the required air mass flow,conditioning their inlet air to the sub it's temperature and the quantity of waterzero temperatures required for simulating in the ambient atmosphere.
icing conditions. These are Cells 3 and 3Uest, the former being used primarily for In Cell 3 West, the consequence of nottesting military epgines and the latter drying the inlet air prior to entering thefor testing large civil fan engines. For cooler is that some of the entrained waterwet icing tests a water spray rake is vapour is deposited on the cooler tubes inmounted in the cell air inlet duct which the form of frost which progressivelyis used to inject a cloud of water builds up until its effect on the .,aturaldroplets into the airstream ahead of the frequency of the tubes is to cause them totest vehicle. An installation diagram of resonate in the air stream leading tosuch an arrangement is shown in Fig 3. curtailment of the test. This phenomenonBoth facilities have large test chambers; is a function of the atmospheric wate'.Cell 3 is 6m diameter and Cell 3 West, vapour content, air flow, air inletwhich has a diameter of 7.6m, is big temperature and duration but isenough to accommodate a helicopter restrictive in practice only on thefuselage (less rotors) as well as the largest civil fan engines at lowerlatest civil fan engines. A majority of altitudes, ie where air flow demand isthe aero engine testing is done in the greatest. The frost particles also have aconnected mode, in which all of the inlet tendency to shed suddenly when the airair flows through a duct into the front of flow is increased, such as during a slamthe engine. Whenever plant capacity acceleration of the engine under test,allows, however, it is preferred to test unintentionally producing a dense cloud ofengines in conjunction with their intakes ice particles which is unrepresentativein the free jet mode, a method which is for the scheduled wet icing test.always applied to helicopter rigs. Forthis technique, air is discharged from a A further difference between these twosubsonic nozzle to envelope the test inlet conditioning systems is the effectvehicle thus giving a better representa- on humidity. Ideally, the relativetion of the free-stream flow field humidity of the air should be between 85presented to it. to 95% at the point where the droplets are
injected so as to minimise the evaporationThere are significant differences between of droplets. Cell 3 has an advantage inthe two cells in the way the inlet air is this respect as the air is inicially driedconditioned, which affects the test and brought up to the decired humidityenvelopes that can be covered and the using a steam injection system. Cell 3relationship between the simulated and Wezt, on the other hand, has to acceptnatural icing conditions. In Cell 3, air whatever humidity levels occur followingis drawn from atmospher3 and dried by partial freeze-drying of ambient airpassing through silica gel beds into the during its passage through the cooler.facility compressors, N. hich then feed a Experience shows, however, that byproportion of the high pressure air after avoiding icing tests on particularly hinida further drying process into a cold air or very dry days, and even choosing mostturbine (CAT) thereby reducing its favourable times of the day, that this istemperature to a minimum value of -70"C. not a too serious drawback. Humidity isThis is then mixed with warm air in a monitored using a Michell cooled mirrorchamber adjacent to the test cell to dew point probe placed in the low velocityproduce the required inlet air air upstream of the spray rake whichtemperature. In Cell 3 West, air is provides dew point temperatures from whichinduced from atmosphere into a 3-stage
:[i

34-4
the relative humidity at the water spray or entry spinner of an engine. Remotelyrake is then automatically calculated, operated high definition still camera
shots are also taken for record purposes,The icing cloud is produced by a number of typical of which is Fig 5, whilst high-air blast water spray nozzles placed in speed cinb up to 1200 frames per see ishorizontal rows about 127 mm apart on an available for recording the ice sheddingarray of arms forming a sturdy structure, and resulting particle trajectorieswhich contain the water feed and air associated with the post-icing enginesupply to individual nozzles. Fig 4 shows accelerations. For connected tests,a typical installation of a spray rake. camera viewing windows are mounted in theThree rake assemblies are available inlet duct. These are kept frost and mistranging from one with 37 nozzles for a free by electro-thermal heating.0.9 m dia duct to one with 242 nozzles fora 2.4 m dia duct. A new rake for the 4 PRODUCTION AND MEASUREMENT OF WATERfuture family of large civil engine will DROPLETSrequire 310 nozzles for a 2.64 m dia duct.The water supply is demineralised and held 4.1 Syrav nozzlein a tank at about 20*C pressurised to690 kPa (100 lb.in' abs), flow being Airblast atomising nozzles are used tocontrolled by remotely-operated valves, produce a cloud of water droplets, aThe water injection system is deceptively typical nozzle being shown in Fig 6complicated and has been the subject of comprising a central water nozzleextensive development at Pyestock over surrounded by an annular air passage.many years, justifying a separate Three different sizes of water nozzles aredescription of it and its calibratLon in currently available depending on the LWCthe following sections. range required. The water jet emerges at
a low velocity compared with itsThe overall spray pattern of the various enveloping air jet, this high relativewater injection rakes is checked in the velocity promoting the break-up of thetest chamber. This is achieved by water into fine droplets. A noteworthymounting a target grid of rods downstream feature of this nozzl.e is the protrusionof the spray rake and blowing air at a of the water nozzle from the air cap face,temperature no higher than -15°C with both which allows the water flow to be sethigh and low water flow rates. The low largely independently of the airflowtemperature ensures that all droplets although there is some increase in waterimpacting on the grid will freeze and the flow with atomising air pressure due toresulting ice accretion pattern when the 'ejector' effect. If, as in someexamined astor 3 to 5 minutes of water nozzle designs the water nozzle isinjection gives an excellent indication of withdrawn into the air cap, then the waterthe uniformity of the spray. flow can be strongly influenced by the
atomising air pressure.Dry ice particles are intr3duced
into the
test cell in a totally different way, The other main parameter in producing theupstream of the water spray rake. They reluired droplet VMD is the atomising airare produced by milling ice blocks which pressure. This is measured by means ofhave been moulded and then cured for hypodermic tubes inserted into two of theseveral days at -20*C. The required control spray arms connected to separatenumber of cured blocks are loaded onto a pressure transducers, ensuring that thevariable speed conveyor inside a pre- pressure is measured as near as possiblecooled chamber and are moved into contact to the actual nozzles. Because of the lowwith a variable speed multi-blade airflow rates, the arms act as plenumcutter. The resulting ice particles, chambers. The mean of these measurementswhich are approximately 1 mm in size, are is taken as representative of the wholecollected and fed into the main airstream rake and the atomising air pressure is setthrough 26 distribution tubes of varying using the difference between this and thelengths. rake duct static pr-ssure.
Before dealing with the subject of 4.2 Water fLow corlproducing and measuring water droplets,meation must first be made of the The control and accurate measurement ofextensive facilities for viewing ice the water flow through the spray rake isaccretion and its subsequent shedding from Important both for the realisation of thethe test vehicle. Five channels of closed specified LWC and the production ofcircuit TV are available for remote correct droplet VMD. The water flowmetersviewing and recording on tape. One of used for this purpose are either of thethese channels can provide a strobed vipw Pelton wheel or turbinc type and areof rotating parts, such as the fan blades calibrated before each icing installation
mmm~mmmmm ~ mq~mM ~ 'Jm ~ m"i-

34-5
using a dedicated traceable gravimetric thousands of droplets in a few seconds andcalibration system. On the large rake can be operated remotely.there is a fundamental problem in that ahead difference of up to 2.4 m between the Various lenses can be used with thetop and bottom arms causes unequal water instrument covering different particleflows if not corrected. The current size ranges and working distances. Themethod of solution uses constant level latter is defined as that distance fromweir chambers on each arm in which the the lens which must contain all the spray.water levels are maintained by optical Experience has shown that the best working
sensors controlling valves in the water arrangement is with a 300mm lens giving
afeed line, shown in Fig 7. The water is working distance of 400mm and a particledisplaced from the chambers by (droplet) cize range of 5.8 to
pressurising them with nitrogen gas. 564 microns. This working distanceWhilst very successful in producing equal accords well with the 610mm tunnel width.flows to the spray nozzles, this system is The lower droplet size limit ofsubject to pulsations in the water supply 5.8 microns is not a disadvantage into the weir chambers caused by the practice as any volume of liquid containedcontinual opening and closing of the below this size would generally be a veryvalves in the feed lines. This has made small proportion of the total in thethe on-line measurement of total water distributions typically used for icingflow difficult. New improved methods of cloud simulations. Additionally, theflow control are currently under Malvern software takes some account of thedevelopment, undersize droplets.
4.3 Spray calibration facility The Malvern particle sizer has become awidely accepted method of particulate
The water droplets should preferably be measurement and is generally self checkingmeasured in the test cell close to the in that mis-alignment or dirty lenses aretest vehicle, but in practice this has not immediately obvious. However, abeen found to be feasible in a large-scale Verification Reticule is also used as anengineering environment not conducive to additional functional check. Thisthe use of delicate instruments. The consists of an optical glass flat whichalternative solution is to calibrate can be attached to the receiving lens ofindividual spray nozzles in a separate the particle sizer on which about 10000facility. At Pyestock, this comprises an chrome dots of known sizes are depositedopen circuit wind tunnel having a 0.37 m
2 randomly within an 8mm diameter circular
working section connected to exhauster area. The VMD of this array is initiallycompressors with capacity to generate up determined by the manufacturers within ato 80 m/s air velocity over a twin nozzle specified tolerance of ±2 microns. If thespray mast, as shown in Fig 8. A laser particle sizer repeats this measurementparticle-sizer produced by Malvern within the above tolerance then it can beInstruments is mounted at the side of the concluded that the system is functioningworking section with its beam directed correctly. With such a complex opto-through the droplet cloud shown in Fig 9. electronic system this alone is of greatThis instrument's principle of operation worth. However, initially it was thoughtis the measurement of the diffracted laser that the reticule might also serve as alight pattern generated by the droplet much needed transfer standard for forwardcloud intercepting the laser beam, Ref 9. diffraction particle sizers.The pattern is then converted into a Unfortunately, a thorough investigation bydroplet volume spectrum by Malvern the National Physical Laboratory (UK)Instruments proprietary software using an showed that this was not feasible forOlivetti computer. A typical computer various reasons, eg the random overlappingoutput showing the spray analysis is shown of the dots make the accurate independentin Fig 10. As can be appteciated, this calculation of the VMD impossible.widely accepted instrument, Refs 10and 11, is a major advance on earlier 5 TYPICAL SPRAY NOZZLE CALIBRATIONStechniques based on the use of oiled orcoated glass slides on which droplets 5.1 Nozzle characteristic curveswere captured and photographed for lateranalysis. The laborious task of sizing a The presentation of spray calibrationfew hundred droplets under a microscope facility results in the form of nozzleagainst a standard graticule did not lend characteristics (Fig 11) at constant wateritself to accurate and repeatable flow rates has mcrked advantages. Themeasurements of a large number of samples. data gathering is expedited by onlyThe laser instrument, on the other hand, needing to change the air pressureis non-intrusive, of-lino, counts many significantly at each test point.
Generally, the whole curve can be covered

34-6
in about thirty minutes of testing with -5°C air stream in under a metre or so, aabout fifteen test points. The form of 30 micron droplet with 27 times more mass,the line is well defined with little might require 5 metres, although it wouldscatter making for excellent overall still be supercooled within about a metre.accuracy. The asymptotic curves clearlyshow the operational limits of the From this point of view, the separationnozzles. For instance, a required VMD between the spray rake and the targetbecomes impossible to achieve above a needs to be greater than 5 m to ensurecertain water flow for a given size nozzle representative ice accretion, especiallyirrespective of atomising air pressure, with a broad droplet spectrum or a VMDIf the LWC is too high, a larger (water) greater than 20 micron.nozzle becomes necessary to produce a20 micron VMD, say. An intrinsic problem with this theoretical
analysis is that the initial heatThis is further illustrated by the transfer is strongly dependant on the20 micron working curves shown in Fig 12 droplet to air stream relative horizontalcomparing four different size nozzles, velocity. As the emergent water jet,These show that the limit of water flow before break-up, is surrounded by thewhich can produce a 20 micron VMD varies (warm) atomising air it cannot be knownfrom 10.4 litre/h for a 0.41 mm dia nozzle precisely at what velocity the drop isto 16.3 litre/h. for a 0.91 mm dia nozzle, actually formed and exposed to the cold
air stream. The way round this has been5.2 Effect of main stream air velocity to consider the two possible extremes of
initial droplet velocity, ie zero and mainAs well as the main parameters of water air stream velocity, and produce twoflow rate and atomising air pressure, it coollng curves where the true state ofhaa been obssrved that the main air stream affairs lies somewhere in-between. Forvelocity over the spray rake also the purposes of this paper and toinfluences droplet size, which reduces as illustrate simply the comparative thermalair velocity increases. The reason for history of three different drop sizes,this is not fully understood, but may be only the zero velocity case has beendue to the increased turbulence causing presented.secondary atomisation. An investigationof this effect was thus undertaken and the 6 CONCLUDING REMARKSresults of VMD vs tunnel air speed over arange of nozzle water flows are shown in Although a solid data base on the PyestockFig 13. It can be seen that this effect spray nozzles has been achieved there isis quite appreciable which justifies the considerable scope for further work mainlyuse of a tunnel for such work rather than through extending the capability of theoperating in still air. One interesting spray calibration facility.feature of these results is that thehigher the water flow the earlier, in The present air velocity limit of 76 m/sterms of air speed, does the effect is not fully representative of thecommence. A factor in this may be the velocities used in the actual icing tests,increasing momentum of the water jet and as previously mentioned, thisallowing it to persist, so giving the parameter can affect the droplet VMD. Itsecondary turbulence longer in which to is intended to increase this velocity byhave an effect, reducing the tunnel area by means of an
insert. This will consist of a tube of5.3 Effect of main stream air 0.4 m dia supported and sealed centrally
temperature in the existing tunnel. Provision will bemade for the Malvern transmitting and
As the demineralised water supply fed to receiving lenses to be sealed into thisthe spray rake is maintained at 20°C to tube. In this way the tunnel air velocityprevent it freezing before or on reaching can be increased to 150 m/s.the nozzle, it may be questioned if thedroplets have become supercooled and/or All the measurements reported on here havereached air stream temperature by the time been made with the spray bar 0.7 m fromthey arrive at the target, as they would the laser beam. This distance is oftenIn a natural clcud. This is important exceeded in icing tests and the effect ofbecause Rof 12, for instance, shows that this is not known and needs to beice accretion takes different forms investigated. Increased evaporation ordepending on the state of the droplets at coalescence may occur, changing the VMD.impact. Theoretical studies at Pyestock, The present tunnel arrangement only allowssome results from which are given in fairly small changes in this samplingFig 14, sueget rhat whil e 10 micron distance and therefore a schcmc haz bccndroplet comes to thermal equilibrium in a suggested whereby a group of nozzles is

~34-7
supported on a 'sting'. This sting is 2 Joint Airworthiness Requirements:then introduced at the mouth of the tunnel JAR-2S large aircraft and JAR-Eand can be inserted varying distances engines, 1986.downstream into the working section of thetunnel,, giving a maximum separation of 3 British Civil Airworthiness4.8 m. Requirements:, BCAR 29 rotorcraft
(post 17.12.86), BCAR.G rotorcraftAs the tunnel air velocity and the nozzle (pre 17.12.186) and Paper G610to laser beam distance increases so does Issue 2 18.9.81 rotorcraft.the spray become more diffuse. On thestandard Malvern instrument it is 4 Federal Aviation Regulations:,necessary for the spray to obscure 10 to Airworthiness Standards Part 2530% of the laser beam to give sufficient transport category airplanes,scattering signal. Because of the very Part 27 normal category rotorcraft,low water flows sometimes specified in the Part 29 transport category rotor-icing tests, even the use of two spray craft and Part 33 aircraft engines.nozzles has not always allowed thiscriterion to be strictly satisfied. For 5 Aircraft ice protection. FAAthis reason the Pyestock particle sizer advisory circular AC 20.73 1971.has had an extra amplification stagefitted allowing the obscuration to go as 6 Continuous maximum and intermittentlow as 2%. maximum atmosphere icing conditions:,
liquid water content versus meanHowever, it is envisaged that with the effective drop diameter.increased tunnel speed and separation even NACA TN 1855, 1949.this may not be sufficient. Therefore theenhanc,,mqnt scheme will provide two 7 Cantinuous maximum and intermittentrepresentative groups of five and seven maximum atmospheric icingnozzles. These will be sting mounted conditions:, liquid water contentcomplete with their air and individual versus cloud horizontal distance.water supplies, and will afford the option NACA TN 2738,, 1952.of choosing any number of active nozzleswithin each group thereby permitting the 8 Continuous maximum and intermittentobscuration to be adjusted depending on maximum atmospheric icingwater flow rate, target distance and conditions:. ambient temperaturetunnel air veloc4 ty. versus pressure altitude.
NACA TN 2569, 1951.Future work at RAE will thus continue tobe aimed at meeting customer requirements 9 Swithenbank, et al, "A laserand satisfying the evolving demands of the diagnostic technique for theinternational regulatory authorities. In measurement of droplet and particlethis respect, a document about to be size distribution". Progress inpublished by the FAA entitled "The Astronautics and Aeronautics 53Aircraft Icing Technology Handbook" should (1977) 421.stimulate international efforts towardsproducing a single comprehensive set of 10 Dodge, L.G. and Cerwin, W.A.,icing requirements aimed at worldwide "Liquid particle size measurementapplication. International effort might techniques". ASTM STP 848 edited byalso be appropriate to update the existing Tishkoff, Ingebo and Kennedy,, 1984.icing cloud characteristics bearing inmind that these arc based on data gathered 11 Ugur Tuzun, Farhad A Farhadpour,nearly forty years ago using flight "Comparison of Light Scattering withinstrumentation far less precise than other Techniques for Particle Sizemodern equipment. Perhaps this should be Measurement". Particleextended to other parts of the globe not Characterization 2 (1985) p104-112.previously surveyed. The test facilitiesat Pyestock could play a role in this work 12 Marck, C J and Bartlett, C S.,by evaluating the latest flight-standard "Stability relationship forinstruments, waterdroplet crystallization within
NASA Lewis icing spray nozzle".REFERENCES AIAA-88-0289 26th Aerospace Sciences1 Defence Standards. 00-970 Vol 1 Meeting, Nevada, 1988.
Aircraft, Vol 2 Rotorcraft and00-971 Engines, 1983 Copyright , Controller HMSO London
(1990)
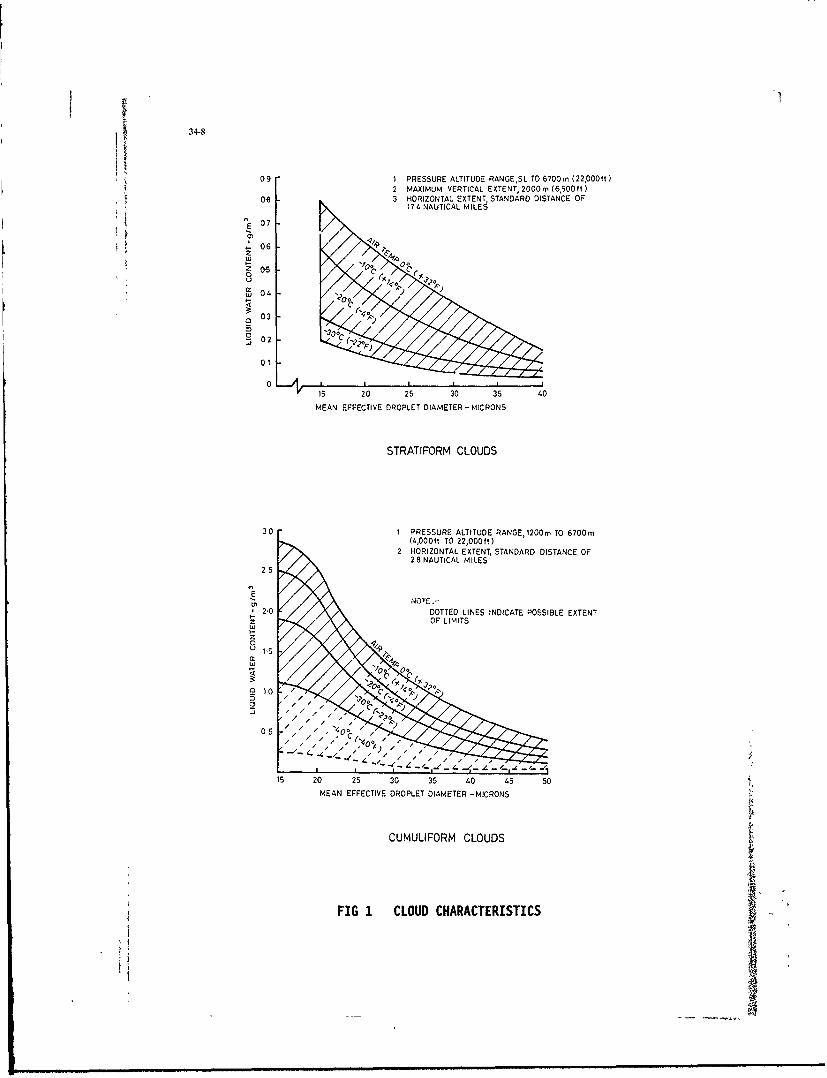
34-8
09 1 PRESSURE ALTITUDE RANGE,SL TO 6700m (22OO00ft)2 MAXIMUM VERTICAL EXTENT, 2000m (6,50010)
0.8 -3 HORIZONTAL EXTENT STANDARD DISTANCE OF174 NAUTICAL MILE
'07
06 C
w 0
03
ow 02
03
15IL 20 25 30 35 40
MEAN EFFECTIVE DROPLET DIAMETER - MICRONS
STRATIFORM CLOUDS
30 1 PRESSURE ALTITUDE RANGE,1200m TO 6700m(4,000ft TO 22,0O0ft)
2 HORIZONTAL EXTENT, STANDARD DISTANCE OF2 8 NAUTICAL MILES
2 5
EU, NOTE.-
2.0 DOTTED LINES INDICATE P05SIBLE EXTENT
z
0
o10 C
15 20 25 30 35 40 45 soMEAN EFFECTIVE DROPLET DIAMETER -MICRONS
CUMULIFORM CLOUDS
FIG 1 CLOUD CHARACTERISTICS

3-.9
FIG 2 AERIAL VIEW OF TEST FACILITY
FREE JET TEST MOSE
FIG 3 TYPICAL ENGINE INSTALLATION

34-10
FIG 4 SPRAY RAKE INSTALLATION
FIG 5 ICE BUILD-UP ON ENGINE INLET

34-11
AIR CAP
AIR FLOW
WATER NOZZLE
FIG 6 TYPICAL SPRAY NOZZLE
NITROU MANIFOLDO -
WATER PRESSURE
FIG 7 SPRAY RAKE ANPl CONTROL SYSTEM
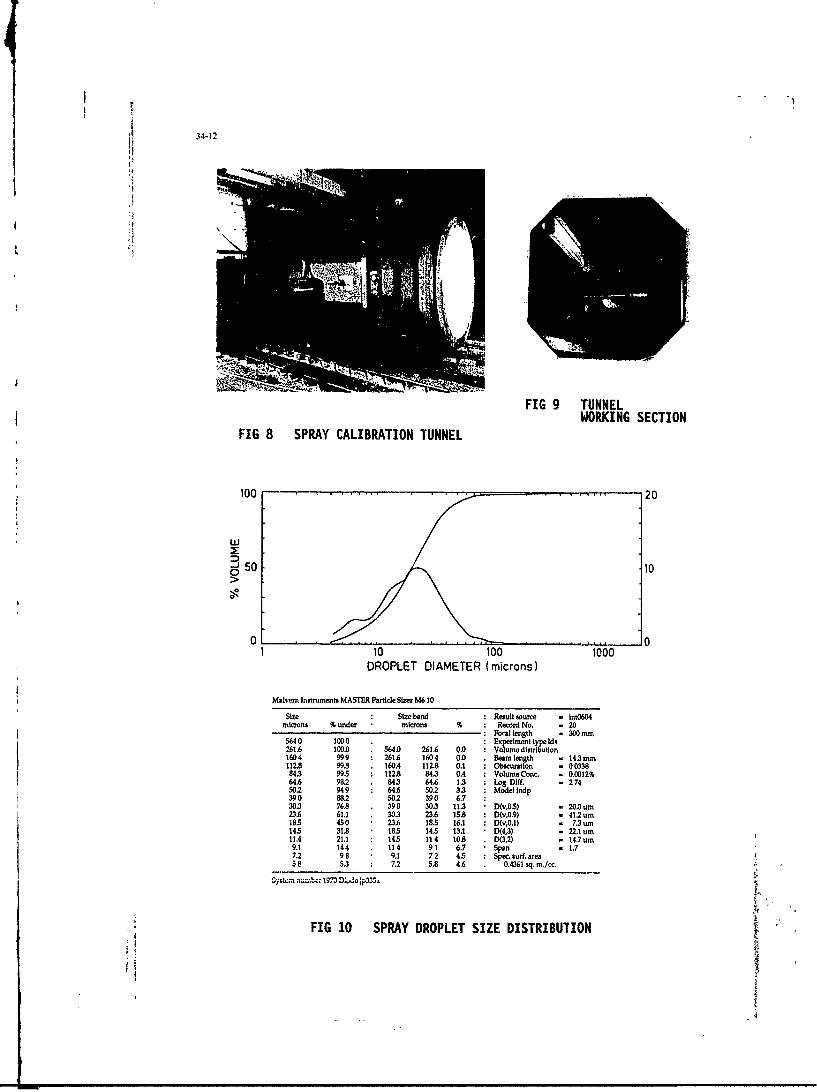
34-12
FIG 9 TUNNELWORKING SECTION
FIG 8 SPRAY CALIBRATION TUNNEL
100 -20
w
-1 50 .100
01 J01 10 100 1000
DROPLET DIAMETER (microns)
Malvern Instruments MASTE Particle Sizer M6 10
size Size band Result source - int0604microns % under microns % Record No. . 20
5640 1000 mlgt id'30m
261.6 100D0 564.0 261.6 0.0 Vrm ~ o1604 999 261.6 1604 0.0 .Besmlnt 4m112.8 99.8 .160.4 1112.8 0.1 Osuain -0033884.3 995 112.8 84.3 0.4 Volume Conc. -0.0012%
646 91 84 4o 3 m if 249350.2 949 64.6 50.2 33 Model lndp
145 118 185 4S 31 D4,3 22.1 urn11.'4 21.*1 14.5 114 10.8i D(3,2) -14.7urn9.1 144 . 114 91 6.7 Span *1.7
7.2 98 9.1 72 4S Spec urf.area59 5.3 7.2 5.8 4.6 . 0.4361 sq. co/cc.
1y;Lir -'urnc ="73 Dkjp
FIG 10 SPRAY DROPLET SIZE DISTRIBUTION
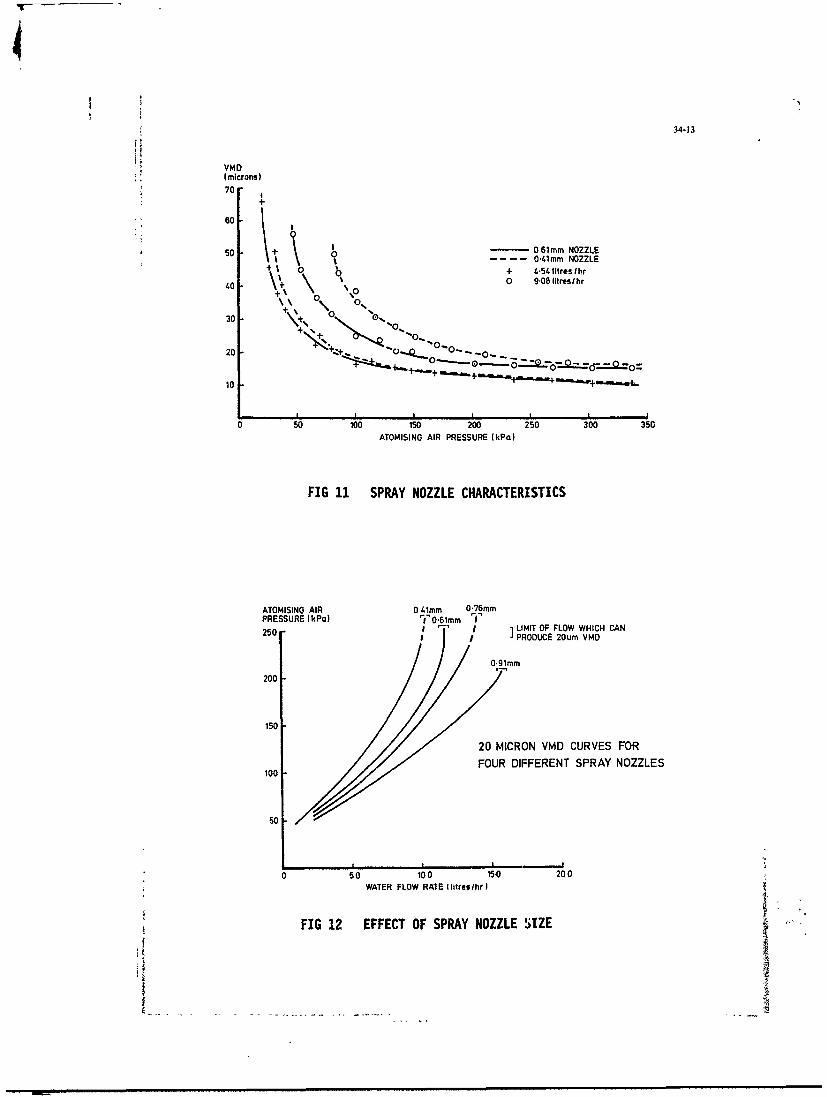
34-13
(microns)70
60 -
50 0 - 061mm NOZZLEI - - - - 0,/1mm NOZZLE
+ /.51. litres I hr
.0 % 0 0 9-08 litres/hr
\ \ 0%30 0
~0*,20 -+- - -
10
0 50 100 150 200 250 300 350ATOMISINO AIR PRESSURE lkPa)
FIG 11 SPRAY NOZZLE CHARACTERISTICS
ATOMISINO AIR 0 1a1mm 076mmPRESSURE (kPo) '0.61mm l250 / LIMIT OF FLOW WHICH CAN250 5mPRODUCE 20um VMD
0.9 1mm
200
150
20 MICRON VMD CURVES FOR
FOUR DIFFERENT SPRAY NOZZLES100
50
0 50 100 150 200WATER FLOW RATE Ilitreslhr)
FIG 12 EFFECT OF SPRAY NOZZLE SIZE
II
m= q mmmm ~ 1. _w

j4
-14
24
0 2:27 Iltres/ hr23 a x 4.54
M AA908MAP*MEAN ATOMISING
AIR PRESSUREE 22 A
20MA:82P M.AAI?.I48O8kPa
z20 Ai tAAP-6-2kPa aA
S19 -oxLU0 0 Ax a
00
17 a0
16. 0
Is0
to 26 30 40 50 60 70 80MAIN AIR STREAM VELOCITY (mis)
FIG 13 EFFECT OF TUNNEL VELOCITY
,or
I CONDITIONS
AIR STREAM TEMPERATURE =-5 *CAIR STREAM VELOCITY -91 4. rn/sDROPLET INITIAL VELOCITY -0
DROPLET INITIAL TEMPERATURE 1 0 0C5
SYMBOL DROP DIA~jum)
x 3
I2 3 45t1J~fl~L NOZLEU PIPPI
F1l! 14 DROPLET TEMPERATURE REDUCTION

34-15
Discussion droplet size (turing the tests at high altitude?As you have not, are you satisfied that the parameters youuse for setting up the droplet size gise correct droplet sizes
1. W. Grabe, NRC Ottawa during the tests at high altitudes?Are the nozzles on a horizontal bar individually controllableand have you found flow graduations from the inlet to the Author-outlet side? It is the practice at RAE to allow for the effect of lowAfter calibration of a nozzle in a calibiation tunnel, do you pressure at altitude an atonization performance by testingcheck it in a test situation and do you then adjust for nozzles in a low pressure chamber. However, by setting airdifferences? pressure by the pressure difference between ambient and
nozzle ai supply we are confident that calibration in theAuthor: wind tunnel is applicable to altitude.The water flow to individual nozzles is not controlled duringa test, but the nozzles could be blanked off prior to a test if 3. C. Scott Bartlett, Serdrup Technologysome bias to the cloud pattern is required. A metal grid is In reference to your data showing a strong influence ofused to collect ice downstream of the spray nozles to check droplet injection station air velocity on test section dropletwether the distribution meets the requirements size, could you comment if this result could be attributed toWe do not check the calibration done in the wind tunnel instrument error and, if not, can you offer an idea of whatagainst mneasurements taken in the test chamber, as the process might cause the effect"latter presents a harsh environment for precision measuringequiment. The most influential parameters (air velocity, Author-atomizing air pressure) are controlled in the calibration RAE are confident that instrument error is not responsibletunnel, and we have no evidence that additional droplet size for the influence of air velocity or mean droplet size %henmeasurements in the test chamber are justified. using the Malvern instrument, although sonic othei
instruments are known to be sensitive to droplet velocity2. E. Brook, Rolls Royce This is a result of the basic principle of operation of theYou hae looked at the vanation of droplet size with air Malvern instrument that produces a stationary diffractionvelocity in your calibration tunnel, but your calibration is image of a moving droplet The effect could result from thecarned out at sea level Have you looked at the variation of reasons mentioned in paragraph 5.2 of the paper
'V
I

1' 35-1
ENTREE D'AIR D'HELICOPTERESPROTECTION POUR LE VOL EN CONDITIONS
NEIGEUSFS OU GIVRANTES
parXavier de Ia SERVETI'E
etPhilippe CABRIT
AEROSPATIALEDivision iidlicopt~res
13725 Marignane CedexFrance
ABSI'RAC 2) CONCEPTION DIUNE ENTREE D'Allt
La fonction principale d'une entr&e d'air eat d'assurer 2.1 Fonictions d'une ente .il'alimentation correcte du moteur ;de plus, celie-ci dolt as-surer la protection du moteur contre lea effets de l'humidlt4s La fonction principale d'une entree d'air eatatmosph,&rique et des objets extdrleurs, afln de garantir la d'asaurer l'alimentatlon correcte du moteur en airs~curit6 du Vol quelles que solent lea conditions extitrieures. dans touc le domaine et lea attitudes de vol reven-Le comportement des diffitrents types d'entr&e d'air utiliss diquks pour I'hMicopisre Un certain nombre desur ii~iicoptsre en conditions de neige et de givre eat pre- crit~res dolt 4tre respectd Afn de garantir ie bonsent6. en Insistant aur ies conditions critiques 1i6es a cha- fonctionnement du moteur (indices de distorsioncune des solutions. L'exp~rimentation 4stant Indispensable en pression et en tenmp~rature en particuier) etpour l'dtude de ce type de phftom~ne, des moyens d'essais d'autres doivent 4tre optimisgs pour smatliorer leasp~ciflques ont 06 ddveiopp~s ; ls permettent niaintenant performances de l'appareil (perte de charge entrtede slmuler toutes lea c~onditions critiques de neige ou de d'air tralnee y compria tralnge y compris tralnegivre ldentli~es ; Ia quails de simulation a dt prouvge par de captation etc..).des esais de recoupemtent en conditions naturellis. Par ailleurt. I'entree d'air ht-licoptre d.
1) MRQD TIOIa protection du moteur contre lea corps kruabi1)_NROUCIO contre le able (dana certalna cas d'utllsation spe-
cifiques oi ies d~gradations des moteurs aunt tr~sLa vol tout temps sans restriction op~rationnelle eat un rapides), et contre ies effets de l'humldlt6 atmo-objectif influctable pour tout v~hlcuie aeronautique. Las snh~rique.h,4ilcopt~res n'Echappent pas A cette r~gle. et leaconstnicteura ont certlIM des appareils en condition de 11 convient aussi de prendre en conipte ]'aspectvoi I F.R., et, plus r~cemment, saris restriction er bruit externe danas ia ddinition de 1'entr~e d'airconditions glvrantes.
Enfin. comme pour tous lea Ei6ments deAujourd'hui, l'utllsation opkrationnelle d'h~licoptkres l'h6licopt~re, lensemble d'entrde d'air dolt Wteavec des conditions mntkorologiques adverses devient de r~allsable en production : un coOt et tine masseplus en plus courante au fur et A meaure que lea op~ra- maximum, presenter une bonne flabilitc, et ne pasteurs prennent conflance dana lea quallt~s de leur p~nallser lea op~rations de maintenancematkriel.
11 apparalt donc qu ]a fonction protection contreLeirsembie des travaux effectu~s pour assurer is certifi- Ia neige et le givre de l'entrie d'aIr eat certea unecation des apparells en vol tout temps (piusleura ann~es fonction pr~pond~rante pour Is s~curitO dedans le cas du' Puma et do Super Puma), associ6 A 'paele nipnaleAc irml uel
1'epdrenc acuis ensericea prmi d'm~lore dene peut en aajcin cas Etre le seol crltre de dimen-mAnti~we trgs signiflcatlve Ia connaissance du comporte- sionnement :,on obtiendrait alors une "mauvaise"ment des entr~es d'air en conditions de neige et de entree d'air peo performante. et pouvant peot 6tregivrage et des risques associfs a ces conditions. Un bon mettre en cause Ia s~curit du vol ao traversex'anple de cette tendance eat donnd par i'Eolution du d'autres crit~res, tels quo des lnistablitfs de fonc-reglement F.AR. en cc qul concerne la protection des tionnement moteur par exempie.entr~es d'alr en vol sous Is nelge :Initialement. aucunemention de cette condition n'Etdlt faite dana le regie- 2.2 Principaux types dentr~e dalmer't, et des apparells teis que le Super Frelon ont Wtcertifids, sans aucuin essal A Ia neige. Puls. Ia notion de Las diltkientes fonctions d'une entrke d'air ftntnelge a Lstd Introdulte dana lea paragraphes de Ia FAR tres varides, et sa forme tre fortement d~pendante27-1093 et 29-1093, et enfln, l'AC 29-2 change 2 propose de l'architectore g~ndraie de Ilh~licopt~re (positiondes ials de d~monstratIon partlculi-rement difficiles A et nornbre des moteors. forme fuselage et capo-riallser (I h 30 d'essai sous la nelge Vombante avec tine sages, recirculation gaz ddechappenment dana le flux
IWW~rl AAA 112e. )rotor, etc..) et dui moteur. I1 n'est pas possibled'envisager une forme universelle d'entr~e dain. OnLa but de ce document eat de synth~tlser l'exp~rience pet cependant d~gager 2 familiesdes ntr~s dir e coditins d nege e degivr. E
acquise par AMrospatile en ce qol concerne Ia protectionparticulier, lea conditions critiques de neige et de givred~tern'in~es sur ies diff~rentes entrdes d'air r~cemment
ddveicpp~es par Adrospatiale serons citdes De plus, leamoyens sp~cllques d'essais ddveloppfs r~cernmenc pour6tudier at justifier lea entrhes d'alr seront d~crits
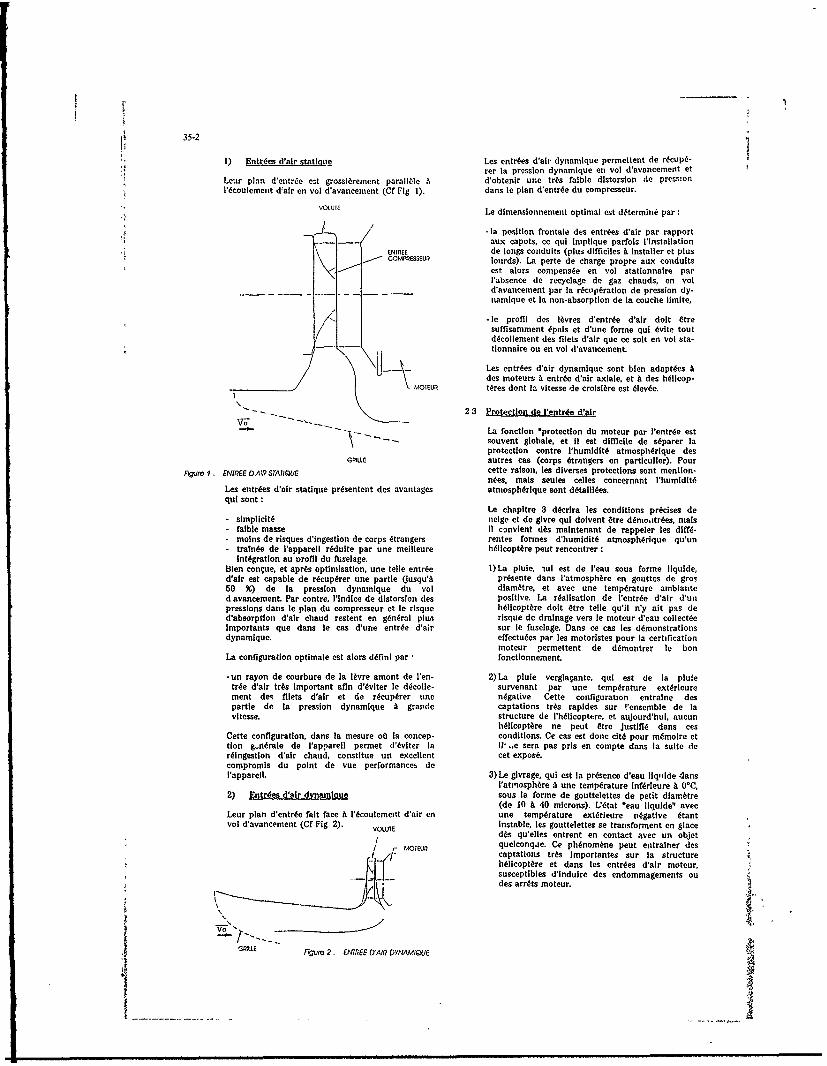
35-2 *
1) Entr~es, d'air statlqu2 Los entrdes d'aIr dynantlque permettent de rdcup6-rer la presslon dynamique en Vol davancement et
Lowr plan do'ntr~e est grossl~rement parall~le A d'obtonlr une tr~s falble dlstorslon do prosonl~coulemeiit d'air en Vol d'avancement (Cf Fig 1). dans le plan d'entrde du compresseur.
VOWIELe dimensionnement optimal est d~termink par:
l a position frontale des entr~es d'air par rapport* aux capots. co qul Implique parfois Ilistallation
CESEU de longs conduits (plus dlfficilos A Installer et plusCOMOSs~sualeurds). La porte do charge propre aux conduits
est alors contpensde en vol stationnalre parlabsence do recyclage, do gaz chauds, en Voldavancement par Ia r~cupratlon do presslon dy-namnique et Ia non-absorption do la couche Ilmito.
leI profil des lMvres d'entrke d'air dolt stresuffisammont 6pals et d'une forme qul Evlte toutdocollement des filets d'air quo ce soft en Vol sta-tionnalre ou en Vol d'avancement.
Los entr~es d'air dynantlque sont blen adapt~es A_ _ _ -vdes moteurs A entrde d'alr axiale, et A des hdllcop-
_____________MOItOO tOres dent Int vitesse do crolal~re oat Elev~e.
2 3 ProtectIon do l'entcfe d'alr
-~ -. La foniction "protection dU motour par 1'entrde eat- -. souvent globalo, et iI eat dlfficile do s~parer Ia
protection centre M'umlditt atmosphkrique desGRE autros cas (corps 6trangers en partlculler). Pour
Flgwie 1 . ENTREE D A;RSTATIQVE cotte ralson, lea divorses protections sont mention-rieos, Trals seutles cellos concornant l'humldlt6
Les entr~es d'air statique prgsontcnt des avantages atniosphirque sent d~tallides.qul sont:
Le chapitro 3 d~scrlra los conditions pr~clses do-simpllcltE nolge et do glvre qul dolvent etre ddmoatr~es, mals-falblo masse 11 coinvlont dOs maintonant do rappoler los diffE--molns do risques d'Ingostion do corps Etrangers rontos formes d'humidlt6 atmosph~rique qutin*trafide de l'apparell r~dulte par tine moilleure h~ilcopt~re petit roncentror
Int~gratIon au Drofil du fuselage.Bilen cengue, et apr~s optimisation, uine tollo entrde I)La plule ,ul eat do l'eau sous forme liquid,d'alr oat capable do r~cup~rer tine partlo (Jusqu'A pr~sente dana Ilatmosph~re en goustos do gros50 %) do Ia presslon dynamlque du Vol diam~tre, et avec Line temp~rature ambianted avancomoent. Par centre, lIIndlco do dlstorsion des positive. La rdallsatlon do l'entrke d'alr dunpresslons dans le plan du compresseur et le risque h~llcopt~re dolt Etre tolle qu'il n'y alt pas dod'abserptlon d'alr chaud restont on g~ndral piua risque do drainage Vera le meteur d'cau collectdeImportants quo dans le cas d'une entr~e d'air sur le fuselage. Dans ce cas lea d~monstrationsdynamique. offectukes par les moteristos pour la certification
motour pormottont do d~montrer le bonLa configuration optlmalo eat alors ddflnl par fonictionnement.
-Un rayon do courburo do Ia l6vre amont do ioen- 2)La plule vorglaganto, qul oat do Ia pluletr~e d'alr tr~s Important afin d'dvlter le d~colle- survonant par tine temp~rature extdrlouremont dos% filets d'alr et tie recupkror tine n~gative Cette configuration ontralne despartle do Ia pressien dynamlque A grando captatlons tr~s rapides stir tensemble do Iavitosso. structure do l'hgllcopttre, et aujourd'hul, aucun
h~llcopt~re no pout 6tro JustARl dans; cesCotte configuration. dan; lia mosuro ofi Ia concep- conditions. Cc cas est donc citEs pour m~molre ettion g-n~rale do I'apparell pormot d'6viter la IP .e sera pas pris en compte dans Ia suite dorklngestion d'alr chaud, constltue tin excellent cot exposE.compromls du point do vue performances doI'apparoll. 3) Le glvrago. qul est Is pr~sence d'oau liq-ilde dans
l'atiosph~re A uno temp~raturo Infdrieure A OTC,2) Entr~es dalr dyn~tMlauo sous la forme do gouttolottos do petit dlam~tro
(do 10 A 40 microns). L'Etat "eaui liqulde" avecLour plan d'entrke fait face A l'dcoulemeitt d'air on tine temp~rature extdrletire n~gatIve EtantVol d'avancement (Cf Fig 2). VOUEInstable, los gouttelottos so transforment en &lace
V~tSJT5d~s quoelles entront on contact avoc tin objet
/ M07EUR quolcenqjo. Co plignom~ne pout ontralner des- captatlons tr~s Importantes stir Ia structure
h~llcept~re et dons los entr~es dair motoursusceptiblos d'Indulre des endommagomonts otides arrgts meteur.
G5SJ~t FIW7ro 2. (NTPEE (YAW DYNAMIQiJE

35.3
4) 1a neige qul est la prfsence d'eau solide (glace)dans l'air A tempdrature lnfrifteture A O*C, sous la~ r~~forme de cristaux. La fortre ties cristaux pettvarier de mani~re tr~s Importante on fonction deIs tempdrature extdrieure et de la Irnfrs ler IAGEtion do la neige (s de neige soulev~e par le COMREoosscEsrotor). On pout grossl~rement dire quo iorsque la-tempdrature eat basse, lea cristaux xoin petits et Apeu collants, et qua lorsqu'elle est procho de oPOR0*C. Ia tendance invers pout Wte observ~eo.tT,pouvant entratner des accumulations Importan- ETE J :Etea Sur [a structure ou lea entr~es; d'alr. AXE DE SYMEIR*
Difrnssytmjsn -uvnmp utlla~g2Pa - - --our-/assrer IA Protection globale des entrdos d'alr Figure 4 SEPAPATEUR DE PAXICULES INTEGRE
1) Syar~me de chauffage
Le prIncIpe est simple et permet do s'affranchir des4) SsbeAgil
probi~mes lI0s A I'humIdlt6 atmosph~rique pour des Une grille plac~e Suir l'entr~e d'air pormet do protd-temp~ratures Infdrieures A O*C on dvitant la forma- ger efflicacement le mote r contre los El6mentstion do captation do glace. 11 pr~sente Atrangers. sauf lorsque las conditions extdrieureslilnconv~nlent de n~cessiter des apports; d'Onorgle lInposent lutilisation d'un filtro anti-sable sp~cd-Importants. qul peuvent 6tre r~dults a'll est tique (cat relativement limitds). De pius. cette grillepossible de seulement d~givrer p~riodiquement assure uine protection efficace en condition do gi-ientree Wair (d~givrsge au lieu d'antigivrage). 11 vrage puisqu'elie capte los gouttelettes d'eaufaut alors quo 10 motetir prksente tine capacltd surfondues prksentes dans l'air. Pour assurerd'ingestion do morceaux de giate suffisante sans l'alimentation dti motour en cas do coimatage do iad~gradation du motour at sans perto de puissance grille. it oat n~cessaire dans certains cas do pr~voirUn moyen compl~montaire do protection contro tin by-pass en arri~re do la grille.lingestion do corps Etrangors dolt 6tro s&ssociE ausimple chauffago Pour le vol snus is noige. Ia grille prot~ge le moteur
contre lingestion do captatlons accumul~es Stir tin2) Syst~me A impulsion point do Is ceilule ot pouvant so d~tacher, par
cnntre. ello nassure aucune protection lntrins~queCost tin syst~me de dkgivrage qul. aui lieu do d6- dans cotte condition car la noigo n'accrocmo pas Stircoiler los captations par chauffago. assure cotte ia grille ;le bon fonctlonnoment d~pend alert do lafonictlon per choc. Co syst~mo nest vraimont effl- forme du conault d'entrke d'air.cca quo lorsquo I'6paiss-ur do captation attelnit 11 apparalt donc qu'une grille oxterno. piac~e Stirpiusiours millIm~tres. et Is majorit6 des potits tur- 1lentr~e d'air. pormet do protgr officacomont Icbomotourt: d'h~llcopt~re nont pat do capacitE moteur dens Ia majorit6 des cat. 11 existed'ingestion stiffizante. copendant des conditions pour losquollos cette
protection pout Wte incomplite (noigo par3) Sysv~me A Inertia example). et dos captations peuvont so produire
dans Ventr~e d'air. 11 oat slams possible do placerLe principe conaisto A donner A I'alr tine compo- tine seconde grille A proximIt6 du irotetir. quuSanto do rotation. afin do centrifuger les particulos dvitora l'Ingostion par celul-ci do captationt(eaui, sabie, corps Otrangers, glace) contonues dans formides dans los conduits d'entrde Wair ;diffdrentscelul-ci. Cotto mise en rotation peut 6tre obtenue At essais ant d~montr6 quo la protection apportde parpartir d'une s~rie do vortex niont~s 5,ur tin panneallI rleetredatiufsnepu vtrtu(Cf Fig. 3) (tris bonne officacitd aui sable. mals is grille dxerns 'e t ufiat ou Sr lav ritertuporte do charge Importante). oti bion dens l'entr~e conteag ee d ien roteto d nredair ousiAsguid'air moteur (i.P.S.) (Cf Fig 4) (offlcaieM do 'intee 2n greie do prtet on l dfinure das~paration moino bonne, mrals porte do chargebied2grlsOtpronEtrIafue5mains imporlarto). Dans certaini, cat, des ddflec-tours sont placks dons l'entr~e d'air hlilcopt~repour assurer cotto foniction. fDans taut lea cat. I] stn~cessaire d' associer un ensemble doextractiondes partlcuies centrifugkes salt par ventilateur, toitpar offot do trompo. Ces systkmes sont efficacos en '
co qui concerno Is protection contro lea objets/Etrangers (y coroprit let me- -eatix do glace), tralts I-.ii eat soti~Ont n~cessaire d'y assocler tin antlgivrage GYqit DEN~TtEdo certaines parties pour assurer mane protectionOtcompikte. Groat
AW 0GE 11-SMEAMYyMETRIGUE
DESDL ROMEL(~ 0000iguic 5 EXEMPLE DE SYSTEME DE PROTECTION A DOUDLE
I ~ Lav .. ;e princ'mai des protections A base do grille- tMNT FOTRANT tsi quo !a pvrit: du chlarge apportie par cot tier-
nieres oat telativemont foible (ellet ant de plustandance A am~liorer los Indices do distortion), etquo coat tin syst~mo passif no n~cessitant aucunapport d'dnergie ot d'tine fiabilit quasi Infinie Doeplus. ls p~nalitE6 en masse ott ndgligeabie compar~e-aux autros solutions Cot diff~rents El4ments ont
VVE D Wz~kEconduit Akrospatiale A rotenir cc principe deVL5 tOSM~rtprotection Sur tout les hglicoptgres recemmont
! r c __ncon~us. bien quo lour mite aui point soit piu~.d~licate quo ics autres syst~mes et qutin certainnombre de conditions critiques dolt 4tre ddmontr6
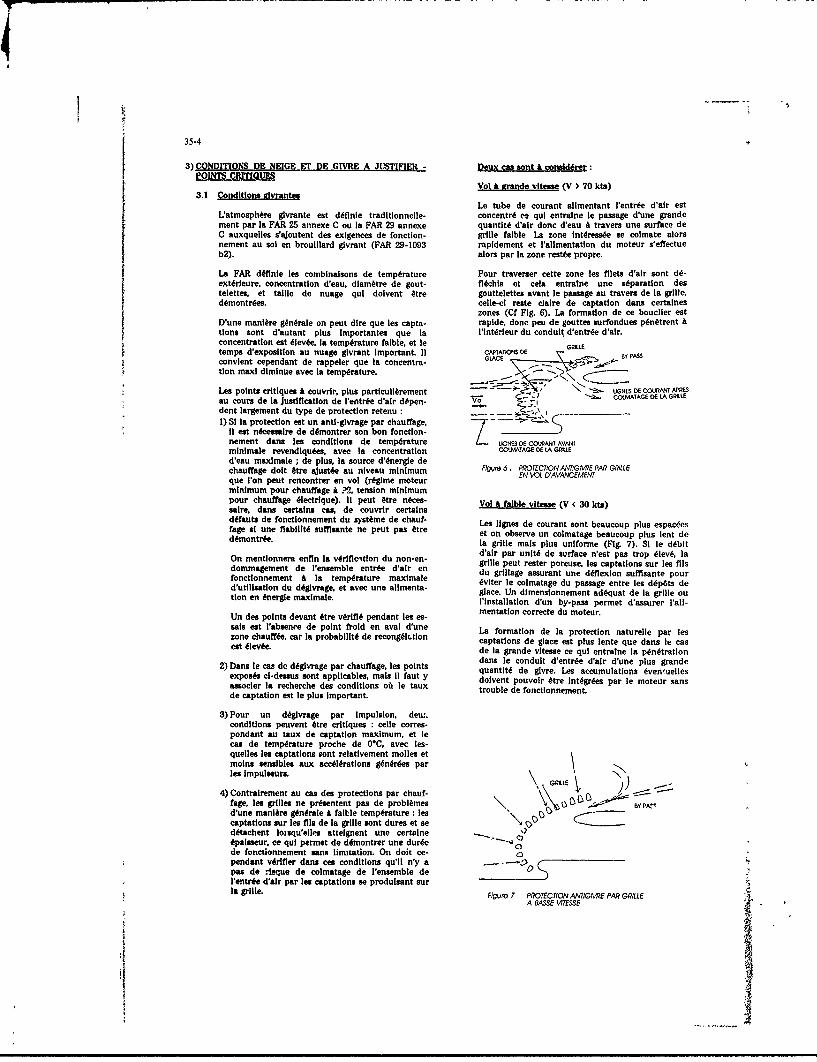
35-4
3) CONDITONS DE NEIGE ET DE GIVRE A JUSTIFIER - Domx cas sont &considrePONT tMoshrgvat a Qll rdtonie onet4c u nri.l asg ogad
Vol & grand. vitesso (V > 70 kts)
Le tube de courant alimentant l'entr~e d'alr ost
mont par Is FAR 25 annexe C ou la FAR 29 annexe quantit6 d'alr donc d'eau A travors une surface deC auxquelles s'ajoutent des exigences de fonction- grille falbie La zone Int~ress~e se colmate aloranement au sol en brouillard glvrant (FAR 29-1093 rapidoment et l'alirnentatlon du moteur s'effectueb2). alors par Ia zone restse propre.
La FAR d~finle les combinaisons de tempdrature Pour traverser cette zone lea fI'lets d'air sont d6-extdrleure, concentration d'eau, diamgtre de gout- fl~chis et cola entrain. une s~paration destelettes, et talille de nuage qul doivent otre gouttelettes avant le passage au travers; de la grille.dfmontrges. cello-cl rest. claire do captation dans certalnes
zones (Cf Fig. 6). La formation do ce bouclier estD'une manl~re g~ndralo on pout dire quo los capta- rapide donc peu do gouttet surfondues p~nL~trent Atdons sont d'autant plus Importantes quo la lI'ntgrleur du conduit d'entr4e d'air.concentration eat 6lev~e, la tempdrature faible, et le GRUEtemps d'expoaltion au nuage glvrant Important. 11 C)PAA1M MO BYPSconvient cependant do rappoler quo Ia concentra- .C
tion msxi diminue avec: Ia tempkmtwre. :;-; MtE
Las points critiques A couvrlr, plus particuii~rement Xz . OAAAG 6L tL
au cours do Ia justification do 1'entr~e d'air d~pen- 0dent largoment du typo do protection retonu -______
1) Si Ia protection oat un anti-givrage par chauffage,-iI eat n~eaiaro do d~montrer son bon fonction-nemont dana lea conditions do teoprature L. IGNES D6 COURTANT AVANtminimal. revendiqu~es, avec Ia concentration COMTAGE DE LA GRtIEd.eau maximal. ; do plus. Ia source d'dnorglo dochauffage dolt 6tre ajust~e au niveau minimum Fi ve6. PROTECTION AN1?GME PAR? GPLILLque I'on pout rencontror en vol (r~glme motour E O AACM~minimum pour chauffage A 32, tension minimumpour chauffagoe 6loctrique). 11 pout Otre n~ces- VlA abevtse( 0kssaire, dans certains cas, do couvrir certainsVo& abevts ( 30t)d~fauts do fonctionnement du sytkme do chauf- Los iignes do courant sont beaucoup plus espac~esfag. A1 une flabilit sumoiante no peut pas 6tre et on observe un coimatago beaucoup plus lent dodkmontr~o. Ia grille mais plus uniform., (Fig. 7). Si le debit
d'air par unltd do surface nest pas trop 61Mv. IaOmmment do a en somblotiene da n-en- grille pout rester porouse. los captations sur les filsdommgemnt e 1ensmbleent~e 'a~ endu grillage assurant une d~flexion suffsante pourfonctionnemont A Ia tempdrature maximale dviter le coimatago du passage entre los d,6p6ts ded'utilisation du d~glvrage. et avec uno ailmenta- glace. Un dimensionnemont ad~qust do Ia grille outdon en dnerl maximalo. instaliation d'un by-pass pormet d'assurer l'ali-
Un des points devant Wte vWriflE pendant los es- etio ret dmtu.sals est l'absenre do point frold en aval d'une La formation do ls protection natureile par loszone chauff~e, car Ia probabilitt do recong~lr~tion captatlons do glace est plus lent. quo dana le casest #Iev~e. do Ia grande vitesse ce qui entraln. Ia pknkratIon
dana le conduit d'entrge d'air d'une plus grande2) Dana le cas do d~glvrage par chauffago, los points quantit# do glvre. Les accumulations Avontuelles
exposfs cI-dessus sont applicables, mals 11 faut y dolvent pouvoir ftre Intkgrkes par le moteur sansassocler Ia rechorche des conditions or) le taux trouble do fonctionnomont.do captation est le plus Important.
3) Pour un d~glvrago par Impulsion, deu:.conditions pouvont 6tre critiques :celi. corres-pondant au taux do captatlon maximum, et iocas do temp~rature proche do OT, avec lea-quelles los captatlons sont relativemont molles etmolna aenaibles aux accdlkratlons ghndrges parlos Impulseurs. \, GRit
4) Contmralrment au cas des protections par chauf-fage, lea grille* no pr~sentent pas do probltmes 1 P~' A-pd'une manlbre g~ndral. i faiblo temp~raturo: loscaptationa sur los Ills de Ia grille sont dures et soed~tachont lisqu'elles atteignont une certaine .
E6paissour co qul permet do d~montrer une dur~e '
do fonctionnoment sans limitation. On dolt ce-pendant vhrifler dana ces conditions qu'll n'y a-pas do risque do colmatago de l'ensemble de01ontrde d'alr par lea captations so produisant sur]a grille. Figure 7 PROTECION ANTIGMIE PAR? GILLE
A aASSE 'AISSE

35.5
Lorsque Ia temperature eat supdrieure A *C, III Los oroblbmes de a onement en vol sous Iaforme des captationi, our Ia grille 4volue cellos-cl neime d'entr~e d'alr o .,Eicoot~rg oouvent 8tre dodeviennent beaucoup plus larges et accroch~es2autour des ils do grille. alors qu'A falble temp6-rature, [a captatlons se forme AL partlr du point 1) absorption par l'entrgo d'air motour ded'arr~t et en amont de celul-cl le colmatage de Is "paquets" de nelge qul so d~tachent do ]a collule,grille eat souvent rapide car los vides do malle sont entratnant uno Instabilit,4 motour. l'ous losremplis par Ia glace. Ce ph~nom~ne s'expllque par prlnclpes do protection d'ontr~e d'air officacesun retard A ]a congdlatfon dQ A un trop falblo 6cart contro llIngostlon do corps Otrangers prottgontdo temp4rature ontre l'amblante et 00C pour corroctomont 1'entr~e d'alr ;.1 pout Otreobtonlr uno congglatlon lnstantan~e (voir travaux n~cessalre do doubler lea grilles dana certalnosdoe simulation doe co point dana lo paragraphe 0. zones pour garantlr un bon ftactionnoment desPour des I tempdratures tr~s proches do 000.' le accumulations do nolgo. Les risques los plusretard pout 6tre sumfsatnment Important pour quo Importants do captatlon sur Ia structure en volIs grille capte partlellement los gouttolettes doeau sous Ia nelge so,,c presents loraque Issurfondue et quo par contro des captatlons se temp~rature ext6rieure oat proche do 000 (grosprodulsont dans In conduit d'entr~e d'aIr et flocons collants) ot lorsque la concentration eatpulasent Indulre des lnstabillitis de fonictionnement 4levke.du moteur. Co ph~nom~ne no so prodult quo danaun domalne do tempkrature tr~s dtrolt (do l'ordre Dans cortains cas, un antlgivrago tr~s offlcace dudo 1,5*C). et I1 est largomont d~pendent do ia forme pare-brise pout entralnor le d~gol do ]a noige.do Ia grille et do sa position rolativement A l'entrL~e puis son rogel cur Is structure, avec formation dodair. La figure 8 pr~soento uno courbo oxp~ri- captations Importantes.mentale donnant dos ceptationa relevdes en aval do]a grille en fonction do IaI temp~rature. 2) accrochage do neige en un point du conduit
d'entr~e d'air, et d~veloppemont d'une captationME D LA TEERI susceptible d'ftre Ing~rde par le motour.
Ce ph~nom~ne neapparalt as syst~matiquoment
AIIW 170 /67 et cat lI6 A Ia forme dec co dults et A Ia tomp$-VIIESSE 25 WhI15 khrature do Ia noigo. D'une mani~re g~n~rale. aul-
CNETAIN0EAU I 9ei cun probl~me do dkvoloppomont do captatlonCO"TE E O n est rencontrE lorsqtie le conduit no prseonte
pas depoint Wr&(coude uacdndesrface) :dens ce c.s eucune protection sp~cifique
CATATONS IN AVAL nest requlco. Par contre, sl le profli d'entr~eDE LAGKLEd'air cat accident. 11 y a formation do captatlon
like au tiansfort thornique noige/parol doentr~e200 d'air Nouc avons pu mottro en EvIdence cotte
relation au cours doessaic oit Ion roproduisait ounon l'amblenco thormique autour de ientr~e
0 P09T 0 SSAJdeair. Dana un cas. des captations tr,%s impor-tentes Etaient relev~es. et dans l'autre. aucuno.
100'j pour los m~rmos conditions d'essal. Nous enaly-sons co ph~nomkno doe captation commo dQ At und~goi do IaI noige au nlveau dtu point d'arr~t (alucontact du conduit), cuivi d'un rogol en aval curun point "froid" oul laccumuletlon so produit.
Les conditions lea plus critiques pour ce cas dofigure sont lorsque Ia temp~rature ext~rieure est
TIC, 8 VOLTIONDESDEPTS D GLCE ANStr~s procho do 000. et qu'll noigo, ou lorsque
VE CONDUIT EN FOCVON DE LA TEMPERATUPE ihMilcoptore falt un statlonnairo en nolge rocir-culanto. evec uno temp~rature extdrioure 10gkre-
Une attention perticulire dolt donc: 6tro apport~e mont positive :co dernior cas cat do loin le plusa Ia vWrifIcatIon du bon fonctionnoment do 1'ontr~e diflicile car on essocle IaI concentration do noiged'air A temp~rature tr~s procice de 000. 6levde duo A Ia recirculation du rotor avec lea
conditions do temp~rature critiques.32 Nolge Lea protections A base do chauffage cont moims
sonsiblos A ce probl~me pour des temp~raturesLos conditfr'cs d'homologation des h~licopt~es en prochos do 000. maic des phdnombnes do d~gel -vol sous IaI .eolge ont 6t6 pr~clskes, par l'indico 2 do rogel pouvent so rencontror A plus falbie temp6-l'Advlcory Circular 29.2. raturo, eves le chauffage minimum. Dana Ia
majoriti dos cas. coest ce point qul dimensionnoOutre Ia vdriication du bon fonictionnement do Ia puissance do chauffago (11 fsut plus d'dnergiel'entree d'air pour diff~ronts typos do neige et do pour faire fonldro Ia nolge quo pour so prot~gertemp~rature, ii cat n~cessairo do faire un vol d'une du glvrage a Isotemp~rature ext~riouro). Unheuro et demle dens des conditions do pr~cipitation point favorable Oct toutofola A mentionner, car Aextrnmes (visibilitd Infdricure A 400m sans broul- faiblo temp~rature los floconc cont momns dense.lard repr~sentant onviron I g/m3), et comportant 5 et Impactent donc momns sur los accidents dumm do qtationnaire en neige recicuooist o -;Il; qpe condu ..-. do3-A .caa~g el~I heuro doe vol do croisl~e le roste du temps 6tant quoen neige tombanto. e5 non pas do In nolgedes op~ratIons de roulago ou d'attento au sol. rocirculante.
11 cat trfs difficile de trouver dens IaI nature des Le point do nolge A temp~rature procho do 000conditions de concentration requisca par co texte 055 aiiasl le point critique des syst~mos de d~gi-do plus. Ia condition de vol en stationnelre noige vrage par Impulsion, car los captations sonS tr~sXrocircuiente no correspond pas A un cas do vol op6- mo lies et peu sonsiblos au choc. 1ratlonnel car Ia vlsibllitE& dens cos conditiornulle et sucun pilote no rosters dens deconditions. Codl montro donc ias cvkritE do ccgencos vAs A vIa dos conditions r~elles d'utlisatlon.

35-6
Les systkmos A Inertie. de par lour farme, n~ces- Tout d'abord le domnaine de vitesse a Wt abaissO Asitent une protection castro Ia neige (chauffage 10 isa ce qui permet une simulation satisfaisantepour IP S.). 11 est possible de s'en aifranchir du atationnairo. Coci n~cessite, outre 1i6tabiissementdana le cas des filtres type vortex en montant d'un 6couiement atable dans [a soul~erie givrante,ces derniers parali~iement & I'dcoulement dair. 11 de r6aiiser un nuage givrant homogbane avoc desy a aimrs effet de separation de Ia neige en vol quantitsa d'eau inject~es faibios (utilisation d'und'avancement petit nombre d'Injecteurs adapt~s A ces conditions
particui~res). Afln de garantir une bonne simuis-Conmoe cecl a dEsJA dtd mentionn6 ci-dessus, ies tion. 11 est apparu n~cessaire de verifiergrilles sont totalomont transparentes aux fiocons 1'6coulement d'air autour de Ia maquetto et de iede neige ; eiies nassurent une protection qu'en comparer A celui reievd en statiornnaire sur hls~ico-
arretant ies captations qui peuvont so former en pt~re (visualisation par fls de iaine). D'autre partamont de Ia griiie. ies bancs: d'essais ant 4t0 instrument~s et calibres
pour offectuer des essais pour une temperatureCest use des raisons pour iesqueiies use procho de 000.aeconde griiie eat mont~e dans certains cas aupius pr6s de i'entrde d'air moteur ,elie 6vite Dans ies deux cas. 11 a Wsa mis en evidence ia nE-i'ingeation par ceiui-ci de captations qui pouvost cessitE de disposer d'un mod~le thsorique permet-se former dans ies conduits d'entrde d'air (voir tant d'dvaluer i'intluence des param~tres d'essai surparagraphe 2. ot figure 5). ia quaiit6 do ]a simuiation au niveau de ]a ma-
quette -ni esai.
4)MOYENS WMSAIS UTIUSES POUR eTUDIER L[A PRO. En elfot ie nuago givrant eat r~ailsE par is puivL'ti-=ECION DES ENTREES DAlE sation de I'eau n~cessairo A temperature posifive
41. Mvem 'essls; u ghdana un courant d'air dont Ia saturation en oau4 .avn desaa u ire: peut ne pas Etre totlie
Lea essais de mise au point et do certification en Pour aboutir A use simuiation satisfaisaste d'ungivrage des entrees d'air d'h~iicoptire s'effectuent nuage givrant 11 eat n~cessairo quo iea goutteiottesdepuis do nombreuses ann~es dana des souflerios arrivent dans ia section d'essai en dtat do surfusionpormettant do roproduiro iea conditions givrantes (temp~rature isfdrieure A 000) A use vitesse volsinenaturelios par pulvsrisatian d'eso dans un courant do ceiie de i',6couioment et quo l'6vaporation dansd'air froid. i*4ouiemcnt non saturE no remette pas en cause Is
concentration d'esai Le modele mis au point parEn France, lea essais sant offectu~s par ie CEPR do ie CEP~ montreSaclay dana des instaliations (Cf Fig. 9) permettantRdo reproduire Ia vitesse do voi, is temperature - Lmportance du temps do transit ontre grille etlailtitudo, I'hygrom~trie le diam~tre des gouttoiosaea maquetto pour lea essais proches do 000. en effetet in concentration d'eaT, use distance griiio/maquetto trap faibie conduit
A grande vitosse A un nuage no contonant qu'unepartie des goutteiottes en surfujsian
GSME "D 0 A&(LE - Leffet do I'hygrom~trie sur In concentration pourCALAES TYEIZlea essais A basso vitesse et A temperature proche
GSSAGE sir~ COLLETcEM do 000. Ia concentration pout Atre r~duite par\ ~ .des facteura de I'ordre do 50 % par l'Ovaporation
des gauttelettes ontre grille et maquette. Dana cecas Ia temperature des gauttelettes eat Inf~rieure
-- CFAM~MENT A cello do 1i6cauiement.
J jl - Lhygrom~trio lnsuftsante donc l'4vaporation,CJSON n'a pas us offet determinant sur les diam~tres de
DAS IL GA.P.E AST gauttos.
MATtEaL EN ESSAJ Les r~sultats obtonus pormettest do mettro en 6vi-NCO 0 tAU dence les paramntres do r~glage Importants pour
CT ovaR chaque typo d'easal et d'apporter paur chaquepoint d'essai effectu6 lea factours correctia corres-
Fl~ue 9 WC D GARAGEDU E~ppandant aux conditions d'essal r~eliementRue9&DE GMIAGE iC~ rencontr~es.
Ces travaux effectu~s par ie CEP ' A Ia fois sur ledomaine d'utilisation des bancs d essais et l'analyse
i.'ssai eat effectud A l'aido d'un bid d'ess-ai repra- des conditions d'essal pormettent do disposer d'undulsant li'nstallation matrico (motour, capotages, mayes d'essal en glvrage artificiol bios adapt6 auxentree d'air et systamo do protection). Los condi- conditions particuli~res des entrees d'aIrtions qul 6talont utiliskes jusquill y a quelques d'h~iicop~r.ann~es pour couvrir lea exigences do certificationd'h~iicoptere no volant pas en conditions givrantos Des recoupements effectu~s sur diffirentes entreespr~vues. ktaiont d'air entro le camportoment observe en simulation
au banc et eoi conditions naturelles ou sur d'autrosVitesse 50 A 130 ista mayens d'essal , d~mantrent use bonne repr~sesta-temperature .5 A -30*C tivit6 dui banc CEPR Y campria A basso vitesse A
use temperature proche do 000. Ce mayen doessalAvec l'dvolution des conditions d'utilisatian des h6- pout 4tre exciusivoment utilisk en certification.Ilcopttres; le CEP a fait Evoluer lea piages d'essaispassibies pour en~Ees d'air heikoptgre.

35-7
4.2 Movens dossal A la neiue Le fonctionnement proiangO dana ces conditions(au-deA de 10 secondes) ne constitue pas une
4.2.1 Esa ncnitosntrl condition d'utiiisatian normale de i'hlcopt~r.En effot 11 s'agit d'dvoluer tr~s prks du so! en
La sui aye d'asalactellmon rocnnupou isi'absence totale de visiblit, ce qul nest possiblecertification des hglicoptgres A )a neige est l'essal que s u unterri ien pa sg are ds ropgerLAen condition de nelge naturelle. Les exigences de au sal qude nt pe cas pa'-isa ne re-certification n~cessitent d'obtenir les conditions psod iue rvodn oaitp o
sulvntescommandO par Ia FAA permet de couvrir 6vecdes marges tr~s Importantes lea conditions
-durde de :es conditions :. I h A 1 h 30 -Los conditions de vol A faible vitosso ne sont pas
condtios crtiqes e tepgrtur (eng~nraln~cessairement, malgr6 ]a concentration piuscodtin crtqe etmeatr4e ~~alev~e, parmi los plus s~veres pour le fonction-atotur do 00C). nemont de i'entr~e dair. En effet ie champ a~ro-
AMin d'effectuer cis ossals avoc un niveau de s~cu- dynamique diffgrent, pour certaina typesrit6 satisfaisant, ces conditions m~taorolegiques d'entrgo d'air. de celul existant en vol de cro1-dolvent Otre rencontrkes dana des zones ot) 11 eat si~re n'entratne pas une concentration de neigepossible do voier A grande vitese avec une visibi- dans los mfmea zones des conduits D'autro partiit.§ r~duite (co qui excint pratiquement ies zones Ia faibie vitosso davancement no favoriso peasdo haute montagno). l'accumulation do noigo, sur ies m~ines zones do
Ia structure quoen voi rapide et no favorite peasLa recherche do ces conditions obligatoirement en le d~tachomoent do ces 6vontuolles accumulationsp~riode hivornale pout n~cessiter plusleurs sc- qul pourralont Otre ingorgos par los moteurs.malnes avec des d~placements sur do grandes dis-tances Afn do s'adapter aux 6volutiona do is A co jour, lea ossals do certification en vol sous Ism~t~orologie. Pour cola. ce typo doesai no pout 6tre noige doivont 4tre effectu~s aur un h~slicopt~re onr~sorvO qu'au parcours final de certification et ii est vol en conditions naturolles Loxpdrlonce moritrodonc n~cessire pour lea constructours do disposer quo le spectre rocommand6 par Ia FAA eat un ob-do mayens do ddvoloppomont permottant de jectif tr~s difficile AL r~alisor. If eat donc n~cessires assurer do is vaildit6 des protections choisies do d~svoloppor des mayens complOmontaires do d6-
monstratlon :coux-ci pouvont comprendre desLa condition do noige naturelle qul pout Otro trau- esals au banc (voir paragraphe suivant) et desv~e le plus als~ment oat le vol stationnaire dana le esals sp~cifiques aux eppareils Le vol prolongd ennuage do neige zouMfle par le rotor do Ih'licoptoe stationnairo neige recirculanto eat un moyen comn-(noigo recirculanto). En effet If suffit do trouvor DlOmentaire tree efficace car if permet rolativemontuno zone recouverto do neigo fralcho et un esal eat facilemont do mettre en 4videnco los pointspossible avec une 6paseur trks faible au-doasus d., "sensibles" d'une ontr~e d'air ,des visualisetionslaquelie Ih'licoptero pout so d~placor Afn d'4trc par ondoacope sont uno aide appr~ciabie pour cetoujours au-dessus do la couche do nelgo fralche (le typo d'essal. La justification d'un temps prnlong6souffle du rotor eyant pour efret do "balayer" la (sup~riour A 10 minutes) en vol en nolgo rocircu-nelgo autour do l'apparoil). lante apparto une grando conflance sur Ia qualitO
do la protection, meis cello-cl dolt dtro confirm~eDes conditions favorabies pour effoctuer des esals on vol davancoment Par contre. la non justifica-en noige recirculanto pouvont 6tro trouv~es als6- tHen d'un temps prolongi no signiflo peasmont pendant la saison hivomnale m~ine apr~s une n~cossairemont quo ]a protection do i'entr~e deiraverse do neige do faiblo Importance Tautofois neat peas certifiable :,if pout on effet existor densi'abtontion des conditions lea plus critiques pour ce certain cea des effete do seull avec does concentra-type d'essai correspond en g~n~ral A une temp~ra- tions 6lov~es, au-dlh deaquels des captationsture do l'air lOgOrement positive, Is noige ne pout pouvont so d~veoppor dens i'ontrOe d'air.slams Otre soulev~e par le rotor quo si cello-cl est Nous consid~rons qu'un autre moyen :ominplmen-rest~e on surface sufflsemment fraide pour 6viter taire do dOmonstretian eat le vol on -inditionsl'agglomoratlon des flocons. Dane ce cas i1 oat r~solies de nelge. toiles qu'eues peuvont stre ren-n~cessaire quo is chute do neige alt ifed a tomp6- contrkos lcrsque 1l6qulpage recherche learature n~gative et soit suivie d'une log0ro 6l6vation "conditions FAA" 11 y a aiors accumulationde tempdrature do l'air ambient :cette condition d'exp~rlenco en vol sous ia neigo dens does condi-neat rencontr~e quo rarement au Lours d'un hive-, tions do nolge trks diveres, avec des dur~esm~me dens uno zone aot ies chutes do noige sont d'exposition variables. suivios ou non do r~chauf-fr~quentes. fage, des vitesses do vol adaptoes A Is visibiltO,
etc.. Le ban fonctionnement de linstailation Ma.Lee paints d'esesi on nolgo recirculante. blen quo ne trice pendant ces vols eat un W1ment Important ALpormottant pa Ia d~monatration complito n~ces- prondre en campto pour la justification de lentrdesaire A Ia certification d'une nouvelle entroo d'air, d'air.peuvent Wtr Intogrks dens le programme do certifi- 4.2.2 Eals artificielscation do ihdilcoptOre. 11 conviont toutefais do faireica remarquea suivantos sur ce type d'eseti: 11 eat tr~s vito apparu Indispensabie do disposer do
mo~,ens d'essal artificiols pour 6tudier le compor--La concentration do neigo pendant un esal en tomont A is neige des ontrkos dair, Afn do r~duire
nelge recirculante eat trfs 6lev~e (de iordre do 3 los coolts do d~veoppemont. mais aussi pour per.A 4 fala celle de avorsosq do neive los n~ji mpttrp de faire doe essia comnarablos entro euxs~vres) (tomporature ambianto. concentration. qualit,% do
neige) et donc do Auger do l'influenco do difldrentsparam~trea.
74

35-8
Les essais peuvont etro effectuft sur un hdlcopt~ro 2) Neigo utillske
complet ott sur un biti d'osl, compronant I'ontr~od'air et son environnemont y c-opris environne- La nolgo utills~e qul eat collect~e avant loessal pout
mont thermique (Cf Fig. 10), avee un ventilateur atre de Ia noigo naturollo fmiate ou de Ia noigeassurant Is d6bit d'air motour. Cotte derni~ro solu- artiflcelle. Cotte domilre solution pormottion eat do loin la plus soupie, et, avec, quelques d'effoctuer los essas en chambre climatique etpr~cautions, pormet de garantir uno bonne simula- donne sinai Is maximum do souploase dans le choixtion. Les essas bane permettent de faire un grand des conditions d'ossai.nombre d'observationa (forme et position dea cap-tations Livontuellea). et do meauros (temperature do La noigo artificiollo eat rOalls~e AL laldo do canonsparol on partieulter). do noigo utillsxfa dans lea stations do ski (canon A
oau pulv&rise et air comprim, canon A oau puiv6-ris~e stir un vontilatour). La mollioure qualitgs do
CAISSO SW.a~4 LA nolgo eat obtonue pour los temp~ratures d'air Inf6-COMPALSIAMNT MOTEAS riouros A -10*C. LA nelgo fabriqu~e eat stoek~e dana1 Ia chambro climatique pour E1tro utIlIs&e dana; los
EMPE- -j houros qul suivont lorsque Ia tempdrature do lossalENISE sCKuWFE eat obtonue (on g~n~ral lea conditions critiques
4-41 sont situ~es prks do 00 C). Cotto m~thode eat prkf6-.,.T -.waAToa Smm rablo A l'utlilsation directo du canon A nolgo sur le
MICET MOEU mattriel on ossal o n offet :
I)L'ossal oat offoctud A Ia tompgraturo d~sign~e (yS comprie au volsinago do 0' ot m~mo AU - '~ 5ONCUATONtemp~rature l6gkromont positive par r~ehauffage
0 AJRO(AsUD do la chambro climatique juste avant l'oasai)
igu(O 10, ESSAJ NUGF AU L1ANC 2) La concentration do neigo oat bion maltris~e.
La mndthodologlo d'ossal sulvanto a 06E mise au 3)11 n'y a pas do superposition do phgsnom~nespoint: parasites commo Is givrago, dos grilles doentrtse
dair par l'oau surfondue contonue dana le nuago
1) M~thodo d'ingoatlon produit par lo csnon A noigo.
11 s'agit do pulvgriser dons l'aIr aspIrE par le 1I oat A notor que Ia noigo artificell no formo pasmotour do la nolgo A Ia concentration voulue. do flocons et prksonto, done des diff~rences parLaL neigo ost pulvdrls~e par brossago devant 1lontr~e rapport A Ia nolgo naturollo tomba'ito. Par exomplodu motour A loentr~e du vontliatour projotant Ia Ia rolation traln~e/masso dos particules oat diff,4-nolge dana Ia zono do 1lontr~e dair (Cf Fig. 11). La ronto (vitosso do chute dana ['air 2 A 3 fois pluspuivdrisation do nolge soffetuo par brossago Importanto), cot El6mont oat done A prendre enmanuel, cotto solution qul pout paraltro trel compto dana des dispositifs s~paratoura A Inertloartisanalo perniot le maximum do r~gularltE ets'adapto alsmont A tous los types do nolgo. Ello a Des essais do comparalson ont dt# offoctu~s A iso-done OtN rotonue pour tous lea ossala A basso condltons d'easal avee do Is nolgo artificlello et dovitesso. Dons le eas oO I'on veut Intdgror loeffot do Ia noigo naturollo. Ces ossals ont montrAs un corn-la vitesso do l'apparoll, 11 eat n~cessairo do soumor portomont qualitatif Idontlque (eaptations auxdo la nolgo A l'amont des capotagos avoc un m~mos endroits) mats quantltativomont ldg~remontvontilateur, mats 11 eat qusimnt Impossible do dlffdrent (captations plus s~vkros avee do Ia nolgogarantir uno concentration pr~ciso au drolt do artiflcell). Cod pout sexpliquor par :
1'ent~e d'ir.1) Des Impacts plus nombroux sur los parols dosconduits coud~s (d~flexions molrts Importantesdes partleulos).
2) Un sceroehage plus facile dos particulos sur losspritks des parola
3) Echange thormiquo plus fact!? ontro eristaux et14EGE parols favorlsant Iafuion psr'.llo do l'oau et
D'autros ossals ont 41t6 offoctu~s afln de comparerENTRE DIARlos r~sultata obtonus au bane avoc: coux do vol. On
ENI tS AiS rotrouveoblmn le m~mo Ecart ouetr ssal-' - on nolgo naturollo et on nolgo artificlollo.
Loexpfrlonco aceumul~e au cours dos ann~es rA-y-,- contos nous ambno dor~navant A mettro au point Iaprotection AL Ia nolgo do I'entr~e d aIr au bane, puts
VENTILATtUR do vWrIfler on vol le bon fonictionnoment do ]aprotection. Ce~to d~marche a Rtd sulvie sur 3Installations motrices diff~rontos ot auctin
HguTJT 11: IA&frbI1ONAJI1I ILL Ut: NtI(zk L)AN4 comportement particullor non d~ceIE au bane n'sUNr ENTIEE DYAR Wt notE au cours dos ossals on vol.

5) CONCLASION Discussion 3-
La part des travaux de d~veioppement d'une entrde dair116e A la protection contre la ielige et le givre a tr~s net- 1. A. Spirki. MWUtement augment6 aui cours des dernl~res arndes. Inila- Have you - in the case of partial accretion of ice on the inletlement, les Otudes ont W~t men~es de manl~e. trL~s screen - observed pressure distortion at the position of thcemplrique, i partIr d'essais effectufs directement sur .hgllcopt~re. Ce moyen dOnvestigatlon dtant trfs Ilit4. engifle inlet?das bancs d'essal sp~elfiques ont W dkveloppds afln de Can you indicate the additional pressure loss caused by aslmuier tt ites les conditions critiques connues. Ces bancs blocked inlet screen, for high engine power level, i.e. highapportent des r~sultats sumfsamment flables pour per- inlet air flow?mettre A eux seuls d'effectuer toute la certifieation enconditions glvrantes de l'entrge d'alr, et limiter lea essals Auhren nelge naturelle aux simples essals de certification Auhr(v.srificatlon des r~sultats obtenus au bane). The effect of an eventu.al pressure inlet distortion due to the
ice accretion on the screen i , checked in two ways. At theLes difl'Arents essais effectufs sur piusleurs d~flnilons end of the icing test point it is checked that the engine is abled'entr~c d'air ont permis de constltuer une banque de to accelerate satisfactorily surge free with the accretion onde alasul r~veont ebs ~alssmn emyn the screen. Secondly during the air inlet pressure distortion
de clculpr~vslonel.tests, a test point is conducted with the simulation of the
Lamglfloratlon de nos connatssanees du fonctionnement screen clogging.de la protection des entrkes d'alr contre Ia neige et Ie Generally the pressure loss through the iced screen does notgivre a modifid le processus classique de d~finitton d'une exceed 5% of the atmospheric pressure. But in most of theentrke d'air qut dtalt essentleliement centr6 sur test points, the loss remained below this value.l'optimisation a~rodynamlque. Aujourd'hul, nous int,6gronr d~s le d~but du ddveloppement des travaux etessals coneernant Ia protection et done de d~finir uneentr~e d'air globalement plus performante.
Lea travaux effectufs par Mrospatile dans lea 4 d, 2. ??nl~res ann~es sur la protection des entr~es d'air ont 460 Can you give me an indication about the pressure loss thatmen~s sur 4 Installations motrice diff~rentes et repr& occurs at fully iced inlets at high mass flows?sentent environ 60 heures d'essai en soumferle givrante40 heures en chambre climatique neige, et 4 campagnes Author:d'essals en vol A la neige. Ils ont permis d'opimiser leconcept de protection par grille qul est A norre aens le It should not be more than 5% of the atmospheric pressureplus performant, tant au nlveau masse. perte de puis- But in most of ihe test points the loss remains below thissance assocl~e, que pour Ia flablillM de la protection, value,

I
REPORT DOCUMENTATION PAGE1. Recipient's Reference 2. Originator's Reference 3. Further Reference 4. Security Classification
of Document
AGARD-CP-480 ISBN 92-835-0618-9 UNCLASSIFIED
5. Originator Advisory Group for Aerospace Research and DevelopmentNorth Atlantic Treaty Organization7 rue Ancelle, 92200 Neuilly sur Seine, France
6. Title LOW TEMPERATURE ENVIRONMENT OPERATIONS OF
TURBOENGINES (DESIGN AND USER'S PROBLEMS)
7. Presented fit the Propulsion and Energetics Panel 76th Symposium held in Brussels,
Belgium, 8th- 12th October 1990.
8. Author(s)/Edltor(s) 9. DateVarious May 1991
10. Author's/Editor's Address 11. Pages
Various 386
12. Distribution Statement This document is distributed in accordance with AGARD
policies and regulations, which are outlined on theback covers of all AGARD publicatiors.
13. Keywords/Descriptors
Turboengine design Low temperature operationsTurboengine operations Icing testsIcing Ice tolerant designCold weather starting Ice protectionAnti-icing systems Low temperature ignition
14. Abstract
The Conference Proceedings contain the 33 papers presented at the Propulsion and EnergeticsPanel 76th Symposium on "Low Temperature Environment Operations of Turboengines (Designand User's Problems)", which was held 8th- 12th October 1990 in Brussels, Belgium.
-The _"'mposium was composed c ithe following sessions: Cold Weather Operational ""perienceand Reqqirements (6); System YJesign Considerations (14); Fuel Effects and Lbricants13 ehaviqt4r (5); lcing,C'onditions and T6sting (8). Questions and answers of the discussions followeach paper in the Proceedings. --,
Both the engine designers and the users made ample use of this Symposium to exchange theirviews of the state of their art and their experience within and between their respectivecommunities. The papers presented and the discussions represent a significant contribution toimproved cold weather tolerant and anti-icing design and to safer aircraft operation in i [owtemteratuieinvironment.,A caqe was also made for advanced and larger dedicated testipnfacilities, and some specialized software developments were indicated. 7' ."
J
|4
40

00 -
2
a 0< 00 00
r.r
0 0o.S
300 0 0
S0 ~ 0
-cn
U 6 W . -8
-> w o -6 o0
0.3)
0 0D0 O tM0 0 0 2
z z
UO U oz -0 r
S 0 too.~00 C 0 0 0 6 m -e i o 2, An (o
0J
00 800 . 00) 60 o
.0) 0. L 0
0 00 00 o 0~ 0
z -4 F z' a E 0
II

-,0
Oz %5r G*' - I-~ i
a- 8-8 m; o
0.-
~~--~ z,--' --
='4
o r
>~ 0 0
0 - 0 i. % CX=
.5LC 21r- . - t.C
- -
2 su A 'o EQ u v cc
'c t :
E E
0''
Ir 0'
1.2. . 0
z 0 W lou 0.7,0~Ou >CE 0C Cc
IxZ
NATO ,~ ITA7RE ANCELLE -92200 NEUILLY.SUR-SEINE DIFFUSION DES PUBLICATIONS
FRANCE AGARD NON; CLASSIFIEES
Tiliphone (1)47.38.57.00 -T6lex 610 176Tilicopie_(1)47.38.57.99 1 __________________________
L'AGARD ne ditient pas dc stocks de sea publications. dans un but de distribution g.Andrale ai I adresse ci-dessus. La diffusion initiale despublications de I'AGARD est effectuie aupr~s des pays membres de cette organisation par l'intermddiairt' des Centres Nationaux deDstribution suivazrts. A l'exception des Etats-Unis, ces centres disposent parfois d'exemplaires additionnels;dass les cascontraire, on peut
se procurer ces exemplaires sous forme de microfiches ou ric nicrocopies aupris des Agences de Vente dont la liste suiteCENTRES DE DIFFUSION NATIONAUX
ALLEM AGNE ISLANLIEFasc'inforta.szentrum, Director of AviationKarlsril'e c/o FlugradD-7514 Egger..'tein-Lceopoldshafen 2 Reykjavik
3ELGIQUE ITALIECoordonnateur AGARD-VSL Aeronautics MilitaireEtat-Major de [s Force Adrienne Uffiio d~l Delegato Nazionale all'AGARf)Quarsier Reine Elisabethi 3 Piazzale AdensuerRue d'Evere. 1140 Bruxelles 00 144 Roa EU R
CANADA LUXEMBOURGDirecteur du Service des Renscignemenis Scientifiques Voir BelgiqueMinist~rc de la Difense NationaleOttawa, Ontario KIA 0K2 NORVEGE
kvorwepsan Defence Research EstablishmentDANEMARK ,'ttn: Biblioteket
Danish Defence Research Board PN. x25~KleVed Idraetspsrken 4 ZM Kile2 100 Copenhagen 0 PAYS-BAS
ESPAGNENetherlands Delegation to AGARDISANA(GREulctos National Aerospace Laboratory NLRPintor Rosales 34~Kuvre28008 Madrd 2629 HS Delft
ETATSUNISPORTUGALETATSUNISPortuguese National Coordinator to AGARD
National Aeronautics and Space Administration Gat'invtc die Esiudos e ProgramasLangley Research Center CLAFAM/S 180 Base' de AlfragideHanmpton, Virginia 23665 Alfragide
FRANCE 2700 AmadoraO.N.E.R.A. (Dtruction) ROYAUMF. UNI29, Avenue de Is Divisioni Leclerc Defenc-e Res?srch Information Centre92320, Chitillon bous Baguseux Kentigern House
65 Brown StreetGRECE Casgow G2 8EX
I lellenic Air ForceAir War College TURQUIEScientific and Technical Library Milli Savunma Ba~ksiiligi (MSB)Dekelia Ai. Force Base A.RGE Daire Ba§kanli~j (ARGE)Dekelia, Athena TGA 10 10 Ankara
LE CENTRE NATIONAL DE DISTRIBUTION DES ETATS-LiNIS (NASA) NE DETIENT PAS DE STOCKSDES PUBLICATIONS AGARD ET LES DEMANDES D'EXEMPLAIRES DOI VENT ETRE ADRESSEES DIR cTEMENT
AU SERVICE NATIONAL TECHNIQUE DE L'INFORMATION (NTIS) DONT L'ADRESSE SUIT.AGENCES DE VENTE
National Technical Information Service ESA/Information Retrieval Service The Brijsli Library( NTIS) European Space Agency Docur ml. Supply Division5285 Port RylRoad 10, rue Piano Nikis Boston Spa, Wetherby
lorn RoyVrgal 216 75015 Paris West Yorkshire LS23 713Q.'ar s n i s, V r i i 2 6 F rance R oysum e U ni r e
Les demarides demicrofiches oti de photocopies de documents AGARD (y compris lea demiandeb faites atipris du NTIS) doivent comporeIs dinomirnaiion AGARD, sinai que Ic numero de sdnie de I'AGARD (par exemrple AGARD-AG-3 15). Ves infort,.. lions analoguses, tellesque le titre et la date de publication soot souhaitables. Veuiller noterqu ii ya lieu de spdifer AGARD-P.-n.n ct AGARD-AR-nrin lors de Iscomsmat,..ede rapport. AGARDetdes rapportsconsultatifs AGARD respectivement. Des% rdfirences bibliographiquescomplitesainsi que
des risumds des publications AGARD figurent dans lea journaux su~vants:Scientlfque and Technical Aerospace Reports (STAR) Goverrnwcnt Reports Announcements and Index (GRA&l)J
pul6par la NASA Scientific and Technical pbiparIcNtoaTehilInrminSrveinformation frivisior, Springfe toa ehnclIfrato evcNASA Head~uarters(7) Vtirginis26
WVAsmigii Di L. 2056 tasQOiEtats-Unis (accesIsiblc ,.*alcinent en mode interactifdjns ia base de
donnees biblioge0. ,"iques en 1190? du NTIS, et stir CD-ROM)
Imprimei par Specialised Prinuing~er-ices Limited40 Chigwell Lante, Loughton, Essex IGJO3TZ

NATO OITAN
7 RUE ANCELLE -92200 NEUILLY.SUR.SEINE DISTRIBUTION OF UNCLASSIFIED
FRANCE AGARlD PUBLICATIONSTelephone (1)47.38.57,00 -Telex 610 176
Telefax tl)47.36.S7.99_________________________
AGARD does NOT hold stocks of AGARI) publications at the above address for general distribution. Initial distribution of AGARDpublications is made to AGARD Member Nations through the following National Distribution Centres.Funther copies are sometimesavailable from these Centres (except in the United States), but if not may bepurchased in Microfiche or Pl-tocopy form from the SalesAgencies listed below.
BELG!UM LUXEMBOURGCoordonnateur AGARD - VSL SeBelgiumEtot-Major de Ia Force A-nenneQuartier Reine Elisabeth NETHERLANDSRue d'Evere, 1140 Bruxelles Netherlands Delegation to AGARD
National Aerospace Laboratory, NLRCANADA
Director Scientific Ir .
Dept of National De mh Nan FMonscOtawa, Ontario ICl 1pcstttr~ 0
DENMAIUCNatinal Aemnautlcs andDanish Defence Res Space AdministrationVed Idraetsparken i Washington, Dr- NnatyP~aI .I ssw2 10W Copenhagen C 2054 9% & OUM AS MAIL
FRlANCEO.N.E.R.A. (Direct Li 001 AGARDCP4809I 0 8 19S0026'72D29 Avenue 2dela Di. DEPTO E ES9230 hiilon DEFENSE TECHNICAL INFORMATION CLNTERGERMANY ATTN -DTIC-FDAB/JOYCE (7HIRASFachitiformaionsztKarisrulte CAMERON STA71ON BLDG 5D-7514 Eggensteir ALEXANDRIA VA 223046145
GREECEHellenic Air ForceAir War CODigScientific and TedDecelia Air ForceiDekela, Athens TGA 10 10 UIE IGO
ICELAND Defence Research Irf. rmation CentreDirector of Aviation Kentigerin Housec/o Flugrad 65 Brown StreetReykjavik Glasgow G2 SEX
ITALYUNITED STATESIAernutLY iltr Nationat Aeronautics and Space Administration (NASA)Arnuffic e lteoN oaeaIGR age eerhCne3 Piazzale Adenauer M/S 18000144 Roma./EUR Hampton, Virginia 23665
THE UNITED STATES NATIONAL DIST1.-BUTION CENTRE (NASA' DOES NOT HOLDSTOCKS OF AGARE? PUBLICATIONS, AND APPLICATIONS FOR COP19S SHOULD BE MADE
DIRECT TO THE NATIONAL TECHNICAL INFORMATION SERVIC.: (NTIS) AT THE ADDRESS BELOW.SALES AGENCIES
National Technical ESA/Information Retrieval Serviue The British LibraryInformation Service (NTIS) European Space Age; -y Document Supply Centre528±. Port Royal Road 10, rue Manolqikis Boston Spa, WIetherbySpringfieldl, Virgina 22161 75015 Paris West Yorkshire LS23 7B0United States France United Kingdom
Requests for microfiches orphotocopies of AGARD docume - .icuding requests to NTIS)sbould include the word AGARI'and theAGARD serial number (for example AGARD-AG-3 15). Collateral informatin...ch as title and publication date is desirable. Note thatAGR eot n dioyRprssol epcfe as AGARD-R-nnn and AGARD-A I1-nnn, respectively. Full bibliographical
references and abstracts of AGARD publications are given ini the following journals:Scientific and Technical Aerospace Reports (STAR) Government Repo. t, Announcemehts anid Index (GRA&l)
bushd b NAS Scentiic nd Tchncalpublished by the National Technical Information ServiceNASorAt Division 22rng6el
Waihintinn TKC2054T U6wUnitd sttes(also available online in the NTIS Bibliographic
Database or on CD-ROM)
Printed bySpecialised Printing Services Limited40 Chigwell Lane, Loughtan, Essex IGit 7Z
ISBN 92-835 -06181.9
Related Documents