. ja j _ . \ nfWiiRiciliT ,. .-IT JTI fill J.. UTt AS... ft Jl. %, Jk Naval Research Laboratory, Washinqton. DC 9970501 083

Welcome message from author
This document is posted to help you gain knowledge. Please leave a comment to let me know what you think about it! Share it to your friends and learn new things together.
Transcript

. ja j _ . \
nfWiiRiciliT ,. .-IT
JTI fill
J..
UTt
AS...
ft Jl. %,
Jk
Naval Research Laboratory, Washinqton. DC 9970501 083
This 1996 NRL Review introduces you to the Naval Research Laboratory—the Navy's Corporate Laboratory—and focuses on research highlights from fiscal year 1995. In addition, it presents the special honors awarded to NRL employees and describes the programs available to NRL and non-NRL employees. This publication offers an exchange of information among scientists, engineers, scholars, and managers, and it is used as a recruiting tool.
As you read the NRL Review, you will become even more aware that the Naval Research Laboratory comprises a dynamic team of scientists, engineers, and support personnel working together to promote the programs that will continue to foster discoveries and scientific advances for the Navy of the future.
General information on the research described in this NRL Review may be obtained from the Public Affairs Office, Code 1230, (202) 767-2541. Information concerning Technology Transfer is available from Dr. Richard Rein, head of the Technology Transfer Office, Code 1004, (202) 767-7230. The sources of information on the various nonresearch programs at NRL are listed in the chapter entitled "Programs for Professional Development."
The NRL Fact Book lists the organization, key personnel, and major facilities for each division. Further, it contains information about Laboratory funding, programs, and field sites. A copy of the Fact Book may be obtained by contacting the Technical Information Division, Publications Branch, Code 5230, (202) 767-2782.
NRL's URL: http://www.cmf.nrl.navy.mil/
Quick Reference Telephone Numbers
NRL NRL- NRL- NRL Washington SSC Monterey CBD
Hotline (202) 767-6543 (601) 688-5001 (408) 656-4737 (202) 767-6543
Personnel Locator (202) 767-3200 (601) 688-3390 (408)656-4706 (410) 257-4000
DSN 297- or 354- 485 878 —
Direct-in-Dialing 767- or 404- 688 656 257
Public Affairs (202) 767-2541 (601) 688-5328 (408) 656-4708 —
Additional telephone numbers are listed on page 249.

DISCLAIM« NOTICE
THIS DOCUMENT IS BEST
QUALITY AVAILABLE. THE COPY
FURNISHED TO DUC CONTAINED
A SIGNIFICANT NUMBER OF
COLOR PAGES WHICH DO NOT
REPRODUCE LEGIBLY ON BLACK
AND WHITE MICROFICHE.
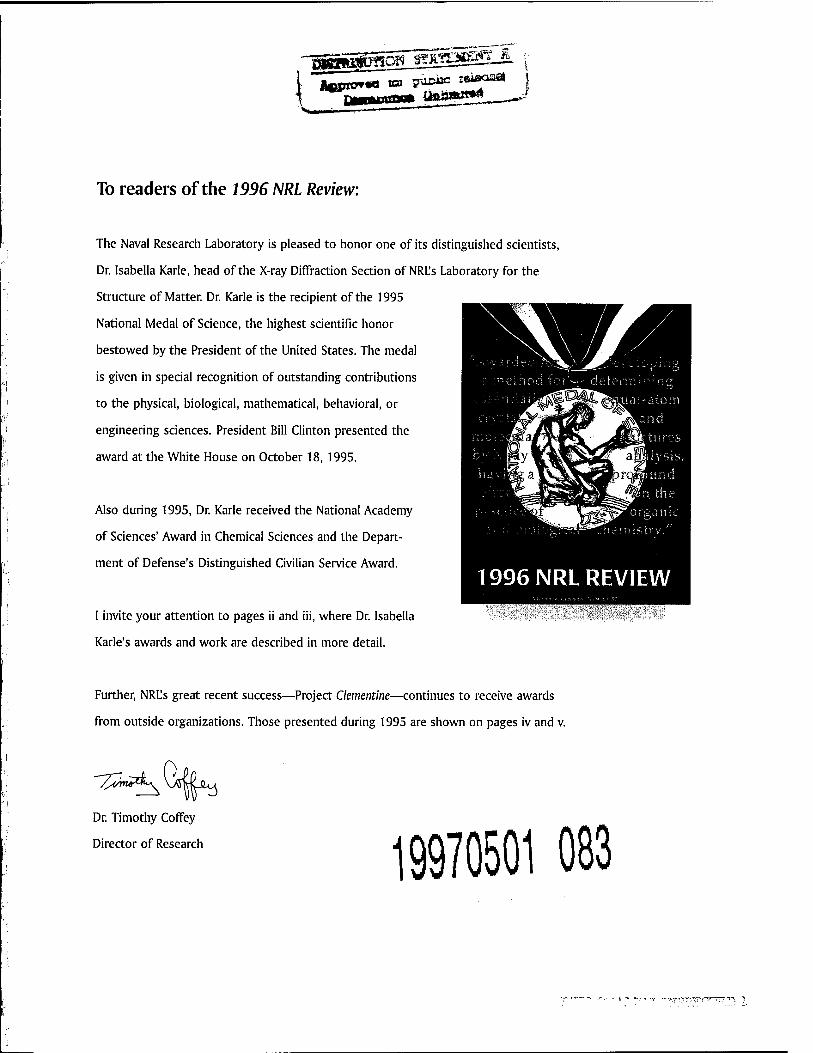
To readers of the 1996 NRL Review:
The Naval Research Laboratory is pleased to honor one of its distinguished scientists,
Dr. Isabella Karle, head of the X-ray Diffraction Section of NRL's Laboratory for the
Structure of Matter. Dr. Karle is the recipient of the 1995
National Medal of Science, the highest scientific honor
bestowed by the President of the United States. The medal
is given in special recognition of outstanding contributions
to the physical, biological, mathematical, behavioral, or
engineering sciences. President Bill Clinton presented the
award at the White House on October 18, 1995.
Also during 1995, Dr. Karle received the National Academy
of Sciences' Award in Chemical Sciences and the Depart-
ment of Defense's Distinguished Civilian Service Award.
I invite your attention to pages ii and iii, where Dr. Isabella
Karle's awards and work are described in more detail.
Further, NRL's great recent success—Project Clementine—continues to receive awards
from outside organizations. Those presented during 1995 are shown on pages iv and v.
/^rnp&\
Dr. Timothy Coffey
Director of Research 19970501 083
™TT^Tr-TvPrr7Tr"T^ i
on
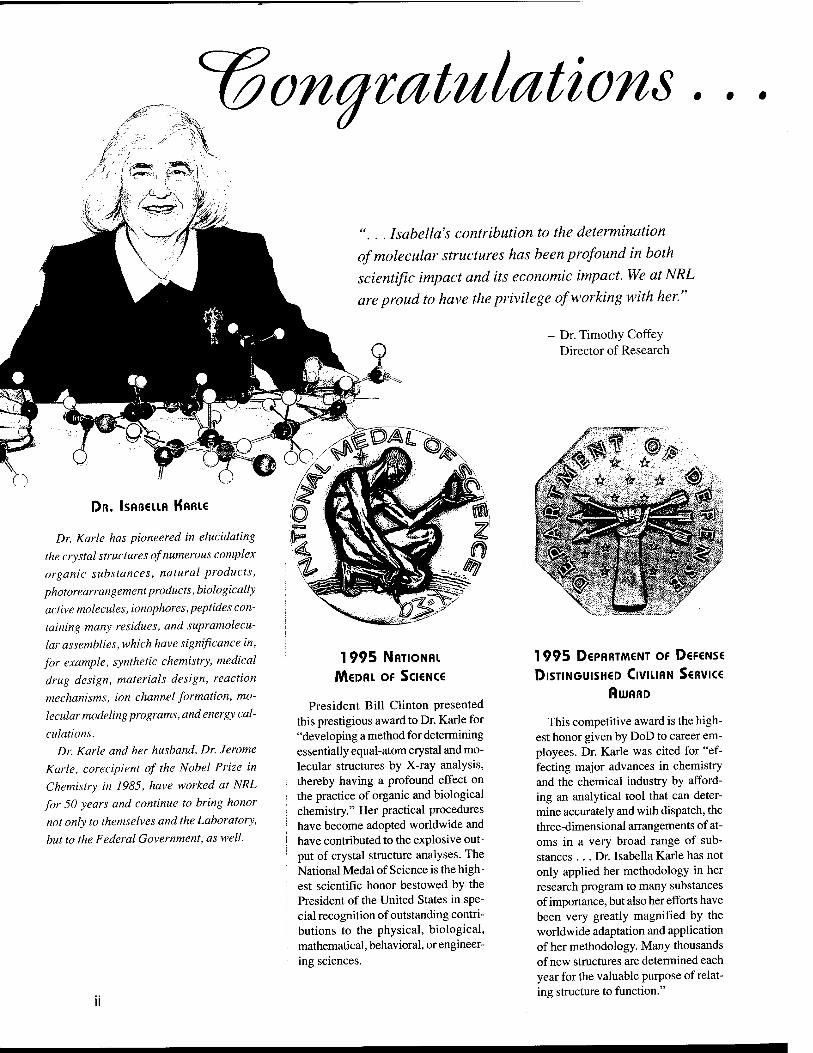
". . . Isabella's contribution to the determination of molecular structures has been profound in both
scientific impact and its economic impact. We at NRL are proud to have the privilege of working with her."
- Dr. Timothy Coffey Director of Research
Dr. Karle has pioneered in elucidating
the crystal structures of numerous complex
organic substances, natural products,
photorearrangement products, biologically
active molecules, ionophores, peptides con-
taining many residues, and supramolecu-
lar assemblies, which have significance in,
for example, synthetic chemistry, medical
drug design, materials design, reaction
mechanisms, ion channel formation, mo-
lecular modeling programs, and energy cal-
culations.
Dr. Karle and her husband, Dr. Jerome
Karle, corecipient of the Nobel Prize in
Chemistry in 1985, have worked at NRL
for 50 years and continue to bring honor
not only to themselves and the Laboratory,
but to the Federal Government, as well.
1995 NATIONAL
JVWDRL OF SCICNCS
President Bill Clinton presented this prestigious award to Dr. Karle for "developing a method for determining essentially equal-atom crystal and mo- lecular structures by X-ray analysis, thereby having a profound effect on the practice of organic and biological chemistry." Her practical procedures have become adopted worldwide and have contributed to the explosive out- put of crystal structure analyses. The National Medal of Science is the high- est scientific honor bestowed by the President of the United States in spe- cial recognition of outstanding contri- butions to the physical, biological, mathematical, behavioral, or engineer- ing sciences.
Jnt f v | 4r dr!
:M:
1 995 D€PHRTM€NT OF D€F€NS€
DISTINGUISHED CIVILIAN SCRVIC«
fluJRRD
This competitive award is the high- est honor given by DoD to career em- ployees. Dr. Karle was cited for "ef- fecting major advances in chemistry and the chemical industry by afford- ing an analytical tool that can deter- mine accurately and with dispatch, the three-dimensional arrangements of at- oms in a very broad range of sub- stances ... Dr. Isabella Karle has not only applied her methodology in her research program to many substances of importance, but also her efforts have been very greatly magnified by the worldwide adaptation and application of her methodology. Many thousands of new structures are determined each year for the valuable purpose of relat- ing structure to function."

x. Isabella (^Kaüe
1995 NRTIONIU ACFIDEMV
OF SCI€NC€S AwflRD
IN CHEMICAL SCIENCES
The Academy presented this award to Dr. Karle "for innovative research in the chemical sciences that, in the broadest sense, contributes to a better understanding of the natural sciences and to the benefit of humanity." Fur- ther, Dr. Karle was honored "for her development of and extensive appli- cation of a method for determining essentially equal-atom crystal molecu- lar structures by X-ray analysis, thereby profoundly affecting the prac- tice of chemistry."
öSEääI
ßOWER AwflRD UND PRIZE
FOR ACHIEVEMENT IN SCIENCE
This award is presented by the Franklin Institute to honor interna- tional achievement in the physical and life sciences that significantly ad- vances human knowledge and welfare. Dr. Karle was cited for her "pioneer- ing contributions in determining the three-dimensional structure of mol- ecules, making use of both X-ray and electron diffraction, and in particular for her definitive introduction ... of the symbolic addition method to re- veal molecular structure directly from X-ray studies." Dr. Karle was the fourth recipient of the prize and the first woman to receive it—clearly a fitting recognition of her half-century career in science and service to the U.S. Navy and mankind.
1988 GREGORI AMINOFF
PRIZE
This award was presented by the Royal Swedish Academy of Sciences, in Stockholm, Sweden. The prize hon- ors "outstanding pioneering contribu- tions to crystallography characterized by scientific beauty and elegance." Dr. Karle was honored for her "eminent crystallographic studies of compli- cated natural products."
Ill

In 1990, a mission was conceived to test the latest in space-based imaging components, using the Moon and a near-Earth asteroid as celestial targets. The Clementine mission was the result of those early investigations. In 22 short months, the construction and integration of the sophisticated deep-space spacecraft was completed.
Clementine is the first satellite to embody the concept of "faster, cheaper, better" and represents the beginning of a new era of coopera- tion in space.
Mr. Jim Campbell (left), Jet Pro- pulsion Laboratory's Clementine manager, Mr. PaulRegeon (center), NRL's Clementine project team manager, and Ms. Linda Greenway (right), NRL's Public Affairs exhibit specialist at the "Best of 1994" ceremony.
The Clementine spacecraft
Populai "The Bi
Cleme moon in cheaper, The 500- in only 2 DoD, D( model fo its names gone fore 1 million
Pi 'ogies"
/isit the "faster, letoric. id built jped by d be a
)n. Like ost and are than
r Science Magazine's ?st ofl994's Top 100 Techno
ntine, the first U.S. spacecraft to > a quarter-century, is proof that the better" mantra is more than just r pound spacecraft was designed a years, for just $80 million. Deveh )E, and NASA, Clementine cou r future military-civilian cooperatic ake, though, Clementine is now " ver," after sending back to Earth m images of the lunar surface.
Mr. Peter Wilhelm (right), director of NRL's Naval
Center for Space Technology accepts the Stellar Award on
behalf of the Clementine team from Mr. Christopher Kraft, former director of the Johnson Space Center.
The Rotary National Award for Space Achievement Foundation's 1994 Stellar Award for Spacecraft Design
NRL's Clementine team was "recognized for its pioneering efforts in successfully demon- strating the first 'faster, cheaper, better' space- craft technology, during the Clementine I mis- sion that mapped the entire lunar surface; for demonstrating that it is possible to build a spacecraft like Clementine in only 22 months (less than one-half the usual time) for one-fifth the usual cost for similar space probes; and for opening a new pathway for reduced operational costs for future Department of Defense and NASA space missions."
IV

Continues to Receive Recognition
Hü'
Bill
TRONTIER rC.'UND^TiON
*
1 1 i
1995 Awardfor Technological Innovation
Discover Magazine selected Clementine as the winner in the Aerospace and Aviation category, one of seven for which awards were presented. A total of 4,000 technolo- gies were considered.
1995 Space Frontier Vision-to-Reality Award
Presented to five Clementine team members, including NRL's Mr. Paul Regeon. "The Clementine team's achievement, in acquiring an impressive quantity of high-quality multispectral, topographic and other data of the moon's surface, while testing military sensor hardware, is remarkable. Further, the demonstration of new approaches to the development, operations and pro- gram management of a planetary explo- ration vehicle is equally commendable. Your participation in this effort is very much appreciated by American citizens like we in the [Space Frontier] Founda- tion who are committed to an open fron- tier in space."
The National Space Club's Nelson P. Jackson Aerospace Award
The Clementine team was cited "for inno- vative spacecraft design, development and op- erations, and the production of meaningful scientific data that was used to build the most comprehensive, multispectral geologic lunar map to date."
Aviation Week and Space Technology's 1994 Laureate Award
Presented to Col. Pedro Rustan, Mission Di- rector, and NRL's Mr. Paul Regeon. "This year's space laureates had a 'supporting cast' composed of an exceptionally talented and dedicated cadre of engineers and scientists ... Clementine fully realized its defense technol- ogy goals, and it produced splendid new lunar science as a bonus. In an era in which 'faster, cheaper, better' has become a mantra in space circles, Clementine is the premier example of a return to the practices that once character- ized all space science missions."
1996 NRL Review
SPECIAL RECOGNITION by Dr. Timothy Coffey
ii Dr. Isabella Karle iv Clementine
CONTENTS
MISSION
REFLECTIONS
1 Chief of Naval Research 2 Commanding Officer and Director of Research
4 Introducing NRL's New Commanding Officer
RADM Marc Y.E. Pelaez, USN CAPT Richard M. Cassidy, USN
and Dr. Timothy Coffey CAPT Bruce W. Buckley, USN
THE NAVAL RESEARCH LABORATORY
7 NRL-Our Heritage, NRL Today, NRL in the Future 34 Highlights of NRL Research in 1995 44 Meet the Researchers
FEATURED RESEARCH
49 Naturally Occurring Biological Modules as Environmentally Acceptable Corrosion Inhibitors
59 A Deep Western Boundary Current in the North Pacific
71 NRL Advances in Computational Fluid Dynamics: FAST3D and FEFLO
E. McCafferty and D.C. Hansen
Z.R. Hallock, W.J. Teague, and E.R. Fillenbaum
A. Landsberg, R. Ramamurti, J.P. Boris, and W.C. Sandberg
ACOUSTICS
83
84 86
Influence of Internal Gravity Waves on Acoustic Propagation S. Finette, S. Wolf, M. Orr, and D. Tielbuerger
High-Frequency Shallow-Water Signal Fluctuations S. Stank, C. Mire, and E. Kennedy Fiber-Optic, Noise-Filtering Acoustic Velocity Sensors J.A. Bucaro, N. Lagakos, and B.H. Houston
VI

CHEMICAL/BIOCHEMICAL RESEARCH
93 Cubane Chemistry: A Source of New Energetic Materials R.D. Gilardi 95 The Many Faces of Silicon LJ. Whitman, S.C. Erwin, and A.A. Baski 97 Field Testing of Environmental Immunosensors A.W. Kusterbeck and L.C. Shriver-Lake
ELECTRONICS AND ELECTROMAGNETICS
103 AN/SPQ-9B ADM Radar 104 Ferroelectric Lens Phased Arrays 106 Small Ship ESM System 108 Missile Radar Performance Characterization 110 A Novel Coaxial Free-Electron Laser
L.M. Liebowitz, L.M. Shaus, and D.J. Cardiel J.B.I. Rao, D.P. Patel, and W.R. Pickles
J.J. Briguglio D.W. Kahl
M. Blank, R.H. Jackson, and H.P. Freund
ENERGETIC PARTICLES, PLASMAS, AND BEAMS
115 In Situ Monitoring of the Absorption of Deuterium E.F. Skelton, S.B. Qadri, P.L. Hagans, into Palladium Using Synchrotron-Wiggler Radiation and D.D. Dominguez
117 Laboratory Research in Space Plasma Physics D.N. Walker, W.E. Amatucci, and J.A. Antoniades 119 Kinetic Limitations to Molecular Beam Epitaxy M.E. Twigg, B.R. Bennett, P.M. Thibado,
B.V. Shanabrook, and LJ. Whitman
INFORMATION TECHNOLOGY AND COMMUNICATION
125 Rejection with Multilayer Neural Networks: B. Kamgar-Parsi and B. Kamgar-Parsi Screening Image Data
127 Scalable Real-time Networking for Distributed Computing S. Batsell, R. Cole, and B. Root 129 Key Management Support Inside 4.4 BSD UNIX D.I. McDonald, B.G. Phan, and R.J. Atkinson
MATERIALS SCIENCE AND TECHNOLOGY
135
137 140
141
Magnetic Metal/Semiconductor Heterostructure Studies in the EPICENTER Facility
B.T. Jonker, P.M. Thibado, E. Kneedler, B.R. Bennett, B.V. Shanabrook,
R.J. Wagner, and LJ. Whitman Hydrogen Exchange Reactions within Density-Functional Theory M.R. Pederson Optical Spectroscopy of Single GaAs Quantum Dots D.G. Gammon, E.S. Snow,
and B.V. Shanabrook Dynamics and Control of Spatio-Temporal Systems LB. Schwartz and I. Triandaf
OCEAN AND ATMOSPHERIC SCIENCE AND TECHNOLOGY
147 Polarimetric SAR Remote Sensing of Topography D.I. Schuler andJ.S. Lee 149 Biophysical Interactions in the Arabian Sea J.C. Kindle, D.K. Young, R.A. Arnone, and A.W. Green 151 An Investigation of the Southerly Surge W.T. Thompson, T. Haack, andJ.D. Doyle 154 Solar Irradiance Variability Models J.T. Mariska, H.P. Warren, andj. Lean
VII

OPTICAL SCIENCE
159 Change Detection Using Multispectral Invariants 162 Nanochannel Glass Replica Membrane Technology 163 Infrared Color Vision 165 Fiber Bragg Grating Laser Sensors
A. Schaum and A. Stocker D.H. Pearson and R.J. Tonucci
D.A. Scribner, M.P. Satyshur, and M. R. Kruer A.D. Kersey and K.P. Koo
REMOTE SENSING
171 Radar Imaging of Underwater Sand Dunes
173 Hydrodynamic and Radar Modeling of Ocean Currents
175 Measurement of Nearshore Dynamics Using Video
T.F. Donato, F. Askari, C.L. Trump, and CO. Marmorino
R.W. Jansen, S.R. Chubb, and C.Y. Shen
K.T. Holland andJ.C. Church
SIMULATION, COMPUTING, AND MODELING
181 A Hybrid Virtual Environment Interface to C3I Information
183 Virtual Firefighting 185 Ultrasonic Tomography of Solids
Using Parallel Processing 188 Laboratory Simulations of the Coupling of
Blast Wave into Solid Materials 191 Observed and Simulated Intraseasonal
Circulation Anomalies
R.P. Darken, T.A. Hill, and B.T. Solan
P.A. Tatem and D.I. Täte R.S. Schechter, R.B. Mignogna, and P.P. Delsanto
C.K. Manka, J. Grun, and H.R. Burris
C.A. Reynolds, R. Gelaro, and T. Murphree
SPACE RESEARCH AND SATELLITE TECHNOLOGY
195
198 199 202 205
208 210
The High-Temperature Superconducting Space Experiment II
Electric Propulsion for Advanced Unmanned Aircraft Global Maps of OH in the Middle Atmosphere Sodium Sulfur Battery Cell Space Flight Experiment HERCULES/MSI: Hand-held Georegistered Multispectral Video
Active Vibration Suppression in Space Structures Twenty Years of HRTS Observations J.W.
T.G. Kawecki, G.E. Price, J.A. Golba V.S. Rose, and M. Nisenoff
R.J. Foch R.R. Conway and M.E. Summers
J.C. Garner and W.E. Baker H.M. Pickard, R.F. Higgins,
and B. Kauftnan R. McClelland, S. Fisher, and A. Bosse
Cook, G.E. Brueckner, and}. Schultz
i SPECIAL AWARDS AND RECOGNITION
215 Special Awards and Recognition 225 Alan Berman Research Publication and Edison Patent Awards 230 Awards for NRL Review Articles
VIII

PROGRAMS FOR PROFESSIONAL DEVELOPMENT
235 Programs for NRL Employees-University Education and Scholarships, Continuing Education, Professional Development, and Other Activities
241 Programs for Non-NRL Employees-Fellowships, Exchange Programs, and Cooperative Employment
GENERAL INFORMATION
247 Technical Output 248 Technology Transfer at NRL 249 Key Personnel 251 Contributions by Divisions, Laboratories, and Departments 254 Employment Opportunities 255 Location of NRL in the Capital Area 256 Subject Index 259 Author Index
Inside back cover NRL Review Staff
IX
\ / I
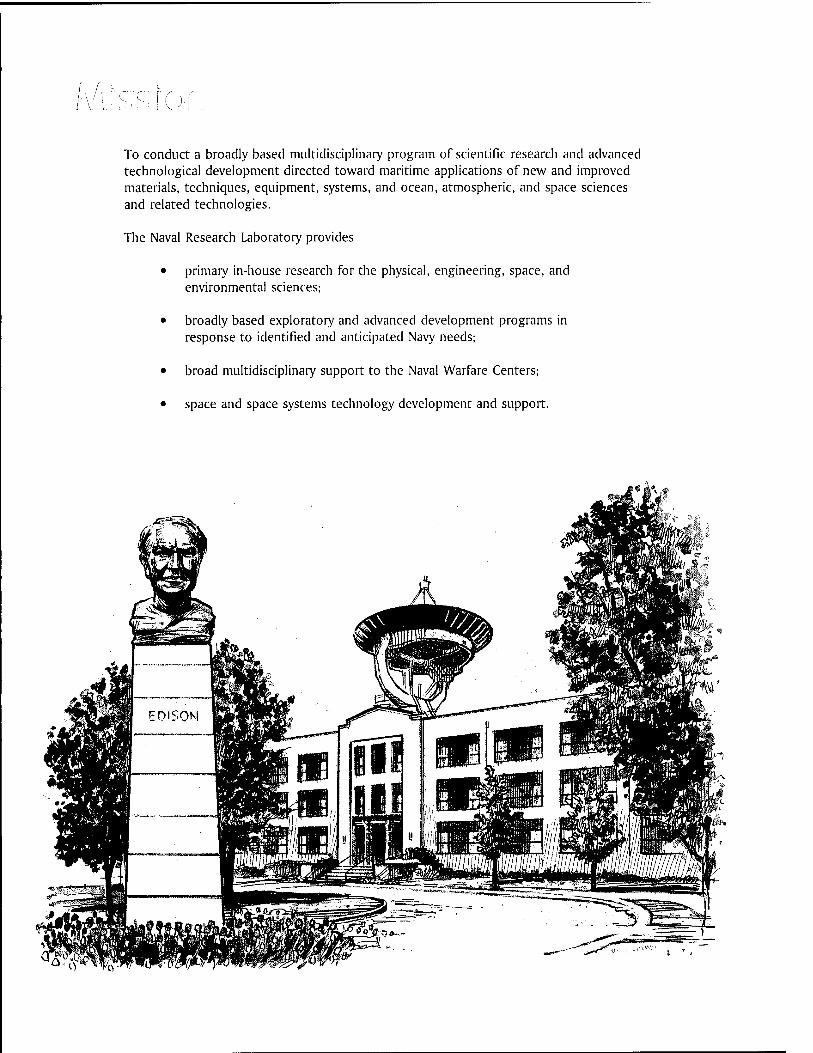
To conduct a broadly based multidisciplinary program of scientific research and advanced technological development directed toward maritime applications of new and improved materials, techniques, equipment, systems, and ocean, atmospheric, and space sciences and related technologies.
The Naval Research Laboratory provides
• primary in-house research for the physical, engineering, space, and environmental sciences;
• broadly based exploratory and advanced development programs in response to identified and anticipated Navy needs;
• broad multidisciplinary support to the Naval Warfare Centers;
• space and space systems technology development and support.

Reflections

1 Chief of Naval Research RADM Marc Y.E. Pelaez, USN
2 Commanding Officer and Director of Research CAPT Richard M. Cassidy, USN, and Dr. Timothy Coffey
4 Introducing NRL's New Commanding Officer CAPT Bruce W. Buckley, USN
täans fro n
^he dawning of the post-Cold War era offers the Ji Department of the Navy the unique opportunity to
plan a new force structure. While the worldwide responsibilities of our naval forces have not changed, our mission, threats, and potential adversaries have.
Our challenge today is greater than it ever has been—we must plan for, in the words of Secretary Dalton "the Navy after next"—one whose enemies are not yet known, but one that must have the technological edge to win.
The naval research and development community is charged with ensuring that our smaller Fleet of sailors and marines have the crucial force-multiplying weap- onry and the supporting state-of-the-art systems needed to win in combat and capably defend American interests and policies. The science and technology (S&T) investments we make today will determine the techno- logical superiority of the future Navy and Marine Corps, so it is imperative that we lay that foundation with informed vision.
Fleet operational requirements drive the need for S&T integration. We work closely with the developers to put improved products in the Fleet. Affordability, jointness, and transition—to the Fleet and to industry— are fundamental to our plan's success. The S&T investment program maintains our strong commitment to work with other services, with other government agencies to leverage our resources, with academia and industry, and, as appropriate, with our foreign allies to support U.S. naval S&T needs. The Office of Naval Research continues to look beyond traditional partner- ships with defense contractors to include new partner- ships with commercial industries, and we are ever more dependent on the high quality products of the Navy's corporate lab—the Naval Research Laboratory (NRL). Through its research divisions, which conduct programs embracing virtually all the physical science disciplines, the Laboratory has responded effectively to solve many of the short- and long-term problems of the Navy and the nation. It has gained a reputation as an institution that searches for and insists on excellence. When it comes to developing affordable, innovative, and superior military technologies from concept through demonstration, NRL has always been a leader.
This year, an exciting year for the Lab, brought such noteworthy achievements as: the Polar Ozone and Aerosol Measurement Experiment (POAM II), which has provided scientists with unique data on ozone chemistry and processes that affect ozone depletion; the development of a new concept for antiship missile defense—the new, AN/SPQ-9B radar, which provides a new, low-cost, quality sea-skimmer detection capability to the Fleet. NRL researchers developed a technique to
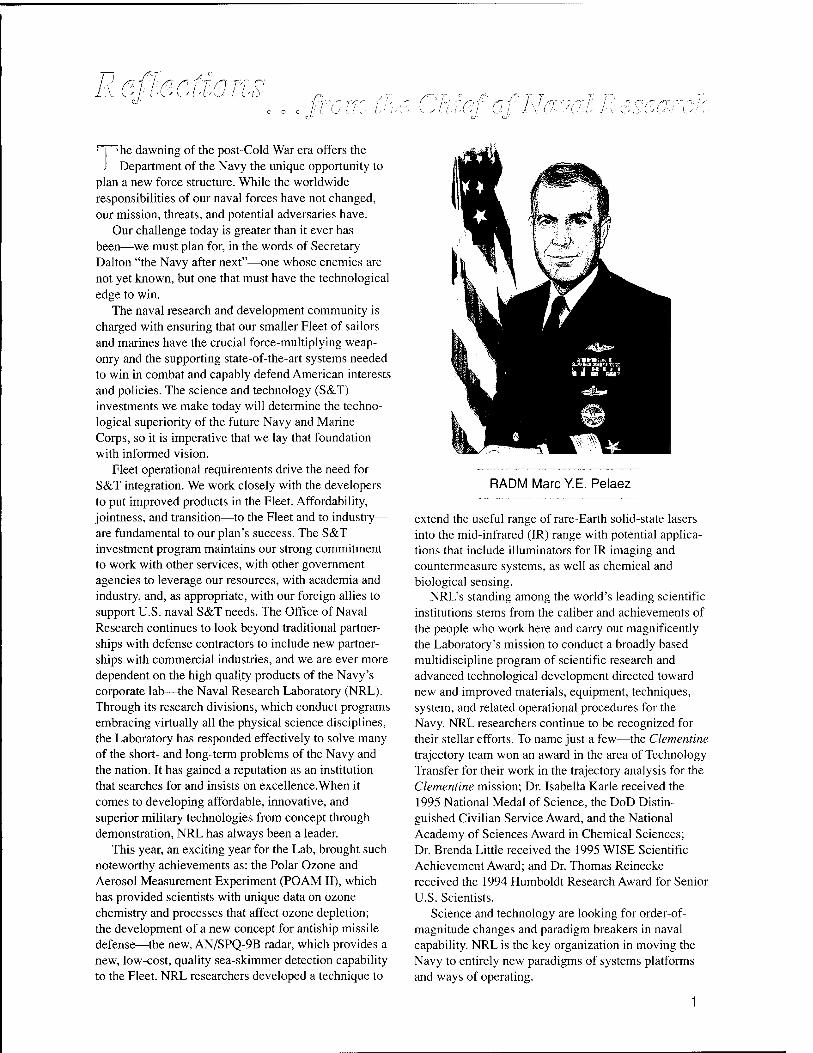
RADM Marc YE. Pelaez
extend the useful range of rare-Earth solid-state lasers into the mid-infrared (IR) range with potential applica- tions that include illuminators for IR imaging and countermeasure systems, as well as chemical and biological sensing.
NRL's standing among the world's leading scientific institutions stems from the caliber and achievements of the people who work here and carry out magnificently the Laboratory's mission to conduct a broadly based multidiscipline program of scientific research and advanced technological development directed toward new and improved materials, equipment, techniques, system, and related operational procedures for the Navy. NRL researchers continue to be recognized for their stellar efforts. To name just a few—the Clementine trajectory team won an award in the area of Technology Transfer for their work in the trajectory analysis for the Clementine mission; Dr. Isabella Karle received the 1995 National Medal of Science, the DoD Distin- guished Civilian Service Award, and the National Academy of Sciences Award in Chemical Sciences; Dr. Brenda Little received the 1995 WISE Scientific Achievement Award; and Dr. Thomas Reinecke received the 1994 Humboldt Research Award for Senior U.S. Scientists.
Science and technology are looking for order-of- magnitude changes and paradigm breakers in naval capability. NRL is the key organization in moving the Navy to entirely new paradigms of systems platforms and ways of operating.
1
iJÜl-er
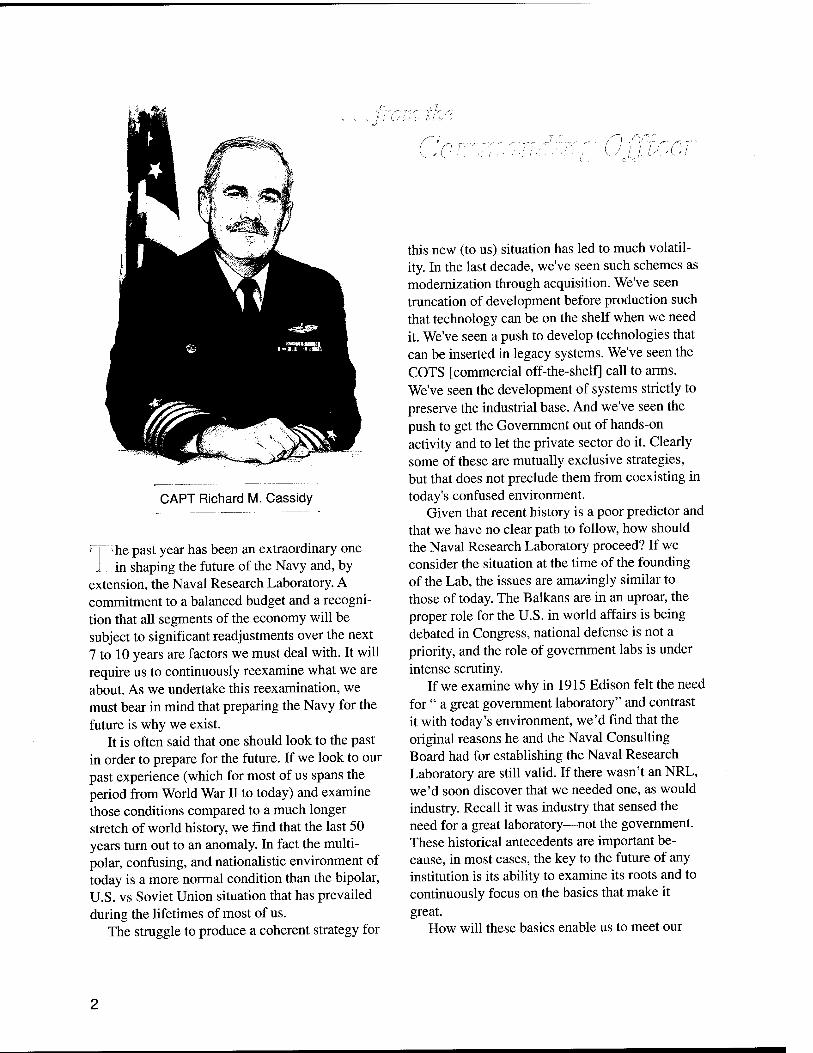
CAPT Richard M. Cassidy
H "he past year has been an extraordinary one J in shaping the future of the Navy and, by
extension, the Naval Research Laboratory. A commitment to a balanced budget and a recogni- tion that all segments of the economy will be subject to significant readjustments over the next 7 to 10 years are factors we must deal with. It will require us to continuously reexamine what we are about. As we undertake this reexamination, we must bear in mind that preparing the Navy for the future is why we exist.
It is often said that one should look to the past in order to prepare for the future. If we look to our past experience (which for most of us spans the period from World War II to today) and examine those conditions compared to a much longer stretch of world history, we find that the last 50 years turn out to an anomaly. In fact the multi- polar, confusing, and nationalistic environment of today is a more normal condition than the bipolar, U.S. vs Soviet Union situation that has prevailed during the lifetimes of most of us.
The struggle to produce a coherent strategy for
this new (to us) situation has led to much volatil- ity. In the last decade, we've seen such schemes as modernization through acquisition. We've seen truncation of development before production such that technology can be on the shelf when we need it. We've seen a push to develop technologies that can be inserted in legacy systems. We've seen the COTS [commercial off-the-shelf] call to arms. We've seen the development of systems strictly to preserve the industrial base. And we've seen the push to get the Government out of hands-on activity and to let the private sector do it. Clearly some of these are mutually exclusive strategies, but that does not preclude them from coexisting in today's confused environment.
Given that recent history is a poor predictor and that we have no clear path to follow, how should the Naval Research Laboratory proceed? If we consider the situation at the time of the founding of the Lab, the issues are amazingly similar to those of today. The Balkans are in an uproar, the proper role for the U.S. in world affairs is being debated in Congress, national defense is not a priority, and the role of government labs is under intense scrutiny.
If we examine why in 1915 Edison felt the need for " a great government laboratory" and contrast it with today's environment, we'd find that the original reasons he and the Naval Consulting Board had for establishing the Naval Research Laboratory are still valid. If there wasn't an NRL, we'd soon discover that we needed one, as would industry. Recall it was industry that sensed the need for a great laboratory—not the government. These historical antecedents are important be- cause, in most cases, the key to the future of any institution is its ability to examine its roots and to continuously focus on the basics that make it great.
How will these basics enable us to meet our
/ , / I
responsibilities in a certain future? Let's start by asserting a few things which are certain over the next 10 years:
Today's Fleet will be 10 years older, and a substantial number of ships and airplanes will be approaching the end of their service lives. Today's threat will be at least two generations better (or worse from our perspective), if you assume that the rest of the world operates on 5-year plans. So we can't declare victory and stop working in areas where we excel today.
• Somewhere in the world where the U.S. has an interest, there will be armed conflict.
• The defense budget will not return to the levels we've seen in the recent past nor will the S&T budgets.
These certainties imply several things to the Naval Research Laboratory. On the one hand, there will be continued pressure to downsize the shore establishment, which frees up limited funds to recapitalize the operating forces. These freed-up funds are always in danger of being eaten up by contingency operations, as in Bosnia, further putting pressure on the shore establishment. On the other hand, since the work we do is threat- driven, there will be a clear need to improve our weapons systems and avoid technological surprise. The fundamental question will be "who should do that and to what extent?".
This is where the basics of NRL's mission and excellence come into play. A broadly based, multidisciplinary program of science and applied technology, which is characteristic of NRL, doesn't exist in industry or in any one university. This broad base frees the Lab from the restriction
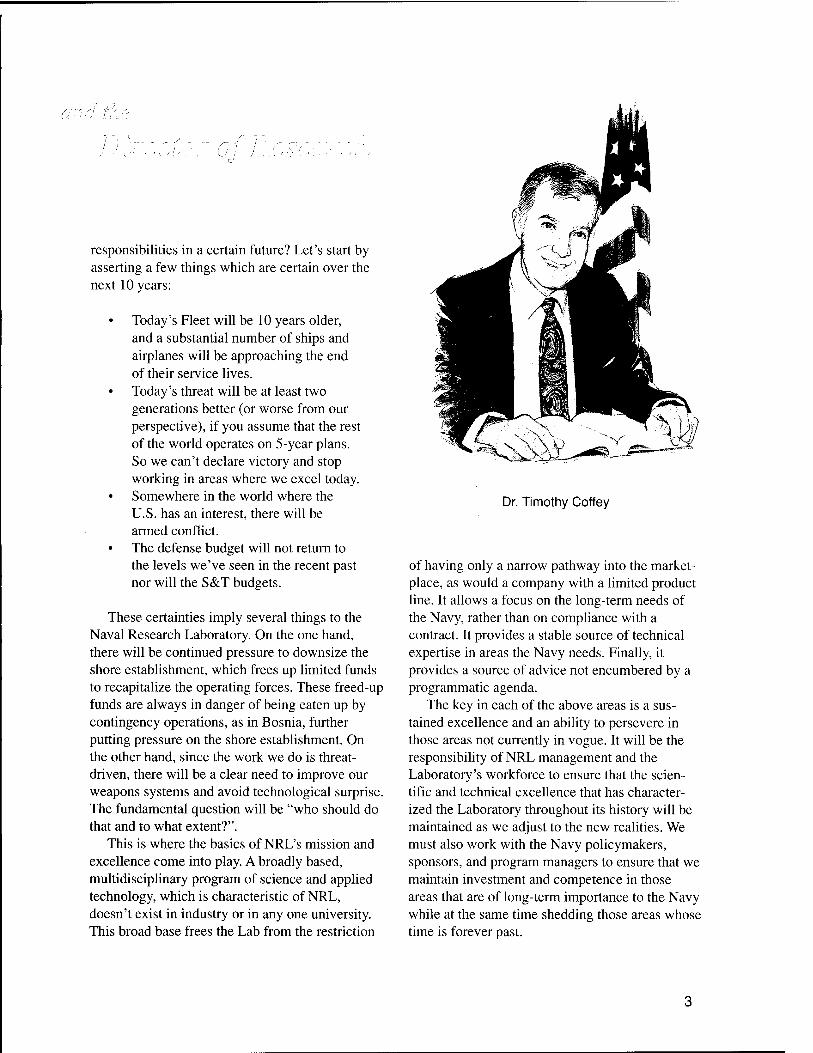
Dr. Timothy Coffey
of having only a narrow pathway into the market- place, as would a company with a limited product line. It allows a focus on the long-term needs of the Navy, rather than on compliance with a contract. It provides a stable source of technical expertise in areas the Navy needs. Finally, it provides a source of advice not encumbered by a programmatic agenda.
The key in each of the above areas is a sus- tained excellence and an ability to persevere in those areas not currently in vogue. It will be the responsibility of NRL management and the Laboratory's workforce to ensure that the scien- tific and technical excellence that has character- ized the Laboratory throughout its history will be maintained as we adjust to the new realities. We must also work with the Navy policymakers, sponsors, and program managers to ensure that we maintain investment and competence in those areas that are of long-term importance to the Navy while at the same time shedding those areas whose time is forever past.

NEW COMMANDING OFFICER
On January 26, 1996, CAPT Bruce W. Buckley replaced CAPT Richard M. Cassidy as the Naval Research Laboratory's Commanding Officer.
Captain Bruce W. Buckley, a native of Lancaster, Ohio, graduated from the United States Naval Acad- emy in 1973. CAPT Buckley entered flight training and was designated a Naval Aviator in December 1974 at Naval Air Station Chase Field, Texas. After completing replacement pilot training in the F-14A at Fighter Squadron 124, he served a fleet assign- ment as an F-14A pilot in Fighter Squadron Twenty Four.
Following his fleet assignment in Fighter Squadron Twenty Four, CAPT Buckley began accumulating extensive experience in research, development, engineering, and project management with a tour on the Joint Test Force of the Air Combat/Air-to-Air Missile Evaluation at Nellis Air Force Base, Nevada. He then attended the Naval Postgraduate School at Monterey, California, where he earned a Master of Science in Electrical Engineering, with Distinction. While at postgraduate school, CAPT Buckley was selected to be designated an Aerospace Engineering Duty Officer (AEDO).
As an AEDO, CAPT Buckley has had positions of increasing responsibility in engineering and program management, including F/A-18 F404 Project Officer
at the Naval Plant Representatives Office, Lynn, Massachusetts; Avionics and Electro-Optics Projects Manager in the F/A-18 Program Management Office, Assistant to the Program Director of Tactical Air- craft Programs, F404 Engine Program Manager, and Program and Policy Branch Head in the Propulsion Division, all at the Naval Air Systems Command Arlington, Virginia. CAPT Buckley then served in two positions—as the F-14 Aircrew Systems Pro- gram Manager and as the Deputy Director of the Research and Engineering Department of the Naval Training Systems Center in Orlando, Florida. Return- ing to Washington and the Naval Air Systems Com- mand in July 1993, he served as the Associate Direc- tor of the Evaluations Division and as the Director of the Propulsion and Power Division before assum- ing his last position as the Executive Assistant to the Commander, Naval Air Systems Command.
CAPT Buckley's decorations include the Legion of Merit, the Meritorious Service Medal, a Joint Service Commendation, and three Navy Commendations. CAPT Buckley is married to Janice E. (Faller) Buckley, formerly of Miami, Florida, and they reside with their two daughters, Michele and Sandra, in Lake Ridge, Virginia.

The Naval
Research Laboratory

7 NRL-Our Heritage, NRL Today, NRL in the Future
34 Highlights of NRL Research in 1995
44 Meet the Researchers
NRL-Our Heritage
Today, when government and science seem inextricably linked, when virtually no one ques- tions the dependence of national defense on the excellence of national technical capabilities, it is noteworthy that in-house defense research is relatively new in our Nation's history. The Naval Research Laboratory (NRL), the first modern research institution created within the United States Navy, began operations in 1923.
Thomas Edison's Vision—The first step came in May 1915, a time when Americans were deeply worried about the great European war. Thomas Edison, when asked by a New York Times corre- spondent to comment on the conflict, argued that the Nation should look to science. "The Govern- ment," he proposed in a published interview, "should maintain a great research laboratory.... In this could be developed...all the technique of military and naval progression without any vast expense." Secretary of the Navyjosephus Daniels seized the opportunity created by Edison's public comments to enlist Edison's support. He agreed to serve as the head of a new body of civilian experts-the Naval Consulting Board-to advise the Navy on science and technology. The Board's most ambitious plan was the creation of a mod- ern research facility for the Navy. Congress allo- cated $1.5 million for the institution in 1916, but wartime delays and disagreements within the Naval Consulting Board postponed construction until 1920.
The Laboratory's two original divisions — Radio and Sound-pioneered in the fields of high- frequency radio and underwater sound propaga- tion. They produced communications equipment, direction-finding devices, sonar sets, and perhaps most significant of all, the first practical radar equipment built in this country. They also per- formed basic research, participating, for example, in the discovery and early exploration of the iono- sphere. Moreover, the Laboratory was able to work gradually toward its goal of becoming a broadly based research facility. By the beginning of World War II, five new divisions had been
added: Physical Optics, Chemistry, Metallurgy, Mechanics and Electricity, and Internal Communi- cations.
The War Years and Growth -Total employment at the Laboratory jumped from 396 in 1941 to 4400 in 1946, expenditures from $1.7 million to $13.7 million, the number of buildings from 23 to 67, and the number of projects from 200 to about 900. During WWII, scientific activities nec- essarily were concentrated almost entirely on applied research. New electronics equipment- radio, radar, sonar—was developed. Counter- measures were devised. New lubricants were produced, as were antifouling paints, luminous identification tapes, and a sea marker to help save survivors of disasters at sea. A thermal diffu- sion process was conceived and used to supply some of the 235U isotope needed for one of the first atomic bombs. Also many new devices that developed from booming wartime industry were type tested and then certified as reliable for the Fleet.
NRL Reorganizes for Peace -Because of the major scientific accomplishments of the war years, the United States emerged into the post- war era determined to consolidate its wartime gains in science and technology and to preserve the working relationship between its armed forces and the scientific community. While the Navy was establishing its Office of Naval Research (ONR) as a liaison with and supporter of basic and applied scientific research, it was also encour- aging NRL to broaden its scope and become, in effect, its corporate research laboratory. There was a transfer of NRL to the administrative over- sight of ONR and a parallel shift of the Labora- tory's research emphasis to one of long-range basic and applied investigation in a broad range of the physical sciences.
However, rapid expansion during the war had left NRL improperly structured to address long-term Navy requirements. One major task— neither easily nor rapidly accomplished-was that
THE NAVAL RESEARCH LABORATORY —
of reshaping and coordinating research. This was achieved by transforming a group of largely autonomous scientific divisions into a unified institution with a clear mission and a fully coor- dinated research program. The first attempt at reorganization vested power in an executive com- mittee composed of all the division superinten- dents. This committee was impracticably large, so in 1949, a civilian director of research was named and given full authority over the program. Posi- tions for associate directors were added in 1954.
The Breadth ofNRL- During the years since the war, the areas of study at the Laboratory have included basic research concerning the Navy's environments of Earth, sea, sky, and space. Inves- tigations have ranged widely from monitoring the Sun's behavior to analyzing marine atmospheric conditions to measuring parameters of the deep oceans. Detection and communication capabilities have benefitted by research that has exploited new portions of the electromagnetic spectrum, extended ranges to outer space, and provided means of transferring information reliably and securely, even through massive jamming. Subma- rine habitability, lubricants, shipbuilding materi- als, fire fighting, and the study of sound in the sea have remained steadfast concerns, to which have been added recent explorations within the fields of virtual reality, superconductivity, and biomolecular science and engineering.
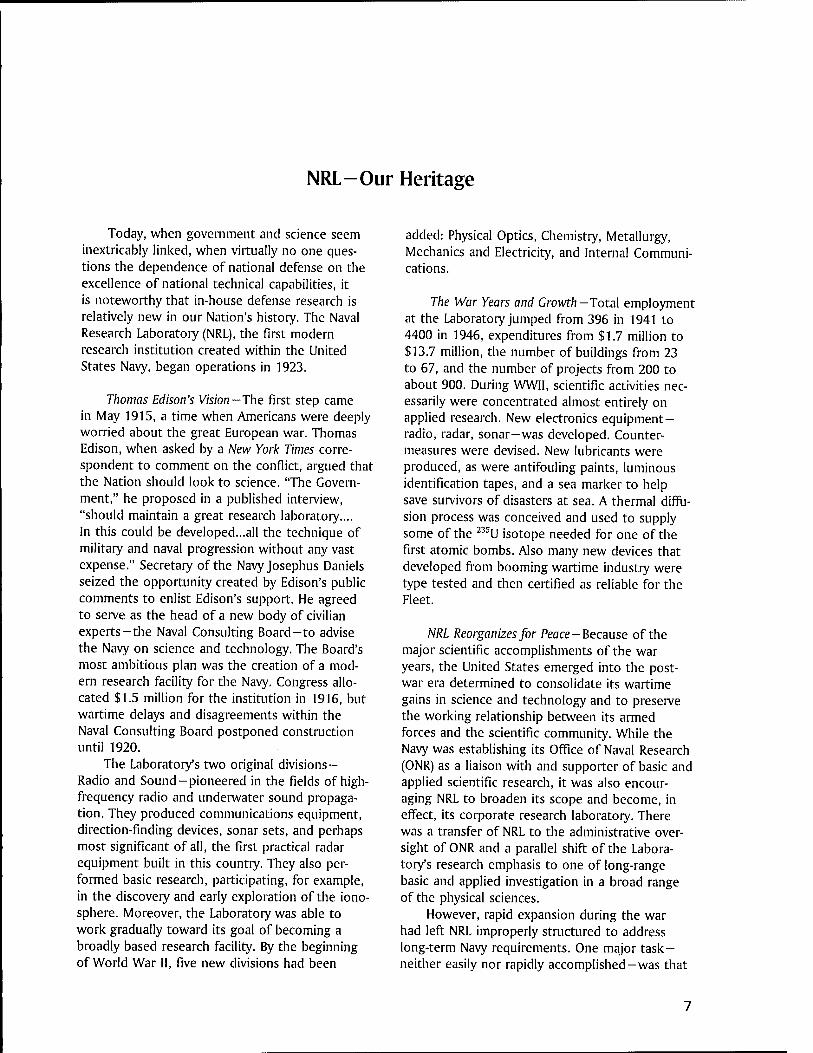
Dr. A.H. Taylor, Dr. C.E. Cleeton, and Mr. J.P. Hagen operate the Navy's first high-power communication trans- mitter from the roof of Building 1 (early 1937).
The Laboratory has pioneered naval research into space from atmospheric probes with cap- tured V-2 rockets through direction of the Van- guard project-America's first satellite program - to involvement in such projects as the Navy's Global Positioning System. Today NRL is the Navy's lead laboratory in space systems research, fire research, tactical electronic warfare, micro- electronic devices, and artificial intelligence.
The consolidation in 1992 of NRL and the Naval Oceanic and Atmospheric Laboratory, with centers at Bay St. Louis, Mississippi, and Monterey, California, added critical new strengths to the Laboratory. NRL now is additionally the lead Navy center for research in ocean and atmo- spheric sciences, with special strengths in physical oceanography, marine geosciences, ocean acous- tics, marine meteorology, and remote oceanic and atmospheric sensing. The expanded Laboratory is focusing its research efforts on new Navy strate- gic interests and needs in the post-Cold War world. Although not abandoning its interests in blue-water operations and research, the Navy is also focusing on defending American interests in the world's littoral regions. NRL scientists and engineers are working to give the Navy the special knowledge and capabilities it needs to operate in these waters.
Scientists within NRL's Radar Division during the last year have developed a new concept for an antiship missile defense. The new AN/SPQ-9B radar maintains present gun-fire control-systems MK 86 support while providing low-cost, quality sea-skimmer detection capability for the Fleet. The system will provide significantly increased sensitivity, along with an improved ability to detect targets in clutter. Researchers in the Lab- oratory's Tactical Electronic Warfare Division have developed a portable electronic warfare (EW) environment simulator capable of generating high-fidelity signals. The simulator can be used for EW training and for checkout of modern ship- board or airborne platforms, while remaining small and inexpensive enough to be placed on every Navy ship.
During FY 95, NRL-Monterey signed a memo- randum of agreement with Lawrence Livermore Laboratory for collaborative research on and transfer of two NRL numerical weather prediction models. The models will be used in predicting atmospheric variables important to forecasting
8
THE NAVAL RESEARCH LABORATORY
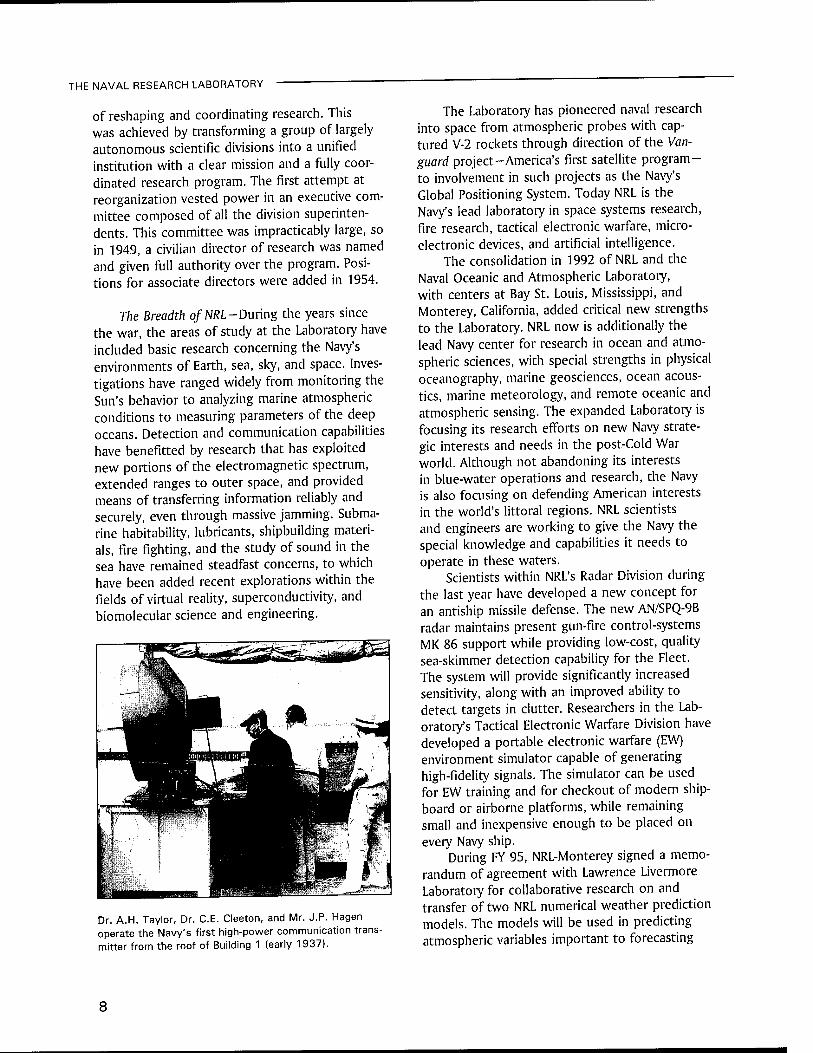
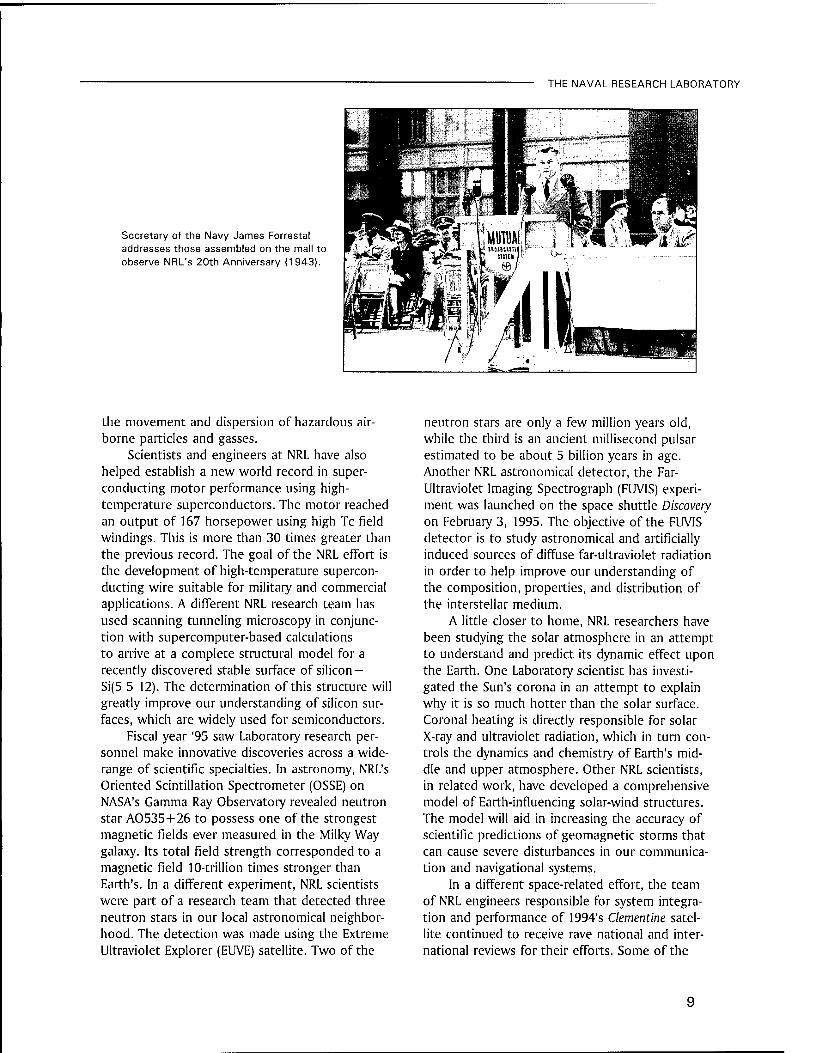
Secretary of the Navy James Forrestal addresses those assembled on the mall to observe NRL's 20th Anniversary (1943).
the movement and dispersion of hazardous air- borne particles and gasses.
Scientists and engineers at NRL have also helped establish a new world record in super- conducting motor performance using high- temperature superconductors. The motor reached an output of 167 horsepower using high Tc field windings. This is more than 30 times greater than the previous record. The goal of the NRL effort is the development of high-temperature supercon- ducting wire suitable for military and commercial applications. A different NRL research team has used scanning tunneling microscopy in conjunc- tion with supercomputer-based calculations to arrive at a complete structural model for a recently discovered stable surface of silicon- Si(5 5 12). The determination of this structure will greatly improve our understanding of silicon sur- faces, which are widely used for semiconductors.
Fiscal year '95 saw Laboratory research per- sonnel make innovative discoveries across a wide- range of scientific specialties. In astronomy, NRL's Oriented Scintillation Spectrometer (OSSE) on NASA's Gamma Ray Observatory revealed neutron star A0535+26 to possess one of the strongest magnetic fields ever measured in the Milky Way galaxy. Its total field strength corresponded to a magnetic field 10-trillion times stronger than Earth's. In a different experiment, NRL scientists were part of a research team that detected three neutron stars in our local astronomical neighbor- hood. The detection was made using the Extreme Ultraviolet Explorer (EUVE) satellite. Two of the
neutron stars are only a few million years old, while the third is an ancient millisecond pulsar estimated to be about 5 billion years in age. Another NRL astronomical detector, the Far- Ultraviolet Imaging Spectrograph (FUVIS) experi- ment was launched on the space shuttle Discovery on February 3, 1995. The objective of the FUVIS detector is to study astronomical and artificially induced sources of diffuse far-ultraviolet radiation in order to help improve our understanding of the composition, properties, and distribution of the interstellar medium.
A little closer to home, NRL researchers have been studying the solar atmosphere in an attempt to understand and predict its dynamic effect upon the Earth. One Laboratory scientist has investi- gated the Sun's corona in an attempt to explain why it is so much hotter than the solar surface. Coronal heating is directly responsible for solar X-ray and ultraviolet radiation, which in turn con- trols the dynamics and chemistry of Earth's mid- dle and upper atmosphere. Other NRL scientists, in related work, have developed a comprehensive model of Earth-influencing solar-wind structures. The model will aid in increasing the accuracy of scientific predictions of geomagnetic storms that can cause severe disturbances in our communica- tion and navigational systems.
In a different space-related effort, the team of NRL engineers responsible for system integra- tion and performance of 1994's Clementine satel- lite continued to receive rave national and inter- national reviews for their efforts. Some of the

THE NAVAL RESEARCH LABORATORY
team's awards include Popular Science Magazine's "Best of 1994's Top 100 Technologies;" "The 1994 Stellar Award for Spacecraft Design," from Rotary National; "The Nelson P. Jackson Aerospace Award," from the National Space Club; Aviation Week & Space Technology's "1994 Laureate Award;" and the 1995 Discover Magazine's "Award for Tech- nological Innovation." (See pp. iv and v.)
Two NRL satellite detectors are playing a big part in providing expanded information on the Earth's atmosphere. The Laboratory's Middle Atmosphere High Resolution Spectrograph Investi- gation (MAHRSI) has given researchers new infor- mation on two trace constituents-nitric oxide and the hydroxyl radical-that are believed to determine the natural balance of ozone in the area above 30 kilometers. The detector has also provided high-quality measurements of ozone in the middle atmosphere. NRL's Polar Ozone and Aerosol Measurement Experiment (POAMII) has provided scientists with data on ozone chemistry and the processes affecting ozone depletion in the polar region. The detector has produced important information on the formation of polar stratospheric clouds, which are indirectly involved in the chemical destruction of ozone by chlorine in the Antarctic ozone hole.
Another NRL environmental detector, the Water Vapor Millimeter-wave Spectrometer
(VWMS), is producing ground-based measure- ments for monitoring the middle atmosphere. The VWMS provides the best current instrumental platform for detecting long-term trends in meso- spheric water vapor. The latter is expected to increase due to man-made effects on methane emission. Yet one more recent NRL detector developed with environmental sensing in mind is the Portable Hyperspectral Imager for Low- Light Spectroscopy (PHILLS). It facilitates the col- lection and analysis of high-quality broadband hyperspectral data in near-real time. PHILLS will greatly expand our capability to detect and identi- fy airborne, land, or water pollution and poten- tially may also be used for damage assessment from natural disasters.
In further environmentally directed research, NRL personnel have developed an environmen- tally friendly antifouling coating for use on the water intakes of electric power plants; created a chemically resistant nontoxic epoxy lining for water pipes to help keep impurities out of drink- ing water; and demonstrated the viability of a manufacturable, hand-held biosensor for detecting the presence of TNT in field sites slated for envi- ronmental clean-up.
Also this year, the Laboratory's Nike Krypton Fluoride Laser Facility was dedicated. NRL began development of the Nike KrF laser in the late
CAPT Bruce W. Buckley and CAPT Richard M. Cassidy cut the ceremonial cake at the Change of Command and Retirement Cermony held on Janu- ary 26, 1996. CAPT Buckley becomes NRL's 32nd commanding officer.
10
THE NAVAL RESEARCH LABORATORY
1980s because of its potential ability for produc- ing a more uniform laser beam. The high unifor- mity holds the potential for high-gain fusion tar- gets. This high gain would be attractive for both military and fusion reactor applications.
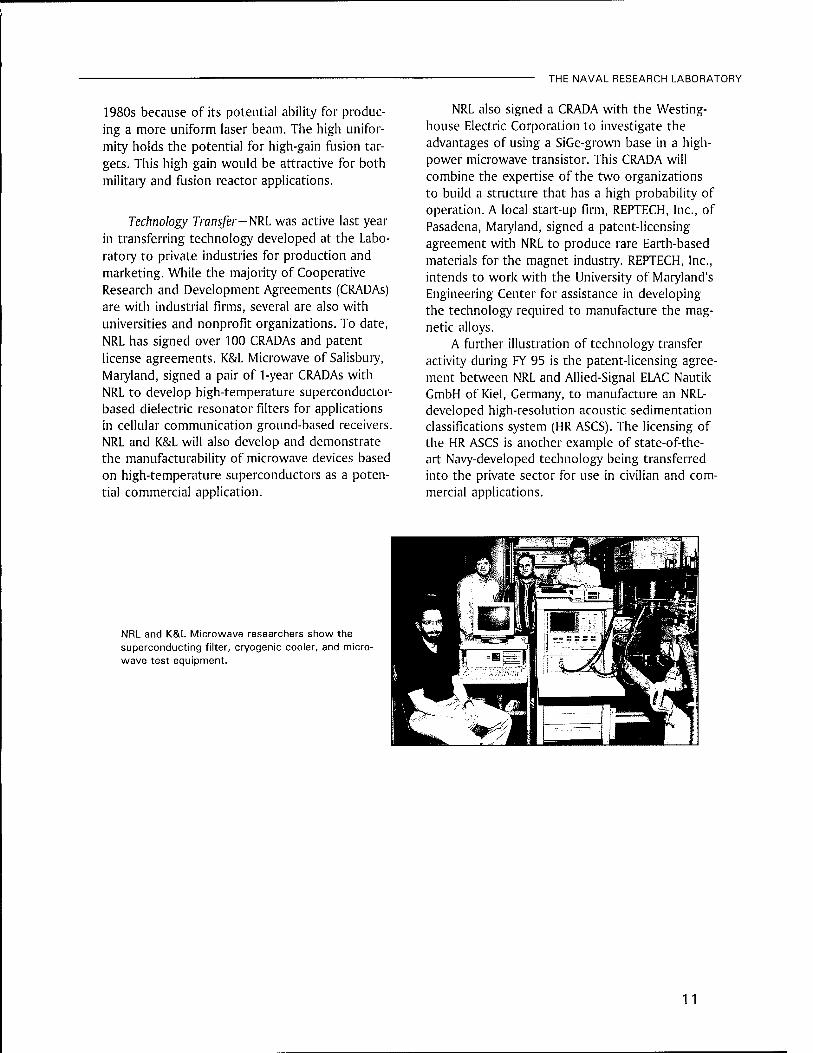
Technology Transfer-NRL was active last year in transferring technology developed at the Labo- ratory to private industries for production and marketing. While the majority of Cooperative Research and Development Agreements (CRADAs) are with industrial firms, several are also with universities and nonprofit organizations. To date, NRL has signed over 100 CRADAs and patent license agreements. K&L Microwave of Salisbury, Maryland, signed a pair of 1-year CRADAs with NRL to develop high-temperature superconductor- based dielectric resonator filters for applications in cellular communication ground-based receivers. NRL and K&L will also develop and demonstrate the manufacturability of microwave devices based on high-temperature superconductors as a poten- tial commercial application.
NRL also signed a CRADA with the Westing- house Electric Corporation to investigate the advantages of using a SiGe-grown base in a high- power microwave transistor. This CRADA will combine the expertise of the two organizations to build a structure that has a high probability of operation. A local start-up firm, REPTECH, Inc., of Pasadena, Maryland, signed a patent-licensing agreement with NRL to produce rare Earth-based materials for the magnet industry. REPTECH, Inc., intends to work with the University of Maryland's Engineering Center for assistance in developing the technology required to manufacture the mag- netic alloys.
A further illustration of technology transfer activity during FY 95 is the patent-licensing agree- ment between NRL and Allied-Signal ELAC Nautik GmbH of Kiel, Germany, to manufacture an NRL- developed high-resolution acoustic sedimentation classifications system (HR ASCS). The licensing of the HR ASCS is another example of state-of-the- art Navy-developed technology being transferred into the private sector for use in civilian and com- mercial applications.
NRL and K&L Microwave researchers show the superconducting filter, cryogenic cooler, and micro- wave test equipment.
11
NRL Today
ORGANIZATION AND ADMINISTRATION
The position of NRL within the Navy is that of a field command under the Chief of Naval Research.
Heading the Laboratory with joint responsi- bilities are the naval Commanding Officer, CAPT Bruce W. Buckley, USN, and the Civilian Director of Research, Dr. Timothy Coffey. Line authority passes from the commanding officer and the director of research to three associate directors of research, planning, a director of the Naval Cen- ter for Space Technology, and an associate direc- tor for business operations. Research is per- formed in the following areas:
• Systems Directorate
• Materials Science and Component Technology
• Ocean and Atmospheric Science and Technology
• Naval Center for Space Technology.
Through FY 95, NRL operated as a Defense Business Operating Fund (DBOF) activity. As a DBOF activity, all costs, including overhead, were charged to various research projects. Funding in FY 95 came from the Chief of Naval Research, the Naval Systems Commands, other Navy sources; government agencies, such as the U.S. Air Force, Advanced Research Projects Agency, the Depart- ment of Energy, and the National Aeronautics and Space Administration; and several nongovernment activities.
PERSONNEL DEVELOPMENT
At the end of FY 95, NRL employed 3803 personnel-46 officers, 133 enlisted, and 3624 civilians. In the research staff, there are 876 employees with doctorate degrees, 450 with masters degrees, and 597 with bachelors degrees. The support staff assists the research staff by providing administrative, computer-aided design, machining, fabrication, electronic construction, publication, personnel development, information
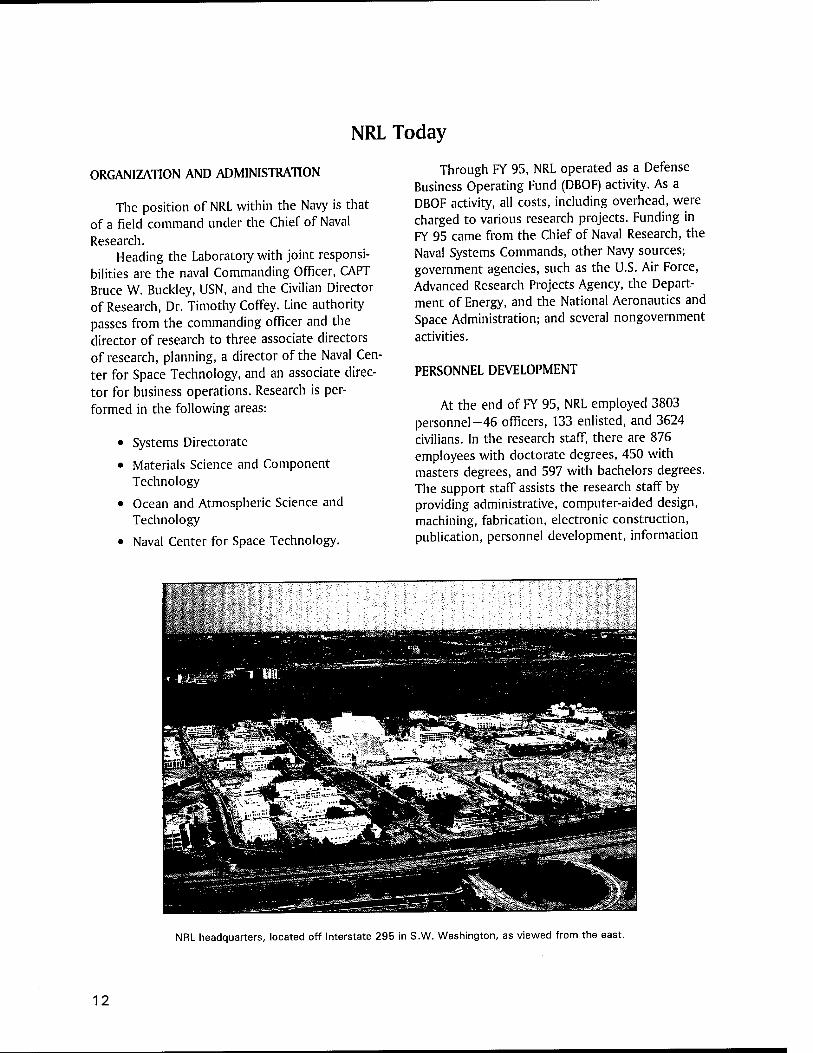
NRL headquarters, located off Interstate 295 in S.W. Washington, as viewed from the east.
12
THE NAVAL RESEARCH LABORATORY
retrieval, large mainframe computer support, and contracting and supply management services.
Opportunities for higher education and other professional training for NRL employees are avail- able through several programs offered by the Employee Development Branch. These programs provide for graduate work leading to advanced degrees, advanced training, college course work, short courses, continuing education, and career counseling. Graduate students, in certain cases, may use their NRL research for thesis material.
For non-NRL employees, several postdoctoral research programs exist. There are also cooper- ative education agreements with several uni- versities, summer and part-time employment programs, and various summer and interchange programs for college faculty members, profes- sional consultants, and employees of other gov- ernment agencies.
NRL has active chapters of Women in Science and Engineering, Sigma Xi, Toastmasters Interna- tional, Federally Employed Women, and the Fed- eral Executive and Professional Association. Three computer clubs meet regularly-NRL Microcom- puter User's Group, NeXT, and Sun NRL Users Group. An amateur radio club, a drama group (the Showboaters), and several sports clubs are also active. NRL has a Recreation Club that pro- vides basketball and Softball leagues and swim, sauna, whirlpool bath, gymnasium, and weight- room facilities. The Recreation Club also offers classes in martial arts, aerobics, swimming, and water walking.
The Community Outreach Program tradition- ally has used its extensive resources to foster programs that provide benefits to students and other community citizens. Volunteer employees assist with and judge science fairs, give lectures, tutor, mentor, coach, and serve as classroom resource teachers. The program also sponsors Black History Month art and essay contests for local schools, student tours of NRL, a student Toastmasters Youth Leadership Program, an annual holiday party for neighborhood chil- dren in December, an equipment loan program that provides surplus equipment to partnership schools, a book donation program for both students and teachers, and an annual collection for Children's Hospital. Through the Community Outreach Program, NRL has active partnerships with four District of Columbia public schools.
NRL has an active, growing Credit Union, with assets over $163 million and a membership numbering over 20,000. The NRL Federal Credit Union offers competitive and innovative financial services.
Public transportation to NRL is provided by Metrobus. Metrorail service is 3 miles away.
For more information, see the NRL Review chapter entitled, "Programs for Professional Development."
SCIENTIFIC FACILITIES
In addition to its Washington, D.C. campus of about 130 acres and 102 main buildings, NRL maintains 14 other research sites, including a vessel for fire research and a Flight Support Detachment. The many diverse scientific and technological research and support facilities are described in the following paragraphs.
Research Facilities
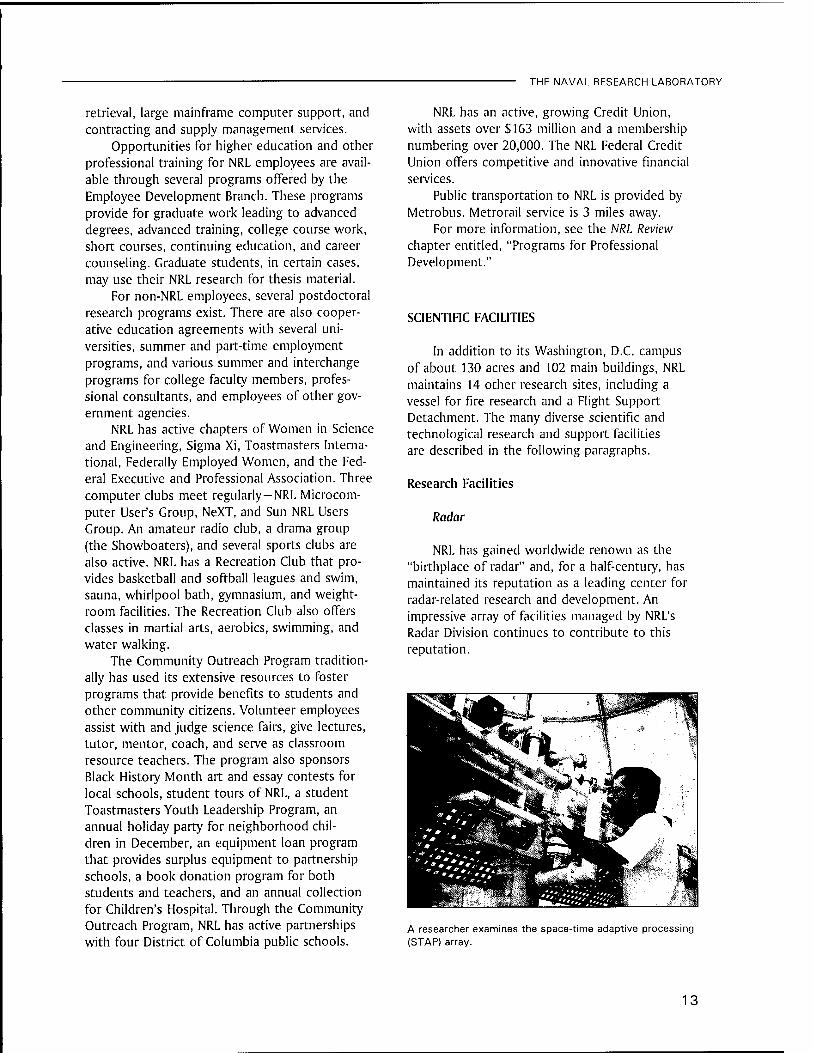
Radar
NRL has gained worldwide renown as the "birthplace of radar" and, for a half-century, has maintained its reputation as a leading center for radar-related research and development. An impressive array of facilities managed by NRL's Radar Division continues to contribute to this reputation.
A researcher examines the space-time adaptive processing (STAP) array.
13
THE NAVAL RESEARCH LABORATORY
In connection with airborne radar, the divi- sion uses a Radar Imaging Facility, consisting of an inverse synthetic aperture radar (ISAR) that can be deployed to collect radar-imaging data from the air in a P-3 aircraft or a trailer for ground or ship installation. New technology associated with aircraft early warning (AEW) radar uses a rooftop space-time adaptive processing (STAP) array and associated processors. In connection with ship- based radar, the division operates a Radar Test Bed Facility at the Chesapeake Bay Detachment (CBD), Rändle Cliffs, Maryland. Represented are test bed radars and related data-processing facili- ties for long-range air search, point defense, and surface search. Concepts and engineering devel- opments in connection with target identification are explored by using an experimental Coopera- tive Aircraft Identification (CAI) System. Other installations operated by the division include an Electromagnetic Interference (EMI) Facility, a Radar Signature Calculation Facility for complex electromagnetic radar target modeling, a Compact Antenna Range (operated jointly with the Space Systems Development Department) for antenna design and development, and a Computer-aided Engineering (CAE) Facility.
Information Technology
The Information Technology Division (ITD) is at the forefront of DoD research and develop- ment in artificial intelligence, telecommunica- tions, computer networking, human-computer interaction, information security, parallel com- putation, and computer science.
The division maintains local area computer networks to support its research and hosts test- beds for advanced high-performance fiber-optic network research. These networks make available hundreds of high-performance computers to local and remote users. The ITD research networks are part of NRL's internal network and also connect via Tl lines to the regional SURAnet, to DISnet, and via ATM/SONET links to ATDnet, an experi- mental wide-area network connecting a number of research organizations in the metropolitan area.
Major shared resources include the systems and networks available in the division's Center for Computational Science, including two Con- nection Machines, a 32-processor CM-5E and a
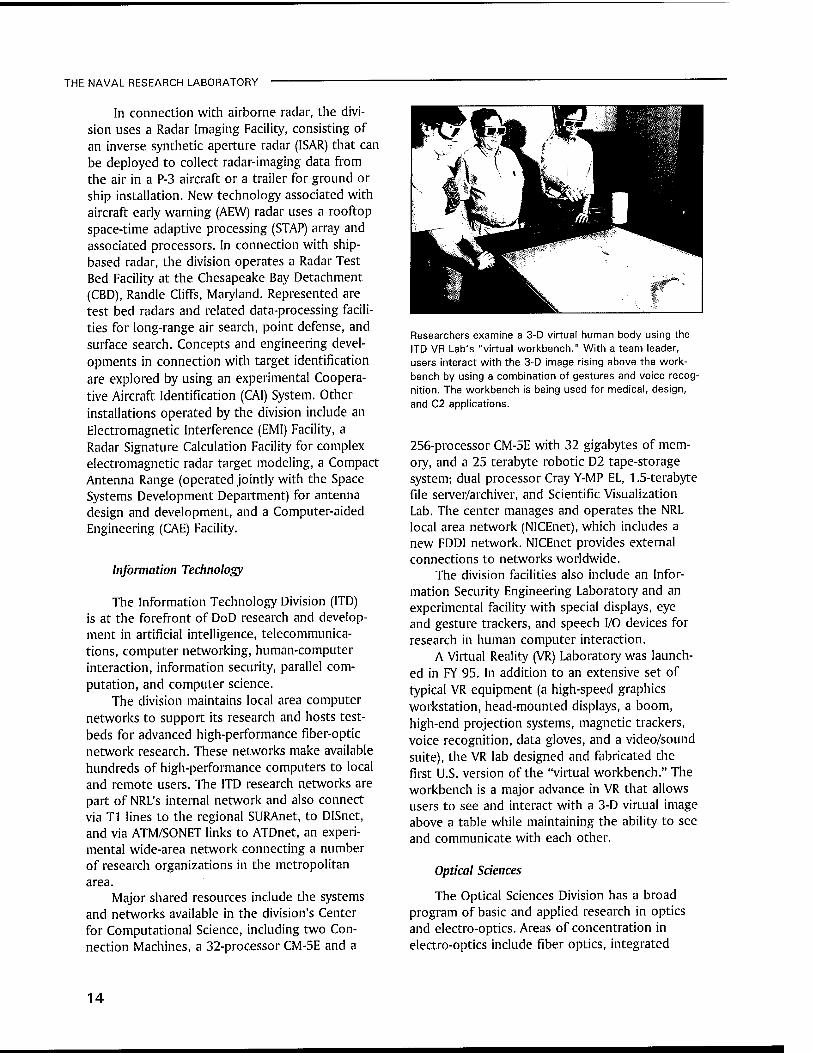
Researchers examine a 3-D virtual human body using the ITD VR Lab's "virtual workbench." With a team leader, users interact with the 3-D image rising above the work- bench by using a combination of gestures and voice recog- nition. The workbench is being used for medical, design, and C2 applications.
256-processor CM-5E with 32 gigabytes of mem- ory, and a 25 terabyte robotic D2 tape-storage system; dual processor Cray Y-MP EL, 1.5-terabyte file server/archiver, and Scientific Visualization Lab. The center manages and operates the NRL local area network (NICEnet), which includes a new FDDI network. NICEnet provides external connections to networks worldwide.
The division facilities also include an Infor- mation Security Engineering Laboratory and an experimental facility with special displays, eye and gesture trackers, and speech I/O devices for research in human computer interaction.
A Virtual Reality (VR) Laboratory was launch- ed in FY 95. In addition to an extensive set of typical VR equipment (a high-speed graphics workstation, head-mounted displays, a boom, high-end projection systems, magnetic trackers, voice recognition, data gloves, and a video/sound suite), the VR lab designed and fabricated the first U.S. version of the "virtual workbench." The workbench is a major advance in VR that allows users to see and interact with a 3-D virtual image above a table while maintaining the ability to see and communicate with each other.
Optical Sciences
The Optical Sciences Division has a broad program of basic and applied research in optics and electro-optics. Areas of concentration in electro-optics include fiber optics, integrated
14
THE NAVAL RESEARCH LABORATORY
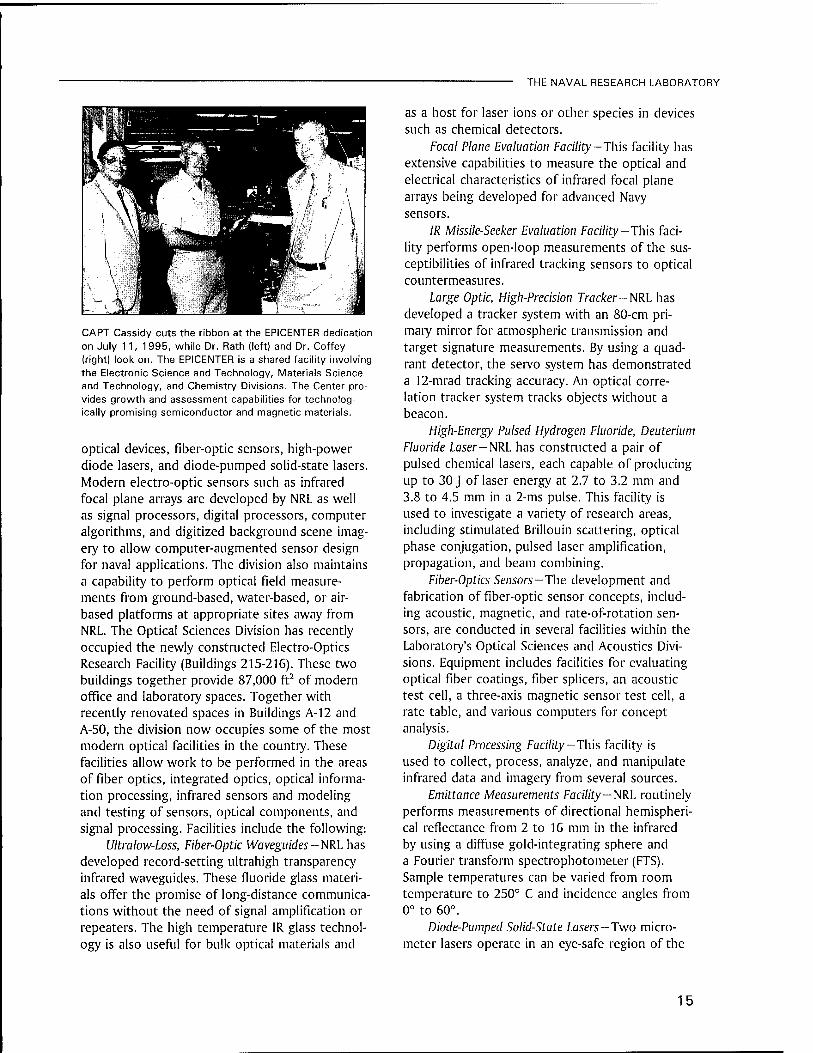
CAPT Cassidy cuts the ribbon at the EPICENTER dedication on July 11, 1995, while Dr. Rath (left) and Dr. Coffey (right) look on. The EPICENTER is a shared facility involving the Electronic Science and Technology, Materials Science and Technology, and Chemistry Divisions. The Center pro- vides growth and assessment capabilities for technolog- ically promising semiconductor and magnetic materials.
optical devices, fiber-optic sensors, high-power diode lasers, and diode-pumped solid-state lasers. Modern electro-optic sensors such as infrared focal plane arrays are developed by NRL as well as signal processors, digital processors, computer algorithms, and digitized background scene imag- ery to allow computer-augmented sensor design for naval applications. The division also maintains a capability to perform optical field measure- ments from ground-based, water-based, or air- based platforms at appropriate sites away from NRL. The Optical Sciences Division has recently occupied the newly constructed Electro-Optics Research Facility (Buildings 215-216). These two buildings together provide 87,000 ft2 of modern office and laboratory spaces. Together with recently renovated spaces in Buildings A-12 and A-50, the division now occupies some of the most modern optical facilities in the country. These facilities allow work to be performed in the areas of fiber optics, integrated optics, optical informa- tion processing, infrared sensors and modeling and testing of sensors, optical components, and signal processing. Facilities include the following:
Ultralow-Loss, Fiber-Optic Waveguides—NRL has developed record-setting ultrahigh transparency infrared waveguides. These fluoride glass materi- als offer the promise of long-distance communica- tions without the need of signal amplification or repeaters. The high temperature IR glass technol- ogy is also useful for bulk optical materials and
as a host for laser ions or other species in devices such as chemical detectors.
Focal Plane Evaluation Facility -This facility has extensive capabilities to measure the optical and electrical characteristics of infrared focal plane arrays being developed for advanced Navy sensors.
IR Missile-Seeker Evaluation Facility -This faci- lity performs open-loop measurements of the sus- ceptibilities of infrared tracking sensors to optical countermeasures.
Large Optic, High-Precision Tracker -NRL has developed a tracker system with an 80-cm pri- mary mirror for atmospheric transmission and target signature measurements. By using a quad- rant detector, the servo system has demonstrated a 12-mrad tracking accuracy. An optical corre- lation tracker system tracks objects without a beacon.
High-Energy Pulsed Hydrogen Fluoride, Deuterium Fluoride Laser—NRL has constructed a pair of pulsed chemical lasers, each capable of producing up to 30 J of laser energy at 2.7 to 3.2 mm and 3.8 to 4.5 mm in a 2-ms pulse. This facility is used to investigate a variety of research areas, including stimulated Brillouin scattering, optical phase conjugation, pulsed laser amplification, propagation, and beam combining.
Fiber-Optics Sensors—The development and fabrication of fiber-optic sensor concepts, includ- ing acoustic, magnetic, and rate-of-rotation sen- sors, are conducted in several facilities within the Laboratory's Optical Sciences and Acoustics Divi- sions. Equipment includes facilities for evaluating optical fiber coatings, fiber splicers, an acoustic test cell, a three-axis magnetic sensor test cell, a rate table, and various computers for concept analysis.
Digital Processing Facility -This facility is used to collect, process, analyze, and manipulate infrared data and imagery from several sources.
Emittance Measurements Facility—NRL routinely performs measurements of directional hemispheri- cal reflectance from 2 to 16 mm in the infrared by using a diffuse gold-integrating sphere and a Fourier transform spectrophotometer (FTS). Sample temperatures can be varied from room temperature to 250° C and incidence angles from 0° to 60°.
Diode-Pumped Solid-State Lasers—Two micro- meter lasers operate in an eye-safe region of the
15
THE NAVAL RESEARCH LABORATORY
optical spectrum, an important issue for laser use in industry or in cases where eye damage to the public could be a safety and liability issue. Research at NRL in the 1980s had a major role in demonstrating room temperature flash- lamp and diode-pumped lasers. The lamp-pumped lasers have found wide usage in laser surgery while diode-pumped lasers appear to be leading candidates for eye-safe laser radars for aircraft and for laser sources to counter IR missile seek- ers. Newer lasers have been found that operate from 0.400 urn in the near UV to beyond 5 urn in the IR.
Electronic Warfare
The scope of research and development at NRL in the field of electronic warfare covers the entire electromagnetic spectrum-from basic technology research, component, and subsystem development-to system design and effectiveness evaluation. Major emphasis is placed on providing the methods and means to counter enemy hostile actions in all battle phases, from the beginning- when enemy forces are mobilized for an attack- through the final engagement stages. For this purpose, NRL has constructed special research and development laboratories, anechoic cham- bers, and facilities for modeling and simulation. NRL has also added extensive new facilities where scientists can focus on the coordinated use of all organic defensive and offensive resources now present in the Fleet.
Structure of Matter
The laboratory investigates the atomic arrangements in materials to improve them or facilitate the development of new substances. Various diffraction methodologies are used to make these investigations. Subjects of interest include the structural and functional aspects of energy conversion, ion transport, device materi- als, and physiologically active substances such as drugs, antibiotics, and antiviral agents. Theo- retical chemistry calculations are used to comple- ment the structural research. A real-time graphics system aids in modeling and molecular dynamics studies.
Chemistry
NRL has been a major center for chemical research in support of naval operational require- ments since the late 1920s. The Chemistry Divi- sion continues its tradition with a broad spectrum of basic and applied research programs concerned with controlled energy release (fuels, fire, com- bustion, countermeasure decoys, explosives), sur- face chemistry (corrosion, adhesion, tribology, adsorbents, film growth/etch), advanced polymeric materials (high-strength/low-weight structures, drag reduction, damping, special function), and advanced detection techniques (environment, chemical/biological, surveillance). Facilities for research include a wide range of the modern photon/electron, magnetic and ion-based spec- troscopic/microscopic techniques for bulk and surface analysis; nanometer-scale fabrication and characterization; multiple facilities for materials synthesis and physical/chemical characterization; a 11,400 ft3 fire research chamber (Fire I); and a 475-ft ex-USS Shadwell (LSD-15) advanced fire research ship.
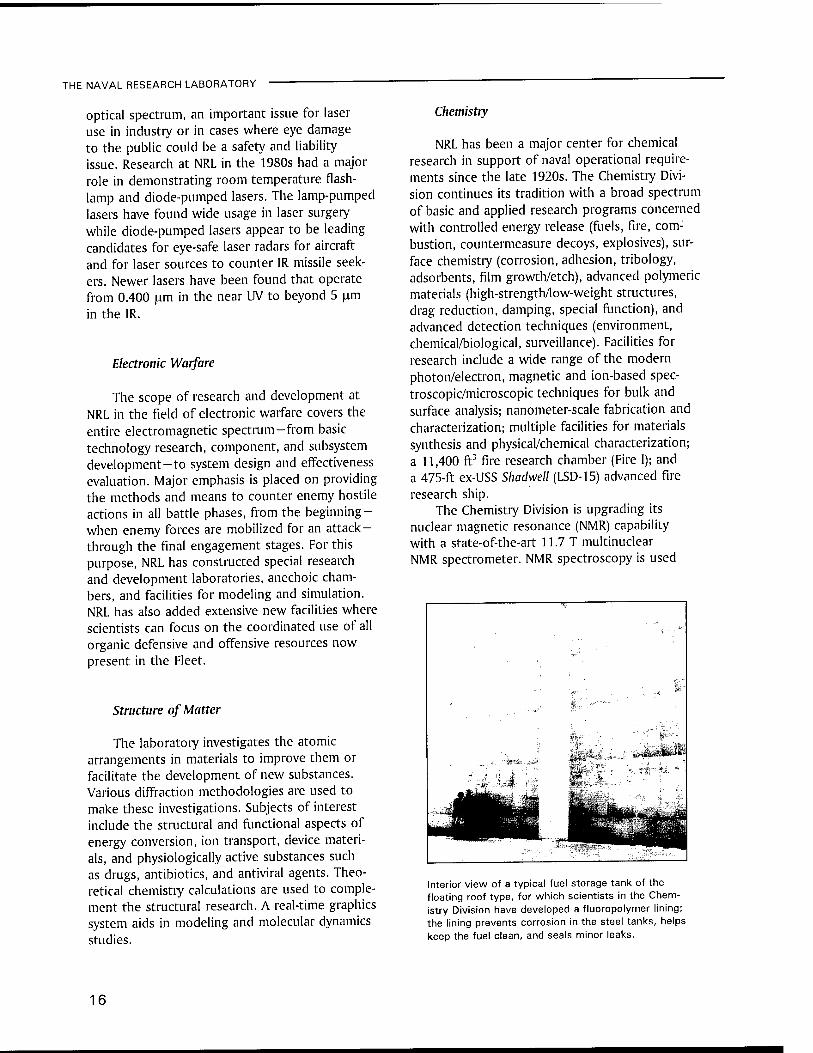
The Chemistry Division is upgrading its nuclear magnetic resonance (NMR) capability with a state-of-the-art 11.7 T multinuclear NMR spectrometer. NMR spectroscopy is used
Interior view of a typical fuel storage tank of the floating roof type, for which scientists in the Chem- istry Division have developed a fluoropolymer lining; the lining prevents corrosion in the steel tanks, helps keep the fuel clean, and seals minor leaks.
16
THE NAVAL RESEARCH LABORATORY
to investigate the structure and dynamics of materials in the solid and liquid states. Through its significantly higher magnetic field, the new spectrometer affords greater sensitivity and spec- tral resolution than existing spectrometers, partic- ularly when observing quadrupolar nuclei such as those found in many ceramics and glasses. The higher magnetic field allows exploration of the use of the induced magnetization to transfer NMR coherence over the distance of 1 um for the prac- tical purpose of imaging. New capabilities include triple resonance in liquids and solids, gradient spectroscopy, variable-angle sample spinning, and self-diffusion measurements in liquids and gases. These capabilities will significantly enhance stud- ies of organic polymers, biomaterials, inorganic materials, and molecules in solution.
Materials
NRL has capabilities for X-ray and electron diffraction analyses and for electron and Auger spectroscopy. Scanning, transmission, and combined scanning-transmission electron micro- scopes are used to study surface and/or internal microstructures. The division has a secondary ion mass spectrometer for surface analysis that signif- icantly extends the diagnostic capability of the technique. A high-resolution, reverse-geometry mass spectrometer is used to probe reactions between ions and molecules. The Laboratory has a fully equipped fatigue and fracture laboratory, a modern vacuum arc melting furnace for reactive metals, an ultrasonic gas atomization system for making metal powders, and hot isostatic press facilities. The Laboratory's cryogenic facilities include dilution refrigerators and superconducting magnetic sensors for measuring ultrasmall mag- netic fields. Also available are two molecular beam epitaxy devices for growing thin films.
Laboratory for Computational Physics and Fluid Dynamics
The Laboratory for Computational Physics and Fluid Dynamics is in round-the-clock produc- tion for computational studies in the fields of compressible and incompressible fluid dynamics, reactive flows, fluid-structure interaction (includ- ing submarine, ship, and aerospace applications), atmospheric and solar magnetoplasma dynamics, and for application of parallel processing to large-
scale problems, such as unstructured grid gen- eration for complex flows, target tracking and correlations for battle management, and other disciplines of continuum and quantum computa- tional physics. The system is used to develop and maintain state-of-the-art analytical and computa- tional capabilities in fluid dynamics and related fields of physics, to establish in-house expertise in parallel processing and on-line graphical ren- dering for large-scale scientific computing, to perform analyses and computational experiments on specific relevant problems, and to transfer this technology to new and ongoing projects through cooperative programs.
The Parallel High Performance Computer/ Graphics Facility is a heterogeneous high- performance computer system composed of a number of autonomous computers with a com- posite peak speed equivalent to about 15 Cray 90 processors. The system is coupled directly to the advanced video recording center described below. The main computational engine is com- prised of three Intel iPSC/860 Touchstone Gamma parallel supercomputers supported by the hard- ware and software environment necessary to develop, debug, and benchmark parallel simula- tions. With multi-MFLOP processors as building blocks, the Intel iPSC/860 is a MIMD-distributed memory machine configured as a hypercube. These three machines comprise a block of 224 parallel nodes with a peak computational speed of 18 GFLOPS with a cross-connected disk farm file system and network connections.
The facility's disk farm also supports three IBM RS/6000 and three DEC AXP high capacity compute-server computers, providing the facility with medium-to-large-scale memory and computa- tional power enabling heterogeneous simulations with a significant scalar component, algorithm development, and diagnostic and postprocessing for large simulations. Special software allows simultaneous use of these computers on a single problem. Access to various other HPCC capabili- ties around the U.S. is accomplished through this system by using the new DoD high-bandwidth communication networks. A six-processor, five- gigabyte SGI Onyx provides the division with state-of-the-art high performance visualization.
A high-quality video studio has been created around a Sony D2 digital recording system, with a coupled Lyon-Lamb animation controller and a large memory Silicon Graphics ONYX workstation.
17

THE NAVAL RESEARCH LABORATORY
Scientists in the Condensed Matter and Radiation Sci- ences Division have developed a method to deposit biocompatible ceramic coatings using the pulsed-laser deposition technique. The method may have applica- tions in dental and orthopedic implants, as well as percutaneous catheters.
Through the network, other graphics stations, including the extensive resources of NRL's Visu- alization Laboratory, can create and record high- quality graphical images of simulation data for analysis and presentation by using digital record- ing techniques.
Condensed Matter and Radiation Sciences
The Condensed Matter and Radiation Sciences Division is the primary Navy center studying the effects of radiation on materials, electronic equipment, satellites, etc., and the production of thin films on diverse objects. The facilities for production and employment of photons, ions, and hypervelocity projectiles available to the division include:
High-Power Microwave (HPM) Facility-The large anechoic chamber (4.9 m x 4.9 m x 9.8 m) can be used at frequencies ranging from 0.5 to 94 GHz. Effects, susceptibility, and survivability of systems are the major research areas of interest.
Laser Facilities-Pulses of up to several joules are available from one system, while time resolu- tions down to 100 femtoseconds are produced by another. Synchronized Q-switched oscillators are configured for pump-probe experiments.
Thin-Film Preparation Facilities -The division has several major capabilities for preparation of thin films of advanced materials, such as high- temperature superconductors and active dielec- trics. These include ion-assisted evaporation (which produces dense, adherent films), various dc plasma sources (which can etch as well as deposit films), and pulsed laser deposition (for production of chemically complex films).
X-ray Facility-Laboratory X-ray sources, monochromators, detectors, and related equip- ment are available for X-ray energies from 0.7 to 25 keV and dose rates up to 105 rads/s.
Synchrotron Radiation Facility -Intense, mono- chromatic X-ray photon beams tunable from 10 eV to 12 keV are available from the three beam lines developed by NRL at the National Synchro- tron Light Source at the Brookhaven National Laboratory. Environmental target chambers can span a pressure range from 10"12 to 105 atmo- spheres and temperatures from 10 to 1500 K.
Ion Implantation Facility-The facility con- sists of a 200-keV ion implanter with specialized ultrahigh vacuum chambers and associated in situ specimen analysis instrumentation.
3-MeV Tandem Van de Graajf-This facility is used to study charged-particle radiation damage effects such as occur in space, to provide high- sensitivity analysis of materials, and to perform MeV energy implants in materials.
Hypervelocity Impact Facilities -Three facilities are used for ballistics research at speeds exceed- ing 6 km/s with inert or explosive targets while measuring projectile velocity, orientation, and dynamic projectile-target interaction.
Plasma Physics
The Plasma Physics Division is the major center for in-house Navy and DoD plasma physics research. The division conducts a broad exper- imental and theoretical program in basic and applied research in plasma physics, which includes laboratory and space plasmas, pulsed- power sources, plasma discharges, intense
18

THE NAVAL RESEARCH LABORATORY
The Plasma Physics Division's Nike KrF Facility.
electron and ion beams, atomic physics, laser physics, plasma processing, nonlinear dynamics and chaos, and numerical simulations. The faci- lities include an extremely high-power laser- Pharos III—for the laboratory simulation of space plasmas and nuclear weapons effects studies, a short pulse, high-intensity Table-Top Terawatt (T3) laser to study intense laser-plasma, laser-electron beam, and laser-matter interactions. The division also has an 11-m3 space chamber capable of reproducing the near-Earth space plasma environ- ment and a radar antenna laboratory where the interaction of high-frequency microwaves and a sheet plasma distribution (agile mirror) is studied. The division has developed a variety of pulsed- power sources to generate intense electron and ion beams, powerful discharges, and various types of radiation. The largest of these pulsers— GAMBLE II—is used to study the production of megampere electron and ion beams and for pro- ducing very hot, high-density plasmas. Other generators are used to produce particle beams that are injected into magnetic fields and/or cavi- ties to generate intense microwave pulses (e.g., the Relativistic Klystron Amplifier (RKA), in the 1 to 10 GHz regime). A large array of high-fre- quency microwave sources (35 to 120 GHz) are available to conduct research on microwave pro- cessing of advanced ceramic materials.
A major 3-kJ KrF laser facility opened on 13 June 1995. This facility is being initiated to provide intense radiation for studying inertial confinement fusion target heating at short wave- lengths (0.25 microns).
Electronics Science and Technology
In addition to specific equipment and facili- ties to support individual science and technology programs, NRL operates the Nanoelectronics Pro- cessing Facility (NPF), the Penthouse Processing Facility (PPF), the Laboratory for Advanced Mate- rial Synthesis (LAMS), and the EPICENTER. The NPF's mission is to provide service to both NRL and external organizations requiring micro- and nanofabrication processing support. Lithography is a particular strength of the NPF, with definition of feature sizes down to 150 A possible with an e-beam nanowriter. The NPF can supply items ranging from individual discrete structures and devices to circuits with very-large-scale inte- gration complexity. The recently completed PPF is dedicated to processing III-V semiconductor devices and circuits in addition to serving the hands-on fabrication needs of individual NRL scientists. The PPF employs a single-pass air- ventilation system to minimize human risk to potentially hazardous III-V semiconductor pro- cesses and associated chemicals, thereby further
19
THE NAVAL RESEARCH LABORATORY
meeting existing safety standards. The LAMS' mission is to support NRL programs that require thin film III-V or refractory semiconductor tech- nology. The LAMS employs organometallic vapor phase epitaxy to synthesize a wide range of thin films such as InSb, InGaP, InP, and GaN. The EPI- CENTER (a joint activity of the Electronic Science and Technology, Materials Science and Techno- logy, and Chemistry Divisions) is dedicated to the production of multilayer microstructures using in-situ surface analytical techniques in either of two ultrahigh vacuum, molecular-beam-epitaxy growth chambers-one for III-V semiconductors and the other for magnetic materials and II-VI semiconductors.
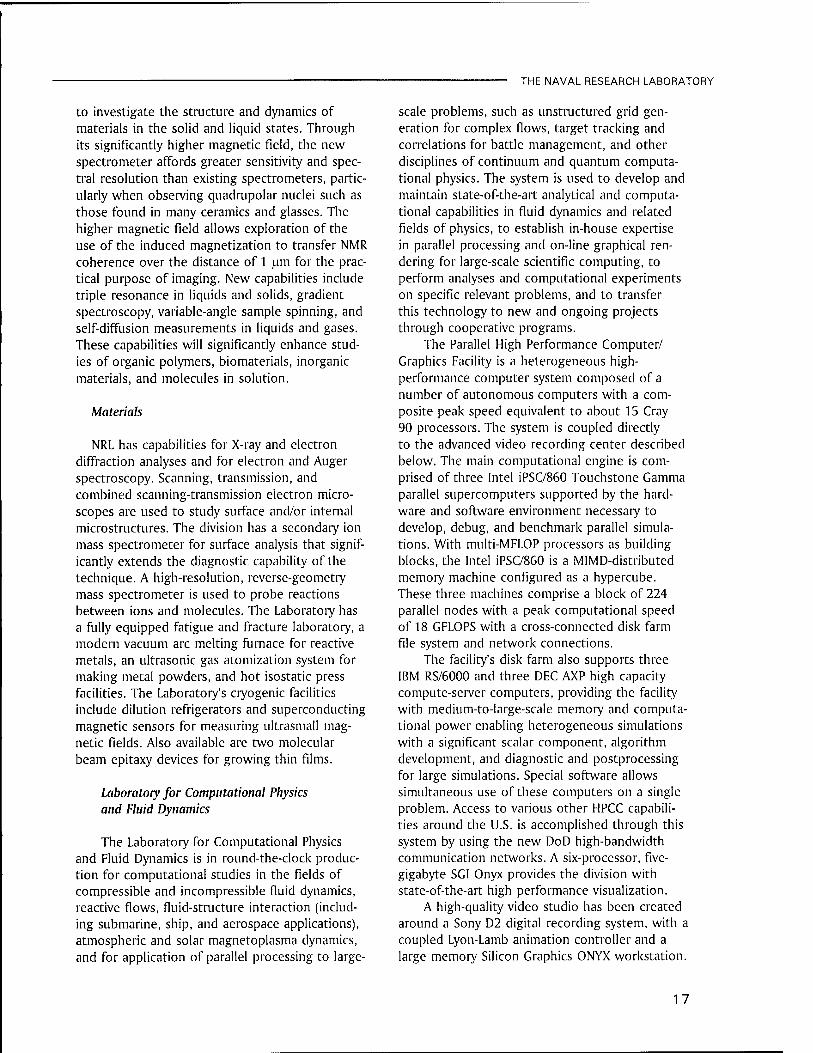
Bio/Molecular Science and Engineering
The Center for Bio/Molecular Science and Engineering conducts research and development using biotechnological approaches to solve prob- lems for the Navy, DoD, and the nation at large. Problems currently being addressed include advanced material development (for electronic, biomedical, and structural applications), combat casualty care, environmental quality (including pollution cleanup and control), and biological warfare defense. The approach to these problems involves long-term research focused on the study of complex materials systems, coupled with inte- grated exploratory and advanced development programs. The staff of the center is an interdis- ciplinary team who performs basic and applied research and development in areas that require expertise in bio- and surface chemistry, biophys- ics, genetic engineering, cell biology, advanced organic synthesis, solid-state and theoretical phys- ics, and electronics and materials engineering. In addition, the center has many collaborations throughout the Laboratory, at universities, and in industry to ensure that a broad base of the required expertise and critical evaluations are part of the research and development programs. Highlights of the program include the develop- ment of liposome-based blood substitutes, the manipulation of biologically derived structures on the nanometer scale, the development of ferro- electric liquid crystal systems with microsecond response times, discovery of an advanced resist system for high-speed, high-density integrated circuits, the patterning of neuronal cells to form neural networks, and the development of biosen- sors for environmental monitoring.
The fiber-optic biosensor is a portable detection system capable of analyzing ppb (ng/ml) concentrations of hazard- ous chemicals and pathogenic agents. It is fast (<10 minutes), easy to use, and capable of simultaneous analy- sis for multiple analytes. It has been field tested for the detection of pollutants and biological warfare agents.
In October 1994, the center occupied newly renovated laboratories and offices in Building 30. These modern facilities, designed to be used into the next century, include general laboratories for research in chemistry, biochemistry, molecular biology, and physics. Specialized areas include a 600-ft2 Class 1000 clean room; an advanced Elec- tron Microscope facility; and a Scanning Probe Microscope laboratory. In addition, instrument rooms in the new building provide access to a variety of spectrophotometers (IR, GC-MS, NMR, and UV-Vis) and other equipment used in bio- chemical or physical analyses of biomaterials. In the near future, laboratories will be set up to accommodate an X-ray diffraction instrument, a liquid crystal fabrication facility, and equipment for advanced electronics and biosensor programs.
Acoustics
The Acoustics Division has three integrated acoustic pool facilities supporting research in submarine target characteristics for ASW, sub- marine acoustic design and quieting, sensors for hull-mounted sonars, and structural acoustics for mine countermeasures. Scaled submarine targets, real mine structures, sensors mounted on hull simulators, and underwater buried objects can all be examined with advanced nearfield holographic and scanning 3-D laser vibrometer systems to measure and visualize the sound fields near a
20
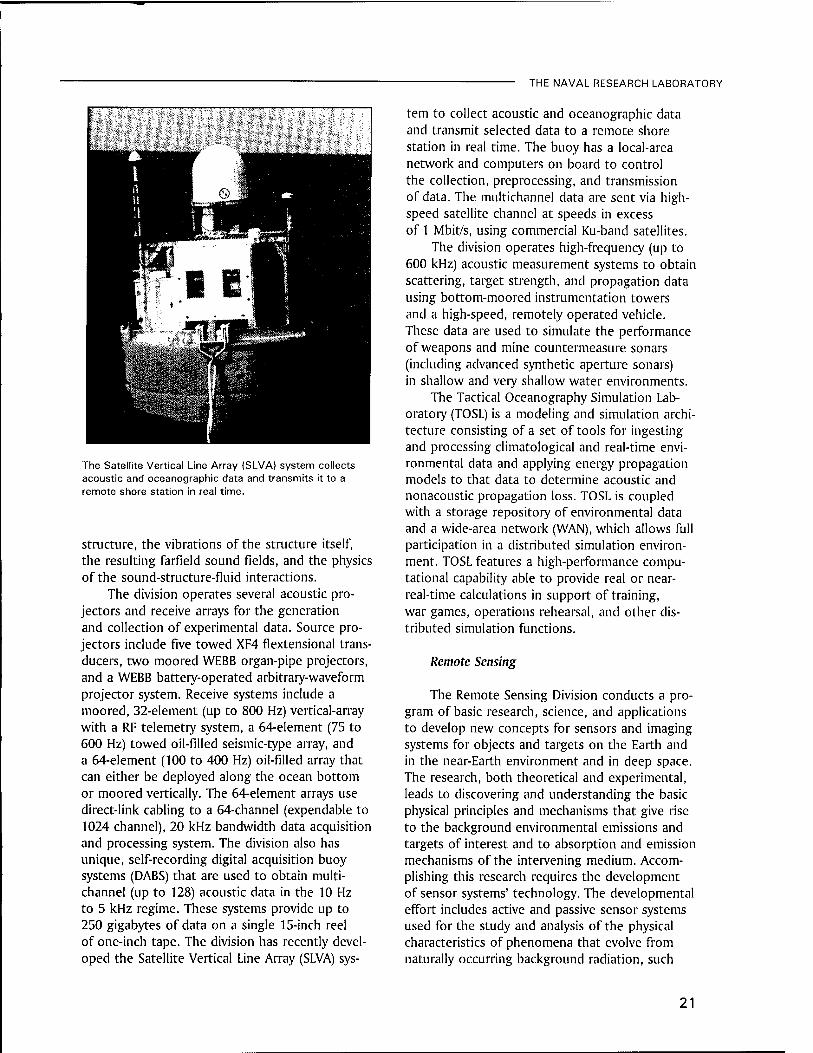
The Satellite Vertical Line Array (SLVA) system collects acoustic and oceanographic data and transmits it to a remote shore station in real time.
structure, the vibrations of the structure itself, the resulting farfield sound fields, and the physics of the sound-structure-fluid interactions.
The division operates several acoustic pro- jectors and receive arrays for the generation and collection of experimental data. Source pro- jectors include five towed XF4 flextensional trans- ducers, two moored WEBB organ-pipe projectors, and a WEBB battery-operated arbitrary-waveform projector system. Receive systems include a moored, 32-eIement (up to 800 Hz) vertical-array with a RF telemetry system, a 64-eIement (75 to 600 Hz) towed oil-filled seismic-type array, and a 64-element (100 to 400 Hz) oil-filled array that can either be deployed along the ocean bottom or moored vertically. The 64-element arrays use direct-link cabling to a 64-channel (expendable to 1024 channel), 20 kHz bandwidth data acquisition and processing system. The division also has unique, self-recording digital acquisition buoy systems (DABS) that are used to obtain multi- channel (up to 128) acoustic data in the 10 Hz to 5 kHz regime. These systems provide up to 250 gigabytes of data on a single 15-inch reel of one-inch tape. The division has recently devel- oped the Satellite Vertical Line Array (SLVA) sys-
THE NAVAL RESEARCH LABORATORY
tern to collect acoustic and oceanographic data and transmit selected data to a remote shore station in real time. The buoy has a local-area network and computers on board to control the collection, preprocessing, and transmission of data. The multichannel data are sent via high- speed satellite channel at speeds in excess of 1 Mbit/s, using commercial Ku-band satellites.
The division operates high-frequency (up to 600 kHz) acoustic measurement systems to obtain scattering, target strength, and propagation data using bottom-moored instrumentation towers and a high-speed, remotely operated vehicle. These data are used to simulate the performance of weapons and mine countermeasure sonars (including advanced synthetic aperture sonars) in shallow and very shallow water environments.
The Tactical Oceanography Simulation Lab- oratory (TOSL) is a modeling and simulation archi- tecture consisting of a set of tools for ingesting and processing climatological and real-time envi- ronmental data and applying energy propagation models to that data to determine acoustic and nonacoustic propagation loss. TOSL is coupled with a storage repository of environmental data and a wide-area network (WAN), which allows full participation in a distributed simulation environ- ment. TOSL features a high-performance compu- tational capability able to provide real or near- real-time calculations in support of training, war games, operations rehearsal, and other dis- tributed simulation functions.
Remote Sensing
The Remote Sensing Division conducts a pro- gram of basic research, science, and applications to develop new concepts for sensors and imaging systems for objects and targets on the Earth and in the near-Earth environment and in deep space. The research, both theoretical and experimental, leads to discovering and understanding the basic physical principles and mechanisms that give rise to the background environmental emissions and targets of interest and to absorption and emission mechanisms of the intervening medium. Accom- plishing this research requires the development of sensor systems' technology. The developmental effort includes active and passive sensor systems used for the study and analysis of the physical characteristics of phenomena that evolve from naturally occurring background radiation, such
21
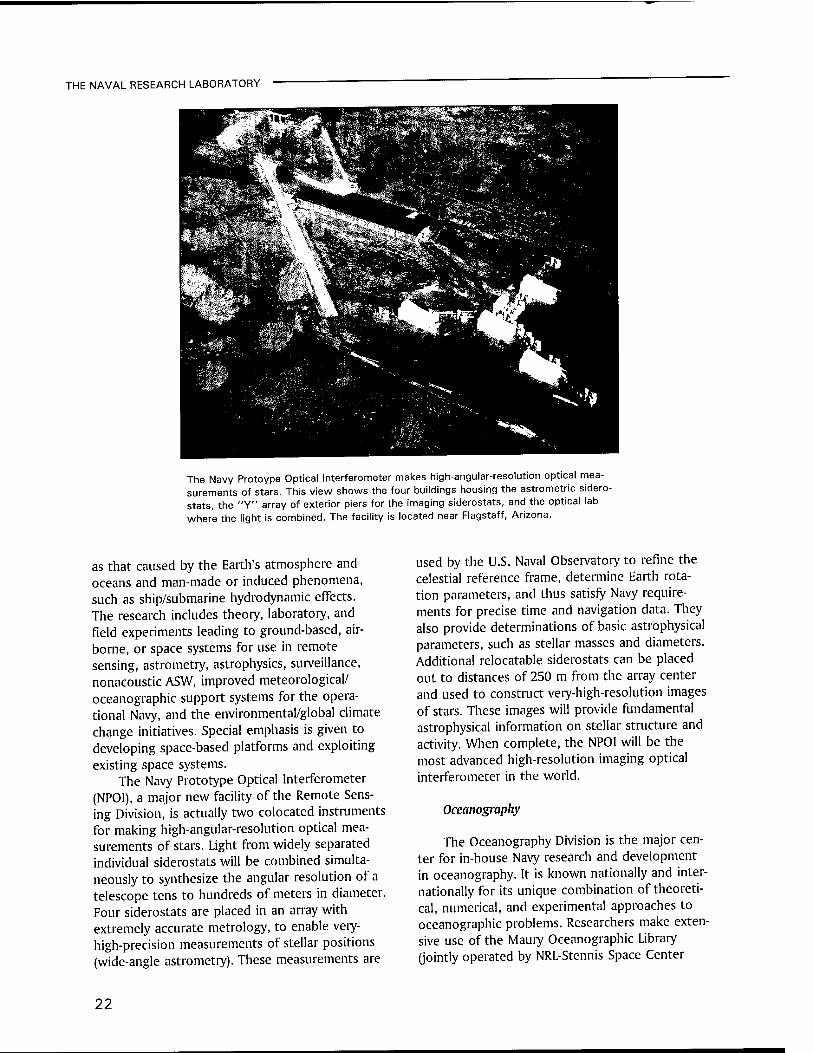
THE NAVAL RESEARCH LABORATORY
The Navy Protoype Optical Interferometer makes high-angular-resolution optical mea- surements of stars. This view shows the four buildings housing the astrometric sidero- stats, the "Y" array of exterior piers for the imaging siderostats, and the optical lab where the light is combined. The facility is located near Flagstaff, Arizona.
as that caused by the Earth's atmosphere and oceans and man-made or induced phenomena, such as ship/submarine hydrodynamic effects. The research includes theory, laboratory, and field experiments leading to ground-based, air- borne, or space systems for use in remote sensing, astrometry, astrophysics, surveillance, nonacoustic ASW, improved meteorological/ oceanographic support systems for the opera- tional Navy, and the environmental/global climate change initiatives. Special emphasis is given to developing space-based platforms and exploiting existing space systems.
The Navy Prototype Optical Interferometer (NPOI), a major new facility of the Remote Sens- ing Division, is actually two colocated instruments for making high-angular-resolution optical mea- surements of stars. Light from widely separated individual siderostats will be combined simulta- neously to synthesize the angular resolution of a telescope tens to hundreds of meters in diameter. Four siderostats are placed in an array with extremely accurate metrology, to enable very- high-precision measurements of stellar positions (wide-angle astrometry). These measurements are
used by the U.S. Naval Observatory to refine the celestial reference frame, determine Earth rota- tion parameters, and thus satisfy Navy require- ments for precise time and navigation data. They also provide determinations of basic astrophysical parameters, such as stellar masses and diameters. Additional relocatable siderostats can be placed out to distances of 250 m from the array center and used to construct very-high-resolution images of stars. These images will provide fundamental astrophysical information on stellar structure and activity. When complete, the NPOI will be the most advanced high-resolution imaging optical interferometer in the world.
Oceanography
The Oceanography Division is the major cen- ter for in-house Navy research and development in oceanography. It is known nationally and inter- nationally for its unique combination of theoreti- cal, numerical, and experimental approaches to oceanographic problems. Researchers make exten- sive use of the Maury Oceanographic Library (jointly operated by NRL-Stennis Space Center
22
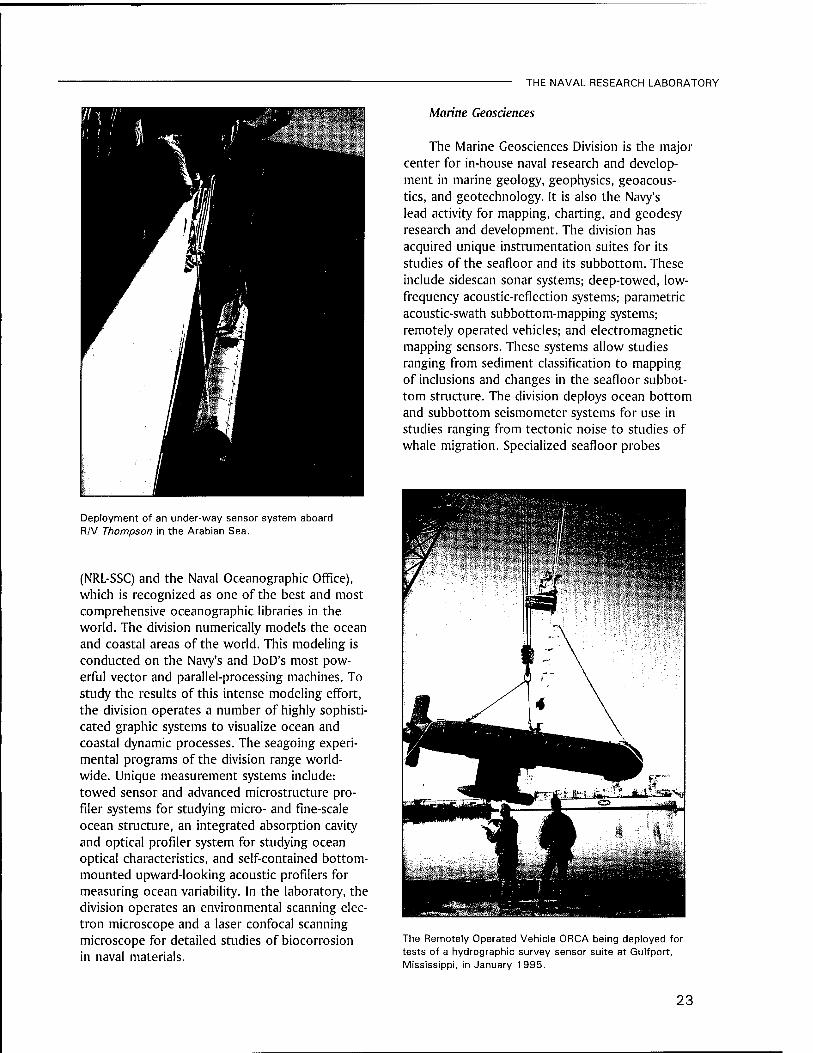
THE NAVAL RESEARCH LABORATORY
Deployment of an under-way sensor system aboard R/V Thompson in the Arabian Sea.
(NRL-SSC) and the Naval Oceanographic Office), which is recognized as one of the best and most comprehensive oceanographic libraries in the world. The division numerically models the ocean and coastal areas of the world. This modeling is conducted on the Navy's and DoD's most pow- erful vector and parallel-processing machines. To study the results of this intense modeling effort, the division operates a number of highly sophisti- cated graphic systems to visualize ocean and coastal dynamic processes. The seagoing experi- mental programs of the division range world- wide. Unique measurement systems include: towed sensor and advanced microstructure pro- filer systems for studying micro- and fine-scale ocean structure, an integrated absorption cavity and optical profiler system for studying ocean optical characteristics, and self-contained bottom- mounted upward-looking acoustic profilers for measuring ocean variability. In the laboratory, the division operates an environmental scanning elec- tron microscope and a laser confocal scanning microscope for detailed studies of biocorrosion in naval materials.
Marine Geosciences
The Marine Geosciences Division is the major center for in-house naval research and develop- ment in marine geology, geophysics, geoacous- tics, and geotechnology. It is also the Navy's lead activity for mapping, charting, and geodesy research and development. The division has acquired unique instrumentation suites for its studies of the seafloor and its subbottom. These include sidescan sonar systems; deep-towed, low- frequency acoustic-reflection systems; parametric acoustic-swath subbottom-mapping systems; remotely operated vehicles; and electromagnetic mapping sensors. These systems allow studies ranging from sediment classification to mapping of inclusions and changes in the seafloor subbot- tom structure. The division deploys ocean bottom and subbottom seismometer systems for use in studies ranging from tectonic noise to studies of whale migration. Specialized seafloor probes
The Remotely Operated Vehicle ORCA being deployed for tests of a hydrographic survey sensor suite at Gulfport, Mississippi, in January 1995.
23
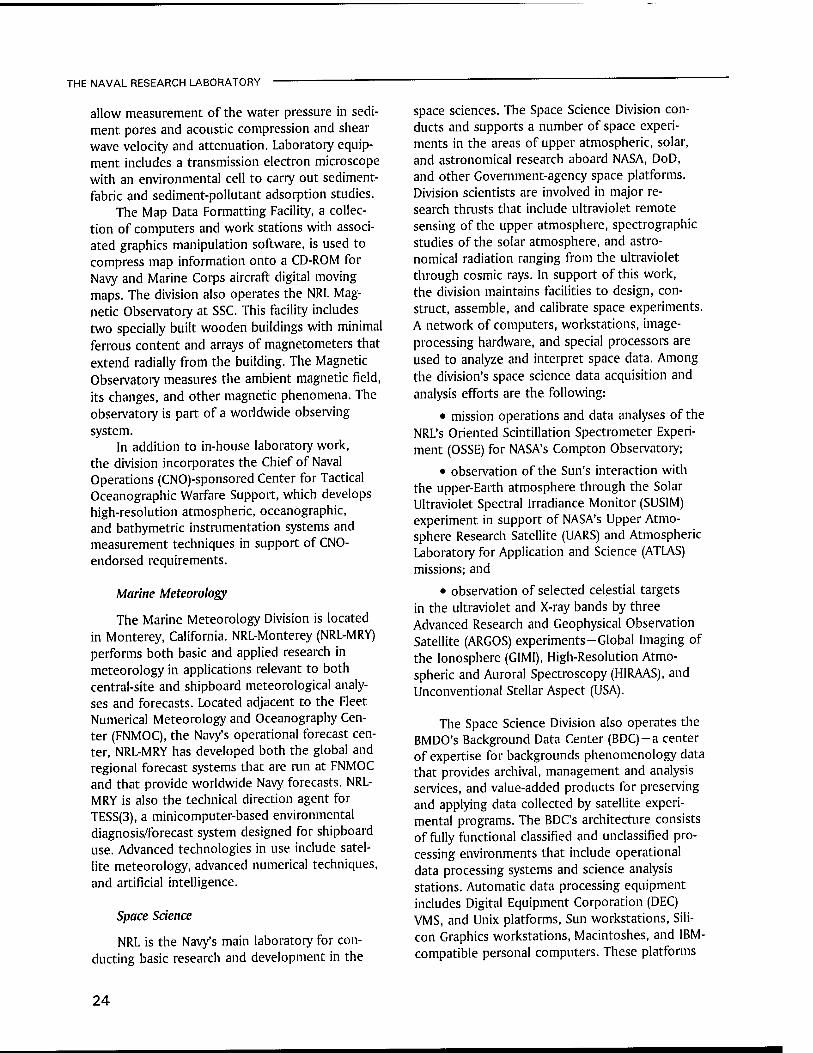
THE NAVAL RESEARCH LABORATORY
allow measurement of the water pressure in sedi- ment pores and acoustic compression and shear wave velocity and attenuation. Laboratory equip- ment includes a transmission electron microscope with an environmental cell to carry out sediment- fabric and sediment-pollutant adsorption studies.
The Map Data Formatting Facility, a collec- tion of computers and work stations with associ- ated graphics manipulation software, is used to compress map information onto a CD-ROM for Navy and Marine Corps aircraft digital moving maps. The division also operates the NRL Mag- netic Observatory at SSC. This facility includes two specially built wooden buildings with minimal ferrous content and arrays of magnetometers that extend radially from the building. The Magnetic Observatory measures the ambient magnetic field, its changes, and other magnetic phenomena. The observatory is part of a worldwide observing system.
In addition to in-house laboratory work, the division incorporates the Chief of Naval Operations (CNO)-sponsored Center for Tactical Oceanographic Warfare Support, which develops high-resolution atmospheric, oceanographic, and bathymetric instrumentation systems and measurement techniques in support of CNO- endorsed requirements.
Marine Meteorology
The Marine Meteorology Division is located in Monterey, California. NRL-Monterey (NRL-MRY) performs both basic and applied research in meteorology in applications relevant to both central-site and shipboard meteorological analy- ses and forecasts. Located adjacent to the Fleet Numerical Meteorology and Oceanography Cen- ter (FNMOC), the Navy's operational forecast cen- ter, NRL-MRY has developed both the global and regional forecast systems that are run at FNMOC and that provide worldwide Navy forecasts. NRL- MRY is also the technical direction agent for TESS(3), a minicomputer-based environmental diagnosis/forecast system designed for shipboard use. Advanced technologies in use include satel- lite meteorology, advanced numerical techniques, and artificial intelligence.
Space Science
NRL is the Navy's main laboratory for con- ducting basic research and development in the
space sciences. The Space Science Division con- ducts and supports a number of space experi- ments in the areas of upper atmospheric, solar, and astronomical research aboard NASA, DoD, and other Government-agency space platforms. Division scientists are involved in major re- search thrusts that include ultraviolet remote sensing of the upper atmosphere, spectrographic studies of the solar atmosphere, and astro- nomical radiation ranging from the ultraviolet through cosmic rays. In support of this work, the division maintains facilities to design, con- struct, assemble, and calibrate space experiments. A network of computers, workstations, image- processing hardware, and special processors are used to analyze and interpret space data. Among the division's space science data acquisition and analysis efforts are the following:
• mission operations and data analyses of the NRL's Oriented Scintillation Spectrometer Experi- ment (OSSE) for NASA's Compton Observatory;
• observation of the Sun's interaction with the upper-Earth atmosphere through the Solar Ultraviolet Spectral Irradiance Monitor (SUSIM) experiment in support of NASA's Upper Atmo- sphere Research Satellite (UARS) and Atmospheric Laboratory for Application and Science (ATLAS) missions; and
• observation of selected celestial targets in the ultraviolet and X-ray bands by three Advanced Research and Geophysical Observation Satellite (ARGOS) experiments-Global Imaging of the Ionosphere (GIMI), High-Resolution Atmo- spheric and Auroral Spectroscopy (HIRAAS), and Unconventional Stellar Aspect (USA).
The Space Science Division also operates the BMDO's Background Data Center (BDC)-a center of expertise for backgrounds phenomenology data that provides archival, management and analysis services, and value-added products for preserving and applying data collected by satellite experi- mental programs. The BDC's architecture consists of fully functional classified and unclassified pro- cessing environments that include operational data processing systems and science analysis stations. Automatic data processing equipment includes Digital Equipment Corporation (DEC) VMS, and Unix platforms, Sun workstations, Sili- con Graphics workstations, Macintoshes, and IBM- compatible personal computers. These platforms
24
THE NAVAL RESEARCH LABORATORY
support a wide variety of standard scientific anal- yses software packages, including Ingres RDBMS, IRAF, IDL, KHOROS, and the MOSAIC/World Wide Web. Unclassified processing environments are linked to scientists throughout the world via the Internet. Data files can be received by or sent from the BDC by using FTP or other protocol. Information about the BDC, the programs it supports, and the services it provides can be obtained via the BDC World Wide Web Home Page-http://bradbury.nrl.navy.mil/.
Space Technology
In its role as a center of excellence for space systems research, the Naval Center for Space Technology (NCST) designs, builds, analyzes, tests, and operates spacecraft, as well as identi- fies and conducts promising research to improve spacecraft and their support systems. NCST facili- ties that support this work include large and small anechoic radio frequency chambers, clean rooms, shock and vibration facilities, an acoustic reverberation chamber, large and small thermal/ vacuum test chambers, control system interaction laboratory, satellite command and control ground stations, fuels test facility, and modal analysis test facilities. NCST has a facility for long-term testing of satellite clock time/frequency standards under thermal/vacuum conditions linked to the Naval Observatory; a 5-m optical bench laser laboratory; and a hologram research laboratory to conduct research in support of the development of space systems.
Building A59 was recently renovated for NCST occupancy.
Research Support Facilities
Technical Information Services
The Ruth H. Hooker Research Library and Technical Information Center contains more than 1 million items, including journals, books, con- ference proceedings, technical reports, and more than a thousand microcomputer software pack- ages. Its collections can be searched by computer- based catalogs. The Library provides interlibrary loans, on-line literature searches, access to CD- ROM and commercial databases, loans of micro- computer software, and a full range of reference services. The Library offers desktop access to its catalogs and databases through its menu- driven InfoNet information system, which can be accessed from offices and laboratories as well as from home. A number of these services are also available via the World Wide Web through the Library's InfoWeb interface. The InfoWeb links to the Library's networked document dissemination system called TORPEDO (The Optical Retrieval Project: Electronic Documents On-line), offering full-text search capabilities and on-line display and printing of selected journals, research reports, and NRL Press Releases.
Publication services include writing, editing, composition, phototypesetting, publications con- sultation, and printing management. The primary focus is on using computer-assisted publishing technology to produce scientific and technical information containing complex artwork, equa- tions, and tabular material.
The research conducted at NRL requires a diversity of graphic support such as technical and scientific illustrations, computer graphics, design services, photographic composites, cal- ligraphy, display panels, sign making, and fram- ing. A high-end workstation provides and delivers a new level of electronic airbrushing and photo- graphic retouching.
Photographic services include high-speed motion picture, video, and still-camera coverage for data documentation both at NRL and in the field. A photographic laboratory offers custom processing and printing of black and white and color films. Photographic images can also be captured with state-of-the-art digital cameras and still video. Video services include producing video reports of scientific and technical programs. A video studio and editing facility with high-quality
25
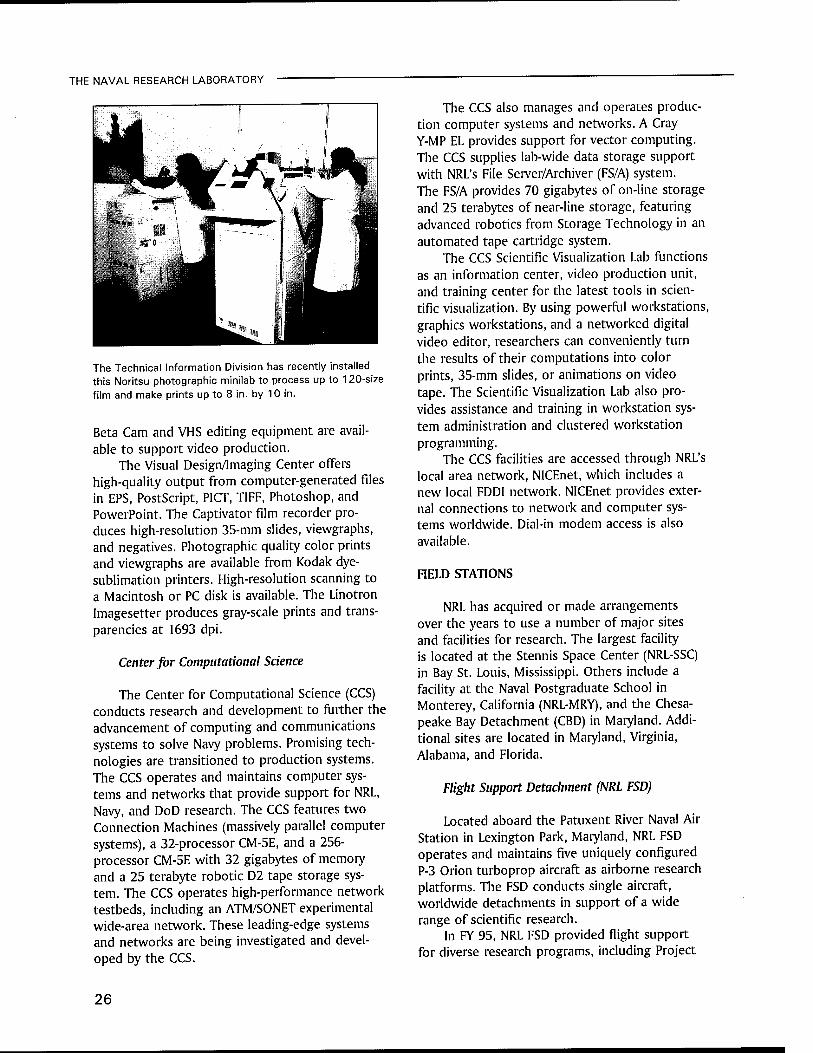
THE NAVAL RESEARCH LABORATORY
The Technical Information Division has recently installed this Noritsu photographic minilab to process up to 120-size film and make prints up to 8 in. by 10 in.
Beta Cam and VHS editing equipment are avail- able to support video production.
The Visual Design/Imaging Center offers high-quality output from computer-generated files in EPS, PostScript, PICT, TIFF, Photoshop, and PowerPoint. The Captivator film recorder pro- duces high-resolution 35-mm slides, viewgraphs, and negatives. Photographic quality color prints and viewgraphs are available from Kodak dye- sublimation printers. High-resolution scanning to a Macintosh or PC disk is available. The Linotron Imagesetter produces gray-scale prints and trans- parencies at 1693 dpi.
Center for Computational Science
The Center for Computational Science (CCS) conducts research and development to further the advancement of computing and communications systems to solve Navy problems. Promising tech- nologies are transitioned to production systems. The CCS operates and maintains computer sys- tems and networks that provide support for NRL, Navy, and DoD research. The CCS features two Connection Machines (massively parallel computer systems), a 32-processor CM-5E, and a 256- processor CM-5E with 32 gigabytes of memory and a 25 terabyte robotic D2 tape storage sys- tem. The CCS operates high-performance network testbeds, including an ATM/SONET experimental wide-area network. These leading-edge systems and networks are being investigated and devel- oped by the CCS.
The CCS also manages and operates produc- tion computer systems and networks. A Cray Y-MP EL provides support for vector computing. The CCS supplies lab-wide data storage support with NRL's File Server/Archiver (FS/A) system. The FS/A provides 70 gigabytes of on-line storage and 25 terabytes of near-line storage, featuring advanced robotics from Storage Technology in an automated tape cartridge system.
The CCS Scientific Visualization Lab functions as an information center, video production unit, and training center for the latest tools in scien- tific visualization. By using powerful workstations, graphics workstations, and a networked digital video editor, researchers can conveniently turn the results of their computations into color prints, 35-mm slides, or animations on video tape. The Scientific Visualization Lab also pro- vides assistance and training in workstation sys- tem administration and clustered workstation programming.
The CCS facilities are accessed through NRL's local area network, NICEnet, which includes a new local FDDI network. NICEnet provides exter- nal connections to network and computer sys- tems worldwide. Dial-in modem access is also available.
FIELD STATIONS
NRL has acquired or made arrangements over the years to use a number of major sites and facilities for research. The largest facility is located at the Stennis Space Center (NRL-SSC) in Bay St. Louis, Mississippi. Others include a facility at the Naval Postgraduate School in Monterey, California (NRL-MRY), and the Chesa- peake Bay Detachment (CBD) in Maryland. Addi- tional sites are located in Maryland, Virginia, Alabama, and Florida.
Flight Support Detachment (NRL FSD)
Located aboard the Patuxent River Naval Air Station in Lexington Park, Maryland, NRL FSD operates and maintains five uniquely configured P-3 Orion turboprop aircraft as airborne research platforms. The FSD conducts single aircraft, worldwide detachments in support of a wide range of scientific research.
In FY 95, NRL FSD provided flight support for diverse research programs, including Project
26

THE NAVAL RESEARCH LABORATORY
..-■••" ,,—-r^*" i ■[-—
jhPt ̂
' i""*! i L_^ —^
' -3M - ;TT WM ,,IJI
1 «sSJP* ^2
-^jjrf* ~Tj™ i
"••■■ I '
wBBm t '«ff.;:: Tpr 1
-^iMMprnnE
Flight Support Detachment aircraft, BUNO 154589, parked in front of Hangar 109 at the Patuxent River Naval Air Station.
Birdseye, involving hydroacoustic research; Fly's Eye, an infrared threat warning system; Airborne Multisensor Pod System (AMPS), a multisensor data collection system; Airborne Geophysical Sensor Suite (AGSS), involving data and gravi- meter testing to detect variations in the ocean floor; and MAKO, an ECM study of received signals.
The NRL FSD aircraft are the sole airborne platforms for numerous projects, such as bathym- etry, electronic countermeasures, gravity map- ping, and radar development research. The de- tachment has an impressive safety record of over 50,880 accident-free flight hours amassed over a 32-year period.
Chesapeake Bay Detachment (CBD)
CBD occupies a 168-acre site near Chesa- peake Beach, Maryland, and provides facilities and support services for research in radar, electronic warfare, optical devices, materials, communica-
tions, and fire research. Because of its location high above the Chesapeake Bay on the western shore, unique experiments can be performed in conjunction with the Tilghman Island site 16 km across the bay from CBD. Some of these experi- ments include low clutter and generally low- background radar measurements. By using CBD's support vessels, experiments are performed that involve dispensing chaff over water and radar target characterizations of aircraft and ships. Basic research is also conducted in radar antenna properties, testing of radar remote-sensing con- cepts, use of radar to sensor ocean waves, and laser propagation. CBD also hosts facilities of the Navy Technology Center for Safety and Surviv- ability, which conducts fire research on simulated carrier, surface, and submarine platforms.
Marine Corrosion Test Facility
Located on Fleming Key at Key West, Florida, this facility offers an ocean-air environment and clear, unpolluted, flowing seawater for studies of environmental effects on materials. Equipment is available for experiments involving weathering, general corrosion, fouling, and electrochemical phenomena, as well as coatings, cathodic protec- tion devices, and other means to combat environ- mental degradation.
Naval Research Laboratory-Stennis Space Center (NRL-SSC)
NRL-SSC, a tenant activity at NASA's Stennis Space Center, is located in the southwest corner
The radar facility located at the Chesapeake Bay Detachment.
27

THE NAVAL RESEARCH LABORATORY
The Marine Corrosion Facility, located at Key West, Florida.
of Mississippi, about 50 miles northeast of New Orleans, Louisiana, and 20 miles from the Missis- sippi Gulf Coast. NRL-SSC encompasses over 200 square miles of land area, including a perimeter buffer zone to insulate surrounding civilian com- munities from the noise of rocket-engine testing by NASA. Other Navy tenants at NRL-SSC include the Commander, Naval Meteorology and Oceanog- raphy Command and the Naval Oceanographic Office, who are major operational users of the oceanographic and atmospheric research and development performed by NRL. The Naval Oceanographic Office provides access for NRL researchers to one of the Navy's largest super- computers. This unique concentration of opera- tional and research oceanographers makes NRL- SSC the center of naval oceanography and the largest such grouping in the Western world.
NRL-SSC provides administrative and business operations support for NRL's Center for Environ- mental Acoustics, Remote Sensing Applications Branch, Oceanography Division, and Marine Geo- sciences Division. NRL-SSC occupies over 200,000 square feet of research, computation, laboratory, administrative, and warehouse space. Facilities include a number of large antennas to receive available oceanographic and meteorological satel- lite data, a Magnetic Observatory building con- structed of nonferrous materials in an electromag- netically quiet area of NRL-SSC, a Pattern Analysis Laboratory, a Map Data Formatting Facility, a water-wave channel, and numerous laboratories for acoustic and oceanographic computation,
instrumentation, analysis, and testing. Special areas are available for constructing, staging, refur- bishing, and storing sea-going equipment.
Marine Meteorology Division Monterey, California (NRL-MRY)
Located in Monterey, California, as a tenant activity of the Naval Postgraduate School (NPS), this facility is collocated with the Fleet Numerical Meteorology and Oceanography Center (FNMOC) to support development and upgrades of numeri- cal atmospheric forecast systems and related user products. NRL-MRY's mission has broadened con- siderably to include basic research and support to other customers. Collocation with FNMOC allows NRL-MRY access to the Navy's largest vec- tor supercomputer mainframe and workstation resources. This access provides real time as well as archived global atmospheric and oceanographic databases for research on-site and at other NRL locations. Interfaces to the Defense Research and Engineering Network through FNMOC and Defense Simulation Internet at NPS have been established. Locally, NRL-MRY has a DEC Alpha Workstation and data archives system for in-house researchers to conduct numerical weather prediction experiments.
NRL-MRY's experience extends to prototype regional and shipboard atmospheric prediction systems. A third-generation Navy system, the Tactical Environmental Support System (TESS(3)), developed for SPAWAR, is installed and has
28
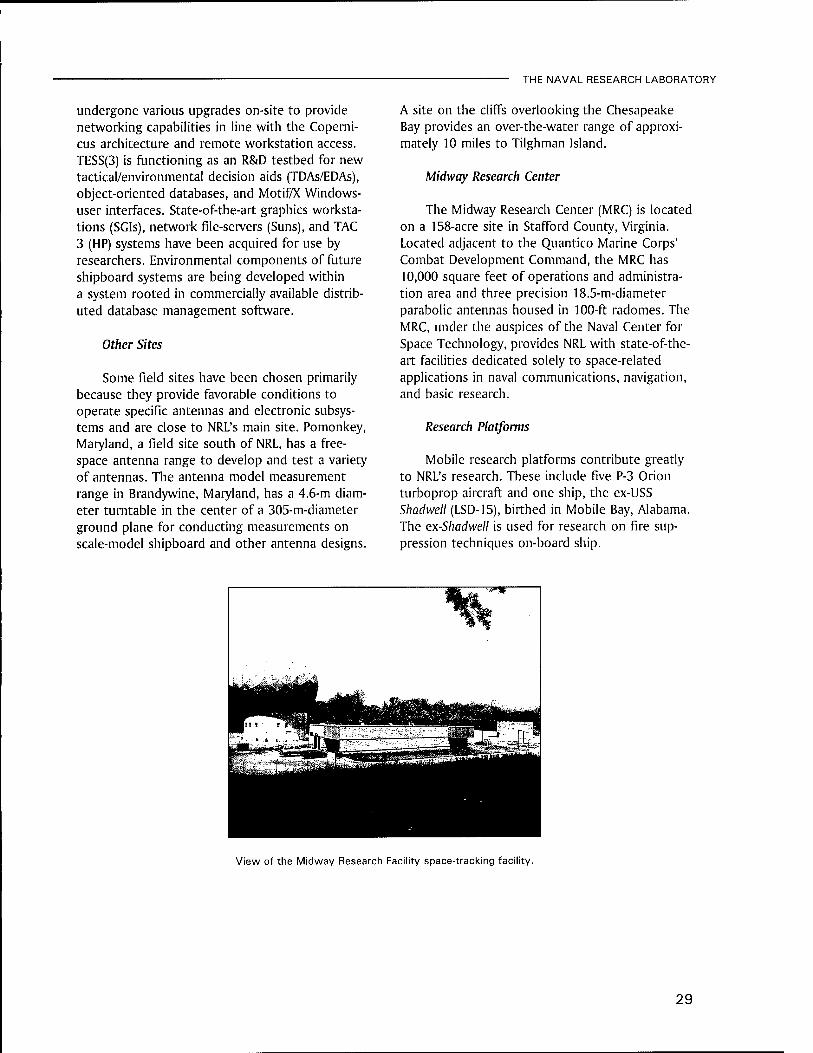
THE NAVAL RESEARCH LABORATORY
undergone various upgrades on-site to provide networking capabilities in line with the Coperni- cus architecture and remote workstation access. TESS(3) is functioning as an R&D testbed for new tactical/environmental decision aids (TDAs/EDAs), object-oriented databases, and Motif/X Windows- user interfaces. State-of-the-art graphics worksta- tions (SGIs), network file-servers (Suns), and TAC 3 (HP) systems have been acquired for use by researchers. Environmental components of future shipboard systems are being developed within a system rooted in commercially available distrib- uted database management software.
Other Sites
Some field sites have been chosen primarily because they provide favorable conditions to operate specific antennas and electronic subsys- tems and are close to NRL's main site. Pomonkey, Maryland, a field site south of NRL, has a free- space antenna range to develop and test a variety of antennas. The antenna model measurement range in Brandywine, Maryland, has a 4.6-m diam- eter turntable in the center of a 305-m-diameter ground plane for conducting measurements on scale-model shipboard and other antenna designs.
A site on the cliffs overlooking the Chesapeake Bay provides an over-the-water range of approxi- mately 10 miles to Tilghman Island.
Midway Research Center
The Midway Research Center (MRC) is located on a 158-acre site in Stafford County, Virginia. Located adjacent to the Quantico Marine Corps' Combat Development Command, the MRC has 10,000 square feet of operations and administra- tion area and three precision 18.5-m-diameter parabolic antennas housed in 100-ft radomes. The MRC, under the auspices of the Naval Center for Space Technology, provides NRL with state-of-the- art facilities dedicated solely to space-related applications in naval communications, navigation, and basic research.
Research Platforms
Mobile research platforms contribute greatly to NRL's research. These include five P-3 Orion turboprop aircraft and one ship, the ex-USS Shadwell (LSD-15), birthed in Mobile Bay, Alabama. The ex-Shadwell is used for research on fire sup- pression techniques on-board ship.
*"*r
I^V^wSiäÄ1!»*^
View of the Midway Research Facility space-tracking facility.
29
NRL in the Future
In order to provide preeminent research for tomorrow's Navy, NRL must maintain and upgrade its scientific and technological equip- ment to keep it at the forefront of modern research facilities. The physical plant to house this equipment must also be state of the art. NRL has embarked on a Corporate Facilities Plan to accomplish these goals. This plan and future facility plans are described below.
THE CORPORATE FACILITIES INVESTMENT PLAN (CFIP)
The CFIP is a financial spending plan to pro- vide modern research facilities at NRL by the year 2000. The plan calls for both Congressional and Laboratory investment and is updated and altered ac changes occur in scientific emphasis and Con- gressional attitude. Over the past several years, Congressionally approved military construction (MILCON) funds were used to construct the new Electro-Optics Laboratory and a high-bay facility for the Naval Center for Space Technology. Funds have been requested for the construction of a new building for nanoscience research.
To complement these efforts, overhead funds have been used to renovate and upgrade labora- tory and support areas in several existing build- ings. To date we have provided modern labora- tory facilities for the Center for Bio/Molecular Science and Engineering, the Material Sciences and Technology Division, and the Remote Sensing Division. Work that is currently in progress will provide new facilities for the Acoustics Division, the Information Technology Division, and the Radar Division.
Center for Computational Sciences
The Center for Computational Science has a procurement in process for a scalable, massively parallel processing (MPP) computer system. The system will be used to continue innovative explo- ration and evaluation of MPP technology for the solution of significant military-relevant problems relating to computational and information sci-
ence. The planned system will allow for contin- uing research into heterogeneous parallel pro- cessing in connection with the NRL Thinking Machines Corporation CM-5E systems and other computational assets.
Optical Sciences
The NRL infrared (IR) test chamber, or IR range, was installed in Building 216 in December 1995 and became fully operational in the second quarter of FY 96. This ultradry chamber is used to measure the IR signature of new surface treat- ments, scale models, and components used for observables control on ships, aircraft, and mis- siles. The IR range can simulate the infrared radi- ance from the Earth and sky at target altitudes ranging from 0 to 30,000 feet. Included in the facility are a midwave solar simulator, a versatile target mount with control over yaw, pitch, and temperature, and seven ports to view the target with IR sensors. This facility complements the NRL Compact Radar Range in Building A59 and is only the second IR Range ever built. It can supply calibrated signature data sufficient to meet the needs of both the Navy and Air Force.
Plasma Physics
The division has established a new facility for research on high-frequency microwave pro- cessing of advanced ceramic materials. It features a unique, tunable (60 to 120 GHz) quasi-optical gyrotron, 35 and 94 GHz fixed-frequency gyro- trons, and a 6 kW, 2.45 GHz industrial microwave source. The facility is being used to investigate the scientific basis for understanding and con- trolling microwave processes, such as sintering/ densification, coating, and joining, for low-loss, refractory ultrafine-grain polycrystalline ceramic materials.
Electronics Science and Technology
Important division emphasis is focused on the continual upgrading of the Nanoelectronics
30
THE NAVAL RESEARCH LABORATORY
Processing Facility (NPF) and the Penthouse Pro- cessing Facility (PPF) and expanding activities in the nanoelectronics, heterostructures, and vacuum electronics science and technology pro- grams. The Laboratory for Advanced Material Synthesis Facility will continue to upgrade its organometallic vapor-phase epitaxy equipment to meet program needs for thin-film semiconductors. Upgrades include safer and more environmentally benign processing and waste disposal techniques. The EPICENTER (a joint activity of the Electronic Science and Technology, Materials Science and Technology, and Chemistry Divisions) will con- tinue to provide new insight into epitaxial semi- conductor growth processes. Knowledge of these growth processes will be used for improved con- trol of film properties for use in the electronic devices of tomorrow.
Ocean Acoustics Research Laboratory
NRL's Ocean Acoustics Research Labora- tory (MILCON Project P-006), a 52,000-square- foot building, will place 90% of NRL-SSC in one closely located area. This project will provide secure laboratory and computing facilities for research and development in ocean science and technology. Completion and occupancy should occur by the end of 1999.
Vacuum Ultraviolet Space Instrument Test Facility
The Space Science Division facilities include an ultraclean solar instrument test facility in Building A-13 on the main NRL campus. The new facility is designed to satisfy the rigorous con- tamination requirements of state-of-the-art solar spaceflight instruments. The facility has a 400- square-foot Class 10 clean room and a large Solar Coronagraph Optical Test Chamber (SCOTCH). This completely dry-pumped, 550-cubic-foot vacu- um chamber is maintained at synchrotron levels of cleanliness. Solar instrumentation up to 1 m in diameter and 5 m in length may be physically accommodated in the chamber. The instrument's optical performance is probed and calibrated with a variety of visible and XUV sources mounted on the chamber's 11-m beamline. The optical testing and characterization of the Large-Angle Spectro- metric Coronagraph (LASCO) instrument for the European Space Agency's Solar Heliospheric
Observatory satellite was conducted in this cham- ber. Coronagraph stray-light characterization was carried out by mounting a set of baffles in the main beamline, illuminating the instrument with a simulated solar beam, and measuring the residual radiation. A stray light background measurement of 10~~12 was successfully measured in the LASCO C3 channel. Coronagraph calibration was carried out by installing back-illuminated, calibrated opals in front of the instrument entrance aperture. Instrument polarization properties were analyzed by using a variety of polarizers installed in a wheel located between the opal and the instru- ment. The wheel was remotely controlled from outside the chamber. Instrument Mueller matrices were verified with a 12-in. diameter, two-plate partial polarizer. Calibration and focus of XUV solar instrumentation are accomplished by expos- ing the instrument to an XUV windowless colli- mator at the end of the tank. The facility also has a small thermal bake/vacuum test chamber used for vacuum conditioning and thermal testing of spaceflight components and subassemblies. Both the SCOTCH and the small test chamber are instrumented with temperature-controlled quartz- crystal monitors and residual gas analyzers for real-time, quantitative measurements of volatile contamination.
Remote Sensing
To validate numerical and theoretical efforts ongoing within the Remote Sensing Division, extensive hierarchical-coupled experiments are planned within a new, Free-Surface Hydrodyn- amics Laboratory. This laboratory will be used to study free-surface turbulence interactions, wave- generation phenomena, jet-flow phenomena, vorticity dynamics, and free-surface/surfactant interactions. Of particular importance is the detailed study of surfactant materials, both in shear and surface wave flows. State-of-the-art diagnostic tools are available, such as Langmuir film balance to measure the properties of surface films, hot-wire and laser-Doppler anemometry, together with the new quantitative flow tech- niques of laser speckle, particle tracking, and particle image velocimetry. These experimental diagnostic techniques use high-powered lasers, high-tolerance optical lenses, and extensive ultra-high-resolution video-imaging hardware and PC-based computerized systems. Further
31
THE NAVAL RESEARCH LABORATORY
computational assets consist of powerful graphi- cal computer work stations, the NRL Connection Machine, and other off-site CRAY supercomputer systems.
Marine Geosciences
The Marine Geosciences Division will greatly enhance the capabilities and quality of seafloor sediment fabric analyses through purchase, instal- lation, and staff training for a 300 kV transmis- sion electron microscope (TEM) and accompany- ing environmental cell (EC) in FY 96. The TEM-EC will be housed in a specially built facility impart- ing a null effect on the functioning of the TEM-EC electronics. The new facility will improve transi- tion of developed capabilities and sediment fabric understanding to applied issues of acoustic and shock-wave propagation, mine burial, and mine countermeasures.
REHABILITATION OF SCIENTIFIC FACILITIES
Specialized facilities are being installed or upgraded in several of the research and support divisions.
Flight Support Detachment
NRL's Flight Support Detachment (FSD) has continued to improve both capabilities and diver- sity among its aircraft platforms. Aircraft 153442 was transferred to the Naval Air Depot, Jackson- ville, Florida, in preparation for extensive aircraft modifications required to install a "roto-dome" antenna and full AEW radar system on the air- craft. These modifications will support the Navy's Theater Air Defense programs, while providing a testbed for advanced EW radar research. Addi- tionally, Aircraft 154589 and 154587 completed modifications to enhance interoperability and support pod-based research programs, such as the Advanced Multipod System (AMPS) and the Integrated Electronic Warfare System (IEWS). These upgrades and modifications will ensure that NRL will have the finest airborne research capa- bilities well into the next century.
Information Technology
The Information Technology Division con- tinues to upgrade its local area network and
research into high-performance network testbeds, including ATM/SONET technology. The 256-pro- cessor CM-5E massively parallel computer will be upgraded in FY 96. The upgrade will include the addition of 100 gigabytes of scalable disk array, 32 additional processor nodes, device/processor expansion cabinets, and an upgraded interproces- sor router. An additional scalable massively paral- lel computer system will be acquired. The new system will allow for continuing research into heterogeneous parallel processing in connection with the existing NRL CM-5E and will provide an alternative globally shared memory programming paradigm. The need for additional facilities to supplement research in virtual environments and Global Grid demonstrations will lead to gradual development of a demonstrationA/R and confer- ence center in Building 34. An upgrade for the Human-Computer Interaction Laboratory will inte- grate and enhance its video and audio presen- tation and recording capabilities.
Materials Science and Technology
Renovation is in progress for Building 3, which is composed of two of the original five buildings at NRL, to contain modern labora- tories for studies of thin-film deposition and char- acterization, superconducting materials, magnetic materials, and other materials science projects. The new space will feature the most modern molecular beam epitaxy and other materials syn- thesis and processing equipment, an up-to-date fatigue and fracture laboratory, and state-of- the-art diagnostic equipment, including electron microscopes, spectrometers, and electron and X-ray diffraction equipment. The renovated build- ing will also contain office and laboratory space for approximately 70 technical personnel.
Plasma Physics
A state-of-the-art short-pulse (<1 ps), high- intensity (> 1 TW) Table-Top Terawatt (T3) laser has been procured for a variety of physics studies. The T3 laser will be integrated into the Pharos III Nd-laser facility to boost its power into the 10 to 100 TW range. This will provide a facility to do fundamental physics experiments in intense laser- plasma interactions and intense laser electron beam interactions.
A low-frequency (300 MHz to 10 GHz), high- power microwave facility that uses a relativistic
32
THE NAVAL RESEARCH LABORATORY
klystron concept is being upgraded to produce multigigawatt coherent radiation pulses.
A compact spectral imager, which records 2-D images of scenes with up to 500 spectral bands and 500 pixel spatial resolution, has been developed. This hyperspectral imager can be de- ployed on aircraft or on the ground for remote- sensing applications.
Remote Sensing
From 1920 through 1990, Building 2 (one of five original buildings at the Laboratory) housed the Engineering Service Division (ESD). ESD is no longer an active division, and renovation of Build- ing 2 to house the Remote Sensing and Acoustics Divisions is currently in progress and scheduled for completion in 1996. After completion, Build-
ing 2 will house office and laboratory space for over 125 personnel of the Remote Sensing Divi- sion.
Marine Geosciences
In September 1995, the division's Mapping, Charting, and Geodesy Branch, located at NRL- SCC, moved into newly refurbished facilities locat- ed in the same building with the division's Sea- floor Sciences Branch and Administrative Offices. This colocation will enhance interaction, efficien- cy, and research product quality of the division elements. Accompanying the change of quarters is an upgrade in hardware to improve electronic data transfer rate and efficiency internal and external to the division and NRL.
33
Highlights of NRL Research in 1995
The Transition of Low Observable Technology into the SPS-49 MPU Program
Radar Division
The SPS-49 MPU (Medium Pulse-Repetition Frequency (PRF) Upgrade) radar is the Navy's principal long- range, shipboard, 2-D, air surveillance radar that is used on major combatant vessels. This radar system was recently upgraded to enhance the Fleet's ability to detect fast, low-cross-section targets. The SPS-49 MPU signal-processing technique initially developed at NRL determines the radial velocity of a contact on a single scan. This velocity estimation and an estimate of target cross-section are then used to reject unwanted, slow-moving contacts resulting from birds and clutter while retaining full sensitivity against desired low-cross-section targets. Analysis of the test data by NRL has led to a number of performance- enhancing modifications to the radar and tracker that will be implemented into production versions. The MPU upgrade will initially be applied to LSD 41 class amphibious ships as part of the Ship's Self-Defense System Program and to Cort FFGs. Follow-on production contracts will upgrade Aegis cruisers, DDG-993, LHD-1, DD-997, and CV/CVN-class ships.
AN/SPQ-9B Radar Program Radar Division
The current AN/SPQ-9 radar's sensitivity is too low to detect difficult threats, and it cannot deal effectively with clutter. Thus the AN/SPQ-9B program objective was to add a low-cost, quality sea- skimmer detection capability to an existing shipboard radar as an ordinance alteration kit, with subsequent rapid introduction into the Fleet. The resulting upgrade provides significantly increased sensitivity and improved ability to detect large targets in clutter while maintaining current operating modes. An improved surface mode maintains the current MK 86 gun-fire control-system support, and a new air mode provides the capability of detecting sea-skimmer targets in a high clutter environment. The air mode of an advanced development model radar (AN/SPQ-9B advanced development model) has been successfully tested at Wallop's Island and in an at-sea shipboard environment. This program will provide a large number of Navy ships with a low-cost, low-RCS, sea-skimmer detection capability in clutter using the pedestal and below-deck spaces of the present AN/SPQ-9A radar.
Data and Voice Integration Advanced Technology Demonstration Information Technology Division
Historically, military communication systems have implemented separate links and networks for each different application, such as voice tactical data, surveillance, intelligence, and command and control. This mode of operation is excessively expensive and wasteful and must be replaced by networks that are shared by multiple missions, multiple users, and multiple applications, including simultaneous voice and data. This capability is almost nonexistent over military tactical wireless networks. The DataAfoice Integration Advanced Technology Demonstration provides technology to integrated digital voice and data services over bandwidth-constrained tactical networks, using Iow-data-rate vocoder technology, unique
34
—— THE NAVAL RESEARCH LABORATORY
multiplexing schemes that support both datagram and virtual-circuit services, and advanced wireless network control schemes. A capability has been demonstrated for high- frequency surface-wave wireless systems operating at link rates as low as 2400 bps. The technology developed under this ATD provides essential capabilities that are needed to share a common wireless network among multiple missions, multiple users, and multiple applications.
Infrared (IR) Ocean Surface Modeling Optical Sciences Division
The Navy requires ocean surface IR models to assess the performance of ship-defense IR surveillance systems and to develop ship signature-reduction techniques. These models must provide rapid and accurate IR imagery in a wide range of environmental conditions. A statistical model for infrared radiance emitted by the ocean surface near the horizon has been developed. This analytical model provides the mean and clutter radiances emitted by the ocean surface and is in good agreement with field-test imagery. Near-field IR models are currently being developed that use an ocean surface topographic realization based on the Pierson-Moskowitz wave-height power-spectral density. This model provides fast and accurate computation of the ocean surface IR imagery for marine IR background simulation models. The upgraded sea-surface model will provide a full spectral description of the mean and clutter radiances.
Ultrahigh Sensitivity Fiber Bragg Grating Laser Sensor Optical Sciences Division
Substantial progress has been made in the use of optical fibers for sensing acoustic fields and other physical measurands. With the introduction of fabricating optical Bragg gratings directly in the optical fiber, new types of optical fiber sensors are emerging. These fiber Bragg grating devices are attractive for their small size, their ease of fabrication, the potential affordable mass production, and relative high sensitivity. An ultrahigh sensitivity fiber sensor configuration has been developed based on the modula- tion of the optical frequency of a small all-fiber Bragg grating-based fiber laser. Sensitivity to laser cavity strain on the order of 10"14 have been demonstrated, and the sensor can be serially multiplexed along a single fiber. This sensor provides a very high sensitivity to weak measurand fields in a compact, passively activated, and interrogated implementation. Also, this type of sensor could have a significant impact on the development of small, high-sensitivity devices for a range of Navy applications, particularly in underwater surveillance.
Self-Navigating Drone Expendable/Recoverable (SENDER) Tactical Electronic Warfare Division
A need existed to develop a quickly deployed platform capable of carrying miniature radiosondes for atmospheric measurements. SENDER, a man-portable, low-cost, autonomous unmanned airplane capable of performing several military and dual-use missions, such as countermeasures deployment, reconnaissance/surveillance, covert payload delivery, and chemical/biological agent sampling, fills this need. SENDER has been designed to carry a three-pound payload for up to 100 nmi (no wind conditions) at an airspeed of 40 to 50 knots. SENDER'S portability, rapid deployability, and low cost will allow radiosonde measurements to be taken within the immediate test area of a live missile firing exercise, before, during, and following the exercise.
35
THE NAVAL RESEARCH LABORATORY
Enzyme-based Detection of Environmentally Important Trace Metals Laboratory for the Structure of Matter
Current methods for determining trace metals possess sufficient sensitivity but suffer from problems involving sample pretreatment and analysis time. It would be desirable to measure trace metals in situ, thus eliminating problems caused by sampling and storage-a currently impractical approach. A system for detecting zinc and cobalt using the metallo-enzyme carbonic anhydrase has been extensively studied; the apocarbonic anhydrase can be reactivated by either metal ion. Enzymes sensitive to copper, cadmium, and lead have also been identified. A prototype flow-through system to determine zinc in the low uM concentration range has been constructed. Such a system will allow near real-time monitoring of metal-ion concentrations. Analysis of trace concentrations of metal ions is important in the environmental and health sciences. The flow-through system currently under development will allow continuous monitoring and should be of great benefit in both environmental monitoring and in studies of the natural environment.
Force-Amplified Biological Sensor (FABS) Chemistry Division
The DoD needed reliable point-detection systems capable of detecting biological agents below incapaci- tating levels in order to provide the user in a battlefield scenario with early-warning and contamination- avoidance information. NRL's task was to develop a sensor technology capable of detecting and identifying biological agents at extremely low concentrations (potentially a single molecule in a 100 microliter sample volume) using minimal instrumentation, without resorting to elaborate chemical amplification schemes. Based on previous experience with the direct measurement of the binding interaction between individual ligand-receptor molecules and complementary strands of DNA and of the development of a micromachined force transducer that is rugged, compact, and fast, this biosensor concept has been reduced to a prototype sensor called the Force Amplified Biological Sensor (FABS). The projected biosensor sensitivity of FABS will dramatically affect our ability to collect and identify biological agents, usually in the form of toxins, viruses, and bacteria. The ultrasensitivity of FABS reduces the sample collection time from hours or days to minutes, and the small size and portability of FABS are amendable to new collection and use scenarios.
Development of a Superconducting Motor Using High Tc Materials Materials Science and Technology Division
Scientists and engineers at NRL and the Naval Surface Warfare Center and partners from private industry have successfully fabricated a motor using coils made from a high Tc-oxide superconductor that establishes a new record for generation of power using this technology. The demonstration represents a major step in the development of HTS wire suitable for military and commercial applications. The motor demonstration may have direct impact on ongoing Navy programs in minesweeping, electric drive, and superconductive magnet energy storage and may benefit other applications such as transportation, electric power transmission and distribution, magnetic-resonance imaging, and other medical devices.
Synthesis and Characterization of New Mercury/Thallium- based High-Temperature Superconductors
Materials Science and Technology Division
The discovery of high-temperature superconductors has spawned a search for new materials with ever higher superconducting transition temperature, Tc, in order to motivate and test theoretical treatments
36
THE NAVAL RESEARCH LABORATORY
of the mechanisms responsible for high-temperature superconduction, which still is not understood. A long-desired application of high-temperature superconductors is in the fabrication of high-current wires. Since these superconductors are complicated, multicomponent materials with short coherence lengths, fabrication of such wires has been difficult. NRL's results disclose a novel, one-step process that produces large, dense Hg-based HTS with a critical current density, Jc, which while still limited by sample granularity, is approximately 1.5 orders of magnitude better than samples synthesized using a conven- tional process. The discovery of the new materials will motivate the continued search for new materials with higher Tc's.
Piezoelectric Ceramics with Functional Gradients: A New Application in Material Design Metamorphic Materials
Materials Science and Technology Division
Piezoelectric ceramics have been designated for use in many applications as displacement transducers, micropositioners, and rotary actuators. A new type of monomorph uses a built-in functional gradient that is attained by doping PZT bars with varying amounts of additives across their thickness. The voltage- induced piezoelectric strain of these monomorph bars is more than double that of homogeneous bars. This new monomorph has no discernible internal seams or boundaries. The advantage of making a monomorph in such a way is that failure from internal debonding or from stress peaks developed in conventional bimorphs is avoided. This functional graded monomorph is to be used as an actuator in smart structures and for active flow control. In addition, it is being evaluated as large area multiple integrated sensor arrays, accelerometer structures, and motor elements.
Hydrogen Storage Materials Materials Science and Technology Division
The current state of development of Mg-based metal-hydride storage alloys has led to the concept of producing power compacts with varying amounts of Ni, which aids the kinetics of hydrogen absorption and desorption by catalyzing the dissociation of the H2 molecule. Mixing and attriting Mg and Ni powers by high-energy ball milling, then compacting the mixture under high pressure, produces an alloy which absorbs and desorbs hydrogen much more rapidly than conventional alloys or power compacts and does so at reasonable temperatures and pressures. The improved behavior is obtained even with very low Ni content, thereby maintaining the low density of the alloy. The development of a low-density, efficient hydride-based hydrogen storage alloy will permit hydrogen to be used as a fuel in seagoing vessels, aircraft, and land vehicles. The current results with ball-milled Mg-Ni alloys are a major step toward that goal.
Modeling of Diamond Growth in Chemical Vapor Deposition Reactors Laboratory for Computational Physics and Fluid Dynamics
Much effort has been directed toward producing reliable, reproducible, and economic growth of thin diamond films using chemical vapor deposition techniques. Thin diamond films exploit the high thermal conductivity and hardness-yet low electrical conductivity-of diamond in coatings for cutting tools, high-transmittance optical windows, thermal spreaders for electrical devices, and high-performance semiconductors. Theoretical analysis and modeling have been applied to understand and optimize the growth of thin diamond films in chemical vapor deposition reactors, using mixtures of alcohol and water vapor as feedstocks in the process. Three-dimensional simulations of flow in geometrically complex reactors were used to develop inflow and outflow configurations that promote mixing and optimal uniformity of the reactants over the growth surfaces. Improvements in the uniformity and robustness of
37
THE NAVAL RESEARCH LABORATORY — —
the growth process promise significant economies of scale in the production of diamond wafers for a variety of technological applications, including several relevant to the military in general and the Navy, in particular. The reactive flow modeling described is contributing to these goals.
Exciton-phonon Coupling in Semiconductor Nanocrystals Condensed Matter and Radiation Division
Resonant and nonresonant exciton-polar complexes have been observed in nanoscale semiconductor quantum dots for the first time. A theory of exciton coupling with spherical phonons has been devel- oped, which quantitatively describes the nanocrystal size dependence of the nonresonant and resonant hybrid exciton-phonon complexes. The sources of the discrepancy between calculated and experimental coupling strengths can now be investigated. This shows for the first time that we fundamentally understand exciton-phonon interactions in nanosize semiconductor crystals. Now we can proceed to investigate the sources of the discrepancy between calculated and experimental coupling strengths.
Transparent Conducting Oxide-stabilized Zirconia Films Condensed Matter and Radiation Division
Transparent conducting films of metallic oxides (TCO) such as ln203> Sn02, and Sn-doped ln203 have gained renewed attention recently because of their possible applications in solar cells, electrical heaters, antistatic coatings, transparent electrodes, display devices, and optical waveguides. In203 and Sn02 are degenerate n-type semiconductors with high electrical conductivities and a wide bandgap that produces a high transparency in the visible but have an undesirable low melting temperature; they are unstable at > 400° C. An electrically conducting film has been produced that one can see through. These could have practical applications in devices such as solar cells, electrical heaters for aircraft windows, antistatic coatings on instrument panes, transparent electrodes for ferroelectric photoconducting storage devices, display devices, and optical waveguides.
Prediction of Negative Electron Affinity for a Diamond Surface Condensed Matter and Radiation Division
Electron emission from semiconductor surfaces can be enhanced by orders of magnitude if the conduc- tion band minimum can be made-by suitable surface treatment-to lie higher in energy than the vacuum level. Electrons excited into the conduction band will be spontaneously emitted into the vacuum. Local density functional techniques and large-scale DoD computing facilities have been applied to address the problem of achieving electron emission from surfaces that are stable in hostile environments. Diamond is a very stable semiconductor, and several methods for growing diamond films have been developed during the past decade. It is found that a diamond (100) surface that is clean, oxygenated, and then cesiated, will have a surface electronic structure that is conducive to strong emission. Possible applications include photomultipliers for night-vision goggles, long-lived unheated photocathodes, flat panel displays, and high definition TV.
Laboratory Investigation of Velocity-Shear-Driven Plasma Instabilities Plasma Physics Division
A major experimental effort in the Space Physics Simulation Chamber (SPSC) has produced the first verification of a mechanism thought to be responsible for observations of ions with more energy than typically found in the auroral ionospheres. The basis of the study is the production of a localized electric
38
THE NAVAL RESEARCH LABORATORY
field contained within the plasma column of the SPSC. Azimuthally rotating waves are produced by this field and are believed to be responsible for the observed ion energization. Both the waves and the enhanced energy levels are being investigated. Understanding the physical processes associated with basic plasma physics acceleration mechanisms has wide-ranging implications for the space environment and the direction of new research in this area. Understanding microscale physics, which result in macroscale phenomena, is necessary in ionospheric applications such as ground-to-satellite and satellite- to-satellite communications. Possible macroscale disturbances of the plasma environment must be understood as fully as possible when designing these communication links. Results of this nature have also been previously demonstrated in vastly different plasma physics parameter regimes, and the extrapolation to even more widely separated regimes is plausible.
GaN Materials and Devices for High-Temperature and Microwave-Frequency Applications
Electronic Science and Technology Division
The interest in the GaN material system has grown recently because of the development of high- efficiency blue-light-emitting diodes. These devices are being applied to flat panel displays and to automotive indicator lights. Although GaN technology is much less developed for electronics application, characteristics of this material offer significant advantages for high-temperature electronics, microwave power generation, and power-switching applications. Because of their excellent electrical characteristics and outstanding thermal and chemical stability, GaN and related III-IV materials are showing great promise for high-temperature active electronic devices. High quality GaN epitaxial layers on sapphire substrates have been achieved at NRL. Several types of applications for this technology are envisioned. Microwave FETs will find use in a wide range of radar and communications systems; GaN devices have potential as electric power control devices for all electric platforms such a motor vehicles, ships, and aircraft; and materials inherent high tolerance to radiation-induced displacement damage along with chemical inertness and high-temperature operation make GaN devices applicable to operation in hostile environments such as spacecraft. The progress in GaN materials and devices described here has brought these applications close to feasibility and has made the NRL research team one of the leaders in the field.
Visible Light Emission from Porous Silicon Electronic Science and Technology Division
NRL has engaged in a broad-ranging program aimed at understanding the optical properties of porous silicon. We have shown that the luminescence properties of etched porous silicon nanostructures are not the result of quantum confinement but the result of emission from oxide-related defect center present at the surface of the silicon crystallites. This work has shown the importance of surfaces and interfaces in describing the optical properties of fabricated semiconductor nanostructures and also prevents futile efforts from being made in the manufacture of laser and other devices whose operation depended critically on quantum confinement. We may now be in a better position to provide optimized light- emitting diodes, chemical gas sensors, and optical down-converters making use of porous silicon luminescence properties.
In situ Detection of Environmental Contaminants Using the Flow Immunosensor
Center for Bio/Molecular Science and Engineering
An NRL flow immunosensor developed to provide instrumentation for detection of explosives in cargo and baggage areas-and later adapted to detection of drugs of abuse-has been adapted for the
39
THE NAVAL RESEARCH LABORATORY
detection of explosive contaminants at Navy and DoD bases. The sensor is based on antigen displace- ment of fluorescently-labeled antigen from antibodies immobilized on beads. Antigen is injected into a flow stream that passes over a column of antibody-coated beads saturated with fluorescently-labeled antigen. The displacement of the labeled antigen causes a proportional increase in fluorescence observed downstream. In field tests at DoD cleanup sites, the flow immunosensor was successful in detecting in parts-per-billion RDX and TNT present in ground-water and leachate samples. The NRL method has a clear advantage over other assays based on cost, analysis time, and simplicity. As a result of this success, the EPA has selected the NRL approach for a year-long field demonstration at the Naval Submarine Base at Bangor, Washington. Using this sensor for on-site testing, sample numbers could be increased at little or no additional cost to the user, providing more complete characterization as well as real time monitoring of cleanup efforts.
Forward-Scatter Detection of Quiet Submarines Acoustics Division
The detection of diesel submarines in shallow-water environments is problematic, especially when the slow-moving diesel is operating on its electric power supply. In this case, active acoustic systems must be exploited. However, conventional active system concepts suffer from two major complications: the active target strength is low and markedly dependent on target aspect and multipath and boundary reverbera- tion mask the desired target returns. Advances in our understanding of forward-scattering target physics and development of modally based source/receiver filtering approaches have led to the development of an exciting new concept to actively detect quiet targets (submarines) in shallow water. This approach has been demonstrated by simulation studies-first for beam aspect and then for multiaspect in a typical shallow-water acoustic environment. Further simulation studies demonstrated large area coverage possibilities and the ability to extract the "free field" target signatures from the complex acoustic returns. This demonstrated concept may provide the only practical approach to long-range detection of quiet diesel submarines operating in shallow-water regions.
First Light with the Navy Prototype Optical Interferometer (NPOI)
Remote Sensing Division
Interferometric techniques have enabled astronomers to attain the highest angular resolution views of the universe. A successful interferometer requires the concurrent operation of a number of complex subsystems: telescope control, narrow-angle tracking, metrology, real-time fringe tracking, beam combination, vacuum, and data monitoring. NRL, world leader in the use of optical interferometry to attain high-precision stellar positions, has developed and operated the Mark III Optical Interferometer on Mt. Wilson. Operation of the Mark III showed it was possible to build a larger interferometer to meet the stringent requirements of Navy systems. NRL (with the Naval Observatory and ONR) has worked to construct a much larger NPOI facility on Anderson Mesa. The culmination of the first phase of construc- tion of the larger facility was achieved with the detection of interference rings from several stars. The NPOI has now demonstrated that there are no potential problems in achieving full operational status and in providing absolute stellar positions with an accuracy of a few milliarcseconds. It will enable precise measurement of spectroscopic binary star orbits to provide direct measurements of stellar distances and masses, and it will provide a thousand-fold improvement in the angular resolution available to stellar
astronomers.
40
THE NAVAL RESEARCH LABORATORY
Water Vapor Millimeter-Wave Spectrometer (WVMS) Remote Sensing Division
Water vapor plays a central role in aeronomic processes in the mesosphere. It is the reservoir of odd hydrogen that catalytically destroys ozone. In addition, chemical time scales for water vapor in the mesosphere are sufficiently long and are excellent tracers of atmospheric motions. These measurements are made using a 22 GHz radiometer, which takes advantage of the change in the shape of the water vapor profile with pressure to obtain information on water vapor as a function of altitude from 40 to 80 km; that is, from a very dry "middle" atmosphere to a very "wet" troposphere. Two NRL-built WVMS instruments have provided continual measurements of water vapor in the middle-atmosphere from California and New Zealand. These instruments have provided the first continuous set of ground-based observations of middle atmospheric water vapor. The retrieved water-vapor profiles show an encouraging interannual consistency, and the seasonal variations show both the annual and semiannual cycles predicted by models of atmospheric transport. The WVMS data are being used to assist in the calibration of the UARS instruments.
Development of a Feature Model for Low-Grazing-Angle Sea Scatter Remote Sensing Division
Low-grazing-angle radar backscatter from the sea surface exhibits polarization anomalies not observed at more moderate incident angles. An example are "sea spikes"-large echoes for which the horizontally polarized radar cross sections are often larger than those for the vertically polarized cross sections. Similar behavior has also been observed for the small-scale breaking associated with current rips and other mesoscale features resulting from strong wave-current interactions. A feature model has been developed that predicts many aspects of low-grazing-angle sea scatter not explained by other models. This model is the first to successfully explain many of the polarization anomalies that characterize low- grazing-angle sea scatter. Conventional models fail to account for scattering events for which the horizontally polarized echo strength exceeds that for vertical, yet these events often dominate backscat- ter in this regime. The model has also been used to explain distinctive features observed in the ultrawideband frequency and polarization responses of breaking waves in a wave tank.
The Importance of Coastal Filaments to the Northern Arabian Sea Phytoplankton Bloom During Southwest Monsoon
Oceanography Division
The Arabian Sea is an area with steady wind forcing during the regularly alternating northeast and southwest monsoons, with wind lulls in Spring and Fall. It is associated with plankton blooms and extremely high productivity during the southwest monsoon and with reduced productivity during the other monsoon. Impoverishment occurs during the Spring transition. These cycles of high productivity alternating with impoverishment are so extreme that they represent end numbers in the range of open- ocean productivity values. The coastal filaments, which are formed by the interaction of the northeast- ward flowing Omani coastal current with the prominent capes along the coast, extend offshore as jets with width scales of up to 100 km and surface velocities as large as 100 cm/s. The Navy needs all available environmental data for operational analyses and forecast models in variable littoral environ- ments. Assessments of model predictions for specific environments are needed to extrapolate findings to areas lacking sufficient databases for operational requirements.
41
THE NAVAL RESEARCH LABORATORY '
MCM Tactical Environmental Data System (MTEDS) Marine Geosciences Division
Mine countermeasure (MCM) operations are significantly impacted by environmental influences on the performance of its combat systems. This is especially significant because this warfare area is almost exclusively conducted within the highly dynamic littoral regions of the world. The MCM force has limited capability in measuring needed environmental information in situ. The alleviation of this deficiency is the major purpose of the MTEDS program, which now has achieved most of its planned objectives. These include a major at-sea demonstration off Key West, Florida, designed to show that selected environmen- tal data (bathymetry, current velocity profile, seafloor sediment classification, sound-speed profile, mine- hunting sonar-reverberation statistics, and differential GPS) can be measured in situ while a ship is underway, stored in a database within an on-board computer, and used for assisting in tactical decision making With this capability clearly demonstrated at sea, the MCM community can transfer this technology to its surface ships using off-the-shelf technology. Also, on-board TAC 3 or 4 computers can be used to store the data, display it, and compute tactically significant information (for example, mine-
burial probability).
Improved Tropical Cyclone Forecasts Using the Navy Operational Global Atmospheric Prediction System (NOGAPS)
Marine Meteorology Division
Since the assimilation of the synthetic tropical cyclone (TC) observations into NOGAPS, NOGAPS has displayed significant TC forecast skill at 48 h and 72 h but little skill at 24 h. It was hypothesized that this lack of skill was largely due to deficiencies in the depiction of the TC steering flow by the NOGAPS initial state. To improve the depiction of the steering flow, the synthetic TC observations were modified to incorporate information of storm motion. An extensive impact experiment was conducted, and it was determined that this enhancement resulted in TC forecast track improvements of 20%, 10%, and 5% at 24 h, 48 h, and 72 h, respectively. After an operational implementation of this enhancement, the TC forecast performance of NOGAPS in the Atlantic was evaluated for Summer 1995. In comparison with the primary TC track-forecasting aid used by NOAA's Tropical Prediction Center, NOGAPS demonstrated forecast improvement of 5%, 13%, and 21% at 24 h, 48 h, and 72 h, respectively. The marked improve- ment in the NOGAPS 24-h forecasts, resulting from the incorporation of storm motion information along with more modest improvements to its demonstrated skill at 48 h and 72 h, has made NOGAPS one of the primary tools of Atlantic hurricane forecasters.
High-Efficiency Multilayer-Coated Gratings Space Science Division
All materials have low reflectance at normal incidence in the extreme ultraviolet (XUV) and X-ray regions. Instruments operating in these wavelength regions typically use grazing-incidence optics that are costly to fabricate and align. These difficulties are overcome by using multilayer interference coatings that selectively reflect the waveband of interest at normal incidence. Diffraction gratings that have dramatical- ly enhanced efficiency at normal incidence in the XUV ultraviolet wavelength region have been devel- oped. These gratings have multilayer interference coatings that preferentially reflect wavebands of importance for the study of laboratory, solar, and astrophysical plasmas. The use of multilayer-coated gratings in the design of spectrometers extends the operating range of normal-incidence gratings to shorter wavelengths and allows the use of traditional normal-incidence instruments that are less costly and have lower weight and smaller size. These are important considerations for flight instruments that are designed for solar and astrophysical studies.
42
THE NAVAL RESEARCH LABORATORY
Germanium Strip Detectors Space Science Division
Future progress in several areas of research and radiological applications requires the development of imaging-gamma-ray detectors with excellent energy resolution. Germanium strip detectors provide the best spectroscopy possible of any radiation detector now in use. They combine the excellent energy resolution typical of (coaxial) germanium detectors and the fine spatial resolution possible in a strip detector. These features are required to increase sensitivity to the gamma-ray line emission associated with nuclear decay in research and applications. They are applicable to and/or enable sensitive, high- spectral resolution, imaging gamma-ray detectors using coded-aperture, Compton telescope, or hard X- ray focusing techniques. The excellent performance of germanium compared to other detector types is essential to make the order-of-magnitude improvements in sensitivity required for the next major space mission.
Next-Generation Global Positioning System (GPS) Space Clocks Space Systems Development Department
The design and construction of atomic clocks for satellites has required unique and highly specialized groups to produce one-of-a-kind designs, thereby limiting the availability and quality of these devices used primarily by the GPS program. The availability of production sources of these units has been a problem. A key design advance in clock technology for use in future GPS satellites has been demonstrat- ed at NRL. An experimental cesium clock that is capable of using beam tubes from four different manufacturers was assembled and tested. This laboratory model exhibited performance at least as good as the tubes provided in their original vendor-built clock electronics. Previous cesium clocks used an analog signal of a few nanoamps to provide frequency error information from the beam tube to the servo-control electronics, and the beam tube received low-level signals back from the electronics. The primary feature of the new clock is a digital approach to interfacing the cesium beam tube to the control electronics. With the new NRL approach to a nearly all-digital electronic design to separate the cesium beam tube from the electronics, not only are the error sources and control instability significantly reduced or eliminated, but the design provides the basis for improved clock diagnostic and test information to be gathered and processed.
Smart Structure Technology Studies Spacecraft Engineering Department
Analytical tools have been developed that enable implementation of smart structure technology into future Navy spacecraft missions. Smart structures refer to the active sensing and augmentation of system dynamics using integrated sensors and actuators for feedback and control. Three-dimensional and planar flexible body dynamics models of a spacecraft with two 50-m booms have been developed to study how on-orbit disturbances affect spacecraft pointing and the accuracy of space-based interferometric measurements, as well, and to analytically implement and simulate the performance of control strategies. A laboratory facility has been constructed as a test bed for experimental implementation of smart structure hardware and control algorithms. The 3.7-m, 12-bay truss is equipped with integrated proof- mass actuators and piezoelectric active struts for control and fiber-optic strain-gage sensors, force and displacement sensors, and accelerometers for feedback. In recent experiments, truss tip motion caused by a disturbing vibration was attenuated by a factor of 40, with an increase of damping by a factor of 20. Precision control of vibration in spacecraft structures will enable lighter and more capable space-based sensors that include multispectral instruments and radio and optical interferometers.
43
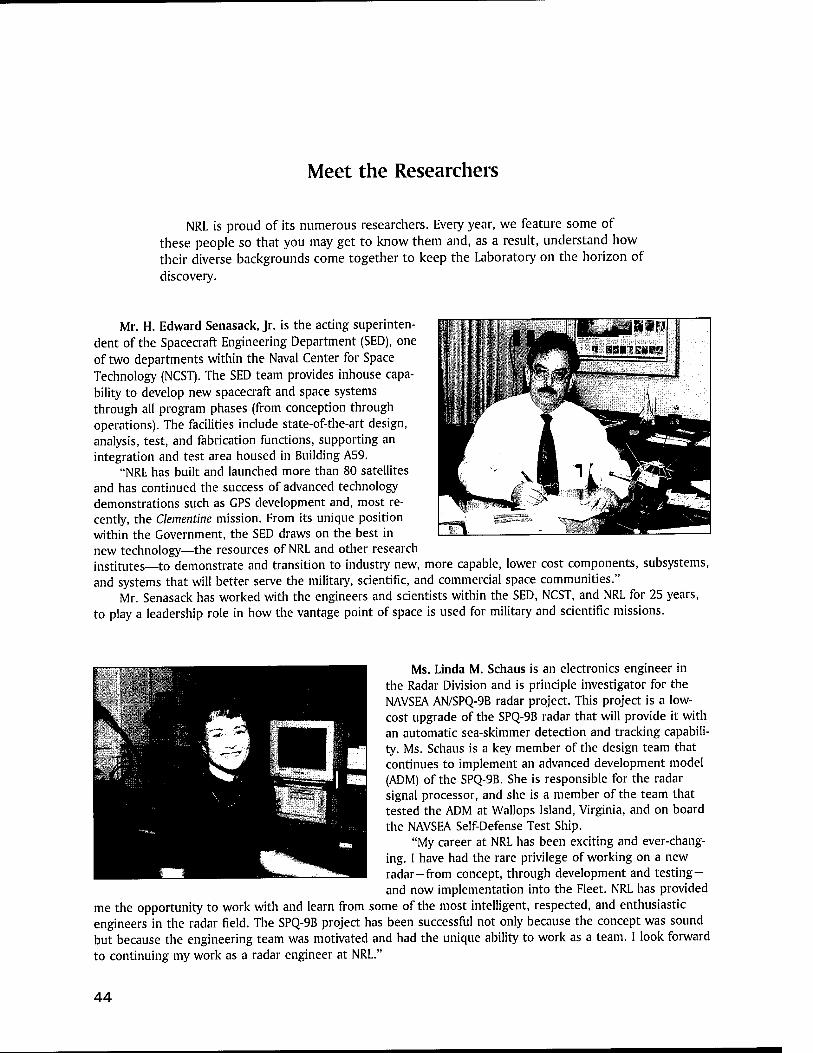
Meet the Researchers
NRL is proud of its numerous researchers. Every year, we feature some of these people so that you may get to know them and, as a result, understand how their diverse backgrounds come together to keep the Laboratory on the horizon of discovery.
Mr. H. Edward Senasack, Jr. is the acting superinten- dent of the Spacecraft Engineering Department (SED), one of two departments within the Naval Center for Space Technology (NCST). The SED team provides inhouse capa- bility to develop new spacecraft and space systems through all program phases (from conception through operations). The facilities include state-of-the-art design, analysis, test, and fabrication functions, supporting an integration and test area housed in Building A59.
"NRL has built and launched more than 80 satellites and has continued the success of advanced technology demonstrations such as GPS development and, most re- cently, the Clementine mission. From its unique position within the Government, the SED draws on the best in new technology—the resources of NRL and other research institutes—to demonstrate and transition to industry new, more capable, lower cost components, subsystems, and systems that will better serve the military, scientific, and commercial space communities."
Mr. Senasack has worked with the engineers and scientists within the SED, NCST, and NRL for 25 years, to play a leadership role in how the vantage point of space is used for military and scientific missions.
Ms. Linda M. Schaus is an electronics engineer in the Radar Division and is principle investigator for the NAVSEA AN/SPQ-9B radar project. This project is a low- cost upgrade of the SPQ-9B radar that will provide it with an automatic sea-skimmer detection and tracking capabili- ty. Ms. Schaus is a key member of the design team that continues to implement an advanced development model (ADM) of the SPQ-9B. She is responsible for the radar signal processor, and she is a member of the team that tested the ADM at Wallops Island, Virginia, and on board the NAVSEA Self-Defense Test Ship.
"My career at NRL has been exciting and ever-chang- ing. I have had the rare privilege of working on a new radar-from concept, through development and testing- and now implementation into the Fleet. NRL has provided
me the opportunity to work with and learn from some of the most intelligent, respected, and enthusiastic engineers in the radar field. The SPQ-9B project has been successful not only because the concept was sound but because the engineering team was motivated and had the unique ability to work as a team. I look forward to continuing my work as a radar engineer at NRL."
44
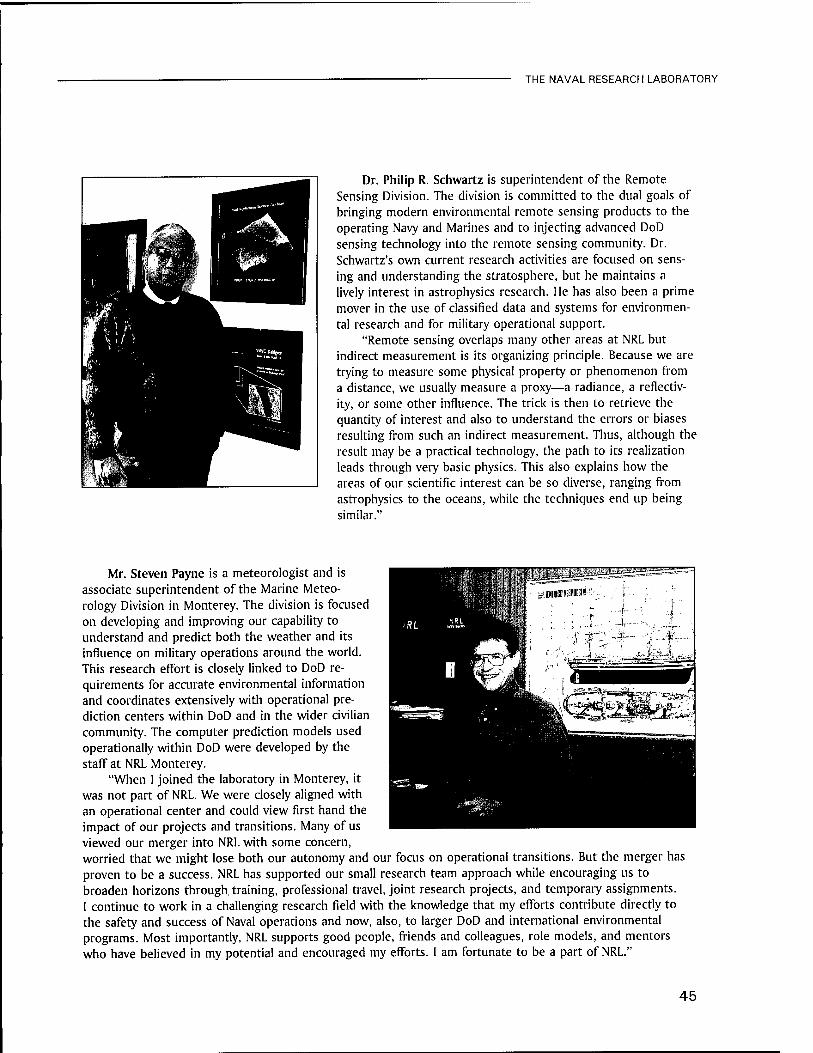
THE NAVAL RESEARCH LABORATORY
Dr. Philip R. Schwartz is superintendent of the Remote Sensing Division. The division is committed to the dual goals of bringing modern environmental remote sensing products to the operating Navy and Marines and to injecting advanced DoD sensing technology into the remote sensing community. Dr. Schwartz's own current research activities are focused on sens- ing and understanding the stratosphere, but he maintains a lively interest in astrophysics research. He has also been a prime mover in the use of classified data and systems for environmen- tal research and for military operational support.
"Remote sensing overlaps many other areas at NRL but indirect measurement is its organizing principle. Because we are trying to measure some physical property or phenomenon from a distance, we usually measure a proxy—a radiance, a reflectiv- ity, or some other influence. The trick is then to retrieve the quantity of interest and also to understand the errors or biases resulting from such an indirect measurement. Thus, although the result may be a practical technology, the path to its realization leads through very basic physics. This also explains how the areas of our scientific interest can be so diverse, ranging from astrophysics to the oceans, while the techniques end up being similar."
Mr. Steven Payne is a meteorologist and is associate superintendent of the Marine Meteo- rology Division in Monterey. The division is focused on developing and improving our capability to understand and predict both the weather and its influence on military operations around the world. This research effort is closely linked to DoD re- quirements for accurate environmental information and coordinates extensively with operational pre- diction centers within DoD and in the wider civilian community. The computer prediction models used operationally within DoD were developed by the staff at NRL Monterey.
"When I joined the laboratory in Monterey, it was not part of NRL. We were closely aligned with an operational center and could view first hand the impact of our projects and transitions. Many of us viewed our merger into NRL with some concern, worried that we might lose both our autonomy and our focus on operational transitions. But the merger has proven to be a success. NRL has supported our small research team approach while encouraging us to broaden horizons through, training, professional travel, joint research projects, and temporary assignments. I continue to work in a challenging research field with the knowledge that my efforts contribute directly to the safety and success of Naval operations and now, also, to larger DoD and international environmental programs. Most importantly, NRL supports good people, friends and colleagues, role models, and mentors who have believed in my potential and encouraged my efforts. I am fortunate to be a part of NRL."
45

Featured Research

49 Naturally Occurring Biological Modules as Environmentally Acceptable Corrosion Inhibitors E. McCafferty and D.C. Hansen
59 A Deep Western Boundary Current in the North Pacific Z.R. Hallock, W.J. Teague, and E.R. Fillenbaum
71 NRL Advances in Computational Fluid Dynamics: FAST3D and FEFLO A. Landsberg, R. Ramamurti, J.P. Boris, and W.C. Sandberg
Naturally Occurring Biological Molecules as Environmentally Acceptable Corrosion Inhibitors
E. McCafFerty and D.C. Hansen Materials Science and Technology Division
Bi 'iological polymers that exhibit a strong affinity for metal surfaces are increasingly becoming important in the development of environmentally friendly, nonpolluting corrosion inhibitors and surface treatments. Recent research on iron and aluminum surfaces has involved the use of various metal complexing agents (siderophores) isolated from bacteria, the adhesive protein isolated from the common blue mussel (Mytilus edulis L), and simple catechols found in plant roots. A combined electrochemical and surface chemical approach has been used to determine the adsorption and effectiveness of the various organic molecules as corrosion inhibitors. Parabactin, a catecholate siderophore, was effective in inhibiting both the corrosion of iron in acid solutions and the pitting of aluminum in sodium chloride. The adhesive protein from the blue mussel was also effective in inhibiting the pitting corrosion of aluminum. These results are interpreted in terms of the molecular structure of the various organic molecules. Future research directions are also addressed.
INTRODUCTION
In recent years, there has been much interest in the development of environmentally acceptable, nonpolluting corrosion inhibitors. Chromates, for example, are excellent corrosion inhibitors and are used routinely in a variety of applications, includ- ing the surface treatment of aluminum alloys for commercial and military aircraft. However, there are major problems with the use of chromates as corrosion inhibitors or for the surface treatment of metals due to the toxicity of chromates to aquatic plants and animals, as well as their pro- longed residence time in the environment.
Natural products constitute a new class of potentially useful corrosion inhibitors and/or addi- tives for incorporation into anodized films or organic coatings. Such compounds are of interest because (1) they generally contain surface-active adsorbable functional groups, and (2) naturally occurring molecules are environmentally unobjec- tionable.
One of the current research thrusts in the area of corrosion has been the study and development of environmentally acceptable corrosion inhibitors. This article discusses recent research in the Materi- als Science and Technology Division [1,2] on metal- binding biological molecules—called siderophores, which are isolated from bacteria and on an adhe- sive protein isolated from the common blue mussel M. edulis.
Pure iron and pure aluminum were used as substrates. In the case of iron, deaerated 1 N HC1 was used as the aqueous medium to provide a rela- tively high uninhibited rate and to allow dissolution of the air-formed oxide film on iron so as to focus on metal-inhibitor interactions. In addition, the be- havior of iron in acid solutions is relevant to corro- sion within confined geometries such as crevices or stress corrosion cracks, within which localized acidi- ties develop. The pitting corrosion of pure alumi- num was studied in deaerated 0.1 M sodium chlo- ride solution, and the effect of selected inhibitors on the initiation of corrosion pits was determined.
49
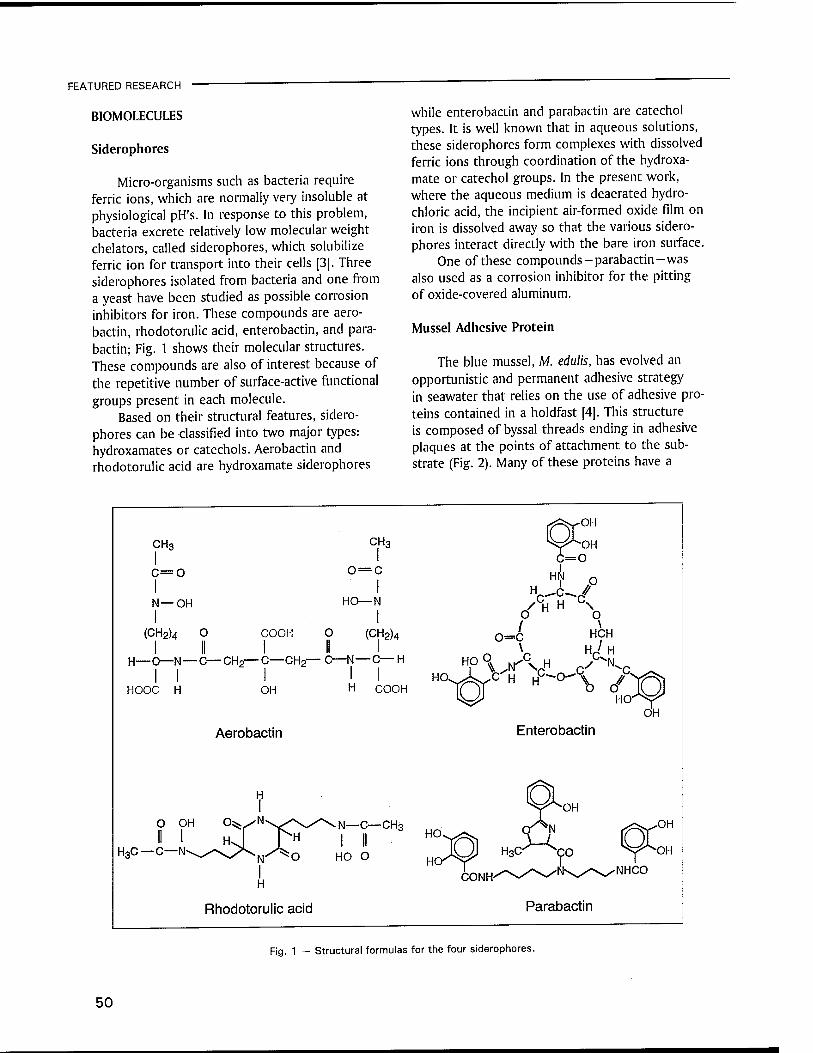
FEATURED RESEARCH "
BIOMOLECULES
Siderophores
Micro-organisms such as bacteria require ferric ions, which are normally very insoluble at physiological pH's. In response to this problem, bacteria excrete relatively low molecular weight chelators, called siderophores, which solubilize ferric ion for transport into their cells [3]. Three siderophores isolated from bacteria and one from a yeast have been studied as possible corrosion inhibitors for iron. These compounds are aero- bactin, rhodotorulic acid, enterobactin, and para- bactin; Fig. 1 shows their molecular structures. These compounds are also of interest because of the repetitive number of surface-active functional groups present in each molecule.
Based on their structural features, sidero- phores can be classified into two major types: hydroxamates or catechols. Aerobactin and rhodotorulic acid are hydroxamate siderophores
while enterobactin and parabactin are catechol types. It is well known that in aqueous solutions, these siderophores form complexes with dissolved ferric ions through coordination of the hydroxa- mate or catechol groups. In the present work, where the aqueous medium is deaerated hydro- chloric acid, the incipient air-formed oxide film on iron is dissolved away so that the various sidero- phores interact directly with the bare iron surface.
One of these compounds-parabactin-was also used as a corrosion inhibitor for the pitting of oxide-covered aluminum.
Mussel Adhesive Protein
The blue mussel, M. edulis, has evolved an opportunistic and permanent adhesive strategy in seawater that relies on the use of adhesive pro- teins contained in a holdfast [4]. This structure is composed of byssal threads ending in adhesive plaques at the points of attachment to the sub- strate (Fig. 2). Many of these proteins have a
CH3
c—o I N—OH
(CH2)4 O COOH o II
CH3
0 = C
I HO—N
(CH2)4
HOOC H
O OH
H*C—C—N
OH
Aerobactin
H I
05t.^'N>
H
H
• N—C—CH3
I II HO O
Rhodotorulic acid
HN
S% H C\
,o
H— C—N—C— CH2— C—CH2— C—N—C— H
II I II H COOH
HO.
/ 0=C
V
orCH H—\
o HCH
Hi H
Enterobactin
CONH
Parabactin
HO' OH
NHCO
Fig. 1 — Structural formulas for the four siderophores.
50
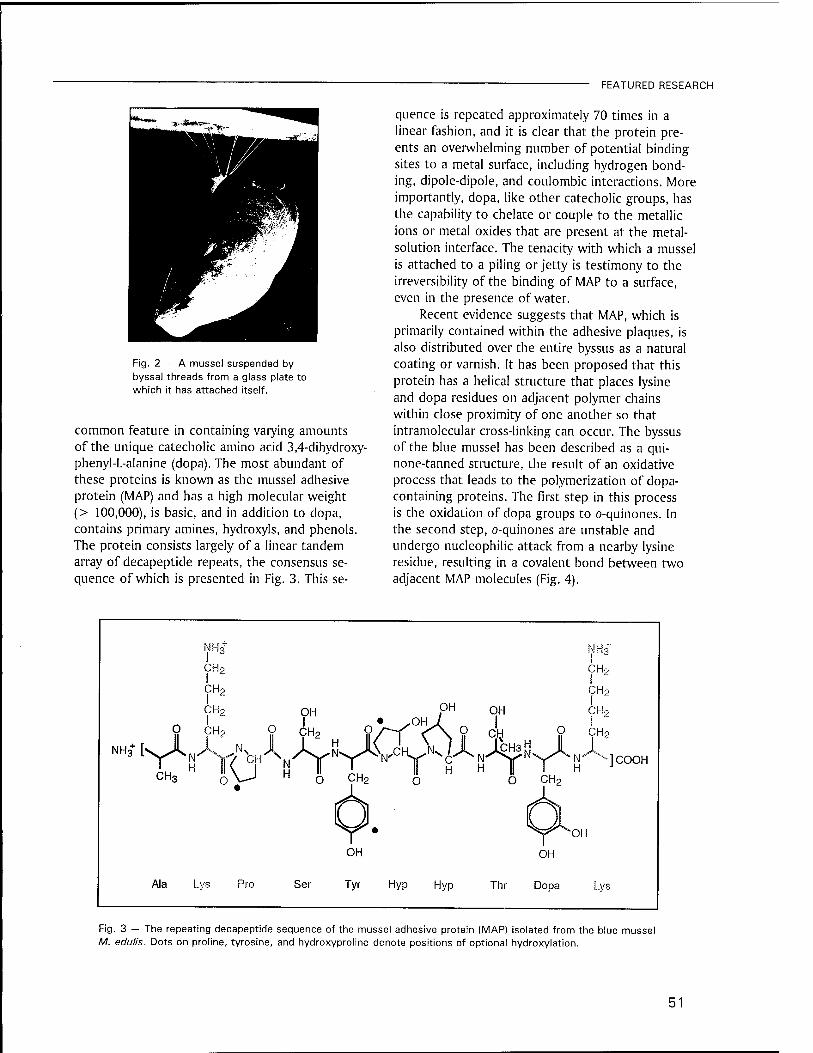
FEATURED RESEARCH
Fig. 2 — A mussel suspended by byssal threads from a glass plate to which it has attached itself.
common feature in containing varying amounts of the unique catecholic amino acid 3,4-dihydroxy- phenyl-L-alanine (dopa). The most abundant of these proteins is known as the mussel adhesive protein (MAP) and has a high molecular weight (> 100,000), is basic, and in addition to dopa, contains primary amines, hydroxyls, and phenols. The protein consists largely of a linear tandem array of decapeptide repeats, the consensus se- quence of which is presented in Fig. 3. This se-
quence is repeated approximately 70 times in a linear fashion, and it is clear that the protein pre- ents an overwhelming number of potential binding sites to a metal surface, including hydrogen bond- ing, dipole-dipole, and coulombic interactions. More importantly, dopa, like other catecholic groups, has the capability to chelate or couple to the metallic ions or metal oxides that are present at the metal- solution interface. The tenacity with which a mussel is attached to a piling or jetty is testimony to the irreversibility of the binding of MAP to a surface, even in the presence of water.
Recent evidence suggests that MAP, which is primarily contained within the adhesive plaques, is also distributed over the entire byssus as a natural coating or varnish. It has been proposed that this protein has a helical structure that places lysine and dopa residues on adjacent polymer chains within close proximity of one another so that intramolecular cross-linking can occur. The byssus of the blue mussel has been described as a qui- none-tanned structure, the result of an oxidative process that leads to the polymerization of dopa- containing proteins. The first step in this process is the oxidation of dopa groups to o-quinones. In the second step, o-quinones are unstable and undergo nucleophilic attack from a nearby lysine residue, resulting in a covalent bond between two adjacent MAP molecules (Fig. 4).
NH3+
NH3+
CH2 CH2 j
CHo CH2
CH2 OH m ,OH
O CH2 O CH2 0/~"Y'0'C\ °
OH CH2
1 1 CH H j? CH2
N ifN \^N 1COOH
O CH2 1
cjx QL» OH OH
Ala Lys Pro Ser Tyr Hyp Hyp Thr Dopa Lys
Fig. 3 — The repeating decapeptide sequence of the mussel adhesive protein (MAP) isolated from the blue mussel M, edulis. Dots on proline, tyrosine, and hydroxyproline denote positions of optional hydroxylation.
51
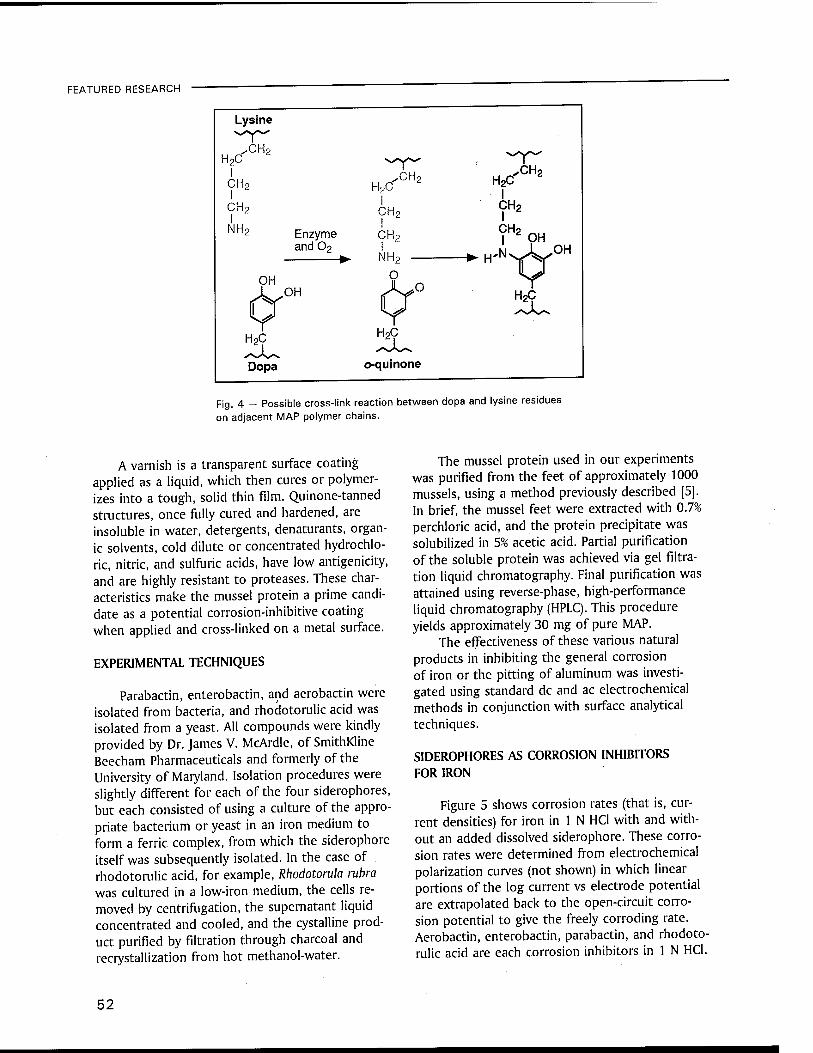
FEATURED RESEARCH
Fig. 4 - Possible cross-link reaction between dopa and lysine residues on adjacent MAP polymer chains.
A varnish is a transparent surface coating applied as a liquid, which then cures or polymer- izes into a tough, solid thin film. Quinone-tanned structures, once fully cured and hardened, are insoluble in water, detergents, denaturants, organ- ic solvents, cold dilute or concentrated hydrochlo- ric, nitric, and sulfuric acids, have low antigenicity, and are highly resistant to proteases. These char- acteristics make the mussel protein a prime candi- date as a potential corrosion-inhibitive coating when applied and cross-linked on a metal surface.
EXPERIMENTAL TECHNIQUES
Parabactin, enterobactin, and aerobactin were isolated from bacteria, and rhodotorulic acid was isolated from a yeast. All compounds were kindly provided by Dr. James V. McArdle, of SmithKline Beecham Pharmaceuticals and formerly of the University of Maryland. Isolation procedures were slightly different for each of the four siderophores, but each consisted of using a culture of the appro- priate bacterium or yeast in an iron medium to form a ferric complex, from which the siderophore itself was subsequently isolated. In the case of rhodotorulic acid, for example, Rhodotorula rubra was cultured in a low-iron medium, the cells re- moved by centrifugation, the supernatant liquid concentrated and cooled, and the cystalline prod- uct purified by filtration through charcoal and recrystallization from hot methanol-water.
The mussel protein used in our experiments was purified from the feet of approximately 1000 mussels, using a method previously described [5]. In brief, the mussel feet were extracted with 0.7% perchloric acid, and the protein precipitate was solubilized in 5% acetic acid. Partial purification of the soluble protein was achieved via gel filtra- tion liquid chromatography. Final purification was attained using reverse-phase, high-performance liquid chromatography (HPLC). This procedure yields approximately 30 mg of pure MAP.
The effectiveness of these various natural products in inhibiting the general corrosion of iron or the pitting of aluminum was investi- gated using standard dc and ac electrochemical methods in conjunction with surface analytical techniques.
SIDEROPHORES AS CORROSION INHIBITORS FOR IRON
Figure 5 shows corrosion rates (that is, cur- rent densities) for iron in 1 N HC1 with and with- out an added dissolved siderophore. These corro- sion rates were determined from electrochemical polarization curves (not shown) in which linear portions of the log current vs electrode potential are extrapolated back to the open-circuit corro- sion potential to give the freely corroding rate. Aerobactin, enterobactin, parabactin, and rhodoto- rulic acid are each corrosion inhibitors in 1 N HC1.
52

FEATURED RESEARCH
40
c o 'to o fc 10 o O
~i i i i i i i i ~i i i i i i i i i
Uninhibited rate
Rhodotorulic acid
Aerobactin
\Enterobactin" °"
n i i i 111
Parabactin J I I I I I il I I I I I I i il i i i i nil
10"5 10"4 10~3
Concentration in Moles/I.
Fig. 5 — Effect of various siderophores on the corrosion current density of iron in deaerated 1 N HCI.
10"
For a given siderophore, the corrosion rate de- creases with increasing concentration of added inhibitor. For a fixed concentration of sidero- phore, the corrosion rates in 1 N HCI follow the order:
rhodotorulic acid > aerobactin > enterobactin > parabactin,
with parabactin providing 93% inhibition at its solubility limit, where % inhibition = ^(unin- hibited) - i(inhibited)]/i(uninhibited).
Figure 6 shows ac impedance data for unin- hibited iron in 1 N HCI and for iron in 1 N HCI containing 3 x 10'3M aerobactin. The data are displayed as Cole-Cole plots, in which the imagi- nary part of the complex impedance is plotted vs the real part. The best semicircle fitted through the data points intersects the X-axis at the values Rs and (Rs + Rp), where Rs is the solution resis- tance and Rp, the more meaningful parameter, is the resistance to charge transfer processes. The higher Rp, the lower the corrosion rate. The addi- tion of 3 x 10 3M aerobactin increases the value
-200
w -1 60 E .c o
_c -120
>* 1—
re -80
O) CO E -40
I I I I I I I I I I I I I I I I I I I I I l I I I I I I I I II I I I I I! I
^_ Circles- experimental Solid line- least squares fit
i i [ i i i i i
0 50 100 150 200 250 300 350 400
Real in ohms
Fig. 6 — Cole-Cole plots for iron in deaerated 1 N HCI.
53

FEATURED RESEARCH
of/? by a factor of nearly 10. For the four sidero- phores, the order of the Rp values in 1 N HC1 in either a saturated solution or 10"3M of the sidero- phore is:
rhodotorulic acid « aerobactin < enterobactin < parabactin.
Thus, the order of effectiveness of the sidero- phores in increasing Rp is the same as the trend in decreasing corrosion rates.
The siderophores reduce the corrosion rate of iron by adsorption at the metal/solution interface. That adsorption occurs was confirmed by both electrochemical measurements and surface analy- sis. Double layer capacitances Q, calculated from the Cole-Cole plots, as described previously [1], decrease from 89 uJVcm2 for uninhibited iron to 35-55 ui7cm2 in the presence of the various sid- erophores. This decrease in Q„ which can result from a decrease in local dielectric constant and/ or an increase in the thickness of the electrical double layer, suggests that the siderophores func- tion by adsorption at the iron/solution interface.
Adsorption of the siderophores (rhodotorulic acid) at the iron/solution interface was verified by X-ray photoelectron spectroscopy (XPS). Figure 7 shows nitrogen Is spectra for iron in solutions of rhodotorulic acid in deaerated hydrochloric acid or in methanol, as well as the result for the con- trol sample. The presence of the nitrogen Is peak (and its absence in the control) clearly shows that rhodotorulic acid chemisorbs from solution onto the iron surface.
To understand the behavior of a series of inhibitors, account must be taken of the molecular area and the electron donating^ability of the adsorbing inhibitor. Construction of molecular models shows that a multiple number of function- al groups can interact with the metal surface if the siderophore chemisorbs in a horizontal (flat) con- figuration. Table 1 lists the cross-sectional areas (in A2) for the siderophores in the horizontal con- figuration as determined from molecular models, which shows that the smaller the molecular cross- sectional area, the less effective the siderophore in reducing the corrosion rate-other factors be- ing equal.
The electron donating ability of a series of organic molecules can be estimated from their
Hydrochloric acid
Multilayers
-SAA»
Interaction of -NH with bare surface
V
Methanol
Multilayers
<r—>„
Control
I _L 404 400 396
Binding Energy in eV
Fig. 7 — Nitrogen 1s XPS spectra for iron emersed from hydrochloric acid or methanol solutions of rhodotorulic acid.
acid dissociation constants pKa. Table 1 also lists the first acid dissociation constants for the four siderophores used in this study. Larger values of pKa, imply stronger conjugate bases and hence better electron donors. The two most efficient inhibitors-enterobactin and parabactin-have the optimum combination of relatively high values of pKa, and the largest molecular cross-sectional areas. The increased efficiency of parabactin com- pared to enterobactin may be attributed to the presence of hydrocarbon linkages in the para- bactin molecule that do not occur in enterobactin. That is, the -(CH2)4- and -(CH2)3- chains in parabac- tin provide the molecule with a degree of flexibili- ty in accommodating itself onto the iron surface during the adsorption process so that a close- packed adsorbed layer is more likely to be formed than with enterobactin.
54
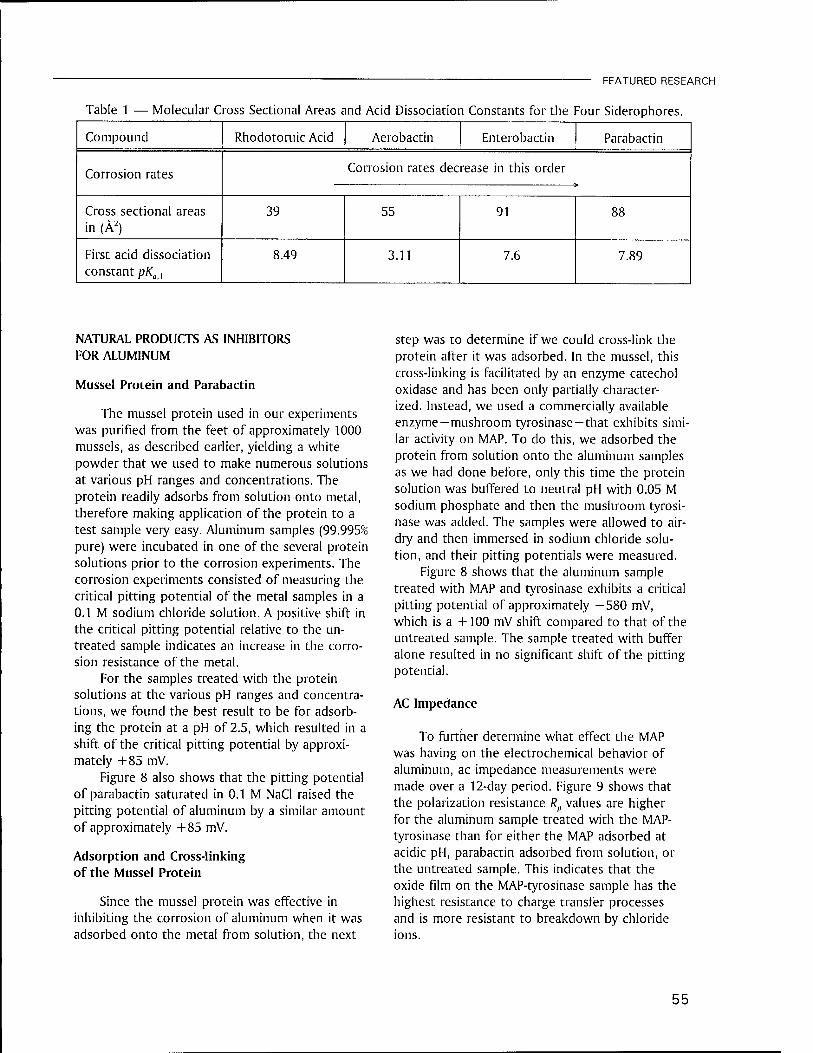
FEATURED RESEARCH
Table 1 — Molecular Cross Sectional Areas and Acid Dissociation Constants for the Four Siderophores.
Compound Rhodotoruic Acid Aerobactin Enterobactin Parabactin
Corrosion rates Corrosion rates decrease in this order *
Cross sectional areas in (Ä2)
39 55 91 88
First acid dissociation constant pKa,
8.49 3.11 7.6 7.89
NATURAL PRODUCTS AS INHIBITORS FOR ALUMINUM
Mussel Protein and Parabactin
The mussel protein used in our experiments was purified from the feet of approximately 1000 mussels, as described earlier, yielding a white powder that we used to make numerous solutions at various pH ranges and concentrations. The protein readily adsorbs from solution onto metal, therefore making application of the protein to a test sample very easy. Aluminum samples (99.995% pure) were incubated in one of the several protein solutions prior to the corrosion experiments. The corrosion experiments consisted of measuring the critical pitting potential of the metal samples in a 0.1 M sodium chloride solution. A positive shift in the critical pitting potential relative to the un- treated sample indicates an increase in the corro- sion resistance of the metal.
For the samples treated with the protein solutions at the various pH ranges and concentra- tions, we found the best result to be for adsorb- ing the protein at a pH of 2.5, which resulted in a shift of the critical pitting potential by approxi- mately + 85 mV.
Figure 8 also shows that the pitting potential of parabactin saturated in 0.1 M NaCl raised the pitting potential of aluminum by a similar amount of approximately +85 mV.
Adsorption and Cross-linking of the Mussel Protein
Since the mussel protein was effective in inhibiting the corrosion of aluminum when it was adsorbed onto the metal from solution, the next
step was to determine if we could cross-link the protein after it was adsorbed. In the mussel, this cross-linking is facilitated by an enzyme catechol oxidase and has been only partially character- ized. Instead, we used a commercially available enzyme-mushroom tyrosinase-that exhibits simi- lar activity on MAP. To do this, we adsorbed the protein from solution onto the aluminum samples as we had done before, only this time the protein solution was buffered to neutral pH with 0.05 M sodium phosphate and then the mushroom tyrosi- nase was added. The samples were allowed to air- dry and then immersed in sodium chloride solu- tion, and their pitting potentials were measured.
Figure 8 shows that the aluminum sample treated with MAP and tyrosinase exhibits a critical pitting potential of approximately —580 mV, which is a +100 mV shift compared to that of the untreated sample. The sample treated with buffer alone resulted in no significant shift of the pitting potential.
AC Impedance
To further determine what effect the MAP was having on the electrochemical behavior of aluminum, ac impedance measurements were made over a 12-day period. Figure 9 shows that the polarization resistance Rp values are higher for the aluminum sample treated with the MAP- tyrosinase than for either the MAP adsorbed at acidic pH, parabactin adsorbed from solution, or the untreated sample. This indicates that the oxide film on the MAP-tyrosinase sample has the highest resistance to charge transfer processes and is more resistant to breakdown by chloride ions.
55

FEATURED RESEARCH
10"
1(f
O 101
i 7, io° -w 'en c 0 irr1 Q 10
c fc 102
Ü
10 -3
I I I | M I | I I I | I II | I II | I I I | I I I | M I | M I | M I
MAP-tyrosinase
1 0"4 i I M I I I I I M I I I I I I I I I I I I I I I I I I I I I I I I I I I I
-1.4 -1.2 -1 -0.8 -0.6 -0.4
Potential vs SCE (V)
Fig. 8 — Anodic polarization curves of aluminum samples treated with MAP, MAP-tyrosinase, the bacterial siderophore parabactin, and an untreated sample.
10°
107
CD O c
106 CO CO ^-^
Cl) E 1— ü
i co 106
o E .c
N o CO 104
o 0.
10"
1(T
-i—i—i—i I i i | i l r I ' I ' I ' Treated with MAP-tyrosinase
-*—*—-*- -*—*—-*
Parabactin
Untreated sample •e e—-®
/ Treated with MAP, pH 2.5
l . I . I i I ■ I l I I I I I I 1 1 1 L.
0 48 96 144 192 240 288
Time (h)
Fig. 9 - Polarization resistance values for aluminum samples treated with MAP, MAP- tyrosinase, the bacterial siderophore parabactin, and an untreated sample in deaerated 0.1 M NaCI as a function of time.
56
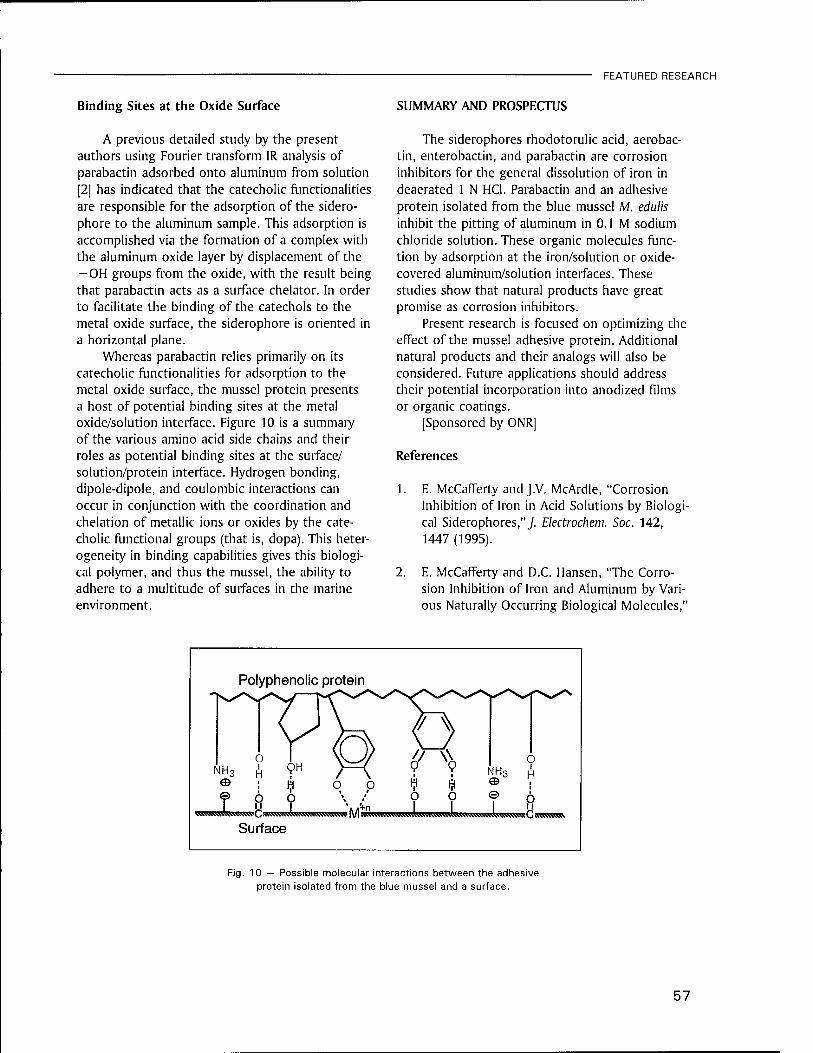
FEATURED RESEARCH
Binding Sites at the Oxide Surface SUMMARY AND PROSPECTUS
A previous detailed study by the present authors using Fourier transform IR analysis of parabactin adsorbed onto aluminum from solution [2] has indicated that the catecholic functionalities are responsible for the adsorption of the sidero- phore to the aluminum sample. This adsorption is accomplished via the formation of a complex with the aluminum oxide layer by displacement of the — OH groups from the oxide, with the result being that parabactin acts as a surface chelator. In order to facilitate the binding of the catechols to the metal oxide surface, the siderophore is oriented in a horizontal plane.
Whereas parabactin relies primarily on its catecholic functionalities for adsorption to the metal oxide surface, the mussel protein presents a host of potential binding sites at the metal oxide/solution interface. Figure 10 is a summary of the various amino acid side chains and their roles as potential binding sites at the surface/ solution/protein interface. Hydrogen bonding, dipole-dipole, and coulombic interactions can occur in conjunction with the coordination and chelation of metallic ions or oxides by the cate- cholic functional groups (that is, dopa). This heter- ogeneity in binding capabilities gives this biologi- cal polymer, and thus the mussel, the ability to adhere to a multitude of surfaces in the marine environment.
The siderophores rhodotorulic acid, aerobac- tin, enterobactin, and parabactin are corrosion inhibitors for the general dissolution of iron in deaerated 1 N HC1. Parabactin and an adhesive protein isolated from the blue mussel M. edulis inhibit the pitting of aluminum in 0.1 M sodium chloride solution. These organic molecules func- tion by adsorption at the iron/solution or oxide- covered aluminum/solution interfaces. These studies show that natural products have great promise as corrosion inhibitors.
Present research is focused on optimizing the effect of the mussel adhesive protein. Additional natural products and their analogs will also be considered. Future applications should address their potential incorporation into anodized films or organic coatings.
[Sponsored by ONR]
References
1. E. McCafferty and J.V. McArdle, "Corrosion Inhibition of Iron in Acid Solutions by Biologi- cal Siderophores,"/ Electrochem. Soc. 142, 1447 (1995).
2. E. McCafferty and D.C. Hansen, "The Corro- sion Inhibition of Iron and Aluminum by Vari- ous Naturally Occurring Biological Molecules,"
Polyphenolic protein
NH3
e
■m*™ O II
Surface
Fig. 10 — Possible molecular interactions between the adhesive protein isolated from the blue mussel and a surface.
57

FEATURED RESEARCH
3.
in Advances in Corrosion and Wear Resistant Coatings, A.R. Srivatska, C.R. Clayton, and J.K. Hirvonen, eds., TMS, (1995), p. 183 and refer- ences therein.
S.R. Cooper, J.V. McArdle, and K.N. Raymond, "Siderophore Electrochemistry: Relation to Intracellular Iron Release Mechanism," Proc. Nat. Acad. Sei. 75, 3551 (1978).
4. J.H. Waite, "Adhesion in Byssally Attached Bivalves," Biol. Rev. 58, 209 (1983).
5. L.M. Rzepecki, S.S. Chin and J.H. Waite, "Molecular Diversity of Marine Glues: Polyphe- nolic Proteins from Five Mussel Species," Mol. Mar. Biol. and Biotech. 1, 78 (1991). ■
THE AUTHORS
EDWARD MCCAFFERTY is head of the Surface Protection Section in the Environ- mental Effects Branch at NRL. His areas of interest include corrosion science, electrochemistry, physical chemistry of surfaces, and surface modification. Dr. McCafferty holds a B.S. in chemistry from Wilkes College and an M.S. and Ph.D. in chemistry from Lehigh University. He will also receive an M.S. in applied math- ematics from Johns Hopkins University in May 1996. He is the author or coauthor of nearly 80 publications, coeditor of two books, and has made over 70 technical presentations. He has received several awards, including the 1992 NRL Sigma Xi Award in Pure Science, the Victor K. LaMer Award of the American Chemical Society, and the William Blum Award of the National Capital Section of the Electrochemical Society. He has received NRL Publication Awards in 1974,1984, and 1990. His professional experience also includes service as scientific officer in the Office of Naval Research and as a part-time faculty member at George Washington University.
DOUGLAS C. HANSEN received a B.S. degree in marine biology from Stockton State College in 1982, an M.S. degree in 1989, and a Ph.D. degree in 1993, both from the Marine Biology/Biochemistry Department at the University of Delaware. For his dissertation, he measured and characterized the adsorption and anticorro- sive effect of the mussel adhesive protein on 304L stainless steel in seawater. He joined NRL as a National Research Council postdoctoral fellow in 1993, investigat- ing organic corrosion inhibitors on aluminum. He joined the staff of the Environ- mental Effects Branch, Surface Protection Section in 1995 as a research chemist. His research interests continue in the field of natural products as corrosion inhibitors, specifically the interaction of biological polymers with metal surfaces, and biomaterials. Dr. Hansen is author or coauthor of more than 10 scientific papers.
58
A Deep Western Boundary Current in the North Pacific
Z.R. Hallock, WJ. Teague, and E.R. Fillenbaum Oceanography Division
A Pacific deep western boundary current (DWBC) was discovered flowing southward along the continental slope of Japan. This discovery is based on 2 years of current velocity observations from four moorings arrayed across the Japan Trench near 35° N. Hydrograph- ie measurements conducted at the beginning of the observational period provide further evidence that the DWBC is, to some degree, part of the global thermohaline circulation. Concurrent inverted echo sounder records and TOPEX altimetric data provide a time history of fluctuating Kuroshio positions. Similar fluctuations in DWBC volume transports suggest a link between Kuroshio and deep variability. These observations were made as part of the Naval Research Laboratory's Kuroshio Extension Regional Experiment.
INTRODUCTION
A Pacific deep western boundary current (DWBC) was discovered flowing southward along the continental slope of Japan. The significance of this discovery is comparable to the discovery of the North Atlantic DWBC, almost 4 decades ago [1]. The Pacific DWBC discovery is based on 2 years of current velocity observations from four moorings arrayed across the Japan Trench near 35° N [2]. Seawater property measurements con- ducted at the beginning of the observational period provide further evidence that the Pacific DWBC is, to some degree, part of the global thermohaline circulation.
In the Atlantic Ocean, where the Gulf Stream separates from the eastern seaboard, a DWBC passes beneath as a southward flow. The Atlantic DWBC is largely the result of the thermohaline circulation, which is predicted by the abyssal circulation theory of H. M. Stornmel and A. B. Arons [3]. In this theory, the abyssal circulation is forced by uniform upwelling throughout the world's oceans. The upwelling is compensated by localized downwelling sources, primarily in the polar regions of the Atlantic. The resulting abyssal circulation consists of broad, slow flows in ocean
basin interiors and concentrated return currents along northern and western boundaries. The downwelling sources affect the strength and sense of the boundary flows but not their loca- tions. Hence, northern and western deep bound- ary currents are predicted for the other oceans as well. The presence of the primary downwelling source in the Greenland/Norwegian Sea area ac- counts for the prominence of the Atlantic DWBC. In the North Pacific, the theory predicts a bound- ary flow westward along the Aleutians and south- ward along the Kamchatka Peninsula and the coast of Japan to about 30° N. North Pacific deep boundary currents are predicted to be consider- ably weaker than those in the Atlantic due to the lack of downwelling sources of deep water.
While it is not reasonable to expect a Pacific DWBC comparable in magnitude to that found in the Atlantic, we present evidence that a dimin- ished, but significant, deep boundary flow does exist. We further show an apparent link between fluctuations in Kuroshio position and volume transport of the deep flow. The observations described here include 2 years of current meter velocities, inverted echo sounder, and satellite altimeter sea surface heights shoreward of, in, and seaward of the Japan Trench. The location of
59
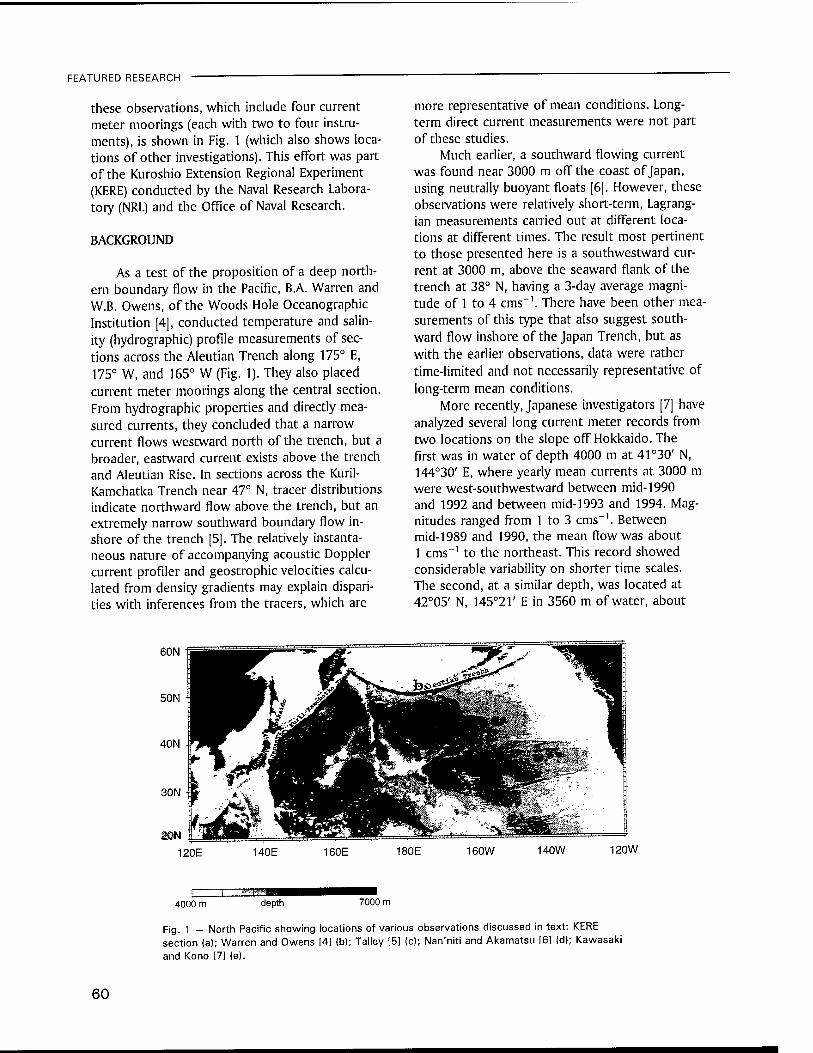
FEATURED RESEARCH
these observations, which include four current meter moorings (each with two to four instru- ments), is shown in Fig. 1 (which also shows loca- tions of other investigations). This effort was part of the Kuroshio Extension Regional Experiment (KERE) conducted by the Naval Research Labora- tory (NRL) and the Office of Naval Research.
BACKGROUND
As a test of the proposition of a deep north- ern boundary flow in the Pacific, B.A. Warren and W.B. Owens, of the Woods Hole Oceanographic Institution [4], conducted temperature and salin- ity (hydrographic) profile measurements of sec- tions across the Aleutian Trench along 175° E, 175° W, and 165° W (Fig. 1). They also placed current meter moorings along the central section. From hydrographic properties and directly mea- sured currents, they concluded that a narrow current flows westward north of the trench, but a broader, eastward current exists above the trench and Aleutian Rise. In sections across the Kuril- Kamchatka Trench near 47° N, tracer distributions indicate northward flow above the trench, but an extremely narrow southward boundary flow in- shore of the trench [5]. The relatively instanta- neous nature of accompanying acoustic Doppler current profiler and geostrophic velocities calcu- lated from density gradients may explain dispari- ties with inferences from the tracers, which are
more representative of mean conditions. Long- term direct current measurements were not part of these studies.
Much earlier, a southward flowing current was found near 3000 m off the coast of Japan, using neutrally buoyant floats [6]. However, these observations were relatively short-term, Lagrang- ian measurements carried out at different loca- tions at different times. The result most pertinent to those presented here is a southwestward cur- rent at 3000 m, above the seaward flank of the trench at 38° N, having a 3-day average magni- tude of 1 to 4 cms-1. There have been other mea- surements of this type that also suggest south- ward flow inshore of the Japan Trench, but as with the earlier observations, data were rather time-limited and not necessarily representative of long-term mean conditions.
More recently, Japanese investigators [7] have analyzed several long current meter records from two locations on the slope off Hokkaido. The first was in water of depth 4000 m at 41°30' N, 144°30' E, where yearly mean currents at 3000 m were west-southwestward between mid-1990 and 1992 and between mid-1993 and 1994. Mag- nitudes ranged from 1 to 3 cms"'. Between mid-1989 and 1990, the mean flow was about 1 cms"1 to the northeast. This record showed considerable variability on shorter time scales. The second, at a similar depth, was located at 42°05' N, 145°21' E in 3560 m of water, about
60N
50N
40N
120E 140E 160E 180E 160W 140W 120W
4000 m depth 7000 m
Fig. 1 — North Pacific showing locations of various observations discussed in text: KERE section (a); Warren and Owens [4] (b); Talley [5] (c); Nan'niti and Akamatsu [6] (d); Kawasaki and Kono [7] (e).
60

FEATURED RESEARCH
90 km to the northeast. During the first year, the current underwent a complete cycle in direction, flowing first westward for several months, north- eastward for the next several months, and then southeastward, resulting in a mean speed close to zero. Speeds during the first year were less than 1 cms-1 most of the time. During the second year, however, the current was quite steady to the west-southwest at about 1 cms-1. It is inter- esting to note that for the 1991-1992 period, the result from the first mooring is quite different from that of the second, even though both re- cords are from nearly the same isobath along the slope. Different bottom slopes at the two loca- tions may be a factor. Furthermore, bottom con- tours change from an essentially north-south orientation to northeast-southwest in this area, and the sill between the Japan Trench and the Kuril-Kamchatka Trench is quite close to Miyake's mooring.
Pacific Ocean simulations using an NRL eddy- resolving model [8], which do not explicitly con- tain thermohaline sources or sinks, reproduce both the position and major features of the Kuro- shio Extension. The simulations show that there are very significant links among specific topo- graphic features, mean currents in the abyssal layer, and mean upper-layer currents. More specif- ically, the instability of the Kuroshio Extension is strongly controlled by the abyssal currents and the large scale bathymetric gradient. The authors [8] hypothesize that the combined impact of baroclinic instability and specific bathymetric features are critical for determining the mean path and variability of the Kuroshio Extension; this work shows that the model produces an eddy-driven southward flow along the continental slope of Japan.
In the light of earlier results, we pose the following questions. Does a persistent deep boundary current exist along the continental slope of Japan? If so, what are its characteristics? Is it affected by local, shallower processes? Is it part of the global thermohaline circulation?
MEASUREMENTS CONDUCTED DURING THE KERE
summer 1994 by NRL as part of the KERE. Other NRL KERE components were numerical modeling and analysis of TOPEX/POSEIDON (T/P) satellite altimetry data.
The in-situ measurements included current meter moorings (CMMs) and inverted echo sound- ers (IESs) deployed for 2 years (with a reset after 1 year), temperature/salinity, and water sampler profiling (hydrography) during the 1992 deploy- ment cruise, and expendable temperature probe (XBT) drops made at IES sites. The emphasis in this article is on the current meter observations. Some discussion of the hydrography is included, and details can be found in a companion study [9]. The locations of the CMMs and IESs are indi- cated in Fig. 2, which also depicts the mean path of the Kuroshio (based on satellite infrared imag- ery) for the 1991-1994 period. It is worth noting that the KERE section is directly beneath a T/P descending groundtrack. The two settings of the moorings are henceforth referred to as "Year 1" (Summer 1992 to Summer 1993) and "Year 2" (Summer 1993 to Summer 1994).
38N
37N
36N
35N
34N
33N
32N 140E 141E 142E 143E 144E 145E
In the region where the Kuroshio turns east- ward from the coast of Japan, in-situ measure- ments were made between summer 1992 and
Fig. 2 — KERE area showing current meter-mooring locations (squares), inverted echo sounder locations (circles), the coincident TOPEX/POSEIDON ground- track (dotted) and bathymetry.
61
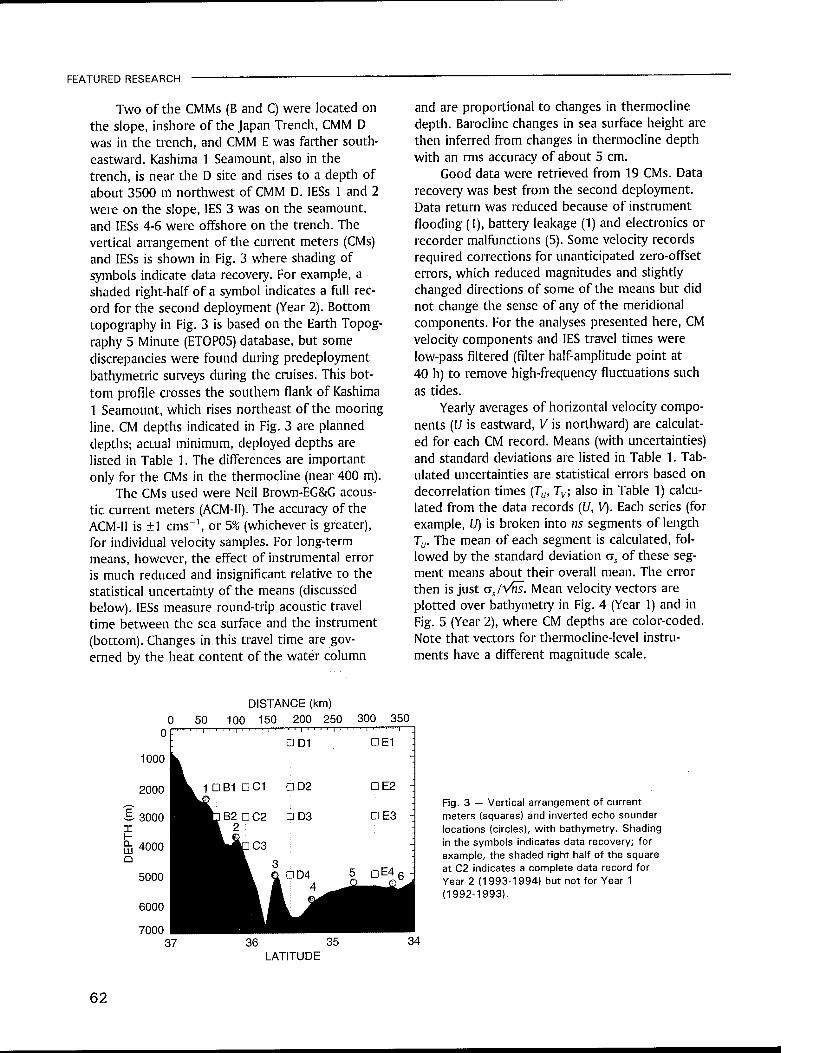
FEATURED RESEARCH
Two of the CMMs (B and C) were located on the slope, inshore of the Japan Trench, CMM D was in the trench, and CMM E was farther south- eastward. Kashima 1 Seamount, also in the trench, is near the D site and rises to a depth of about 3500 rrt northwest of CMM D. IESs 1 and 2 were on the slope, IES 3 was on the seamount, and IESs 4-6 were offshore on the trench. The vertical arrangement of the current meters (CMs) and IESs is shown in Fig. 3 where shading of symbols indicate data recovery. For example, a shaded right-half of a symbol indicates a full rec- ord for the second deployment (Year 2). Bottom topography in Fig. 3 is based on the Earth Topog- raphy 5 Minute (ETOP05) database, but some discrepancies were found during predeployment bathymetric surveys during the cruises. This bot- tom profile crosses the southern flank of Kashima 1 Seamount, which rises northeast of the mooring line. CM depths indicated in Fig. 3 are planned depths; actual minimum, deployed depths are listed in Table 1. The differences are important only for the CMs in the thermocline (near 400 m).
The CMs used were Neil Brown-EG&G acous- tic current meters (ACM-II). The accuracy of the ACM-II is ±1 cms"1, or 5% (whichever is greater), for individual velocity samples. For long-term means, however, the effect of instrumental error is much reduced and insignificant relative to the statistical uncertainty of the means (discussed below). IESs measure round-trip acoustic travel time between the sea surface and the instrument (bottom). Changes in this travel time are gov- erned by the heat content of the water column
and are proportional to changes in thermocline depth. Baroclinc changes in sea surface height are then inferred from changes in thermocline depth with an rms accuracy of about 5 cm.
Good data were retrieved from 19 CMs. Data recovery was best from the second deployment. Data return was reduced because of instrument flooding (1), battery leakage (1) and electronics or recorder malfunctions (5). Some velocity records required corrections for unanticipated zero-offset errors, which reduced magnitudes and slightly changed directions of some of the means but did not change the sense of any of the meridional components. For the analyses presented here, CM velocity components and IES travel times were low-pass filtered (filter half-amplitude point at 40 h) to remove high-frequency fluctuations such as tides.
Yearly averages of horizontal velocity compo- nents (U is eastward, V is northward) are calculat- ed for each CM record. Means (with uncertainties) and standard deviations are listed in Table 1. Tab- ulated uncertainties are statistical errors based on decorrelation times (TUt Tv; also in Table 1) calcu- lated from the data records (U, V). Each series (for example, U) is broken into ns segments of length Tv. The mean of each segment is calculated, fol- lowed by the standard deviation rjs of these seg- ment means about their overall mean. The error then is just ajVns. Mean velocity vectors are plotted over bathymetry in Fig. 4 (Year 1) and in Fig. 5 (Year 2), where CM depths are color-coded. Note that vectors for thermocline-Ievel instru- ments have a different magnitude scale.
0 50
DISTANCE (km)
100 150 200 250 300 350 0
1000
2000
3000
gj 4000 Q
5000
6000
7000
I ' ' ' ' I ' ' ' ' I ' ' ' ■ I , i | . i i i
DD1
i . i i • i ' ■ ' ' i
DE1
^L 1 GB1 DC1 OD2 DE2 -_
il B2 D C2 DD3 DE3 :
^MPC3 :_ 3
DD4 4
5 QE46-
37 36 35 34
Fig. 3 — Vertical arrangement of current meters (squares) and inverted echo sounder locations (circles), with bathymetry. Shading in the symbols indicates data recovery; for example, the shaded right half of the square at C2 indicates a complete data record for Year 2 (1993-1994) but not for Year 1 (1992-1993).
LATITUDE
62
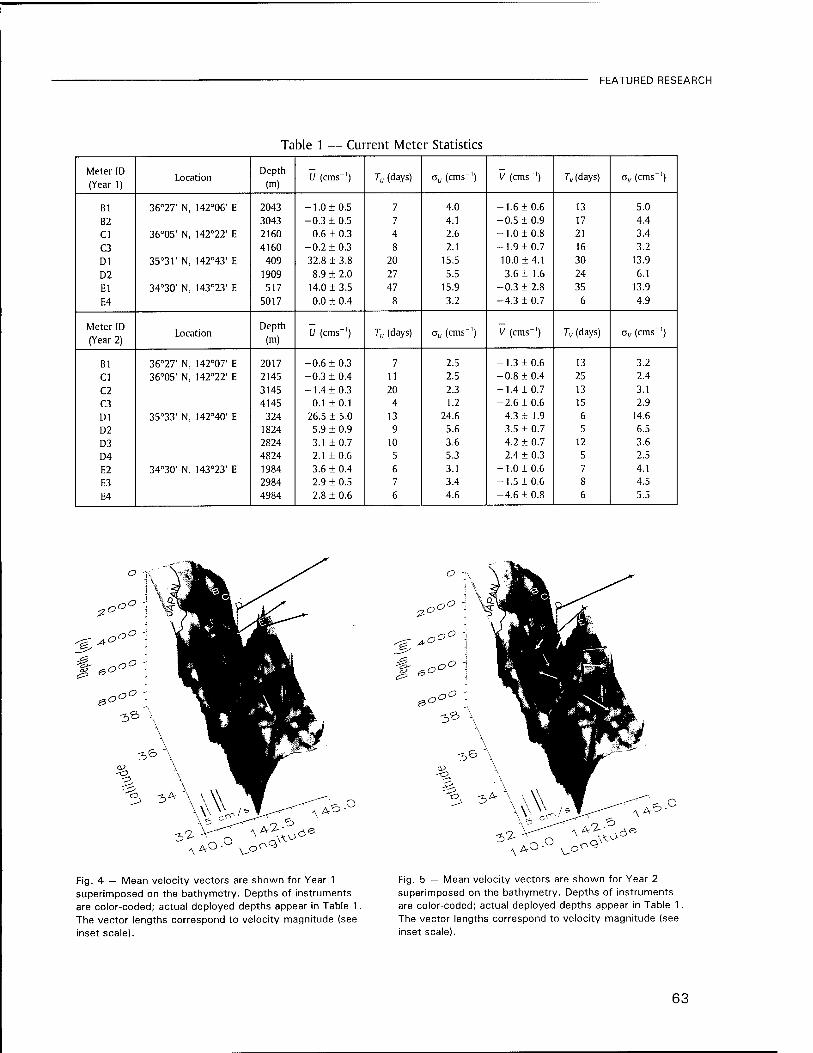
FEATURED RESEARCH
Table 1 — Current Meter Statistics
Meter ID (Year 1)
Location Depth (m)
U (cms"1) TU (days) a„ (cms"') V (cms"') Todays) ov (cms ')
Bl 36°27' N, 142°06' E 2043 -1.0 ±0.5 7 4.0 -1.6 ±0.6 13 5.0 B2 3043 -0.3 + 0.5 7 4.1 -0.5 + 0.9 17 4.4 Cl 36°05' N, 142°22' E 2160 0.6 ± 0.3 4 2.6 -1.0 + 0.8 21 3.4 C3 4160 -0.2 + 0.3 8 2.1 -1.9 ±0.7 16 3.2 Dl 35°31' N, 142°43' E 409 32.8 + 3.8 20 15.5 10.0 ±4.1 30 13.9
D2 1909 8.9 + 2.0 27 5.5 3.6 ± 1.6 24 6.1 El 34°30' N, 143°23' E 517 14.0 + 3.5 47 15.9 -0.3 ± 2.8 35 13.9
E4 5017 0.0 ± 0.4 8 3.2 -4.3 ± 0.7 6 4.9
Meter ID (Year 2)
Location Depth (m)
U (cms"1) Tu (days) a„ (cms-1) V (cms-1) Tv (days) ov (cms"')
Bl 36°27' N, 142°07' E 2017 -0.6 + 0.3 7 2.5 -1.3 ±0.6 13 3.2 Cl 36°05' N, 142°22' E 2145 -0.3 ± 0.4 11 2.5 -0.8 ±0.4 25 2.4 C2 3145 -1.4 ±0.3 20 2.3 -1.4 + 0.7 13 3.1 C3 4145 0.1 +0.1 4 1.2 -2.6 ±0.6 15 2.9 Dl 35°33' N, 142°40' E 324 26.5 ± 5.0 13 24.6 4.3 ± 1.9 6 14.6
D2 1824 5.9 + 0.9 9 5.6 3.5 ±0.7 5 6.5 D3 2824 3.1 +0.7 10 3.6 4.2 ± 0.7 12 3.6 D4 4824 -2.1 ±0.6 5 5.3 2.4 ± 0.3 5 2.5 E2 34°30' N, 143°23' E 1984 3.6 + 0.4 6 3.1 -1.0 + 0.6 7 4.1 E3 2984 2.9 + 0.5 7 3.4 -1.5 + 0.6 8 4.5 E4 4984 2.8 + 0.6 6 4.6 -4.6 ±0.8 6 5.5
^AO-°^o^ A ■
Fig. 4 — Mean velocity vectors are shown for Year 1 superimposed on the bathymetry. Depths of instruments are color-coded; actual deployed depths appear in Table 1.
The vector lengths correspond to velocity magnitude (see inset scale).
Fig. 5 — Mean velocity vectors are shown for Year 2 superimposed on the bathymetry. Depths of instruments are color-coded; actual deployed depths appear in Table 1. The vector lengths correspond to velocity magnitude (see inset scale).
63

FEATURED RESEARCH
The uppermost instrument on each moor- ing recorded pressure, which is used to estimate the vertical excursions of the CMs as a result of mooring motion. Direct mooring motion con- tamination of measured velocities due to lateral movement of the current meters is minimal, but thermocline instruments (Dl, El) sampled a range of depths where vertical shear was high, introduc- ing some uncertainties in depths associated with calculated means. This effect is negligible for instruments at 2000 m and deeper. For Dl and El, mean depths are only slightly deeper than the minimum values and standard deviations are rela- tively small, indicating that large excursions are anomalous. Statistics of velocity components are unchanged from those in Table 1 when recalculat- ed after omitting segments of the Dl, El records where depths were deeper than their respective minimum values by at least 100 m.
MEAN CURRENTS
The mean Kuroshio is apparent at Dl, D2, and El. A decrease in current speed at Dl for Year 2 is accompanied by an increase in variabili- ty (Table 1), implying increased meander or eddy activity. Counterclockwise (clockwise) changes in direction with depth at D (E) show the transition from the east-northeastward-flowing Kuroshio and the northward (southward) deep flows. At D4, which is deeper (5000 m) than the peak of the Kashima-1 Seamount, the mean flow is northwest- ward, consistent with predicted anticyclonic flow of a stratified Taylor column around such a fea- ture. Inshore of the Japan Trench (B, C), the year- ly mean flows are generally directed southward along the isobaths, with magnitudes ranging from about 0.5 cms-1 to 2.6 cms"1. All but B2 (Year 1) have negative meridional components that are significantly different from zero. These magni- tudes are consistent with westward annual means found inshore of the Aleutian Trench [4]. We estimate mean meridional volume transports along the slope at 2 Sv (1 Sv = 1 x 10⁶ mV1), based on current records from moorings B and C.
B.A. Warren and W.B. Owens [4] use maps of potential temperature (0) to delineate regimes of deep flow in the northwest Pacific. They asso- ciate cold tongues (minima) with the boundary between westward, along-slope flow, and east- ward flow above the Aleutian Trench. We extend
their analysis of 6 at 4000 m to the vicinity of the KERE observations (Fig. 6). A cold tongue (0 < 1.15° C) parallels the coast to about 35° N, where it becomes more irregular and shows signs of turning eastward. Between 150° E and 160° E, another cold feature is evident, which extends eastward. All the KERE observations fall westward of the primary cold tongue in Fig. 6, but a nar- rower, cold feature (0 < 1.15° C) lies along the trench. Variability at 4000 m appears to be great- er south of about 40° N than father north and off the Aleutians. The horizontal variability apparent in Fig. 6 is probably more the result of aliasing of temporal changes than of real horizontal struc- ture in the mean temperature. This view is sup- ported by examination of the relative importance of current velocity variance in the KERE region compared with that of Warren and Owens. In particular, the ratios of the magnitude of mean currents to standard deviations calculated with the KERE CM data (as well as from the results of other investigators) are typically only one-third to one-half the ratios calculated with Warren and Owens results.
40N
160E
Fig. 6 — Map of potential temperature (9) at 4000-m depth for the KERE region and northeast- ward. KERE current meter moorings are indicated by squares. The analysis is based on historical hydrographic observations; station locations are indicated by pluses. The 4000-m depth contour is included.
64

FEATURED RESEARCH
This variability tends to obscure inferences of thermohaline flow from time-limited observations such as the KERE hydrographic section and from historical data sets (Fig. 6) where temporal alias- ing and smearing can occur. Anomalies of a chem- ical tracer (such as the concentration of silica) may indicate a distinct source of a particular flow in a more integral way, minimizing the effect of temporal aliasing [5]. Positive silica anomalies near mooring B between 2000 m and 3300 m are consistent with a southward transport of water from the Bering Sea or northeast Pacific. Like- wise, a negative silica anomaly found between moorings C and D (in the same depth range) is consistent with northward flow from a southern region.
At our southeastemmost mooring, we see a 2-year mean southward component of flow. In this region, depth decreases slowly to the west with a slope of about 1 x 10~3. According to a later study by H.M. Stommel and A.B. Arons [10] a broad, equatorward flow is consistent with a slope of this magnitude and can coexist with a narrow boundary flow such as that seen at B and C. Approaching the Japan Trench, the slope de- creases and depth reaches a minimum just sea- ward of mooring D, where a deep northward flow is encountered. Poleward flows were not consid- ered in their treatment. Due to the complex bot- tom topography in this region, deep mean flows are likely to be locally intensified and more com- plex than those predicted by this type of model, even when simply sloping bottoms are included. Also, narrow features may be undersampled by existing mooring data. Further potential problems with the Stommel-Arons model arise with recent observations showing that the upwelling of abys- sal water is not uniform everywhere [11]. Hence, observed flows in the region are likely comprised of local recirculations driven by topography and eddy fluxes, superimposed on the large-scale thermohaline flow.
FLUCTUATIONS OF THE CURRENTS
The Kuroshio exhibits strong variability in the KERE observational area. This variability primarily takes the form of meanders (defined as changes in direction and cross-stream position). Meanders sometimes increase or decrease in amplitude as standing waves, or they can propagate along- stream (usually downstream). A useful measure
of variability is the eddy kinetic energy (EKE), de- fined as the kinetic-energy-per-unit mass associat- ed with the velocity field with the mean removed. This is half the sum of the variances of the veloci- ty components (that is, from Table 1: EKE = 0.5 (cru
2 + a„2)). EKE is plotted as a function of lati- tude for all CM records in Fig. 7. The salient results are a significant increase in EKE from Year 1 to Year 2 for the shallowest instrument in the Kuroshio (Dl) and for deeper instruments on moorings D and E. There is a concurrent decrease in EKE for Bl. For the Dl records, there is a cor- responding decrease in the kinetic energy of the mean (see Table 1), consistent with a general increase in eddy or meander activity in the Year 2. These results further suggest a dynamic link between Kuroshio variability and that of the deep currents.
Another way to assess eddy activity is to examine the decorrelation times T for the velocity components (Table 1). Relatively longer values of T indicate the presence of longer period coherent structures or events, such as eddies. This is the case for records from instruments located in the thermocline and/or near the Kuroshio influence (Dl, D2, El). This result is anticipated near such mesoscale features. What is perhaps more inter- esting is that for all the deep slope instruments (on moorings B and C), with the exception of C2 (Year 2), Tv is considerably greater than Tu. The implication is that the velocity components are governed by different dynamics, with the longer time scales roughly associated with the along- slope direction, further suggesting strong topo- graphic interaction.
While EKE and other quantities at instrument locations provide quantitative information about the flow field, more integral analyses better de- scribe specific phenomena. We take such an ap- proach to examine the relationship of Kuroshio changes to the strength of the DWBC. Figure 8 is a time history of surface height along the KERE section. It is based on a combined analysis of hydrography, IES records, and T/P altimetry [12]. Lateral shifting of the axis region (red band) of the Kuroshio is evident, changing on a time scale of about 100 days. Strength of the component of flow normal to the section is proportional to the height gradient along the section. Since meander- ing is mostly due to changes in lateral position and direction rather than flow magnitude, chang- es in the gradient (width of the red band) mostly
65
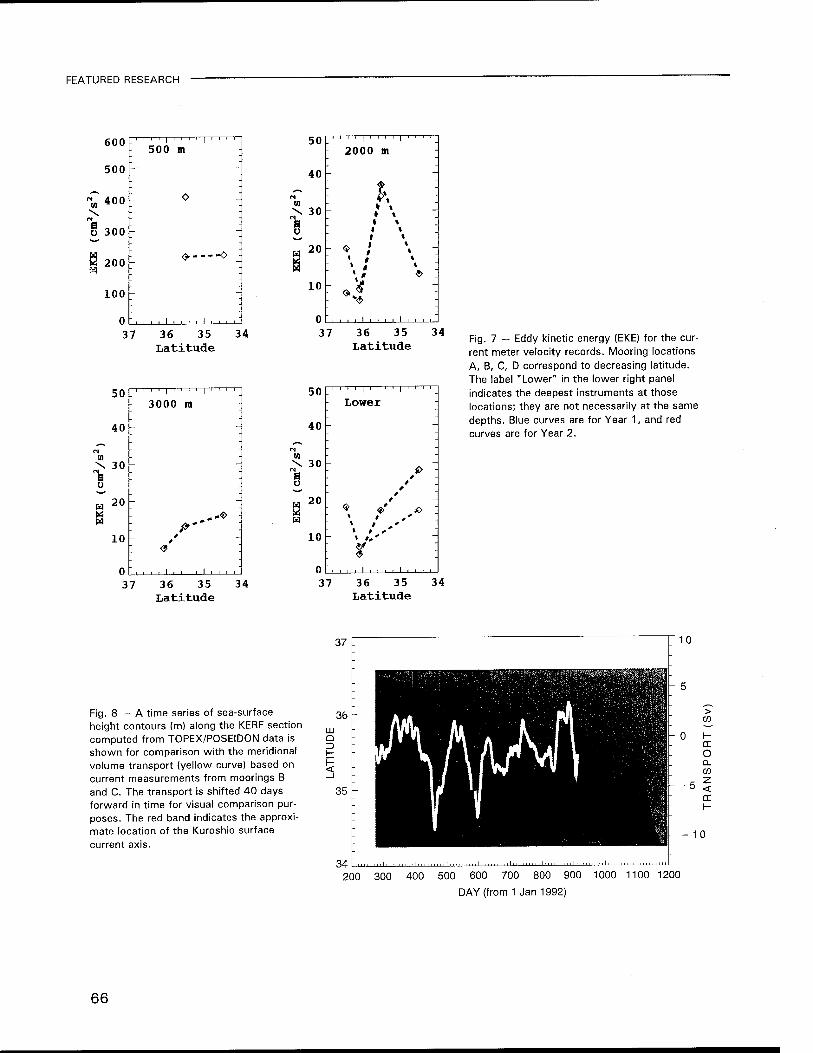
FEATURED RESEARCH
600 ;
1 1 1 1
500 i i i
m i i i i _
500 - -_
£ 400 7 <> -_
0 300
w K 200 •SI
100
1 ♦ -" --o j
0 , , 37 36 35 34
Latitude
50 I I 1 1 1 1 1 1 1 1 1 1 1 1 _
2000 m
40 1
M \ 30 * »
e u
«20
H
• »
A ' * -
» * * . : \* * -
10 :" N' : 0 ■ I , , , ,"
37 36 35 Latitude
34
50 _, 1 I 1 1 I 1 1 1 1 1 1 1 1 _
Lower
40 '- - ~ - w . \ 30 - — >j (0 - e * 0 /
H 2«
10 » »,' : r ; 0 '. ■
Fig. 7 — Eddy kinetic energy (EKE) for the cur- rent meter velocity records. Mooring locations A, B, C, D correspond to decreasing latitude. The label "Lower" in the lower right panel indicates the deepest instruments at those locations; they are not necessarily at the same depths. Blue curves are for Year 1, and red curves are for Year 2.
37 36 35 34 Latitude
37 36 35 34 Latitude
Fig. 8 — A time series of sea-surface height contours (m) along the KERE section computed from TOPEX/POSEIDON data is shown for comparison with the meridional volume transport (yellow curve) based on current measurements from moorings B and C. The transport is shifted 40 days forward in time for visual comparison pur- poses. The red band indicates the approxi- mate location of the Kuroshio surface current axis.
- 5
>
cc O Q. CO z <
- - 10
200 300 400 500 600 700 800 900
DAY (from 1 Jan 1992)
1000 1100 1200
66

FEATURED RESEARCH
represent changes in direction relative to the ori- entation of the section. The deep flows exhibit similar variability scales. A time series of merid- ional volume transport (indicated by the yellow curve in Fig. 8), based on all CMs from moorings B and C, shows similar scales of variability. In particular, a large, negative excursion is apparent between days 400 and 450 for both the transport and Kuroshio position. That is, a large, south- ward shift of the Kuroshio axis corresponds to a strong, southward surge of the DWBC. However, the transport has been shifted forward in time by 40 days, and thus leads the shift of the Kuroshio axis. This is significant because it implies that the shift of the axis might be caused by the DWBC change rather than the other way around. An- other possibility is that both events are the result of nonlocal forcing such as large-scale windstress changes of long Rossby-wave activity. Similar causal links have been found by others for the Gulf Stream near Cape Hatteras.
SUMMARY
A southward mean North Pacific DWBC has been found along the continental slope of Honshu Island which is, to some extent, part of the global thermohaline circulation, although eddy-driving is also likely to be a factor. This volume transport of this current is about 2 Sv southward but shows strong variability that may be dynamically linked to meanders of the Kuroshio. Deep mean flows near the Japan Trench are generally northward and affected by topographic features, while sea- ward of the trench, the deep mean currents are again southward. In-situ measurements, such as those obtained in the KERE, are essential for understanding the dynamics of western boundary currents. Such understanding is required for accu- rate modeling and prediction in these regimes. This work provides a touchstone for the evalua- tion of circulation models for the Pacific Ocean.
ACKNOWLEDGMENTS
This work was supported by the Office of Naval Research under the Accelerated Research Initiative Kuroshio Extension Regional Experiment (KERE). The KERE was conducted under the lead-
ership of Jimmy L. Mitchell (NRL; University of Colorado).
[Sponsored by ONR]
REFERENCES
1. J.C. Swallow and LV. Worthington, "Mea- surements of Deep Currents in the Western North Atlantic," Nature 179, 1183-1184 (1957).
2. Z.R. Hallock and W.J. Teague, "Evidence for a North Pacific Deep Western Boundary Cur- rent,"/ Geophys. Res., accepted (1995).
3. H. Stommel and A.B. Arons, "On the Abyssal Circulation of the World Ocean I, Stationary Planetary Flow Patterns on a Sphere," Deep Sea Res. 6, 140-154 (1960).
4. B.A. Warren and W.B. Owens, "Deep Cur- rents in the Central Subarctic Pacific Ocean," J. Phys. Oceanogr. 18, 529-551 (1988).
5. L.D. Talley, T.M.Joyce, and R.A DeSzoeke, "Transpacific Sections at 47° N and 152° W: Distribution of Properties," Deep Sea Res. 38, Supp. 1, S63-S82 (1991).
6. T. Nan'niti and H. Akamatsu, "Deep Current Observations in the Pacific Ocean Near the Japan Trench," J. Oceanogr. Soc. Japan 22(4), 154-166 (1966).
7. Y. Kawasaki and T. Kono, "Results of Cur- rent Measurements Southeast of Kushiro," in Nemuro Workshop on Western Subarctic Circulation '93, Hokkaido National Fisheries Research Institute, September 19-23, 1993.
8. H.E. Hurlburt, AJ. Wallcraft, W.J. Schmitz, P.J. Hogan, and E.J. Metzger, "Dynamics of the Kuroshio/Oyashio Current System Using Eddy-Resolving Models of the North Pacific Ocean," J. Geophys. Res., accepted (1995).
9. W.J. Teague, A.M. Shiller, and Z.R. Hallock, "Hydrographie Section Across the Kuroshio
67
FEATURED RESEARCH
Near 35° N, 143° E," J. Geophys. Res. 99(C4), 7639-7650 (1994).
10. H. Stommel and A.B. Arons, "On the Abyssal Circulation of the World Ocean V; The Influ- ence of Bottom Slope on the Broadening of Inertial Boundary Currents," Deep Sea Res. 19, 707-718 (1972).
11. J.R. Toggweiler and B. Samuels, "New Radiocarbon Constraints on the Upwelling
of Abyssal Water to the Ocean's Surface," in The Global Carbon Cycle, ML Heimann, ed. (NATO ASI Series, Springer Verlag, Berlin, 1993), pp. 333-366.
12. W.J. Teague, Z.R. Hallock, G.A. Jacobs, and J.L. Mitchell, "Kuroshio Sea Surface Height Fluctuations Observed Simultaneously with Inverted Echo Sounders and TOPEX/POSEI- DON,"y. Geophys. Res., 100 (C12), 24987- 24994 (1995).
THE AUTHORS
ZACHARIAH R. HALLOCK received a B.S. in physics from the Polytechnic Institute of Brooklyn in 1970, and M.S and Ph.D. degrees in physical oceanography in 1973 and 1977, respectively, from the Rosenstiel School of Marine and Atmospheric Science of the University of Miami. He then joined the U. S. Naval Oceanographic Office in 1977. In 1981, he joined the Oceanography Division at NRL (then NORDA) where he conducted research in oceanic thermohaline finestructure using observations from frontal regions. Beginning in 1985, Dr. Hallock pursued research in oceanic mesoscale variability in multidisciplinary programs. This work included field observations and analyses of moored and profile measurements in combination with satellite altimetry and model results. In addition, he conducted GEOSAT validation studies for the open ocean. In 1990, he began a study of deep boundary flows in the northwest Pacific near Japan, in collaboration with concurrent NRL remote-sensing and modeling efforts. He received the NORDA Best Publication Award in 1989, the NOARL Code 330 Best Publication Award in 1991, an NRL Review Publication Award in 1994, and an NRL Technology Transfer Award in 1995. He is a member of the American Geophysical Union.
WILLIAM J. TEAGUE received a B.S. degree in physics from the University of Miami in 1972 and an M.S. degree in physical oceanography from the Rosenstiel School of Marine and Atmospheric Science of the University of Miami in 1975. He is a physical oceanographer and was employed by the U.S. Naval Oceanographic Office from 1976 to 1983. He joined the Oceanography Division at NRL (then NORDA) in 1983 and was involved in collecting and analyzing hydrographic, inverted echo sounder, and altimetric data for the GEOSAT field program and in developing database management systems. More recently, he has been investigat- ing the dynamics of the Kuroshio Extension, off the coast of Japan. Present work involves analyzing TOPEX altimetric data and studying the dynamics of the Yellow and East China Seas to winds and currents. He received an NRL Technology Award in 1995, an Alan Berman Research Publication Award in 1995, an NRL Review Publication Award in 1994, the best NOARL directorate publication award in 1991, best NOARL division publication awards in 1990 and 1991, and the Naval Oceanographic Office Goldsborough Publication Award in 1984. He is a member of the American Geophysical Union, TOPEX/POSEIDON Science Team, and ERS1 Science Team.
68

FEATURED RESEARCH
EVE R. FILLENBAUM received a BA. degree in physics from Carleton College in 1989, and a Ph. D. in physical oceanography from the Rosenstiel School of Marine and Atmospheric Science of the University of Miami in 1994. Her dissertation research involved investigation of the variability of the meridional heat flux in the North Atlantic Ocean. In 1995, she joined NRL as a Consortium for Oceanographic Research and Education postdoctoral fellow, working on volume transports in the Kuroshio Extension area. Dr. Fillenbaum is a member of the American Geophysical Union, the Oceanography Society, and Sigma Xi.
69
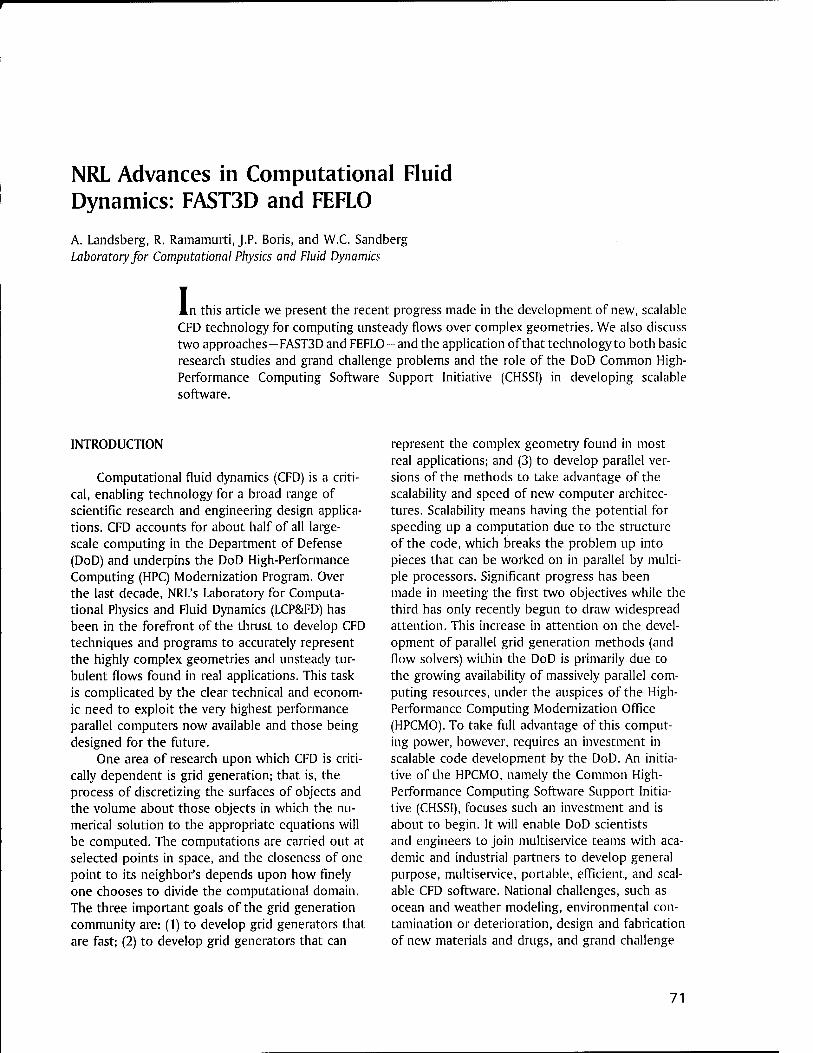
NRL Advances in Computational Fluid Dynamics: FAST3D and FEFLO
A. Landsberg, R. Ramamurti, J.P. Boris, and W.C. Sandberg Laboratory for Computational Physics and Fluid Dynamics
I n this article we present the recent progress made in the development of new, scalable CFD technology for computing unsteady flows over complex geometries. We also discuss two approaches —FAST3D and FEFLO-and the application ofthat technology to both basic research studies and grand challenge problems and the role of the DoD Common High- Performance Computing Software Support Initiative (CHSSI) in developing scalable software.
INTRODUCTION
Computational fluid dynamics (CFD) is a criti- cal, enabling technology for a broad range of scientific research and engineering design applica- tions. CFD accounts for about half of all large- scale computing in the Department of Defense (DoD) and underpins the DoD High-Performance Computing (HPC) Modernization Program. Over the last decade, NRL's Laboratory for Computa- tional Physics and Fluid Dynamics (LCP&FD) has been in the forefront of the thrust to develop CFD techniques and programs to accurately represent the highly complex geometries and unsteady tur- bulent flows found in real applications. This task is complicated by the clear technical and econom- ic need to exploit the very highest performance parallel computers now available and those being designed for the future.
One area of research upon which CFD is criti- cally dependent is grid generation; that is, the process of discretizing the surfaces of objects and the volume about those objects in which the nu- merical solution to the appropriate equations will be computed. The computations are carried out at selected points in space, and the closeness of one point to its neighbor's depends upon how finely one chooses to divide the computational domain. The three important goals of the grid generation community are: (1) to develop grid generators that are fast; (2) to develop grid generators that can
represent the complex geometry found in most real applications; and (3) to develop parallel ver- sions of the methods to take advantage of the scalability and speed of new computer architec- tures. Scalability means having the potential for speeding up a computation due to the structure of the code, which breaks the problem up into pieces that can be worked on in parallel by multi- ple processors. Significant progress has been made in meeting the first two objectives while the third has only recently begun to draw widespread attention. This increase in attention on the devel- opment of parallel grid generation methods (and flow solvers) within the DoD is primarily due to the growing availability of massively parallel com- puting resources, under the auspices of the High- Performance Computing Modernization Office (HPCMO). To take full advantage of this comput- ing power, however, requires an investment in scalable code development by the DoD. An initia- tive of the HPCMO, namely the Common High- Performance Computing Software Support Initia- tive (CHSSI), focuses such an investment and is about to begin. It will enable DoD scientists and engineers to join multiservice teams with aca- demic and industrial partners to develop general purpose, multiservice, portable, efficient, and scal- able CFD software. National challenges, such as ocean and weather modeling, environmental con- tamination or deterioration, design and fabrication of new materials and drugs, and grand challenge
71

FEATURED RESEARCH
military applications, are representative of the problems being tackled under the new initiative. The military applications include submarine, air- craft and missile maneuvering, blast dynamics and structural response, fire propagation and control, electromagnetic scattering from complex surfaces, and signal processing for real-time control. Signifi- cant progress on such computational challenges will be delayed without the application of the new, parallel-computing resources. This paper describes the recent progress made at NRL in the development of scalable CFD technology and the application of that technology to both basic re- search questions and grand challenge problems.
GRID GENERATION TECHNOLOGY
The rapid generation of a suitable computa- tional grid upon which to carry out a flow, struc- tural mechanics, or electromagnetic or acoustic signature computation for a complex geometric object has been a long-time goal of the mathemat- ical and computational communities. There are essentially three ways of representing complex geometry. The first uses structured multiblock or overset grids where the individual grid blocks are bent around various parts of the body. The second uses globally structured rectilinear grids where the body cuts smoothly through the cells of the grid. The third uses unstructured finite-element grids comprised of tetrahedra. Numerous examples of all three approaches to gridding complex shapes can be seen in Ref. [1]. At the LCP&FD, we have pursued both the structured and unstructured grid approaches. The structured grid approach is dis- cussed first.
FAST3D AND GLOBALLY STRUCTURED GRID TECHNOLOGY
For structured grid approaches, we have developed a new, faster alternative to multiple blocks or overset grids-namely, the globally structured grid with virtual cell embedding (VCE). This approach was chosen because it allows sim- pler data structures aimed at efficient use of the existing and emerging highly parallel architectures with little sacrifice in speed, memory require- ments, or flow-field accuracy [2]. A structured rectilinear mesh is used as the basis for VCE, but variable spacing between the grid planes and even motion of the grid planes is allowed. The method
allows surfaces of complex objects to cut smooth- ly through the rectilinear grid. The smooth inter- section with the grid is accomplished by subdivid- ing the mesh into very fine subcells. The method is called virtual because the subcells embedded within a cell are not stored in memory or integrat- ed in the solution and, hence, the computation time is essentially independent of the high resolu- tion used to replicate the geometric detail. VCE is used within the CFD program FAST3D, which is the DoD's scalable reactive flow benchmark pro- gram. FAST3D solves 3-D, time-dependent, com- pressible, reactive flow problems. There are three software components of the FAST3D system-the grid generator GRIDGEN, the flow solver FAST3D, and the asynchronous graphics package VOYEUR. An important aspect of VOYEUR is the ability it provides to watch the time evolution of computed data on selected visualization cross-sections while the simulation is proceeding on one of the DoD's scalable high-performance computers.
The underlying fluid dynamics algorithm in FAST3D is the high-resolution, direction-split, flux- corrected transport (FCT) algorithm called LCPFCT [3]. The FAST3D flow-solver model approximates the high Reynolds number limit solutions of the Navier-Stokes equations within the resolution limits controlled by the fundamental grid spacing chosen by the user. It is particularly advantageous to use the FCT algorithm with the VCE method since both algorithms are highly parallel. The FCT and VCE algorithms have been implemented for distributed memory parallel computers such as the Intel iPSC/860, Intel Paragon, and clustered work- station architectures. In the parallel implementa- tion of FAST3D, domain decomposition is used to distribute the grid cells across the processors while a running transpose is used for the inter- processor communications. The VCE data structure implemented in FAST3D for complex geometry is partitioned for efficient parallel processing and communication.
An example of the power of the VCE to repre- sent complex geometry is given in Fig. 1, which is an instantaneous snapshot of the unsteady air wake about the LHD aircraft carrier. Detailed knowledge of the unsteady air flow around a ship superstructure is necessary to assess the suitability of a platform for air operations, to predict and rank the relative merits of proposed topside de- sign modifications, and to improve the fidelity of ship air-wake models in pilot training simulators.
72
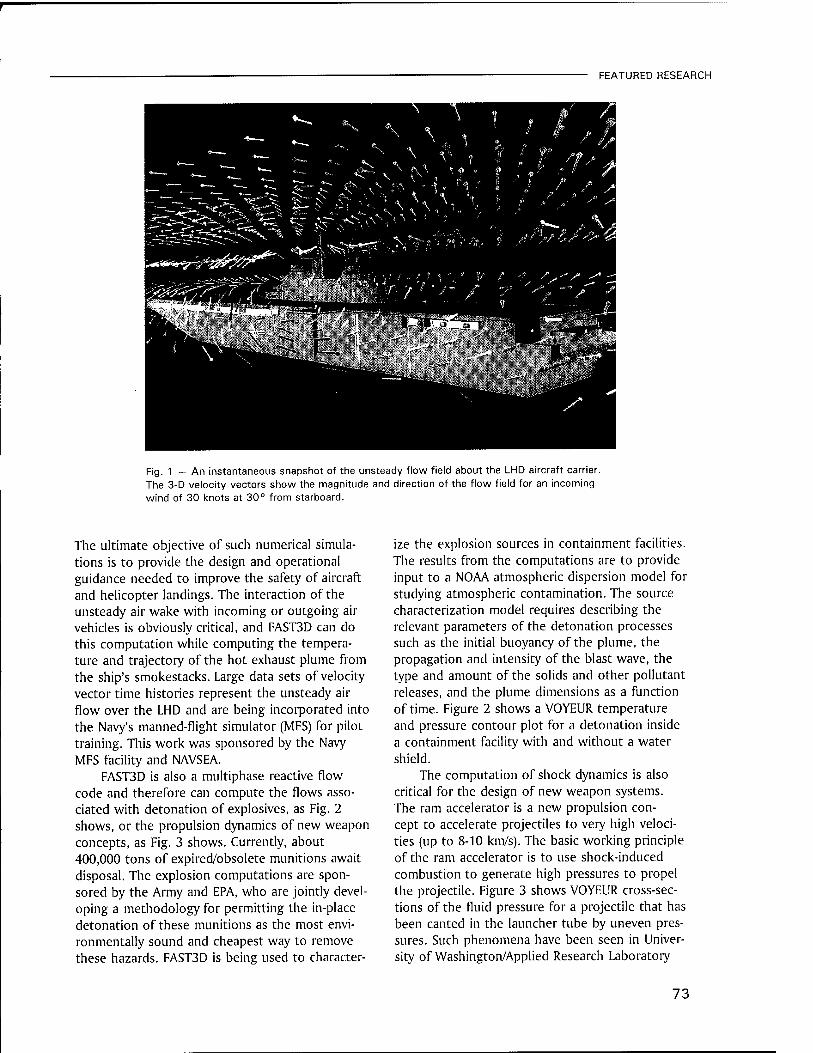
FEATURED RESEARCH
Fig. 1 — An instantaneous snapshot of the unsteady flow field about the LHD aircraft carrier. The 3-D velocity vectors show the magnitude and direction of the flow field for an incoming wind of 30 knots at 30° from starboard.
The ultimate objective of such numerical simula- tions is to provide the design and operational guidance needed to improve the safety of aircraft and helicopter landings. The interaction of the unsteady air wake with incoming or outgoing air vehicles is obviously critical, and FAST3D can do this computation while computing the tempera- ture and trajectory of the hot exhaust plume from the ship's smokestacks. Large data sets of velocity vector time histories represent the unsteady air flow over the LHD and are being incorporated into the Navy's manned-flight simulator (MFS) for pilot training. This work was sponsored by the Navy MFS facility and NAVSEA.
FAST3D is also a multiphase reactive flow code and therefore can compute the flows asso- ciated with detonation of explosives, as Fig. 2 shows, or the propulsion dynamics of new weapon concepts, as Fig. 3 shows. Currently, about 400,000 tons of expired/obsolete munitions await disposal. The explosion computations are spon- sored by the Army and EPA, who are jointly devel- oping a methodology for permitting the in-place detonation of these munitions as the most envi- ronmentally sound and cheapest way to remove these hazards. FAST3D is being used to character-
ize the explosion sources in containment facilities. The results from the computations are to provide input to a NOAA atmospheric dispersion model for studying atmospheric contamination. The source characterization model requires describing the relevant parameters of the detonation processes such as the initial buoyancy of the plume, the propagation and intensity of the blast wave, the type and amount of the solids and other pollutant releases, and the plume dimensions as a function of time. Figure 2 shows a VOYEUR temperature and pressure contour plot for a detonation inside a containment facility with and without a water shield.
The computation of shock dynamics is also critical for the design of new weapon systems. The ram accelerator is a new propulsion con- cept to accelerate projectiles to very high veloci- ties (up to 8-10 km/s). The basic working principle of the ram accelerator is to use shock-induced combustion to generate high pressures to propel the projectile. Figure 3 shows VOYEUR cross-sec- tions of the fluid pressure for a projectile that has been canted in the launcher tube by uneven pres- sures. Such phenomena have been seen in Univer- sity of Washington/Applied Research Laboratory
73
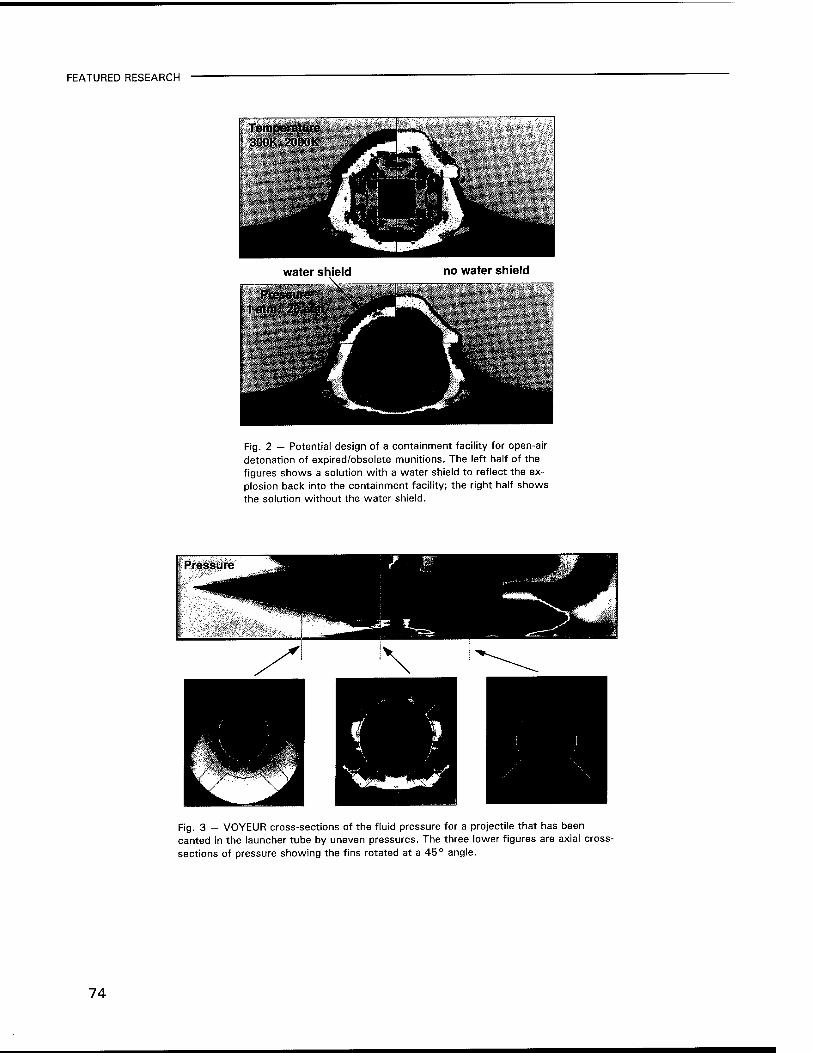
FEATURED RESEARCH
water shield
Pressure
no water shield
Fig. 2 — Potential design of a containment facility for open-air detonation of expired/obsolete munitions. The left half of the figures shows a solution with a water shield to reflect the ex- plosion back into the containment facility; the right half shows the solution without the water shield.
Fig. 3 — VOYEUR cross-sections of the fluid pressure for a projectile that has been canted in the launcher tube by uneven pressures. The three lower figures are axial cross- sections of pressure showing the fins rotated at a 45° angle.
74

FEATURED RESEARCH
experiments and represent a real concern for the efficiency and accuracy of the device. This work is sponsored by the Air Force and Navy.
In addition to computations for solving appli- cations problems in complex geometries, we also carry out computations in simple geometries where the physical processes may be extremely complicated. One such example is in the study of the dynamics that occurs during the laser-induced ablation of initially spherical fuel pellets in inertial confinement fusion experiments. Since radiation transport hydrodynamics is important for laser- matter interaction computations, a separate ver- sion of FAST3D that incorporates radiation trans- port hydrodynamics has been developed at NRL under DOE and NRL sponsorship [4]. This version of FAST3D is being used to simulate the evolution of 85-um-thick NIKE simple plastic ablator targets accelerated with prototype inertial-confinement fusion (ICF) driver conditions. In addition to assist- ing in the design of high-gain ICF pellets, the code is also being used to assist in the design and diag- nosis of laboratory experiments on spherical pel- lets for the NRL NIKE KrF Laser Facility (Laser Plasma Branch, Plasma Physics Division).
Each of the above FAST3D applications was performed using several different computers. In addition to the Intel iPSC/860, Intel Paragon, Con- vex, IBM and DEC Workstations, and SGI Power Challenge systems used in these examples, vari- ants of this CFD model exist for the TMC Connec- tion Machines, Cray T3D, IBM SP2, and Cray C90. Each application, to date, has used a somewhat different version of the program. One aim of the CHSSI project is to unify these capabilities within a single portable code.
FEFLO: UNSTRUCTURED GRID TECHNOLOGY
FEFLO is an unsteady, implicit, finite element, Navier-Stokes solver that uses unstructured grids for modeling both compressible and incompress- ible flows. Like FAST3D, the compressible version of the flow solver uses the FCT algorithm. In addi- tion to the compressible and incompressible flow solvers, there is a CAD/CAM interface (FECAD), a grid generator (FRGEN3D), and a flow-visualization code written especially for unstructured grids (FEPOST3D). Unstructured grids are built with triangular cells in 2-D and tetrahedral cells in 3-D. The cells surrounding any particular computational element can be, and usually are, distributed irreg-
ularly. This allows one to place tightly packed tetrahedra close to the body surface as needed to capture geometric detail or resolve viscous bound- ary layers while using significantly less resolution in immediately adjacent regions away from the body surface where flow gradients are moderate. Where high gradients do occur, one can adaptively remesh as needed to capture and track the evolu- tion of the flow unsteadiness. This is very useful for unsteady separating flows where one wishes to track the shed vorticity and for flows about moving surfaces, deforming surfaces, and in time- varying computational domains. The unstructured grid-generation process in FEFLO is very fast and thus well suited for rapid regridding of geometric configuration changes, which is essential for time- ly design iterations.
Viscous, turbulent separating flows are an area of intense fluid dynamic research. The dy- namics of these flows need to be understood in order to predict confidently the behavior of ships, submarines, torpedoes, and propulsors. FEFLO and the unstructured grid technology development were funded by ARPA and the Navy because they offer significant promise in this area and because of their ability to examine the details of unsteady separation and vorticity shedding. Figure 4 is an example of such an investigation, which gives the computed results for the distribution of vorticity at various streamwise locations for the flow over a prolate spheroid at an angle of attack. The prolate spheroid was selected because it has been the subject of several fundamental experiments to map steady and unsteady flows over bodies at an angle of attack. Comparison of the computational results with experimental results have shown quite good agreement [5] and have focused the next phase of work on turbulence models for massively separating flows.
A natural extension of prolate spheroid flow is submarine flow computation. An extremely challenging problem related to submarine flow is the prediction of forces, moments, and trajecto- ries during the torpedo launch process. The flow fields are affected by two-body interactions, pro- pulsor-generated flows, and unsteady water-jet interactions. Successful development of advanced launcher and unmanned underwater vehicle con- cepts may depend on being able to make the computations of the flow so that a range of vehi- cle/propulsor/control system alternatives can be assessed prior to costly prototype construction
75

FEATURED RESEARCH
Fig. 4 - Unsteady separating flow past a 1:6 prolate spheroid, a = 10°, Re = 60,000. Longitudinal cuts show instantaneous vorticity.
and testing. Figure 5 shows the velocity about a torpedo as it exits from the launch tube of a mov- ing submarine. The adaptive remeshing incom- pressible flow solver was applied to simulate the unsteady flow throughout the entire launch pro- cess.
In addition to weapons launch, the subma- rine community is also challenged to predict the forces, moment, and trajectories of the submarine itself as it responds to control surface commands. An ability to compute the unsteady flow about moving control surfaces is therefore critical. Fish, such as tuna, propel themselves almost exclusively by motion of the last 10% or so of their body where their caudal fin is located. They thus pro- vide an interesting example in nature of flows about reasonably streamlined bodies with control surface activity, such as submarines. Until now, hydrodynamic computations to model fish motion have been restricted to slender body theory. The difficulties that have heretofore prevented the development of computational capabilities for understanding the hydrodynamics of fish motion are its complex geometry, the undulatory motion of the body and the fins, as well as the interaction of the body and fin flow fields. Figure 6 shows the results of the first 3-D unsteady computations of surface pressure distribution on a swimming fish [6]. The computations included continuous fin deformation and oscillation.
Moving from the low-speed undersea world of swimming fish to the high-speed atmospheric world of recoverable rockets takes us out of the world of incompressible phenomena and into the world of compressible fluid dynamics. Computa- tions of compressible flows were carried out using
the unstructured grid code, FEFL096. The purpose of this effort is to support the study (by NRL's Naval Center for Space Technology) of the subson- ic recovery of the BLUE (Basic Launch Understand- ing Effort) launch vehicle. The vehicle uses a re- covery system called the subsonic recovery decel- erator (SRD) that deploys during descent, for a controlled landing. Figure 7 shows the simulated flow field past a re-entry vehicle with a SRD dur- ing its deployment phase. Additional FEFLO appli- cations using a coupled CFD and computational structural dynamics (CSD) methodology, developed by Löhner and his coworkers under Air Force and DNA support, include the blast dynamics in the World Trade Center [7] and aircraft interior blast loads and structural responses.
The development of the parallel software necessary to implement these codes on massively parallel hardware began under the ARPA sponsor- ship. In our parallel code-development effort, we have demonstrated a robust 2-D and 3-D parallel unstructured grid generation code on the LCP&FD Intel iPSC/860 system. A domain partitioner and an implicit incompressible flow solver in both 2-D and 3-D have also been implemented on this sys- tem. The scalability and performance of the flow solver has been demonstrated for the very compli- cated geometry of a landing configuration tri- element airfoil using 384 processors on the Cal- tech Intel Delta machine. In this work, a domain decomposition algorithm that results in efficient load balancing and an optimum computation-to- communication balance was also developed. The development of scalable and portable codes for the adaptive remeshing on parallel architectures will be carried out as part of the CHSSI effort.
76

FEATURED RESEARCH
Fig. 5 — Simulation of a torpedo launch, f = 2.0 s. Surface triangulation and instantaneous velocity vectors as torpedo exits the launch tube.
Fig. 6 — Pressure distribution about 3-D tuna with forward velocity. Caudal fin is being continuously deformed and is executing sinusoidal oscillations with amplitude and frequency of actual tuna motions.
77
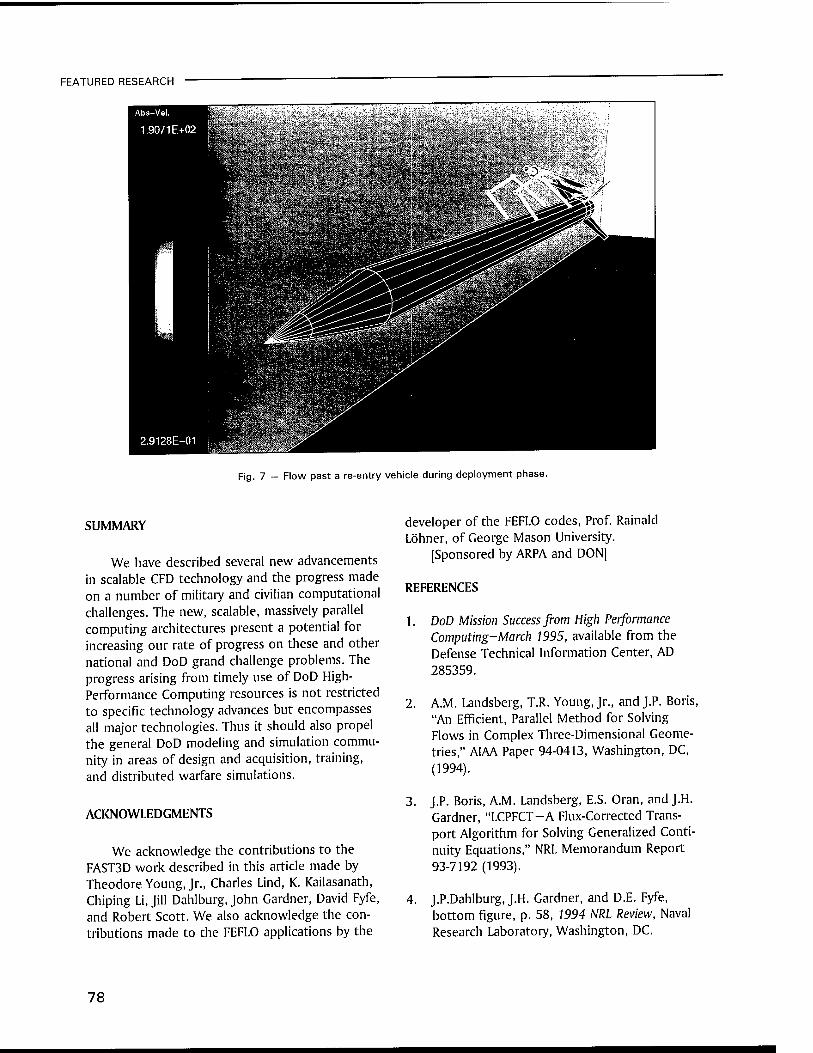
FEATURED RESEARCH
Fig. 7 — Flow past a re-entry vehicle during deployment phase.
SUMMARY
We have described several new advancements in scalable CFD technology and the progress made on a number of military and civilian computational challenges. The new, scalable, massively parallel computing architectures present a potential for increasing our rate of progress on these and other national and DoD grand challenge problems. The progress arising from timely use of DoD High- Performance Computing resources is not restricted to specific technology advances but encompasses all major technologies. Thus it should also propel the general DoD modeling and simulation commu- nity in areas of design and acquisition, training, and distributed warfare simulations.
ACKNOWLEDGMENTS
We acknowledge the contributions to the FAST3D work described in this article made by Theodore Young, Jr., Charles Lind, K. Kailasanath, Chiping Li, Jill Dahlburg, John Gardner, David Fyfe, and Robert Scott. We also acknowledge the con- tributions made to the FEFLO applications by the
developer of the FEFLO codes, Prof. Rainald Löhner, of George Mason University.
[Sponsored by ARPA and DON]
REFERENCES
1. DoD Mission Success from High Performance Computing-March 1995, available from the Defense Technical Information Center, AD 285359.
2. A.M. Landsberg, T.R. Young, Jr., and J.P. Boris, "An Efficient, Parallel Method for Solving Flows in Complex Three-Dimensional Geome- tries," AIAA Paper 94-0413, Washington, DC, (1994).
3. J.P. Boris, A.M. Landsberg, E.S. Oran, and J.H. Gardner, "LCPFCT-A Flux-Corrected Trans- port Algorithm for Solving Generalized Conti- nuity Equations," NRL Memorandum Report 93-7192 (1993).
4. J.P.Dahlburg, J.H. Gardner, and D.E. Fyfe, bottom figure, p. 58, 1994 NRL Review, Naval Research Laboratory, Washington, DC.
78

FEATURED RESEARCH
R. Ramamurti, R. Löhner, and W.C. Sandberg, "Evaluation of a Scalable 3-D Incompressible Finite Element Solver," AIM Paper 94-0756, Washington, D.C. (1994).
W.C. Sandberg, R. Ramamurti, and R. Löhner, "Computing Unsteady Flow About Deforming Bodies," Review Meeting on Biolocomotion and Rotational Flow Over Compliant Surfaces, Baltimore, MD, March 1995.
7. J.D. Baum, H. Luo and R. Löhner, "Develop- ment of a Coupled CFD/CSD Methodology," DoD Mission Success from High Performance Computing-March 1995, available from the Defense Technical Information Center, AD 285359.
THE AUTHORS
ALEXANDRA LANDSBERG received her B.S. and M.S. degees in aeronautics and astronautics from the Massachusetts Institute of Technology in 1988 and 1991, respectively. She has been an aerospace engineer in the Laboratory for Computa- tional Physics and Fluid Dynamics at the Naval Research Laboratory since 1991. Her research has concerned both the development and application of numerical algorithms for solving flows in complex geometries. A major contribution has been the development of the "virtual" cell embedding method for representing and solving flow in complex geometries with Cartesian grids. This method has been implemented in the parallel CFD simulation code, FAST3D. Ms. Landsberg's work on the unsteady airflow about the DDG 51 destroyer has generated interest within the U.S. Navy as well as in England, Australia, and Canada through TTCP Dynamic Interface meetings. Ms. Landsberg is currently studying molecular dynamics simulations of lattices for her Ph.D. in computational physics at George Mason University.
."|:.~: -.' :;-x
(fit " :
RUl «S3
"A r ■j
Ü I^HS t nHSmtSSu
«WM ^^■Äffl u ^pfl
RAVI RAMAMURTI received his B. Tech. in mechanical engineering from the Indian Institute of Technology, Madras, India, in 1980 and his M.S. and Ph. D. degrees in aerospace engineering from University of Cincinnati, in 1983 and 1986, respectively. He is an aerospace engineer in the Laboratory for Computational Physics and Fluid Dynamics at NRL. Dr. Ramamurti has extensive experience in computational aerodynamics and hydrodynamics, including the generation of unstructured grids for complex geometries. Dr. Ramamurti's primary areas of research are in the development of codes for unsteady incompressible flows for submerged vehicles, weapon launch flows, external two-body flows, and moving and deforming surfaces. He is also active in the development of scalable software for parallel computing architectures. He is a member of AIAA and Sigma Xi.
79

FEATURED RESEARCH
JAY P. BORIS received his B A degree in physics from Princeton University in 1964, magna cum laude, and his MA and Ph.D. degrees in astrophysical sciences in 1966 and 1968, also from Princeton. He joined NRL in 1970. In 1978, he was appointed to the SES and established in the NRL Chair of Science in Computa- tional Physics. As director of NRL's Laboratory for Computational Physics and Fluid Dynamics, he has conceived and led computational research efforts on many Navy and DoD fluid dynamics, many-body dynamics, reactive flow, and plasma physics problems and has developed several of the now standard simulation algorithms in use in these fields. His professional recognition includes the Navy's Captain Robert Dexter Conrad and Distinguished Achievement in Science Awards and the Arthur S. Fleming Award. Dr. Boris is a fellow of the American Physical Society and the American Institute for Aeronautics and Astronautics and is the DoD's Computational Technology Area Leader for Fluid Dynamics.
WILLIAM C. SANDBERG received his B.S. degree in physics from Boston College (1967) and M.Sc. in naval architecture from M.I.T (1970). He joined the Naval Ship Engineering Center (later NAVSEA) and was involved in hull form design and hydrodynamic performance assessments for submarines and surface ships. He received a Ph.D. in physics from the Catholic University of America (1987) and joined NRL later that year. His research area is nonequilibrium molecular dynamics of atomic and molecular liquids, focusing primarily on shear-induced structural dynamics and transport processes. He is also involved in computational fluid dynamics for a variety of naval applications.
80

Acoustics

83 Influence of Internal Gravity Waves on Acoustic Propagation S. Finette, S. Wolf, M. On, and D. Tielbuerger
84 High-Frequency Shallow-Water Signal Fluctuations S. Stank, C. Mire, and E. Kennedy
86 Fiber-Optic, Noise-Filtering Acoustic Velocity Sensors JA. Bucaro, N. Lagakos, and B.H. Houston
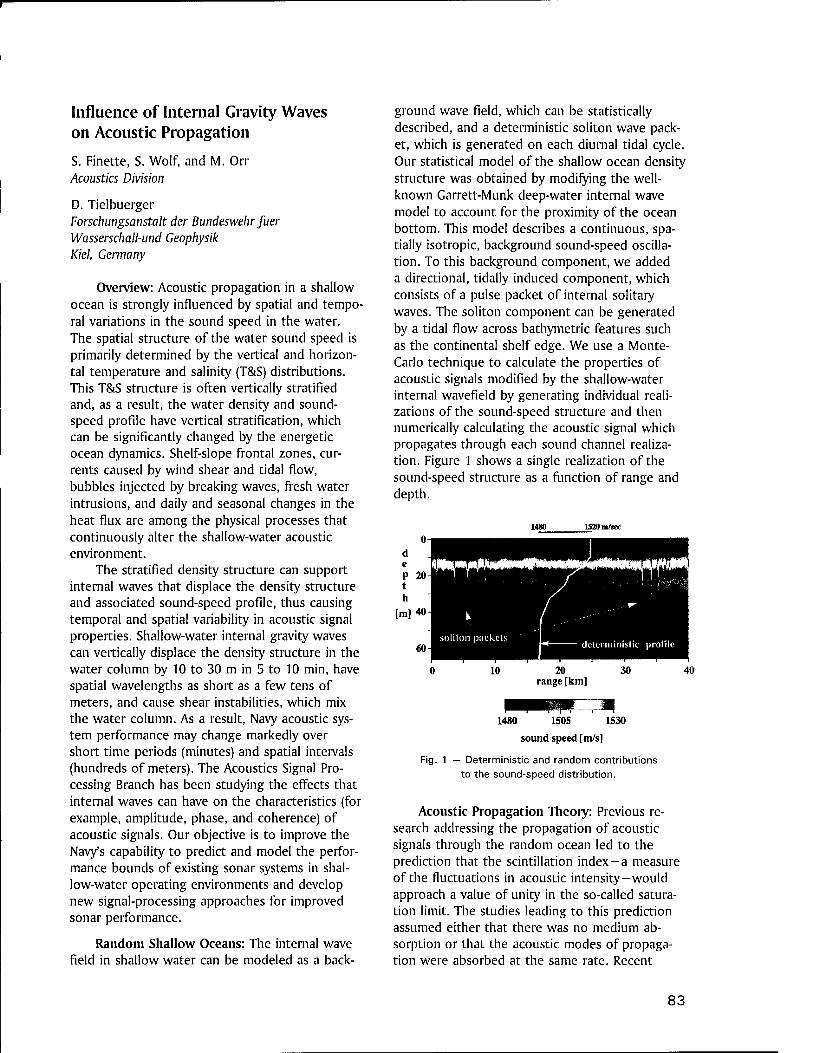
Influence of Internal Gravity Waves on Acoustic Propagation
S. Finette, S. Wolf, and M. Orr Acoustics Division
D. Tielbuerger Forschungsanstalt der Bundeswehr flier Wasserschall-und Geophysik Kiel, Germany
Overview: Acoustic propagation in a shallow ocean is strongly influenced by spatial and tempo- ral variations in the sound speed in the water. The spatial structure of the water sound speed is primarily determined by the vertical and horizon- tal temperature and salinity (T&S) distributions. This T&S structure is often vertically stratified and, as a result, the water density and sound- speed profile have vertical stratification, which can be significantly changed by the energetic ocean dynamics. Shelf-slope frontal zones, cur- rents caused by wind shear and tidal flow, bubbles injected by breaking waves, fresh water intrusions, and daily and seasonal changes in the heat flux are among the physical processes that continuously alter the shallow-water acoustic environment.
The stratified density structure can support internal waves that displace the density structure and associated sound-speed profile, thus causing temporal and spatial variability in acoustic signal properties. Shallow-water internal gravity waves can vertically displace the density structure in the water column by 10 to 30 m in 5 to 10 min, have spatial wavelengths as short as a few tens of meters, and cause shear instabilities, which mix the water column. As a result, Navy acoustic sys- tem performance may change markedly over short time periods (minutes) and spatial intervals (hundreds of meters). The Acoustics Signal Pro- cessing Branch has been studying the effects that internal waves can have on the characteristics (for example, amplitude, phase, and coherence) of acoustic signals. Our objective is to improve the Navy's capability to predict and model the perfor- mance bounds of existing sonar systems in shal- low-water operating environments and develop new signal-processing approaches for improved sonar performance.
Random Shallow Oceans: The internal wave field in shallow water can be modeled as a back-
ground wave field, which can be statistically described, and a deterministic soliton wave pack- et, which is generated on each diurnal tidal cycle. Our statistical model of the shallow ocean density structure was obtained by modifying the well- known Garrett-Munk deep-water internal wave model to account for the proximity of the ocean bottom. This model describes a continuous, spa- tially isotropic, background sound-speed oscilla- tion. To this background component, we added a directional, tidally induced component, which consists of a pulse packet of internal solitary waves. The soliton component can be generated by a tidal flow across bathymetric features such as the continental shelf edge. We use a Monte- Carlo technique to calculate the properties of acoustic signals modified by the shallow-water internal wavefield by generating individual reali- zations of the sound-speed structure and then numerically calculating the acoustic signal which propagates through each sound channel realiza- tion. Figure 1 shows a single realization of the sound-speed structure as a function of range and depth.
[m] 40
20 range [km]
1480 1505
sound speed [m/s]
Fig. 1 — Deterministic and random contributions to the sound-speed distribution.
Acoustic Propagation Theory: Previous re- search addressing the propagation of acoustic signals through the random ocean led to the prediction that the scintillation index—a measure of the fluctuations in acoustic intensity—would approach a value of unity in the so-called satura- tion limit. The studies leading to this prediction assumed either that there was no medium ab- sorption or that the acoustic modes of propaga- tion were absorbed at the same rate. Recent
83
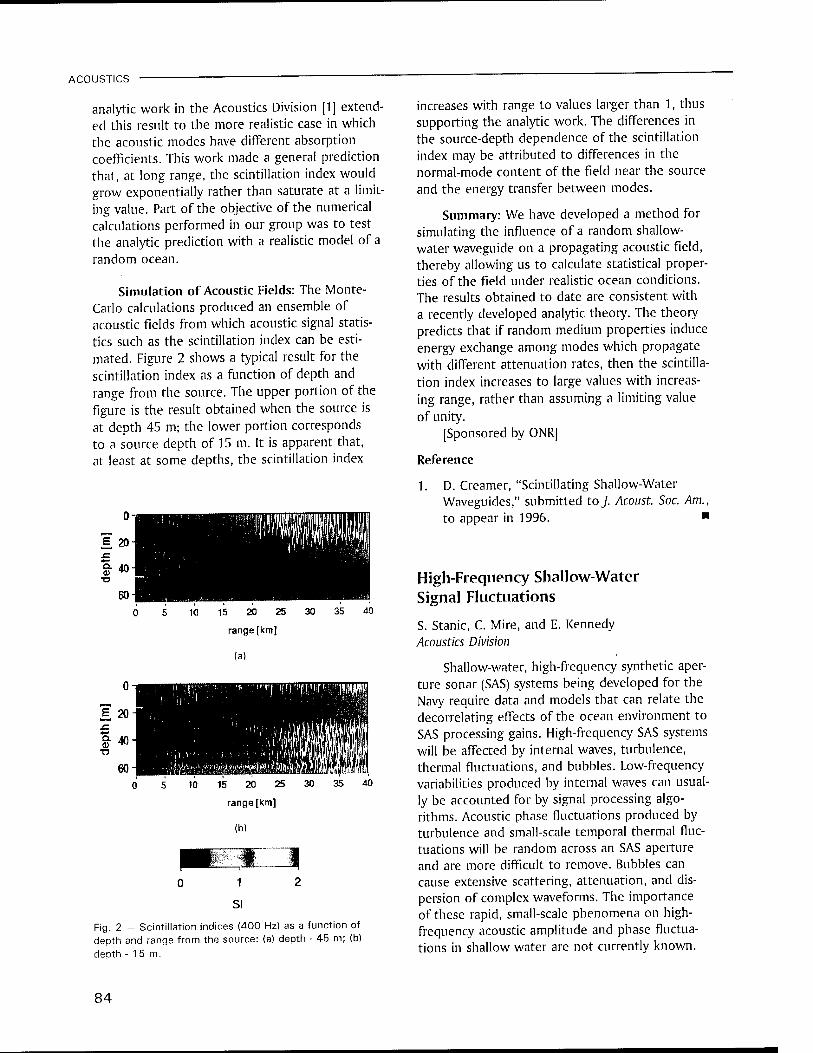
ACOUSTICS
analytic work in the Acoustics Division [1] extend- ed this result to the more realistic case in which the acoustic modes have different absorption coefficients. This work made a general prediction that, at long range, the scintillation index would grow exponentially rather than saturate at a limit- ing value. Part of the objective of the numerical calculations performed in our group was to test the analytic prediction with a realistic model of a random ocean.
Simulation of Acoustic Fields: The Monte- Carlo calculations produced an ensemble of acoustic fields from which acoustic signal statis- tics such as the scintillation index can be esti- mated. Figure 2 shows a typical result for the scintillation index as a function of depth and range from the source. The upper portion of the figure is the result obtained when the source is at depth 45 m; the lower portion corresponds to a source depth of 15 m. It is apparent that, at least at some depths, the scintillation index
15 20 25
range [km]
(a)
35 40
10 15 20 25
range [km]
(b)
30
~9 i
SI
Fig. 2 - Scintillation indices (400 Hz) as a function of depth and range from the source: (a) depth - 45 m; (b)
deDth -15m.
increases with range to values larger than 1, thus supporting the analytic work. The differences in the source-depth dependence of the scintillation index may be attributed to differences in the normal-mode content of the field near the source and the energy transfer between modes.
Summary: We have developed a method for simulating the influence of a random shallow- water waveguide on a propagating acoustic field, thereby allowing us to calculate statistical proper- ties of the field under realistic ocean conditions. The results obtained to date are consistent with a recently developed analytic theory. The theory predicts that if random medium properties induce energy exchange among modes which propagate with different attenuation rates, then the scintilla- tion index increases to large values with increas- ing range, rather than assuming a limiting value of unity.
[Sponsored by ONR]
Reference
1. D. Creamer, "Scintillating Shallow-Water Waveguides," submitted toj. Acoust. Soc. Am., to appear in 1996. ■
High-Frequency Shallow-Water Signal Fluctuations
S. Stanic, C. Mire, and E. Kennedy Acoustics Division
Shallow-water, high-frequency synthetic aper- ture sonar (SAS) systems being developed for the Navy require data and models that can relate the decorrelating effects of the ocean environment to SAS processing gains. High-frequency SAS systems will be affected by internal waves, turbulence, thermal fluctuations, and bubbles. Low-frequency variabilities produced by internal waves can usual- ly be accounted for by signal processing algo- rithms. Acoustic phase fluctuations produced by turbulence and small-scale temporal thermal fluc- tuations will be random across an SAS aperture and are more difficult to remove. Bubbles can cause extensive scattering, attenuation, and dis- persion of complex waveforms. The importance of these rapid, small-scale phenomena on high- frequency acoustic amplitude and phase fluctua- tions in shallow water are not currently known.
84

ACOUSTICS
Experimental Measurements: During the Spring of 1995, NRL conducted a series of very shallow-water (25 to 40 ft), high-frequency (10 to 200 kHz) acoustic signal propagation measure- ments in an area 1200 ft off the beach in Panama City, Florida. These experiments were designed to determine the limits that the shallow-water envi- ronment places on SAS processing gains. Figure 3 is a schematic of the experimental configuration. Because of the very shallow-water environment, highly directional source and receiving arrays were designed. They were mounted on 13-ft high towers and deployed in the shallow coastal area off Panama City. To eliminate surface and bottom multipaths, these arrays were designed to have very narrow vertical beams (1° to 2°). These arrays also had broad horizontal beams (60° to 125°) enabling both receiving systems to be simultaneously insonified. In this configuration, the distance between the receiving systems formed part of a simulated synthetic aperture. The distances between the receivers ranged from 40 to 120 ft. The source-to-receiver ranges varied between 85 and 300 ft. Figure 4 shows the source arrays and the two receiving systems. Measurements of both the temporal and spatial small-scale thermal fluctuations, currents, and sound velocity profiles were made and are being used to relate the high-frequency acoustic phase and amplitude fluctuations to environmental parameters.
Fig. 4 — Source and receiving systems.
Acoustic Phase Variability: Measurements were made of the instantaneous phase differences between signals transmitted from the source to the receivers and replicas of the transmitted sig- nals. Figure 5(a) shows instantaneous temporal phase variations for 300 acoustic pulses transmit- ted to one of the receivers 85 ft away. The fre- quencies were 20 kHz and 110 kHz, the pulse length was 1 ms, and the pulse repetition fre- quency was 1 Hz. During the time of these mea- surements, the instantaneous phase variations at 20 kHz were between -20° and +20°, and the phase variations at 110 kHz ranged from -110° to +100°. Figures 5(b) and (c) show the histo- grams of these phase variations. In these cases,
Fig. 3 — Experimental configuration.
85
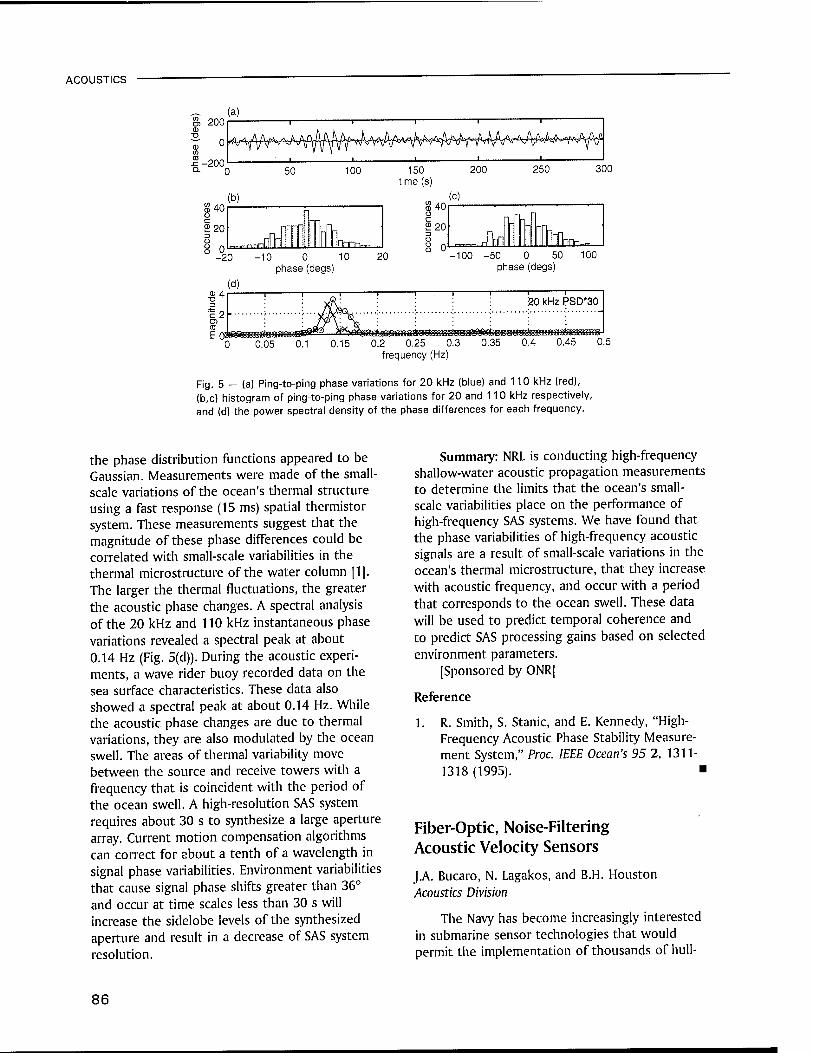
ACOUSTICS
200
-200
(a)
50 100 150 time (s)
200 250 300
(b) 8 40 o
£20
g 01» -20
DDDC
!40 (c)
£20
-,-rJ inn tfl DDo. -10 0 10
phase (degs) 20 -100 -50 0 50
phase (degs) 100
0.05 0.1 0.15 0.2 0.25 0.3 frequency (Hz)
0.35 0.4 0.45 0.5
Fig. 5 - (a) Ping-to-ping phase variations for 20 kHz (blue) and 110 kHz (red), (b,c) histogram of ping-to-ping phase variations for 20 and 110 kHz respectively, and (d) the power spectral density of the phase differences for each frequency.
the phase distribution functions appeared to be Gaussian. Measurements were made of the small- scale variations of the ocean's thermal structure using a fast response (15 ms) spatial thermistor system. These measurements suggest that the magnitude of these phase differences could be correlated with small-scale variabilities in the thermal microstructure of the water column [1]. The larger the thermal fluctuations, the greater the acoustic phase changes. A spectral analysis of the 20 kHz and 110 kHz instantaneous phase variations revealed a spectral peak at about 0.14 Hz (Fig. 5(d)). During the acoustic experi- ments, a wave rider buoy recorded data on the sea surface characteristics. These data also showed a spectral peak at about 0.14 Hz. While the acoustic phase changes are due to thermal variations, they are also modulated by the ocean swell. The areas of thermal variability move between the source and receive towers with a frequency that is coincident with the period of the ocean swell. A high-resolution SAS system requires about 30 s to synthesize a large aperture array. Current motion compensation algorithms can correct for about a tenth of a wavelength in signal phase variabilities. Environment variabilities that cause signal phase shifts greater than 36° and occur at time scales less than 30 s will increase the sidelobe levels of the synthesized aperture and result in a decrease of SAS system resolution.
Summary: NRL is conducting high-frequency shallow-water acoustic propagation measurements to determine the limits that the ocean's small- scale variabilities place on the performance of high-frequency SAS systems. We have found that the phase variabilities of high-frequency acoustic signals are a result of small-scale variations in the ocean's thermal microstructure, that they increase with acoustic frequency, and occur with a period that corresponds to the ocean swell. These data will be used to predict temporal coherence and to predict SAS processing gains based on selected environment parameters.
[Sponsored by ONR]
Reference
1. R. Smith, S. Stanic, and E. Kennedy, "High- Frequency Acoustic Phase Stability Measure- ment System," Proc. IEEE Ocean's 95 2, 1311- 1318 (1995). ■
Fiber-Optic, Noise-Filtering Acoustic Velocity Sensors
JA. Bucaro, N. Lagakos, and B.H. Houston Acoustics Division
The Navy has become increasingly interested in submarine sensor technologies that would permit the implementation of thousands of hull-
86
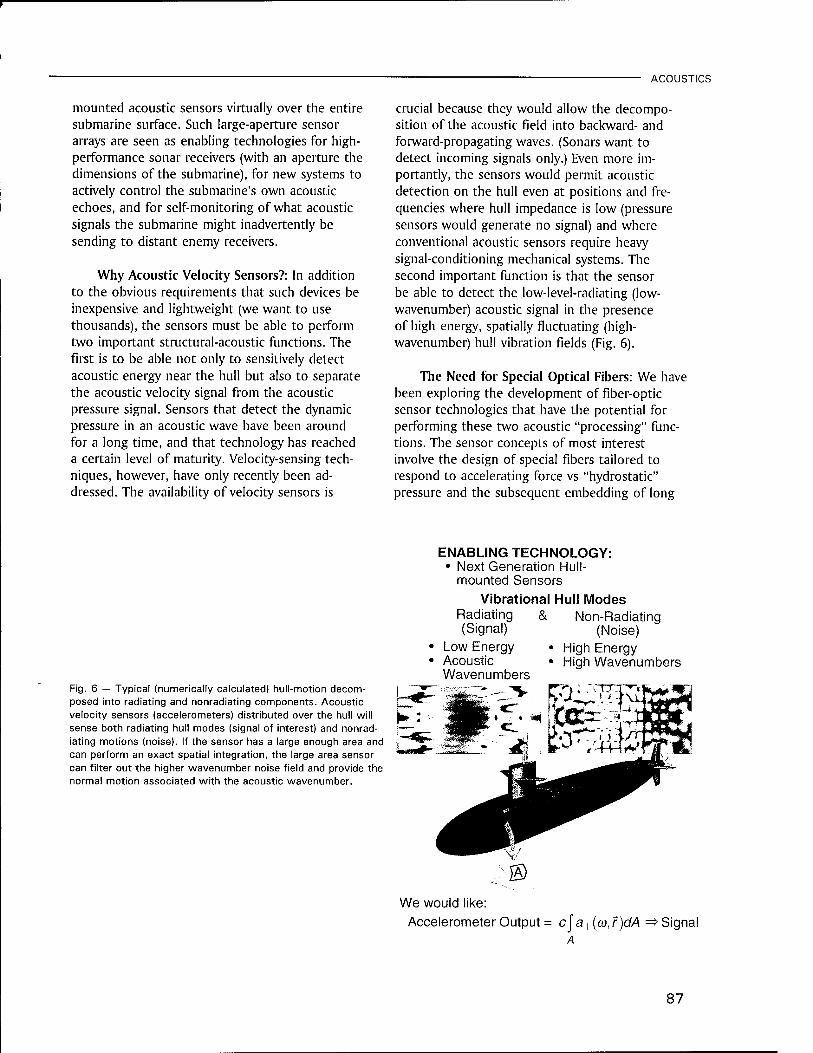
ACOUSTICS
mounted acoustic sensors virtually over the entire submarine surface. Such large-aperture sensor arrays are seen as enabling technologies for high- performance sonar receivers (with an aperture the dimensions of the submarine), for new systems to actively control the submarine's own acoustic echoes, and for self-monitoring of what acoustic signals the submarine might inadvertently be sending to distant enemy receivers.
Why Acoustic Velocity Sensors?: In addition to the obvious requirements that such devices be inexpensive and lightweight (we want to use thousands), the sensors must be able to perform two important structural-acoustic functions. The first is to be able not only to sensitively detect acoustic energy near the hull but also to separate the acoustic velocity signal from the acoustic pressure signal. Sensors that detect the dynamic pressure in an acoustic wave have been around for a long time, and that technology has reached a certain level of maturity. Velocity-sensing tech- niques, however, have only recently been ad- dressed. The availability of velocity sensors is
crucial because they would allow the decompo- sition of the acoustic field into backward- and forward-propagating waves. (Sonars want to detect incoming signals only.) Even more im- portantly, the sensors would permit acoustic detection on the hull even at positions and fre- quencies where hull impedance is low (pressure sensors would generate no signal) and where conventional acoustic sensors require heavy signal-conditioning mechanical systems. The second important function is that the sensor be able to detect the low-level-radiating (low- wavenumber) acoustic signal in the presence of high energy, spatially fluctuating (high- wavenumber) hull vibration fields (Fig. 6).
The Need for Special Optical Fibers: We have been exploring the development of fiber-optic sensor technologies that have the potential for performing these two acoustic "processing" func- tions. The sensor concepts of most interest involve the design of special fibers tailored to respond to accelerating force vs "hydrostatic" pressure and the subsequent embedding of long
Fig. 6 — Typical (numerically calculated) hull-motion decom- posed into radiating and nonradiating components. Acoustic velocity sensors (accelerometers) distributed over the hull will sense both radiating hull modes (signal of interest) and nonrad- iating motions (noise). If the sensor has a large enough area and can perform an exact spatial integration, the large area sensor can filter out the higher wavenumber noise field and provide the normal motion associated with the acoustic wavenumber.
ENABLING TECHNOLOGY: • Next Generation Hull-
mounted Sensors Vibrational Hull Modes
Radiating & Non-Radiating (Noise)
High Energy High Wavenumbers
(Signal) Low Energy Acoustic Wavenumbers
We would like: Accelerometer Output = cja±(co,r)dA => Signal
87

ACOUSTICS —" " '
lengths of such fiber in large area polymer layers. Our philosophy is this: if we can arrive at embed- ded fibers that respond primarily to normal accel- eration (acceleration is related to velocity by a single time derivative), then we can use the spa- tially integrating property of the large area sensor to suppress the vibrational noise field by (in essence) filtering out the higher wavenumber noise. We are attempting to achieve this perfor- mance by appropriate fiber, composition, and sensor design.
This is not a trivial goal since, typically, opti- cal fibers respond more readily to acoustic pres- sure than to uniaxial accelerating forces. Consider that if one places an ideal segment of glass fiber in a fluid through which is passing a plane acous- tic wave, the fiber's phase response due to accel- eration is a factor 1(T5 x frequency smaller than that due to acoustic pressure. Good signal to noise would require that the acceleration-to- pressure response ratio be at least 102. For exam- ple, at 1 kHz, the glass fiber would have to be modified in such a way so as to preferentially increase its acceleration response by 104.
A New Sensor Concept: Figure 7 shows one such design [1]. In this sensor, a typical communication-grade single-mode glass fiber is first coated with a hard polymer material. A soft elastomer gel-like material is then deposited, and finally a thin, stainless-steel jacket is formed around the entire fiber. Long lengths of this com-
posite fiber (tens of meters) are then shaped into a flat spiral coil and encapsulated in a thin, flexi- ble elastomer layer-typically a polyurethane material. Sensors made in this way have been subjected to a variety of tests, including response to broadband normal-acceleration forces (the signal of interest) and to the pressure component of an acoustic field (an unwanted, contaminat- ing signal). For the former, we find a strong, frequency-independent response up to 1.5 kHz while the latter is found to be, as required, extremely low. In addition, nearfield acoustic holography measurements performed with the sensor mounted on a vibrating-hull simulator structure demonstrate the sensor's ability to cor- rectly spatially integrate the local acceleration (or velocity) of the hull over this band of frequencies [2]. This is a crucial step because it means that the sensor can indeed filter out the unwanted vibrational noise field (high wavenumber flexural motion).
These results are very encouraging. Indeed, at low frequencies (< ~1 kHz), this sensor tech- nology appears ready for transition to system applications. Large numbers of these sensors would be inexpensive and directly compatible with optical fiber multiplexing and distribution systems. Current efforts are focused on extending the frequency range. A challenging goal in this regard would be to reach the tactical sonar fre- quency bands. This requires increasing the normal acceleration response of the embedded fiber
thin metal jacket
elastomer gel with optimum Young's modulus
thin hard polymer coating
for protection and to provide
adhesion to soft polymer
typical single mode glass fiber wavequide
Fig. 7 — A recently developed large-area fiber-optic acoustic velocity sensor for hull-mounted applications. The sensor uses a specially designed optical fiber to respond to acceleration vs acoustic pressure.
88

ACOUSTICS
■Optical Fiber
3-D Laser Vibrometer
Fig. 8 — Dual 3-D laser vibrometer scanning system. The system provides the three dynamic displacement (velocity or acceleration) components on the interior and exterior of a vibrating structure.
structure at the higher frequencies and decreas- ing the sensor's response to in-plane structural strains and transverse acceleration. To accomplish this, finite element numerical modeling and advanced experimental measurement techniques are now being used. The latter includes interior/ exterior 3-D laser-vibrometer scanning technolo- gies recently developed at NRL (Fig. 8), which allow the mapping of all hull-vibration wave types and the resulting displacement and strains of the polymer layer.
[Sponsored by ONR]
References
1. N. Lagakos and J.A. Bucaro, "Planar Fiber Optic Acoustic Velocity Sensor," J. Acoust. Soc. Am. 97, 1660 (1995).
2. J.A. Bucaro, N. Lagakos, B.H. Houston, and L. Kraus, "Large Area Planar Fiber Optic Acceler- ometers for Measurement of Acoustic Velo- city," Proceedings of Acoustic Velocity Sensor Focused Workshop, Sept. 1995, Mystic, Connecticut. ■
89

Chemical/ Biochemical
Research

93 Cubane Chemistry: A Source of New Energetic Materials R.D. Gilardi
95 The Many Faces of Silicon L.J. Whitman, S.C. Erwin, and A.A. Baski
97 Field Testing of Environmental Immunosensors A.W. Kusterbeck and L.C. Shriver-Lake
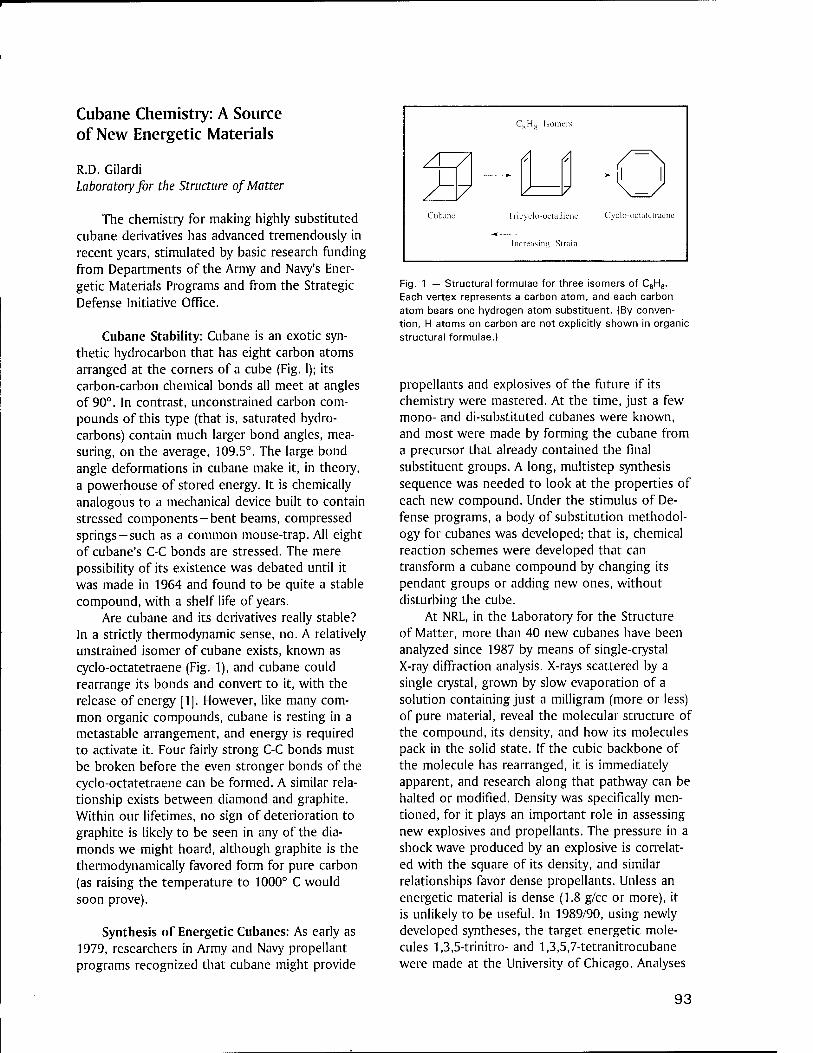
Cubane Chemistry: A Source of New Energetic Materials
R.D. Gilardi Laboratory for the Structure of Matter
The chemistry for making highly substituted cubane derivatives has advanced tremendously in recent years, stimulated by basic research funding from Departments of the Army and Navy's Ener- getic Materials Programs and from the Strategic Defense Initiative Office.
Cubane Stability: Cubane is an exotic syn- thetic hydrocarbon that has eight carbon atoms arranged at the corners of a cube (Fig. 1); its carbon-carbon chemical bonds all meet at angles of 90°. In contrast, unconstrained carbon com- pounds of this type (that is, saturated hydro- carbons) contain much larger bond angles, mea- suring, on the average, 109.5°. The large bond angle deformations in cubane make it, in theory, a powerhouse of stored energy. It is chemically analogous to a mechanical device built to contain stressed components-bent beams, compressed springs—such as a common mouse-trap. All eight of cubane's C-C bonds are stressed. The mere possibility of its existence was debated until it was made in 1964 and found to be quite a stable compound, with a shelf life of years.
Are cubane and its derivatives really stable? In a strictly thermodynamic sense, no. A relatively unstrained isomer of cubane exists, known as cyclo-octatetraene (Fig. 1), and cubane could rearrange its bonds and convert to it, with the release of energy [1]. However, like many com- mon organic compounds, cubane is resting in a metastable arrangement, and energy is required to activate it. Four fairly strong C-C bonds must be broken before the even stronger bonds of the cyclo-octatetraene can be formed. A similar rela- tionship exists between diamond and graphite. Within our lifetimes, no sign of deterioration to graphite is likely to be seen in any of the dia- monds we might hoard, although graphite is the thermodynamically favored form for pure carbon (as raising the temperature to 1000° C would soon prove).
Synthesis of Energetic Cubanes: As early as 1979, researchers in Army and Navy propellant programs recognized that cubane might provide
A /
7 /, /,
) /
Cuban Tricvclo-octadiene
Increasing Strain
Cvclo-oclatelraene
Fig. 1 — Structural formulae for three isomers of CeHe. Each vertex represents a carbon atom, and each carbon atom bears one hydrogen atom substituent. (By conven- tion, H atoms on carbon are not explicitly shown in organic structural formulae.)
propellants and explosives of the future if its chemistry were mastered. At the time, just a few mono- and di-substituted cubanes were known, and most were made by forming the cubane from a precursor that already contained the final substituent groups. A long, multistep synthesis sequence was needed to look at the properties of each new compound. Under the stimulus of De- fense programs, a body of substitution methodol- ogy for cubanes was developed; that is, chemical reaction schemes were developed that can transform a cubane compound by changing its pendant groups or adding new ones, without disturbing the cube.
At NRL, in the Laboratory for the Structure of Matter, more than 40 new cubanes have been analyzed since 1987 by means of single-crystal X-ray diffraction analysis. X-rays scattered by a single crystal, grown by slow evaporation of a solution containing just a milligram (more or less) of pure material, reveal the molecular structure of the compound, its density, and how its molecules pack in the solid state. If the cubic backbone of the molecule has rearranged, it is immediately apparent, and research along that pathway can be halted or modified. Density was specifically men- tioned, for it plays an important role in assessing new explosives and propellants. The pressure in a shock wave produced by an explosive is correlat- ed with the square of its density, and similar relationships favor dense propellants. Unless an energetic material is dense (1.8 g/cc or more), it is unlikely to be useful. In 1989/90, using newly developed syntheses, the target energetic mole- cules 1,3,5-trinitro-and 1,3,5,7-tetranitrocubane were made at the University of Chicago. Analyses
93
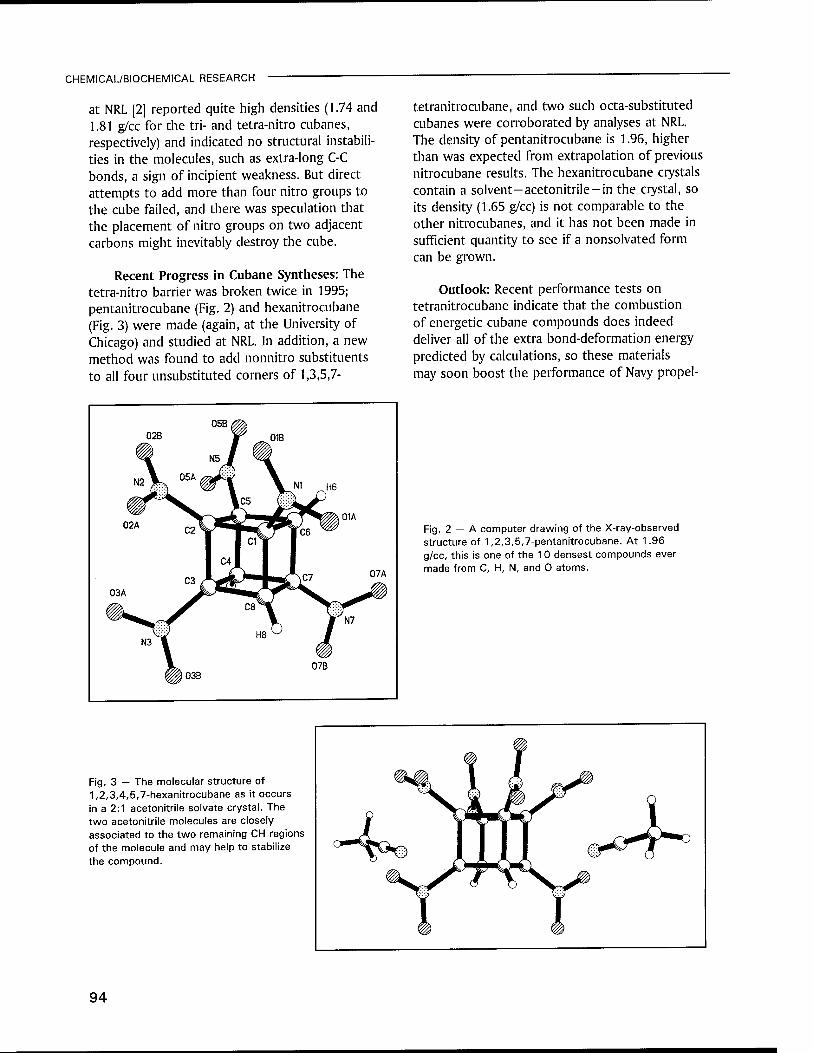
CHEMICAL/BIOCHEMICAL RESEARCH
at NRL [2] reported quite high densities (1.74 and 1.81 g/cc for the tri- and tetra-nitro cubanes, respectively) and indicated no structural instabili- ties in the molecules, such as extra-long C-C bonds, a sign of incipient weakness. But direct attempts to add more than four nitro groups to the cube failed, and there was speculation that the placement of nitro groups on two adjacent carbons might inevitably destroy the cube.
Recent Progress in Cubane Syntheses: The tetra-nitro barrier was broken twice in 1995; pentanitrocubane (Fig. 2) and hexanitrocubane (Fig. 3) were made (again, at the University of Chicago) and studied at NRL. In addition, a new method was found to add nonnitro substituents to all four unsubstituted corners of 1,3,5,7-
tetranitrocubane, and two such octa-substituted cubanes were corroborated by analyses at NRL. The density of pentanitrocubane is 1.96, higher than was expected from extrapolation of previous nitrocubane results. The hexanitrocubane crystals contain a solvent-acetonitrile-in the crystal, so its density (1.65 g/cc) is not comparable to the other nitrocubanes, and it has not been made in sufficient quantity to see if a nonsolvated form can be grown.
Outlook: Recent performance tests on tetranitrocubane indicate that the combustion of energetic cubane compounds does indeed deliver all of the extra bond-deformation energy predicted by calculations, so these materials may soon boost the performance of Navy propel-
05B^ 02B
N5 /
r OB
N2 Ik 05A^
\A1 nH6
C5 (p^^^
02A cz\
C4J
«^sMiirTiiii OIA
air 1
C3 f ^L*\C7 07A
03A Cf3% ^Tx^^^
\ jf N7
N3 <|
P03B
H8 J
07B
Fig. 2 — A computer drawing of the X-ray-observed structure of 1,2,3,5,7-pentanitrocubane. At 1.96 g/cc, this is one of the 10 densest compounds ever made from C, H, N, and 0 atoms.
Fig. 3 — The molecular structure of 1,2,3,4,5,7-hexanitrocubane as it occurs in a 2:1 acetonitrile solvate crystal. The two acetonitrile molecules are closely associated to the two remaining CH regions of the molecule and may help to stabilize the compound.
94

CHEMICAL/BIOCHEMICAL RESEARCH
lants and explosives. One ultimate target—octani- trocubane—was once scoffed at by many chem- ists, but the thermal stability of penta- and hexa- nitrocubane and of octa-substituted nitrocubanes has changed the outlook; it is now considered highly likely that it will be made, and that it will be stable.
[Sponsored by ONR]
References
1. P.E. Eaton and D. Stossel, "Synthesis of Alkynylcyclooctatetraenes and Alkynylcu- banes,";. Org. Chem. 56, 5138 (1991).
2. P.E. Eaton, Y. Xiong, and R. Gilardi, "System- atic Substitution on the Cubane Nucleus. Synthesis and Properties of 1,3,5-Trinitro- cubane and l,3,5,7-Tetranitrocubane,"J. Am. Chem. Soc. 115, 10195 (1993).
K. Lukin, J. Li, P.E. Eaton, and R. Gilardi, "Penta- and Hexanitrocubanes. N204 Nitrati of Group I-A Organometallics," Angewandte Chemie, submitted October 1995.
The Many Faces of Silicon
LJ. Whitman Chemistry Division
S.C. Erwin Condensed Matter and Radiation Sciences Division
A.A. Baski NRC/NRL Cooperative Research Associate
What are the stable surfaces of silicon and what determines their stability? Given that the fabrication of almost every electronic device be- gins with a clean surface of crystalline silicon, this question is of more than esoteric importance- the answer has implications for technologies of the future.
When a crystal is truncated to expose a sur- face, the surface atoms are left with uncoordinat- ed chemical bonds. In an effort to reduce the density of these dangling bonds, the atoms in the top few layers rearrange-a process known
as surface reconstruction. Every different slice through a crystal exposes a surface with a differ- ent periodic arrangement of atoms (referred to as the unit cell), with each surface described by a set of indices, (x y z) (Fig. 4). The low-index surfaces have the smallest unit cells and simplest surface structures. More complicated surfaces are created when crystals are sliced to high indices, exposing unit cells that are large and composed of many atoms. Such complex faces are usually unstable and reconstruct into facets of low-index planes (like the facets on a gemstone).
Fig. 4 — The low-index planes of a simple cubic crystal. Each plane can be described by indices (x y z) associated with the vector perpendicular to that plane, as defined by the axes of the crystal; for example, the (111) plane is perpendicular to the vector 1x + 1y + 1z. Note that silicon has a more complex crystal structure than shown (it has the diamond structure).
The surfaces of silicon, the basis for the multibillion-dollar electronics industry, may be the most widely studied of all. Despite such scrutiny, only a few stable silicon surfaces are known, of which only three have known structures: (001), (111), and (113). Although most electronic devices are fabricated on Si(001), high-index surfaces are being considered as possible substrates for future applications. To date, a general understanding of the structure and stability of high-index silicon surfaces does not exist.
Approach: We have used scanning tunneling microscopy (STM) in combination with first-prin- ciples electronic-structure calculations to deter- mine the atomic-scale structure of silicon surfaces
95
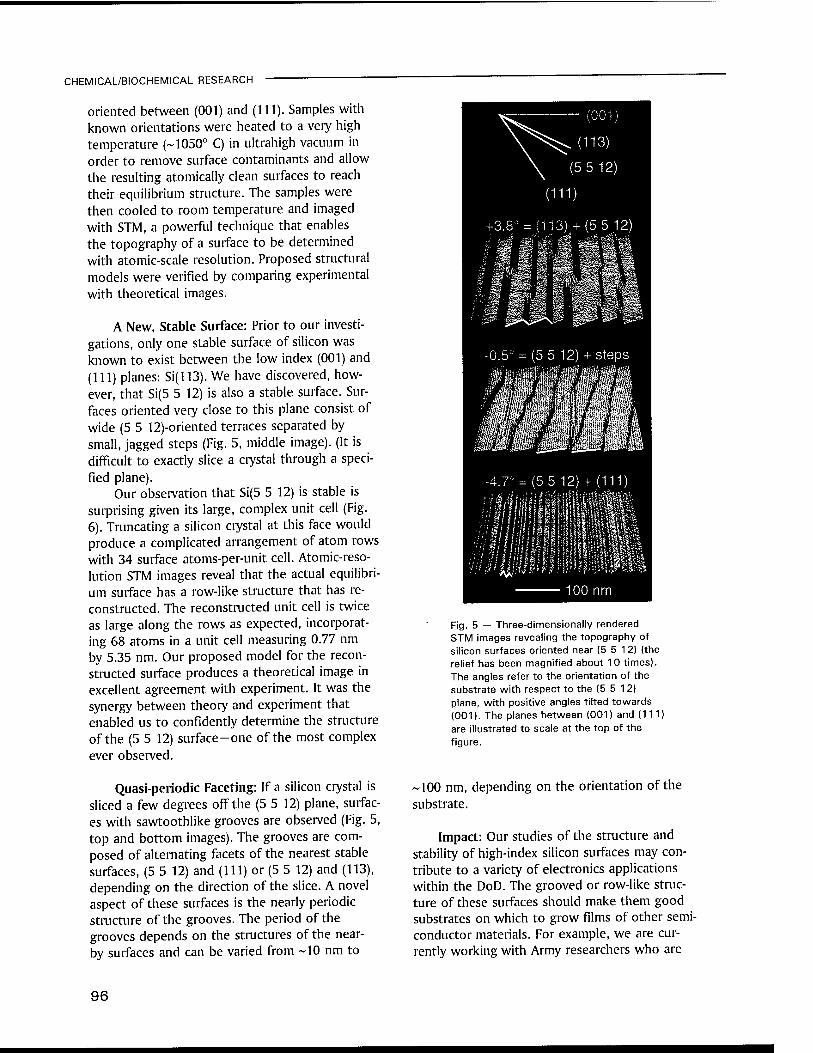
CHEMICAL/BIOCHEMICAL RESEARCH
oriented between (001) and (111). Samples with known orientations were heated to a very high temperature (-1050° C) in ultrahigh vacuum in order to remove surface contaminants and allow the resulting atomically clean surfaces to reach their equilibrium structure. The samples were then cooled to room temperature and imaged with STM, a powerful technique that enables the topography of a surface to be determined with atomic-scale resolution. Proposed structural models were verified by comparing experimental with theoretical images.
A New, Stable Surface: Prior to our investi- gations, only one stable surface of silicon was known to exist between the low index (001) and (111) planes: Si(113). We have discovered, how- ever, that Si(5 5 12) is also a stable surface. Sur- faces oriented very close to this plane consist of wide (5 5 12)-oriented terraces separated by small, jagged steps (Fig. 5, middle image). (It is difficult to exactly slice a crystal through a speci- fied plane).
Our observation that Si(5 5 12) is stable is surprising given its large, complex unit cell (Fig. 6). Truncating a silicon crystal at this face would produce a complicated arrangement of atom rows with 34 surface atoms-per-unit cell. Atomic-reso- lution STM images reveal that the actual equilibri- um surface has a row-like structure that has re- constructed. The reconstructed unit cell is twice as large along the rows as expected, incorporat- ing 68 atoms in a unit cell measuring 0.77 nm by 5.35 nm. Our proposed model for the recon- structed surface produces a theoretical image in excellent agreement with experiment. It was the synergy between theory and experiment that enabled us to confidently determine the structure of the (5 5 12) surface-one of the most complex ever observed.
Quasi-periodic Faceting: If a silicon crystal is sliced a few degrees off the (5 5 12) plane, surfac- es with sawtoothlike grooves are observed (Fig. 5, top and bottom images). The grooves are com- posed of alternating facets of the nearest stable surfaces, (5 5 12) and (111) or (5 5 12) and (113), depending on the direction of the slice. A novel aspect of these surfaces is the nearly periodic structure of the grooves. The period of the grooves depends on the structures of the near- by surfaces and can be varied from ~10 nm to
Fig. 5 — Three-dimensionally rendered STM images revealing the topography of silicon surfaces oriented near (5 5 12) (the relief has been magnified about 10 times). The angles refer to the orientation of the substrate with respect to the (5 5 12) plane, with positive angles tilted towards (001). The planes between (001) and (111)
are illustrated to scale at the top of the
figure.
~100 nm, depending on the orientation of the substrate.
Impact: Our studies of the structure and stability of high-index silicon surfaces may con- tribute to a variety of electronics applications within the DoD. The grooved or row-like struc- ture of these surfaces should make them good substrates on which to grow films of other semi- conductor materials. For example, we are cur- rently working with Army researchers who are
96
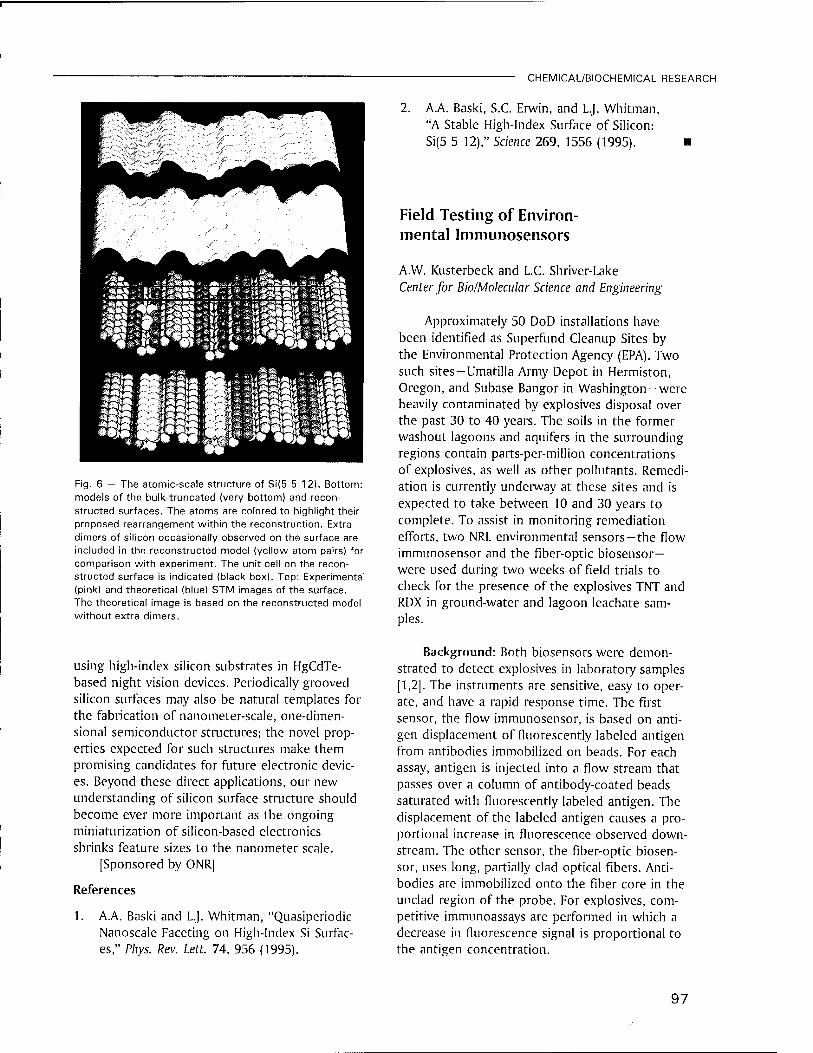
CHEMICAL/BIOCHEMICAL RESEARCH
Fig. 6 — The atomic-scale structure of Si(5 5 12). Bottom: models of the bulk-truncated (very bottom) and recon-
structed surfaces. The atoms are colored to highlight their proposed rearrangement within the reconstruction. Extra dimers of silicon occasionally observed on the surface are included in the reconstructed model (yellow atom pairs) for comparison with experiment. The unit cell on the recon- structed surface is indicated (black box). Top: Experimental (pink) and theoretical (blue) STM images of the surface. The theoretical image is based on the reconstructed model without extra dimers.
using high-index silicon substrates in HgCdTe- based night vision devices. Periodically grooved silicon surfaces may also be natural templates for the fabrication of nanometer-scale, one-dimen- sional semiconductor structures; the novel prop- erties expected for such structures make them promising candidates for future electronic devic- es. Beyond these direct applications, our new understanding of silicon surface structure should become ever more important as the ongoing miniaturization of silicon-based electronics shrinks feature sizes to the nanometer scale.
[Sponsored by ONR]
References
1. A.A. Baski and LJ. Whitman, "Quasiperiodic Nanoscale Faceting on High-Index Si Surfac- es," Phys. Rev. Lett. 74, 956 (1995).
2. A.A. Baski, S.C. Erwin, and LJ. Whitman, "A Stable High-Index Surface of Silicon: Si(5 5 12)," Science 269, 1556 (1995).
Field Testing of Environ- mental Immunosensors
A.W. Kusterbeck and L.C. Shriver-Lake Center for Bio/Molecular Science and Engineering
Approximately 50 DoD installations have been identified as Superfund Cleanup Sites by the Environmental Protection Agency (EPA). Two such sites—Umatilla Army Depot in Hermiston, Oregon, and Subase Bangor in Washington-were heavily contaminated by explosives disposal over the past 30 to 40 years. The soils in the former washout lagoons and aquifers in the surrounding regions contain parts-per-million concentrations of explosives, as well as other pollutants. Remedi- ation is currently underway at these sites and is expected to take between 10 and 30 years to complete. To assist in monitoring remediation efforts, two NRL environmental sensors—the flow immunosensor and the fiber-optic biosensor- were used during two weeks of field trials to check for the presence of the explosives TNT and RDX in ground-water and lagoon leachate sam- ples.
Background: Both biosensors were demon- strated to detect explosives in laboratory samples [1,2]. The instruments are sensitive, easy to oper- ate, and have a rapid response time. The first sensor, the flow immunosensor, is based on anti- gen displacement of fluorescently labeled antigen from antibodies immobilized on beads. For each assay, antigen is injected into a flow stream that passes over a column of antibody-coated beads saturated with fluorescently labeled antigen. The displacement of the labeled antigen causes a pro- portional increase in fluorescence observed down- stream. The other sensor, the fiber-optic biosen- sor, uses long, partially clad optical fibers. Anti- bodies are immobilized onto the fiber core in the unclad region of the probe. For explosives, com- petitive immunoassays are performed in which a decrease in fluorescence signal is proportional to the antigen concentration.
97
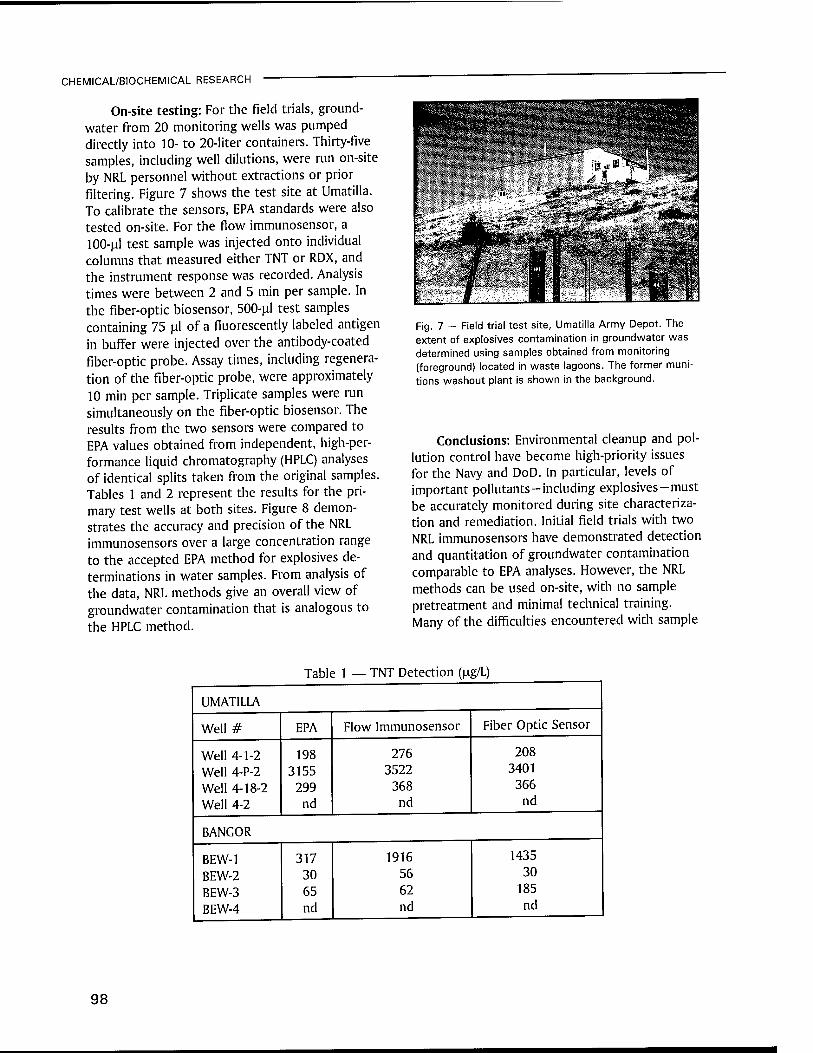
CHEMICAL/BIOCHEMICAL RESEARCH
On-site testing: For the field trials, ground- water from 20 monitoring wells was pumped directly into 10- to 20-liter containers. Thirty-five samples, including well dilutions, were run on-site by NRL personnel without extractions or prior filtering. Figure 7 shows the test site at Umatilla. To calibrate the sensors, EPA standards were also tested on-site. For the flow immunosensor, a 100-ul test sample was injected onto individual columns that measured either TNT or RDX, and the instrument response was recorded. Analysis times were between 2 and 5 min per sample. In the fiber-optic biosensor, 500-ul test samples containing 75 JJ.1 of a fluorescently labeled antigen in buffer were injected over the antibody-coated fiber-optic probe. Assay times, including regenera- tion of the fiber-optic probe, were approximately 10 min per sample. Triplicate samples were run simultaneously on the fiber-optic biosensor. The results from the two sensors were compared to EPA values obtained from independent, high-per- formance liquid chromatography (HPLC) analyses of identical splits taken from the original samples. Tables 1 and 2 represent the results for the pri- mary test wells at both sites. Figure 8 demon- strates the accuracy and precision of the NRL immunosensors over a large concentration range to the accepted EPA method for explosives de- terminations in water samples. From analysis of the data, NRL methods give an overall view of groundwater contamination that is analogous to the HPLC method.
Fig. 7 — Field trial test site, Umatilla Army Depot. The extent of explosives contamination in groundwater was determined using samples obtained from monitoring (foreground) located in waste lagoons. The former muni- tions washout plant is shown in the background.
Conclusions: Environmental cleanup and pol- lution control have become high-priority issues for the Navy and DoD. In particular, levels of important pollutants-including explosives - must be accurately monitored during site characteriza- tion and remediation. Initial field trials with two NRL immunosensors have demonstrated detection and quantitation of groundwater contamination comparable to EPA analyses. However, the NRL methods can be used on-site, with no sample pretreatment and minimal technical training. Many of the difficulties encountered with sample
Table 1 — TNT Detection (ug/L)
UMATILLA
Well# EPA Flow Immunosensor Fiber Optic Sensor
Well 4-1-2 Well 4-P-2 Well 4-18-2 Well 4-2
198 3155
299 nd
276 3522
368 nd
208 3401
366 nd
BANGOR
BEW-1 BEW-2 BEW-3 BEW-4
317 30 65 nd
1916 56 62 nd
1435 30
185 nd
98
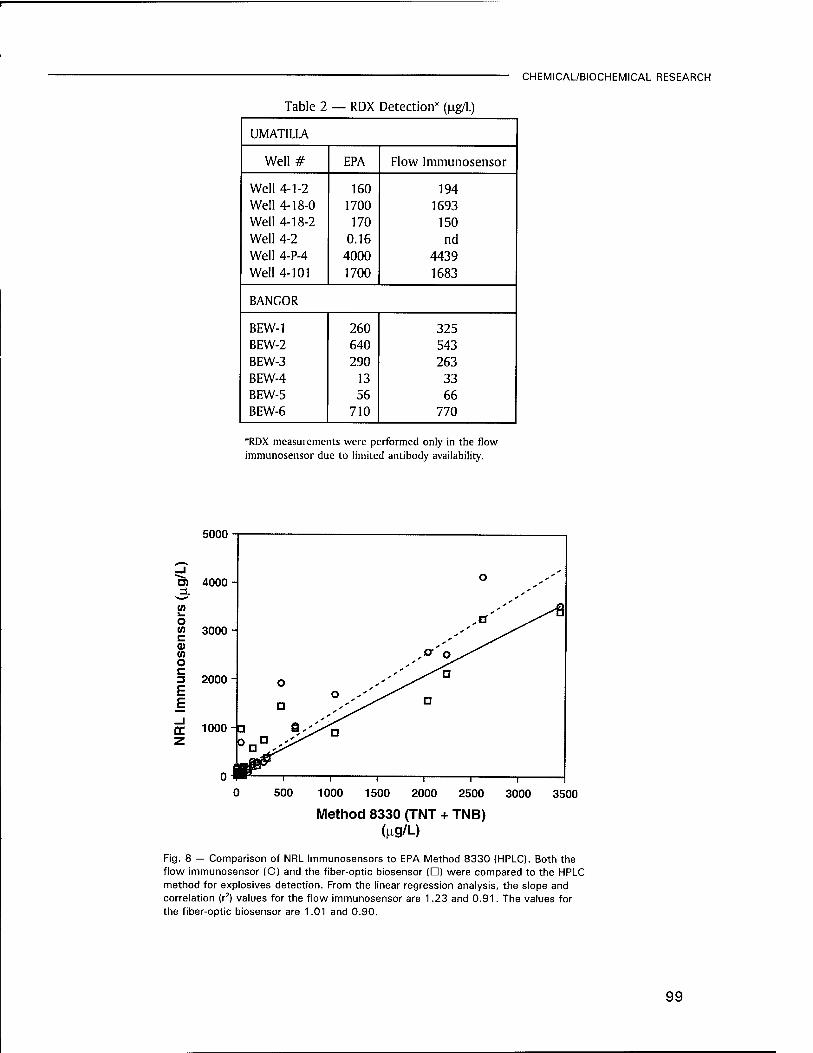
CHEMICAL/BIOCHEMICAL RESEARCH
5000
Table 2 — RDX Detection* ([ig/l)
UMATILLA
Well# EPA Flow Immunosensor
Well 4-1-2 160 194 Well 4-18-0 1700 1693 Well 4-18-2 170 150 Well 4-2 0.16 nd Well 4-P-4 4000 4439 Well 4-101 1700 1683
BANGOR
BEW-1 260 325 BEW-2 640 543 BEW-3 290 263 BEW-4 13 33 BEW-5 56 66 BEW-6 710 770
*RDX measurements were performed only in the flow immunosensor due to limited antibody availability.
Oi 4000 =L
in i—
o 10 c 3000
CO o c 3 2000 E E
1000
0 500 1000 1500 2000 2500 3000 3500
Method 8330 (TNT + TNB) (i^g/L)
Fig. 8 — Comparison of NRL Immunosensors to EPA Method 8330 (HPLC). Both the flow immunosensor (O) and the fiber-optic biosensor (D) were compared to the HPLC method for explosives detection. From the linear regression analysis, the slope and correlation (r2) values for the flow immunosensor are 1.23 and 0.91. The values for the fiber-optic biosensor are 1.01 and 0.90.
99
CHEMICAL/BIOCHEMICAL RESEARCH —■
shipping, use of solvents, and laboratory report- ing times (typically 2 to 4 weeks) can also be avoided. Application of these systems to the envi- ronmental problem should provide improved, cost-effective alternatives to traditional laboratory methods.
Acknowledgment: The authors thank J. Bart, B. Donner, L. Judd, and P. Charles for their tech- nical contributions in these field trials. H. Craig of EPA's Regions 10 coordinated the field trials.
[Sponsored by SERDP and ESTCP]
References
1. J.P. Whelan, A.W. Kusterbeck, G.A. Wemhoff, R. Bredehorst, and F.S. Ligler, "Continuous- Flow Immunosensor for Detection of Explo- sives," Analy. Chem. 65, 3561-3565 (1993).
2. L.C. Shriver-Lake, K.A. Breslin, P.T. Charles, D.W. Conrad, J.P. Golden, and F.S. Ligler, "Detection of TNT in Water Using an Evanes- cent Wave Fiber-Optic Biosensor," Analy. Chem. 67, 2431-2435 (1995). ■
100

€lectronks and
electromagnetics

103 AN/SPQ-9B ADM Radar L.M. Liebowitz, L.M. Shaus, and D.J. Cardiel
104 Ferroelectric Lens Phased Arrays J.B.I. Rao, D.P. Patel, and W.R. Pickles
106 Small Ship ESM System J.J. Briguglio
108 Missile Radar Performance Characterization D.W. Kahl
110 A Novel Coaxial Free-Electron Laser M. Blank, R.H. Jackson, and H.P. Freund

AN/SPQ-9B ADM Radar
L.M. Leibowitz, L.M. Schaus, and D.J. Cardiel Radar Division
Sea-skimming missiles are a major threat to U.S. naval ships. NRL, supported by the Program Executive Office, Theater Air Defense (PEO(TAD)), has developed an important new concept for anti- ship missile defense (ASMD). The AN/SPQ-9B radar concept maintains AN/SPQ-9A radar Gun Fire Con- trol System (GFCS) MK 86 support while adding a new, low-cost, quality sea-skimmer detection capability to the Fleet. The AN/SPQ-9B provides significantly increased sensitivity and improved ability to detect targets in clutter. A surface mode maintains or improves performance in support of the GFCS MK 86 and backup navigation. An air mode provides the new sea-skimmer detection capability. An AN/SPQ-9B Advanced Development Model (ADM) radar was successfully land-based tested at Wallops Island, Virginia, and more recently in an at-sea shipboard environment.
ADM Radar: NRL designed and assembled an ADM radar to prove the AN/SPQ-9B concept and reduce development risk [1]. State-of-the-art nondevelopment item and commercial-off-the- shelf (COTS) components were used to obtain significant advances in signal-to-clutter perfor- mance on a tight schedule at low cost. The cur- rent pedestal was modified, the reflector was replaced by a larger unit with multiple feeds, a new processor and receiver/exciter were devel- oped, and the transmitter was replaced by a USAF AN/APG-68 radar transmitter.
A sensitivity high enough to detect difficult threats is achieved by the larger antenna, increased power from the AN/APG-68 low-phase noise transmitter, receiver noise figure improve- ment by use of a low-noise amplifier (LNA) at the antenna, and other loss reductions. In the air mode, pulse-Doppler waveforms with appropriate pulse-repetition frequencies (PRFs) provide a velocity notch that allows sea-skimmer detection in clutter. Clutter filtering is sufficient to reduce close-in clutter (competing with weak far-range targets) to near thermal noise. Current surface functions are maintained by a pulse waveform, which is time- and frequency-division multiplexed with the pulse-Doppler waveform to form a com- posite radar waveform and essentially provide
two radars in one. Surface mode video returns are displayed on a pulse-position indicator (PPI) and are used for GFCS MK 86 functions.
Major units of the ADM radar include an- tenna, transmitter, receiver/exciter, processor, display, and radome. The current AN/SPQ-9A radar antenna unit was modified under contract to provide a larger reflector having three beam posi- tions controlled by an electronic microwave switch, a new azimuth drive motor to provide a reduced rotation rate, slip rings in the azimuth drive system to furnish control signals to the microwave switch, a circulator and receiver pro- tector, a microwave enclosure housing the LNA, and a COTS radome. An AN/APG-68 radar trans- mitter was borrowed from the USAF and, under contract, configured for shipboard use. An ultra- low phase-noise signal generator, used for fre- quency synthesis, was procured. The circulator, receiver protector, and high-power microwave switch were purchased. The processor was con- figured from COTS 6U-size VME bus boards and supported by COTS software. The track display was implemented by a Sun SPARCstation 2 with NRL-modified Johns Hopkins University/Applied Physics Laboratory AutoID software. Using COTS components, NRL designed and constructed the local oscillation (LO) distribution, exciter, receiver, and baseband waveform generator. NRL wrote the software for the system controller, timing, I/O, signal processing, and tracking functions, performed system integration, testing, and docu- mented the results.
Testing: The AN/SPQ-9B ADM radar was suc- cessfully land-based tested at Wallops Island in 1993 using test targets, including Doppler repeat- ers, Lear jet aircraft, and airborne towed targets. The results demonstrate the ability to provide required firm-track ranges and achieve a major improvement in the detection of targets in clut- ter. As shown in Fig. 1, the ADM radar was installed on board the PEO(TAD) Self-Defense Test Ship for risk-reduction testing in an at-sea littoral environment in December 1994 and January 1995. Test targets included a BQM-74E sea skimmer, F-16 supersonic fighter aircraft, EA-6B aircraft, and targets of opportunity. Excellent firm-track ranges were obtained in excess of the minimum required thresholds. These results confirm the ability of the AN/SPQ-9B radar concept to achieve firm-track performance thresholds in an at-sea
103
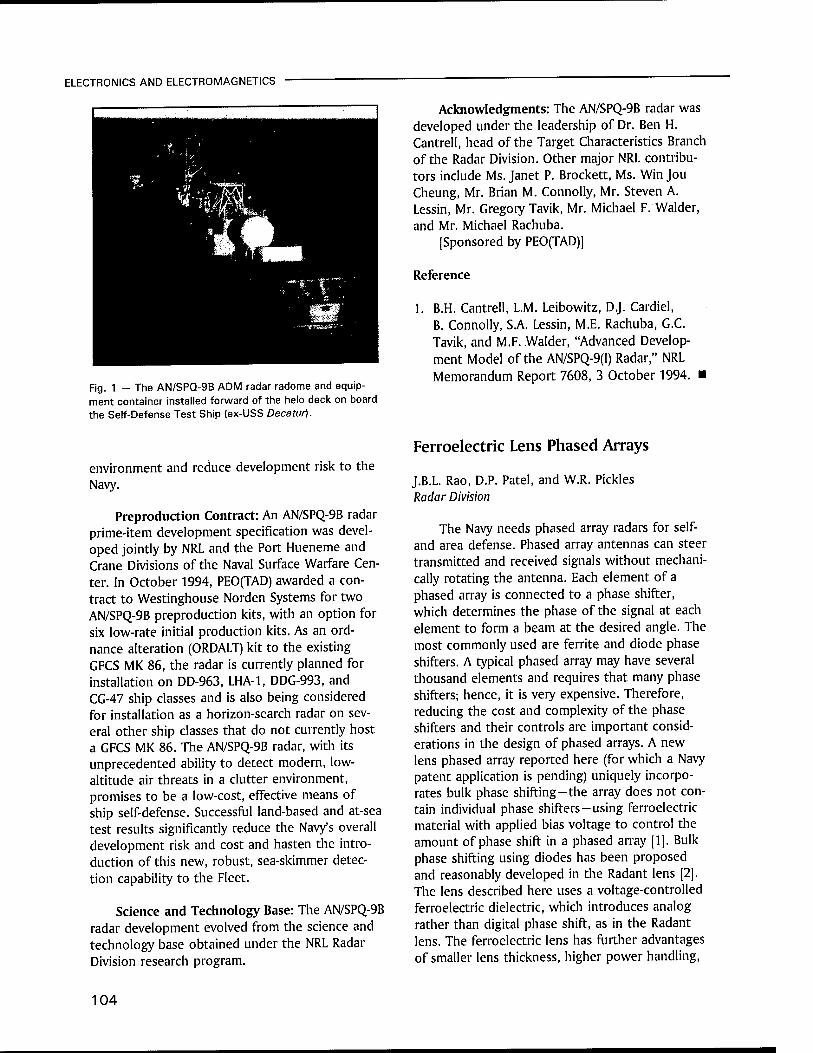
ELECTRONICS AND ELECTROMAGNETICS
Fig. 1 - The AN/SPQ-9B ADM radar radome and equip- ment container installed forward of the helo deck on board the Self-Defense Test Ship (ex-USS Decatur).
environment and reduce development risk to the Navy.
Preproduction Contract: An AN/SPQ-9B radar prime-item development specification was devel- oped jointly by NRL and the Port Hueneme and Crane Divisions of the Naval Surface Warfare Cen- ter. In October 1994, PEO(TAD) awarded a con- tract to Westinghouse Norden Systems for two AN/SPQ-9B preproduction kits, with an option for six low-rate initial production kits. As an ord- nance alteration (ORDALT) kit to the existing GFCS MK 86, the radar is currently planned for installation on DD-963, LHA-1, DDG-993, and CG-47 ship classes and is also being considered for installation as a horizon-search radar on sev- eral other ship classes that do not currently host a GFCS MK 86. The AN/SPQ-9B radar, with its unprecedented ability to detect modern, low- altitude air threats in a clutter environment, promises to be a low-cost, effective means of ship self-defense. Successful land-based and at-sea test results significantly reduce the Navy's overall development risk and cost and hasten the intro- duction of this new, robust, sea-skimmer detec- tion capability to the Fleet.
Science and Technology Base: The AN/SPQ-9B radar development evolved from the science and technology base obtained under the NRL Radar Division research program.
Acknowledgments: The AN/SPQ-9B radar was developed under the leadership of Dr. Ben H. Cantrell, head of the Target Characteristics Branch of the Radar Division. Other major NRL contribu- tors include Ms. Janet P. Brockett, Ms. Win Jou Cheung, Mr. Brian M. Connolly, Mr. Steven A. Lessin, Mr. Gregory Tavik, Mr. Michael F. Wälder, and Mr. Michael Rachuba.
[Sponsored by PEO(TAD)]
Reference
1. B.H. Cantrell, L.M. Leibowitz, DJ. Cardiel, B. Connolly, S.A. Lessin, M.E. Rachuba, G.C. Tavik, and M.F. Wälder, "Advanced Develop- ment Model of the AN/SPQ-9(I) Radar," NRL Memorandum Report 7608, 3 October 1994. ■
Ferroelectric Lens Phased Arrays
J.B.L. Rao, D.P. Patel, and W.R. Pickles Radar Division
The Navy needs phased array radars for self- and area defense. Phased array antennas can steer transmitted and received signals without mechani- cally rotating the antenna. Each element of a phased array is connected to a phase shifter, which determines the phase of the signal at each element to form a beam at the desired angle. The most commonly used are ferrite and diode phase shifters. A typical phased array may have several thousand elements and requires that many phase shifters; hence, it is very expensive. Therefore, reducing the cost and complexity of the phase shifters and their controls are important consid- erations in the design of phased arrays. A new lens phased array reported here (for which a Navy patent application is pending) uniquely incorpo- rates bulk phase shifting-the array does not con- tain individual phase shifters-using ferroelectric material with applied bias voltage to control the amount of phase shift in a phased array [1]. Bulk phase shifting using diodes has been proposed and reasonably developed in the Radant lens [2]. The lens described here uses a voltage-controlled ferroelectric dielectric, which introduces analog rather than digital phase shift, as in the Radant lens. The ferroelectric lens has further advantages of smaller lens thickness, higher power handling,
104
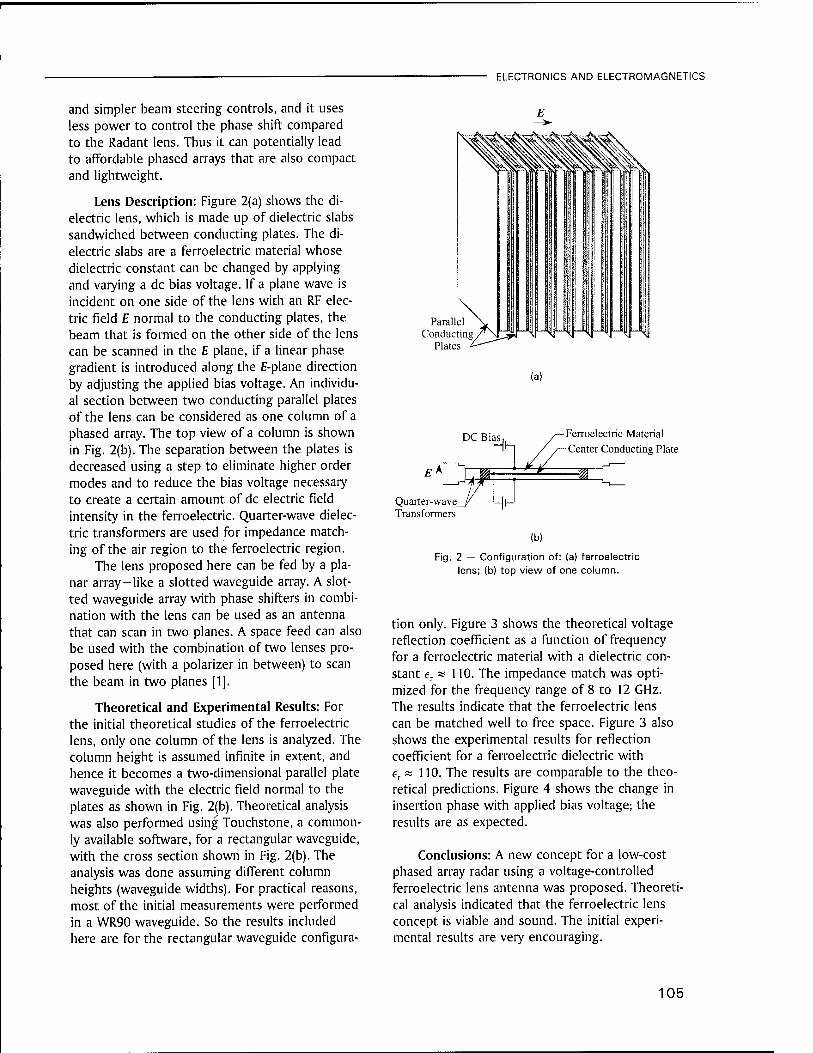
ELECTRONICS AND ELECTROMAGNETICS
and simpler beam steering controls, and it uses less power to control the phase shift compared to the Radant lens. Thus it can potentially lead to affordable phased arrays that are also compact and lightweight.
Lens Description: Figure 2(a) shows the di- electric lens, which is made up of dielectric slabs sandwiched between conducting plates. The di- electric slabs are a ferroelectric material whose dielectric constant can be changed by applying and varying a dc bias voltage. If a plane wave is incident on one side of the lens with an RF elec- tric field E normal to the conducting plates, the beam that is formed on the other side of the lens can be scanned in the £ plane, if a linear phase gradient is introduced along the E-plane direction by adjusting the applied bias voltage. An individu- al section between two conducting parallel plates of the lens can be considered as one column of a phased array. The top view of a column is shown in Fig. 2(b). The separation between the plates is decreased using a step to eliminate higher order modes and to reduce the bias voltage necessary to create a certain amount of dc electric field intensity in the ferroelectric. Quarter-wave dielec- tric transformers are used for impedance match- ing of the air region to the ferroelectric region.
The lens proposed here can be fed by a pla- nar array-like a slotted waveguide array. A slot- ted waveguide array with phase shifters in combi- nation with the lens can be used as an antenna that can scan in two planes. A space feed can also be used with the combination of two lenses pro- posed here (with a polarizer in between) to scan the beam in two planes [1].
Theoretical and Experimental Results: For the initial theoretical studies of the ferroelectric lens, only one column of the lens is analyzed. The column height is assumed infinite in extent, and hence it becomes a two-dimensional parallel plate waveguide with the electric field normal to the plates as shown in Fig. 2(b). Theoretical analysis was also performed using Touchstone, a common- ly available software, for a rectangular waveguide, with the cross section shown in Fig. 2(b). The analysis was done assuming different column heights (waveguide widths). For practical reasons, most of the initial measurements were performed in a WR90 waveguide. So the results included here are for the rectangular waveguide configura-
Parallel Conducting
Plates
(a)
DC Bias,
Quarter-wave Transformers
Ferroelectric Material Center Conducting Plate
(b)
Fig. 2 — Configuration of: (a) ferroelectric lens; (b) top view of one column.
tion only. Figure 3 shows the theoretical voltage reflection coefficient as a function of frequency for a ferroelectric material with a dielectric con- stant er « 110. The impedance match was opti- mized for the frequency range of 8 to 12 GHz. The results indicate that the ferroelectric lens can be matched well to free space. Figure 3 also shows the experimental results for reflection coefficient for a ferroelectric dielectric with er « 110. The results are comparable to the theo- retical predictions. Figure 4 shows the change in insertion phase with applied bias voltage; the results are as expected.
Conclusions: A new concept for a low-cost phased array radar using a voltage-controlled ferroelectric lens antenna was proposed. Theoreti- cal analysis indicated that the ferroelectric lens concept is viable and sound. The initial experi- mental results are very encouraging.
105
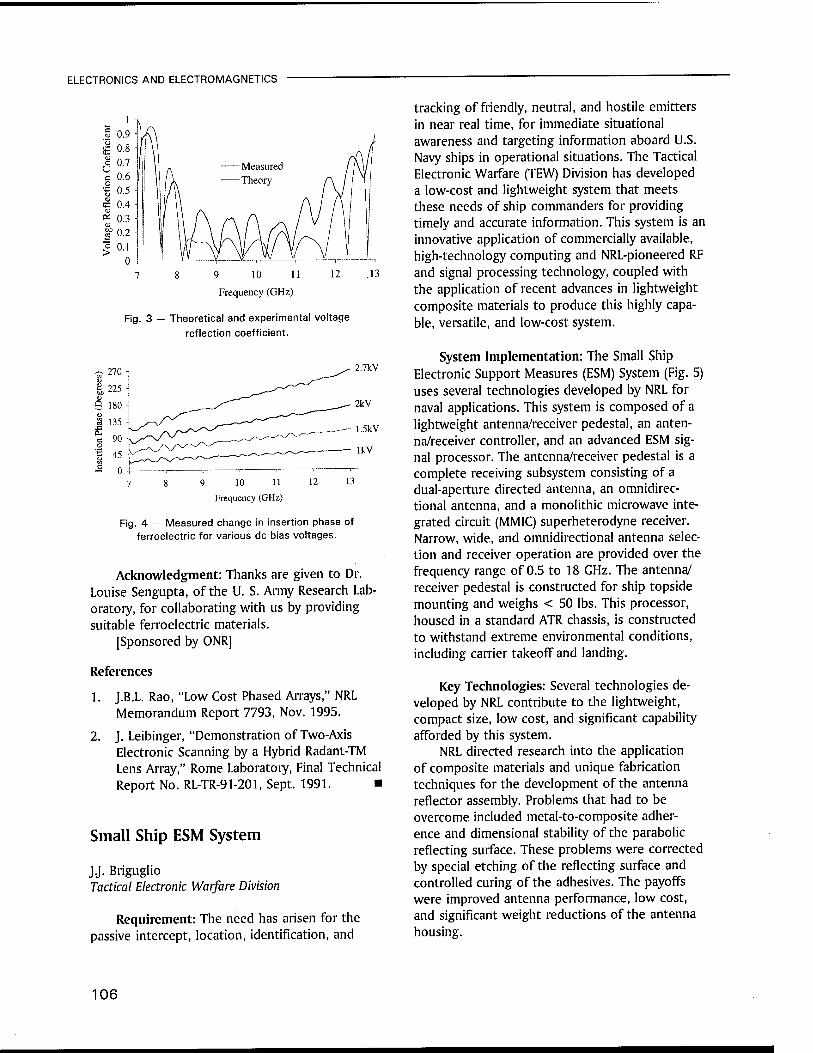
ELECTRONICS AND ELECTROMAGNETICS
9 10 11
Frequency (GHz)
12
Fig. 3 — Theoretical and experimental voltage reflection coefficient.
2.7kV
9 10 11
Frequency (GHz)
12
Fig. 4 — Measured change in insertion phase of ferroelectric for various dc bias voltages.
Acknowledgment: Thanks are given to Dr. Louise Sengupta, of the U. S. Army Research Lab- oratory, for collaborating with us by providing suitable ferroelectric materials.
[Sponsored by ONR]
References
1. J.B.L. Rao, "Low Cost Phased Arrays," NRL Memorandum Report 7793, Nov. 1995.
2. J. Leibinger, "Demonstration of Two-Axis Electronic Scanning by a Hybrid Radant-TM Lens Array," Rome Laboratory, Final Technical Report No. RL-TR-91-201, Sept. 1991. ■
Small Ship ESM System
JJ. Briguglio Tactical Electronic Warfare Division
Requirement: The need has arisen for the passive intercept, location, identification, and
tracking of friendly, neutral, and hostile emitters in near real time, for immediate situational awareness and targeting information aboard U.S. Navy ships in operational situations. The Tactical Electronic Warfare (TEW) Division has developed a low-cost and lightweight system that meets these needs of ship commanders for providing timely and accurate information. This system is an innovative application of commercially available, high-technology computing and NRL-pioneered RF and signal processing technology, coupled with the application of recent advances in lightweight composite materials to produce this highly capa- ble, versatile, and low-cost system.
System Implementation: The Small Ship Electronic Support Measures (ESM) System (Fig. 5) uses several technologies developed by NRL for naval applications. This system is composed of a lightweight antenna/receiver pedestal, an anten- na/receiver controller, and an advanced ESM sig- nal processor. The antenna/receiver pedestal is a complete receiving subsystem consisting of a dual-aperture directed antenna, an omnidirec- tional antenna, and a monolithic microwave inte- grated circuit (MMIC) superheterodyne receiver. Narrow, wide, and omnidirectional antenna selec- tion and receiver operation are provided over the frequency range of 0.5 to 18 GHz. The antenna/ receiver pedestal is constructed for ship topside mounting and weighs < 50 lbs. This processor, housed in a standard ATR chassis, is constructed to withstand extreme environmental conditions, including carrier takeoff and landing.
Key Technologies: Several technologies de- veloped by NRL contribute to the lightweight, compact size, low cost, and significant capability afforded by this system.
NRL directed research into the application of composite materials and unique fabrication techniques for the development of the antenna reflector assembly. Problems that had to be overcome included metal-to-composite adher- ence and dimensional stability of the parabolic reflecting surface. These problems were corrected by special etching of the reflecting surface and controlled curing of the adhesives. The payoffs were improved antenna performance, low cost, and significant weight reductions of the antenna housing.
106

ELECTRONICS AND ELECTROMAGNETICS
Fig. 5 — Small ship ESM system.
The NRL-developed compact wideband MMIC receiver (Fig. 6) also contributes to size, weight, and cost reduction while improving overall system performance. To accomplish the production of the compact, wideband receiver, NRL developed several custom MMIC components specifically for this application, pushing MMIC technology to new limits. These and commercially available compo- nents were combined with power management logic to form the current Phase II MMIC EW re- ceiver.
The advanced signal processor uses the latest technology in analog-to-digital signal sampling and digital signal processing techniques to sepa- rate and identify simple and complex emitters. A
key component is a complete baseband digital receiver. High-speed digital sampling allows accu- rate timing and signal parameters to be mea- sured. The processing techniques include several novel and unique algorithms pioneered by NRL for identification and tracking purposes. These processing techniques have proven to be opera- tionally imperative for certain missions and useful on all platforms.
Operational Uses: This system can be easily installed on small and large ships to intercept, locate, and identify emitters and associated plat- forms based on platform RF emissions. These systems and variants are presently in use by
Fig. 6 — Conventional EW receiver (top) vs MMIC EW receiver.
107

ELECTRONICS AND ELECTROMAGNETICS
operational forces to collect and identify signals. The operational effectiveness of these systems has been demonstrated in both field exercises and by deployed forces.
Acknowledgments: The lightweight antenna technology was fabricated at Daedalus Research Inc; the MMIC/EW receiver was fabricated by Kaman Sciences; and the advanced signal proces- sor was fabricated by Hughes Aircraft Corp.
[Sponsored by ONR, NSA, UASCOM, and NAV- SEA]
References
1. L.W. Lemley, "The Microwave Monolithic Integrated Circuit/Electronic Warfare Receiv- er," 1994 NRL Review, Naval Research Labo- ratory, Washington, D.C., pp. 141-144. ■
Missile Radar Performance Characterization
D.W. Kahl Tactical Electronic Warfare Division
Background: All tracking radar systems have characteristics that define their ability to detect and track targets. In addition to quantitative characteristics, such as transmitted power, anten- na gain, and operating frequency, the perform- ance of many radar systems is also significantly affected by the ability of the operator who inter- prets and reacts to the data displayed on the radar screen. Missile radar guidance systems are quite different, however, since they generally operate autonomously after launch. The missile radar seeker scans the environment for potential targets, selects a target to track, and then pro- vides guidance data to the missile autopilot. All of these functions are performed without human intervention. If the logic programmed into the seeker performs as designed and the seeker does not encounter any unexpected conditions, the missile will ultimately intercept the target.
Radar Characteristics and EW: For NRL's Tactical Electronic Warfare Division (TEWD), knowledge of the performance characteristics of missile radar guidance systems is essential to
fulfilling its mission of developing and testing electronic warfare (EW) tactics and techniques for the U.S. Navy. Although developing EW tech- niques is somewhat of an art, the technique de- veloper begins the process with the knowledge of the missile radar system's operational characteris- tics and weaknesses. Since much of these data are typically not available outside the manufactur- ing environment, they must be determined by the EW community prior to developing and deploying an effective countermeasure. The Integrated EW Simulations (IEWS) Branch of the TEWD has devel- oped a set of automated tests for characterizing the performance of RF-guided missile seekers in the Central Target Simulator (CTS) facility. The tests quantify numerous tracking radar character- istics, and the test data aid division personnel with the development and optimization of both passive and active countermeasures.
CTS Characterization: The CTS facility con- sists of a large RF anechoic chamber which, under computer control, generates and radiates realistic radar returns for the missile seeker to receive and process. IEWS engineers have developed charac- terization test software for CTS using the Visual Basic programming language. Visual Basic pro- vides the tools necessary to develop a user-friend- ly graphical interface that runs on a standard PC under the familiar Windows environment. Engi- neers use the software's main window, shown in Fig. 7, to select the characterization test, data acquisition system, and target generation system interface. A second-level window is used to estab- lish the required target and test parameters. Default values allow tests to be performed with- out entering information. The third-level window, shown in Fig. 8, is used to view seeker data while the test is being performed. This feature allows the test operator to visually verify the results prior to saving the data. The intuitive design of the graphical interface makes it a valuable tool for accessing the numerous capabilities of CTS, including those not required for characterization testing. The interface has also simplified the pro- cess of training new CTS operations personnel.
The characterization software currently runs on a 66 MHz 80486 computer. During test peri- ods, this computer communicates with three other PCs in the facility to set up the required test conditions and acquire data from the missile seeker being evaluated. The software initially
108
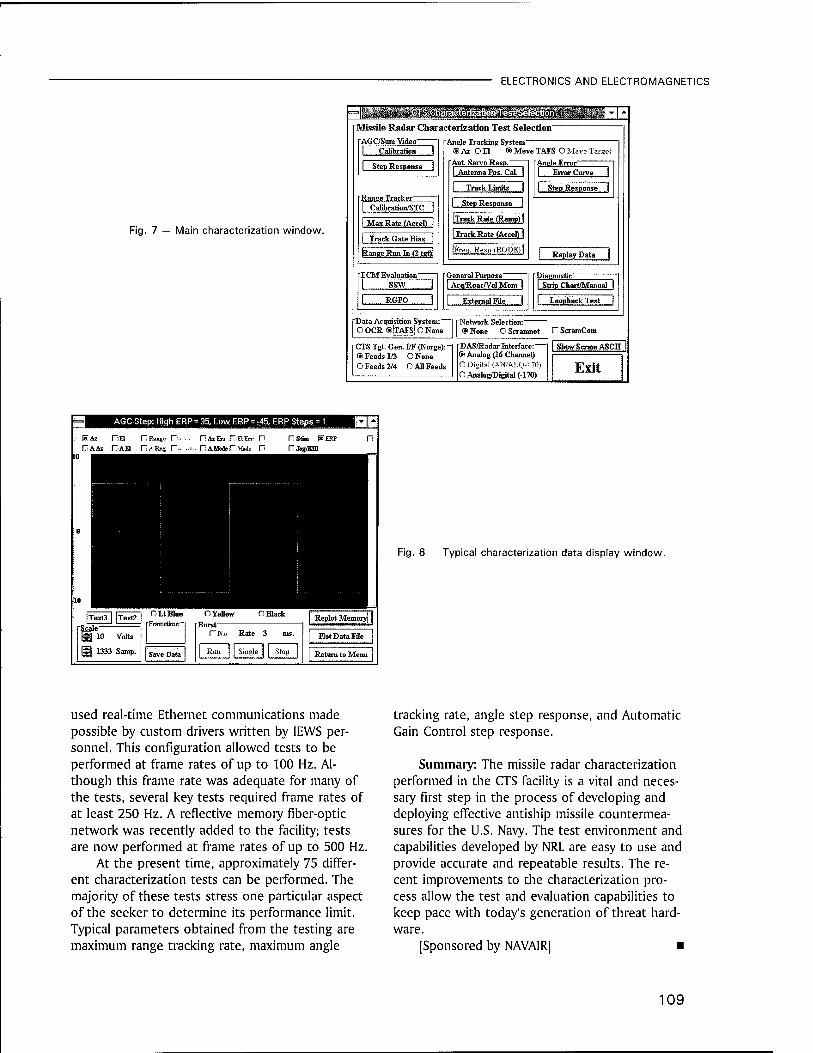
ELECTRONICS AND ELECTROMAGNETICS
Fig. 7 — Main characterization window.
U S Chrird( Ipruation To t Selection
Missile Radar Characterization Test Selection AGC/SnmVideo-
I Step_Response____|
Range Tracker I CaKbralion/SlC
_Max Rate (Accel)
..Track Gate_Bias__
iRange Run-in (2 _tgt)l
Angle Tracking System ® Az O El ® Move TAFS O Move Target
Ant. Servo Resp." Antenna Pos. Cal. J
Track limits a
Step Response
Track Rate .(Ramp) I
Track.Rate (Accel) I
!Freg.RespfBODE)l
Angle Error I Error Curve
I Step Response J
[ Replay Data j
ECMEvaluation- I ...SSW
General Purpose I Acn/Reac/VelMem I
I External File 1
Diagnostic I Strip Chart/Manual I
I.. Loopback Test 1
[Data Acquisition System: O OCR ®|TAFS|0 None
Network Selection: ® None O Scramnet 1" ScramCom
CIS Igt. Gen. I/F (Norge)r @ Feeds 1/3 O None O Feeds 2/4 O All Feeds
DAS/Radar Interface: — ® Analog (16 Channel) O Digital (AN/ALQ-170) O Analog/Digital (-170)
Show Scram ASCII
Exit
AGC Step: High ERP = 35, Low EBP - -»5, ERP Steps = 1
KAZ na riRaiiäi! n HA Al IJAH riARjig n
10 Volts
|#j 1333 Samp.
Fig. 8 — Typical characterization data display window.
used real-time Ethernet communications made possible by custom drivers written by IEWS per- sonnel. This configuration allowed tests to be performed at frame rates of up to 100 Hz. Al- though this frame rate was adequate for many of the tests, several key tests required frame rates of at least 250 Hz. A reflective memory fiber-optic network was recently added to the facility; tests are now performed at frame rates of up to 500 Hz.
At the present time, approximately 75 differ- ent characterization tests can be performed. The majority of these tests stress one particular aspect of the seeker to determine its performance limit. Typical parameters obtained from the testing are maximum range tracking rate, maximum angle
tracking rate, angle step response, and Automatic Gain Control step response.
Summary: The missile radar characterization performed in the CTS facility is a vital and neces- sary first step in the process of developing and deploying effective antiship missile countermea- sures for the U.S. Navy. The test environment and capabilities developed by NRL are easy to use and provide accurate and repeatable results. The re- cent improvements to the characterization pro- cess allow the test and evaluation capabilities to keep pace with today's generation of threat hard- ware.
[Sponsored by NAVAIR] ■
109
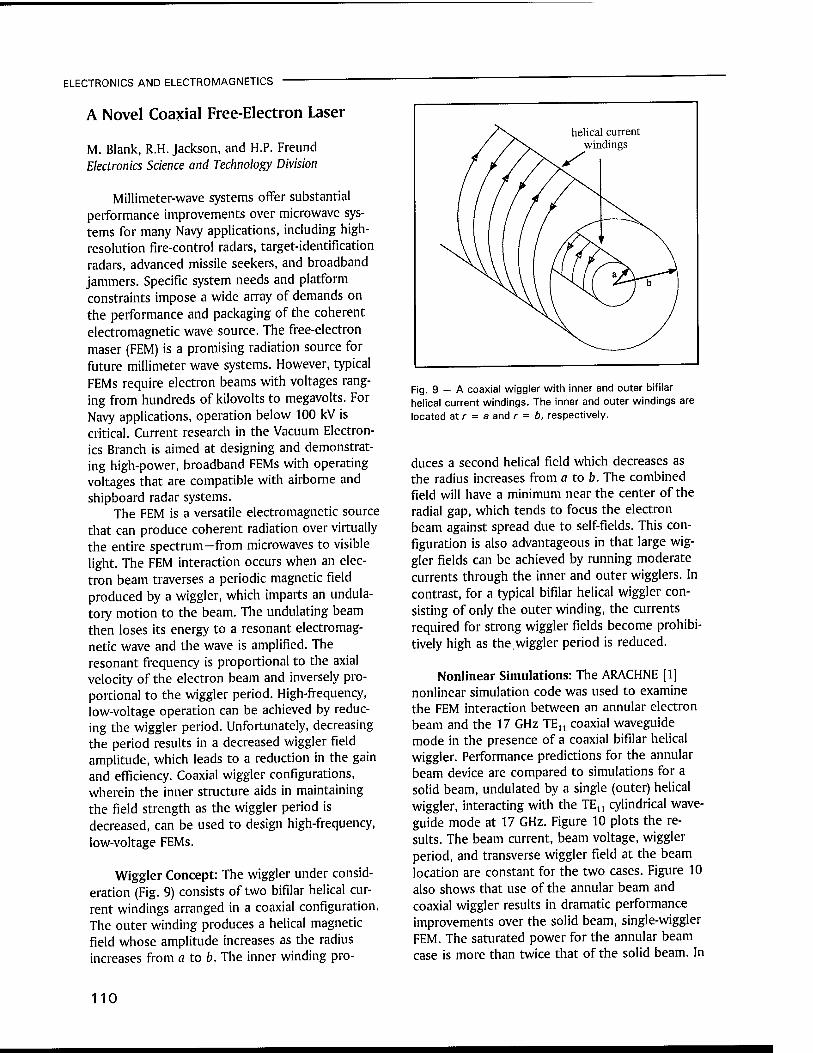
ELECTRONICS AND ELECTROMAGNETICS
A Novel Coaxial Free-Electron Laser
M. Blank, R.H.Jackson, and H.P. Freund Electronics Science and Technology Division
Millimeter-wave systems offer substantial performance improvements over microwave sys- tems for many Navy applications, including high- resolution fire-control radars, target-identification radars, advanced missile seekers, and broadband jammers. Specific system needs and platform constraints impose a wide array of demands on the performance and packaging of the coherent electromagnetic wave source. The free-electron maser (FEM) is a promising radiation source for future millimeter wave systems. However, typical FEMs require electron beams with voltages rang- ing from hundreds of kilovolts to megavolts. For Navy applications, operation below 100 kV is critical. Current research in the Vacuum Electron- ics Branch is aimed at designing and demonstrat- ing high-power, broadband FEMs with operating voltages that are compatible with airborne and shipboard radar systems.
The FEM is a versatile electromagnetic source that can produce coherent radiation over virtually the entire spectrum-from microwaves to visible light. The FEM interaction occurs when an elec- tron beam traverses a periodic magnetic field produced by a wiggler, which imparts an undula- tory motion to the beam. The undulating beam then loses its energy to a resonant electromag- netic wave and the wave is amplified. The resonant frequency is proportional to the axial velocity of the electron beam and inversely pro- portional to the wiggler period. High-frequency, low-voltage operation can be achieved by reduc- ing the wiggler period. Unfortunately, decreasing the period results in a decreased wiggler field amplitude, which leads to a reduction in the gain and efficiency. Coaxial wiggler configurations, wherein the inner structure aids in maintaining the field strength as the wiggler period is decreased, can be used to design high-frequency, low-voltage FEMs.
Wiggler Concept: The wiggler under consid- eration (Fig. 9) consists of two bifilar helical cur- rent windings arranged in a coaxial configuration. The outer winding produces a helical magnetic field whose amplitude increases as the radius increases from a tob. The inner winding pro-
helical current windings
Fig. 9 — A coaxial wiggler with inner and outer bifilar helical current windings. The inner and outer windings are located at r = a and r = b, respectively.
duces a second helical field which decreases as the radius increases from a to b. The combined field will have a minimum near the center of the radial gap, which tends to focus the electron beam against spread due to self-fields. This con- figuration is also advantageous in that large wig- gler fields can be achieved by running moderate currents through the inner and outer wigglers. In contrast, for a typical bifilar helical wiggler con- sisting of only the outer winding, the currents required for strong wiggler fields become prohibi- tively high as the wiggler period is reduced.
Nonlinear Simulations: The ARACHNE [1] nonlinear simulation code was used to examine the FEM interaction between an annular electron beam and the 17 GHz TEn coaxial waveguide mode in the presence of a coaxial bifilar helical wiggler. Performance predictions for the annular beam device are compared to simulations for a solid beam, undulated by a single (outer) helical wiggler, interacting with the TEn cylindrical wave- guide mode at 17 GHz. Figure 10 plots the re- sults. The beam current, beam voltage, wiggler period, and transverse wiggler field at the beam location are constant for the two cases. Figure 10 also shows that use of the annular beam and coaxial wiggler results in dramatic performance improvements over the solid beam, single-wiggler FEM. The saturated power for the annular beam case is more than twice that of the solid beam. In
110

ELECTRONICS AND ELECTROMAGNETICS
35
30 -
I o t 15
25
20
3 o 10
annular beam
0 10 20 30 40 50
Interaction Length (cm)
Fig. 10 — Nonlinear theory predictions of output power for a solid beam in a single bifilar helical wiggler field (red) and an annular beam in a coaxial wiggler (blue). The beam voltage, beam current, wiggler period, and wiggler field at the beam location were held constant for the two cases.
addition, the saturation length is significantly re- duced for the hollow beam, indicating that a reduction in device length is possible.
The nonlinear code was next used to exam- ine the theoretical efficiency vs frequency for the coaxial FEM; Fig. 11 plots the results. The simula- tions were made for a 55 kV, 5 Ä annular elec- tron beam. The wiggler period is 0.9 cm and the currents in the inner and outer windings are 275 A and 450 Ä, respectively. The combined radial wiggler field at the center of the gap is approxi- mately 1 kG. In addition, a 3 kG constant ampli- tude axial guide field is applied. The input power is 1 W in the coaxial TEn mode.
As Fig. 11 shows, the maximum efficiency is 11.8%, corresponding to an output power of 33 kW and 45 dB saturated gain. The 3 dB instan- taneous bandwidth is greater than 20%. These simulated results can be compared to the results of a Ku-band FEM experiment recently completed in the branch [2]. In the experiment, a 255 kV, 94 Ä solid electron beam interacted with the TEn
cylindrical waveguide mode in Ka band. A single outer helical wiggler was used. The measured efficiency was 17.5%, and the instantaneous band-
st
w
T-i—r—r | i—i T i | i—i'"i Mir ;■ ■T-r—T—r-f—r-t—r-r*^—
-i—I,..I i I „„I i i.ji-.L-1 i i i I « ' i ■ ' ■ t f ■ I r i ■ i I o 14.5 15 15.5 16 16.5 17 17.5 18
Frequency (GHz)
Fig. 11 — Nonlinear theory predictions of efficiency for the coaxial FEM.
width was greater than 22%. The simulations show that a 55 kV coaxial Ku-band FEM achieves an efficiency and bandwidth that are comparable to those of a 255 kV cylindrical waveguide FEM. Thus, the novel coaxial wiggler can be used to maintain device performance while reducing the beam kinetic energy by more than a factor of four. With high output power, large instanta- neous bandwidth, and reduced operating voltage, the coaxial FEM is a promising source for future millimeter wave systems.
Acknowledgments: The authors thank D.E. Peshing and J.M. Taccetti for their contributions to the work through numerous technical discus- sions.
[Sponsored by ONR]
References
1. H.P. Freund and T.M. Antonsen, Jr., in Princi- ples of Free-Electron Lasers (Chapman & Hall, London, 1992).
2. D.E. Pershing, R.D. Seeley, R.H.Jackson, H.P. Freund, "Amplifier Performance of the NRL Ubitron," Nucl. Instr. and Meth. Phys. Res. A, 358, 104-107 (1995). ■
111

€nergetk Particles, Plasmas,
and Beams

115 In Situ Monitoring of the Absorption of Deuterium into Palladium Using Synchrotron-Wiggler Radiation E.F. Skelton, S.B. Qadri, P.L. Hagans, and D.D. Dominguez
117 Laboratory Research in Space Plasma Physics D.N. Walker, W.E. Amatucci, andJA. Antoniades
119 Kinetic Limitations to Molecular Beam Epitaxy M.E. Twigg, B.R. Bennett, P.M. Thibado, B.V. Shanabrook, and L.J. Whitman
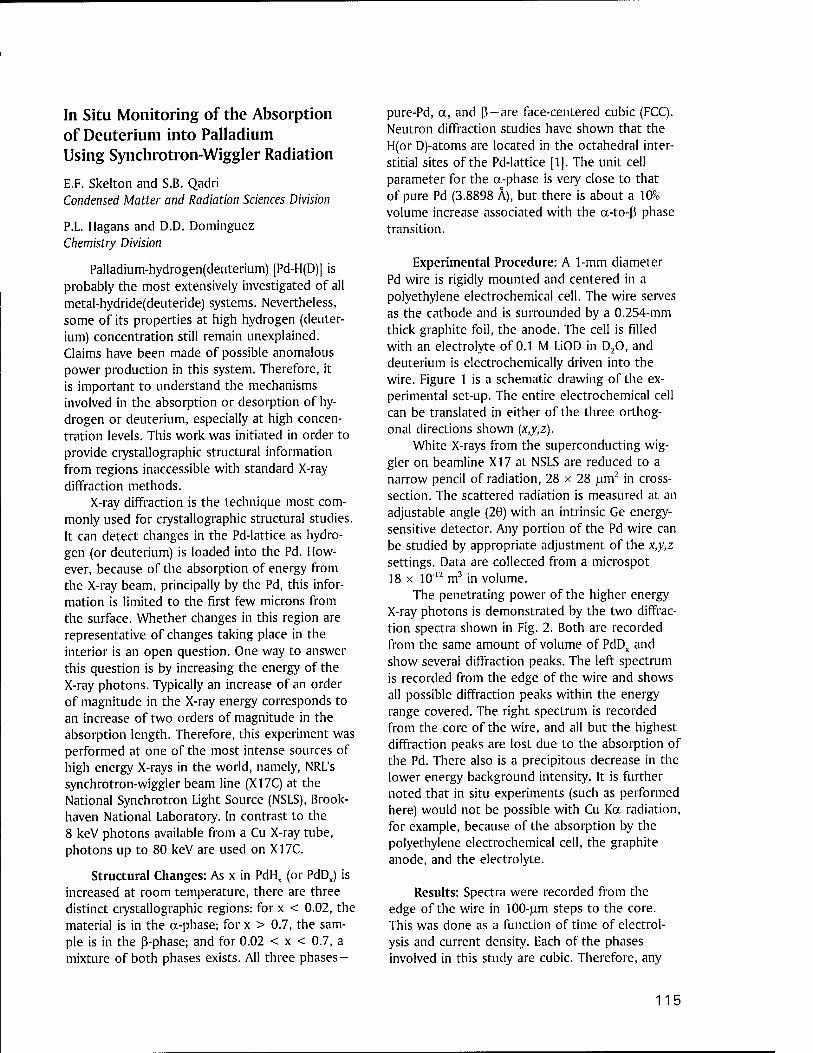
In Situ Monitoring of the Absorption of Deuterium into Palladium Using Synchrotron-Wiggler Radiation
E.F. Skelton and S.B. Qadri Condensed Matter and Radiation Sciences Division
P.L. Hagans and D.D. Dominguez Chemistry Division
Palladium-hydrogen(deuterium) [Pd-H(D)] is probably the most extensively investigated of all metal-hydride(deuteride) systems. Nevertheless, some of its properties at high hydrogen (deuter- ium) concentration still remain unexplained. Claims have been made of possible anomalous power production in this system. Therefore, it is important to understand the mechanisms involved in the absorption or desorption of hy- drogen or deuterium, especially at high concen- tration levels. This work was initiated in order to provide crystallographic structural information from regions inaccessible with standard X-ray diffraction methods.
X-ray diffraction is the technique most com- monly used for crystallographic structural studies. It can detect changes in the Pd-lattice as hydro- gen (or deuterium) is loaded into the Pd. How- ever, because of the absorption of energy from the X-ray beam, principally by the Pd, this infor- mation is limited to the first few microns from the surface. Whether changes in this region are representative of changes taking place in the interior is an open question. One way to answer this question is by increasing the energy of the X-ray photons. Typically an increase of an order of magnitude in the X-ray energy corresponds to an increase of two orders of magnitude in the absorption length. Therefore, this experiment was performed at one of the most intense sources of high energy X-rays in the world, namely, NRL's synchrotron-wiggler beam line (X17C) at the National Synchrotron Light Source (NSLS), Brook- haven National Laboratory. In contrast to the 8 keV photons available from a Cu X-ray tube, photons up to 80 keV are used on XI7C.
Structural Changes: As x in PdHx (or PdDx) is increased at room temperature, there are three distinct crystallographic regions: for x < 0.02, the material is in the a-phase; for x > 0.7, the sam- ple is in the ß-phase; and for 0.02 < x < 0.7, a mixture of both phases exists. All three phases-
pure-Pd, a, and ß—are face-centered cubic (FCC). Neutron diffraction studies have shown that the H(or D)-atoms are located in the octahedral inter- stitial sites of the Pd-lattice [1]. The unit cell parameter for the a-phase is very close to that of pure Pd (3.8898 Ä), but there is about a 10% volume increase associated with the a-to-ß phase transition.
Experimental Procedure: A 1-mm diameter Pd wire is rigidly mounted and centered in a polyethylene electrochemical cell. The wire serves as the cathode and is surrounded by a 0.254-mm thick graphite foil, the anode. The cell is filled with an electrolyte of 0.1 M LiOD in D20, and deuterium is electrochemically driven into the wire. Figure 1 is a schematic drawing of the ex- perimental set-up. The entire electrochemical cell can be translated in either of the three orthog- onal directions shown (x,y,z).
White X-rays from the superconducting wig- gler on beamline XI7 at NSLS are reduced to a narrow pencil of radiation, 28 x 28 um2 in cross- section. The scattered radiation is measured at an adjustable angle (20) with an intrinsic Ge energy- sensitive detector. Any portion of the Pd wire can be studied by appropriate adjustment of the x,y,z settings. Data are collected from a microspot 18 x 10"12 m3 in volume.
The penetrating power of the higher energy X-ray photons is demonstrated by the two diffrac- tion spectra shown in Fig. 2. Both are recorded from the same amount of volume of PdDx and show several diffraction peaks. The left spectrum is recorded from the edge of the wire and shows all possible diffraction peaks within the energy range covered. The right spectrum is recorded from the core of the wire, and all but the highest diffraction peaks are lost due to the absorption of the Pd. There also is a precipitous decrease in the lower energy background intensity. It is further noted that in situ experiments (such as performed here) would not be possible with Cu Kcc radiation, for example, because of the absorption by the polyethylene electrochemical cell, the graphite anode, and the electrolyte.
Results: Spectra were recorded from the edge of the wire in 100-um steps to the core. This was done as a function of time of electrol- ysis and current density. Each of the phases involved in this study are cubic. Therefore, any
115
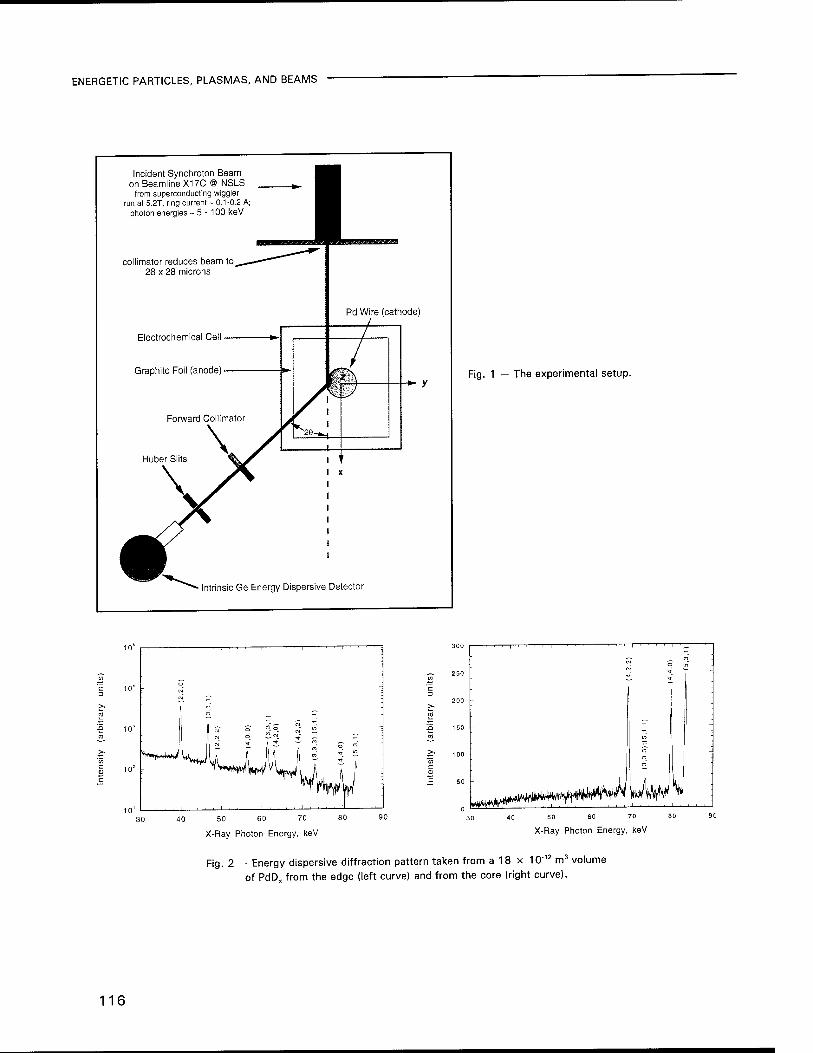
ENERGETIC PARTICLES, PLASMAS, AND BEAMS
Incident Synohroton Beam onBeamlineX17C @ NSLS
from superconducting wiggler run at 5.2T; ring current - 0.1-0.2 A;
photon energies - 5 - 100 keV
collimator reduces beam to 28 x 28 microns
Electrochemical Cell
Graphite Foil (anode)
Huber Slits
*- y
Intrinsic Ge Energy Dispersive Detector
Fig. 1 — The experimental setup.
50 60 70
X-Ray Photon Energy, keV
~~ 250
^^^mm'^0 W^iV lVW V
X-Ray Photon Energy, keV
Fig. 2 - Energy dispersive diffraction pattern taken from a 18 x 10"12 m3 volume
of PdDx from the edge (left curve) and from the core (right curve).
116
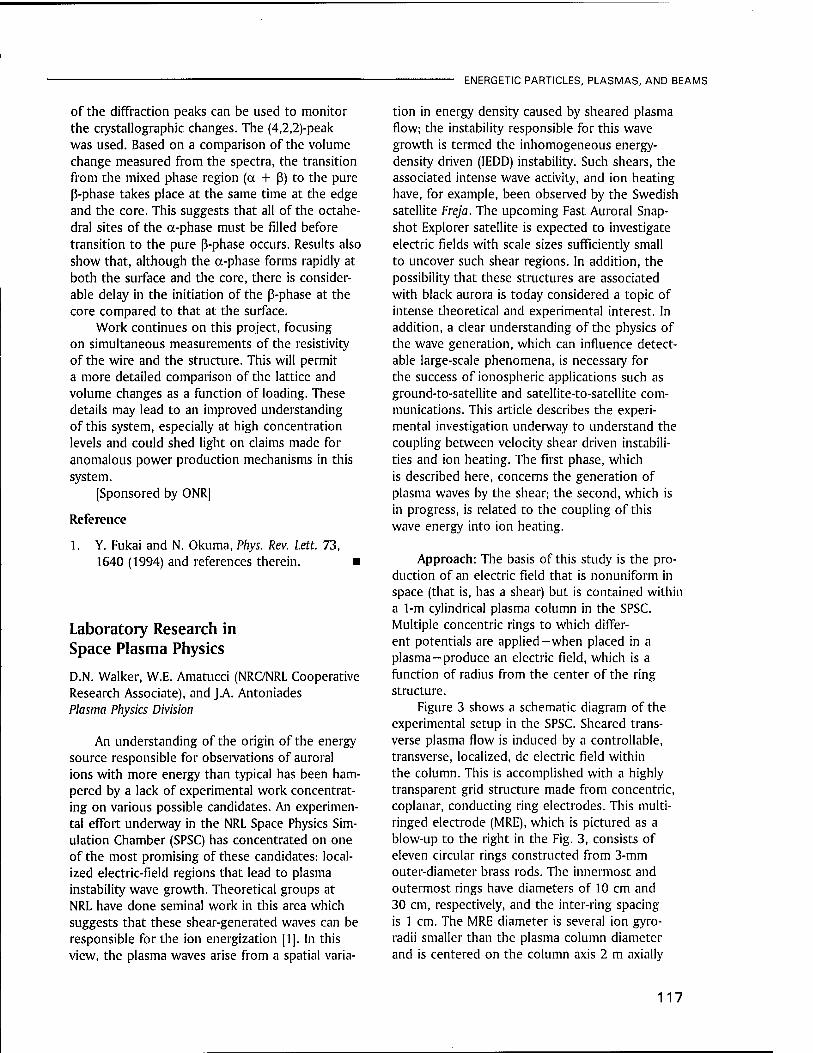
ENERGETIC PARTICLES, PLASMAS, AND BEAMS
of the diffraction peaks can be used to monitor the crystallographic changes. The (4,2,2)-peak was used. Based on a comparison of the volume change measured from the spectra, the transition from the mixed phase region (a + ß) to the pure ß-phase takes place at the same time at the edge and the core. This suggests that all of the octahe- dral sites of the a-phase must be filled before transition to the pure ß-phase occurs. Results also show that, although the a-phase forms rapidly at both the surface and the core, there is consider- able delay in the initiation of the ß-phase at the core compared to that at the surface.
Work continues on this project, focusing on simultaneous measurements of the resistivity of the wire and the structure. This will permit a more detailed comparison of the lattice and volume changes as a function of loading. These details may lead to an improved understanding of this system, especially at high concentration levels and could shed light on claims made for anomalous power production mechanisms in this system.
[Sponsored by ONR]
Reference
1. Y. Fukai and N. Okuma, Phys. Rev. Lett. 73, 1640 (1994) and references therein. ■
Laboratory Research in Space Plasma Physics
D.N. Walker, W.E. Amatucci (NRC/NRL Cooperative Research Associate), and J.A. Antoniades Plasma Physics Division
An understanding of the origin of the energy source responsible for observations of auroral ions with more energy than typical has been ham- pered by a lack of experimental work concentrat- ing on various possible candidates. An experimen- tal effort underway in the NRL Space Physics Sim- ulation Chamber (SPSC) has concentrated on one of the most promising of these candidates: local- ized electric-field regions that lead to plasma instability wave growth. Theoretical groups at NRL have done seminal work in this area which suggests that these shear-generated waves can be responsible for the ion energization [1]. In this view, the plasma waves arise from a spatial varia-
tion in energy density caused by sheared plasma flow; the instability responsible for this wave growth is termed the inhomogeneous energy- density driven (IEDD) instability. Such shears, the associated intense wave activity, and ion heating have, for example, been observed by the Swedish satellite Freja. The upcoming Fast Auroral Snap- shot Explorer satellite is expected to investigate electric fields with scale sizes sufficiently small to uncover such shear regions. In addition, the possibility that these structures are associated with black aurora is today considered a topic of intense theoretical and experimental interest. In addition, a clear understanding of the physics of the wave generation, which can influence detect- able large-scale phenomena, is necessary for the success of ionospheric applications such as ground-to-satellite and satellite-to-satellite com- munications. This article describes the experi- mental investigation underway to understand the coupling between velocity shear driven instabili- ties and ion heating. The first phase, which is described here, concerns the generation of plasma waves by the shear; the second, which is in progress, is related to the coupling of this wave energy into ion heating.
Approach: The basis of this study is the pro- duction of an electric field that is nonuniform in space (that is, has a shear) but is contained within a 1-m cylindrical plasma column in the SPSC. Multiple concentric rings to which differ- ent potentials are applied-when placed in a plasma-produce an electric field, which is a function of radius from the center of the ring structure.
Figure 3 shows a schematic diagram of the experimental setup in the SPSC. Sheared trans- verse plasma flow is induced by a controllable, transverse, localized, dc electric field within the column. This is accomplished with a highly transparent grid structure made from concentric, coplanar, conducting ring electrodes. This multi- ringed electrode (MRE), which is pictured as a blow-up to the right in the Fig. 3, consists of eleven circular rings constructed from 3-mm outer-diameter brass rods. The innermost and outermost rings have diameters of 10 cm and 30 cm, respectively, and the inter-ring spacing is 1 cm. The MRE diameter is several ion gyro- radii smaller than the plasma column diameter and is centered on the column axis 2 m axially
117
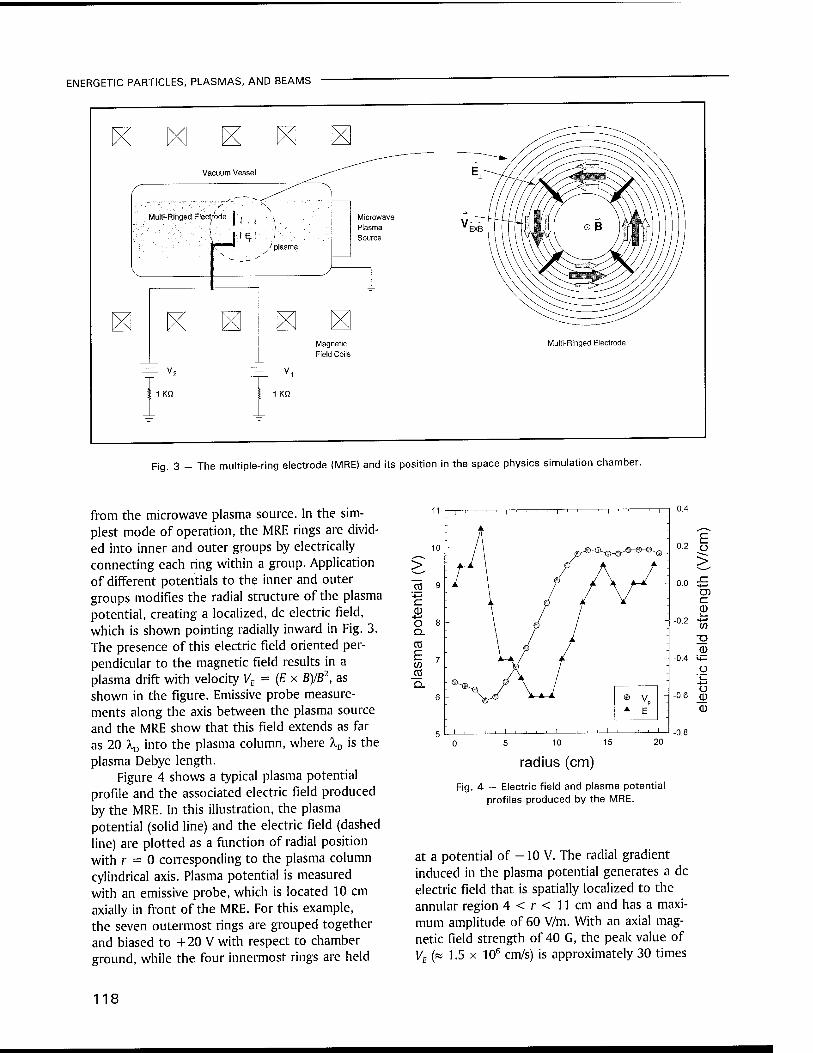
ENERGETIC PARTICLES, PLASMAS, AND BEAMS
Vacuum Vessel
. Multi-Ringed Elect/ode
Magnetic Field Coils
Multi-Ringed Electrode
Fig. 3 - The multiple-ring electrode (MRE) and its position in the space physics simulation chamber.
from the microwave plasma source. In the sim- plest mode of operation, the MRE rings are divid- ed into inner and outer groups by electrically connecting each ring within a group. Application of different potentials to the inner and outer groups modifies the radial structure of the plasma potential, creating a localized, dc electric field, which is shown pointing radially inward in Fig. 3. The presence of this electric field oriented per- pendicular to the magnetic field results in a plasma drift with velocity VE = (E x B)/B2, as shown in the figure. Emissive probe measure- ments along the axis between the plasma source and the MRE show that this field extends as far as 20 A,D into the plasma column, where XD is the plasma Debye length.
Figure 4 shows a typical plasma potential profile and the associated electric field produced by the MRE. In this illustration, the plasma potential (solid line) and the electric field (dashed line) are plotted as a function of radial position with r = 0 corresponding to the plasma column cylindrical axis. Plasma potential is measured with an emissive probe, which is located 10 cm axially in front of the MRE. For this example, the seven outermost rings are grouped together and biased to +20 V with respect to chamber ground, while the four innermost rings are held
> TO 9 -
"-4—' c 0 o Q.
CO
E </> m
\ V /
I
\V V^A e v p
*■ E -
i , , , , i , , , , I , , . ,
- 0.2
-0.2
-0.4
-0.6
15 20
radius (cm)
E o >
c 0 i™
w
<u
Ü "l_ •*—> Ü 0 0
Fig. 4 — Electric field and plasma potential profiles produced by the MRE.
at a potential of -10 V. The radial gradient induced in the plasma potential generates a dc electric field that is spatially localized to the annular region 4 < r < 11 cm and has a maxi- mum amplitude of 60 V/m. With an axial mag- netic field strength of 40 G, the peak value of VE (w 1.5 x 106 cm/s) is approximately 30 times
118

ENERGETIC PARTICLES, PLASMAS, AND BEAMS
the ion thermal velocity. The electric field strength can be increased to a maximum of ap- proximately 100 V/m (peak VE « 2.5 x 106 cm/s). At radii less than 4 cm or larger than 11 cm, the plasma potential is relatively uniform, indicating little electric field. In the cylindrical plasma column geometry, radial shear in the azimuthal plasma flow is induced within the boundary layers separating these regions. The scale length of the electric field gradient LE « 5 cm, which is approxi- mately equal to one ion gyroradius, indicates that the ions are magnetized within the velocity shear layer.
Fig. 5 - MRE inside the SPSC with three azimuthally separated probes.
Results: When an electric field of sufficient magnitude (as described above) is imposed, plas- ma waves in the ion-cyclotron frequency range can be detected with Langmuir probes or from fluctuations in dc current collected by the MRE sections. The transverse and field-aligned wave- vector components ke = 2TZI\ and kz = 2izfkz
have been determined using cross-correlation techniques to measure the phase differences between ion saturation current fluctuations sim- ultaneously obtained from pairs of Langmuir probes. For the measurement of azimuthal wave- length, three Langmuir probes with identical tips are positioned at the same radial and axial posi- tions but are separated in azimuth. A photograph of the actual arrangement is shown in Fig. 5 and schematically in Fig. 3. The probes are placed at identical radial and axial coordinates to measure only azimuthal contributions to the phase differ- ence A(|). Unequal azimuthal spacing is used to reduce the possibility of aliased azimuthal mode numbers. The measured phase difference between the simultaneously acquired signal of the various possible probe separations is compared to the measured angular separation of the probes. The measured values of A(j) are consistent with an m = 1 mode with ke = 0.11 ± 0.01 cm"1 propagat- ing azimuthally in the ExB direction. The axial wavenumber kz is determined in a similar fashion. These measurements indicate axial propagation away from the plasma source with wave number kz = 1.32 x 10"2± 1 x 10~3 cm"1. The mode has been identified as the IEDD instability based upon excellent agreement between experimentally ob- served mode characteristics and those predicted by theory.
[Sponsored by ONR].
References
1. G. Ganguli, Y.C. Lee, and P.J. Palmadesso, "Kinetic Theory for Electrostatic Waves Due to Transverse Velocity Shear," Phys. Fluids, 31, 823 (1988). ■
Kinetic Limitations to Molecular Beam Epitaxy
M.E. Twigg,1 B.R. Bennett,1 P.M. Thibado,2
B.V. Shanabrook,1 and L.J. Whitman3
^Electronics Science and Technology Division 2NRC/NRL Cooperative Research Associate,
Chemistry Division 3Chemistry Division
The novel properties of many modern semi- conductor devices depend on the ability to grow
119

ENERGETIC PARTICLES, PLASMAS, AND BEAMS
thin layers with thickness and composition con- trolled on an atomic scale. This degree of control can be achieved by molecular beam epitaxy (MBE), a form of vapor phase growth in that molecular or atomic beams deposit a thin film onto a substrate surface which is maintained at an elevated temperature in ultrahigh vacuum. Although under thermodynamic equilibrium the deposited atoms (that is, adatoms) may form a smooth and uniform surface, kinetic limitations may dictate otherwise. When the diffusing ad- atoms do not have the opportunity to seek out their equilibrium positions, the resulting surface may not be smooth. Instead, the adatoms may find themselves bunched together in clusters or may leave clusters of unfilled (vacancy) sites. These clusters give the surface a jagged morphol- ogy so that when a layer of different composition is deposited onto such a surface, the resulting interface is rough as well.
Interface Roughness: For advanced opto- electronic devices, such as infrared detectors based on a sandwich of alternating semiconduct- ing InAs and GaSb layers (that is, an InAs/GaSb superlattice), the deleterious effects of interface roughness are particularly important. In these device structures, each layer of the superlattice may consist of as few as 10 InAs or GaSb mono- layers (ML) [1]. Here, a monolayer is defined as a single layer of compound semiconductor atoms — for example, 1 ML of InAs consists of one atomic layer of In joined to one of As, with a total thick- ness of 0.3 nm.
An atomic-scale view of the interface is pro- vided by High-Resolution Transmission Electron Microscopy (HRTEM). In HRTEM, high-energy electrons passing through a thin (20-nm) sample form a projected image of the individual atomic columns. A superlattice sample can be mounted so that it is viewed in the microscope edge-on, providing a cross-sectional view of the interfaces. In addition, the coherent electron scattering mechanism that gives rise to HRTEM imaging also allows the observer to identify the chemical dif- ference between adjacent atomic columns.
As can be seen in the cross-sectional HRTEM image in Fig. 6, in an InAs/GaSb superlattice, the interfaces make up a significant volume fraction of the material. Therefore, any degree of inter- facial roughness will have a profound effect on the material properties. Image analysis marks the
1 GaSb
k
3 1 nAs
tu
I GaSb 9
\ 1 nAs
1 GaSb
ifct ? # #■#■» # # * .* jfc# *
:L:. t'iw «## E *"- it
Mtim , iff. i ytffri^-
*■'/*;?
";^fe!*>..'f»t*Si » »
&/'*'*•*+ + *'****f$
r . ,. <(,*!.<•#•## *!#■..*. Ifti* * ,■■ i f ä £ * ** *■:£ ■*■■*-* *«*rf
," *^ **£ ***##* VJM
5 nm
Fig. 6 — Cross-sectional HRTEM image of InAs/GaSb superlattice. White dots in InAs layers corresponds to columns of As atoms; white dots in GaSb layers correspond to In atoms. Note how the registry of the image changes at each interface.
chemical transition at the interface and thereby determines the degree of interfacial roughness, as Fig. 7 shows [2]. As one follows the interface from left to right, it is seen to wander up and down by as much as 0.3 nm so that the interface roughness amounts to 1 ML. Because the HRTEM sample is 20-nm thick, this roughness indicates that over a 20-nm region of the interfacial sur- face, one is likely to encounter either a vacancy (filled by the next layer) or an adatom cluster (inserted into the next layer).
Control of Surface Topography: A comple- mentary view of the interface is afforded by scan- ning tunneling microscopy (STM) performed in situ immediately after MBE growth. STM provides a planar view of the surface topography with atomic-scale resolution. An STM image of a single InAs monolayer on GaSb is displayed in Fig. 8 (left), revealing large, atomically smooth terraces (~ 50-nm wide) separated by monolayer-height steps with a few adatom and vacancy clusters.
120
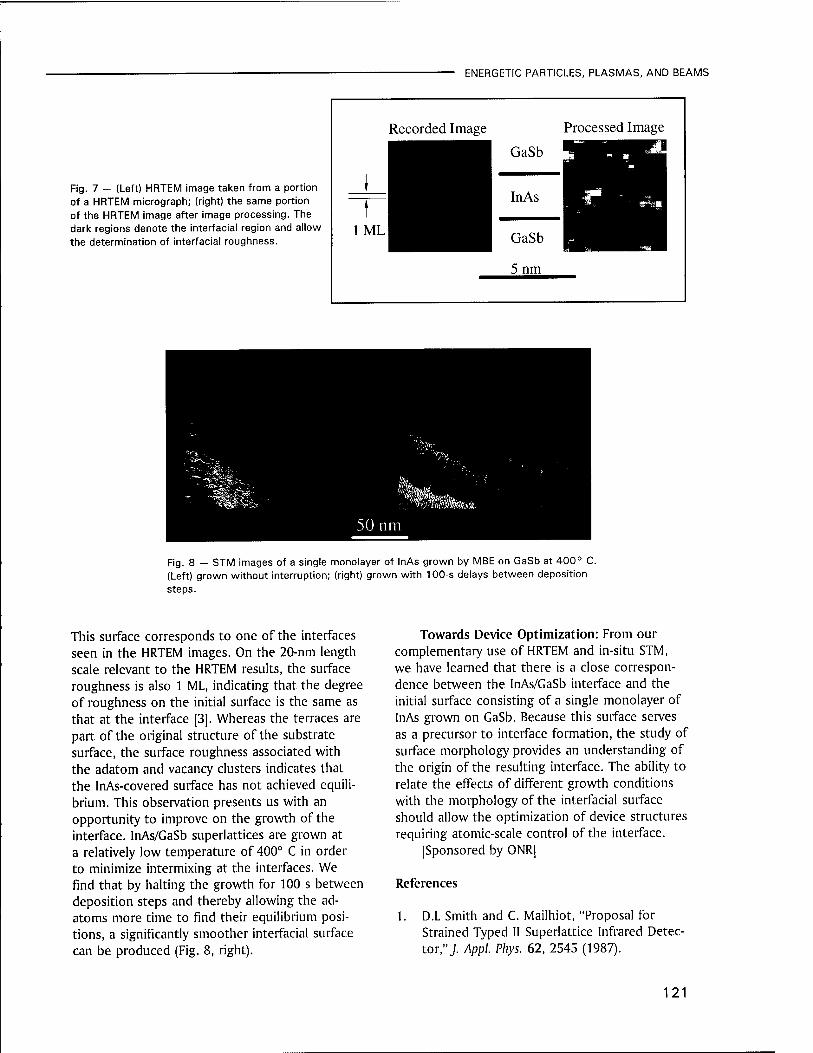
ENERGETIC PARTICLES, PLASMAS, AND BEAMS
Fig. 7 — (Left) HRTEM image taken from a portion of a HRTEM micrograph; (right) the same portion of the HRTEM image after image processing. The dark regions denote the interfacial region and allow the determination of interfacial roughness.
1 t
IML
Recorded Image
GaSb
Processed Image
InAs
GaSb
5 nm
Fig. 8 — STM images of a single monolayer of InAs grown by MBE on GaSb at 400° C (Left) grown without interruption; (right) grown with 100-s delays between deposition steps.
This surface corresponds to one of the interfaces seen in the HRTEM images. On the 20-nm length scale relevant to the HRTEM results, the surface roughness is also 1 ML, indicating that the degree of roughness on the initial surface is the same as that at the interface [3]. Whereas the terraces are part of the original structure of the substrate surface, the surface roughness associated with the adatom and vacancy clusters indicates that the InAs-covered surface has not achieved equili- brium. This observation presents us with an opportunity to improve on the growth of the interface. InAs/GaSb superlattices are grown at a relatively low temperature of 400° C in order to minimize intermixing at the interfaces. We find that by halting the growth for 100 s between deposition steps and thereby allowing the ad- atoms more time to find their equilibrium posi- tions, a significantly smoother interfacial surface can be produced (Fig. 8, right).
Towards Device Optimization: From our complementary use of HRTEM and in-situ STM, we have learned that there is a close correspon- dence between the InAs/GaSb interface and the initial surface consisting of a single monolayer of InAs grown on GaSb. Because this surface serves as a precursor to interface formation, the study of surface morphology provides an understanding of the origin of the resulting interface. The ability to relate the effects of different growth conditions with the morphology of the interfacial surface should allow the optimization of device structures requiring atomic-scale control of the interface.
[Sponsored by ONR]
References
1. D.L Smith and C. Mailhiot, "Proposal for Strained Typed II Superlattice Infrared Detec- tor," J. Appl. Phys. 62, 2545 (1987).
121

ENERGETIC PARTICLES, PLASMAS, AND BEAMS —
2. M.E. Twigg, B.R. Bennett, and B.V. Shana- 3. P.M Thibado, B.R. Bennett, M.E. Twigg, B.V. brook, "Influence of Interface and Buffer Shanabrook, and LJ. Whitman, "Origins of Layer on the Structure of InAs/GaSb Super- Interfacial Disorder in GaSb/InAs Superlat- lattices," Appl. Phys. Lett. 67, 1609 (1995). tices," Appl. Phys. Lett. 67 (1995).
122

Information Technology
and Communication

125 Rejection with Multilayer Neural Networks: Screening Image Data B. Kamgar-Parsi and B. Kamgar-Parsi
127 Scalable Real-time Networking for Distributed Computing S. Batsell, R. Cole, and B. Root
129 Key Management Support Inside 4.4 BSD UNIX D.I. McDonald, B.G. Phan, and R.J. Atkinson
Rejection with Multilayer Neural Networks: Screening Image Data
B. Kamgar-Parsi and B. Kamgar-Parsi Information Technology Division
Existing neural networks are unable to reject unfamiliar patterns and thus misclassify them as members of classes of patterns with which they are familiar. Indeed, other classifiers in the fields of computer vision, statistical pattern recognition, etc., also suffer from a similar shortcoming, as they can only find the closest class-which may or may not be the correct class. Hence, the use of neural networks and other classifiers for pat- tern recognition have been limited to controlled environments, that is, environments that only in- volve a limited number of known classes of pat- terns (classes used in the design of the classifier), for example, optical character recognition. In uncontrolled environments encompassing many real-life problems, however, there is no guarantee that all the patterns that will be presented to the network (or other classifiers) would actually be- long to one of the classes on which the network has been trained. For application in such environ- ments, current pattern recognition and computer vision techniques resort to some ad hoc thresh- olds in order to decide whether to accept or reject the unknown pattern as belonging to a certain class. This often produces unreliable re- sults. We have developed a method to construct multilayer perceptrons with rejection capabilities for visual patterns that are meaningful to humans. The method is potentially applicable to a variety of problems that are of interest both to the Navy and the commercial sector.
Approach: We develop rejection capability assuming that there is only one acceptable class. The extension to more classes is straightforward. Consider the following problem. Assuming that P is a visual pattern which has a meaning to humans, we want to develop a neural network to determine whether an unknown pattern is a cor- rect match of P or not. We make the following observation. If we subject P to deformation, but the magnitude of deformation is sufficiently small, then the resulting pattern will still be recognized as P by humans. However, if we deform P more and more, in a fixed manner, the resulting pat-
tern will eventually lose its similarity to P. More- over, further deformation will never make it look similar to P again. This implies that in the pattern space, the manifold of borderline patterns enclos- es P and its acceptable matches. Thus, to define the acceptable decision region which will be learned by the network, we need to know how to construct the manifold of borderline patterns M. We do this by generating a large training set composed of two classes of patterns-those which are close to M but still acceptable and those which are close to M but unacceptable. This is done by deforming P. The magnitude of defor- mation is determined by the human eye, more precisely by an expert or trained eye, depending on the domain of application. Patterns that are projected just inside the decision boundaries are those which are fairly deformed, yet-judging by eye-they still possess sufficient resemblance to pattern P. And patterns that are projected just outside the decision boundaries are those whose resemblance to P, judging by eye, is somewhat less than acceptable. If a sufficiently large training set of such patterns is composed, then the deci- sion boundaries defined by the network will be expected to be sufficiently close to M. Note that one may interpret P as a prototype of the class of interest. Also, to represent a class adequately, it may be necessary to use more than one proto- type pattern per class.
The number of required patterns is generally very large, to the extent that collecting sufficient real (and borderline) data is generally beyond one's resources or time constraints. The reason is as follows: if a network is designed to distinguish members of several classes of patterns from each other and is guaranteed to encounter only mem- bers of those limited classes, then decision boundaries may not need to be defined very tightly. This is because, in general, different classes are separate from each other. But, a net- work that is designed to distinguish members of one class-say class /4-from members of all other classes of patterns in the universe, requires far more accurately defined decision boundaries because the rest of the patterns will include (false) look- alikes of class A. In other words, the decision region belonging to class A will be surrounded in every direction by borderline patterns not belong- ing to A. In our approach, we use real data to train the eye but not to (directly) train the net- work. After training the eye on real data, we use
125
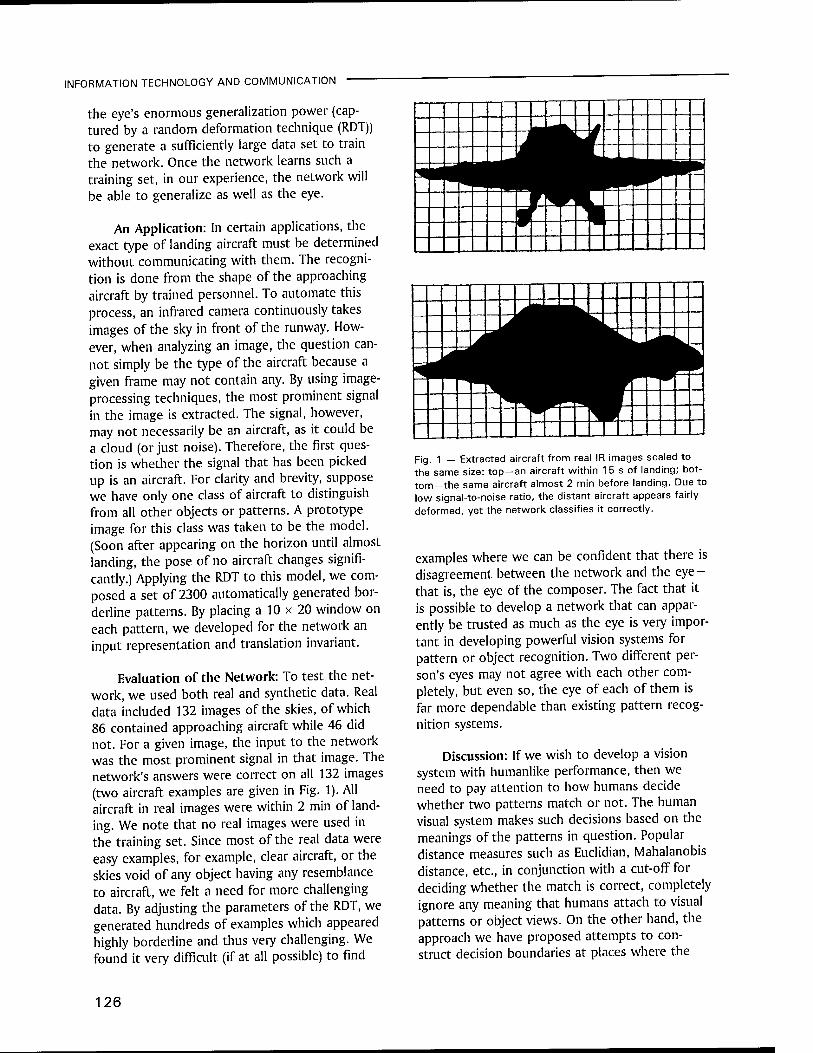
INFORMATION TECHNOLOGY AND COMMUNICATION
the eye's enormous generalization power (cap- tured by a random deformation technique (RDT)) to generate a sufficiently large data set to train the network. Once the network learns such a training set, in our experience, the network will be able to generalize as well as the eye.
An Application: In certain applications, the exact type of landing aircraft must be determined without communicating with them. The recogni- tion is done from the shape of the approaching aircraft by trained personnel. To automate this process, an infrared camera continuously takes images of the sky in front of the runway. How- ever, when analyzing an image, the question can- not simply be the type of the aircraft because a given frame may not contain any. By using image- processing techniques, the most prominent signal in the image is extracted. The signal, however, may not necessarily be an aircraft, as it could be a cloud (or just noise). Therefore, the first ques- tion is whether the signal that has been picked up is an aircraft. For clarity and brevity, suppose we have only one class of aircraft to distinguish from all other objects or patterns. A prototype image for this class was taken to be the model. (Soon after appearing on the horizon until almost landing, the pose of no aircraft changes signifi- cantly.) Applying the RDT to this model, we com- posed a set of 2300 automatically generated bor- derline patterns. By placing a 10 x 20 window on each pattern, we developed for the network an input representation and translation invariant.
Evaluation of the Network: To test the net- work, we used both real and synthetic data. Real data included 132 images of the skies, of which 86 contained approaching aircraft while 46 did not. For a given image, the input to the network was the most prominent signal in that image. The network's answers were correct on all 132 images (two aircraft examples are given in Fig. 1). All aircraft in real images were within 2 min of land- ing. We note that no real images were used in the training set. Since most of the real data were easy examples, for example, clear aircraft, or the skies void of any object having any resemblance to aircraft, we felt a need for more challenging data. By adjusting the parameters of the RDT, we generated hundreds of examples which appeared highly borderline and thus very challenging. We found it very difficult (if at all possible) to find
Fig. 1 — Extracted aircraft from real IR images scaled to the same size: top —an aircraft within 1 5 s of landing; bot- tom—the same aircraft almost 2 min before landing. Due to low signal-to-noise ratio, the distant aircraft appears fairly deformed, yet the network classifies it correctly.
examples where we can be confident that there is disagreement between the network and the eye- that is, the eye of the composer. The fact that it is possible to develop a network that can appar- ently be trusted as much as the eye is very impor- tant in developing powerful vision systems for pattern or object recognition. Two different per- son's eyes may not agree with each other com- pletely, but even so, the eye of each of them is far more dependable than existing pattern recog- nition systems.
Discussion: If we wish to develop a vision system with humanlike performance, then we need to pay attention to how humans decide whether two patterns match or not. The human visual system makes such decisions based on the meanings of the patterns in question. Popular distance measures such as Euclidian, Mahalanobis distance, etc., in conjunction with a cut-off for deciding whether the match is correct, completely ignore any meaning that humans attach to visual patterns or object views. On the other hand, the approach we have proposed attempts to con- struct decision boundaries at places where the
126

INFORMATION TECHNOLOGY AND COMMUNICATION
human eye appears to "draw" the line between acceptable and unacceptable patterns. Based on our technique, we have developed a network that screens images of the skies and discards those not containing approaching aircraft. The discrimi- nating power of the network is comparable to that of the human eye.
[Sponsored by ONR] ■
Scalable Real-time Networking for Distributed Computing
S. Batsell, R. Cole, and B. Root Information Technology Division
Introduction: Building a distributed comput- ing environment for military war-gaming has been an on-going effort at the Advanced Research Projects Agency (ARPA) over the last decade. Under the current Synthetic Theater of War (STOW) Advanced Concept and Technology Demonstration, ARPA's goal is to demonstrate that distributed interactive simulation (DIS) is capable of simulating an entire theater of war, with participating sites networked together over large distances. In order to achieve this, a network solution is required that can meet the demands of a highly dynamic simulation environment, provide both the required scalability and bandwidth, and yet minimize end-to-end latency. ARPA initiated
the Real-time Information and Networking (RITN) program to support STOW network requirements (Fig. 2). Under RITN, NRL has developed an integrated effort of research, advanced develop- ment, and test and evaluation leading to a solution for implementation of the underlying network and communications for the STOW 97 Demonstration.
The Multicast Paradigm for Distributed Computing: Current DIS applications broadcast all information to all of the participating sites. This is an inefficient use of the network bandwidth because not all receiving sites require the informa- tion. Further, the broadcast nature of the current DIS will not scale to support a very large number of entities (tanks, missiles, aircraft, etc.) in a theater-size simulation. DIS simulations in the RITN program are based on a distributed comput- ing paradigm that uses multicast to organize infor- mation so that only those hosts that need the infor- mation receive it. As a result, network bandwidth demands are minimized, and the offered load to the simulation hosts is reduced. The battle space is divided into a grid with each grid square repre- senting a multicast group. Each square is then assigned an internet protocol (IP) multicast ad- dress. In addition to receiving information from their own geographic grid square, entities in the battle space receive data for other multicast groups depending on direction of movement for the enti- ty, velocity, line-of-site visibility, and other fac- tors. Multicast groups may be short-lived, and
Fig. 2 — Plot showing how ARPA's Real- time Information Networking (RITN) pro- gram supports the Synthetic Theater of War (STOW) network requirements.
127
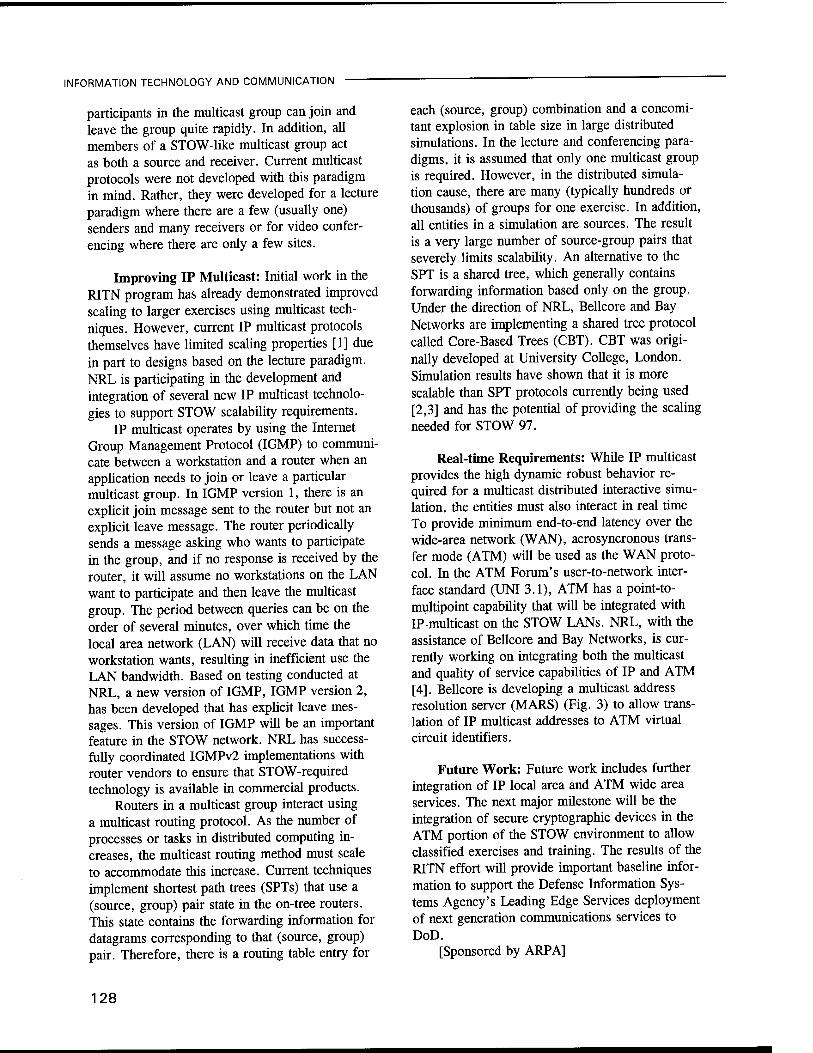
INFORMATION TECHNOLOGY AND COMMUNICATION
participants in the multicast group can join and leave the group quite rapidly. In addition, all members of a STOW-like multicast group act as both a source and receiver. Current multicast protocols were not developed with this paradigm in mind. Rather, they were developed for a lecture paradigm where there are a few (usually one) senders and many receivers or for video confer- encing where there are only a few sites.
Improving IP Multicast: Initial work in the RITN program has already demonstrated improved scaling to larger exercises using multicast tech- niques. However, current IP multicast protocols themselves have limited scaling properties [1] due in part to designs based on the lecture paradigm. NRL is participating in the development and integration of several new IP multicast technolo- gies to support STOW scalability requirements.
IP multicast operates by using the Internet Group Management Protocol (IGMP) to communi- cate between a workstation and a router when an application needs to join or leave a particular multicast group. In IGMP version 1, there is an explicit join message sent to the router but not an explicit leave message. The router periodically sends a message asking who wants to participate in the group, and if no response is received by the router, it will assume no workstations on the LAN want to participate and then leave the multicast group. The period between queries can be on the order of several minutes, over which time the local area network (LAN) will receive data that no workstation wants, resulting in inefficient use the LAN bandwidth. Based on testing conducted at NRL, a new version of IGMP, IGMP version 2, has been developed that has explicit leave mes- sages. This version of IGMP will be an important feature in the STOW network. NRL has success- fully coordinated IGMPv2 implementations with router vendors to ensure that STOW-required technology is available in commercial products.
Routers in a multicast group interact using a multicast routing protocol. As the number of processes or tasks in distributed computing in- creases, the multicast routing method must scale to accommodate this increase. Current techniques implement shortest path trees (SPTs) that use a (source, group) pair state in the on-tree routers. This state contains the forwarding information for datagrams corresponding to that (source, group) pair. Therefore, there is a routing table entry for
each (source, group) combination and a concomi- tant explosion in table size in large distributed simulations. In the lecture and conferencing para- digms, it is assumed that only one multicast group is required. However, in the distributed simula- tion cause, there are many (typically hundreds or thousands) of groups for one exercise. In addition, all entities in a simulation are sources. The result is a very large number of source-group pairs that severely limits scalability. An alternative to the SPT is a shared tree, which generally contains forwarding information based only on the group. Under the direction of NRL, Bellcore and Bay Networks are implementing a shared tree protocol called Core-Based Trees (CBT). CBT was origi- nally developed at University College, London. Simulation results have shown that it is more scalable than SPT protocols currently being used [2,3] and has the potential of providing the scaling needed for STOW 97.
Real-time Requirements: While IP multicast provides the high dynamic robust behavior re- quired for a multicast distributed interactive simu- lation, the entities must also interact in real time. To provide minimum end-to-end latency over the wide-area network (WAN), acrosyncronous trans- fer mode (ATM) will be used as the WAN proto- col. In the ATM Forum's user-to-network inter- face standard (UNI 3.1), ATM has a point-to- multipoint capability that will be integrated with IP-multicast on the STOW LANs. NRL, with the assistance of Bellcore and Bay Networks, is cur- rently working on integrating both the multicast and quality of service capabilities of IP and ATM [4]. Bellcore is developing a multicast address resolution server (MARS) (Fig. 3) to allow trans- lation of IP multicast addresses to ATM virtual circuit identifiers.
Future Work: Future work includes further integration of IP local area and ATM wide area services. The next major milestone will be the integration of secure cryptographic devices in the ATM portion of the STOW environment to allow classified exercises and training. The results of the RITN effort will provide important baseline infor- mation to support the Defense Information Sys- tems Agency's Leading Edge Services deployment of next generation communications services to DoD.
[Sponsored by ARPA]
128
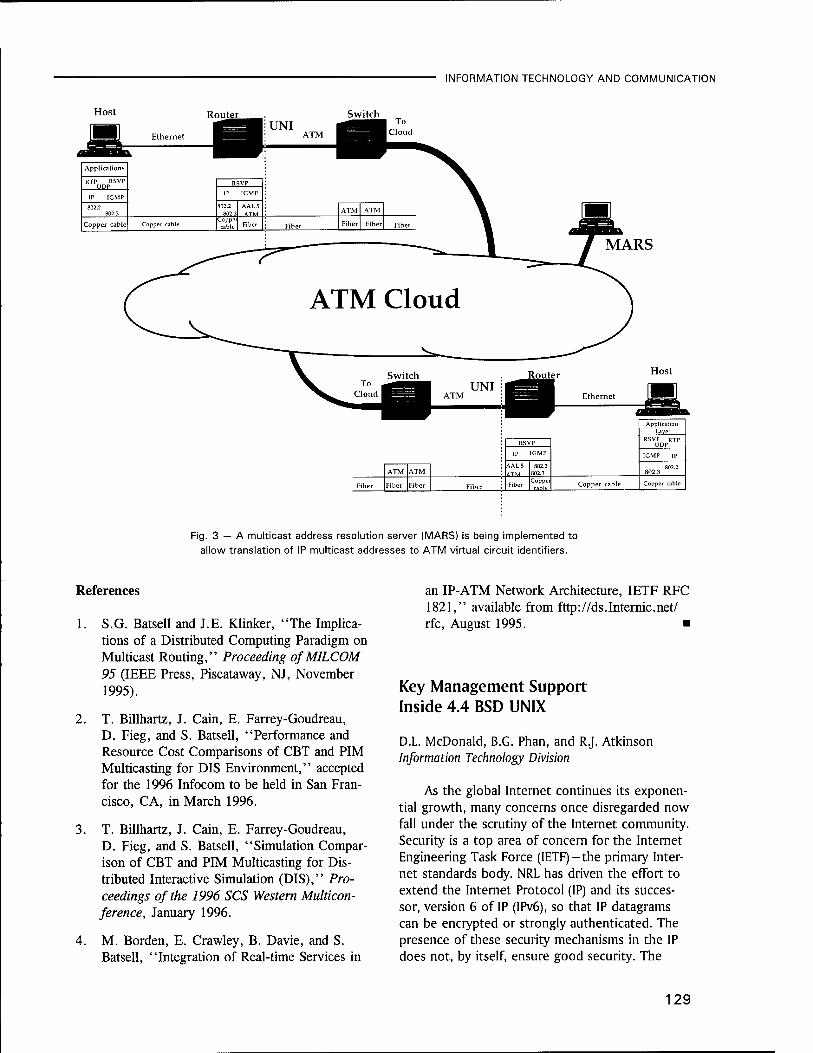
INFORMATION TECHNOLOGY AND COMMUNICATION
Host Router
Ethernet
Applications
Copper cable
802.2 802.3
Coppei cable
AAL 5 ATM
Switch UNI
ATM
MARS
ATM Cloud
Router Host
Ethernet
AAL 5 ATM
802.2 802.3 Coppe table
Copper cable
Application Laver
Fig. 3 — A multicast address resolution server (MARS) is being implemented to allow translation of IP multicast addresses to ATM virtual circuit identifiers.
References
1. S.G. Batsell and J.E. Klinker, "The Implica- tions of a Distributed Computing Paradigm on Multicast Routing," Proceeding ofMILCOM 95 (IEEE Press, Piscataway, NJ, November 1995).
2. T. Billhartz, J. Cain, E. Farrey-Goudreau, D. Fieg, and S. Batsell, "Performance and Resource Cost Comparisons of CBT and PIM Multicasting for DIS Environment," accepted for the 1996 Infocom to be held in San Fran- cisco, CA, in March 1996.
3. T. Billhartz, J. Cain, E. Farrey-Goudreau, D. Fieg, and S. Batsell, "Simulation Compar- ison of CBT and PIM Multicasting for Dis- tributed Interactive Simulation (DIS)," Pro- ceedings of the 1996 SCS Western Multicon- ference, January 1996.
4. M. Borden, E. Crawley, B. Davie, and S. Batsell, "Integration of Real-time Services in
an IP-ATM Network Architecture, IETF RFC 1821," available from fttp://ds.Internic.net/ rfc, August 1995. ■
Key Management Support Inside 4.4 BSD UNIX
D.L. McDonald, B.G. Phan, and R.J. Atkinson Information Technology Division
As the global Internet continues its exponen- tial growth, many concerns once disregarded now fall under the scrutiny of the Internet community. Security is a top area of concern for the Internet Engineering Task Force (IETF)—the primary Inter- net standards body. NRL has driven the effort to extend the Internet Protocol (IP) and its succes- sor, version 6 of IP (IPv6), so that IP datagrams can be encrypted or strongly authenticated. The presence of these security mechanisms in the IP does not, by itself, ensure good security. The
129

INFORMATION TECHNOLOGY AND COMMUNICATION
establishment and maintenance of cryptographic keys and related security information, also known as key management, is also crucial to effective security. Key management for the IP is a subject of much experimentation and debate. NRL has implemented IPv6 inside the 4.4 BSD UNIX oper- ating system. To allow experimentation with different key management solutions, the imple- mentation includes a general purpose mechanism to allow management of security associations. A security association (Fig. 4) specifies the crypto- graphic key, as well as the security service and which parties are using it.
Key Security service and algorithm Source IPv6 address Destination IPv6 address Lifetime Sensitivity level of association
Fig. 4 — A security association
History: The Internet Protocol suite has gained popularity largely because of its avail- ability in the Berkeley Software Distribution (BSD) versions of the UNIX operating system. Even though many commercial operating systems no longer use the BSD networking implementation, they still support BSD abstractions for application programmers, such as the sockets application programming interface (API). The sockets inter- face allows applications in BSD to communicate with other applications, or sometimes, even with the operating system itself. One of the recent developments in BSD was the routing socket, allowing a privileged application to alter a machine's routing tables, which influences the path an IP datagram takes to reach its destina- tion. This abstraction allows a BSD computer to implement whatever routing policy the adminis- trator sees fit. When confronted with the task of placing security associations inside the operating system for use by the IP security services, the authors chose to use a key socket to allow privi- leged applications to alter the operating system's security associations. The similarity between the
operating system's routing tables and the security association table was strong enough to merit an analogous solution. This key socket, known as PF_KEY after the symbolic name of this type of socket (other examples include PF_ROUTE, for routing sockets, and PFJNET6 for IPv6 net- work sockets), is how key management can be separated out for purposes of experimentation and high-assurance implementation. Different key management strategies can be implemented in different applications, all of which use PF_KEY to affect changes in the operating system's security association table.
Security Association Table Mechanisms: The security association table resides inside the oper- ating system and is actually modified by a key engine that handles requests from either applica- tions or other operating system services. PF_KEY is the interface to the key engine presented to applications. Key management software uses the PF_KEY interface to maintain the security associa- tions that will be used by services inside the operating system. Key management applications send PF_KEY messages to the operating system to add, delete, get, or update security associations. The operating system sends a PF_KEY message to key management programs to signal the need for more keys.
A different interface to the key engine is pre- sented to other parts of the operating system-in particular, the networking services. For example, consider an IPv6 datagram arriving with an en- crypted data payload. Using a cleartext portion of the datagram, the IPv6 engine will access the security association table to obtain a decryption key or authentication key for this datagram. On outgoing datagrams, the IPv6 engine queries the security association table based on the destina- tion IPv6 address. The outgoing datagram is then authenticated or encrypted with the key obtained from the table.
A Framework for Experimentation: Figure 5 shows the interactions among the networking portions of the kernel, the key engine, and user applications that use network services and those that perform key management. Experimenting with different key management strategies is
130
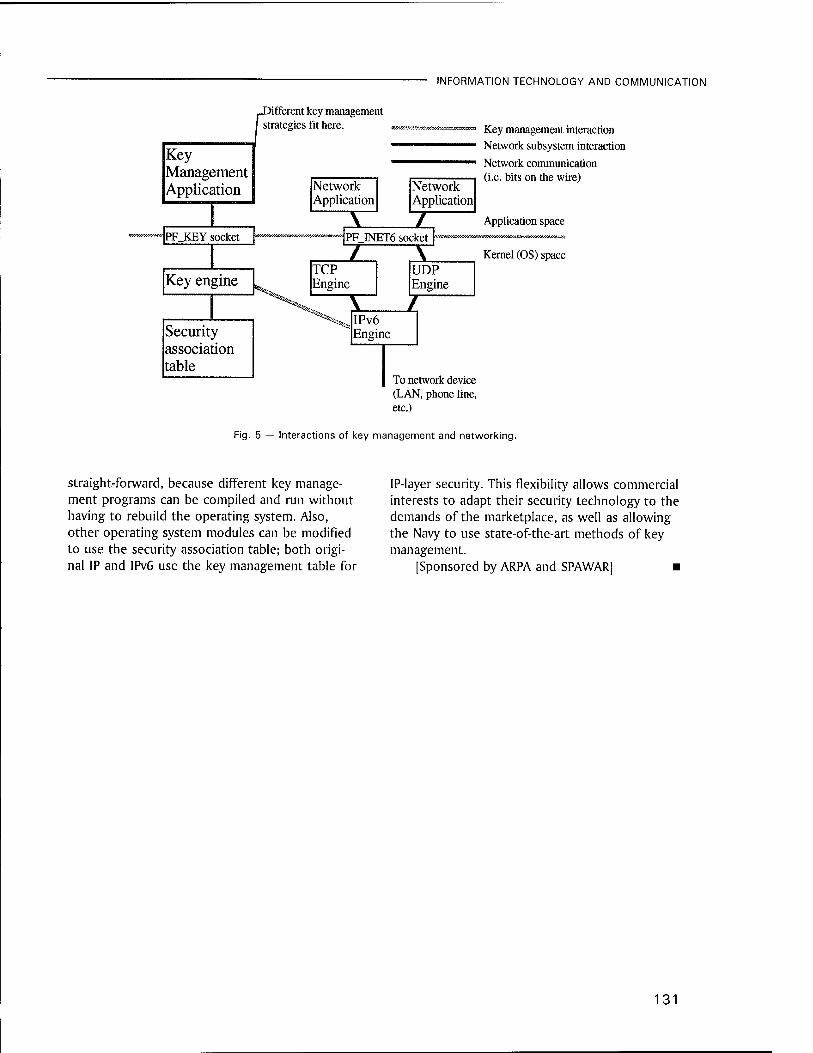
.Different key management strategies fit here.
Key Management Application
*WM49*WW*<W PF KEY socket tt<ww*w<B»j>»5'»s«fl«£ww^^
Network Application
INFORMATION TECHNOLOGY AND COMMUNICATION
Key management interaction Network subsystem interaction
Network communication (i.e. bits on the wire)
Network Application
z
Key engine
PFJNET6 socket z TCP Engine
Security association table
UDP Engine
Application space
Kernel (OS) space
IPv6 Engine
To network device (LAN, phone line, etc.)
Fig. 5 — Interactions of key management and networking.
straight-forward, because different key manage- ment programs can be compiled and run without having to rebuild the operating system. Also, other operating system modules can be modified to use the security association table; both origi- nal IP and IPv6 use the key management table for
IP-layer security. This flexibility allows commercial interests to adapt their security technology to the demands of the marketplace, as well as allowing the Navy to use state-of-the-art methods of key management.
[Sponsored by ARPA and SPAWAR] ■
131

Materials Science
and Technology

135 Magnetic Metal/Semiconductor Heterostructure Studies in the EPICENTER Facility B.T. Jonker, P.M. Thibado, E. Kneedler, B.R. Bennett, B.V. Shanabrook, R.J. Wagner, and L.J. Whitman
137 Hydrogen Exchange Reactions within Density-Functional Theory M.R. Pederson
140 Optical Spectroscopy of Single GaAs Quantum Dots D.G. Gammon, E.S. Snow and B.V. Shanabrook
141 Dynamics and Control of Spatio-Temporal Systems LB. Schwartz and I. Triandaf
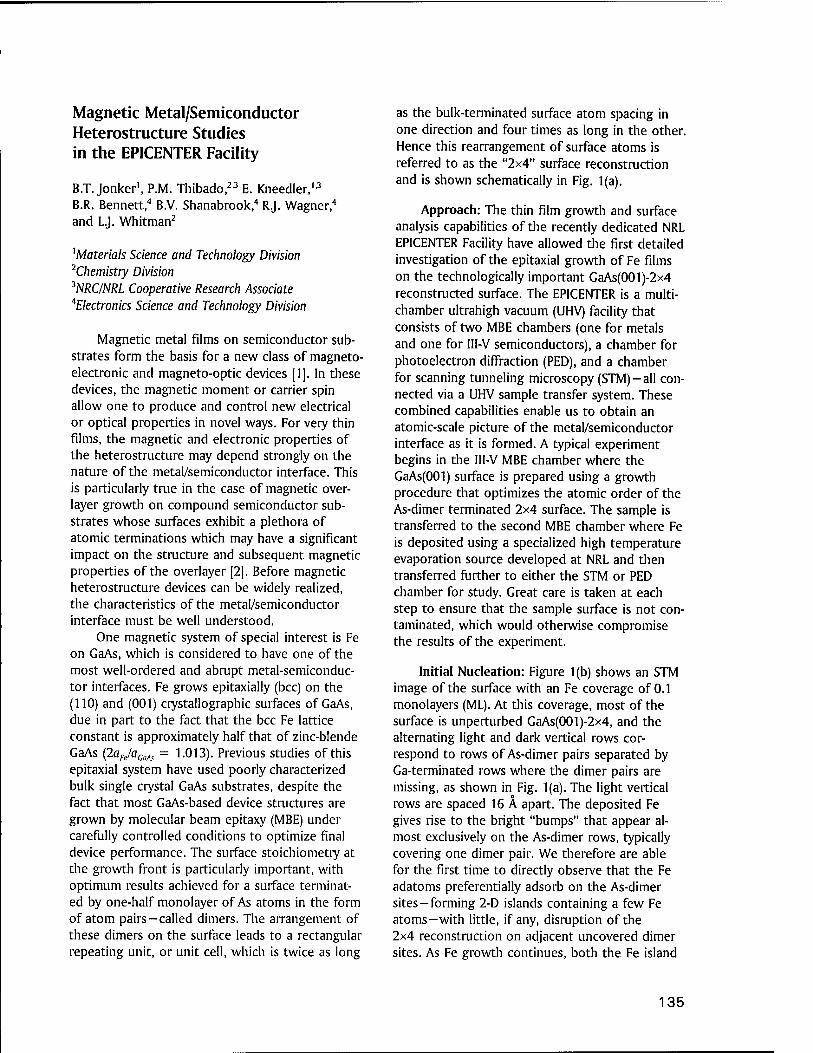
Magnetic Metal/Semiconductor Heterostructure Studies in the EPICENTER Facility
B.T. Jonker1, P.M. Thibado,23 E. Kneedler,'3
B.R. Bennett,4 B.V. Shanabrook,4 R.J. Wagner4
and L.J. Whitman2
^Materials Science and Technology Division 2Chemistry Division 3NRC/NRL Cooperative Research Associate ^Electronics Science and Technology Division
Magnetic metal films on semiconductor sub- strates form the basis for a new class of magneto- electronic and magneto-optic devices [1]. In these devices, the magnetic moment or carrier spin allow one to produce and control new electrical or optical properties in novel ways. For very thin films, the magnetic and electronic properties of the heterostructure may depend strongly on the nature of the metal/semiconductor interface. This is particularly true in the case of magnetic over- layer growth on compound semiconductor sub- strates whose surfaces exhibit a plethora of atomic terminations which may have a significant impact on the structure and subsequent magnetic properties of the overlayer [2]. Before magnetic heterostructure devices can be widely realized, the characteristics of the metal/semiconductor interface must be well understood.
One magnetic system of special interest is Fe on GaAs, which is considered to have one of the most well-ordered and abrupt metal-semiconduc- tor interfaces. Fe grows epitaxially (bcc) on the (110) and (001) crystallographic surfaces of GaAs, due in part to the fact that the bcc Fe lattice constant is approximately half that of zinc-blende GaAs (2aFe/aCaAs = 1.013). Previous studies of this epitaxial system have used poorly characterized bulk single crystal GaAs substrates, despite the fact that most GaAs-based device structures are grown by molecular beam epitaxy (MBE) under carefully controlled conditions to optimize final device performance. The surface stoichiometry at the growth front is particularly important, with optimum results achieved for a surface terminat- ed by one-half monolayer of As atoms in the form of atom pairs—called dimers. The arrangement of these dimers on the surface leads to a rectangular repeating unit, or unit cell, which is twice as long
as the bulk-terminated surface atom spacing in one direction and four times as long in the other. Hence this rearrangement of surface atoms is referred to as the "2x4" surface reconstruction and is shown schematically in Fig. 1(a).
Approach: The thin film growth and surface analysis capabilities of the recently dedicated NRL EPICENTER Facility have allowed the first detailed investigation of the epitaxial growth of Fe films on the technologically important GaAs(001)-2x4 reconstructed surface. The EPICENTER is a multi- chamber ultrahigh vacuum (UHV) facility that consists of two MBE chambers (one for metals and one for III-V semiconductors), a chamber for photoelectron diffraction (PED), and a chamber for scanning tunneling microscopy (STM)-all con- nected via a UHV sample transfer system. These combined capabilities enable us to obtain an atomic-scale picture of the metal/semiconductor interface as it is formed. A typical experiment begins in the III-V MBE chamber where the GaAs(OOl) surface is prepared using a growth procedure that optimizes the atomic order of the As-dimer terminated 2x4 surface. The sample is transferred to the second MBE chamber where Fe is deposited using a specialized high temperature evaporation source developed at NRL and then transferred further to either the STM or PED chamber for study. Great care is taken at each step to ensure that the sample surface is not con- taminated, which would otherwise compromise the results of the experiment.
Initial Nucleation: Figure 1(b) shows an STM image of the surface with an Fe coverage of 0.1 monolayers (ML). At this coverage, most of the surface is unperturbed GaAs(001)-2x4, and the alternating light and dark vertical rows cor- respond to rows of As-dimer pairs separated by Ga-terminated rows where the dimer pairs are missing, as shown in Fig. 1(a). The light vertical rows are spaced 16 Ä apart. The deposited Fe gives rise to the bright "bumps" that appear al- most exclusively on the As-dimer rows, typically covering one dimer pair. We therefore are able for the first time to directly observe that the Fe adatoms preferentially adsorb on the As-dimer sites-forming 2-D islands containing a few Fe atoms-with little, if any, disruption of the 2x4 reconstruction on adjacent uncovered dimer sites. As Fe growth continues, both the Fe island
135

MATERIALS SCIENCE AND TECHNOLOGY
(a) O 1st layer As • 2nd layer Ga 0 3rd layer As • 4th layer Ga
[110]
[110]
•-■0-"*~~<>-m • *~*9" oJo*o*o«o|
p.o»o»-
o • o tl o - • - o- -•- -o - • - o- -•- -o •
Fig. 1 (a) - Model of the As-dimer terminated GaAs(001 )-2 x4 recon- structed surface. The dashed rectangle indicates the 2 x4 unit cell. STM images (40 nm x 40 nm) of the surface after deposition of (b) 0.1 ML and (c) 0.5 ML of Fe.
density along the dinner rows and the average island size increase, as seen in Fig. 1(c) where an image of a 0.5-ML-thick film is shown. Although the surface is almost completely covered by Fe islands, the rowlike structure of the (2x4) sub- strate reconstruction is still evident in the general alignment of the islands. The islands are now typically wider than the As dimer rows, indicating that Fe adsorption, initially confined to the dimer rows, has now taken place on the missing dimer rows.
Layer Formation: Whereas STM provides an excellent view of the atomic-scale surface topog- raphy following Fe deposition, PED provides com- plementary information regarding the structure and composition of the Fe overlayers. In this technique, an incident X-ray photon from a mono- chromatic source is absorbed by an atom in the sample, resulting in the emission of an electron (called a photoelectron) from one of the electron- ic levels with an energy characteristic of that atom. At sufficiently high energy (> 300 eV), the photoelectrons are focused along the directions of neighboring atoms, which act as electronic lenses. This focusing effect results in peaks in photoelectron emission intensity along the princi-
ple crystallographic axes of the crystal. If one measures the angles at which these intensity maxima occur with an appropriate electron detec- tor as a function of coverage, one can determine the early growth morphology since the appear- ance of intensity maxima at angles characteristic of the structure signals the occupation of second, third, or fourth layer sites, as seen in Fig. 2(a).
The photoelectron emission intensity from the Fe 2p core level is plotted as a function of emission angle in Fig. 2(b) for a range of Fe coverages on the GaAs(001)-2x4 surface. The polar scan for 0.5 ML of Fe clearly shows a maxi- mum in the [111] direction, which by comparison with Fig. 2(a), indicates that some second layer sites are already occupied. These results, together with the STM data, reveal that as the Fe covers the Ga atoms in the missing dimer rows, bilayer growth occurs between the dimer rows to main- tain a flat surface. The PED spectrum at 1.25 ML exhibits a strong [111] peak, as expected as the second layer forms. In addition, a much weaker peak along [001] (the surface normal) indicates that some third layer sites are occupied, as well. As the third equivalent monolayer of Fe is depos- ited, the PED polar scan at 2.5 ML shows strong [001] and [111] features as anticipated but, in
136
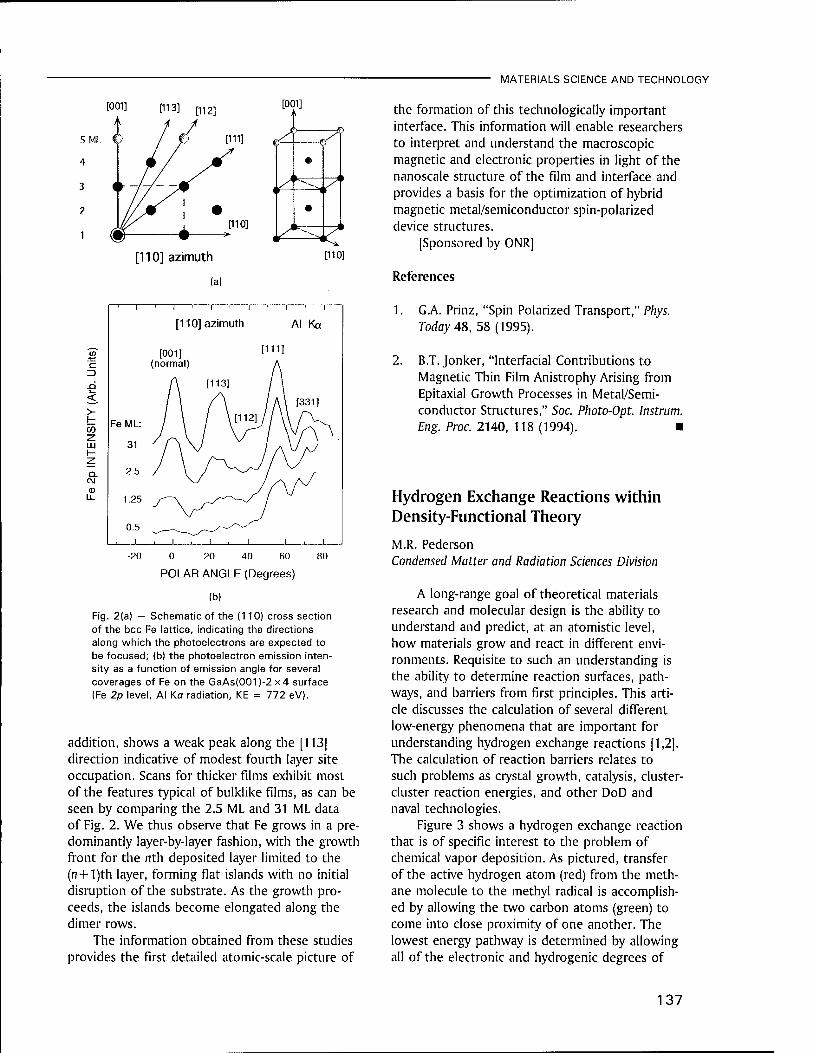
[001] [113] [112] [001]
[110]
,<d^?'
k^ [110] azimuth [110]
MATERIALS SCIENCE AND TECHNOLOGY
the formation of this technologically important interface. This information will enable researchers to interpret and understand the macroscopic magnetic and electronic properties in light of the nanoscale structure of the film and interface and provides a basis for the optimization of hybrid magnetic metal/semiconductor spin-polarized device structures.
[Sponsored by ONR]
References
< > H
■z. Ill
CM
T ' 1 ' 1 ■
[110] azimuth
[001] (normal)
Al Ka
[111]
0 20 40 60
POLAR ANGLE (Degrees)
(b)
Fig. 2(a) — Schematic of the (110) cross section of the bcc Fe lattice, indicating the directions along which the photoelectrons are expected to be focused; (b) the photoelectron emission inten- sity as a function of emission angle for several coverages of Fe on the GaAs(001)-2 x4 surface (Fe 2p level, Al Ka radiation, KE = 772 eV).
addition, shows a weak peak along the [113] direction indicative of modest fourth layer site occupation. Scans for thicker films exhibit most of the features typical of bulklike films, as can be seen by comparing the 2.5 ML and 31 ML data of Fig. 2. We thus observe that Fe grows in a pre- dominantly layer-by-layer fashion, with the growth front for the nth deposited layer limited to the (n + l)th layer, forming flat islands with no initial disruption of the substrate. As the growth pro- ceeds, the islands become elongated along the dimer rows.
The information obtained from these studies provides the first detailed atomic-scale picture of
1. G.A. Prinz, "Spin Polarized Transport," Phys. Today 48, 58(1995).
2. B.T. Jonker, "Interfacial Contributions to Magnetic Thin Film Anistrophy Arising from Epitaxial Growth Processes in Metal/Semi- conductor Structures," Soc. Photo-Opt. Instrum. Eng. Proc. 2140, 118 (1994). ■
Hydrogen Exchange Reactions within Density-Functional Theory
M.R. Pederson Condensed Matter and Radiation Sciences Division
A long-range goal of theoretical materials research and molecular design is the ability to understand and predict, at an atomistic level, how materials grow and react in different envi- ronments. Requisite to such an understanding is the ability to determine reaction surfaces, path- ways, and barriers from first principles. This arti- cle discusses the calculation of several different low-energy phenomena that are important for understanding hydrogen exchange reactions [1,2]. The calculation of reaction barriers relates to such problems as crystal growth, catalysis, cluster- cluster reaction energies, and other DoD and naval technologies.
Figure 3 shows a hydrogen exchange reaction that is of specific interest to the problem of chemical vapor deposition. As pictured, transfer of the active hydrogen atom (red) from the meth- ane molecule to the methyl radical is accomplish- ed by allowing the two carbon atoms (green) to come into close proximity of one another. The lowest energy pathway is determined by allowing all of the electronic and hydrogenic degrees of
137

MATERIALS SCIENCE AND TECHNOLOGY
TRANSITION STATE
REACTANTS PRODUCTS
Fig 3 — Reaction pathway followed during a methyl-methane hydrogen exchange reaction.
freedom to relax as a function of the C-C separa- tion. In nature, the energy barrier for this reac- tion is known to be approximately 0.6 eV. Also, in this class of reactions, is the transfer of a hydrogen from a methane molecule to a gas- phase hydrogen atom. Related reactions are re- sponsible for abstraction of hydrogen atoms from diamond surfaces. The latter reaction also gov- erns the production of gas-phase methyl radicals, which are then exothermically attached to vacant sites on the diamond surface.
Theory and Computation: The underlying theory on which these calculations are based is the density-functional formalism. This formalism allows for a quantum-mechanical solution of the electronic motion and a semiclassical treatment of the motion of the nuclei. To solve quantum- mechanically for the electronic wavefunctions, a local-orbital cluster code developed at NRL by the author and coworkers, has been used. The charge densities from the electronic wavefunctions are used to determine interatomic forces. The infor- mation obtained from the interatomic forces at many different atomic configurations allows the determination of molecular geometries, transition states, and vibrational modes. The calculations
have been performed on the DoD CEWES (Corps of Engineers Waterway Experimental Station) and NAVO (Naval Oceanographic Office) computers, as well as local workstations. A recent theoretical development of importance to reaction barriers is the Perdew-Wang generalized-gradient approxi- mation (GGA) to the density-functional theory. Personnel within the Complex-Systems Theory Branch participated in the first comprehensive numerical test of this theory in 1991 [3]. In con- trast to older versions of the density-functional theory that overestimated bonding energies by approximately 0.7 eV/atom, the GGA predicts hydrocarbon formation energies with an accuracy of approximately 0.1 eV/atom [3]. Since typical reaction barriers are in the 0.2-1.0 eV energy range and reaction rates depend exponentially on such barriers, the improvements realized from GGA are an absolute necessity.
Results: We have determined the lowest energy pathway for the methyl-methane hydrogen exchange reaction (Fig. 3). Within the GGA, we predict a classical reaction barrier of 0.44 eV [2]. As the two reactants proceed to the transition- state geometry, general arguments suggest that effects due to zero-point vibration will slightly enhance the barrier. To estimate the effects due to zero-point motion, vibrational modes and dis- placement vectors associated with each atomic configuration are calculated within the harmonic approximation. Figure 4 shows the resulting fre- quencies. In addition to the frequencies in Fig. 4, it is necessary to account for the very large anharmonic effects observed by the transition state mode to calculate enhancements due to zero-point motion. Following this prescription, we estimate the reaction barrier to be 0.47 eV [1,2]. For comparison, we note that the experimental barrier is approximately 0.61 eV.
The CH3-H2 hydrogen exchange reaction has also been studied within the GGA [2]. Figure 5 summarizes the transition-state geometry and the classical reaction surface. Neglecting zero- point effects, we predict that the [H,CH4] prod- ucts are more stable than the [H2,CH3] reactants by 0.22 eV. Inclusion of zero-point effects de- creases the enthalpy of reaction to 0.108 eV, which is in excellent agreement with the experi- mentally determined value of 0.113 eV. While the net enthalpy of reaction is only 0.108 eV, the reaction energy is determined by the barrier
138
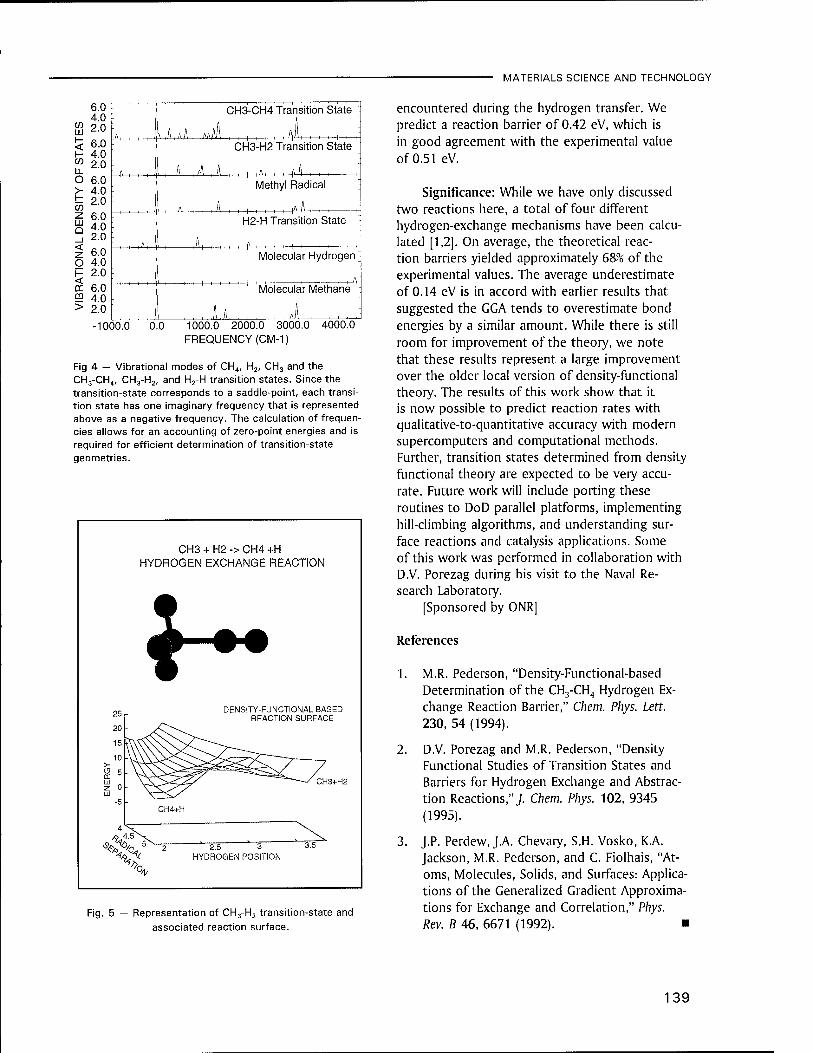
MATERIALS SCIENCE AND TECHNOLOGY
LL O > H
CO -z. LU Q _l < o < CD
>
CH3-CH4 Transition State
|AA,A
CH3-H2 Transition State
,A, A A Methyl Radical
\ A A . . ,■
H2-H Transition State
-4- Molecular Hydrogen
6.0 4.0 2.0 6.0 4.0 2.0
6.0 4.0 2.0
6.0 4.0 2.0 6.0 4.0 2.0
6.0 4.0 2.0 I_^___JUL -1000.0 0.0 1000.0 2000.0 3000.CT 4000.0
FREQUENCY (CM-1)
Fig 4 — Vibrational modes of CH4, H2, CH3 and the CH3-CH„, CH3-H2, and H2-H transition states. Since the transition-state corresponds to a saddle-point, each transi- tion state has one imaginary frequency that is represented above as a negative frequency. The calculation of frequen- cies allows for an accounting of zero-point energies and is required for efficient determination of transition-state geometries.
J\. Molecular Methane
ix
CH3 + H2 -> CH4 +H HYDROGEN EXCHANGE REACTION
DENSITY-FUNCTIONAL BASED REACTION SURFACE
CH3+H2
4^T
2.5 3 HYDROGEN POSITION
Fig. 5 — Representation of CH3-H2 transition-state and associated reaction surface.
encountered during the hydrogen transfer. We predict a reaction barrier of 0.42 eV, which is in good agreement with the experimental value of 0.51 eV.
Significance: While we have only discussed two reactions here, a total of four different hydrogen-exchange mechanisms have been calcu- lated [1,2]. On average, the theoretical reac- tion barriers yielded approximately 68% of the experimental values. The average underestimate of 0.14 eV is in accord with earlier results that suggested the GGA tends to overestimate bond energies by a similar amount. While there is still room for improvement of the theory, we note that these results represent a large improvement over the older local version of density-functional theory. The results of this work show that it is now possible to predict reaction rates with qualitative-to-quantitative accuracy with modern supercomputers and computational methods. Further, transition states determined from density functional theory are expected to be very accu- rate. Future work will include porting these routines to DoD parallel platforms, implementing hill-climbing algorithms, and understanding sur- face reactions and catalysis applications. Some of this work was performed in collaboration with D.V. Porezag during his visit to the Naval Re- search Laboratory.
[Sponsored by ONR]
References
1. M.R. Pederson, "Density-Functional-based Determination of the CH3-CH4 Hydrogen Ex- change Reaction Barrier," Chem. Phys. Lett. 230, 54 (1994).
2. D.V. Porezag and M.R. Pederson, "Density Functional Studies of Transition States and Barriers for Hydrogen Exchange and Abstrac- tion Reactions,";. Chem. Phys. 102, 9345 (1995).
3. J.P. Perdew, J.A. Chevary, S.H. Vosko, K.A. Jackson, M.R. Pederson, and C. Fiolhais, "At- oms, Molecules, Solids, and Surfaces: Applica- tions of the Generalized Gradient Approxima- tions for Exchange and Correlation," Phys. Rev. B 46, 6671 (1992). ■
139
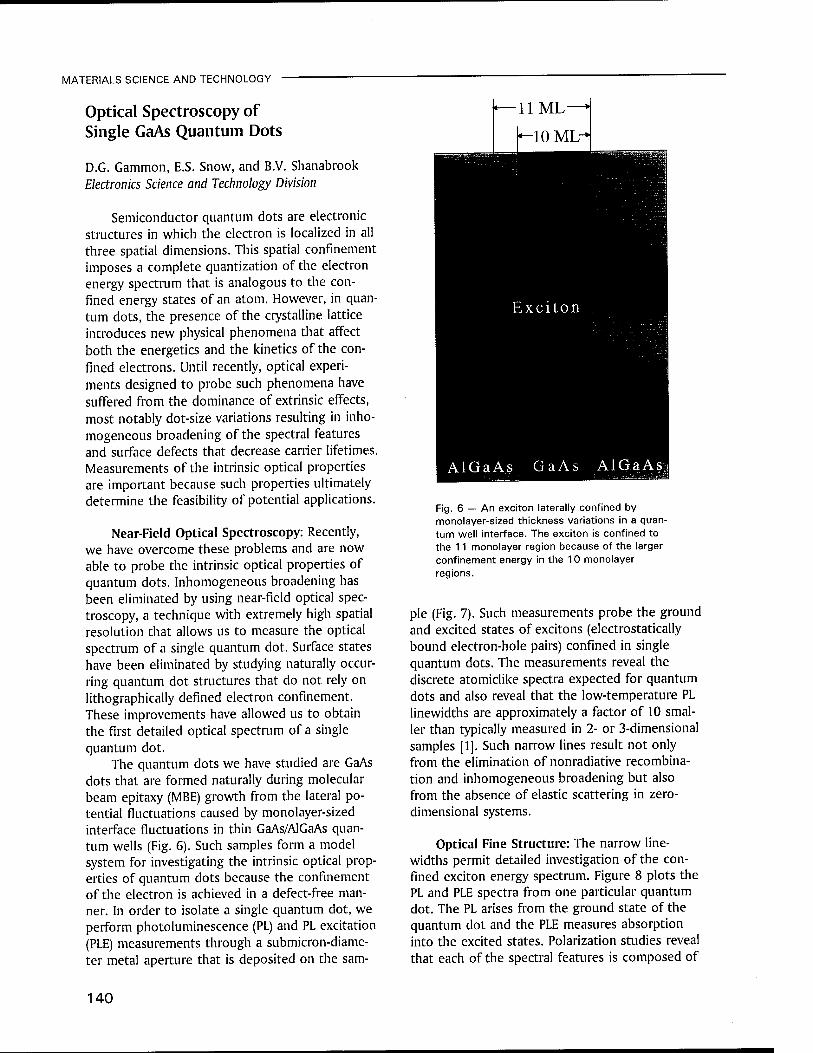
MATERIALS SCIENCE AND TECHNOLOGY
Optical Spectroscopy of Single GaAs Quantum Dots
D.G. Gammon, E.S. Snow, and B.V. Shanabrook Electronics Science and Technology Division
Semiconductor quantum dots are electronic structures in which the electron is localized in all three spatial dimensions. This spatial confinement imposes a complete quantization of the electron energy spectrum that is analogous to the con- fined energy states of an atom. However, in quan- tum dots, the presence of the crystalline lattice introduces new physical phenomena that affect both the energetics and the kinetics of the con- fined electrons. Until recently, optical experi- ments designed to probe such phenomena have suffered from the dominance of extrinsic effects, most notably dot-size variations resulting in inho- mogeneous broadening of the spectral features and surface defects that decrease carrier lifetimes. Measurements of the intrinsic optical properties are important because such properties ultimately determine the feasibility of potential applications.
Near-Field Optical Spectroscopy: Recently, we have overcome these problems and are now able to probe the intrinsic optical properties of quantum dots. Inhomogeneous broadening has been eliminated by using near-field optical spec- troscopy, a technique with extremely high spatial resolution that allows us to measure the optical spectrum of a single quantum dot. Surface states have been eliminated by studying naturally occur- ring quantum dot structures that do not rely on lithographically defined electron confinement. These improvements have allowed us to obtain the first detailed optical spectrum of a single quantum dot.
The quantum dots we have studied are GaAs dots that are formed naturally during molecular beam epitaxy (MBE) growth from the lateral po- tential fluctuations caused by monolayer-sized interface fluctuations in thin GaAs/AlGaAs quan- tum wells (Fig. 6). Such samples form a model system for investigating the intrinsic optical prop- erties of quantum dots because the confinement of the electron is achieved in a defect-free man- ner. In order to isolate a single quantum dot, we perform photoluminescence (PL) and PL excitation (PLE) measurements through a submicron-diame- ter metal aperture that is deposited on the sam-
11 ML—
«-10 ML-
Exciton
Al GaAs GaAs ALGaAs|
Fig. 6 — An exciton laterally confined by monolayer-sized thickness variations in a quan- tum well interface. The exciton is confined to the 11 monolayer region because of the larger confinement energy in the 10 monolayer regions.
pie (Fig. 7). Such measurements probe the ground and excited states of excitons (electrostatically bound electron-hole pairs) confined in single quantum dots. The measurements reveal the discrete atomiclike spectra expected for quantum dots and also reveal that the low-temperature PL linewidths are approximately a factor of 10 smal- ler than typically measured in 2- or 3-dimensional samples [1]. Such narrow lines result not only from the elimination of nonradiative recombina- tion and inhomogeneous broadening but also from the absence of elastic scattering in zero- dimensional systems.
Optical Fine Structure: The narrow line- widths permit detailed investigation of the con- fined exciton energy spectrum. Figure 8 plots the PL and PLE spectra from one particular quantum dot. The PL arises from the ground state of the quantum dot and the PLE measures absorption into the excited states. Polarization studies reveal that each of the spectral features is composed of
140

MATERIALS SCIENCE AND TECHNOLOGY
c 0
1 1' 1
EL=2.4 eV
I 1 1 1 1
Hole
, 0.2 Lim
^ykL ili^MK^'-5^ 11 mono.
„ 10 mono.
/ ^y \ 25 um
1.66 1.67 1.68 1.69 Energy (eV)
1.70 1.71
Fig. 7 — PL spectra from a 25, 1.5 and 0.2 um diameter aperture. The two peaks in the 25 u.m spectrum arise from the inhomogeneously broadened PL in the 10 and 11 monolayer-wide regions of the quantum well. The much sharper homogeneous PL peaks from the individual quan- tum dots are resolved by using the smaller apertures.
c CD
-100 0 100 AE (neV)
0 4 En-E0 (meV)
_i ££ LÜJ
1.682 1.684 1.686 1.688 Energy (eV)
Fig. 8 — The ground state PL line and the PLE spectrum from the excited states of a single GaAs quantum dot. Each spectral feature is actually composed of a linearly polarized doublet (top left insert). The top right insert shows the linewidth of each of the states as a function of its energy relative to the ground state.
a doublet (separated by ~ 40 ueV) that is linearly polarized along the (110) and the (110 crystallo- graphic axes (top left insert, Fig. 8). Although this fine structure was not predicted by theory, it most likely arises from a spatial asymmetry in the confining potential. Such an asymmetry has been observed by scanning tunneling microscopy and arises from the elongation of the interface fluctu- ations along the (110) direction. We propose that the excitation of the quantum dot gives rise to depolarization fields that cause a small shift of the quantized exciton energy states. The observed splitting arises from the different de- polarization shifts for excitons polarized along the elongated (110) axis relative to the shorter (110) direction.
Homogeneous Linewidths: Additional infor- mation is gleaned from the homogeneous line- widths of the ground and excited states. Our measurements indicate that the ground state linewidth (~ 25 ueV) is consistent (via the uncer- tainty relationship) with theoretical predictions of the radiative exciton lifetime in a quantum dot. We also observe a systematic increase in line- width with increasing energy of the excited states (top right insert, Fig. 8) that indicates an increase in phonon emission rate. Such lifetime informa- tion is critical to applications like quantum dot lasers that depend on the details of the exciton kinetics. This vital information can be obtained only from experiments such as these that probe the intrinsic optical properties of single quantum dots.
[Sponsored by ONR]
Reference
1. D. Gammon, E.S. Snow, and D.S. Katzer, Appl. Phys. Lett. 67, 2391 (1995). ■
Dynamics and Control of Spatio-Temporal Systems
I.B. Schwartz Plasma Physics Division
I. Triandaf Science Applications International Corporation McLean, Virginia
A great deal of interest has been devoted recently to the study of complex spatio-temporal
141

MATERIALS SCIENCE AND TECHNOLOGY
1.0-
Chaotic Bursting in a Reaction Diffusion System
Ä^-^ifiiiiii^iil^'f^^iwtirt^il^w^'WiiNÄ
0.0- 720.0 740.0 760.0
time
780.0 800.0
-2.0 -1.4 -0.8 -0.2
u(x,t)
Fig 9 — One species (scaled) of the chemical reaction is shown as a function of space and time. The underlying dynamics is one of chaotic bursting. The reaction dominant regime is in the middle red region. Bursting occurs at the peak near white intensity. The diffusion domi- nant regime is in the blue region.
dynamics that occur as nonlinear systems are driven away from thermal equilibrium. Such sys- tems play important roles in technological fields such as classical mechanics and materials (buck- ling of plate, piezoelectric materials), hydrody- namics (thermal convection, liquid crystal instabil- ities, turbulence), chemistry (corrosion, nonlinear waves, Turing patterns), and solid-state physics (solidification, melting, growth). In this paper, we show how powerful new tools [1] can be applied to control the dynamics of such systems in an experimental system. To exemplify the new meth- ods, we study the dynamics of a particular chem- ical reaction that is used in open flow systems such as annular gel and tubular reactors. We demonstrate how to improve dramatically the reaction by using control and tracking methods.
Introduction: Recent developments in the theory of nonlinear dynamical systems have pro- vided experimentalists with new tools for explor- ing a wide range of aspects in the dynamics of real systems based on analyzing a single time series [2]. Methods such as embedding techniques allow one to reconstruct a geometric model of an attractor and recover all its essential properties from time series measurements alone. Employing embedding methods for attractor reconstruction has led to a new, highly adaptive control and tracking algorithm for stabilizing orbits inside a
chaotic attractor and tracking (or following) these orbits as functions of parameters. Because of the generality of the method, the application of track- ing and control has been applied to many prob- lems in different fields such as chemistry, mech- anics, smart materials, and excitable biological media, to name just a few. In this article, we illustrate the control for a reaction-diffusion sys- tem used in modeling a class of annular gel reac- tors that exhibit chaotic dynamics [3].
Nonlinear Dynamics of a Reaction-Diffusion System: The model we consider is one that ap- proximates the experimental conditions and re- quirements of chemical kinetics laws in many types of processes, such as electrochemical reac- tions, corrosion, gas-solid, and gas-liquid interfa- cial reactions. The following equations model the qualitative behavior in the Couette flow reactor associated with the observed front patterns in achlorite-iodide reaction and have been used for investigating the formation and dynamics of sus- tained front patterns:
du_ D d2u
8x2 /(«)]
RD
dt = D
dx2 u + a
142
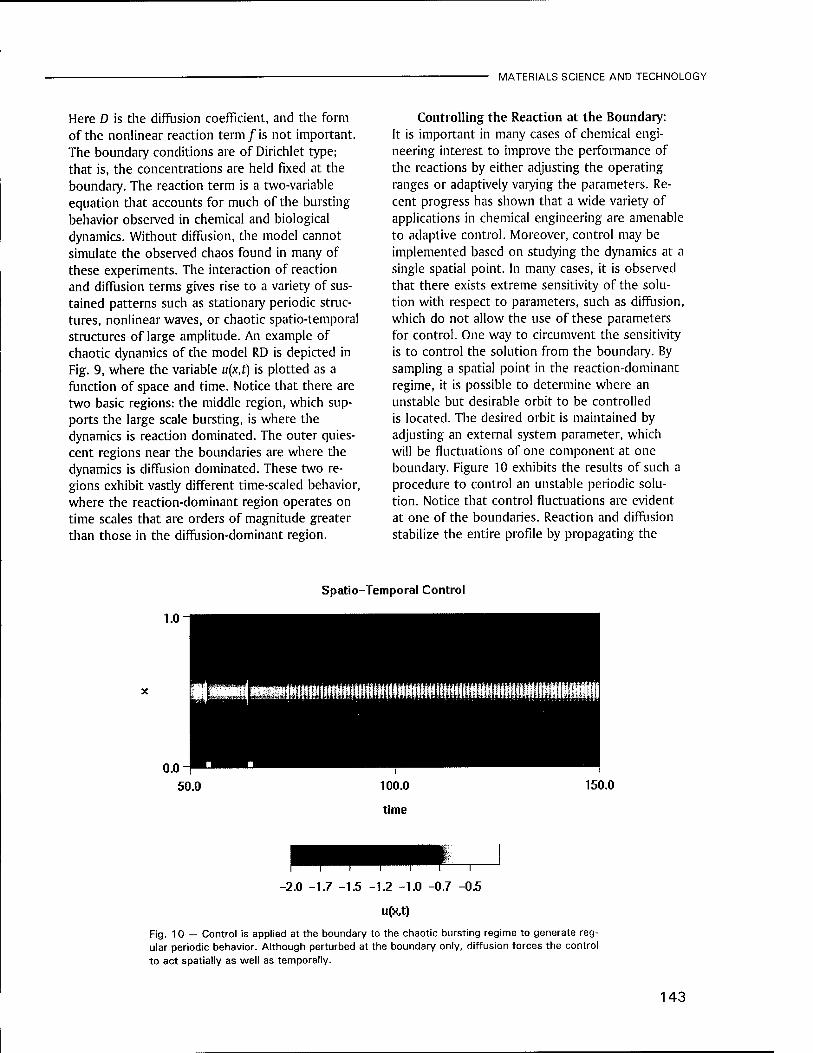
MATERIALS SCIENCE AND TECHNOLOGY
Here D is the diffusion coefficient, and the form of the nonlinear reaction term /is not important. The boundary conditions are of Dirichlet type; that is, the concentrations are held fixed at the boundary. The reaction term is a two-variable equation that accounts for much of the bursting behavior observed in chemical and biological dynamics. Without diffusion, the model cannot simulate the observed chaos found in many of these experiments. The interaction of reaction and diffusion terms gives rise to a variety of sus- tained patterns such as stationary periodic struc- tures, nonlinear waves, or chaotic spatio-temporal structures of large amplitude. An example of chaotic dynamics of the model RD is depicted in Fig. 9, where the variable u(x,t) is plotted as a function of space and time. Notice that there are two basic regions: the middle region, which sup- ports the large scale bursting, is where the dynamics is reaction dominated. The outer quies- cent regions near the boundaries are where the dynamics is diffusion dominated. These two re- gions exhibit vastly different time-scaled behavior, where the reaction-dominant region operates on time scales that are orders of magnitude greater than those in the diffusion-dominant region.
Controlling the Reaction at the Boundary: It is important in many cases of chemical engi- neering interest to improve the performance of the reactions by either adjusting the operating ranges or adaptively varying the parameters. Re- cent progress has shown that a wide variety of applications in chemical engineering are amenable to adaptive control. Moreover, control may be implemented based on studying the dynamics at a single spatial point. In many cases, it is observed that there exists extreme sensitivity of the solu- tion with respect to parameters, such as diffusion, which do not allow the use of these parameters for control. One way to circumvent the sensitivity is to control the solution from the boundary. By sampling a spatial point in the reaction-dominant regime, it is possible to determine where an unstable but desirable orbit to be controlled is located. The desired orbit is maintained by adjusting an external system parameter, which will be fluctuations of one component at one boundary. Figure 10 exhibits the results of such a procedure to control an unstable periodic solu- tion. Notice that control fluctuations are evident at one of the boundaries. Reaction and diffusion stabilize the entire profile by propagating the
Spatio-Temporal Control
1.0
lll^Ä^O^^iH.MiiuHiHnnniHiMMiinHiHUüHi^HiiiiHnM^iMHHnMtMHlMi«
0.0 50.0 100.0
time
150.0
-2.0 -1.7 -1.5 -1.2 -1.0 -0.7 -0.5
u(xt)
Fig. 10 — Control is applied at the boundary to the chaotic bursting regime to generate reg- ular periodic behavior. Although perturbed at the boundary only, diffusion forces the control to act spatially as well as temporally.
143
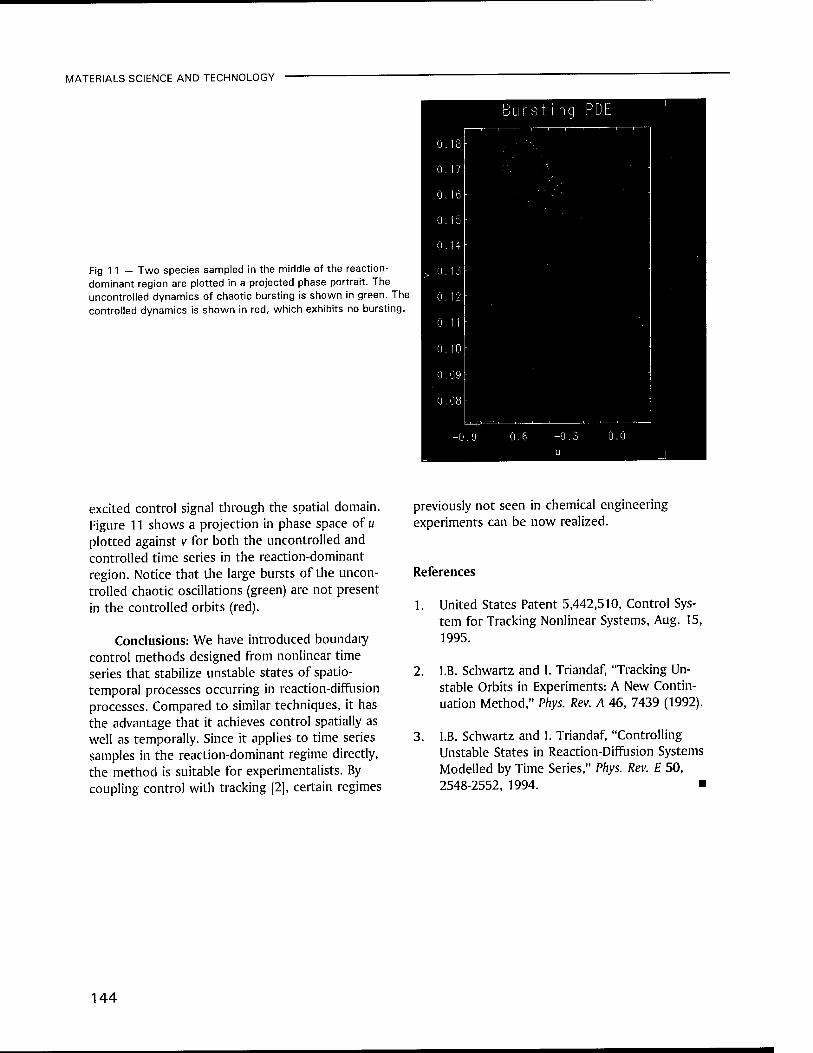
MATERIALS SCIENCE AND TECHNOLOGY
Fig 11 — Two species sampled in the middle of the reaction- dominant region are plotted in a projected phase portrait. The uncontrolled dynamics of chaotic bursting is shown in green. The controlled dynamics is shown in red, which exhibits no bursting.
excited control signal through the spatial domain. Figure 11 shows a projection in phase space of u plotted against v for both the uncontrolled and controlled time series in the reaction-dominant region. Notice that the large bursts of the uncon- trolled chaotic oscillations (green) are not present in the controlled orbits (red).
Conclusions: We have introduced boundary control methods designed from nonlinear time series that stabilize unstable states of spatio- temporal processes occurring in reaction-diffusion processes. Compared to similar techniques, it has the advantage that it achieves control spatially as well as temporally. Since it applies to time series samples in the reaction-dominant regime directly, the method is suitable for experimentalists. By coupling control with tracking [2], certain regimes
previously not seen in chemical engineering experiments can be now realized.
References
1. United States Patent 5,442,510, Control Sys- tem for Tracking Nonlinear Systems, Aug. 15, 1995.
2. I.B. Schwartz and I. Triandaf, "Tracking Un- stable Orbits in Experiments: A New Contin- uation Method," Phys. Rev. A 46, 7439 (1992).
3. I.B. Schwartz and I. Triandaf, "Controlling Unstable States in Reaction-Diffusion Systems Modelled by Time Series," Phys. Rev. E 50, 2548-2552, 1994. ■
144

Ocean and
Atmospheric Science
and Technology

147 Polarimetric SAR Remote Sensing of Topography D.L. Schuler andJ.S. Lee
149 Biophysical Interactions in the Arabian Sea J.C Kindle, D.K. Young, R.A. Arnone, and A.W. Green
151 An Investigation of the Southerly Surge W.T. Thompson, T. Haack, andJ.D. Doyle
154 Solar Irradiance Variability Models J.T. Mariska, H.P. Warren, and]. Lean

Polarimetric SAR Remote Sensing of Topography
D.L. Schüler and J.S. Lee Remote Sensing Division
A new technique for terrain measurement using polarimetric synthetic aperture radar (SAR) data has been developed. It produces profiles of terrain slopes and elevations in the azimuthal (or along-track) direction. The technique estimates the average shift in the polarization orientation angle of copolarization backscatter caused by azimuthal tilts in the scattering plane. The first test of this technique was made using data from a forested area near Freiburg, Germany. Subse- quent tests of the algorithm have been conducted using polarimetric SAR data in a mountainous, nonforested region of the Mojave Desert. The radar-measured slope and elevation profiles have low rms errors (and high correlation values), when compared with digital-elevation model (DEM) values for the two areas. The algorithm is capable of adaptively making a transition from forested areas to regions having open terrain. Using this technique, spacebome and airborne polarimetric SAR will be capable of providing topographic information over wide areas.
Terrain slope maps in the along-track direc- tion can be produced by the technique without any prior knowledge of the terrain. Terrain eleva- tions can be derived from the polarimetric SAR slope measurements by integrating the slopes in the azimuthal direction. To obtain absolute (rather than relative) elevation values, at least one elevation "tie point" must be independently known somewhere along each slope profile. Com- plete elevation and slope mapping of the terrain in two dimensions is possible using this technique when azimuthal elevation profiles are produced throughout the range extent of the SAR image.
Concept: Figure 1 illustrates the concept by showing that physical terrain tilts in the azi- muthal direction produce significant shifts in the orientation angle of the copolarization maximum in P-band polarimetric SAR data. This observation is supported by other comparisons of signature peak displacements and DEM-derived surface tilts throughout the datasets [1]. A search-based algo- rithm has been developed to accurately and effi-
o 90
Orientate
180 tdeg-1
Orientation y - [deg.]
(b)
Fig. 1 — (a) Co-pol signature of P-band scatter in the Black Forest and (b) a contour plot of a forest signature from terrain having an azimuthal tilt of 22°. Note: The horizon- tal-transmit/receive peak (normally at (i|/ = 0°/180°) has
shifted to v|/ = 158°).
ciently measure the location of the maximum of polarization signatures in (\\i,%) space, where v|/ is the orientation angle and % is the ellipticity angle. In the algorithm, the location of the maxi- mum is determined for each SAR slant-range reso- lution cell. Changes in position of the maximum (Av|/) parallel to the orientation axis are related to topography, while values (%) in the orthogonal direction measure the ellipticity. Both physical parameters yield useful information. The algo- rithm adapts automatically to changing open or forested terrain conditions throughout the image.
Forested Terrain Studies: The effect of topography on P-band (68-cm wavelength) back- scatter from forested areas was studied [1] using
147
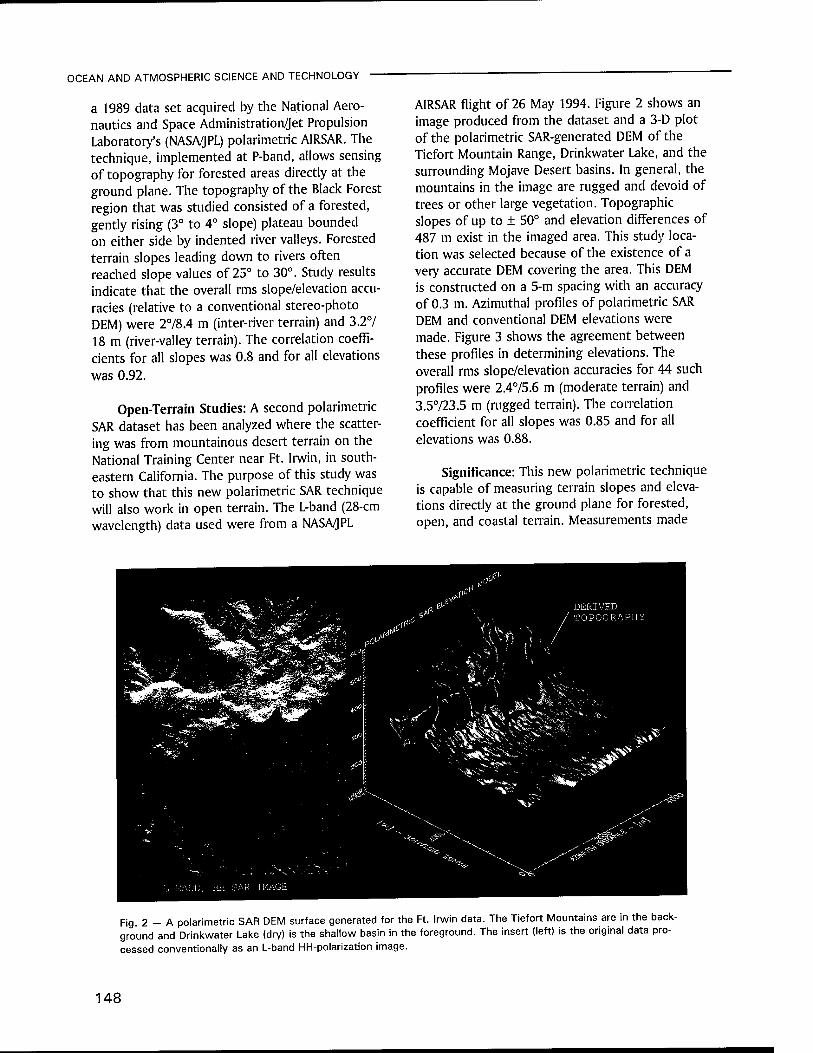
OCEAN AND ATMOSPHERIC SCIENCE AND TECHNOLOGY
a 1989 data set acquired by the National Aero- nautics and Space Administration/Jet Propulsion Laboratory's (NASA/JPL) polarimetric AIRSAR. The technique, implemented at P-band, allows sensing of topography for forested areas directly at the ground plane. The topography of the Black Forest region that was studied consisted of a forested, gently rising (3° to 4° slope) plateau bounded on either side by indented river valleys. Forested terrain slopes leading down to rivers often reached slope values of 25° to 30°. Study results indicate that the overall rms slope/elevation accu- racies (relative to a conventional stereo-photo DEM) were 278.4 m (inter-river terrain) and 3.27 18 m (river-valley terrain). The correlation coeffi- cients for all slopes was 0.8 and for all elevations was 0.92.
Open-Terrain Studies: A second polarimetric SAR dataset has been analyzed where the scatter- ing was from mountainous desert terrain on the National Training Center near Ft. Irwin, in south- eastern California. The purpose of this study was to show that this new polarimetric SAR technique will also work in open terrain. The L-band (28-cm wavelength) data used were from a NASA/JPL
AIRSAR flight of 26 May 1994. Figure 2 shows an image produced from the dataset and a 3-D plot of the polarimetric SAR-generated DEM of the Tiefort Mountain Range, Drinkwater Lake, and the surrounding Mojave Desert basins. In general, the mountains in the image are rugged and devoid of trees or other large vegetation. Topographic slopes of up to ± 50° and elevation differences of 487 m exist in the imaged area. This study loca- tion was selected because of the existence of a very accurate DEM covering the area. This DEM is constructed on a 5-m spacing with an accuracy of 0.3 m. Azimuthal profiles of polarimetric SAR DEM and conventional DEM elevations were made. Figure 3 shows the agreement between these profiles in determining elevations. The overall rms slope/elevation accuracies for 44 such profiles were 2.475.6 m (moderate terrain) and 3.5723.5 m (rugged terrain). The correlation coefficient for all slopes was 0.85 and for all elevations was 0.88.
Significance: This new polarimetric technique is capable of measuring terrain slopes and eleva- tions directly at the ground plane for forested, open, and coastal terrain. Measurements made
Fig. 2 - A polarimetric SAR DEM surface generated for the Ft. Irwin data. The Tiefort Mountains are in the back- ground and Drinkwater Lake (dry) is the shallow basin in the foreground. The insert (left) is the original data pro- cessed conventionally as an L-band HH-polarization image.
148

OCEAN AND ATMOSPHERIC SCIENCE AND TECHNOLOGY
400
2000 3000
Distance (m)
5000
Fig. 3 — Comparison of elevations derived for an azimuthal transect of the Tiefort Mountains (1) from polarimetric SAR data (solid line) and (2) from the Ft. Irwin DEM (dashed line). The polarimetric SAR elevation profile is initialized to the DEM value at the right side.
from aircraft and (potentially) from satellites will provide topographic information over wide areas of the Earth.
[Sponsored by ONR and ARPA]
References
1. D.L. Schüler, J.S. Lee, and G. De Grandi, "The Remote Sensing of Topography Using Polari- metric SAR," Proc. Geosci. Remote Sens. Symp. (IGARSS'95), Vol. Ill, 10-14 July 1995, Flor- ence, Italy, pp. 1789-1791.
2. D.L. Schüler, J.S. Lee, and G. De Grandi, "The Measurement of Topography Using Polari- metric SAR Images," submitted to IEEE Trans. Geosci. Remote Sens., March 1995. ■
Biophysical Interactions in the Arabian Sea
J.C. Kindle,1 D.K. Young,' R.A. Arnone,2
and A.W. Green1
10ceanography Division 2Remote Sensing Division
Background: The Arabian Sea is an area with steady wind-forcing during the regularly alternat- ing southwest (June-September) and northeast (December-February) monsoons (Fig. 4), with wind
lulls in Spring and Fall. These regular wind rever- sals make the region one of the few where one encounters a complete switch in wind-forcing and ocean-current response on a regular basis. The switch is associated with plankton blooms and extremely high production during the southwest (SW) monsoon and with reduced productivity in the other monsoon and impoverishment during the Spring transition. These cycles of high pro- ductivity, alternating with impoverishment, are so extreme that they represent end members in the range of open-ocean productivity values. This wide range makes the region especially appealing for investigating the response of the ecosystem to changes in the physical environment, which is the primary goal of the Accelerated Research Initia- tive, "Forced Upper Ocean Dynamics."
Approach: NRL scientists used a combination of numerical modeling, remote sensing, and field work to examine the source of nutrients for the 300- to 400-km wide phytoplankton bloom in the northern Arabian Sea during the SW monsoon. The intense southwesterly winds during the Sum- mer monsoon are conducive to coastal upwelling along the coasts of Somalia and Oman. Coastal filaments, which are formed by the interaction of the northeastward-flowing Omani Coastal Cur- rent with the prominent capes along the coast, extend offshore as jets, with width scales of up to 100 km and surface velocities as large as 100 cm/s.
The potential importance of the coastal fila- ments to the large-scale bio-optical response to the SW monsoon in the northern Arabian Sea was hypothesized in the modeling work of Young and Kindle [1] and the follow-on study of Gallacher and Rochford [2]; Fig. 5 depicts the offshore advection of nitrate (an essential nutrient for phytoplankton growth) by the coastal filaments as represented by the coupled biophysical model of the Arabian Sea. Subsequently, images from historical-advanced very-high-resolution radiome- ter (AVHRR) databases at NRL provided informa- tion about the timing and horizontal scales of the jets. Use of the modeling results, together with the IR imagery, permitted the definition of an optimum sampling scheme for an observational field program during both monsoon seasons. The field work, consisting of four cruises jointly fund- ed by NRL and ONR, was in collaboration with the National Science Foundation's Joint Global Ocean
149
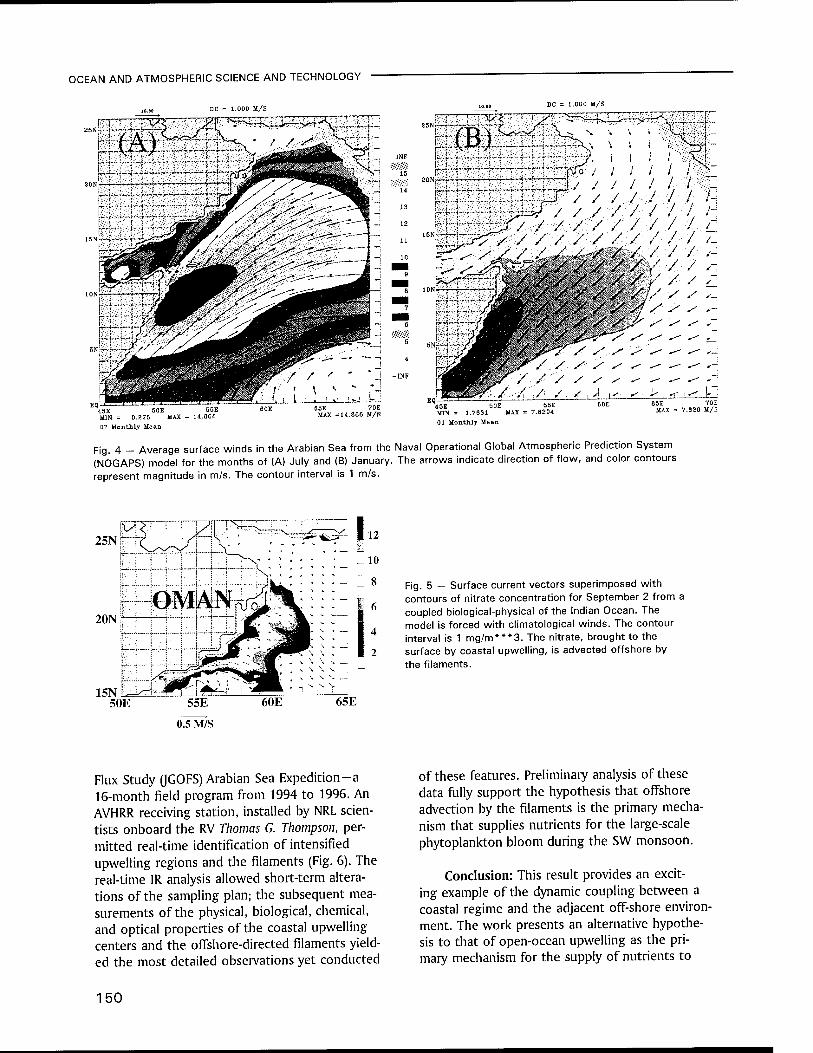
OCEAN AND ATMOSPHERIC SCIENCE AND TECHNOLOGY
DC = 1.000 U/S
EQLHH 50E
0.276 MAX
07 Monthly Mean
45E MIN
45E MIN :
50E 55E 1.7631 MAX = 7.8204
01 Monthly Mean
Fig. 4 - Average surface winds in the Arabian Sea from the Naval Operational Global Atmospheric Prediction System (NOGAPS) model for the months of (A) July and (B) January. The arrows indicate direction of flow, and color contours represent magnitude in m/s. The contour interval is 1 m/s.
25N
20N
15NL= 50E 55E
0.5 M/S
60E 65E
Fig. 5 — Surface current vectors superimposed with contours of nitrate concentration for September 2 from a coupled biological-physical of the Indian Ocean. The model is forced with climatological winds. The contour interval is 1 mg/m***3. The nitrate, brought to the surface by coastal upwelling, is advected offshore by the filaments.
Flux Study (JGOFS) Arabian Sea Expedition-a 16-month field program from 1994 to 1996. An AVHRR receiving station, installed by NRL scien- tists onboard the RV Thomas G. Thompson, per- mitted real-time identification of intensified upwelling regions and the filaments (Fig. 6). The real-time IR analysis allowed short-term altera- tions of the sampling plan; the subsequent mea- surements of the physical, biological, chemical, and optical properties of the coastal upwelling centers and the offshore-directed filaments yield- ed the most detailed observations yet conducted
of these features. Preliminary analysis of these data fully support the hypothesis that offshore advection by the filaments is the primary mecha- nism that supplies nutrients for the large-scale phytoplankton bloom during the SW monsoon.
Conclusion: This result provides an excit- ing example of the dynamic coupling between a coastal regime and the adjacent off-shore environ- ment. The work presents an alternative hypothe- sis to that of open-ocean upwelling as the pri- mary mechanism for the supply of nutrients to
150
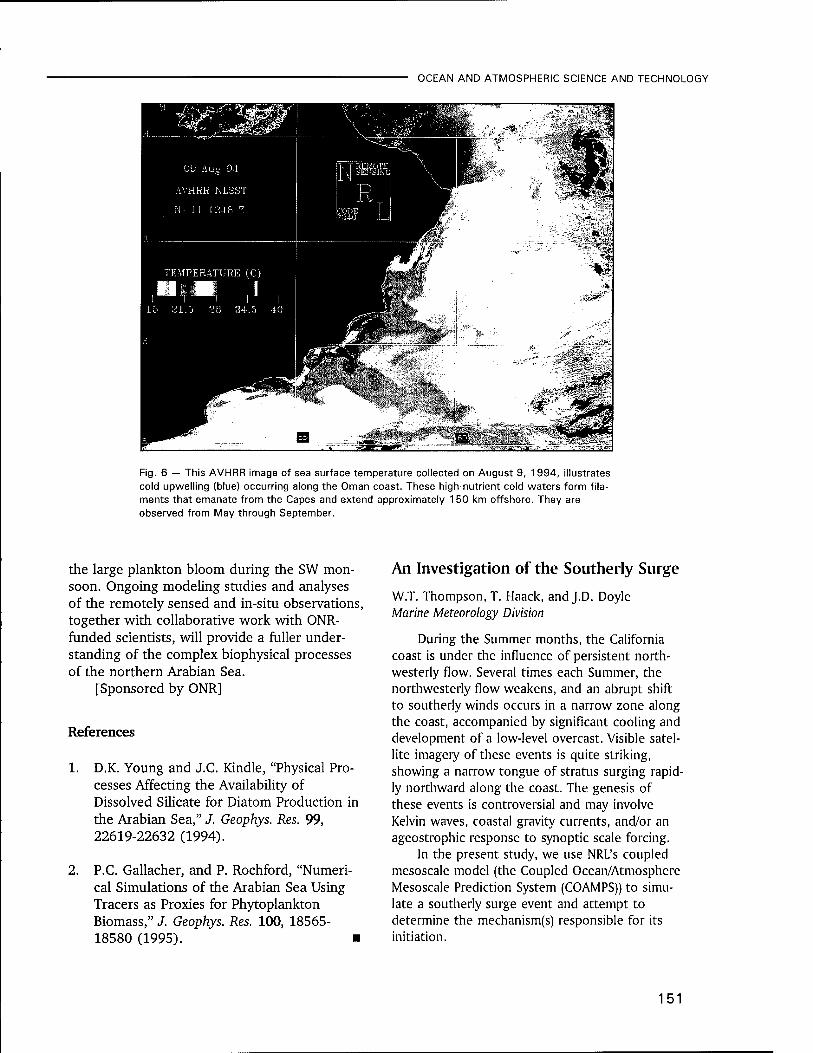
OCEAN AND ATMOSPHERIC SCIENCE AND TECHNOLOGY
Fig. 6 — This AVHRR image of sea surface temperature collected on August 9, 1994, illustrates cold upwelling (blue) occurring along the Oman coast. These high-nutrient cold waters form fila- ments that emanate from the Capes and extend approximately 150 km offshore. They are observed from May through September.
the large plankton bloom during the SW mon- soon. Ongoing modeling studies and analyses of the remotely sensed and in-situ observations, together with collaborative work with ONR- funded scientists, will provide a fuller under- standing of the complex biophysical processes of the northern Arabian Sea.
[Sponsored by ONR]
References
1. D.K. Young and J.C. Kindle, "Physical Pro- cesses Affecting the Availability of Dissolved Silicate for Diatom Production in the Arabian Sea," J. Geophys. Res. 99, 22619-22632 (1994).
2. P.C. Gallacher, and P. Rochford, "Numeri- cal Simulations of the Arabian Sea Using Tracers as Proxies for Phytoplankton Biomass," J. Geophys. Res. 100, 18565- 18580 (1995). ■
An Investigation of the Southerly Surge
W.T. Thompson, T. Haack, and J.D. Doyle Marine Meteorology Division
During the Summer months, the California coast is under the influence of persistent north- westerly flow. Several times each Summer, the northwesterly flow weakens, and an abrupt shift to southerly winds occurs in a narrow zone along the coast, accompanied by significant cooling and development of a low-level overcast. Visible satel- lite imagery of these events is quite striking, showing a narrow tongue of stratus surging rapid- ly northward along the coast. The genesis of these events is controversial and may involve Kelvin waves, coastal gravity currents, and/or an ageostrophic response to synoptic scale forcing.
In the present study, we use NRL's coupled mesoscale model (the Coupled Ocean/Atmosphere Mesoscale Prediction System (COAMPS)) to simu- late a southerly surge event and attempt to determine the mechanism(s) responsible for its initiation.
151

OCEAN AND ATMOSPHERIC SCIENCE AND TECHNOLOGY
Model Description: COAMPS [1] is a triply nested, nonhydrostatic mesoscale model with detailed parameterizations of moist processes, radiation, and boundary layer turbulence. A sophisticated data assimilation procedure is also used to provide initial conditions. Lateral boundary conditions are supplied by the Navy's global model. In the present study, simulations were performed with horizontal resolutions of 45 km, 15 km, and 5 km on the three nests with 30 vertical levels.
Case Description: We performed simulations of the 10-11 June 1994 surge event [2]. This event begins with weak southerly flow just south of
Pt. Conception at 0600 UTC 10 June. The northward extent of the southerly flow reaches Monterey Bay at 1700 UTC 10 June and Pt. Reyes (just north of the Golden Gate) by 0900 UTC 11 June. Southerly flow extends along the coast over 850 km and peaks at 8 m/s. The "surging" of coastal stratus northward along the coast is clear- ly evident in satellite imagery for this period, although the southerly flow precedes the clouds by up to 3 h in some locations. Figure 7 is a visible satellite image for 18:10 UTC 10 June.
Model Results: The model is able to capture this evolution quite realistically. Figure 8 shows a model 19-h forecast valid at 1900 UTC of cloud
Fig. 7 - Visible satellite image valid at 1810 UTC 10 June 1994.
152
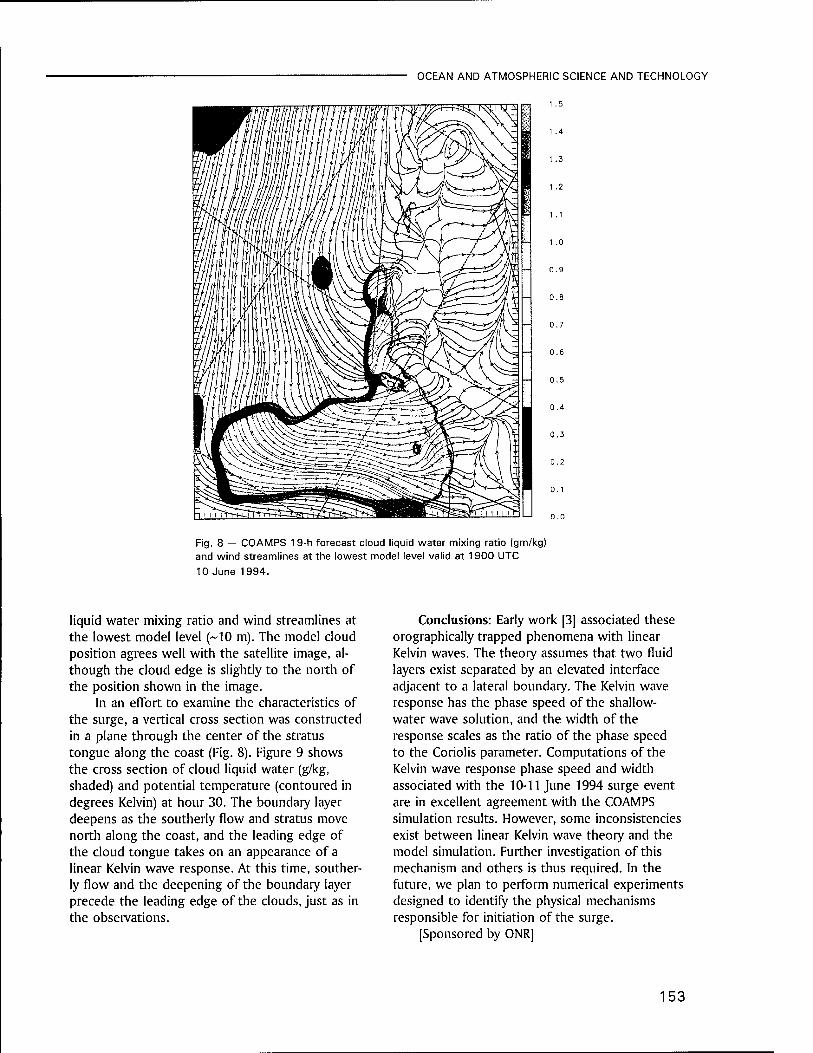
OCEAN AND ATMOSPHERIC SCIENCE AND TECHNOLOGY
- - 0.5
0.3
Fig. 8 — COAMPS 19-h forecast cloud liquid water mixing ratio (gm/kg) and wind streamlines at the lowest model level valid at 1900 UTC
10 June 1994.
liquid water mixing ratio and wind streamlines at the lowest model level (~10 m). The model cloud position agrees well with the satellite image, al- though the cloud edge is slightly to the north of the position shown in the image.
In an effort to examine the characteristics of the surge, a vertical cross section was constructed in a plane through the center of the stratus tongue along the coast (Fig. 8). Figure 9 shows the cross section of cloud liquid water (g/kg, shaded) and potential temperature (contoured in degrees Kelvin) at hour 30. The boundary layer deepens as the southerly flow and stratus move north along the coast, and the leading edge of the cloud tongue takes on an appearance of a linear Kelvin wave response. At this time, souther- ly flow and the deepening of the boundary layer precede the leading edge of the clouds, just as in the observations.
Conclusions: Early work [3] associated these orographically trapped phenomena with linear Kelvin waves. The theory assumes that two fluid layers exist separated by an elevated interface adjacent to a lateral boundary. The Kelvin wave response has the phase speed of the shallow- water wave solution, and the width of the response scales as the ratio of the phase speed to the Coriolis parameter. Computations of the Kelvin wave response phase speed and width associated with the 10-11 June 1994 surge event are in excellent agreement with the COAMPS simulation results. However, some inconsistencies exist between linear Kelvin wave theory and the model simulation. Further investigation of this mechanism and others is thus required. In the future, we plan to perform numerical experiments designed to identify the physical mechanisms responsible for initiation of the surge.
[Sponsored by ONR]
153
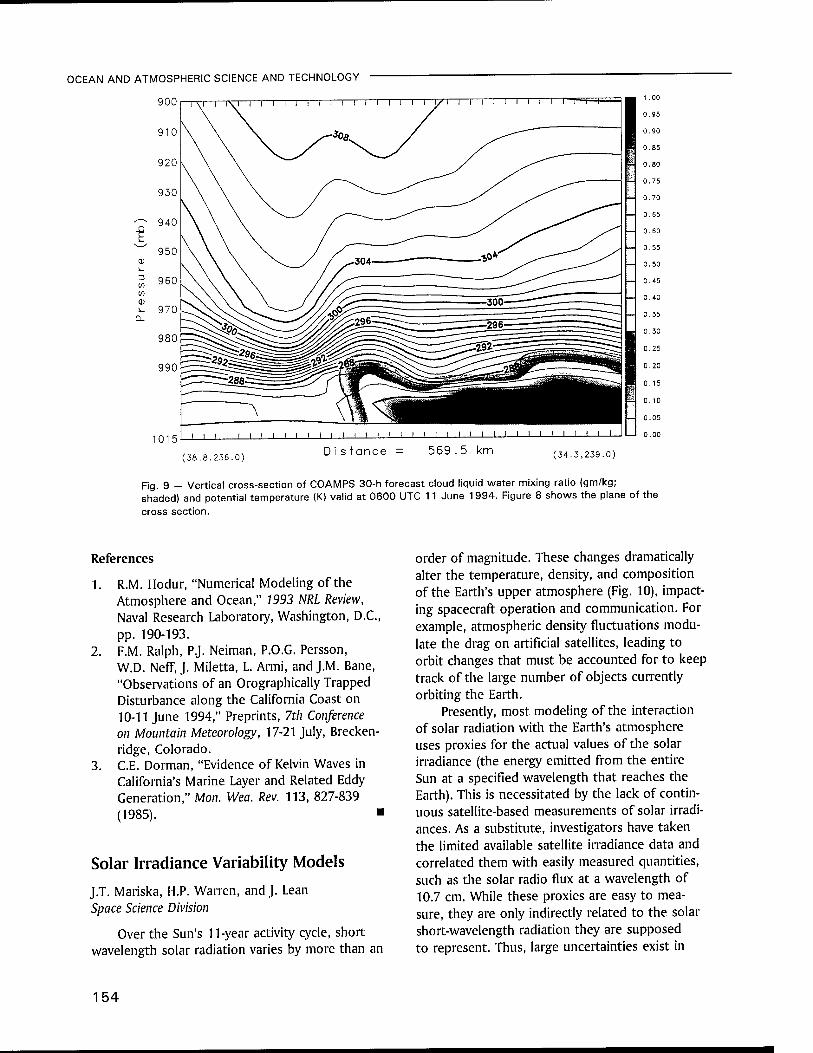
OCEAN AND ATMOSPHERIC SCIENCE AND TECHNOLOGY
900
(38.8,236.0) Distance = 569.5 km (34.3,239.0)
Fig. 9 - Vertical cross-section of COAMPS 30-h forecast cloud liquid water mixing ratio (gm/kg; shaded) and potential temperature (K) valid at 0600 UTC 11 June 1994. Figure 8 shows the plane cross section.
of the
References
1. R.M. Hodur, "Numerical Modeling of the Atmosphere and Ocean," 1993 NRL Review, Naval Research Laboratory, Washington, D.C., pp. 190-193.
2. F.M. Ralph, P.J. Neiman, P.O.G. Persson, W.D. Neff, J. Miletta, L. Armi, and J.M. Bane, "Observations of an Orographically Trapped Disturbance along the California Coast on 10-11 June 1994," Preprints, 7th Conference on Mountain Meteorology, 17-21 July, Brecken- ridge, Colorado.
3. C.E. Dorman, "Evidence of Kelvin Waves in California's Marine Layer and Related Eddy Generation," Mon. Wea. Rev. 113, 827-839 (1985). ■
Solar Irradiance Variability Models
J.T. Mariska, H.P. Warren, andj. Lean Space Science Division
Over the Sun's 11-year activity cycle, short wavelength solar radiation varies by more than an
order of magnitude. These changes dramatically alter the temperature, density, and composition of the Earth's upper atmosphere (Fig. 10), impact- ing spacecraft operation and communication. For example, atmospheric density fluctuations modu- late the drag on artificial satellites, leading to orbit changes that must be accounted for to keep track of the large number of objects currently orbiting the Earth.
Presently, most modeling of the interaction of solar radiation with the Earth's atmosphere uses proxies for the actual values of the solar irradiance (the energy emitted from the entire Sun at a specified wavelength that reaches the Earth). This is necessitated by the lack of contin- uous satellite-based measurements of solar irradi- ances. As a substitute, investigators have taken the limited available satellite irradiance data and correlated them with easily measured quantities, such as the solar radio flux at a wavelength of 10.7 cm. While these proxies are easy to mea- sure, they are only indirectly related to the solar short-wavelength radiation they are supposed to represent. Thus, large uncertainties exist in
154

OCEAN AND ATMOSPHERIC SCIENCE AND TECHNOLOGY
■13 -12 log Density (kg/m3)
■11 -10 -9 500 i » i i
*♦ density *♦ - r i i
temperature \ : %/ \\ *<^^ ~~~~~~-~+ ■
♦ ♦ . ♦ ♦
400
: solar ♦ ♦ solar ":
-x min ** »max I ♦ ♦
% 300 r x\ solar /solar •z- ♦♦ \ min / max < ♦. ♦ -
200 '- >:♦ ^ " y <\^*^ ;
100 500 1000
Temperature (K)
I 500
Fig. 10 — Temperature and density distribution in the Earth's upper atmosphere at maximum and minimum levels of solar activity.
specifying the Sun's irradiance for any given level of solar activity.
A Physics-based Model: Since the early days of space research, solar physicists in the Space Science Division and elsewhere have been study- ing extreme ultraviolet and soft X-ray radiation from the Sun's outer atmosphere under different conditions of solar activity. These studies provide a detailed semi-empirical physical picture of the ever-changing physical conditions in the outer layers of the solar atmosphere (Fig. 11). Using this understanding and drawing on NRL's leader- ship position in both solar physics and extreme ultraviolet and soft X-ray spectroscopy, we have developed a physics-based solar irradiance vari- ability model [1, 2].
Our model combines three key ingredients. First, we employ the extensive solar ultraviolet and X-ray data available at NRL and elsewhere to produce descriptions of the average physical properties of the primary features of the outer solar atmosphere. Second, we have assembled a database of the atomic physics parameters neces- sary to compute the emission from the Sun's high-temperature plasma for any spectral line or continuum in the extreme ultraviolet and soft X-ray wavelength region. These two ingredients permit us to compute the radiance (energy emit- ted from a small region of the Sun at a specified wavelength at the Earth).
SOLAR ATMOSPHERE 10 JAN 92
3000
2500
E 2000
^ 1500
'£ 1000
500
0 10"" 10"T 10*' 10
Temperature (K)
Fig. 11 — Average temperature structure of the solar atmosphere together with images showing how the Sun appears at different levels of the atmosphere. The solar photosphere is imaged in broad-band visible light, the chromosphere in the light of singly ionized Ca, and the corona in soft X-rays. Extreme ultraviolet and soft X-ray radiation comes from the upper chromosphere and corona.
Finally, we have developed algorithms for using ground-based visible light images and space-based X-ray images to estimate the fraction of the Sun covered by each kind of emitting structure. Combining this last ingredient with the radiances produces an irradiance at any selected wavelength for any level of solar activity.
155
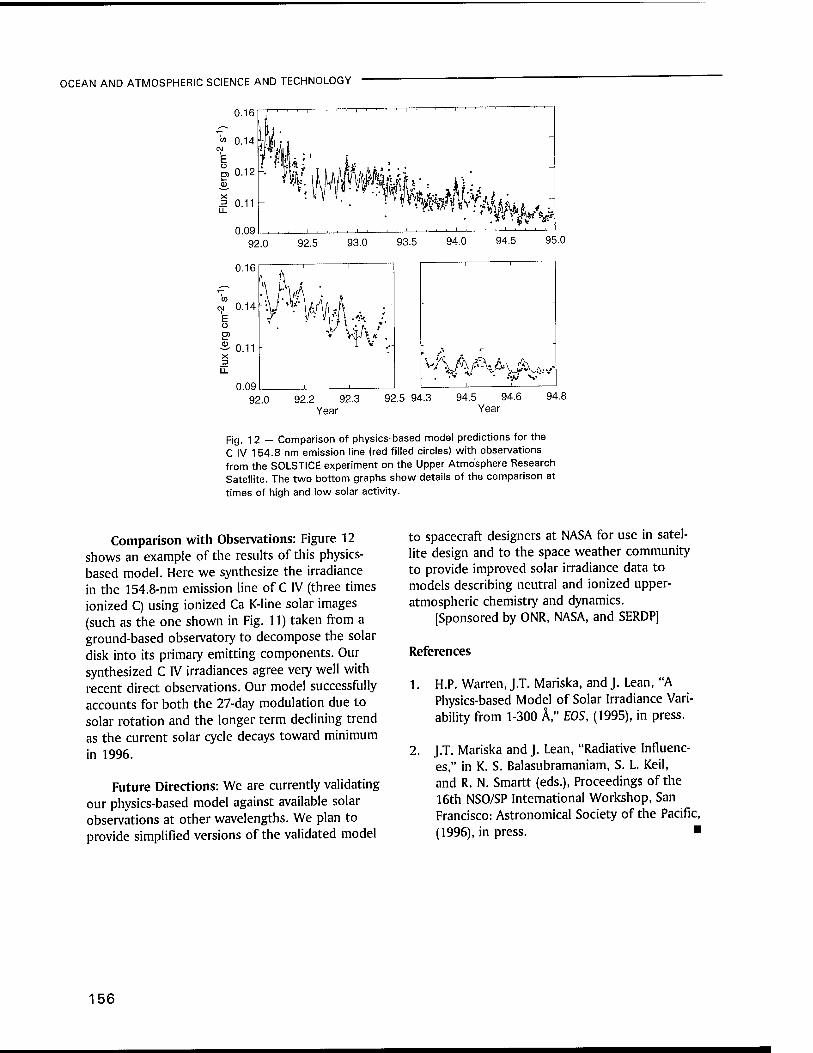
OCEAN AND ATMOSPHERIC SCIENCE AND TECHNOLOGY
0.09 92.0 92.2 92.3 92.5 94.3 94.5 94.6 94.!
Year Year
Fig. 12 — Comparison of physics-based model predictions for the C IV 154.8 nm emission line (red filled circles) with observations from the SOLSTICE experiment on the Upper Atmosphere Research Satellite. The two bottom graphs show details of the comparison at times of high and low solar activity.
Comparison with Observations: Figure 12 shows an example of the results of this physics- based model. Here we synthesize the irradiance in the 154.8-nm emission line of C IV (three times ionized C) using ionized Ca K-line solar images (such as the one shown in Fig. 11) taken from a ground-based observatory to decompose the solar disk into its primary emitting components. Our synthesized C IV irradiances agree very well with recent direct observations. Our model successfully accounts for both the 27-day modulation due to solar rotation and the longer term declining trend as the current solar cycle decays toward minimum in 1996.
Future Directions: We are currently validating our physics-based model against available solar observations at other wavelengths. We plan to provide simplified versions of the validated model
to spacecraft designers at NASA for use in satel- lite design and to the space weather community to provide improved solar irradiance data to models describing neutral and ionized upper- atmospheric chemistry and dynamics.
[Sponsored by ONR, NASA, and SERDP]
References
1. H.P. Warren, J.T. Mariska, and J. Lean, "A Physics-based Model of Solar Irradiance Vari- ability from 1-300 A," EOS, (1995), in press.
2. J.T. Mariska andj. Lean, "Radiative Influenc- es," in K. S. Balasubramaniam, S. L. Keil, and R. N. Smartt (eds.), Proceedings of the 16th NSO/SP International Workshop, San Francisco: Astronomical Society of the Pacific, (1996), in press. ■
156

Optical Science

159 Change Detection Using Multispectral Invariants A. Schaum and A. Stocker
162 Nanochannel Glass Replica Membrane Technology D.H. Pearson and R.J. Tonucci
163 Infrared Color Vision D.A. Scribner, M.P. Satyshur, and M.R. Kruer
165 Fiber Bragg Grating Laser Sensors AD. Kersey and K.P. Koo
Change Detection Using Multispectral Invariants
A. Schaum Optical Sciences Division
A. Stocker Space Computer Corporation
Progress in achieving worldwide remote sens- ing capabilities for Earth resources management, environmental monitoring, and surveillance appli- cations has been limited by the need to cover enormous ground areas and by the requirement for a human analyst to interpret individual imag- es. Autonomous detection methods could make effective wide-area coverage feasible for crop management, pollution control, treaty verification, and many other remote-sensing applications. The feature common to many of the activities that need to be monitored is some type of localized change. NRL has developed new algorithms for change detection that promise to make wide-area coverage feasible, by screening large volumes of imagery and efficiently selecting areas for human intervention. The new signal-processing methods incorporate spectroscopic analysis into a target- detection formalism.
If digitized imagery can be collected often enough, then simple image subtraction can make any changes prominent by removing neighboring clutter from the background. But a requirement for frequent revisits conflicts with many wide-area operational concepts. Realistic intervals between data collections are often many hours or even months. During such periods, natural background evolution causes undesired changes to dominate subtracted images, making discrimination be- tween targets and background impossible with conventional techniques.
Spectral Methods: Continuing advances in electro-optical sensor technologies have made the simultaneous collection of images in many different wavebands possible. The extra spectral dimension can often be used to identify subpixel- scale objects or tenuous gases in cases where spatial discrimination is impossible. But certain targets of interest can have color signatures that are too weak to be detected in a single multi- spectral image. Nevertheless, although static detection of a dim target's presence might prove
infeasible, spectral-temporal information can often be exploited to detect its appearance.
The principle behind this form of change detection is the use of color information to find temporally invariant features in the background. If, for example, each scene pixel can be modeled as a mixture of a few primary constituents, then spectral measurements can be used to generate estimates of their concentrations. In the simplest cases, these concentrations can supplant the mea- sured radiances as the appropriate background descriptors. Furthermore, they should be con- served over time, in the absence of a real change. In an ideal sensing environment, one could ex- pect to detect novel features, even after long intervals, by examining changes in constituent concentrations.
In practice, the estimation of constituent concentrations in remotely sensed data is a some- what immature art. Figure 1 shows the apparent fractional concentrations of a particular back- ground constituent in several pixels of a multi- band thermal infrared image. The data are derived from measurements collected by the Joint Multispectral Program, a tri-service effort to explore spectral techniques of image exploitation. The concentration estimates in the figure are based on a simple additive model of constituent contributions to the total background. Although these estimates are not perfectly conserved, the plots for different pixels seldom cross, indicating correlated behavior over time. Strong correlation in background descriptors is an invaluable tool for detecting anomalies like local changes.
The use of intrinsic spectral-temporal correla- tions to detect a real subpixel target in multiband infrared data is illustrated by the two-band spec- tral scatter plots shown in Fig. 2. The target clearly cannot be separated from its local back- ground using a single dual-band observation. However, in this case, the same background pix- els were imaged several hours prior to target insertion, and these correlated reference data were processed to predict the dual-band scene containing the target. The pixel prediction errors shown in Fig. 2 are variable but correlated except at the target pixel, thus allowing it to be readily discriminated. This two-look multispectral proce- dure has been successfully applied to locate extremely small changes, most notably a camou- flaged target in a desert background that filled only 1.6% of a pixel and was not detectable
159

OPTICAL SCIENCE
o U <*- o c o
a
0.8
0.6
0.4
0.2
===53_«4== 8=-=:
Observation Time Index
Fig. 1 - Fractional concentrations of a background constituent vs time in 30 pixels of a multiband thermal infrared image, estimated by means of a linear spectral mixture model. Although the estimated fractions are not perfectly conserved, their temporal trajectories are highly correlated over time. This provides a physical basis for back- ground clutter suppression in change detection applications.
3
>
Q.
ffl
50
40
30
20
10
-10
-20
a Background Pixel Observations B Target Pixel Observation o Background Prediction Error • Target Pixel Prediction Error
D a tfO
\ Single-Look Data
Two-Look Change Data
V Target Easily Detected
-20 i I i i i i I
-10 0 I I I I I I I—I I I I I
10 20 30 i i I i i i i
40 50
Band 1 Pixel Value
Fig. 2 - Dual-band spectral scatter plots of pixels in a thermal infrared image contain- ing a heterogeneous background and an M60 tank target that fills only 25% of a single pixel. The unresolved target cannot be separated from the background in the original single-look image observations. However, if spectral invariants are used to predict the scene containing the tank from one collected prior to target insertion, discrimination becomes easy in the prediction error image.
160
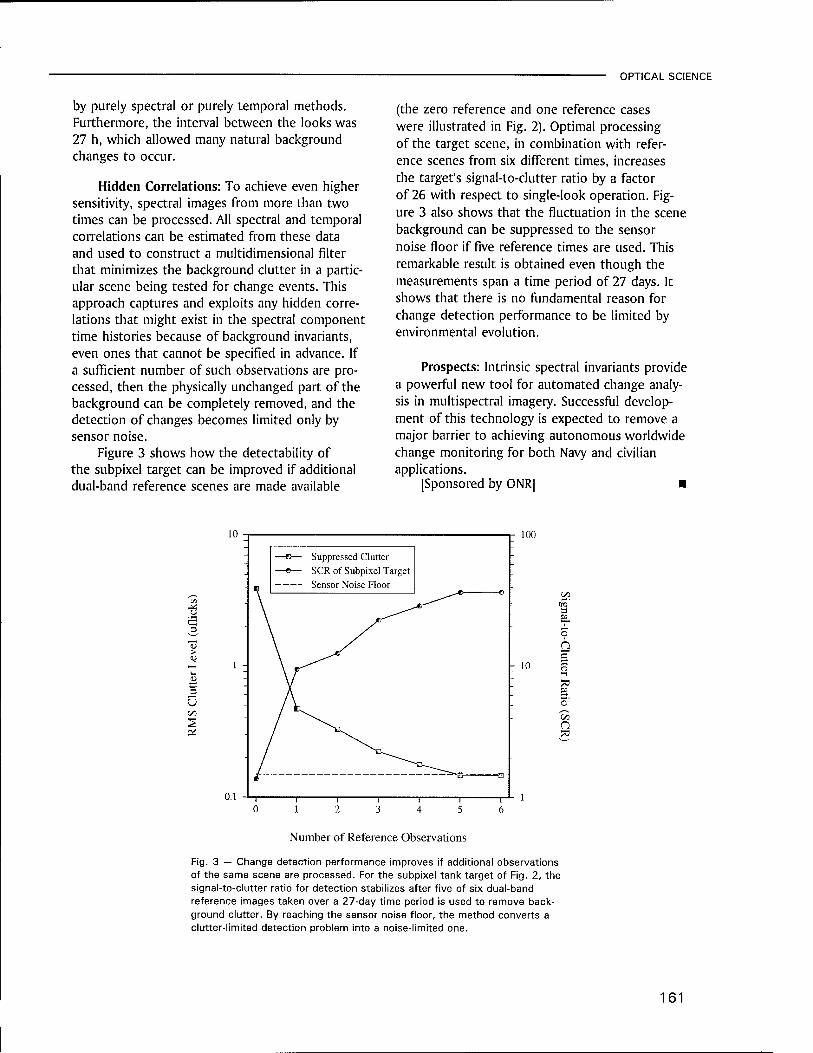
OPTICAL SCIENCE
by purely spectral or purely temporal methods. Furthermore, the interval between the looks was 27 h, which allowed many natural background changes to occur.
Hidden Correlations: To achieve even higher sensitivity, spectral images from more than two times can be processed. All spectral and temporal correlations can be estimated from these data and used to construct a multidimensional filter that minimizes the background clutter in a partic- ular scene being tested for change events. This approach captures and exploits any hidden corre- lations that might exist in the spectral component time histories because of background invariants, even ones that cannot be specified in advance. If a sufficient number of such observations are pro- cessed, then the physically unchanged part of the background can be completely removed, and the detection of changes becomes limited only by sensor noise.
Figure 3 shows how the detectability of the subpixel target can be improved if additional dual-band reference scenes are made available
(the zero reference and one reference cases were illustrated in Fig. 2). Optimal processing of the target scene, in combination with refer- ence scenes from six different times, increases the target's signal-to-clutter ratio by a factor of 26 with respect to single-look operation. Fig- ure 3 also shows that the fluctuation in the scene background can be suppressed to the sensor noise floor if five reference times are used. This remarkable result is obtained even though the measurements span a time period of 27 days. It shows that there is no fundamental reason for change detection performance to be limited by environmental evolution.
Prospects: Intrinsic spectral invariants provide a powerful new tool for automated change analy- sis in multispectral imagery. Successful develop- ment of this technology is expected to remove a major barrier to achieving autonomous worldwide change monitoring for both Navy and civilian applications.
[Sponsored by ONR] ■
10
> J
B 3 G CO
s
0.1
Suppressed Clutter SCR of Subpixel Target Sensor Noise Floor
100
- 10
3 P.
o Q c
70 P
t/3 n 73
Number of Reference Observations
Fig. 3 — Change detection performance improves if additional observations of the same scene are processed. For the subpixel tank target of Fig. 2, the signal-to-clutter ratio for detection stabilizes after five of six dual-band reference images taken over a 27-day time period is used to remove back- ground clutter. By reaching the sensor noise floor, the method converts a clutter-limited detection problem into a noise-limited one.
161
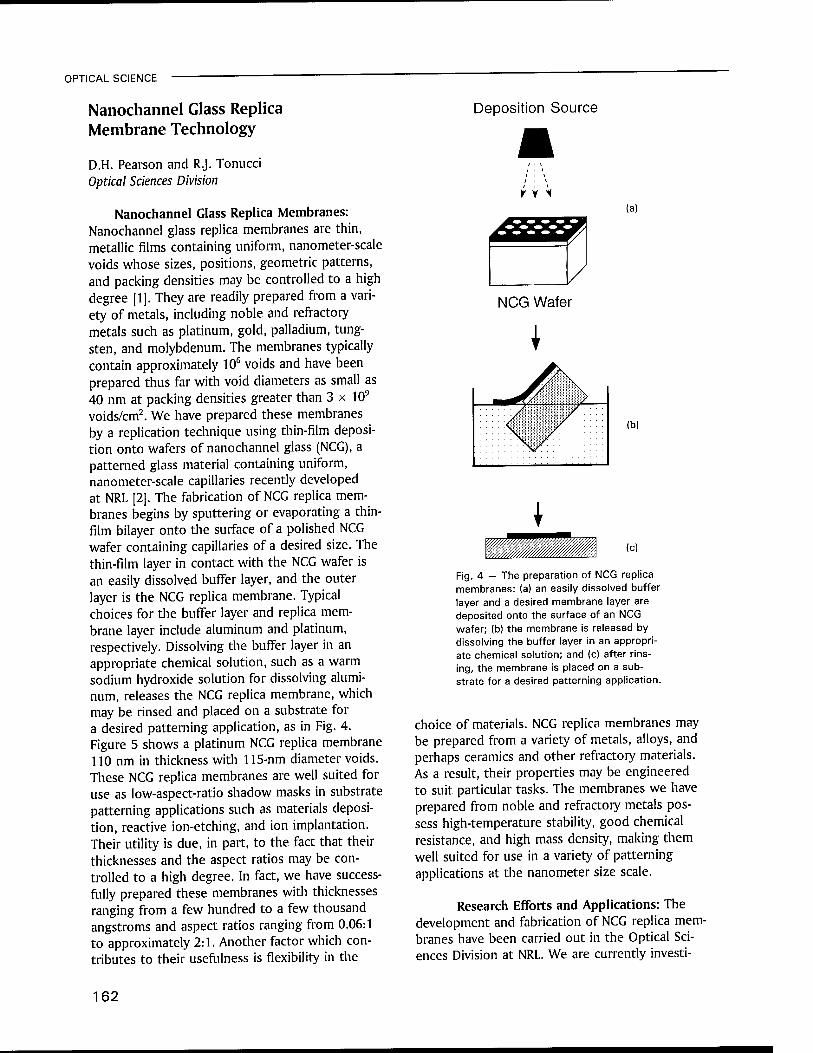
OPTICAL SCIENCE
Nanochannel Glass Replica Membrane Technology
D.H. Pearson and R.J. Tonucci Optical Sciences Division
Nanochannel Glass Replica Membranes: Nanochannel glass replica membranes are thin, metallic films containing uniform, nanometer-scale voids whose sizes, positions, geometric patterns, and packing densities may be controlled to a high degree [1]. They are readily prepared from a vari- ety of metals, including noble and refractory metals such as platinum, gold, palladium, tung- sten, and molybdenum. The membranes typically contain approximately 106 voids and have been prepared thus far with void diameters as small as 40 nm at packing densities greater than 3 x 10⁹
voids/cm2. We have prepared these membranes by a replication technique using thin-film deposi- tion onto wafers of nanochannel glass (NCG), a patterned glass material containing uniform, nanometer-scale capillaries recently developed at NRL [2]. The fabrication of NCG replica mem- branes begins by sputtering or evaporating a thin- film bilayer onto the surface of a polished NCG wafer containing capillaries of a desired size. The thin-film layer in contact with the NCG wafer is an easily dissolved buffer layer, and the outer layer is the NCG replica membrane. Typical choices for the buffer layer and replica mem- brane layer include aluminum and platinum, respectively. Dissolving the buffer layer in an appropriate chemical solution, such as a warm sodium hydroxide solution for dissolving alumi- num, releases the NCG replica membrane, which may be rinsed and placed on a substrate for a desired patterning application, as in Fig. 4. Figure 5 shows a platinum NCG replica membrane 110 nm in thickness with 115-nm diameter voids. These NCG replica membranes are well suited for use as low-aspect-ratio shadow masks in substrate patterning applications such as materials deposi- tion, reactive ion-etching, and ion implantation. Their utility is due, in part, to the fact that their thicknesses and the aspect ratios may be con- trolled to a high degree. In fact, we have success- fully prepared these membranes with thicknesses ranging from a few hundred to a few thousand angstroms and aspect ratios ranging from 0.06:1 to approximately 2:1. Another factor which con- tributes to their usefulness is flexibility in the
Deposition Source
1 1 t
f V i
/
NCG Wafer
1
: : : <i. : :; \ v/
(a)
(b)
I (c)
Fig. 4 — The preparation of NCG replica membranes: (a) an easily dissolved buffer layer and a desired membrane layer are deposited onto the surface of an NCG wafer; (b) the membrane is released by dissolving the buffer layer in an appropri- ate chemical solution; and (c) after rins- ing, the membrane is placed on a sub- strate for a desired patterning application.
choice of materials. NCG replica membranes may be prepared from a variety of metals, alloys, and perhaps ceramics and other refractory materials. As a result, their properties may be engineered to suit particular tasks. The membranes we have prepared from noble and refractory metals pos- sess high-temperature stability, good chemical resistance, and high mass density, making them well suited for use in a variety of patterning applications at the nanometer size scale.
Research Efforts and Applications: The development and fabrication of NCG replica mem- branes have been carried out in the Optical Sci- ences Division at NRL. We are currently investi-
162

OPTICAL SCIENCE
Fig. 5 — Scanning electron microscopy micrograph of a platinum NCG replica membrane with a thickness of 110 nm and voids 115 nm in diameter.
gating numerous patterning applications of NCG replica membranes involving materials growth, reactive-ion etching (RIE), and ion implantation in collaboration with NRL researchers through the Nanostructure Array Advanced Research Initiative begun in FY 95. This research is carried out by the Chemistry, Electronics Science and Technolo- gy, Materials Science and Technology, and Con- densed Matter and Radiation Sciences Divisions at NRL. Work is also being carried out in conjunc- tion with NRL's Nanoelectronics Processing Facili- ty, the National Institute of Standards and Tech- nology, and several universities including Caltech, the University of Illinois, and the University of Houston.
One of our ongoing studies involves the use of NCG replica membranes as deposition masks for the first-ever in-situ growth of submi- cron, laterally patterned metallic and semiconduc- tor structures by molecular beam epitaxy (MBE). The use of NCG replica membranes that are com- patible with the high-temperature, ultrahigh vacu- um environments encountered in MBE provides an opportunity to prepare nanometer-scale struc- tures in a single-step process with a potential reduction in growth defects. Other current stud- ies involve the use of NCG replica membranes as
shadow masks to laterally pattern semiconductor materials and diamond on a nanometer scale by RIE and ion implantation. Patterned semiconduc- tor materials provide an opportunity for optical and electronic studies of quantum-confinement effects. In addition, patterned diamond is poten- tially useful through enhanced thermal transfer properties in device applications.
[Sponsored by ONR and ARPA]
References
1. D.H. Pearson and R.J. Tonucci, "Nanochannel Glass Replica Membranes," Science 270, 68 (1995).
2. R.J. Tonucci, B.L. Justus, A.J. Campillo, and C.E. Ford, "Nanochannel Array Glass," Science 258, 783 (1992). ■
Infrared Color Vision
D.A. Scribner, M.P. Satyshur, and M.R. Kruer Optical Sciences Division
The development of infrared (IR) focal plane arrays [1] (IRFPA) and associated IRFPA sensors have led to a new generation of IR imag- ing systems for defense applications. However, the probability of detecting military targets in background clutter can be very poor, even when the sensor is performing near its ideal limit of sensitivity. The probability of detection is poorest when the contrast between the background and the target is low or when the target is partially obscured. Intuitively, it is expected that the use of information from multiple bands should im- prove performance. In human vision, color is sometimes as important as intensity or shape for overcoming the effects of camouflage. An infrared color vision system combines multiple bands and creates a composite color image in a manner such that all the information in each of the bands is contained in a single composite color image. In order to take advantage of the multidimensional color space that is created, algorithms need to be developed to enhance the color contrast between man-made objects and natural backgrounds and display these differences in a color scheme that is synergistic with that of the human eye-brain color processing system.
163

OPTICAL SCIENCE
Approach: Initial investigations in this area have involved two basic efforts. First, composite IR color images have been generated from previ- ously recorded multispectral data. Visualization was performed to analyze the general color phenomenology of the scene. Second, spatio- spectral matched filters were derived and used to perform processing based on form and color combined.
A three-band IR system with wide individu- al spectral bands is of special interest for several reasons. First, implementation of three bands on an IRFPA is conceivable in a staring mode. A multispectral IR system with a large number of narrow sub-bands (for example 10 or even 1000) could probably be implemented only as a scan- ning system. Compared to staring systems, scan- ning systems generally have very short integration times and, thus, lower sensitivity as well as being more mechanically complex and unreliable. Sec- ond, studies of human color vision in general have shown that three basis functions give near- optimum performance; that is, more than three bands add only marginal performance compared to a three-band system [2]. Finally, because the human observer's eye/brain cognitive system is essentially a three-band system, it would be a natural choice to transform multispectral IR images into a color display.
The starting approach was to construct a composite color image by normalizing and scaling each IR band to correspond to the red, green, and blue bands of a visible image. The normaliz- ing and scaling can be done in either a global or local manner. A composite IR color image is formed using the three-band images. Computer visualization is achieved by assigning eight bits of color to the intensities of each band-red for LWIR, green for MWIR, and blue for SWIR. Com- bining these colors on a pixel-by-pixel basis cre- ates a composite color image that can be immedi- ately examined-all the information from the three bands is contained in the composite color image.
In an IR color vision system, an important performance concern is the amount of color con- trast between the target and the background. If the three bands are highly correlated, the con- trast enhancement can be performed to allow better target-background discrimination when viewing the display. In the visible color domain,
this would be equivalent to saying that all three color bands are highly correlated, resulting in a background that is comprised of nearly equal ratios of red, green, and blue. The image would then appear in various shades of grey. If the tar- get color component were uncorrelated, then it would have a unique color. The degree of target- background correlation in the visible/IR spectral region is an area of ongoing study.
Performance: In order to make a quantita- tive comparison of target-background discrimina- tion between single-band and composite color systems, multidimensional matched-filtering oper- ations were performed. For the color images, a spatio-spectral matched filter (3-D) was derived. For the single-band case, a spatial-only filter (2-D) was derived. The derivation of the filters consid- ered a generic aircraft target and the background statistics of specific scenes. In the case of the 3-D spatio-spectral filter, the third dimension was based on the spectral values.
Figure 6 shows two test images that were created using three bands each. The top image used three IR bands (SWIR, MWIR, and LWIR). The bottom image used three visible bands, roughly corresponding to the spectral response functions of the red, green, and blue cones of the human retina. One method of analyzing the tar- get detection performance of the filtered results is to plot a receiver-operator curve (ROC) in which misdetections and false alarms are com- piled and plotted for varying threshold settings. ROC curves are shown for both the visible and IR cases. For each spectral region, ROC curves are exhibited for three single-band results, as well as the composite color result. For the visible case, when the threshold is set for an equal number of misdetections and false alarms, the composite color results are over an order of magnitude better than any of the single band results. For the IR case, the composite color results are over two orders of magnitude better than the single bands results.
[Sponsored by ONR]
References
1. DA. Scribner, M.R. Krucr, andJ.M. Killiany, "Infrared Focal Plane Array Technology," IEEE Proc. 79, 66 (1961).
164
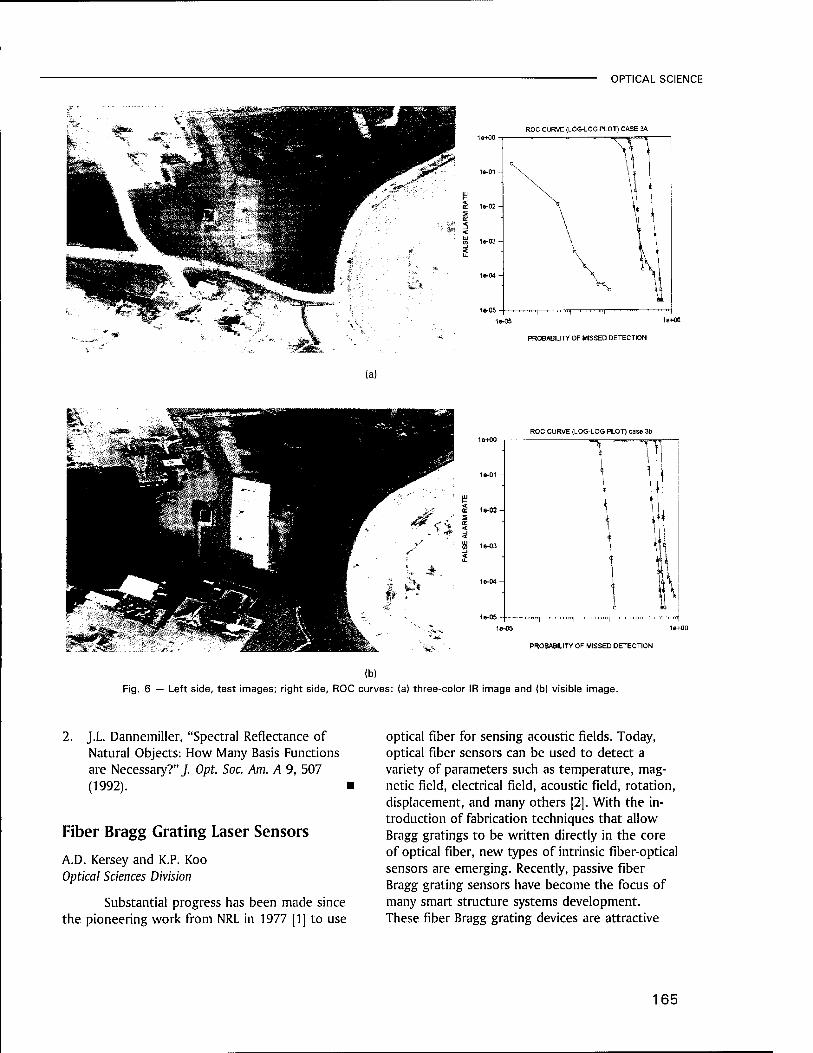
OPTICAL SCIENCE
1e-05 1e-*O0
PROBABILITY OF MISSED DETECTION
ROC CURVE (LOG-LOG PLOT) cass 3b
1e-05 1e+oo
PROBABILITY OF MISSED DETECTION
(b) Fig. 6 — Left side, test images; right side, ROC curves: (a) three-color IR image and (b) visible image.
2. J.L. Dannemiller, "Spectral Reflectance of Natural Objects: How Many Basis Functions are Necessary?" J. Opt. Soc. Am. A 9, 507 (1992). ■
Fiber Bragg Grating Laser Sensors
A.D. Kersey and K.P. Koo Optical Sciences Division
Substantial progress has been made since the pioneering work from NRL in 1977 [1] to use
optical fiber for sensing acoustic fields. Today, optical fiber sensors can be used to detect a variety of parameters such as temperature, mag- netic field, electrical field, acoustic field, rotation, displacement, and many others [2]. With the in- troduction of fabrication techniques that allow Bragg gratings to be written directly in the core of optical fiber, new types of intrinsic fiber-optical sensors are emerging. Recently, passive fiber Bragg grating sensors have become the focus of many smart structure systems development. These fiber Bragg grating devices are attractive
165

OPTICAL SCIENCE
due to their small size (on the order of 1 cm), their ease of fabrication, the potential for afford- able mass production, and relatively high sensitiv- ity. Another area associated with the in-line fiber Bragg grating is the emergence of active fiber Bragg grating devices such as fiber Bragg grating laser sensors. The fiber Bragg grating laser sen- sors offer many attractive features, including small size, more power per bandwidth than pas- sive grating sensors, single frequency lasing capa- bility, remote optical pumping (remote activa- tion), remote interrogation, and ultrahigh sen- sitivity.
Operation Principle: In sensings parame- ters using the fiber laser sensor approach, the sensed parameter is encoded onto the emission wavelength of a single frequency fiber laser via a parameter-induced optical path length change in the fiber laser cavity. In our system, minute changes in the laser wavelength are detected with ultrahigh resolution using a read-out, two-arm interferometer with an optical path difference [3] that is large compared to the laser cavity length. This read-out interferometer transposes the wave- length shift to relatively large phase shifts, which can easily be detected.
Sensor Description: Figure 7 is a schemat- ic of a single-frequency fiber Bragg grating laser sensor system. The fiber laser is made up of a short piece of Erbium-doped fiber with two fiber Bragg gratings written directly in the Erbium fiber. For single frequency operation, the laser cavity defined by the two Bragg gratings is cho- sen to be approximately 2.5-cm long. The Erbium fiber forms the active medium and can be optical pumped by a laser operating at either the wave- length of 980 nm or 1480 nm, using a wavelength selective coupler. When the pump power is strong enough to achieve lasing threshold, the Erbium fiber laser will läse at the wavelength determined by the Bragg grating wavelength of the fiber grating. The laser output is extracted from the return port of the wavelength selective coupler. Measurand fields that cause a strain or an optical path length change in the fiber laser cavity will induce a wavelength shift at the laser output. Because of the long coherence length of this type of fiber laser, a two-arm fiber read-out interferometer with a large optical path difference (OPD) on the order of 100 m can be used. The ratio of the OPD of the read-out interferometer to the laser cavity length effectively enhances the detectability of small frequency or wavelength
Fiber Laser Sensor 2.5 cm long
Mach Zehnder Read-Out
Interferometer OPD=100m
photodetectors
Sensor output
Fig. 7 — Fiber Bragg grating-based laser arrangement with interferometric readout.
166

OPTICAL SCIENCE
Single-Mode FBG Laser Sensor
10"1 F
(L =2.5 cm, phase gain=1920) i i i i i i |
E BW=18.7Hz
* io-2 k M II
Test Signal
Phase res.=26 |iRad RMS/VHZ
(strain res =5.6xl(r14 RMS/VHZ)
PD
■4 10-" Q
10"
10'
10
1 6!
-13 g-
0 2 4 6 8 10 Frequency (kHz)
Fig. 8 — Dynamic strain sensitivity over the 0 to 10 kHz range.
changes in the fiber laser sensor output. Ultrahigh strain resolution on the order of 10~14A/'HZ for dynamic strains at frequencies greater than 3 kHz have been demonstrated in our laboratory [3] (Fig. 8). This kind of resolution is limited by ther- mally induced fluctuations of the fiber laser cavity length.
Applications: Using the approach described here, fiber laser sensors can serve as compact sensor heads with high performance commensurate to more traditional but less-com- pact interferometric optical fiber sensors that use much longer lengths of sensing fiber. In addition, fiber laser sensors are readily adaptable to wave- length multiplexing [3] for the integration of an array of these sensors for multipoint sensing in system applications. Furthermore, a given sensor array can be configured to sense different types of parameters by incorporating the proper trans-
ducer onto the different laser cavity fibers. Re- search related to various applications of this com- pact, high-sensitivity fiber laser sensor are cur- rently being evaluated.
[Sponsored by ONR]
References
1. J.A. Bucaro, H.D. Dardy, and E. Carome, "Fiber Optic Hydrophone,"/ Acoust. Soc. Amer. 62, 1302-1304 (1977).
2. For example, Fiber Optic Sensors, Eric Udd, ed. (John Wiley & Sons, Inc., New York, 1991).
3. K.P. Koo and A.D. Kersy, "Bragg Grating- based Laser Sensors Systems with Interfer- ometric Interrogation and Wavelength Division Multiplexing,"/ Lightwave Technol. 13, 1243-1249 (1995). ■
167

Remote Sensing

171 Radar Imaging of Underwater Sand Dunes T.F. Donato, F. Askari, C.L. Trump, and CO. Marmorino
173 Hydrodynamic and Radar Modeling of Ocean Currents R.W. Jansen, S.R. Chubb, and C.Y. Shen
175 Measurement of Nearshore Dynamics Using Video K.T. Holland andJ.C. Church
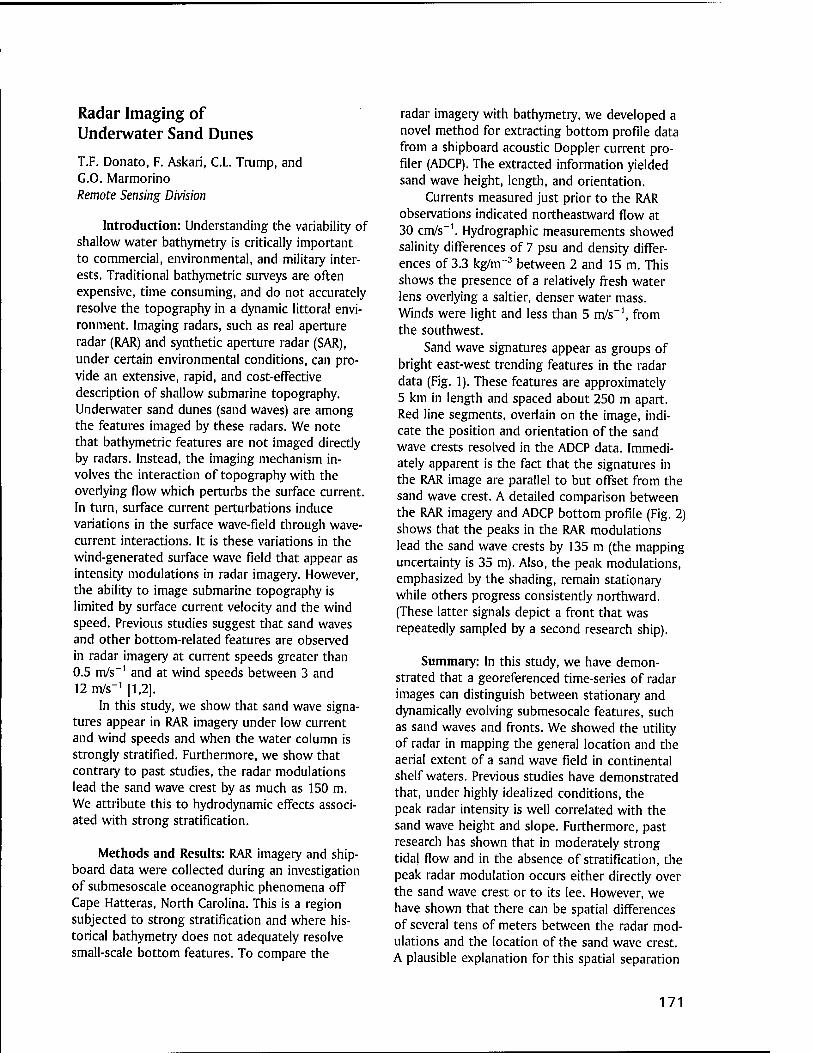
Radar Imaging of Underwater Sand Dunes
T.F. Donato, F. Askari, C.L. Trump, and G.O. Marmorino Remote Sensing Division
Introduction: Understanding the variability of shallow water bathymetry is critically important to commercial, environmental, and military inter- ests. Traditional bathymetric surveys are often expensive, time consuming, and do not accurately resolve the topography in a dynamic littoral envi- ronment. Imaging radars, such as real aperture radar (RAR) and synthetic aperture radar (SAR), under certain environmental conditions, can pro- vide an extensive, rapid, and cost-effective description of shallow submarine topography. Underwater sand dunes (sand waves) are among the features imaged by these radars. We note that bathymetric features are not imaged directly by radars. Instead, the imaging mechanism in- volves the interaction of topography with the overlying flow which perturbs the surface current. In turn, surface current perturbations induce variations in the surface wave-field through wave- current interactions. It is these variations in the wind-generated surface wave field that appear as intensity modulations in radar imagery. However, the ability to image submarine topography is limited by surface current velocity and the wind speed. Previous studies suggest that sand waves and other bottom-related features are observed in radar imagery at current speeds greater than 0.5 m/s-1 and at wind speeds between 3 and 12 m/s"' [1,2].
In this study, we show that sand wave signa- tures appear in RAR imagery under low current and wind speeds and when the water column is strongly stratified. Furthermore, we show that contrary to past studies, the radar modulations lead the sand wave crest by as much as 150 m. We attribute this to hydrodynamic effects associ- ated with strong stratification.
Methods and Results: RAR imagery and ship- board data were collected during an investigation of submesoscale oceanographic phenomena off Cape Hatteras, North Carolina. This is a region subjected to strong stratification and where his- torical bathymetry does not adequately resolve small-scale bottom features. To compare the
radar imagery with bathymetry, we developed a novel method for extracting bottom profile data from a shipboard acoustic Doppler current pro- filer (ADCP). The extracted information yielded sand wave height, length, and orientation.
Currents measured just prior to the RAR observations indicated northeastward flow at 30 cm/s-1. Hydrographie measurements showed salinity differences of 7 psu and density differ- ences of 3.3 kg/m"3 between 2 and 15 m. This shows the presence of a relatively fresh water lens overlying a saltier, denser water mass. Winds were light and less than 5 m/s-1, from the southwest.
Sand wave signatures appear as groups of bright east-west trending features in the radar data (Fig. 1). These features are approximately 5 km in length and spaced about 250 m apart. Red line segments, overlain on the image, indi- cate the position and orientation of the sand wave crests resolved in the ADCP data. Immedi- ately apparent is the fact that the signatures in the RAR image are parallel to but offset from the sand wave crest. A detailed comparison between the RAR imagery and ADCP bottom profile (Fig. 2) shows that the peaks in the RAR modulations lead the sand wave crests by 135 m (the mapping uncertainty is 35 m). Also, the peak modulations, emphasized by the shading, remain stationary while others progress consistently northward. (These latter signals depict a front that was repeatedly sampled by a second research ship).
Summary: In this study, we have demon- strated that a georeferenced time-series of radar images can distinguish between stationary and dynamically evolving submesocale features, such as sand waves and fronts. We showed the utility of radar in mapping the general location and the aerial extent of a sand wave field in continental shelf waters. Previous studies have demonstrated that, under highly idealized conditions, the peak radar intensity is well correlated with the sand wave height and slope. Furthermore, past research has shown that in moderately strong tidal flow and in the absence of stratification, the peak radar modulation occurs either directly over the sand wave crest or to its lee. However, we have shown that there can be spatial differences of several tens of meters between the radar mod- ulations and the location of the sand wave crest. A plausible explanation for this spatial separation
171

REMOTE SENSING
Fig. 1 - This is an example of a radar image depicting sand waves. The sand waves appear as bright linear features. The red line segments denote the position and orientation of sand wave crests as extracted from shipboard ADCP data. This image was taken from a RAR flown aboard one of NRL's P-3 aircraft on 18 June 1993.
i Run 28
Possible 2nd Fi
Run 29
Run 32
E j Bathymetry 530
35 35.325 35.320 35.315 35.310 35.305
Latitude 35.300 35.295 35.290 35.285
Fig. 2 - A comparison of radar modulation and ADCP bottom profile for four RAR passes. A latitude cut centered at 75.10° W, corresponding with the ADCP tract, was extracted from each pass. The shaded regions in the RAR profiles and the white bracket in the ADCP profile emphasize a section used for detailed analysis.
172

REMOTE SENSING
is the complex interaction between topography and stratified flow. Additional research is required on the interaction of stratified flow with complex topography and the surface wave field before quantitative information, such as sand wave height and slope, can be derived from radar imag- ery. Simulation studies are planned to investigate these interactions.
Acknowledgments: This research was sup- ported by the NRL High-Resolution Remote Sens- ing ARI.
[Sponsored by ONR]
References
1. W. Aipers and I. Hennings, "A Theory of the Imaging Mechanism of Underwater Bottom Topography by Real and Synthetic Aperture Radar," J. Geophys. Res. 89, 10,529-10,546 (1984).
2. J. Vogelzang, G.J. Wensink, G.P. DeLoor, H.C. Peters, and H. Pouwels, "Sea Bottom Topography with X-band SLAR: The Relation Between Radar Imagery and Bathymetry." Int.
J. Remote Sens. 10, 1943-1958 (1992). ■
Hydrodynamic and Radar Modeling of Ocean Currents
R.W. Jansen, S.R. Chubb, and C.Y. Shen Remote Sensing Division
Introduction: Inferring ocean currents and associated ocean properties from radar measure- ments are long-standing problems of considerable interest to the Navy. Because microwaves cannot directly probe the subsurface, many aspects of the ocean-current/radar relationship are still poor- ly understood. To gain a better understanding of this problem, NRL and ONR have cosponsored the High-Resolution Remote Sensing Advanced Research Initiative. Through this program, two field experiments involving in-situ current/ oceanographic measurements and radar data collection have been conducted. Here an "end- to-end" approach [1] that incorporates subsurface and surface hydrodynamics, wave-surface current
interaction, and radar backscatter modeling is used to investigate a particularly strong line- shaped radar signature that was observed by real aperture radar over a Gulf Stream boundary region during the first experiment [2]. This is the first time such an "end-to-end" approach has been applied to study the relationship between subsurface currents and radar signatures.
Subsurface Hydrodynamics: The long, line- shaped signature is shown by in-situ measure- ments to coincide with a surface current conver- gence or "Rip" at the Gulf Stream/Shelf-water boundary. This convergence front is formed when denser, more saline Gulf Stream water intrudes onto the Shelf, subducts under and flows oppo- site to the lighter, fresher shelf water. The effect is modeled numerically by using a rigid-lid, 2-D solution of the Navier Stokes hydrodynamic equa- tions for a current/density boundary on a flat shelf. Figure 3 shows the vertical configuration of the density boundary after about an hour of evolution (top) and the formation (bottom), con- sistent with observation, of a sharp current Rip (where V varies from light to dark blue at zero depth). Additionally, the modeling reveals subsur- face wavelike structures and that the influence of the Coriolis force on the along-front current (not shown) significantly increases the rate of frontal formation.
Surface Waves: Since the radar image is essentially a reflectivity map of the ocean surface waves, adequate treatment of the surface-wave characteristics is an integral requirement of the radar modeling. A statistical distribution of sur- face waves in the vicinity of the Rip was gener- ated using a spectral wave propagation model. The input parameters to the model are the sur- face currents (taken from the subsurface hydrody- namics model) and surface winds (from shipboard measurements). As the waves propagate over the converging currents at the Rip edge (Gulf Stream/ Shelf-water boundary), their wavelengths and directions are altered as a result of the advective and refractive effects of wave-current interaction. The surface-wave model shows a buildup of 1- to 3-m waves to the north of the Rip and a shift to the north in the propagation direction. The bright line in the radar image is a direct consequence of this shift in the wave distribution.
173
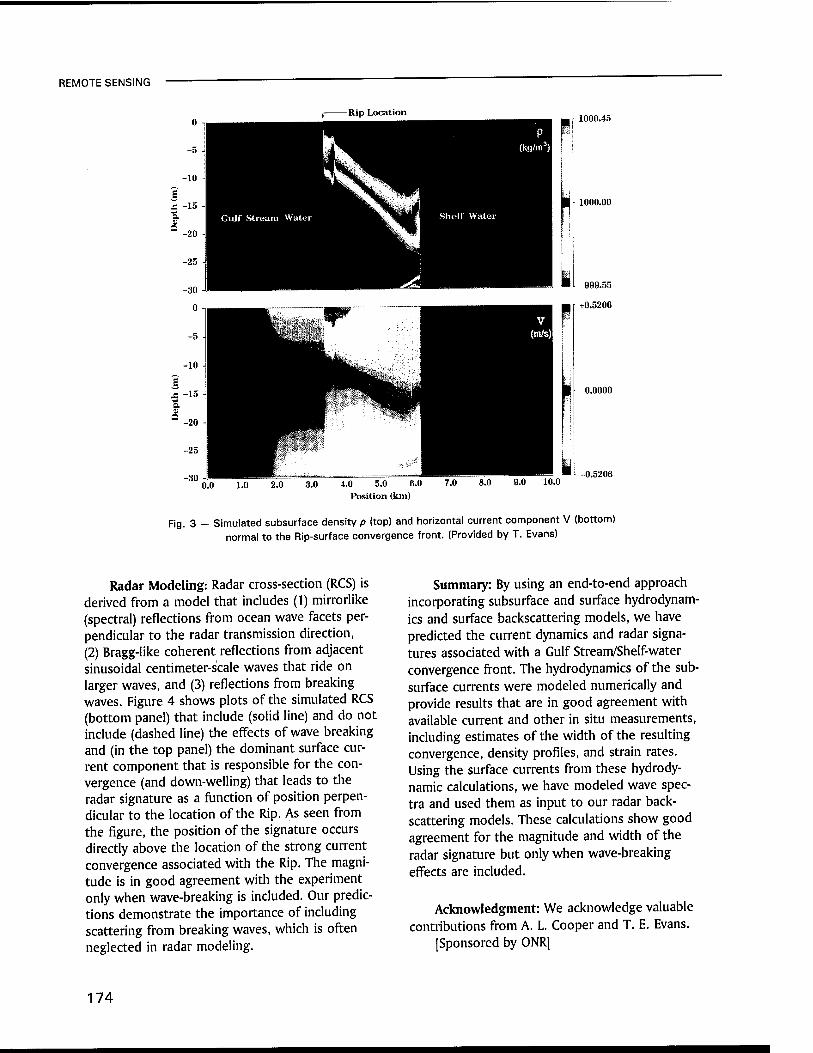
REMOTE SENSING
-Rip Location 1000.45
1000.00
0.0000
0.5206
Fig. 3 - Simulated subsurface density/? (top) and horizontal current component V (bottom) normal to the Rip-surface convergence front. (Provided by T. Evans)
Radar Modeling: Radar cross-section (RCS) is derived from a model that includes (1) mirrorlike (spectral) reflections from ocean wave facets per- pendicular to the radar transmission direction, (2) Bragg-like coherent reflections from adjacent sinusoidal centimeter-scale waves that ride on larger waves, and (3) reflections from breaking waves. Figure 4 shows plots of the simulated RCS (bottom panel) that include (solid line) and do not include (dashed line) the effects of wave breaking and (in the top panel) the dominant surface cur- rent component that is responsible for the con- vergence (and down-welling) that leads to the radar signature as a function of position perpen- dicular to the location of the Rip. As seen from the figure, the position of the signature occurs directly above the location of the strong current convergence associated with the Rip. The magni- tude is in good agreement with the experiment only when wave-breaking is included. Our predic- tions demonstrate the importance of including scattering from breaking waves, which is often neglected in radar modeling.
Summary: By using an end-to-end approach incorporating subsurface and surface hydrodynam- ics and surface backscattering models, we have predicted the current dynamics and radar signa- tures associated with a Gulf Stream/Shelf-water convergence front. The hydrodynamics of the sub- surface currents were modeled numerically and provide results that are in good agreement with available current and other in situ measurements, including estimates of the width of the resulting convergence, density profiles, and strain rates. Using the surface currents from these hydrody- namic calculations, we have modeled wave spec- tra and used them as input to our radar back- scattering models. These calculations show good agreement for the magnitude and width of the radar signature but only when wave-breaking effects are included.
Acknowledgment: We acknowledge valuable contributions from A. L. Cooper and T. E. Evans.
[Sponsored by ONR]
174
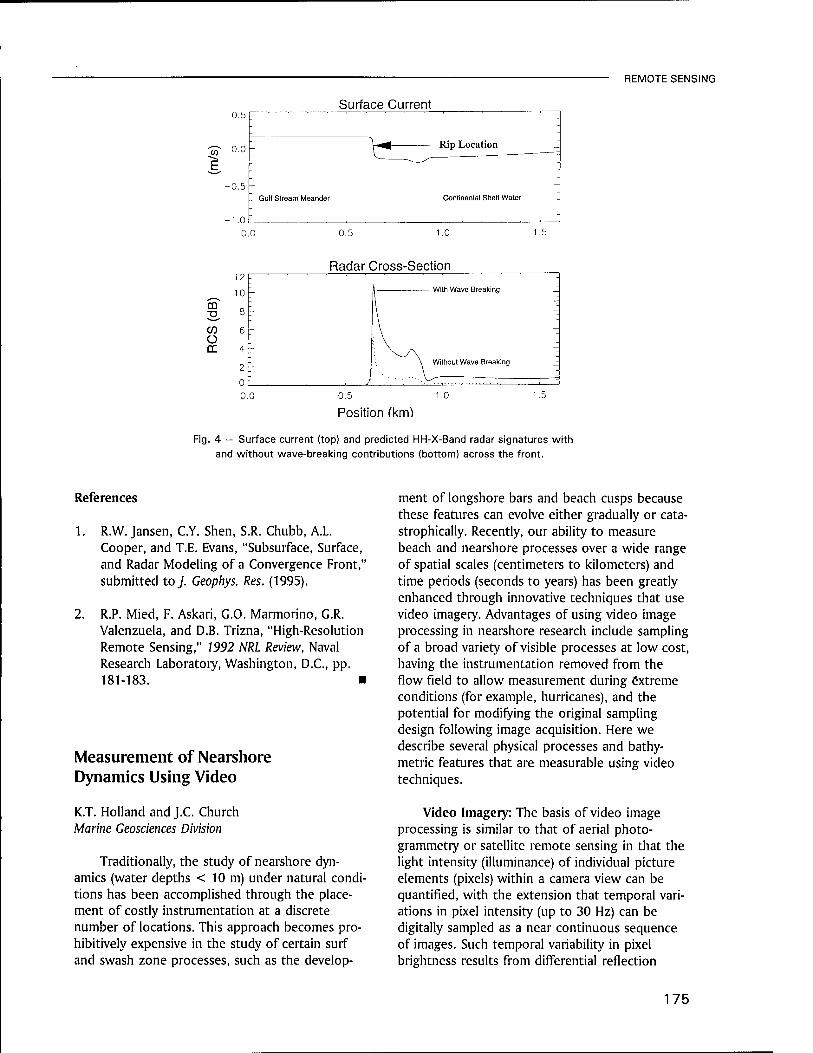
REMOTE SENSING
Surface Current 0.5
0.0
-0.5
-1.0 0.
^ Rip Location
Gulf Stream Meander Continental Shelf Water
0.5
Radar Cross-Section
m 33,
CO ü f£
12 :
10;
8
6
4
2
0 0.0
r
) ■ - x.,
0.5 1.0
Position (km}
1.5
Fig. 4 — Surface current (top) and predicted HH-X-Band radar signatures with and without wave-breaking contributions (bottom) across the front.
References
1. R.W. Jansen, C.Y. Shen, S.R. Chubb, A.L. Cooper, and T.E. Evans, "Subsurface, Surface, and Radar Modeling of a Convergence Front," submitted toy. Geophys. Res. (1995).
2. R.P. Mied, F. Askari, G.O. Marmorino, G.R. Valenzuela, and D.B. Trizna, "High-Resolution Remote Sensing," 1992 NRL Review, Naval Research Laboratory, Washington, D.C., pp. 181-183. ■
Measurement of Nearshore Dynamics Using Video
K.T. Holland and J.C. Church Marine Geosciences Division
Traditionally, the study of nearshore dyn- amics (water depths < 10 m) under natural condi- tions has been accomplished through the place- ment of costly instrumentation at a discrete number of locations. This approach becomes pro- hibitively expensive in the study of certain surf and swash zone processes, such as the develop-
ment of longshore bars and beach cusps because these features can evolve either gradually or cata- strophically. Recently, our ability to measure beach and nearshore processes over a wide range of spatial scales (centimeters to kilometers) and time periods (seconds to years) has been greatly enhanced through innovative techniques that use video imagery. Advantages of using video image processing in nearshore research include sampling of a broad variety of visible processes at low cost, having the instrumentation removed from the flow field to allow measurement during extreme conditions (for example, hurricanes), and the potential for modifying the original sampling design following image acquisition. Here we describe several physical processes and bathy- metric features that are measurable using video techniques.
Video Imagery: The basis of video image processing is similar to that of aerial photo- grammetry or satellite remote sensing in that the light intensity (illuminance) of individual picture elements (pixels) within a camera view can be quantified, with the extension that temporal vari- ations in pixel intensity (up to 30 Hz) can be digitally sampled as a near continuous sequence of images. Such temporal variability in pixel brightness results from differential reflection
175
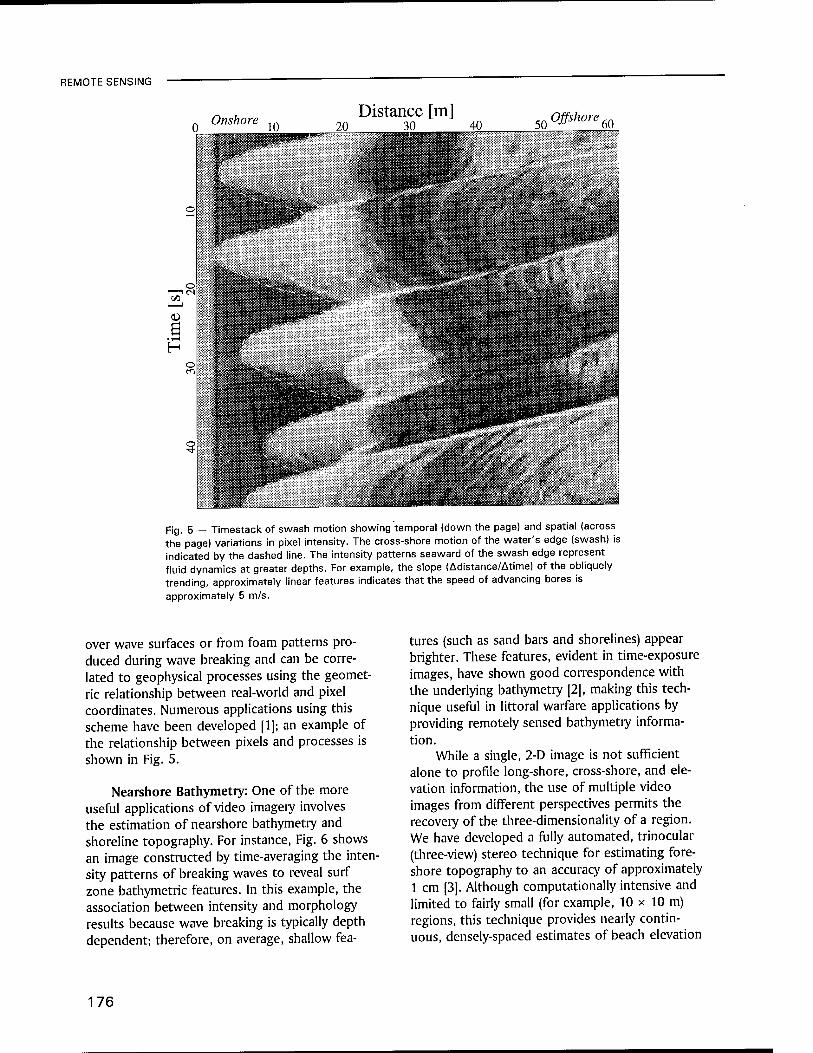
REMOTE SENSING
L_J
^1
Onshore 10 20 Distance [m]
30 40 % *>y-3^ "■^^^
50°^Org60
■■Jtaf
ys^:
i—in -n
Kai. ">*" bö^fi'*-
i* SWS*" ■■&■
!■ ■ *** .. '
L-1
|KP^
»' V-.-- i
sidk;i...isi;
Fig. 5 — Timestack of swash motion showing temporal (down the page) and spatial (across the page) variations in pixel intensity. The cross-shore motion of the water's edge (swash) is indicated by the dashed line. The intensity patterns seaward of the swash edge represent fluid dynamics at greater depths. For example, the slope (Adistance/Atime) of the obliquely trending, approximately linear features indicates that the speed of advancing bores is approximately 5 m/s.
over wave surfaces or from foam patterns pro- duced during wave breaking and can be corre- lated to geophysical processes using the geomet- ric relationship between real-world and pixel coordinates. Numerous applications using this scheme have been developed [1]; an example of the relationship between pixels and processes is shown in Fig. 5.
Nearshore Bathymetry: One of the more useful applications of video imagery involves the estimation of nearshore bathymetry and shoreline topography. For instance, Fig. 6 shows an image constructed by time-averaging the inten- sity patterns of breaking waves to reveal surf zone bathymetric features. In this example, the association between intensity and morphology results because wave breaking is typically depth dependent; therefore, on average, shallow fea-
tures (such as sand bars and shorelines) appear brighter. These features, evident in time-exposure images, have shown good correspondence with the underlying bathymetry [2], making this tech- nique useful in littoral warfare applications by providing remotely sensed bathymetry informa- tion.
While a single, 2-D image is not sufficient alone to profile long-shore, cross-shore, and ele- vation information, the use of multiple video images from different perspectives permits the recovery of the three-dimensionality of a region. We have developed a fully automated, trinocular (three-view) stereo technique for estimating fore- shore topography to an accuracy of approximately 1 cm [3]. Although computationally intensive and limited to fairly small (for example, 10 x 10 m) regions, this technique provides nearly contin- uous, densely-spaced estimates of beach elevation
176
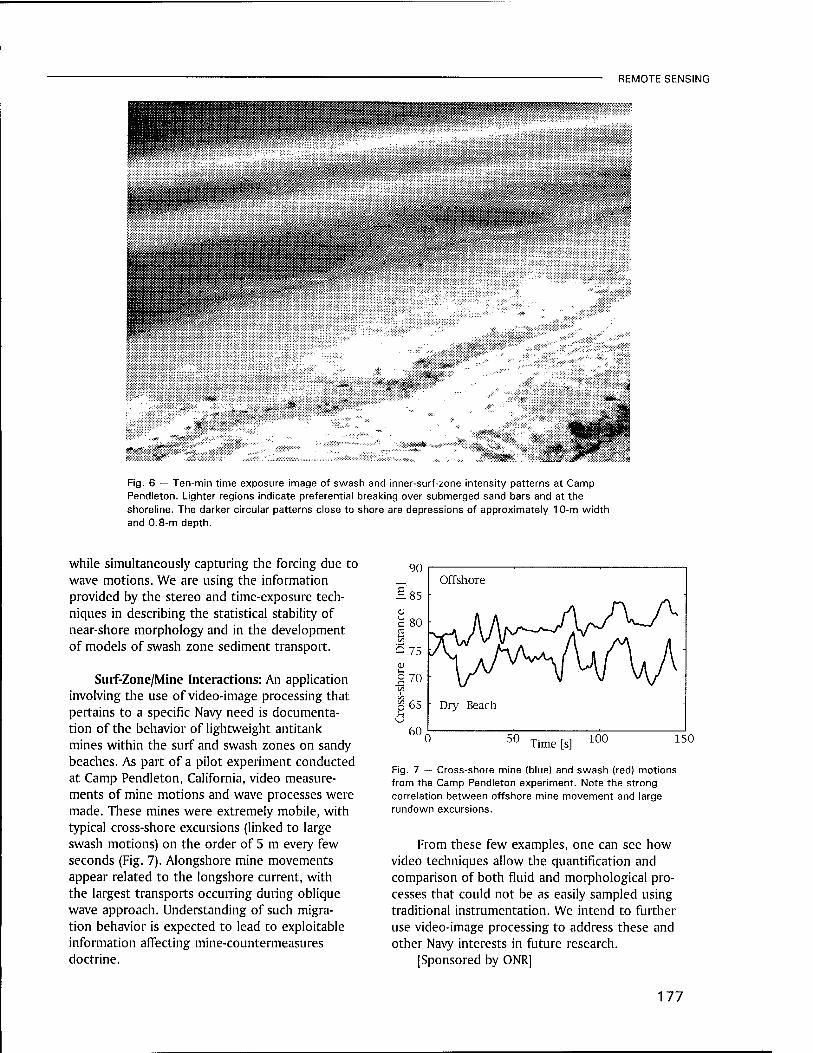
REMOTE SENSING
P^HK**1^
W^fflffiBfesgfej^^^^P
mm
iÄiip^
♦
Fig. 6 — Ten-min time exposure image of swash and inner-surf-zone intensity patterns at Camp Pendleton. Lighter regions indicate preferential breaking over submerged sand bars and at the shoreline. The darker circular patterns close to shore are depressions of approximately 10-m width and 0.8-m depth.
while simultaneously capturing the forcing due to wave motions. We are using the information provided by the stereo and time-exposure tech- niques in describing the statistical stability of near-shore morphology and in the development of models of swash zone sediment transport.
Surf-Zone/Mine Interactions: An application involving the use of video-image processing that pertains to a specific Navy need is documenta- tion of the behavior of lightweight antitank mines within the surf and swash zones on sandy beaches. As part of a pilot experiment conducted at Camp Pendleton, California, video measure- ments of mine motions and wave processes were made. These mines were extremely mobile, with typical cross-shore excursions (linked to large swash motions) on the order of 5 m every few seconds (Fig. 7). Alongshore mine movements appear related to the longshore current, with the largest transports occurring during oblique wave approach. Understanding of such migra- tion behavior is expected to lead to exploitable information affecting mine-countermeasures doctrine.
Time [s] 150
Fig. 7 — Cross-shore mine (blue) and swash (red) motions from the Camp Pendleton experiment. Note the strong correlation between offshore mine movement and large rundown excursions.
From these few examples, one can see how video techniques allow the quantification and comparison of both fluid and morphological pro- cesses that could not be as easily sampled using traditional instrumentation. We intend to further use video-image processing to address these and other Navy interests in future research.
[Sponsored by ONR]
177

REMOTE SENSING "
References niclue Based on Wave Dissipation," J. Geophys. Res. 94,995-1011 (1989).
1. R.A. Holman, A.H. Sallenger, Jr., T.C. Lipp- mann and J.W. Haines, "The Application of 3 K T Honanci and R.A. Holman, "Video Estima- Video-Image Processing to the Study of Near- tjon of Fore.snore Topography Using Trinocu- shore Processes," Oceanogr. 6, 78-85 (1993). |ar Stere0i»y. coastal Res. 12, (1996). ■
2. T.C. Lippmann and R.A. Holman, "Quantifica- tion of Sand-Bar Morphology: A Video Tech-
178

Simulation, Computing,
and Modeling

181 A Hybrid Virtual Environment Interface to C3I Information R.P. Darken, T.A. Hill, and B.T. Solan
183 Virtual Firefighting P.A. Tatem and D.I. Täte
185 Ultrasonic Tomography of Solids Using Parallel Processing R.S. Schechter, R.B. Mignogna, and P.P. Delsanto
188 Laboratory Simulations of the Coupling of Blast Waves into Solid Materials C.K. MankaJ. Grün, and H.R. Burris
191 Observed and Simulated Intraseasonal Circulation Anomalies C.A. Reynolds, R. Gelaro, and T. Murphree
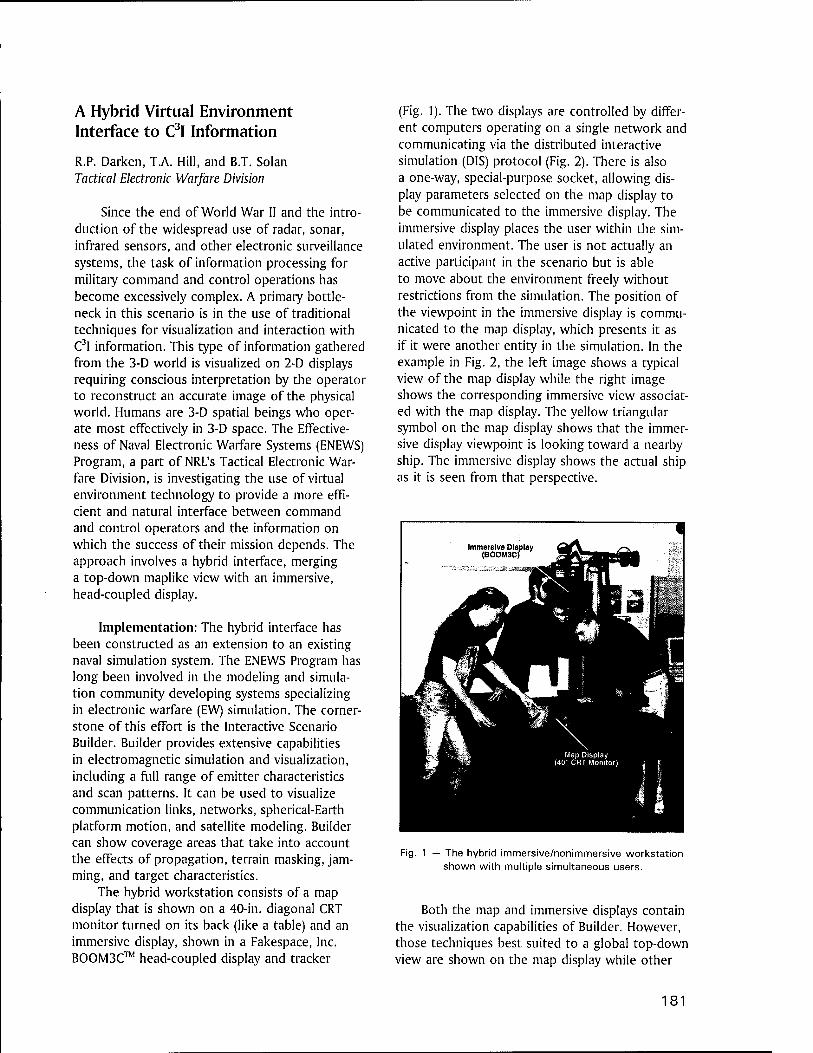
A Hybrid Virtual Environment Interface to C3I Information
R.P. Darken, T.A. Hill, and B.T. Solan Tactical Electronic Warfare Division
Since the end of World War II and the intro- duction of the widespread use of radar, sonar, infrared sensors, and other electronic surveillance systems, the task of information processing for military command and control operations has become excessively complex. A primary bottle- neck in this scenario is in the use of traditional techniques for visualization and interaction with C3I information. This type of information gathered from the 3-D world is visualized on 2-D displays requiring conscious interpretation by the operator to reconstruct an accurate image of the physical world. Humans are 3-D spatial beings who oper- ate most effectively in 3-D space. The Effective- ness of Naval Electronic Warfare Systems (ENEWS) Program, a part of NRL's Tactical Electronic War- fare Division, is investigating the use of virtual environment technology to provide a more effi- cient and natural interface between command and control operators and the information on which the success of their mission depends. The approach involves a hybrid interface, merging a top-down maplike view with an immersive, head-coupled display.
Implementation: The hybrid interface has been constructed as an extension to an existing naval simulation system. The ENEWS Program has long been involved in the modeling and simula- tion community developing systems specializing in electronic warfare (EW) simulation. The corner- stone of this effort is the Interactive Scenario Builder. Builder provides extensive capabilities in electromagnetic simulation and visualization, including a full range of emitter characteristics and scan patterns. It can be used to visualize communication links, networks, spherical-Earth platform motion, and satellite modeling. Builder can show coverage areas that take into account the effects of propagation, terrain masking, jam- ming, and target characteristics.
The hybrid workstation consists of a map display that is shown on a 40-in. diagonal CRT monitor turned on its back (like a table) and an immersive display, shown in a Fakespace, Inc. BOOM3C™ head-coupled display and tracker
(Fig. 1). The two displays are controlled by differ- ent computers operating on a single network and communicating via the distributed interactive simulation (DIS) protocol (Fig. 2). There is also a one-way, special-purpose socket, allowing dis- play parameters selected on the map display to be communicated to the immersive display. The immersive display places the user within the sim- ulated environment. The user is not actually an active participant in the scenario but is able to move about the environment freely without restrictions from the simulation. The position of the viewpoint in the immersive display is commu- nicated to the map display, which presents it as if it were another entity in the simulation. In the example in Fig. 2, the left image shows a typical view of the map display while the right image shows the corresponding immersive view associat- ed with the map display. The yellow triangular symbol on the map display shows that the immer- sive display viewpoint is looking toward a nearby ship. The immersive display shows the actual ship as it is seen from that perspective.
Fig. 1 — The hybrid immersive/nonimmersive workstation shown with multiple simultaneous users.
Both the map and immersive displays contain the visualization capabilities of Builder. However, those techniques best suited to a global top-down view are shown on the map display while other
181
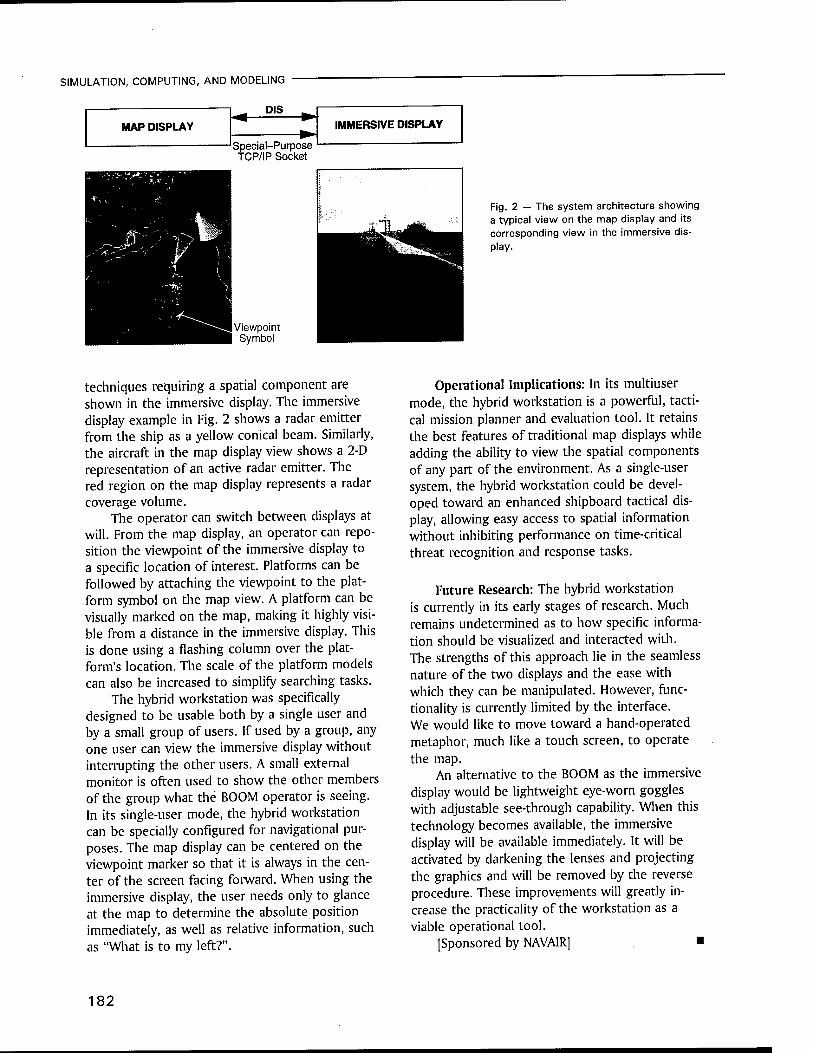
SIMULATION, COMPUTING, AND MODELING
DIS
MAP DISPLAY
Special-Purpose TCP/IP Socket
IMMERSIVE DISPLAY
Viewpoint Symbol
Fig. 2 — The system architecture showing a typical view on the map display and its corresponding view in the immersive dis- play.
techniques requiring a spatial component are shown in the immersive display. The immersive display example in Fig. 2 shows a radar emitter from the ship as a yellow conical beam. Similarly, the aircraft in the map display view shows a 2-D representation of an active radar emitter. The red region on the map display represents a radar coverage volume.
The operator can switch between displays at will. From the map display, an operator can repo- sition the viewpoint of the immersive display to a specific location of interest. Platforms can be followed by attaching the viewpoint to the plat- form symbol on the map view. A platform can be visually marked on the map, making it highly visi- ble from a distance in the immersive display. This is done using a flashing column over the plat- form's location. The scale of the platform models can also be increased to simplify searching tasks.
The hybrid workstation was specifically designed to be usable both by a single user and by a small group of users. If used by a group, any one user can view the immersive display without interrupting the other users. A small external monitor is often used to show the other members of the group what the BOOM operator is seeing. In its single-user mode, the hybrid workstation can be specially configured for navigational pur- poses. The map display can be centered on the viewpoint marker so that it is always in the cen- ter of the screen facing forward. When using the immersive display, the user needs only to glance at the map to determine the absolute position immediately, as well as relative information, such as "What is to my left?".
Operational Implications: In its multiuser mode, the hybrid workstation is a powerful, tacti- cal mission planner and evaluation tool. It retains the best features of traditional map displays while adding the ability to view the spatial components of any part of the environment. As a single-user system, the hybrid workstation could be devel- oped toward an enhanced shipboard tactical dis- play, allowing easy access to spatial information without inhibiting performance on time-critical threat recognition and response tasks.
Future Research: The hybrid workstation is currently in its early stages of research. Much remains undetermined as to how specific informa- tion should be visualized and interacted with. The strengths of this approach lie in the seamless nature of the two displays and the ease with which they can be manipulated. However, func- tionality is currently limited by the interface. We would like to move toward a hand-operated metaphor, much like a touch screen, to operate the map.
An alternative to the BOOM as the immersive display would be lightweight eye-worn goggles with adjustable see-through capability. When this technology becomes available, the immersive display will be available immediately. It will be activated by darkening the lenses and projecting the graphics and will be removed by the reverse procedure. These improvements will greatly in- crease the practicality of the workstation as a viable operational tool.
[Sponsored by NAVAIR] ■
182
SIMULATION, COMPUTING, AND MODELING
Virtual Firefighting
P.A. Tätern Chemistry Division
D.L. Täte Information Technology Division
Since World War II, significant technical ad- vances in shipboard firefighting have included the development and deployment of new materials and devices to be used on the scene by damage control/firefighting personnel, such as Aqueous Film-Forming Foam (AFFF), the Naval Firefighter's Thermal Imager (NFTI), and HALON 1301. More recently, the Damage Control System has been under development to integrate communications among all the ship's systems for simultaneous containment and recovery from damage by im- proving the damage control capability to fight through damage. However, there is room for more innovation in the techniques that the Navy uses to actively and passively protect its platforms against fire and train its personnel.
Readiness is receiving increased focus by emphasizing better preparation through cost- effective training and virtual rather than real danger in training. Environmental issues and constraints are constantly being raised and are becoming severely restrictive. The government is placing higher constraints on insult to the envi- ronment and restricting the smoke and water additive release into the atmosphere. The mech- anisms for training Navy firefighting personnel have become increasingly difficult and expensive.
An emerging technology—virtual reality—can be used as a means for damage control training without costly live fires. In this application, a human operator can be immersed in a realistic but virtual environment to develop damage con- trol skills without safety and environmental con- cerns. This technology has been used significantly in training applications for agencies such as NASA and the Department of the Army. It differs from conventional interactive computer simulation found in training simulators in that a virtual envi- ronment creates a much stronger illusion of actu- ally being there and being able to interact and generate change. An environment, including a virtual fire, could be created with interactive capabilities to which firefighters can respond and react through optimized sensors attached to the
firefighter's suit. Virtual environment (VE) training can bridge the gap very effectively between the classroom and the live trainer. VE can provide the opportunity in individual and team training for exposure to unlimited fires, to study the fire physics of each, and to evaluate the damage con- trol options that can be taken.
Identifying Key Technologies: The Damage Control/Firefighting into the 21st Century Workshop [1] was held at the Naval Research Laboratory in June 1994 to identify all technolo- gies that could make an impact on innovative damage control concepts and systems, specifically firefighting, so the Navy can move out smartly in the 21st century. The key technologies identified were: (a) Fire simulation: What are our current capabilities and limitations? What modeling ap- proach should be taken to adequately describe the fire physics? (b) Computing capability: What hardware/software approaches should be taken to achieve the speed and detail required? (c) Display capability: How should the issues of imagery, object resolution, tracking, and hypermedia inte- gration (video, still, simulations, audio) be resolv- ed to achieve the desired operator/training ef- fects? (d) Virtual reality: What are the human fac- tors and sensors issues that must be resolved to achieve a state of immersion that is as effective for training as real life? How successful have other applications of virtual reality been in other training environments? Based on issues raised in the workshop, an initial effort was undertaken to assess the effectiveness of using immersive VE as a tool for firefighter training and mission rehears- al in firefighting exercises aboard the ex-USS Shadwell, NRL's full-scale fire-research ship, locat- ed in Mobile Bay, Alabama.
Virtual Environment Feasibility Tests: Feasi- bility tests of the use of VE for firefighter training were performed aboard the ex-USS Shadwell dur- ing September 18-22, 1995 [2]. The objectives of these tests were to demonstrate and measure the effectiveness of VE training and mission rehearsal on the navigation and firefighting performance of trained firefighters in unfamiliar ship's spaces. The tests were performed in areas aboard the ex- USS Shadwell that had been modeled in VE with simulated smoke and fire. The tests were per- formed under realistic conditions with real ship- board fires, using Navy firefighting teams.
183
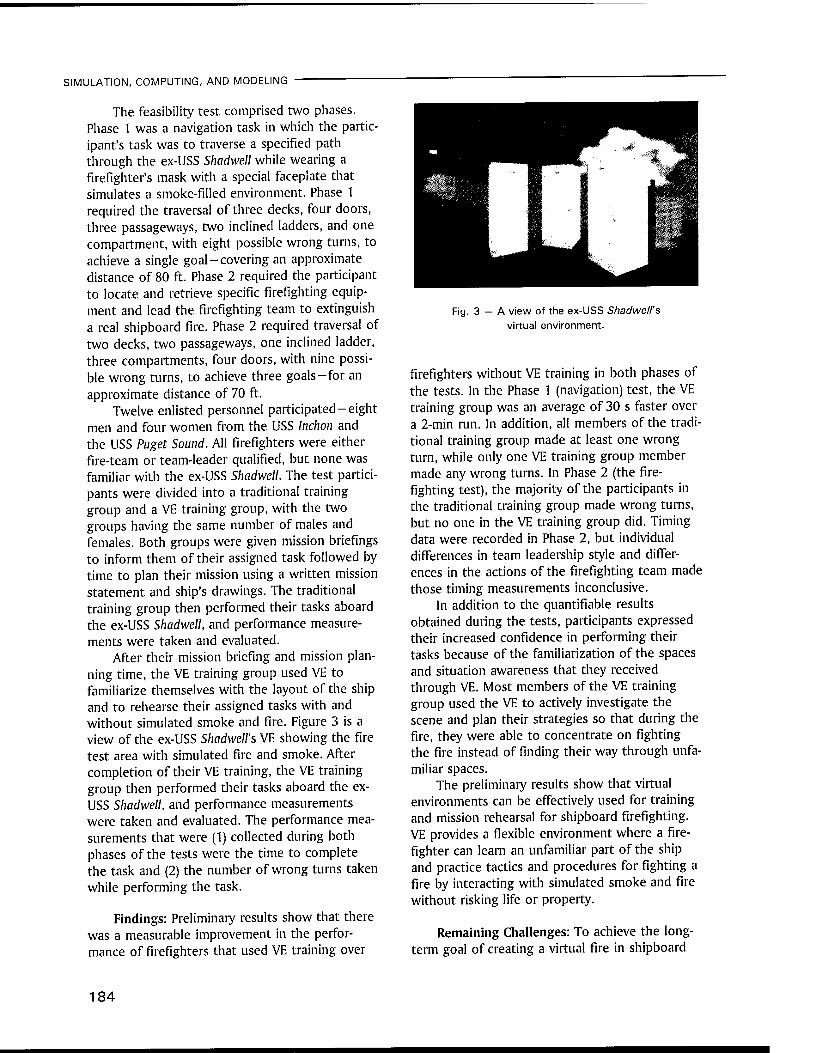
SIMULATION, COMPUTING, AND MODELING
The feasibility test comprised two phases. Phase 1 was a navigation task in which the partic- ipant's task was to traverse a specified path through the ex-USS Shadwell while wearing a firefighter's mask with a special faceplate that simulates a smoke-filled environment. Phase 1 required the traversal of three decks, four doors, three passageways, two inclined ladders, and one compartment, with eight possible wrong turns, to achieve a single goal-covering an approximate distance of 80 ft. Phase 2 required the participant to locate and retrieve specific firefighting equip- ment and lead the firefighting team to extinguish a real shipboard fire. Phase 2 required traversal of two decks, two passageways, one inclined ladder, three compartments, four doors, with nine possi- ble wrong turns, to achieve three goals-for an approximate distance of 70 ft.
Twelve enlisted personnel participated-eight men and four women from the USS Inchon and the USS Puget Sound. All firefighters were either fire-team or team-leader qualified, but none was familiar with the ex-USS Shadwell. The test partici- pants were divided into a traditional training group and a VE training group, with the two groups having the same number of males and females. Both groups were given mission briefings to inform them of their assigned task followed by time to plan their mission using a written mission statement and ship's drawings. The traditional training group then performed their tasks aboard the ex-USS Shadwell, and performance measure- ments were taken and evaluated.
After their mission briefing and mission plan- ning time, the VE training group used VE to familiarize themselves with the layout of the ship and to rehearse their assigned tasks with and without simulated smoke and fire. Figure 3 is a view of the ex-USS Shadwell's VE showing the fire test area with simulated fire and smoke. After completion of their VE training, the VE training group then performed their tasks aboard the ex- USS Shadwell, and performance measurements were taken and evaluated. The performance mea- surements that were (1) collected during both phases of the tests were the time to complete the task and (2) the number of wrong turns taken while performing the task.
Findings: Preliminary results show that there was a measurable improvement in the perfor- mance of firefighters that used VE training over
Fig. 3 — A view of the ex-USS Shadwell's virtual environment.
firefighters without VE training in both phases of the tests. In the Phase 1 (navigation) test, the VE training group was an average of 30 s faster over a 2-min run. In addition, all members of the tradi- tional training group made at least one wrong turn, while only one VE training group member made any wrong turns. In Phase 2 (the fire- fighting test), the majority of the participants in the traditional training group made wrong turns, but no one in the VE training group did. Timing data were recorded in Phase 2, but individual differences in team leadership style and differ- ences in the actions of the firefighting team made those timing measurements inconclusive.
In addition to the quantifiable results obtained during the tests, participants expressed their increased confidence in performing their tasks because of the familiarization of the spaces and situation awareness that they received through VE. Most members of the VE training group used the VE to actively investigate the scene and plan their strategies so that during the fire, they were able to concentrate on fighting the fire instead of finding their way through unfa- miliar spaces.
The preliminary results show that virtual environments can be effectively used for training and mission rehearsal for shipboard firefighting. VE provides a flexible environment where a fire- fighter can learn an unfamiliar part of the ship and practice tactics and procedures for fighting a fire by interacting with simulated smoke and fire without risking life or property.
Remaining Challenges: To achieve the long- term goal of creating a virtual fire in shipboard
184

SIMULATION, COMPUTING, AND MODELING
VE for firefighter training, there are remaining technological challenges that must be addressed in fire simulation and sensor development, as well as VE. To generate the required sense of realism, computing capability and resolution for a fire/ smoke spread model must be improved to assure that the immersion experience effectively trans- fers to real life. In addition, manual intervention for firefighting tactics must be included, such as active manipulation of ventilation systems for desmoking or active suppression with extinguish- ers/suppression systems. The requirements for the sensor suite for the firefighter suit in the training environment have not been defined. Questions remain as to how to make the trainer "feel" the hostile environment created by the fire but not be harmed by it. Work is currently being per- formed under a Small Business Innovative Re- search effort to investigate the requirements for firefighter sensors to create the realism desired for VE training.
[Sponsored by ONR and OPNAV]
References
1. P.A. Tatem, "Proceedings on the Damage Control/Firefighting into the 21st Century Workshop," NRL Memorandum Report 6180- 94-7643, Dec. 21, 1994.
2. D.L. Täte, L. Sibert, F.W. Williams, T. King, and D.H. Hewitt, "Virtual Environment Fire- fighting/Ship Familiarization Feasibility Tests Aboard the Ex-USS Shadwell," NRL Letter Re- port 6180/0672A.1, Oct. 17, 1995. ■
Ultrasonic Tomography of Solids Using Parallel Processing
R.S. Schechter and R.B. Mignogna Materials Science and Technology Division
P.P. Delsanto Politecnico di Torino, 10129 Torino, Italy
Using ultrasonic waves, reconstruction of different material properties and their spatial distribution inside solids may be accomplished. Current ultrasonic tomography methods do not
properly handle cases involving refraction, mode conversion, scattering, and finite apertures. (These effects are absent with X-ray-based tomog- raphy, where the energy travels in straight lines.) To account for these different effects, we have developed a method using a very efficient code to model elastic wave propagation on a mas- sively parallel computer. The wave propagation approach permits improved tomographic recon- structions in cases having large changes in the refractive index (> 10%), where traditional ray- tracing approaches, based on the geometrical acoustics approximation, become numerically unstable. The entire tomography computation required is immense but is feasible because the code is highly parallel and implemented on a parallel supercomputer.
Tomography Algorithms: There are two classes of tomographic reconstruction techni- ques. One class is based on Fourier transforms and includes such methods as the filtered back- projection and others. These methods are fast but have the restriction that the data be acquired on evenly spaced sets of straight ray paths, called projections.
A second method employs an iterative proce- dure to reconstruct an image. Iterative techniques are less efficient than transform-based methods, however they have several advantages. They can be used with irregular sampling geometries and may incorporate ray-bending at each iteration.
There are other methods to correct for weak scattering occurring in media in which the veloci- ty changes are small, such as soft biologic tissues. These techniques fall into the category of diffrac- tion tomography and involve using a first-order Born or Rytov approximation in the standard back-projection technique.
Wave Propagation Simulation Approach: The method presented here is intended for specimens with large velocity changes in their interiors (> 10%), commonly encountered in solids in non- destructive evaluation. Using our recently devel- oped local interaction approach (LISA) [1,2], which accurately models sharp interfaces between mate- rials of different physical properties, the process- es of radiation from a finite aperture, propaga- tion, and scattering are modeled in detail. In these simulations, all elastic wave effects are captured, including mode conversion. In addition,
185

SIMULATION, COMPUTING, AND MODELING
we have developed a novel method of using the wave propagation code to determine the path of the first arrival acoustic energy from a receiver back to the source by using the vector field along the wave front [3]. These computed ray paths are used in an iterative tomography algorithm called the algebraic reconstruction technique, or ART. Embedding a forward num- erical simulation inside an inverse algorithm allows the faithful modeling of the physics of propagation and scattering needed in ultrasonic tomography.
Simulated Inclusion Case: A simulated case of an 8.45-mm diameter inclusion embedded in a 16.3-mm square piece of plexiglas is considered first. The inclusion has the same density as plexiglas but with the Lame constants X and \i being twice those of plexiglas, to give a longi- tudinal velocity about 40% higher than plexiglas (2.67 mm/jus in the plexiglas and 3.78 mm/jus in the inclusion). This represents a large velocity change-introducing strong refraction and scattering-not handled by other techniques.
Figure 4(a) shows a "snapshot," gray-scale image of the amplitude of the entire displace- ment field at 3.7 \xs into the simulation, obtained from a forward run with the specimen known
beforehand. The leading edge-or in this case, longitudinal wavefront-is used to trace the first arrival acoustic energy through the specimen. The first arrival ray paths, along with the positions of the longitudinal wavefront computed for a source position at the center of one edge of the speci- men, are shown in Fig. 4(b). The ray paths are curved near the source because of the finite aper- ture near the edge of the inclusion due to scat- tering and inside the inclusion due to refraction. There are 31 such source positions along each side and 63 receivers (not shown).
The resulting velocity tomogram has 31 x 31 tomography cells (defined by the sources) and is shown in Fig. 5(a). The image shows a well- resolved circular scatterer. Figure 5(b) shows the same tomogram as a surface. In Fig. 5(c), a cut through the center of the tomogram is shown along with the ideal cut, or true profile of the velocity field. The computed profile comes close to the ideal profile, only slightly underestimating the velocity of the inclusion. A second case, iden- tical to the previous one, is done except that now the ray paths are computed for every iteration instead of being known beforehand. The resulting tomograms in Figs. 6(a) and 6(b) show a less spa- tially resolved scatterer. The computed profile (Fig. 6(c)) is not nearly as square as in Fig. 5(c).
(a) (b)
Fig. 4 - Snapshot (a) of displacement wavefield after 275 time steps for circular inclusion case and (b) ray-path reconstruction for a source located at center of left edge of specimen.
186
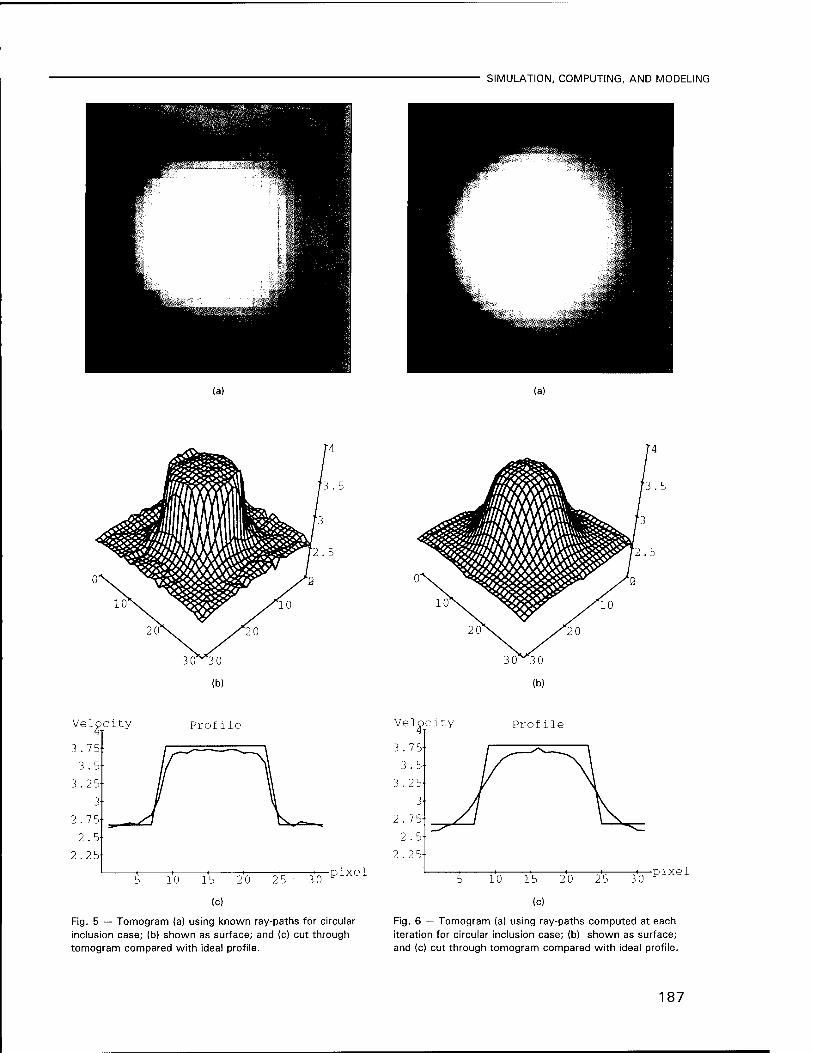
SIMULATION, COMPUTING, AND MODELING
(a) (a)
3.5 3.5
Velocity Profile Velocity Profile
pixel
Fig. 5 — Tomogram (a) using known ray-paths for circular inclusion case; (b) shown as surface; and (c) cut through tomogram compared with ideal profile.
pixel
Fig. 6 — Tomogram (a) using ray-paths computed at each iteration for circular inclusion case; (b) shown as surface; and (c) cut through tomogram compared with ideal profile.
187
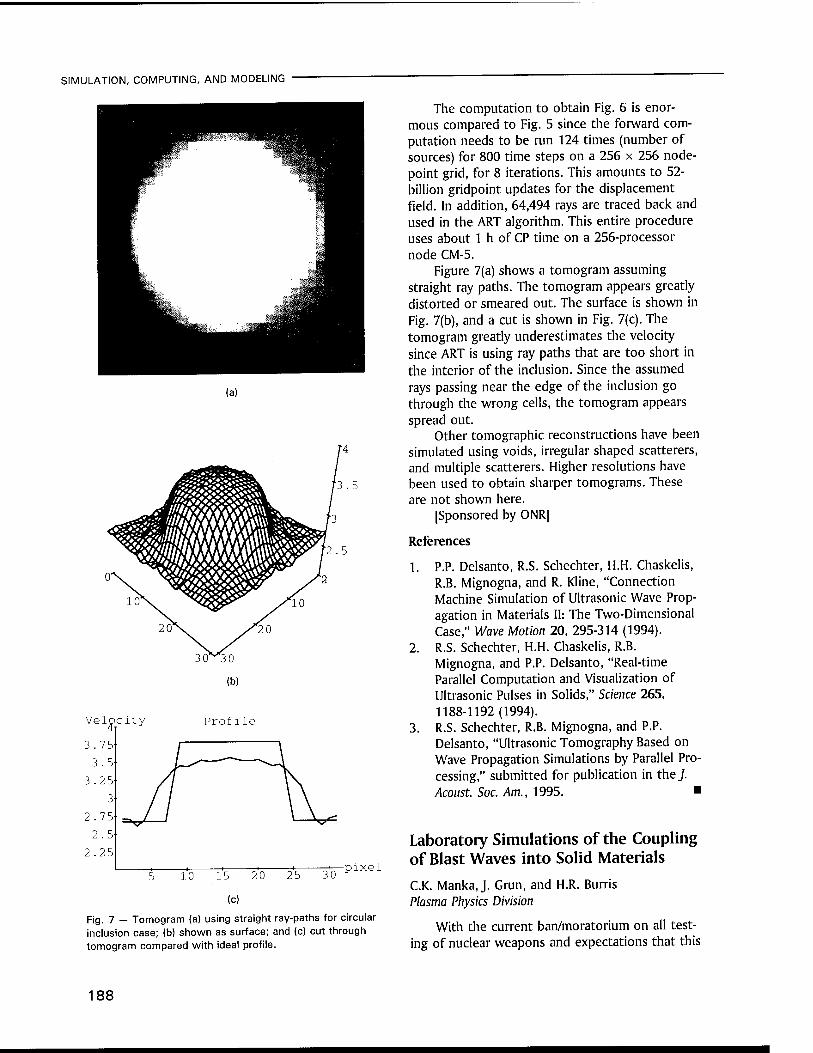
SIMULATION, COMPUTING, AND MODELING
(a)
3.5
Velocity Profile
10 15 20 25 30
(c)
pixel
Fig. 7 — Tomogram (a) using straight ray-paths for circular inclusion case; (b) shown as surface; and (c) cut through tomogram compared with ideal profile.
The computation to obtain Fig. 6 is enor- mous compared to Fig. 5 since the forward com- putation needs to be run 124 times (number of sources) for 800 time steps on a 256 x 256 node- point grid, for 8 iterations. This amounts to 52- billion gridpoint updates for the displacement field. In addition, 64,494 rays are traced back and used in the ART algorithm. This entire procedure uses about 1 h of CP time on a 256-processor node CM-5.
Figure 7(a) shows a tomogram assuming straight ray paths. The tomogram appears greatly distorted or smeared out. The surface is shown in Fig. 7(b), and a cut is shown in Fig. 7(c). The tomogram greatly underestimates the velocity since ART is using ray paths that are too short in the interior of the inclusion. Since the assumed rays passing near the edge of the inclusion go through the wrong cells, the tomogram appears spread out.
Other tomographic reconstructions have been simulated using voids, irregular shaped scatterers, and multiple scatterers. Higher resolutions have been used to obtain sharper tomograms. These are not shown here.
[Sponsored by ONR]
References
1. P.P. Delsanto, R.S. Schechter, H.H. Chaskelis, R.B. Mignogna, and R. Kline, "Connection Machine Simulation of Ultrasonic Wave Prop- agation in Materials II: The Two-Dimensional Case," Wave Motion 20, 295-314 (1994).
2. R.S. Schechter, H.H. Chaskelis, R.B. Mignogna, and P.P. Delsanto, "Real-time Parallel Computation and Visualization of Ultrasonic Pulses in Solids," Science 265, 1188-1192(1994).
3. R.S. Schechter, R.B. Mignogna, and P.P. Delsanto, "Ultrasonic Tomography Based on Wave Propagation Simulations by Parallel Pro- cessing," submitted for publication in the./. Acoust. Soc. Am., 1995. ■
Laboratory Simulations of the Coupling of Blast Waves into Solid Materials C.K. Manka, J. Grun, and H.R. Burris Plasma Physics Division
With the current ban/moratorium on all test- ing of nuclear weapons and expectations that this
188
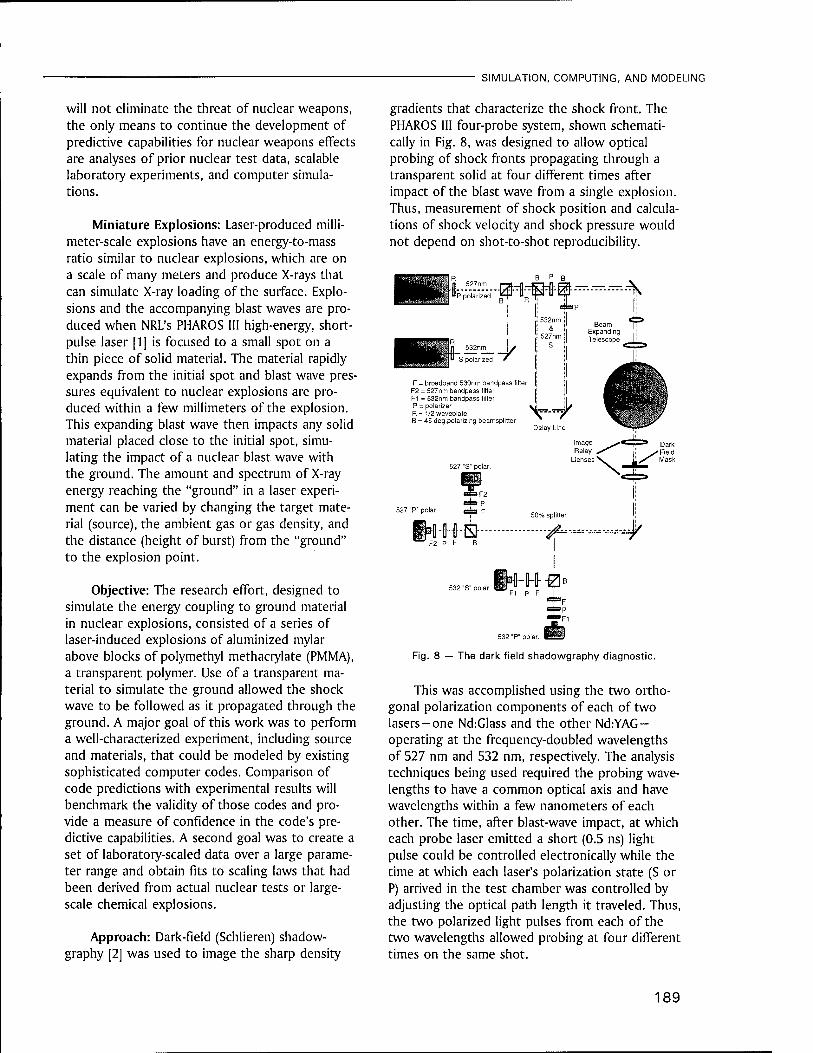
SIMULATION, COMPUTING, AND MODELING
will not eliminate the threat of nuclear weapons, the only means to continue the development of predictive capabilities for nuclear weapons effects are analyses of prior nuclear test data, scalable laboratory experiments, and computer simula- tions.
Miniature Explosions: Laser-produced milli- meter-scale explosions have an energy-to-mass ratio similar to nuclear explosions, which are on a scale of many meters and produce X-rays that can simulate X-ray loading of the surface. Explo- sions and the accompanying blast waves are pro- duced when NRL's PHAROS III high-energy, short- pulse laser [1] is focused to a small spot on a thin piece of solid material. The material rapidly expands from the initial spot and blast wave pres- sures equivalent to nuclear explosions are pro- duced within a few millimeters of the explosion. This expanding blast wave then impacts any solid material placed close to the initial spot, simu- lating the impact of a nuclear blast wave with the ground. The amount and spectrum of X-ray energy reaching the "ground" in a laser experi- ment can be varied by changing the target mate- rial (source), the ambient gas or gas density, and the distance (height of burst) from the "ground" to the explosion point.
Objective: The research effort, designed to simulate the energy coupling to ground material in nuclear explosions, consisted of a series of laser-induced explosions of aluminized mylar above blocks of polymethyl methacrylate (PMMA), a transparent polymer. Use of a transparent ma- terial to simulate the ground allowed the shock wave to be followed as it propagated through the ground. A major goal of this work was to perform a well-characterized experiment, including source and materials, that could be modeled by existing sophisticated computer codes. Comparison of code predictions with experimental results will benchmark the validity of those codes and pro- vide a measure of confidence in the code's pre- dictive capabilities. A second goal was to create a set of laboratory-scaled data over a large parame- ter range and obtain fits to scaling laws that had been derived from actual nuclear tests or large- scale chemical explosions.
Approach: Dark-field (Schlieren) shadow- graphy [2] was used to image the sharp density
gradients that characterize the shock front. The PHAROS III four-probe system, shown schemati- cally in Fig. 8, was designed to allow optical probing of shock fronts propagating through a transparent solid at four different times after impact of the blast wave from a single explosion. Thus, measurement of shock position and calcula- tions of shock velocity and shock pressure would not depend on shot-to-shot reproducibility.
B P B
^4-p-fl--
532nm \j
polarized *
F = broadband 530nm bandpass filter F2 = 527nm bandpass filler F1 = 532nm bandpass filter P = polarizer R= 1/2 waveplate B = 45 deg.polarizing beamsplitter
527 "S" polar.
527 "P° polar.
3F2 3 P a F
Dark i ^ Field iy^ Mask
50% splittei
F2 P F B
^■^■^^■Jy
532 "P" polar.
Fig. 8 — The dark field shadowgraphy diagnostic.
This was accomplished using the two ortho- gonal polarization components of each of two lasers-one Nd:Glass and the other NdrYAG — operating at the frequency-doubled wavelengths of 527 nm and 532 nm, respectively. The analysis techniques being used required the probing wave- lengths to have a common optical axis and have wavelengths within a few nanometers of each other. The time, after blast-wave impact, at which each probe laser emitted a short (0.5 ns) light pulse could be controlled electronically while the time at which each laser's polarization state (S or P) arrived in the test chamber was controlled by adjusting the optical path length it traveled. Thus, the two polarized light pulses from each of the two wavelengths allowed probing at four different times on the same shot.
189
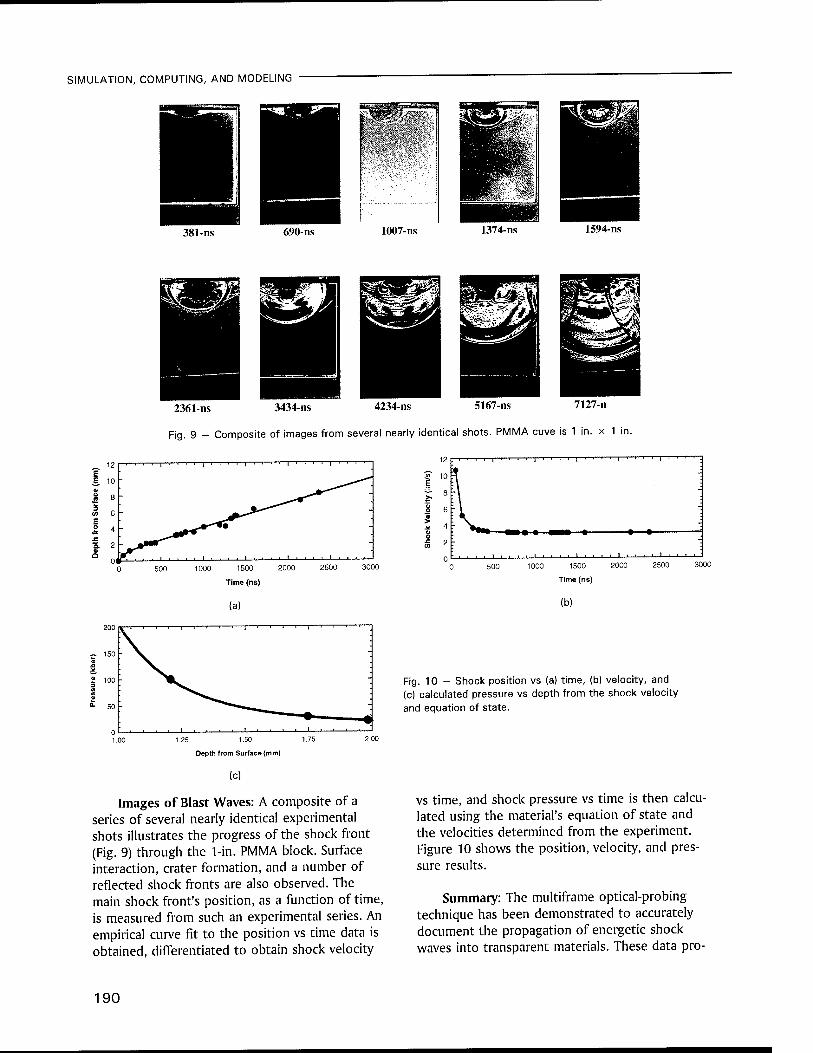
SIMULATION, COMPUTING, AND MODELING
-"^'■„ :,Sär-"i
381-ns 690-ns 1007-ns 1374-ns 1594-ns
2361-ns 3434-ns 4234-ns 5167-ns 7127-n
Fig. 9 - Composite of images from several nearly identical shots. PMMA cuve is 1 in. x 1 in.
12 ' 1 ' ' ' 1 ' ' ■~T I ' I ' 1 ' ' 1 ' ' ' '
10
8 _*"-•"" 6 - 4 ä^"*-""**^ - 2
01 1T\ . .,,).... 1000 1500
Time (ns)
(a)
1.25 1.50
Depth from Surface (mm)
(C)
Images of Blast Waves: A composite of a series of several nearly identical experimental shots illustrates the progress of the shock front (Fig. 9) through the 1-in. PMMA block. Surface interaction, crater formation, and a number of reflected shock fronts are also observed. The main shock front's position, as a function of time, is measured from such an experimental series. An empirical curve fit to the position vs time data is obtained, differentiated to obtain shock velocity
12 . ■ ■ ■ • i i . i . i ' ' 1 ' i ' '—'" . i i i ■ . i i
E 10 s j
U o >
2
;L -.
o
i . . . , i . . . i . . . , i . j i—i—:
1000 1500 2000
Time (ns)
(b)
Fig. 10 — Shock position vs (a) time, (b) velocity, and (c) calculated pressure vs depth from the shock velocity and equation of state.
vs time, and shock pressure vs time is then calcu- lated using the material's equation of state and the velocities determined from the experiment. Figure 10 shows the position, velocity, and pres- sure results.
Summary: The multiframe optical-probing technique has been demonstrated to accurately document the propagation of energetic shock waves into transparent materials. These data pro-
190

SIMULATION, COMPUTING, AND MODELING
vide the foundation for the benchmarking of sophisticated, predictive computer models of nuclear blast waves. Additionally, this work dem- onstrates a method for calibrating newly devel- oped, ultrafast pressure probes which, in turn, will be able to document the propagation of ener- getic shock waves into opaque materials such as soils, rocks, and complicated structures or geo- logic features.
Acknowledgment: The authors thank all members of the Laser Experiments Section, Beam Physics Branch, and Dr. Jeff Hurley, Berkeley Schol- ars. Our work is a team effort.
[Sponsored by DNA]
References
1. J.M. McMahon, R.P. Burns, T.H. DeRieux, R.A. Hunsicker, and R.H. Lehmberg, IEEEJ. Quan- tum Electron. QE-17, 1629 (1981).
2. J.A. Stamper, E.A. McLean, S.P. Obenschain, and B.H. Ripin, "Concepts and Illustrations of Optical Probing Diagnostics for Laser- Produced Plasmas," Fast Electrical and Optical Measurements, p. 691, (NATO ASI Series E109, Martinus Nijhoff Publishers, 1986), p. 691. ■
Observed and Simulated Intraseasonal Circulation Anomalies
C.A. Reynolds and R. Gelaro Marine Meteorology Division
T. Murphree Naval Postgraduate School
Observations have shown that there are sig- nificant atmospheric circulation anomalies on intraseasonal time scales (20 to 70 days). Previous studies indicate that these circulation anomalies can have a significant impact on medium-range weather forecasting. The ability of the Navy Oper- ational Global Atmospheric Prediction System (NOGAPS) to simulate the observed primary modes of intraseasonal variability in the Northern Hemisphere during boreal winter is examined. The NOGAPS data come from 9 winters of a 10- year integration of the model run at T47 resolu- tion with observed time-varying sea surface tem- peratures. Atmospheric analyses prepared by the
European Centre for Medium-range Weather Fore- casts are used to represent observations.
To identify the primary modes of observed and simulated intraseasonal variability, we use rotated empirical orthogonal function (REOF) analysis. The observed and simulated upper- tropospheric zonal and meridional wind fields were first filtered to retain only variations with periods between 20 and 70 days. REOFs were then computed for the North Pacific and North Atlantic regions based on these filtered wind fields. Diagnostic tools such as time-lagged com- posite analyses and wave activity flux vectors [1] were used to examine the temporal evolution of these modes and their relationship to tropical and extratropical forcing. Diagnostic studies of this type help illuminate the basic mechanisms that force and guide these modes and provide impor- tant guidance for diagnosing model errors. One example is given here.
Jet-guided Wave Trains: The upper-tropo- spheric circulation anomalies associated with an east-west-oriented wave train propagating across the Pacific in the model simulation and observa- tions are shown in Fig. 11. The wave trains ap- pear similar to each other in the western Pacific. However, over the central and eastern Pacific, the observed wave train arcs equatorward and has significant amplitude in the subtropics, while the simulated wave train arcs poleward toward the Gulf of Alaska. These differences may account for the fact that the model is deficient in intrasea- sonal variability in the subtropical Pacific, yet has excess amounts of intraseasonal variability in the region south of Alaska. The REOFs representing these wave trains account for 18% and 16% of the observed and simulated variance in this region, respectively.
Figure 12 shows the corresponding wave- activity flux vectors for these modes super- imposed on the time-mean upper-tropospheric zonal wind. The direction and length of the ar- rows indicate the direction and strength, respec- tively, of the stationary wave energy propagation associated with these modes. Over the western Pacific, the flux vectors (and wave trains) are aligned along the axis of maximum wind speed associated with the upper tropospheric jet and are bounded on either side by zones of strong meridional wind shear. In the observations, the
191

SIMULATION, COMPUTING, AND MODELING
MODEL'200 rnb CIRCULATION ANOMALY
0 - ^ 100E 120E 140E 160E 180 160W 14CW 120W 100W BOW
OBSERVED 200 mb CIRCULATION ANOMALY
to
100E 120E 140E 160E 1B0 160W 140W 120W 100W BOW
-3D. 00 -E6.00 -22.00 -IH.i
Fig. 11 — The upper-tropospheric circulation anomalies (that is, 200-mb streamfunction anomalies), representing an east-west-oriented wave train across the Pacific, for the model simulation (top) and observations (bottom). Blue colors represent cyclonic (counter-clockwise) anomalies and red colors represent anticyclonic (clockwise) anoma- lies. Contour interval is 4 x 10⁶ m2/s_1.
MODEL 200 mb ZONAL WIND
120E 140E 160E 180 160T 140T 120W 100W BOW
OBSERVED 200 mb ZONAL WIND
Fig. 12 — The wave activity flux vectors associated with the circulation anomalies shown in Fig. 11, superimposed on the time-mean upper-tropospheric zonal wind for the model simulation (top), and observations (bottom). Blue contours represent easterly winds. Contour interval is 8 m/s"1. A vector length of 10 mm represents 140 m2/s"2
meridional shear on the southern flank of the jet in the central Pacific (180°-160° W), along with the jet itself, are weaker than in the model simulation. Where the shear zone weakens, the observed wave train shows a strong equatorward component. In contrast, the simulated wave train shows eastward and poleward propagation as far as North America.
Implications for Forecasting: These results provide observational support for previous theo- retical work, which suggests that shear zones along the flanks of jets act as regions of wave reflection because they are regions where the meridional gradient of vorticity vanishes [2]. These and other results not shown indicate that the model captures the basic mechanisms respon- sible for the generation and propagation of extra- tropically forced modes of variability. However, biases in the time-mean flow result in a misplace- ment of these intraseasonal modes. In the above example, this could result in an erroneous north- ward displacement of storms over the western U.S. in a medium-range forecast. Work in other NRL projects is aimed toward developing im- proved physical parameterization schemes for NOGAPS. These improvements will have a direct impact on the simulation of the time-mean circu- lation and should, in turn, allow for a more realis- tic simulation of the transient structures that directly affect our medium-range forecast skill.
Acknowledgments: The 10-year simulation of NOGAPS was conducted at NRL by Tim Hogan and Tom Rosmond as part of the Atmospheric Model Intercomparison Project. Computer support was provided by the Department of Defense High Performance Computing Program. Support of the Office of Naval Research, Program Element 0601153N, is gratefully acknowledged.
[Sponsored by ONR]
References
1. G. Branstator, "Horizontal Energy Prop- agation in a Barotropic Atmosphere with Meridional and Zonal Structure,"/ Atmos. Sei. 40, 1689-1708 (1983).
2. R.A. Plumb, "On the Three-Dimensional Prop- agation of Stationary Waves." J. Atmos. Sei. 42, 217-229 (1985). ■
192

Space Research
and Satellite
Technology
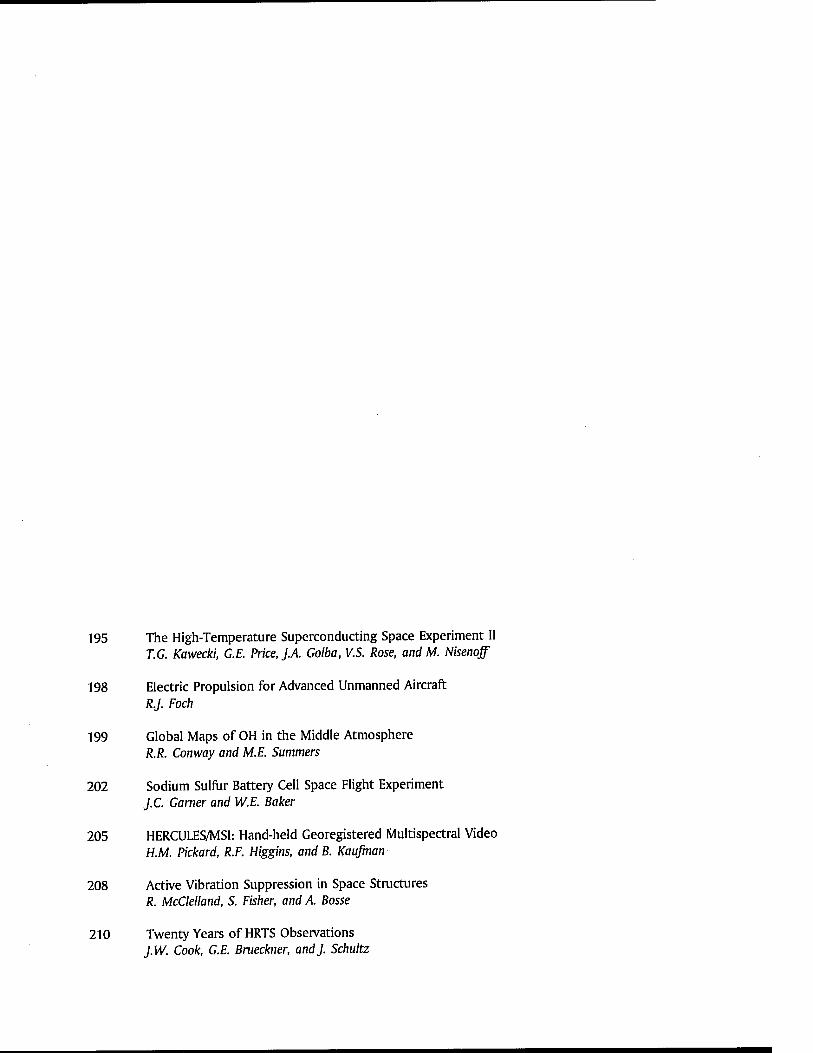
195 The High-Temperature Superconducting Space Experiment II T.G. Kawecki, G.E. Price, JA. Golba, V.S. Rose, and M. Nisenoff
198 Electric Propulsion for Advanced Unmanned Aircraft R.J. Foch
199 Global Maps of OH in the Middle Atmosphere R.R. Conway and M.E. Summers
202 Sodium Sulfur Battery Cell Space Flight Experiment J.C. Garner and W.E. Baker
205 HERCULES/MSI: Hand-held Georegistered Multispectral Video H.M. Pickard, R.F. Higgins, and B. Kaufman
208 Active Vibration Suppression in Space Structures R. McClelland, S. Fisher, and A. Bosse
210 Twenty Years of HRTS Observations J.W. Cook, G.E. Brueckner, and}. Schultz
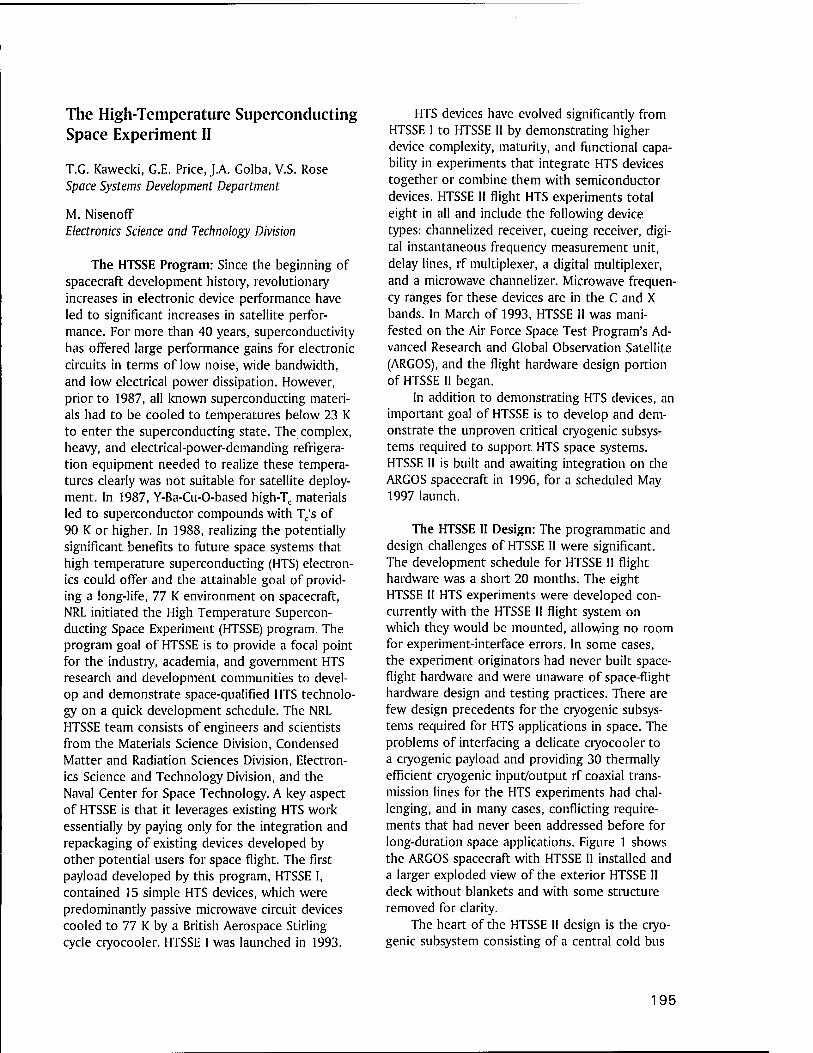
The High-Temperature Superconducting Space Experiment II
T.G. Kawecki, G.E. Price, J.A. Golba, V.S. Rose Space Systems Development Department
M. NisenofF Electronics Science and Technology Division
The HTSSE Program: Since the beginning of spacecraft development history, revolutionary increases in electronic device performance have led to significant increases in satellite perfor- mance. For more than 40 years, superconductivity has offered large performance gains for electronic circuits in terms of low noise, wide bandwidth, and low electrical power dissipation. However, prior to 1987, all known superconducting materi- als had to be cooled to temperatures below 23 K to enter the superconducting state. The complex, heavy, and electrical-power-demanding refrigera- tion equipment needed to realize these tempera- tures clearly was not suitable for satellite deploy- ment. In 1987, Y-Ba-Cu-O-based high-Tc materials led to superconductor compounds with Tc's of 90 K or higher. In 1988, realizing the potentially significant benefits to future space systems that high temperature superconducting (HTS) electron- ics could offer and the attainable goal of provid- ing a long-life, 77 K environment on spacecraft, NRL initiated the High Temperature Supercon- ducting Space Experiment (HTSSE) program. The program goal of HTSSE is to provide a focal point for the industry, academia, and government HTS research and development communities to devel- op and demonstrate space-qualified HTS technolo- gy on a quick development schedule. The NRL HTSSE team consists of engineers and scientists from the Materials Science Division, Condensed Matter and Radiation Sciences Division, Electron- ics Science and Technology Division, and the Naval Center for Space Technology. A key aspect of HTSSE is that it leverages existing HTS work essentially by paying only for the integration and repackaging of existing devices developed by other potential users for space flight. The first payload developed by this program, HTSSE I, contained 15 simple HTS devices, which were predominantly passive microwave circuit devices cooled to 77 K by a British Aerospace Stirling cycle cryocooler. HTSSE I was launched in 1993.
HTS devices have evolved significantly from HTSSE I to HTSSE II by demonstrating higher device complexity, maturity, and functional capa- bility in experiments that integrate HTS devices together or combine them with semiconductor devices. HTSSE II flight HTS experiments total eight in all and include the following device types: channelized receiver, cueing receiver, digi- tal instantaneous frequency measurement unit, delay lines, rf multiplexer, a digital multiplexer, and a microwave channelizer. Microwave frequen- cy ranges for these devices are in the C and X bands. In March of 1993, HTSSE II was mani- fested on the Air Force Space Test Program's Ad- vanced Research and Global Observation Satellite (ARGOS), and the flight hardware design portion of HTSSE II began.
In addition to demonstrating HTS devices, an important goal of HTSSE is to develop and dem- onstrate the unproven critical cryogenic subsys- tems required to support HTS space systems. HTSSE II is built and awaiting integration on the ARGOS spacecraft in 1996, for a scheduled May 1997 launch.
The HTSSE II Design: The programmatic and design challenges of HTSSE II were significant. The development schedule for HTSSE II flight hardware was a short 20 months. The eight HTSSE II HTS experiments were developed con- currently with the HTSSE II flight system on which they would be mounted, allowing no room for experiment-interface errors. In some cases, the experiment originators had never built space- flight hardware and were unaware of space-flight hardware design and testing practices. There are few design precedents for the cryogenic subsys- tems required for HTS applications in space. The problems of interfacing a delicate cryocooler to a cryogenic payload and providing 30 thermally efficient cryogenic input/output rf coaxial trans- mission lines for the HTS experiments had chal- lenging, and in many cases, conflicting require- ments that had never been addressed before for long-duration space applications. Figure 1 shows the ARGOS spacecraft with HTSSE II installed and a larger exploded view of the exterior HTSSE II deck without blankets and with some structure removed for clarity.
The heart of the HTSSE II design is the cryo- genic subsystem consisting of a central cold bus
195
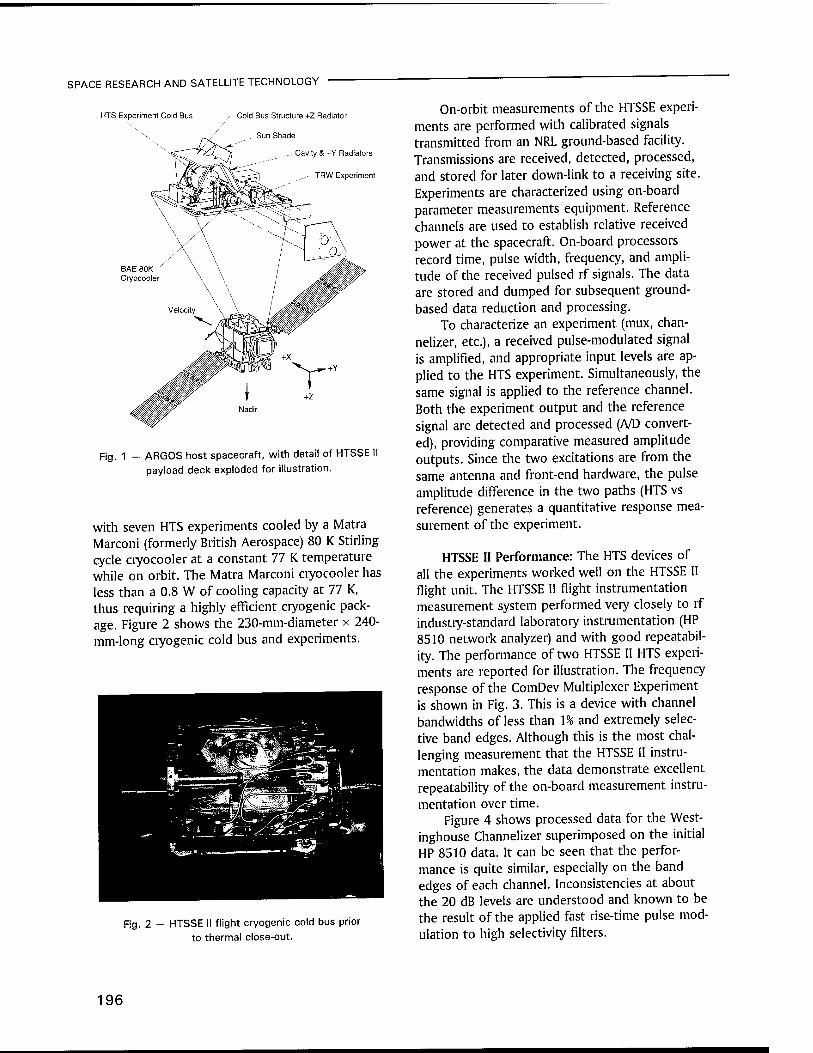
SPACE RESEARCH AND SATELLITE TECHNOLOGY
HTS Experiment Cold Bus Cold Bus Structure +Z Radiator
^ Sun Shade
..- Cavity & +Y Radiators
^- TRW Experiment
Fig. 1 - ARGOS host spacecraft, with detail of HTSSE I payload deck exploded for illustration.
with seven HTS experiments cooled by a Matra Marconi (formerly British Aerospace) 80 K Stirling cycle cryocooler at a constant 77 K temperature while on orbit. The Matra Marconi cryocooler has less than a 0.8 W of cooling capacity at 77 K, thus requiring a highly efficient cryogenic pack- age. Figure 2 shows the 230-mm-diameter x 240- mm-long cryogenic cold bus and experiments.
Fig. 2 - HTSSE II flight cryogenic cold bus prior to thermal close-out.
On-orbit measurements of the HTSSE experi- ments are performed with calibrated signals transmitted from an NRL ground-based facility. Transmissions are received, detected, processed, and stored for later down-link to a receiving site. Experiments are characterized using on-board parameter measurements equipment. Reference channels are used to establish relative received power at the spacecraft. On-board processors record time, pulse width, frequency, and ampli- tude of the received pulsed rf signals. The data are stored and dumped for subsequent ground- based data reduction and processing.
To characterize an experiment (mux, chan- nelize^ etc.), a received pulse-modulated signal is amplified, and appropriate input levels are ap- plied to the HTS experiment. Simultaneously, the same signal is applied to the reference channel. Both the experiment output and the reference signal are detected and processed (A/D convert- ed), providing comparative measured amplitude outputs. Since the two excitations are from the same antenna and front-end hardware, the pulse amplitude difference in the two paths (HTS vs reference) generates a quantitative response mea- surement of the experiment.
HTSSE II Performance: The HTS devices of all the experiments worked well on the HTSSE II flight unit. The HTSSE II flight instrumentation measurement system performed very closely to rf industry-standard laboratory instrumentation (HP 8510 network analyzer) and with good repeatabil- ity. The performance of two HTSSE II HTS experi- ments are reported for illustration. The frequency response of the ComDev Multiplexer Experiment is shown in Fig. 3. This is a device with channel bandwidths of less than \% and extremely selec- tive band edges. Although this is the most chal- lenging measurement that the HTSSE II instru- mentation makes, the data demonstrate excellent repeatability of the on-board measurement instru- mentation over time.
Figure 4 shows processed data for the West- inghouse Channelizer superimposed on the initial HP 8510 data. It can be seen that the perfor- mance is quite similar, especially on the band edges of each channel. Inconsistencies at about the 20 dB levels are understood and known to be the result of the applied fast rise-time pulse mod- ulation to high selectivity filters.
196
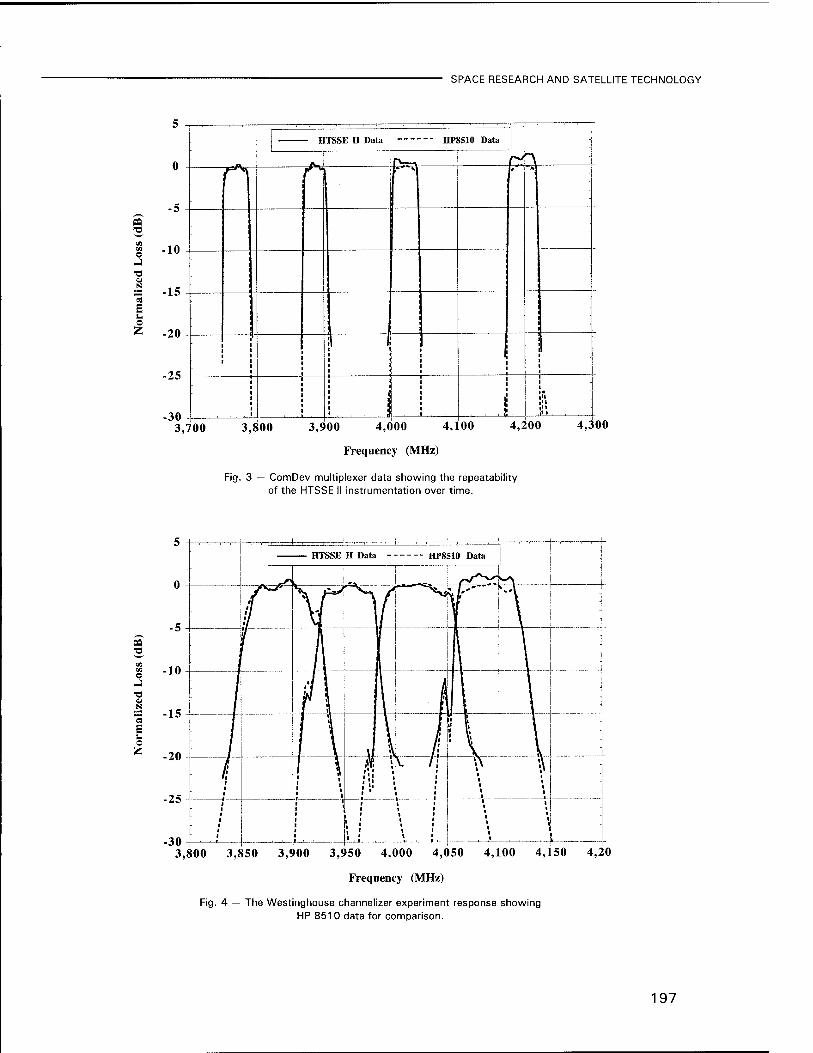
o
•a 01 s S3
s o Z
-10
a -15
-20
-25
-30 3,700
SPACE RESEARCH AND SATELLITE TECHNOLOGY
-*=**
HTSSE n Data HP8S10 Data
n
3,800 3,900 4,000 4,100
Frequency (MHz)
-PQ
4,200 4,300
Fig. 3 — ComDev multiplexer data showing the repeatability of the HTSSE II instrumentation over time.
pa
o J ts a N
©
3,800 3,850 3,900 3,950 4,000 4,050 4,100 4,150 4,20
Frequency (MHz)
Fig. 4 — The Westinghouse channelizer experiment response showing HP 8510 data for comparison.
197
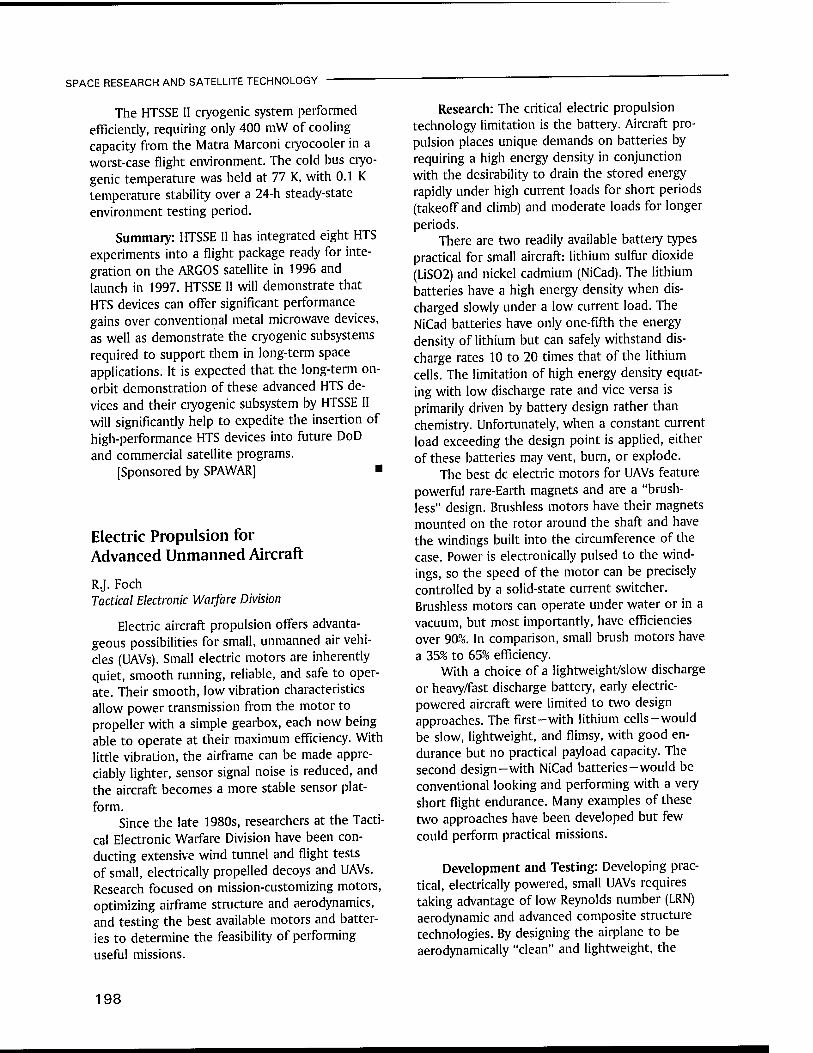
SPACE RESEARCH AND SATELLITE TECHNOLOGY
The HTSSE II cryogenic system performed efficiently, requiring only 400 mW of cooling capacity from the Matra Marconi cryocooler in a worst-case flight environment. The cold bus cryo- genic temperature was held at 77 K, with 0.1 K temperature stability over a 24-h steady-state environment testing period.
Summary: HTSSE II has integrated eight HTS experiments into a flight package ready for inte- gration on the ARGOS satellite in 1996 and launch in 1997. HTSSE II will demonstrate that HTS devices can offer significant performance gains over conventional metal microwave devices, as well as demonstrate the cryogenic subsystems required to support them in long-term space applications. It is expected that the long-term on- orbit demonstration of these advanced HTS de- vices and their cryogenic subsystem by HTSSE II will significantly help to expedite the insertion of high-performance HTS devices into future DoD and commercial satellite programs.
[Sponsored by SPAWAR] ■
Electric Propulsion for Advanced Unmanned Aircraft
RJ. Foch Tactical Electronic Warfare Division
Electric aircraft propulsion offers advanta- geous possibilities for small, unmanned air vehi- cles (UAVs). Small electric motors are inherently quiet, smooth running, reliable, and safe to oper- ate. Their smooth, low vibration characteristics allow power transmission from the motor to propeller with a simple gearbox, each now being able to operate at their maximum efficiency. With little vibration, the airframe can be made appre- ciably lighter, sensor signal noise is reduced, and the aircraft becomes a more stable sensor plat- form.
Since the late 1980s, researchers at the Tacti- cal Electronic Warfare Division have been con- ducting extensive wind tunnel and flight tests of small, electrically propelled decoys and UAVs. Research focused on mission-customizing motors, optimizing airframe structure and aerodynamics, and testing the best available motors and batter- ies to determine the feasibility of performing useful missions.
Research: The critical electric propulsion technology limitation is the battery. Aircraft pro- pulsion places unique demands on batteries by requiring a high energy density in conjunction with the desirability to drain the stored energy rapidly under high current loads for short periods (takeoff and climb) and moderate loads for longer periods.
There are two readily available battery types practical for small aircraft: lithium sulfur dioxide (LiS02) and nickel cadmium (NiCad). The lithium batteries have a high energy density when dis- charged slowly under a low current load. The NiCad batteries have only one-fifth the energy density of lithium but can safely withstand dis- charge rates 10 to 20 times that of the lithium cells. The limitation of high energy density equat- ing with low discharge rate and vice versa is primarily driven by battery design rather than chemistry. Unfortunately, when a constant current load exceeding the design point is applied, either of these batteries may vent, burn, or explode.
The best dc electric motors for UAVs feature powerful rare-Earth magnets and are a "brush- less" design. Brushless motors have their magnets mounted on the rotor around the shaft and have the windings built into the circumference of the case. Power is electronically pulsed to the wind- ings, so the speed of the motor can be precisely controlled by a solid-state current switcher. Brushless motors can operate under water or in a vacuum, but most importantly, have efficiencies over 90%. In comparison, small brush motors have a 35% to 65% efficiency.
With a choice of a lightweight/slow discharge or heavy/fast discharge battery, early electric- powered aircraft were limited to two design approaches. The first-with lithium cells-would be slow, lightweight, and flimsy, with good en- durance but no practical payload capacity. The second design-with NiCad batteries-would be conventional looking and performing with a very short flight endurance. Many examples of these two approaches have been developed but few could perform practical missions.
Development and Testing: Developing prac- tical, electrically powered, small UAVs requires taking advantage of low Reynolds number (LRN) aerodynamic and advanced composite structure technologies. By designing the airplane to be aerodynamically "clean" and lightweight, the
198
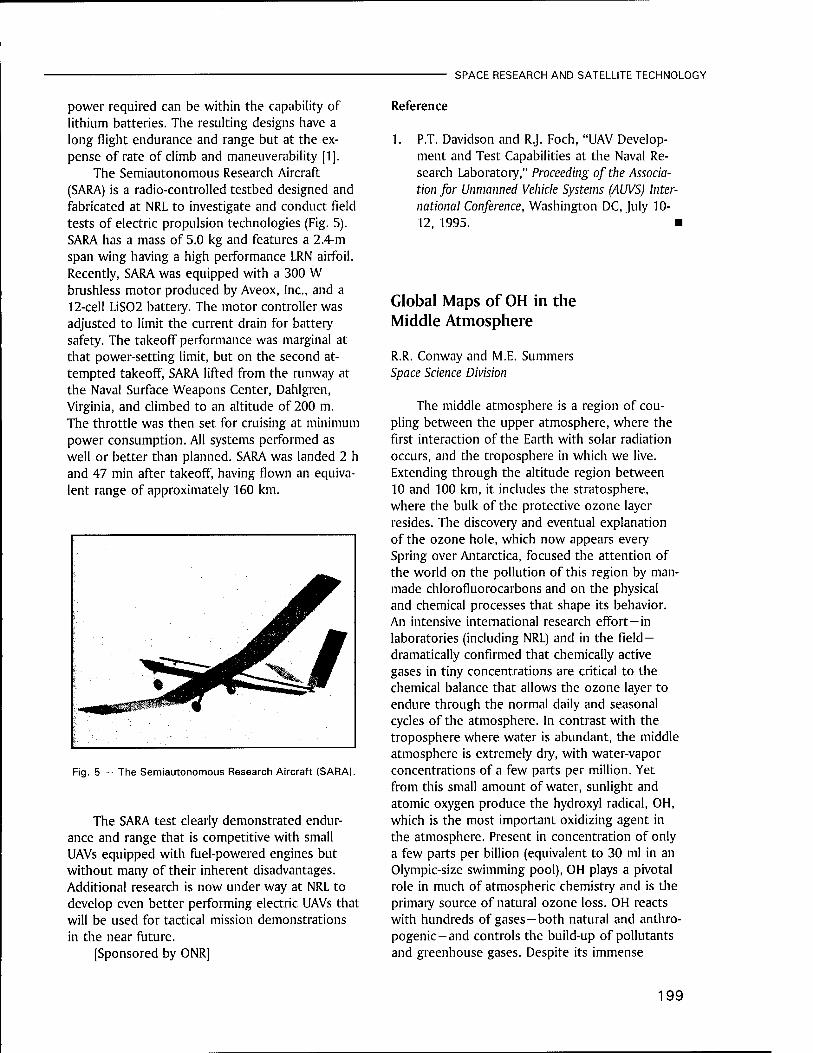
SPACE RESEARCH AND SATELLITE TECHNOLOGY
power required can be within the capability of lithium batteries. The resulting designs have a long flight endurance and range but at the ex- pense of rate of climb and maneuverability [1].
The Semiautonomous Research Aircraft (SARA) is a radio-controlled testbed designed and fabricated at NRL to investigate and conduct field tests of electric propulsion technologies (Fig. 5). SARA has a mass of 5.0 kg and features a 2.4-m span wing having a high performance LRN airfoil. Recently, SARA was equipped with a 300 W brushless motor produced by Aveox, Inc., and a 12-cell LiS02 battery. The motor controller was adjusted to limit the current drain for battery safety. The takeoff performance was marginal at that power-setting limit, but on the second at- tempted takeoff, SARA lifted from the runway at the Naval Surface Weapons Center, Dahlgren, Virginia, and climbed to an altitude of 200 m. The throttle was then set for cruising at minimum power consumption. All systems performed as well or better than planned. SARA was landed 2 h and 47 min after takeoff, having flown an equiva- lent range of approximately 160 km.
Fig. 5 — The Semiautonomous Research Aircraft (SARA).
The SARA test clearly demonstrated endur- ance and range that is competitive with small UAVs equipped with fuel-powered engines but without many of their inherent disadvantages. Additional research is now under way at NRL to develop even better performing electric UAVs that will be used for tactical mission demonstrations in the near future.
[Sponsored by ONR]
Reference
1. P.T. Davidson and R.J. Foch, "UAV Develop- ment and Test Capabilities at the Naval Re- search Laboratory," Proceeding of the Associa- tion for Unmanned Vehicle Systems (AUVS) Inter- national Conference, Washington DC, July 10- 12, 1995. ■
Global Maps of OH in the Middle Atmosphere
R.R. Conway and M.E. Summers Space Science Division
The middle atmosphere is a region of cou- pling between the upper atmosphere, where the first interaction of the Earth with solar radiation occurs, and the troposphere in which we live. Extending through the altitude region between 10 and 100 km, it includes the stratosphere, where the bulk of the protective ozone layer resides. The discovery and eventual explanation of the ozone hole, which now appears every Spring over Antarctica, focused the attention of the world on the pollution of this region by man- made chlorofluorocarbons and on the physical and chemical processes that shape its behavior. An intensive international research effort-in laboratories (including NRL) and in the field- dramatically confirmed that chemically active gases in tiny concentrations are critical to the chemical balance that allows the ozone layer to endure through the normal daily and seasonal cycles of the atmosphere. In contrast with the troposphere where water is abundant, the middle atmosphere is extremely dry, with water-vapor concentrations of a few parts per million. Yet from this small amount of water, sunlight and atomic oxygen produce the hydroxyl radical, OH, which is the most important oxidizing agent in the atmosphere. Present in concentration of only a few parts per billion (equivalent to 30 ml in an Olympic-size swimming pool), OH plays a pivotal role in much of atmospheric chemistry and is the primary source of natural ozone loss. OH reacts with hundreds of gases—both natural and anthro- pogenic-and controls the build-up of pollutants and greenhouse gases. Despite its immense
199

SPACE RESEARCH AND SATELLITE TECHNOLOGY
importance, OH has remained one of the most poorly measured constituents of the atmosphere. In the Fall of 1994, NRL took a major step toward correcting this situation by making the first global-scale measurements of OH. This article briefly describes the results of the MAHRSI exper- iment, which made the measurements from a satellite deployed and retrieved by the space shuttle.
MAHRSI: The Middle Atmosphere High Reso- lution Spectrograph Investigation (MAHRSI) is a spectrograph experiment designed and built in NRL's Space Science Division to measure the Earth's ultraviolet airglow from space. In collabo- ration with the University of Wuppertal in Ger- many, the German Space Agency, and NASA, NRL flew MAHRSI on the CRISTA-SPAS satellite released by the shuttle during its STS-66 mission. With a nearly circular orbit at a height of 304 km, the satellite provided an extremely stable observ- ing platform for 8 days of free flight. When OH in the atmosphere scatters sunlight, it produces a bright emission with a unique spectral signature in the ultraviolet. By accurately measuring the brightness of this glow and how it varies with altitude, we were able to infer the amount of OH at each altitude. A major difficulty with the mea- surement is the need to discriminate the spectral- ly narrow lines of the OH emission from the bright Rayleigh scattering of the solar Fraunhofer spectrum. Rayleigh scattering is the process that produces the blue sky. In the MAHRSI data, the complex Rayleigh scattering spectrum is blended with the OH emission. MAHRSI separates these two signals by using very high spectral resolution.
Figure 6 shows the success of that separation. The remarkable agreement achieved between the observed OH spectral signature and the theoreti- cal prediction of its shape was critical to the successful mapping of the OH distribution.
Global OH Images: Figure 7 demonstrates how the MAHRSI data are used to construct OH maps. This image shows the vertical density pro- file of OH between the altitudes of 50 and 80 km for each latitude between 52° S and 62° N. All of the data were recorded during a single orbital day (about 50 min). The local time for the profiles varied from dawn to dusk due to the satellite's orbital motion. The data taken in southern lati- tudes represent Spring mornings and the data in the north represent late Fall afternoons. Knowl- edge of these variations is of immense value in delineating the global structure of OH-a critical element needed for validating atmospheric mod- els. For example, Fig. 8 is a model calculation of the OH abundance profile above the equator but for different local times and fixed to November 5. It shows that OH vanishes below 80 km during the night but reforms rapidly as the sun rises. By 10 A.M., two distinct layers have formed-one at an altitude near 70 km and one near 50 km. Although the observations shown in Fig. 6 also contain the effect of latitudinal and seasonal vari- ability ignored by the model, they clearly show the general features of the predicted behavior. There are however important differences, and the explanation of those will provide the real scientif- ic progress. MAHRSI acquired 75 such orbits of data covering a wide range of latitudes, longi- tudes, and local times.
H Z
1.5
1.0
0.5
-0.5
210 K
4-nI,,,, - BACKGROUND
%J\J WVwwt 308.0 308.5 309.0 309.5 310.0 310.5
WAVELENGTH (NM)
Fig. 6 — The observed OH emission at 70 km. The spec- trum was retrieved by subtracting the Rayleigh back- ground spectrum from the observed airglow. The result is compared to the theoretically predicted OH spectrum, which is shown by the red curve.
200
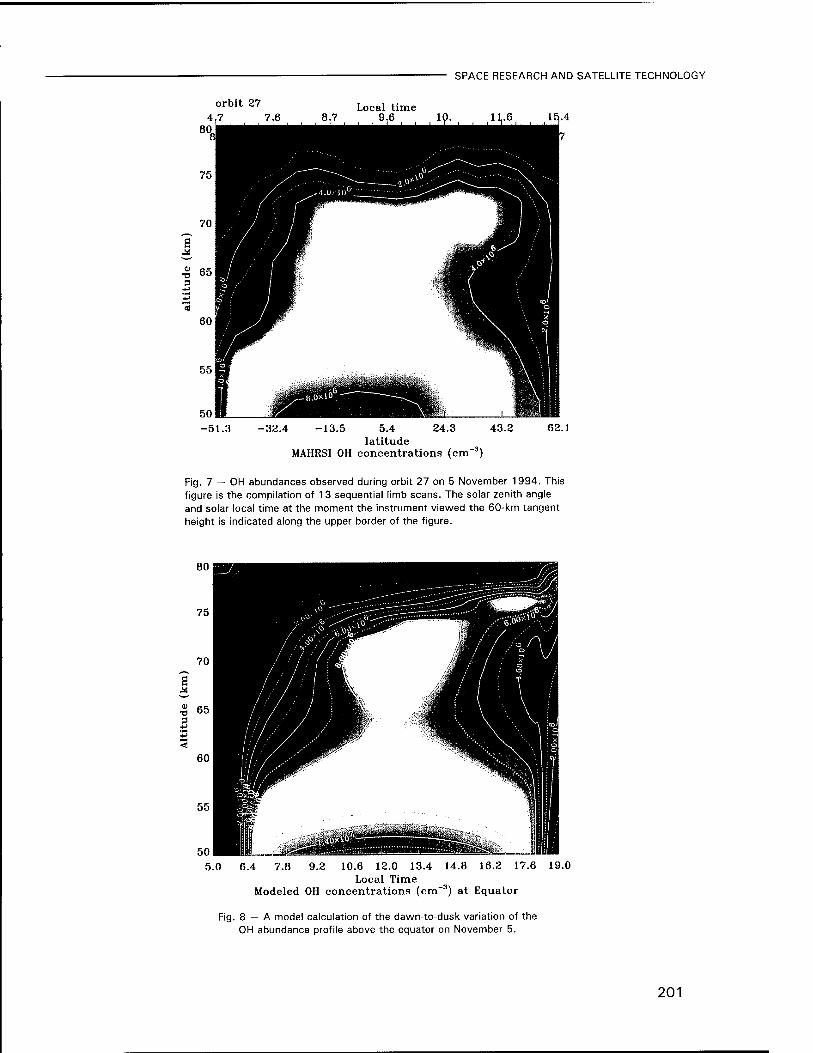
SPACE RESEARCH AND SATELLITE TECHNOLOGY
orbit 27 Local time
-51.3 -32.4 5.4 latitude
MAHRSI OH concentrations (cm"3)
Fig. 7 — OH abundances observed during orbit 27 on 5 November 1994. This figure is the compilation of 1 3 sequential limb scans. The solar zenith angle and solar local time at the moment the instrument viewed the 60-km tangent height is indicated along the upper border of the figure.
50 5.0 6.4 7.8 9.2 10.6 12.0 13.4 14.8 16.2 17.6 19.0
Local Time Modeled OH concentrations (cm-3) at Equator
Fig. 8 — A model calculation of the dawn-to-dusk variation of the OH abundance profile above the equator on November 5.
201
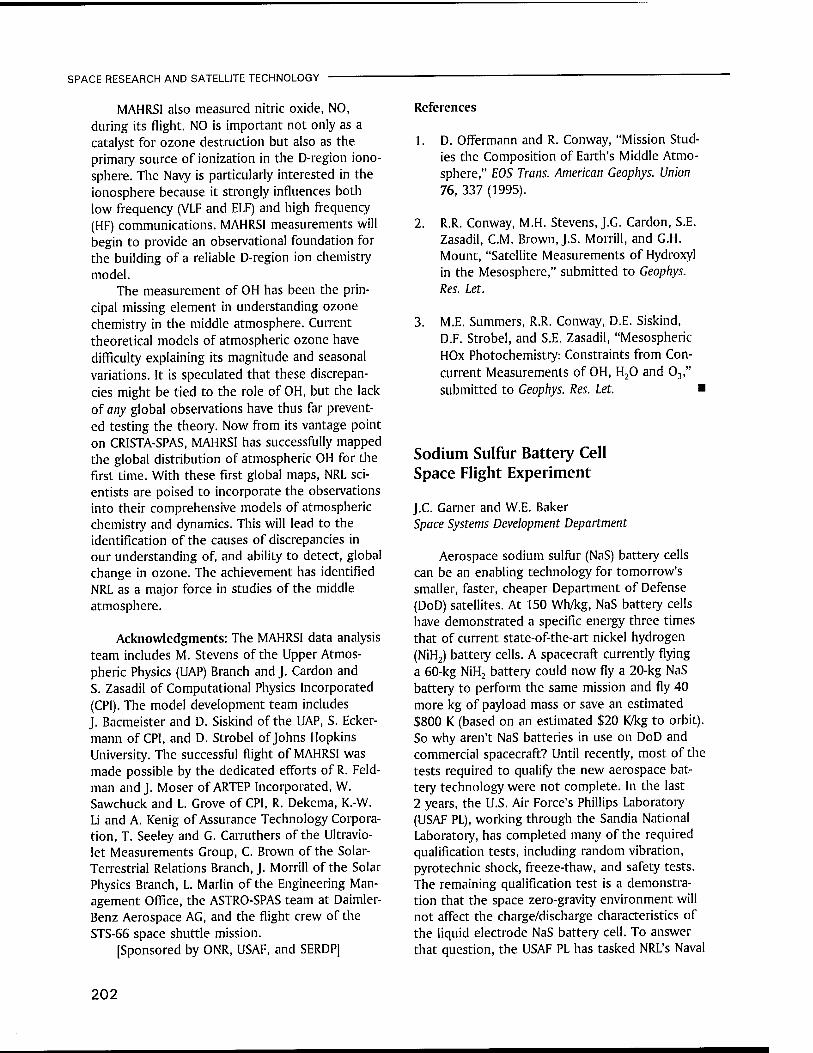
SPACE RESEARCH AND SATELLITE TECHNOLOGY
MAHRSI also measured nitric oxide, NO, during its flight. NO is important not only as a catalyst for ozone destruction but also as the primary source of ionization in the D-region iono- sphere. The Navy is particularly interested in the ionosphere because it strongly influences both low frequency (VLF and ELF) and high frequency (HF) communications. MAHRSI measurements will begin to provide an observational foundation for the building of a reliable D-region ion chemistry model.
The measurement of OH has been the prin- cipal missing element in understanding ozone chemistry in the middle atmosphere. Current theoretical models of atmospheric ozone have difficulty explaining its magnitude and seasonal variations. It is speculated that these discrepan- cies might be tied to the role of OH, but the lack of any global observations have thus far prevent- ed testing the theory. Now from its vantage point on CRISTA-SPAS, MAHRSI has successfully mapped the global distribution of atmospheric OH for the first time. With these first global maps, NRL sci- entists are poised to incorporate the observations into their comprehensive models of atmospheric chemistry and dynamics. This will lead to the identification of the causes of discrepancies in our understanding of, and ability to detect, global change in ozone. The achievement has identified NRL as a major force in studies of the middle atmosphere.
Acknowledgments: The MAHRSI data analysis team includes M. Stevens of the Upper Atmos- pheric Physics (UAP) Branch andj. Cardon and S. Zasadil of Computational Physics Incorporated (CPI). The model development team includes J. Bacmeister and D. Siskind of the UAP, S. Ecker- mann of CPI, and D. Strobel of Johns Hopkins University. The successful flight of MAHRSI was made possible by the dedicated efforts of R. Feld- man and J. Moser of ARTEP Incorporated, W. Sawchuck and L. Grove of CPI, R. Dekema, K.-W. Li and A. Kenig of Assurance Technology Corpora- tion, T. Seeley and G. Carruthers of the Ultravio- let Measurements Group, C. Brown of the Solar- Terrestrial Relations Branch, J. Morrill of the Solar Physics Branch, L. Marlin of the Engineering Man- agement Office, the ASTRO-SPAS team at Daimler- Benz Aerospace AG, and the flight crew of the STS-66 space shuttle mission.
[Sponsored by ONR, USAF, and SERDP]
References
1. D. Offermann and R. Conway, "Mission Stud- ies the Composition of Earth's Middle Atmo- sphere," EOS Trans. American Geophys. Union 76, 337 (1995).
2. R.R. Conway, M.H. Stevens, J.G. Cardon, S.E. Zasadil, CM. Brown, J.S. Morrill, and G.H. Mount, "Satellite Measurements of Hydroxyl in the Mesosphere," submitted to Geophys. Res. Let.
3. M.E. Summers, R.R. Conway, D.E. Siskind, D.F. Strobel, and S.E. Zasadil, "Mesospheric HOx Photochemistry: Constraints from Con- current Measurements of OH, H20 and 03," submitted to Geophys. Res. Let. «
Sodium Sulfur Battery Cell Space Flight Experiment
J.C. Garner and W.E. Baker Space Systems Development Department
Aerospace sodium sulfur (NaS) battery cells can be an enabling technology for tomorrow's smaller, faster, cheaper Department of Defense (DoD) satellites. At 150 Wh/kg, NaS battery cells have demonstrated a specific energy three times that of current state-of-the-art nickel hydrogen (NiH2) battery cells. A spacecraft currently flying a 60-kg NiH2 battery could now fly a 20-kg NaS battery to perform the same mission and fly 40 more kg of payload mass or save an estimated $800 K (based on an estimated $20 K/kg to orbit). So why aren't NaS batteries in use on DoD and commercial spacecraft? Until recently, most of the tests required to qualify the new aerospace bat- tery technology were not complete. In the last 2 years, the U.S. Air Force's Phillips Laboratory (USAF PL), working through the Sandia National Laboratory, has completed many of the required qualification tests, including random vibration, pyrotechnic shock, freeze-thaw, and safety tests. The remaining qualification test is a demonstra- tion that the space zero-gravity environment will not affect the charge/discharge characteristics of the liquid electrode NaS battery cell. To answer that question, the USAF PL has tasked NRL's Naval
202

SPACE RESEARCH AND SATELLITE TECHNOLOGY
Center for Space Technology to design, fabricate, and integrate a NaS battery cell flight experiment (NaSBE). The NaSBE will fly on the Wake Shield Facility (WSF) Shuttle Cross Bay Carrier mission 03, which is scheduled for launch in late 1996 on STS-80.
NaS Battery Cells: The concept of a second- ary NaS battery cell was first announced in 1967. At an operational temperature of 350° C, the sys- tem uses a molten sodium anode, a molten sulfur cathode, and a solid material that functions as both a sodium ion-conducting electrolyte and a separator. For the experiment, NaS cells will be manufactured by Eagle Picher Industries Inc., of Joplin, Missouri (Fig. 9). The ceramic ß"-Alumina electrolytes are manufactured by Ceramatec.
sequence: 2 100% depth-of-discharge (DOD) char- acterization cycles, 2 60% DOD simulated geosyn- chronus orbit cycles, and 15 40% DOD simulated low-Earth-orbit (LEO) cycles. Following the conclu- sion of the last LEO charge cycle, the NaS cells will be discharged to different states of charge, the heaters will be disabled allowing the experi- ment temperature to drop and the battery elec- trodes to solidify. After the Shuttle mission is complete, NaSBE will be removed from the WSF Cross Bay Carrier and sent back to the USAF PL. At PL, the NaS cells will be removed and subject- ed to a destructive physical analysis (DPA). The purpose of the DPA will be to determine what effects the cycling of the cells in zero G have on the cell morphology as a function of state of charge.
Experiment Description: The primary pur- pose of NaSBE is to characterize the performance of the NaS cell's operation in zero gravity (G). Four NaS cells and associated experimental hard- ware will be mounted in a "smart can" on the WSF Cross Bay Carrier. The experiment will be launched unpowered with the NaS battery cells charged and the electrodes frozen at a tempera- ture of 25° C. After the shuttle is in orbit and the WSF has been removed from the Cross Bay Carrier, the experiment will be powered up and experiment heaters energized to raise the battery cell temperature to 350° C at a rate of 25° C/h. After reaching the operating temperature, the NaS cells will be subjected to the following test
Experiment Design: Figure 10 shows a block diagram of the experiment. In order to fit the entire experiment within the smart can, the ex- periment electronics boxes are mounted to the can lid, and the battery cell safety enclosure is suspended from the lid to a deck in the middle of the can. For safety reasons, the battery cells are contained in a cylindrical 304 stainless steel vessel. By design, the vessel will be capable of withstanding a worst-case cell breach, which could generate internal temperature and pressure in excess of 600° C and 180 psi. The battery vessel is suspended below the mid-deck by a se- ries of kinematic mounts. When the vessel is heated to 350° C, it grows 0.0028 m in the axial
REDUNDANT MECHANICAL' SEAL WELDED TO CATHODE TUBE AND GLASSED TO NEGATIVE
ALPHA ALUMINA- HEADER CLASSED
•■ s'TxfcEL'EetRokrfe'; CHROME PLATED MOLYBDENUM CATHODE CONTAINER
EAGLE PICHER
-ALUMINA FIBER COATING
-8IM0DAL CATHODE STRUCTURE IMPREGNATED WITH SULFUR
BETA" ALUMINA ELECTROLYTE
ALPHA ALUMINA- INSULATOR
SODIUM FILL TUBE- (NEGATIVE)
Fig. 9 — Sodium sulfur battery cell design.
203
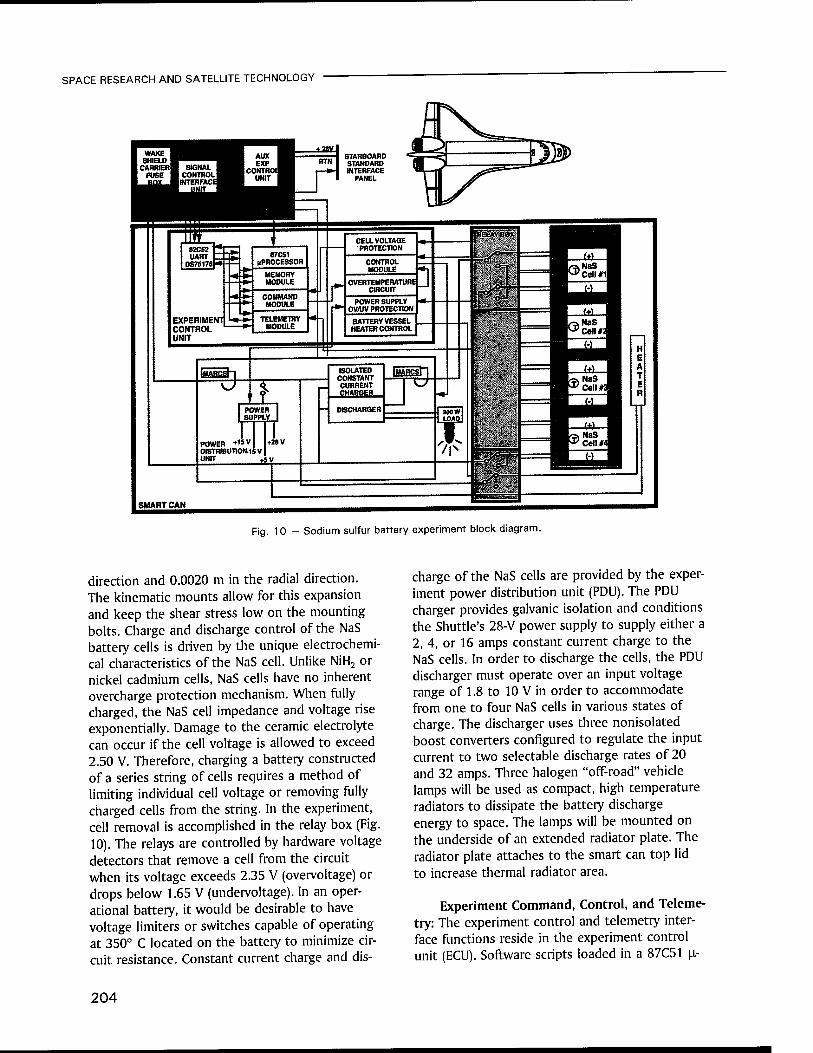
SPACE RESEARCH AND SATELLITE TECHNOLOGY
POWER *WV| DISTRIBUTKW15V UNtr +5V
SMARTCAN
Fig. 10 - Sodium sulfur battery experiment block diagram.
direction and 0.0020 m in the radial direction. The kinematic mounts allow for this expansion and keep the shear stress low on the mounting bolts. Charge and discharge control of the NaS battery cells is driven by the unique electrochemi- cal characteristics of the NaS cell. Unlike NiH2 or nickel cadmium cells, NaS cells have no inherent overcharge protection mechanism. When fully charged, the NaS cell impedance and voltage rise exponentially. Damage to the ceramic electrolyte can occur if the cell voltage is allowed to exceed 2.50 V. Therefore, charging a battery constructed of a series string of cells requires a method of limiting individual cell voltage or removing fully charged cells from the string. In the experiment, cell removal is accomplished in the relay box (Fig. 10). The relays are controlled by hardware voltage detectors that remove a cell from the circuit when its voltage exceeds 2.35 V (overvoltage) or drops below 1.65 V (undervoltage). In an oper- ational battery, it would be desirable to have voltage limiters or switches capable of operating at 350° C located on the battery to minimize cir- cuit resistance. Constant current charge and dis-
charge of the NaS cells are provided by the exper- iment power distribution unit (PDU). The PDU charger provides galvanic isolation and conditions the Shuttle's 28-V power supply to supply either a 2, 4, or 16 amps constant current charge to the NaS cells. In order to discharge the cells, the PDU discharger must operate over an input voltage range of 1.8 to 10 V in order to accommodate from one to four NaS cells in various states of charge. The discharger uses three nonisolated boost converters configured to regulate the input current to two selectable discharge rates of 20 and 32 amps. Three halogen "off-road" vehicle lamps will be used as compact, high temperature radiators to dissipate the battery discharge energy to space. The lamps will be mounted on the underside of an extended radiator plate. The radiator plate attaches to the smart can top lid to increase thermal radiator area.
Experiment Command, Control, and Teleme- try: The experiment control and telemetry inter- face functions reside in the experiment control unit (ECU). Software scripts loaded in a 87C51 u-
204

SPACE RESEARCH AND SATELLITE TECHNOLOGY
processor control the experiment sequences. Scripts may be changed or new scripts may be uploaded from ground control. The u-processor contains a built-in clock for timing the charge/ discharge sequences. In addition, the scripts con- tain safety-limit checking functions to back up the hardware limit checking. For each battery cell, voltage, current, three temperatures, and on-line/ off-line status are recorded along with other experiment data once a minute in a solid state memory bank. RS-485 protocol is used for the interchange of data between NaSBE and the WSF CBC. Plans are to downlink experiment data at least once per orbit and probably more frequent- ly. However, if required, NaSBE can store up to two orbits of data in the solid state memory bank.
To quantify the results against the perfor- mance of NaS cells in a 1-G environment, the brassboard experiment hardware and four new NaS cells will be operated in parallel with the flight experiment. The entire test sequence of the flight experiment will be duplicated. Then as an option, the ground test cells may also be sub- jected to a DPA.
Acknowledgments: This work is overseen by Lt. V. Kennedy and Capt. S. Smellie. In addi- tion, these persons made significant contributions to this effort: M. Adams, W. Barnes, W. Braun, R. Circle, D. Dyer, J. Gauvin, G. Hickman, R. Hobbs, B. Kramer, J. Kim, S. Lam, L. Larson, A. Marderness, R. Ruth, J. Shortt, and R. Skalitzky.
[Sponsored by USAF PL]
Reference
1. D. Linden, Handbook of Batteries and Fuel Cells, (McGraw Hill, New York, 1984), pp. 32-1 - 32-3. ■
is a camera system designed to image and geo- locate Earth targets from space. HERCULES/multi- spectral imagery (MSI) is the third of a sequence of hand-held, shuttle-based, geolocating imaging' devices developed jointly by the Navy, Army, and NASA. Its current configuration includes a video camera from the Xybion Corporation, which al- lows it to produce geolocated MSI from space [1]. By integrating a camera with an attitude refer- ence unit (ARU), HERCULES can geolocate-in real-time-Earth images taken from the space shuttle.
Project History
Phase I: The idea for a geolocating space camera came from a comment made more than a decade ago by Navy astronaut Dave Griggs to Dr. William E. Howard III. Griggs observed that a picture taken from space is often unidentifiable because its location is unknown. Dr. Howard, then technical director of the Naval Space Com- mand, started a cooperative effort between the Navy and NASA to address this need. The first attempt was a NASA-built space sextant, called the Latitude/Longitude Locator (L3), which suc- cessfully produced geolocations accurate to 24 km but could not work at high magnification and did not allow on-orbit viewing of the film-based images.
Phase II: HERCULES began to address the deficiencies of L3 and the need for better geolo- cation accuracy in 1988. NRL's Naval Center for Space Technology (NCST) was tasked with the development of the geolocation system and over- all program management. NASA was tasked to develop a megapixel electronic still camera (ESC) to allow pictures taken from space to be viewed instantly on orbit or down-linked to the ground.
HERCULES/MSI: Hand-held Georegistered Multispectral Video
H.M. Pickard, R.F. Higgins, and B. Kaufman Space Systems Development Department
Overview: HERCULES (Hand-held, Earth- oriented, Real-time, Cooperative, User-friendly, Locating, Targeting, and Environmental System)
HERCULES' Geolocation Hardware: At the core of the geolocation hardware is an ARU de- veloped by the Honeywell Corporation. The ARU consists of three orthogonally mounted helium- neon ring laser gyros and their associated elec- tronics. When attached to the camera, the ARU provides three-axis knowledge of the orientation of the camera to within arc-seconds. NRL devel- oped the electronics and software to integrate the output of the ARU and maintain continuous, precise knowledge of the orientation of the
205
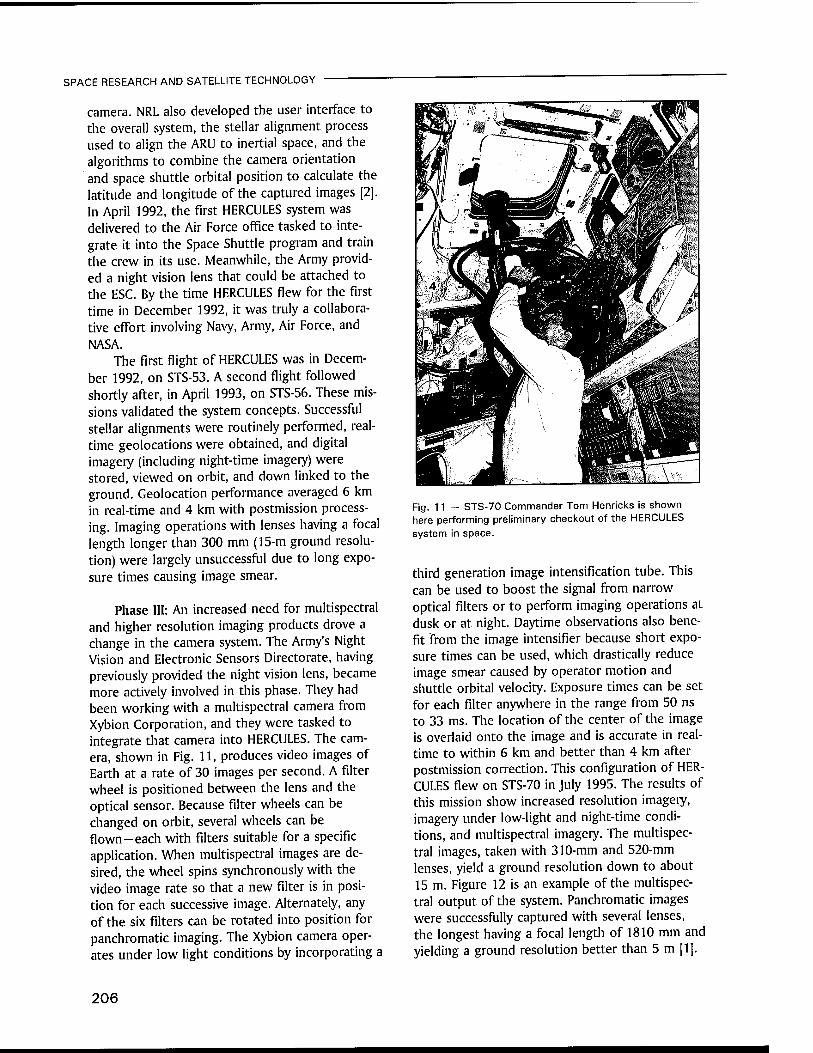
SPACE RESEARCH AND SATELLITE TECHNOLOGY
camera. NRL also developed the user interface to the overall system, the stellar alignment process used to align the ARU to inertial space, and the algorithms to combine the camera orientation and space shuttle orbital position to calculate the latitude and longitude of the captured images [2]. In April 1992, the first HERCULES system was delivered to the Air Force office tasked to inte- grate it into the Space Shuttle program and train the crew in its use. Meanwhile, the Army provid- ed a night vision lens that could be attached to the ESC. By the time HERCULES flew for the first time in December 1992, it was truly a collabora- tive effort involving Navy, Army, Air Force, and NASA.
The first flight of HERCULES was in Decem- ber 1992, on STS-53. A second flight followed shortly after, in April 1993, on STS-56. These mis- sions validated the system concepts. Successful stellar alignments were routinely performed, real- time geolocations were obtained, and digital imagery (including night-time imagery) were stored, viewed on orbit, and down linked to the ground. Geolocation performance averaged 6 km in real-time and 4 km with postmission process- ing. Imaging operations with lenses having a focal length longer than 300 mm (15-m ground resolu- tion) were largely unsuccessful due to long expo- sure times causing image smear.
Phase III: An increased need for multispectral and higher resolution imaging products drove a change in the camera system. The Army's Night Vision and Electronic Sensors Directorate, having previously provided the night vision lens, became more actively involved in this phase. They had been working with a multispectral camera from Xybion Corporation, and they were tasked to integrate that camera into HERCULES. The cam- era, shown in Fig. 11, produces video images of Earth at a rate of 30 images per second. A filter wheel is positioned between the lens and the optical sensor. Because filter wheels can be changed on orbit, several wheels can be flown-each with filters suitable for a specific application. When multispectral images are de- sired, the wheel spins synchronously with the video image rate so that a new filter is in posi- tion for each successive image. Alternately, any of the six filters can be rotated into position for panchromatic imaging. The Xybion camera oper- ates under low light conditions by incorporating a
Fig. 11 — STS-70 Commander Tom Henricks is shown here performing preliminary checkout of the HERCULES system in space.
third generation image intensification tube. This can be used to boost the signal from narrow optical filters or to perform imaging operations at dusk or at night. Daytime observations also bene- fit from the image intensifier because short expo- sure times can be used, which drastically reduce image smear caused by operator motion and shuttle orbital velocity. Exposure times can be set for each filter anywhere in the range from 50 ns to 33 ms. The location of the center of the image is overlaid onto the image and is accurate in real- time to within 6 km and better than 4 km after postmission correction. This configuration of HER- CULES flew on STS-70 in July 1995. The results of this mission show increased resolution imagery, imagery under low-light and night-time condi- tions, and multispectral imagery. The multispec- tral images, taken with 310-mm and 520-mm lenses, yield a ground resolution down to about 15 m. Figure 12 is an example of the multispec- tral output of the system. Panchromatic images were successfully captured with several lenses, the longest having a focal length of 1810 mm and yielding a ground resolution better than 5 m [1].
206
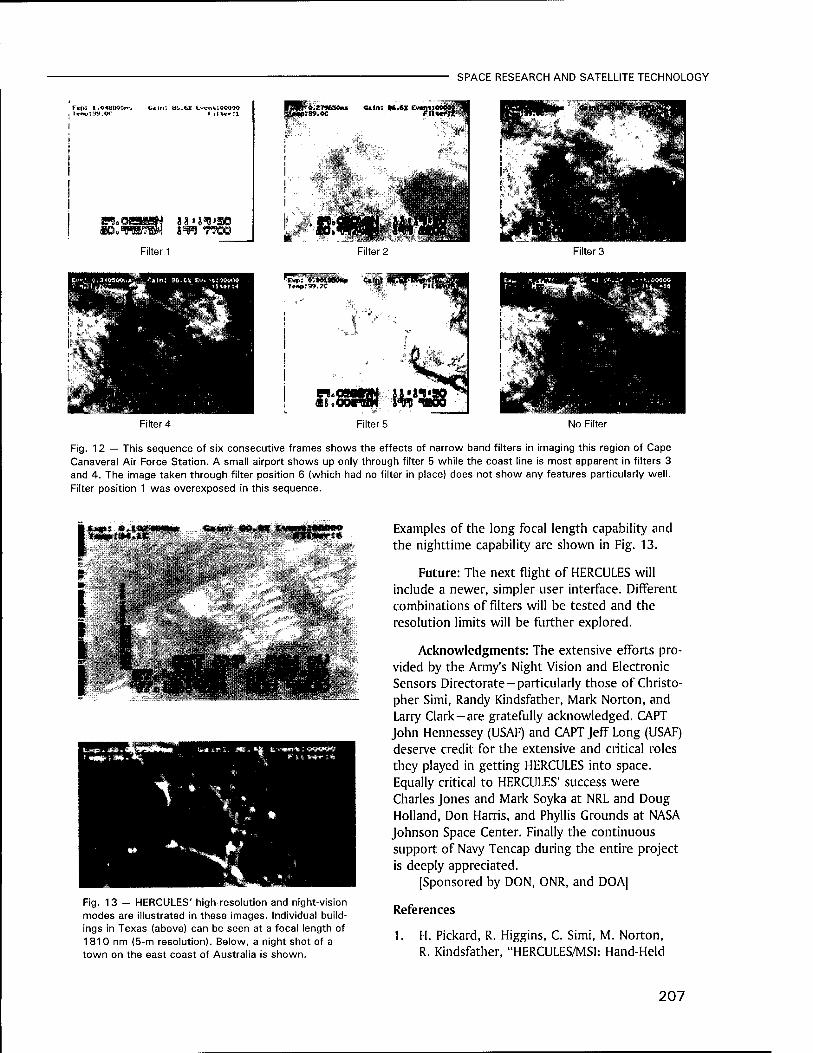
SPACE RESEARCH AND SATELLITE TECHNOLOGY
CT. 01
Filter 1
Filter 4
it.a He Filter 5
Filter 3
No Filter
Fig. 12 — This sequence of six consecutive frames shows the effects of narrow band filters in imaging this region of Cape Canaveral Air Force Station. A small airport shows up only through filter 5 while the coast line is most apparent in filters 3 and 4. The image taken through filter position 6 (which had no filter in place) does not show any features particularly well. Filter position 1 was overexposed in this sequence.
I«:
i I \
ifi.ic m*ar:«.
Fig. 13 — HERCULES' high-resolution and night-vision modes are illustrated in these images. Individual build- ings in Texas (above) can be seen at a focal length of 1810 nm (5-m resolution). Below, a night shot of a town on the east coast of Australia is shown.
Examples of the long focal length capability and the nighttime capability are shown in Fig. 13.
Future: The next flight of HERCULES will include a newer, simpler user interface. Different combinations of filters will be tested and the resolution limits will be further explored.
Acknowledgments: The extensive efforts pro- vided by the Army's Night Vision and Electronic Sensors Directorate—particularly those of Christo- pher Simi, Randy Kindsfather, Mark Norton, and Larry Clark-are gratefully acknowledged. CAPT John Hennessey (USAF) and CAPT Jeff Long (USAF) deserve credit for the extensive and critical roles they played in getting HERCULES into space. Equally critical to HERCULES' success were Charles Jones and Mark Soyka at NRL and Doug Holland, Don Harris, and Phyllis Grounds at NASA Johnson Space Center. Finally the continuous support of Navy Tencap during the entire project is deeply appreciated.
[Sponsored by DON, ONR, and DOA]
References
1. H. Pickard, R. Higgins, C. Simi, M. Norton, R. Kindsfather, "HERCULES/MSI: Hand-Held
207
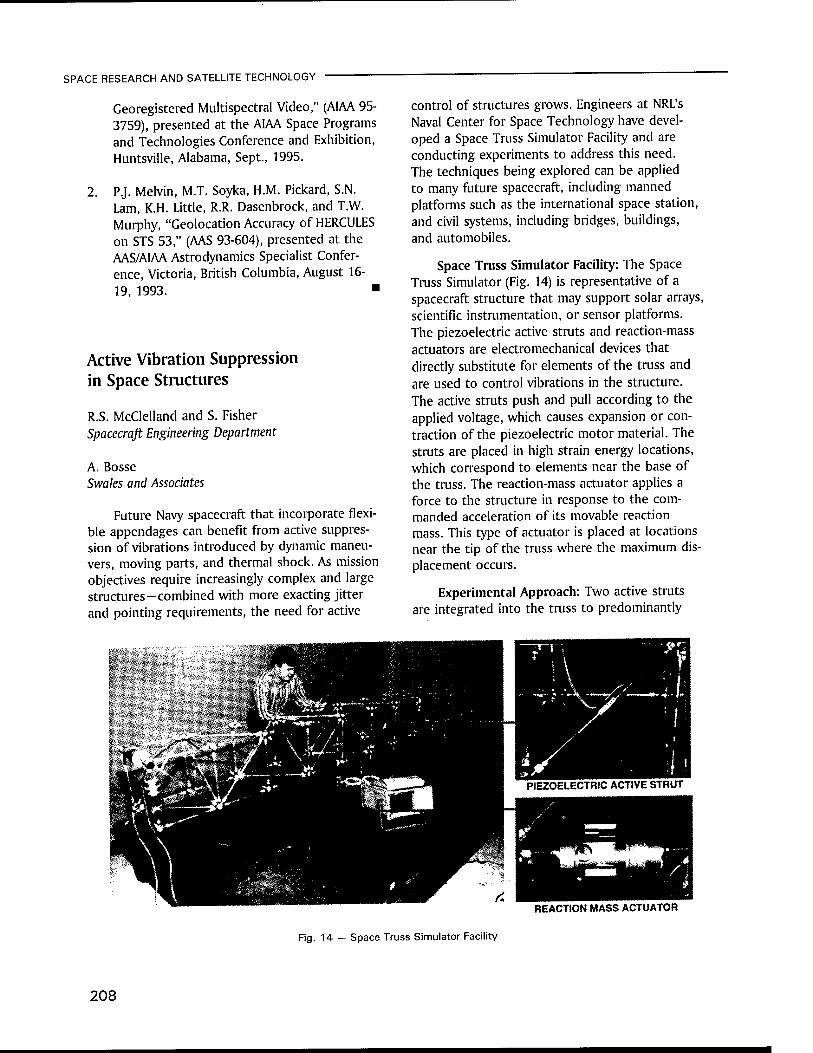
SPACE RESEARCH AND SATELLITE TECHNOLOGY
Georegistered Multispectral Video," (AIM 95- 3759), presented at the AIM Space Programs and Technologies Conference and Exhibition, Huntsville, Alabama, Sept., 1995.
2. P.J. Melvin, M.T. Soyka, H.M. Pickard, S.N. Lam, K.H. Little, R.R. Dasenbrock, and T.W. Murphy, "Geolocation Accuracy of HERCULES on STS 53," (MS 93-604), presented at the AAS/AIM Astrodynamics Specialist Confer- ence, Victoria, British Columbia, August 16- 19, 1993. ■
Active Vibration Suppression in Space Structures
R.S. McClelland and S. Fisher Spacecraft Engineering Department
A. Bosse Swales and Associates
Future Navy spacecraft that incorporate flexi- ble appendages can benefit from active suppres- sion of vibrations introduced by dynamic maneu- vers, moving parts, and thermal shock. As mission objectives require increasingly complex and large structures-combined with more exacting jitter and pointing requirements, the need for active
control of structures grows. Engineers at NRL's Naval Center for Space Technology have devel- oped a Space Truss Simulator Facility and are conducting experiments to address this need. The techniques being explored can be applied to many future spacecraft, including manned platforms such as the international space station, and civil systems, including bridges, buildings, and automobiles.
Space Truss Simulator Facility: The Space Truss Simulator (Fig. 14) is representative of a spacecraft structure that may support solar arrays, scientific instrumentation, or sensor platforms. The piezoelectric active struts and reaction-mass actuators are electromechanical devices that directly substitute for elements of the truss and are used to control vibrations in the structure. The active struts push and pull according to the applied voltage, which causes expansion or con- traction of the piezoelectric motor material. The struts are placed in high strain energy locations, which correspond to elements near the base of the truss. The reaction-mass actuator applies a force to the structure in response to the com- manded acceleration of its movable reaction mass. This type of actuator is placed at locations near the tip of the truss where the maximum dis- placement occurs.
Experimental Approach: Two active struts are integrated into the truss to predominantly
REACTION MASS ACTUATOR
Fig. 14 — Space Truss Simulator Facility
208
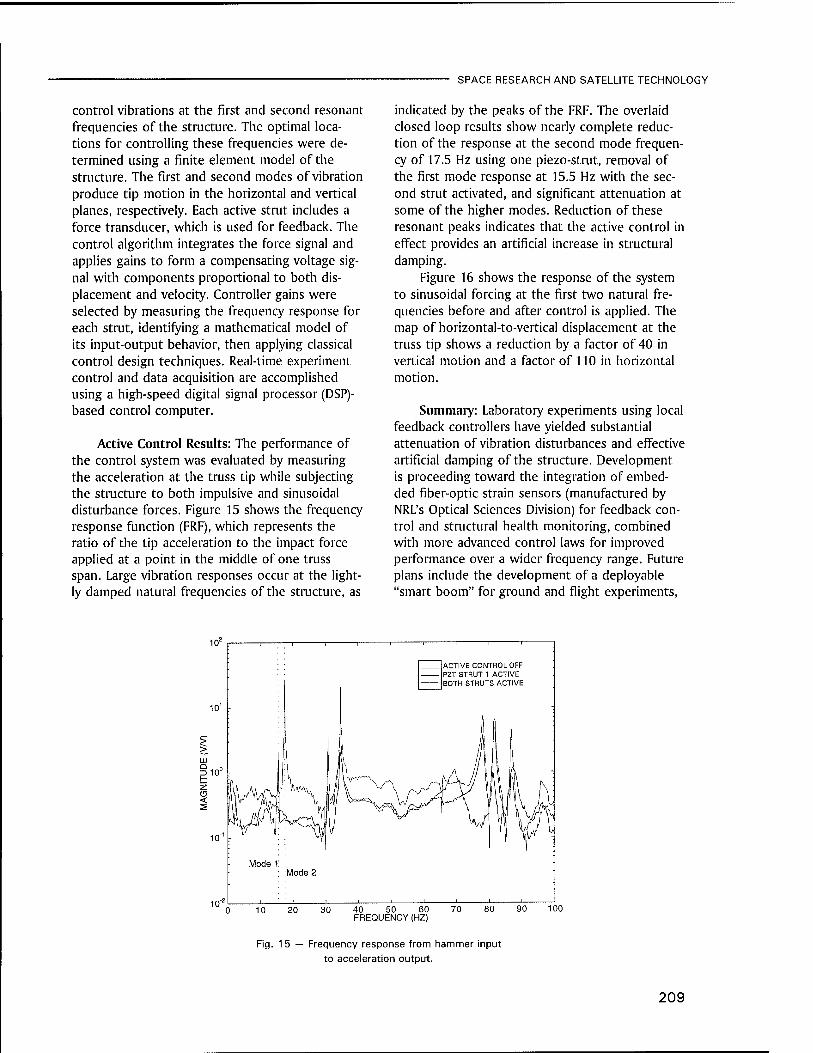
SPACE RESEARCH AND SATELLITE TECHNOLOGY
control vibrations at the first and second resonant frequencies of the structure. The optimal loca- tions for controlling these frequencies were de- termined using a finite element model of the structure. The first and second modes of vibration produce tip motion in the horizontal and vertical planes, respectively. Each active strut includes a force transducer, which is used for feedback. The control algorithm integrates the force signal and applies gains to form a compensating voltage sig- nal with components proportional to both dis- placement and velocity. Controller gains were selected by measuring the frequency response for each strut, identifying a mathematical model of its input-output behavior, then applying classical control design techniques. Real-time experiment control and data acquisition are accomplished using a high-speed digital signal processor (DSP)- based control computer.
Active Control Results: The performance of the control system was evaluated by measuring the acceleration at the truss tip while subjecting the structure to both impulsive and sinusoidal disturbance forces. Figure 15 shows the frequency response function (FRF), which represents the ratio of the tip acceleration to the impact force applied at a point in the middle of one truss span. Large vibration responses occur at the light- ly damped natural frequencies of the structure, as
indicated by the peaks of the FRF. The overlaid closed loop results show nearly complete reduc- tion of the response at the second mode frequen- cy of 17.5 Hz using one piezo-strut, removal of the first mode response at 15.5 Hz with the sec- ond strut activated, and significant attenuation at some of the higher modes. Reduction of these resonant peaks indicates that the active control in effect provides an artificial increase in structural damping.
Figure 16 shows the response of the system to sinusoidal forcing at the first two natural fre- quencies before and after control is applied. The map of horizontal-to-vertical displacement at the truss tip shows a reduction by a factor of 40 in vertical motion and a factor of 110 in horizontal motion.
Summary: Laboratory experiments using local feedback controllers have yielded substantial attenuation of vibration disturbances and effective artificial damping of the structure. Development is proceeding toward the integration of embed- ded fiber-optic strain sensors (manufactured by NRL's Optical Sciences Division) for feedback con- trol and structural health monitoring, combined with more advanced control laws for improved performance over a wider frequency range. Future plans include the development of a deployable "smart boom" for ground and flight experiments,
10" r
10"
ACTIVE CONTROL OFF PZT-STRUT 1 ACTIVE BOTH STRUTS ACTIVE
Mode 1: Mode 2
0 10 20 30 40 50 60 70 80 90 100 FREQUENCY (HZ)
Fig. 15 — Frequency response from hammer input
to acceleration output.
209
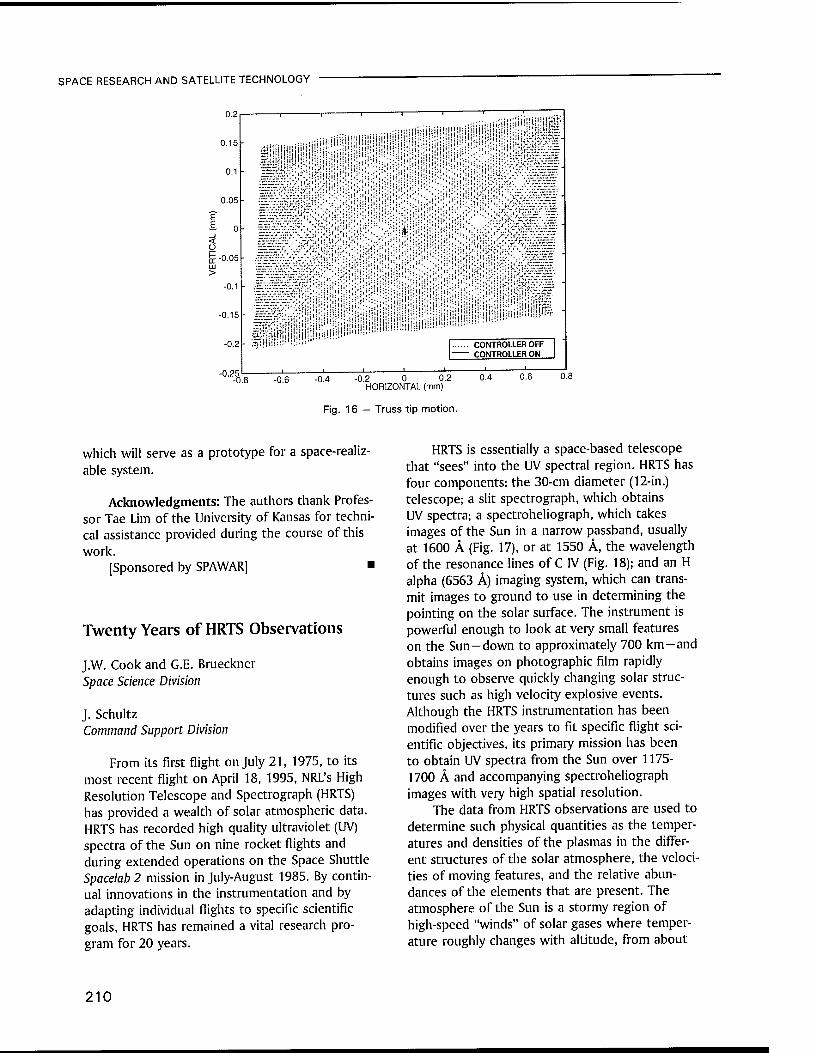
SPACE RESEARCH AND SATELLITE TECHNOLOGY
0.2
0.15
0.1
0.05
< O £ -0.05 LU >
-0.1
-0.15
-0.2
-0.25 -0,
,-^iiiijiii!H!!iii!iHi!:!J!
Illlgll?*::5»;: ■.:";i!!{ii!|.:
ji;;.;
'"'""'"'"iiiil-vüii'lj^ii'"'" '
,!ih;;iiilj!!^!:::;;;il!iiiiii!!i!H;!i!!-!iiiiifi^ iiiiuiiuuih!Ü liüiü!!'»' hm' liiiilHlili!!!!!!""!!-'
SffiiliiliiiilliiiHiii:"^^11'11
CONTROLLER OFF CONTROLLER ON
-0 6 -0.4 -0.2 0 0.2 0.4 0.6 O.f HORIZONTAL (mm)
Fig. 16 — Truss tip motion.
which will serve as a prototype for a space-realiz- able system.
Acknowledgments: The authors thank Profes- sor Tae Lim of the University of Kansas for techni- cal assistance provided during the course of this work.
[Sponsored by SPAWAR] ■
Twenty Years of HRTS Observations
J.W. Cook and G.E. Brueckner Space Science Division
J. Schultz Command Support Division
From its first flight on July 21, 1975, to its most recent flight on April 18, 1995, NRL's High Resolution Telescope and Spectrograph (HRTS) has provided a wealth of solar atmospheric data. HRTS has recorded high quality ultraviolet (UV) spectra of the Sun on nine rocket flights and during extended operations on the Space Shuttle Spacelab 2 mission in July-August 1985. By contin- ual innovations in the instrumentation and by adapting individual flights to specific scientific goals, HRTS has remained a vital research pro- gram for 20 years.
HRTS is essentially a space-based telescope that "sees" into the UV spectral region. HRTS has four components: the 30-cm diameter (12-in.) telescope; a slit spectrograph, which obtains UV spectra; a spectroheliograph, which takes images of the Sun in a narrow passband, usually at 1600 Ä (Fig. 17), or at 1550 Ä, the wavelength of the resonance lines of C IV (Fig. 18); and an H alpha (6563 Ä) imaging system, which can trans- mit images to ground to use in determining the pointing on the solar surface. The instrument is powerful enough to look at very small features on the Sun-down to approximately 700 km-and obtains images on photographic film rapidly enough to observe quickly changing solar struc- tures such as high velocity explosive events. Although the HRTS instrumentation has been modified over the years to fit specific flight sci- entific objectives, its primary mission has been to obtain UV spectra from the Sun over 1175- 1700 Ä and accompanying spectroheliograph images with very high spatial resolution.
The data from HRTS observations are used to determine such physical quantities as the temper- atures and densities of the plasmas in the differ- ent structures of the solar atmosphere, the veloci- ties of moving features, and the relative abun- dances of the elements that are present. The atmosphere of the Sun is a stormy region of high-speed "winds" of solar gases where temper- ature roughly changes with altitude, from about
210
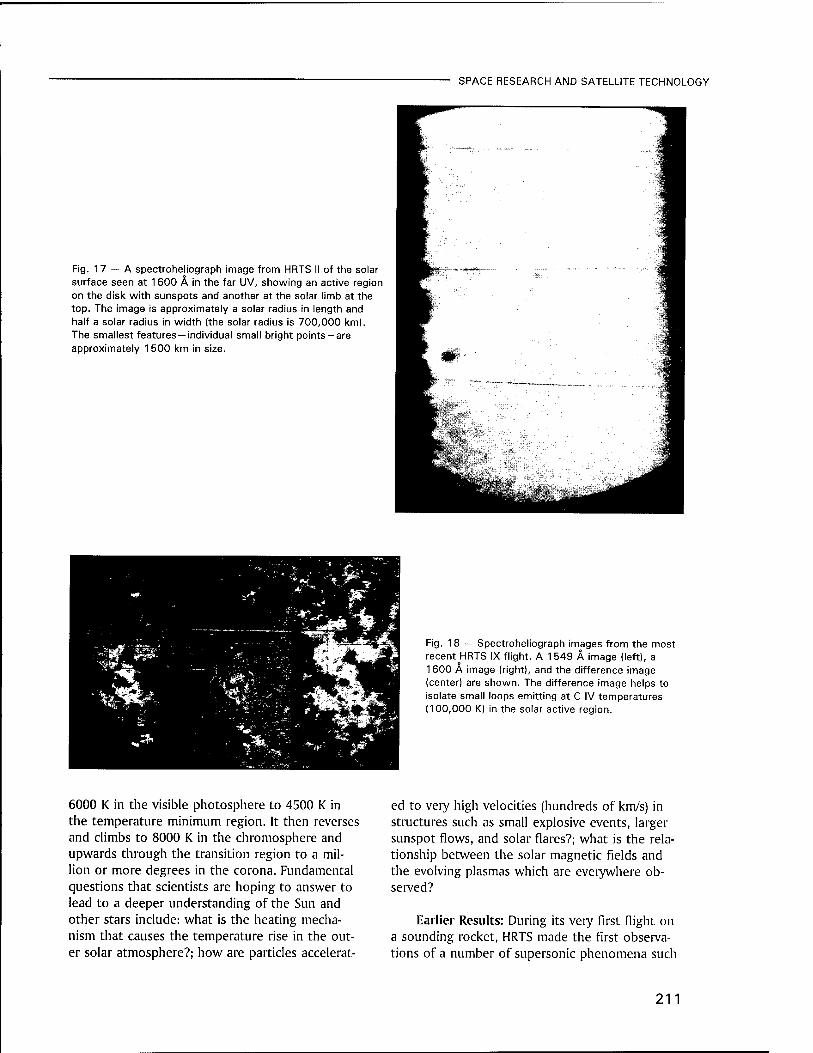
SPACE RESEARCH AND SATELLITE TECHNOLOGY
Fig. 17 — A spectroheliograph image from HRTS II of the solar surface seen at 1600 A in the far UV, showing an active region on the disk with sunspots and another at the solar limb at the top. The image is approximately a solar radius in length and half a solar radius in width (the solar radius is 700,000 km). The smallest features—individual small bright points-are approximately 1 500 km in size.
Fig. 18 — Spectroheliograph images from the most recent HRTS IX flight. A 1549 A image (left), a 1600 A image (right), and the difference image (center) are shown. The difference image helps to isolate small loops emitting at C IV temperatures (100,000 K) in the solar active region.
6000 K in the visible photosphere to 4500 K in the temperature minimum region. It then reverses and climbs to 8000 K in the chromosphere and upwards through the transition region to a mil- lion or more degrees in the corona. Fundamental questions that scientists are hoping to answer to lead to a deeper understanding of the Sun and other stars include: what is the heating mecha- nism that causes the temperature rise in the out- er solar atmosphere?; how are particles accelerat-
ed to very high velocities (hundreds of km/s) in structures such as small explosive events, larger sunspot flows, and solar flares?; what is the rela- tionship between the solar magnetic fields and the evolving plasmas which are everywhere ob- served?
Earlier Results: During its very first flight on a sounding rocket, HRTS made the first observa- tions of a number of supersonic phenomena such
211
SPACE RESEARCH AND SATELLITE TECHNOLOGY
as transition region jets, explosive events, and sunspot downflows. These were only observable because of the great increase in spatial resolution along the spectrograph slit that was possible because of the innovative optical design. Data on the high-velocity outflows from these events led to the suggestion that they were potential sourc- es for the solar wind. This flight also yielded the first observations of solar molecular hydrogen.
In 1985, HRTS flew as one of the instruments on NASA's historic Spacelab 2 mission, providing the first opportunity for HRTS to make extended observations of the Sun. Solar physicists onboard the shuttle as payload specialists were able to operate several solar instruments, including HRTS, and to point the telescopes at targets of interest. The Spacelab 2 mission provided new information on UV spicules viewed at the solar limb, the glob- al statistics of the small, high-velocity explosive events, and data on sunspots and prominences. These data led scientists to believe that the study of the plasma-magnetic field interaction produc- ing the explosive events could provide clues to the mechanism for solar flare heating.
Most Recent Flight: For the most recent HRTS flight, the instrument was reconfigured to observe the near-UV lines of Mg II, one of the strongest emitters of radiation from the solar chromosphere, at 2800 Ä. By studying the surface variations of the Mg II lines, researchers hope to understand the contribution solar features such as active regions make to observed changes in the solar irradiance (the total brightness of the entire Sun). A second innovation was a modified spectroheliograph, which could obtain images at four different wavelengths instead of only ^ one. Images were obtained at 1600 Ä, 1560 Ä, 1549 Ä, and 1540 Ä. The goal was to obtain a subtraction image-a difference image between the 1549 Ä image, which is partly but not entire- ly from the C IV transition region lines and one of the other wavelength images-in order to better show features that are truly from plasmas emitting C IV radiation. In fact, first results show small, bright loops in C IV using the differ- ence images of 1549 Ä and 1600 A, as Fig. 18 shows.
[Sponsored by NASA and ONR] ■
212

Special Awards
and Recognition

215 Special Awards and Recognition
225 Alan Berman Research Publication and Edison Patent Awards
230 Awards for NRL Review Articles

Special Awards and Recognition
NRL is proud of its many distinguished scientists, engineers, and support staff. Here we feature some who have received awards from prestigious institutions, the Department of the Navy, and NRL.
Dr. Jerome Karle Nobel Laureate
Laboratory for the Structure of Matter
1992 ETTORE MAJORANA—ERICE—SCIENCE FOR PEACE PRIZE
This award is given by the Ettore Majorana Center for Scientific Culture, in Erice, Italy. Dr. Karle, a corecipient, was recognized for his "discoveries relative to the structure of materials with diffractive methods," and for his "engagement to promote inter- national scientific collaboration above any ideological-political- racial barrier giving, in this way, concrete accomplishments to the Spirit of Erice."
NAVY LEAGUE'S ALBERT A. MICHELSON AWARD
Dr. Giallorenzi was cited "for his significant accomplishments in the development and utilization of fiber optics and electro- optics in the Departments of the Navy and Defense. The award recognizes a civilian scientist, technology innovator, or technical organization...for scientific or technical achievement that results in a significant improvement in the strength of our maritime forces or to the enhancement of our industrial technological base."
Dr. Thomas G. Giallorenzi Optical Sciences Division
215
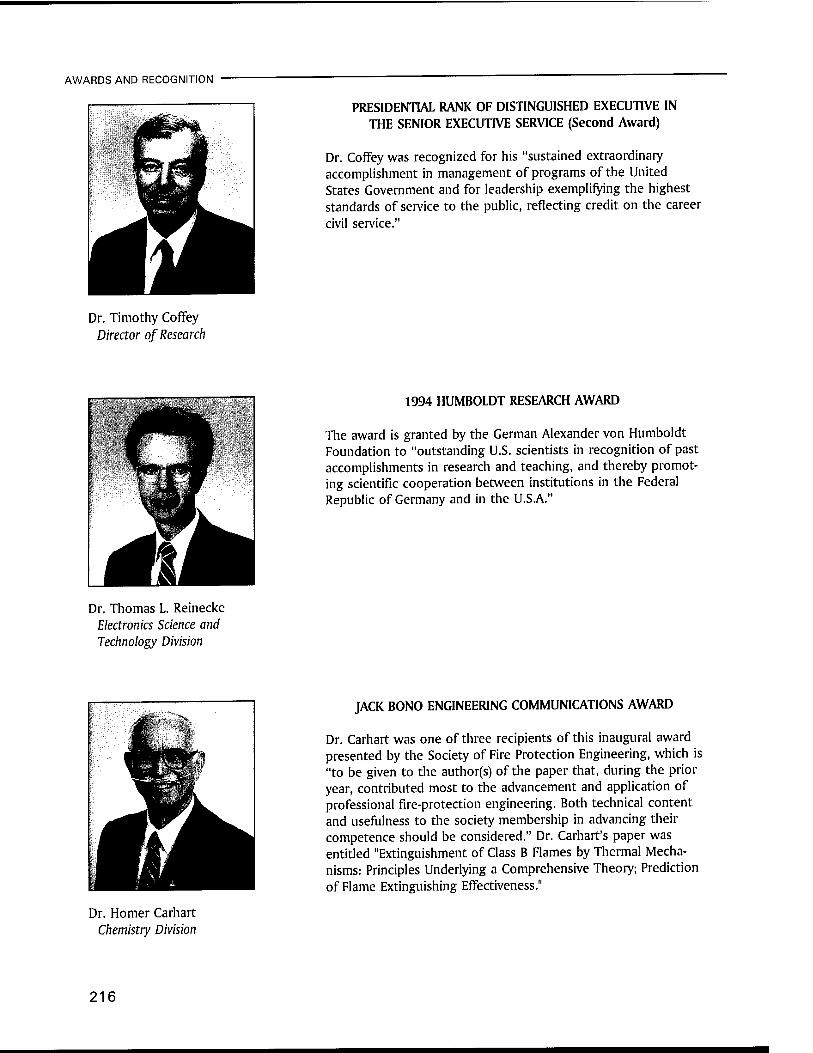
AWARDS AND RECOGNITION
Dr. Timothy CofFey Director of Research
Dr. Thomas L. Reinecke Electronics Science and Technology Division
PRESIDENTIAL RANK OF DISTINGUISHED EXECUTIVE IN THE SENIOR EXECUTIVE SERVICE (Second Award)
Dr. CofFey was recognized for his "sustained extraordinary accomplishment in management of programs of the United States Government and for leadership exemplifying the highest standards of service to the public, reflecting credit on the career civil service."
1994 HUMBOLDT RESEARCH AWARD
The award is granted by the German Alexander von Humboldt Foundation to "outstanding U.S. scientists in recognition of past accomplishments in research and teaching, and thereby promot- ing scientific cooperation between institutions in the Federal Republic of Germany and in the U.S.A."
JACK BONO ENGINEERING COMMUNICATIONS AWARD
Dr. Carhart was one of three recipients of this inaugural award presented by the Society of Fire Protection Engineering, which is "to be given to the author(s) of the paper that, during the prior year, contributed most to the advancement and application of professional fire-protection engineering. Both technical content and usefulness to the society membership in advancing their competence should be considered." Dr. Carhart's paper was entitled "Extinguishment of Class B Flames by Thermal Mecha- nisms: Principles Underlying a Comprehensive Theory; Prediction of Flame Extinguishing Effectiveness."
Dr. Homer Carhart Chemistry Division
216
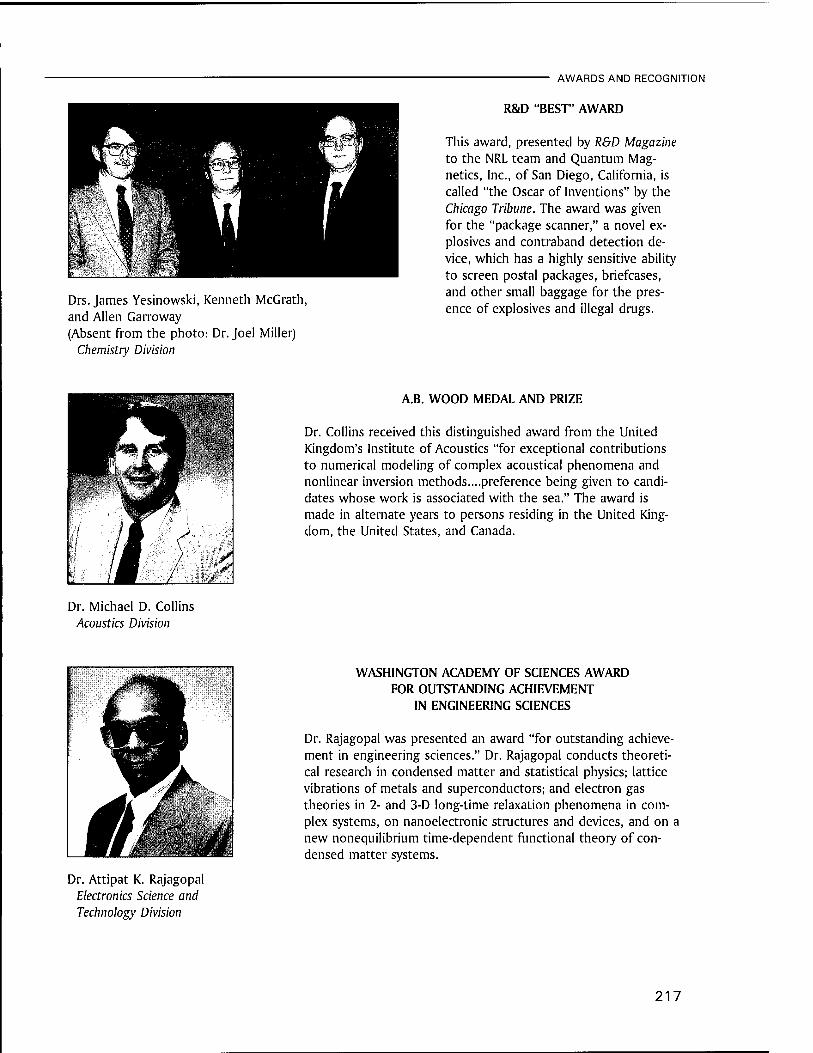
AWARDS AND RECOGNITION
Drs. James Yesinowski, Kenneth McGrath, and Allen Garroway (Absent from the photo: Dr. Joel Miller)
Chemistry Division
R&D "BEST" AWARD
This award, presented by R&D Magazine to the NRL team and Quantum Mag- netics, Inc., of San Diego, California, is called "the Oscar of Inventions" by the Chicago Tribune. The award was given for the "package scanner," a novel ex- plosives and contraband detection de- vice, which has a highly sensitive ability to screen postal packages, briefcases, and other small baggage for the pres- ence of explosives and illegal drugs.
Dr. Michael D. Collins Acoustics Division
Dr. Attipat K. Rajagopal Electronics Science and Technology Division
A.B. WOOD MEDAL AND PRIZE
Dr. Collins received this distinguished award from the United Kingdom's Institute of Acoustics "for exceptional contributions to numerical modeling of complex acoustical phenomena and nonlinear inversion methods....preference being given to candi- dates whose work is associated with the sea." The award is made in alternate years to persons residing in the United King- dom, the United States, and Canada.
WASHINGTON ACADEMY OF SCIENCES AWARD FOR OUTSTANDING ACHIEVEMENT
IN ENGINEERING SCIENCES
Dr. Rajagopal was presented an award "for outstanding achieve- ment in engineering sciences." Dr. Rajagopal conducts theoreti- cal research in condensed matter and statistical physics; lattice vibrations of metals and superconductors; and electron gas theories in 2- and 3-D long-time relaxation phenomena in com- plex systems, on nanoelectronic structures and devices, and on a new nonequilibrium time-dependent functional theory of con- densed matter systems.
217

AWARDS AND RECOGNITION
Dr. David L. Griscom Optical Sciences Division
Dr. Brenda Little Oceanography Division
1995 OTTO SCHOTT RESEARCH AWARD
Dr. Griscom was cited by the Carl-Zeiss-Stiftung, in Germany, "for being among the first to apply the electron-spin resonance techniques to glass materials. He applied lattice defect ideas of solid-state physics to the amorphous state and was able to identify several defects by methods like high-energy radiation, fiber drawing, or compositional additives. All results on defects in silica caused by redox reactions and manufacturing-induced impurities or nonequilibrium structures were highly significant for the emerging technology of optical communication via fiber waveguides."
1995 WOMEN IN SCIENCE AND ENGINEERING SCIENTIFIC ACHIEVEMENT AWARD
Dr. Little was cited "as being the most outstanding woman scientist in the federal government." This prestigious award is given to women who not only have made important contribu- tions to science but who have also given their time to encour- age young women to pursue scientific careers.
TOPEX/POSEIDON AWARD
The Jet Propulsion Laboratory presented this award to Dr. Mitch- ell "as a small token of the TOPEX/POSEIDON Project's gratitude and recognition of...significant contributions to the establish- ment, preparation, and execution of TOPEX/POSEIDON" and for his "research accomplishments in oceanography, and...effective communication of the results to the public, and...personal enthu- siasm and knowledge of ocean measurements."
Dr. Jimmie L. Mitchell Oceanography Division
218

AWARDS AND RECOGNITION
Dr. George A. Doschek Space Science Division
Mr. James W. Gately, Jr. (Awarded Posthumously)
Command Support Division
Mr. Donald J. DeYoung Executive Directorate
E.O. 1994 NAVAL RESEARCH LABORATORY'S
HULBURT SCIENCE AND ENGINEERING AWARD
Dr. Doschek was cited for "sustained superior performance over a number of years in the research areas of solar physics and astrophysics, laboratory plasma spectroscopy, and atomic phys- ics." He was also recognized for being "the driving force behind the conception and construction of several flight instruments that have revolutionized our understanding of solar flare phys- ics."
NAVY MERITORIOUS CIVILIAN SERVICE AWARD
Mr. Gately was recognized for "his outstanding contributions to the Laboratory and the Navy, particularly in his position as Public Affairs Officer....The public affairs program he developed provides the highest quality of service to the Laboratory, other commands and activities, and the Navy."
NAVY MERITORIOUS CIVILIAN SERVICE AWARD
Mr. DeYoung was recognized for his "extraordinary contribu- tions to the Department of the Navy during the period March 1994 through June 1995....Mr. DeYoung has made a substantial and significant contribution to the capabilities and competitive- ness of the U.S. Navy of the 21st century. His willingness to take on any assignment and carry it through to completion, and his strong defense of the integrity of the base closure process set an example for other team members to follow. His performance was in the finest tradition of the Navy to 'do it right and do it well."'
219
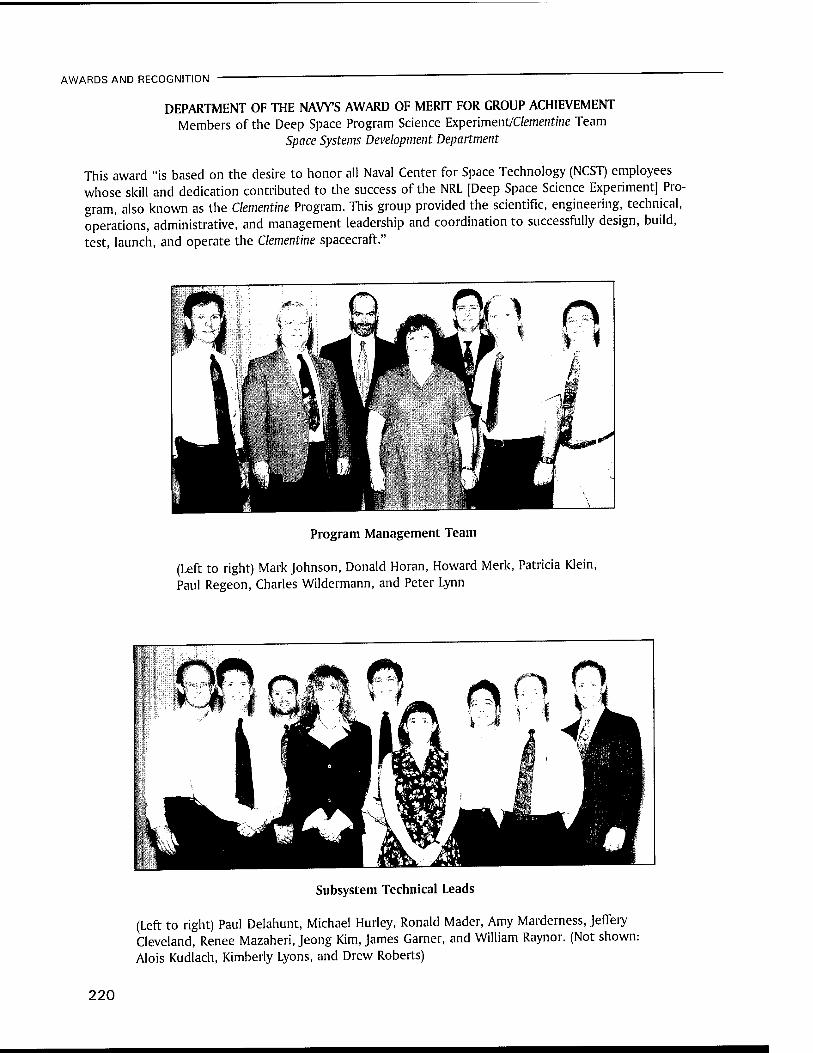
AWARDS AND RECOGNITION "
DEPARTMENT OF THE NAVY'S AWARD OF MERIT FOR GROUP ACHIEVEMENT Members of the Deep Space Program Science Experiment/Clementine Team
Space Systems Development Department
This award "is based on the desire to honor all Naval Center for Space Technology (NCST) employees whose skill and dedication contributed to the success of the NRL [Deep Space Science Experiment] Pro- gram, also known as the Clementine Program. This group provided the scientific, engineering, technical, operations, administrative, and management leadership and coordination to successfully design, build, test, launch, and operate the Clementine spacecraft."
Program Management Team
(Left to right) Mark Johnson, Donald Horan, Howard Merk, Patricia Klein, Paul Regeon, Charles Wildermann, and Peter Lynn
Subsystem Technical Leads
(Left to right) Paul Delahunt, Michael Hurley, Ronald Mader, Amy Marderness, Jeffery Cleveland, Renee Mazaheri, Jeong Kim, James Garner, and William Raynor. (Not shown: Alois Kudlach, Kimberly Lyons, and Drew Roberts)
220
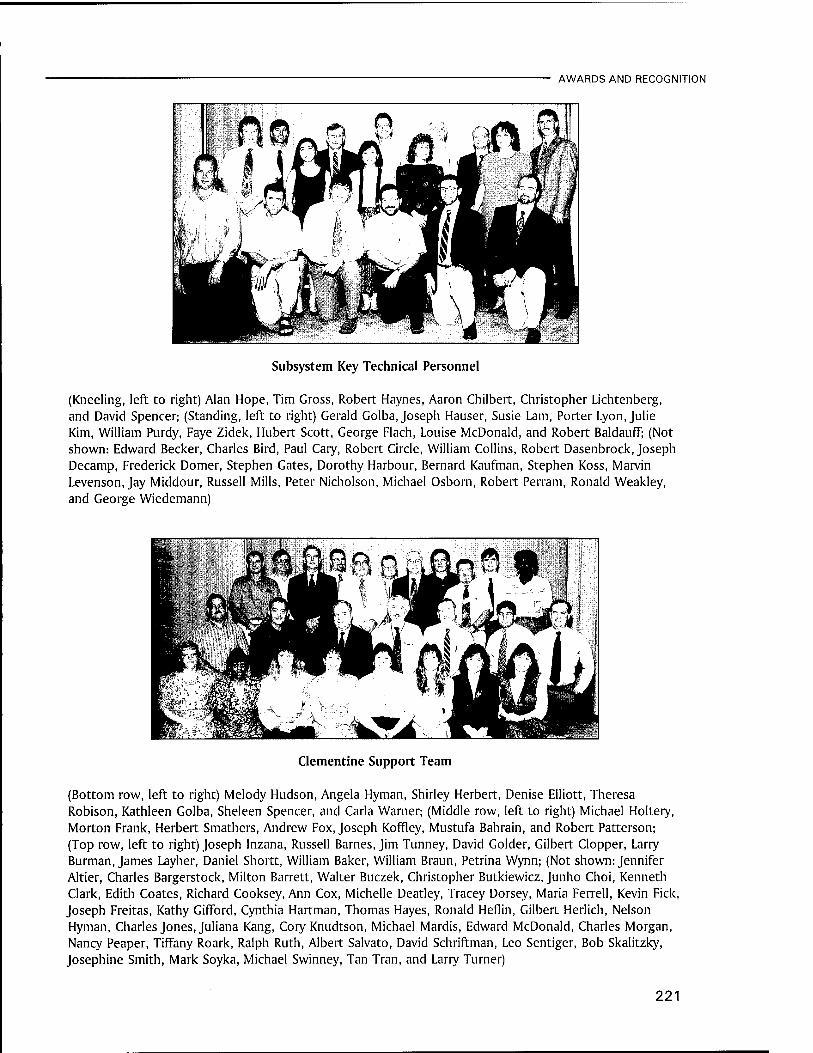
AWARDS AND RECOGNITION
Subsystem Key Technical Personnel
(Kneeling, left to right) Alan Hope, Tim Gross, Robert Haynes, Aaron Chilbert, Christopher Lichtenberg, and David Spencer; (Standing, left to right) Gerald Golba, Joseph Häuser, Susie Lam, Porter Lyon, Julie Kim, William Purdy, Faye Zidek, Hubert Scott, George Flach, Louise McDonald, and Robert Baldauff; (Not shown: Edward Becker, Charles Bird, Paul Cary, Robert Circle, William Collins, Robert Dasenbrock, Joseph Decamp, Frederick Domer, Stephen Gates, Dorothy Harbour, Bernard Kaufman, Stephen Koss, Marvin Levenson, Jay Middour, Russell Mills, Peter Nicholson, Michael Osborn, Robert Perram, Ronald Weakley, and George Wiedemann)
Clementine Support Team
(Bottom row, left to right) Melody Hudson, Angela Hyman, Shirley Herbert, Denise Elliott, Theresa Robison, Kathleen Golba, Sheleen Spencer, and Carla Warner; (Middle row, left to right) Michael Holtery, Morton Frank, Herbert Smathers, Andrew Fox, Joseph Koffley, Mustufa Bahrain, and Robert Patterson; (Top row, left to right) Joseph Inzana, Russell Barnes, Jim Tunney, David Golder, Gilbert Clopper, Larry Burman, James Layher, Daniel Shortt, William Baker, William Braun, Petrina Wynn; (Not shown: Jennifer Altier, Charles Bargerstock, Milton Barrett, Walter Buczek, Christopher Butkiewicz, Junho Choi, Kenneth Clark, Edith Coates, Richard Cooksey, Ann Cox, Michelle Deatley, Tracey Dorsey, Maria Ferrell, Kevin Fick, Joseph Freitas, Kathy Gifford, Cynthia Hartman, Thomas Hayes, Ronald Heflin, Gilbert Herlich, Nelson Hyman, Charles Jones, Juliana Kang, Cory Knudtson, Michael Mardis, Edward McDonald, Charles Morgan, Nancy Peaper, Tiffany Roark, Ralph Ruth, Albert Salvato, David Schriftman, Leo Sentiger, Bob Skalitzky, Josephine Smith, Mark Soyka, Michael Swinney, Tan Tran, and Larry Turner)
221
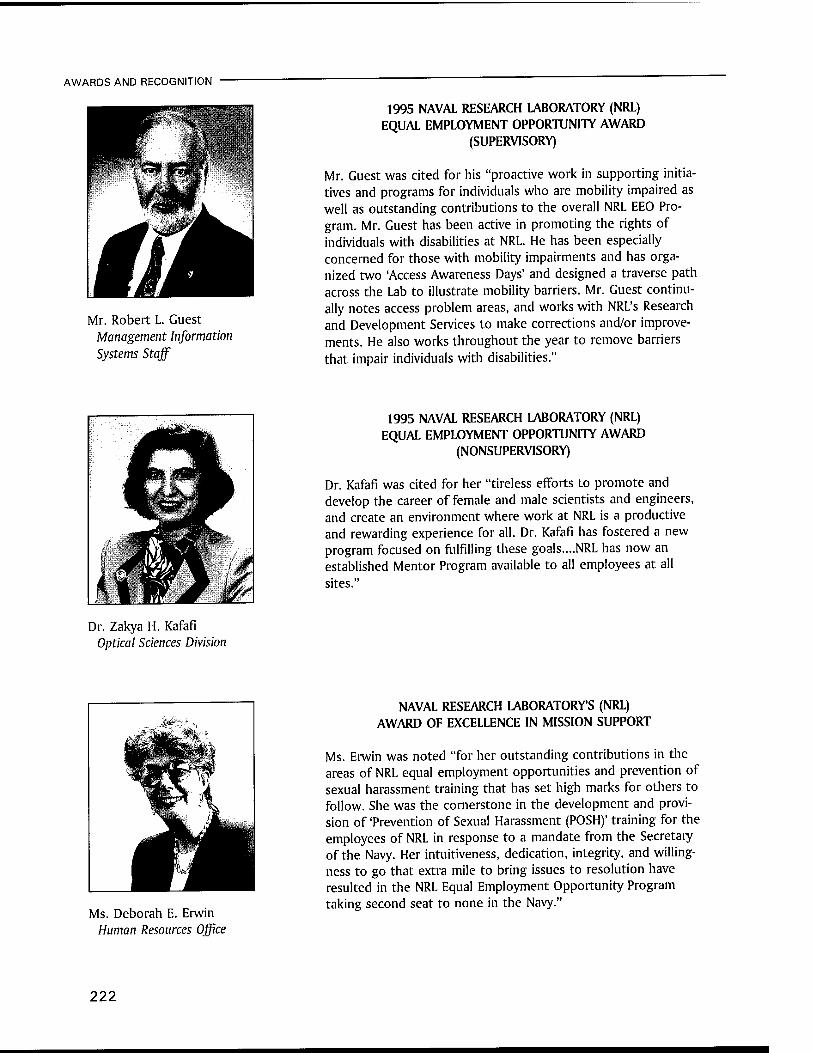
AWARDS AND RECOGNITION
Mr. Robert L. Guest Management Information Systems Staff
1995 NAVAL RESEARCH LABORATORY (NRL) EQUAL EMPLOYMENT OPPORTUNITY AWARD
(SUPERVISORY)
Mr. Guest was cited for his "proactive work in supporting initia- tives and programs for individuals who are mobility impaired as well as outstanding contributions to the overall NRL EEO Pro- gram. Mr. Guest has been active in promoting the rights of individuals with disabilities at NRL. He has been especially concerned for those with mobility impairments and has orga- nized two 'Access Awareness Days' and designed a traverse path across the Lab to illustrate mobility barriers. Mr. Guest continu- ally notes access problem areas, and works with NRL's Research and Development Services to make corrections and/or improve- ments. He also works throughout the year to remove barriers that impair individuals with disabilities."
Dr. Zakya H. Kafafi Optical Sciences Division
1995 NAVAL RESEARCH LABORATORY (NRL) EQUAL EMPLOYMENT OPPORTUNITY AWARD
(NONSUPERVISORY)
Dr. Kafafi was cited for her "tireless efforts to promote and develop the career of female and male scientists and engineers, and create an environment where work at NRL is a productive and rewarding experience for all. Dr. Kafafi has fostered a new program focused on fulfilling these goals....NRL has now an established Mentor Program available to all employees at all sites."
teJiZT?' IKjgK M
»Er' *\
^^m m
Ms. Deborah E. Erwin Human Resources Office
NAVAL RESEARCH LABORATORY'S (NRL) AWARD OF EXCELLENCE IN MISSION SUPPORT
Ms. Erwin was noted "for her outstanding contributions in the areas of NRL equal employment opportunities and prevention of sexual harassment training that has set high marks for others to follow. She was the cornerstone in the development and provi- sion of 'Prevention of Sexual Harassment (POSH)' training for the employees of NRL in response to a mandate from the Secretary of the Navy. Her intuitiveness, dedication, integrity, and willing- ness to go that extra mile to bring issues to resolution have resulted in the NRL Equal Employment Opportunity Program taking second seat to none in the Navy."
222

Ms. Joyce Smithwick Materials Science and Com- ponent Technology Directorate
Ms. Velma Stiverson Ocean and Atmospheric Sciences Directorate
AWARDS AND RECOGNITION
NAVAL RESEARCH LABORATORY'S AWARD FOR EXCELLENCE IN SECRETARIAL SUPPORT
Ms. Smithwick was commended for her "exceptional secretarial support and professionalism in the execution of tasks of the Office of the Materials Science and Component Technology Directorate and for performing a multitude of additional re- sponsibilities for the Laboratory in an exemplary manner."
NAVAL RESEARCH LABORATORY'S AWARD FOR EXCELLENCE IN SECRETARIAL SUPPORT
Ms. Stiverson is credited with being "important to the early success of the directorate." She was also chosen for ensuring that all clerical/administrative procedures are well planned, executed, and coordinated.
NAVAL RESEARCH LABORATORY'S AWARD FOR EXCELLENCE IN SECRETARIAL SUPPORT
Ms. Trgina was recognized for "demonstrating extraordinary dedication and skill in performing her work...not just the tradi- tional tasks one expects of a secretary, but virtually anything that comes to her attention....Ms. Trgina goes beyond complet- ing work successfully and...she is adept at devising innovative solutions to problems that arise in the division."
Ms. Carol Trgina Space Science Division
223

AWARDS AND RECOGNITION
NAVAL RESEARCH LABORATORY'S TECHNOLOGY TRANSFER AWARD Mr. Jay Middour, Mr. Alan Hope, Mr. Bernard Kaufman,
Dr. Robert Dasenbrock, and Mr. Mark Soyka Space Systems Development Department
This award was presented for their work in trajectory analysis for the recent Clementine mission. The team was responsible for the entire mission, which included the original trajectory design, launch win- dow analysis, maneuver planning and execution, lunar orbit insertion, lunar orbit maintenance, Earth return, lunar gravity assist to the asteroid Geographos, and contingency planning.
NAVAL RESEARCH LABORATORYS AWARD OF EXCELLENCE IN MISSION SUPPORT Mr. Robert Spragg, Ms. Miriam Oliver, Ms. Judy McKinney, Ms. Angela Allison,
Ms. Brenda Norwood, Mr. Victor Papagno, and Mr. Richard Leadley Office of Management and Administration
The award was given to the Office for "its exceptional and significant contributions in support of the Laboratory's scientific program." The group's "dedication, skill, and insight have contributed in a major way to the quality of service and productivity of the Laboratory."
224
Alan Berman Research Publication and Edison Patent Awards
The Annual Research Publication Awards Program was established in 1968 to recognize the authors of the best NRL publications each year. These awards not only honor individuals for superior scientific accomplishments in the field of naval research but also seek to promote continued excellence in research and in its documentation. In 1982, the name of this award was changed to the Alan Berman Research Publication Award, in honor of its founder.
There were 235 separate publications submitted by the divisions in 1995 to be considered for recognition. Of those considered, 38 were selected. These selected publications represent 155 authors, each of whom received a publication awards certificate, a bronze paperweight, and a booklet listing the publications that were chosen for special recognition. In addition, NRL authors share in their respective division's monetary award.
The winning papers and their respective authors are listed below by their research units. Non- Laboratory coauthors are indicated by an asterisk.
NRL also recognizes patents as part of its annual publication awards program. The NRL Edison Patent Award was established in January 1991 to recognize NRL employees for outstanding patents issued to NRL by the U.S. Patent and Trademark Office during the preceding calendar year. The award recognizes significant NRL contributions to science and engineering as demonstrated by the patent process that are perceived to have the greatest potential benefit to the country. Of the 11 patents considered for 1995, 2 were selected and an additional 1 was selected for a special award, representing 6 inventors. They are listed under the NRL Edison Patent Awards.
Command Support Division
Radiation Dosimetry Using Thermoluminescence of Semiconductor-doped Vycor Glass Tommy L. Johnson, Brian L. Justus, and Alan L. Huston
Radar Division
RADARC Model Comparisons with Amchitka Radar Data James M. Headrick, Benjamin T. Root, and Joseph F. Thomason
AN/SPQ-9B ADM Radar Test Results Ben H. Cantrell, Lawrence M. Leibowitz, David J. Cardiel, Win Jou Cheung,
Linda M. Schaus, and Gregory C. Tavik
225
AWARDS AND RECOGNITION -
Information Technology Division
Standard Clock Simulation and Ordinal Optimization Applied to Admission Control in Integrated Communication Networks
Jeffrey E. Wieselthier, Craig M. Barnhart, and Anthony Ephremides*
A Network Version of the Pump Myong H. Kang, Ira S. Moskowitz, and Daniel C. Lee
Optical Sciences Division
Performance Evaluation of a Staring Two Color MWIR Missile Approach Warning System Kenneth A. Sarkady, Garry R. Katz, John P. Mateosky, Michael A. Colbert,
Melvin R. Kruer, Ralph A. York * Stephen P. Michaels * and Eddie L Wilder*
True Time-Delay Fiber-Optic Control of an Ultrawideband Array Transmitter/Receiver with Multibeam Capability
Michael Y. Frankel and Ronald D. Esman
Tactical Electronic Warfare Division
Super-resolution Precision Direction-Finding Techniques and Measurements Hal L. Levitt, Edward M. Alexander, Anthony Y. Tse, and Anthony E. Spezio
Universal Exciter Communications Electronic Attack Applications William W. Everett, John M. Eardley, and Robert A. Weber
Laboratory for the Structure of Matter
Quantum Crystallography and the Use of Kernel Projector Matrices Lou Massa* LuLu Huang* and Jerome Karle
Chemistry Division
Results of a Magnetometry Survey at TA-50, MDA-C, Los Alamos National Laboratory, Los Alamos, New Mexico
J. R. McDonald and Richard Robertson*
A Stable High-Index Surface of Silicon: Si (5 5 12) Alison A. Baski* Steven C. Erwin, and Lloyd J. Whitman
Materials Science and Technology Division
Characterization of Strain-induced Damage in Composites Based on the Dissipated Energy Density, Parts I, II, and III
P. W. Mast, G. E. Nash,*J.G. Michopoulos, R. Thomas* R. Badaliance, and I. Wolock*
226

AWARDS AND RECOGNITION
Corrosion Inhibition of Iron in Acid Solutions by Biological Siderophores E. McCafFerty and J.V. McArdle*
Laboratory for Computational Physics and Fluid Dynamics
Radiating Plasma Structures in Ablating, Laser-Produced Plasmas J. P. Dahlburg, M. Klapisch,* J. H. Gardner, C. R. DeVore,
A. J. Schmitt, and A. Bar-Shalom*
Condensed Matter and Radiation Sciences Division
Orthogonal Strains and Onset of Plasticity in Shocked LiF Crystals Robert R. Whitlock and Justin S. Wark*
Vibron Excitations in Solid Hydrogen: A Generalized Binary Random Alloy Problem Joseph L. Feldman,Jon H. Eggert,*Jan De Kinder* Russell J. Hemley*
Ho-kwang Mao * and Dirk Schoemaker*
Plasma Physics Division
Controlling the Resistive Hose Instability in Relativistic Electron Beams Richard F. Fernsler, Steven P. Slinker, Martin Lampe, and Richard F. Hubbard
Time-Dependent Asymmetries in Laser-Fusion Hohlraums Steven E. Bodner
Electronics Science and Technology Division
Optically Detected Magnetic Resonance of GaN Films Grown by Organometallic Chemical-Vapor Deposition
E. R. Glaser, T. A. Kennedy, K. Doverspike, L. B. Rowland, D. K. Gaskill, J. A. Freitas, Jr.* M. Asif Khan* D. T. Olson*J. N. Kuznia* and D. K. Wickenden*
AFM Fabrication ofSub-IO nm Metal-Oxide Devices with In Situ Control of Electrical Properties
E. S. Snow and P. M. Campbell
Center for Bio/Molecular Science and Engineering
Detection of TNT in Water Using an Evanescent Wave Fiber-Optic Biosensor Lisa C. Shiver-Lake, Kristen A. Breslin* Paul T. Charles, David W. Conrad,
Joel P. Golden, and Frances S. Ligler
New Fluctuation Mode in a Chiral Smectic-A Liquid Crystal with a Uniaxial Layer Modulation Samual N. Sprunt*Jonathan V. Selinger, Gregory P. Crawford*
Banahalli R. Ratna, and Ranganathan Shashidhar
227

AWARDS AND RECOGNITION —
Acoustics Division
Supersonic Acoustic Intensity Earl G. Williams
Scattering from Collective Modes of Air Bubbles in Water and the Physical Mechanism of Super-resonances
Christopher Feuillade
Remote Sensing Division
First Results from POAM II: The Dissipation of the 1993 Antarctic Ozone Hole Richard M. Bevilacqua, Karl W. Hoppel.John S. Hornstein, Robert L. Lucke, Eric P. Shettle,
Thomas L. Ainsworth* D. Debrestian * M. D. Fromm* S. S. Krigman* J. Lumpe* W. Glaccum* J. J. Olivero* R. T. Clancy* C. E. Randall* D. W. Rusch* E. Chassefiere* F. Dalaudier*
C. Deniel* C. Brogniez* and J. Lenoble
A Microwave Technique to Improve the Measurement of Directional Wave Spectra Dale L. Schüler and Jong-Sen Lee
Oceanography Division
Error in Predicting Hydrosol Backscattering from Remotely Sensed Reflectance Alan D. Weidemann, Robert H. Stavn,*J. R. V. Zaneveld* and Michael R. Wilcox*
The Ocean Response to Operational Westerly Wind Bursts During the 1991-1992 El Nino John C. Kindle and Patricia Phoebus
Marine Geosciences Division
Full Waveform Inversion of Seismic Interface Wave Data Leonard Dale Bibee and Leroy M. Dorman*
Marine Meteorology Division
Coupled Ocean Wave/Atmosphere Mesoscale Model Simulations of Cyclogenesis Jim D. Doyle
Numerical Simulations of the Life Cycle of a Baroclinic Wave William T. Thompson
Space Science Division
The Role of Magnetic Reconnection in Chromospheric Eruptions Judith T. Karpen, Spiro K. Antiochos, and C. Richard DeVore
The Large Angle Spectroscopic Coronagraph (LASCO) Guenter E. Brueckner, Russell A. Howard, Clarence M. Korendyke,
Donald J. Michels, J. Daniel Moses, Dennis G. Socker, Kenneth P. Dere, Martin J. Koomen* Philippe Lamy * Antoine Llebaria * Maurice Bout* Ranier Schwenn *
George M. Simnett* David K. Bedford* and Christopher J. Eyles*
228

AWARDS AND RECOGNITION
Space Systems Development Department
The Analysis of GPS Attitude Data from a Slowly Rotating, Symmetrical Gravity Gradient Satellite Peter J. Melvin, Lisa M. Ward* and Penina Axelrad*
Determination of the Complex Aperture Distribution of a Planar Spiral Antenna from 3-D Far-Field Radiation Pattern Data
Wendy L. Lippincott, Michael S. Kluskens, and Mark Kragalott
Spacecraft Engineering Department
Close Conjunction Detection on Parallel Computer Liam M. Healy
Vibrations of the Low Power Atmospheric Compensation Experiment Satellite Shalom Fisher, Kenneth I. Schultz* and Lawrence W. Taylor,Jr.*
NRL Edison Patent Awards
Magnetoresistive Linear Displacement Sensor, Angular Displacement Sensor, and Variable Resistor
Gary A. Prinz MATERIALS SCIENCE AND TECHNOLOGY DIVISION
Barry A. Edelberg OFFICE OF COUNSEL
Nontoxic Antifouling Systems James R. Griffith
CHEMISTRY DIVISION
George A. Kap OFFICE OF COUNSEL
Navigation System Using Satellites and Passive Ranging Techniques Roger L. Easton,* Retired SPACE SYSTEMS DIVISION
J. Murray OFFICE OF COUNSEL
229
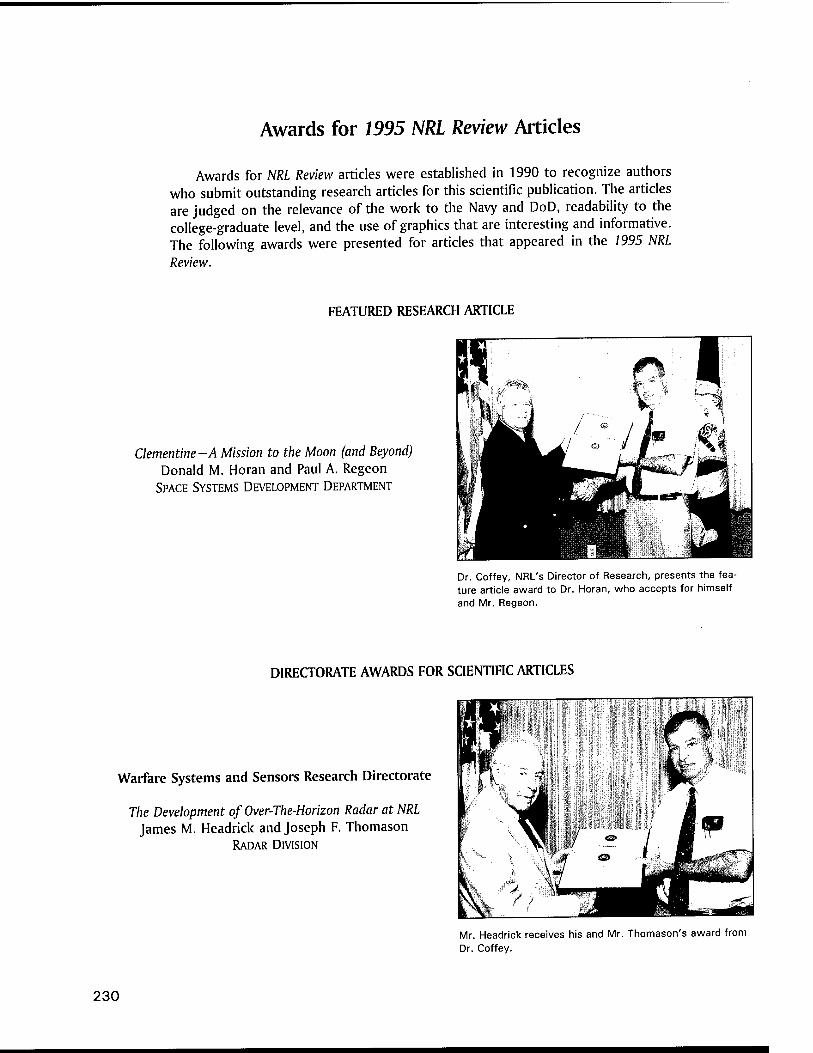
Awards for 1995 NRL Review Articles
Awards for NRL Review articles were established in 1990 to recognize authors who submit outstanding research articles for this scientific publication. The articles are judged on the relevance of the work to the Navy and DoD, readability to the college-graduate level, and the use of graphics that are interesting and informative. The following awards were presented for articles that appeared in the 1995 NRL Review.
FEATURED RESEARCH ARTICLE
Clementine-A Mission to the Moon (and Beyond) Donald M. Horan and Paul A. Regeon
SPACE SYSTEMS DEVELOPMENT DEPARTMENT
Dr. Coffey, NRL's Director of Research, presents the fea- ture article award to Dr. Horan, who accepts for himself and Mr. Regeon.
DIRECTORATE AWARDS FOR SCIENTIFIC ARTICLES
Warfare Systems and Sensors Research Directorate
The Development of Over-The-Horizon Radar at NRL James M. Headrick and Joseph F. Thomason
RADAR DIVISION
Mr. Headrick receives his and Mr. Thomason's award from Dr. Coffey.
230

AWARDS AND RECOGNITION
Materials Science and Component Technology Directorate
Metal-Ion Biosensors for Environmental Studies Jeffrey R. Deschamps and Keith B. Ward
LABORATORY FOR STRUCTURE OF MATTER
Dr. Coffey presents the Materials Science and Component Technology Directorate award to Dr. K. Ward (left) and to Dr. J. Deschamps (right).
Ocean and Atmospheric Science and Technology Directorate
Model Sensitivity Evaluation Using the Adjoint Methods Rolf H. Langland and Russell L. Elsberry
MARINE METEOROLOGY DIVISION
Mr. Langland accepts the award from Dr. Coffey for himself and Mr. Elsberry.
231
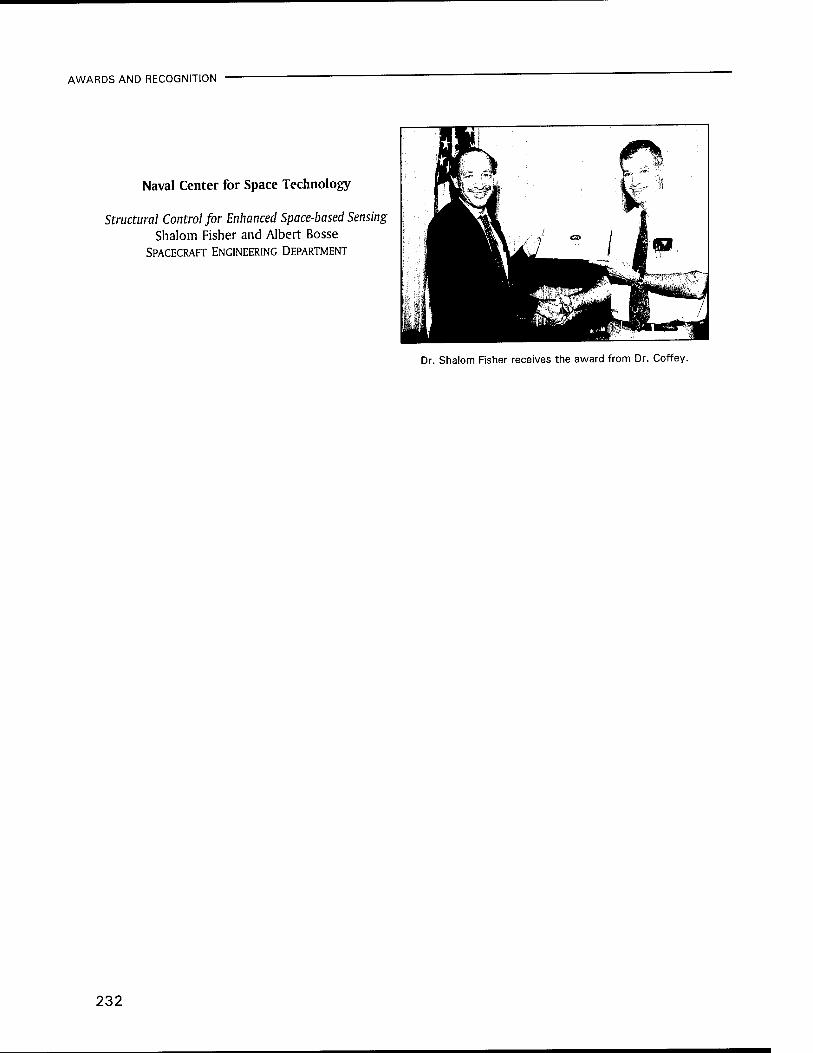
AWARDS AND RECOGNITION
Naval Center for Space Technology
Structural Control for Enhanced Space-based Sensing Shalom Fisher and Albert Bosse
SPACECRAFT ENGINEERING DEPARTMENT
Dr. Shalom Fisher receives the award from Dr. Coffey.
232

Programs for
Professional Development

235 Programs for NRL Employees-University Education and Scholarships, Continuing Education, Professional Development, and Other Activities
241 Programs for Non-NRL Employees-Fellowships, Exchange Programs, and Cooperative Employment
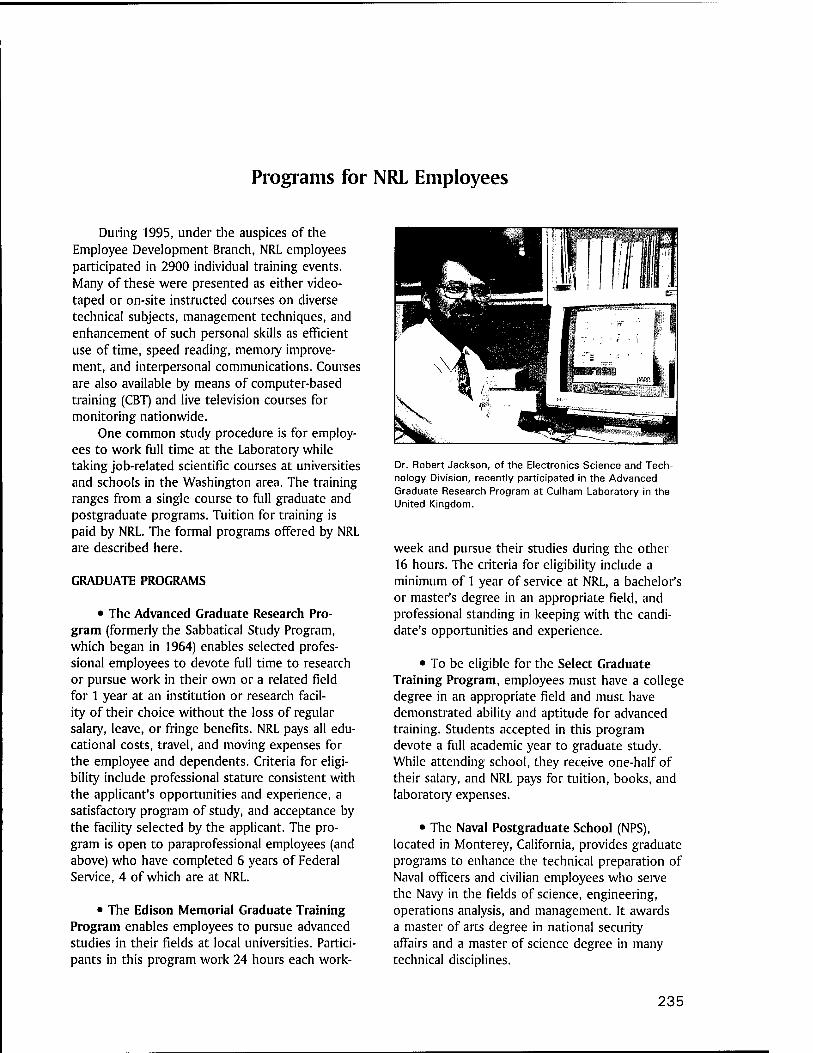
Programs for NRL Employees
During 1995, under the auspices of the Employee Development Branch, NRL employees participated in 2900 individual training events. Many of these were presented as either video- taped or on-site instructed courses on diverse technical subjects, management techniques, and enhancement of such personal skills as efficient use of time, speed reading, memory improve- ment, and interpersonal communications. Courses are also available by means of computer-based training (CBT) and live television courses for monitoring nationwide.
One common study procedure is for employ- ees to work full time at the Laboratory while taking job-related scientific courses at universities and schools in the Washington area. The training ranges from a single course to full graduate and postgraduate programs. Tuition for training is paid by NRL. The formal programs offered by NRL are described here.
GRADUATE PROGRAMS
• The Advanced Graduate Research Pro- gram (formerly the Sabbatical Study Program, which began in 1964) enables selected profes- sional employees to devote full time to research or pursue work in their own or a related field for 1 year at an institution or research facil- ity of their choice without the loss of regular salary, leave, or fringe benefits. NRL pays all edu- cational costs, travel, and moving expenses for the employee and dependents. Criteria for eligi- bility include professional stature consistent with the applicant's opportunities and experience, a satisfactory program of study, and acceptance by the facility selected by the applicant. The pro- gram is open to paraprofessional employees (and above) who have completed 6 years of Federal Service, 4 of which are at NRL.
• The Edison Memorial Graduate Training Program enables employees to pursue advanced studies in their fields at local universities. Partici- pants in this program work 24 hours each work-
Dr. Robert Jackson, of the Electronics Science and Tech- nology Division, recently participated in the Advanced Graduate Research Program at Culham Laboratory in the United Kingdom.
week and pursue their studies during the other 16 hours. The criteria for eligibility include a minimum of 1 year of service at NRL, a bachelor's or master's degree in an appropriate field, and professional standing in keeping with the candi- date's opportunities and experience.
• To be eligible for the Select Graduate Training Program, employees must have a college degree in an appropriate field and must have demonstrated ability and aptitude for advanced training. Students accepted in this program devote a full academic year to graduate study. While attending school, they receive one-half of their salary, and NRL pays for tuition, books, and laboratory expenses.
• The Naval Postgraduate School (NPS), located in Monterey, California, provides graduate programs to enhance the technical preparation of Naval officers and civilian employees who serve the Navy in the fields of science, engineering, operations analysis, and management. It awards a master of arts degree in national security affairs and a master of science degree in many technical disciplines.
235
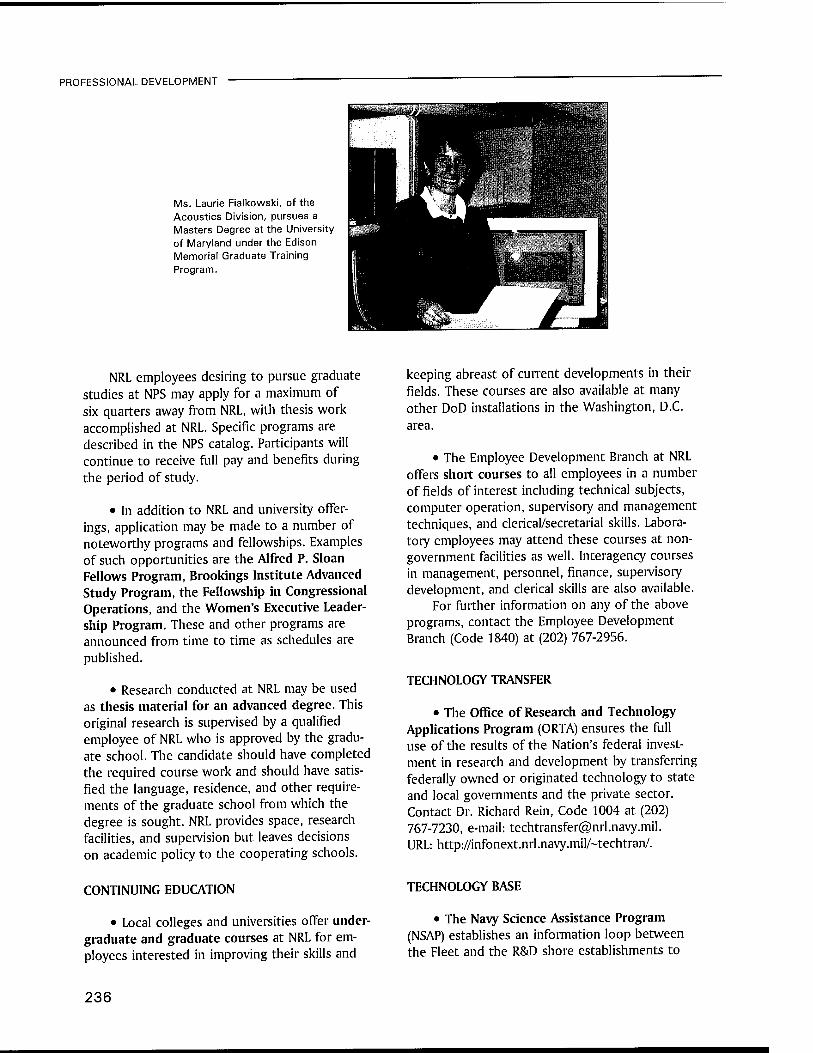
PROFESSIONAL DEVELOPMENT
Ms. Laurie Fialkowski, of the Acoustics Division, pursues a Masters Degree at the University of Maryland under the Edison Memorial Graduate Training Program.
NRL employees desiring to pursue graduate studies at NPS may apply for a maximum of six quarters away from NRL, with thesis work accomplished at NRL. Specific programs are described in the NPS catalog. Participants will continue to receive full pay and benefits during the period of study.
• In addition to NRL and university offer- ings, application may be made to a number of noteworthy programs and fellowships. Examples of such opportunities are the Alfred P. Sloan Fellows Program, Brookings Institute Advanced Study Program, the Fellowship in Congressional Operations, and the Women's Executive Leader- ship Program. These and other programs are announced from time to time as schedules are published.
• Research conducted at NRL may be used as thesis material for an advanced degree. This original research is supervised by a qualified employee of NRL who is approved by the gradu- ate school. The candidate should have completed the required course work and should have satis- fied the language, residence, and other require- ments of the graduate school from which the degree is sought. NRL provides space, research facilities, and supervision but leaves decisions on academic policy to the cooperating schools.
CONTINUING EDUCATION
• Local colleges and universities offer under- graduate and graduate courses at NRL for em- ployees interested in improving their skills and
keeping abreast of current developments in their fields. These courses are also available at many other DoD installations in the Washington, D.C. area.
• The Employee Development Branch at NRL offers short courses to all employees in a number of fields of interest including technical subjects, computer operation, supervisory and management techniques, and clerical/secretarial skills. Labora- tory employees may attend these courses at non- government facilities as well. Interagency courses in management, personnel, finance, supervisory development, and clerical skills are also available.
For further information on any of the above programs, contact the Employee Development Branch (Code 1840) at (202) 767-2956.
TECHNOLOGY TRANSFER
• The Office of Research and Technology Applications Program (ORTA) ensures the full use of the results of the Nation's federal invest- ment in research and development by transferring federally owned or originated technology to state and local governments and the private sector. Contact Dr. Richard Rein, Code 1004 at (202) 767-7230, e-mail: [email protected]. URL: http://infonext.nrl.navy.mil/~techtran/.
TECHNOLOGY BASE
• The Navy Science Assistance Program (NSAP) establishes an information loop between the Fleet and the R&D shore establishments to
236

PROFESSIONAL DEVELOPMENT
expedite technology transfer to the user. The program addresses operational problems, focuses resources to solve specific technical problems, and develops a nucleus of senior scientific personnel familiar with the impact of current research and system performance on military operations.
• The Scientist-to-Sea Program (STSP) provides increased opportunities for Navy R&D laboratory/center personnel to go to sea to gain first-hand insight into operational factors affecting system design, performance, and operations on a variety of ships.
For further information on the Technology Base Programs, contact Dr. Stephen Sacks, Code 5006, at (202) 767-3666.
PROFESSIONAL DEVELOPMENT
NRL has several programs, professional soci- ety chapters, and informal clubs that enhance the professional growth of employees. Some of these are listed below.
• The Counseling Referral Service (C/RS) helps employees to achieve optimal job per- formance through counseling and resolution of problems such as family, stress and anxiety, behavioral, emotional, and alcohol- or drug- related problems that may adversely impact job performance.
C/RS provides confidential assessments and short-term counseling, training workshops, and referrals to additional resources in the commu- nity. (Contact Ms. Kelly Kramp at (202) 767-6857.)
• A chartered chapter of Women in Science and Engineering (WISE) was established at NRL in 1983. Informal luncheons and seminars are scheduled to inform scientists and engineers of women's research at NRL and to provide an infor- mal environment for members to practice their presentations. WISE also sponsors a colloquium series to feature outstanding women scientists. (Contact Dr. Wendy Fuller-Mora at (202) 767- 6207, Dr. Debra Rolison at (202) 767-3617, or Dr. Cha-Mei Tang at (202) 767-4148.)
• Sigma Xi, the scientific research society, encourages and acknowledges original investiga-
tion in pure and applied science. As an honor society for research scientists, individuals who have demonstrated the ability to perform original research are elected to membership in local chap- ters. The NRL Edison Chapter, comprised of approximately 600 members, recognizes original research by presenting awards annually in pure and applied science to outstanding NRL staff members. The chapter also sponsors lectures at NRL on a wide range of scientific topics for the entire NRL community. These lectures are deliv- ered by scientists from all over the nation and the world. The highlight of the Sigma Xi lecture series is the Edison Memorial Lecture, tradi- tionally featuring a Nobel laureate. (Contact Dr. Wendy Fuller-Mora at (202) 767-6207 or Dr. Robert Morris at (202) 767-3845.)
• The NRL Mentor Program was established to provide an innovative approach to professional and career training and an environment for per- sonal and professional growth. It is open to per- manent NRL employees in all job series and at all sites. Mentorees are matched with successful, experienced colleagues with more technical and/or managerial experience who can provide them with the knowledge and skills needed to maximize their contribution to the success of their immediate organization, to NRL, to the Navy, and to their chosen career fields. The ulti- mate goal of the program is to increase job pro- ductivity, creativity, and satisfaction through better communication, understanding, and train- ing. NRL Instruction 12400.1 established the NRL Mentor Program, and it provides the policy and procedures for the program. (Contact Dr. Pat Tatem at (202) 767-2476.)
• The Charlotte Moore-Sitterly Chapter of Federally Employed Women, Inc. (FEW) was char- tered at NRL in 1993. FEW is an international organization of federally employed women and men whose purpose is to eliminate sex discrimi- nation and sexual harassment and enhance career opportunities for women in government. FEW works closely with other Federal agencies and organizations, including the Office of Personnel Management, Equal Employment Opportunity Commission, and Federal Women's Program sub- committees. (Contact Ms. Jeanie Osburn at (202) 767-3885.)
237
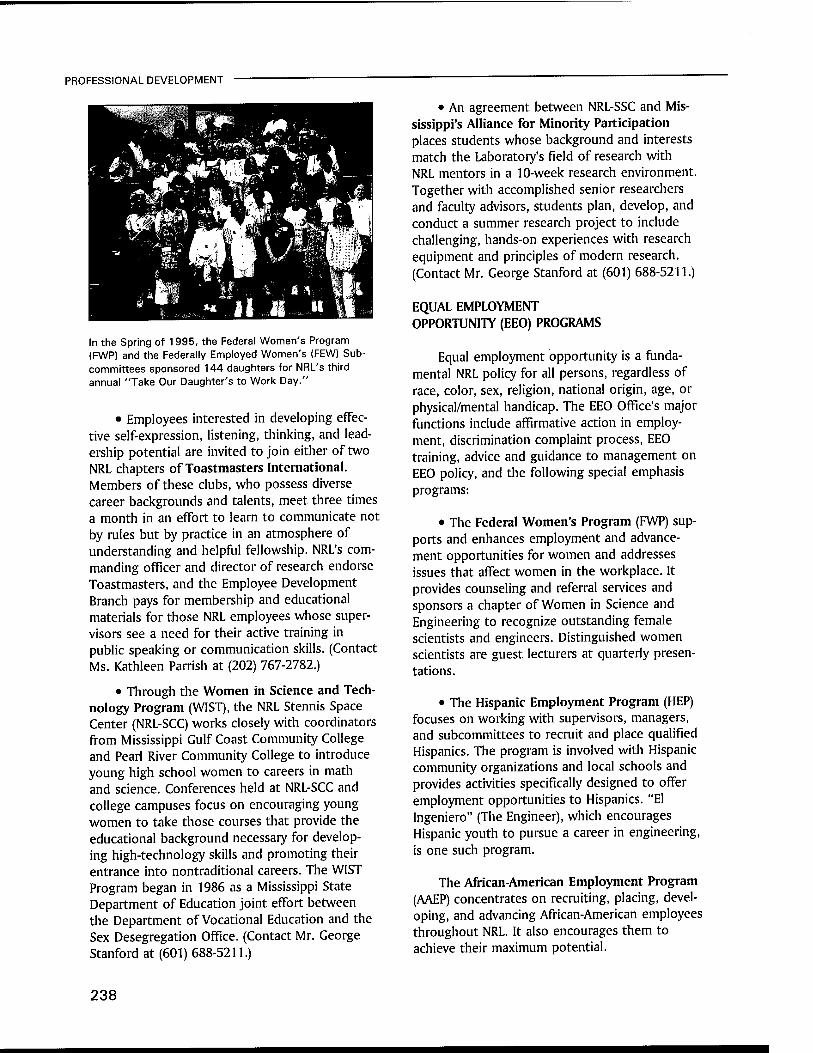
PROFESSIONAL DEVELOPMENT
In the Spring of 1995, the Federal Women's Program (FWP) and the Federally Employed Women's (FEW) Sub- committees sponsored 144 daughters for NRL's third annual "Take Our Daughter's to Work Day."
• Employees interested in developing effec- tive self-expression, listening, thinking, and lead- ership potential are invited to join either of two NRL chapters of Toastmasters International. Members of these clubs, who possess diverse career backgrounds and talents, meet three times a month in an effort to learn to communicate not by rules but by practice in an atmosphere of understanding and helpful fellowship. NRL's com- manding officer and director of research endorse Toastmasters, and the Employee Development Branch pays for membership and educational materials for those NRL employees whose super- visors see a need for their active training in public speaking or communication skills. (Contact Ms. Kathleen Parrish at (202) 767-2782.)
• Through the Women in Science and Tech- nology Program (WIST), the NRL Stennis Space Center (NRL-SCC) works closely with coordinators from Mississippi Gulf Coast Community College and Pearl River Community College to introduce young high school women to careers in math and science. Conferences held at NRL-SCC and college campuses focus on encouraging young women to take those courses that provide the educational background necessary for develop- ing high-technology skills and promoting their entrance into nontraditional careers. The WIST Program began in 1986 as a Mississippi State Department of Education joint effort between the Department of Vocational Education and the Sex Desegregation Office. (Contact Mr. George Stanford at (601) 688-5211.)
• An agreement between NRL-SSC and Mis- sissippi's Alliance for Minority Participation places students whose background and interests match the Laboratory's field of research with NRL mentors in a 10-week research environment. Together with accomplished senior researchers and faculty advisors, students plan, develop, and conduct a summer research project to include challenging, hands-on experiences with research equipment and principles of modern research. (Contact Mr. George Stanford at (601) 688-5211.)
EQUAL EMPLOYMENT OPPORTUNITY (EEO) PROGRAMS
Equal employment opportunity is a funda- mental NRL policy for all persons, regardless of race, color, sex, religion, national origin, age, or physical/mental handicap. The EEO Office's major functions include affirmative action in employ- ment, discrimination complaint process, EEO training, advice and guidance to management on EEO policy, and the following special emphasis programs:
• The Federal Women's Program (FWP) sup- ports and enhances employment and advance- ment opportunities for women and addresses issues that affect women in the workplace. It provides counseling and referral services and sponsors a chapter of Women in Science and Engineering to recognize outstanding female scientists and engineers. Distinguished women scientists are guest lecturers at quarterly presen- tations.
• The Hispanic Employment Program (HEP) focuses on working with supervisors, managers, and subcommittees to recruit and place qualified Hispanics. The program is involved with Hispanic community organizations and local schools and provides activities specifically designed to offer employment opportunities to Hispanics. "El Ingeniero" (The Engineer), which encourages Hispanic youth to pursue a career in engineering, is one such program.
The African-American Employment Program (AAEP) concentrates on recruiting, placing, devel- oping, and advancing African-American employees throughout NRL. It also encourages them to achieve their maximum potential.
238
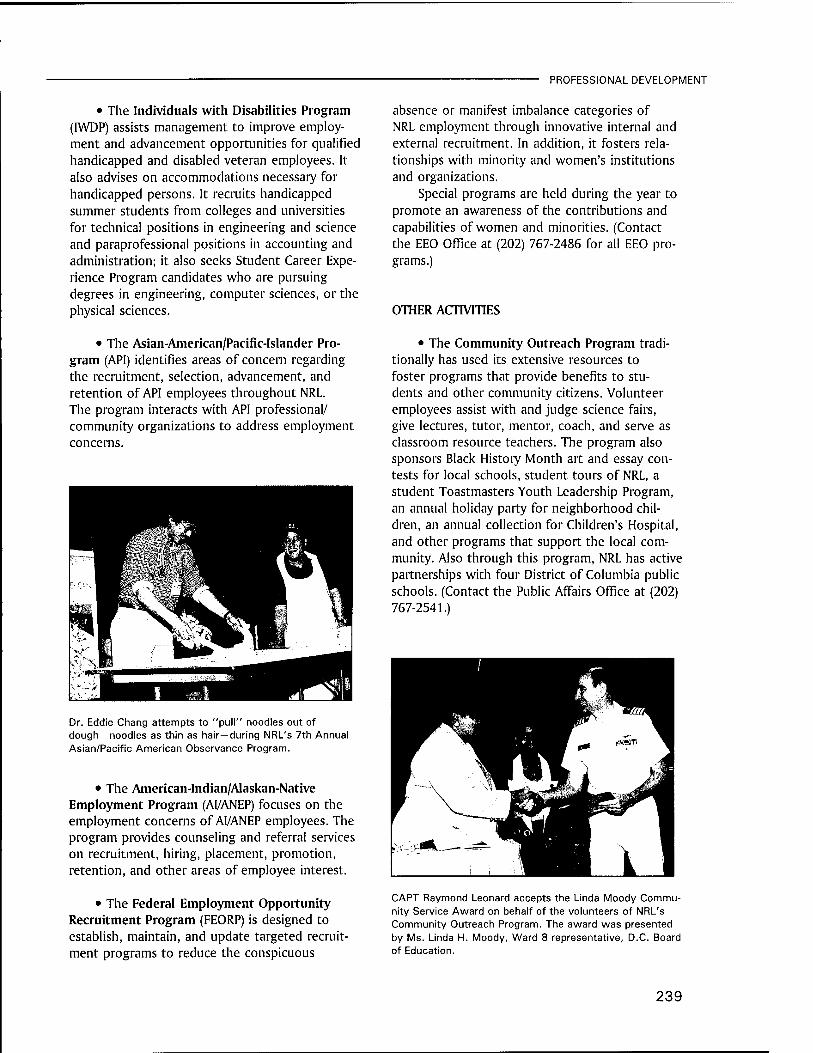
PROFESSIONAL DEVELOPMENT
• The Individuals with Disabilities Program (IWDP) assists management to improve employ- ment and advancement opportunities for qualified handicapped and disabled veteran employees. It also advises on accommodations necessary for handicapped persons. It recruits handicapped summer students from colleges and universities for technical positions in engineering and science and paraprofessional positions in accounting and administration; it also seeks Student Career Expe- rience Program candidates who are pursuing degrees in engineering, computer sciences, or the physical sciences.
absence or manifest imbalance categories of NRL employment through innovative internal and external recruitment. In addition, it fosters rela- tionships with minority and women's institutions and organizations.
Special programs are held during the year to promote an awareness of the contributions and capabilities of women and minorities. (Contact the EEO Office at (202) 767-2486 for all EEO pro- grams.)
OTHER ACTIVITIES
• The Asian-American/Pacific-Islander Pro- gram (API) identifies areas of concern regarding the recruitment, selection, advancement, and retention of API employees throughout NRL. The program interacts with API professional/ community organizations to address employment concerns.
Dr. Eddie Chang attempts to "pull" noodles out of dough —noodles as thin as hair—during NRL's 7th Annual Asian/Pacific American Observance Program.
• The American-Indian/Alaskan-Native Employment Program (AI/ANEP) focuses on the employment concerns of AI/ANEP employees. The program provides counseling and referral services on recruitment, hiring, placement, promotion, retention, and other areas of employee interest.
• The Federal Employment Opportunity Recruitment Program (FEORP) is designed to establish, maintain, and update targeted recruit- ment programs to reduce the conspicuous
• The Community Outreach Program tradi- tionally has used its extensive resources to foster programs that provide benefits to stu- dents and other community citizens. Volunteer employees assist with and judge science fairs, give lectures, tutor, mentor, coach, and serve as classroom resource teachers. The program also sponsors Black History Month art and essay con- tests for local schools, student tours of NRL, a student Toastmasters Youth Leadership Program, an annual holiday party for neighborhood chil- dren, an annual collection for Children's Hospital, and other programs that support the local com- munity. Also through this program, NRL has active partnerships with four District of Columbia public schools. (Contact the Public Affairs Office at (202) 767-2541.)
CAPT Raymond Leonard accepts the Linda Moody Commu- nity Service Award on behalf of the volunteers of NRL's Community Outreach Program. The award was presented by Ms. Linda H. Moody, Ward 8 representative, D.C. Board of Education.
239
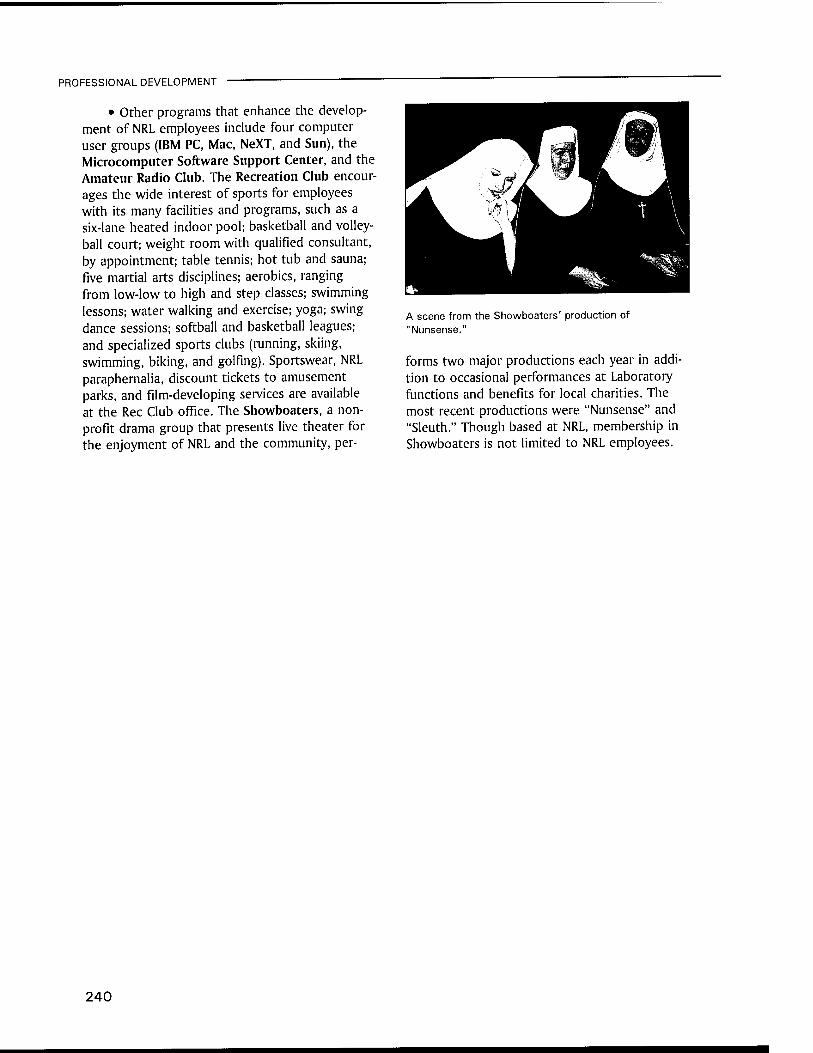
PROFESSIONAL DEVELOPMENT
• Other programs that enhance the develop- ment of NRL employees include four computer user groups (IBM PC, Mac, NeXT, and Sun), the Microcomputer Software Support Center, and the Amateur Radio Club. The Recreation Club encour- ages the wide interest of sports for employees with its many facilities and programs, such as a six-lane heated indoor pool; basketball and volley- ball court; weight room with qualified consultant, by appointment; table tennis; hot tub and sauna; five martial arts disciplines; aerobics, ranging from low-low to high and step classes; swimming lessons; water walking and exercise; yoga; swing dance sessions; softball and basketball leagues; and specialized sports clubs (running, skiing, swimming, biking, and golfing). Sportswear, NRL paraphernalia, discount tickets to amusement parks, and film-developing services are available at the Rec Club office. The Showboaters, a non- profit drama group that presents live theater for the enjoyment of NRL and the community, per-
A scene from the Showboaters' production of "Nunsense."
forms two major productions each year in addi- tion to occasional performances at Laboratory functions and benefits for local charities. The most recent productions were "Nunsense" and "Sleuth." Though based at NRL, membership in Showboaters is not limited to NRL employees.
240
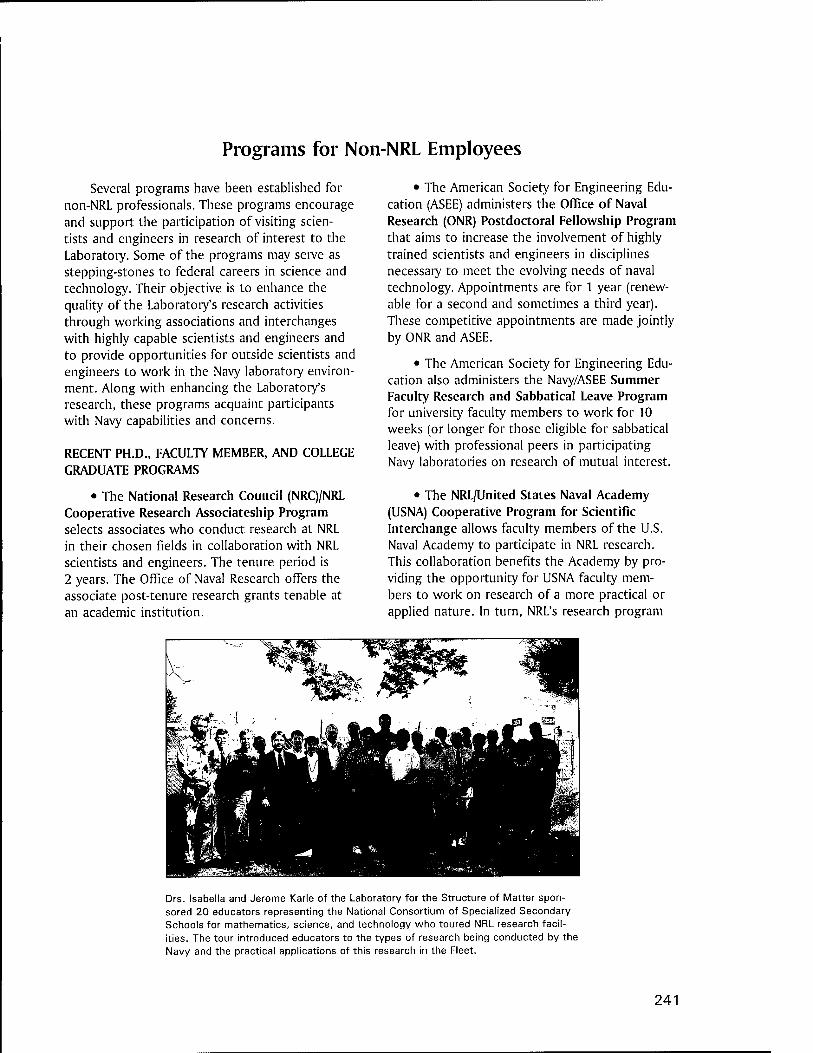
Programs for Non-NRL Employees
Several programs have been established for non-NRL professionals. These programs encourage and support the participation of visiting scien- tists and engineers in research of interest to the Laboratory. Some of the programs may serve as stepping-stones to federal careers in science and technology. Their objective is to enhance the quality of the Laboratory's research activities through working associations and interchanges with highly capable scientists and engineers and to provide opportunities for outside scientists and engineers to work in the Navy laboratory environ- ment. Along with enhancing the Laboratory's research, these programs acquaint participants with Navy capabilities and concerns.
RECENT PH.D., FACULTY MEMBER, AND COLLEGE GRADUATE PROGRAMS
• The National Research Council (NRQ/NRL Cooperative Research Associateship Program selects associates who conduct research at NRL in their chosen fields in collaboration with NRL scientists and engineers. The tenure period is 2 years. The Office of Naval Research offers the associate post-tenure research grants tenable at an academic institution.
• The American Society for Engineering Edu- cation (ASEE) administers the Office of Naval Research (ONR) Postdoctoral Fellowship Program that aims to increase the involvement of highly trained scientists and engineers in disciplines necessary to meet the evolving needs of naval technology. Appointments are for 1 year (renew- able for a second and sometimes a third year). These competitive appointments are made jointly by ONR and ASEE.
• The American Society for Engineering Edu- cation also administers the Navy/ASEE Summer Faculty Research and Sabbatical Leave Program for university faculty members to work for 10 weeks (or longer for those eligible for sabbatical leave) with professional peers in participating Navy laboratories on research of mutual interest.
• The NRL/United States Naval Academy (USNA) Cooperative Program for Scientific Interchange allows faculty members of the U.S. Naval Academy to participate in NRL research. This collaboration benefits the Academy by pro- viding the opportunity for USNA faculty mem- bers to work on research of a more practical or applied nature. In turn, NRL's research program
Drs. Isabella and Jerome Karle of the Laboratory for the Structure of Matter spon- sored 20 educators representing the National Consortium of Specialized Secondary Schools for mathematics, science, and technology who toured NRL research facil- ities. The tour introduced educators to the types of research being conducted by the Navy and the practical applications of this research in the Fleet.
241

PROFESSIONAL DEVELOPMENT
is strengthened by the available scientific and engineering expertise of the USNA faculty.
• The National Defense Science and Engi- neering Graduate Fellowship Program helps U.S. citizens obtain advanced training in disciplines of science and engineering critical to the U.S. Navy. The 3-year program awards fellowships to recent outstanding graduates to support their study and research leading to doctoral degrees in specified disciplines such as electrical engineering, comput- er sciences, material sciences, applied physics, and ocean engineering. Award recipients are encouraged to continue their study and research in a Navy laboratory during the summer.
For further information about the above five programs, please contact Mrs. Jessica Hileman at (202) 767-3865.
• The Professional Development Program for Ensigns assigns newly commissioned ensigns, who are awaiting future training, to NRL to work in areas of their own choosing commensurate with their academic qualifications. These young officers provide a fruitful summer of research assistance while gaining valuable experience in the Navy's R&D program. For more information, contact the Military Administrative Office at (202) 767-2103.
PROFESSIONAL APPOINTMENTS
• Faculty Member Appointments use the special skills and abilities of faculty members for short periods to fill positions of a scientific, engi- neering, professional, or analytical nature.
• Consultants and experts are employed because they are outstanding in their fields of specialization or because they possess ability of a rare nature and could not normally be employed as regular civil servants.
• Intergovernmental Personnel Act Appoint- ments temporarily assign personnel from the state or local government or educational institu- tion to the Federal Government (or vice versa) to improve public services rendered by all levels of government.
STUDENT PROGRAMS
The student programs, tailored to the under- graduate, provide employment and work experi- ence in naval research. These are designed to attract applicants for student and full professional employment in the Laboratory's shortage category positions, such as engineers, physicists, mathema- ticians, and computer scientists. The student employment programs build an understanding of NRL job opportunities between students and educational personnel so that educators can pro- vide students who will meet NRL's occupational needs. The employment programs for college students include the following:
• The Student Career Experience Program (formerly known as Cooperative Education Pro- gram) employs students in study-related occupa- tions. The program is conducted in accordance with a planned schedule and a working agree- ment between NRL, the educational institution, and the student. Primary focus is on students
NRL's Navy Technology Center for Safety and Survivability researchers at the ex-USS Shadwell in Mobile, Alabama, sponsored the Shadweil Mariners, a local boys' baseball team.
242
PROFESSIONAL DEVELOPMENT
pursuing bachelor degrees in engineering, com- puter science, or the physical sciences.
• The Student Temporary Employment Pro- gram (STEP) enables students to earn a salary while continuing their studies and offers them valuable work experience.
• The Summer Employment Program em- ploys students for the summer in paraprofessional and technician positions in engineering, physical sciences, computer sciences, and mathematics.
• The Student Volunteer Program helps students gain valuable experience by allow- ing them to voluntarily perform educationally related work at NRL
For additional information on these under- graduate college student programs, contact Cindy Stiles at (202) 767-8312.
HIGH SCHOOL PROGRAMS
• The DoD Science & Engineering Apprentice Program (SEAP) employs high school juniors and seniors to serve for 8 weeks as junior research associates. Under the direction of a mentor, stu- dents gain a better understanding of research, its challenges, and its opportunities through partici- pation in scientific programs. Criteria for eligibili- ty are based on science and mathematics courses completed and grades achieved; scientific motiva- tion, curiosity, and capacity for sustained hard work; a desire for a technical career; teacher recommendations; and achievement test scores. The NRL Program is the lead program and the largest in DoD.
For additional information, contact the Em- ployee Development Branch (Code 1840) at (202) 767-2956.
243

General Information
247 Technical Output
248 Technology Transfer at NRL
249 Key Personnel
251 Contributions by Divisions, Laboratories, and Departments
254 Employment Opportunities
255 Location of NRL in the Capital Area
256 Subject Index
259 Author Index
Inside back cover NRL Review Staff

Technical Output
The Navy continues to be a pioneer in initi- ating new developments and a leader in apply- ing these advancements to military requirements. The primary method of informing the scientific and engineering community of the advances made at NRL is through the Laboratory's technical output-reports, articles in scientific journals, contributions to books, papers presented to scien- tific societies and topical conferences, patents, and inventions.
The figures for calendar year 1995 presented below represent the output of NRL facilities in Washington, D.C.; Bay St. Louis, Mississippi; and Monterey, California.
In addition to the output listed, NRL scien- tists made more than 1423 oral presentations during 1995.
A complete listing of the publications by NRL authors appears in the Bibliography of NRL Publications, a separate annual publication.
Type of Contribution
Articles in periodicals, chapters in books, and papers in published proceedings
NRL Formal Reports
NRL Memorandum Reports
Other NRL Reports and NRL Publications
Books
Patents granted
Statutory Invention Registrations (SIRs)
Unclassified Classified Total
1041 0 1041
38 13 51
119 27 146
21 11 32
0 0
78
10
•This is a provisional total based on information available to the Ruth H. Hooker Research Library and Technical Infor- mation Center on January 10, 1996. Additional publications carrying a 1995 publication date are anticipated.
247
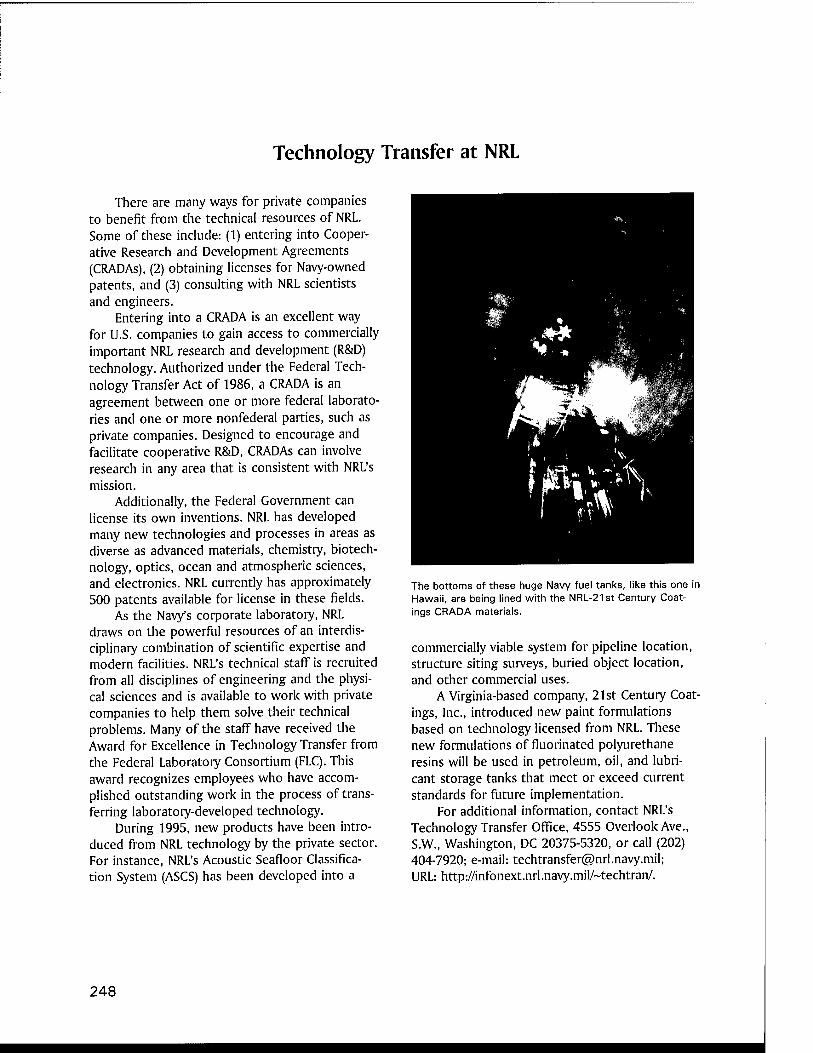
Technology Transfer at NRL
There are many ways for private companies to benefit from the technical resources of NRL. Some of these include: (1) entering into Cooper- ative Research and Development Agreements (CRADAs), (2) obtaining licenses for Navy-owned patents, and (3) consulting with NRL scientists and engineers.
Entering into a CRADA is an excellent way for U.S. companies to gain access to commercially important NRL research and development (R&D) technology. Authorized under the Federal Tech- nology Transfer Act of 1986, a CRADA is an agreement between one or more federal laborato- ries and one or more nonfederal parties, such as private companies. Designed to encourage and facilitate cooperative R&D, CRADAs can involve research in any area that is consistent with NRL's mission.
Additionally, the Federal Government can license its own inventions. NRL has developed many new technologies and processes in areas as diverse as advanced materials, chemistry, biotech- nology, optics, ocean and atmospheric sciences, and electronics. NRL currently has approximately 500 patents available for license in these fields.
As the Navy's corporate laboratory, NRL draws on the powerful resources of an interdis- ciplinary combination of scientific expertise and modern facilities. NRL's technical staff is recruited from all disciplines of engineering and the physi- cal sciences and is available to work with private companies to help them solve their technical problems. Many of the staff have received the Award for Excellence in Technology Transfer from the Federal Laboratory Consortium (FLC). This award recognizes employees who have accom- plished outstanding work in the process of trans- ferring laboratory-developed technology.
During 1995, new products have been intro- duced from NRL technology by the private sector. For instance, NRL's Acoustic Seafloor Classifica- tion System (ASCS) has been developed into a
The bottoms of these huge Navy fuel tanks, like this one in Hawaii, are being lined with the NRL-21st Century Coat- ings CRADA materials.
commercially viable system for pipeline location, structure siting surveys, buried object location, and other commercial uses.
A Virginia-based company, 21st Century Coat- ings, Inc., introduced new paint formulations based on technology licensed from NRL. These new formulations of fluorinated polyurethane resins will be used in petroleum, oil, and lubri- cant storage tanks that meet or exceed current standards for future implementation.
For additional information, contact NRL's Technology Transfer Office, 4555 Overlook Ave., S.W., Washington, DC 20375-5320, or call (202) 404-7920; e-mail: [email protected]; URL: http://infonext.nrl.navy.mil/~techtran/.
248

Key Personnel Area Code (202) unless otherwise listed
Personnel Locator - 767-3200 DSN-297 or 754
Code Office EXECUTIVE DIRECTORATE
1000 Commanding Officer 1000.1/1002 Inspector General/Chief Staff Officer 1001 Director of Research 1001.1 Scientific Staff Assistant 1004 Head, Technology Transfer 1006 Head, Office of Program and Administration and Policy Development 1200 Head, Command Support Division 1220 Head, Security 1230 Public Affairs Officer 1240 Head, Safety Branch 1400 Head, Military Support Division 1600 Officer-in-Charge, Flight Support Detachment 1800 Director, Human Resources Office 1803 Deputy EEO Officer 3204 Deputy for Small Business
CAPT B.W. Buckley, USN CAPT R.E. Leonard, USN Dr. T. Coffey Mr. K.W. Lackie Dr. R. Rein Ms. S. Herrin (Acting) Mr. J.C. Payne Mr. C. Herbert Mr. R. Baturin Mr. K.J. King
CDR R. Francisco, USN CDR D.R. Dowell, USN Ms. B. Duffield Ms. D. Erwin
Ms. P. Schaefer
Phone Number
767-3403 767-3621 767-3301 767-2880 767-7230 767-3086 767-3048 767-0793 767-2541 767-2232 767-2271
301-863-3751 767-3421 767-2486 767-6263
BUSINESS OPERATIONS DIRECTORATE 3000 Associate Director of Research 3008 Legal Counsel
Head, Management Information Systems Staff 3200 Head, Contracting Division 3300 Comptroller, Financial Management Division 3400 Supply Officer 3500 Director, Research and Development Services Division
Mr. R.E. Doak Ms. H.J. Halper Mr. R.L. Guest Mr. J.C. Ely Mr. D.T. Green Ms. C. Hartman Mr. D.K. Woodington
767-2371 767-2244 3030
767-2030 767-5227 767-3405 767-3446 767-3371
SYSTEMS DIRECTORATE 5000 Associate Director of Research 5200 Head, Technical Information Division 5300 Superintendent, Radar Division 5500 Superintendent, Information Technology Division 5600 Superintendent, Optical Sciences Division 5700 Superintendent, Tactical Electronic Warfare Division
Dr. R.A. LeFande Mr. P.H. Imhof Dr. M.I. Skolnik Dr. R.P. Shumaker Dr. T.G. Giallorenzi Dr. J.A. Montgomery
767-3324 767-2187 767-2936 767-2903 767-3171 767-6278
MATERIALS SCIENCE AND COMPONENT TECHNOLOGY DIRECTORATE 6000 Associate Director of Research Dr. B.B. Rath 6030 Head, Laboratory for Structure of Matter Dr. J. Karle 6100 Superintendent, Chemistry Division Dr. J.S. Murday 6300 Superintendent, Materials Science & Technology Division Dr. D.U. Gubser 6400 Director, Lab. for Computational Physics and Fluid Dynamics Dr. J.P. Boris 6600 Superintendent, Condensed Matter & Radiation Sciences Division Dr. DJ. Nagel 6700 Superintendent, Plasma Physics Division Dr. S. Ossakow 6800 Superintendent, Electronics Science & Technology Division Dr. G.M. Borsuk 6900 Center for Bio/Molecular Sciences and Engineering Dr. J. Schnur
OCEAN AND ATMOSPHERIC SCIENCE AND TECHNOLOGY DIRECTORATE 7000 Associate Director of Research Dr. E.O. Hartwig 7030 Head, Office of Research Support Services Mr. G. Bower 7100 Superintendent, Acoustics Division Dr. E.R. Franchi 7200 Superintendent, Remote Sensing Division Dr. P. Schwartz (Acting) 7300 Superintendent, Oceanography Division Dr. W.B. Moseley 7400 Superintendent, Marine Geosciences Division Dr. H.C. Eppert, Jr. 7500 Superintendent, Marine Meteorology Division Dr. T.L. Tsui (Acting) 7600 Superintendent, Space Science Division Dr. H. Gursky
NAVAL CENTER FOR SPACE TECHNOLOGY 8000 Director Mr. P.G. Wilhelm 8100 Superintendent, Space Systems Development Department Mr. R.E. Eisenhauer 8200 Superintendent, Spacecraft Engineering Department Mr. H.E. Senasack.Jr. (Acting)
767-3566 767-2665 767-3026 767-2926 767-3055 767-2931 767-2723 767-3525 404-6000
404-8690 601-688-4010
767-3482 767-3391
601-688-4670 601-688-4650 408-656-4721
767-6343
767-6547 767-0410 767-6411
•Additional Duty
249
Contributions by Divisions, Laboratories, and Departments
Command Support Division
210 Twenty Years of HRTS Observations John W. Cook, Guenter E. Brueckner, and Janice Schultz
Radar Division
103 AN/SPQ-9B ADM Radar Lawrence M. Leibowitz, Linda M. Schaus, and David J. Cardiel
104 Ferroelectric Lens Phased Arrays Jaganmohan B.L. Rao, Dharmesh P. Patel, and William R. Pickles
Information Technology Division
125 Rejection with Multilayer Neural Networks: Screening Image Data
Behrooz Kamgar-Parsi and Behzad Kamgar- Parsi
127 Scalable Real-Time Networking for Distributed Computing
Stephen Batsell, Ray Cole, and Barth Root
129 Key Management Support Inside 4.4 BSD UNIX
Daniel L McDonald, Bao G. Phan, and Randall J. Atkinson
183 Virtual Firefighting Patricia A. Tatem and David L Täte
Optical Science Division
159 Change Detection Using Multispectral Invariants
Alan Schaum and Alan Stocker
162 Nanochannel Glass Replica Membrane Technology
Douglas H. Pearson and Ronald J. Tonucci
163 Infrared Color Vision Dean A. Scribner, Michael P. Satyshur, and Melvin R. Kruer
165 Fiber Bragg Grating Laser Sensors Alan D. Kersey and Kee P. Koo
Tactical Electronic Warfare Division
106 Small Ship ESM System John J. Briguglio
108 Missile Radar Performance Characterization Donald W. Kahl
181 A Hybrid Virtual Environment Interface to C3I Information
Rudolph P. Darken, Tobin A. Hill, and Brian T. Solan
198 Electric Propulsion for Advanced Unmanned Aircraft
Richard J. Foch
Laboratory for the Structure of Matter
93 Cubane Chemistry: A Source of New Energetic Materials
Richard D. Gilardi
Chemistry Division
95 The Many Faces of Silicon Lloyd J. Whitman, Steven C. Erwin, and Alison A. Baski
115 In Situ Monitoring of the Absorption of Deuterium into Palladium Using Synchrotron- Wiggler Radiation
Earl F. Skelton, Syed B. Qadri, Patrick L. Hagans, and Dawn D. Dominguez
251

119 Kinetic Limitations to Molecular Beam Epitaxy Mark E. Twigg, Brian R. Bennett, Paul M. Thibado, Benjamin V. Shanabrook, and Lloyd J. Whitman
135 Magnetic Metal/Semiconductor Heterostructure Studies in the EPICENTER Facility
Berend T. Jonker, Paul M. Thibado, Brian R. Bennett, Benjamin V. Shanabrook, Robert J. Wagner, and Lloyd J. Whitman
183 Virtual Firefighting Patricia A. Tatem and David L. Täte
Materials Science and Technology Division
49 Naturally Occurring Biological Molecules as Environmentally Acceptable Corrosion Inhibitors
Edward McCajferty and Douglas C. Hansen
135 Magnetic Metal/Semiconductor Heterostruc- ture Studies in the EPICENTER Facility
Berend T. Jonker, Paul M. Thibado, Eric M. Kneedler, Brian R. Bennett, Benjamin V. Shanabrook, Robert J. Wagner, and Lloyd J. Whitman
185 Ultrasonic Tomography of Solids Using Parallel Processing
Richard S. Schechter, Richard B. Mignogna, and Pier P. Delsanto
Laboratory for Computational Physics and Fluid Dynamics
71 NRL Advances in Computational Fluid Dynamics: FAST3D and FEFLO
Alexandra Landsberg, Ravi Ramamurti, Jay P. Boris, and William C. Sandberg
Condensed Matter and Radiation Sciences Division
95 The Many Faces of Silicon Lloyd J. Whitman, Steven C. Erwin, and Alison A. Baski
115 In Situ Monitoring of the Absorption of Deuterium into Palladium Using Synchrotron- Wiggler Radiation
Earl F. Skelton, Syed B. Qadri, Patrick L. Hagans, and Dawn D. Dominguez
137 Hydrogen Exchange Reactions within Density- Functional Theory
Mark R. Pederson
Plasma Physics Division
117 Laboratory Research in Space Plasma Physics David N. Walker, William E. Amatucci, and John A. Antoniades
141 Dynamics and Control of Spatio-Temporal Systems
Ira B. Schwartz and Ioana Triandaf
188 Laboratory Simulations of the Coupling of Blast Waves into Solid Materials
Charles K. Manka, Jacob Grun, and Harris R. Burris
Electronics Science and Technology Division
110 A Novel Coaxial Free-Electron Maser Monica Blank, Robert H. Jackson, and Henry P. Freund
119 Kinetic Limitations to Molecular Beam Epitaxy Mark E. Twigg, Brian R. Bennett, Paul M. Thibado, Benjamin V. Shanabrook, and Lloyd J. Whitman
135 Magnetic Metal/Semiconductor Heterostructure Studies in the EPICENTER Facility
Berend T. Jonker, Paul M. Thibado, Brian R. Bennett, Benjamin V. Shanabrook, Robert J. Wagner, and Lloyd J. Whitman
140 Optical Spectroscopy of Single GaAs Quantum Dots
Daniel G. Gammon, Eric S. Snow, and Benjamin V. Shanabrook
195 The High Temperature Superconducting Space Experiment II
Thomas G. Kawecki, George E. Price, Jerry A. Golba, Vince S. Rose, and Martin Nisenojf
Center for Biomolecular Science and Engineering
97 Field Testing of Environmental Immunosensors
Anne W. Kusterbeck and Lisa C. Shriver-Lake
252

Acoustics Division Marine Meteorology Division
83 Influence of Internal Gravity Waves on Acoustic Propagation
Steven Finette, Stephen Wolf, and Marshall On, and Dirk Tielbuerger
84 High-Frequency Shallow-Water Signal Fluctuations
Steve Stank, Christine Mire, and Edgar Kennedy
86 Fiber-Optic, Noise-Filtering Acoustic Velocity Sensors
Joseph A. Bucaro, Nicholas Lagakos, and Brian H. Houston
Remote Sensing Division
147 Polarimetric SAR Remote Sensing of Topography
Dale L Schüler and Jong S. Lee
149 Biophysical Interactions in the Arabian Sea John C. Kindle, David K. Young, Robert A. Arnone, and Albert W. Green
171 Radar Imaging of Underwater Sand Dunes Timothy F. Donato, Farid Askari, Clifford L. Trump, and George 0. Marmorino
173 Hydrodynamic and Radar Modeling of Ocean Currents
Robert W. Jansen, Scott R. Chubb, and Colin Y. Shen
Oceanography Division
59 A Deep Western Boundary Current in the North Pacific
Zachariah R. Hallock, William J. Teague, and Eve R. Fillenbaum
149 Biophysical Interactions in the Arabian Sea John C. Kindle, David K. Young, Robert A. Arnone, and Albert W. Green
Marine Geosciences Division
175 Measurement of Nearshore Dynamics Using Video
K. Todd Holland andj. Casey Church
151 An Investigation of the Southerly Surge William T. Thompson, Tracy Haack, and James D. Doyle
191 Observed and Simulated Intraseasonal Circulation Anomalies
Carolyn A. Reynolds, Ronald Gelaro, and Tom Murphree
Space Science Division
154 Solar Irradiance Variability Models John T. Mariska, Harry P. Warren, and Judith Lean
199 Global Maps of OH in the Middle Atmosphere Robert R. Conway and Michael E. Summers
210 Twenty Years of HRTS Observations John W. Cook, Guenter E. Brueckner, and Janice Schultz
Space Systems Development Department
195 The High-Temperature Superconducting Space Experiment II
Thomas G. Kawecki, George E. Price, Jerry A. Golba, Vince S. Rose, and Martin Nisenoff
202 Sodium Sulfur Battery Cell Space Flight Experiment
J. Christopher Garner and William E. Baker
205 HERCULES/MSI: Hand-held Georegistered Multispectral Video
Henry M. Pickard, Robert F. Higgins, and Bernard Kaufman
Spacecraft Engineering Department
195 The High-Temperature Superconducting Space Experiment II
Thomas G. Kawecki, George E. Price, Jerry A. Golba, Vince S. Rose, and Martin Nisenoff
208 Active Vibration Suppression in Space Structures
Robert S. McClelland, Shalom Fisher, and Albert Bosse
253
Employment Opportunities for Entry-Level and Experienced Personnel
The NRL Review illustrates some of the excit- ing science and engineering carried out at the Naval Research Laboratory as well as the potential for new personnel.
NRL offers a wide variety of challenging posi- tions that involve the full range of work from basic and applied research to equipment develop- ment. The nature of the research and develop- ment conducted at NRL requires professionals with experience. Typically there is a continuing need for electronics, mechanical, aerospace, ceramic, and materials engineers, metallurgists, computer scientists, and oceanographers with bachelor's and/or advanced degrees and physical and computer scientists with Ph.D. degrees. Opportunities exist in the areas described below:
Ceramic Engineers and Materials Scientists/Engi- neers. These employees are recruited to work on materials, microstructure characterization, elec- tronic ceramics, solid-state physics, fiber optics, electro-optics, microelectronics, fracture mech- anics, vacuum science, laser physics technology, and radio frequency/microwave/millimeter wave/ infrared technology.
Electronics Engineers and Computer Scien- tists. These employees may work in the areas of communications systems, electromagnetic scattering, electronics instrumentation, electronic warfare systems, radio frequency/microwave/ millimeter wave/infrared technology, radar sys- tems, laser physics technology, radio-wave propa- gation, electron device technology, spacecraft design, artificial intelligence, information process- ing, signal processing, plasma physics, vacuum science, microelectronics, electro-optics, fiber optics, solid state, software engineering, com- puter design/architecture, ocean acoustics, stress analysis, and expert systems.
Mechanical Engineers. These employees may be assigned to spacecraft design, remote sensing, propulsion, experimental fluid mechanics, experi- mental structural mechanics, solid mechanics, elastic/plastic fracture mechanics, materials, finite- element methods, nondestructive evaluation, characterization of fracture resistance of struc- tural alloys, combustion, and CAD/CAM.
Chemists. Chemists are recruited to work in the areas of combustion, polymer science, bioengi- neering and molecular engineering, surface sci- ence, materials, fiber optics, electro-optics, micro- electronics, electron-device technology, and laser physics.
Physicists. Physics graduates may concentrate on such fields as materials, solid-state physics, fiber optics, electro-optics, microelectronics, vacuum science, plasma physics, fluid mechanics, signal processing, ocean acoustics, information process- ing, artificial intelligence, electron-device technol- ogy, radio-wave propagation, laser physics, ultra- violet/X-ray/gamma-ray technology, electronic warfare, electromagnetic interaction, communica- tions systems, radio frequency/microwave/milli- meter wave/infrared technology, and computa- tional physics.
Oceanographers, Meteorologists, and Marine Geophysicists. These employees work in the areas of ocean dynamics, air-sea interaction, upper- ocean dynamics, oceanographic bio-optical model- ing, oceanic and atmospheric numerical modeling and prediction, artificial intelligence applications for satellite analyses, benthic processes, aerogeo- physics, marine sedimentary processes, and ad- vanced mapping techniques. Oceanographers and marine geophysicists are located in Washington, D.C., and the Stennis Space Center, Bay St. Louis, Mississippi. Meteorologists are located in Wash- ington, D.C., and Monterey, California.
254
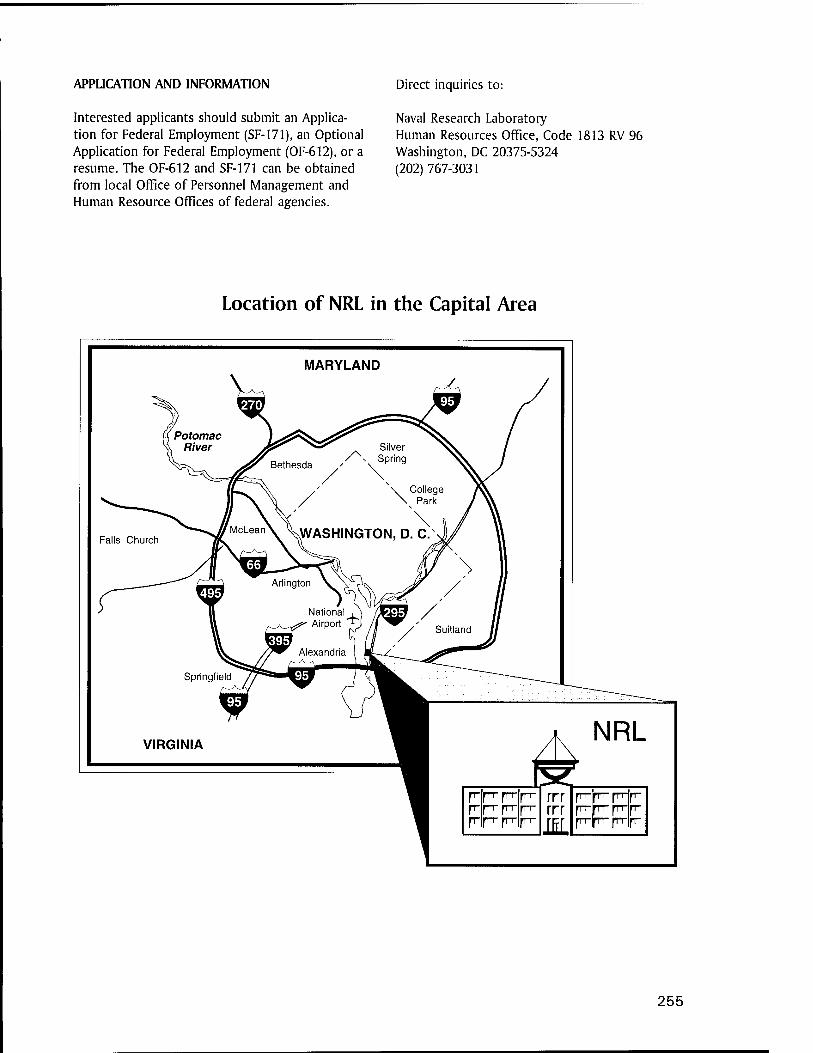
APPLICATION AND INFORMATION Direct inquiries to:
Interested applicants should submit an Applica- tion for Federal Employment (SF-171), an Optional Application for Federal Employment (OF-612), or a resume. The OF-612 and SF-171 can be obtained from local Office of Personnel Management and Human Resource Offices of federal agencies.
Naval Research Laboratory Human Resources Office, Code 1813 RV 96 Washington, DC 20375-5324 (202) 767-3031
Location of NRL in the Capital Area
MARYLAND
VIRGINIA
ITT rrr
rKrr p-frrrrrp-
255
Subject Index
Acoustic propagation, 84 Acoustic tomography, 185 Acoustic velocity sensors, 86 Acoustics, 20 Active damping, 208 ADM radar, 103 Advanced Graduate Research
Program, 235 Advanced Multipod System
(AMPS), 32 Advanced Research and
Geophysical Observation Satellite (ARGOS), 24
African-American Employment Program, 238
Alfred P. Sloan Fellows Program, 236
Amateur Radio Club, 13, 240 American-Indian/Alaskan-Native
Employment Program (AI/ANEP), 239
Antiship missile defense (ASMD), 103
Arabian Sea, 149 Asian-American/Pacific Islander
Program (API), 239 Atmospheric Laboratory for
Application and Science (ATLAS), 24
Atmospheric science, 191 Background Data Center (BDC),
24 Bio/Molecular Science and
Engineering, 20 Biomolecules, 49 Biophysical interactions, 149 Biosensor, 97 Black History Month art and
essay contests, 13 Brookings Institute Advanced
Study Program, 236 Brandywine, Maryland, 29 Catalysis, 137 Center for Computational Science,
26, 30
Central Target Simulator Facility, 108
Change detection, 159 Chaos, 141 Chemical vapor deposition, 137 Chemistry, 16 Chesapeake Bay Detachment
(CBD), 26, 27 Clementine, vi, 9 Clutter target discrimination,
163 Color vision, 163 Command and control, 181 Community Outreach Program,
13, 239 Compact Antenna Range, 14 Complex geometries, 71 Computational Fluid Dynamics,
71 Computer-aided Engineering
(CAE) Facility, 14 Condensed Matter and Radiation
Sciences, 18 Control, 141 Cooperative Aircraft Identification
(CAI), 14 Corporate Facilities Investment
Plan (CFIP), 30 Corrosion, 49 Counseling Referral Service
(C/RS), 237 Credit Union, 13 Cryogenic microwave devices,
195 Cubanes, 93 Currents, 59 Damage control, 183 DC brushless motors, 198 Digital Processing Facility, 15 Diode-Pumped Solid-State
Lasers, 15 Distributed simulation, 127 DoD Science & Engineering
Apprentice Program, 243 Dynamics, 141
Edison Memorial Graduate Training Program, 235, 236
Electric propulsion, 198 Electrochemical diffusion, 115 Electromagnetic Interference
(EMI) Facility, 14 Electronic Warfare, 16, 106 Electronic Warfare System
(EWS), 32 Electronics Science and
Technology, 19, 30 Electro-Optics Research
Facility, 15, 30 Emittance Measurements
Facility, 15 Energetic materials, 93 Energy dispersive, 115 Environmental, 97 Environmentally acceptable,
49 EPICENTER, 19, 31 Epitaxy, 135 ESM, 106 Explosives, 97 Extreme Ultraviolet Explorer
(EUVE), 8 Ex-USS Shadwell (LSD-15), 29 Faculty Member Appointments,
242 Far-Ultraviolet Imaging
Spectrograph (FUVIS), 8 Federally Employed Women,
Inc. (FEW), 13, 237, 238 Federal Employment
Opportunity Recruitment Program (FEORP), 239
Federal Executive and Professional Association, 13
Federal Women's Program (FWP), 238
Fellowship in Congressional Operations, 236
Ferroelectric, 104 Fiber-Optics Sensors, 15, 165 Firefighting, 183
256

Fires, 183 Flight Support Detachment
(NRL FSD), 26, 32 Focal Plane Evaluation Facility, 15 Free-electron maser, 110 Free-Surface Hydrodynamics
Laboratory, 31 GAMBLE II, 19 Geolocation, 205 Global Imaging of the Ionosphere
(GIMI), 24 Graphical Interface, 108 HERCULES, 205 High-Energy Pulsed Hydrogen
Fluoride, Deuterium Fluoride Laser, 15
High-Power Microwave (HPM) Facility, 18
High-Resolution Atmospheric and Auroral Spectroscopy (HIRAAS), 24
High-temperature superconductivity, 195
Hispanic Employment Program (HEP), 238
Human-computer interaction, 181 Hydroxyl radical, 199 Hypervelocity Impact Facilities,
18 Image intensifier, 205 Imaging radars, 171 Immunoassay, 97 Individuals with Disabilities
Program (IWDP), 239 InfoNet, 25 Information Security Engineering
Laboratory, 14 Information Technology, 14,
32, 125 Ion Implantation Facility, 18 Information Technology and
Communication, 129 Infrared, 159 Infrared detectors, 119 Infrared (IR) test chamber, 30 Instability, 117 Interfaces, 119 Intergovernmental Personnel
Act Appointments, 242 Internal waves, 93 IR Missile-Seeker Evaluation
Facility, 15 Joint multispectral program, 159 Karle, Dr. Isabella, iv
Kuroshio, 59 Laboratory for Advanced Material
Synthesis (LAMS), 19 Laboratory for Computational
Physics and Fluid Dynamics, 17 Land-based testing, 103 Large Optic, High-Precision
Tracker, 15 Large-scale dynamics, 191 Laser explosion, 188 Laser facilities, 18 Laser sensing, 137 Lens antenna, 104 Littoral environment, 103 Localized, 117 Low cost, 104 Magnetic, 135 Map Data Formatting Facility,
24, 28 Mask, 162 Materials Science and Technology,
17, 32 Marine Corrosion Test Facility,
27 Marine Geosciences, 23, 32, 33 Marine Meteorology Division
Monterey, California (NRL-MRY), 24, 28
Mesoscale coastal nonhydrostatic, 151
Meteorology, 151 Microcomputer Software Support
Center, 240 Middle Atmosphere High
Resolution Spectrograph Investigation (MAHRSI), 9
Midway Research Center (MRC), 29
Millimeter wave source, 110
Mississippi's Alliance for Minority Participation, 238
Multicast, 127 Multispectral, 159 Nanochannel glass, 162 Nanoelectronic Processing
Facility (NPF), 19, 30 National Defense Science
and Engineering Graduate Fellowship Program, 242
National Research Council (NRQ/NRL Cooperative Research Associate Program, 241
Natural products, 49 Naval Center for Space
Technology (NCST), 25 Naval Postgraduate School
(NPS), 235 Navy Prototype Optical
Interferometer (NPOI), 22 Navy Science Assistance
Program (NSAP), 236 Near-field optical spectroscopy,
140 Nearshore dynamics, 175 NICEnet, 14 Night vision, 205 Nike Krypton Fluoride Laser
Facility, 10, 19 NRL Magnetic Observatory, 24 NRL Mentor Program, 237 NRL Review Awards, 230 NRL/United States Naval Academy
(USNA) Cooperative Program for Scientific Interchange, 241
Numerical modeling, 149 Ocean Acoustics Research
Laboratory, 31 Ocean currents, 173 Oceanography, 22 Ocean Science, 59 Office of Naval Research (ONR)
Postdoctoral Fellowship Program, 241
Office of Research and Technology Applications Program (ORTA), 236
Optical measurements, 165 Optical probe shock, 188 Optical Sciences, 14, 30 Organic chemistry, 93 Oriented Scintillation
Spectrometer (OSSE), 8, 24 Parallel High-Performance
Computer/Graphics Facility, 17 Parallel processing, 185 Pattern Analysis Laboratory, 28 Patterning, 162 Penthouse Processing Facility
(PPF), 19, 31 Pharos III Nd-laser facility,
32 Phase change, 84 Phased arrays, 104 Photoelectron diffraction, 135 Plasma, 117 Plasma Physics, 18, 30, 32
257
Polar Ozone and Aerosol Measurement Experiment (POAMII), 9
Polarimetric SAR, 147 P-3 Orion turboprop aircraft,
29 Pomonkey, Maryland, 29 Portable Hyperspectral Imager
for Low-Light Spectroscopy (PHILLS), 9
Professional Development Program for Ensigns, 242
Quantum dot, 140 Radar, 13, 173 Radar Imaging Facility, 14 Radar Signature Calculation
Facility, 14 Radar Test Bed Facility, 14 Reaction barriers, 137 Reaction-diffusion, 141 Receiving systems, 106 Recreation Club, 13, 240 Remote Sensing, 21, 31, 32,
147, 199 RF-guided missile, 108 Ruth H. Hooker Research Library
and Technical Information Center, 25
Sand waves, 171 Satellite Vertical Line Array
(SLVA) system, 21 Scalable software, 71 Scanning tunneling microsopy,
14, 119, 135, Scientific Visualization Lab,
26 Scintillation index, 93 Sea-skimming missiles, 103 Sediment transport, 175 Select Graduate Training
Program, 235 Semiautonomous Research
Aircraft (SARA), 198 Semiconductors, 119 Shallow water acoustics, 93 Shallow water bathymetry, 171 Shipboard, 106
Showboaters, 13, 240 Sigma Xi, 13, 237 Silicon, 95 Simulation, 181, 199 Sodium sulfur batteries, 202 Solar Coronagraph Optical Test
Chamber (SCOTCH), 31 Solar physics, 154 Solar radiation, 154 Solar Ultraviolet Spectral
Irradiance Monitor (SUSIM), 24 Solar variability, 154 Space experiment, 202 Space Science Division, 24,
31, 199 Space structures, 208 Space weather, 154 Spin, 135 Stennis Space Center, Mississippi
(NRL-SSC), 27 Stratified flow, 171 Structural control, 208 Structure of Matter, 16 Structured and unstructured
grids, 71 Student Career Experience
Program, 239, 242 Student Temporary Employment
Program (STEP), 243 Student Volunteer Program, 243 Summer Employment Program,
243 Summer Faculty Research
Sabbatical Leave Program, 241 Sun, 210 Surfaces, 95, 119, 135, 137, Synchrotron Radiation Facility,
18 Synchrotron-Wiggler radiation, 115
Table-Top Terawatt (T3), 19, 32 Tactical Environmental Support
System (TESS((3)), 28 Tactical Oceanography Simulation
Laboratory (TOSL), 21 Technical Information, 25 Temperature fluctuations, 84
Terrain mapping, 147 The Navy Prototype Optical
Interferometer (NPOI), 22 Thin-Film Preparation Facilities,
18 3-kJ KrF laser facility, 10, 19 3-Mev Tandem Van de Graaff
Accelerator, 18 Toastmasters International,
13, 238 Toastmasters Youth Leadership
Program, 13 TORPEDO, 25 Transmission electron
microscopy, 119 Ultralow-Loss, Fiber-Optic
Waveguides, 15 Ultrasonic tomography, 185 Ultraviolet spectroscopy, 210 Unconventional Stellar Aspect
(USA), 24 Unsteady plows, 71 Upper Atmosphere Research
Satellite (UARS), 24 Vacuum Ultraviolet Space
Instrument Test Facility, 31 Velocity shear, 117 Video imaging, 175 Virtual environment, 181, 183 Virtual Reality (VR) Laboratory,
14 Visual Design/Imaging Center, 26 Visualization, 181 Voltage controlled, 104 Water Vapor Millimeter-wave
Spectrometer (WVMS), 9 Waves, 175 Weather forecasting, 191 Wiggler, 110 Women in Science and
Engineering, 13, 237 Women's Executive Leadership
Program, 236 X-ray diffraction, 115 X-ray Facility, 18 X-rays, 93 Xybion, 205
258
Author Index
Amatucci, W.E., 177 AntoniadesJA, 117 Arnone, RA., 149 Askari, F., 171 Atkinson, R.J., 129 Baker, W.E., 202 Baski, A.A., 95 Batseil, S., 127 Bennett, B.R., 119, 135 Blank, M., 110 Boris, J.P., 71 Bosse, A., 208 Briguglio.JJ., 106 Brueckner, G.E., 210 Bucaro, J.A., 86 Burris, H.R., 188 Cardiel, DJ., 103 Chubb, S.R., 173 Church, J.C., 175 Cole, R., 127 Conway, R.R., 199 Cook, J.W., 210 Darken, R.P., 181 Delsanto, P.P., 185 Dominguez, D.D., 115 Donato, T.F., 171 DoyleJ.D., 151 Erwin, S.C., 95 Fillenbaum, E.R., 59 Finette, S., 83 Fisher, S., 208 Foch, R.J., 198 Freund, H.P., 110 Gammon, D.G., 140 Garner, J.C., 202 Gelaro, R., 191 Gilardi, R., 93 Golba,J.A., 195 Green, A.W., 149 Grun.J., 188 Haack.T., 151 Hagans, P.L., 115
Hallock, Z.R., 59 Hansen, D.C., 49 Higgins, R.F., 205 Hill, T.A., 181 Holland, K.T., 175 Houston, B.H., 86 Jackson, R.H., 110 Jansen, R.W., 173 Jonker, B.T., 135 Kahl, D.W., 108 Kamgar-Parsi, B., 125 Kamgar-Parsi, B., 125 Kaufman, B., 205 Kawecki, T.G., 195 Kennedy, E., 84 Kersey, A.D., 165 Kindle, J.C., 149 Kneedler, E., 135 Koo, K.P., 165 Kruer, M.R., 163 Kusterbeck, A.W., 97 Lagakos, N., 86 Landsberg, A., 71 LeanJ.L., 154 Lee.J.S., 147 Leibowitz, L.M., 103 Manka, C.K., 188 Mariska, J.T., 154 Marmorino, G.O., 171 McCafferty, E., 49 McClelland, R.S., 208 McDonald, D.L., 129 Mignogna, R.B., 185 Mire, C, 84 Murphree, T., 191 Nisenoff, M., 195 Orr, M., 83 Patel, D.P., 104 Pearson, D.H., 162 Pederson, M.R., 137 Phan, B.G., 129 Pickard, H.M., 205
Pickles, W.R., 104 Price, G.E., 195 Qadri, S.B., 115 Ramamurti, R., 71 Rao.J.B.L, 104 Reynolds, CA., 191 Root, B., 127 Rose, V.S., 195 Sandberg, W.C., 71 Satyshur, M.P., 163 Schaum, A.P., 159 Schaus, L.M., 103 Schechter, R.S., 185 Schuler, D.L., 147 SchuItz.J., 210 Schwartz, I.B., 141 Scribner, D.A., 163 Shanabrook, B.V., 119, 135, 140 Shen, C.Y., 173 Shriver-Lake, L.C., 97 Skelton, E.F., 115 Snow, E.S., 140 Solan, B.T., 181 Stanic, S., 84 Stocker, A., 159 Summers, M.E., 199 Täte, D.L., 183 Tatem, P.A., 183 Teague, W.J., 59 Thibado, P.M., 119, 135 Thompson, W.T., 151 Tielbuerger, D., 83 Tonucci, R.J., 162 Triandaf, I., 141 Trump, C.L., 171 Twigg, M.E., 119 Wagner, R.J., 135 Walker, D.N., 117 Warren, H.P., 154 Whitman, L.J., 95, 119, 135 Wolf, S., 83 Young, D.K., 149
259

NRL Review Staff
Senior Science Editor: Senior TID Editor:
Assistant Editor: TID Consultants
Dr. John D. Bultman Patricia Staffieri Jonna Atkinson Kathleen Parrish and Timothy Calderwood
Illustrator: Rob Sprouse
Computerized composition and design: Donna Gloystein and Judy Kögok
Graphic support: Jan Morrow, Jonna Atkinson, Suzanne Guilimineau, Carol Hambric, and Cathy Johnson
Historical update: Dr. David van Keuren
Photographic production: Richard Bussey, Gayle Fullerton, Jarnes. Marshall, Barbara Padgett, and Michael Savell '
Production assistance: Rosie Bankert, Diltricia Montgomery, Leona Sprankel, and Paul Sweeney
Distribution: Joyce Harris and Barbara Jollijfe
Head, Technical Information Division: Peter H. Imhof
REVIEWED AND APPROVED NRiyPU/5230--96-300
March 1996
-ScA'
Bruce W. Buckley Captain, USN
Commanding Officer
Approved for public release; distribution is unlimited.
Related Documents


