RD-AhB3 256 DETECTION OF CAPSULE TAMPERING BY NEAR- INFERRED 1/1 REFLECTANCE RLYSIS(U) INDIANA UNIV AT BLOOMINGTON DEPT OF CHEMISTRY R A LODER ET AL. 61 AUG B? UNLSIFIED INU/VD NTR-V NNI4-E-K-036 F/G 6/15NL EEEEEEEEEEEmh EEEEEEEEEEEEEE EEEEEEEEEEEEl

Welcome message from author
This document is posted to help you gain knowledge. Please leave a comment to let me know what you think about it! Share it to your friends and learn new things together.
Transcript
RD-AhB3 256 DETECTION OF CAPSULE TAMPERING BY NEAR- INFERRED 1/1REFLECTANCE RLYSIS(U) INDIANA UNIV AT BLOOMINGTONDEPT OF CHEMISTRY R A LODER ET AL. 61 AUG B?
UNLSIFIED INU/VD NTR-V NNI4-E-K-036 F/G 6/15NL
EEEEEEEEEEEmhEEEEEEEEEEEEEEEEEEEEEEEEEEl
11 1.0 o 1.2
111111-- .4 1_6
111 1.10 .4 'm
ltII.2 l.l . 1
MICROCOPY RESOLUTION TEST CHIARTNATIONAL BUREAU OF STANOARDS-1963-A
. " 'U -• W '* ,5 % , • % . . ... 3 . g'',.% , ., % , 5
I*hclassified " C
AD-A 183 25 UMENTATION PAGEI&. REPORT SECURITY CLASSIF iN - me"i lb. OWRICTIVE MARKINGS
NA kEE gaSECURITY CLASSIFICO AUTH 3 DISTRIBUTION /AVAILABILITY OF REPORT
2b. 0ECLASSIFICATIONiDOWNGRADIR DULE Distribution Unlimited; Approved for PublicNA Release
.PERFORMING ORGANIZATION REPOR NUMBESn S. MONITORING ORGANIZATION REPORT NUMBER(S)INDU/DC/GMH/TR-87-06 "'Z .. NA6a. NAME OF PERFORMING ORGANIZATION 6b. OFFICE SYMBOL 7a. NAME OF MONITORING ORGANIZATION
Indiana University (if apkabi)NAON
6C. ADDRESS (Cty, State, and ZIPCodC) 7b. ADDRESS (City, State, ad ZP Code)Department of Chemistry 800 N. Quincy StreetBloomington, IN 47405 Arlington, VA 22217
B. NAME OF FUNDING/SPONSORING 1b OFFICE SYMBOL 9 PROCUREMENT INSTRUMENT IDENTIFICATION NUMBERORGANIZATION (If applkiable)
NA Contract N00014-86-K-0366
Bc. ADDRESS (City, State, and ZIPCode) 10. SOURCE OF FUNDING NUMBERSPROGRAM PROJECT TASK WORK UNITELEMENT NO. NO. NO CCESSION NO
4134006
11. TITLE (kkid Secuft ClniCfiatln)
Detection of Capsule Tampering by Near-Infrared ance Analysis
12 PERSONAL AUTHOR(S) .Robert A. Lodder, Hark Selby and Gary M. Hi i etj e
13a TYPE OF REPORT 13b. TIME COVERED h4 DAT.,O1f REPORT (Year, Month, Dy) IS PAGE COUNTTechnical FROM TO OILI 53
16. SUPPLEMENTARY NOTATION
Prepared for publication in Analytic Chemistry
17. COSATI CODES Is. SUBJ TERMS (Contop on reverse if necessary and kdentify by block number)FIELD GROUP SUB-GROUP Sensors, near infrared reflectance analysis,
capsule tampering, fault detection
19. ABSTRACT (Continue on reverse if necesary and i*entify by block w7 The growing incidence ot product tamper -.
ing has brought to attention the need for a rapid, reliable, inexpensive, noninvasive andnondestructive method of screening. Such a method, based on near-infrared reflectanceanalysis (NIRA), is presented here for the detection of adulterated nonprescription drugs. %The method relies upon a nonparametric clustering algorithm known as the BEAST (Bootstrap rError-Adjusted Single-sample Technique). Specially-designed sampling reflectors have beenconstructed to enable rapid and convenient measurement of capsules. A right-circular coni- %cal reflector has been found to be optimal for this purpose; the capsules fit directly intothe reflector and need not be opened for analysis. A variety of foreign substances havebeen successfully detected in capsules by grobing the capsule contents directly through thegelatin walls; these substances include Fe2O3n, Al shavings, NaF, As'0!, NaCN and KCN. TheNIRA response for KCN is linear down to a detection limit of 2.6 mg (0.4% of capsuleweight). An incidental advantage in the use of the conical reflector is that the res . e 4is dependent not only upon the mass of adulterant but its location within the capsule. The
... ..
(continued ...)
20 DISTRIBUTION /AVAILABILITY OF ABSTRACT 21 ABSTRACT SECURITY CLASSIFICATION
]UNCLASSIFIED/UNLIMITED 0 SAME AS RPT [ DIC USERS Distribution Unlimitedr22aNAME OF RESPONSIBLE INDIVIDUAL 22b. TELEPHONE (Include Area Code) I 22c OFFICE SYM "!f
Gar H. HieftJe (812) 335-2189DO FORM 1473,84 MAR 83 APR edition may be used until exhausted SECURITY CLASSIFICATI6'N OF THIS PAGE
All other editions are obsolete SOJ r , ,, . , "Unclas ife '" 114edv'r
87.
19. Abstract (continued)
ability to noninvasively determine the location of foreign substances withincapsules might be important in forensic applications of the method.
Acce ,ioi, ForNTIS CRA&iDTIC 1AS U)U~ann;, .c"xi F]-S
Ju ti c l ,r;..........................
By
AvJIabihiy (uljp's
A. DTIC
DiI, co-v.py1,,.!,)
INSPECTED
6
/* @ ,
%-
1Up " i 'F \" i n' t " lP t ' - J -
OFFICE OF NAVAL RESEARCH
Contract N14-86-K-0366
R&T Code 4134006
TECHNICAL REPORT NO. INDU/DC/GMH/TR-87-06
DETECTION OF CAPSULE TAMPERING BY
NEAR-INFRARED REFLECTANCE ANALYSIS
by
ROBERT A. LODDER, MARK SELBY, AND GARY M. HIEFTJE
Prepared for Publication
in
ANALYTICAL CHEMISTRY
Indiana UniversityDepartment of Chemistry
Bloomington, Indiana 47405
1 August 1987
Reproduction in whole or in part is permitted forany purpose of the United States Government
This document has been approved for public releaseand sale; its distribution is unlimited
V.g'a
-4-
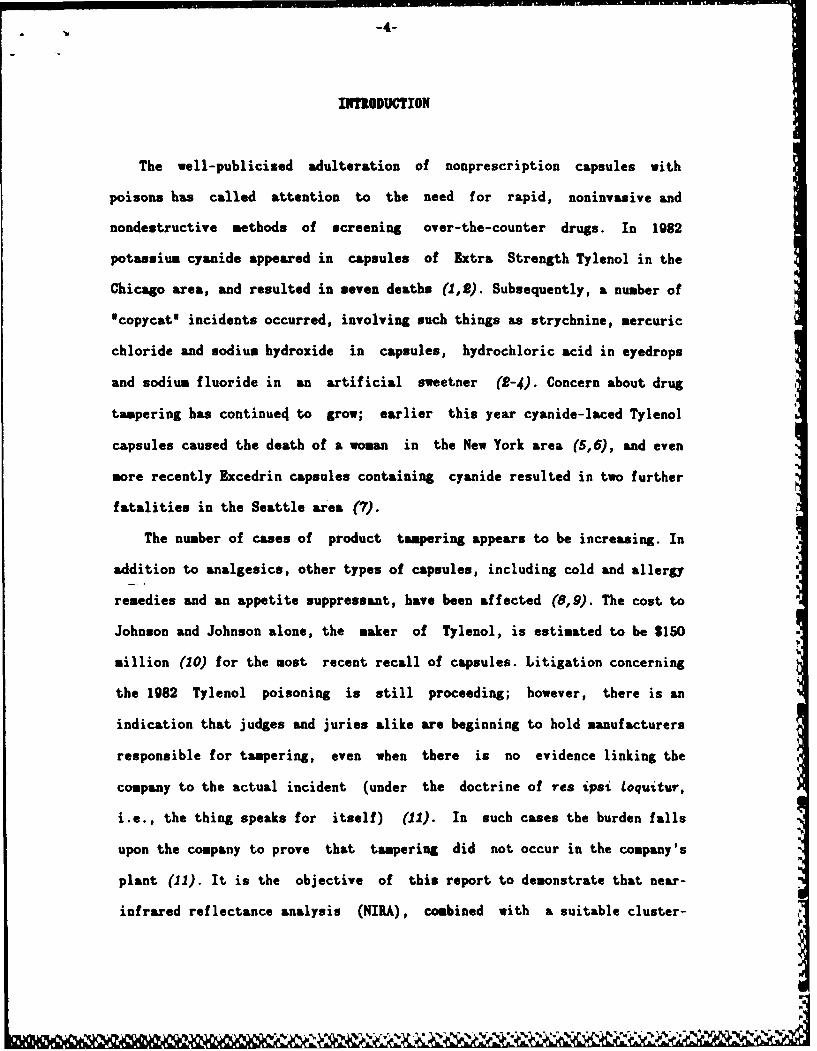
INTRODUCTION
The well-publicised adulteration of nonprescription capsules with
poisons has called attention to the need for rapid, noninvasive and
nondestructive methods of screening over-the-counter drugs. In 1982
potassium cyanide appeared in capsules of Extra Strength Tylenol in the
Chicago area, and resulted in seven deaths (1,S). Subsequently, a number of
Ucopycati incidents occurred, involving such things as strychnine, mercuric
chloride and sodium hydroxide in capsules, hydrochloric acid in eyedrops
and sodium fluoride in an artificial sweetner (2-4). Concern about drug
tampering has continue4 to grow; earlier this year cyanide-laced Tylenol
capsules caused the death of a woman in the New York area (5,6), and even
more recently Excedrin capsules containing cyanide resulted in two further
fatalities in the Seattle area (7).
The number of cases of product tampering appears to be increasing. In
addition to analgesics, other types of capsules, including cold and allergy
remedies and an appetite suppressant, have been affected (8,9). The cost to
Johnson and Johnson alone, the maker of Tylenol, is estimated to be $150
million (10) for the most recent recall of capsules. Litigation concerning
the 1982 Tylenol poisoning is still proceeding; however, there is an
indication that judges and juries alike are beginning to hold manufacturers
responsible for tampering, even when there is no evidence linking the
company to the actual incident (under the doctrine of res ipsi Loquitur,
i.e., the thing speaks for itself) (11). In such cases the burden falls
upon the company to prove that tampering did not occur in the company's
plant (11). It is the objective of this report to demonstrate that near-
infrared reflectance analysis (NIRA), combined with a suitable cluster-
-5-
analysis algorithm, can be used to indicate that capsules (or similar
products) have or have not been adulterated.
Subsequent to the 1982 incident the Food and Drug Administration (FDA)
collected and tested two million capsules of Tylenol in a search for
contaminated bottles of the drug (1). Capsules were batched into groups of
5-10 for analysis. While the FDA avoided much publicizing of its methods,
several techniques have been reported for various capsule analyses,
including such simple methods as inspection by visual appearance and odor.
In the Tylenol case the capsules had been grossly contaminated with 500 to
S0 mg of KCN, and the KCN consisted of fairly large crystals while the
analgesic was a powder of small particle size (4,12). Potassium cyanide is
also deliquescent, which resulted in a readily identifiable distortion and
discoloration of some of the adulterated capsules. KCN can also emit an
odor of bitter almonds (1I,14). Nevertheless, the possibility exists that
tainted capsules will not be spotted and, in any case, the procedure is not
suitable for detecting lower-level contamination. In another case, UY
spectrometry has been used to identify substitution of phentermine,
phenylpropanolamine, and caffeine (15). Thin-layer chromatography (15) and
microcrystal tests have also been used to detect counterfeit lonamin
capsules (15). X-ray spectrometry, using grain inspection or clinical
mammographic instrumentation, has been employed to detect cyanide in
Tylenol capsules (12); however, the majority of these determinations were
performed using differential pulse polarography of cyanide reduction at
about -0.3 V vs. SCE (12). Inductively-coupled plasma atomic emission
spectrometry (ICP-AES) of trace elements in KCN has also been used to
obtain an elemental 'fingerprints of the tainted capsules in an effort to
trace the source of the KCN (4).
-6-
With the possible exception of X-ray methods, all of the above techniques
require that the capsules be opened and their contents emptied for
analysis. Clearly, a nondestructive method of probing the contents of
suspect capsules (or similar products) directly through the walls of the
container would be desirable for rapid screening in large numbers. NIRA, in
conjunction with appropriate data analysis, is suitable for such a
screening of over-the-counter drugs and is simpler and less expensive to
implement than x-ray methods.
NIRA is a rapid analytical technique that typically uses the diffuse
reflectance of a sample at several wavelengths to determine the sample's
composition (16). Through a coqputerised modeling process NIRA is able to
correct automatically for background and sample-matrix interferences,N
making ordinarily difficult determinations seem routine. This modeling
process employs a "training set* of samples to, in effect, 'teach* the
computer to recognise relationships between minute spectral features and
sample composition. Of course, the contents of the training-set samples
must have been previously determined by some other method.
The model developed in NIRA is composed of linear equations of the form
nConcentration(A) = CO + E CiR i (1)
i= 1
where A is the sample component of interest (one equation is required for
each component), n is the number of wavelengths, Ri is the reflectance at
the i-th wavelength, and the C's represent the constant factors determined
through a multiple regression process. In other words, the model gives the
sample composition from a number of linear equations, each of which
expresses a particular component concentration as a weighted sum of the
reflectances observed at a number of wavelengths.
7%
A .A A-
-7-
The instrument used in NIRA can be as simple as a filter photometer or
as complex as an FTIR (the former is more common than the latter). The
broad spectral features and highly correlated wavelength vectors (Ri's)
make only a few filters (less than 10) usually necessary, so NIRA
instruments are relatively inexpensive. Little or no ample preparation is
required in NIRA, and powders can be directly analysed. Finally, near-
infrared radiation penetrates most compounds rather well because the
absorptions in this spectral region .are usually weak. These basic
characteristics suggest that NIRA can be easily and profitably employed in
the detection of tampering.
However, there is an obstacle to such a use of NIRA: it is not possible
to predict what might be placed in a particular product. The modeling
process described above relies on the availability of a training set
composed of known products and known contaminants. Even if one could
assemble sets of all of the products and adulterants that have been
involved to date, there is no guarantee that a new adulterant would not
appear in the product tomorrow. Unfortunately, using a multiple regression
model, any amount of reflectance at the selected analytical wavelengths
generates some sort of composition value regardless of the material
responsible for the reflection. In other words, when a ample contains a
component that is not present in the training set, erroneous composition
values can result without any indication of the error.
One cure for this problem would be to find a method of spotting
anomalous samples based on their near-infrared spectra. The use of such a
method would allow different linear models (calibration equations) to be
applied in the analysis of the components of different samples. The problem
of assigning a particular spectrum to a particular linear model has been
F .1 dr r. 1 .- . . 1. .-. . I . - .
called the 'false-smple problem', and a method has been proposed to solve
it (17). This method, the Quantile BEAST (Bootstrap Error-Adjusted Single-
sample Technique), goes beyond a simple qualitative analysis of mixtures to
determine whether a quantitative prediction equation applies to a
particular sample. This method can be used to: (1) detect any tampered
product by determining that it is not similar to the previously-analysed
unadulterated product, (2) qualitatively identify the contaminant from a
library of known adulterants in that product, and (3) provide a
quantitative indication of the amount of contaminant present.
The Quantile BEAST considers each monitored wavelength to be a
dimension in hyperspace. For example, a spectrum recorded at n wavelengths
can be represented as a single point in n-dimensional hyperspace,
translated from the origin in each dimension by an amount that corresponds
to the magnitude of the reflectance observed at each wavelength. In this
scheme, similar spectra appear in similar regions of hyperspace. The
distribution of ref lectances on each wavelength axis provides a projection
of the clusters of similar points (spectra) (see Figure 1). Valid
(unadulterated) samples are defined as those that fall inside the cluster
of training-set points when the BEAST is trained with unadulterated product
samples. False (tampered) samples are those that fall outside of the same
cluster. Confidence limits are set along any linear combination of
wavelengths (dimensions) to define the surface of the cluster at a
specified level.
.1"
These confidence limits are obtained by using a bootstrap procedure
(18) to arrive at an estimate of the real-sample distribution based on the
training-set distribution. The bootstrap procedure has three basic steps:
1. A training set is carefully constructed from real (in this case
unadulterated) samples in a way that captures all of the possible
sample variance. Fortunately, NIRA is predicated on the construction
of such training sets, and a good deal of knowledge has been
accumulated in this area (19,20). Spectra are then recorded to
produce training-set points in hyperspace.
2. A randomly selected set of samples (the same size as the training
set) is chosen from the training set, with replacement from the
training set, to form a bootstrap sample set. The bootstrap sample
set is analyzed as though it were an actual sample set - in the
tampering work, this analysis is based on locating the center of the
sample distribution in hyperspace.
3. The complete hyperspace distribution of real-sample centers is
approximated by the bootstrap distribution of centers. This
approximation is calculated using a Monte Carlo integration of the
bootstrap distribution while the training set is held fixed at the
values obtained in step I.
After it develops an estimate of the real-sample distribution from the
training set, the BEAST computes the center of the real-sample
distribution. When a new sample (suspect product) is analysed, its spectrum
is projected as a point into this hyperspace. A vector is then formed in
hyperspace between this new spectral point and the computed center point of
the real-sample distribution. A hypercylinder formed around this line (with
a radius typically 2 or 3 orders of magnitude smaller than its length (17))
-10-
will contain a number of BEAST-estimated real-sample spectral points. When
the coordinates of these points are transformed into distances from the
estimated center of the real-sample distribution, a univariate distribution
is formed. It is this univariate distribution that is used to construct
confidence limits by selecting two quantiles in one of the clusters (17).
The reliance of the BEAST on nonparametric techniques (techniques that
assume no particular underlying distribution) produces an analytical method
that functions without assumptions about the shape, size, symmetry, or
orientation of spectral-point clusters in hyperspace. This freedom isS.,
important because cluster characteristics have been shown to be
unpredictable (17). The detection of abnormal capsules encompasses both
process-control applications (in which empty capsules, rust, metal
shavings, etc. are of interest) and the identification of instances of
deliberate tampering (in which almost anything might appear in the
capsule). Under such widely varying conditions the unpredictability of the
cluster characteristics can only be magnified, making the use of 0
nonparametric techniques even more worthwhile.
%.
*4"
IS
IIPRIMBNTAL SECTION
lquipment Used. Spectral data for all of the experiments were collected
at 18 discrete wavelengths by a Technicon InfraAlyser 400 filter
spectrophotometer connected to a VAX 11/780 computer (Digital Equipment
Corporation) and with custom interface, graphics and database-management
programs. These programs, and the BEAST algorithm described earlier, were
written in Speakeasy IV Delta (VMS version, Speakeasy Computing
Corporation, Chicago, IL) and VAX 11 Basic (Version 2.4). The programs can
be obtained by arrangement with the authors at the address given above.
Reproducible positioning of capsules is important in minimising the
error of repeated readings of the individual capsules. The initial results
(with Hook's Cold Caps [cold remedy capsules]) were obtained by placing the
capsules into an elliptically-shaped aluminum reflector (#1468 Progressus
Company, Freeport, NY) (see Figure 2). Reproducible positioning of the
capsules within the reflector was achieved by removing the 'blister' from a
Cold Caps 'blister-pack," trimming it to about 2 m in height and gluing it
into the center of the reflector with the open side up.
Datril and Anacin-3 capsule results were obtained using a 900 conical
reflector machined from aluminum (Figure 3). A nichrome wire support was
used to achieve reproducible upright vertical capsule positioning within
the cone. Optical surfaces of both reflectors were polished with a
commercial polishing paste.
Materials Used. Three brands of capsules were selected for this study:
1. look's Cold Caps (Hook's Drug's, Inc., Indianapolis, IN), an allergy
and cold remedy containing a decongestant (phenylpropanolamine
hydrochloride) and an antihistamine (chlorphenirmine maleate), and
colored red and white.
* U ., o - .•% .. ... . " . . . . ... . . . . - - . -' '
-12-
2. Extra Strength Datril capsules (500 mg acetaminophen [N-(4-
Hydroxyphenyl)acetamide], Bristol-Myers Company, New York, NY),
colored green and white.
3. Maximum Strength Anacin-3 capsules (500 mg acetaminophen, Whitehall
Laboratories, Inc., New York, NY), colored blue and white.
The adulterants selected for study can be divided into two categories:
those that might appear in capsules as the result of process-control
problems, and substances that are more likely to appear as the result of
deliberate tampering. The process-control substances tested were:
1. Ferric Oxide, reagent grade (J.T. Baker Chemical Company,
Phillipsburg, NJ).
2. Aluminum metal, 20 mesh (Fisher Scientific, Fairlawn, NJ).
The substances selected that are more likely to be present as the result of
deliberate tampering were:
1. Arsenic trioxide, reagent grade (Fisher Scientific). The lowest
lethal dose reported for humans is 2.941 mg/kg, or 206 mg for an
average 70 kg person (13).
2. Sodium fluoride, reagent grade (MCB, Norwood, OH). The lowest lethal
dose (oral) reported for humans is 75 mg/kg, or 5.25 g for a 70 kg
person (is).
3. Crystalline sodium cyanide, reagent grade (Aldrich Chemical Company,
Milwaukee, WI). The lowest reported lethal (oral) dose for humans is
2.857 mg/kg, or 200 mg for a 70 kg person (13).
4. Granular potassium cyanide, reagent grade (Mallinckrodt, Paris, KY).
The lowest lethal dose reported in humans is 2.941 mg/kg, or 30F mg
for a 70 kg person (13).
-13-
All adulterants were added to the capsules on an 'as is' basis without any
grinding, sifting, or sample preparation. One or two grams of the cyanide
were removed from the reagent container at a time and kept covered to
reduce the absorption of water. Capsules were filled from this covered
reservoir and no additional steps were taken to control water absorption.
Each experiment performed with the capsules began by training the BEAST
(with 10-13 unadulterated capsules) to recognize a 'good' capsule. The
training process was then tested by using the BEAST to measure the distance
(in standard deviations) of the same number (10-13, depending upon the
capsule brand) of 'good" capsules from the center (mean) of the training-
sample cluster. The sjurface of a cluster was defined as being 3 standard
deviations (SDs) away from its center (mean). In theory, then, all of the
'good' test capsules (validation capsules) should appear less than 3 SDs
from the training-set center, while all of the 'bad' capsules (contaminated
samples) should appear more than 3 SDs from the training-set center.
Types of Experiments Performed. The first experiment involved placing
arsenic trioxide, sodium fluoride, sodium cyanide, ferric oxide, and
aluminum shavings in cold capsules to test the feasibility of using NIRA to
analyze the contents of intact capsules. Two wavelengths were monitored
using the simple elliptical reflector. On the basis of this experiment, the
second conical reflector was designed and tested with Datril capsules.
Further experiments employed the conical reflector to analyze intact Datril
and Anacin-3 capsules at 4 wavelengths. The spatial response and
orientation effects of sodium cyanide in Datril and Anacin-3 were
determined, and a detection limit was calculated for potassium cyanide in %
Anacin-3.
-14-
Analysis of the Sample Reflectors. The empty elliptical reflector
(Figure 3) gave log(l/R) values at 18 wavelengths between 0.31 and 0.42.
When a capsule was placed in the reflector these values roughly doubled. It
was thought that the amount of specular reflectance passing from the
reflector to the detector and bypassing the sample capsule must be rather
large. A new reflector (Figure 3) was constructed to reduce the specular
reflectance. This 900 conical reflector, when empty, reflects radiation
back toward, its source, parallel to the incident beam. When a sample
capsule is positioned along the axis of rotation of the conical reflector,
the specular reflectance can be minimized while the diffuse reflectance is
maximized. Radiation reflected from the surface of the capsule is returned
to the source when the incident radiation is perpendicular to the base of
the cone (this is the configuration used in the spectrophotometer).
Radiation is then focused along the length of the capsule. Any radiation
that might pass through the capsules without being scattered is also
returned to the source. The bulk of the radiation reaching the detector is
therefore radiation scattered by the contents of the capsule.
If one assumes that the base of the conical reflector is uniformly
illuminated by collimated radiation (this is the way that the
spectrophotometer is designed), the amount of radiation incident on any
given section of the capsule is directly proportional to the curved surface
area of the frustum in which it lies. In turn, a frustum (a conic section
taken parallel to the base of the cone) near the vertex and a frustum near
the base of the same cone do not have the same curved surface area. (The
curved surface area of a frustum is given by vs(rl+r 2), where r, and r2 are
the radii of the base and top of a right circular frustum, respectively,
and s is the length of the generator line, i.e., the length between the top
and bottom measured along the surface of the cone).
Suppose that the length of the capsule is divided into 1 -m sections
and that these slices are numbered from I to 20, starting at the end of the
capsule toward the vertex of the cone. From the discussion in the preceding
two paragraphs, the top slice of the capsule (i.e., slice no. 20) receives
39 times more light than the bottom slice (slice no. 1). In fact, the
amount of light (P) received by a particular slice numbered R (the height
of the section above the inverted vertex of the cone) is given by:
P = k(21r,/2)R-wiV2, (2)
Of course, there is not a detector on each I mm section of the capsule.
Instead, there is a detector inside an integrating sphere, and the signal
from the entire capsule is integrated to produce the detector response:
detector response =k'(wr/2)R'2-(r,/2)R', (3)
where k and k' are proportionality constants that depend principally on the
amount of incident radiation and the nature of the material in the capsule,P
and R' is the total number of vertical capsule "slices' filled, i.e., from
1=1 to R'.
The diameter of the incident beam in our instrument is 26 -o, making
direct illumination of the upper segments (R=13 to 20) by the incident beam
the predominant factor in producing a signal from this region. The amount
of light on each slice decreases exponentially as the slice number is
decreased in this zone. Of course, the entire cone is filled with
scattered light, and the thickness and composition of the capsule wall are
not uniform over the capsule length. These two factors, combined with the
-16-
probable sample inhomogeneity, prevent a simple analysis from completely e
explaining the signal observed from an individual capsule. However, the
overall response follows the trends outlined above.
Computation Procedure. A training set composed of ten capsules produces
a total of 92378 possible bootstrap samples (calculated from 2n-1
combinations of n points, taken n at a time with replacement from the
training set). Calculation of 1000 bootstrap replications represents more
than 1% of the possible bootstrap distribution, a greater proportion of the
distribution than is usually covered by Monte Carlo techniques. A ,
compromise between coverage and execution time must be reached when one
uses the BEAST; therefore, 1000 bootstrap replications were used for all
the foregoing capsule experiments, resulting in a BEAST analysis time ofe
about four seconds per capsule. A BEAST algorithm optimized for process
control instead of research would be even faster. A training-set sise of
.7only ten capsules is rather small, yet is large enough for the capsule
experiments because the variability is small from capsule to capsule among
the uncontaminated samples. In general, as the variability of the mixtures '%
in the training set increases, the number of training samples required by
the BEAST also increases. This requirement is a common one among NIRA %
techniques and is ordinarily not too burdensome. In order to assure that
there were enough points (about 50 are required) in the hypercylinder to
set confidence limits, the hypercylinder radius was set at 0.00060 (17).
This value has the same dimensions as the log(l/R) values collected by the
spectrophotometer. The reproducibility of BEAST distances is a function of
the number of bootstrap replications employed, the hypercylinder radius, 'S
and the training set. The parameters given above (and used to obtain all
of the experimental results) have been found to give RSD's around 7% (17).
,9
-17-
RESULTS AND DISCUSSION
Tables I and Table II summarize the results of the cold-capsule experiment.
Ten look's Cold Caps were used to train the BEAST at two wavelengths; it
was assured that extreme cases of the standard capsules were adequately
represented in the training set on the basis of the most unusual spectra.
The net effect of this procedure is to make the training-set cluster in
hyperspace larger, and the distances measured in this space in SDs smaller.
Although this procedure increases the likelihood that unadulterated
capsules will test as 'good' it also makes it more likely that adulterated
samples will test similarly. However, this error would arise only when
contaminated samples are spectroscopically very similar to the
uncontaminated ones; such similarity was not observed in any of these W
experiments. The most likely effect of exaggerating the training set with
extreme examples of unadulterated capsules is the raising of the detection
limit for some contaminants. The importance of this possibility will be
examined below.
The distances of the spectra of ten unadulterated cold capsules, in
units of standard deviations, from the center of the hyperspace cluster of
training-sample spectra are as follows: 0.30, 0.69, 0.42, 0.38, 0.85, 0.70,
0.33, 0.58, 0.23, 0.84. These ten capsules are not the ten that were used
to train the BEAST and serve therefore to validate the results of the
training process. The fact that all of these distances are less than one
standard deviation indicates that the BEAST is unlikely to reject a good
capsule accidentally. Table I gives the distances of the spectra of 21
contaminated cold capsules from the center of the training-set spectral
cluster. In every case the distance exceeds the 3 SD limit set as the
dividing line between 9good' and 'bad' capsules. The results indicate that
a variety of contaminants can be detected in intact capsules by using only
two NIl wavelengths and a simple reflector-based capsule mount. Aluminum
shavings are clearly detectable inside the capsule even though the
reflector is also aluminum. A completely empty capsule can be easily
differentiated from a capsule contaminated with aluminum. The BEAST
algorithm works by detecting the absence of components that should be
present an well as by detecting the presence of components that should be
absent. This type of functioning gives the BEAST a powerful ability to '
detect all kinds of tampering. Presumably it is the absence of cold remedy,
combined with the added scattering of specular radiation from the aluminum
shavings inside the capsule, that produces the difference between the
aluminum-containing capsules and the cold remedy that is measured by the
BEAST.
Spatial Character isation of the Capsules. When an adulterant is packed %5IL
into a capsule and the capsule spectrum is measured in the conical
reflector, the results can be fairly well predicted by our model of the
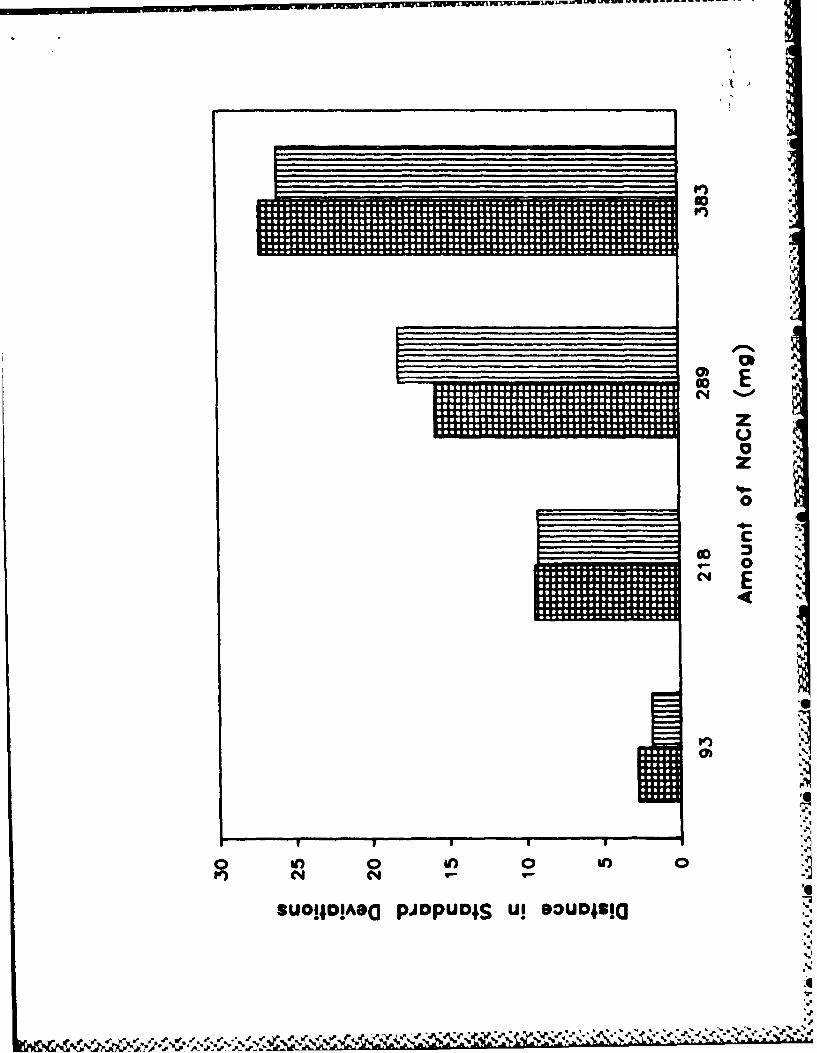
detector response. Figure 4 shows the actual response (in SDs from the
center of Datril training set) of four Datril capsules containing 93, 218,
289 and 383 mg of sodium cyanide. This cyanide was packed into the white
end of the capsule, which was oriented toward the vertex (bottom) of the
conical reflector. The slight differences between the theoretical and
observed results can probably be attributed principally to two factors:
1. the thickness and opacity of the capsule itself are not constant from
one end to the other (for instance, there are two layers of gelatin
in the middle of the capsule);
2. peculiarities are introduced into the capsule spectra, and therefore
into the distances in 8Dm, by the particular orientations that the
capsule contents (both sodium cyanide and acetaminophen crystals)
assume in a mingle capsule packing.
Knowledge of the characteristics of the conical reflector permits some
spatial profiling of the capsule for a given contaminant. A specific BEAST
response can indicate either a relatively large amount of contaminant in
the lower sections of the capsule or a relatively small amount of
contaminant in the higher sections. This classic dilemma - that of too many
unknowns and too few equations - is solved simply by inverting the capsule
and running the BEAST again. The total amount of contaminant in the capsule
is obtained by developing ordinary NIRA calibrations using homogeneous
training sets (containing only one type of capsule configuration).
Discriminating Ability of the Reflectors. The most important feature of
the reflector cone, however, is its ability to discriminate between
capsules with similar component concentrations. This ability is
demonstrated by an experiment conducted with four tainted Datril capsules.
Capsules I and 2 contained about 170 mg of NaCN, while capsules 3 and 4
contained about 460 mg of NaCN. The remainder of each capsule was composed
of the acetaminophen powder normally found in the capsules, giving an
average total capsule mass of about 600 mg. Data were collected at four
wavelengths with both the elliptical and conical reflectors, and the
Euclidean distances among the spectra of the four capsules was determined.
The reflector with the greatest discriminating capability maximises the
average distance ratio
distance between spectra of dissimilar capsulesdistance between spectra of similar capsules
-20-
This ratio was calculated for each reflector using all possible
combinations of the four capsules. The average ratio was only 3.83 using
the elliptical reflector, but climbed to 10.53 for the same capsules using
the cone. These results indicate that the conical reflector is more
sensitive to slight differences in capsule composition, probably because
less specular reflectance (from the reflector and the surface of the
capsule) reaches the detector using this corner-reflector configuration.
Spectroscopically, the ends of most capsules are not equivalent. In
Anacin-3 and Datril, the shorter end of the gelatin capsule is brightly
colored (blue in Anacin-3 and green in Datril) while the longer end is I
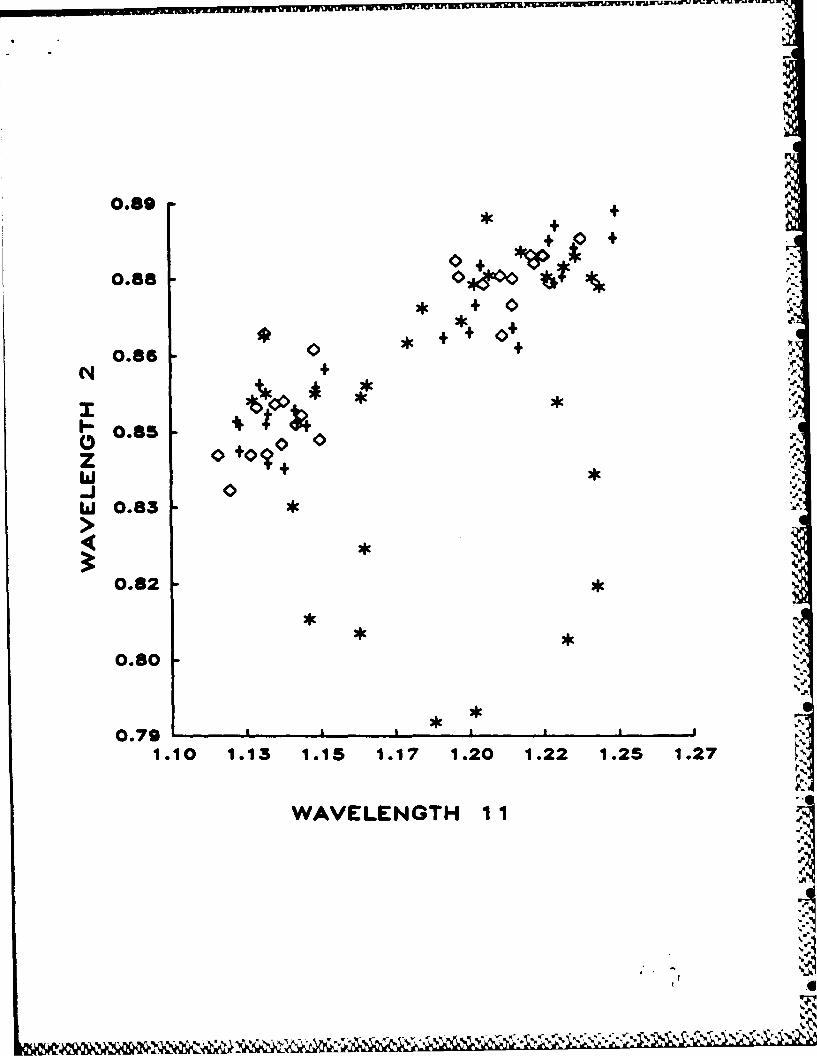
white and-contains a light-scattering medium. Figure 5 shows the training,
validation, and NaC-containing sample sets for Anacin-3 in a two-
wavelength space. The two distinct training clusters and the two distinct
validation clusters are the result of including both of the possible
orientations of Anacin-3 in the reflector cone (colored end up and colored
end down) in the plot. It is interesting to note that the corresponding
training and validation clusters are not necessarily the same siae or
shape, even though the same capsules were used in each and only the capsule
orientation in the cone had changed. In addition, the major axes of the •
NaCN-containing clusters are approximately perpendicular to those of the
training and validation samples. These facts demonstrate that the sise,
shape and directional orientation of spectral clusters in space are not
predictable a priori. This unpredictability, in turn, violates basic
assumptions of other qualitative NIRA techniques (21,2), making their use
in many applications somewhat suspect.
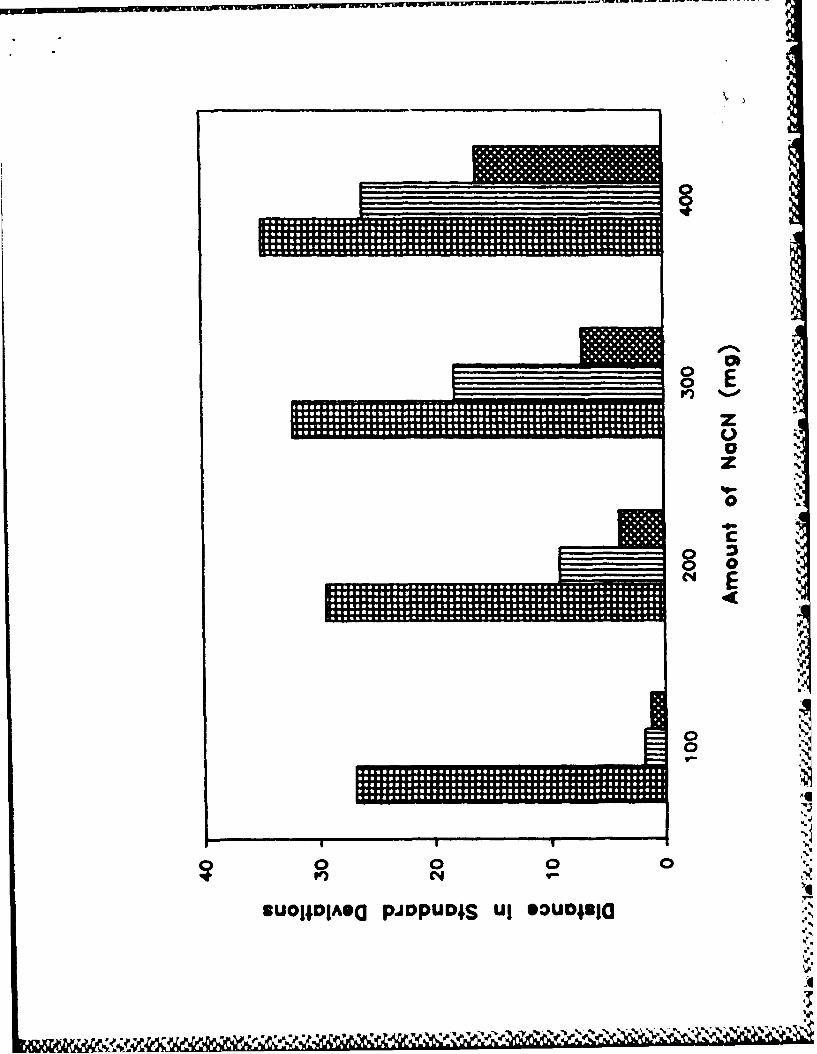
Datril capsules containing approximately 100, 200, 300 and 400 Mg JaCN
and in three configurations (N&CH packed in the colored end of the capsule,
%.
*'ltNWWfN tWn§VauVW'.,
-21-
in the white end, and mixed into the acetaminophen throughout the capsule)
were analysed at four wavelengths by means of the conical reflector. It was
desired to determine the BEAST distance response (in SDs) for different
amounts of contaminant in various locations throughout a capsule. The a
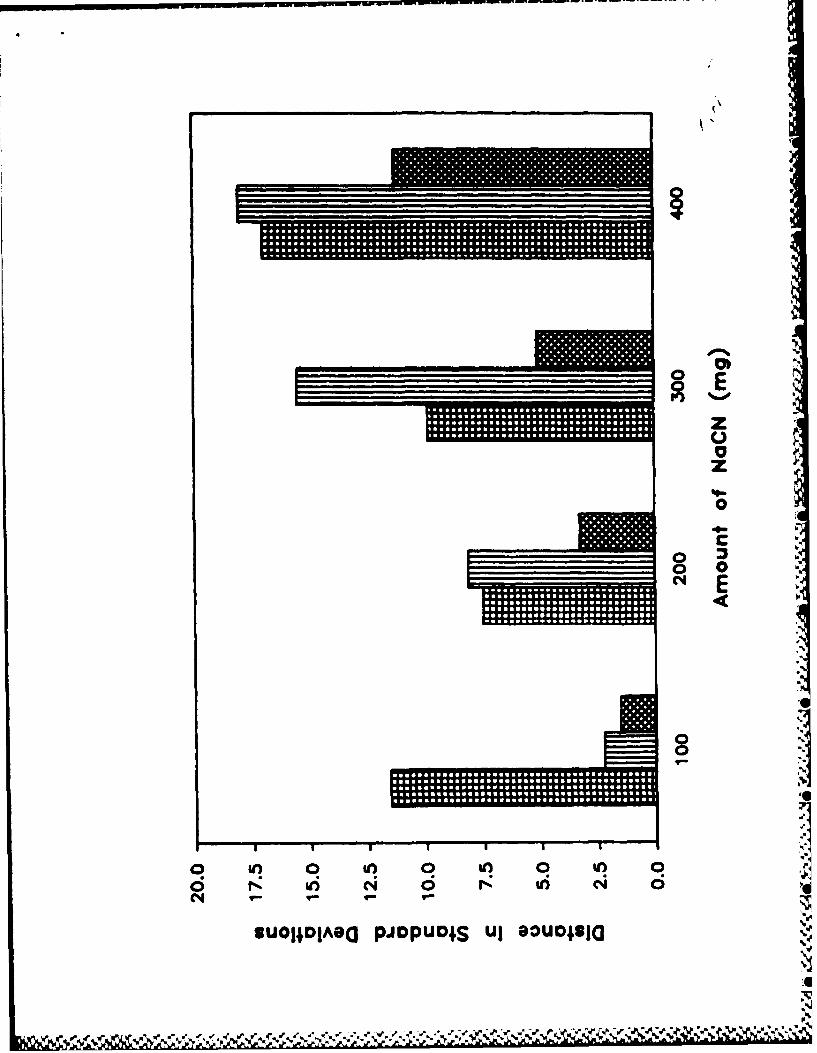
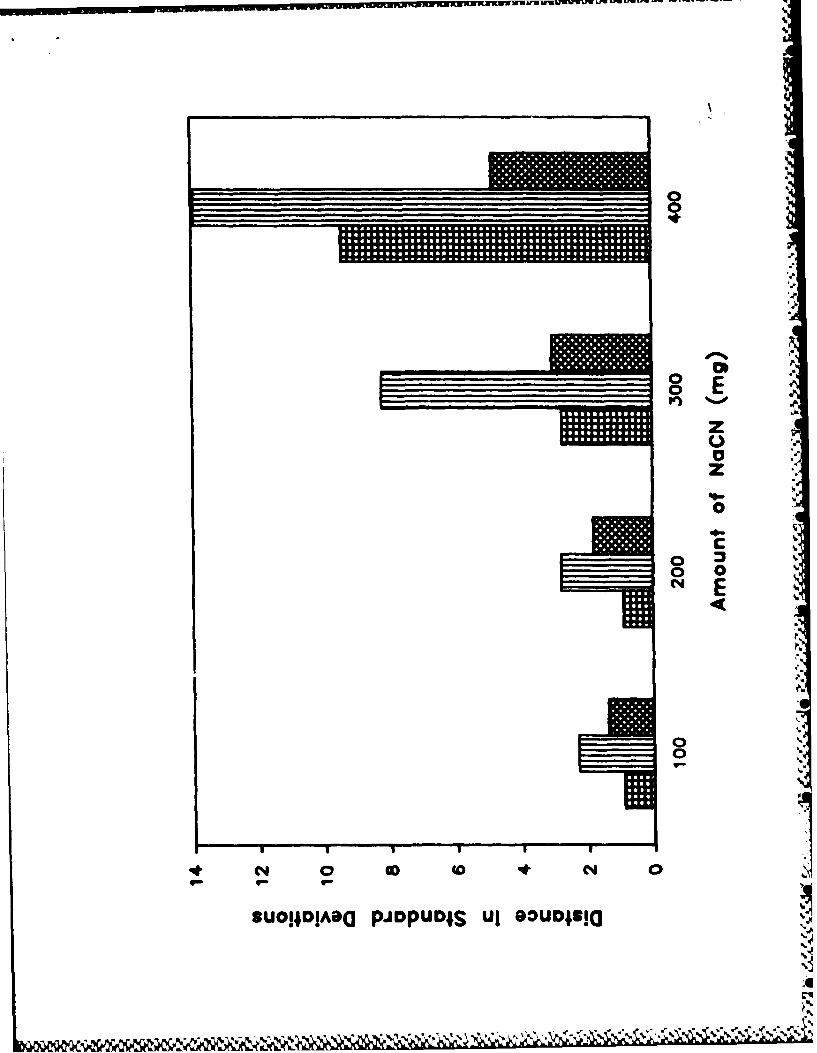
results are summarized in Figures 6 and 7. The data in Figure 6 were
collected with the colored end of the capsule up in the reflector cone,
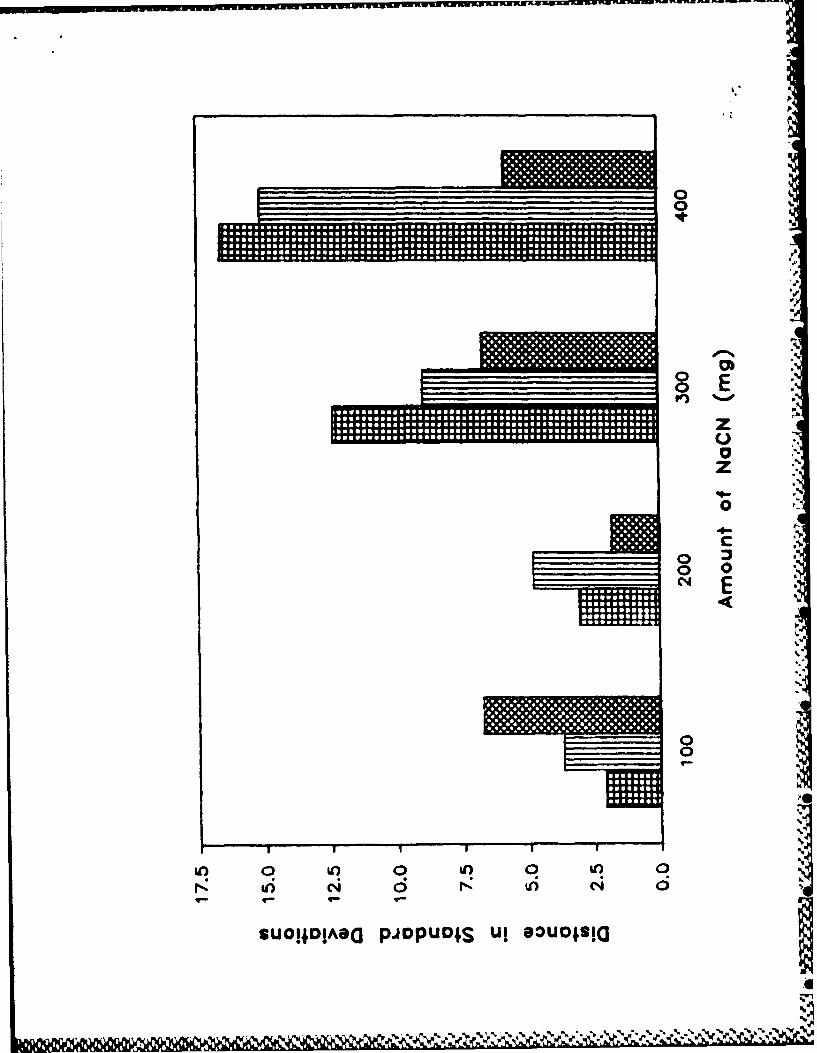
whereas the data in Figure 7 were collected with the colored end of the
capsule down. In general, the distances in SDs measured from the training-
set spectra to those of the adulterated capsules are greater when the
colored ends of the capsule are up in the reflector cone. The Euclidean
distances, however, are about the same for both capsule orientations. The 4
distance in SDs varies because the BEAST scales the Euclidean distance
with the probability of the point lying in its particular direction, and
the training-set cluster suse (probability) is larger when capsules are
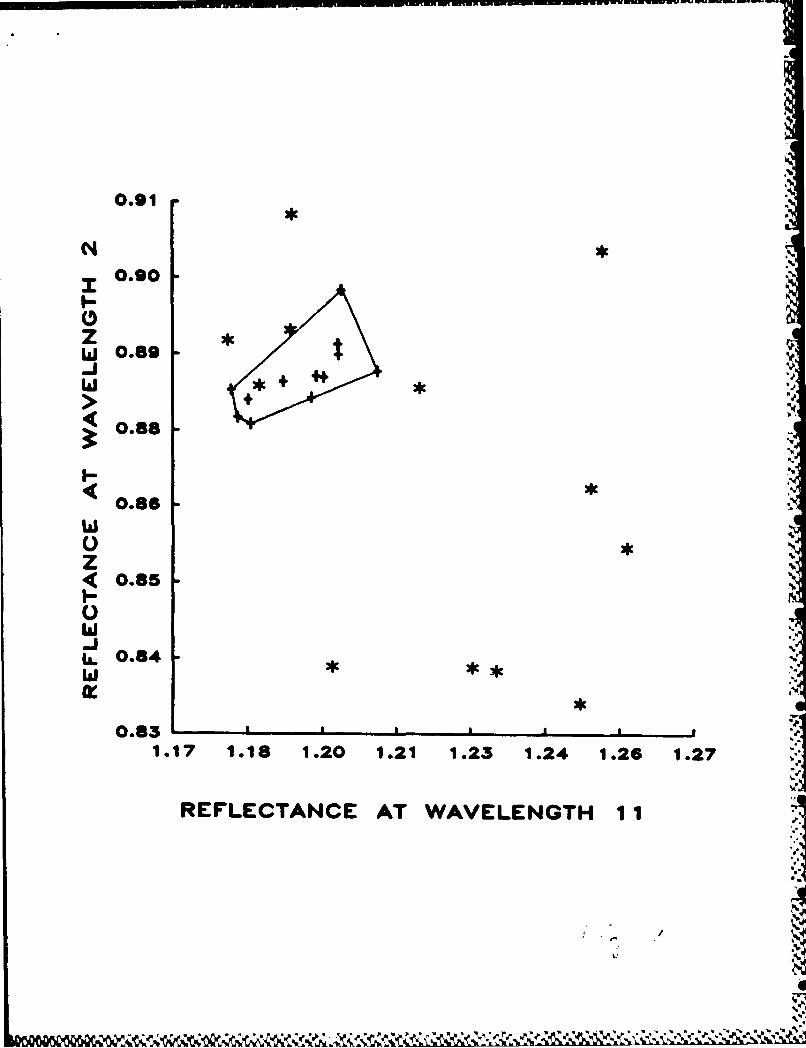
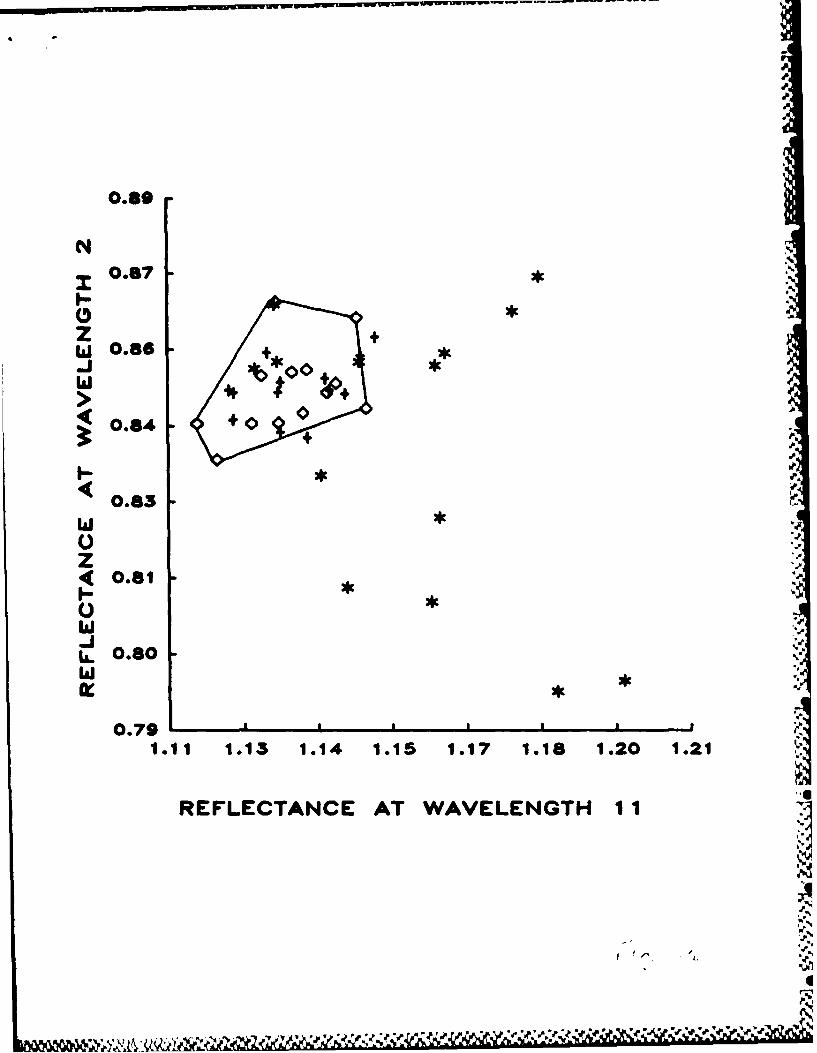
measured with their white ends pointing up in the reflector cone. Figure 8 4
shows one of six orthogonal views of the four-dimensional wavelength space
in which the Datril capsules were analysed. The Figure-8 data were obtained
with the colored end of the capsule up. The corresponding colored-end -down
views are similar; however, the training-set cluster is slightly larger and
the distances to the contaminated samples are slightly smaller. The net
effect of these changes is to reduce the sensitivity of NINA and the BEAST
when measurements are taken through the white end of the capsule (i.e., 4
with the colored end down in the cone). This result is predictable because
NINA gives information about particle size as well as about the chemical
contents of a capsule; the particle-size information is obscured somewhatI
by the light-scattering medium in the white end of the capsule.
-22-
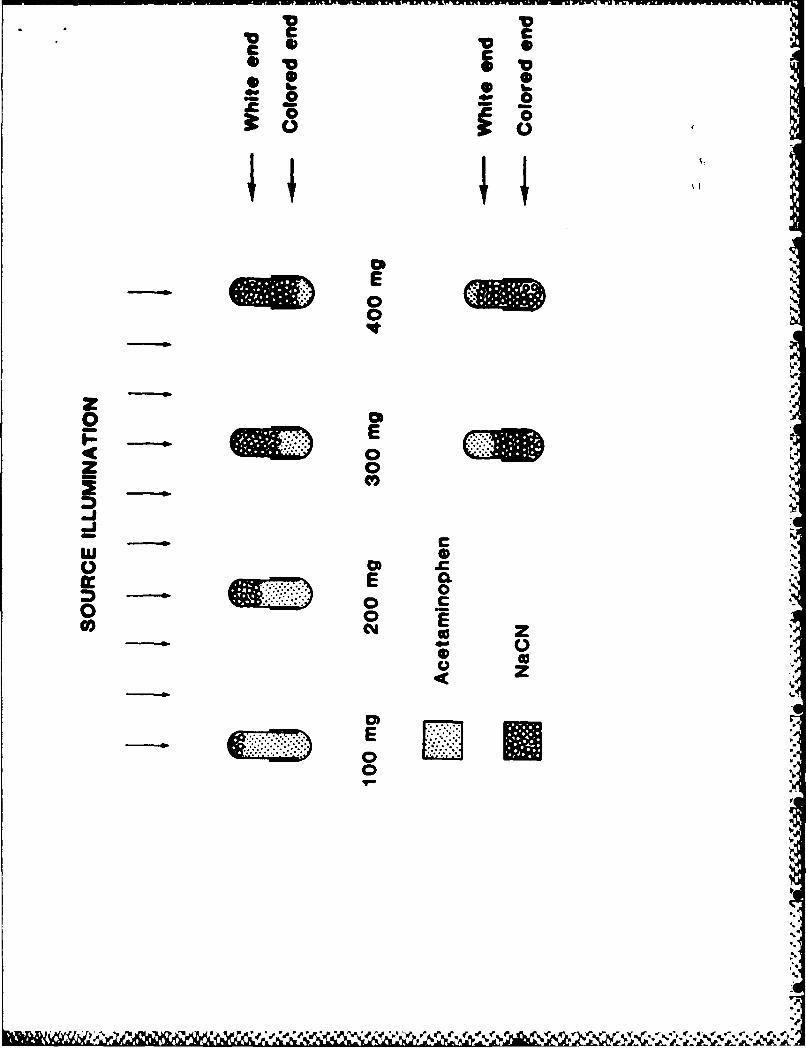
Figure 7 demonstrates further the effect of taking the capsule-contents
spectrum through two different layers of gelatin. An examination of the
data for the 100 and 200 mg samples shows that packing these amounts of
NaCN in the white end of the capsule produces greater discrimination (in
SDs) than packing them in the colored end. However, packing 300 and 400 mg
of NaCN into the white end produces a smaller response than packing the
same amount in the colored end. The reason that this reversal is observed
is simply that the colored end allows more information about the capsule
contents to pass through: when 100 and 200 mg of N&CN are in the white end,
essentially all of the sample reflectance reaching the detector passes
through the white end. However, when 300 and 400 mg of NaCN are packed into
the capsule the capsule is more than half full and a significant amount of
the diffuse reflectance is able to reach the detector through the white end
as well as the colored end even when the NaCN is packed into the colored
end (see Figure 9). Unadulterated capsules are quite full of acetaminophen
and typically some must be removed to make room for any added adulterant.
The ability to ascertain the profile of the distribution of contaminant in
a capsule might provide useful forensic evidence because there is more than
one way to introduce an adulterant into a capsule. The distribution profile
has obvious applications in quality control as well.
Profiling experiments were also conducted with Anacin-3 capsules using
NaCN as a contaminant. As with the Datril capsules, approximately 100, 200,
300 and 400 mg of NaCN were placed in the capsule in three configurations
(packed toward the colored end, toward the white end, and mixed throughout
the capsule). The results appear in Figures 10 and 11. For Anacin-3, the
colored end (blue) of the capsule might absorb more in the near-infrared,
relative to the white end, than the colored end of a Datril capsule
-.
Voss I, M , _W*Ze! t" -
-23-
(green). The ratio of the scale maxima of the figures for Datril (Figure
6:Figure 7) is 40:17 or 2.29:1, while the same ratio for Anacin-3 is 20:14
or only 1.43:1 (Figure 1O:Figure 11). The difference in these ratios
indicates that it is more difficult to measure the contents of an Anacin-3
capsule through the colored end than it is to measure the contents of a
Datril capsule through the colored end. Another explanation for the reduced
ability of NIRA to read through the colored end of the Anacin-3 capsule is
based on the contents of the capsules. In fact, there is a noticeable
difference in the consistency of unadulterated powder from a Datril and an
Anacin-3 capsule. Anacin-3 seemed to consist of larger flakes than Datril,
and also had a greater tendency to adhere to the walls of the capsule, in
spite of attempts to empty it. The amount of powder remaining in the
capsules after they were emptied (but just before they were repacked) was
not measured, and it is quite possible that this amount was significantly
larger in the Anacin-3 capsules than it was in the Datril product. Special
attempts were not made to remove this clinging powder because a tamperer p
would probably not make such attempts either. 'Screening' of the
contaminant by the acetaminophen powder could therefore be a significant
factor in the Anacin-3 results observed. p%
Overall, the histograms show that the differences (SD distances)
between the contaminated capsules from the training set are smaller for
Anacin-3 than they are for Datril. The immediate reason is that the Anacin-
3 spectral training-set cluster itself is larger than the Datril training
set, relative to the contaminated samples (compare Figure 12 for Anacin-3
to the corresponding Datril Figure 8). The fact that the Anacin-3 training-
set cluster is larger indicates that Anacin-3 capsules are normally more
variable in their contents than Datrils - a fact confirmed by weighing the
No
~\ % V ~ > ~ J ./~B pV %*% 't
-24-
capsules in each training set. The mean mass of the Datril capsules was
694 mg, with a standard deviation of 5.5 mg. The mean of the Anacin-3
capsules was 670 ag with a standard deviation of 1g.2 mg. Our samples of
Anacin-3 capsules are therefore about 3.5 times more variable than the
Datril units, making the detection of any kind of contamination in Anacin-3
a more difficult proposition than the corresponding determination in
Datril. Nevertheless, the fact that the BEAST responds to the absence of
components that should be present as well as to the presence of
contaminants that should not be in the sample makes the detection of
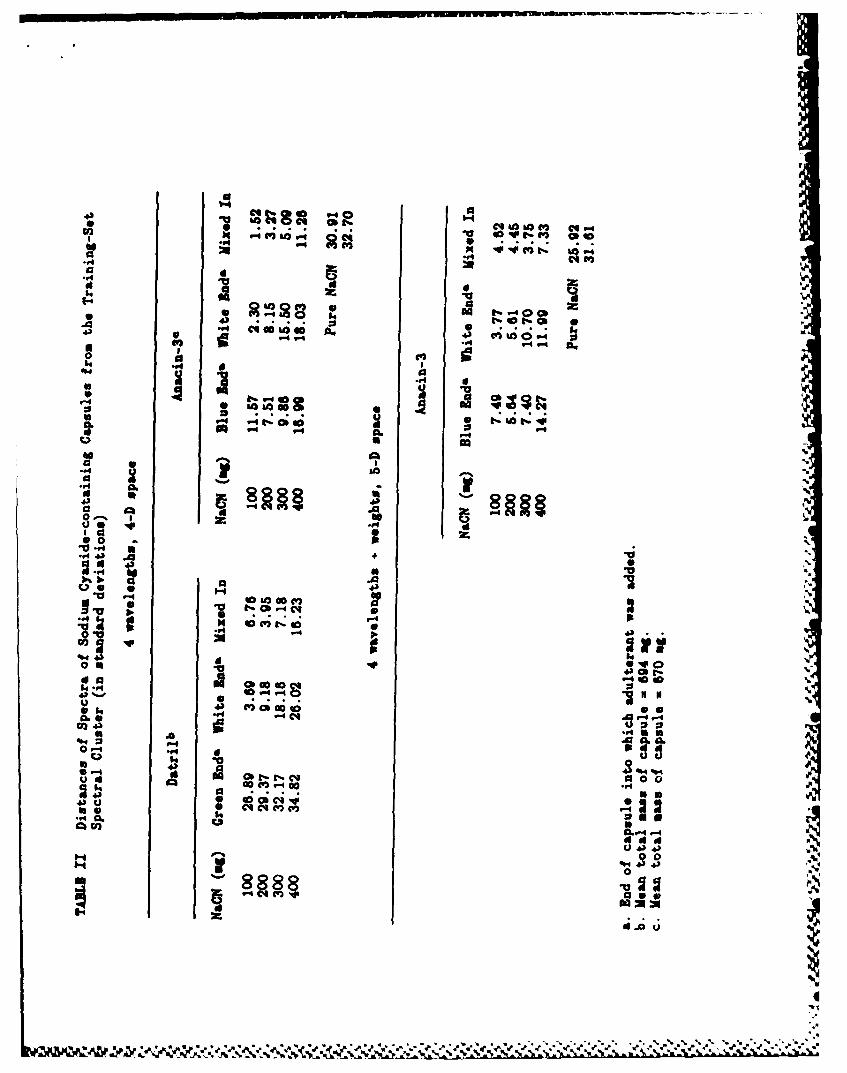
adulteration possible under less-than-ideal conditions. Table II gives
BEAST distances in SDs for NaCN-pontaminated Datril and Anacin-3 capsules.
Both capsule orientations (colored end up and colored end down) were
checked and the larger of the two discrimination values appears in the
Table. Using the larger of the two values is the ordinary mode of operation
in process-control applications. When the commonly used limit of 3 SDs is
applied to the training-set cluster it is apparent that all of the
contaminated Datril capsules could be detected and rejected. All but two of
the contaminated Anacin-3 capsules are also rejected when only four
wavelengths are used. The two Anacin-3 capsules that are not rejected
represent the lowest NaCN concentrations and in the most unfavorable
configurations.
The fundamentally nonparametric character of the Quantile BEAST permits
information vectors other than near-infrared wavelengths to be used Idirectly in the calculations as though these vectors were near-infrared
wavelengths. For example, the retention time of a substance in a liquid
chromatography (IC) experiment could be added to the near-infrared
wavelength reflectance data from n wavelengths to produce a BEAST analysis1%
X_ %
-25-
in the (nl)-dimensional space created by the addition of the retention
time. Distributional assumptions of normality are often hard enough to
justify when only near-infrared wavelengths are used, and the addition of
dissimilar information only makes these assumptions more difficult to
justify. The performance of the BEAST, being free of assumptions regarding
data distributions, should prove to be even more superior to parametric
methods in such applications. The current proliferation of laboratory
information management systems makes a wealth of information available to
investigators, most of which might be profitably used with the BEAST.
In order for us to demonstrate this flexibility of the BEAST we added
the total masses of the Anacin-3 training-set capsules to the training set.
Capsule mass is an important parameter because, in unadulterated capsules,
this variable is rather tightly controlled. In addition, the weighing of
capsules is one of the few tests that can be performed more rapidly than
NIRA. Of course, capsule weight is not in itself a sufficient indicator of
tampering. For example, unadulterated Datril capsules weighed 694 mg (SD =
5.5 mg) whereas the NaCN-contaminated capsules weighed 711 mg (SD =
61.5 mg). Accordingly, a substantial portion of tainted Datril capsules
would pass a test based on weight information alone. 1p.
The last group of Anacin-3 distances in Table II represents the same
set of capsules that produced the 4-D-space distances, except that the
total mass of each capsule was included to create a 5-D space. The BEAST
was then retrained by adding the total capsule mass also to each training
set sample. The addition of the mass information is enough to allow the
BEAST to correctly identify every NaCN-containing capsule as being tainted.
Control, or validation, samples (unadulterated Anacin-3 capsules that
were not used in the training set) are also correctly identified in every
I
" I
-26-
case (both with and without the weight information) as being untainted (see
Table III). Unlike the situation for Hook's Cold Caps capsules discussed
earlier, the unadulterated Anmacin-3 capsules were intentionally divided
randomly into training and validation sets. The only precaution taken in
constructing these sets was to make sure that both sets contained
approximately equal numbers of capsules and with total masses below and
above the mean capsule mass. The more random nature of this selection
process increases the distance in SDs of the validation capsules from the
training set. As in Table II, the higher value of the two possible capsule
orientations (colored end up and colored end down) is shown.
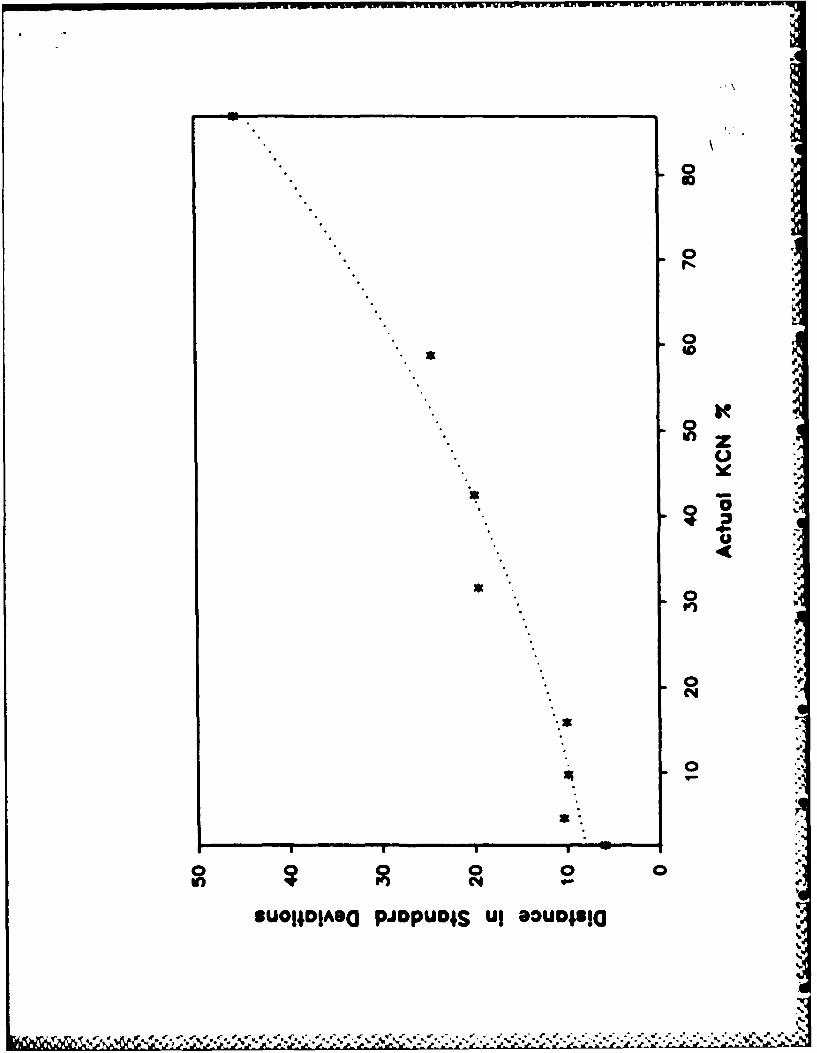
KCN is perhaps the most common highly toxic adulterant added to over-
the-counter drugs (12,.13). The detection limit for KCN under optimal
conditions in over-the-counter capsules is thus of great interest. KCI4 was
packed into the colored end of eight Anacin-3 capsules, over a range of
concentrations from 1 to 87% (by weight). A strong functional relationship
exists between the concentration of KCN in the capsules and the distance of
the capsule (in SDs) from the training set determined by the BEAST (see
Figure 13). This relationship suggests that the BEAST might be directly
useful as a system or process control technique when:
1. the syptem is defined by one or more monitored variables (such as the
wavelengths in this experiment);
2. the BEAST can be trained to recognise a 'normal' state as described
by typical variations of the monitored variables (in the same way
that the BEAST was trained by using a set of unadulterated capsules
in the present experiment);
3. a given BEAST distance response in a particular direction can be
functionally related back to a parameter of interest in the system
-27-
(as the quadratic response of the reflector cone can be used to
predict the location and amount of a contaminant in a capsule).
The ease with which the BEAST problem can be restructured into a form
readily solvable by parallel-processing techniques (17) might soon make
real-time control with the BEAST an effortlessly attainable goal.
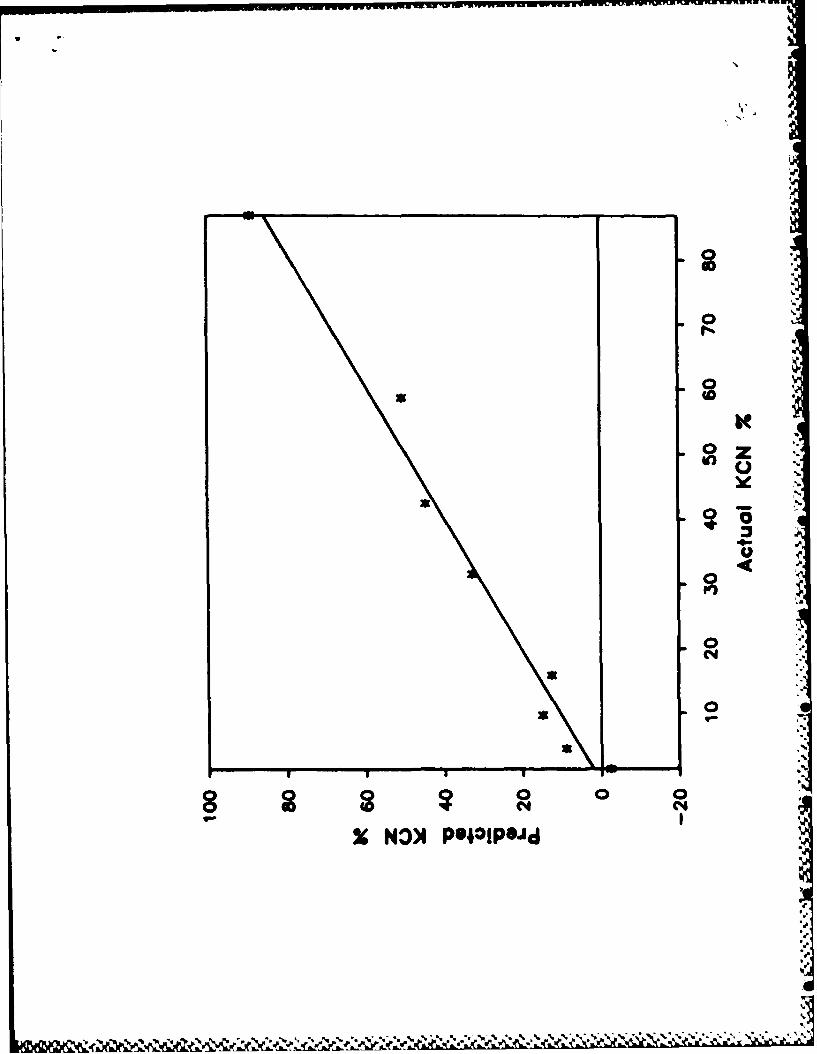
The KCN 3-SD detection limit calculated from the eight Anacin-3
capsules above is 2.6 mg (less than 0.4% of the typical weight of an
Anacin-3 capsule). Figure 14 depicts the relationship between the actual
KCN concentration and the KCN concentration predicted by NIRA when four
wavelengths are used for the eight Anacin-3 capsules. The smallest amount
of KCN p aci-in these capsules, 9 mg, caused the capsule in which it was
placed to appear 5.96 SDs from the training set in 4-D (4-wavelength)
space.
CONCLUSIONS
The Quantile BEAST method, when used in conjunction with NIRA data at
only four rvelengths, is able to quickly detect a wide variety of
contaminants in capsules, obviating the need to open them. The ability of
this technique to detect the absence of components that should be present
as well as the presence of components that should absent enables it even to
signal the presence of contaminants that have no near-infrared absorption.
Good results are achieved on a simple filter-based instrument, without the
need for complex wavelength-selection procedures. The detection limit for
KCN in capsules that has been obtained in this work is as much as two
orders of magnitude below the lowest reported lethal dose (13). Substances
Fl
F.NPL7IUE I
-28-
other than KCN in capsules could also be detected at low concentrations.
Selecting analytical wavelengths near the absorption features of components
of interest should improve detection limits beyond those observed in these
experiments.
A representative training set composed of unadulterated samples is
required to train the BEAST algorithm to recognize a good sample. In this
research, collecting the training-set spectra took leis than one hour and
training the BEAST algorithm required less than 5 seconds. All of the
training-set spectra were collected in a single day, but the tampering
experiments took place over a period of two weeks. Nevertheless, repeated
runs of validation samples showed that the calibration remained stable
throughout the duration of the experiment. More samples, it seems,
collected over time, would only enhance the reliability of the method.
ClEDI!
This work has been supported in part by the National Science Foundation
through grant CUE 83-20053, by the Office of Naval Research, and by the a
Upjohn Company.
:I
(1) Tifft, S. Time 1982, 120(Oct. 11), 18.
(2) Church, G.J. Time 1982, 10(Oct. 18), 16-18.
(3) Church, G.J. Time 1982, 12O(Nov. 8), 27
(4) Wolnik, K.A.; Fricke F.L.; Bonnin, 9; Gaston, C.M.; Satsger, R.D.
Anal. Chem. 1984, 56, 466A-474A.
(5) Waldhole, M. Wall Street Jowrnal 1986, (Feb. 14), 3.
(6) Davidson, S. Time 1986, lt7(Feb. 24), 22.
(7) Anon. WaLl Street Jourral 1986, (Jun. 19), 2 and 18.
48) Shenon, P. New York Times 1986, (Mar.21), Al and D19.
(9) Anon. CS. News and WorLd Report 1986, 100(Mar. 31), 8.
(10) Greenwald, J. Business Insurance 1986, Feb. 24, 2.
(11) Andresky, J. Forbes 1986, 197(Apr. 28), 76-77.
(12) Borman, S.A. Anal. Chem. 1982, 54, 1474A.
(13) Sax, N.I. 'Dangerous Properties of Industrial Materials'; Van
Nostrand Reinhold: New York, 1984.
(14) Reese, K.M. Chemical and Engineering News 1982, 60(Dec. 13), 82.
(15) Hlad.ija, B.W.; Mattock, A.M. Forensic Sci. Int. 1983, 3, 143-147.
(16) Wetzel, D.L. Anal. Chem. 1983, 55, 1165A-1176A.
(17) Lodder, R.A.; Hieftje, G.M. Anal. Chem. (submitted).
(18) Efron, B. Biouetrika 1981, 68(3), 589-599.
(19) flonigs, D.E.; Hirschfeld, T.B.; Hieftje, G.M. App. Spectrosc. 1986,
39, 1062-1065.
(20) Honigs, D.E.; Hieftje, G.M.; Hirschfeld, T.B. AppL. Spectrosc. 1984,
38, 844-847.
(21) Mark, H.L.; Tunnell, D. Anal. Chen. 1985, 57, 1449-1456.
(22) Mark, H.L. Anal. Chen. 1986, 87, 379-384.
MI
716
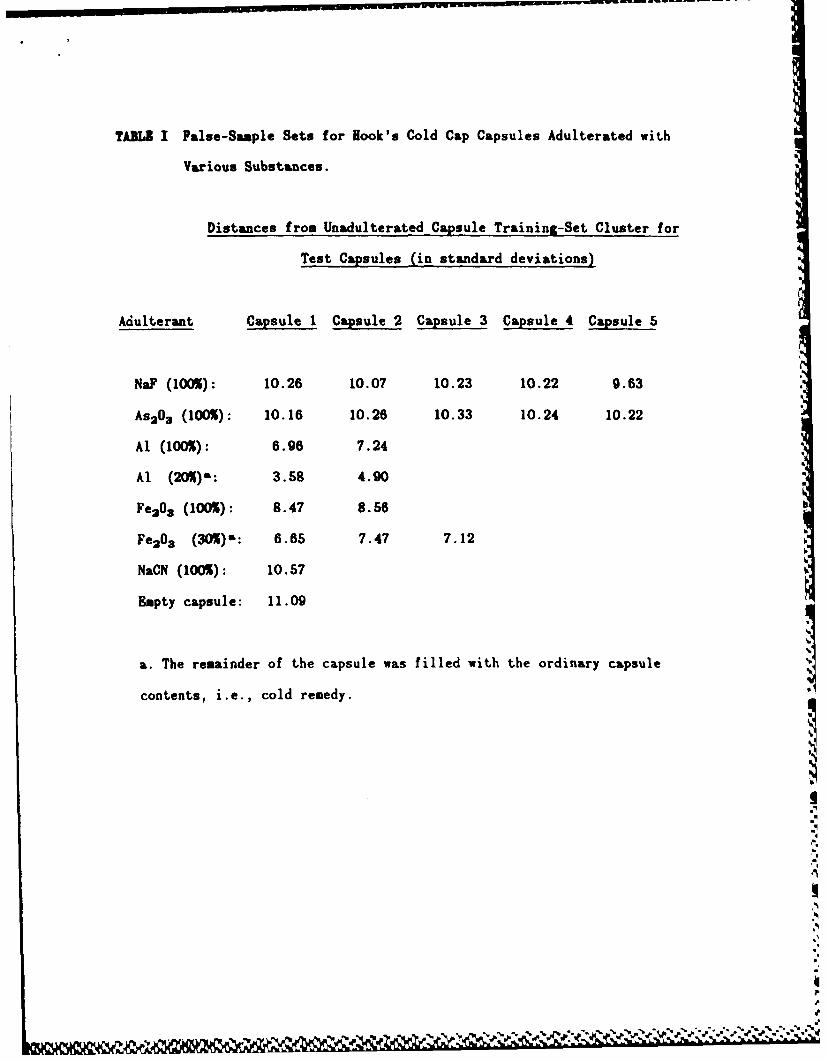
TAML I False-Sample Sets for Hook's Cold Cap Capsules Adulterated with
Various Substances.
Distances from Unadulterated Capsule Training-Set Cluster for
Test Capsules (in standard deviations)
Adulterant Capsule 1 Capsule 2 Capsule 3 Capsule 4 Capsule 5
Na? (100%): 10.26 10.07 10.23 10.22 9.63
As203 (100%): 10.16 10.26 10.33 10.24 10.22
Al (100%): 6.96 7.24
A1 (20%)L: 3.58 4.90
Fe 2O (100%): 8.47 8.56
Fe203 (30%)0: 6.65 7.47 7.12
NaCN (100%): 10.57
Empty capsule: 11.09
a. The remainder of the capsule was filled with the ordinary capsule
contents, i.e., cold remedy.
- " '- '
" 1 ' "]q''r' Y.' ,' , }[' I' #Y' ' } Y' r ? D '' ' ' ' . * ." . - j . . . . . ..
V9 -0j- i 0C
W-60 a co
-- 4 "12OO a
*~I La- do
o no'4 1
0 0*0 00 Mt
S b . 0 %
S. a do.6.4 ii a
A
0- d 1
644
001-4
A IX e
-4 4'.0
'11- 43-C1
0.-i 0
I
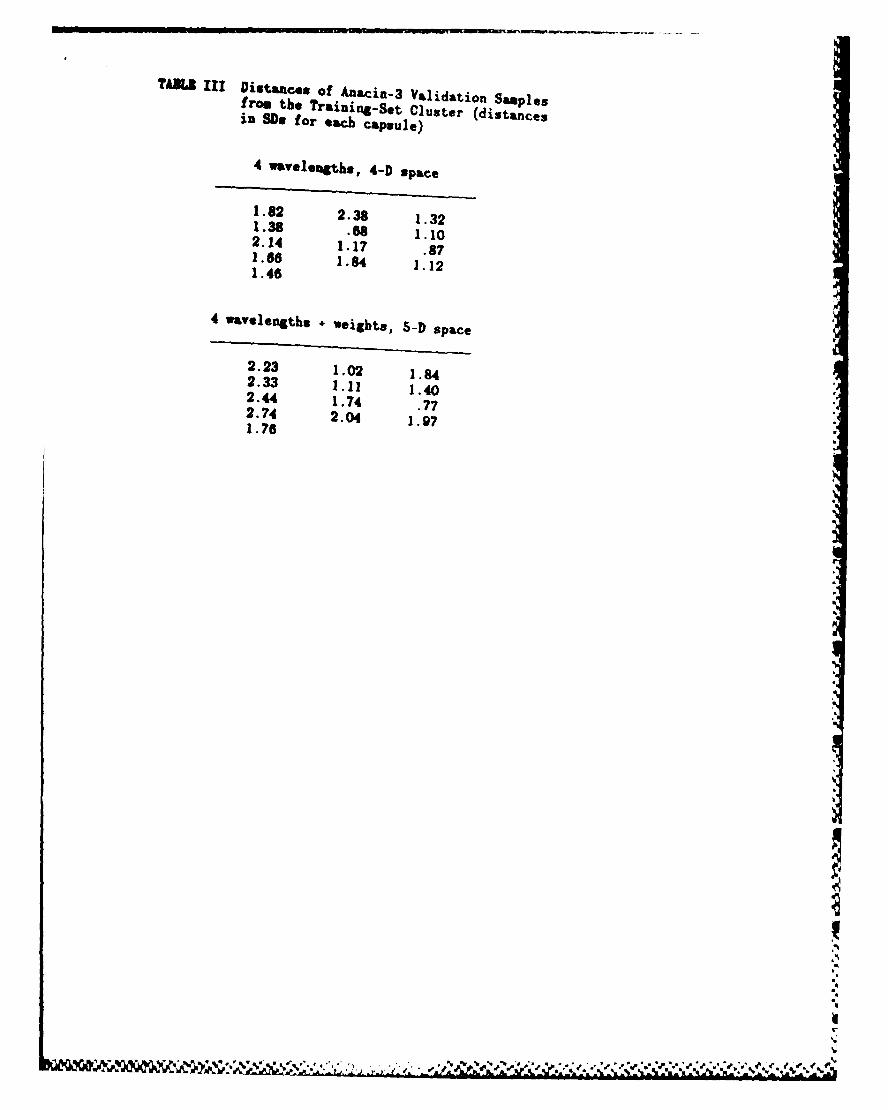
TALI III Distasnces of Anacin-3 Validation Samplesfro, the Training..Set Custer (distancesin SD. for each capsule)
4 wavelengths, 4-D space
1.82 2.38 1.321.38 .68 1.102.14 1.17 .871.86 1.64 1.121.46
4 wavelengths * weights, S-D space
2.23 1.02 1.842.33 1.11 1.402.44 1.74 .772.74 2.04 1.971. 76
h
I-C.
FIOUtI CAPTIONS
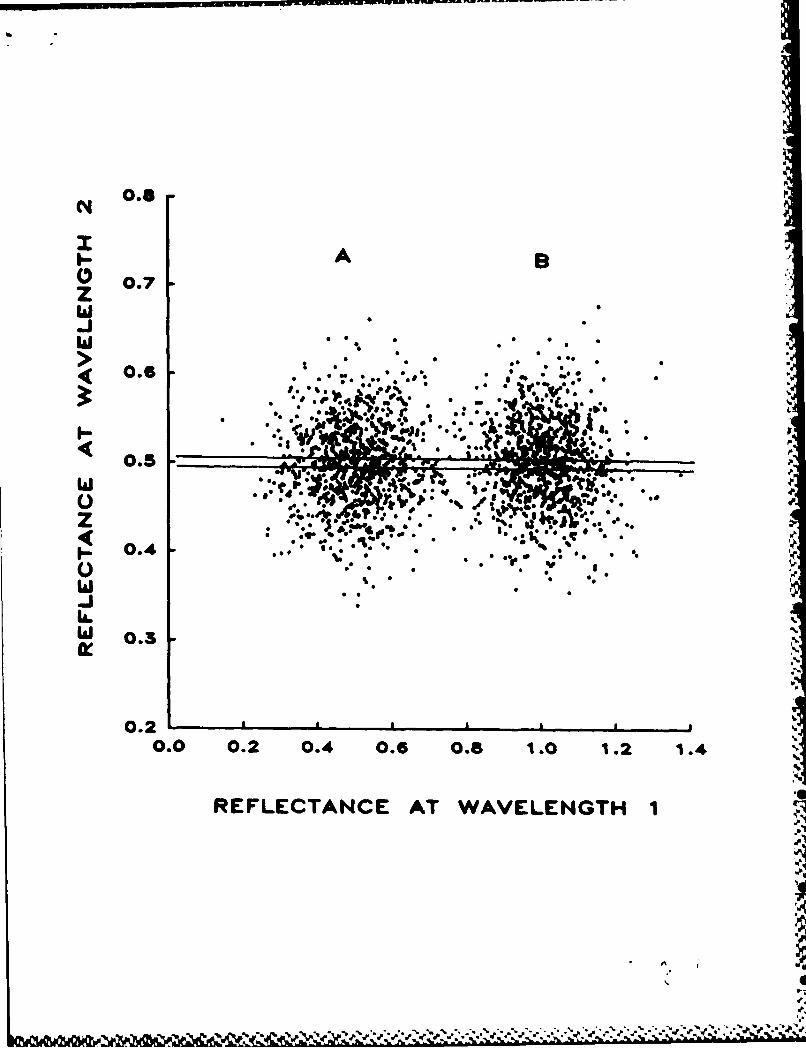
FIG. 1. Two hypothetical compounds, A and B, whose spectra are measured
at two wavelengths. Uncertainty in the measurements at each wavelength is
represented by taking 1000 replicate spectra of both A and B, resulting in
clusters of points varying about A and B. The centers of the clusters
represent the best point estimate of the spectra of A and B. A line is
defined by the centers of the two clusters, and the locus of all points
within a user-specified distance of this line forms a cylinder in the space
of three or more dimensions.
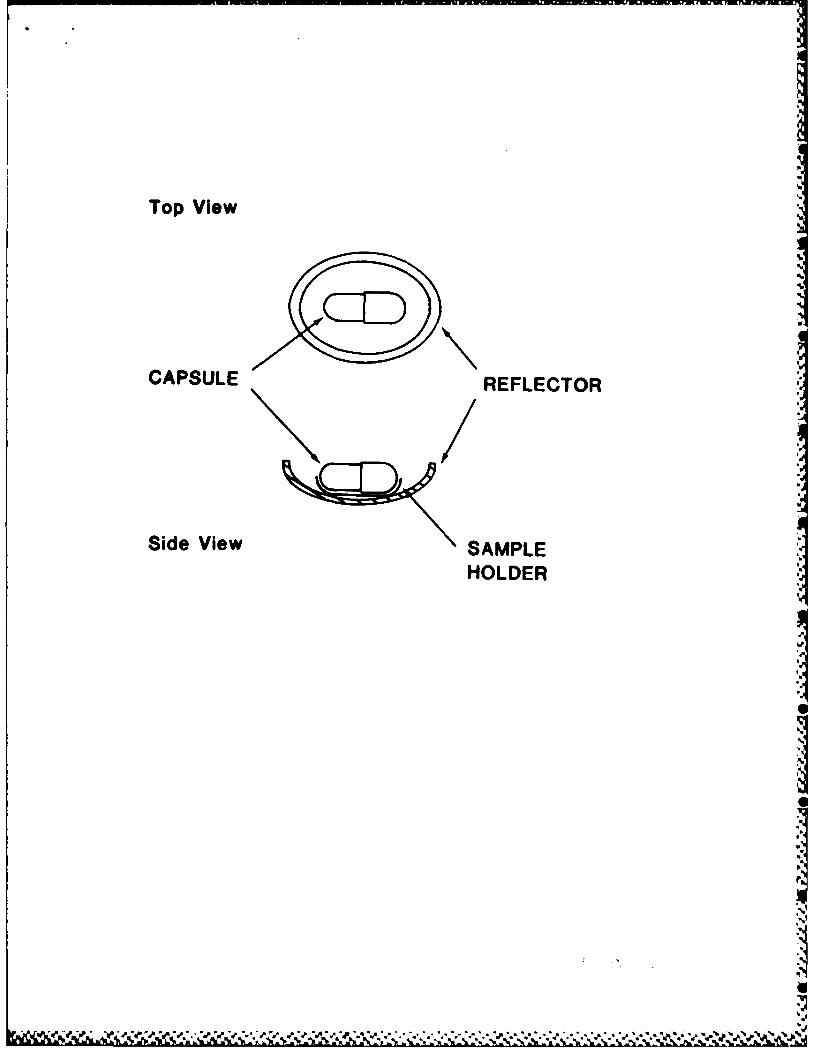
FIG. 2. The elliptical reflector used in the initial capsule-tampering
experiments. The reflector fits into the open sample cup supplied with the
InfraAlyser 400. The sample cup is then positioned in the sample drawer in
the usual fashion for analysis.
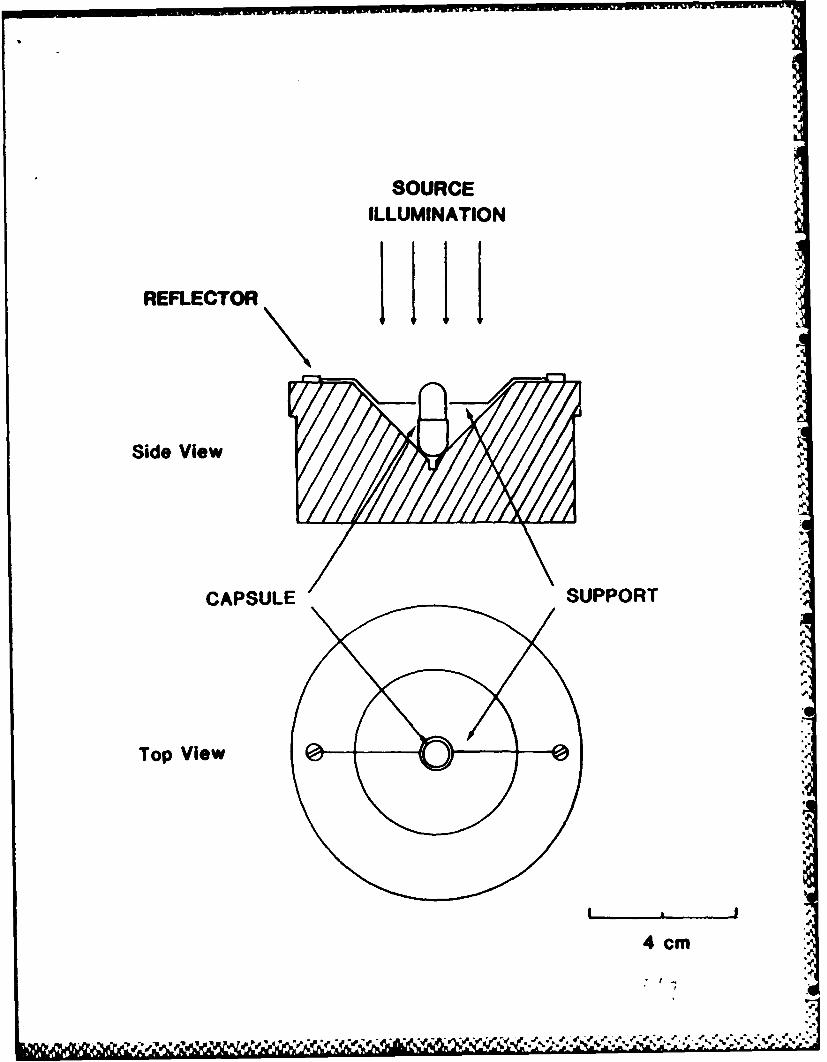
FIG. 3. The 90 right-circular conical reflector used for most of the
capsule-tampering experiments. This reflector replaces the cups provided
for use with the spectrophotometer and fits directly into the sample
drawer. The conical reflector design permits some spatial profiling of the
contents of the capsule.
FIG. 4. The theoretical and actual response for a contaminant packed in
the lower end of a Datril capsule in the conical reflector. The first bar
(i) represents the scaled NaCN theoretical distance (from Eq. 3) response
of the BEAST for an adulterated capsule filled from the bottom to the top
r--e •
*
in 100 ag steps. The second bar (III) represents the actual response of the
BUT for N&CM packed into the white (bottom) end of a Datril capsule.
4.
FIG. 6. Spectral clusters of Anacin-3 capsules obtained at two
wavelengths with the conical reflector, and with both orientations (colored
end up and colored end down). The cluster on the left is formed by readings
taken with the colored end up in the cone, while the cluster on the right
is formed from the the same capsules, read with the colored end down in the
reflector. Training-set capsule (0); validation-set capsule (.) and
cyanide-containing capsule (s).
FIG. 6. Datril capsules read with the colored end up in the reflector
cone, containing approximately 100, 200, 300, and 400 m NaCK packed in
three configurations: in the colored end (1), in the white end (11 I) sad
mixed throughout the capsule (i). The distance in standard deviations is
given in term of the training set of unadulterated Datril capsules in the
direction of the NaCN-containing capsule.
FIG. 7. Datril capsules read with the colored end down in the reflector
cone (white end up), containing approximately 100, 200, 300, and 400 q
N&CM packed in three configurations: in the colored end (#), in the white
end (I11) and mixed throughout the capsule (]]). The distance in standard
deviations is given in terms of the training set of unadulterated Datril
capsules in the direction of the NaCN-containing capsule. The seemingly
anomalous 100 mg Imixed' reading is probably the result of particle-sise
noise from, for instance, a large NaCK crystal against the blue end of the
capsule wall.
IL "
°"
FIG. 8 One of six orthogonal views of a four-dimensional space formed by
taking Datril-capsule spectra at four wavelengths, for training-set
capsules (+) and N&CM-containing capsules (*). This figure shows the
smallest convex polygon that can completely surround the training-set
spectral points.
FIG. g. The capsule orientation, the two different kinds of gelatin
(scattering (white) and non-scattering (colored)] and the configuration of
the contents of the capsule all affect the distance response
(discrimination ability) of the DLAST for a given contaminant
concentration. These factors can be used to advantage to provide additional
information about the sample. The use of a conical reflector (positioned
with the buse of the cone perpendicular to the source illumination and with
the vertex down toward the colored end of the capsules in this figure)'S.
permits spatial profiling of the capsule for an identified component.
FIG. 10. Anacin-3 capsules read with the colored (blue) end up in the
reflector cone, containing approximately 100, 200, 300, and 400 ng a&I
packed in three configurations: in the colored end (), in the white end
(I I I) and mixed throughout the capsule (in).
FIG. 11. Anacin-3 capsules read with the colored end down in the reflector
cone (white end up), containing approximately 100, 200, 300, and 400 ug
N&CN packed in three configurations: in the colored end (i), in the white
end (III) and mixed throughout the capsule (XM).
p.
FIG. 12. One view of the four-dimensional space in which the Anacin-3
capsules were analysed. This figure corresponds to the Datril capsule
Figure 8. The smallest convex polygon containing all of the training-set
capsules is show., and is larger than the corresponding Datril polygon. The
difference in the size of the polygons is indicative of the greater
variability of unadulterated Anacin-3 capsules, a variability that is also
reflected in the weight of the Anacin-3 capsules compared to that of the
Datril capsules.
FIG. 13. The EAST distance response (in SDs) as a function of the known
KCN concentration in Anacin-3 capsules. These capsules were analysed with
the colored end up in the reflector cone. In general, the distance response
is largely quadratic with concentration, as predicted for a conical
reflector. The Pearson product-moment correlation coefficient (r) for a
quadratic fit to the data is 0.985.
FIG. 14. Typical analytical working curve for KCN content in Anacin-3
capsules. The ordinate scale (predicted KCN I) is found from a linear
combination of log(1/l) values at the four wavelengths. The horisontal line
shows zero predicted KCN %.
. . . . . . .. . ._
N 0.6
IA B-
0.7z
0.6 0 Is * o * a
Is j
z S io so.S ** eS~
. .
IL6
W 0.3
0.2
0.0 0.2 0.4 0.6 0.6 1.0 1.2 1.4I
REFLECTANCE AT WAVELENGTH 1
Top View
CAPSULE REFLECTOR
Side View SAMPLEHOLDER
SOURCEILLUMINATION
REFLECTORjjjj
Side View
CAPSULESUPPORT
Top View
4 cm
Ole~
N '
z
0
I7.-
00
NN
SUOID!Ao PJPUD# UlOOUDB0)
0.89
+0.89 * ? 0
* + 0 +
0.86 *N +
Ii0.85
w +,.JW 0.83 *
>*
0.82 *
0.80
0.795
0.79 , *:. i p a I
1.10 1.13 1.15 1.17 1.20 1.22 1.25 1.27
WAVELENGTH 11
-A
I*4fs
0
c
oo
I,
0a
0
IIIIINeill P PU III U1111fllss *maUD4S
Al.
I4 I o lIII"11 1 a lil flIII I
..... .... .... .... ....
0
o oN
0 0 u0ui&
__!D!o .Sputsu suos
0.91
N*
0.90
zw 0.89
0.88
I-
0.86w
z(0.85wI-
.JLL. 0.84
0.83 ,1.17 1.18 1.20 1.21 1.23 1.24 1.26 1.27
REFLECTANCE AT WAVELENGTH 1 1
'¢e, ,' '; ' , ;' , ".: ; ," ," , " : ' '. , ,,.', ' . , ,v:,., :,:,,,. .,:,, .:,',''-;S
Sam.c 0 -
E C00
0
Ecm
ol
z
0
o 0NE
.... .. .. .. ..
.........
o0 I 0 0 IA 0 'o C4 6 r uZi C4
3U014DJA.Q PJOPUDIS Ul S*UD48SjQN
.... .. .. . ... .. .. .. .. .. . ... .... . . .... , -, - - - - - - - - - --
0
.... ... . .:: :::: :::: :::: :: ...:: ...... ::
.. .. . .. .. . .. .. . .. .. . .. .. ........... z
z0
0
0 0N
r _A-'-Il (0000 4" N¢ 0
SUo04DIAo(] PJDPUDIS Ul qOUD4S|(]
-. . .. , -
6"m
,m
0.89
0.87
0.5
z +W 0.86 +ml *0t r
> + 00.84 +0
0o.83
0.83
I .0.8*
0.79
1.11 1.13 1.14 1.15 1.17 1.18 1.20 1.21
REFLECTANCE AT WAVELENGTH 1 1
PS"
U
o0
01%
0* 0
z
.3 Ni
U4
* 0I')
8~
oN
U'
0
a:
'Nf' 0 0 0
SUOIIDIASU PJDPUDIS U~ *OUDISIU
'N
NEW,
U
.is
0
S I
(~)
S
Io0V)
'a
0 .5
N
S
S 0
S
0 0 N N0 (0 0 0
I S
~ NO)I P0PIP0IcI
4.9.
.4
*1~
.4.
5.
5-
' ~
" "l 1 8
CL /1113/86/2
TECHNICAL REPORT DISTRIBUTION LIST, GENp
No. No. -Copies Copies
Office of Naval Research 2 Dr. David Young IAttn: Code 1113 Code 3-4800 N. Quincy Street NORDAArlington, Virginia 22217-5000 NSTL, Mississippi 39529
Dr. Bernard Douda 1 Naval Weapons Center INaval Weapons Support Center Attn: Dr. Ron AtkinsCode 50C Chemistry DivisionCrane, Indiana 47522-5050 China Lake, California q3555 l
Scientific Advisor 1Naval Civil Engineering Laboratory I Commandant of the Marine CorpsAttn: Dr. R. W. Drisko, Code L52 Code RD-IPort Hueneme, California 93401 Washington, D.C. 20380
U.S. Army Research Office IDefense Technical Information Center 12 Attn: CRD-AA-IPBuilding 5, Cameron Station high P.O. Box 12211Alexandria, Virginia 22314 quality Research Triangle Park, NC 27709
Mr. John Boyle I"DTNSROC Materials BranchAttn: Dr. H. Singerman Naval Ship Engineering CenterApplled Chemistry Division Philadelphia, Pennsylvania 19112Annapolis, Maryland 21401
Naval Ocean Systems Center 1Dr. William Tolles Attn: Dr. S. YamamotoSuperintendent Marine Sciences DivisionChemistry Division, Code 6100 San Diego, California 91232Naval Research LaboratoryWashington, D.C. 20375-5000
4.
I
*
~d. .~ ~ e w- *.e~--.~-.';t~* *.~u*., P UP. %
Related Documents