ADA UOO 38b SYSTEMS RESEARCH LABS INC DAYTON OHIO RESEARCH APPLI——ETC FIG 11/2 - ~~ PROPERTIES AND MICROSTRUCTURES OF HIGH TEMPERATL’RE MATERIALS.(UI UNCLASSIFIED AUG 78 MGMENDIRATTA. N S CHOUDHLJRY F33615—75—C—11105 :J _________ _ S ____ _ I i _ _ WU! ~ ISSAU9UU U. 11111 _

Welcome message from author
This document is posted to help you gain knowledge. Please leave a comment to let me know what you think about it! Share it to your friends and learn new things together.
Transcript
A D A UOO 38b SYSTEMS RESEARCH LABS INC DAYTON OHIO RESEARCH APPLI——ETC FIG 11/2 -
~~
PROPERTIES AND MICROSTRUCTURES OF HIGH TEMPERATL’RE MATERIALS. (UI
UNCLASSIFIED AUG 78 MGMENDIR AT TA . N S CHOUDHLJRY F336 15—75—C—11105
:J _________
_ S _ _ _ _ _
_ Ii __WU!
~
ISSAU9UUU.11111
_
1
~~~ ~~~~~~~~~~
2 -AFML-TR-78-1l2
PROPERTIES AND MICROSTRUCTURE S OF HIGH-TEMPERATURE MATERIAL S
Research Applications Division~~~ Systens Research Laboratories, Inc.
2800 Indian Ripple RoadDayton, Ohio 45440
August 1978
TEC}INICAL REPORT AFML—TR—78-1 12Final Technical Report for period 1 December 1974 — 31 March 1978
Approved for public release; distribution unlimited.
AIR FORCE MATERIALS LABORATORYAIR FORCE WRIGHT AERONAUTI CAL LABORATORIESAIR FORCE SYSTEMS COMMAN DWRIGHT-PAT TERS ON AIR FORCE BASE , OHIO 45433
NOTICE
When Government drawings, specifications, or other data are used for anypurpose other than in connection with a definitely related Government procure—merit operation, the United States Government thereby incurs no responsibilitynor any obligation whatsoever; and the fact that the Government may haveformulated, furnished , or in any way supplied the said drawings, specifica-tions, or other data, is riot to be regarded by implication or otherwise as inany manner licensing the holder or any other person or corporation , orconveying any rights or permission to manufacture, use, or sell any patentedinvention that may in any way be related thereto.
This report has been reviewed by the Information Office (01) and isreleasable to the National Technical Information Service (NTIS). At NTIS,it will be available to the general public, including foreign nations.
This technical report has been reviewed and is approved for publication.
DL~~~~~~~~~~~~S//
~~~Project Engineer
FOR T~E COMMANDER
DR. HE C. GRAHAMActing hiefProcessing and High Temperature
Materials BranchMetals and Ceramics Division
If your address has changed, if you wish to be removed from our mailing list,or if the addressee is no longer employed by your organization, please notifyAFML/LLM , WPAFB , OH 45433 to help us maintain a current mailing list.
Copies of this report should not be returned unless return is required bysecurity considerations, contractual obligations, or notice on a specificdocument.AIR FORCE/56180/1o October 1978 —150
UN CLASSIFIEDSECURtT Y CLASSIFIC A TION OF THIS PAGE (iTh,n D.~. Entered )
________________________________________________________ BEF O RE_CO MPLETIN G_FO RMREPORT DOCUMENTATION PAGE REM) INSTRUCTIONS
RFR 2. GOVT ACCESSION NO. 3 R E C i P i E N T ’S C A T A L C G N U M B E R
I A ~!~IrR_ 78-ll~J ________________________
~~~~ a.~._.ILE.~E4. I4~bfflter - - . -- --. - . - —.--——— / /
I_- T YP~ OF -M.~ eG*~ -b Pff~~~~~~~~~ Q~j&$&~~~.
Final Technical ~ep.vt,~~~OPERTIES AND ~IICROSTRUCTU RES OF HIGH—~f~MPERATURE MAT~ kIAL S _ 1 Dec . 4974 - 31 March 11978)
— 4~ P .ORMflq~ oøo______ - - 3165
.~~~~~ ORT MUMb&h..
1 AU THO
~~J n ~~~~a t t a ~~ ~~~~~LQ~~T OR GRANT NUM~~ER( )
~ ~‘F336l5—75—C—l0O5 I
N. s. /choudhurY _~~ _.
9. PERFORMING ORGANIZATION NAME AND A DDRESS tO. PROGRAM ELEMENT . P R O J E C T . TASKSystems Research Laboratories , Inc. AREA S WOR K UNIT NUMBERS
2800 Indian Ripple Road ____
Dayton , Ohio 45440 ( ~~~~P3O3 (1ii?~ i~II. CONTRO LLING OFFICE NAME AND ADDRESS TZ . REPORT DATE
Processing and High Temperature Materials Branc~~~j I
~~~g118t 1978 /p ~ p~A~~
•!~Air Force Materials Laboratory
86Wright—Pa~~~r~ pn Air Fnrc’p ~~~~~~~~ (Thi n & c&’~~ ____________________________14. MONITORING AGENCY NAME & ADDRESS (I( di f f erent from Cot’. t rol i ing O f f i c e)
- IS. SEC URITY CLASS. (of thi, report)
Unclassified
IS.. DECLASSIF ICAT ION DOWNGRADINGSCHEDULE
16. DISTRIBUTION S T A T E M E N T (of th in Repor t)
Approved for public release; distribution unlimited.
17. DISTRIB UTION STATEMENT (of the s bs f r ~ cI ent ered In Block 20, If d i f feren t IromL2. .M3—-—- ..~~~~~~~
-
18. SUPPLEM ENTARY NOTES
19. KEY WORDS (Continue on rever s e s ide if necessary end Jden l i fy by block number)
Creep Fracture Mechanics Titanium AluminidesOxidation Four—Point Bend Strength Silicon Nitrid eFractography Microstructure Silicon CarbideControlled Flaws Fracture Toughness
20. A B S T R A C T (Continue on reverse aide if nece ssary and iden t i fy by block number)
‘This f ina l technical report contains information on investigationswhose aim was to study specif ic aspects of properties and microstructures ofhigh— temperature materials . These investigations are : 1) f racture fromcontrolled surface flaws in structural ceramics, 2) fractography of reaction—sintered silicon ni t r ide , 3) oxidation behavior of t i tanium aluminides , and4) creep behavior of Ti3A1 and Ti Al + 10 wt% Nb. The scientific basis andadvantages and disadvantages of t~e microhardness indentation technique in
DD ~ 1473 EDITION OF I NOV 65 IS OB SOLETE UNCLASSIFIEDSECURITY CLASSIFICATI ON OF THIS PAGE (When Date Entered)
~ O7 ~~~
~~~~~~~~~~~~~~~~~~~~~~~~~~~~~~~~~~~~~~
UNCLASSIFIEDSE C U R I T Y C L A S S I F I C A T I O N OF T H I S PAGE(ITh.n Data EnI.r.d)
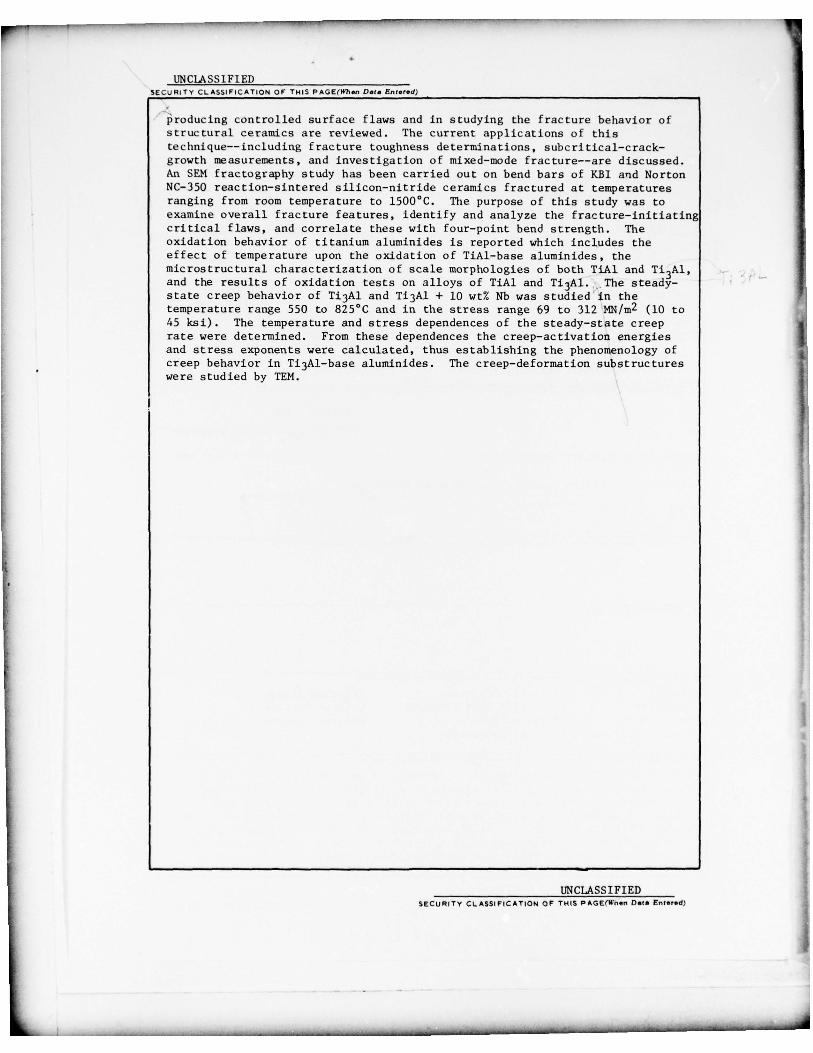
~roducing controlled surface flaws and in studying the fracture behavior ofstructural ceramics are reviewed . The current applications of thistechnique——including fracture toughness determinations , subcritical—crack—growth measurements , and investigation of mixed—mode frac ture——are discussed.An SEM fractography study has been carried out on bend bars of KBI a’~d NortonNC—35 0 reaction—sintered sil icon—nitride ceramics f ractured at temperaturesranging from room temperature to 1500°C. The purpose of this study was toexamine overall fracture features, identify and analyze the fracture—initiatingcritical f laws , and correlate these with four—point bend strength. Theoxidation behavior of titanium aluminides is reported which includes thee f f e c t of temperature upon the oxidation of T1A1—base aluminides , themicrostructural characterization of scale morphologies of both TIAI and Ti3Al ,and the results of oxidation tests on alloys of TiAl and Ti3A1. -
The steady—state creep behavior of Ti 3Al and Ti3A1 + 10 wt% Nb was studied in thetemperature range 550 to 825°C and in the stress range 69 to 312 MN/rn 2 (10 to45 ksi) . The temperature and stress dependences of the steady—state creeprate were determined . From these dependences the creep—activation energiesand stress exponents were calculated, thus establishing the phenomenology ofcr eep behavior in Ti 3A 1—base aluminides . The creep—deformation substructureswere studied by TEM.
UNCLASSIFIEDSECURITY CLASSIF ICATION OF THIS PAG E(Wn.n Dale EnI.r .d)
FORE WORD
This report was prepared by the Research Applications Division , SystemsResearch Laboratories, Inc., Dayton , Oh io, under Air Force Contract F33615—75—C—lOOS , Project 2306, Task P2, Work Unit 04. Dr. H. A . Lipsitt and
Dr. H. C. Graham of the Processing and High Temperature Materials Branch ,
Air Force Materials Laboratory (AFNL/LLM), Wright—Patterson Air Force Base,
Ohio 45433, were the Government project monitors . The research reported
herein covered the period 1 December 1974 through 31 March 1978.
iii
~~~~~~~~—~~--— .~~--—--~~~
TABLE OF CONTENTS
SECTION PAGE
INTR ODUCTION 1
II FRACTURE FROM CONTROLLED SURFACE FLAWS 6
1. Introduction 6
2. Mj crohardness Indentation Cracking 6
3. Surface Flaws in Four—Point Bending 12
4. Fracture Mechanics of Surface Flaws 15
5. Current Applications of the Controlled—Surface—Flaw Technique 17
6. Disadvantages of the Controlled—Surface—FlawTechnique 18
7. Advantages of the Controlled—Surface—Flaw Technique 26
8. Conclusions 27
III FRACTOGRAPHIC STUDIES ON REACTION—SINTERED Si3N4 29
1. Introduction 29
2. Materials Studied and Experimental Procedure 30
3. Results and Discussion 31
a. Fracture Modes and Fracture Microstructures 31
b. High—Temp erature Fracture Appearance 34
C . Fracture Origins 37
d. Fracture Mirrors 38
e. KIC Calculations 44
4. Summary
IV OXIDATION BEHAVIOR OF TITANIUM ALUMINIDES 47
1. Effect of Temperature upon the Oxidation Behaviorof Titanium Aluminides 47
2. Microstructural Characterization of the Oxide Scales 47
a. Scale Morphology for TiAl 47
b. Scale Morphology f or T13A1 493. Effect of Composition upon the Oxidation Behavior
of Binary TiAl Alloys in Air at 950°C 574. Results of Oxidation Tests of Alloys Based upon
TiA1 and Ti 3Al 57
v
L - - _ :i: .~~~~~~~~~~~_ _ _ _ _
TABLE OF CONTENTS (cont’d)
SECTION PAGE
V STEADY—STATE CREEP BEHAVIOR OF T13A1—BASEINTERNETALLICS 60
1. Introduction 60
2. Experimental Procedure 61
3. Results and Discussion 62
a. Microstructures of the Heat—TreatedIntermetallics 62
b. Creep Curves 64
c. Temperature Dependence of Steady—State Creep Rate 64
Ti3Al 64 }
Ti3Al + 10 Nb 66
d. Stress Dependence of Steady—State Creep Rates 66
TI3A1 66
Ti3A1 + 10 Nb 70
e. Phenomenology of Steady—State Creep 72
f . Dislocation Substructures 75
Temperature Dependence of the Substructures 75
Stress Dependence of the Substructure 79
4. Conclusions
REFERENCES 84
iiI
vi
1!
- - ~~~~~~~~~~~~~~~~~~~~~~~~~~~~~~~~~~~~~~~~~~~~~~~~~~~~~~~~~~~~~~~~~~~~~~~~~~~~~~~~~~~~~~~~~~~~~~~~~~~~
~~~~~~~~~~~~~~~~~~~~~~~~~~~~~~~~~~~~~~~~~ 1LIST OF ILLUSTRATIONS
FIGUR E PAGE
1 2600— gm Diamond Pyramid Indentation in HP S13N4(a) Indentation on Polished Surface 7(b) Crack Pattern after 8-urn Surface Removal 8
2 2600—gm Knoop Indentation in HP S13N4(a) Indentation on Polished Surface 9(b) Crack Pattern after 8-jim Surface Removal 10
3 Surface Flaw Produced by a 2600—gm Knoop Indentation inHP S1
3N4 11
4 Schematic of Controlled Surface Flaw on the TensileSurface of a Four—Point Bend Specimen 13
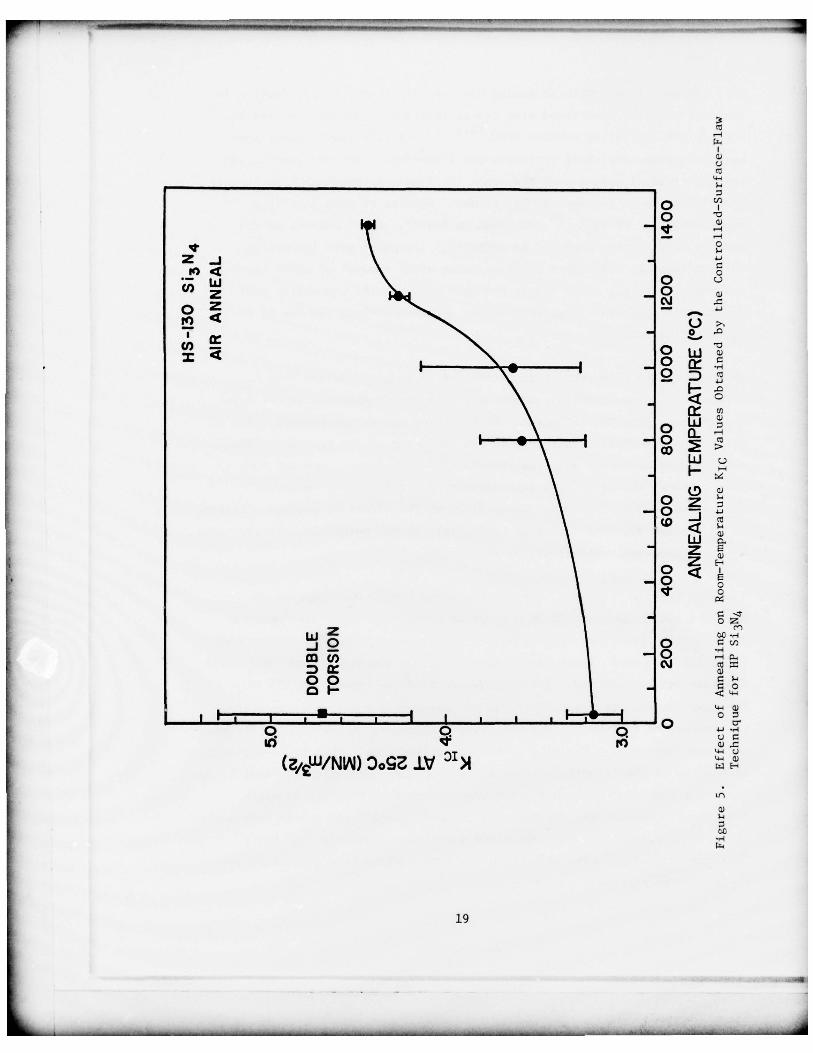
5 Effect of Annealing on Room—Temperature KIC ValuesObtained by the Controlled—Surface—Flaw Techniquefor HP S13N4 19
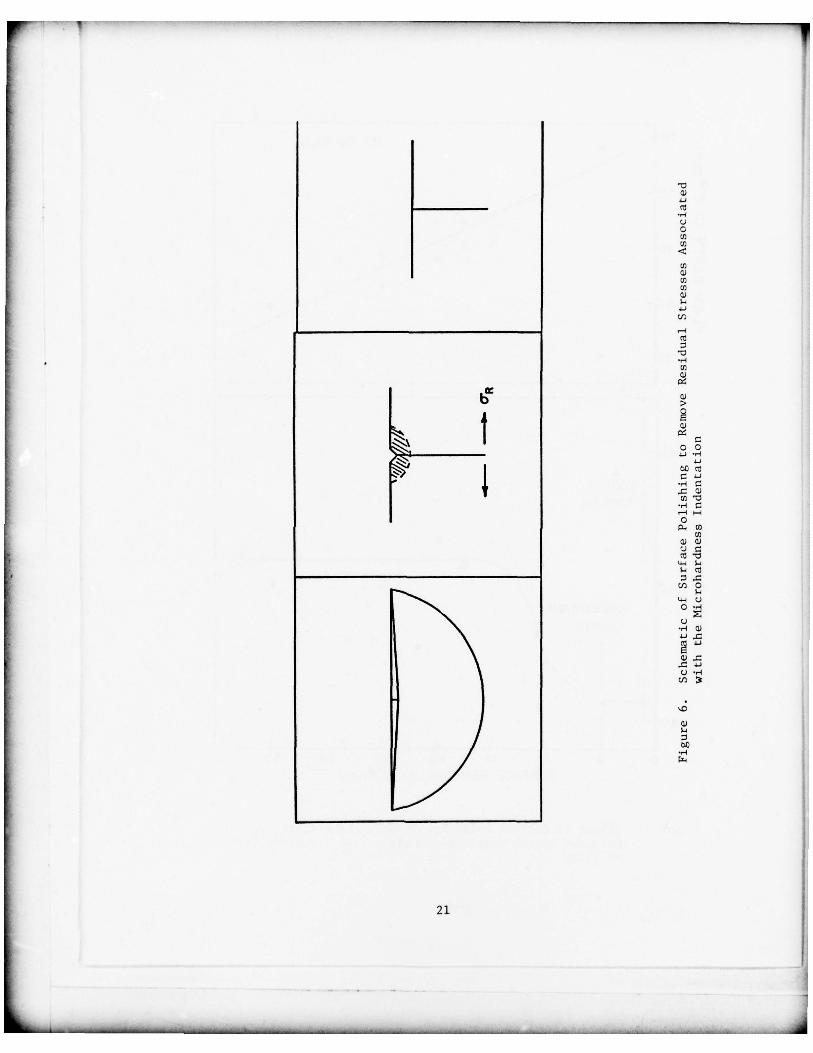
6 Schematic of Surface Polishing to Remove Residual StressesAssociated with the Microhardness Indentation 21
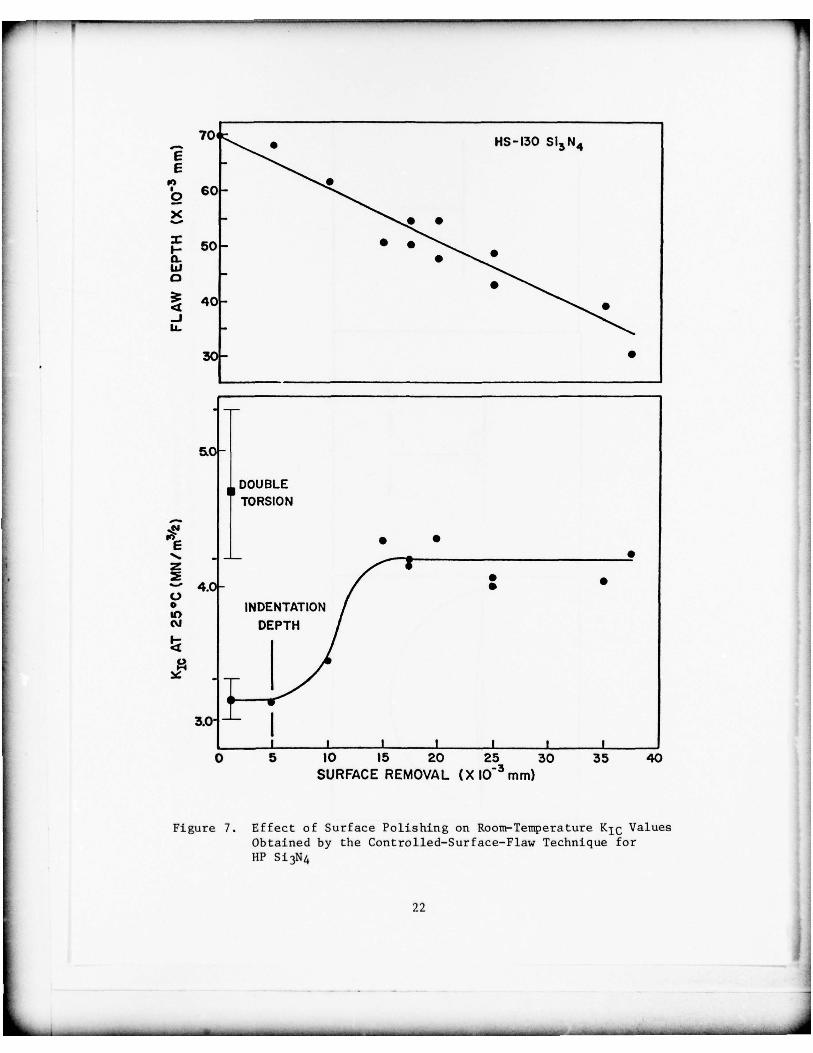
7 Effect of Surface Polishing on Room—Temperature KicValues Obtained by the Controlled—Surface—FlawTechnique for HP Si3N4 22
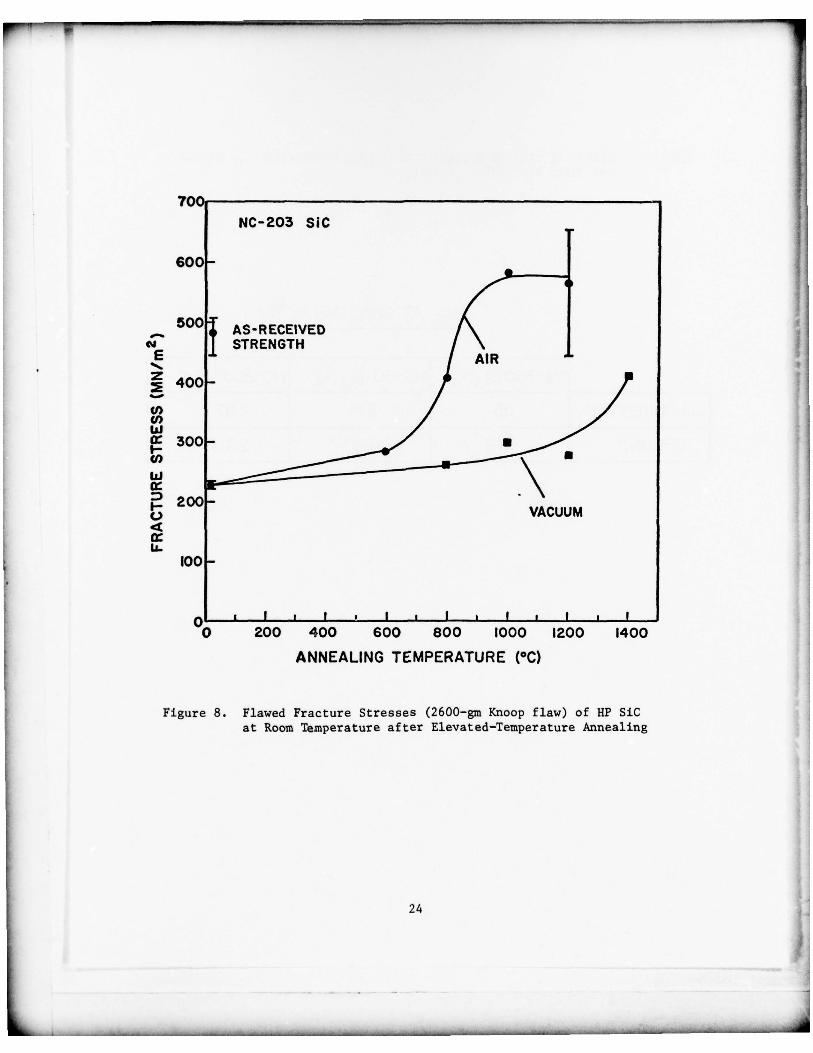
8 Flawed Fracture Stresses (2600—gm Knoop flaw) of HP SiCat Room Temperature after Elevated—Temperature Annealing 24
9 Fracture Surface Showing Microstructure of NC—350 S13N4 32
10 Fracture Surfaces Showing Microstructure of KBI Si3N4 33
11 Fracture Surface Showing Microstructure of NC—350 S13N4Fractured at 1200°C in Air 35
12 Fracture—Originating Flaw and Associated Inner Mirror inNC—35O S13N 4 39
13 Fracture—Originating Flaw in NC—350 S13N4 Bend BarFractured at 1200°C in Air 40
14 Fracture—Originating Flaw in NC—350 Si3N4
Bend BarFractured at 1500° C in Air (S .E . Mode) 42
15 Plot of log k~ as Function of lIT Showing Data Obtainedfor Oxidation of Ti—36 w/o Al in Air and in 02 48
vii
_ _ , - - ~~~~~~~~~~~
-~~~~~~~~~~~~~~~~~ -— _ _
LIST OF ILLUSTRATION S (cont ’d)
FIGURE PAGE
16 Backscattered Electron Image and Elemental Distr ibutionPatterns of a Transverse Section of a Ti—36 Al AlloyOxidized in Air at 1000° C 50
17 Electron Microprobe Line Scans through a TransverseSection of Ti—36 A1 Alloy Oxidized in Air at 1000°C 51
18 Backscattered Electron Image and Elemental DistributionPatterns of a Ti—36 A1 Alloy Oxidized in Air at 1200°C 52
19 Photomicrograph of a Transversi~ Section of a Ti3Al AlloyOxidized in Air at 950°C 53
20 Electron Microprobe Line Scans of a TI3A1 Alloy Oxidizedin Air at 950°C 55
21 Photomicrograph of a Transverse Section of a T13A1Sample Oxidized at 950 ° C in a 50% N 2 , 49 .8% CO ,0.2% CO2 Mixture 56
22 (a) Microstructure of Extruded and Heat—Treated Ti—16A1 63(b) Light Micrograph Showing Microstructure of Extruded
and Heat—Treated TI3A1 + 10 wt% Nb 63
23 Creep Curves for TI3A1 + 10 wt% Nb 65
24 Temperature Dependence of Steady—State Creep Rate 67
25 Temperature Dependence of Steady—Sta te Creep Rate forTi3A1 + lO wt %Nb 68
26 Stress Dependence of Steady—State Creep Rate for T13A1 69
27 Normalized Stress Dependence of Steady—S ate Creep Ratefor TI3A1 + 10 wt% Nb 71
28 Stress Dependence of Temperature—Compensated Steady—S tateCreep Rate 73
29 Normalized Stress Dependence of Temperature—CompensatedSteady—State Creep Rate 74
30 General Dislocation Structures in Creep Deformed Ti3A1 76
31 (a) Ti.~Al ÷ 10 wt% Nb Creep Deformed at 608°C, 45 ksi(b) A sketch of the Hexagonal Nets Formed <~~> Super—
dislocations(c) Dislocation Structures in Sample Creep Deformed at
750°C, 45 kal 78
viii
. .
~
- - -
LIST OF ILLUSTRATIONS (cont ’d)
FIGURE PAGE
32 Stacking Fault in Creep Deformed Ti3Al + 10 wt% Nb(750°C, 45 ksi) 80
33 General Dislocation Substructure in Creep Deforme dTi3Al (800°C, 20 ksi) 81
ix
• I-I-- -—- ~~~- - - - - - -—— ~~~~~~~~~~~~~~~~~~~~~~~~~~~~~~~~~~ ~~~~~~~~~~~~~~~~~~~~~
Section I
iNT RODUCTION
The gas—turbine engine presents to materials scientists challenging problems
of materials development as a result of the stringent high—temperature and
corrosive environments. Materials which can be used under these severe
conditions must possess adequate mechanical properties including short— and
long—term static and cyclic strength and thermal—shock resistance. In
addition , these materials must exhibit adequate oxidation resistance——achieved
through the formation of an adherent , continuous protective oxide scale which
does not spall off during thermal cycling and can withstand hot—corrosion
attacks resulting from reactions with sulfur and other contaminants ingested
with inlet air and contained in fuel.
The past two decades have seen spectacular alloy—development payoffs ,
resulting in Ni— and Co—base superalloys capable of operation at -. 1000°C.However, chances seen rather slim for further development of these alloys to
provide a still higher temperature capability , the major reason being the
rapid loss of s trength above — 1000° C. Also , these alloys , even with coatings ,
may not be able to withstand the very damaging effect of oxidation and hot
corrosion combined with loss of strength at high temperatures . The elements
used in the Ni— and Co—base alloys are of strategic importance and are being
depleted rapidly . The densities of Ni—base superalloys currently in use in
gas—turbine engines range from 7 .75 to 9 .27 g/cc . Replacement of these
alloys with ligh ter—weight mater ials will improv e engine performance and
fuel economy .
Significant improvements in the performance of current turbine engines can
be achieved through higher operating temperatures and lower—density
structural materials. It has been established that higher operating
temperatures in turbine engines will significantly improve f uel economy
and operating efficiency . Lower densities——or , more direc tly , higher ratios
of strength and modulus to density——will also improve engine performance
and , thus , effect significant fuel saving . This dual objective has prompted
1
research effor ts toward the development of ceramics and intermetallics , many
of wh ich possess low dens ities and high strengths and iner tness up to h igh
tempera tures.
A t the Air Force Materials Laboratory at Wright—Patterson Air Force Base ,
considerable research efforts are being directed toward development of Si—
bearing structural ceramics and titanium aluminides for high—temperature
applications . Systems Research Laboratories, Inc. (SRL), has par ticipa ted
in these programs and this report includes the results of investigations in
four principal areas:
1) Fracture from controlled surface flaws in structural ceramics
2) Fractography of reaction—sintered silicon nitride (RS S13N4)
3) Oxidation behavior of titanium aluminides
4) Creep behavior of T13A1 and T1
3A1 + 10 wt% Nb
The publications and presentations which have resulted from these and related
investigations are listed below.
1. “Fracture from Controlled Surface Flaws ,” M. C. Mendiratta(with J. J. Petrovic). Accepted for presentation andpublication at the Special Session on Fracture MechanicsTests for Br i t t le—Non—Meta l l ic Materials , ASTM 11th NationalSymposium on Fracture Mechanics to be held 12—14 June 1978,Blacksburg, Virginia.
2. “Use of Controlled Surface Flaws in Studying Slow Crack Growthin Structural Ceramics,” H. G. Mendiratta (with I. J. Petrovicand P. L. Land), presented at the 29th Pacific Coast Regional
• Meeting of the American Ceramic Society , San Francisco, CA ,31 October — 3 November 1976. Accepted for publication in theJournal of the American Ceramic Society , May—June 1978 issue.
3. “Compounds arid Properties of the Si—A1—0—N System ,” N. S.Choudhury (with P. L. Land , J. M. Wimmer, and R. W. Burns),J. Amer. Ceram. Soc. 61, 56 (Jan—Feb 1978).
4. “Steady State Creep Behavior of Ti3Al in Air and in InertAtmosphere,” M. C. Mendiratta (with S. M. L. Sastry , W. J.Yang , and H. A. Lipsitt), presented at the Annual Meetingof the Metallurgical Society of AIME , Atlanta, Georgia ,6—10 March 1977 (to be published).
2
~~~~~ -.--- -~~- -• — . — - —~~~~~~~~~~~~~~~~~~~~~~~~~~~~~~~~ --~~~~~~~~~~~~~~~ -— •~~ • • -~~~.-- ~~~~- . • • - . • • • .- ~~ ••
5. “Effec t of Temperature upon the Oxidation Behavior of Ti—36w/o Al Alloy,” N. S. Choudhury (with J. E. Henry and H. C.Graham), presented at the Annual Meeting of the MetallurgicalSociety of AIME, Atlanta, Georgia, 6—10 March 1977.
6. “Oxidation Behavior of Titanium Aluminides ,” N. S. Choudhury(with H. C. Graham and J. W. Hinze), presented at the Symposiumon Properties of High—Temperature Alloys sponsored jointly bythe Electrochemical Society and the Metallurgical Society ofAIME held in Las Vegas, Nevada , 17—22 October 1976. Publishedin Proceedings of the Symposium on Properties of High TemperatureAlloys (The Electrochemical Society , Pr ince ton , NJ , March 1977),pp. 668—680.
7. “Lifetime Prediction of Brittle Materials Having SpatialVariations in Fracture Properties of Ki~
and v versus K1, ”M. G. Mendiratta (with P. L. Land), J. Mater. Sci. 12,1421 (1977).
8. “Dynamic KIc and Dynamic Flexural Strength in HS—13O Si3N4,”H. C. Mendiratta (with J. M. Wimxner and I. Bransky), J. Mater.Sci. 12, 212 (1977).
9. “Fractography of Reaction—Sintered Si3N4,” M. C. Mendiratta(with P. L. Land, R. Ruh, R. W. Rice, and D. C. Larsen),presented at the Fall Meeting of the American Ceramic Society ,Hyannis, MA, September 1977.
10. “Silicon Cerium Oxynitride,” R. R. Wills (with J. A. Cunningham),J. Mater. Sci. 12, 208 (1977).
11. “Fabrication of Reaction—Sintered Sialon ,” R. R. Wills (withJ. M. Winimer and R. W. Stewart), J. Amer. Ceram. Soc. 60,64 (1977).
• 12. “Effect of Composition and X—Phase upon the Intrinsic Propertiesof Reaction—Sintered Sialon,” R. R. Wills (with J. H. Witnmerand R. W. Stewart), Bull. Amer. Ceram. Soc. 56, 194 (1977).
13. “Phase Relationships in the System Si3N4—Y2O3—SiO2,” R. R. Wills(with S. Holinquist, J. M. Wixnmer, and J. A. Cunningham),J. Mater. Sd . 11, 1305 (July 1976).
14. “The Stability of the Silicon—Yttrium Oxynitrides,” R. R. Wills(with J. A. Cunningham, J. H. Winimer, and R. W . Stewart),J. Amer. Ceram. Soc. 59, 269 (May—June 1976).
15. “Pressureless Densification in the Si—A1—0—N System ,” R. R.Wills (with R. W. Stewart and J. M. Wimmer), presented at theAnnual Spring Meeting of the American Ceramic Society ,Cincinnati, OH, 3—5 May
1976.3
16. “Further Studies on the Silicon Lanthanide Oxynitrides,” R. R.Wills (with R. W. Stewart, J. A. Cunningham, J. N. Wimmer, andS. Holmquist), presented at the Annual Spring Meeting of theAmerican Ceramic Society, Cincinnati , Ohio , 3—5 May 1976.
17. “Intrinsic Properties of Reaction—Sintered Sialon and theEffect of the X and J Phase upon Them,” R. R. Wills (withJ. H. Wimmer and R. W. Stewart), presented at the AnnualSpring Meeting of the American Ceramic Society, Cincinnati,Ohio , 3—5 May 1976.
18. “Steady State Creep of Ti3Al—Base Alloys,” M. G. Mendiratta(with S. N. L. Sastry, W. J. Yang, and H. A. Lipsitt),presented at the AIME—ASM Meeting, Niagara Falls, NY ,May 1976 (to be published).
19. “The Silicon Lanthanide Oxynitrides ,” R. R. Wills (with R. W.Stewart , J. A. Cunningham, and J. M. Wimmer), J. Mater. Sci.11, 749 (April 1976) .
20. “Oxidation Behavior of Titanium—Aluminum Alloys,” N. S.Choudhury (with J. W. Hinze and H. C. Graham) , presentedat the AFWAL/AIAA Mini—Symposium on New Avenues for Progressin Aerospace Research Technology and Systems, Air ForceInstitute of Technology, Wright—Patterson Air Force Base,25 March 1976 .
21. “The Silicon Metal Oxynitrides ,” R. R. Wills, presen ted atthe AFWAL/ALAA Mini—Symposium on New Avenues for Progressin Aerospace Research Technology and Systems , Air ForceInst i tute of Technology , Wright—Patterson Air Force Base,
• 25 March 1976.
22. “Use of Controlled—Surface—Flaw Technique in the Study ofFracture Behavior in Structural Ceramics ,” M. G. Mendiratta ,presented at the AFWAL/AIAA Mini—Symposium on New Avenuesfor Progress in Aerospace Research Technology and Systems ,Air Force Institute of Technology , Wright—Patterson AirForce Base , 25 March 1976.
23. “Effect of Grain Size upon Flaw and Fracture in aPrecipitation—Strengthened Ti—8 wt% Al — 0.25 wt% SiAlloy ,” N. C. Mendiratta (with S. M. L. Sastry and J. V.Smith) , J. Mater . Sc!. 11, 1835 (1976) .
24. “Controlled—Surface—Flaw—Init iated Fracture in Reaction—Bonded Si3N4, ” M. G. Mendiratta (with R. R. Wills and J. J.Petrovic), J . Mater. Sci. 11, 1330 (1976) .
25. “Mixed—Mode Fracture from Controlled Surface Flaws in Hot—Pressed SI3N4 , ” M. C. Nendiratta (with J. J. Petrovic),J. Amer. Ceram . Soc. 59, 163 (1976)
.4
_ _ _ _ _ _ _ _ _ _ _ _ _ _ _ _ _ _ _ _ _ _ _ _ _ _ _ _ _ _ _ _ _ _ _ _ _ _ _ _ _ _ _ _ _ _ _ _ _
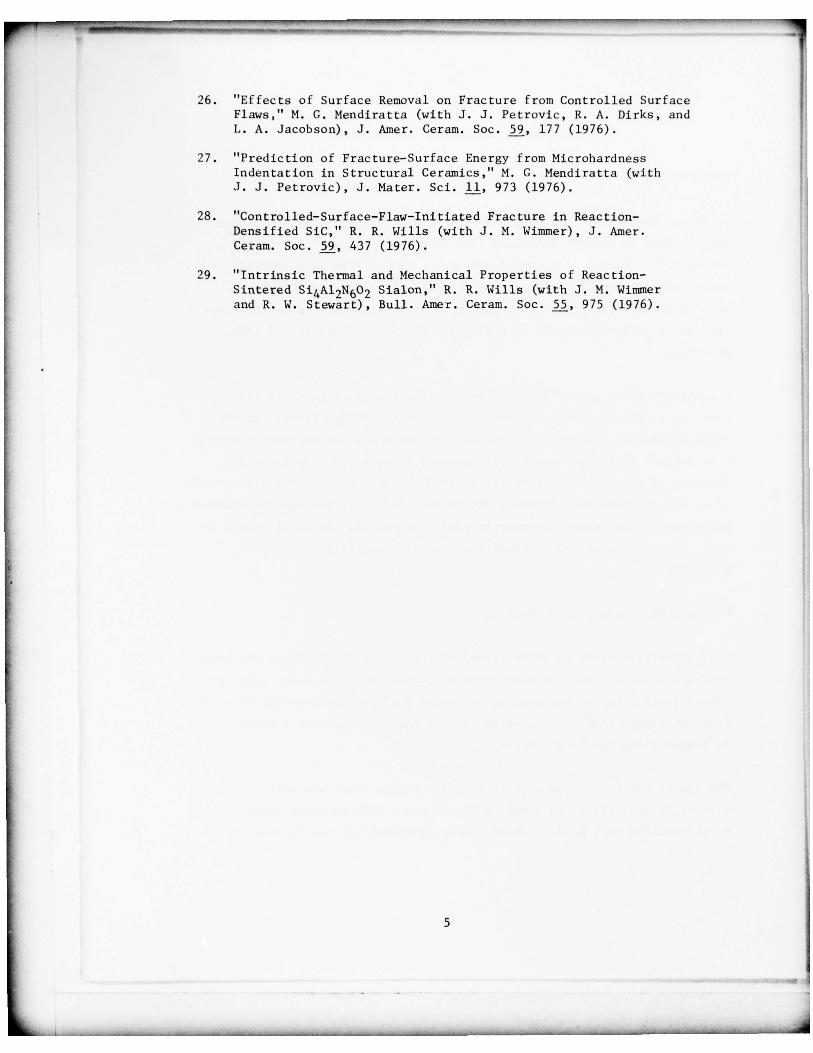
26. “Effec ts of Surface Removal on Fracture from Controlled SurfaceFlaws ,” M. C. Mendiratta (with J. J. Petrovic , R. A. Dirks , andL. A. Jacobson), J. Amer. Ceram. Soc. 59, 177 (1976) .
27. “Predic tion of Fracture—Surface Energy from MicrohardnessIndentation in Structural Ceramics,” M. C. Nendiratta (withJ . J. Petrovic), J. Mater. Sci. 11, 973 (1976) .
28. “Control led—Surface—Flaw—Init iated Fracture in Reaction—Densified SiC ,” R. R. Wills (with J. M. Wimmer), J. Amer.Ceram . Soc . 59 , 437 (1976) .
29. “ Intr insic Thermal and Mechanical Properties of Reaction—Sintered Si4A12N6O2 Sialon ,” R. R. Wills (with .3. M. Wiimnerand R. W. Stewart), Bull . Amer. Ceram. Soc. 55, 975 (1976).
5
_ _ ~~~~~~~ ~~~.- - .-- —.- • - •- •-- •~~~
Section II
FRACTURE FROM CONTROLLED SURFACE FLAWS
INTRODUCTION
In recent years crack patterns produced in the vicinity of microhardness
indentations in brittle materials have been the subject of increasing
scrutiny.~~~5 In the past such cracking has been viewed as a generally
undesirable element associated with the hardness testing of bri t t le
materials; however , i t is now recognized that indentation—produced cracks
can play a valuable role in determining the fracture behavior of these
materials.
One aspect of the use of indentation cracking to investigate brittle
fracture is the area of fracture from controlled surface flaws. In this
technique surface flaws of controlled size and shape are introduced into
a mechanical test specimen by tnicrohardness indentation. Subsequent
fracture of the test sample initiates from the site of the controlled surface
flaw, and the resultant fracture may be analyzed to derive fracture—mechanics
parameters. The present section reviews this method , its applica tions toda te , its advantages and disadvantages , and its potential for futureapplication.
MICROHARDNESS INDENTATION CRACKING
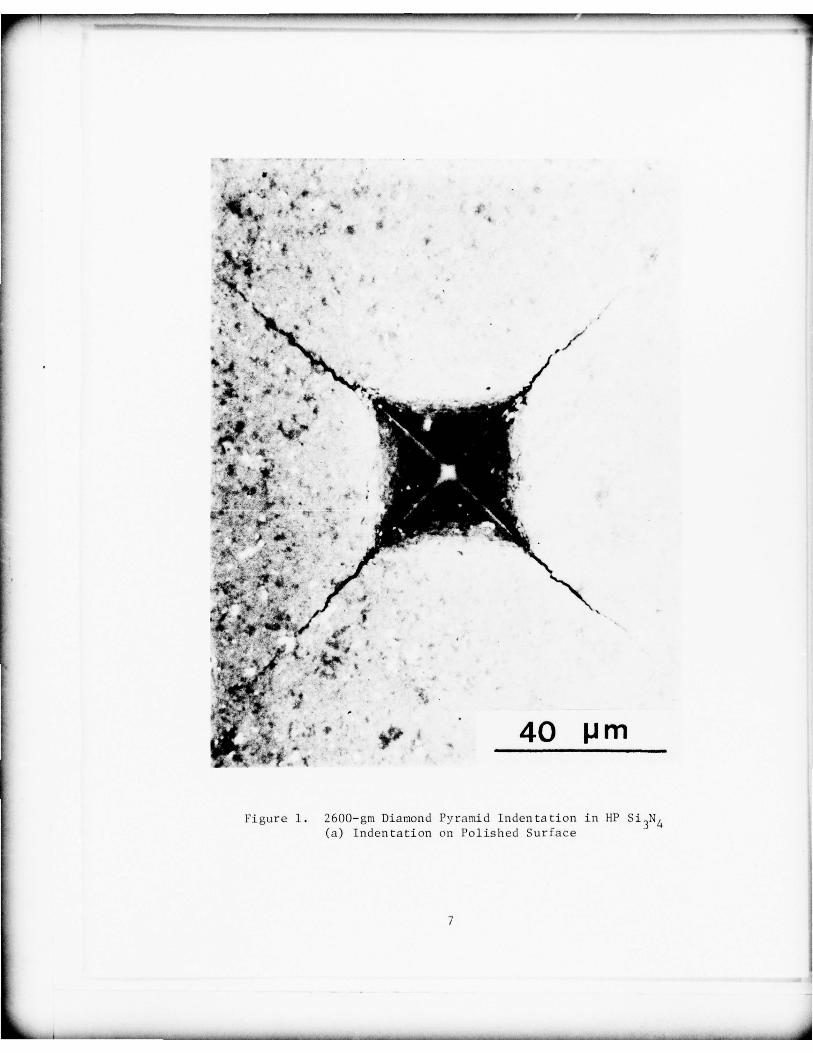
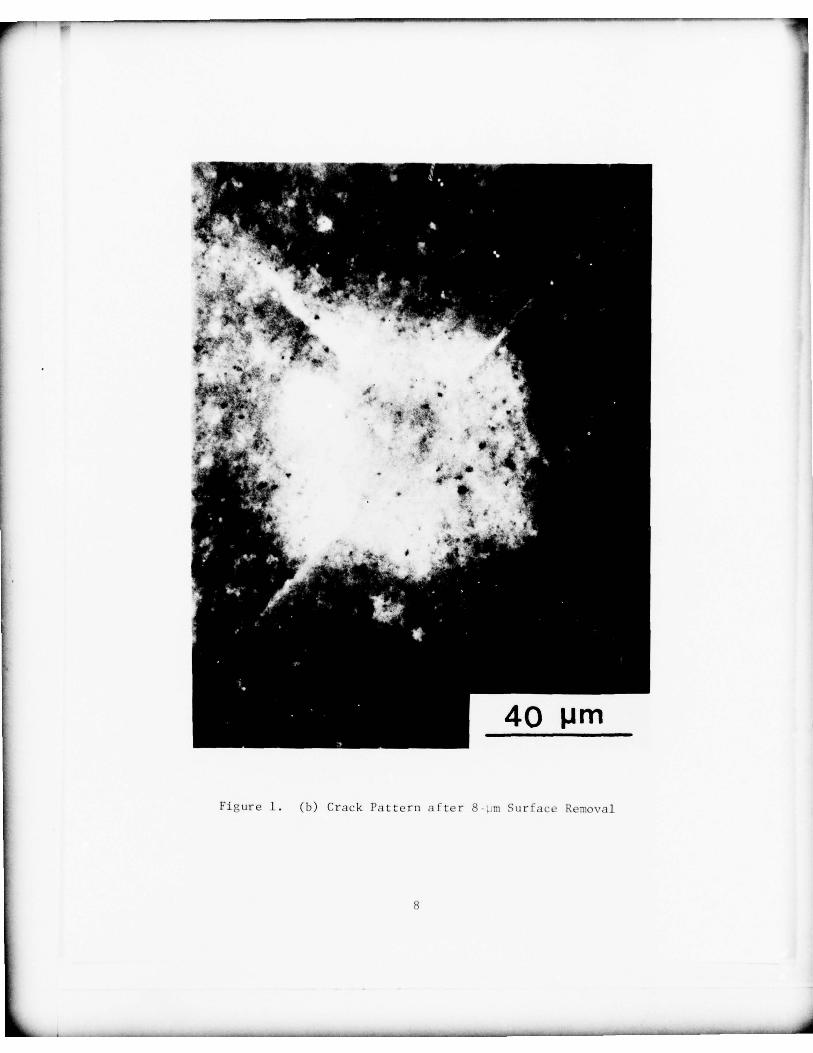
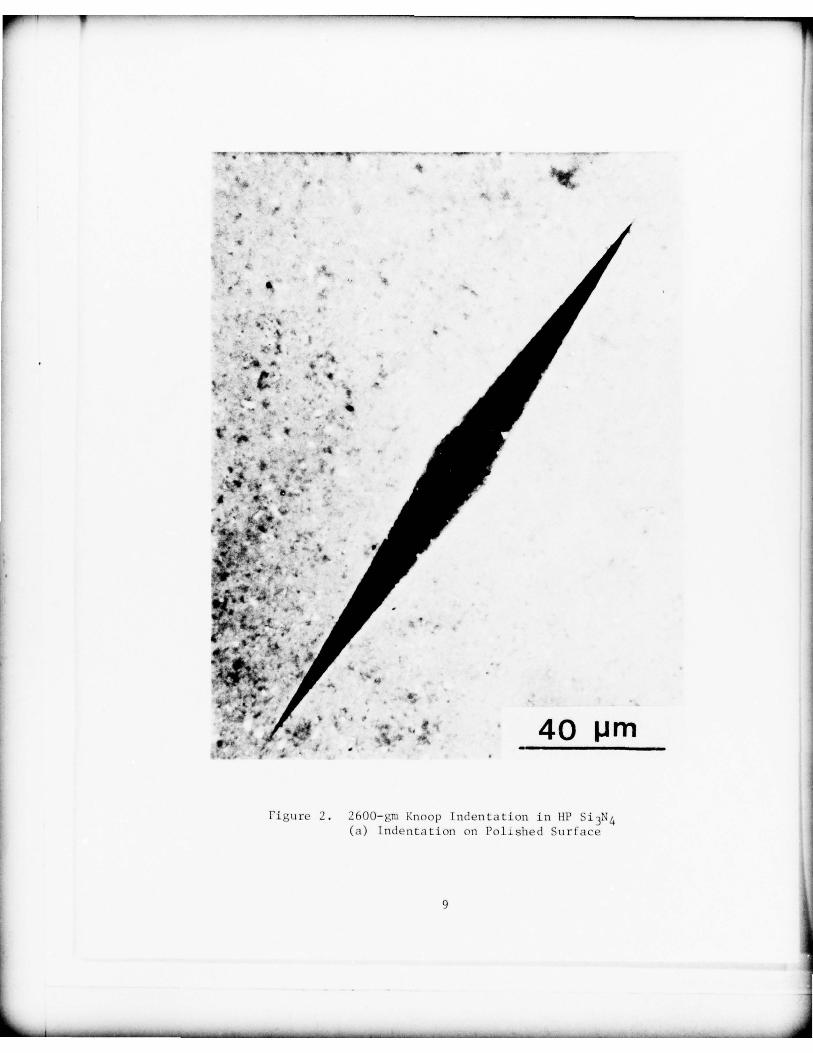
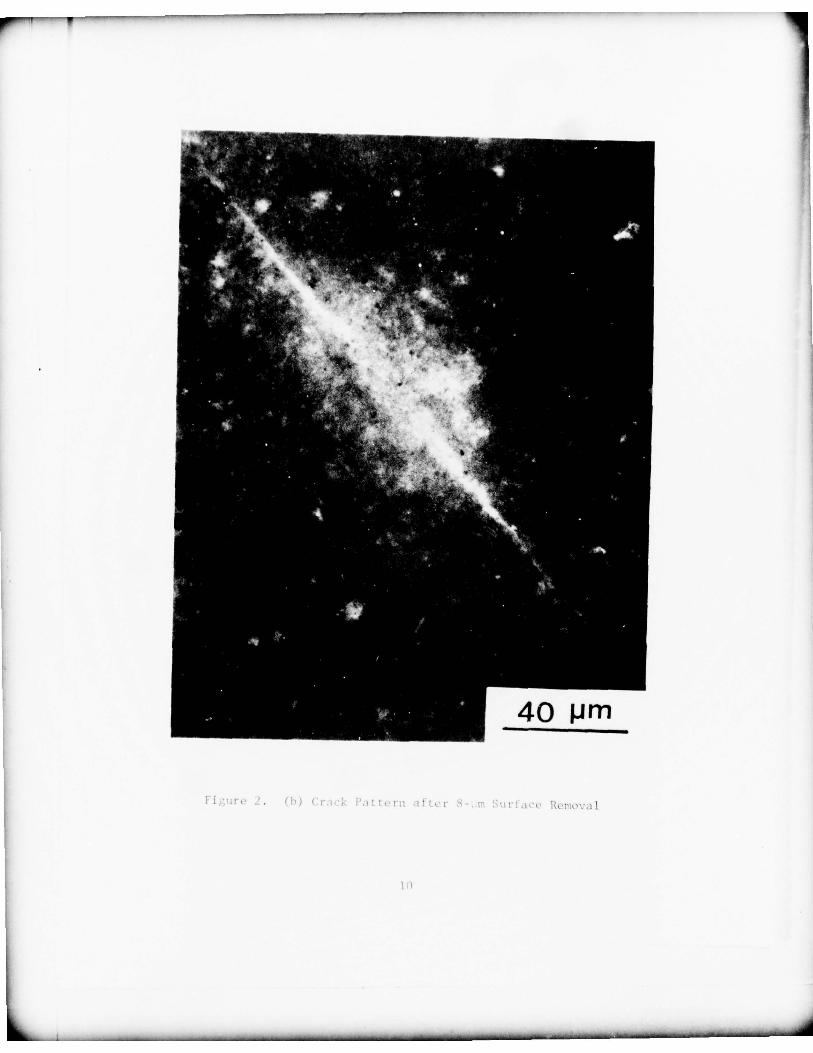
Typical surface crack patterns around microhardness indentations are shown
in Figs. 1 and 2, for a diamond—pyramId indentation and a Knoop indentation ,
• respectively. On the surface , sharp cracks radia te from the corners of thediamond—pyrami d indentation, while for the Knoop indentation a sharp crackis formed along the long diagonal.
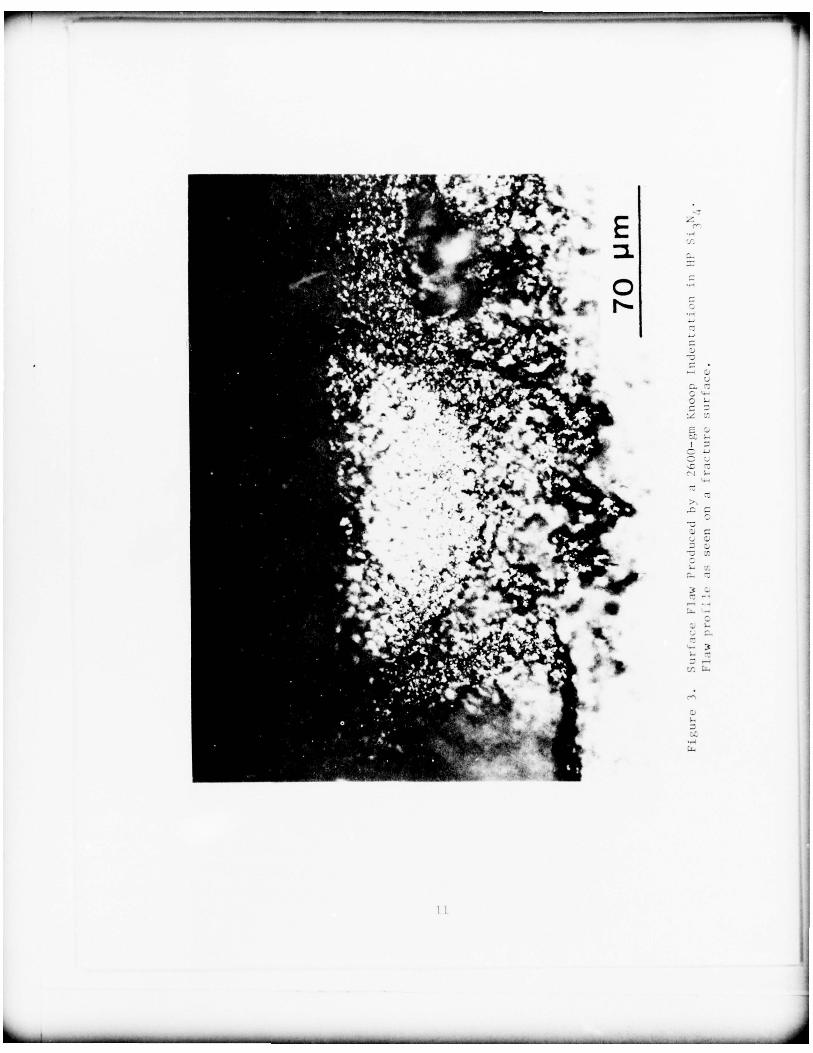
The cracks visible on the surface actually extend below the surface with a
semi—ellip tical shape , as shown in Fig. 3 for a 2600—gm Knoop indentationin hot—pressed (HP) Si
3N4. These cracks correspond to the “median vents”
6
~~~ --- •~~~~ - . • • • ~~-• • •• - • ••
-- ~~~~~~~~~~~~~~~~~~~~~~~~ - -. —~~~~~- .~~~~~~~~~~~ - -. - -— . - .~~
I - -~
~~~~~~~~ ~~~~~~~ ~
4.
.~;
‘ti.. ~.. -
~~~~ -~~
-
-.
.
‘?~~p~ ~~- . ,.A~~, -.~
~ - -
.~~~~~ - .
-.
• ~~~~~~~~~~~~~~~~~~~~~~~~~~~~~~~~~~~
..• -.; ~.
4...
..
-
~~~~~~~~~~ ‘
~~~~~~~~~~~~~~~~~ 40 pm
Figure 1. 2600—gm Diamond Pyramid Indenta t ion in HP Si 3N 4(a) Inden ta t ion on Polished S u r f a c e
7
_ _ _ _ _ _ _ _ _ _ ~~~~~~~~~ • ••
~‘
_______________ - •
I
~
*
~~~~~~~~~~~~~ :~_
-
~~~~~~~~~~~~~~~~~~
40 p m
Figure 1. (b) Crack P a t t e r n a f t e r 8 - r n S u r f ~-ic1 Removal8
- ___________
-V. • • . — - — ~~~~~~
~‘— •v~—• -
~~~~ --—• _ __- . - - -
-. -
-, p.
4 S
- •~ •
• .,.
_
• _•.
• -.~~~~~
• p . .~.
fr •- -
~~~, -
• ‘~~.‘•~~~ .
. . .
~~~~~~- .
.. . .
-
-. . i4 ~~~. .-
•4 k~~~ V
.
...
•: ~~~~~~ ,~
• •~~~~ •~~~.* . , .
-, - .
-
• ~~~~~.
,, ...
~.
•
40 pm
Figure 2. 2600—gm Knoop Indentation in HP Si 3N 4(a) Indentation on Polished Surface
9
--
~
• •
~
~~~~~~~~~~~~~~~~~~~~~~~~~~~~~~~~~~~~~~~~~~~~~~
V
~~~~~~ TIP~~~~~~~~~~~~~~~~
—.
~
-—
40 pm
I I ~~~j F ~ • ( h ) ( r~ i1-- I . ~ t ru ;1 S-- rn •~-~ ~ -~- e v;1 I
- • •
~~~~~~~~~~~~~~~~~~~~~~ ~~~~~~~~~~~~~~~~~~~~~~~~~~~~~ - -
L
~~~~~~~~~~~~~~~ ~~~~~~~~~~~4 ,
• .
c ~~~~~~~~ ~~~.
• ~• -~: ~~~~~ ~~
r~
i~i~-•~
c p~ ~J’- -.~~
.
~~~~~~~~~~~~~~~~~~~~~~~~~~~~~~ .-•w
wi ::
*
5, —
•
~
_ ~~~~~~~~~~~~~~~~~~~~~~~~~~~~~~~~~~~~~~~~
desc ribed by Lawn, et al.’3 Thus , with microhardness indentation , it is
possible to introduce semi—elliptical surface flaws into brittle materials.
In the present ci for t , the use of flaws produced by Knoop indentations as
opposed to diamond—pyramid indentations was preferred for the following
reasons : Firs t , w i t h the Knoop indentat ion there is no crack perpendicular
to the primary surface f law as there is with the diamond—pyramid indentation.
This is a more desirable situation from a fracture—mechanics—analysis point
of view. Secondly , orien ta tion of Knoop surface flaws is more convenien t
and can be con trolled more easily since alignment is ach ieved by aligningthe long axis of the Knoop inden tation .
Surface flaws produced by Knoop indentation are “controlled” in the sense
that their basic shape is semi—elliptical and their size is determined by
the applied Knoop microhardness load .
SURFACE FLAWS IN FOUR-POINT BENDING
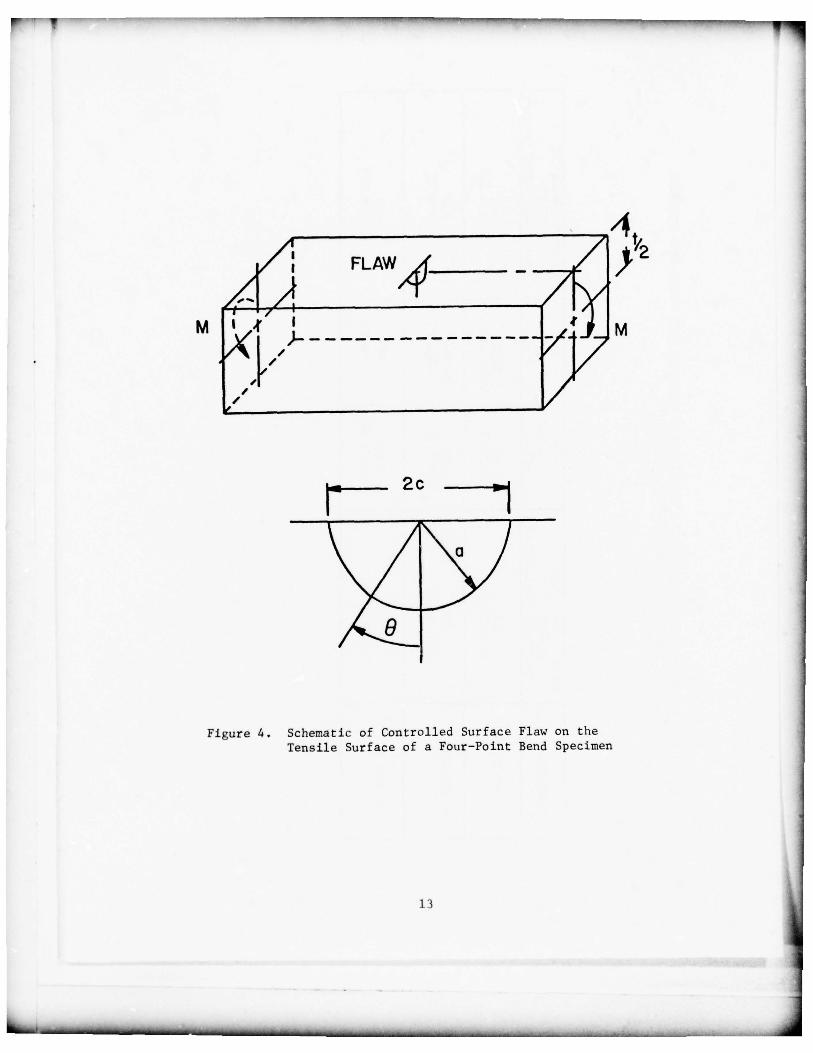
If a single controlled surface flaw of suitable size is p laced on thetensile surface of a four—point bend specimen and accurately alignedperpendicular to the tensile—stress direction , as shown schema tically inFig. 4, fracture initiates at the site of this flaw because it is the
“wors t f law” in the specimen. A consequent reduction in fracture stress ,
as compared to tha t in the “unflawed” condition , occurs and the surf ace—f law profile is visible on the fracture surfaces .
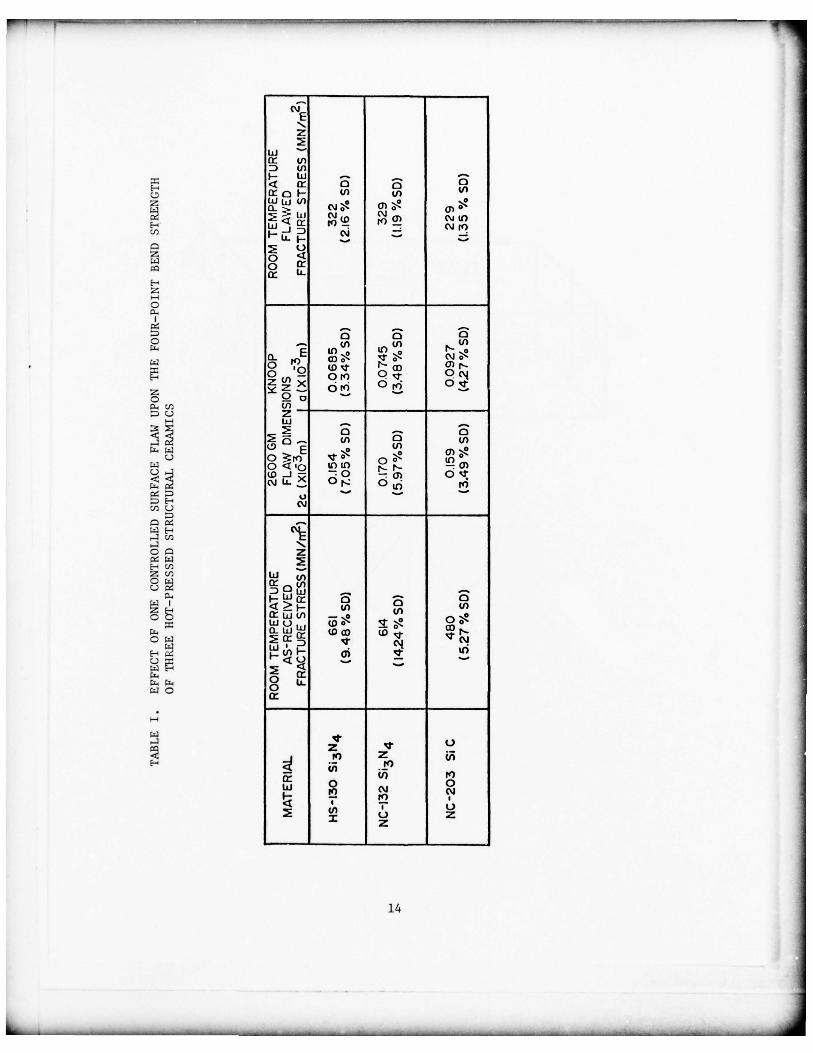
Table I shows the ef fec t of a single surface flaw upon the f rac ture stressof three structural ceramic materials. Taking Norton HS—l30 HP Si
3N4 as
an example , the room—temperature fracture stress of the as—received specimenwas 661 MN/rn2. The surface flaw produced by a 2600—gm Knoop indentation
was qui te small , having a dep th (a) of 68.5 ~im and a surface length (2c)of 154 ~.nn. For HS—130 S1
3N4
presence of this flaw reduced the f rac turestress to 322 MN/rn2, approxima tely a factor—of—two reduction . It is also
importan t to notice that the scatter in fracture stress was redu~~ d by a
12
r- V — _ - - _• • • - - •
__• - — _— — -_ — • • • - •~ ~~~~ • •- - •----- - _ -
~
4
/
~~~~~~
FLAW4
~~~~~ ,~1’
_ _ _ 2c _ _ _
Figure 4. Schematic of Controlled Surface Flaw on theTensile Surface of a Four—Point Bend Specimen
13
~~~~~~~~~~~~~~~~~~~~~~~~~~~~~~~~~~~~~~~~~~~~~~~~~~~~~~~~~~~~~~~~~~~~~~~~~~~~~~~~~~~~~~~~~~
ppur.~ -• -~~~~~~~ -~~~~~~
zw -.a:D (a
0a:o I- u U)
Z U) c~j~ C~~~~
: :•~~~~~~ U)
U~ ~flU
Q- ,0 a~~~ ‘~3•~~
h 1
’!
~~~~~~~U O •~ rfl ~~~~~~~0 4’o ‘° ‘°tD _i — o — a ., O~~~‘•j Li~ _~ °r- ~~~
5-
(••J
o~~ z—Z r j~ w
a:~~0w -• -~o
(a U) U)
g iude, ~~~ o~~~ (DG~ ~~Z
U)40 —0 ~c a o
()
a: U) N)ILl NF- - N)4 ... 0
I zz
14
_ _ _ _ _ _ _ _ _ _ ~~~~ - — ~_ - - ~~~~~~~ - - - ---~~~~~~~ ---- —~~~~~~ -_
F — - - - - -
~~~~~
- - - - - - —- - - • - • -----
~~
- - • •• - - • •--—---—-
factor of four as a result of the flaw being present. This indicates that
the flaws introduced by microhardness indentation were highly reproducible.
Similar •~ fects are evident for the othe r materials in Table I.
FRACTURE MECHANICS OF SURFACE FLAWS
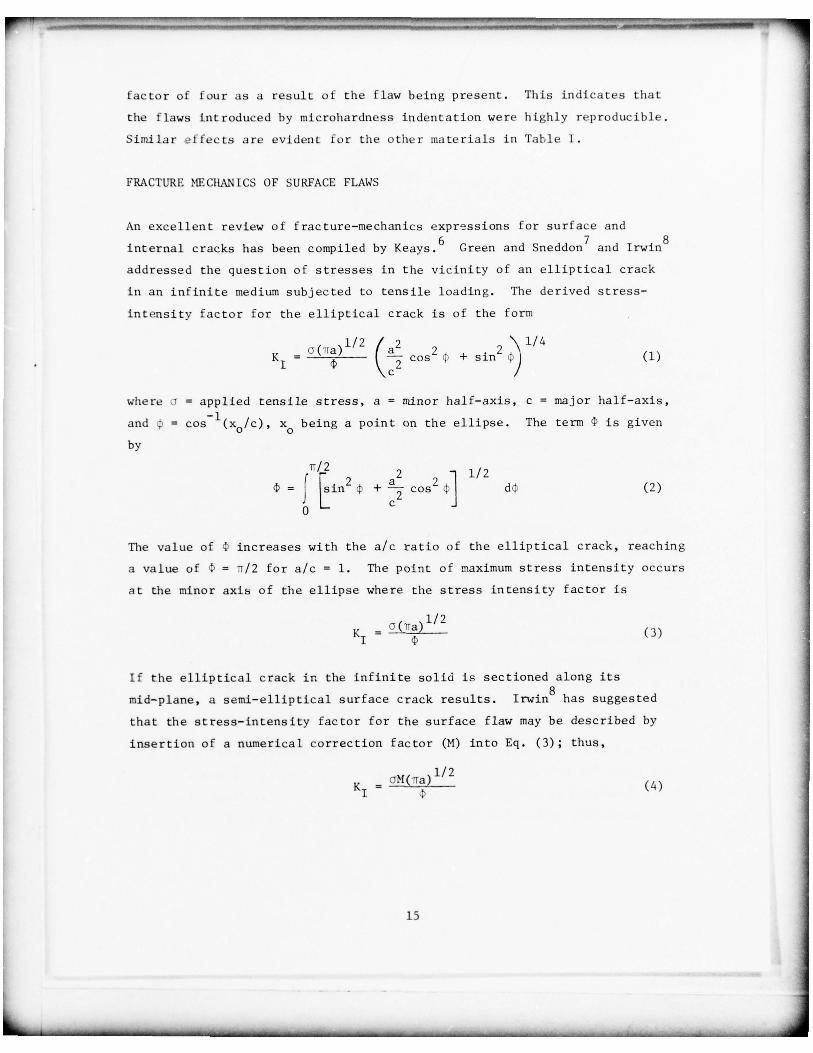
An excellen t review of fracture—mechanics expressions for surface and
internal cracks has been compiled by Keays .6 Green and Sneddon7 and Irw in8
addressed the question of stresses in the vicinity of an elliptical crack
in an infinite medium subjected to tensile loading. The derived stress—
intensity fac tor for the ellip tical crack is o f the f orm
K1
= Q(~~~ l/2 (
~ cos2 ~ + sin2
\\ 1/4
where ~ = appl ied tensile stress , a = minor half—axis, c major half—axis ,
and ~ = cos 1(x0/c), x being a point on the ellipse. The term 4~ is given
by
rr /2 2 ~1 1/2
= J ~~~~~~~~ ~~
+ ~~
-
~~
- cos~ d~ (2)c
The value of ~ increases with the a/c ratio of the elliptical crack , reaching
a value of ~ = Tr /2 for a/c = 1. The point of maximum stress intensi ty occurs
at the minor axis of the ellipse where the stress in tens i ty f ac to r is
K1 =
If the el l ipt ical crack in the i n f in i t e solid is sectioned along its
mid—plane , a semi—ell ipt ical surface crack results. Irwin8 has suggested
that the s t ress—intens i ty fac tor for the surface flaw may be described by
insertion of a numerical correction factor (M) into Eq. (3); thus ,
1/2K —
c~M(-ra) (4)I
15
I - -~~ •_ — • ~~~~-- ~ _—— _• .- • —— _ •- ~~~~~~~ ~-- • —
_________- ~~~~~~~~~~~~~~~~~~~~~~~~~~~~~~~~~~~~~~~~ ~~~~~~~~~~~~~~~ ~~~~~~~~~~~~~~~~~~~~~~~~~~~~~~~~
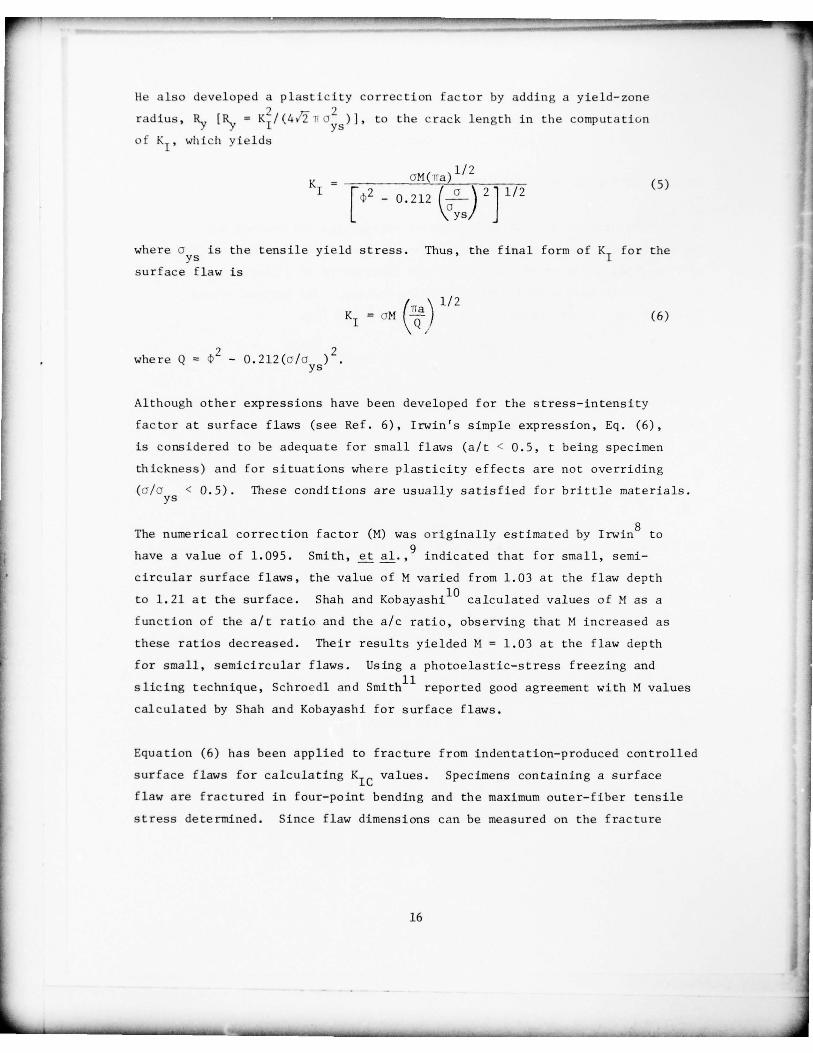
He also developed a plasticity correction factor by add ing a yield—zone
radius , R~ [R.~ = K~ / ( 4~’~�1i o~~~) I , to the crack length in the computation
of K1, wh ich yields
1/2— c7 M( rr a )
I —
[
~2 — 0.212 (
~~G) 2]
1/2
where a is the tensile yield stress. Thus, the f inal form of K for theys Isu r face flaw is
/ \ l/2K1
= c~M (6)
2 2where Q — O . 2 l 2 (o / o )
Al though other expressions have been developed for the stress—intensity
f a c t o r at sur face flaws (see Re f . 6 ) , Irw in~s simple expression , Eq. (6),
is considered to be adequate for small flaws (a/t < 0.5, t being spec imen
thickness) and for situations where plasticity effects are not overriding
(a/a < 0.5). These conditions are usually satisfied for brittle materials.
The numerical correction factor (M) was originally estimated by Irwin8
to
have a value of 1.095. Smith, et al.,9 indicated that for small, semi—
- • circular sur fac e flaws , the value of H varied from 1.03 at the flaw depthto 1.21 at the surface. Shah and Kobayashi10 calculated val ues of M as afunction of the a/t ratio and the a/c ratio , observing that M increased as
these ratios decreased. Their results y ielded H 1.03 at the flaw depth
for small , semicircular flaws . Usin g a photoelast ic—stress f reezing and
slicing technique , Schroedl and Smith’1 reported good agreement with M values
calculated by Shah and Kobayashi for sur face f laws .
Equat ion (6) has been app lied to fracture from indentation—produced controlled
surface flaw s for calcula ting Ki~ values. Specimens containing a surface
flaw are fractured in four—point bending and the maximum outer—fiber tensile
stress determined. Since flaw dimensions can be measured on the fracture
16
-~~
sur f ace , this provides the necessary infornrition to calculate KIC fromEq. (6). For brittle fracture , the plasticity correction term is usually
neglected.
CURRENT APPLICATIONS OF THE CONTROLLED—SURFACE-FLAW TECHNIQUE
The controlled—surface—flaw technique has been applied to the measurement of
• Kic values at both room and elevated temperatures for the structural ceramics
Si 3N4 and SiC. For the case of SiC, this techniq ue could be used todistinguish differences in f rac ture behav ior associated with air and vacuum
environments . Ingelstrom and Nordberg16
used the method to determine KICvalues for WC—Co composite materials at room temperature. Govila 17 has
examined the frac ture behavior of VC single crys tals , measuring fracture—
surface energy as a function of temperature .
A slight modification of the technique was employed by Pe trovic and
Mendiratta in a study of mixed—mode fracture in HP Si3N4.
18 19 Ra therthan orienting the surface flaw perpendicular to the bending—tensile—
stress direc tion, they accurately positioned it at a number of different
angles which led to mixed—mode fracture conditions , with Modes I , II , and
LII being present. This was found to be an experimentally convenient
technique for observing mixed—mode fracture.
Mendiratta, Wiminer, and Bransky2° used the controlled—surface—flaw techniqueto ob tain dynamic KIC values both at room temperature and 1300°C for HP SI
3N4 .
Flawed bend bars were employed in conjunction with an instrumented drop—
• weight apparatus . Dynamic KIC values were less temperature dependent thanstatic K IC values in this material.
The elevated— temperature slow—crack—growth behavior of HP Si3N4
was
investigated by Mendiratta and Pe.trovic.21 In this case arrays of sur face
flaws of d i f feren t sizes were placed on a single pour—point bend bar and
then subjected to stress at elevated temperatures for various tlme periods .
Average crack velocities and K1 values were determined by observation of
17
surface—crack extension. Slow crack growth from individual flaws was
erra tic and not well described by the empirical relationship V = AKn
Land and Mendira tta have put forward a theoretical framework which
explains such behavior in terms of the interactions of the flaw with
material inhomogeneities.
• It is evident from the above discussion that the controlled—surface—flaw
techni que has a wide range of applications to date . This technique is
useful for examining a number of phenomen a associated with the frac turebehavior of brittle materials. However, the potential applications for
this method have not yet been fully explored.
DISADVANTAGES OF THE CONTROLLED-SURFACE-FLAW TECHNIQUE
-• As with all fracture—mechanics tests for brittle materials , cer tain
disadvantages are associated with the use of the controlled—surface—flaw
method . These are:
1. Residual stress effects
2. Flaw “healing” at elevated temperatures
3. Observation of the flaw profile on the fracture
sur face
4. Applicability of the technique to a wide range of
• brittle materials
These advantages will now be discussed in detail.
• In order to gather the data shown in Fig. 5, surface flaws were placed on bendbar s of HP Si
3N4; these bars were then subjected to an elevated—temperature
air—annealing treatment prior to subsequent fracture at room temperature .23
Although fracture always initiated at the flaw site, room— temperature
values increased as a result of the annealing treatment. This effect was inde-
pendent of annealing environment since 1t also occurred for vacuum annealing)’5
Ingeistrom and Nordberg~’6 observed similar effects in WC—Co alloys.
• 18
- —-—-—• --- ~~~~~~~~~~~~ ~~~~~~~~~~~~~~~~~~~ _____ _____
:1.a
I-
oo
I ‘S I -
‘ — 4-’V
4 0
_ _
\\
\:
a)
0 Z ~~— 4-1W — ~~~~
a)
- z~~Z E -
-‘S.
n -a’- oz
- gN
0 001— -
i I ~~ I i ~~~~~ I0 0 0 0
u sIt)
(~~ W/NvJ) 3oG~ iV 31)4
‘4-
‘I-’a)I-ia
5”
19
- • - •-— ——--~~ - ____ ____ •_•~~ — --- -- -- ~~~- • • --• -—— • -~~~~ - _~ — - -—-~~~- • - • •_ _ c
This increase in K IC with annealing has been attributed to a reduction in
residual stresses associated with the microhardness indentation used to
produce the controlled surface flaw .12 ’13’16 If this is the case , then
caref ul sur face polishing to remove the inden ta tion zone and associa ted
tensile residual stresses at the crack tip (shown schematically in Fig. 6)
should lead to an increase in K IC values. Results of such polishing23
experiments for HP S13N4
are shown in Fig. 7. KIC (compensated forchanges in flaw size produced by polishing) increased with increasingsurface removal, rea ching a cons tant value af ter removal of about threeindentation depths . This result strongly supports the contention that
res idual stresses can a f f ec t KIC values obtained through the use of thesurface flaw technique.
Residual stress effects must be eliminated in order to derive true KICvalues for a given material; therefore , this would appear to be the major
disadvantage with the technique. As indicated above, two methods for
eliminating residual stress effects are annealing of the indented/flawed
material and polishing away the indentation . If attempts are not made to
take residual stress ef fec ts into acco un t, KIC values will be low in
comparison to actual values. Table II shows the effect of surface polishing
on KIC values obtained for three struc tural ceramic materials . In all cases,
KIC increased upon removal of the indentation.
For some brittle materials, surface flaws can “heal” when exposed toelevated temperatures. Figure 8 gives an example of such flaw “healing”
in HP SiC)5 Specimens were indented , exposed to an elevated—temperature
annealing trea tmen t , subsequently tested at room temperature, and the flawed
fracture stress measured. The as—indented fracture stress was 225 MN/rn2.
The room— tempe rature f racture stress increased as a funct ion of annealing
temperature up to 1000 °C. For annealing temperatures above 1000 ° C , fracture
no longer occurred at the site of the controlled flaw. This is an indication
of healing of the intentional flaw above 1000°C to such an extent that it was
no longer the wors t flaw in the specimen. Note that f rac ture stresses
observed for cases where the flaw had “healed” (1000 °C and above ) were hi gher• than the strengths for the as—received mate rial , suggesting that f law—
“healing” mechanisms also influenced the nature of surface defects in the
as—fabricated samples .
20
0a)
4-4_ _ _ _ Ca
uCCC
Ca)CCa)I-4-4c/i
Caa-o
CO
~~~ 1a
,~~~~4
C
ca -u
I- c a
c / i C5__._ 5—
.5 ‘4- 0
~~~~~~~~
) u
--~~a)4-4 -s~~~4J
s - s
0 .-I
.0
a)Sata-,-I54
21
—
70 ~~~~~~~~~~~~~~~~~~~~~~~~~~ HS-130 S13 N4
~~~~5O-
o - •
—-.—..---
3C -
_______________________________
• DOUBLETORSION
-a
I I I , I t I
SURFACE REMOVAL (X 10 3 mm)
Figure 7. Effect of Surface Polishing on Room—Temperature KIC ValuesObtained by the Control led—Surface—Flaw Techniq ue forHP Si 3N4
22
________ _ _ -- -•‘ —~~~~~~~~~~~ - - -~~~~~~~~~~~~~~~~—-~~~~~~~~~~--— - • -•-- ~~~~~~~~~~
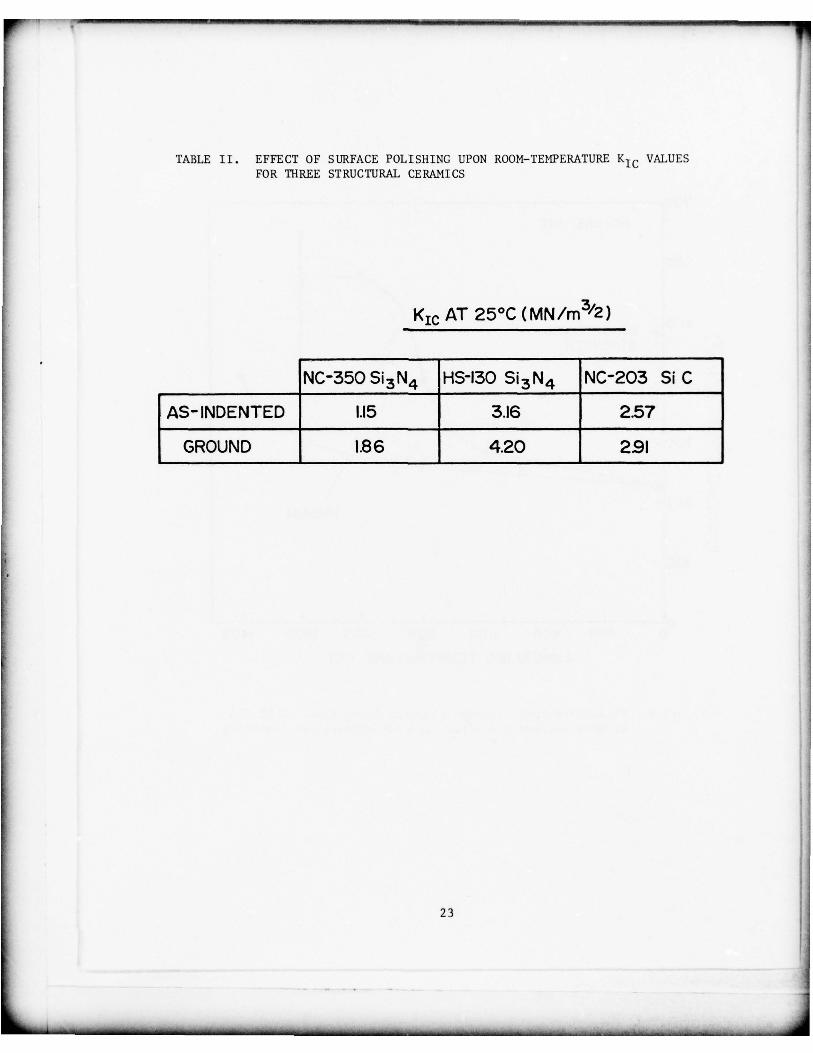
TABLE II. EFFECT OF SURFACE POLISHING UPON ROOM-TEMPERATURE KIC VALUESFOR ThREE STRUCTU RAL CERAMICS
<IC AT 25°C (MN/m312)
NC-350 Si3N4 HS-130 S13N4 NC-203 Si C
AS-INDENTED 1.15 3.16 2.57
GROUND 1.86 4.20 291
23
- —_ ~~~ - -~-------- - — - --- -- - ----- - —-— —~~~ - -~~~ — ---- ——
-
~~
b CNC-203 SIC
600~
5O0~~ AS-RECEIVEDSTRENGTH
E AIR
~~~4OO
f~~~3OO -(I)LsJ
VACUUM
Li~100 -
I t I • I • I • I • I , I0 200 400 600 800 1000 1200 1400
ANNEALING TEMPERATURE (°C)
Figure 8. Flawed Fracture Stresses (2600—gm Knoop flaw) of HP SiCat Room Temperature after Elevated—Temperature Annealing
~~~~~~~~~~~~~~~~~~~~~~~~~~~~~~~~~~~~~~~~~~~~~~~~~~~ ~~~~~~~~~~~~~~~~~~~~~~~~~~~~~~~~~~~~~~~~~~~~~~~~~~~~~~~~~
- - _____
Some f law healing may have occurred in vacuum, although not to the extentindicated in air (see Fig. 8). This may indicate that part of the healing in
the case of SiC was due to relief of res idual stresses and par t was due tooxida tion . For vacuum annealing, the subsequent room—temperature fracture
always occurred at the site of the flaw , even for the highest—temperature
annealing treatments. For HP SiC the presence of a small preload on the
spec imen during the air—annealing treatment eliminated the f law— ”healing”
e f f e c t s , a resul t possibly related to small displacemen ts of the flawsurfaces produced by the preload .
The controlled—surface—flaw technique depends upon the ability to see the
flaw profile on the fracture surface . With knowledge of the fracture stress , -
measured flaw dimensions allow calcula tion of KIC from Eq. (6). The
visibility of the flaw on the frac ture surfaces suggests d i f fe rences betweenthe na ture of inden tation frac ture and subseq uen t fas t , ca tastroph icfracture from the flaw site. However , the reasons for such differences havenot, to the authors ’ knowledge , been addressed in any definitive way .
13Surface—flaw profiles were readily visible on fracture surfaces in HP Si3N4
and HP SiC.15
However , flaws were somewhat more difficult to observe in
reaction—sintered (RS) Si3N414
which is a material having large porosity . This
sugges ts the possibility tha t in some bri ttle mater ials , flaws may beessentially invisible on fracture surfaces. In this case, laborious butdefinitive incremental polishing techniques could be employed to establish
the flaw—profile dimensions)’3 A systematic study of surface—flaw visibility
over a wide range of brittle materials has not been performed .
An appropriate question is whether semi—elliptical surface flaws of repro—
ducible sizes can be introduced into all br i t t l e materials using microhardnessindentation. For example , if grain—size and density limits to the productionof these flaws exist, the size and shape of flaws could become ill—defined
and nonreproducible . It seems likely that such limits exist , but their
range has not yet been defined.
25
r~ : - - - - - - - - - -~~~~~~~
- ----- -- _ - - - -— -----. ---
ADVANTAGES OF THE CONTROLLED—SURFACE—FLAW TECHNIQUE
The controlled—surface—flaw method has distinct advantages with regard to
examination of fracture in brittle materials . Foremost among these are :
1. A simple bend—bar specimen geometry is used.
2. Potential exists for adaptation of the techniq ue to
other specimen geometries .
3. The controlled surface flaw approximates natural
failure defec ts in brittle materials .
Applications of the controlled—surface—flaw technique to date have employed
a four—point bend—bar test specimen which is small , inexpensive , and can
be obtained readily in most situations. Furthermore, bend tests are
experimentally convenient to perform. For these reasons , controlled—
surface—flaw experiments can be conducted under severe environmental
conditions such as high temperatures , controlled atmospheres, corrosive
environments, and high strain rates. Thus, the controlled—surface—flaw
technique possesses a high degree of versatility with regard to potential
applications.
Controlled surface flaws have potential for use with specimen geometries
other than the bend bar. A controlled surface flaw might be placed onthe surface of a disc specimen and the disc fractured in biaxial flexure .24
Often in brittle—materials development programs , only small quantities ofmaterial are produced. In such instances bend bars may not always be
available, although right cylinders can usually be made. With a right
cylinder , the diametral—compression test25 could be used in conjunction
with a properly oriented controlled surface flaw on the flat end of the
cylinder (where tensile stresses exist) to fracture the material in
tension using a compressive loading mode and thus derive values of Kic.
An interesting question arises with regard to the use of controlled surface
f laws in conjunction with the direct compression test: Will the controlled
surf ace flaw which is the “worst flaw” in tension also be the “worst flaw”
in compression? If not , then th is would cons t i tu te a s igni f icant observation
in i t s e l f . However , if so , con trolled sur face flaws migh t be used toexamine details of compressive f r a c t u r e . Such flaws could be placed ,
suitably inclined , on the circumferential surface of a right—cylindrical #
compression specimen and thus be subjected to compressive loading .
Surface flaws could also be loaded in torsion. In such cases , f rac ture
would be a combina tion of Modes II and III , with no Mode I being present .It may also be possible to investigate mixed—mode fracture using combinations
of tension/torsion and compression/torsion.
Controlled surface flaws approximate actual failure defects in brittle
ma terials , with fracture initiating from a very small crack which is
well characterized in terms of its size and shape. Although this crack
is the “wors t f law” in the material, its size is still close to the sizerange of naturally occurring material defects.
The following question should be addressed: Are small flaws equivalent to
large cracks with respect to the fracture of brittle materials? It seems
possible tha t small f laws interac t more d irec tly with local ma terial
inhomo geneities such as poros ity , gra in bo undaries , and compositional
variations to produce differences in frac ture behavior related to the
size of the fracture—initiating crack. Recent studies21’22
have indicated
that this may be true with respect to elevated—temperature slow crack growth .
CONCLUSION S
Controlled surface flaws associated wi th microhardness indentations can be
a valuable tool in the examination of various aspects of brittle fracture.
In this method semi—elliptical surface flaws of controlled size and shape
produced by Knoop indentation initiate fracture in four—point bend specimens.
Fracture—mechanics analysis for surface flaws in bending may be appl ied
to this fracture to obtain the critical stress—intensity fa ctor KIC . The
technique , which employ s a simple specimen geome try and is exper imentallyconvenien t, has been used to derive both static and dynamic KIC values at
27
_ _ _ _ _ _ _ -~~~ - -“~- -
both ambient and elevated temperatures as well as to examine mixed—mode
fracture and elevated—temperature slow crack growth. Effects of residual
stresses associated with the microhardness indentation required to produce
the controlled surface flaw constitute the major disadvantage of the
technique. Its advantages include simplicity and versatility; in addition ,
the f rac ture—ini t ia t ing crack approximates natural defec ts in b r i t t l e
materials.
28
--- -- -------- --~~~~~~~~~~~~
--~~~~~~~~~~~~~~~~~
==---- - --- --—-- - ------ — - - ---- - - - - - - ---- —---- -- ---
~~~~
------- ---.
~~~~~~~~~
Sec t ion Il l
FRACTOGRAPHIC STUDIES ON REACTION—SIN’l l-:RED S13N4
INTRODUCTiON
React i on—sin t e red s i l icon n i t r i d e (RS Si 3N 4 ) has emerged as a leading
cand ida te material for Air Force systems app lications such as gas—turbine
stators ,26
missile heat shields and nozzles ,27
radomes , and other applici-
t ions such as bearings and furnace components . Th is ma te r i a l is an
attractive choice for such applications because it can be easily and
economically fabricated into near—ne t complex shapes by eithe r pressing
or slip casting silicon powder and subsequently nitriding the green
compacts . In addi t ion , RS Si 3N 4 exhibits excellent thermal shock,
oxidation , co rrosion , and erosion resi stance and has reasonabl y high
strength at room temperature with good strength retention up to 1400°C;
no measurable subcritical crack growth has been detected up to 1400°C.
An extensive property screening and evaluation of RS Si3N4
is curren tly
being carr ied out by lIT Research Institute (IITRI), Chicago , under the
sponsorship of the Air Force Materials Laboratory (Contract F336l5—75—C—5196).
One of the properties being measured is the four—point—bend tensile fracture
s treng th , o~, as a function of testing temperature . Since there is no measur-
abl e plas tici ty in RS Si3N4, even a t very h igh tempera ture , strength variations
can be direc tly interpreted on the basis of fracture—mechanics considerations
involving the SL~c of the critical flaw and the intrinsic materials
parameters which are fracture—surface energy , y, and Youn g ’s Modul us, E.The strength—controlling flaws are introduced by the particular processing
and fabrica tion proced ures and mac h ining utilized in RS Si3N4
ob tained
from different suppliers ; the identification and characterization of these
flaws is of extreme importance in understanding the fracture—strength
variation as related to processing and fabrication. Fractographic
examination by scanning electron microscopy (SEM) is emerging as a powerful
technique in achieving this understanding in structural ceramics .
29
_
The objective of the presen t study was to perform a comprehensive fracto—
graph ic inves tigation on RS Si3N4 bars fractured in four—point bending by
IITRI at room temperature and at 1200, 1350 , and 1500°C. IITRI has carried
out strength measurements and other property evaluation on ceramics supplied
by two differen t suppliers——Norton RS Si3N4 (NC—35O Si3
N4) and Kawecki—
Berylco RS Si3N4
(KB I Si3N4). Both materials were included in the presen t
frac tography study. The objective of this study was to gain an understanding
of the fracture behavior and also establish fracture—mechanics parameters
(i.e., rela tionship between flaw size, fracture mirror size, and strength)
• to aid in the failure analysis of structural components made from RS Si3N4.
MATERIALS STUDIED AND EXPERIMENTAL PROCEDURE
The Norton NC—35O RS Si3N4
used in this study was prepared by cold pressing
a large silicon plate which was then nitrided. Samples were diamond machined—
to a surface f in i sh of ‘~ 5 pm RNS . The KBI RS Si3N4
samples were
machined from a cold—pressed silicon block , ind ivid ually nitrided , and then
finished by diamond machining. Surface finish ranged from 20 to 60 ~rn RNS .
Impurity analysis of both materials has been presented previously ;28 in
gener:d, the Norton material has a somewhat higher purity. In light of
the above d i f f erences in the two materials , different microstructura l
features may govern the fracture behavior. Similar materials from two
different suppliers were studied in the hope that a better understanding
of the features chat control fracture could be gained. The four—point bend
strength , elastic modulus, and density of the two materials have been
measured and included in the IITRI report.28
The bend bars fractured at different temperatures were obtained from IITRI .
All pieces were inspected under a 14_6OX binocular light microscope in order
to look for the charac ter istic radia ting ridges which are of ten observed
to converge toward the origin of the fracture and frequently to originate
in a smooth , sometimes mirror—like region surrounding the flaw. At room
temperature the bars generally broke into two or three p ieces , and the
localized cri tical flaws could usually be iden ti f ied wi th confidence f rom
the f r a c t u r e markings . However , a t high tempera tures the bars broke in
30
many pieces , and identification of the prima ry fracture surface and ,therefore, the location of the critical flaw was difficul t due to missing
pieces , damag e to th e pr imary feature area , and occurren ce of f laws andmirrors at secondary fracture sites with dimensions comp arable to those at
primary sites. The pieces containing probable critical flaws and several
examp les of secondary f rac tures were design ated for stud y in the SEM.
While making observations with the light microscope , the p ieces of br okenbar were reassembled in order to determine the position of the critical
flaw and to permit tracing of the fracture features. Pieces of the bars
were selected for study and photographing in an AMR SEM. These pieces were
coated with a thin uniform inner layer of carbon and a thicker outer layer
of gold—palladium alloy which is the combination giving the best SEM signal
and resolution. The SEM examination was usually performed in the secondary—
emission mode which is particularly suitable for observing gross three—
dimensional features in fracture topography . The backscattered electron
mode was also employed selectively; in this mode the high—energy reflected
elec trons travel in more nearly straight lines and , therefore , the f4 ner
topogra phic fea tures of the frac ture are emphasized by shadows in the image.
RESULTS AND DISCUSSION
• Fracture Modes and Fracture Microstruc tures
Fracture surfaces of both the NC—350 Si3N4
and KBI Si3N4 bend bars were
examined in the SEM for general fracture features. Representative examples
of fracture surfaces for specimens broken at room temperature are shown
in the SEN micrographs in Fig. 9 for NC—350 and in Fig. 10 (a) and (b) for
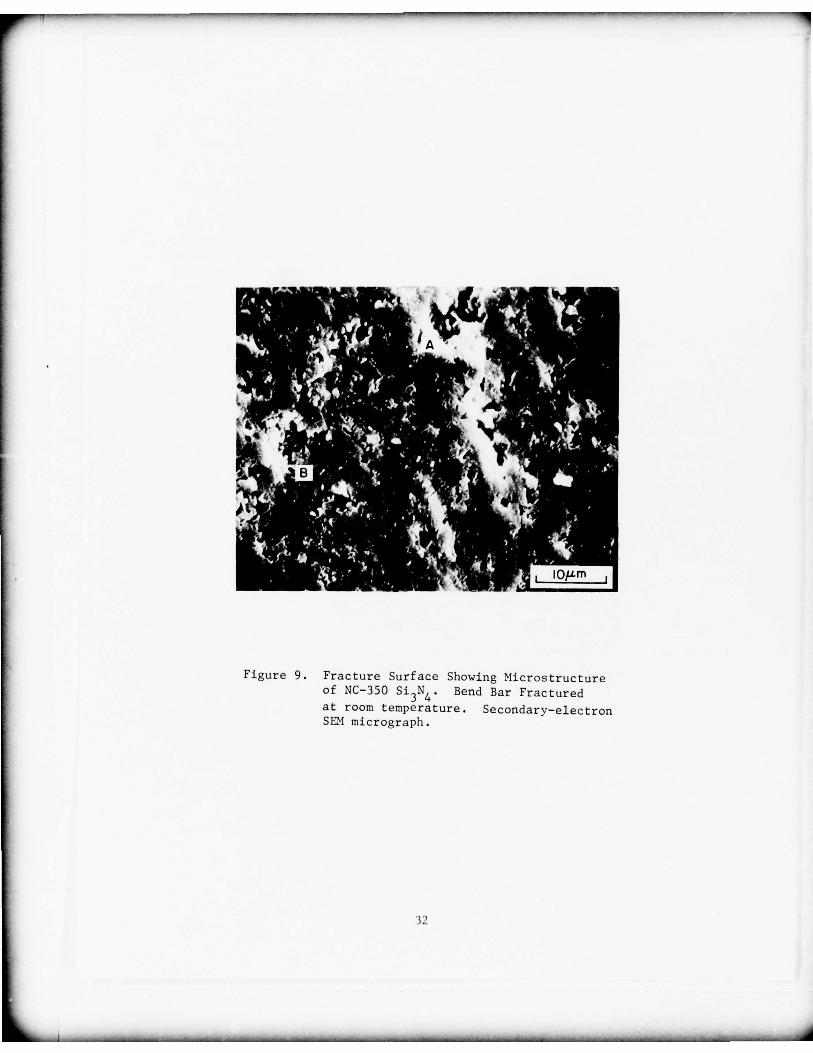
KBI Si3N4. As shown in Fig. 9, the fracture surface of NC—35O exhibited
uniform , planar features representing the transgranular fracture mode. These
planar features representing grains were measured to be -~ 3—6 pm. A relatively
uniform dis tribu tion of pores having a size range of 1.5—2 pm can be observed
from the micrograph; however , isolated larger pores or pore—coagglotnerates
having a size of 10 pm were also observed frequently (shown at locations A
31
~~~~~ -- - - - - - _-- -- -— J
_ - . _ _ _ _ _
a .
- -
t
-
, ~
B
.
-~~~~~~~~~
- ~~iO~m
Figure 9. Fracture Surface Showing Microstructureof NC—350 Si
3N4. Bend Bar Fractured
at room temperature. Secondary—electronSEM micrograph .
32
~~—-- - ~~~~ -- - -
- -
•
~.L
( a )
L 20/.Lrn ~
( b )
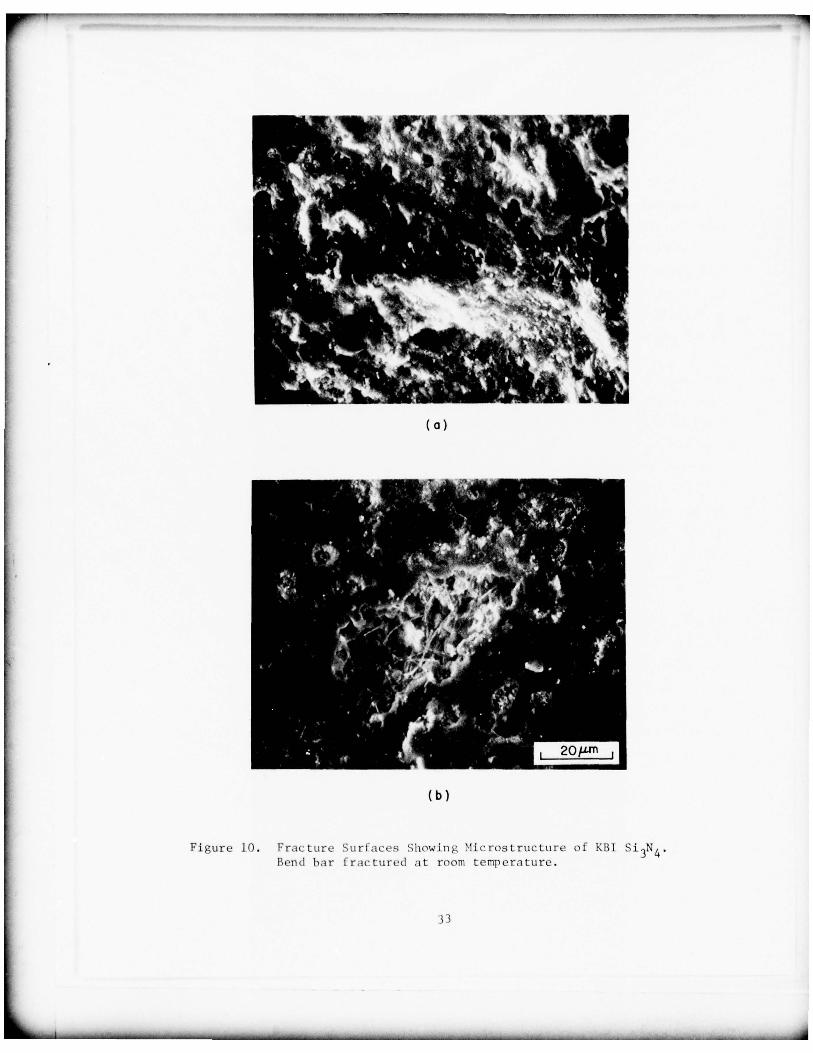
F igure 10. F r a c t u r e surfaces Showing Microstructure of KBI 5i 3N4.Bend bar f r a c t u r e d at room t e m p e r a t u r e .
- -- ~~~~~~~~~~~~~~~~~~~~~~~~~~~~~~~~~~~~~~~~~~~~~~~~~~~~~~~~~ - - ~~~~~~~~~~~~~~~~~~ - - -~~~~~--~~~~~~~~~~ -- -~~~~~~~~~~~~~~
_ _ _ _ -
and B in Fig. 9). The volume f rac t ion of the porosity was measured by
standard lineal analysis and had a value of -. 20%. This value is in
reasonable agreement with that estimated from the measured density.28
In contrast to the relatively sharp fracture features in NC—350 , for the
KBI material , in general , diffused nonuniform fracture features were revealed
[see Fig. 10 (a) and ( b ) } . Figure 10 (a) shows i l l—defined fea tures givin g
a wooly appearance ; it is difficult to determine whether the fracture is
transgranular or intergranular. Small pores having a size range of — 2—5 pm
can be seen in the micrograph. Many large pores showing unreacted material
and having a size of - 50 pm were also observed frequently ; an example of
such a pore can be seen in Fig. 10 (b).
The fracture features for the two materials as described above were observed
some distance away from the fracture—originating flaws. These general
fea tures we re conunon to nes t of the bend bars and , therefore , independen t of
strength distribution. The more uniform fracture features , the flat trans—
granular fracture mode , and the smaller , more uniform porosity in the NC—350
material indicate that this material had been more completely sintered than
the KBI material. For this reason, NC—35O should exhibit less scatter in
strength values and a higher mean strength value than that exhibited by
the KBI material. The strength data given in the IITRI report28 indica te
that indeed such is the case.
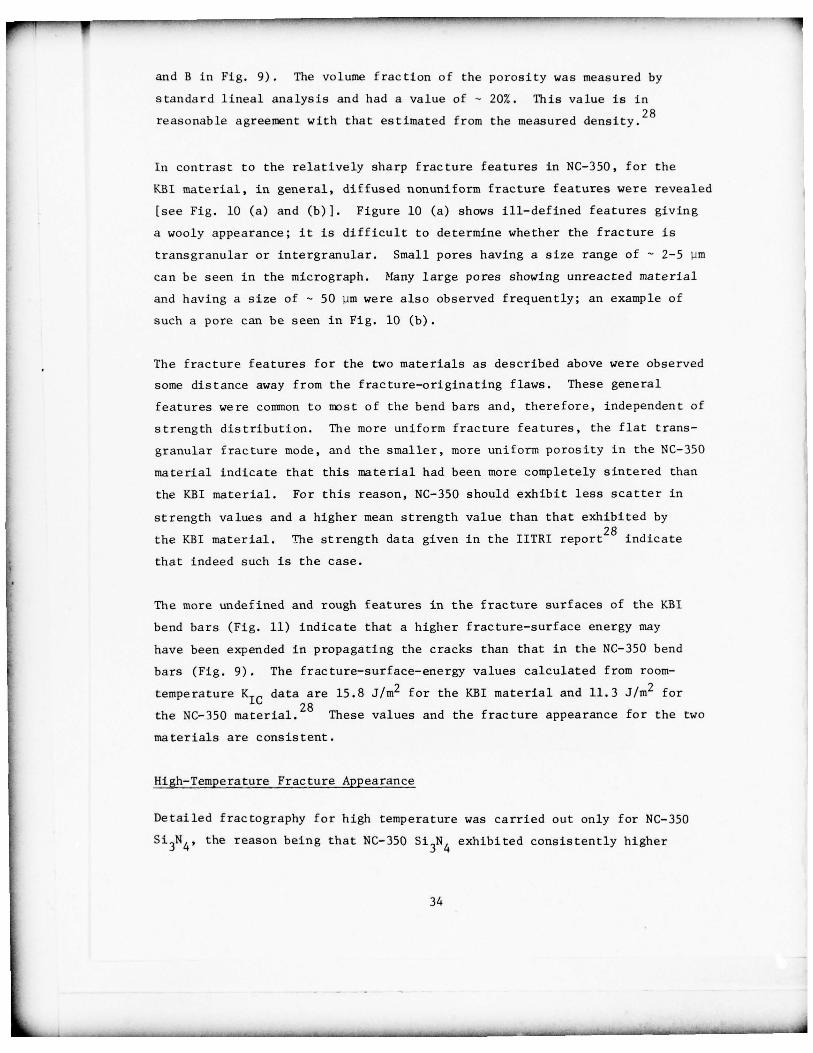
The more undefined and rough features in the fracture surfaces of the KBI
bend bars (Fig. 11) indicate that a higher f rac ture—surface energy may
have been expended in propagating the cracks than that in the NC—350 bend
bars (Fig. 9 ) . The fracture—surface—energy values calculated from room—
temperature KIC data are 15.8 JIm 2 for the KBI material and 11.3 JIm 2 for
the NC—35O material.28 These values and the f rac ture appearance for the two
materials are consistent .
High—Temperature Fracture Appearance
Detailed f rac tography fo r high temperature was carried out only for NC— 35O
S13N 4 , the reason being that NC—350 Si3N4 exhibited consistently higher
34
~~~~~~~~~~~~~~~~~~~~~~~~~~~~~~~~~~~~~~~~~~~~~~~~~~~~~~~~~~~~~~~~~~~~~~~~~~~~~~~~~~~~~~~~~~~~~~~~~~~~~~~~~~~~~~~~~~~~~~~~~~~~~~~~~~~~~~~~~~~~~~~~~~~~~~~~~~~~~~~~~~~~~~~~~~~~~~~~~~~~~~~~~~~~~~~~~
_
_
•
_
_‘
~~~~~~~~~~~~~~~~~~~~~~~~
.
•$‘
~~~~~s i;~rc3I
L~ A~IWI~~~ IO~ m~~~~• ! ‘1_ . . .~
Fi gure 11. Fracture Sur face Showing Mic ros t ruc tu reof NC—350 S1
3N4
Frac tu red a t 1200°C inAir . Secondary—electron SEM micrograph.
35
______________
streng th than KBI Si3N4. The strength at 1200°C in air increased signifi-
cantly as compared to that at room temperature ; above 1200°C the streng th
dropped sligh tly bu t still was higher than that at room temperature .It was hoped that fractography of the bend bars broken at elevated temperatures
might give a clue as to the reasons for the increase in strength levels at
elevated temperatures.
The fra cture surfaces of bend bars broken at 1200 °C exhibited a markeddi f ference in appearance as compared to those broken at room temperature .
The 1200 °C frac ture surface did not show uniform, planar features ; rather
it showed diff used , undefined fea tures similar to the room—temperature
f rac tu re exhibited by KBI material. Figure 11 is an SEM micrograph of the
f rac ture surface of a bend bar broken at 1200 °C in air. From the appearance
it is difficult to judge whether the fracture mode is transgranular or
intergranular; however, in comparison with the room—temperature fracture
appearance , the fracture mode has definitely changed.
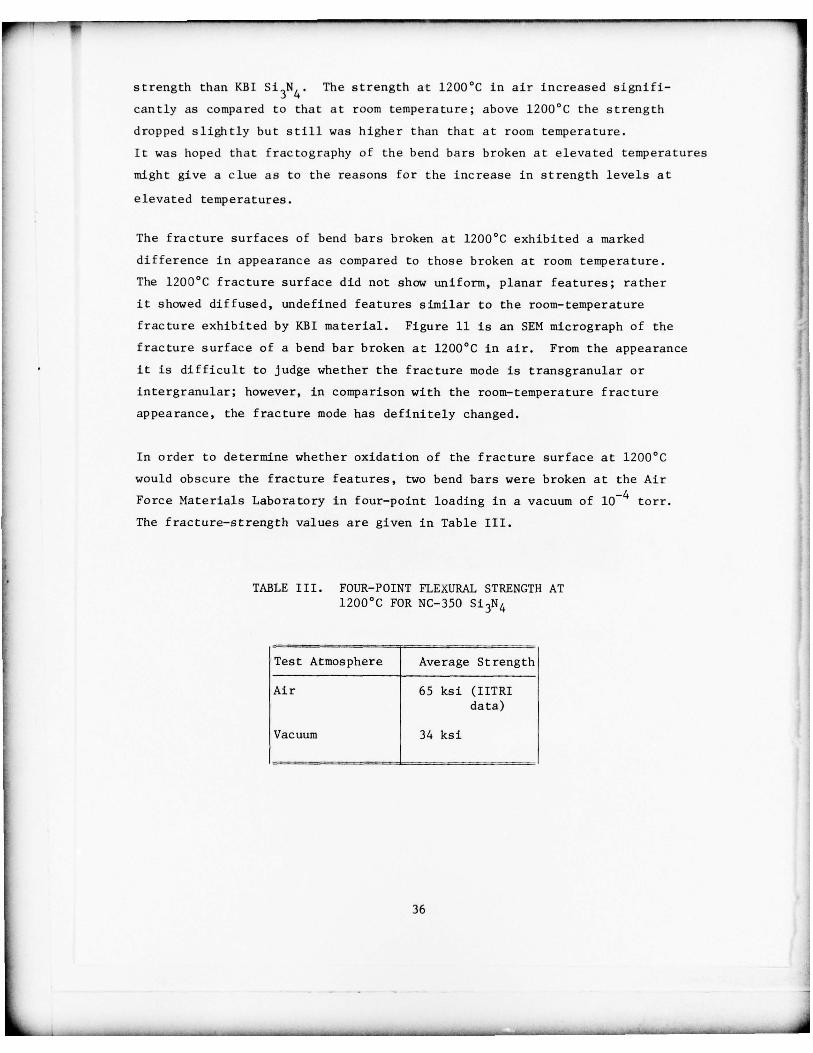
In order to determine whether oxidation of the fracture surface at 1200°C
would obscure the frac ture fea tures , two bend bars were broken at the Air
Force Materials Laboratory in four—point loading in a vacuum of 1O~~ torr.
The fracture—strength values are given in Table III.
TABLE III . FOUR-POINT FLEXURAL STRENGTH AT1200°C FOR NC—350 Si3N4
Test Atmosphere Average Strength
Air 65 ksi (IITRIdata)
Vacuum 34 ksi
36
The fracture—surface appearance of the bend bars broken at 1200°C in vacuum
was very similar to tha t of the bars br oken a t 1200 °C in air (Fig. 11).Oxidation at 1200° C, therefore , did not obscure the appearance of the
f rac tu re surfaces , and i t can be s ta ted that there was a de f in i t e change
in fracture mode at high temperatures as compared to room temperature .
However , this change did not seem to affect the strength values; an average
strength value of 34 ksi at 1200°C in vacuum was obtained which is very near
the average value at room temperature. The strength increase at 1200°C in
air could possibly be due to flaw—tip blunting by the formation of a thin
layer of silica and the consequent increase in effective fracture—surface
energy , y. The short pretest time at 1200°C is not expec ted to decreasethe critical—flaw sizes significantly but could blun t sharp flaws.
Fracture Origins
The sites of fracture origins were located by searching for inner mirr orsbounded by rough radiating ridges in the fracture surfaces of the bend bars .The preliminary search for mirrors was made on the binocular light microscope
and in the SEN at magnifications below 2Ox . The fracture—originating flaws
were then observed at successively higher magnifications in the SEM. Only
in - 40% of the bend bars could the fracture mirrors be seen ; in the
remainder of the f rac tured bars , either the regions containing the mirrors
were chipped away due to multiple fracture or the mechanisms that produce
clearly observable mirrors were not operative ; e.g., for large flaws and lowfrac ture stren gth, the crack—growth velocity may be too low for the formationof mirror boundaries.
29
In both NC—350 and KBI Si3N4, the most dominant fracture—originating f laws
observed following the above procedure were pores and pore agglomerates.
However, a number of other types of flaws were also observed. These were:
1. Bands of porosity (pores 10—20 pm in diam.)
2. Bands of glassy—looking phase, perhaps indicating local
overheating of the material during the fabrication
procedure or local chemistry differences
37
— - - - - - —
-
3. Machining flaws, i.e., surface chipping and surface gouging.
Only about 10% of the f rac ture surfaces observed indicated
that machining f l aws were f r ac tu re init iating . It appears
tha t machining damage is insignificant in RS Si3N4.
4. Flaked , fibrous band of material, signif ying incompletelocal nitriding.
Except for machining flaws, the other types of flaws described above are
obviously the result of the impurities and size distribution of silicon
powde rs used and the ni t r iding and sintering procedures . Since the materials
were ob tained from commercial sources , it was not possible in the presentstudy to relate the na ture of the flaws observed by SEN to the fabrica tion
procedures. Attempts were made to obtain chemistry variations in the
immediate vicinity of some of the flaws utilizing the energy—dispersive
x—ray technique ; however, no significant differences in chemistry could
be detected.
Fracture Mirrors
Clearly delineated fracture mirrors could be observed only in the NC—350
Si3N4. In the KBI material, although vague impressions of a mirror region
were observed, it was difficult to measure——even approximately——the size
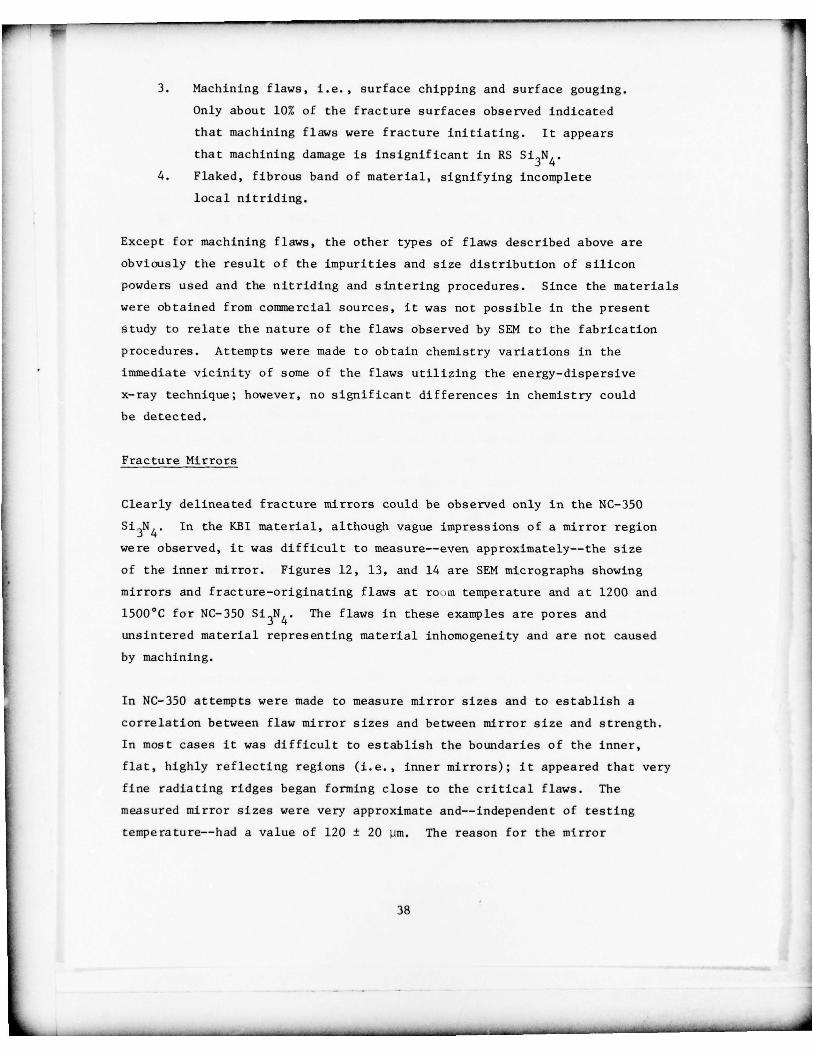
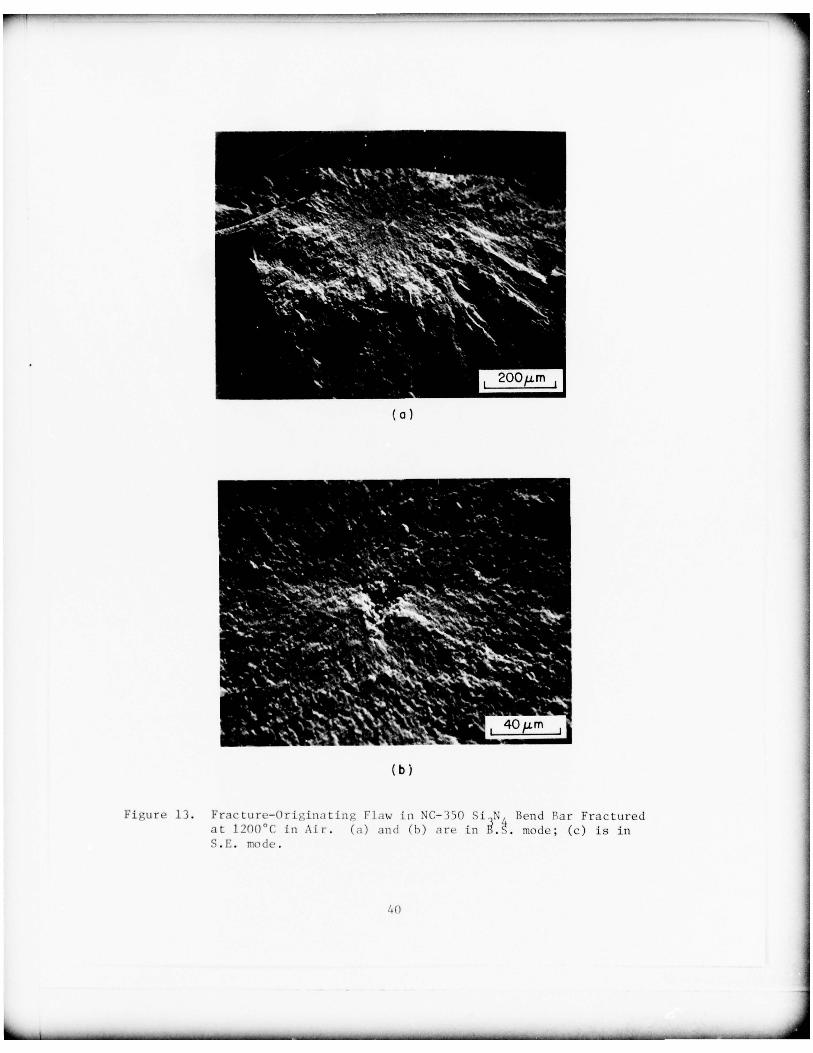
of the inner mirror. Figures 12, 13, and 14 are SEM micrographs showingmirrors and fracture—originating flaws at room temperature and at 1200 and
1500 °C fo r NC—350 SI 3N 4. The flaws in these examples are pores and
unsin tered ma terial representing material inhomogeneity and are not caused
by machining.
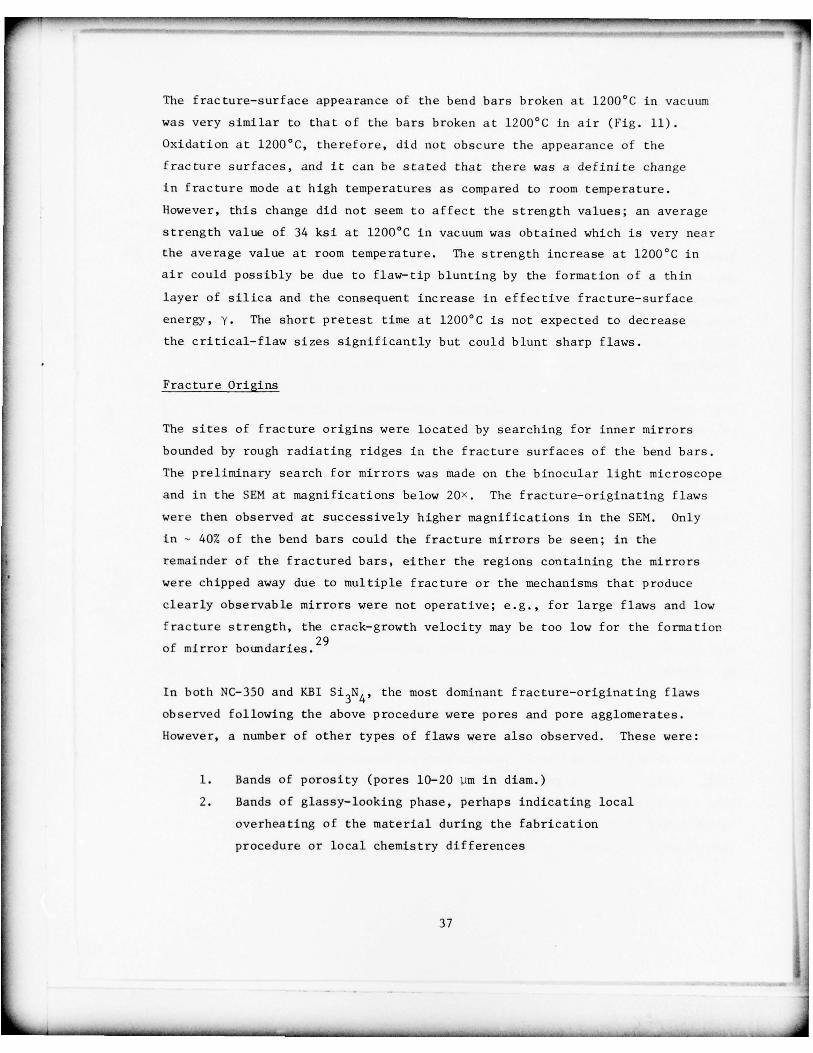
In NC—350 attempts were made to measure mirror sizes and to establish a
correlation between flaw mirror sizes and between mirror size and strength.
In most cases it was difficult to establish the boundaries of the inner,
fla t, highly reflecting regions (i.e., inner mirrors); it appeared that very
fine radiating ridges began forming close to the critical flaws. The
measured mirror sizes were very approximate and——independent of testing
tempera ture——had a value of 120 ± 20 pm . The reason for the mirror
38
_______________________________ -
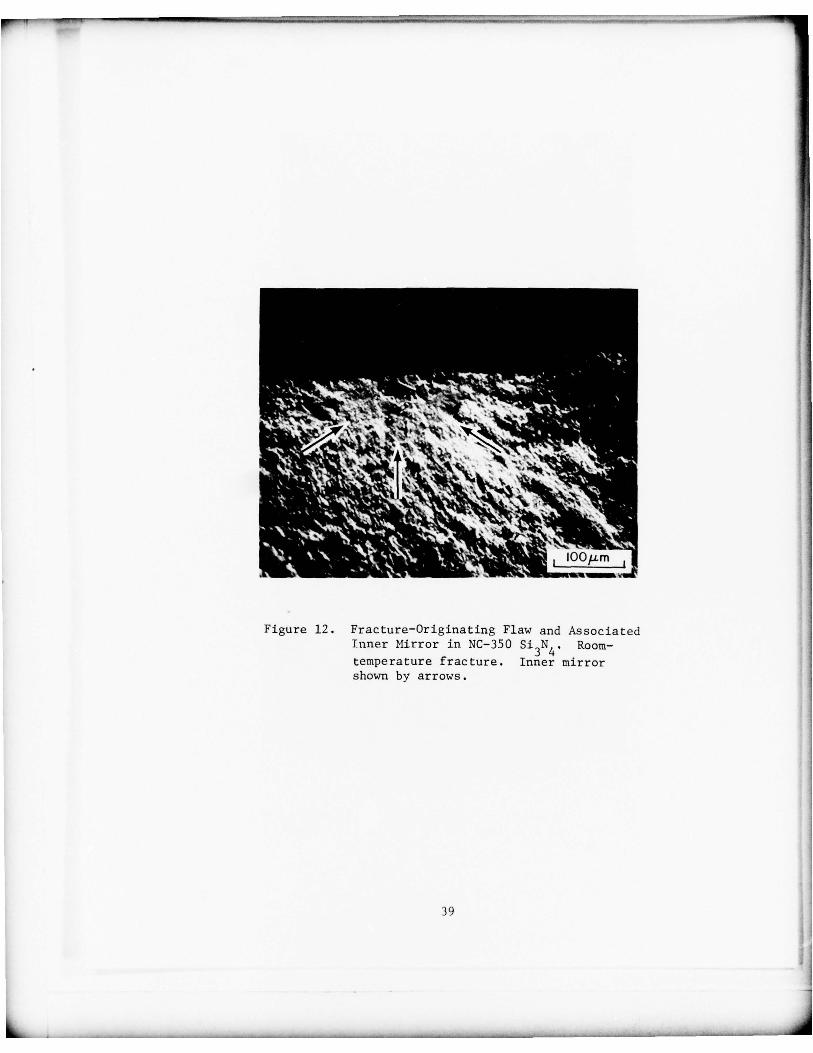
!hIP II.~~~~~~~~~~~
Figure 12. Fracture—Originating Flaw and AssociatedInner Mirror in NC—350 S1
3N4. Room—
temperature fracture. Inner mirrorshown by arrows.
39 1
‘—- - S - - — -- - _-----—-—— -,-,—-- -------- ---- -_ —— - ~~~~~~~~~~~~ — ~~
_ _
~~
~~~~~~~~~~~~~~~~~~~~~~~~~~~~~~~~~~~~~~~~~~~ ~~~~~~~~~~~~~~~
~~‘,,
~~~~ • •. S
•s ,S , -. . _______
2OOp.m 1~
( a )
40 p.m
( b )
Figure 13. Fractur c—O ripiiiot in~ Flow in NC— YjO Si N , Bend Bar Fracturedat 1 200°C in .\i r. (a) and (h) are in ~~~~ mode ; (c) is inS.E. mode.
_ _ _ _ _ _ _ _ _ _ _
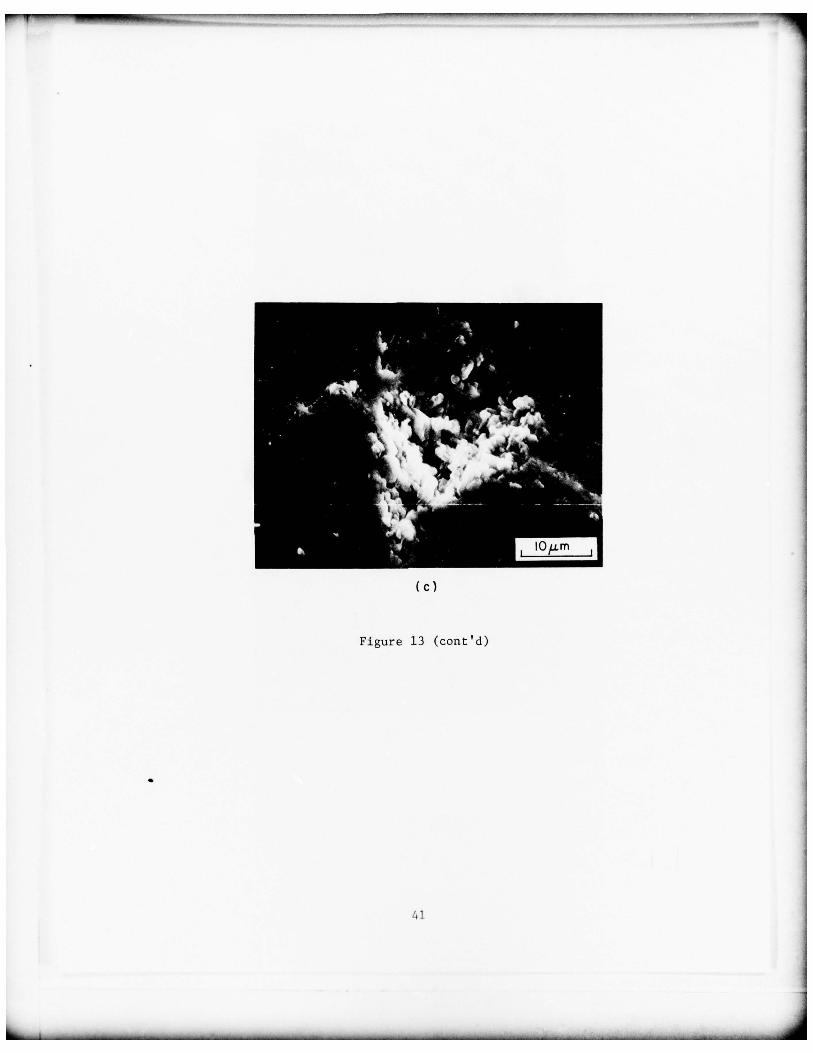
1 IO~~m
( c )
Figure 13 (cont ’d)
S
4 1
-~~~~~~~— - — -- —~~~~~~~-—~~~ _ - ~ -—~~ ,—- _____
- - - - ____________ - - _____________________
IOOO/.Lm~
( 0)
I
( b )
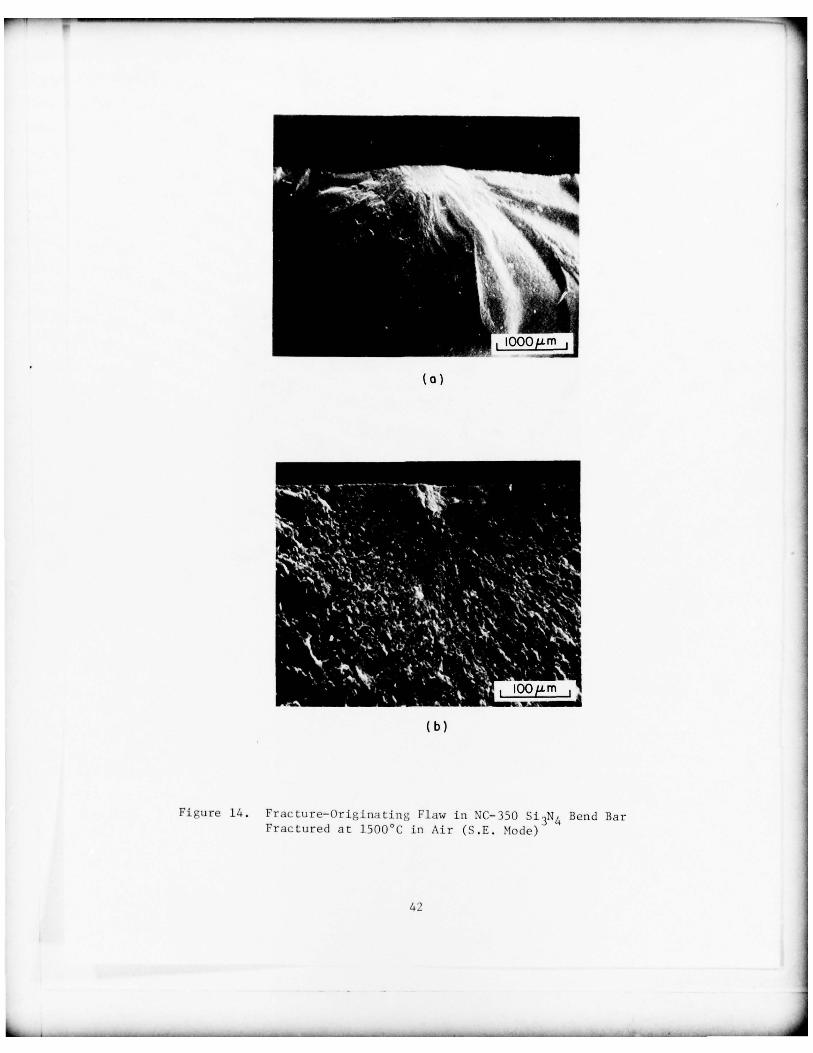
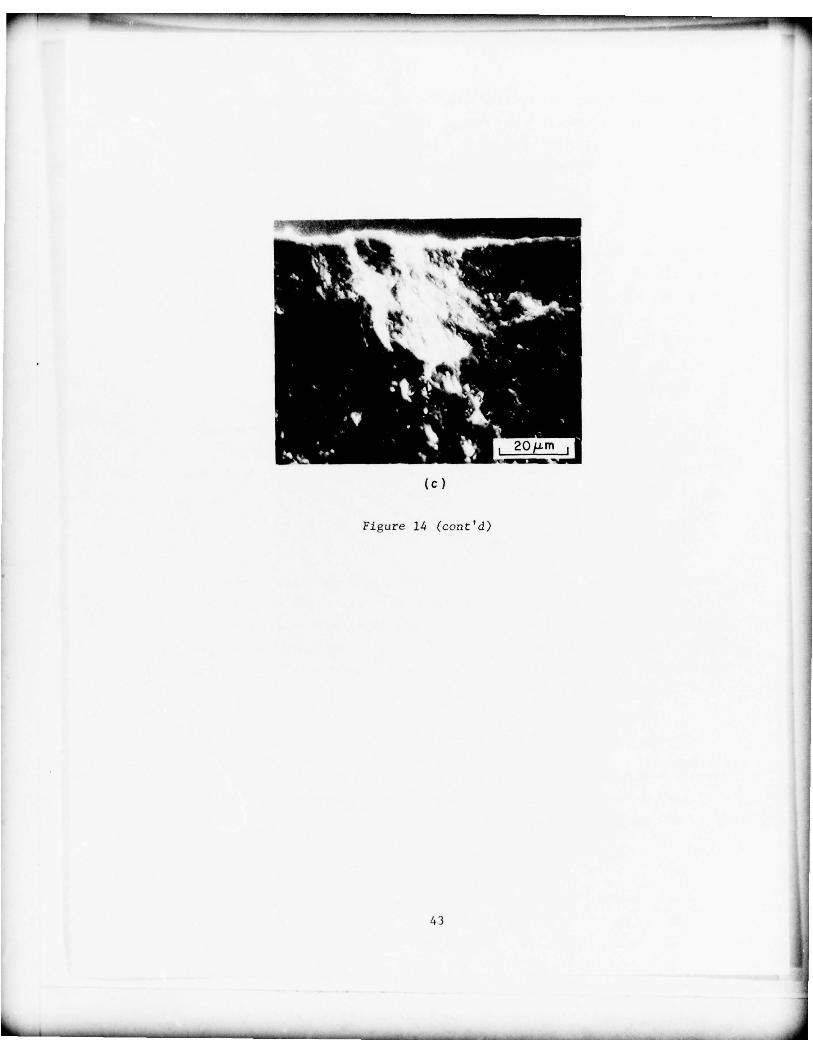
Figure 14. Frac t u r e — O r i g i n at i n g Flaw in N C—35 0 Si 3N 4 Bend BarFrac tu red at 1500 ° C in Air ( S .E . Mode)
42
-- - -
~
-
~
- - - - -- -- - I -- -
- - ~~~~~~~~~~ -- S S._.
20p.m
( C )
Figure 14 (cont ’d)
43
-
~
- S
~
~~~~~~~~~~~~~~~~~~~~~~~~~~~~~~~ —---- ---- -~~~ - — -~~~~- S- - --~ - -~~~~~ -- -
- —-
~~~~~~~-
~~~~~~ ___
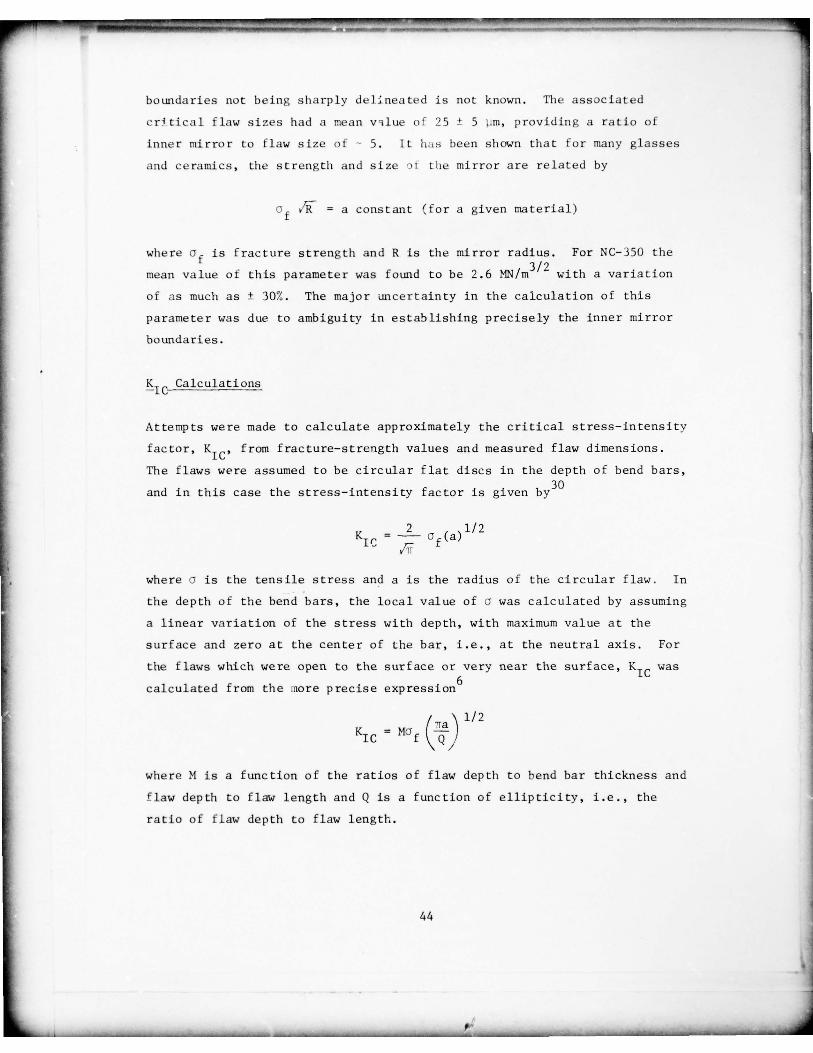
boundaries not being sharp ly de1~~neated is not known . The associated
c r i t i c a l f l aw sizes had a mean value of 25 ± 5 pm , p rov id ing a r a t i o of
inner mirror to flaw size of — 5. It ii~ s been shown t ha t f o r many glasses
and ceramics , the s t r e n g t h and s ize O i t h e mirror are related by
= a constant (for a given material)
where Gf is fracture strength and R is the mirror radius .
For NC—350 the
mean value of this parameter was found to be 2.6 ~~/m3~’2 with a variation
of is much as ± 30%. The major uncertainty in the calculation of this
paramete r was due to ambiguity in establishing precisely the inner mir ror
boundaries.
Calculations
At tempts were made to calculate approximately the crit ical s t ress—intens i ty
fac tor , KIC, from fracture—strength values and measured flaw dimensions .
The flaws were assumed to be circular flat discs in the depth of bend bars,
and in this case the stress—intensity factor is given by3°
2 1/2K r = — a (a)Tr
where a is the tensile stress and a is the radius of the circular flaw . In
the depth of the bend bars , the local value of a was calculated by assuming
a linear variation of the stress with dep th , with maximum value at the
su r f ace and zero at the center of the bar , i . e . , at the neutral axis. For
the f laws which were open to the surface or very near the surface , KIC was
calculated from the nore precise expression6
\ 1/2KIC
= Ma f (~~~ )
wher e M is a func tion of the ra tios of flaw dep th to bend bar thickness and
flaw dep th to flaw length and Q is a function of ellipticity , i.e., therat io of flaw depth to flaw length.
44
_ _ _ _ _ _ _ _ _ _ _ _ _ _ _ _ _ --—--~~~~~~~~~~~~~~~~~~~~~ _—--~~~~~~~~~~~~~
_ 1I-u-I~
For NC—35 0 S13N 4 the room-temperature values of K ic were fo und to vary
between 1.22 and 1.6 MN/ m 3/’2 . The double— torsion technique was utilized
by IITRI to obtain a room—tempera ture K IC value fo r NC— 35O; a mean value
of 2.06 MN/m 2 was reported. This value is somewhat higher than the values
calculated in the present investigation. This difference may be due to
highly local stress intensification and weak material in the vicinity of
small material flaws in contrast to the large artificial crack utilized
in the double—torsion technique which averages the microstructural variations .
It is interesting to note that average KIC values of 1.87 ~~ /m31”2 were
obtained by Wills, et al.,31
who utilized a controlled—surface—flaw technique;
in this technique a surface flaw having a depth of - 135 pm was utilized.
This crack dimension is about four times larger than the dimensions of the
natural critical flaws but is much smaller than the crack front size used
in double torsion.
At elevated temperatures , although the strength in air increased substan-
tially, the dimensions of the critical flaws were not differen t than those
a t room tempera ture , i.e., 25 pm. The calculated values of KIC were
found to be 2.1 to 2.4 ~~~~ at high temperatures (i.e. , above 1200°C) ,with no systematic dependence upon temperature . The increase in KIC athigher tempe ratures was probably due to increased fracture—surface energy
resulting from flaw—tip blunting .
SUMMARY
A frac tographic study was carried out on two reaction—bonded silicon
nitride materials——Norton NC—35O Si3N4
and KBI Si3N4 by SEM. The fracture
surfaces of the bars fractured in four—point bending at room temperature
and at 1200 , 1350 , and 1500°C were examined. In bars tested at room tempera-
ture , the general fracture features in NC—35O Si3N4 were uniform , plana r
features representing the transgranular fracture mode, un if ormly dis tr ibu ted
small pores having a size range of 1—2 pm or less , and isola ted large pores
having a size of — 10 pm. In contrast , the KBI material tested at room tem-
perature exhibited nonuniform, di f f use , and ill—defined fracture features ,
small pores having a size range of 2—5 pm , and many large pores having a size of
45
_ _ _ _ _ _ _ _ _
_ —~~~~-.--S
- 50 pm. In some regions the KBI mater ia l exhibited fea tures similar to
those in NC—35O Si3N4, i.e., transgran ular and uniform , which indica ted
that the KBI material did not have a uniform microstructure , pr obabl y due
to inadequate reaction bonding. The room— temperature strength variations ,
i.e., higher mean s t rength and less scat ter in s t rength values in the NC—350
material than in the KBI material, are consistent with the differences in
general fracture features in the two materials . At high temperatures the
fracture appearance in NC—350 Si3N4 was ill defined and diffuse , indica ting
a change in fracture mode . However, this change in mode in itself did not
seem to increase the fracture—surface energy.
In NC—350 fracture mirrors were frequently observed , al though the boundariesof inner mirrors were ill defined . The fracture—originating flaws in NC—35O
were predominantly the large pores or pore agglomerates , al though other
types of flaws——including bands of small pores, bands of a glassy—looking
phase, surface chipping and gauging , and a flaked and fibrous band of
mater ia l——were present. In the KBI material, because of d i f f u s e and ill—
defined fracture features, it was not possible to observe mirrors and,
therefore , the sites of fracture initiation.
In NC—350 the measured radius of the inner mirrors had a mean value of
120 ± 20 pm and the size of the associated critical flaw had a mean value
of 25 ± 5 pm , thus providing a ratio of the inner mirror to flaw size of — 5 .
F The parameter Gf V~i~ had a value of 2.6 ~~/m3~’2
with a variation of as much
as ± 30%. Thus, in the failure analysis of a component where it may be
possible to measure the radius of the inner mirror, the local stress could
be p redicted to within ± 30%. At room temperature the values of Ki~ ranged
from 1.22 to 1.6 MN/m31’2. At high temperatures, the calculated K1~
, values3/2were between 2.1 and 2 .4 MN/m
46
Sec tion IV
OXIDATION BEHAVIOR OF TITANIUM ALUMINIDES
Most of the fundamental research on the oxidation behavior of titanium
aluminides has been reported in Ref. 32. Significant results from
addit ional fundamental studies in this area are summarized below .
EFFECT OF TEMPERATURE UPON THE OXIDATIONBEHAVIOR OF TITANIUM ALUNINIDES
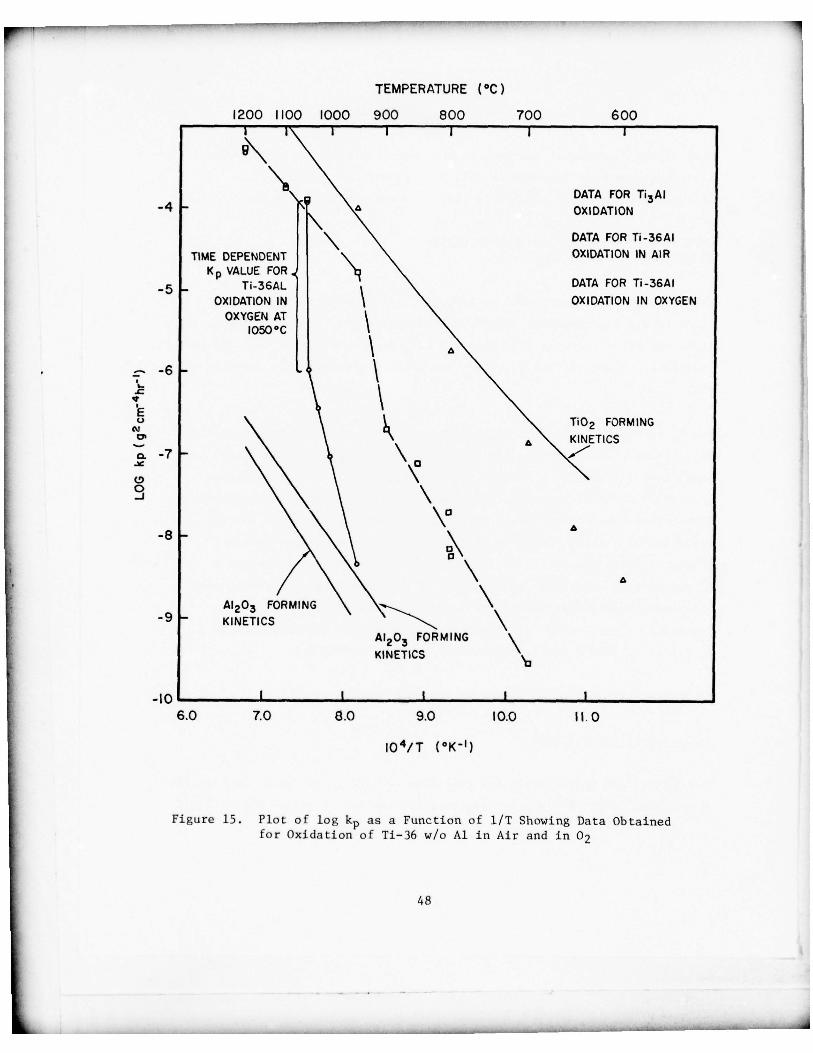
Figure 15 shows the parabolic rate constants for oxidation of TiAl and
Ti3Al in air and oxygen as functions of temperature. The k~ values fo r
TI 3A1 oxidation indicate predominantly Ti02—forming kinetics, and the rate
constants are not influenced by the oxidizing atmosphere (viz., oxygen or
air) .
The k.~ values for oxidation of TiA1 in air or oxygen above 1050 °C are not
significantly differen t and are indica tive of Ti02—forming kinetics. At
lowe r tempera tures the k~ values for oxidation in air deviate somewhatfrom the TiO
2—forming kinetics; however, the overall ra tes are still much
higher than those characteristic of alumina—forming kinetics. For the
oxidation of TiAl in oxygen at or below 950 °C , the k~ values indicate
alumina—forming kinetics. For 1050°C oxidation in 02 , time—dependent
values were exhibited , ~~ being low at the beginning of an experiment
and mono tonically approaching the high value with time . Thus, the
transition from titania— to alumina—forming kinetics for oxidation in
02 begins at 1050°C and is essentially complete at 950°C.
MICROSTRUCTURAL CHARACTERIZATION OF THE OXIDE SCALES
Scale Morphology for TiA1
The oxide—scale morphologies for oxidation of TiA1 in air have been described
previously.32 The scale morphologies for oxidation in oxygen above 1000°C
47
~~~~~~~~~~~~~~~~~~~~~~~~~~~~~~~~~~~~~~~~~~~~~~~~~~~~~~~~~~~~ -5- -
TEMPERATURE (°C )
1200 1100 1000 900 800 700 600I I
-4 -
-
A DATA FOR Ti3AIOXIDATION
\ DATA FOR Ti-36A 1OXIDATION IN AIRTIME DEPENDENT
K p VALUE FOR ,DATA FOR Ti-36A 1.5 . Ti -36AL OXIDATION IN OXYGENOXIDATION IN
OXYGEN AT1050°C
A- . .
\N\
C.) T102 FORMING
r oJ
A KINETICS
~~~~ 7 . \C,
\\ \t3
\A
A1203 FORMING \KINETICS
,—5.--5---..._. \
A1203 FORMING \KINETICS
I I I I
6.0 7.0 ~~.O 9.0 10.0 1 1 . 0
i~~~ii (°K ’ )
Figure 15. Plot of log k~ as a Function of l/T Showing Data Obtainedfor Oxida tion of Ti—36 w/o Al in Air and in 02
48
IlL - . 5
- -
are similar to those in a i r . The oxide scale is charact er ized by an oute r
Ti02 laye r , beneath whic h is a mixed—oxide layer composed of titania and
alumina. A me tallic layer is also formed between the substrate and the
oxide . This metallic layer has been identified by TEM to have a Ti3Al—typ e
crystal structure.
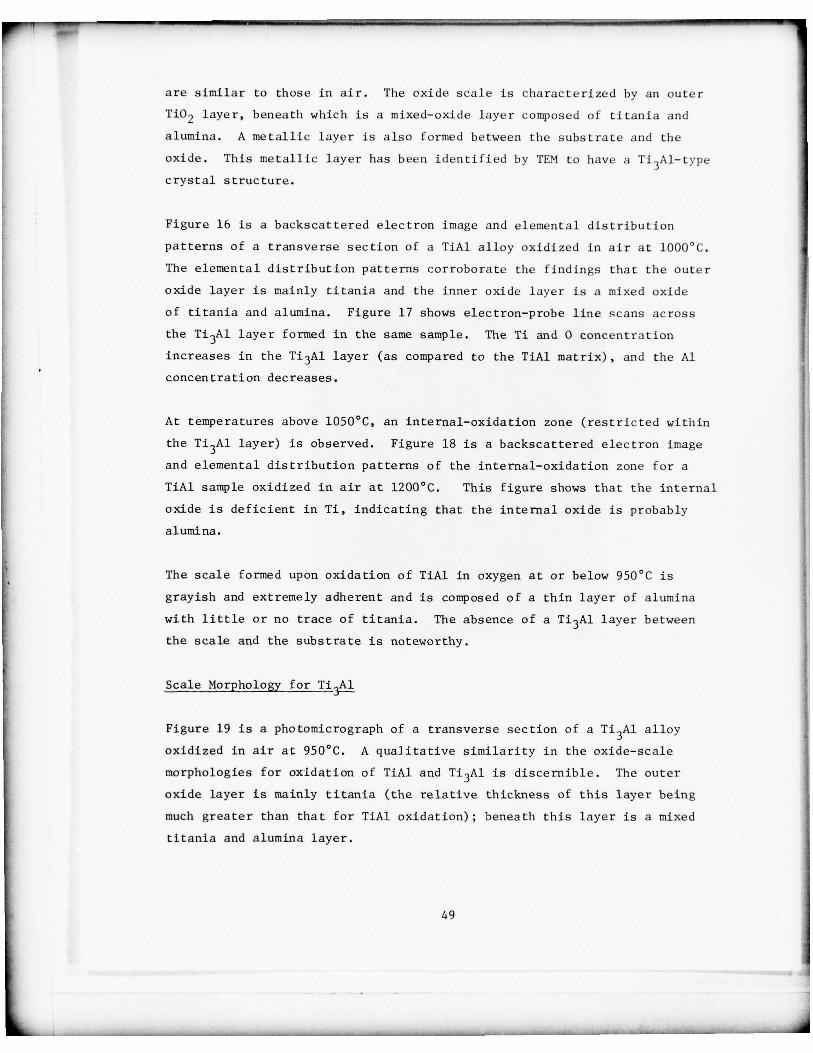
Figure 16 is a backscattered electron image and elemental distribution
pa tterns of a transverse sec tion of a TiAl alloy oxid ized in a ir a t 1000 °C.The elemental distribution patterns corroborate the findings that the outer
oxide layer is mainly titania and the inner oxide layer is a mixed oxide
of titania and alumina. Figure 17 shows electron—probe line scans across
the Ti3A1 layer formed in the same sample . The Ti and 0 concentration
increases in the Ti 3Al layer (as compared to the TiA1 matrix), and the Alconcentration decreases .
At temperatures above 1050°C, an internal—oxidation zone (restricted within
the Ti 3Al layer) is observed. Figure 18 is a backscattered electron image
and elemental distribution patterns of the internal—oxidation zone for a
TiA1 sample oxidized in air at 1200°C. This figure shows that the internal
oxide is deficient in Ti , indicating that the internal oxide is probably
alumina.
The scale formed upon oxidation of TiAl in oxygen at or below 950°C is
grayish and extremely adherent and is composed of a thin layer of alumina
with little or no trace of titania. The absence of a Ti3A1 layer between
the scale and the substrate is noteworthy .
Scale Morphology for Ti~~~
Figure 19 is a photomicrograph of a transverse section of a Ti3Al alloy
oxidized in air at 950 °C. A qualitative similarity in the oxide—scale
morphologies for oxidation of TiAl and Ti 3Al is discernible. The outer
oxide layer is mainly titania (the relative thickness of this layer being
much greater than that for TiA1 oxidation) ; beneath this layer is a mixedt i tania and alumina layer.
49
-~~~~~~~~~ - - - - - -
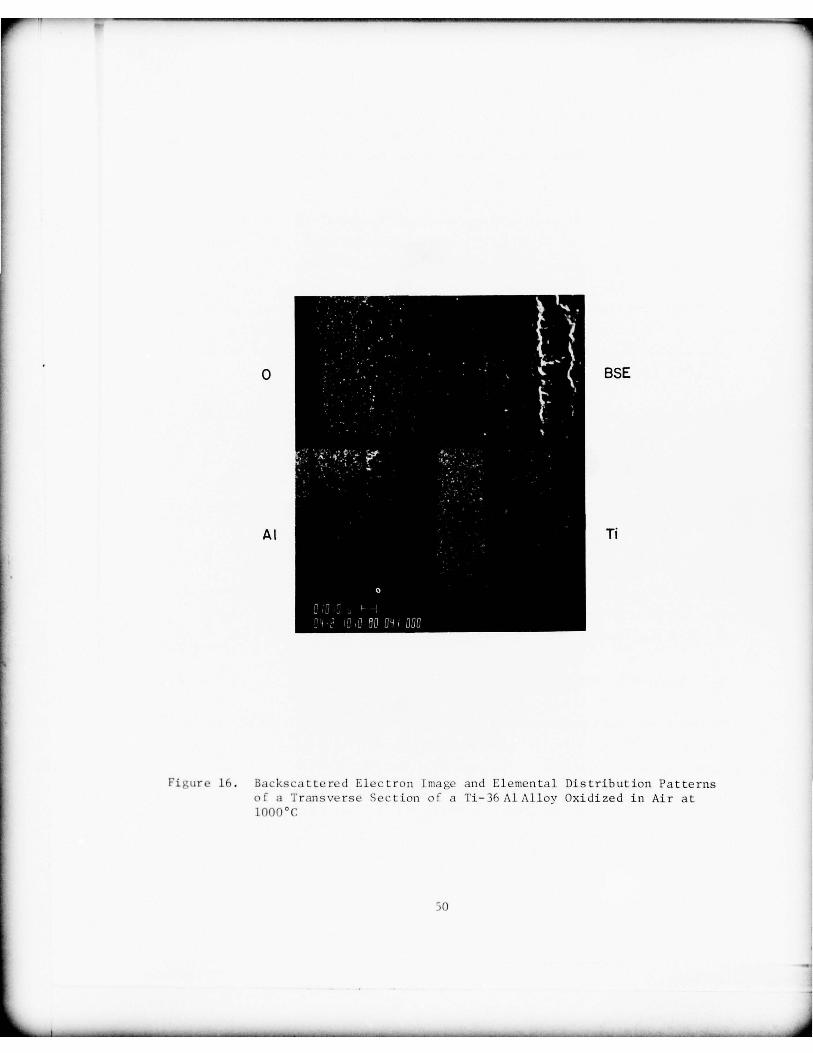
rp,__~y
~~~~ 5—— -—__- V —--5-- - -~~~~~~
0 BSE
Al Ti
I I Ill
F iCL1 r i~ 16. Backscattered Electron Image and Elemental Distribution Patternsof a Transverse Section of a Ti—36 A l Alloy Oxidized in Air at1000°C
Jo
_ _ V
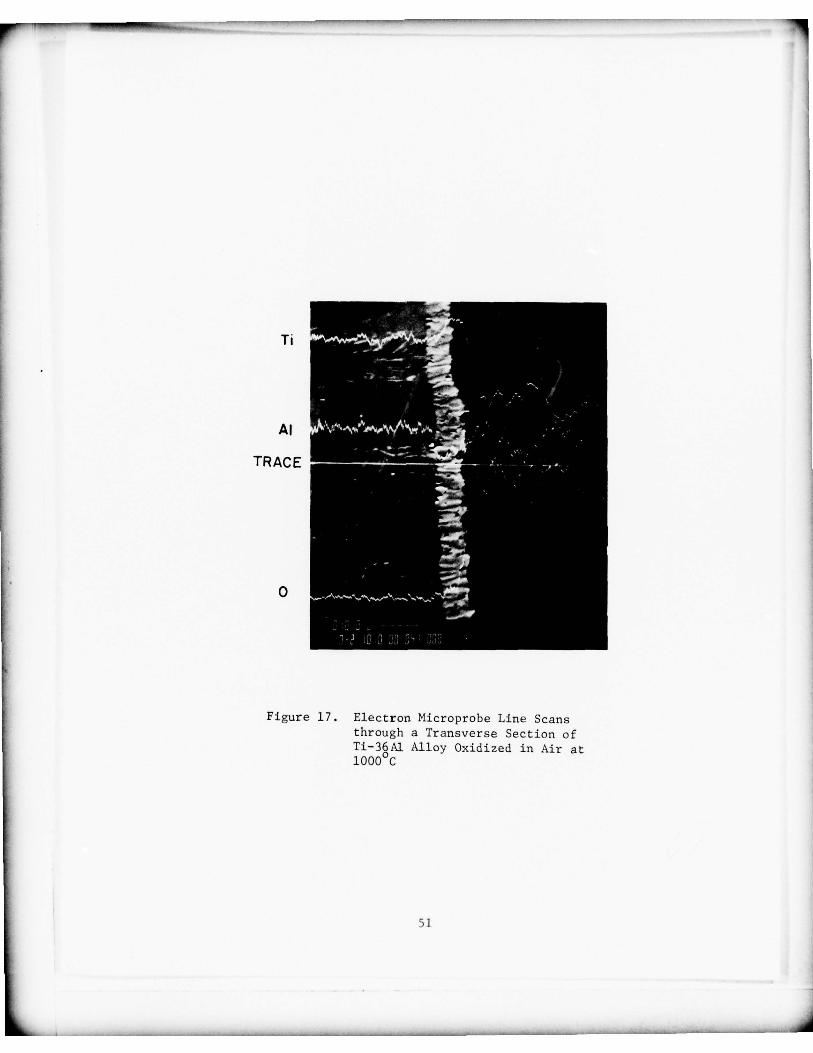
r - -—
~~~~~~~
-— -~~~~--—-—V.—-- --
Ti
—~~~~~~~
—---.
~
—
~~~~~
-—
Al ________ —
—
TRACE
i-V.-
0 ____
--‘~~~~~~~~~~~~--
Figure 17. Electron Microprobe Line Scansthrough a Transverse Section ofTi—36A1 Alloy Oxidized in Air at1000 C
51
_ _ _ _ _ _ _ _ _ _ A
-- . .~~~- - -
~~~~-
~~~~~~~~~~~~~~~~~~~~
BSE
Al .
Ti
Figure 18. Backscattered Electron Image and ElementalDistribution Patterns of a Ti—36 Al AlloyOxidized in Air at 1200 C
52
I’
- - ~~~-- -- -- -~~~~~ -~~~~~~~~~~~~~~~~ - - -5 ~~~- - - -V _ _ _ _
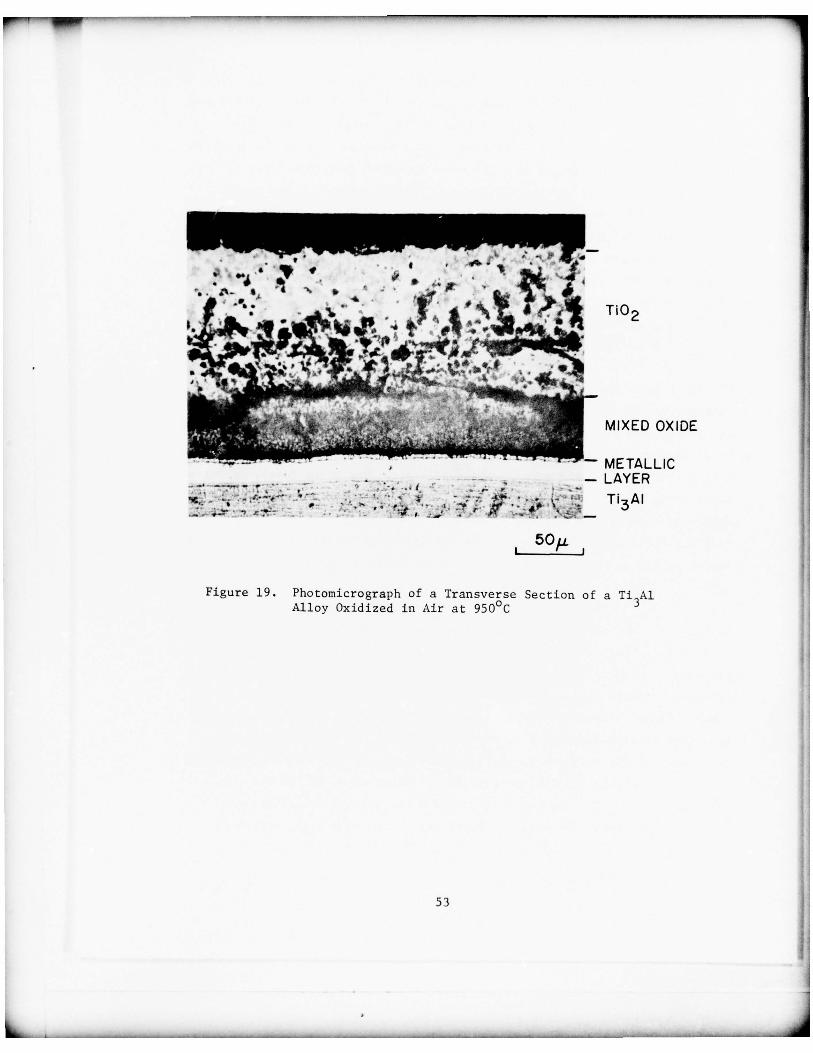
V— V V~ - - - — - ------ -
~ .
.
. .. .
V
V
... ~~~ ~ .. f.
P
,
~~~~~~
~~~~~~~~~~~~ Ti0
_ _ _ _ _ _ _ _ _ _ _ _ _ _ _ _ _ _ _ _ _ _ _ _ _ _ _ _ _ _ _ _ _ _
DE
— LAYE R
~ :~ ‘:‘ ~ ~ :~ 4’ —
Ti3AI
5Ou, j
Figure 19. Photomicrograph of a Transverse Section of a Ti3Al
Alloy Oxidized in Air at 950°C
53
5- V~~~~~~~~~~~~~~~~~~~~~~~~~~~ 5 : 5- V V~~~~~~~~~~~~~~~ _ _ _
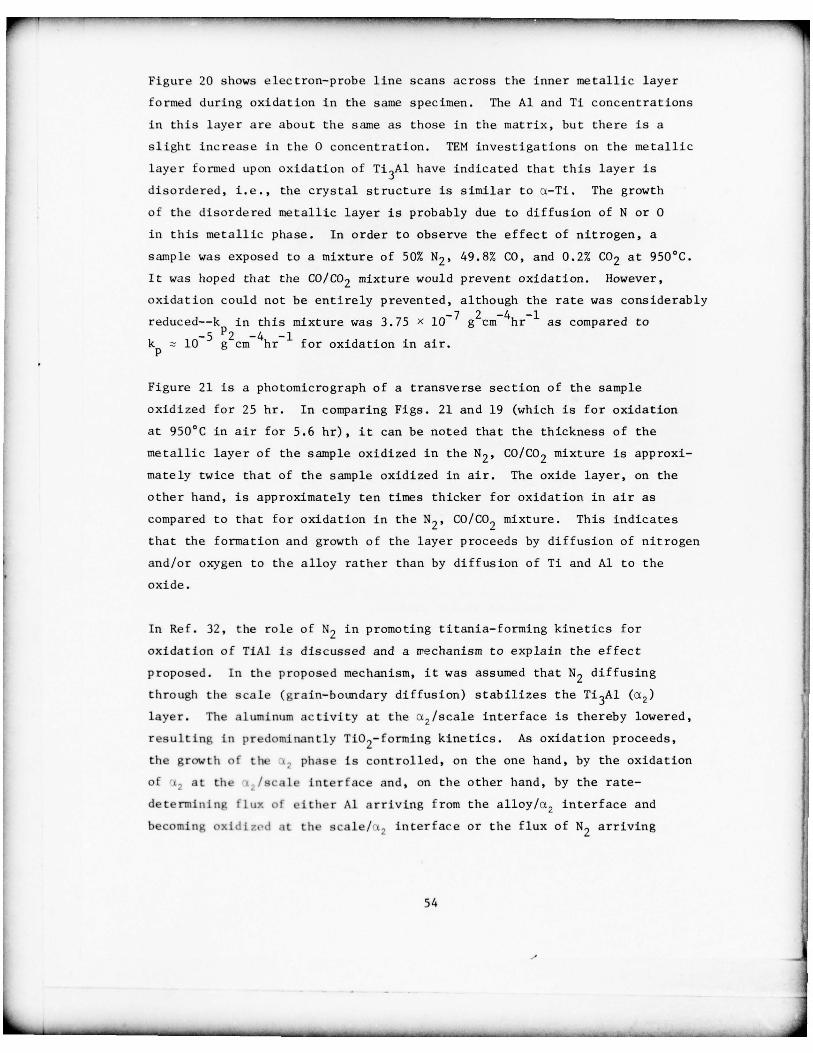
— V ~~~~~~~~~~~~~~~~~~~~~~~~~~~~~~~~ ~~~~~~~~~~~~~~~~~~~~~~~~~~~~~~~~~~~~~~~~~~~~~~~~~~~~~~~~~~~~~~
Figure 20 shows electron—probe line scans across the inner metallic layer
formed during oxidation in the same specimen . The Al and Ti concentrations
in this layer are about the same as those in the matrix , but there is a
slight inc rease in the 0 concentrat ion. TEM investigations on the metallic
layer formed upon oxida tion of Ti3Al have indicated that this layer is
disordered , i.e., the crystal structure is similar to cz—Ti . The growth
of the disordered metallic layer is probably due to diffusion of N or 0
in this metallic phase . In order to observe the effect of nitrogen, a
sample was exposed to a mixture of 50% N 2 , 49.8% CO , and 0 .2% CO2 at 950 °C.
I t was hoped tha t the CO/CO2 mixture would prevent oxidation. However,
oxidation could not be entirely prevented , although the rate was considerably
reduced——k in this mixture was 3.75 x ~~~~ g2cm 4hr 1 as compared to-4 -lk~ 10 g cm hr for oxidation in air.
Figure 21 is a photomicrograph of a transverse section of the sample
oxidized for 25 hr. In comparing Figs. 21 and 19 (which is for oxidation
at 950 °C in air for 5.6 hr) , it can be noted that the thickness of the
metallic layer of the sample oxidized in the N2 , CO/CO 2 mixture is approxi-
mately twice that of the sample oxidized in air. The oxide layer, on the
other hand , is approximately ten times thicker for oxidation in air as
compared to that fo r oxidation in the N 2, CO/CO 2 mixture . This indicates
tha t the forma tion and growth of the layer proceeds by dif f usion of ni trogen
and/or oxygen to the alloy rather than by d i f f u s ion of Ti and Al to the
oxide.
In Re f . 32 , the role of N2 in promoting titania—forming kinetics for
oxida t ion of TiAl is discussed and a trechanism to explain the e f fec t
proposed . In the proposed mechanism, it was assumed that N2 diff using
through the scale (grain—boundary diffusion) stabilizes the T13A1 (c~2)layer. The aluminum activity at the c~2/scale interface is thereby lowered ,
resulting in predominantly Ti02—forming kinetics. As oxidation proceeds,
the growth of th~ ~~. phase is controlled, on the one hand , by the oxidation
of ~ . at the t 2 /scale interface and , on the other hand , by the rate—
determining fl ux of either Al arriving from the alloy/a2 in terface andbecoming o x i dj z v d It the scale/
~2 i n t e r f ace or the f lux of N 2 arriving
54
5,
- - V -- —5- - —— -- - —-— —--~~ --V- - —---—--5 -~~--5V
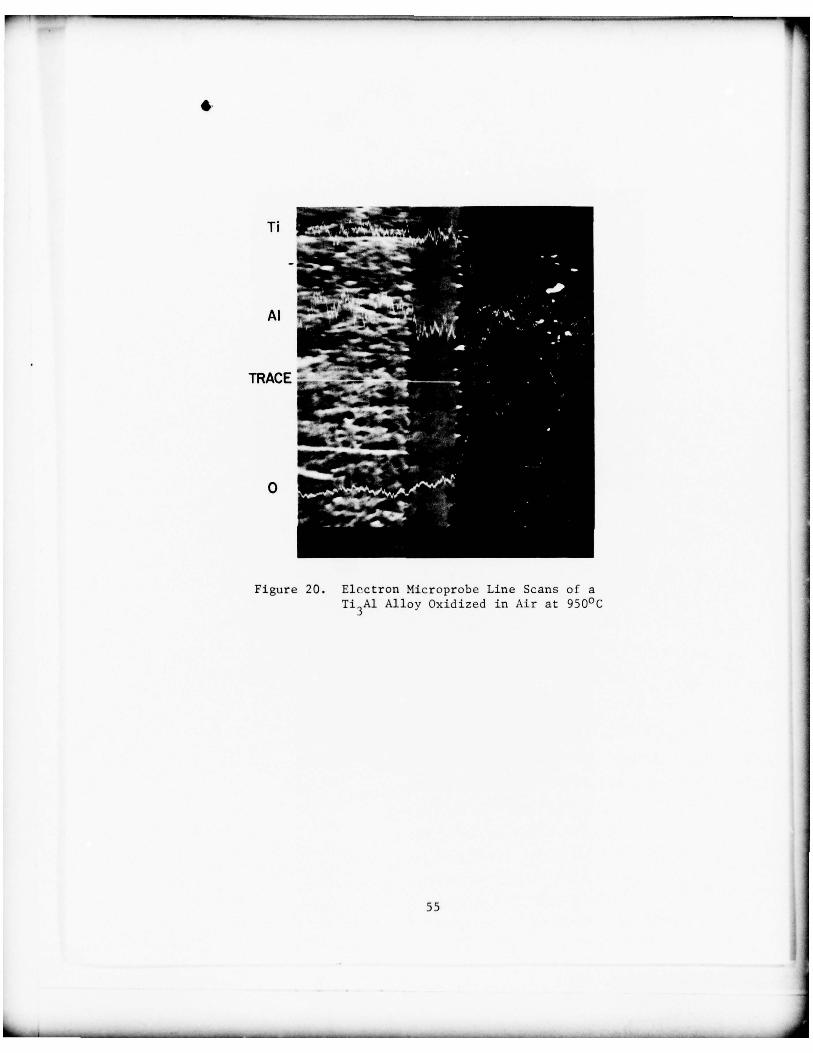
- ~~~~~~~~~~~~~~~~~~~~~~~~~~~~~~~~ - -
‘V
Ti~~~~~~~~~~~~~~
Al—-
V
TRACE - -
~~~-.I- ~~~~~~~~~~~~
0
Figure 20. Electron Microprobe Line Scans of aT1
3A1 Alloy Oxidized in Air at 950°C
55
_ _ _ _ _ _ _ _ _ _ _ _ _ _ _ _ ~~~~~~ -— - -.—
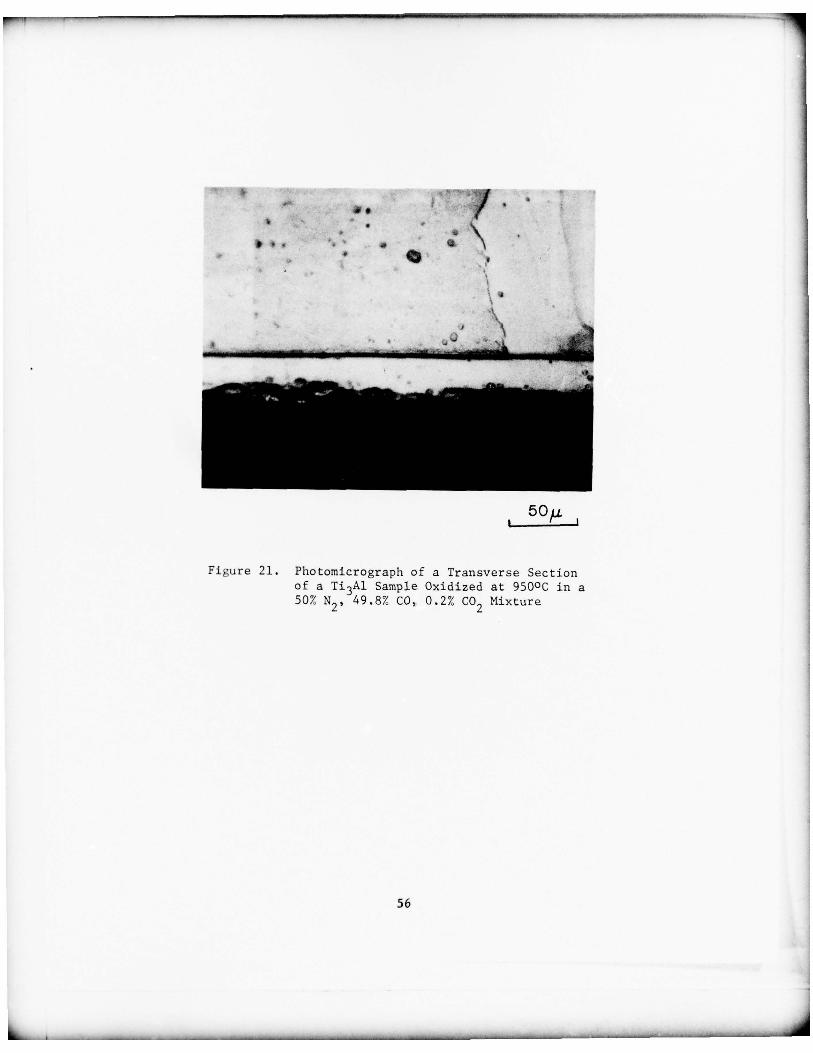
—~
- -__________ VV ~ —V — ~V V
•fV VV5-
~~5V V1
~__1 ~~~~~~~~~~~~~~~~~~~~~~~~ ~~~~ ~~~~~~~~~~~~~~~~~~~~~~~~~~~~~~~~~~~~~~~~~ - - -- V - . -~
~rP~V~i I V
•
a.V S -
* . ,. • 0
.9
V -,,
-
.
~~~
~~~~
5OLL
Fi gure 21. Photomicrograph of a Transverse Sectionof a Ti3A1 Sample Oxidized at 950°C in a50% N 2 , 49.8% CO , 0.2% CO
2 Mixture
56
_ _ _ —-V

1
from the scale/a2 in terface and proceeding to the i~2/all oy interface. At
tempera tures above 1050°C, 02 also stabilizes the t2—layer , and the role
of 02 is similar to tha t of NV ) .
In the oxida tion of TiAl in air , only one metallic layer (viz., the (12—layer)is observed between the scale and the matrix. However , in the oxidation of
Ti3A1, the metallic layer formed be tween the scale and the ma tr ix isdisordered , i.e., the crystal structure is that of i—Ti. The absence of
an -i—Ti laye r atop the a2—layer formed during oxidation of TiAl requires
some explanation. It is possible t~’at during the oxidation of TiA1, the
flux of Al through the a2—layer is sufficiently large to allow the aluminumchemical potential at the scale/a2 interface to be effectively maintained
at a hi gher leve l than that necessary for a—Ti , a2(Ti3Al) coexistence ; thus ,
no a—Ti layer forms on the a 2 (Ti 3A1) layer.
EFFECT OF COMPOSITION UPON THE OXIDATION BEHAVIOR OFBINARY TiA1 ALLOY S IN AIR AT 950 °C
In order to determine whether increased Al content in TiAl alloys promotes
A1203—forming kinetics, two alloys——Ti—38 .7w/o Al (665) and Ti—40 w/oAl
(5102)——were oxidized in air at 950°C. The observed k~ values f or thesealloys were 2 . 6 7 x 10— 6 and 1.85 x 1O
_6 g2cm 4hr 1
, respectively——well
wi thin the sca tter range of k~ values observed for oxidation of Ti—36w/oAl(i.e., TiA1) alloys in air at 950°C. Thus, it is apparen t tha t increasing
the Al content from 36 to 40 w/o had no apprec iable effec t upon theoxidation behavior in air at 950 °C.
RE SULTS OF OXIDATION TESTS OF ALLOYS BASED UPON TiA1 AND Ti3Al
A number of alloys based upon TiAl and Ti3
A1 were subjec ted to cyclic and
noncyclic oxidation tests in order to evaluate the relative oxidation
resistances of these alloys . The results are tabulated in Tables IV and V.
The beneficial effect of Nb and W additions is worth noting. This effect
is probably due to increased Al ac tivity in these ternary and qua terna ry
alloys , which promotes relatively more Al203
(as compared to TiO2) formation
and reduces k~ and Increases scale adherence.
57
- - - -~~~~~-- - -- - 5 - —~~~~~~~~~~~~ - ------ - - - ~~~~~ - 5 - - --- --- — V- -~~~~ - - V -
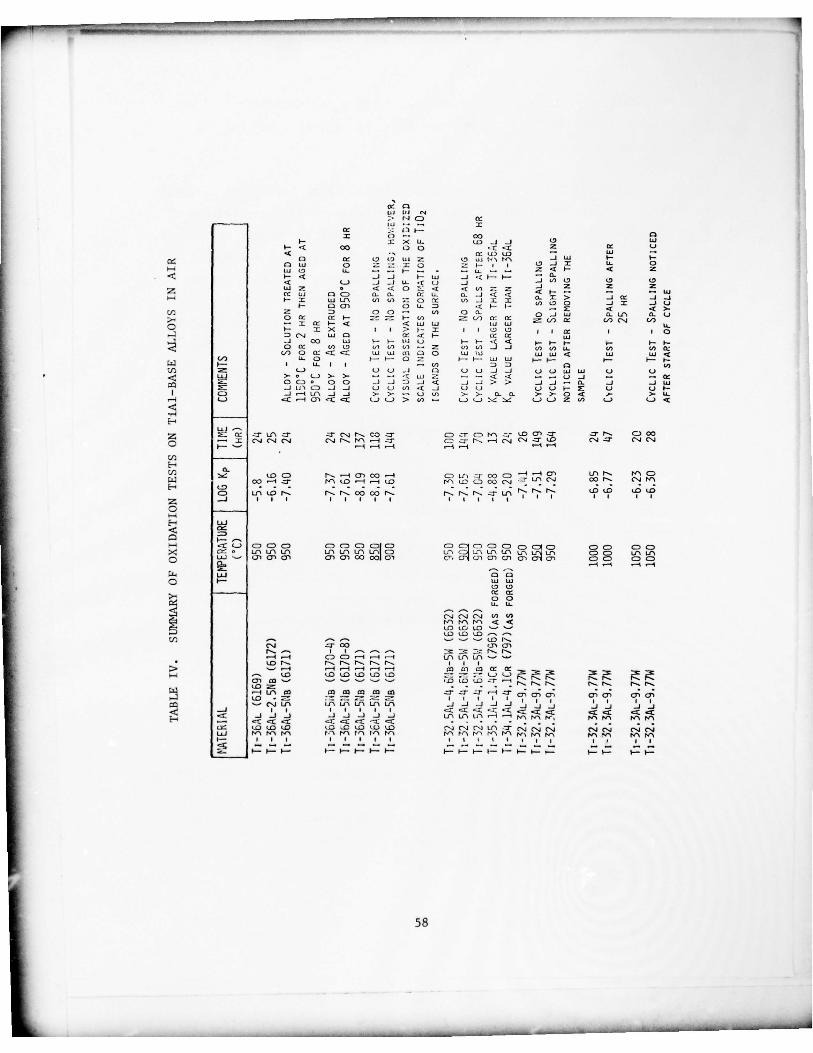
_ _ _ _ _ _ _ _ _ _ _ _ _ _
-
~~~~- , - -
Li Li 91
“3 ,-. —.‘—‘ I---
(V)0 Li
l— .( 00 0 0 .t .~~ Z Li
C~~~ U) L0 — Li —.0 (~ 01 01 Ui ~~ (5 ~ii ~~~ ~~~ —~ (U 3— 3-
O W 0 ~~~~~~~~ X 0 ~~~~~~~ 0.J X U- 0
3- W (]) U. — I - - - . - — u ~~~— .-.3— .c _ VVI .53 ~~ i~U _ V•j ~(
JV__ 3_V. — OVVLi - - t L) 5]
l U z . ~~~~~~~~~~ < U )~~~~~~~ Z V.—CC L’3 C) CO a. a. a. U- o_ ~~ •.C -~ < 5]3- i— z uj u~ U) (1) 0 a. (3) _3 ~ 01 0 5] ~~ 5] Lii- 0 0) 0 U. ~~ ~~. ) . — <0 0 (3) O O V o 5 J uJ a. Lt) 0- L i0 CC CC I— ~ — - 3— U) (VI) a. CC CC U) NJ (/)— CC 3- Ui Li lii Li U.I- X >. I I ~~ I - I I 01 (5 I I CC I I 0~~~C-’J W O ~~~~~~~~~~3--
.5] VI CX) Li ‘— 3— I3~I Li )-~ 3- ~~ 3- 3- 3- — l- 3-0 CC (3) (.5 Ui U) (I) . Z U) U) ...i .4 I)) (3) Ii. (3) (3) 3).(j~) 0 CC C Li Ui I) 0 0 Ui Iii w w < w w ~(I) U- 0 3— 3— 0 Z I— I— Li Li ,_ i-fl- ~~~ 3--. 3-._
U. I I — (/) IS U)(4 U 5] (5 U (4 ~i (.3 U Ui (U Li Li
V.V~ ~- o L) )— )— .- ---.~~~~~~W Z ~~~~~~~~~~~~~~~~ .. ... (J _J
O C O X 0 0 J i ~~~) __I -~Z i _ i > ~‘ . 4 _ i — U.. _i ...J L U
._ i (.f( CO _.J _J I J IVVV ) ( / )~~~~~~~ 5] LIL ) O U 3 _ Z Li L i i - -C) 5] ~~1 (0 5] 5] >- >- -. LI U) >- >- 0- 0- ). > 0 < ~~- )- U.Li ~~ .—1 0) ~~ -~t I..4 (V .3 > Id) Li Li ‘-~ ~~~ Li Li Z U) Li L.) c~
Z U-i
~~ ~r NJ N. CO 0 CD 0~ CO Lb 0) .D~ N. C) 00— X Ni Ni NJ NJ N. N~ ~~I CD CD N.. V~~~ NJ CD (N CD (N (N3— ‘-~ ~~4 . j , 1 r-i .1 ~
Cl] Lb CD N.. —l CO 03 .3- CD (VI CD CO C) —~ Cl ( 0 N~ rd~ C)03~~ 3 - VC D ~~~~~~~~~~~~~-1Lb C D C O (.VJ V L( NJ
-(.0 . . N. N. N. Lb (.0 Lb LbCD U) Lb N N. N.. 00 00 N N. N. N. ~~ IVV__J I I I I I I I I 3 I I I I
0 _____
3-U_i
-~
3-— --3- CO~~~~~C O C ) C OC )~~~~~C) C D C D
~~~~, LO LfI Lft U-\ L11 1r, LrI CD I C D4L’\ LO LC r, u-~ u-, cs- v tr, ir,
V U_i --. CO C) 0) 0) C) 0 0 0 0 0) CD. Cl 0) CO 0) CO Cl Ci 03 03 C) CD5-..
,3-
U_i 0 0o ~~~ 0 0
IC IC0 0U - U .
NJC ’.iNi C~) U)<
.5]CJ~] -~ -‘ -‘ ‘— — - Lb N.
(N CD 00 0 ) 0 )N. .—. I I —. N. N..-~~~--3 CD CO ’3- —~~~~~Lb N. N. N. N. N. N. I I
.3- .3- .3- ~3- ~3- .3- ~fl 01 (5 CC CC.—. (.0 Lb Lb Lb (0 (0 Li Li ~~
(C N .N . N . N.N.. N.N..3- 1.3
~~~~~~~~~~~~~~~~~~~~ C) CO C1 Ci Ci 0) 0)5-- NJ U) LOU) (0 It) It) i j .j
~ ~ .!~ .~~ ~~ ~~.5] i I I I I I I -~~~ (Z .~ ..~t_ I
~~~ .~~~~~~~~~~~~~~~~~~~~~
L(~~~~~~~~~~~~~~~~~~~~~~ N P (O N)
(0 (0 (0 (0 ~C Lb (0 (0 (N (N Ni ((I ~~ (N (N (N NJ Ni NJ (N
uJ Fl) ~~~ (V~ VV, iv’, r’\ r’, to r~l) 3 V3~) NVV ( N\ N) >~-~ ~~~ >.—~ ~~
-, ‘I-, ~~~I—V.-. 3 I I I I I I I l~~~~~~~~~ I l I I I • I I
~~~ 3~~~I~~~ 3-~~ 3-- 3 _ - 3-~~i--- 3_ ~~~~~~~~~~~~~~~~~ ~~~~~~~ ).3-
58
- - -- --.5--I
- - -~~~~~~ - .5- -
~~~~~~~ - --
~ _
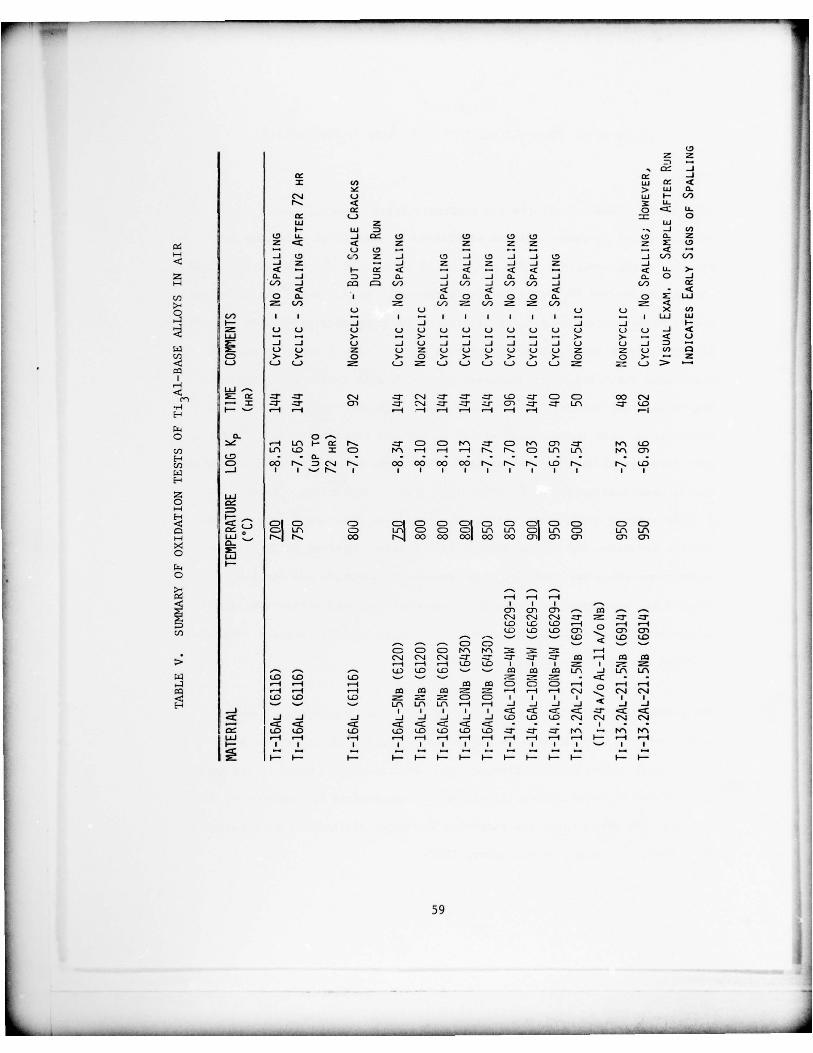
_ _ - V.5 VV_ V V__ VVV
~1
(0z z
.‘ o:~ _iIC ICx ci, LU IC
> LU(N U LU I- C/)N. Ii.
o ~r Li.IC Li 0Ui Z LUI— LU 5] U)
(U Li. 5] C~ (0 (0 (9 (9 (9 Q~z ~~ .~~ z ~ z (0— L) (9 — -. — — < —3-I
~ I (U (.) Z .5] (9 -.3 01 5] 5] tO 5] Cl) Cl)5] — ..i Z 5] 5] 5] Z 5]— I- IC — < U .
Z 0. .5] ~~ 0-. 5] 0-. 5] 0. 0. 5] 0.. 0 5]3- (i’) -5] CO CD (VI) 5] (1) ~ J C/) 0’) .4 (/) IC
-
CO 0 0. I 0 0. 0 0. 0 0 0. 0 E LUCl) ~~ (1) Cl) Cl)
U 0 U Li )< U)‘.5] Cl) I I ~
.. I I I I I I I — — I Li_i LiiI.- _i _I -.1 5] I-U U U U U Li Li Li Li Li Li Li Li Li .-.-l
LA_i — .-. >. >- >- )- — < U5] 5] 0 -.1 U —.3 5] .5] 5] .5] 5] (V.3 (.3 5]U U Li Z U U Li Li Li Li Z ~~ Li U)
CO CD )- >- 0 )- 0 >- >- >- >- )- >- 0 0 >- — Z05] Li Li Li Li Li Li Li Li Li Li >U)
-~ LLJ - --.
1~) IC .0 .n (N -~~ -~~ .0 (0 -Ct CD CD 00 (N
.,.~
— X -~~ -~~~ C) -~~~ (N -~~ .~~ zJ- C) -Cr .o- U) -~~ (0‘- ‘ . I .3- 4 -~~~ .3- .3- .3- .3- .3- ~~I
o 0. 0~~ -..~~ .3- U) I— IC N. -~~~ CD CD N) Cr CD N) 01 -~~~ N) (0
CO U) (0 ~~ CD N) ‘—4 .3- .3- N. N. CD U) U) N) C)(0 . . 0. . CD 00 N. ~~~~C’4 N. 00 00 00 00 N. N.. N. (0 N. N. (0
I I ~~~~~~~~ I I I I I I I I I I I I
I-’zoI-I
~ 3 CD CD CD CDI CD CD CDI 03 CD CDI CD CD CD CDCD U) CD Lr)I CD CD CDI U) (C) CDI U) CD U) U)
H LU N. N.. 00 N.J 00 00 001 00 00 C1~ C) Cl C) C)
oI—
0
‘-I .3- ‘-I
Cl C) C) -.. U) .—. -~~~ I I I
(N (N (N Cr Cr Cr(0 (0 (0 .3- .3- .3-
Cl) ~~ ~~ 0)—
__ __ ..-_ ... (0 (0 (0
r. r 0 CD ~~~‘ -V.. %~~C) CD CD N) N) D~ ‘-1(N (N (N -~~ z]~ -Ct Cr Cr U) ~~4 U) U).3- .3- .3- (0 (0 I I I I(hi (0 (0 ‘— U) U) U) U) -5] U) U)(0 (0 (0 ~— ‘~~~ 0 . .C5 -.3- #-I .3- U) U) CD CD CD 1 4 ‘3-
U) ~3- ‘—4 ~.4 U) U) U) ~~ ,3- —4 (N (N (N(0 (0 (0 CD CD I I I I I I
E-I ‘—V. U) U) (C) ~3- 9-3 5] .5] 5] .5] 5] 5].5] I I I I I ~~~ Cr.~~ 5] 5] .5] 5] .5] 5] 5] 5] (.0 (0 (0 (N (N (N (N— .(~~ ~~~~ ~~~~~~ (0 (0 (0 (0 (0 (0 (0 (0 Cr Cr Cr N) - N) N)Lii ~ 1 -I .3- ‘-I ‘-I ‘—I .3- .3- .3- .3- .3- .3- 3- .3- .3-
I I I I I I I I I I I I I I
3 - 3 - 3- - 3 - 3 - 3 - -3- 3-- 3-- I — 3 -
59
ii
L . _ _
--—-- ~~~ - —--~~~--~~~~~--—---- — -~~~~~~~~~~-—- ~~~~~~~
Section V
STEADY—STATE CREEP BEHAVIOR OF T13A 1-BASE INTE RME TPILLICS
INTRODUCTION
Considerable research efforts are presently being directed toward
development of c~2—phase titanium aluminides as structural materials for
aircraft turbine engines. The c~2—phase is based upon the composition T13A1
and has an ordered D019—type lattice structure. Recent work33
has shown that
the Ti 3Al—base alloys——although brittle at low temperatures——retain reasonable
strength levels up to 800°C. At about 550°C the alloys begin to exhibit
measurable ductility which increases gradually with increasing temperature .
The tensile deformation modes in Ti3Al have been studied by Williams and
Blackburn at room temperature34 and by Sastry and L ips i r t at 700° C. 35 The
main findings of these investigations are that slip in Ti3A1 is highly planar
and is comprised mostly of ~ <1120>— type (Il all ) dislocations. A few
-~~ <1126>~ type (“c+a”) dislocations have also been observed.34 The ordered
lattice structure and restriction of s u p systems observed in Ti3A1 appear
to be responsible for both the high—temperature strength and the low—
temperature brittleness. Ordering—transformation25 and strain—amplitude—
controlled cyclic deformation36
studies have also been carried out recently
on Ti3Al—base internietallics .
The present investigation is direc ted toward an understanding of the
steady—state creep behavior in Ti3Al—base materials in the stress and
temperature ranges which correspond to practical applications . This goal
was pursued by establishing the stress and temperature dependences of the
steady—state creep rates and examining the creep dislocation substructures
by transmission electron microscopy (TEM).
60
_ __ -— __ _ VV V _ _ V ~~~~~~__ _ V V ~~~~~~~~~~~~~~~~~~~~ ~~~- - - -~~~~~~~~
- .5~~~~~~~~~~~ V
EXPERIMENTAL PROCEDURE
Two i n t e rme ta l l i c s we re used in this i nves t i gat ion : the near—
stoichiometric Ti3Al (nominal composition : Ti—16w/o Nh) and Ti
3Al +
l0w/oNb (nominal composition : Ti—16 w/oAl--lO w/oNb) . Nb is added in
the Ti3Al—base alloy primarily to improve the oxidation resistance;
significan t improvement has been shown to occur37
with the addition of
5 — l0w/oNb. The alloy used in this study was cast as rod ingots and
converted by Nuclear Metals, Inc., to a powder form of —35 mesh using a
rotating electrode process. The powders were packed in Ti—6A1—4V cans,
evacua ted , sealed , and hot extruded at 1200°C with an extrusion ratio of
26: 1. The detai ls of the extrusion process, the method of specimen
machining, and the geometry of the specimen are described in a recent
paper.38 The machined specimens were given an annealing t rea tment of
1000°C/4 hr in vacuum in order to stabilize the microstructure and were
then furnace cooled .
A lever— type constant—load creep machine was utilized fo r the creep
experimen ts . The tests were performed in air at stresses ranging from
69 to 312 MN/rn2 (10—45 ksi) and at temperatures ranging from 550 to 825°C.
During the creep tests the temperature was controlled to within ± 2°C.
Most of the tests were carried out at constant (nominal) stresses ; however,
in some tests stress levels were increased on the same specimen after the
onset of steady—state creep . In all expe riments the steady—state creep
regimes were observed to be well established below 2% total strain. Thus,
the correction necessary to convert the nominal stress to true stress was
ve ry small and , there fore , neglected. In the creep exper imen ts the specimen
elongation was continuously recorded by means of an LVDT and a mechanical
61
. 5— - - ~~~~V .5
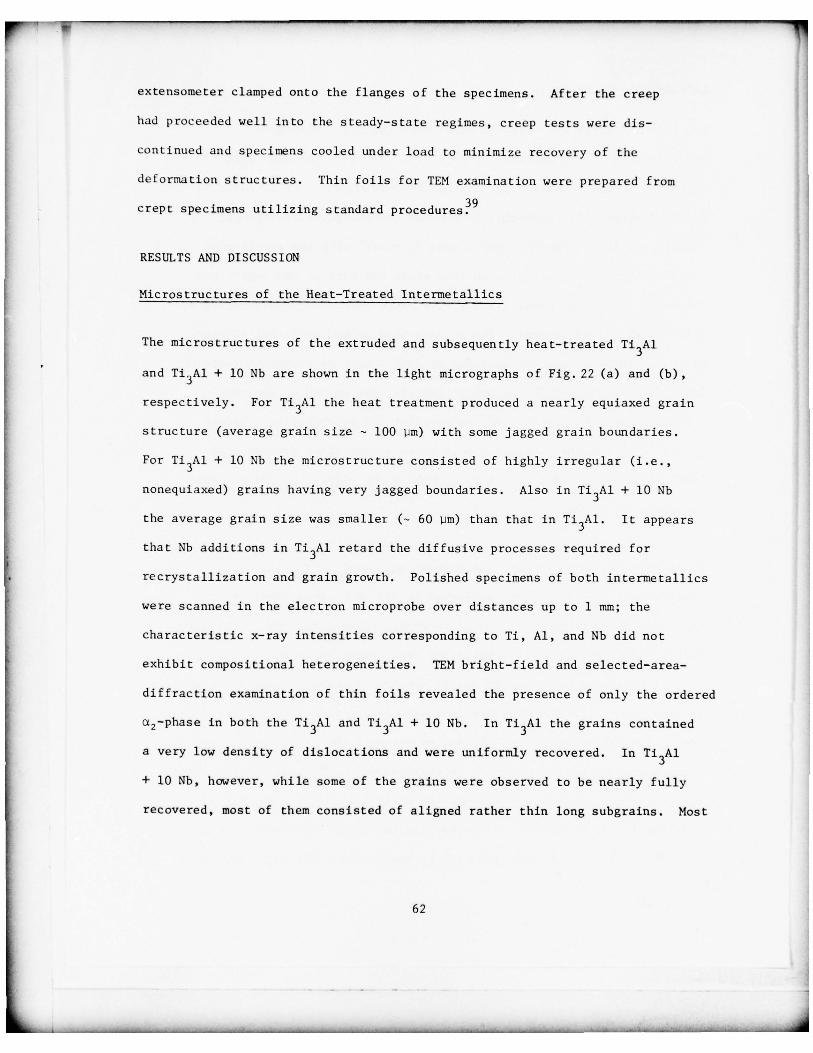
extensometer clamped onto the flanges of the specimens . A f t e r the creep
had proceeded well into the steady—state regimes , creep tests were dis—
continued and specimens cooled under load to minimize recovery of the
deformation structures. Thin foils for TEM examination were prepared from
crept specimens utilizing standard procedures~9
RESULTS AND DISCUSSION
Microstructures of the Heat—Treated Intermetall ics
The micr ostruc tures of the extruded and subsequently hea t—trea ted Ti3Al
and Tj3A1 + 10 Nb are shown in the light micrographs of Fig. 22 (a) and (b) ,
respectively. For Ti 3Al the heat treatment produced a nearly equiaxed grain
structure (average grain size — 100 ~im) with some jagged grain boundaries.
For Tj3A1 + 10 Nb the microstructure consisted of highly irregular (i.e.,
nonequiaxed) grains having very jagged boundaries . Also in Ti3Al + 10 Nb
the average grai n size was smaller (— 60 lim) than that in Ti3A1. It appears
tha t Nb addi tions in T13A1 re tard the d i f f usive processes required for
recrystallization and grain growth. Polished specimens of both intermetallics
were scanned in the electron microprobe over distances up to 1 mm; the
characteristic x— ray intensities corresponding to Ti, Al , and Nb did not
exhibi t compositional heterogeneities . TEM bright—field and selected—area—
diffraction examination of thin foils revealed the presence of only the ordered
ct2—phase in both the Ti3Al and Ti
3A1 + 10 Nb. In Ti
3Al the grains con tained
a very low density of dislocations and were uniformly recovered . In T13A1
+ 10 Nb , however , while some of the grains were observed to be nearly fu l ly
recovered , most of them consisted of aligned rather thin long subgrains. Most
62
.5 ~~~~~~~~~~~~~~~~~~~~~~~~~~~~~~~~~~~~~~~~~~~~~~~~~~ - - -~~~~~~~~~~ ~~~~~~~ -- --
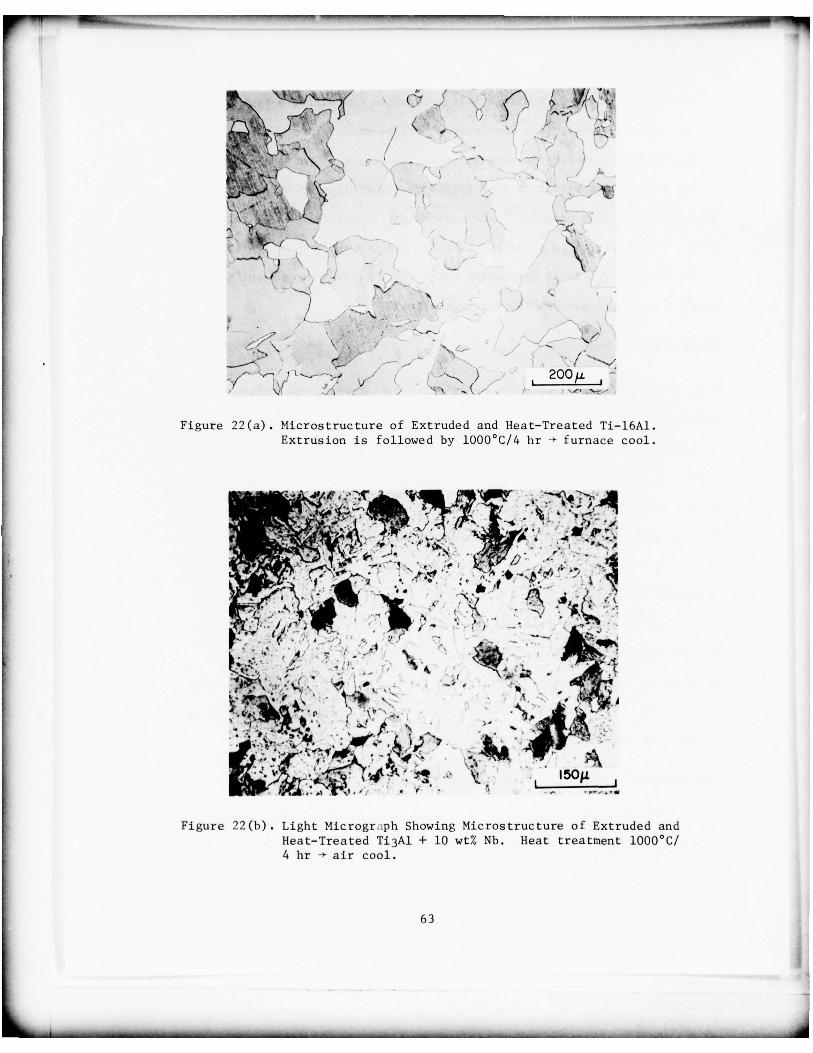
~~~ y V -W ~ - V V ~~~~.5 ~~~~~~~~~~~~~~~~~~~~~~~~~~~~~~~~~~~~~~
-~~~~~~~~~
(T~ J ~ (~ ~ -I~- -
~~~~~~~~~~~~~~~~~~~~~~~~~~~~~~~~~~~~~~ r e --.. -2
~~ V —5~~~
• V~~~ V
/ V
V - - - V~ -~~
-~~~~~~~~~~
~~~ !r~~ ‘
-
5’ ~Vl#
C~~
V..~~.~ A
~~ ~~ 1E-VVf
V -V•-VV-VV •
(V -V \
_,
~~~~
-
~~~/
_ ‘-
A - - -
-
V -
-~~~~~~~ -VVV
~~ V\ -
. ~l - -- ~~~~~~~
~~~
( -~~~~~~
- / V
~~~ ) 2OO~~
--_ _I ~~~~
- I - - I I -
Figure 22(a). Microstruc ture of Extruded and Heat—Treated Ti—l6Al .Ex trusion is followe d by 1000°C/4 hr -~- furnace cool.
~~,.
-
~~~, ~~Vz’ ‘
~~
-V. —
V.’ -
I __ -
- ._
. 1V .. - .V S - V
— —
~~~~~~~~~~~~~~~~~~~~~~~~~~~~~~~~ ~~~~~~~~~~~~~~~
_) - . ~~~-
~~~~~~~~~~~~ \~ I5O~L~~~
Figure 22(b). Light Microgr iph Showing Microstructure of Extruded andHeat—Treated Ti3Al + 10 wt% Nb. Heat treatment l000°C/4 hr -÷ air cool.
63
~
-
~~~~~~~~~~~~~~~~~~~~~~~~~~~~~~~~~~~~~~~~~~~~~~~~~~~~~~~~~~~~~~~~~~~~~~~~~~~~~~~~~~~~~~~~~~~~~~~~~~~~~~~~~~ -~- -~~~~-~~~~~~~~~~ --
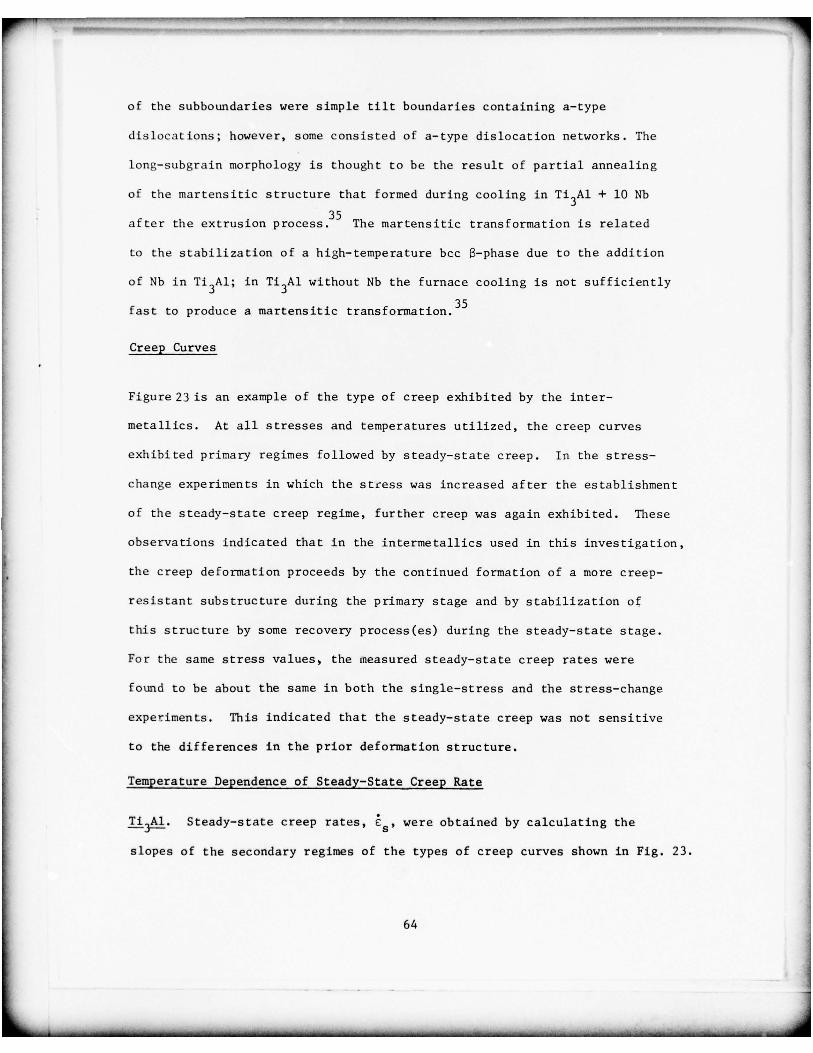
of the subboundaries were simple tilt boundaries containing a—type
dislocations ; however , some consisted of a—type dislocation networks . The
long—subgrain morphology is though t to be the result of partial annealing
of the mar tens i t i c s t ruc tu re that for med during cooling in Ti3A1 + 10 Nb
a f t e r the extrusion process.35 The mar tensi t ic t ransformat ion is related
to the s tabil izat ion of a high—temperature bcc 3—phase due to the addition
of Nb in Ti3Al; in Ti
3A1 without Nb the furnace cooling is not sufficiently
fas t to produce a martensi t ic t ransformation.35
Creep Curves
Figure 23 is an example of the type of creep exhibited by the inter—
metallics. At all stresses and temperatures utilized , the creep curves
exhibi ted primary regimes followed by steady—state creep. In the stress—
change experimen ts in which the stress was increased af ter the es tablishmen t
of the steady—state creep regime, further creep was again exhibited . These
observations indicated that in the intermetallics used in this investigation ,
the creep deformation proceeds by the continued formation of a more creep—
resistant substructure during the primary stage and by stabilization of
thi s structure by some recovery process(es) during the s teady—state stage .
For the same stress values , the measured steady—state creep rates were
found to be about the same in both the single—stress and the stress—change
experiments . This indicated that the s teady—state creep was not sensitive
to the differences in the prior deformation structure.
Temperature Dependence of Steady—State Creep Rate
Ti~~i. Steady—state creep rates,
~~~~~, were obtained by calculating the
slopes of the secondary regimes of the types of creep curves shown in Fig. 23.
64
-~~~~~ ~~~~~~~~~~~~~~~~~~~~~~~~~~~~~~~~~~~~~~~~~~~~~~~~~~~~~~~~~~~~~~~~~~~~~~~~~~~~ - - . 5 -~~~
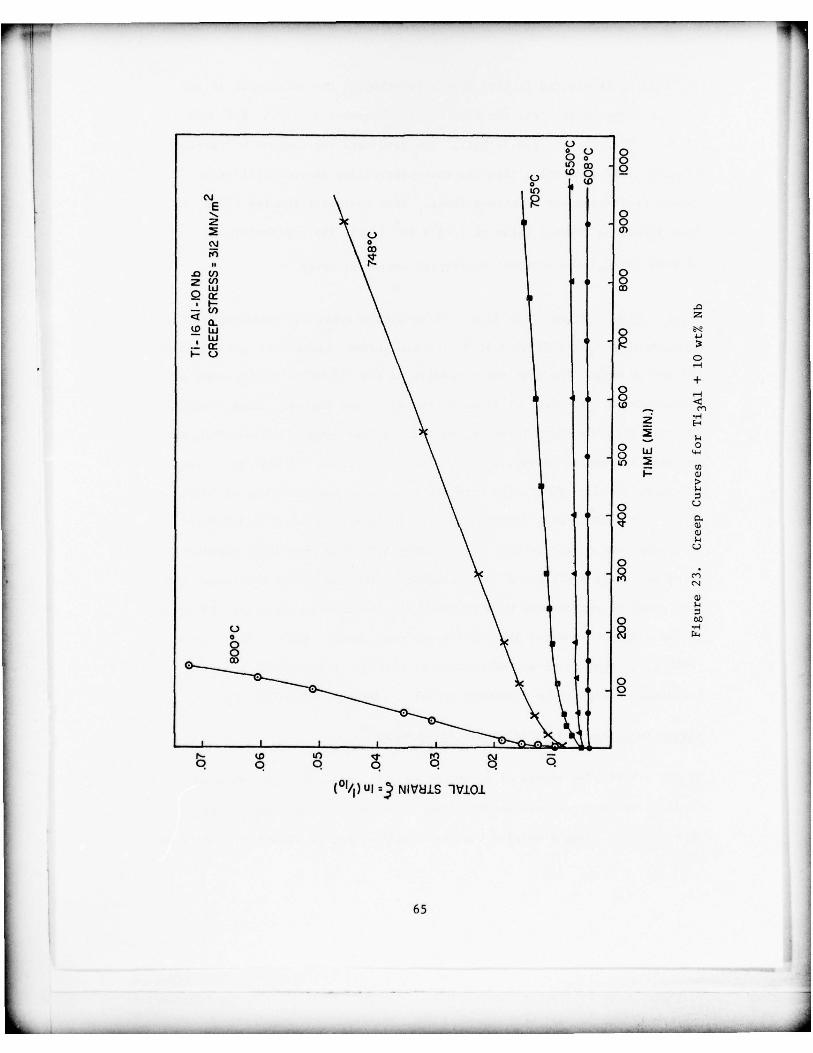
C.)
~~-~~~‘
8
H
1
\ 3 w
~~~~~~~~~~~~~~~~~~~~~~~~~~~~~~~~~~~~~~~~~~~~~~~~~~~~~~~~~~~~~~~~~~~~~~~~~~~~~~~~~~~~~~~~~~~~~~~~~~~~~~~~~~~~~~~~
a0
- ç‘-4
C-)
0
I:)‘Ia
o
8U)
0. 0
I I 1
(°I/1 )UI :~ 3 N lV~J1S 1v1oj.
65
~~~~~~~~~~~~~~~~~~~~~~~~~~~~~~~~~~~~~~~~~~~~~~~~~~~~~~ .5
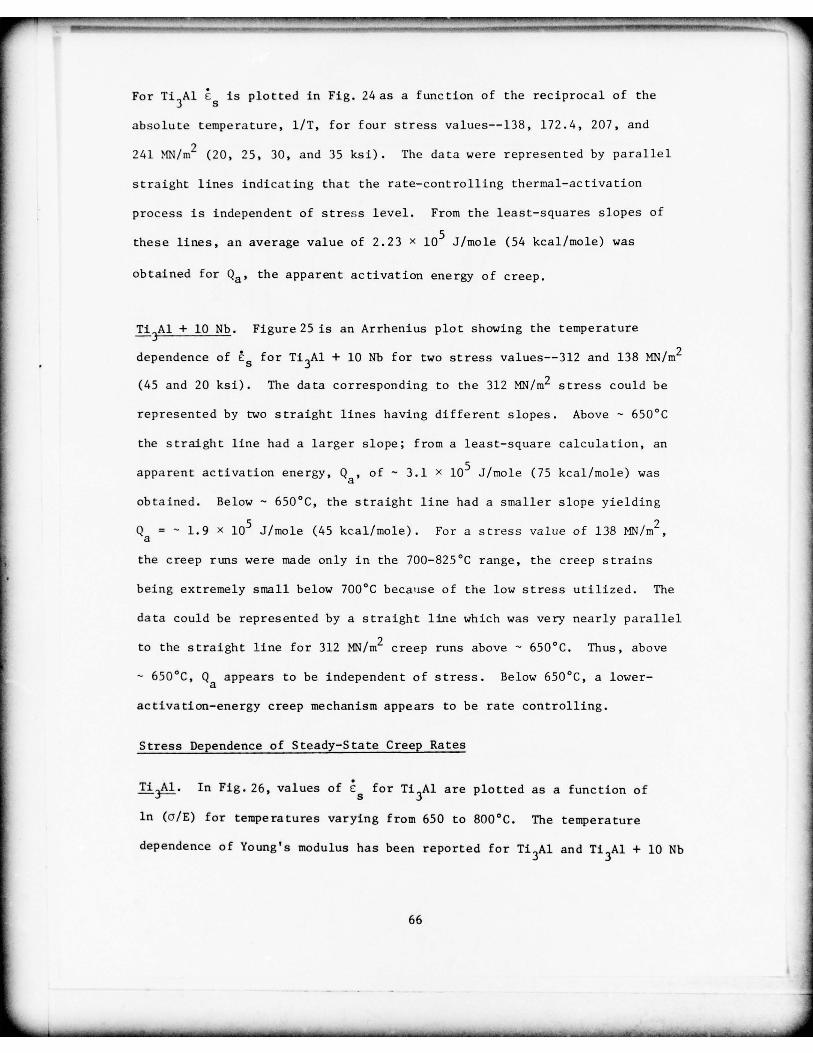
~~~~~~~~ V.V •- V - ~~~~~~~~~ V VV
V~~~~~ V ~~~~~~~~~~~~~~~~~~~~~~~~~~~~~~~~~~~~~~~~~~~~~~~~~~~~~~~~~~~~~~~~~~~~~~~~~~~~~~~~~ - V~~~~~~~~~~~~ UJ~~~~~~
For T13A1
~~ is plotted in Fig. 24 as a func t ion of the reciprocal of the
absol ute tempera ture , l/T , for four stress values——138, 172.4, 207 , and
241 MN/m2 (20 , 25 , 30 , and 35 ksi). The data were represented by parallel
straight lines indicating that the rate—controlling thermal—activation
process is independen t of stress level. From the least—squares slopes of
these lines, an average value of 2.23 x l0~ J/mole (54 kcal/mole) was
ob tained for ~a’
the apparent activation energy of creep.
Ti3Al + 10 Nb. Figure 25 is an Arrhenius plot showing the temperature
dependence of for Ti3A1 + 10 Nb for two stress values——3l2 and 138 MN/m2
(45 and 20 ksi). The data corresponding to the 312 MN/rn2 stress could be
represented by two straight lines having different slopes . Above — 650°C
the straight line had a larger slope ; from a least—square calculation , an
apparent activation energy, Q , of — 3.1 x l0~ J/rnole (75 kcal/mole) was
obtained. Below — 650°C, the straight line had a smaller slope yielding
= — 1.9 x lO~ J/mole (45 kcal/niole). For a stress value of 138 MN/rn2,
the creep runs were made only in the 700—825°C range , the creep strains
being extremely small below 700°C because of the low stress utilized. The
data could be represented by a straigh t line which was very nearly parallel
to the straight line for 312 MN/rn2 creep runs above - 650 °C. Thus, above
— 650 °C, Q appears to be independent of stress. Below 650°C, a lower—
activation—energy creep mechanism appears to be rate controlling .
Stress Dependence of Steady—State Creep Rates
Ti~~i. In Fig. 26, values of i~ for Ti
3Al are plotted as a function of
ln (OlE) for temperatures varying from 650 to 800°C. The temperature
dependence of Young’s modulus has been reported for Ti3A1 and Ti
3A1 + 10 Nb
66
- - ~~~~~~~ - - —— —- ~~~~~~~~ - - .5- -- ~~~~~~~~~~- -~~~~~~~~~ —— ~~~~~~~~~
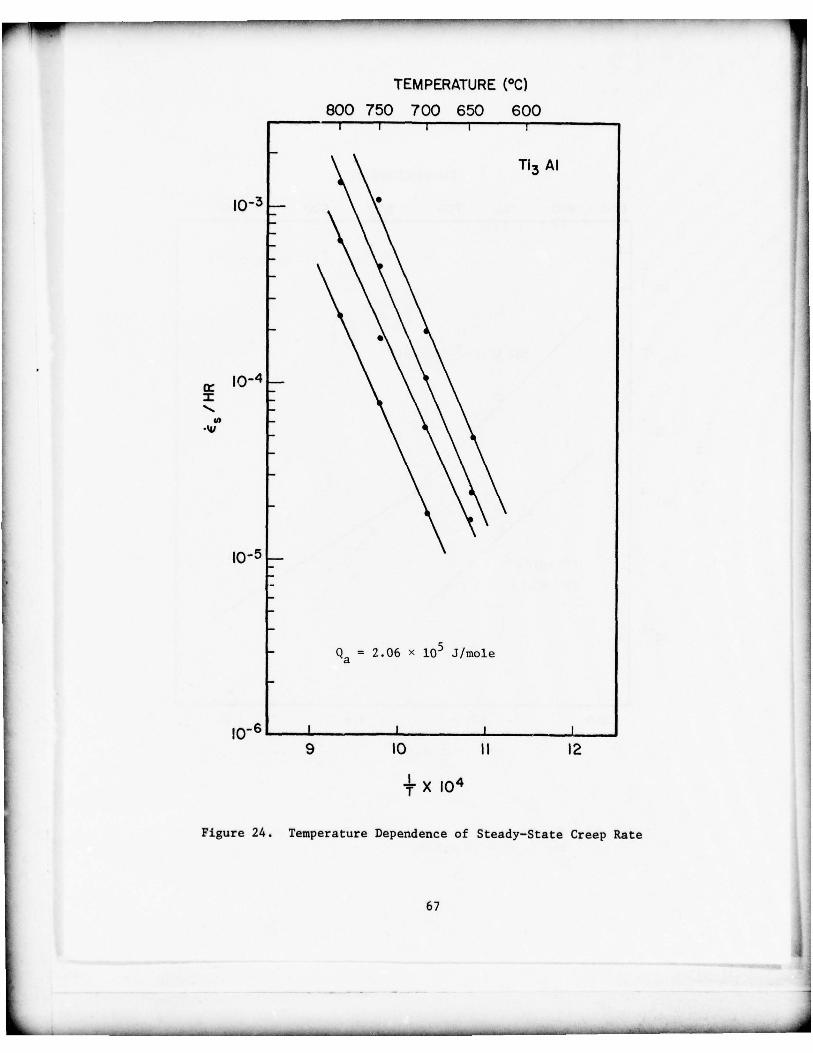
_
TEMPERATURE (°C)800 750 700 650 600
I I I
-
TI3 AI
ir ~-4 —-
to -.w
-
~a = 2.06 X l0~ J/tnole
V 0 6 I9 ~0 II 12
+X 104
Figure 24. Temperature Dependence of Steady—State Creep Rate
67
1
~~~~~~~~~~~~~~~~~~~~~~~~~~~~~~~~~~~~~~~~~~~~~~~~~~~~~~~~~~~~~~~~~~~~
.5--- ~~~~~~~~~~~~~~~~~~~~~~~~~~~~~~~~~~~~~~~~~~~~~~~~~ ~~~~~~~~~~~~~~~~~~~~~~ .4
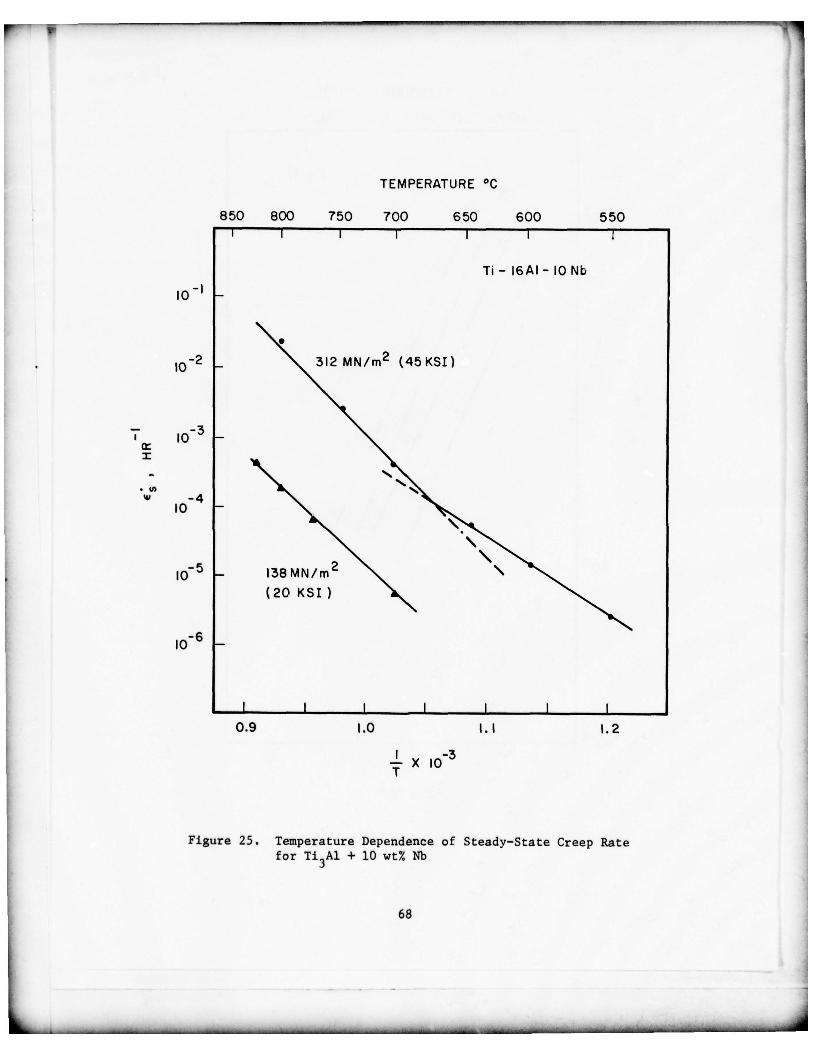
TEMPERATURE °C
850 800 750 700 650 600 550I I I 1 I I
T i - 16A 1 - 10 Nb
io~ -
lO_2
- 312 MN/rn 2 (45 KS1)
T io~ -
...~~ -
l0~~ -
io 6 -
I I I I I I I0.9 1.0 1 . 1 1.2
+ X IO3
Figure 25. Temperature Dependence of Steady—State Creep Ratefor Ti
3A1 + 10 wt% Nb
68
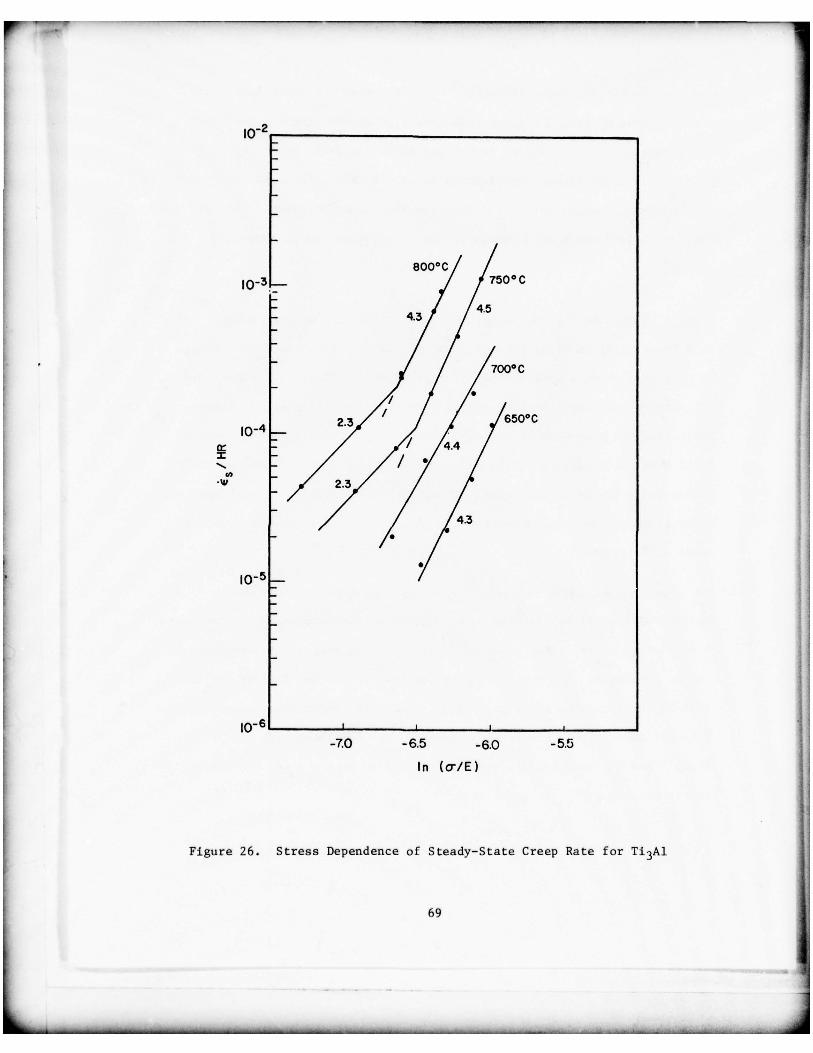
10 2 -
800°C /I0~
— J /750°c
4.3
.
700°C
i°~~ ~~~~~~~~~~~~~~~~~~~~~~~~~
4
6500C
10-6 I
-ZO -6.5 -6.0 -5.5In (alE)
Figure 26. Stress Dependence of Steady—State Creep Rate for Ti3A1
69
------.5—----- V V - V .5 --- -- — ~~~SV_ ~~~~~~~~ ISV .5 ~~~~V.5 VV! -—
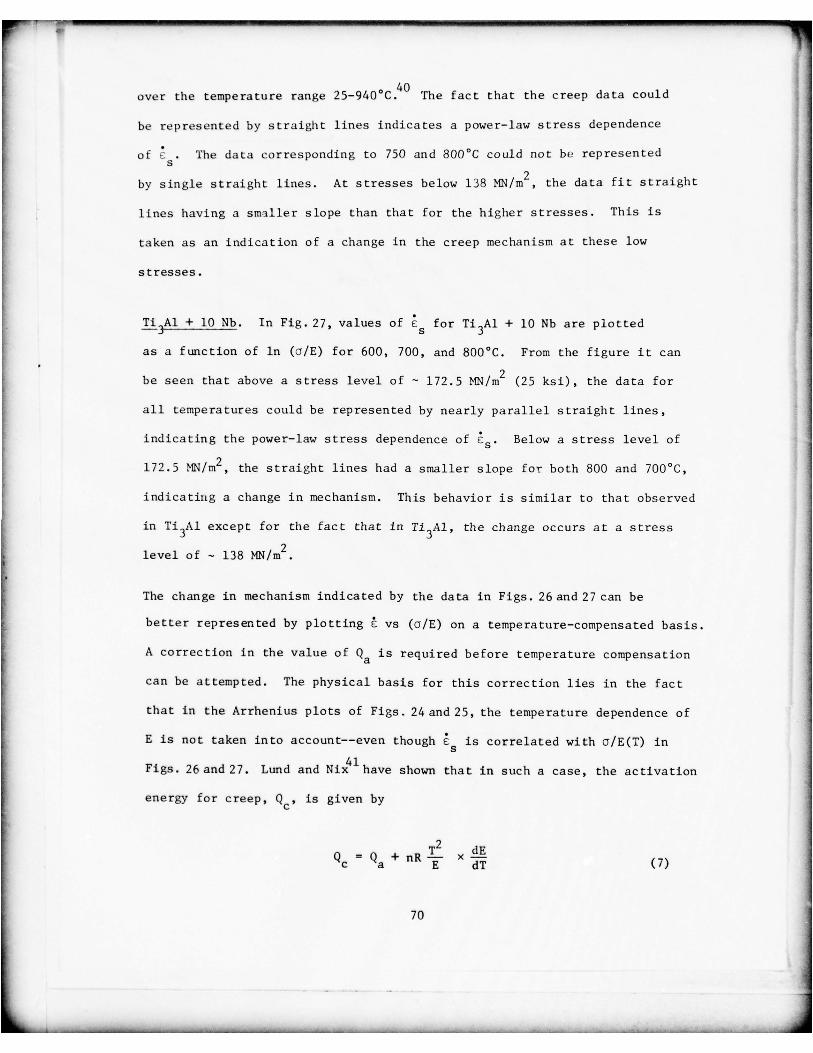
--
over the temperature range 2 5— 94 0 °C.40 The f a c t tha t the creep data could
be represented by straight lines indicates a power—law stress dependence
of ~ . The data corresponding to 750 and 800 °C could not be represented
by single straight lines. At stresses below 138 MN/m2, the data fit straight
lines having a smaller slope than that for the higher stresses. This is
taken as an indication of a change in the creep mechanism at these low
stresses.
Ti3A1 + 10 Nb. In Fig . 27 , values of E for Ti
3A1 + 10 Nb are p lotted
as a function of ln (o/E) for 600, 700 , and 800°C. From the figure it can
be seen that above a stress level of — 172.5 MN/rn2 (25 ksi), the data for
all temperatures could be represented by nearly parallel straigh t lines ,
indicating the power—law stress dependence of ~~~~
. Below a stress level of
172.5 MN/rn2, the straight lines had a smaller slope fo!- both 800 and 700°C,
indicatin g a change in mechanism. This behavior is similar to tha t observed
in Ti3Al except for the fac t that in Ti
3A1, the change occ urs a t a s tress
2level of — 138 MN/rn -
The change in mechanism indicated by the data in Figs. 26 and 27 can be
be tter repres en ted by plo tt ing ~ vs (o/E) on a temperature—compensated basis.
A correc tion in the value of ~~
is req uired before tempera ture compensa tion
can be attempted. The physical basis for this correction lies in the fact
that in the Arrhenius plots of Figs. 24 and 25, the tempera ture dependence of
E is not taken into account——even though ~~
is correlated with a/E(T) in
Figs. 26 and27. Lund and Ni~~~have show-n that in such a case, the activation
energy for creep, Q , is given by
dE~c~~~~ a ’”~j
x~~~
70
_ _ _
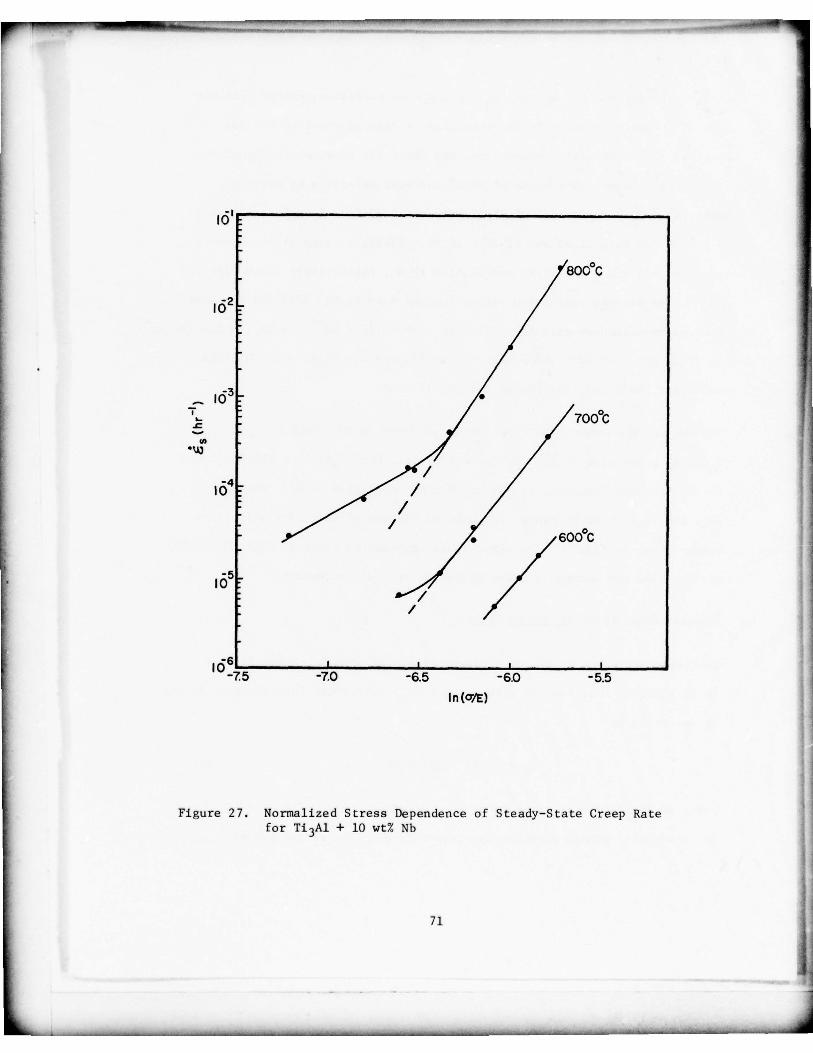
- —
~~~
‘5,
/800°c
102
~~3 . •
V
~~~~~~~~~~~~~~~~~~~~~~~~~~~~~~~~~~~~~~~~~~~~~~~~~~~~~~~
/700
0C
/y/6000C
-
In(a~’E)
Figure 27. Normalized Stress Dependence of Steady—State Creep Ratefor Ti 3Al + 10 wt% Nb
II
71
*
_ _ _ --- - .5 ~~~~~~~~~~~~~~~~~~~~~~~~~~~~~~~~~~~~~ -— -~~~~~~~~~ ~~~~~ -— -~~~~~~~~~~~~~~~~~~~~-. 5 - -
~~~~~~- - -—-
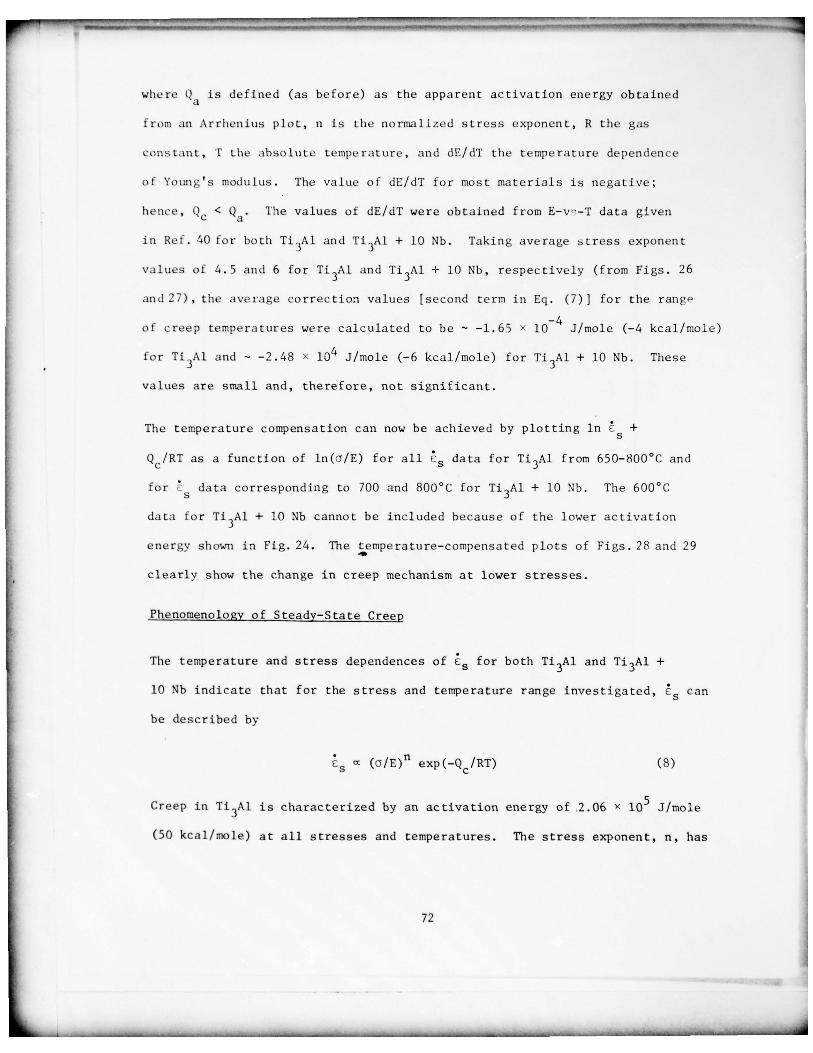
V . 5 .5V - V V T~~~~~ J~~ V :T V V~~~~~~
T--— - VV —. ~~~~~
where ~a
is defined (as before) as the apparent activation energy obtained
f r o m an A r rh e n i u s p lo t , n is the normal ized s t ress exponent , R the gas
constant , T the absolute temperature , and dE/dT the temperature dependence
of Young ’s modulus . The value of dE/dT for most materials is negative ;
hence , ~~
< ~~~
The values of dE/dT were obtained f rom E—v - ’— T data given
in Ref . 40 for bo th Ti3
A 1 and Ti3A1 + 10 Nb. Taking average stress exponen t
values of 4 . 5 and 6 for Ti3A1 and Ti
3Al + 10 Nb , respectively (from Figs. 26
and 2 7 ) , the ave rage correct ion values [second term in Eq. ( 7 ) ] for the range
of c reep t empera tu res were calculated to be — — 1 . 6 5 ~ 10~~ J/tnole (—4 kca l/moie )
fo r Ti3
Al and - -2 .48 ~ l0~ J/mole (-6 kcal/mole) fo r TI 3A 1 + 10 N b . These
values are small and , therefore , not significant.
The t empera tu re compensation can now be achieved b y p l o t t i n g in +
Qc~~T as a function of ln(~ /E) for all data for Ti3Al from 650—800°C and
fo r data cor responding to 700 and 800 ° C fo r Ti 3A1 + 10 Nb . Th e 600 °C
data for Ti3A1 + 10 Nb canno t be included because of the lower activation
energy shown in Fig. 24. The t empera tu re—compensa t ed p lo t s of Figs . 28 and 29
clearly show the change in creep mechanism at lower stresses.
Phenomenology of Steady—State Creep
The tempera ture and stress dependences of for bo th Ti3A1 and Ti3Al +
10 Nb indicate that fo r the stress and tempera ture range investigated , ~~
can
be described by
(OlE) tm exp(_ Qc /RT) (8)
Creep in Ti 3Al is characterized by an activation energy of .2 .06 ~ l0~ .3/mole
(50 kca i /mole ) a t all stresses and temperatures . The stress exponent, n , has
72
-- - - ~~~~~~~~~~~~~~~ _ _ _ _ _
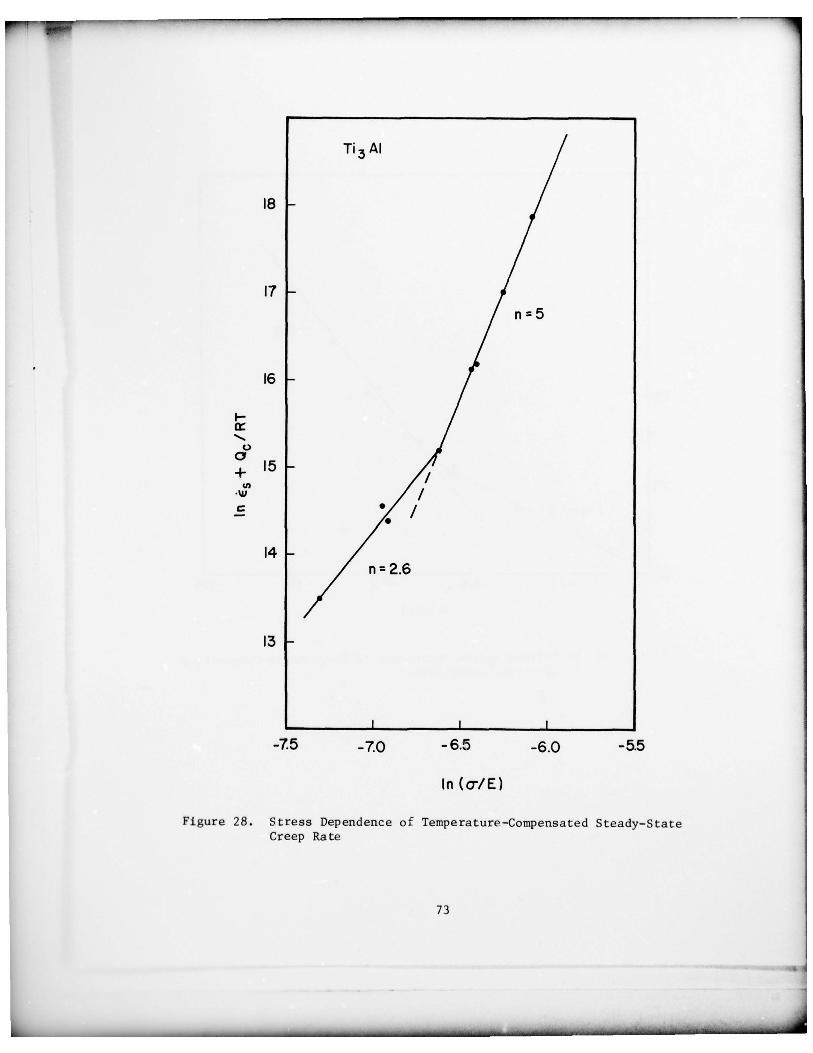
r~w~
V -~~~
-
~~~~
Ti341 /18 -
17 -
16 -
I—
C.)a± 1 5 -
/-V /C • 1
S
4 -
n=2.6
13 -
I I
-7.5 -~.o - 6.5 -6.0 -5.5
In (o/E)
Figure 28. Stress Dependence of Temperature—Compensated Steady—StateCreep Ra te
73
—I
- — .5_V • ~~~~~~~~~~~~~~ ~~~~~~~~~~~~~~~~~~~~~~~~~~ ~~~~~~~~~~~~~~~~~~~~~~~~~~ - -
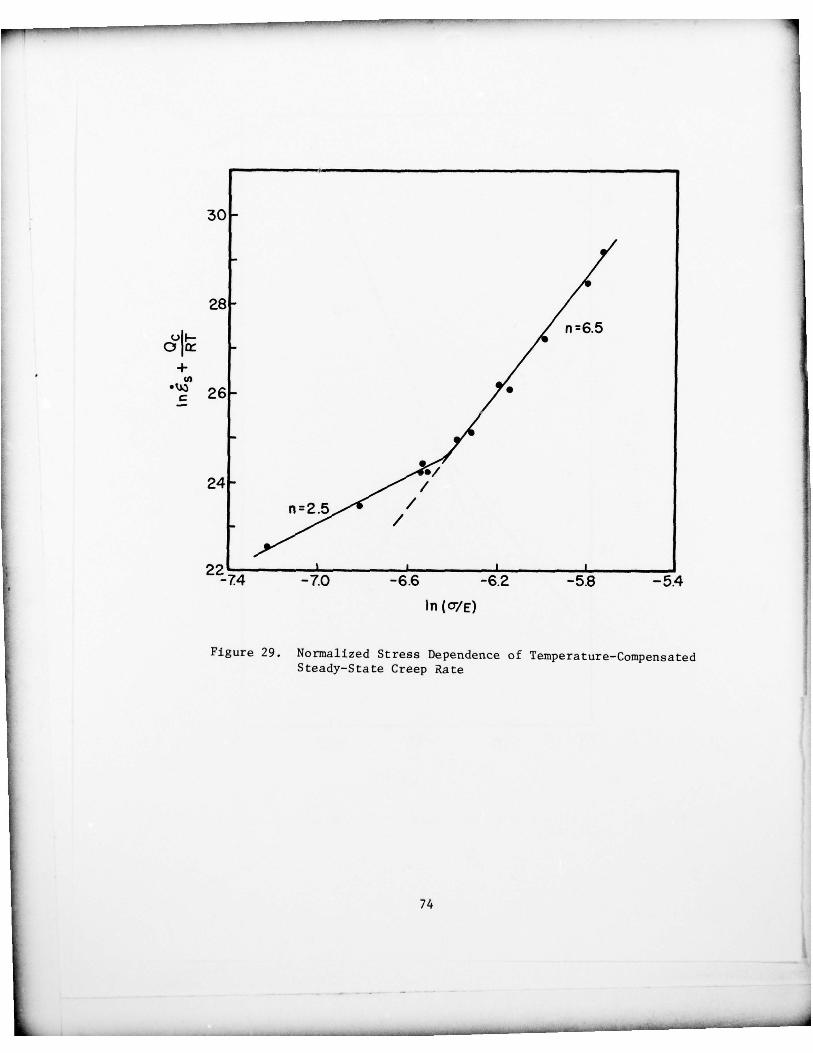
.5 .5- --
30 -
28 -/ n 6.5
/~~~~26 -
::~4 -5~8 -5.4
ln( cT/E)
Figure 29. Normalized Stress Dependence of Temperature—CompensatedSteady—State Creep Rate
74
- V -~~ V.5 - - -.5—-— - . 5- — — ~~~~~~~~~~~~~~~~~~~~~~~~~~~~~~ —s
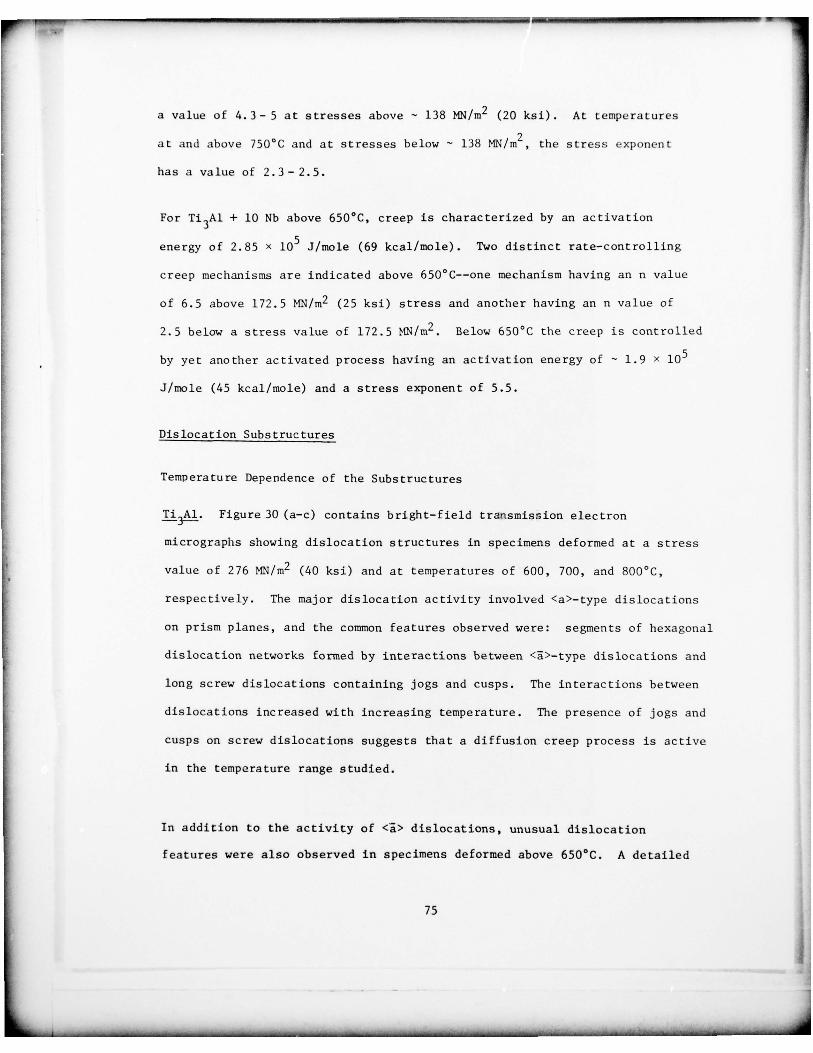
a value of 4.3—5 at stresses above — 138 MN/rn2 (20 ksi). At temperatures
2at and above 750 C and at stresses below — 138 MN/ rn , the stress exponent
has a value of 2.3—2.5.
For T13A1 + 10 Nb above 650°C , creep is characterized by an ac t ivat ion
energy of 2.85 x l0~ J/mole (69 kcal /rnole) . Two distinct rate—controlling
creep mechanisns are indicated above 650°C——one mechanism having an n value
of 6.5 above 172.5 MN/rn 2 (25 ksi) stress and another having an n value of
2 .5 below a stress value of 172.5 MN/rn2. Below 650 ° C the creep is controlled
by yet another activated process having an activation energy of - 1.9 x l0~
J/mole (45 kcal/mole) and a stress exponent of 5.5.
Dislocation Substructures
Temperature Dependence of the Substructures
Ti~ 4~~. Figure 30 (a—c) contains b r igh t—f ie ld tran srnis— ion electron
micrographs showing dislocation structures in specimens deformed at a s t ress
value of 276 MN / rn2 (40 ksi) and at temperatures of 600 , 700 , and 800° C ,
respective ly. The major dislocation activity involved <a>—type dislocations
on prism planes , and the common features observed were : segments of hexagonal
dislocation networks formed by interactions between <ã>—type dislocations and
lon g screw dislocations containing jogs and cusps. The interact ions between
dislocations increased with increasing temperature. The presence of jogs and
cusps on screw dislocations suggests that a diffusion creep process is active
In the temperature range studied.
In add ition to the ac tivity of <~~> dislocations, unusual dislocation
features were also observed in specimens deformed above 650°C. A detailed
75
~
— -- --- --.5- - ~~~~~~~~~~~~~~~~~~~~~~~~~~~~~~~~~~~~~~~~~~~~~~ - -—— -.5-
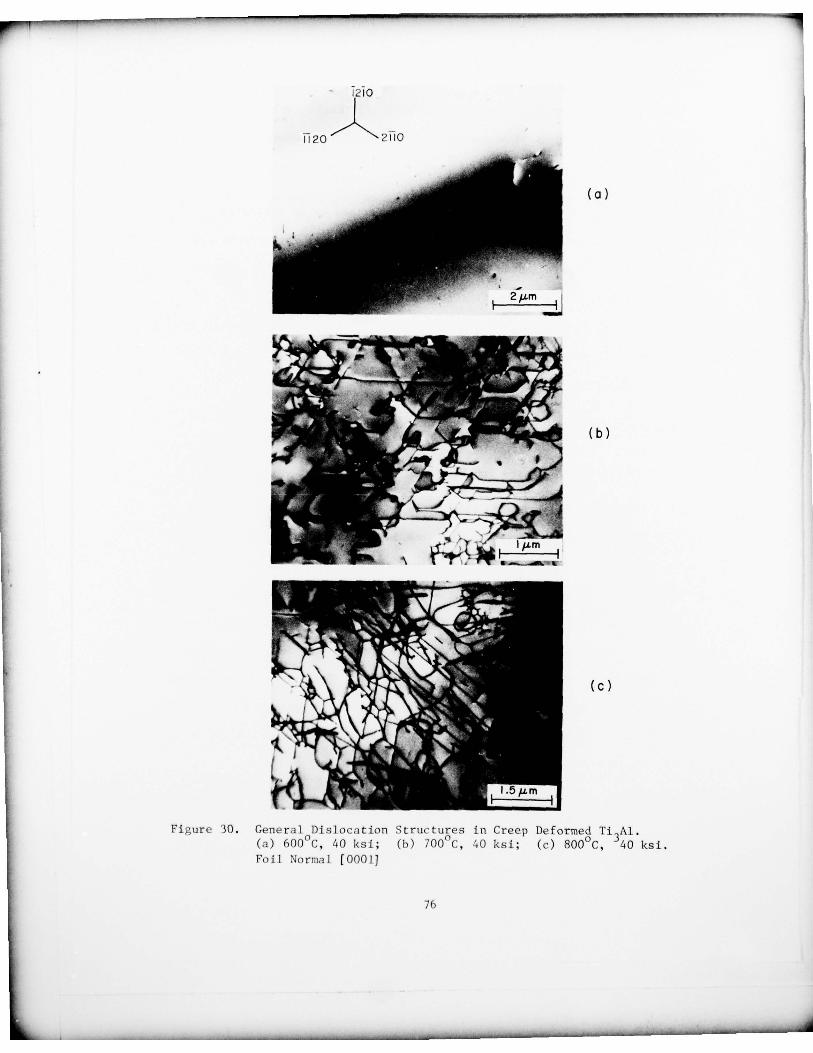
______ .5.5 -
210
fl20 ~~~~~~~ 2fl0
-I ( a )
H -~~~~
r~~~~~
2~~m
4
-
- ( b )
- ~~
— V ~~
V ( c )
1~. ~~~~~~~~~~~~~~~~~~~~~~~
___
I.5~~ m
Fi gure 30. Genera l D i s l o ca t i o n S t r u c t u r e s in Creep Deformed Ti 3A 1.(a) 600°C, 40 ksi; (b) 700°c, 40 ksi; (c) 800°C, 40 ksi.Foil Norma l [0001.]
76
presentation and analysis of these features is included in another paper .42
These features were : 1) non—<~ >.-type dislocations , and 2) stacking faults
with a <~~ ÷ ‘~~~~> displacement vector . The non—<~>_ type dislocations have
been identified as [~~
j dislocations .42
These [E] dislocations were found
to be high ly jogged , straigh t dislocations . The stacking faults were
analyzed and found to be intrinsic in nature, and the fault plane was found
to be (000l).42 The <~~ + ½~> stacking faults may result from the dissociation
of the [~] dislocations.43
The presence of jogged [E] dislocations and the
stack ing fa ults again indica tes tha t a dif f usive process is operative during
creep . The movement of [~] dislocations is probab ly accompl ished by a cl imb43process since their glide is not energetically favored.
Ti3A1 + 10 Nb. Figure 31 (a) shows the creep substructure in specimens
deformed at 600°C. The substruc ture consisted of hexagonal networks formed
by <~ >— type superdislocations . The results of the Burgers—vector analys is
indicated that the hexagonal nets are formed by the following dislocation
reaction :
•
~~ [2110] + -
~~
- [1210] - *-~~- [1ñ0].
Figure 31 (b) is a schematic diagram of this reaction. -
~~
<1010> ex tended
dislocations were also observed in this reaction . The presence of extended
dis locat ions in Ti3A1 + 10 Nb (and not in Ti
3A1) indicated a lowering of
stacking—fault energy due to the addition of Nb in Ti3Al. However , the
tendency to form superdislocation networks was observed only in specimens
crept at 600 °C and no t at higher temperatures. The thermal fluctuations at
higher temperatures (> 600° C) appear to aid in the movement of unit dislocations
77
— . 5- - -
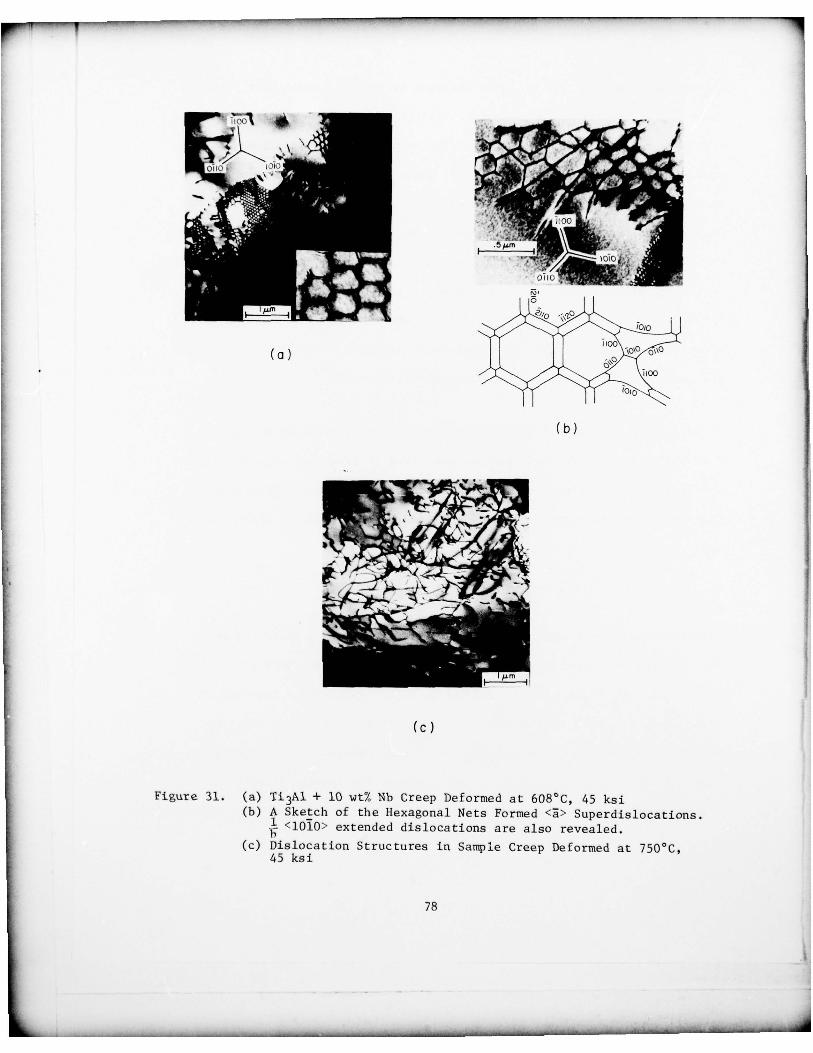
- - V~~~ V . 5 .5 .5
~~~~~~~~~~~~~~~~~~~~- _
( b )
~LL m 1
( c )
Figure 31. (a) Ti3AI + 10 wt% Nb Creep Deformed at 608CC, 45 ksi(b) A Sketch of the Hexagonal Nets Formed <
~~> Superdislocations .<1010> extended dislocations are also revealed.
(c) Dislocation Structures in Sample Creep Deformed at 750°C,45 ksi
78
- - - - --- -~~~~~---- p - V-
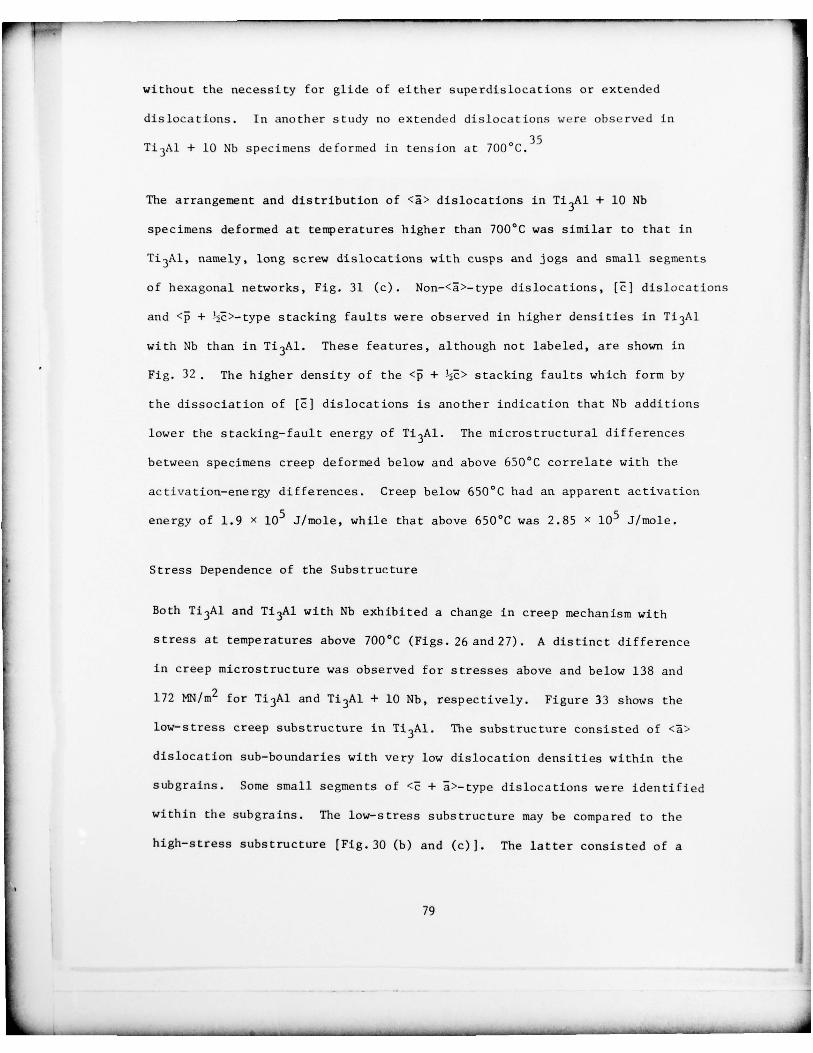
without the necessity for glide of either superdislocations or extended
dislocat ions. In another s tudy no extended d is loca t ions were observed in
T13A1 ÷ 10 Nb specimens de formed in tension at 700°C.35
The arrangement and distr ibution of <a> dislocations in Ti 3Al + 10 Nb
specimens deformed at temperatures higher than 700°C was similar to that in
T~ 3A1V~ namely , long screw dislocations with cusps and jogs and small segments
of hexagonal ne tworks , Fig. 31 (c). Non—<ã>— type dislocations , [~~1 dislocations
and <~~ + ½E>—type stacking fa ults were observed in higher dens ities in Ti 3Al
with Nb than in Ti 3A1. These features , al tho ugh no t labeled , are shown in
Fig. 32 . The higher density of the <~~ + ½E> stacking faul ts which for m by
the dissociat ion of [~] dislocations is another indication that Nb additions
lower the stacking—fault energy of Ti3Al . The microstructural differences
between specimens creep deformed below and above 650°C correlate with the
activat ion—ene rgy differences. Creep below 650 °C had art apparen t activation
energy of 1.9 x l0~ J/mole, while tha t above 650°C was 2.85 x l0~ J/mole.
Stress Dependence of the Substructure
Both Ti3Al and Ti3A1 with Nb exhibited a change in creep mechanism with
V stress at temperatures above 700°C (Figs. 26 and27). A distinct difference
in creep microstructure was observed fo r stresses above and below 138 and
172 MN /rn2 for Ti3A1 and Ti3Al + 10 Nb , respectively . Figure 33 shows the
low—stress creep substructure in T13A1. The substruc ture consisted of <~~>
dislocation sub—boundaries with very low dislocation densities within the
subgrains . Some small segments of <E + ~>— type dislocations were identified
within the subgrains. The low—stress substructure may be compared to the
high—stress substructure [Fig. 30 (b) and (c)J. The latter consisted of a
79
_ - .5- - .5—--
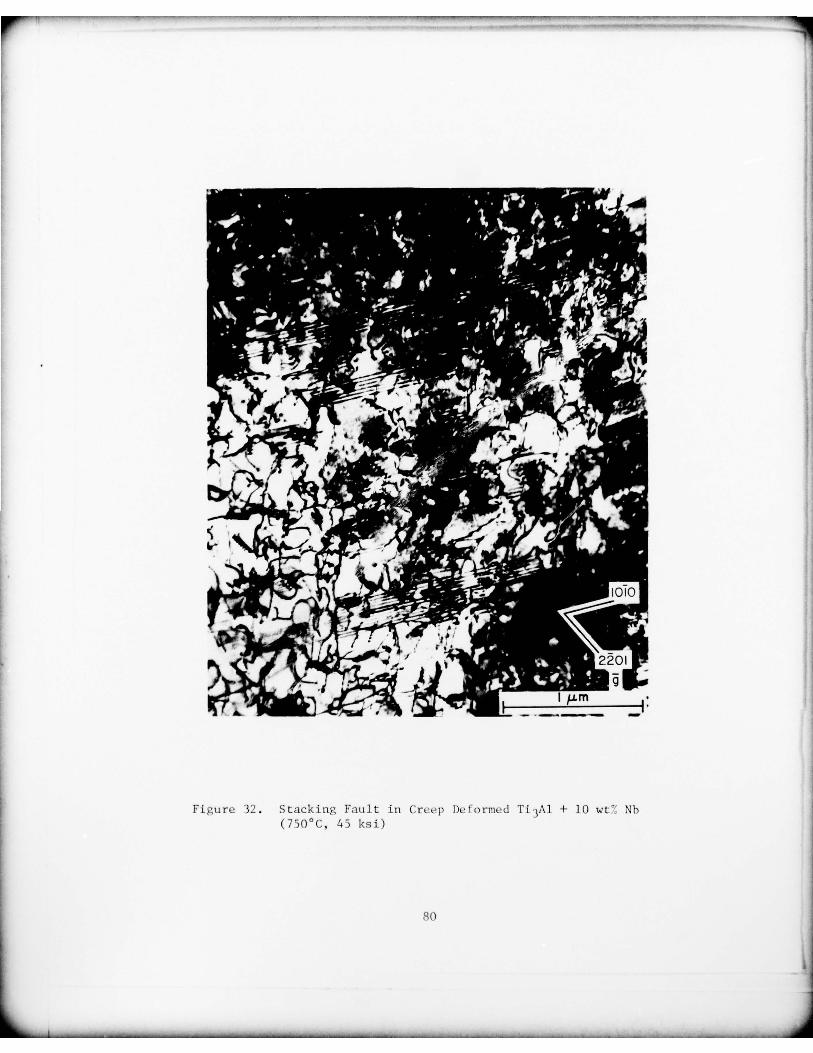
~~~~~~~~~~~~~~~~~~~~~~~~~~~~~~~~~~~~~~~~~~~~~~~~~~~~~~
V -4.
V .s~
-. -. -- olo
.5 -
-
T.1 -
•
‘1 ;‘:.220 1
V 4
- - I _ _ _
i:
Figure 32 . S t a c k i n g Faul t in CrL- ~-p J ) eform ed Ti 3A1 + 10 wt ~~ Nb(750°C, 45 ksi )
80
- - . 5 - -- .5---
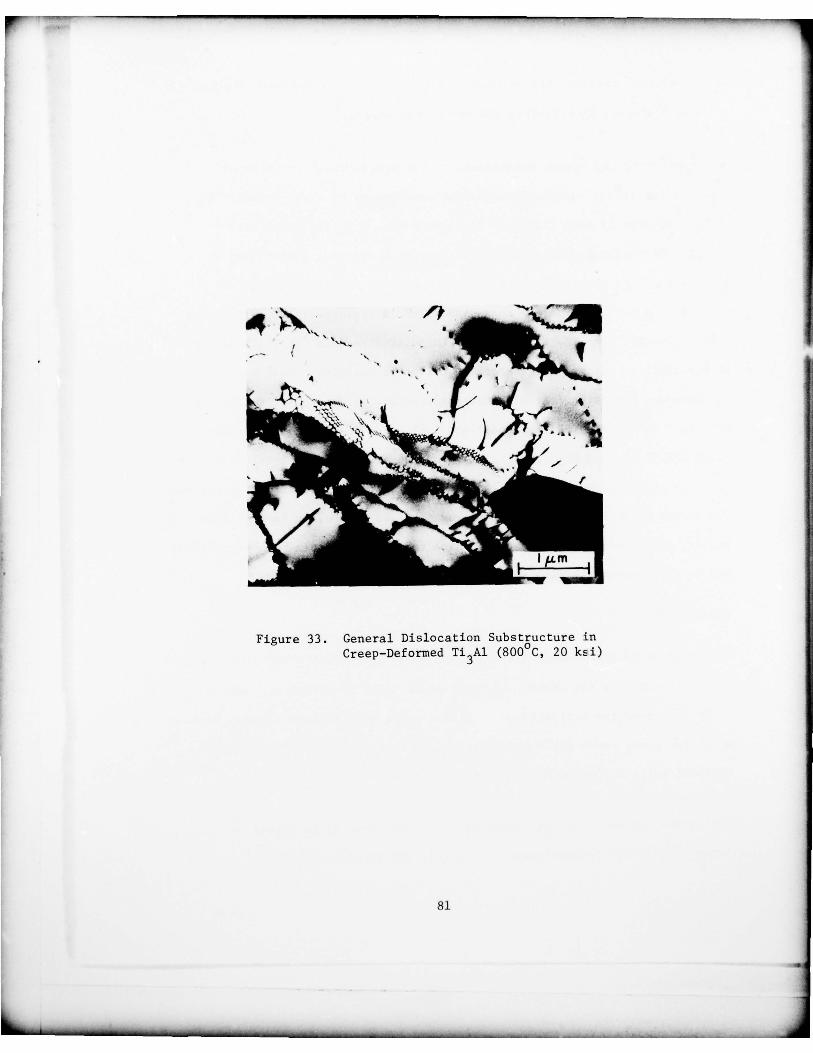
- . 5 - ~~~~~~~~~~~~~~~~~~~~~~~~~~~~~ . 5—
4 .
~~~~~~~~~~~~~~~ ‘
-
_ V~-V -V
V
~~~
~~~~~~~~14
~~~~~~~~~~~~~~~~T 1
- - -
S
I p.m
Figure 33. General Dislocation Substructure inCreep—Deformed Ti
3A1 (800°C, 20 ksi)
81
~
— .5 - V -~~~~~~~~~~~~~ - V - .5V~~~~ -V_ _~~~~~ _______
u-~~~~~ J TT:J1T —
~~~ ~~ I--J ~~~~~~~~~~~~~~~~~~~~~~~~~~~~~~~~~~~~~~~~~~~~~~~~~~~~~~~~~~~~~~~~~~~~~~~~~~~~~~~~~~~~~~
V
high density of complex three—dimensional dislocation arrangements similar
44to those exhibited by h igh—st reng th aus teni t ic steels .
The temperature and stress dependences of the steady—state creep rates
appear to correla te reasonably well with development of creep—deformation
microstructures in both Ti3A1 and Ti 3Al + 10 Nb. This indicates that
distinct diffus ion and/or dislocation mechanisms are rate controlling in
d i f f e r e n t stress and temperature regimes . However , it is d i f f i c u l t to
ident i f y the particular creep mechanism which is operative ; this difficulty
stems pr imari ly from the unavailability of d i f f usion da ta for Ti3Al—base
in te rmeta l l ics . At present the creep—activation energies cannot be compared
to those for diffusion. At high temperatures and stresses , activation energies
of 2.06 x 1o~ J/mole (50 kcal/mole) and 2.85 X l0~ .3/mole (69 kcal/mole) fo r
Ti 3A1 and Ti 3A1 + 10 Nb , respect ively, and the s tress exponent values of 4 — 6
indicate that dislocation climb is the most probable rate—controlling process.
The change in mechanism indicated at low stresses may be , in fac t , a t rans i t ion
regime , and at very low stresses and high temperaturec grain—boundary sl iding
may be the rate—controlling mechanism.
V CONCLUSIONS
The creep activation energy for Ti3Al was found to be 2.06 x l0~ J/mole
(50 kcal/mole) for the stress and temperature range investigated. Addition
of Nb increased the activation energy to a value of 2.85 x ~~~ .3/mole (69 kcal/
mole) for creep above 650°C and decreased it to a value of 1.9 X l0~ J/mole
(45 kcal/mole) for creep below 650°C.
The stress exponent for both intermetallics was found to be stress
dependent at high temperatures. For Ti3A1, the stress exponent had a value
82
- .5 .5 - - - -. 5- - - . 5 - - - - - -- -- - - ~ .~~~~ - - V
flr.~of 4.3—5 above 138 MN/rn 2 (20 ksi) and 2.3—2.5 below 138 MN/rn2, while f or
TI3AIV + 10 Nb the stress exponent had a value of 6.5 above 172.5 MN/rn2
(25 ksi) and 2.5 below 172.5 MN/rn2. At low temperatures the stress
exponent was found to be independent of stress fo r both mater ia ls , having
values of 4.3—5 and 6.5 for Ti3Al and Ti3Al + 10 Nb , respec tively .
The development of creep—dislocation microstriictures correlated well
with d i f f e r e n t creep regimes , as charac terized by dif f e ren t stress and
temperature dependences of the steady—s tate creep rates . However , due to
nonavailability of diffusion data at present, it was not possible to identify
the rate controlling creep mechanisms in these internietallics .
-:V-
— V
REFERENCE S
1. B. Lawn and R. Wilshaw , J. Mater. Sd . 10, 1049 (1975) .
2. B. R. Lawn and M. V. Swain, J. Mater. Sci. 10, 113 (1975).
3. B. R. Lawn and E. R. Fuller, J. Mater. Sci. 10, 2016 (1975).
4. B. R. Lawn, E. R. Fuller , and S. M. Wiederhorn, J. Amer. Ceram. Soc .59 , 193 (1976) .
5. A. C. Evans and T. R. Wilshaw, Acta Met. 24, 939 (1976).
6. R . H. Keays , A Review of Stress Intensi ty Factors for Surface andInternal Cracks, Structures and Materials Report 343 (Departmen tof Supply , Australian Defence Scientific Service , AeronauticalResearch Labora tories , April 1973).
7. A. E. Green and I. N. Sneddon, Proc. Cambridge Phil. Soc. 46,159 (1950) .
8. G. R. Irwin, J. App l. Mech. 29, Trans. ASME 84, Series E , 651 (1962).
9. F. W . Smith , A. F. Emery, and A. S. Kobayashi , J. Appl. Mech. 34,Trans. ASNE 89, Series E , 95 3 (1967) .
10. R. C. Shah and A. S. Kobayashi , “Stress In tensi ty Fac tor for anElliptical Crack Approaching the Surface of a Plate in Bending,”in Stress Analysis and Growth of Cracks, Proceedings of the 1971National Symposium on Fracture Mechanics, Part 1, ASTM STP 513(American Society for Tes ting and Ma terials , Ph iladelph ia , PA ,1972), pp. 3—21.
-• 11. M. A. Schroedl and C. W. Smith, “Local Stresses near Deep Surface
Flaws under Cylindrical Bending Fields ,” in Progress in Flaw Growthand Fracture Toughness Testin&, ASTM STP 536 (American Society forTesting and Materials , Philadelphia, PA , 1973) , pp. 45—63.
12. 3. .3. Petrovic and L. A. Jacobson, “The Strength of Silicon Nitridea f t e r Exposure to Di f f e ren t Environments , ” in Ceramics for Hi gj i .5VPerformance Applications (J. .3. Burke , A. E. Corum, and R. N. Katz,eds.), Proceedings of the Second Army Materials Technology Conference,13—16 November 1973, Hyannis, MA (Brook Hill Publishing Co., Ches tnutHill , MA, 1974).
13. 3. .3. Petrovic , L. A. Jacobson , P. K. Talty, and A. K. Vasudevan ,J. Amer. Ceram . Soc. 58 , 113 (1975) .
14. R. R. Wills, M. G. Mendiratta, and .3. .3. Petrovic , .3. Mater . Sci. 11,1330 (1976).
15. J. J. Petrovic and L. A. Jacobson , .3. Amer. Ceram . Soc. 59, 34 (1976).
84
_ _ _ _ ~~~~-V-V~~~ V- VV.5 -V~~~~~~~~~
____ .5
16. N. Ingelstrom and H. Nordberg, Eng. Frac. Mech. 6, 597 (1974).
17. R. K. Covila , Ac ta Met. 20, 447 (1972).
18. J. J . Petrovic and M. G. Mendiratta , J . Amer. Ceram . Soc. 59,163 (1976).
19. J. 3. Petrovic and M. G. Mendira tta, .3. Amer. Ceram. Soc. 60,463 (1977).
20. M. C. Mendiratta, 3. Wiinmer , and I. Bransky , 3. Mater . Sd . 12 ,212 (1977).
21. M. C. Mendiratta and J. J. Petrovic , “Slow Cra ck G rowth f rom Con trolledSurface Flaws in Hot—Pressed Si
3N~ ,” Accepted for publication in the
May—June 1978 issue of the Journat of the American Ceramic Society.
22. P. L. Land and M. C. Mendira tta , 3. Mater. Sci. 12, 1421 (1977).
23. J. J. Petrovic , R. A. Dirks, L. A. Jacobson , and M. C. Mendiratta ,.3. Amer. Ceram. Soc. 59, 177 (1976).
24. J. B. Wachtman, Jr., W. Capps , and J. Mandel , J. of Mat., JNLSA , 7,188 (1972) .
25. A. Rudnick , A. R. Hunter , and F. C. Holden , Mat. Res. and Stand. 3,283 (1963).
26. A. F. McLean , ASME Publication 70—CT—105 (American Society ofMechanical Engineers , New York , May 1970).
27. D. J. Godfrey , J. Bri t. Interplanet. Soc. 22, 353 (1969).
28. D. C. Larsen, “Proper ty Screening ~~d Evaluation of Ceramic VaneMaterials ,” Report No. IITRI—D61l4—ITR—l8 (Interim Technical ReportNo. 3), Air Force Contract F33615—75---C—5l96 , 26 February 1977.
29. R. W. Rice, “Frac ture Topography of Ceramics ,” in Surfaces andInterfaces of Glass and Ceramics (V. D. Frechette , W . C. LaCourse ,and V. L. Burdick , eds.)(Plenum Publishing Co., New York , 1974).
30. W. F. Brown, J r . , and J. E. Srawley , ASTM STP 410 (American Societyfor Testing and Materials , Philadelphia , PA , 1967), pp. 1—15.
31. R. R. Wills, M. C. Mendiratta , and J. J. Pe trovic , J. Mater. Sci. 11,1330 (1976).
32. N. S. Choudhury , H. C. Graham, and J . W. Hinze , “Oxidation Behavio rof Titanium Aluminides ,” in Proceedings of the Symposium on Propertiesof High Tempera ture Alloys (Elec trochemical Socie ty, Prince ton , NJ ,March 1977), pp. 668—680.
85
---- V_V.5~~~~~~~~~~~~~~
.5~~~~~~~~~~~.5~~~~~~~~
. 5 . 5 — - - -~~~~---- - V ---- - - - - -~~~~~~~
—.5-
~1
33. H. A. L ips i t t , R . E. Schafrik , and D. Schechtman . private communication .
34. 3. C. Williams and M. 3. Blackburn , in Ordered Alloys (H. Kear , T. Sims ,S. Stoloff , and J. H. Westbrook , eds.)(Claitor ’s P’tblishing Division ,Baton Rouge, LA , 1970), pp. 425—445.
35. S. M. L. Sastry and H. A. Lipsitt , Met. Trans . 8A , 1543 (1977).
36. S. M. L. Sastry and H. A. Lipsitt , Acta Met. 25, 1279 (1977) .
37. N. S. Choudhury and .3. E. Henry , unpublished research.
38. H. A. Lipsitt, D. Schechtman, and R. E. Schafrik , Met. Trans. 6A ,1991 (1975) .
39. M. 3. Blackburn and 3. C. Williams, Trans. TMS—AINE 239, 187 (1967) .
40. R. W. Schafrik , Met. Trans. 8A, 1003 (1977).
41. R. W. Lund and W. D. Nix, Met. Trans 6A , 1329 (1975).
42. W . J. Yang , J. C. Williams, M. G. Mendiratta , and H. A. Lipsitt ,private communication.
43. W. J. Yang, private communication.
44. B. Modeer and R. Lagneborg, Jernkont. Ann. 155, 363 (1971) .
86*U.S.Gov ern ment Print ing OffI c e~ 19 7 8 — 757-080/133
-- ~~~~~~~~~~~~~~ _ _ _ _ ~~~~~~~~~~~~~~~~~~~~~~~~~ .— ~~~~~~- V
Related Documents