geosciences Article Formation MicroScanner Providing Better Answers for Carbonate Secondary Porosity in Alamein Dolomite Formation, NW Desert, Egypt Mohamed R. Shalaby, Nurhazwana Jumat * ID and Md. Aminul Islam Department of Physical and Geological Sciences, Universiti Brunei Darussalam, JalanTungku Link, Gadong BE1410, Brunei Darussalam; [email protected] (M.R.S.); [email protected] (M.A.I.) * Correspondence: [email protected]; Tel.: +673-8125090 Received: 19 December 2017; Accepted: 13 March 2018; Published: 2 April 2018 Abstract: The use of borehole imaging tools has become widespread in recent years with more specialized studies of reservoir properties, particularly in highly-porous and fractured carbonate systems. In this study, the Formation MicroScanner (FMS) borehole imaging tool and conventional well log data have been used to study the secondary porosity of the dolomitic Alamein Formation in the Alamein Field, north Western Desert, Egypt. Based on well log analyses of the formation from Tourmaline-1X and N.Alamein-6X wells, we show that secondary porosity occurs across the formation, and is filled mostly with hydrocarbon. We also show that the formation has good average effective porosity and hydrocarbon saturation. FMS images of the Tourmaline-1X well confirms that the formation is intermittently vuggy with solution-filled channels from the top to its base. The vug pores are observed to be well-connected, which supports good effective porosity values interpreted from petrophysical data. An additional set of core photographs of the Alamein Formation from N.Alamein-5X well confirms the presence of secondary pores, which are filled by hydrocarbon, and exhibit intense fluorescence under UV light. Our results show that the abundance of secondary porosity in Alamein Formation would play a key role in evaluating its reservoir quality and reservoir performance. Keywords: borehole imaging; secondary porosity; formation evaluation; Egypt; vugs; fractures; formation microscanner; north western desert; well logging; petrophysical 1. Introduction Secondary porosity is an important feature in carbonates. All carbonate reservoir rocks have undergone significant diagenesis, so the understanding of their diagenetic history is important in order to understand their depositional history and the reservoir quality evolution [1]. In carbonate reservoirs, hydrocarbon production strongly depends on fractures and secondary porosity. The different methods and data used for reservoir fracture identifications include: core, image log, wireline log, well test, thermal survey, mud loss and stoneley wires [2]. Core analysis has been the main source for obtaining data from small-scale fractures observed in boreholes. However, availability of such data is often limited by the cost and availaibility of core samples. Conventional subsurface one-dimensional wireline logging techniques have been previously used to evaluate clastic and carbonate reservoirs in many study areas [3–9]. However, these tools should be applied considering the limitations defined by formation heterogeneity and the tool resolution [8]. In the past, defining many depositional and diagenetic facies was complicated by decimeter-scale resolution range for many of the previously used logging tools [10]. Application of 2D borehole imaging overcomes many of these limitations and enables imaging of lateral variations of the rock properties, including detection of the Geosciences 2018, 8, 118; doi:10.3390/geosciences8040118 www.mdpi.com/journal/geosciences

Welcome message from author
This document is posted to help you gain knowledge. Please leave a comment to let me know what you think about it! Share it to your friends and learn new things together.
Transcript

geosciences
Article
Formation MicroScanner Providing Better Answersfor Carbonate Secondary Porosity in AlameinDolomite Formation, NW Desert, Egypt
Mohamed R. Shalaby, Nurhazwana Jumat * ID and Md. Aminul Islam
Department of Physical and Geological Sciences, Universiti Brunei Darussalam, JalanTungku Link,Gadong BE1410, Brunei Darussalam; [email protected] (M.R.S.); [email protected] (M.A.I.)* Correspondence: [email protected]; Tel.: +673-8125090
Received: 19 December 2017; Accepted: 13 March 2018; Published: 2 April 2018�����������������
Abstract: The use of borehole imaging tools has become widespread in recent years with morespecialized studies of reservoir properties, particularly in highly-porous and fractured carbonatesystems. In this study, the Formation MicroScanner (FMS) borehole imaging tool and conventionalwell log data have been used to study the secondary porosity of the dolomitic Alamein Formationin the Alamein Field, north Western Desert, Egypt. Based on well log analyses of the formationfrom Tourmaline-1X and N.Alamein-6X wells, we show that secondary porosity occurs across theformation, and is filled mostly with hydrocarbon. We also show that the formation has goodaverage effective porosity and hydrocarbon saturation. FMS images of the Tourmaline-1X wellconfirms that the formation is intermittently vuggy with solution-filled channels from the top toits base. The vug pores are observed to be well-connected, which supports good effective porosityvalues interpreted from petrophysical data. An additional set of core photographs of the AlameinFormation from N.Alamein-5X well confirms the presence of secondary pores, which are filled byhydrocarbon, and exhibit intense fluorescence under UV light. Our results show that the abundanceof secondary porosity in Alamein Formation would play a key role in evaluating its reservoir qualityand reservoir performance.
Keywords: borehole imaging; secondary porosity; formation evaluation; Egypt; vugs; fractures;formation microscanner; north western desert; well logging; petrophysical
1. Introduction
Secondary porosity is an important feature in carbonates. All carbonate reservoir rocks haveundergone significant diagenesis, so the understanding of their diagenetic history is important in orderto understand their depositional history and the reservoir quality evolution [1].
In carbonate reservoirs, hydrocarbon production strongly depends on fractures and secondaryporosity. The different methods and data used for reservoir fracture identifications include: core,image log, wireline log, well test, thermal survey, mud loss and stoneley wires [2]. Core analysis hasbeen the main source for obtaining data from small-scale fractures observed in boreholes. However,availability of such data is often limited by the cost and availaibility of core samples. Conventionalsubsurface one-dimensional wireline logging techniques have been previously used to evaluate clasticand carbonate reservoirs in many study areas [3–9]. However, these tools should be applied consideringthe limitations defined by formation heterogeneity and the tool resolution [8]. In the past, definingmany depositional and diagenetic facies was complicated by decimeter-scale resolution range for manyof the previously used logging tools [10]. Application of 2D borehole imaging overcomes many of theselimitations and enables imaging of lateral variations of the rock properties, including detection of the
Geosciences 2018, 8, 118; doi:10.3390/geosciences8040118 www.mdpi.com/journal/geosciences

Geosciences 2018, 8, 118 2 of 16
secondary porosity structures such as vugs, fractures and channels .The use of borehole imagery hasbecome more widespread in recent times, particularly utilized to study the factors controlling porosityand permeability [11–15]. However, borehole images only produce information in the borehole andother important information such as hydrocarbon content of the true formation cannot be obtainedfrom them. Hence, borehole imaging tools do not replace the conventional logging data and shouldbe used considering the associated limitations. The best results are obtained when both imaging andtraditional one-dimensional logging techniques are used together, complimenting each other.
Borehole imaging tools produce an image of the borehole wall typically based on physical propertycontrasts. The two principal imaging devices utilized in the industry are electrical and ultrasonicborehole imaging tools. An ultrasonic device is based on acoustic reflectivity from the boreholewall, and record amplitude and travel time. Examples include the borehole televiewer (BHTV),circumferential borehole imaging tool (CBIL) and ultrasonic borehole imager (UBI). Electrical imagingis based on conductivity and resolves finer scale features. Dark areas on the image indicate lowresistivity, whereas light indicates areas of high resistivity. Some examples are formation microimager(FMI), formation microscanner (FMS) and electrical microimaging (EMI). In this paper, an electricalFMS imaging tool is used to study secondary porosity in Alamein Formation. Notable featuresobserved on image tools include vugs and fractures. Vugs are pore spaces inside rocks that aretypically formed by any of the following: cracks and fissures opened by tectonic activity, open spaceswithin ancient collapse breccias, dissolution or erosion of mineral crystals or fossils inside a rock matrix.Vuggy porosity is divided into two groups according to how the pore space is connected: ‘Separatevugs’ (such as ooids or skeletal material, and intrafossil porosity) and ‘touching vugs’. The isolation ofseparate vugs adversely affects the permeability. Drilling-induced fractures (DIFs), on the other hand,are typically created when stresses around a borehole exceed that required to cause tensile failureof the wellbore wall [15]. Evaluation of secondary porosity and fractures in relation to hydrocarbonconduits has been covered by many [16–21].
In this study, FMS is utilized to evaluate the reservoir quality and secondary porosities, resultingfrom diagenetic processes, of the dolomitic Alamein Formation in the Alamein Field. Petrophysicaland well log and core data from the formation are also utilized to produce an integrated study ofsecondary porosity evaluation of the Alamein Formation.
2. Study Area
2.1. Lithostratigraphy
The Western Desert covers two-thirds of the whole area of Egypt. The coastal basins of Matruh,Shushan, Alamein and Natrun are located in the northern half of the Western Desert. The area ofstudy covers the Alamein Field (Figure 1), located between latitudes 28◦00′–30◦00′ S and longitudes28◦00′–30◦00′ E. The lithostratigraphic column in the northern part of the Western Desert comprisesformation intervals from Pre-Cambrian basement rocks to recent deposits. The thickness of thesedimentary section is about 14,000 feet. Throughout the entire Mesozoic and a large part of theCenozoic period, the northern Western Desert existed as a broad shelfal area at the southern margin ofthe neo-Tethys Ocean and experienced multiple transgression-regression cycles, which resulted in theformation of alternate carbonate and clastic deposits [22].

Geosciences 2018, 8, 118 3 of 16
Figure 1. Location of the project wells within Alamein Field, Western Desert, Egypt.
2.2. Hydrocarbon Potential
The tectono-stratigraphic history of the Western Desert resulted in the creation of the variousreservoir and seal combinations and contributed to formation of oil deposits. Consequently, highpotential reservoirs are widespread in the area [23,24]. Most of these reservoirs are related to structuresthat were initiated during the Late Cretaceous-Eocene period and are located within or at the edges ofthe early depocentres. These structures eventually became kitchen areas for hydrocarbons [25].
Hydrocarbons in the Western Desert are present in sediments of various stratigraphic periods,including the Paleozoic, Mesozoic (Jurassic and Cretaceous) and Tertiary (Eocene), with the mostprolific oilfields mostly restricted to the Cretaceous sediments. According to Metwalli and AbdEl-Hady [26], oil and gas pay zones in the Western Desert include, from top to base, Lower Miocenesandstone, Turonian carbonate rocks, Cenomanian carbonate rocks, Cenomanian clastic rocks, Aptiandolomite, Aptianclastic rocks and Middle Jurassic sandstone. The carbonate reservoirs of the WesternDesert consist of dolomites and limestones from the Cretaceous age [27,28]. Sandstone reservoirsinclude the Jurassic Khatatba and Ras Qattara Formations from the Jurassic age, Alam El-Bueiband Kharita Formations of Lower Cretaceous age, Bahariya Formation and Abu Roash “C” and “E”members from the Upper Cretaceous age (Figure 2). Hydrocarbon production in the northern part ofthe Western Desert, which was used for the present study, is concentrated exclusively in the Aptianand the Cenomanian-Turonian carbonate-clastic reservoirs.
In the northern Western Desert, the most important carbonate reservoir is the Aptian AlameinDolomite [22]. The Alamein Dolomite, which is the focus of this study, is one of the most prolific oilproducing reservoirs and the first commercial reservoir discovered in the Western Desert. The AlameinField was discovered in 1966 and commenced production in 1968. It is part of the Alamein-Yidma blockwhich also comprises of Zain and Yidma fields. In 2012, it was reported that the fields are estimated tocontain initial recoverable oil reserves of 12.1 million barrels (MMbbl), of which 7 MMbbl remain [29].The Alamein Field is one of the largest fields discovered to date in the area.
The Alamein Formation consists of fractured microcrystalline dolomites with minor shalesof Lower Cretaceous Mid-Aptian age. It is a shallow marine carbonate layer and it representsa fine-grained break, between the two sandstone cycles of Kharita Formation at the top, and theunderlying Alam El-Buib Formation. Based on the petrographic study done by Zein El-Din et al. [24],the Alamein Formation has undergone dolomitization and contains variable amounts of calcite withanhydrite and iron oxide as minor minerals. Badr and Ayoub [30], after analysis of microelectricalborehole images, concluded that many of the Middle Eastern carbonate reservoirs, in spite of theirreputation for being homogeneous deposits, are very heterogeneous.

Geosciences 2018, 8, 118 4 of 16
Figure 2. Litho-stratigraphic column of the north Western Desert of Egypt, modified version of [31].
3. Materials and Methods
3.1. Well Logging and Petrophysical Data
For the present study, wireline log data two vertical wells, Tourmaline-1X and N.Alamein-6X,were used.Tourmaline-1X well was logged from 8880–9450 ft and N.Alamein-5X well 3656–11,655ft. The log suite includes several conventional one-dimensional logs, including gamma ray, caliper,neutron, density, sonic and shallow and deep resistivity logs. The following logged intervals havebeen used for the evaluation: Tourmaline-1X 9070 to 9370 ft (total thickness of 300 ft); N.Alamein-6X8954 to 9278 ft (total thickness of 324 ft). The upper part of the N.Alamein-6X (8954–8988.15 ft) wasidentified as pure shale based on the analysis of the wireline log data and was excluded from the study.Interpretation of wireline log data was performed using the Interactive Petrophysics (IP) 4.2 softwarepackage developed by LR Senergy (Scotland, UK). The neutron-density equation is used to computeporosity and the dual water equation is used to evaluate the water saturation value Additionally,density vs. neutron cross-plot has been applied for determination of the expected formation lithology.

Geosciences 2018, 8, 118 5 of 16
Sonic vs. neutron-density cross-plot has also been produced to classify the type of porosity betweenprimary and secondary. Sonic porosity is calculated based on the Wyllie Equation.
3.2. Formation MicroScanner
A Formation MicroScanner (FMS) has been used to image the Tourmaline-1X well at specificdepth interval between 9070 and 9636 ft. It is a downhole resistivity imaging tool, which providesan image of the wellbore wall based on resistivity contrasts [32]. It has four orthogonal pads eachcontaining 16 electrodes. The pads are in direct contact with the borehole wall and scan formation by2.4 mm vertical sampling rate [33]. Each electrode independently measures resistivity of formation.The measured resistivity is then converted into an image illustrating resistivity contrast in the boreholewall [33]. On the FMS log, light shaded areas indicate high resistivity zones while dark shadedareasindicate zones with low resistivity response. After the FMS data is processed, interpretation isdone to characterize geological features around the drilled borehole such as fractures, bedding planesand voids/vugs or channels.
3.3. Core Photographs under White and UV Light
Photographs of core samples under white light and ultraviolet (UV) light for the depth intervalsbetween 9088 and 9113 ft of N.Alamein-5X well have been used for the study. Long-wave ultraviolet(UV) causes most hydrocarbons to fluoresce in the visible green, blue or red spectra ranges [34,35].Although fluorescence under UV itself is insufficient to verify the presence of mobile oil due to theprobable presence other sources of fluorescence (e.g., fluorescent minerals, OBM/lubricants used, deadoil or bitumen and gilsonite cement), it could still help to prove the presence of considerable totalhydrocarbon-enriched secondary porosity in the carbonate reservoir. In the situation of known lowprimary porosity, this observation can be an indication of the presence of secondary porosity structures.
4. Results
4.1. Interpreted Well Logs and Petrophysical Results
Available conventional one-dimensional subsurface wireline log data from two wells in thestudy area, the Tourmaline-1X well (Figure 3) and the N.Alamein-6X well (Figure 4), show that theAlamein Formation is predominantly a dolomitic layer with abundant secondary porosity. Averagepetrophysical properties for both wells (see Table 1) indicate good reservoir quality of AlameinFormation. Interpretation of well data for the N.Alamein-6X well is similar to the first well and yieldssimilar results (see Figures 4 and 5). Neutron–density porosity vs. sonic porosity cross-plots usingthe Wyllie Equation (Figure 6) shows that the porosity in the Alamein dolomite formation is highlyinfluenced by secondary porosity.
Table 1. Petrophysical parameters for Alamein Formation for Tourmaline-1X and N.Alamein-6X wells.
Thickness/Net Porosity Fluids
BoreholeWells Top (ft) Bottom
(ft)Gross
(ft)Net
Reservoir (ft)Net Pay
(ft)Ave PHIE
(%)Vsh(%)
Ave Sw(%)
Ave Sh(%)
Tourmaline-1X 9070 9370 300 172.8 158.8 8 6.2 24.6 75.4N.Alamein-6X 8988.5 9278 289.5 64.6 63.9 11.4 4.7 27.4 72.6

Geosciences 2018, 8, 118 6 of 16
Figure 3. Analysis of well logging data for Tourmaline-1X showing high secondary porosity in theAlamein Formation, where zones with greatest secondary porosity are labeled (A–D), and 6(a)–6(b)and 7(a)–7(b) are intervals where image log is utilized.
4.2. Secondary Porosity Derived from FMS
Evaluated Alamein Formation is considerably affected by diagenesis, which resulted in thecreation of several types of secondary porosity structures. The major secondary porosity featuresidentified in Tourmaline-1X well are (A) vugs, (B) drilling-induced factures and (C) channels.
(A) Vugs
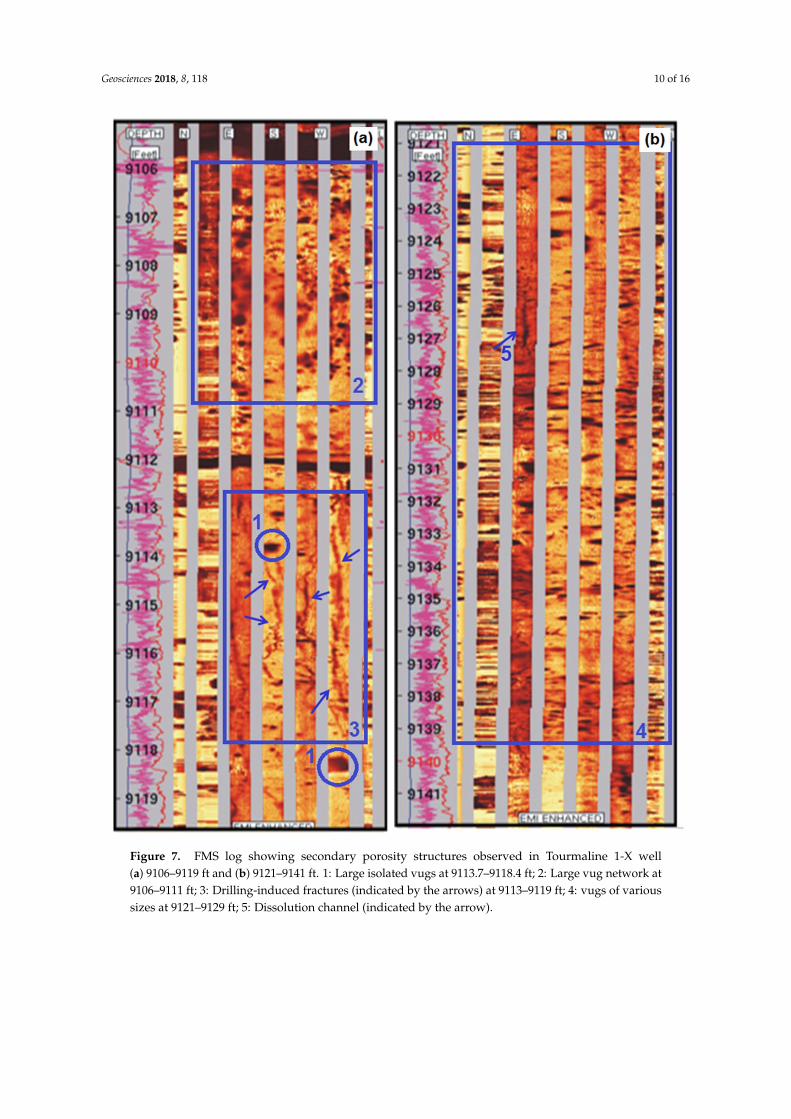
In the Tourmaline-1X well, FMS indicates that vuggy pores are very abundant and dominantacross the whole studied interval (Figures 7 and 8). These vugs vary in size and exist in formsof isolated and interconnected vugs. For example, a majority of isolated vugs is located in theinterval of 9113.7–9118.4 ft (see Figure 7a). However, considering the two-dimensional nature ofthe FMS image, this assumed poorly-connected pore may well be connected. A large vug networkis located in the interval between 9106 and 9111 ft. A number of poorly-interconnected smallervugs also exist in intervals 9180–9182.5 ft and 9189–9191 ft. Besides these observations, however,most of the vugs in the studied Alamein Formation are well-connected. This fact correlates withthe results of the petrophysical interpretation which yields high effective porosity values (Table 1).For example, vugs of various sizes are located in the zone 9121 ft–9139 ft (Figure 7b). Good qualitycarbonate reservoir sections containing abundant secondary porosity structures are observed at9182.5–9189 ft and between 9357 ft and 9362 ft (Figure 8b). These vuggy intervals are in parallelagreement with the secondary porosity information obtained from well logs (Figures 3 and 4),indicating good agreement between the two methods.

Geosciences 2018, 8, 118 7 of 16
(B) Fractures
Drilling-induced vertical fractures can be seen in Tourmaline-1X well at the interval between9113 ft and 9119 ft (Figure 7a) and are almost parallel to the borehole.
(C) Channels
The Alamein Formation in the Tourmaline-1X well has numerous dissolution channels(Figures 7b and 8b).
Figure 4. Analysis of well logging data for N.Alamein-6X showing high secondary porosity in theAlamein Formation, where zones with greatest secondary porosity are labeled A–C. Secondary porosity,fluid composition and lithology were derived using the same approach as described in the subscriptionfor Figure 3.
4.3. Core Evaluation Using White Light and UV Light
The Alamein Formation core samples from the N.Alamein-5X well exhibit bright yellow fluoresceupon exposure to UV light (Figure 9). Intensive fluorescence is observed at depths of 9101, 9107 and9111 ft (Figure 9a–c), respectively. Some areas exhibit dark blue hues, most notably 9088, 9094 and9095 ft (Figures 8a and 9a,b), respectively.

Geosciences 2018, 8, 118 8 of 16
Figure 5. Neutron (NPHI)–Density (RHOB) lithology cross-plots for Tourmaline-1X andN.Alamein-6X wells.

Geosciences 2018, 8, 118 9 of 16
Figure 6. Neutron–density vs. sonic porosity cross-plots for porosity evaluation.
Geosciences 2018, 8, 118 10 of 16
Figure 7. FMS log showing secondary porosity structures observed in Tourmaline 1-X well(a) 9106–9119 ft and (b) 9121–9141 ft. 1: Large isolated vugs at 9113.7–9118.4 ft; 2: Large vug network at9106–9111 ft; 3: Drilling-induced fractures (indicated by the arrows) at 9113–9119 ft; 4: vugs of varioussizes at 9121–9129 ft; 5: Dissolution channel (indicated by the arrow).

Geosciences 2018, 8, 118 11 of 16
Figure 8. FMS log showing secondary porosity structures observed in Tourmaline-1X well(a) 9180–9191 ft and (b) 9356–9363 ft. 1: Many small poorly-interconnected vugs at 9180–9182.5 ft and9189–9191 ft; 2: Multiple interconnected vugs at 9182.5–9189 ft and 9357–9362 ft 3: Dissolution channels(indicated by the arrows).

Geosciences 2018, 8, 118 12 of 16
Figure 9. Photographs of core samples from the N.Alamein-5X well under white (1a–1c) and ultraviolet (2a–2c) light.
5. Discussion
5.1. Interpreted Well Logs and Petrophysical Results
For the Tourmaline-1X well, the gamma ray log shows low shale content. The gamma ray logdetects naturally occurring gamma radiation, and, in particular, shales usually emit more gamma raysthan other sedimentary rocks. The combination of neutron and density logs provides a good sourceof porosity data. The positive separation observed on the neutron–density log overlay is positivefor dolomite, with limestone or calcite intervals observed at several depths. This observation is inagreement with the NPHI-RHOB cross-plot (Figure 5), which shows that the studied formation isprimarily formed of dolomite and calcareous dolomite. Neutron and density porosity logs are used inthis study to infer lithology and fluid content (refer to Section 3.1). Deep lateralog (LLD) measuresthe true formation resistivity, whereas micro-spherical focused log (MSFL) evaluates the boreholeresistivity. Due to its poor conductivity nature, where hydrocarbon is present, the resistivity values are

Geosciences 2018, 8, 118 13 of 16
high. Thus, large separation between MSFL and LLD resistivities (Figure 3) indicates oil bearing zones.Both secondary porosity and effective porosities, derived from the wireline log data, remain significantacross the pay. The zones with the highest secondary porosity (annotated A–D in Figure 3) are locatedin hydrocarbon-bearing intervals of 9124–9130 ft, 9160–9178 ft, 9198–9216 ft and 9260–9268 ft. Basedon the results of the performed analysis the average effective porosity across the pay is estimated as8%, and a corresponding average hydrocarbon saturation of 75.4%.
Secondary porosity for the N.Alamein-6X well is higher compared to Tourmaline-1X with zonesof the highest level of the secondary porosity located in oil bearing intervals 8988–9016 ft, 9041–9072 ftand 9080–9278 ft. Defined average effective porosity is 11.4%, which is higher than for the first wellwith a corresponding hydrocarbon saturation of 72.6%.
The neutron–density crossplot indicating that the porosity in the Alamein dolomite formation isstrongly influenced by secondary porosity supports with previous findings made by Kassab et al. [34],whose petrographical study showed that the diagenesis-influenced porosity of the Cretaceous rocksamples in the study area, which included the Alamein Formation, comprises not only interparticle,but also vugs and molds, in addition to fractures and channel porosities.
5.2. Secondary Porosity Derived from FMS
FMS images are useful in this study, as they provide information regarding secondary porositythat could not be obtained from intepretation of wireline log. While logging tools could estimate thevolume of secondary porosity, they could not differentiate the types, shapes and sizes of secondarypores that may be present in the studied interval. As aforementioned in the Results section, there arethree main types of secondary porosity observed in the four sections assessed in the FMS images of theTourmaline-1X well. Via borehole images, these structures are identified and differentiated accordingly.
Secondary porosity, which is observed in abundance in the Alamein Formation, is a product ofdiagenesis. Diagenesis involves the mineralogical and textural changes undergone by a rock whenthey are brought into contact with waters of varying chemical composition. Secondary porosity isproduced by the diagenetic process of dissolution, whereby carbonate minerals are dissolved andremoved, thus creating and modifying pore space in reservoir rocks. The effect of this process onpermeability depends upon the geometry and location of the resulting voids relative to the rock fabric.Secondary dissolution may be fabric-selective and results in formation of isolated pores, or it mayenlarge fractures and interparticle pores resulting in large, connected pores. The types of secondaryporosities encountered include: moldic, channel, inter-crystalline, fracture or vuggy porosity. In thisstudy, vugs and channels were observed. A majority of the vugs in the studied Alamein Formationare well-connected, which support the secondary porosity information intepreted from well logs(Figures 3 and 4), indicating good integration between the two methods.
Drilling-induced fractures (DIF), on the other hand, are a product of drilling. DIFs are dependenton the rock properties. When the drilling pressure exceeds the elasticity limit of the rock, it may not beable to withstand this pressure and may fracture as a result. Carbonates are relatively highly rigid innature, and consequently have low elasticity, which makes them more susceptible to fracture. Unlikenatural fractures that tend to cross-cut the wellbore, DIFs typically develop as narrow, sharply definedfeatures that are sub-parallel or slightly inclined to the borehole axis in vertical wells.
Overall, from the borehole image logs, we conclude that the dolomitic Alamein Formation in theevaluated interval contains abundant secondary porosity structures, including vugs, channels andfractures. Location of the zones with these structures (see Figures 7 and 8) correlates with depths ofthe zones having higher secondary porosity values according to the interpretation of the well loggingdata (see Figures 3 and 4). The interpreted secondary porosity from the FMS images in this study isin parallel agreement with the petrographic study by Kassab et al. [36], where Alamein Formationcontains abundant vugs, molds, fractures and channel porosities.
Geosciences 2018, 8, 118 14 of 16
5.3. Core Evaluation Using White Light and UV Light
It can be concluded that the bright yellow fluorescence is consistent with oil-bearing dolomite,magnesite and limestone rocks, which typically fluoresce with yellow, yellowish brown to dark browncolor under UV light [37]. This confirms the presence of hydrocarbon-filled porosity. To some extent,the observed fluorescence reflects the degree of hydrocarbon content in each zone: the stronger it is,the higher is the hydrocarbon content.
6. Conclusions
Analysis of wireline logs for Tourmaline-1 and N.Alamein-6X wellsf or the Alamein Formationindicates the presence of secondary porosity across the evaluated depth ranges (9070–9370 ft and8954–9278 ft correspondingly). Secondary pores are located in hydrocarbon-reach zones withhydrocarbon saturation levels of over 70%. Application of the Formation MicroScanner (FMS)image logging enabled further understanding on the types and morphological configuration ofthese secondary pore spaces, which could not be identified by the well logging data. FMS imagesof Tourmaline-1X well confirm the presence of different secondary porosity structures, which arevugs, drilling-induced fractures (DIF) and dissolution channels, across the evaluated depth intervals.The vugs are observed to be interconnected, which support the evaluation of the petrophysical data forthe same well, which reveals that the average effective porosity is 8% across the pay studied interval.The presence of hydrocarbons in the zones with high secondary porosity was further confirmed by thefluorescence of core samples from the N.Alamein-5X well. This integrated study provides a furthercontribution to the understanding of the production performance of the Alamein Dolomite Formation.
Acknowledgments: The authors are very grateful to the Khalda Petroleum Company (Cairo, Egypt) for providingthe necessary data for this research. Many thanks and much appreciation are also extended to Universiti BruneiDarussalam for supporting this research work.
Author Contributions: The completion of this research article is made possible with the collaboration betweenthe co-authors. The first author, Mohamed R. Shalaby obtained the data from Khelda Petroleum Company,conceived and designed the experiments, with contribution to data interpretation and analyses. The secondauthor, Nurhazwana Jumat contributed in data interpretation and analyses and write-up of article. The thirdauthor, Md. Aminul Islam, joined the analyses and data interpretation.
Conflicts of Interest: The authors declare no conflict of interest.
References
1. Roehl, P.O.; Choduette, P.W. Carbonate Petroleum Reservoirs; Spring: New York, NY, USA, 1985; p. 622.2. Khoshbakht, F.; Azizzadeh, M.; Memarian, H.; Nourozi, G.H.; Moallemi, S.A. Comparison of electrical image
log with core in a fractured carbonate reservoir. J. Petrol. Sci. Eng. 2012, 86–87, 289–296. [CrossRef]3. Abd El-Gawad, E.A. The use of well logs to determine the reservoir characteristics of Miocene rocks at the
Bahar Northeast Field, Gulf of Suez, Egypt. J. Petrol. Geol. 2007, 30, 175–188. [CrossRef]4. Hakimi, M.H.; Shalaby, M.R.; Abdullah, W.H. Application of well log analysis to assess the petrophysical
patterns of the Lower Cretaceous Biyad Formation, East Shabowah Oilfields, Masila Basin, Yemen.World Appl. Sci. J. 2012, 16, 1227–1238.
5. Lahsin, A.; Morgen, S. Analysis of well log and pressure data of the gas-bearing sand reservoirs of KafrEl-Sheikh formation: Case study from the off-shore Nile Delta-Egypt. Int. J. Phys. Sci. 2012, 7, 5353–5366.
6. Ahmed Abdel-Rahman, A.Y. Well log analysis and hydrocarbon potential of the Khoman Formation, GPTField, North Western Desert, Egypt. World Appl. Sci. J. 2013, 28, 2288–2301.
7. Shalaby, M.R.; Islam, M.A. Fracture detection using conventional well logging in carbonate MatullaFormation, Geisum Oilfield, Gulf of Suez, Egypt. J. Petrol. Explor. Prod. Technol. 2017, 7, 977–989. [CrossRef]
8. Jumat, N.; Shalaby, M.R.; Islam, M.A. Integrated reservoir characterization of the Paleocene FarewellFormation, Taranaki Basin, New Zealand, using petrophysical and petrographical analyses. J. Petrol. Expl.Prod. Technol. 2017, 1–17. [CrossRef]
9. Swee, P.D.; Shalaby, M.R.; Islam, M.A. Integrated Reservoir Characterization Study of the McKee Formation,Onshore Taranaki Basin, New Zealand. Geosciences 2018, 8, 105.
Geosciences 2018, 8, 118 15 of 16
10. Nurmi, R.; Charara, M.; Waterhouse, M.; Park, R. Heterogeneities in carbonate reservoirs: Detection andanalysis using borehole electrical imagery. In Geological Applications of Wireline Logs; Hurst, A., Lovell, M.A.,Morton, A.C., Eds.; Geological Society of London Special Publication: London, UK, 1990; Volume 48,pp. 95–111.
11. Akbar, M.; Vissapragada, B.; Alghamdi, A.H.; Allen, D.; Herron, M.; Carnegie, A.; Dutta, D.; Olesen, J.R.;Chourasiya, R.D.; Logan, D.; et al. A snapshot of carbonate reservoir evaluation. Schlumberger Oilfield Rev.2000, 12, 20–41.
12. Russell, S.D.; Akbar, M.; Vissapragada, B.; Walkden, G.M. Rock types and permeability prediction fromdipmeter and image logs: Shuaiba reservoir (Aptian), Abu Dhabi. AAPG Bull. 2002, 86, 1709–1732.
13. Ahr, W.M.; Allen, D.; Boyd, A.; Bachman, H.N.; Smithson, T.; Clerke, E.A.; Gzara, K.B.M.; Hassal, J.K.;Murty, C.R.K.; Zubari, H.; Ramamoorthy, R. Confronting the carbonate conundrum. Schlumberger OilfieldRev. Spring 2005, 17, 18–29.
14. Wilson, M.E.; Lewis, D.; Yogi, O.; Holland, D.; Hombo, L.; Goldberg, A. Development of Papua NewGuinean onshore carbonate reservoir: A comparative borehole image (FMI) and petrographic evaluation.Mar. Petrol. Geol. 2013, 44, 164–195. [CrossRef]
15. Aadnoy, B.S. Inversion technique to determine the in-situ stress field from fracturing data. J. Petrol. Sci. Eng.1990, 4, 127–141. [CrossRef]
16. Brace, W.F. Permeability of crystalline and argillaceous rocks. Int. J. Rock Mech. Min. Sci. Geomech. 1980, 17,241–251. [CrossRef]
17. Aydin, A. Fractures, faults, and hydrocarbon entrapment, migration and flow. Mar. Petrol. Geol. 2000, 17,797–814. [CrossRef]
18. Gudmundsson, A. Fracture dimensions, displacements and fluid transport. J. Struct. Geol. 2000, 22,1221–1231. [CrossRef]
19. Michie, E.A.H.; Haines, T.J.; Healy, D.; Neilson, J.E.; Timms, N.E.; Wibberley, C.A.J. Influence of carbonatefacies on fault zone architecture. J. Struct. Geol. 2014, 65, 82–99. [CrossRef]
20. Michie, E.A.H. Influence of host lithofacies on fault rock variation in carbonate fault zones: A case studyfrom the Island of Malta. J. Struct. Geol. 2015, 76, 61–79. [CrossRef]
21. Trippetta, F.; Carpenter, B.M.; Mollo, S.; Scuderi, M.M.; Scarlato, P.; Collettini, C. Physical and TransportProperty Variations within Carbonate-Bearing Fault Zones: Insights from the Monte Maggio Fault (CentralItaly). Geochem. Geophys. Geosyst. 2017. [CrossRef]
22. Sestini, G. Egypt. In Regional Petroleum Geology of the World, Part II: Africa, America, Australia and Antartica;Kulke, H., Ed.; Gebrüder Borntraeger: Berlin/Stuttgart, Germany, 1995; pp. 57–87.
23. Elzarka, M.H. Mode of hydrocarbon generation and prospects of the northern part of the Western Desert,Egypt. J. Afr. Earth Sci. 1983, 14, 294–318. [CrossRef]
24. Zein El-Din, M.Y.; Matbouly, S.I.; Moussa, S.M.; Kralik, M.A. Geochemistry and oil-oil correlations in theWestern Desert; Abstract. In Proceedings of the 10th Egyptian Petroleum Conference, Cairo, Egypt, 7–19November 1990.
25. Abu el Naga, M. Paleozoic and Mesozoic depocentres and hydrocarbon generating areas, Northern WesternDesert. In Proceedings of the EGPC 7th Exploration and Production Conference; EGPC: Cairo, Egypt, 1984;pp. 269–287.
26. Metwalli, M.H.; Abd El-Hady, Y.E. Petrographic characteristics of oil-bearing rocks in Alamein oil field:Significance of source reservoir relations in North Western Desert, Egypt. AAPG Bull. 1975, 59, 510–523.
27. Said, R. The Geology of Egypt; AA Balkerma: Rotterdam, The Netherlands, 1990; p. 734.28. Ahmed, M.A. Geodynamic Evolution and Petroleum System of Abu Gharadig Basin, North Western Desert,
Egypt. Ph.D. Thesis, Institute of Geology and Geochemistry of Petroleum and Coal (LEK), RWTH-AachenUniversity Germany, Aachen, Germany, 2008; p. 255.
29. Egypt Oil & Gas. Egypt Production Report; Egypt Oil & Gas: Cairo Governorate, Egypt, 2012; p. 143.30. Badr, A.R.; Ayoub, M.R. Study of a complex carbonate reservoir using the Formation MicroScanner (FMS)
Tool. In Proceedings of the SPE Middle East Oil Technical Conference and Exhibition, Manama, Bahrain,25–28 September 1989; pp. 507–516.
31. Abdou, A. Deep wells in Khalda West: A brief review. In Proceedings of the 14th EGPC PetroleumConference, Cairo, Egypt, 12–15 October 1998; pp. 517–533.

Geosciences 2018, 8, 118 16 of 16
32. Ekstrom, M.P.; Dahan, C.; Chen, M.Y.; Lloyd, P.; Rossi, D.J. Formation imaging with microelectrical scanningarrays. In Proceedings of the SPWLA 27th Annual Logging Symposium, London, UK, 29 June–2 July 1987;Volume 28, pp. 294–306.
33. Serra, O. Formation Micoscanner Image Interpretation; Schlumberger Educational Service: Houston, TX, USA,1989; p. 177.
34. Beckman, H. Geological Prospecting of Petroleum; Halted Press: New York, NY, USA, 1918; pp. 97–111.35. Bowers, R.J. Rotary drilling investigative techniques and tools. In Hydrocarbon Contaminated Soils, Volume III;
Kostecki, P.T., Calabrese, E.J., Eds.; Lewis Publishers: Chelsea, MI, USA, 1993; pp. 89–105.36. Kasaab, M.A.; Abdou, A.A.; El Gendy, M.G.; Shehata, M.G.; Abuhagaza, A.A. Mutual relations between
petrographical and petrophysical properties of Cretaceous rock samples for some wells in the North WesternDesert, Egypt. Egypt. J. Petrol. 2013, 22, 73–90. [CrossRef]
37. Exploration Logging, Inc. Mud Logging: Principles and Interpretations; IHRDC: Boston, MA, USA, 1985; p. 92.
© 2018 by the authors. Licensee MDPI, Basel, Switzerland. This article is an open accessarticle distributed under the terms and conditions of the Creative Commons Attribution(CC BY) license (http://creativecommons.org/licenses/by/4.0/).
Related Documents