catalysts Article Microkinetic Modeling of the Oxidation of Methane Over PdO Catalysts—Towards a Better Understanding of the Water Inhibition Effect Kevin Keller 1 , Patrick Lott 1 , Henning Stotz 1 , Lubow Maier 2 and Olaf Deutschmann 1,2, * 1 Institute for Chemical Technology and Polymer Chemistry, ITCP, Karlsruhe Institute of Technology, KIT, Engesserstr. 20, 76131 Karlsruhe, Germany; [email protected] (K.K.); [email protected] (P.L.); [email protected] (H.S.) 2 Institute of Catalysis Research and Technology, IKFT, Hermann-von-Helmholtz-Platz 1, 76344 Eggenstein-Leopldshafen, Germany; [email protected] * Correspondence: [email protected]; Tel.: +49-721-608-43064 Received: 17 July 2020; Accepted: 5 August 2020; Published: 11 August 2020 Abstract: Water, which is an intrinsic part of the exhaust gas of combustion engines, strongly inhibits the methane oxidation reaction over palladium oxide-based catalysts under lean conditions and leads to severe catalyst deactivation. In this combined experimental and modeling work, we approach this challenge with kinetic measurements in flow reactors and a microkinetic model, respectively. We propose a mechanism that takes the instantaneous impact of water on the noble metal particles into account. The dual site microkinetic model is based on the mean-field approximation and consists of 39 reversible surface reactions among 23 surface species, 15 related to Pd-sites, and eight associated with the oxide. A variable number of available catalytically active sites is used to describe light-off activity tests as well as spatially resolved concentration profiles. The total oxidation of methane is studied at atmospheric pressure, with space velocities of 160,000 h -1 in the temperature range of 500–800 K for mixtures of methane in the presence of excess oxygen and up to 15% water, which are typical conditions occurring in the exhaust of lean-operated natural gas engines. The new approach presented is also of interest for modeling catalytic reactors showing a dynamic behavior of the catalytically active particles in general. Keywords: methane oxidation; water inhibition; microkinetic modeling; reactor modeling; spatial profiling 1. Introduction Power-to-gas technologies, e.g., the combination of electrolysis and methanation for energy storage, gained lots of attention in the recent past [1,2]. Such processes may provide a sustainable solution to cover the increasing demand for renewable energy sources for both stationary and mobile applications, and may alleviate the anthropogenic climate change. Moreover, its advantageous hydrogen-to-carbon ratio also makes methane a highly attractive energy carrier, hence natural gas (NG) engines could play an important role in the near future [3]. Despite high fuel efficiency and comparatively low raw emissions, efficient exhaust gas after-treatment systems of natural gas engines are indispensable nowadays, especially in the mobility sector [4,5]. Emissions of CH 4 , with over 20 times higher global warming potential compared to CO 2 [6], need to be avoided under any circumstances. In the context of the catalytic total oxidation of methane, particularly PdO-based catalysts supported on alumina show high activities in the low temperature regime between 600 K and 700 K under lean (oxygen excess) operation [7,8]. In comparison to stoichiometric operation, whereby a three-way catalytic converter can be applied for emission control, lean operation would further increase the Catalysts 2020, 10, 922; doi:10.3390/catal10080922 www.mdpi.com/journal/catalysts

Welcome message from author
This document is posted to help you gain knowledge. Please leave a comment to let me know what you think about it! Share it to your friends and learn new things together.
Transcript
catalysts
Article
Microkinetic Modeling of the Oxidation of MethaneOver PdO Catalysts—Towards a BetterUnderstanding of the Water Inhibition Effect
Kevin Keller 1, Patrick Lott 1 , Henning Stotz 1 , Lubow Maier 2 and Olaf Deutschmann 1,2,*1 Institute for Chemical Technology and Polymer Chemistry, ITCP, Karlsruhe Institute of Technology, KIT,
Engesserstr. 20, 76131 Karlsruhe, Germany; [email protected] (K.K.); [email protected] (P.L.);[email protected] (H.S.)
2 Institute of Catalysis Research and Technology, IKFT, Hermann-von-Helmholtz-Platz 1,76344 Eggenstein-Leopldshafen, Germany; [email protected]
* Correspondence: [email protected]; Tel.: +49-721-608-43064
Received: 17 July 2020; Accepted: 5 August 2020; Published: 11 August 2020�����������������
Abstract: Water, which is an intrinsic part of the exhaust gas of combustion engines, strongly inhibitsthe methane oxidation reaction over palladium oxide-based catalysts under lean conditions and leadsto severe catalyst deactivation. In this combined experimental and modeling work, we approachthis challenge with kinetic measurements in flow reactors and a microkinetic model, respectively.We propose a mechanism that takes the instantaneous impact of water on the noble metal particlesinto account. The dual site microkinetic model is based on the mean-field approximation and consistsof 39 reversible surface reactions among 23 surface species, 15 related to Pd-sites, and eight associatedwith the oxide. A variable number of available catalytically active sites is used to describe light-off
activity tests as well as spatially resolved concentration profiles. The total oxidation of methane isstudied at atmospheric pressure, with space velocities of 160,000 h−1 in the temperature range of500–800 K for mixtures of methane in the presence of excess oxygen and up to 15% water, which aretypical conditions occurring in the exhaust of lean-operated natural gas engines. The new approachpresented is also of interest for modeling catalytic reactors showing a dynamic behavior of thecatalytically active particles in general.
Keywords: methane oxidation; water inhibition; microkinetic modeling; reactor modeling;spatial profiling
1. Introduction
Power-to-gas technologies, e.g., the combination of electrolysis and methanation for energy storage,gained lots of attention in the recent past [1,2]. Such processes may provide a sustainable solution tocover the increasing demand for renewable energy sources for both stationary and mobile applications,and may alleviate the anthropogenic climate change. Moreover, its advantageous hydrogen-to-carbonratio also makes methane a highly attractive energy carrier, hence natural gas (NG) engines couldplay an important role in the near future [3]. Despite high fuel efficiency and comparatively lowraw emissions, efficient exhaust gas after-treatment systems of natural gas engines are indispensablenowadays, especially in the mobility sector [4,5]. Emissions of CH4, with over 20 times higher globalwarming potential compared to CO2 [6], need to be avoided under any circumstances.
In the context of the catalytic total oxidation of methane, particularly PdO-based catalysts supportedon alumina show high activities in the low temperature regime between 600 K and 700 K under lean(oxygen excess) operation [7,8]. In comparison to stoichiometric operation, whereby a three-waycatalytic converter can be applied for emission control, lean operation would further increase the
Catalysts 2020, 10, 922; doi:10.3390/catal10080922 www.mdpi.com/journal/catalysts
Catalysts 2020, 10, 922 2 of 21
efficiency and therefore reduce the fuel consumption of natural gas engines. Despite extensive researchefforts, there is still no adequate catalytic after-treatment system available for the reduction of methaneemissions from lean operated NG engines. The best catalytic system found so far, PdO-based catalysts,does not achieve the desired long-term activity in the presence of water, which is always formed incombustion and therefore an intrinsic component of the exhaust gas. The underlying mechanismof the water deactivation effect is still not fully understood. According to Ciuparu et al. [9,10],hydroxyl accumulation on the surface of the active particle leads to the observed activity shift towardshigher temperatures and continuous deactivation, which is even more pronounced with steam presentin the feed gas.
Furthermore, methane oxidation follows the Mars–van Krevelen mechanism [11,12], hence theoverall activity strongly depends on the size of the noble metal particles [13,14]. The catalytic behaviormay even change during the course of the reaction due to the reversible phase transformation of PdOand Pd and the combined effect of morphology and structural changes [15]. Structural differencesof the PdO-phase also differ in the process of methane oxidation, with PdO(100) being thethermodynamically most stable facet, whereas PdO(101) shows the comparatively lowest energybarrier for methane activation [16,17]. Amongst these properties, the catalyst is moreover influenced bythe support material [18,19] and by further noble metal dopants such as platinum [20,21]. Furthermore,Lott et al. recently described an enhanced oxidation performance for pre-reduced PdO catalysts inthe presence and absence of externally dosed water, pointing to a strong dependence of the catalyticactivity on the catalyst history [22,23]. All the mentioned aspects result in the complex non-linearbehavior of the catalytic PdO system.
In order to capture the dynamics and the effect of externally dosed water on the catalytic system,the combination of systematic experiments with microkinetic modeling can help to understand thephysical interplay between transport phenomena, kinetics, and surface state of the noble metal particles.The basis of this study are surface reaction mechanisms that were recently developed for the oxidationof methane over reduced [24] and oxidized Pd-based catalysts [25]. With both of these mechanisms,the hysteresis behavior of PdO catalysts [26,27], which was attributed to different rates of CH4 oxidationupon cooling and heating of the system, could be explained.
In this study, we propose an approach that is able to also model the instant inhibition effect ofwater on the catalytic total oxidation of methane over palladium-based catalysts. Aside from theinstant loss in activity due to steam, the catalyst also experiences long-term deactivation due to thermalaging for instance, which is not in the focus of the model development of this study.
A set of flow reactor experiments was conducted using powder catalysts to capture the waterinhibition effect, which is fully developed with increasing amount of externally dosed water. Based onconsecutive conclusions drawn from the systematic experiments, the recently published microkineticmodel of Stotz et al. [25] was extended to better capture the water inhibition effect. In their studyStotz et al. [25] denoted dissociative adsorption of methane via hydrogen abstraction over Pd-O activesite-pairs as the rate controlling step. The microkinetic model in their formulation partly capturesan observerd water inhibition effect by taking a site blocking process due to formation of hydroxylspecies as well as competing reversible H2O/OH adsorption on available catalyst sites into account.However, the water inhibition on this microkinetic level is still underestimated, making further modeldevelopment inevitable. Hereby, the impact on the overall catalytically active surface is assessedqualitatively for different concentrations of externally dosed steam, which contributes to understandingthe blocking mechanism on a molecular level of the active particles. Finally, the optimized modelcan also describe the catalytic activity tests and spatially resolved concentration profiles obtained fora monolithic catalyst sample.

Catalysts 2020, 10, 922 3 of 21
2. Results and Discussion
2.1. Experimental Results
The experimental results reported in this section are the basis the necessary model extension tocapture the effect of water inhibition on catalytic activity. A summary of the catalyst characterizationresults is given in Table 1. To investigate the influence of externally dosed water, the catalytic conversionof methane is measured in light-off activity tests at different steam concentrations. The results for a dryreaction mixture (3200 ppm CH4, 10% O2 in N2, GHSV = 140,000 h−1) and with water added in theconcentrations of 1%, 2%, 3%, 6%, 9%, 12%, and 15% are depicted in Figure 1.
Table 1. Results of the catalyst characterizations obtained from N2-physisorption, chemisorption,transmission electron microscopy (TEM) and elemental analysis.
Method PdO/Al2O3
BET surface area/m2 g−1 176Pore volume/mL g−1 0.46
Noble metal dispersion/% 28Mean particle diameter (TEM), as prepared catalyst/nm 1.5
Mean particle diameter (TEM), aged catalyst/nm 2.5Noble metal loading/wt.% 2.23
Catalysts 2020, 10, x FOR PEER REVIEW 3 of 20
2. Results and Discussion
2.1. Experimental Results
The experimental results reported in this section are the basis the necessary model extension to capture the effect of water inhibition on catalytic activity. A summary of the catalyst characterization results is given in Table 1. To investigate the influence of externally dosed water, the catalytic conversion of methane is measured in light-off activity tests at different steam concentrations. The results for a dry reaction mixture (3200 ppm CH4, 10% O2 in N2, GHSV = 140,000 h−1) and with water added in the concentrations of 1%, 2%, 3%, 6%, 9%, 12%, and 15% are depicted in Figure 1.
Table 1. Results of the catalyst characterizations obtained from N2-physisorption, chemisorption, transmission electron microscopy (TEM) and elemental analysis.
Method PdO/Al2O3 BET surface area/m2 g−1 176
Pore volume/mL g−1 0.46 Noble metal dispersion/% 28
Mean particle diameter (TEM), as prepared catalyst/nm 1.5 Mean particle diameter (TEM), aged catalyst/nm 2.5
Noble metal loading/wt.% 2.23
Figure 1. Different light-off measurements for PdO/Al2O3 in 3200 ppm CH4, 10% O2 and balance N2 in the absence of steam and in the presence of different water concentrations, with a temperature ramp of 3 K min−1. GHSV = 140,000 h−1.
The effect of water in the feed gas is clearly visible: with increasing water concentration, the activity of the catalyst was decreased and therefore the conversion of CH4 was shifted towards higher temperatures. While in the dry reaction mixture 50% conversion (T50) are achieved at 578 K and nearly full conversion (T100) is reached at 630 K, already 1% of externally dosed water leads to a T50-temperature shift of approximately 60 K. The inhibition becomes even more severe at higher steam concentration, resulting in a shift of 143 K for T100 when 15% water are added. While the general slope of the light-off curve is only slightly influenced by the inhibition effect, catalytic activity is continuously shifted towards higher temperatures. To show that the inhibition effect on the catalytically active particles is already fully developed within the water concentrations of the experiments, the temperature shifts of T50 and T100 are summarized in Figure 2.
500 550 600 650 700 750 800
0
20
40
60
80
100
CH
4 con
vers
ion
/ %
Temperature / K
Dry 1 % H2O 2 % H2O 3 % H2O 6 % H2O 9 % H2O 12 % H2O 15 % H2O
Figure 1. Different light-off measurements for PdO/Al2O3 in 3200 ppm CH4, 10% O2 and balance N2 inthe absence of steam and in the presence of different water concentrations, with a temperature ramp of3 K min−1. GHSV = 140,000 h−1.
The effect of water in the feed gas is clearly visible: with increasing water concentration,the activity of the catalyst was decreased and therefore the conversion of CH4 was shifted towardshigher temperatures. While in the dry reaction mixture 50% conversion (T50) are achieved at 578 Kand nearly full conversion (T100) is reached at 630 K, already 1% of externally dosed water leads toa T50-temperature shift of approximately 60 K. The inhibition becomes even more severe at higher steamconcentration, resulting in a shift of 143 K for T100 when 15% water are added. While the general slopeof the light-off curve is only slightly influenced by the inhibition effect, catalytic activity is continuouslyshifted towards higher temperatures. To show that the inhibition effect on the catalytically activeparticles is already fully developed within the water concentrations of the experiments, the temperatureshifts of T50 and T100 are summarized in Figure 2.
Catalysts 2020, 10, 922 4 of 21
Catalysts 2020, 10, x FOR PEER REVIEW 4 of 20
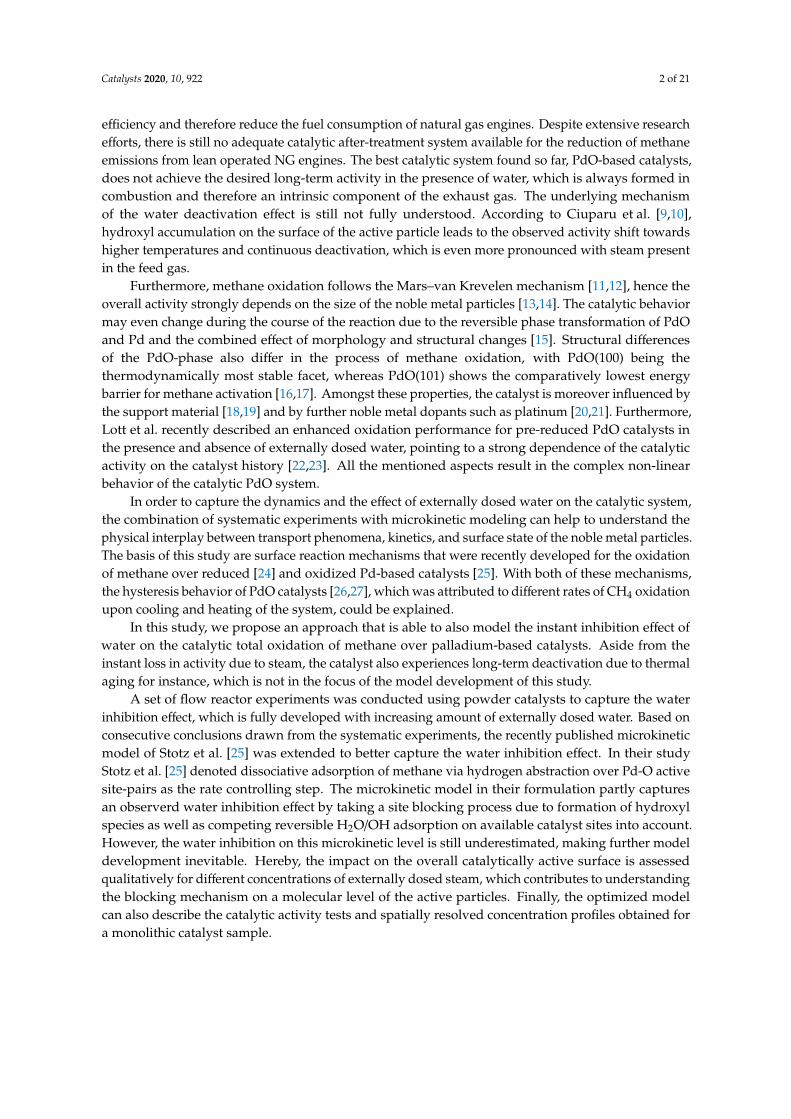
Figure 2. ΔT50 and ΔT100 for different light-off measurements for PdO/Al2O3 in 3200 ppm CH4, 10% O2 and balance N2 in the absence of steam and in the presence of different water concentrations, with a temperature ramp of 3 K min−1. GHSV = 140,000 h−1.
(a) (b)
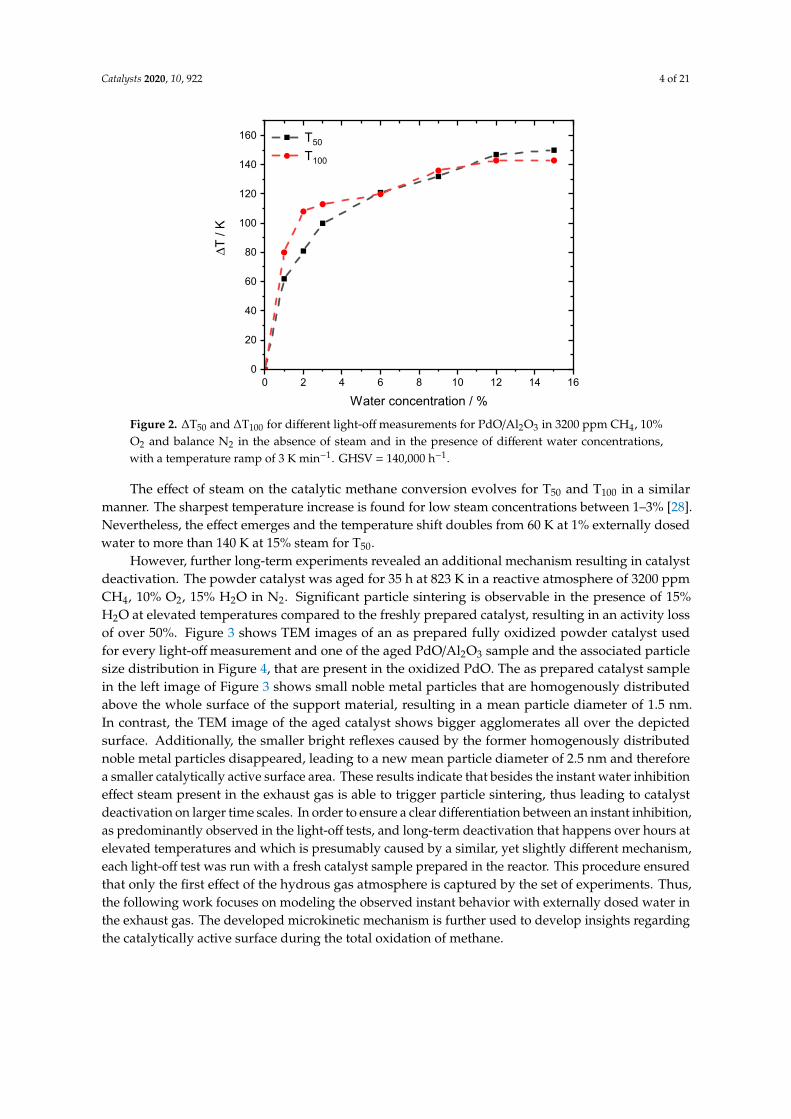
Figure 3. TEM images of a freshly prepared PdO/Al2O3 catalyst sample (a) and of an aged PdO/Al2O3 catalyst sample after 35 h at 823 K in 3200 ppm CH4, 15% H2O, 10% O2 in N2 (b).
The effect of steam on the catalytic methane conversion evolves for T50 and T100 in a similar manner. The sharpest temperature increase is found for low steam concentrations between 1–3% [28]. Nevertheless, the effect emerges and the temperature shift doubles from 60 K at 1% externally dosed water to more than 140 K at 15% steam for T50.
However, further long-term experiments revealed an additional mechanism resulting in catalyst deactivation. The powder catalyst was aged for 35 h at 823 K in a reactive atmosphere of 3200 ppm CH4, 10% O2, 15% H2O in N2. Significant particle sintering is observable in the presence of 15% H2O
0 2 4 6 8 10 12 14 160
20
40
60
80
100
120
140
160
ΔT /
K
Water concentration / %
T50
T100
Figure 2. ∆T50 and ∆T100 for different light-off measurements for PdO/Al2O3 in 3200 ppm CH4, 10%O2 and balance N2 in the absence of steam and in the presence of different water concentrations,with a temperature ramp of 3 K min−1. GHSV = 140,000 h−1.
The effect of steam on the catalytic methane conversion evolves for T50 and T100 in a similarmanner. The sharpest temperature increase is found for low steam concentrations between 1–3% [28].Nevertheless, the effect emerges and the temperature shift doubles from 60 K at 1% externally dosedwater to more than 140 K at 15% steam for T50.
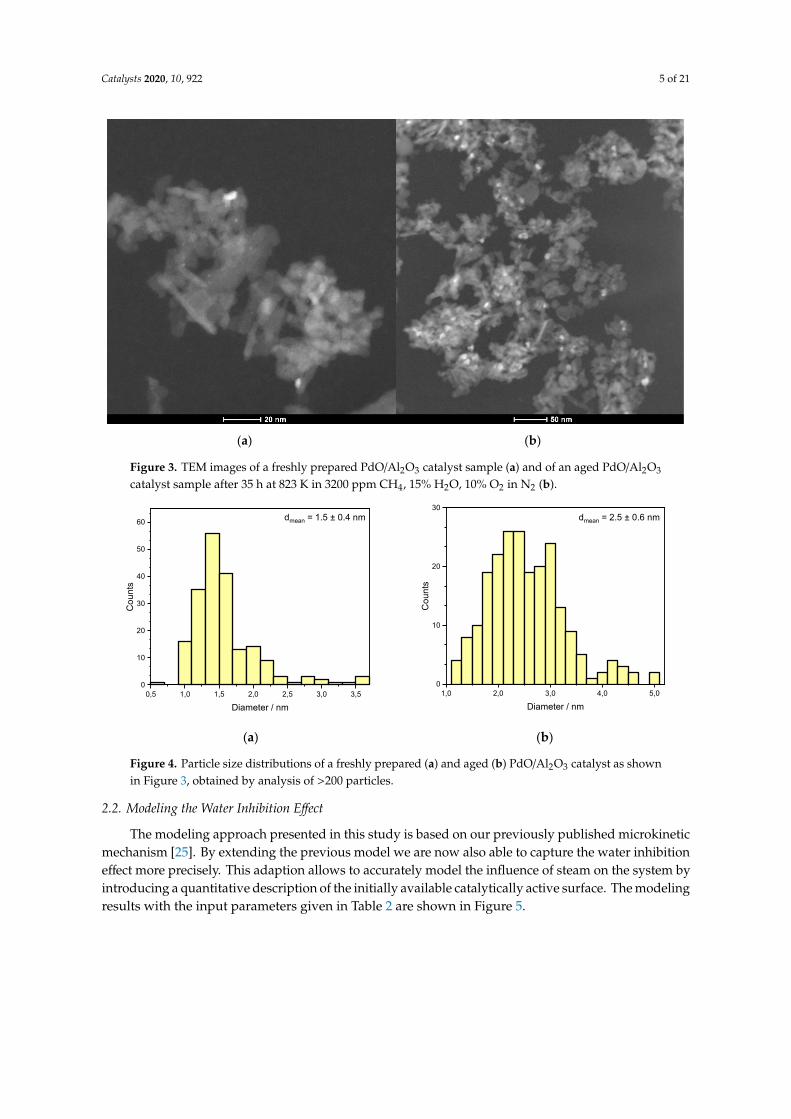
However, further long-term experiments revealed an additional mechanism resulting in catalystdeactivation. The powder catalyst was aged for 35 h at 823 K in a reactive atmosphere of 3200 ppmCH4, 10% O2, 15% H2O in N2. Significant particle sintering is observable in the presence of 15%H2O at elevated temperatures compared to the freshly prepared catalyst, resulting in an activity lossof over 50%. Figure 3 shows TEM images of an as prepared fully oxidized powder catalyst usedfor every light-off measurement and one of the aged PdO/Al2O3 sample and the associated particlesize distribution in Figure 4, that are present in the oxidized PdO. The as prepared catalyst samplein the left image of Figure 3 shows small noble metal particles that are homogenously distributedabove the whole surface of the support material, resulting in a mean particle diameter of 1.5 nm.In contrast, the TEM image of the aged catalyst shows bigger agglomerates all over the depictedsurface. Additionally, the smaller bright reflexes caused by the former homogenously distributednoble metal particles disappeared, leading to a new mean particle diameter of 2.5 nm and thereforea smaller catalytically active surface area. These results indicate that besides the instant water inhibitioneffect steam present in the exhaust gas is able to trigger particle sintering, thus leading to catalystdeactivation on larger time scales. In order to ensure a clear differentiation between an instant inhibition,as predominantly observed in the light-off tests, and long-term deactivation that happens over hours atelevated temperatures and which is presumably caused by a similar, yet slightly different mechanism,each light-off test was run with a fresh catalyst sample prepared in the reactor. This procedure ensuredthat only the first effect of the hydrous gas atmosphere is captured by the set of experiments. Thus,the following work focuses on modeling the observed instant behavior with externally dosed water inthe exhaust gas. The developed microkinetic mechanism is further used to develop insights regardingthe catalytically active surface during the total oxidation of methane.
Catalysts 2020, 10, 922 5 of 21
Catalysts 2020, 10, x FOR PEER REVIEW 4 of 20
Figure 2. ΔT50 and ΔT100 for different light-off measurements for PdO/Al2O3 in 3200 ppm CH4, 10% O2 and balance N2 in the absence of steam and in the presence of different water concentrations, with a temperature ramp of 3 K min−1. GHSV = 140,000 h−1.
(a) (b)
Figure 3. TEM images of a freshly prepared PdO/Al2O3 catalyst sample (a) and of an aged PdO/Al2O3 catalyst sample after 35 h at 823 K in 3200 ppm CH4, 15% H2O, 10% O2 in N2 (b).
The effect of steam on the catalytic methane conversion evolves for T50 and T100 in a similar manner. The sharpest temperature increase is found for low steam concentrations between 1–3% [28]. Nevertheless, the effect emerges and the temperature shift doubles from 60 K at 1% externally dosed water to more than 140 K at 15% steam for T50.
However, further long-term experiments revealed an additional mechanism resulting in catalyst deactivation. The powder catalyst was aged for 35 h at 823 K in a reactive atmosphere of 3200 ppm CH4, 10% O2, 15% H2O in N2. Significant particle sintering is observable in the presence of 15% H2O
0 2 4 6 8 10 12 14 160
20
40
60
80
100
120
140
160
ΔT /
K
Water concentration / %
T50
T100
Figure 3. TEM images of a freshly prepared PdO/Al2O3 catalyst sample (a) and of an aged PdO/Al2O3
catalyst sample after 35 h at 823 K in 3200 ppm CH4, 15% H2O, 10% O2 in N2 (b).
Catalysts 2020, 10, x FOR PEER REVIEW 5 of 20
at elevated temperatures compared to the freshly prepared catalyst, resulting in an activity loss of over 50%. Figure 3 shows TEM images of an as prepared fully oxidized powder catalyst used for every light-off measurement and one of the aged PdO/Al2O3 sample and the associated particle size distribution in Figure 4, that are present in the oxidized PdO. The as prepared catalyst sample in the left image of Figure 3 shows small noble metal particles that are homogenously distributed above the whole surface of the support material, resulting in a mean particle diameter of 1.5 nm. In contrast, the TEM image of the aged catalyst shows bigger agglomerates all over the depicted surface. Additionally, the smaller bright reflexes caused by the former homogenously distributed noble metal particles disappeared, leading to a new mean particle diameter of 2.5 nm and therefore a smaller catalytically active surface area. These results indicate that besides the instant water inhibition effect steam present in the exhaust gas is able to trigger particle sintering, thus leading to catalyst deactivation on larger time scales. In order to ensure a clear differentiation between an instant inhibition, as predominantly observed in the light-off tests, and long-term deactivation that happens over hours at elevated temperatures and which is presumably caused by a similar, yet slightly different mechanism, each light-off test was run with a fresh catalyst sample prepared in the reactor. This procedure ensured that only the first effect of the hydrous gas atmosphere is captured by the set of experiments. Thus, the following work focuses on modeling the observed instant behavior with externally dosed water in the exhaust gas. The developed microkinetic mechanism is further used to develop insights regarding the catalytically active surface during the total oxidation of methane.
(a)
(b)
Figure 4. Particle size distributions of a freshly prepared (a) and aged (b) PdO/Al2O3 catalyst as shown in Figure 3, obtained by analysis of > 200 particles.
2.2. Modeling the Water Inhibition Effect
The modeling approach presented in this study is based on our previously published microkinetic mechanism [25]. By extending the previous model we are now also able to capture the water inhibition effect more precisely. This adaption allows to accurately model the influence of steam on the system by introducing a quantitative description of the initially available catalytically active surface. The modeling results with the input parameters given in Table 2 are shown in Figure 5.
Up to this point, all parameters are set by the experiment. The model parameter Fcat,geo represents the dimensionless accessible catalytically active surface area and was determined as described in the computational part by the mean average particle size that was derived by TEM. The accuracy of the derived calculation is validated with the dry case, which is the light-off measurement without externally dosed water (Figure 5). The model predicts the ignition of the reaction around 500 K as well as T50 and T100 rather well. The further model modification to capture the water inhibition effect relies on an altered catalytically active surface area with different amounts of externally dosed water.
0,5 1,0 1,5 2,0 2,5 3,0 3,50
10
20
30
40
50
60
Cou
nts
Diameter / nm
dmean = 1.5 ± 0.4 nm
1,0 2,0 3,0 4,0 5,00
10
20
30
Cou
nts
Diameter / nm
dmean = 2.5 ± 0.6 nm
Figure 4. Particle size distributions of a freshly prepared (a) and aged (b) PdO/Al2O3 catalyst as shownin Figure 3, obtained by analysis of >200 particles.
2.2. Modeling the Water Inhibition Effect
The modeling approach presented in this study is based on our previously published microkineticmechanism [25]. By extending the previous model we are now also able to capture the water inhibitioneffect more precisely. This adaption allows to accurately model the influence of steam on the system byintroducing a quantitative description of the initially available catalytically active surface. The modelingresults with the input parameters given in Table 2 are shown in Figure 5.

Catalysts 2020, 10, 922 6 of 21
Table 2. Summary of the experimental parameters and model input.
Parameter Value Unit
CH4 3200 ppmO2 10 Vol.%N2 75–90 Vol.%
H2O 0–15 Vol.%GHSV 140,000 h−1
Pressure p 1000 kPaLength of the packed bed L 15 mm
Inner diameter of the reactor DL 6 mmParticle size (sieve fraction) D 125–250 µm
Catalytic to geometric surface area ratio Fcat,geo 510 -
Catalysts 2020, 10, x FOR PEER REVIEW 6 of 20
Table 2. Summary of the experimental parameters and model input.
Parameter Value Unit CH4 3200 ppm O2 10 Vol.% N2 75–90 Vol.%
H2O 0–15 Vol.% GHSV 140,000 h−1
Pressure p 1000 kPa Length of the packed bed L 15 mm
Inner diameter of the reactor DL 6 mm Particle size (sieve fraction) D 125–250 μm
Catalytic to geometric surface area ratio Fcat,geo 510 -
Figure 5. Comparison between experimental data (dots) and simulation results (lines) for the modified model in 3200 ppm CH4, 10% O2 and balance N2 in the absence and presence of different H2O concentrations. GHSV = 140,000 h−1.
Figure 6. Results for the obtained change of the catalytically active surface area in comparison to the experimental shift in T50 for the light-off measurements in absence and presence of externally dosed water.
500 550 600 650 700 750 800
0
20
40
60
80
100
CH
4 con
vers
ion
/ %
Temperature / K
Dry Dry 1 % 1 % 2 % 2 % 3 % 3 % 6 % 6 % 9 % 9 % 12 % 12 % 15 % 15 %
-2 0 2 4 6 8 10 12 14 160
20
40
60
80
100 Catalytically active surface ΔT50
Water concentration / %
Rem
aini
ng a
ctiv
e su
rface
are
a / %
-20
0
20
40
60
80
100
120
140
160
ΔT50
/ K
Figure 5. Comparison between experimental data (dots) and simulation results (lines) for the modifiedmodel in 3200 ppm CH4, 10% O2 and balance N2 in the absence and presence of different H2Oconcentrations. GHSV = 140,000 h−1.
Up to this point, all parameters are set by the experiment. The model parameter Fcat,geo representsthe dimensionless accessible catalytically active surface area and was determined as described inthe computational part by the mean average particle size that was derived by TEM. The accuracy ofthe derived calculation is validated with the dry case, which is the light-off measurement withoutexternally dosed water (Figure 5). The model predicts the ignition of the reaction around 500 K as wellas T50 and T100 rather well. The further model modification to capture the water inhibition effect relieson an altered catalytically active surface area with different amounts of externally dosed water.
The variations in accessible surface sites were considered when fitting Fcat,geo to T50 of the light-off
measurements, to capture ignition of the reaction. With this procedure, all experiments are describedas accurately as the dry case (Figure 5). The modeling work focuses on T50 for two reasons. Firstly,the initial start of the activity is better captured in the low temperature regime, which is the mainadvantage of using PdO-based catalysts in the first place. Secondly, at full conversion and highertemperatures with rather fast chemical reactions, other phenomena such as transport limitation [29]or advanced aging of the catalyst may occur. With a temperature ramp of 3 K min−1, the time onstream would differ about 47 min for the experiment with 1% compared to the 12% of externallydosed water, resulting in incomparable performance results. However, a slight difference is noticeablefor smaller water concentrations between 1% and 3%. Although the average H2O concentrationmet the set value in this range, minor oscillations around the mean value due to less precise waterdosage by the controlled evaporation mixer occurred, which are optimized for a higher water dosage.

Catalysts 2020, 10, 922 7 of 21
Additionally, it might be reasonable to accept a higher water inhibition effect at elevated temperatureswith increasing steam concentration, however, the impact at lower temperatures will be more severedue to persistent blockage of the surface. This combination may contribute to the minor discrepanciesin the experimental data. With the applied modification, the influence of the gaseous environment onthe noble metal particles can be calculated, resulting in different surface areas for the range of waterconcentrations in the experiments as depicted in Figure 6. The change in the model input parametersfollows the trend for the water inhibition effect, the methane oxidation is decreasing. While with1% externally dosed water already 50% of the surface is blocked, this effect enlarges up to 87.8% ata water concentration of 15%. To our best knowledge, this is the first attempt in literature to finda direct quantitative correlation between the instant water inhibition effect on methane oxidation andthe accessible catalytic surface area. With increasing amount of externally dosed water, clearly lesscatalytically active surface area is accessible for the methane oxidation. For this model adaptation,thermodynamic consistency is still guaranteed, because the microkinetic mechanism remains uniform,which is the main advantage of the chosen method. Whether the active particles react to the gaseousenvironment with a different active facet or shape, i.e., as observed for Zn-O-Cu catalysts for methanolsynthesis [30–32], or in combination with hydroxyl formation [33], solely a change in Fcat,geo accountsfor a different catalytic activity.
Catalysts 2020, 10, x FOR PEER REVIEW 6 of 20
Table 2. Summary of the experimental parameters and model input.
Parameter Value Unit CH4 3200 ppm O2 10 Vol.% N2 75–90 Vol.%
H2O 0–15 Vol.% GHSV 140,000 h−1
Pressure p 1000 kPa Length of the packed bed L 15 mm
Inner diameter of the reactor DL 6 mm Particle size (sieve fraction) D 125–250 μm
Catalytic to geometric surface area ratio Fcat,geo 510 -
Figure 5. Comparison between experimental data (dots) and simulation results (lines) for the modified model in 3200 ppm CH4, 10% O2 and balance N2 in the absence and presence of different H2O concentrations. GHSV = 140,000 h−1.
Figure 6. Results for the obtained change of the catalytically active surface area in comparison to the experimental shift in T50 for the light-off measurements in absence and presence of externally dosed water.
500 550 600 650 700 750 800
0
20
40
60
80
100
CH
4 con
vers
ion
/ %
Temperature / K
Dry Dry 1 % 1 % 2 % 2 % 3 % 3 % 6 % 6 % 9 % 9 % 12 % 12 % 15 % 15 %
-2 0 2 4 6 8 10 12 14 160
20
40
60
80
100 Catalytically active surface ΔT50
Water concentration / %
Rem
aini
ng a
ctiv
e su
rface
are
a / %
-20
0
20
40
60
80
100
120
140
160
ΔT50
/ K
Figure 6. Results for the obtained change of the catalytically active surface area in comparison tothe experimental shift in T50 for the light-off measurements in absence and presence of externallydosed water.
Ideally, the uniform microkinetic mechanism covers experiments with a wide variety of reactionconditions and a broad range of gas concentrations. In the following, the model is used to describemethane conversion as observed in monolith experiments [24], which were conducted for thedevelopment of the initial PdO-based model with a fixed dispersion. The input parameters aswell as the parameters of the monolithic catalyst are set by the experiment and listed in the publicationin great detail [24]. The results for the fixed dispersion value and the modified model are compared inFigure 7.
Catalysts 2020, 10, 922 8 of 21
Catalysts 2020, 10, x FOR PEER REVIEW 8 of 20
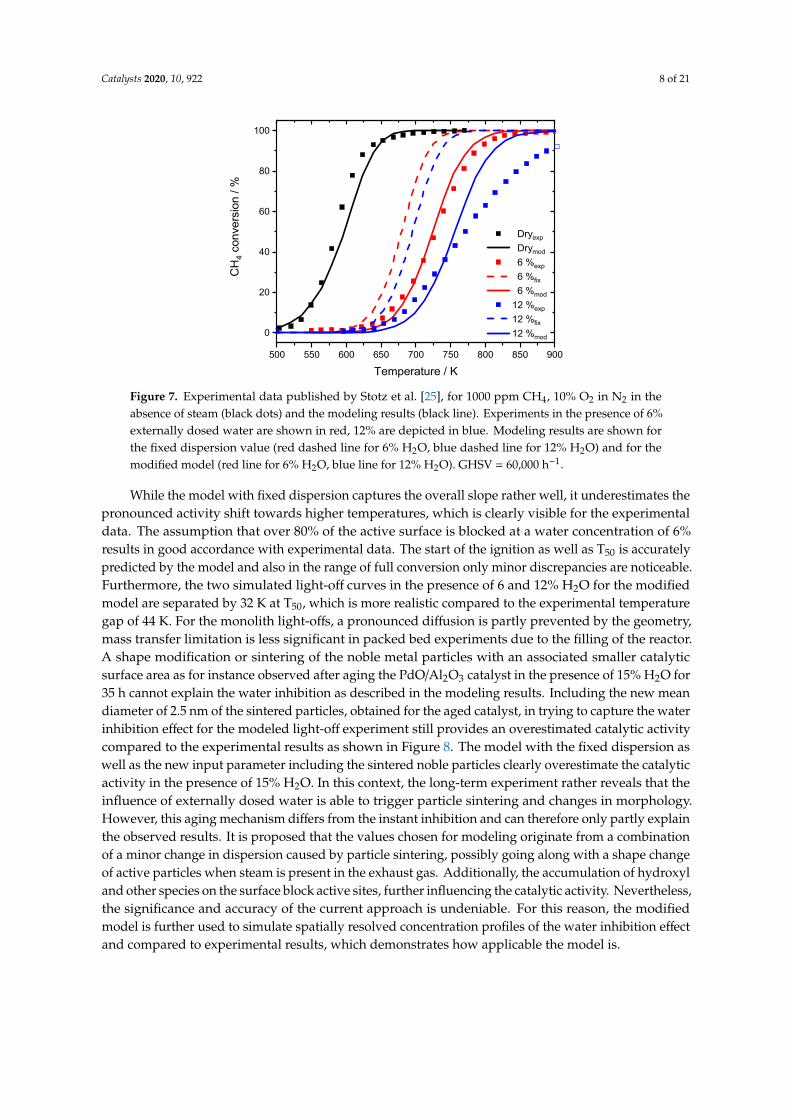
noble particles clearly overestimate the catalytic activity in the presence of 15% H2O. In this context, the long-term experiment rather reveals that the influence of externally dosed water is able to trigger particle sintering and changes in morphology. However, this aging mechanism differs from the instant inhibition and can therefore only partly explain the observed results. It is proposed that the values chosen for modeling originate from a combination of a minor change in dispersion caused by particle sintering, possibly going along with a shape change of active particles when steam is present in the exhaust gas. Additionally, the accumulation of hydroxyl and other species on the surface block active sites, further influencing the catalytic activity. Nevertheless, the significance and accuracy of the current approach is undeniable. For this reason, the modified model is further used to simulate spatially resolved concentration profiles of the water inhibition effect and compared to experimental results, which demonstrates how applicable the model is.
Figure 7. Experimental data published by Stotz et al. [25], for 1000 ppm CH4, 10% O2 in N2 in the absence of steam (black dots) and the modeling results (black line). Experiments in the presence of 6% externally dosed water are shown in red, 12% are depicted in blue. Modeling results are shown for the fixed dispersion value (red dashed line for 6% H2O, blue dashed line for 12% H2O) and for the modified model (red line for 6% H2O, blue line for 12% H2O). GHSV = 60,000 h−1.
500 550 600 650 700 750 800 850 900
0
20
40
60
80
100
CH
4 con
vers
ion
/ %
Temperature / K
Dryexp
Drymod
6 %exp
6 %fix
6 %mod
12 %exp
12 %fix
12 %mod
500 550 600 650 700 750 800
0
20
40
60
80
100
CH
4 con
vers
ion
/ %
Temperature / K
15 % H2O Fixed dispersion model Modified model 2.5 nm particles
Figure 7. Experimental data published by Stotz et al. [25], for 1000 ppm CH4, 10% O2 in N2 in theabsence of steam (black dots) and the modeling results (black line). Experiments in the presence of 6%externally dosed water are shown in red, 12% are depicted in blue. Modeling results are shown forthe fixed dispersion value (red dashed line for 6% H2O, blue dashed line for 12% H2O) and for themodified model (red line for 6% H2O, blue line for 12% H2O). GHSV = 60,000 h−1.
While the model with fixed dispersion captures the overall slope rather well, it underestimates thepronounced activity shift towards higher temperatures, which is clearly visible for the experimentaldata. The assumption that over 80% of the active surface is blocked at a water concentration of 6%results in good accordance with experimental data. The start of the ignition as well as T50 is accuratelypredicted by the model and also in the range of full conversion only minor discrepancies are noticeable.Furthermore, the two simulated light-off curves in the presence of 6 and 12% H2O for the modifiedmodel are separated by 32 K at T50, which is more realistic compared to the experimental temperaturegap of 44 K. For the monolith light-offs, a pronounced diffusion is partly prevented by the geometry,mass transfer limitation is less significant in packed bed experiments due to the filling of the reactor.A shape modification or sintering of the noble metal particles with an associated smaller catalyticsurface area as for instance observed after aging the PdO/Al2O3 catalyst in the presence of 15% H2O for35 h cannot explain the water inhibition as described in the modeling results. Including the new meandiameter of 2.5 nm of the sintered particles, obtained for the aged catalyst, in trying to capture the waterinhibition effect for the modeled light-off experiment still provides an overestimated catalytic activitycompared to the experimental results as shown in Figure 8. The model with the fixed dispersion aswell as the new input parameter including the sintered noble particles clearly overestimate the catalyticactivity in the presence of 15% H2O. In this context, the long-term experiment rather reveals that theinfluence of externally dosed water is able to trigger particle sintering and changes in morphology.However, this aging mechanism differs from the instant inhibition and can therefore only partly explainthe observed results. It is proposed that the values chosen for modeling originate from a combinationof a minor change in dispersion caused by particle sintering, possibly going along with a shape changeof active particles when steam is present in the exhaust gas. Additionally, the accumulation of hydroxyland other species on the surface block active sites, further influencing the catalytic activity. Nevertheless,the significance and accuracy of the current approach is undeniable. For this reason, the modifiedmodel is further used to simulate spatially resolved concentration profiles of the water inhibition effectand compared to experimental results, which demonstrates how applicable the model is.

Catalysts 2020, 10, 922 9 of 21
Catalysts 2020, 10, x FOR PEER REVIEW 8 of 20
noble particles clearly overestimate the catalytic activity in the presence of 15% H2O. In this context, the long-term experiment rather reveals that the influence of externally dosed water is able to trigger particle sintering and changes in morphology. However, this aging mechanism differs from the instant inhibition and can therefore only partly explain the observed results. It is proposed that the values chosen for modeling originate from a combination of a minor change in dispersion caused by particle sintering, possibly going along with a shape change of active particles when steam is present in the exhaust gas. Additionally, the accumulation of hydroxyl and other species on the surface block active sites, further influencing the catalytic activity. Nevertheless, the significance and accuracy of the current approach is undeniable. For this reason, the modified model is further used to simulate spatially resolved concentration profiles of the water inhibition effect and compared to experimental results, which demonstrates how applicable the model is.
Figure 7. Experimental data published by Stotz et al. [25], for 1000 ppm CH4, 10% O2 in N2 in the absence of steam (black dots) and the modeling results (black line). Experiments in the presence of 6% externally dosed water are shown in red, 12% are depicted in blue. Modeling results are shown for the fixed dispersion value (red dashed line for 6% H2O, blue dashed line for 12% H2O) and for the modified model (red line for 6% H2O, blue line for 12% H2O). GHSV = 60,000 h−1.
500 550 600 650 700 750 800 850 900
0
20
40
60
80
100
CH
4 con
vers
ion
/ %
Temperature / K
Dryexp
Drymod
6 %exp
6 %fix
6 %mod
12 %exp
12 %fix
12 %mod
500 550 600 650 700 750 800
0
20
40
60
80
100
CH
4 con
vers
ion
/ %
Temperature / K
15 % H2O Fixed dispersion model Modified model 2.5 nm particles
Figure 8. Light-off measurements for the experimental results for PdO/Al2O3 in 3200 ppm CH4,12% H2O, 10% O2 in N2 (black dots). The red curve represents the simulation results with the fixeddispersion and the blue curve shows the modified model with adaptation of the accessible catalyticallyactive area. Simulating the new obtained mean particle size with 2.5 nm leads to the green line,underestimating the effect of the water inhibition.
2.3. Modeling Spatially Resolved Concentration Profiles
The extended model is further used to describe experimental monolith data for methane oxidationthat were conducted in a setup dedicated for spatial profiling (SpaciPro) [34–36]. First, light-off
measurements justify the applicability of the model. Subsequently, conducted temperature andconcentration profiles inside a channel of the monolith are modeled and compared to the results ofthe measurements.
The results for the light-off measurements in the SpaciPro setup in the absence and presenceof 6% and 12% water are shown in Figure 9. The overall activity of the catalytic system is in goodaccordance to the light-off tests of Figure 7. Whereas the gas hourly space velocity (GHSV) is halved,the methane concentration is increased from 1000 ppm to 3200 ppm, leading to a T50 temperatureof 608 K, which is 20 K above the dry experiments [25]. The instant water inhibition effect on thecatalytic activity is also captured by the extended model. Since no TEM images were available for thenoble metal particles, assumptions of Stotz et al. [25] were used to correlate the surface of the reducedpalladium species determined by chemisorption to the initial surface of the PdO particles. Taking thisinto account, the ignition of the total oxidation and T50 is described in sufficient detail. Thus, the lowerGHSV slightly minimizes the effect of internal mass transfer limitation, leading to better accordance ofthe general light-off slope at elevated temperatures for 12% externally dosed water.

Catalysts 2020, 10, 922 10 of 21
Catalysts 2020, 10, x FOR PEER REVIEW 9 of 20
Figure 8. Light-off measurements for the experimental results for PdO/Al2O3 in 3200 ppm CH4, 12% H2O, 10% O2 in N2 (black dots). The red curve represents the simulation results with the fixed dispersion and the blue curve shows the modified model with adaptation of the accessible catalytically active area. Simulating the new obtained mean particle size with 2.5 nm leads to the green line, underestimating the effect of the water inhibition.
2.3. Modeling Spatially Resolved Concentration Profiles
The extended model is further used to describe experimental monolith data for methane oxidation that were conducted in a setup dedicated for spatial profiling (SpaciPro) [34–36]. First, light-off measurements justify the applicability of the model. Subsequently, conducted temperature and concentration profiles inside a channel of the monolith are modeled and compared to the results of the measurements.
The results for the light-off measurements in the SpaciPro setup in the absence and presence of 6% and 12% water are shown in Figure 9. The overall activity of the catalytic system is in good accordance to the light-off tests of Figure 7. Whereas the gas hourly space velocity (GHSV) is halved, the methane concentration is increased from 1000 ppm to 3200 ppm, leading to a T50 temperature of 608 K, which is 20 K above the dry experiments [25]. The instant water inhibition effect on the catalytic activity is also captured by the extended model. Since no TEM images were available for the noble metal particles, assumptions of Stotz et al. [25] were used to correlate the surface of the reduced palladium species determined by chemisorption to the initial surface of the PdO particles. Taking this into account, the ignition of the total oxidation and T50 is described in sufficient detail. Thus, the lower GHSV slightly minimizes the effect of internal mass transfer limitation, leading to better accordance of the general light-off slope at elevated temperatures for 12% externally dosed water.
Three different approaches are compared when modeling the spatially resolved concentration profile obtained with a monolithic sample. Figure 10a shows the experimental concentration profile inside a catalytic channel in the absence of water, as well as the isothermal, adiabatic and discretized simulation, that uses the associated temperature profile (black line) depicted in Figure 10b as an input for the channel wall temperature at the given axial position.
Figure 9. Light-off experiments conducted with the SpaciPro setup for 3200 ppm CH4, 10% O2 in N2 with different amounts of externally dosed water. Shown is the experiment in absence of water (black dots), the affiliated model (black line), as well as results for 6% H2O (exp: red dots, sim: red line) and for 12% H2O (exp: blue dots, sim: blue line). GHSV = 30,000 h−1.
500 550 600 650 700 750 800
0
20
40
60
80
100
CH
4 con
vers
ion
/ %
Temperature / K
Dryexp
Drymod
6 %exp
6 %mod
12 %exp
12 %mod
Figure 9. Light-off experiments conducted with the SpaciPro setup for 3200 ppm CH4, 10% O2 inN2 with different amounts of externally dosed water. Shown is the experiment in absence of water(black dots), the affiliated model (black line), as well as results for 6% H2O (exp: red dots, sim: red line)and for 12% H2O (exp: blue dots, sim: blue line). GHSV = 30,000 h−1.
Three different approaches are compared when modeling the spatially resolved concentrationprofile obtained with a monolithic sample. Figure 10a shows the experimental concentration profileinside a catalytic channel in the absence of water, as well as the isothermal, adiabatic and discretizedsimulation, that uses the associated temperature profile (black line) depicted in Figure 10b as an inputfor the channel wall temperature at the given axial position.
Catalysts 2020, 10, x FOR PEER REVIEW 10 of 20
(a) (b)
Figure 10. (a) Spatially resolved concentration profile at an inlet temperature of 648 K for the measurement (black line), the isothermal model (red line), the discretized simulation using the experimentally measured temperature profile (blue line) and the adiabatic simulation (green line) for 3200 ppm CH4, 10% O2 in N2. The dashed lines (0 and 19 mm) indicate the monoliths length. (b) Associated spatially resolved temperature profiles for the experimentally measured (black line), the simulated adiabatic profile (red line) in comparison to the isothermal simulation (blue line) for the measurement in absence of water at an inlet temperature of 648 K. GHSV = 30,000 h−1.
The isothermal simulation for a reactor temperature of 648 K clearly underestimates the methane conversion inside the monolith channel. In the light-off simulation full conversion is achieved after 660 K. Therefore, the spatially resolved simulation is leading to an end of pipe concentration of 0.023% CH4, which is a conversion of 92.8%. In contrast, the adiabatic simulation slightly overestimates the catalytic performance of the system. Full conversion is achieved within the first 5 mm of the channel that has a total length of 19 mm. The increased activity originates from an overestimated heat development that is predicted by the adiabatic simulation in Figure 10 b. After 6 mm inside the channel, the gas and wall temperature reach the maximum temperature of 730 K. Compared to the experimental results, the temperature profile shows a significant hotspot with 690 K after 9 mm. Using this temperature profile as the model input ensures the most accurate results in the so-called discretized simulation, which is a stepwise isothermal simulation.
It should be noted that, according to Hettel et al. [37], the intrusion of the capillary affects the flow inside the channel leading to an increased residence time and therefore higher catalytic conversion. With respect to the results presented in this paper, this means that the monitored conversion is higher compared to the remaining monolith channels, thus the most representative profile is a combination of the isothermal and discretized simulation.
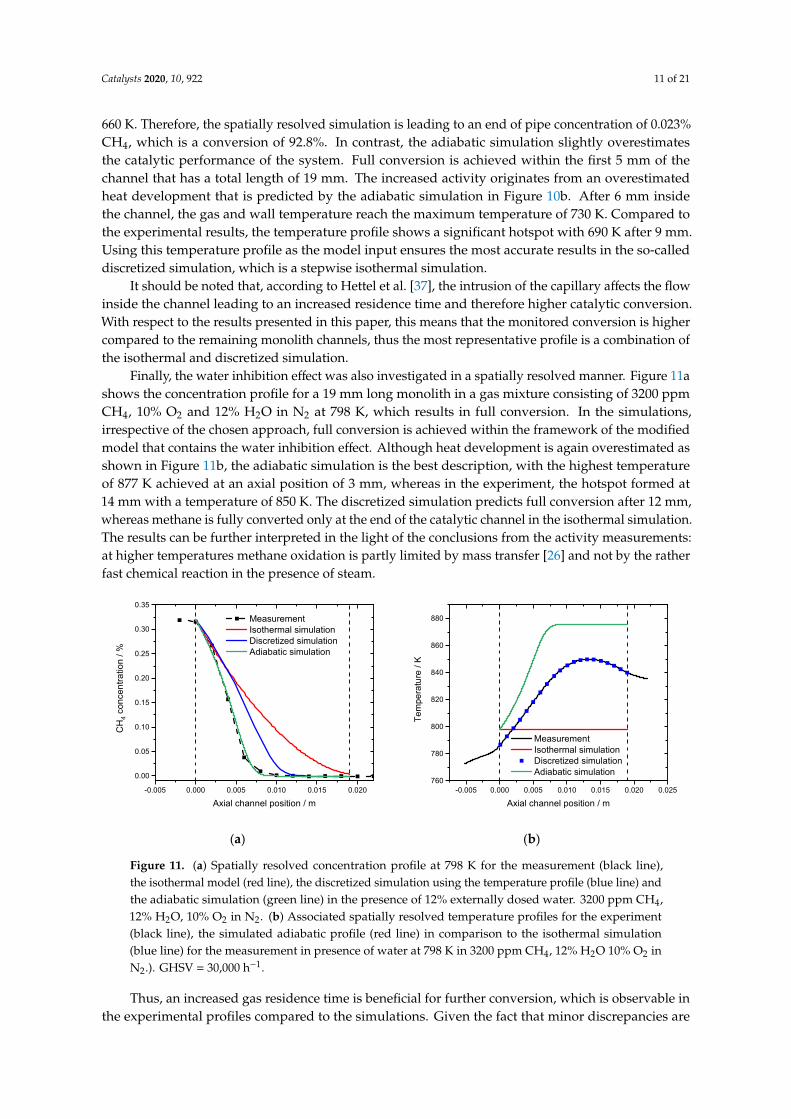
Finally, the water inhibition effect was also investigated in a spatially resolved manner. Figure 11 a shows the concentration profile for a 19 mm long monolith in a gas mixture consisting of 3200 ppm CH4, 10% O2 and 12% H2O in N2 at 798 K, which results in full conversion. In the simulations, irrespective of the chosen approach, full conversion is achieved within the framework of the modified model that contains the water inhibition effect. Although heat development is again overestimated as shown in Figure 11 b, the adiabatic simulation is the best description, with the highest temperature of 877 K achieved at an axial position of 3 mm, whereas in the experiment, the hotspot formed at 14 mm with a temperature of 850 K. The discretized simulation predicts full conversion after 12 mm, whereas methane is fully converted only at the end of the catalytic channel in the isothermal simulation. The results can be further interpreted in the light of the conclusions from the activity measurements: at higher temperatures methane oxidation is partly limited by mass transfer [26] and not by the rather fast chemical reaction in the presence of steam.
-0.005 0.000 0.005 0.010 0.015 0.0200.00
0.05
0.10
0.15
0.20
0.25
0.30
0.35
CH
4 con
cent
ratio
n / %
Axial channel position / m
Measurement Isothermal simulation Discretized simulation Adiabatic simulation
-0.005 0.000 0.005 0.010 0.015 0.020 0.025
620
640
660
680
700
720
740
Tem
pera
ture
/ K
Axial channel position / m
Measurement Isothermal simulation Discretized simulation Adiabatic simulation
Figure 10. (a) Spatially resolved concentration profile at an inlet temperature of 648 K for themeasurement (black line), the isothermal model (red line), the discretized simulation using theexperimentally measured temperature profile (blue line) and the adiabatic simulation (green line)for 3200 ppm CH4, 10% O2 in N2. The dashed lines (0 and 19 mm) indicate the monoliths length.(b) Associated spatially resolved temperature profiles for the experimentally measured (black line),the simulated adiabatic profile (red line) in comparison to the isothermal simulation (blue line) for themeasurement in absence of water at an inlet temperature of 648 K. GHSV = 30,000 h−1.
The isothermal simulation for a reactor temperature of 648 K clearly underestimates the methaneconversion inside the monolith channel. In the light-off simulation full conversion is achieved after
Catalysts 2020, 10, 922 11 of 21
660 K. Therefore, the spatially resolved simulation is leading to an end of pipe concentration of 0.023%CH4, which is a conversion of 92.8%. In contrast, the adiabatic simulation slightly overestimatesthe catalytic performance of the system. Full conversion is achieved within the first 5 mm of thechannel that has a total length of 19 mm. The increased activity originates from an overestimatedheat development that is predicted by the adiabatic simulation in Figure 10b. After 6 mm insidethe channel, the gas and wall temperature reach the maximum temperature of 730 K. Compared tothe experimental results, the temperature profile shows a significant hotspot with 690 K after 9 mm.Using this temperature profile as the model input ensures the most accurate results in the so-calleddiscretized simulation, which is a stepwise isothermal simulation.
It should be noted that, according to Hettel et al. [37], the intrusion of the capillary affects the flowinside the channel leading to an increased residence time and therefore higher catalytic conversion.With respect to the results presented in this paper, this means that the monitored conversion is highercompared to the remaining monolith channels, thus the most representative profile is a combination ofthe isothermal and discretized simulation.
Finally, the water inhibition effect was also investigated in a spatially resolved manner. Figure 11ashows the concentration profile for a 19 mm long monolith in a gas mixture consisting of 3200 ppmCH4, 10% O2 and 12% H2O in N2 at 798 K, which results in full conversion. In the simulations,irrespective of the chosen approach, full conversion is achieved within the framework of the modifiedmodel that contains the water inhibition effect. Although heat development is again overestimated asshown in Figure 11b, the adiabatic simulation is the best description, with the highest temperatureof 877 K achieved at an axial position of 3 mm, whereas in the experiment, the hotspot formed at14 mm with a temperature of 850 K. The discretized simulation predicts full conversion after 12 mm,whereas methane is fully converted only at the end of the catalytic channel in the isothermal simulation.The results can be further interpreted in the light of the conclusions from the activity measurements:at higher temperatures methane oxidation is partly limited by mass transfer [26] and not by the ratherfast chemical reaction in the presence of steam.
Catalysts 2020, 10, x FOR PEER REVIEW 11 of 20
(a) (b)
Figure 11. (a) Spatially resolved concentration profile at 798 K for the measurement (black line), the isothermal model (red line), the discretized simulation using the temperature profile (blue line) and the adiabatic simulation (green line) in the presence of 12% externally dosed water. 3200 ppm CH4, 12% H2O, 10% O2 in N2. (b) Associated spatially resolved temperature profiles for the experiment (black line), the simulated adiabatic profile (red line) in comparison to the isothermal simulation (blue line) for the measurement in presence of water at 798 K in 3200 ppm CH4, 12% H2O 10% O2 in N2.). GHSV = 30,000 h−1.
Thus, an increased gas residence time is beneficial for further conversion, which is observable in the experimental profiles compared to the simulations. Given the fact that minor discrepancies are visible in the initial light-off experiment in Figure 9, the accuracy of the spatially resolved concentration profile is fairly sufficient.
Again, for the overall activity of the monolith, a combination of the flatter course for the discretized and isothermal simulation is the best representation for the conditions of the experiments. Due to the filigree and thin capillary technique of the SpaciPro setup, the concentration profiles were axially aligned to match a monolith entrance concentration of 3200 ppm CH4.
3. Materials and Methods
3.1. Experimental
The PdO/Al2O3 catalyst was prepared by incipient wetness impregnation (IWI) with a target noble metal loading of 2.4 wt%. After impregnating γ-Al2O3 (SASOL) with an aqueous solution of tetraaminepalladium(II)-nitrate (Chempur, 3.3 wt% Pd) the received powder catalyst was first dried at 70 °C for 1 h and subsequently calcined at 550 °C for 5 h. The noble metal loading was determined by elemental analysis (inductively coupled plasma optical emission spectrometry, ICP-OES) to be 2.23 wt%. Prior to the N2-physiosorption measurement, the surface was cleaned by degassing the catalyst for 2 h at 300 °C. Afterwards, the BET-measurement [38] was conducted in a BELSORP Mini II analyser (MicrotracBEL). Scanning transmission electron microscopy (STEM) images were obtained with a FEI OSIRIS microscope (200 kV electron energy) at the Laboratory for Electron Microscopy (LEM, KIT, Karlsruhe, Germany). Analyzing over 400 noble metal particles with the software package Fiji in high angle annular dark field scanning (HAADF) and bright field mode (BF) led to the particle size distribution shown in Figure 4.
3.2. Activity Tests
The as prepared catalyst was sieved to a particle fraction of 125–250 μm to minimize internal mass transfer limitation [39]. Subsequently, 300 mg of this fraction was diluted with 700 mg SiO2 of
-0.005 0.000 0.005 0.010 0.015 0.020
0.00
0.05
0.10
0.15
0.20
0.25
0.30
0.35
CH
4 con
cent
ratio
n / %
Axial channel position / m
Measurement Isothermal simulation Discretized simulation Adiabatic simulation
-0.005 0.000 0.005 0.010 0.015 0.020 0.025760
780
800
820
840
860
880
Tem
pera
ture
/ K
Axial channel position / m
Measurement Isothermal simulation Discretized simulation Adiabatic simulation
Figure 11. (a) Spatially resolved concentration profile at 798 K for the measurement (black line),the isothermal model (red line), the discretized simulation using the temperature profile (blue line) andthe adiabatic simulation (green line) in the presence of 12% externally dosed water. 3200 ppm CH4,12% H2O, 10% O2 in N2. (b) Associated spatially resolved temperature profiles for the experiment(black line), the simulated adiabatic profile (red line) in comparison to the isothermal simulation(blue line) for the measurement in presence of water at 798 K in 3200 ppm CH4, 12% H2O 10% O2 inN2.). GHSV = 30,000 h−1.
Thus, an increased gas residence time is beneficial for further conversion, which is observable inthe experimental profiles compared to the simulations. Given the fact that minor discrepancies are
Catalysts 2020, 10, 922 12 of 21
visible in the initial light-off experiment in Figure 9, the accuracy of the spatially resolved concentrationprofile is fairly sufficient.
Again, for the overall activity of the monolith, a combination of the flatter course for the discretizedand isothermal simulation is the best representation for the conditions of the experiments. Due tothe filigree and thin capillary technique of the SpaciPro setup, the concentration profiles were axiallyaligned to match a monolith entrance concentration of 3200 ppm CH4.
3. Materials and Methods
3.1. Experimental
The PdO/Al2O3 catalyst was prepared by incipient wetness impregnation (IWI) with a targetnoble metal loading of 2.4 wt%. After impregnating γ-Al2O3 (SASOL) with an aqueous solution oftetraaminepalladium(II)-nitrate (Chempur, 3.3 wt% Pd) the received powder catalyst was first dried at70 ◦C for 1 h and subsequently calcined at 550 ◦C for 5 h. The noble metal loading was determinedby elemental analysis (inductively coupled plasma optical emission spectrometry, ICP-OES) to be2.23 wt%. Prior to the N2-physiosorption measurement, the surface was cleaned by degassing thecatalyst for 2 h at 300 ◦C. Afterwards, the BET-measurement [38] was conducted in a BELSORP Mini IIanalyser (MicrotracBEL). Scanning transmission electron microscopy (STEM) images were obtainedwith a FEI OSIRIS microscope (200 kV electron energy) at the Laboratory for Electron Microscopy(LEM, KIT, Karlsruhe, Germany). Analyzing over 400 noble metal particles with the software packageFiji in high angle annular dark field scanning (HAADF) and bright field mode (BF) led to the particlesize distribution shown in Figure 4.
3.2. Activity Tests
The as prepared catalyst was sieved to a particle fraction of 125–250 µm to minimize internalmass transfer limitation [39]. Subsequently, 300 mg of this fraction was diluted with 700 mg SiO2
of the same particle size to prevent local hotspots. A quartz glass tubular reactor (inner diameter:6 mm) was loaded with the powder. The resulting fixed packed bed had a length of approximately1.5 cm. For every conducted activity test, freshly prepared catalyst was used to capture the instantwater inhibition effect, rather than combined aging phenomena. The light-off measurements wereconducted in the Exhaust gas center Karlsruhe with a gaseous environment of 3200 ppm CH4, 10% O2,and different amounts of externally dosed water in balance N2. Mass flow controllers (MFC, Bronkhost)allowed for the precise dosage of the different gases, whereas steam was dosed with a controlledevaporator and mixer system (CEM, Bronkhost). Gas concentrations were measured end of pipe witha Fourier-transform infrared spectrometer (FTIR, Multigas MG2030, MKS) and the entire setup wascontrolled with an in-house developed LabView software tool. Heating was realized with Eurothermcontrollers to conduct light-off cycles with a temperature ramp of 3 K min−1 between 500 K and825 K. An initial degreening of the catalyst at 825 K in a reactive gas environment in the absence ofwater (3200 ppm CH4, 10% O2 in N2) guaranteed identical starting conditions. All activity tests wereconducted with a constant gas hour space velocity (GHSV) of 140,000 h−1.
3.3. Spatially Resolved Profiles
Spatially resolved concentration profiles were recorded in monolith experiments with a setupdedicated for spatial profiling (SpaciPro) [34–36]. The honeycomb structure with 400 cpsi had a totalnoble metal loading of 100 g ft−3. The monolith coating was realized by applying a slurry containing thecatalyst and AlO(OH) (Disperal P2, SASOL) as a binder via dip coating. The resulting monolith samplewas 19 mm long with a diameter of 18 mm. The in-situ axial concentration profiles were obtainedby inserting a small capillary (outer diameter 170 µm, inner diameter 100 µm) into a single centralmonolithic channel that was connected with a mass spectrometer (Hiden Analytical, HPR20). For thetemperature profiles a type K thermocouple (diameter 250 µm) was used. Both measuring instruments
Catalysts 2020, 10, 922 13 of 21
were pulled out of the monolith channel by an electric motorized linear stage (Zaber Technologies,T-LSM 100A). For a detailed description of the setup the reader is referred to previous studies [34].
3.4. Computational Methods—Reactor Model
The recently published microkinetic model developed by Stotz et al. [25] was applied toisothermally model the oxidation of methane to carbon dioxide and water. The steady-state speciesconcentration profiles were obtained using the software package DETCHEMTM, more specifically thecode DETCHEMCHANNEL [40]. Monolith and packed bed experiments were simulated with the samecode package and are thus directly comparable. The porosity of the latter is taken into account usingthe formula proposed by Pushnov [41] leading to an imaginary pathway through the reactor, which issynonymous with modelling a channel of monolith experiments. With the pipe diameter D, which isat least twice the particle size dp (sieve fraction) and the height of the column being at least 20 times dp
the porosity ε can be estimated with
ε =ADdp
n + B (1)
where A, B, and n are constants given by Pushnov [41]. To gain physically meaningful inputparameters for reliable simulations the channel diameter was set to the diameter of the catalystparticles. A steady-state two-dimensional flow is computed using the boundary-layer approximation.Fundamentally, this approach relies on the governing partial differential equations of mass conservation,axial momentum conservation, radial momentum, and energy and species continuity. These aredefined in the following.
Mass conservation:ε =
ADdp
n + B (2)
Axial momentum conservation:
∂(rρu)∂z
+∂(rpv)∂r
= 0 (3)
Radial momentum continuity:
∂(rρu2
)∂z
+∂(rpuv)∂r
= −r∂p∂z
+∂∂r
(µr∂u∂r
)(4)
Energy continuity:
∂(rρuh)∂z
+∂(rpvh)∂r
= u∂p∂z
+∂∂r
(λr∂T∂r
)−∂∂r
∑i
rjihi (5)
Species continuity:∂(rρuYi)
∂z+∂(rpvYi)
∂r=
∂∂r
(rji) + r.
wi (6)
Ideal gas equation of state:
p =pMRT
(7)
In the equations above, z. denotes the axial, r the radial coordinate respectively, ρ the density,u the axial and v the radial velocity component. Additionally, h is the enthalpy, p the pressure, λ thethermal conductivity and T the corresponding temperature. Y describes the mass fraction, j the radialdiffusion flux, and
.wi the gas phase production rate of the species i. In the ideal gas equation of state
M is the mean molecular weight of the gas-mixture and R the universal gas constant. As a modelinput parameter, the inlet flow velocity had to be calculated from the measured experimental volume
Catalysts 2020, 10, 922 14 of 21
flux that was adjusted to the correlated gas inlet temperature. Furthermore, the simulations basedon monolith experiments used the effectiveness model to represent limited diffusion behavior insidethe channel.
Owing to the comparable low temperatures of the oxidation reaction, gas phase reactions typicallydo not occur, hence only surface reactions are embedded in the elementary-step based reactionmechanism. The chemical source term
.si of the surface species i is described within approximations of
the mean-field theory.
.si = k f ,k
Ng+Ns∏j=1
cv′jkj − kr,k
Ng+Ns∏j=1
cv′′jkj (8)
Herein, v′jk and, v′′jk are the stoichiometric coefficients of all species j involved in step k for theforward reaction k f ,k and the backward reaction kr,k respectively. The species concentrations arerepresented by c j, whereas Ns and Ng are the surface and gas-phase species also involved in adsorptionand desorption processes. Subsequently, the surface coverages θi in steady-state yields into
θi = ciσiΓ
(9)
where σi is the number of occupied surface sites and Γ = 3.553 ∗ 10−9mol cm−2 [25] is the surface sitedensity of PdO. Furthermore, a modified Arrhenius expression is used to describe the rate coefficientsof the surface reactions that accounts for the coverage dependency εi of the activation energy.
kk = AkTβk exp[−
Ea,k
RT
]∗
Ns∏i=1
exp[νi,kεiθi
RT
](10)
Equation (10) uses the pre-exponential factor Ak which is temperature corrected with Tβk .Adsorption reactions are modelled with sticking coefficients s0
i that calculate rate constants as
kads =s0
iΓnk
√RT
2πMi(11)
Here, the exponent nk accounts for the molecular adsorption with the value of 1 for molecularadsorption and a dissociative adsorption with nk = 2. Additionally, the mechanism used in this studyexhibits full thermodynamic consistency, which means that the equilibrium is represented in the limitof an infinite time scale for all elementary steps being reversible. The procedure has been described ingreat detail in the literature [42]. Particularly, the model input parameter Fcat,geo is focus of the study,which is the quotient of the catalytically active area Acat and the geometric area Ageo.
Fcat,geo =Acat
Ageo(12)
The latter is given by the product of the converted geometric surface that are the channel diameterD and the length of the catalyst L.
Ageo = πDL (13)
Acat can be calculated with the mean particle diameter dNP determined by TEM images and thehemispherical particle assumption [43]
Acat =6mPdO
dNPρPdO(14)
The used mass of PdO is denoted by mPdO with the density ρPdO.

Catalysts 2020, 10, 922 15 of 21
3.5. Chemical Model
Our group recently published the chemical model used in this study, shown in Appendix ATable A1 [25] The unchanged kinetic parameters for the modified Arrhenius expressions are based onDFT derived energetics by Grönbeck et al. [44] with coordinatively unsaturated Pd (a) and lattice oxygensites of PdO (b) present in the (101) facet and listed subsequently. The detailed reaction simulations arebased on mean field approximations comprising the dual sites with a Mars–van Krevelen mechanism.In total, 23 surface intermediates are implemented in the mechanism, 15 species on the related Pd-sites((a), O(a), O2(a), OH(a), H2O(a), CO(a), HCOO(a), H(a), CO2(a), CH3(a), CH2OH(a), CH2O(a), CHO(a),CH2(a), CH(a)) and 8 on the oxygen part of the oxide ((b), vac(b), O(b), H(b), CO(b), CH2(b), CH3(b),CHO(b)). Additionally, these oxide sites can react to form oxygen vacancies (vac(b)) in accordance withthe Mars–van-Krevelen formulation. Subsequent regeneration is also considered. CO as an intermediateof the chemical reactions on the surface is not part of the feed gas, thus adsorption and desorptionis neglected, leading to an improved numerical performance of the simulations for the remainingparticipating gas species CH4, O2, H2O, and CO2. Furthermore, the microkinetic mechanism representsdifferent carbonaceous reaction routes for methane oxidation. A preferential pathway at dry conditionsand low temperatures with mainly CH2OH species over (a) sites is implemented as well as a pathwayafter light-off at dry conditions and with externally dosed water being present over CH2 (a) speciesand a subsequent exchange on (b) sites as described in the reaction pathway analysis [25]. Herein,the new approach to capture the water inhibition effect relies on altering the accessible surface areaFcat,geo for the catalytic reaction, hence thermodynamic consistency is still guaranteed.
3.6. Model Development
Most parts of the simulations were carried out with the software tool CaRMeN (Catalytic reactionmechanism network) [45,46] developed by our group to digitalize the work around catalyst researchand reactor modeling. The software provides an efficient way to archive and combine experimentaland modeling results, i.e., for light-off experiments as well as spatially resolved simulation along theaxial length of a monolith, CaRMeN sufficiently accelerated the process of model development andvalidation. Based on the present work, the software tool ensured a good visualization of the impact ofexternally dosed water on the methane conversion during the oxidation process. In addition to thewater inhibition effect, the described effect of systematically inaccessible surface area was depictableand comparable instantaneously in order to improve the understanding of the catalytic system.
4. Conclusions
Based on systematic light-off tests in the absence and presence of various steam concentrations,a microkinetic model was extended to capture the instant water deactivation effect of the catalyticmethane oxidation over Pd-based catalysts. We introduced a blocking mechanism where the catalyticallyactive surface is covered, thereby decreasing the methane conversion. Based on the trends observed forthe activity, which shifts towards a higher temperature with an increasing amount of externally dosedwater, we propose that for steam concentrations between 1 and 15% the accessible surface area decreasesby 50.0%–87.8%. The model was further tested with profound packed bed and monolith experiments.Additionally, the accuracy was demonstrated by comparing modeled results with experimentallyobtained spatially resolved concentration profiles inside a channel of the monolith. This new approachoffers a way to include dynamic inhibition effects into microkinetic models of catalytic reactors.
Author Contributions: Conceptualization, P.L., H.S. and K.K.; methodology, P.L., O.D, and K.K.; writing—originaldraft preparation, K.K.; supervision, P.L., L.M., and O.D. All authors have read and agreed to the publishedversion of the manuscript.
Funding: The authors kindly acknowledge the financial support by German Research Foundation(Deutsche Forschungsgemeinschaft, DFG) through project CRC 1441.

Catalysts 2020, 10, 922 16 of 21
Acknowledgments: The authors gratefully thank A. Deutsch for the BET-measurements, S. Bastian for hissupport during the spatially resolved concentration profile measurements, H. Störmer (LEM, KIT) for the TEMmeasurements, T. Bergfeldt (IAM, KIT) for the elemental analysis and J.-D. Grunwaldt as well as M. Casapu forfruitful discussions. Furthermore the authors thank Steinbeis GmbH für Technologietransfer (STZ 240 ReaktiveStrömungen) for a cost-free license of DETCHEMTM.
Conflicts of Interest: The authors declare no conflict of interest.
Appendix A
Shown is the chemical model developed by Stotz et al. as presented in the literature [25].
Catalysts 2020, 10, 922 17 of 21
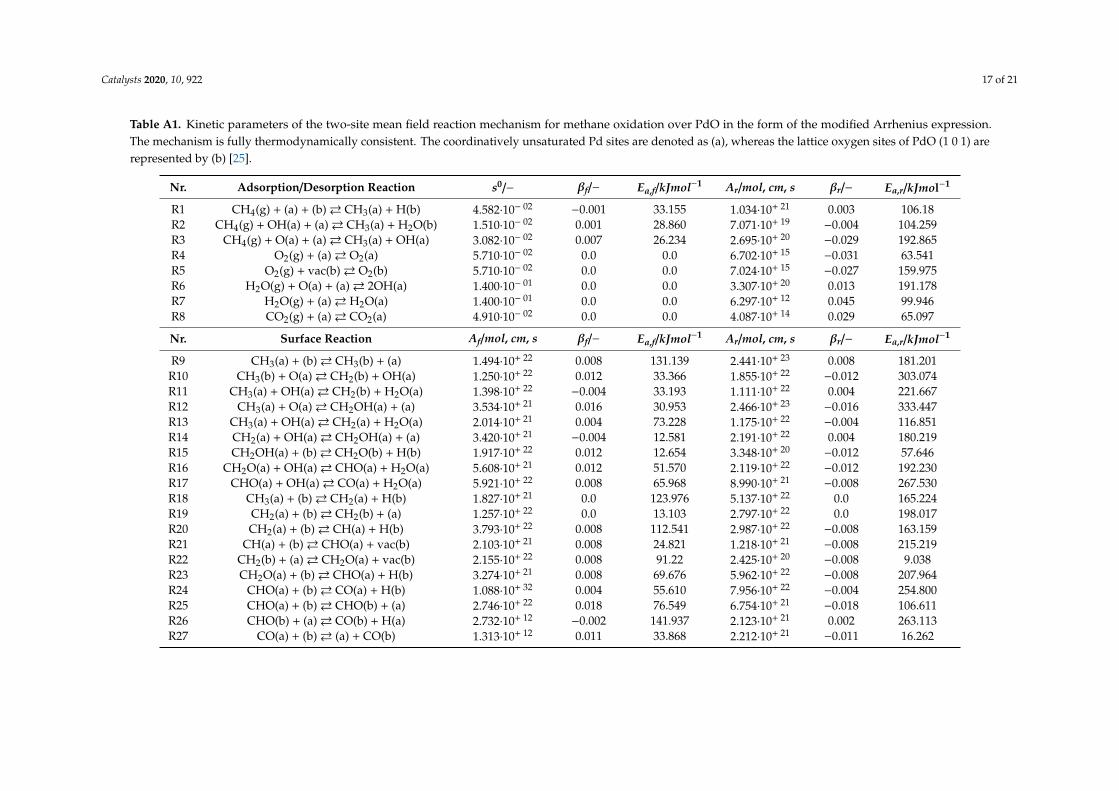
Table A1. Kinetic parameters of the two-site mean field reaction mechanism for methane oxidation over PdO in the form of the modified Arrhenius expression.The mechanism is fully thermodynamically consistent. The coordinatively unsaturated Pd sites are denoted as (a), whereas the lattice oxygen sites of PdO (1 0 1) arerepresented by (b) [25].
Nr. Adsorption/Desorption Reaction s0/− βf/− Ea,f/kJmol−1 Ar/mol, cm, s βr/− Ea,r/kJmol−1
R1 CH4(g) + (a) + (b)� CH3(a) + H(b) 4.582·10− 02 −0.001 33.155 1.034·10+ 21 0.003 106.18R2 CH4(g) + OH(a) + (a)� CH3(a) + H2O(b) 1.510·10− 02 0.001 28.860 7.071·10+ 19 −0.004 104.259R3 CH4(g) + O(a) + (a)� CH3(a) + OH(a) 3.082·10− 02 0.007 26.234 2.695·10+ 20 −0.029 192.865R4 O2(g) + (a)� O2(a) 5.710·10− 02 0.0 0.0 6.702·10+ 15 −0.031 63.541R5 O2(g) + vac(b)� O2(b) 5.710·10− 02 0.0 0.0 7.024·10+ 15 −0.027 159.975R6 H2O(g) + O(a) + (a)� 2OH(a) 1.400·10− 01 0.0 0.0 3.307·10+ 20 0.013 191.178R7 H2O(g) + (a)� H2O(a) 1.400·10− 01 0.0 0.0 6.297·10+ 12 0.045 99.946R8 CO2(g) + (a)� CO2(a) 4.910·10− 02 0.0 0.0 4.087·10+ 14 0.029 65.097
Nr. Surface Reaction Af/mol, cm, s βf/− Ea,f/kJmol−1 Ar/mol, cm, s βr/− Ea,r/kJmol−1
R9 CH3(a) + (b)� CH3(b) + (a) 1.494·10+ 22 0.008 131.139 2.441·10+ 23 0.008 181.201R10 CH3(b) + O(a)� CH2(b) + OH(a) 1.250·10+ 22 0.012 33.366 1.855·10+ 22 −0.012 303.074R11 CH3(a) + OH(a)� CH2(b) + H2O(a) 1.398·10+ 22 −0.004 33.193 1.111·10+ 22 0.004 221.667R12 CH3(a) + O(a)� CH2OH(a) + (a) 3.534·10+ 21 0.016 30.953 2.466·10+ 23 −0.016 333.447R13 CH3(a) + OH(a)� CH2(a) + H2O(a) 2.014·10+ 21 0.004 73.228 1.175·10+ 22 −0.004 116.851R14 CH2(a) + OH(a)� CH2OH(a) + (a) 3.420·10+ 21 −0.004 12.581 2.191·10+ 22 0.004 180.219R15 CH2OH(a) + (b)� CH2O(b) + H(b) 1.917·10+ 22 0.012 12.654 3.348·10+ 20 −0.012 57.646R16 CH2O(a) + OH(a)� CHO(a) + H2O(a) 5.608·10+ 21 0.012 51.570 2.119·10+ 22 −0.012 192.230R17 CHO(a) + OH(a)� CO(a) + H2O(a) 5.921·10+ 22 0.008 65.968 8.990·10+ 21 −0.008 267.530R18 CH3(a) + (b)� CH2(a) + H(b) 1.827·10+ 21 0.0 123.976 5.137·10+ 22 0.0 165.224R19 CH2(a) + (b)� CH2(b) + (a) 1.257·10+ 22 0.0 13.103 2.797·10+ 22 0.0 198.017R20 CH2(a) + (b)� CH(a) + H(b) 3.793·10+ 22 0.008 112.541 2.987·10+ 22 −0.008 163.159R21 CH(a) + (b)� CHO(a) + vac(b) 2.103·10+ 21 0.008 24.821 1.218·10+ 21 −0.008 215.219R22 CH2(b) + (a)� CH2O(a) + vac(b) 2.155·10+ 22 0.008 91.22 2.425·10+ 20 −0.008 9.038R23 CH2O(a) + (b)� CHO(a) + H(b) 3.274·10+ 21 0.008 69.676 5.962·10+ 22 −0.008 207.964R24 CHO(a) + (b)� CO(a) + H(b) 1.088·10+ 32 0.004 55.610 7.956·10+ 22 −0.004 254.800R25 CHO(a) + (b)� CHO(b) + (a) 2.746·10+ 22 0.018 76.549 6.754·10+ 21 −0.018 106.611R26 CHO(b) + (a)� CO(b) + H(a) 2.732·10+ 12 −0.002 141.937 2.123·10+ 21 0.002 263.113R27 CO(a) + (b)� (a) + CO(b) 1.313·10+ 12 0.011 33.868 2.212·10+ 21 −0.011 16.262

Catalysts 2020, 10, 922 18 of 21
Table A1. Cont.
R28 CO(b) + (a)� CO2(a) + vac(b) 1.40·10+ 21 0.010 42.023 9.554·10+ 20 −0.010 78.477R29 H(b) + (a)� OH(a) + vac(b) 1.886·10+ 22 0.0 137.8 4.222·10+ 21 0.0 27.9R30 O2(a) + (a)� O(a) + O(a) 3.815·10+ 22 0.005 174.961 1.744·10+ 21 −0.005 59.139R31 O(b) + (a)� O(a) + (b) 2.380·10+ 22 0.027 116.625 1.797·10+ 21 −0.027 107.875R32 O(a) + vac(b)� (a) + (b) 8.012·10+ 21 0.020 48.597 1.387·10+ 22 −0.020 252.103R33 O2(a) + vac(b)� O(a) + (b) 1.196·10+ 24 0.025 81.408 9.469·10+ 22 −0.025 169.092R34 H(b) + (a)� H(a) + (b) 6.133·10+ 22 0.002 148.173 9.505·10+ 21 −0.002 117.827R35 CHO(b) + OH(a)� H2O(a) + CO(b) 2.992·10+ 22 0.001 2.168 3.113·10+ 22 −0.001 156.062R36 CHO(b) + (a)� HCOO(a) + vac(b) 3.658·10+ 21 0.0 11.580 1.210·10+ 21 0.0 8.680R37 HCOO(a) + OH(a)� CO2(a) + H2O(a) 2.305·10+ 23 0.011 193.191 4.912·10+ 23 −0.011 376.439R38 HCOO(a) + (b)� H(b) + CO2(a) 1.681·10+ 23 0.007 177.623 1.726·10+ 24 −0.007 368.497R39 H2O(a) + (b)� OH(a) + H(b) 3.659·10+ 21 0.0 12.5 1.763·10+ 22 0.008 10.126
Catalysts 2020, 10, 922 19 of 21
References
1. Lewandowska-Bernat, A.; Desideri, A. Opportunities of power-to-gas technology in different energy systemsarchitectures. Appl. Energy 2018, 228, 57–67. [CrossRef]
2. Eveloy, V.; Gebreegziabher, T. A review of projected power-to-gas deployment scenarios. Energies 2018, 11,1824. [CrossRef]
3. Engerer, H.; Horn, M. Natural gas vehicles: An option for Europe. Energy Policy 2010, 38, 1017–1029.[CrossRef]
4. Deutschmann, O.; Grunwaldt, J.-D. Exhaust gas aftertreatment in mobile systems: Status, challenges,and perspectives. Chem.-Ing.-Tech. 2013, 85, 595–617. [CrossRef]
5. Gremminger, A.; Pihl, J.; Casapi, M.; Grunwaldt, J.-D.; Toops, T.J. PGM based catalysts for exhaust-gasafter-treatment under typical diesel, gasoline and gas engine conditions with focus on methane andformaldehyde oxidation. Appl. Catal. B 2020, 15, 118571. [CrossRef]
6. Karion, A.; Sweeney, C.; Pétron, G.; Frost, G.; Hardesty, R.M.; Kofler, J.; Miller, B.R.; Newberger, T.; Wolter, S.;Banta, R.; et al. Methane emissions estimate from airborne measurements over a western United Statesnatural gas field. Geophys. Res. Lett. 2013, 40, 4393–4397. [CrossRef]
7. Ciuparu, D.; Lyubovsky, M.R.; Altmann, E.; Pfefferle, L.D.; Datye, A.T. Catalytic combustion of methane overpalladium-based catalysts. Catal. Rev. Sci. Eng. 2002, 44, 593–649. [CrossRef]
8. Gelin, P.; Primet, M. Complete oxidation of methane at low temperature over noble metal based catalysts:A review. Appl. Catal. B 2002, 39, 1–37. [CrossRef]
9. Ciuparu, D.; Bozon-Verduraz, F.; Pfefferle, L.D. Oxygen exchange between palladium and oxide supports incombustion catalysts. J. Phys. Chem. B 2002, 106, 3434–3442. [CrossRef]
10. Ciuparu, D.; Perkins, E.; Pfefferle, L.D. In situ DR-FTIR investigation of surface hydroxyls on γ-Al2O3
supported PdO catalysts during methane combustion. Appl. Catal. A 2004, 263, 145–153. [CrossRef]11. Au-Yeung, J.; Chen, K.; Bell, A.T.; Iglesia, E. Isotopic studies of methane oxidation pathways on PdO catalysts.
J. Catal. 1999, 188, 132–139. [CrossRef]12. Ciuparu, D.; Altman, E.; Pfefferle, L. Contributions of lattice oxygen in methane combustion over PdO-based
catalysts. J. Catal. 2001, 203, 64–74. [CrossRef]13. Müller, C.A.; Maciejewski, M.; Koeppel, R.A.; Baiker, A. Combustion of methane over palladium/zirconia:
Effect of Pd-particle size and role of lattice oxygen. Catal. Today 1999, 47, 245–252. [CrossRef]14. Stakheev, A.Y.; Batkin, A.M.; Teleguina, N.S.; Bragina, O.; Zaikovsky, V.I.; Prosvirin, I.P.; Khudorozhkov, A.K.;
Bukhtiyarov, V.I. Particle Size Effect on CH4 Oxidation Over Noble Metals: Comparison of Pt and PdCatalysts. Top. Catal. 2013, 56, 306–310. [CrossRef]
15. Chin, Y.C.; Buda, C.; Neurock, M.; Iglesia, E. Consequences of Metal–Oxide Interconversion for C–H BondActivation during CH4 Reactions on Pd Catalysts. J. Am. Chem. Soc. 2013, 135, 15425–15442. [CrossRef][PubMed]
16. Rogal, J.; Reuter, K.; Scheffler, M. Thermodynamic stability of PdO surfaces. Phys. Rev. B 2004, 69, 075421.[CrossRef]
17. Lundgren, E.; Gustafson, J.; Mikkelsen, A.; Andersen, J.N.; Stierle, A.; Dosch, H.; Todorova, M.; Rogal, J.;Reuter, K.; Scheffler, M. Kinetic hindrance during the initial oxidation of Pd (100) at ambient pressures.Phys. Rev. Lett. 2004, 92, 046101. [CrossRef]
18. Cargnello, M.; Jaen, J.J.D.; Garrido, J.C.H.; Bakhmutsky, K.; Montini, T.; Gamez, J.J.C.; Gorte, R.J.; Fornasiero, P.Exceptional activity for methane combustion over modular Pd CeO2 subunits on functionalized Al2O3.Science 2012, 337, 713–717. [CrossRef]
19. Colussi, S.; Trovarelli, A.; Groppi, G.; Llorca, J. The effect of CeO2 on the dynamics of Pd–PdO transformationover Pd/Al2O3 combustion catalysts. Catal. Commun. 2007, 8, 1263–1266. [CrossRef]
20. Gremminger, A.T.; de Carvalho, H.W.P.; Popescu, R.; Grunwaldt, J.-D.; Deutschmann, O. Influence of gascomposition on activity and durability of bimetallic Pd-Pt/Al2O3 catalysts for total oxidation of methane.Catal. Today 2015, 258, 470–480. [CrossRef]
21. Gremminger, A.T.; Lott, P.; Merts, M.; Casapu, M.; Grunwaldt, J.-D.; Deutschmann, O. Sulfur poisoning andregeneration of bimetallic Pd-Pt methane oxidation catalysts. Appl. Catal B 2017, 218, 833–843. [CrossRef]
Catalysts 2020, 10, 922 20 of 21
22. Lott, P.; Dolcet, P.; Casapu, M.; Grunwaldt, J.-D.; Deutschmann, O. The Effect of Prereduction on thePerformance of Pd/Al2O3 and Pd/CeO2 Catalysts during Methane Oxidation. Ind. Eng. Chem. Res. 2019, 58,12561–12570. [CrossRef]
23. Karinshak, K.A.; Lott, P.; Harold, M.P.; Deutschmann, O. In situ activation of bimetallic Pd-Pt methaneoxidation catalysts. Chem. Cat. Chem. 2020, 12, 1–10.
24. Stotz, H.; Maier, L.; Deutschmann, O. Methane oxidation over palladium: On the mechanism in fuel-richmixtures at high temperatures. Top. Catal. 2017, 60, 83–109. [CrossRef]
25. Stotz, H.; Maier, L.; Boubnov, A.; Gremminger, A.; Grunwaldt, J.-D.; Deutschmann, O. Surface reactionkinetics of methane oxidation over PdO. J. Catal. 2019, 370, 152–175. [CrossRef]
26. Farrauto, R.J.; Hobson, M.C.; Kennelly, T.; Waterman, E.M. Catalytic chemistry of supported palladium forcombustion of methane. Appl. Catal. A 1992, 81, 227–237. [CrossRef]
27. Grunwaldt, J.-D.; van Vegten, N.; Baiker, A. Insight into the structure of supported palladium catalystsduring the total oxidation of methane. Chem. Commun. 2007, 4635–4637. [CrossRef]
28. Torkashvand, B.; Gremminger, A.; Valchera, S.; Casappu, M. The impact of pre-turbine catalyst placementon methane oxidation in lean-burn gas engines: An experimental and numerical study. SAE Tech. Pap.2017, 1019. [CrossRef]
29. Torkashvand, B.; Maier, L.; Hettel, M.; Schedlbauer, T.; Grunwaldt, J.-D.; Deutschmann, O. On the challengesand constrains of ultra-low emission limits: Formaldehyde oxidation in catalytic sinusoidal-shaped channels.Chem. Eng. Sci. 2019, 195, 841–850. [CrossRef]
30. Ovesen, C.; Clausen, B.; Schiøtz, J.; Stoltze, P.; Topsøe ,̧ H.; Nørskov, E.J. Kinetic implications of dynamicalchanges in catalyst morphology during methanol synthesis over Cu/ZnO catalysts. J. Catal. 1997, 168,133–142. [CrossRef]
31. Grunwaldt, J.-D.; Molenbroek, A.; Topsøe, N.-Y.; Topsøe, H.; Clausen, B. In situ investigations of structuralchanges in Cu/ZnO catalysts. J. Catal. 2000, 194, 452–460. [CrossRef]
32. Hansen, P.L.; Wagner, J.B.; Helveg, S.; Rostrup-Nielsen, J.R.; Clausen, B.S.; Topsøe, H. Atom-resolved imagingof dynamic shape changes in supported copper nanocrystals. Science 2002, 295, 2053–2055. [CrossRef][PubMed]
33. Barrett, W.; Shen, J.; Hu, Y.; Hayes, R.E.; Scott, R.W.J.; Semagina, N. Understanding the Role of SnO2 Supportin Water-Tolerant Methane Combustion: In situ Observation of Pd(OH)2 and Comparison with Pd/Al2O3.ChemCatChem 2019, 12, 944–952. [CrossRef]
34. Livio, D.; Diehm, C.; Donazzi, A.; Beretta, A.; Deutschmann, O. Catalytic partial oxidation of ethanol overRh/Al2O3: Spatially resolved temperature and concentration profiles. Appl. Catal. A 2013, 467, 530–541.[CrossRef]
35. Chan, D.; Tischer, S.; Heck, J.; Diehm, C.; Deutschmann, O. Correlation between catalytic activity and catalyticsurface area of a Pt/Al2O3 DOC: An experimental and microkinetic modeling study. Appl. Catal. B 2014,156–157, 153–165. [CrossRef]
36. Schedlbauer, T.; Lott, P.; Casapu, M.; Störmer, H.; Deutschmann, O. Impact of the Support on the CatalyticPerformance, Inhibition Effects and SO2 Poisoning Resistance of Pt-Based Formaldehyde Oxidation Catalysts.Top. Catal. 2018, 62, 198–205. [CrossRef]
37. Hettel, M.; Diehm, C.; Torkashvand, B.; Deutschmann, O. Critical evaluation of in situ probe techniques forcatalytic honeycomb monoliths. Catal. Today 2013, 216, 2–10. [CrossRef]
38. Brunauer, S.; Emmett, P.H.; Teller, E. Adsorption of gases in multimolecular layers. J. Am. Chem. Soc. 1938,60, 309–319. [CrossRef]
39. Groppi, G.; Ibashi, W.; Tronconi, E.; Forzatti, P. Structured reactors for kinetic measurements under severeconditions in catalytic combustion over palladium supported systems. Catal. Today 2001, 69, 399–408.[CrossRef]
40. Deutschmann, O.; Tischer, S.; Correa, C.; Chatterjee, D.; Kleditzsch, S.; Janardhanan, V.M.; Mladenov, N.;Minh, H.D.; Karadeniz, H.; Hettel, M. DETCHEM Software Package, 2.6 ed., Karlsruhe 2020. Available online:http://www.detchem.com (accessed on 11 August 2020).
41. Pushnov, A.S. Calculation of average bed porosity. Chem. Pet. Eng. 2006, 42, 14–17. [CrossRef]42. Delgado, K.; Maier, L.; Tischer, S.; Zellner, A.; Stotz, H.; Deutschmann, O. Surface reaction kinetics of
steam-and CO2-reforming as well as oxidation of methane over nickel-based catalysts. Catalysts 2015, 5,871–904. [CrossRef]

Catalysts 2020, 10, 922 21 of 21
43. Bergeret, G.; Gallezot, P. Makrokinetics and Transport Processes. In Handbook of Heterogeneous Catalysis,2nd ed.; Wiley-VCH: Weinheim, Germany, 2008.
44. Van den Bossche, M.; Grönbeck, H. Methane oxidation over PdO (101) revealed by first-principles kineticmodeling. J. Am. Chem. Soc. 2015, 137, 12035–12044. [CrossRef] [PubMed]
45. Gossler, H.; Maier, L.; Angeli, S.; Tischer, S.; Deutschmann, O. CaRMeN: A tool for analysing and derivingkinetics in the real world. Phys. Chem. Chem. Phys. 2018, 20, 10857–10876. [CrossRef] [PubMed]
46. Gossler, H.; Maier, L.; Angeli, S.; Tischer, S.; Deutschmann, O. CaRMeN: An Improved Computer-AidedMethod for Developing Catalytic Reaction Mechanisms. Catalysts 2019, 9, 227. [CrossRef]
© 2020 by the authors. Licensee MDPI, Basel, Switzerland. This article is an open accessarticle distributed under the terms and conditions of the Creative Commons Attribution(CC BY) license (http://creativecommons.org/licenses/by/4.0/).
Related Documents