PUBLICATION INFORMATION
This is the author’s version of a work that was accepted for publication in the Bulletin of Indonesian Economic Studies journal. Changes resulting from the publishing process, such as peer review, editing, corrections, structural formatting, and other quality control mechanisms may not be reflected in this document. Changes may have been made to this work since it was submitted for publication. A definitive version was subsequently published in https://doi.org/10.1080/00074918.2019.1576855 Digital reproduction on this site is provided to CIFOR staff and other researchers who visit this site for research consultation and scholarly purposes. Further distribution and/or any further use of the works from this site is strictly forbidden without the permission of the Bulletin of Indonesian Economic Studies journal. You may download, copy and distribute this manuscript for non-commercial purposes. Your license is limited by the following restrictions: 1. The integrity of the work and identification of the author, copyright owner and publisher must be
preserved in any copy. 2. You must attribute this manuscript in the following format: This is a manuscript version of an article by Clements, C., Alwang, J., Achdiawan, R. 2019. Value Chain Approaches in a Stagnant Industry: The Case of Furniture Production in Jepara, Indonesia. Bulletin of Indonesian Economic Studies. DOI: https://doi.org/10.1080/00074918.2019.1576855
1
Value Chain Approaches in a Stagnant Industry: The Case of Furniture Production in Jepara, Indonesia
Abstract
This article assesses impacts of the Jepara Furniture Value Chain project, which was intended to
address challenges faced by small-scale furniture producers in Jepara, Indonesia. The assessment
focuses on effects of membership in the APKJ, an association started as part of the project.
Propensity score matching was used to compare differences in outcome variables for association
members and matched non-members. A limited, positive impact of APKJ membership was found.
Members have improved their marketing behaviors in ways that will allow them to retain more value
compared to non-members. APKJ members are also more likely to have obtained certificates of
timber legality. Membership in the APKJ does not have a significant effect on firm profit and there
is little evidence of an industry transformation. The paper also provides a critique of indiscriminate
use of a value chain approach.
INTRODUCTION
The teak and mahogany carving industry of Jepara, Indonesia has been culturally and
economically important to the region for hundreds of years. The industry is now confronted by
scarcity of timber, international pressure for assurance of timber legality, and increased international
competition (Loebis and Schmitz 2005). Small-scale producers are particularly vulnerable to
pressures faced by the industry and suffer additional challenges of limited ability to bargain and
obtain higher prices, inadequate access to credit, restricted market access, and lack of knowledge of
modern business practices (Purnomo et al. 2013). The Jepara Furniture Value Chain (FVC) project,
conducted by the Centre for International Forestry Research (CIFOR) from 2008 to 2013, sought to
address challenges faced by small-scale furniture producers in Jepara. This study evaluates impacts of
2
membership in the producer association, the Assosiasi Pengrajin Kecil di Jepara (APKJ), established as
part of the project.
The FVC project applied a value chain approach to a relatively backward industry
undergoing stress and experiencing stagnating demand. In contrast to most value chain
development efforts, which use buyer-driven engagement responding to growth of new demands,
the FVC was producer-driven, focusing on actions to increase profitability of small-scale producers.
In a standard value chain exercise, buyer-driven demand or transformation of upstream marketing
processes creates pressure to replace traditional market arrangements with new ones (Handschuch,
Wollni and Villalobos 2013; Maertens and Swinnen 2012; Maertens, Minten and Swinnen 2012). In
the FVC project, the idea was to modernize the furniture value chain in the absence of tangible
growth in new markets. Without demand-related rewards, profit gains from value chain
improvements can be small, leaving few incentives to participate in upgrading. This is the case in
Jepara, where the development of the value chain was not driven by buyer demands; instead the
project focused on improvements in actions of suppliers.
The impact of value chain upgrading is assessed by comparing the outcomes of furniture
producers who participated in the APKJ to what the outcome would have been without the project.
Propensity score matching is used to establish the counterfactual; we match project participants with
objectively similar non-participants. This study quantifies economic impacts of the project by
comparing firm profits of APKJ members against a counterfactual, and determines the influence of
APKJ membership on firm management, marketing and selling behaviour.
We find that APKJ membership is not significantly related to firm profit and there is little
evidence of an industry transformation. APKJ members have improved their ability to bargain with
buyers, adopted improved marketing behaviors, and are more likely to have obtained certificates of
timber legality. However, the organization has not attracted additional members in the four years
3
since termination of the project and economic returns to membership are limited, at least in the
short- to medium-run.
BACKGROUND
The Jepara Furniture Industry
Jepara District is located in Central Java, Indonesia. Its population, which exceeded 1 million
in 2008, is spread over 16 administrative sub-districts called Kecamatan (Anggara et al. 2013). The
furniture industry is central to the District’s economy. Teak and mahogany carving have been
culturally and economically important to the region for hundreds of years, though the strength of
the industry has fluctuated over time. The industry was estimated to have employed 120,000 workers
and contributed 26% to Jepara’s GDP in 2010 (Angarra, Purnomo, and Shantiko 2013; Purnomo et
al. 2014). In 2010, Jepara had more than 11,000 log parks, sawmills, ironmongeries, workshops,
showrooms and warehouses (Anggara, Purnomo and Shantiko 2013). The vast majority of these
units are small in scale and production is relatively rustic.
In Jepara’s furniture industry, timber is produced in plantation and (mostly community-
based) agro-forests. Furniture wood, mainly teak and mahogany, moves through two distinct
networks; wood brokers sell directly to mechanized furniture producers, while in the smaller-scale
industry, a focus of the FVC project, wood retailers and sawmill owners sell to small- and medium-
scale furniture producers. These furniture producers sell through three channels: to finishing and
exporting companies, directly to retailers, and to domestic furniture brokers. Some small-scale
producers sell directly to final consumers, either through showrooms or local market sales (Roda et
al. 2007; see Purnomo et al. 2014 for a value chain flowchart). Value from small- and medium-scale
production is, however, not evenly distributed; small-scale tree producers and small- and medium-
4
scale furniture producers are virtually excluded from high shares of the final value (Purnomo et al.
2009).
The industry faces several challenges. Increased international competition and timber
scarcity represent threats as furniture exports from China and Vietnam enter international and
domestic markets. The ASEAN-China free trade agreement of 2012 reduced trade barriers, allowing
furniture from China and Vietnam to flood the Indonesian market, adversely affecting market shares
and profitability of domestic producers (Purnomo et al. 2014). Timber scarcity has increased the
price and lowered the quality of inputs and facilitated development of a large illegal timber trade.
Illegal timber harvesting diminishes timber stocks, leads to forest degradation, and jeopardizes
industry sustainability. However, purchasing illegal timber is an appealing alternative for furniture
producers, as it can reduce timber procurement costs by as much as 60% (Loebis and Schmitz 2005;
Yovi, Bahruni and Nurrochmat 2009).
A policy to reduce the illegal timber trade represents another challenge to small-scale
furniture producers. A regulation called Sistem Verifikasi Legalis Kayu (SVLK) passed in 2009 as a
mechanism to certify that timber products are legal. It was created as part of a Voluntary Partnership
Agreement with the European Union in accordance with the EU’s regulations against import of
illegally sourced timber products. Under the SVLK, all exporters must have certification indicating
that timber was obtained in compliance with Indonesian law (Fishman and Obidzinski 2015).
Requirements for legality certificates vary by operation type. Timber processors (such as furniture
producers) must have proof that they are authorized to operate and be able to trace the source of
their timber (Fishman and Obidzinski 2015). SVLK requires maintenance of records of purchased
timber, a challenge for small-scale producers with limited education. Additionally, certification
5
requires the business to be formally registered and pay taxes, which discourages small-scale
producers from obtaining certification.
Small-scale producers also face challenges due to their scale and to the structure of the
industry. They have limited access to markets and credit, low bargaining power, and heavy reliance
on middlemen (Anggara, Irawati and Purnomo 2009). Few of these “challenges” are related to a
transformation in the ways that furniture moves from producers to end consumers. While actions
are needed to enhance the viability of the industry, it is not clear that a value chain approach is
proper in the absence of a partnership with downstream buyers (e.g. international brokers and
domestic retailers) and lead firms. Of course, the timber legality restrictions as manifest in the
SVLK are largely driven by international buyers, but the other challenges are not due to demand-
related change in markets.
In order to understand how these factors affect industry actors, the FVC project conducted
value chain analysis. This analysis methodically evaluates the range of activities carrying a product
from conception to the final consumer (Herr and Muzira 2009). By characterizing and analysing the
relationships, incentives, and capacities of actors in the value chain, the analysis identifies system-
wide constraints and bottlenecks.
The FVC project analysis found that in most cases value chain actors closer to end
consumers capture a larger share of the final product’s value. Purnomo et al. (2009) evaluated the
distribution of benefits among actors across the value chain. They found that different actors
capture different shares of value added. Shares of final value captured by upstream actors are low:
teak growers, log traders and sawmills receive 5.6%, 0.9% and 0.6% respectively. Furniture
producers and finishers receive 3.6% and 3.2%, while exporters, overseas exporters, and
international wholesalers receive 11.4%, 6.1% and 21.9%, respectively. Value-added capture clearly
6
varies with the “position” of the actor within the value chain. Similar to Purnomo et al. (2009),
Effendi and Parlinah (2009) found that retailers capture 52% of product value in the domestic
market, and exporters capture 36% of the international market value. Partly as a result of these
findings, several FVC project activities focused on “moving producers up” -- training them to
engage directly in product marketing.
While export demand may create opportunities for small-scale producers, the furniture
export market is increasingly competitive. There is no evidence of emergence of a consolidated
export channel into which small-scale producers can enter. The value chain literature largely
documents buyer-driven benefits to participation in export markets resulting from emergence of
new export channels. For example, literature on participation in global supply chains for vegetable
producers consider an established supply chain as the point of departure and show potential benefits
to small-scale producers through entry into the chain (Reardon, et al. 2009; van den Broeck,
Swinnen and Maertens 2017). Similarly, the literature on the growth of supermarkets in developing
countries notes that supermarkets themselves create opportunities for smallholders because of
change in demands and opportunities (Reardon, et al. 2003). Ability to up-grade a position in a
value-chain comes from the appearance of a new opportunity and, in virtually all cases of successful
value chains, private sector actors drive formation of the chain.
In contrast, the FVC project viewed value chain upgrading as a means of addressing market
and institutional challenges to industry viability; the project is designed to preserve or enhance
opportunities in the absence of a change in downstream purchase processes such as the emergence
of new export brokers who focus on the small-scale market. There has been no fundamental change
in the Indonesian furniture value chain. As noted by Koponen and Arbelius (2009), value chain
7
analysis in the context of declining or stagnant industry suppliers requires a different perspective
from that of a vibrant global supply chain.
The Jepara Furniture Value Chain Project
The Jepara Furniture Value Chain Project attempted to address the challenges faced by
small-scale furniture producers in Jepara. The FVC project began in August 2008 as a collaboration
between the CIFOR, the Forestry Research and Development Agency of the Indonesian Ministry of
Forestry and the Faculty of Forestry of Bogor Agricultural University. It built upon an EU-funded
project, “Levelling the Playing Field”, conducted from 2003–2007. Value chain analysis and other
research undertaken as part of this earlier project informed the FVC project. Project objectives were
to: (i) enhance the structure and function of the furniture industry for the benefit of small-scale
producers; (ii) improve marketing by small-scale producers and their industry associations; and (iii)
monitor the effects and early acceptance of innovations from objectives 1 and 2 (Purnomo et al.
2013).
The value chain upgrading approach employs value chain analysis to develop a strategy for
system change and upgrading (Herr and Muzira 2009). Upgrading consists of changes to enhance
competitiveness by improving the efficiency of operations or adopting new activities (Humphrey
and Schmitz 2002; Kaplinsky and Morris 2000). Three specific types of upgrading have been
identified in the literature: process upgrading through adoption of improved technologies; product
upgrading, or moving into higher value or more sophisticated product lines; and functional upgrading by
acquiring new functions to increase the overall skill content of activities (Humphrey and Schmitz,
2002, p. 1020). Functional upgrading involves increasing the capture of value added by changing
activities conducted as a normal part of doing businesses. For example, it might involve changing
accounting or logistic functions (either undertaking such activities within the firm or outsourcing to
8
others), adding design functions, or others (Kaplinsky and Morris, 2000, p. 42). A fourth type of
upgrading-intersectoral upgrading- is not relevant for the study. The FVC project analysis provided
insights into the particular forms of upgrading needed by specific kinds of producers to enable
insertion into more modern furniture value chains.
The participatory action research conducted by the FVC project provided an opportunity for
small-scale furniture producers to voice a need for “an industry association through which they
could increase their market access, enhance their design skills and product quality, and improve their
access to credit”(Purnomo et al. 2013). The project implemented four integrated ‘upgrading
scenarios’: moving-up, collaborating down, green certification, and formation of a producer
association; each of these was in some way related to the upgrading concepts outlined above. The
links in the FVC project between the upgrading scenarios and the upgrading concepts in the value-
chain literature are described below. In the Formation of the Asosiasi Pengrajin Kecil Jepara (APKJ),
small producer’s association of Jepara, was the lynchpin, facilitating implementation of the other
scenarios by bringing producers together to participate in training, improve marketing, form credit
cooperatives, and obtain group certification.
The moving-up scenario promoted functional and product upgrading. Functional upgrading
involved empowering producers to move into downstream positions on the value chain, and
included activities to increase the ability to capture value by finishing, marketing, and trading.
Improved finishing techniques were taught to female APKJ members through workshops that
trained in sanding skills, incorporation of modern designs into finished products, and quality
improvement during the finishing process (Purnomo et al. 2014). Product upgrading was promoted
by training producers in marketing and product quality and process upgrading was promoted by
training in and facilitating use of more sophisticated marketing methods. A website was created to
showcase and sell the products of APKJ members. This webpage facilitated transactions totalling
9
around IDR 100 million ($7,857 US at the exchange rate on June 28, 2015) from 2010 to 2013
(Purnomo et al. 2013), but the retail side of the website has been disabled due to hacking.
Participation in exhibitions was another effort at process upgrading for APKJ members. Project
participants attended 14 trade shows and exhibitions, one of which was held in China and another in
India (Purnomo et al. 2013). Successful upgrading would lead to workshops selling high-quality,
finished products and engaging in sophisticated marketing mechanisms such as online marketing.
The collaborating-down set of activities contained some process and some product
upgrading. These activities sought to strengthen linkages between furniture producers and lower
stages in the value chain; for example, APKJ producers were encouraged to seek alternative and
regular sources of timber suppliers. The benefits of contractual arrangements were highlighted and
other forms of input supply management were stressed as a part of this training. The expectation of
the project was that active collaboration between furniture producers and their input suppliers
would lower and lead to less variability in input costs for furniture producers.
Green certification activities, a form of product upgrading, supported producers in obtaining
SVLK certification. Following certification, the same products are sold, but product quality (and
price received) has been improved, reflecting an upgrading of the product. The project provided
trainings in record-keeping, “chain of custody certification”, and in application for and maintenance
of green certification. The APKJ facilitated formation of groups to obtain group certification
(Purnomo et al. 2013). Sustainable timber certification can add value to furniture, acting as a form of
product differentiation.
The association scenario helped facilitate other project activities and promoted all three
forms of upgrading. Trainings covered topics such as financial management, entrepreneurship,
quality control, finishing, carving, and furniture design. Training stimulated establishment of small
10
credit cooperatives of APKJ members. APKJ members formed groups to obtain SVLK certification
(Van Geenhuizen, Indarti, and Soetanto 2010).
The FVC project also assisted in development of a strategic plan to address challenges faced
by the furniture industry. Various stakeholders, including APKJ members, were brought together to
identify potential actions by the district-level government in support of the industry. The plan was
made into district law as a PERDA. The PERDA provides a regulatory foundation and budget for
supporting small-scale furniture producers in marketing, production, certification and institution
strengthening (Purnomo et al. 2016). The PERDA influenced budget allocations in 2015 and
additional actions were implemented in 2016, but it is too soon to evaluate its effectiveness.
This assessment focuses on the effect of membership in the APKJ, and is especially
appropriate as the project began some six years prior to the evaluation. The project never set up a
data panel for evaluation, so propensity score matching (PSM) was used to compare outcome
variables of association members and matched non-members. Propensity score matching requires
observations on covariates that are either unchanging or observed prior to selection into the event in
question (in this case, participation in the APKJ). A 2009 presidential election in Indonesia provides
a well-known point of reference for asking retrospective questions. Responses to these questions
enabled estimation of a propensity score and estimates of changes in production and marketing
behavior. Firm profit and adoption of specific upgrading activities were outcomes.
METHODS
Participation in the APKJ was non-random because individual producers decided to join.
Characteristics that lead a furniture maker to join the APKJ may also influence the outcome
variables such as profits or marketing behavior, and a simple comparison of member to non-
members outcomes may lead to a biased estimate of the impact of membership. Several alternatives
11
exist to overcome this selection bias. Propensity score matching, described below, was used in this
case.
Propensity Score Matching
Propensity score matching minimizes selection bias by matching treated and non-treated
units on their probability of receiving treatment (join the APKJ), and reduces dimensionality by
allowing matching to occur with only one variable (the propensity score) (Rosenbaum and Rubin
1983). The probability of treatment conditional on characteristics, called the propensity score, is not
known, but can be estimated by regressing a binary dependent variable reflecting membership in the
APKJ on observable pre-treatment and time-invariant characteristics.
Various algorithms are available for using the estimated propensity score to match or weight
units (Khandker et al. 2010; Ichino et al. 2008). Nearest neighbour matching, used in this study,
compares a treated unit to a fixed number of control units with the closest valued propensity scores
to obtain the treatment effect. Matching was implemented to one nearest neighbour with
replacement, allowing the same control unit to be matched to multiple treated units. Matching
without replacement can cause bias by matching treated units to dissimilar control units, and
requires a determination on the order of matching (Dehejia and Wahba 2002).
In order to use the propensity score, two assumptions must be met: conditional
independence and common support. Conditional independence means that not participating in a
program (i.e. joining the APKJ) is completely explained by observable characteristics (Khandker et
al. 2010; Ichino et al. 2008; Caliendo and Kopeinig 2008). The average treatment effect on the
treated (ATET) focuses explicitly on effects of program participation on actual participants in order
to determine the impact of membership.
12
The second critical assumption of PSM is the presence of common support: there must be
sufficient overlap in the propensity scores of the treatment and control groups to run analysis that
compares individuals with similar scores. Without common support, no comparisons between
groups could be made, and PSM could not be used (Caliendo and Kopeinig 2008). There may be
ranges within the range of common support where there are not neighbours that are close enough
for good matches. Specifying a caliper, or maximum distance between the propensity scores of
matched units, can address gaps in common support, and increase the similarity of the treated and
control groups. A caliper was used equal to 0.2 times the standard deviation of the logit model used
to calculate the propensity score, following Austin (2011).
Data Collection
Data were obtained from a 2015 survey of 598 furniture makers in Jepara, of which 121 were
APKJ members and others were identified at random from a list of area producers. The survey
instrument collected information on outcome variables, including marketing initiatives, business
practices, and profit. The largest portion of the survey consisted of questions used to estimate profit
as accurately as possible. The survey also gathered data on firm and owner characteristics expected
to influence participation in the APKJ. In order to be able to use information about a firm’s
operations as covariates, it was necessary to gather information about firm activities in 2009, before
the APKJ was formed. Retrospective questions focused on relatively important outcomes, such as
product types, source and type of timber, marketing methods, sales channels and sales modalities,
and labor use in 2009. Recalls of these variables should be of good quality since a presidential
election was held in 2009, providing a temporal reference to assist in framing the response.
The survey instrument contains ten sections. The first two gathered information about the
firm and owner. Section three focused on firm characteristics, including type of unit, year started,
and size. Section four obtained the retrospective information on firm and product characteristics.
13
Section five gathered information on current sales channels and marketing methods. Sections six
through nine collected data for estimation of the primary outcome variable of interest, profit.
Section ten garnered information on ownership of capital equipment and vehicles. Enumerators also
asked about assets owned in 2009 not owned currently. The last section asked respondents about
participation in training held by the Jepara FVC project.
Propensity Score Estimation
Studies using PSM to evaluate impacts from membership in a cooperative or association
follow the same logic as technology adoption studies when specifying the model to calculate the
propensity score. Factors affecting participation in the APKJ are associated with expectations about
net benefits of APKJ membership. Covariates typically include decision-maker age and education,
membership in other organizations (related to social networks), location, asset ownership, labour
utilization, type of operations and measures of operation size (Verhofstadt and Maertens 2014;
Wollni and Zeller 2007; Ruben and Zuniga 2010; Rodriguez, Rejesus, and Aragon 2007). These
categories of covariates were also used to predict participation in the APKJ, with a focus on those
providing insight to a firm’s operations and position on the value chain. As current operations could
be affected by participation in the APKJ, covariates measuring specifics about firm operations, such
as sales channel or type of wood used, are 2009 recall values. Other time-invariant covariates, such
as owner’s level of education and firm location, use current values.
Covariates
The propensity score is estimated using a logit model with thirty eight covariates. Since the
concern is to generate a model that best describes participation and attains balance, extraneous
variables, which can be associated with multicolinearity and inefficiently estimated parameters, are
not viewed as a problem (Austin, 2008, 2009; Garrido et al. 2014; Wyss et al. 2013). A valid
14
evaluation of the propensity score focuses on the extent to which our matching reduces bias in the
matched sample is examined in some detail using the imbalance rate and an assessment of common
support overlap (Austin 2009; Garrido et al., 2014).
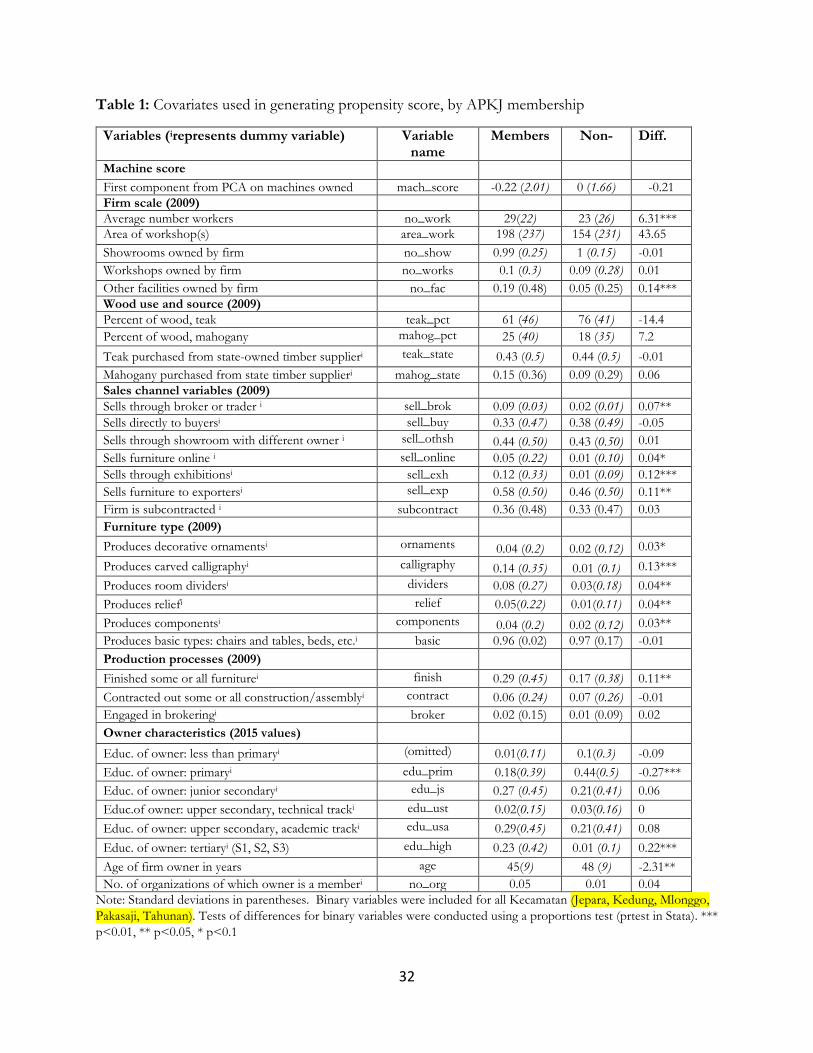
A woodworking equipment index was included as an indicator of firm size and
sophistication (table 1). Twelve woodworking equipment categories reflected the degree of
sophistication and scale of operation and included the following: whipsaw, circle saw, chainsaw,
jointer, etc. Principal Component Analysis (PCA), which creates factor weights for covariates that
are correlated across multiple dimensions and collapses them into a single woodworking equipment
index (Fry, Firestone and Chakraborty, 2014). From the set of correlated variables, uncorrelated
linear weighted combinations of variables (components) are created. The eigenvectors of the
correlation matrix provide the factor weights for these principal components, and their variance is
given by the eigenvalue of the corresponding eigenvector. The first principal component, which is
used to create an index, explains the maximal overall variance, thereby maximizing discrimination
between observations (Larochelle, Alwang and Taruvinga, 2014; McKenzie, 2003).
In addition the equipment index, several covariates reflect the scale of the firm’s operations.
An average of workers in the high, low and normal seasons during 2009 is used as a measure of firm
scale. Total workshop area in 2009 provides an additional measure of firm scale. The number
workshops owned in 2009 was also included as a variable, as was the number of showrooms owned.
Other business units related to the furniture industry were owned by some firms, including
showrooms, sawmills, kilns, and hardware stores and a dummy variable was included to reflect
ownership of other units in 2009. At a statistically significant level, APKJ members had more
workers and more non-workshop business units than non-members, but other differences were not
significant.
15
Types of wood used for furniture production in 2009, recalled by survey respondents,
included teak, mahogany, mango, coconut, jackfruit, trembesi, sonokeling, and others. Teak and
mahogany were most common. The percent of teak and mahogany were used as variables in the
model. Binary variables indicate whether the teak/mahogany was sourced from Perum Perhutani,
the offical state supplier of timber. Differences between members and non-members are not
significant (table 1).
The questionnaire gathered information about the way products are sold: sales channels,
specific buyers and the state of contractual arrangements between producers and those to whom
they sell their products, and marketing. This information was combined to generate variables to
reflect sophistication of sales strategies and the purchasers of furniture buyers, which include
brokers, wholesalers and final users (table 1). Binary variables indicate the broad categories of
furniture produced in 2009. Basic furniture types were placed in single category that included vanity
tables, beds, cabinets/wardrobes, chairs and tables and the catchall “other furniture types”. Separate
binary variables were included for the production of wooden ornaments, calligraphy pieces, room
dividers, and relief, the production of which suggest some level of specialization. An additional
variable was included for production of furniture components (such as chair and table legs); this
production suggests a lower level of upgrading than a firm that produces whole furniture pieces.
Insert table 1 about here
When data on furniture produced in 2009 was missing, it was assumed that furniture
production in 2009 was the same as production in 2015. Four percent of sampled non-members
who were operating in 2015 were missing data for furniture types in 2009, and 3% of APKJ
members who were operating in 2015 were missing data for furniture types in 2009. More APKJ
members than non-members produced carved decorations, calligraphy, room dividers and relief,
16
implying a higher level of sophistication. However, more APKJ members than non-members also
produced furniture pieces, an indication of less sophistication (table 1).
Variables about production processes capture information about the firm’s level of
upgrading and its position of power within the value chain. Finishing furniture is a high value-added
activity. Respondents were asked to estimate the percent of production that was finished in-house,
the percent that was contracted out to be finished, and the percent that was sold unfinished. If a
firm is contracting out work to another firm, it holds a position of relative power over the firm that
it has contracted to do the work. The final model included binary variables reflecting the processes
used by the firm in 2009 (table 1).
Estimation
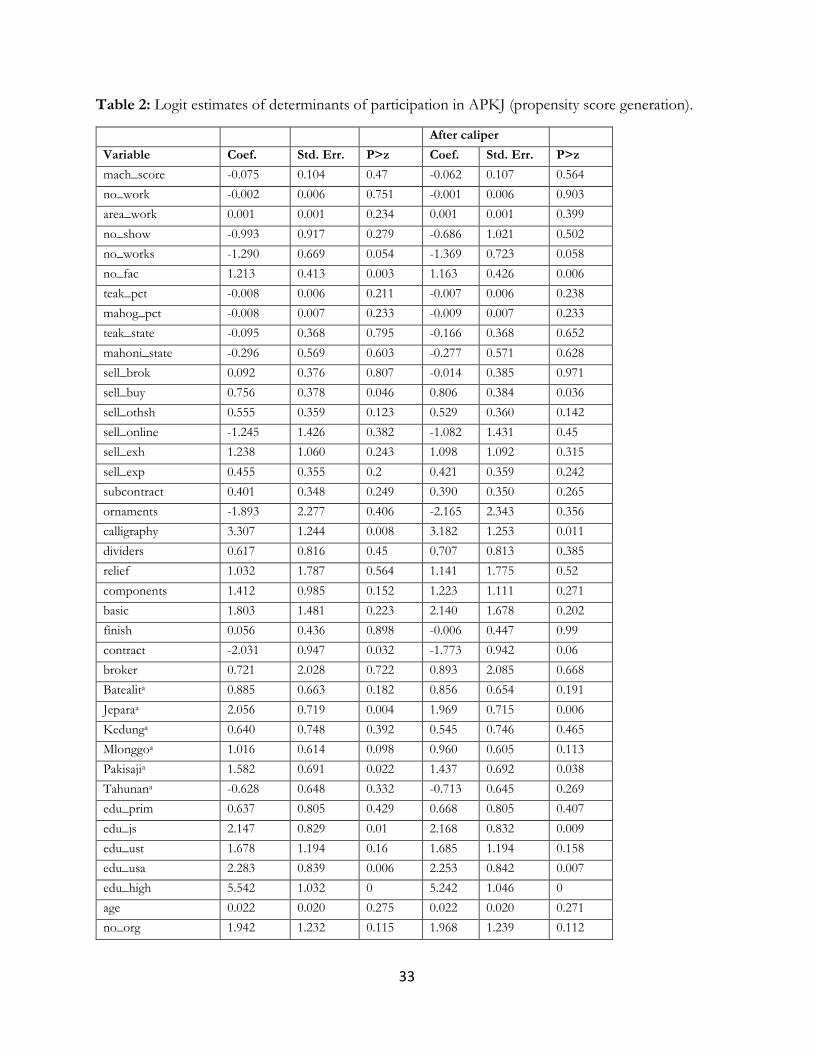
The estimated logit model had 11 significant covariates (at 5 percent) and a pseudo-R2 of .34
(table 2). In addition to overall model fit, the signs of coefficients were consistent with expectations.
Since the model is predicting participation in a program offering enhanced skills to small-scale
producers, already advanced producers, such as those with more workshops and those with existing
contracts with downstream buyers, such as brokers (both measured in 2009), were significantly less
likely to participate in the APKJ. As the program was targeted to areas where disseminated
information was more likely to spread, location in a Kecamatan was associated with more likely
participation. Three of the six Kecamatan dummy variables has significantly positive coefficients
and two of the remaining three were also positive. Since the comparison group was furniture
producers located in low-density areas, the positive signs were consistent with the way the project
was targeted. As expected, better-educated owners were more likely than those without primary
education to participate in the APKJ, with the highest likelihood of participation and most
17
significant coefficient for the highest-educated class of owners. All of these findings were consistent
with logic and prior expectations.
In order assure common support, the propensity score was also estimated with the caliper
noted above. Thirteen members did not have matches within the caliper and were dropped during
estimation (table 2 shows estimates from the logit model without and with the caliper). Following
estimation, observations with the eight highest propensity scores were dropped, as well as five
observations with propensity scores between 0.82 and 0.85. Common support after matching to one
nearest neighbour within a caliper is shown in figure 1.
After matching, distributions of covariates should be balanced between treatment and
control groups. Two-sided t-tests were used to evaluate post-matching covariate balance, and four
(out of 40) covariates were found to be significantly different between groups. While significant
differences suggest that covariates are not uniformly balanced, a ten % imbalance rate following
matching is consistent with expectations. All in all, the analysis shows an acceptable use of matching
procedures. The estimating (participation) equation had reasonable fit (especially considering that it
was estimated with cross-sectional data) and the signs and significance of the variables were
consistent with expectations. The resulting matches were well-balanced in the covariates. As an
additional check, treatment effects were estimated using matching without replacement (the results
here are with replacement) which can result in higher bias, but can also reduce the variance of the
estimator. The results obtained from matching without replacement are qualitatively similar to those
reported here; in particular APKJ is linked with some improvement, but the effect is limited. Profits
are not significantly different between members and non-members in either case (results available
from author on request).
18
Insert table 2 about here
RESULTS
Impact of Membership on Firm Profits
Fulfilment of the first objective, to quantify the livelihood impact of the project by
comparing firm profits of APKJ members against a counterfactual, required examining profit as an
outcome variable. Benefits from any upgrading undertaken were predicted to be reflected as an
increase in profit. Firm profit was estimated based on information on costs and revenues collected
during interviews. Because profit measurement requires detailed information on inputs and outputs,
2009 recall data could not be used and the comparison is based on differences in levels of profits
between APKJ members and matched non-members in 2015. Costs included in profit estimation
are: wood inputs, labor expenses, contracting-out costs, and other inputs and expenses such as
transportation, fuel, electricity, and oil/wax finishes. Rent on capital was not included as a cost.
Insert figure 1 about here
This manner of accounting for firm profits is subject to limitations. The timing of input
purchases and output sales may not have always lined up properly, seasonality adjustments were
approximations, and variations in production and prices were not captured by the survey. Prior to
analysis, observations with very high or very low levels of profit were re-examined. Fifteen
observations were dropped because their profit estimations were unrealistically high or low, or they
were missing critical data.
Insert figures 2 & 3 about here
Despite multiple steps to correct the profit measure, it is still imprecise; a large range in
estimated profit levels was found between members (treated) and non-members (untreated) groups
19
before (figure 2) and after matching (figure 3). Furthermore, as other upgrading activities are
undertaken, profit gains may be slow in coming as adopters gain experience and gradually increase
profit. Still, the profit outcome variable is useful for providing a comprehensive (though imprecise)
measure of the impact of APKJ membership on small firms.
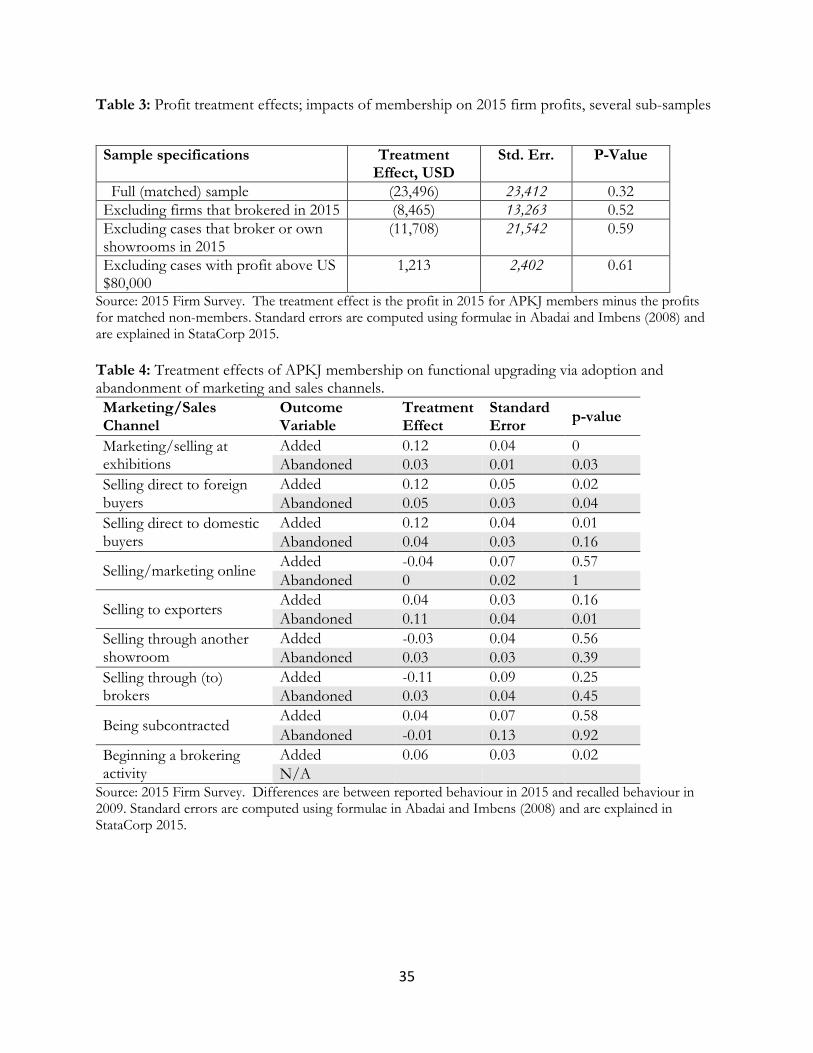
Using PSM, the impact of membership on profit was found to be non-significant (table 3).
The analysis was also conducted with more restricted samples. PSM was applied to samples that
excluded: (i) firms whose 2015 operations included brokering; (ii) firms that engaged in brokering or
owned a showroom in 2015; and, (iii) firms with extreme profit levels above $80,000. The treatment
effects calculated using the restricted samples were also not significant (see table 3), but the results
show that several of the matched firms had very large profits, confirming earlier evidence of
substantial heterogeneity. Profits are not affected by APKJ membership even six years after the
project commenced. The lack of effect on profit likely explains why APKJ membership has not
grown over time; economic incentives are such that there is no short-term economic reward from
membership.
Insert table 3 about here
APKJ Membership and Upgrading Sales Activities
Determining the influence of APKJ membership on the uptake of upgraded marketing and
sales channels required estimating treatment effects for variables reflecting changes over time in
sales channels and marketing methods. Either adding or abandoning a sales channel can be seen as
functional upgrading, depending on the sophistication of the channel in question. For example,
adding an internet-based sales channel can be viewed as upgrading, while abandoning sales in low-
value local markets can likewise be considered upgrading. Different sales channels can also be
20
evidence of product upgrading if the new sales channel change leads to higher prices to the
producers. Binary variables were created to reflect addition or abandonment of marketing/sales
channels between 2009 and 2015.
Several significant differences in sales and marketing behaviour were observed between
members and matched non-members, with differences emerging for the addition and abandonment
of marketing and sales channels (table 4). A significant positive relationship was found between
exhibition attendance and APKJ membership. Twelve percent more APKJ members than the
matched counterfactual adopted the practice of selling through exhibitions. Addition of exhibition
attendance as a sales and marketing channel indicates functional upgrading through increased
marketing sophistication and establishment of new marketing channels.
Insert table 4 about here
As opposed to selling to purchasing agents and other institutional buyers, selling directly to
final consumers, whether foreign or domestic, indicates that a firm has an advanced position on the
value chain and is another example of functional upgrading. Since we do not observe the quality and
attributes of furniture sold through these channels, we cannot be sure whether product upgrading
has occurred as a part of this process. At the 5% significance level, 12% more APKJ members than
matched non-members began selling directly to foreign purchasers (final consumers and
wholesalers/brokers) between 2009 and 2015. However, 5% more APKJ members than matched
non-members also abandoned selling directly to foreign buyers over the same time period; on net,
APKJ membership is associated with a 7% increase in adoption of these practices.
A firm that sells directly to domestic consumers, another form of functional upgrading, also
has more bargaining power. When producers interact directly with buyers, price and furniture
specifications can be negotiated. At the 1% significance level, 12% more APKJ members than
21
matched non-members began selling directly to domestic consumers between 2009 and 2015,
suggesting that the APKJ helped small-scale furniture producers shift to sales channels with more
opportunity for negotiation, an example of functional upgrading. Although APKJ members were
also more likely to abandon this channel, the difference was not statistically significant and we can
say that there is evidence of upgrading by APKJ members through changes in sales channels.
APKJ membership had a significant, positive effect on abandoning selling through an
exporter. Selling furniture through an exporter suggests that a firm is capable of adhering to
international standards, but the practice involves directed networks in which exporters, not
producers, have bargaining power. It is unclear whether this change would be considered evidence
of upgrading.
No significant relationship was found between APKJ membership and use of online
marketing. The relationship between APKJ membership and change in selling through other
showrooms was also not significant. Either adding or abandoning selling through domestic
showrooms could be seen as upgrading. While producers who sell to other showrooms are not able
to negotiate directly with end-users, the relationship between producers and domestic showrooms is
based on marketing principles, encouraging producers to maintain high quality, and there is a
possibility of moving to a balanced network, evidence of upgrading (Irawati et al. 2010). In either
case, no statistically significant changes in activities between members and matched non-members
was observed.
Membership in the APKJ also had no significant effect on changes in selling to brokers, or
on being subcontracted by other firms. Selling to a broker and being subcontracted both represent
positions of very low bargaining power, where the buyer defines the product and the price.
However, subcontracting might be associated with a means of entry into a higher-return value chain;
for example many suppliers of fruits and vegetables are contracted and this contract (a form of
22
functional upgrading) has frequently been found to benefit producers (Barrett et al. 2011). A larger
percentage of APKJ members than matched non-members started being subcontracted between
2009 and 2015, and fewer members abandoned being subcontracted than in the counterfactual
group. This result could be interpreted as representing a possible failure of the project to increase
market power among the most vulnerable members. It could also be interpreted as an indication that
the project helped inject small-scale producers into more lucrative marketing channels. The latter
conclusion is, however, not overly convincing because there is no evidence of higher profits from
APKJ participation.
While sales to brokers have not changed for members versus non-members, actual
participation in brokering has increased for members. Six percent more APKJ members than
matched non-members changed from not brokering in 2009 to brokering in 2015. Brokering is a
position with substantial bargaining power, and firms engaged in brokering receive a larger portion
of the final price than firms focusing only on carving wood. Brokering requires business acumen
that APKJ training workshops sought to impart; with respect to the brokering, the project has led to
upgrading.
Findings demonstrate uneven success of the project’s efforts to achieve functional upgrading
by improving marketing practices and bargaining power for small-scale furniture producers.
Producers are more likely to abandon selling through brokers and agents and begin selling directly to
consumers (foreign and domestic), and at exhibitions if they are members of the APKJ than if they
did not join the association. Members, however, are more likely to abandon selling directly to
foreign consumers and are no more likely to abandon being subcontracted or add online marketing
than if they had not joined. Members are also more engaged in furniture brokering, further evidence
of upgrading. The Jepara FVC met with the most success when the APKJ facilitated a specific
behaviour such as exhibition attendance.
23
Further Functional Upgrading Activities
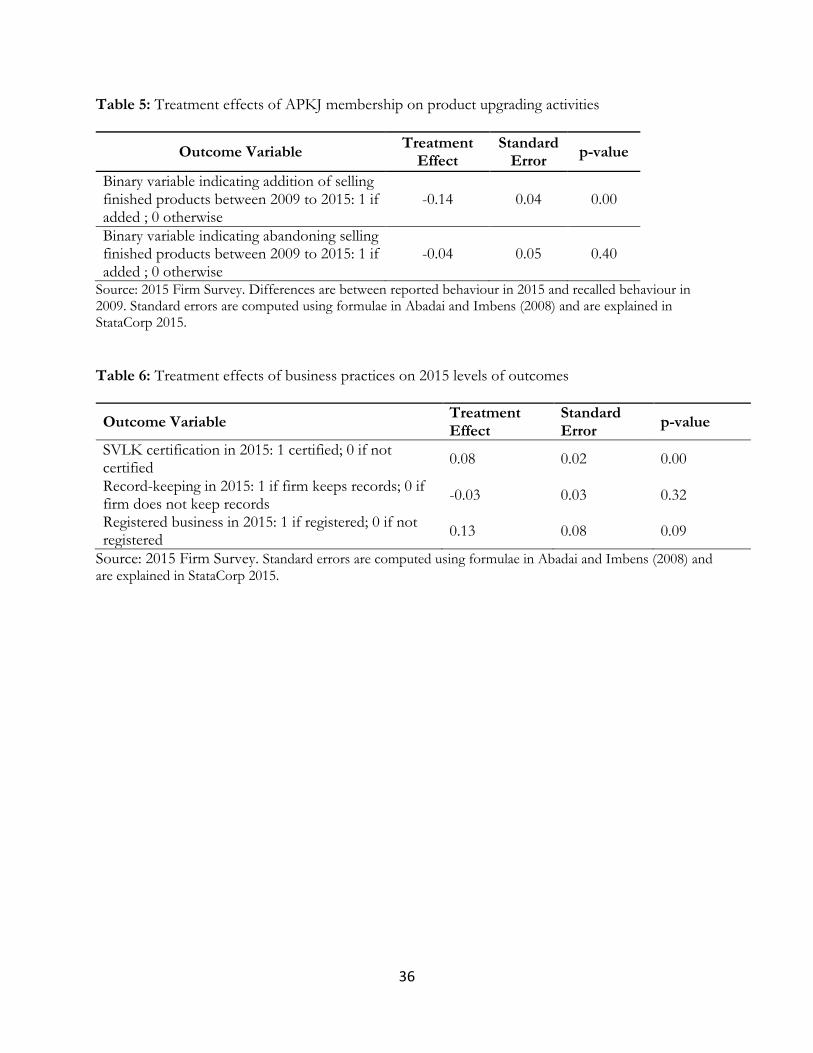
To understand whether membership in APKJ led to changes in selling finished furniture, we
examine changes in sales of finished furniture. The results, reported in table 5, indicate that APKJ
membership was negatively associated with this type of upgrading. About 14 percentage point fewer
APKJ members than matched non-members began selling finished furniture between 2009 and
2015. Finishing is an ‘upgraded’ process that allows firms to attain a larger share of the final price
than they would through carving alone, and requires skills and knowledge that were taught in APKJ
training workshops. The results indicate that the Project was not successful in promoting such
upgrading.
Insert table 5 about here
Process Upgrading via Changes in Business Practices
The fourth objective of this study was to determine if APKJ membership increased the
likelihood that the participating firm engages in upgrading by employing good business management
practices. Project training workshops encouraged application of good practices such as record-
keeping and officially registering the business. The project also facilitated obtaining SVLK
certification. Results for business registration and SVLK certification show that APKJ members are
more likely than non-members to have good business management practices, although members are
no more likely than non-members to keep business records (table 6). To the extent that SVLK led to
higher-quality (and higher-priced) products, this certification is also an example of product
upgrading.
Insert table 6 about here
24
Eight percent more APKJ members than matched non-members were SVLK certified in
2015. Empowering small-scale producers to obtain SVLK certification was a key focus of the FVC
project. While only a modest number of members obtained certification, the treatment effect shows
that the influence of membership on obtaining certification is positive and significant. APKJ
membership does not have a significant effect on improvements in record-keeping, but does have a
significant effect on whether a business is registered. Thirteen percent more members than matched
non-members have formally registered businesses (significant at the 10% level).
Qualitative Survey Responses
The survey also asked respondents directly about their perceptions of benefits of APKJ
membership (table 7). Ninety members (67% of respondents who were members) listed training as a
benefit. Eight (7%) listed improved credit access, 15 (13%) listed improved market access, 12 (10%)
listed increased access to raw materials, and 10 (8%) listed help with means of production. Several
members added comments about the APKJ. Forty-two said they had gained insight, knowledge,
market access, experience or opportunities, and 11 emphasized the opportunity to build
relationships that the APKJ had created. However, 15 commented that they had not experienced
any benefit from the association. Two of these members had joined late, in 2013, missing the
training sessions.
Insert table 7 about here
A major weakness of the project that became clear over the course of the study was the
inability for the APKJ to thrive independent of the Jepara FVC project. Membership has not grown
since 2013 with current membership of 125. Activities encouraged by the FVC project such as
planting fast-growing teak have waned. Additional training sessions have not been provided. Since
training sessions were a primary advantage of membership, the subsequent lack of training helps
25
explain why membership has not grown. It is also clear that the project lacked the potential for
articulation of members into established value-chains. As a result, membership was no guarantee of
increased returns or access to a stable market, short-run profit differentials were not found, and
economic incentives for membership were minor.
DISCUSSION and CONCLUSION
Findings indicate a modest positive impact of APKJ membership. While no significant
difference in profit was attributable to membership, other outcome variables indicate some influence
on members’ marketing and business practices, with most of the influence being observed through
attempts to establish new marketing channels and assuming new marketing and trading functions.
The net influence of APKJ membership is ambiguous: members improved in some regards, but not
in others.
Several factors limited the study. First, training by the project was not limited to APKJ
members, meaning that the control group may have been contaminated. Second, the study used data
on what a respondent could recall about their operations six years prior to the evaluation. The recall
data are included in estimation of the propensity score, and are employed used to measure changes
in outcomes. While the timing of the 2009 presidential election may have assisted in creating a time
reference, six years is a long time to recall business practices and other factors.
Profit is estimated using survey responses and do not include costs such as rent or a
mortgage, depreciation expenses or debt expenses. Wood purchases tend to be irregular and we
faced difficulty in getting a full accounting of them. Production and input time spans are not
uniform so information for costs and revenues may not correspond, and assumptions about
seasonality and consistency were used when scaling up costs and revenues to an annual basis.
Furthermore, the likelihood of getting significant results with the profit outcome variable is limited
26
by the small sample size for treated units and the large variance in estimated profit. Increased profit
is a longer-term goal of the FVC project and it is not surprising that significant differences in profits
were not detected over the short-medium term.
The FVC project assumed that project activities would affect the entire furniture industry of
Jepara. The policy roadmap discussed above works towards this objective, but its efficacy cannot yet
be evaluated. An assessment report being drafted by CIFOR notes the important role of CIFOR in
passing the legislation, and is optimistic about the capacity of the policy to improve the structure and
function of the Jepara furniture value chain. Portions of local budgets have been allocated to
implement this policy (Purnomo et al. 2016).
While the APKJ did not significantly alter the structure of the value chain for the benefit of
small-scale producers, participation in the APKJ improved bargaining power of some members. In
contrast to most value chain development efforts, which use engagement of large-scale buyers to
effect transformation of a value chain, the FVC was producer-driven, focusing on actions to increase
the profitability of small-scale producers. This improvement was mainly effected through training in
more sophisticated marketing processes. A significantly higher percentage of APKJ members than
matched control units abandoned selling to a broker, which affords little power for negotiation in
product specification or pricing. Additionally, a significantly higher percentage of APKJ members
began brokering, a position with market power that claims a large portion of the product’s final
value. More APKJ members than non-members obtained SVLK certification, providing
opportunities to sell to buyers in Europe. Additionally, there is some evidence that membership in
the APKJ membership improved the ability of members to function within the current structure of
the value chain. This evidence was found in the statistical results; the qualitative interviews with
APKJ members also uncovered evidence of enhanced satisfaction with marketing activities post-
project.
27
Functional upgrading was also evident in increased marketing activities. More APKJ
members than non-members began marketing through exhibitions, affording the opportunity to
interact directly with consumers and develop their own brand. None of these changes, however,
affected firm profit, possibly because of the relatively short time between implementation and
evaluation, possibly because profit measurement was fraught with difficulty.
Knowledge generated by the project allowed researchers to pinpoint inefficiencies in the
value chain. Many of the challenges identified during the value chain analysis, such as timber
scarcity, lack of access to credit, low bargaining power, and international competition cannot be
addressed by a single project or policy. The absence of a large, well-defined marketing channel
limited the ability of the project and subsequent actions by APKJ members to effect changes.
The treatment effects for upgrading outcomes indicate that APKJ members changed more
(for better and for worse) than matched control units. These bimodal outcomes may indicate that
the APKJ attracts two types of furniture producers: those whose businesses are floundering join the
APKJ in hopes of improvement, and others who are particularly motivated and view the APKJ as an
opportunity to improve its business activities. The APKJ did not succeed in improving firms of the
first type, but those of the second were able to leverage the opportunities and resources of the APKJ
to improve their businesses.
Using a value chain perspective, the FVC project viewed upgrading as a means to improve
all producers’ livelihoods. While some upgrading activities such as obtaining SVLK certification and
improving product quality add value to current production, the project also promoted moving up in
the value chain. Shifting to or incorporating a higher stage in the value chain, such as finishing
furniture or brokering, has potential to allow an individual to realize a larger portion of the final
value of a product. However, uniformly encouraging producers to move up ignores the economic
principles of specialization and comparative advantage, and disregards the interdependence of value
28
chain actors. Since actors are needed at all levels of the chain, encouraging all actors to move up is
not a sustainable solution to challenges facing the industry.
Furthermore, anticipated impacts of the project relied on expectations that APKJ members
would share knowledge, and that the APKJ would grow over time. These expectations were not
realized. The project directly engaged only with APKJ members and other attendees of training
sessions, a small portion of furniture producers in Jepara. As of 2015, APKJ membership totals 125,
while there are more than 11,000 business units in the industry. Project designers must be wary of
basing expectation on assumptions such as independent growth of the APKJ, particularly when
membership is associated with limited opportunities for profit growth.
Not all value chains are ripe for “improvement”. In contrast to most dynamic value chains,
the Jepara case was an example of an attempt to improve the value chain without fundamental
demand change by marketing agents and other furniture buyers. While demand in Europe has
grown for certified wood products, the structure of the market has not changed. Development of
high-value market chains is likely to occur only where opportunities for profit stimulate interest of
the private sector and changes in demands by marketing agents and other large-scale buyers, in turn,
create space for upgrading of value chain participants. Successful value-chain projects link
producers to a dynamic chain that is, in turn, linked to a tangible external demand (they are buyer-
driven). This was not the case in Jepara where domestic and international challenges endangered the
furniture industry, but no emergent marketing channel was present. While demand for timber
legality is driven by international buyers, this demand did nothing to create a specific opportunity for
Jepara producers. In the absence of a dynamic large-scale market to which producers can be
articulated, attempts to enhance value chains may be fraught.
29
Sources
Abadie, Alberto, and Guido W. Imbens. 2006. 'Large sample properties of matching estimators for average treatment effects'. Econometrica 74 (1):235-267.
Abadie, A., and G. W. Imbens. 2012. Matching on the estimated propensity score. Harvard University and National Bureau of Economic Research. http://www.nber.org/papers/w15301.
Anggara, Melati, Rika Harini Irawati, and Herry Purnomo. 2009. Upgrading wood-based industries: harnessing the social network of small-scale furniture producers and their institutions, Paper presented at International Seminar Research on Plantation Forests: Challenges and Opportunities held by Centre for Plantation Forest Research and Development – Bogor, INDONESIA.
Anggara, Melati, Herry Purnomo, and Bayuni Shantiko. 2013. Making research work for small-scale furniture makers: Action research in the Jepara furniture industry, Indonesia. Bogor, Indonesia: Center for International Forestry Research (CIFOR).
Austin, P.C. 2008. 'Goodness‐of‐fit diagnostics for the propensity score model when estimating treatment effects using covariate adjustment with the propensity score.' Pharmacoepidemiology and Drug Safety, 17(12): 1202-1217.
Austin, P.C. 2009. 'Balance diagnostics for comparing the distribution of baseline covariates between treatment groups in propensity-score matched samples.' Statistics Medicine, 28(25):3083-107.
Austin, P.C. 2011. 'Optimal caliper widths for propensity-score matching when estimating differences in means and differences in proportions in observational studies.' Pharmaceutical Statistics. 10(2): 150-161.
Barrett, Christopher B., Maren E. Bachke, Marc F. Bellemare, Hope C. Michelson, Sudha Narayanan, and Thomas F. Walker. 2011. 'Smallholder participation in contract farming: Comparative evidence from five countries'. World Development 40 (4): 715-730.
van den Broeck, Goedele, Johan Swinnen, and Miet Maertens. 2017. 'Global value chains, large-scale farming, and poverty: Long-term effects in Senegal'. Food Policy 66:97-107.
Caliendo, Marco, and Sabine Kopeinig. 2008. "Some practical guidance for the implementaiton of propensity score matching'. Journal of Economic Surveys 22 (1):31-72. doi: 10.1111/j.1467-6419.2007.00527.x.
Dehejia, Rajeev H., and Sadek Wahba. 2002. 'Propensity Score-Matching Methods for Nonexperimental Causal Studies'. The Review of Economics and Statistics 84 (1):151-161. doi: 10.2307/3211745.
Effendi, Rachman, and Nunung Parlinah. 2009. Cluster of teak and mahogany furniture industry. Background paper. Jakarta, Indonesia: Center for Social Economic and Policy Research on Forestry, Forestry Research and Development Agency.
Fishman, Akiva, and Krystof Obidzinski. 2015. 'Verified legal?: Ramifications of the EU timber regulation and Indonesia's voluntary partnership agreement for the legality of Indonesian timber. International Forestry Review 17(1): 10-19.
Fry, K., R. Firestone and N.M. Chakraborty. Measuring Equity with Nationally Representative Wealth Quintiles. Washington, DC: PSI.
Garrido, M.M., A. S. Kelley, J. Paris, K. Roza, D. E. Meier, R. S. Morrison & M. D. Aldridge. 2014. 'Methods for constructing and assessing propensity scores.' Health Services Research, 9(5): 1701–1720.
Herr, Matthias L, and Tapera J Muzira. 2009. Value chain development for decent work: a guide for development practitioners, government and private sector initiatives. Geneva: EMP/ENTERPRISE, ILO.
30
Humphrey, John, and Hubert Schmitz. 2002. 'How does insertion in global value chains affect upgrading in industrial clusters?' Regional studies 36 (9):1017-1027.
Ichino, Andrea, Fabrizia Mealli, and Tommaso Nannicini. 2008. 'From Temporary Help Jobs to Permanent Employment: What Can We Learn from Matching Estimators and Their Sensitivity?' Journal of Applied Econometrics 23 (3):305-327. doi: 10.2307/25144550.
Irawati, Rika Harini, Melati Anggara, and Herry Purnomo. 2010. Analysis of value chain governance: scenarios to develop small - scale furniture producers. Vol. XV, Jurnal Manajemen Hutan Tropika.
Kaplinsky, R., & Morris, M. (2000). A handbook for value chain research (Vol. 113). University of Sussex, Institute of Development Studies.
Khandker, Shahidur R, Gayatri B Koolwal, and Hussain A Samad. 2010. Handbook on impact evaluation: quantitative methods and practices. Washington, DC, USA: World Bank Publications.
Koponen, Jasu, and Heike. Arbelius. 2009. Strategic Management of Declining Industries - A Literature Review. Helsinki University of Technology.
Larochelle, Catherine, Jeffrey Alwang and Nelson Taruvinga. 2014. 'Inter-temporal changes in well-being during a period of hyperinflation: Evidence from Zimbabwe.' Journal of African Economies, 23(2): 225-256.
Loebis, Lienda, and Hubert Schmitz. 2005. 'Java furniture makers: Globalisation winners or losers?' Development in Practice 15 (3-4):514-521. doi: 10.1080/09614520500075979.
Ozanne, Lucie K., and Richard P. Vlosky. 1997. 'Willingness to pay for environmentally certified wood products: A consumer perspective'. Forest Products Journal 47 (6):39-48.
McKenzie, D. J. 2003. 'Measuring inequality with asset indicators.' Journal of Population Economics, 18, 229-260.
Prestvik, Ann. 2009. Small-scale furniture producers in Jepara. Survey report. Bogor, Indonesia: CIFOR.
Purnomo, Herry, Ramadhani Achdiawan, Bayuni Shantiko, Sulthon M. Amin, Rika Harini Irawati, Melati Anggara, and A. Wardell. 2016. 'Multi-stakeholder processes for strengthening policy affecting small and medium-scale forestry enterprises.' International Forestry Review 18(4): 485-501.
Purnomo Herry, Philippe Guizol, and Dwi R. Muhtaman. 2009. Governing the teak furniture business: a global value chain system dynamic modelling approach. Environmental Model Software. 24:1391–1401
Purnomo, Herry, Ramadhani Achdiawan, Melati Anggara, Rika Harini Irawati, Sulthon M. Amin, Bayuni Shantiko, and A. Wardell. 2014. 'Value-chain dynamics: strengthening the institution of small-scale furniture producers to improve their value addition'. Forests, Trees and Livelihoods 23(1-2): 87-101.
Purnomo, Herry, Rika Harini Irawati, Ramadhani Achdiawan, Bayuni Shantiko, and Melati Anggara. 2013. Action research approach to strengthening small-scale furniture producers in Indonesia through policy development, Commoners and the Changing Commons: Livelihoods, Environmental Security, and Shared Knowledge, presented at the Fourteenth Biennial Conference of the International Association for the Study of the Commons, Japan, June 3-7, 2013.
Purnomo, Herry, Bayuni Shantiko, Rika Harini Irawati, Ramadhani Achdiawan, Atie Puntodewo, Melati Anggara (CIFOR), Nunung Parlinah, Rachman Effendi (FORDA), Efi Yuliati Yovi, Dodik Ridho Nurrochmat, Bahruni (IPB), Sulthon M. Amin, Margono Arya, Legiman Ary, and Ahmad Zainudin. 2013. Final report for: Mahogany and teak furniture: action research to improve value chain efficiency and enhance livelihoods. Australian Centre for International Forestry Research (ACIAR).
31
Reardon, Thomas, Christopher B. Barrett, Julio A. Berdegué, and Johan F. M. Swinnen. (2009). The Agrifood Industry Transformation and Small Farmers in Developing Countries. World Development, 37 (11): 1717-1727.
Reardon, Thomas., C. Timmer, Christopher B. Barrett, and Julio A. Berdegué. (2003). The rise of supermarkets in Africa, Asia, and Latin America. American Journal of Agricultural Economics, 85 (5): 1140–1146.
Roda, Jean-Marc , Philippe Cadène, Philippe Guizol, Levania Santoso, and Achmad Uzair Fauzan. 2007. Atlas of wooden furniture industry in Jepara, Indonesia. Montpellier, France: French Agricultural Research Centre for International Development (CIRAD) and Bogor, Indonesia: Center for International Forestry Research (CIFOR).
Rodriguez, Divina Gracia P., Roderick M. Rejesus, and Corazon T. Aragon. 2007. 'Impact of an Agricultural Development Program for Poor Coconut Producers in the Philippines: An Approach Using Panel Data and Propensity Score Matching Techniques'. Journal of Agricultural and Resource Economics 32 (3):534-557.
Rosenbaum, Paul R., and Donald B. Rubin. 1983. 'The central role of the propensity score in observational studies for causal effects'. Biometrika 70 (1):41-55. doi: 10.1093/biomet/70.1.41.
Ruben, Ruerd, and Guillermo Zuniga. 2010. 'How standards compete: comparative impact of coffee certification schemes in Northern Nicaragua.' Supply Chain Management: An International Journal 16 (2):98-109.
StataCorp. 2015. "teffects psmatch — Propensity-score matching." Stata Press, accessed May 2. http://www.stata.com/manuals13/teteffectspsmatch.pdf.
Van Geenhuizen, Marina, Nurul Indarti, and Danny P Soetanto. 2010. 'Knowledge acquisition and innovation: potentials for upgrading of very small and small firms in furniture manufacturing in Indonesia'. International Journal of Foresight and Innovation Policy 6 (4):207-224.
Veisten, Knut. 2007. "Willingness to pay for eco-labelled wood furniture: Choice-based conjoint analysis versus open-ended contingent valuation." Journal of Forest Economics 13 (1):29-48. doi: http://dx.doi.org/10.1016/j.jfe.2006.10.002.
Verhofstadt, Ellen, and Miet Maertens. 2014. 'Smallholder cooperatives and agricultural performance in Rwanda: do organizational differences matter?' Agricultural Economics:n/a-n/a. doi: 10.1111/agec.12128.
Vlosky, Richard P., Lucie K. Ozanne, and Renée J. Fontenot. 1999. 'A conceptual model of US consumer willingness‐to‐pay for environmentally certified wood products'. Journal of Consumer Marketing 16 (2):122-140. doi: doi:10.1108/07363769910260498.
Wollni, Meike, and Manfred Zeller. 2007. 'Do farmers benefit from participating in specialty markets and cooperatives? The case of coffee marketing in Costa Rica'. Agricultural Economics 37 (2-3):243-248. doi: 10.1111/j.1574-0862.2007.00270.x.
Wyss, R., C.J. Girman, R.J. LoCasale, A.M. Brookhart & T.V. Stürmer. 2013. 'Variable selection for propensity score models when estimating treatment effects on multiple outcomes: a simulation study.' Pharmacoepidemiol Drug Safety, 22(1):77-85.
Yovi, Efi Yuliati, Bahruni, and Dodick Ridho Nurrochmat. 2009. Sources of Timber and Constraints to the Timber Acquisition of Jepara`s Small-Scale Furniture Industries.
32
Table 1: Covariates used in generating propensity score, by APKJ membership
Variables (irepresents dummy variable) Variable name
Members Non- Diff.
Machine score First component from PCA on machines owned mach_score -0.22 (2.01) 0 (1.66) -0.21 Firm scale (2009) Average number workers no_work 29(22) 23 (26) 6.31*** Area of workshop(s) area_work 198 (237) 154 (231) 43.65 Showrooms owned by firm no_show 0.99 (0.25) 1 (0.15) -0.01 Workshops owned by firm no_works 0.1 (0.3) 0.09 (0.28) 0.01 Other facilities owned by firm no_fac 0.19 (0.48) 0.05 (0.25) 0.14*** Wood use and source (2009) Percent of wood, teak teak_pct 61 (46) 76 (41) -14.4 Percent of wood, mahogany mahog_pct 25 (40) 18 (35) 7.2 Teak purchased from state-owned timber supplieri teak_state 0.43 (0.5) 0.44 (0.5) -0.01 Mahogany purchased from state timber supplieri mahog_state 0.15 (0.36) 0.09 (0.29) 0.06 Sales channel variables (2009) Sells through broker or trader i sell_brok 0.09 (0.03) 0.02 (0.01) 0.07** Sells directly to buyersi sell_buy 0.33 (0.47) 0.38 (0.49) -0.05 Sells through showroom with different owner i sell_othsh 0.44 (0.50) 0.43 (0.50) 0.01 Sells furniture online i sell_online 0.05 (0.22) 0.01 (0.10) 0.04* Sells through exhibitionsi sell_exh 0.12 (0.33) 0.01 (0.09) 0.12*** Sells furniture to exportersi sell_exp 0.58 (0.50) 0.46 (0.50) 0.11** Firm is subcontracted i subcontract 0.36 (0.48) 0.33 (0.47) 0.03 Furniture type (2009) Produces decorative ornamentsi ornaments 0.04 (0.2) 0.02 (0.12) 0.03* Produces carved calligraphyi calligraphy 0.14 (0.35) 0.01 (0.1) 0.13*** Produces room dividersi dividers 0.08 (0.27) 0.03(0.18) 0.04** Produces reliefi relief 0.05(0.22) 0.01(0.11) 0.04** Produces componentsi components 0.04 (0.2) 0.02 (0.12) 0.03** Produces basic types: chairs and tables, beds, etc.i basic 0.96 (0.02) 0.97 (0.17) -0.01 Production processes (2009) Finished some or all furniturei finish 0.29 (0.45) 0.17 (0.38) 0.11** Contracted out some or all construction/assemblyi contract 0.06 (0.24) 0.07 (0.26) -0.01 Engaged in brokeringi broker 0.02 (0.15) 0.01 (0.09) 0.02 Owner characteristics (2015 values) Educ. of owner: less than primaryi (omitted) 0.01(0.11) 0.1(0.3) -0.09 Educ. of owner: primaryi edu_prim 0.18(0.39) 0.44(0.5) -0.27*** Educ. of owner: junior secondaryi edu_js 0.27 (0.45) 0.21(0.41) 0.06 Educ.of owner: upper secondary, technical tracki edu_ust 0.02(0.15) 0.03(0.16) 0 Educ. of owner: upper secondary, academic tracki edu_usa 0.29(0.45) 0.21(0.41) 0.08 Educ. of owner: tertiaryi (S1, S2, S3) edu_high 0.23 (0.42) 0.01 (0.1) 0.22*** Age of firm owner in years age 45(9) 48 (9) -2.31** No. of organizations of which owner is a memberi no_org 0.05 0.01 0.04
Note: Standard deviations in parentheses. Binary variables were included for all Kecamatan (Jepara, Kedung, Mlonggo, Pakasaji, Tahunan). Tests of differences for binary variables were conducted using a proportions test (prtest in Stata). *** p<0.01, ** p<0.05, * p<0.1
33
Table 2: Logit estimates of determinants of participation in APKJ (propensity score generation).
After caliper
Variable Coef. Std. Err. P>z Coef. Std. Err. P>z mach_score -0.075 0.104 0.47 -0.062 0.107 0.564 no_work -0.002 0.006 0.751 -0.001 0.006 0.903 area_work 0.001 0.001 0.234 0.001 0.001 0.399 no_show -0.993 0.917 0.279 -0.686 1.021 0.502 no_works -1.290 0.669 0.054 -1.369 0.723 0.058 no_fac 1.213 0.413 0.003 1.163 0.426 0.006 teak_pct -0.008 0.006 0.211 -0.007 0.006 0.238 mahog_pct -0.008 0.007 0.233 -0.009 0.007 0.233 teak_state -0.095 0.368 0.795 -0.166 0.368 0.652 mahoni_state -0.296 0.569 0.603 -0.277 0.571 0.628 sell_brok 0.092 0.376 0.807 -0.014 0.385 0.971 sell_buy 0.756 0.378 0.046 0.806 0.384 0.036 sell_othsh 0.555 0.359 0.123 0.529 0.360 0.142 sell_online -1.245 1.426 0.382 -1.082 1.431 0.45 sell_exh 1.238 1.060 0.243 1.098 1.092 0.315 sell_exp 0.455 0.355 0.2 0.421 0.359 0.242 subcontract 0.401 0.348 0.249 0.390 0.350 0.265 ornaments -1.893 2.277 0.406 -2.165 2.343 0.356 calligraphy 3.307 1.244 0.008 3.182 1.253 0.011 dividers 0.617 0.816 0.45 0.707 0.813 0.385 relief 1.032 1.787 0.564 1.141 1.775 0.52 components 1.412 0.985 0.152 1.223 1.111 0.271 basic 1.803 1.481 0.223 2.140 1.678 0.202 finish 0.056 0.436 0.898 -0.006 0.447 0.99 contract -2.031 0.947 0.032 -1.773 0.942 0.06 broker 0.721 2.028 0.722 0.893 2.085 0.668 Batealita 0.885 0.663 0.182 0.856 0.654 0.191 Jeparaa 2.056 0.719 0.004 1.969 0.715 0.006 Kedunga 0.640 0.748 0.392 0.545 0.746 0.465 Mlonggoa 1.016 0.614 0.098 0.960 0.605 0.113 Pakisajia 1.582 0.691 0.022 1.437 0.692 0.038 Tahunana -0.628 0.648 0.332 -0.713 0.645 0.269 edu_prim 0.637 0.805 0.429 0.668 0.805 0.407 edu_js 2.147 0.829 0.01 2.168 0.832 0.009 edu_ust 1.678 1.194 0.16 1.685 1.194 0.158 edu_usa 2.283 0.839 0.006 2.253 0.842 0.007 edu_high 5.542 1.032 0 5.242 1.046 0 age 0.022 0.020 0.275 0.022 0.020 0.271 no_org 1.942 1.232 0.115 1.968 1.239 0.112

34
Intercept -6.186 2.300 0.007 -6.704 2.502 0.007 Obs 534
521
Pseudo R2 0.341
0.282
a Dummy variable representing location of furniture workshop in a high-density area. The omitted category is workshops outside of city limits (those Kecamatan with low densities of furniture businesses).
35
Table 3: Profit treatment effects; impacts of membership on 2015 firm profits, several sub-samples
Sample specifications Treatment Effect, USD
Std. Err. P-Value
Full (matched) sample (23,496) 23,412 0.32 Excluding firms that brokered in 2015 (8,465) 13,263 0.52 Excluding cases that broker or own showrooms in 2015
(11,708) 21,542 0.59
Excluding cases with profit above US $80,000
1,213 2,402 0.61
Source: 2015 Firm Survey. The treatment effect is the profit in 2015 for APKJ members minus the profits for matched non-members. Standard errors are computed using formulae in Abadai and Imbens (2008) and are explained in StataCorp 2015. Table 4: Treatment effects of APKJ membership on functional upgrading via adoption and abandonment of marketing and sales channels. Marketing/Sales Channel
Outcome Variable
Treatment Effect
Standard Error p-value
Marketing/selling at exhibitions
Added 0.12 0.04 0 Abandoned 0.03 0.01 0.03
Selling direct to foreign buyers
Added 0.12 0.05 0.02 Abandoned 0.05 0.03 0.04
Selling direct to domestic buyers
Added 0.12 0.04 0.01 Abandoned 0.04 0.03 0.16
Selling/marketing online Added -0.04 0.07 0.57 Abandoned 0 0.02 1
Selling to exporters Added 0.04 0.03 0.16 Abandoned 0.11 0.04 0.01
Selling through another showroom
Added -0.03 0.04 0.56 Abandoned 0.03 0.03 0.39
Selling through (to) brokers
Added -0.11 0.09 0.25 Abandoned 0.03 0.04 0.45
Being subcontracted Added 0.04 0.07 0.58 Abandoned -0.01 0.13 0.92
Beginning a brokering activity
Added 0.06 0.03 0.02 N/A
Source: 2015 Firm Survey. Differences are between reported behaviour in 2015 and recalled behaviour in 2009. Standard errors are computed using formulae in Abadai and Imbens (2008) and are explained in StataCorp 2015.
36
Table 5: Treatment effects of APKJ membership on product upgrading activities
Outcome Variable Treatment Effect
Standard Error p-value
Binary variable indicating addition of selling finished products between 2009 to 2015: 1 if added ; 0 otherwise
-0.14 0.04 0.00
Binary variable indicating abandoning selling finished products between 2009 to 2015: 1 if added ; 0 otherwise
-0.04 0.05 0.40
Source: 2015 Firm Survey. Differences are between reported behaviour in 2015 and recalled behaviour in 2009. Standard errors are computed using formulae in Abadai and Imbens (2008) and are explained in StataCorp 2015.
Table 6: Treatment effects of business practices on 2015 levels of outcomes
Outcome Variable Treatment Effect
Standard Error p-value
SVLK certification in 2015: 1 certified; 0 if not certified 0.08 0.02 0.00
Record-keeping in 2015: 1 if firm keeps records; 0 if firm does not keep records -0.03 0.03 0.32
Registered business in 2015: 1 if registered; 0 if not registered 0.13 0.08 0.09
Source: 2015 Firm Survey. Standard errors are computed using formulae in Abadai and Imbens (2008) and are explained in StataCorp 2015.
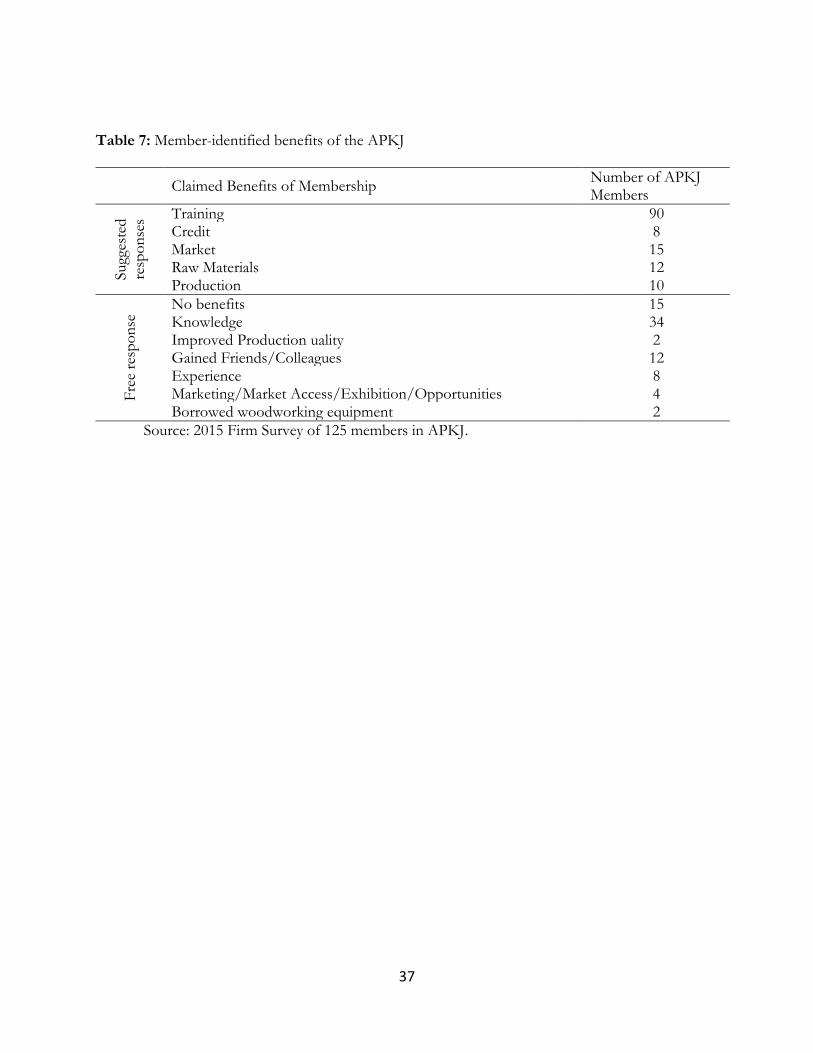
37
Table 7: Member-identified benefits of the APKJ
Claimed Benefits of Membership Number of APKJ Members
Sugg
este
d re
spon
ses Training 90
Credit 8 Market 15 Raw Materials 12 Production 10
Free
resp
onse
No benefits 15 Knowledge 34 Improved Production uality 2 Gained Friends/Colleagues 12 Experience 8 Marketing/Market Access/Exhibition/Opportunities 4 Borrowed woodworking equipment 2
Source: 2015 Firm Survey of 125 members in APKJ.
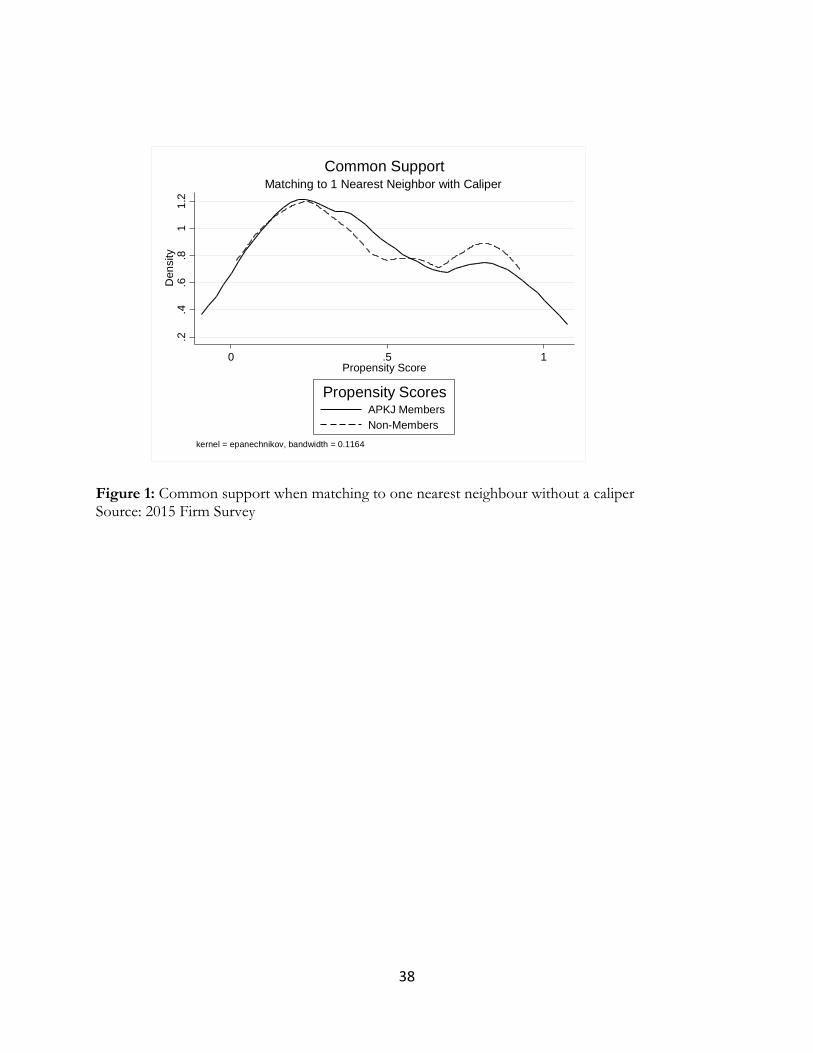
38
Figure 1: Common support when matching to one nearest neighbour without a caliper Source: 2015 Firm Survey
.2.4
.6.8
11.
2D
ensi
ty
0 .5 1Propensity Score
APKJ MembersNon-Members
Propensity Scores
kernel = epanechnikov, bandwidth = 0.1164
Matching to 1 Nearest Neighbor with CaliperCommon Support
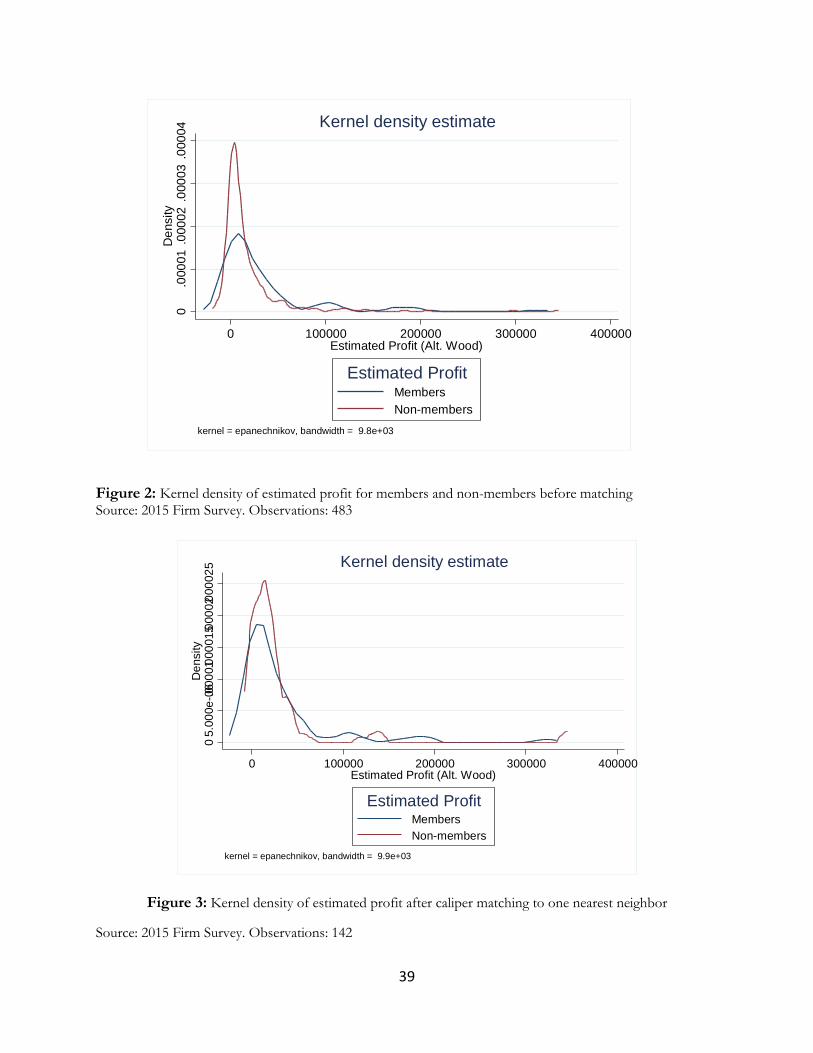
39
Figure 2: Kernel density of estimated profit for members and non-members before matching Source: 2015 Firm Survey. Observations: 483
Figure 3: Kernel density of estimated profit after caliper matching to one nearest neighbor
Source: 2015 Firm Survey. Observations: 142
0.0
0001
.000
02.0
0003
.000
04D
ensi
ty
0 100000 200000 300000 400000Estimated Profit (Alt. Wood)
Members Non-members
Estimated Profit
kernel = epanechnikov, bandwidth = 9.8e+03
Kernel density estimate
05.
000e
-06.000
01.00
0015.
0000
2 .000
025
Den
sity
0 100000 200000 300000 400000Estimated Profit (Alt. Wood)
Members Non-members
Estimated Profit
kernel = epanechnikov, bandwidth = 9.9e+03
Kernel density estimate