Policy Research Working Paper 6166
Internal Migration in Egypt
Levels, Determinants, Wages, and Likelihood of Employment
Santiago HerreraKarim Badr
The World BankMiddle East and North Africa RegionPoverty Reduction and Economic Management UnitAugust 2012
WPS6166P
ublic
Dis
clos
ure
Aut
horiz
edP
ublic
Dis
clos
ure
Aut
horiz
edP
ublic
Dis
clos
ure
Aut
horiz
edP
ublic
Dis
clos
ure
Aut
horiz
ed
Produced by the Research Support Team
Abstract
The Policy Research Working Paper Series disseminates the findings of work in progress to encourage the exchange of ideas about development issues. An objective of the series is to get the findings out quickly, even if the presentations are less than fully polished. The papers carry the names of the authors and should be cited accordingly. The findings, interpretations, and conclusions expressed in this paper are entirely those of the authors. They do not necessarily represent the views of the International Bank for Reconstruction and Development/World Bank and its affiliated organizations, or those of the Executive Directors of the World Bank or the governments they represent.
Policy Research Working Paper 6166
This paper describes stylized facts about internal migration and the labor force in Egypt, and shows how internal migration in the country is low compared with international standards. Using aggregate labor force survey data, the paper shows how individuals migrate to governorates with higher wages. With a Mincerian equation, the analysis finds that migrants earn premiums with respect to non-migrants, except for those migrants with low education levels. The aggregate labor statistics reveal lower unemployment rates among migrants, a phenomenon that is verified by an employment equation. According to the econometric results, migrants are more
This paper is a product of the Poverty Reduction and Economic Management Unit, Middle East and North Africa Region. It is part of a larger effort by the World Bank to provide open access to its research and make a contribution to development policy discussions around the world. Policy Research Working Papers are also posted on the Web at http://econ.worldbank.org. The authors may be contacted at [email protected] and [email protected].
likely to be employed, even after controlling for other observable individual characteristics. Finally, the paper estimates a Probit model for the decision to migrate, finding that more educated individuals are more likely to migrate, agricultural workers have a lower probability of migrating, and individuals from governorates in which food production for own consumption is higher are less likely to migrate. These results suggest that low educational attainment and the “food problem”, which ties resources to food production to meet subsistence requirements, are at the root of low migration in Egypt.
Internal migration in Egypt: Levels, determinants, wages, and likelihood of employment
Santiago Herrera1
Karim Badr2
JEL Classification: R23, J61
Keywords: Egypt, Internal Migration, employment, wages
Sector Board: POV
1 Santiago Herrera is lead country economist, World Bank , Cairo Office
2 Karim Badr is research analyst, World Bank, Cairo Office.
2
Introduction
Although Egypt (pop. 83 million in 2011) experienced striking economic growth alongside a
variety of developmental improvements from 2004 till 2010, spatial inequality and poverty
persist. Egyptians in urban and Lower Egypt enjoy higher living standards than those in rural
and Upper Egypt, yet internal migration rates are surprisingly low compared to other countries.
This paper offers three explanations for the low migration rates: 1) low educational level, 2)
labor is tied up in agricultural activity either as paid workers or unpaid family workers, and 3)
rural households’ ability to raise a portion of their food offsetting the impact of soaring food
prices and reducing the incentive to migrate. The paper also finds two telling characteristics of
internal migrants: 1) they are more likely to find employment than non-migrants; and 2) they
earn higher wages, in particular the more educated individuals.
Literature Review
All existing studies address the issue of internal migration in Egypt without, however,
suggesting why the rates are comparatively low:
Wahba, “An Overview of Internal and International Migration in Egypt” (2007) used the Egypt
Labor Market Panel Survey (ELMPS 06) to demonstrate that while internal migration increased
in 1998 -2006, the rate remained very low. The author notes that both rural-to- urban and
urban-to- rural migration increased in that period as did commuting patterns.
Zohry, “The Development Impact of Internal Migration: Findings from Egypt” (2009) discussed
the main motivations behind internal and international migration in Egypt drawing on field
work in two governorates (Cairo and Beni Suief ). Zohry suggested that migrants were more
often forced to move by dire economic necessity rather than the wish to seek a better living
situation.
Stylized Facts
Data
This study used the Labor Force Survey conducted by the Central Agency for Public Mobilization
and Statistics (CAPMAS) for the first quarter of year 2010. The survey has over 60 questions,
clustered in three sections: 1) demographic and professional status (28 questions); 2) employed
characteristics (26 questions); and 3) unemployed characteristics (5 questions). The survey has
88,000 respondents.
3
An internal migrant is defined as an individual who has left the governorate of residence since
birth in order to live in another region/governorate.3 The internal migration rate is calculated as
a ratio of the number of migrants to that of the total population.
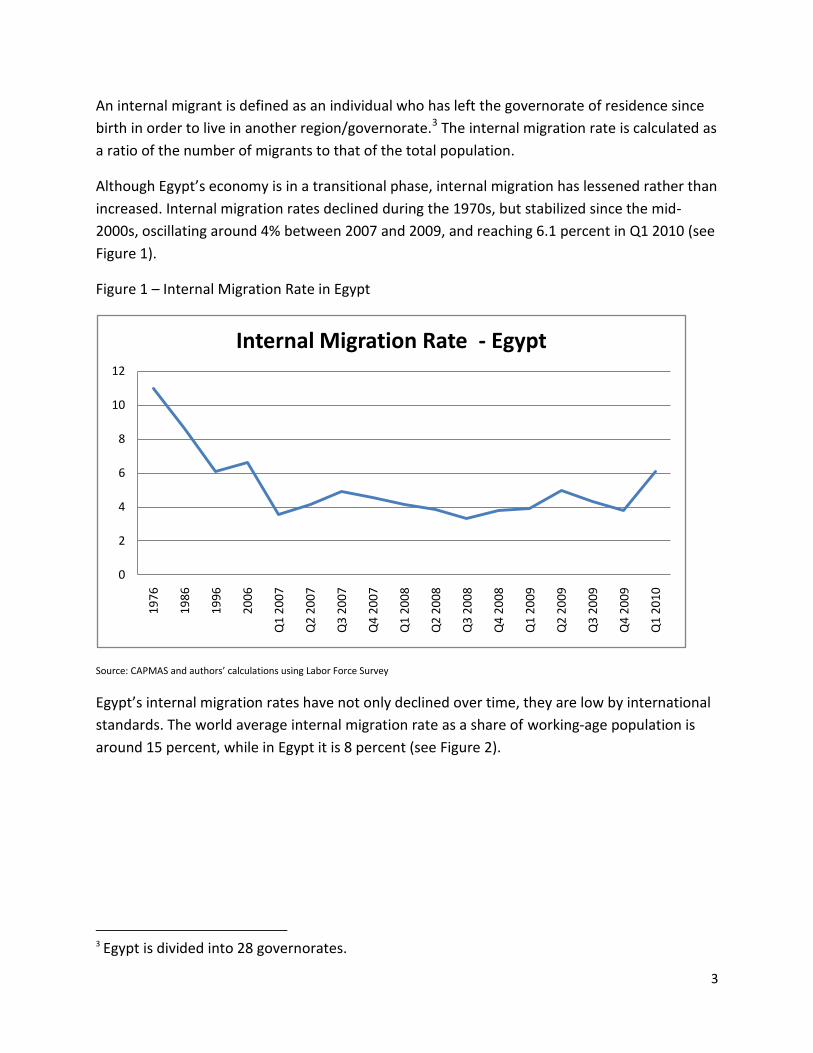
Although Egypt’s economy is in a transitional phase, internal migration has lessened rather than
increased. Internal migration rates declined during the 1970s, but stabilized since the mid-
2000s, oscillating around 4% between 2007 and 2009, and reaching 6.1 percent in Q1 2010 (see
Figure 1).
Figure 1 – Internal Migration Rate in Egypt
Source: CAPMAS and authors’ calculations using Labor Force Survey
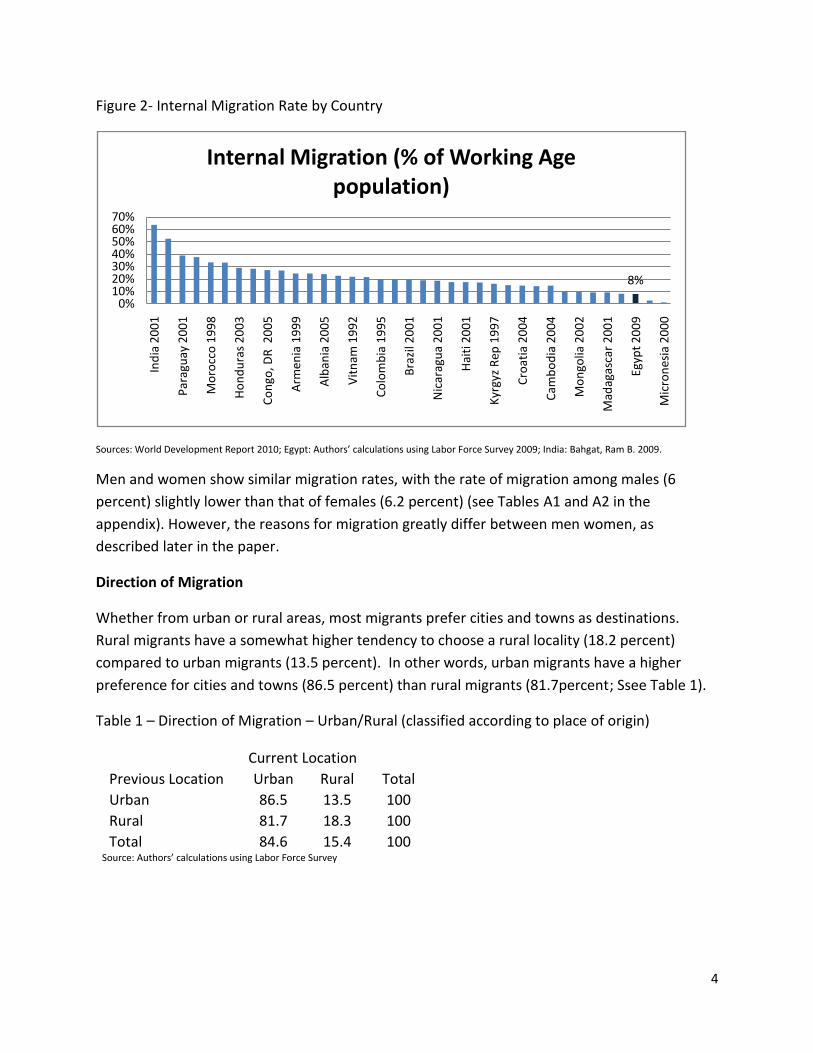
Egypt’s internal migration rates have not only declined over time, they are low by international
standards. The world average internal migration rate as a share of working-age population is
around 15 percent, while in Egypt it is 8 percent (see Figure 2).
3 Egypt is divided into 28 governorates.
0
2
4
6
8
10
12
19
76
19
86
19
96
20
06
Q1
20
07
Q2
20
07
Q3
20
07
Q4
20
07
Q1
20
08
Q2
20
08
Q3
20
08
Q4
20
08
Q1
20
09
Q2
20
09
Q3
20
09
Q4
20
09
Q1
20
10
Internal Migration Rate - Egypt
4
Figure 2- Internal Migration Rate by Country
Sources: World Development Report 2010; Egypt: Authors’ calculations using Labor Force Survey 2009; India: Bahgat, Ram B. 2009.
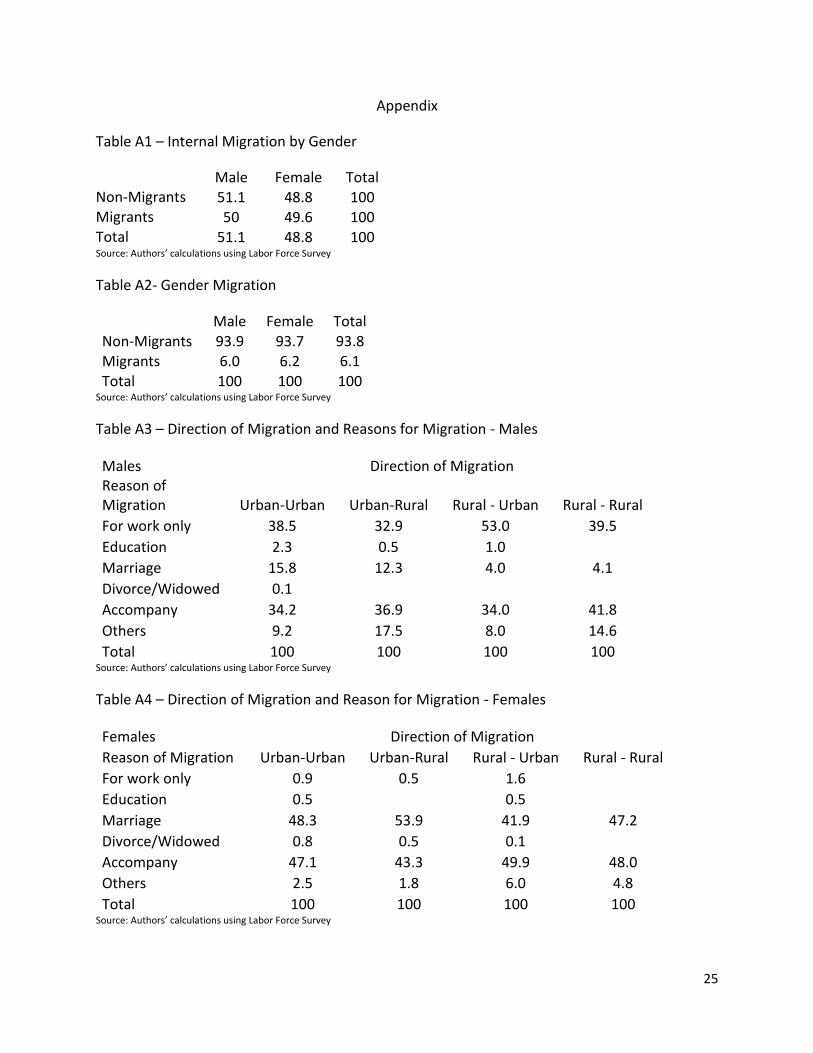
Men and women show similar migration rates, with the rate of migration among males (6
percent) slightly lower than that of females (6.2 percent) (see Tables A1 and A2 in the
appendix). However, the reasons for migration greatly differ between men women, as
described later in the paper.
Direction of Migration
Whether from urban or rural areas, most migrants prefer cities and towns as destinations.
Rural migrants have a somewhat higher tendency to choose a rural locality (18.2 percent)
compared to urban migrants (13.5 percent). In other words, urban migrants have a higher
preference for cities and towns (86.5 percent) than rural migrants (81.7percent; Ssee Table 1).
Table 1 – Direction of Migration – Urban/Rural (classified according to place of origin)
Current Location
Previous Location Urban Rural Total
Urban 86.5 13.5 100
Rural 81.7 18.3 100
Total 84.6 15.4 100
Source: Authors’ calculations using Labor Force Survey
8%
0%10%20%30%40%50%60%70%
Ind
ia 2
00
1
Par
agu
ay 2
00
1
Mo
rocc
o 1
99
8
Ho
nd
ura
s 2
00
3
Co
ngo
, DR
20
05
Arm
enia
19
99
Alb
ania
20
05
Vit
nam
19
92
Co
lom
bia
19
95
Bra
zil 2
00
1
Nic
arag
ua
20
01
Hai
ti 2
00
1
Kyr
gyz
Rep
19
97
Cro
atia
20
04
Cam
bo
dia
20
04
Mo
ngo
lia 2
00
2
Mad
agas
car
20
01
Egyp
t 2
00
9
Mic
ron
esia
20
00
Internal Migration (% of Working Age population)
5
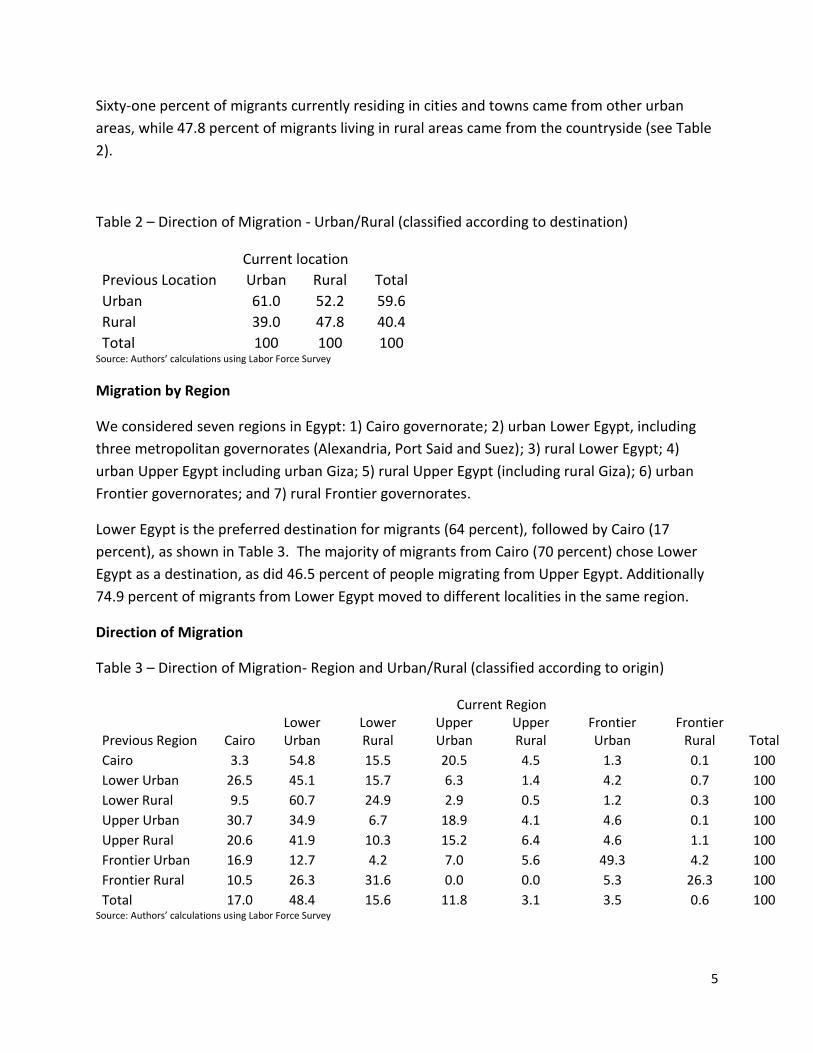
Sixty-one percent of migrants currently residing in cities and towns came from other urban
areas, while 47.8 percent of migrants living in rural areas came from the countryside (see Table
2).
Table 2 – Direction of Migration - Urban/Rural (classified according to destination)
Current location
Previous Location Urban Rural Total
Urban 61.0 52.2 59.6
Rural 39.0 47.8 40.4
Total 100 100 100 Source: Authors’ calculations using Labor Force Survey
Migration by Region
We considered seven regions in Egypt: 1) Cairo governorate; 2) urban Lower Egypt, including
three metropolitan governorates (Alexandria, Port Said and Suez); 3) rural Lower Egypt; 4)
urban Upper Egypt including urban Giza; 5) rural Upper Egypt (including rural Giza); 6) urban
Frontier governorates; and 7) rural Frontier governorates.
Lower Egypt is the preferred destination for migrants (64 percent), followed by Cairo (17
percent), as shown in Table 3. The majority of migrants from Cairo (70 percent) chose Lower
Egypt as a destination, as did 46.5 percent of people migrating from Upper Egypt. Additionally
74.9 percent of migrants from Lower Egypt moved to different localities in the same region.
Direction of Migration
Table 3 – Direction of Migration- Region and Urban/Rural (classified according to origin)
Current Region
Previous Region Cairo Lower Urban
Lower Rural
Upper Urban
Upper Rural
Frontier Urban
Frontier Rural Total
Cairo 3.3 54.8 15.5 20.5 4.5 1.3 0.1 100
Lower Urban 26.5 45.1 15.7 6.3 1.4 4.2 0.7 100
Lower Rural 9.5 60.7 24.9 2.9 0.5 1.2 0.3 100
Upper Urban 30.7 34.9 6.7 18.9 4.1 4.6 0.1 100
Upper Rural 20.6 41.9 10.3 15.2 6.4 4.6 1.1 100
Frontier Urban 16.9 12.7 4.2 7.0 5.6 49.3 4.2 100
Frontier Rural 10.5 26.3 31.6 0.0 0.0 5.3 26.3 100
Total 17.0 48.4 15.6 11.8 3.1 3.5 0.6 100 Source: Authors’ calculations using Labor Force Survey
6
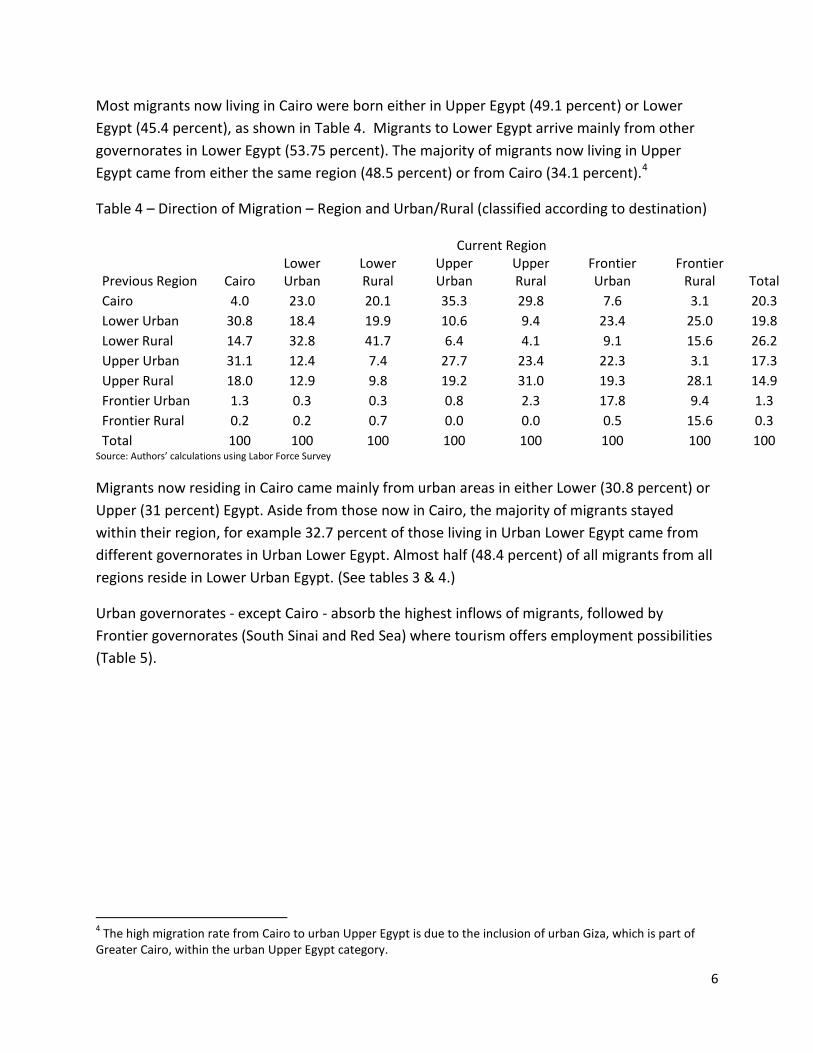
Most migrants now living in Cairo were born either in Upper Egypt (49.1 percent) or Lower
Egypt (45.4 percent), as shown in Table 4. Migrants to Lower Egypt arrive mainly from other
governorates in Lower Egypt (53.75 percent). The majority of migrants now living in Upper
Egypt came from either the same region (48.5 percent) or from Cairo (34.1 percent).4
Table 4 – Direction of Migration – Region and Urban/Rural (classified according to destination)
Current Region
Previous Region Cairo Lower Urban
Lower Rural
Upper Urban
Upper Rural
Frontier Urban
Frontier Rural Total
Cairo 4.0 23.0 20.1 35.3 29.8 7.6 3.1 20.3
Lower Urban 30.8 18.4 19.9 10.6 9.4 23.4 25.0 19.8
Lower Rural 14.7 32.8 41.7 6.4 4.1 9.1 15.6 26.2
Upper Urban 31.1 12.4 7.4 27.7 23.4 22.3 3.1 17.3
Upper Rural 18.0 12.9 9.8 19.2 31.0 19.3 28.1 14.9
Frontier Urban 1.3 0.3 0.3 0.8 2.3 17.8 9.4 1.3
Frontier Rural 0.2 0.2 0.7 0.0 0.0 0.5 15.6 0.3
Total 100 100 100 100 100 100 100 100 Source: Authors’ calculations using Labor Force Survey
Migrants now residing in Cairo came mainly from urban areas in either Lower (30.8 percent) or
Upper (31 percent) Egypt. Aside from those now in Cairo, the majority of migrants stayed
within their region, for example 32.7 percent of those living in Urban Lower Egypt came from
different governorates in Urban Lower Egypt. Almost half (48.4 percent) of all migrants from all
regions reside in Lower Urban Egypt. (See tables 3 & 4.)
Urban governorates - except Cairo - absorb the highest inflows of migrants, followed by
Frontier governorates (South Sinai and Red Sea) where tourism offers employment possibilities
(Table 5).
4 The high migration rate from Cairo to urban Upper Egypt is due to the inclusion of urban Giza, which is part of
Greater Cairo, within the urban Upper Egypt category.
7
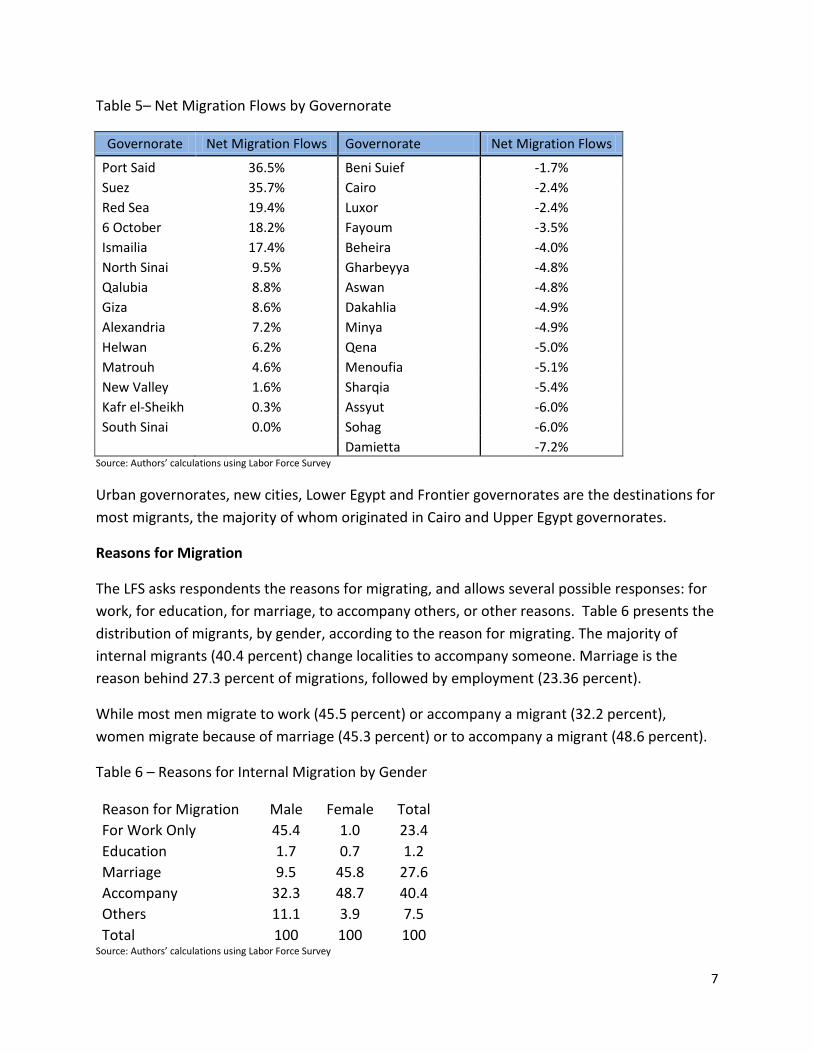
Table 5– Net Migration Flows by Governorate
Governorate Net Migration Flows Governorate Net Migration Flows
Port Said 36.5% Beni Suief -1.7%
Suez 35.7% Cairo -2.4%
Red Sea 19.4% Luxor -2.4%
6 October 18.2% Fayoum -3.5%
Ismailia 17.4% Beheira -4.0%
North Sinai 9.5% Gharbeyya -4.8%
Qalubia 8.8% Aswan -4.8%
Giza 8.6% Dakahlia -4.9%
Alexandria 7.2% Minya -4.9%
Helwan 6.2% Qena -5.0%
Matrouh 4.6% Menoufia -5.1%
New Valley 1.6% Sharqia -5.4%
Kafr el-Sheikh 0.3% Assyut -6.0%
South Sinai 0.0% Sohag -6.0%
Damietta -7.2% Source: Authors’ calculations using Labor Force Survey
Urban governorates, new cities, Lower Egypt and Frontier governorates are the destinations for
most migrants, the majority of whom originated in Cairo and Upper Egypt governorates.
Reasons for Migration
The LFS asks respondents the reasons for migrating, and allows several possible responses: for
work, for education, for marriage, to accompany others, or other reasons. Table 6 presents the
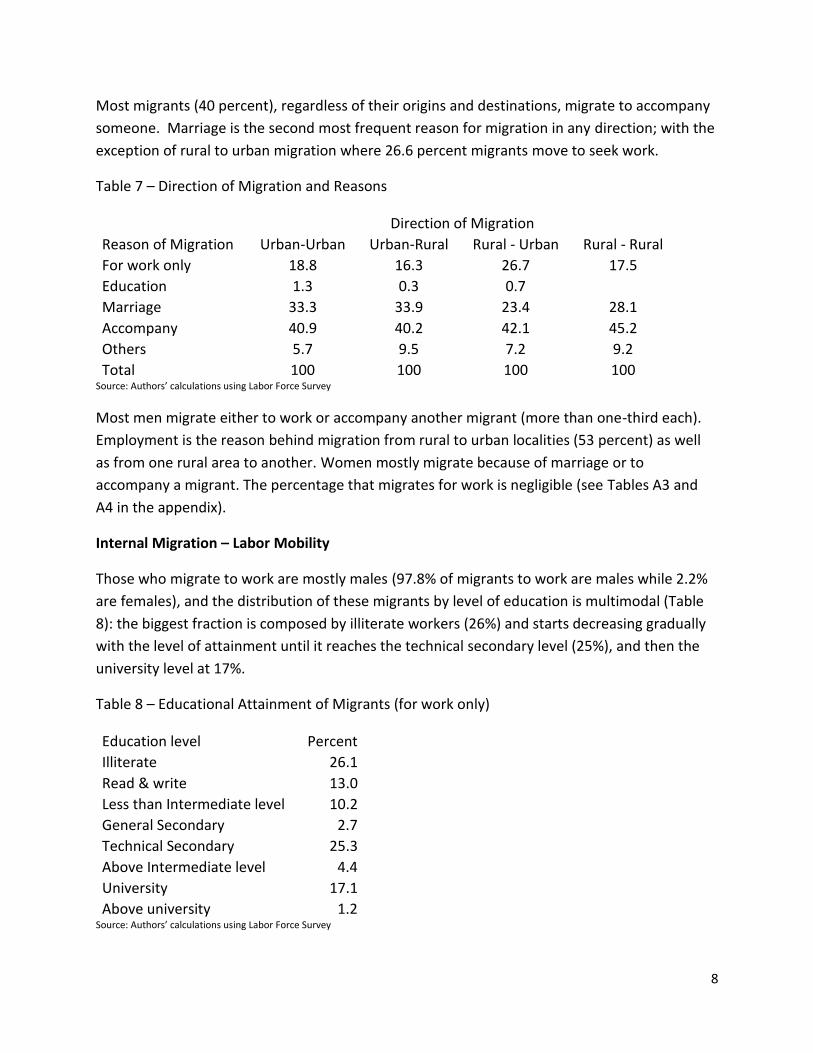
distribution of migrants, by gender, according to the reason for migrating. The majority of
internal migrants (40.4 percent) change localities to accompany someone. Marriage is the
reason behind 27.3 percent of migrations, followed by employment (23.36 percent).
While most men migrate to work (45.5 percent) or accompany a migrant (32.2 percent),
women migrate because of marriage (45.3 percent) or to accompany a migrant (48.6 percent).
Table 6 – Reasons for Internal Migration by Gender
Reason for Migration Male Female Total
For Work Only 45.4 1.0 23.4
Education 1.7 0.7 1.2
Marriage 9.5 45.8 27.6
Accompany 32.3 48.7 40.4
Others 11.1 3.9 7.5
Total 100 100 100 Source: Authors’ calculations using Labor Force Survey
8
Most migrants (40 percent), regardless of their origins and destinations, migrate to accompany
someone. Marriage is the second most frequent reason for migration in any direction; with the
exception of rural to urban migration where 26.6 percent migrants move to seek work.
Table 7 – Direction of Migration and Reasons
Direction of Migration
Reason of Migration Urban-Urban Urban-Rural Rural - Urban Rural - Rural
For work only 18.8 16.3 26.7 17.5
Education 1.3 0.3 0.7 Marriage 33.3 33.9 23.4 28.1
Accompany 40.9 40.2 42.1 45.2
Others 5.7 9.5 7.2 9.2
Total 100 100 100 100 Source: Authors’ calculations using Labor Force Survey
Most men migrate either to work or accompany another migrant (more than one-third each).
Employment is the reason behind migration from rural to urban localities (53 percent) as well
as from one rural area to another. Women mostly migrate because of marriage or to
accompany a migrant. The percentage that migrates for work is negligible (see Tables A3 and
A4 in the appendix).
Internal Migration – Labor Mobility
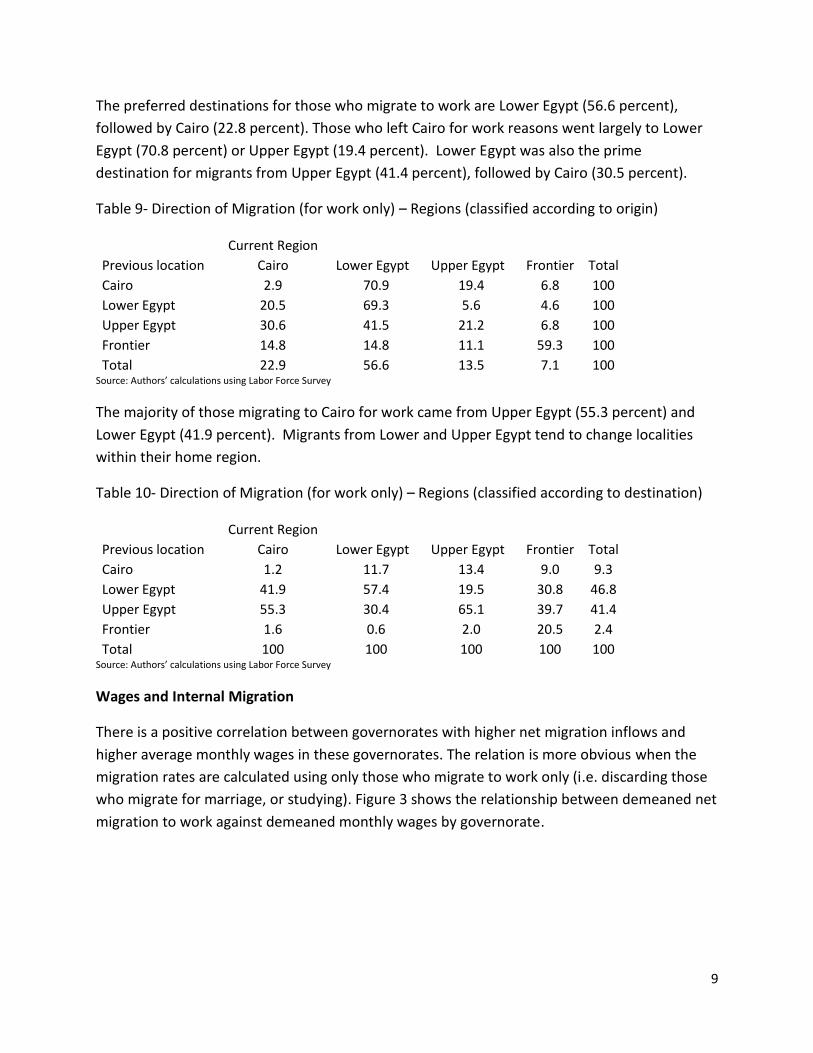
Those who migrate to work are mostly males (97.8% of migrants to work are males while 2.2%
are females), and the distribution of these migrants by level of education is multimodal (Table
8): the biggest fraction is composed by illiterate workers (26%) and starts decreasing gradually
with the level of attainment until it reaches the technical secondary level (25%), and then the
university level at 17%.
Table 8 – Educational Attainment of Migrants (for work only)
Education level Percent
Illiterate 26.1
Read & write 13.0
Less than Intermediate level 10.2
General Secondary 2.7
Technical Secondary 25.3
Above Intermediate level 4.4
University 17.1
Above university 1.2 Source: Authors’ calculations using Labor Force Survey
9
The preferred destinations for those who migrate to work are Lower Egypt (56.6 percent),
followed by Cairo (22.8 percent). Those who left Cairo for work reasons went largely to Lower
Egypt (70.8 percent) or Upper Egypt (19.4 percent). Lower Egypt was also the prime
destination for migrants from Upper Egypt (41.4 percent), followed by Cairo (30.5 percent).
Table 9- Direction of Migration (for work only) – Regions (classified according to origin)
Current Region
Previous location Cairo Lower Egypt Upper Egypt Frontier Total
Cairo 2.9 70.9 19.4 6.8 100
Lower Egypt 20.5 69.3 5.6 4.6 100
Upper Egypt 30.6 41.5 21.2 6.8 100
Frontier 14.8 14.8 11.1 59.3 100
Total 22.9 56.6 13.5 7.1 100 Source: Authors’ calculations using Labor Force Survey
The majority of those migrating to Cairo for work came from Upper Egypt (55.3 percent) and
Lower Egypt (41.9 percent). Migrants from Lower and Upper Egypt tend to change localities
within their home region.
Table 10- Direction of Migration (for work only) – Regions (classified according to destination)
Current Region
Previous location Cairo Lower Egypt Upper Egypt Frontier Total
Cairo 1.2 11.7 13.4 9.0 9.3
Lower Egypt 41.9 57.4 19.5 30.8 46.8
Upper Egypt 55.3 30.4 65.1 39.7 41.4
Frontier 1.6 0.6 2.0 20.5 2.4
Total 100 100 100 100 100 Source: Authors’ calculations using Labor Force Survey
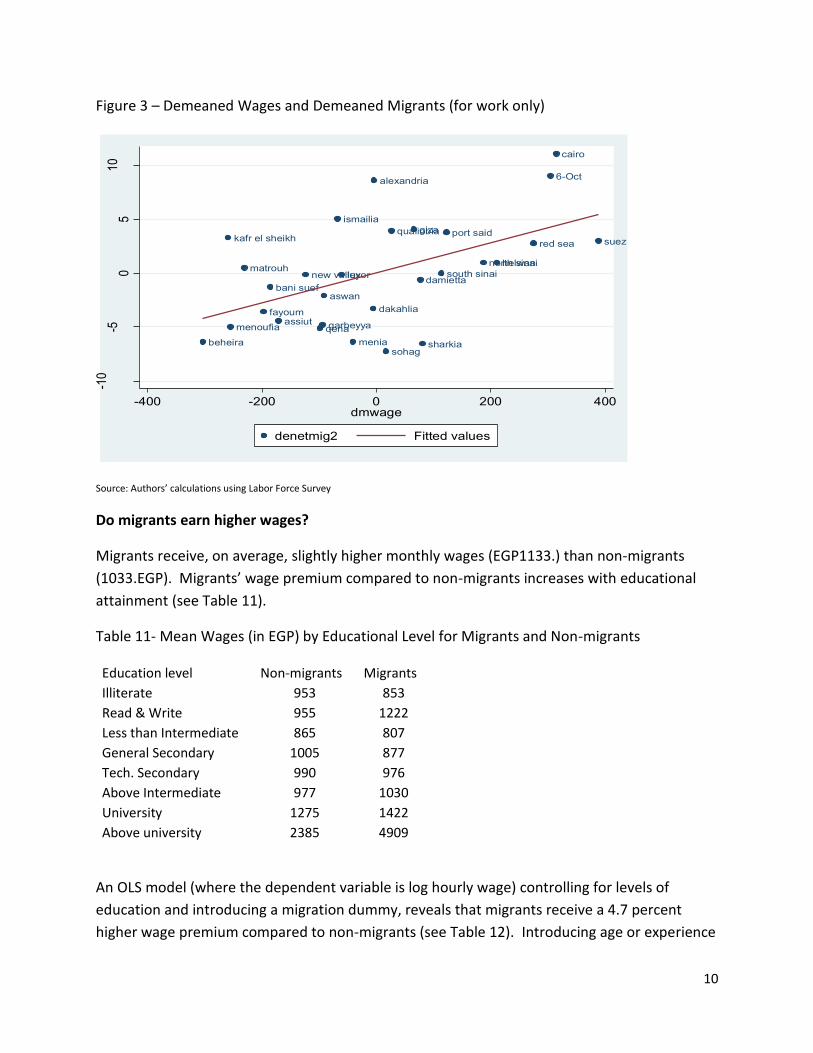
Wages and Internal Migration
There is a positive correlation between governorates with higher net migration inflows and
higher average monthly wages in these governorates. The relation is more obvious when the
migration rates are calculated using only those who migrate to work only (i.e. discarding those
who migrate for marriage, or studying). Figure 3 shows the relationship between demeaned net
migration to work against demeaned monthly wages by governorate.
10
Figure 3 – Demeaned Wages and Demeaned Migrants (for work only)
Source: Authors’ calculations using Labor Force Survey
Do migrants earn higher wages?
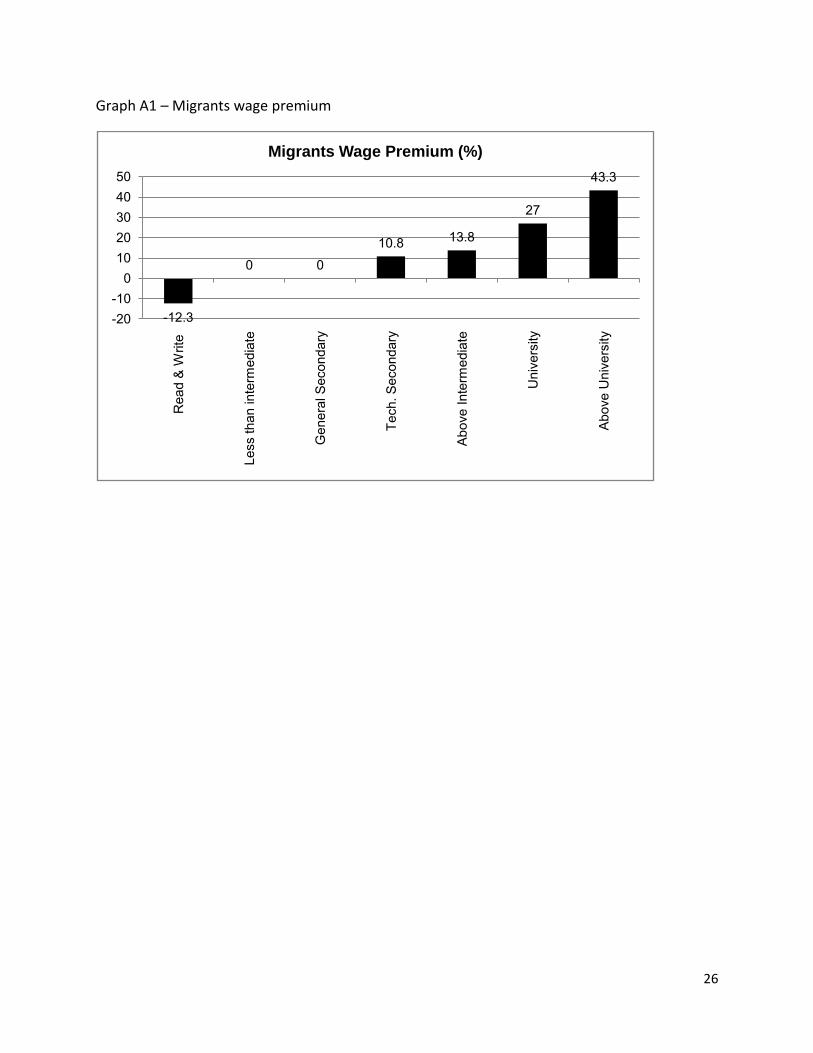
Migrants receive, on average, slightly higher monthly wages (EGP1133.) than non-migrants
(1033.EGP). Migrants’ wage premium compared to non-migrants increases with educational
attainment (see Table 11).
Table 11- Mean Wages (in EGP) by Educational Level for Migrants and Non-migrants
Education level Non-migrants Migrants
Illiterate 953 853
Read & Write 955 1222
Less than Intermediate 865 807
General Secondary 1005 877
Tech. Secondary 990 976
Above Intermediate 977 1030
University 1275 1422
Above university 2385 4909
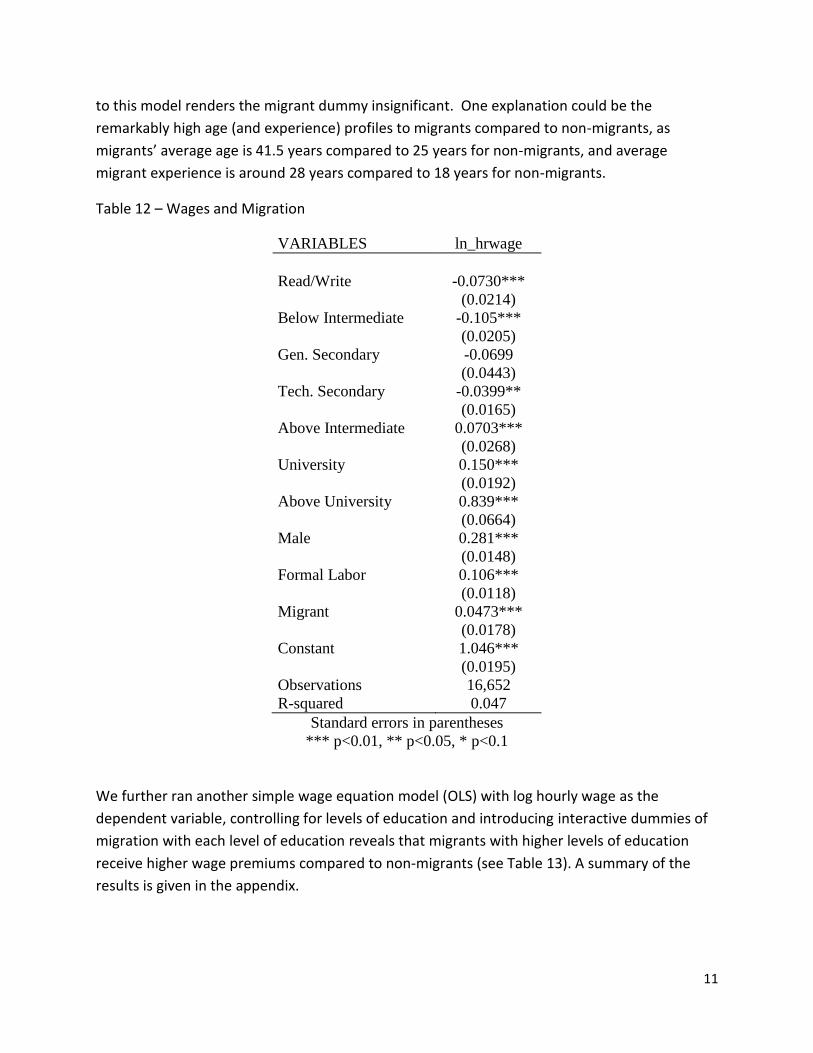
An OLS model (where the dependent variable is log hourly wage) controlling for levels of
education and introducing a migration dummy, reveals that migrants receive a 4.7 percent
higher wage premium compared to non-migrants (see Table 12). Introducing age or experience
damietta
sohag
assiut
sharkia
menoufia qenamenia
dakahlia
garbeyya
aswan
beheira
fayoum
cairo
luxorbani suef
south sinai
kafr el sheikh
new valleymatrouh helwan
alexandria
gizaqualiobia
north sinai
ismailia
6-Oct
red sea suezport said
-10
-50
510
-400 -200 0 200 400dmwage
denetmig2 Fitted values
11
to this model renders the migrant dummy insignificant. One explanation could be the
remarkably high age (and experience) profiles to migrants compared to non-migrants, as
migrants’ average age is 41.5 years compared to 25 years for non-migrants, and average
migrant experience is around 28 years compared to 18 years for non-migrants.
Table 12 – Wages and Migration
VARIABLES ln_hrwage
Read/Write -0.0730***
(0.0214)
Below Intermediate -0.105***
(0.0205)
Gen. Secondary -0.0699
(0.0443)
Tech. Secondary -0.0399**
(0.0165)
Above Intermediate 0.0703***
(0.0268)
University 0.150***
(0.0192)
Above University 0.839***
(0.0664)
Male 0.281***
(0.0148)
Formal Labor 0.106***
(0.0118)
Migrant 0.0473***
(0.0178)
Constant 1.046***
(0.0195)
Observations 16,652
R-squared 0.047
Standard errors in parentheses
*** p<0.01, ** p<0.05, * p<0.1
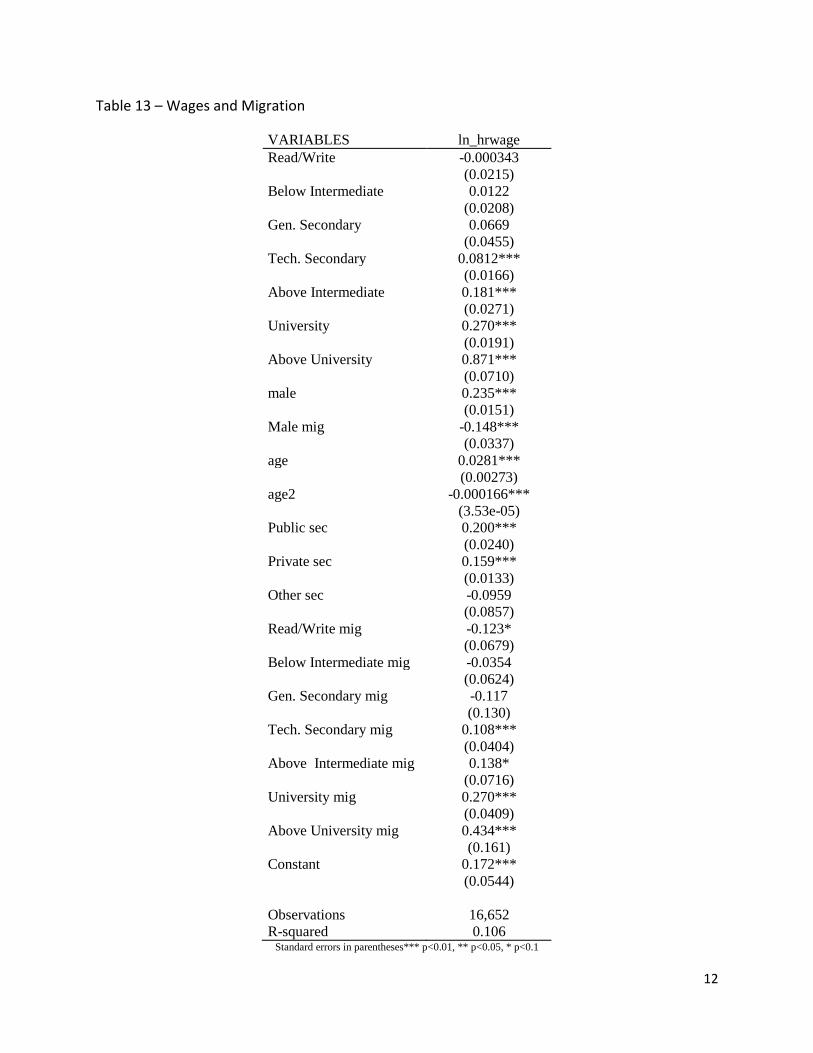
We further ran another simple wage equation model (OLS) with log hourly wage as the
dependent variable, controlling for levels of education and introducing interactive dummies of
migration with each level of education reveals that migrants with higher levels of education
receive higher wage premiums compared to non-migrants (see Table 13). A summary of the
results is given in the appendix.
12
Table 13 – Wages and Migration
VARIABLES ln_hrwage
Read/Write -0.000343
(0.0215)
Below Intermediate 0.0122
(0.0208)
Gen. Secondary 0.0669
(0.0455)
Tech. Secondary 0.0812***
(0.0166)
Above Intermediate 0.181***
(0.0271)
University 0.270***
(0.0191)
Above University 0.871***
(0.0710)
male 0.235***
(0.0151)
Male mig -0.148***
(0.0337)
age 0.0281***
(0.00273)
age2 -0.000166***
(3.53e-05)
Public sec 0.200***
(0.0240)
Private sec 0.159***
(0.0133)
Other sec -0.0959
(0.0857)
Read/Write mig -0.123*
(0.0679)
Below Intermediate mig -0.0354
(0.0624)
Gen. Secondary mig -0.117
(0.130)
Tech. Secondary mig 0.108***
(0.0404)
Above Intermediate mig 0.138*
(0.0716)
University mig 0.270***
(0.0409)
Above University mig 0.434***
(0.161)
Constant 0.172***
(0.0544)
Observations 16,652
R-squared 0.106 Standard errors in parentheses*** p<0.01, ** p<0.05, * p<0.1
13
Reasons for Low Migration Rates
Three stylized facts presented below suggest three interrelated reasons for Egypt’s reduced
internal migration rates. The first is low educational attainment, as migration rates tend to
increase with level of education. Second, labor is absorbed by low-productivity agricultural
activities, which relates to the third reason for low migration, that of households producing
significant portions on their total food consumption, in what has been labled the “food
problem” (Gollin, Parente and Rogerson, 2008).
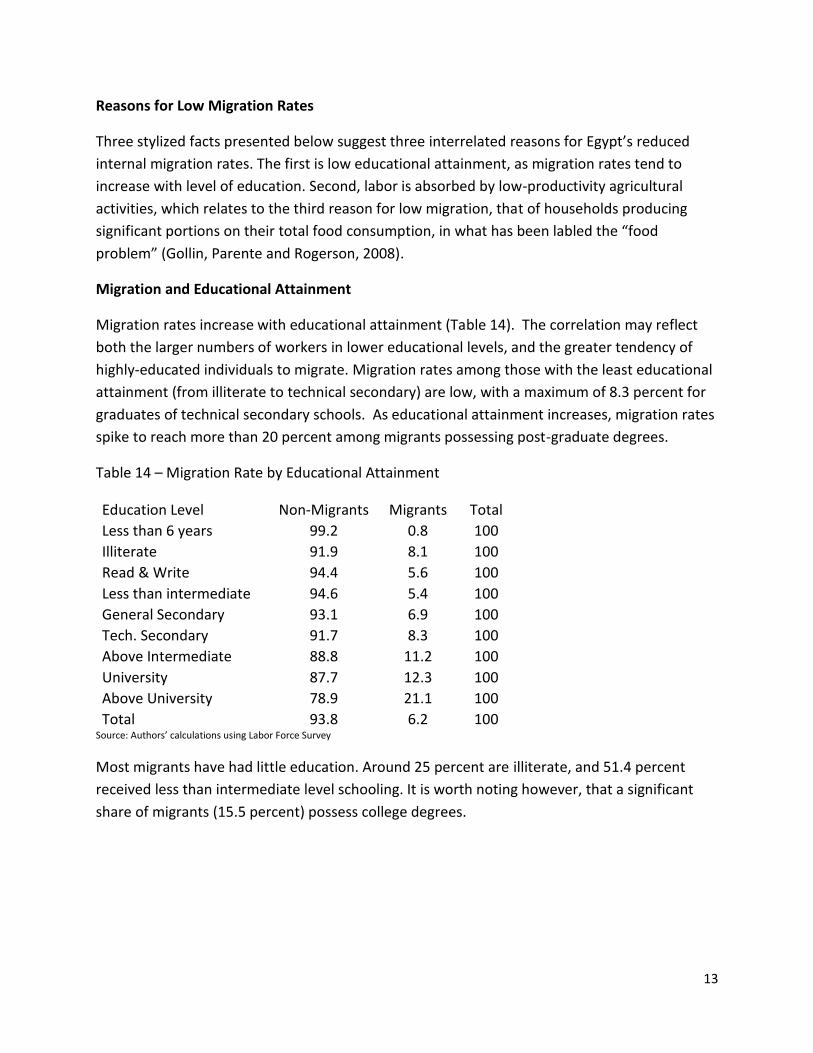
Migration and Educational Attainment
Migration rates increase with educational attainment (Table 14). The correlation may reflect
both the larger numbers of workers in lower educational levels, and the greater tendency of
highly-educated individuals to migrate. Migration rates among those with the least educational
attainment (from illiterate to technical secondary) are low, with a maximum of 8.3 percent for
graduates of technical secondary schools. As educational attainment increases, migration rates
spike to reach more than 20 percent among migrants possessing post-graduate degrees.
Table 14 – Migration Rate by Educational Attainment
Education Level Non-Migrants Migrants Total
Less than 6 years 99.2 0.8 100
Illiterate 91.9 8.1 100
Read & Write 94.4 5.6 100
Less than intermediate 94.6 5.4 100
General Secondary 93.1 6.9 100
Tech. Secondary 91.7 8.3 100
Above Intermediate 88.8 11.2 100
University 87.7 12.3 100
Above University 78.9 21.1 100
Total 93.8 6.2 100 Source: Authors’ calculations using Labor Force Survey
Most migrants have had little education. Around 25 percent are illiterate, and 51.4 percent
received less than intermediate level schooling. It is worth noting however, that a significant
share of migrants (15.5 percent) possess college degrees.
14
Table 15 – Educational Attainment of Migrants and Non-migrants
Education level Non-Migrants Migrants Total
Less than 6 years 22.8 2.7 21.6
Illiterate 19.6 26.2 20.0
Read & Write 12.6 11.4 12.6
Less than Intermediate 16.0 13.9 15.9
General Secondary 3.6 4.1 3.7
Tech. Secondary 15.9 21.9 16.3
Above Intermediate 2.0 3.8 2.1
University 7.3 15.5 7.8
Above University 0.2 0.6 0.2
Total 100 100 100 Source: Authors’ calculations using Labor Force Survey
Agricultural Sector Involvement
The second stylized fact that can explain Egypt’s low internal migration rate is involvement in
agricultural activities that ties people to the land, often as unpaid family workers. Agricultural
workers have lower migration rates than workers with other occupations (see Table 16).
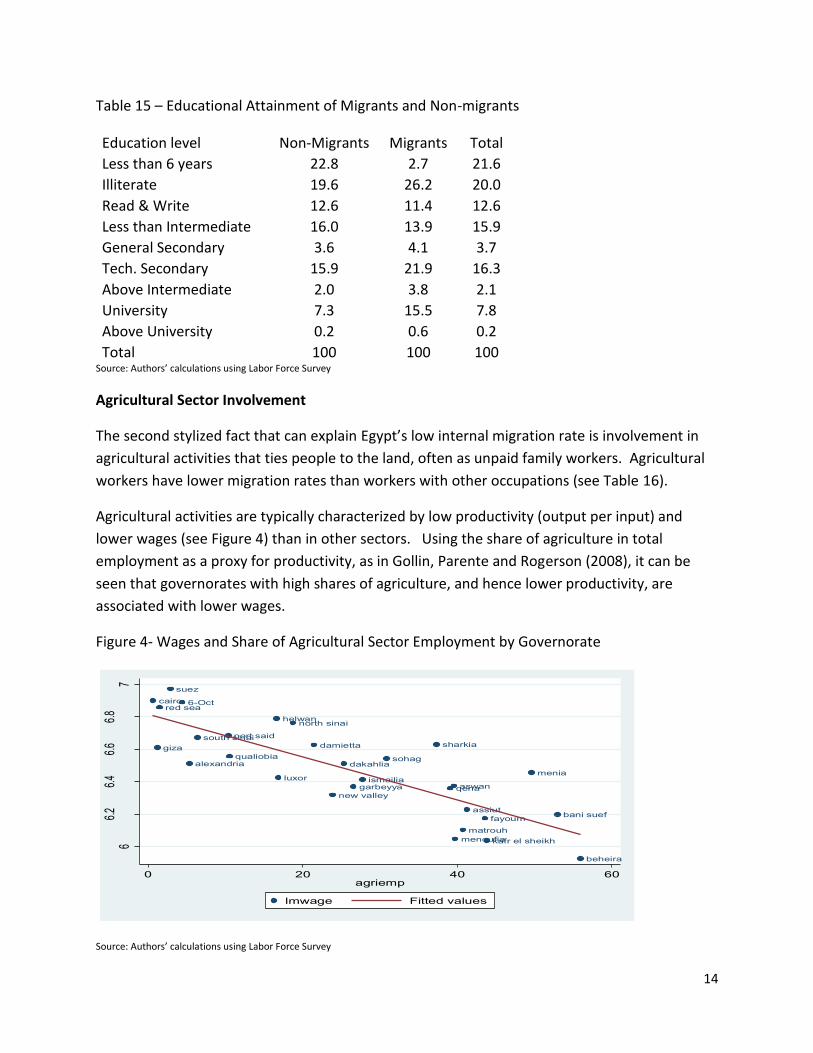
Agricultural activities are typically characterized by low productivity (output per input) and
lower wages (see Figure 4) than in other sectors. Using the share of agriculture in total
employment as a proxy for productivity, as in Gollin, Parente and Rogerson (2008), it can be
seen that governorates with high shares of agriculture, and hence lower productivity, are
associated with lower wages.
Figure 4- Wages and Share of Agricultural Sector Employment by Governorate
Source: Authors’ calculations using Labor Force Survey
cairo
alexandria
port said
suez
6-Oct
helwan
damietta
dakahlia
sharkia
qualiobia
kafr el sheikh
garbeyya
menoufia
beheira
ismailia
giza
bani sueffayoum
menia
assiut
sohag
qenaaswanluxor
red sea
new valley
matrouh
north sinai
south sinai
66.2
6.46.6
6.87
0 20 40 60agriemp
lmwage Fitted values
15
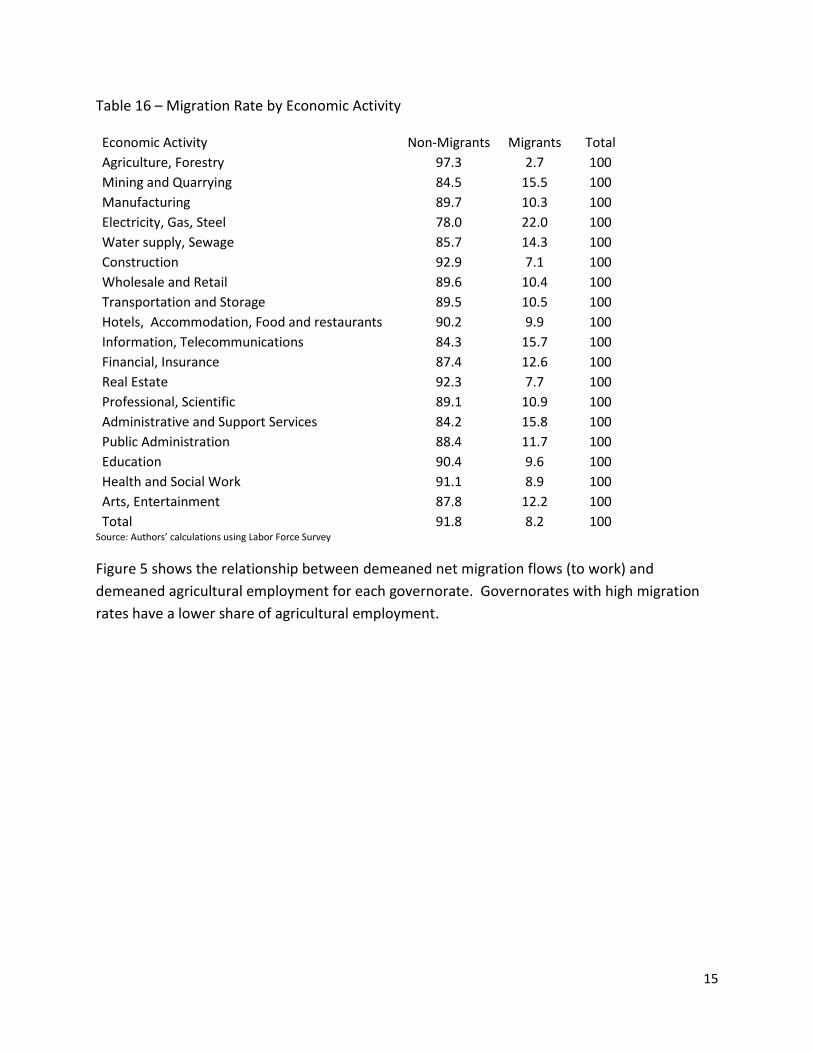
Table 16 – Migration Rate by Economic Activity
Economic Activity Non-Migrants Migrants Total
Agriculture, Forestry 97.3 2.7 100
Mining and Quarrying 84.5 15.5 100
Manufacturing 89.7 10.3 100
Electricity, Gas, Steel 78.0 22.0 100
Water supply, Sewage 85.7 14.3 100
Construction 92.9 7.1 100
Wholesale and Retail 89.6 10.4 100
Transportation and Storage 89.5 10.5 100
Hotels, Accommodation, Food and restaurants 90.2 9.9 100
Information, Telecommunications 84.3 15.7 100
Financial, Insurance 87.4 12.6 100
Real Estate 92.3 7.7 100
Professional, Scientific 89.1 10.9 100
Administrative and Support Services 84.2 15.8 100
Public Administration 88.4 11.7 100
Education 90.4 9.6 100
Health and Social Work 91.1 8.9 100
Arts, Entertainment 87.8 12.2 100
Total 91.8 8.2 100 Source: Authors’ calculations using Labor Force Survey
Figure 5 shows the relationship between demeaned net migration flows (to work) and
demeaned agricultural employment for each governorate. Governorates with high migration
rates have a lower share of agricultural employment.
16
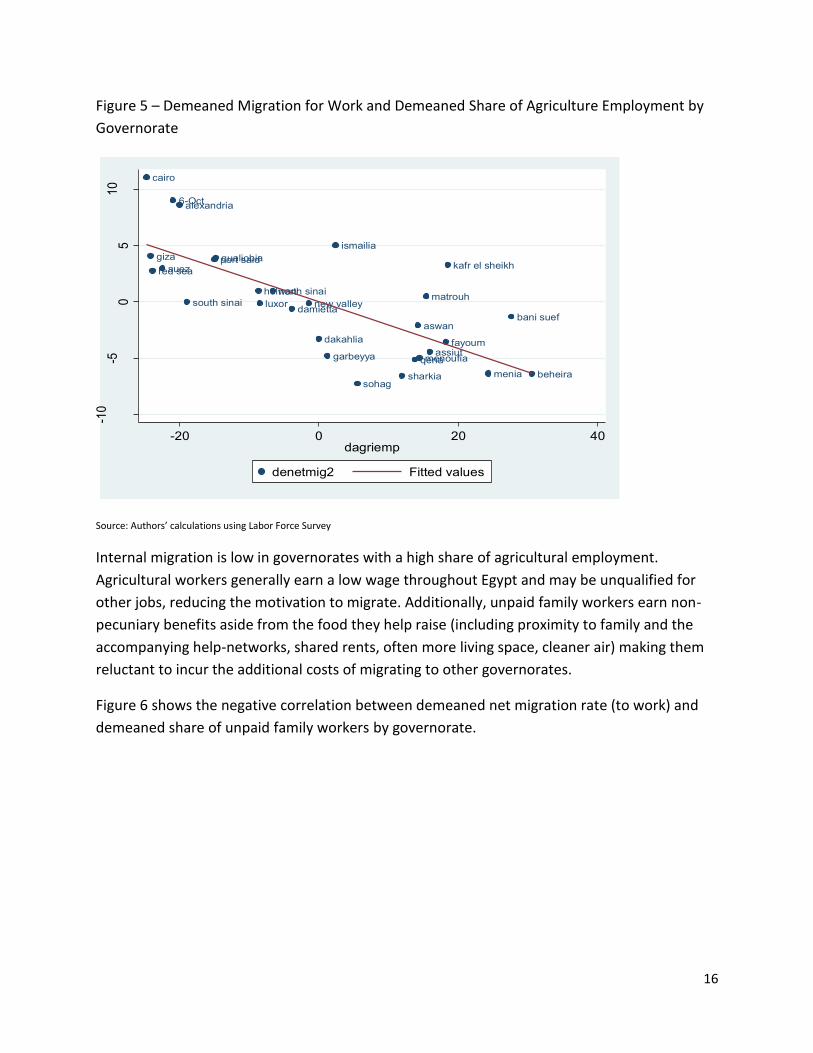
Figure 5 – Demeaned Migration for Work and Demeaned Share of Agriculture Employment by
Governorate
Source: Authors’ calculations using Labor Force Survey
Internal migration is low in governorates with a high share of agricultural employment.
Agricultural workers generally earn a low wage throughout Egypt and may be unqualified for
other jobs, reducing the motivation to migrate. Additionally, unpaid family workers earn non-
pecuniary benefits aside from the food they help raise (including proximity to family and the
accompanying help-networks, shared rents, often more living space, cleaner air) making them
reluctant to incur the additional costs of migrating to other governorates.
Figure 6 shows the negative correlation between demeaned net migration rate (to work) and
demeaned share of unpaid family workers by governorate.
damietta
sohag
assiut
sharkia
menoufiaqenamenia
dakahlia
garbeyya
aswan
beheira
fayoum
cairo
luxorbani suef
south sinai
kafr el sheikh
new valleymatrouhhelwan
alexandria
giza qualiobia
north sinai
ismailia
6-Oct
red seasuezport said
-10
-50
510
-20 0 20 40dagriemp
denetmig2 Fitted values
17
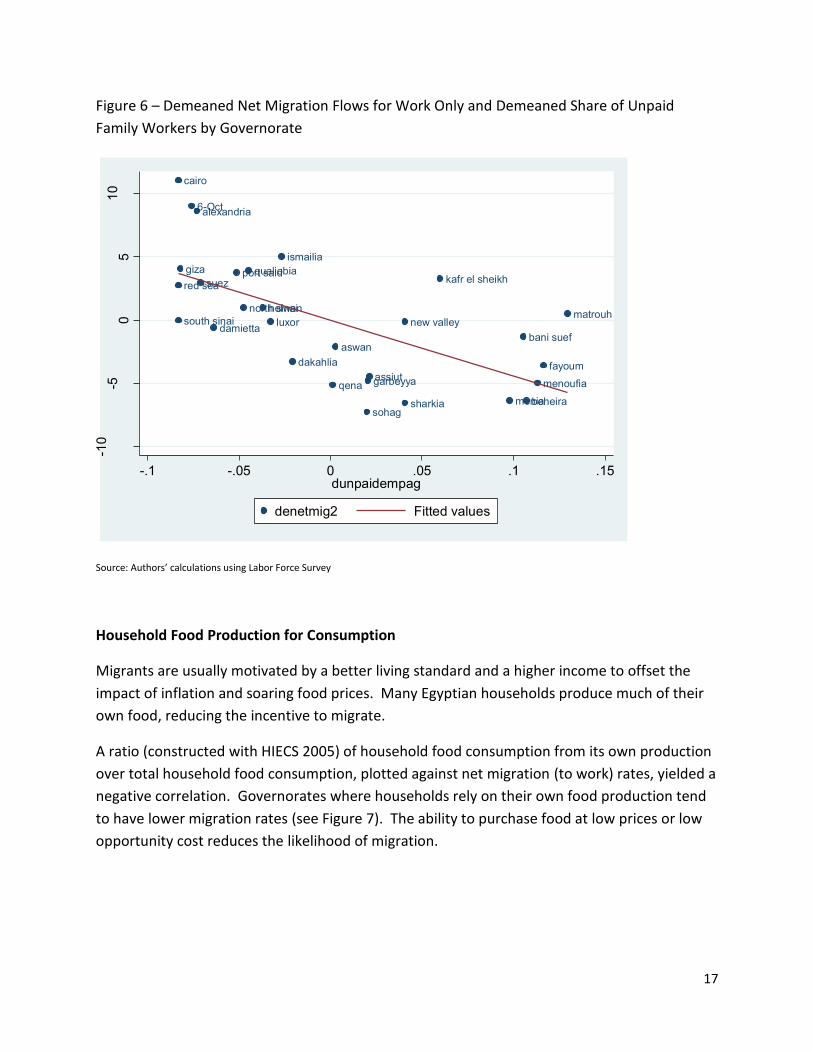
Figure 6 – Demeaned Net Migration Flows for Work Only and Demeaned Share of Unpaid
Family Workers by Governorate
Source: Authors’ calculations using Labor Force Survey
Household Food Production for Consumption
Migrants are usually motivated by a better living standard and a higher income to offset the
impact of inflation and soaring food prices. Many Egyptian households produce much of their
own food, reducing the incentive to migrate.
A ratio (constructed with HIECS 2005) of household food consumption from its own production
over total household food consumption, plotted against net migration (to work) rates, yielded a
negative correlation. Governorates where households rely on their own food production tend
to have lower migration rates (see Figure 7). The ability to purchase food at low prices or low
opportunity cost reduces the likelihood of migration.
damietta
sohag
assiut
sharkia
menoufiaqenamenia
dakahlia
garbeyya
aswan
beheira
fayoum
cairo
luxorbani suef
south sinai
kafr el sheikh
new valleymatrouhhelwan
alexandria
giza qualiobia
north sinai
ismailia
6-Oct
red seasuezport said
-10
-50
510
-.1 -.05 0 .05 .1 .15dunpaidempag
denetmig2 Fitted values
18
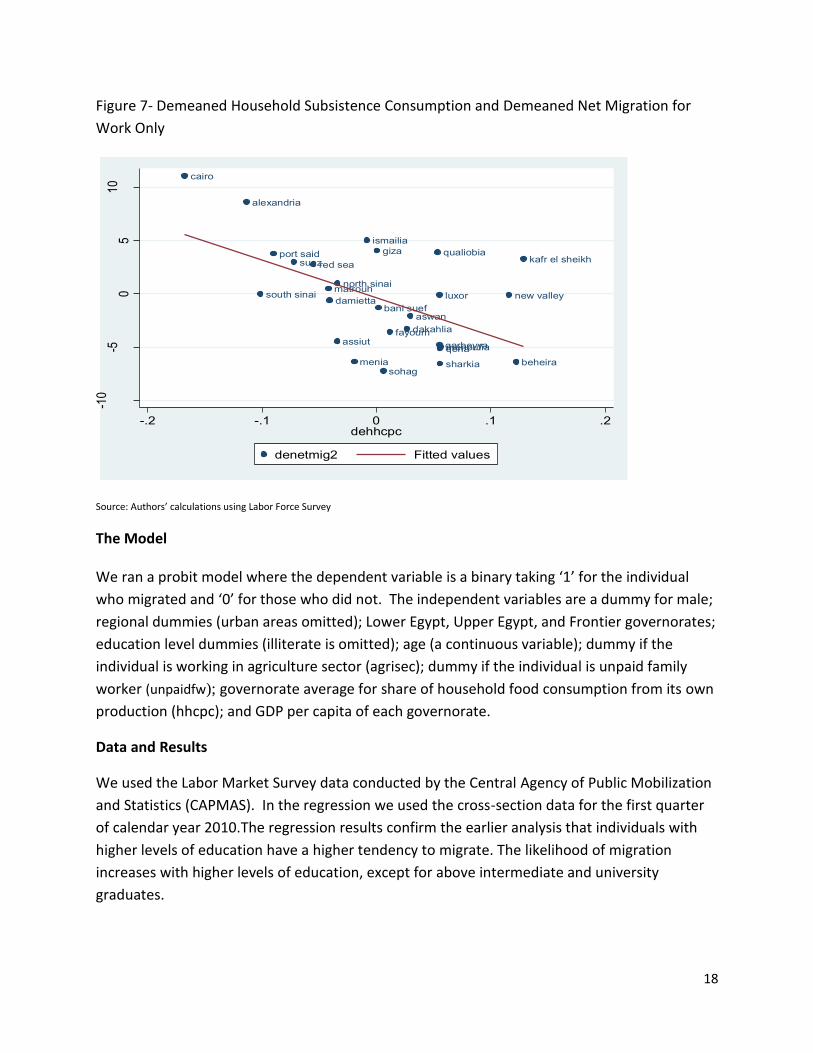
Figure 7- Demeaned Household Subsistence Consumption and Demeaned Net Migration for
Work Only
Source: Authors’ calculations using Labor Force Survey
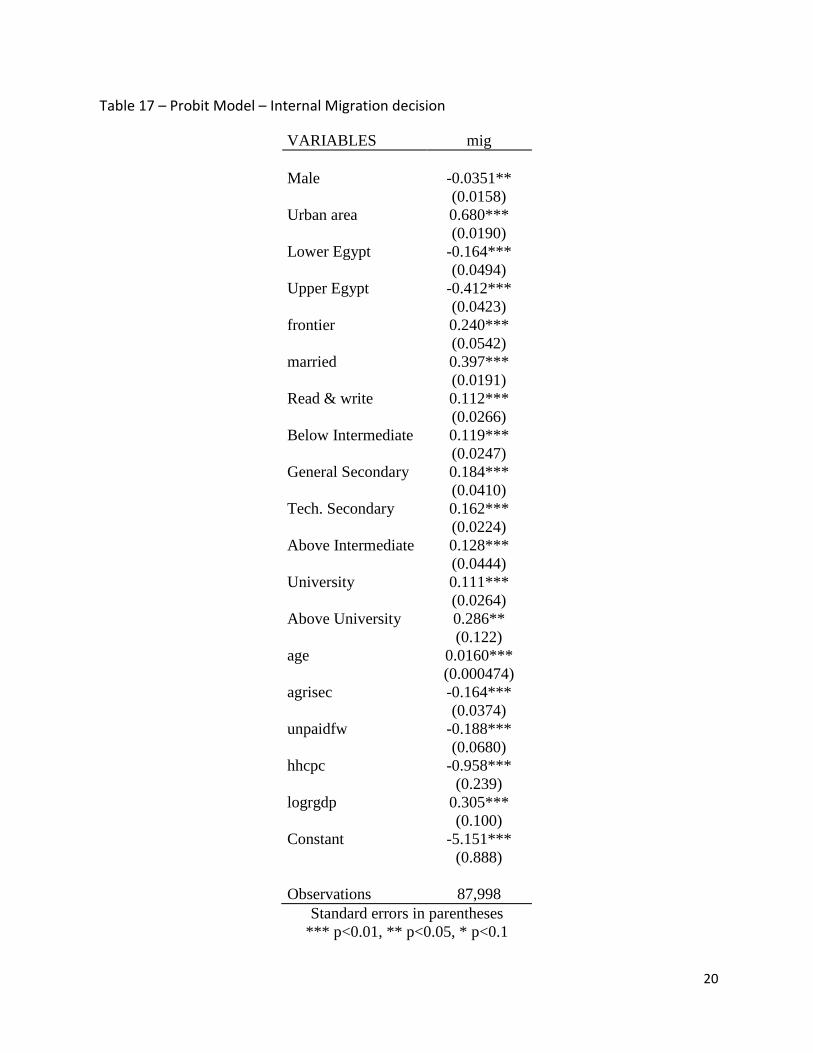
The Model
We ran a probit model where the dependent variable is a binary taking ‘1’ for the individual
who migrated and ‘0’ for those who did not. The independent variables are a dummy for male;
regional dummies (urban areas omitted); Lower Egypt, Upper Egypt, and Frontier governorates;
education level dummies (illiterate is omitted); age (a continuous variable); dummy if the
individual is working in agriculture sector (agrisec); dummy if the individual is unpaid family
worker (unpaidfw); governorate average for share of household food consumption from its own
production (hhcpc); and GDP per capita of each governorate.
Data and Results
We used the Labor Market Survey data conducted by the Central Agency of Public Mobilization
and Statistics (CAPMAS). In the regression we used the cross-section data for the first quarter
of calendar year 2010.The regression results confirm the earlier analysis that individuals with
higher levels of education have a higher tendency to migrate. The likelihood of migration
increases with higher levels of education, except for above intermediate and university
graduates.
damietta
sohag
assiut
sharkia
menoufiaqenamenia
dakahlia
garbeyya
aswan
beheira
fayoum
cairo
luxorbani suef
south sinai
kafr el sheikh
new valleymatrouh
alexandria
giza qualiobia
north sinai
ismailia
red seasuezport said
-10
-50
510
-.2 -.1 0 .1 .2dehhcpc
denetmig2 Fitted values
19
Migrants prefer to reside in metropolitan governorates, Lower Egypt and frontier governorates
rather than Upper Egypt. People migrate to governorates with higher GDP per capita and
wages.
Workers in agriculture and unpaid family workers have a lower tendency to migrate. Both have
negative and significant signs (-0.16 and -0.18, respectively).
Governorates with high household food consumption from its own production have lower
tendency of migration.
20
Table 17 – Probit Model – Internal Migration decision
VARIABLES mig
Male -0.0351**
(0.0158)
Urban area 0.680***
(0.0190)
Lower Egypt -0.164***
(0.0494)
Upper Egypt -0.412***
(0.0423)
frontier 0.240***
(0.0542)
married 0.397***
(0.0191)
Read & write 0.112***
(0.0266)
Below Intermediate 0.119***
(0.0247)
General Secondary 0.184***
(0.0410)
Tech. Secondary 0.162***
(0.0224)
Above Intermediate 0.128***
(0.0444)
University 0.111***
(0.0264)
Above University 0.286**
(0.122)
age 0.0160***
(0.000474)
agrisec -0.164***
(0.0374)
unpaidfw -0.188***
(0.0680)
hhcpc -0.958***
(0.239)
logrgdp 0.305***
(0.100)
Constant -5.151***
(0.888)
Observations 87,998
Standard errors in parentheses
*** p<0.01, ** p<0.05, * p<0.1
21
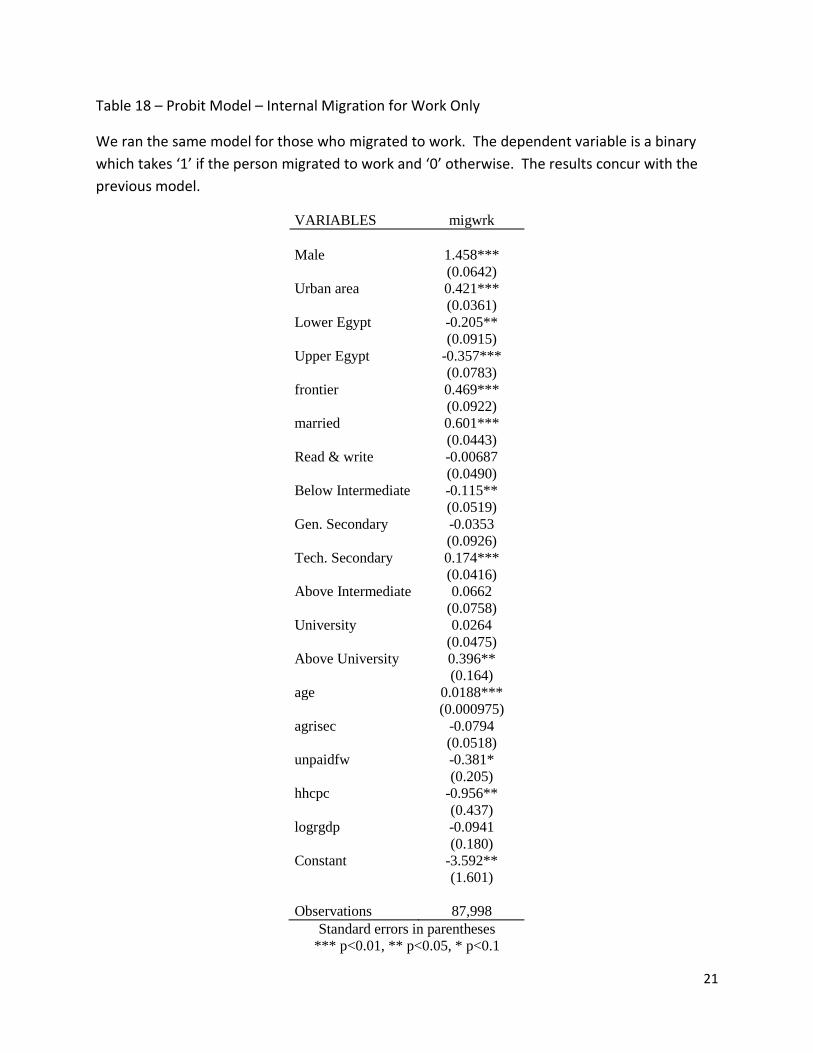
Table 18 – Probit Model – Internal Migration for Work Only
We ran the same model for those who migrated to work. The dependent variable is a binary
which takes ‘1’ if the person migrated to work and ‘0’ otherwise. The results concur with the
previous model.
VARIABLES migwrk
Male 1.458***
(0.0642)
Urban area 0.421***
(0.0361)
Lower Egypt -0.205**
(0.0915)
Upper Egypt -0.357***
(0.0783)
frontier 0.469***
(0.0922)
married 0.601***
(0.0443)
Read & write -0.00687
(0.0490)
Below Intermediate -0.115**
(0.0519)
Gen. Secondary -0.0353
(0.0926)
Tech. Secondary 0.174***
(0.0416)
Above Intermediate 0.0662
(0.0758)
University 0.0264
(0.0475)
Above University 0.396**
(0.164)
age 0.0188***
(0.000975)
agrisec -0.0794
(0.0518)
unpaidfw -0.381*
(0.205)
hhcpc -0.956**
(0.437)
logrgdp -0.0941
(0.180)
Constant -3.592**
(1.601)
Observations 87,998
Standard errors in parentheses
*** p<0.01, ** p<0.05, * p<0.1
22
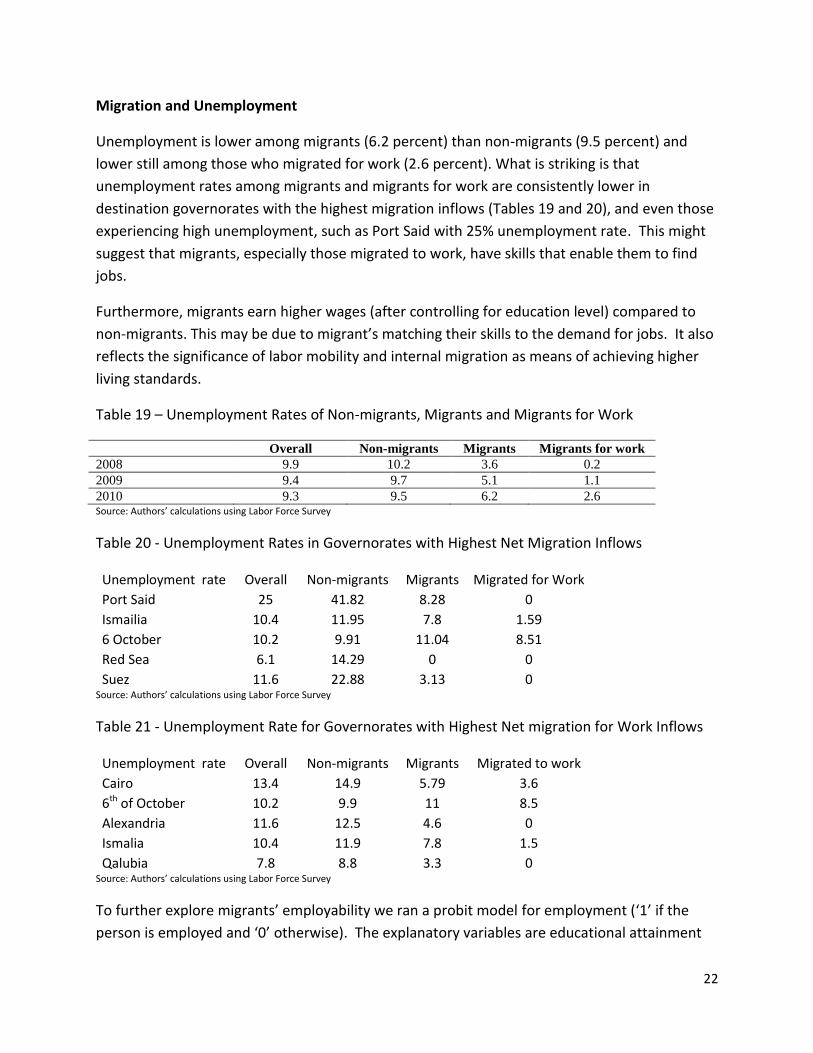
Migration and Unemployment
Unemployment is lower among migrants (6.2 percent) than non-migrants (9.5 percent) and
lower still among those who migrated for work (2.6 percent). What is striking is that
unemployment rates among migrants and migrants for work are consistently lower in
destination governorates with the highest migration inflows (Tables 19 and 20), and even those
experiencing high unemployment, such as Port Said with 25% unemployment rate. This might
suggest that migrants, especially those migrated to work, have skills that enable them to find
jobs.
Furthermore, migrants earn higher wages (after controlling for education level) compared to
non-migrants. This may be due to migrant’s matching their skills to the demand for jobs. It also
reflects the significance of labor mobility and internal migration as means of achieving higher
living standards.
Table 19 – Unemployment Rates of Non-migrants, Migrants and Migrants for Work
Overall Non-migrants Migrants Migrants for work
2008 9.9 10.2 3.6 0.2
2009 9.4 9.7 5.1 1.1
2010 9.3 9.5 6.2 2.6 Source: Authors’ calculations using Labor Force Survey
Table 20 - Unemployment Rates in Governorates with Highest Net Migration Inflows
Unemployment rate Overall Non-migrants Migrants Migrated for Work
Port Said 25 41.82 8.28 0
Ismailia 10.4 11.95 7.8 1.59
6 October 10.2 9.91 11.04 8.51
Red Sea 6.1 14.29 0 0
Suez 11.6 22.88 3.13 0 Source: Authors’ calculations using Labor Force Survey
Table 21 - Unemployment Rate for Governorates with Highest Net migration for Work Inflows
Unemployment rate Overall Non-migrants Migrants Migrated to work
Cairo 13.4 14.9 5.79 3.6
6th of October 10.2 9.9 11 8.5
Alexandria 11.6 12.5 4.6 0
Ismalia 10.4 11.9 7.8 1.5
Qalubia 7.8 8.8 3.3 0 Source: Authors’ calculations using Labor Force Survey
To further explore migrants’ employability we ran a probit model for employment (‘1’ if the
person is employed and ‘0’ otherwise). The explanatory variables are educational attainment
23
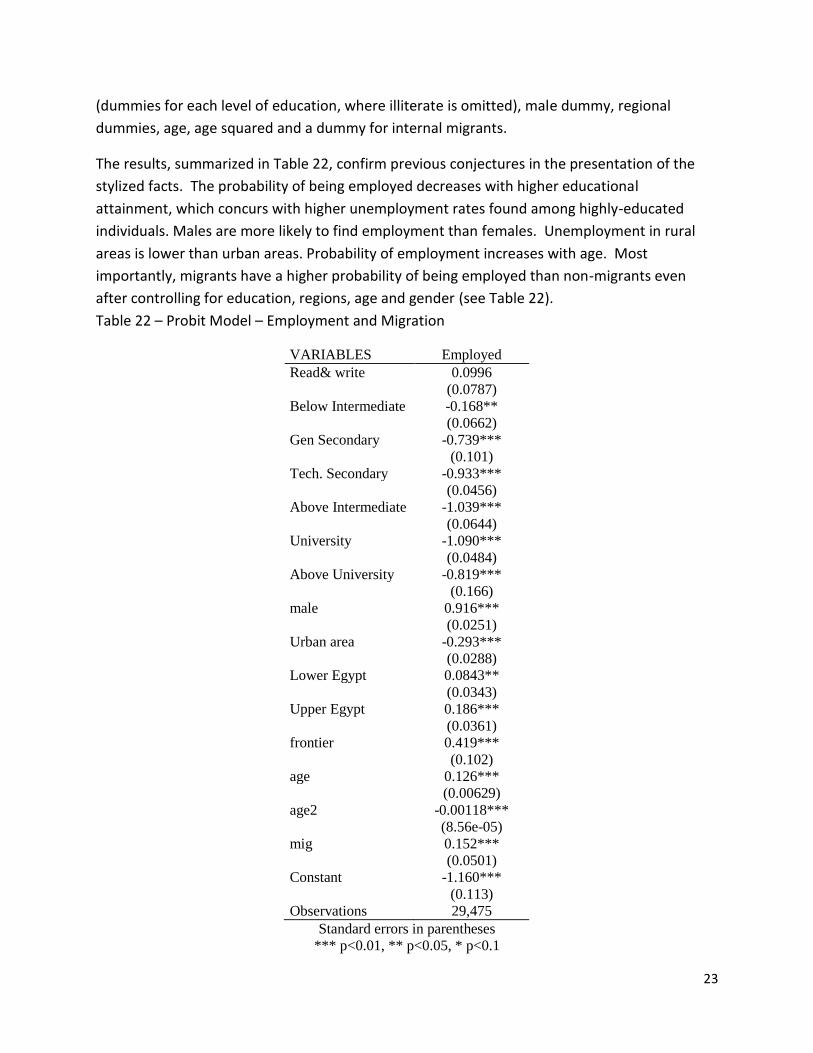
(dummies for each level of education, where illiterate is omitted), male dummy, regional
dummies, age, age squared and a dummy for internal migrants.
The results, summarized in Table 22, confirm previous conjectures in the presentation of the
stylized facts. The probability of being employed decreases with higher educational
attainment, which concurs with higher unemployment rates found among highly-educated
individuals. Males are more likely to find employment than females. Unemployment in rural
areas is lower than urban areas. Probability of employment increases with age. Most
importantly, migrants have a higher probability of being employed than non-migrants even
after controlling for education, regions, age and gender (see Table 22).
Table 22 – Probit Model – Employment and Migration
VARIABLES Employed
Read& write 0.0996
(0.0787)
Below Intermediate -0.168**
(0.0662)
Gen Secondary -0.739***
(0.101)
Tech. Secondary -0.933***
(0.0456)
Above Intermediate -1.039***
(0.0644)
University -1.090***
(0.0484)
Above University -0.819***
(0.166)
male 0.916***
(0.0251)
Urban area -0.293***
(0.0288)
Lower Egypt 0.0843**
(0.0343)
Upper Egypt 0.186***
(0.0361)
frontier 0.419***
(0.102)
age 0.126***
(0.00629)
age2 -0.00118***
(8.56e-05)
mig 0.152***
(0.0501)
Constant -1.160***
(0.113)
Observations 29,475
Standard errors in parentheses
*** p<0.01, ** p<0.05, * p<0.1
24
Conclusions and Direction for Further Work Given Egypt’s economic growth and the regional disparity in living standards, we would expect
high levels of internal migration and labor mobility to equalize returns on economic benefits.
Migrants have a higher probability of employment even in governorates with high
unemployment rates, in addition to earning higher wages compared to non-migrants.
However, internal migration rates in Egypt were low in periods of economic growth compared
to international rates.
In this paper we offered three explanations to low internal migration rate. First is the prevailing
low level of educational attainment. Second, labor is tied up in low productivity agricultural
activity. The third reason concerns rural households’ ability to produce a significant portion of
their food needs and/or offer their members other non-pecuniary benefits, thus reducing the
motivation to migrate. Given inflated commodity prices, rent and transportation costs, internal
migration, unless a job is secured at the outset, is unaffordable.
Other factors beyond those analyzed and quantified in this report also contribute to low
migration rates. For instance, the lack of land tenure security originated by inadequate land
titling inhibits small farmers from renting their plots, which would liberate resources for non-
agriculture activities or commercial agriculture. Also, the lack of affordable housing in urban
centers imposes costs on labor mobility, as well as road congestion. These factors are
discussed elsewhere (World Bank 2012). Social factors may also contribute to low migration
rates. Although unsupported by data these include attachment to family and related help-
networks (including access to small loans from a communal savings pool with benefits rotating
among members and support in frequent cases of ill health ); the common wisdom that urban
areas are already oversaturated with the unemployed; the lack of affordable housing in urban
areas except in overcrowded slums lacking basic services and the fact that while a marginal
improvement in wages may allow some small amount to be saved or sent home to help family,
this is perceived as less valuable than a physical presence, for example to care for children and
the elderly while others work. Finally, jobs are often found through extended
family/friend/neighborhood networks, another reason for staying home (closer to the source of
potential jobs).
25
Appendix
Table A1 – Internal Migration by Gender
Male Female Total Non-Migrants 51.1 48.8 100 Migrants 50 49.6 100 Total 51.1 48.8 100 Source: Authors’ calculations using Labor Force Survey
Table A2- Gender Migration
Male Female Total
Non-Migrants 93.9 93.7 93.8 Migrants 6.0 6.2 6.1 Total 100 100 100
Source: Authors’ calculations using Labor Force Survey
Table A3 – Direction of Migration and Reasons for Migration - Males
Males Direction of Migration Reason of Migration Urban-Urban Urban-Rural Rural - Urban Rural - Rural
For work only 38.5 32.9 53.0 39.5
Education 2.3 0.5 1.0 Marriage 15.8 12.3 4.0 4.1
Divorce/Widowed 0.1 Accompany 34.2 36.9 34.0 41.8
Others 9.2 17.5 8.0 14.6
Total 100 100 100 100 Source: Authors’ calculations using Labor Force Survey
Table A4 – Direction of Migration and Reason for Migration - Females
Females Direction of Migration
Reason of Migration Urban-Urban Urban-Rural Rural - Urban Rural - Rural
For work only 0.9 0.5 1.6 Education 0.5
0.5
Marriage 48.3 53.9 41.9 47.2
Divorce/Widowed 0.8 0.5 0.1 Accompany 47.1 43.3 49.9 48.0
Others 2.5 1.8 6.0 4.8
Total 100 100 100 100 Source: Authors’ calculations using Labor Force Survey
26
Graph A1 – Migrants wage premium
-12.3
0 010.8 13.8
27
43.3
-20-10
01020304050
Rea
d &
Writ
e
Less
than
inte
rmed
iate
Gen
eral
Sec
onda
ry
Tech
. Sec
onda
ry
Abov
e In
term
edia
te
Uni
vers
ity
Abov
e U
nive
rsity
Migrants Wage Premium (%)
27
References
Wahba, Jackline. 2007. An Overview of Internal and International Migration in Egypt. ERF
Working Paper Series.
Zohry, Aymen. 2009. The Development Impact of Internal Migration: Findings from Egypt.
International Union for the Scientific Study of Population.
World Development Report. 2010. The World Bank.
Bhagat, Ram B. 2009. Internal migration in India: are the underclass more mobile?. The 26th IUSSP General Population Conference.
Gollin, Douglas & Parente, Stephen & Rogerson, Richard. 2004. The Food Problem and the Evolution of International Income Levels. Working Papers 899, Economic Growth Center, Yale University