DISCUSSION PAPER SERIES Forschungsinstitut zur Zukunft der Arbeit Institute for the Study of Labor Media Exposure and Internal Migration: Evidence from Indonesia IZA DP No. 6012 October 2011 Lídia Farré Francesco Fasani

Welcome message from author
This document is posted to help you gain knowledge. Please leave a comment to let me know what you think about it! Share it to your friends and learn new things together.
Transcript
DI
SC
US
SI
ON
P
AP
ER
S
ER
IE
S
Forschungsinstitut zur Zukunft der ArbeitInstitute for the Study of Labor
Media Exposure and Internal Migration: Evidence from Indonesia
IZA DP No. 6012
October 2011
Lídia FarréFrancesco Fasani
Media Exposure and Internal Migration:
Evidence from Indonesia
Lídia Farré IAE-CSIC, Barcelona GSE
and IZA
Francesco Fasani IAE-CSIC, Barcelona GSE,
MOVE-INSIDE, CReAM and IZA
Discussion Paper No. 6012 October 2011
IZA
P.O. Box 7240 53072 Bonn
Germany
Phone: +49-228-3894-0 Fax: +49-228-3894-180
E-mail: [email protected]
Any opinions expressed here are those of the author(s) and not those of IZA. Research published in this series may include views on policy, but the institute itself takes no institutional policy positions. The Institute for the Study of Labor (IZA) in Bonn is a local and virtual international research center and a place of communication between science, politics and business. IZA is an independent nonprofit organization supported by Deutsche Post Foundation. The center is associated with the University of Bonn and offers a stimulating research environment through its international network, workshops and conferences, data service, project support, research visits and doctoral program. IZA engages in (i) original and internationally competitive research in all fields of labor economics, (ii) development of policy concepts, and (iii) dissemination of research results and concepts to the interested public. IZA Discussion Papers often represent preliminary work and are circulated to encourage discussion. Citation of such a paper should account for its provisional character. A revised version may be available directly from the author.
IZA Discussion Paper No. 6012 October 2011
ABSTRACT
Media Exposure and Internal Migration: Evidence from Indonesia*
This paper investigates the impact of television on internal migration in Indonesia. We exploit the differential introduction of private television throughout the country and the variation in signal reception due to topography to estimate the causal effect of media exposure. Our estimates reveal important long and short run effects. An increase of one standard deviation in the number of private TV channels received in the area of residence reduces future inter-provincial migration by 1.7-2.7 percentage points, and all migration (inter and intra-provincial) by 4-7.4 percentage points. Short run effects are slightly smaller, but still sizeable and statistically significant. We also show that respondents less exposed to private TV are more likely to consider themselves among the poorest groups of the society. As we discuss in a stylized model of migration choice under imperfect information, these findings are consistent with Indonesia citizens over-estimating the net gains from internal migration. JEL Classification: J61, L82, O15 Keywords: information, migration decisions, television Corresponding author: Francesco Fasani Institut d’Anàlisi Econòmica IAE-CSIC, Campus UAB 08193 Bellaterra, Barcelona Spain E-mail: [email protected]
* We would like to thank Christian Dustmann, Luca Flabbi, Luigi Minale, Benjamin Olken, Daniel Suryadarma and participants at the 4th International Conference on MIGRATION AND DEVELOPMENT at the Center for International Development (CID), Harvard Kennedy School. The authors acknowledge the support of INSIDE-MOVE (Markets, Organizations and Votes in Economics), the Barcelona GSE Research Network and the Government of Catalonia. Farré also acknowledges the Spanish Ministry of Science (grant ECO2011-29663).
1 Introduction
The decision to migrate involves the comparison of income gains and other benefits associated
to the move with its pecuniary and non-pecuniary costs. To estimate the expected returns
of moving to alternative destinations, potential immigrants gather information from different
sources. The role played by relatives and friends, previous migrants and networks abroad
has been widely analyzed by economists (see, for example, Winters et al. 2001; Munshi 2003;
Hanson and McIntosh 2008; McKenzie and Rapoport 2007 and 2010). By providing information
on the migration process, facilitating the access to the job market and helping integration upon
arrival, networks are crucial to individual migration decisions. Networks, therefore, are a source
of information, but they may also directly reduce migration costs and influence employment
outcomes at destination: disentangling the pure information effect from networks is far from
straightforward (Carrington et al. 1996).
In order to isolate the role of information on migration decisions, we focus on an alternative
popular source of information: exposure to television. The impact of media exposure on indi-
vidual attitudes and behaviors has been studied in various economic fields. For instance, Della
Vigna and Kaplan (2007) show that the introduction of the conservative Fox News channel in
the cable programming had a positive effect on the vote share to the Republican party in the
US. Also in the US, Gerber et al. (2009) find that receiving a free subscription of either the
Washington Times or the Washington Post led to more support for the Democratic candidate
and to an increase in 2006 voter turnout. There is also evidence that exposure to different news
programs significantly affects the public opinion on illegal immigration (Facchini et al. 2009).
Outside the US, Gentzkow and Shapiro (2004) find that television can affect attitudes towards
the West in Muslim countries. Della Vigna et al. (2011) document that residents of Croatian
villages exposed to the Serbian public radio are more likely to vote for extreme nationalist
parties. In the developing world, Olken (2009) shows that TV decreases participation in social
organizations in Indonesia, La Ferrara et al. (2007) find that exposure to soap operas in Brazil
2
reduces fertility, while Jensen and Oster (2009) relates the introduction of cable television to a
women’s status improvement in rural India.
Studying migration phenomena is essentially about understanding why people decide to
move or not. Information on possible destination regions is a crucial input in these individual
decisions. Which type of information potential migrants have access to? How do they use it in
their decisional process? From which sources do they gather it? How do their decisions change
if more/better information becomes available? These are all key research questions which need
to be addressed. Individuals with limited information will make sub-optimal choices, with
important consequences for their welfare. From a policy perspective, the fact that one could
influence migration outcomes - and, therefore, individuals’ welfare - just by intervening on the
access to information has considerable implications. This is especially relevant because the
(scarce) evidence we have on migrants’ expectations in developing countries (McKenzie et al.
2009) shows how deeply inaccurate these can be.1
In standard migration decision models, individuals optimally choose to migrate if the ex-
pected gains from doing so - net of monetary and non-monetary costs - exceed the expected
gains from staying in the original location (Sjaastad, 1962). However, net gains from migrating
are subject to a substantial amount of uncertainty. The seminal paper by Harris and Todaro
(1970) already considered the effect of uncertainty by incorporating a positive probability of
remaining unemployed in the destination labor market, nonetheless agents still have perfect
information on the expected gains from migrating. The theoretical literature has investigated
different aspects of the relationship between information and migration. Katz and Stark (1987)
analyze the effect of asymmetric information on migration, where the nature of the asymmetry
comes from migrant workers being more informed about their skills than national employers.2
1Migration is not the only area where incomplete information may lead to sub-optimal individual decisions.A related literature has recently revealed the existence of significant gaps between perceived and actual returnsto educational choices in developing countries (Attanasio and Kaufmann, 2009; Jensen, 2010).
2Different aspects of this information asymmetry have been investigated by the same authors (Katz andStark, 1986; Stark, 1995).
3
Other authors have modeled the process of gathering information during the job search process
in the new destination labor markets (Herzog et al. 1985; Vishwanath 1991; Daneshvary et
al. 1992). Relatively few papers, instead, have looked at how information - or the lack of it
- may influence actual moving decisions. Among these exceptions, Pessino (1991) proposes a
migration model across geographically separated markets with uncertainty and imperfect in-
formation at destination, where agents learn by migrating. In Borjas and Bratsberg (1994),
instead, basing initial migration decisions on erroneous information about opportunities at des-
tination leads to return migration. On the empirical side, some authors have studied the type
of information available to potential migrants and how they gather it. Banerjee B. (1984), for
instance, analyzes rural-urban migration in India, while McKenzie et al. (2009) study expec-
tations of Tonga citizens on labor market prospects in New Zealand. Only a couple of recent
papers have considered the impact of access to media on migration. Aker et al. (2011) finds
that access to mobile phone technology in Niger has a large positive effect on seasonal migration
by increasing information about the labor market at destination. While Braga (2007) shows
that the likelihood of migrating to Italy of Albanian citizens increases with the reception of
Italian TV in their regions of origin.
The focus of our paper is on the effect of private television exposure on internal migration
in Indonesia. This is an interesting case to analyze the impact of TV broadcasting thanks
to a process of TV liberalization which was started in this country in the late 1980s. This
process dramatically expanded the supply of TV broadcasting, from one single government-run
television station - as it was until the last period of Suharto’s regime - up to eleven national
channels. The differential introduction of private television throughout the country and the
variation in signal reception due to topography provide an exogenous source of variation to
investigate the causal effect of media exposure on individual migration decisions.3 There are
3The expansion of private television broadcasting in Indonesia was accompanied by a contemporaneousgrowth of private radio networks. As there are no detailed data on radio reception, we limit our analysis tothe impact of television. Olken (2009) shows that TV and radio signal are strongly positively correlated. Thus,
4
several reasons to focus the analysis on internal migration. First, internal migration, as opposed
to international, represent the bulk of geographical movements in Indonesia: in 2000 more than
10 percent of the population was living in a province different from that of birth (with intra-
provincial migration being about two-three times larger), while in 2006 only an estimated 1.5
percent was living abroad.4 Second, the population size and geographical extension of Indonesia
makes it a suitable candidate to draw lessons on internal movements for comparable countries,
such as India or China, where the issue has increasing policy relevance. Third, the longitudinal
survey employed in the paper (the Indonesian Family Life Survey) is particularly suitable for
analyzing internal migration: individuals are tracked down if they move within the country and
full migration histories are carefully recorded. Finally, while it is clear that wider access to
private TV networks increased the amount (and quality) of information regarding Indonesia, it
is harder to establish whether the same happened for the information about foreign countries.5
As we argue throughout the paper, analyzing internal migration allow us to establish a clear
link between information availability and migration choices.
Would better informed individuals migrate more or less? As we show in our theoretical
model (section 2), the answer depends on the type of mistakes they make in assessing net gains
from migration. Indeed, if potential migrants over-estimate (under-estimate) their employment
and life prospects in the destination region, wider access to information may decrease (increase)
migration pressures. Our empirical results show a negative effect of television exposure on
even if data were available, it would be difficult to separately identify the two effects. Throughout the paper,we will always refer to television exposure because this is what we measure in the data, but one needs to bearin mind that part of the impact we observe on migration choices may possibly come from increased access toprivate radio broadcasting.
4Although the focus of the paper is on internal migration, we also investigate the impact of TV exposure oninternational migration.
5Having more access to television may on the one hand make individuals in origin countries more aware ofconditions and opportunities in potential destination countries, but it may also convey distorted information -through feature films, TV series or soap operas. Some sociologists describe the relationship between media andmigration in terms of a magnetic attraction of countries who ”receive” Western television programs (and ”send”migrants) and countries who ”send” television programmes (and ”receive” migrants in return). Mai (2004), forinstance, analyzes the effects of foreign media on the migration projects of Albanians. His qualitative studyreveals that exposure to Italian television provided Albanian young people with an utopian and misleadingrepresentation of Western societies.
5
propensity to internally migrate. In particular, individuals who, during their early teens, lived in
areas with less television exposure, are more likely to move to a different region later in life than
individuals who lived in areas with better reception. Similarly, we find evidence of a negative
short term effect of TV exposure on migration decisions. Moreover, our estimates also indicate
that individuals less exposed to television are systematically more likely to consider themselves
among the poorest groups in the country. We address possible concerns of endogeneity of
local TV exposure by an instrumental variable strategy and carefully test the robustness of our
results. We conclude that wider access to media increases citizens information and allows them
to make more accurate choices. Accordingly, the observed reduction in internal movements
suggests that Indonesian citizens were over-estimating the net gains from migrating and that
TV information helped them to bridge the gap between perceived and actual gains.6
In the following section, we briefly describe the characteristics of the television market in
Indonesia and its migration history. Section 3 sketches a stylized migration model that incor-
porates the role of information in the migration decision. Section 4 discusses our identification
strategy, while section 5 reports some descriptive evidence. Estimation results and robustness
checks are presented in section 6 and 7. Finally, the last section provides some concluding
remarks.
2 Television and Internal Migration in Indonesia
2.1 Television in Indonesia
The liberalization of the television market that took place in Indonesia during the 1990s rep-
resents an extremely interesting case-study to investigate the impact of media exposure on
individual behavior. In the last few decades, the evolution of the media market in Indonesia
6An alternative interpretation of our results is that television access is associated with an increase in utilitylarge enough as to reduce the incentives to migrate. The two explanations cannot be empirically distinguished.Although we can not rule out the amenity interpretation, throughout the paper we will argue that access towider information has played a major role in affecting Indonesians’ migration decisions.
6
was deeply linked to - and often determined by - the political events which repeatedly changed
the system of government of the country and its degree of democracy.7
Until 1989 there was only one government-owned television station (TVRI, Televi Repub-
lik Indonesia): founded in 1962, it had finally started to broadcast throughout the entire
archipelago only in 1976, after the launch of the first Indonesian communication satellite. TVRI
was supervised by the Ministry of Information - that is, it was under the direct control of pres-
ident Suharto - and its programmes were expected to contribute to the unity of the nation
and to its growth, by supporting government’s development policies as well as by promoting
national cohesion, law and order. The editorial policy was not independent: the government
imposed the so-called ”SARA doctrine”, which implied the prohibition of any mentioning in the
media of sensitive issues such as ethnicity, religion, race, and social class (Suku, Agama, Ras,
Antargolongan) (d’Haenens et al., 1999). Negative reporting was also actively discouraged.
The first step towards a partial liberalization of the media took place in 1986: in that year,
the government adopted the Open Sky policy which allowed private television distribution
through satellite dishes and cable networks. As a result, five private networks were created:
RCTI (1987), SCTV (1989), TPI (1990), ANTV (1993), and Indosiar (1995). During these
first few years, commercial television was only available to those who could afford the service,
but in 1992 the government liberalized the television market, allowing commercial channels
to offer free-to-air services that progressively covered the whole country (Kukuh, 2002). This
first phase of deregulation was far from a complete liberalization: the licensing process was not
transparent (as licenses were basically issued to Suhartos relatives or cronies), the government
7In 1950, one year after the recognition of its independency by the Netherlands, Indonesia adopted a parlia-mentary democracy system which lasted until 1957. President Sukarno - the leader of the Indonesian indepen-dence struggle - proclaimed martial law and established a presidential system (in 1959), turning the existingparliamentary democracy into a ”guided democracy” (Demokrasi Terpimpin), a system which progressivelybecame more and more autocratic. In 1965, general Suharto seized the power: he was appointed presidentand replaced Sukarno’s ”guided democracy” with his version of a dictatorial regime, the ”New Order” (Orde
Baru). The Asian financial crisis of 1997 - which dramatically hit the Indonesian economy - triggered a violentoutburst of the lasting demand for democratic reform. Suharto’s rule ended in 1998, when he was forced toresign by student protests and riots across the country. Indonesia then entered a constitutional reform processthat defined its current system of government - a presidential republic - and the balance of powers within that.The first democratic elections were held in 1999.
7
maintained formal (and informal) control on programs content and private news production was
not allowed (Hollander et al., 2009). Although the government did not block the emergence
of commercial stations, a clear legal framework was not developed until 1996. During this
period commercial stations operated in a twilight zone, circumventing the prohibition on news
production by broadcasting news under the guise of so-called ”information programmes”. With
the 1996 Broadcasting Act, private TV stations were officially authorized to broadcast their own
news programmes. This decision formally broke the government monopoly in the production of
television news, but all channels were still required to broadcast the 7.00 and 9.00 p.m. public
TVRI network news and all the government messages (d’Haenens et al. 1999).
In the early 1990s, the increasing pressure from the Indonesian society for democratic reforms
also included a strong demand for more information and, especially, for independent news.
Private TV channels found themselves in the difficult position of finding a balance between
pleasing the government’s censorship and providing enough TV news to win audience shares
(and advertising revenues) in an increasingly competitive environment. During the escalation of
protests in 1998, while the public TVRI network was completely ignoring the events, commercial
stations provided full coverage. After the resignation of Suharto (on May 21, 1998) private TV
networks also played an active role in the transition to democracy. Hollander et al. (2009) argue
that the switch of private TV from government direction towards a focus on the information
needs of the society, may have actually boosted the process of reforms after Suharto’s fall.
Between 2000 and 2002, five newcomers entered the market. Thus, today there are 11
television stations with license for nationwide broadcasting over the air. Those include the
government-run channel (TVRI), three major networks (RCTI, SCTV, and Indosiar), one
all-news station (Metro TV), and six minor networks (ANTV, GLOBALTV, LATIVI, TV7,
TransTV and TPI). All the private channels (except for Metro TV) broadcast a similar combi-
nation of programs including news, entertainment and sports.
8
2.2 Internal Migration in Indonesia
With more than 230 million inhabitants in 2008, Indonesia is the fourth most populous country
in the world. Census data reveal a sustained growth of the Indonesian population in the
last few decades: the total population increased from 119 million in 1971 to 204 million in
2000 (Tirtosudarmo 2009). Indonesia is the world’s largest archipelago, consisting of about 17
thousand islands which span more than 5,000 km eastward from Sabang in northern Sumatra
to Merauke in Irian Jaya.
Internal migration in Indonesia is not a recent phenomenon. Already during the last period
of the Dutch rule, the country had a highly geographically mobile population. According to the
1930 census, 11.5% of the total native population lived outside their district of birth, although
only about half of them (5.6%) had moved beyond provincial borders. Internal migration in
the early 20th century was also actively encouraged by the Dutch administration in order to
relieve population pressure in Java and to support the expansion of plantations in other islands
(Hardjono 1988; Tirtosudarmo 2009). After independence, the Indonesian government revived
these colonization program under the name of ”transmigration” plans: about 90 thousand
households (420 thousand individuals) were moved during the period 1950-1968. Between 1969
and 1998 six transmigration policy plans (”Repelita”) were implemented: by 1997, a cumulative
total of approximately 1.4 million families, or 6.5 million people, had been shipped to the
outer islands (Fearnside 1997; Tirtosudarmo 2009). After the economic crises of 1997, and the
subsequent transition to democracy, transmigration programs were practically abandoned.
While the government was actively trying to relieve pressure on land resources in Java, free
internal migration was not constrained in any way. Actually, it was constantly increasing -
driven by the wage differentials between provinces and by the attractiveness of the Jakarta area
- and generally flowing in the opposite direction with respect to the government transmigration
policies.8 In 1971, the size of inter-provincial migration was still similar to that of the colonial
8For instance, Fearnside (1997) estimates that transmigration programs during the 80s relieved at most 17percent of the population growth in Java.
9
period (4.9%), while it increased to 7 percent in 1980, to 8.2 percent in 1990 and to 10.1 by
2000 (Hill et al. 2008; Tirtosudarmo 2009). In 2000, therefore, about 20 million people were
living in a province different from that of birth.
International migration of Indonesian citizens, instead, is a relatively recent phenomenon
which reached sizeable dimension only in the last two-three decades. The Indonesian Ministry
of Labour estimates that in 2006 there were around 2.7 million Indonesians working overseas
who went through official channels and another 800 thousand who went through informal ones
(Ducanes and Abella 2009). According to these figures, roughly 1.5 percent of the Indonesian
population was living and working abroad in 2006.
3 Theoretical framework: information, media and mi-
gration choices
In standard migration decision models, individuals optimally choose to move if the expected
gains from doing so - net of monetary and non-monetary costs - exceed the gains from staying in
the original location (Sjaastad, 1962). A crucial assumption in this approach is that individuals
have sufficient information to correctly predicts these gains and costs. However, potential
migrants may have a very imprecise idea of the level of earnings and probability of finding a job
in labor markets where they have never been before, and they may fail to accurately account
for all the direct and indirect costs associated to the move.
Lack of information in migrating decisions implies that, although individuals act rationally,
they may take sub-optimal decisions. That is, if potential migrants tend to over-estimate
(under-estimate) the net gains from migrating, there will be more (less) migration than opti-
mal. Within this framework, we model access to information - TV exposure - as a factor that
contributes to reduce the gap between expectations about the (net) gains from migration and
the real ones. Starting from a standard Roy model applied to migration choices (Borjas, 1987),
10
we develop the simplest theoretical setup to illustrate the role of information in this context.
Suppose individuals originate in source region S and consider the possibility of moving to
destination region D.9 Potential migrants are assumed to be risk neutral. The log earnings
distribution in the source and destination regions are:
wj = µj + ǫj with j = S, D (1)
where µj is the mean log earnings and ǫj is the individual return (i.e. ability) in region j. An
individual migrates (I = 1) if earnings at destination are higher than (or equal to) those in the
source region, net of a migration cost (π):
µD + ǫD − π ≥ µS + ǫS. (2)
This condition can be re-written as: v ≥ ∆, where v = (ǫD − ǫS) and ∆ = (µS − µD + π).
Assuming that v ∼ N(0, σ2v), we have:
Pr(I = 1) = Pr(v ≥ ∆) = 1 − Φ
(
∆
σv
)
(3)
where Φ is the standard normal distribution function.
Now, suppose individuals do not know exactly their net earnings at destination. We model
this possibility by including an additive error term (q) in the left hand side of inequality (2).
We assume that this error term is constant in the population and equal to q. It is positive if
individuals over-estimate the net gain from migrating and negative if they under-estimate it.
When taking their moving decisions, individuals ignore both the size and the sign of q. An
9In our stylized setup, we consider only one potential destination. In the presence of several destinations,incomplete information leads to sub-optimal choices when individuals are not able to correctly rank the differentalternatives. The implications of our simple model also hold in this context.
11
individual will then migrate (Iq = 1) if:
(µD + ǫD − π) + q ≥ µS + ǫS (4)
This new condition can be re-written as: v + q ≥ ∆. Given that (v + q) ∼ N(q, σ2v), we have:
Pr(Iq = 1) = Pr(v + q ≥ ∆) = 1 − Φ
(
∆ − q
σv
)
. (5)
The presence of the error term (q) shifts the distribution of v to the left or the right,
depending on whether q is positive (over-estimation) or negative (under-estimation). Thus, the
probability of migrating will be higher (lower) if q is positive (negative). Indeed:
Pr(Iq = 1) ≥ Pr(I = 1) if∆ − q
σv
≤∆
σv
(6)
which is always true for q ≥ 0, and never for q < 0. Within this framework, individuals can
be classified in four different groups. In the presence of over-estimated gains (q ≥ 0), there is
more migration than it would otherwise be optimal: there are individuals for whom migration
is always optimal (optimal migrants, OM) and others who would have not migrated had they
not over-estimated the gains from doing so (sub-optimal migrants, SM). Those who decide to
stay in spite of the over-estimated gain would have stayed in any case (optimal stayers, OS).
When individuals under-estimate migration gains (q < 0), instead, all migrants are optimal
(OM), while among the stayers there are optimal stayers (OS) and sub-optimal stayers (SS).
The latter group would have migrated in absence of the negative error q.
We illustrate these four groups in figure 1. The vertical axis corresponds to the measure
of individual ability (v), while on the horizontal one there is the error in predicting the gains
from migration (q). The solid line with negative slope is given by (∆ − q) and it crosses the
vertical axis at v = ∆. All individuals with a value of v above this line migrate. Note that
when q = 0, all migrants are optimal (i.e. all stayers are optimal). For positive values of q,12
instead, the larger is q the larger is the number of people migrating: we have an increasing
share of sub-optimal migrants (and a decreasing share of optimal stayers). The opposite is true
for negative values of q: the more negative is q, the less people migrate, and the larger is the
share of sub-optimal stayers (at the expenses of the share of optimal migrants). The shares of
individuals in each group (OM, SM, OS and SS) are given by the following probabilities:
Pr(OM = 1) = Pr(Iq = 1; I = 1) = Pr(v + q ≥ ∆; v ≥ ∆) =
Pr(v ≥ ∆) if q > 0
Pr(v ≥ ∆ − q) if q < 0
(7)
Pr(SM = 1) = Pr(Iq = 1; I = 0) = Pr(v+q ≥ ∆; v < ∆) =
Pr(∆ − q ≤ v < ∆) if q > 0
0 if q < 0
(8)
Pr(OS = 1) = Pr(Iq = 0; I = 0) = Pr(v + q < ∆; v < ∆) =
Pr(v < ∆ − q) if q > 0
Pr(v < ∆) if q < 0
(9)
Pr(SS = 1) = Pr(Iq = 0; I = 1) = Pr(v+q < ∆; v ≥ ∆) =
0 if q > 0
Pr(∆ ≤ v < ∆ − q) if q < 0
(10)
Now, suppose the error individuals make in assessing the net gains from migration negatively
depends on the amount of information available. That is:
q∗ =q
i(11)
where q is the constant error term and i is the level of information individuals have access
to, with i ∈ [1, +∞). We can now study how migration decisions respond to an increased
availability of information. After replacing q with q∗ in equations (7)-(10), it is straightforward
to show that:
13
∂Pr(OM = 1)
∂i
= 0 if q > 0
> 0 if q < 0(12)
∂Pr(SM = 1)
∂i
< 0 if q > 0
= 0 if q < 0(13)
∂Pr(OS = 1)
∂i
> 0 if q > 0
= 0 if q < 0(14)
∂Pr(SS = 1)
∂i
= 0 if q > 0
< 0 if q < 0(15)
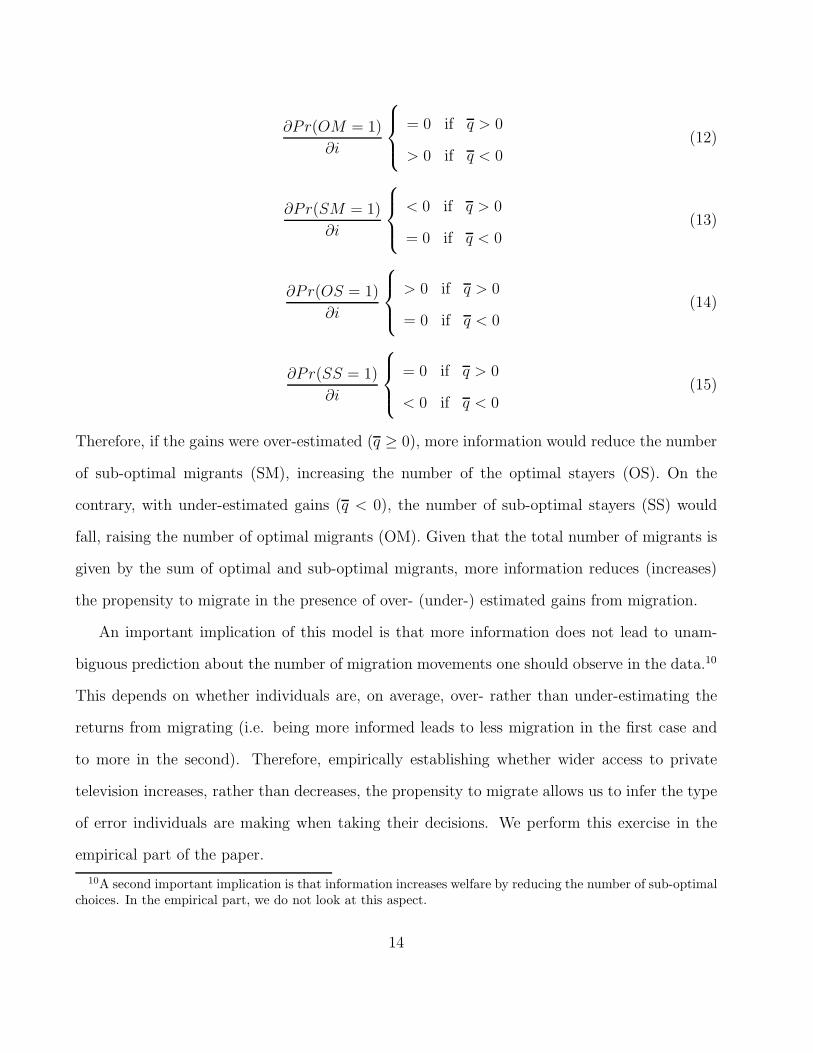
Therefore, if the gains were over-estimated (q ≥ 0), more information would reduce the number
of sub-optimal migrants (SM), increasing the number of the optimal stayers (OS). On the
contrary, with under-estimated gains (q < 0), the number of sub-optimal stayers (SS) would
fall, raising the number of optimal migrants (OM). Given that the total number of migrants is
given by the sum of optimal and sub-optimal migrants, more information reduces (increases)
the propensity to migrate in the presence of over- (under-) estimated gains from migration.
An important implication of this model is that more information does not lead to unam-
biguous prediction about the number of migration movements one should observe in the data.10
This depends on whether individuals are, on average, over- rather than under-estimating the
returns from migrating (i.e. being more informed leads to less migration in the first case and
to more in the second). Therefore, empirically establishing whether wider access to private
television increases, rather than decreases, the propensity to migrate allows us to infer the type
of error individuals are making when taking their decisions. We perform this exercise in the
empirical part of the paper.
10A second important implication is that information increases welfare by reducing the number of sub-optimalchoices. In the empirical part, we do not look at this aspect.
14
4 Empirical analysis
4.1 Empirical model
In our empirical exercise, we first take a long run perspective and analyze the effect of having
been exposed to TV as an adolescent on the future migration behavior of Indonesian citizens
(throughout the paper, we refer to this part of the analysis as early exposure). Given that most
of the migration movements take place at a young age, they may be substantially influenced
by expectations formed early in life. Having more or less access to television is likely to shape
individuals’ views on their country, their area of residence and on their relative position in
society: these are all elements which will concur in determining future migration decisions.
However, migration choices are not just the deterministic outcome of beliefs matured at a young
age. Individuals may update their expectations when new information becomes available, and
re-optimize their decisions. Hence, in the second part of the empirical analysis, we focus on
these short run effects and estimate the contemporaneous relationship between TV exposure
and migrating decisions (we refer to this part of the analysis as current exposure).
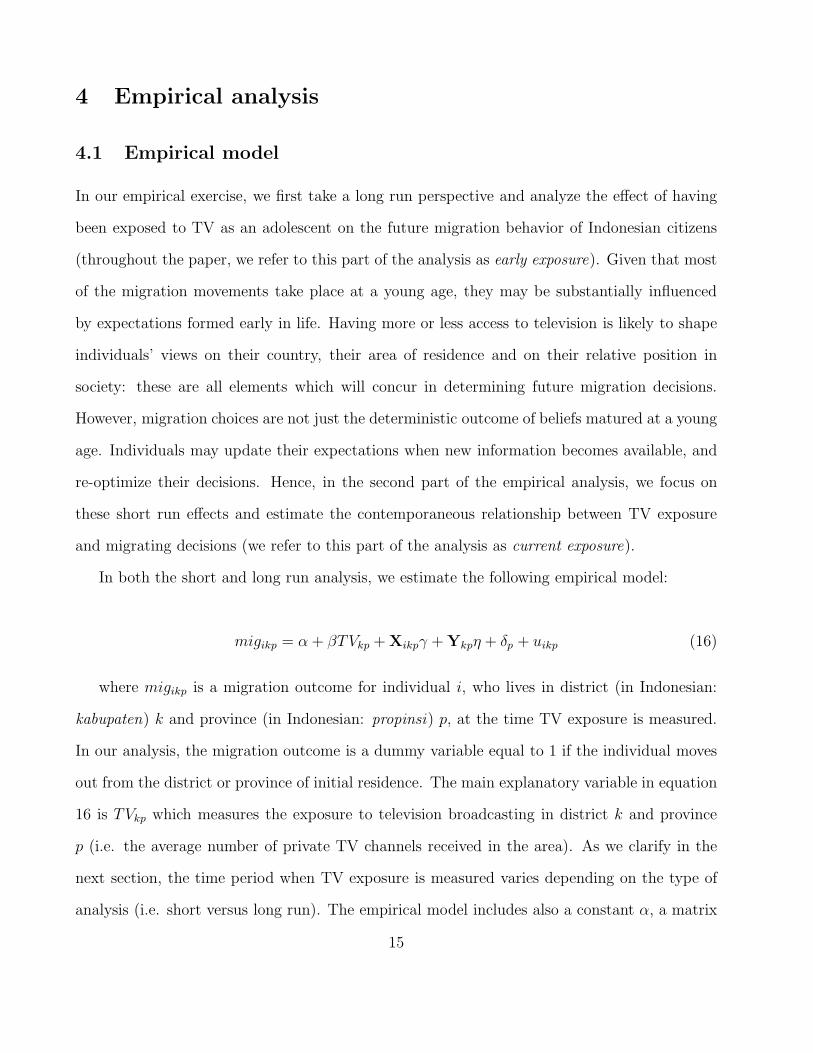
In both the short and long run analysis, we estimate the following empirical model:
migikp = α + βTVkp + Xikpγ + Ykpη + δp + uikp (16)
where migikp is a migration outcome for individual i, who lives in district (in Indonesian:
kabupaten) k and province (in Indonesian: propinsi) p, at the time TV exposure is measured.
In our analysis, the migration outcome is a dummy variable equal to 1 if the individual moves
out from the district or province of initial residence. The main explanatory variable in equation
16 is TVkp which measures the exposure to television broadcasting in district k and province
p (i.e. the average number of private TV channels received in the area). As we clarify in the
next section, the time period when TV exposure is measured varies depending on the type of
analysis (i.e. short versus long run). The empirical model includes also a constant α, a matrix
15
of individual-level control variables Xikp (gender, age, education, etc.), province fixed effects
(δp) and an unobserved error term, uikp. In some specifications, we also include a matrix of
district-level controls (Ykp).
4.2 Data
We employ two main datasets: the Indonesia Family Life Survey (IFLS), which provides indi-
vidual data and migration histories, and the PODES (The Village Potential Statistics), which
has information on TV reception at the village level.
The Indonesia Family Life Survey is an on-going longitudinal survey: it contains over 30,000
individuals living in 13 different provinces, representative of about 83% of the Indonesian popu-
lation. Four waves have been conducted so far: in 1993 (IFLS1), in 1997-1998 (IFLS2), in 2000
(IFLS3) and in 2007-2008 (IFLS4). The design of this survey makes it particularly suitable for
analyzing internal migration. Indeed, there has been a strong commitment to tracking and in-
terviewing individuals who had moved, or split off, from the households where they were firstly
interviewed. This commitment has led to very high re-interview rates.11 Moreover, a substan-
tial effort has been made to record the migration histories of each individual in the survey. At
the time of the first interview, respondents are asked about any migration they undertook in
the past, and in all subsequent waves they are asked to report any movement occurred in the
span of time elapsed since the last interview. We use all the four ILFS waves in our analysis.
The information on TV reception comes from our second data source: the Village Poten-
tial Statistics (PODES). The PODES provides information about village characteristics for all
Indonesia and it is surveyed in the context of the periodic censuses (Agriculture, Economy,
Population). Detailed questions on reception of each of the existing 11 Indonesian TV channels
11In IFLS1, 7,224 households were interviewed and detailed individual-level data were collected from over22,000 individuals. In IFLS2, 94% of IFLS1 households and 91% of IFLS1 targeted individuals were re-interviewed. In IFLS3, 95.3% of IFLS1 households were re-contacted and in IFLS4 the re-contact rate was93.6%. Among IFLS1 dynasty households (any part of the original IFLS1 households) 87.6% were actuallyinterviewed in all four waves and 3% died.
16
were introduced only in the PODES conducted in 2006.12 For each TV channel, the head of the
village is asked whether there is sufficient signal in the village as to clearly watch the programs.
We obtain our measure of TV reception at the district level by averaging the information on
the number of channels received in each village.13
In order to carry out our analysis of long and short run effects of TV exposure, we construct
two distinct samples. We focus on the fourth wave of the survey (2007-2008) to investigate the
long term impact. This wave contains information on about 20 thousand individuals aged 16
and older, which become 14,728 when we restrict the sample - as we do in most of our analysis
- to those aged 45 or less.14 For each individual we recover the residence at age 12 and at birth,
and for those interviewed in more than one wave also the current residence at each interview.
We then match each individual with the degree of TV reception in the district of residence
where they lived as adolescents. We employ the information on TV reception from the PODES
2006 combined with that on the years when the different private TV channel were created,
to reconstruct a measure of TV reception for each channel and district at any point in time.
In the analysis we identify as internal migrants those respondents whose current residence in
2007-2008 - or current residence recorded in any of the previous waves of the survey - is different
from that at age 12. We define two different dependent variables: one that includes both inter
and intra-provincial migrations and one that considers only inter-provincial movements.
In the short run analysis, we employ the third and the fourth wave of the IFLS, and recover
all movements that occurred between 2000 and 2007. Migration histories are available for
about 11 thousand individuals aged 16 or older (reduced to 8,345 when we restrict the analysis
12Questions about TV reception were introduced for the first time in the PODES conducted in 2003. However,in that year the questions referred only to the public channel and to four of the private ones (TPI, RCTI, SCTVand Indosiar).
13We follow Olken (2009) and exclude from the analysis major cities such as Jakarta, Surabaya, and Medan,where private television broadcasting started well before than in the rest of the country. We also exclude theconflict-ridden provinces of Aceh, Maluku, East Timor, and Iran Jaya, where there are serious concerns aboutdata quality in all Indonesian government surveys.
14We restrict the analysis to this age range as the bulk of migration movements occurs during this age span.In the robustness tests we remove this restriction and our main results remain unaffected. Individuals youngerthan 16 are not interviewed in the personal section of the IFLS survey, thus we do not have information on theirmigration trajectories.
17
to those aged 45 or less). To estimate the short run effect of TV exposure, we now match
individuals with reception in the district of residence in 2000 and investigate its impact on
subsequent migrating decisions. As in the long run analysis we analyze migration both at the
inter and intra-provincial level. In this case, respondents are identified as internal migrants if
they changed district and/or province of residence between 2000 and 2007-2008 (and stayed in
the new residence for at least six months).
The Data Appendix A contains a detailed description of how we construct the measures of
TV exposure and the migration variables in both the long and short run sample.
4.3 Identification strategy
The main parameter of interest in our analysis is the coefficient β in equation (16), which
measure the impact of TV exposure on the individual propensity to migrate. If one had exper-
imental data, with individuals randomly assigned to areas with different exposure to television,
the β coefficient would identify the causal impact of media on migration outcomes. Our data
are not experimental and, therefore, we need to carefully discuss under which conditions this
parameter can be identified.
The first general concern is the endogeneity of individual choices in using media. Given
the existing set of possibilities to access media, individuals choose whether to use them and,
if so, which particular media and to which extent. Thus, a significant relationship between
media usage and some individual outcome may simply result from some unobserved hetero-
geneity determining both variables. In our case, this would be a concern if, for instance, more
entrepreneurial individuals used media more intensively and were also more likely to migrate.
Moreover, access to media may simply proxy for some individual/household observable charac-
teristic which is not fully captured in survey data. For example, wealthier households may be
more likely to own a TV set and less likely to migrate. To overcome these concerns, we measure
media exposure using TV reception in the area where the interviewees live, rather than as the
18
actual individual TV ownership or time spent watching TV.15
Still, TV reception in the region is not necessarily exogenous. An obvious concern is the
presence of unobserved factors simultaneously affecting TV reception and migration patterns
in different areas. For example, affluent areas may be more successful in attracting private TV
broadcasters and, at the same time, present a lower out-migration rates. This will lead to a
downward bias estimate of β. It is also possible that more remote areas have weaker TV signal
and show lower migration rates due to the higher costs of moving away from there. In this case,
the OLS estimate of β will present a positive bias. On the other hand, insofar as the variation
in the number of channels across different areas purely responds to topographic accidents (i.e.
mountains, valleys or flats) that have no direct impact on migration patterns, the OLS estimate
of β will be unbiased.
In the empirical analysis, we combine three different strategies to investigate the potential
endogeneity of TV reception and estimate its causal effect. First, we include province fixed
effects in equation 16 to capture any time-invariant characteristics at the provincial level.16
Second, we add a set of control variables at the district level to our empirical model in order
to capture geographical, economic and demographic characteristics. Finally, we apply an in-
strumental variable strategy based on the Indonesia’s mountainous terrain developed by Olken
(2009). This strategy exploits the differences across districts in television reception that are
due to the topography (i.e. mountains and curvature of earth) between the districts’ reception
points and the location of television transmitters. Indeed, the strength of TV signal negatively
depends on (a) the distance between the TV transmitter and the reception area, and (b) the
presence, and altitude, of mountains between the two points. Olken (2009) uses a physical
model of electromagnetic signal propagation to predict the signal loss due to topography and
15Olken (2009) shows that each additional TV channel received is associated with about an 8% increase intime spent watching TV (with respect to its mean value).
16Although TV exposure is measured at the district level, district fixed effects can not be identified as thevariation of TV exposure is almost exclusively cross-sectional in the long run sample and exclusively cross-sectional in the short run one.
19
distance between a geographical point and each of the television station transmitters through-
out Indonesia. He computes the ”predicted signal strength” (TV − PSS) each district will get
by subtracting from each television station transmission power the signal loss calculated from
the model. The ”predicted signal strength” (TV − PSS) captures both the effects of topog-
raphy as well as the fact that some reception points are closer to the transmission locations
than others. Thus, in order to isolate the pure effect of topography, Olken (2009) uses the same
signal propagation model and estimates the ”free-space signal strength” (TV − FSS): this is
the strength that would have been obtained if there was a direct line of sight between the trans-
mitter and the receiver.17 Including this latter variable (TV −FSS) as an additional control for
the effect of distance in equation 16, and using the ”predicted signal strength” (TV −PSS) as
an instrument for the actual TV exposure, one can isolate the variation in signal strength that
is due exclusively to topographical idiosyncrasies and the curvature of earth. The exclusion
restriction for this instrumental variable strategy holds under the reasonable assumption that,
once other district-level geographical variables (distance from the nearest city, distance from
the nearest TV transmitter, altitude, etc.) are controlled for, topographical idiosyncrasies have
no direct effect on migration decisions.
5 Descriptive evidence
Table 1 reports descriptive statistics for the two samples employed in the analysis. The upper
part refers to the sample employed for the long term (early exposure) analysis. There are
14,728 individuals aged 16-45: 48 percent are male, and the average age is 29 years. Looking
at schooling, 34 percent have received only a primary education, 55 percent have a secondary
education and 10 percent went to college. About 14 percent of the sample resided in an urban
area at age 12. There are about 4.5 thousand migrants in this sample, where migrants are all
17Note that Olken (2009) defines the TV − PSS and TV − FSS variable as the maximum signal strengthbetween all transmitters and receiver points at the subdistrict level. Since we conduct the analysis at the districtlevel, these variables are defined as district averages.
20
those individuals who moved inter or intra-provincially. While the share of males is substantially
identical, migrants are slightly older and more educated than non-migrants. They also seem
slightly less likely to live in urban areas at age 12. The lower part of table 1, instead, reports
the values for the sample employed in the short term (current exposure) analysis. There are
8,345 individuals aged 45 or younger, their average characteristics are fairly similar to those in
the previous sample and about a thousand of them are identified as migrants.
Crucial to the identification of internal migrants is a careful analysis of how administrative
divisions and geographical coding evolved over time. Otherwise, one runs the risk of incor-
rectly identify as migrants individuals who never moved but lived in areas whose name or code
changed over time, or were split/merged in smaller/larger geographical units. When the IFLS
survey started in 1993 there were 27 provinces in Indonesia and the IFLS covered only in 13
of them. However, these provinces hosted the bulk of the Indonesian population (the survey
was representative of an 83% of the population). Moreover, if individuals moved outside these
13 provinces an effort was made to re-contact them at their new destinations. Over the years
the administrative division of Indonesia has substantially changed. As a result of consecutive
subdivisions, in 2000 there were 6 new provinces, and the IFLS covered 19 out of a total of 33.
Provinces are divided into districts (kabupaten) that have their own local government and leg-
islative body, and can decide about the provision of public schools and public health facilities.
There were 502 districts (kabupaten) in Indonesia in 2000, and 223 were included in the IFLS
survey. Each district is divided into subdistricts (kecamatan) and then into villages (Desa).
In 2000, there were 6,543 subdistricts and 75,244 villages. The early exposure sample contains
individuals living in 18 different provinces at age 12 and 161 districts (table 2). The smaller
current exposure sample includes individuals residing in 2000 in 11 different provinces and in
135 districts (table 2).
Our focus is on inter and intra-provincial migration as we think that the information ob-
tained through media exposure is only relevant for destinations that are relatively far away.
For movements within the same district or subdistrict, individuals can get information from21
neighbors or just by visiting the place. Table 3 reports some descriptive evidence on internal
migration rates. About 30 percent of the individuals in the early exposure sample have migrated
inter or intra-provincially with respect to the district of residence at age 12, with the subset
which migrated to another province being 11 percent. The current exposure sample shows an
analogous pattern, although the migration rates are all sizeably lower: about 12 percent of
the sample migrated inter or intra-provincially since 2000, and 5.5 percent changed province of
residence.18 In both samples, the propensity to migrate is fairly similar for male and female,
and clearly increases with the level of education.
Where do these migrants come from and where do they go? Table 2 reports the distribution
of respondents across provinces according to the original residence (i.e. residence at age 12
for the early exposure sample and current residence in 2000 for the current exposure one) and
to the residence in 2007/2008. The bulk of our sample resides in the three provinces of Jawa
Barat, Jawa Tengah and Jawa Timur, each of which hosts 15-20 percent of the respondents.
About 7-10 percent of the interviewees reside, instead, in each of the two provinces of Bali and
Nusa Tenggara Barat. In developing countries internal movements are generally thought to
occur from rural to urban areas. Table 4, instead, shows that the majority of people in our
sample move across rural areas (42 percent in the early exposure sample and 51 percent in the
current exposure one), while a smaller, but still considerable, fraction migrate form rural to
urban areas (38 percent in the early exposure sample and 30 percent in the current exposure
one). A sizeable number of respondents move from urban to rural areas (respectively, 12 and 7
percent) and across urban areas (respectively, 7 and 11 percent).
Finally, we look at our measure of TV reception. For each of the 11 channels that operate in
Indonesia in 2006, table 5 reports the year of establishment (or first year on air) and descriptive
statistics for the two samples we use in the empirical analysis. In particular, the table reports
the average TV exposure at the district level by TV network. TV exposure for each TV channel
18The lower migration rates in the current exposure sample is the obvious consequence of the different timespan considered in the two samples: the long-run one looks at migratory movements occurred between the age12 and the years 2007-2008, while the short-run one looks only at the period from 2000 to 2007-08.
22
is measured as the fraction of villages in the district having a clear reception of that particular
network. For instance, in the early exposure sample respondents lived as adolescents in districts
where, in average, 44 percent of the villages had good reception of the public network TVRI.
As for all the other networks, the average reception of TVRI increases (to 88 percent) when
looking at the current exposure sample.19 The bottom part of the table reports descriptive
statistics for the main explanatory variables employed in the analysis. The (TV − private)
variable is obtained by summing up the average reception in each district of each private TV
network. It provides the average number of private channels received in the district and it
varies between 0 and 10. In the early exposure sample, respondents lived in districts receiving
in average 1.23 private channels, with some districts having zero reception and others receiving
up to 8.4 channels. In the current exposure sample, instead, the average number of private
channels increases to 6.2, there are district receiving all the ten channels and others having no
reception. The variable (TV − all) gives the number of channels - public and private - received
in each district, and it is obtained by adding the reception of the public network TVRI to the
private channel variable (TV − private).
6 Estimation results
6.1 TV reception and district characteristics
We start our empirical analysis addressing the possibility that TV reception may be capturing
some characteristics of the local areas that may also produce a direct effect on migration
patterns. In doing so, we estimate the following regression:
TVkp = µ0 + Xkpλ + δp + εkp (17)
19Note that in the current exposure sample the values of TV reception are equal to those measured in thePODES 2006, while in the early exposure they are obtained through the interpolation described in the DataAppendix A and therefore the values are all lower.
23
where the dependent variable is the average number of channels received by the villages
within each district k in province p. As explained before, TV reception is measured in 2006 by
the PODES survey. The regression includes a a vector of district characteristic controls Xkp,
which capture both geographical features (distance in km to the province capital, time and
economic cost of this trip, elevation with respect to the sea level) and measures of the economic
and demographic composition of the local area (number of schools, log of total population,
percentage of households living in slums, percentage of households with at least one member
that has attended university, percentage of poor households, percentage of villages within the
district where the main activity is agriculture, industry or trade).20 Finally, δp is a province
fixed effect and εkp is an idiosyncratic error term.
The OLS estimates of equation 17 are presented in table 6. After controlling for province
fixed effects, the number of TV channels received in each district is only correlated with the
distance to the province capital: the negative coefficient implies that the number of chan-
nels received increases with proximity to the capital. None of the other controls - capturing
geographical, demographic and economic features of the districts - influence TV reception.
This preliminary analysis provides us with two relevant insights. First, TV reception at
the district level is not simply proxying for the level of economic development in the area
(which is likely to be an important determinant of migratory flows). Second, proximity to
the province capital affects TV reception and it is also likely to directly affect migration (by
reducing moving costs): omitting adequate measures of geographical remoteness of the different
districts could potentially bias our estimates. Hence, in all our specifications, we will condition
on distance from the nearest TV transmitter - which is usually located in the nearest town or
city - by including the ”free-space signal strength” variable (TV − FSS) described in section
4.3. Moreover, in our preferred specification, we will always add district controls to capture
altitude, location and remoteness of the districts.
20All the controls are measured using the third wave of the IFLS collected in 2000. We have the full set ofcontrols for 110 districts.
24
6.2 Long and short run effects of TV exposure
Our main results for the long run analysis of early TV exposure are reported in table 7. The
table shows the estimation results for alternative specifications of equation (16). The first half
of the table (columns 1-6) looks at both inter and intra-provincial migration, while the second
half (columns 7-12) focuses only on inter-provincial movements. All the standard errors are
clustered by district to allow for any possible correlation in the unobservables of individuals
who lived in the same district at age 12.
Apart from the measure of TV exposure at the district level (TV − private), our baseline
specification (columns 1, 4, 7 and 10) includes the predicted ”free-space signal strength variable”
(TV − FSS), a dummy for male respondent, a set of year of birth dummies and dummies for
the province of origin (i.e. province of residence at age 12). In columns 2, 5, 8 and 11, we
add four education dummies (primary, secondary, college and other education). In order to
further examine the possibility that TV exposure is capturing some omitted characteristics of
the local area that may have an effect on migration, we also include a set of district-level controls
(columns 3, 6, 9 and 12). These are measured at the very beginning of the liberalization period
using the first wave of the IFLS in 1993 and are the following: average distance to the province
capital (in km); number of schools; average altitude; a coastal district dummy; the share of
villages where primary activity is agriculture, industry or trade; number of households; and the
share of houses with cement walls.21 The inclusion of these additional controls do not alter the
estimated coefficient on TV exposure. This implies that our results are not trivially driven by
omitted district variables affecting both migration patterns and TV reception.
All the specifications reveal strong evidence of early exposure to TV playing a significant
role in reducing future propensity to migrate. The OLS estimates of inter and intra-provincial
migration (columns 1-3), indicate that having been exposed to one more TV channel as an
adolsecent reduces the propensity to migrate by about 2.2-2.3 percentage points. Similar re-
21Note that due to missing values, the inclusion of these additional variables reduces the sample from 14,728observations to 12,834.
25
sults are obtained for the propensity to migrate to a different province (columns 7-9), though
the coefficient is about half in size: exposure to one more TV channel reduces the probabil-
ity of inter-provincial migration by about 0.9-1 percentage points. Estimated coefficients are
remarkably stable across alternative specifications.
To address any further concern regarding the presence of endogeneity, we then implement
our IV strategy. The potentially endogenous TV reception variable, (TV − private), is instru-
mented using the ”predicted signal strength” variable, (TV − PSS), as constructed by Olken
(2009). In all regressions we also include the ”predicted free-space signal strength” measure
(TV − FSS), which controls for the mere effect of distance to the nearest TV transmitter.
Once this latter variable is included in the estimation, the instrument captures only the varia-
tion in signal reception due to differences in the mountainous terrain between transmitter and
receiving points.22 Table 8 shows first stage estimates of the IV strategy for the early exposure
analysis (columns 1-3). In all specifications, the instrument (TV − PSS) is significant at any
conventional level. At the bottom of the table, we report the F-statistic of the excluded instru-
ment. It oscillates between 220 and 280, well above the conventional threshold of 10 for strong
instruments. Therefore, there should be no concerns about potential biases in the second stage
due to the use of weak instruments. The second stage results for inter and intra-provincial
migration (columns 4-6) and for inter-provincial migration only (columns 10-12) are presented
in table 7. In all cases the estimated IV coefficient on TV exposure are negative, strongly
significant and larger in magnitude than the OLS. According to these estimates, the exposure
to one additional private TV channel reduces inter-provincial migration by 1.4-1.5 percentage
point, and all migration movements by 3.7-4.0 percentage points.
A few conclusions can be drawn from this set of estimates. First, we find clear empirical
22In the analysis on early exposure, the measure of private TV exposure varies cross-sectionally but also withthe cohort of birth: older cohorts have zero - or close to zero - exposure and younger cohorts have progressivelymore exposure. We have therefore interacted the ”predicted signal strength” variable, (TV − PSS), witha dummy which is equal one after 1992 (i.e. after the TV liberalization). In each district, therefore, theinstrument is zero until 1992 and then constant from 1993 onwards. Our results are robust to the choice of anyyear in the neighborhood of 1992.
26
evidence that being exposed to more private TV channel has caused a reduction in the future
propensity to migrate towards other areas of the country. Second, the comparison between
OLS and IV estimates indicates that OLS estimates are upward biased. As discussed in section
4.3, OLS estimates would present a positive bias if we failed to fully control for the remoteness
of the districts: isolated areas may have lower TV signal and lower migration rates (due to
the higher cost of moving away). The inclusion of our measures of distance and the average
elevation of the district may not be entirely capturing the degree or remoteness of the areas.
On the contrary, we can rule out the hypothesis that local level of development is driving both
TV reception and migration outcomes: if wealthier areas have stronger TV signal and lower
emigration rates, our OLS estimates should be downward biased. Finally, a closer look at the
difference between OLS and IV estimates allows us to discuss the extent of endogeneity in our
estimations. The IV coefficients are about 1.4-1.7 times the OLS ones and the standard errors
increase by about the same factor. In the absence of endogeneity, OLS and IV estimates should
differ only by sampling error. To formally test the presence of endogeneity we perform the
regression-based version of the Hausman test, which is asymptotically equivalent to the original
version of the Hausman test, but it allows to easily obtain a fully robust statistic (Wooldridge,
2002). Accordingly, we include the residuals of the first-stage regression as an additional control
in equation (16) and test whether the coefficient on these residuals (i.e. the control function)
is statistically significant. The estimated coefficient on the control function, and its associated
standard errors, are displayed in the last two rows of columns 4-6 and 10-12 of table 7. The test
shows weak evidence of endogeneity: the residuals are significant at the 10 percent level in two
cases and not significant in the other four. Therefore, we cannot clearly reject the exogeneity of
TV exposure. This will be a consistent finding throughout our empirical analysis and it implies
that one can give a causal interpretation to the OLS estimates. The exogeneity of TV exposure
is not a particularly surprising finding. First of all, we are using a measure of TV exposure
which is orthogonal to individual decisions such as those regarding TV ownership or time spent
watching TV. Moreover, once we control for distance to the province capital, distance from27
the nearest TV transmitter (through the TV − FSS variable) and altitude, the variation in
topography between transmitting and receiving locations is what ultimately drives the district
differences in TV reception. It is not unreasonable to think that these differences in topography
are substantially as good as random.23
After estimating the long run impact of TV exposure on migration decisions, we examine
its contemporaneous effect, using the current exposure sample described in section 4.2. Table
9 reports OLS and IV estimates of the propensity to migrate at the inter and intra-provincial
level (columns 1-6) and at the provincial level only (columns 7-12). The estimating equation
and specifications (baseline, with education dummies, with district controls) are identical to
those used to assess the long run effect, and the table follows exactly the same structure as
table 7.24 The OLS estimates of the short run impact on inter and intra-provincial migration
of TV exposure are negative and highly significant (column 1-3). In particular, exposure to one
additional private channel decreases the chances of migrating during the next few years by 0.7-
1.2 percentage point. This is fully consistent with the previous results in the long run analysis.
When the dependent variable is migration across provinces (column 7-9), the estimated effect
is still negative and highly significant but smaller in magnitude: exposure to one additional
private TV channel increases the propensity to migrate by 0.6 to 0.8 percentage points.
Let us now comment on the IV estimates. First-stage estimates are reported in table 8
(columns 4-6). In all specifications, the instrument (TV − PSS) is highly significant and one
can clearly reject the null of weak instruments (the F-statistic varies between 27 and 40). The
second stage estimates are reported in table 9, columns 4-6 (inter and intra-provincial migra-
23Our findings regarding the exogeneity of TV exposure are consistent with those in Olken (2009), who findsIV results very similar to the OLS ones.
24In this case, the included district level controls are measured in 2000 using IFLS3 data. These controls are:distance in km to the province capital, time and economic cost of this trip, elevation with respect to the sealevel, number of schools, log of total population, share of households living in slums, share of households withat least one member that has attended university, share of poor households, and the share of villages within thedistrict where the main activity is agriculture, industry or trade. Note that the sample size is reduced by about2,100 observation when the district controls are included in estimation. However, when we estimate the modelwithout the district controls on this restricted sample the results remain unaffected.
28
tion) and 10-12 (inter-provincial migration). In our preferred specification (column 6, which
includes district level controls), an additional private TV channel decreases (inter and intra-
provincial) migration by almost 1.6 percentage points (rather than by 1.2 percentage points,
as implied by the OLS estimate). For inter-provincial migration the gap between OLS and IV
estimates is even smaller, but the latter are never significant. Given that the standard errors
of the IV estimates are (at least) twice as large as those of the OLS ones, it is not surprising
that the IV coefficients lose significance. Similarly to the results for the long run analysis, we
do not observe strong evidence of endogeneity in the TV − private variable: in the latter two
rows of table 9, columns (4-6 and 10-12), the regression-based Hausman test fails to reject the
exogeneity of TV exposure in all cases.25 In the absence of endogeneity, OLS and IV estimates
are both consistent, but OLS estimates are more efficient and should be preferred.
How large are the estimated effects? In the early exposure sample the variable measuring
exposure to private TV channels has mean equal to 1.23 with a standard deviation of 1.85
(table 5). According to our long term estimates, an increase of a one standard deviation in
the number of private TV channels received will reduce inter-provincial migration by 1.7-2.7
percentage points, and all migration movements (inter and intra-provincial) by 4-7.4 percentage
points. This increase in TV exposure represents a reduction in all migration movements (inter
and intra-provincial) of about 8-16 percent of its standard deviation (which is 0.46; see table
3) and a reduction in inter-provincial movements of only about 5-8 percent of its standard
deviation (which is 0.31; see table 3). Short run effects are also sizeable. In the current
exposure sample, the measure of private TV exposure has mean 6.2 and standard deviation
3.3. Therefore, a one standard deviation increase in TV exposure would imply a reduction for
inter and intra-provincial migration of about 7-16 percent of its standard deviation, and for
25This is clearly the case for the estimates of inter and intra-provincial migration, where both OLS and IVestimates are negative and highly significant. However we are slightly more cautious in interpreting the resultsfor inter-provincial migration. In this case the IV estimate is not significant at conventional levels and thus itmay be that the true effect of TV exposure on inter-provincial migration is actually zero.
29
inter-provincial migration of 7-11 percent. All these effects are far from negligible.
6.3 Robustness tests
After establishing our main result - exposure to private TV causally reduces the propensity to
internally migrate of Indonesian citizens - we perform a number of additional tests to assess
the robustness of our estimates. Here, we also have a look at some other dimensions of the
migratory decisions.
International migrants. The negative effect of TV exposure on internal migration could be,
at least partially, explained by an increased tendency to migrate internationally. If access to
private TV networks increased the propensity to migrate abroad and if the individuals moving
abroad would have, otherwise, migrated within Indonesia, one could observe a drop in internal
migration following an expansion in TV exposure. The IFLS survey allows us to identify (some
of the) international migrants: it collects information on the new residence of individuals who
were interviewed in any of the four waves and then moved out of Indonesia.26 We identify 375
international migrants in the early exposure sample (2.8 percent of the sample) and 190 in the
current exposure one (2.9 percent), and add them to our main estimating samples. We then
estimate equation 16 using as a dependent variable an indicator that identifies international
migrants from individuals who remained in Indonesia (no matter whether they internally moved
or not). Table 10 reports OLS and IV estimation results for both the early exposure and current
exposure sample. There is no evidence of any significant impact of ”early exposure” (column 1
and 2). As for the short run effect, the OLS estimate (column 3) suggests a small and negative
effect of TV exposure on international migration (-0.003). This coefficient is about one fourth of
that estimated for inter- and intra-provincial migration (one half for inter-provincial migration)
and it is significant only at the 10 percent level. When the private TV exposure variable is
26Respondents who moved abroad are not tracked down and, therefore, they leave the sample. However,some information is still collected by interviewing other household members. Thought there are inherent dataproblems in performing this kind of empirical analysis (i.e. high attrition rates and misleading informationreported by family members) we think it is worth revising this evidence.
30
instrumented, the coefficient becomes positive and not significantly different from zero. In this
case, the Hausman test marginally rejects the exogeneity of TV exposure, (TV − private),
suggesting that one should relay more on the IV estimates. From this evidence we conclude
that there does not seem to be a significant impact of TV exposure on the decision to migrate
abroad. In particular, one does not find any significant positive coefficient on TV exposure:
the reduction in internal migration we have observed in the previous section cannot be simply
explained by an increased in the propensity to move abroad.
Return migrants. Having access to more information should allow individuals to make bet-
ter migration choices. If a fraction of the return migrants are individuals who over-estimated
the gains from migration and who, once they found out their mistake, returned to their original
residence (Borjas and Bartsberg, 1996), we may observe less return migration among the indi-
viduals who had more access to TV (i.e. were more informed). On the other hand, being able
to better choose both the destination and the timing for migration, should speed up the eco-
nomic assimilation of migrants. That is, if they have some sort of target-saving behavior, better
informed migrants may manage to meet their target quicker and return back home earlier.27
Therefore, the predictions about the effect of information on return migration are theoretically
ambiguous. We test this on our data, using the early exposure sample, which covers a larger
span of time and allows more individuals to return. In this sample, about 8 percent of the
inter-provincial migrants returned to their province of initial residence, and 5 percent of the
internal migrants returned to the district of origin. We restrict the sample only to internal
migrants and estimate equation 16 using as a dependent variable an indicator that identifies
return migrants. In unreported regressions, we do not find any significant relationship between
being a return migrant and TV exposure.28
To conclude, we perform a few standard robustness checks. First, we check the implications
27Target-saving behavior could be created by preferences for consumption and/or higher purchasing power inthe home country (Dustmann, 2001; Dustmann and Weiss, 2007)
28Estimation results can be provided upon request.
31
of our age restriction (i.e. age comprised between 16 and 45) by conducting the analysis without
the age constraint (i.e. age ≥ 16). The results are reported in table A 1. By removing this
constraint the number of observations increases to 18.7 thousand in the early exposure sample,
(columns 1-6), and to 9.7 thousand in the current exposure one, (columns 7-12). A comparison
with the tables 7 and 9 shows that including older people in the analysis does not alter our
results.
Next, we examine whether the impact of TV exposure on migration choices vary by gen-
der, age or level of education, by estimating equation 16 including interactions of private TV
reception with all these demographic characteristics. We do not find any clear evidence of
heterogeneous effects.
Finally, in table A 2, the measure of exposure to private TV channels, (TV − private), is
replaced by a measure which also includes the public TVRI network, (TV −all). The inclusion
of exposure to public TV - on top of that to private channels - produces negligible changes in
the estimated coefficients. In unreported regressions, we split the private TV networks variable
into major networks (Indosiar, RCTI and SCTV) and minor ones (Anteve, Global TV, Lativi,
Metro TV, TPI, Trans TV and TV7-Trans 7). Our results show that both types of networks
significantly reduce the propensity to internally migrate.29
7 Discussion and further results
Our results show that higher exposure to private TV broadcasting has reduced the propensity
to migrate of Indonesian citizens both in the short and in the long run. The size of the effect
is non-negligible and has a causal interpretation.
The theoretical framework presented in section 3 produces an ambiguous prediction re-
garding the sign of the relationship between information and migration. In that framework,
information makes individuals more able to accurately predict the benefits and costs associated
29Estimation results can be provided upon request.
32
to geographical movements. Then, if individuals are over- rather than under-estimating the
net gains from migration, more information should lead to, respectively, less, rather than more,
willingness to migrate. The empirical evidence in the previous section uncovers a negative
relationship between TV exposure and migration, suggesting that individuals were on average
over-estimating the benefits (and/or underestimating the cost) of moving somewhere else within
the country.
The IFLS allows us to further explore this aspect thanks to a set of questions designed
to record respondents’ perceptions about their relative position in the income distribution. If
individuals think to be relatively poorer than they actually are, they may be more willing to
migrate somewhere else to improve their situation (Stark and Taylor, 1991). In this context,
more TV exposure may allow individuals to better assess their position in society and reduce
migration pressures. To test this conjecture we focus on the following question: ”Please imagine
a six-step ladder where on the bottom (the first step), stand the poorest people, and on the highest
step (the sixth step), stand the richest people. On which step are you today?”. The estimation
results are presented in Table 11. The empirical model is that in equation (16) where the
dependent variable is replaced by an indicator that takes value 1 if the individual reports to
be in the first or second step of the income ladder (i.e. among the poorest) and 0 otherwise.30
In an extended specification, we also include, as additional controls, individual labor market
status and monthly wage (columns 2 and 4).31
Table 11 reports the results based on the early exposure sample.32 Both OLS and IV
estimates are negative and strongly significant. As before, IV coefficients are larger but not
remarkably different from the OLS ones, and we find mixed evidence of endogeneity in our
regressions. According to these estimates, individuals more exposed to private TV are less
likely to see themselves at the bottom end of the income distribution. This is the case even
30In our sample, roughly 30 percent of the respondents place themselves in the bottom part of the incomedistribution.
31Similar results are obtained if the dependent variable is a categorical indicator taking values from 1 (thefirst step) to 6 (the sixth step).
32Results from the current exposure sample are qualitatively very similar and can be provided upon request.
33
when we compare individuals with same employment status and monthly wage. More precisely,
one additional private TV channel reduces the probability of reporting to be among the poorest
group by 2.6 percentage points. We interpret this finding as evidence that individuals with less
TV reception have less information about the prevailing income distribution in the country and
tend to under-estimate their position on it.33
Why should citizens with less access to private TV networks be systematically less informed
about their relative position on the income distribution? This may be a general finding in
countries - such as Indonesia - undergoing periods of sustained growth and fast urbanization. In
a context of rapid change, citizens may be induced to think that moving somewhere else within
the country would increase their economic status, even if they do not have all the relevant
information to asses whether this is likely to happen or not. Receiving more information on
potential destinations, could then curb their ”migratory enthusiasm”: if their expectations
were somehow inflated, this may lead to a reduction in the propensity to migrate. Comparable
evidence from similar countries, such as India or China, would help assessing the generality
of our results. On the other hand, our findings may be strictly related to the Indonesian
case. Indeed, before the TV liberalization process, Indonesian citizens had only access to the
public TV channel. This channel was under the strict control of the government, who placed
severe restrictions on news production and on the discussion of sensitive matters which could
undermine the image of national prosperity and cohesion. In order to maintain popular support,
all regimes have a strong interest in presenting the country under a much better light than the
actual reality is: this was clearly the case under Suharto’s rule (see section 2.1). In this context,
the role played by the expansion of private TV channels in providing Indonesian citizens with
better information and true reporting on their country may have been crucial also in shaping
their internal migration decisions.
33An alternative interpretation of our results could be that having more access to TV broadcasting alsoincreases utility. Indeed, television may have reduced the sense of exclusion from the rest of the Indonesiansociety among those living in relatively remote areas. If individuals who feel more included also feel less deprived,they may place themselves in a higher position in the income ladder. We find this explanation more speculativeand far less convincing than the one based on the information channel.
34
8 Conclusions
Although the empirical evidence is still scarce (see Braga 2007 for one of the few exceptions),
there is a widespread perception that access to Western media, movies and TV series may
increase the willingness to migrate abroad of citizens in developing countries. Exposure to
foreign media may foster individuals’ economic aspirations, modify comparison groups and
create false expectations about life in other countries.34 However, it is less clear what one
should expect about the relationship between increased access to media and internal migration.
In this paper, we show that having better media coverage of one’s own country does not nec-
essarily increase the incentives to internally migrate. More information leads to more accurate
migration choices. Hence, the final effect on migration depends on whether individuals were
under rather than over-estimating the potential gains from migrating. We uncover a strong
negative effect of TV exposure on the propensity to internally migrate, thus suggesting that
Indonesian citizens, prior to the expansion of private TV broadcasting, were too optimistic in
assessing the potential gains from moving.
In order to estimate the causal effect of media exposure, we exploit the differential intro-
duction of private television throughout Indonesia and the variation in signal reception due to
topography. We address possible concerns of endogeneity of local TV exposure by an instru-
mental variable strategy and carefully test the robustness of our results. Our estimates reveal
important long and short run effects of private TV broadcasting. In particular, an increase
of one standard deviation in the number of private TV channels received in an area would
reduce inter-provincial migration by 1.7-2.7 percentage points, and all migration movements
(inter and intra-provincial) by 4-7.4 percentage points. Short-run effects are slightly smaller,
but still sizeable and significant. We also show that respondents less exposed to private TV are
systematically more likely to consider themselves among the poorest groups of the Indonesian
34”The most obvious transformation of our life was the arrival of television, which shows us with total intimacy
how other people live. Where people once compared themselves with the people round the corner, they can now
compare themselves with anyone they like, up to J.R. in Dallas. It would be astonishing if such comparisons
were not unsettling.” (Layard, 2003; p.15).
35
society. As we discuss in a stylized model of migration choice under imperfect information,
these findings are consistent with Indonesia citizens over-estimating the net gains from internal
migration.
The main policy implication of our findings is that increasing access to information in
developing countries not only can help citizens make better migration choices - improving
their welfare - but it can also reduce migratory pressures. This has important implications
for countries such as China, where the government is extremely concerned about the size of
internal migration: providing more information could be an alternative to restrictive measures
on geographical movements.
36
References
[1] Aker, J., Clemens, M. and Ksoll, C., 2011. Mobiles and mobility: The Effect of MobilePhones on Migration in Niger. mimeo.
[2] Attanasio, O. and Kaufmann, K., 2009. Educational Choices, Subjective Expectations,and Credit Constraints. NBER Working Papers 15087.
[3] Banerjee B., 1984. Information flow, expectations and job search: Rural-to-urban migrationprocess in India. Journal of Development Economics. 15(1-3), 239-257.
[4] Braga, M., 2007. Dreaming Another Life. The Role of Foreign Media in Migration Deci-sions. Evidence from Albania. mimeo.
[5] Borjas, G. J., 1987. Self-Selection and the Earnings of Immigrants. American EconomicReview. 77(4), 531-553.
[6] Borjas, G.J. and Bratsberg, B., 1996. Who Leaves? The Outmigration of the Foreign-Born.The Review of Economics and Statistics. 78(1), 165-176.
[7] Carrington,W.J., Detragiache, E. and Vishwanath, T., 1996. Migration with EndogenousMoving Costs. The American Economic Review. 86(4), 909-930.
[8] Daneshvary N., Herzog, H.W., Hofler, R.A., and Schlottmann, A.M., 1992. Job Search andImmigrant Assimilation: An Earnings Frontier Approach. The Review of Economics andStatistics. 74(3), 482-492.
[9] Della Vigna, S., Enikolopov, R., Mironova, V., Petrova, M. and Zhuravskaya, E., 2011. Un-intended media effects in a conflict environment: Serbian radio and Croatian nationalism.NBER Working Paper No. 16989.
[10] Della Vigna, S., Kaplan, E., 2007. The Fox News Effect: Media Bias and Voting. QuarterlyJournal of Economics. 122, 1187-1234.
[11] d’Haenens, L., Gazali, E. and Verelst, C., 1999. Indonesian Television News-Making Beforeand After Suharto. International Communication Gazette. 61(2), 127-152.
[12] Ducanes, G. and Abella, M., 2009. Prospects for future outward migration flows: Chinaand Southeast Asia. ILO/EU - Asian Programme on the Governance of Labour Migration- WP No. 24.
[13] Dustmann, C., 2001. Return decisions of immigrants, in: S. Djajic (ed.), InternationalMigration: Trends and Policy and Economic Impact. London: Routledge, pp. 228-250.
[14] Dustmann, C. and Weiss, Y., 2007. Return Migration: Theory and Empirical Evidencefrom the UK. British Journal of Industrial Relations. 45(2), 236-256.
37
[15] Facchini, G., Mayda, M., Puglisi, R., 2009. Illegal immigration and media exposure: Evi-dence on individual attitudes. CEPR Discussion Papers 7593.
[16] Fearnside P.M., 1997. Transmigration in Indonesia: Lessons from Its Environmental andSocial Impacts. Environmental Management. 21(4), 553-570.
[17] Gentzkow, M. and Shapiro, J., 2004. Media, Education and Anti-Americanism in theMuslim World. Journal of Economic Perspectives. 18, 117-133.
[18] Gerber, A., Karlan, D. and Bergan, D., 2009. Does the media matter? A field experimentmeasuring the effect of newspapers on voting behavior and political opinions. AmericanEconomic Journal: Applied Economics. 1(2), 35-52.
[19] Gilbert, A. and Koser, K., 2006. Coming to the UK: What do Asylum-Seekers Know Aboutthe UK before Arrival? Journal of Ethnic and Migration Studies. 32(7), 1209-1225.
[20] Hardjono, J., 1988. The Indonesian Transmigration Program in Historical Perspective.International Migratio. 26(4), 427-439.
[21] Hill, H., Resosudarmo, B.P. and Vidyattama, Y., 2008. Indonesia’S Changing EconomicGeography. Bulletin of Indonesian Economic Studies. 44(3), 407-435.
[22] Hanson, G. H. and McIntosh, C., 2010. The Great Mexican Emigration. The Review ofEconomics and Statistics. 92(4), 798-810.
[23] Harris, J.R. and Todaro, M.P., 1970. Migration, Unemployment and Development: ATwo-Sector Analysis. American Economic Review. 60(1), 126–142.
[24] Herzog, H.W., Hofler, R.A. and Schlottmann, A.M., 1985. Life on the Frontier: MigrantInformation, Earnings and Past Mobility. The Review of Economics and Statistics. 67(3),373-382.
[25] Hollander, E., d’Haenens, L., Bardoel, J., 2009. Television performance in Indonesia: steer-ing between civil society, state and market. Asian Journal of Communication. 19(1), 39-58.
[26] Jensen R. and Oster, E., 2009. The Power of TV: Cable Television and Women’s Statusin India. Quaterly Journal of Economics. 124(3), 1057-1094.
[27] Jensen, R., 2010. The (Perceived) Returns to Education and the Demand for Schooling.The Quarterly Journal of Economics. 125(2), 515-548.
[28] Katz, E. and Stark, O., 1986. Labor mobility under asymmetric information with movingand signalling costs. Economics Letters. 21(1), 89-94.
[29] Katz, E. and Stark, O. 1987. International Migration under Asymmetric Information. TheEconomic Journal. 97(387), 718-726.
[30] Kukuh, S., 2002. Indonesian television and the dynamics of transition, in Russell Hiang-Khng Heng (ed), Media Fortunes, Changing Times, Institute of Southeast Asian Studies.
38
[31] La Ferrara, E., Chong, A., Duryea, S., 2007. Soap operas and fertility: Evidence fromBrazil. CEPR Discussion Paper No. DP6785.
[32] Layard, R., 2003. Happiness: has social science got a clue. Lionel Robbins Memorial Lec-tures 2002/03, London School of Economics - lecture 2.
[33] Mai, N., 2004. ’Looking for a More Modern Life ...’: the Role of Italian Television in theAlbanian Migration to Italy. Westminster Papers in Communication and Culture. 1(1),3-22.
[34] McKenzie, D., Gibson, J. and Stillman, S., 2007. A land of milk and honey with streetspaved with gold: Do emigrants have over-optimistic expectations about incomes abroad?CReAM working paper.
[35] McKenzie, D. and Rapoport, H., 2007. Network effects and the dynamics of migrationand inequality: Theory and evidence from Mexico. Journal of Development Economics,Elsevier. 84(1), 1-24.
[36] McKenzie, D. and Rapoport, H., 2010. Self-Selection Patterns in Mexico-U.S. Migration:The Role of Migration Networks. The Review of Economics and Statistics. 92(4), 811-821.
[37] Munshi, K., 2003. Networks in the Modern Economy: Mexican Migrants in the US LaborMarket. Quarterly Journal of Economics. 118, 549-599.
[38] Olken, B., 2009. Do Television and Radio Destroy Social Capital? Evidence from Indone-sian Villages. American Economic Journal: Applied Economics. 1(4), 1-33.
[39] Pessino C., 1991. Sequential migration theory and evidence from Peru. Journal of Devel-opment Economics. 36(1), 55-87.
[40] Sjaastad, L. A., 1962. Costs and Returns of Human Migration. Journal of Political Econ-omy. 70(5), 80-93.
[41] Stark, O., 1995. Return and Dynamics: The Path of Labor Migration When Workers Differin Their Skills and Information Is Asymmetric. Scandinavian Journal of Economics. 97(1),55-71.
[42] Stark, O., Taylor, J.E., 1991. Migration incentives, migration types: the role of relativedeprivation. Economic Journal. 101(408), 1163-1178.
[43] Tirtosudarmo, R., 2009. Mobility and Human Development in Indonesia. Human Devel-opment Research Paper (HDRP) Series. 19(2009).
[44] Vishwanath, T., 1991. Information flow, job search, and migration. Journal of DevelopmentEconomics. 36(2), 313-335.
[45] Van Lottum, J. and Marks, J., 2010. The Determinants of Internal migration in a Devel-oping Country: Quantitative Evidence from Indonesia, 1930-2000. mimeo.
39

[46] Winters, P., de Janvry, A. and Sadoulet, E., 2001. Family and Community Networks inMexico-U.S. Migration. The Journal of Human Resources. 36(1), 159-184.
[47] Wooldridge J.M., 2002. Econometric analysis of cross section and panel data, The MITpress.
40
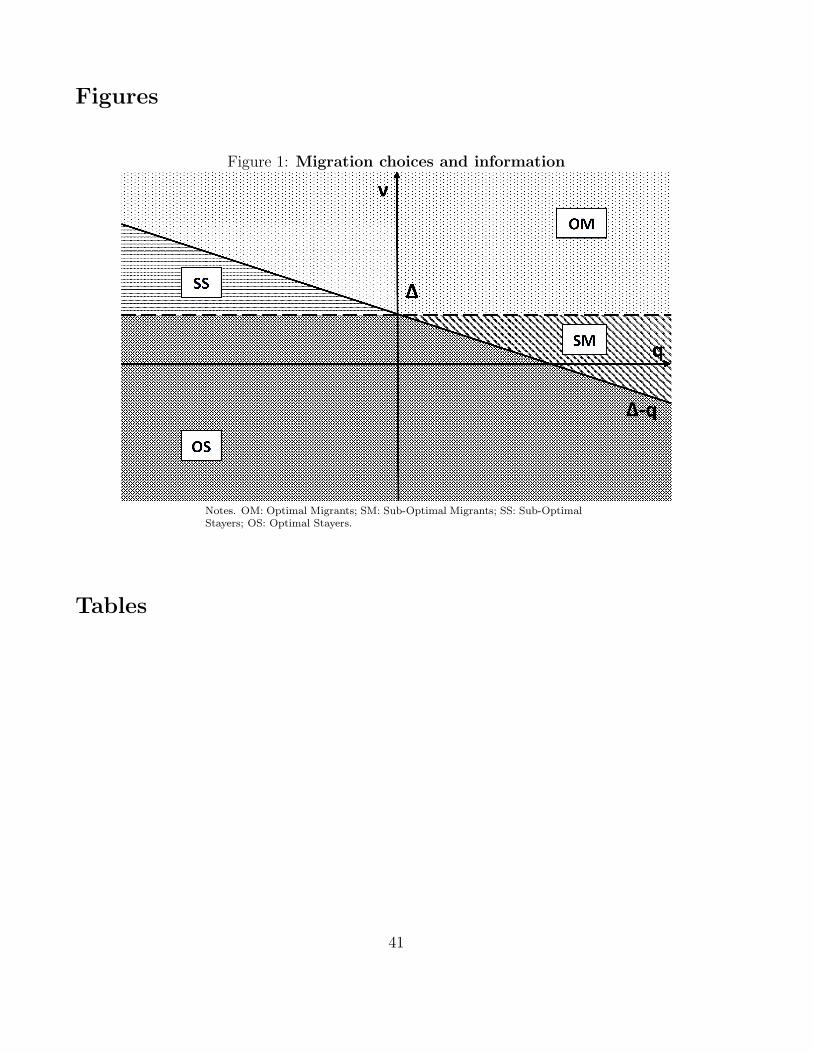
Figures
Figure 1: Migration choices and information
Notes. OM: Optimal Migrants; SM: Sub-Optimal Migrants; SS: Sub-OptimalStayers; OS: Optimal Stayers.
Tables
41
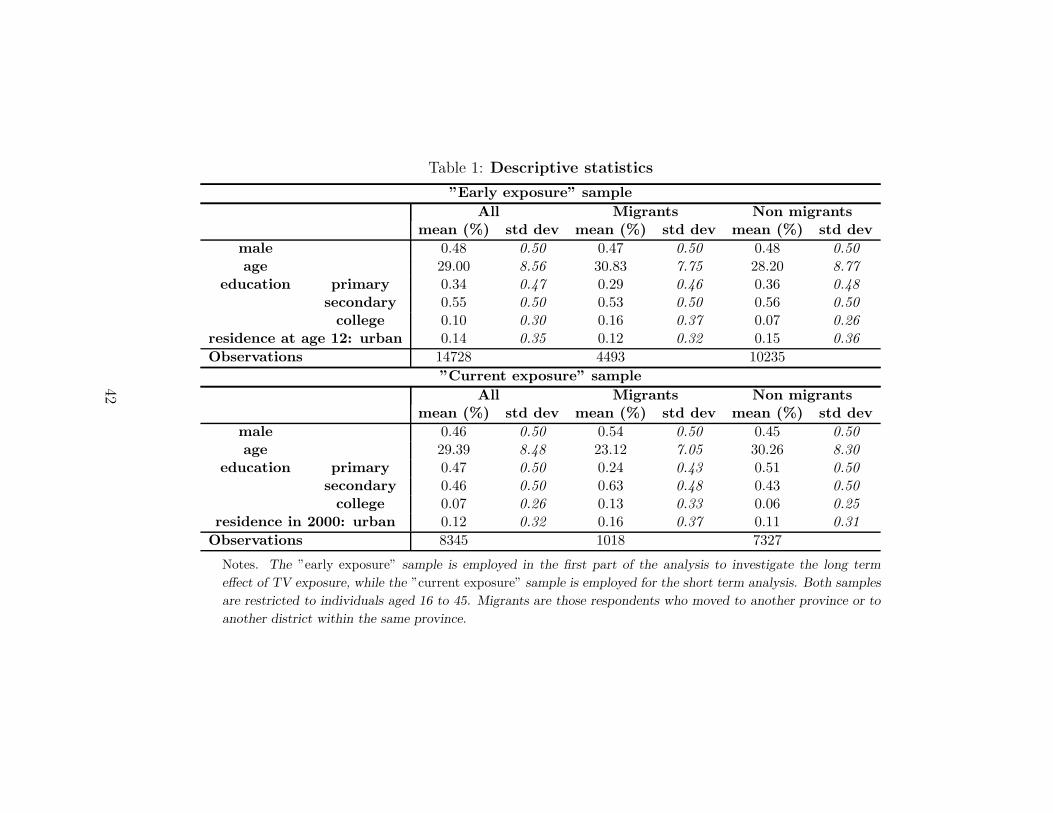
Table 1: Descriptive statistics
”Early exposure” sample
All Migrants Non migrantsmean (%) std dev mean (%) std dev mean (%) std dev
male 0.48 0.50 0.47 0.50 0.48 0.50
age 29.00 8.56 30.83 7.75 28.20 8.77
education primary 0.34 0.47 0.29 0.46 0.36 0.48
secondary 0.55 0.50 0.53 0.50 0.56 0.50
college 0.10 0.30 0.16 0.37 0.07 0.26
residence at age 12: urban 0.14 0.35 0.12 0.32 0.15 0.36
Observations 14728 4493 10235
”Current exposure” sample
All Migrants Non migrantsmean (%) std dev mean (%) std dev mean (%) std dev
male 0.46 0.50 0.54 0.50 0.45 0.50
age 29.39 8.48 23.12 7.05 30.26 8.30
education primary 0.47 0.50 0.24 0.43 0.51 0.50
secondary 0.46 0.50 0.63 0.48 0.43 0.50
college 0.07 0.26 0.13 0.33 0.06 0.25
residence in 2000: urban 0.12 0.32 0.16 0.37 0.11 0.31
Observations 8345 1018 7327
Notes. The ”early exposure” sample is employed in the first part of the analysis to investigate the long term
effect of TV exposure, while the ”current exposure” sample is employed for the short term analysis. Both samples
are restricted to individuals aged 16 to 45. Migrants are those respondents who moved to another province or to
another district within the same province.
42
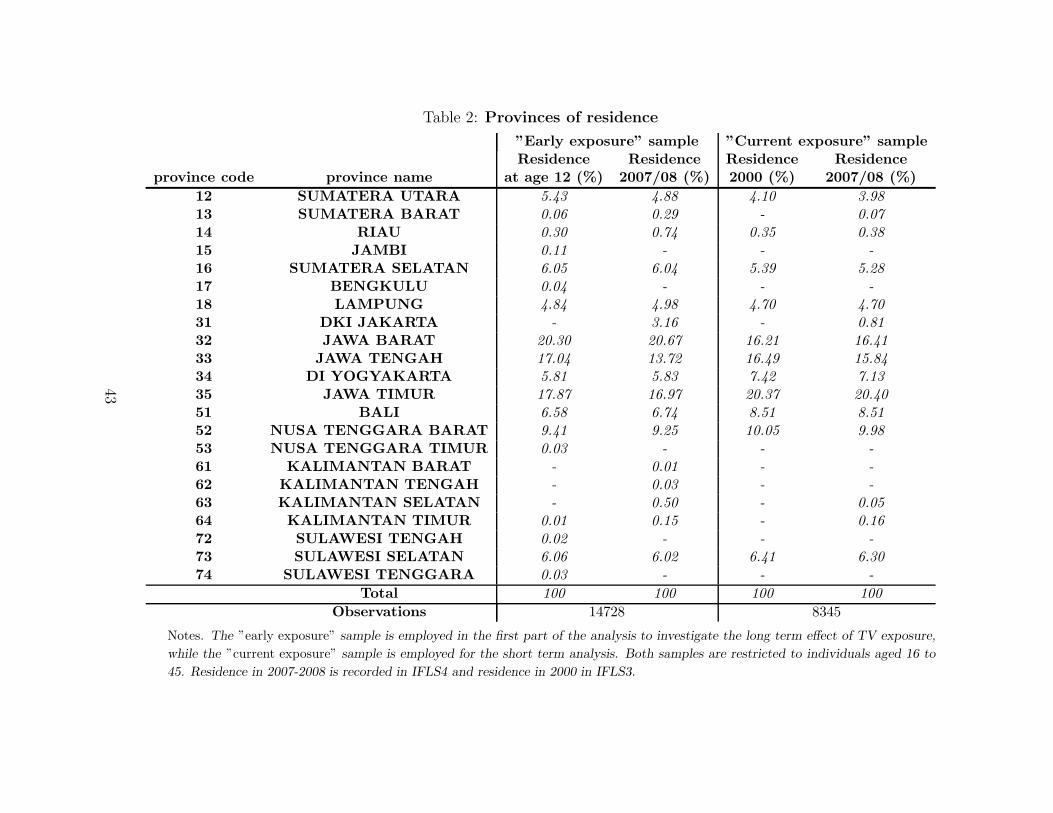
Table 2: Provinces of residence
”Early exposure” sample ”Current exposure” sampleResidence Residence Residence Residence
province code province name at age 12 (%) 2007/08 (%) 2000 (%) 2007/08 (%)
12 SUMATERA UTARA 5.43 4.88 4.10 3.98
13 SUMATERA BARAT 0.06 0.29 - 0.07
14 RIAU 0.30 0.74 0.35 0.38
15 JAMBI 0.11 - - -
16 SUMATERA SELATAN 6.05 6.04 5.39 5.28
17 BENGKULU 0.04 - - -
18 LAMPUNG 4.84 4.98 4.70 4.70
31 DKI JAKARTA - 3.16 - 0.81
32 JAWA BARAT 20.30 20.67 16.21 16.41
33 JAWA TENGAH 17.04 13.72 16.49 15.84
34 DI YOGYAKARTA 5.81 5.83 7.42 7.13
35 JAWA TIMUR 17.87 16.97 20.37 20.40
51 BALI 6.58 6.74 8.51 8.51
52 NUSA TENGGARA BARAT 9.41 9.25 10.05 9.98
53 NUSA TENGGARA TIMUR 0.03 - - -
61 KALIMANTAN BARAT - 0.01 - -
62 KALIMANTAN TENGAH - 0.03 - -
63 KALIMANTAN SELATAN - 0.50 - 0.05
64 KALIMANTAN TIMUR 0.01 0.15 - 0.16
72 SULAWESI TENGAH 0.02 - - -
73 SULAWESI SELATAN 6.06 6.02 6.41 6.30
74 SULAWESI TENGGARA 0.03 - - -
Total 100 100 100 100
Observations 14728 8345
Notes. The ”early exposure” sample is employed in the first part of the analysis to investigate the long term effect of TV exposure,
while the ”current exposure” sample is employed for the short term analysis. Both samples are restricted to individuals aged 16 to
45. Residence in 2007-2008 is recorded in IFLS4 and residence in 2000 in IFLS3.
43
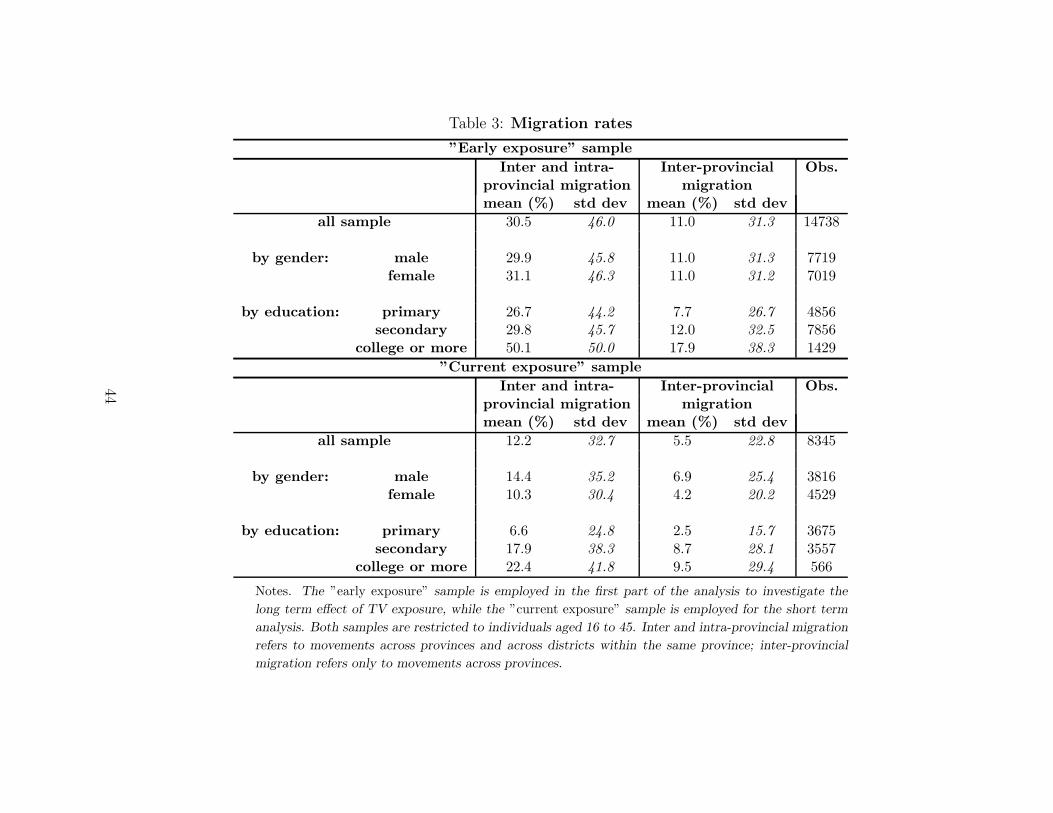
Table 3: Migration rates
”Early exposure” sample
Inter and intra- Inter-provincial Obs.provincial migration migrationmean (%) std dev mean (%) std dev
all sample 30.5 46.0 11.0 31.3 14738
by gender: male 29.9 45.8 11.0 31.3 7719female 31.1 46.3 11.0 31.2 7019
by education: primary 26.7 44.2 7.7 26.7 4856secondary 29.8 45.7 12.0 32.5 7856
college or more 50.1 50.0 17.9 38.3 1429
”Current exposure” sample
Inter and intra- Inter-provincial Obs.provincial migration migrationmean (%) std dev mean (%) std dev
all sample 12.2 32.7 5.5 22.8 8345
by gender: male 14.4 35.2 6.9 25.4 3816female 10.3 30.4 4.2 20.2 4529
by education: primary 6.6 24.8 2.5 15.7 3675secondary 17.9 38.3 8.7 28.1 3557
college or more 22.4 41.8 9.5 29.4 566
Notes. The ”early exposure” sample is employed in the first part of the analysis to investigate the
long term effect of TV exposure, while the ”current exposure” sample is employed for the short term
analysis. Both samples are restricted to individuals aged 16 to 45. Inter and intra-provincial migration
refers to movements across provinces and across districts within the same province; inter-provincial
migration refers only to movements across provinces.
44
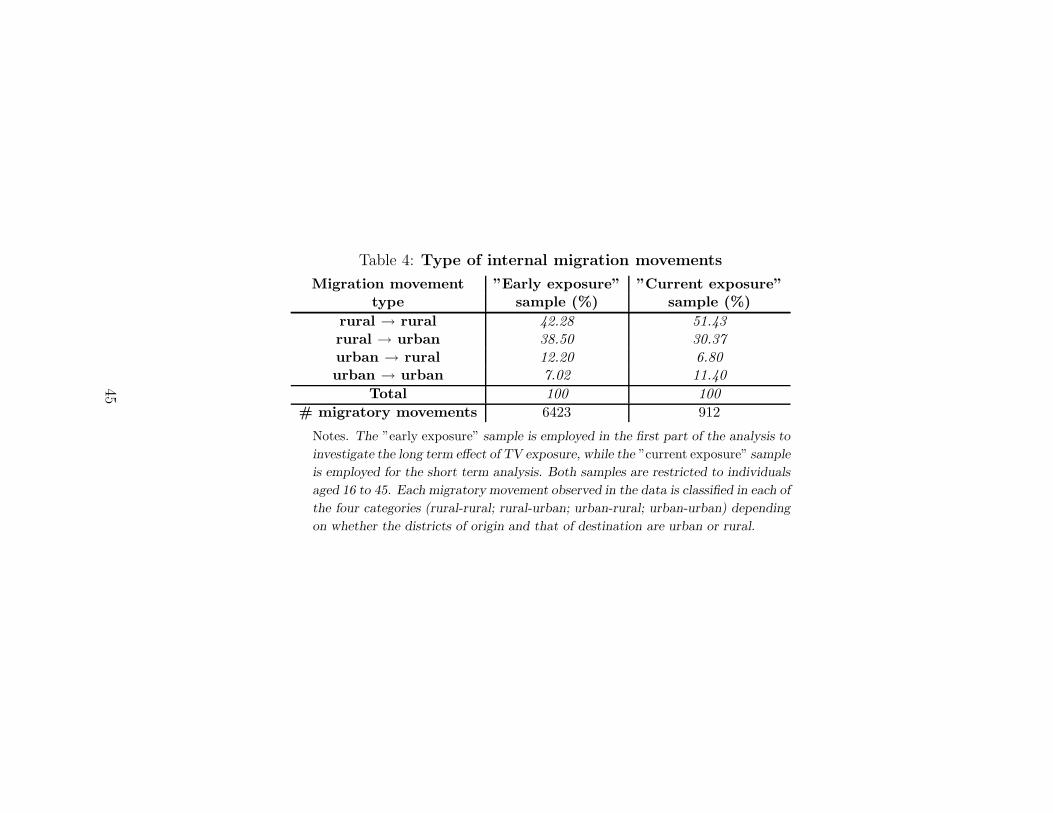
Table 4: Type of internal migration movements
Migration movement ”Early exposure” ”Current exposure”type sample (%) sample (%)
rural → rural 42.28 51.43
rural → urban 38.50 30.37
urban → rural 12.20 6.80
urban → urban 7.02 11.40
Total 100 100
# migratory movements 6423 912
Notes. The ”early exposure” sample is employed in the first part of the analysis to
investigate the long term effect of TV exposure, while the ”current exposure” sample
is employed for the short term analysis. Both samples are restricted to individuals
aged 16 to 45. Each migratory movement observed in the data is classified in each of
the four categories (rural-rural; rural-urban; urban-rural; urban-urban) depending
on whether the districts of origin and that of destination are urban or rural.
45
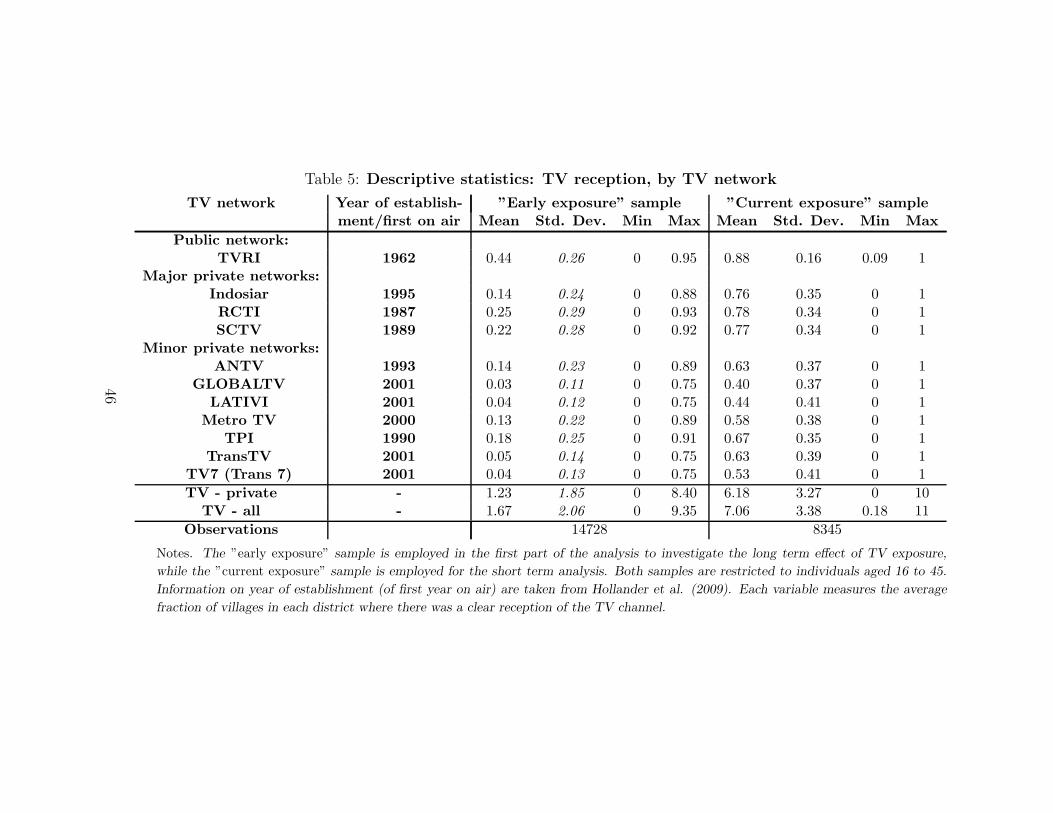
Table 5: Descriptive statistics: TV reception, by TV network
TV network Year of establish- ”Early exposure” sample ”Current exposure” samplement/first on air Mean Std. Dev. Min Max Mean Std. Dev. Min Max
Public network:TVRI 1962 0.44 0.26 0 0.95 0.88 0.16 0.09 1
Major private networks:Indosiar 1995 0.14 0.24 0 0.88 0.76 0.35 0 1RCTI 1987 0.25 0.29 0 0.93 0.78 0.34 0 1SCTV 1989 0.22 0.28 0 0.92 0.77 0.34 0 1
Minor private networks:ANTV 1993 0.14 0.23 0 0.89 0.63 0.37 0 1
GLOBALTV 2001 0.03 0.11 0 0.75 0.40 0.37 0 1LATIVI 2001 0.04 0.12 0 0.75 0.44 0.41 0 1
Metro TV 2000 0.13 0.22 0 0.89 0.58 0.38 0 1TPI 1990 0.18 0.25 0 0.91 0.67 0.35 0 1
TransTV 2001 0.05 0.14 0 0.75 0.63 0.39 0 1TV7 (Trans 7) 2001 0.04 0.13 0 0.75 0.53 0.41 0 1
TV - private - 1.23 1.85 0 8.40 6.18 3.27 0 10TV - all - 1.67 2.06 0 9.35 7.06 3.38 0.18 11
Observations 14728 8345
Notes. The ”early exposure” sample is employed in the first part of the analysis to investigate the long term effect of TV exposure,
while the ”current exposure” sample is employed for the short term analysis. Both samples are restricted to individuals aged 16 to 45.
Information on year of establishment (of first year on air) are taken from Hollander et al. (2009). Each variable measures the average
fraction of villages in each district where there was a clear reception of the TV channel.
46
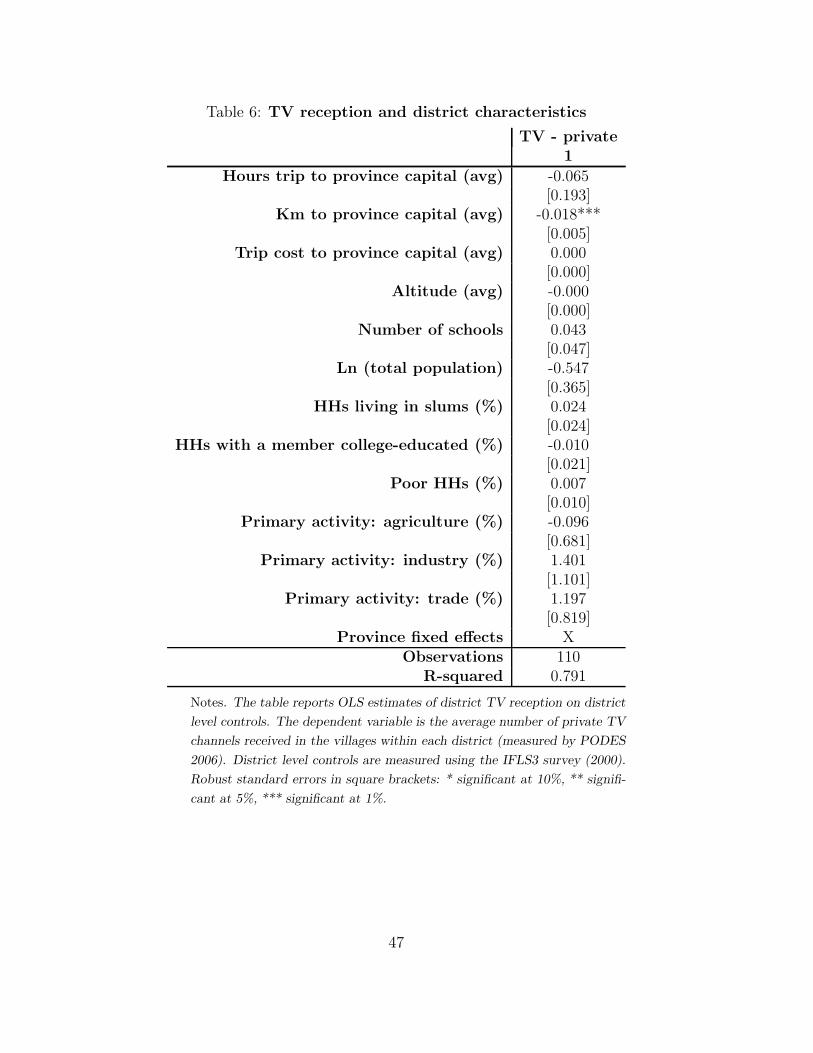
Table 6: TV reception and district characteristics
TV - private1
Hours trip to province capital (avg) -0.065[0.193]
Km to province capital (avg) -0.018***[0.005]
Trip cost to province capital (avg) 0.000[0.000]
Altitude (avg) -0.000[0.000]
Number of schools 0.043[0.047]
Ln (total population) -0.547[0.365]
HHs living in slums (%) 0.024[0.024]
HHs with a member college-educated (%) -0.010[0.021]
Poor HHs (%) 0.007[0.010]
Primary activity: agriculture (%) -0.096[0.681]
Primary activity: industry (%) 1.401[1.101]
Primary activity: trade (%) 1.197[0.819]
Province fixed effects XObservations 110
R-squared 0.791
Notes. The table reports OLS estimates of district TV reception on district
level controls. The dependent variable is the average number of private TV
channels received in the villages within each district (measured by PODES
2006). District level controls are measured using the IFLS3 survey (2000).
Robust standard errors in square brackets: * significant at 10%, ** signifi-
cant at 5%, *** significant at 1%.
47
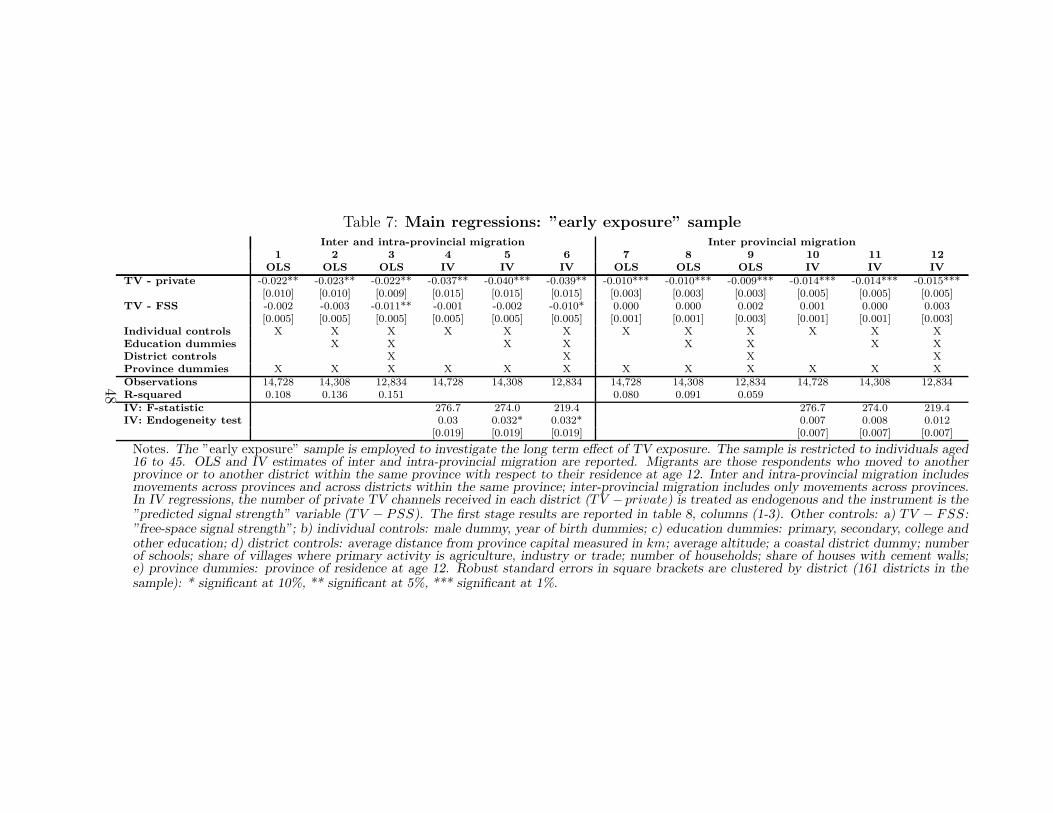
Table 7: Main regressions: ”early exposure” sampleInter and intra-provincial migration Inter provincial migration
1 2 3 4 5 6 7 8 9 10 11 12
OLS OLS OLS IV IV IV OLS OLS OLS IV IV IV
TV - private -0.022** -0.023** -0.022** -0.037** -0.040*** -0.039** -0.010*** -0.010*** -0.009*** -0.014*** -0.014*** -0.015***[0.010] [0.010] [0.009] [0.015] [0.015] [0.015] [0.003] [0.003] [0.003] [0.005] [0.005] [0.005]
TV - FSS -0.002 -0.003 -0.011** -0.001 -0.002 -0.010* 0.000 0.000 0.002 0.001 0.000 0.003[0.005] [0.005] [0.005] [0.005] [0.005] [0.005] [0.001] [0.001] [0.003] [0.001] [0.001] [0.003]
Individual controls X X X X X X X X X X X XEducation dummies X X X X X X X XDistrict controls X X X XProvince dummies X X X X X X X X X X X XObservations 14,728 14,308 12,834 14,728 14,308 12,834 14,728 14,308 12,834 14,728 14,308 12,834R-squared 0.108 0.136 0.151 0.080 0.091 0.059IV: F-statistic 276.7 274.0 219.4 276.7 274.0 219.4IV: Endogeneity test 0.03 0.032* 0.032* 0.007 0.008 0.012
[0.019] [0.019] [0.019] [0.007] [0.007] [0.007]
Notes. The ”early exposure” sample is employed to investigate the long term effect of TV exposure. The sample is restricted to individuals aged16 to 45. OLS and IV estimates of inter and intra-provincial migration are reported. Migrants are those respondents who moved to anotherprovince or to another district within the same province with respect to their residence at age 12. Inter and intra-provincial migration includesmovements across provinces and across districts within the same province; inter-provincial migration includes only movements across provinces.In IV regressions, the number of private TV channels received in each district (TV − private) is treated as endogenous and the instrument is the”predicted signal strength” variable (TV − PSS). The first stage results are reported in table 8, columns (1-3). Other controls: a) TV − FSS:”free-space signal strength”; b) individual controls: male dummy, year of birth dummies; c) education dummies: primary, secondary, college andother education; d) district controls: average distance from province capital measured in km; average altitude; a coastal district dummy; numberof schools; share of villages where primary activity is agriculture, industry or trade; number of households; share of houses with cement walls;e) province dummies: province of residence at age 12. Robust standard errors in square brackets are clustered by district (161 districts in thesample): * significant at 10%, ** significant at 5%, *** significant at 1%.
48
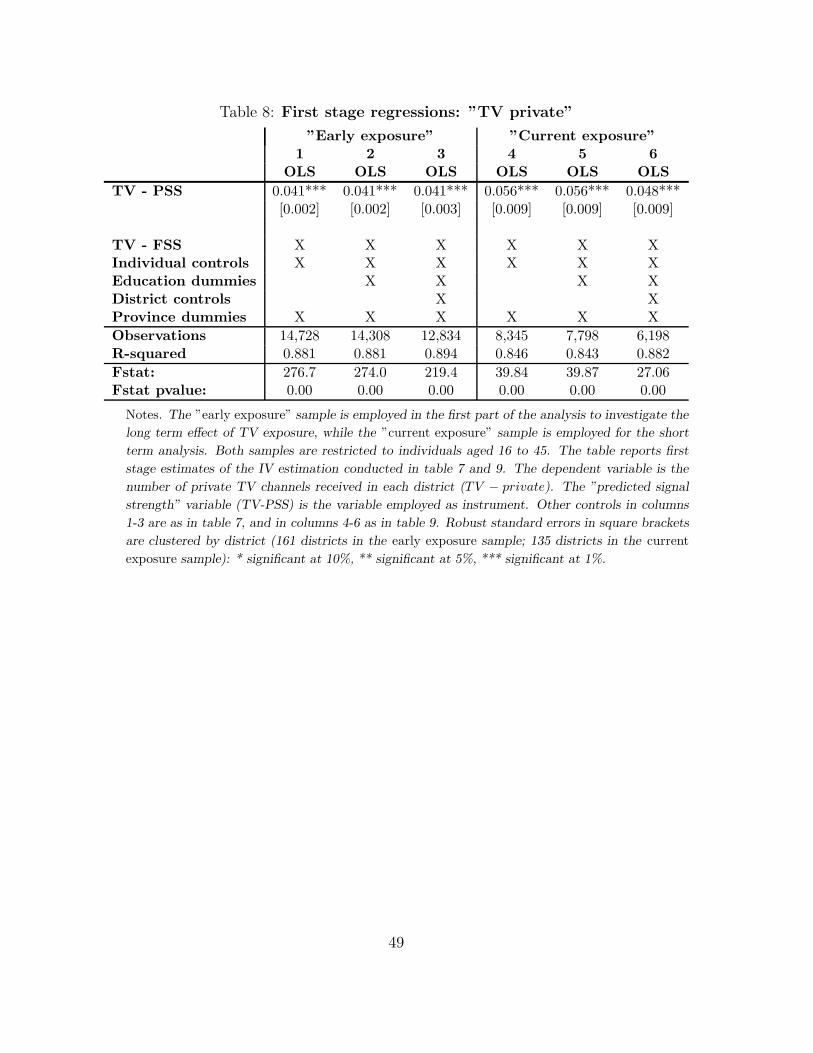
Table 8: First stage regressions: ”TV private”
”Early exposure” ”Current exposure”1 2 3 4 5 6
OLS OLS OLS OLS OLS OLS
TV - PSS 0.041*** 0.041*** 0.041*** 0.056*** 0.056*** 0.048***[0.002] [0.002] [0.003] [0.009] [0.009] [0.009]
TV - FSS X X X X X XIndividual controls X X X X X XEducation dummies X X X XDistrict controls X XProvince dummies X X X X X X
Observations 14,728 14,308 12,834 8,345 7,798 6,198R-squared 0.881 0.881 0.894 0.846 0.843 0.882
Fstat: 276.7 274.0 219.4 39.84 39.87 27.06Fstat pvalue: 0.00 0.00 0.00 0.00 0.00 0.00
Notes. The ”early exposure” sample is employed in the first part of the analysis to investigate the
long term effect of TV exposure, while the ”current exposure” sample is employed for the short
term analysis. Both samples are restricted to individuals aged 16 to 45. The table reports first
stage estimates of the IV estimation conducted in table 7 and 9. The dependent variable is the
number of private TV channels received in each district (TV − private). The ”predicted signal
strength” variable (TV-PSS) is the variable employed as instrument. Other controls in columns
1-3 are as in table 7, and in columns 4-6 as in table 9. Robust standard errors in square brackets
are clustered by district (161 districts in the early exposure sample; 135 districts in the current
exposure sample): * significant at 10%, ** significant at 5%, *** significant at 1%.
49

Table 9: Main regressions: ”current exposure” sampleInter and intra-provincial migration Inter provincial migration
1 2 3 4 5 6 7 8 9 10 11 12
OLS OLS OLS IV IV IV OLS OLS OLS IV IV IV
TV - private -0.007** -0.009*** -0.012*** -0.013** -0.014** -0.016** -0.006*** -0.007*** -0.008*** -0.005 -0.005 -0.005[0.003] [0.003] [0.003] [0.006] [0.006] [0.007] [0.002] [0.002] [0.002] [0.004] [0.004] [0.005]
TV - FSS 0.001 0.001 -0.001 0.003 0.003 0.000 0.003*** 0.003*** 0.002 0.002 0.002 0.001[0.001] [0.001] [0.002] [0.002] [0.002] [0.003] [0.001] [0.001] [0.001] [0.002] [0.002] [0.002]
Individual controls X X X X X X X X X X X XEducation dummies X X X X X X X X
District controls X X X XProvince dummies X X X X X X X X X X X X
Observations 8,345 7,798 6,198 8,345 7,798 6,198 8,345 7,798 6,198 8,345 7,798 6,198R-squared 0.180 0.182 0.176 0.106 0.108 0.108
IV: F-statistic 39.84 39.87 27.06 39.84 39.87 27.06IV: Endogeneity test 0.007 0.006 0.004 -0.002 -0.002 -0.004
[0.008] [0.008] [0.008] [0.005] [0.005] [0.006]
Notes. The ”current exposure” sample is employed to measure the short term effect of TV exposure. The sample is restricted to individualsaged 16 to 45. OLS and IV estimates of inter and intra-provincial migration are reported. Migrants are those respondents who movedto another province or to another district within the same province between 2000 and 2007-2008 (and stayed in the new residence morethan 6 months). Inter and intra-provincial migration includes movements across provinces and across districts within the same province;inter-provincial migration includes only movements across provinces. In IV regressions, the number of private TV channels received in eachdistrict (TV − private) is treated as endogenous and instrumented using the ”predicted signal strength” variable (TV − PSS). The firststage results are reported in table 8, columns (4-6). Other controls: a) TV − FSS: ”free-space signal strength”; b) individual controls:male dummy, year of birth dummies and marital status; c) education dummies: primary, secondary, college and other education; d) districtcontrols: average distance in km to the province capital; average time and economic cost of traveling to the province capital; averageelevation with respect to the sea level; number of schools; log of total population; share of households living in slums; share of householdswith at least one member that has attended university; share of poor households; share of villages within the district where main activity isagriculture, industry or trade; e) province dummies: province of residence in 2000. Robust standard errors in square brackets are clusteredby district (135 districts): * significant at 10%, ** significant at 5%, *** significant at 1%.
50
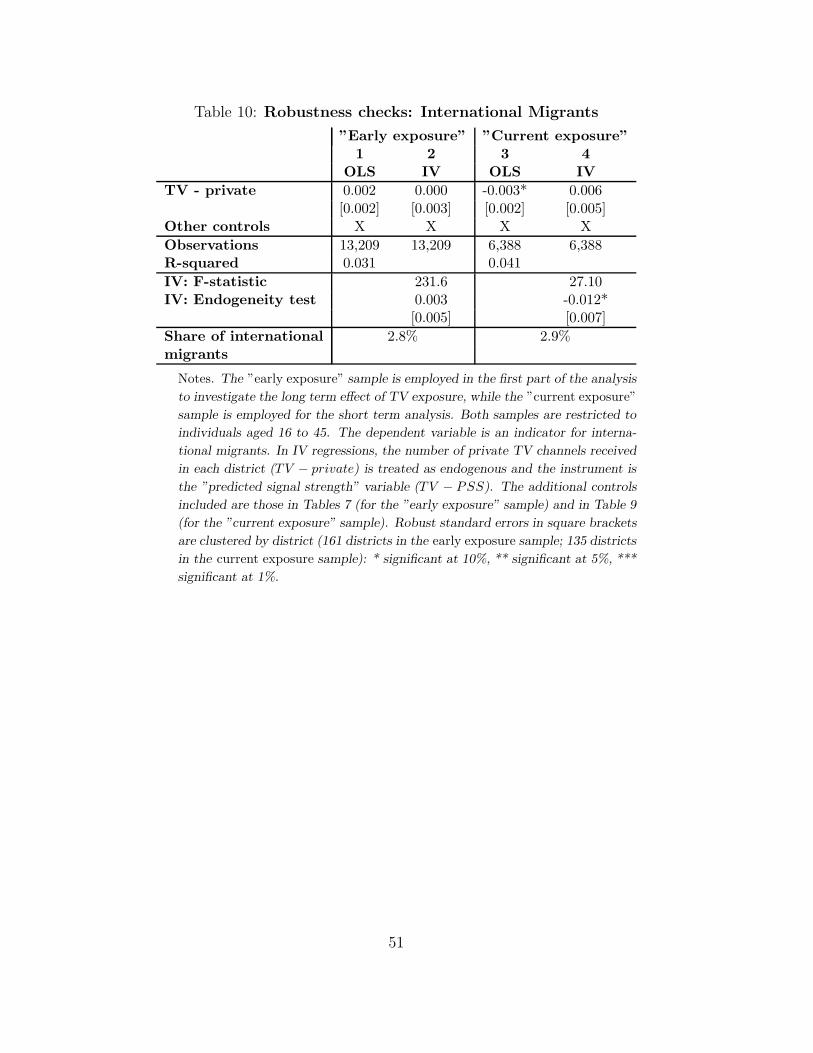
Table 10: Robustness checks: International Migrants
”Early exposure” ”Current exposure”1 2 3 4
OLS IV OLS IV
TV - private 0.002 0.000 -0.003* 0.006[0.002] [0.003] [0.002] [0.005]
Other controls X X X X
Observations 13,209 13,209 6,388 6,388R-squared 0.031 0.041
IV: F-statistic 231.6 27.10IV: Endogeneity test 0.003 -0.012*
[0.005] [0.007]
Share of international 2.8% 2.9%migrants
Notes. The ”early exposure” sample is employed in the first part of the analysis
to investigate the long term effect of TV exposure, while the ”current exposure”
sample is employed for the short term analysis. Both samples are restricted to
individuals aged 16 to 45. The dependent variable is an indicator for interna-
tional migrants. In IV regressions, the number of private TV channels received
in each district (TV − private) is treated as endogenous and the instrument is
the ”predicted signal strength” variable (TV − PSS). The additional controls
included are those in Tables 7 (for the ”early exposure” sample) and in Table 9
(for the ”current exposure” sample). Robust standard errors in square brackets
are clustered by district (161 districts in the early exposure sample; 135 districts
in the current exposure sample): * significant at 10%, ** significant at 5%, ***
significant at 1%.
51
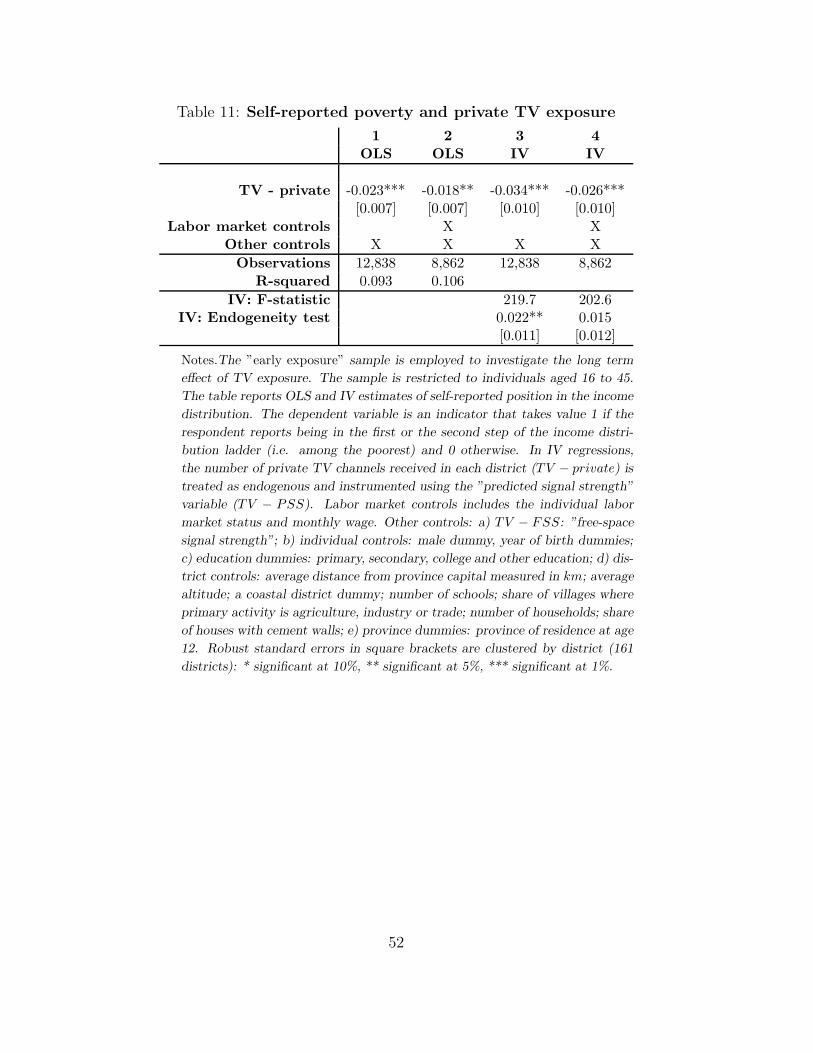
Table 11: Self-reported poverty and private TV exposure
1 2 3 4OLS OLS IV IV
TV - private -0.023*** -0.018** -0.034*** -0.026***[0.007] [0.007] [0.010] [0.010]
Labor market controls X XOther controls X X X X
Observations 12,838 8,862 12,838 8,862R-squared 0.093 0.106
IV: F-statistic 219.7 202.6IV: Endogeneity test 0.022** 0.015
[0.011] [0.012]
Notes.The ”early exposure” sample is employed to investigate the long term
effect of TV exposure. The sample is restricted to individuals aged 16 to 45.
The table reports OLS and IV estimates of self-reported position in the income
distribution. The dependent variable is an indicator that takes value 1 if the
respondent reports being in the first or the second step of the income distri-
bution ladder (i.e. among the poorest) and 0 otherwise. In IV regressions,
the number of private TV channels received in each district (TV − private) is
treated as endogenous and instrumented using the ”predicted signal strength”
variable (TV − PSS). Labor market controls includes the individual labor
market status and monthly wage. Other controls: a) TV − FSS: ”free-space
signal strength”; b) individual controls: male dummy, year of birth dummies;
c) education dummies: primary, secondary, college and other education; d) dis-
trict controls: average distance from province capital measured in km; average
altitude; a coastal district dummy; number of schools; share of villages where
primary activity is agriculture, industry or trade; number of households; share
of houses with cement walls; e) province dummies: province of residence at age
12. Robust standard errors in square brackets are clustered by district (161
districts): * significant at 10%, ** significant at 5%, *** significant at 1%.
52
Appendix A - Data Appendix
To analyze the long term impact of TV we match individuals with the degree of TV receptionin the district of residence where they lived as adolescents. The main challenge with measuringearly TV exposure is that information on TV reception is only available from the PODES 2006and that there are no available records on how TV reception evolved over time in differentareas. Therefore, we need to make a few assumptions to reconstruct the development of TVreception.
In Indonesia, the television sector was gradually liberalized from the late 1980s onwards, andwe know in which year each channel was founded and started broadcasting (table 5). Therefore,for each district and each channel, we set TV reception of private channels equal to zero untilthe year when they started broadcasting and then we assume that it increased linearly fromzero up to the level seized in 2006 by the PODES survey. Similarly, given that the public TVchannel (TVRI) started broadcasting at the national level through the satellite in 1976, wecompute the linear interpolation between a zero value in 1975 up to the 2006 level measured bythe PODES. In this way we obtain, for each year and district, the average number of channelswhich was possible to receive with clear signal. Using this information, we construct two mainmeasures: one only for private channels (TV − private) and one which also includes the publicnetwork (TV − all). We then match each individual with our measure of TV reception in thedistrict of residence at age 12 and average it over the six years when the individual was aged10-16.35 In this way, individuals who were residing in the same district as adolescents will havea different TV exposure only if they were born in different years. In particular, individualswho were aged 10-16 before the first private network was created (1987) had zero exposure toprivate TV channels, while younger cohorts will have a higher level of ”early exposure” thanolder cohorts from the same district of origin. In this way, we not only exploit the cross-sectionalvariation in signal reception due to geography, but also the time variation that is due to thenatural experiment related to the TV liberalization process.
In analyzing the long term effect of TV exposure, we identify as internal migrants thoserespondents whose current residence in 2007-2008 - or current residence recorded in any of theprevious waves of the survey - is different from that at age 12.36 The dependent variable in ouranalysis is then an indicator variable that takes value one if the respondent, at a certain pointin life, moved out from the area where she was living when she was 12 years old.37 We thendefine two variables: one that includes both inter and intra-provincial migrations and one onlyfor inter-provincial movements. The first category includes individuals who changed district ofresidence with respect to age 12 (either moving within the same province or to a different one),while the second one includes only those who moved across provinces.
To investigate the short run effects of media exposure we match individuals with reception
35Experimenting with different age ranges for the ”early exposure” does not significantly change our results.36For less than two percent of the respondents in our sample, the residence at age 12 is missing while the
information on the residence at birth is recorded. For this subset of individuals we imputed the residence atage 12 equal to that at birth. In unreported regressions, we drop these observations from the sample: resultsremain unchanged.
37Note that our measure of internal migrant also includes return migrants, that is, those who changed residencethroughout the waves but then returned to the ”original” one.
53

in the district of residence in 2000 and investigate its impact on migration decisions that oc-curred between 2000 and 2007-2008. As discussed above, TV reception is only available fromthe PODES 2006. Given that in this part of the analysis we only exploit the cross-sectionalvariation, we assume that the geographical distribution of TV reception in 2000 is the sameas in 2006. As before we analyzes migration at the inter and intra-provincial level. In thiscase, respondents are identified as internal migrants if they changed district and/or province ofresidence between 2000 and 2007-2008 (and stayed in the new residence for at least six months).
Appendix B - Tables
54
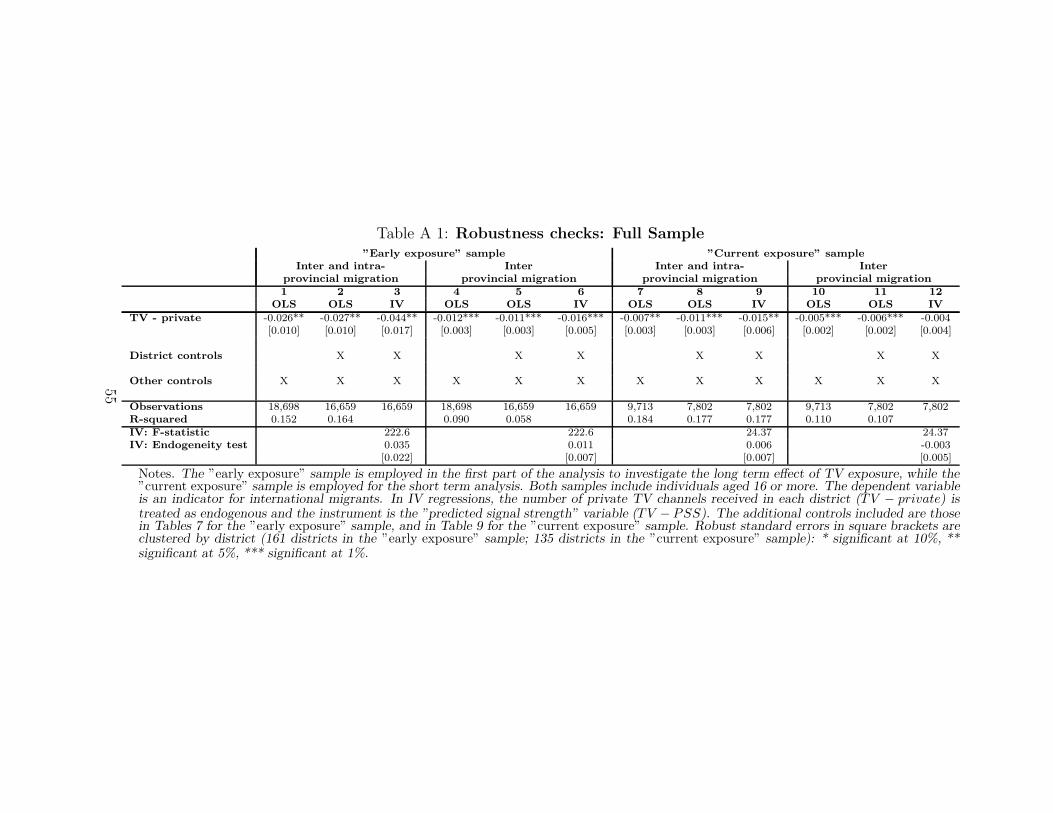
Table A 1: Robustness checks: Full Sample”Early exposure” sample ”Current exposure” sample
Inter and intra- Inter Inter and intra- Inter
provincial migration provincial migration provincial migration provincial migration
1 2 3 4 5 6 7 8 9 10 11 12
OLS OLS IV OLS OLS IV OLS OLS IV OLS OLS IV
TV - private -0.026** -0.027** -0.044** -0.012*** -0.011*** -0.016*** -0.007** -0.011*** -0.015** -0.005*** -0.006*** -0.004[0.010] [0.010] [0.017] [0.003] [0.003] [0.005] [0.003] [0.003] [0.006] [0.002] [0.002] [0.004]
District controls X X X X X X X X
Other controls X X X X X X X X X X X X
Observations 18,698 16,659 16,659 18,698 16,659 16,659 9,713 7,802 7,802 9,713 7,802 7,802R-squared 0.152 0.164 0.090 0.058 0.184 0.177 0.177 0.110 0.107IV: F-statistic 222.6 222.6 24.37 24.37IV: Endogeneity test 0.035 0.011 0.006 -0.003
[0.022] [0.007] [0.007] [0.005]
Notes. The ”early exposure” sample is employed in the first part of the analysis to investigate the long term effect of TV exposure, while the”current exposure” sample is employed for the short term analysis. Both samples include individuals aged 16 or more. The dependent variableis an indicator for international migrants. In IV regressions, the number of private TV channels received in each district (TV − private) istreated as endogenous and the instrument is the ”predicted signal strength” variable (TV − PSS). The additional controls included are thosein Tables 7 for the ”early exposure” sample, and in Table 9 for the ”current exposure” sample. Robust standard errors in square brackets areclustered by district (161 districts in the ”early exposure” sample; 135 districts in the ”current exposure” sample): * significant at 10%, **significant at 5%, *** significant at 1%.
55
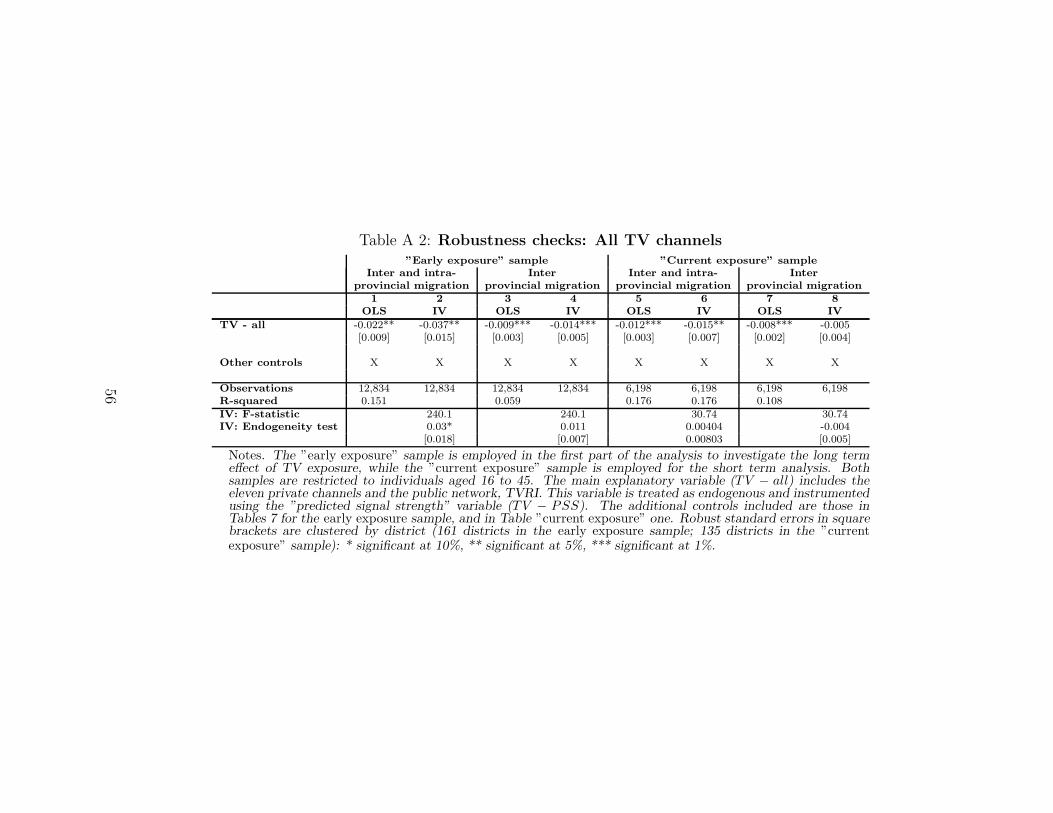
Table A 2: Robustness checks: All TV channels”Early exposure” sample ”Current exposure” sample
Inter and intra- Inter Inter and intra- Inter
provincial migration provincial migration provincial migration provincial migration
1 2 3 4 5 6 7 8
OLS IV OLS IV OLS IV OLS IV
TV - all -0.022** -0.037** -0.009*** -0.014*** -0.012*** -0.015** -0.008*** -0.005[0.009] [0.015] [0.003] [0.005] [0.003] [0.007] [0.002] [0.004]
Other controls X X X X X X X X
Observations 12,834 12,834 12,834 12,834 6,198 6,198 6,198 6,198R-squared 0.151 0.059 0.176 0.176 0.108IV: F-statistic 240.1 240.1 30.74 30.74IV: Endogeneity test 0.03* 0.011 0.00404 -0.004
[0.018] [0.007] 0.00803 [0.005]
Notes. The ”early exposure” sample is employed in the first part of the analysis to investigate the long termeffect of TV exposure, while the ”current exposure” sample is employed for the short term analysis. Bothsamples are restricted to individuals aged 16 to 45. The main explanatory variable (TV − all) includes theeleven private channels and the public network, TVRI. This variable is treated as endogenous and instrumentedusing the ”predicted signal strength” variable (TV − PSS). The additional controls included are those inTables 7 for the early exposure sample, and in Table ”current exposure” one. Robust standard errors in squarebrackets are clustered by district (161 districts in the early exposure sample; 135 districts in the ”currentexposure” sample): * significant at 10%, ** significant at 5%, *** significant at 1%.
56
Related Documents