Old Trade, New Tricks: Insights into the Spontaneous
Mutation Process from the Partnering of Classical Mutation
Accumulation Experiments with High-Throughput Genomic
Approaches
Vaishali Katju* and Ulfar Bergthorsson
Department of Veterinary Integrative Biosciences, College of Veterinary Medicine and Biomedical Sciences, Texas A&M University, College Station,
TX 77843-4458.
*Corresponding author: E-mail: [email protected].
Accepted: November 22, 2018
Abstract
Mutations spawngenetic variationwhich, in turn, fuels evolution.Hence, experimental investigations into the rateandfitness effects
of spontaneous mutations are central to the study of evolution. Mutation accumulation (MA) experiments have served as a corner-
stone for furthering our understanding of spontaneous mutations for four decades. In the pregenomic era, phenotypic measure-
ments of fitness-related traits in MA lines were used to indirectly estimate key mutational parameters, such as the genomic mutation
rate, new mutational variance per generation, and the average fitness effect of mutations. Rapidly emerging next-generating
sequencing technology has supplanted this phenotype-dependent approach, enabling direct empirical estimates of the mutation
rate and a more nuanced understanding of the relative contributions of different classes of mutations to the standing genetic
variation. Whole-genome sequencing of MA lines bears immense potential to provide a unified account of the evolutionary process
at multiple levels—the genetic basis of variation, and the evolutionary dynamics of mutations under the forces of selection and drift.
In this review, we have attempted to synthesize key insights into the spontaneous mutation process that are rapidly emerging from
the partnering of classical MA experiments with high-throughput sequencing, with particular emphasis on the spontaneous rates
and molecular properties of different mutational classes in nuclear and mitochondrial genomes of diverse taxa, the contribution of
mutations to the evolution of gene expression, and the rate and stability of transgenerational epigenetic modifications. Future
advances in sequencing technologies will enable greater species representation to further refine our understanding of mutational
parameters and their functional consequences.
Key words: effective population size, genetic drift, mutation rate, mutation accumulation, next-generation sequencing,
whole-genome sequencing, RNA-Seq.
Introduction
Darwin’s theory of evolution by natural selection is inextrica-
bly dependent on the presence of heritable variation among
individuals within a population. For evolutionary change to
occur, there must exist genetic variation that enables the
spread of one genotype in lieu of another genotype via the
action of major evolutionary forces, such as natural selection
or random genetic drift. Indeed, this relationship is embodied
in Fisher’s fundamental theorem of natural selection (Fisher
1930) which mathematically demonstrates a correlation be-
tween the amount of genetic variation in a population and
the rate of evolutionary change by natural selection.
Mutation, as the evolutionary force that induces this genetic
variation, therefore occupies a central place in evolutionary
biology. However, the majority of spontaneous mutations
have detrimental effects on organismal fitness (Muller
1950). The rate and fitness effects of new mutations impinge
on a multitude of evolutionary and biological phenomena,
including but not limited to the maintenance of genetic var-
iation (Lynch and Walsh 1998; Charlesworth and Hughes
1999), the contribution to quantitative trait variation
(Caballero and Keightley 1994; Azevedo et al. 2002), the
evolution of sex, mating systems and recombination
(Pamilo et al. 1987; Kondrashov 1988; Charlesworth 1990;
� The Author(s) 2018. Published by Oxford University Press on behalf of the Society for Molecular Biology and Evolution.
This isanOpenAccessarticledistributedunderthetermsoftheCreativeCommonsAttributionNon-CommercialLicense(http://creativecommons.org/licenses/by-nc/4.0/),whichpermitsnon-
commercial re-use, distribution, and reproduction in any medium, provided the original work is properly cited. For commercial re-use, please contact [email protected]
136 Genome Biol. Evol. 11(1):136–165. doi:10.1093/gbe/evy252 Advance Access publication November 26, 2018
GBED
ownloaded from
https://academic.oup.com
/gbe/article/11/1/136/5209700 by guest on 13 January 2022
Peck et al. 1997; Otto and Michalakis 1998; Neiman et al.
2010), inbreeding depression (Charlesworth D and
Charlesworth B 1987; Charlesworth et al. 1990; Deng and
Lynch 1996), the evolution of senescence (Hamilton 1966;
Partridge and Barton 1993; Charlesworth and Hughes 1996),
the persistence of gene duplicates (Li 1980; Walsh 1995;
Force et al. 1999), and the evolution of ploidy level
(Kondrashov and Crow 1991; Perrot et al. 1991). Lastly,
there has been much interest in the consequences of spon-
taneous mutations for the maintenance of numerous threat-
ened populations of plants and animals at small population
sizes (Lynch and Gabriel 1990; Gabriel et al. 1993; Lande
1994; Lynch et al. 1995a, 1995b; Katju et al. 2018).
Given the centrality of mutations in genetics and evolution,
significant effort has been expended in gaining insights into
the rate and molecular properties of newly originating muta-
tions. The evolutionary fate of mutations in a population
depends on the rate at which they originate as well as the
combined action of evolutionary forces, such as natural selec-
tion and genetic drift (Kimura 1983; Ohta 1992; Yampolsky
and Stoltzfus 2001; Charlesworth 2009; Halligan and
Keightley 2009). A key challenge in mutation research is ow-
ing to a paradox regarding the nature of mutations. While
mutational variation is requisite for adaptive evolution, the
vast majority of mutations leading to a change in phenotype
usually have detrimental or deleterious effects on the fitness
of the carrier (Keightley and Eyre-Walker 1999; Drake 2006).
Hence, wild or natural populations under intense selection
offer extremely limited opportunities to conduct a compre-
hensive analysis of newly originating mutations given that the
majority are rapidly eradicated via selection in a short evolu-
tionary period. Mutation accumulation (MA hereafter) experi-
ments, theoretically considered by Muller in the 1920s (1928)
but experimentally pioneered by Mukai and Ohnishi (Mukai
1964; Mukai et al. 1972; Ohnishi 1977a, 1977b, 1977c), have
served as an exemplar approach to estimate key mutational
parameters from phenotypic data in the pregenomic era. The
underlying principle behind MA experiments is straightfor-
ward: Multiple replicate lines derived from an inbred ancestral
stock population are allowed to evolve independently of one
another under conditions of extreme bottlenecking each gen-
eration. In species where selfing is the primary mode of re-
production (e.g., Saccharomyces cerevisiae, Chlamydomonas
reinhardtii, Caenorhabditis elegans and Caenorhabditis brigg-
sae, Daphnia, and Arabidopsis), Ne is kept constant at one
individual per generation. For obligate outcrossing species
such as Drosophila, each new generation has a sibling mating
pair as the founders. This regime of selfing or inbreeding
dictates that newly arising mutations, if not lost via drift,
are rapidly driven to homozygosity in diploid species. In
microbial systems, single-cell bottlenecks can be created
via restreaking of colonies (Andersson and Hughes 1996;
Kibota and Lynch 1996) or single cell dilution (Krasovec
et al. 2016). The repeated bottlenecks severely diminish
the efficacy of natural selection, promoting evolutionary
divergence due to the accumulation of mutations by ran-
dom genetic drift (fig. 1). Where possible, excess individ-
uals descended from the same ancestral genotype/line as
the experimental lines are cryopreserved in a presumably
inert, unevolving state for subsequent phenotypic or mo-
lecular comparisons with experimental lines subjected to
multiple MA generations. Hence, MA studies circumvent
the challenges of studying mutations in natural popula-
tions where strong selection may purge the very muta-
tional variants of interest.
Under the assumption that the majority of newly occurring
mutations have deleterious fitness effects, an expected signa-
ture of MA studies is an average fitness decline of the exper-
imental lines and an increase in among-line variance with
additional generations of bottlenecking. As the vast majority
of mutations occur and become fixed/lost spontaneously un-
der the experimental regime of MA studies, they represent an
ideal and relatively unbiased sample set for investigating the
rates, fitness effects, and other properties of spontaneous
mutations. The fitness effect of a mutation can range contin-
uously from lethal to deleterious to neutral to beneficial. Loss
or fixation of mutations and their consequences for popula-
tion fitness depend upon the selection coefficients (s) associ-
ated with individual mutations and the effective population
size, Ne. For sexually reproducing diploids, the dynamics of
mutations with jsj � 1/2Ne and jsj � 1/2Ne are dictated by
drift and selection, respectively (Kimura 1962, 1983).
Similarly, for haploid species, the dynamics of mutations
with jsj � 1/Ne and jsj � 1/Ne are dictated by drift and
selection, respectively. Deleterious mutations with extremely
large effects are unlikely to pose a long-term threat to popu-
lation fitness as they are rapidly eradicated via selection and
unlikely to reach fixation; those with extremely small or no
effects would be effectively neutral. Although the long-term
consequence of a mutation is dependent on the effective size
of a population, the prevailing opinion is that the most detri-
mental class of mutations influencing long-term population
fitness includes mutations with intermediate selection coeffi-
cients (Ohta 1992). Such mutations would be eradicated via
purifying selection at high Ne, but can behave in an effectively
neutral manner and reach fixation by genetic drift under low
Ne conditions although they may not be neutral with respect
to absolute fitness (Lynch et al. 1999). Therefore, small pop-
ulations subjected to attenuated selection and an increased
magnitude of genetic drift can potentially accumulate muta-
tions with extremely large effects in addition to ones with
moderate to very slight effects. It should be mentioned that
while the majority of MA experiments display a pattern of
average fitness decline, it is not universally observed as
some experimental lines may maintain ancestral fitness levels
despite an extended MA regime (Hall et al. 2013; Dillon and
Cooper 2016; Krasovec et al. 2017). A lack of fitness decline
could be owing to the stochastic accumulation of mutations
Mutation Accumulation Meets Genomics GBE
Genome Biol. Evol. 11(1):136–165 doi:10.1093/gbe/evy252 Advance Access publication November 26, 2018 137
Dow
nloaded from https://academ
ic.oup.com/gbe/article/11/1/136/5209700 by guest on 13 January 2022
in some lines but not others, a load of neutral to near-neutral
mutations with minimal contribution to phenotypic evolution,
or the choice of a trait lacking a substantial fitness component
in the benign MA experimental conditions.
Since the initial experiments of Mukai and Ohnishi, many
MA studies (both spontaneous and mutagen-induced) have
been conducted in a diverse set of organisms, from viruses to
multicellular eukaryotes (reviewed by Halligan and Keightley
2009). In a period spanning approximately three decades
(mid-1960s to late 1990s), most of our insights into the basic
fundamental properties of new genetic variation stemming
from spontaneous mutations have been gleaned from phe-
notypic analyses of these time- and labor-intensive MA experi-
ments. The MA experiments from this period provided
indirect estimates of key mutational parameters for life-
history or quantitative traits, such as the haploid genome-
wide mutation rate per generation (U), the average selection
coefficient of mutations [E(a)], the degree of dominance of
new mutations, the nature of epistatic interactions between
mutations, and their environmental context-dependence,
among others (see Halligan and Keightley 2009). For example,
phenotypic estimates of U in eukaryotes ranged widely
(>700-fold) from 0.00065 to 0.47 per genome per genera-
tion, likely reflecting differences in experimental conditions
and the nature of the fitness-trait measured (Mukai 1964;
Mukai et al. 1972; Houle et al. 1992; Keightley and
Caballero 1997; Garc�ıa-Dorado et al. 1998; Fry et al. 1999;
Vassilieva et al. 2000; �Avila and Garcia-Dorado 2002;
Charlesworth et al. 2004; Joseph and Hall 2004; Baer et al.
2005; Schoen 2005). Another intriguing result from pheno-
typic analyses of MA studies is that assays under competitive
or stress conditions tend to yield higher estimates of U (Fry
et al. 1999; Gong et al. 2005) relative to benign assays sug-
gesting that phenotypic data from MA studies under benign
conditions can detect causal mutations only if they are of
moderate to large effects. If phenotypic assays consistently
underestimate U relative to direct molecular approaches,
this points to the possibility of a large fraction of cryptic
new mutations with very mild deleterious effects on fitness
or some unknown fraction of mutations that behave neutrally
under benign conditions but may be deleterious in the wild.
Together, this vast range in values of U from phenotypic
assays of MA lines and discrepancies in U estimates from be-
nign versus competitive phenotypic assays underscores the
idea that our ability to infer U is limited by experimental res-
olution and simplifying assumptions implicit in the analytical
approach (e.g., equal fitness effects of new mutations).
The advent of the genomic revolution since the late 1990s
has led to a burgeoning of studies directly employing whole-
genome sequencing (WGS) technology to directly estimate
the mutation rate in MA lines of diverse species. Direct
WGS approaches, currently utilizing next- or second-
generation (Illumina/Solexa, 454 Pyrosequencing, SOLiD/
Applied Biosystems, Ion Torrent) and third-generation
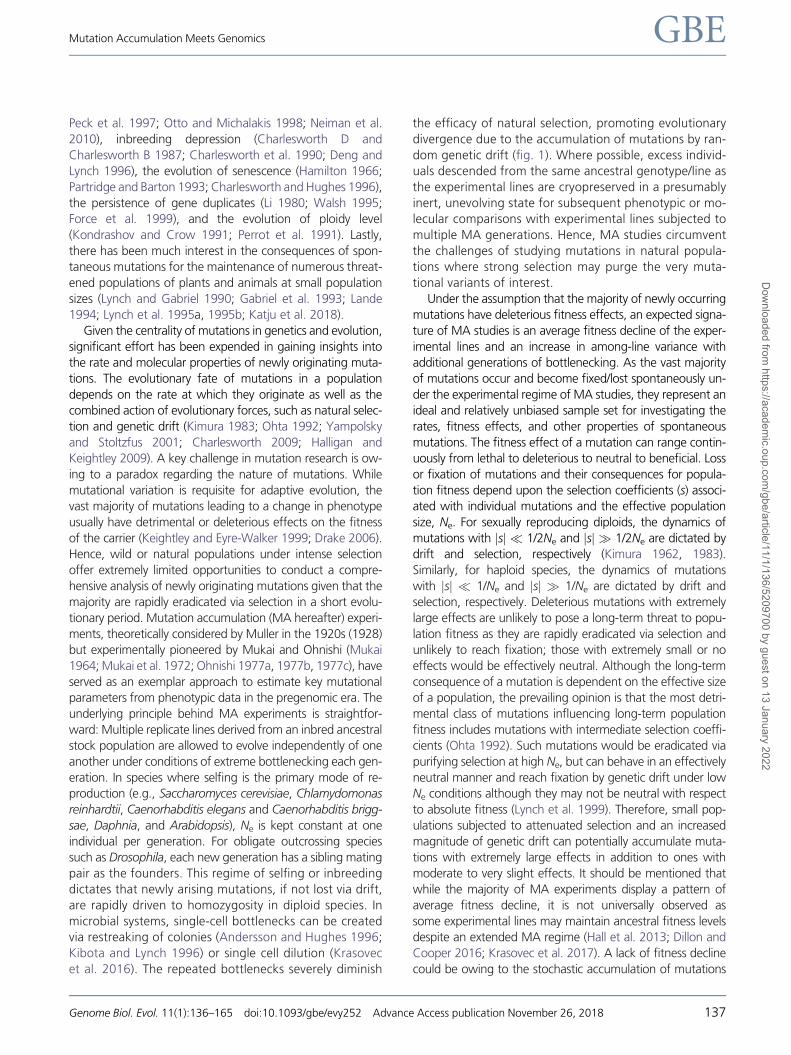
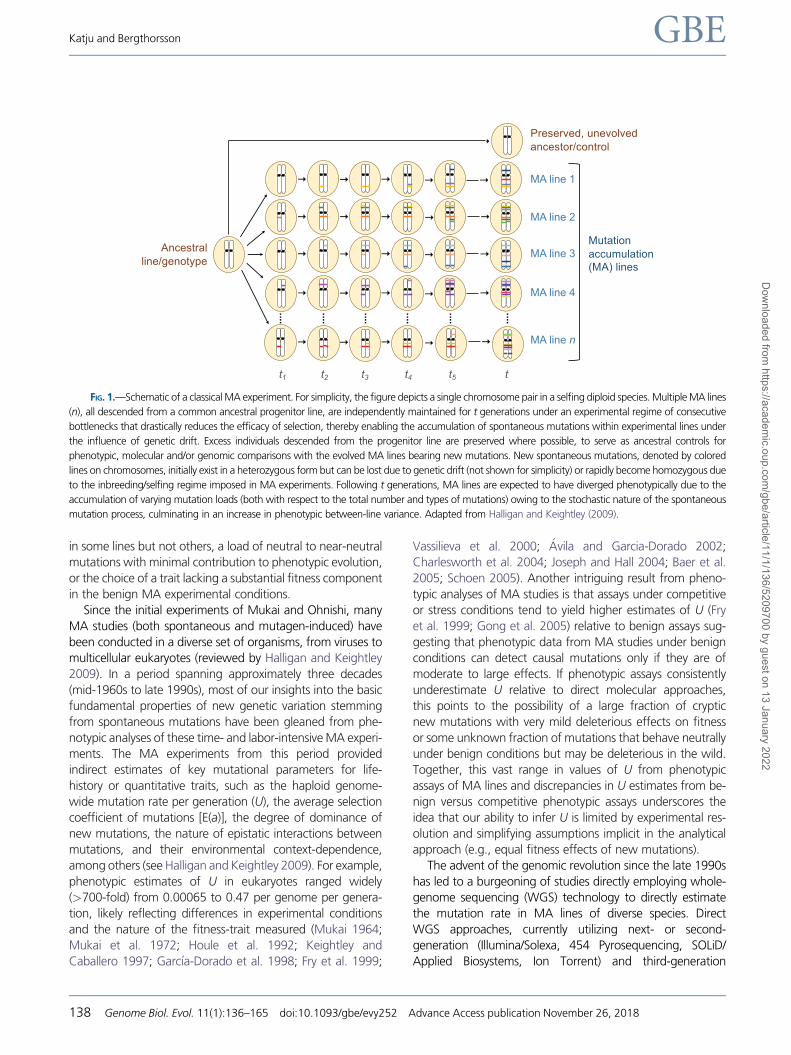
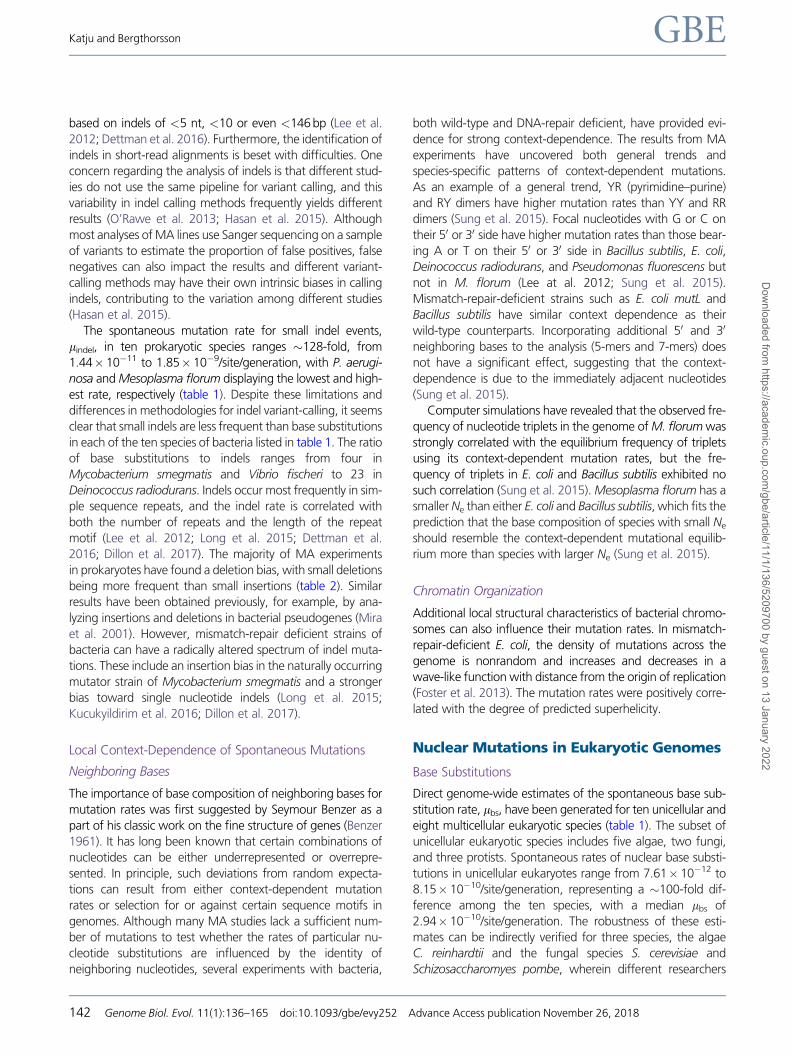
FIG. 1.—Schematic of a classical MA experiment. For simplicity, the figure depicts a single chromosome pair in a selfing diploid species. Multiple MA lines
(n), all descended from a common ancestral progenitor line, are independently maintained for t generations under an experimental regime of consecutive
bottlenecks that drastically reduces the efficacy of selection, thereby enabling the accumulation of spontaneous mutations within experimental lines under
the influence of genetic drift. Excess individuals descended from the progenitor line are preserved where possible, to serve as ancestral controls for
phenotypic, molecular and/or genomic comparisons with the evolved MA lines bearing new mutations. New spontaneous mutations, denoted by colored
lines on chromosomes, initially exist in a heterozygous form but can be lost due to genetic drift (not shown for simplicity) or rapidly become homozygous due
to the inbreeding/selfing regime imposed in MA experiments. Following t generations, MA lines are expected to have diverged phenotypically due to the
accumulation of varying mutation loads (both with respect to the total number and types of mutations) owing to the stochastic nature of the spontaneous
mutation process, culminating in an increase in phenotypic between-line variance. Adapted from Halligan and Keightley (2009).
Katju and Bergthorsson GBE
138 Genome Biol. Evol. 11(1):136–165 doi:10.1093/gbe/evy252 Advance Access publication November 26, 2018
Dow
nloaded from https://academ
ic.oup.com/gbe/article/11/1/136/5209700 by guest on 13 January 2022
sequencing technologies (PacBio), offer both short (25–
200 bp) and long (up to 10 kb) DNA sequences (reads) that
are generated using a massively parallel, automated ap-
proach. Short reads of the genomes of MA lines (MA-WGS,
henceforth) and the ancestral control are then assembled us-
ing a published reference genome. MA-WGS approaches of-
fer considerable advantages in furthering our understanding
of the spontaneous mutation process. First, they yield a direct
empirical estimate of the genome-wide spontaneous muta-
tion rate inclusive of 1) mutations leading to phenotypic
changes, 2) previously undetected cryptic neutral or nearly
neutral mutations with no discernible effect on phenotype,
and 3) cryptic deleterious mutations with no fitness effects
under benign laboratory conditions while engendering phe-
notypic effects under wild or stringent conditions. A second
important consideration is that MA-WGS studies enable direct
estimation of the spontaneous mutation rates of different
classes of mutations, such as base substitutions, short inser-
tion and deletion events, inversions, and copy-number
changes. Third, MA-WGS approaches enable estimation of
mutation rates in nuclear versus organellar genomes (mito-
chondrial, chloroplast) of eukaryotic species. Fourth, MA-
WGS permits more nuanced investigations into the heteroge-
neity of rates and properties of spontaneous mutations occur-
ring in 1) different genomic regions (interchromosomal, and
intrachromosomal regions such as arms, cores, and tips), 2)
genomic regions that may be under differing selective con-
straints such as exonic regions under more stringent selection
versus intergenic and intron regions that may evolve in a more
neutral fashion overall, and 3) differential mutability and se-
lective constraints at specific sites within exonic, intronic, and
intergenic regions. Lastly, high-throughput RNA-sequencing
technology has the potential to usher in the first genome-
wide insights into the transcriptional and functional conse-
quences of different mutational classes, in conjunction with
the role of environmental conditions and differing develop-
mental stages in dictating the realized phenotype.
There have been several excellent reviews of MA experi-
ments and their evolutionary implications (Garc�ıa-Dorado
et al. 1999; Keightley and Eyre-Walker 1999; Lynch et al.
1999; Halligan and Keightley 2009) based on phenotypic
measurements of MA lines. However, the last decade has
seen a rapid emergence of studies partnering classical MA
experiments with modern next-generation sequencing tech-
nology to generate direct molecular estimates of the sponta-
neous mutation rates pertaining to different classes of
mutations and in different genomic regions with initial forays
into the use of transcriptomics to investigate the effects of
mutation on gene expression divergence. In this review, we
summarize the findings of these MA-WGS studies and discuss
their influence on our current understanding of the sponta-
neous mutation process in diverse organisms. We have largely
limited our discussion to spontaneous MA experiments using
high-throughput genomic approaches, but have included
earlier genome-wide studies of MA lines using Sanger se-
quencing approaches where relevant. We have reviewed
and synthesized the results of spontaneous MA-WGS studies
to compare spontaneous mutation rates and the spectrum of
mutations across prokaryotes, unicellular eukaryotes, and
multicellular eukaryotes to determine both taxa-specific and
broadly shared features across these diverse organisms. We
additionally review in detail the mutation process in one
organellar genome, namely the mitochondrial DNA
(mtDNA) of eukaryotes. Our analysis further delves into the
comparison of phenotypic versus direct molecular estimates
of the genomic mutation rate U and offers explanations for
the observed discrepancy that exists between the two esti-
mates. The evolution of mutation rates as a function of ge-
nome size and effective population size (Ne) is further
explored though a thorough treatment of the subject is pro-
vided in preceding reviews (Baer et al. 2007; Lynch 2010a;
Lynch et al. 2016). Lastly, we provide the first comprehensive
review of transcriptional and epigenetic changes due to mu-
tation, as gleaned from MA-WGS studies.
Mutational Landscape in ProkaryoticGenomes
MA experiments in prokaryotes typically involve picking and
streaking colonies on agar. Each time a colony is restreaked,
the population of cells in the colony is passed through a bot-
tleneck of a single cell. After 20–30 generations, the number
of cells per colony can be in the range of 106–109 but the Ne
remains small because of the repeated single-cell bottlenecks,
or roughly half the number of generations of growth in the
colony. Experiments in Salmonella typhimurium and
Escherichia coli showed that there is an average decrease in
growth rates associated with repeated single-cell bottlenecks
and a divergence in growth rates between lines, both hall-
marks of MA (Andersson and Hughes 1996; Kibota and Lynch
1996). Furthermore, multiple lines of evidence suggest that
selection is negligible in MA studies of prokaryotes, and that
the rates and patterns of mutations in prokaryotic genomes
have not been biased by selection during repeated colony
restreaking.
Spontaneous Rates of Base Substitutions
In prokaryotes, the spontaneous rate of base substitution, lbs,
ranges�300-fold, from 7.9� 10�11 to 2.34� 10�8/site/gen-
eration (table 1) with a median rate of 3.28� 10�10.
Although the sample size is still fairly limited, the species
that have been analyzed thus far range broadly in genome
size, number of chromosomes and GþC-content. These in-
clude Mesoplasma florum with a genome size of only 780 kb
and a GþC-content of 27%, Mycobacterium smegmatis with
a genome size of 7 Mb and GþC-content of 67%,
Burkholderia cenocepacia with a genome size of 8 Mb and
Mutation Accumulation Meets Genomics GBE
Genome Biol. Evol. 11(1):136–165 doi:10.1093/gbe/evy252 Advance Access publication November 26, 2018 139
Dow
nloaded from https://academ
ic.oup.com/gbe/article/11/1/136/5209700 by guest on 13 January 2022
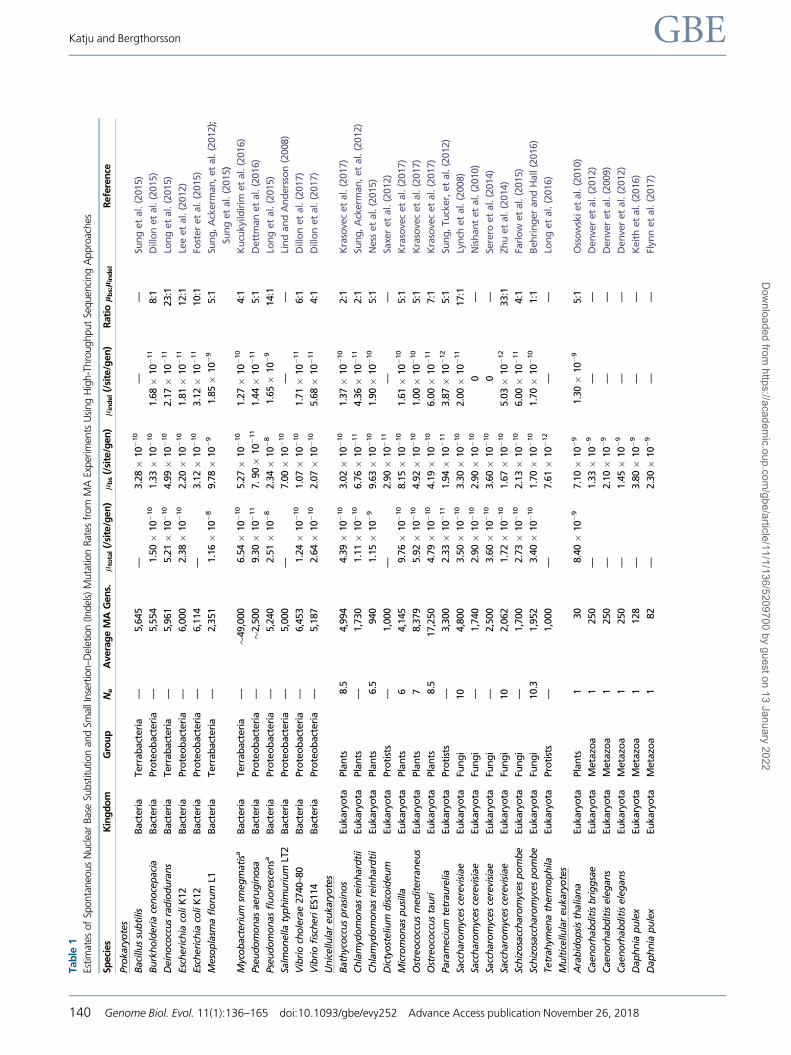
Tab
le1
Estim
ates
of
Sponta
neo
us
Nucl
ear
Bas
eSu
bst
itution
and
Smal
lInse
rtio
n–D
elet
ion
(Indel
s)M
uta
tion
Rat
esfr
om
MA
Exper
imen
tsU
sing
Hig
h-T
hro
ughput
Sequen
cing
Appro
aches
Sp
eci
es
Kin
gd
om
Gro
up
Ne
Avera
ge
MA
Gen
s.l
tota
l(/
site
/gen
)l b
s(/
site
/gen
)l i
nd
el(/
site
/gen
)R
ati
ol
bs:l
ind
el
Refe
ren
ce
Pro
kary
ote
s
Baci
llus
sub
tilis
Bact
eri
aTerr
ab
act
eri
a—
5,6
45
—3.2
8�
10�
10
——
Sun
get
al.
(2015)
Bu
rkh
old
eri
ace
no
cep
aci
aB
act
eri
aPro
teo
bact
eri
a—
5,5
54
1.5
0�
10�
10
1.3
3�
10�
10
1.6
8�
10�
11
8:1
Dill
on
et
al.
(2015)
Dein
oco
ccu
sra
dio
du
ran
sB
act
eri
aTerr
ab
act
eri
a—
5,9
61
5.2
1�
10�
10
4.9
9�
10�
10
2.1
7�
10�
11
23:1
Lon
get
al.
(2015)
Esc
heri
chia
coli
K12
Bact
eri
aPro
teo
bact
eri
a—
6,0
00
2.3
8�
10�
10
2.2
0�
10�
10
1.8
1�
10�
11
12:1
Lee
et
al.
(2012)
Esc
heri
chia
coli
K12
Bact
eri
aPro
teo
bact
eri
a—
6,1
14
—3.1
2�
10�
10
3.1
2�
10�
11
10:1
Fost
er
et
al.
(2015)
Meso
pla
sma
flo
rum
L1B
act
eri
aTerr
ab
act
eri
a—
2,3
51
1.1
6�
10�
89.7
8�
10�
91.8
5�
10�
95:1
Sun
g,
Ack
erm
an
,et
al.
(2012);
Sun
get
al.
(2015)
Myc
ob
act
eri
um
smeg
mati
saB
act
eri
aTerr
ab
act
eri
a—
�49,0
00
6.5
4�
10�
10
5.2
7�
10�
10
1.2
7�
10�
10
4:1
Ku
cukyi
ldir
imet
al.
(2016)
Pse
ud
om
on
as
aeru
gin
osa
Bact
eri
aPro
teo
bact
eri
a—
�2,5
00
9.3
0�
10�
11
7.
90�
10�
11
1.4
4�
10�
11
5:1
Dett
man
et
al.
(2016)
Pse
ud
om
on
as
flu
ore
scen
saB
act
eri
aPro
teo
bact
eri
a—
5,2
40
2.5
1�
10�
82.3
4�
10�
81.6
5�
10�
914:1
Lon
get
al.
(2015)
Salm
on
ella
typ
him
uri
um
LT2
Bact
eri
aPro
teo
bact
eri
a—
5,0
00
—7.0
0�
10�
10
——
Lin
dan
dA
nd
ers
son
(2008)
Vib
rio
cho
lera
e2740–8
0B
act
eri
aPro
teo
bact
eri
a—
6,4
53
1.2
4�
10�
10
1.0
7�
10�
10
1.7
1�
10�
11
6:1
Dill
on
et
al.
(2017)
Vib
rio
fisc
heri
ES1
14
Bact
eri
aPro
teo
bact
eri
a—
5,1
87
2.6
4�
10�
10
2.0
7�
10�
10
5.6
8�
10�
11
4:1
Dill
on
et
al.
(2017)
Un
icellu
lar
eu
kary
ote
s
Bath
yco
ccu
sp
rasi
no
sEu
kary
ota
Pla
nts
8.5
4,9
94
4.3
9�
10�
10
3.0
2�
10�
10
1.3
7�
10�
10
2:1
Kra
sove
cet
al.
(2017)
Ch
lam
ydo
mo
nas
rein
hard
tii
Eu
kary
ota
Pla
nts
—1,7
30
1.1
1�
10�
10
6.7
6�
10�
11
4.3
6�
10�
11
2:1
Sun
g,
Ack
erm
an
,et
al.
(2012)
Ch
lam
ydo
mo
nas
rein
hard
tii
Eu
kary
ota
Pla
nts
6.5
940
1.1
5�
10�
99.6
3�
10�
10
1.9
0�
10�
10
5:1
Ness
et
al.
(2015)
Dic
tyo
steliu
md
isco
ideu
mEu
kary
ota
Pro
tist
s—
1,0
00
—2.9
0�
10�
11
——
Saxe
ret
al.
(2012)
Mic
rom
on
as
pu
silla
Eu
kary
ota
Pla
nts
64,1
45
9.7
6�
10�
10
8.1
5�
10�
10
1.6
1�
10�
10
5:1
Kra
sove
cet
al.
(2017)
Ost
reo
cocc
us
med
iterr
an
eu
sEu
kary
ota
Pla
nts
78,3
79
5.9
2�
10�
10
4.9
2�
10�
10
1.0
0�
10�
10
5:1
Kra
sove
cet
al.
(2017)
Ost
reo
cocc
us
tau
riEu
kary
ota
Pla
nts
8.5
17,2
50
4.7
9�
10�
10
4.1
9�
10�
10
6.0
0�
10�
11
7:1
Kra
sove
cet
al.
(2017)
Para
meci
um
tetr
au
relia
Eu
kary
ota
Pro
tist
s—
3,3
00
2.3
3�
10�
11
1.9
4�
10�
11
3.8
7�
10�
12
5:1
Sun
g,
Tu
cker,
et
al.
(2012)
Sacc
haro
myc
es
cere
visi
ae
Eu
kary
ota
Fun
gi
10
4,8
00
3.5
0�
10�
10
3.3
0�
10�
10
2.0
0�
10�
11
17:1
Lyn
chet
al.
(2008)
Sacc
haro
myc
es
cere
visi
ae
Eu
kary
ota
Fun
gi
—1,7
40
2.9
0�
10�
10
2.9
0�
10�
10
0—
Nis
han
tet
al.
(2010)
Sacc
haro
myc
es
cere
visi
ae
Eu
kary
ota
Fun
gi
—2,5
00
3.6
0�
10�
10
3.6
0�
10�
10
0—
Sere
roet
al.
(2014)
Sacc
haro
myc
es
cere
visi
ae
Eu
kary
ota
Fun
gi
10
2,0
62
1.7
2�
10�
10
1.6
7�
10�
10
5.0
3�
10�
12
33:1
Zh
uet
al.
(2014)
Sch
izo
sacc
haro
myc
es
po
mb
eEu
kary
ota
Fun
gi
—1,7
00
2.7
3�
10�
10
2.1
3�
10�
10
6.0
0�
10�
11
4:1
Farl
ow
et
al.
(2015)
Sch
izo
sacc
haro
myc
es
po
mb
eEu
kary
ota
Fun
gi
10.3
1,9
52
3.4
0�
10�
10
1.7
0�
10�
10
1.7
0�
10�
10
1:1
Beh
rin
ger
an
dH
all
(2016)
Tetr
ah
ymen
ath
erm
op
hila
Eu
kary
ota
Pro
tist
s—
1,0
00
—7.6
1�
10�
12
——
Lon
get
al.
(2016)
Mu
ltic
ellu
lar
eu
kary
ote
s
Ara
bid
op
sis
thalia
na
Eu
kary
ota
Pla
nts
130
8.4
0�
10�
97.1
0�
10�
91.3
0�
10�
95:1
Oss
ow
ski
et
al.
(2010)
Caen
orh
ab
dit
isb
rig
gsa
eEu
kary
ota
Meta
zoa
1250
—1.3
3�
10�
9—
—D
en
ver
et
al.
(2012)
Caen
orh
ab
dit
isele
gan
sEu
kary
ota
Meta
zoa
1250
—2.1
0�
10�
9—
—D
en
ver
et
al.
(2009)
Caen
orh
ab
dit
isele
gan
sEu
kary
ota
Meta
zoa
1250
—1.4
5�
10�
9—
—D
en
ver
et
al.
(2012)
Dap
hn
iap
ule
xEu
kary
ota
Meta
zoa
1128
—3.8
0�
10�
9—
—K
eit
het
al.
(2016)
Dap
hn
iap
ule
xEu
kary
ota
Meta
zoa
182
—2.3
0�
10�
9—
—Fl
ynn
et
al.
(2017)
Katju and Bergthorsson GBE
140 Genome Biol. Evol. 11(1):136–165 doi:10.1093/gbe/evy252 Advance Access publication November 26, 2018
Dow
nloaded from https://academ
ic.oup.com/gbe/article/11/1/136/5209700 by guest on 13 January 2022
GþC-content of 67% and three chromosomes (most prokar-
yotes have only one circular chromosome), and Deinococcus
radiodurans, famous for being the world’s most extremophile
bacterium according to the Guinness Book of World Records.
In addition to these, there are mutation rate measurements
from more traditionally studied bacteria, such as Bacillus sub-
tilis, E. coli (several strains), Pseudomonas sp. aeruginosa, and
Salmonella typhimurium.
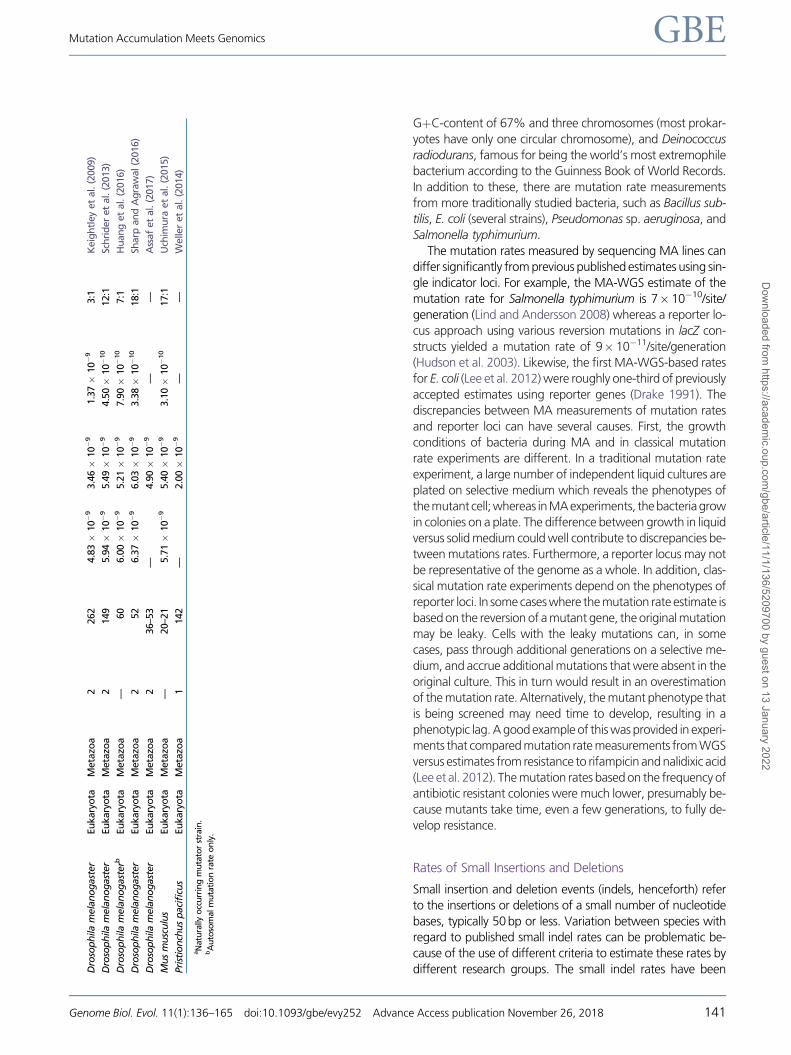
The mutation rates measured by sequencing MA lines can
differ significantly from previous published estimates using sin-
gle indicator loci. For example, the MA-WGS estimate of the
mutation rate for Salmonella typhimurium is 7� 10�10/site/
generation (Lind and Andersson 2008) whereas a reporter lo-
cus approach using various reversion mutations in lacZ con-
structs yielded a mutation rate of 9� 10�11/site/generation
(Hudson et al. 2003). Likewise, the first MA-WGS-based rates
for E. coli (Lee et al. 2012) were roughly one-third of previously
accepted estimates using reporter genes (Drake 1991). The
discrepancies between MA measurements of mutation rates
and reporter loci can have several causes. First, the growth
conditions of bacteria during MA and in classical mutation
rate experiments are different. In a traditional mutation rate
experiment, a large number of independent liquid cultures are
plated on selective medium which reveals the phenotypes of
themutant cell;whereas inMAexperiments, thebacteriagrow
in colonies on a plate. The difference between growth in liquid
versus solid medium could well contribute to discrepancies be-
tween mutations rates. Furthermore, a reporter locus may not
be representative of the genome as a whole. In addition, clas-
sical mutation rate experiments depend on the phenotypes of
reporter loci. In some cases where the mutation rate estimate is
based on the reversion of a mutant gene, the original mutation
may be leaky. Cells with the leaky mutations can, in some
cases, pass through additional generations on a selective me-
dium, and accrue additional mutations that were absent in the
original culture. This in turn would result in an overestimation
of the mutation rate. Alternatively, the mutant phenotype that
is being screened may need time to develop, resulting in a
phenotypic lag. A good example of this was provided in experi-
ments that compared mutation rate measurements from WGS
versus estimates from resistance to rifampicin and nalidixic acid
(Lee et al. 2012). The mutation rates based on the frequency of
antibiotic resistant colonies were much lower, presumably be-
cause mutants take time, even a few generations, to fully de-
velop resistance.
Rates of Small Insertions and Deletions
Small insertion and deletion events (indels, henceforth) refer
to the insertions or deletions of a small number of nucleotide
bases, typically 50 bp or less. Variation between species with
regard to published small indel rates can be problematic be-
cause of the use of different criteria to estimate these rates by
different research groups. The small indel rates have beenDro
sop
hila
mela
no
gast
er
Eu
kary
ota
Meta
zoa
2262
4.8
3�
10�
93.4
6�
10�
91.3
7�
10�
93:1
Keig
htl
ey
et
al.
(2009)
Dro
sop
hila
mela
no
gast
er
Eu
kary
ota
Meta
zoa
2149
5.9
4�
10�
95.4
9�
10�
94.5
0�
10�
10
12:1
Sch
rid
er
et
al.
(2013)
Dro
sop
hila
mela
no
gast
erb
Eu
kary
ota
Meta
zoa
—60
6.0
0�
10�
95.2
1�
10�
97.9
0�
10�
10
7:1
Hu
an
get
al.
(2016)
Dro
sop
hila
mela
no
gast
er
Eu
kary
ota
Meta
zoa
252
6.3
7�
10�
96.0
3�
10�
93.3
8�
10�
10
18:1
Sharp
an
dA
gra
wal
(2016)
Dro
sop
hila
mela
no
gast
er
Eu
kary
ota
Meta
zoa
236–5
3—
4.9
0�
10�
9—
—A
ssaf
et
al.
(2017)
Mu
sm
usc
ulu
sEu
kary
ota
Meta
zoa
—20–2
15.7
1�
10�
95.4
0�
10�
93.1
0�
10�
10
17:1
Uch
imu
raet
al.
(2015)
Pri
stio
nch
us
paci
ficu
sEu
kary
ota
Meta
zoa
1142
—2.0
0�
10�
9—
—W
elle
ret
al.
(2014)
aN
atu
rally
occ
urr
ing
mu
tato
rst
rain
.bA
uto
som
al
mu
tati
on
rate
on
ly.
Mutation Accumulation Meets Genomics GBE
Genome Biol. Evol. 11(1):136–165 doi:10.1093/gbe/evy252 Advance Access publication November 26, 2018 141
Dow
nloaded from https://academ
ic.oup.com/gbe/article/11/1/136/5209700 by guest on 13 January 2022
based on indels of <5 nt, <10 or even <146 bp (Lee et al.
2012; Dettman et al. 2016). Furthermore, the identification of
indels in short-read alignments is beset with difficulties. One
concern regarding the analysis of indels is that different stud-
ies do not use the same pipeline for variant calling, and this
variability in indel calling methods frequently yields different
results (O’Rawe et al. 2013; Hasan et al. 2015). Although
most analyses of MA lines use Sanger sequencing on a sample
of variants to estimate the proportion of false positives, false
negatives can also impact the results and different variant-
calling methods may have their own intrinsic biases in calling
indels, contributing to the variation among different studies
(Hasan et al. 2015).
The spontaneous mutation rate for small indel events,
lindel, in ten prokaryotic species ranges �128-fold, from
1.44� 10�11 to 1.85� 10�9/site/generation, with P. aerugi-
nosa and Mesoplasma florum displaying the lowest and high-
est rate, respectively (table 1). Despite these limitations and
differences in methodologies for indel variant-calling, it seems
clear that small indels are less frequent than base substitutions
in each of the ten species of bacteria listed in table 1. The ratio
of base substitutions to indels ranges from four in
Mycobacterium smegmatis and Vibrio fischeri to 23 in
Deinococcus radiodurans. Indels occur most frequently in sim-
ple sequence repeats, and the indel rate is correlated with
both the number of repeats and the length of the repeat
motif (Lee et al. 2012; Long et al. 2015; Dettman et al.
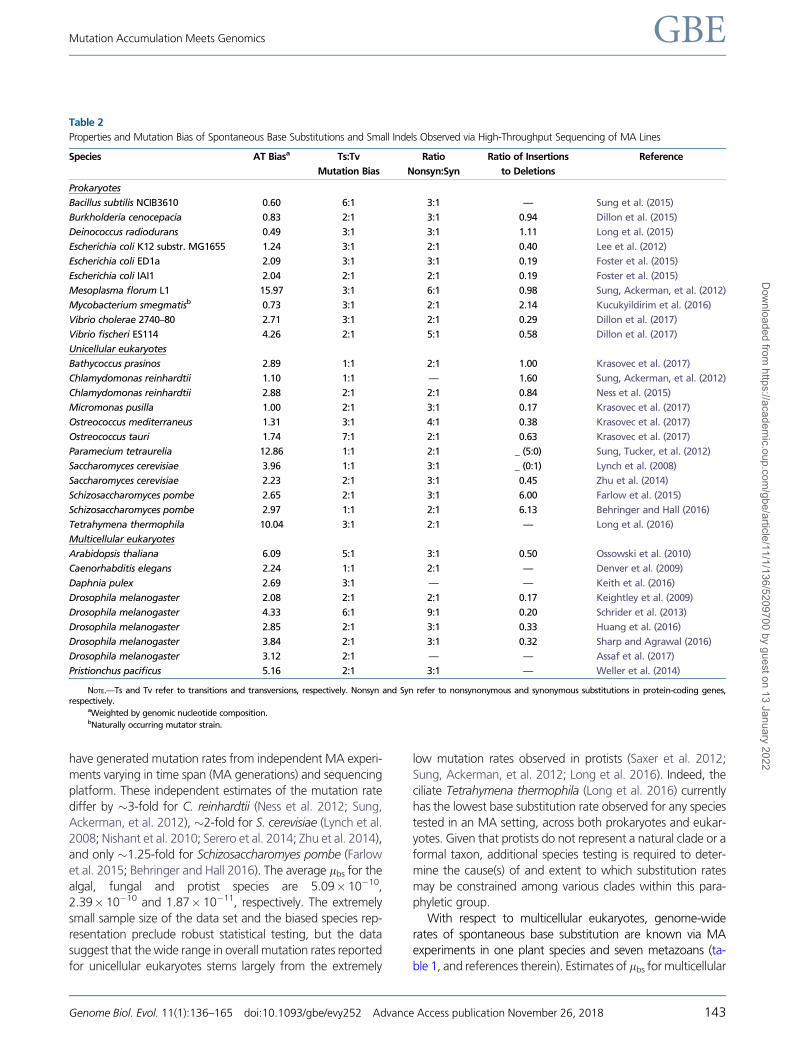
2016; Dillon et al. 2017). The majority of MA experiments
in prokaryotes have found a deletion bias, with small deletions
being more frequent than small insertions (table 2). Similar
results have been obtained previously, for example, by ana-
lyzing insertions and deletions in bacterial pseudogenes (Mira
et al. 2001). However, mismatch-repair deficient strains of
bacteria can have a radically altered spectrum of indel muta-
tions. These include an insertion bias in the naturally occurring
mutator strain of Mycobacterium smegmatis and a stronger
bias toward single nucleotide indels (Long et al. 2015;
Kucukyildirim et al. 2016; Dillon et al. 2017).
Local Context-Dependence of Spontaneous Mutations
Neighboring Bases
The importance of base composition of neighboring bases for
mutation rates was first suggested by Seymour Benzer as a
part of his classic work on the fine structure of genes (Benzer
1961). It has long been known that certain combinations of
nucleotides can be either underrepresented or overrepre-
sented. In principle, such deviations from random expecta-
tions can result from either context-dependent mutation
rates or selection for or against certain sequence motifs in
genomes. Although many MA studies lack a sufficient num-
ber of mutations to test whether the rates of particular nu-
cleotide substitutions are influenced by the identity of
neighboring nucleotides, several experiments with bacteria,
both wild-type and DNA-repair deficient, have provided evi-
dence for strong context-dependence. The results from MA
experiments have uncovered both general trends and
species-specific patterns of context-dependent mutations.
As an example of a general trend, YR (pyrimidine–purine)
and RY dimers have higher mutation rates than YY and RR
dimers (Sung et al. 2015). Focal nucleotides with G or C on
their 50 or 30 side have higher mutation rates than those bear-
ing A or T on their 50 or 30 side in Bacillus subtilis, E. coli,
Deinococcus radiodurans, and Pseudomonas fluorescens but
not in M. florum (Lee at al. 2012; Sung et al. 2015).
Mismatch-repair-deficient strains such as E. coli mutL and
Bacillus subtilis have similar context dependence as their
wild-type counterparts. Incorporating additional 50 and 30
neighboring bases to the analysis (5-mers and 7-mers) does
not have a significant effect, suggesting that the context-
dependence is due to the immediately adjacent nucleotides
(Sung et al. 2015).
Computer simulations have revealed that the observed fre-
quency of nucleotide triplets in the genome of M. florum was
strongly correlated with the equilibrium frequency of triplets
using its context-dependent mutation rates, but the fre-
quency of triplets in E. coli and Bacillus subtilis exhibited no
such correlation (Sung et al. 2015). Mesoplasma florum has a
smaller Ne than either E. coli and Bacillus subtilis, which fits the
prediction that the base composition of species with small Ne
should resemble the context-dependent mutational equilib-
rium more than species with larger Ne (Sung et al. 2015).
Chromatin Organization
Additional local structural characteristics of bacterial chromo-
somes can also influence their mutation rates. In mismatch-
repair-deficient E. coli, the density of mutations across the
genome is nonrandom and increases and decreases in a
wave-like function with distance from the origin of replication
(Foster et al. 2013). The mutation rates were positively corre-
lated with the degree of predicted superhelicity.
Nuclear Mutations in Eukaryotic Genomes
Base Substitutions
Direct genome-wide estimates of the spontaneous base sub-
stitution rate, lbs, have been generated for ten unicellular and
eight multicellular eukaryotic species (table 1). The subset of
unicellular eukaryotic species includes five algae, two fungi,
and three protists. Spontaneous rates of nuclear base substi-
tutions in unicellular eukaryotes range from 7.61� 10�12 to
8.15� 10�10/site/generation, representing a �100-fold dif-
ference among the ten species, with a median lbs of
2.94� 10�10/site/generation. The robustness of these esti-
mates can be indirectly verified for three species, the algae
C. reinhardtii and the fungal species S. cerevisiae and
Schizosaccharomyes pombe, wherein different researchers
Katju and Bergthorsson GBE
142 Genome Biol. Evol. 11(1):136–165 doi:10.1093/gbe/evy252 Advance Access publication November 26, 2018
Dow
nloaded from https://academ
ic.oup.com/gbe/article/11/1/136/5209700 by guest on 13 January 2022
have generated mutation rates from independent MA experi-
ments varying in time span (MA generations) and sequencing
platform. These independent estimates of the mutation rate
differ by �3-fold for C. reinhardtii (Ness et al. 2012; Sung,
Ackerman, et al. 2012), �2-fold for S. cerevisiae (Lynch et al.
2008; Nishant et al. 2010; Serero et al. 2014; Zhu et al. 2014),
and only �1.25-fold for Schizosaccharomyes pombe (Farlow
et al. 2015; Behringer and Hall 2016). The average lbs for the
algal, fungal and protist species are 5.09� 10�10,
2.39� 10�10 and 1.87� 10�11, respectively. The extremely
small sample size of the data set and the biased species rep-
resentation preclude robust statistical testing, but the data
suggest that the wide range in overall mutation rates reported
for unicellular eukaryotes stems largely from the extremely
low mutation rates observed in protists (Saxer et al. 2012;
Sung, Ackerman, et al. 2012; Long et al. 2016). Indeed, the
ciliate Tetrahymena thermophila (Long et al. 2016) currently
has the lowest base substitution rate observed for any species
tested in an MA setting, across both prokaryotes and eukar-
yotes. Given that protists do not represent a natural clade or a
formal taxon, additional species testing is required to deter-
mine the cause(s) of and extent to which substitution rates
may be constrained among various clades within this para-
phyletic group.
With respect to multicellular eukaryotes, genome-wide
rates of spontaneous base substitution are known via MA
experiments in one plant species and seven metazoans (ta-
ble 1, and references therein). Estimates of lbs for multicellular
Table 2
Properties and Mutation Bias of Spontaneous Base Substitutions and Small Indels Observed via High-Throughput Sequencing of MA Lines
Species AT Biasa Ts:Tv
Mutation Bias
Ratio
Nonsyn:Syn
Ratio of Insertions
to Deletions
Reference
Prokaryotes
Bacillus subtilis NCIB3610 0.60 6:1 3:1 — Sung et al. (2015)
Burkholderia cenocepacia 0.83 2:1 3:1 0.94 Dillon et al. (2015)
Deinococcus radiodurans 0.49 3:1 3:1 1.11 Long et al. (2015)
Escherichia coli K12 substr. MG1655 1.24 3:1 2:1 0.40 Lee et al. (2012)
Escherichia coli ED1a 2.09 3:1 3:1 0.19 Foster et al. (2015)
Escherichia coli IAI1 2.04 2:1 2:1 0.19 Foster et al. (2015)
Mesoplasma florum L1 15.97 3:1 6:1 0.98 Sung, Ackerman, et al. (2012)
Mycobacterium smegmatisb 0.73 3:1 2:1 2.14 Kucukyildirim et al. (2016)
Vibrio cholerae 2740–80 2.71 3:1 2:1 0.29 Dillon et al. (2017)
Vibrio fischeri ES114 4.26 2:1 5:1 0.58 Dillon et al. (2017)
Unicellular eukaryotes
Bathycoccus prasinos 2.89 1:1 2:1 1.00 Krasovec et al. (2017)
Chlamydomonas reinhardtii 1.10 1:1 — 1.60 Sung, Ackerman, et al. (2012)
Chlamydomonas reinhardtii 2.88 2:1 2:1 0.84 Ness et al. (2015)
Micromonas pusilla 1.00 2:1 3:1 0.17 Krasovec et al. (2017)
Ostreococcus mediterraneus 1.31 3:1 4:1 0.38 Krasovec et al. (2017)
Ostreococcus tauri 1.74 7:1 2:1 0.63 Krasovec et al. (2017)
Paramecium tetraurelia 12.86 1:1 2:1 _ (5:0) Sung, Tucker, et al. (2012)
Saccharomyces cerevisiae 3.96 1:1 3:1 _ (0:1) Lynch et al. (2008)
Saccharomyces cerevisiae 2.23 2:1 3:1 0.45 Zhu et al. (2014)
Schizosaccharomyces pombe 2.65 2:1 3:1 6.00 Farlow et al. (2015)
Schizosaccharomyces pombe 2.97 1:1 2:1 6.13 Behringer and Hall (2016)
Tetrahymena thermophila 10.04 3:1 2:1 — Long et al. (2016)
Multicellular eukaryotes
Arabidopsis thaliana 6.09 5:1 3:1 0.50 Ossowski et al. (2010)
Caenorhabditis elegans 2.24 1:1 2:1 — Denver et al. (2009)
Daphnia pulex 2.69 3:1 — — Keith et al. (2016)
Drosophila melanogaster 2.08 2:1 2:1 0.17 Keightley et al. (2009)
Drosophila melanogaster 4.33 6:1 9:1 0.20 Schrider et al. (2013)
Drosophila melanogaster 2.85 2:1 3:1 0.33 Huang et al. (2016)
Drosophila melanogaster 3.84 2:1 3:1 0.32 Sharp and Agrawal (2016)
Drosophila melanogaster 3.12 2:1 — — Assaf et al. (2017)
Pristionchus pacificus 5.16 2:1 3:1 — Weller et al. (2014)
NOTE.—Ts and Tv refer to transitions and transversions, respectively. Nonsyn and Syn refer to nonsynonymous and synonymous substitutions in protein-coding genes,respectively.
aWeighted by genomic nucleotide composition.bNaturally occurring mutator strain.
Mutation Accumulation Meets Genomics GBE
Genome Biol. Evol. 11(1):136–165 doi:10.1093/gbe/evy252 Advance Access publication November 26, 2018 143
Dow
nloaded from https://academ
ic.oup.com/gbe/article/11/1/136/5209700 by guest on 13 January 2022
eukaryotes range from 1.33 to 7.1� 10�9/site/generation,
with the nematode Caenorhabditis. briggsae and the angio-
sperm Arabidopsis thaliana representing the lower and upper
ends of the rate spectrum, respectively. The median lbs is
2.53� 10�9/site/generation. The range of base substitution
rates in multicellular eukaryotes is �5-fold, far narrower
than the �100-fold difference observed for unicellular eukar-
yotes. If only metazoans are considered, the difference in base
substitution rates contracts further, to a 4-fold difference. The
nematodes, Caenorhabditis elegans, Caenorhabditis briggsae,
and Pristionchus pacificus, exhibit an average base substitu-
tion rate of 1.7� 10�9. The five independent estimates of the
mutation rate for Drosophila melanogaster differ by �2-fold
with an average rate of 5.02� 10�9. The microcrustacean,
Daphnia pulex, falls in the middle of the metazoan spectrum,
with an average rate of 3.05� 10�9. Additional MA experi-
ments in plants will be required to address whether the A.
thaliana rate is representative of the taxon, and is, on average,
higher than that of metazoans. The median lbs of unicellular
eukaryotes is more similar to that of prokaryotes (�1.1-fold
difference) relative to multicellular eukaryotes (�9-fold differ-
ence) and may be due to larger effective population sizes of
unicellular eukaryotes and greater intensity of selection on the
evolution of the mutation rate (see section on the Sources of
Variation in Mutation Rates).
Small Indel Events
Direct genome-wide estimates of the small indel rate, lindel,
have been generated for nine unicellular and three multicel-
lular eukaryotic species (table 1). The subset of unicellular
eukaryotic species includes five algae, two fungi, and one
ciliate. In unicellular eukaryotes, lindel ranges from
3.87� 10�12 to 1.61� 10�10/site/generation, representing
a�40-fold difference among the eight species, with a median
lindel of 8.82� 10�11/site/generation. Average lindel values
for the algal, fungal and protist species are 1.07� 10�10,
6.06� 10�11 and 3.87� 10�12, respectively. The data set
for small indel rates in multicellular eukaryotes is more limited,
with one estimate for Arabidopsis (1.3� 10�9/site/genera-
tion), four independent estimates for D. melanogaster (aver-
age 7.4� 10�10/site/generation), and one estimate for Mus
musculus (3.1� 10�9/site/generation). The average small
indel rate is �1 order of magnitude greater in multicellular
eukaryotes (1.13� 10�9/site/generation) relative to unicellular
eukaryotes (8.24� 10�11/site/generation). If all 12 species of
eukaryotes are pooled together, the lindel ranges from
3.87� 10�12 to 1.3� 10�9/site/generation, representing a
�340-fold difference among them, and with a median lindel
of 1.16� 10�10/site/generation.
The small sample size of the data set and biased species
representation preclude robust statistical testing, but the data
are suggestive of some trends. For each of the 12 eukaryotic
species, small indels are, on average, less frequent than base
substitutions (table 1, and references therein),
recapitulating the pattern observed in prokaryotes. With the
exception of Schizosaccharomyes pombe (Behringer and Hall
2016), the ratio of base substitutions to indels ranges from 2 in
the algal species Bathycoccus prasinos (Krasovec et al. 2017)
and C. reinhardtii to 33 in one estimate for S. cerevisiae (Zhu
etal. 2014).Additionally, the sizeof smalldeletions is frequently
greater than that of small insertions (Ness et al. 2015;
Krasovec et al. 2017). Arabidopsis and Drosophila display
a deletion bias as is observed in the majority of MA experi-
ments with prokaryotes. However, there are also notable
exceptions to the rule of a deletion bias. Two independent
MA experiments with Schizosaccharomyes pombe found
that insertions were six times more common than deletions
(Farlow et al. 2015; Behringer and Hall 2016). There were
also instances of discordant results within the same spe-
cies. Experiments with genetically divergent lines of C. rein-
hardtii have found significant variation in mutation rates,
including indel rates (table 2). The most extensive MA ex-
periment in C. reinhardtii found that deletions were more
common than insertions and that deletions were, on aver-
age, larger than insertions (Ness et al. 2015). However,
there was considerable variation between lines, which
also includes variation in the patterns of indel mutations.
One line in particular displayed an excess of 9-bp deletions
that were not associated with any particular sequence
motifs. After removing the disproportionately large num-
ber of 9-bp deletions from this line, the average frequency
of deletions was not significantly different from the aver-
age frequency of insertions, but the average length of dele-
tions was still greater than the average length of insertions.
Mutational Spectra of Nuclear Changes
All eukaryotic genomes analyzed to date have a strong A/T
mutation bias (table 2). The data are consistent with a substan-
tial contribution from oxidative damage resulting in 5-hydrox-
yuracil from oxidative deamination of 5-methylcytosine and
C:G!T:A transitions, and 8-oxoguanine resulting in G:C!T:A transversions (Duncan and Miller 1980; Grollman and
Moriya 1993). Not only are these major sources of mutation
in eukaryotes, but also a major source of mutation rate varia-
tion within species. MA experiments in D. melanogaster un-
covered genetic variation in mutation rate that was primarily
due to high levels of C:G!T:A transitions in one line (Schrider
etal. 2013). In lightof these results, it is possible tocalculate the
expected equilibrium base composition at silent sites and com-
pare it with the observed. Thus far, it appears that the GþC-
content in silent sites of genomes is higher than expected
basedonmutationpressurealone.GC-biasedgeneconversion
is one possible neutral mechanism for increasing GþC-content
(Duret and Galtier 2009), but it is not clear whether it is suffi-
cient to counter the pervasive erosion of GþC by spontaneous
mutations (Weller et al. 2014; Keith et al. 2016).
Katju and Bergthorsson GBE
144 Genome Biol. Evol. 11(1):136–165 doi:10.1093/gbe/evy252 Advance Access publication November 26, 2018
Dow
nloaded from https://academ
ic.oup.com/gbe/article/11/1/136/5209700 by guest on 13 January 2022
Copy-Number Changes (Large Duplications and Deletions)
The importance of gene duplications in the evolution of life
has long been recognized (Ohno 1970). More recently, a
technological revolution in genomics has revealed both a
rich history of past gene duplications written in sequenced
genomes (reviewed by Katju 2012) and an abundance of
gene copy-number variation (CNV) caused by duplications
and deletions in natural populations (reviewed by Katju and
Bergthorsson 2013; Bergthorsson and Katju 2016). The fre-
quency of duplications in populations is determined by the
rate of spontaneous duplications and their preservation or
elimination by natural selection and genetic drift. By compar-
ing the rate and spectrum of spontaneous gene duplication
with the rate of fixation of duplications in genomes and their
distribution in natural populations, we gain valuable insight
into the relative roles that the duplication rate, selection, and
genetic drift play in determining the fate of duplications in
natural populations and as a source of evolutionary novelties.
Using a combination of oligonucleotide array comparative
genomic hybridization (oaCGH) and pulsed-field gel electro-
phoresis, Lynch et al. (2008) analyzed eight S. cerevisiae MA
lines that were passaged through 200 single-cell bottlenecks
and �4,800 generations. The spontaneous duplication and
deletion rates were measured to be 3.4� 10�6 and
2.1� 10�6/gene/generation, respectively. An earlier study in-
volving the analysis of ten MA lines of Caenorhabditis elegans
by oaCGH provided the first empirical, genome-wide esti-
mates of the spontaneous rate of duplication rate in a multi-
cellular eukaryote (Lipinski et al. 2011). The duplication rate
was found to be 3.4� 10�7 per gene/generation when all
gene duplications were included (complete and partial genes).
When only completely duplicated genes were considered, the
duplication rate was 1.25� 10�7/gene/generation. Paired-
end sequencing of D. melanogaster MA lines found that the
duplication rate was similar to that in Caenorhabditis elegans:
3.75� 10�7 duplications/gene/generation for partial or com-
plete duplications and 1.25� 10�7/gene/generation if only
complete duplications were considered (Schrider et al.
2013). The spontaneous gene duplication rate for single-
copy genes in Daphnia pulex is 3.27� 10�5 (Keith et al.
2016), an order of magnitude higher than the oaCGH-
based estimate in Caenorhabditis elegans (Lipinski et al.
2011) or D. melanogaster (Schrider et al. 2013). Recently,
Konrad et al. (2018) used Illumina sequencing and a modified
oaCGH approach on a different set of Caenorhabditis elegans
MA lines to generate a lduplication estimate of 2.9� 10�5
which is very similar to that for Daphnia (Keith et al. 2016)
and almost 2 orders of magnitude greater than the preceding
estimate for Caenorhabditis elegans (Lipinski et al. 2011). MA
experiments in Salmonella estimated the deletion rate to be
5� 10�7 (Nilsson et al. 2005). The same MA experiments that
measured the gene duplication rates in eukaryotes also mea-
sured the deletion rates. The gene deletion rates for S. cere-
visiae (Lynch et al. 2008), Caenorhabditis elegans (Konrad
et al. 2018), D. melanogaster (Schrider et al. 2013) and
Daphnia pulex (Keith et al. 2016) were estimated to be
2.1� 10�6, 0.5� 10�5, 9.37� 10�7 and 3.71� 10�5/gene/
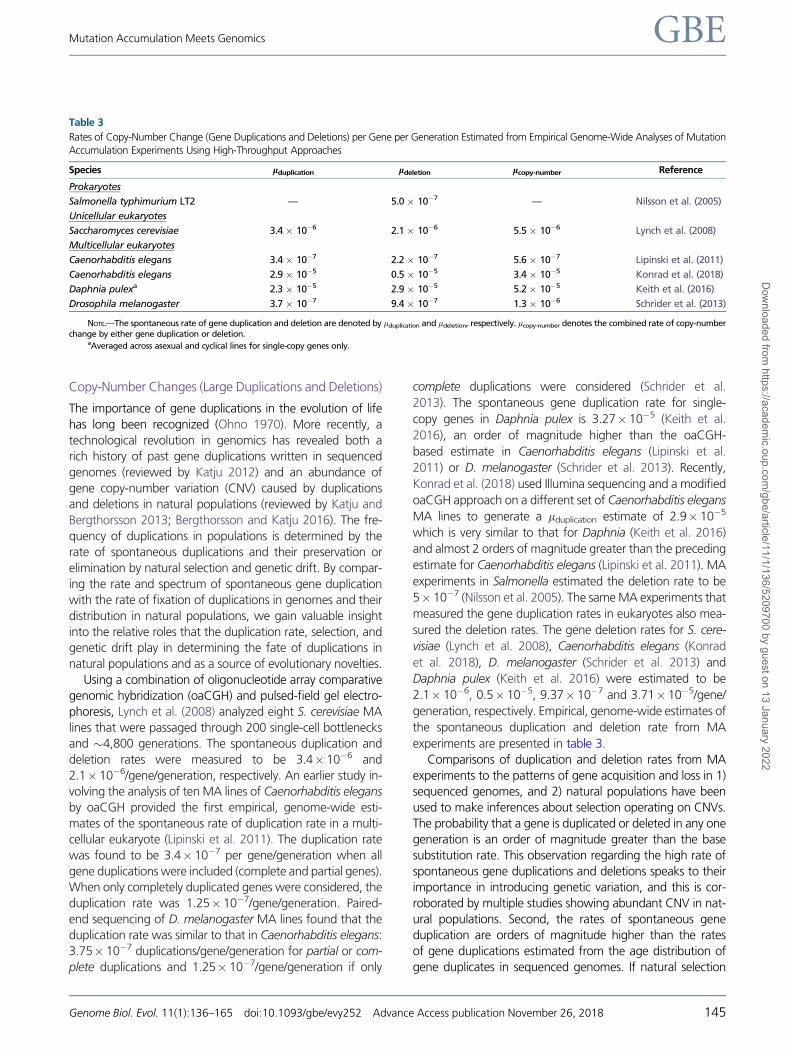
generation, respectively. Empirical, genome-wide estimates of
the spontaneous duplication and deletion rate from MA
experiments are presented in table 3.
Comparisons of duplication and deletion rates from MA
experiments to the patterns of gene acquisition and loss in 1)
sequenced genomes, and 2) natural populations have been
used to make inferences about selection operating on CNVs.
The probability that a gene is duplicated or deleted in any one
generation is an order of magnitude greater than the base
substitution rate. This observation regarding the high rate of
spontaneous gene duplications and deletions speaks to their
importance in introducing genetic variation, and this is cor-
roborated by multiple studies showing abundant CNV in nat-
ural populations. Second, the rates of spontaneous gene
duplication are orders of magnitude higher than the rates
of gene duplications estimated from the age distribution of
gene duplicates in sequenced genomes. If natural selection
Table 3
Rates of Copy-Number Change (Gene Duplications and Deletions) per Gene per Generation Estimated from Empirical Genome-Wide Analyses of Mutation
Accumulation Experiments Using High-Throughput Approaches
Species lduplication ldeletion lcopy-number Reference
Prokaryotes
Salmonella typhimurium LT2 — 5.0 � 10�7 — Nilsson et al. (2005)
Unicellular eukaryotes
Saccharomyces cerevisiae 3.4 � 10�6 2.1 � 10�6 5.5 � 10�6 Lynch et al. (2008)
Multicellular eukaryotes
Caenorhabditis elegans 3.4 � 10�7 2.2 � 10�7 5.6 � 10�7 Lipinski et al. (2011)
Caenorhabditis elegans 2.9 � 10�5 0.5 � 10�5 3.4 � 10�5 Konrad et al. (2018)
Daphnia pulexa 2.3 � 10�5 2.9 � 10�5 5.2 � 10�5 Keith et al. (2016)
Drosophila melanogaster 3.7 � 10�7 9.4 � 10�7 1.3 � 10�6 Schrider et al. (2013)
NOTE.—The spontaneous rate of gene duplication and deletion are denoted by lduplication and ldeletion, respectively. lcopy-number denotes the combined rate of copy-numberchange by either gene duplication or deletion.
aAveraged across asexual and cyclical lines for single-copy genes only.
Mutation Accumulation Meets Genomics GBE
Genome Biol. Evol. 11(1):136–165 doi:10.1093/gbe/evy252 Advance Access publication November 26, 2018 145
Dow
nloaded from https://academ
ic.oup.com/gbe/article/11/1/136/5209700 by guest on 13 January 2022
eradicates some fraction of gene duplicates in their infancy
before they accrue any nucleotide substitutions, the age dis-
tribution of extant gene duplicates within a genome will result
in an underestimate of the spontaneous duplication rate. The
observation that empirical measures of the gene duplication
and deletion rates from MA experiments are orders of mag-
nitude higher than those from bioinformatic analysis of se-
quenced genomes is best explained by the loss of the vast
majority of young CNVs by natural selection in the latter
(Lipinski et al. 2011; Schrider et al. 2013).
The duplication/deletion rates in MA lines have been com-
pared with natural polymorphism in the same species to make
inferences about natural selection on CNVs. For Daphnia
pulex, the observed number of base pairs in CNVs is close
to 19-fold lower than expected from the rate and size distri-
bution of copy-number changes in MA experiments (Keith
et al. 2016). The results suggest that most large CNVs are
deleterious and purged from Daphnia pulex populations by
purifying selection. Furthermore, comparisons of the duplica-
tion/deletion rates in MA lines with CNVs in natural popula-
tions of D. melanogaster concluded that 99% of all new
CNVs were deleterious, and moreover, that CNVs were 10-
fold more likely to be removed by natural selection than
amino acid replacement substitutions (Schrider et al. 2013).
Rate and Spectrum of Mutations inEukaryotic Mitochondrial Genomes
Introduction
Since the ancient evolutionary event wherein an a-proteobac-
terium took up residence in a eukaryotic host cell and evolved
to become the modern-day energy workhorse of eukaryotic
cells now known as mitochondria, most of its independent
function and genetic material has been lost or transferred to
the host nucleus. Modern mitochondria retain a fraction of
their ancestral genome to manufacture the components re-
quired for ATP production. The biology and transmission ge-
netics of mtDNA is an unorthodox one, with additional and
striking taxa-specific differences. The mutation rate of animal
mitochondria exceeds that of their host’s nuclear genome by
an order of magnitude or more (Brown et al. 1982), and mi-
tochondrial mutations are increasingly being associated with a
variety of human diseases (Wallace and Chalkia 2013;
Wallace 2015). The rapid rate of molecular evolution also
renders metazoan mitochondria an amenable tool in evolu-
tionary studies, as a marker for determining relationships be-
tween closely related populations or species and in studies of
contemporary geographic distributions of organisms (Avise
2000). In contrast, plant mitochondrial genomes possess ex-
tremely low rates of sequence evolution relative to the nuclear
genome (Wolfe et al. 1987) and have been gainfully
employed in investigating deeper phylogenetic relationships
(Bowe et al. 2000). A similarly wide diversity in pattern is
displayed in the inheritance of mtDNA across taxa (reviewed
by White et al. 2008). In the majority of instances, mtDNA is
inherited uniparentally through the maternal germline.
However, even in species with a predominantly maternal
transmission pattern, biparental inheritance of mtDNA can
occur at low frequencies via paternal leakage (Neale et al.
1989; Kondo et al. 1990; Gyllensten et al. 1991; Kvist et al.
2003; Ballard and Whitlock 2004; Barr et al. 2005; McCauley
et al. 2005; White et al. 2008). Doubly uniparental inheritance
of mtDNA, wherein female offspring inherit maternal mtDNA
and male offspring inherit the mtDNA of both parents, is ob-
served in several bivalve families (Zouros et al. 1994; Skibinski
et al. 1994; reviewed by Breton et al. 2007). At the other end
of the spectrum, a few plant species including cucumbers and
some conifers (Havey 1997; Neale et al. 1989) are reported to
have a predominantly paternal mode of mtDNA transmission.
An early and long-held assumption in the study of mito-
chondria was that individuals only possessed one mtDNA hap-
lotype, often referred to as homoplasmy (Birky 2001). A state
of homoplasmy necessitates that mtDNA molecules are essen-
tially nonrecombining. This presumed lack of recombination in
mtDNA came with the implicit assumption that existing varia-
tion was generated by mutational changes alone, thereby
establishing it as the molecular markerof choice for delineating
evolutionary change in populations and species and dating
evolutionary events. The last two decades have demonstrated
that the population structure of mitochondria is far more com-
plex and is best described as a nested hierarchy of populations,
with multiple mtDNA molecules per mitochondria, multiple
mitochondria per oocyte, multiple oocytes per females, and
so forth (Rand 2001). Newly arising mtDNA mutations create
a heterogeneous population of mutant and wild-type mtDNA
molecules, generating a state known as heteroplasmy.
Heteroplasmycanbe regardedasan intermediatepolymorphic
stage following the origin of new mitochondrial alleles via mu-
tation and preceding their ultimate fixation or loss within the
nestedpopulationhierarchyof mitochondria. The frequency of
these heteroplasmic alleles can shift during meiotic and mitotic
events, due to both random genetic drift as well as natural
selection (Rand 2001; Wallace 2015). A state of heteroplasmy
can also enable the formation of novel recombinant mtDNA
molecules. Although the extent to which this occurs is still un-
der vigorous debate (Kraytsberg et al. 2004; reviewed by Barr
et al. 2005; Hagstrom et al. 2014), there is clear evidence for
recombination in fungal (Taylor 1986; MacAlpine et al. 1998;
Birky 2001), plant (Lonsdale et al. 1988; Remacle et al. 1995;
St€adler and Delph 2002; Bergthorsson et al. 2003), and animal
(Passamonti et al. 2003; Ladoukakis and Eyre-Walker 2004;
reviewed by Piganeau et al. 2004) mitochondria. The existence
of even rare recombination in mitochondrial genomes can im-
pedetheaccumulationofdeleteriousmutations (Charlesworth
et al. 1993; Neiman and Taylor 2009).
Both traditional Sanger and massively parallel sequencing
technologies have facilitated direct molecular analyses of MA
Katju and Bergthorsson GBE
146 Genome Biol. Evol. 11(1):136–165 doi:10.1093/gbe/evy252 Advance Access publication November 26, 2018
Dow
nloaded from https://academ
ic.oup.com/gbe/article/11/1/136/5209700 by guest on 13 January 2022
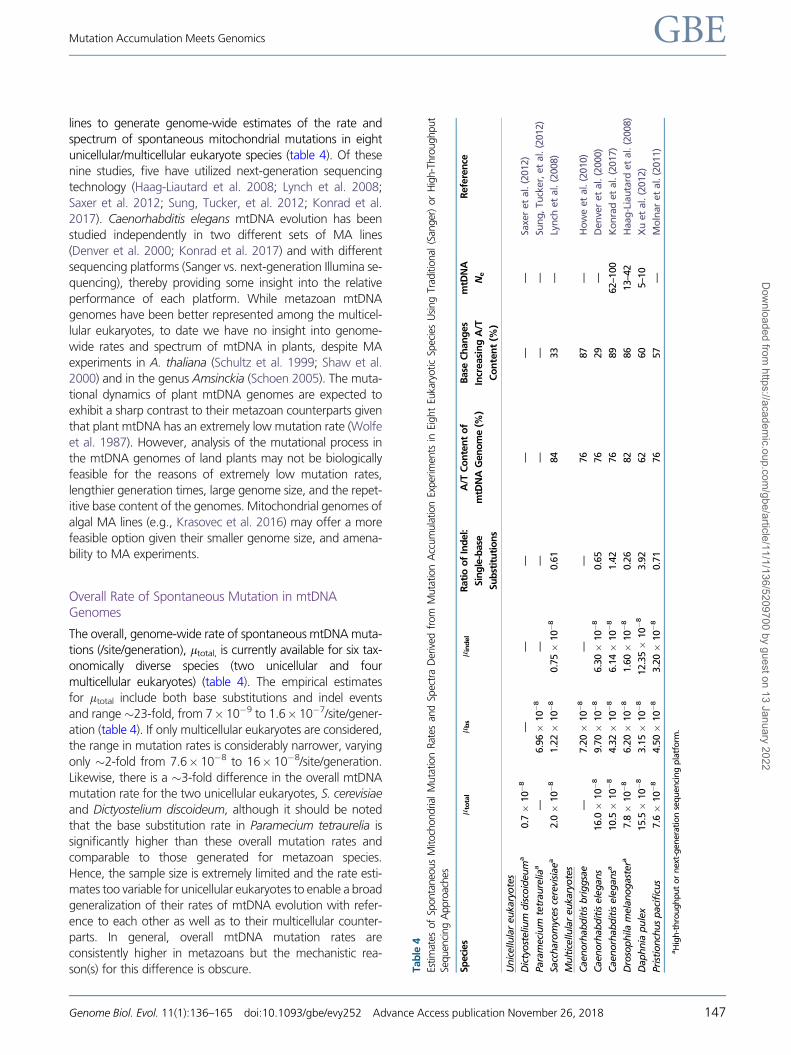
lines to generate genome-wide estimates of the rate and
spectrum of spontaneous mitochondrial mutations in eight
unicellular/multicellular eukaryote species (table 4). Of these
nine studies, five have utilized next-generation sequencing
technology (Haag-Liautard et al. 2008; Lynch et al. 2008;
Saxer et al. 2012; Sung, Tucker, et al. 2012; Konrad et al.
2017). Caenorhabditis elegans mtDNA evolution has been
studied independently in two different sets of MA lines
(Denver et al. 2000; Konrad et al. 2017) and with different
sequencing platforms (Sanger vs. next-generation Illumina se-
quencing), thereby providing some insight into the relative
performance of each platform. While metazoan mtDNA
genomes have been better represented among the multicel-
lular eukaryotes, to date we have no insight into genome-
wide rates and spectrum of mtDNA in plants, despite MA
experiments in A. thaliana (Schultz et al. 1999; Shaw et al.
2000) and in the genus Amsinckia (Schoen 2005). The muta-
tional dynamics of plant mtDNA genomes are expected to
exhibit a sharp contrast to their metazoan counterparts given
that plant mtDNA has an extremely low mutation rate (Wolfe
et al. 1987). However, analysis of the mutational process in
the mtDNA genomes of land plants may not be biologically
feasible for the reasons of extremely low mutation rates,
lengthier generation times, large genome size, and the repet-
itive base content of the genomes. Mitochondrial genomes of
algal MA lines (e.g., Krasovec et al. 2016) may offer a more
feasible option given their smaller genome size, and amena-
bility to MA experiments.
Overall Rate of Spontaneous Mutation in mtDNAGenomes
The overall, genome-wide rate of spontaneous mtDNA muta-
tions (/site/generation), ltotal, is currently available for six tax-
onomically diverse species (two unicellular and four
multicellular eukaryotes) (table 4). The empirical estimates
for ltotal include both base substitutions and indel events
and range�23-fold, from 7� 10�9 to 1.6� 10�7/site/gener-
ation (table 4). If only multicellular eukaryotes are considered,
the range in mutation rates is considerably narrower, varying
only �2-fold from 7.6� 10�8 to 16� 10�8/site/generation.
Likewise, there is a �3-fold difference in the overall mtDNA
mutation rate for the two unicellular eukaryotes, S. cerevisiae
and Dictyostelium discoideum, although it should be noted
that the base substitution rate in Paramecium tetraurelia is
significantly higher than these overall mutation rates and
comparable to those generated for metazoan species.
Hence, the sample size is extremely limited and the rate esti-
mates too variable for unicellular eukaryotes to enable a broad
generalization of their rates of mtDNA evolution with refer-
ence to each other as well as to their multicellular counter-
parts. In general, overall mtDNA mutation rates are
consistently higher in metazoans but the mechanistic rea-
son(s) for this difference is obscure. Tab
le4
Estim
ates
of
Sponta
neo
us
Mitoch
ondrial
Muta
tion
Rat
esan
dSp
ectr
aD
eriv
edfr
om
Muta
tion
Acc
um
ula
tion
Exper
imen
tsin
Eight
Euka
ryotic
Spec
ies
Using
Trad
itio
nal
(San
ger
)or
Hig
h-T
hro
ughput
Sequen
cing
Appro
aches
Sp
eci
es
lto
tal
l bs
l in
del
Rati
oo
fIn
del:
Sin
gle
-base
Su
bst
itu
tio
ns
A/T
Co
nte
nt
of
mtD
NA
Gen
om
e(%
)
Base
Ch
an
ges
Incr
easi
ng
A/T
Co
nte
nt
(%)
mtD
NA
Ne
Refe
ren
ce
Un
icellu
lar
eu
kary
ote
s
Dic
tyo
steliu
md
isco
ideu
ma
0.7�
10�
8—
——
——
—Sa
xer
et
al.
(2012)
Para
meci
um
tetr
au
relia
a—
6.9
6�
10�
8—
——
——
Sun
g,
Tu
cker,
et
al.
(2012)
Sacc
haro
myc
es
cere
visi
ae
a2.0�
10�
81.2
2�
10�
80.7
5�
10�
80.6
184
33
—Ly
nch
et
al.
(2008)
Mu
ltic
ellu
lar
eu
kary
ote
s
Caen
orh
ab
dit
isb
rig
gsa
e—
7.2
0�
10�
8—
—76
87
—H
ow
eet
al.
(2010)
Caen
orh
ab
dit
isele
gan
s16.0�
10�
89.7
0�
10�
86.3
0�
10�
80.6
576
29
—D
en
ver
et
al.
(2000)
Caen
orh
ab
dit
isele
gan
sa10.5�
10�
84.3
2�
10�
86.1
4�
10�
81.4
276
89
62–1
00
Ko
nra
det
al.
(2017)
Dro
sop
hila
mela
no
gast
era
7.8�
10�
86.2
0�
10�
81.6
0�
10�
80.2
682
86
13–4
2H
aag
-Lia
uta
rdet
al.
(2008)
Dap
hn
iap
ule
x15.5�
10�
83.1
5�
10�
812.3
5�
10�
83.9
262
60
5–1
0X
uet
al.
(2012)
Pri
stio
nch
us
paci
ficu
s7.6�
10�
84.5
0�
10�
83.2
0�
10�
80.7
176
57
—M
oln
ar
et
al.
(2011)
aH
igh
-th
rou
gh
pu
to
rn
ext
-gen
era
tio
nse
qu
en
cin
gp
latf
orm
.
Mutation Accumulation Meets Genomics GBE
Genome Biol. Evol. 11(1):136–165 doi:10.1093/gbe/evy252 Advance Access publication November 26, 2018 147
Dow
nloaded from https://academ
ic.oup.com/gbe/article/11/1/136/5209700 by guest on 13 January 2022
Spontaneous Rate of Base Substitutions in mtDNAGenomes
Direct empirical estimates of the spontaneous mtDNA base
substitution rate, lbs, from Sanger or high-throughput se-
quencing of MA lines are currently available for seven species
(two unicellular and five multicellular eukaryotes, respec-
tively). Estimates of lbs for the unicellular eukaryotes S. cer-
evisiae and the protist Paramecium tetraurelia differ �6�(1.22� 10�8 versus 6.96� 10�8 base substitutions/nucleo-
tide site/generation, respectively) (table 4). For the five multi-
cellular eukaryotes, the spontaneous mtDNA base
substitution rate is surprisingly consistent, varying �3� with
a range of 3.15� 10�8 to 9.7� 10�8 base substitutions/nu-
cleotide site/generation with the rate in Daphnia pulex repre-
senting the lower end of the spectrum (table 4). The paucity
of estimates for unicellular eukaryotic species precludes a
meaningful comparison and potential insights into how they
may differ from multicellular species.
Spontaneous Rate of Indel Events in mtDNA Genomes
There exists a slightly greater disparity in the spontaneous
mutation rate for indel events, lindel (table 4) relative to lbs.
lindel estimates from five eukaryotes (one unicellular, four
multicellular) range �16�, from 0.75� 10�7 to 1.23� 10�7
changes/site/generation, with S. cerevisiae and Daphnia pulex
displaying the lowest and highest rate, respectively. lindel esti-
mates exceed lbs for Daphnia pulex (Xu et al. 2012) and
Caenorhabditis elegans (Konrad et al. 2017), but the converse
is observed for D. melanogaster, S. cerevisiae, D. mela-
nogaster, and Pristionchus pacificus (Haag-Liautard et al.
2008; Lynch et al. 2008; Molnar et al. 2011). This is reflected
in the ratio of indel to single-base substitutions which ranges
from 0.61 to 3.92 (table 4). Hence, no discernible pattern can
be ascribed to the frequency of indel events among taxo-
nomic groups given the extremely limited sample size in the
case of unicellular eukaryotes and the fact that metazoan
species have indel rates that either exceed or are lesser than
their base substitution rates. However, in general, species-
specific lindel estimates appear to be quite similar to their
lbs counterparts, with the exception of Daphnia pulex.
Mutational Spectrum of Base Substitutions in mtDNAGenomes
In general, metazoan mitochondrial genomes tend to be AþT-
biased (Castellana et al. 2011, and references therein), al-
though there are some notable exceptions. What factors dic-
tate the extant base composition of a mitochondrial genome?
The simplest model posits that the prevalent base composition
is due to mutational input. In terms of the AþT-rich mtDNA
genomes, the observed skew in base composition is therefore
owing to a strong, biased mutation pressure toward A/T base
substitutions. An alternative competing hypothesis posits that
theobservedbasecomposition inmtDNAgenomes reflects the
influence of countering selective forces to maintain an opti-
mum equilibrium. Hence, in the case of the AþT-rich mtDNA
genomes, it is possible that spontaneous G/C base substitu-
tions arise more frequently but are subsequently eradicated via
purifying selection to enhance an AþT skew in base composi-
tion. An analysis of the spectrum of new spontaneous base
substitutions in the mtDNA genomes of long-term MA lines
can help distinguish between these two competing hypothe-
ses. In this kind of analyses, third codon positions and inter-
genic regions are less likely to be under selection and are hence
preferable to first and second codon positions in detecting the
cumulativeeffectsofprevalentmutationbiases in thegenome.
Genome-wide analyses of spontaneous mitochondrial muta-
tions in MA lines first conducted in Caenorhabditis elegans
using a direct sequencing approach (Denver et al. 2000)
reported a strongly biased mutation pressure toward G/C
changes. Given that the Caenorhabditis elegans mtDNA ge-
nome has a 76% AþT-content, Denver et al. (2000) therefore
argued for a dominant role of selection in shaping the base
composition of the mtDNA genome. Similar to the pattern
observed in Caenorhabditis elegans by Denver et al. (2000),
Lynch et al. (2008) concluded a G/C mutation bias in S. cere-
visiae. The conclusions from subsequent mtDNA analysis of
MA lines of other multicellular eukaryotic species have been
at odds with the pattern first observed in Caenorhabditis ele-
gans (Denver et al. 2000) andS. cerevisiae (Lynchet al. 2008).A
strong G/C! A/T mutation bias has been reported in both D.
melanogaster (Haag-Liautard et al. 2008) and the nematode
Pristionchus pacificus (Molnar et al. 2011). Likewise, a strong
bias toward A/T mtDNA mutations was also reported in a study
that employed Sanger sequencing of Caenorhabditis briggsae
MA lines (Howe et al. 2010). These contrasting patterns of
mtDNA base substitution bias in otherwise AþT-rich mtDNA
genomes were referred to as a “muddle of mutation across
taxa” (Montooth and Rand 2008). A recent study investigating
the spontaneous mtDNA mutation process via Illumina paired-
end sequencing in an independent set of long-term
Caenorhabditis elegans MA lines provides evidence for an ex-
tremely strong G/C ! A/T mutation bias with 89% of new
spontaneous point mutations resulting in an increased AþT-
content (Konrad et al. 2017). This finding contradicts those of
Denver et al. (2000) and underscores the contribution of a
strongly biased A/T mutation pressure leading to the skewed
base composition observed in mtDNA genomes of all
multicellular eukaryotes studied to date via MA experiments
(table 4). A general conclusion regarding the role of mutation
biases versus selection in dictating base composition of the
mtDNA genomes of unicellular eukaryotes is currently lacking.
Further in-depth analyses of the mtDNA mutational spectrum
of additional unicellular eukaryotic species such as
Dictyostelium discoideum and Paramecium tetraurelia are
much needed to offer a comparative genomic perspective
regards any notable differences among diverse unicellular
Katju and Bergthorsson GBE
148 Genome Biol. Evol. 11(1):136–165 doi:10.1093/gbe/evy252 Advance Access publication November 26, 2018
Dow
nloaded from https://academ
ic.oup.com/gbe/article/11/1/136/5209700 by guest on 13 January 2022
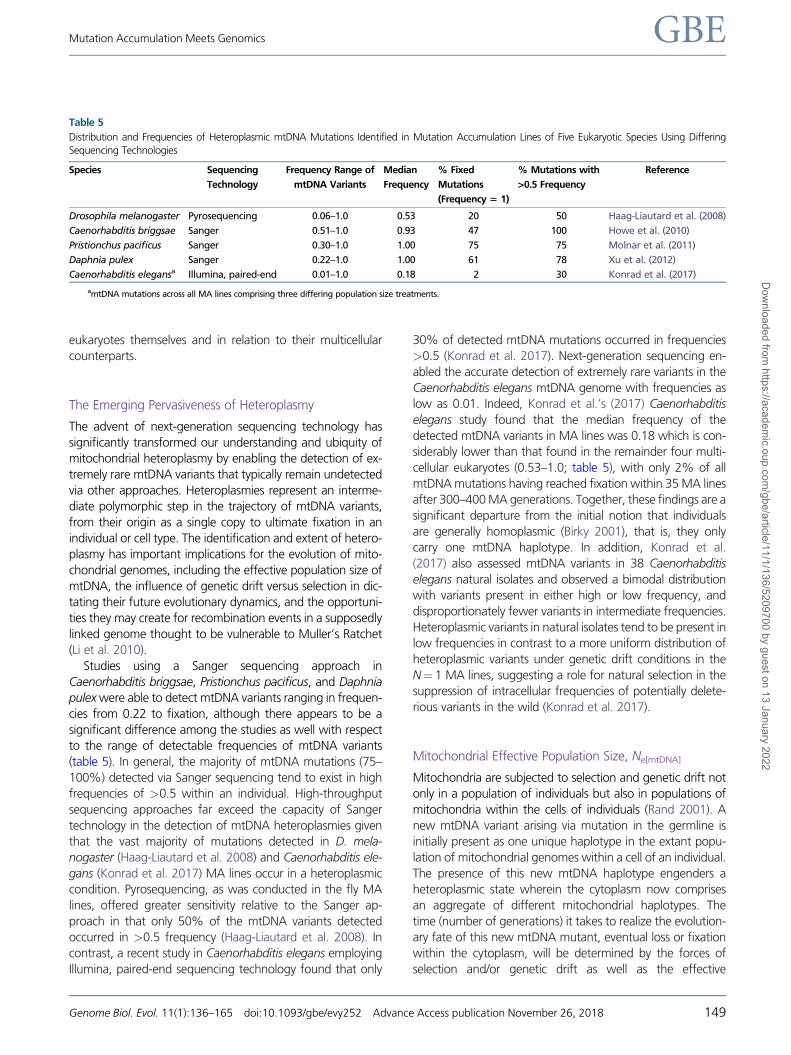
eukaryotes themselves and in relation to their multicellular
counterparts.
The Emerging Pervasiveness of Heteroplasmy
The advent of next-generation sequencing technology has
significantly transformed our understanding and ubiquity of
mitochondrial heteroplasmy by enabling the detection of ex-
tremely rare mtDNA variants that typically remain undetected
via other approaches. Heteroplasmies represent an interme-
diate polymorphic step in the trajectory of mtDNA variants,
from their origin as a single copy to ultimate fixation in an
individual or cell type. The identification and extent of hetero-
plasmy has important implications for the evolution of mito-
chondrial genomes, including the effective population size of
mtDNA, the influence of genetic drift versus selection in dic-
tating their future evolutionary dynamics, and the opportuni-
ties they may create for recombination events in a supposedly
linked genome thought to be vulnerable to Muller’s Ratchet
(Li et al. 2010).
Studies using a Sanger sequencing approach in
Caenorhabditis briggsae, Pristionchus pacificus, and Daphnia
pulex were able to detect mtDNA variants ranging in frequen-
cies from 0.22 to fixation, although there appears to be a
significant difference among the studies as well with respect
to the range of detectable frequencies of mtDNA variants
(table 5). In general, the majority of mtDNA mutations (75–
100%) detected via Sanger sequencing tend to exist in high
frequencies of >0.5 within an individual. High-throughput
sequencing approaches far exceed the capacity of Sanger
technology in the detection of mtDNA heteroplasmies given
that the vast majority of mutations detected in D. mela-
nogaster (Haag-Liautard et al. 2008) and Caenorhabditis ele-
gans (Konrad et al. 2017) MA lines occur in a heteroplasmic
condition. Pyrosequencing, as was conducted in the fly MA
lines, offered greater sensitivity relative to the Sanger ap-
proach in that only 50% of the mtDNA variants detected
occurred in >0.5 frequency (Haag-Liautard et al. 2008). In
contrast, a recent study in Caenorhabditis elegans employing
Illumina, paired-end sequencing technology found that only
30% of detected mtDNA mutations occurred in frequencies
>0.5 (Konrad et al. 2017). Next-generation sequencing en-
abled the accurate detection of extremely rare variants in the
Caenorhabditis elegans mtDNA genome with frequencies as
low as 0.01. Indeed, Konrad et al.’s (2017) Caenorhabditis
elegans study found that the median frequency of the
detected mtDNA variants in MA lines was 0.18 which is con-
siderably lower than that found in the remainder four multi-
cellular eukaryotes (0.53–1.0; table 5), with only 2% of all
mtDNA mutations having reached fixation within 35 MA lines
after 300–400 MA generations. Together, these findings are a
significant departure from the initial notion that individuals
are generally homoplasmic (Birky 2001), that is, they only
carry one mtDNA haplotype. In addition, Konrad et al.
(2017) also assessed mtDNA variants in 38 Caenorhabditis
elegans natural isolates and observed a bimodal distribution
with variants present in either high or low frequency, and
disproportionately fewer variants in intermediate frequencies.
Heteroplasmic variants in natural isolates tend to be present in
low frequencies in contrast to a more uniform distribution of
heteroplasmic variants under genetic drift conditions in the
N¼ 1 MA lines, suggesting a role for natural selection in the
suppression of intracellular frequencies of potentially delete-
rious variants in the wild (Konrad et al. 2017).
Mitochondrial Effective Population Size, Ne[mtDNA]
Mitochondria are subjected to selection and genetic drift not
only in a population of individuals but also in populations of
mitochondria within the cells of individuals (Rand 2001). A
new mtDNA variant arising via mutation in the germline is
initially present as one unique haplotype in the extant popu-
lation of mitochondrial genomes within a cell of an individual.
The presence of this new mtDNA haplotype engenders a
heteroplasmic state wherein the cytoplasm now comprises
an aggregate of different mitochondrial haplotypes. The
time (number of generations) it takes to realize the evolution-
ary fate of this new mtDNA mutant, eventual loss or fixation
within the cytoplasm, will be determined by the forces of
selection and/or genetic drift as well as the effective
Table 5
Distribution and Frequencies of Heteroplasmic mtDNA Mutations Identified in Mutation Accumulation Lines of Five Eukaryotic Species Using Differing
Sequencing Technologies
Species Sequencing
Technology
Frequency Range of
mtDNA Variants
Median
Frequency
% Fixed
Mutations
(Frequency 5 1)
% Mutations with
>0.5 Frequency
Reference
Drosophila melanogaster Pyrosequencing 0.06–1.0 0.53 20 50 Haag-Liautard et al. (2008)
Caenorhabditis briggsae Sanger 0.51–1.0 0.93 47 100 Howe et al. (2010)
Pristionchus pacificus Sanger 0.30–1.0 1.00 75 75 Molnar et al. (2011)
Daphnia pulex Sanger 0.22–1.0 1.00 61 78 Xu et al. (2012)
Caenorhabditis elegansa Illumina, paired-end 0.01–1.0 0.18 2 30 Konrad et al. (2017)
amtDNA mutations across all MA lines comprising three differing population size treatments.
Mutation Accumulation Meets Genomics GBE
Genome Biol. Evol. 11(1):136–165 doi:10.1093/gbe/evy252 Advance Access publication November 26, 2018 149
Dow
nloaded from https://academ
ic.oup.com/gbe/article/11/1/136/5209700 by guest on 13 January 2022
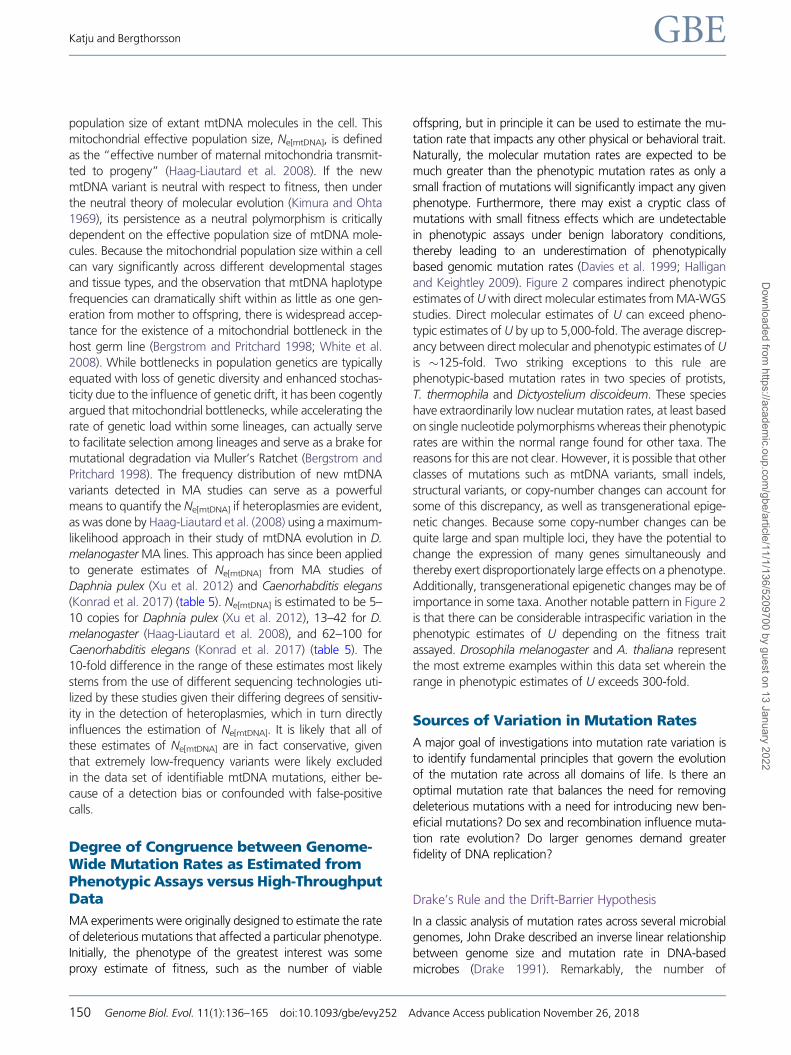
population size of extant mtDNA molecules in the cell. This
mitochondrial effective population size, Ne[mtDNA], is defined
as the “effective number of maternal mitochondria transmit-
ted to progeny” (Haag-Liautard et al. 2008). If the new
mtDNA variant is neutral with respect to fitness, then under
the neutral theory of molecular evolution (Kimura and Ohta
1969), its persistence as a neutral polymorphism is critically
dependent on the effective population size of mtDNA mole-
cules. Because the mitochondrial population size within a cell
can vary significantly across different developmental stages
and tissue types, and the observation that mtDNA haplotype
frequencies can dramatically shift within as little as one gen-
eration from mother to offspring, there is widespread accep-
tance for the existence of a mitochondrial bottleneck in the
host germ line (Bergstrom and Pritchard 1998; White et al.
2008). While bottlenecks in population genetics are typically
equated with loss of genetic diversity and enhanced stochas-
ticity due to the influence of genetic drift, it has been cogently
argued that mitochondrial bottlenecks, while accelerating the
rate of genetic load within some lineages, can actually serve
to facilitate selection among lineages and serve as a brake for
mutational degradation via Muller’s Ratchet (Bergstrom and
Pritchard 1998). The frequency distribution of new mtDNA
variants detected in MA studies can serve as a powerful
means to quantify the Ne[mtDNA] if heteroplasmies are evident,
as was done by Haag-Liautard et al. (2008) using a maximum-
likelihood approach in their study of mtDNA evolution in D.
melanogaster MA lines. This approach has since been applied
to generate estimates of Ne[mtDNA] from MA studies of
Daphnia pulex (Xu et al. 2012) and Caenorhabditis elegans
(Konrad et al. 2017) (table 5). Ne[mtDNA] is estimated to be 5–
10 copies for Daphnia pulex (Xu et al. 2012), 13–42 for D.
melanogaster (Haag-Liautard et al. 2008), and 62–100 for
Caenorhabditis elegans (Konrad et al. 2017) (table 5). The
10-fold difference in the range of these estimates most likely
stems from the use of different sequencing technologies uti-
lized by these studies given their differing degrees of sensitiv-
ity in the detection of heteroplasmies, which in turn directly
influences the estimation of Ne[mtDNA]. It is likely that all of
these estimates of Ne[mtDNA] are in fact conservative, given
that extremely low-frequency variants were likely excluded
in the data set of identifiable mtDNA mutations, either be-
cause of a detection bias or confounded with false-positive
calls.
Degree of Congruence between Genome-Wide Mutation Rates as Estimated fromPhenotypic Assays versus High-ThroughputData
MA experiments were originally designed to estimate the rate
of deleterious mutations that affected a particular phenotype.
Initially, the phenotype of the greatest interest was some
proxy estimate of fitness, such as the number of viable
offspring, but in principle it can be used to estimate the mu-
tation rate that impacts any other physical or behavioral trait.
Naturally, the molecular mutation rates are expected to be
much greater than the phenotypic mutation rates as only a
small fraction of mutations will significantly impact any given
phenotype. Furthermore, there may exist a cryptic class of
mutations with small fitness effects which are undetectable
in phenotypic assays under benign laboratory conditions,
thereby leading to an underestimation of phenotypically
based genomic mutation rates (Davies et al. 1999; Halligan
and Keightley 2009). Figure 2 compares indirect phenotypic
estimates of U with direct molecular estimates from MA-WGS
studies. Direct molecular estimates of U can exceed pheno-
typic estimates of U by up to 5,000-fold. The average discrep-
ancy between direct molecular and phenotypic estimates of U
is �125-fold. Two striking exceptions to this rule are
phenotypic-based mutation rates in two species of protists,
T. thermophila and Dictyostelium discoideum. These species
have extraordinarily low nuclear mutation rates, at least based
on single nucleotide polymorphisms whereas their phenotypic
rates are within the normal range found for other taxa. The
reasons for this are not clear. However, it is possible that other
classes of mutations such as mtDNA variants, small indels,
structural variants, or copy-number changes can account for
some of this discrepancy, as well as transgenerational epige-
netic changes. Because some copy-number changes can be
quite large and span multiple loci, they have the potential to
change the expression of many genes simultaneously and
thereby exert disproportionately large effects on a phenotype.
Additionally, transgenerational epigenetic changes may be of
importance in some taxa. Another notable pattern in Figure 2
is that there can be considerable intraspecific variation in the
phenotypic estimates of U depending on the fitness trait
assayed. Drosophila melanogaster and A. thaliana represent
the most extreme examples within this data set wherein the
range in phenotypic estimates of U exceeds 300-fold.
Sources of Variation in Mutation Rates
A major goal of investigations into mutation rate variation is
to identify fundamental principles that govern the evolution
of the mutation rate across all domains of life. Is there an
optimal mutation rate that balances the need for removing
deleterious mutations with a need for introducing new ben-
eficial mutations? Do sex and recombination influence muta-
tion rate evolution? Do larger genomes demand greater
fidelity of DNA replication?
Drake’s Rule and the Drift-Barrier Hypothesis
In a classic analysis of mutation rates across several microbial
genomes, John Drake described an inverse linear relationship
between genome size and mutation rate in DNA-based
microbes (Drake 1991). Remarkably, the number of
Katju and Bergthorsson GBE
150 Genome Biol. Evol. 11(1):136–165 doi:10.1093/gbe/evy252 Advance Access publication November 26, 2018
Dow
nloaded from https://academ
ic.oup.com/gbe/article/11/1/136/5209700 by guest on 13 January 2022
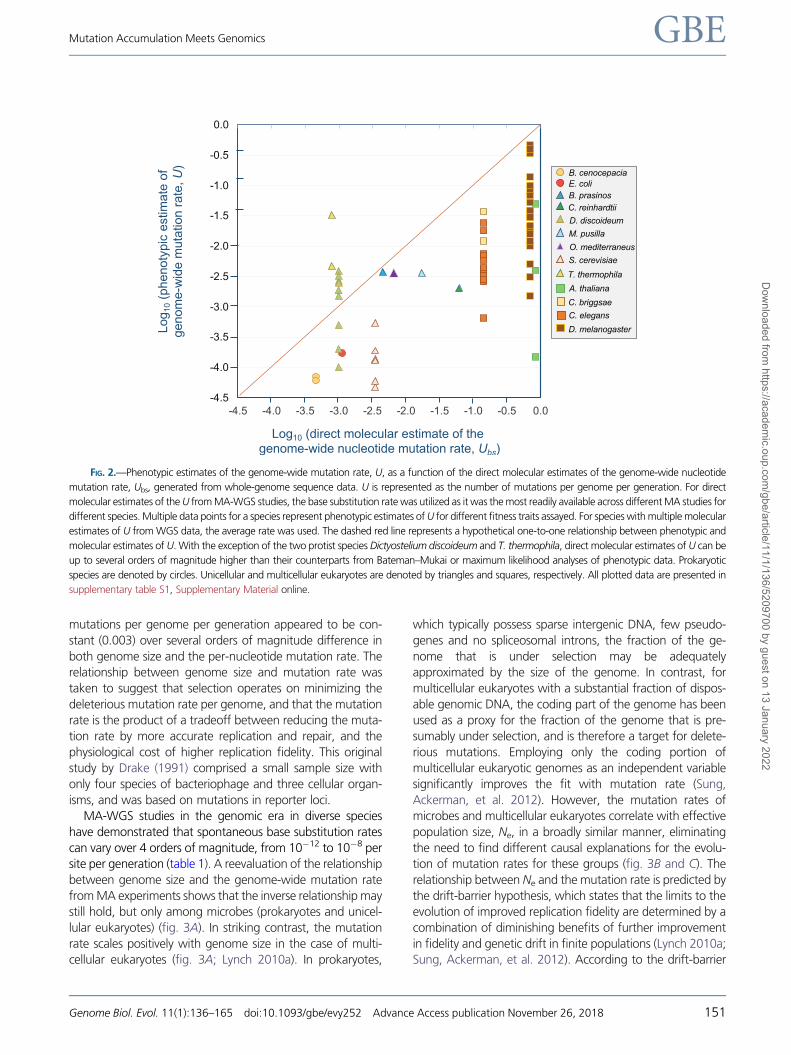
mutations per genome per generation appeared to be con-
stant (0.003) over several orders of magnitude difference in
both genome size and the per-nucleotide mutation rate. The
relationship between genome size and mutation rate was
taken to suggest that selection operates on minimizing the
deleterious mutation rate per genome, and that the mutation
rate is the product of a tradeoff between reducing the muta-
tion rate by more accurate replication and repair, and the
physiological cost of higher replication fidelity. This original
study by Drake (1991) comprised a small sample size with
only four species of bacteriophage and three cellular organ-
isms, and was based on mutations in reporter loci.
MA-WGS studies in the genomic era in diverse species
have demonstrated that spontaneous base substitution rates
can vary over 4 orders of magnitude, from 10�12 to 10�8 per
site per generation (table 1). A reevaluation of the relationship
between genome size and the genome-wide mutation rate
from MA experiments shows that the inverse relationship may
still hold, but only among microbes (prokaryotes and unicel-
lular eukaryotes) (fig. 3A). In striking contrast, the mutation
rate scales positively with genome size in the case of multi-
cellular eukaryotes (fig. 3A; Lynch 2010a). In prokaryotes,
which typically possess sparse intergenic DNA, few pseudo-
genes and no spliceosomal introns, the fraction of the ge-
nome that is under selection may be adequately
approximated by the size of the genome. In contrast, for
multicellular eukaryotes with a substantial fraction of dispos-
able genomic DNA, the coding part of the genome has been
used as a proxy for the fraction of the genome that is pre-
sumably under selection, and is therefore a target for delete-
rious mutations. Employing only the coding portion of
multicellular eukaryotic genomes as an independent variable
significantly improves the fit with mutation rate (Sung,
Ackerman, et al. 2012). However, the mutation rates of
microbes and multicellular eukaryotes correlate with effective
population size, Ne, in a broadly similar manner, eliminating
the need to find different causal explanations for the evolu-
tion of mutation rates for these groups (fig. 3B and C). The
relationship between Ne and the mutation rate is predicted by
the drift-barrier hypothesis, which states that the limits to the
evolution of improved replication fidelity are determined by a
combination of diminishing benefits of further improvement
in fidelity and genetic drift in finite populations (Lynch 2010a;
Sung, Ackerman, et al. 2012). According to the drift-barrier
FIG. 2.—Phenotypic estimates of the genome-wide mutation rate, U, as a function of the direct molecular estimates of the genome-wide nucleotide
mutation rate, Ubs, generated from whole-genome sequence data. U is represented as the number of mutations per genome per generation. For direct
molecular estimates of the U from MA-WGS studies, the base substitution rate was utilized as it was the most readily available across different MA studies for
different species. Multiple data points for a species represent phenotypic estimates of U for different fitness traits assayed. For species with multiple molecular
estimates of U from WGS data, the average rate was used. The dashed red line represents a hypothetical one-to-one relationship between phenotypic and
molecular estimates of U. With the exception of the two protist species Dictyostelium discoideum and T. thermophila, direct molecular estimates of U can be
up to several orders of magnitude higher than their counterparts from Bateman–Mukai or maximum likelihood analyses of phenotypic data. Prokaryotic
species are denoted by circles. Unicellular and multicellular eukaryotes are denoted by triangles and squares, respectively. All plotted data are presented in
supplementary table S1, Supplementary Material online.
Mutation Accumulation Meets Genomics GBE
Genome Biol. Evol. 11(1):136–165 doi:10.1093/gbe/evy252 Advance Access publication November 26, 2018 151
Dow
nloaded from https://academ
ic.oup.com/gbe/article/11/1/136/5209700 by guest on 13 January 2022
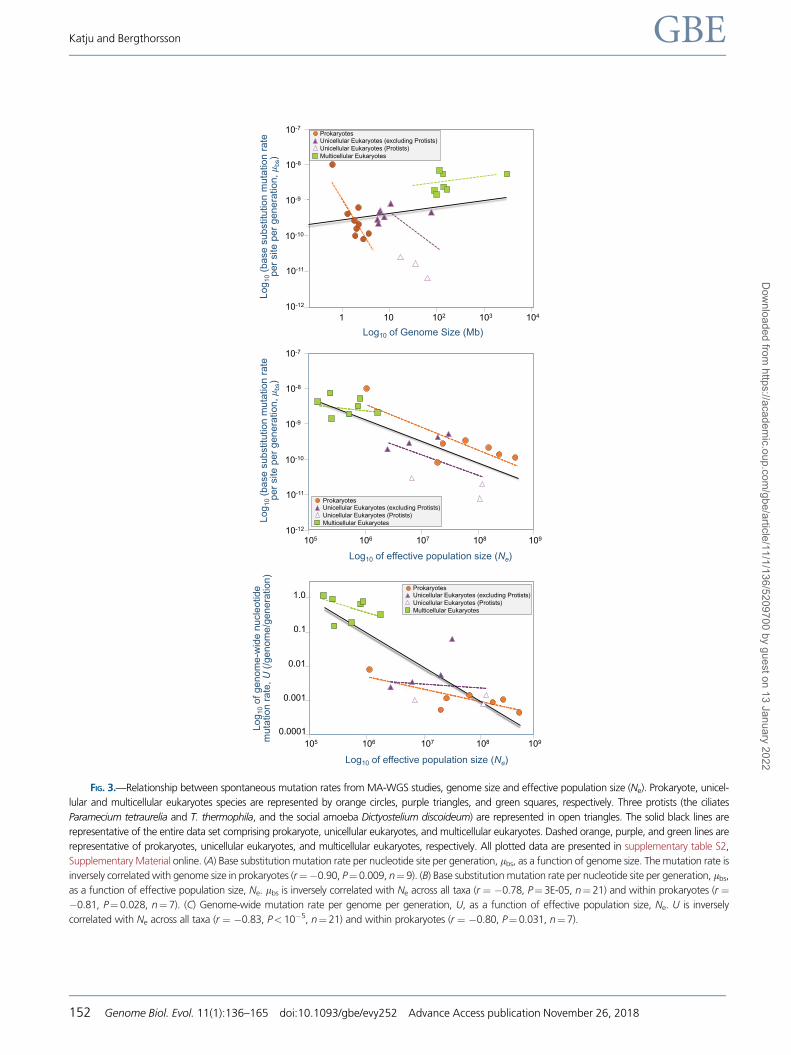
FIG. 3.—Relationship between spontaneous mutation rates from MA-WGS studies, genome size and effective population size (Ne). Prokaryote, unicel-
lular and multicellular eukaryotes species are represented by orange circles, purple triangles, and green squares, respectively. Three protists (the ciliates
Paramecium tetraurelia and T. thermophila, and the social amoeba Dictyostelium discoideum) are represented in open triangles. The solid black lines are
representative of the entire data set comprising prokaryote, unicellular eukaryotes, and multicellular eukaryotes. Dashed orange, purple, and green lines are
representative of prokaryotes, unicellular eukaryotes, and multicellular eukaryotes, respectively. All plotted data are presented in supplementary table S2,
Supplementary Material online. (A) Base substitution mutation rate per nucleotide site per generation, lbs, as a function of genome size. The mutation rate is
inversely correlated with genome size in prokaryotes (r¼�0.90, P¼0.009, n¼9). (B) Base substitution mutation rate per nucleotide site per generation, lbs,
as a function of effective population size, Ne. lbs is inversely correlated with Ne across all taxa (r ¼ �0.78, P¼3E-05, n¼21) and within prokaryotes (r ¼�0.81, P¼0.028, n¼7). (C) Genome-wide mutation rate per genome per generation, U, as a function of effective population size, Ne. U is inversely
correlated with Ne across all taxa (r ¼ �0.83, P<10�5, n¼21) and within prokaryotes (r ¼ �0.80, P¼0.031, n¼7).
Katju and Bergthorsson GBE
152 Genome Biol. Evol. 11(1):136–165 doi:10.1093/gbe/evy252 Advance Access publication November 26, 2018
Dow
nloaded from https://academ
ic.oup.com/gbe/article/11/1/136/5209700 by guest on 13 January 2022
hypothesis, the main obstacle to reducing the mutation rate in
the wild does not arise from trade-offs with the physiological
cost of increased fidelity, although such trade-offs may exist.
Rather, the obstacle to reducing the mutation rate results in
part from the limits, set by Ne, to the efficacy of natural se-
lection in removing deleterious mutations that increase the
mutation rate. Additionally, genetic drift in finite populations
limits the efficacy of selection in fixing much rarer beneficial
mutations that reduce the mutation rate. Consequently, se-
lection in very large populations can attain (and maintain)
greater improvement in replication fidelity relative to smaller
effective populations (Lynch 2010b; Lynch et al. 2016). The
drift-barrier hypothesis does not deny the importance of the
size of the mutational target, the part of the genome that is
under selection, as an important determinant in the evolution
of mutation rate. However, the primary contributing factor is
still Ne which determines the contribution of genetic drift to
the evolution of mutation rate. As such, it is currently the best
explanation for the large-scale patterns in mutation rate var-
iation across genomes across all domains of life, including
viruses.
Base Composition Bias
There exists immense variation in the base composition of
genomes. Among the prokaryotes, for instance, GþC-con-
tent can vary from 16.5% in Carsonella ruddii (Nakabachi
et al. 2006) to 75% in Anaeromyxobacter dehalogenans
(Sanford et al. 2002). Base composition within prokaryotic
genomes can also vary locally. For example, regions or genes
that were recently acquired by horizontal gene transfer can
differ significantly from the average base composition of the
genome (Lawrence and Ochman 1997). Furthermore, the
two strands of the bacterial chromosome can have different
compositional biases that are associated with leading and lag-
ging strand replication (Lobry 1996).
The diversity in GþC-content, both within and between
genomes, has engendered both neutral- (mutation bias or
GC-biased gene conversion) and selection-based hypotheses
for their origin. Perhaps, the simplest explanation for the im-
mense variation in GþC-content between and within
genomes is that they reflect prevailing mutation biases, or
mutation pressure. Freese (1962) and Sueoka (1962) pro-
posed that the GþC-content of genomes represents the equi-
librium state of the rate of mutations from G/C! A/T and A/T
! G/C. In this view, the amino acid composition of proteins
imposes constraints on the otherwise neutral evolution of
G+C-content, and hence only the G+C-content at silent sites
is expected to reach equilibrium from mutation pressure alone
(Sueoka 1988). Deviations from the expected equilibrium
have in turn been viewed as evidence of selection on GþC-
content, or evidence for other processes that influence GþC-
content, such as GC-biased gene conversion.
Base substitution patterns in genomes have been analyzed
by mutation experiments employing reporter loci, polymor-
phisms in natural populations, and MA experiments. Reporter
loci have the disadvantage of being confined to a single or
few locations in the genome, as well as the possibility that the
phenotypes for different mutations may not all take the same
time to develop, thereby potentially biasing the results.
Polymorphisms in natural populations may have been subject
to natural selection, and MA experiments are typically per-
formed in a single or few environments and may not reflect
the variation in mutation patterns found in the wild. The A/T
mutation bias in prokaryotes ranges from �0.6 to 16 in MA
experiments. The majority of MA experiments with wild-type
bacteria have found a mutation bias toward higher A/T con-
tent. MA experiments with E. coli found that in wild-type
strains, G/C ! A/T mutations occur at rates 1.24� 2�greater than A/T ! G/C mutations. All else being equal, an
A/T bias predicts that silent sites should be A/T-rich. Instead,
silent sites in E. coli tend to be slightly G/C-rich. Some species
with relatively G/C-rich genomes, such as B. cenocepacia
(66.8% G/C), Mycobacterium smegmatis (65.6% G/C), and
Deinococcus radiodurans (67% G/C), do indeed display a mu-
tation bias toward a higher G/C-content (Dillon et al. 2015;
Kucukyildirim et al. 2016). On the opposite end of the A/T
mutation bias spectrum is Mesoplasma florum with an A/T
bias of �16.0 (Sung, Ackerman, et al. 2012).
Indel rates can disproportionally affect repeats based on
GþC-content. In mismatch-repair-deficient lines of P. aerugi-
nosa, indels occurred primarily in homopolymeric runs of G/C
base pairs (Dettman et al. 2016). Furthermore, there was an
evident strand bias in the indel rate as indels were more com-
mon with a G in the lagging strand template compared with
the leading strand. In B. cenocepacia, G/C base pairs were
deleted more frequently than A/T base pairs without a com-
measurable increase in G/C base pair insertions compared
with A/T insertions. This bias toward deletions in G/C base
pairs would contribute to an increase in the AþT-content of
genomes in the absence of opposing selective mechanisms
for increasing or maintaining high GþC-content.
Unsurprisingly, there is a correlation between the predicted
and the observed G+C-content of prokaryotic genomes.
However, the observed G+C-contents tend to be greater
than predicted by mutation pressure alone. This difference
reflects, among other things, the constraints that the genetic
code places on the base composition of genome. Amino acids
with high G/C codons are required for protein function in
genomes regardless of the mutation bias, and this sets limits
to the degree to which nucleotide composition of the ge-
nome reflects the prevailing mutation biases. In addition, se-
lection on silent sites and G/C-biased gene conversion also
contribute to the deviation of the observed from the expected
base composition of genomes. Furthermore, the deviations
from the equilibrium G+C-content (GCeq) can also contribute
to the variation in mutation rates. The higher G+C-content of
Mutation Accumulation Meets Genomics GBE
Genome Biol. Evol. 11(1):136–165 doi:10.1093/gbe/evy252 Advance Access publication November 26, 2018 153
Dow
nloaded from https://academ
ic.oup.com/gbe/article/11/1/136/5209700 by guest on 13 January 2022
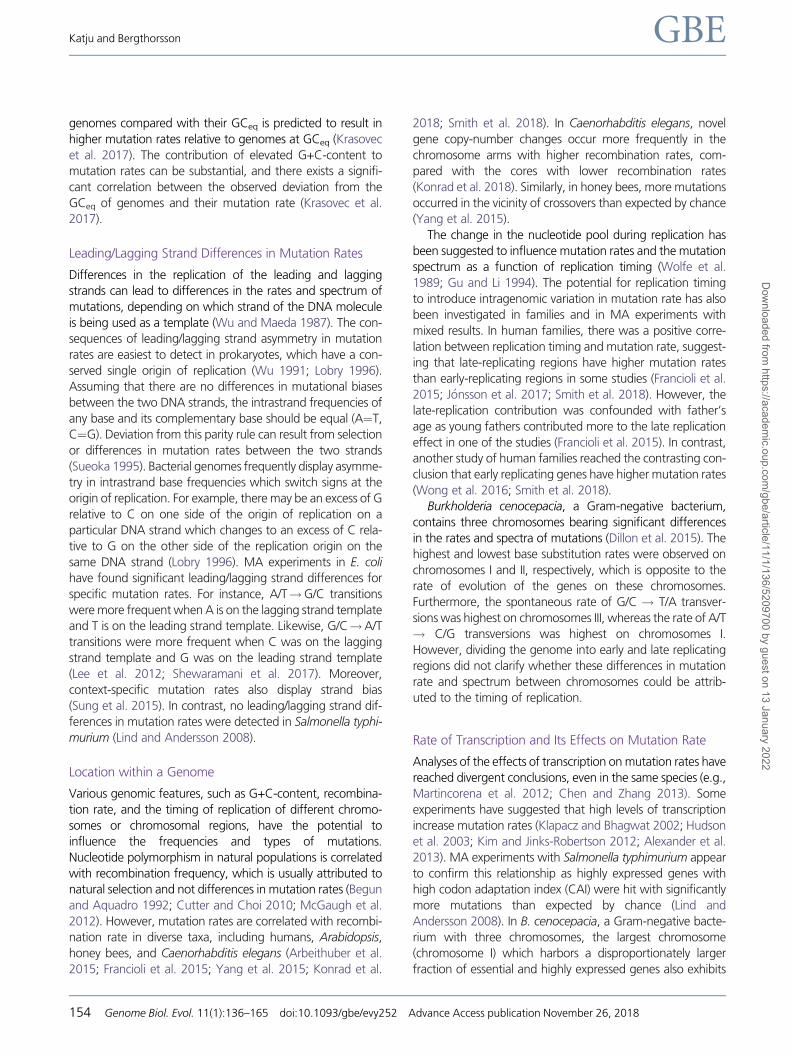
genomes compared with their GCeq is predicted to result in
higher mutation rates relative to genomes at GCeq (Krasovec
et al. 2017). The contribution of elevated G+C-content to
mutation rates can be substantial, and there exists a signifi-
cant correlation between the observed deviation from the
GCeq of genomes and their mutation rate (Krasovec et al.
2017).
Leading/Lagging Strand Differences in Mutation Rates
Differences in the replication of the leading and lagging
strands can lead to differences in the rates and spectrum of
mutations, depending on which strand of the DNA molecule
is being used as a template (Wu and Maeda 1987). The con-
sequences of leading/lagging strand asymmetry in mutation
rates are easiest to detect in prokaryotes, which have a con-
served single origin of replication (Wu 1991; Lobry 1996).
Assuming that there are no differences in mutational biases
between the two DNA strands, the intrastrand frequencies of
any base and its complementary base should be equal (A¼T,
C¼G). Deviation from this parity rule can result from selection
or differences in mutation rates between the two strands
(Sueoka 1995). Bacterial genomes frequently display asymme-
try in intrastrand base frequencies which switch signs at the
origin of replication. For example, there may be an excess of G
relative to C on one side of the origin of replication on a
particular DNA strand which changes to an excess of C rela-
tive to G on the other side of the replication origin on the
same DNA strand (Lobry 1996). MA experiments in E. coli
have found significant leading/lagging strand differences for
specific mutation rates. For instance, A/T!G/C transitions
were more frequent when A is on the lagging strand template
and T is on the leading strand template. Likewise, G/C!A/T
transitions were more frequent when C was on the lagging
strand template and G was on the leading strand template
(Lee et al. 2012; Shewaramani et al. 2017). Moreover,
context-specific mutation rates also display strand bias
(Sung et al. 2015). In contrast, no leading/lagging strand dif-
ferences in mutation rates were detected in Salmonella typhi-
murium (Lind and Andersson 2008).
Location within a Genome
Various genomic features, such as G+C-content, recombina-
tion rate, and the timing of replication of different chromo-
somes or chromosomal regions, have the potential to
influence the frequencies and types of mutations.
Nucleotide polymorphism in natural populations is correlated
with recombination frequency, which is usually attributed to
natural selection and not differences in mutation rates (Begun
and Aquadro 1992; Cutter and Choi 2010; McGaugh et al.
2012). However, mutation rates are correlated with recombi-
nation rate in diverse taxa, including humans, Arabidopsis,
honey bees, and Caenorhabditis elegans (Arbeithuber et al.
2015; Francioli et al. 2015; Yang et al. 2015; Konrad et al.
2018; Smith et al. 2018). In Caenorhabditis elegans, novel
gene copy-number changes occur more frequently in the
chromosome arms with higher recombination rates, com-
pared with the cores with lower recombination rates
(Konrad et al. 2018). Similarly, in honey bees, more mutations
occurred in the vicinity of crossovers than expected by chance
(Yang et al. 2015).
The change in the nucleotide pool during replication has
been suggested to influence mutation rates and the mutation
spectrum as a function of replication timing (Wolfe et al.
1989; Gu and Li 1994). The potential for replication timing
to introduce intragenomic variation in mutation rate has also
been investigated in families and in MA experiments with
mixed results. In human families, there was a positive corre-
lation between replication timing and mutation rate, suggest-
ing that late-replicating regions have higher mutation rates
than early-replicating regions in some studies (Francioli et al.
2015; J�onsson et al. 2017; Smith et al. 2018). However, the
late-replication contribution was confounded with father’s
age as young fathers contributed more to the late replication
effect in one of the studies (Francioli et al. 2015). In contrast,
another study of human families reached the contrasting con-
clusion that early replicating genes have higher mutation rates
(Wong et al. 2016; Smith et al. 2018).
Burkholderia cenocepacia, a Gram-negative bacterium,
contains three chromosomes bearing significant differences
in the rates and spectra of mutations (Dillon et al. 2015). The
highest and lowest base substitution rates were observed on
chromosomes I and II, respectively, which is opposite to the
rate of evolution of the genes on these chromosomes.
Furthermore, the spontaneous rate of G/C ! T/A transver-
sions was highest on chromosomes III, whereas the rate of A/T
! C/G transversions was highest on chromosomes I.
However, dividing the genome into early and late replicating
regions did not clarify whether these differences in mutation
rate and spectrum between chromosomes could be attrib-
uted to the timing of replication.
Rate of Transcription and Its Effects on Mutation Rate
Analyses of the effects of transcription on mutation rates have
reached divergent conclusions, even in the same species (e.g.,
Martincorena et al. 2012; Chen and Zhang 2013). Some
experiments have suggested that high levels of transcription
increase mutation rates (Klapacz and Bhagwat 2002; Hudson
et al. 2003; Kim and Jinks-Robertson 2012; Alexander et al.
2013). MA experiments with Salmonella typhimurium appear
to confirm this relationship as highly expressed genes with
high codon adaptation index (CAI) were hit with significantly
more mutations than expected by chance (Lind and
Andersson 2008). In B. cenocepacia, a Gram-negative bacte-
rium with three chromosomes, the largest chromosome
(chromosome I) which harbors a disproportionately larger
fraction of essential and highly expressed genes also exhibits
Katju and Bergthorsson GBE
154 Genome Biol. Evol. 11(1):136–165 doi:10.1093/gbe/evy252 Advance Access publication November 26, 2018
Dow
nloaded from https://academ
ic.oup.com/gbe/article/11/1/136/5209700 by guest on 13 January 2022
the highest mutation rate of the genome’s three chromo-
somes (Dillon et al. 2015). The high mutation rate in chromo-
some I stands in contrast with the slower rate of molecular
evolution of genes on this chromosome. Although consistent
with mutagenic consequences of transcription, the difference
in mutation rate between different chromosomes could also
be the consequence of early versus late replication of different
chromosomes (Dillon et al. 2015). In contrast, experiments in
E. coli mutL mutants found a negative correlation between
CAI and the number of mutations, which suggests that gene
expression may not increase the mutation rate in E. coli (Lee
et al. 2012). In these cases, the rate of transcription was in-
ferred indirectly from CAI or location in the genome. Analysis
of MA in microalgae found that transcript abundance was
negatively associated with mutations in intergenic regions,
implicating transcription-coupled repair in reducing the mu-
tation rate (Krasovec et al. 2017). However, this association
was not detected in coding sequences of the same species
(Krasovec et al. 2017). The relative contributions of
transcription-coupled repair and transcription-associated mu-
tagenesis to the mutation rate seem to vary between species
and between regions of the genome, although in microbes,
transcription appears to cause a slight increase in their muta-
tion rates (Lynch et al. 2016).
Intraspecific Variation in Mutation Rates
MA studies with different strains within species have also
found that there can be significant intraspecific variation in
the mutation rate. The intraspecific variation in mutation rate
at a genome-wide level was elegantly demonstrated in MA
experiments with C. reinhardtii which found a 7-fold differ-
ence in mutation rate between six genetically diverse strains
(Ness et al. 2015). The causes of intraspecific variation in mu-
tation rates are still not well understood. It has been shown
that mutator alleles can increase in frequency during adapta-
tion to novel environments, and it is possible that some intra-
specific variation arises from transient alleles increasing the
mutation rate due to selection (Sniegowski et al. 1997;
Taddei et al. 1997; Raynes et al. 2011). However, variation
in mutation rate is also expected from mutation–selection
balance of novel detrimental mutations that increase the mu-
tation rate.
Paternal Contribution to Variation in Mutation Rates
Haldane (1935) suggested that mutation rates could be
higher in males than in females. This hypothesis is supported
by considerable evidence amassed from comparing variation
and divergence in the sex chromosomes relative to the auto-
somes (Miyata et al. 1987; Ellegren 2007; Wilson Sayres and
Makova 2011). WGS analysis of the frequency of spontane-
ous mutations in human families has provided direct estimates
of the relative paternal and maternal contributions to muta-
tion rates and moreover found a strong correlation with
paternal age (Kong et al. 2012; Francioli et al. 2015;
Jonsson et al. 2017). The male contribution to mutation
rate is primarily due to the greater number of cell divisions
in the male germline than in the female germline and not due
to a higher mutation rate per cell division in males (Link et al.
2017). It appears that the age of the father contributes sig-
nificantly to the variation in mutation among humans and
may, in fact, explain most of the variation in mutation rates
in human families (Kong et al. 2012; Jonsson et al. 2017). This
association with paternal age has also been observed in chim-
panzees (Venn et al. 2014). The strong male contribution to
mutation frequency would also contribute to interspecific var-
iation in mutation rate as, all else being equal, species with
older breeding males should have higher per generation mu-
tation rates relative to species with young breeding males. An
analysis of new mutations in a family of collared flycatchers
found only slightly more mutations attributable to males than
females, as well as an overall lower mutation rate compared
with humans (Smeds et al. 2016). The authors speculated that
lower mutation rates in birds and mice compared with
humans and chimpanzees can in part be explained by pater-
nal mutations (Smeds et al. 2016).
Transcriptional Consequences ofSpontaneous Mutations
The first progression toward understanding the eventual phe-
notypic consequences of mutation is to determine the influ-
ence of mutations on the evolution of gene expression.
Alterations in the expression profiles of both protein-coding
and regulatory genes can effect morphological change, with a
growing body of evidence implicating a strong role for regu-
latory changes in the process that was previously obscured
(Beldade et al. 2002; Wittkopp et al. 2003; Wray et al. 2003;
Abzhanov et al. 2004; Shapiro et al. 2004; Fay and Wittkopp
2008; Romero et al. 2012). The genomics revolution has fa-
cilitated the development of technologies capable of gener-
ating a transcriptome, namely the quantification of an entire
set of transcripts in a cell specific to a particular environmental
condition and unique developmental stage of an organism.
The transcripts under study are not restricted to mRNAs; in-
deed, a major goal of transcriptomics is enable analysis of all
flavors of transcripts additionally encompassing noncoding
RNA and small RNAs (Wang et al. 2009). In the late 1990s
and early 2000s, hybridization-based approaches involving
custom-made or commercial microarrays initially served as
the method of choice for investigating patterns of global
gene expression. However, a major limitation of microarray
technology is its dependence on an a priori known genome
sequence to facilitate probe design, which certainly played a
role in restricting initial transcriptome analysis to that of a
handful of model species. Microarray technology has further
limitations, namely 1) greater noise in a data set stemming
from high background levels due to cross-hybridization which
Mutation Accumulation Meets Genomics GBE
Genome Biol. Evol. 11(1):136–165 doi:10.1093/gbe/evy252 Advance Access publication November 26, 2018 155
Dow
nloaded from https://academ
ic.oup.com/gbe/article/11/1/136/5209700 by guest on 13 January 2022
can lead to spurious correlations (Okoniewski and Miller
2006), 2) limits to range of detection due to background
and saturation of signals, and 3) challenges associated with
the comparison of expression profiles across different sets of
experiments (Wang et al. 2009). Commencing in 2008, the
high-throughput, sequence-based approach of RNA-Seq has
revolutionized the field of transcriptomics given 1) its nonre-
liance on existing genomic sequence information and hence,
suitability to nonmodel as well as model organisms, 2) high
level of resolution in determining the precise location of tran-
scription boundaries, 3) extremely low background signal, 4)
the ability to detect a wide range of expression levels (both
extremely low and high), 5) high reproducibility across tech-
nical and biological replicates, and 6) relatively low cost
(reviewed by Wang et al. 2009).
Spontaneous MA experiments provide a powerful frame-
work to investigate divergence in global transcription profiles
due to accumulated genetic changes without interference from
the effects of purifying selection. Expression profiles of MA lines
relative to the ancestral control in themselves offer key insights
into the divergence of expression profiles due to the input of
new genetic variants. However, if all ensuing genetic changes
in MA lines have been characterized via genome sequencing a
priori, it further enables the dissection of gene expression alter-
ation as a function of the particular characteristics of the mu-
tation in question, both with respect to its genomic location
and mutation class (coding vs. regulatory, single nucleotide
polymorphisms vs. CNVs vs. small indels, etc.). To date, only
six studies have examined long-term MA lines of three eukary-
otic species to offer the first glimpses into the influence of
spontaneous MA on gene expression divergence with the ma-
jority (all but two) using hybridization-based, microarray tech-
nology. It remains to be seen if the initial conclusions of the
microarray studies can be recapitulated with the application of
the more modern approach of RNA-Seq.
Denver et al. (2005) applied a microarray approach to four
Caenorhabditis elegans MA lines propagated across 280 con-
secutive MA generations, their ancestral N2 control, and five
natural isolates in order to examine and contrast global ex-
pression patterns under conditions of genetic drift (MA lines)
versus strong natural selection (natural isolates). Rifkin et al.
(2005) conducted a similar transcriptome analysis of 12 D.
melanogaster lines following their passage through 200 MA
generations using microarray technology. Gene expression
levels were measured at two developmental stages, namely
the third larval instar and at puparium formation. Landry et al.
(2007) extended these investigations to a unicellular eukary-
ote by examining four MA lines of S. cerevisiae propagated for
4,000 generation at Ne ¼ 10. Huang et al. (2016) assessed
transcriptional divergence of 25 D. melanogaster lines main-
tained by full-sib mating at N¼ 20 following 60 MA gener-
ations. Most recently, Zalts and Yanai (2017) conducted the
first RNA-Seq analysis of gene expression during the embry-
onic development of 19 Caenorhabditis elegans MA lines
following 250 generations followed by Konrad et al. (2018)
who investigated the transcriptional consequences of copy-
number changes in Caenorhabditis elegans MA lines sub-
jected to varying intensity of selection.
Relative Roles of Selection versus Drift in Shaping theEvolution of Expression Divergence
Phenotypic variation within a population (including gene ex-
pression) can be partitioned into genetic (Vg) and/or environ-
mental (Ve) components (Falconer and Mackay 1996; Lynch
and Walsh 1998). In the case of MA lines, between-line ge-
netic variation can be attributed to the input of novel spon-
taneous mutations (Vm), and the within-line phenotypic
variation due to environmental or technical noise (Ve, or its
proxy, the residual variance Vr). The relative roles of neutral
evolution versus selection in shaping expression divergence
can be investigated by comparing the gene-specific ratios of
transcriptional genetic variance (Vg) in the natural isolates with
the transcriptional mutational variance (Vm) in the MA lines.
Specifically, Vm is defined as the per-generation increase in
trait variance across a population that is due to mutation
alone whereas Vg represents the among-line or standing ge-
netic variance. If gene expression divergence is neutral, the
expected Vg/Vm ratio is equal to 4Ne in a self-fertilizing diploid
species, such as Caenorhabditis elegans (Lynch and Hill 1986).
An increasing role for purifying selection in constraining tran-
script abundance will manifest as smaller observed Vg/Vm ra-
tios. Denver et al. (2005) found all the observed Vg/Vm ratios
to be well below the neutral expectation, which suggests that
strong stabilizing selection constrains gene expression in the
wild. Patterns of expression divergence in two independent
sets of Drosophila MA lines (Rifkin et al. 2005; Huang et al.
2016) recapitulate the conclusion from the Caenorhabditis
elegans study that strong stabilizing selection has far greater
influence than drift in shaping the evolution of gene expres-
sion. The observed expression divergence between species (D.
melanogaster, Drosophila simulans, and Drosophila yakuba)
was much lower than expected given the Vm estimates for
transcription in the MA lines and a neutral model for compar-
ison (Rifkin et al. 2005).
Gene Functionality and the Potential for TranscriptionalEvolution
Are genes equally mutable in their ability to diverge at the
transcriptional level? Patterns of observed nucleotide diver-
gence among orthologous genes in diverse organisms would
suggest otherwise, given that some genes can remain virtually
unchanged in sequence over lengthy evolutionary periods
whereas others exhibit accelerated sequence evolution.
These divergent patterns in the rates of sequence evolution
of different genes have long been taken to imply that selective
constraints can vary considerably among genes involved in
different biological processes. An examination of gene
Katju and Bergthorsson GBE
156 Genome Biol. Evol. 11(1):136–165 doi:10.1093/gbe/evy252 Advance Access publication November 26, 2018
Dow
nloaded from https://academ
ic.oup.com/gbe/article/11/1/136/5209700 by guest on 13 January 2022
expression profiles offers a more direct approach to investi-
gate the differential capacity of genes to evolve at the tran-
scriptional level and determine whether gene-specific
patterns are shared across diverse species.
In Caenorhabditis elegans, genes involved in carbohydrate,
amino acid, and lipid metabolism as a class appeared to be
under the least influence of stabilizing selection. In contrast,
genes implicated in the signal transduction pathway exhibited
a strong signature of stabilizing selection (Denver et al. 2005).
A similar pattern was recapitulated in D. melanogaster. Genes
involved in essential cellular functions relating to transcription,
translation, cell cycle, and energy metabolism displayed sig-
nificantly lower variability in expression suggesting stringent
selective constraints, whereas those encoding enzymes and
structural proteins involved in chitin metabolism, iron binding,
and sensory perception of chemical stimuli displayed a signif-
icant capacity for gene expression evolution (Rifkin et al.
2005; Huang et al. 2016). Zalts and Yanai (2017) used an
RNA-Seq platform to explore gene expression variation during
embryonic development in Caenorhabditis elegans spanning
seven stages, from a four-cell embryo to a newly hatched L1
larva. Gene expression divergence was found to be signifi-
cantly depleted in mid-embryogenesis which marks a highly
constrained developmental stage across diverse species, with
homeodomain transcription factors and genes responsible for
the integration of germ layers during morphogenesis evolving
under stringent selection.
Relative Roles of Cis- versus Trans-acting Changes in theEvolution of Gene Expression
MA experiments are especially amenable to understanding
the rate of evolution of expression divergence, given that
the evolutionary time since divergence from the ancestral con-
trol is precisely known. A determination of the rate of expres-
sion divergence relative to the rate of genic changes further
enables the disentangling of the relative roles of cis- versus
trans-mutations in effecting the evolution of gene expression.
Approximately two-thirds of the differentially expressed genes
in the Caenorhabditis elegans MA lines were restricted to
seven sets of coregulated genes, which suggests that most
of the observed global change in transcription patterns was
due to mutations at relatively few trans-acting loci with pleio-
tropic effects (Denver et al. 2005). Mutations with multiple
trans-acting effects are likely to be deleterious and would be
weeded out by purifying selection in natural populations.
Furthermore, genes in close proximity to one another were
also overrepresented among the set of differentially expressed
genes, which suggests an influence of cis-acting regulatory
mutations, changes in chromatin organization or novel CNVs.
Indeed, Gibson (2005) examined Denver et al.’s (2005)
Caenorhabditis elegans data and estimated that the rate of
gene expression divergence is approximately an order of mag-
nitude higher than the rate of genic change per line per
generation, implicating the contribution of both cis- and
trans-acting mutations toward changes in expression.
Are Gene Expression Patterns Associated with ParticularFeatures of the Genetic and Genomic Architecture?
Given the considerable variation in the genome organization
of different groups of organisms, how might a species’ pre-
vailing genomic and genetic architecture impinge on the evo-
lution of its transcriptome? The genomes of eukaryotic
species are highly variable in size and can comprise large
expanses of repetitive, gene-poor regions of low complexity
as well as a high incidence of selfish genetic elements.
Furthermore, there exists genomic variation in recombination
frequency which in conjunction with selection further influ-
ences the patterns of nucleotide variation. In Caenorhabditis
elegans, gene organization is nonrandom within and be-
tween chromosomes (Cutter et al. 2009) comprising gene-
poor autosomal arms with high rates of recombination versus
gene-rich, centrally located autosomal clusters/cores exhibit-
ing limited recombination (Barnes et al. 1995; Rockman and
Kruglyak 2009). Caenorhabditis elegans MA lines with differ-
ential gene expression were not significantly biased toward
autosomal arms versus core regions. In contrast, differentially
expressed genes in the natural isolate lines exhibited a signif-
icant distributional bias toward autosomal arms (Denver et al.
2005) which was taken to represent stronger purifying selec-
tion against expression divergence of core-residing genes.
Additionally, Huang et al. (2016) used Vm/Vg as an indicator
of the strength of the apparent stabilizing selection to observe
stronger constraints on the expression of X-linked genes in D.
melanogaster, with a more pronounced effect in males rela-
tive to females.
Transcriptional Consequences of Copy-Number Changes
The three previously mentioned studies investigated genome-
wide changes in transcription following MA, but did not an-
alyze the transcriptional consequences of any particular class
of mutation. Gene duplications, a class of copy-number
changes, have the potential to alter transcript abundance of
any gene contained within the duplication tract as well as
other genes whose transcription is under the direct or indirect
control of the duplicated genes. A handful of recent studies
aiming to investigate the role of segmental gene duplications
in shaping gene expression patterns have arrived at contrast-
ing conclusions. Some studies of gene duplications in natural
or laboratory populations of yeast, Drosophila, and mammals
have concluded a minimal or no change in gene expression
associated with an increase in gene copy-number (Qian et al.
2010; Guschanski et al. 2017; Rogers et al. 2017). In stark
contrast, an engineered duplication inserted into different
locations in the Drosophila genome often resulted in a >2-
fold increase in transcript abundance (Loehlin and Carroll
2016). Konrad et al. (2018) specifically investigated the
Mutation Accumulation Meets Genomics GBE
Genome Biol. Evol. 11(1):136–165 doi:10.1093/gbe/evy252 Advance Access publication November 26, 2018 157
Dow
nloaded from https://academ
ic.oup.com/gbe/article/11/1/136/5209700 by guest on 13 January 2022
transcriptional consequences of gene copy-number changes
in Caenorhabditis elegans MA lines under minimal selection
(N¼ 1) and observed that the average increase in transcript
abundance following gene duplication significantly exceeded
2-fold. This suggests that the lack of significant increase in
transcript abundance of gene duplicates in wild or laboratory
populations is either the result of selection against duplica-
tions that lead to increased transcription, or secondary muta-
tions that downregulate the transcription of duplicated genes.
Konrad et al.’s (2018) study in Caenorhabditis elegans also
implemented a modified MA approach with different popu-
lation bottlenecks of N¼ 1, 10, and 100 individuals per gen-
eration, thereby modulating the intensity of selection during
experimental evolution. Bottlenecks of single individuals allow
genetic drift to operate to the maximum degree possible, and
larger MA populations are expected to experience greater
selection intensity against deleterious mutations, inversely
proportional to the Ne. MA lines with larger population bottle-
necks (N¼ 10 and 100 individuals) had a significantly lower
increase in average transcript abundance of duplicated genes
relative to standard MA lines with single individual bottlenecks
in every generation (N¼ 1). Furthermore, the genes dupli-
cated in MA lines maintained at larger population sizes had
significantly lower ancestral transcript abundance than the
genes duplicated in the N¼ 1 lines. Together, these results
show that 1) duplications of highly expressed genes are more
detrimental than duplications of genes with low transcript
abundance, and 2) the deleterious fitness consequences of
duplications are associated with the increase in transcript
abundance they engender.
Evolution of Canalization in Response to Genetic versusEnvironmental Perturbations
Phenotypic variability in organisms can display remarkable ro-
bustness despite exposure to persistent genetic and environ-
mental perturbations, often referred to as canalization
(Waddington 1942). While genetic and environmental pertur-
bations appear to be distinct processes, the mechanism of buff-
ering, itself, may be an evolutionarily shared, generic response
to constrain the effects of any class of perturbations
(Meiklejohn and Hartl 2002). Under this scenario, traits that
are buffered against the effects of environmental perturbations
may also be buffered to a similar degree against the effects of
genetic mutations. In other words, does genetic variation ac-
cumulate faster (or slower) in genes exhibiting greater (or low-
ered) plasticity in response to environmental perturbations? In
technical terms, this would be manifested as a significant pos-
itive correlation between the mutational variance (Vm) and en-
vironmental (residual) variance (Ve or Vr) which has been
observed in three studies studying gene expression divergence
in D. melanogaster (Rifkin et al. 2005; Huang et al. 2016) and S.
cerevisiae (Landry et al. 2007). These results would imply that
perturbations, irrespective of source (genetic or environmental),
affect gene expression in similar ways and the evolved genetic
mechanism(s) for promoting or buffering the transcriptional
response may be the same.
Epigenetic Changes during MA
Cytosine methylation is a widespread form of DNA modifica-
tion in eukaryotes and is associated with epigenetic silencing
of genes and transposons. The rate at which epigenetic mod-
ifications to the DNA are gained and lost (epimutations) is
essential for understanding the population dynamics of epi-
genetic variation and its contribution to adaptation or the
genetic load (Slatkin 2009; Furrow and Feldman 2014; van
der Graaf et al. 2015). The introduction of a sodium bisulfate
treatment to genomic DNA, which converts unmethylated
cytosines to uracil, allows for the genome-wide analysis of
cytosine methylation. Several studies have applied these
methods to MA lines of Arabidopsis to measure the rate
and spectrum of epigenetic mutations (Becker et al. 2011;
Schmitz et al. 2011; Jiang et al. 2014; van der Graaf et al.
2015). The estimated epigenetic mutation rate of CpG dinu-
cleotides in Arabidopsis ranges from 2.56� 10�4 to
6.30� 10�4 per nucleotide per generation, with methylation
losses close to 3-fold more common than methylation gains
(Schmitz et al. 2011; van der Graaf et al. 2015). The excess of
gains over losses is consistent with the proportion of CpG sites
that are methylated in the genome. However, plant transpos-
able elements, which are heavily methylated at CpG sites,
have a methylation loss rate that is much lower, at �1/30
of the gain rate. It appears that the methylation patterns of
transposable elements can be explained by a low ratio of
gains to loss of CpG methylation. The environment can influ-
ence both the rate of mutations as well as the rate of epimu-
tations. One set of experiments with Arabidopsis measured
the mutation rate and the rate of changes in methylated
cytosines in plants reared in a standard soil versus highly saline
soil (Jiang et al. 2014). The mutation rate was 2-fold higher for
plants grown in a high-salinity soil, with the rate of transver-
sions exceeding that of transitions. Furthermore, differentially
methylated CpG sites were increased by 40% in plants from
the high-saline soil.
A common objection to the long-term evolutionary poten-
tial of epimutations is that they are too unstable (Slatkin 2009;
Furrow 2014). The high rate of epimutations is certainly borne
out with the analyses of these MA lines as the per-nucleotide
epimutation rate is 5 orders of magnitude higher than the
DNA-based mutation rate. Nonetheless, epimutations may
be stable enough to respond to selection (van der Graaf
et al. 2015).
Conclusions and Future Directions
The mutation rate is a fundamental parameter for under-
standing a multitude of biological phenomena. Attempts to
Katju and Bergthorsson GBE
158 Genome Biol. Evol. 11(1):136–165 doi:10.1093/gbe/evy252 Advance Access publication November 26, 2018
Dow
nloaded from https://academ
ic.oup.com/gbe/article/11/1/136/5209700 by guest on 13 January 2022
estimate mutation rates have a long history in evolutionary
biology and have utilized a wide variety of methods, including
direct observations of mutant phenotypes under laboratory
conditions, estimates from polymorphisms in natural popula-
tions, and analysis of silent site divergence between taxa
(reviewed by Kondrashov FA and Kondrashov AS 2010).
The wide availability of cost-effective next-generation se-
quencing methods and computing power has provided un-
precedented opportunities for direct measurements of
mutation rates in a wide variety of taxa. In some cases, the
measurements can be made by parent–offspring genotype
comparisons (parent–offspring trios) and counting the num-
ber of mutations across a single generation. This is a reason-
able approach for taxa that have a relatively high number of
mutations per generation. Humans, for example, have a base
substitution rate ranging from 1.1 to 1.7� 10�8/site/genera-
tion yielding �100 new mutations in an offspring
(Kondrashov 2002; Lynch 2016, and references therein).
However, many taxa have much lower mutation rates and
no new mutations in the majority of their offspring. For ex-
ample, model organisms, such as D. melanogaster,
Caenorhabditis elegans and A. thaliana, have base substitu-
tion rates on the order of 10�9/nucleotide site/generation
whereas bacteria and protists have even lower mutation rates
on the order of 10�10 and 10�11–10�12/nucleotide site/gen-
eration (table 1). Multigenerational MA experiments part-
nered with high-throughput genomic technologies have
proved indispensable in enabling robust measures of muta-
tion rates and their properties for these organisms.
MA experiments can be labor- and time-intensive, and it
can take a substantial time investment to reap rewards in the
form of new and exciting data. However, many processes that
contribute to heritable variation and evolutionary change are
rare, and if we are to investigate them experimentally rather
than being content with retrospective analysis of extant
organisms, MA experiments are still an unparalleled experi-
mental approach. MA experiments continue to provide us
with important information about mutational processes and
their consequences. The broad variation in mutation rates
across the tree of life, most of which have been measured
in MA lines, has resulted in an original theory of the evolution
of mutation rates, the drift-barrier hypothesis (Sung,
Ackerman, et al. 2012). MA-WGS studies have been crucial
in revealing a significant contribution of copy-number
changes to standing genetic variation across diverse genomes,
by enabling direct estimation of the spontaneous rates of
gene duplication and deletion, on the order of 10�5–10�7/
gene/generation (table 3). This discovery has engendered a
recognition of a significant role of CNVs in generating intra-
specific genetic variation, the full functional and phenotypic
consequences of which remain obscure. Future investigations
should focus on further elucidating the transcriptional, phe-
notypic, and fitness consequences of this form of genetic
variation that until now has been largely ignored. Indeed,
Konrad et al.’s study (2018) on the transcriptional consequen-
ces of copy-number changes in Caenorhabditis elegans MA
lines has taken a first step in this direction to demonstrate that
while gene duplications play a unique role in adaptation and
the origin of evolutionary novelties, their immediate transcrip-
tional consequences are deleterious with respect to fitness.
The application of WGS to novel mutations in organelles is
giving insights into the population dynamics of mutations at a
different level altogether, within the cytoplasm. These exam-
ples come from only a few species and it is of great impor-
tance to expand this sample to include more taxa beyond the
traditional model organisms to elucidate general patterns
and, perhaps, important and illustrative exceptions. Next-
generation sequencing technology has also aided in the de-
tection of low-frequency heteroplasmic variants and demon-
strated their pervasiveness within mitochondrial genomes
(Haag-Liautard et al. 2008; Konrad et al. 2017). This in turn
suggests that the mitochondrial effective population size may
be greater than previously recognized.
MA as an experimental system was originally conceived as
a method to measure the rate of deleterious mutations, but it
is now emerging as a powerful framework to analyze the
molecular spectrum of mutations and their transcriptional
consequences. The MA model should also be extended be-
yond standard DNA-based genotyping of base substitutions,
indels, and structural variants. In this respect, we have already
seen a handful of MA experiments that have investigated the
transcriptional consequences of mutations. It is possible that
changes in gene regulation are of greater importance in evo-
lution than changes in protein structure. The first few experi-
ments analyzing transcriptional changes in MA lines highlight
that regulation of gene expression is under strong selection.
This is an area that has a lot of untapped potential and should
be extended. Another important topic that can be addressed
with MA experiments is the rate and stability of epimutations.
Perhaps, one of the most promising future directions that
MA experiments can take is the use of a modified MA design
with differing population size treatments. Thus far, the vast
majority of MA studies have maintained the focal organism at
a constant minimal Ne for the purpose of drastically reducing
the efficacy of selection and enabling the accumulation of the
vast majority of mutations (all but the most deleterious mu-
tation that confer complete sterility or mortality). A recent
spontaneous MA study in Caenorhabditis elegans (Konrad
et al. 2017, 2018) maintained multiple replicate lines at the
minimal population size (N¼ 1) but additionally encompassed
replicate populations maintained at incrementally increasing
population sizes of N¼ 10 and N¼ 100 individuals per gen-
eration. The varying Ne treatment offers a powerful frame-
work to assess how spontaneous mutational input in
conjunction with varying strengths of natural selection shapes
genomes. Indeed, Halligan and Keightley (2009) highlighted a
sore need for future studies exploring MA in populations of
different sizes in order to reveal the distribution of fitness
Mutation Accumulation Meets Genomics GBE
Genome Biol. Evol. 11(1):136–165 doi:10.1093/gbe/evy252 Advance Access publication November 26, 2018 159
Dow
nloaded from https://academ
ic.oup.com/gbe/article/11/1/136/5209700 by guest on 13 January 2022
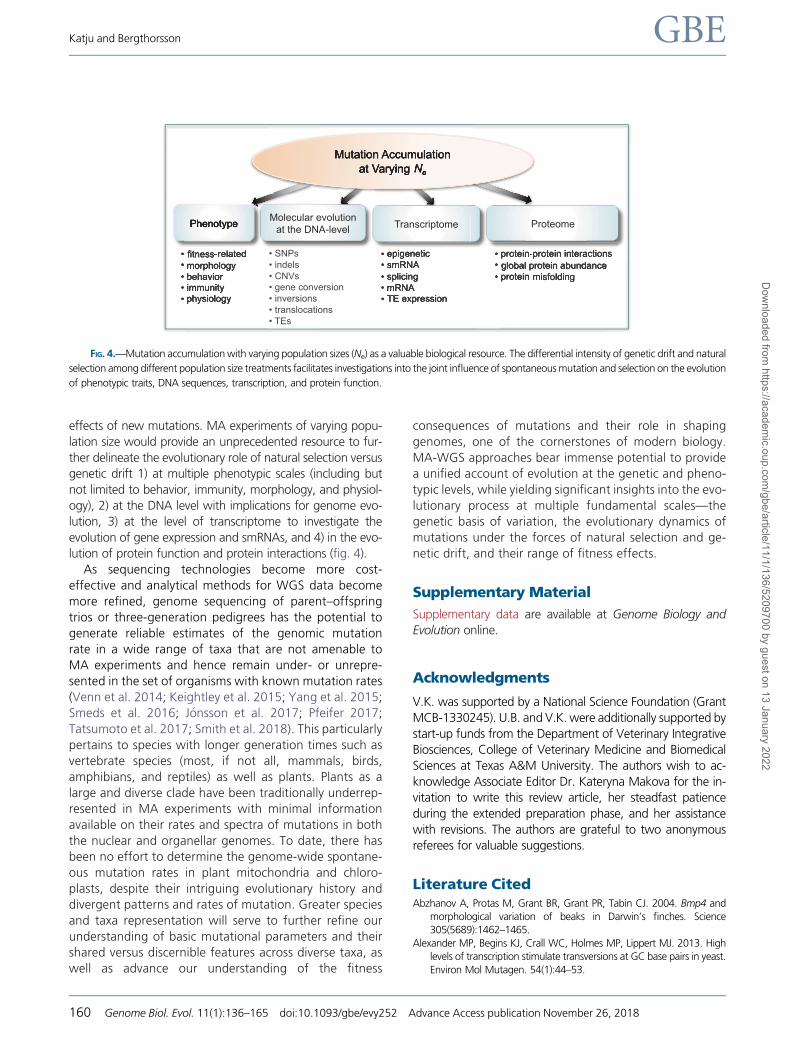
effects of new mutations. MA experiments of varying popu-
lation size would provide an unprecedented resource to fur-
ther delineate the evolutionary role of natural selection versus
genetic drift 1) at multiple phenotypic scales (including but
not limited to behavior, immunity, morphology, and physiol-
ogy), 2) at the DNA level with implications for genome evo-
lution, 3) at the level of transcriptome to investigate the
evolution of gene expression and smRNAs, and 4) in the evo-
lution of protein function and protein interactions (fig. 4).
As sequencing technologies become more cost-
effective and analytical methods for WGS data become
more refined, genome sequencing of parent–offspring
trios or three-generation pedigrees has the potential to
generate reliable estimates of the genomic mutation
rate in a wide range of taxa that are not amenable to
MA experiments and hence remain under- or unrepre-
sented in the set of organisms with known mutation rates
(Venn et al. 2014; Keightley et al. 2015; Yang et al. 2015;
Smeds et al. 2016; J�onsson et al. 2017; Pfeifer 2017;
Tatsumoto et al. 2017; Smith et al. 2018). This particularly
pertains to species with longer generation times such as
vertebrate species (most, if not all, mammals, birds,
amphibians, and reptiles) as well as plants. Plants as a
large and diverse clade have been traditionally underrep-
resented in MA experiments with minimal information
available on their rates and spectra of mutations in both
the nuclear and organellar genomes. To date, there has
been no effort to determine the genome-wide spontane-
ous mutation rates in plant mitochondria and chloro-
plasts, despite their intriguing evolutionary history and
divergent patterns and rates of mutation. Greater species
and taxa representation will serve to further refine our
understanding of basic mutational parameters and their
shared versus discernible features across diverse taxa, as
well as advance our understanding of the fitness
consequences of mutations and their role in shaping
genomes, one of the cornerstones of modern biology.
MA-WGS approaches bear immense potential to provide
a unified account of evolution at the genetic and pheno-
typic levels, while yielding significant insights into the evo-
lutionary process at multiple fundamental scales—the
genetic basis of variation, the evolutionary dynamics of
mutations under the forces of natural selection and ge-
netic drift, and their range of fitness effects.
Supplementary Material
Supplementary data are available at Genome Biology and
Evolution online.
Acknowledgments
V.K. was supported by a National Science Foundation (Grant
MCB-1330245). U.B. and V.K. were additionally supported by
start-up funds from the Department of Veterinary Integrative
Biosciences, College of Veterinary Medicine and Biomedical
Sciences at Texas A&M University. The authors wish to ac-
knowledge Associate Editor Dr. Kateryna Makova for the in-
vitation to write this review article, her steadfast patience
during the extended preparation phase, and her assistance
with revisions. The authors are grateful to two anonymous
referees for valuable suggestions.
Literature CitedAbzhanov A, Protas M, Grant BR, Grant PR, Tabin CJ. 2004. Bmp4 and
morphological variation of beaks in Darwin’s finches. Science
305(5689):1462–1465.
Alexander MP, Begins KJ, Crall WC, Holmes MP, Lippert MJ. 2013. High
levels of transcription stimulate transversions at GC base pairs in yeast.
Environ Mol Mutagen. 54(1):44–53.
FIG. 4.—Mutation accumulation with varying population sizes (Ne) as a valuable biological resource. The differential intensity of genetic drift and natural
selection among different population size treatments facilitates investigations into the joint influence of spontaneous mutation and selection on the evolution
of phenotypic traits, DNA sequences, transcription, and protein function.
Katju and Bergthorsson GBE
160 Genome Biol. Evol. 11(1):136–165 doi:10.1093/gbe/evy252 Advance Access publication November 26, 2018
Dow
nloaded from https://academ
ic.oup.com/gbe/article/11/1/136/5209700 by guest on 13 January 2022
Andersson DI, Hughes D. 1996. Muller’s ratchet decreases fitness of a
DNA-based microbe. Proc Natl Acad Sci U S A. 93(2):906–907.
Arbeithuber B, Betancourt AJ, Ebner T, Tiemann-Boege I. 2015.
Crossovers are associated with mutation and biased gene con-
version at recombination hotspots. Proc Natl Acad Sci U S A.
112(7):2109–2114.
Assaf ZJ, Tilk S, Park J, Siegal ML, Petrov DA. 2017. Deep sequencing of
natural and experimental populations of Drosophila melanogaster
reveals biases in the spectrum of new mutations. Genome Res.
27(12):1988–2000.�Avila A, Garcia-Dorado A. 2002. The effects of spontaneous mutation on
competitive fitness in Drosophila melanogaster. J Evol Biol.
15(4):561–566.
Avise JC. 2000. Phylogeography: the history and formation of species.
Cambridge: Harvard University Press.
Azevedo RBR, et al. 2002. Spontaneous mutational variation for body size
in Caenorhabditis elegans. Genetics 162:755–765.
Baer CF, et al. 2005. Comparative evolutionary genetics of spontaneous
mutations affecting fitness in rhabditid nematodes. Proc Natl Acad Sci
U S A. 102(16):5785–5790.
Baer CF, Miyamoto MM, Denver DR. 2007. Mutation rate variation in
multicellular eukaryotes: causes and consequences. Nat Rev Genet.
8(8):619–631.
Ballard JWO, Whitlock MC. 2004. The incomplete natural history of mi-
tochondria. Mol Ecol. 13(4):729–744.
Barnes TM, Kohara Y, Coulson A, Hekimi S. 1995. Meiotic recombination,
noncoding DNA and genomic organization in Caenorhabditis elegans.
Genetics 141(1):159–179.
Barr CM, Neiman M, Taylor DR. 2005. Inheritance and recombination of
mitochondrial genomes in plants, fungi and animals. New Phytol.
l68:39–50.
Becker C, et al. 2011. Spontaneous epigenetic variation in the Arabidopsis
thaliana methylome. Nature 480(7376):245–249.
Begun DJ, Aquadro CF. 1992. Levels of naturally occurring DNA polymor-
phism correlate with recombination rates in D. melanogaster. Nature
356(6369):519–520.
Behringer MG, Hall DW. 2016. Genome-wide estimates of mutation rates
and spectrum in Schizosaccharomyces pombe indicate CpG sites are
highly mutagenic despite the absence of DNA methylation. G3
12:149–160.
Beldade P, Brakefield PM, Long AD. 2002. Contribution of distal-less to
quantitative variation in butterfly eyespots. Nature
415(6869):315–318.
Benzer S. 1961. On the topography of genetic fine structure. Proc Natl
Acad Sci U S A. 47(3):403–415.
Bergstrom CT, Pritchard J. 1998. Germline bottlenecks and the evolution-
ary maintenance of mitochondrial genomes. Genetics
149(4):2135–2146.
Bergthorsson U, Adams KL, Thomason B, Palmer JD. 2003. Widespread
horizontal transfer of mitochondrial genes in flowering plants. Nature
424(6945):197–201.
Bergthorsson U, Katju V. 2016. Gene Copy-Number Changes in
Evolution. In eLS, John Wiley & Sons, Ltd (Ed.). doi:10.1002/
9780470015902.a0026319
Birky CW. 2001. The inheritance of genes in mitochondria and chloro-
plasts: laws, mechanisms and models. Annu Rev Genet.
35(1):125–148.
Bowe LM, Coat G, dePamphilis CW. 2000. Phylogeny of seed plants based
on all three genomic compartments: extant gymnosperms are mono-
phyletic and Gnetales’ closest relatives are conifers. Proc Natl Acad Sci
U S A. 97(8):4092–4097.
Breton S, Beaupr�e HC, Stewart DT, Hoeh WR, Blier PU. 2007. The unusual
system of doubly uniparental inheritance of mtDNA: isn’t one
enough? Trends Genet. 23(9):465–474.
Brown WM, Prager EM, Wan A, Wilson AC. 1982. Mitochondrial DNA
sequences in primates: tempo and mode of evolution. J Mol Evol.
18(4):225–239.
Caballero A, Keightley PD. 1994. A pleiotropic nonadditive model of var-
iation in quantitative traits. Genetics 138(3):883–900.
Castellana S, Vicario S, Saccone C. 2011. Evolutionary patterns of the
mitochondrial genome in Metazoa: exploring the role of mutation
and selection in mitochondrial protein coding genes. Genome Biol
Evol. 3:1067–1079.
Charlesworth B. 1990. Mutation-selection balance and the
evolutionary advantage of sex and recombination. Genet Res.
55(3):199–221.
Charlesworth B. 2009. Fundamental concepts in genetics: effective pop-
ulation size and patterns of molecular evolution and variation. Nat Rev
Genet. 10(3):195–205.
Charlesworth B, Borthwick H, Bartolom�e C, Pignatelli P. 2004. Estimates of
the genomic mutation rate for detrimental alleles in Drosophila mela-
nogaster. Genetics. 167(2):815–826.
Charlesworth B, Charlesworth D, Morgan MT. 1990. Genetic loads and
estimates of mutation rates in highly inbred plant populations. Nature
347:308–382.
Charlesworth B, Hughes KA. 1996. Age-specific inbreeding
depression and components of genetic variance in relation to
the evolution of senescence. Proc Natl Acad Sci U S A.
93(12):6140–6145.
Charlesworth B, Hughes KA. 1999. The maintenance of genetic variation
in life history traits. In Singh RS, Krimbas CB, editors. Evolutionary
genetics from molecules to morphology. Vol. 1. Cambridge:
Cambridge University Press. p. 369–392.
Charlesworth D, Charlesworth B. 1987. Inbreeding depression and is evo-
lutionary consequences. Annu Rev Ecol Syst. 18(1):237–368.
Charlesworth D, Morgan MT, Charlesworth B. 1993. Mutation accumu-
lation in finite outbreeding and inbreeding populations. Genet Res.
61(01):39–56.
Chen X, Zhang J. 2013. No gene-specific optimization of mutation rate in
Escherichia coli. Mol Biol Evol. 30(7):1559–1562.
Cutter AD, Choi JY. 2010. Natural selection shapes nucleotide polymor-
phism across the genome of the nematode Caenorhabditis briggsae.
Genome Res. 20(8):1103–1111.
Cutter AD, Dey A, Murray RL. 2009. Evolution of the Caenorhabditis
elegans genome. Mol Biol Evol. 26(6):1199–1234.
Davies EK, Peters AD, Keightley PD. 1999. High frequency of cryptic del-
eterious mutations in Caenorhabditis elegans. Science
285(5434):1748–1751.
Deng W-H, Lynch M. 1996. Estimation of deleterious-mutation parame-
ters in natural populations. Genetics 144:349–360.
Denver DR, et al. 2005. The transcriptional consequences of mutation and
natural selection in Caenorhabditis elegans. Nat Genet.
37(5):544–548.
Denver DR, et al. 2009. A genome-wide view of Caenorhabditis elegans
base-substitution mutation processes. Proc Natl Acad Sci U S A.
106(38):16310–16314.
Denver DR, et al. 2012. Variation in base-substitution mutation in exper-
imental and natural lineages of Caenorhabditis nematodes. Genome
Biol Evol. 4(4):513–522.
Denver DR, Morris K, Lynch M, Vassilieva LL, Thomas WK. 2000. High
direct estimate of the mutation rate in the mitochondrial genome of
Caenorhabditis elegans. Science 289(5488):2342–2344.
Dettman JR, Sztepanacz JL, Kassen R. 2016. The properties of spontane-
ous mutations in the opportunistic pathogen Pseudomonas aerugi-
nosa. BMC Genomics 17:27.
Dillon MM, Cooper VS. 2016. The fitness effects of spontaneous muta-
tions nearly unseen by selection in a bacterium with multiple chromo-
somes. Genetics 204(3):1225–1238.
Mutation Accumulation Meets Genomics GBE
Genome Biol. Evol. 11(1):136–165 doi:10.1093/gbe/evy252 Advance Access publication November 26, 2018 161
Dow
nloaded from https://academ
ic.oup.com/gbe/article/11/1/136/5209700 by guest on 13 January 2022
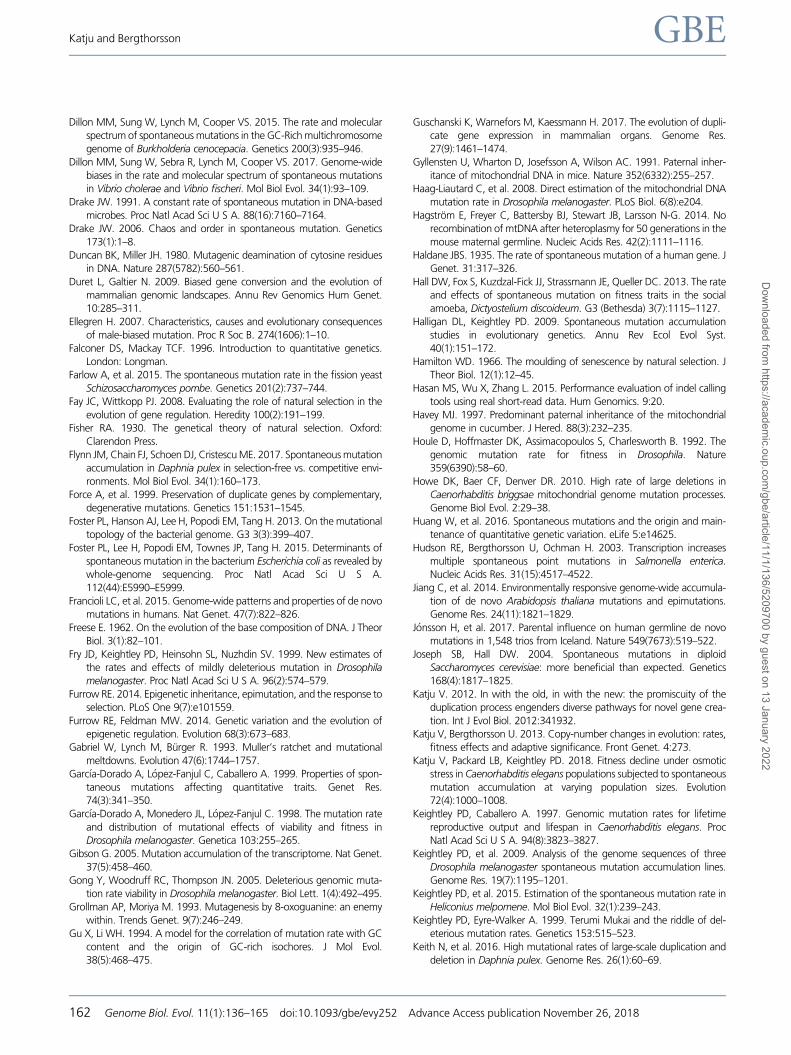
Dillon MM, Sung W, Lynch M, Cooper VS. 2015. The rate and molecular
spectrum of spontaneous mutations in the GC-Rich multichromosome
genome of Burkholderia cenocepacia. Genetics 200(3):935–946.
Dillon MM, Sung W, Sebra R, Lynch M, Cooper VS. 2017. Genome-wide
biases in the rate and molecular spectrum of spontaneous mutations
in Vibrio cholerae and Vibrio fischeri. Mol Biol Evol. 34(1):93–109.
Drake JW. 1991. A constant rate of spontaneous mutation in DNA-based
microbes. Proc Natl Acad Sci U S A. 88(16):7160–7164.
Drake JW. 2006. Chaos and order in spontaneous mutation. Genetics
173(1):1–8.
Duncan BK, Miller JH. 1980. Mutagenic deamination of cytosine residues
in DNA. Nature 287(5782):560–561.
Duret L, Galtier N. 2009. Biased gene conversion and the evolution of
mammalian genomic landscapes. Annu Rev Genomics Hum Genet.
10:285–311.
Ellegren H. 2007. Characteristics, causes and evolutionary consequences
of male-biased mutation. Proc R Soc B. 274(1606):1–10.
Falconer DS, Mackay TCF. 1996. Introduction to quantitative genetics.
London: Longman.
Farlow A, et al. 2015. The spontaneous mutation rate in the fission yeast
Schizosaccharomyces pombe. Genetics 201(2):737–744.
Fay JC, Wittkopp PJ. 2008. Evaluating the role of natural selection in the
evolution of gene regulation. Heredity 100(2):191–199.
Fisher RA. 1930. The genetical theory of natural selection. Oxford:
Clarendon Press.
Flynn JM, Chain FJ, Schoen DJ, Cristescu ME. 2017. Spontaneous mutation
accumulation in Daphnia pulex in selection-free vs. competitive envi-
ronments. Mol Biol Evol. 34(1):160–173.
Force A, et al. 1999. Preservation of duplicate genes by complementary,
degenerative mutations. Genetics 151:1531–1545.
Foster PL, Hanson AJ, Lee H, Popodi EM, Tang H. 2013. On the mutational
topology of the bacterial genome. G3 3(3):399–407.
Foster PL, Lee H, Popodi EM, Townes JP, Tang H. 2015. Determinants of
spontaneous mutation in the bacterium Escherichia coli as revealed by
whole-genome sequencing. Proc Natl Acad Sci U S A.
112(44):E5990–E5999.
Francioli LC, et al. 2015. Genome-wide patterns and properties of de novo
mutations in humans. Nat Genet. 47(7):822–826.
Freese E. 1962. On the evolution of the base composition of DNA. J Theor
Biol. 3(1):82–101.
Fry JD, Keightley PD, Heinsohn SL, Nuzhdin SV. 1999. New estimates of
the rates and effects of mildly deleterious mutation in Drosophila
melanogaster. Proc Natl Acad Sci U S A. 96(2):574–579.
Furrow RE. 2014. Epigenetic inheritance, epimutation, and the response to
selection. PLoS One 9(7):e101559.
Furrow RE, Feldman MW. 2014. Genetic variation and the evolution of
epigenetic regulation. Evolution 68(3):673–683.
Gabriel W, Lynch M, Burger R. 1993. Muller’s ratchet and mutational
meltdowns. Evolution 47(6):1744–1757.
Garc�ıa-Dorado A, L�opez-Fanjul C, Caballero A. 1999. Properties of spon-
taneous mutations affecting quantitative traits. Genet Res.
74(3):341–350.
Garc�ıa-Dorado A, Monedero JL, L�opez-Fanjul C. 1998. The mutation rate
and distribution of mutational effects of viability and fitness in
Drosophila melanogaster. Genetica 103:255–265.
Gibson G. 2005. Mutation accumulation of the transcriptome. Nat Genet.
37(5):458–460.
Gong Y, Woodruff RC, Thompson JN. 2005. Deleterious genomic muta-
tion rate viability in Drosophila melanogaster. Biol Lett. 1(4):492–495.
Grollman AP, Moriya M. 1993. Mutagenesis by 8-oxoguanine: an enemy
within. Trends Genet. 9(7):246–249.
Gu X, Li WH. 1994. A model for the correlation of mutation rate with GC
content and the origin of GC-rich isochores. J Mol Evol.
38(5):468–475.
Guschanski K, Warnefors M, Kaessmann H. 2017. The evolution of dupli-
cate gene expression in mammalian organs. Genome Res.
27(9):1461–1474.
Gyllensten U, Wharton D, Josefsson A, Wilson AC. 1991. Paternal inher-
itance of mitochondrial DNA in mice. Nature 352(6332):255–257.
Haag-Liautard C, et al. 2008. Direct estimation of the mitochondrial DNA
mutation rate in Drosophila melanogaster. PLoS Biol. 6(8):e204.
Hagstrom E, Freyer C, Battersby BJ, Stewart JB, Larsson N-G. 2014. No
recombination of mtDNA after heteroplasmy for 50 generations in the
mouse maternal germline. Nucleic Acids Res. 42(2):1111–1116.
Haldane JBS. 1935. The rate of spontaneous mutation of a human gene. J
Genet. 31:317–326.
Hall DW, Fox S, Kuzdzal-Fick JJ, Strassmann JE, Queller DC. 2013. The rate
and effects of spontaneous mutation on fitness traits in the social
amoeba, Dictyostelium discoideum. G3 (Bethesda) 3(7):1115–1127.
Halligan DL, Keightley PD. 2009. Spontaneous mutation accumulation
studies in evolutionary genetics. Annu Rev Ecol Evol Syst.
40(1):151–172.
Hamilton WD. 1966. The moulding of senescence by natural selection. J
Theor Biol. 12(1):12–45.
Hasan MS, Wu X, Zhang L. 2015. Performance evaluation of indel calling
tools using real short-read data. Hum Genomics. 9:20.
Havey MJ. 1997. Predominant paternal inheritance of the mitochondrial
genome in cucumber. J Hered. 88(3):232–235.
Houle D, Hoffmaster DK, Assimacopoulos S, Charlesworth B. 1992. The
genomic mutation rate for fitness in Drosophila. Nature
359(6390):58–60.
Howe DK, Baer CF, Denver DR. 2010. High rate of large deletions in
Caenorhabditis briggsae mitochondrial genome mutation processes.
Genome Biol Evol. 2:29–38.
Huang W, et al. 2016. Spontaneous mutations and the origin and main-
tenance of quantitative genetic variation. eLife 5:e14625.
Hudson RE, Bergthorsson U, Ochman H. 2003. Transcription increases
multiple spontaneous point mutations in Salmonella enterica.
Nucleic Acids Res. 31(15):4517–4522.
Jiang C, et al. 2014. Environmentally responsive genome-wide accumula-
tion of de novo Arabidopsis thaliana mutations and epimutations.
Genome Res. 24(11):1821–1829.
J�onsson H, et al. 2017. Parental influence on human germline de novo
mutations in 1,548 trios from Iceland. Nature 549(7673):519–522.
Joseph SB, Hall DW. 2004. Spontaneous mutations in diploid
Saccharomyces cerevisiae: more beneficial than expected. Genetics
168(4):1817–1825.
Katju V. 2012. In with the old, in with the new: the promiscuity of the
duplication process engenders diverse pathways for novel gene crea-
tion. Int J Evol Biol. 2012:341932.
Katju V, Bergthorsson U. 2013. Copy-number changes in evolution: rates,
fitness effects and adaptive significance. Front Genet. 4:273.
Katju V, Packard LB, Keightley PD. 2018. Fitness decline under osmotic
stress in Caenorhabditis elegans populations subjected to spontaneous
mutation accumulation at varying population sizes. Evolution
72(4):1000–1008.
Keightley PD, Caballero A. 1997. Genomic mutation rates for lifetime
reproductive output and lifespan in Caenorhabditis elegans. Proc
Natl Acad Sci U S A. 94(8):3823–3827.
Keightley PD, et al. 2009. Analysis of the genome sequences of three
Drosophila melanogaster spontaneous mutation accumulation lines.
Genome Res. 19(7):1195–1201.
Keightley PD, et al. 2015. Estimation of the spontaneous mutation rate in
Heliconius melpomene. Mol Biol Evol. 32(1):239–243.
Keightley PD, Eyre-Walker A. 1999. Terumi Mukai and the riddle of del-
eterious mutation rates. Genetics 153:515–523.
Keith N, et al. 2016. High mutational rates of large-scale duplication and
deletion in Daphnia pulex. Genome Res. 26(1):60–69.
Katju and Bergthorsson GBE
162 Genome Biol. Evol. 11(1):136–165 doi:10.1093/gbe/evy252 Advance Access publication November 26, 2018
Dow
nloaded from https://academ
ic.oup.com/gbe/article/11/1/136/5209700 by guest on 13 January 2022
Kibota TT, Lynch M. 1996. Estimate of the genomic mutation rate dele-
terious to overall fitness in E. coli. Nature 381(6584):694–696.
Kim N, Jinks-Robertson S. 2012. Transcription as a source of genome
instability. Nat Rev Genet. 13(3):204–214.
Kimura M. 1962. On the probability of fixation of mutant genes in a
population. Genetics 47:713–719.
Kimura M. 1983. The neutral theory of molecular evolution. Cambridge:
Cambridge University Press.
Kimura M, Ohta T. 1969. Average number of generations until fixation of
a mutant gene in a finite population. Genetics 61:763–771.
Klapacz J, Bhagwat AS. 2002. Transcription-dependent increase in multi-
ple classes of base substitution mutations in Escherichia coli. J Bacteriol.
184(24):6866–6872.
Kondo R, et al. 1990. Incomplete maternal transmission of mitochondrial
DNA in Drosophila. Genetics 126:657–663.
Kondrashov AS. 1988. Deleterious mutations and the evolution of sexual
reproduction. Nature 336(6198):435–440.
Kondrashov AS. 2002. Direct estimates of human per nucleotide mutation
rates at 20 loci causing Mendelian disease. Hum Mutat. 21(1):12–27.
Kondrashov AS, Crow JF. 1991. Haploid or diploid: which is better? Nature
351(6324):314–315.
Kondrashov FA, Kondrashov AS. 2010. Measurements of spontaneous
rates of mutations in the recent past and in the near future. Philos
Trans R Soc B. 365(1544):1169–1176.
Kong A, et al. 2012. Rate of de novo mutations and the importance of
father’s age to disease risk. Nature 488(7412):471–475.
Konrad A, et al. 2017. Mitochondrial mutation rate, spectrum and
heteroplasmy in Caenorhabditis elegans spontaneous mutation
accumulation lines of differing population size. Mol Biol Evol.
34(6):1319–1334.
Konrad A, et al. 2018. Mutational and transcriptional landscape of spon-
taneous gene duplications and deletions in Caenorhabditis elegans.
Proc Natl Acad Sci U S A. 115(28):7386–7391.
Krasovec M, et al. 2016. Fitness effects of spontaneous mutations in
picoeukaryotic marine green algae. G3 (Bethesda) 6(7):2063–2071.
Krasovec M, Eyre-Walker A, Sanchez-Ferandin S, Piganeau G. 2017.
Spontaneous mutation rate in the smallest photosynthetic eukaryotes.
Mol Biol Evol. 34(7):1770–1779.
Kraytsberg Y, et al. 2004. Recombination of human mitochondrial DNA.
Science 304(5673):981.
Kucukyildirim S, et al. 2016. The rate and spectrum of spontaneous
mutations in Mycobacterium smegmatis, a bacterium naturally
devoid of the postreplicative mismatch repair pathway. G3
6(7):2157–2163.
Kvist L, Martens J, Nazarenko AA, Orell M. 2003. Paternal leakage of
mitochondrial DNA in the great tit (Parus major). Mol Biol Evol.
20(2):243–247.
Ladoukakis ED, Eyre-Walker A. 2004. Evolutionary genetics: direct evi-
dence of recombination in human mitochondrial DNA. Heredity
93(4):321.
Lande R. 1994. The risk of population extinction from new deleterious
mutations. Evolution 48(5):1460–1469.
Landry CR, Lemos B, Rifkin SA, Dickinson WJ, Hartl DL. 2007. Genetic
properties influencing the evolvability of gene expression. Science
317(5834):118–121.
Lawrence JG, Ochman H. 1997. Amelioration of bacterial genomes: rates
of change and exchange. J Mol Evol. 44(4):383–397.
Lee H, Popodi E, Tang H, Foster PL. 2012. Rate and molecular spectrum of
spontaneous mutations in the bacterium Escherichia coli as deter-
mined by whole-genome sequencing. Proc Natl Acad Sci U S A.
109(41):E2774–E2783.
Li M, et al. 2010. Detecting heteroplasmy from high-throughput sequenc-
ing of complete human mitochondrial DNA genomes. Am J Hum
Genet. 87(2):237–249.
Li W-H. 1980. Rate of gene silencing at duplicate loci: a theoretical study
and interpretation of data from tetraploid fishes. Genetics
95(1):237–258.
Lind PA, Andersson DI. 2008. Whole-genome mutational biases in bacte-
ria. Proc Natl Acad Sci U S A. 105(46):17878–17883.
Link V, Aguilar-G�omez D, Ram�ırez-Su�astegui C, Hurst LD, Cortez D. 2017.
Male mutation bias is the main force shaping chromosomal substitu-
tion rates in monotreme mammals. Genome Biol Evol.
9(9):2198–2210.
Lipinski KJ, et al. 2011. High spontaneous rate of gene duplication in
Caenorhabditis elegans. Curr Biol. 21(4):306–310.
Lobry JR. 1996. Asymmetric substitution patterns in the two DNA strands
of bacteria. Mol Biol Evol. 13(5):660–665.
Loehlin DW, Carroll SB. 2016. Expression of tandem gene duplicates is
often greater than twofold. Proc Natl Acad Sci U S A.
113(21):5988–5992.
Long H, et al. 2015. Background mutational features of the radiation-
resistant bacterium Deinococcus radiodurans. Mol Biol Evol.
32(9):2383–2392.
Long H, et al. 2016. Low base-substitution mutation rate in the germline
genome of the ciliate Tetrahymena thermophila. Genome Biol Evol.
8:3629–3639.
Lonsdale DM, Brears T, Hodge TP, Melville SE, Rottman WH. 1988. The
plant mitochondrial genome: homologous recombination as a mech-
anism for generating heterogeneity. Philos Trans R Soc Lond B.
319(1193):149–163.
Lynch M. 2010a. Evolution of the mutation rate. Trends Genet.
26(8):345–352.
Lynch M. 2010b. Rate, molecular spectrum and consequences of human
mutation. Proc Natl Acad Sci U S A. 107(3):961–968.
Lynch M. 2016. Mutation and human exceptionalism: our future genetic
load. Genetics 202(3):869–875.
Lynch M, Conery J, Burger R. 1995a. Mutational accumulation and the
extinction of small populations. Am Nat. 146(4):489–518.
Lynch M, Conery J, Burger R. 1995b. Mutational meltdowns in sexual
populations. Evolution 49(6):1067–1080.
Lynch M, et al. 1999. Perspective: spontaneous deleterious mutation.
Evolution 53(3):645–663.
Lynch M, et al. 2008. A genome-wide view of the spectrum of spontane-
ous mutations in yeast. Proc Natl Acad Sci U S A. 105(27):9272–9277.
Lynch M, et al. 2016. Genetic drift, selection and the evolution of the
mutation rate. Nat Rev Genet. 17(11):704–714.
Lynch M, Gabriel W. 1990. Mutation load and the survival of small pop-
ulations. Evolution 44(7):1725–1737.
Lynch M, Hill WG. 1986. Phenotypic evolution by neutral mutation.
Evolution 40(5):915–935.
Lynch M, Walsh B. 1998. Genetics and analysis of quantitative traits.
Sunderland (MA): Sinauer Associates.
MacAlpine DM, Perlman PS, Butow RA. 1998. The high mobility group
protein Abf2p influences the level of yeast mitochondrial DNA recom-
bination intermediates in vivo. Proc Natl Acad Sci U S A.
95(12):6739–6743.
Martincorena I, Seshasayee AS, Luscombe NM. 2012. Evidence of non-
random mutation rates suggests an evolutionary risk management
strategy. Nature 485(7396):95–98.
McCauley DE, Bailey MF, Sherman NA, Darnell MZ. 2005. Evidence for
paternal transmission and heteroplasmy in the mitochondrial genome
of Silene vulgaris, a gynodioecious plant. Heredity 95(1):50–58.
McGaugh SE, et al. 2012. Recombination modulates how selection affects
linked sites in Drosophila. PLoS Biol. 10(11):e1001422.
Meiklejohn CD, Hartl DL. 2002. A single mode of canalization. Trends Ecol
Evol. 17(10):468–473.
Mira A, Ochman H, Moran NA. 2001. Deletional bias and the evolution of
bacterial genomes. Trends Genet. 17(10):589–596.
Mutation Accumulation Meets Genomics GBE
Genome Biol. Evol. 11(1):136–165 doi:10.1093/gbe/evy252 Advance Access publication November 26, 2018 163
Dow
nloaded from https://academ
ic.oup.com/gbe/article/11/1/136/5209700 by guest on 13 January 2022
Miyata T, Hayashida H, Kuma K, Mitsuyasu K, Yasunaga T. 1987. Male-
driven molecular evolution: a model and nucleotide sequence analysis.
Cold Spring Harb Symp Quant Biol. 52:863–867.
Molnar RI, Bartelmes G, Dinkelacker I, Witte H, Sommer RJ. 2011.
Mutation rates and intraspecific divergence of the mitochondrial ge-
nome of Pristionchus pacificus. Mol Biol Evol. 28(8):2317–2326.
Montooth KL, Rand DM. 2008. The spectrum of mitochondrial mutation
differs across species. PLoS Biol. 6(8):e213.
Mukai T. 1964. The genetic structure of natural populations of Drosophila
melanogaster. I. Spontaneous mutation rate of polygenes controlling
viability. Genetics 50:1–19.
Mukai T, Chigusa SI, Mettler LE, Crow JF. 1972. Mutation rate and dom-
inance of genes affecting viability in Drosophila melanogaster. I.
Genetics 72:333–355.
Muller HJ. 1928. The measurement of gene mutation rate in Drosophila,
its high variability, and its dependence on temperature. Genetics
13:279–357.
Muller HJ. 1950. Our load of mutations. Am J Hum Genet. 2(2):111–176.
Nakabachi A, et al. 2006. The 160-kilobase genome of the bacterial en-
dosymbiont Carsonella. Science 314(5797):267.
Neale DB, Marshall KA, Sederoff RR. 1989. Chloroplast and mitochondrial
DNA are paternally inherited in Sequoia sempervirens D. Don Endl.
Proc Natl Acad Sci U S A. 86(23):9347–9349.
Neiman M, Hehman G, Miller JT, Logsdon JMJr, Taylor DR. 2010.
Accelerated mutation accumulation in asexual lineages of a freshwater
snail. Mol Biol Evol. 27(4):954–963.
Neiman M, Taylor DR. 2009. The causes of mutation accumulation in
mitochondrial genomes. Proc Biol Sci. 276(1660):1201–1209.
Ness RW, Morgan AD, Colegrave N, Keightley PD. 2012. Estimate of the
spontaneous mutation rate in Chlamydomonas reinhardtii. Genetics
192(4):1447–1454.
Ness RW, Morgan AD, Vasanthakrishnan RB, Colegrave N, Keightley PD.
2015. Extensive de novo mutation rate variation between individuals
and across the genome of Chlamydomonas reinhardtii. Genome Res.
25(11):1739–1749.
Nilsson AI, et al. 2005. Bacterial genome size reduction by experimental
evolution. Proc Natl Acad Sci U S A. 102(34):12112–12116.
Nishant KT, et al. 2010. The baker’s yeast diploid genome is
remarkably stable in vegetative growth and meiosis. PLoS Genet.
6(9):e1001109.
Ohnishi O. 1977a. Spontaneous and ethyl methanesuflate-induced muta-
tions controlling viability in Drosophila melanogaster. I. Recessive lethal
mutations. Genetics 87:519–527.
Ohnishi O. 1977b. Spontaneous and ethyl methanesuflate-induced muta-
tions controlling viability in Drosophila melanogaster. II. Homozygous
effect of polygenic mutations. Genetics 87:529–545.
Ohnishi O. 1977c. Spontaneous and ethyl methanesuflate-induced muta-
tions controlling viability in Drosophila melanogaster. III. Heterozygous
effect of polygenic mutations. Genetics 87:547–556.
Ohno S. 1970. Evolution by gene duplication. New York: Springer.
Ohta T. 1992. The nearly neutral theory of molecular evolution. Annu Rev
Ecol Syst. 23(1):263–286.
Okoniewski MJ, Miller CJ. 2006. Hybridization interactions between pro-
besets in short oligo microarrays lead to spurious correlations. BMC
Bioinformatics 7:276.
O’Rawe J, et al. 2013. Low concordance of multiple variant-calling pipe-
lines: practical implications for exome and genome sequencing.
Genome Med. 5(3):28.
Ossowski S, et al. 2010. The rate and molecular spectrum of spontaneous
mutations in Arabidopsis thaliana. Science 327(5961):92–94.
Otto SP, Michalakis Y. 1998. The evolution of recombination in changing
environments. Trends Ecol Evol. 13(4):145–151.
Pamilo P, Nei M, Li W-H. 1987. Accumulation of mutations in sexual and
asexual populations. Genet Res. 49(2):135–146.
Partridge L, Barton NH. 1993. Optimality, mutation and the evolution of
aging. Nature 362(6418):305–311.
Passamonti M, Boore JL, Scali V. 2003. Molecular evolution and recombi-
nation in gender-associated mitochondrial DNAs of the Manila clam
Tapes philippinarum. Genetics 164(2):603–611.
Peck JR, Barreau G, Heath SC. 1997. Imperfect genes, Fisherian mutation
and the evolution of sex. Genetics 145(4):1171–1199.
Perrot VS, Richerd S, Valero M. 1991. Transition from haploidy to diploidy.
Nature 351(6324):315–317.
Pfeifer SP. 2017. Direct estimate of the spontaneous germ line mutation
rate in African green monkeys. Evolution 71(12):2858–2870.
Piganeau G, Gardner M, Eyre-Walker A. 2004. A broad survey of recom-
bination in animal mitochondria. Mol Biol Evol. 21(12):2319–2325.
Qian W, Liao B-Y, Chang AY-F, Zhang J. 2010. Maintenance of duplicate
genes and their functional redundancy by reduced expression. Trends
Genet. 26(10):425–430.
Rand DM. 2001. The units of selection on mitochondrial DNA. Annu Rev
Ecol Syst. 32(1):415–448.
Raynes Y, Gazzara MR, Sniegowski PD. 2011. Mutator dynamics in sexual
and asexual experimental populations of yeast. BMC Evol Biol.
11(158):158.
Remacle C, Colin M, Matagne RF. 1995. Genetic mapping of mitochon-
drial markers by recombinational analysis in Chlamydomonas reinhard-
tii. Mol Gen Genet. 249(2):185–190.
Rifkin SA, Houle D, Kim J, White KP. 2005. A mutation accumulation assay
reveals a broad capacity for rapid evolution of gene expression. Nature
438(7065):220–223.
Rockman MV, Kruglyak L. 2009. Recombinational landscape and popula-
tion genomics of Caenorhabditis elegans. PLoS Genet. 5(3):e1000419.
Rogers RL, Shao L, Thornton KR. 2017. Tandem duplications lead to novel
expression patterns through exon shuffling in Drosophila yakuba. PLoS
Genet. 13(5):e1006795.
Romero IG, Ruvinsky I, Gilad Y. 2012. Comparative studies of gene ex-
pression and the evolution of gene regulation. Nat Rev Genet.
13(7):505–516.
Sanford RA, Cole JR, Tiedje JM. 2002. Characterization and description of
Anaeromyxobacter dehalogenans gen. nov., sp. nov., an aryl-
halorespiring facultative anaerobic myxobacterium. Appl Environ
Microbiol. 68(2):893–900.
Saxer G, et al. 2012. Whole genome sequencing of mutation accumula-
tion lines reveals a low mutation rate in the social amoeba
Dictyostelium discoideum. PLoS One 7(10):e46759.
Schmitz RJ, et al. 2011. Transgenerational epigenetic instability is a source
of novel methylation variants. Science 334(6054):369–373.
Schoen DJ. 2005. Deleterious mutation in related species of the plant
genus Amsinckia with contrasting mating systems. Evolution
59(11):2370–2377.
Schrider DR, Houle D, Lynch M, Hahn MW. 2013. Rates and genomic
consequences of spontaneous mutational events in Drosophila mela-
nogaster. Genetics 194(4):937–954.
Schultz ST, Lynch M, Willis JH. 1999. Spontaneous deleterious mutation in
Arabidopsis. Proc Natl Acad Sci U S A. 96(20):11393–11398.
Serero A, Jubin C, Loeillet S, Legoix-N�e P, Nicolas AG. 2014. Mutational
landscape of yeast mutator strains. Proc Natl Acad Sci U S A.
111(5):1897–1902.
Shapiro MD, et al. 2004. Genetic and developmental basis of evolutionary
pelvic reduction in threespine sticklebacks. Nature 428(6984):717–723.
Sharp NP, Agrawal AF. 2016. Low genetic quality alters key dimension of
the mutational spectrum. PLoS Biol. 14(3):e1002419.
Shaw RG, Byers DL, Darmo E. 2000. Spontaneous mutational effects on
reproductive traits of Arabidopsis thaliana. Genetics 155(1):369–378.
Shewaramani S, et al. 2017. Anaerobically grown Escherichia coli has an
enhanced mutation rate and distinct mutational spectra. PLoS Genet.
13(1):e1006570.
Katju and Bergthorsson GBE
164 Genome Biol. Evol. 11(1):136–165 doi:10.1093/gbe/evy252 Advance Access publication November 26, 2018
Dow
nloaded from https://academ
ic.oup.com/gbe/article/11/1/136/5209700 by guest on 13 January 2022
Skibinski DOF, Gallagher C, Beynon CM. 1994. Sex-limited mitochondrial
DNA transmission in the marine mussel Mytilus edulis. Genetics
138:801–809.
Slatkin M. 2009. Epigenetic inheritance and the missing heritability prob-
lem. Genetics 182(3):845–850.
Smeds L, Qvarnstrom A, Ellegren H. 2016. Direct estimate of the rate of
germline mutation in a bird. Genome Res. 26(9):1211–1218.
Smith TCA, Arndt PF, Eyre-Walker A. 2018. Large scale variation in the rate
of germ-line de novo mutation, base composition, divergence and
diversity in humans. PLoS Genet. 14(3):e1007254.
Sniegowski PD, Gerrish PJ, Lenski RE. 1997. Evolution of high mutation
rates in experimental populations of E. coli. Nature
387(6634):703–705.
St€adler T, Delph LF. 2002. Ancient mitochondrial haplotypes and evidence
for intragenic recombination in a gynodioecious plant. Proc Natl Acad
Sci U S A. 99:11730–11735.
Sueoka N. 1962. On the genetic basis of variation and heterogeneity of
DNA base composition. Proc Natl Acad Sci U S A. 48:582–592.
Sueoka N. 1988. Directional mutation pressure and neutral molecular evo-
lution. Proc Natl Acad Sci U S A. 85(8):2653–2657.
Sueoka N. 1995. Intrastrand parity rules of DNA base composition and
usage biases of synonymous codons. J Mol Evol. 40(3):318–325.
Sung W, Ackerman MS, et al. 2012. Drift-barrier hypothesis and mutation-
rate evolution. Proc Natl Acad Sci U S A. 109(45):18488–18492.
Sung W, Tucker AE, et al. 2012. Extraordinary genome stability in the
ciliate Paramecium tetraurelia. Proc Natl Acad Sci U S A.
109(47):19339–19344.
Sung W, et al. 2015. Asymmetric context-dependent mutation patterns
revealed through mutation-accumulation experiments. Mol Biol Evol.
32(7):1672–1683.
Taddei F, et al. 1997. Role of mutator alleles in adaptive evolution. Nature
387(6634):700–702.
Tatsumoto S, et al. 2017. Direct estimation of de novo mutation rates in a
chimpanzee parent-offspring trio by ultra-deep whole genome se-
quencing. Sci Rep. 7:13561.
Taylor JW. 1986. Topical review: fungal evolutionary biology and mito-
chondrial DNA. Exp Mycol. 10(4):259–269.
Uchimura A, et al. 2015. Germline mutation rates and the long-term
phenotypic effects of mutation accumulation in wild-type laboratory
mice and mutator mice. Genome Res. 25(8):1125–1134.
van der Graaf A, et al. 2015. Rate, spectrum, and evolutionary dynamics of
spontaneous epimutations. Proc Natl Acad Sci U S A.
112(21):6676–6681.
Vassilieva LL, Hook AM, Lynch M. 2000. The fitness effects of spontaneous
mutations in Caenorhabditis elegans. Evolution 151:119–129.
Venn O, et al. 2014. Strong male bias drives germline mutation in chim-
panzees. Science 344(6189):1272–1275.
Waddington CH. 1942. Canalization of development and the inheritance
of acquired characters. Nature 150(3811):563–565.
Wallace DC. 2015. Mitochondrial DNA variation in human radiation and
disease. Cell 163(1):33–38.
Wallace DC, Chalkia D. 2013. Mitochondrial DNA genetics and the het-
eroplasmy conundrum I evolution and disease. Cold Spring Harb
Perspect Biol. 5(11):a021220.
Walsh JB. 1995. How often do duplicated genes evolve new functions?
Genetics 110:345–364.
Wang Z, Gerstein M, Snyder M. 2009. RNA-Seq: a revolutionary tool for
transcriptomics. Nat Rev Genet. 10(1):57–63.
Weller AM, Rodelsperger C, Eberhardt G, Molnar RI, Sommer RJ. 2014.
Opposing forces of A/T-biased mutations and G/C-biased gene con-
versions shape the genome of the nematode Pristionchus pacificus.
Genetics 196(4):1145–1452.
White DJ, Wolff JB, Pierson M, Gemmell NJ. 2008. Revealing the hidden
complexities of mtDNA inheritance. Mol Ecol. 17(23):4925–4942.
Wilson Sayres MA, Makova KD. 2011. Genome analyses substantiate male
mutation bias in many species. Biosessays 33(12):938–945.
Wittkopp PJ, Williams BL, Selegue JE, Carroll SB. 2003. Drosophila pig-
mentation evolution: divergent genotypes underlying convergent phe-
notypes. Proc Natl Acad Sci U S A. 100(4):1808–1813.
Wolfe KH, Li W-H, Sharp PM. 1987. Rates of nucleotide substitution vary
greatly among plant mitochondrial, chloroplast and nuclear DNAs.
Proc Natl Acad Sci U S A. 84(24):9054–9058.
Wolfe KH, Sharp PM, Li WH. 1989. Mutation rates differ among regions of
the mammalian genome. Nature 337(6204):283–285.
Wong WSW, et al. 2016. New observations on maternal age effect on
germline de novo mutations. Nat Commun. 7:10486.
Wray GA, et al. 2003. The evolution of transcriptional regulation in eukar-
yotes. Mol Biol Evol. 20(9):1377–1419.
Wu C-I. 1991. DNA strand asymmetry. Nature 352(6331):114.
Wu C-I, Maeda N. 1987. Inequality of mutation rates of the two strands of
DNA. Nature 327(6118):169–170.
Xu S, et al. 2012. High mutation rates in the mitochondrial genomes of
Daphnia pulex. Mol Biol Evol. 29(2):763–769.
Yampolsky LY, Stoltzfus A. 2001. Bias in the introduction of variation as an
orienting factor in evolution. Evol Dev. 3(2):73–83.
Yang S, et al. 2015. Parent-progeny sequencing indicates higher mutation
rates in heterozygotes. Nature 523(7561):463–467.
Zalts H, Yanai I. 2017. Developmental constraints shape the evolution of
the nematode mid-developmental transition. Nat Ecol Evol. 1:0113.
Zhu YO, Siegal ML, Hall DW, Petrov DA. 2014. Precise estimates of mu-
tation rate and spectrum in yeast. Proc Natl Acad Sci U S A.
111(22):E2310–E2318.
Zouros E, Ball AO, Saavedra C, Freeman KR. 1994. An unusual type of
mitochondrial DNA inheritance in the blue mussel Mytilus. Proc Natl
Acad Sci U S A. 91(16):7463–7467.
Associate editor: Kateryna Makova.
Mutation Accumulation Meets Genomics GBE
Genome Biol. Evol. 11(1):136–165 doi:10.1093/gbe/evy252 Advance Access publication November 26, 2018 165
Dow
nloaded from https://academ
ic.oup.com/gbe/article/11/1/136/5209700 by guest on 13 January 2022