SHORT NOTES Idiosyncrasies in cities: evaluating patterns and drivers of ant biodiversity along urbanization gradients Abe Perez * and Sarah E. Diamond Department of Biology, Case Western Reserve University, 2080 Adelbert Road, Cleveland, OH 44106, USA *Corresponding author. E-mail: [email protected] Submitted: 3 September 2018; Received (in revised form): 15 August 2019; Accepted: 22 August 2019 Abstract Urbanization is expected to reduce biodiversity. However, an increasing number of studies report urban biodiversity compa- rable to that of surrounding nonurban areas, leaving open the question: what maintains biodiversity in cities? We charac- terized patterns of ant biodiversity across urbanization gradients of three major cities in the Midwestern United States and evaluated the support for two mechanisms underlying the maintenance of biodiversity in cities, specifically via introduced non-native species and differential phenology of communities along each urbanization gradient. We observed idiosyncra- sies in ant species diversity such that each city displayed either increased, decreased or no change in biodiversity across the urbanization gradient. We found partial support (one of the three cities) for the hypothesis that non-native species can con- tribute positively to overall species diversity in cities, though even with introduced species removed from consideration, native ant biodiversity was maintained along the urbanization gradient. We found no support for systematic differential phenology across urbanization gradients, although species diversity did vary over time across all sites. Our results further challenge the assumption of biodiversity loss in cities, as two of our three cities exhibited maintained species diversity along the urbanization gradient. Most importantly, our study demonstrates that urban biodiversity can be maintained entirely by native communities. Key words: Formicidae, urban biodiversity, land-use change, global change, phenological shifts, non-native species Introduction For decades, cities have been viewed as barren ecosystems that negatively affect biodiversity (Davis 1978; Denys and Schmidt 1998). This assumption is supported by multiple studies, many of which observed urban communities composed of only a few, but highly abundant species (Holway and Suarez 2006; Thompson and McLachlan 2007; McKinney 2008; Luck and Smallbone 2010; Buczkowski and Richmond 2012; Tagwireyi and Sullivan 2015). However, as the field of urban ecology continues to grow, some studies have challenged the idea that biodiversity is lost in cities, finding comparable or even modest increases in biodiversity to that of the surrounding nonurban areas (Magura, Lo ¨ vei, and To ´ thme ´re ´ sz 2010; Ives et al. 2013; Saari et al. 2016). One straightforward explanation for the maintenance or in- crease of biodiversity in cities is the presence of introduced, non-native species, especially early after their introduction and before they can cause potentially negative effects on native bio- diversity (Gaertner et al. 2017; Ricotta et al. 2017). This pattern and mechanism is seen in plant communities, for which greater biodiversity is observed in urban areas compared with the sur- rounding areas due to the high frequency of deliberate non- native species introductions by humans (Fig. 1a; McKinney 2008; Faeth, Bang, and Saari 2011). While urban plant commu- nity composition is often the result of intense human interven- tion, community composition in many other taxa is not (Faeth, Bang, and Saari 2011). In many invertebrate systems, biodiver- sity is resilient to urban land-use change, with diversity V C The Author(s) 2019. Published by Oxford University Press. This is an Open Access article distributed under the terms of the Creative Commons Attribution License (http://creativecommons.org/licenses/by/4.0/), which permits unrestricted reuse, distribution, and reproduction in any medium, provided the original work is properly cited. 1 Journal of Urban Ecology, 2019, 1–10 doi: 10.1093/jue/juz017 Short notes Downloaded from https://academic.oup.com/jue/article/5/1/juz017/5584262 by guest on 12 January 2022

Welcome message from author
This document is posted to help you gain knowledge. Please leave a comment to let me know what you think about it! Share it to your friends and learn new things together.
Transcript

S H O R T N O T E S
Idiosyncrasies in cities evaluating patterns and drivers
of ant biodiversity along urbanization gradientsAbe Perez and Sarah E Diamond
Department of Biology Case Western Reserve University 2080 Adelbert Road Cleveland OH 44106 USA
Corresponding author E-mail jap194caseedu
Submitted 3 September 2018 Received (in revised form) 15 August 2019 Accepted 22 August 2019
Abstract
Urbanization is expected to reduce biodiversity However an increasing number of studies report urban biodiversity compa-rable to that of surrounding nonurban areas leaving open the question what maintains biodiversity in cities We charac-terized patterns of ant biodiversity across urbanization gradients of three major cities in the Midwestern United States andevaluated the support for two mechanisms underlying the maintenance of biodiversity in cities specifically via introducednon-native species and differential phenology of communities along each urbanization gradient We observed idiosyncra-sies in ant species diversity such that each city displayed either increased decreased or no change in biodiversity across theurbanization gradient We found partial support (one of the three cities) for the hypothesis that non-native species can con-tribute positively to overall species diversity in cities though even with introduced species removed from considerationnative ant biodiversity was maintained along the urbanization gradient We found no support for systematic differentialphenology across urbanization gradients although species diversity did vary over time across all sites Our results furtherchallenge the assumption of biodiversity loss in cities as two of our three cities exhibited maintained species diversityalong the urbanization gradient Most importantly our study demonstrates that urban biodiversity can be maintainedentirely by native communities
Key words Formicidae urban biodiversity land-use change global change phenological shifts non-native species
Introduction
For decades cities have been viewed as barren ecosystems thatnegatively affect biodiversity (Davis 1978 Denys and Schmidt1998) This assumption is supported by multiple studies many ofwhich observed urban communities composed of only a few buthighly abundant species (Holway and Suarez 2006 Thompson andMcLachlan 2007 McKinney 2008 Luck and Smallbone 2010Buczkowski and Richmond 2012 Tagwireyi and Sullivan 2015)However as the field of urban ecology continues to grow somestudies have challenged the idea that biodiversity is lost in citiesfinding comparable or even modest increases in biodiversity tothat of the surrounding nonurban areas (Magura Lovei andTothmeresz 2010 Ives et al 2013 Saari et al 2016)
One straightforward explanation for the maintenance or in-crease of biodiversity in cities is the presence of introducednon-native species especially early after their introduction andbefore they can cause potentially negative effects on native bio-diversity (Gaertner et al 2017 Ricotta et al 2017) This patternand mechanism is seen in plant communities for which greaterbiodiversity is observed in urban areas compared with the sur-rounding areas due to the high frequency of deliberate non-native species introductions by humans (Fig 1a McKinney2008 Faeth Bang and Saari 2011) While urban plant commu-nity composition is often the result of intense human interven-tion community composition in many other taxa is not (FaethBang and Saari 2011) In many invertebrate systems biodiver-sity is resilient to urban land-use change with diversity
VC The Author(s) 2019 Published by Oxford University PressThis is an Open Access article distributed under the terms of the Creative Commons Attribution License (httpcreativecommonsorglicensesby40)which permits unrestricted reuse distribution and reproduction in any medium provided the original work is properly cited
1
Journal of Urban Ecology 2019 1ndash10
doi 101093juejuz017Short notes
Dow
nloaded from httpsacadem
icoupcomjuearticle51juz0175584262 by guest on 12 January 2022
exhibiting little change or even modest increases across urbani-zation gradients (Niemela and Kotze 2009 Hill et al 2016 2017)while also retaining assemblages predominantly composed ofnative species (Barratt et al 2015 Barbato et al 2017) The ques-tion therefore remains what maintains biodiversity in citiesparticularly in invertebrate systems
An alternative hypothesis to explain the (apparent) mainte-nance of urban biodiversity is differential phenological patternsin communities along the urbanization gradient Species phe-nology is often controlled by seasonal environmental fluctua-tions in critical climatic parameters including temperature(Scranton and Amarasekare 2017 Tonkin et al 2017) Cities gen-erate elevated environmental temperatures compared withnearby nonurban areas (the urban heat island effect Imhoffet al 2010) and while warming-induced shifts in the timing ofemergence and other population dynamics such as the timingof peak abundance and the duration of activity periods are well
documented (Parmesan 2006 Diez et al 2012) most compari-sons across urbanization gradients are performed at only a fewor single time point (Santos 2016) This focus on a limited num-ber of temporal samples may obscure the signal of urban-drivenchanges in total biodiversity For example if urban communi-ties experience warmer temperatures and reach peak abun-dance earlier in the year compared with nonurbancommunities biodiversity may appear to be greater in citiesdue to altered phenologies even when total urban biodiversityis in fact lower (Fig 1b)
To uncover whether and how urban species diversity mightbe maintained in invertebrate communities we first describeoverall patterns of species diversity change in a ubiquitous in-vertebrate taxon ants (Hymenoptera Formicidae) across threeurbanization gradients of major cities within the same ecore-gion (Midwestern United States) Second we evaluate two alter-native hypotheses for maintained or increased species diversityin cities Our study asks (1) whether ant biodiversity increasesdecreases or is maintained across urbanization gradients(2) whether patterns of ant biodiversity along urbanization gra-dients are influenced by the presence of introduced non-nativespecies at sites with greater urban development and (3) whetherpatterns of ant biodiversity along urbanization gradients areinfluenced by differential patterns of phenology or temporalturnover of communities
MethodsStudy area and sampling design
We sampled ant assemblages across urbanization gradients atthree major cities in the state of Ohio USA including Cleveland(414993N 816944W) Columbus (399612N 829988W) andCincinnati (391031N 845120W) We used ants as a focaltaxon as they are geographically widespread abundant in citiesand vary in species composition along natural environmentalgradients of key climatic variables such as temperature andaridity (Dunn et al 2010) that are known to be altered as a func-tion of urbanization (see below) Our focal cities of ClevelandColumbus and Cincinnati are all located in the MidwesternUnited States and are roughly comparable in size and age thecities were constructed between 1816 and 1836 and have popu-lation sizes between 2 057 009 and 2 190 209 throughout themetropolitan area (US Census Bureau Population Division2018) Importantly our sampling design that uses percent-developed impervious surface area (ISA) to quantify the degreeof urbanization along each of the three gradients allowed us tomake direct comparisons across each city ISA is the percentageof surface area covered by artificial surfaces such as pavementroads and building infrastructure with larger percentages indi-cating increased urban development Percent-developed ISA is acommonly used proxy for urbanization (Raciti et al 2012Bounoua et al 2018) as it correlates with changes in tempera-ture (Imhoff et al 2010) soil chemistry (Pouyat et al 2008 Racitiet al 2012 Bettez and Groffman 2013) water quantity and qual-ity (Martin and Stabler 2002 Weitzell et al 2016) and air pollu-tants (Gregg Jones and Dawson 2003 George et al 2007) Asconfirmation of the transferability of ISA across each of thethree urbanization gradients our ground-based sensor networkshowed a very repeatable temperature difference between themost urbanized sites (80 ISA) and the least urbanized sites(0 ISA) The differences ranged from 27C in Cleveland to186C in Columbus and 144C in Cincinnati (SupplementaryFig S1) All percent-developed ISA data were derived from the
Figure 1 Two alternative hypotheses for increased species diversity in urban
environments including (a) the presence of introduced non-native species and
(b) differential patterns of phenology of communities (a) Hypothetical species
composition of communities across percent-developed impervious surface area
(ISA) While the number of native species (gray bars) may be higher at low per-
cent-developed ISA sites the added number of non-native species (purple bar)
introduced to high ISA sites (either direct or indirectly) may initially positively
contribute to the overall number of species (though negative effects of intro-
duced species on native biodiversity can arise later see main text) (b)
Hypothetical pattern of differential phenologies between biological communi-
ties at sites of 80 and 0 developed ISA If communities at sites with 80 devel-
oped ISA (red line) experience warmer temperatures and initiate activity earlier
in the year (earlier Julian day) compared with communities at 0 ISA sites (blue
line) the number of species may appear to be greater in cities if sampling only
occurs early in the activity season (within the vertical dashed lines) For simplic-
ity depicted ISA values represent the extremes of our study design Species di-
versity patterns for sites of intermediate ISA values would be expected to fall
within these extreme responses
2 | Journal of Urban Ecology 2019 Vol 5 No 1
Dow
nloaded from httpsacadem
icoupcomjuearticle51juz0175584262 by guest on 12 January 2022
2011 National Land Cover Database (NLCD) at a 30-m resolution(Homer et al 2015)
In each city we established five sites along a continuouspercent-developed ISA gradient extending out from the citycenter in increments of 20 ISA (80 60 40 20 and 0 ISAFig 2 Supplementary Table S1) Although we took multiplesamples from each site in a transect design we did not havemultiple independent replicates of the same ISA incrementswithin each city Therefore we cannot estimate the repeatabil-ity of diversity patterns within each ISA increment for each cityRather our experimental design harnesses the power of explor-ing diversity patterns across relatively fine-scale ISA incre-ments for each city and allows us to compare these ISA-diversity relationships among cities Under this experimentaldesign even nonrepresentative diversity estimates at one oreven more ISA increments should be compensated by exploringthe diversity trend across the entire set of five ISA incrementsfor a given city Thus our design allows us to compare ant di-versity changes across three urbanization gradients in a man-ner comparable to well-studied biogeographic diversity patternsalong elevation or latitudinal clines (Dunn et al 2010)
The extent of our sampling design exceeded the grid size ofthe NLCD data Therefore we estimated site-level ISA by takingthe mean of all percent-developed ISA values within a 90-mbuffer using the Focal Statistics function in ArcMap v 103Because percent-developed impervious surface only describesthe degree of urban development rather than land cover type(eg 0 ISA could equally describe a forest as an agriculturalfield) we were also careful to match general habitat featuressuch as the presence of parking lots pathways roads and activepublic use within and between our different urbanization gra-dients Furthermore urban ant diversity and community com-position are known to be affected by habitat type (Uno Cottonand Philpott 2010) We avoided selecting sites at vacant lotscommunity gardens forest remnants and private residencesWithin a given urbanization gradient we selected seminaturalrecreational park habitat with parking lots pathways androads as the 0 ISA site and similar but more heavily devel-oped areas with increased amounts of parking lots pathwaysand roads as the higher ISA-valued sites (Supplementary FigS2) We kept this assignment the same across the different ur-banization gradients to ensure comparability of ISA categoriesacross the three cities (Supplementary Table S1)
We sampled each site from May to September of 2015 (withthe exception of two sites in Columbus each sampled from Julyto September and one site in Cincinnati that was not sampledin July) Due to the mosaic of impervious surfaces and naturalland-use fragments at each site it was nearly impossible to es-tablish a linear sampling transect where we could reliably set(dig) traps at a given increment of space We determined thenumber and spatial coverage of traps from previous studies thatsuccessfully sampled ant communities in urban environments(Gibb and Hochuli 2002 Clarke Fisher and LeBuhn 2008Pecarevic Danoff-Burg and Dunn 2010 Menke et al 2011)Additionally we increased the temporal resolution of the sam-pling effort from the above-mentioned studies to capture theseasonal components of biodiversity Every 30 days we placedfive pitfall traps spaced 20-m apart in a semilinear transectand allowed them to operate for 48-h Traps consisted of anopen specimen cup (52 mm in diameter and 60 mm in height)buried so the lip was flush with the ground allowing easy ac-cess to ground foraging invertebrates such as ants We partiallyfilled traps (approximate volume 50 ml) with 70 ethanol solu-tion as a preservative This ethanol solution does not attract or
repel ants (Greenslade and Greenslade 1971 Bestelmeyer et al2000) and a sufficient amount of ethanol solution to preserveall captured ant specimens remained in all pitfall traps after the48-h sampling period In addition we performed a mini-Winkler extraction which consisted of vigorously sifting a 1-m2
sample of surface material (mulch leaves litter) through a 1-cmgrid sieve The resulting siftate was then loaded into a mesh bagsuspended within a larger funnel-shaped enclosure (Winklerextractor) for 48-h Invertebrates that dropped out of the meshbag were collected in a small specimen cup filled with ethanolplaced at the bottom of the funnel With this overall samplingdesign we aimed to minimize potential biases in species body-size foraging-range and natural history (Gotelli et al 2011)while maintaining adequate coverage of the site Voucher speci-mens are retained at the Diamond Lab Entomology Collection atCase Western Reserve University
Ant species assemblages and diversity
All ant specimens collected from the urbanization gradientswere counted and identified at least to species group using re-gional identification keys (Coovert 2005 Ellison et al 2012)Owing to their eusocial organization estimating numericalabundance of ants can be challenging since individuals col-lected within a single trap likely originate from the same colony(Gotelli et al 2011) To alleviate potential biases from this con-straint we used species incidences across sampling units pertime point as our measure of abundance instead of raw individ-ual counts (Gotelli et al 2011) Thus the maximum lsquoabundancersquoany ant species can have at a site is six (five pitfall traps plusone Winkler extraction) We quantified ant species diversity us-ing the first two Hill numbers (Hill 1973 Jost 2006) which areweighted measures of species richness that take relative abun-dance (species incidences) into account Hill numbers are rec-ommended for comparative biodiversity studies as they reportin units of lsquoeffective number of speciesrsquo and are appropriate forcomparing diversities across communities (Chao et al 2014)The first Hill number (Hill1) is equal to the exponent of theShannon index (Shannon and Weaver 1949) and weighs eachspecies according to its abundance in the community repre-senting the number of common species (Jost 2006) The secondHill number (Hill2) is equal to the inverse of the Simpson index(Simpson 1949) and places less weight on rare species and canbe interpreted as the number of highly abundant species in thecommunity Using both Hill numbers we can evaluate the con-tribution of rare versus common species in the overall diversitypatterns
Statistical analyses
Characterizing biodiversity patterns across urbanization gradientsTo evaluate how well our sampling procedures were able to de-tect each species within the ant community of each city (sam-pling completeness) we generated species accumulation curvesbased on sampling incidence (ie the presence or absence of anant species in a sample) using the program EstimateS (Colwell2013) Curves reaching a plateau at values of maximum sam-pling effort indicate that the number of sampled species likelyrepresents the actual number of species within each city(Soberon and Llorente 1993)
To examine the patterns of ant species diversity acrossspace (sites along the urbanization gradient) and time (from thebeginning to the end of the activity season) in our three focalcities we constructed linear regression models with the main
Evaluating patterns and drivers of ant biodiversity | 3
Dow
nloaded from httpsacadem
icoupcomjuearticle51juz0175584262 by guest on 12 January 2022
effects and interaction effects (up to the three-way interaction)of percent-developed ISA (continuous variable the five sam-pling sites in increments of 20 ISA) Julian Day (continuousvariable the 30-day sampling interval points from May toSeptember) and City (the three focal cities of ClevelandColumbus and Cincinnati) We modeled City as a fixed effect(rather than a random effect) as we were specifically interestedin the question of whether our three focal cities harbored simi-lar or different relationships between diversity and urbaniza-tion rather than the cross-city overall trend We performedseparate models with Hill1 and Hill2 as the response variablesIn the case of significant interaction effects including the Cityterm we used this as justification to analyze species diversityresponses to percent-developed ISA and Julian Day for each cityseparately in subsequent analyses This modeling frameworkallowed us to evaluate whether biodiversity is maintained in
cities (significance of the percent-developed ISA term) whetherbiodiversity is stable across the activity season (significance ofthe Julian Day term) whether biodiversity patterns are similaramong the urbanization gradients in different cities (signifi-cance of the City percent-developed ISA interaction term)whether biodiversity patterns are similar among time in differ-ent cities (significance of the City Julian Day interaction term)and whether biodiversity patterns among sites with differentpercent-developed ISA values depend on time andor City (sig-nificance of the percent-developed ISA Julian Day andorpercent-developed ISA Julian Day City interaction terms)
In addition to overall patterns of biodiversity we examinedhow species composition was influenced by urbanization over thecourse of the activity season We used permutational multivariateanalysis of variance (PERMANOVA) based on species incidenceBrayCurtis dissimilarity matrices with percent-developed ISA
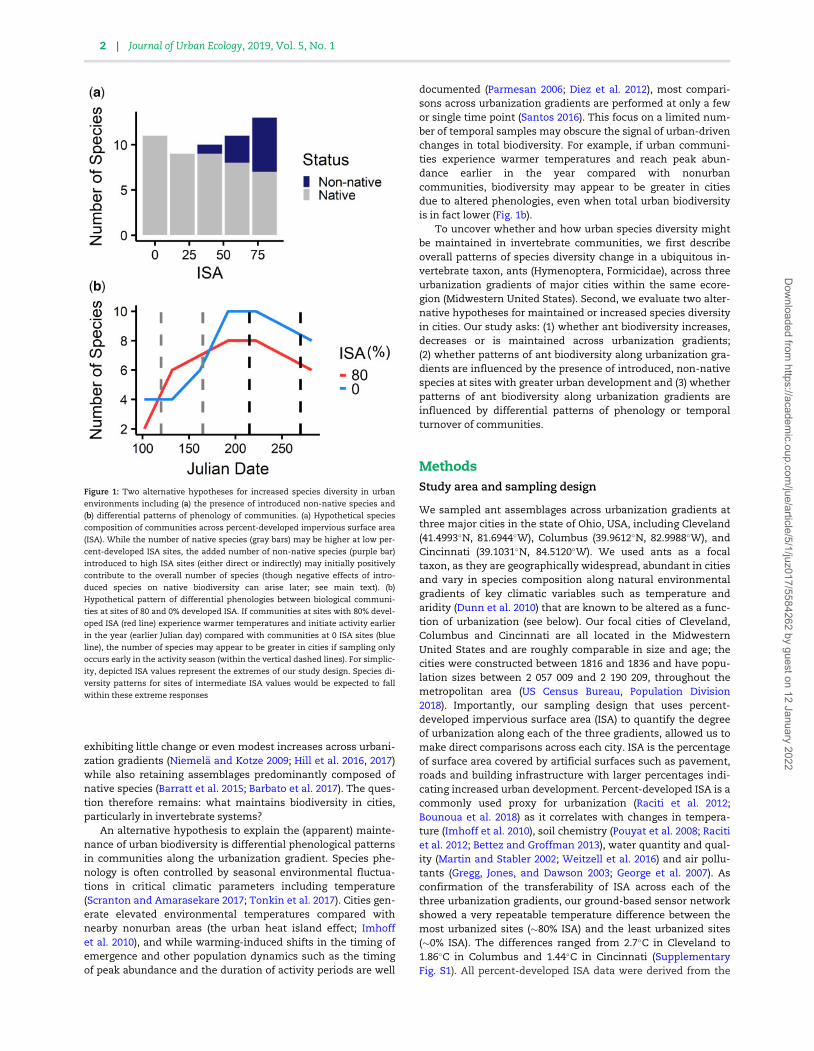
Figure 2 Top left inset Map of the study area (Ohio USA) including the locations of the cities of Cleveland (a) Columbus (b) and Cincinnati (c) Left panel percent-de-
veloped impervious surface area (ISA) map of each studied city Sampled sites are identified by points labeled with the approximate site-specific percent-developed
ISA in connected boxes Map colors indicate ISA value with lighter colors representing areas of high ISA and darker colors areas of low ISA Right panel relationship be-
tween Hill1 and Hill2 (species diversity) and percent-developed ISA for each city with predicted values (solid lines) and 95 confidence intervals (dashed lines)
Multiple points within the same ISA value correspond to the different temporal sampling points throughout the activity season (ie Julian Day)
4 | Journal of Urban Ecology 2019 Vol 5 No 1
Dow
nloaded from httpsacadem
icoupcomjuearticle51juz0175584262 by guest on 12 January 2022
Julian Day and their interaction as predictors we performed 999permutations for each test (McArdle and Anderson 2001) We per-formed separate PERMANOVAs for each city While our diversityanalyses allowed us to examine how the number of specieschanges across urbanization gradients our composition analysesallowed us to examine whether the same or different groups ofspecies were present in low and high percent-developed ISA sitesTo visualize urban-driven shifts in species composition we per-formed nonmetric multidimensional scaling (NMDS) based onspecies incidence BrayCurtis dissimilarity matrices ordinatedalong two dimensions Both analyses for species compositionwere conducted with the vegan package in R (Oksanen et al 2017)
Evaluating the mechanisms of urban biodiversity patternsTo explore whether non-native species were driving our observedpatterns of ant biodiversity along urbanization gradients we reranour above-described models of diversity while excluding all non-native species We then compared the results of the analyses us-ing the full suite of species and those using only native species toassess the influence of non-native species on our observed diver-sity patterns To explore an alternative mechanism specificallywhether differential phenologies along the urbanization gradientcould explain our observed patterns of ant biodiversity we exam-ined the significance of the percent-developed ISA Julian Day in-teraction term from the diversity models described above If urbanheat islands drive phenological advancement of ant peak abun-dance and activity leading to spurious patterns of the mainte-nance of urban biodiversity we would expect a significantpercent-developed ISA Julian Day interaction such that higherbiodiversity would be associated with sites with higher percent-developed ISA values earlier in the season (Fig 1b) All statisticalanalyses were performed using R version 342 (R Core Team 2018)unless otherwise specified
Results and discussion
Numerous studies have challenged the assumption of biodiver-sity loss in cities finding comparable levels of biodiversity tothat of the surrounding nonurban areas (Magura Lovei andTothmeresz 2010 Saari et al 2016 Hill et al 2017) Yet how fre-quently and by what mechanisms biodiversity is maintained incities remains largely unknown Although habitat type appearsto play an important role in structuring urban biodiversity (Gibband Hochuli 2002 Uno Cotton and Philpott 2010 Nielsen et al2014 Aronson et al 2017) it is unclear how given the same gen-eral habitat type embedded within increasing amounts of im-pervious surfaces species introductions or differences inphenology could drive the maintenance of biodiversity in citiesIn this study we used fine-scale spatio-temporal mapping of di-versity patterns of ant communities within and among threemajor cities in the Midwestern United States to explore themaintenance of biodiversity in urbanized areas We found thatin two out of three cities biodiversity was maintained along theurbanization gradient from nonurban to heavily urbanizedareas and that neither non-native introduced species nor al-tered seasonal activity were responsible for these patterns As aconsequence urban ant biodiversity was maintained through-out the typical activity season by native communities
Positive but mixed support for the maintenance ofurban biodiversity in ants
Species accumulation curves generated for each city demon-strate that the number of sampled ant species increased with
sampling effort and began to level at maximum sampling effort(Supplementary Fig S3) Additional sampling effort or alterna-tive methods such as baiting andor hand collecting may be re-quired for a complete inventory of ant species at each city but itis important to note that collecting all species at a site is highlyunlikely (Longino Coddington and Colwell 2002 Groc et al2007) Indeed our sampling protocol may have been biased to-wards ground-dwelling species however outside of tropicalsystems there are no strict arboreal species (Gotelli et al 2011)and previous work has shown that the combination of thesetwo methods effectively inventories ant communities in tem-perate systems (Martelli Ward and Fraser 2004 Groc et al2007) Therefore few additional species would have been col-lected with additional sampling effort
Adding to a growing body of work (Niemela and Kotze 2009Ives et al 2013 Hill et al 2016 Saari et al 2016) we find that ur-banization does not consistently reduce biodiversity Insteadwe observed idiosyncratic responses among our three focal cit-ies A significant interaction between percent-developed ISAand City (Supplementary Table S2) motivated us to perform sep-arate models of diversity (Hill1 and Hill2) as a function of ISAfor each city (Table 1) We effectively found three different pat-terns of biodiversity across the urbanization gradients in thethree cities though importantly in the majority of cases(Columbus and Cincinnati) we found that biodiversity was atleast maintained from nonurban into highly urbanized sites(Fig 2 Table 2) Specifically for Cincinnati we observed a non-significant (though positive-trending) relationship betweenHill1 species diversity (species weighted by relative abundance)and percent-developed ISA (Table 2) However for Hill2 (moreweight on common species) we found a significant positive re-lationship where species diversity was highest at more urban-ized sites (Table 2) Together these results suggest thatcommunities at lower percent-developed ISA may be composedof numerous species but only a few of these species are com-mon whereas at high percent-developed ISA sites the ant com-munities are composed of numerous species that are all equallyabundant with only a few rare species Only Cleveland exhib-ited the widely assumed pattern of decreased biodiversity withincreasing levels of urbanization (Fig 2 Table 2) Thus in a ma-jority of our cities (two out of three) we do not find support forthe expectation of urban-driven biodiversity loss The criticalquestion then becomes what mechanisms maintain urban bio-diversity Indeed few studies have evaluated the mechanisticdrivers of biodiversity patterns in cities (Shochat et al 2006Diamond et al 2015) though arguably to predict current and fu-ture consequences for urbanization impacts on biodiversity weneed to understand why biodiversity patterns arise (Diamondet al 2015)
Non-native species introductions can contributepositively to species diversity but do not entirelyexplain the maintenance of urban biodiversity
Humans can modify species diversity in cities through directintroductions of non-native species In some cases this mecha-nism underlies patterns of maintained or increased species di-versity relative to the surrounding undeveloped areas (Fig 1aHope et al 2003 Faeth Bang and Saari 2011) When we re-moved non-native species from our analyses we found that ourresults were unchanged in Cleveland and Columbus (decreasedand maintained diversity respectively Table 2 SupplementaryTable S3) In contrast in Cincinnati exclusion of the non-nativespecies changed the previous interpretation of increased urban
Evaluating patterns and drivers of ant biodiversity | 5
Dow
nloaded from httpsacadem
icoupcomjuearticle51juz0175584262 by guest on 12 January 2022
biodiversity (Hill2) to one of maintained urban biodiversity Ouranalysis revealed nonsignificant differences in species diversityacross percent-developed ISA (Table 2 Supplementary TableS3) These results suggest that in Cincinnati non-native specieswere highly abundant at the most urban sites contributing pos-itively to Hill2 species diversity
Beyond the numerical contribution to biodiversity in Cincinnatiit is worthwhile asking what the broader effects of the non-nativeant species are on the native ant community Although introducedspecies can contribute positively to biodiversity immediately aftertheir introduction given sufficient time to interact with native spe-cies introduced species could eventually have negative effects onnative ant biodiversity (Sanders et al 2003 Holway and Suarez2006 Wittman 2014 Wills and Landis 2018) For example
introduced ant species could plausibly outcompete native speciesfor food and nest resources (Bertelsmeier Blight and Courchamp2016) However this scenario appears to be unlikely in our particu-lar study system The two non-native species sampled in our study(Nylanderia flavipes and Tetramorium immigrans) while numericallyabundant in urban habitats (Bruder and Gupta 1972 Lessard andBuddle 2005 Ivanov and Milligan 2008 Pecarevic Danoff-Burg andDunn 2010 Ivanov et al 2011) may only have marginal effects onnative ant communities (Pecarevic Danoff-Burg and Dunn 2010)Nylanderia flavipes avoids aggressive interactions with native antsand is quickly displaced at food resources (Ivanov 2016)Tetramorium immigrans has been labeled as an urban exploiter andwhile its abundance can be negatively correlated with local antspecies richness (Steiner et al 2006 2008 Ivanov 2016 Gippet et al2017) it is primarily aggressive towards conspecifics (Kwon et al2014 personal observation) and has been observed to lose controlof baits to native ant species (Menke et al 2010)
Furthermore while we find that these introduced ant spe-cies currently have a positive effect on total biodiversity and areunlikely to have later negative effects on native biodiversity itis possible that the introduced species biodiversity could col-lapse in the future This phenomenon has been documented inseveral introduced ant species including Anoplolepis gracilipesPheidole megacephala and Linepithema humile Each of these spe-cies have been found to rapidly decline or collapse following aninitial population expansion (Cooling et al 2012 Wetterer 2012Cooling and Hoffmann 2015 and see Lester and Gruber 2016 fora recent possibility in Lasius neglectus) In our study system al-though T immigrans is a relatively old introduction (SuarezMcGlynn and Tsutsui 2010) N flavipes was recorded for the firsttime in Cleveland in 2005 (Ivanov and Milligan 2008) and speci-mens from this study represent its first observation inColumbus We are still learning the ecology of N flavipes outsideits native range (Ivanov et al 2011 Ivanov 2016) so it is unclearif this introduced species will continue to contribute positivelyto urban biodiversity or whether it will undergo extirpation inurbanized environments In a broad sense the effects of non-native ant species on native ant biodiversity are rather complexWhether non-natives numerically bolster biodiversity oractively reduce biodiversity appear to largely depend on the na-ture of their interactions with other species and the timeelapsed since their introduction rather than their status asnon-natives per se
Table 1 Linear model summary table for species diversity (Hill1Hill2) modeled as a function of percent-developed ImperviousSurface Area (ISA) Julian Day and their interaction for each city con-sidered separately (Cleveland Columbus and Cincinnati)
City Response Term F P
Cleveland Hill1 ISA 10817 0004Julian Day 1679 0207ISAJulian Day 0696 0393
Hill2 ISA 12828 0002Julian Day 1123 0300ISAJulian Day 1076 0296
Columbus Hill1 ISA 2659 0123Julian Day 0097 0746ISAJulian Day 1116 0308
Hill2 ISA 1274 0276Julian Day 0111 0730ISAJulian Day 0544 0476
Cincinnati Hill1 ISA 3081 0096Julian Day 1402 0255ISAJulian Day 0796 0372
Hill2 ISA 7667 0019Julian Day 0201 0667ISAJulian Day 0933 0337
Sample sizes were Cleveland frac14 25 Columbus frac14 20 and Cincinnati frac14 24 The nu-
merator degrees of freedom for each term was 1 as each term was modeled as a
continuous predictor Significant P-values are in bold
Table 2 Estimates standard errors test statistics and P-values from linear models of the relationship between species diversity (Hill1 Hill2)and percent-developed Impervious Surface Area (ISA)
Data subset City Response Estimate SE t P
All species (native and introducednon-native species)
Cleveland Hill1 0037 0011 3262 0003
Hill2 0036 0010 3566 0002Columbus Hill1 0017 0010 1667 0113
Hill2 0010 0008 1173 0256Cincinnati Hill1 0014 0008 1748 0095
Hill2 0019 0007 2825 0010Native species Cleveland Hill1 0037 0011 3387 0003
Hill2 0034 0010 3459 0002Columbus Hill1 0017 0010 1772 0093
Hill2 0010 0008 1227 0236Cincinnati Hill1 0004 0008 0452 0656
Hill2 0085 0007 1239 0228
Separate models are performed for each diversity metric (Hill1 and Hill2) for each city and for data subsets including all species versus only native species Data are
pooled across the non-significant term of Julian Day Significant P-values are in bold
6 | Journal of Urban Ecology 2019 Vol 5 No 1
Dow
nloaded from httpsacadem
icoupcomjuearticle51juz0175584262 by guest on 12 January 2022
No indication of differential phenologies in communitiesalong urbanization gradients
Timing of peak abundance and the duration of activity periodsoften follows seasonal environmental fluctuations in abioticfactors such as temperature (Scranton and Amarasekare 2017Tonkin et al 2017) Owing to urban heat islands urbanizationmay create differential phenological patterns in communitiesalong urbanization gradients (Shochat et al 2006) This differ-ence in timing may lead to spurious inferences regarding totalbiodiversity when limited temporal samples are taken (Fig 1b)However we failed to find any support for this hypothesiswhile we observed variable spatial patterns of species diversityalong each urbanization gradient temporally we found no sig-nificant interaction between percent-developed ISA and JulianDay (Table 1)This indicates that along each gradient biodiver-sity did not display any systematic temporal pattern across siteswith different percent-developed ISA values Our analyses ofcommunity composition further support these results NMDSordinations revealed spatial differences in species compositionalong each urbanization gradient (Cleveland Columbus andCincinnati) demonstrated by the clear distinction between antcommunities in high and low percent-developed ISA valuesHowever along the activity season we found clustering ofpoints within Julian Day These results show that while compo-sition changed significantly along each of our three urbaniza-tion gradients composition was invariant over time (Fig 3Table 3)
While we sampled across a typical activity season for temper-ate North American ant species (Herbers 1985 1989) it is possiblethat if we were to extend the sampling interval across the entireyear we may then observe differential patterns of phenology
among sites with different percent-developed ISA values A widearray of organisms show phenological advancement in citiessuch as plants (Neil and Wu 2006) birds (Deviche and Davies2014) and scale insects (Meineke Dunn and Frank 2014) thoughthe opposite pattern has also been found in butterflies (Diamondet al 2014) Recent work in the study area has shown that urbanheat islands can advance reproductive phenology for the ant spe-cies Temnothorax curvispinosus by 1 month (Chick et al 2019)Overall however we know very little about urban-driven pheno-logical shifts in ants as biodiversity studies are overwhelminglybased on sampling during a typical activity season with few con-tributions focused on early season late season or overwintering
Figure 3 Two-dimensional nonmetric multidimensional scaling (NMDS BrayCurtis dissimilarity matrix) ordination of the sampled ant communities across percent-
developed impervious surface area (ISA) and Julian Day for the cities of Cleveland Columbus and Cincinnati Final stress of 018 for Cleveland 016 for Columbus and
017 for Cincinnati signifying good representation of the variance of species assemblages in the reduced dimensions Symbols and colors correspond to sampled spe-
cies composition at each (a) ISA site and (b) Julian Day of each sampling point Ellipses represent 95 confidence interval around the centroid of points
Table 3 PERMANOVA summary table examining differences in antcommunities across percent-developed Impervious Surface Area(ISA) Julian Day and their interaction for each city (ClevelandColumbus and Cincinnati)
City Term F R2 P
Cleveland ISA 3676 0140 0001Julian Day 1014 0039 0419ISAJulian Day 0614 0023 0773
Columbus ISA 4617 0204 0001Julian Day 1329 0059 0002ISAJulian Day 0692 0031 0698
Cincinnati ISA 8746 0272 0001Julian Day 2583 0080 0018ISAJulian Day 0987 0027 0496
Sample sizes were Cleveland frac14 25 Columbus frac14 20 and Cincinnati frac14 24 The nu-
merator degrees of freedom for each term was 1 as each term was modeled as a
continuous predictor Significant P-values are in bold
Evaluating patterns and drivers of ant biodiversity | 7
Dow
nloaded from httpsacadem
icoupcomjuearticle51juz0175584262 by guest on 12 January 2022
responses (Santos 2016) Although the question of year-roundphenological change in cities merits further study our main fo-cus was on whether the timing of sampling along the urbaniza-tion gradient could lead to the apparent maintenance ofbiodiversity in cities (Fig 1b) At least for ants sampled during thetypical activity season this possibility appears unlikely howeverit remains to be seen how generalizable our temporal patterns ofant biodiversity are across other systems
Study limitations and future directions
Our study finds support for the maintenance of urban ant biodi-versity in some cities but not all and therefore it is important toconsider how differences among cities themselves might con-tribute to this variation in biodiversity patterns We selected cit-ies within the same geographic region (the Midwestern UnitedStates) and with relatively similar city ages and sizes Howeveramong our focal cities potential sources of inter-city variationinclude differences in background climate and proximity to largebodies of water with Cleveland having cooler mean annual tem-peratures and positioned adjacent to Lake Erie These factorshave been shown to interact with urbanization gradients to influ-ence ant physiology and behavior (Warren Bayba and Krupp2018) and may play a role in structuring communities by facilitat-ing or preventing the movement of certain species into cities Ata broader scale future research involving syntheses of multipleurban biodiversity studies might be able to find general patternsin how variation among cities with respect to size age andmany other factors (McDonnell et al 1997 Grimm et al 2008McIntyre Knowles-Yanez and Hope 2008) contributes systemat-ically (or not) to urban biodiversity patterns
Urban biodiversity is increasingly recognized for maintain-ing ecosystem function and social and cultural well-being(Muller and Werner 2010) Our study found that cities can main-tain or even increase levels of biodiversity relative to the sur-rounding nonurban areas From a conservation standpoint themaintenance of ant urban biodiversity may facilitate ecosystemfunction as ants perform key ecosystem services including de-composition soil aeration and seed dispersal (Del ToroRibbons and Pelini 2012) While we find that introducednon-native ant species can contribute positively to urbanbiodiversity a pattern and mechanism seen in urban plantcommunities in the majority of cities we examined the main-tenance of biodiversity was driven by responses of native antcommunities This suggests that ants may be resilient to someforms of anthropogenic change including urbanization Movingforward uncovering the degree to which different componentsof native biodiversity are affected by urbanization such as func-tional trait diversity are ripe areas for future research and willfurther aid in understanding the mechanisms driving commu-nity structure and species diversity in cities
Data availability
Data included in the manuscript is available on request
Supplementary data
Supplementary data are available at JUECOL online
Acknowledgements
We are grateful to Zara Perez Crystal Zhao Bethany Lutterand Yu Huan for field assistance and specimen sorting
Cleveland State University Case Western ReserveUniversity John Carroll University Hathaway BrownSchool Holden Arboretum and Gardens Columbus StateCommunity College The Columbus Foundation CapitalUniversity Columbus Metropolitan Libraries TheUniversity of Cincinnati Xavier University The PublicLibrary of Cincinnati and Hamilton County The CincinnatiObservatory and Ohio Department of Natural Resourcesgenerously provided access to sites L Chick R Martin MDugas M Moore and four anonymous reviewers that pro-vided helpful comments on a previous version of this man-uscript A Perez and S Diamond designed the studyconducted the analyses and wrote the manuscript APerez collected the data
Funding
This project was partially supported by the Ohio BiologicalSurvey small grants program This material is based uponwork supported by the National Science FoundationGraduate Research Fellowship Any opinion findings andconclusions or recommendations expressed in this materialare those of the authors and do not necessarily reflect theviews of the National Science Foundation
Conflict of interest statement None declared
ReferencesAronson M F et al (2017) lsquoBiodiversity in the City Key
Challenges for Urban Green Space Managementrsquo Frontiers inEcology and the Environment 15 189ndash96
Barbato D et al (2017) lsquoThe Role of Dispersal andLocal Environment in Urban Land Snail Assemblages AnExample of Three Cities in Central Italyrsquo Urban Ecosystems20 919
Barratt B I P et al (2015) lsquoBiodiversity of Coleoptera and OtherInvertebrates in Urban Gardens A Case Study in a NewZealand Cityrsquo Insect Conservation and Diversity 8 428ndash37
Bertelsmeier C Blight O and Courchamp F (2016) lsquoInvasionsof Ants (Hymenoptera Formicidae) in Light of Global ClimateChangersquo Myrmecological News 22 25ndash42
Bestelmeyer B T et al (2000) lsquoField Techniques for the Study ofGround-Dwelling Ant An Overview Description andEvaluationrsquo in Ants Standard Methods for Measuring andMonitoring Biodiversity pp 122ndash45
Bettez N D and Groffman P M (2013) lsquoNitrogen Deposition inand Near an Urban Ecosystemrsquo Environmental Science ampTechnology 47 6047ndash51
Bounoua L et al (2018) lsquoMapping Urbanization in the UnitedStates from 2001 to 2011rsquo Applied Geography 90 123ndash33
Bruder K W and Gupta A P (1972) lsquoBiology of the PavementAnt Tetramorium caespitum (Hymenoptera Formicidae)rsquoAnnals of the Entomological Society of America 65 358ndash67
Buczkowski G and Richmond D S (2012) lsquoThe Effect ofUrbanization on Ant Abundance and Diversity A TemporalExamination of Factors Affecting Biodiversityrsquo PLoS One 7 e41729
Chao A et al (2014) lsquoRarefaction and Extrapolation With HillNumbers A Framework for Sampling and Estimation inSpecies Diversity Studiesrsquo Ecological Monographs 84 45ndash67
Chick L D et al (2019) lsquoUrban Heat Islands Advance the Timingof Reproduction in a Social Insectrsquo Journal of Thermal Biology80 119ndash25
8 | Journal of Urban Ecology 2019 Vol 5 No 1
Dow
nloaded from httpsacadem
icoupcomjuearticle51juz0175584262 by guest on 12 January 2022
Clarke K M Fisher B L and LeBuhn G (2008) lsquoThe Influence ofUrban Park Characteristics on Ant (Hymenoptera Formicidae)Communitiesrsquo Urban Ecosystems 11 317ndash34
Colwell R K (2013) EstimateS Statistical estimation of speciesrichness and shared species from samples Version 9 lthttppurl oclcorgestimatesgt accessed 15 Aug 2018
Cooling M et al (2012) lsquoThe Widespread Collapse of an InvasiveSpecies Argentine Ants (Linepithema humile) in New ZealandrsquoBiology Letters 8 430ndash3
and Hoffmann B D (2015) lsquoHere Today Gone TomorrowDeclines and Local Extinctions of Invasive Ant Populations inthe Absence of Interventionrsquo Biological Invasions 17 3351ndash7
Coovert G A (2005) The Ants of Ohio (Hymenoptera Formicidae)Columbus OH Ohio Biological Survey
Davis B (1978) Urbanisation and the Diversity of Insects Diversity ofInsect Faunas pp 126ndash38 Oxford Blackwell Scientific
Del Toro I Ribbons R R and Pelini S L (2012) lsquoThe LittleThings That Run the World Revisited A Review ofAnt-Mediated Ecosystem Services and Disservices(Hymenoptera Formicidae)rsquo Myrmecological News 17 133ndash46
Denys C and Schmidt H (1998) lsquoInsect Communities onExperimental Mugwort (Artemisia vulgaris L) Plots along anUrban Gradientrsquo Oecologia 113 269ndash77
Deviche P and Davies S (2014) lsquoReproductive Phenology ofUrban Birds Environmental Cues and Mechanismsrsquo in D Giland H Brumm (eds) Avian Urban Ecology Behavioural andPhysiological Adaptations pp 98ndash115 Oxford UK OxfordUniversity Press
Diamond S E et al (2014) lsquoUnexpected Phenological Responsesof Butterflies to the Interaction of Urbanization andGeographic Temperaturersquo Ecology 95 2613ndash21
et al (2015) lsquoShared and Unique Responses of Insects to theInteraction of Urbanization and Background Climatersquo CurrentOpinion in Insect Science 11 71ndash7
Diez J M et al (2012) lsquoForecasting Phenology From SpeciesVariability to Community Patterns Phenological Variationacross Scalesrsquo Ecology Letters 15 545ndash53
Dunn R R et al (2010) lsquoGeographic Gradientsrsquo in L Lach C ParrK Abbott (eds) Ant Ecology pp 38ndash58 Oxford UK OxfordUniversity Press
Ellison A M et al (2012) A Field Guide to the Ants of New EnglandNew Haven Connecticut Yale University Press
Faeth S H Bang C and Saari S (2011) lsquoUrban BiodiversityPatterns and Mechanisms Urban Biodiversityrsquo Annals of theNew York Academy of Sciences 1223 69ndash81
Gaertner M et al (2017) lsquoNon-Native Species in UrbanEnvironments Patterns Processes Impacts and ChallengesrsquoBiological Invasions 19 3461ndash9
George K et al (2007) lsquoElevated Atmospheric CO2 Concentrationand Temperature across an UrbanndashRural TransectrsquoAtmospheric Environment 41 7654ndash65
Gibb H and Hochuli D F (2002) lsquoHabitat Fragmentation in an UrbanEnvironment Large and Small Fragments Support DifferentArthropod Assemblagesrsquo Biological Conservation 106 91ndash100
Gippet J M W et al (2017) lsquoIrsquom Not like Everybody ElseUrbanization Factors Shaping Spatial Distribution of Nativeand Invasive Ants Are Species-Specificrsquo Urban Ecosystems 20157ndash69
Gotelli N J et al (2011) lsquoCounting Ants (HymenopteraFormicidae) Biodiversity Sampling and Statistical Analysis forMyrmecologistsrsquo Myrmecological News 15 13ndash9
Greenslade P and Greenslade P J M (1971) lsquoThe Use of Baitsand Preservatives in Pitfall Trapsrsquo Australian Journal ofEntomology 10 253ndash60
Gregg J W Jones C G and Dawson T E (2003) lsquoUrbanizationEffects on Tree Growth in the Vicinity of New York CityrsquoNature 424 183ndash7
Grimm N B et al (2008) lsquoThe Changing Landscape EcosystemResponses to Urbanization and Pollution across Climatic andSocietal Gradientsrsquo Frontiers in Ecology and the Environment 6264ndash72
Groc S et al (2007) lsquoAnt Species Diversity in the lsquoGrandsCaussesrsquo (Aveyron France) in Search of Sampling MethodsAdapted to Temperate Climatesrsquo Comptes Rendus Biologies 330913ndash22
Herbers J (1985) lsquoSeasonal Structuring of a North TemperatureAnt Communityrsquo Insectes Sociaux 32 224ndash40
Herbers J M (1989) lsquoCommunity Structure in North TemperateAnts Temporal and Spatial Variationrsquo Oecologia 81 201ndash11
Hill M J et al (2017) lsquoUrban Ponds as an Aquatic BiodiversityResource in Modified Landscapesrsquo Global Change Biology 23986ndash99
et al (2016) lsquoMacroinvertebrate Diversity in Urban andRural Ponds Implications for Freshwater BiodiversityConservationrsquo Biological Conservation 201 50ndash9
Hill M O (1973) lsquoDiversity and Evenness A Unifying Notationand Its Consequencesrsquo Ecology 54 427ndash32
Holway D A and Suarez A V (2006) lsquoHomogenization of AntCommunities in Mediterranean California The Effects ofUrbanization and Invasionrsquo Biological Conservation 127 319ndash26
Homer C G et al (2015) lsquoCompletion of the 2011 National LandCover Database for the Conterminous UnitedStates-Representing a Decade of Land Cover ChangeInformationrsquo Photogrammetric Engineering and Remote Sensing81 345ndash54
Hope D et al (2003) lsquoSocioeconomics Drive Urban PlantDiversityrsquo Proceedings of the National Academy of Sciences 1008788ndash92
Imhoff M L et al (2010) lsquoRemote Sensing of the Urban HeatIsland Effect across Biomes in the Continental USArsquo RemoteSensing of Environment 114 504ndash13
Ivanov K (2016) lsquoExotic Ants (Hymenoptera Formicidae) ofOhiorsquo Journal of Hymenoptera Research 51 203ndash26
et al (2011) lsquoStatus of the Exotic Ant Nylanderia flavipes(Hymenoptera Formicidae) in Northeastern Ohiorsquo BiologicalInvasions 13 1945ndash50
and Milligan J (2008) lsquoParatrechina flavipes (Smith)(Hymenoptera Formicidae) a New Exotic Ant for OhiorsquoProceedings of the Entomological Society of Washington 110439ndash44
Ives C D et al (2013) lsquoEffect of Catchment Urbanization on AntDiversity in Remnant Riparian Corridorsrsquo Landscape and UrbanPlanning 110 155ndash63
Jost L (2006) lsquoEntropy and Diversityrsquo Oikos 113 363ndash75Kwon T-S et al (2014) lsquoPrediction of Abundance of Ants Due to
Climate Warming in South Korearsquo Journal of Asia-PacificBiodiversity 7 e179ndash96
Lessard J-P and Buddle C M (2005) lsquoThe Effects ofUrbanization on Ant Assemblages (Hymenoptera Formicidae)Associated with the Molson Nature Reserve Quebecrsquo TheCanadian Entomologist 137 215ndash25
Lester P J and Gruber M A M (2016) lsquoBooms Busts and PopulationCollapses in Invasive Antsrsquo Biological Invasions 18 3091ndash101
Longino J T Coddington J and Colwell R K (2002) lsquoThe AntFauna of a Tropical Rain Forest Estimating Species RichnessThree Different Waysrsquo Ecology 83 689ndash702
Luck G W and Smallbone L T (2010) lsquoSpecies Diversityand Urbanisation Patterns Drivers and Implicationsrsquo in
Evaluating patterns and drivers of ant biodiversity | 9
Dow
nloaded from httpsacadem
icoupcomjuearticle51juz0175584262 by guest on 12 January 2022
K J Gaston (ed) Urban Ecology pp 88ndash119 Cambridge UKCambridge University Press
Magura T Lovei G L and Tothmeresz B (2010) lsquoDoesUrbanization Decrease Diversity in Ground Beetle (Carabidae)Assemblages Urbanization and Carabid Diversityrsquo GlobalEcology and Biogeography 19 16ndash26
Martelli M G Ward M M and Fraser A M (2004) lsquoAntDiversity and Sampling on the Southern Cumberland PlateauA Comparison of Litter Sifting and Pitfall TrappingrsquoSoutheastern Naturalist 3 113ndash27
Martin C A and Stabler L B (2002) lsquoPlant Gas Exchange andWater Status in Urban Desert Landscapesrsquo Journal of AridEnvironments 51 235ndash54
McArdle B H and Anderson M J (2001) lsquoFitting MultivariateModels to Community Data A Comment on Distance-BasedRedundancy Analysisrsquo Ecology 82 290ndash7
McDonnell M J et al (1997) lsquoEcosystem Processes along anUrban-to-Rural Gradientrsquo Urban Ecosystems 1 21ndash36
McIntyre N E Knowles-Yanez K and Hope D (2008) lsquoUrbanEcology as an Interdisciplinary Field Differences in the Use ofldquoUrbanrdquo between the Social and Natural Sciencesrsquo in UrbanEcology pp 49ndash65 Boston MA Springer
McKinney M L (2008) lsquoEffects of Urbanization on SpeciesRichness A Review of Plants and Animalsrsquo Urban Ecosystems11 161ndash76
Meineke E K Dunn R R and Frank S D (2014) lsquoEarly PestDevelopment and Loss of Biological Control Are AssociatedWith Urban Warmingrsquo Biology Letters 10 20140586
Menke S B et al (2010) lsquoIs It Easy to Be Urban ConvergentSuccess in Urban Habitats among Lineages of a WidespreadNative Antrsquo PLoS One 5 e9194
et al (2011) lsquoUrban Areas May Serve as Habitat andCorridors for Dry-Adapted Heat Tolerant Species an Examplefrom Antsrsquo Urban Ecosystems 14 135ndash63
Muller N and Werner P (2010) lsquoUrban Biodiversity and theCase for Implementing the Convention on Biological Diversityin Towns and Citiesrsquo in N Muller P Werner J G Kelcey (eds)Urban Biodiversity and Design Oxford John Wiley amp Sons Inc
Neil K and Wu J (2006) lsquoEffects of Urbanization on PlantFlowering Phenology A Reviewrsquo Urban Ecosystems 9 243ndash57
Nielsen A B et al (2014) lsquoSpecies Richness in Urban Parks andIts Drivers A Review of Empirical Evidencersquo Urban Ecosystems17 305ndash27
Niemela J and Kotze D J (2009) lsquoCarabid Beetle Assemblagesalong Urban to Rural Gradients A Reviewrsquo Landscape and UrbanPlanning 92 65ndash71
Oksanen J et al (2017) vegan Community Ecology Package Rpackage version 230 2015
Parmesan C (2006) lsquoEcological and Evolutionary Responses toRecent Climate Change Annual Review of Ecologyrsquo AnnualReview of Ecology Evolution and Systematics 37 637ndash69
Pecarevic M Danoff-Burg J and Dunn R R (2010) lsquoBiodiversityon Broadway - Enigmatic Diversity of the Societies of Ants(Formicidae) on the Streets of New York Cityrsquo PLoS One 5e13222
Pouyat R V et al (2008) lsquoResponse of Forest Soil Properties toUrbanization Gradients in Three Metropolitan AreasrsquoLandscape Ecology 23 1187ndash203
R Core Team (2018) R A Language and Environment for StatisticalComputing Vienna Austria R Foundation for StatisticalComputing
Raciti S M et al (2012) lsquoInconsistent Definitions of ldquoUrbanrdquoResult in Different Conclusions about the Size of Urban Carbonand Nitrogen Stocksrsquo Ecological Applications 22 1015ndash35
Ricotta C et al (2017) lsquoBritish Plants as Aliens in New ZealandCities Residence Time Moderates Their Impact on the BetaDiversity of Urban Florasrsquo Biological Invasions 19 3589ndash99
Saari S et al (2016) lsquoUrbanization Is Not Associated withIncreased Abundance or Decreased Richness of TerrestrialAnimals - Dissecting the Literature through Meta-AnalysisrsquoUrban Ecosystems 19 1251ndash64
Sanders N J et al (2003) lsquoCommunity Disassembly by anInvasive Speciesrsquo Proceedings of the National Academy of Sciences100 2474ndash77
Santos M N (2016) lsquoResearch on Urban Ants Approaches andGapsrsquo Insectes Sociaux 63 359ndash71
Scranton K and Amarasekare P (2017) lsquoPredicting PhenologicalShifts in a Changing Climatersquo Proceedings of the NationalAcademy of Sciences 114 13212ndash17
Shannon C E and Weaver W (1949) The Mathematical Theory ofInformation Urbana IL The University of Illinois Press pp1ndash117
Shochat E et al (2006) lsquoFrom Patterns to Emerging Processes inMechanistic Urban Ecologyrsquo Trends in Ecology amp Evolution 21186ndash91
Simpson E H (1949) lsquoMeasurement of Diversityrsquo Nature 163 688Soberon J and Llorente J (1993) lsquoThe Use of Species
Accumulation Functions for the Prediction of SpeciesRichnessrsquo Conservation Biology 7 480ndash8
Steiner F M et al (2006) lsquoTetramorium Tsushimae a NewInvasive Ant in North Americarsquo Biological Invasions 8 117ndash23
et al (2008) lsquoCombined Modelling of Distribution and Nichein Invasion Biology A Case Study of Two InvasiveTetramorium Ant Species Distribution and Niche in InvasionModellingrsquo Diversity and Distributions 14 538ndash45
Suarez A V McGlynn T P and Tsutsui N D (2010)lsquoBiogeographic and Taxonomic Patterns of Introduced Antsrsquo inL Lach C Parr K Abbott (eds) Ant Ecology pp 233ndash44 OxfordUK Oxford University Press
Tagwireyi P and Sullivan S M P (2015) lsquoRiverine LandscapePatch Heterogeneity Drives Riparian Ant Assemblages in theScioto River Basin USArsquo PLoS One 10 e0124807
Thompson B and McLachlan S (2007) lsquoThe Effects ofUrbanization on Ant Communities and Myrmecochory inManitoba Canadarsquo Urban Ecosystems 10 43ndash52
Tonkin J D et al (2017) lsquoSeasonality and Predictability ShapeTemporal Species Diversityrsquo Ecology 98 1201ndash16
United States Census Bureau Population Division (2018) AnnualEstimates of the Resident Population April 1 2010 to July 12018mdashUnited StatesmdashMetropolitan Statistical Area and forPuerto Rico
Uno S Cotton J and Philpott S M (2010) lsquoDiversityAbundance and Species Composition of Ants in Urban GreenSpacesrsquo Urban Ecosystems 13 425ndash41
Warren R J II Bayba S and Krupp K T (2018) lsquoInteractingEffects of Urbanization and Coastal Gradients on Ant ThermalResponsesrsquo Journal of Urban Ecology 4
Weitzell R E et al (2016) lsquoExtent of Stream Burial andRelationships to Watershed Area Topography andImpervious Surface Arearsquo Water 8 538
Wetterer J K (2012) lsquoWorldwide Spread of the AfricanBig-Headed Ant Pheidole megacephala (HymenopteraFormicidae)rsquo Myrmecological News 17 51ndash62
Wills B D and Landis D A (2018) lsquoThe Role of Ants in NorthTemperate Grasslands A Reviewrsquo Oecologia 186 323ndash38
Wittman S E (2014) lsquoImpacts of Invasive Ants on Native AntCommunities (Hymenoptera Formicidae)rsquo MyrmecologicalNews 19 111ndash23
10 | Journal of Urban Ecology 2019 Vol 5 No 1
Dow
nloaded from httpsacadem
icoupcomjuearticle51juz0175584262 by guest on 12 January 2022
- juz017-TF1
- juz017-TF2
- juz017-TF3
-
exhibiting little change or even modest increases across urbani-zation gradients (Niemela and Kotze 2009 Hill et al 2016 2017)while also retaining assemblages predominantly composed ofnative species (Barratt et al 2015 Barbato et al 2017) The ques-tion therefore remains what maintains biodiversity in citiesparticularly in invertebrate systems
An alternative hypothesis to explain the (apparent) mainte-nance of urban biodiversity is differential phenological patternsin communities along the urbanization gradient Species phe-nology is often controlled by seasonal environmental fluctua-tions in critical climatic parameters including temperature(Scranton and Amarasekare 2017 Tonkin et al 2017) Cities gen-erate elevated environmental temperatures compared withnearby nonurban areas (the urban heat island effect Imhoffet al 2010) and while warming-induced shifts in the timing ofemergence and other population dynamics such as the timingof peak abundance and the duration of activity periods are well
documented (Parmesan 2006 Diez et al 2012) most compari-sons across urbanization gradients are performed at only a fewor single time point (Santos 2016) This focus on a limited num-ber of temporal samples may obscure the signal of urban-drivenchanges in total biodiversity For example if urban communi-ties experience warmer temperatures and reach peak abun-dance earlier in the year compared with nonurbancommunities biodiversity may appear to be greater in citiesdue to altered phenologies even when total urban biodiversityis in fact lower (Fig 1b)
To uncover whether and how urban species diversity mightbe maintained in invertebrate communities we first describeoverall patterns of species diversity change in a ubiquitous in-vertebrate taxon ants (Hymenoptera Formicidae) across threeurbanization gradients of major cities within the same ecore-gion (Midwestern United States) Second we evaluate two alter-native hypotheses for maintained or increased species diversityin cities Our study asks (1) whether ant biodiversity increasesdecreases or is maintained across urbanization gradients(2) whether patterns of ant biodiversity along urbanization gra-dients are influenced by the presence of introduced non-nativespecies at sites with greater urban development and (3) whetherpatterns of ant biodiversity along urbanization gradients areinfluenced by differential patterns of phenology or temporalturnover of communities
MethodsStudy area and sampling design
We sampled ant assemblages across urbanization gradients atthree major cities in the state of Ohio USA including Cleveland(414993N 816944W) Columbus (399612N 829988W) andCincinnati (391031N 845120W) We used ants as a focaltaxon as they are geographically widespread abundant in citiesand vary in species composition along natural environmentalgradients of key climatic variables such as temperature andaridity (Dunn et al 2010) that are known to be altered as a func-tion of urbanization (see below) Our focal cities of ClevelandColumbus and Cincinnati are all located in the MidwesternUnited States and are roughly comparable in size and age thecities were constructed between 1816 and 1836 and have popu-lation sizes between 2 057 009 and 2 190 209 throughout themetropolitan area (US Census Bureau Population Division2018) Importantly our sampling design that uses percent-developed impervious surface area (ISA) to quantify the degreeof urbanization along each of the three gradients allowed us tomake direct comparisons across each city ISA is the percentageof surface area covered by artificial surfaces such as pavementroads and building infrastructure with larger percentages indi-cating increased urban development Percent-developed ISA is acommonly used proxy for urbanization (Raciti et al 2012Bounoua et al 2018) as it correlates with changes in tempera-ture (Imhoff et al 2010) soil chemistry (Pouyat et al 2008 Racitiet al 2012 Bettez and Groffman 2013) water quantity and qual-ity (Martin and Stabler 2002 Weitzell et al 2016) and air pollu-tants (Gregg Jones and Dawson 2003 George et al 2007) Asconfirmation of the transferability of ISA across each of thethree urbanization gradients our ground-based sensor networkshowed a very repeatable temperature difference between themost urbanized sites (80 ISA) and the least urbanized sites(0 ISA) The differences ranged from 27C in Cleveland to186C in Columbus and 144C in Cincinnati (SupplementaryFig S1) All percent-developed ISA data were derived from the
Figure 1 Two alternative hypotheses for increased species diversity in urban
environments including (a) the presence of introduced non-native species and
(b) differential patterns of phenology of communities (a) Hypothetical species
composition of communities across percent-developed impervious surface area
(ISA) While the number of native species (gray bars) may be higher at low per-
cent-developed ISA sites the added number of non-native species (purple bar)
introduced to high ISA sites (either direct or indirectly) may initially positively
contribute to the overall number of species (though negative effects of intro-
duced species on native biodiversity can arise later see main text) (b)
Hypothetical pattern of differential phenologies between biological communi-
ties at sites of 80 and 0 developed ISA If communities at sites with 80 devel-
oped ISA (red line) experience warmer temperatures and initiate activity earlier
in the year (earlier Julian day) compared with communities at 0 ISA sites (blue
line) the number of species may appear to be greater in cities if sampling only
occurs early in the activity season (within the vertical dashed lines) For simplic-
ity depicted ISA values represent the extremes of our study design Species di-
versity patterns for sites of intermediate ISA values would be expected to fall
within these extreme responses
2 | Journal of Urban Ecology 2019 Vol 5 No 1
Dow
nloaded from httpsacadem
icoupcomjuearticle51juz0175584262 by guest on 12 January 2022
2011 National Land Cover Database (NLCD) at a 30-m resolution(Homer et al 2015)
In each city we established five sites along a continuouspercent-developed ISA gradient extending out from the citycenter in increments of 20 ISA (80 60 40 20 and 0 ISAFig 2 Supplementary Table S1) Although we took multiplesamples from each site in a transect design we did not havemultiple independent replicates of the same ISA incrementswithin each city Therefore we cannot estimate the repeatabil-ity of diversity patterns within each ISA increment for each cityRather our experimental design harnesses the power of explor-ing diversity patterns across relatively fine-scale ISA incre-ments for each city and allows us to compare these ISA-diversity relationships among cities Under this experimentaldesign even nonrepresentative diversity estimates at one oreven more ISA increments should be compensated by exploringthe diversity trend across the entire set of five ISA incrementsfor a given city Thus our design allows us to compare ant di-versity changes across three urbanization gradients in a man-ner comparable to well-studied biogeographic diversity patternsalong elevation or latitudinal clines (Dunn et al 2010)
The extent of our sampling design exceeded the grid size ofthe NLCD data Therefore we estimated site-level ISA by takingthe mean of all percent-developed ISA values within a 90-mbuffer using the Focal Statistics function in ArcMap v 103Because percent-developed impervious surface only describesthe degree of urban development rather than land cover type(eg 0 ISA could equally describe a forest as an agriculturalfield) we were also careful to match general habitat featuressuch as the presence of parking lots pathways roads and activepublic use within and between our different urbanization gra-dients Furthermore urban ant diversity and community com-position are known to be affected by habitat type (Uno Cottonand Philpott 2010) We avoided selecting sites at vacant lotscommunity gardens forest remnants and private residencesWithin a given urbanization gradient we selected seminaturalrecreational park habitat with parking lots pathways androads as the 0 ISA site and similar but more heavily devel-oped areas with increased amounts of parking lots pathwaysand roads as the higher ISA-valued sites (Supplementary FigS2) We kept this assignment the same across the different ur-banization gradients to ensure comparability of ISA categoriesacross the three cities (Supplementary Table S1)
We sampled each site from May to September of 2015 (withthe exception of two sites in Columbus each sampled from Julyto September and one site in Cincinnati that was not sampledin July) Due to the mosaic of impervious surfaces and naturalland-use fragments at each site it was nearly impossible to es-tablish a linear sampling transect where we could reliably set(dig) traps at a given increment of space We determined thenumber and spatial coverage of traps from previous studies thatsuccessfully sampled ant communities in urban environments(Gibb and Hochuli 2002 Clarke Fisher and LeBuhn 2008Pecarevic Danoff-Burg and Dunn 2010 Menke et al 2011)Additionally we increased the temporal resolution of the sam-pling effort from the above-mentioned studies to capture theseasonal components of biodiversity Every 30 days we placedfive pitfall traps spaced 20-m apart in a semilinear transectand allowed them to operate for 48-h Traps consisted of anopen specimen cup (52 mm in diameter and 60 mm in height)buried so the lip was flush with the ground allowing easy ac-cess to ground foraging invertebrates such as ants We partiallyfilled traps (approximate volume 50 ml) with 70 ethanol solu-tion as a preservative This ethanol solution does not attract or
repel ants (Greenslade and Greenslade 1971 Bestelmeyer et al2000) and a sufficient amount of ethanol solution to preserveall captured ant specimens remained in all pitfall traps after the48-h sampling period In addition we performed a mini-Winkler extraction which consisted of vigorously sifting a 1-m2
sample of surface material (mulch leaves litter) through a 1-cmgrid sieve The resulting siftate was then loaded into a mesh bagsuspended within a larger funnel-shaped enclosure (Winklerextractor) for 48-h Invertebrates that dropped out of the meshbag were collected in a small specimen cup filled with ethanolplaced at the bottom of the funnel With this overall samplingdesign we aimed to minimize potential biases in species body-size foraging-range and natural history (Gotelli et al 2011)while maintaining adequate coverage of the site Voucher speci-mens are retained at the Diamond Lab Entomology Collection atCase Western Reserve University
Ant species assemblages and diversity
All ant specimens collected from the urbanization gradientswere counted and identified at least to species group using re-gional identification keys (Coovert 2005 Ellison et al 2012)Owing to their eusocial organization estimating numericalabundance of ants can be challenging since individuals col-lected within a single trap likely originate from the same colony(Gotelli et al 2011) To alleviate potential biases from this con-straint we used species incidences across sampling units pertime point as our measure of abundance instead of raw individ-ual counts (Gotelli et al 2011) Thus the maximum lsquoabundancersquoany ant species can have at a site is six (five pitfall traps plusone Winkler extraction) We quantified ant species diversity us-ing the first two Hill numbers (Hill 1973 Jost 2006) which areweighted measures of species richness that take relative abun-dance (species incidences) into account Hill numbers are rec-ommended for comparative biodiversity studies as they reportin units of lsquoeffective number of speciesrsquo and are appropriate forcomparing diversities across communities (Chao et al 2014)The first Hill number (Hill1) is equal to the exponent of theShannon index (Shannon and Weaver 1949) and weighs eachspecies according to its abundance in the community repre-senting the number of common species (Jost 2006) The secondHill number (Hill2) is equal to the inverse of the Simpson index(Simpson 1949) and places less weight on rare species and canbe interpreted as the number of highly abundant species in thecommunity Using both Hill numbers we can evaluate the con-tribution of rare versus common species in the overall diversitypatterns
Statistical analyses
Characterizing biodiversity patterns across urbanization gradientsTo evaluate how well our sampling procedures were able to de-tect each species within the ant community of each city (sam-pling completeness) we generated species accumulation curvesbased on sampling incidence (ie the presence or absence of anant species in a sample) using the program EstimateS (Colwell2013) Curves reaching a plateau at values of maximum sam-pling effort indicate that the number of sampled species likelyrepresents the actual number of species within each city(Soberon and Llorente 1993)
To examine the patterns of ant species diversity acrossspace (sites along the urbanization gradient) and time (from thebeginning to the end of the activity season) in our three focalcities we constructed linear regression models with the main
Evaluating patterns and drivers of ant biodiversity | 3
Dow
nloaded from httpsacadem
icoupcomjuearticle51juz0175584262 by guest on 12 January 2022
effects and interaction effects (up to the three-way interaction)of percent-developed ISA (continuous variable the five sam-pling sites in increments of 20 ISA) Julian Day (continuousvariable the 30-day sampling interval points from May toSeptember) and City (the three focal cities of ClevelandColumbus and Cincinnati) We modeled City as a fixed effect(rather than a random effect) as we were specifically interestedin the question of whether our three focal cities harbored simi-lar or different relationships between diversity and urbaniza-tion rather than the cross-city overall trend We performedseparate models with Hill1 and Hill2 as the response variablesIn the case of significant interaction effects including the Cityterm we used this as justification to analyze species diversityresponses to percent-developed ISA and Julian Day for each cityseparately in subsequent analyses This modeling frameworkallowed us to evaluate whether biodiversity is maintained in
cities (significance of the percent-developed ISA term) whetherbiodiversity is stable across the activity season (significance ofthe Julian Day term) whether biodiversity patterns are similaramong the urbanization gradients in different cities (signifi-cance of the City percent-developed ISA interaction term)whether biodiversity patterns are similar among time in differ-ent cities (significance of the City Julian Day interaction term)and whether biodiversity patterns among sites with differentpercent-developed ISA values depend on time andor City (sig-nificance of the percent-developed ISA Julian Day andorpercent-developed ISA Julian Day City interaction terms)
In addition to overall patterns of biodiversity we examinedhow species composition was influenced by urbanization over thecourse of the activity season We used permutational multivariateanalysis of variance (PERMANOVA) based on species incidenceBrayCurtis dissimilarity matrices with percent-developed ISA
Figure 2 Top left inset Map of the study area (Ohio USA) including the locations of the cities of Cleveland (a) Columbus (b) and Cincinnati (c) Left panel percent-de-
veloped impervious surface area (ISA) map of each studied city Sampled sites are identified by points labeled with the approximate site-specific percent-developed
ISA in connected boxes Map colors indicate ISA value with lighter colors representing areas of high ISA and darker colors areas of low ISA Right panel relationship be-
tween Hill1 and Hill2 (species diversity) and percent-developed ISA for each city with predicted values (solid lines) and 95 confidence intervals (dashed lines)
Multiple points within the same ISA value correspond to the different temporal sampling points throughout the activity season (ie Julian Day)
4 | Journal of Urban Ecology 2019 Vol 5 No 1
Dow
nloaded from httpsacadem
icoupcomjuearticle51juz0175584262 by guest on 12 January 2022
Julian Day and their interaction as predictors we performed 999permutations for each test (McArdle and Anderson 2001) We per-formed separate PERMANOVAs for each city While our diversityanalyses allowed us to examine how the number of specieschanges across urbanization gradients our composition analysesallowed us to examine whether the same or different groups ofspecies were present in low and high percent-developed ISA sitesTo visualize urban-driven shifts in species composition we per-formed nonmetric multidimensional scaling (NMDS) based onspecies incidence BrayCurtis dissimilarity matrices ordinatedalong two dimensions Both analyses for species compositionwere conducted with the vegan package in R (Oksanen et al 2017)
Evaluating the mechanisms of urban biodiversity patternsTo explore whether non-native species were driving our observedpatterns of ant biodiversity along urbanization gradients we reranour above-described models of diversity while excluding all non-native species We then compared the results of the analyses us-ing the full suite of species and those using only native species toassess the influence of non-native species on our observed diver-sity patterns To explore an alternative mechanism specificallywhether differential phenologies along the urbanization gradientcould explain our observed patterns of ant biodiversity we exam-ined the significance of the percent-developed ISA Julian Day in-teraction term from the diversity models described above If urbanheat islands drive phenological advancement of ant peak abun-dance and activity leading to spurious patterns of the mainte-nance of urban biodiversity we would expect a significantpercent-developed ISA Julian Day interaction such that higherbiodiversity would be associated with sites with higher percent-developed ISA values earlier in the season (Fig 1b) All statisticalanalyses were performed using R version 342 (R Core Team 2018)unless otherwise specified
Results and discussion
Numerous studies have challenged the assumption of biodiver-sity loss in cities finding comparable levels of biodiversity tothat of the surrounding nonurban areas (Magura Lovei andTothmeresz 2010 Saari et al 2016 Hill et al 2017) Yet how fre-quently and by what mechanisms biodiversity is maintained incities remains largely unknown Although habitat type appearsto play an important role in structuring urban biodiversity (Gibband Hochuli 2002 Uno Cotton and Philpott 2010 Nielsen et al2014 Aronson et al 2017) it is unclear how given the same gen-eral habitat type embedded within increasing amounts of im-pervious surfaces species introductions or differences inphenology could drive the maintenance of biodiversity in citiesIn this study we used fine-scale spatio-temporal mapping of di-versity patterns of ant communities within and among threemajor cities in the Midwestern United States to explore themaintenance of biodiversity in urbanized areas We found thatin two out of three cities biodiversity was maintained along theurbanization gradient from nonurban to heavily urbanizedareas and that neither non-native introduced species nor al-tered seasonal activity were responsible for these patterns As aconsequence urban ant biodiversity was maintained through-out the typical activity season by native communities
Positive but mixed support for the maintenance ofurban biodiversity in ants
Species accumulation curves generated for each city demon-strate that the number of sampled ant species increased with
sampling effort and began to level at maximum sampling effort(Supplementary Fig S3) Additional sampling effort or alterna-tive methods such as baiting andor hand collecting may be re-quired for a complete inventory of ant species at each city but itis important to note that collecting all species at a site is highlyunlikely (Longino Coddington and Colwell 2002 Groc et al2007) Indeed our sampling protocol may have been biased to-wards ground-dwelling species however outside of tropicalsystems there are no strict arboreal species (Gotelli et al 2011)and previous work has shown that the combination of thesetwo methods effectively inventories ant communities in tem-perate systems (Martelli Ward and Fraser 2004 Groc et al2007) Therefore few additional species would have been col-lected with additional sampling effort
Adding to a growing body of work (Niemela and Kotze 2009Ives et al 2013 Hill et al 2016 Saari et al 2016) we find that ur-banization does not consistently reduce biodiversity Insteadwe observed idiosyncratic responses among our three focal cit-ies A significant interaction between percent-developed ISAand City (Supplementary Table S2) motivated us to perform sep-arate models of diversity (Hill1 and Hill2) as a function of ISAfor each city (Table 1) We effectively found three different pat-terns of biodiversity across the urbanization gradients in thethree cities though importantly in the majority of cases(Columbus and Cincinnati) we found that biodiversity was atleast maintained from nonurban into highly urbanized sites(Fig 2 Table 2) Specifically for Cincinnati we observed a non-significant (though positive-trending) relationship betweenHill1 species diversity (species weighted by relative abundance)and percent-developed ISA (Table 2) However for Hill2 (moreweight on common species) we found a significant positive re-lationship where species diversity was highest at more urban-ized sites (Table 2) Together these results suggest thatcommunities at lower percent-developed ISA may be composedof numerous species but only a few of these species are com-mon whereas at high percent-developed ISA sites the ant com-munities are composed of numerous species that are all equallyabundant with only a few rare species Only Cleveland exhib-ited the widely assumed pattern of decreased biodiversity withincreasing levels of urbanization (Fig 2 Table 2) Thus in a ma-jority of our cities (two out of three) we do not find support forthe expectation of urban-driven biodiversity loss The criticalquestion then becomes what mechanisms maintain urban bio-diversity Indeed few studies have evaluated the mechanisticdrivers of biodiversity patterns in cities (Shochat et al 2006Diamond et al 2015) though arguably to predict current and fu-ture consequences for urbanization impacts on biodiversity weneed to understand why biodiversity patterns arise (Diamondet al 2015)
Non-native species introductions can contributepositively to species diversity but do not entirelyexplain the maintenance of urban biodiversity
Humans can modify species diversity in cities through directintroductions of non-native species In some cases this mecha-nism underlies patterns of maintained or increased species di-versity relative to the surrounding undeveloped areas (Fig 1aHope et al 2003 Faeth Bang and Saari 2011) When we re-moved non-native species from our analyses we found that ourresults were unchanged in Cleveland and Columbus (decreasedand maintained diversity respectively Table 2 SupplementaryTable S3) In contrast in Cincinnati exclusion of the non-nativespecies changed the previous interpretation of increased urban
Evaluating patterns and drivers of ant biodiversity | 5
Dow
nloaded from httpsacadem
icoupcomjuearticle51juz0175584262 by guest on 12 January 2022
biodiversity (Hill2) to one of maintained urban biodiversity Ouranalysis revealed nonsignificant differences in species diversityacross percent-developed ISA (Table 2 Supplementary TableS3) These results suggest that in Cincinnati non-native specieswere highly abundant at the most urban sites contributing pos-itively to Hill2 species diversity
Beyond the numerical contribution to biodiversity in Cincinnatiit is worthwhile asking what the broader effects of the non-nativeant species are on the native ant community Although introducedspecies can contribute positively to biodiversity immediately aftertheir introduction given sufficient time to interact with native spe-cies introduced species could eventually have negative effects onnative ant biodiversity (Sanders et al 2003 Holway and Suarez2006 Wittman 2014 Wills and Landis 2018) For example
introduced ant species could plausibly outcompete native speciesfor food and nest resources (Bertelsmeier Blight and Courchamp2016) However this scenario appears to be unlikely in our particu-lar study system The two non-native species sampled in our study(Nylanderia flavipes and Tetramorium immigrans) while numericallyabundant in urban habitats (Bruder and Gupta 1972 Lessard andBuddle 2005 Ivanov and Milligan 2008 Pecarevic Danoff-Burg andDunn 2010 Ivanov et al 2011) may only have marginal effects onnative ant communities (Pecarevic Danoff-Burg and Dunn 2010)Nylanderia flavipes avoids aggressive interactions with native antsand is quickly displaced at food resources (Ivanov 2016)Tetramorium immigrans has been labeled as an urban exploiter andwhile its abundance can be negatively correlated with local antspecies richness (Steiner et al 2006 2008 Ivanov 2016 Gippet et al2017) it is primarily aggressive towards conspecifics (Kwon et al2014 personal observation) and has been observed to lose controlof baits to native ant species (Menke et al 2010)
Furthermore while we find that these introduced ant spe-cies currently have a positive effect on total biodiversity and areunlikely to have later negative effects on native biodiversity itis possible that the introduced species biodiversity could col-lapse in the future This phenomenon has been documented inseveral introduced ant species including Anoplolepis gracilipesPheidole megacephala and Linepithema humile Each of these spe-cies have been found to rapidly decline or collapse following aninitial population expansion (Cooling et al 2012 Wetterer 2012Cooling and Hoffmann 2015 and see Lester and Gruber 2016 fora recent possibility in Lasius neglectus) In our study system al-though T immigrans is a relatively old introduction (SuarezMcGlynn and Tsutsui 2010) N flavipes was recorded for the firsttime in Cleveland in 2005 (Ivanov and Milligan 2008) and speci-mens from this study represent its first observation inColumbus We are still learning the ecology of N flavipes outsideits native range (Ivanov et al 2011 Ivanov 2016) so it is unclearif this introduced species will continue to contribute positivelyto urban biodiversity or whether it will undergo extirpation inurbanized environments In a broad sense the effects of non-native ant species on native ant biodiversity are rather complexWhether non-natives numerically bolster biodiversity oractively reduce biodiversity appear to largely depend on the na-ture of their interactions with other species and the timeelapsed since their introduction rather than their status asnon-natives per se
Table 1 Linear model summary table for species diversity (Hill1Hill2) modeled as a function of percent-developed ImperviousSurface Area (ISA) Julian Day and their interaction for each city con-sidered separately (Cleveland Columbus and Cincinnati)
City Response Term F P
Cleveland Hill1 ISA 10817 0004Julian Day 1679 0207ISAJulian Day 0696 0393
Hill2 ISA 12828 0002Julian Day 1123 0300ISAJulian Day 1076 0296
Columbus Hill1 ISA 2659 0123Julian Day 0097 0746ISAJulian Day 1116 0308
Hill2 ISA 1274 0276Julian Day 0111 0730ISAJulian Day 0544 0476
Cincinnati Hill1 ISA 3081 0096Julian Day 1402 0255ISAJulian Day 0796 0372
Hill2 ISA 7667 0019Julian Day 0201 0667ISAJulian Day 0933 0337
Sample sizes were Cleveland frac14 25 Columbus frac14 20 and Cincinnati frac14 24 The nu-
merator degrees of freedom for each term was 1 as each term was modeled as a
continuous predictor Significant P-values are in bold
Table 2 Estimates standard errors test statistics and P-values from linear models of the relationship between species diversity (Hill1 Hill2)and percent-developed Impervious Surface Area (ISA)
Data subset City Response Estimate SE t P
All species (native and introducednon-native species)
Cleveland Hill1 0037 0011 3262 0003
Hill2 0036 0010 3566 0002Columbus Hill1 0017 0010 1667 0113
Hill2 0010 0008 1173 0256Cincinnati Hill1 0014 0008 1748 0095
Hill2 0019 0007 2825 0010Native species Cleveland Hill1 0037 0011 3387 0003
Hill2 0034 0010 3459 0002Columbus Hill1 0017 0010 1772 0093
Hill2 0010 0008 1227 0236Cincinnati Hill1 0004 0008 0452 0656
Hill2 0085 0007 1239 0228
Separate models are performed for each diversity metric (Hill1 and Hill2) for each city and for data subsets including all species versus only native species Data are
pooled across the non-significant term of Julian Day Significant P-values are in bold
6 | Journal of Urban Ecology 2019 Vol 5 No 1
Dow
nloaded from httpsacadem
icoupcomjuearticle51juz0175584262 by guest on 12 January 2022
No indication of differential phenologies in communitiesalong urbanization gradients
Timing of peak abundance and the duration of activity periodsoften follows seasonal environmental fluctuations in abioticfactors such as temperature (Scranton and Amarasekare 2017Tonkin et al 2017) Owing to urban heat islands urbanizationmay create differential phenological patterns in communitiesalong urbanization gradients (Shochat et al 2006) This differ-ence in timing may lead to spurious inferences regarding totalbiodiversity when limited temporal samples are taken (Fig 1b)However we failed to find any support for this hypothesiswhile we observed variable spatial patterns of species diversityalong each urbanization gradient temporally we found no sig-nificant interaction between percent-developed ISA and JulianDay (Table 1)This indicates that along each gradient biodiver-sity did not display any systematic temporal pattern across siteswith different percent-developed ISA values Our analyses ofcommunity composition further support these results NMDSordinations revealed spatial differences in species compositionalong each urbanization gradient (Cleveland Columbus andCincinnati) demonstrated by the clear distinction between antcommunities in high and low percent-developed ISA valuesHowever along the activity season we found clustering ofpoints within Julian Day These results show that while compo-sition changed significantly along each of our three urbaniza-tion gradients composition was invariant over time (Fig 3Table 3)
While we sampled across a typical activity season for temper-ate North American ant species (Herbers 1985 1989) it is possiblethat if we were to extend the sampling interval across the entireyear we may then observe differential patterns of phenology
among sites with different percent-developed ISA values A widearray of organisms show phenological advancement in citiessuch as plants (Neil and Wu 2006) birds (Deviche and Davies2014) and scale insects (Meineke Dunn and Frank 2014) thoughthe opposite pattern has also been found in butterflies (Diamondet al 2014) Recent work in the study area has shown that urbanheat islands can advance reproductive phenology for the ant spe-cies Temnothorax curvispinosus by 1 month (Chick et al 2019)Overall however we know very little about urban-driven pheno-logical shifts in ants as biodiversity studies are overwhelminglybased on sampling during a typical activity season with few con-tributions focused on early season late season or overwintering
Figure 3 Two-dimensional nonmetric multidimensional scaling (NMDS BrayCurtis dissimilarity matrix) ordination of the sampled ant communities across percent-
developed impervious surface area (ISA) and Julian Day for the cities of Cleveland Columbus and Cincinnati Final stress of 018 for Cleveland 016 for Columbus and
017 for Cincinnati signifying good representation of the variance of species assemblages in the reduced dimensions Symbols and colors correspond to sampled spe-
cies composition at each (a) ISA site and (b) Julian Day of each sampling point Ellipses represent 95 confidence interval around the centroid of points
Table 3 PERMANOVA summary table examining differences in antcommunities across percent-developed Impervious Surface Area(ISA) Julian Day and their interaction for each city (ClevelandColumbus and Cincinnati)
City Term F R2 P
Cleveland ISA 3676 0140 0001Julian Day 1014 0039 0419ISAJulian Day 0614 0023 0773
Columbus ISA 4617 0204 0001Julian Day 1329 0059 0002ISAJulian Day 0692 0031 0698
Cincinnati ISA 8746 0272 0001Julian Day 2583 0080 0018ISAJulian Day 0987 0027 0496
Sample sizes were Cleveland frac14 25 Columbus frac14 20 and Cincinnati frac14 24 The nu-
merator degrees of freedom for each term was 1 as each term was modeled as a
continuous predictor Significant P-values are in bold
Evaluating patterns and drivers of ant biodiversity | 7
Dow
nloaded from httpsacadem
icoupcomjuearticle51juz0175584262 by guest on 12 January 2022
responses (Santos 2016) Although the question of year-roundphenological change in cities merits further study our main fo-cus was on whether the timing of sampling along the urbaniza-tion gradient could lead to the apparent maintenance ofbiodiversity in cities (Fig 1b) At least for ants sampled during thetypical activity season this possibility appears unlikely howeverit remains to be seen how generalizable our temporal patterns ofant biodiversity are across other systems
Study limitations and future directions
Our study finds support for the maintenance of urban ant biodi-versity in some cities but not all and therefore it is important toconsider how differences among cities themselves might con-tribute to this variation in biodiversity patterns We selected cit-ies within the same geographic region (the Midwestern UnitedStates) and with relatively similar city ages and sizes Howeveramong our focal cities potential sources of inter-city variationinclude differences in background climate and proximity to largebodies of water with Cleveland having cooler mean annual tem-peratures and positioned adjacent to Lake Erie These factorshave been shown to interact with urbanization gradients to influ-ence ant physiology and behavior (Warren Bayba and Krupp2018) and may play a role in structuring communities by facilitat-ing or preventing the movement of certain species into cities Ata broader scale future research involving syntheses of multipleurban biodiversity studies might be able to find general patternsin how variation among cities with respect to size age andmany other factors (McDonnell et al 1997 Grimm et al 2008McIntyre Knowles-Yanez and Hope 2008) contributes systemat-ically (or not) to urban biodiversity patterns
Urban biodiversity is increasingly recognized for maintain-ing ecosystem function and social and cultural well-being(Muller and Werner 2010) Our study found that cities can main-tain or even increase levels of biodiversity relative to the sur-rounding nonurban areas From a conservation standpoint themaintenance of ant urban biodiversity may facilitate ecosystemfunction as ants perform key ecosystem services including de-composition soil aeration and seed dispersal (Del ToroRibbons and Pelini 2012) While we find that introducednon-native ant species can contribute positively to urbanbiodiversity a pattern and mechanism seen in urban plantcommunities in the majority of cities we examined the main-tenance of biodiversity was driven by responses of native antcommunities This suggests that ants may be resilient to someforms of anthropogenic change including urbanization Movingforward uncovering the degree to which different componentsof native biodiversity are affected by urbanization such as func-tional trait diversity are ripe areas for future research and willfurther aid in understanding the mechanisms driving commu-nity structure and species diversity in cities
Data availability
Data included in the manuscript is available on request
Supplementary data
Supplementary data are available at JUECOL online
Acknowledgements
We are grateful to Zara Perez Crystal Zhao Bethany Lutterand Yu Huan for field assistance and specimen sorting
Cleveland State University Case Western ReserveUniversity John Carroll University Hathaway BrownSchool Holden Arboretum and Gardens Columbus StateCommunity College The Columbus Foundation CapitalUniversity Columbus Metropolitan Libraries TheUniversity of Cincinnati Xavier University The PublicLibrary of Cincinnati and Hamilton County The CincinnatiObservatory and Ohio Department of Natural Resourcesgenerously provided access to sites L Chick R Martin MDugas M Moore and four anonymous reviewers that pro-vided helpful comments on a previous version of this man-uscript A Perez and S Diamond designed the studyconducted the analyses and wrote the manuscript APerez collected the data
Funding
This project was partially supported by the Ohio BiologicalSurvey small grants program This material is based uponwork supported by the National Science FoundationGraduate Research Fellowship Any opinion findings andconclusions or recommendations expressed in this materialare those of the authors and do not necessarily reflect theviews of the National Science Foundation
Conflict of interest statement None declared
ReferencesAronson M F et al (2017) lsquoBiodiversity in the City Key
Challenges for Urban Green Space Managementrsquo Frontiers inEcology and the Environment 15 189ndash96
Barbato D et al (2017) lsquoThe Role of Dispersal andLocal Environment in Urban Land Snail Assemblages AnExample of Three Cities in Central Italyrsquo Urban Ecosystems20 919
Barratt B I P et al (2015) lsquoBiodiversity of Coleoptera and OtherInvertebrates in Urban Gardens A Case Study in a NewZealand Cityrsquo Insect Conservation and Diversity 8 428ndash37
Bertelsmeier C Blight O and Courchamp F (2016) lsquoInvasionsof Ants (Hymenoptera Formicidae) in Light of Global ClimateChangersquo Myrmecological News 22 25ndash42
Bestelmeyer B T et al (2000) lsquoField Techniques for the Study ofGround-Dwelling Ant An Overview Description andEvaluationrsquo in Ants Standard Methods for Measuring andMonitoring Biodiversity pp 122ndash45
Bettez N D and Groffman P M (2013) lsquoNitrogen Deposition inand Near an Urban Ecosystemrsquo Environmental Science ampTechnology 47 6047ndash51
Bounoua L et al (2018) lsquoMapping Urbanization in the UnitedStates from 2001 to 2011rsquo Applied Geography 90 123ndash33
Bruder K W and Gupta A P (1972) lsquoBiology of the PavementAnt Tetramorium caespitum (Hymenoptera Formicidae)rsquoAnnals of the Entomological Society of America 65 358ndash67
Buczkowski G and Richmond D S (2012) lsquoThe Effect ofUrbanization on Ant Abundance and Diversity A TemporalExamination of Factors Affecting Biodiversityrsquo PLoS One 7 e41729
Chao A et al (2014) lsquoRarefaction and Extrapolation With HillNumbers A Framework for Sampling and Estimation inSpecies Diversity Studiesrsquo Ecological Monographs 84 45ndash67
Chick L D et al (2019) lsquoUrban Heat Islands Advance the Timingof Reproduction in a Social Insectrsquo Journal of Thermal Biology80 119ndash25
8 | Journal of Urban Ecology 2019 Vol 5 No 1
Dow
nloaded from httpsacadem
icoupcomjuearticle51juz0175584262 by guest on 12 January 2022
Clarke K M Fisher B L and LeBuhn G (2008) lsquoThe Influence ofUrban Park Characteristics on Ant (Hymenoptera Formicidae)Communitiesrsquo Urban Ecosystems 11 317ndash34
Colwell R K (2013) EstimateS Statistical estimation of speciesrichness and shared species from samples Version 9 lthttppurl oclcorgestimatesgt accessed 15 Aug 2018
Cooling M et al (2012) lsquoThe Widespread Collapse of an InvasiveSpecies Argentine Ants (Linepithema humile) in New ZealandrsquoBiology Letters 8 430ndash3
and Hoffmann B D (2015) lsquoHere Today Gone TomorrowDeclines and Local Extinctions of Invasive Ant Populations inthe Absence of Interventionrsquo Biological Invasions 17 3351ndash7
Coovert G A (2005) The Ants of Ohio (Hymenoptera Formicidae)Columbus OH Ohio Biological Survey
Davis B (1978) Urbanisation and the Diversity of Insects Diversity ofInsect Faunas pp 126ndash38 Oxford Blackwell Scientific
Del Toro I Ribbons R R and Pelini S L (2012) lsquoThe LittleThings That Run the World Revisited A Review ofAnt-Mediated Ecosystem Services and Disservices(Hymenoptera Formicidae)rsquo Myrmecological News 17 133ndash46
Denys C and Schmidt H (1998) lsquoInsect Communities onExperimental Mugwort (Artemisia vulgaris L) Plots along anUrban Gradientrsquo Oecologia 113 269ndash77
Deviche P and Davies S (2014) lsquoReproductive Phenology ofUrban Birds Environmental Cues and Mechanismsrsquo in D Giland H Brumm (eds) Avian Urban Ecology Behavioural andPhysiological Adaptations pp 98ndash115 Oxford UK OxfordUniversity Press
Diamond S E et al (2014) lsquoUnexpected Phenological Responsesof Butterflies to the Interaction of Urbanization andGeographic Temperaturersquo Ecology 95 2613ndash21
et al (2015) lsquoShared and Unique Responses of Insects to theInteraction of Urbanization and Background Climatersquo CurrentOpinion in Insect Science 11 71ndash7
Diez J M et al (2012) lsquoForecasting Phenology From SpeciesVariability to Community Patterns Phenological Variationacross Scalesrsquo Ecology Letters 15 545ndash53
Dunn R R et al (2010) lsquoGeographic Gradientsrsquo in L Lach C ParrK Abbott (eds) Ant Ecology pp 38ndash58 Oxford UK OxfordUniversity Press
Ellison A M et al (2012) A Field Guide to the Ants of New EnglandNew Haven Connecticut Yale University Press
Faeth S H Bang C and Saari S (2011) lsquoUrban BiodiversityPatterns and Mechanisms Urban Biodiversityrsquo Annals of theNew York Academy of Sciences 1223 69ndash81
Gaertner M et al (2017) lsquoNon-Native Species in UrbanEnvironments Patterns Processes Impacts and ChallengesrsquoBiological Invasions 19 3461ndash9
George K et al (2007) lsquoElevated Atmospheric CO2 Concentrationand Temperature across an UrbanndashRural TransectrsquoAtmospheric Environment 41 7654ndash65
Gibb H and Hochuli D F (2002) lsquoHabitat Fragmentation in an UrbanEnvironment Large and Small Fragments Support DifferentArthropod Assemblagesrsquo Biological Conservation 106 91ndash100
Gippet J M W et al (2017) lsquoIrsquom Not like Everybody ElseUrbanization Factors Shaping Spatial Distribution of Nativeand Invasive Ants Are Species-Specificrsquo Urban Ecosystems 20157ndash69
Gotelli N J et al (2011) lsquoCounting Ants (HymenopteraFormicidae) Biodiversity Sampling and Statistical Analysis forMyrmecologistsrsquo Myrmecological News 15 13ndash9
Greenslade P and Greenslade P J M (1971) lsquoThe Use of Baitsand Preservatives in Pitfall Trapsrsquo Australian Journal ofEntomology 10 253ndash60
Gregg J W Jones C G and Dawson T E (2003) lsquoUrbanizationEffects on Tree Growth in the Vicinity of New York CityrsquoNature 424 183ndash7
Grimm N B et al (2008) lsquoThe Changing Landscape EcosystemResponses to Urbanization and Pollution across Climatic andSocietal Gradientsrsquo Frontiers in Ecology and the Environment 6264ndash72
Groc S et al (2007) lsquoAnt Species Diversity in the lsquoGrandsCaussesrsquo (Aveyron France) in Search of Sampling MethodsAdapted to Temperate Climatesrsquo Comptes Rendus Biologies 330913ndash22
Herbers J (1985) lsquoSeasonal Structuring of a North TemperatureAnt Communityrsquo Insectes Sociaux 32 224ndash40
Herbers J M (1989) lsquoCommunity Structure in North TemperateAnts Temporal and Spatial Variationrsquo Oecologia 81 201ndash11
Hill M J et al (2017) lsquoUrban Ponds as an Aquatic BiodiversityResource in Modified Landscapesrsquo Global Change Biology 23986ndash99
et al (2016) lsquoMacroinvertebrate Diversity in Urban andRural Ponds Implications for Freshwater BiodiversityConservationrsquo Biological Conservation 201 50ndash9
Hill M O (1973) lsquoDiversity and Evenness A Unifying Notationand Its Consequencesrsquo Ecology 54 427ndash32
Holway D A and Suarez A V (2006) lsquoHomogenization of AntCommunities in Mediterranean California The Effects ofUrbanization and Invasionrsquo Biological Conservation 127 319ndash26
Homer C G et al (2015) lsquoCompletion of the 2011 National LandCover Database for the Conterminous UnitedStates-Representing a Decade of Land Cover ChangeInformationrsquo Photogrammetric Engineering and Remote Sensing81 345ndash54
Hope D et al (2003) lsquoSocioeconomics Drive Urban PlantDiversityrsquo Proceedings of the National Academy of Sciences 1008788ndash92
Imhoff M L et al (2010) lsquoRemote Sensing of the Urban HeatIsland Effect across Biomes in the Continental USArsquo RemoteSensing of Environment 114 504ndash13
Ivanov K (2016) lsquoExotic Ants (Hymenoptera Formicidae) ofOhiorsquo Journal of Hymenoptera Research 51 203ndash26
et al (2011) lsquoStatus of the Exotic Ant Nylanderia flavipes(Hymenoptera Formicidae) in Northeastern Ohiorsquo BiologicalInvasions 13 1945ndash50
and Milligan J (2008) lsquoParatrechina flavipes (Smith)(Hymenoptera Formicidae) a New Exotic Ant for OhiorsquoProceedings of the Entomological Society of Washington 110439ndash44
Ives C D et al (2013) lsquoEffect of Catchment Urbanization on AntDiversity in Remnant Riparian Corridorsrsquo Landscape and UrbanPlanning 110 155ndash63
Jost L (2006) lsquoEntropy and Diversityrsquo Oikos 113 363ndash75Kwon T-S et al (2014) lsquoPrediction of Abundance of Ants Due to
Climate Warming in South Korearsquo Journal of Asia-PacificBiodiversity 7 e179ndash96
Lessard J-P and Buddle C M (2005) lsquoThe Effects ofUrbanization on Ant Assemblages (Hymenoptera Formicidae)Associated with the Molson Nature Reserve Quebecrsquo TheCanadian Entomologist 137 215ndash25
Lester P J and Gruber M A M (2016) lsquoBooms Busts and PopulationCollapses in Invasive Antsrsquo Biological Invasions 18 3091ndash101
Longino J T Coddington J and Colwell R K (2002) lsquoThe AntFauna of a Tropical Rain Forest Estimating Species RichnessThree Different Waysrsquo Ecology 83 689ndash702
Luck G W and Smallbone L T (2010) lsquoSpecies Diversityand Urbanisation Patterns Drivers and Implicationsrsquo in
Evaluating patterns and drivers of ant biodiversity | 9
Dow
nloaded from httpsacadem
icoupcomjuearticle51juz0175584262 by guest on 12 January 2022
K J Gaston (ed) Urban Ecology pp 88ndash119 Cambridge UKCambridge University Press
Magura T Lovei G L and Tothmeresz B (2010) lsquoDoesUrbanization Decrease Diversity in Ground Beetle (Carabidae)Assemblages Urbanization and Carabid Diversityrsquo GlobalEcology and Biogeography 19 16ndash26
Martelli M G Ward M M and Fraser A M (2004) lsquoAntDiversity and Sampling on the Southern Cumberland PlateauA Comparison of Litter Sifting and Pitfall TrappingrsquoSoutheastern Naturalist 3 113ndash27
Martin C A and Stabler L B (2002) lsquoPlant Gas Exchange andWater Status in Urban Desert Landscapesrsquo Journal of AridEnvironments 51 235ndash54
McArdle B H and Anderson M J (2001) lsquoFitting MultivariateModels to Community Data A Comment on Distance-BasedRedundancy Analysisrsquo Ecology 82 290ndash7
McDonnell M J et al (1997) lsquoEcosystem Processes along anUrban-to-Rural Gradientrsquo Urban Ecosystems 1 21ndash36
McIntyre N E Knowles-Yanez K and Hope D (2008) lsquoUrbanEcology as an Interdisciplinary Field Differences in the Use ofldquoUrbanrdquo between the Social and Natural Sciencesrsquo in UrbanEcology pp 49ndash65 Boston MA Springer
McKinney M L (2008) lsquoEffects of Urbanization on SpeciesRichness A Review of Plants and Animalsrsquo Urban Ecosystems11 161ndash76
Meineke E K Dunn R R and Frank S D (2014) lsquoEarly PestDevelopment and Loss of Biological Control Are AssociatedWith Urban Warmingrsquo Biology Letters 10 20140586
Menke S B et al (2010) lsquoIs It Easy to Be Urban ConvergentSuccess in Urban Habitats among Lineages of a WidespreadNative Antrsquo PLoS One 5 e9194
et al (2011) lsquoUrban Areas May Serve as Habitat andCorridors for Dry-Adapted Heat Tolerant Species an Examplefrom Antsrsquo Urban Ecosystems 14 135ndash63
Muller N and Werner P (2010) lsquoUrban Biodiversity and theCase for Implementing the Convention on Biological Diversityin Towns and Citiesrsquo in N Muller P Werner J G Kelcey (eds)Urban Biodiversity and Design Oxford John Wiley amp Sons Inc
Neil K and Wu J (2006) lsquoEffects of Urbanization on PlantFlowering Phenology A Reviewrsquo Urban Ecosystems 9 243ndash57
Nielsen A B et al (2014) lsquoSpecies Richness in Urban Parks andIts Drivers A Review of Empirical Evidencersquo Urban Ecosystems17 305ndash27
Niemela J and Kotze D J (2009) lsquoCarabid Beetle Assemblagesalong Urban to Rural Gradients A Reviewrsquo Landscape and UrbanPlanning 92 65ndash71
Oksanen J et al (2017) vegan Community Ecology Package Rpackage version 230 2015
Parmesan C (2006) lsquoEcological and Evolutionary Responses toRecent Climate Change Annual Review of Ecologyrsquo AnnualReview of Ecology Evolution and Systematics 37 637ndash69
Pecarevic M Danoff-Burg J and Dunn R R (2010) lsquoBiodiversityon Broadway - Enigmatic Diversity of the Societies of Ants(Formicidae) on the Streets of New York Cityrsquo PLoS One 5e13222
Pouyat R V et al (2008) lsquoResponse of Forest Soil Properties toUrbanization Gradients in Three Metropolitan AreasrsquoLandscape Ecology 23 1187ndash203
R Core Team (2018) R A Language and Environment for StatisticalComputing Vienna Austria R Foundation for StatisticalComputing
Raciti S M et al (2012) lsquoInconsistent Definitions of ldquoUrbanrdquoResult in Different Conclusions about the Size of Urban Carbonand Nitrogen Stocksrsquo Ecological Applications 22 1015ndash35
Ricotta C et al (2017) lsquoBritish Plants as Aliens in New ZealandCities Residence Time Moderates Their Impact on the BetaDiversity of Urban Florasrsquo Biological Invasions 19 3589ndash99
Saari S et al (2016) lsquoUrbanization Is Not Associated withIncreased Abundance or Decreased Richness of TerrestrialAnimals - Dissecting the Literature through Meta-AnalysisrsquoUrban Ecosystems 19 1251ndash64
Sanders N J et al (2003) lsquoCommunity Disassembly by anInvasive Speciesrsquo Proceedings of the National Academy of Sciences100 2474ndash77
Santos M N (2016) lsquoResearch on Urban Ants Approaches andGapsrsquo Insectes Sociaux 63 359ndash71
Scranton K and Amarasekare P (2017) lsquoPredicting PhenologicalShifts in a Changing Climatersquo Proceedings of the NationalAcademy of Sciences 114 13212ndash17
Shannon C E and Weaver W (1949) The Mathematical Theory ofInformation Urbana IL The University of Illinois Press pp1ndash117
Shochat E et al (2006) lsquoFrom Patterns to Emerging Processes inMechanistic Urban Ecologyrsquo Trends in Ecology amp Evolution 21186ndash91
Simpson E H (1949) lsquoMeasurement of Diversityrsquo Nature 163 688Soberon J and Llorente J (1993) lsquoThe Use of Species
Accumulation Functions for the Prediction of SpeciesRichnessrsquo Conservation Biology 7 480ndash8
Steiner F M et al (2006) lsquoTetramorium Tsushimae a NewInvasive Ant in North Americarsquo Biological Invasions 8 117ndash23
et al (2008) lsquoCombined Modelling of Distribution and Nichein Invasion Biology A Case Study of Two InvasiveTetramorium Ant Species Distribution and Niche in InvasionModellingrsquo Diversity and Distributions 14 538ndash45
Suarez A V McGlynn T P and Tsutsui N D (2010)lsquoBiogeographic and Taxonomic Patterns of Introduced Antsrsquo inL Lach C Parr K Abbott (eds) Ant Ecology pp 233ndash44 OxfordUK Oxford University Press
Tagwireyi P and Sullivan S M P (2015) lsquoRiverine LandscapePatch Heterogeneity Drives Riparian Ant Assemblages in theScioto River Basin USArsquo PLoS One 10 e0124807
Thompson B and McLachlan S (2007) lsquoThe Effects ofUrbanization on Ant Communities and Myrmecochory inManitoba Canadarsquo Urban Ecosystems 10 43ndash52
Tonkin J D et al (2017) lsquoSeasonality and Predictability ShapeTemporal Species Diversityrsquo Ecology 98 1201ndash16
United States Census Bureau Population Division (2018) AnnualEstimates of the Resident Population April 1 2010 to July 12018mdashUnited StatesmdashMetropolitan Statistical Area and forPuerto Rico
Uno S Cotton J and Philpott S M (2010) lsquoDiversityAbundance and Species Composition of Ants in Urban GreenSpacesrsquo Urban Ecosystems 13 425ndash41
Warren R J II Bayba S and Krupp K T (2018) lsquoInteractingEffects of Urbanization and Coastal Gradients on Ant ThermalResponsesrsquo Journal of Urban Ecology 4
Weitzell R E et al (2016) lsquoExtent of Stream Burial andRelationships to Watershed Area Topography andImpervious Surface Arearsquo Water 8 538
Wetterer J K (2012) lsquoWorldwide Spread of the AfricanBig-Headed Ant Pheidole megacephala (HymenopteraFormicidae)rsquo Myrmecological News 17 51ndash62
Wills B D and Landis D A (2018) lsquoThe Role of Ants in NorthTemperate Grasslands A Reviewrsquo Oecologia 186 323ndash38
Wittman S E (2014) lsquoImpacts of Invasive Ants on Native AntCommunities (Hymenoptera Formicidae)rsquo MyrmecologicalNews 19 111ndash23
10 | Journal of Urban Ecology 2019 Vol 5 No 1
Dow
nloaded from httpsacadem
icoupcomjuearticle51juz0175584262 by guest on 12 January 2022
- juz017-TF1
- juz017-TF2
- juz017-TF3
-
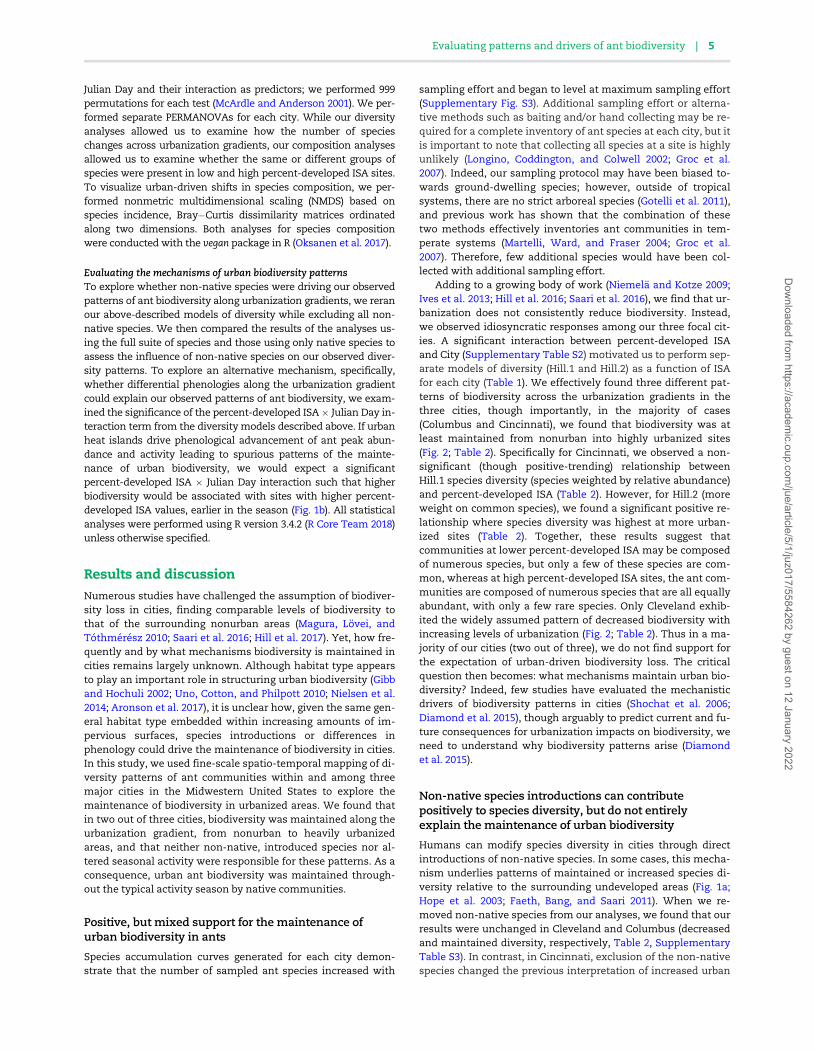
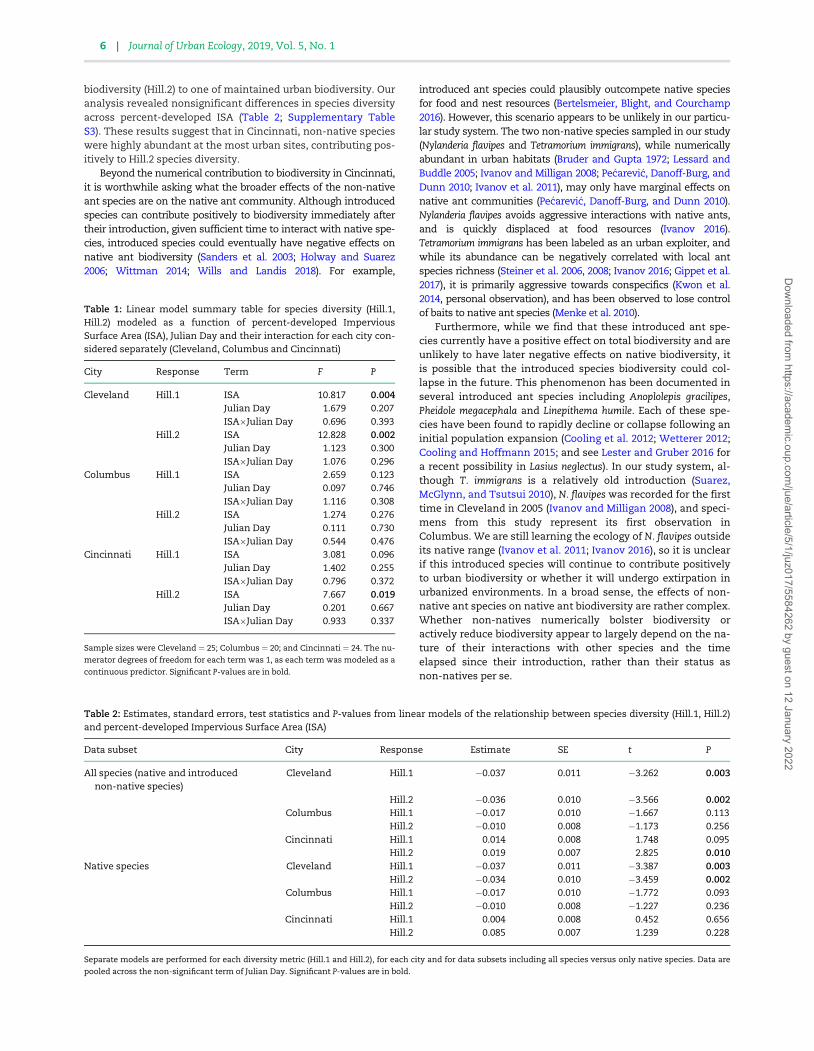
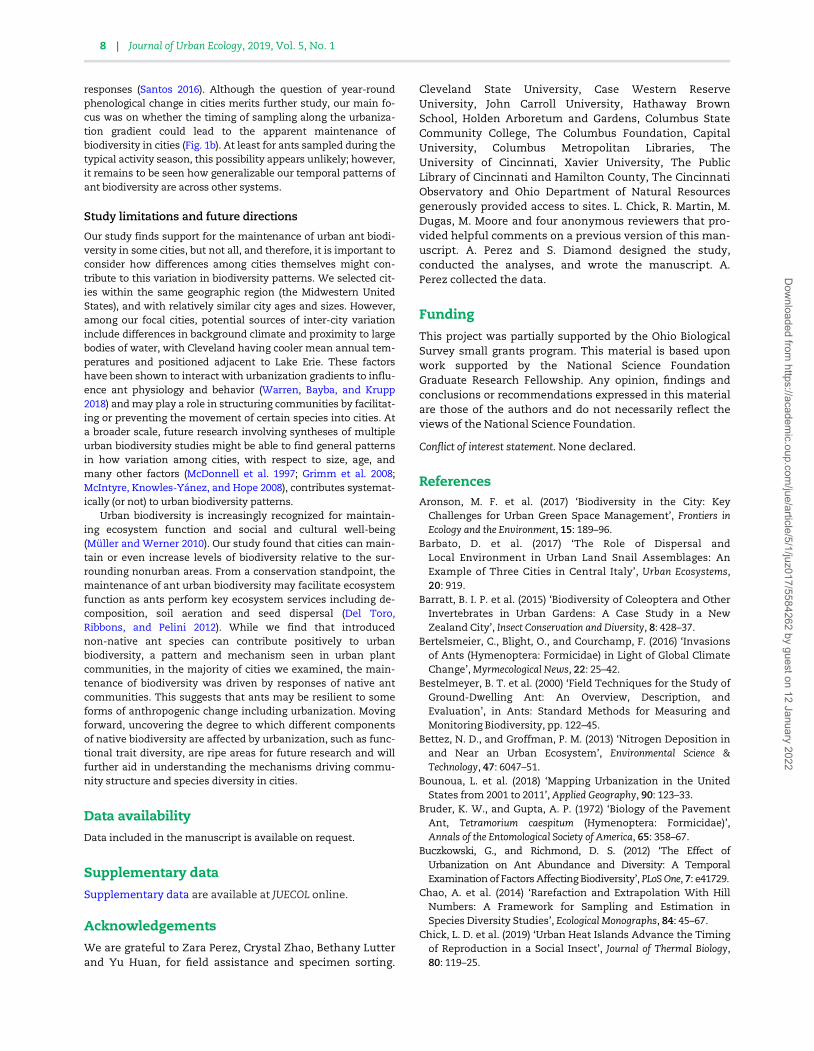
Related Documents