9542–9556 Nucleic Acids Research, 2019, Vol. 47, No. 18 Published online 2 August 2019 doi: 10.1093/nar/gkz665 Transcriptome analyses of cells carrying the Type II Csp231I restriction–modification system reveal cross-talk between two unrelated transcription factors: C protein and the Rac prophage repressor Alessandro Negri 1 , Marcin J ˛ akalski 2 , Aleksandra Szczuka 1 , Leszek P. Pryszcz 3 and Iwona Mruk 1,* 1 Department of Microbiology, Faculty of Biology, University of Gdansk, WitaStwosza 59, Gdansk 80-308, Poland, 2 Department of Plant Taxonomy and Nature Conservation, University of Gdansk, Wita Stwosza 59, 80-308 Gdansk, Poland and 3 Laboratory of Zebrafish Developmental Genomics, International Institute of Molecular and Cell Biology, Warsaw, ul. Trojdena 4, 02-109 Warsaw, Poland Received February 25, 2019; Revised July 16, 2019; Editorial Decision July 17, 2019; Accepted July 23, 2019 ABSTRACT Restriction-modification (R–M) systems represent an effective mechanism of defence against invading bacteriophages, and are widely spread among bacte- ria and archaea. In acquiring a Type II R–M system via horizontal gene transfer, the new hosts become more resistant to phage infection, through the action of a restriction endonuclease (REase), which recognizes and cleaves specific target DNAs. To protect the host cell’s DNA, there is also a methyltransferase (MTase), which prevents DNA cleavage by the cognate REase. In some R–M systems, the host also accepts a cis- acting transcription factor (C protein), which regu- lates the counteracting activities of REase and MTase to avoid host self-restriction. Our study character- ized the unexpected phenotype of Escherichia coli cells, which manifested as extensive cell filamenta- tion triggered by acquiring the Csp231I R–M system from Citrobacter sp. Surprisingly, we found that the cell morphology defect was solely dependent on the C regulator. Our transcriptome analysis supported by in vivo and in vitro assays showed that C protein directly silenced the expression of the RacR repres- sor to affect the Rac prophage-related genes. The rac locus ydaST genes, when derepressed, exerted a toxicity indicated by cell filamentation through an un- known mechanism. These results provide an appar- ent example of transcription factor cross-talk, which can have significant consequences for the host, and may represent a constraint on lateral gene transfer. INTRODUCTION Bacteria are highly diverse organisms, that can adapt to a wide range of habitats mostly due to the plasticity of their genomes, which is driven mainly by horizontal gene trans- fer (HGT), as well as by other mechanisms, such as point mutations, and DNA rearrangements. However, HGT is the most important mechanism, which strongly affects the evo- lution and speciation of prokaryotes (1,2). Among many factors that modulate this process, restriction–modification (R–M) systems play a crucial role. R–M systems limit the flow of genetic material into the host cell (3–5), and pro- duce recombinogenic ends on the acquired DNA, to fa- cilitate their integration into the genome (6,7). However, the most prominent role of R–M systems involves cellu- lar defence against invasive DNAs, such as bacteriophages (8). It is possible that this beneficiary feature for hosts re- sulted in the R–M systems being prevalent and diverse in bacteria and archaea. R–M systems are found in nearly all bacterial genomes, and are especially numerous in nat- urally competent cells, which suggests that R–M systems not only control, but also circulate using HGT routes (6,9– 12). Among the four types, the Type II is the most frequent and also the simplest in structure. It is composed of two in- dependent enzymes, which involve a restriction endonucle- ase (REase) and a DNA methyltransferase (MTase). Both enzymes recognize the same short specific DNA sequences, where MTase adds a methyl group to modify such sites, to protect them from further cleavage by the cognate REase (13). Such counteracting activities often are compared to the action of toxin–antitoxin systems (14). Mobile Type II R–M systems, when successfully intro- duced into new hosts, lead to global changes in the host cell physiology associated with the actions of their two en- zymatic entities: MTase and REase. First, the cell genome * To whom correspondence should be addressed. Email: [email protected] C The Author(s) 2019. Published by Oxford University Press on behalf of Nucleic Acids Research. This is an Open Access article distributed under the terms of the Creative Commons Attribution Non-Commercial License (http://creativecommons.org/licenses/by-nc/4.0/), which permits non-commercial re-use, distribution, and reproduction in any medium, provided the original work is properly cited. For commercial re-use, please contact [email protected] Downloaded from https://academic.oup.com/nar/article/47/18/9542/5542886 by guest on 15 July 2022

Welcome message from author
This document is posted to help you gain knowledge. Please leave a comment to let me know what you think about it! Share it to your friends and learn new things together.
Transcript
9542–9556 Nucleic Acids Research, 2019, Vol. 47, No. 18 Published online 2 August 2019doi: 10.1093/nar/gkz665
Transcriptome analyses of cells carrying the Type IICsp231I restriction–modification system revealcross-talk between two unrelated transcriptionfactors: C protein and the Rac prophage repressorAlessandro Negri1, Marcin Jakalski 2, Aleksandra Szczuka1, Leszek P. Pryszcz 3 andIwona Mruk 1,*
1Department of Microbiology, Faculty of Biology, University of Gdansk, Wita Stwosza 59, Gdansk 80-308, Poland,2Department of Plant Taxonomy and Nature Conservation, University of Gdansk, Wita Stwosza 59, 80-308 Gdansk,Poland and 3Laboratory of Zebrafish Developmental Genomics, International Institute of Molecular and Cell Biology,Warsaw, ul. Trojdena 4, 02-109 Warsaw, Poland
Received February 25, 2019; Revised July 16, 2019; Editorial Decision July 17, 2019; Accepted July 23, 2019
ABSTRACT
Restriction-modification (R–M) systems represent aneffective mechanism of defence against invadingbacteriophages, and are widely spread among bacte-ria and archaea. In acquiring a Type II R–M system viahorizontal gene transfer, the new hosts become moreresistant to phage infection, through the action of arestriction endonuclease (REase), which recognizesand cleaves specific target DNAs. To protect the hostcell’s DNA, there is also a methyltransferase (MTase),which prevents DNA cleavage by the cognate REase.In some R–M systems, the host also accepts a cis-acting transcription factor (C protein), which regu-lates the counteracting activities of REase and MTaseto avoid host self-restriction. Our study character-ized the unexpected phenotype of Escherichia colicells, which manifested as extensive cell filamenta-tion triggered by acquiring the Csp231I R–M systemfrom Citrobacter sp. Surprisingly, we found that thecell morphology defect was solely dependent on theC regulator. Our transcriptome analysis supportedby in vivo and in vitro assays showed that C proteindirectly silenced the expression of the RacR repres-sor to affect the Rac prophage-related genes. Therac locus ydaST genes, when derepressed, exerted atoxicity indicated by cell filamentation through an un-known mechanism. These results provide an appar-ent example of transcription factor cross-talk, whichcan have significant consequences for the host, andmay represent a constraint on lateral gene transfer.
INTRODUCTION
Bacteria are highly diverse organisms, that can adapt to awide range of habitats mostly due to the plasticity of theirgenomes, which is driven mainly by horizontal gene trans-fer (HGT), as well as by other mechanisms, such as pointmutations, and DNA rearrangements. However, HGT is themost important mechanism, which strongly affects the evo-lution and speciation of prokaryotes (1,2). Among manyfactors that modulate this process, restriction–modification(R–M) systems play a crucial role. R–M systems limit theflow of genetic material into the host cell (3–5), and pro-duce recombinogenic ends on the acquired DNA, to fa-cilitate their integration into the genome (6,7). However,the most prominent role of R–M systems involves cellu-lar defence against invasive DNAs, such as bacteriophages(8). It is possible that this beneficiary feature for hosts re-sulted in the R–M systems being prevalent and diverse inbacteria and archaea. R–M systems are found in nearlyall bacterial genomes, and are especially numerous in nat-urally competent cells, which suggests that R–M systemsnot only control, but also circulate using HGT routes (6,9–12). Among the four types, the Type II is the most frequentand also the simplest in structure. It is composed of two in-dependent enzymes, which involve a restriction endonucle-ase (REase) and a DNA methyltransferase (MTase). Bothenzymes recognize the same short specific DNA sequences,where MTase adds a methyl group to modify such sites, toprotect them from further cleavage by the cognate REase(13). Such counteracting activities often are compared tothe action of toxin–antitoxin systems (14).
Mobile Type II R–M systems, when successfully intro-duced into new hosts, lead to global changes in the hostcell physiology associated with the actions of their two en-zymatic entities: MTase and REase. First, the cell genome
*To whom correspondence should be addressed. Email: [email protected]
C© The Author(s) 2019. Published by Oxford University Press on behalf of Nucleic Acids Research.This is an Open Access article distributed under the terms of the Creative Commons Attribution Non-Commercial License(http://creativecommons.org/licenses/by-nc/4.0/), which permits non-commercial re-use, distribution, and reproduction in any medium, provided the original workis properly cited. For commercial re-use, please contact [email protected]
Dow
nloaded from https://academ
ic.oup.com/nar/article/47/18/9542/5542886 by guest on 15 July 2022
Nucleic Acids Research, 2019, Vol. 47, No. 18 9543
acquires the new epigenetic status related to the specificityof the introduced MTase. As a result, all genomic targetsites are methylated, forming a new, unique set of epigeneticmarkers, which generates a cell-specific methylome depen-dent on the repertoire of active MTases (15–17). The methylgroup may change expression of a single gene if it is lo-cated within the promoter/operator region, by blocking ei-ther RNA polymerase recruitment or binding by transcrip-tion factors. An increasing number of studies have reportedthat methylation may cause global transcriptome changes,yielding distinct cell phenotypes related to stress response,fitness, motility, or production of virulence factors (18–25).
Second, the new REase might serve as an efficient anti-phage defence as long as its activity is precisely controlledto minimize genome damage (14). Nevertheless, global re-sponse to DNA damage (SOS response) is often triggeredwhen the R–M system is not balanced (26) or not transmit-ted properly to progeny cells, resulting in post-segregationalcell killing (27). In the latter case, the remaining REase maycleave the genome no longer fully protected by MTase, andthe cell may die unless DNA repair occurs (28,29). In thiscontext, the bacterial hosts remain in an intimate and de-pendent relationship with their acquired R–M systems.
A large number of Type II R–M systems also possess aspecific transcription factor, C protein, dedicated to the con-trol of their own gene expression (30). C proteins are rela-tively small proteins (8–11 kDa), which bind to a specificDNA operator sequence called the C-box (31,32). Their he-lical structure, comprising helix-turn-helix (HTH) DNA-binding motifs, resembles that of the Xre family of tran-scription regulators, including the � and 434 phage repres-sors. This suggests a common mechanism of DNA recog-nition and their effect on transcription by direct contactwith �70 RNA polymerase (33,34). The controlling effectof a C protein on R–M system expression was first foundin the PvuII system and then in several others (31,35–41). C protein action is dependent on location and struc-ture of its C-box-DNA recognition site. It is usually lo-cated within the promoter of its own gene and of con-trolled genes (REase and/or MTase) (36,42). The C-boxcomprises two palindromic binding sites (proximal and dis-tal) for two C protein homodimers. The C protein cooper-atively binds the C-box sequence in a highly concentration-dependent manner (43,44), and has greater affinity for theproximal C-box sequence, which facilitates its interactionwith RNA polymerase and promotes the activation step(ON) during transcription. Subsequent C protein accu-mulation leads to binding both proximal and distal se-quences, resulting in transcriptional repression representingthe mode of action of a typical genetic switch (35,40,44).The C-box DNA sequence varies for different families of Cproteins; some consensus sequences have been determined(32), and C protein:C-box co-crystal structures have beendetermined (45–47). The box structures of C proteins arespecific and complex (due to nearly palindromic repeatedsequences), enough to be unique in the genome. Althoughcross-complementation can occur (41), if two R–M operonswith the C proteins of the same family exist in the same cell,exclusion of one R–M system can occur (48).
The main function of C proteins is providing temporalregulation, which is essential during R–M system transfer
to the new host. Specifically, C protein mediates a delayin REase expression to enable the MTase to complete themodification process of the host genome (48–51).
Although previous studies have shown the effect ofMTase or REase on global gene expression of the bacte-rial hosts, there has been no report characterizing the effectof the introduced transcription factor linked to the R–Msystem. In the present study, using a combination of genet-ics and transcriptomics, we characterized the unusual phe-nomenon of Escherichia coli cell filamentation that is mani-fested when acquiring genes of the Csp231I R–M system,and in particular its C protein. We show that this trans-fer phenomenon results from the adventitious cross-talk be-tween two transcription factors. One of these factors, the Cprotein of the incoming R–M system reduced expression ofRacR, the essential regulator of the cryptic Rac prophage(52–54). As a result, two Rac genes, ydaS and ydaT werederepressed and had a toxic effect manifested by cell fila-mentation, as well as loss of cell viability and fitness. In gen-eral, such transcription factor interconnectivity may havefatal consequences for the host and may become a seriousconstraint in lateral gene transfer. This process may alsoexemplify genetic transfer as a possible deleterious event,which is subsequently lost from the cell population.
MATERIALS AND METHODS
Bacterial strains and plasmids
The source of Csp231I and EcoO109I R–M systems wereCitrobacter sp. RFL231 (kindly supplied by MBI Ferman-tas, Lithuania) and E. coli H709c (55,56). Despite E. coliand Citrobacter both being members of the Enterobacte-riaceae, expression of the Csp231I R–M system in E. colineeds additional protection by a second MTase of the samespecificity. Accordingly, any manipulation with the wild-type (WT) Csp231I R–M system requires competent cellsprepared from MM294 strain of E. coli, which expressesthe MTase gene from pEcoVIIIM to ensure the protec-tion of the host genome. M.Csp231I and M.EcoVIII bothrecognize the same specific nucleotide sequence (56). TheMG1655 strain was used for chromosomal gene knock-outs. The other strains and plasmids used are listed in Sup-plementary Table S1 (Supplementary File 1).
High-throughput sequencing
Cultures of E. coli MG1655 carrying pMCsp231 with anadditional protective MTase gene on the pACYC177 deriva-tive, and with a plasmid with RMs of interest, WT (p18) andtwo variants of C-R+ (p30) and C+R– (p24), were grown inLB medium. At mid log phase, the cells were harvested andresuspended in RNALater solution (Sigma-Aldrich, USA).Total RNA was extracted with RiboPure (Ambion, USA)in two biological replicates. The amount and quality of theresulting RNA extracts were determined using a BioAna-lyzer instrument (Agilent, USA) with an RIN >8.4. TheRNA was then treated with DNase I (Ambion) to removeresidual DNA, inactivated with a chemical reagent fromthe Ambion kit, centrifuged, and precipitated according torecommendations from Macrogen (Seoul, Republic of Ko-rea). RNA samples in two biological replicates per vari-
Dow
nloaded from https://academ
ic.oup.com/nar/article/47/18/9542/5542886 by guest on 15 July 2022
9544 Nucleic Acids Research, 2019, Vol. 47, No. 18
ant were sent in ethanol to Macrogen. Prior to sequencing,RNA was rRNA-depleted using a Ribo-Zero rRNA Re-moval Kit for bacteria (Thermo Fisher, USA). A RNA-seqlibrary was prepared according to the TruSeq RNA Sam-ple Preparation, version 2 Guide (Illumina, San Diego, CA,USA) and sequencing of the libraries was performed usingan Illumina HiSeq2500 platform at Macrogen (paired-endand non-strand specific 101 bp long reads with an averagemedian insert size across all samples of 155 bp). The to-tal read bases averaged 10.6 Gbp per sample. The resultshave been deposited in the NCBI GEO (accession numberGSE126248). Additional details are included in the Supple-mentary File 1.
Search for homologs of Rac prophage region and C protein
Escherichia coli genomes available at GenBank (495 com-plete genomes with protein annotations; access date20 July 2018) were obtained from the NCBI ftp site. Aminoacid sequences of 21 Rac region genes and the C pro-tein (C.Csp231I and C.EcoO109I) were used as queries forsearches against the E. coli proteomes using the phmmersearch tool (version 3.2.1) from the HMMER package (57)with the e-value parameter (–E) set to 1e−20, analogous tothe analyses by Krishnamurthi et al. (54).
Chromosomal gene knock-outs
The knockout strains were constructed using the lambda-red recombination method with a pSIM5 plasmid carryingthe recombineering proteins, Gam, Exo, and Beta (58,59),and using pKD46 as a template plasmid for ampicillin re-sistance cassette amplification. The constructed strains andprimers used are listed in Tables S1 and S2 (SupplementaryFile 1).
Fluorescence assay and microscopy
To measure the SOS response, the MP060 and MP064 cellswere grown with shaking to the exponential phase in LBor M9-glucose medium, then gently pelleted, washed oncewith phosphate-buffered saline (PBS) and resuspended in500 �l of PBS. Half of the sample was read to monitor theoptical density (600 nm) of bacteria and the other half usedto read the yellow fluorescence (YFP) intensity (excitationat 515 nm with emission at 545 nm) in a 96-well plate reader(EnSpire Multimode; Perkin Elmer, USA). Relative fluores-cence was corrected by subtracting the level of fluorescenceof non-YFP bacterial cells and dividing by the optical den-sity. For microscopy analyses, the cells were stained withSYTO9 dye (Invitrogen, USA) alone or with a combina-tion of SynaptoRed (Sigma-Aldrich) and 4′,6-diamidino-2-phenylindole (DAPI) (Sigma-Aldrich), then visualizedusing a fluorescence microscope (DMB400B; Leica, Ger-many).
Relative restriction activity assay
The restriction activity of E. coli cells carrying the Csp231IR–M system and its variants was measured using the effi-ciency of plaque formation (EOP) of phage �vir. There are
six recognition sites in the �vir genome. The EOP of �vir wascalculated as the ratio of plaques formed on E. coli MG1655containing plasmids with no R–M system to those formedon the same strain containing a plasmid with the Csp231IR–M system or their variants.
Cell viability and LacZ reporter assay
Cell survival was measured using the spotting assay. Theovernight cultures were subcultured in LB /M9 medium,and when they reached an OD of 0.3, they were split intotwo cultures, with and without 0.1% L-arabinose; both cul-tures continued to grow. They were then serially diluted andspotted on LB agar plates with and without arabinose. CFUvalues were calculated and cell survival was determined asthe ratio of induced cells divided by uninduced cells. For theLacZ assay, MG1655 �rac cells were grown in M9 mediumwith glycerol as the carbon source. At the induction time,glucose or arabinose were added at the indicated concentra-tions. The o-nitrophenyl-�-D-galactopyranoside (ONPG)test was performed as previously described (60).
Electrophoretic mobility shift assays (EMSA)
DNA substrates were double-stranded PCR-amplified frag-ments that were fluorescently labelled from one end by theCy5 tag introduced by the primer (Table S2 of Supple-mentary File 1). WT substrate (176 bp) covered the entireracR promoter/operator region and part of its coding se-quence (racR), but its mutated variant (racRmut) had CT-TAG sequence within coding sequence replaced by CGCATto eliminate possible binding. Reactions containing 25 nMof DNA and the indicated purified C protein concentrations(60) were prepared in binding buffer [10 mM Tris–HCl (pH8.0), 50 mM NaCl, 10 mM MgCl2, 1 �g of poly(dIdC)] toa final volume of 20 �l, and incubated for 20 min at 22◦C.Samples were electrophoresed on 5% native polyacrylamidegels in 0.5× TBE buffer at 22◦C. Detection of the Cy5-labeled DNA was performed using the Typhoon 9200 vari-able mode imager (Molecular Dynamics, USA).
Testing the rac+/C+ conflict by biological assay
A single colony of E. coli MG1655 (rac+) carrying the p24plasmid, with the active csp231IC gene, was picked froma fresh transformation on LB-agar (with appropriate se-lective antibiotic) and inoculated into 5 ml of LB mediumin triplicate. The colony was confirmed to present the ex-pected extensive filamentation. Every 15–18 h of incubationat 37◦C with shaking, the culture was diluted 102 into freshLB medium with antibiotic. Samples of culture were spreadquantitatively to count the CFUs based on their size (smallversus large) to calculate their ratio, as well as the genera-tion number. At each time, we inspected cells by microscopyto assess cell filamentation.
Dow
nloaded from https://academ
ic.oup.com/nar/article/47/18/9542/5542886 by guest on 15 July 2022
Nucleic Acids Research, 2019, Vol. 47, No. 18 9545
0 1000 2000
pBR322
p34
p30
p32
p24
p23
p18
RecA-
RecA+
C RM
Cmut RM
RM
RM
C RM
C RM
WT
Cmut
R-
∆C; PRmut
∆C
PRmut
control; no R-Ms
Cellfilaments
Relativerestriction
++ ++
- +
++ -
++ -
- ++
- -- -
A C
D
0
1E+09
2E+09
3E+09
4E+09
5E+09
6E+09
7E+09
60 120 180 240 300 360 420 480 540 600
colo
ny fo
rmin
g un
its (C
FU) /
mL
time (min.)
(R+∆C)
no R-Ms
(R-C+)
(WT=R+C+)
pBR322 p18 p30 p24(no RMs) (WT=R+M+C+) (R+M+∆C) (R-M+C+)
C R M
PC PR
PMC-box
putative resolvases
BRelative fluorescence of YFP
SOS reporter (au)
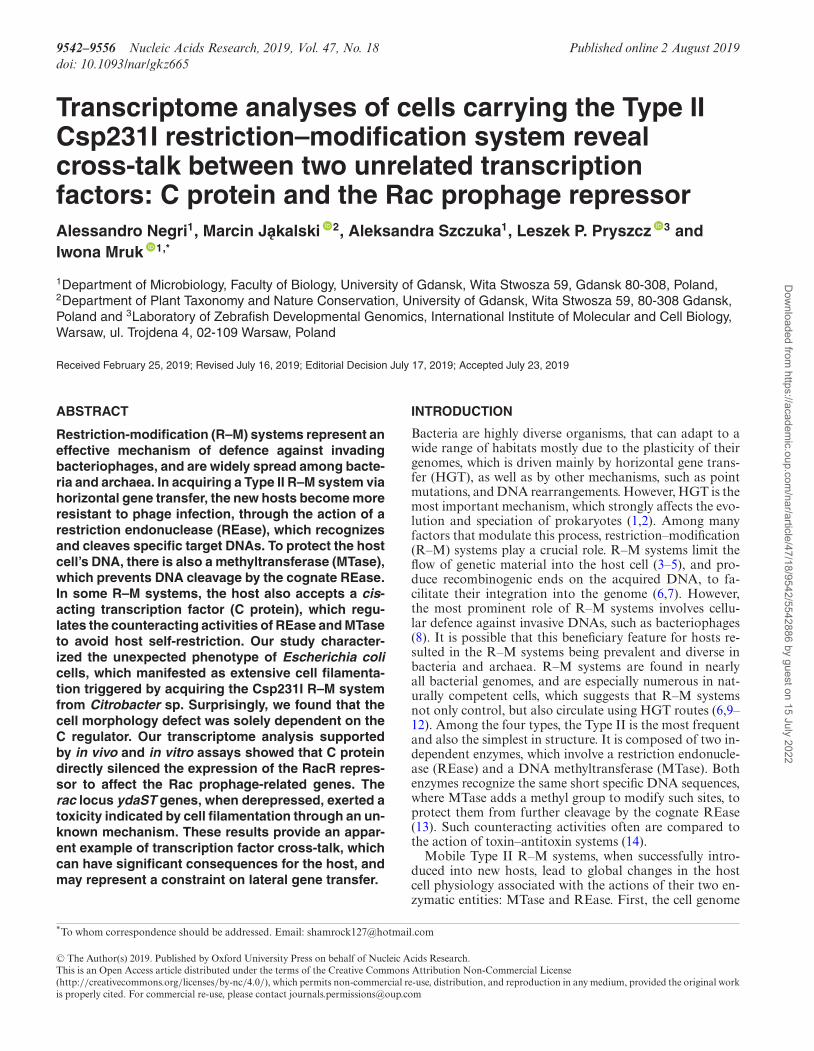
Figure 1. Presence of the active C protein within the Csp231I R–M system changes the host cell morphology from rod-shaped into extensively elongatedregardless of restriction endonuclease activity. (A) Schematic diagram of the wild-type (WT) Csp231I R–M system (not to scale). (B) Induction of the SOSresponse for cells carrying the indicated plasmids were measured by relative fluorescence in context of: recA positive (dark bars) and recA negative (whitebars), where the yellow fluorescent protein was fused to the sulA promoter (PsulA-yfp). Tested R–M system variants are presented on the left and data inpanel B are adjusted to be read horizontally. The unchanged MTase gene is not shown, while varying elements are depicted in red. Briefly: p18 (WT); p23(Cmut; substitutions: A33G; R34E; Q37A in C protein); p24 (knock-out of REase gene, XhoI cut and Klenow filling); p32 (REase main promoter PRmutated; -10 hexamer TTAAAT→CCCGGG); p30 (deletion of C gene and its upstream region including C-box and PC); p32 (mutation of -10 box of PR1,TTAAAT→CCCGGG); p34 (C-deleted variant of p30 mutated as in p32). The standard deviation from four experiments is shown. Cell morphology fortested strains were determined by microscopy: normal rod-shaped cells (–) or filamentous (++). Relative restriction was measured using �vir phage, anddetermined from highly restrictive (++), low restrictive (+), to restriction-negative (–); as also previously shown by EOP values (60). (C) Cell morphologytypical for filamentous and non-filamentous phenotypes. (D) Growth curves for cells cultured in LB media carrying plasmids presented in panel C; pBR322(black diamonds); p30 (black triangles); p18 (white squares); p24 (white circles). Error bars represent the standard deviation from three replicates of eachculture.
0
200
400
600
800
1000
1200
1400
1600
1800
0.2% glu - 0.001% ARA 0.01% ARA 0.1% ARA
Rel
ativ
eYF
P flu
ores
cenc
e(a
.u.) CWT
Cmut
glu 0 0.001%ara 0.01%ara 0.1% ara
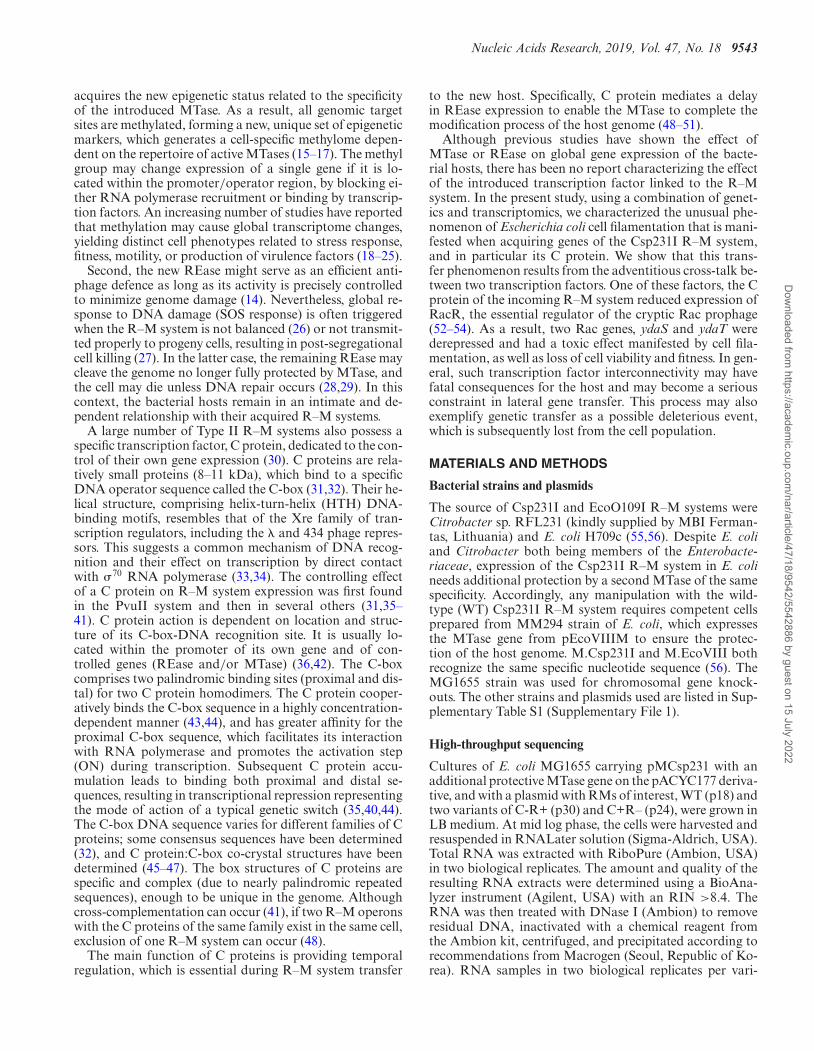
Figure 2. C protein alone triggers cell filamentation. Cells carrying the yellow fluorescent protein fused to the promoter of sulA (PsulA-yfp) (E. coli MP064)was used to measure the global response to DNA damage. Wild-type C gene under inducible ParaBAD promoter or its C gene mutant (Cmut) unable tobind DNA was delivered by plasmids. The cells were grown in minimal media with glycerol as the carbon source and with glucose (glu) or arabinose (ara)at gradually increasing concentrations (from 0 to 0.1%). The error bars indicate the averages (±SD) of four independent experiments.
Dow
nloaded from https://academ
ic.oup.com/nar/article/47/18/9542/5542886 by guest on 15 July 2022
9546 Nucleic Acids Research, 2019, Vol. 47, No. 18
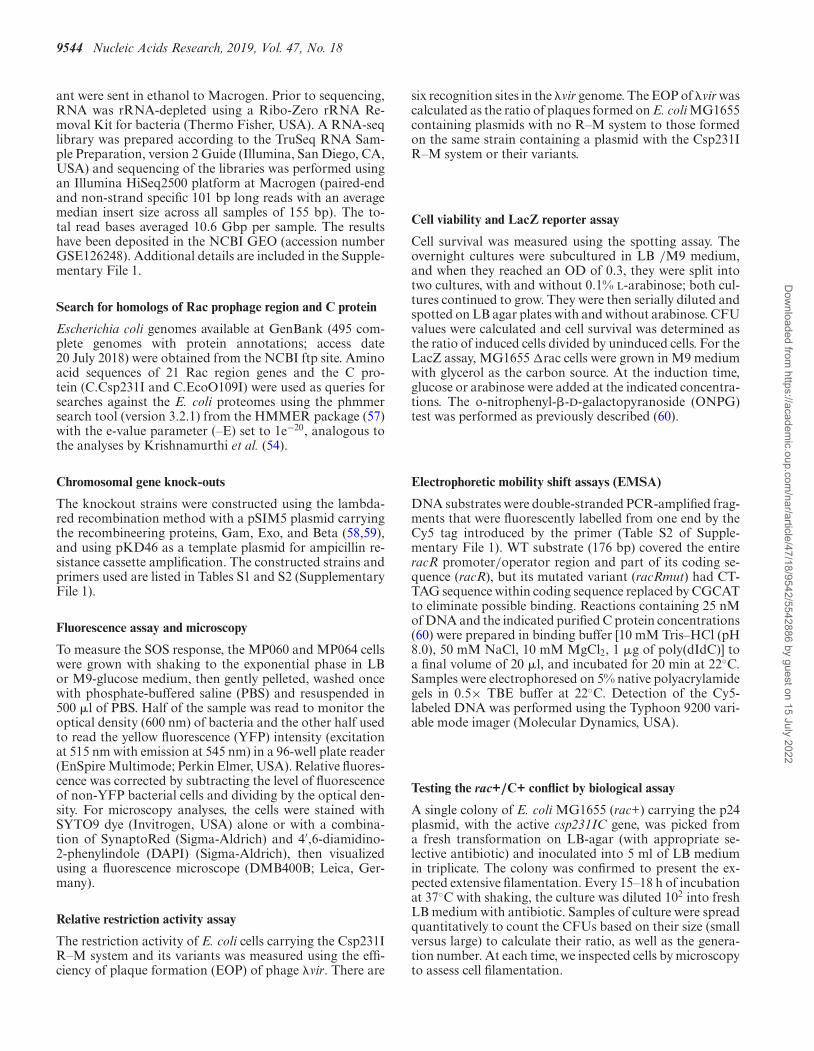
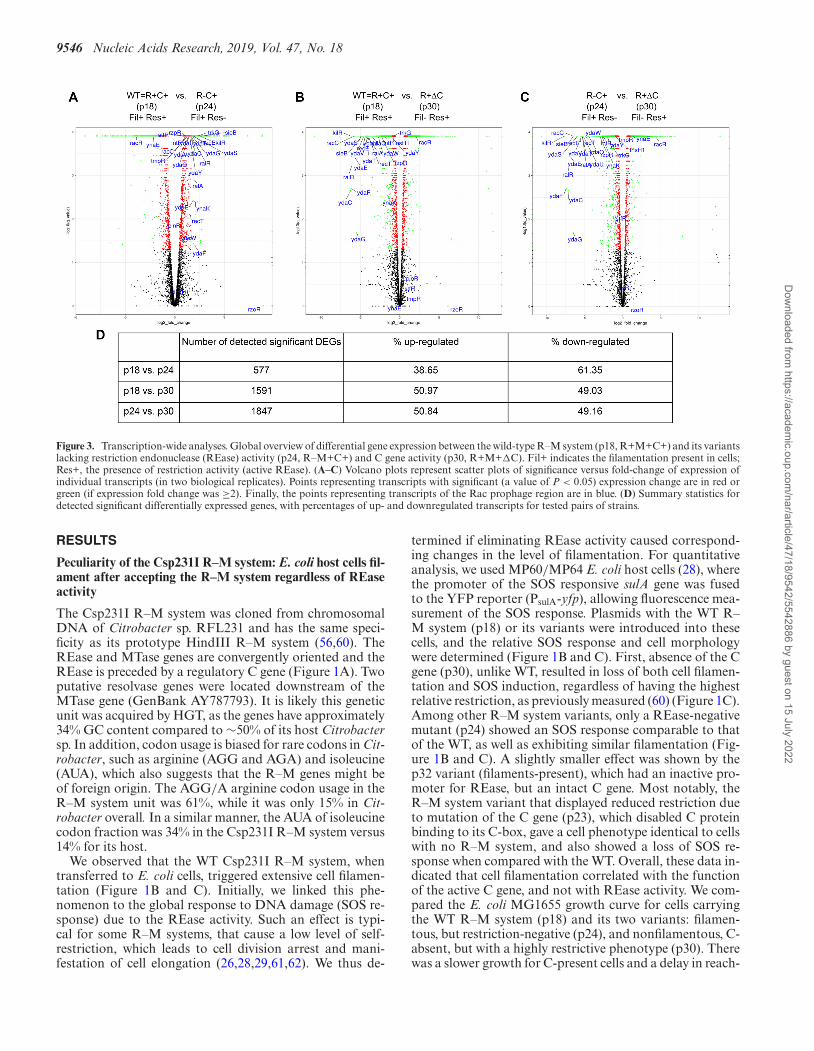
Figure 3. Transcription-wide analyses. Global overview of differential gene expression between the wild-type R–M system (p18, R+M+C+) and its variantslacking restriction endonuclease (REase) activity (p24, R–M+C+) and C gene activity (p30, R+M+�C). Fil+ indicates the filamentation present in cells;Res+, the presence of restriction activity (active REase). (A–C) Volcano plots represent scatter plots of significance versus fold-change of expression ofindividual transcripts (in two biological replicates). Points representing transcripts with significant (a value of P < 0.05) expression change are in red orgreen (if expression fold change was ≥2). Finally, the points representing transcripts of the Rac prophage region are in blue. (D) Summary statistics fordetected significant differentially expressed genes, with percentages of up- and downregulated transcripts for tested pairs of strains.
RESULTS
Peculiarity of the Csp231I R–M system: E. coli host cells fil-ament after accepting the R–M system regardless of REaseactivity
The Csp231I R–M system was cloned from chromosomalDNA of Citrobacter sp. RFL231 and has the same speci-ficity as its prototype HindIII R–M system (56,60). TheREase and MTase genes are convergently oriented and theREase is preceded by a regulatory C gene (Figure 1A). Twoputative resolvase genes were located downstream of theMTase gene (GenBank AY787793). It is likely this geneticunit was acquired by HGT, as the genes have approximately34% GC content compared to ∼50% of its host Citrobactersp. In addition, codon usage is biased for rare codons in Cit-robacter, such as arginine (AGG and AGA) and isoleucine(AUA), which also suggests that the R–M genes might beof foreign origin. The AGG/A arginine codon usage in theR–M system unit was 61%, while it was only 15% in Cit-robacter overall. In a similar manner, the AUA of isoleucinecodon fraction was 34% in the Csp231I R–M system versus14% for its host.
We observed that the WT Csp231I R–M system, whentransferred to E. coli cells, triggered extensive cell filamen-tation (Figure 1B and C). Initially, we linked this phe-nomenon to the global response to DNA damage (SOS re-sponse) due to the REase activity. Such an effect is typi-cal for some R–M systems, that cause a low level of self-restriction, which leads to cell division arrest and mani-festation of cell elongation (26,28,29,61,62). We thus de-
termined if eliminating REase activity caused correspond-ing changes in the level of filamentation. For quantitativeanalysis, we used MP60/MP64 E. coli host cells (28), wherethe promoter of the SOS responsive sulA gene was fusedto the YFP reporter (PsulA-yfp), allowing fluorescence mea-surement of the SOS response. Plasmids with the WT R–M system (p18) or its variants were introduced into thesecells, and the relative SOS response and cell morphologywere determined (Figure 1B and C). First, absence of the Cgene (p30), unlike WT, resulted in loss of both cell filamen-tation and SOS induction, regardless of having the highestrelative restriction, as previously measured (60) (Figure 1C).Among other R–M system variants, only a REase-negativemutant (p24) showed an SOS response comparable to thatof the WT, as well as exhibiting similar filamentation (Fig-ure 1B and C). A slightly smaller effect was shown by thep32 variant (filaments-present), which had an inactive pro-moter for REase, but an intact C gene. Most notably, theR–M system variant that displayed reduced restriction dueto mutation of the C gene (p23), which disabled C proteinbinding to its C-box, gave a cell phenotype identical to cellswith no R–M system, and also showed a loss of SOS re-sponse when compared with the WT. Overall, these data in-dicated that cell filamentation correlated with the functionof the active C gene, and not with REase activity. We com-pared the E. coli MG1655 growth curve for cells carryingthe WT R–M system (p18) and its two variants: filamen-tous, but restriction-negative (p24), and nonfilamentous, C-absent, but with a highly restrictive phenotype (p30). Therewas a slower growth for C-present cells and a delay in reach-
Dow
nloaded from https://academ
ic.oup.com/nar/article/47/18/9542/5542886 by guest on 15 July 2022
Nucleic Acids Research, 2019, Vol. 47, No. 18 9547
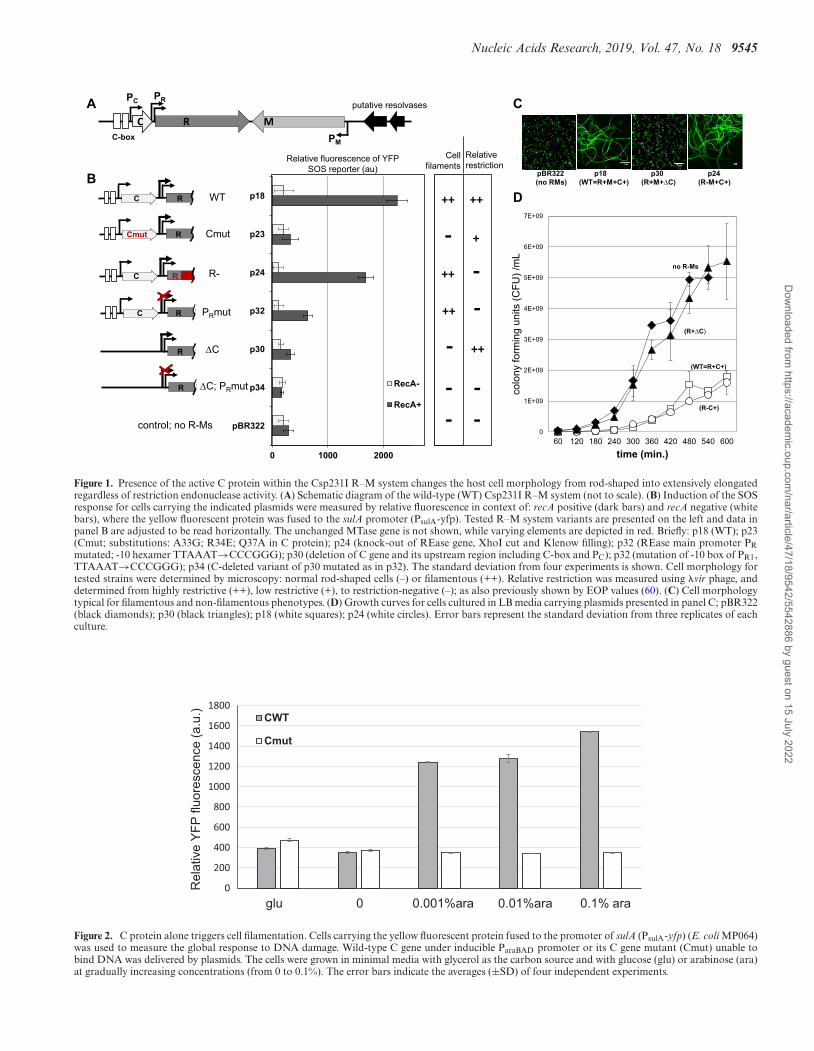
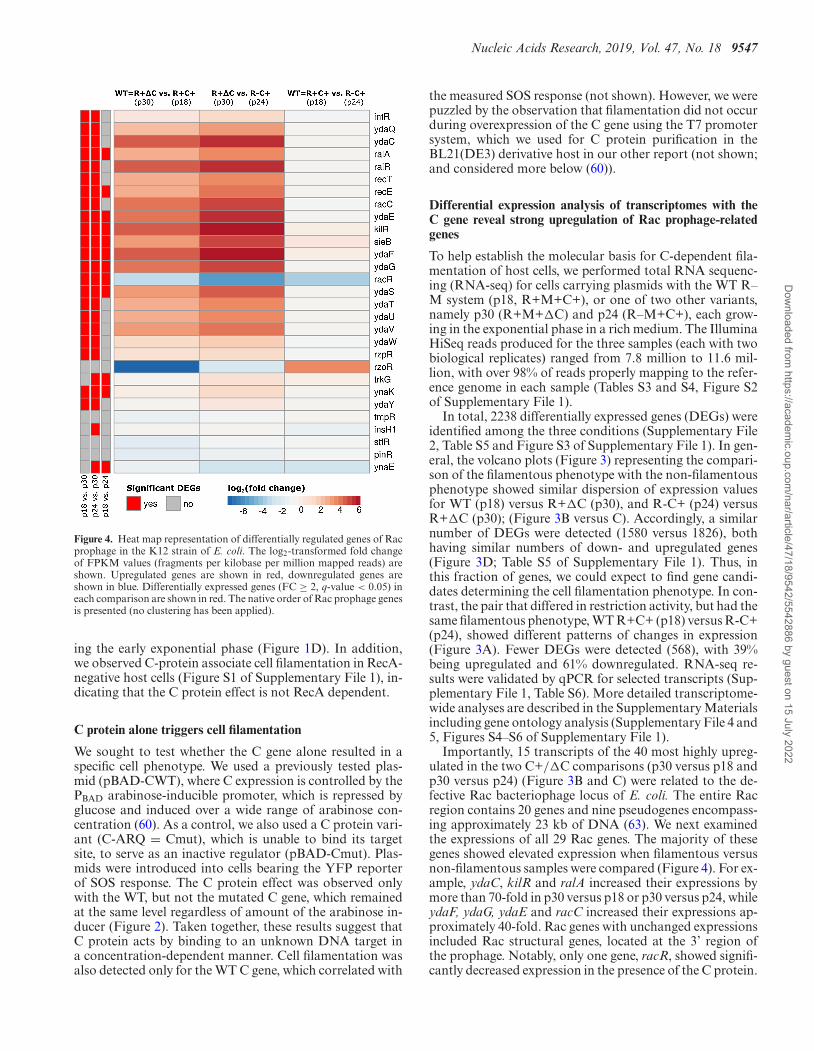
Figure 4. Heat map representation of differentially regulated genes of Racprophage in the K12 strain of E. coli. The log2-transformed fold changeof FPKM values (fragments per kilobase per million mapped reads) areshown. Upregulated genes are shown in red, downregulated genes areshown in blue. Differentially expressed genes (FC ≥ 2, q-value < 0.05) ineach comparison are shown in red. The native order of Rac prophage genesis presented (no clustering has been applied).
ing the early exponential phase (Figure 1D). In addition,we observed C-protein associate cell filamentation in RecA-negative host cells (Figure S1 of Supplementary File 1), in-dicating that the C protein effect is not RecA dependent.
C protein alone triggers cell filamentation
We sought to test whether the C gene alone resulted in aspecific cell phenotype. We used a previously tested plas-mid (pBAD-CWT), where C expression is controlled by thePBAD arabinose-inducible promoter, which is repressed byglucose and induced over a wide range of arabinose con-centration (60). As a control, we also used a C protein vari-ant (C-ARQ = Cmut), which is unable to bind its targetsite, to serve as an inactive regulator (pBAD-Cmut). Plas-mids were introduced into cells bearing the YFP reporterof SOS response. The C protein effect was observed onlywith the WT, but not the mutated C gene, which remainedat the same level regardless of amount of the arabinose in-ducer (Figure 2). Taken together, these results suggest thatC protein acts by binding to an unknown DNA target ina concentration-dependent manner. Cell filamentation wasalso detected only for the WT C gene, which correlated with
the measured SOS response (not shown). However, we werepuzzled by the observation that filamentation did not occurduring overexpression of the C gene using the T7 promotersystem, which we used for C protein purification in theBL21(DE3) derivative host in our other report (not shown;and considered more below (60)).
Differential expression analysis of transcriptomes with theC gene reveal strong upregulation of Rac prophage-relatedgenes
To help establish the molecular basis for C-dependent fila-mentation of host cells, we performed total RNA sequenc-ing (RNA-seq) for cells carrying plasmids with the WT R–M system (p18, R+M+C+), or one of two other variants,namely p30 (R+M+�C) and p24 (R–M+C+), each grow-ing in the exponential phase in a rich medium. The IlluminaHiSeq reads produced for the three samples (each with twobiological replicates) ranged from 7.8 million to 11.6 mil-lion, with over 98% of reads properly mapping to the refer-ence genome in each sample (Tables S3 and S4, Figure S2of Supplementary File 1).
In total, 2238 differentially expressed genes (DEGs) wereidentified among the three conditions (Supplementary File2, Table S5 and Figure S3 of Supplementary File 1). In gen-eral, the volcano plots (Figure 3) representing the compari-son of the filamentous phenotype with the non-filamentousphenotype showed similar dispersion of expression valuesfor WT (p18) versus R+�C (p30), and R-C+ (p24) versusR+�C (p30); (Figure 3B versus C). Accordingly, a similarnumber of DEGs were detected (1580 versus 1826), bothhaving similar numbers of down- and upregulated genes(Figure 3D; Table S5 of Supplementary File 1). Thus, inthis fraction of genes, we could expect to find gene candi-dates determining the cell filamentation phenotype. In con-trast, the pair that differed in restriction activity, but had thesame filamentous phenotype, WT R+C+ (p18) versus R-C+(p24), showed different patterns of changes in expression(Figure 3A). Fewer DEGs were detected (568), with 39%being upregulated and 61% downregulated. RNA-seq re-sults were validated by qPCR for selected transcripts (Sup-plementary File 1, Table S6). More detailed transcriptome-wide analyses are described in the Supplementary Materialsincluding gene ontology analysis (Supplementary File 4 and5, Figures S4–S6 of Supplementary File 1).
Importantly, 15 transcripts of the 40 most highly upreg-ulated in the two C+/�C comparisons (p30 versus p18 andp30 versus p24) (Figure 3B and C) were related to the de-fective Rac bacteriophage locus of E. coli. The entire Racregion contains 20 genes and nine pseudogenes encompass-ing approximately 23 kb of DNA (63). We next examinedthe expressions of all 29 Rac genes. The majority of thesegenes showed elevated expression when filamentous versusnon-filamentous samples were compared (Figure 4). For ex-ample, ydaC, kilR and ralA increased their expressions bymore than 70-fold in p30 versus p18 or p30 versus p24, whileydaF, ydaG, ydaE and racC increased their expressions ap-proximately 40-fold. Rac genes with unchanged expressionsincluded Rac structural genes, located at the 3’ region ofthe prophage. Notably, only one gene, racR, showed signifi-cantly decreased expression in the presence of the C protein.
Dow
nloaded from https://academ
ic.oup.com/nar/article/47/18/9542/5542886 by guest on 15 July 2022
9548 Nucleic Acids Research, 2019, Vol. 47, No. 18
A
B C
MG1655 rac+ ∆rac ∆ralRA ∆kilR ∆ralRA – kilR ∆sieB – ydaU ∆ydaF – ydaT ∆racR – ydaT(21 kb) (372 bp) (383 bp) (4824 bp) (3315 bp) (1952 bp) (1343 bp)
intR ydaQ ydaC recT recE racC ydaE sieB ydaF ydaG ydaS ydaT ydaU ydaV ydaW
ralRA kilR racR
rac
∆ralA – kilR
∆sieB – ydaU
∆ydaF – ydaT
∆racR – ydaTMG1655 rac+[p24; pBAD-RacR]
ac�ve C gene inside [p24]
MG1655 racR+ydaS::bla[p24]
MG1655 racR+ydaT::bla[p24]
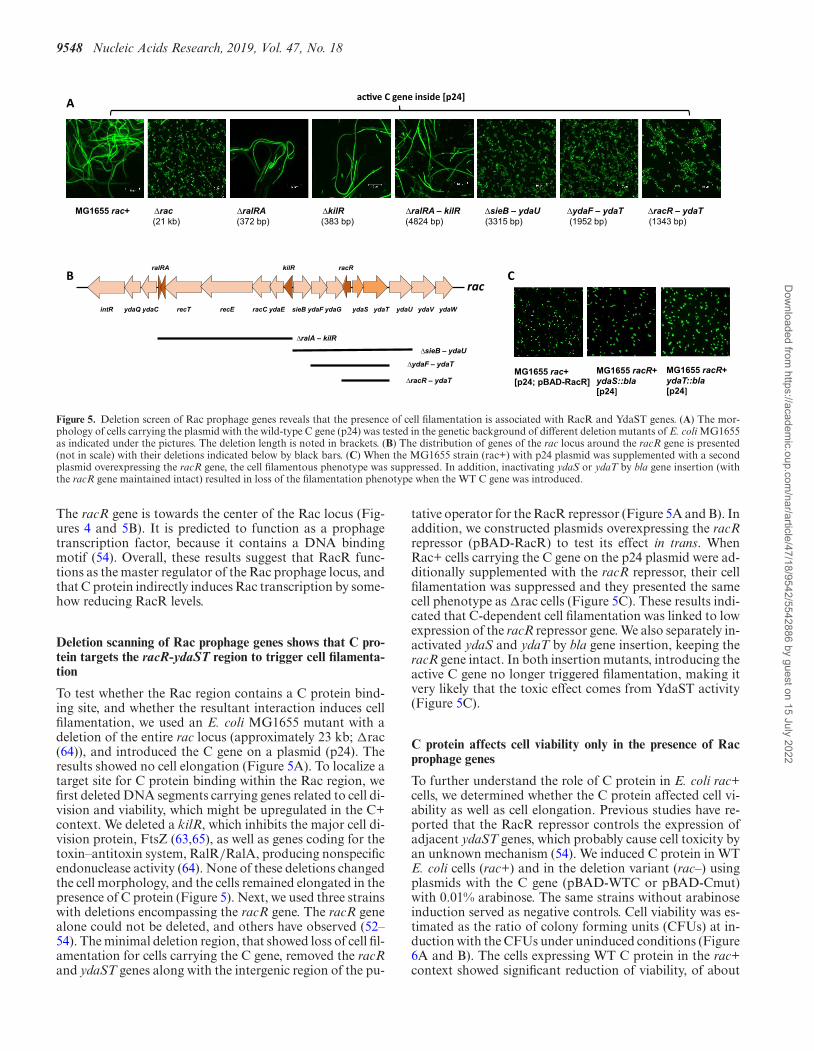
Figure 5. Deletion screen of Rac prophage genes reveals that the presence of cell filamentation is associated with RacR and YdaST genes. (A) The mor-phology of cells carrying the plasmid with the wild-type C gene (p24) was tested in the genetic background of different deletion mutants of E. coli MG1655as indicated under the pictures. The deletion length is noted in brackets. (B) The distribution of genes of the rac locus around the racR gene is presented(not in scale) with their deletions indicated below by black bars. (C) When the MG1655 strain (rac+) with p24 plasmid was supplemented with a secondplasmid overexpressing the racR gene, the cell filamentous phenotype was suppressed. In addition, inactivating ydaS or ydaT by bla gene insertion (withthe racR gene maintained intact) resulted in loss of the filamentation phenotype when the WT C gene was introduced.
The racR gene is towards the center of the Rac locus (Fig-ures 4 and 5B). It is predicted to function as a prophagetranscription factor, because it contains a DNA bindingmotif (54). Overall, these results suggest that RacR func-tions as the master regulator of the Rac prophage locus, andthat C protein indirectly induces Rac transcription by some-how reducing RacR levels.
Deletion scanning of Rac prophage genes shows that C pro-tein targets the racR-ydaST region to trigger cell filamenta-tion
To test whether the Rac region contains a C protein bind-ing site, and whether the resultant interaction induces cellfilamentation, we used an E. coli MG1655 mutant with adeletion of the entire rac locus (approximately 23 kb; �rac(64)), and introduced the C gene on a plasmid (p24). Theresults showed no cell elongation (Figure 5A). To localize atarget site for C protein binding within the Rac region, wefirst deleted DNA segments carrying genes related to cell di-vision and viability, which might be upregulated in the C+context. We deleted a kilR, which inhibits the major cell di-vision protein, FtsZ (63,65), as well as genes coding for thetoxin–antitoxin system, RalR/RalA, producing nonspecificendonuclease activity (64). None of these deletions changedthe cell morphology, and the cells remained elongated in thepresence of C protein (Figure 5). Next, we used three strainswith deletions encompassing the racR gene. The racR genealone could not be deleted, and others have observed (52–54). The minimal deletion region, that showed loss of cell fil-amentation for cells carrying the C gene, removed the racRand ydaST genes along with the intergenic region of the pu-
tative operator for the RacR repressor (Figure 5A and B). Inaddition, we constructed plasmids overexpressing the racRrepressor (pBAD-RacR) to test its effect in trans. WhenRac+ cells carrying the C gene on the p24 plasmid were ad-ditionally supplemented with the racR repressor, their cellfilamentation was suppressed and they presented the samecell phenotype as �rac cells (Figure 5C). These results indi-cated that C-dependent cell filamentation was linked to lowexpression of the racR repressor gene. We also separately in-activated ydaS and ydaT by bla gene insertion, keeping theracR gene intact. In both insertion mutants, introducing theactive C gene no longer triggered filamentation, making itvery likely that the toxic effect comes from YdaST activity(Figure 5C).
C protein affects cell viability only in the presence of Racprophage genes
To further understand the role of C protein in E. coli rac+cells, we determined whether the C protein affected cell vi-ability as well as cell elongation. Previous studies have re-ported that the RacR repressor controls the expression ofadjacent ydaST genes, which probably cause cell toxicity byan unknown mechanism (54). We induced C protein in WTE. coli cells (rac+) and in the deletion variant (rac–) usingplasmids with the C gene (pBAD-WTC or pBAD-Cmut)with 0.01% arabinose. The same strains without arabinoseinduction served as negative controls. Cell viability was es-timated as the ratio of colony forming units (CFUs) at in-duction with the CFUs under uninduced conditions (Figure6A and B). The cells expressing WT C protein in the rac+context showed significant reduction of viability, of about
Dow
nloaded from https://academ
ic.oup.com/nar/article/47/18/9542/5542886 by guest on 15 July 2022
Nucleic Acids Research, 2019, Vol. 47, No. 18 9549
A B
C
-1
-2
-3
-4
-5
-6
dilution induced uninduced
rac+ ∆racWT mut WT mutC gene:
rac+ ∆racWT mut WT mut
∆rac rac+
WT C gene
0,0001
0,001
0,01
0,1
1
Cel
l via
bilit
y
CWT
Cmut
rac+ ∆rac
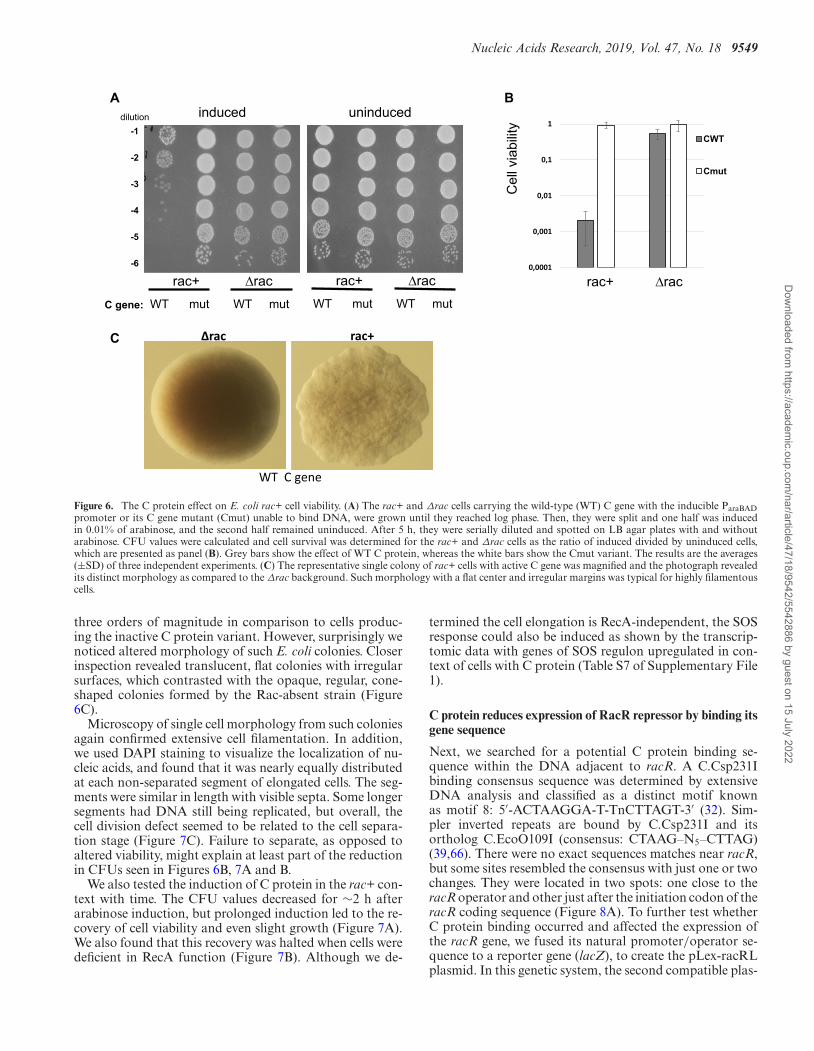
Figure 6. The C protein effect on E. coli rac+ cell viability. (A) The rac+ and Δrac cells carrying the wild-type (WT) C gene with the inducible ParaBADpromoter or its C gene mutant (Cmut) unable to bind DNA, were grown until they reached log phase. Then, they were split and one half was inducedin 0.01% of arabinose, and the second half remained uninduced. After 5 h, they were serially diluted and spotted on LB agar plates with and withoutarabinose. CFU values were calculated and cell survival was determined for the rac+ and Δrac cells as the ratio of induced divided by uninduced cells,which are presented as panel (B). Grey bars show the effect of WT C protein, whereas the white bars show the Cmut variant. The results are the averages(±SD) of three independent experiments. (C) The representative single colony of rac+ cells with active C gene was magnified and the photograph revealedits distinct morphology as compared to the Δrac background. Such morphology with a flat center and irregular margins was typical for highly filamentouscells.
three orders of magnitude in comparison to cells produc-ing the inactive C protein variant. However, surprisingly wenoticed altered morphology of such E. coli colonies. Closerinspection revealed translucent, flat colonies with irregularsurfaces, which contrasted with the opaque, regular, cone-shaped colonies formed by the Rac-absent strain (Figure6C).
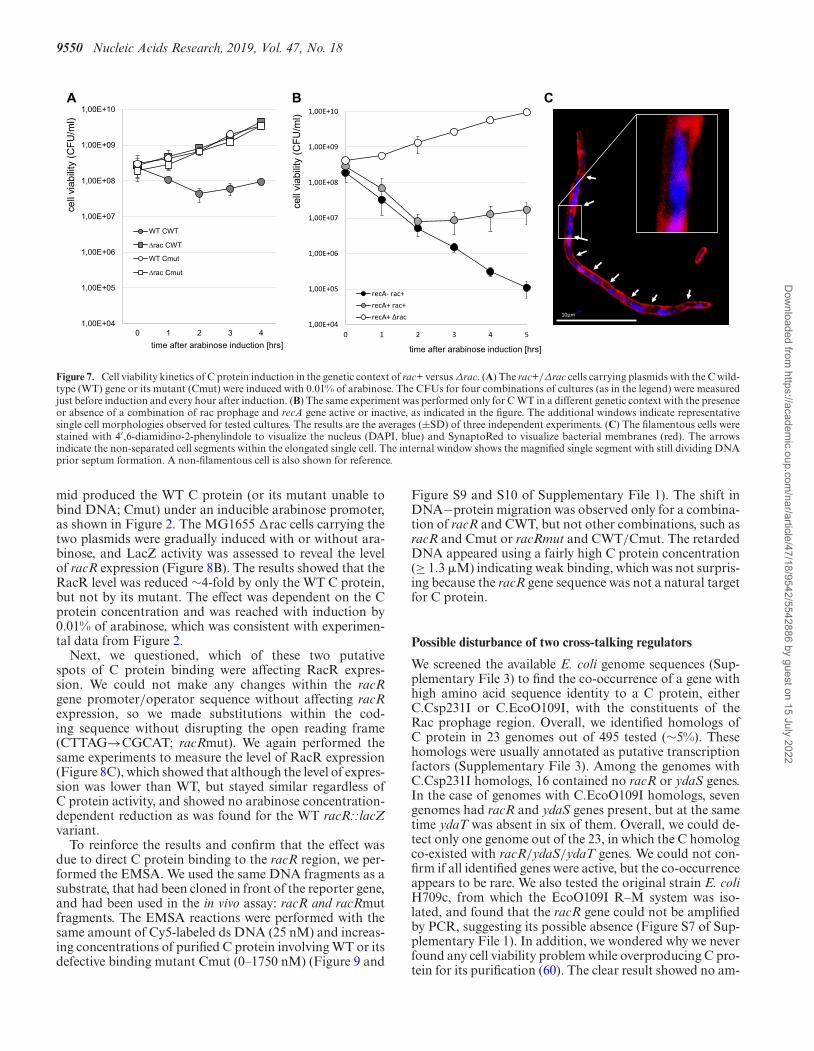
Microscopy of single cell morphology from such coloniesagain confirmed extensive cell filamentation. In addition,we used DAPI staining to visualize the localization of nu-cleic acids, and found that it was nearly equally distributedat each non-separated segment of elongated cells. The seg-ments were similar in length with visible septa. Some longersegments had DNA still being replicated, but overall, thecell division defect seemed to be related to the cell separa-tion stage (Figure 7C). Failure to separate, as opposed toaltered viability, might explain at least part of the reductionin CFUs seen in Figures 6B, 7A and B.
We also tested the induction of C protein in the rac+ con-text with time. The CFU values decreased for ∼2 h afterarabinose induction, but prolonged induction led to the re-covery of cell viability and even slight growth (Figure 7A).We also found that this recovery was halted when cells weredeficient in RecA function (Figure 7B). Although we de-
termined the cell elongation is RecA-independent, the SOSresponse could also be induced as shown by the transcrip-tomic data with genes of SOS regulon upregulated in con-text of cells with C protein (Table S7 of Supplementary File1).
C protein reduces expression of RacR repressor by binding itsgene sequence
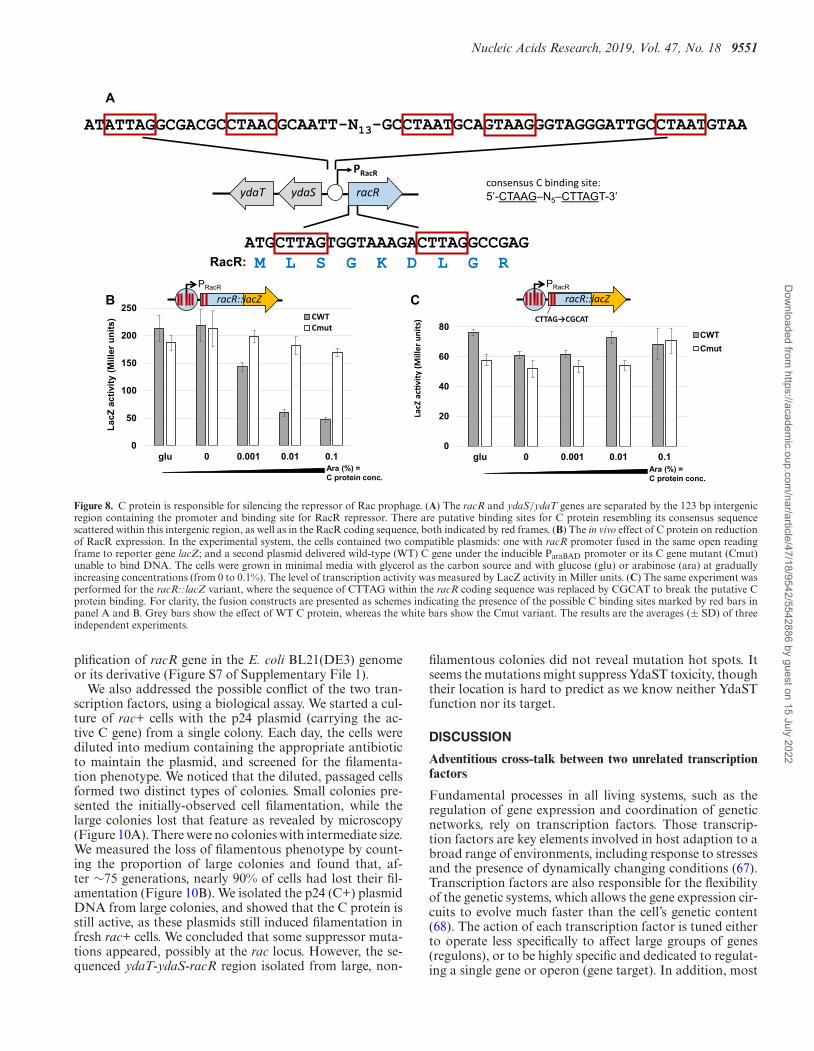
Next, we searched for a potential C protein binding se-quence within the DNA adjacent to racR. A C.Csp231Ibinding consensus sequence was determined by extensiveDNA analysis and classified as a distinct motif knownas motif 8: 5′-ACTAAGGA-T-TnCTTAGT-3′ (32). Sim-pler inverted repeats are bound by C.Csp231I and itsortholog C.EcoO109I (consensus: CTAAG–N5–CTTAG)(39,66). There were no exact sequences matches near racR,but some sites resembled the consensus with just one or twochanges. They were located in two spots: one close to theracR operator and other just after the initiation codon of theracR coding sequence (Figure 8A). To further test whetherC protein binding occurred and affected the expression ofthe racR gene, we fused its natural promoter/operator se-quence to a reporter gene (lacZ), to create the pLex-racRLplasmid. In this genetic system, the second compatible plas-
Dow
nloaded from https://academ
ic.oup.com/nar/article/47/18/9542/5542886 by guest on 15 July 2022
9550 Nucleic Acids Research, 2019, Vol. 47, No. 18
1,00E+04
1,00E+05
1,00E+06
1,00E+07
1,00E+08
1,00E+09
1,00E+10
0 1 2 3 4time after arabinose induction [hrs]
WT CWT
∆rac CWT
WT Cmut
∆rac Cmut
1,00E+04
1,00E+05
1,00E+06
1,00E+07
1,00E+08
1,00E+09
1,00E+10
0 1 2 3 4 5
time after arabinose induction [hrs]
recA- rac+
recA+ rac+
recA+ ∆rac
cell
ytilibaiv)l
m/UF
C(
cell
viab
ility
(CFU
/ml)
A B C
10μm
Figure 7. Cell viability kinetics of C protein induction in the genetic context of rac+ versus Δrac. (A) The rac+/Δrac cells carrying plasmids with the C wild-type (WT) gene or its mutant (Cmut) were induced with 0.01% of arabinose. The CFUs for four combinations of cultures (as in the legend) were measuredjust before induction and every hour after induction. (B) The same experiment was performed only for C WT in a different genetic context with the presenceor absence of a combination of rac prophage and recA gene active or inactive, as indicated in the figure. The additional windows indicate representativesingle cell morphologies observed for tested cultures. The results are the averages (±SD) of three independent experiments. (C) The filamentous cells werestained with 4′,6-diamidino-2-phenylindole to visualize the nucleus (DAPI, blue) and SynaptoRed to visualize bacterial membranes (red). The arrowsindicate the non-separated cell segments within the elongated single cell. The internal window shows the magnified single segment with still dividing DNAprior septum formation. A non-filamentous cell is also shown for reference.
mid produced the WT C protein (or its mutant unable tobind DNA; Cmut) under an inducible arabinose promoter,as shown in Figure 2. The MG1655 �rac cells carrying thetwo plasmids were gradually induced with or without ara-binose, and LacZ activity was assessed to reveal the levelof racR expression (Figure 8B). The results showed that theRacR level was reduced ∼4-fold by only the WT C protein,but not by its mutant. The effect was dependent on the Cprotein concentration and was reached with induction by0.01% of arabinose, which was consistent with experimen-tal data from Figure 2.
Next, we questioned, which of these two putativespots of C protein binding were affecting RacR expres-sion. We could not make any changes within the racRgene promoter/operator sequence without affecting racRexpression, so we made substitutions within the cod-ing sequence without disrupting the open reading frame(CTTAG→CGCAT; racRmut). We again performed thesame experiments to measure the level of RacR expression(Figure 8C), which showed that although the level of expres-sion was lower than WT, but stayed similar regardless ofC protein activity, and showed no arabinose concentration-dependent reduction as was found for the WT racR::lacZvariant.
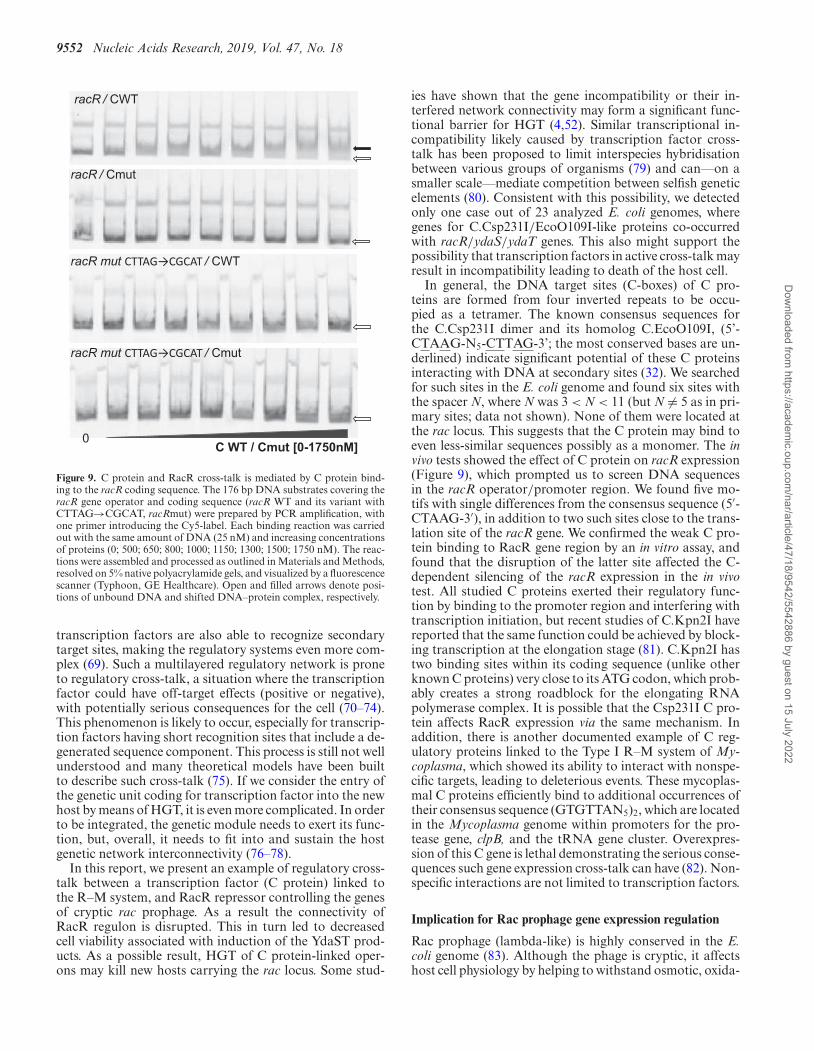
To reinforce the results and confirm that the effect wasdue to direct C protein binding to the racR region, we per-formed the EMSA. We used the same DNA fragments as asubstrate, that had been cloned in front of the reporter gene,and had been used in the in vivo assay: racR and racRmutfragments. The EMSA reactions were performed with thesame amount of Cy5-labeled ds DNA (25 nM) and increas-ing concentrations of purified C protein involving WT or itsdefective binding mutant Cmut (0–1750 nM) (Figure 9 and
Figure S9 and S10 of Supplementary File 1). The shift inDNA−protein migration was observed only for a combina-tion of racR and CWT, but not other combinations, such asracR and Cmut or racRmut and CWT/Cmut. The retardedDNA appeared using a fairly high C protein concentration(≥ 1.3 �M) indicating weak binding, which was not surpris-ing because the racR gene sequence was not a natural targetfor C protein.
Possible disturbance of two cross-talking regulators
We screened the available E. coli genome sequences (Sup-plementary File 3) to find the co-occurrence of a gene withhigh amino acid sequence identity to a C protein, eitherC.Csp231I or C.EcoO109I, with the constituents of theRac prophage region. Overall, we identified homologs ofC protein in 23 genomes out of 495 tested (∼5%). Thesehomologs were usually annotated as putative transcriptionfactors (Supplementary File 3). Among the genomes withC.Csp231I homologs, 16 contained no racR or ydaS genes.In the case of genomes with C.EcoO109I homologs, sevengenomes had racR and ydaS genes present, but at the sametime ydaT was absent in six of them. Overall, we could de-tect only one genome out of the 23, in which the C homologco-existed with racR/ydaS/ydaT genes. We could not con-firm if all identified genes were active, but the co-occurrenceappears to be rare. We also tested the original strain E. coliH709c, from which the EcoO109I R–M system was iso-lated, and found that the racR gene could not be amplifiedby PCR, suggesting its possible absence (Figure S7 of Sup-plementary File 1). In addition, we wondered why we neverfound any cell viability problem while overproducing C pro-tein for its purification (60). The clear result showed no am-
Dow
nloaded from https://academ
ic.oup.com/nar/article/47/18/9542/5542886 by guest on 15 July 2022
Nucleic Acids Research, 2019, Vol. 47, No. 18 9551
ATATTAGGCGAC
B
A
C
ATGCTTAGTGGTAAAGACTTAGGCCGAGM L S G K D L G R
ydaT ydaS racR
PRacR
GCCTAACGCAATT-N13-GCCTAATGCAGTAAGGGTAGGGATTGCCTAATGTAA
0
50
100
150
200
250
glu 0 0.001 0.01 0.1
LacZ
activ
ity(M
iller
uni
ts) CWT
Cmut
Ara (%) =C protein conc.
RacR:
Ara (%) =C protein conc.
consensus C binding site:5’-CTAAG–N5–CTTAGT-3’
CTTAG→CGCAT
PRacR
racR::lacZPRacR
racR::lacZ
0
20
40
60
80
glu 0 0.001 0.01 0.1
LacZ
ac�
vity
(Mill
er u
nits
)
CWTCmut
Figure 8. C protein is responsible for silencing the repressor of Rac prophage. (A) The racR and ydaS/ydaT genes are separated by the 123 bp intergenicregion containing the promoter and binding site for RacR repressor. There are putative binding sites for C protein resembling its consensus sequencescattered within this intergenic region, as well as in the RacR coding sequence, both indicated by red frames. (B) The in vivo effect of C protein on reductionof RacR expression. In the experimental system, the cells contained two compatible plasmids: one with racR promoter fused in the same open readingframe to reporter gene lacZ; and a second plasmid delivered wild-type (WT) C gene under the inducible ParaBAD promoter or its C gene mutant (Cmut)unable to bind DNA. The cells were grown in minimal media with glycerol as the carbon source and with glucose (glu) or arabinose (ara) at graduallyincreasing concentrations (from 0 to 0.1%). The level of transcription activity was measured by LacZ activity in Miller units. (C) The same experiment wasperformed for the racR::lacZ variant, where the sequence of CTTAG within the racR coding sequence was replaced by CGCAT to break the putative Cprotein binding. For clarity, the fusion constructs are presented as schemes indicating the presence of the possible C binding sites marked by red bars inpanel A and B. Grey bars show the effect of WT C protein, whereas the white bars show the Cmut variant. The results are the averages (± SD) of threeindependent experiments.
plification of racR gene in the E. coli BL21(DE3) genomeor its derivative (Figure S7 of Supplementary File 1).
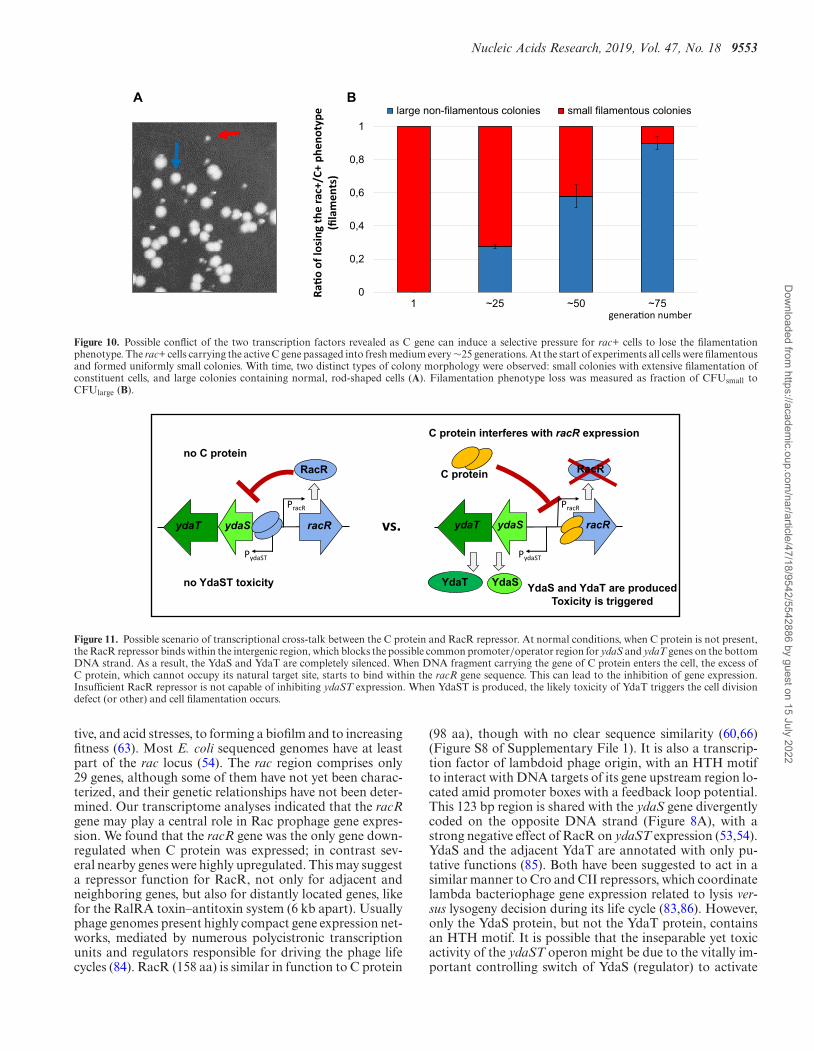
We also addressed the possible conflict of the two tran-scription factors, using a biological assay. We started a cul-ture of rac+ cells with the p24 plasmid (carrying the ac-tive C gene) from a single colony. Each day, the cells werediluted into medium containing the appropriate antibioticto maintain the plasmid, and screened for the filamenta-tion phenotype. We noticed that the diluted, passaged cellsformed two distinct types of colonies. Small colonies pre-sented the initially-observed cell filamentation, while thelarge colonies lost that feature as revealed by microscopy(Figure 10A). There were no colonies with intermediate size.We measured the loss of filamentous phenotype by count-ing the proportion of large colonies and found that, af-ter ∼75 generations, nearly 90% of cells had lost their fil-amentation (Figure 10B). We isolated the p24 (C+) plasmidDNA from large colonies, and showed that the C protein isstill active, as these plasmids still induced filamentation infresh rac+ cells. We concluded that some suppressor muta-tions appeared, possibly at the rac locus. However, the se-quenced ydaT-ydaS-racR region isolated from large, non-
filamentous colonies did not reveal mutation hot spots. Itseems the mutations might suppress YdaST toxicity, thoughtheir location is hard to predict as we know neither YdaSTfunction nor its target.
DISCUSSION
Adventitious cross-talk between two unrelated transcriptionfactors
Fundamental processes in all living systems, such as theregulation of gene expression and coordination of geneticnetworks, rely on transcription factors. Those transcrip-tion factors are key elements involved in host adaption to abroad range of environments, including response to stressesand the presence of dynamically changing conditions (67).Transcription factors are also responsible for the flexibilityof the genetic systems, which allows the gene expression cir-cuits to evolve much faster than the cell’s genetic content(68). The action of each transcription factor is tuned eitherto operate less specifically to affect large groups of genes(regulons), or to be highly specific and dedicated to regulat-ing a single gene or operon (gene target). In addition, most
Dow
nloaded from https://academ
ic.oup.com/nar/article/47/18/9542/5542886 by guest on 15 July 2022
9552 Nucleic Acids Research, 2019, Vol. 47, No. 18
racR / CWT
C WT / Cmut [0-1750nM]0
racR mut CTTAG→CGCAT / Cmut
racR mut CTTAG→CGCAT / CWT
racR / Cmut
Figure 9. C protein and RacR cross-talk is mediated by C protein bind-ing to the racR coding sequence. The 176 bp DNA substrates covering theracR gene operator and coding sequence (racR WT and its variant withCTTAG→CGCAT, racRmut) were prepared by PCR amplification, withone primer introducing the Cy5-label. Each binding reaction was carriedout with the same amount of DNA (25 nM) and increasing concentrationsof proteins (0; 500; 650; 800; 1000; 1150; 1300; 1500; 1750 nM). The reac-tions were assembled and processed as outlined in Materials and Methods,resolved on 5% native polyacrylamide gels, and visualized by a fluorescencescanner (Typhoon, GE Healthcare). Open and filled arrows denote posi-tions of unbound DNA and shifted DNA–protein complex, respectively.
transcription factors are also able to recognize secondarytarget sites, making the regulatory systems even more com-plex (69). Such a multilayered regulatory network is proneto regulatory cross-talk, a situation where the transcriptionfactor could have off-target effects (positive or negative),with potentially serious consequences for the cell (70–74).This phenomenon is likely to occur, especially for transcrip-tion factors having short recognition sites that include a de-generated sequence component. This process is still not wellunderstood and many theoretical models have been builtto describe such cross-talk (75). If we consider the entry ofthe genetic unit coding for transcription factor into the newhost by means of HGT, it is even more complicated. In orderto be integrated, the genetic module needs to exert its func-tion, but, overall, it needs to fit into and sustain the hostgenetic network interconnectivity (76–78).
In this report, we present an example of regulatory cross-talk between a transcription factor (C protein) linked tothe R–M system, and RacR repressor controlling the genesof cryptic rac prophage. As a result the connectivity ofRacR regulon is disrupted. This in turn led to decreasedcell viability associated with induction of the YdaST prod-ucts. As a possible result, HGT of C protein-linked oper-ons may kill new hosts carrying the rac locus. Some stud-
ies have shown that the gene incompatibility or their in-terfered network connectivity may form a significant func-tional barrier for HGT (4,52). Similar transcriptional in-compatibility likely caused by transcription factor cross-talk has been proposed to limit interspecies hybridisationbetween various groups of organisms (79) and can––on asmaller scale––mediate competition between selfish geneticelements (80). Consistent with this possibility, we detectedonly one case out of 23 analyzed E. coli genomes, wheregenes for C.Csp231I/EcoO109I-like proteins co-occurredwith racR/ydaS/ydaT genes. This also might support thepossibility that transcription factors in active cross-talk mayresult in incompatibility leading to death of the host cell.
In general, the DNA target sites (C-boxes) of C pro-teins are formed from four inverted repeats to be occu-pied as a tetramer. The known consensus sequences forthe C.Csp231I dimer and its homolog C.EcoO109I, (5’-CTAAG-N5-CTTAG-3’; the most conserved bases are un-derlined) indicate significant potential of these C proteinsinteracting with DNA at secondary sites (32). We searchedfor such sites in the E. coli genome and found six sites withthe spacer N, where N was 3 < N < 11 (but N �= 5 as in pri-mary sites; data not shown). None of them were located atthe rac locus. This suggests that the C protein may bind toeven less-similar sequences possibly as a monomer. The invivo tests showed the effect of C protein on racR expression(Figure 9), which prompted us to screen DNA sequencesin the racR operator/promoter region. We found five mo-tifs with single differences from the consensus sequence (5′-CTAAG-3′), in addition to two such sites close to the trans-lation site of the racR gene. We confirmed the weak C pro-tein binding to RacR gene region by an in vitro assay, andfound that the disruption of the latter site affected the C-dependent silencing of the racR expression in the in vivotest. All studied C proteins exerted their regulatory func-tion by binding to the promoter region and interfering withtranscription initiation, but recent studies of C.Kpn2I havereported that the same function could be achieved by block-ing transcription at the elongation stage (81). C.Kpn2I hastwo binding sites within its coding sequence (unlike otherknown C proteins) very close to its ATG codon, which prob-ably creates a strong roadblock for the elongating RNApolymerase complex. It is possible that the Csp231I C pro-tein affects RacR expression via the same mechanism. Inaddition, there is another documented example of C reg-ulatory proteins linked to the Type I R–M system of My-coplasma, which showed its ability to interact with nonspe-cific targets, leading to deleterious events. These mycoplas-mal C proteins efficiently bind to additional occurrences oftheir consensus sequence (GTGTTAN5)2, which are locatedin the Mycoplasma genome within promoters for the pro-tease gene, clpB, and the tRNA gene cluster. Overexpres-sion of this C gene is lethal demonstrating the serious conse-quences such gene expression cross-talk can have (82). Non-specific interactions are not limited to transcription factors.
Implication for Rac prophage gene expression regulation
Rac prophage (lambda-like) is highly conserved in the E.coli genome (83). Although the phage is cryptic, it affectshost cell physiology by helping to withstand osmotic, oxida-
Dow
nloaded from https://academ
ic.oup.com/nar/article/47/18/9542/5542886 by guest on 15 July 2022
Nucleic Acids Research, 2019, Vol. 47, No. 18 9553
A B
genera�on number
0
0,2
0,4
0,6
0,8
1
1 ~25 ~50 ~75Ra
�o
of lo
sing
the
rac+
/C+
phen
otyp
e(fi
lam
ents
)
large non-filamentous colonies small filamentous colonies
Figure 10. Possible conflict of the two transcription factors revealed as C gene can induce a selective pressure for rac+ cells to lose the filamentationphenotype. The rac+ cells carrying the active C gene passaged into fresh medium every ∼25 generations. At the start of experiments all cells were filamentousand formed uniformly small colonies. With time, two distinct types of colony morphology were observed: small colonies with extensive filamentation ofconstituent cells, and large colonies containing normal, rod-shaped cells (A). Filamentation phenotype loss was measured as fraction of CFUsmall toCFUlarge (B).
C protein interferes with racR expression
YdaS and YdaT are producedToxicity is triggered
C protein
YdaT YdaS
ydaT ydaS racR
PydaST
PracR
RacRno C protein
no YdaST toxicity
ydaT ydaS racR
RacR
PydaST
PracR
vs.
Figure 11. Possible scenario of transcriptional cross-talk between the C protein and RacR repressor. At normal conditions, when C protein is not present,the RacR repressor binds within the intergenic region, which blocks the possible common promoter/operator region for ydaS and ydaT genes on the bottomDNA strand. As a result, the YdaS and YdaT are completely silenced. When DNA fragment carrying the gene of C protein enters the cell, the excess ofC protein, which cannot occupy its natural target site, starts to bind within the racR gene sequence. This can lead to the inhibition of gene expression.Insufficient RacR repressor is not capable of inhibiting ydaST expression. When YdaST is produced, the likely toxicity of YdaT triggers the cell divisiondefect (or other) and cell filamentation occurs.
tive, and acid stresses, to forming a biofilm and to increasingfitness (63). Most E. coli sequenced genomes have at leastpart of the rac locus (54). The rac region comprises only29 genes, although some of them have not yet been charac-terized, and their genetic relationships have not been deter-mined. Our transcriptome analyses indicated that the racRgene may play a central role in Rac prophage gene expres-sion. We found that the racR gene was the only gene down-regulated when C protein was expressed; in contrast sev-eral nearby genes were highly upregulated. This may suggesta repressor function for RacR, not only for adjacent andneighboring genes, but also for distantly located genes, likefor the RalRA toxin–antitoxin system (6 kb apart). Usuallyphage genomes present highly compact gene expression net-works, mediated by numerous polycistronic transcriptionunits and regulators responsible for driving the phage lifecycles (84). RacR (158 aa) is similar in function to C protein
(98 aa), though with no clear sequence similarity (60,66)(Figure S8 of Supplementary File 1). It is also a transcrip-tion factor of lambdoid phage origin, with an HTH motifto interact with DNA targets of its gene upstream region lo-cated amid promoter boxes with a feedback loop potential.This 123 bp region is shared with the ydaS gene divergentlycoded on the opposite DNA strand (Figure 8A), with astrong negative effect of RacR on ydaST expression (53,54).YdaS and the adjacent YdaT are annotated with only pu-tative functions (85). Both have been suggested to act in asimilar manner to Cro and CII repressors, which coordinatelambda bacteriophage gene expression related to lysis ver-sus lysogeny decision during its life cycle (83,86). However,only the YdaS protein, but not the YdaT protein, containsan HTH motif. It is possible that the inseparable yet toxicactivity of the ydaST operon might be due to the vitally im-portant controlling switch of YdaS (regulator) to activate
Dow
nloaded from https://academ
ic.oup.com/nar/article/47/18/9542/5542886 by guest on 15 July 2022
9554 Nucleic Acids Research, 2019, Vol. 47, No. 18
the ydaT gene via a common promoter and possible poly-cistronic transcript. The exertion of toxicity manifested byextensive cell filamentation might therefore originate solelyfrom the YdaT protein, although the overexpression of tran-scription factors, like lambda CII can also lead to cell elon-gation (87,88). The present study showed the indispensablerole of the RacR repressor in the Rac prophage gene net-work and showed how an external transcription factor isable to interfere with this network via transcriptional cross-talk (Figure 11). The mechanism of YdaT toxicity alone isnot understood, as well as its putative function in the Racprophage context. Previously, it was linked indirectly to celldivision inhibition by acting on DNA replication or chro-mosome segregation due to the absence of well-segregatednucleoids in filamentous cells (89). However, in contrast,our results showed a strong DAPI signal distributed at eachnon-separated segment of elongated cells, which was con-sistent with other studies (53). It is probable that the cell di-vision defect was related to the cell separation stage (Figure7C).
DATA AVAILABILITY
The results have been deposited in the NCBI GEO (acces-sion number GSE126248).
SUPPLEMENTARY DATA
Supplementary Data are available at NAR Online.
ACKNOWLEDGEMENTS
We thank Drs Katarzyna Potrykus, Calin Guet, YunxueGuo, Revathy Krishnamurthi and Aswin Seshasayee for thegift of strains/plasmids. We also acknowledge the technicalhelp of Ania Maliszewska, and Dr Malgorzata Kapusta.
FUNDING
National Science Center (Poland) [2015/19/B/NZ2/01835to I.M.]; European Union’s Horizon 2020 Research andInnovation Program under the Marie Sklodowska-Curie[665778 to L.P.P.]. Funding for open access charge: Na-tional Science Center (Poland) [2015/19/B/NZ2/01835].Conflict of interest statement. None declared.
REFERENCES1. Vos,M., Hesselman,M.C., Te Beek,T.A., van Passel,M.W.J. and
Eyre-Walker,A. (2015) Rates of lateral gene transfer in prokaryotes:high but why? Trends Microbiol., 23, 598–605.
2. Treangen,T.J. and Rocha,E.P. (2011) Horizontal transfer, notduplication, drives the expansion of protein families in prokaryotes.PLos Genet., 7, e1001284.
3. Jeltsch,A. (2003) Maintenance of species identity and controllingspeciation of bacteria: a new function for restriction/modificationsystems? Gene, 317, 13–16.
4. Thomas,C.M. and Nielsen,K.M. (2005) Mechanisms of, and barriersto, horizontal gene transfer between bacteria. Nat. Rev. Microbiol., 3,711–721.
5. Johnston,C.D., Skeete,C.A., Fomenkov,A., Roberts,R.J. andRittling,S.R. (2017) Restriction-modification mediated barriers toexogenous DNA uptake and incorporation employed by Prevotellaintermedia. PLoS One, 12, e0185234.
6. Vasu,K. and Nagaraja,V. (2013) Diverse functions ofrestriction–modification systems in addition to cellular defense.Microbiol. Mol. Biol. Rev., 77, 53–72.
7. Oliveira,P.H., Touchon,M. and Rocha,E.P. (2016) Regulation ofgenetic flux between bacteria by restriction–modification systems.Proc. Natl. Acad. Sci. U.S.A., 113, 5658–5663.
8. Labrie,S.J., Samson,J.E. and Moineau,S. (2010) Bacteriophageresistance mechanisms. Nat. Rev. Microbiol., 8, 317–327.
9. Oliveira,P.H., Touchon,M. and Rocha,E.P. (2014) The interplay ofrestriction–modification systems with mobile genetic elements andtheir prokaryotic hosts. Nucleic Acids Res., 42, 10618–10631.
10. Makarova,K.S., Wolf,Y.I., Snir,S. and Koonin,E.V. (2011) Defenseislands in bacterial and archaeal genomes and prediction of noveldefense systems. J. Bacteriol., 193, 6039–6056.
11. Furuta,Y., Abe,K. and Kobayashi,I. (2010) Genome comparison andcontext analysis reveals putative mobile forms ofrestriction–modification systems and related rearrangements. NucleicAcids Res., 38, 2428–2443.
12. Werbowy,O. and Kaczorowski,T. (2016) Plasmid pEC156, a naturallyoccurring Escherichia coli genetic element that carries genes of theEcoVIII restriction-modification system, is mobilizable amongEnterobacteria. PLoS ONE, 11, e0148355.
13. Loenen,W.A., Dryden,D.T., Raleigh,E.A., Wilson,G.G. andMurray,N.E. (2014) Highlights of the DNA cutters: a short history ofthe restriction enzymes. Nucleic Acids Res., 42, 3–19.
14. Mruk,I. and Kobayashi,I. (2014) To be or not to be: regulation ofrestriction–modification systems and other toxin-antitoxin systems.Nucleic Acids Res., 42, 70–86.
15. Mruk,I. and Kobayashi,I. (2016) In: De,B and Frans,J (ed).Epigenetics Mediated by Restriction Modification Systems. Stress andEnvironmental Regulation of Gene Expression and Adaptation inBacteria. Wiley Blackwell, cop, Hoboken, Vol. 1, pp. 425–436.
16. Furuta,Y., Namba-Fukuyo,H., Shibata,T.F., Nishiyama,T.,Shigenobu,S., Suzuki,Y., Sugano,S., Hasebe,M. and Kobayashi,I.(2014) Methylome diversification through changes in DNAmethyltransferase sequence specificity. PLos Genet., 10, e1004272.
17. Krebes,J., Morgan,R.D., Bunk,B., Sproer,C., Luong,K., Parusel,R.,Anton,B.P., Konig,C., Josenhans,C., Overmann,J. et al. (2014) Thecomplex methylome of the human gastric pathogen Helicobacterpylori. Nucleic Acids Res., 42, 2415–2432.
18. Shell,S.S., Prestwich,E.G., Baek,S.H., Shah,R.R., Sassetti,C.M.,Dedon,P.C. and Fortune,S.M. (2013) DNA methylation impacts geneexpression and ensures hypoxic survival of Mycobacteriumtuberculosis. PLoS Pathog., 9, e1003419.
19. Gonzalez,D. and Collier,J. (2013) DNA methylation by CcrMactivates the transcription of two genes required for the division ofCaulobacter crescentus. Mol. Microbiol., 88, 203–218.
20. Mouammine,A. and Collier,J. (2018) The impact of DNAmethylation in Alphaproteobacteria. Mol. Microbiol., 110,doi:10.1111/mmi.14079.
21. Atack,J.M., Tan,A., Bakaletz,L.O., Jennings,M.P. and Seib,K.L.(2018) Phasevarions of bacterial pathogens: methylomics sheds newlight on old enemies. Trends Microbiol., 26, 715–726.
22. Gauntlett,J.C., Nilsson,H.O., Fulurija,A., Marshall,B.J. andBenghezal,M. (2014) Phase-variable restriction/modification systemsare required for Helicobacter pylori colonization. Gut Pathog, 6, 35.
23. Casselli,T., Tourand,Y., Scheidegger,A., Arnold,W.K., Proulx,A.,Stevenson,B. and Brissette,C.A. (2018) DNA methylation byrestriction modification systems affects the global transcriptomeprofile. J. Bacteriol., 200, e00395-18.
24. Nell,S., Estibariz,I., Krebes,J., Bunk,B., Graham,D.Y., Overmann,J.,Song,Y., Sproer,C., Yang,I., Wex,T. et al. (2018) Genome andmethylome variation in Helicobacter pylori with a cag pathogenicityisland during early stages of human infection. Gastroenterology, 154,612–623.
25. Doberenz,S., Eckweiler,D., Reichert,O., Jensen,V., Bunk,B.,Sproer,C., Kordes,A., Frangipani,E., Luong,K., Korlach,J. et al.(2017) Identification of a Pseudomonas aeruginosa PAO1 DNAmethyltransferase, Its targets, and physiological roles. MBio, 8,e02312-16.
26. Katna,A., Boratynski,R., Furmanek-Blaszk,B., Zolcinska,N. andSektas,M. (2010) Unbalanced restriction impairs SOS-induced DNArepair effects. J. Microbiol. Biotechnol., 20, 30–38.
Dow
nloaded from https://academ
ic.oup.com/nar/article/47/18/9542/5542886 by guest on 15 July 2022
Nucleic Acids Research, 2019, Vol. 47, No. 18 9555
27. Naito,T., Kusono,K. and Kobayashi,I. (1995) Selfish behavior ofrestriction–modification systems. Science, 267, 897–899.
28. Pleska,M., Qian,L., Okura,R., Bergmiller,T., Wakamoto,Y.,Kussell,E. and Guet,C.C. (2016) Bacterial autoimmunity due to arestriction-modification system. Curr. Biol., 26, 404–409.
29. Handa,N. and Kobayashi,I. (1999) Post-segregational killing byrestriction modification gene complexes: observations of individualcell deaths. Biochimie, 81, 931–938.
30. Roberts,R.J., Vincze,T., Posfai,J. and Macelis,D. (2015) REBASE––adatabase for DNA restriction and modification: enzymes, genes andgenomes. Nucleic Acids Res., 43, D298–D299.
31. Tao,T., Bourne,J.C. and Blumenthal,R.M. (1991) A family ofregulatory genes associated with type II restriction–modificationsystems. J. Bacteriol., 173, 1367–1375.
32. Sorokin,V., Severinov,K. and Gelfand,M.S. (2009) Systematicprediction of control proteins and their DNA binding sites. NucleicAcids Res., 37, 441–451.
33. McGeehan,J.E., Streeter,S.D., Papapanagiotou,I., Fox,G.C. andKneale,G.G. (2005) High-resolution crystal structure of therestriction–modification controller protein C.AhdI from Aeromonashydrophila. J. Mol. Biol., 346, 689–701.
34. Aggarwal,A.K., Rodgers,D.W., Drottar,M., Ptashne,M. andHarrison,S.C. (1988) Recognition of a DNA operator by the repressorof phage 434: a view at high resolution. Science, 242, 899–907.
35. Bogdanova,E., Djordjevic,M., Papapanagiotou,I., Heyduk,T.,Kneale,G. and Severinov,K. (2008) Transcription regulation of thetype II restriction–modification system AhdI. Nucleic Acids Res., 36,1429–1442.
36. Bogdanova,E., Zakharova,M., Streeter,S., Taylor,J., Heyduk,T.,Kneale,G. and Severinov,K. (2009) Transcription regulation ofrestriction–modification system Esp1396I. Nucleic Acids Res., 37,3354–3366.
37. Cesnaviciene,E., Mitkaite,G., Stankevicius,K., Janulaitis,A. andLubys,A. (2003) Esp1396I restriction–modification system: structuralorganization and mode of regulation. Nucleic Acids Res., 31, 743–749.
38. Mruk,I., Rajesh,P. and Blumenthal,R.M. (2007) Regulatory circuitbased on autogenous activation-repression: roles of C-boxes andspacer sequences in control of the PvuII restriction–modificationsystem. Nucleic Acids Res., 35, 6935–6952.
39. Kita,K., Tsuda,J. and Nakai,S.Y. (2002) C.EcoO109I, a regulatoryprotein for production of EcoO109I restriction endonuclease,specifically binds to and bends DNA upstream of its translationalstart site. Nucleic Acids Res., 30, 3558–3565.
40. Semenova,E., Minakhin,L., Bogdanova,E., Nagornykh,M.,Vasilov,A., Heyduk,T., Solonin,A., Zakharova,M. and Severinov,K.(2005) Transcription regulation of the EcoRVrestriction–modification system. Nucleic Acids Res., 33, 6942–6951.
41. Ives,C.L., Sohail,A. and Brooks,J.E. (1995) The regulatory C proteinsfrom different restriction–modification systems cancross-complement. J. Bacteriol., 177, 6313–6315.
42. Vijesurier,R.M., Carlock,L., Blumenthal,R.M. and Dunbar,J.C.(2000) Role and mechanism of action of C.PvuII, a regulatory proteinconserved among restriction–modification systems. J. Bacteriol., 182,477–487.
43. McGeehan,J.E., Papapanagiotou,I., Streeter,S.D. and Kneale,G.G.(2006) Cooperative binding of the C.AhdI controller protein to theC/R promoter and its role in endonuclease gene expression. J. Mol.Biol., 358, 523–531.
44. Mruk,I. and Blumenthal,R.M. (2009) Tuning the relative affinities foractivating and repressing operators of a temporally regulatedrestriction–modification system. Nucleic Acids Res., 37, 983–998.
45. Ball,N.J., McGeehan,J.E., Streeter,S.D., Thresh,S.J. and Kneale,G.G.(2012) The structural basis of differential DNA sequence recognitionby restriction–modification controller proteins. Nucleic Acids Res.,40, 10532–10542.
46. Ball,N., Streeter,S.D., Kneale,G.G. and McGeehan,J.E. (2009)Structure of the restriction–modification controller proteinC.Esp1396I. Acta Crystallogr. D. Biol. Crystallogr., 65, 900–905.
47. Martin,R.N., McGeehan,J.E., Ball,N.J., Streeter,S.D., Thresh,S.J. andKneale,G.G. (2013) Structural analysis of DNA-protein complexesregulating the restriction–modification system Esp1396I. ActaCrystallogr. Sect. F Struct. Biol. Cryst. Commun., 69, 962–966.
48. Nakayama,Y. and Kobayashi,I. (1998) Restriction-modification genecomplexes as selfish gene entities: roles of a regulatory system in their
establishment, maintenance, and apoptotic mutual exclusion. Proc.Natl. Acad. Sci. U.S.A., 95, 6442–6447.
49. Mruk,I. and Blumenthal,R.M. (2008) Real-time kinetics ofrestriction–modification gene expression after entry into a new hostcell. Nucleic Acids Res., 36, 2581–2593.
50. Williams,K., Savageau,M.A. and Blumenthal,R.M. (2013) A bistablehysteretic switch in an activator-repressor regulatedrestriction–modification system. Nucleic Acids Res., 41, 6045–6057.
51. Morozova,N., Sabantsev,A., Bogdanova,E., Fedorova,Y.,Maikova,A., Vedyaykin,A., Rodic,A., Djordjevic,M.,Khodorkovskii,M. and Severinov,K. (2016) Temporal dynamics ofmethyltransferase and restriction endonuclease accumulation inindividual cells after introducing a restriction–modification system.Nucleic Acids Res., 44, 790–800.
52. Sorek,R., Zhu,Y., Creevey,C.J., Francino,M.P., Bork,P. andRubin,E.M. (2007) Genome-wide experimental determination ofbarriers to horizontal gene transfer. Science, 318, 1449–1452.
53. Bindal,G., Krishnamurthi,R., Seshasayee,A.S.N. and Rath,D. (2017)CRISPR-Cas-mediated gene silencing reveals RacR to be a negativeregulator of YdaS and YdaT toxins in. mSphere, 2, e00483-17.
54. Krishnamurthi,R., Ghosh,S., Khedkar,S. and Seshasayee,A.S.N.(2017) Repression of YdaS toxin is mediated by transcriptionalrepressor RacR in the cryptic. mSphere, 2, e00392-17.
55. Kita,K., Tsuda,J., Kato,T., Okamoto,K., Yanase,H. and Tanaka,M.(1999) Evidence of horizontal transfer of the EcoO109Irestriction–modification gene to Escherichia coli chromosomal DNA.J. Bacteriol., 181, 6822–6827.
56. Mruk,I. and Kaczorowski,T. (2007) A rapid and efficient method forcloning genes of type II restriction–modification systems by use of akiller plasmid. Appl. Environ. Microbiol., 73, 4286–4293.
57. Eddy,S.R. (2011) Accelerated profile HMM searches. PLoS Comput.Biol., 7, e1002195.
58. Sharan,S.K., Thomason,L.C., Kuznetsov,S.G. and Court,D.L. (2009)Recombineering: a homologous recombination-based method ofgenetic engineering. Nat. Protoc., 4, 206–223.
59. Datta,S., Costantino,N. and Court,D.L. (2006) A set ofrecombineering plasmids for gram-negative bacteria. Gene, 379,109–115.
60. Rezulak,M., Borsuk,I. and Mruk,I. (2016) Natural C-independentexpression of restriction endonuclease in a C protein-associatedrestriction–modification system. Nucleic Acids Res., 44, 2646–2660.
61. Nagamalleswari,E., Rao,S., Vasu,K. and Nagaraja,V. (2017)Restriction endonuclease triggered bacterial apoptosis as amechanism for long time survival. Nucleic Acids Res., 45, 8423–8434.
62. Handa,N., Ichige,A., Kusano,K. and Kobayashi,I. (2000) Cellularresponses to postsegregational killing by restriction–modificationgenes. J. Bacteriol., 182, 2218–2229.
63. Wang,X., Kim,Y., Ma,Q., Hong,S.H., Pokusaeva,K., Sturino,J.M.and Wood,T.K. (2010) Cryptic prophages help bacteria cope withadverse environments. Nat. Commun., 1, 147.
64. Guo,Y., Quiroga,C., Chen,Q., McAnulty,M.J., Benedik,M.J.,Wood,T.K. and Wang,X. (2014) RalR (a DNase) and RalA (a smallRNA) form a type I toxin-antitoxin system in Escherichia coli.Nucleic Acids Res., 42, 6448–6462.
65. Conter,A., Bouche,J.P. and Dassain,M. (1996) Identification of a newinhibitor of essential division gene ftsZ as the kil gene of defectiveprophage Rac. J. Bacteriol., 178, 5100–5104.
66. Shevtsov,M.B., Streeter,S.D., Thresh,S.J., Swiderska,A.,McGeehan,J.E. and Kneale,G.G. (2015) Structural analysis of DNAbinding by C.Csp231I, a member of a novel class of R–M controllerproteins regulating gene expression. Acta Crystallogr. D. Biol.Crystallogr., 71, 398–407.
67. van Hijum,S.A., Medema,M.H. and Kuipers,O.P. (2009) Mechanismsand evolution of control logic in prokaryotic transcriptionalregulation. Microbiol. Mol. Biol. Rev., 73, 481–509.
68. Lozada-Chavez,I., Janga,S.C. and Collado-Vides,J. (2006) Bacterialregulatory networks are extremely flexible in evolution. Nucleic AcidsRes., 34, 3434–3445.
69. Wunderlich,Z. and Mirny,L.A. (2009) Different gene regulationstrategies revealed by analysis of binding motifs. Trends Genet., 25,434–440.
70. Rowland,M.A., Abdelzaher,A., Ghosh,P. and Mayo,M.L. (2017)Crosstalk and the dynamical modularity of feed-forward loops intranscriptional regulatory networks. Biophys. J., 112, 1539–1550.
Dow
nloaded from https://academ
ic.oup.com/nar/article/47/18/9542/5542886 by guest on 15 July 2022
9556 Nucleic Acids Research, 2019, Vol. 47, No. 18
71. Todeschini,A.L., Georges,A. and Veitia,R.A. (2014) Transcriptionfactors: specific DNA binding and specific gene regulation. TrendsGenet., 30, 211–219.
72. San Millan,A., Toll-Riera,M., Qi,Q. and MacLean,R.C. (2015)Interactions between horizontally acquired genes create a fitness costin Pseudomonas aeruginosa. Nat. Commun., 6, 6845.
73. Miyazaki,R., Yano,H., Sentchilo,V. and van der Meer,J.R. (2018)Physiological and transcriptome changes induced by Pseudomonasputida acquisition of an integrative and conjugative element. Sci.Rep., 8, 5550.
74. Harrison,E., Guymer,D., Spiers,A.J., Paterson,S. andBrockhurst,M.A. (2015) Parallel compensatory evolution stabilizesplasmids across the parasitism-mutualism continuum. Curr. Biol., 25,2034–2039.
75. Friedlander,T., Prizak,R., Guet,C.C., Barton,N.H. and Tkacik,G.(2016) Intrinsic limits to gene regulation by global crosstalk. Nat.Commun., 7, 12307.
76. Davids,W. and Zhang,Z. (2008) The impact of horizontal genetransfer in shaping operons and protein interaction networks–directevidence of preferential attachment. BMC Evol. Biol., 8, 23.
77. Dorman,C.J. (2009) Regulatory integration ofhorizontally-transferred genes in bacteria. Front. Biosci. (LandmarkEd), 14, 4103–4112.
78. Lercher,M.J. and Pal,C. (2008) Integration of horizontallytransferred genes into regulatory interaction networks takes manymillion years. Mol. Biol. Evol., 25, 559–567.
79. Tulchinsky,A.Y., Johnson,N.A., Watt,W.B. and Porter,A.H. (2014)Hybrid incompatibility arises in a sequence-based bioenergetic modelof transcription factor binding. Genetics, 198, 1155–1166.
80. Kobayashi,I. (2001) Behavior of restriction–modification systems asselfish mobile elements and their impact on genome evolution.Nucleic Acids Res., 29, 3742–3756.
81. Klimuk,E., Bogdanova,E., Nagornykh,M., Rodic,A., Djordjevic,M.,Medvedeva,S., Pavlova,O. and Severinov,K. (2018) Controller proteinof restriction–modification system Kpn2I affects transcription of itsgene by acting as a transcription elongation roadblock. Nucleic AcidsRes., 46, 10810–10826.
82. Fisunov,G.Y., Evsyutina,D.V., Manuvera,V.A. and Govorun,V.M.(2017) Binding site of restriction–modification system controllerprotein in Mollicutes. BMC Microbiol., 17, 26.
83. Casjens,S. (2003) Prophages and bacterial genomics: what have welearned so far? Mol. Microbiol., 49, 277–300.
84. Atsumi,S. and Little,J.W. (2004) Regulatory circuit design andevolution using phage lambda. Genes Dev., 18, 2086–2094.
85. Jobling,M.G. (2018) Ectopic expression of the ydaS and ydaTgenes ofthe cryptic prophage Rac of Escherichia coli K-12 may be toxic but dothey really encode toxins?: a case for using genetic context tounderstand function. mSphere, 3, e00163-18.
86. Ptashne,M., Johnson,A.D. and Pabo,C.O. (1982) A genetic switch ina bacterial virus. Sci. Am., 247, 128–130.
87. Kedzierska,B., Glinkowska,M., Iwanicki,A., Obuchowski,M.,Sojka,P., Thomas,M.S. and Wegrzyn,G. (2003) Toxicity of thebacteriophage lambda cII gene product to Escherichia coli arises frominhibition of host cell DNA replication. Virology, 313, 622–628.
88. Rajamanickam,K. and Hayes,S. (2018) The bacteriophage lambdaCII phenotypes for complementation, cellular toxicity and replicationinhibition are suppressed in CII-OOP constructs expressing the smallRNA OOP. Viruses, 10, E115.
89. Campos,M., Govers,S.K., Irnov,I., Dobihal,G.S., Cornet,F. andJacobs-Wagner,C. (2018) Genomewide phenotypic analysis ofgrowth, cell morphogenesis, and cell cycle events in. Mol. Syst. Biol.,14, e7573.
Dow
nloaded from https://academ
ic.oup.com/nar/article/47/18/9542/5542886 by guest on 15 July 2022
Related Documents


