An ‘Omics Approach to Unraveling the Paradoxical Effect of Diet on Perfluorooctanesulfonic Acid (PFOS) and Perfluorononanoic Acid (PFNA)-Induced Hepatic Steatosis Marisa Pfohl,* Emily Marques,* Adam Auclair ,* Benjamin Barlock,* Rohitash Jamwal ,* Michael Goedken, † Fatemeh Akhlaghi,* and Angela L. Slitt *, 1 *Department of Biomedical and Pharmaceutical Sciences, University of Rhode Island, Kingston, Rhode Island 02881 and † Rutgers Translational Sciences, Rutgers University, Piscataway, New Jersey 08901 1 To whom correspondence should be addressed at University of Rhode Island, 7 Greenhouse Rd. Kingston, RI 02881. E-mail: [email protected]. ABSTRACT Perfluoroalkyl substances (PFAS) are a family of toxicants universally detected in human serum and known to cause dyslipi- demia in animals and humans. Hepatic steatosis, which is defined as lipid deposition in the liver, is known to be a conse- quence of poor diet. Similarly, PFAS are known to induce hepatic steatosis in animals on a low-fat chow. This study ex- plored diet-PFAS interactions in the liver and their potential to modulate hepatic steatosis. Male C57BL/6J mice were fed with either a low-fat diet (10% kcal from fat, LFD) or a moderately high-fat diet (45% kcal from fat, HFD) with or without per- fluorooctanesulfonic acid (3 ppm, PFOS) or perfluorononanoic acid (3 ppm, PFNA) in feed for 12 weeks. Livers were excised for histology and quantification of PFAS and lipids. The PFOS and PFNA coadministration with HFD reduced the hepatic ac- cumulation of lipid and PFAS relative to the LFD treatment groups. Furthermore, transcriptomic analysis revealed that PFAS administration in the presence of an HFD significantly reduces expression of known hepatic PFAS uptake transporters, or- ganic anion transporter proteins. Transcriptomics and proteomics further revealed several pathways related to lipid metab- olism, synthesis, transport, and storage that were modulated by PFAS exposure and further impacted by the presence of die- tary fat. Both dietary fat content and the chemical functional head group exerted significant influence on hepatic PFAS accumulation and the resulting biochemical signature, suggesting that diet and structure should be considered in the de- sign and interpretation of research on PFAS induced hepatic steatosis. Key words: fatty liver; PFNA; PFOS; steatosis; high-fat diet; ‘omics; hepatotoxicity. According to the American Liver Foundation, about one-quarter of the American population suffers from diet-induced hepatic steatosis, or fatty liver, representing the most common form of liver disease. Furthermore, fatty liver serves as a risk factor for other adverse health outcomes, such as cardiovascular disease (Ismaiel and Dumitras¸cu, 2019). Obesity, metabolic syndrome, and diabetes are all known risk factors for hepatic steatosis, fur- ther environmental toxicants have been known to induce fatty liver onset (Joshi-Barve et al., 2015). The lack of serum bio- markers to diagnose hepatic steatosis and the need to acquire thin needle biopsy samples present a challenge in assessing the human exposures that cause hepatic steatosis. Thus, rodent V C The Author(s) 2021. Published by Oxford University Press on behalf of the Society of Toxicology. All rights reserved. For permissions, please e-mail: [email protected] 277 TOXICOLOGICAL SCIENCES, 180(2), 2021, 277–294 doi: 10.1093/toxsci/kfaa172 Advance Access Publication Date: January 23, 2021 Research Article Downloaded from https://academic.oup.com/toxsci/article/180/2/277/6112049 by guest on 26 August 2022

Welcome message from author
This document is posted to help you gain knowledge. Please leave a comment to let me know what you think about it! Share it to your friends and learn new things together.
Transcript

An ‘Omics Approach to Unraveling the Paradoxical
Effect of Diet on Perfluorooctanesulfonic Acid (PFOS)
and Perfluorononanoic Acid (PFNA)-Induced Hepatic
SteatosisMarisa Pfohl,* Emily Marques,* Adam Auclair ,* Benjamin Barlock,*Rohitash Jamwal ,* Michael Goedken,† Fatemeh Akhlaghi,* andAngela L. Slitt *,1
*Department of Biomedical and Pharmaceutical Sciences, University of Rhode Island, Kingston, Rhode Island02881 and †Rutgers Translational Sciences, Rutgers University, Piscataway, New Jersey 089011To whom correspondence should be addressed at University of Rhode Island, 7 Greenhouse Rd. Kingston, RI 02881. E-mail: [email protected].
ABSTRACT
Perfluoroalkyl substances (PFAS) are a family of toxicants universally detected in human serum and known to cause dyslipi-demia in animals and humans. Hepatic steatosis, which is defined as lipid deposition in the liver, is known to be a conse-quence of poor diet. Similarly, PFAS are known to induce hepatic steatosis in animals on a low-fat chow. This study ex-plored diet-PFAS interactions in the liver and their potential to modulate hepatic steatosis. Male C57BL/6J mice were fedwith either a low-fat diet (10% kcal from fat, LFD) or a moderately high-fat diet (45% kcal from fat, HFD) with or without per-fluorooctanesulfonic acid (3 ppm, PFOS) or perfluorononanoic acid (3 ppm, PFNA) in feed for 12 weeks. Livers were excisedfor histology and quantification of PFAS and lipids. The PFOS and PFNA coadministration with HFD reduced the hepatic ac-cumulation of lipid and PFAS relative to the LFD treatment groups. Furthermore, transcriptomic analysis revealed that PFASadministration in the presence of an HFD significantly reduces expression of known hepatic PFAS uptake transporters, or-ganic anion transporter proteins. Transcriptomics and proteomics further revealed several pathways related to lipid metab-olism, synthesis, transport, and storage that were modulated by PFAS exposure and further impacted by the presence of die-tary fat. Both dietary fat content and the chemical functional head group exerted significant influence on hepatic PFASaccumulation and the resulting biochemical signature, suggesting that diet and structure should be considered in the de-sign and interpretation of research on PFAS induced hepatic steatosis.
Key words: fatty liver; PFNA; PFOS; steatosis; high-fat diet; ‘omics; hepatotoxicity.
According to the American Liver Foundation, about one-quarterof the American population suffers from diet-induced hepaticsteatosis, or fatty liver, representing the most common form ofliver disease. Furthermore, fatty liver serves as a risk factor forother adverse health outcomes, such as cardiovascular disease(Ismaiel and Dumitrascu, 2019). Obesity, metabolic syndrome,
and diabetes are all known risk factors for hepatic steatosis, fur-ther environmental toxicants have been known to induce fattyliver onset (Joshi-Barve et al., 2015). The lack of serum bio-markers to diagnose hepatic steatosis and the need to acquirethin needle biopsy samples present a challenge in assessing thehuman exposures that cause hepatic steatosis. Thus, rodent
VC The Author(s) 2021. Published by Oxford University Press on behalf of the Society of Toxicology.All rights reserved. For permissions, please e-mail: [email protected]
277
TOXICOLOGICAL SCIENCES, 180(2), 2021, 277–294
doi: 10.1093/toxsci/kfaa172Advance Access Publication Date: January 23, 2021Research Article
Dow
nloaded from https://academ
ic.oup.com/toxsci/article/180/2/277/6112049 by guest on 26 August 2022

models are often used as surrogates to understand the relation-ship between environmental exposures and fatty liverendpoints.
Perfluoroalkyl substances are a family of man-made chemi-cals used in manufacturing of Teflon, aqueous film-formingfoams, food packaging, and stain resistant sprays for theirunique surfactant and antistick properties (Buck et al., 2011).These long-chain fluorinated structures are extremely resistantto degradation leading to their accumulation in water sources,dust, and even ambient air (Hu et al., 2016; Winkens et al., 2018;Barber et al., 2007). In a study conducted by the Centers forDisease Control and Prevention (CDC), it was revealed that fourPFAS members have been nearly ubiquitous in human serumsince at least 1999 including, among others, perfluorooctanesul-fonic acid (PFOS) and perfluorononanoic acid (PFNA) (NationalReport on Human Exposure to Environmental Chemicals j CDC,2020; Olsen et al., 2017). The PFOS and PFNA are slow to excretefrom the human body with half-lives spanning several years,5.4 and 4.3 years, respectively (Olsen et al., 2007; Zhang et al.,2013). Once in the body, PFOS and PFNA distribute mainly toprotein-rich body compartments, such as serum and liver (Jianet al., 2018). This distribution pattern leads to relatively high ex-posure of PFAS to hepatocytes, increasing potential risk for he-patic toxicity.
Perfluoroalkyl substances have been associated with the fol-lowing adverse human health effects: Impaired immune func-tion (Grandjean et al., 2012) elevated serum cholesterol (Nelsonet al., 2010), thyroid disease (Ballesteros et al., 2017), low fetalbirth weight (Shoaff et al., 2018), elevated serum markers of liverinjury (Salihovic et al., 2018), and even kidney and testicular can-cer (Nicole, 2013). The PFAS are significantly associated with el-evated serum alanine aminotransferase, however, themechanism of liver injury remains uncertain. Studies con-ducted in mice (Das et al., 2017), rats (Curran et al., 2008), and cy-nomolgus monkeys (Seacat et al., 2002) have demonstrated thatsome PFAS members augment lipid accumulation and steatosisin the liver at high doses. Likewise, PFAS have been demon-strated to induce lipid accumulation and perturb lipid metabo-lism in human hepatocytes (Bjork et al., 2011; Rosen et al., 2013).To date there is only one study concerning the long-term effectsof relatively low-level exposure to common PFAS, in combina-tion with dietary risk factors, and their potential role in aug-menting the onset of hepatic steatosis (Huck et al., 2018). Hucket al. reported that PFOS exhibited a surprising preventative ef-fect against fatty liver in the presence of a high-fat diet (HFD).The present study is the first to confirm this finding, expand itto include PFNA, and delve further into the mechanistic driversof diet-PFAS interactions.
Understanding the potential health effects of PFAS membersplays a vital role in guiding the risk assessments that determinefederal health advisory levels in drinking water. Due to emerg-ing toxicity data, the EPA health advisory for PFOS in drinkingwater was lowered to 70 ppt in 2016 (US EPA, 2016). This healthadvisory level was derived from a no observable adverse effectlevel (NOAEL) dose of 0.1 mg/kg/day obtained from rodent toxic-ity studies evaluating the effects of developmental PFOS expo-sure on pup weight and mortality (Luebker et al., 2005a,b). ThePFAS manufacturing companies, such as 3M, have voluntarilyremoved PFOS from manufacturing. However, PFNA can still le-gally be used as a PFAS replacement in manufacturing and con-sumer products. Despite the high potential for similar toxicity,the EPA has not yet released a health advisory for PFNA. Both
PFOS and PFNA continue to be highly prevalent in the tissues ofhumans, wildlife, and the environment today (Jian et al., 2018).This study investigates the potential consequences of chronicrelatively low-level PFOS or PFNA exposure concurrently withdiet-induced hepatic steatosis. Our work also characterizes andcompares the hepatic signatures of the sulfonic acid, PFOS, andthe carboxylic acid, PFNA while exploring the additional impactof diet interactions.
MATERIALS AND METHODS
Chemicals and reagents. The PFOS (catalog number 33829-100 mg)and PFNA (catalog number 394459-5G) chemical stocks werepurchased from Sigma-Aldrich (St Louis, Missouri). The internalstandards used for liquid chromatography with tandem massspectrometry (LC-MS/MS) included C9 labeled PFNA (catalognumber CLM-8060-1.2, Cambridge Isotope Laboratories,Andover, Massachusetts) and C4 labeled PFOS (catalog numberMPFOS, Wellington Laboratories, Ontario, Canada).
Animals. The study was conducted at the University of RhodeIsland under an approved Institutional Animal Care and UseCommittee (IACUC) protocol. C57BL/6J mice were acquired fromJackson Labs (Bar Harbor, Maine) at 6-weeks-old and were accli-mated for 2 weeks prior to being weight paired and housed fourper cage. The mice were housed in a temperature-controlledroom and kept on a strict 12-hour dark/light cycle with access tofood and water ad libitum. Body weights and food consumptionwere monitored weekly. Following 12 weeks of diet administra-tion, all mice were anesthetized using isoflurane and eutha-nized by cervical dislocation. Tissues were immediatelyharvested and snap frozen in liquid nitrogen. Gross liver weightwas recorded prior to sectioning in 10% formalin for histology.The remaining liver was snap frozen for downstream analysis.
The PFOS and PFNA dosing in feed. Mice were fed either a 10% kcal,low-fat diet (LFD, D12450B Research Diets, New Brunswick), or amatched 45% kcal, moderately HFD (D12451 Research Diets,New Brunswick). To mimic the major route of PFAS exposure,oral consumption, mice were assigned to diet alone or diet con-taining either 0.0003% PFOS or 0.0003% PFNA and fed ad libitumfor 12 weeks. The resulting treatment groups were as follows:LFD, HFD, LFD þ PFOS (LPFOS), HFD þ PFOS (HPFOS), LFD þ PFNA(LPFNA), and HFD þ PFNA (HPFNA) with n¼ 8 per treatmentgroup. The daily exposure to PFAS via diet was roughly approxi-mately 0.24 mg/kg/day based on an overall average daily foodconsumption of 2.37 g and average body weight of 29.89 g overthe course of the study. In the current EPA health advisory doc-ument for PFOS, 0.1 mg/kg/day was considered the NOAEL dosefor PFOS-induced developmental toxicity (US EPA, 2016; Luebkeret al., 2005a).
Hepatic lipid isolation and analysis. Liver lipids were isolated fromapproximately 50 mg of liver tissue using the Folch chloroform-methanol extraction (Folch et al., 1957). Triacylglyceride (TAG)and total cholesterol were measured using kits from PointeScientific (Ann Arbor, Michigan). Total non-esterified free fattyacids (FFAs) were quantified using a kit from Wako Chemicals(Richmond, Virginia). Phospholipids were quantified using theEnzyChrom phospholipid colorimetric assay kit (BioAssaySystems, Hayward, California) according to kit instructions.
278 | PARADOXICAL EFFECT OF DIET ON PFOS AND PFNA
Dow
nloaded from https://academ
ic.oup.com/toxsci/article/180/2/277/6112049 by guest on 26 August 2022

Liver tissue sections were fixed in 10% buffered formalin priorto paraffin embedding. Paraffin sections (5 lm) were cut andstained with hematoxylin and eosin (H&E). Stains and scoringwere conducted by Rutgers University Research PathologyServices (Piscataway, New Jersey). The histopathological classi-fication was made by a board-certified pathologist. Scoresranged from 0 to 5, with 0 being the least and 5 the most severe.
Quantification of PFAS content in liver. The LC-MS/MS was used toquantify hepatic PFAS concentrations and to further explore theeffect of diet on internal distribution of PFAS to the liver. ThePFAS were isolated from liver using an adapted 3M method pub-lished by Chang et al. (2017). Roughly 100 mg of tissue was ho-mogenized in 4� LC-MS grade water spiked with internalstandards. Of the homogenate, 250 ll was transferred to a newtube containing 10% 1 N KOH and digested overnight. Followingdigestion, 100 ll of sample was combined with 100 ll 1 N formicacid, 500 ll 2 N HCL, 500 ll saturated ammonium sulfate, and5 ml LC-MS grade MTBE. The samples were shaken and thencentrifuged for 5 min at 2500 � g. For each sample, 4.5 ml of theorganic layer was transferred to a fresh tube and evaporatedovernight. The dried samples were resuspended in 10 ml aceto-nitrile:water and shaken for 30 min at room temperature. Thesamples were filtered through a 0.2 lm syringe filter prior to in-jection on the instrument. The LC-MS/MS analysis was run innegative mode on a QTRAP 4500 LC-MS/MS System coupled toan SHIMADZU Prominence UPLC (SCIEX, Framingham,Massachusetts). A Waters XBridge C18 (100 mm � 4.6 mm, 5 lm)column was used. Sample injection volume was 10 ll with aflow rate of 0.6 ml/min.
RNA preparation and transcriptomics. RNA was isolated fromroughly 50 mg of hepatic tissue using the Trizol method. TheRNA was quantified and checked for purity on a ThermoFisherNanodrop 1000 and diluted with DEPC water to equal concentra-tions. RNA integrity was measured on an Agilent Bioanalyzerusing an Agilent RNA 6000 Nano kit. Only pure, intact RNA sam-ples were used for downstream analysis, RIN score of �8. AnAffymetrix mouse ST 2.0 global array (Affymetrix, Waltham,Massachusetts) was conducted according to the manufacturer’sprotocols. The array was conducted by the Genomics CoreFacility at Brown University (Providence, Rhode Island). Raw .celfiles were uploaded into the Transcriptome Analysis Console(TAC) version 4.0.1 (ThermoFisher, Waltham, Massachusetts).The TAC software was used to conduct data normalization,quality control, and differential expression analysis (GEO acces-sion number GSE138602). The data were filtered using the crite-ria of �1.5-fold change and p-value <.05. Pathway analysis wasconducted using the ingenuity pathway analysis (IPA) databasefrom Qiagen (Kr€amer et al., 2014). The upstream analysis featurewas used to predict upstream regulators. The IPA’s comparisonanalysis tool was used to compare predicted activation and in-hibition between treatment groups. In addition to the untar-geted global array, a targeted assessment of key genes wasconducted.
QuantiGene plex targeted gene expression. Targeted gene expres-sion analysis was conducted using a custom QuantiGeneLuminex xMAP gene expression panel (ThermoFisher) using0.5 mg of total RNA input. The multiplex panel was performedaccording to the manufacturer’s protocols with mean fluores-cence intensity quantified using a Bio-plex 200 instrument (Bio-
rad, Hercules, California). Intensity values were normalized tohousekeeper gene beta-actin (Actb) and converted to foldchange relative to the control. Hepatic genes involved in inflam-mation, lipid uptake, lipid metabolism, and lipid regulationwere analyzed. Genes of interest in the liver included Acaca,Acot2, Ccl2, Cd36, Cpt1a, Cpt1b, Csf2ra, Cyp4a14, Ehhdh, Gstm3,Fabp1, Cidea, Fabp4, Fas, Gapdh, Gclc, Gpam, Gusb, Hmgsc1, IL6, Lpl,Nrf2, Nqo1, Ppara, Pparc, Scd1, Slc27a1, Sod1, Srebf1, Tnfa, Actb,Hprt, Ppia, and Ppib (Supplementary Table 1).
Protein digestions and SWATH-MS proteomics. Protein sampleswere obtained from 50 mg of liver tissue homogenized in 1 ml ofhomogenization buffer (0.25 mM sucrose, 10 mM Tris-HCL [pH7.8], 0.5 mM ethylenediaminetetraacetic acid, 10% vol/vol glyc-erol, 1 mM dithiothreitol [DTT], 20 mM butylated hydroxytolu-ene). Protein samples were centrifuged at 10 000 � g for 20 minat 4�C. The supernatant containing the S9 fraction enriched formicrosomal and cytosolic proteins was transferred to a freshtube. The S9 protein was quantified using the Pierce BCAProtein Assay Kit (ThermoFisher Scientific, Rockford, Illinois)according to the manufacturer’s instructions. Stock S9 proteinsamples (5 mg/ml) were diluted to 2.5 mg/ml. Protein (200 mg)was spiked with 2 mg BSA and denatured with 20 ml DTT(100 mM) at 95�C for 15 min in a shaking water bath (100 rpm).After denaturation, samples were alkylated in the dark with20 ml indole-3-acetic acid (200 mM) for 30 min at room tempera-ture. Subsequently, 40 ml of 50 mM ammonium bicarbonate wasadded to each sample was pH was confirmed to be alkaline.Furthermore, N-tosyl-L-phenylalanine chloromethyl ketone(TPCK)-treated trypsin (10mg) was added to samples at a ratio of1:20 (trypsin:protein) and 150 ml of the resulting solution wastransferred into digestion tube (PCT MicroTubes, PressureBiosciences Inc, Easton, Massachusetts). The barocycler was runat 50�C, for 90 cycles with 60 s per pressure-cycle (50 s high pres-sure, 10 s ambient pressure, 25 kpsi). Furthermore, to 145 ml ofdigested peptide sample, 5 ml of acetonitrile (ACN)(1:1, vol/volcontaining 5% formic acid) was added to acidify the samplesand quench trypsin reaction. Samples were spun to remove anyprecipitate and 125 ml supernatant was collected (10 000 rpm for5 min at 10�C). Subsequently, 20 ml of the resulting peptide solu-tion was injected into the analytical column and samples wereanalyzed using LC-MS/MS. SWATH-DIA proteomics was con-ducted as previously published (Jamwal et al., 2017) The proteo-mics was run on an Acquity UHPLC HClass system (WatersCorp, Milford, Massachusetts) coupled to an SCIEX 5600TripleTOF mass spectrometer (SCIEX, Concord, Canada). Themethod used a run time of 60 min at 100 ll/min and a linear gra-dient. Global protein changes were assessed using MaxQuant(Tyanova et al., 2016a) and Perseus (Tyanova et al., 2016b).Targeted data analysis was conducted on the open-source soft-ware Skyline (MacLean et al., 2010) (MacCoss Lab Software) andnormalized to peptide concentration and BSA spiked control.The mass spectrometry proteomics data have been deposited tothe ProteomeXchange Consortium via the PRIDE partner reposi-tory with the dataset identifier PXD015977.
Statistical analysis. Body weight, tissue weight, and hepatic PFASconcentrations are shown as mean 6 standard error (SEM).Unless otherwise indicated, data were analyzed using 1-wayanalysis of variance (ANOVA) followed by the Bonferroni posthoc test to correct for multiple comparisons, where p< .05 wasdenoted as statistically significant. Calculations were performed
PFOHL ET AL. | 279
Dow
nloaded from https://academ
ic.oup.com/toxsci/article/180/2/277/6112049 by guest on 26 August 2022

using Graphpad Prism (Graphpad Prism Software for WindowsVer 8.0, La Jolla, California).
RESULTS
Perfluorooctanesulfonic Acid and PFNA Exert Differential Effects onWhite Adipose Tissue, Liver, and Body WeightMice were weight matched prior to assignment to treatmentgroup. Body, liver, and white adipose tissue (WAT) weight in-creased approximately 41%, 36%, and 144%, respectively, withinthe HFD controls relative to the LFD controls (Table 1).Interestingly, both PFOS and PFNA caused significant
modulation of tissue and body weights, but the effects differedbased on the compound. For example, the LPFOS group pro-duced a 44% increase in WAT weight whereas LPFNA treatmentresulted in a 44% decrease relative to the LFD controls.Furthermore, PFNA produced a dramatic change in liver weightwith increases of 155% and 73%, relative to the LFD and HFDcontrol, whereas PFOS only increased liver weight by 18% and13%, respectively. Lastly, we observed a significant discrepancyin weight gain between the PFOS- and PFNA-treated micewithin both diets, with HPFNA-treated mice gaining 5.5 g lessand LPFNA gaining 2.9 g less relative to their PFOS-treatedcounterparts.
Table 1. Body and Tissue Weights
Unit LFD LPFOS LPFNA HFD HPFOS HPFNA
Body weight g 30.2 6 1.1# 30.6 6 1.2#,& 27.7 6 0.7#,& 42.6 6 1.4* 40.5 6 0.3*,$,& 35.0 6 1.0*,$,&
WAT weight g 0.9 6 0.2# 1.3 6 0.1*,#,$,& 0.5 6 0.1*,#,$,& 2.2 6 0.1* 2.3 6 0.1*,$,& 1.6 6 0.1*,#,$,&
Liver weight g 1.1 6 0.1 1.3 6 0.1$ 2.8 6 0.3*,#,$ 1.5 6 0.1 1.7 6 0.0$ 2.6 6 0.2*,#,$
Liver: BW % 4.4 6 0.7 4.3 6 0.1$,& 10.2 6 1.0*#$& 3.4 6 0.3 4.1 6 0.1$,& 7.4 6 0.5*,#,$,&
WAT: BW % 2.9 6 0.4# 4.3 6 0.2*,#,$,& 1.7 6 0.3*#$& 5.3 6 0.3* 5.7 6 0.3*,$,& 4.6 6 0.2*,$,&
Weight gain % 25.1 6 4.5# 26.8 6 4.3#,$,& 18.7 6 1.9#$& 79.1 6 5.2* 66.4 6 2.6*,$,& 48.2 6 7.0*,$,&
Male C57BL/6 mice were fed with either a low-fat diet or a moderately high-fat diet with or without PFOS or PFNA (0.0003% wt/wt in feed) for 12 weeks (n¼8). After
euthanization, gross body and organ weights were recorded and analyzed.
*p< .05, significant in comparison to the LFD control.
#p< .05, significant in comparison to the HFD control.
$p< .05, significance between PFOS and PFNA within the same diet (ie, L/HPFOS vs L/HPFNA).
&p< .05, significance between diet treatment within the same compound (ie, LPFAS vs HPFAS).
Figure 1. The PFOS and PFNA reduce hepatic phospholipid concentrations. Lipid moieties were quantified from approximately 50 mg hepatic tissue and normalized to
liver weight, expressed as milligrams per grams. Lipids measured included: A, Non-esterified fatty acids (NEFA); B, triglycerides; C, cholesterol; and D, phospholipids.
Statistical significance was calculated using 1-way ANOVA where *: significant from the LFD control; #: significant from the HFD control; $: significance between PFOS
and PFNA within each diet; and &: significance between diet within each compound.
280 | PARADOXICAL EFFECT OF DIET ON PFOS AND PFNA
Dow
nloaded from https://academ
ic.oup.com/toxsci/article/180/2/277/6112049 by guest on 26 August 2022

Dietary Fat Has a Significant Impact on PFAS Modulation of HepaticLipid ContentAn excess of dietary fatty acids within the liver can augmentformation of hepatic lipid droplets and trigger the onset of he-patic steatosis. To explore the potential interaction of dietaryfat with PFOS and PFNA modulation of hepatic lipid content,liver lipids were extracted and TAG, FFA, cholesterol, and phos-pholipids were quantified (Figure 1). In LFD mice, the FFA levelsin liver were similar between all groups. As expected, the HFDincreased FFA concentrations in liver by 60.6%. However, thisincrease in FFA content was not observed in HPFOS or HPFNAlivers, which were similar to LFD controls (Figure 1A). Likewise,TAG concentrations were similar between the LFD treatments.The HFD increased TAG content by 54.3% and HPFOS by 92.6%relative to LFD and LPFOS, respectively. An HPFNA decreasedtriglyceride content by 28.4% relative to the HFD control(Figure 1B). Liver cholesterol was similar between all treatmentgroups (Figure 1C). However, PFAS treated reduced hepaticphospholipids. Within the LFD, PFOS, and PFNA decreased he-patic phospholipid content, by 34.3% and 15.6%. This effect wasconserved within the HFD with reduction by 31.6% and 33.6%,respectively (Figure 1D). To tabulate hepatic steatosis, liver sec-tions were collected at necropsy and scored by a board-certifiedpathologist for lipid accumulation (Table 2).
Representative images using hematoxylin and eosin (H&E)staining for each treatment group are shown in Figure 2A.Arrows highlight hepatic lipid droplets indicative of steatosis.The HFD controls exhibited clear macrovesicular steatosis andoverall significantly higher scoring for lipid accumulation whencompared with the LFD control. The LFD controls exhibitedhealthy liver pathology with 0% of the mice achieving a lipid ac-cumulation score greater than or equal to 2. Within the LFD fedgroups, PFOS and PFNA caused an expected increase in liverlipid accumulation, with 38% and 50% scoring �2. The observedincrease in microvesicular steatosis was significant within theLPFNA group. However, within the HFD, PFNA exposure resultedin a slight decrease in scoring for liver lipid accumulation whencompared with HFD controls. Out of 8 mice, 100% of the HFDcontrols scored �2, whereas only 86% for PFOS and 75% forPFNA. Visually, there was a reduction in macrovesicular steato-sis within the HPFOS- and HPFNA-treated mice when comparedwith the HFD controls. Figure 2B depicts the lipid accumulationscores as ranks. All HFD groups, HFD, HPFNA, and HPFOS, exhib-ited significantly higher lipid accumulation relative to the LFDcontrol. An HPFOS exhibited significantly more lipid accumula-tion that LPFOS, however, there was no significant differencebetween LPFNA and HPFNA. Within the HFD, PFNA significantlyreduced hepatic lipid accumulation relative to HFD controls.
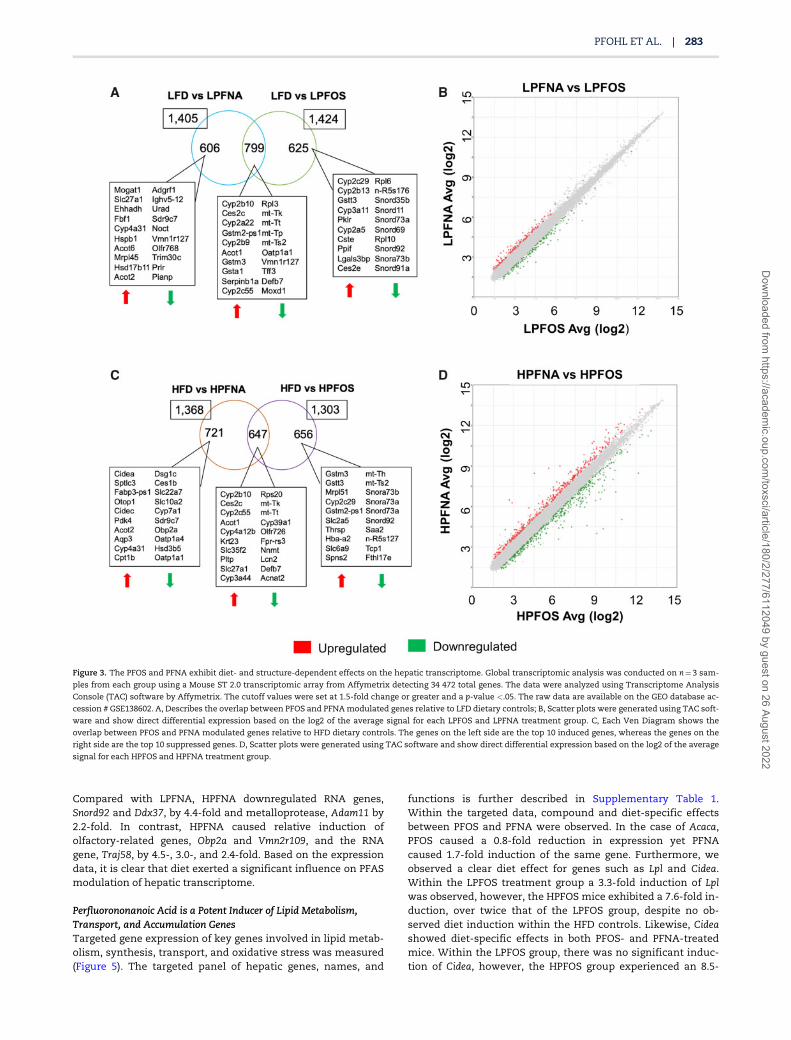
Perfluorooctanesulfonic Acid and PFNA Modulation of the HepaticTranscriptome is Significantly Affected by the PFAS ChemicalFunctional Head GroupHepatic gene expression was explored to determine the conse-quence of PFOS and PFNA structure, differing by functionalhead group, in the liver (Figure 3). Hepatic RNA was prepared foran untargeted transcriptomic array, detecting 34 472 totalgenes. Between 1303 and 1424 hepatic genes were significantlymodulated (p< .05) by PFOS or PFNA by at least 1.5-fold. To ex-plore the top genes impacted by PFAS exposure, the top 5 globalgenes modulated by diet-PFAS treatment were identified(Table 3). Cyp2b10, a gene involved in the oxidation of fattyacids, steroids, and xenobiotics, was the top impacted gene in 3out of the 4 PFAS groups: LFD versus LPFOS (59.1-fold), LFD ver-sus LPFNA (27.0-fold), and HFD versus HPFOS (33.5-fold). Cidea, a
gene involved in lipid droplet enlargement, was heavily modu-lated by the HPFNA group with a measured global fold changeof 88.1 relative to the HFD control. Although the total number ofgenes modulated by PFNA or PFOS are similar, the transcrip-tomic signatures, as measured by overlap between genes im-pacted, were remarkably unique. Moreover, scatter plotsdirectly comparing the log2 of the average signal intensity forPFOS versus PFNA highlight the structure-specific modulationin red and green.
Within the LFD, structure-specific effects were observed.Compared with the LFD, LPFNA, and LPFOS modulated a total of1405 and 1424 hepatic genes, respectively. Out of the total numberof differentially expressed genes, only 799 genes, were shared be-tween PFOS and PFNA. This suggests that there are both shared andunique genes modulated by PFOS and PFNA within in the liver. Thetop genes induced or repressed within each comparison are sum-marized within each box. Figure 3B shows a direct comparison ofthe average signal (log2) of LPFNA to LPFOS revealing 260 differen-tially expressed genes. Compared with LPFOS, LPFNA upregulatedRNA associated genes Ddx3y, Mt-tq, and Supt4b by 4.7-, 3.4-, and 2.5-fold, respectively. Overall, LPFNA suppressed keratinization and im-mune response-related genes, whereas upregulating genes involvedin RNA processing and transcription when compared with LPFOS.
Structure-dependent effects on hepatic gene expressionwere more pronounced within the HFD treatment groups. Outof 1368 and 1303 genes modulated by HFD versus HPFNA andHFD versus HPFOS, only 647 of those genes were conserved be-tween the treatment groups (Figure 3C). Roughly half of thegenes modulated by PFOS or PFNA were unique to the com-pound’s functional head group, 656 and 721, respectively.Figure 3D depicts 764 differentially expressed genes when com-paring HPFNA to HPFOS directly. Cidea was the top differentiallyexpressed gene, induced 73.7-fold times higher within theHPFNA treatment group compared with HPFOS. Furthermore,HPFNA caused relative induction of Fabp3, a known fatty acidand potential PFAS uptake transporter, by 52.3-fold and Spltc3,involved in the rate limiting step of sphingolipid biosynthesis,by 34.5-fold. In contrast, HPFNA reduced expression of Hsd3b5,involved in the biosynthesis of active steroids, by 21.4-fold incomparison to HPFOS. In addition, HPFNA reduced the expres-sion of Oatp1a1 and Oatp1a4, known PFOS uptake transportergenes, by 16.6- and 11.3-fold in comparison to HPFOS. These ro-bust changes in expression within the same base diets confirms
Table 2. Lipid Accumulation Scores
Treatment LFD LPFOS LPFNA HFD HPFOS HPFNA
0 3/8 2/8 0/8 0/8 0/7 0/81 5/8 3/8 4/8 0/8 1/7 2/82 0/8 3/8 4/8 2/8 3/7 5/83 0/8 0/8 0/8 5/8 3/7 1/84 0/8 0/8 0/8 1/8 0/7 0/8% �2 0%# 38%#,& 50%*,# 100%* 86%*,& 75%*,#
The lipid accumulation score assigned out of total mice per group. Assigned
scores ranged from 0 to 4, with 0 being the least and 4 the most severe.
Statistical analysis was performed using Kruskal–Wallis test to derive ranks fol-
lowed by Dunn’s multiple comparison test for multiple comparisons using
GraphPad Prism software v8.2.0 (La Jolla, CA).
*p< .05, significant in comparison to the LFD control.
#p< .05, significant in comparison to the HFD control.
$p< .05, significance between PFOS and PFNA within the same diet (ie, L/HPFOS
vs L/HPFNA).
&p< .05, significance between diet treatment within the same compound (ie,
LPFAS vs HPFAS).
PFOHL ET AL. | 281
Dow
nloaded from https://academ
ic.oup.com/toxsci/article/180/2/277/6112049 by guest on 26 August 2022

a significant and PFAS-specific alteration to the hepatic tran-scriptome, attributable to the functional head group.
Perfluorooctanesulfonic Acid and PFNA Modulation of the HepaticTranscriptome is Significantly Impacted by Dietary FatA notable diet effect was observed on hepatic transcriptomic ex-pression. When comparing the PFOS impacted genes withineach diet only 617 were shared between LPFOS and HPFOS com-pared with control diet (Figure 4A). When directly comparingHPFOS to LPFOS gene expression, 824 differentially expressedgenes were identified (Figure 4B). Cidea, a gene involved in lipiddroplet enlargement, was the top differentially expressed gene,induced 73.7-fold times higher within the HPFOS treatmentgroup compared with LPFOS. Furthermore, HPFOS caused rela-tive induction of Fabp3, a known fatty acid and potential PFAS
uptake transporter, by 52.3-fold and Spltc3, involved in the ratelimiting step of sphingolipid biosynthesis, by 34.5-fold. In con-trast, HPFOS reduced expression of Hsd3b5, involved in the bio-synthesis of active steroids, by 21.4-fold in comparison toLPFOS. In addition, HPFOS reduced the expression of Oatp1a1and Oatp1a4, known PFOS uptake transporter genes, by 16.6-and 11.3-fold relative to LPFOS. Overall, diet modulated PFOS in-duced expression of genes involved in lipid and PFOS uptake,lipid and steroid synthesis, and lipid droplet enlargement.
The pronounced diet effect observed with PFOS exposurewas conserved in the PFNA-treated groups. LFD versus LPFNAmodulated 824, whereas HFD versus HPFNA impacted 787 genesunique to the diet. As measured by scatter plot, the direct com-parison of LPFNA to HPFNA based on the log2 of the average sig-nal intensity yielded 279 differentially expressed genes.
Figure 2. Dietary fat determines PFOS and PFNA modulation of hepatic steatosis. A, Representative H&E stained liver sections. B, Scores were converted to ranks and
graphed as scatter plots. The horizontal line denotes the mean and the vertical lines represent the standard error from the mean. Statistical significance was calculated
using 1-way ANOVA where *: significant from the LFD control, #: significant from the HFD control, $: significance between PFOS and PFNA within each diet and &: sig-
nificance between diet within each compound.
282 | PARADOXICAL EFFECT OF DIET ON PFOS AND PFNA
Dow
nloaded from https://academ
ic.oup.com/toxsci/article/180/2/277/6112049 by guest on 26 August 2022
Compared with LPFNA, HPFNA downregulated RNA genes,Snord92 and Ddx37, by 4.4-fold and metalloprotease, Adam11 by2.2-fold. In contrast, HPFNA caused relative induction ofolfactory-related genes, Obp2a and Vmn2r109, and the RNAgene, Traj58, by 4.5-, 3.0-, and 2.4-fold. Based on the expressiondata, it is clear that diet exerted a significant influence on PFASmodulation of hepatic transcriptome.
Perfluorononanoic Acid is a Potent Inducer of Lipid Metabolism,Transport, and Accumulation GenesTargeted gene expression of key genes involved in lipid metab-olism, synthesis, transport, and oxidative stress was measured(Figure 5). The targeted panel of hepatic genes, names, and
functions is further described in Supplementary Table 1.Within the targeted data, compound and diet-specific effectsbetween PFOS and PFNA were observed. In the case of Acaca,PFOS caused a 0.8-fold reduction in expression yet PFNAcaused 1.7-fold induction of the same gene. Furthermore, weobserved a clear diet effect for genes such as Lpl and Cidea.Within the LPFOS treatment group a 3.3-fold induction of Lplwas observed, however, the HPFOS mice exhibited a 7.6-fold in-duction, over twice that of the LPFOS group, despite no ob-served diet induction within the HFD controls. Likewise, Cideashowed diet-specific effects in both PFOS- and PFNA-treatedmice. Within the LPFOS group, there was no significant induc-tion of Cidea, however, the HPFOS group experienced an 8.5-
Figure 3. The PFOS and PFNA exhibit diet- and structure-dependent effects on the hepatic transcriptome. Global transcriptomic analysis was conducted on n¼3 sam-
ples from each group using a Mouse ST 2.0 transcriptomic array from Affymetrix detecting 34 472 total genes. The data were analyzed using Transcriptome Analysis
Console (TAC) software by Affymetrix. The cutoff values were set at 1.5-fold change or greater and a p-value <.05. The raw data are available on the GEO database ac-
cession # GSE138602. A, Describes the overlap between PFOS and PFNA modulated genes relative to LFD dietary controls; B, Scatter plots were generated using TAC soft-
ware and show direct differential expression based on the log2 of the average signal for each LPFOS and LPFNA treatment group. C, Each Ven Diagram shows the
overlap between PFOS and PFNA modulated genes relative to HFD dietary controls. The genes on the left side are the top 10 induced genes, whereas the genes on the
right side are the top 10 suppressed genes. D, Scatter plots were generated using TAC software and show direct differential expression based on the log2 of the average
signal for each HPFOS and HPFNA treatment group.
PFOHL ET AL. | 283
Dow
nloaded from https://academ
ic.oup.com/toxsci/article/180/2/277/6112049 by guest on 26 August 2022

Table 3. Top Global Hepatic Genes
Gene Fold Change ANOVA P-Value Gene Fold Change ANOVA P-Value
L Versus LPFOS L Versus LPFNACyp2b10 59.14 0.000021 Cyp2b10 26.99 0.005249Cyp2c55 15.86 0.000059 Mogat1 7.06 0.037019Cyp2c53 9.83 0.003011 Serpinb1a 7.02 0.001564Gstm3 8.79 0.00236 Gstm3 6.95 0.003246Cyp2b13 6.94 0.039922 Slc271 6.45 0.015992H Versus HPFOS H Versus HPFNACyp2b10 33.48 0.000018 Cidea 88.09 0.009264Gstm3 6.76 0.009034 Sptlc3 42.16 0.000055Cyp2c55 6.23 0.000548 Fabp3-ps3 38.98 0.000156Cyp4a12b 4.59 0.000737 Gm15441 22.9 0.000037Gstt3 4.33 0.000259 Otop1 11.12 0.00137
Transcriptomic array fold change and p-values were derived from the Transcriptome Analysis Console (TAC). The top genes were identified through the use of IPA
(QIAGEN Inc). The top 5 differentially expressed genes are summarized for each PFAS-diet comparison. Cyp2b10 was the top modulated gene in 3 out of 4 comparisons.
Figure 4. The PFOS and PFNA exhibit diet- and structure-dependent effects on the hepatic transcriptome. The raw data are available on the GEO database accession
number GSE138602. A, The Venn diagram summarizes the overlap between LPFOS and HPFOS modulated genes relative to dietary controls. The genes on the left side
are the top 10 induced genes, whereas the genes on the right side are the top 10 suppressed genes. B, Scatter plots were generated using TAC software and show direct
differential expression based on the log2 of the average signal for LPFOS versus the HPFOS treatment group. C, The Venn diagram summarizes the overlap between
LPFNA and HPFNA modulated genes relative to dietary controls. The genes on the left side are the top 10 induced genes, whereas the genes on the right side are the top
10 suppressed genes. D, Scatter plots were generated using TAC software and show direct differential expression based on the log2 of the average signal for LPFNA ver-
sus the HPFNA treatment group.
Dow
nloaded from https://academ
ic.oup.com/toxsci/article/180/2/277/6112049 by guest on 26 August 2022
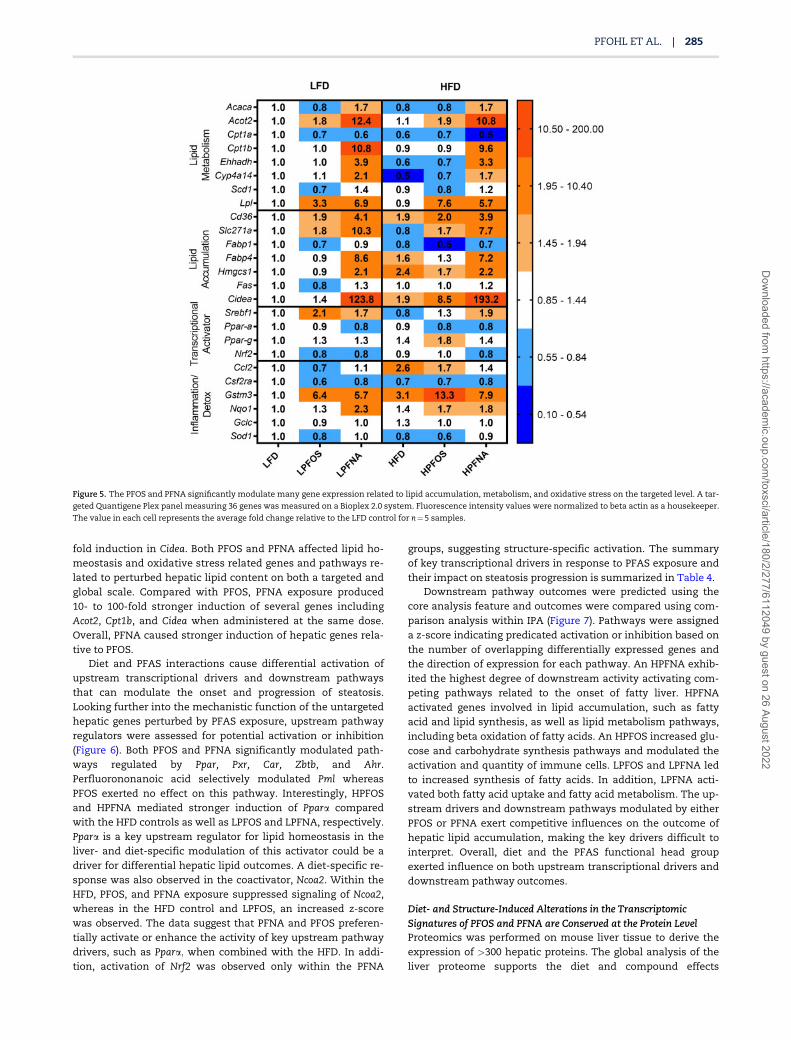
fold induction in Cidea. Both PFOS and PFNA affected lipid ho-meostasis and oxidative stress related genes and pathways re-lated to perturbed hepatic lipid content on both a targeted andglobal scale. Compared with PFOS, PFNA exposure produced10- to 100-fold stronger induction of several genes includingAcot2, Cpt1b, and Cidea when administered at the same dose.Overall, PFNA caused stronger induction of hepatic genes rela-tive to PFOS.
Diet and PFAS interactions cause differential activation ofupstream transcriptional drivers and downstream pathwaysthat can modulate the onset and progression of steatosis.Looking further into the mechanistic function of the untargetedhepatic genes perturbed by PFAS exposure, upstream pathwayregulators were assessed for potential activation or inhibition(Figure 6). Both PFOS and PFNA significantly modulated path-ways regulated by Ppar, Pxr, Car, Zbtb, and Ahr.Perfluorononanoic acid selectively modulated Pml whereasPFOS exerted no effect on this pathway. Interestingly, HPFOSand HPFNA mediated stronger induction of Ppara comparedwith the HFD controls as well as LPFOS and LPFNA, respectively.Ppara is a key upstream regulator for lipid homeostasis in theliver- and diet-specific modulation of this activator could be adriver for differential hepatic lipid outcomes. A diet-specific re-sponse was also observed in the coactivator, Ncoa2. Within theHFD, PFOS, and PFNA exposure suppressed signaling of Ncoa2,whereas in the HFD control and LPFOS, an increased z-scorewas observed. The data suggest that PFNA and PFOS preferen-tially activate or enhance the activity of key upstream pathwaydrivers, such as Ppara; when combined with the HFD. In addi-tion, activation of Nrf2 was observed only within the PFNA
groups, suggesting structure-specific activation. The summaryof key transcriptional drivers in response to PFAS exposure andtheir impact on steatosis progression is summarized in Table 4.
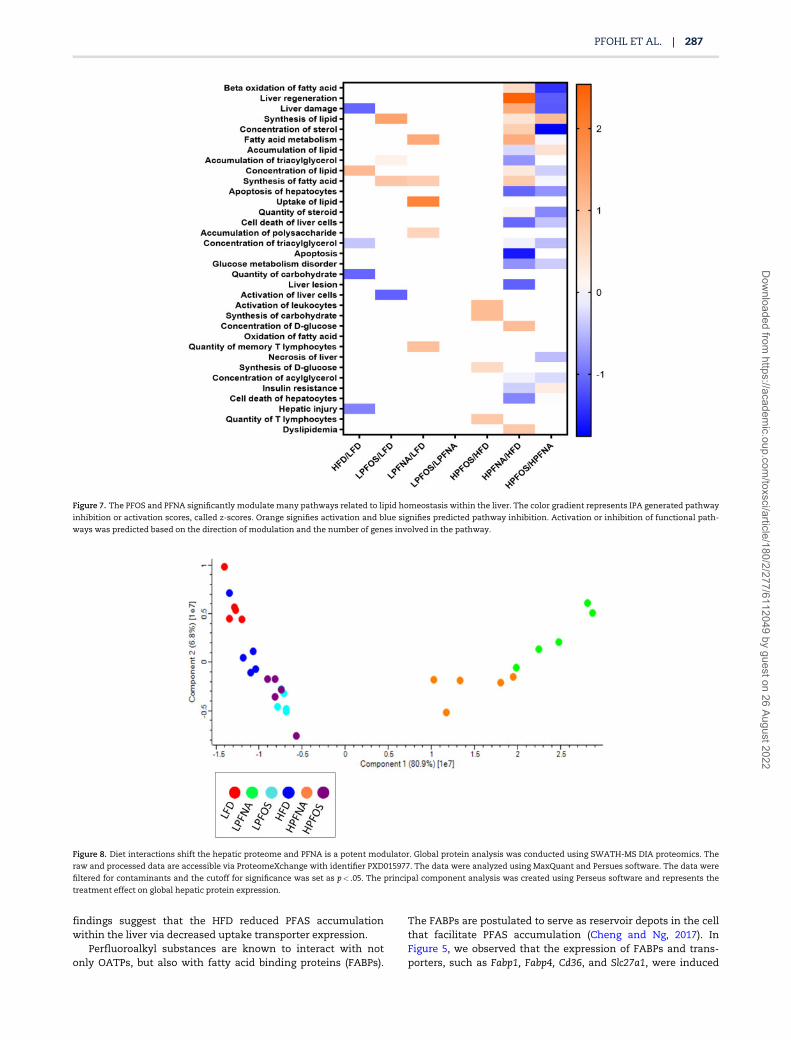
Downstream pathway outcomes were predicted using thecore analysis feature and outcomes were compared using com-parison analysis within IPA (Figure 7). Pathways were assigneda z-score indicating predicated activation or inhibition based onthe number of overlapping differentially expressed genes andthe direction of expression for each pathway. An HPFNA exhib-ited the highest degree of downstream activity activating com-peting pathways related to the onset of fatty liver. HPFNAactivated genes involved in lipid accumulation, such as fattyacid and lipid synthesis, as well as lipid metabolism pathways,including beta oxidation of fatty acids. An HPFOS increased glu-cose and carbohydrate synthesis pathways and modulated theactivation and quantity of immune cells. LPFOS and LPFNA ledto increased synthesis of fatty acids. In addition, LPFNA acti-vated both fatty acid uptake and fatty acid metabolism. The up-stream drivers and downstream pathways modulated by eitherPFOS or PFNA exert competitive influences on the outcome ofhepatic lipid accumulation, making the key drivers difficult tointerpret. Overall, diet and the PFAS functional head groupexerted influence on both upstream transcriptional drivers anddownstream pathway outcomes.
Diet- and Structure-Induced Alterations in the TranscriptomicSignatures of PFOS and PFNA are Conserved at the Protein LevelProteomics was performed on mouse liver tissue to derive theexpression of >300 hepatic proteins. The global analysis of theliver proteome supports the diet and compound effects
Figure 5. The PFOS and PFNA significantly modulate many gene expression related to lipid accumulation, metabolism, and oxidative stress on the targeted level. A tar-
geted Quantigene Plex panel measuring 36 genes was measured on a Bioplex 2.0 system. Fluorescence intensity values were normalized to beta actin as a housekeeper.
The value in each cell represents the average fold change relative to the LFD control for n¼5 samples.
PFOHL ET AL. | 285
Dow
nloaded from https://academ
ic.oup.com/toxsci/article/180/2/277/6112049 by guest on 26 August 2022

observed in the transcriptomic data. A PCA plot was generatedto visualize changes in the global liver proteome (Figure 8).Distinct groupings can be observed between treatment groups.Both diet and the PFAS compound caused distinct shifts in theproteomic signature of the liver. Interestingly, PFNA showed adrastic shift in grouping compared with both PFOS and dietarycontrols. In Figure 9, the total number of differentially expressedproteins out of total proteins detected can be found within the
box next to each comparison. Again, both diet- and structure-dependent effects on expression were observed. For example,LPFNA significantly impacted the expression of 197 out of ap-proximately 300 proteins detected whereas LPFOS modulated65. LPFNA and LPFOS shared 46 proteins, whereas LPFOSretained 19 and LPFNA 151 unique changes.
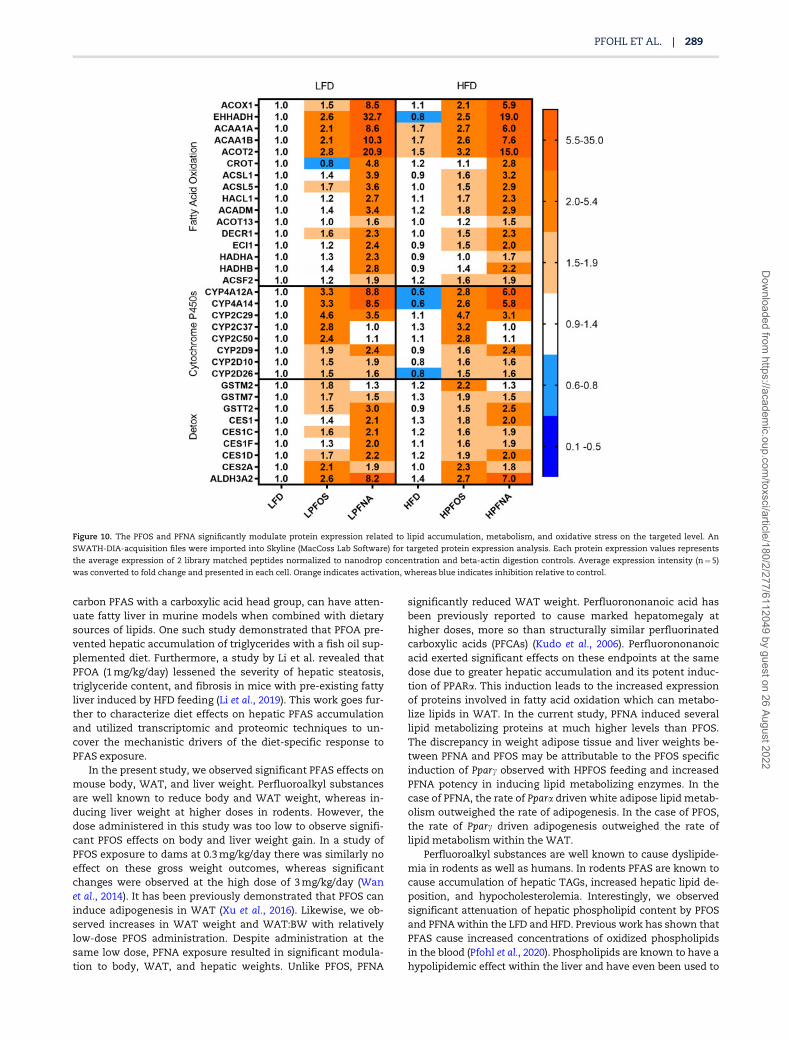
To confirm the global changes observed, targeted quantifica-tion of relevant lipid and oxidative stress related molecules wasperformed using open source targeted proteomic analysis soft-ware, Skyline (Figure 10). The elevated potency of PFNA can beclearly observed at the protein level in the expression of fattyacid metabolizing, cytochrome P450s, and antioxidant proteins.For the cytochrome P450s, PFOS exhibited stronger inductionfor CYP2C enzymes including, CYP2C50 and CYP2C37. However,PFNA showed more potent induction for CYP4A enzymes,CYP4A12, and CYP4A14. Lastly, we observed that the relative in-duction of gene and protein expression was conserved for manyof the overlapping gene and protein targets such as EHHDAHand CYP4A14. In conclusion, both PFOS and PFNA significantlymodulated the liver proteome and potential metabolic functionat a relatively low dose.
Diet-Specific Modulation of Liver Pathology in the Presence of PFASCould Be Attributed to Altered Expression of PFAS UptakeTransportersDiet exerted a dramatic influence on the resulting liver pathol-ogy. Perfluorooctanesulfonic acid and PFNA have low passivepermeability and a high (�400) molecular weight (Cheng andNg, 2017). Perfluoroalkyl substances uptake into the liver andreabsorption from the kidney is known to be driven by a class oftransporters called organic anion transporter proteins (OATPs).In the liver, there are 4 major Oatps that mediate hepatic uptakefrom the bloodstream: OATP1A1, OATP1A4, OATP1B2, andOATP2B1 (Zhao et al., 2017). In the HFD-treated groups, Oatp
transporter expression was significantly reduced by PFAS expo-sure (Figure 11). To examine if diet influences the uptake ofPFOS and PFNA into the liver, internal hepatic exposure to PFOSand PFNA was quantified by LC-MS/MS (Table 5). An HFD feed-ing caused a significant decrease in hepatic concentration ofPFOS and PFNA when compared with LFD feeding. In addition,PFNA achieved significantly higher hepatic concentrations thanPFOS within both the LFD- and HFD-treated groups when ad-ministered at the same dose. When taken together, these
Figure 6. The PFOS and PFNA significantly modulate many transcriptional driv-
ers related to lipid homeostasis within the liver. Upstream analysis was used to
predict transcriptional drivers. Orange signifies activation and blue signifies pre-
dicted upstream regulator inhibition. Activation or inhibited or a transcriptional
regulator was predicted based on the expression state of the downstream tar-
gets and a z-score for activation or inhibition was assigned using Ingenuity
Pathway Analysis software by Qiagen.
Table 4. Effects of Upstream Transcriptional Regulators on NAFLD Onset
Ppara Zbtb20 Pxr Car Ahr Lxr
HFD/LFD �1.44 1.63 1.98* 2.62** 1.66LPFOS/LFD 2.55* 1.29 0.27 1.93LPFNA/LFD 3.17* 1.89 1.41 0.77 �0.73 1.93HPFOS/LFD 0.17 2.89** 2.95** 2.79** 0.27 2.16*HPFNA/LFD 4.82** �0.50 2.34* �0.03 2.02* 2.17*HPFOS/HFD 1.49 1.51 1.72 1.32 �1.28 2.00*HPFNA/HFD 5.00** �0.91 1.81 �0.43 �2.23* 1.93Steatosis (�) (1) (1) (�) (�) (1)
Kim et al. (2017) Liu et al. (2017) Zhou et al. (2006) Yamazaki et al.(2007)
Wada et al. (2016) Jung et al. (2011)
Treatment activation or inhibition of upstream regulators based on IPA derived z-scores using the upstream analysis feature. Each z-score represents the number of
deviations from the mean, whereas a blank well represents no prediction.
*Significance at � the 95% confidence level.
**Significance at � the 99% confidence level. The impact of pathway activation on hepatic steatosis is summarized in the steatosis row, (�) denotes attenuation and (þ)
augmentation of this endpoint. Literature sources are included below.
286 | PARADOXICAL EFFECT OF DIET ON PFOS AND PFNA
Dow
nloaded from https://academ
ic.oup.com/toxsci/article/180/2/277/6112049 by guest on 26 August 2022
findings suggest that the HFD reduced PFAS accumulationwithin the liver via decreased uptake transporter expression.
Perfluoroalkyl substances are known to interact with notonly OATPs, but also with fatty acid binding proteins (FABPs).
The FABPs are postulated to serve as reservoir depots in the cellthat facilitate PFAS accumulation (Cheng and Ng, 2017). InFigure 5, we observed that the expression of FABPs and trans-porters, such as Fabp1, Fabp4, Cd36, and Slc27a1, were induced
Figure 7. The PFOS and PFNA significantly modulate many pathways related to lipid homeostasis within the liver. The color gradient represents IPA generated pathway
inhibition or activation scores, called z-scores. Orange signifies activation and blue signifies predicted pathway inhibition. Activation or inhibition of functional path-
ways was predicted based on the direction of modulation and the number of genes involved in the pathway.
Figure 8. Diet interactions shift the hepatic proteome and PFNA is a potent modulator. Global protein analysis was conducted using SWATH-MS DIA proteomics. The
raw and processed data are accessible via ProteomeXchange with identifier PXD015977. The data were analyzed using MaxQuant and Persues software. The data were
filtered for contaminants and the cutoff for significance was set as p< .05. The principal component analysis was created using Perseus software and represents the
treatment effect on global hepatic protein expression.
PFOHL ET AL. | 287
Dow
nloaded from https://academ
ic.oup.com/toxsci/article/180/2/277/6112049 by guest on 26 August 2022

by PFAS within both diets. In Figure 6, a notable increase inPpara activity within the HFD þ PFAS groups can be observed.Ppara activation leads to the downregulation of Oatps (Chengand Klaassen, 2008). This diet-specific downregulation coupledwith an elevated influx of dietary fatty acids from the HFD intothe serum may lead to increased competition between PFASand FFAs for hepatic uptake. This competitive uptake could leadto a decrease in both lipid and PFAS accumulation in the liver. Apotential mechanism to explain the paradoxical effect of PFASin combination with HFD on the onset of hepatic steatosis isproposed in Figure 12.
DISCUSSION
The majority of studies examining PFAS induced hepatic steato-sis utilize relatively high doses of PFAS, acute exposure win-dows, and a standard chow (Wan et al., 2012; Kudo et al., 2006;Bagley et al., 2017; Curran et al., 2008). It has been well-established that a high dose of PFAS can incite the onset of fattyliver when administered with a lean standard mouse chow(Armstrong and Guo, 2019). However, the mechanism of thistoxicant-associated fatty liver disease is still poorly understood.
The current theories include PFAS induced choline deficiency(Zhang et al., 2016), impaired mitochondrial function (Quistet al., 2015; Yao et al., 2016), impaired lipid export via VLDL(Bijland et al., 2011; Wang et al., 2015), and an imbalance be-tween FA synthesis and beta oxidation (Das et al., 2017).Perfluoroalkyl substances exposure is lifelong and there is aneed to better understand the potential hepatotoxicity of PFASunder chronic exposure. Moreover, the largest risk factor for he-patic steatosis is metabolic syndrome, often initiated by poordiet. In order to better explore the ability of PFAS to augmentfatty liver risk, the experimental design must take into accountthe most common risk factor for fatty liver, diet induced meta-bolic syndrome.
Few papers have examined the exposure to PFAS in combi-nation with dietary fat on the development of hepatic steatosis.According to Huck et al., HFD feeding in combination with0.0001% PFOS (approximately 0.1 mg/kg/day). Using a dose of0.0003% PFAS in diet (approximately 0.24 mg/kg/day), this studyconfirms that coadministration with an HFD can attenuatePFOS induced hepatic lipid accumulation. Furthermore, this ef-fect was demonstrated with PFNA for the first time. Other stud-ies have demonstrated that perfluorooctanoic acid (PFOA), an 8-
Figure 9. Structure-specific interactions shift the hepatic proteomic signature of PFNA and PFOS. Each Venn diagram depicts the overlap between the significantly
modulated proteins from each treatment group. Significance was calculated on the SWATH-MS acquired data using MaxQuant software.
288 | PARADOXICAL EFFECT OF DIET ON PFOS AND PFNA
Dow
nloaded from https://academ
ic.oup.com/toxsci/article/180/2/277/6112049 by guest on 26 August 2022
carbon PFAS with a carboxylic acid head group, can have atten-uate fatty liver in murine models when combined with dietarysources of lipids. One such study demonstrated that PFOA pre-vented hepatic accumulation of triglycerides with a fish oil sup-plemented diet. Furthermore, a study by Li et al. revealed thatPFOA (1 mg/kg/day) lessened the severity of hepatic steatosis,triglyceride content, and fibrosis in mice with pre-existing fattyliver induced by HFD feeding (Li et al., 2019). This work goes fur-ther to characterize diet effects on hepatic PFAS accumulationand utilized transcriptomic and proteomic techniques to un-cover the mechanistic drivers of the diet-specific response toPFAS exposure.
In the present study, we observed significant PFAS effects onmouse body, WAT, and liver weight. Perfluoroalkyl substancesare well known to reduce body and WAT weight, whereas in-ducing liver weight at higher doses in rodents. However, thedose administered in this study was too low to observe signifi-cant PFOS effects on body and liver weight gain. In a study ofPFOS exposure to dams at 0.3 mg/kg/day there was similarly noeffect on these gross weight outcomes, whereas significantchanges were observed at the high dose of 3 mg/kg/day (Wanet al., 2014). It has been previously demonstrated that PFOS caninduce adipogenesis in WAT (Xu et al., 2016). Likewise, we ob-served increases in WAT weight and WAT:BW with relativelylow-dose PFOS administration. Despite administration at thesame low dose, PFNA exposure resulted in significant modula-tion to body, WAT, and hepatic weights. Unlike PFOS, PFNA
significantly reduced WAT weight. Perfluorononanoic acid hasbeen previously reported to cause marked hepatomegaly athigher doses, more so than structurally similar perfluorinatedcarboxylic acids (PFCAs) (Kudo et al., 2006). Perfluorononanoicacid exerted significant effects on these endpoints at the samedose due to greater hepatic accumulation and its potent induc-tion of PPARa. This induction leads to the increased expressionof proteins involved in fatty acid oxidation which can metabo-lize lipids in WAT. In the current study, PFNA induced severallipid metabolizing proteins at much higher levels than PFOS.The discrepancy in weight adipose tissue and liver weights be-tween PFNA and PFOS may be attributable to the PFOS specificinduction of Pparc observed with HPFOS feeding and increasedPFNA potency in inducing lipid metabolizing enzymes. In thecase of PFNA, the rate of Ppara driven white adipose lipid metab-olism outweighed the rate of adipogenesis. In the case of PFOS,the rate of Pparc driven adipogenesis outweighed the rate oflipid metabolism within the WAT.
Perfluoroalkyl substances are well known to cause dyslipide-mia in rodents as well as humans. In rodents PFAS are known tocause accumulation of hepatic TAGs, increased hepatic lipid de-position, and hypocholesterolemia. Interestingly, we observedsignificant attenuation of hepatic phospholipid content by PFOSand PFNA within the LFD and HFD. Previous work has shown thatPFAS cause increased concentrations of oxidized phospholipidsin the blood (Pfohl et al., 2020). Phospholipids are known to have ahypolipidemic effect within the liver and have even been used to
Figure 10. The PFOS and PFNA significantly modulate protein expression related to lipid accumulation, metabolism, and oxidative stress on the targeted level. An
SWATH-DIA-acquisition files were imported into Skyline (MacCoss Lab Software) for targeted protein expression analysis. Each protein expression values represents
the average expression of 2 library matched peptides normalized to nanodrop concentration and beta-actin digestion controls. Average expression intensity (n¼5)
was converted to fold change and presented in each cell. Orange indicates activation, whereas blue indicates inhibition relative to control.
PFOHL ET AL. | 289
Dow
nloaded from https://academ
ic.oup.com/toxsci/article/180/2/277/6112049 by guest on 26 August 2022

attenuate fatty liver disease (Gundermann et al., 2016).Phospholipids are also known to predict PFAS partitioning andthe ability of phospholipids to associate with PFAS has been con-firmed (Dassuncao et al., 2019; Sanchez Garcia et al., 2018).Furthermore, PFAS are able to intercalate into cellular mem-branes and increase membrane permeability (Nouhi et al., 2018;Fitzgerald et al., 2018). Phospholipids act as a surfactant to stabi-lize lipid droplets, are the major constituent of cell membranes,and aid in vesicle formation for lipid export. The implication ofPFAS reduction in hepatic phospholipids and its implications inhepatic steatosis has not been adequately explored.
A reduction in TAG content was produced by PFNA and PFOSsupplementation within the HFD. Similarly, previous reportsdemonstrated that PFOA reduced hepatic triglycerides in thepresence of dietary lipids (Kudo and Kawashima, 1997; Li et al.,2019). This result supports the histopathology showing signifi-cant reduction in hepatic lipid accumulation with coadministra-tion of PFAS and HFD. The present work is the second study toreport that a subchronic exposure to PFOS attenuates the onsetof HFD induced hepatic steatosis. Furthermore, this is the firstpaper to demonstrate this preventative effect using PFNA. Ourgroup went further to quantify the hepatic concentration ofPFAS within each treatment group.
Diet and structure related effects on hepatic accumulation ofPFAS were observed. Interestingly, we observed significant re-duction in hepatic PFAS concentration with administration ofan HFD. A developmental study reported that an HFD
significantly increased hepatic PFAS concentrations in pupswith perinatal exposure to PFAS via dams (Wan et al., 2014).However, a study by Pfohl et al. (2020) demonstrated that directcoadministration with an HFD results in a significant reductionof PFOS and PFHxS hepatic accumulation. The present workconfirms this finding with PFOS and reports the conservation ofthis effect with PFNA. Lastly, we confirmed previous reportsthat PFNA has more bioaccumulative potential within the mu-rine liver when compared with the sulfonic acid, PFOS. It is alsoknown that PFNA accumulates in the liver at higher levels than
Table 5. Hepatic Concentration of PFAS
PFOS (mg/g) PFNA (mg/g)
LFD 115.7 6 6.8$,& 169.7 6 3.8$,&
HFD 87.3 6 7.4$,& 110.9 6 11.1$,&
PFOS and PFNA were measured in hepatic tissue following 12 weeks of exposure
to chemical in diet. All control groups exhibited PFOS and PFNA concentrations
below the lower limit of quantification (LLOQ) of 15 ng/ml. Likewise, no quantifi-
able cross-contamination between PFOS- and PFNA-treated groups was found.
Calculations were performed using a 1-way ANOVA followed by post hoc
Bonferroni test. All values represent the average 6 SEM; n¼7–8.
$p< .05, significance between PFOS and PFNA within the same diet (ie, LPFOS vs
LPFNA).
&p< .05, significance between diet treatment within the same compound (ie,
LPFAS vs HPFAS).
Figure 11. Mechanistic drivers of PFAS-diet interactions. Significance was calculated using 1-way ANOVA followed by Fisher’s LSD test. *p< .05, significance from the
LFD controls. #p< .05, significance from the HFD controls. $p< .05, significance between PFOS and PFNA within the same diet (ie, L/HPFOS vs L/HPFNA). &p< .05, signifi-
cance between diet treatment within the same compound (ie, LPFAS vs HPFAS). A, Expression is presented as the log2 of the average signal 6 SEM. The values were
generated via transcriptomic array on n¼3 individual samples per treatment group. B, Male C57BL/6 mice were fed with either a low-fat diet or a moderately high-fat
diet with or without PFOS or PFNA (0.0003% wt/wt in feed) for 12 weeks. After necropsy, PFOS and PFNA were extracted from liver and quantified using LC-MS/MS. All
control groups exhibited PFOS and PFNA concentrations below the lower limit of quantification (LLOQ). Likewise, no quantifiable cross-contamination between PFOS-
and PFNA-treated groups was found. All values are means 6 SEM; n¼7–8.
290 | PARADOXICAL EFFECT OF DIET ON PFOS AND PFNA
Dow
nloaded from https://academ
ic.oup.com/toxsci/article/180/2/277/6112049 by guest on 26 August 2022

similar PFCAs of varying chain lengths (Kudo and Kawashima,2003). Furthermore, it has been demonstrated PFCAs alter he-patic fatty acid profiles in a hepatic concentration-dependentmanner (Kudo et al., 2011). The increased hepatic uptake relativeto PFOS within the same diet could be in part due to the PFNA-specific induction of Fabp4, a potential PFAS uptake transporter(Ng and Hungerbuhler, 2014).
The mechanism of diet-PFAS interactions has not been ade-quately explored. The previously published work by Huck et al.suggests that the driver of the diet-specific response is differen-tial regulation of Pparc and its down-stream target, Cd36.However, in the current study no diet-specific response in Pparcnor the fatty acid uptake transporter, Cd36, was observed. Thisfinding was confirmed by Western blot (Supplementary Figure3). Li et al. suggested that PFAS lessened the severity of pre-existing fatty liver because PFOA potentiated genes related tolipid metabolism within the HFD. In contrast, the present studyrevealed that gene and protein expression of lipid metabolizingenzymes was potentiated more within the low fat þ PFAS diets,especially the LPFNA group. The comparison of the PFOS andPFNA outcomes and hepatic signatures relative to diet suggeststhat there may be an alternative mechanism for the protectiveeffect of PFAS combined with an HFD.
Ppara induces the metabolic breakdown of fatty acids and isknown to have a protective effect against the onset of hepatic
steatosis. Perfluoroalkyl substances are generally accepted to berobust Ppara inducers and the findings presented here confirmthis. Overall, PFNA was a more potent inducer of Ppara and theoverall transcriptome when compared with PFOS. Given thatPFNA achieves greater hepatic concentrations relative to PFOS itis not surprising that it would result in a greater level of induc-tion. However, in the present study HPFNA and LPFOS concen-trations were very similar in the liver suggesting that theincreased level of induction observed with PFNA is not solelydependent on increased hepatic deposition and is likely attrib-utable to the difference in functional head group. This potent ef-fect on both gene and protein level expression suggests thatPFNA alters the hepatic signature at lower doses than PFOS andtherefore may require stricter regulation.
Diet imposed significant influence on the overall hepatic sig-natures for both PFOS and PFNA. OATPs are known transportersof PFAS and have been demonstrated to mediate PFAS deposi-tion and reabsorption from the liver. The HFD þ PFAS groupshad much greater predicted activation of PPARa relative to theirmatched LFD þ PFAS groups. Furthermore, PFAS have beenshown to reduce the expression of Oatps via Ppara mediatedsuppression (Cheng and Klaassen, 2008). High-fat diet feeding isknown to initially induce PPARa, given that its endogenousligands include fatty acids and triglycerides (Patsouris et al.,2006). This activation can serve a protective role by inducingfatty acid oxidation and improving insulin sensitivity. Withchronic HFD feeding there is often a shift to downregulation ofPPARa due to the resulting development of diet-related healthoutcomes such as dyslipidemia or insulin resistance(Dom�ınguez-Avila et al., 2016). Similarly, the HFD controls in thepresent study did exhibit downregulation of PPARa and in-creased hepatic lipid accumulation, therefore, PPARa mediatedsuppression of OATPs would not be expected within the HFDcontrols. Given the attenuating effect of PFAS on the onset ofchronic HFD-induced outcomes, such dyslipidemia and fattyliver, this may result in a synergistic increase in both diet andPFAS mediated upregulation of PPARa. This could explain thediet-specific activation of PPARa and resulting suppression ofOATPs. Both PFAS and fatty acids are known to interact withFABPs for hepatic uptake/accumulation. The decreased expres-sion of a primary PFAS transporter coupled with increasingcompetition between FFAs and PFAS for uptake could present anovel mechanism for the underlying cause of the diminished
hepatic deposition of both lipid and PFAS within the HFD treat-ment groups.
CONCLUSIONS
Using a diet-induced obesity rodent model, we sought to ex-plore the potential role of diet in PFOS and PFNA induced fattyliver. Despite the lack of federal regulation, PFNA was signifi-cantly more potent than PFOS in altering hepatic molecularpathways and exhibited increased hepatic deposition. Thesefindings suggest that PFNA may require stricter regulation thanPFOS despite its structural similarity. Importantly, dietary fatexhibits a prominent influence on PFAS hepatic accumulation,pathology, and biochemical pathways. This effect may becaused by Ppara mediated suppression of PFAS uptake trans-porters, Oatps. Further studies are warranted to further confirmand explore PFAS-diet interactions and their potential implica-tions in assessing internal exposure and risk.
Figure 12. Hypothesized mechanism of the PFAS-diet effect on hepatic steatosis.
An HPFNA and HPFOS enhanced activity of Ppara relative to dietary controls and
LPFAS groups. Ppara activation causes a reduction in Oatp expression, a known
uptake transporter for PFAS. Decreased Oatp expression coupled with increased
serum FFAs from diet creates increased competition for fatty acid uptake trans-
porters. This competition may reduce hepatic FFA and PFAS accumulation.
PFOHL ET AL. | 291
Dow
nloaded from https://academ
ic.oup.com/toxsci/article/180/2/277/6112049 by guest on 26 August 2022
SUPPLEMENTARY DATA
Supplementary data are available at Toxicological Sciencesonline.
DECLARATION OF CONFLICTING INTERESTS
The authors declared no potential conflicts of interest with re-spect to the research, authorship, and/or publication of thisarticle.
FUNDING
This work was supported by National Institute of Health(NIH) grants 1R15ES025404-01 and P42ES027706. This mate-rial is based upon work conducted at University of RhodeIsland at a Rhode Island National Science Foundation’sEstablished Program to Stimulate Competitive Research(NSF EPSCoR) research facility, the Genomics andSequencing Center, and the Molecular CharacterizationFacility, supported in part by the NSF EPSCoR CoopoerativeAgreement Number OIA-1655221. The transcriptomic arraywas conducted at the Brown University Genomics Facilitywith partial support from the National Institutes of Health(NIGMS Grant No. P30GM103410, NCRR Grant No.P30RR031153, P20RR018728, and S10RR02763), NationalScience Foundation (EPSCoR Grant No. 0554548), LifespanRhode Island Hospital, and the Division of Biology andMedicine, Brown University.
REFERENCESArmstrong, L. E., and Guo, G. L. (2019). Understanding environ-
mental contaminants’ direct effects on non-alcoholic fattyliver disease progression. Curr. Environ. Health Rep. 6, 95–104.
Bagley, B. D., Chang, S.-C., Ehresman, D. J., Eveland, A., Zitzow, J.D., Parker, G. A., Peters, J. M., Wallace, K. B., and Butenhoff, J.L. (2017). Perfluorooctane sulfonate-induced hepatic steato-sis in male Sprague Dawley rats is not attenuated by dietarycholine supplementation. Toxicol. Sci. 160, 284–298.
Ballesteros, V., Costa, O., I~niguez, C., Fletcher, T., Ballester, F.,and Lopez-Espinosa, M.-J. (2017). Exposure to perfluoroalkylsubstances and thyroid function in pregnant women andchildren: A systematic review of epidemiologic studies. Env.Int. 99, 15–28.
Barber, J. L., Berger, U., Chaemfa, C., Huber, S., Jahnke, A.,Temme, C., and Jones, K. C. (2007). Analysis of per- and poly-fluorinated alkyl substances in air samples from NorthwestEurope. J. Environ. Monit. 9, 530–541.
Bechmann LP, Hannivoort RA, Gerken G, Hotamisligil GS,Trauner M, and Canbay A (2012) The interaction of hepaticlipid and glucose metabolism in liver diseases. J Hepatol56,952–964.
Bijland, S., Rensen, P. C. N., Pieterman, E. J., Maas, A. C. E., vander Hoorn, J. W., van Erk, M. J., Havekes, L. M., Willems vanDijk, K., Chang, S.-C., Ehresman, D. J., et al. (2011).Perfluoroalkyl sulfonates cause alkyl chain length-depen-dent hepatic steatosis and hypolipidemia mainly by impair-ing lipoprotein production in APOE3-Leiden CETP mice.Toxicol. Sci. 123, 290–303.
Bjork, J. A., Butenhoff, J. L., and Wallace, K. B. (2011). Multiplicityof nuclear receptor activation by PFOA and PFOS in primaryhuman and rodent hepatocytes. Toxicology 288, 8–17.
Boesen AC, Martinez A, and Hornbuckle KC (2020) Air-water PCBfluxes from southwestern Lake Michigan revisited. EnvironSci Pollut Res Int 27,8826–8834.
Buck, R. C., Franklin, J., Berger, U., Conder, J. M., Cousins, I. T., deVoogt, P., Jensen, A. A., Kannan, K., Mabury, S. A., and vanLeeuwen, S. P. J. (2011). Perfluoroalkyl and polyfluoroalkylsubstances in the environment: Terminology, classification,and origins. Integr. Environ. Assess Manag. 7, 513–541.
Chang, S., Allen, B. C., Andres, K. L., Ehresman, D. J., Falvo, R.,Provencher, A., Olsen, G. W., and Butenhoff, J. L. (2017).Evaluation of serum lipid, thyroid, and hepatic clinical chem-istries in association with serum perfluorooctanesulfonate(PFOS) in Cynomolgus monkeys after oral dosing with potas-sium PFOS. Toxicol. Sci. 156, 387–401.
Cheng, W., and Ng, C. A. (2017). A Permeability-LimitedPhysiologically Based Pharmacokinetic (PBPK) Model forPerfluorooctanoic Acid (PFOA) in Male Rats. https://pubs.acs.org/doi/pdf/10.1021/acs.est.7b02602. Accessed August 17, 2020.
Cheng, X., and Klaassen, C. D. (2008). Critical role of PPAR-a inperfluorooctanoic acid– and perfluorodecanoic acid–induceddownregulation of Oatp uptake transporters in mouse livers.Toxicol. Sci. 106, 37–45.
Curran, I., Hierlihy, S. L., Liston, V., Pantazopoulos, P.,Nunnikhoven, A., Tittlemier, S., Barker, M., Trick, K., andBondy, G. (2008). Altered fatty acid homeostasis and relatedtoxicologic sequelae in rats exposed to dietary potassiumperfluorooctanesulfonate (PFOS). J. Toxicol. Environ. Health A71, 1526–1541.
Das, K. P., Wood, C. R., Lin, M. T., Starkov, A. A., Lau, C., Wallace,K. B., Corton, J. C., and Abbott, B. D. (2017). Perfluoroalkylacids-induced liver steatosis: Effects on genes controllinglipid homeostasis. Toxicology 378, 37–52.
Dassuncao, C., Pickard, H., Pfohl, M., Tokranov, A. K., Li, M.,Mikkelsen, B., Slitt, A., and Sunderland, E. M. (2019).Phospholipid levels predict the tissue distribution of poly-and perfluoroalkyl substances in a marine mammal. Environ.Sci. Technol. Lett. 6, 119–125. http://pubs.acs.org/doi/10.1021/acs.estlett.9b00031. Accessed March 3, 2019.
Dzierlenga MW, Yoon M, Wania F, Ward PL, Armitage JM, WoodSA, Clewell HJ, and Longnecker MP (2019) Quantitative biasanalysis of the association of type 2 diabetes mellitus with2,2’,4,4’,5,5’-hexachlorobiphenyl (PCB-153). Environ Int125,291–299.
Ellsworth RE, Mamula KA, Costantino NS, Deyarmin B,Kostyniak PJ, Chi LH, Shriver CD, and Ellsworth DL (2015)Abundance and distribution of polychlorinated biphenyls(PCBs) in breast tissue. Environ Res 138,291–297.
Fitzgerald, N. J. M., Wargenau, A., Sorenson, C., Pedersen, J.,Tufenkji, N., Novak, P. J., and Simcik, M. F. (2018). Partitioningand accumulation of perfluoroalkyl substances in modellipid bilayers and bacteria. Environ. Sci. Technol. 52,10433–10440.
Folch, J., Lees, M., and Sloane Stanley, G. H. (1957). A simplemethod for the isolation and purification of total lipides fromanimal tissues. J. Biol. Chem. 226, 497–509.
Fu, Z. D., & Cui, J. Y. (2017). Remote Sensing Between Liver andIntestine: Importance of Microbial Metabolites. Curr.Pharmacol. Rep. 3, 101–113.
Grandjean, P., Andersen, E. W., Budtz-Jørgensen, E., Nielsen, F.,Mølbak, K., Weihe, P., and Heilmann, C. (2012). Serum vaccineantibody concentrations in children exposed to perfluori-nated compounds. JAMA 307, 391–397.
Grimm FA, He X, Teesch LM, Lehmler HJ, Robertson LW, andDuffel MW (2015) Tissue Distribution, Metabolism, and
292 | PARADOXICAL EFFECT OF DIET ON PFOS AND PFNA
Dow
nloaded from https://academ
ic.oup.com/toxsci/article/180/2/277/6112049 by guest on 26 August 2022
Excretion of 3,3’-Dichloro-4’-sulfooxy-biphenyl in the Rat.Environ Sci Technol 49,8087–8095.
Gundermann, K.-J., Gundermann, S., Drozdzik, M., and MohanPrasad, V. (2016). Essential phospholipids in fatty liver: A sci-entific update. Clin. Exp. Gastroenterol. 9, 105–117.
Hu, J., Raikhel, V., Gopalakrishnan, K., Fernandez-Hernandez, H.,Lambertini, L., Manservisi, F., Falcioni, L., Bua, L., Belpoggi, F.,L.Teitelbaum, S., et al. (2016). Effect of postnatal low-dose ex-posure to environmental chemicals on the gut microbiomein a rodent model. Microbiome 4, 26.
Huck, I., Beggs, K., and Apte, U. (2018). Paradoxical protective ef-fect of perfluorooctanesulfonic acid against high-fat diet-in-duced hepatic steatosis in mice. Int. J. Toxicol. 37, 383–392.
Ismaiel, A., and Dumitrascu, D. L. (2019). Cardiovascular risk infatty liver disease: The liver-heart axis—Literature review.Front. Med. (Lausanne) 6. https://www.ncbi.nlm.nih.gov/pmc/articles/PMC6763690/. Accessed June 30, 2020.
Jahnke JC and Hornbuckle KC (2019) PCB Emissions from PaintColorants. Environ Sci Technol 53:5187–5194.
Jian, J.-M., Chen, D., Han, F.-J., Guo, Y., Zeng, L., Lu, X., and Wang,F. (2018). A short review on human exposure to and tissuedistribution of per- and polyfluoroalkyl substances (PFASs).Sci. Total Environ. 636, 1058–1069.
Jin H, Dai W, Li Y, Hu X, Zhu J, Wu P, Wang W, and Zhang Q (2019)Semi-volatile organic compounds in tap water fromHangzhou, China: Influence of pipe material and implicationfor human exposure. Sci Total Environ 677:671–678.
Joshi-Barve, S., Kirpich, I., Cave, M. C., Marsano, L. S., andMcClain, C. J. (2015). Alcoholic, nonalcoholic, and toxicant-associated steatohepatitis: Mechanistic similarities and dif-ferences. Cell Mol. Gastroenterol. Hepatol. 1, 356–367.
Jung, U. J., Millman, P. N., Tall, A. R., and Deckelbaum, R. J. (2011).n-3 Fatty acids ameliorate hepatic steatosis and dysfunctionafter LXR agonist ingestion in mice. Biochim. Biophys. Acta1811, 491–497.
Klocke C and Lein PJ (2020) Evidence Implicating Non-Dioxin-Like Congeners as the Key Mediators ofPolychlorinated Biphenyl (PCB) DevelopmentalNeurotoxicity. Int J Mol Sci 21.
Kolodziejczyk AA, Zheng D, Shibolet O, and Elinav E (2019) Therole of the microbiome in NAFLD and NASH. EMBO Mol Med11.
Korrick SA and Sagiv SK (2008) Polychlorinated biphenyls, organ-ochlorine pesticides and neurodevelopment. Curr OpinPediatr 20,198–204.
Kr€amer, A., Green, J., Pollard, J., and Tugendreich, S. (2014).Causal analysis approaches in ingenuity pathway analysis.Bioinformatics 30, 523–530.
Kudo, N., and Kawashima, Y. (1997). Fish oil-feeding preventsperfluorooctanoic acid-induced fatty liver in mice. Toxicol.Appl. Pharmacol. 145, 285–293.
Kudo, N., and Kawashima, Y. (2003). Toxicity and toxicokineticsof perfluorooctanoic acid in humans and animals. J. Toxicol.Sci. 28, 49–57.
Kudo, N., Suzuki-Nakajima, E., Mitsumoto, A., and Kawashima,Y. (2006). Responses of the liver to perfluorinated fatty acidswith different carbon chain length in male and female mice:In relation to induction of hepatomegaly, peroxisomal b-oxi-dation and microsomal 1-acylglycerophosphocholine acyl-transferase. Biol. Pharm. Bull. 29, 1952–1957.
Kudo, N., Yamazaki, T., Sakamoto, T., Sunaga, K., Tsuda, T.,Mitsumoto, A., and Kawashima, Y. (2011). Effects of perfluori-nated fatty acids with different carbon chain length on fatty
acid profiles of hepatic lipids in mice. Biol. Pharm. Bull. 34,856–864.
Li, X., Wang, Z., and Klaunig, J. E. (2019). The effects of perfluor-ooctanoate on high fat diet induced non-alcoholic fatty liverdisease in mice. Toxicology 416, 1–14.
Li ZM, Hernandez-Moreno D, Main KM, Skakkebaek NE,Kiviranta H, Toppari J, Feldt-Rasmussen U, Shen H, SchrammKW, and De Angelis M (2018) Association of In UteroPersistent Organic Pollutant Exposure With PlacentalThyroid Hormones. Endocrinology 159:3473–3481.
Luebker, D. J., Case, M. T., York, R. G., Moore, J. A., Hansen, K. J.,and Butenhoff, J. L. (2005a). Two-generation reproductionand cross-foster studies of perfluorooctanesulfonate (PFOS)in rats. Toxicology 215, 126–148.
Luebker, D. J., York, R. G., Hansen, K. J., Moore, J. A., andButenhoff, J. L. (2005b). Neonatal mortality from in utero ex-posure to perfluorooctanesulfonate (PFOS) in Sprague-Dawley rats: Dose-response, and biochemical and pharama-cokinetic parameters. Toxicology 215, 149–169.
MacLean, B., Tomazela, D. M., Shulman, N., Chambers, M.,Finney, G. L., Frewen, B., Kern, R., Tabb, D. L., Liebler, D. C.,and MacCoss, M. J. (2010). Skyline: An open source documenteditor for creating and analyzing targeted proteomics experi-ments. Bioinformatics 26, 966–968.
Meek EC, Jones DD, Crow JA, Wills RW, Cooke WH, 3rd, andChambers JE (2019) Association of serum levels of p,p’-Dichlorodiphenyldichloroethylene (DDE) with type 2 diabe-tes in African American and Caucasian adult men from agri-cultural (Delta) and non-agricultural (non-Delta) regions ofMississippi. J Toxicol Environ Health A 82:387–400.
National Report on Human Exposure to EnvironmentalChemicals j CDC. (2020). https://www.cdc.gov/exposurere-port/index.html. Accessed July 12, 2020.
Nelson, J. W., Hatch, E. E., and Webster, T. F. (2010). Exposure topolyfluoroalkyl chemicals and cholesterol, body weight, andinsulin resistance in the general U.S. population. Environ.Health Perspect. 118, 197–202.
Ng, C. A., and Hungerbuhler, K. (2014). Bioaccumulation of per-fluorinated alkyl acids: Observations and models. Environ.Sci. Technol. 48, 4637–4648.
Nicole, W. (2013). PFOA and cancer in a highly exposed commu-nity: New findings from the C8 science panel. Environ. HealthPerspect. 121(11–12), A340.
Nouhi, S., Ahrens, L., Campos Pereira, H., Hughes, A. V.,Campana, M., Gutfreund, P., Palsson, G. K., Vorobiev, A., andHellsing, M. S. (2018). Interactions of perfluoroalkyl substan-ces with a phospholipid bilayer studied by neutron reflec-tometry. J. Colloid. Interface Sci. 511, 474–481.
Olsen, G. W., Burris, J. M., Ehresman, D. J., Froehlich, J. W., Seacat,A. M., Butenhoff, J. L., and Zobel, L. R. (2007). Half-life of se-rum elimination of perfluorooctanesulfonate, perfluorohex-anesulfonate, and perfluorooctanoate in retiredfluorochemical production workers. Environ. Health Perspect.115, 1298–1305.
Olsen, G. W., Mair, D. C., Lange, C. C., Harrington, L. M., Church,T. R., Goldberg, C. L., Herron, R. M., Hanna, H., Nobiletti, J. B.,Rios, J. A., et al. (2017). Per- and polyfluoroalkyl substances(PFAS) in American Red Cross adult blood donors, 2000–2015.Environ. Res. 157, 87–95.
Pfohl, M., Ingram, L., Marques, E., Auclair, A., Barlock, B., Jamwal,R., Anderson, D., Cummings, B., and Slitt, A. L. (2020).Perfluorooctanesulfonic acid (PFOS) and perfluorohexanesul-fonic acid (PFHxS) alter the blood lipidome and the hepaticproteome in a murine model of diet-induced obesity. Toxicol.
PFOHL ET AL. | 293
Dow
nloaded from https://academ
ic.oup.com/toxsci/article/180/2/277/6112049 by guest on 26 August 2022

Sci. https://academic.oup.com/toxsci/advance-article/doi/10.1093/toxsci/kfaa148/5912943. Accessed October 3, 2020.
Quist, E. M., Filgo, A. J., Cummings, C. A., Kissling, G. E.,Hoenerhoff, M. J., and Fenton, S. E. (2015). Hepatic mitochon-drial alteration in CD-1 mice associated with prenatal expo-sures to low doses of perfluorooctanoic acid (PFOA). Toxicol.Pathol. 43, 546–557.
Rahman ML, Zhang C, Smarr MM, Lee S, Honda M, Kannan K,Tekola-Ayele F, and Buck Louis GM (2019) Persistent organicpollutants and gestational diabetes: A multi-center prospec-tive cohort study of healthy US women. Environ Int124,249–258.
Ramirez T, Daneshian M, Kamp H, Bois FY, Clench MR, Coen M,Donley B, Fischer SM, Ekman DR, Fabian E, Guillou C, Heuer J,Hogberg HT, Jungnickel H, Keun HC, Krennrich G, Krupp E,Luch A, Noor F, Peter E, Riefke B, Seymour M, Skinner N,Smirnova L, Verheij E, Wagner S, Hartung T, vanRavenzwaay B, and Leist M (2013) Metabolomics in toxicologyand preclinical research. ALTEX 30:209–225.
Rosen, M. B., Das, K. P., Wood, C. R., Wolf, C. J., Abbott, B. D., andLau, C. (2013). Evaluation of perfluoroalkyl acid activity usingprimary mouse and human hepatocytes. Toxicology 308,129–137.
Salihovic, S., Stubleski, J., Korrman, A., Larsson, A., Fall, T., Lind,L., and Lind, P. M. (2018). Changes in markers of liver functionin relation to changes in perfluoroalkyl substances—A longi-tudinal study. Environ. Int. 117, 196–203.
Sanchez Garcia, D., Sjodin, M., Hellstrandh, M., Norinder, U.,Nikiforova, V., Lindberg, J., Wincent, E., Bergman, A.,Cotgreave, I., and Munic Kos, V. (2018). Cellular accumulationand lipid binding of perfluorinated alkylated substances(PFASs) – A comparison with lysosomotropic drugs. Chemico-Biol. Interactions 281, 1–10.
Schug TT, Blawas AM, Gray K, Heindel JJ, and Lawler CP (2015)Elucidating the links between endocrine disruptors and neu-rodevelopment. Endocrinology 156, 1941–1951.
Scoville DK, Li CY, Wang D, Dempsey JL, Raftery D, Mani S, Gu H,and Cui JY (2019) Polybrominated Diphenyl Ethers and GutMicrobiome Modulate Metabolic Syndrome-Related AqueousMetabolites in Mice. Drug Metab Dispos 47, 928–940.
Seacat, A. M., Thomford, P. J., Hansen, K. J., Olsen, G. W., Case, M.T., and Butenhoff, J. L. (2002). Subchronic toxicity studies onperfluorooctanesulfonate potassium salt in Cynomolgusmonkeys. Toxicol. Sci. 68, 249–264.
Shoaff, J., Papandonatos, G. D., Calafat, A. M., Chen, A.,Lanphear, B. P., Ehrlich, S., Kelsey, K. T., and Braun, J. M.(2018). Prenatal exposure to perfluoroalkyl substances:Infant birth weight and early life growth. Environ. Epidemiol. 2,e010.
Stremy M, Sutova Z, Murinova LP, Richterova D, Wimmerova S,Conka K, Drobna B, Fabelova L, Jureckova D, Jusko TA,Tihanyi J, and Trnovec T (2019) The spatial distribution ofcongener-specific human PCB concentrations in a PCB-pol-luted region. Sci Total Environ 651:2292–2303.
Spanogiannopoulos, P., Bess, E. N., Carmody, R. N., & Turnbaugh,P. J. (2016). The microbial pharmacists within us: A metage-nomic view of xenobiotic metabolism. Nat. Rev. Microbiol. 14,273–287.
Tornevi A, Sommar J, Rantakokko P, Akesson A, Donat-Vargas C,Kiviranta H, Rolandsson O, Rylander L, Wennberg M, andBergdahl IA (2019) Chlorinated persistent organic pollutants
and type 2 diabetes - A population-based study with pre- andpost- diagnostic plasma samples. Environ Res 174:35–45.
Tyanova, S., Temu, T., and Cox, J. (2016a). The MaxQuant compu-tational platform for mass spectrometry-based shotgun pro-teomics. Nat. Protocols 11, 2301–2319.
Tyanova, S., Temu, T., Sinitcyn, P., Carlson, A., Hein, M. Y.,Geiger, T., Mann, M., and Cox, J. (2016b). The Perseus compu-tational platform for comprehensive analysis of (prote)omicsdata. Nat. Methods 13, 731–740.
United States Environmental Protection Agency [US EPA]. (18 May2016). Drinking Water Health Advisory for PerfluorooctaneSulfonate (PFOS). Environmental Protection Agency. DocumentNo.: EPA 822-R-16-004. Available at: https://www.epa.gov/sites/production/files/2016-05/documents/pfos_health_advisory_final_508.pdf. Accessed July 31, 2020.
Wan, H. T., Zhao, Y. G., Leung, P. Y., and Wong, C. K. C. (2014).Perinatal exposure to perfluorooctane sulfonate affects glu-cose metabolism in adult offspring. PLoS One 9, e87137.
Wan, H. T., Zhao, Y. G., Wei, X., Hui, K. Y., Giesy, J. P., and Wong,C. K. C. (2012). PFOS-induced hepatic steatosis, the mechanis-tic actions on b-oxidation and lipid transport. Biochim.Biophys. Acta 1820, 1092–1101.
Wang, L., Wang, Y., Liang, Y., Li, J., Liu, Y., Zhang, J., Zhang, A.,Fu, J., and Jiang, G. (2015). PFOS induced lipid metabolism dis-turbances in BALB/c mice through inhibition of low densitylipoproteins excretion. Sci. Rep. 4, 4582.
Weber R, Herold C, Hollert H, Kamphues J, Blepp M, andBallschmiter K (2018) Reviewing the relevance of dioxin andPCB sources for food from animal origin and the need fortheir inventory, control and management. Environ Sci Eur 30,42.
Winkens, K., Giovanoulis, G., Koponen, J., Vestergren, R., Berger,U., Karvonen, A. M., Pekkanen, J., Kiviranta, H., and Cousins,I. T. (2018). Perfluoroalkyl acids and their precursors in floordust of children’s bedrooms - Implications for indoor expo-sure. Environ. Int. 119, 493–502.
Xu, J., Shimpi, P., Armstrong, L., Salter, D., and Slitt, A. L. (2016).PFOS induces adipogenesis and glucose uptake in associa-tion with activation of Nrf2 signaling pathway. Toxicol. Appl.Pharmacol. 290, 21–30.
Yao, X., Sha, S., Wang, Y., Sun, X., Cao, J., Kang, J., Jiang, L., Chen,M., and Ma, Y. (2016). Perfluorooctane sulfonate inducesautophagy-dependent apoptosis through spinster 1-medi-ated lysosomal-mitochondrial axis and impaired mitophagy.Toxicol. Sci. 153, 198–211.
Zhang, L., Krishnan, P., Ehresman, D. J., Smith, P. B., Dutta, M.,Bagley, B. D., Chang, S.-C., Butenhoff, J. L., Patterson, A. D.,and Peters, J. M. (2016). Editor’s highlight: Perfluorooctanesulfonate-choline ion pair formation: A potential mecha-nism modulating hepatic steatosis and oxidative stress inmice. Toxicol. Sci. 153, 186–197.
Zhang, Y., Beesoon, S., Zhu, L., and Martin, J. W. (2013).Biomonitoring of perfluoroalkyl acids in human urine andestimates of biological half-life. Environ. Sci. Technol. 47,10619–10627.
Zhao, W., Zitzow, J. D., Weaver, Y., Ehresman, D. J., Chang, S.-C.,Butenhoff, J. L., and Hagenbuch, B. (2017). Organic aniontransporting polypeptides contribute to the disposition ofperfluoroalkyl acids in humans and rats. Toxicol. Sci. 156,84–95.
294 | PARADOXICAL EFFECT OF DIET ON PFOS AND PFNA
Dow
nloaded from https://academ
ic.oup.com/toxsci/article/180/2/277/6112049 by guest on 26 August 2022
Related Documents


