Page | 1
Census 2011 Briefing Paper
Basic Demographic Overview Date of Publication: 3 April 2013
Published by: Policy, Research and Engagement
o
1. Introduction
The Census was conducted in March, 2011 and the response rate was 92%.
2. Population change
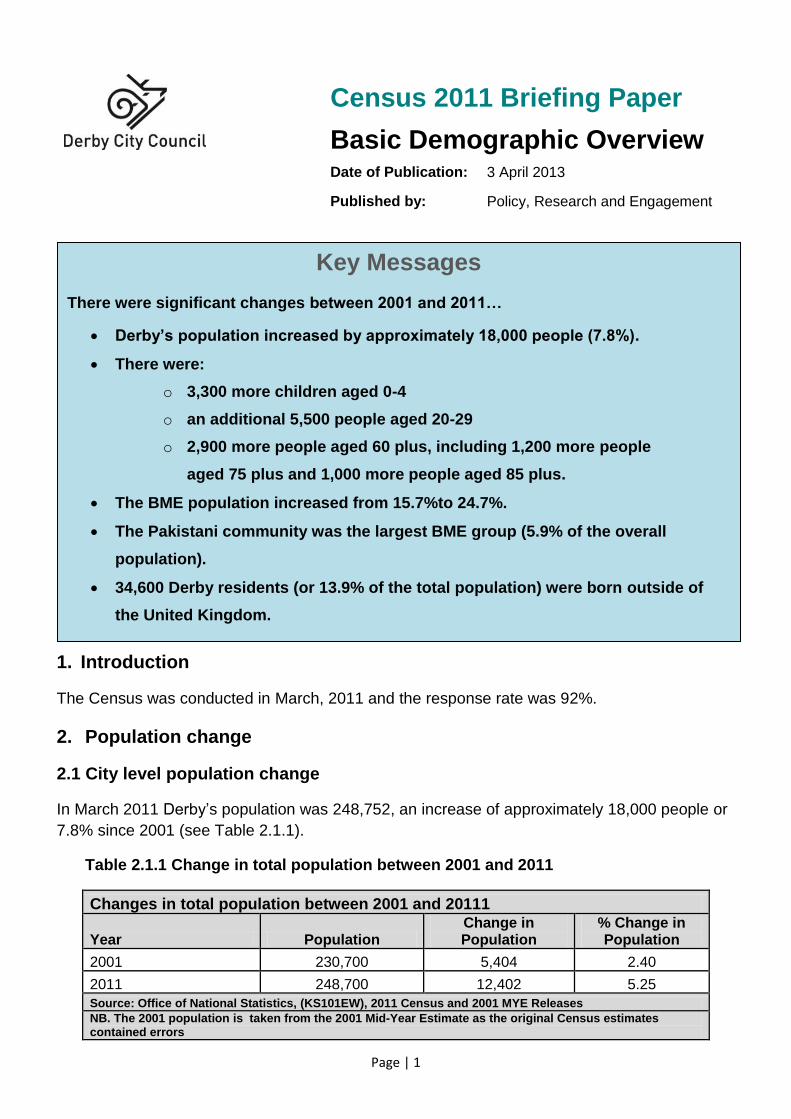
2.1 City level population change
In March 2011 Derby’s population was 248,752, an increase of approximately 18,000 people or
7.8% since 2001 (see Table 2.1.1).
Table 2.1.1 Change in total population between 2001 and 2011
Changes in total population between 2001 and 20111
Year Population Change in Population
% Change in Population
2001 230,700 5,404 2.40
2011 248,700 12,402 5.25
Source: Office of National Statistics, (KS101EW), 2011 Census and 2001 MYE Releases
NB. The 2001 population is taken from the 2001 Mid-Year Estimate as the original Census estimates contained errors
Key Messages
There were significant changes between 2001 and 2011…
Derby’s population increased by approximately 18,000 people (7.8%).
There were:
o 3,300 more children aged 0-4
o an additional 5,500 people aged 20-29
o 2,900 more people aged 60 plus, including 1,200 more people
aged 75 plus and 1,000 more people aged 85 plus.
The BME population increased from 15.7%to 24.7%.
The Pakistani community was the largest BME group (5.9% of the overall
population).
34,600 Derby residents (or 13.9% of the total population) were born outside of
the United Kingdom.
Page | 2
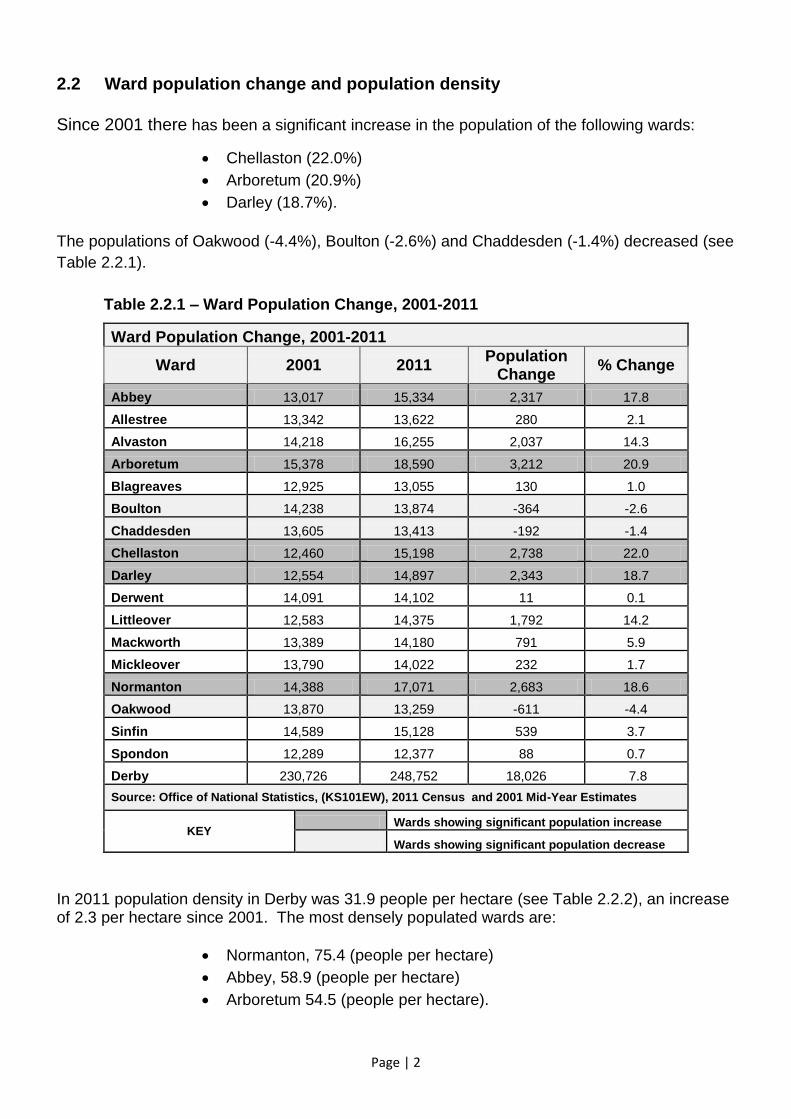
2.2 Ward population change and population density
Since 2001 there has been a significant increase in the population of the following wards:
Chellaston (22.0%)
Arboretum (20.9%)
Darley (18.7%).
The populations of Oakwood (-4.4%), Boulton (-2.6%) and Chaddesden (-1.4%) decreased (see
Table 2.2.1).
Table 2.2.1 – Ward Population Change, 2001-2011
Ward Population Change, 2001-2011
Ward 2001 2011 Population
Change % Change
Abbey 13,017 15,334 2,317 17.8
Allestree 13,342 13,622 280 2.1
Alvaston 14,218 16,255 2,037 14.3
Arboretum 15,378 18,590 3,212 20.9
Blagreaves 12,925 13,055 130 1.0
Boulton 14,238 13,874 -364 -2.6
Chaddesden 13,605 13,413 -192 -1.4
Chellaston 12,460 15,198 2,738 22.0
Darley 12,554 14,897 2,343 18.7
Derwent 14,091 14,102 11 0.1
Littleover 12,583 14,375 1,792 14.2
Mackworth 13,389 14,180 791 5.9
Mickleover 13,790 14,022 232 1.7
Normanton 14,388 17,071 2,683 18.6
Oakwood 13,870 13,259 -611 -4.4
Sinfin 14,589 15,128 539 3.7
Spondon 12,289 12,377 88 0.7
Derby 230,726 248,752 18,026 7.8
Source: Office of National Statistics, (KS101EW), 2011 Census and 2001 Mid-Year Estimates
KEY Wards showing significant population increase
Wards showing significant population decrease
In 2011 population density in Derby was 31.9 people per hectare (see Table 2.2.2), an increase of 2.3 per hectare since 2001. The most densely populated wards are:
Normanton, 75.4 (people per hectare)
Abbey, 58.9 (people per hectare)
Arboretum 54.5 (people per hectare).
Page | 3
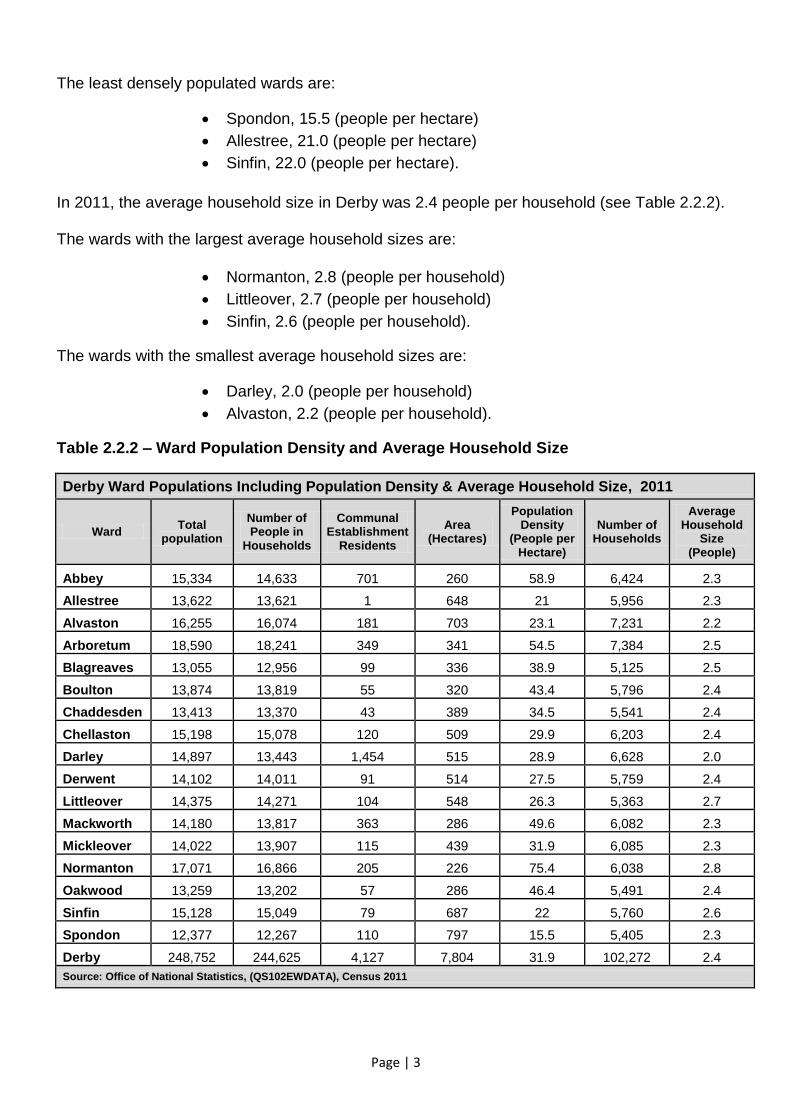
The least densely populated wards are:
Spondon, 15.5 (people per hectare)
Allestree, 21.0 (people per hectare)
Sinfin, 22.0 (people per hectare).
In 2011, the average household size in Derby was 2.4 people per household (see Table 2.2.2). The wards with the largest average household sizes are:
Normanton, 2.8 (people per household)
Littleover, 2.7 (people per household)
Sinfin, 2.6 (people per household).
The wards with the smallest average household sizes are:
Darley, 2.0 (people per household)
Alvaston, 2.2 (people per household).
Table 2.2.2 – Ward Population Density and Average Household Size
Derby Ward Populations Including Population Density & Average Household Size, 2011
Ward Total
population
Number of People in
Households
Communal Establishment
Residents
Area (Hectares)
Population Density
(People per Hectare)
Number of Households
Average Household
Size (People)
Abbey 15,334 14,633 701 260 58.9 6,424 2.3
Allestree 13,622 13,621 1 648 21 5,956 2.3
Alvaston 16,255 16,074 181 703 23.1 7,231 2.2
Arboretum 18,590 18,241 349 341 54.5 7,384 2.5
Blagreaves 13,055 12,956 99 336 38.9 5,125 2.5
Boulton 13,874 13,819 55 320 43.4 5,796 2.4
Chaddesden 13,413 13,370 43 389 34.5 5,541 2.4
Chellaston 15,198 15,078 120 509 29.9 6,203 2.4
Darley 14,897 13,443 1,454 515 28.9 6,628 2.0
Derwent 14,102 14,011 91 514 27.5 5,759 2.4
Littleover 14,375 14,271 104 548 26.3 5,363 2.7
Mackworth 14,180 13,817 363 286 49.6 6,082 2.3
Mickleover 14,022 13,907 115 439 31.9 6,085 2.3
Normanton 17,071 16,866 205 226 75.4 6,038 2.8
Oakwood 13,259 13,202 57 286 46.4 5,491 2.4
Sinfin 15,128 15,049 79 687 22 5,760 2.6
Spondon 12,377 12,267 110 797 15.5 5,405 2.3
Derby 248,752 244,625 4,127 7,804 31.9 102,272 2.4
Source: Office of National Statistics, (QS102EWDATA), Census 2011
Page | 4
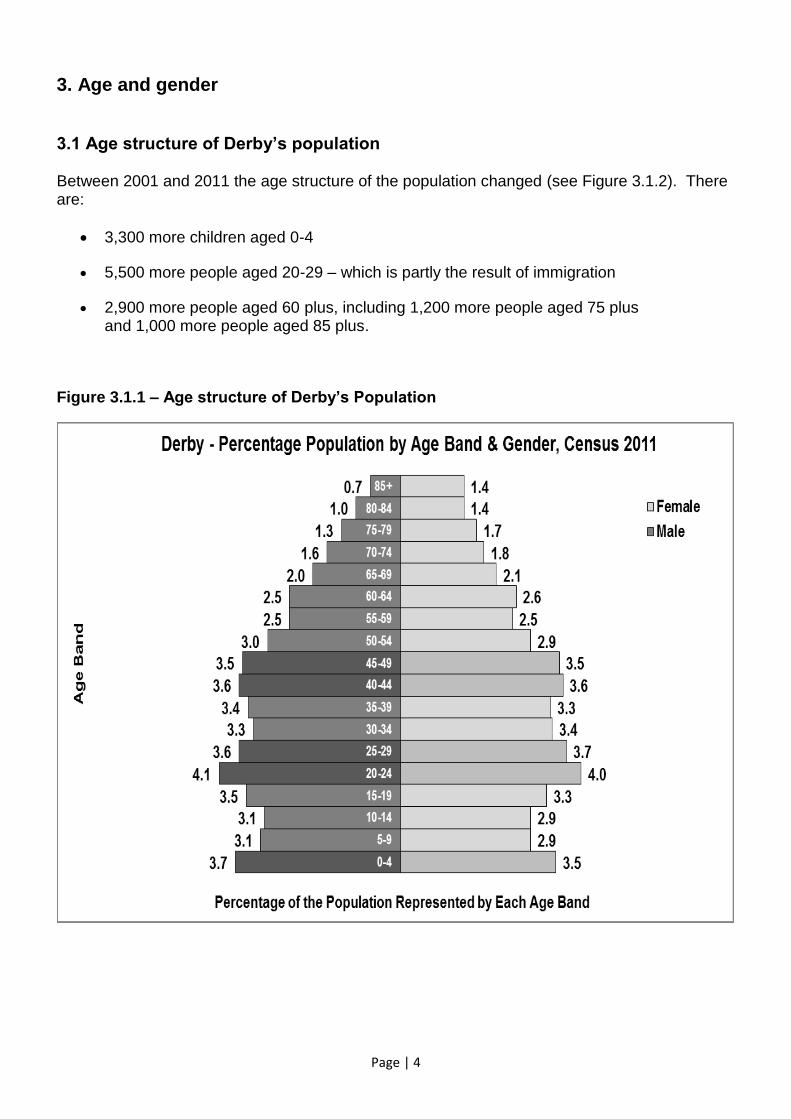
3. Age and gender
3.1 Age structure of Derby’s population Between 2001 and 2011 the age structure of the population changed (see Figure 3.1.2). There are:
3,300 more children aged 0-4
5,500 more people aged 20-29 – which is partly the result of immigration
2,900 more people aged 60 plus, including 1,200 more people aged 75 plus and 1,000 more people aged 85 plus.
Figure 3.1.1 – Age structure of Derby’s Population
Page | 5
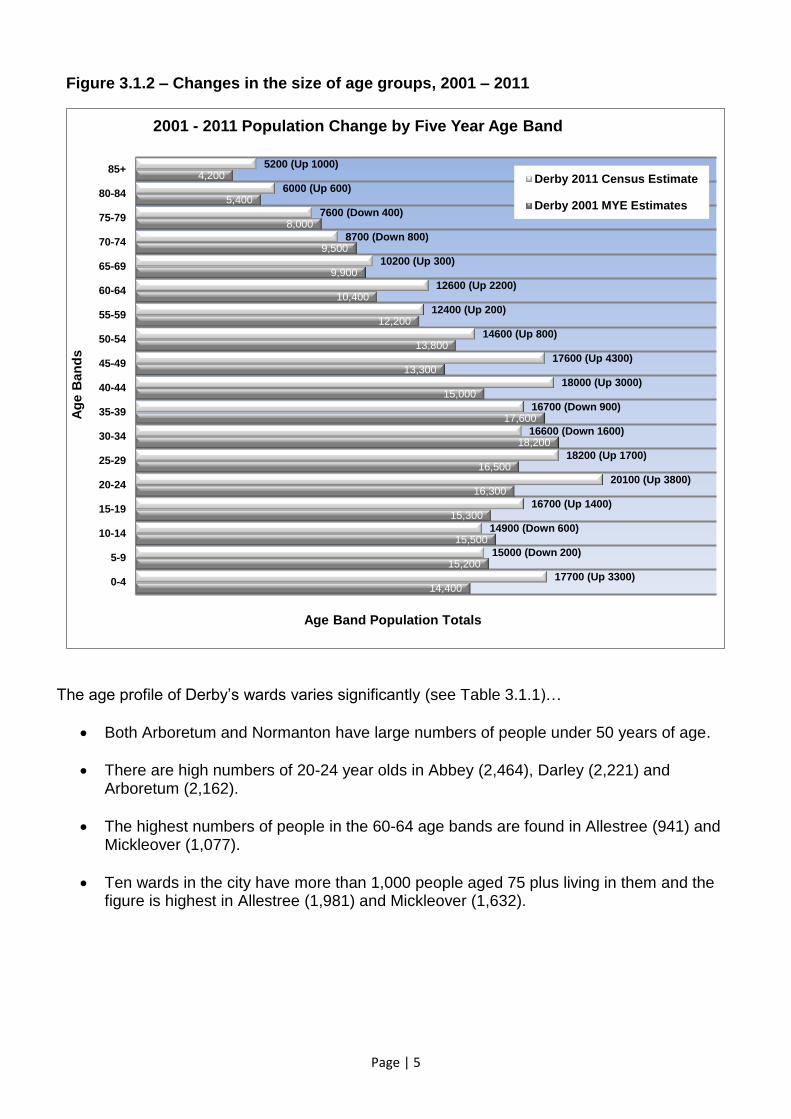
Figure 3.1.2 – Changes in the size of age groups, 2001 – 2011
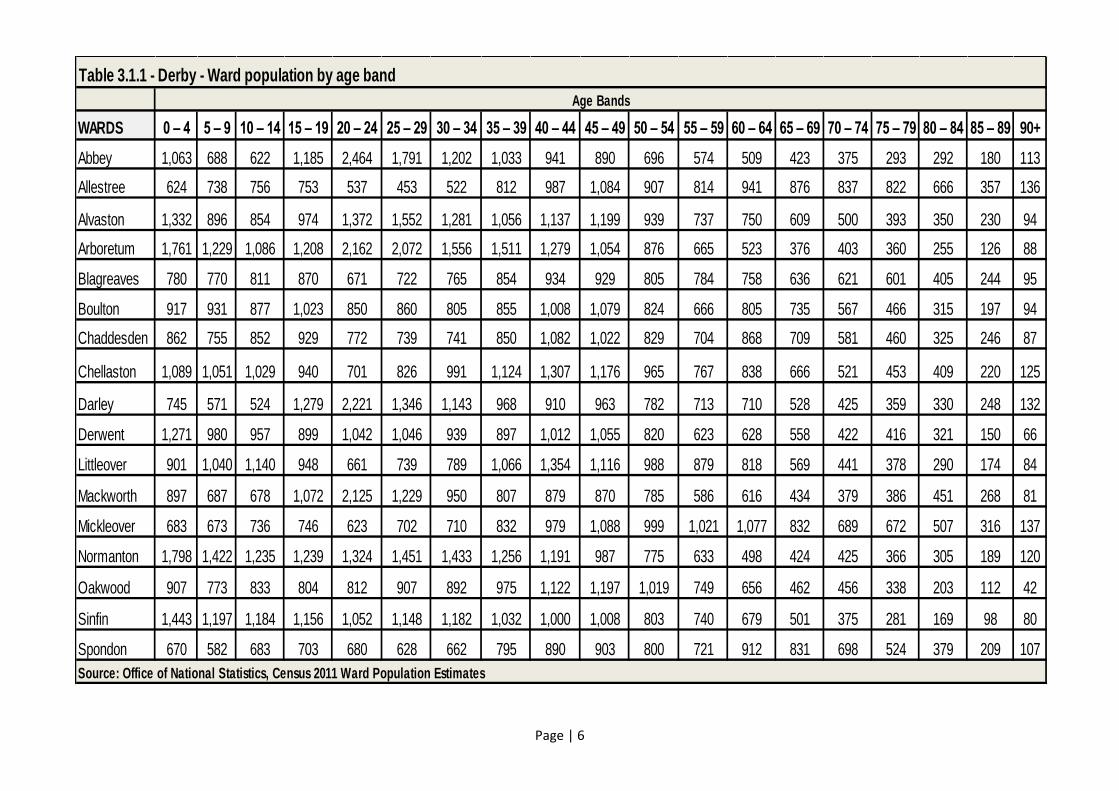
The age profile of Derby’s wards varies significantly (see Table 3.1.1)…
Both Arboretum and Normanton have large numbers of people under 50 years of age.
There are high numbers of 20-24 year olds in Abbey (2,464), Darley (2,221) and Arboretum (2,162).
The highest numbers of people in the 60-64 age bands are found in Allestree (941) and Mickleover (1,077).
Ten wards in the city have more than 1,000 people aged 75 plus living in them and the figure is highest in Allestree (1,981) and Mickleover (1,632).
14,400
15,200
15,500
15,300
16,300
16,500
18,200
17,600
15,000
13,300
13,800
12,200
10,400
9,900
9,500
8,000
5,400
4,200
17700 (Up 3300)
15000 (Down 200)
14900 (Down 600)
16700 (Up 1400)
20100 (Up 3800)
18200 (Up 1700)
16600 (Down 1600)
16700 (Down 900)
18000 (Up 3000)
17600 (Up 4300)
14600 (Up 800)
12400 (Up 200)
12600 (Up 2200)
10200 (Up 300)
8700 (Down 800)
7600 (Down 400)
6000 (Up 600)
5200 (Up 1000)
0-4
5-9
10-14
15-19
20-24
25-29
30-34
35-39
40-44
45-49
50-54
55-59
60-64
65-69
70-74
75-79
80-84
85+
Age Band Population Totals
Ag
e B
an
ds
2001 - 2011 Population Change by Five Year Age Band
Derby 2011 Census Estimate
Derby 2001 MYE Estimates
Page | 6
WARDS 0 ‒ 4 5 ‒ 9 10 ‒ 14 15 ‒ 19 20 ‒ 24 25 ‒ 29 30 ‒ 34 35 ‒ 39 40 ‒ 44 45 ‒ 49 50 ‒ 54 55 ‒ 59 60 ‒ 64 65 ‒ 69 70 ‒ 74 75 ‒ 79 80 ‒ 84 85 ‒ 89 90+
Abbey 1,063 688 622 1,185 2,464 1,791 1,202 1,033 941 890 696 574 509 423 375 293 292 180 113
Allestree 624 738 756 753 537 453 522 812 987 1,084 907 814 941 876 837 822 666 357 136
Alvaston 1,332 896 854 974 1,372 1,552 1,281 1,056 1,137 1,199 939 737 750 609 500 393 350 230 94
Arboretum 1,761 1,229 1,086 1,208 2,162 2,072 1,556 1,511 1,279 1,054 876 665 523 376 403 360 255 126 88
Blagreaves 780 770 811 870 671 722 765 854 934 929 805 784 758 636 621 601 405 244 95
Boulton 917 931 877 1,023 850 860 805 855 1,008 1,079 824 666 805 735 567 466 315 197 94
Chaddesden 862 755 852 929 772 739 741 850 1,082 1,022 829 704 868 709 581 460 325 246 87
Chellaston 1,089 1,051 1,029 940 701 826 991 1,124 1,307 1,176 965 767 838 666 521 453 409 220 125
Darley 745 571 524 1,279 2,221 1,346 1,143 968 910 963 782 713 710 528 425 359 330 248 132
Derwent 1,271 980 957 899 1,042 1,046 939 897 1,012 1,055 820 623 628 558 422 416 321 150 66
Littleover 901 1,040 1,140 948 661 739 789 1,066 1,354 1,116 988 879 818 569 441 378 290 174 84
Mackworth 897 687 678 1,072 2,125 1,229 950 807 879 870 785 586 616 434 379 386 451 268 81
Mickleover 683 673 736 746 623 702 710 832 979 1,088 999 1,021 1,077 832 689 672 507 316 137
Normanton 1,798 1,422 1,235 1,239 1,324 1,451 1,433 1,256 1,191 987 775 633 498 424 425 366 305 189 120
Oakwood 907 773 833 804 812 907 892 975 1,122 1,197 1,019 749 656 462 456 338 203 112 42
Sinfin 1,443 1,197 1,184 1,156 1,052 1,148 1,182 1,032 1,000 1,008 803 740 679 501 375 281 169 98 80
Spondon 670 582 683 703 680 628 662 795 890 903 800 721 912 831 698 524 379 209 107
Source: Office of National Statistics, Census 2011 Ward Population Estimates
Age Bands
Table 3.1.1 - Derby - Ward population by age band
Page | 7
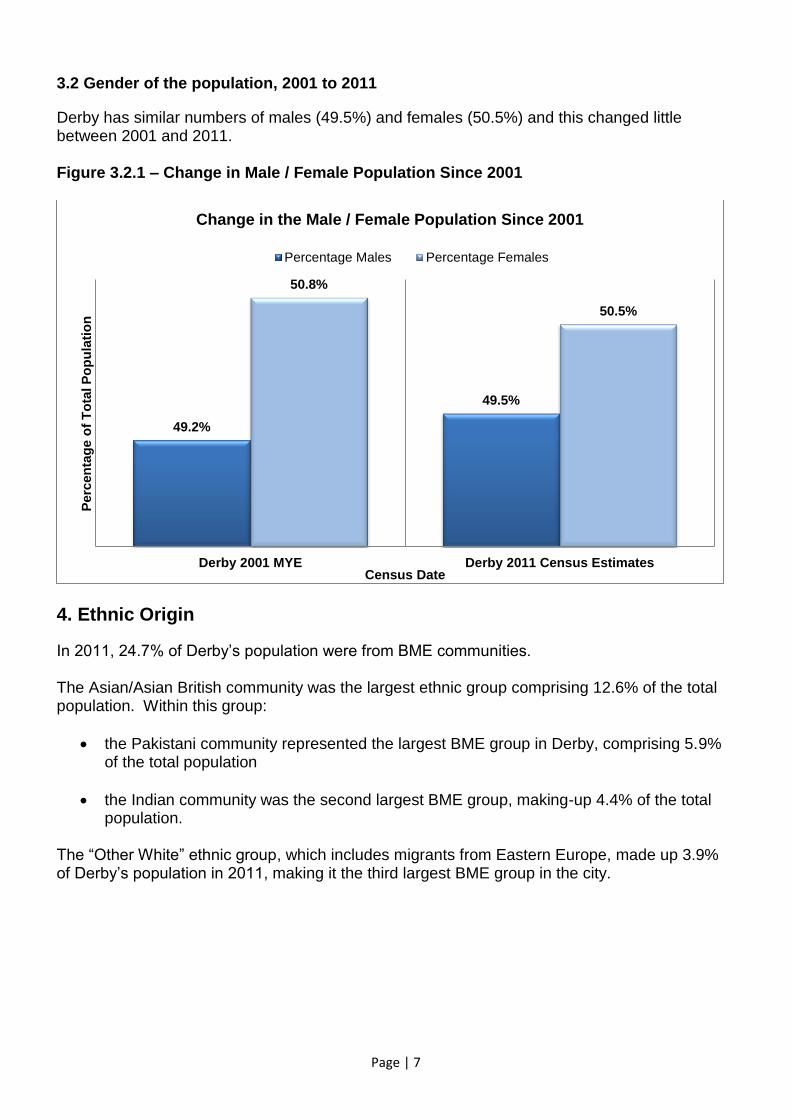
3.2 Gender of the population, 2001 to 2011
Derby has similar numbers of males (49.5%) and females (50.5%) and this changed little between 2001 and 2011. Figure 3.2.1 – Change in Male / Female Population Since 2001
4. Ethnic Origin
In 2011, 24.7% of Derby’s population were from BME communities. The Asian/Asian British community was the largest ethnic group comprising 12.6% of the total population. Within this group:
the Pakistani community represented the largest BME group in Derby, comprising 5.9% of the total population
the Indian community was the second largest BME group, making-up 4.4% of the total population.
The “Other White” ethnic group, which includes migrants from Eastern Europe, made up 3.9% of Derby’s population in 2011, making it the third largest BME group in the city.
49.2%
49.5%
50.8%
50.5%
Derby 2001 MYE Derby 2011 Census Estimates
Perc
en
tag
e o
f T
ota
l P
op
ula
tio
n
Census Date
Change in the Male / Female Population Since 2001
Percentage Males Percentage Females
Page | 8
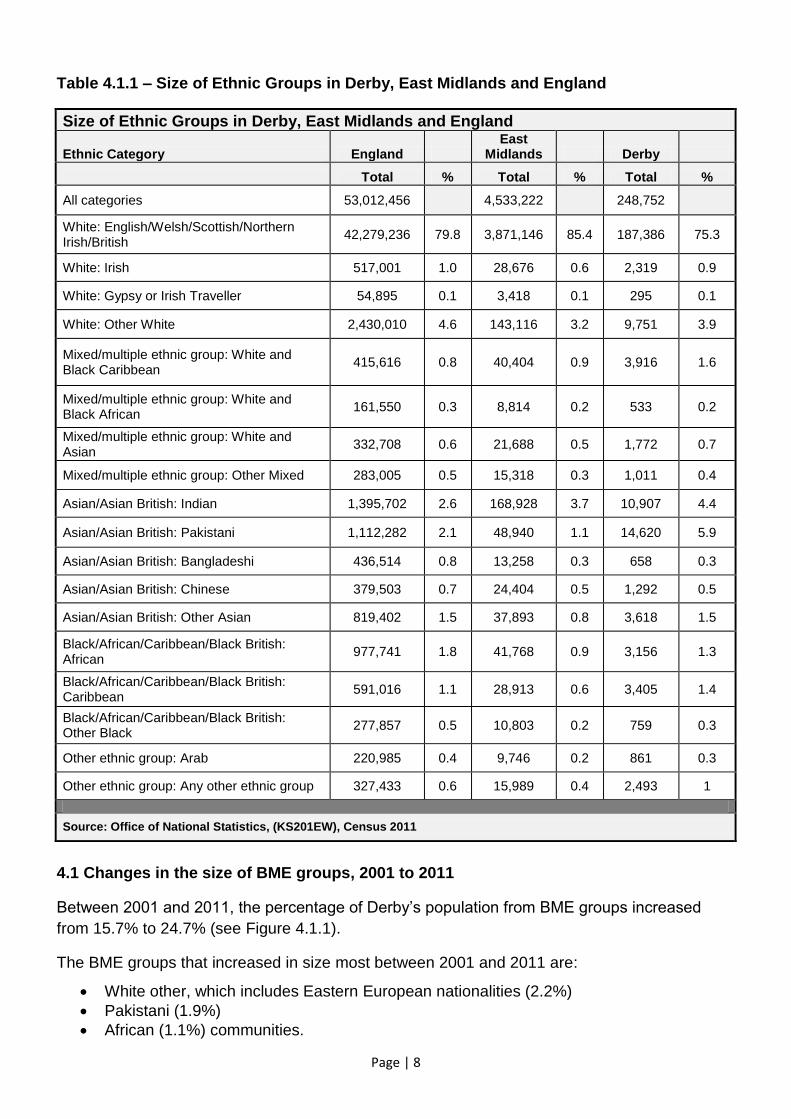
Table 4.1.1 – Size of Ethnic Groups in Derby, East Midlands and England
Size of Ethnic Groups in Derby, East Midlands and England
Ethnic Category England East
Midlands Derby
Total % Total % Total %
All categories 53,012,456
4,533,222
248,752
White: English/Welsh/Scottish/Northern Irish/British
42,279,236 79.8 3,871,146 85.4 187,386 75.3
White: Irish 517,001 1.0 28,676 0.6 2,319 0.9
White: Gypsy or Irish Traveller 54,895 0.1 3,418 0.1 295 0.1
White: Other White 2,430,010 4.6 143,116 3.2 9,751 3.9
Mixed/multiple ethnic group: White and Black Caribbean
415,616 0.8 40,404 0.9 3,916 1.6
Mixed/multiple ethnic group: White and Black African
161,550 0.3 8,814 0.2 533 0.2
Mixed/multiple ethnic group: White and Asian
332,708 0.6 21,688 0.5 1,772 0.7
Mixed/multiple ethnic group: Other Mixed 283,005 0.5 15,318 0.3 1,011 0.4
Asian/Asian British: Indian 1,395,702 2.6 168,928 3.7 10,907 4.4
Asian/Asian British: Pakistani 1,112,282 2.1 48,940 1.1 14,620 5.9
Asian/Asian British: Bangladeshi 436,514 0.8 13,258 0.3 658 0.3
Asian/Asian British: Chinese 379,503 0.7 24,404 0.5 1,292 0.5
Asian/Asian British: Other Asian 819,402 1.5 37,893 0.8 3,618 1.5
Black/African/Caribbean/Black British: African
977,741 1.8 41,768 0.9 3,156 1.3
Black/African/Caribbean/Black British: Caribbean
591,016 1.1 28,913 0.6 3,405 1.4
Black/African/Caribbean/Black British: Other Black
277,857 0.5 10,803 0.2 759 0.3
Other ethnic group: Arab 220,985 0.4 9,746 0.2 861 0.3
Other ethnic group: Any other ethnic group 327,433 0.6 15,989 0.4 2,493 1
Source: Office of National Statistics, (KS201EW), Census 2011
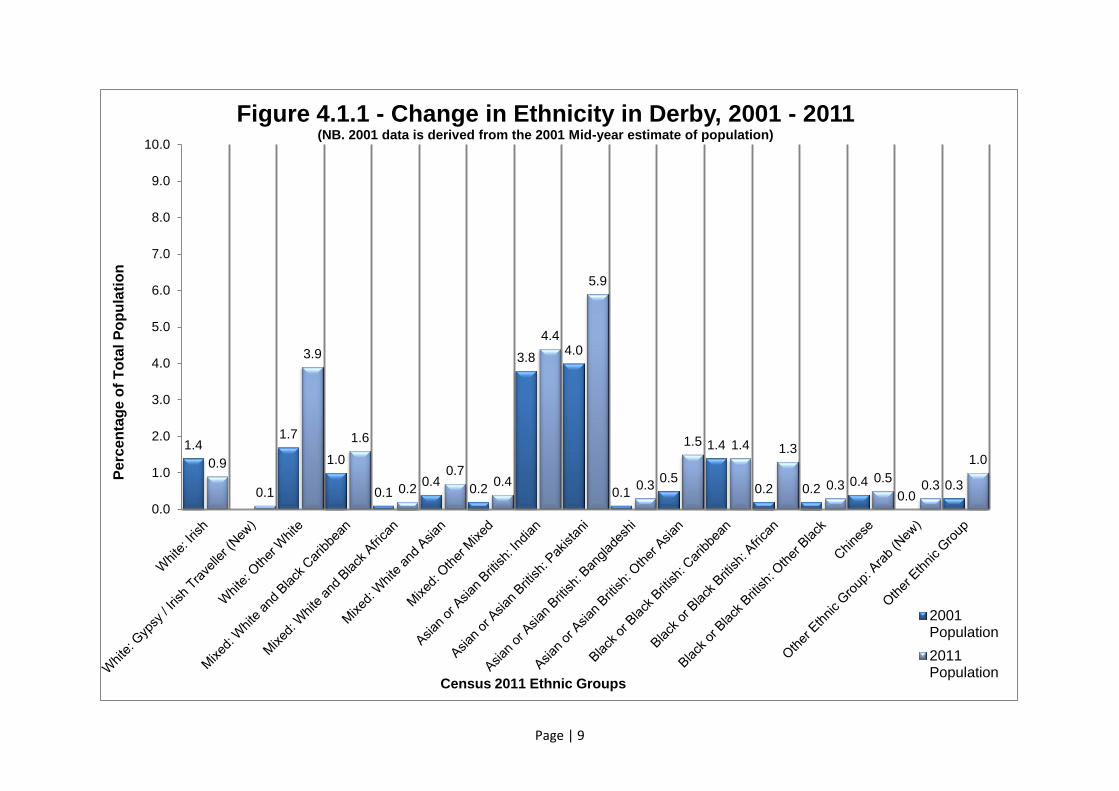
4.1 Changes in the size of BME groups, 2001 to 2011
Between 2001 and 2011, the percentage of Derby’s population from BME groups increased
from 15.7% to 24.7% (see Figure 4.1.1).
The BME groups that increased in size most between 2001 and 2011 are:
White other, which includes Eastern European nationalities (2.2%)
Pakistani (1.9%)
African (1.1%) communities.
Page | 9
1.4 1.7
1.0
0.1 0.4
0.2
3.8 4.0
0.1 0.5
1.4
0.2 0.2 0.4
0.0 0.3
0.9
0.1
3.9
1.6
0.2
0.7 0.4
4.4
5.9
0.3
1.5 1.4 1.3
0.3 0.5
0.3
1.0
0.0
1.0
2.0
3.0
4.0
5.0
6.0
7.0
8.0
9.0
10.0
Pe
rce
nta
ge
of
To
tal P
op
ula
tio
n
Census 2011 Ethnic Groups
Figure 4.1.1 - Change in Ethnicity in Derby, 2001 - 2011 (NB. 2001 data is derived from the 2001 Mid-year estimate of population)
2001Population
2011Population
Page | 10
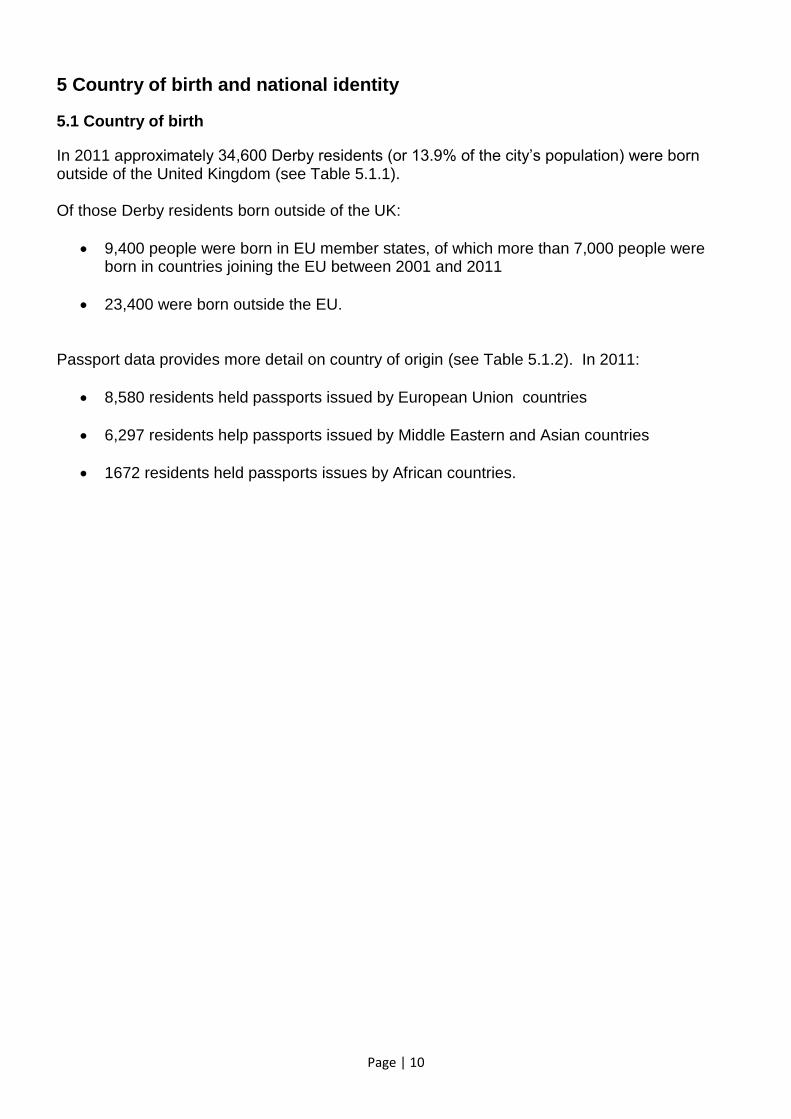
5 Country of birth and national identity
5.1 Country of birth
In 2011 approximately 34,600 Derby residents (or 13.9% of the city’s population) were born outside of the United Kingdom (see Table 5.1.1). Of those Derby residents born outside of the UK:
9,400 people were born in EU member states, of which more than 7,000 people were born in countries joining the EU between 2001 and 2011
23,400 were born outside the EU. Passport data provides more detail on country of origin (see Table 5.1.2). In 2011:
8,580 residents held passports issued by European Union countries
6,297 residents help passports issued by Middle Eastern and Asian countries
1672 residents held passports issues by African countries.
Page | 11
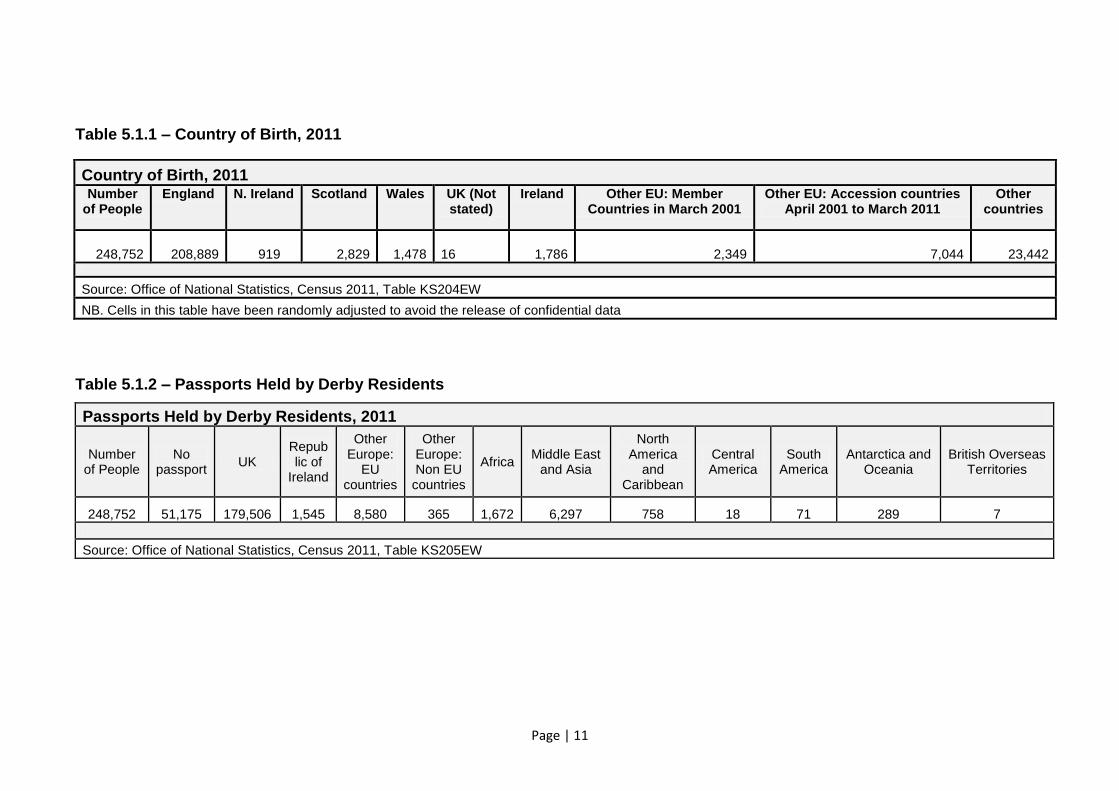
Table 5.1.1 – Country of Birth, 2011
Country of Birth, 2011 Number
of People England N. Ireland Scotland Wales UK (Not
stated) Ireland Other EU: Member
Countries in March 2001 Other EU: Accession countries
April 2001 to March 2011 Other
countries
248,752 208,889 919 2,829 1,478
16
1,786 2,349 7,044 23,442
Source: Office of National Statistics, Census 2011, Table KS204EW
NB. Cells in this table have been randomly adjusted to avoid the release of confidential data
Table 5.1.2 – Passports Held by Derby Residents
Passports Held by Derby Residents, 2011
Number of People
No passport
UK Republic of
Ireland
Other Europe:
EU countries
Other Europe: Non EU countries
Africa Middle East
and Asia
North America
and Caribbean
Central America
South America
Antarctica and Oceania
British Overseas Territories
248,752 51,175 179,506 1,545 8,580 365 1,672 6,297 758 18 71 289 7
Source: Office of National Statistics, Census 2011, Table KS205EW
Page | 12
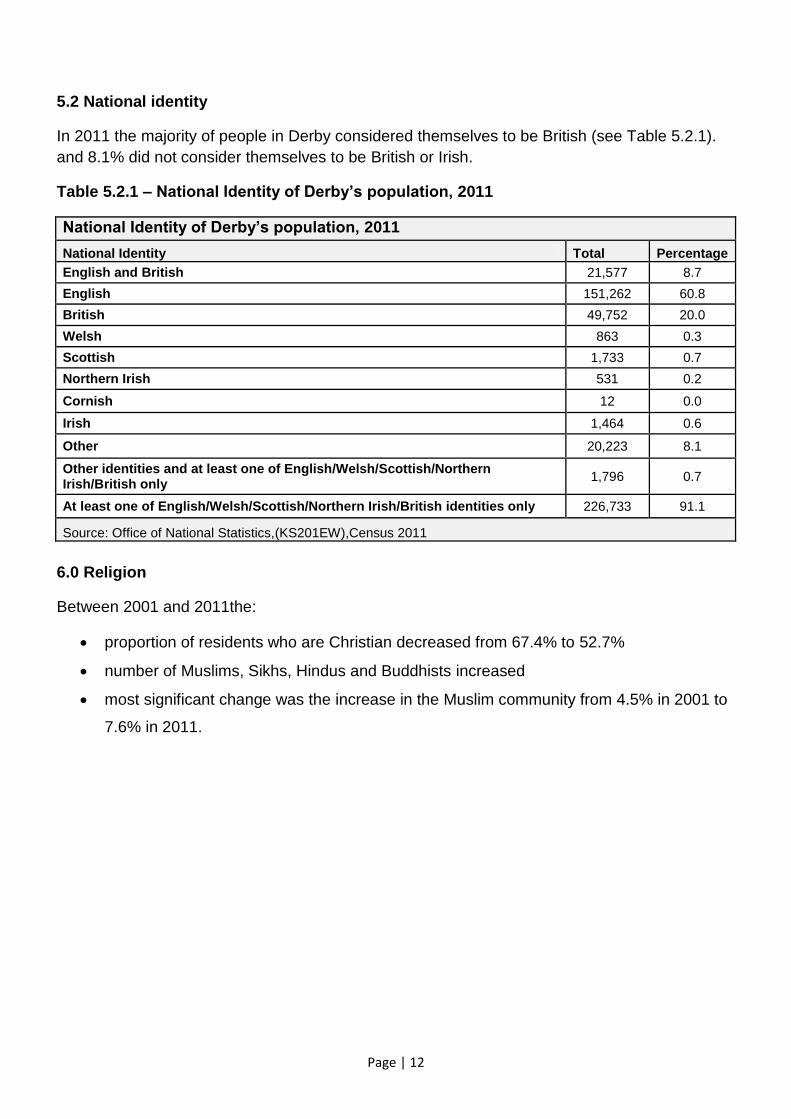
5.2 National identity
In 2011 the majority of people in Derby considered themselves to be British (see Table 5.2.1).
and 8.1% did not consider themselves to be British or Irish.
Table 5.2.1 – National Identity of Derby’s population, 2011
National Identity of Derby’s population, 2011
National Identity Total Percentage
English and British 21,577 8.7
English 151,262 60.8
British 49,752 20.0
Welsh 863 0.3
Scottish 1,733 0.7
Northern Irish 531 0.2
Cornish 12 0.0
Irish 1,464 0.6
Other 20,223 8.1
Other identities and at least one of English/Welsh/Scottish/Northern Irish/British only
1,796 0.7
At least one of English/Welsh/Scottish/Northern Irish/British identities only 226,733 91.1
Source: Office of National Statistics,(KS201EW),Census 2011
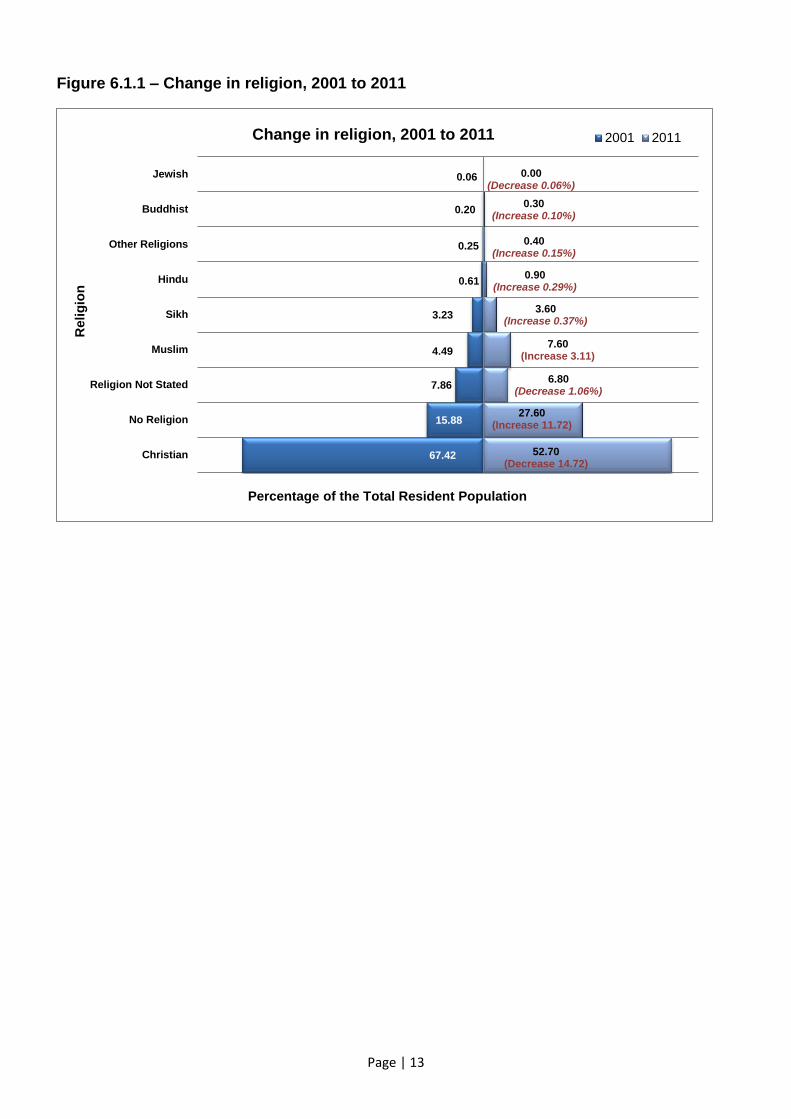
6.0 Religion
Between 2001 and 2011the:
proportion of residents who are Christian decreased from 67.4% to 52.7%
number of Muslims, Sikhs, Hindus and Buddhists increased
most significant change was the increase in the Muslim community from 4.5% in 2001 to
7.6% in 2011.
Page | 13
Figure 6.1.1 – Change in religion, 2001 to 2011
67.42
15.88
7.86
4.49
3.23
0.61
0.25
0.20
0.06
52.70 (Decrease 14.72)
27.60 (Increase 11.72)
6.80 (Decrease 1.06%)
7.60 (Increase 3.11)
3.60 (Increase 0.37%)
0.90 (Increase 0.29%)
0.40 (Increase 0.15%)
0.30 (Increase 0.10%)
0.00 (Decrease 0.06%)
Christian
No Religion
Religion Not Stated
Muslim
Sikh
Hindu
Other Religions
Buddhist
Jewish
Percentage of the Total Resident Population
Relig
ion
Change in religion, 2001 to 2011 2001 2011