Agenda for Quarterly Meeting on MDUFA III (FY 2013-2017) PerformanceNovember 9, 2015
10:00 A.M.
Welcome. Barbara Zimmerman, CDRH-ODE.
Guidance Development
• Paul Gadiock, CDRH-OCD.
FDA MDUFA Performance — Actions through September 30, 2015
• Report on decisions goals for 4th Quarter of FY 2015.
o CDRH: Barbara Zimmerman, CDRH.
o CBER: Sheryl Kochman, CBER.
Qualitative Update on Finances – 4th Quarter of FY 2015
• User fee receipts through the 4th Quarter of FY 2015 – Maurille Beheton and David Miller,
FDA-OFM.
CDRH Registration and Listing
• Report on registration and listing- Dave Gartner, CDRH-OC.
Independent Assessment
• Progress and update- Raphaela (Madonna) Simon, FDA-OC.
CDRH Staff Training Update
• Jacqueline Woodard, CDRH-OCE.
Set date for next meeting, following close of Q1 FY 2016 -Target Date: TBD, 2015 from 10:00
am - Noon
Page 1 of 371

Page intentionally left blank
Page 2 of 371
Medical Device Guidance Documents
Issued in FY 2015
(July 1, 2015 through September 30, 2015)
1. Heparin-Containing Medical Devices and Combination Products: Recommendations for Labeling and Safety Testing - Draft Guidance for Industry and Food and Drug Administration Staff (7/09/2015) http://www.fda.gov/MedicalDevices/DeviceRegulationandGuidance/GuidanceDo cuments/UCM453819
2. Submission of Premarket Notifications for Magnetic Resonance Diagnostic Devices - Draft Guidance for Industry and Food and Drug Administration Staff http://www.fda.gov/MedicalDevices/DeviceRegulationandGuidance/GuidanceDocumen ts/UCM454613 (7/14/2015)
3. FY 2016 Medical Device User Fee Small Business Qualification and Certification - Guidance for Industry, Food and Drug Administration Staff and Foreign Governments (8/3/2015) http://www.fda.gov/MedicalDevices/DeviceRegulationandGuidance/GuidanceDoc uments/UCM456779
4. Class II Special Controls Guideline: Nucleic Acid Amplification Assays for the Detection of Trichomonas vaginalis - Guideline for Industry and Food and Drug Administration Staff (8/4/2015) http://www.fda.gov/MedicalDevices/DeviceRegulationandGuidance/GuidanceDoc uments/UCM458913
5. Refuse to Accept Policy for 510(k)s - Guidance for Industry and Food and Drug Administration Staff (8/4/2015) http://www.fda.gov/MedicalDevices/DeviceRegulationandGuidance/GuidanceDoc uments/UCM315014
6. Global Unique Device Identification Database (GUDID): Data Submission Compliance Date of September 24, 2015 - Guidance for Industry and Food and Drug Administration Staff (8/14/2015) http://www.fda.gov/MedicalDevices/DeviceRegulationandGuidance/GuidanceDo cuments/UCM458634
7. Intent to Exempt Certain Unclassified, Class II, and Class I Reserved Medical Devices from Premarket Notification Requirements - Guidance for Industry and Food and Drug Administration Staff (8/14/2015) http://www.fda.gov/MedicalDevices/DeviceRegulationandGuidance/GuidanceDo cuments/UCM407292
Page 3 of 371
8. Establishing the Performance Characteristics of In Vitro Diagnostic Devices for the Detection or Detection and Differentiation of Human Papillomaviruses - Draft Guidance for Industry and Food and Drug Administration Staff (8/14/2015) http://www.fda.gov/MedicalDevices/DeviceRegulationandGuidance/GuidanceDo cuments/UCM458179
9. Endotoxin Testing Recommendations for Single-Use Intraocular Ophthalmic Devices -Guidance for Industry and Food and Drug Administration Staff (8/17/2015) http://www.fda.gov/MedicalDevices/DeviceRegulationandGuidance/GuidanceDo cuments/UCM393376
10. Select Updates for Non-Clinical Engineering Tests and Recommended Labeling for Intravascular Stents and Associated Delivery Systems - Guidance for Industry and Food and Drug Administration Staff (8/27/2015) http://www.fda.gov/MedicalDevices/DeviceRegulationandGuidance/GuidanceDo cuments/UCM458490
11. Class II Special Controls Guideline Document: Toxin Gene Amplification Assays for the Detection of Clostridium difficile - Guideline for Industry and Food and Drug Administration Staff (8/27/2015) http://www.fda.gov/MedicalDevices/DeviceRegulationandGuidance/GuidanceDo cuments/UCM459917
Page 4 of 371

Quarterly Update on Medical Device Performance Goals
----MDUFA III CDRH Performance Data ---Action through 30 September 2015
Page 5 of 371
Table of Contents
Acronyms and Abbreviations‐‐‐‐‐‐‐‐‐‐‐‐‐‐‐‐‐‐‐‐‐‐‐‐‐‐‐‐‐‐‐‐‐‐‐‐‐‐‐‐‐‐‐‐‐‐‐‐‐‐‐‐‐‐‐‐‐‐‐‐‐‐‐‐‐‐‐‐‐‐‐‐‐‐‐‐‐‐ 9
Section 1: PMA Originals and Panel Track Supplements ‐‐‐‐‐‐‐‐‐‐‐‐‐‐‐‐‐‐‐‐‐‐‐‐‐‐‐‐‐‐‐‐‐‐‐‐‐‐‐‐‐‐ 11 PMA Originals and Panel Track Supplements – Center Level ‐‐‐‐‐‐‐‐‐‐‐‐‐‐‐‐‐‐‐‐‐‐‐‐‐‐‐‐‐‐‐‐‐‐‐‐‐‐‐‐‐‐‐‐‐‐‐‐‐‐‐‐‐‐‐‐‐ 27
PMA Originals and Panel Track Supplements – Office Level
ODE ‐‐‐‐‐‐‐‐‐‐‐‐‐‐‐‐‐‐‐‐‐‐‐‐‐‐‐‐‐‐‐‐‐‐‐‐‐‐‐‐‐‐‐‐‐‐‐‐‐‐‐‐‐‐‐‐‐‐‐‐‐‐‐‐‐‐‐‐‐‐‐‐‐‐‐‐‐‐‐‐‐‐‐‐‐‐‐‐‐‐‐‐‐‐‐‐‐‐‐‐‐‐‐‐‐‐‐‐‐‐‐‐‐‐‐‐‐‐‐‐‐‐ 33
OIR ‐‐‐‐‐‐‐‐‐‐‐‐‐‐‐‐‐‐‐‐‐‐‐‐‐‐‐‐‐‐‐‐‐‐‐‐‐‐‐‐‐‐‐‐‐‐‐‐‐‐‐‐‐‐‐‐‐‐‐‐‐‐‐‐‐‐‐‐‐‐‐‐‐‐‐‐‐‐‐‐‐‐‐‐‐‐‐‐‐‐‐‐‐‐‐‐‐‐‐‐‐‐‐‐‐‐‐‐‐‐‐‐‐‐‐‐‐‐‐‐‐‐‐ 39
PMA Originals and Panel Track Supplements – Division Level
DAGRID ‐‐‐‐‐‐‐‐‐‐‐‐‐‐‐‐‐‐‐‐‐‐‐‐‐‐‐‐‐‐‐‐‐‐‐‐‐‐‐‐‐‐‐‐‐‐‐‐‐‐‐‐‐‐‐‐‐‐‐‐‐‐‐‐‐‐‐‐‐‐‐‐‐‐‐‐‐‐‐‐‐‐‐‐‐‐‐‐‐‐‐‐‐‐‐‐‐‐‐‐‐‐‐‐‐‐‐‐‐‐‐‐‐ 45
DCD‐‐‐‐‐‐‐‐‐‐‐‐‐‐‐‐‐‐‐‐‐‐‐‐‐‐‐‐‐‐‐‐‐‐‐‐‐‐‐‐‐‐‐‐‐‐‐‐‐‐‐‐‐‐‐‐‐‐‐‐‐‐‐‐‐‐‐‐‐‐‐‐‐‐‐‐‐‐‐‐‐‐‐‐‐‐‐‐‐‐‐‐‐‐‐‐‐‐‐‐‐‐‐‐‐‐‐‐‐‐‐‐‐‐‐‐‐‐ 51
DNPMD ‐‐‐‐‐‐‐‐‐‐‐‐‐‐‐‐‐‐‐‐‐‐‐‐‐‐‐‐‐‐‐‐‐‐‐‐‐‐‐‐‐‐‐‐‐‐‐‐‐‐‐‐‐‐‐‐‐‐‐‐‐‐‐‐‐‐‐‐‐‐‐‐‐‐‐‐‐‐‐‐‐‐‐‐‐‐‐‐‐‐‐‐‐‐‐‐‐‐‐‐‐‐‐‐‐‐‐‐‐‐‐‐‐ 57
DOD ‐‐‐‐‐‐‐‐‐‐‐‐‐‐‐‐‐‐‐‐‐‐‐‐‐‐‐‐‐‐‐‐‐‐‐‐‐‐‐‐‐‐‐‐‐‐‐‐‐‐‐‐‐‐‐‐‐‐‐‐‐‐‐‐‐‐‐‐‐‐‐‐‐‐‐‐‐‐‐‐‐‐‐‐‐‐‐‐‐‐‐‐‐‐‐‐‐‐‐‐‐‐‐‐‐‐‐‐‐‐‐‐‐‐‐‐‐ 63
DOED‐‐‐‐‐‐‐‐‐‐‐‐‐‐‐‐‐‐‐‐‐‐‐‐‐‐‐‐‐‐‐‐‐‐‐‐‐‐‐‐‐‐‐‐‐‐‐‐‐‐‐‐‐‐‐‐‐‐‐‐‐‐‐‐‐‐‐‐‐‐‐‐‐‐‐‐‐‐‐‐‐‐‐‐‐‐‐‐‐‐‐‐‐‐‐‐‐‐‐‐‐‐‐‐‐‐‐‐‐‐‐‐‐‐‐‐ 69
DRGUD‐‐‐‐‐‐‐‐‐‐‐‐‐‐‐‐‐‐‐‐‐‐‐‐‐‐‐‐‐‐‐‐‐‐‐‐‐‐‐‐‐‐‐‐‐‐‐‐‐‐‐‐‐‐‐‐‐‐‐‐‐‐‐‐‐‐‐‐‐‐‐‐‐‐‐‐‐‐‐‐‐‐‐‐‐‐‐‐‐‐‐‐‐‐‐‐‐‐‐‐‐‐‐‐‐‐‐‐‐‐‐‐‐‐ 75
DSD ‐‐‐‐‐‐‐‐‐‐‐‐‐‐‐‐‐‐‐‐‐‐‐‐‐‐‐‐‐‐‐‐‐‐‐‐‐‐‐‐‐‐‐‐‐‐‐‐‐‐‐‐‐‐‐‐‐‐‐‐‐‐‐‐‐‐‐‐‐‐‐‐‐‐‐‐‐‐‐‐‐‐‐‐‐‐‐‐‐‐‐‐‐‐‐‐‐‐‐‐‐‐‐‐‐‐‐‐‐‐‐‐‐‐‐‐‐‐ 81
DCTD ‐‐‐‐‐‐‐‐‐‐‐‐‐‐‐‐‐‐‐‐‐‐‐‐‐‐‐‐‐‐‐‐‐‐‐‐‐‐‐‐‐‐‐‐‐‐‐‐‐‐‐‐‐‐‐‐‐‐‐‐‐‐‐‐‐‐‐‐‐‐‐‐‐‐‐‐‐‐‐‐‐‐‐‐‐‐‐‐‐‐‐‐‐‐‐‐‐‐‐‐‐‐‐‐‐‐‐‐‐‐‐‐‐‐‐‐ 87
DIHD‐‐‐‐‐‐‐‐‐‐‐‐‐‐‐‐‐‐‐‐‐‐‐‐‐‐‐‐‐‐‐‐‐‐‐‐‐‐‐‐‐‐‐‐‐‐‐‐‐‐‐‐‐‐‐‐‐‐‐‐‐‐‐‐‐‐‐‐‐‐‐‐‐‐‐‐‐‐‐‐‐‐‐‐‐‐‐‐‐‐‐‐‐‐‐‐‐‐‐‐‐‐‐‐‐‐‐‐‐‐‐‐‐‐‐‐‐ 93
DMD‐‐‐‐‐‐‐‐‐‐‐‐‐‐‐‐‐‐‐‐‐‐‐‐‐‐‐‐‐‐‐‐‐‐‐‐‐‐‐‐‐‐‐‐‐‐‐‐‐‐‐‐‐‐‐‐‐‐‐‐‐‐‐‐‐‐‐‐‐‐‐‐‐‐‐‐‐‐‐‐‐‐‐‐‐‐‐‐‐‐‐‐‐‐‐‐‐‐‐‐‐‐‐‐‐‐‐‐‐‐‐‐‐‐‐‐‐ 99
DMGP ‐‐‐‐‐‐‐‐‐‐‐‐‐‐‐‐‐‐‐‐‐‐‐‐‐‐‐‐‐‐‐‐‐‐‐‐‐‐‐‐‐‐‐‐‐‐‐‐‐‐‐‐‐‐‐‐‐‐‐‐‐‐‐‐‐‐‐‐‐‐‐‐‐‐‐‐‐‐‐‐‐‐‐‐‐‐‐‐‐‐‐‐‐‐‐‐‐‐‐‐‐‐‐‐‐‐‐‐‐‐‐‐‐‐‐105
DRH‐‐‐‐‐‐‐‐‐‐‐‐‐‐‐‐‐‐‐‐‐‐‐‐‐‐‐‐‐‐‐‐‐‐‐‐‐‐‐‐‐‐‐‐‐‐‐‐‐‐‐‐‐‐‐‐‐‐‐‐‐‐‐‐‐‐‐‐‐‐‐‐‐‐‐‐‐‐‐‐‐‐‐‐‐‐‐‐‐‐‐‐‐‐‐‐‐‐‐‐‐‐‐‐‐‐‐‐‐‐‐‐‐‐‐‐‐‐111
Section 2: PMA 180 Day Supplements ‐‐‐‐‐‐‐‐‐‐‐‐‐‐‐‐‐‐‐‐‐‐‐‐‐‐‐‐‐‐‐‐‐‐‐‐‐‐‐‐‐‐‐‐‐‐‐‐‐‐‐‐‐‐‐‐‐‐‐‐‐‐‐‐‐117 PMA 180 Day Supplements – Center Level‐‐‐‐‐‐‐‐‐‐‐‐‐‐‐‐‐‐‐‐‐‐‐‐‐‐‐‐‐‐‐‐‐‐‐‐‐‐‐‐‐‐‐‐‐‐‐‐‐‐‐‐‐‐‐‐‐‐‐‐‐‐‐‐‐‐‐‐‐‐‐‐‐‐‐‐‐‐‐‐121
PMA 180 Day Supplements – Office Level ODE ‐‐‐‐‐‐‐‐‐‐‐‐‐‐‐‐‐‐‐‐‐‐‐‐‐‐‐‐‐‐‐‐‐‐‐‐‐‐‐‐‐‐‐‐‐‐‐‐‐‐‐‐‐‐‐‐‐‐‐‐‐‐‐‐‐‐‐‐‐‐‐‐‐‐‐‐‐‐‐‐‐‐‐‐‐‐‐‐‐‐‐‐‐‐‐‐‐‐‐‐‐‐‐‐‐‐‐‐‐‐‐‐‐‐‐‐‐‐‐‐‐‐123
OIR ‐‐‐‐‐‐‐‐‐‐‐‐‐‐‐‐‐‐‐‐‐‐‐‐‐‐‐‐‐‐‐‐‐‐‐‐‐‐‐‐‐‐‐‐‐‐‐‐‐‐‐‐‐‐‐‐‐‐‐‐‐‐‐‐‐‐‐‐‐‐‐‐‐‐‐‐‐‐‐‐‐‐‐‐‐‐‐‐‐‐‐‐‐‐‐‐‐‐‐‐‐‐‐‐‐‐‐‐‐‐‐‐‐‐‐‐‐‐‐‐‐‐‐125
PMA 180 Day Supplements – Division Level
DAGRID ‐‐‐‐‐‐‐‐‐‐‐‐‐‐‐‐‐‐‐‐‐‐‐‐‐‐‐‐‐‐‐‐‐‐‐‐‐‐‐‐‐‐‐‐‐‐‐‐‐‐‐‐‐‐‐‐‐‐‐‐‐‐‐‐‐‐‐‐‐‐‐‐‐‐‐‐‐‐‐‐‐‐‐‐‐‐‐‐‐‐‐‐‐‐‐‐‐‐‐‐‐‐‐‐‐‐‐‐‐‐‐‐‐127
DCD‐‐‐‐‐‐‐‐‐‐‐‐‐‐‐‐‐‐‐‐‐‐‐‐‐‐‐‐‐‐‐‐‐‐‐‐‐‐‐‐‐‐‐‐‐‐‐‐‐‐‐‐‐‐‐‐‐‐‐‐‐‐‐‐‐‐‐‐‐‐‐‐‐‐‐‐‐‐‐‐‐‐‐‐‐‐‐‐‐‐‐‐‐‐‐‐‐‐‐‐‐‐‐‐‐‐‐‐‐‐‐‐‐‐‐‐‐‐129
DNPMD ‐‐‐‐‐‐‐‐‐‐‐‐‐‐‐‐‐‐‐‐‐‐‐‐‐‐‐‐‐‐‐‐‐‐‐‐‐‐‐‐‐‐‐‐‐‐‐‐‐‐‐‐‐‐‐‐‐‐‐‐‐‐‐‐‐‐‐‐‐‐‐‐‐‐‐‐‐‐‐‐‐‐‐‐‐‐‐‐‐‐‐‐‐‐‐‐‐‐‐‐‐‐‐‐‐‐‐‐‐‐‐‐‐131
DOD ‐‐‐‐‐‐‐‐‐‐‐‐‐‐‐‐‐‐‐‐‐‐‐‐‐‐‐‐‐‐‐‐‐‐‐‐‐‐‐‐‐‐‐‐‐‐‐‐‐‐‐‐‐‐‐‐‐‐‐‐‐‐‐‐‐‐‐‐‐‐‐‐‐‐‐‐‐‐‐‐‐‐‐‐‐‐‐‐‐‐‐‐‐‐‐‐‐‐‐‐‐‐‐‐‐‐‐‐‐‐‐‐‐‐‐‐‐133
DOED‐‐‐‐‐‐‐‐‐‐‐‐‐‐‐‐‐‐‐‐‐‐‐‐‐‐‐‐‐‐‐‐‐‐‐‐‐‐‐‐‐‐‐‐‐‐‐‐‐‐‐‐‐‐‐‐‐‐‐‐‐‐‐‐‐‐‐‐‐‐‐‐‐‐‐‐‐‐‐‐‐‐‐‐‐‐‐‐‐‐‐‐‐‐‐‐‐‐‐‐‐‐‐‐‐‐‐‐‐‐‐‐‐‐‐‐135
DRGUD‐‐‐‐‐‐‐‐‐‐‐‐‐‐‐‐‐‐‐‐‐‐‐‐‐‐‐‐‐‐‐‐‐‐‐‐‐‐‐‐‐‐‐‐‐‐‐‐‐‐‐‐‐‐‐‐‐‐‐‐‐‐‐‐‐‐‐‐‐‐‐‐‐‐‐‐‐‐‐‐‐‐‐‐‐‐‐‐‐‐‐‐‐‐‐‐‐‐‐‐‐‐‐‐‐‐‐‐‐‐‐‐‐‐137
DSD ‐‐‐‐‐‐‐‐‐‐‐‐‐‐‐‐‐‐‐‐‐‐‐‐‐‐‐‐‐‐‐‐‐‐‐‐‐‐‐‐‐‐‐‐‐‐‐‐‐‐‐‐‐‐‐‐‐‐‐‐‐‐‐‐‐‐‐‐‐‐‐‐‐‐‐‐‐‐‐‐‐‐‐‐‐‐‐‐‐‐‐‐‐‐‐‐‐‐‐‐‐‐‐‐‐‐‐‐‐‐‐‐‐‐‐‐‐‐139
DCTD ‐‐‐‐‐‐‐‐‐‐‐‐‐‐‐‐‐‐‐‐‐‐‐‐‐‐‐‐‐‐‐‐‐‐‐‐‐‐‐‐‐‐‐‐‐‐‐‐‐‐‐‐‐‐‐‐‐‐‐‐‐‐‐‐‐‐‐‐‐‐‐‐‐‐‐‐‐‐‐‐‐‐‐‐‐‐‐‐‐‐‐‐‐‐‐‐‐‐‐‐‐‐‐‐‐‐‐‐‐‐‐‐‐‐‐‐141
DIHD‐‐‐‐‐‐‐‐‐‐‐‐‐‐‐‐‐‐‐‐‐‐‐‐‐‐‐‐‐‐‐‐‐‐‐‐‐‐‐‐‐‐‐‐‐‐‐‐‐‐‐‐‐‐‐‐‐‐‐‐‐‐‐‐‐‐‐‐‐‐‐‐‐‐‐‐‐‐‐‐‐‐‐‐‐‐‐‐‐‐‐‐‐‐‐‐‐‐‐‐‐‐‐‐‐‐‐‐‐‐‐‐‐‐‐‐‐143
DMD‐‐‐‐‐‐‐‐‐‐‐‐‐‐‐‐‐‐‐‐‐‐‐‐‐‐‐‐‐‐‐‐‐‐‐‐‐‐‐‐‐‐‐‐‐‐‐‐‐‐‐‐‐‐‐‐‐‐‐‐‐‐‐‐‐‐‐‐‐‐‐‐‐‐‐‐‐‐‐‐‐‐‐‐‐‐‐‐‐‐‐‐‐‐‐‐‐‐‐‐‐‐‐‐‐‐‐‐‐‐‐‐‐‐‐‐‐145
DMGP ‐‐‐‐‐‐‐‐‐‐‐‐‐‐‐‐‐‐‐‐‐‐‐‐‐‐‐‐‐‐‐‐‐‐‐‐‐‐‐‐‐‐‐‐‐‐‐‐‐‐‐‐‐‐‐‐‐‐‐‐‐‐‐‐‐‐‐‐‐‐‐‐‐‐‐‐‐‐‐‐‐‐‐‐‐‐‐‐‐‐‐‐‐‐‐‐‐‐‐‐‐‐‐‐‐‐‐‐‐‐‐‐‐‐‐147
DRH‐‐‐‐‐‐‐‐‐‐‐‐‐‐‐‐‐‐‐‐‐‐‐‐‐‐‐‐‐‐‐‐‐‐‐‐‐‐‐‐‐‐‐‐‐‐‐‐‐‐‐‐‐‐‐‐‐‐‐‐‐‐‐‐‐‐‐‐‐‐‐‐‐‐‐‐‐‐‐‐‐‐‐‐‐‐‐‐‐‐‐‐‐‐‐‐‐‐‐‐‐‐‐‐‐‐‐‐‐‐‐‐‐‐‐‐‐‐149
Section 3: PMA Real Time Supplements ‐‐‐‐‐‐‐‐‐‐‐‐‐‐‐‐‐‐‐‐‐‐‐‐‐‐‐‐‐‐‐‐‐‐‐‐‐‐‐‐‐‐‐‐‐‐‐‐‐‐‐‐‐‐‐‐‐‐‐‐‐‐‐151 PMA Real Time Supplements – Center Level ‐‐‐‐‐‐‐‐‐‐‐‐‐‐‐‐‐‐‐‐‐‐‐‐‐‐‐‐‐‐‐‐‐‐‐‐‐‐‐‐‐‐‐‐‐‐‐‐‐‐‐‐‐‐‐‐‐‐‐‐‐‐‐‐‐‐‐‐‐‐‐‐‐‐‐‐‐155
PMA Real Time Supplements – Office Level
ODE ‐‐‐‐‐‐‐‐‐‐‐‐‐‐‐‐‐‐‐‐‐‐‐‐‐‐‐‐‐‐‐‐‐‐‐‐‐‐‐‐‐‐‐‐‐‐‐‐‐‐‐‐‐‐‐‐‐‐‐‐‐‐‐‐‐‐‐‐‐‐‐‐‐‐‐‐‐‐‐‐‐‐‐‐‐‐‐‐‐‐‐‐‐‐‐‐‐‐‐‐‐‐‐‐‐‐‐‐‐‐‐‐‐‐‐‐‐‐‐‐‐‐156
OIR ‐‐‐‐‐‐‐‐‐‐‐‐‐‐‐‐‐‐‐‐‐‐‐‐‐‐‐‐‐‐‐‐‐‐‐‐‐‐‐‐‐‐‐‐‐‐‐‐‐‐‐‐‐‐‐‐‐‐‐‐‐‐‐‐‐‐‐‐‐‐‐‐‐‐‐‐‐‐‐‐‐‐‐‐‐‐‐‐‐‐‐‐‐‐‐‐‐‐‐‐‐‐‐‐‐‐‐‐‐‐‐‐‐‐‐‐‐‐‐‐‐‐‐157
Page 6 of 371

PMA Real Time Supplements – Division Level
DAGRID ‐‐‐‐‐‐‐‐‐‐‐‐‐‐‐‐‐‐‐‐‐‐‐‐‐‐‐‐‐‐‐‐‐‐‐‐‐‐‐‐‐‐‐‐‐‐‐‐‐‐‐‐‐‐‐‐‐‐‐‐‐‐‐‐‐‐‐‐‐‐‐‐‐‐‐‐‐‐‐‐‐‐‐‐‐‐‐‐‐‐‐‐‐‐‐‐‐‐‐‐‐‐‐‐‐‐‐‐‐‐‐‐‐158
DCD‐‐‐‐‐‐‐‐‐‐‐‐‐‐‐‐‐‐‐‐‐‐‐‐‐‐‐‐‐‐‐‐‐‐‐‐‐‐‐‐‐‐‐‐‐‐‐‐‐‐‐‐‐‐‐‐‐‐‐‐‐‐‐‐‐‐‐‐‐‐‐‐‐‐‐‐‐‐‐‐‐‐‐‐‐‐‐‐‐‐‐‐‐‐‐‐‐‐‐‐‐‐‐‐‐‐‐‐‐‐‐‐‐‐‐‐‐‐159
DNPMD ‐‐‐‐‐‐‐‐‐‐‐‐‐‐‐‐‐‐‐‐‐‐‐‐‐‐‐‐‐‐‐‐‐‐‐‐‐‐‐‐‐‐‐‐‐‐‐‐‐‐‐‐‐‐‐‐‐‐‐‐‐‐‐‐‐‐‐‐‐‐‐‐‐‐‐‐‐‐‐‐‐‐‐‐‐‐‐‐‐‐‐‐‐‐‐‐‐‐‐‐‐‐‐‐‐‐‐‐‐‐‐‐‐160
DOD ‐‐‐‐‐‐‐‐‐‐‐‐‐‐‐‐‐‐‐‐‐‐‐‐‐‐‐‐‐‐‐‐‐‐‐‐‐‐‐‐‐‐‐‐‐‐‐‐‐‐‐‐‐‐‐‐‐‐‐‐‐‐‐‐‐‐‐‐‐‐‐‐‐‐‐‐‐‐‐‐‐‐‐‐‐‐‐‐‐‐‐‐‐‐‐‐‐‐‐‐‐‐‐‐‐‐‐‐‐‐‐‐‐‐‐‐‐161
DOED‐‐‐‐‐‐‐‐‐‐‐‐‐‐‐‐‐‐‐‐‐‐‐‐‐‐‐‐‐‐‐‐‐‐‐‐‐‐‐‐‐‐‐‐‐‐‐‐‐‐‐‐‐‐‐‐‐‐‐‐‐‐‐‐‐‐‐‐‐‐‐‐‐‐‐‐‐‐‐‐‐‐‐‐‐‐‐‐‐‐‐‐‐‐‐‐‐‐‐‐‐‐‐‐‐‐‐‐‐‐‐‐‐‐‐‐162
DRGUD‐‐‐‐‐‐‐‐‐‐‐‐‐‐‐‐‐‐‐‐‐‐‐‐‐‐‐‐‐‐‐‐‐‐‐‐‐‐‐‐‐‐‐‐‐‐‐‐‐‐‐‐‐‐‐‐‐‐‐‐‐‐‐‐‐‐‐‐‐‐‐‐‐‐‐‐‐‐‐‐‐‐‐‐‐‐‐‐‐‐‐‐‐‐‐‐‐‐‐‐‐‐‐‐‐‐‐‐‐‐‐‐‐‐163
DSD ‐‐‐‐‐‐‐‐‐‐‐‐‐‐‐‐‐‐‐‐‐‐‐‐‐‐‐‐‐‐‐‐‐‐‐‐‐‐‐‐‐‐‐‐‐‐‐‐‐‐‐‐‐‐‐‐‐‐‐‐‐‐‐‐‐‐‐‐‐‐‐‐‐‐‐‐‐‐‐‐‐‐‐‐‐‐‐‐‐‐‐‐‐‐‐‐‐‐‐‐‐‐‐‐‐‐‐‐‐‐‐‐‐‐‐‐‐‐164
DCTD ‐‐‐‐‐‐‐‐‐‐‐‐‐‐‐‐‐‐‐‐‐‐‐‐‐‐‐‐‐‐‐‐‐‐‐‐‐‐‐‐‐‐‐‐‐‐‐‐‐‐‐‐‐‐‐‐‐‐‐‐‐‐‐‐‐‐‐‐‐‐‐‐‐‐‐‐‐‐‐‐‐‐‐‐‐‐‐‐‐‐‐‐‐‐‐‐‐‐‐‐‐‐‐‐‐‐‐‐‐‐‐‐‐‐‐‐165
DIHD‐‐‐‐‐‐‐‐‐‐‐‐‐‐‐‐‐‐‐‐‐‐‐‐‐‐‐‐‐‐‐‐‐‐‐‐‐‐‐‐‐‐‐‐‐‐‐‐‐‐‐‐‐‐‐‐‐‐‐‐‐‐‐‐‐‐‐‐‐‐‐‐‐‐‐‐‐‐‐‐‐‐‐‐‐‐‐‐‐‐‐‐‐‐‐‐‐‐‐‐‐‐‐‐‐‐‐‐‐‐‐‐‐‐‐‐‐166
DMD‐‐‐‐‐‐‐‐‐‐‐‐‐‐‐‐‐‐‐‐‐‐‐‐‐‐‐‐‐‐‐‐‐‐‐‐‐‐‐‐‐‐‐‐‐‐‐‐‐‐‐‐‐‐‐‐‐‐‐‐‐‐‐‐‐‐‐‐‐‐‐‐‐‐‐‐‐‐‐‐‐‐‐‐‐‐‐‐‐‐‐‐‐‐‐‐‐‐‐‐‐‐‐‐‐‐‐‐‐‐‐‐‐‐‐‐‐167
DMGP ‐‐‐‐‐‐‐‐‐‐‐‐‐‐‐‐‐‐‐‐‐‐‐‐‐‐‐‐‐‐‐‐‐‐‐‐‐‐‐‐‐‐‐‐‐‐‐‐‐‐‐‐‐‐‐‐‐‐‐‐‐‐‐‐‐‐‐‐‐‐‐‐‐‐‐‐‐‐‐‐‐‐‐‐‐‐‐‐‐‐‐‐‐‐‐‐‐‐‐‐‐‐‐‐‐‐‐‐‐‐‐‐‐‐‐168
DRH‐‐‐‐‐‐‐‐‐‐‐‐‐‐‐‐‐‐‐‐‐‐‐‐‐‐‐‐‐‐‐‐‐‐‐‐‐‐‐‐‐‐‐‐‐‐‐‐‐‐‐‐‐‐‐‐‐‐‐‐‐‐‐‐‐‐‐‐‐‐‐‐‐‐‐‐‐‐‐‐‐‐‐‐‐‐‐‐‐‐‐‐‐‐‐‐‐‐‐‐‐‐‐‐‐‐‐‐‐‐‐‐‐‐‐‐‐‐169
Section 4: Pre‐Market Report Submissions ‐‐‐‐‐‐‐‐‐‐‐‐‐‐‐‐‐‐‐‐‐‐‐‐‐‐‐‐‐‐‐‐‐‐‐‐‐‐‐‐‐‐‐‐‐‐‐‐‐‐‐‐‐‐‐‐‐‐‐171
Section 5: PMA Annual Metrics and Goals ‐‐‐‐‐‐‐‐‐‐‐‐‐‐‐‐‐‐‐‐‐‐‐‐‐‐‐‐‐‐‐‐‐‐‐‐‐‐‐‐‐‐‐‐‐‐‐‐‐‐‐‐‐‐‐‐‐‐‐‐173
Section 6: 510(k) MDUFA III Performance ‐‐‐‐‐‐‐‐‐‐‐‐‐‐‐‐‐‐‐‐‐‐‐‐‐‐‐‐‐‐‐‐‐‐‐‐‐‐‐‐‐‐‐‐‐‐‐‐‐‐‐‐‐‐‐‐‐‐‐‐175 510(k) MDUFA III Performance – Center Level ‐‐‐‐‐‐‐‐‐‐‐‐‐‐‐‐‐‐‐‐‐‐‐‐‐‐‐‐‐‐‐‐‐‐‐‐‐‐‐‐‐‐‐‐‐‐‐‐‐‐‐‐‐‐‐‐‐‐‐‐‐‐‐‐‐‐‐‐‐‐‐‐‐‐‐191
510(k) MDUFA III Performance – Office Level
ODE ‐‐‐‐‐‐‐‐‐‐‐‐‐‐‐‐‐‐‐‐‐‐‐‐‐‐‐‐‐‐‐‐‐‐‐‐‐‐‐‐‐‐‐‐‐‐‐‐‐‐‐‐‐‐‐‐‐‐‐‐‐‐‐‐‐‐‐‐‐‐‐‐‐‐‐‐‐‐‐‐‐‐‐‐‐‐‐‐‐‐‐‐‐‐‐‐‐‐‐‐‐‐‐‐‐‐‐‐‐‐‐‐‐‐‐‐‐‐‐‐‐‐195
OIR ‐‐‐‐‐‐‐‐‐‐‐‐‐‐‐‐‐‐‐‐‐‐‐‐‐‐‐‐‐‐‐‐‐‐‐‐‐‐‐‐‐‐‐‐‐‐‐‐‐‐‐‐‐‐‐‐‐‐‐‐‐‐‐‐‐‐‐‐‐‐‐‐‐‐‐‐‐‐‐‐‐‐‐‐‐‐‐‐‐‐‐‐‐‐‐‐‐‐‐‐‐‐‐‐‐‐‐‐‐‐‐‐‐‐‐‐‐‐‐‐‐‐‐199
510(k) MDUFA III Performance – Division Level
DAGRID ‐‐‐‐‐‐‐‐‐‐‐‐‐‐‐‐‐‐‐‐‐‐‐‐‐‐‐‐‐‐‐‐‐‐‐‐‐‐‐‐‐‐‐‐‐‐‐‐‐‐‐‐‐‐‐‐‐‐‐‐‐‐‐‐‐‐‐‐‐‐‐‐‐‐‐‐‐‐‐‐‐‐‐‐‐‐‐‐‐‐‐‐‐‐‐‐‐‐‐‐‐‐‐‐‐‐‐‐‐‐‐‐‐203
DCD‐‐‐‐‐‐‐‐‐‐‐‐‐‐‐‐‐‐‐‐‐‐‐‐‐‐‐‐‐‐‐‐‐‐‐‐‐‐‐‐‐‐‐‐‐‐‐‐‐‐‐‐‐‐‐‐‐‐‐‐‐‐‐‐‐‐‐‐‐‐‐‐‐‐‐‐‐‐‐‐‐‐‐‐‐‐‐‐‐‐‐‐‐‐‐‐‐‐‐‐‐‐‐‐‐‐‐‐‐‐‐‐‐‐‐‐‐‐207
DNPMD ‐‐‐‐‐‐‐‐‐‐‐‐‐‐‐‐‐‐‐‐‐‐‐‐‐‐‐‐‐‐‐‐‐‐‐‐‐‐‐‐‐‐‐‐‐‐‐‐‐‐‐‐‐‐‐‐‐‐‐‐‐‐‐‐‐‐‐‐‐‐‐‐‐‐‐‐‐‐‐‐‐‐‐‐‐‐‐‐‐‐‐‐‐‐‐‐‐‐‐‐‐‐‐‐‐‐‐‐‐‐‐‐‐211
DOD ‐‐‐‐‐‐‐‐‐‐‐‐‐‐‐‐‐‐‐‐‐‐‐‐‐‐‐‐‐‐‐‐‐‐‐‐‐‐‐‐‐‐‐‐‐‐‐‐‐‐‐‐‐‐‐‐‐‐‐‐‐‐‐‐‐‐‐‐‐‐‐‐‐‐‐‐‐‐‐‐‐‐‐‐‐‐‐‐‐‐‐‐‐‐‐‐‐‐‐‐‐‐‐‐‐‐‐‐‐‐‐‐‐‐‐‐‐215
DOED‐‐‐‐‐‐‐‐‐‐‐‐‐‐‐‐‐‐‐‐‐‐‐‐‐‐‐‐‐‐‐‐‐‐‐‐‐‐‐‐‐‐‐‐‐‐‐‐‐‐‐‐‐‐‐‐‐‐‐‐‐‐‐‐‐‐‐‐‐‐‐‐‐‐‐‐‐‐‐‐‐‐‐‐‐‐‐‐‐‐‐‐‐‐‐‐‐‐‐‐‐‐‐‐‐‐‐‐‐‐‐‐‐‐‐‐219
DRGUD‐‐‐‐‐‐‐‐‐‐‐‐‐‐‐‐‐‐‐‐‐‐‐‐‐‐‐‐‐‐‐‐‐‐‐‐‐‐‐‐‐‐‐‐‐‐‐‐‐‐‐‐‐‐‐‐‐‐‐‐‐‐‐‐‐‐‐‐‐‐‐‐‐‐‐‐‐‐‐‐‐‐‐‐‐‐‐‐‐‐‐‐‐‐‐‐‐‐‐‐‐‐‐‐‐‐‐‐‐‐‐‐‐‐223
DSD ‐‐‐‐‐‐‐‐‐‐‐‐‐‐‐‐‐‐‐‐‐‐‐‐‐‐‐‐‐‐‐‐‐‐‐‐‐‐‐‐‐‐‐‐‐‐‐‐‐‐‐‐‐‐‐‐‐‐‐‐‐‐‐‐‐‐‐‐‐‐‐‐‐‐‐‐‐‐‐‐‐‐‐‐‐‐‐‐‐‐‐‐‐‐‐‐‐‐‐‐‐‐‐‐‐‐‐‐‐‐‐‐‐‐‐‐‐‐227 DCTD ‐‐‐‐‐‐‐‐‐‐‐‐‐‐‐‐‐‐‐‐‐‐‐‐‐‐‐‐‐‐‐‐‐‐‐‐‐‐‐‐‐‐‐‐‐‐‐‐‐‐‐‐‐‐‐‐‐‐‐‐‐‐‐‐‐‐‐‐‐‐‐‐‐‐‐‐‐‐‐‐‐‐‐‐‐‐‐‐‐‐‐‐‐‐‐‐‐‐‐‐‐‐‐‐‐‐‐‐‐‐‐‐‐‐‐‐231
DIHD‐‐‐‐‐‐‐‐‐‐‐‐‐‐‐‐‐‐‐‐‐‐‐‐‐‐‐‐‐‐‐‐‐‐‐‐‐‐‐‐‐‐‐‐‐‐‐‐‐‐‐‐‐‐‐‐‐‐‐‐‐‐‐‐‐‐‐‐‐‐‐‐‐‐‐‐‐‐‐‐‐‐‐‐‐‐‐‐‐‐‐‐‐‐‐‐‐‐‐‐‐‐‐‐‐‐‐‐‐‐‐‐‐‐‐‐‐235
DMD‐‐‐‐‐‐‐‐‐‐‐‐‐‐‐‐‐‐‐‐‐‐‐‐‐‐‐‐‐‐‐‐‐‐‐‐‐‐‐‐‐‐‐‐‐‐‐‐‐‐‐‐‐‐‐‐‐‐‐‐‐‐‐‐‐‐‐‐‐‐‐‐‐‐‐‐‐‐‐‐‐‐‐‐‐‐‐‐‐‐‐‐‐‐‐‐‐‐‐‐‐‐‐‐‐‐‐‐‐‐‐‐‐‐‐‐‐239
DMGP ‐‐‐‐‐‐‐‐‐‐‐‐‐‐‐‐‐‐‐‐‐‐‐‐‐‐‐‐‐‐‐‐‐‐‐‐‐‐‐‐‐‐‐‐‐‐‐‐‐‐‐‐‐‐‐‐‐‐‐‐‐‐‐‐‐‐‐‐‐‐‐‐‐‐‐‐‐‐‐‐‐‐‐‐‐‐‐‐‐‐‐‐‐‐‐‐‐‐‐‐‐‐‐‐‐‐‐‐‐‐‐‐‐‐‐243
DRH‐‐‐‐‐‐‐‐‐‐‐‐‐‐‐‐‐‐‐‐‐‐‐‐‐‐‐‐‐‐‐‐‐‐‐‐‐‐‐‐‐‐‐‐‐‐‐‐‐‐‐‐‐‐‐‐‐‐‐‐‐‐‐‐‐‐‐‐‐‐‐‐‐‐‐‐‐‐‐‐‐‐‐‐‐‐‐‐‐‐‐‐‐‐‐‐‐‐‐‐‐‐‐‐‐‐‐‐‐‐‐‐‐‐‐‐‐‐247
Section 7: 510(k) Annual General Metrics ‐‐‐‐‐‐‐‐‐‐‐‐‐‐‐‐‐‐‐‐‐‐‐‐‐‐‐‐‐‐‐‐‐‐‐‐‐‐‐‐‐‐‐‐‐‐‐‐‐‐‐‐‐‐‐‐‐‐‐‐251
Section 8: Annual Metrics for De Novo Requests ‐‐‐‐‐‐‐‐‐‐‐‐‐‐‐‐‐‐‐‐‐‐‐‐‐‐‐‐‐‐‐‐‐‐‐‐‐‐‐‐‐‐‐‐‐‐‐‐‐‐‐253
Page 7 of 371

Section 9: Pre‐Submissions‐‐‐‐‐‐‐‐‐‐‐‐‐‐‐‐‐‐‐‐‐‐‐‐‐‐‐‐‐‐‐‐‐‐‐‐‐‐‐‐‐‐‐‐‐‐‐‐‐‐‐‐‐‐‐‐‐‐‐‐‐‐‐‐‐‐‐‐‐‐‐‐‐‐‐‐‐‐‐‐265 Pre‐Submissions – Center Level ‐‐‐‐‐‐‐‐‐‐‐‐‐‐‐‐‐‐‐‐‐‐‐‐‐‐‐‐‐‐‐‐‐‐‐‐‐‐‐‐‐‐‐‐‐‐‐‐‐‐‐‐‐‐‐‐‐‐‐‐‐‐‐‐‐‐‐‐‐‐‐‐‐‐‐‐‐‐‐‐‐‐‐‐‐‐‐‐‐‐‐‐‐‐269
Pre‐Submissions – Office Level
ODE ‐‐‐‐‐‐‐‐‐‐‐‐‐‐‐‐‐‐‐‐‐‐‐‐‐‐‐‐‐‐‐‐‐‐‐‐‐‐‐‐‐‐‐‐‐‐‐‐‐‐‐‐‐‐‐‐‐‐‐‐‐‐‐‐‐‐‐‐‐‐‐‐‐‐‐‐‐‐‐‐‐‐‐‐‐‐‐‐‐‐‐‐‐‐‐‐‐‐‐‐‐‐‐‐‐‐‐‐‐‐‐‐‐‐‐‐‐‐‐‐‐‐270
OIR ‐‐‐‐‐‐‐‐‐‐‐‐‐‐‐‐‐‐‐‐‐‐‐‐‐‐‐‐‐‐‐‐‐‐‐‐‐‐‐‐‐‐‐‐‐‐‐‐‐‐‐‐‐‐‐‐‐‐‐‐‐‐‐‐‐‐‐‐‐‐‐‐‐‐‐‐‐‐‐‐‐‐‐‐‐‐‐‐‐‐‐‐‐‐‐‐‐‐‐‐‐‐‐‐‐‐‐‐‐‐‐‐‐‐‐‐‐‐‐‐‐‐‐271
Pre‐Submissions – Division Level
DAGRID ‐‐‐‐‐‐‐‐‐‐‐‐‐‐‐‐‐‐‐‐‐‐‐‐‐‐‐‐‐‐‐‐‐‐‐‐‐‐‐‐‐‐‐‐‐‐‐‐‐‐‐‐‐‐‐‐‐‐‐‐‐‐‐‐‐‐‐‐‐‐‐‐‐‐‐‐‐‐‐‐‐‐‐‐‐‐‐‐‐‐‐‐‐‐‐‐‐‐‐‐‐‐‐‐‐‐‐‐‐‐‐‐‐272
DCD‐‐‐‐‐‐‐‐‐‐‐‐‐‐‐‐‐‐‐‐‐‐‐‐‐‐‐‐‐‐‐‐‐‐‐‐‐‐‐‐‐‐‐‐‐‐‐‐‐‐‐‐‐‐‐‐‐‐‐‐‐‐‐‐‐‐‐‐‐‐‐‐‐‐‐‐‐‐‐‐‐‐‐‐‐‐‐‐‐‐‐‐‐‐‐‐‐‐‐‐‐‐‐‐‐‐‐‐‐‐‐‐‐‐‐‐‐‐273
DNPMD ‐‐‐‐‐‐‐‐‐‐‐‐‐‐‐‐‐‐‐‐‐‐‐‐‐‐‐‐‐‐‐‐‐‐‐‐‐‐‐‐‐‐‐‐‐‐‐‐‐‐‐‐‐‐‐‐‐‐‐‐‐‐‐‐‐‐‐‐‐‐‐‐‐‐‐‐‐‐‐‐‐‐‐‐‐‐‐‐‐‐‐‐‐‐‐‐‐‐‐‐‐‐‐‐‐‐‐‐‐‐‐‐‐273
DOD ‐‐‐‐‐‐‐‐‐‐‐‐‐‐‐‐‐‐‐‐‐‐‐‐‐‐‐‐‐‐‐‐‐‐‐‐‐‐‐‐‐‐‐‐‐‐‐‐‐‐‐‐‐‐‐‐‐‐‐‐‐‐‐‐‐‐‐‐‐‐‐‐‐‐‐‐‐‐‐‐‐‐‐‐‐‐‐‐‐‐‐‐‐‐‐‐‐‐‐‐‐‐‐‐‐‐‐‐‐‐‐‐‐‐‐‐‐274 DOED‐‐‐‐‐‐‐‐‐‐‐‐‐‐‐‐‐‐‐‐‐‐‐‐‐‐‐‐‐‐‐‐‐‐‐‐‐‐‐‐‐‐‐‐‐‐‐‐‐‐‐‐‐‐‐‐‐‐‐‐‐‐‐‐‐‐‐‐‐‐‐‐‐‐‐‐‐‐‐‐‐‐‐‐‐‐‐‐‐‐‐‐‐‐‐‐‐‐‐‐‐‐‐‐‐‐‐‐‐‐‐‐‐‐‐‐274
DRGUD‐‐‐‐‐‐‐‐‐‐‐‐‐‐‐‐‐‐‐‐‐‐‐‐‐‐‐‐‐‐‐‐‐‐‐‐‐‐‐‐‐‐‐‐‐‐‐‐‐‐‐‐‐‐‐‐‐‐‐‐‐‐‐‐‐‐‐‐‐‐‐‐‐‐‐‐‐‐‐‐‐‐‐‐‐‐‐‐‐‐‐‐‐‐‐‐‐‐‐‐‐‐‐‐‐‐‐‐‐‐‐‐‐‐275
DSD ‐‐‐‐‐‐‐‐‐‐‐‐‐‐‐‐‐‐‐‐‐‐‐‐‐‐‐‐‐‐‐‐‐‐‐‐‐‐‐‐‐‐‐‐‐‐‐‐‐‐‐‐‐‐‐‐‐‐‐‐‐‐‐‐‐‐‐‐‐‐‐‐‐‐‐‐‐‐‐‐‐‐‐‐‐‐‐‐‐‐‐‐‐‐‐‐‐‐‐‐‐‐‐‐‐‐‐‐‐‐‐‐‐‐‐‐‐‐275
DCTD ‐‐‐‐‐‐‐‐‐‐‐‐‐‐‐‐‐‐‐‐‐‐‐‐‐‐‐‐‐‐‐‐‐‐‐‐‐‐‐‐‐‐‐‐‐‐‐‐‐‐‐‐‐‐‐‐‐‐‐‐‐‐‐‐‐‐‐‐‐‐‐‐‐‐‐‐‐‐‐‐‐‐‐‐‐‐‐‐‐‐‐‐‐‐‐‐‐‐‐‐‐‐‐‐‐‐‐‐‐‐‐‐‐‐‐‐276
DIHD‐‐‐‐‐‐‐‐‐‐‐‐‐‐‐‐‐‐‐‐‐‐‐‐‐‐‐‐‐‐‐‐‐‐‐‐‐‐‐‐‐‐‐‐‐‐‐‐‐‐‐‐‐‐‐‐‐‐‐‐‐‐‐‐‐‐‐‐‐‐‐‐‐‐‐‐‐‐‐‐‐‐‐‐‐‐‐‐‐‐‐‐‐‐‐‐‐‐‐‐‐‐‐‐‐‐‐‐‐‐‐‐‐‐‐‐‐276
DMD‐‐‐‐‐‐‐‐‐‐‐‐‐‐‐‐‐‐‐‐‐‐‐‐‐‐‐‐‐‐‐‐‐‐‐‐‐‐‐‐‐‐‐‐‐‐‐‐‐‐‐‐‐‐‐‐‐‐‐‐‐‐‐‐‐‐‐‐‐‐‐‐‐‐‐‐‐‐‐‐‐‐‐‐‐‐‐‐‐‐‐‐‐‐‐‐‐‐‐‐‐‐‐‐‐‐‐‐‐‐‐‐‐‐‐‐‐277
DMGP ‐‐‐‐‐‐‐‐‐‐‐‐‐‐‐‐‐‐‐‐‐‐‐‐‐‐‐‐‐‐‐‐‐‐‐‐‐‐‐‐‐‐‐‐‐‐‐‐‐‐‐‐‐‐‐‐‐‐‐‐‐‐‐‐‐‐‐‐‐‐‐‐‐‐‐‐‐‐‐‐‐‐‐‐‐‐‐‐‐‐‐‐‐‐‐‐‐‐‐‐‐‐‐‐‐‐‐‐‐‐‐‐‐‐‐277
DRH‐‐‐‐‐‐‐‐‐‐‐‐‐‐‐‐‐‐‐‐‐‐‐‐‐‐‐‐‐‐‐‐‐‐‐‐‐‐‐‐‐‐‐‐‐‐‐‐‐‐‐‐‐‐‐‐‐‐‐‐‐‐‐‐‐‐‐‐‐‐‐‐‐‐‐‐‐‐‐‐‐‐‐‐‐‐‐‐‐‐‐‐‐‐‐‐‐‐‐‐‐‐‐‐‐‐‐‐‐‐‐‐‐‐‐‐‐‐278
Section 10: CLIA Waiver Annual Metrics ‐‐‐‐‐‐‐‐‐‐‐‐‐‐‐‐‐‐‐‐‐‐‐‐‐‐‐‐‐‐‐‐‐‐‐‐‐‐‐‐‐‐‐‐‐‐‐‐‐‐‐‐‐‐‐‐‐‐‐‐‐‐279
Section 11: Investigational Device Exemptions (IDEs) ‐‐‐‐‐‐‐‐‐‐‐‐‐‐‐‐‐‐‐‐‐‐‐‐‐‐‐‐‐‐‐‐‐‐‐‐‐‐‐‐‐‐‐‐‐283 IDEs – Center Level ‐‐‐‐‐‐‐‐‐‐‐‐‐‐‐‐‐‐‐‐‐‐‐‐‐‐‐‐‐‐‐‐‐‐‐‐‐‐‐‐‐‐‐‐‐‐‐‐‐‐‐‐‐‐‐‐‐‐‐‐‐‐‐‐‐‐‐‐‐‐‐‐‐‐‐‐‐‐‐‐‐‐‐‐‐‐‐‐‐‐‐‐‐‐‐‐‐‐‐‐‐‐‐‐‐‐‐‐‐‐287
IDEs – Office Level
ODE ‐‐‐‐‐‐‐‐‐‐‐‐‐‐‐‐‐‐‐‐‐‐‐‐‐‐‐‐‐‐‐‐‐‐‐‐‐‐‐‐‐‐‐‐‐‐‐‐‐‐‐‐‐‐‐‐‐‐‐‐‐‐‐‐‐‐‐‐‐‐‐‐‐‐‐‐‐‐‐‐‐‐‐‐‐‐‐‐‐‐‐‐‐‐‐‐‐‐‐‐‐‐‐‐‐‐‐‐‐‐‐‐‐‐‐‐‐‐‐‐‐‐288
OIR ‐‐‐‐‐‐‐‐‐‐‐‐‐‐‐‐‐‐‐‐‐‐‐‐‐‐‐‐‐‐‐‐‐‐‐‐‐‐‐‐‐‐‐‐‐‐‐‐‐‐‐‐‐‐‐‐‐‐‐‐‐‐‐‐‐‐‐‐‐‐‐‐‐‐‐‐‐‐‐‐‐‐‐‐‐‐‐‐‐‐‐‐‐‐‐‐‐‐‐‐‐‐‐‐‐‐‐‐‐‐‐‐‐‐‐‐‐‐‐‐‐‐‐288
IDEs – Division Level
DAGRID ‐‐‐‐‐‐‐‐‐‐‐‐‐‐‐‐‐‐‐‐‐‐‐‐‐‐‐‐‐‐‐‐‐‐‐‐‐‐‐‐‐‐‐‐‐‐‐‐‐‐‐‐‐‐‐‐‐‐‐‐‐‐‐‐‐‐‐‐‐‐‐‐‐‐‐‐‐‐‐‐‐‐‐‐‐‐‐‐‐‐‐‐‐‐‐‐‐‐‐‐‐‐‐‐‐‐‐‐‐‐‐‐‐288
DCD‐‐‐‐‐‐‐‐‐‐‐‐‐‐‐‐‐‐‐‐‐‐‐‐‐‐‐‐‐‐‐‐‐‐‐‐‐‐‐‐‐‐‐‐‐‐‐‐‐‐‐‐‐‐‐‐‐‐‐‐‐‐‐‐‐‐‐‐‐‐‐‐‐‐‐‐‐‐‐‐‐‐‐‐‐‐‐‐‐‐‐‐‐‐‐‐‐‐‐‐‐‐‐‐‐‐‐‐‐‐‐‐‐‐‐‐‐‐288 DNPMD ‐‐‐‐‐‐‐‐‐‐‐‐‐‐‐‐‐‐‐‐‐‐‐‐‐‐‐‐‐‐‐‐‐‐‐‐‐‐‐‐‐‐‐‐‐‐‐‐‐‐‐‐‐‐‐‐‐‐‐‐‐‐‐‐‐‐‐‐‐‐‐‐‐‐‐‐‐‐‐‐‐‐‐‐‐‐‐‐‐‐‐‐‐‐‐‐‐‐‐‐‐‐‐‐‐‐‐‐‐‐‐‐‐289
DOD ‐‐‐‐‐‐‐‐‐‐‐‐‐‐‐‐‐‐‐‐‐‐‐‐‐‐‐‐‐‐‐‐‐‐‐‐‐‐‐‐‐‐‐‐‐‐‐‐‐‐‐‐‐‐‐‐‐‐‐‐‐‐‐‐‐‐‐‐‐‐‐‐‐‐‐‐‐‐‐‐‐‐‐‐‐‐‐‐‐‐‐‐‐‐‐‐‐‐‐‐‐‐‐‐‐‐‐‐‐‐‐‐‐‐‐‐‐289
DOED‐‐‐‐‐‐‐‐‐‐‐‐‐‐‐‐‐‐‐‐‐‐‐‐‐‐‐‐‐‐‐‐‐‐‐‐‐‐‐‐‐‐‐‐‐‐‐‐‐‐‐‐‐‐‐‐‐‐‐‐‐‐‐‐‐‐‐‐‐‐‐‐‐‐‐‐‐‐‐‐‐‐‐‐‐‐‐‐‐‐‐‐‐‐‐‐‐‐‐‐‐‐‐‐‐‐‐‐‐‐‐‐‐‐‐‐289
DRGUD‐‐‐‐‐‐‐‐‐‐‐‐‐‐‐‐‐‐‐‐‐‐‐‐‐‐‐‐‐‐‐‐‐‐‐‐‐‐‐‐‐‐‐‐‐‐‐‐‐‐‐‐‐‐‐‐‐‐‐‐‐‐‐‐‐‐‐‐‐‐‐‐‐‐‐‐‐‐‐‐‐‐‐‐‐‐‐‐‐‐‐‐‐‐‐‐‐‐‐‐‐‐‐‐‐‐‐‐‐‐‐‐‐‐289
DSD ‐‐‐‐‐‐‐‐‐‐‐‐‐‐‐‐‐‐‐‐‐‐‐‐‐‐‐‐‐‐‐‐‐‐‐‐‐‐‐‐‐‐‐‐‐‐‐‐‐‐‐‐‐‐‐‐‐‐‐‐‐‐‐‐‐‐‐‐‐‐‐‐‐‐‐‐‐‐‐‐‐‐‐‐‐‐‐‐‐‐‐‐‐‐‐‐‐‐‐‐‐‐‐‐‐‐‐‐‐‐‐‐‐‐‐‐‐‐290
DCTD ‐‐‐‐‐‐‐‐‐‐‐‐‐‐‐‐‐‐‐‐‐‐‐‐‐‐‐‐‐‐‐‐‐‐‐‐‐‐‐‐‐‐‐‐‐‐‐‐‐‐‐‐‐‐‐‐‐‐‐‐‐‐‐‐‐‐‐‐‐‐‐‐‐‐‐‐‐‐‐‐‐‐‐‐‐‐‐‐‐‐‐‐‐‐‐‐‐‐‐‐‐‐‐‐‐‐‐‐‐‐‐‐‐‐‐‐290
DIHD‐‐‐‐‐‐‐‐‐‐‐‐‐‐‐‐‐‐‐‐‐‐‐‐‐‐‐‐‐‐‐‐‐‐‐‐‐‐‐‐‐‐‐‐‐‐‐‐‐‐‐‐‐‐‐‐‐‐‐‐‐‐‐‐‐‐‐‐‐‐‐‐‐‐‐‐‐‐‐‐‐‐‐‐‐‐‐‐‐‐‐‐‐‐‐‐‐‐‐‐‐‐‐‐‐‐‐‐‐‐‐‐‐‐‐‐‐290
DMD‐‐‐‐‐‐‐‐‐‐‐‐‐‐‐‐‐‐‐‐‐‐‐‐‐‐‐‐‐‐‐‐‐‐‐‐‐‐‐‐‐‐‐‐‐‐‐‐‐‐‐‐‐‐‐‐‐‐‐‐‐‐‐‐‐‐‐‐‐‐‐‐‐‐‐‐‐‐‐‐‐‐‐‐‐‐‐‐‐‐‐‐‐‐‐‐‐‐‐‐‐‐‐‐‐‐‐‐‐‐‐‐‐‐‐‐‐290
DMGP ‐‐‐‐‐‐‐‐‐‐‐‐‐‐‐‐‐‐‐‐‐‐‐‐‐‐‐‐‐‐‐‐‐‐‐‐‐‐‐‐‐‐‐‐‐‐‐‐‐‐‐‐‐‐‐‐‐‐‐‐‐‐‐‐‐‐‐‐‐‐‐‐‐‐‐‐‐‐‐‐‐‐‐‐‐‐‐‐‐‐‐‐‐‐‐‐‐‐‐‐‐‐‐‐‐‐‐‐‐‐‐‐‐‐‐291
DRH‐‐‐‐‐‐‐‐‐‐‐‐‐‐‐‐‐‐‐‐‐‐‐‐‐‐‐‐‐‐‐‐‐‐‐‐‐‐‐‐‐‐‐‐‐‐‐‐‐‐‐‐‐‐‐‐‐‐‐‐‐‐‐‐‐‐‐‐‐‐‐‐‐‐‐‐‐‐‐‐‐‐‐‐‐‐‐‐‐‐‐‐‐‐‐‐‐‐‐‐‐‐‐‐‐‐‐‐‐‐‐‐‐‐‐‐‐‐291
Appendix A: Variable Definitions ‐‐‐‐‐‐‐‐‐‐‐‐‐‐‐‐‐‐‐‐‐‐‐‐‐‐‐‐‐‐‐‐‐‐‐‐‐‐‐‐‐‐‐‐‐‐‐‐‐‐‐‐‐‐‐‐‐‐‐‐‐‐‐‐‐‐‐‐‐‐‐‐297
Page 8 of 371

Acronyms and Abbreviations 510(k) Premarket Notification CDRH Center for Devices and Radiologic Health CLIA Clinical Laboratory Improvement Act DAGRID Division of Anesthesiology, General Hospital, Respiratory, Infection Control, and
Dental Devices DCD Division of Cardiovascular Devices DCTD Division of Chemistry and Toxicology Devices DIHD Division of Immunology and Hematology Devices DMD Division of Microbiology Devices DMGP Division of Molecular Genetics and Pathology DNPMD Division of Neurological and Physical Medicine Devices DOD Division of Orthopedic Devices DOED Division of Ophthalmic and Ear, Nose and Throat Devices DRGUD Division of Reproductive, Gastro-Renal, and Urological Devices DRH Division of Radiological Health DSD Division of Surgical Devices IDE Investigational Device Exemption MDUFA Medical Device User Fee Act NSE Not Substantially Equivalent ODE Office of Device Evaluation OIR Office of In Vitro Diagnostics and Radiological Health PMA Premarket Application RTA Refuse to Accept RTF Refuse to File SE Substantially Equivalent SI Substantive Interaction
Note: Data may change in subsequent quarterly and annual reports.
Page 9 of 371

Page intentionally left blank
Page 10 of 371
PMAs
Page 11 of 371

Percent of PMAs With Major Deficiency Letter (MAJR) on 1st FDA Review Cycle*
100%
Perc
ent W
ith M
AJR
90% 80% 70% 60% 50% 40% 30% 20% 10%
0%
40%
51% 56% 49%
62% 54%
68%
80% 77% 78% 86%
70% 71% 76%
57% 67%
2000 2001 2002 2003 2004 2005 2006 2007 2008 2009 2010 2011 2012 2013 2014 2015 (9 mos.)
Fiscal Year (Filed Cohort) *Includes original PMAs only; FY 2013 - FY 2015 are receipt cohorts including PMAs
filed as of 06/30/2015, prior cohorts are filed cohorts; FY 2015 (9 mos.) excludes 3 PMAs for which the 1st cycle was incomplete as of 09/30/2015, data for FY 2015 will change
Page 12 of 371
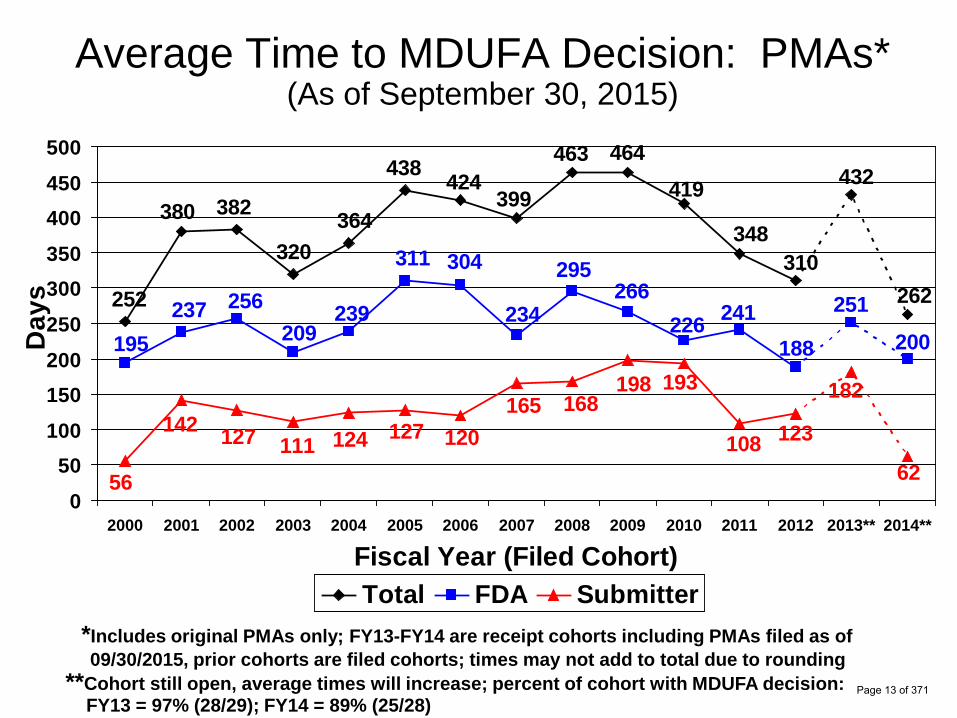
Average Time to MDUFA Decision: PMAs*(As of September 30, 2015)
Day
s
500 450 400 350 300 250 200 150 100
50 0
252
195
56
380
237
142
382
256
127
320
209
111
364
239
124
438
311
127
424
304
120
399
234
165
463
295
168
419 464
226 266
198 193
348
241
108
310
188
123
432
251
182
262
200
62
2000 2001 2002 2003 2004 2005 2006 2007 2008 2009 2010 2011 2012 2013** 2014**
Fiscal Year (Filed Cohort) Total FDA Submitter
*Includes original PMAs only; FY13-FY14 are receipt cohorts including PMAs filed as of 09/30/2015, prior cohorts are filed cohorts; times may not add to total due to rounding
**Cohort still open, average times will increase; percent of cohort with MDUFA decision: FY13 = 97% (28/29); FY14 = 89% (25/28)
Page 13 of 371
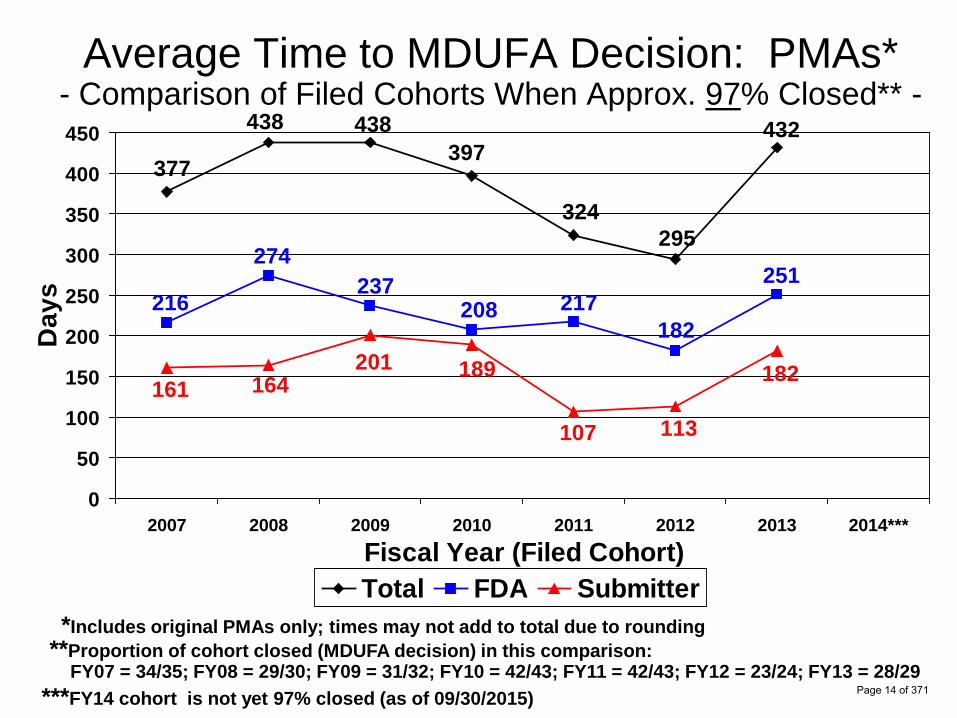
Average Time to MDUFA Decision: PMAs*- Comparison of Filed Cohorts When Approx. 97% Closed**
438 438 432
Day
s
450
400
350
300
250
200
150
100
50
0
377
216
161
274
164
237
201
397
208
189
324
217
107
295
182
113
251
182
2007 2008 2009 2010 2011 2012 2013 2014*** Fiscal Year (Filed Cohort) Total FDA Submitter
*Includes original PMAs only; times may not add to total due to rounding **Proportion of cohort closed (MDUFA decision) in this comparison:
FY07 = 34/35; FY08 = 29/30; FY09 = 31/32; FY10 = 42/43; FY11 = 42/43; FY12 = 23/24; FY13 = 28/29 Page 14 of 371***FY14 cohort is not yet 97% closed (as of 09/30/2015)

Average Time to MDUFA Decision: PMAs*- Comparison of Filed Cohorts When Approx. 89% Closed**
Day
s
450
400
350
300
250
200
150
100
50
0
355
198
157
402
238
163
412
203 209
367
200
167
291
202
89
278
173
105
410
256
154
262
200
62
2007 2008 2009 2010 2011 2012 2013 2014 Fiscal Year (Filed Cohort) Total FDA Submitter
*Includes original PMAs only; times may not add to total due to rounding **Proportion of cohort closed (MDUFA decision) in this comparison:
FY07 = 31/35; FY08 = 27/30; FY09 = 29/32; FY10 = 38/43; FY11 = 38/43; FY12 = 21/24; FY13 = 26/29; FY14 = 25/28
Page 15 of 371

Average Time to MDUFA Decision: PMAs With Panel Review*(As of September 30, 2015)
700
600
500 440
289
151
630
448
182
572
520
52
576
404
172
580
432
147
466
299
167
504
374
130
377
337
40
Day
s
400
300
200
100
0 2007 n = 7
2008 n = 7
2009 2010 2011 2012
Fiscal Year (Filed Cohort) n = 6 n = 7 n = 11 n = 2
2013** n = 10
2014** n = 3
Total FDA Subm itter *Includes original PMAs only; FY13-FY14 are receipt cohorts including PMAs filed as of 09/30/2015, prior cohorts are filed cohorts; times may not add to total due to rounding;
**Cohort still open, average times will increase; percent of cohort with MDUFA decision: FY13 = 91% (10/11) and FY14 = 60% (3/5)
Page 16 of 371

Average Time to MDUFA Decision: PMAs Without Panel Review*(As of September 30, 2015)
700
600
389
220
169
412
248
164
439
207 232
388
191 197
269
175
94
296
177
119
393
182 211
247
181
65
500
Day
s
400
300
200
100
0 2007 n = 28
2008 n = 23
2009 n = 26
2010 n = 36
2011 n = 32
2012 n = 22
2013 n = 18
2014** n = 22
Fiscal Year (Filed Cohort) Total FDA Subm itter
*Includes original PMAs only; FY13-FY14 are receipt cohorts including PMAs filed as of 09/30/2015, prior cohorts are filed cohorts; times may not add to total due to rounding
**Cohort still open, average times will increase; percent of cohort with MDUFA decision: FY14 = 96% (22/23)
Page 17 of 371

PMAs Pending* at End of Year N
o. o
f PM
As
100
90
80 70
60
50
40
30 20
10
0 2005 2006 2007 2008 2009 2010 2011 2012 2013** 2014** 2015**
Fiscal Year
91
82 74 74 73
92 92
58 52 50
55
*Original PMAs under review or on hold **Excludes FY 2013 - FY 2015 receipts that were not accepted for review at year’s end;
FY 2015 increase reflects increase in filed PMAs (42 PMAs compared to 24, 29, and 28 Page 18 of 371
for FY 2012 – FY 2014, respectively)
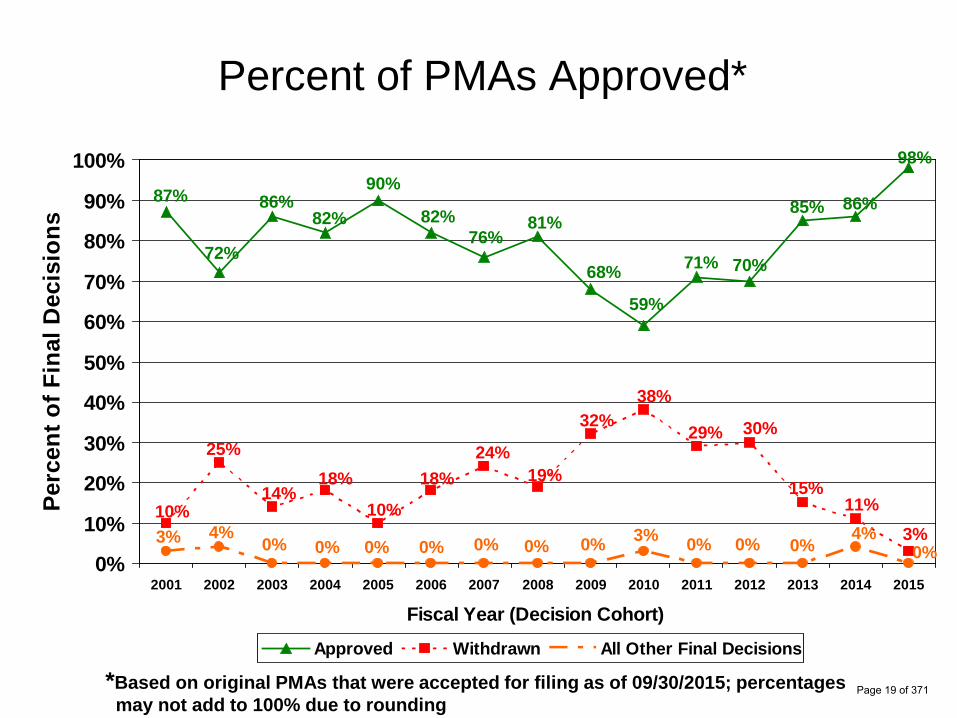
Percent of PMAs Approved* Pe
rcen
t of F
inal
Dec
isio
ns
100%
90%
80%
70%
60%
50%
40%
30%
20%
10%
0%
98%
86%85%
70%
90%87%
72%
86% 82% 82%
76% 81%
68%
59%
71%
3% 11%
15%
30%
10%
25%
14% 18%
10%
18% 24%
19%
32% 38%
29%
0% 4%
0%0%3% 4% 0% 0% 0% 0% 0% 0% 0% 3% 0%
2001 2002 2003 2004 2005 2006 2007 2008 2009 2010 2011 2012 2013 2014 2015
Fiscal Year (Decision Cohort)
Approved Withdrawn All Other Final Decisions
*Based on original PMAs that were accepted for filing as of 09/30/2015; percentages may not add to 100% due to rounding
Page 19 of 371

Page intentionally left blank
Page 20 of 371
�$�'
�$ �$
�$
�$
�$
�$ ��$
��$ ��$
��$
��$
��$
��$
�$
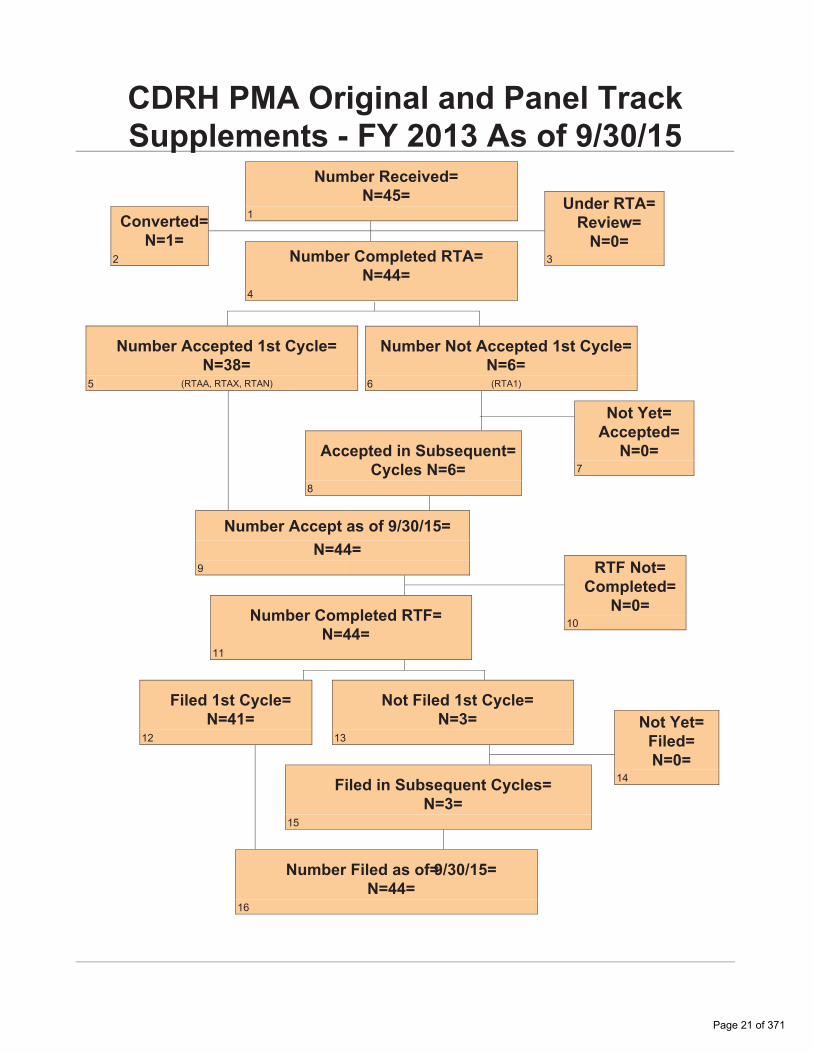
&'5+�30$�2ULJLQDO�DQG�3DQHO�7UDFN 6XSSOHPHQWV���)<������$V�RI�9/30���
1XPEHU�1RW�$FFHSWHG��VW�&\FOH 1 �
� �57$��
1XPEHU�$FFHSWHG��VW�&\FOH 1 ��
� �57$$��57$;��57$1�
1XPEHU�5HFHLYHG 1 ��
�
1XPEHU�&RPSOHWHG�57$ 1 ��
�
&RQYHUWHG 1 �
�
8QGHU�57$ 5HYLHZ 1 �
�
1RW�<HW $FFHSWHG
1 � �
$FFHSWHG�LQ�6XEVHTXHQW &\FOHV�1 �
�
1XPEHU�$FFHSW�DV�RI�9/30/�� 1 ��
� 57)�1RW &RPSOHWHG
1 � ��1XPEHU�&RPSOHWHG�57)
1 �� ��
)LOHG��VW�&\FOH 1 ��
��
1RW�)LOHG��VW�&\FOH 1 �
�� 1RW�<HW )LOHG 1 �
��)LOHG�LQ�6XEVHTXHQW�&\FOHV 1 �
��
1XPEHU�)LOHG�DV�RI 9/30��� 1 ��
��
Page 21 of 371
�D�D
��D�D
��D
��D
�D
�D�D
��D
�D�D
�D
��D��D
��D��D ��D
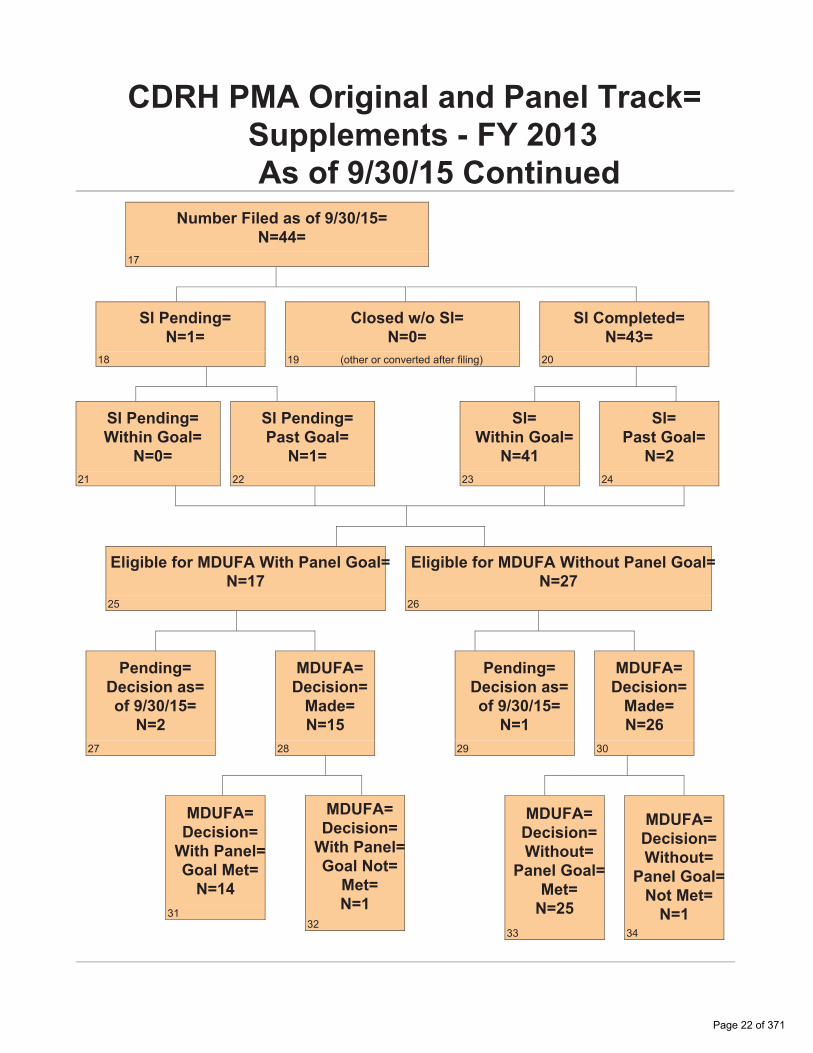
&'5+�30$�2ULJLQDO�DQG�3DQHO�7UDFN ��6XSSOHPHQWV���)<����3 $V�RI�9/30����&RQtinued
1XPEHU�)LOHG�DV�RI�9/30��� 1 ��
��
6O�3HQGLQJ 1 �
��
&ORVHG�Z�R�6O 1 �
�� ��RWKHU�RU�FRQYHUWHG�DIWHU�ILOLQJ�
6O�&RPSOHWHG 1 ��
��
6O�3HQGLQJ :LWKLQ�*RDO
1 � ��
6O�3HQGLQJ 3DVW�*RDO
1 � ��
6O :LWKLQ�*RDO
1 �� ��
6O 3DVW�*RDO
1 � ��
(OLJLEOH�IRU�0'8)$�:LWK�3DQHO�*RDO 1 �7
��
(OLJLEOH�IRU�0'8)$�:LWKRXW�3DQHO�*RDO 1 �7
��
3HQGLQJ 'HFLVLRQ�DV RI�9/30���
1 2 ��
0'8)$ 'HFLVLRQ 0DGH 1 �5
��
3HQGLQJ 'HFLVLRQ�DV RI�9/30���
1 1 ��
0'8)$ 'HFLVLRQ 0DGH 1 �6
��
0'8)$ 'HFLVLRQ :LWK�3DQHO *RDO�0HW 1 �4
��
0'8)$ 'HFLVLRQ :LWK�3DQHO *RDO�1RW
0HW 1 1
��
0'8)$ 'HFLVLRQ :LWKRXW
3DQHO�*RDO 0HW 1 �5
��
0'8)$ 'HFLVLRQ :LWKRXW
3DQHO�*RDO 1RW�0HW 1 �
��
Page 22 of 371

�$�'
�$ �$
�$
�$
�$
�$ ��$
��$ ��$
��$
��$
��$
��$
�$
&'5+�30$�2ULJLQDO�DQG�3DQHO�7UDFN 6XSSOHPHQWV���)<������$V�RI�9/30���
1XPEHU�1RW�$FFHSWHG��VW�&\FOH 1 �
� �57$��
1XPEHU�$FFHSWHG��VW�&\FOH 1 ��
� �57$$��57$;��57$1�
1XPEHU�5HFHLYHG 1 ��
�
1XPEHU�&RPSOHWHG�57$ 1 ��
�
&RQYHUWHG 1 �
�
8QGHU�57$ 5HYLHZ 1 �
�
1RW�<HW $FFHSWHG
1 � �
$FFHSWHG�LQ�6XEVHTXHQW &\FOHV�1 �
�
1XPEHU�$FFHSW�DV�RI�9/30��� 1 ��
� 57)�1RW &RPSOHWHG
1 1 ��1XPEHU�&RPSOHWHG�57)
1 �2 ��
)LOHG��VW�&\FOH 1 �1
��
1RW�)LOHG��VW�&\FOH 1 �
�� 1RW�<HW )LOHG 1 �
��)LOHG�LQ�6XEVHTXHQW�&\FOHV 1 �
��
1XPEHU�)LOHG�DV�RI�9/30��� 1 �2
��
Page 23 of 371

�D�D
��D�D
��D
��D
�D
�D�D
��D
�D�D
�D
��D��D
��D��D ��D
&'5+�30$�2ULJLQDO�DQG�3DQHO�7UDFN ���6XSSOHPHQWV���)<����� $V�RI�9/30����&RQWLQXHG
1XPEHU�)LOHG�DV�RI�9/30��� 1 �2
��
6O�3HQGLQJ 1 �
��
&ORVHG�Z�R�6O 1 �
�� ��RWKHU�RU�FRQYHUWHG�DIWHU�ILOLQJ�
6O�&RPSOHWHG 1 �2
��
6O�3HQGLQJ :LWKLQ�*RDO
1 � ��
6O�3HQGLQJ 3DVW�*RDO
1 � ��
6O :LWKLQ�*RDO
1 40 ��
6O 3DVW�*RDO
1 � ��
(OLJLEOH�IRU�0'8)$�:LWK�3DQHO�*RDO 1 6
��
(OLJLEOH�IRU�0'8)$�:LWKRXW�3DQHO�*RDO 1 �6
��
3HQGLQJ 'HFLVLRQ�DV RI�9/30���
1 2 ��
0'8)$ 'HFLVLRQ 0DGH 1 4
��
3HQGLQJ 'HFLVLRQ�DV RI�9/30���
1 1 ��
0'8)$ 'HFLVLRQ 0DGH 1 35
��
0'8)$ 'HFLVLRQ :LWK�3DQHO *RDO�0HW
1 3
��
0'8)$ 'HFLVLRQ :LWK�3DQHO *RDO�1RW
0HW 1 1
��
0'8)$ 'HFLVLRQ :LWKRXW
3DQHO�*RDO 0HW 1 34
��
0'8)$ 'HFLVLRQ :LWKRXW
3DQHO�*RDO 1RW�0HW 1 1
��
Page 24 of 371

�$�'
�$ �$
�$
�$
�$
�$ ��$
��$ ��$
��$
��$
��$
��$
�$
&'5+�30$�2ULJLQDO�DQG�3DQHO�7UDFN 6XSSOHPHQWV���)<������$V�RI�9/30���
1XPEHU�1RW�$FFHSWHG��VW�&\FOH 1 4
� �57$��
1XPEHU�$FFHSWHG��VW�&\FOH 1 64
� �57$$��57$;��57$1�
1XPEHU�5HFHLYHG 1 72
�
1XPEHU�&RPSOHWHG�57$ 1 68
�
&RQYHUWHG 1 1
�
8QGHU�57$ 5HYLHZ 1 3
�
1RW�<HW $FFHSWHG
1 0 �
$FFHSWHG�LQ�6XEVHTXHQW &\FOHV�1 �
�
1XPEHU�$FFHSW�DV�RI�9/30��� 1 68
� 57)�1RW &RPSOHWHG
1 5 ��1XPEHU�&RPSOHWHG�57)
1 63 ��
)LOHG��VW�&\FOH 1 63
��
1RW�)LOHG��VW�&\FOH 1 �
�� 1RW�<HW )LOHG 1 �
��)LOHG�LQ�6XEVHTXHQW�&\FOHV 1 �
��
1XPEHU�)LOHG�DV�RI�9/30��� 1 63
��
Page 25 of 371

�D�D
��D�D
��D
��D
�D
�D�D
��D
�D�D
�D
��D��D
��D��D ��D
&'5+�30$�2ULJLQDO�DQG�3DQHO�7UDFN 6XSSOHPHQWV���)<����5 $V�RI�9/30����&RQtinued
1XPEHU�)LOHG�DV�RI�9/30��� 1 63
��
6O�3HQGLQJ 1 �6
��
&ORVHG�Z�R�6O 1 0
�� ��RWKHU�RU�FRQYHUWHG�DIWHU�ILOLQJ�
6O�&RPSOHWHG 1 47
��
6O�3HQGLQJ :LWKLQ�*RDO
1 �4 ��
6O�3HQGLQJ 3DVW�*RDO
1 2 ��
6O :LWKLQ�*RDO
1 43 ��
6O 3DVW�*RDO
1 4 ��
(OLJLEOH�IRU�0'8)$�:LWK�3DQHO�*RDO 1 �
��
(OLJLEOH�IRU�0'8)$�:LWKRXW�3DQHO�*RDO 1 62
��
3HQGLQJ 'HFLVLRQ�DV RI�9/30���
1 � ��
0'8)$ 'HFLVLRQ 0DGH 1 �
��
3HQGLQJ 'HFLVLRQ�DV RI�9/30��� 1 46
��
0'8)$ 'HFLVLRQ 0DGH 1 16
��
0'8)$ 'HFLVLRQ :LWK�3DQHO *RDO�0HW
1 � ��
0'8)$ 'HFLVLRQ :LWK�3DQHO *RDO�1RW
0HW 1 �
��
0'8)$ 'HFLVLRQ :LWKRXW
3DQHO�*RDO 0HW 1 13
��
0'8)$ 'HFLVLRQ :LWKRXW
3DQHO�*RDO 1RW�0HW 1 3
��
Page 26 of 371
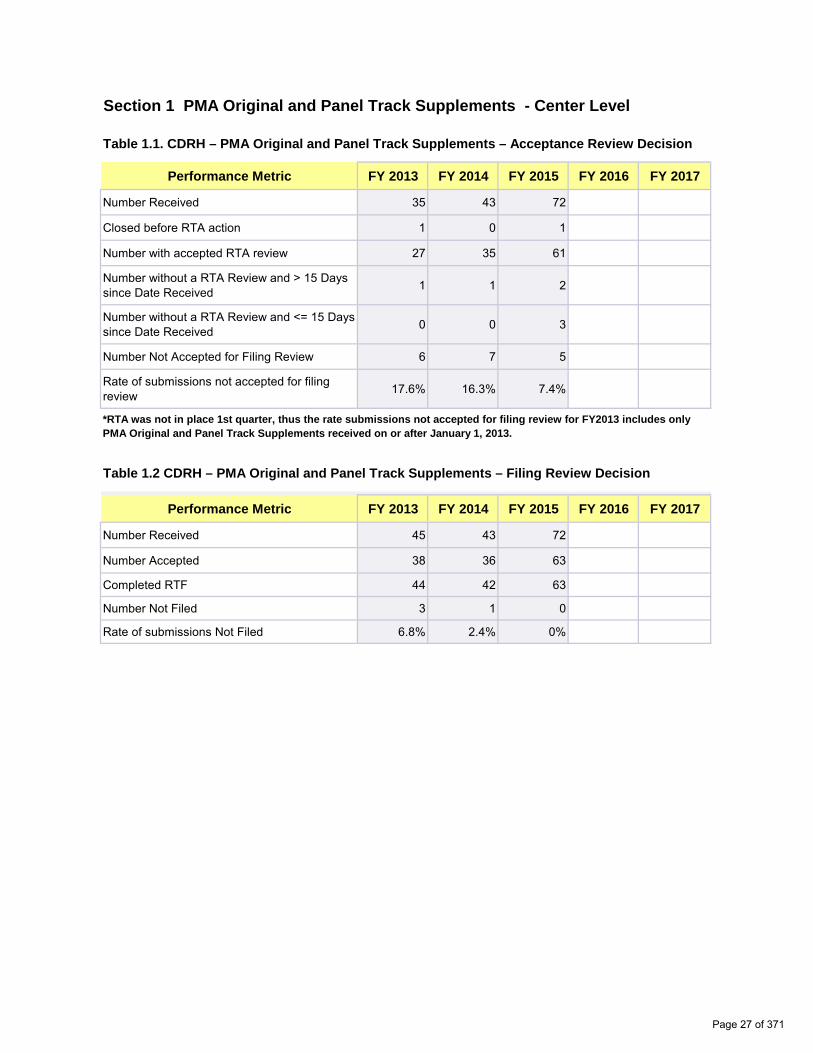
Section 1 PMA Original and Panel Track Supplements - Center Level
Table 1.1. CDRH – PMA Original and Panel Track Supplements – Acceptance Review Decision
Performance Metric FY 2013 FY 2014 FY 2015 FY 2016 FY 2017
Number Received 35 43 72
Closed before RTA action 1 0 1
Number with accepted RTA review 27 35 61
Number without a RTA Review and > 15 Days since Date Received 1 1 2
Number without a RTA Review and <= 15 Days since Date Received 0 0 3
Number Not Accepted for Filing Review 6 7 5
Rate of submissions not accepted for filing review 17.6% 16.3% 7.4%
*RTA was not in place 1st quarter, thus the rate submissions not accepted for filing review for FY2013 includes only PMA Original and Panel Track Supplements received on or after January 1, 2013.
Table 1.2 CDRH – PMA Original and Panel Track Supplements – Filing Review Decision
Performance Metric FY 2013 FY 2014 FY 2015 FY 2016 FY 2017
Number Received 45 43 72
Number Accepted 38 36 63
Completed RTF 44 42 63
Number Not Filed 3 1 0
Rate of submissions Not Filed 6.8% 2.4% 0%
Page 27 of 371

Table 1.3 CDRH – PMA Originals & Panel-Track Supplements Substantive Interaction Performance Goals
Substantive Interaction (SI) Goals:
FY 2013 FY 2014 FY 2015 FY 2016 FY 2017
65% SI within 90 FDA days
75% SI within 90 FDA days
85% SI within 90 FDA days
95% SI within 90 FDA days
95% SI within 90 FDA days
Eligible for SI 44 42 63
SI Goal Met 41 40 43
SI Goal Not Met 2 2 4
SI Pending Within Goal 0 0 14
SI Pending Past Goal 1 0 2
Closed without SI 0 0 0
Current SI Performance Percent Goal Met 93.2% 95.2% 87.8%
Table 1.4 CDRH – PMA Originals and Panel Track Supplements Substantive Interaction Metrics – Time to Substantive Interaction
Performance Metric FY 2013 FY 2014 FY 2015 FY 2016 FY 2017
Number of Substantive Interactions 43 42 47
Average number of FDA days to Substantive Interaction
88.30 90.02 90.13
20th Percentile FDA days to Substantive Interaction
86 87 84
40th Percentile FDA days to Substantive Interaction
88 88 88
60th Percentile FDA days to Substantive Interaction
90 89 89
80th Percentile FDA days to Substantive Interaction
90 90 90
Maximum FDA days to Substantive Interaction 117 136 168
Page 28 of 371

Table 1.5 CDRH – PMA Originals & Panel-Track Supplements (without Panel Review) MDUFA Decision Performance Goals
Performance Goals: FY 2013 FY 2014 FY 2015 FY 2016 FY 2017
Number of PMAs filed 27 36 62
Non-MDUFA III Decisions 0 0 0
MDUFA III Decisions 26 35 16
MDUFA III Decisions Goal Met 25 34 13
PMAs pending MDUFA III Decision 1 1 46
PMAs pending MDUFA III Decision Past Goal 1 0 0
Current Performance Percent Goal Met 92.6% 97.1% 81%
Table 1.6 CDRH – PMA Originals & Panel-Track Supplements (with Panel Review) MDUFA Decision Performance Goals
Performance Goals: FY 2013 FY 2014 FY 2015 FY 2016 FY 2017
Number of PMAs filed 17 6 1
Non-MDUFA III Decisions 0 0 0
MDUFA III Decisions 15 4 0
MDUFA III Decisions Goal Met 14 3 0
PMAs pending MDUFA III Decision 2 2 1
PMAs pending MDUFA III Decision Past Goal 0 0 0
Current Performance Percent Goal Met 93.3% 75% N/A
Page 29 of 371

Table 1.7 CDRH – PMA Original and Panel Track Supplements (without Panel Review) Performance Metrics – Time to MDUFA Decision
Performance Metric FY 2013 FY 2014 FY 2015 FY 2016 FY 2017
Number with MDUFA III decision 26 35 16
Average FDA days to MDUFA III decision 177.19 178.34 170.63
20th Percentile FDA days to MDUFA III decision 175 177 170
40th Percentile FDA days to MDUFA III decision 177 179 177
60th Percentile FDA days to MDUFA III decision 180 179 179
80th Percentile FDA days to MDUFA III decision 180 180 180
Maximum FDA days to MDUFA III decision 291 359 189
Average Industry days to MDUFA III decision 170.12 50.11 23.69
20th Percentile Industry days to MDUFA III decision 0 0 0
40th Percentile Industry days to MDUFA III decision 81 0 0
60th Percentile Industry days to MDUFA III decision 118 46 40
80th Percentile Industry days to MDUFA III decision 356 92 44
Maximum Industry days to MDUFA III decision 563 238 78
Average Total days to MDUFA III decision 347.31 235.91 194.31
20th Percentile Total days to MDUFA III decision 180 179 177
40th Percentile Total days to MDUFA III decision 248 190 179
60th Percentile Total days to MDUFA III decision 307 246 196
80th Percentile Total days to MDUFA III decision 531 290 233
Maximum Total days to MDUFA III decision 743 440 246
Page 30 of 371
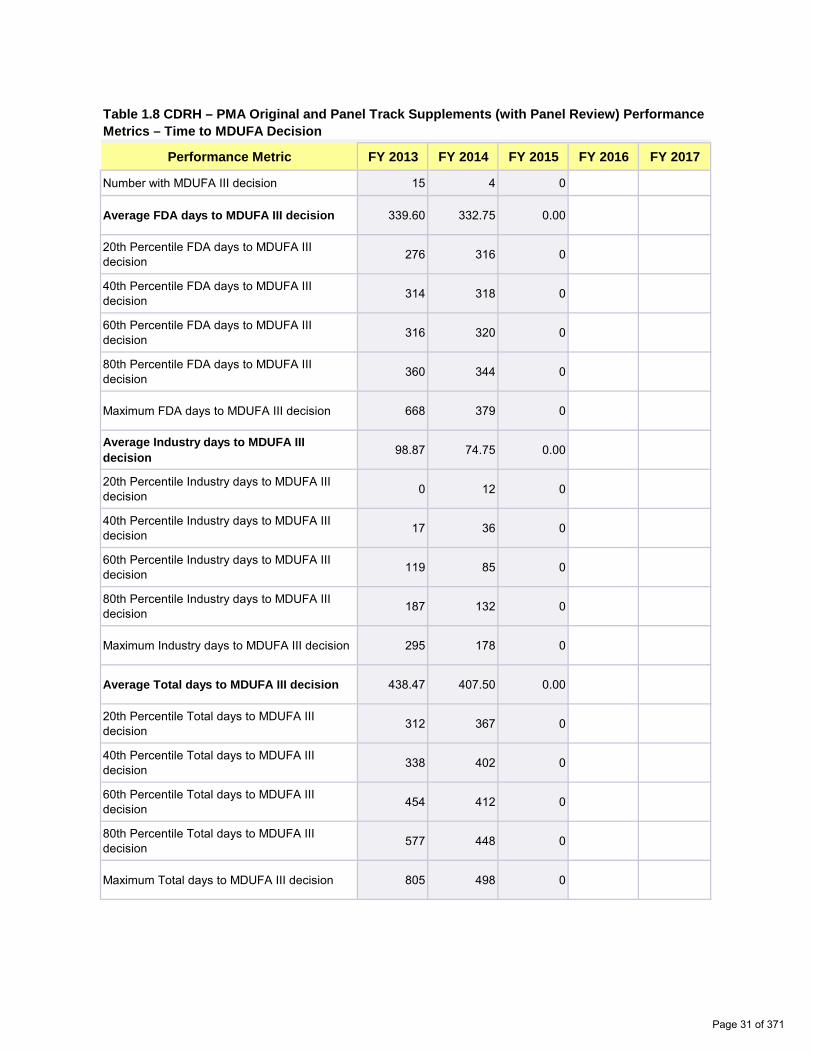
Table 1.8 CDRH – PMA Original and Panel Track Supplements (with Panel Review) Performance Metrics – Time to MDUFA Decision
Performance Metric FY 2013 FY 2014 FY 2015 FY 2016 FY 2017
Number with MDUFA III decision 15 4 0
Average FDA days to MDUFA III decision 339.60 332.75 0.00
20th Percentile FDA days to MDUFA III decision 276 316 0
40th Percentile FDA days to MDUFA III decision 314 318 0
60th Percentile FDA days to MDUFA III decision 316 320 0
80th Percentile FDA days to MDUFA III decision 360 344 0
Maximum FDA days to MDUFA III decision 668 379 0
Average Industry days to MDUFA III decision 98.87 74.75 0.00
20th Percentile Industry days to MDUFA III decision 0 12 0
40th Percentile Industry days to MDUFA III decision 17 36 0
60th Percentile Industry days to MDUFA III decision 119 85 0
80th Percentile Industry days to MDUFA III decision 187 132 0
Maximum Industry days to MDUFA III decision 295 178 0
Average Total days to MDUFA III decision 438.47 407.50 0.00
20th Percentile Total days to MDUFA III decision 312 367 0
40th Percentile Total days to MDUFA III decision 338 402 0
60th Percentile Total days to MDUFA III decision 454 412 0
80th Percentile Total days to MDUFA III decision 577 448 0
Maximum Total days to MDUFA III decision 805 498 0
Page 31 of 371
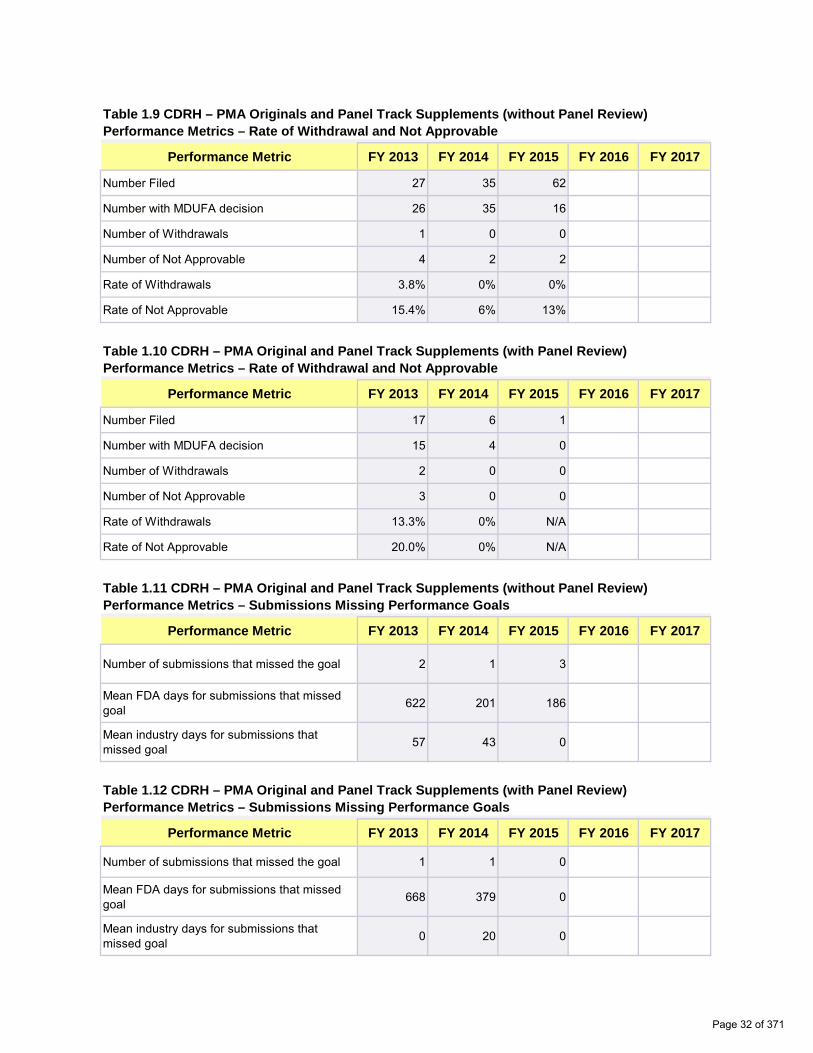
Table 1.9 CDRH – PMA Originals and Panel Track Supplements (without Panel Review) Performance Metrics – Rate of Withdrawal and Not Approvable
Performance Metric FY 2013 FY 2014 FY 2015 FY 2016 FY 2017
Number Filed 27 35 62
Number with MDUFA decision 26 35 16
Number of Withdrawals 1 0 0
Number of Not Approvable 4 2 2
Rate of Withdrawals 3.8% 0% 0%
Rate of Not Approvable 15.4% 6% 13%
Table 1.10 CDRH – PMA Original and Panel Track Supplements (with Panel Review) Performance Metrics – Rate of Withdrawal and Not Approvable
Performance Metric FY 2013 FY 2014 FY 2015 FY 2016 FY 2017
Number Filed 17 6 1
Number with MDUFA decision 15 4 0
Number of Withdrawals 2 0 0
Number of Not Approvable 3 0 0
Rate of Withdrawals 13.3% 0% N/A
Rate of Not Approvable 20.0% 0% N/A
Table 1.11 CDRH – PMA Original and Panel Track Supplements (without Panel Review) Performance Metrics – Submissions Missing Performance Goals
Performance Metric FY 2013 FY 2014 FY 2015 FY 2016 FY 2017
Number of submissions that missed the goal 2 1 3
Mean FDA days for submissions that missed goal 622 201 186
Mean industry days for submissions that missed goal 57 43 0
Table 1.12 CDRH – PMA Original and Panel Track Supplements (with Panel Review) Performance Metrics – Submissions Missing Performance Goals
Performance Metric FY 2013 FY 2014 FY 2015 FY 2016 FY 2017
Number of submissions that missed the goal 1 1 0
Mean FDA days for submissions that missed goal 668 379 0
Mean industry days for submissions that missed goal 0 20 0
Page 32 of 371

Section 1 PMA Original and Panel Track Supplements - Office Level Metrics
Table 1.1.ODE - CDRH – PMA Original and Panel Track Supplements – Acceptance Review Decision Performance Metric FY 2013 FY 2014 FY 2015 FY 2016 FY 2017 Number Received 28 37 55 Closed before RTA action 1 0 1 Number with accepted RTA review 20 30 45 Number without a RTA Review and > 15 Days since Date Received 1 1 2
Number without a RTA Review and <= 15 Days since Date Received 0 0 2
Number Not Accepted for Filing Review 6 6 5
Rate of submissions not accepted for filing review 22.2% 16.2% 9.6%
*RTA was not in place 1st quarter, thus the rate submissions not accepted for filing review for FY2013 includes only PMA Original and Panel Track Supplements received on or after January 1, 2013.
Table 1.2.ODE - CDRH – PMA Original and Panel Track Supplements – Acceptance and Filing Review Decision Performance Metric FY 2013 FY 2014 FY 2015 FY 2016 FY 2017 Number Received 35 37 55 Number Accepted 28 31 47 Completed RTF 34 36 47 Number Not Filed 3 1 0 Rate of submissions Not Filed 8.8% 2.8% 0%
Page 33 of 371

Table 1.3.ODE - CDRH – PMA Originals & Panel-Track Supplements Substantive Interaction Performance Goals
Substantive Interaction (SI) Goals:
FY 2013 FY 2014 FY 2015 FY 2016 FY 2017
65% SI within 90 FDA days
75% SI within 90 FDA days
85% SI within 90 FDA days
95% SI within 90 FDA days
95% SI within 90 FDA days
Eligible for SI 34 36 47 SI Goal Met 31 34 31 SI Goal Not Met 2 2 3 SI Pending Within Goal 0 0 11 SI Pending Past Goal 1 0 2 Closed without SI 0 0 0
Current SI Performance Percent Goal Met 91.2% 94.4% 86.1%
Table 1.4 ODE - CDRH – PMA Originals and Panel Track Supplements Substantive Interaction Metrics – Time to Substantive Interaction Performance Metric FY 2013 FY 2014 FY 2015 FY 2016 FY 2017 Number of Substantive Interactions 33 36 34 Average number of FDA days to Substantive Interaction 88.15 90.64 92.82
20th Percentile FDA days to Substantive Interaction 86 87 85
40th Percentile FDA days to Substantive Interaction 88 88 88
60th Percentile FDA days to Substantive Interaction 89 89 89
80th Percentile FDA days to Substantive Interaction 90 90 90
Maximum FDA days to Substantive Interaction 117 136 168
Page 34 of 371
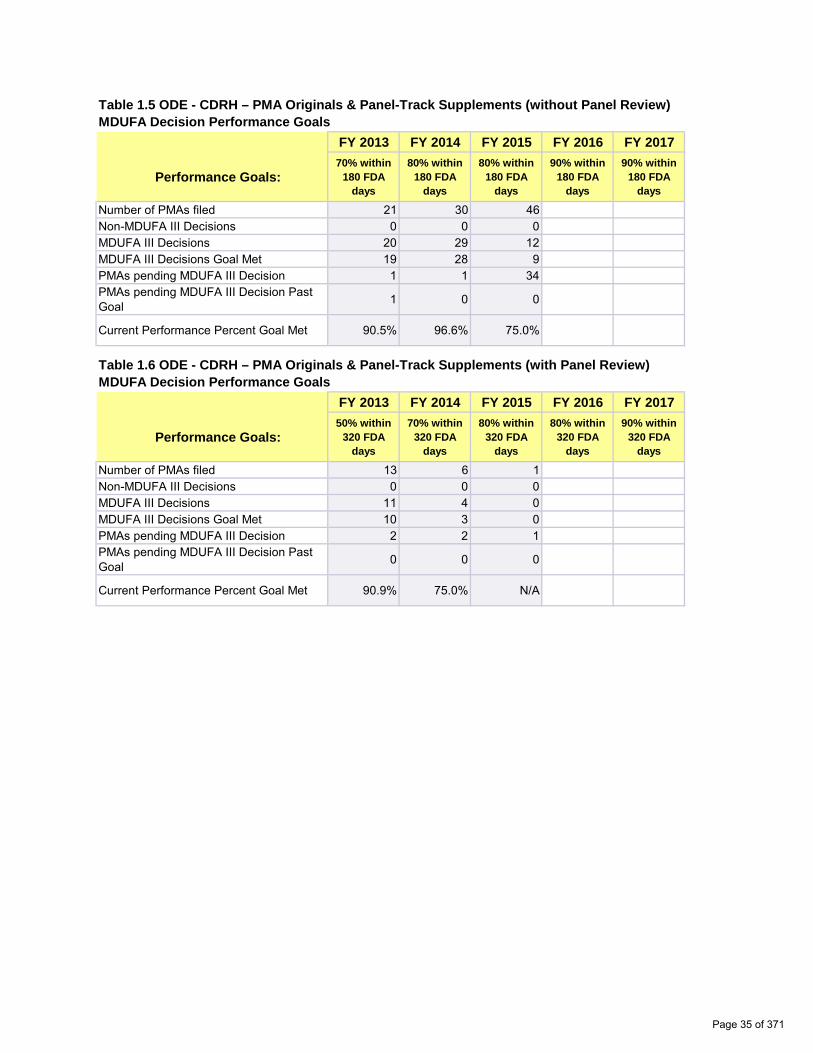
Table 1.5 ODE - CDRH – PMA Originals & Panel-Track Supplements (without Panel Review) MDUFA Decision Performance Goals
Performance Goals:
FY 2013 FY 2014 FY 2015 FY 2016 FY 201770% within
180 FDA days
80% within 180 FDA
days
80% within 180 FDA
days
90% within 180 FDA
days
90% within 180 FDA
days
Number of PMAs filed 21 30 46 Non-MDUFA III Decisions 0 0 0 MDUFA III Decisions 20 29 12 MDUFA III Decisions Goal Met 19 28 9 PMAs pending MDUFA III Decision 1 1 34 PMAs pending MDUFA III Decision Past Goal 1 0 0
Current Performance Percent Goal Met 90.5% 96.6% 75.0%
Table 1.6 ODE - CDRH – PMA Originals & Panel-Track Supplements (with Panel Review) MDUFA Decision Performance Goals
Performance Goals:
FY 2013 FY 2014 FY 2015 FY 2016 FY 201750% within
320 FDA days
70% within 320 FDA
days
80% within 320 FDA
days
80% within 320 FDA
days
90% within 320 FDA
days
Number of PMAs filed 13 6 1 Non-MDUFA III Decisions 0 0 0 MDUFA III Decisions 11 4 0 MDUFA III Decisions Goal Met 10 3 0 PMAs pending MDUFA III Decision 2 2 1 PMAs pending MDUFA III Decision Past Goal 0 0 0
Current Performance Percent Goal Met 90.9% 75.0% N/A
Page 35 of 371

Table 1.7 ODE - CDRH – PMA Original and Panel Track Supplements (without Panel Review) Performance Metrics – Time to MDUFA Decision Performance Metric FY 2013 FY 2014 FY 2015 FY 2016 FY 2017 Number with MDUFA III decision 20 29 12 Average FDA days to MDUFA III decision 184.75 181.45 174.25
20th Percentile FDA days to MDUFA III decision 177 177 177
40th Percentile FDA days to MDUFA III decision 180 179 178
60th Percentile FDA days to MDUFA III decision 180 180 180
80th Percentile FDA days to MDUFA III decision 180 180 181
Maximum FDA days to MDUFA III decision 291 359 189 Average Industry days to MDUFA III decision 175.65 44.48 16.50
20th Percentile Industry days to MDUFA III decision 0 0 0
40th Percentile Industry days to MDUFA III decision 75 4 0
60th Percentile Industry days to MDUFA III decision 145 44 0
80th Percentile Industry days to MDUFA III decision 357 80 44
Maximum Industry days to MDUFA III decision 563 168 66
Average Total days to MDUFA III decision 360.40 225.93 190.75
20th Percentile Total days to MDUFA III decision 180 179 177
40th Percentile Total days to MDUFA III decision 255 183 178
60th Percentile Total days to MDUFA III decision 381 232 181
80th Percentile Total days to MDUFA III decision 533 262 231
Maximum Total days to MDUFA III decision 743 392 246
Page 36 of 371
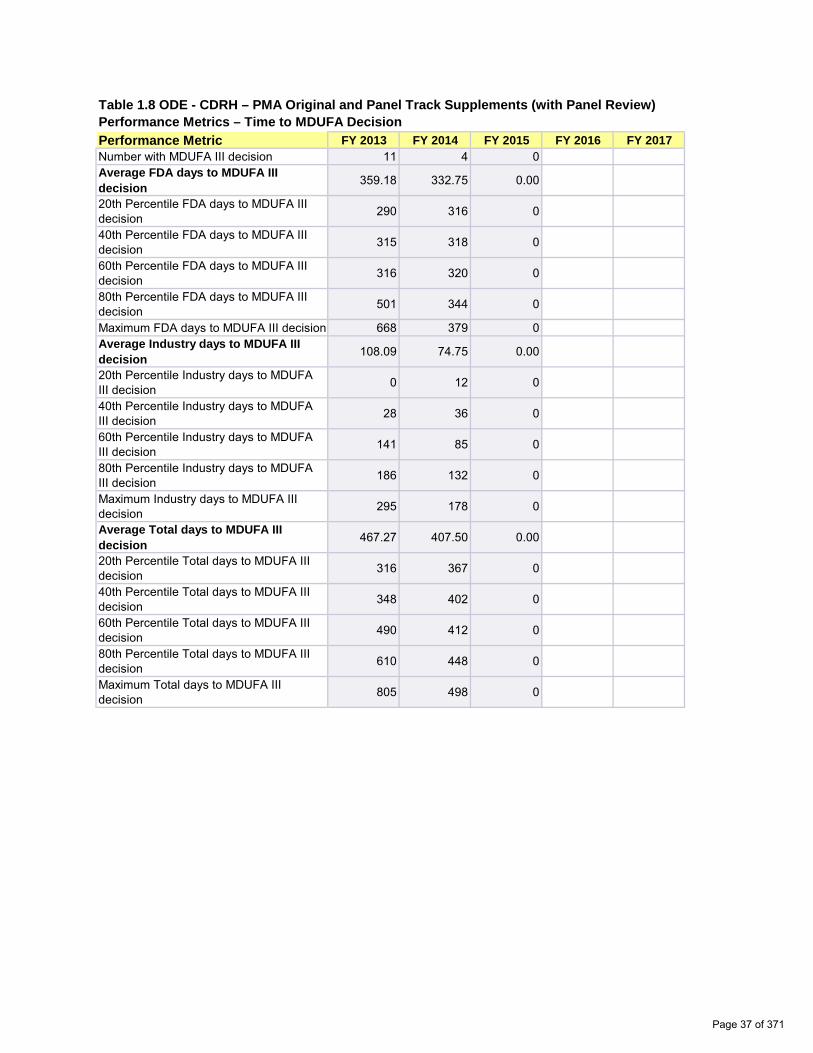
Table 1.8 ODE - CDRH – PMA Original and Panel Track Supplements (with Panel Review) Performance Metrics – Time to MDUFA Decision Performance Metric FY 2013 FY 2014 FY 2015 FY 2016 FY 2017 Number with MDUFA III decision 11 4 0 Average FDA days to MDUFA III decision 359.18 332.75 0.00
20th Percentile FDA days to MDUFA III decision 290 316 0
40th Percentile FDA days to MDUFA III decision 315 318 0
60th Percentile FDA days to MDUFA III decision 316 320 0
80th Percentile FDA days to MDUFA III decision 501 344 0
Maximum FDA days to MDUFA III decision 668 379 0 Average Industry days to MDUFA III decision 108.09 74.75 0.00
20th Percentile Industry days to MDUFA III decision 0 12 0
40th Percentile Industry days to MDUFA III decision 28 36 0
60th Percentile Industry days to MDUFA III decision 141 85 0
80th Percentile Industry days to MDUFA III decision 186 132 0
Maximum Industry days to MDUFA III decision 295 178 0
Average Total days to MDUFA III decision 467.27 407.50 0.00
20th Percentile Total days to MDUFA III decision 316 367 0
40th Percentile Total days to MDUFA III decision 348 402 0
60th Percentile Total days to MDUFA III decision 490 412 0
80th Percentile Total days to MDUFA III decision 610 448 0
Maximum Total days to MDUFA III decision 805 498 0
Page 37 of 371

Table 1.9 ODE - CDRH – PMA Originals and Panel Track Supplements (without Panel Review) Performance Metrics – Rate of Withdrawal and Not Approvable Performance Metric FY 2013 FY 2014 FY 2015 FY 2016 FY 2017 Number Filed 21 29 46 Number with MDUFA decision 20 29 12 Number of Withdrawals 1 0 0 Number of Not Approvable 3 2 2 Rate of Withdrawals 5.0% 0% 0% Rate of Not Approvable 15.0% 7% 17%
Table 1.10 ODE - CDRH – PMA Original and Panel Track Supplements (with Panel Review) Performance Metrics – Rate of Withdrawal and Not Approvable Performance Metric FY 2013 FY 2014 FY 2015 FY 2016 FY 2017 Number Filed 13 6 1 Number with MDUFA decision 11 4 0 Number of Withdrawals 2 0 0 Number of Not Approvable 2 0 0 Rate of Withdrawals 18.2% 0% N/A Rate of Not Approvable 18.2% 0% N/A
Table 1.11 ODE - CDRH – PMA Original and Panel Track Supplements (without Panel Review) Performance Metrics – Submissions Missing Performance Goals Performance Metric FY 2013 FY 2014 FY 2015 FY 2016 FY 2017 Number of submissions that missed the goal 2 1 3
Mean FDA days for submissions that missed goal 622 201 186
Mean industry days for submissions that missed goal 57 43 0
Table 1.12 ODE - CDRH – PMA Original and Panel Track Supplements (with Panel Review) Performance Metrics – Submissions Missing Performance Goals Performance Metric FY 2013 FY 2014 FY 2015 FY 2016 FY 2017 Number of submissions that missed the goal 1 1 0
Mean FDA days for submissions that missed goal 668 379 0
Mean industry days for submissions that missed goal 0 20 0
Page 38 of 371

Table 1.1.OIR - CDRH – PMA Original and Panel Track Supplements – Acceptance Review Decision Performance Metric FY 2013 FY 2014 FY 2015 FY 2016 FY 2017 Number Received 7 6 17 Closed before RTA action 0 0 0 Number with accepted RTA review 7 5 16 Number without a RTA Review and > 15 Days since Date Received 0 0 0
Number without a RTA Review and <= 15 Days since Date Received 0 0 1
Number Not Accepted for Filing Review 0 1 0
Rate of submissions not accepted for filing review 0% 16.7% 0%
*RTA was not in place 1st quarter, thus the rate submissions not accepted for filing review for FY2013 includes only PMA Original and Panel Track Supplements received on or after January 1, 2013.
Table 1.2.OIR - CDRH – PMA Original and Panel Track Supplements – Acceptance and Filing Review Decision Performance Metric FY 2013 FY 2014 FY 2015 FY 2016 FY 2017 Number Received 10 6 17 Number Accepted 10 5 16 Completed RTF 10 6 16 Number Not Filed 0 0 0 Rate of submissions Not Filed 0% 0% 0%
Page 39 of 371

Table 1.3.OIR - CDRH – PMA Originals & Panel-Track Supplements Substantive Interaction Performance Goals
Substantive Interaction (SI) Goals:
FY 2013 FY 2014 FY 2015 FY 2016 FY 2017 65% SI
within 90 FDA days
75% SI within 90 FDA days
85% SI within 90 FDA days
95% SI within 90 FDA days
95% SI within 90 FDA days
Eligible for SI 10 6 16 SI Goal Met 10 6 12 SI Goal Not Met 0 0 1 SI Pending Within Goal 0 0 3 SI Pending Past Goal 0 0 0 Closed without SI 0 0 0
Current SI Performance Percent Goal Met 100% 100% 92.3%
Table 1.4 OIR - CDRH – PMA Originals and Panel Track Supplements Substantive Interaction Metrics – Time to Substantive Interaction Performance Metric FY 2013 FY 2014 FY 2015 FY 2016 FY 2017 Number of Substantive Interactions 10 6 13 Average number of FDA days to Substantive Interaction 88.80 86.33 83.08
20th Percentile FDA days to Substantive Interaction 86 85 77
40th Percentile FDA days to Substantive Interaction 90 86 88
60th Percentile FDA days to Substantive Interaction 90 87 90
80th Percentile FDA days to Substantive Interaction 90 88 90
Maximum FDA days to Substantive Interaction 112 89 91
Page 40 of 371

Table 1.5 OIR - CDRH – PMA Originals & Panel-Track Supplements (without Panel Review) MDUFA Decision Performance Goals
Performance Goals:
FY 2013 FY 2014 FY 2015 FY 2016 FY 201770% within
180 FDA days
80% within 180 FDA
days
80% within 180 FDA
days
90% within 180 FDA
days
90% within 180 FDA
days
Number of PMAs filed 6 6 16 Non-MDUFA III Decisions 0 0 0 MDUFA III Decisions 6 6 4 MDUFA III Decisions Goal Met 6 6 4 PMAs pending MDUFA III Decision 0 0 12 PMAs pending MDUFA III Decision Past Goal 0 0 0
Current Performance Percent Goal Met 100% 100% 100%
Table 1.6 OIR - CDRH – PMA Originals & Panel-Track Supplements (with Panel Review) MDUFA Decision Performance Goals
Performance Goals:
FY 2013 FY 2014 FY 2015 FY 2016 FY 201750% within
320 FDA days
70% within 320 FDA
days
80% within 320 FDA
days
80% within 320 FDA
days
90% within 320 FDA
days
Number of PMAs filed 4 0 0 Non-MDUFA III Decisions 0 0 0 MDUFA III Decisions 4 0 0 MDUFA III Decisions Goal Met 4 0 0 PMAs pending MDUFA III Decision 0 0 0 PMAs pending MDUFA III Decision Past Goal 0 0 0
Current Performance Percent Goal Met 100% N/A N/A
Page 41 of 371
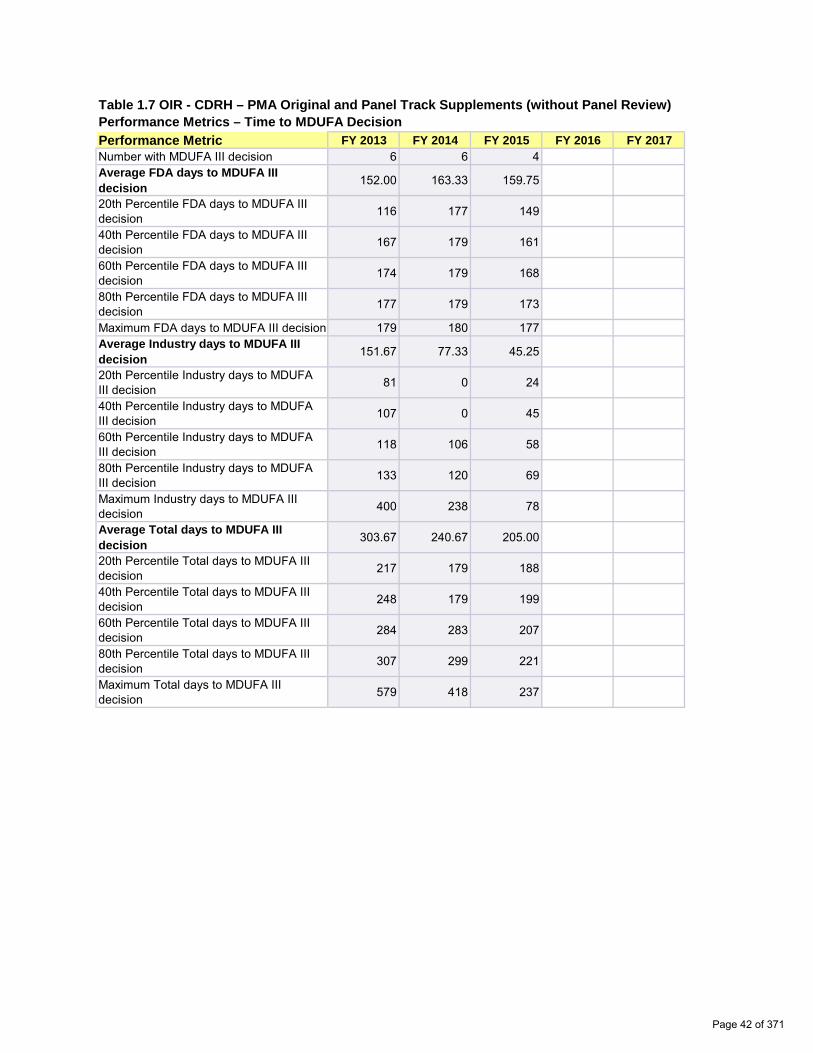
Table 1.7 OIR - CDRH – PMA Original and Panel Track Supplements (without Panel Review) Performance Metrics – Time to MDUFA Decision Performance Metric FY 2013 FY 2014 FY 2015 FY 2016 FY 2017 Number with MDUFA III decision 6 6 4 Average FDA days to MDUFA III decision 152.00 163.33 159.75
20th Percentile FDA days to MDUFA III decision 116 177 149
40th Percentile FDA days to MDUFA III decision 167 179 161
60th Percentile FDA days to MDUFA III decision 174 179 168
80th Percentile FDA days to MDUFA III decision 177 179 173
Maximum FDA days to MDUFA III decision 179 180 177 Average Industry days to MDUFA III decision 151.67 77.33 45.25
20th Percentile Industry days to MDUFA III decision 81 0 24
40th Percentile Industry days to MDUFA III decision 107 0 45
60th Percentile Industry days to MDUFA III decision 118 106 58
80th Percentile Industry days to MDUFA III decision 133 120 69
Maximum Industry days to MDUFA III decision 400 238 78
Average Total days to MDUFA III decision 303.67 240.67 205.00
20th Percentile Total days to MDUFA III decision 217 179 188
40th Percentile Total days to MDUFA III decision 248 179 199
60th Percentile Total days to MDUFA III decision 284 283 207
80th Percentile Total days to MDUFA III decision 307 299 221
Maximum Total days to MDUFA III decision 579 418 237
Page 42 of 371

Table 1.8 OIR - CDRH – PMA Original and Panel Track Supplements (with Panel Review) Performance Metrics – Time to MDUFA Decision Performance Metric FY 2013 FY 2014 FY 2015 FY 2016 FY 2017 Number with MDUFA III decision 4 0 0 Average FDA days to MDUFA III decision 285.75 0.00 0.00
20th Percentile FDA days to MDUFA III decision 261 0 0
40th Percentile FDA days to MDUFA III decision 301 0 0
60th Percentile FDA days to MDUFA III decision 311 0 0
80th Percentile FDA days to MDUFA III decision 319 0 0
Maximum FDA days to MDUFA III decision 325 0 0 Average Industry days to MDUFA III decision 73.50 0.00 0.00
20th Percentile Industry days to MDUFA III decision 0 0 0
40th Percentile Industry days to MDUFA III decision 21 0 0
60th Percentile Industry days to MDUFA III decision 84 0 0
80th Percentile Industry days to MDUFA III decision 139 0 0
Maximum Industry days to MDUFA III decision 189 0 0
Average Total days to MDUFA III decision 359.25 0.00 0.00
20th Percentile Total days to MDUFA III decision 261 0 0
40th Percentile Total days to MDUFA III decision 324 0 0
60th Percentile Total days to MDUFA III decision 403 0 0
80th Percentile Total days to MDUFA III decision 460 0 0
Maximum Total days to MDUFA III decision 504 0 0
Page 43 of 371

Table 1.9 OIR - CDRH – PMA Originals and Panel Track Supplements (without Panel Review) Performance Metrics – Rate of Withdrawal and Not Approvable Performance Metric FY 2013 FY 2014 FY 2015 FY 2016 FY 2017 Number Filed 6 6 16 Number with MDUFA decision 6 6 4 Number of Withdrawals 0 0 0 Number of Not Approvable 1 0 0 Rate of Withdrawals 0.0% 0% 0% Rate of Not Approvable 16.7% 0% 0%
Table 1.10 OIR - CDRH – PMA Original and Panel Track Supplements (with Panel Review) Performance Metrics – Rate of Withdrawal and Not Approvable Performance Metric FY 2013 FY 2014 FY 2015 FY 2016 FY 2017 Number Filed 4 0 0 Number with MDUFA decision 4 0 0 Number of Withdrawals 0 0 0 Number of Not Approvable 1 0 0 Rate of Withdrawals 0.0% N/A N/A Rate of Not Approvable 25.0% N/A N/A
Table 1.11 OIR - CDRH – PMA Original and Panel Track Supplements (without Panel Review) Performance Metrics – Submissions Missing Performance Goals Performance Metric FY 2013 FY 2014 FY 2015 FY 2016 FY 2017 Number of submissions that missed the goal 0 0 0
Mean FDA days for submissions that missed goal 0 0 0
Mean industry days for submissions that missed goal 0 0 0
Table 1.12 OIR - CDRH – PMA Original and Panel Track Supplements (with Panel Review) Performance Metrics – Submissions Missing Performance Goals Performance Metric FY 2013 FY 2014 FY 2015 FY 2016 FY 2017 Number of submissions that missed the goal 0 0 0
Mean FDA days for submissions that missed goal 0 0 0
Mean industry days for submissions that missed goal 0 0 0
Page 44 of 371
Section 1 PMA Original and Panel Track Supplements - Division Level Metrics
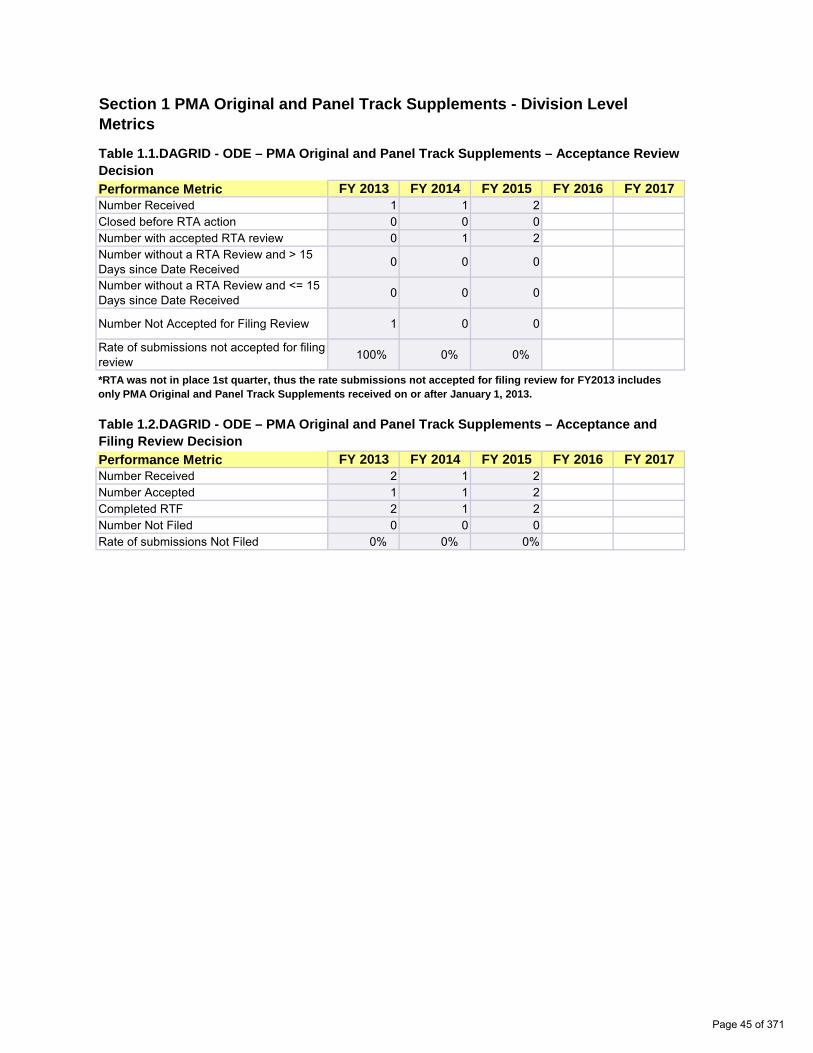
Table 1.1.DAGRID - ODE – PMA Original and Panel Track Supplements – Acceptance Review Decision Performance Metric FY 2013 FY 2014 FY 2015 FY 2016 FY 2017 Number Received 1 1 2 Closed before RTA action 0 0 0 Number with accepted RTA review 0 1 2 Number without a RTA Review and > 15 Days since Date Received 0 0 0
Number without a RTA Review and <= 15 Days since Date Received 0 0 0
Number Not Accepted for Filing Review 1 0 0
Rate of submissions not accepted for filing review 100% 0% 0%
*RTA was not in place 1st quarter, thus the rate submissions not accepted for filing review for FY2013 includes only PMA Original and Panel Track Supplements received on or after January 1, 2013.
Table 1.2.DAGRID - ODE – PMA Original and Panel Track Supplements – Acceptance and Filing Review Decision Performance Metric FY 2013 FY 2014 FY 2015 FY 2016 FY 2017 Number Received 2 1 2 Number Accepted 1 1 2 Completed RTF 2 1 2 Number Not Filed 0 0 0 Rate of submissions Not Filed 0% 0% 0%
Page 45 of 371
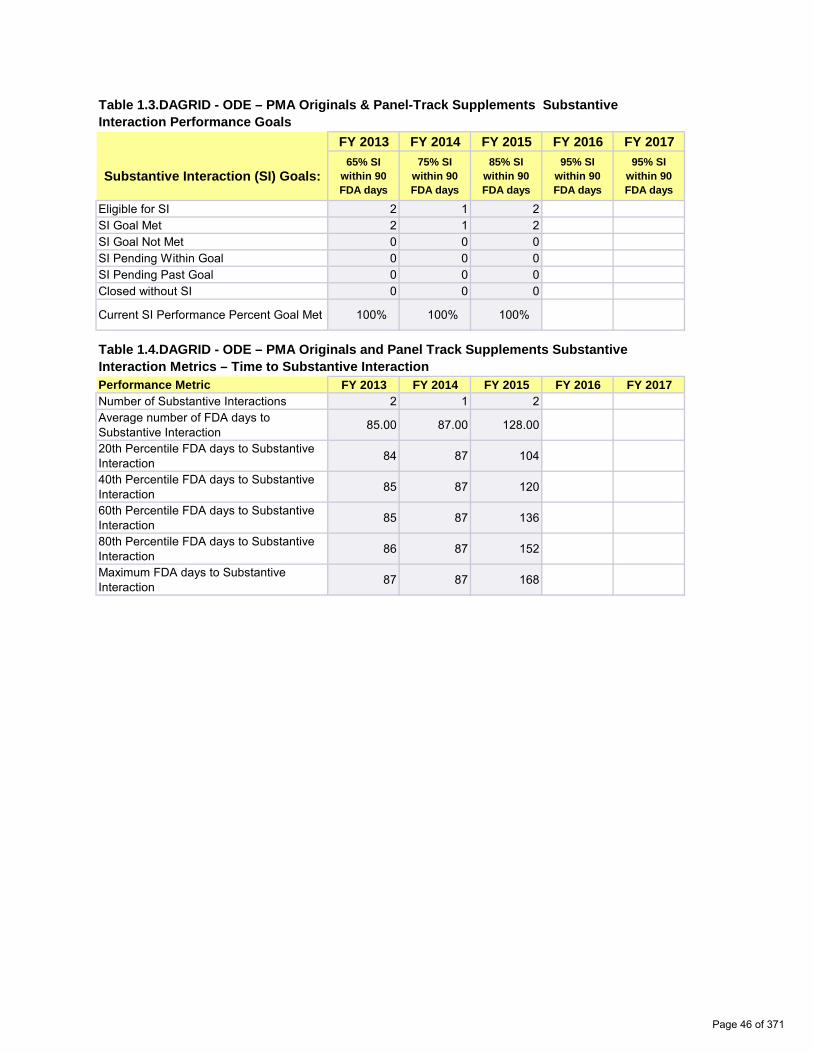
Table 1.3.DAGRID - ODE – PMA Originals & Panel-Track Supplements Substantive Interaction Performance Goals
Substantive Interaction (SI) Goals:
FY 2013 FY 2014 FY 2015 FY 2016 FY 2017 65% SI
within 90 FDA days
75% SI within 90 FDA days
85% SI within 90 FDA days
95% SI within 90 FDA days
95% SI within 90 FDA days
Eligible for SI 2 1 2 SI Goal Met 2 1 2 SI Goal Not Met 0 0 0 SI Pending Within Goal 0 0 0 SI Pending Past Goal 0 0 0 Closed without SI 0 0 0
Current SI Performance Percent Goal Met 100% 100% 100%
Table 1.4.DAGRID - ODE – PMA Originals and Panel Track Supplements Substantive Interaction Metrics – Time to Substantive Interaction Performance Metric FY 2013 FY 2014 FY 2015 FY 2016 FY 2017 Number of Substantive Interactions 2 1 2 Average number of FDA days to Substantive Interaction 85.00 87.00 128.00
20th Percentile FDA days to Substantive Interaction 84 87 104
40th Percentile FDA days to Substantive Interaction 85 87 120
60th Percentile FDA days to Substantive Interaction 85 87 136
80th Percentile FDA days to Substantive Interaction 86 87 152
Maximum FDA days to Substantive Interaction 87 87 168
Page 46 of 371

Table 1.5.DAGRID - ODE – PMA Originals & Panel-Track Supplements (without Panel Review) MDUFA Decision Performance Goals
Performance Goals:
FY 2013 FY 2014 FY 2015 FY 2016 FY 201770% within
180 FDA days
80% within 180 FDA
days
80% within 180 FDA
days
90% within 180 FDA
days
90% within 180 FDA
days
Number of PMAs filed 1 1 2 Non-MDUFA III Decisions 0 0 0 MDUFA III Decisions 1 1 0 MDUFA III Decisions Goal Met 1 1 0 PMAs pending MDUFA III Decision 0 0 2 PMAs pending MDUFA III Decision Past Goal 0 0 0
Current Performance Percent Goal Met 100% 100% N/A
Table 1.6.DAGRID - ODE – PMA Originals & Panel-Track Supplements (with Panel Review) MDUFA Decision Performance Goals
Performance Goals:
FY 2013 FY 2014 FY 2015 FY 2016 FY 201750% within
320 FDA days
70% within 320 FDA
days
80% within 320 FDA
days
80% within 320 FDA
days
90% within 320 FDA
days
Number of PMAs filed 1 0 0 Non-MDUFA III Decisions 0 0 0 MDUFA III Decisions 1 0 0 MDUFA III Decisions Goal Met 1 0 0 PMAs pending MDUFA III Decision 0 0 0 PMAs pending MDUFA III Decision Past Goal 0 0 0
Current Performance Percent Goal Met 100% N/A N/A
Page 47 of 371

Table 1.7.DAGRID - ODE – PMA Original and Panel Track Supplements (without Panel Review) Performance Metrics – Time to MDUFA Decision Performance Metric FY 2013 FY 2014 FY 2015 FY 2016 FY 2017 Number with MDUFA III decision 1 1 0 Average FDA days to MDUFA III decision 180.00 179.00 0.00
20th Percentile FDA days to MDUFA III decision 180 179 0
40th Percentile FDA days to MDUFA III decision 180 179 0
60th Percentile FDA days to MDUFA III decision 180 179 0
80th Percentile FDA days to MDUFA III decision 180 179 0
Maximum FDA days to MDUFA III decision 180 179 0 Average Industry days to MDUFA III decision 360.00 0.00 0.00
20th Percentile Industry days to MDUFA III decision 360 0 0
40th Percentile Industry days to MDUFA III decision 360 0 0
60th Percentile Industry days to MDUFA III decision 360 0 0
80th Percentile Industry days to MDUFA III decision 360 0 0
Maximum Industry days to MDUFA III decision 360 0 0
Average Total days to MDUFA III decision 540.00 179.00 0.00
20th Percentile Total days to MDUFA III decision 540 179 0
40th Percentile Total days to MDUFA III decision 540 179 0
60th Percentile Total days to MDUFA III decision 540 179 0
80th Percentile Total days to MDUFA III decision 540 179 0
Maximum Total days to MDUFA III decision 540 179 0
Page 48 of 371

Table 1.8.DAGRID - ODE – PMA Original and Panel Track Supplements (with Panel Review) Performance Metrics – Time to MDUFA Decision Performance Metric FY 2013 FY 2014 FY 2015 FY 2016 FY 2017 Number with MDUFA III decision 1 0 0 Average FDA days to MDUFA III decision 320.00 0.00 0.00
20th Percentile FDA days to MDUFA III decision 320 0 0
40th Percentile FDA days to MDUFA III decision 320 0 0
60th Percentile FDA days to MDUFA III decision 320 0 0
80th Percentile FDA days to MDUFA III decision 320 0 0
Maximum FDA days to MDUFA III decision 320 0 0 Average Industry days to MDUFA III decision 28.00 0.00 0.00
20th Percentile Industry days to MDUFA III decision 28 0 0
40th Percentile Industry days to MDUFA III decision 28 0 0
60th Percentile Industry days to MDUFA III decision 28 0 0
80th Percentile Industry days to MDUFA III decision 28 0 0
Maximum Industry days to MDUFA III decision 28 0 0
Average Total days to MDUFA III decision 348.00 0.00 0.00
20th Percentile Total days to MDUFA III decision 348 0 0
40th Percentile Total days to MDUFA III decision 348 0 0
60th Percentile Total days to MDUFA III decision 348 0 0
80th Percentile Total days to MDUFA III decision 348 0 0
Maximum Total days to MDUFA III decision 348 0 0
Page 49 of 371

Table 1.9.DAGRID - ODE – PMA Originals and Panel Track Supplements (without Panel Review) Performance Metrics – Rate of Withdrawal and Not Approvable Performance Metric FY 2013 FY 2014 FY 2015 FY 2016 FY 2017 Number Filed 1 1 2 Number with MDUFA decision 1 1 0 Number of Withdrawals 0 0 0 Number of Not Approvable 0 0 0 Rate of Withdrawals 0% 0% N/A Rate of Not Approvable 0% 0% N/A
Table 1.10.DAGRID - ODE – PMA Original and Panel Track Supplements (with Panel Review) Performance Metrics – Rate of Withdrawal and Not Approvable Performance Metric FY 2013 FY 2014 FY 2015 FY 2016 FY 2017 Number Filed 1 0 0 Number with MDUFA decision 1 0 0 Number of Withdrawals 0 0 0 Number of Not Approvable 0 0 0 Rate of Withdrawals 0% N/A N/A Rate of Not Approvable 0% N/A N/A
Table 1.11.DAGRID - ODE – PMA Original and Panel Track Supplements (without Panel Review) Performance Metrics – Submissions Missing Performance Goals Performance Metric FY 2013 FY 2014 FY 2015 FY 2016 FY 2017 Number of submissions that missed the goal 0 0 0
Mean FDA days for submissions that missed goal 0 0 0
Mean industry days for submissions that missed goal 0 0 0
Table 1.12.DAGRID - ODE – PMA Original and Panel Track Supplements (with Panel Review) Performance Metrics – Submissions Missing Performance Goals Performance Metric FY 2013 FY 2014 FY 2015 FY 2016 FY 2017 Number of submissions that missed the goal 0 0 0
Mean FDA days for submissions that missed goal 0 0 0
Mean industry days for submissions that missed goal 0 0 0
Page 50 of 371

Table 1.1.DCD - ODE – PMA Original and Panel Track Supplements – Acceptance Review Decision Performance Metric FY 2013 FY 2014 FY 2015 FY 2016 FY 2017 Number Received 17 17 28 Closed before RTA action 1 0 1 Number with accepted RTA review 15 15 25 Number without a RTA Review and > 15 Days since Date Received 1 1 0
Number without a RTA Review and <= 15 Days since Date Received 0 0 0
Number Not Accepted for Filing Review 0 1 2
Rate of submissions not accepted for filing review 0% 5.9% 7.4%
*RTA was not in place 1st quarter, thus the rate submissions not accepted for filing review for FY2013 includes only PMA Original and Panel Track Supplements received on or after January 1, 2013.
Table 1.2.DCD - ODE – PMA Original and Panel Track Supplements – Acceptance and Filing Review Decision Performance Metric FY 2013 FY 2014 FY 2015 FY 2016 FY 2017 Number Received 20 17 28 Number Accepted 19 16 25 Completed RTF 19 17 26 Number Not Filed 0 0 0 Rate of submissions Not Filed 0% 0% 0%
Page 51 of 371

Table 1.3.DCD - ODE – PMA Originals & Panel-Track Supplements Substantive Interaction Performance Goals
Substantive Interaction (SI) Goals:
FY 2013 FY 2014 FY 2015 FY 2016 FY 2017 65% SI
within 90 FDA days
75% SI within 90 FDA days
85% SI within 90 FDA days
95% SI within 90 FDA days
95% SI within 90 FDA days
Eligible for SI 19 17 26 SI Goal Met 17 16 18 SI Goal Not Met 1 1 1 SI Pending Within Goal 0 0 5 SI Pending Past Goal 1 0 2 Closed without SI 0 0 0
Current SI Performance Percent Goal Met 89.5% 94.1% 85.7%
Table 1.4.DCD - ODE – PMA Originals and Panel Track Supplements Substantive Interaction Metrics – Time to Substantive Interaction Performance Metric FY 2013 FY 2014 FY 2015 FY 2016 FY 2017 Number of Substantive Interactions 18 17 19 Average number of FDA days to Substantive Interaction 88.33 87.71 88.63
20th Percentile FDA days to Substantive Interaction 84 87 85
40th Percentile FDA days to Substantive Interaction 88 88 88
60th Percentile FDA days to Substantive Interaction 90 89 88
80th Percentile FDA days to Substantive Interaction 90 90 90
Maximum FDA days to Substantive Interaction 117 91 113
Page 52 of 371
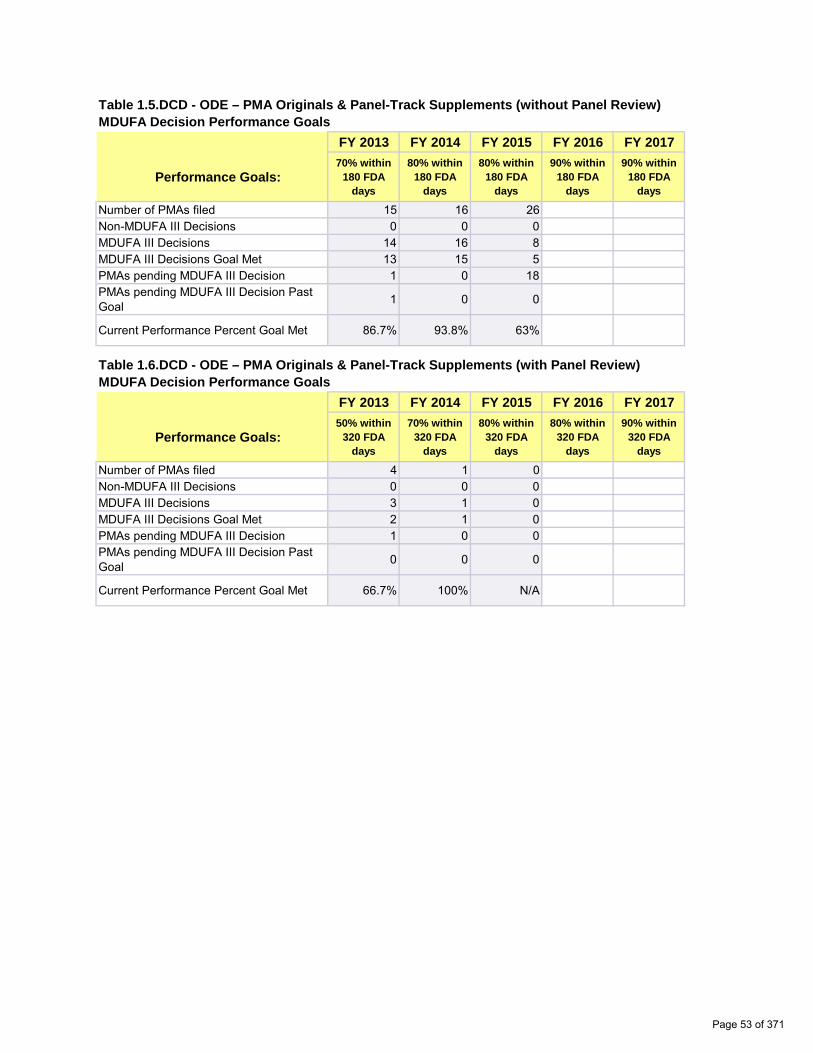
Table 1.5.DCD - ODE – PMA Originals & Panel-Track Supplements (without Panel Review) MDUFA Decision Performance Goals
Performance Goals:
FY 2013 FY 2014 FY 2015 FY 2016 FY 201770% within
180 FDA days
80% within 180 FDA
days
80% within 180 FDA
days
90% within 180 FDA
days
90% within 180 FDA
days
Number of PMAs filed 15 16 26 Non-MDUFA III Decisions 0 0 0 MDUFA III Decisions 14 16 8 MDUFA III Decisions Goal Met 13 15 5 PMAs pending MDUFA III Decision 1 0 18 PMAs pending MDUFA III Decision Past Goal 1 0 0
Current Performance Percent Goal Met 86.7% 93.8% 63%
Table 1.6.DCD - ODE – PMA Originals & Panel-Track Supplements (with Panel Review) MDUFA Decision Performance Goals
Performance Goals:
FY 2013 FY 2014 FY 2015 FY 2016 FY 201750% within
320 FDA days
70% within 320 FDA
days
80% within 320 FDA
days
80% within 320 FDA
days
90% within 320 FDA
days
Number of PMAs filed 4 1 0 Non-MDUFA III Decisions 0 0 0 MDUFA III Decisions 3 1 0 MDUFA III Decisions Goal Met 2 1 0 PMAs pending MDUFA III Decision 1 0 0 PMAs pending MDUFA III Decision Past Goal 0 0 0
Current Performance Percent Goal Met 66.7% 100% N/A
Page 53 of 371

Table 1.7.DCD - ODE – PMA Original and Panel Track Supplements (without Panel Review) Performance Metrics – Time to MDUFA Decision Performance Metric FY 2013 FY 2014 FY 2015 FY 2016 FY 2017 Number with MDUFA III decision 14 16 8 Average FDA days to MDUFA III decision 187.36 174.25 172.13
20th Percentile FDA days to MDUFA III decision 177 177 177
40th Percentile FDA days to MDUFA III decision 180 178 179
60th Percentile FDA days to MDUFA III decision 180 179 180
80th Percentile FDA days to MDUFA III decision 180 180 186
Maximum FDA days to MDUFA III decision 291 201 189 Average Industry days to MDUFA III decision 165.71 29.31 16.50
20th Percentile Industry days to MDUFA III decision 0 0 0
40th Percentile Industry days to MDUFA III decision 70 0 0
60th Percentile Industry days to MDUFA III decision 103 0 9
80th Percentile Industry days to MDUFA III decision 329 43 44
Maximum Industry days to MDUFA III decision 563 161 44
Average Total days to MDUFA III decision 353.07 203.56 188.63
20th Percentile Total days to MDUFA III decision 180 179 177
40th Percentile Total days to MDUFA III decision 250 179 180
60th Percentile Total days to MDUFA III decision 284 180 189
80th Percentile Total days to MDUFA III decision 527 244 229
Maximum Total days to MDUFA III decision 743 338 233
Page 54 of 371
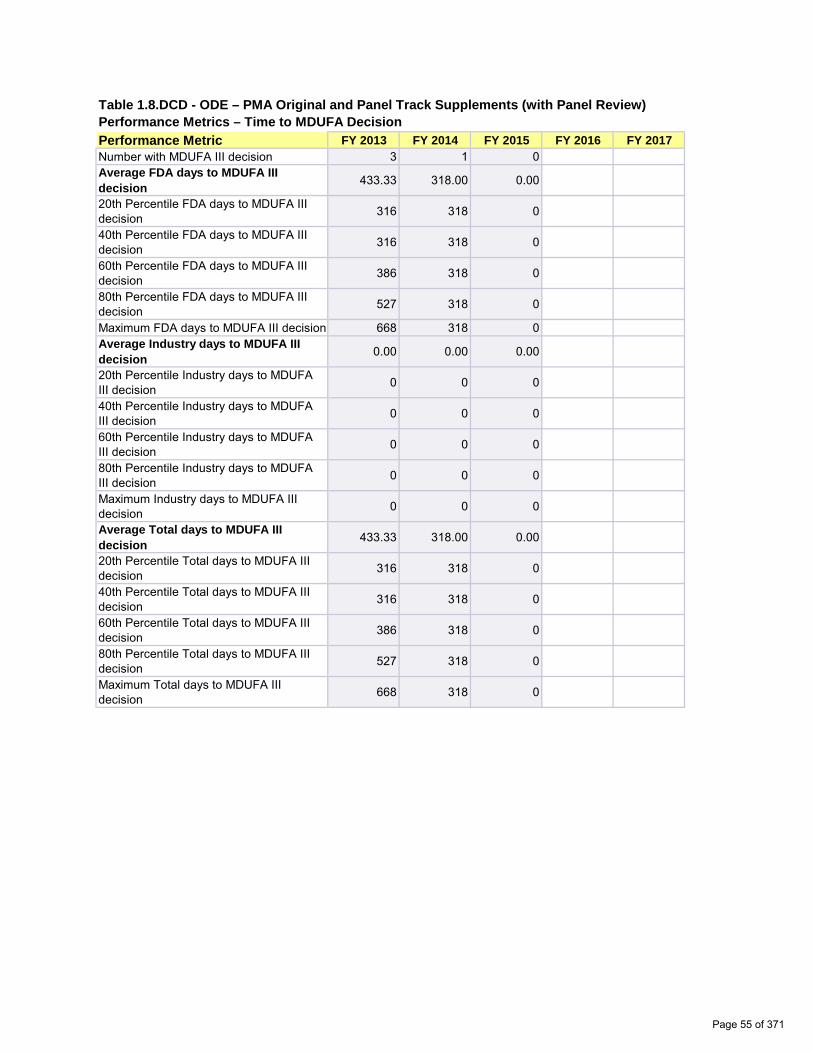
Table 1.8.DCD - ODE – PMA Original and Panel Track Supplements (with Panel Review) Performance Metrics – Time to MDUFA Decision Performance Metric FY 2013 FY 2014 FY 2015 FY 2016 FY 2017 Number with MDUFA III decision 3 1 0 Average FDA days to MDUFA III decision 433.33 318.00 0.00
20th Percentile FDA days to MDUFA III decision 316 318 0
40th Percentile FDA days to MDUFA III decision 316 318 0
60th Percentile FDA days to MDUFA III decision 386 318 0
80th Percentile FDA days to MDUFA III decision 527 318 0
Maximum FDA days to MDUFA III decision 668 318 0 Average Industry days to MDUFA III decision 0.00 0.00 0.00
20th Percentile Industry days to MDUFA III decision 0 0 0
40th Percentile Industry days to MDUFA III decision 0 0 0
60th Percentile Industry days to MDUFA III decision 0 0 0
80th Percentile Industry days to MDUFA III decision 0 0 0
Maximum Industry days to MDUFA III decision 0 0 0
Average Total days to MDUFA III decision 433.33 318.00 0.00
20th Percentile Total days to MDUFA III decision 316 318 0
40th Percentile Total days to MDUFA III decision 316 318 0
60th Percentile Total days to MDUFA III decision 386 318 0
80th Percentile Total days to MDUFA III decision 527 318 0
Maximum Total days to MDUFA III decision 668 318 0
Page 55 of 371

Table 1.9.DCD - ODE – PMA Originals and Panel Track Supplements (without Panel Review) Performance Metrics – Rate of Withdrawal and Not Approvable Performance Metric FY 2013 FY 2014 FY 2015 FY 2016 FY 2017 Number Filed 15 16 26 Number with MDUFA decision 14 16 8 Number of Withdrawals 1 0 0 Number of Not Approvable 2 0 2 Rate of Withdrawals 7.1% 0% 0% Rate of Not Approvable 14.3% 0% 25%
Table 1.10.DCD - ODE – PMA Original and Panel Track Supplements (with Panel Review) Performance Metrics – Rate of Withdrawal and Not Approvable Performance Metric FY 2013 FY 2014 FY 2015 FY 2016 FY 2017 Number Filed 4 1 0 Number with MDUFA decision 3 1 0 Number of Withdrawals 0 0 0 Number of Not Approvable 0 0 0 Rate of Withdrawals 0% 0% N/A Rate of Not Approvable 0% 0% N/A
Table 1.11.DCD - ODE – PMA Original and Panel Track Supplements (without Panel Review) Performance Metrics – Submissions Missing Performance Goals Performance Metric FY 2013 FY 2014 FY 2015 FY 2016 FY 2017 Number of submissions that missed the goal 2 1 3
Mean FDA days for submissions that missed goal 622 201 186
Mean industry days for submissions that missed goal 57 43 0
Table 1.12.DCD - ODE – PMA Original and Panel Track Supplements (with Panel Review) Performance Metrics – Submissions Missing Performance Goals Performance Metric FY 2013 FY 2014 FY 2015 FY 2016 FY 2017 Number of submissions that missed the goal 1 0 0
Mean FDA days for submissions that missed goal 668 0 0
Mean industry days for submissions that missed goal 0 0 0
Page 56 of 371
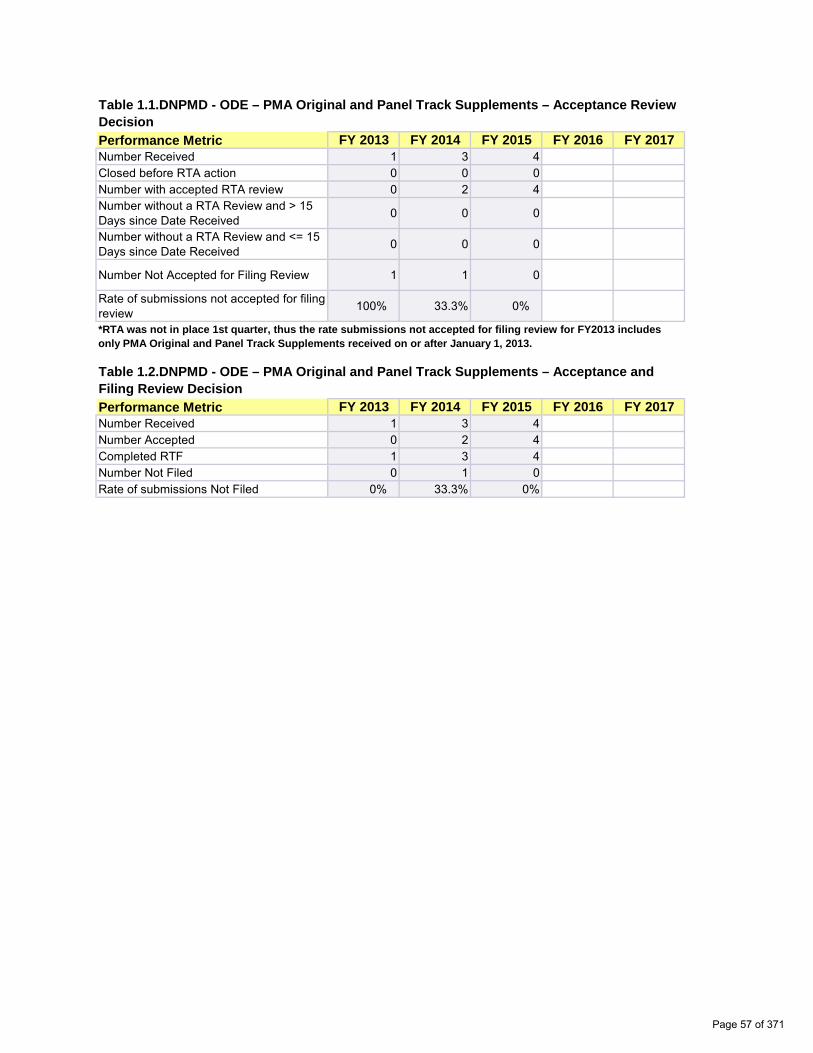
Table 1.1.DNPMD - ODE – PMA Original and Panel Track Supplements – Acceptance Review Decision Performance Metric FY 2013 FY 2014 FY 2015 FY 2016 FY 2017 Number Received 1 3 4 Closed before RTA action 0 0 0 Number with accepted RTA review 0 2 4 Number without a RTA Review and > 15 Days since Date Received 0 0 0
Number without a RTA Review and <= 15 Days since Date Received 0 0 0
Number Not Accepted for Filing Review 1 1 0
Rate of submissions not accepted for filing review 100% 33.3% 0%
*RTA was not in place 1st quarter, thus the rate submissions not accepted for filing review for FY2013 includes only PMA Original and Panel Track Supplements received on or after January 1, 2013.
Table 1.2.DNPMD - ODE – PMA Original and Panel Track Supplements – Acceptance and Filing Review Decision Performance Metric FY 2013 FY 2014 FY 2015 FY 2016 FY 2017 Number Received 1 3 4 Number Accepted 0 2 4 Completed RTF 1 3 4 Number Not Filed 0 1 0 Rate of submissions Not Filed 0% 33.3% 0%
Page 57 of 371

Table 1.3.DNPMD - ODE – PMA Originals & Panel-Track Supplements Substantive Interaction Performance Goals
Substantive Interaction (SI) Goals:
FY 2013 FY 2014 FY 2015 FY 2016 FY 2017 65% SI
within 90 FDA days
75% SI within 90 FDA days
85% SI within 90 FDA days
95% SI within 90 FDA days
95% SI within 90 FDA days
Eligible for SI 1 3 4 SI Goal Met 0 2 3 SI Goal Not Met 1 1 0 SI Pending Within Goal 0 0 1 SI Pending Past Goal 0 0 0 Closed without SI 0 0 0
Current SI Performance Percent Goal Met 0% 66.7% 100%
Table 1.4.DNPMD - ODE – PMA Originals and Panel Track Supplements Substantive Interaction Metrics – Time to Substantive Interaction Performance Metric FY 2013 FY 2014 FY 2015 FY 2016 FY 2017 Number of Substantive Interactions 1 3 3 Average number of FDA days to Substantive Interaction 92.00 90.33 114.33
20th Percentile FDA days to Substantive Interaction 92 90 88
40th Percentile FDA days to Substantive Interaction 92 90 89
60th Percentile FDA days to Substantive Interaction 92 90 105
80th Percentile FDA days to Substantive Interaction 92 91 136
Maximum FDA days to Substantive Interaction 92 91 166
Page 58 of 371

Table 1.5.DNPMD - ODE – PMA Originals & Panel-Track Supplements (without Panel Review) MDUFA Decision Performance Goals
Performance Goals:
FY 2013 FY 2014 FY 2015 FY 2016 FY 201770% within
180 FDA days
80% within 180 FDA
days
80% within 180 FDA
days
90% within 180 FDA
days
90% within 180 FDA
days
Number of PMAs filed 1 3 4 Non-MDUFA III Decisions 0 0 0 MDUFA III Decisions 1 3 1 MDUFA III Decisions Goal Met 1 3 1 PMAs pending MDUFA III Decision 0 0 3 PMAs pending MDUFA III Decision Past Goal 0 0 0
Current Performance Percent Goal Met 100% 100% 100%
Table 1.6.DNPMD - ODE – PMA Originals & Panel-Track Supplements (with Panel Review) MDUFA Decision Performance Goals
Performance Goals:
FY 2013 FY 2014 FY 2015 FY 2016 FY 201750% within
320 FDA days
70% within 320 FDA
days
80% within 320 FDA
days
80% within 320 FDA
days
90% within 320 FDA
days
Number of PMAs filed 0 0 0 Non-MDUFA III Decisions 0 0 0 MDUFA III Decisions 0 0 0 MDUFA III Decisions Goal Met 0 0 0 PMAs pending MDUFA III Decision 0 0 0 PMAs pending MDUFA III Decision Past Goal 0 0 0
Current Performance Percent Goal Met N/A N/A N/A
Page 59 of 371

Table 1.7.DNPMD - ODE – PMA Original and Panel Track Supplements (without Panel Review) Performance Metrics – Time to MDUFA Decision Performance Metric FY 2013 FY 2014 FY 2015 FY 2016 FY 2017 Number with MDUFA III decision 1 3 1 Average FDA days to MDUFA III decision 180.00 182.33 178.00
20th Percentile FDA days to MDUFA III decision 180 178 178
40th Percentile FDA days to MDUFA III decision 180 179 178
60th Percentile FDA days to MDUFA III decision 180 182 178
80th Percentile FDA days to MDUFA III decision 180 186 178
Maximum FDA days to MDUFA III decision 180 190 178 Average Industry days to MDUFA III decision 0.00 91.67 0.00
20th Percentile Industry days to MDUFA III decision 0 48 0
40th Percentile Industry days to MDUFA III decision 0 69 0
60th Percentile Industry days to MDUFA III decision 0 97 0
80th Percentile Industry days to MDUFA III decision 0 132 0
Maximum Industry days to MDUFA III decision 0 168 0
Average Total days to MDUFA III decision 180.00 274.00 178.00
20th Percentile Total days to MDUFA III decision 180 227 178
40th Percentile Total days to MDUFA III decision 180 246 178
60th Percentile Total days to MDUFA III decision 180 276 178
80th Percentile Total days to MDUFA III decision 180 317 178
Maximum Total days to MDUFA III decision 180 358 178
Page 60 of 371

Table 1.8.DNPMD - ODE – PMA Original and Panel Track Supplements (with Panel Review) Performance Metrics – Time to MDUFA Decision Performance Metric FY 2013 FY 2014 FY 2015 FY 2016 FY 2017 Number with MDUFA III decision 0 0 0 Average FDA days to MDUFA III decision 0.00 0.00 0.00
20th Percentile FDA days to MDUFA III decision 0 0 0
40th Percentile FDA days to MDUFA III decision 0 0 0
60th Percentile FDA days to MDUFA III decision 0 0 0
80th Percentile FDA days to MDUFA III decision 0 0 0
Maximum FDA days to MDUFA III decision 0 0 0 Average Industry days to MDUFA III decision 0.00 0.00 0.00
20th Percentile Industry days to MDUFA III decision 0 0 0
40th Percentile Industry days to MDUFA III decision 0 0 0
60th Percentile Industry days to MDUFA III decision 0 0 0
80th Percentile Industry days to MDUFA III decision 0 0 0
Maximum Industry days to MDUFA III decision 0 0 0
Average Total days to MDUFA III decision 0.00 0.00 0.00
20th Percentile Total days to MDUFA III decision 0 0 0
40th Percentile Total days to MDUFA III decision 0 0 0
60th Percentile Total days to MDUFA III decision 0 0 0
80th Percentile Total days to MDUFA III decision 0 0 0
Maximum Total days to MDUFA III decision 0 0 0
Page 61 of 371
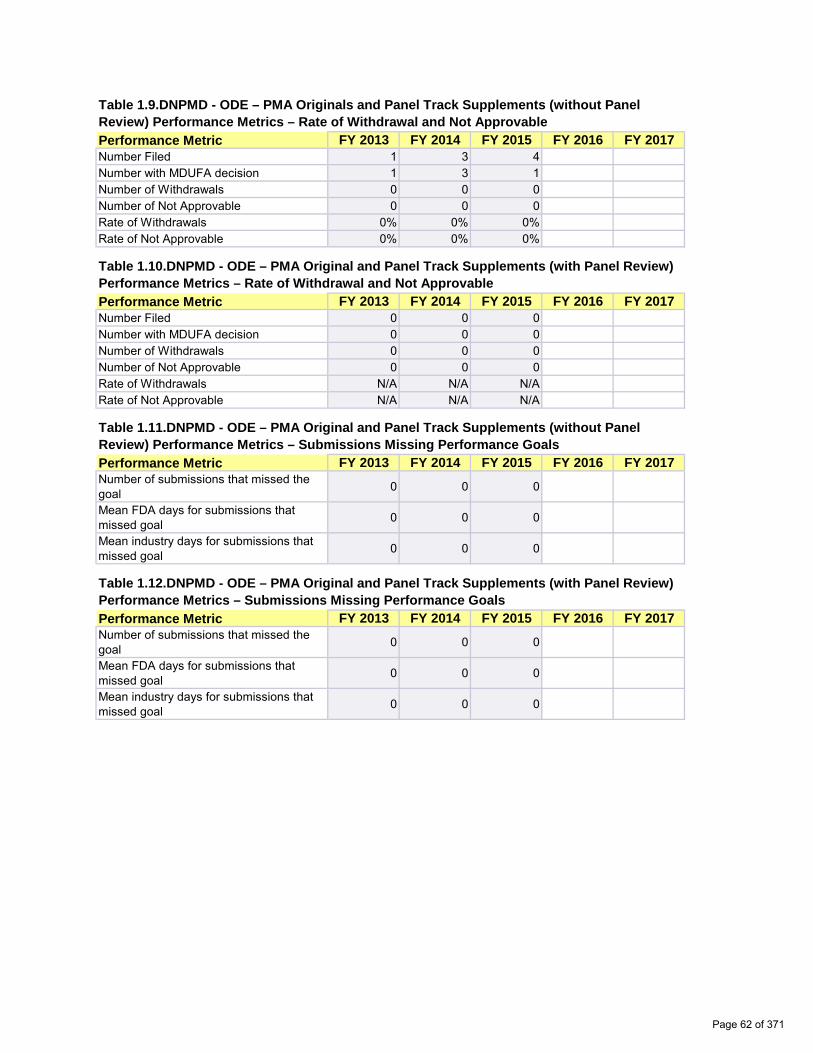
Table 1.9.DNPMD - ODE – PMA Originals and Panel Track Supplements (without Panel Review) Performance Metrics – Rate of Withdrawal and Not Approvable Performance Metric FY 2013 FY 2014 FY 2015 FY 2016 FY 2017 Number Filed 1 3 4 Number with MDUFA decision 1 3 1 Number of Withdrawals 0 0 0 Number of Not Approvable 0 0 0 Rate of Withdrawals 0% 0% 0% Rate of Not Approvable 0% 0% 0%
Table 1.10.DNPMD - ODE – PMA Original and Panel Track Supplements (with Panel Review) Performance Metrics – Rate of Withdrawal and Not Approvable Performance Metric FY 2013 FY 2014 FY 2015 FY 2016 FY 2017 Number Filed 0 0 0 Number with MDUFA decision 0 0 0 Number of Withdrawals 0 0 0 Number of Not Approvable 0 0 0 Rate of Withdrawals N/A N/A N/A Rate of Not Approvable N/A N/A N/A
Table 1.11.DNPMD - ODE – PMA Original and Panel Track Supplements (without Panel Review) Performance Metrics – Submissions Missing Performance Goals Performance Metric FY 2013 FY 2014 FY 2015 FY 2016 FY 2017 Number of submissions that missed the goal 0 0 0
Mean FDA days for submissions that missed goal 0 0 0
Mean industry days for submissions that missed goal 0 0 0
Table 1.12.DNPMD - ODE – PMA Original and Panel Track Supplements (with Panel Review) Performance Metrics – Submissions Missing Performance Goals Performance Metric FY 2013 FY 2014 FY 2015 FY 2016 FY 2017 Number of submissions that missed the goal 0 0 0
Mean FDA days for submissions that missed goal 0 0 0
Mean industry days for submissions that missed goal 0 0 0
Page 62 of 371

Table 1.1.DOD - ODE – PMA Original and Panel Track Supplements – Acceptance Review Decision Performance Metric FY 2013 FY 2014 FY 2015 FY 2016 FY 2017 Number Received 0 4 7 Closed before RTA action 0 0 0 Number with accepted RTA review 0 4 5 Number without a RTA Review and > 15 Days since Date Received 0 0 0
Number without a RTA Review and <= 15 Days since Date Received 0 0 0
Number Not Accepted for Filing Review 0 0 2
Rate of submissions not accepted for filing review N/A N/A 28.6%
*RTA was not in place 1st quarter, thus the rate submissions not accepted for filing review for FY2013 includes only PMA Original and Panel Track Supplements received on or after January 1, 2013.
Table 1.2.DOD - ODE – PMA Original and Panel Track Supplements – Acceptance and Filing Review Decision Performance Metric FY 2013 FY 2014 FY 2015 FY 2016 FY 2017 Number Received 2 4 7 Number Accepted 2 4 5 Completed RTF 2 4 6 Number Not Filed 0 0 0 Rate of submissions Not Filed 0% 0% 0%
Page 63 of 371

Table 1.3.DOD - ODE – PMA Originals & Panel-Track Supplements Substantive Interaction Performance Goals
Substantive Interaction (SI) Goals:
FY 2013 FY 2014 FY 2015 FY 2016 FY 2017 65% SI
within 90 FDA days
75% SI within 90 FDA days
85% SI within 90 FDA days
95% SI within 90 FDA days
95% SI within 90 FDA days
Eligible for SI 2 4 6 SI Goal Met 2 4 3 SI Goal Not Met 0 0 1 SI Pending Within Goal 0 0 2 SI Pending Past Goal 0 0 0 Closed without SI 0 0 0
Current SI Performance Percent Goal Met 100% 100% 75.0%
Table 1.4.DOD - ODE – PMA Originals and Panel Track Supplements Substantive Interaction Metrics – Time to Substantive Interaction Performance Metric FY 2013 FY 2014 FY 2015 FY 2016 FY 2017 Number of Substantive Interactions 2 4 4 Average number of FDA days to Substantive Interaction 86.00 100.00 89.50
20th Percentile FDA days to Substantive Interaction 86 89 86
40th Percentile FDA days to Substantive Interaction 86 89 88
60th Percentile FDA days to Substantive Interaction 86 90 90
80th Percentile FDA days to Substantive Interaction 86 107 92
Maximum FDA days to Substantive Interaction 86 133 96
Page 64 of 371

Table 1.5.DOD - ODE – PMA Originals & Panel-Track Supplements (without Panel Review) MDUFA Decision Performance Goals
Performance Goals:
FY 2013 FY 2014 FY 2015 FY 2016 FY 201770% within
180 FDA days
80% within 180 FDA
days
80% within 180 FDA
days
90% within 180 FDA
days
90% within 180 FDA
days
Number of PMAs filed 1 2 6 Non-MDUFA III Decisions 0 0 0 MDUFA III Decisions 1 2 1 MDUFA III Decisions Goal Met 1 2 1 PMAs pending MDUFA III Decision 0 0 5 PMAs pending MDUFA III Decision Past Goal 0 0 0
Current Performance Percent Goal Met 100% 100% 100%
Table 1.6.DOD - ODE – PMA Originals & Panel-Track Supplements (with Panel Review) MDUFA Decision Performance Goals
Performance Goals:
FY 2013 FY 2014 FY 2015 FY 2016 FY 201750% within
320 FDA days
70% within 320 FDA
days
80% within 320 FDA
days
80% within 320 FDA
days
90% within 320 FDA
days
Number of PMAs filed 1 2 0 Non-MDUFA III Decisions 0 0 0 MDUFA III Decisions 1 1 0 MDUFA III Decisions Goal Met 1 1 0 PMAs pending MDUFA III Decision 0 1 0 PMAs pending MDUFA III Decision Past Goal 0 0 0
Current Performance Percent Goal Met 100% 100% N/A
Page 65 of 371
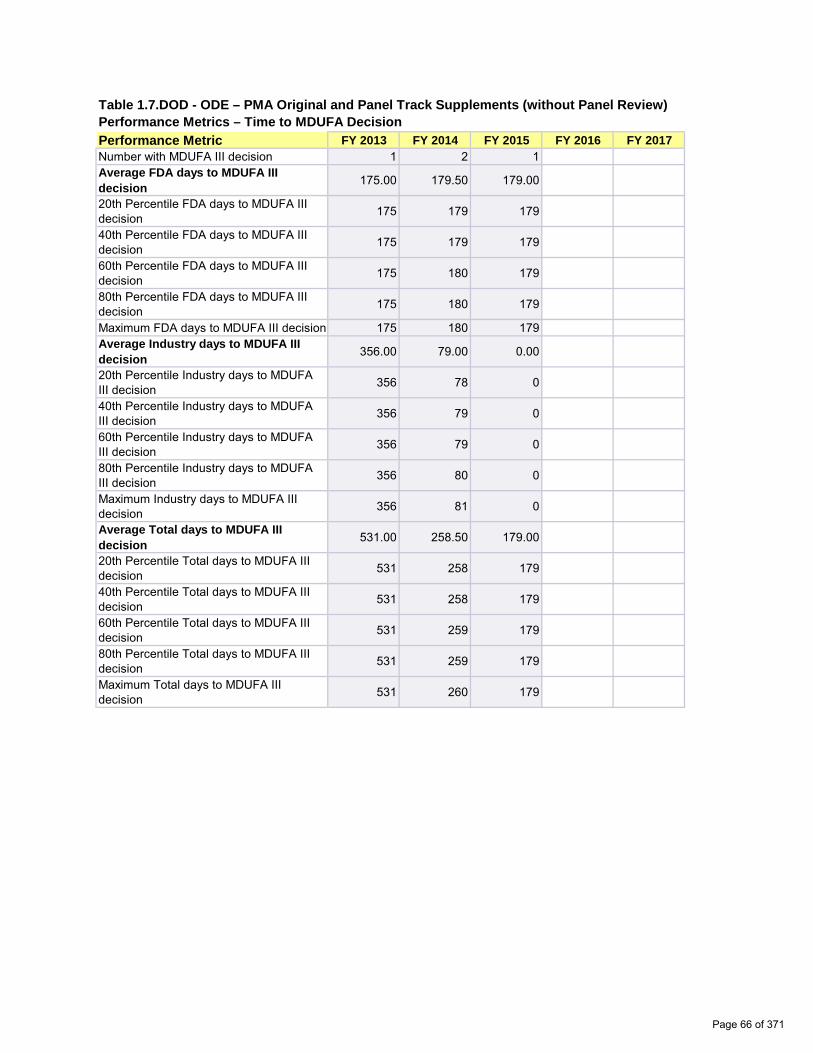
Table 1.7.DOD - ODE – PMA Original and Panel Track Supplements (without Panel Review) Performance Metrics – Time to MDUFA Decision Performance Metric FY 2013 FY 2014 FY 2015 FY 2016 FY 2017 Number with MDUFA III decision 1 2 1 Average FDA days to MDUFA III decision 175.00 179.50 179.00
20th Percentile FDA days to MDUFA III decision 175 179 179
40th Percentile FDA days to MDUFA III decision 175 179 179
60th Percentile FDA days to MDUFA III decision 175 180 179
80th Percentile FDA days to MDUFA III decision 175 180 179
Maximum FDA days to MDUFA III decision 175 180 179 Average Industry days to MDUFA III decision 356.00 79.00 0.00
20th Percentile Industry days to MDUFA III decision 356 78 0
40th Percentile Industry days to MDUFA III decision 356 79 0
60th Percentile Industry days to MDUFA III decision 356 79 0
80th Percentile Industry days to MDUFA III decision 356 80 0
Maximum Industry days to MDUFA III decision 356 81 0
Average Total days to MDUFA III decision 531.00 258.50 179.00
20th Percentile Total days to MDUFA III decision 531 258 179
40th Percentile Total days to MDUFA III decision 531 258 179
60th Percentile Total days to MDUFA III decision 531 259 179
80th Percentile Total days to MDUFA III decision 531 259 179
Maximum Total days to MDUFA III decision 531 260 179
Page 66 of 371

Table 1.8.DOD - ODE – PMA Original and Panel Track Supplements (with Panel Review) Performance Metrics – Time to MDUFA Decision Performance Metric FY 2013 FY 2014 FY 2015 FY 2016 FY 2017 Number with MDUFA III decision 1 1 0 Average FDA days to MDUFA III decision 219.00 314.00 0.00
20th Percentile FDA days to MDUFA III decision 219 314 0
40th Percentile FDA days to MDUFA III decision 219 314 0
60th Percentile FDA days to MDUFA III decision 219 314 0
80th Percentile FDA days to MDUFA III decision 219 314 0
Maximum FDA days to MDUFA III decision 219 314 0 Average Industry days to MDUFA III decision 186.00 101.00 0.00
20th Percentile Industry days to MDUFA III decision 186 101 0
40th Percentile Industry days to MDUFA III decision 186 101 0
60th Percentile Industry days to MDUFA III decision 186 101 0
80th Percentile Industry days to MDUFA III decision 186 101 0
Maximum Industry days to MDUFA III decision 186 101 0
Average Total days to MDUFA III decision 405.00 415.00 0.00
20th Percentile Total days to MDUFA III decision 405 415 0
40th Percentile Total days to MDUFA III decision 405 415 0
60th Percentile Total days to MDUFA III decision 405 415 0
80th Percentile Total days to MDUFA III decision 405 415 0
Maximum Total days to MDUFA III decision 405 415 0
Page 67 of 371

Table 1.9.DOD - ODE – PMA Originals and Panel Track Supplements (without Panel Review) Performance Metrics – Rate of Withdrawal and Not Approvable Performance Metric FY 2013 FY 2014 FY 2015 FY 2016 FY 2017 Number Filed 1 2 6 Number with MDUFA decision 1 2 1 Number of Withdrawals 0 0 0 Number of Not Approvable 1 1 0 Rate of Withdrawals 0% 0% 0% Rate of Not Approvable 100% 50% 0%
Table 1.10.DOD - ODE – PMA Original and Panel Track Supplements (with Panel Review) Performance Metrics – Rate of Withdrawal and Not Approvable Performance Metric FY 2013 FY 2014 FY 2015 FY 2016 FY 2017 Number Filed 1 2 0 Number with MDUFA decision 1 1 0 Number of Withdrawals 1 0 0 Number of Not Approvable 0 0 0 Rate of Withdrawals 100% 0% N/A Rate of Not Approvable 0% 0% N/A
Table 1.11.DOD - ODE – PMA Original and Panel Track Supplements (without Panel Review) Performance Metrics – Submissions Missing Performance Goals Performance Metric FY 2013 FY 2014 FY 2015 FY 2016 FY 2017 Number of submissions that missed the goal 0 0 0
Mean FDA days for submissions that missed goal 0 0 0
Mean industry days for submissions that missed goal 0 0 0
Table 1.12.DOD - ODE – PMA Original and Panel Track Supplements (with Panel Review) Performance Metrics – Submissions Missing Performance Goals Performance Metric FY 2013 FY 2014 FY 2015 FY 2016 FY 2017 Number of submissions that missed the goal 0 0 0
Mean FDA days for submissions that missed goal 0 0 0
Mean industry days for submissions that missed goal 0 0 0
Page 68 of 371
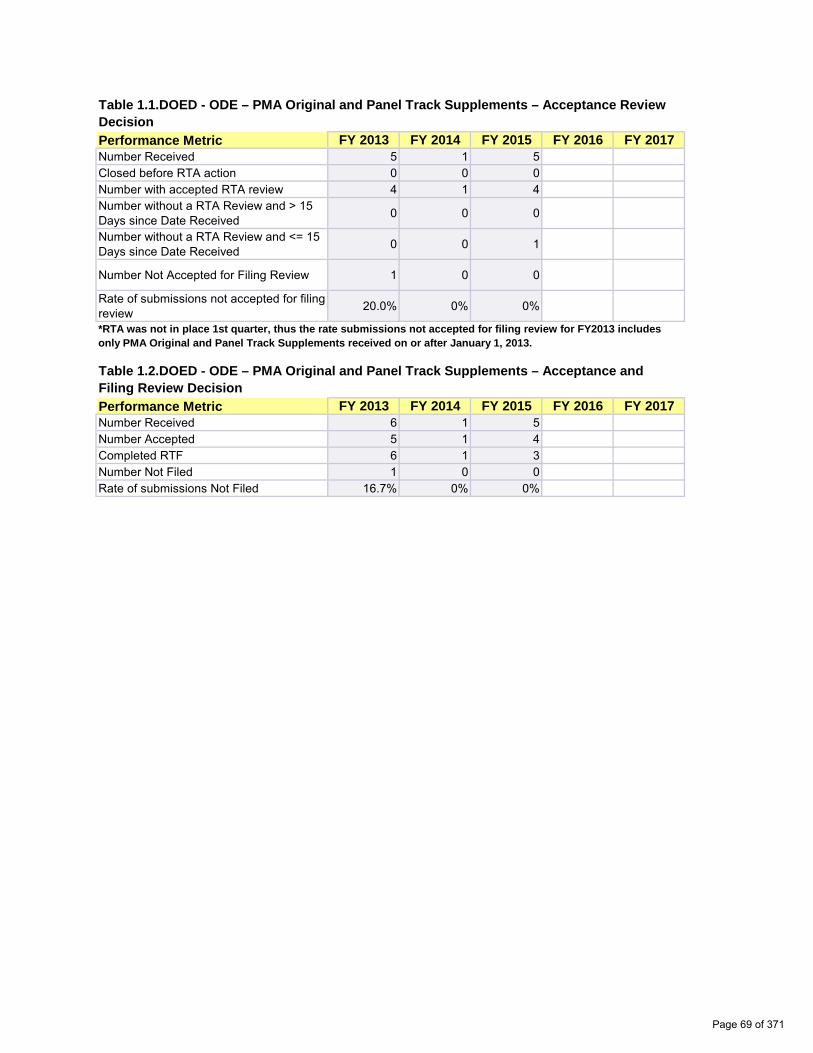
Table 1.1.DOED - ODE – PMA Original and Panel Track Supplements – Acceptance Review Decision Performance Metric FY 2013 FY 2014 FY 2015 FY 2016 FY 2017 Number Received 5 1 5 Closed before RTA action 0 0 0 Number with accepted RTA review 4 1 4 Number without a RTA Review and > 15 Days since Date Received 0 0 0
Number without a RTA Review and <= 15 Days since Date Received 0 0 1
Number Not Accepted for Filing Review 1 0 0
Rate of submissions not accepted for filing review 20.0% 0% 0%
*RTA was not in place 1st quarter, thus the rate submissions not accepted for filing review for FY2013 includes only PMA Original and Panel Track Supplements received on or after January 1, 2013.
Table 1.2.DOED - ODE – PMA Original and Panel Track Supplements – Acceptance and Filing Review Decision Performance Metric FY 2013 FY 2014 FY 2015 FY 2016 FY 2017 Number Received 6 1 5 Number Accepted 5 1 4 Completed RTF 6 1 3 Number Not Filed 1 0 0 Rate of submissions Not Filed 16.7% 0% 0%
Page 69 of 371

Table 1.3.DOED - ODE – PMA Originals & Panel-Track Supplements Substantive Interaction Performance Goals
Substantive Interaction (SI) Goals:
FY 2013 FY 2014 FY 2015 FY 2016 FY 2017 65% SI
within 90 FDA days
75% SI within 90 FDA days
85% SI within 90 FDA days
95% SI within 90 FDA days
95% SI within 90 FDA days
Eligible for SI 6 1 3 SI Goal Met 6 1 1 SI Goal Not Met 0 0 1 SI Pending Within Goal 0 0 1 SI Pending Past Goal 0 0 0 Closed without SI 0 0 0
Current SI Performance Percent Goal Met 100% 100% 50.0%
Table 1.4.DOED - ODE – PMA Originals and Panel Track Supplements Substantive Interaction Metrics – Time to Substantive Interaction Performance Metric FY 2013 FY 2014 FY 2015 FY 2016 FY 2017 Number of Substantive Interactions 6 1 2 Average number of FDA days to Substantive Interaction 88.50 81.00 86.00
20th Percentile FDA days to Substantive Interaction 88 81 82
40th Percentile FDA days to Substantive Interaction 88 81 85
60th Percentile FDA days to Substantive Interaction 89 81 87
80th Percentile FDA days to Substantive Interaction 90 81 90
Maximum FDA days to Substantive Interaction 90 81 93
Page 70 of 371

Table 1.5.DOED - ODE – PMA Originals & Panel-Track Supplements (without Panel Review) MDUFA Decision Performance Goals
Performance Goals:
FY 2013 FY 2014 FY 2015 FY 2016 FY 201770% within
180 FDA days
80% within 180 FDA
days
80% within 180 FDA
days
90% within 180 FDA
days
90% within 180 FDA
days
Number of PMAs filed 2 1 3 Non-MDUFA III Decisions 0 0 0 MDUFA III Decisions 2 1 1 MDUFA III Decisions Goal Met 2 1 1 PMAs pending MDUFA III Decision 0 0 2 PMAs pending MDUFA III Decision Past Goal 0 0 0
Current Performance Percent Goal Met 100% 100% 100%
Table 1.6.DOED - ODE – PMA Originals & Panel-Track Supplements (with Panel Review) MDUFA Decision Performance Goals
Performance Goals:
FY 2013 FY 2014 FY 2015 FY 2016 FY 201750% within
320 FDA days
70% within 320 FDA
days
80% within 320 FDA
days
80% within 320 FDA
days
90% within 320 FDA
days
Number of PMAs filed 4 0 0 Non-MDUFA III Decisions 0 0 0 MDUFA III Decisions 3 0 0 MDUFA III Decisions Goal Met 3 0 0 PMAs pending MDUFA III Decision 1 0 0 PMAs pending MDUFA III Decision Past Goal 0 0 0
Current Performance Percent Goal Met 100% N/A N/A
Page 71 of 371
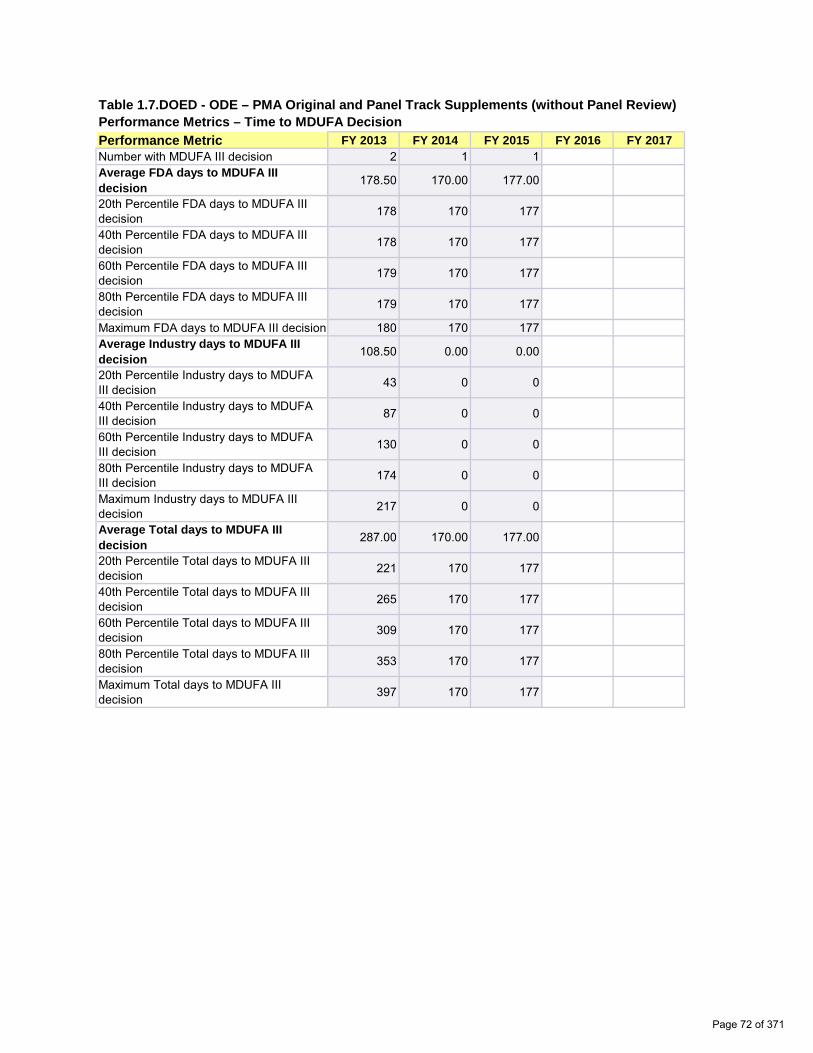
Table 1.7.DOED - ODE – PMA Original and Panel Track Supplements (without Panel Review) Performance Metrics – Time to MDUFA Decision Performance Metric FY 2013 FY 2014 FY 2015 FY 2016 FY 2017 Number with MDUFA III decision 2 1 1 Average FDA days to MDUFA III decision 178.50 170.00 177.00
20th Percentile FDA days to MDUFA III decision 178 170 177
40th Percentile FDA days to MDUFA III decision 178 170 177
60th Percentile FDA days to MDUFA III decision 179 170 177
80th Percentile FDA days to MDUFA III decision 179 170 177
Maximum FDA days to MDUFA III decision 180 170 177 Average Industry days to MDUFA III decision 108.50 0.00 0.00
20th Percentile Industry days to MDUFA III decision 43 0 0
40th Percentile Industry days to MDUFA III decision 87 0 0
60th Percentile Industry days to MDUFA III decision 130 0 0
80th Percentile Industry days to MDUFA III decision 174 0 0
Maximum Industry days to MDUFA III decision 217 0 0
Average Total days to MDUFA III decision 287.00 170.00 177.00
20th Percentile Total days to MDUFA III decision 221 170 177
40th Percentile Total days to MDUFA III decision 265 170 177
60th Percentile Total days to MDUFA III decision 309 170 177
80th Percentile Total days to MDUFA III decision 353 170 177
Maximum Total days to MDUFA III decision 397 170 177
Page 72 of 371

Table 1.8.DOED - ODE – PMA Original and Panel Track Supplements (with Panel Review) Performance Metrics – Time to MDUFA Decision Performance Metric FY 2013 FY 2014 FY 2015 FY 2016 FY 2017 Number with MDUFA III decision 3 0 0 Average FDA days to MDUFA III decision 328.00 0.00 0.00
20th Percentile FDA days to MDUFA III decision 225 0 0
40th Percentile FDA days to MDUFA III decision 268 0 0
60th Percentile FDA days to MDUFA III decision 334 0 0
80th Percentile FDA days to MDUFA III decision 423 0 0
Maximum FDA days to MDUFA III decision 512 0 0 Average Industry days to MDUFA III decision 144.67 0.00 0.00
20th Percentile Industry days to MDUFA III decision 56 0 0
40th Percentile Industry days to MDUFA III decision 113 0 0
60th Percentile Industry days to MDUFA III decision 171 0 0
80th Percentile Industry days to MDUFA III decision 232 0 0
Maximum Industry days to MDUFA III decision 293 0 0
Average Total days to MDUFA III decision 472.67 0.00 0.00
20th Percentile Total days to MDUFA III decision 303 0 0
40th Percentile Total days to MDUFA III decision 316 0 0
60th Percentile Total days to MDUFA III decision 419 0 0
80th Percentile Total days to MDUFA III decision 612 0 0
Maximum Total days to MDUFA III decision 805 0 0
Page 73 of 371

Table 1.9.DOED - ODE – PMA Originals and Panel Track Supplements (without Panel Review) Performance Metrics – Rate of Withdrawal and Not Approvable Performance Metric FY 2013 FY 2014 FY 2015 FY 2016 FY 2017 Number Filed 2 1 3 Number with MDUFA decision 2 1 1 Number of Withdrawals 0 0 0 Number of Not Approvable 0 0 0 Rate of Withdrawals 0% 0% 0% Rate of Not Approvable 0% 0% 0%
Table 1.10.DOED - ODE – PMA Original and Panel Track Supplements (with Panel Review) Performance Metrics – Rate of Withdrawal and Not Approvable Performance Metric FY 2013 FY 2014 FY 2015 FY 2016 FY 2017 Number Filed 4 0 0 Number with MDUFA decision 3 0 0 Number of Withdrawals 0 0 0 Number of Not Approvable 0 0 0 Rate of Withdrawals 0% N/A N/A Rate of Not Approvable 0% N/A N/A
Table 1.11.DOED - ODE – PMA Original and Panel Track Supplements (without Panel Review) Performance Metrics – Submissions Missing Performance Goals Performance Metric FY 2013 FY 2014 FY 2015 FY 2016 FY 2017 Number of submissions that missed the goal 0 0 0
Mean FDA days for submissions that missed goal 0 0 0
Mean industry days for submissions that missed goal 0 0 0
Table 1.12.DOED - ODE – PMA Original and Panel Track Supplements (with Panel Review) Performance Metrics – Submissions Missing Performance Goals Performance Metric FY 2013 FY 2014 FY 2015 FY 2016 FY 2017 Number of submissions that missed the goal 1 0 0
Mean FDA days for submissions that missed goal 520 0 0
Mean industry days for submissions that missed goal 79 0 0
Page 74 of 371

Table 1.1.DRGUD - ODE – PMA Original and Panel Track Supplements – Acceptance Review Decision Performance Metric FY 2013 FY 2014 FY 2015 FY 2016 FY 2017 Number Received 4 5 3 Closed before RTA action 0 0 0 Number with accepted RTA review 1 3 2 Number without a RTA Review and > 15 Days since Date Received 0 0 1
Number without a RTA Review and <= 15 Days since Date Received 0 0 0
Number Not Accepted for Filing Review 3 2 0
Rate of submissions not accepted for filing review 75.0% 40.0% 0%
*RTA was not in place 1st quarter, thus the rate submissions not accepted for filing review for FY2013 includes only PMA Original and Panel Track Supplements received on or after January 1, 2013.
Table 1.2.DRGUD - ODE – PMA Original and Panel Track Supplements – Acceptance and Filing Review Decision Performance Metric FY 2013 FY 2014 FY 2015 FY 2016 FY 2017 Number Received 4 5 3 Number Accepted 1 3 3 Completed RTF 4 5 2 Number Not Filed 2 0 0 Rate of submissions Not Filed 50.0% 0% 0%
Page 75 of 371

Table 1.3.DRGUD - ODE – PMA Originals & Panel-Track Supplements Substantive Interaction Performance Goals
Substantive Interaction (SI) Goals:
FY 2013 FY 2014 FY 2015 FY 2016 FY 2017 65% SI
within 90 FDA days
75% SI within 90 FDA days
85% SI within 90 FDA days
95% SI within 90 FDA days
95% SI within 90 FDA days
Eligible for SI 4 5 2 SI Goal Met 4 5 1 SI Goal Not Met 0 0 0 SI Pending Within Goal 0 0 1 SI Pending Past Goal 0 0 0 Closed without SI 0 0 0
Current SI Performance Percent Goal Met 100% 100% 100%
Table 1.4.DRGUD - ODE – PMA Originals and Panel Track Supplements Substantive Interaction Metrics – Time to Substantive Interaction Performance Metric FY 2013 FY 2014 FY 2015 FY 2016 FY 2017 Number of Substantive Interactions 4 5 1 Average number of FDA days to Substantive Interaction 88.50 97.80 86.00
20th Percentile FDA days to Substantive Interaction 88 88 86
40th Percentile FDA days to Substantive Interaction 88 88 86
60th Percentile FDA days to Substantive Interaction 88 89 86
80th Percentile FDA days to Substantive Interaction 89 99 86
Maximum FDA days to Substantive Interaction 90 136 86
Page 76 of 371

Table 1.5.DRGUD - ODE – PMA Originals & Panel-Track Supplements (without Panel Review) MDUFA Decision Performance Goals
Performance Goals:
FY 2013 FY 2014 FY 2015 FY 2016 FY 201770% within
180 FDA days
80% within 180 FDA
days
80% within 180 FDA
days
90% within 180 FDA
days
90% within 180 FDA
days
Number of PMAs filed 1 4 1 Non-MDUFA III Decisions 0 0 0 MDUFA III Decisions 1 3 0 MDUFA III Decisions Goal Met 1 3 0 PMAs pending MDUFA III Decision 0 1 1 PMAs pending MDUFA III Decision Past Goal 0 0 0
Current Performance Percent Goal Met 100% 100% N/A
Table 1.6.DRGUD - ODE – PMA Originals & Panel-Track Supplements (with Panel Review) MDUFA Decision Performance Goals
Performance Goals:
FY 2013 FY 2014 FY 2015 FY 2016 FY 201750% within
320 FDA days
70% within 320 FDA
days
80% within 320 FDA
days
80% within 320 FDA
days
90% within 320 FDA
days
Number of PMAs filed 3 1 1 Non-MDUFA III Decisions 0 0 0 MDUFA III Decisions 3 0 0 MDUFA III Decisions Goal Met 3 0 0 PMAs pending MDUFA III Decision 0 1 1 PMAs pending MDUFA III Decision Past Goal 0 0 0
Current Performance Percent Goal Met 100% N/A N/A
Page 77 of 371

Table 1.7.DRGUD - ODE – PMA Original and Panel Track Supplements (without Panel Review) Performance Metrics – Time to MDUFA Decision Performance Metric FY 2013 FY 2014 FY 2015 FY 2016 FY 2017 Number with MDUFA III decision 1 3 0 Average FDA days to MDUFA III decision 180.00 229.00 0.00
20th Percentile FDA days to MDUFA III decision 180 161 0
40th Percentile FDA days to MDUFA III decision 180 174 0
60th Percentile FDA days to MDUFA III decision 180 216 0
80th Percentile FDA days to MDUFA III decision 180 287 0
Maximum FDA days to MDUFA III decision 180 359 0 Average Industry days to MDUFA III decision 260.00 80.33 0.00
20th Percentile Industry days to MDUFA III decision 260 47 0
40th Percentile Industry days to MDUFA III decision 260 61 0
60th Percentile Industry days to MDUFA III decision 260 82 0
80th Percentile Industry days to MDUFA III decision 260 111 0
Maximum Industry days to MDUFA III decision 260 140 0
Average Total days to MDUFA III decision 440.00 309.33 0.00
20th Percentile Total days to MDUFA III decision 440 264 0
40th Percentile Total days to MDUFA III decision 440 280 0
60th Percentile Total days to MDUFA III decision 440 309 0
80th Percentile Total days to MDUFA III decision 440 350 0
Maximum Total days to MDUFA III decision 440 392 0
Page 78 of 371

Table 1.8.DRGUD - ODE – PMA Original and Panel Track Supplements (with Panel Review) Performance Metrics – Time to MDUFA Decision Performance Metric FY 2013 FY 2014 FY 2015 FY 2016 FY 2017 Number with MDUFA III decision 3 0 0 Average FDA days to MDUFA III decision 376.00 0.00 0.00
20th Percentile FDA days to MDUFA III decision 313 0 0
40th Percentile FDA days to MDUFA III decision 314 0 0
60th Percentile FDA days to MDUFA III decision 352 0 0
80th Percentile FDA days to MDUFA III decision 427 0 0
Maximum FDA days to MDUFA III decision 501 0 0 Average Industry days to MDUFA III decision 180.33 0.00 0.00
20th Percentile Industry days to MDUFA III decision 112 0 0
40th Percentile Industry days to MDUFA III decision 156 0 0
60th Percentile Industry days to MDUFA III decision 201 0 0
80th Percentile Industry days to MDUFA III decision 248 0 0
Maximum Industry days to MDUFA III decision 295 0 0
Average Total days to MDUFA III decision 556.33 0.00 0.00
20th Percentile Total days to MDUFA III decision 522 0 0
40th Percentile Total days to MDUFA III decision 553 0 0
60th Percentile Total days to MDUFA III decision 577 0 0
80th Percentile Total days to MDUFA III decision 594 0 0
Maximum Total days to MDUFA III decision 610 0 0
Page 79 of 371
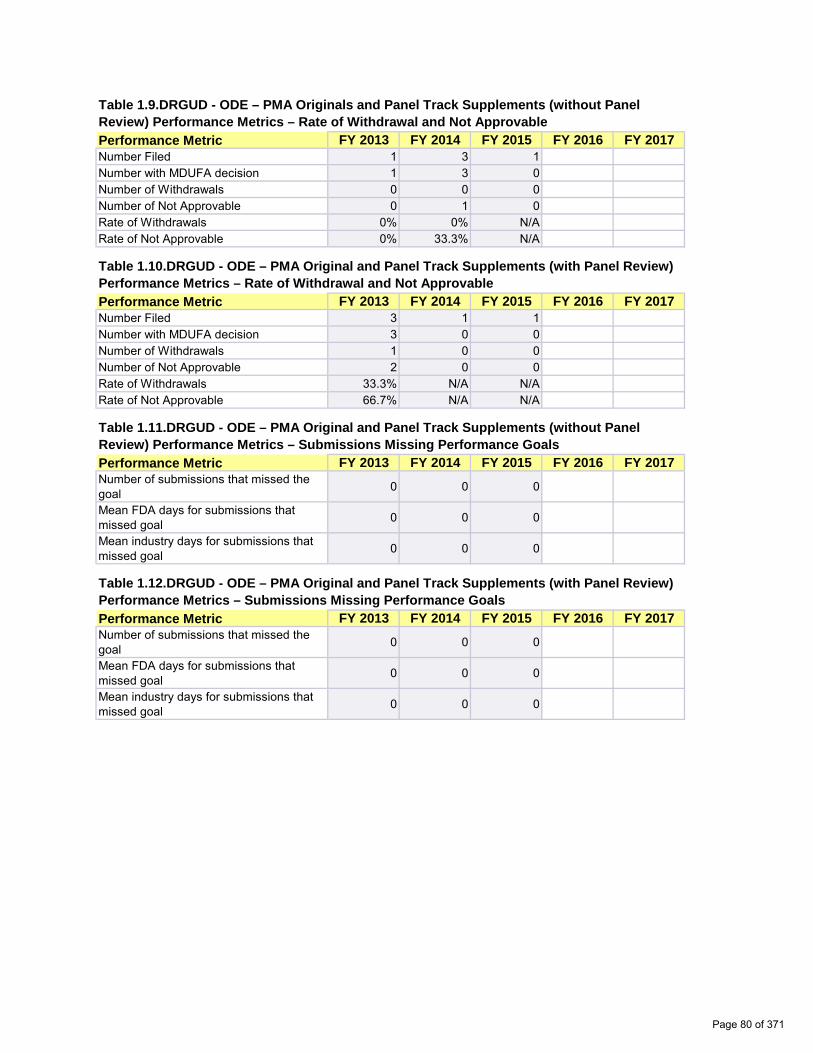
Table 1.9.DRGUD - ODE – PMA Originals and Panel Track Supplements (without Panel Review) Performance Metrics – Rate of Withdrawal and Not Approvable Performance Metric FY 2013 FY 2014 FY 2015 FY 2016 FY 2017 Number Filed 1 3 1 Number with MDUFA decision 1 3 0 Number of Withdrawals 0 0 0 Number of Not Approvable 0 1 0 Rate of Withdrawals 0% 0% N/A Rate of Not Approvable 0% 33.3% N/A
Table 1.10.DRGUD - ODE – PMA Original and Panel Track Supplements (with Panel Review) Performance Metrics – Rate of Withdrawal and Not Approvable Performance Metric FY 2013 FY 2014 FY 2015 FY 2016 FY 2017 Number Filed 3 1 1 Number with MDUFA decision 3 0 0 Number of Withdrawals 1 0 0 Number of Not Approvable 2 0 0 Rate of Withdrawals 33.3% N/A N/A Rate of Not Approvable 66.7% N/A N/A
Table 1.11.DRGUD - ODE – PMA Original and Panel Track Supplements (without Panel Review) Performance Metrics – Submissions Missing Performance Goals Performance Metric FY 2013 FY 2014 FY 2015 FY 2016 FY 2017 Number of submissions that missed the goal 0 0 0
Mean FDA days for submissions that missed goal 0 0 0
Mean industry days for submissions that missed goal 0 0 0
Table 1.12.DRGUD - ODE – PMA Original and Panel Track Supplements (with Panel Review) Performance Metrics – Submissions Missing Performance Goals Performance Metric FY 2013 FY 2014 FY 2015 FY 2016 FY 2017 Number of submissions that missed the goal 0 0 0
Mean FDA days for submissions that missed goal 0 0 0
Mean industry days for submissions that missed goal 0 0 0
Page 80 of 371

Table 1.1.DSD - ODE – PMA Original and Panel Track Supplements – Acceptance Review Decision Performance Metric FY 2013 FY 2014 FY 2015 FY 2016 FY 2017 Number Received 0 6 6 Closed before RTA action 0 0 0 Number with accepted RTA review 0 4 3 Number without a RTA Review and > 15 Days since Date Received 0 0 1
Number without a RTA Review and <= 15 Days since Date Received 0 0 1
Number Not Accepted for Filing Review 0 2 1
Rate of submissions not accepted for filing review N/A 33.3% 20.0%
*RTA was not in place 1st quarter, thus the rate submissions not accepted for filing review for FY2013 includes only PMA Original and Panel Track Supplements received on or after January 1, 2013.
Table 1.2.DSD - ODE – PMA Original and Panel Track Supplements – Acceptance and Filing Review Decision Performance Metric FY 2013 FY 2014 FY 2015 FY 2016 FY 2017 Number Received 0 6 6 Number Accepted 0 4 4 Completed RTF 0 5 4 Number Not Filed 0 0 0 Rate of submissions Not Filed N/A 0% 0%
Page 81 of 371

Table 1.3.DSD - ODE – PMA Originals & Panel-Track Supplements Substantive Interaction Performance Goals
Substantive Interaction (SI) Goals:
FY 2013 FY 2014 FY 2015 FY 2016 FY 2017 65% SI
within 90 FDA days
75% SI within 90 FDA days
85% SI within 90 FDA days
95% SI within 90 FDA days
95% SI within 90 FDA days
Eligible for SI 0 5 4 SI Goal Met 0 5 3 SI Goal Not Met 0 0 0 SI Pending Within Goal 0 0 1 SI Pending Past Goal 0 0 0 Closed without SI 0 0 0
Current SI Performance Percent Goal Met N/A 100% 100%
Table 1.4.DSD - ODE – PMA Originals and Panel Track Supplements Substantive Interaction Metrics – Time to Substantive Interaction Performance Metric FY 2013 FY 2014 FY 2015 FY 2016 FY 2017 Number of Substantive Interactions 0 5 3 Average number of FDA days to Substantive Interaction 0.00 88.80 85.67
20th Percentile FDA days to Substantive Interaction 0 88 83
40th Percentile FDA days to Substantive Interaction 0 90 86
60th Percentile FDA days to Substantive Interaction 0 90 88
80th Percentile FDA days to Substantive Interaction 0 90 89
Maximum FDA days to Substantive Interaction 0 90 90
Page 82 of 371
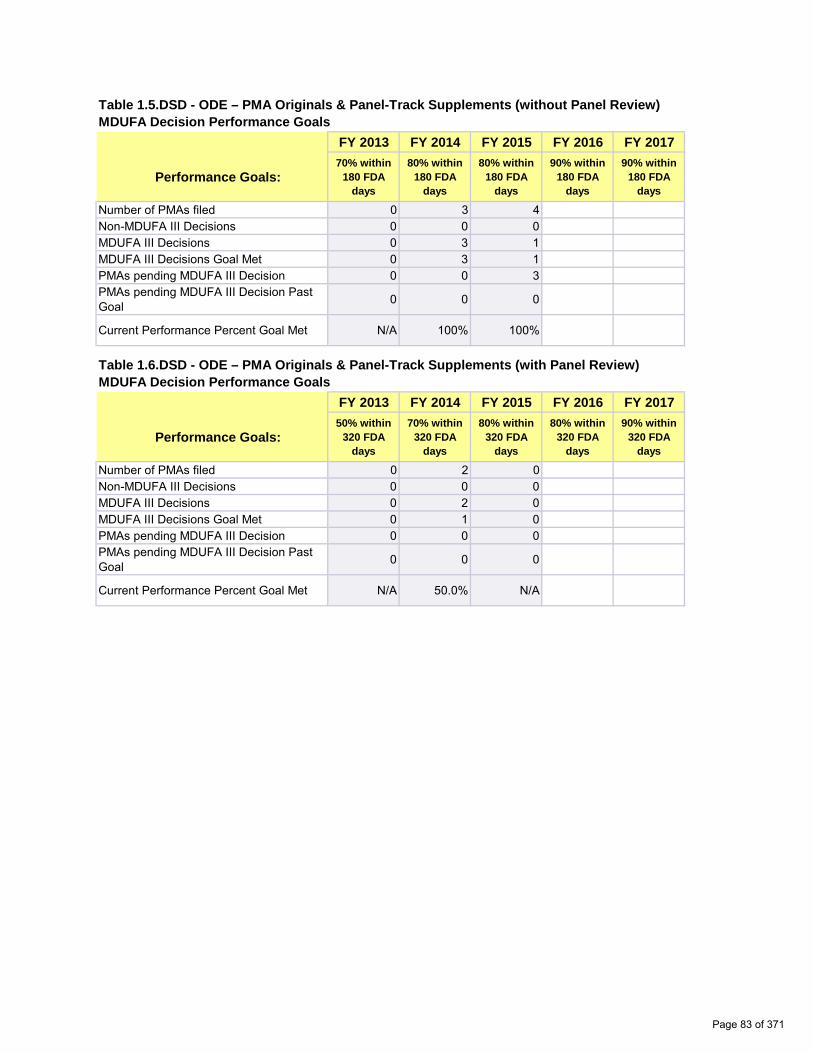
Table 1.5.DSD - ODE – PMA Originals & Panel-Track Supplements (without Panel Review) MDUFA Decision Performance Goals
Performance Goals:
FY 2013 FY 2014 FY 2015 FY 2016 FY 201770% within
180 FDA days
80% within 180 FDA
days
80% within 180 FDA
days
90% within 180 FDA
days
90% within 180 FDA
days
Number of PMAs filed 0 3 4 Non-MDUFA III Decisions 0 0 0 MDUFA III Decisions 0 3 1 MDUFA III Decisions Goal Met 0 3 1 PMAs pending MDUFA III Decision 0 0 3 PMAs pending MDUFA III Decision Past Goal 0 0 0
Current Performance Percent Goal Met N/A 100% 100%
Table 1.6.DSD - ODE – PMA Originals & Panel-Track Supplements (with Panel Review) MDUFA Decision Performance Goals
Performance Goals:
FY 2013 FY 2014 FY 2015 FY 2016 FY 201750% within
320 FDA days
70% within 320 FDA
days
80% within 320 FDA
days
80% within 320 FDA
days
90% within 320 FDA
days
Number of PMAs filed 0 2 0 Non-MDUFA III Decisions 0 0 0 MDUFA III Decisions 0 2 0 MDUFA III Decisions Goal Met 0 1 0 PMAs pending MDUFA III Decision 0 0 0 PMAs pending MDUFA III Decision Past Goal 0 0 0
Current Performance Percent Goal Met N/A 50.0% N/A
Page 83 of 371

Table 1.7.DSD - ODE – PMA Original and Panel Track Supplements (without Panel Review) Performance Metrics – Time to MDUFA Decision Performance Metric FY 2013 FY 2014 FY 2015 FY 2016 FY 2017 Number with MDUFA III decision 0 3 1 Average FDA days to MDUFA III decision 0.00 177.33 180.00
20th Percentile FDA days to MDUFA III decision 0 175 180
40th Percentile FDA days to MDUFA III decision 0 178 180
60th Percentile FDA days to MDUFA III decision 0 179 180
80th Percentile FDA days to MDUFA III decision 0 180 180
Maximum FDA days to MDUFA III decision 0 180 180 Average Industry days to MDUFA III decision 0.00 49.00 66.00
20th Percentile Industry days to MDUFA III decision 0 46 66
40th Percentile Industry days to MDUFA III decision 0 47 66
60th Percentile Industry days to MDUFA III decision 0 49 66
80th Percentile Industry days to MDUFA III decision 0 52 66
Maximum Industry days to MDUFA III decision 0 55 66
Average Total days to MDUFA III decision 0.00 226.33 246.00
20th Percentile Total days to MDUFA III decision 0 222 246
40th Percentile Total days to MDUFA III decision 0 223 246
60th Percentile Total days to MDUFA III decision 0 226 246
80th Percentile Total days to MDUFA III decision 0 230 246
Maximum Total days to MDUFA III decision 0 234 246
Page 84 of 371

Table 1.8.DSD - ODE – PMA Original and Panel Track Supplements (with Panel Review) Performance Metrics – Time to MDUFA Decision Performance Metric FY 2013 FY 2014 FY 2015 FY 2016 FY 2017 Number with MDUFA III decision 0 2 0 Average FDA days to MDUFA III decision 0.00 349.50 0.00
20th Percentile FDA days to MDUFA III decision 0 332 0
40th Percentile FDA days to MDUFA III decision 0 344 0
60th Percentile FDA days to MDUFA III decision 0 355 0
80th Percentile FDA days to MDUFA III decision 0 367 0
Maximum FDA days to MDUFA III decision 0 379 0 Average Industry days to MDUFA III decision 0.00 99.00 0.00
20th Percentile Industry days to MDUFA III decision 0 52 0
40th Percentile Industry days to MDUFA III decision 0 83 0
60th Percentile Industry days to MDUFA III decision 0 115 0
80th Percentile Industry days to MDUFA III decision 0 146 0
Maximum Industry days to MDUFA III decision 0 178 0
Average Total days to MDUFA III decision 0.00 448.50 0.00
20th Percentile Total days to MDUFA III decision 0 419 0
40th Percentile Total days to MDUFA III decision 0 439 0
60th Percentile Total days to MDUFA III decision 0 458 0
80th Percentile Total days to MDUFA III decision 0 478 0
Maximum Total days to MDUFA III decision 0 498 0
Page 85 of 371
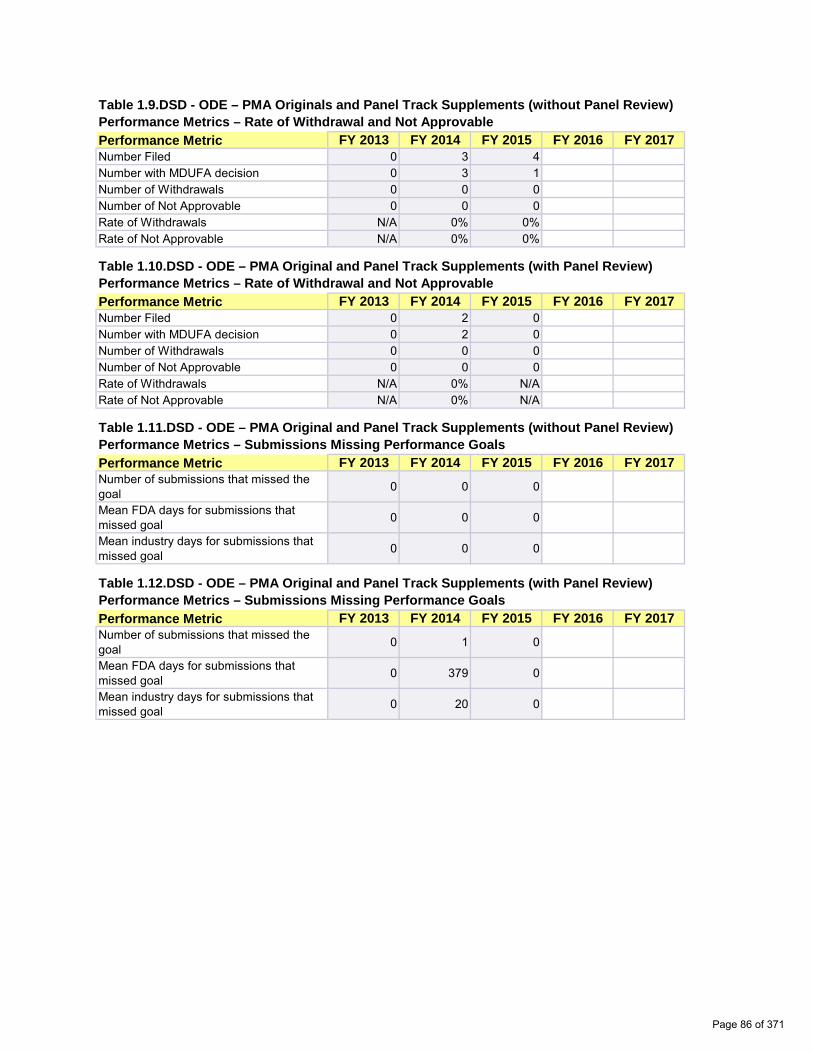
Table 1.9.DSD - ODE – PMA Originals and Panel Track Supplements (without Panel Review) Performance Metrics – Rate of Withdrawal and Not Approvable Performance Metric FY 2013 FY 2014 FY 2015 FY 2016 FY 2017 Number Filed 0 3 4 Number with MDUFA decision 0 3 1 Number of Withdrawals 0 0 0 Number of Not Approvable 0 0 0 Rate of Withdrawals N/A 0% 0% Rate of Not Approvable N/A 0% 0%
Table 1.10.DSD - ODE – PMA Original and Panel Track Supplements (with Panel Review) Performance Metrics – Rate of Withdrawal and Not Approvable Performance Metric FY 2013 FY 2014 FY 2015 FY 2016 FY 2017 Number Filed 0 2 0 Number with MDUFA decision 0 2 0 Number of Withdrawals 0 0 0 Number of Not Approvable 0 0 0 Rate of Withdrawals N/A 0% N/A Rate of Not Approvable N/A 0% N/A
Table 1.11.DSD - ODE – PMA Original and Panel Track Supplements (without Panel Review) Performance Metrics – Submissions Missing Performance Goals Performance Metric FY 2013 FY 2014 FY 2015 FY 2016 FY 2017 Number of submissions that missed the goal 0 0 0
Mean FDA days for submissions that missed goal 0 0 0
Mean industry days for submissions that missed goal 0 0 0
Table 1.12.DSD - ODE – PMA Original and Panel Track Supplements (with Panel Review) Performance Metrics – Submissions Missing Performance Goals Performance Metric FY 2013 FY 2014 FY 2015 FY 2016 FY 2017 Number of submissions that missed the goal 0 1 0
Mean FDA days for submissions that missed goal 0 379 0
Mean industry days for submissions that missed goal 0 20 0
Page 86 of 371

Table 1.1.DCTD - OIR – PMA Original and Panel Track Supplements – Acceptance Review Decision Performance Metric FY 2013 FY 2014 FY 2015 FY 2016 FY 2017 Number Received 2 2 8 Closed before RTA action 0 0 0 Number with accepted RTA review 2 2 7 Number without a RTA Review and > 15 Days since Date Received 0 0 0
Number without a RTA Review and <= 15 Days since Date Received 0 0 1
Number Not Accepted for Filing Review 0 0 0
Rate of submissions not accepted for filing review 0% 0% 0%
*RTA was not in place 1st quarter, thus the rate submissions not accepted for filing review for FY2013 includes only PMA Original and Panel Track Supplements received on or after January 1, 2013.
Table 1.2.DCTD - OIR – PMA Original and Panel Track Supplements – Acceptance and Filing Review Decision Performance Metric FY 2013 FY 2014 FY 2015 FY 2016 FY 2017 Number Received 2 2 8 Number Accepted 2 2 7 Completed RTF 2 2 7 Number Not Filed 0 0 0 Rate of submissions Not Filed 0% 0% 0%
Page 87 of 371

Table 1.3.DCTD - OIR – PMA Originals & Panel-Track Supplements Substantive Interaction Performance Goals
Substantive Interaction (SI) Goals:
FY 2013 FY 2014 FY 2015 FY 2016 FY 2017 65% SI
within 90 FDA days
75% SI within 90 FDA days
85% SI within 90 FDA days
95% SI within 90 FDA days
95% SI within 90 FDA days
Eligible for SI 2 2 7 SI Goal Met 2 2 6 SI Goal Not Met 0 0 0 SI Pending Within Goal 0 0 1 SI Pending Past Goal 0 0 0 Closed without SI 0 0 0
Current SI Performance Percent Goal Met 100% 100% 100%
Table 1.4.DCTD - OIR – PMA Originals and Panel Track Supplements Substantive Interaction Metrics – Time to Substantive Interaction Performance Metric FY 2013 FY 2014 FY 2015 FY 2016 FY 2017 Number of Substantive Interactions 2 2 6 Average number of FDA days to Substantive Interaction 90.00 88.00 78.83
20th Percentile FDA days to Substantive Interaction 90 87 63
40th Percentile FDA days to Substantive Interaction 90 88 86
60th Percentile FDA days to Substantive Interaction 90 88 88
80th Percentile FDA days to Substantive Interaction 90 89 90
Maximum FDA days to Substantive Interaction 90 89 90
Page 88 of 371

Table 1.5.DCTD - OIR – PMA Originals & Panel-Track Supplements (without Panel Review) MDUFA Decision Performance Goals
Performance Goals:
FY 2013 FY 2014 FY 2015 FY 2016 FY 201770% within
180 FDA days
80% within 180 FDA
days
80% within 180 FDA
days
90% within 180 FDA
days
90% within 180 FDA
days
Number of PMAs filed 2 2 7 Non-MDUFA III Decisions 0 0 0 MDUFA III Decisions 2 2 1 MDUFA III Decisions Goal Met 2 2 1 PMAs pending MDUFA III Decision 0 0 6 PMAs pending MDUFA III Decision Past Goal 0 0 0
Current Performance Percent Goal Met 100% 100% 100%
Table 1.6.DCTD - OIR – PMA Originals & Panel-Track Supplements (with Panel Review) MDUFA Decision Performance Goals
Performance Goals:
FY 2013 FY 2014 FY 2015 FY 2016 FY 201750% within
320 FDA days
70% within 320 FDA
days
80% within 320 FDA
days
80% within 320 FDA
days
90% within 320 FDA
days
Number of PMAs filed 0 0 0 Non-MDUFA III Decisions 0 0 0 MDUFA III Decisions 0 0 0 MDUFA III Decisions Goal Met 0 0 0 PMAs pending MDUFA III Decision 0 0 0 PMAs pending MDUFA III Decision Past Goal 0 0 0
Current Performance Percent Goal Met N/A N/A N/A
Page 89 of 371

Table 1.7.DCTD - OIR – PMA Original and Panel Track Supplements (without Panel Review) Performance Metrics – Time to MDUFA Decision Performance Metric FY 2013 FY 2014 FY 2015 FY 2016 FY 2017 Number with MDUFA III decision 2 2 1 Average FDA days to MDUFA III decision 176.50 179.50 177.00
20th Percentile FDA days to MDUFA III decision 175 179 177
40th Percentile FDA days to MDUFA III decision 176 179 177
60th Percentile FDA days to MDUFA III decision 177 180 177
80th Percentile FDA days to MDUFA III decision 178 180 177
Maximum FDA days to MDUFA III decision 179 180 177 Average Industry days to MDUFA III decision 266.50 119.00 0.00
20th Percentile Industry days to MDUFA III decision 186 48 0
40th Percentile Industry days to MDUFA III decision 240 95 0
60th Percentile Industry days to MDUFA III decision 293 143 0
80th Percentile Industry days to MDUFA III decision 347 190 0
Maximum Industry days to MDUFA III decision 400 238 0
Average Total days to MDUFA III decision 443.00 298.50 177.00
20th Percentile Total days to MDUFA III decision 361 227 177
40th Percentile Total days to MDUFA III decision 416 275 177
60th Percentile Total days to MDUFA III decision 470 322 177
80th Percentile Total days to MDUFA III decision 525 370 177
Maximum Total days to MDUFA III decision 579 418 177
Page 90 of 371

Table 1.8.DCTD - OIR – PMA Original and Panel Track Supplements (with Panel Review) Performance Metrics – Time to MDUFA Decision Performance Metric FY 2013 FY 2014 FY 2015 FY 2016 FY 2017 Number with MDUFA III decision 0 0 0 Average FDA days to MDUFA III decision 0.00 0.00 0.00
20th Percentile FDA days to MDUFA III decision 0 0 0
40th Percentile FDA days to MDUFA III decision 0 0 0
60th Percentile FDA days to MDUFA III decision 0 0 0
80th Percentile FDA days to MDUFA III decision 0 0 0
Maximum FDA days to MDUFA III decision 0 0 0 Average Industry days to MDUFA III decision 0.00 0.00 0.00
20th Percentile Industry days to MDUFA III decision 0 0 0
40th Percentile Industry days to MDUFA III decision 0 0 0
60th Percentile Industry days to MDUFA III decision 0 0 0
80th Percentile Industry days to MDUFA III decision 0 0 0
Maximum Industry days to MDUFA III decision 0 0 0
Average Total days to MDUFA III decision 0.00 0.00 0.00
20th Percentile Total days to MDUFA III decision 0 0 0
40th Percentile Total days to MDUFA III decision 0 0 0
60th Percentile Total days to MDUFA III decision 0 0 0
80th Percentile Total days to MDUFA III decision 0 0 0
Maximum Total days to MDUFA III decision 0 0 0
Page 91 of 371
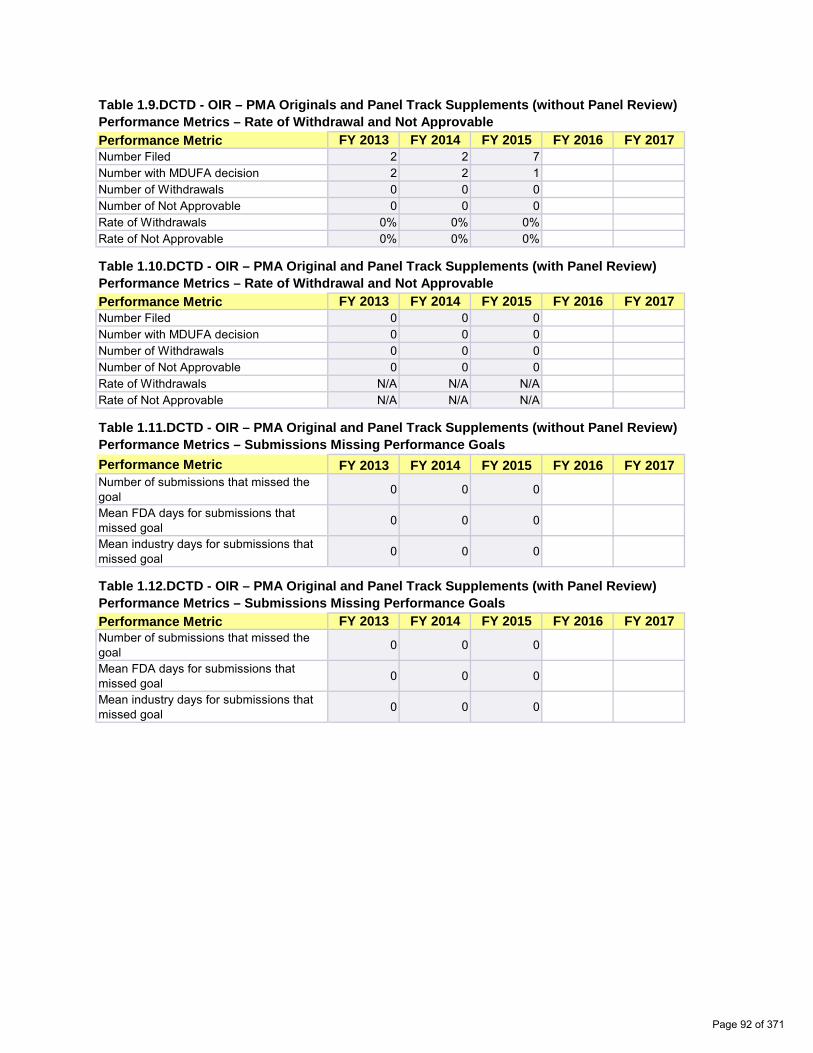
Table 1.9.DCTD - OIR – PMA Originals and Panel Track Supplements (without Panel Review) Performance Metrics – Rate of Withdrawal and Not Approvable Performance Metric FY 2013 FY 2014 FY 2015 FY 2016 FY 2017 Number Filed 2 2 7 Number with MDUFA decision 2 2 1 Number of Withdrawals 0 0 0 Number of Not Approvable 0 0 0 Rate of Withdrawals 0% 0% 0% Rate of Not Approvable 0% 0% 0%
Table 1.10.DCTD - OIR – PMA Original and Panel Track Supplements (with Panel Review) Performance Metrics – Rate of Withdrawal and Not Approvable Performance Metric FY 2013 FY 2014 FY 2015 FY 2016 FY 2017 Number Filed 0 0 0 Number with MDUFA decision 0 0 0 Number of Withdrawals 0 0 0 Number of Not Approvable 0 0 0 Rate of Withdrawals N/A N/A N/A Rate of Not Approvable N/A N/A N/A
Table 1.11.DCTD - OIR – PMA Original and Panel Track Supplements (without Panel Review) Performance Metrics – Submissions Missing Performance Goals Performance Metric FY 2013 FY 2014 FY 2015 FY 2016 FY 2017 Number of submissions that missed the goal 0 0 0
Mean FDA days for submissions that missed goal 0 0 0
Mean industry days for submissions that missed goal 0 0 0
Table 1.12.DCTD - OIR – PMA Original and Panel Track Supplements (with Panel Review) Performance Metrics – Submissions Missing Performance Goals Performance Metric FY 2013 FY 2014 FY 2015 FY 2016 FY 2017 Number of submissions that missed the goal 0 0 0
Mean FDA days for submissions that missed goal 0 0 0
Mean industry days for submissions that missed goal 0 0 0
Page 92 of 371

Table 1.1.DIHD - OIR – PMA Original and Panel Track Supplements – Acceptance Review Decision Performance Metric FY 2013 FY 2014 FY 2015 FY 2016 FY 2017 Number Received 0 0 0 Closed before RTA action 0 0 0 Number with accepted RTA review 0 0 0 Number without a RTA Review and > 15 Days since Date Received 0 0 0
Number without a RTA Review and <= 15 Days since Date Received 0 0 0
Number Not Accepted for Filing Review 0 0 0
Rate of submissions not accepted for filing review N/A N/A N/A
*RTA was not in place 1st quarter, thus the rate submissions not accepted for filing review for FY2013 includes only PMA Original and Panel Track Supplements received on or after January 1, 2013.
Table 1.2.DIHD - OIR – PMA Original and Panel Track Supplements (with Panel Review) Performance Metrics – Submissions Missing Performance Goals Performance Metric FY 2013 FY 2014 FY 2015 FY 2016 FY 2017 Number Received 0 0 0 Number Accepted 0 0 0 Completed RTF 0 0 0 Number Not Filed 0 0 0 Rate of submissions Not Filed N/A N/A N/A
Page 93 of 371

Table 1.3.DIHD - OIR – PMA Originals & Panel-Track Supplements Substantive Interaction Performance Goals
Substantive Interaction (SI) Goals:
FY 2013 FY 2014 FY 2015 FY 2016 FY 2017 65% SI
within 90 FDA days
75% SI within 90 FDA days
85% SI within 90 FDA days
95% SI within 90 FDA days
95% SI within 90 FDA days
Eligible for SI 0 0 0 SI Goal Met 0 0 0 SI Goal Not Met 0 0 0 SI Pending Within Goal 0 0 0 SI Pending Past Goal 0 0 0 Closed without SI 0 0 0
Current SI Performance Percent Goal Met N/A N/A N/A
Table 1.4.DIHD - OIR – PMA Originals and Panel Track Supplements Substantive Interaction Metrics – Time to Substantive Interaction Performance Metric FY 2013 FY 2014 FY 2015 FY 2016 FY 2017 Number of Substantive Interactions 0 0 0 Average number of FDA days to Substantive Interaction 0.00 0.00 0.00
20th Percentile FDA days to Substantive Interaction 0 0 0
40th Percentile FDA days to Substantive Interaction 0 0 0
60th Percentile FDA days to Substantive Interaction 0 0 0
80th Percentile FDA days to Substantive Interaction 0 0 0
Maximum FDA days to Substantive Interaction 0 0 0
Page 94 of 371

Table 1.5.DIHD - OIR – PMA Originals & Panel-Track Supplements (without Panel Review) MDUFA Decision Performance Goals
Performance Goals:
FY 2013 FY 2014 FY 2015 FY 2016 FY 201770% within
180 FDA days
80% within 180 FDA
days
80% within 180 FDA
days
90% within 180 FDA
days
90% within 180 FDA
days
Number of PMAs filed 0 0 0 Non-MDUFA III Decisions 0 0 0 MDUFA III Decisions 0 0 0 MDUFA III Decisions Goal Met 0 0 0 PMAs pending MDUFA III Decision 0 0 0 PMAs pending MDUFA III Decision Past Goal 0 0 0
Current Performance Percent Goal Met N/A N/A N/A
Table 1.6.DIHD - OIR – PMA Originals & Panel-Track Supplements (with Panel Review) MDUFA Decision Performance Goals
Performance Goals:
FY 2013 FY 2014 FY 2015 FY 2016 FY 201750% within
320 FDA days
70% within 320 FDA
days
80% within 320 FDA
days
80% within 320 FDA
days
90% within 320 FDA
days
Number of PMAs filed 0 0 0 Non-MDUFA III Decisions 0 0 0 MDUFA III Decisions 0 0 0 MDUFA III Decisions Goal Met 0 0 0 PMAs pending MDUFA III Decision 0 0 0 PMAs pending MDUFA III Decision Past Goal 0 0 0
Current Performance Percent Goal Met N/A N/A N/A
Page 95 of 371

Table 1.7.DIHD - OIR – PMA Original and Panel Track Supplements (without Panel Review) Performance Metrics – Time to MDUFA Decision Performance Metric FY 2013 FY 2014 FY 2015 FY 2016 FY 2017 Number with MDUFA III decision 0 0 0 Average FDA days to MDUFA III decision 0.00 0.00 0.00
20th Percentile FDA days to MDUFA III decision 0 0 0
40th Percentile FDA days to MDUFA III decision 0 0 0
60th Percentile FDA days to MDUFA III decision 0 0 0
80th Percentile FDA days to MDUFA III decision 0 0 0
Maximum FDA days to MDUFA III decision 0 0 0 Average Industry days to MDUFA III decision 0.00 0.00 0.00
20th Percentile Industry days to MDUFA III decision 0 0 0
40th Percentile Industry days to MDUFA III decision 0 0 0
60th Percentile Industry days to MDUFA III decision 0 0 0
80th Percentile Industry days to MDUFA III decision 0 0 0
Maximum Industry days to MDUFA III decision 0 0 0
Average Total days to MDUFA III decision 0.00 0.00 0.00
20th Percentile Total days to MDUFA III decision 0 0 0
40th Percentile Total days to MDUFA III decision 0 0 0
60th Percentile Total days to MDUFA III decision 0 0 0
80th Percentile Total days to MDUFA III decision 0 0 0
Maximum Total days to MDUFA III decision 0 0 0
Page 96 of 371

Table 1.8.DIHD - OIR – PMA Original and Panel Track Supplements (with Panel Review) Performance Metrics – Time to MDUFA Decision Performance Metric FY 2013 FY 2014 FY 2015 FY 2016 FY 2017 Number with MDUFA III decision 0 0 0 Average FDA days to MDUFA III decision 0.00 0.00 0.00
20th Percentile FDA days to MDUFA III decision 0 0 0
40th Percentile FDA days to MDUFA III decision 0 0 0
60th Percentile FDA days to MDUFA III decision 0 0 0
80th Percentile FDA days to MDUFA III decision 0 0 0
Maximum FDA days to MDUFA III decision 0 0 0 Average Industry days to MDUFA III decision 0.00 0.00 0.00
20th Percentile Industry days to MDUFA III decision 0 0 0
40th Percentile Industry days to MDUFA III decision 0 0 0
60th Percentile Industry days to MDUFA III decision 0 0 0
80th Percentile Industry days to MDUFA III decision 0 0 0
Maximum Industry days to MDUFA III decision 0 0 0
Average Total days to MDUFA III decision 0.00 0.00 0.00
20th Percentile Total days to MDUFA III decision 0 0 0
40th Percentile Total days to MDUFA III decision 0 0 0
60th Percentile Total days to MDUFA III decision 0 0 0
80th Percentile Total days to MDUFA III decision 0 0 0
Maximum Total days to MDUFA III decision 0 0 0
Page 97 of 371

Table 1.9.DIHD - OIR – PMA Originals and Panel Track Supplements (without Panel Review) Performance Metrics – Rate of Withdrawal and Not Approvable Performance Metric FY 2013 FY 2014 FY 2015 FY 2016 FY 2017 Number Filed 0 0 0 Number with MDUFA decision 0 0 0 Number of Withdrawals 0 0 0 Number of Not Approvable 0 0 0 Rate of Withdrawals N/A N/A N/A Rate of Not Approvable N/A N/A N/A
Table 1.10.DIHD - OIR – PMA Original and Panel Track Supplements (with Panel Review) Performance Metrics – Rate of Withdrawal and Not Approvable Performance Metric FY 2013 FY 2014 FY 2015 FY 2016 FY 2017 Number Filed 0 0 0 Number with MDUFA decision 0 0 0 Number of Withdrawals 0 0 0 Number of Not Approvable 0 0 0 Rate of Withdrawals N/A N/A N/A Rate of Not Approvable N/A N/A N/A
Table 1.11.DIHD - OIR – PMA Original and Panel Track Supplements (without Panel Review) Performance Metrics – Submissions Missing Performance Goals Performance Metric FY 2013 FY 2014 FY 2015 FY 2016 FY 2017 Number of submissions that missed the goal 0 0 0
Mean FDA days for submissions that missed goal 0 0 0
Mean industry days for submissions that missed goal 0 0 0
Table 1.12.DIHD - OIR – PMA Original and Panel Track Supplements (with Panel Review) Performance Metrics – Submissions Missing Performance Goals Performance Metric FY 2013 FY 2014 FY 2015 FY 2016 FY 2017 Number of submissions that missed the goal 0 0 0
Mean FDA days for submissions that missed goal 0 0 0
Mean industry days for submissions that missed goal 0 0 0
Page 98 of 371

Table 1.1.DMD - OIR – PMA Original and Panel Track Supplements – Acceptance Review Decision Performance Metric FY 2013 FY 2014 FY 2015 FY 2016 FY 2017 Number Received 2 1 3 Closed before RTA action 0 0 0 Number with accepted RTA review 2 1 3 Number without a RTA Review and > 15 Days since Date Received 0 0 0
Number without a RTA Review and <= 15 Days since Date Received 0 0 0
Number Not Accepted for Filing Review 0 0 0
Rate of submissions not accepted for filing review 0% 0% 0%
*RTA was not in place 1st quarter, thus the rate submissions not accepted for filing review for FY2013 includes only PMA Original and Panel Track Supplements received on or after January 1, 2013.
Table 1.2.DMD - OIR – PMA Original and Panel Track Supplements – Acceptance and Filing Review Decision Performance Metric FY 2013 FY 2014 FY 2015 FY 2016 FY 2017 Number Received 2 1 3 Number Accepted 2 1 3 Completed RTF 2 1 3 Number Not Filed 0 0 0 Rate of submissions Not Filed 0% 0% 0%
Page 99 of 371

Table 1.3.DMD - OIR – PMA Originals & Panel-Track Supplements Substantive Interaction Performance Goals
Substantive Interaction (SI) Goals:
FY 2013 FY 2014 FY 2015 FY 2016 FY 2017 65% SI
within 90 FDA days
75% SI within 90 FDA days
85% SI within 90 FDA days
95% SI within 90 FDA days
95% SI within 90 FDA days
Eligible for SI 2 1 3 SI Goal Met 2 1 2 SI Goal Not Met 0 0 1 SI Pending Within Goal 0 0 0 SI Pending Past Goal 0 0 0 Closed without SI 0 0 0
Current SI Performance Percent Goal Met 100% 100% 66.7%
Table 1.4.DMD - OIR – PMA Originals and Panel Track Supplements Substantive Interaction Metrics – Time to Substantive Interaction Performance Metric FY 2013 FY 2014 FY 2015 FY 2016 FY 2017 Number of Substantive Interactions 2 1 3 Average number of FDA days to Substantive Interaction 86.00 83.00 88.67
20th Percentile FDA days to Substantive Interaction 86 83 87
40th Percentile FDA days to Substantive Interaction 86 83 88
60th Percentile FDA days to Substantive Interaction 86 83 89
80th Percentile FDA days to Substantive Interaction 86 83 90
Maximum FDA days to Substantive Interaction 86 83 91
Page 100 of 371

Table 1.5.DMD - OIR – PMA Originals & Panel-Track Supplements (without Panel Review) MDUFA Decision Performance Goals
Performance Goals:
FY 2013 FY 2014 FY 2015 FY 2016 FY 201770% within
180 FDA days
80% within 180 FDA
days
80% within 180 FDA
days
90% within 180 FDA
days
90% within 180 FDA
days
Number of PMAs filed 1 1 3 Non-MDUFA III Decisions 0 0 0 MDUFA III Decisions 1 1 1 MDUFA III Decisions Goal Met 1 1 1 PMAs pending MDUFA III Decision 0 0 2 PMAs pending MDUFA III Decision Past Goal 0 0 0
Current Performance Percent Goal Met 100% 100% 100%
Table 1.6.DMD - OIR – PMA Originals & Panel-Track Supplements (with Panel Review) MDUFA Decision Performance Goals
Performance Goals:
FY 2013 FY 2014 FY 2015 FY 2016 FY 201750% within
320 FDA days
70% within 320 FDA
days
80% within 320 FDA
days
80% within 320 FDA
days
90% within 320 FDA
days
Number of PMAs filed 1 0 0 Non-MDUFA III Decisions 0 0 0 MDUFA III Decisions 1 0 0 MDUFA III Decisions Goal Met 1 0 0 PMAs pending MDUFA III Decision 0 0 0 PMAs pending MDUFA III Decision Past Goal 0 0 0
Current Performance Percent Goal Met 100% N/A N/A
Page 101 of 371

Table 1.7.DMD - OIR – PMA Original and Panel Track Supplements (without Panel Review) Performance Metrics – Time to MDUFA Decision Performance Metric FY 2013 FY 2014 FY 2015 FY 2016 FY 2017 Number with MDUFA III decision 1 1 1 Average FDA days to MDUFA III decision 177.00 179.00 159.00
20th Percentile FDA days to MDUFA III decision 177 179 159
40th Percentile FDA days to MDUFA III decision 177 179 159
60th Percentile FDA days to MDUFA III decision 177 179 159
80th Percentile FDA days to MDUFA III decision 177 179 159
Maximum FDA days to MDUFA III decision 177 179 159 Average Industry days to MDUFA III decision 107.00 0.00 78.00
20th Percentile Industry days to MDUFA III decision 107 0 78
40th Percentile Industry days to MDUFA III decision 107 0 78
60th Percentile Industry days to MDUFA III decision 107 0 78
80th Percentile Industry days to MDUFA III decision 107 0 78
Maximum Industry days to MDUFA III decision 107 0 78
Average Total days to MDUFA III decision 284.00 179.00 237.00
20th Percentile Total days to MDUFA III decision 284 179 237
40th Percentile Total days to MDUFA III decision 284 179 237
60th Percentile Total days to MDUFA III decision 284 179 237
80th Percentile Total days to MDUFA III decision 284 179 237
Maximum Total days to MDUFA III decision 284 179 237
Page 102 of 371

Table 1.8.DMD - OIR – PMA Original and Panel Track Supplements (with Panel Review) Performance Metrics – Time to MDUFA Decision Performance Metric FY 2013 FY 2014 FY 2015 FY 2016 FY 2017 Number with MDUFA III decision 1 0 0 Average FDA days to MDUFA III decision 297.00 0.00 0.00
20th Percentile FDA days to MDUFA III decision 297 0 0
40th Percentile FDA days to MDUFA III decision 297 0 0
60th Percentile FDA days to MDUFA III decision 297 0 0
80th Percentile FDA days to MDUFA III decision 297 0 0
Maximum FDA days to MDUFA III decision 297 0 0 Average Industry days to MDUFA III decision 0.00 0.00 0.00
20th Percentile Industry days to MDUFA III decision 0 0 0
40th Percentile Industry days to MDUFA III decision 0 0 0
60th Percentile Industry days to MDUFA III decision 0 0 0
80th Percentile Industry days to MDUFA III decision 0 0 0
Maximum Industry days to MDUFA III decision 0 0 0
Average Total days to MDUFA III decision 297.00 0.00 0.00
20th Percentile Total days to MDUFA III decision 297 0 0
40th Percentile Total days to MDUFA III decision 297 0 0
60th Percentile Total days to MDUFA III decision 297 0 0
80th Percentile Total days to MDUFA III decision 297 0 0
Maximum Total days to MDUFA III decision 297 0 0
Page 103 of 371
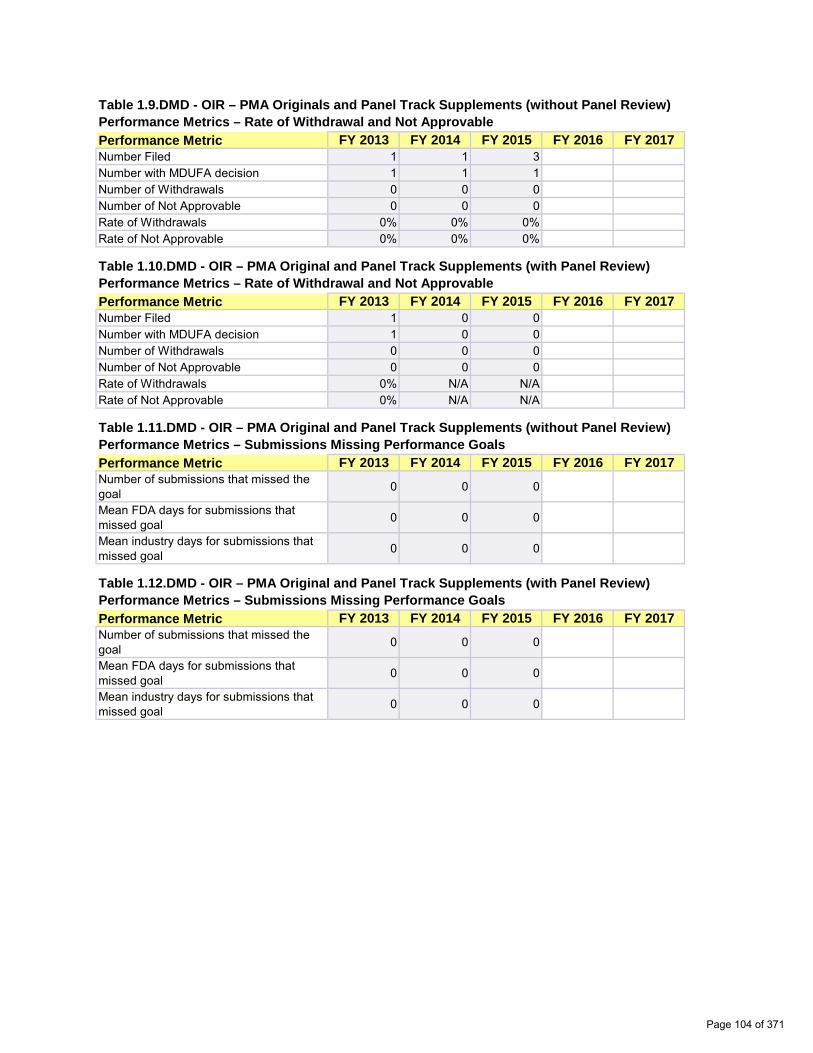
Table 1.9.DMD - OIR – PMA Originals and Panel Track Supplements (without Panel Review) Performance Metrics – Rate of Withdrawal and Not Approvable Performance Metric FY 2013 FY 2014 FY 2015 FY 2016 FY 2017 Number Filed 1 1 3 Number with MDUFA decision 1 1 1 Number of Withdrawals 0 0 0 Number of Not Approvable 0 0 0 Rate of Withdrawals 0% 0% 0% Rate of Not Approvable 0% 0% 0%
Table 1.10.DMD - OIR – PMA Original and Panel Track Supplements (with Panel Review) Performance Metrics – Rate of Withdrawal and Not Approvable Performance Metric FY 2013 FY 2014 FY 2015 FY 2016 FY 2017 Number Filed 1 0 0 Number with MDUFA decision 1 0 0 Number of Withdrawals 0 0 0 Number of Not Approvable 0 0 0 Rate of Withdrawals 0% N/A N/A Rate of Not Approvable 0% N/A N/A
Table 1.11.DMD - OIR – PMA Original and Panel Track Supplements (without Panel Review) Performance Metrics – Submissions Missing Performance Goals Performance Metric FY 2013 FY 2014 FY 2015 FY 2016 FY 2017 Number of submissions that missed the goal 0 0 0
Mean FDA days for submissions that missed goal 0 0 0
Mean industry days for submissions that missed goal 0 0 0
Table 1.12.DMD - OIR – PMA Original and Panel Track Supplements (with Panel Review) Performance Metrics – Submissions Missing Performance Goals Performance Metric FY 2013 FY 2014 FY 2015 FY 2016 FY 2017 Number of submissions that missed the goal 0 0 0
Mean FDA days for submissions that missed goal 0 0 0
Mean industry days for submissions that missed goal 0 0 0
Page 104 of 371
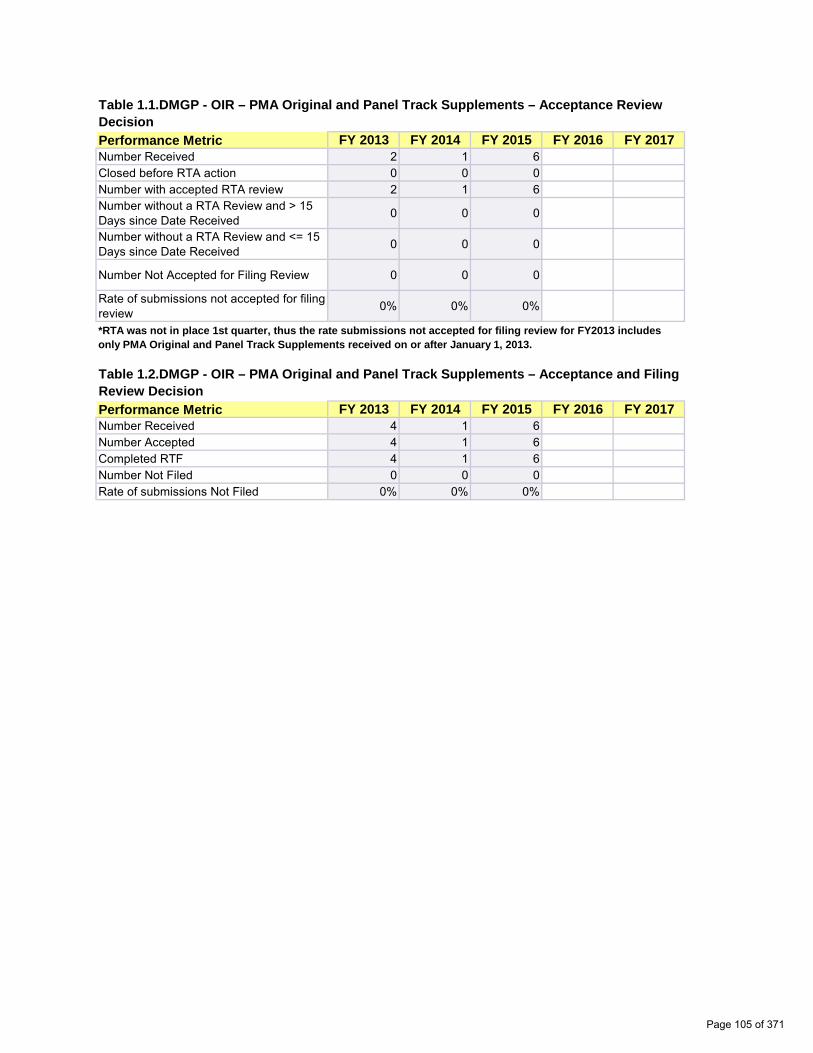
Table 1.1.DMGP - OIR – PMA Original and Panel Track Supplements – Acceptance Review Decision Performance Metric FY 2013 FY 2014 FY 2015 FY 2016 FY 2017 Number Received 2 1 6 Closed before RTA action 0 0 0 Number with accepted RTA review 2 1 6 Number without a RTA Review and > 15 Days since Date Received 0 0 0
Number without a RTA Review and <= 15 Days since Date Received 0 0 0
Number Not Accepted for Filing Review 0 0 0
Rate of submissions not accepted for filing review 0% 0% 0%
*RTA was not in place 1st quarter, thus the rate submissions not accepted for filing review for FY2013 includes only PMA Original and Panel Track Supplements received on or after January 1, 2013.
Table 1.2.DMGP - OIR – PMA Original and Panel Track Supplements – Acceptance and Filing Review Decision Performance Metric FY 2013 FY 2014 FY 2015 FY 2016 FY 2017 Number Received 4 1 6 Number Accepted 4 1 6 Completed RTF 4 1 6 Number Not Filed 0 0 0 Rate of submissions Not Filed 0% 0% 0%
Page 105 of 371

Table 1.3.DMGP - OIR – PMA Originals & Panel-Track Supplements Substantive Interaction Performance Goals
Substantive Interaction (SI) Goals:
FY 2013 FY 2014 FY 2015 FY 2016 FY 2017 65% SI
within 90 FDA days
75% SI within 90 FDA days
85% SI within 90 FDA days
95% SI within 90 FDA days
95% SI within 90 FDA days
Eligible for SI 4 1 6 SI Goal Met 4 1 4 SI Goal Not Met 0 0 0 SI Pending Within Goal 0 0 2 SI Pending Past Goal 0 0 0 Closed without SI 0 0 0
Current SI Performance Percent Goal Met 100% 100% 100%
Table 1.4.DMGP - OIR – PMA Originals and Panel Track Supplements Substantive Interaction Metrics – Time to Substantive Interaction Performance Metric FY 2013 FY 2014 FY 2015 FY 2016 FY 2017 Number of Substantive Interactions 4 1 4 Average number of FDA days to Substantive Interaction 95.25 86.00 85.25
20th Percentile FDA days to Substantive Interaction 90 86 82
40th Percentile FDA days to Substantive Interaction 90 86 90
60th Percentile FDA days to Substantive Interaction 90 86 90
80th Percentile FDA days to Substantive Interaction 99 86 90
Maximum FDA days to Substantive Interaction 112 86 90
Page 106 of 371

Table 1.5.DMGP - OIR – PMA Originals & Panel-Track Supplements (without Panel Review) MDUFA Decision Performance Goals
Performance Goals:
FY 2013 FY 2014 FY 2015 FY 2016 FY 201770% within
180 FDA days
80% within 180 FDA
days
80% within 180 FDA
days
90% within 180 FDA
days
90% within 180 FDA
days
Number of PMAs filed 2 1 6 Non-MDUFA III Decisions 0 0 0 MDUFA III Decisions 2 1 2 MDUFA III Decisions Goal Met 2 1 2 PMAs pending MDUFA III Decision 0 0 4 PMAs pending MDUFA III Decision Past Goal 0 0 0
Current Performance Percent Goal Met 100% 100% 100%
Table 1.6.DMGP - OIR – PMA Originals & Panel-Track Supplements (with Panel Review) MDUFA Decision Performance Goals
Performance Goals:
FY 2013 FY 2014 FY 2015 FY 2016 FY 201750% within
320 FDA days
70% within 320 FDA
days
80% within 320 FDA
days
80% within 320 FDA
days
90% within 320 FDA
days
Number of PMAs filed 2 0 0 Non-MDUFA III Decisions 0 0 0 MDUFA III Decisions 2 0 0 MDUFA III Decisions Goal Met 2 0 0 PMAs pending MDUFA III Decision 0 0 0 PMAs pending MDUFA III Decision Past Goal 0 0 0
Current Performance Percent Goal Met 100% N/A N/A
Page 107 of 371

Table 1.7.DMGP - OIR – PMA Original and Panel Track Supplements (without Panel Review) Performance Metrics – Time to MDUFA Decision Performance Metric FY 2013 FY 2014 FY 2015 FY 2016 FY 2017 Number with MDUFA III decision 2 1 2 Average FDA days to MDUFA III decision 107.50 86.00 151.50
20th Percentile FDA days to MDUFA III decision 102 86 140
40th Percentile FDA days to MDUFA III decision 106 86 148
60th Percentile FDA days to MDUFA III decision 109 86 155
80th Percentile FDA days to MDUFA III decision 113 86 163
Maximum FDA days to MDUFA III decision 116 86 170 Average Industry days to MDUFA III decision 94.50 0.00 51.50
20th Percentile Industry days to MDUFA III decision 80 0 45
40th Percentile Industry days to MDUFA III decision 90 0 49
60th Percentile Industry days to MDUFA III decision 99 0 54
80th Percentile Industry days to MDUFA III decision 109 0 58
Maximum Industry days to MDUFA III decision 118 0 63
Average Total days to MDUFA III decision 202.00 86.00 203.00
20th Percentile Total days to MDUFA III decision 193 86 199
40th Percentile Total days to MDUFA III decision 199 86 202
60th Percentile Total days to MDUFA III decision 205 86 204
80th Percentile Total days to MDUFA III decision 211 86 207
Maximum Total days to MDUFA III decision 217 86 210
Page 108 of 371

Table 1.8.DMGP - OIR – PMA Original and Panel Track Supplements (with Panel Review) Performance Metrics – Time to MDUFA Decision Performance Metric FY 2013 FY 2014 FY 2015 FY 2016 FY 2017 Number with MDUFA III decision 2 0 0 Average FDA days to MDUFA III decision 320.00 0.00 0.00
20th Percentile FDA days to MDUFA III decision 317 0 0
40th Percentile FDA days to MDUFA III decision 319 0 0
60th Percentile FDA days to MDUFA III decision 321 0 0
80th Percentile FDA days to MDUFA III decision 323 0 0
Maximum FDA days to MDUFA III decision 325 0 0 Average Industry days to MDUFA III decision 147.00 0.00 0.00
20th Percentile Industry days to MDUFA III decision 122 0 0
40th Percentile Industry days to MDUFA III decision 139 0 0
60th Percentile Industry days to MDUFA III decision 155 0 0
80th Percentile Industry days to MDUFA III decision 172 0 0
Maximum Industry days to MDUFA III decision 189 0 0
Average Total days to MDUFA III decision 467.00 0.00 0.00
20th Percentile Total days to MDUFA III decision 445 0 0
40th Percentile Total days to MDUFA III decision 460 0 0
60th Percentile Total days to MDUFA III decision 474 0 0
80th Percentile Total days to MDUFA III decision 489 0 0
Maximum Total days to MDUFA III decision 504 0 0
Page 109 of 371

Table 1.9.DMGP - OIR – PMA Originals and Panel Track Supplements (without Panel Review) Performance Metrics – Rate of Withdrawal and Not Approvable Performance Metric FY 2013 FY 2014 FY 2015 FY 2016 FY 2017 Number Filed 2 1 6 Number with MDUFA decision 2 1 2 Number of Withdrawals 0 0 0 Number of Not Approvable 0 0 0 Rate of Withdrawals 0% 0% 0% Rate of Not Approvable 0% 0% 0%
Table 1.10.DMGP - OIR – PMA Original and Panel Track Supplements (with Panel Review) Performance Metrics – Rate of Withdrawal and Not Approvable Performance Metric FY 2013 FY 2014 FY 2015 FY 2016 FY 2017 Number Filed 2 0 0 Number with MDUFA decision 2 0 0 Number of Withdrawals 0 0 0 Number of Not Approvable 1 0 0 Rate of Withdrawals 0% N/A N/A Rate of Not Approvable 50.0% N/A N/A
Table 1.11.DMGP - OIR – PMA Original and Panel Track Supplements (without Panel Review) Performance Metrics – Submissions Missing Performance Goals Performance Metric FY 2013 FY 2014 FY 2015 FY 2016 FY 2017 Number of submissions that missed the goal 0 0 0
Mean FDA days for submissions that missed goal 0 0 0
Mean industry days for submissions that missed goal 0 0 0
Table 1.12.DMGP - OIR – PMA Original and Panel Track Supplements (with Panel Review) Performance Metrics – Submissions Missing Performance Goals Performance Metric FY 2013 FY 2014 FY 2015 FY 2016 FY 2017 Number of submissions that missed the goal 1 0 0
Mean FDA days for submissions that missed goal 325 0 0
Mean industry days for submissions that missed goal 147 0 0
Page 110 of 371
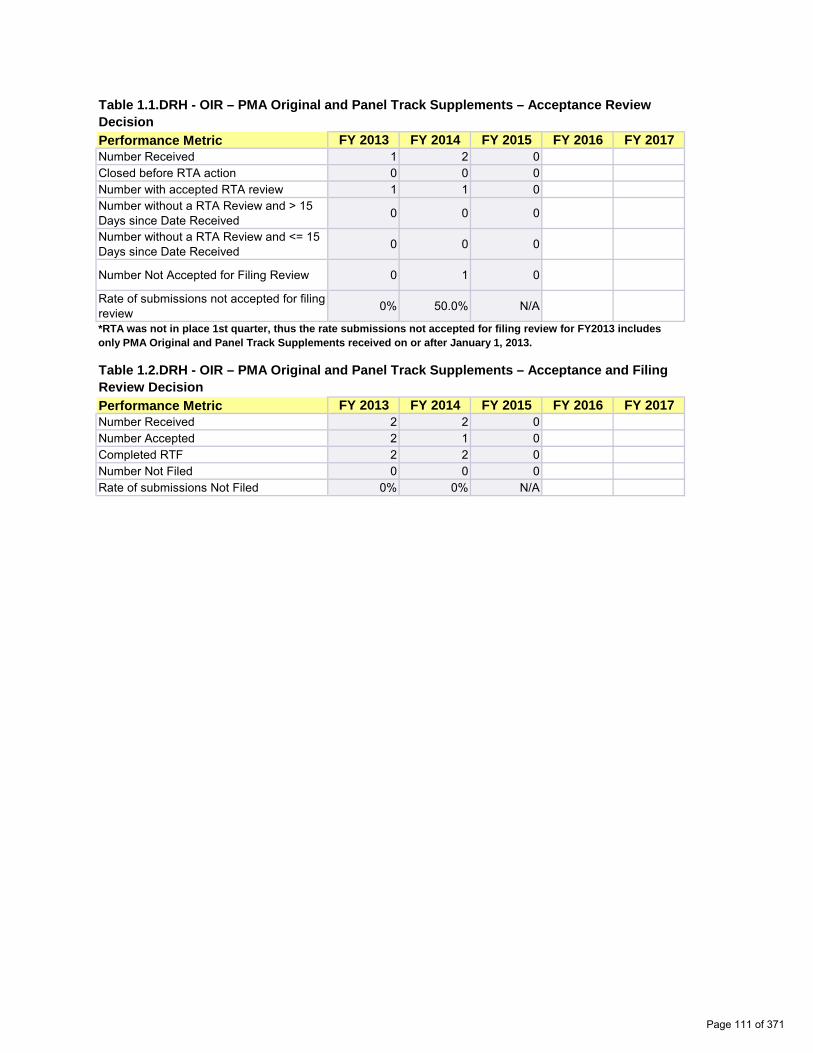
Table 1.1.DRH - OIR – PMA Original and Panel Track Supplements – Acceptance Review Decision Performance Metric FY 2013 FY 2014 FY 2015 FY 2016 FY 2017 Number Received 1 2 0 Closed before RTA action 0 0 0 Number with accepted RTA review 1 1 0 Number without a RTA Review and > 15 Days since Date Received 0 0 0
Number without a RTA Review and <= 15 Days since Date Received 0 0 0
Number Not Accepted for Filing Review 0 1 0
Rate of submissions not accepted for filing review 0% 50.0% N/A
*RTA was not in place 1st quarter, thus the rate submissions not accepted for filing review for FY2013 includes only PMA Original and Panel Track Supplements received on or after January 1, 2013.
Table 1.2.DRH - OIR – PMA Original and Panel Track Supplements – Acceptance and Filing Review Decision Performance Metric FY 2013 FY 2014 FY 2015 FY 2016 FY 2017 Number Received 2 2 0 Number Accepted 2 1 0 Completed RTF 2 2 0 Number Not Filed 0 0 0 Rate of submissions Not Filed 0% 0% N/A
Page 111 of 371

Table 1.3.DRH - OIR – PMA Originals & Panel-Track Supplements Substantive Interaction Performance Goals
Substantive Interaction (SI) Goals:
FY 2013 FY 2014 FY 2015 FY 2016 FY 2017 65% SI
within 90 FDA days
75% SI within 90 FDA days
85% SI within 90 FDA days
95% SI within 90 FDA days
95% SI within 90 FDA days
Eligible for SI 2 2 0 SI Goal Met 2 2 0 SI Goal Not Met 0 0 0 SI Pending Within Goal 0 0 0 SI Pending Past Goal 0 0 0 Closed without SI 0 0 0
Current SI Performance Percent Goal Met 100% 100% N/A
Table 1.4.DRH - OIR – PMA Originals and Panel Track Supplements Substantive Interaction Metrics – Time to Substantive Interaction Performance Metric FY 2013 FY 2014 FY 2015 FY 2016 FY 2017 Number of Substantive Interactions 2 2 0 Average number of FDA days to Substantive Interaction 77.50 86.50 0.00
20th Percentile FDA days to Substantive Interaction 70 86 0
40th Percentile FDA days to Substantive Interaction 75 86 0
60th Percentile FDA days to Substantive Interaction 80 87 0
80th Percentile FDA days to Substantive Interaction 85 87 0
Maximum FDA days to Substantive Interaction 90 88 0
Page 112 of 371
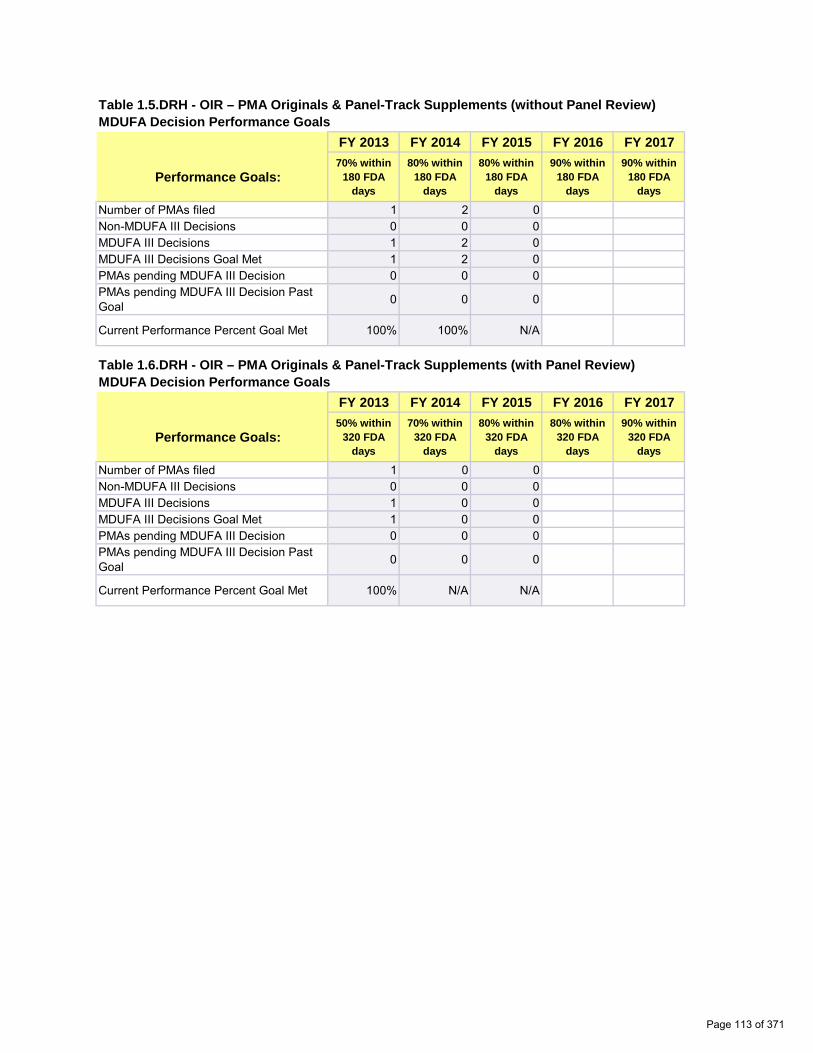
Table 1.5.DRH - OIR – PMA Originals & Panel-Track Supplements (without Panel Review) MDUFA Decision Performance Goals
Performance Goals:
FY 2013 FY 2014 FY 2015 FY 2016 FY 201770% within
180 FDA days
80% within 180 FDA
days
80% within 180 FDA
days
90% within 180 FDA
days
90% within 180 FDA
days
Number of PMAs filed 1 2 0 Non-MDUFA III Decisions 0 0 0 MDUFA III Decisions 1 2 0 MDUFA III Decisions Goal Met 1 2 0 PMAs pending MDUFA III Decision 0 0 0 PMAs pending MDUFA III Decision Past Goal 0 0 0
Current Performance Percent Goal Met 100% 100% N/A
Table 1.6.DRH - OIR – PMA Originals & Panel-Track Supplements (with Panel Review) MDUFA Decision Performance Goals
Performance Goals:
FY 2013 FY 2014 FY 2015 FY 2016 FY 201750% within
320 FDA days
70% within 320 FDA
days
80% within 320 FDA
days
80% within 320 FDA
days
90% within 320 FDA
days
Number of PMAs filed 1 0 0 Non-MDUFA III Decisions 0 0 0 MDUFA III Decisions 1 0 0 MDUFA III Decisions Goal Met 1 0 0 PMAs pending MDUFA III Decision 0 0 0 PMAs pending MDUFA III Decision Past Goal 0 0 0
Current Performance Percent Goal Met 100% N/A N/A
Page 113 of 371
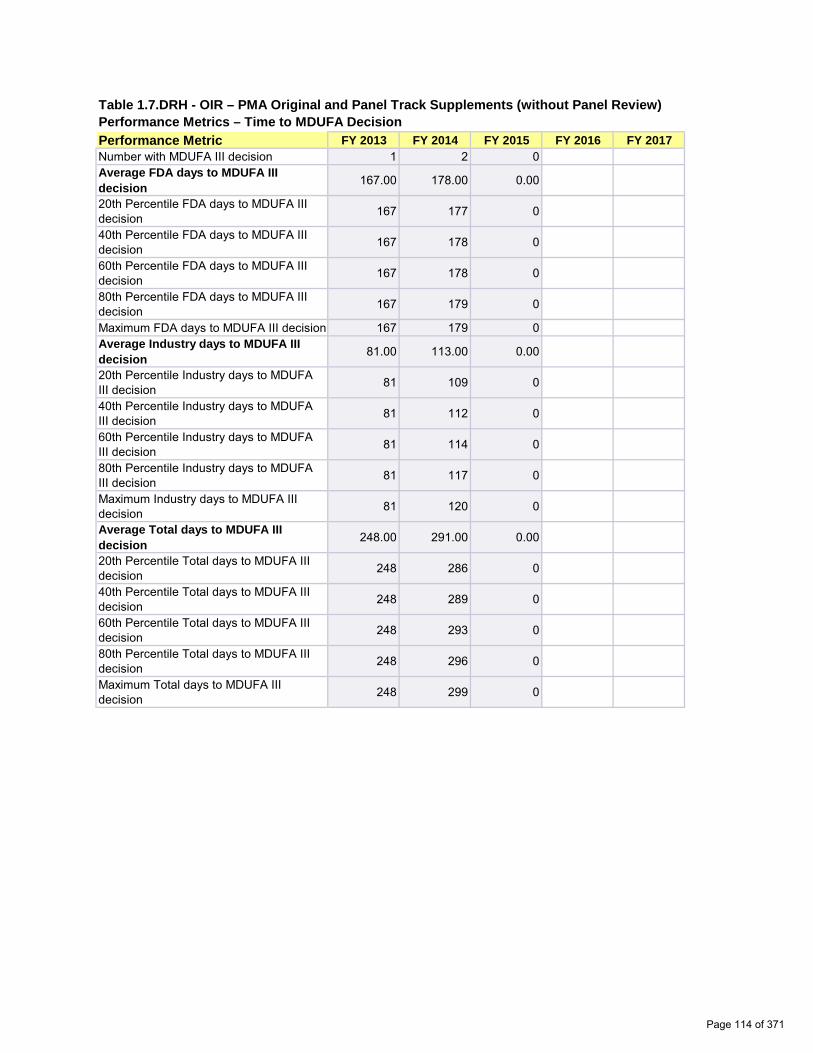
Table 1.7.DRH - OIR – PMA Original and Panel Track Supplements (without Panel Review) Performance Metrics – Time to MDUFA Decision Performance Metric FY 2013 FY 2014 FY 2015 FY 2016 FY 2017 Number with MDUFA III decision 1 2 0 Average FDA days to MDUFA III decision 167.00 178.00 0.00
20th Percentile FDA days to MDUFA III decision 167 177 0
40th Percentile FDA days to MDUFA III decision 167 178 0
60th Percentile FDA days to MDUFA III decision 167 178 0
80th Percentile FDA days to MDUFA III decision 167 179 0
Maximum FDA days to MDUFA III decision 167 179 0 Average Industry days to MDUFA III decision 81.00 113.00 0.00
20th Percentile Industry days to MDUFA III decision 81 109 0
40th Percentile Industry days to MDUFA III decision 81 112 0
60th Percentile Industry days to MDUFA III decision 81 114 0
80th Percentile Industry days to MDUFA III decision 81 117 0
Maximum Industry days to MDUFA III decision 81 120 0
Average Total days to MDUFA III decision 248.00 291.00 0.00
20th Percentile Total days to MDUFA III decision 248 286 0
40th Percentile Total days to MDUFA III decision 248 289 0
60th Percentile Total days to MDUFA III decision 248 293 0
80th Percentile Total days to MDUFA III decision 248 296 0
Maximum Total days to MDUFA III decision 248 299 0
Page 114 of 371

Table 1.8.DRH - OIR – PMA Original and Panel Track Supplements (with Panel Review) Performance Metrics – Time to MDUFA Decision Performance Metric FY 2013 FY 2014 FY 2015 FY 2016 FY 2017 Number with MDUFA III decision 1 0 0 Average FDA days to MDUFA III decision 206.00 0.00 0.00
20th Percentile FDA days to MDUFA III decision 206 0 0
40th Percentile FDA days to MDUFA III decision 206 0 0
60th Percentile FDA days to MDUFA III decision 206 0 0
80th Percentile FDA days to MDUFA III decision 206 0 0
Maximum FDA days to MDUFA III decision 206 0 0 Average Industry days to MDUFA III decision 0.00 0.00 0.00
20th Percentile Industry days to MDUFA III decision 0 0 0
40th Percentile Industry days to MDUFA III decision 0 0 0
60th Percentile Industry days to MDUFA III decision 0 0 0
80th Percentile Industry days to MDUFA III decision 0 0 0
Maximum Industry days to MDUFA III decision 0 0 0
Average Total days to MDUFA III decision 206.00 0.00 0.00
20th Percentile Total days to MDUFA III decision 206 0 0
40th Percentile Total days to MDUFA III decision 206 0 0
60th Percentile Total days to MDUFA III decision 206 0 0
80th Percentile Total days to MDUFA III decision 206 0 0
Maximum Total days to MDUFA III decision 206 0 0
Page 115 of 371

Table 1.9.DRH - OIR – PMA Originals and Panel Track Supplements (without Panel Review) Performance Metrics – Rate of Withdrawal and Not Approvable Performance Metric FY 2013 FY 2014 FY 2015 FY 2016 FY 2017 Number Filed 1 2 0 Number with MDUFA decision 1 2 0 Number of Withdrawals 0 0 0 Number of Not Approvable 1 0 0 Rate of Withdrawals 0% 0% N/A Rate of Not Approvable 100% 0% N/A
Table 1.10.DRH - OIR – PMA Original and Panel Track Supplements (with Panel Review) Performance Metrics – Rate of Withdrawal and Not Approvable Performance Metric FY 2013 FY 2014 FY 2015 FY 2016 FY 2017 Number Filed 1 0 0 Number with MDUFA decision 1 0 0 Number of Withdrawals 0 0 0 Number of Not Approvable 0 0 0 Rate of Withdrawals 0% N/A N/A Rate of Not Approvable 0% N/A N/A
Table 1.11.DRH - OIR – PMA Original and Panel Track Supplements (without Panel Review) Performance Metrics – Submissions Missing Performance Goals Performance Metric FY 2013 FY 2014 FY 2015 FY 2016 FY 2017 Number of submissions that missed the goal 0 0 0
Mean FDA days for submissions that missed goal 0 0 0
Mean industry days for submissions that missed goal 0 0 0
Table 1.12.DRH - OIR – PMA Original and Panel Track Supplements (with Panel Review) Performance Metrics – Submissions Missing Performance Goals Performance Metric FY 2013 FY 2014 FY 2015 FY 2016 FY 2017 Number of submissions that missed the goal 0 0 0
Mean FDA days for submissions that missed goal 0 0 0
Mean industry days for submissions that missed goal 0 0 0
Page 116 of 371
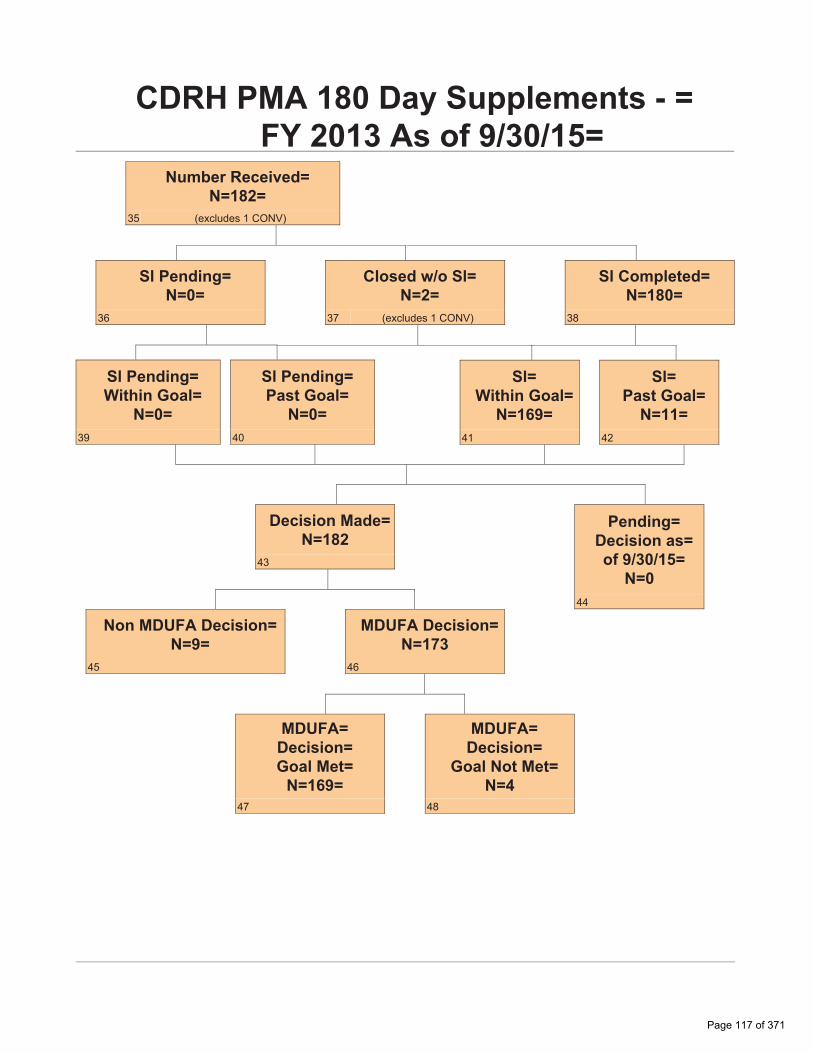
�D�D
��D�D
��D
��D
�D
�D�D
��D
�D�D
�D
��D
��D��D
�D�
&'5+�30$�����'D\�6XSSOHPHQWV��� )<������$V�RI�9/30���
1XPEHU�5HFHLYHG 1 ���
�� �H[FOXGHV���&219�
6O�3HQGLQJ 1 �
��
&ORVHG�Z�R�6O 1 �
�� �H[FOXGHV���&219�
6O�&RPSOHWHG 1 ���
��
6O�3HQGLQJ :LWKLQ�*RDO
1 � ��
6O�3HQGLQJ 3DVW�*RDO
1 � ��
6O :LWKLQ�*RDO
1 ��� ��
6O 3DVW�*RDO 1 ��
��
'HFLVLRQ�0DGH 1 ��2
��
3HQGLQJ 'HFLVLRQ�DV RI�9/30���
1 0 ��
1RQ�0'8)$�'HFLVLRQ 1 �
��
0'8)$�'HFLVLRQ 1 ��3
��
0'8)$ 'HFLVLRQ *RDO�0HW 1 ���
��
0'8)$ 'HFLVLRQ
*RDO�1RW�0HW 1 4
��
Page 117 of 371

�D�D
��D�D
��D
��D
�D
�D�D
��D
�D�D
�D
��D
��D��D
�D�
&'5+�30$�����'D\�6XSSOHPHQWV��� )<�������$V�RI�9/30���
1XPEHU�5HFHLYHG 1 ���
��
6O�3HQGLQJ 1 �
��
&ORVHG�Z�R�6O 1 �
��
6O�&RPSOHWHG 1 ���
��
6O�3HQGLQJ :LWKLQ�*RDO
1 � ��
6O�3HQGLQJ 3DVW�*RDO
1 � ��
6O :LWKLQ�*RDO
1 ��� ��
6O 3DVW�*RDO
1 � ��
'HFLVLRQ�0DGH 1 �71
��
3HQGLQJ 'HFLVLRQ�DV RI�9/30��� 1 7
��
1RQ�0'8)$�'HFLVLRQ 1 4
��
0'8)$�'HFLVLRQ 1 �67
��
0'8)$ 'HFLVLRQ *RDO�0HW 1 �67
��
0'8)$ 'HFLVLRQ
*RDO�1RW�0HW 1 �
��
Page 118 of 371

�D�D
��D�D
��D
��D
�D
�D�D
��D
�D�D
�D
��D
��D��D
�D�
&'5+�30$�����'D\�6XSSOHPHQWV��� )<������$V�RI�9/30���
1XPEHU�5HFHLYHG 1 201
��
6O�3HQGLQJ 1 46
��
&ORVHG�Z�R�6O 1 7
��
6O�&RPSOHWHG 1 148
��
6O�3HQGLQJ :LWKLQ�*RDO
1 44 ��
6O�3HQGLQJ 3DVW�*RDO
1 2 ��
6O :LWKLQ�*RDO
1 139 ��
6O 3DVW�*RDO
1 9 ��
'HFLVLRQ�0DGH 1 95
��
3HQGLQJ 'HFLVLRQ�DV RI�9/30��� 1 106
��
1RQ�0'8)$�'HFLVLRQ 1 7
��
0'8)$�'HFLVLRQ 1 88
��
0'8)$ 'HFLVLRQ *RDO�0HW 1 88
��
0'8)$ 'HFLVLRQ
*RDO�1RW�0HW 1 �
��
Page 119 of 371

Page intentionally left blank
Page 120 of 371
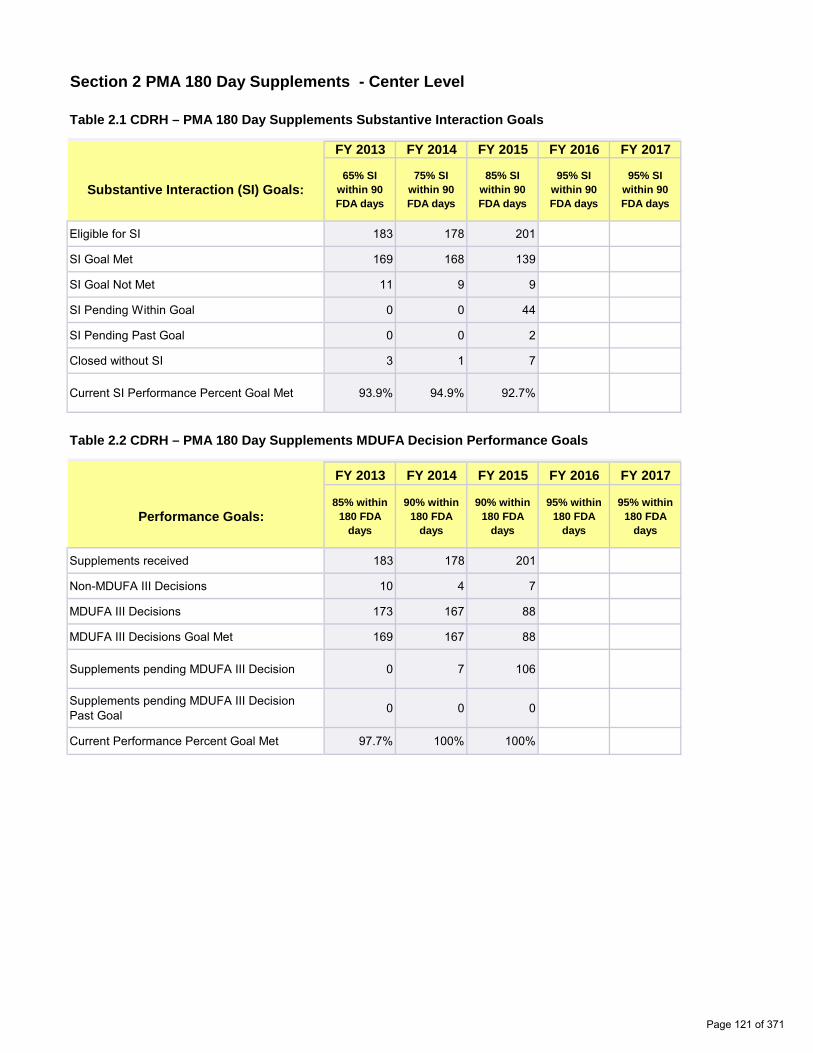
0 0
0 0
0 0
0 0
0 0
0 0
0.00% 0.00%
0 0
0 0
0 0
0 0
0 0
0 0
0.00% 0.00%
Section 2 PMA 180 Day Supplements - Center Level
Table 2.1 CDRH – PMA 180 Day Supplements Substantive Interaction Goals
Substantive Interaction (SI) Goals:
FY 2013 FY 2014 FY 2015 FY 2016 FY 2017
65% SI within 90 FDA days
75% SI within 90 FDA days
85% SI within 90 FDA days
95% SI within 90 FDA days
95% SI within 90 FDA days
Eligible for SI 183 178 201
SI Goal Met 169 168 139
SI Goal Not Met 11 9 9
SI Pending Within Goal 0 0 44
SI Pending Past Goal 0 0 2
Closed without SI 3 1 7
Current SI Performance Percent Goal Met 93.9% 94.9% 92.7%
Table 2.2 CDRH – PMA 180 Day Supplements MDUFA Decision Performance Goals
Performance Goals:
FY 2013 FY 2014 FY 2015 FY 2016 FY 2017
85% within 180 FDA
days
90% within 180 FDA
days
90% within 180 FDA
days
95% within 180 FDA
days
95% within 180 FDA
days
Supplements received 183 178 201
Non-MDUFA III Decisions 10 4 7
MDUFA III Decisions 173 167 88
MDUFA III Decisions Goal Met 169 167 88
Supplements pending MDUFA III Decision 0 7 106
Supplements pending MDUFA III Decision Past Goal 0 0 0
Current Performance Percent Goal Met 97.7% 100% 100%
Page 121 of 371

0 0
0 0
0 0
0.00% 0.00%
0 0
0 0
0 0
Table 2.3 CDRH – PMA 180 Day Supplements Performance Metrics – Rate of Not Approvable
Performance Metric FY 2013 FY 2014 FY 2015 FY 2016 FY 2017
Number Received 183 178 201
Number with MDUFA decision 173 167 88
Number of Not Approvable 11 5 1
Rate of Not Approvable 6.4% 3.0% 1.1%
Table 2.4 CDRH – PMA 180 Day Supplements Performance Metrics – Submissions Missing Performance Goals
Performance Metric FY 2013 FY 2014 FY 2015 FY 2016 FY 2017
Number of submissions that missed the goal 4 0 0
Mean FDA days for submissions that missed goal 209 0 0
Mean Industry days for submissions that missed goal 246 0 0
Page 122 of 371

0 0
0 0
0 0
0 0
0 0
0 0
0.00% 0.00%
0 0
0 0
0 0
0 0
0 0
0.00% 0.00%
Section 2 PMA 180 Day Supplements - Office Level
Table 2.1.ODE - CDRH – PMA 180 Day Supplements Substantive Interaction Goals
Substantive Interaction (SI) Goals:
FY 2013 FY 2014 FY 2015 FY 2016 FY 2017
65% SI within 90 FDA days
75% SI within 90 FDA days
85% SI within 90 FDA days
95% SI within 90 FDA days
95% SI within 90 FDA days
Eligible for SI 162 165 165
SI Goal Met 148 155 115
SI Goal Not Met 11 9 8
SI Pending Within Goal 0 0 35
SI Pending Past Goal 0 0 2
Closed without SI 3 1 5
Current SI Performance Percent Goal Met 93.1% 94.5% 92.0%
Table 2.2.ODE - CDRH – PMA 180 Day Supplements MDUFA Decision Performance Goals
Performance Goals:
FY 2013 FY 2014 FY 2015 FY 2016 FY 2017
85% within 180 FDA
days
90% within 180 FDA
days
90% within 180 FDA
days
95% within 180 FDA
days
95% within 180 FDA
days
Supplements received 162 165 165
Non-MDUFA III Decisions 9 3 5
MDUFA III Decisions 153 157 77
MDUFA III Decisions Goal Met 149 157 77
Supplements pending MDUFA III Decision 0 5 83
Supplements pending MDUFA III Decision Past Goal 0 0 0
Current Performance Percent Goal Met 97.4% 100% 100%
Page 123 of 371

0 0
0 0
0.00% 0.00%
0 0
0 0
0 0
Table 2.3.ODE - CDRH – PMA 180 Day Supplements Performance Metrics – Rate of Not Approvable
Performance Metric FY 2013 FY 2014 FY 2015 FY 2016 FY 2017
Number Received 162 165 165
Number with MDUFA decision 153 157 77
Number of Not Approvable 11 5 0
Rate of Not Approvable 7.2% 3.2% 0%
Table 2.4.ODE - CDRH – PMA 180 Day Supplements Performance Metrics – Submissions Missing Performance Goals
Performance Metric FY 2013 FY 2014 FY 2015 FY 2016 FY 2017
Number of submissions that missed the goal 4 0 0
Mean FDA days for submissions that missed goal 209 0 0
Mean Industry days for submissions that missed goal 246 0 0
Page 124 of 371

0 0
0 0
0 0
0 0
0 0
0 0
0.00% 0.00%
0 0
0 0
0 0
0 0
0 0
0.00% 0.00%
Table 2.1.OIR - CDRH – PMA 180 Day Supplements Substantive Interaction Goals
Substantive Interaction (SI) Goals:
FY 2013 FY 2014 FY 2015 FY 2016 FY 2017
65% SI within 90 FDA days
75% SI within 90 FDA days
85% SI within 90 FDA days
95% SI within 90 FDA days
95% SI within 90 FDA days
Eligible for SI 21 13 36
SI Goal Met 21 13 24
SI Goal Not Met 0 0 1
SI Pending Within Goal 0 0 9
SI Pending Past Goal 0 0 0
Closed without SI 0 0 2
Current SI Performance Percent Goal Met 100% 100% 96.0%
Table 2.2.OIR - CDRH – PMA 180 Day Supplements MDUFA Decision Performance Goals
Performance Goals:
FY 2013 FY 2014 FY 2015 FY 2016 FY 2017
85% within 180 FDA
days
90% within 180 FDA
days
90% within 180 FDA
days
95% within 180 FDA
days
95% within 180 FDA
days
Supplements received 21 13 36
Non-MDUFA III Decisions 1 1 2
MDUFA III Decisions 20 10 11
MDUFA III Decisions Goal Met 20 10 11
Supplements pending MDUFA III Decision 0 2 23
Supplements pending MDUFA III Decision Past Goal 0 0 0
Current Performance Percent Goal Met 100% 100% 100%
Page 125 of 371
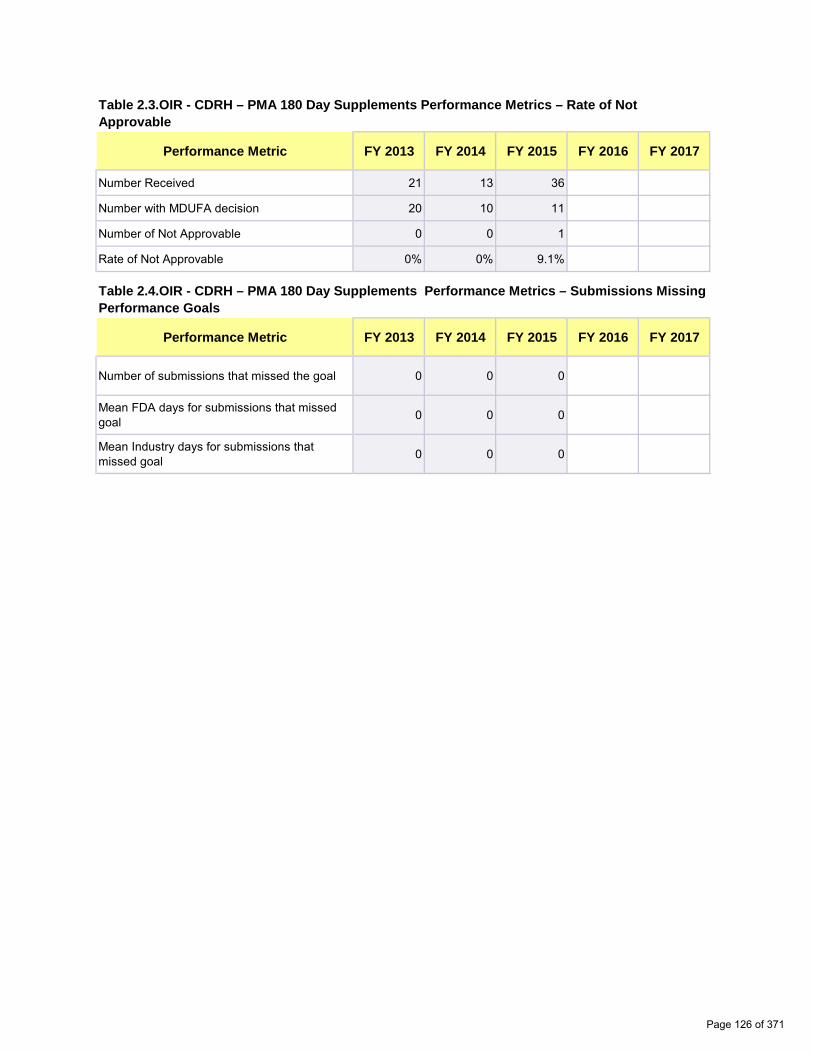
0 0
0 0
0.00% 0.00%
0 0
0 0
0 0
Table 2.3.OIR - CDRH – PMA 180 Day Supplements Performance Metrics – Rate of Not Approvable
Performance Metric FY 2013 FY 2014 FY 2015 FY 2016 FY 2017
Number Received 21 13 36
Number with MDUFA decision 20 10 11
Number of Not Approvable 0 0 1
Rate of Not Approvable 0% 0% 9.1%
Table 2.4.OIR - CDRH – PMA 180 Day Supplements Performance Metrics – Submissions Missing Performance Goals
Performance Metric FY 2013 FY 2014 FY 2015 FY 2016 FY 2017
Number of submissions that missed the goal 0 0 0
Mean FDA days for submissions that missed goal 0 0 0
Mean Industry days for submissions that missed goal 0 0 0
Page 126 of 371
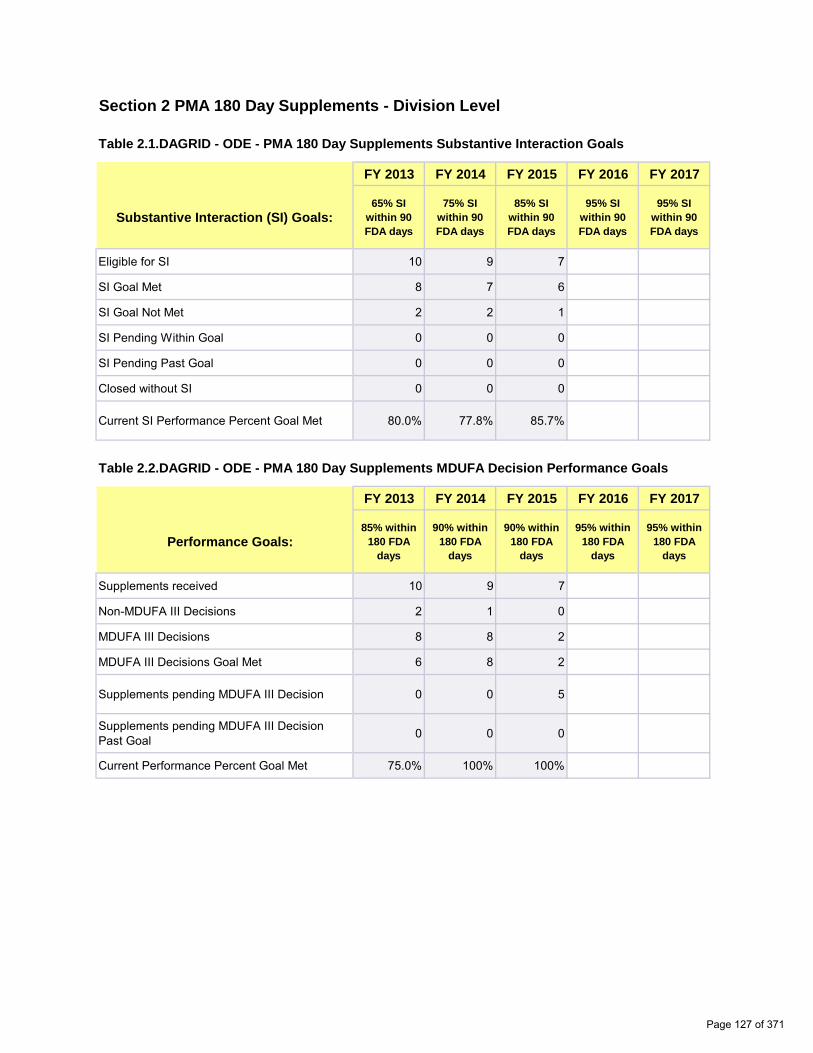
0 0
0 0
0 0
0 0
0 0
0 0
0.00% 0.00%
0 0
0 0
0 0
0 0
0 0
0 0
0.00% 0.00%
Section 2 PMA 180 Day Supplements - Division Level
Table 2.1.DAGRID - ODE - PMA 180 Day Supplements Substantive Interaction Goals
Substantive Interaction (SI) Goals:
FY 2013 FY 2014 FY 2015 FY 2016 FY 2017
65% SI within 90 FDA days
75% SI within 90 FDA days
85% SI within 90 FDA days
95% SI within 90 FDA days
95% SI within 90 FDA days
Eligible for SI 10 9 7
SI Goal Met 8 7 6
SI Goal Not Met 2 2 1
SI Pending Within Goal 0 0 0
SI Pending Past Goal 0 0 0
Closed without SI 0 0 0
Current SI Performance Percent Goal Met 80.0% 77.8% 85.7%
Table 2.2.DAGRID - ODE - PMA 180 Day Supplements MDUFA Decision Performance Goals
Performance Goals:
FY 2013 FY 2014 FY 2015 FY 2016 FY 2017
85% within 180 FDA
days
90% within 180 FDA
days
90% within 180 FDA
days
95% within 180 FDA
days
95% within 180 FDA
days
Supplements received 10 9 7
Non-MDUFA III Decisions 2 1 0
MDUFA III Decisions 8 8 2
MDUFA III Decisions Goal Met 6 8 2
Supplements pending MDUFA III Decision 0 0 5
Supplements pending MDUFA III Decision Past Goal 0 0 0
Current Performance Percent Goal Met 75.0% 100% 100%
Page 127 of 371
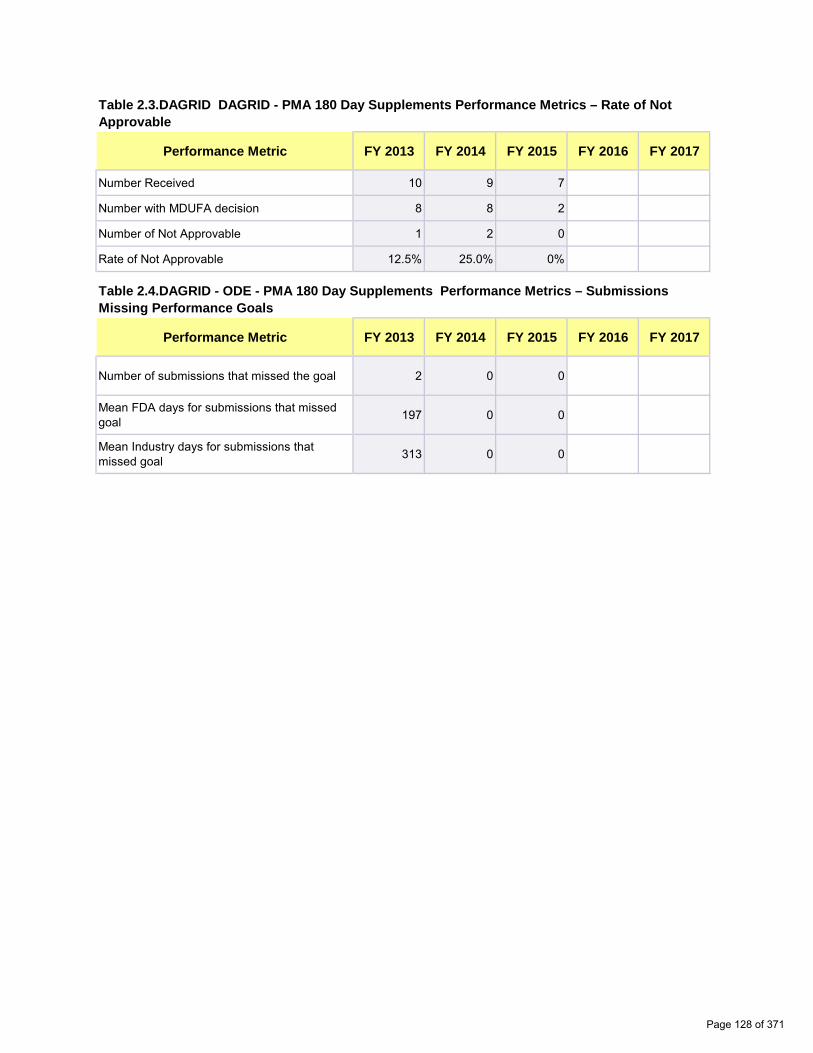
0 0
0 0
0.00% 0.00%
0 0
0 0
0 0
Table 2.3.DAGRID DAGRID - PMA 180 Day Supplements Performance Metrics – Rate of Not Approvable
Performance Metric FY 2013 FY 2014 FY 2015 FY 2016 FY 2017
Number Received 10 9 7
Number with MDUFA decision 8 8 2
Number of Not Approvable 1 2 0
Rate of Not Approvable 12.5% 25.0% 0%
Table 2.4.DAGRID - ODE - PMA 180 Day Supplements Performance Metrics – Submissions Missing Performance Goals
Performance Metric FY 2013 FY 2014 FY 2015 FY 2016 FY 2017
Number of submissions that missed the goal 2 0 0
Mean FDA days for submissions that missed goal 197 0 0
Mean Industry days for submissions that missed goal 313 0 0
Page 128 of 371

0 0
0 0
0 0
0 0
0 0
0 0
0.00% 0.00%
0 0
0 0
0 0
0 0
0
0 0
0.00% 0.00%
Table 2.1.DCD - ODE - PMA 180 Day Supplements Substantive Interaction Goals
Substantive Interaction (SI) Goals:
FY 2013 FY 2014 FY 2015 FY 2016 FY 2017
65% SI within 90 FDA days
75% SI within 90 FDA days
85% SI within 90 FDA days
95% SI within 90 FDA days
95% SI within 90 FDA days
Eligible for SI 116 94 105
SI Goal Met 108 93 69
SI Goal Not Met 5 1 2
SI Pending Within Goal 0 0 28
SI Pending Past Goal 0 0 1
Closed without SI 3 0 5
Current SI Performance Percent Goal Met 95.6% 98.9% 95.8%
Table 2.2.DCD - ODE - PMA 180 Day Supplements MDUFA Decision Performance Goals
Performance Goals:
FY 2013 FY 2014 FY 2015 FY 2016 FY 2017
85% within 180 FDA
days
90% within 180 FDA
days
90% within 180 FDA
days
95% within 180 FDA
days
95% within 180 FDA
days
Supplements received 116 94 105
Non-MDUFA III Decisions 4 1 5
MDUFA III Decisions 112 93 43
MDUFA III Decisions Goal Met 111 93 43
Supplements pending MDUFA III Decision 0 0 57
Supplements pending MDUFA III Decision Past Goal 0 0 0
Current Performance Percent Goal Met 99.1% 100% 100%
Page 129 of 371

0 0
0 0
0.00% 0.00%
0 0
0 0
0 0
Table 2.3.DCD DCD - PMA 180 Day Supplements Performance Metrics – Rate of Not Approvable
Performance Metric FY 2013 FY 2014 FY 2015 FY 2016 FY 2017
Number Received 116 94 105
Number with MDUFA decision 112 93 43
Number of Not Approvable 6 0 0
Rate of Not Approvable 5.4% 0% 0%
Table 2.4.DCD - ODE - PMA 180 Day Supplements Performance Metrics – Submissions Missing Performance Goals
Performance Metric FY 2013 FY 2014 FY 2015 FY 2016 FY 2017
Number of submissions that missed the goal 1 0 0
Mean FDA days for submissions that missed goal 182 0 0
Mean Industry days for submissions that missed goal 0 0 0
Page 130 of 371

0 0
0 0
0 0
0 0
0 0
0 0
0.00% 0.00%
0 0
0 0
0 0
0 0
0 0
0 0
0.00% 0.00%
Table 2.1.DNPMD - ODE - PMA 180 Day Supplements Substantive Interaction Goals
Substantive Interaction (SI) Goals:
FY 2013 FY 2014 FY 2015 FY 2016 FY 2017
65% SI within 90 FDA days
75% SI within 90 FDA days
85% SI within 90 FDA days
95% SI within 90 FDA days
95% SI within 90 FDA days
Eligible for SI 8 14 14
SI Goal Met 7 13 11
SI Goal Not Met 1 0 1
SI Pending Within Goal 0 0 2
SI Pending Past Goal 0 0 0
Closed without SI 0 1 0
Current SI Performance Percent Goal Met 87.5% 100% 91.7%
Table 2.2.DNPMD - ODE - PMA 180 Day Supplements MDUFA Decision Performance Goals
Performance Goals:
FY 2013 FY 2014 FY 2015 FY 2016 FY 2017
85% within 180 FDA
days
90% within 180 FDA
days
90% within 180 FDA
days
95% within 180 FDA
days
95% within 180 FDA
days
Supplements received 8 14 14
Non-MDUFA III Decisions 2 1 0
MDUFA III Decisions 6 13 5
MDUFA III Decisions Goal Met 6 13 5
Supplements pending MDUFA III Decision 0 0 9
Supplements pending MDUFA III Decision Past Goal 0 0 0
Current Performance Percent Goal Met 100% 100% 100%
Page 131 of 371

0 0
0 0
0.00% 0.00%
0 0
0 0
0 0
Table 2.3.DNPMD DNPMD - PMA 180 Day Supplements Performance Metrics – Rate of Not Approvable
Performance Metric FY 2013 FY 2014 FY 2015 FY 2016 FY 2017
Number Received 8 14 14
Number with MDUFA decision 6 13 5
Number of Not Approvable 1 0 0
Rate of Not Approvable 16.7% 0% 0%
Table 2.4.DNPMD - ODE - PMA 180 Day Supplements Performance Metrics – Submissions Missing Performance Goals
Performance Metric FY 2013 FY 2014 FY 2015 FY 2016 FY 2017
Number of submissions that missed the goal 0 0 0
Mean FDA days for submissions that missed goal 0 0 0
Mean Industry days for submissions that missed goal 0 0 0
Page 132 of 371

0 0
0 0
0 0
0 0
0 0
0 0
0.00% 0.00%
0 0
0 0
0 0
0 0
0 0
0 0
0.00% 0.00%
Table 2.1.DOD - ODE - PMA 180 Day Supplements Substantive Interaction Goals
Substantive Interaction (SI) Goals:
FY 2013 FY 2014 FY 2015 FY 2016 FY 2017
65% SI within 90 FDA days
75% SI within 90 FDA days
85% SI within 90 FDA days
95% SI within 90 FDA days
95% SI within 90 FDA days
Eligible for SI 2 4 6
SI Goal Met 2 2 4
SI Goal Not Met 0 2 1
SI Pending Within Goal 0 0 1
SI Pending Past Goal 0 0 0
Closed without SI 0 0 0
Current SI Performance Percent Goal Met 100% 50.0% 80.0%
Table 2.2.DOD - ODE - PMA 180 Day Supplements MDUFA Decision Performance Goals
Performance Goals:
FY 2013 FY 2014 FY 2015 FY 2016 FY 2017
85% within 180 FDA
days
90% within 180 FDA
days
90% within 180 FDA
days
95% within 180 FDA
days
95% within 180 FDA
days
Supplements received 2 4 6
Non-MDUFA III Decisions 0 0 0
MDUFA III Decisions 2 4 2
MDUFA III Decisions Goal Met 2 4 2
Supplements pending MDUFA III Decision 0 0 4
Supplements pending MDUFA III Decision Past Goal 0 0 0
Current Performance Percent Goal Met 100% 100% 100%
Page 133 of 371
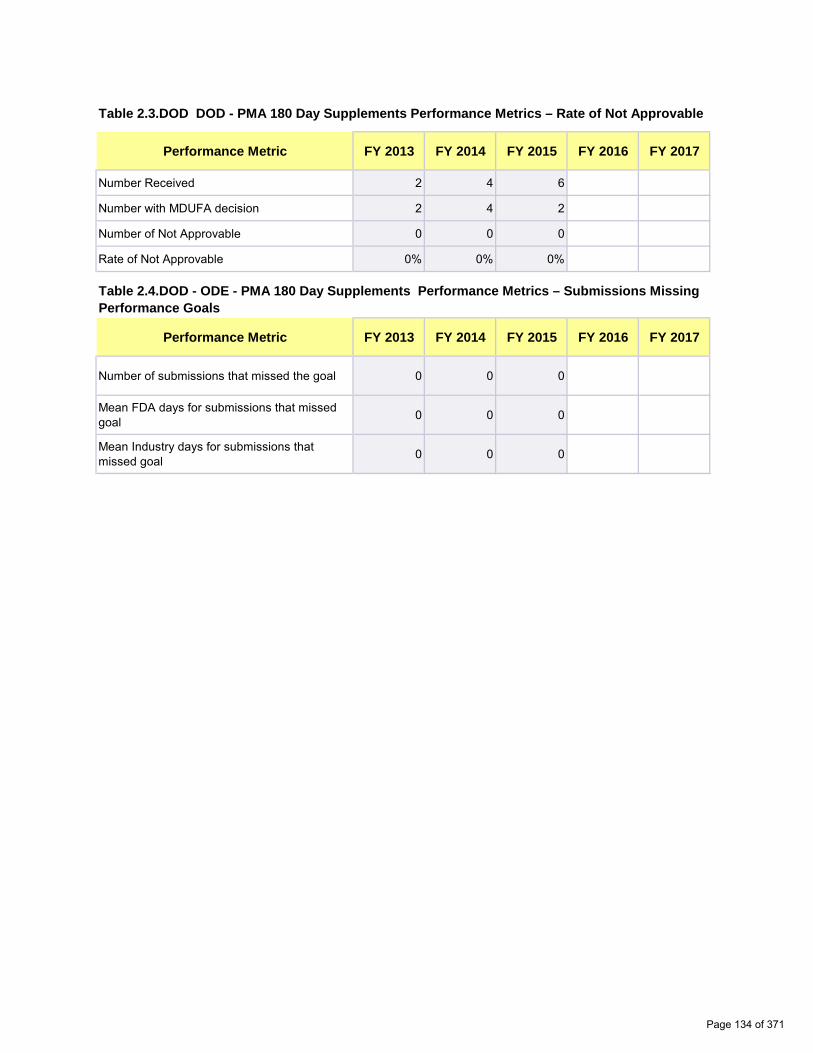
0 0
0 0
0.00% 0.00%
0 0
0 0
0 0
Table 2.3.DOD DOD - PMA 180 Day Supplements Performance Metrics – Rate of Not Approvable
Performance Metric FY 2013 FY 2014 FY 2015 FY 2016 FY 2017
Number Received 2 4 6
Number with MDUFA decision 2 4 2
Number of Not Approvable 0 0 0
Rate of Not Approvable 0% 0% 0%
Table 2.4.DOD - ODE - PMA 180 Day Supplements Performance Metrics – Submissions Missing Performance Goals
Performance Metric FY 2013 FY 2014 FY 2015 FY 2016 FY 2017
Number of submissions that missed the goal 0 0 0
Mean FDA days for submissions that missed goal 0 0 0
Mean Industry days for submissions that missed goal 0 0 0
Page 134 of 371

0 0
0 0
0 0
0 0
0 0
0 0
0.00% 0.00%
0 0
0 0
0 0
0 0
0 0
0 0
0.00% 0.00%
Table 2.1.DOED - ODE - PMA 180 Day Supplements Substantive Interaction Goals
Substantive Interaction (SI) Goals:
FY 2013 FY 2014 FY 2015 FY 2016 FY 2017
65% SI within 90 FDA days
75% SI within 90 FDA days
85% SI within 90 FDA days
95% SI within 90 FDA days
95% SI within 90 FDA days
Eligible for SI 12 24 18
SI Goal Met 11 24 15
SI Goal Not Met 1 0 1
SI Pending Within Goal 0 0 2
SI Pending Past Goal 0 0 0
Closed without SI 0 0 0
Current SI Performance Percent Goal Met 91.7% 100% 93.8%
Table 2.2.DOED - ODE - PMA 180 Day Supplements MDUFA Decision Performance Goals
Performance Goals:
FY 2013 FY 2014 FY 2015 FY 2016 FY 2017
85% within 180 FDA
days
90% within 180 FDA
days
90% within 180 FDA
days
95% within 180 FDA
days
95% within 180 FDA
days
Supplements received 12 24 18
Non-MDUFA III Decisions 0 0 0
MDUFA III Decisions 12 20 15
MDUFA III Decisions Goal Met 12 20 15
Supplements pending MDUFA III Decision 0 4 3
Supplements pending MDUFA III Decision Past Goal 0 0 0
Current Performance Percent Goal Met 100% 100% 100%
Page 135 of 371

0 0
0 0
0.00% 0.00%
0 0
0 0
0 0
Table 2.3.DOED DOED - PMA 180 Day Supplements Performance Metrics – Rate of Not Approvable
Performance Metric FY 2013 FY 2014 FY 2015 FY 2016 FY 2017
Number Received 12 24 18
Number with MDUFA decision 12 20 15
Number of Not Approvable 1 1 0
Rate of Not Approvable 8.3% 5.0% 0%
Table 2.4.DOED - ODE - PMA 180 Day Supplements Performance Metrics – Submissions Missing Performance Goals
Performance Metric FY 2013 FY 2014 FY 2015 FY 2016 FY 2017
Number of submissions that missed the goal 0 0 0
Mean FDA days for submissions that missed goal 0 0 0
Mean Industry days for submissions that missed goal 0 0 0
Page 136 of 371

0 0
0 0
0 0
0 0
0 0
0 0
0.00% 0.00%
0 0
0 0
0 0
0 0
0 0
0 0
0.00% 0.00%
Table 2.1.DRGUD - ODE - PMA 180 Day Supplements Substantive Interaction Goals
Substantive Interaction (SI) Goals:
FY 2013 FY 2014 FY 2015 FY 2016 FY 2017
65% SI within 90 FDA days
75% SI within 90 FDA days
85% SI within 90 FDA days
95% SI within 90 FDA days
95% SI within 90 FDA days
Eligible for SI 10 7 8
SI Goal Met 9 7 7
SI Goal Not Met 1 0 0
SI Pending Within Goal 0 0 1
SI Pending Past Goal 0 0 0
Closed without SI 0 0 0
Current SI Performance Percent Goal Met 90.0% 100% 100%
Table 2.2.DRGUD - ODE - PMA 180 Day Supplements MDUFA Decision Performance Goals
Performance Goals:
FY 2013 FY 2014 FY 2015 FY 2016 FY 2017
85% within 180 FDA
days
90% within 180 FDA
days
90% within 180 FDA
days
95% within 180 FDA
days
95% within 180 FDA
days
Supplements received 10 7 8
Non-MDUFA III Decisions 0 0 0
MDUFA III Decisions 10 7 6
MDUFA III Decisions Goal Met 10 7 6
Supplements pending MDUFA III Decision 0 0 2
Supplements pending MDUFA III Decision Past Goal 0 0 0
Current Performance Percent Goal Met 100% 100% 100%
Page 137 of 371

0 0
0 0
0.00% 0.00%
0 0
0 0
0 0
Table 2.3.DRGUD DRGUD - PMA 180 Day Supplements Performance Metrics – Rate of Not Approvable
Performance Metric FY 2013 FY 2014 FY 2015 FY 2016 FY 2017
Number Received 10 7 8
Number with MDUFA decision 10 7 6
Number of Not Approvable 1 1 0
Rate of Not Approvable 10.0% 14.3% 0%
Table 2.4.DRGUD - ODE - PMA 180 Day Supplements Performance Metrics – Submissions Missing Performance Goals
Performance Metric FY 2013 FY 2014 FY 2015 FY 2016 FY 2017
Number of submissions that missed the goal 0 0 0
Mean FDA days for submissions that missed goal 0 0 0
Mean Industry days for submissions that missed goal 0 0 0
Page 138 of 371
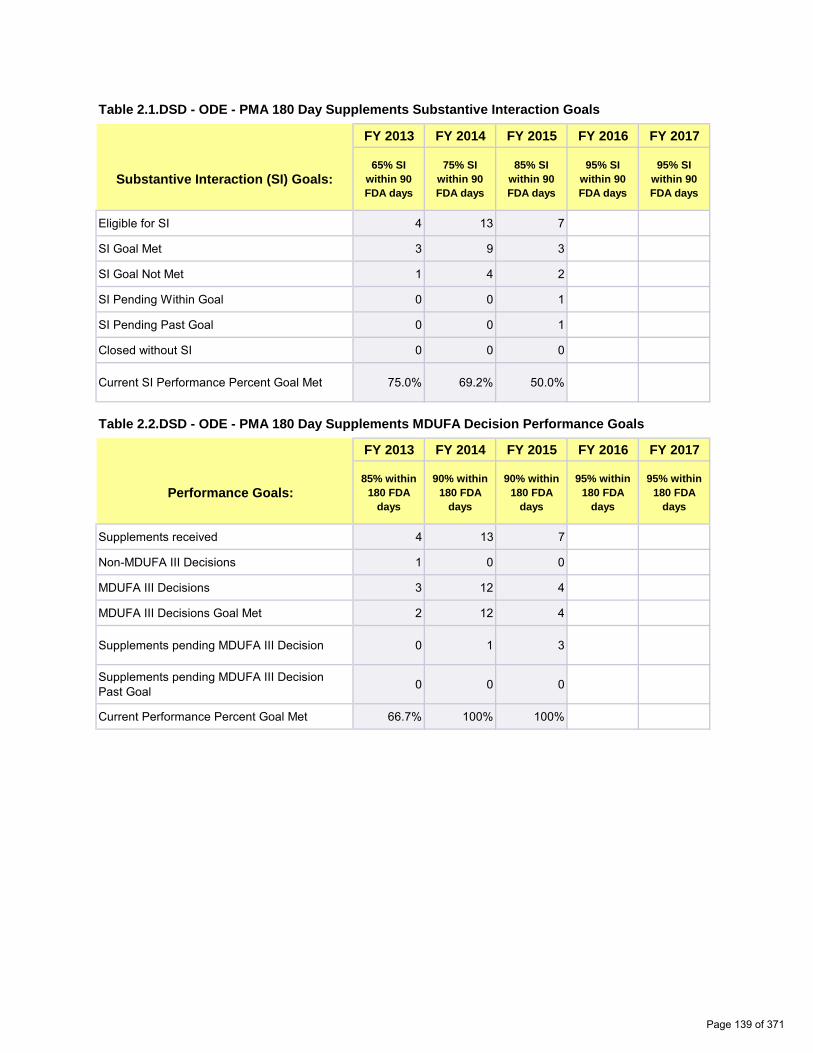
0 0
0 0
0 0
0 0
0 0
0 0
0.00% 0.00%
0 0
0 0
0 0
0 0
0 0
0 0
0.00% 0.00%
Table 2.1.DSD - ODE - PMA 180 Day Supplements Substantive Interaction Goals
Substantive Interaction (SI) Goals:
FY 2013 FY 2014 FY 2015 FY 2016 FY 2017
65% SI within 90 FDA days
75% SI within 90 FDA days
85% SI within 90 FDA days
95% SI within 90 FDA days
95% SI within 90 FDA days
Eligible for SI 4 13 7
SI Goal Met 3 9 3
SI Goal Not Met 1 4 2
SI Pending Within Goal 0 0 1
SI Pending Past Goal 0 0 1
Closed without SI 0 0 0
Current SI Performance Percent Goal Met 75.0% 69.2% 50.0%
Table 2.2.DSD - ODE - PMA 180 Day Supplements MDUFA Decision Performance Goals
Performance Goals:
FY 2013 FY 2014 FY 2015 FY 2016 FY 2017
85% within 180 FDA
days
90% within 180 FDA
days
90% within 180 FDA
days
95% within 180 FDA
days
95% within 180 FDA
days
Supplements received 4 13 7
Non-MDUFA III Decisions 1 0 0
MDUFA III Decisions 3 12 4
MDUFA III Decisions Goal Met 2 12 4
Supplements pending MDUFA III Decision 0 1 3
Supplements pending MDUFA III Decision Past Goal 0 0 0
Current Performance Percent Goal Met 66.7% 100% 100%
Page 139 of 371

0 0
0 0
0.00% 0.00%
0 0
0 0
0 0
Table 2.3.DSD DSD - PMA 180 Day Supplements Performance Metrics – Rate of Not Approvable
Performance Metric FY 2013 FY 2014 FY 2015 FY 2016 FY 2017
Number Received 4 13 7
Number with MDUFA decision 3 12 4
Number of Not Approvable 1 1 0
Rate of Not Approvable 33.3% 8.3% 0%
Table 2.4.DSD - ODE - PMA 180 Day Supplements Performance Metrics – Submissions Missing Performance Goals
Performance Metric FY 2013 FY 2014 FY 2015 FY 2016 FY 2017
Number of submissions that missed the goal 1 0 0
Mean FDA days for submissions that missed goal 261 0 0
Mean Industry days for submissions that missed goal 358 0 0
Page 140 of 371
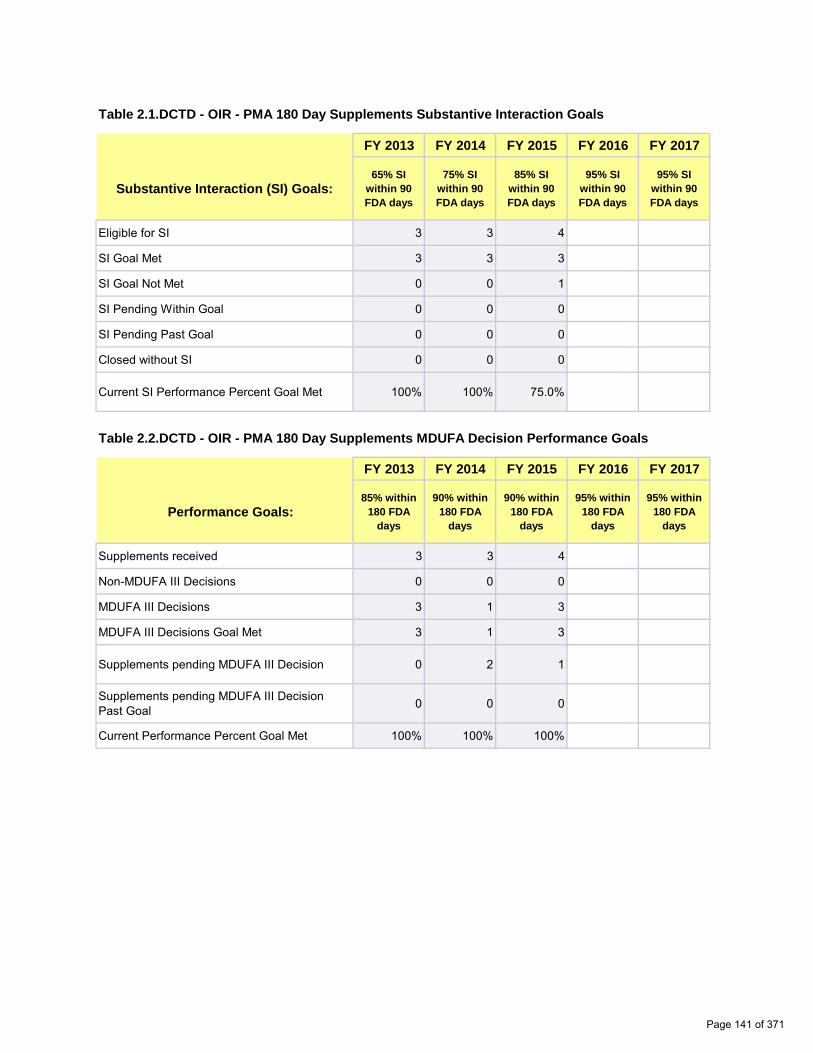
0
0
0
0
0
0
0.00%
0 0
0 0
0 0
0 0
0 0
0 0
0.00% 0.00%
Table 2.1.DCTD - OIR - PMA 180 Day Supplements Substantive Interaction Goals
Substantive Interaction (SI) Goals:
FY 2013 FY 2014 FY 2015 FY 2016 FY 2017
65% SI within 90 FDA days
75% SI within 90 FDA days
85% SI within 90 FDA days
95% SI within 90 FDA days
95% SI within 90 FDA days
Eligible for SI 3 3 4
SI Goal Met 3 3 3
SI Goal Not Met 0 0 1
SI Pending Within Goal 0 0 0
SI Pending Past Goal 0 0 0
Closed without SI 0 0 0
Current SI Performance Percent Goal Met 100% 100% 75.0%
Table 2.2.DCTD - OIR - PMA 180 Day Supplements MDUFA Decision Performance Goals
Performance Goals:
FY 2013 FY 2014 FY 2015 FY 2016 FY 2017
85% within 180 FDA
days
90% within 180 FDA
days
90% within 180 FDA
days
95% within 180 FDA
days
95% within 180 FDA
days
Supplements received 3 3 4
Non-MDUFA III Decisions 0 0 0
MDUFA III Decisions 3 1 3
MDUFA III Decisions Goal Met 3 1 3
Supplements pending MDUFA III Decision 0 2 1
Supplements pending MDUFA III Decision Past Goal 0 0 0
Current Performance Percent Goal Met 100% 100% 100%
Page 141 of 371

0 0
0 0
0.00% 0.00%
0 0
0 0
0 0
Table 2.3.DCTD DCTD - PMA 180 Day Supplements Performance Metrics – Rate of Not Approvable
Performance Metric FY 2013 FY 2014 FY 2015 FY 2016 FY 2017
Number Received 3 3 4
Number with MDUFA decision 3 1 3
Number of Not Approvable 0 0 0
Rate of Not Approvable 0% 0% 0%
Table 2.4.DCTD - OIR - PMA 180 Day Supplements Performance Metrics – Submissions Missing Performance Goals
Performance Metric FY 2013 FY 2014 FY 2015 FY 2016 FY 2017
Number of submissions that missed the goal 0 0 0
Mean FDA days for submissions that missed goal 0 0 0
Mean Industry days for submissions that missed goal 0 0 0
Page 142 of 371

0 0
0 0
0 0
0 0
0 0
0 0
0.00% 0.00%
0 0
0 0
0 0
0 0
0 0
0 0
0.00% 0.00%
Table 2.1.DIHD - OIR - PMA 180 Day Supplements Substantive Interaction Goals
Substantive Interaction (SI) Goals:
FY 2013 FY 2014 FY 2015 FY 2016 FY 2017
65% SI within 90 FDA days
75% SI within 90 FDA days
85% SI within 90 FDA days
95% SI within 90 FDA days
95% SI within 90 FDA days
Eligible for SI 1 1 3
SI Goal Met 1 1 2
SI Goal Not Met 0 0 0
SI Pending Within Goal 0 0 1
SI Pending Past Goal 0 0 0
Closed without SI 0 0 0
Current SI Performance Percent Goal Met 100% 100% 100%
Table 2.2.DIHD - OIR - PMA 180 Day Supplements MDUFA Decision Performance Goals
Performance Goals:
FY 2013 FY 2014 FY 2015 FY 2016 FY 2017
85% within 180 FDA
days
90% within 180 FDA
days
90% within 180 FDA
days
95% within 180 FDA
days
95% within 180 FDA
days
Supplements received 1 1 3
Non-MDUFA III Decisions 0 1 0
MDUFA III Decisions 1 0 0
MDUFA III Decisions Goal Met 1 0 0
Supplements pending MDUFA III Decision 0 0 3
Supplements pending MDUFA III Decision Past Goal 0 0 0
Current Performance Percent Goal Met 100% N/A N/A
Page 143 of 371

0 0
0 0
0.00% 0.00%
0 0
0 0
0 0
Table 2.3.DIHD DIHD - PMA 180 Day Supplements Performance Metrics – Rate of Not Approvable
Performance Metric FY 2013 FY 2014 FY 2015 FY 2016 FY 2017
Number Received 1 1 3
Number with MDUFA decision 1 0 0
Number of Not Approvable 0 0 0
Rate of Not Approvable 0% N/A N/A
Table 2.4.DIHD - OIR - PMA 180 Day Supplements Performance Metrics – Submissions Missing Performance Goals
Performance Metric FY 2013 FY 2014 FY 2015 FY 2016 FY 2017
Number of submissions that missed the goal 0 0 0
Mean FDA days for submissions that missed goal 0 0 0
Mean Industry days for submissions that missed goal 0 0 0
Page 144 of 371

0 0
0 0
0 0
0 0
0 0
0 0
0.00% 0.00%
0 0
0 0
0 0
0 0
0 0
0 0
0.00% 0.00%
Table 2.1.DMD - OIR - PMA 180 Day Supplements Substantive Interaction Goals
Substantive Interaction (SI) Goals:
FY 2013 FY 2014 FY 2015 FY 2016 FY 2017
65% SI within 90 FDA days
75% SI within 90 FDA days
85% SI within 90 FDA days
95% SI within 90 FDA days
95% SI within 90 FDA days
Eligible for SI 7 4 14
SI Goal Met 7 4 7
SI Goal Not Met 0 0 0
SI Pending Within Goal 0 0 7
SI Pending Past Goal 0 0 0
Closed without SI 0 0 0
Current SI Performance Percent Goal Met 100% 100% 100%
Table 2.2.DMD - OIR - PMA 180 Day Supplements MDUFA Decision Performance Goals
Performance Goals:
FY 2013 FY 2014 FY 2015 FY 2016 FY 2017
85% within 180 FDA
days
90% within 180 FDA
days
90% within 180 FDA
days
95% within 180 FDA
days
95% within 180 FDA
days
Supplements received 7 4 14
Non-MDUFA III Decisions 1 0 0
MDUFA III Decisions 6 4 1
MDUFA III Decisions Goal Met 6 4 1
Supplements pending MDUFA III Decision 0 0 13
Supplements pending MDUFA III Decision Past Goal 0 0 0
Current Performance Percent Goal Met 100% 100% 100%
Page 145 of 371

0 0
0 0
0.00% 0.00%
0 0
0 0
0 0
Table 2.3.DMD DMD - PMA 180 Day Supplements Performance Metrics – Rate of Not Approvable
Performance Metric FY 2013 FY 2014 FY 2015 FY 2016 FY 2017
Number Received 7 4 14
Number with MDUFA decision 6 4 1
Number of Not Approvable 0 0 0
Rate of Not Approvable 0% 0% 0%
Table 2.4.DMD - OIR - PMA 180 Day Supplements Performance Metrics – Submissions Missing Performance Goals
Performance Metric FY 2013 FY 2014 FY 2015 FY 2016 FY 2017
Number of submissions that missed the goal 0 0 0
Mean FDA days for submissions that missed goal 0 0 0
Mean Industry days for submissions that missed goal 0 0 0
Page 146 of 371

0 0
0 0
0 0
0 0
0 0
0 0
0.00% 0.00%
0 0
0 0
0 0
0 0
0 0
0 0
0.00% 0.00%
Table 2.1.DMGP - OIR - PMA 180 Day Supplements Substantive Interaction Goals
Substantive Interaction (SI) Goals:
FY 2013 FY 2014 FY 2015 FY 2016 FY 2017
65% SI within 90 FDA days
75% SI within 90 FDA days
85% SI within 90 FDA days
95% SI within 90 FDA days
95% SI within 90 FDA days
Eligible for SI 5 4 11
SI Goal Met 5 4 8
SI Goal Not Met 0 0 0
SI Pending Within Goal 0 0 1
SI Pending Past Goal 0 0 0
Closed without SI 0 0 2
Current SI Performance Percent Goal Met 100% 100% 100%
Table 2.2.DMGP - OIR - PMA 180 Day Supplements MDUFA Decision Performance Goals
Performance Goals:
FY 2013 FY 2014 FY 2015 FY 2016 FY 2017
85% within 180 FDA
days
90% within 180 FDA
days
90% within 180 FDA
days
95% within 180 FDA
days
95% within 180 FDA
days
Supplements received 5 4 11
Non-MDUFA III Decisions 0 0 2
MDUFA III Decisions 5 4 5
MDUFA III Decisions Goal Met 5 4 5
Supplements pending MDUFA III Decision 0 0 4
Supplements pending MDUFA III Decision Past Goal 0 0 0
Current Performance Percent Goal Met 100% 100% 100%
Page 147 of 371

0 0
0 0
0.00% 0.00%
0 0
0 0
0 0
Table 2.3.DMGP DMGP - PMA 180 Day Supplements Performance Metrics – Rate of Not Approvable
Performance Metric FY 2013 FY 2014 FY 2015 FY 2016 FY 2017
Number Received 5 4 11
Number with MDUFA decision 5 4 5
Number of Not Approvable 0 0 0
Rate of Not Approvable 0% 0% 0%
Table 2.4.DMGP - OIR - PMA 180 Day Supplements Performance Metrics – Submissions Missing Performance Goals
Performance Metric FY 2013 FY 2014 FY 2015 FY 2016 FY 2017
Number of submissions that missed the goal 0 0 0
Mean FDA days for submissions that missed goal 0 0 0
Mean Industry days for submissions that missed goal 0 0 0
Page 148 of 371

0 0
0 0
0 0
0 0
0 0
0 0
0.00% 0.00%
0 0
0 0
0 0
0 0
0 0
0 0
0.00% 0.00%
Table 2.1.DRH - OIR - PMA 180 Day Supplements Substantive Interaction Goals
Substantive Interaction (SI) Goals:
FY 2013 FY 2014 FY 2015 FY 2016 FY 2017
65% SI within 90 FDA days
75% SI within 90 FDA days
85% SI within 90 FDA days
95% SI within 90 FDA days
95% SI within 90 FDA days
Eligible for SI 5 1 4
SI Goal Met 5 1 4
SI Goal Not Met 0 0 0
SI Pending Within Goal 0 0 0
SI Pending Past Goal 0 0 0
Closed without SI 0 0 0
Current SI Performance Percent Goal Met 100% 100% 100%
Table 2.2.DRH - OIR - PMA 180 Day Supplements MDUFA Decision Performance Goals
Performance Goals:
FY 2013 FY 2014 FY 2015 FY 2016 FY 2017
85% within 180 FDA
days
90% within 180 FDA
days
90% within 180 FDA
days
95% within 180 FDA
days
95% within 180 FDA
days
Supplements received 5 1 4
Non-MDUFA III Decisions 0 0 0
MDUFA III Decisions 5 1 2
MDUFA III Decisions Goal Met 5 1 2
Supplements pending MDUFA III Decision 0 0 2
Supplements pending MDUFA III Decision Past Goal 0 0 0
Current Performance Percent Goal Met 100% 100% 100%
Page 149 of 371
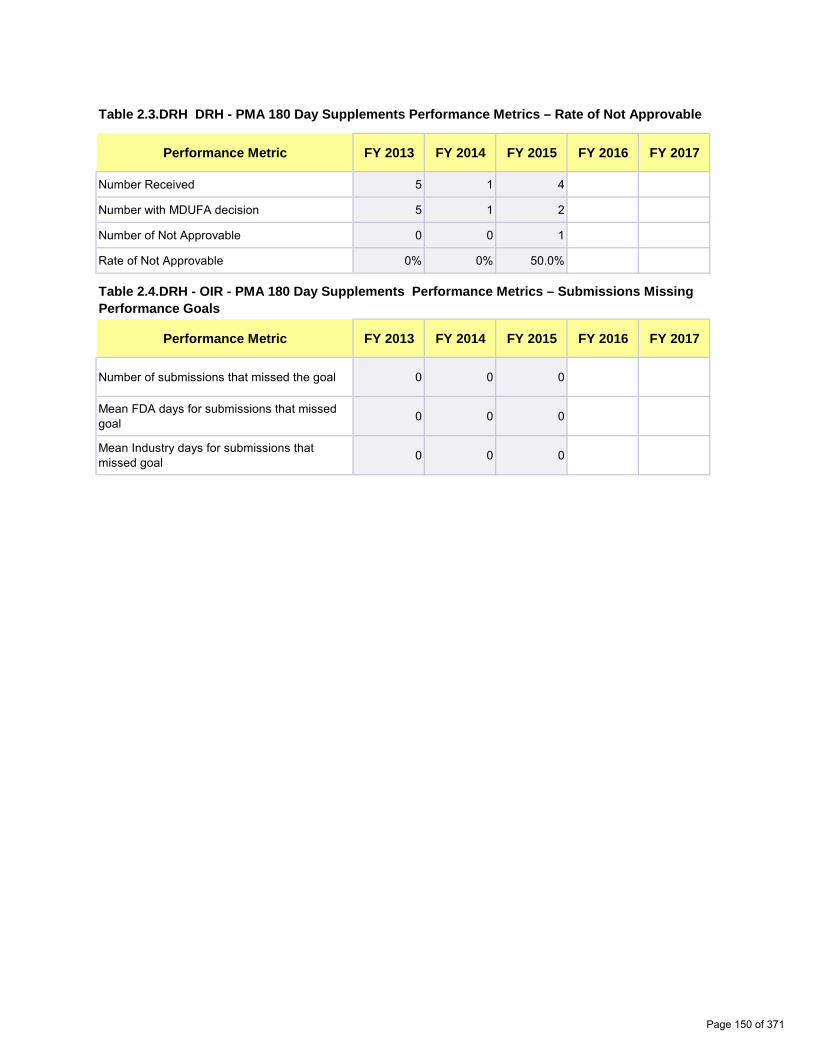
0 0
0 0
0.00% 0.00%
0 0
0 0
0 0
Table 2.3.DRH DRH - PMA 180 Day Supplements Performance Metrics – Rate of Not Approvable
Performance Metric FY 2013 FY 2014 FY 2015 FY 2016 FY 2017
Number Received 5 1 4
Number with MDUFA decision 5 1 2
Number of Not Approvable 0 0 1
Rate of Not Approvable 0% 0% 50.0%
Table 2.4.DRH - OIR - PMA 180 Day Supplements Performance Metrics – Submissions Missing Performance Goals
Performance Metric FY 2013 FY 2014 FY 2015 FY 2016 FY 2017
Number of submissions that missed the goal 0 0 0
Mean FDA days for submissions that missed goal 0 0 0
Mean Industry days for submissions that missed goal 0 0 0
Page 150 of 371

��D
��D
��D
��D
��D��D
&'5+�30$�5HDO�7LPH�6XSSOHPHQWV�� )<������$V�RI�9/30���
1XPEHU�5HFHLYHG 1 ���
��
'HFLVLRQ�0DGH 1 ���
��
3HQGLQJ 'HFLVLRQ�DV RI�9/30���
1 � ��
1RQ�0'8)$ 'HFLVLRQ 1 ��
��
0'8)$ 'HFLVLRQ 1 ���
��
0'8)$ 'HFLVLRQ *RDO�0HW 1 ���
��
0'8)$ 'HFLVLRQ
*RDO�1RW�0HW 1 �
��
Page 151 of 371

��D
��D
��D
��D
��D��D
&'5+�30$�5HDO�7LPH�6XSSOHPHQWV�� )<������$V�RI�9/30���
1XPEHU�5HFHLYHG 1 ���
��
'HFLVLRQ�0DGH 1 ���
��
3HQGLQJ 'HFLVLRQ�DV RI�9/30���
1 � ��
1RQ�0'8)$ 'HFLVLRQ 1 �
��
0'8)$ 'HFLVLRQ 1 ���
��
0'8)$ 'HFLVLRQ *RDO�0HW 1 ���
��
0'8)$ 'HFLVLRQ
*RDO�1RW�0HW 1 �
��
Page 152 of 371
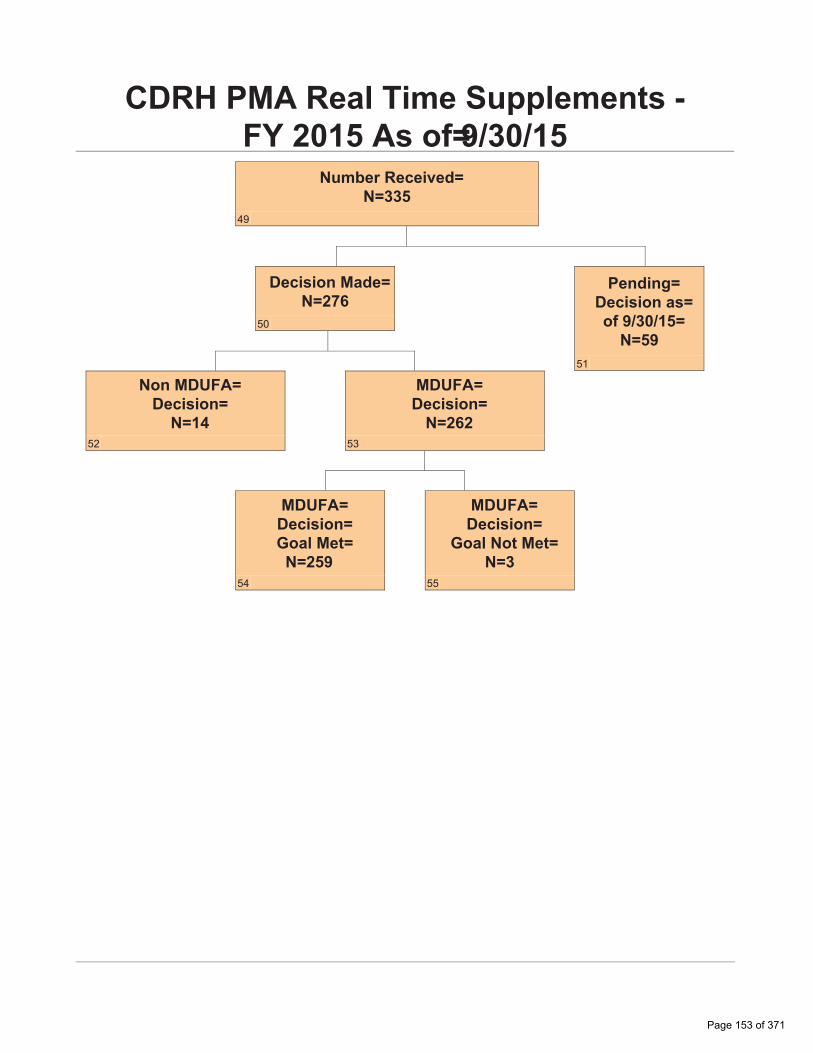
��D
��D
��D
��D
��D��D
&'5+�30$�5HDO�7LPH�6XSSOHPHQWV�� )<������$V�RI 9/30���
1XPEHU�5HFHLYHG 1 335
��
'HFLVLRQ�0DGH 1 276
��
3HQGLQJ 'HFLVLRQ�DV RI�9/30��� 1 59
��
1RQ�0'8)$ 'HFLVLRQ 1 14
��
0'8)$ 'HFLVLRQ 1 262
��
0'8)$ 'HFLVLRQ *RDO�0HW 1 259
��
0'8)$ 'HFLVLRQ
*RDO�1RW�0HW 1 3
��
Page 153 of 371

Page intentionally left blank
Page 154 of 371

0 0
0 0
0 0
0 0
0 0
0 0
0.00% 0.00%
0 0
0 0
0 0
0.00% 0.00%
0 0
0 0
0 0
Section 3 PMA Real Time Supplements - Center Level Metrics
Table 3.1 CDRH – Real Time PMA Supplements MDUFA Performance Goals
Performance Goals:
FY 2013 FY 2014 FY 2015 FY 2016 FY 2017
90% within 90 FDA days
90% within 90 FDA days
95% within 90 FDA days
95% within 90 FDA days
95% within 90 FDA days
Supplements received 308 339 335
Non-MDUFA III Decisions 10 8 14
MDUFA III Decisions 298 331 262
MDUFA III Decisions Goal Met 296 328 259
Supplements pending MDUFA III Decision 0 0 59
Supplements pending MDUFA III Decision Past Goal 0 0 2
Current Performance Percent Goal Met 99.3% 99.1% 98.1%
Table 3.2 CDRH – Real Time PMA Supplements Performance Metrics – Rate of Not Approvable
Performance Metric FY 2013 FY 2014 FY 2015 FY 2016 FY 2017
Number Received 308 339 335
Number with MDUFA decision 298 331 262
Number of Not Approvable 20 3 16
Rate of Not Approvable 6.7% 0.9% 6.1%
Table 3.3 CDRH – Real Time PMA Supplements Performance Metrics – Submissions Missing Performance Goals
Performance Metric FY 2013 FY 2014 FY 2015 FY 2016 FY 2017
Number of submissions that missed the goal 2 3 3
Mean FDA days for submissions that missed goal 143 99 136
Mean Industry days for submissions that missed goal 0 0 0
Page 155 of 371

0 0
0 0
0 0
0 0
0 0
0.00% 0.00%
0 0
0 0
0 0
0.00% 0.00%
0 0
0 0
0 0
Section 3 PMA Real Time Supplements - Office Level Metrics
Table 3.1.ODE - CDRH – Real Time PMA Supplements MDUFA Performance Goals
Performance Goals:
FY 2013 FY 2014 FY 2015 FY 2016 FY 2017
90% within 90 FDA days
90% within 90 FDA days
95% within 90 FDA days
95% within 90 FDA days
95% within 90 FDA days
Supplements received 269 283 283
Non-MDUFA III Decisions 9 6 13
MDUFA III Decisions 260 277 218
MDUFA III Decisions Goal Met 258 274 215
Supplements pending MDUFA III Decision 0 0 52
Supplements pending MDUFA III Decision Past Goal 0 0 2
Current Performance Percent Goal Met 99.2% 98.9% 97.7%
Table 3.2.ODE - CDRH – Real Time PMA Supplements Performance Metrics – Rate of Not Approvable
Performance Metric FY 2013 FY 2014 FY 2015 FY 2016 FY 2017
Number Received 269 283 283
Number with MDUFA decision 260 277 218
Number of Not Approvable 15 3 11
Rate of Not Approvable 5.8% 1.1% 5.0%
Table 3.3.ODE - CDRH – Real Time PMA Supplements Performance Metrics – Submissions Missing Performance Goals
Performance Metric FY 2013 FY 2014 FY 2015 FY 2016 FY 2017
Number of submissions that missed the goal 2 3 3
Mean FDA days for submissions that missed goal 143 99 136
Mean Industry days for submissions that missed goal 0 0 0
Page 156 of 371

0 0
0 0
0 0
0 0
0 0
0.00% 0.00%
0 0
0 0
0 0
0.00% 0.00%
0 0
0 0
0 0
Table 3.1.OIR - CDRH – Real Time PMA Supplements MDUFA Performance Goals
Performance Goals:
FY 2013 FY 2014 FY 2015 FY 2016 FY 2017
90% within 90 FDA days
90% within 90 FDA days
95% within 90 FDA days
95% within 90 FDA days
95% within 90 FDA days
Supplements received 39 56 52
Non-MDUFA III Decisions 1 2 1
MDUFA III Decisions 38 54 44
MDUFA III Decisions Goal Met 38 54 44
Supplements pending MDUFA III Decision 0 0 7
Supplements pending MDUFA III Decision Past Goal 0 0 0
Current Performance Percent Goal Met 100% 100% 100%
Table 3.2.OIR - CDRH – Real Time PMA Supplements Performance Metrics – Rate of Not Approvable
Performance Metric FY 2013 FY 2014 FY 2015 FY 2016 FY 2017
Number Received 39 56 52
Number with MDUFA decision 38 54 44
Number of Not Approvable 5 0 5
Rate of Not Approvable 13.2% 0% 11.4%
Table 3.3.OIR - CDRH – Real Time PMA Supplements Performance Metrics – Submissions Missing Performance Goals
Performance Metric FY 2013 FY 2014 FY 2015 FY 2016 FY 2017
Number of submissions that missed the goal 0 0 0
Mean FDA days for submissions that missed goal 0 0 0
Mean Industry days for submissions that missed goal 0 0 0
Page 157 of 371
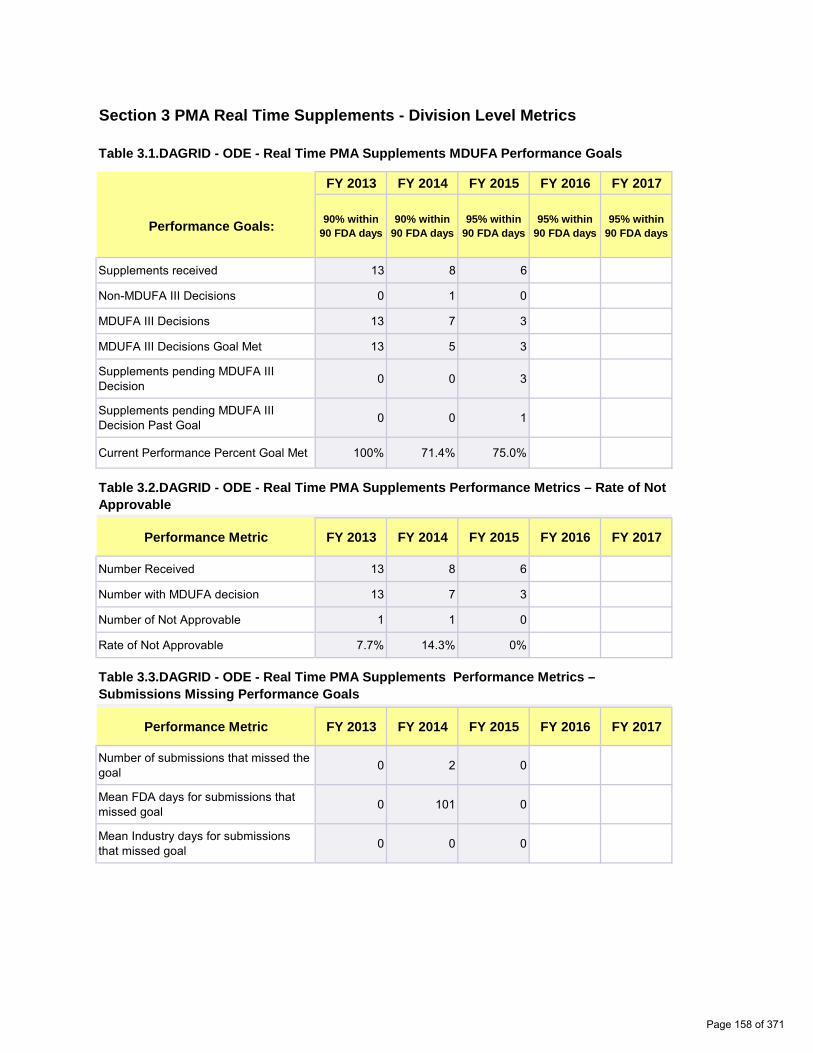
0 0
0 0
0 0
0 0
0 0
0 0
0.00% 0.00%
0 0
0 0
0 0
0.00% 0.00%
0 0
0 0
0 0
Section 3 PMA Real Time Supplements - Division Level Metrics
Table 3.1.DAGRID - ODE - Real Time PMA Supplements MDUFA Performance Goals
Performance Goals:
FY 2013 FY 2014 FY 2015 FY 2016 FY 2017
90% within 90 FDA days
90% within 90 FDA days
95% within 90 FDA days
95% within 90 FDA days
95% within 90 FDA days
Supplements received 13 8 6
Non-MDUFA III Decisions 0 1 0
MDUFA III Decisions 13 7 3
MDUFA III Decisions Goal Met 13 5 3
Supplements pending MDUFA III Decision 0 0 3
Supplements pending MDUFA III Decision Past Goal 0 0 1
Current Performance Percent Goal Met 100% 71.4% 75.0%
Table 3.2.DAGRID - ODE - Real Time PMA Supplements Performance Metrics – Rate of Not Approvable
Performance Metric FY 2013 FY 2014 FY 2015 FY 2016 FY 2017
Number Received 13 8 6
Number with MDUFA decision 13 7 3
Number of Not Approvable 1 1 0
Rate of Not Approvable 7.7% 14.3% 0%
Table 3.3.DAGRID - ODE - Real Time PMA Supplements Performance Metrics – Submissions Missing Performance Goals
Performance Metric FY 2013 FY 2014 FY 2015 FY 2016 FY 2017
Number of submissions that missed the goal 0 2 0
Mean FDA days for submissions that missed goal 0 101 0
Mean Industry days for submissions that missed goal 0 0 0
Page 158 of 371

0 0
0 0
0 0
0 0
0 0
0 0
0.00% 0.00%
0 0
0 0
0 0
0.00% 0.00%
0 0
0 0
0 0
Table 3.1.DCD - ODE - Real Time PMA Supplements MDUFA Performance Goals
Performance Goals:
FY 2013 FY 2014 FY 2015 FY 2016 FY 2017
90% within 90 FDA days
90% within 90 FDA days
95% within 90 FDA days
95% within 90 FDA days
95% within 90 FDA days
Supplements received 176 218 200
Non-MDUFA III Decisions 6 3 11
MDUFA III Decisions 170 215 161
MDUFA III Decisions Goal Met 170 215 158
Supplements pending MDUFA III Decision 0 0 28
Supplements pending MDUFA III Decision Past Goal 0 0 0
Current Performance Percent Goal Met 100% 100% 98.1%
Table 3.2.DCD - ODE - Real Time PMA Supplements Performance Metrics – Rate of Not Approvable
Performance Metric FY 2013 FY 2014 FY 2015 FY 2016 FY 2017
Number Received 176 218 200
Number with MDUFA decision 170 215 161
Number of Not Approvable 7 1 10
Rate of Not Approvable 4.1% 0.5% 6.2%
Table 3.3.DCD - ODE - Real Time PMA Supplements Performance Metrics – Submissions Missing Performance Goals
Performance Metric FY 2013 FY 2014 FY 2015 FY 2016 FY 2017
Number of submissions that missed the goal 0 0 3
Mean FDA days for submissions that missed goal 0 0 136
Mean Industry days for submissions that missed goal 0 0 0
Page 159 of 371

0 0
0 0
0 0
0 0
0 0
0 0
0.00% 0.00%
0 0
0 0
0 0
0.00% 0.00%
0 0
0 0
0 0
Table 3.1.DNPMD - ODE - Real Time PMA Supplements MDUFA Performance Goals
Performance Goals:
FY 2013 FY 2014 FY 2015 FY 2016 FY 2017
90% within 90 FDA days
90% within 90 FDA days
95% within 90 FDA days
95% within 90 FDA days
95% within 90 FDA days
Supplements received 23 17 23
Non-MDUFA III Decisions 0 0 0
MDUFA III Decisions 23 17 15
MDUFA III Decisions Goal Met 23 16 15
Supplements pending MDUFA III Decision 0 0 8
Supplements pending MDUFA III Decision Past Goal 0 0 0
Current Performance Percent Goal Met 100% 94.1% 100%
Table 3.2.DNPMD - ODE - Real Time PMA Supplements Performance Metrics – Rate of Not Approvable
Performance Metric FY 2013 FY 2014 FY 2015 FY 2016 FY 2017
Number Received 23 17 23
Number with MDUFA decision 23 17 15
Number of Not Approvable 1 1 0
Rate of Not Approvable 4.3% 5.9% 0%
Table 3.3.DNPMD - ODE - Real Time PMA Supplements Performance Metrics – Submissions Missing Performance Goals
Performance Metric FY 2013 FY 2014 FY 2015 FY 2016 FY 2017
Number of submissions that missed the goal 0 1 0
Mean FDA days for submissions that missed goal 0 97 0
Mean Industry days for submissions that missed goal 0 0 0
Page 160 of 371

0 0
0 0
0 0
0 0
0 0
0 0
0.00% 0.00%
0 0
0 0
0 0
0.00% 0.00%
0 0
0 0
0 0
Table 3.1.DOD - ODE - Real Time PMA Supplements MDUFA Performance Goals
Performance Goals:
FY 2013 FY 2014 FY 2015 FY 2016 FY 2017
90% within 90 FDA days
90% within 90 FDA days
95% within 90 FDA days
95% within 90 FDA days
95% within 90 FDA days
Supplements received 8 10 14
Non-MDUFA III Decisions 0 2 1
MDUFA III Decisions 8 8 9
MDUFA III Decisions Goal Met 8 8 9
Supplements pending MDUFA III Decision 0 0 4
Supplements pending MDUFA III Decision Past Goal 0 0 1
Current Performance Percent Goal Met 100% 100% 90.0%
Table 3.2.DOD - ODE - Real Time PMA Supplements Performance Metrics – Rate of Not Approvable
Performance Metric FY 2013 FY 2014 FY 2015 FY 2016 FY 2017
Number Received 8 10 14
Number with MDUFA decision 8 8 9
Number of Not Approvable 2 0 0
Rate of Not Approvable 25.0% 0% 0%
Table 3.3.DOD - ODE - Real Time PMA Supplements Performance Metrics – Submissions Missing Performance Goals
Performance Metric FY 2013 FY 2014 FY 2015 FY 2016 FY 2017
Number of submissions that missed the goal 0 0 0
Mean FDA days for submissions that missed goal 0 0 0
Mean Industry days for submissions that missed goal 0 0 0
Page 161 of 371

0 0
0 0
0 0
0 0
0 0
0 0
0.00% 0.00%
0 0
0 0
0 0
0.00% 0.00%
0 0
0 0
0 0
Table 3.1.DOED - ODE - Real Time PMA Supplements MDUFA Performance Goals
Performance Goals:
FY 2013 FY 2014 FY 2015 FY 2016 FY 2017
90% within 90 FDA days
90% within 90 FDA days
95% within 90 FDA days
95% within 90 FDA days
95% within 90 FDA days
Supplements received 16 17 22
Non-MDUFA III Decisions 0 0 1
MDUFA III Decisions 16 17 18
MDUFA III Decisions Goal Met 16 17 18
Supplements pending MDUFA III Decision 0 0 3
Supplements pending MDUFA III Decision Past Goal 0 0 0
Current Performance Percent Goal Met 100% 100% 100%
Table 3.2.DOED - ODE - Real Time PMA Supplements Performance Metrics – Rate of Not Approvable
Performance Metric FY 2013 FY 2014 FY 2015 FY 2016 FY 2017
Number Received 16 17 22
Number with MDUFA decision 16 17 18
Number of Not Approvable 0 0 0
Rate of Not Approvable 0% 0% 0%
Table 3.3.DOED - ODE - Real Time PMA Supplements Performance Metrics – Submissions Missing Performance Goals
Performance Metric FY 2013 FY 2014 FY 2015 FY 2016 FY 2017
Number of submissions that missed the goal 0 0 0
Mean FDA days for submissions that missed goal 0 0 0
Mean Industry days for submissions that missed goal 0 0 0
Page 162 of 371

0 0
0 0
0 0
0 0
0 0
0 0
0.00% 0.00%
0 0
0 0
0 0
0.00% 0.00%
0 0
0 0
0 0
Table 3.1.DRGUD - ODE - Real Time PMA Supplements MDUFA Performance Goals
Performance Goals:
FY 2013 FY 2014 FY 2015 FY 2016 FY 2017
90% within 90 FDA days
90% within 90 FDA days
95% within 90 FDA days
95% within 90 FDA days
95% within 90 FDA days
Supplements received 19 2 11
Non-MDUFA III Decisions 2 0 0
MDUFA III Decisions 17 2 8
MDUFA III Decisions Goal Met 17 2 8
Supplements pending MDUFA III Decision 0 0 3
Supplements pending MDUFA III Decision Past Goal 0 0 0
Current Performance Percent Goal Met 100% 100% 100%
Table 3.2.DRGUD - ODE - Real Time PMA Supplements Performance Metrics – Rate of Not Approvable
Performance Metric FY 2013 FY 2014 FY 2015 FY 2016 FY 2017
Number Received 19 2 11
Number with MDUFA decision 17 2 8
Number of Not Approvable 1 0 0
Rate of Not Approvable 5.9% 0% 0%
Table 3.3.DRGUD - ODE - Real Time PMA Supplements Performance Metrics – Submissions Missing Performance Goals
Performance Metric FY 2013 FY 2014 FY 2015 FY 2016 FY 2017
Number of submissions that missed the goal 0 0 0
Mean FDA days for submissions that missed goal 0 0 0
Mean Industry days for submissions that missed goal 0 0 0
Page 163 of 371
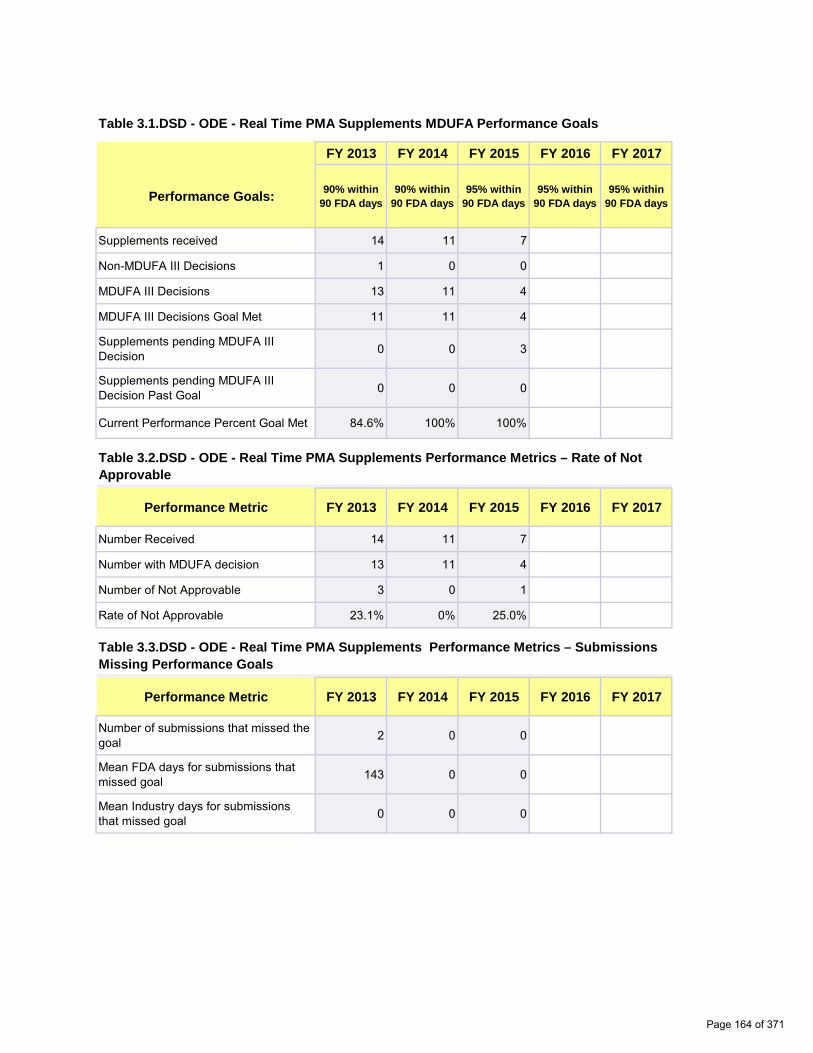
0 0
0 0
0 0
0 0
0 0
0 0
0.00% 0.00%
0 0
0 0
0 0
0.00% 0.00%
0 0
0 0
0 0
Table 3.1.DSD - ODE - Real Time PMA Supplements MDUFA Performance Goals
Performance Goals:
FY 2013 FY 2014 FY 2015 FY 2016 FY 2017
90% within 90 FDA days
90% within 90 FDA days
95% within 90 FDA days
95% within 90 FDA days
95% within 90 FDA days
Supplements received 14 11 7
Non-MDUFA III Decisions 1 0 0
MDUFA III Decisions 13 11 4
MDUFA III Decisions Goal Met 11 11 4
Supplements pending MDUFA III Decision 0 0 3
Supplements pending MDUFA III Decision Past Goal 0 0 0
Current Performance Percent Goal Met 84.6% 100% 100%
Table 3.2.DSD - ODE - Real Time PMA Supplements Performance Metrics – Rate of Not Approvable
Performance Metric FY 2013 FY 2014 FY 2015 FY 2016 FY 2017
Number Received 14 11 7
Number with MDUFA decision 13 11 4
Number of Not Approvable 3 0 1
Rate of Not Approvable 23.1% 0% 25.0%
Table 3.3.DSD - ODE - Real Time PMA Supplements Performance Metrics – Submissions Missing Performance Goals
Performance Metric FY 2013 FY 2014 FY 2015 FY 2016 FY 2017
Number of submissions that missed the goal 2 0 0
Mean FDA days for submissions that missed goal 143 0 0
Mean Industry days for submissions that missed goal 0 0 0
Page 164 of 371
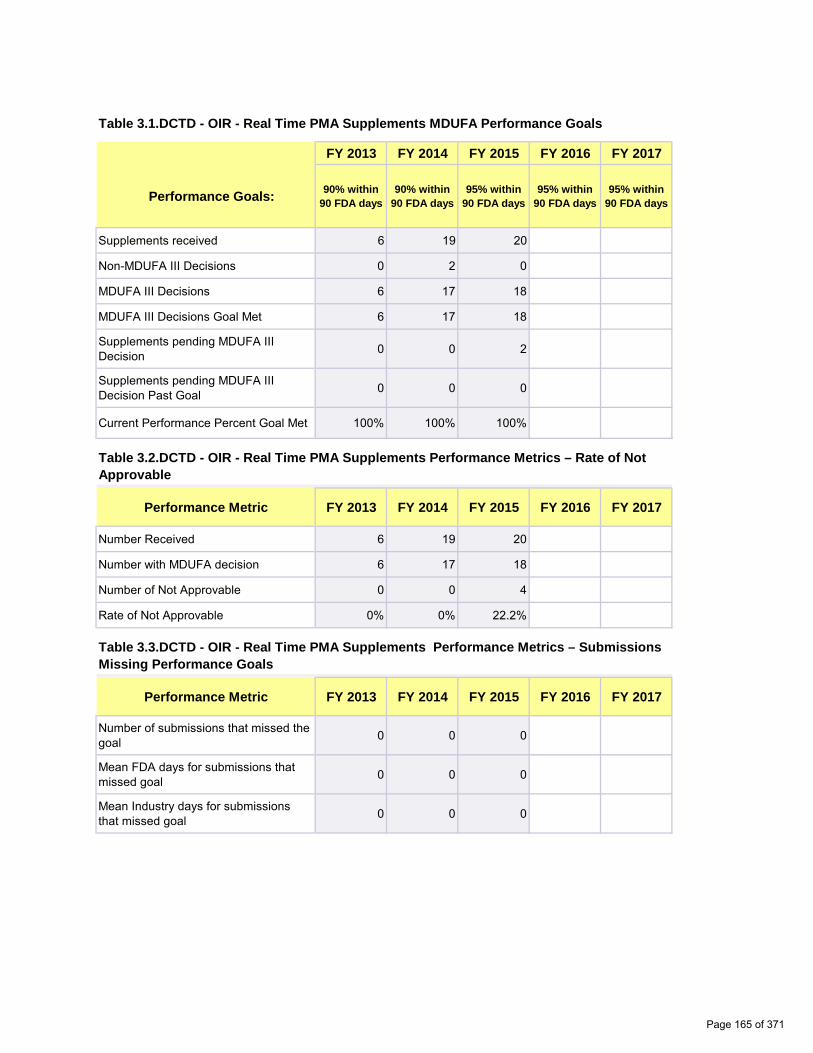
0 0
0 0
0 0
0 0
0 0
0 0
0.00% 0.00%
0 0
0 0
0 0
0.00% 0.00%
0 0
0 0
0 0
Table 3.1.DCTD - OIR - Real Time PMA Supplements MDUFA Performance Goals
Performance Goals:
FY 2013 FY 2014 FY 2015 FY 2016 FY 2017
90% within 90 FDA days
90% within 90 FDA days
95% within 90 FDA days
95% within 90 FDA days
95% within 90 FDA days
Supplements received 6 19 20
Non-MDUFA III Decisions 0 2 0
MDUFA III Decisions 6 17 18
MDUFA III Decisions Goal Met 6 17 18
Supplements pending MDUFA III Decision 0 0 2
Supplements pending MDUFA III Decision Past Goal 0 0 0
Current Performance Percent Goal Met 100% 100% 100%
Table 3.2.DCTD - OIR - Real Time PMA Supplements Performance Metrics – Rate of Not Approvable
Performance Metric FY 2013 FY 2014 FY 2015 FY 2016 FY 2017
Number Received 6 19 20
Number with MDUFA decision 6 17 18
Number of Not Approvable 0 0 4
Rate of Not Approvable 0% 0% 22.2%
Table 3.3.DCTD - OIR - Real Time PMA Supplements Performance Metrics – Submissions Missing Performance Goals
Performance Metric FY 2013 FY 2014 FY 2015 FY 2016 FY 2017
Number of submissions that missed the goal 0 0 0
Mean FDA days for submissions that missed goal 0 0 0
Mean Industry days for submissions that missed goal 0 0 0
Page 165 of 371
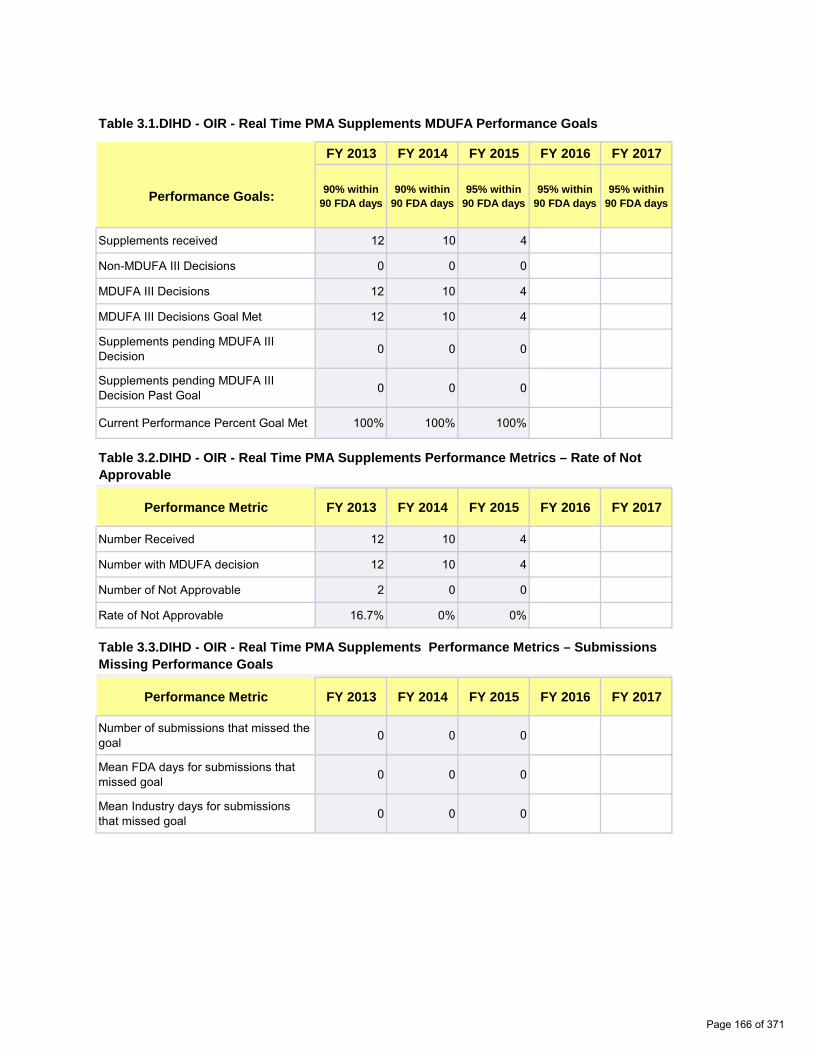
0 0
0 0
0 0
0 0
0 0
0 0
0.00% 0.00%
0 0
0 0
0 0
0.00% 0.00%
0 0
0 0
0 0
Table 3.1.DIHD - OIR - Real Time PMA Supplements MDUFA Performance Goals
Performance Goals:
FY 2013 FY 2014 FY 2015 FY 2016 FY 2017
90% within 90 FDA days
90% within 90 FDA days
95% within 90 FDA days
95% within 90 FDA days
95% within 90 FDA days
Supplements received 12 10 4
Non-MDUFA III Decisions 0 0 0
MDUFA III Decisions 12 10 4
MDUFA III Decisions Goal Met 12 10 4
Supplements pending MDUFA III Decision 0 0 0
Supplements pending MDUFA III Decision Past Goal 0 0 0
Current Performance Percent Goal Met 100% 100% 100%
Table 3.2.DIHD - OIR - Real Time PMA Supplements Performance Metrics – Rate of Not Approvable
Performance Metric FY 2013 FY 2014 FY 2015 FY 2016 FY 2017
Number Received 12 10 4
Number with MDUFA decision 12 10 4
Number of Not Approvable 2 0 0
Rate of Not Approvable 16.7% 0% 0%
Table 3.3.DIHD - OIR - Real Time PMA Supplements Performance Metrics – Submissions Missing Performance Goals
Performance Metric FY 2013 FY 2014 FY 2015 FY 2016 FY 2017
Number of submissions that missed the goal 0 0 0
Mean FDA days for submissions that missed goal 0 0 0
Mean Industry days for submissions that missed goal 0 0 0
Page 166 of 371

0 0
0 0
0 0
0 0
0 0
0 0
0.00% 0.00%
0 0
0 0
0 0
0.00% 0.00%
0 0
0 0
0 0
Table 3.1.DMD - OIR - Real Time PMA Supplements MDUFA Performance Goals
Performance Goals:
FY 2013 FY 2014 FY 2015 FY 2016 FY 2017
90% within 90 FDA days
90% within 90 FDA days
95% within 90 FDA days
95% within 90 FDA days
95% within 90 FDA days
Supplements received 13 12 13
Non-MDUFA III Decisions 0 0 0
MDUFA III Decisions 13 12 10
MDUFA III Decisions Goal Met 13 12 10
Supplements pending MDUFA III Decision 0 0 3
Supplements pending MDUFA III Decision Past Goal 0 0 0
Current Performance Percent Goal Met 100% 100% 100%
Table 3.2.DMD - OIR - Real Time PMA Supplements Performance Metrics – Rate of Not Approvable
Performance Metric FY 2013 FY 2014 FY 2015 FY 2016 FY 2017
Number Received 13 12 13
Number with MDUFA decision 13 12 10
Number of Not Approvable 3 0 0
Rate of Not Approvable 23.1% 0% 0%
Table 3.3.DMD - OIR - Real Time PMA Supplements Performance Metrics – Submissions Missing Performance Goals
Performance Metric FY 2013 FY 2014 FY 2015 FY 2016 FY 2017
Number of submissions that missed the goal 0 0 0
Mean FDA days for submissions that missed goal 0 0 0
Mean Industry days for submissions that missed goal 0 0 0
Page 167 of 371

0 0
0 0
0 0
0 0
0 0
0 0
0.00% 0.00%
0 0
0 0
0 0
0.00% 0.00%
0 0
0 0
0 0
Table 3.1.DMGP - OIR - Real Time PMA Supplements MDUFA Performance Goals
Performance Goals:
FY 2013 FY 2014 FY 2015 FY 2016 FY 2017
90% within 90 FDA days
90% within 90 FDA days
95% within 90 FDA days
95% within 90 FDA days
95% within 90 FDA days
Supplements received 8 13 12
Non-MDUFA III Decisions 1 0 0
MDUFA III Decisions 7 13 10
MDUFA III Decisions Goal Met 7 13 10
Supplements pending MDUFA III Decision 0 0 2
Supplements pending MDUFA III Decision Past Goal 0 0 0
Current Performance Percent Goal Met 100% 100% 100%
Table 3.2.DMGP - OIR - Real Time PMA Supplements Performance Metrics – Rate of Not Approvable
Performance Metric FY 2013 FY 2014 FY 2015 FY 2016 FY 2017
Number Received 8 13 12
Number with MDUFA decision 7 13 10
Number of Not Approvable 0 0 1
Rate of Not Approvable 0% 0% 10.0%
Table 3.3.DMGP - OIR - Real Time PMA Supplements Performance Metrics – Submissions Missing Performance Goals
Performance Metric FY 2013 FY 2014 FY 2015 FY 2016 FY 2017
Number of submissions that missed the goal 0 0 0
Mean FDA days for submissions that missed goal 0 0 0
Mean Industry days for submissions that missed goal 0 0 0
Page 168 of 371

0 0
0 0
0 0
0 0
0 0
0 0
0.00% 0.00%
0 0
0 0
0 0
0.00% 0.00%
0 0
0 0
0 0
Table 3.1.DRH - OIR - Real Time PMA Supplements MDUFA Performance Goals
Performance Goals:
FY 2013 FY 2014 FY 2015 FY 2016 FY 2017
90% within 90 FDA days
90% within 90 FDA days
95% within 90 FDA days
95% within 90 FDA days
95% within 90 FDA days
Supplements received 0 2 3
Non-MDUFA III Decisions 0 0 1
MDUFA III Decisions 0 2 2
MDUFA III Decisions Goal Met 0 2 2
Supplements pending MDUFA III Decision 0 0 0
Supplements pending MDUFA III Decision Past Goal 0 0 0
Current Performance Percent Goal Met N/A 100% 100%
Table 3.2.DRH - OIR - Real Time PMA Supplements Performance Metrics – Rate of Not Approvable
Performance Metric FY 2013 FY 2014 FY 2015 FY 2016 FY 2017
Number Received 0 2 3
Number with MDUFA decision 0 2 2
Number of Not Approvable 0 0 0
Rate of Not Approvable N/A 0% 0%
Table 3.3.DRH - OIR - Real Time PMA Supplements Performance Metrics – Submissions Missing Performance Goals
Performance Metric FY 2013 FY 2014 FY 2015 FY 2016 FY 2017
Number of submissions that missed the goal 0 0 0
Mean FDA days for submissions that missed goal 0 0 0
Mean Industry days for submissions that missed goal 0 0 0
Page 169 of 371

Page intentionally left blank
Page 170 of 371

Section 4 Pre-Market Report Submissions
There were no pre-market reports received by FDA between October 1, 2014 and September 30, 2015.
Page 171 of 371

Page intentionally left blank
Page 172 of 371
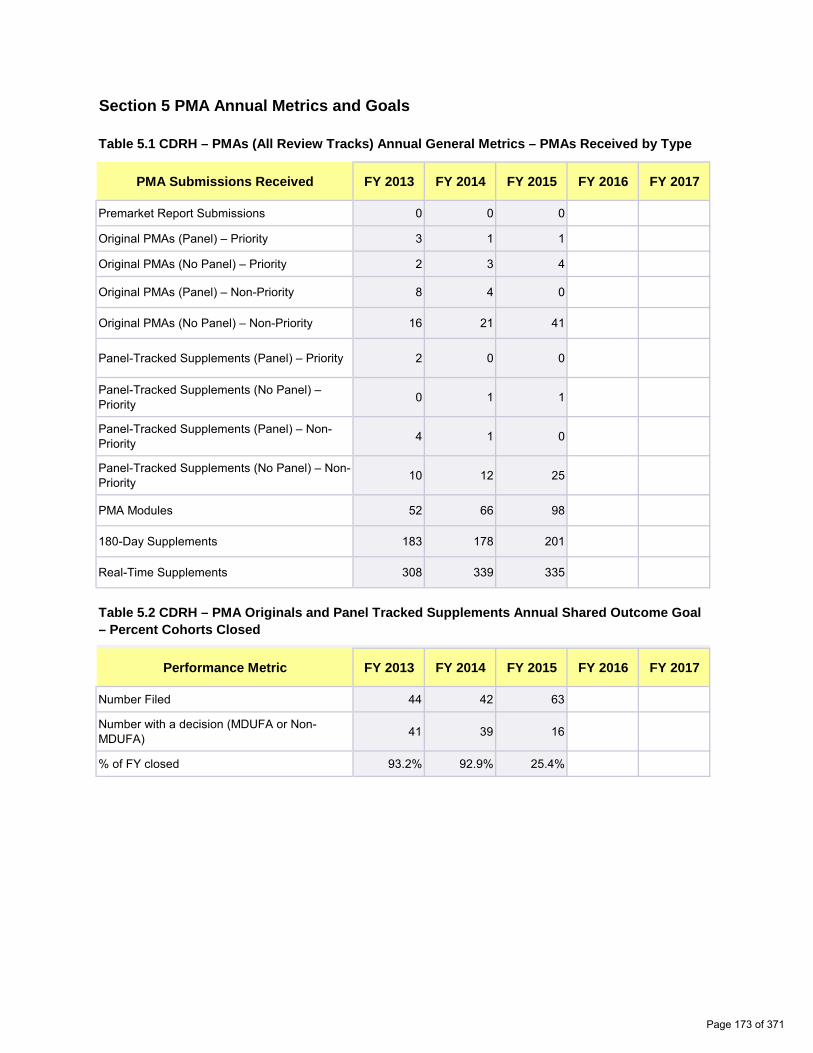
Section 5 PMA Annual Metrics and Goals
Table 5.1 CDRH – PMAs (All Review Tracks) Annual General Metrics – PMAs Received by Type
PMA Submissions Received FY 2013 FY 2014 FY 2015 FY 2016 FY 2017
Premarket Report Submissions 0 0 0
Original PMAs (Panel) – Priority 3 1 1
Original PMAs (No Panel) – Priority 2 3 4
Original PMAs (Panel) – Non-Priority 8 4 0
Original PMAs (No Panel) – Non-Priority 16 21 41
Panel-Tracked Supplements (Panel) – Priority 2 0 0
Panel-Tracked Supplements (No Panel) – Priority 0 1 1
Panel-Tracked Supplements (Panel) – Non-Priority 4 1 0
Panel-Tracked Supplements (No Panel) – Non-Priority 10 12 25
PMA Modules 52 66 98
180-Day Supplements 183 178 201
Real-Time Supplements 308 339 335
Table 5.2 CDRH – PMA Originals and Panel Tracked Supplements Annual Shared Outcome Goal – Percent Cohorts Closed
Performance Metric FY 2013 FY 2014 FY 2015 FY 2016 FY 2017
Number Filed 44 42 63
Number with a decision (MDUFA or Non-MDUFA) 41 39 16
% of FY closed 93.2% 92.9% 25.4%
Page 173 of 371

Table 5.3 CDRH – PMA Originals and Panel Track Supplements Annual Shared Outcome Goal – Three-year Rolling Average Time to MDUFA Decision - Will not be reported out since the cohort has not reached 95% closure rate.
Number with a MDUFA decision
Number with a MDUFA decision after trimming the upper and lower 5%
Three-year Rolling Average Total Time to MDUFA decision
Page 174 of 371

510(k)s
Page 175 of 371
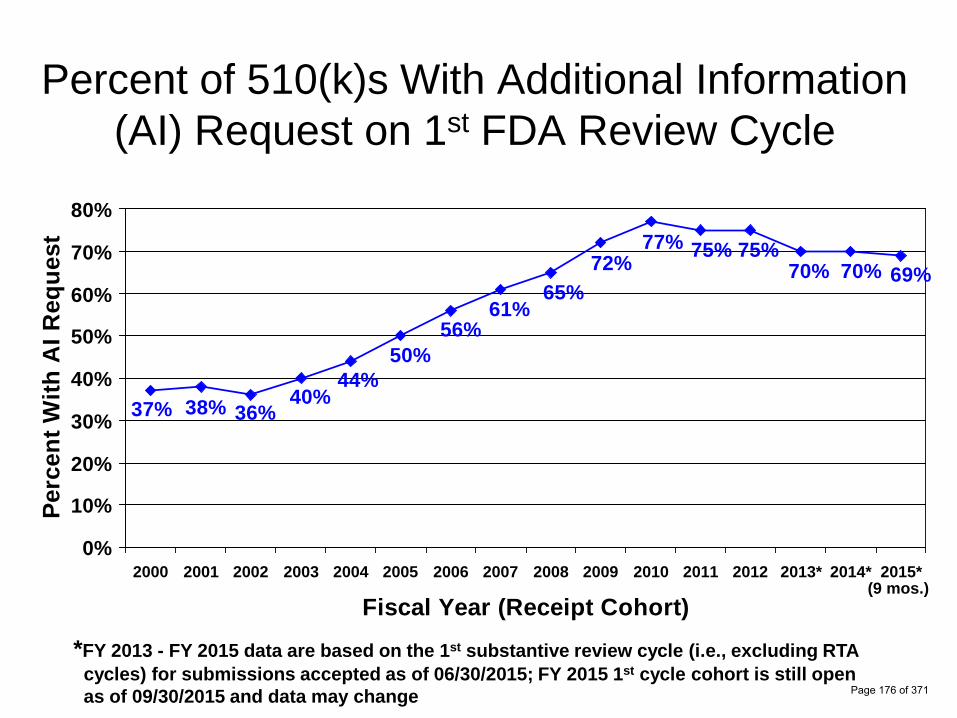
Percent of 510(k)s With Additional Information (AI) Request on 1st FDA Review Cycle
80%
Perc
ent W
ith A
I Req
uest
70%
60%
50%
40%
30%
20%
10%
0%
37% 38% 36% 40%
44% 50%
56% 61%
65% 72%
77% 75% 75% 70% 70% 69%
2000 2001 2002 2003 2004 2005 2006 2007 2008 2009 2010 2011 2012 2013* 2014* 2015* (9 mos.)
Fiscal Year (Receipt Cohort) *FY 2013 - FY 2015 data are based on the 1st substantive review cycle (i.e., excluding RTA
cycles) for submissions accepted as of 06/30/2015; FY 2015 1st cycle cohort is still open Page 176 of 371as of 09/30/2015 and data may change
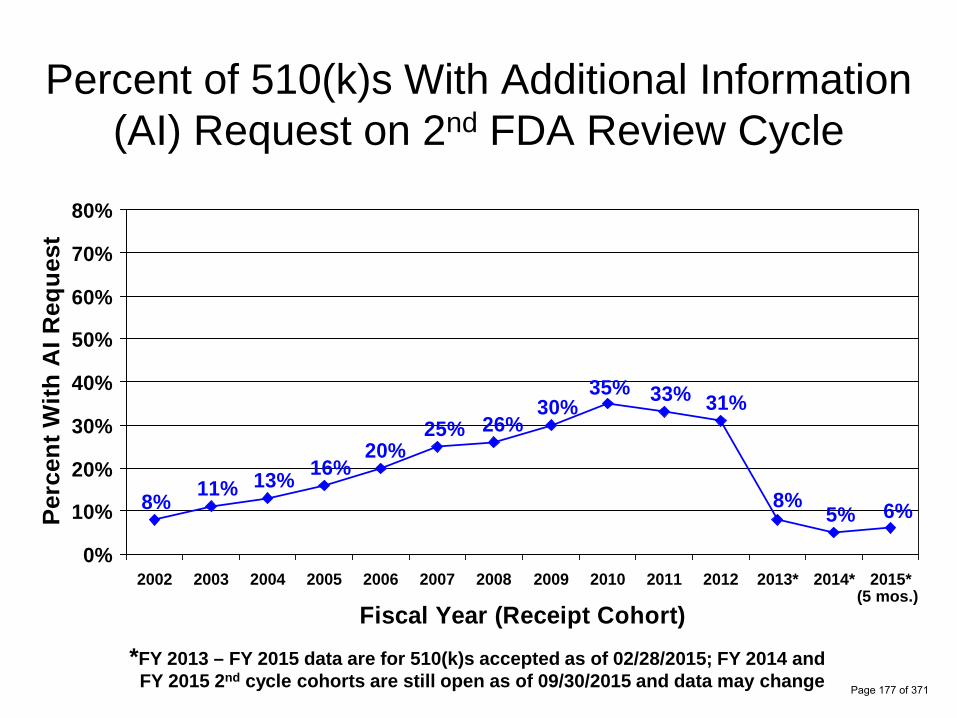
Percent of 510(k)s With Additional Information (AI) Request on 2nd FDA Review Cycle
80%
Perc
ent W
ith A
I Req
uest
70%
60%
50%
40%
30%
20%
10%
0%
8%
31%33%35% 30%
26%25%
16%13%11%
20%
5%8% 6%
2002 2003 2004 2005 2006 2007 2008 2009 2010 2011 2012 2013* 2014* 2015* (5 mos.)
Fiscal Year (Receipt Cohort) *FY 2013 – FY 2015 data are for 510(k)s accepted as of 02/28/2015; FY 2014 and FY 2015 2nd cycle cohorts are still open as of 09/30/2015 and data may change
Page 177 of 371

Day
s
Average Time to Decision: 510(k)s*(Receipt Cohorts as of September 30, 2015)
160
140
120
100
80
60
40
20
0 2000 2001 2002 2003 2004 2005 2006 2007 2008 2009** 2010 2011 2012 2013 2014** 2015**
Fiscal Year (Receipt Cohort)
95
126128
145149154
140
119116
99 90
1019710296 92
667271707275
746666 75
605664
77788075
29
5457
7779
66 5350
3834 2824
192121
Total FDA Submitter *SE and NSE decisions only; times may not add to total due to rounding
**Cohorts still open; percentage of cohort closed: FY 2009 = 99.9%, FY 2014 = 98.5%, Page 178 of 371and FY 2015 = 57.2%—average times for FY 2014 and FY 2015 will increase
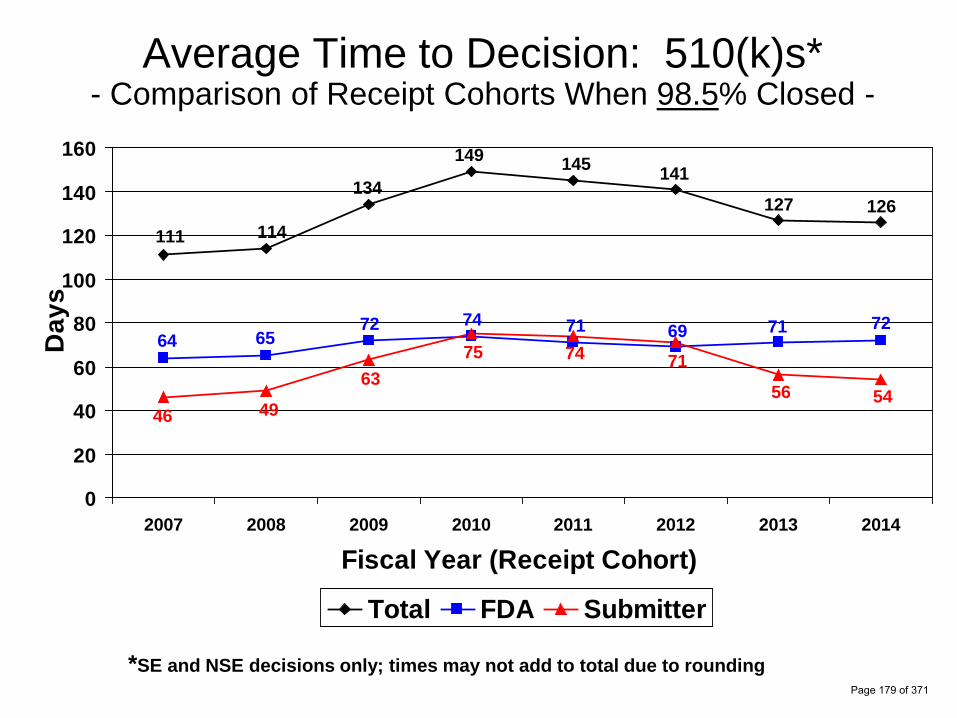
Average Time to Decision: 510(k)s*- Comparison of Receipt Cohorts When 98.5% Closed
160
140
120
100
80
60
40
20
0
111
64
46
114
65
49
134
72
63
149
74
75
145
71 74
141
69 71
127
71
56
126
72
54
Day
s
2007 2008 2009 2010 2011 2012 2013 2014
Fiscal Year (Receipt Cohort)
Total FDA Submitter
*SE and NSE decisions only; times may not add to total due to rounding
Page 179 of 371

Average Time to Decision: 510(k)s*- Comparison of Receipt Cohorts When 57.2% Closed
160
140
120
69
52
17
78
55
23
89
60
29
103
64
38
98
63
35
98
62
36
94
63
31
93
65
28
95
66
29
Day
s 100
80
60
40
20
0 2007 2008 2009 2010 2011 2012 2013 2014 2015
Fiscal Year (Receipt Cohort)
Total FDA Submitter
*SE and NSE decisions only; times may not add to total due to rounding
Page 180 of 371
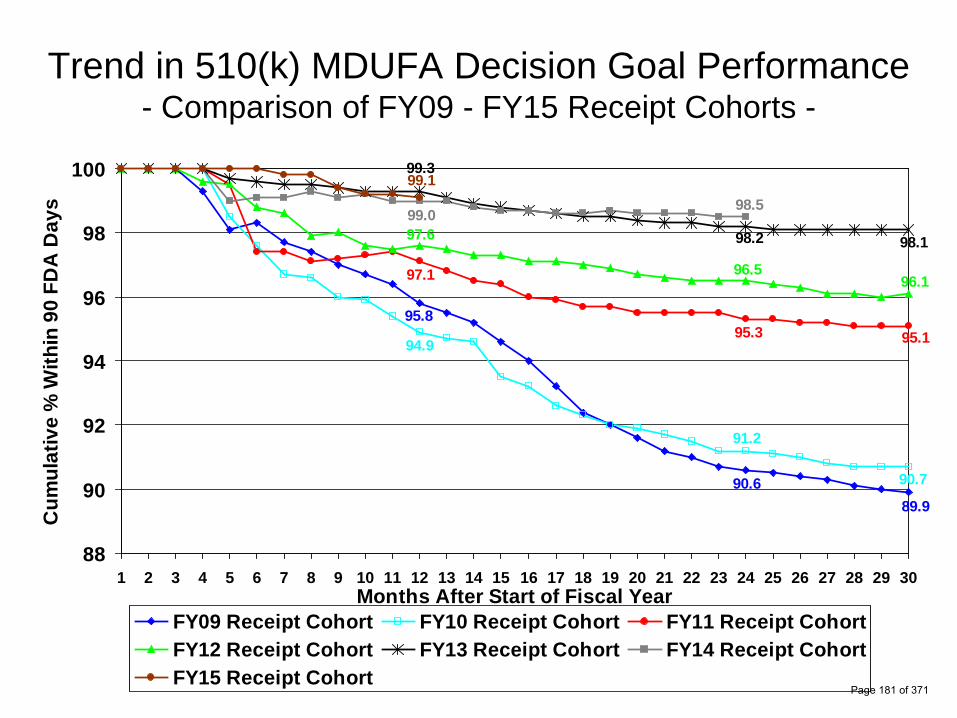
Trend in 510(k) MDUFA Decision Goal Performance - Comparison of FY09 - FY15 Receipt Cohorts
89.9 90.6
95.8
90.7
91.2
94.9 95.1 95.3
97.1 96.1 96.5
97.6 98.1 98.2
99.3
98.5 99.0
99.1
88
90
92
94
96
98
100
Cum
ulat
ive
% W
ithin
90
FDA
Day
s
1 2 3 4 5 6 7 8 9 10 11 12 13 14 15 16 17 18 19 20 21 22 23 24 25 26 27 28 29 30 Months After Start of Fiscal Year
FY09 Receipt Cohort FY10 Receipt Cohort FY11 Receipt Cohort FY12 Receipt Cohort FY13 Receipt Cohort FY14 Receipt Cohort FY15 Receipt Cohort
Page 181 of 371

2000
510(k)s Pending* at End of Year N
o. o
f 510
(k)s
1800
1600
1400
1200
1000
800
600
400
200
0
1052
69
1245
79
1370
101
1549
103
1823
119
1917
147
1821
83
1839
35
1402
28
1385 1383
8 16
2005 2006 2007 2008 2009 2010 2011 2012 2013** 2014** 2015** Fiscal Year
Total Pending Pending With More Than 90 FDA Days
*Under review or on hold **Excludes FY 2013 - FY 2015 receipts that were not accepted for review as of end of
year
Page 182 of 371

Percent of 510(k)s Determined to be Substantially Equivalent (SE)*
Perc
ent o
f Dec
isio
ns
100%
90%
80%
70%
60%
50%
40%
30%
20%
10%
0%
85% 84% 79% 80%
87% 83% 83% 85%
88% 87% 85% 83% 80%
73% 78%
2%3%4%4% 1% 2% 2% 3% 4% 3% 4% 4% 4%
8% 5%
13%13% 17%16%16% 15%
12% 9% 9% 9% 11% 14%
17% 19% 17%
2001 2002 2003 2004 2005 2006 2007 2008 2009 2010 2011 2012 2013** 2014** 2015**
Fiscal Year (Decision Cohort) Substantially Equivalent (SE) Not Substantially Equivalent (NSE) Other
*Percentages may not add to 100% due to rounding **Excludes final decisions made on FY 2013 - FY 2015 receipts that were not accepted for
review as of 09/30/2015
Page 183 of 371

Page intentionally left blank
Page 184 of 371
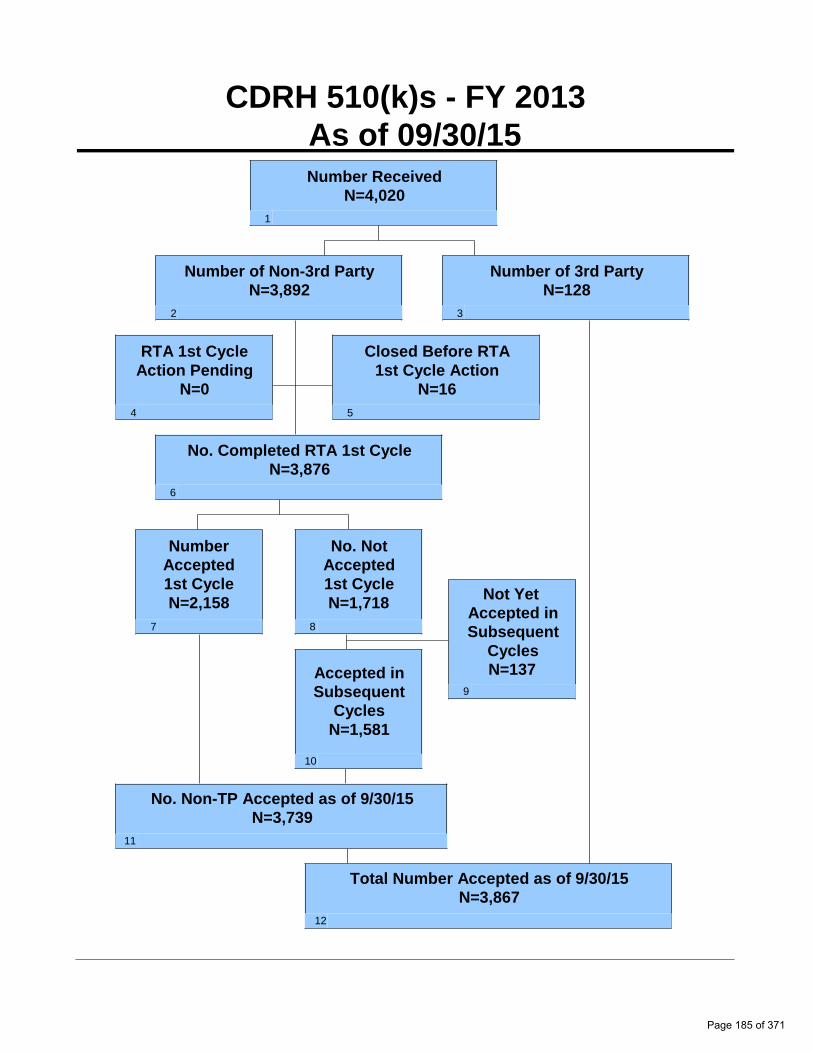
CDRH 510(k)s - FY 2013 As of 09/30/15 Number Received
N=4,020 1
Number of Non-3rd Party N=3,892
2
Number of 3rd Party N=128
3
RTA 1st Cycle Action Pending
N=0 4
Closed Before RTA 1st Cycle Action
N=16 5
No. Completed RTA 1st Cycle N=3,876
6
Number Accepted 1st Cycle N=2,158
7
No. Not Accepted 1st Cycle N=1,718
8
Not Yet Accepted in Subsequent
Cycles Accepted in Subsequent
Cycles N=1,581
N=137 9
10
No. Non-TP Accepted as of 9/30/15 N=3,739
11
Total Number Accepted as of 9/30/15 N=3,867
12
Page 185 of 371
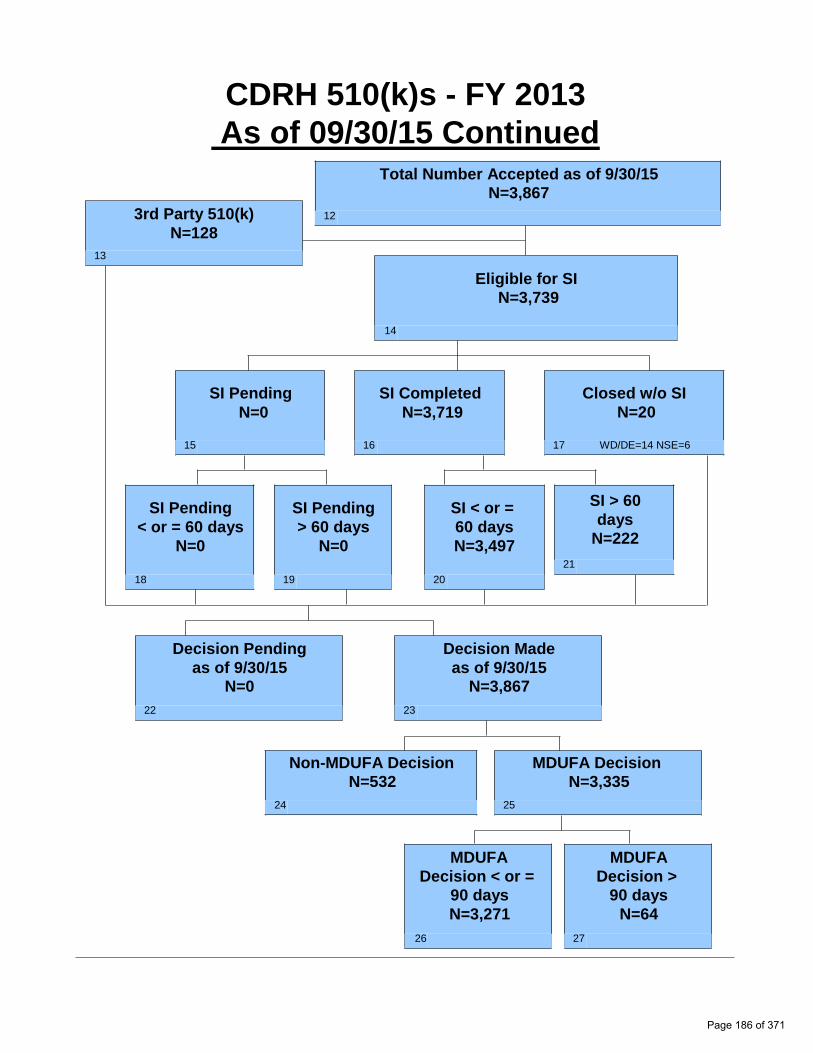
CDRH 510(k)s - FY 2013 As of 09/30/15 Continued
3rd Party 510(k) N=128
13
Total Number Accepted as of 9/30/15 N=3,867
12
Eligible for SI N=3,739
14
SI Pending N=0
SI Completed N=3,719
Closed w/o SI N=20
15 16 17 WD/DE=14 NSE=6
SI Pending < or = 60 days
N=0
18
SI Pending > 60 days
N=0
19
SI < or = 60 days N=3,497
20
SI > 60 days
N=222 21
Decision Pending as of 9/30/15
N=0 22
Decision Made as of 9/30/15
N=3,867 23
Non-MDUFA Decision N=532
24
MDUFA Decision N=3,335
25
MDUFA Decision < or =
90 days N=3,271
26
MDUFA Decision >
90 days N=64
27
Page 186 of 371

CDRH 510(k)s - FY 2014 As of 09/30/15 Number Received
N=3,765 1
Number of Non-3rd Party N=3,681
2
Number of 3rd Party N=84
3
RTA 1st Cycle Action Pending
N=0 4
Closed Before RTA 1st Cycle Action N=8
5
No. Completed RTA 1st Cycle N=3,673
6
Number Accepted 1st Cycle N=1,943
7
No. Not Accepted 1st Cycle N=1,730
8
Not Yet Accepted in Subsequent
Cycles Accepted in Subsequent
Cycles N=1,578
N=152 9
10
No. Non-TP Accepted as of 9/30/15 N=3,521
11
Total Number Accepted as of 9/30/15 N=3,605
12
Page 187 of 371

CDRH 510(k)s - FY 2014 As of 09/30/15 Continued
3rd Party 510(k) N=84
13
Total Number Accepted as of 9/30/15 N=3,605
12
Eligible for SI N=3,521
14
SI Pending N=1
SI Completed N=3,499
Closed w/o SI N=21
15 16 17 WD/DE=15 NSE=6
SI Pending < or = 60 days
N=1
18
SI Pending > 60 days
N=0
19
SI < or = 60 days N=3,395
20
SI > 60 days
N=104 21
Decision Pending as of 9/30/15
N=47 22
Decision Made as of 9/30/15
N=3,558 23
Non-MDUFA Decision N=438
24
MDUFA Decision N=3,120
25
MDUFA Decision < or =
90 days N=3,074
26
MDUFA Decision >
90 days N=46
27
Page 188 of 371

CDRH 510(k)s - FY 2015 As of 09/30/15 Number Received
N=3,726 1
Number of Non-3rd Party N=3,641
2
Number of 3rd Party N=85
3
RTA 1st Cycle Action Pending
N=166 4
Closed Before RTA 1st Cycle Action
N=18 5
No. Completed RTA 1st Cycle N=3,457
6
Number Accepted 1st Cycle N=2,194
7
No. Not Accepted 1st Cycle N=1,263
8
Not Yet Accepted in Subsequent
Cycles Accepted in Subsequent
Cycles N=953
N=310 9
10
No. Non-TP Accepted as of 9/30/15 N=3,147
11
Total Number Accepted as of 9/30/15 N=3,232
12
Page 189 of 371

CDRH 510(k)s - FY 2015 As of 09/30/15 Continued
3rd Party 510(k) N=85
13
Total Number Accepted as of 9/30/15 N=3,232
12
Eligible for SI N=3,147
14
SI Pending N=426
SI Completed N=2,715
Closed w/o SI N=5
15 16 17 WD/DE=3 NSE=2
SI Pending < or = 60 days
N=425
18
SI Pending > 60 days
N=1
19
SI < or = 60 days N=2,661
20
SI > 60 days N=55
21
Decision Pending as of 9/30/15
N=1,334 22
Decision Made as of 9/30/15
N=1,898 23
Non-MDUFA Decision N=116
24
MDUFA Decision N=1,782
25
MDUFA Decision < or =
90 days N=1,766
26
MDUFA Decision >
90 days N=16
27
Page 190 of 371

0 0
0 0
0 0 0 0
0 0
0 0 0.00% 0.00%
0 0
0 0
0 0
0 0
0 0
0 0
0 0 0.00% 0.00%
Section 6 510(k) Center Level Metrics
Table 6.1 CDRH – 510(k) Acceptance Review Decision
Performance Metric FY 2013 FY 2014 FY 2015 FY 2016 FY 2017
Number Received 2,965 3,681 3,641
Closed before RTA action 11 8 18
Number Accepted 1,197 1,886 2,169 Number without a RTA Review and > 15 Days since Date Received 42 57 25
Number without a RTA Review and <= 15 Days since Date Received 0 0 166
Number Not Accepted 1,715 1,730 1,263 Rate of submissions not accepted for filing review 58.1% 47.1% 36.5%
* RTA was not in place 1st quarter, thus Table 6.1 for FY2013 includes only 510(k)s received on or after January 1, 2013. All other tables include 510(k)s received on or after October 1, 2012.
Table 6.2 CDRH – 510(k) Substantive Interaction Performance Goals
Performance Metric FY 2013 FY 2014 FY 2015 FY 2016 FY 2017
Eligible for SI 3,739 3,521 3,147
Deleted or withdrawn prior to SI 14 15 3
SI within 60 FDA days 3,497 3,395 2,661
SI over 60 FDA days 222 104 55
SI pending within 60 FDA days 0 1 425
SI pending over 60 FDA days 0 0 1
510(k)s NSE without SI 6 6 2 Current SI Performance Percent within 60 FDA days 93.9% 96.9% 97.9%
Page 191 of 371

0 0 0 0
0 0
0 0
0 0
0 0
0 0
0 0
0 0
0 0
0 0
0 0
0 0
0.00% 0.00%
Table 6.3 CDRH – 510(k) Substantive Interaction Metrics – Time to Substantive Interaction
Performance Metric FY 2013 FY 2014 FY 2015 FY 2016 FY 2017
Number of Substantive Interactions 3,719 3,499 2,716 Average number of FDA days to Substantive Interaction 47.6 49.4 49.0
20th Percentile FDA days to Substantive Interaction 30 33 32
40th Percentile FDA days to Substantive Interaction 48 52 51
60th Percentile FDA days to Substantive Interaction 56 57 57
80th Percentile FDA days to Substantive Interaction 59 59 59
Maximum FDA days to Substantive Interaction 98 188 93
Table 6.4 CDRH – 510(k) MDUFA Decision Performance Goals
Performance Metric FY 2013 FY 2014 FY 2015 FY 2016 FY 2017
510(k)s accepted 3,867 3,605 3,232
Non-MDUFA III Decisions 532 438 116
MDUFA III Decisions (SE/NSE) 3,335 3,120 1,782
MDUFA III Decisions within 90 FDA Days 3,271 3,074 1,766
510(k)s pending MDUFA III Decision 0 47 1,334 510(k) pending MDUFA III Decision over 90 FDA days 0 4 10
Current Performance Percent within 90 FDA Days 98.1% 98.4% 98.5%
Page 192 of 371

0 0
0 0
0 0
0 0
0 0
0 0
0 0
0 0
0 0
0 0
0 0
0 0
0 0
0 0
0 0
0 0
0 0
0 0
0 0
0 0
Table 6.5 CDRH – 510(k) Time to MDUFA Decision
Performance Metric FY 2013 FY 2014 FY 2015 FY 2016 FY 2017
Average review cycles 1.7 1.7 1.6
Number with MDUFA III decision 3,335 3,120 1,782
Average FDA days to MDUFA III decision 70.8 71.9 65.8
20th Percentile FDA days to MDUFA III decision 48 51 30
40th Percentile FDA days to MDUFA III decision 76 80 60
60th Percentile FDA days to MDUFA III decision 86 87 85
80th Percentile FDA days to MDUFA III decision 89 89 89
Maximum FDA days to MDUFA III decision 342 245 160
Average Industry days to MDUFA III decision 57.2 54.2 29.4
20th Percentile Industry days to MDUFA III decision 0 0 0
40th Percentile Industry days to MDUFA III decision 14 13 0
60th Percentile Industry days to MDUFA III decision 44 44 17
80th Percentile Industry days to MDUFA III decision 116 113 53
Maximum Industry days to MDUFA III decision 467 469 275
Average Total days to MDUFA III decision 127.9 126.1 95.2
20th Percentile Total days to MDUFA III decision 56 57 33
40th Percentile Total days to MDUFA III decision 90 90 75
60th Percentile Total days to MDUFA III decision 127 127 98
80th Percentile Total days to MDUFA III decision 199 199 137
Maximum Total days to MDUFA III decision 691 556 356
Page 193 of 371

0 0
0 0
0 0
0 0
0 0
0 0
0.00% 0.00%
0.00% 0.00%
0.00% 0.00%
0.00% 0.00%
Table 6.6 CDRH – 510(k) Performance Metrics – Rate of SE, NSE, Withdrawal and Delete Decisions
Performance Metric FY 2013 FY 2014 FY 2015 FY 2016 FY 2017
510(k)s accepted 3,867 3,605 3,232
Number with MDUFA decision 3,335 3,120 1,782
Number of SE decisions 3,202 3,038 1,762
Number of NSE decisions 133 82 20
Number of Withdrawals 231 205 72
Number deleted 279 200 33
Rate of SE decisions 96.0% 97.4% 98.9%
Rate of NSE decisions 4.0% 2.6% 1.1%
Rate of Withdrawals 6.0% 5.7% 2.2%
Rate of Deleted 7.2% 5.5% 1.0%
Table 6.7 CDRH – 510(k) Performance Metrics – Submissions Missing Performance Goals
Performance Metric FY 2013 FY 2014 FY 2015 FY 2016 FY 2017
Number of submissions that missed the goal 64 46 16
Mean FDA days for submissions that missed goal 119 105 104
Mean industry days for submissions that missed goal 138 110 42
Page 194 of 371
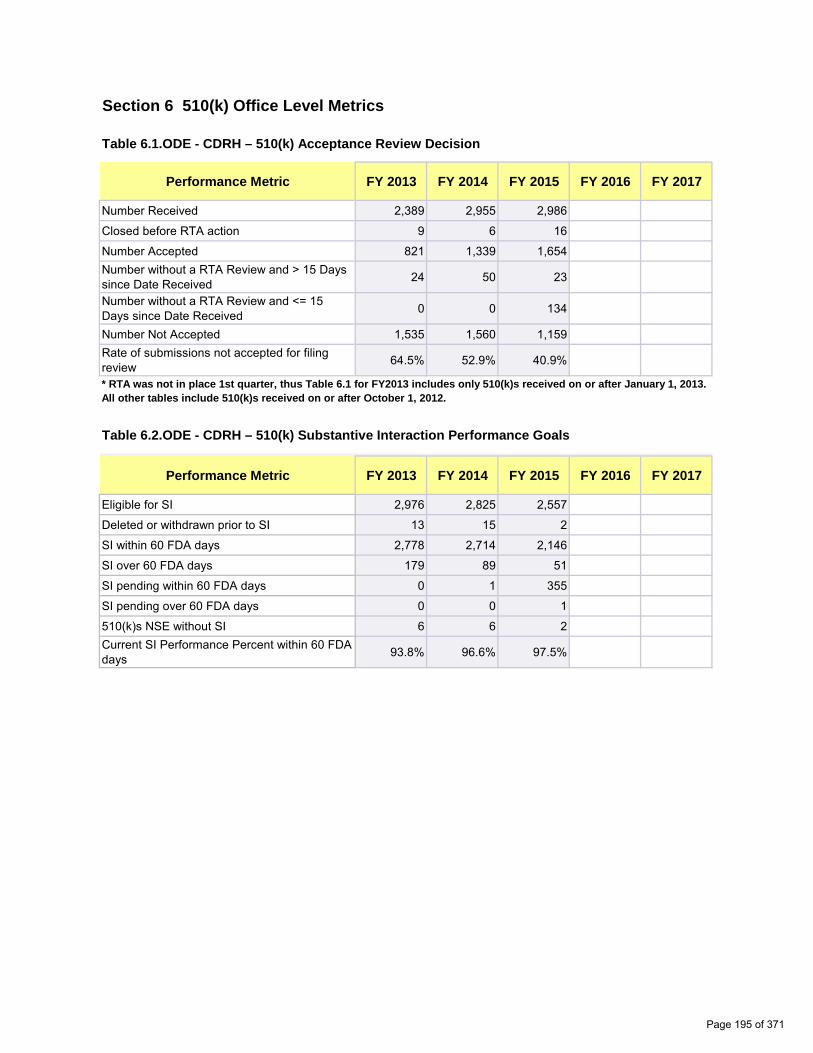
0 0
0 0
0 0 0 0
0 0
0 0 0.00% 0.00%
0 0
0 0
0 0
0 0
0 0
0 0
0 0 0.00% 0.00%
Section 6 510(k) Office Level Metrics
Table 6.1.ODE - CDRH – 510(k) Acceptance Review Decision
Performance Metric FY 2013 FY 2014 FY 2015 FY 2016 FY 2017
Number Received 2,389 2,955 2,986
Closed before RTA action 9 6 16
Number Accepted 821 1,339 1,654 Number without a RTA Review and > 15 Days since Date Received 24 50 23
Number without a RTA Review and <= 15 Days since Date Received 0 0 134
Number Not Accepted 1,535 1,560 1,159 Rate of submissions not accepted for filing review 64.5% 52.9% 40.9%
* RTA was not in place 1st quarter, thus Table 6.1 for FY2013 includes only 510(k)s received on or after January 1, 2013. All other tables include 510(k)s received on or after October 1, 2012.
Table 6.2.ODE - CDRH – 510(k) Substantive Interaction Performance Goals
Performance Metric FY 2013 FY 2014 FY 2015 FY 2016 FY 2017
Eligible for SI 2,976 2,825 2,557
Deleted or withdrawn prior to SI 13 15 2
SI within 60 FDA days 2,778 2,714 2,146
SI over 60 FDA days 179 89 51
SI pending within 60 FDA days 0 1 355
SI pending over 60 FDA days 0 0 1
510(k)s NSE without SI 6 6 2 Current SI Performance Percent within 60 FDA days 93.8% 96.6% 97.5%
Page 195 of 371
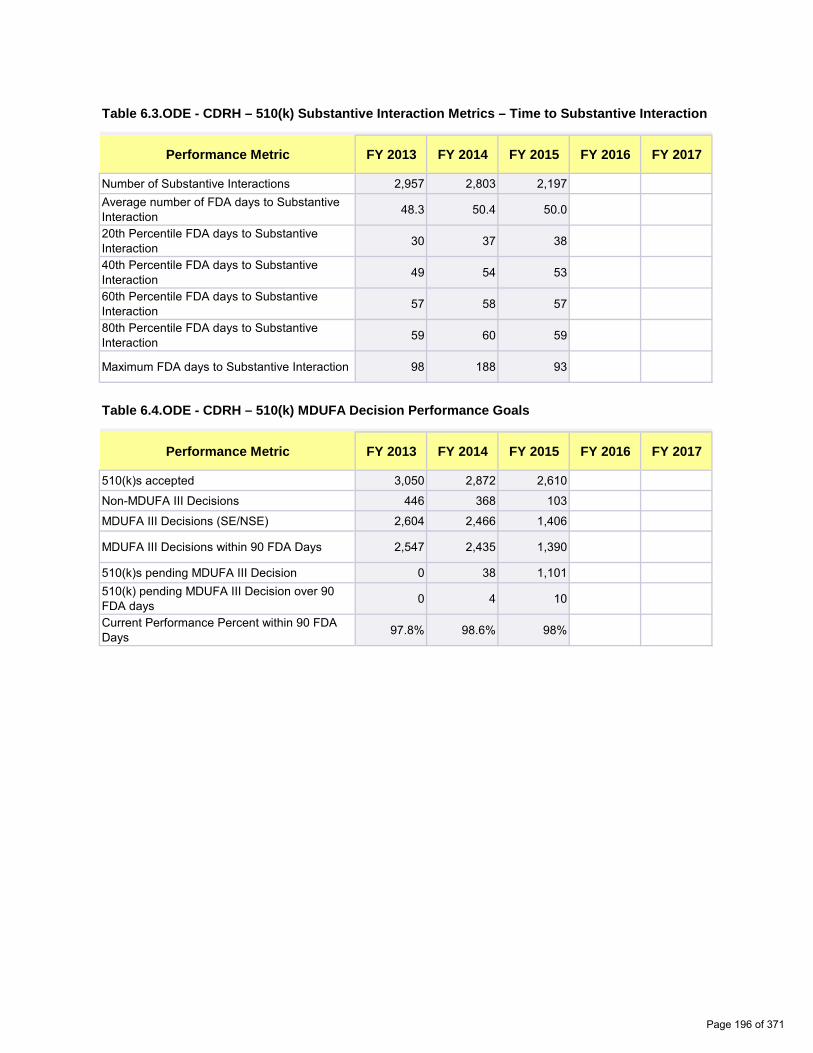
0 0 0 0
0 0
0 0
0 0
0 0
0 0
0 0
0 0
0 0
0 0
0 0
0 0
0.00% 0.00%
Table 6.3.ODE - CDRH – 510(k) Substantive Interaction Metrics – Time to Substantive Interaction
Performance Metric FY 2013 FY 2014 FY 2015 FY 2016 FY 2017
Number of Substantive Interactions 2,957 2,803 2,197 Average number of FDA days to Substantive Interaction 48.3 50.4 50.0
20th Percentile FDA days to Substantive Interaction 30 37 38
40th Percentile FDA days to Substantive Interaction 49 54 53
60th Percentile FDA days to Substantive Interaction 57 58 57
80th Percentile FDA days to Substantive Interaction 59 60 59
Maximum FDA days to Substantive Interaction 98 188 93
Table 6.4.ODE - CDRH – 510(k) MDUFA Decision Performance Goals
Performance Metric FY 2013 FY 2014 FY 2015 FY 2016 FY 2017
510(k)s accepted 3,050 2,872 2,610
Non-MDUFA III Decisions 446 368 103
MDUFA III Decisions (SE/NSE) 2,604 2,466 1,406
MDUFA III Decisions within 90 FDA Days 2,547 2,435 1,390
510(k)s pending MDUFA III Decision 0 38 1,101 510(k) pending MDUFA III Decision over 90 FDA days 0 4 10
Current Performance Percent within 90 FDA Days 97.8% 98.6% 98%
Page 196 of 371

0 0
0 0
0 0
0 0
0 0
0 0
0 0
0 0
0 0
0 0
0 0
0 0
0 0
0 0
0 0
0 0
0 0
0 0
0 0
Table 6.5.ODE - CDRH – 510(k) Time to MDUFA Decision
Performance Metric FY 2013 FY 2014 FY 2015 FY 2016 FY 2017
Average review cycles 1.8 1.7 1.6
Number with MDUFA III decision 2,604 2,466 1,406
Average FDA days to MDUFA III decision 72.8 73.6 68.7
20th Percentile FDA days to MDUFA III decision 53 55 43
40th Percentile FDA days to MDUFA III decision 80 82 70
60th Percentile FDA days to MDUFA III decision 87 87 87
80th Percentile FDA days to MDUFA III decision 89 89 89
Maximum FDA days to MDUFA III decision 342 245 160
Average Industry days to MDUFA III decision 57.3 54.7 30.3
20th Percentile Industry days to MDUFA III decision 0 0 0
40th Percentile Industry days to MDUFA III decision 17 16 0
60th Percentile Industry days to MDUFA III decision 46 46 19
80th Percentile Industry days to MDUFA III decision 116 114 54
Maximum Industry days to MDUFA III decision 438 359 199
Average Total days to MDUFA III decision 130.1 128.4 99.0
20th Percentile Total days to MDUFA III decision 59 61 46
40th Percentile Total days to MDUFA III decision 94 94 84
60th Percentile Total days to MDUFA III decision 129 130 102
80th Percentile Total days to MDUFA III decision 200 202 140
Maximum Total days to MDUFA III decision 691 448 287
Page 197 of 371

0 0
0 0
0 0
0 0
0 0
0 0
0.00% 0.00%
0.00% 0.00%
0.00% 0.00%
0.00% 0.00%
Table 6.6.ODE - CDRH – 510(k) Performance Metrics – Rate of SE, NSE, Withdrawal and Delete Decisions
Performance Metric FY 2013 FY 2014 FY 2015 FY 2016 FY 2017
510(k)s accepted 3,050 2,872 2,610
Number with MDUFA decision 2,604 2,466 1,406
Number of SE decisions 2,493 2,403 1,391
Number of NSE decisions 111 63 15
Number of Withdrawals 189 169 64
Number deleted 237 167 28
Rate of SE decisions 95.7% 97.4% 99%
Rate of NSE decisions 4.3% 2.6% 1.1%
Rate of Withdrawals 6.2% 5.9% 2.5%
Rate of Deleted 7.8% 5.8% 1.1%
Table 6.7.ODE - CDRH – 510(k) Performance Metrics – Submissions Missing Performance Goals
Performance Metric FY 2013 FY 2014 FY 2015 FY 2016 FY 2017
Number of submissions that missed the goal 57 31 16
Mean FDA days for submissions that missed goal 121 108 104
Mean industry days for submissions that missed goal 137 130 42
Page 198 of 371

0 0
0 0
0 0 0 0
0 0
0 0 0.00% 0.00%
0 0
0 0
0 0
0 0
0 0
0 0
0 0 0.00% 0.00%
Table 6.1.OIR - CDRH – 510(k) Acceptance Review Decision
Performance Metric FY 2013 FY 2014 FY 2015 FY 2016 FY 2017
Number Received 576 726 655
Closed before RTA action 2 2 2
Number Accepted 376 547 515 Number without a RTA Review and > 15 Days since Date Received 18 7 2
Number without a RTA Review and <= 15 Days since Date Received 0 0 32
Number Not Accepted 180 170 104 Rate of submissions not accepted for filing review 31.4% 23.5% 16.7%
* RTA was not in place 1st quarter, thus Table 6.1 for FY2013 includes only 510(k)s received on or after January 1, 2013. All other tables include 510(k)s received on or after October 1, 2012.
Table 6.2.OIR - CDRH – 510(k) Substantive Interaction Performance Goals
Performance Metric FY 2013 FY 2014 FY 2015 FY 2016 FY 2017
Eligible for SI 763 696 590
Deleted or withdrawn prior to SI 1 0 1
SI within 60 FDA days 719 681 515
SI over 60 FDA days 43 15 4
SI pending within 60 FDA days 0 0 70
SI pending over 60 FDA days 0 0 0
510(k)s NSE without SI 0 0 0 Current SI Performance Percent within 60 FDA days 94.4% 97.8% 99.2%
Page 199 of 371

0 0 0 0
0 0
0 0
0 0
0 0
0 0
0 0
0 0
0 0
0 0
0 0
0 0
0.00% 0.00%
Table 6.3.OIR - CDRH – 510(k) Substantive Interaction Metrics – Time to Substantive Interaction
Performance Metric FY 2013 FY 2014 FY 2015 FY 2016 FY 2017
Number of Substantive Interactions 762 696 519 Average number of FDA days to Substantive Interaction 45.0 45.6 44.5
20th Percentile FDA days to Substantive Interaction 29 30 29
40th Percentile FDA days to Substantive Interaction 43 45 43
60th Percentile FDA days to Substantive Interaction 51 53 52
80th Percentile FDA days to Substantive Interaction 58 58 58
Maximum FDA days to Substantive Interaction 91 93 70
Table 6.4.OIR - CDRH – 510(k) MDUFA Decision Performance Goals
Performance Metric FY 2013 FY 2014 FY 2015 FY 2016 FY 2017
510(k)s accepted 817 733 622
Non-MDUFA III Decisions 86 70 13
MDUFA III Decisions (SE/NSE) 731 654 376
MDUFA III Decisions within 90 FDA Days 724 639 376
510(k)s pending MDUFA III Decision 0 9 233 510(k) pending MDUFA III Decision over 90 FDA days 0 0 0
Current Performance Percent within 90 FDA Days 99.0% 97.7% 100%
Page 200 of 371

0 0
0 0
0 0
0 0
0 0
0 0
0 0
0 0
0 0
0 0
0 0
0 0
0 0
0 0
0 0
0 0
0 0
0 0
0 0
Table 6.5.OIR - CDRH – 510(k) Time to MDUFA Decision
Performance Metric FY 2013 FY 2014 FY 2015 FY 2016 FY 2017
Average review cycles 1.7 1.7 1.4
Number with MDUFA III decision 731 654 376
Average FDA days to MDUFA III decision 63.5 65.5 54.9
20th Percentile FDA days to MDUFA III decision 34 33 28
40th Percentile FDA days to MDUFA III decision 58 60 46
60th Percentile FDA days to MDUFA III decision 81 84 66
80th Percentile FDA days to MDUFA III decision 88 88 83
Maximum FDA days to MDUFA III decision 121 137 90
Average Industry days to MDUFA III decision 56.7 52.1 26.0
20th Percentile Industry days to MDUFA III decision 0 0 0
40th Percentile Industry days to MDUFA III decision 0 0 0
60th Percentile Industry days to MDUFA III decision 36 38 0
80th Percentile Industry days to MDUFA III decision 112 103 46
Maximum Industry days to MDUFA III decision 467 469 275
Average Total days to MDUFA III decision 120.2 117.6 80.9
20th Percentile Total days to MDUFA III decision 36 35 29
40th Percentile Total days to MDUFA III decision 77 84 50
60th Percentile Total days to MDUFA III decision 111 112 82
80th Percentile Total days to MDUFA III decision 194 186 121
Maximum Total days to MDUFA III decision 557 556 356
Page 201 of 371

0 0
0 0
0 0
0 0
0 0
0 0
0.00% 0.00%
0.00% 0.00%
0.00% 0.00%
0.00% 0.00%
Table 6.6.OIR - CDRH – 510(k) Performance Metrics – Rate of SE, NSE, Withdrawal and Delete Decisions
Performance Metric FY 2013 FY 2014 FY 2015 FY 2016 FY 2017
510(k)s accepted 817 733 622
Number with MDUFA decision 731 654 376
Number of SE decisions 709 635 371
Number of NSE decisions 22 19 5
Number of Withdrawals 42 36 8
Number deleted 42 33 5
Rate of SE decisions 97.0% 97.1% 98.7%
Rate of NSE decisions 3.0% 2.9% 1.3%
Rate of Withdrawals 5.1% 4.9% 1.3%
Rate of Deleted 5.1% 4.5% 0.8%
Table 6.7.OIR - CDRH – 510(k) Performance Metrics – Submissions Missing Performance Goals
Performance Metric FY 2013 FY 2014 FY 2015 FY 2016 FY 2017
Number of submissions that missed the goal 7 15 0
Mean FDA days for submissions that missed goal 103 100 N/A
Mean industry days for submissions that missed goal 143 67 N/A
Page 202 of 371
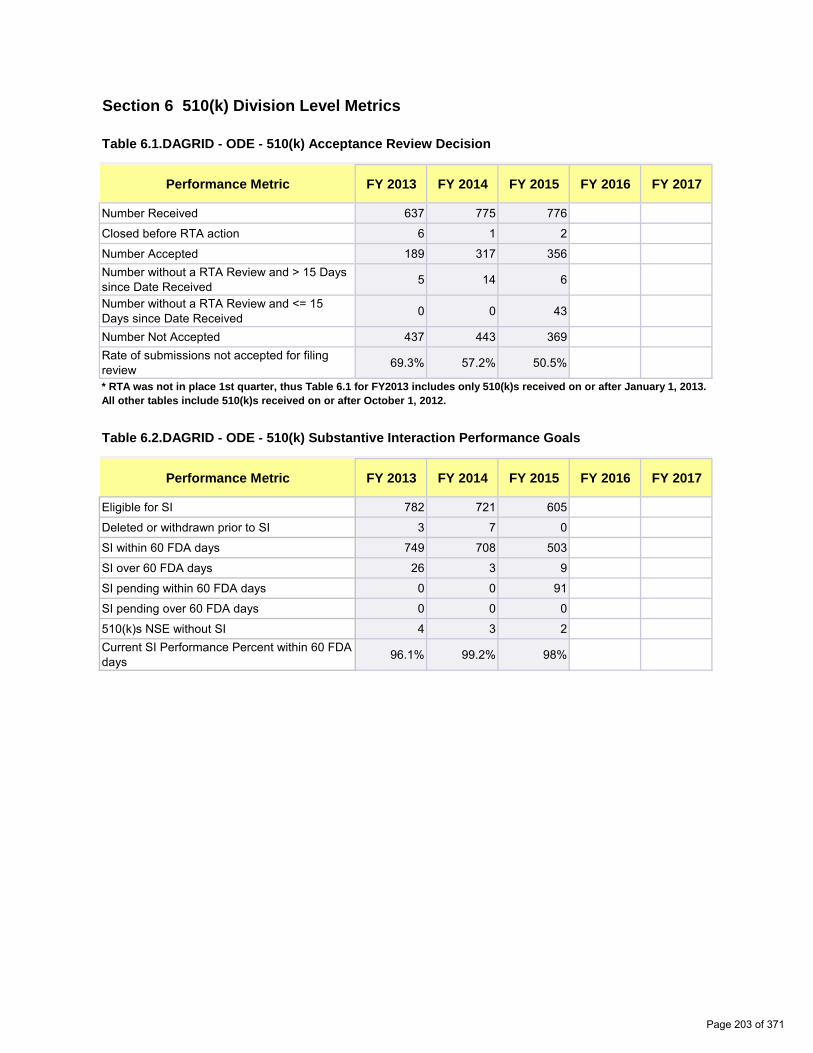
0 0
0 0
0 0 0 0
0 0
0 0 0.00% 0.00%
0 0
0 0
0 0
0 0
0 0
0 0
0 0 0.00% 0.00%
Section 6 510(k) Division Level Metrics
Table 6.1.DAGRID - ODE - 510(k) Acceptance Review Decision
Performance Metric FY 2013 FY 2014 FY 2015 FY 2016 FY 2017
Number Received 637 775 776
Closed before RTA action 6 1 2
Number Accepted 189 317 356 Number without a RTA Review and > 15 Days since Date Received 5 14 6
Number without a RTA Review and <= 15 Days since Date Received 0 0 43
Number Not Accepted 437 443 369 Rate of submissions not accepted for filing review 69.3% 57.2% 50.5%
* RTA was not in place 1st quarter, thus Table 6.1 for FY2013 includes only 510(k)s received on or after January 1, 2013. All other tables include 510(k)s received on or after October 1, 2012.
Table 6.2.DAGRID - ODE - 510(k) Substantive Interaction Performance Goals
Performance Metric FY 2013 FY 2014 FY 2015 FY 2016 FY 2017
Eligible for SI 782 721 605
Deleted or withdrawn prior to SI 3 7 0
SI within 60 FDA days 749 708 503
SI over 60 FDA days 26 3 9
SI pending within 60 FDA days 0 0 91
SI pending over 60 FDA days 0 0 0
510(k)s NSE without SI 4 3 2 Current SI Performance Percent within 60 FDA days 96.1% 99.2% 98%
Page 203 of 371

0 0
0 0
0 0
0 0
0 0
0 0
0 0
0 0
0 0
0 0
0 0
0 0
0.00% 0.00%
Table 6.3.DAGRID - ODE - 510(k) Substantive Interaction Metrics – Time to Substantive Interaction
Performance Metric FY 2013 FY 2014 FY 2015 FY 2016 FY 2017
Number of Substantive Interactions 775 711 512 Average number of FDA days to Substantive Interaction 50.9 53.4 54.0
20th Percentile FDA days to Substantive Interaction 43 50 51
40th Percentile FDA days to Substantive Interaction 55 57 57
60th Percentile FDA days to Substantive Interaction 58 59 58
80th Percentile FDA days to Substantive Interaction 60 60 60
Maximum FDA days to Substantive Interaction 90 188 79
Table 6.4.DAGRID - ODE - 510(k) MDUFA Decision Performance Goals
Performance Metric FY 2013 FY 2014 FY 2015 FY 2016 FY 2017
510(k)s accepted 797 735 621
Non-MDUFA III Decisions 165 109 26
MDUFA III Decisions (SE/NSE) 632 611 280
MDUFA III Decisions within 90 FDA Days 613 597 271
510(k)s pending MDUFA III Decision 0 15 315 510(k) pending MDUFA III Decision over 90 FDA days 0 2 5
Current Performance Percent within 90 FDA Days 97.0% 97.4% 95.1%
Page 204 of 371

0 0
0 0
0 0
0 0
0 0
0 0
0 0
0 0
0 0
0 0
0 0
0 0
0 0
0 0
0 0
0 0
0 0
0 0
0 0
Table 6.5.DAGRID - ODE - 510(k) Time to MDUFA Decision
Performance Metric FY 2013 FY 2014 FY 2015 FY 2016 FY 2017
Average review cycles 1.8 1.8 1.7
Number with MDUFA III decision 632 611 280
Average FDA days to MDUFA III decision 78.0 79.9 79.6
20th Percentile FDA days to MDUFA III decision 63 78 82
40th Percentile FDA days to MDUFA III decision 84 86 87
60th Percentile FDA days to MDUFA III decision 88 88 88
80th Percentile FDA days to MDUFA III decision 90 90 90
Maximum FDA days to MDUFA III decision 280 107 99
Average Industry days to MDUFA III decision 64.2 66.8 38.4
20th Percentile Industry days to MDUFA III decision 0 0 0
40th Percentile Industry days to MDUFA III decision 21 28 12
60th Percentile Industry days to MDUFA III decision 54 69 31
80th Percentile Industry days to MDUFA III decision 141 139 69
Maximum Industry days to MDUFA III decision 420 272 181
Average Total days to MDUFA III decision 142.2 146.7 118.0
20th Percentile Total days to MDUFA III decision 78 87 87
40th Percentile Total days to MDUFA III decision 102 114 95
60th Percentile Total days to MDUFA III decision 140 155 116
80th Percentile Total days to MDUFA III decision 220 226 156
Maximum Total days to MDUFA III decision 610 361 270
Page 205 of 371

0 0
0 0
0 0
0 0
0 0
0 0
0.00% 0.00%
0.00% 0.00%
0.00% 0.00%
0.00% 0.00%
0 0
0 0
0 0
Table 6.6.DAGRID - ODE - 510(k) Performance Metrics – Rate of SE, NSE, Withdrawal and Delete Decisions
Performance Metric FY 2013 FY 2014 FY 2015 FY 2016 FY 2017
510(k)s accepted 797 735 621
Number with MDUFA decision 632 611 280
Number of SE decisions 603 587 276
Number of NSE decisions 29 24 4
Number of Withdrawals 56 50 16
Number deleted 104 48 5
Rate of SE decisions 95.4% 96.1% 98.6%
Rate of NSE decisions 4.6% 3.9% 1.4%
Rate of Withdrawals 7.0% 6.8% 2.6%
Rate of Deleted 13.0% 6.5% 0.8%
Table 6.7.DAGRID - ODE - 510(k) Performance Metrics – Submissions Missing Performance Goals
Performance Metric FY 2013 FY 2014 FY 2015 FY 2016 FY 2017
Number of submissions that missed the goal 19 14 9
Mean FDA days for submissions that missed goal 125 98 95
Mean industry days for submissions that missed goal 157 161 36
Page 206 of 371

0 0
0 0
0 0 0 0
0 0
0 0 0.00% 0.00%
0 0
0 0
0 0
0 0
0 0
0 0
0 0 0.00% 0.00%
Table 6.1.DCD - ODE - 510(k) Acceptance Review Decision
Performance Metric FY 2013 FY 2014 FY 2015 FY 2016 FY 2017
Number Received 336 407 406
Closed before RTA action 0 1 2
Number Accepted 151 196 263 Number without a RTA Review and > 15 Days since Date Received 10 9 5
Number without a RTA Review and <= 15 Days since Date Received 0 0 19
Number Not Accepted 175 201 117 Rate of submissions not accepted for filing review 52.1% 49.5% 30.4%
* RTA was not in place 1st quarter, thus Table 6.1 for FY2013 includes only 510(k)s received on or after January 1, 2013. All other tables include 510(k)s received on or after October 1, 2012.
Table 6.2.DCD - ODE - 510(k) Substantive Interaction Performance Goals
Performance Metric FY 2013 FY 2014 FY 2015 FY 2016 FY 2017
Eligible for SI 432 400 364
Deleted or withdrawn prior to SI 2 2 1
SI within 60 FDA days 392 379 293
SI over 60 FDA days 38 19 9
SI pending within 60 FDA days 0 0 61
SI pending over 60 FDA days 0 0 0
510(k)s NSE without SI 0 0 0 Current SI Performance Percent within 60 FDA days 91.2% 95.2% 97.0%
Page 207 of 371
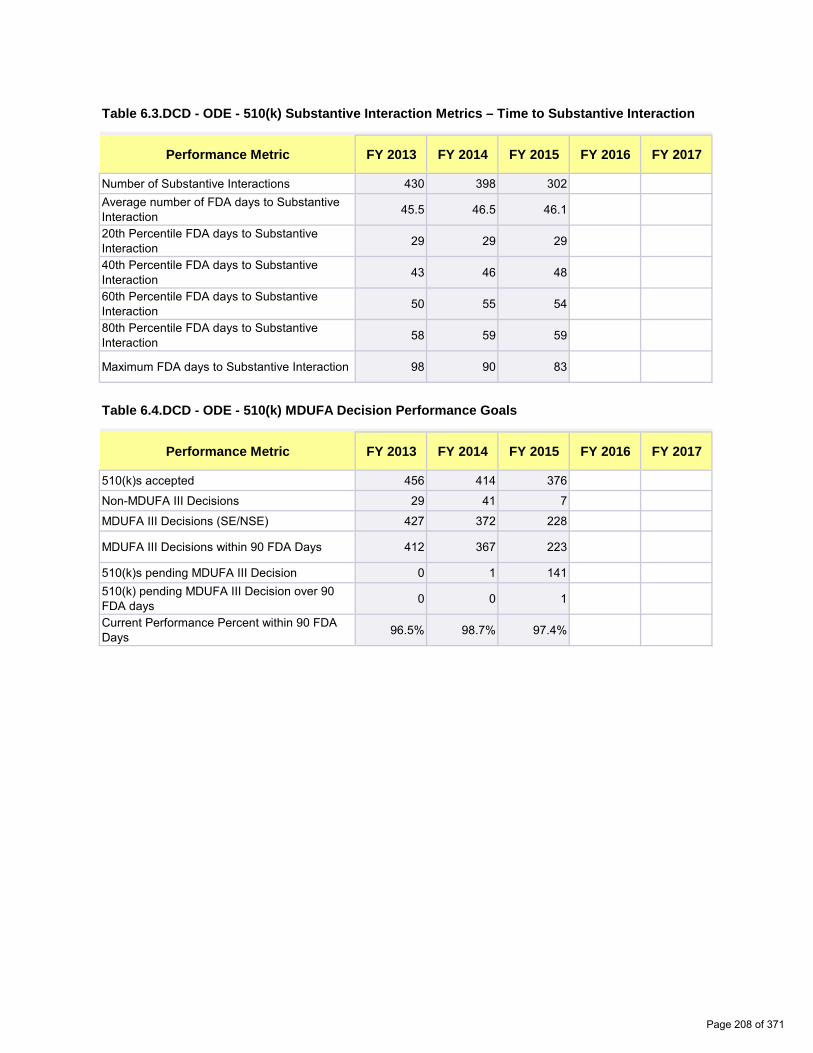
0 0
0 0
0 0
0 0
0 0
0 0
0 0
0 0
0 0
0 0
0 0
0 0
0.00% 0.00%
Table 6.3.DCD - ODE - 510(k) Substantive Interaction Metrics – Time to Substantive Interaction
Performance Metric FY 2013 FY 2014 FY 2015 FY 2016 FY 2017
Number of Substantive Interactions 430 398 302 Average number of FDA days to Substantive Interaction 45.5 46.5 46.1
20th Percentile FDA days to Substantive Interaction 29 29 29
40th Percentile FDA days to Substantive Interaction 43 46 48
60th Percentile FDA days to Substantive Interaction 50 55 54
80th Percentile FDA days to Substantive Interaction 58 59 59
Maximum FDA days to Substantive Interaction 98 90 83
Table 6.4.DCD - ODE - 510(k) MDUFA Decision Performance Goals
Performance Metric FY 2013 FY 2014 FY 2015 FY 2016 FY 2017
510(k)s accepted 456 414 376
Non-MDUFA III Decisions 29 41 7
MDUFA III Decisions (SE/NSE) 427 372 228
MDUFA III Decisions within 90 FDA Days 412 367 223
510(k)s pending MDUFA III Decision 0 1 141 510(k) pending MDUFA III Decision over 90 FDA days 0 0 1
Current Performance Percent within 90 FDA Days 96.5% 98.7% 97.4%
Page 208 of 371

0 0
0 0
0 0
0 0
0 0
0 0
0 0
0 0
0 0
0 0
0 0
0 0
0 0
0 0
0 0
0 0
0 0
0 0
0 0
Table 6.5.DCD - ODE - 510(k) Time to MDUFA Decision
Performance Metric FY 2013 FY 2014 FY 2015 FY 2016 FY 2017
Average review cycles 1.7 1.7 1.6
Number with MDUFA III decision 427 372 228
Average FDA days to MDUFA III decision 67.2 68.1 62.8
20th Percentile FDA days to MDUFA III decision 36 40 29
40th Percentile FDA days to MDUFA III decision 59 60 57
60th Percentile FDA days to MDUFA III decision 86 87 83
80th Percentile FDA days to MDUFA III decision 89 89 89
Maximum FDA days to MDUFA III decision 237 140 160
Average Industry days to MDUFA III decision 47.5 47.9 29.5
20th Percentile Industry days to MDUFA III decision 0 0 0
40th Percentile Industry days to MDUFA III decision 11 9 0
60th Percentile Industry days to MDUFA III decision 38 34 18
80th Percentile Industry days to MDUFA III decision 84 112 52
Maximum Industry days to MDUFA III decision 358 226 178
Average Total days to MDUFA III decision 114.8 116.0 92.3
20th Percentile Total days to MDUFA III decision 41 45 29
40th Percentile Total days to MDUFA III decision 85 87 59
60th Percentile Total days to MDUFA III decision 119 119 102
80th Percentile Total days to MDUFA III decision 171 194 138
Maximum Total days to MDUFA III decision 451 315 267
Page 209 of 371

0 0
0 0
0 0
0 0
0 0
0 0
0.00% 0.00%
0.00% 0.00%
0.00% 0.00%
0.00% 0.00%
0 0
0 0
0 0
Table 6.6.DCD - ODE - 510(k) Performance Metrics – Rate of SE, NSE, Withdrawal and Delete Decisions
Performance Metric FY 2013 FY 2014 FY 2015 FY 2016 FY 2017
510(k)s accepted 456 414 376
Number with MDUFA decision 427 372 228
Number of SE decisions 418 369 223
Number of NSE decisions 9 3 5
Number of Withdrawals 14 21 6
Number deleted 14 20 1
Rate of SE decisions 97.9% 99.2% 97.8%
Rate of NSE decisions 2.1% 0.8% 2.2%
Rate of Withdrawals 3.1% 5.1% 1.6%
Rate of Deleted 3.1% 4.8% 0.3%
Table 6.7.DCD - ODE - 510(k) Performance Metrics – Submissions Missing Performance Goals
Performance Metric FY 2013 FY 2014 FY 2015 FY 2016 FY 2017
Number of submissions that missed the goal 15 5 5
Mean FDA days for submissions that missed goal 123 110 116
Mean industry days for submissions that missed goal 114 104 63
Page 210 of 371
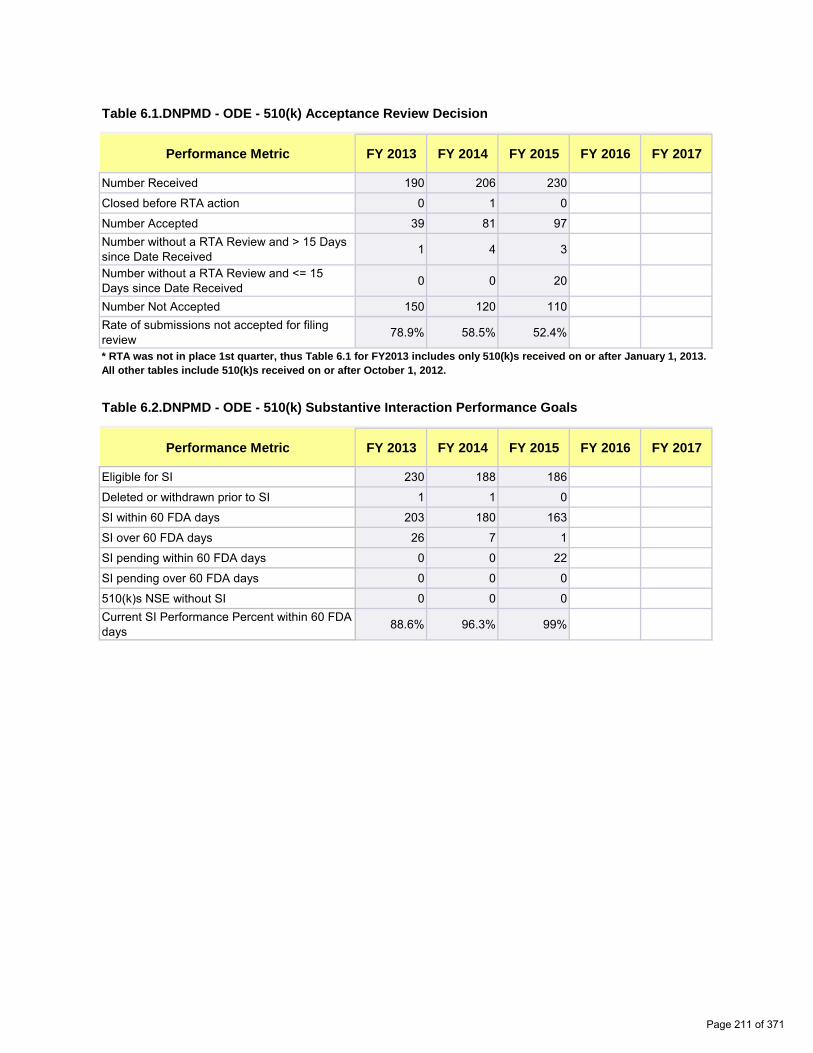
0 0
0 0
0 0 0 0
0 0
0 0 0.00% 0.00%
0 0
0 0
0 0
0 0
0 0
0 0
0 0 0.00% 0.00%
Table 6.1.DNPMD - ODE - 510(k) Acceptance Review Decision
Performance Metric FY 2013 FY 2014 FY 2015 FY 2016 FY 2017
Number Received 190 206 230
Closed before RTA action 0 1 0
Number Accepted 39 81 97 Number without a RTA Review and > 15 Days since Date Received 1 4 3
Number without a RTA Review and <= 15 Days since Date Received 0 0 20
Number Not Accepted 150 120 110 Rate of submissions not accepted for filing review 78.9% 58.5% 52.4%
* RTA was not in place 1st quarter, thus Table 6.1 for FY2013 includes only 510(k)s received on or after January 1, 2013. All other tables include 510(k)s received on or after October 1, 2012.
Table 6.2.DNPMD - ODE - 510(k) Substantive Interaction Performance Goals
Performance Metric FY 2013 FY 2014 FY 2015 FY 2016 FY 2017
Eligible for SI 230 188 186
Deleted or withdrawn prior to SI 1 1 0
SI within 60 FDA days 203 180 163
SI over 60 FDA days 26 7 1
SI pending within 60 FDA days 0 0 22
SI pending over 60 FDA days 0 0 0
510(k)s NSE without SI 0 0 0 Current SI Performance Percent within 60 FDA days 88.6% 96.3% 99%
Page 211 of 371

0 0
0 0
0 0
0 0
0 0
0 0
0 0
0 0
0 0
0 0
0 0
0 0
0.00% 0.00%
Table 6.3.DNPMD - ODE - 510(k) Substantive Interaction Metrics – Time to Substantive Interaction
Performance Metric FY 2013 FY 2014 FY 2015 FY 2016 FY 2017
Number of Substantive Interactions 229 187 164 Average number of FDA days to Substantive Interaction 51.9 53.8 53.7
20th Percentile FDA days to Substantive Interaction 43 53 49
40th Percentile FDA days to Substantive Interaction 55 58 57
60th Percentile FDA days to Substantive Interaction 58 59 59
80th Percentile FDA days to Substantive Interaction 60 60 60
Maximum FDA days to Substantive Interaction 80 64 61
Table 6.4.DNPMD - ODE - 510(k) MDUFA Decision Performance Goals
Performance Metric FY 2013 FY 2014 FY 2015 FY 2016 FY 2017
510(k)s accepted 236 191 194
Non-MDUFA III Decisions 31 37 9
MDUFA III Decisions (SE/NSE) 205 152 96
MDUFA III Decisions within 90 FDA Days 199 148 96
510(k)s pending MDUFA III Decision 0 2 89 510(k) pending MDUFA III Decision over 90 FDA days 0 0 1
Current Performance Percent within 90 FDA Days 97.1% 97.4% 99.0%
Page 212 of 371
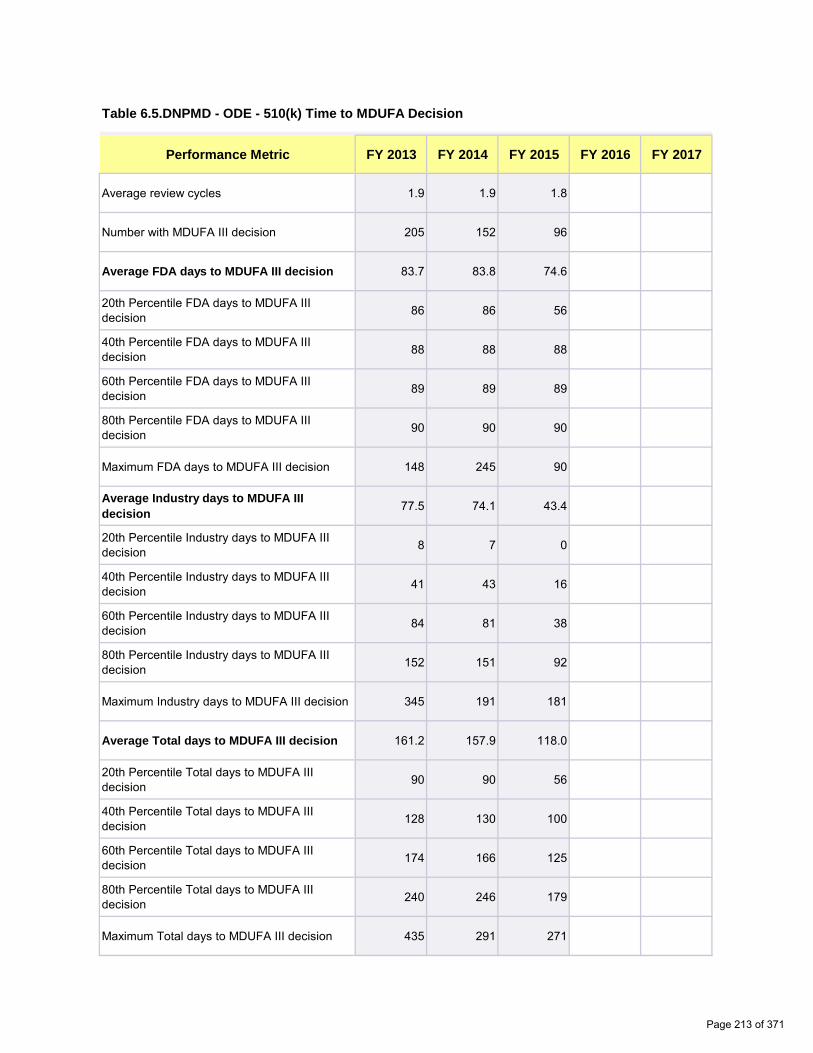
0 0
0 0
0 0
0 0
0 0
0 0
0 0
0 0
0 0
0 0
0 0
0 0
0 0
0 0
0 0
0 0
0 0
0 0
0 0
Table 6.5.DNPMD - ODE - 510(k) Time to MDUFA Decision
Performance Metric FY 2013 FY 2014 FY 2015 FY 2016 FY 2017
Average review cycles 1.9 1.9 1.8
Number with MDUFA III decision 205 152 96
Average FDA days to MDUFA III decision 83.7 83.8 74.6
20th Percentile FDA days to MDUFA III decision 86 86 56
40th Percentile FDA days to MDUFA III decision 88 88 88
60th Percentile FDA days to MDUFA III decision 89 89 89
80th Percentile FDA days to MDUFA III decision 90 90 90
Maximum FDA days to MDUFA III decision 148 245 90
Average Industry days to MDUFA III decision 77.5 74.1 43.4
20th Percentile Industry days to MDUFA III decision 8 7 0
40th Percentile Industry days to MDUFA III decision 41 43 16
60th Percentile Industry days to MDUFA III decision 84 81 38
80th Percentile Industry days to MDUFA III decision 152 151 92
Maximum Industry days to MDUFA III decision 345 191 181
Average Total days to MDUFA III decision 161.2 157.9 118.0
20th Percentile Total days to MDUFA III decision 90 90 56
40th Percentile Total days to MDUFA III decision 128 130 100
60th Percentile Total days to MDUFA III decision 174 166 125
80th Percentile Total days to MDUFA III decision 240 246 179
Maximum Total days to MDUFA III decision 435 291 271
Page 213 of 371

0 0
0 0
0 0
0 0
0 0
0 0
0.00% 0.00%
0.00% 0.00%
0.00% 0.00%
0.00% 0.00%
0 0
0 0
0 0
Table 6.6.DNPMD - ODE - 510(k) Performance Metrics – Rate of SE, NSE, Withdrawal and Delete Decisions
Performance Metric FY 2013 FY 2014 FY 2015 FY 2016 FY 2017
510(k)s accepted 236 191 194
Number with MDUFA decision 205 152 96
Number of SE decisions 187 144 96
Number of NSE decisions 18 8 0
Number of Withdrawals 13 18 4
Number deleted 13 16 4
Rate of SE decisions 91.2% 94.7% 100%
Rate of NSE decisions 8.8% 5.3% 0%
Rate of Withdrawals 5.5% 9.4% 2.1%
Rate of Deleted 5.5% 8.4% 2.1%
Table 6.7.DNPMD - ODE - 510(k) Performance Metrics – Submissions Missing Performance Goals
Performance Metric FY 2013 FY 2014 FY 2015 FY 2016 FY 2017
Number of submissions that missed the goal 6 4 0
Mean FDA days for submissions that missed goal 105 150 0
Mean industry days for submissions that missed goal 122 95 0
Page 214 of 371

0 0
0 0
0 0 0 0
0 0
0 0 0.00% 0.00%
0 0
0 0
0 0
0 0
0 0
0 0
0 0 0.00% 0.00%
Table 6.1.DOD - ODE - 510(k) Acceptance Review Decision
Performance Metric FY 2013 FY 2014 FY 2015 FY 2016 FY 2017
Number Received 523 665 669
Closed before RTA action 0 1 3
Number Accepted 181 313 386 Number without a RTA Review and > 15 Days since Date Received 0 3 0
Number without a RTA Review and <= 15 Days since Date Received 0 0 15
Number Not Accepted 342 348 265 Rate of submissions not accepted for filing review 65.4% 52.4% 40.7%
* RTA was not in place 1st quarter, thus Table 6.1 for FY2013 includes only 510(k)s received on or after January 1, 2013. All other tables include 510(k)s received on or after October 1, 2012.
Table 6.2.DOD - ODE - 510(k) Substantive Interaction Performance Goals
Performance Metric FY 2013 FY 2014 FY 2015 FY 2016 FY 2017
Eligible for SI 655 654 621
Deleted or withdrawn prior to SI 3 1 0
SI within 60 FDA days 623 636 534
SI over 60 FDA days 29 15 13
SI pending within 60 FDA days 0 0 74
SI pending over 60 FDA days 0 0 0
510(k)s NSE without SI 0 2 0 Current SI Performance Percent within 60 FDA days 95.6% 97.4% 98%
Page 215 of 371

0 0
0 0
0 0
0 0
0 0
0 0
0 0
0 0
0 0
0 0
0 0
0 0
0.00% 0.00%
Table 6.3.DOD - ODE - 510(k) Substantive Interaction Metrics – Time to Substantive Interaction
Performance Metric FY 2013 FY 2014 FY 2015 FY 2016 FY 2017
Number of Substantive Interactions 652 651 547 Average number of FDA days to Substantive Interaction 47.9 48.8 47.9
20th Percentile FDA days to Substantive Interaction 30 29 30
40th Percentile FDA days to Substantive Interaction 48 52 49
60th Percentile FDA days to Substantive Interaction 56 57 56
80th Percentile FDA days to Substantive Interaction 59 59 58
Maximum FDA days to Substantive Interaction 88 90 92
Table 6.4.DOD - ODE - 510(k) MDUFA Decision Performance Goals
Performance Metric FY 2013 FY 2014 FY 2015 FY 2016 FY 2017
510(k)s accepted 656 654 621
Non-MDUFA III Decisions 73 46 20
MDUFA III Decisions (SE/NSE) 583 604 391
MDUFA III Decisions within 90 FDA Days 579 602 391
510(k)s pending MDUFA III Decision 0 4 210 510(k) pending MDUFA III Decision over 90 FDA days 0 0 0
Current Performance Percent within 90 FDA Days 99.3% 99.7% 100%
Page 216 of 371

0 0
0 0
0 0
0 0
0 0
0 0
0 0
0 0
0 0
0 0
0 0
0 0
0 0
0 0
0 0
0 0
0 0
0 0
0 0
Table 6.5.DOD - ODE - 510(k) Time to MDUFA Decision
Performance Metric FY 2013 FY 2014 FY 2015 FY 2016 FY 2017
Average review cycles 1.6 1.6 1.5
Number with MDUFA III decision 583 604 391
Average FDA days to MDUFA III decision 69.9 69.0 64.5
20th Percentile FDA days to MDUFA III decision 49 47 35
40th Percentile FDA days to MDUFA III decision 74 73 58
60th Percentile FDA days to MDUFA III decision 85 85 82
80th Percentile FDA days to MDUFA III decision 88 88 87
Maximum FDA days to MDUFA III decision 100 94 90
Average Industry days to MDUFA III decision 40.5 38.4 19.8
20th Percentile Industry days to MDUFA III decision 0 0 0
40th Percentile Industry days to MDUFA III decision 2 0 0
60th Percentile Industry days to MDUFA III decision 30 23 7
80th Percentile Industry days to MDUFA III decision 75 78 36
Maximum Industry days to MDUFA III decision 430 264 182
Average Total days to MDUFA III decision 110.4 107.4 84.3
20th Percentile Total days to MDUFA III decision 52 50 42
40th Percentile Total days to MDUFA III decision 85 84 66
60th Percentile Total days to MDUFA III decision 110 105 89
80th Percentile Total days to MDUFA III decision 163 161 113
Maximum Total days to MDUFA III decision 520 352 266
Page 217 of 371

0 0
0 0
0 0
0 0
0 0
0 0
0.00% 0.00%
0.00% 0.00%
0.00% 0.00%
0.00% 0.00%
0 0
0 0
0 0
Table 6.6.DOD - ODE - 510(k) Performance Metrics – Rate of SE, NSE, Withdrawal and Delete Decisions
Performance Metric FY 2013 FY 2014 FY 2015 FY 2016 FY 2017
510(k)s accepted 656 654 621
Number with MDUFA decision 583 604 391
Number of SE decisions 564 596 391
Number of NSE decisions 19 8 0
Number of Withdrawals 37 26 13
Number deleted 35 20 7
Rate of SE decisions 96.7% 98.7% 100%
Rate of NSE decisions 3.3% 1.3% 0%
Rate of Withdrawals 5.6% 4.0% 2.1%
Rate of Deleted 5.3% 3.1% 1.1%
Table 6.7.DOD - ODE - 510(k) Performance Metrics – Submissions Missing Performance Goals
Performance Metric FY 2013 FY 2014 FY 2015 FY 2016 FY 2017
Number of submissions that missed the goal 4 2 0
Mean FDA days for submissions that missed goal 97 93 0
Mean industry days for submissions that missed goal 104 53 0
Page 218 of 371

0 0
0 0
0 0 0 0
0 0
0 0 0.00% 0.00%
0 0
0 0
0 0
0 0
0 0
0 0
0 0 0.00% 0.00%
Table 6.1.DOED - ODE - 510(k) Acceptance Review Decision
Performance Metric FY 2013 FY 2014 FY 2015 FY 2016 FY 2017
Number Received 118 142 142
Closed before RTA action 0 0 1
Number Accepted 59 75 75 Number without a RTA Review and > 15 Days since Date Received 5 2 2
Number without a RTA Review and <= 15 Days since Date Received 0 0 8
Number Not Accepted 54 65 56 Rate of submissions not accepted for filing review 45.8% 45.8% 42.1%
* RTA was not in place 1st quarter, thus Table 6.1 for FY2013 includes only 510(k)s received on or after January 1, 2013. All other tables include 510(k)s received on or after October 1, 2012.
Table 6.2.DOED - ODE - 510(k) Substantive Interaction Performance Goals
Performance Metric FY 2013 FY 2014 FY 2015 FY 2016 FY 2017
Eligible for SI 139 137 122
Deleted or withdrawn prior to SI 0 1 0
SI within 60 FDA days 134 135 102
SI over 60 FDA days 5 1 2
SI pending within 60 FDA days 0 0 18
SI pending over 60 FDA days 0 0 0
510(k)s NSE without SI 0 0 0 Current SI Performance Percent within 60 FDA days 96.4% 99.3% 98.1%
Page 219 of 371

0 0
0 0
0 0
0 0
0 0
0 0
0 0
0 0
0 0
0 0
0 0
0 0
0.00% 0.00%
Table 6.3.DOED - ODE - 510(k) Substantive Interaction Metrics – Time to Substantive Interaction
Performance Metric FY 2013 FY 2014 FY 2015 FY 2016 FY 2017
Number of Substantive Interactions 139 136 104 Average number of FDA days to Substantive Interaction 48.7 51.3 51.9
20th Percentile FDA days to Substantive Interaction 43 46 49
40th Percentile FDA days to Substantive Interaction 49 53 54
60th Percentile FDA days to Substantive Interaction 54 57 58
80th Percentile FDA days to Substantive Interaction 57 59 59
Maximum FDA days to Substantive Interaction 88 62 64
Table 6.4.DOED - ODE - 510(k) MDUFA Decision Performance Goals
Performance Metric FY 2013 FY 2014 FY 2015 FY 2016 FY 2017
510(k)s accepted 146 139 125
Non-MDUFA III Decisions 20 25 7
MDUFA III Decisions (SE/NSE) 126 110 70
MDUFA III Decisions within 90 FDA Days 123 110 70
510(k)s pending MDUFA III Decision 0 4 48 510(k) pending MDUFA III Decision over 90 FDA days 0 0 0
Current Performance Percent within 90 FDA Days 97.6% 100% 100%
Page 220 of 371

0 0
0 0
0 0
0 0
0 0
0 0
0 0
0 0
0 0
0 0
0 0
0 0
0 0
0 0
0 0
0 0
0 0
0 0
0 0
Table 6.5.DOED - ODE - 510(k) Time to MDUFA Decision
Performance Metric FY 2013 FY 2014 FY 2015 FY 2016 FY 2017
Average review cycles 1.8 1.8 1.6
Number with MDUFA III decision 126 110 70
Average FDA days to MDUFA III decision 75.5 78.2 70.5
20th Percentile FDA days to MDUFA III decision 56 60 54
40th Percentile FDA days to MDUFA III decision 84 87 64
60th Percentile FDA days to MDUFA III decision 88 89 88
80th Percentile FDA days to MDUFA III decision 90 90 90
Maximum FDA days to MDUFA III decision 91 90 90
Average Industry days to MDUFA III decision 62.8 55.5 30
20th Percentile Industry days to MDUFA III decision 0 0 0
40th Percentile Industry days to MDUFA III decision 21 21 0
60th Percentile Industry days to MDUFA III decision 60 42 17
80th Percentile Industry days to MDUFA III decision 160 115 49
Maximum Industry days to MDUFA III decision 250 333 168
Average Total days to MDUFA III decision 138.3 133.8 100.2
20th Percentile Total days to MDUFA III decision 70 77 56
40th Percentile Total days to MDUFA III decision 105 105 75
60th Percentile Total days to MDUFA III decision 135 132 107
80th Percentile Total days to MDUFA III decision 230 197 134
Maximum Total days to MDUFA III decision 332 423 258
Page 221 of 371

0 0
0 0
0 0
0 0
0 0
0 0
0.00% 0.00%
0.00% 0.00%
0.00% 0.00%
0.00% 0.00%
0 0
0 0
0 0
Table 6.6.DOED - ODE - 510(k) Performance Metrics – Rate of SE, NSE, Withdrawal and Delete Decisions
Performance Metric FY 2013 FY 2014 FY 2015 FY 2016 FY 2017
510(k)s accepted 146 139 125
Number with MDUFA decision 126 110 70
Number of SE decisions 121 104 66
Number of NSE decisions 5 6 4
Number of Withdrawals 8 6 4
Number deleted 11 16 2
Rate of SE decisions 96.0% 94.5% 94.3%
Rate of NSE decisions 4.0% 5.5% 5.7%
Rate of Withdrawals 5.5% 4.3% 3.2%
Rate of Deleted 7.5% 11.5% 1.6%
Table 6.7.DOED - ODE - 510(k) Performance Metrics – Submissions Missing Performance Goals
Performance Metric FY 2013 FY 2014 FY 2015 FY 2016 FY 2017
Number of submissions that missed the goal 3 0 0
Mean FDA days for submissions that missed goal 91 0 0
Mean industry days for submissions that missed goal 123 0 0
Page 222 of 371
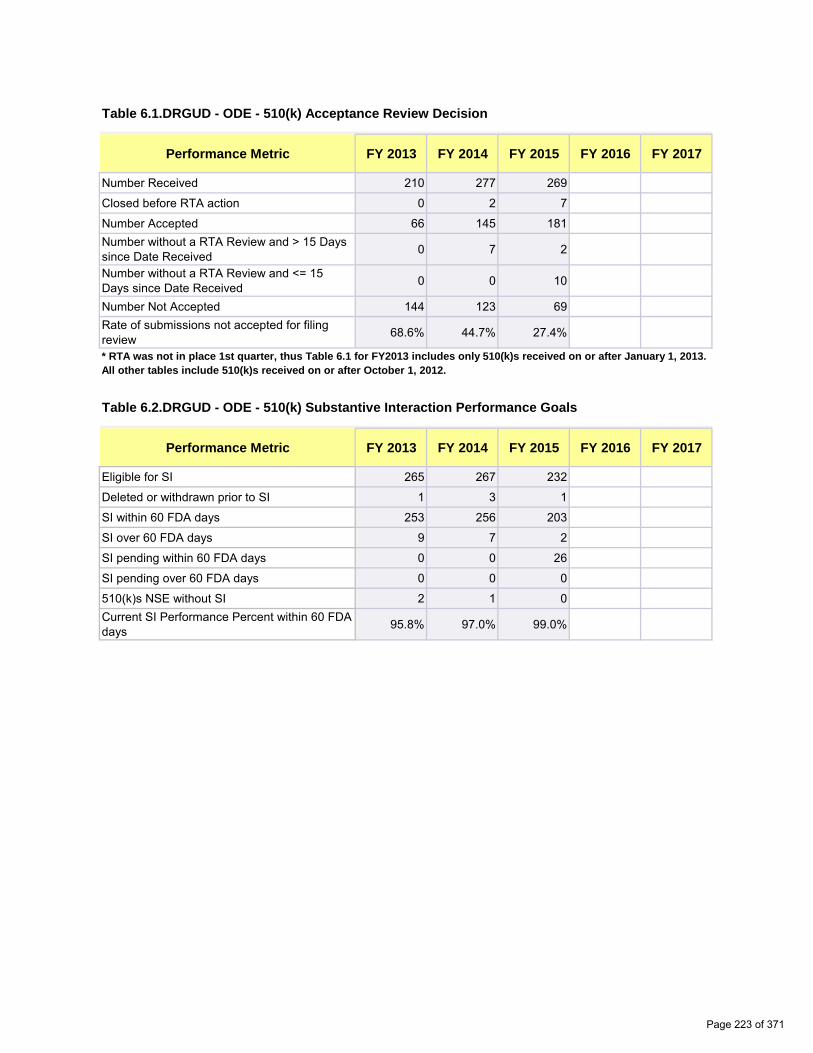
0 0
0 0
0 0 0 0
0 0
0 0 0.00% 0.00%
0 0
0 0
0 0
0 0
0 0
0 0
0 0 0.00% 0.00%
Table 6.1.DRGUD - ODE - 510(k) Acceptance Review Decision
Performance Metric FY 2013 FY 2014 FY 2015 FY 2016 FY 2017
Number Received 210 277 269
Closed before RTA action 0 2 7
Number Accepted 66 145 181 Number without a RTA Review and > 15 Days since Date Received 0 7 2
Number without a RTA Review and <= 15 Days since Date Received 0 0 10
Number Not Accepted 144 123 69 Rate of submissions not accepted for filing review 68.6% 44.7% 27.4%
* RTA was not in place 1st quarter, thus Table 6.1 for FY2013 includes only 510(k)s received on or after January 1, 2013. All other tables include 510(k)s received on or after October 1, 2012.
Table 6.2.DRGUD - ODE - 510(k) Substantive Interaction Performance Goals
Performance Metric FY 2013 FY 2014 FY 2015 FY 2016 FY 2017
Eligible for SI 265 267 232
Deleted or withdrawn prior to SI 1 3 1
SI within 60 FDA days 253 256 203
SI over 60 FDA days 9 7 2
SI pending within 60 FDA days 0 0 26
SI pending over 60 FDA days 0 0 0
510(k)s NSE without SI 2 1 0 Current SI Performance Percent within 60 FDA days 95.8% 97.0% 99.0%
Page 223 of 371
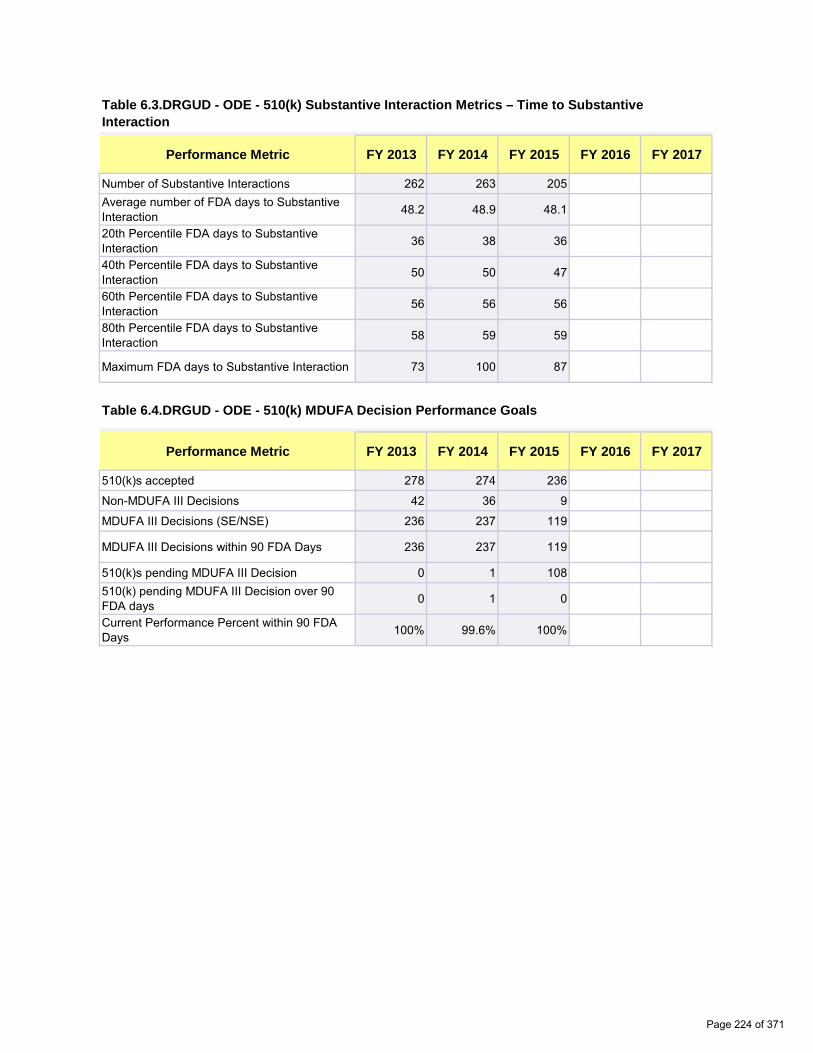
0 0
0 0
0 0
0 0
0 0
0 0
0 0
0 0
0 0
0 0
0 0
0 0
0.00% 0.00%
Table 6.3.DRGUD - ODE - 510(k) Substantive Interaction Metrics – Time to Substantive Interaction
Performance Metric FY 2013 FY 2014 FY 2015 FY 2016 FY 2017
Number of Substantive Interactions 262 263 205 Average number of FDA days to Substantive Interaction 48.2 48.9 48.1
20th Percentile FDA days to Substantive Interaction 36 38 36
40th Percentile FDA days to Substantive Interaction 50 50 47
60th Percentile FDA days to Substantive Interaction 56 56 56
80th Percentile FDA days to Substantive Interaction 58 59 59
Maximum FDA days to Substantive Interaction 73 100 87
Table 6.4.DRGUD - ODE - 510(k) MDUFA Decision Performance Goals
Performance Metric FY 2013 FY 2014 FY 2015 FY 2016 FY 2017
510(k)s accepted 278 274 236
Non-MDUFA III Decisions 42 36 9
MDUFA III Decisions (SE/NSE) 236 237 119
MDUFA III Decisions within 90 FDA Days 236 237 119
510(k)s pending MDUFA III Decision 0 1 108 510(k) pending MDUFA III Decision over 90 FDA days 0 1 0
Current Performance Percent within 90 FDA Days 100% 99.6% 100%
Page 224 of 371

0 0
0 0
0 0
0 0
0 0
0 0
0 0
0 0
0 0
0 0
0 0
0 0
0 0
0 0
0 0
0 0
0 0
0 0
0 0
Table 6.5.DRGUD - ODE - 510(k) Time to MDUFA Decision
Performance Metric FY 2013 FY 2014 FY 2015 FY 2016 FY 2017
Average review cycles 1.9 1.8 1.5
Number with MDUFA III decision 236 237 119
Average FDA days to MDUFA III decision 71.4 71.1 66.8
20th Percentile FDA days to MDUFA III decision 54 52 36
40th Percentile FDA days to MDUFA III decision 80 77 68
60th Percentile FDA days to MDUFA III decision 86 86 84
80th Percentile FDA days to MDUFA III decision 88 88 88
Maximum FDA days to MDUFA III decision 90 90 90
Average Industry days to MDUFA III decision 73.1 58.1 36.4
20th Percentile Industry days to MDUFA III decision 0 0 0
40th Percentile Industry days to MDUFA III decision 32 22 0
60th Percentile Industry days to MDUFA III decision 74 55 24
80th Percentile Industry days to MDUFA III decision 152 112 71
Maximum Industry days to MDUFA III decision 416 236 182
Average Total days to MDUFA III decision 144.6 129.1 103.2
20th Percentile Total days to MDUFA III decision 59 60 42
40th Percentile Total days to MDUFA III decision 112 103 84
60th Percentile Total days to MDUFA III decision 154 135 101
80th Percentile Total days to MDUFA III decision 239 199 154
Maximum Total days to MDUFA III decision 506 316 270
Page 225 of 371

0 0
0 0
0 0
0 0
0 0
0 0
0.00% 0.00%
0.00% 0.00%
0.00% 0.00%
0.00% 0.00%
0 0
0 0
0 0
Table 6.6.DRGUD - ODE - 510(k) Performance Metrics – Rate of SE, NSE, Withdrawal and Delete Decisions
Performance Metric FY 2013 FY 2014 FY 2015 FY 2016 FY 2017
510(k)s accepted 278 274 236
Number with MDUFA decision 236 237 119
Number of SE decisions 221 232 119
Number of NSE decisions 15 5 0
Number of Withdrawals 18 11 7
Number deleted 22 21 1
Rate of SE decisions 93.6% 97.9% 100%
Rate of NSE decisions 6.4% 2.1% 0%
Rate of Withdrawals 6.5% 4.0% 3.0%
Rate of Deleted 7.9% 7.7% 0.4%
Table 6.7.DRGUD - ODE - 510(k) Performance Metrics – Submissions Missing Performance Goals
Performance Metric FY 2013 FY 2014 FY 2015 FY 2016 FY 2017
Number of submissions that missed the goal 0 0 0
Mean FDA days for submissions that missed goal 0 0 0
Mean industry days for submissions that missed goal 0 0 0
Page 226 of 371

0 0
0 0
0 0 0 0
0 0
0 0 0.00% 0.00%
0 0
0 0
0 0
0 0
0 0
0 0
0 0 0.00% 0.00%
Table 6.1.DSD - ODE - 510(k) Acceptance Review Decision
Performance Metric FY 2013 FY 2014 FY 2015 FY 2016 FY 2017
Number Received 375 483 494
Closed before RTA action 3 0 1
Number Accepted 136 212 296 Number without a RTA Review and > 15 Days since Date Received 3 11 5
Number without a RTA Review and <= 15 Days since Date Received 0 0 19
Number Not Accepted 233 260 173 Rate of submissions not accepted for filing review 62.6% 53.8% 36.5%
* RTA was not in place 1st quarter, thus Table 6.1 for FY2013 includes only 510(k)s received on or after January 1, 2013. All other tables include 510(k)s received on or after October 1, 2012.
Table 6.2.DSD - ODE - 510(k) Substantive Interaction Performance Goals
Performance Metric FY 2013 FY 2014 FY 2015 FY 2016 FY 2017
Eligible for SI 473 458 427
Deleted or withdrawn prior to SI 3 0 0
SI within 60 FDA days 424 420 348
SI over 60 FDA days 46 37 15
SI pending within 60 FDA days 0 1 63
SI pending over 60 FDA days 0 0 1
510(k)s NSE without SI 0 0 0 Current SI Performance Percent within 60 FDA days 90.2% 91.9% 95.6%
Page 227 of 371
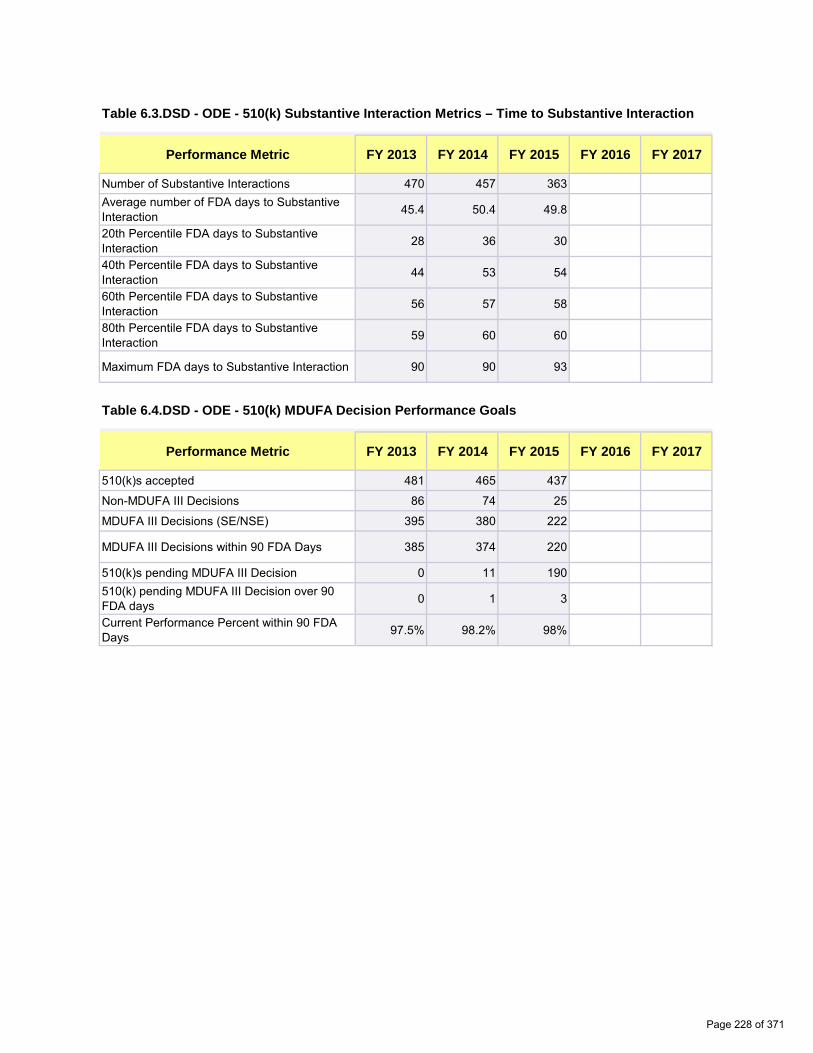
0 0
0 0
0 0
0 0
0 0
0 0
0 0
0 0
0 0
0 0
0 0
0 0
0.00% 0.00%
Table 6.3.DSD - ODE - 510(k) Substantive Interaction Metrics – Time to Substantive Interaction
Performance Metric FY 2013 FY 2014 FY 2015 FY 2016 FY 2017
Number of Substantive Interactions 470 457 363 Average number of FDA days to Substantive Interaction 45.4 50.4 49.8
20th Percentile FDA days to Substantive Interaction 28 36 30
40th Percentile FDA days to Substantive Interaction 44 53 54
60th Percentile FDA days to Substantive Interaction 56 57 58
80th Percentile FDA days to Substantive Interaction 59 60 60
Maximum FDA days to Substantive Interaction 90 90 93
Table 6.4.DSD - ODE - 510(k) MDUFA Decision Performance Goals
Performance Metric FY 2013 FY 2014 FY 2015 FY 2016 FY 2017
510(k)s accepted 481 465 437
Non-MDUFA III Decisions 86 74 25
MDUFA III Decisions (SE/NSE) 395 380 222
MDUFA III Decisions within 90 FDA Days 385 374 220
510(k)s pending MDUFA III Decision 0 11 190 510(k) pending MDUFA III Decision over 90 FDA days 0 1 3
Current Performance Percent within 90 FDA Days 97.5% 98.2% 98%
Page 228 of 371

0 0
0 0
0 0
0 0
0 0
0 0
0 0
0 0
0 0
0 0
0 0
0 0
0 0
0 0
0 0
0 0
0 0
0 0
0 0
Table 6.5.DSD - ODE - 510(k) Time to MDUFA Decision
Performance Metric FY 2013 FY 2014 FY 2015 FY 2016 FY 2017
Average review cycles 1.8 1.7 1.6
Number with MDUFA III decision 395 380 222
Average FDA days to MDUFA III decision 69.0 72.5 66.5
20th Percentile FDA days to MDUFA III decision 43 54 30
40th Percentile FDA days to MDUFA III decision 70 79 65
60th Percentile FDA days to MDUFA III decision 85 87 86
80th Percentile FDA days to MDUFA III decision 89 89 89
Maximum FDA days to MDUFA III decision 342 147 129
Average Industry days to MDUFA III decision 60.0 57.9 30.7
20th Percentile Industry days to MDUFA III decision 0 0 0
40th Percentile Industry days to MDUFA III decision 20 16 0
60th Percentile Industry days to MDUFA III decision 44 49 20
80th Percentile Industry days to MDUFA III decision 125 119 58
Maximum Industry days to MDUFA III decision 438 359 199
Average Total days to MDUFA III decision 129.1 130.5 97.3
20th Percentile Total days to MDUFA III decision 51 61 30
40th Percentile Total days to MDUFA III decision 93 90 81
60th Percentile Total days to MDUFA III decision 128 133 100
80th Percentile Total days to MDUFA III decision 204 209 140
Maximum Total days to MDUFA III decision 691 448 287
Page 229 of 371
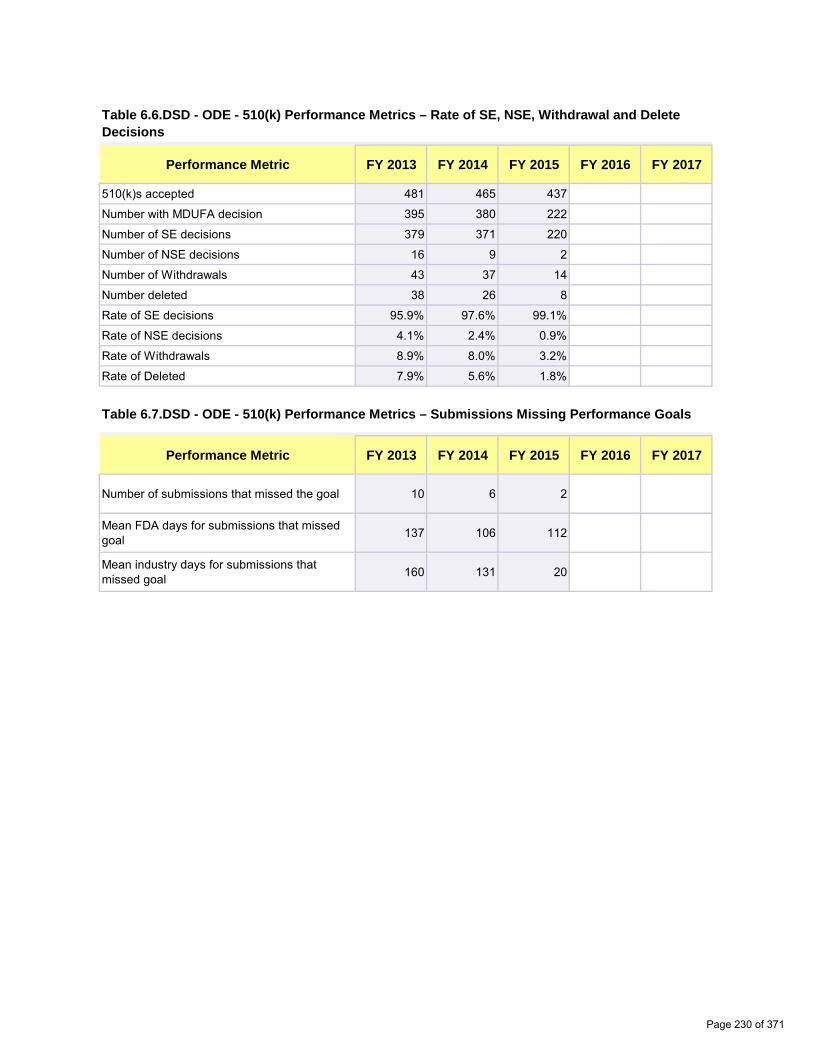
0 0
0 0
0 0
0 0
0 0
0 0
0.00% 0.00%
0.00% 0.00%
0.00% 0.00%
0.00% 0.00%
0 0
0 0
0 0
Table 6.6.DSD - ODE - 510(k) Performance Metrics – Rate of SE, NSE, Withdrawal and Delete Decisions
Performance Metric FY 2013 FY 2014 FY 2015 FY 2016 FY 2017
510(k)s accepted 481 465 437
Number with MDUFA decision 395 380 222
Number of SE decisions 379 371 220
Number of NSE decisions 16 9 2
Number of Withdrawals 43 37 14
Number deleted 38 26 8
Rate of SE decisions 95.9% 97.6% 99.1%
Rate of NSE decisions 4.1% 2.4% 0.9%
Rate of Withdrawals 8.9% 8.0% 3.2%
Rate of Deleted 7.9% 5.6% 1.8%
Table 6.7.DSD - ODE - 510(k) Performance Metrics – Submissions Missing Performance Goals
Performance Metric FY 2013 FY 2014 FY 2015 FY 2016 FY 2017
Number of submissions that missed the goal 10 6 2
Mean FDA days for submissions that missed goal 137 106 112
Mean industry days for submissions that missed goal 160 131 20
Page 230 of 371

0 0
0 0
0 0 0 0
0 0
0 0 0.00% 0.00%
0 0
0 0
0 0
0 0
0 0
0 0
0 0 0.00% 0.00%
Table 6.1.DCTD - OIR - 510(k) Acceptance Review Decision
Performance Metric FY 2013 FY 2014 FY 2015 FY 2016 FY 2017
Number Received 188 195 192
Closed before RTA action 1 1 1
Number Accepted 118 127 150 Number without a RTA Review and > 15 Days since Date Received 0 1 0
Number without a RTA Review and <= 15 Days since Date Received 0 0 7
Number Not Accepted 69 66 34 Rate of submissions not accepted for filing review 36.9% 34.0% 18.5%
* RTA was not in place 1st quarter, thus Table 6.1 for FY2013 includes only 510(k)s received on or after January 1, 2013. All other tables include 510(k)s received on or after October 1, 2012.
Table 6.2.DCTD - OIR - 510(k) Substantive Interaction Performance Goals
Performance Metric FY 2013 FY 2014 FY 2015 FY 2016 FY 2017
Eligible for SI 247 184 169
Deleted or withdrawn prior to SI 0 0 0
SI within 60 FDA days 247 184 145
SI over 60 FDA days 0 0 2
SI pending within 60 FDA days 0 0 22
SI pending over 60 FDA days 0 0 0
510(k)s NSE without SI 0 0 0 Current SI Performance Percent within 60 FDA days 100% 100% 99%
Page 231 of 371
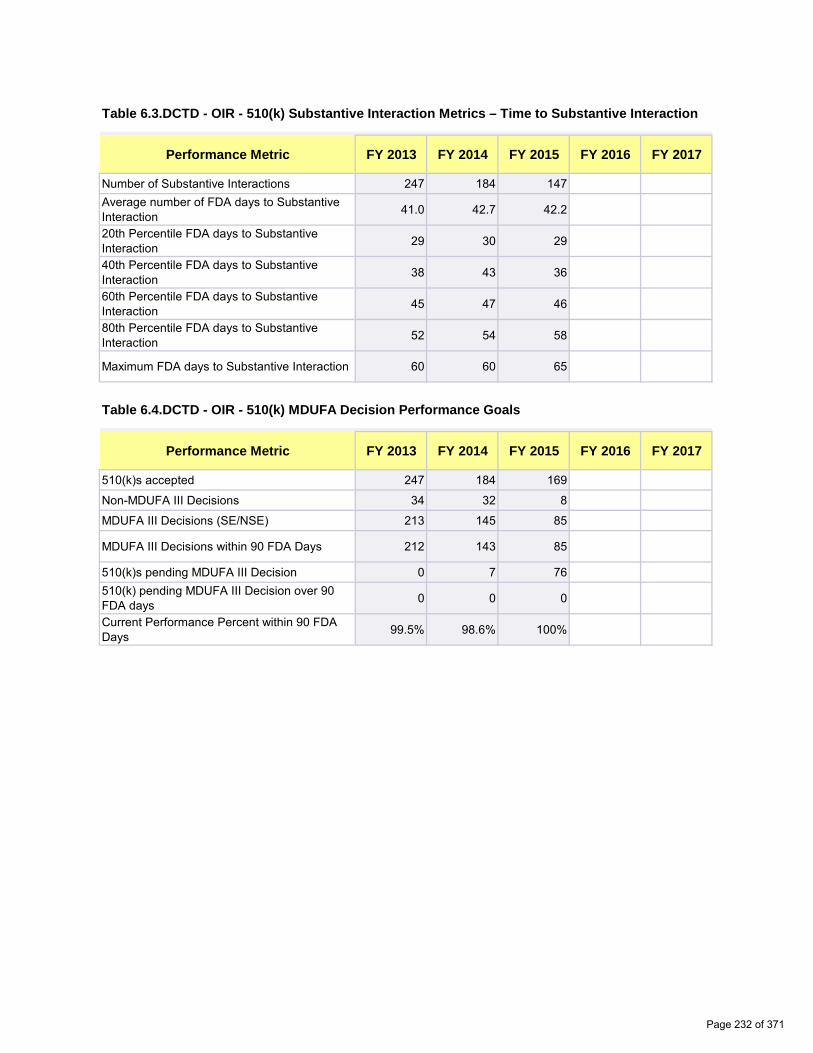
0 0
0 0
0 0
0 0
0 0
0 0
0 0
0 0
0 0
0 0
0 0
0 0
0.00% 0.00%
Table 6.3.DCTD - OIR - 510(k) Substantive Interaction Metrics – Time to Substantive Interaction
Performance Metric FY 2013 FY 2014 FY 2015 FY 2016 FY 2017
Number of Substantive Interactions 247 184 147 Average number of FDA days to Substantive Interaction 41.0 42.7 42.2
20th Percentile FDA days to Substantive Interaction 29 30 29
40th Percentile FDA days to Substantive Interaction 38 43 36
60th Percentile FDA days to Substantive Interaction 45 47 46
80th Percentile FDA days to Substantive Interaction 52 54 58
Maximum FDA days to Substantive Interaction 60 60 65
Table 6.4.DCTD - OIR - 510(k) MDUFA Decision Performance Goals
Performance Metric FY 2013 FY 2014 FY 2015 FY 2016 FY 2017
510(k)s accepted 247 184 169
Non-MDUFA III Decisions 34 32 8
MDUFA III Decisions (SE/NSE) 213 145 85
MDUFA III Decisions within 90 FDA Days 212 143 85
510(k)s pending MDUFA III Decision 0 7 76 510(k) pending MDUFA III Decision over 90 FDA days 0 0 0
Current Performance Percent within 90 FDA Days 99.5% 98.6% 100%
Page 232 of 371

0 0
0 0
0 0
0 0
0 0
0 0
0 0
0 0
0 0
0 0
0 0
0 0
0 0
0 0
0 0
0 0
0 0
0 0
0 0
Table 6.5.DCTD - OIR - 510(k) Time to MDUFA Decision
Performance Metric FY 2013 FY 2014 FY 2015 FY 2016 FY 2017
Average review cycles 1.9 1.9 1.5
Number with MDUFA III decision 213 145 85
Average FDA days to MDUFA III decision 64.9 66.7 56.0
20th Percentile FDA days to MDUFA III decision 34 34 29
40th Percentile FDA days to MDUFA III decision 58 59 37
60th Percentile FDA days to MDUFA III decision 84 85 65
80th Percentile FDA days to MDUFA III decision 88 88 85
Maximum FDA days to MDUFA III decision 99 131 90
Average Industry days to MDUFA III decision 83.4 80.0 28
20th Percentile Industry days to MDUFA III decision 0 0 0
40th Percentile Industry days to MDUFA III decision 12 10 0
60th Percentile Industry days to MDUFA III decision 69 61 0
80th Percentile Industry days to MDUFA III decision 166 174 58
Maximum Industry days to MDUFA III decision 467 469 275
Average Total days to MDUFA III decision 148.4 146.7 83.8
20th Percentile Total days to MDUFA III decision 35 34 29
40th Percentile Total days to MDUFA III decision 87 80 37
60th Percentile Total days to MDUFA III decision 148 146 82
80th Percentile Total days to MDUFA III decision 245 260 129
Maximum Total days to MDUFA III decision 557 556 356
Page 233 of 371
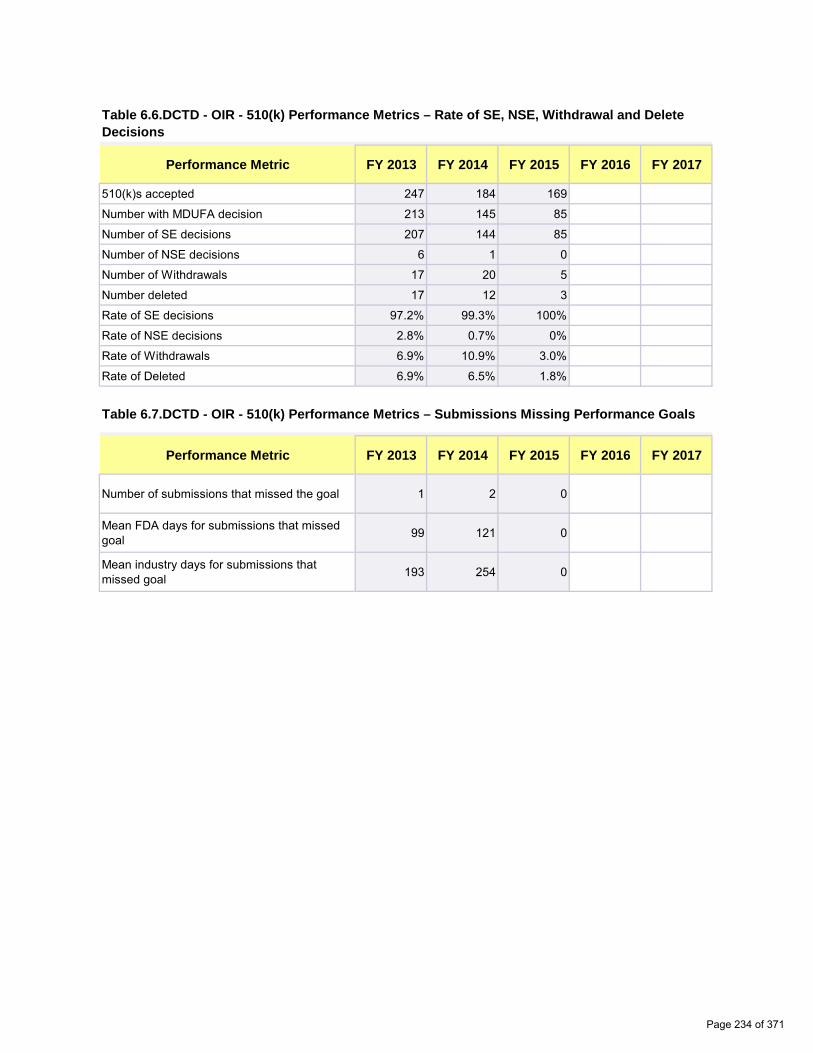
0 0
0 0
0 0
0 0
0 0
0 0
0.00% 0.00%
0.00% 0.00%
0.00% 0.00%
0.00% 0.00%
0 0
0 0
0 0
Table 6.6.DCTD - OIR - 510(k) Performance Metrics – Rate of SE, NSE, Withdrawal and Delete Decisions
Performance Metric FY 2013 FY 2014 FY 2015 FY 2016 FY 2017
510(k)s accepted 247 184 169
Number with MDUFA decision 213 145 85
Number of SE decisions 207 144 85
Number of NSE decisions 6 1 0
Number of Withdrawals 17 20 5
Number deleted 17 12 3
Rate of SE decisions 97.2% 99.3% 100%
Rate of NSE decisions 2.8% 0.7% 0%
Rate of Withdrawals 6.9% 10.9% 3.0%
Rate of Deleted 6.9% 6.5% 1.8%
Table 6.7.DCTD - OIR - 510(k) Performance Metrics – Submissions Missing Performance Goals
Performance Metric FY 2013 FY 2014 FY 2015 FY 2016 FY 2017
Number of submissions that missed the goal 1 2 0
Mean FDA days for submissions that missed goal 99 121 0
Mean industry days for submissions that missed goal 193 254 0
Page 234 of 371

0 0
0 0
0 0 0 0
0 0
0 0 0.00% 0.00%
0 0
0 0
0 0
0 0
0 0
0 0
0 0 0.00% 0.00%
Table 6.1.DIHD - OIR - 510(k) Acceptance Review Decision
Performance Metric FY 2013 FY 2014 FY 2015 FY 2016 FY 2017
Number Received 56 73 60
Closed before RTA action 1 1 0
Number Accepted 38 57 48 Number without a RTA Review and > 15 Days since Date Received 3 0 1
Number without a RTA Review and <= 15 Days since Date Received 0 0 2
Number Not Accepted 14 15 9 Rate of submissions not accepted for filing review 25.5% 20.8% 15.5%
* RTA was not in place 1st quarter, thus Table 6.1 for FY2013 includes only 510(k)s received on or after January 1, 2013. All other tables include 510(k)s received on or after October 1, 2012.
Table 6.2.DIHD - OIR - 510(k) Substantive Interaction Performance Goals
Performance Metric FY 2013 FY 2014 FY 2015 FY 2016 FY 2017
Eligible for SI 69 64 55
Deleted or withdrawn prior to SI 0 0 1
SI within 60 FDA days 68 64 50
SI over 60 FDA days 1 0 0
SI pending within 60 FDA days 0 0 4
SI pending over 60 FDA days 0 0 0
510(k)s NSE without SI 0 0 0 Current SI Performance Percent within 60 FDA days 98.6% 100% 100%
Page 235 of 371

0 0
0 0
0 0
0 0
0 0
0 0
0 0
0 0
0 0
0 0
0 0
0 0
0.00% 0.00%
Table 6.3.DIHD - OIR - 510(k) Substantive Interaction Metrics – Time to Substantive Interaction
Performance Metric FY 2013 FY 2014 FY 2015 FY 2016 FY 2017
Number of Substantive Interactions 69 64 50 Average number of FDA days to Substantive Interaction 47.6 50.8 51.9
20th Percentile FDA days to Substantive Interaction 41 46 40
40th Percentile FDA days to Substantive Interaction 50 51 57
60th Percentile FDA days to Substantive Interaction 54 57 59
80th Percentile FDA days to Substantive Interaction 58 58 60
Maximum FDA days to Substantive Interaction 63 60 60
Table 6.4.DIHD - OIR - 510(k) MDUFA Decision Performance Goals
Performance Metric FY 2013 FY 2014 FY 2015 FY 2016 FY 2017
510(k)s accepted 69 64 55
Non-MDUFA III Decisions 22 20 4
MDUFA III Decisions (SE/NSE) 47 44 20
MDUFA III Decisions within 90 FDA Days 47 43 20
510(k)s pending MDUFA III Decision 0 0 31 510(k) pending MDUFA III Decision over 90 FDA days 0 0 0
Current Performance Percent within 90 FDA Days 100% 97.7% 100%
Page 236 of 371

0 0
0 0
0 0
0 0
0 0
0 0
0 0
0 0
0 0
0 0
0 0
0 0
0 0
0 0
0 0
0 0
0 0
0 0
0 0
Table 6.5.DIHD - OIR - 510(k) Time to MDUFA Decision
Performance Metric FY 2013 FY 2014 FY 2015 FY 2016 FY 2017
Average review cycles 2.0 1.9 1.6
Number with MDUFA III decision 47 44 20
Average FDA days to MDUFA III decision 71.6 79.5 61.1
20th Percentile FDA days to MDUFA III decision 50 70 28
40th Percentile FDA days to MDUFA III decision 77 88 31
60th Percentile FDA days to MDUFA III decision 86 89 88
80th Percentile FDA days to MDUFA III decision 88 90 90
Maximum FDA days to MDUFA III decision 90 91 90
Average Industry days to MDUFA III decision 115.4 106.4 63
20th Percentile Industry days to MDUFA III decision 29 45 0
40th Percentile Industry days to MDUFA III decision 89 63 0
60th Percentile Industry days to MDUFA III decision 157 154 79
80th Percentile Industry days to MDUFA III decision 177 176 151
Maximum Industry days to MDUFA III decision 329 325 183
Average Total days to MDUFA III decision 187.0 185.8 123.6
20th Percentile Total days to MDUFA III decision 91 118 28
40th Percentile Total days to MDUFA III decision 151 140 31
60th Percentile Total days to MDUFA III decision 236 237 167
80th Percentile Total days to MDUFA III decision 264 265 241
Maximum Total days to MDUFA III decision 417 414 273
Page 237 of 371
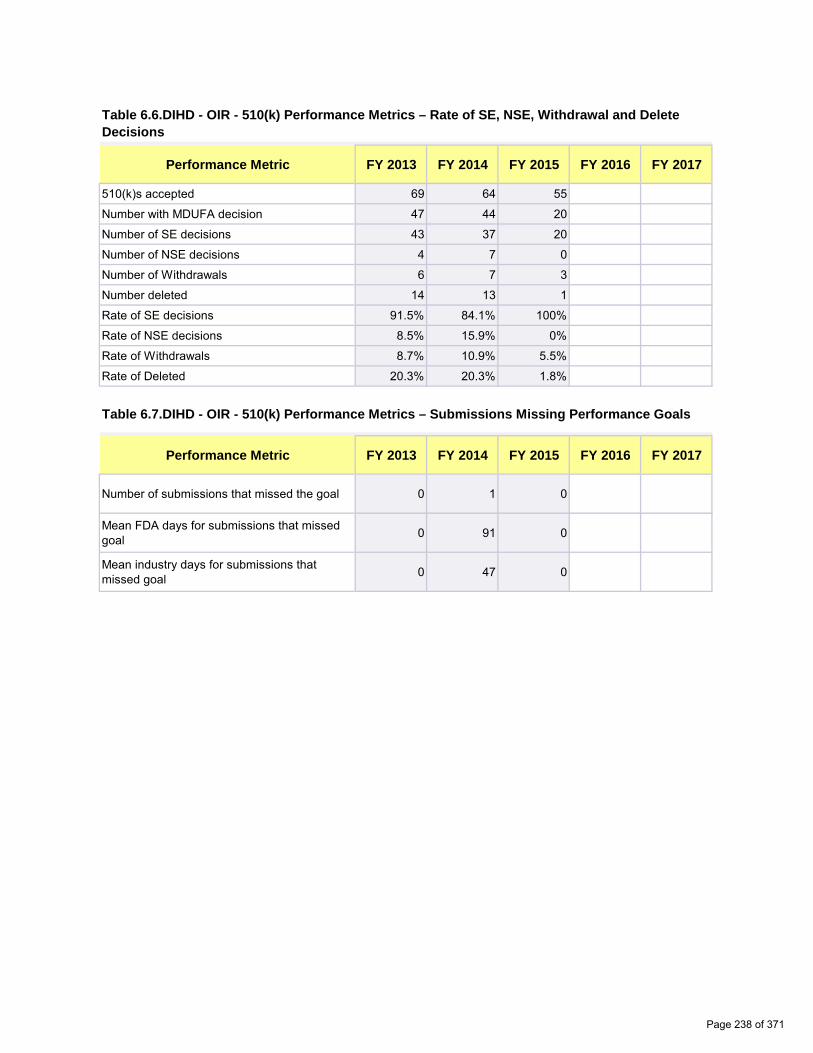
0 0
0 0
0 0
0 0
0 0
0 0
0.00% 0.00%
0.00% 0.00%
0.00% 0.00%
0.00% 0.00%
0 0
0 0
0 0
Table 6.6.DIHD - OIR - 510(k) Performance Metrics – Rate of SE, NSE, Withdrawal and Delete Decisions
Performance Metric FY 2013 FY 2014 FY 2015 FY 2016 FY 2017
510(k)s accepted 69 64 55
Number with MDUFA decision 47 44 20
Number of SE decisions 43 37 20
Number of NSE decisions 4 7 0
Number of Withdrawals 6 7 3
Number deleted 14 13 1
Rate of SE decisions 91.5% 84.1% 100%
Rate of NSE decisions 8.5% 15.9% 0%
Rate of Withdrawals 8.7% 10.9% 5.5%
Rate of Deleted 20.3% 20.3% 1.8%
Table 6.7.DIHD - OIR - 510(k) Performance Metrics – Submissions Missing Performance Goals
Performance Metric FY 2013 FY 2014 FY 2015 FY 2016 FY 2017
Number of submissions that missed the goal 0 1 0
Mean FDA days for submissions that missed goal 0 91 0
Mean industry days for submissions that missed goal 0 47 0
Page 238 of 371
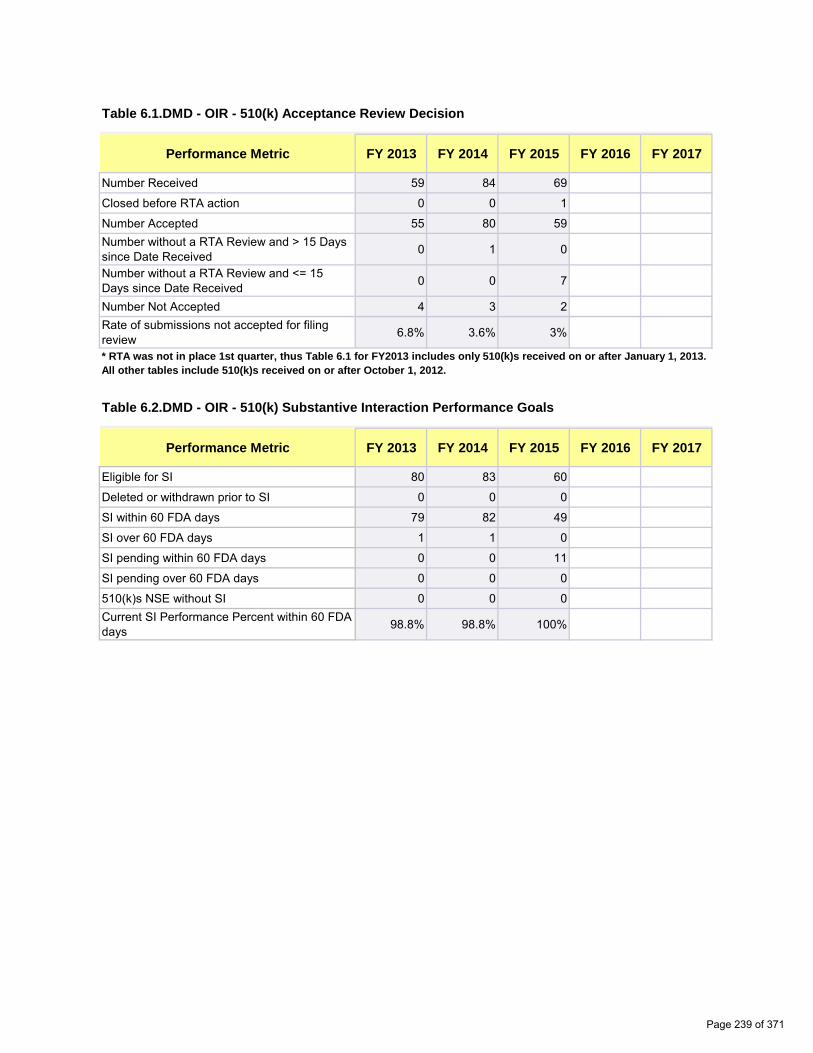
0 0
0 0
0 0 0 0
0 0
0 0 0.00% 0.00%
0 0
0 0
0 0
0 0
0 0
0 0
0 0 0.00% 0.00%
Table 6.1.DMD - OIR - 510(k) Acceptance Review Decision
Performance Metric FY 2013 FY 2014 FY 2015 FY 2016 FY 2017
Number Received 59 84 69
Closed before RTA action 0 0 1
Number Accepted 55 80 59 Number without a RTA Review and > 15 Days since Date Received 0 1 0
Number without a RTA Review and <= 15 Days since Date Received 0 0 7
Number Not Accepted 4 3 2 Rate of submissions not accepted for filing review 6.8% 3.6% 3%
* RTA was not in place 1st quarter, thus Table 6.1 for FY2013 includes only 510(k)s received on or after January 1, 2013. All other tables include 510(k)s received on or after October 1, 2012.
Table 6.2.DMD - OIR - 510(k) Substantive Interaction Performance Goals
Performance Metric FY 2013 FY 2014 FY 2015 FY 2016 FY 2017
Eligible for SI 80 83 60
Deleted or withdrawn prior to SI 0 0 0
SI within 60 FDA days 79 82 49
SI over 60 FDA days 1 1 0
SI pending within 60 FDA days 0 0 11
SI pending over 60 FDA days 0 0 0
510(k)s NSE without SI 0 0 0 Current SI Performance Percent within 60 FDA days 98.8% 98.8% 100%
Page 239 of 371

0 0
0 0
0 0
0 0
0 0
0 0
0 0
0 0
0 0
0 0
0 0
0 0
0.00% 0.00%
Table 6.3.DMD - OIR - 510(k) Substantive Interaction Metrics – Time to Substantive Interaction
Performance Metric FY 2013 FY 2014 FY 2015 FY 2016 FY 2017
Number of Substantive Interactions 80 83 49 Average number of FDA days to Substantive Interaction 43.1 47.6 48.4
20th Percentile FDA days to Substantive Interaction 28 29 34
40th Percentile FDA days to Substantive Interaction 39 51 55
60th Percentile FDA days to Substantive Interaction 53 56 57
80th Percentile FDA days to Substantive Interaction 57 59 58
Maximum FDA days to Substantive Interaction 61 61 60
Table 6.4.DMD - OIR - 510(k) MDUFA Decision Performance Goals
Performance Metric FY 2013 FY 2014 FY 2015 FY 2016 FY 2017
510(k)s accepted 80 83 60
Non-MDUFA III Decisions 9 7 0
MDUFA III Decisions (SE/NSE) 71 75 33
MDUFA III Decisions within 90 FDA Days 71 75 33
510(k)s pending MDUFA III Decision 0 1 27 510(k) pending MDUFA III Decision over 90 FDA days 0 0 0
Current Performance Percent within 90 FDA Days 100% 100% 100%
Page 240 of 371

0 0
0 0
0 0
0 0
0 0
0 0
0 0
0 0
0 0
0 0
0 0
0 0
0 0
0 0
0 0
0 0
0 0
0 0
0 0
Table 6.5.DMD - OIR - 510(k) Time to MDUFA Decision
Performance Metric FY 2013 FY 2014 FY 2015 FY 2016 FY 2017
Average review cycles 1.3 1.5 1.4
Number with MDUFA III decision 71 75 33
Average FDA days to MDUFA III decision 58.5 65.7 63.4
20th Percentile FDA days to MDUFA III decision 29 35 31
40th Percentile FDA days to MDUFA III decision 55 72 58
60th Percentile FDA days to MDUFA III decision 78 81 83
80th Percentile FDA days to MDUFA III decision 81 86 86
Maximum FDA days to MDUFA III decision 89 90 88
Average Industry days to MDUFA III decision 31.5 50.2 34
20th Percentile Industry days to MDUFA III decision 0 0 0
40th Percentile Industry days to MDUFA III decision 0 0 0
60th Percentile Industry days to MDUFA III decision 0 22 6
80th Percentile Industry days to MDUFA III decision 65 126 71
Maximum Industry days to MDUFA III decision 180 349 176
Average Total days to MDUFA III decision 90.0 115.9 96.9
20th Percentile Total days to MDUFA III decision 29 35 31
40th Percentile Total days to MDUFA III decision 58 85 83
60th Percentile Total days to MDUFA III decision 81 95 93
80th Percentile Total days to MDUFA III decision 133 197 136
Maximum Total days to MDUFA III decision 267 434 254
Page 241 of 371

0 0
0 0
0 0
0 0
0 0
0 0
0.00% 0.00%
0.00% 0.00%
0.00% 0.00%
0.00% 0.00%
0 0
0 0
0 0
Table 6.6.DMD - OIR - 510(k) Performance Metrics – Rate of SE, NSE, Withdrawal and Delete Decisions
Performance Metric FY 2013 FY 2014 FY 2015 FY 2016 FY 2017
510(k)s accepted 80 83 60
Number with MDUFA decision 71 75 33
Number of SE decisions 71 72 32
Number of NSE decisions 0 3 1
Number of Withdrawals 6 5 0
Number deleted 3 2 0
Rate of SE decisions 100% 96.0% 97.0%
Rate of NSE decisions 0% 4.0% 3.0%
Rate of Withdrawals 7.5% 6.0% 0%
Rate of Deleted 3.8% 2.4% 0%
Table 6.7.DMD - OIR - 510(k) Performance Metrics – Submissions Missing Performance Goals
Performance Metric FY 2013 FY 2014 FY 2015 FY 2016 FY 2017
Number of submissions that missed the goal 0 0 0
Mean FDA days for submissions that missed goal 0 0 0
Mean industry days for submissions that missed goal 0 0 0
Page 242 of 371

0 0
0 0
0 0 0 0
0 0
0 0 0.00% 0.00%
0 0
0 0
0 0
0 0
0 0
0 0
0 0 0.00% 0.00%
Table 6.1.DMGP - OIR - 510(k) Acceptance Review Decision
Performance Metric FY 2013 FY 2014 FY 2015 FY 2016 FY 2017
Number Received 17 9 5
Closed before RTA action 0 0 0
Number Accepted 14 9 4 Number without a RTA Review and > 15 Days since Date Received 0 0 0
Number without a RTA Review and <= 15 Days since Date Received 0 0 0
Number Not Accepted 3 0 1 Rate of submissions not accepted for filing review 17.6% 0% 20.0%
* RTA was not in place 1st quarter, thus Table 6.1 for FY2013 includes only 510(k)s received on or after January 1, 2013. All other tables include 510(k)s received on or after October 1, 2012.
Table 6.2.DMGP - OIR - 510(k) Substantive Interaction Performance Goals
Performance Metric FY 2013 FY 2014 FY 2015 FY 2016 FY 2017
Eligible for SI 18 9 5
Deleted or withdrawn prior to SI 0 0 0
SI within 60 FDA days 18 9 5
SI over 60 FDA days 0 0 0
SI pending within 60 FDA days 0 0 0
SI pending over 60 FDA days 0 0 0
510(k)s NSE without SI 0 0 0 Current SI Performance Percent within 60 FDA days 100% 100% 100%
Page 243 of 371
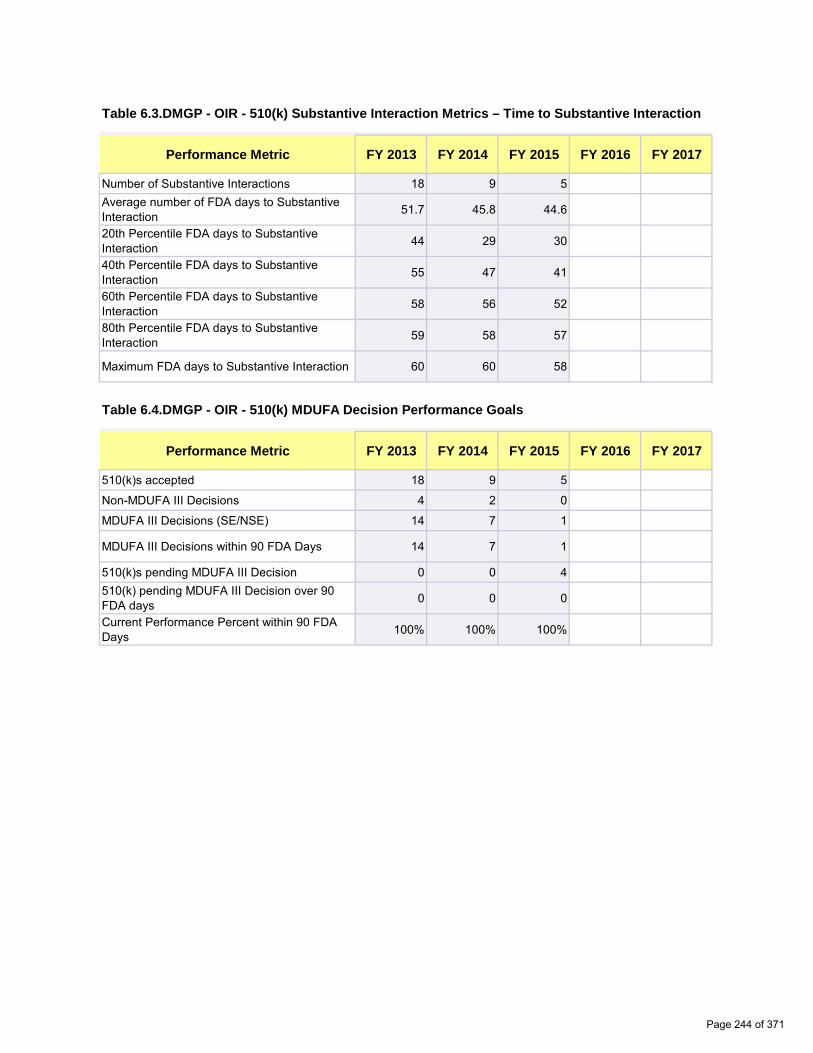
0 0
0 0
0 0
0 0
0 0
0 0
0 0
0 0
0 0
0 0
0 0
0 0
0.00% 0.00%
Table 6.3.DMGP - OIR - 510(k) Substantive Interaction Metrics – Time to Substantive Interaction
Performance Metric FY 2013 FY 2014 FY 2015 FY 2016 FY 2017
Number of Substantive Interactions 18 9 5 Average number of FDA days to Substantive Interaction 51.7 45.8 44.6
20th Percentile FDA days to Substantive Interaction 44 29 30
40th Percentile FDA days to Substantive Interaction 55 47 41
60th Percentile FDA days to Substantive Interaction 58 56 52
80th Percentile FDA days to Substantive Interaction 59 58 57
Maximum FDA days to Substantive Interaction 60 60 58
Table 6.4.DMGP - OIR - 510(k) MDUFA Decision Performance Goals
Performance Metric FY 2013 FY 2014 FY 2015 FY 2016 FY 2017
510(k)s accepted 18 9 5
Non-MDUFA III Decisions 4 2 0
MDUFA III Decisions (SE/NSE) 14 7 1
MDUFA III Decisions within 90 FDA Days 14 7 1
510(k)s pending MDUFA III Decision 0 0 4 510(k) pending MDUFA III Decision over 90 FDA days 0 0 0
Current Performance Percent within 90 FDA Days 100% 100% 100%
Page 244 of 371

0 0
0 0
0 0
0 0
0 0
0 0
0 0
0 0
0 0
0 0
0 0
0 0
0 0
0 0
0 0
0 0
0 0
0 0
0 0
Table 6.5.DMGP - OIR - 510(k) Time to MDUFA Decision
Performance Metric FY 2013 FY 2014 FY 2015 FY 2016 FY 2017
Average review cycles 2.4 1.6 3.0
Number with MDUFA III decision 14 7 1
Average FDA days to MDUFA III decision 83.7 78.1 90.0
20th Percentile FDA days to MDUFA III decision 81 79 90
40th Percentile FDA days to MDUFA III decision 88 88 90
60th Percentile FDA days to MDUFA III decision 88 89 90
80th Percentile FDA days to MDUFA III decision 89 90 90
Maximum FDA days to MDUFA III decision 90 90 90
Average Industry days to MDUFA III decision 151.9 81.7 164.0
20th Percentile Industry days to MDUFA III decision 26 0 164
40th Percentile Industry days to MDUFA III decision 166 16 164
60th Percentile Industry days to MDUFA III decision 175 122 164
80th Percentile Industry days to MDUFA III decision 233 177 164
Maximum Industry days to MDUFA III decision 320 179 164
Average Total days to MDUFA III decision 235.6 159.9 254.0
20th Percentile Total days to MDUFA III decision 103 80 254
40th Percentile Total days to MDUFA III decision 255 106 254
60th Percentile Total days to MDUFA III decision 263 211 254
80th Percentile Total days to MDUFA III decision 317 266 254
Maximum Total days to MDUFA III decision 408 267 254
Page 245 of 371

0 0
0 0
0 0
0 0
0 0
0 0
0.00% 0.00%
0.00% 0.00%
0.00% 0.00%
0.00% 0.00%
0 0
0 0
0 0
Table 6.6.DMGP - OIR - 510(k) Performance Metrics – Rate of SE, NSE, Withdrawal and Delete Decisions
Performance Metric FY 2013 FY 2014 FY 2015 FY 2016 FY 2017
510(k)s accepted 18 9 5
Number with MDUFA decision 14 7 1
Number of SE decisions 11 6 1
Number of NSE decisions 3 1 0
Number of Withdrawals 3 2 0
Number deleted 1 0 0
Rate of SE decisions 78.6% 85.7% 100%
Rate of NSE decisions 21.4% 14.3% 0%
Rate of Withdrawals 16.7% 22.2% 0%
Rate of Deleted 5.6% 0% 0%
Table 6.7.DMGP - OIR - 510(k) Performance Metrics – Submissions Missing Performance Goals
Performance Metric FY 2013 FY 2014 FY 2015 FY 2016 FY 2017
Number of submissions that missed the goal 0 0 0
Mean FDA days for submissions that missed goal 0 0 0
Mean industry days for submissions that missed goal 0 0 0
Page 246 of 371
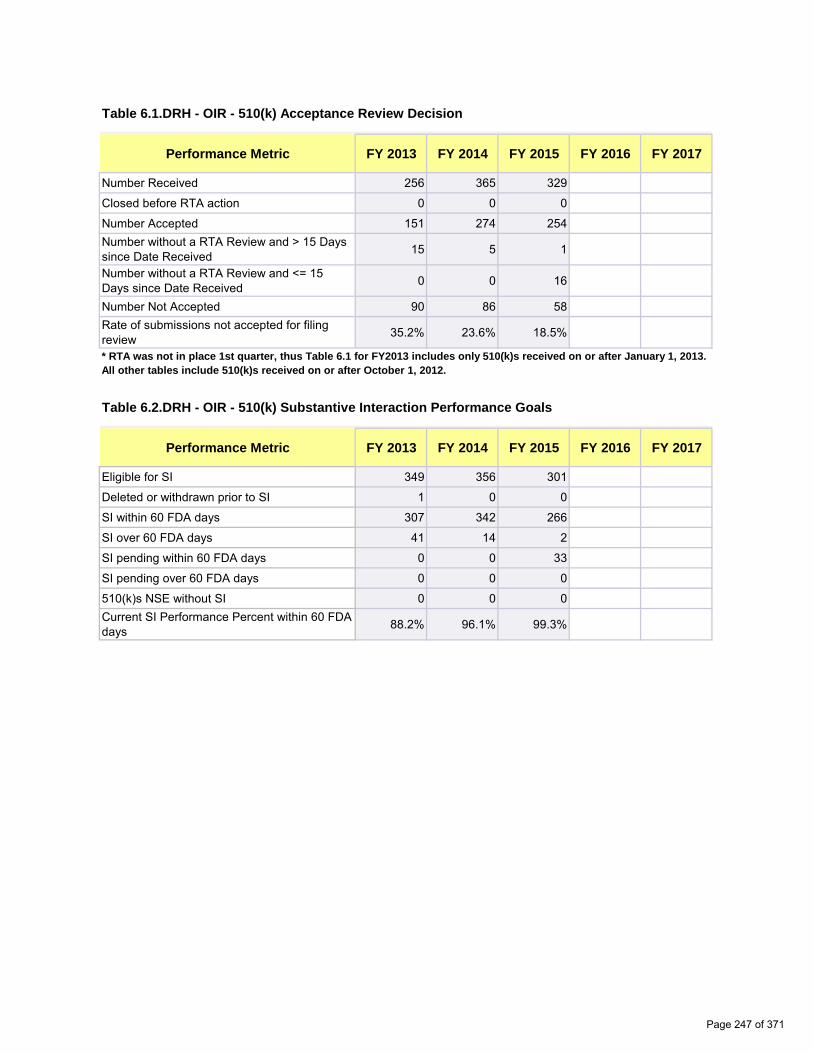
0 0
0 0
0 0 0 0
0 0
0 0 0.00% 0.00%
0 0
0 0
0 0
0 0
0 0
0 0
0 0 0.00% 0.00%
Table 6.1.DRH - OIR - 510(k) Acceptance Review Decision
Performance Metric FY 2013 FY 2014 FY 2015 FY 2016 FY 2017
Number Received 256 365 329
Closed before RTA action 0 0 0
Number Accepted 151 274 254 Number without a RTA Review and > 15 Days since Date Received 15 5 1
Number without a RTA Review and <= 15 Days since Date Received 0 0 16
Number Not Accepted 90 86 58 Rate of submissions not accepted for filing review 35.2% 23.6% 18.5%
* RTA was not in place 1st quarter, thus Table 6.1 for FY2013 includes only 510(k)s received on or after January 1, 2013. All other tables include 510(k)s received on or after October 1, 2012.
Table 6.2.DRH - OIR - 510(k) Substantive Interaction Performance Goals
Performance Metric FY 2013 FY 2014 FY 2015 FY 2016 FY 2017
Eligible for SI 349 356 301
Deleted or withdrawn prior to SI 1 0 0
SI within 60 FDA days 307 342 266
SI over 60 FDA days 41 14 2
SI pending within 60 FDA days 0 0 33
SI pending over 60 FDA days 0 0 0
510(k)s NSE without SI 0 0 0 Current SI Performance Percent within 60 FDA days 88.2% 96.1% 99.3%
Page 247 of 371
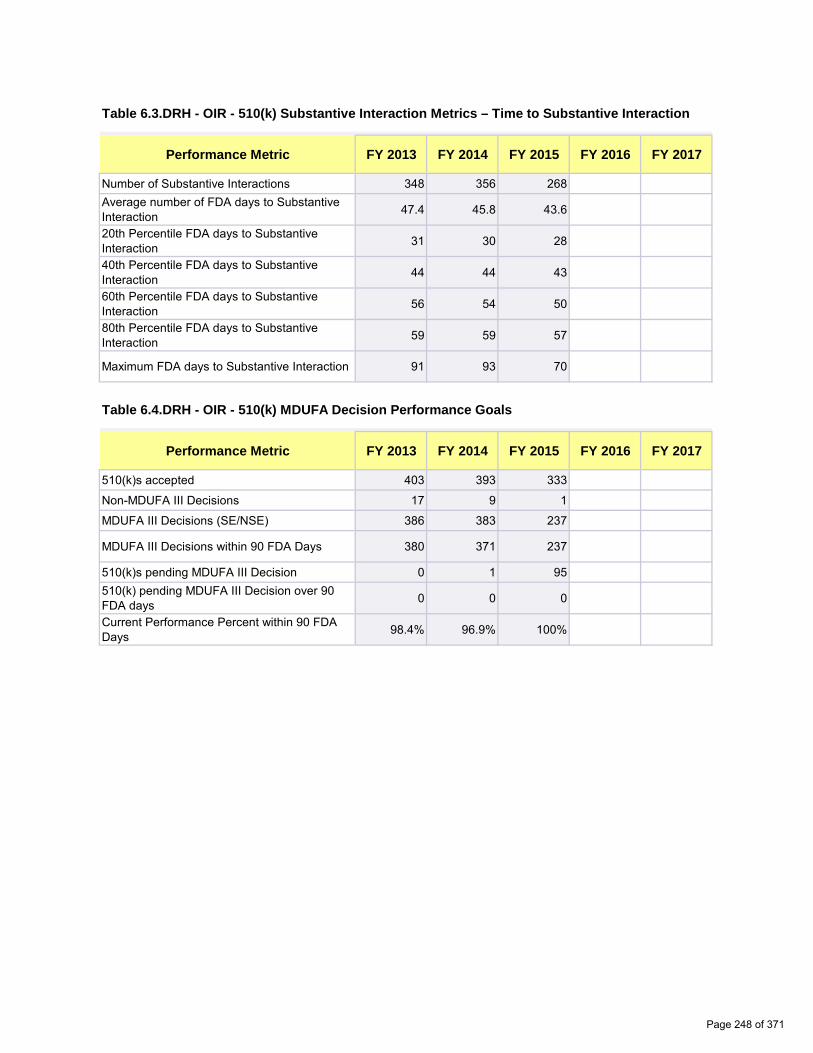
0 0
0 0
0 0
0 0
0 0
0 0
0 0
0 0
0 0
0 0
0 0
0 0
0.00% 0.00%
Table 6.3.DRH - OIR - 510(k) Substantive Interaction Metrics – Time to Substantive Interaction
Performance Metric FY 2013 FY 2014 FY 2015 FY 2016 FY 2017
Number of Substantive Interactions 348 356 268 Average number of FDA days to Substantive Interaction 47.4 45.8 43.6
20th Percentile FDA days to Substantive Interaction 31 30 28
40th Percentile FDA days to Substantive Interaction 44 44 43
60th Percentile FDA days to Substantive Interaction 56 54 50
80th Percentile FDA days to Substantive Interaction 59 59 57
Maximum FDA days to Substantive Interaction 91 93 70
Table 6.4.DRH - OIR - 510(k) MDUFA Decision Performance Goals
Performance Metric FY 2013 FY 2014 FY 2015 FY 2016 FY 2017
510(k)s accepted 403 393 333
Non-MDUFA III Decisions 17 9 1
MDUFA III Decisions (SE/NSE) 386 383 237
MDUFA III Decisions within 90 FDA Days 380 371 237
510(k)s pending MDUFA III Decision 0 1 95 510(k) pending MDUFA III Decision over 90 FDA days 0 0 0
Current Performance Percent within 90 FDA Days 98.4% 96.9% 100%
Page 248 of 371

0 0
0 0
0 0
0 0
0 0
0 0
0 0
0 0
0 0
0 0
0 0
0 0
0 0
0 0
0 0
0 0
0 0
0 0
0 0
Table 6.5.DRH - OIR - 510(k) Time to MDUFA Decision
Performance Metric FY 2013 FY 2014 FY 2015 FY 2016 FY 2017
Average review cycles 1.6 1.7 1.4
Number with MDUFA III decision 386 383 237
Average FDA days to MDUFA III decision 61.9 63.1 52.7
20th Percentile FDA days to MDUFA III decision 35 31 27
40th Percentile FDA days to MDUFA III decision 56 58 46
60th Percentile FDA days to MDUFA III decision 77 79 63
80th Percentile FDA days to MDUFA III decision 87 88 78
Maximum FDA days to MDUFA III decision 121 137 90
Average Industry days to MDUFA III decision 35.9 35.2 20.6
20th Percentile Industry days to MDUFA III decision 0 0 0
40th Percentile Industry days to MDUFA III decision 0 0 0
60th Percentile Industry days to MDUFA III decision 20 27 4
80th Percentile Industry days to MDUFA III decision 60 63 40
Maximum Industry days to MDUFA III decision 358 313 185
Average Total days to MDUFA III decision 97.8 98.3 73.3
20th Percentile Total days to MDUFA III decision 37 32 28
40th Percentile Total days to MDUFA III decision 71 77 50
60th Percentile Total days to MDUFA III decision 90 102 75
80th Percentile Total days to MDUFA III decision 137 141 110
Maximum Total days to MDUFA III decision 466 393 258
Page 249 of 371
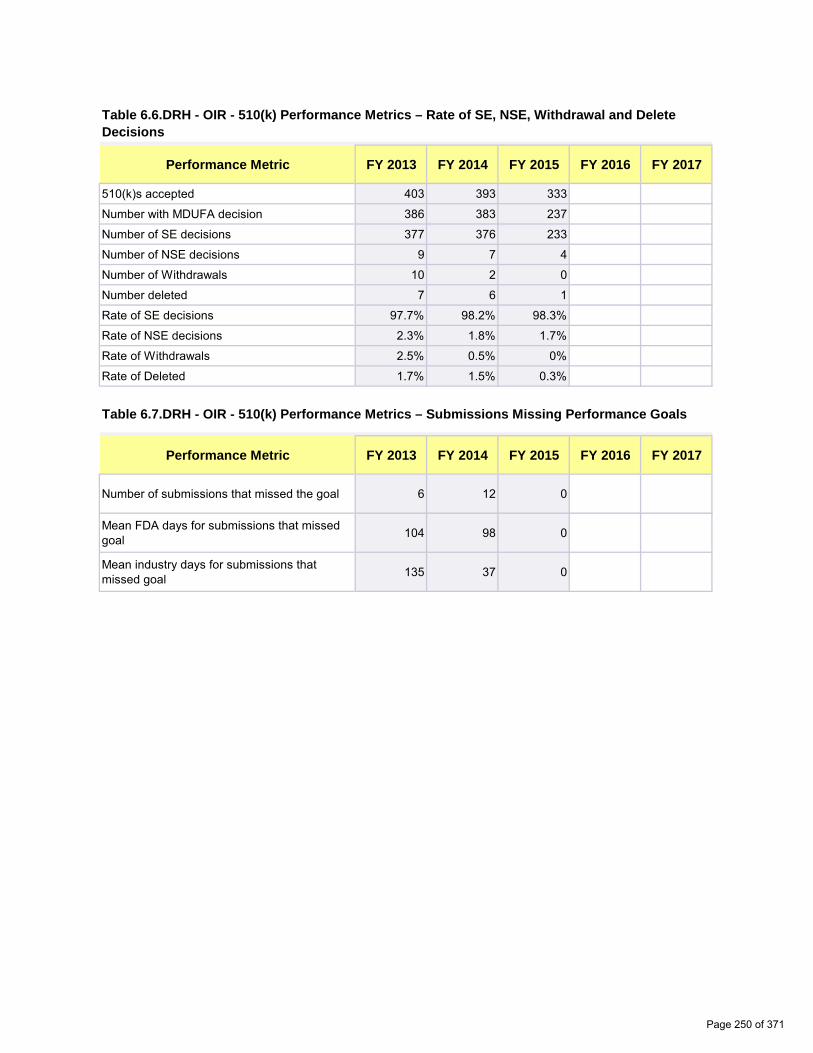
0 0
0 0
0 0
0 0
0 0
0 0
0.00% 0.00%
0.00% 0.00%
0.00% 0.00%
0.00% 0.00%
0 0
0 0
0 0
Table 6.6.DRH - OIR - 510(k) Performance Metrics – Rate of SE, NSE, Withdrawal and Delete Decisions
Performance Metric FY 2013 FY 2014 FY 2015 FY 2016 FY 2017
510(k)s accepted 403 393 333
Number with MDUFA decision 386 383 237
Number of SE decisions 377 376 233
Number of NSE decisions 9 7 4
Number of Withdrawals 10 2 0
Number deleted 7 6 1
Rate of SE decisions 97.7% 98.2% 98.3%
Rate of NSE decisions 2.3% 1.8% 1.7%
Rate of Withdrawals 2.5% 0.5% 0%
Rate of Deleted 1.7% 1.5% 0.3%
Table 6.7.DRH - OIR - 510(k) Performance Metrics – Submissions Missing Performance Goals
Performance Metric FY 2013 FY 2014 FY 2015 FY 2016 FY 2017
Number of submissions that missed the goal 6 12 0
Mean FDA days for submissions that missed goal 104 98 0
Mean industry days for submissions that missed goal 135 37 0
Page 250 of 371
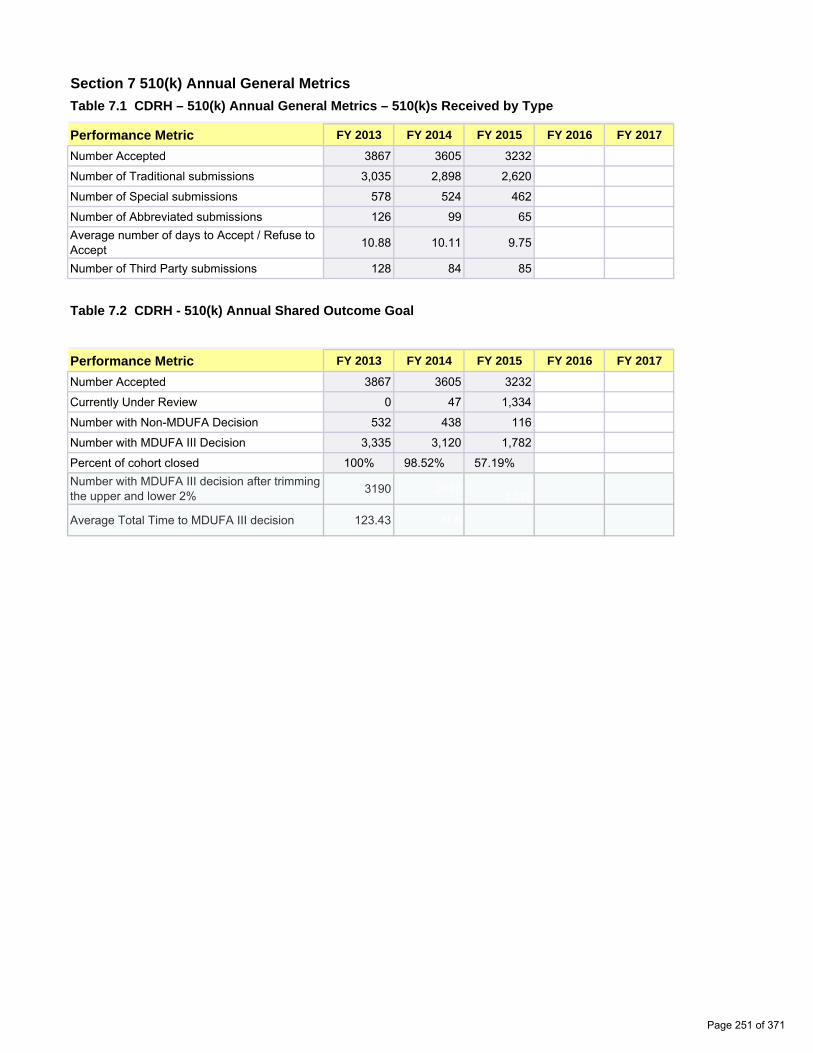
0 0
0 0
0 0
0 0
0.00 0.00
0 0
0 0
0 0
0 0
0 0
Section 7 510(k) Annual General Metrics Table 7.1 CDRH – 510(k) Annual General Metrics – 510(k)s Received by Type
Performance Metric FY 2013 FY 2014 FY 2015 FY 2016 FY 2017
Number Accepted 3867 3605 3232
Number of Traditional submissions 3,035 2,898 2,620
Number of Special submissions 578 524 462
Number of Abbreviated submissions 126 99 65 Average number of days to Accept / Refuse to Accept 10.88 10.11 9.75
Number of Third Party submissions 128 84 85
Table 7.2 CDRH - 510(k) Annual Shared Outcome Goal
Performance Metric FY 2013 FY 2014 FY 2015 FY 2016 FY 2017
Number Accepted 3867 3605 3232
Currently Under Review 0 47 1,334
Number with Non-MDUFA Decision 532 438 116
Number with MDUFA III Decision 3,335 3,120 1,782
Percent of cohort closed 100% 98.52% 57.19% Number with MDUFA III decision after trimming the upper and lower 2% 3190 2837 1712
Average Total Time to MDUFA III decision 123.43 N A
Page 251 of 371

Page intentionally left blank
Page 252 of 371

2a1a
5a
6a
8a
12a
CDRH De Novos - FY 2013As of 9/30/15Number De Novos
Received N=46
1
Direct De Novos Received
N=31 2
Post-NSE De Novos Received
N=15 3
Direct De Novos
Closed as of 09/30/15
N=31
Avg Days to Decision=263
4
Direct De Novos
Pending as of 09/30/15
N=0
5
Post-NSE De Novos
Closed as of 09/30/15
N=15
Avg Days to Decision=249
6
Post-NSE De Novos
Pending as of 09/30/15
N=0
7
Page 253 of 371

2a1a
5
6 8a
3
9
10
CDRH De Novos - FY 2013As of 9/30/15
Direct De Novos
Closed as of 09/30/15
N=31
Avg Days to Decision=263
4
Direct De Novos Granted
N=16 8
Direct De Novos
Granted in > 120
days N=14
12
Direct De Novos
Other Decision in <= 120
days N=6
15
Direct De Novos Declined
N=4 9
Direct De Novos Other
Decision N=11
10
Direct De Novos
Granted in <= 120
days N=2
11
Direct De Novos
Declined in <= 120
days N=3
13
Direct De Novos
Declined in > 120
days N=1
14
Direct De Novos
Other Decision in > 120
days N=5
16
Page 254 of 371
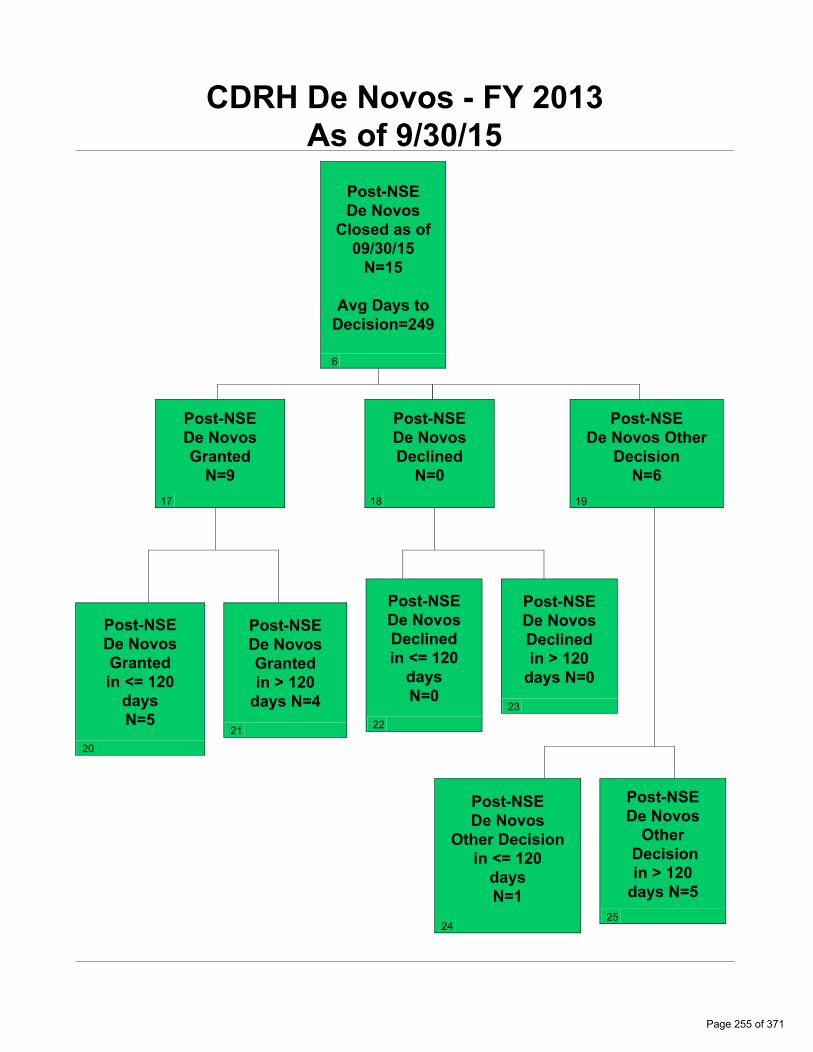
2a1a
5
68a
3
9
10
CDRH De Novos - FY 2013As of 9/30/15
Post-NSE De Novos
Closed as of 09/30/15
N=15
Avg Days to Decision=249
6
Post-NSE De Novos Granted
N=9 17
Post-NSE De Novos Granted in > 120
days N=4
21
Post-NSE De Novos
Other Decision in <= 120
days N=1
24
Post-NSE De Novos Declined
N=0 18
Post-NSE De Novos Other
Decision N=6
19
Post-NSE De Novos Granted in <= 120
days N=5
20
Post-NSE De Novos Declined in <= 120
days N=0
22
Post-NSE De Novos Declined in > 120
days N=0
23
Post-NSE De Novos
Other Decision in > 120
days N=5 25
Page 255 of 371
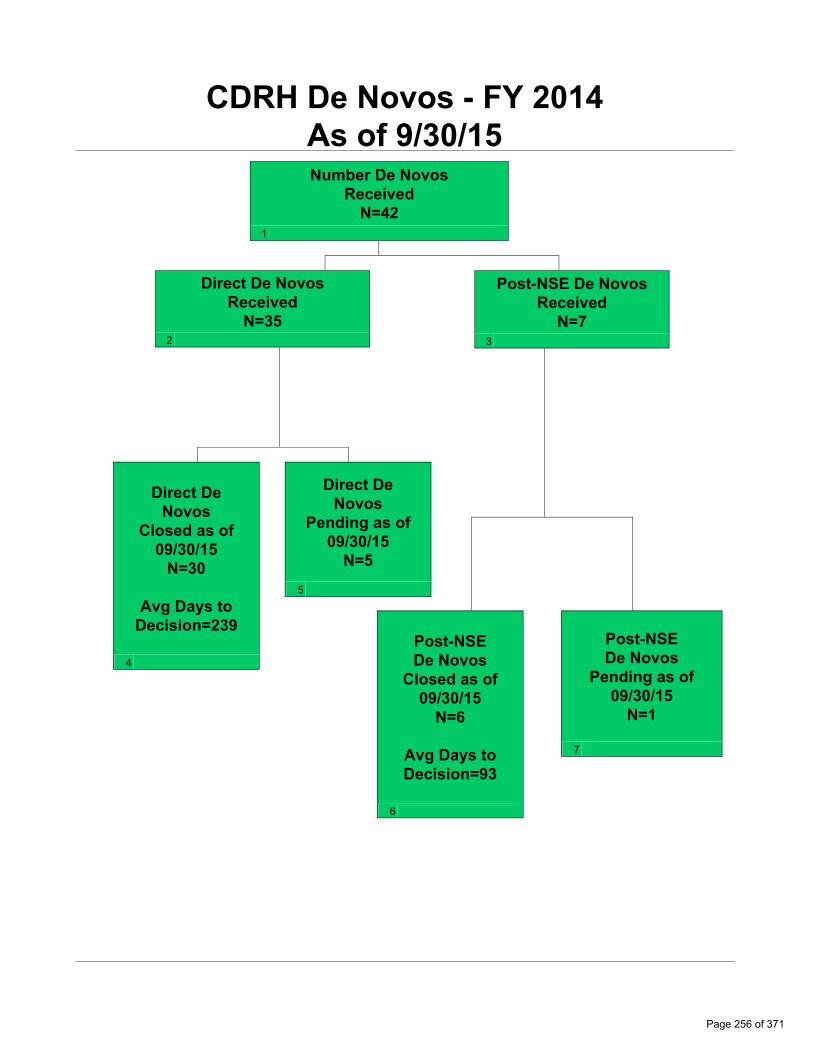
2a1a
5a
6a
8a
12a
CDRH De Novos - FY 2014As of 9/30/15Number De Novos
Received N=42
1
Direct De Novos Received
N=35 2
Post-NSE De Novos Received
N=7 3
Direct De Novos
Closed as of 09/30/15
N=30
Avg Days to Decision=239
4
Direct De Novos
Pending as of 09/30/15
N=5
5
Post-NSE De Novos
Closed as of 09/30/15
N=6
Avg Days to Decision=93
6
Post-NSE De Novos
Pending as of 09/30/15
N=1
7
Page 256 of 371
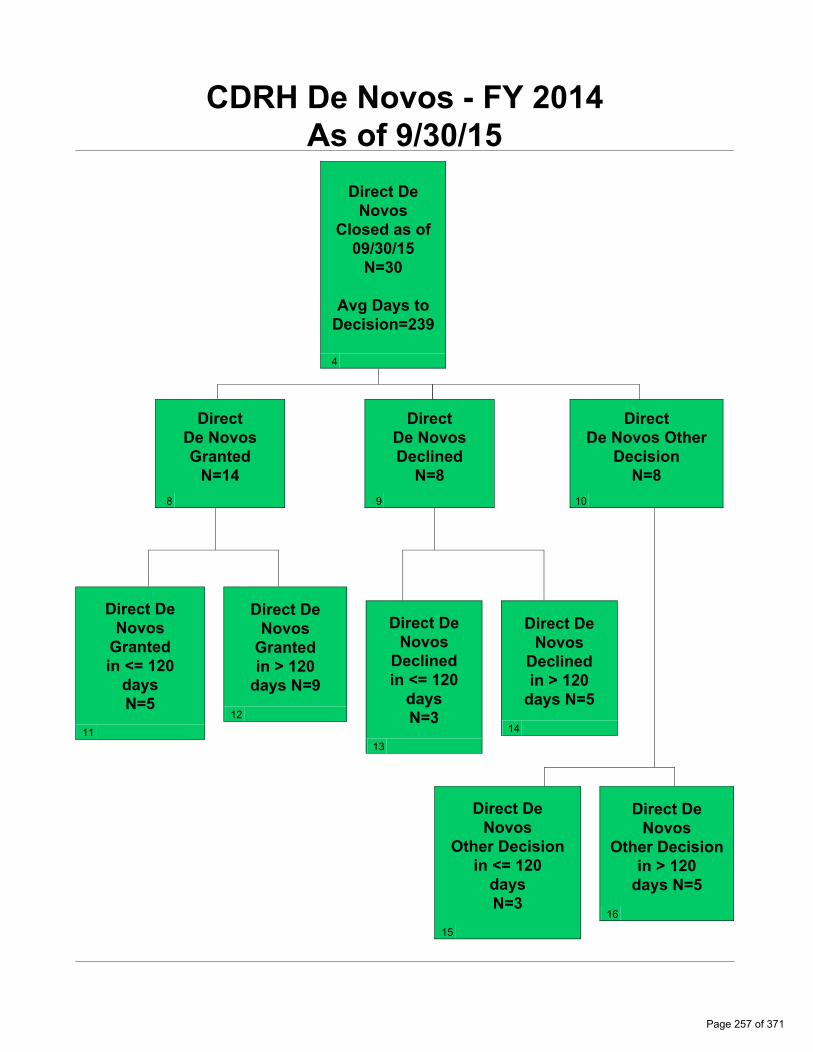
2a1a
5
6 8a
3
9
10
CDRH De Novos - FY 2014As of 9/30/15
Direct De Novos
Closed as of 09/30/15
N=30
Avg Days to Decision=239
4
Direct De Novos Granted
N=14 8
Direct De Novos
Granted in > 120
days N=9
12
Direct De Novos
Other Decision in <= 120
days N=3
15
Direct De Novos Declined
N=8 9
Direct De Novos Other
Decision N=8
10
Direct De Novos
Granted in <= 120
days N=5
11
Direct De Novos
Declined in <= 120
days N=3
13
Direct De Novos
Declined in > 120
days N=5
14
Direct De Novos
Other Decision in > 120
days N=5
16
Page 257 of 371

2a1a
5
68a
3
9
10
CDRH De Novos - FY 2014As of 9/30/15
Post-NSE De Novos
Closed as of 09/30/15
N=6
Avg Days to Decision=93
6
Post-NSE De Novos Granted
N=5 17
Post-NSE De Novos Granted in > 120
days N=0
21
Post-NSE De Novos
Other Decision in <= 120
days N=0
24
Post-NSE De Novos Declined
N=1 18
Post-NSE De Novos Other
Decision N=0
19
Post-NSE De Novos Granted in <= 120
days N=5
20
Post-NSE De Novos Declined in <= 120
days N=0
22
Post-NSE De Novos Declined in > 120
days N=1
23
Post-NSE De Novos
Other Decision in > 120
days N=0 25
Page 258 of 371

2a1a
5a
6a
8a
12a
CDRH De Novos - FY 2015As of 9/30/15Number De Novos
Received N=59
1
Direct De Novos Received
N=58 2
Post-NSE De Novos Received
N=1 3
Direct De Novos
Closed as of 09/30/15
N=18
Avg Days to Decision=116
4
Direct De Novos
Pending as of 09/30/15
N=40
5
Post-NSE De Novos
Closed as of 09/30/15
N=1
Avg Days to Decision=115
6
Post-NSE De Novos
Pending as of 09/30/15
N=0
7
Page 259 of 371

2a1a
5
6 8a
3
9
10
CDRH De Novos - FY 2015As of 9/30/15
Direct De Novos
Closed as of 09/30/15
N=18
Avg Days to Decision=116
4
Direct De Novos Granted
N=3 8
Direct De Novos
Granted in > 120
days N=2
12
Direct De Novos
Other Decision in <= 120
days N=7
15
Direct De Novos Declined
N=7 9
Direct De Novos Other
Decision N=8
10
Direct De Novos
Granted in <= 120
days N=1
11
Direct De Novos
Declined in <= 120
days N=4
13
Direct De Novos
Declined in > 120
days N=3
14
Direct De Novos
Other Decision in > 120
days N=1
16
Page 260 of 371

2a1a
5
68a
3
9
10
CDRH De Novos - FY 2015As of 9/30/15
Post-NSE De Novos
Closed as of 09/30/15
N=1
Avg Days to Decision=115
6
Post-NSE De Novos Granted
N=1 17
Post-NSE De Novos Granted in > 120
days N=0
21
Post-NSE De Novos
Other Decision in <= 120
days N=0
24
Post-NSE De Novos Declined
N=0 18
Post-NSE De Novos Other
Decision N=0
19
Post-NSE De Novos Granted in <= 120
days N=1
20
Post-NSE De Novos Declined in <= 120
days N=0
22
Post-NSE De Novos Declined in > 120
days N=0
23
Post-NSE De Novos
Other Decision in > 120
days N=0 25
Page 261 of 371

Page intentionally left blank
Page 262 of 371

Section 8 De Novo - Center Level Metrics
Table 8.1 CDRH – Annual General Metric Report for De Novo Requests
Performance Goals: FY 2013 FY 2014 FY 2015 FY 2016 FY 2017
Number of De Novo Requests Received 46 42 59
Number of De Novo Requests With Decision 46 36 19
Number of De Novo Requests With Decision Pending 0 6 40
Average Number of Days to Decision 258.3 214.5 115.9
Page 263 of 371

Page intentionally left blank
Page 264 of 371
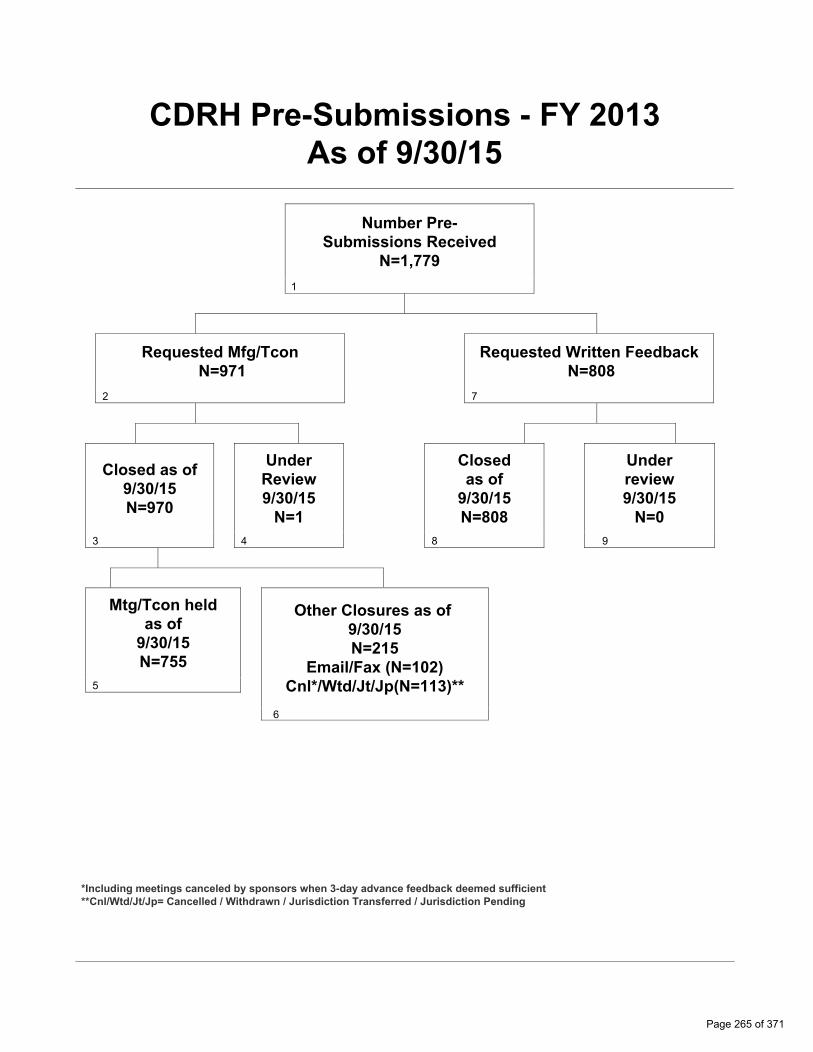
3a
4a
2a
5a
7a
6a
1a
CDRH Pre-Submissions - FY 2013As of 9/30/15
Number Pre-Submissions Received
N=1,779 1
Requested Mfg/Tcon N=971
2
Closed as of 9/30/15 N=970
3
Under Review 9/30/15
N=1 4
Mtg/Tcon held as of 9/30/15 N=755
5
Closed as of 9/30/15 N=808
8
Requested Written Feedback N=808
7
Under review 9/30/15
N=0 9
Other Closures as of 9/30/15 N=215
Email/Fax (N=102) Cnl*/Wtd/Jt/Jp(N=113)**
6
*Including meetings canceled by sponsors when 3-day advance feedback deemed sufficient **Cnl/Wtd/Jt/Jp= Cancelled / Withdrawn / Jurisdiction Transferred / Jurisdiction Pending
Page 265 of 371
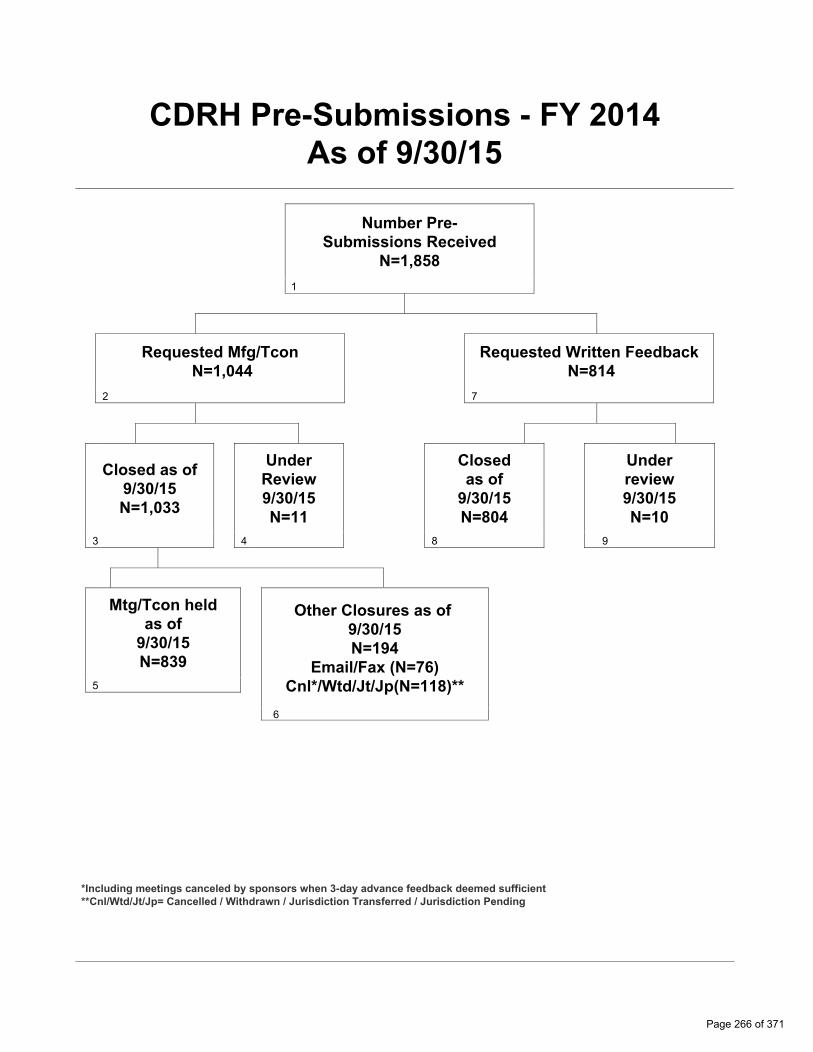
3a
4a
2a
5a
7a
6a
1a
CDRH Pre-Submissions - FY 2014As of 9/30/15
Number Pre-Submissions Received
N=1,858 1
Requested Mfg/Tcon N=1,044
2
Closed as of 9/30/15 N=1,033
3
Under Review 9/30/15 N=11
4
Mtg/Tcon held as of 9/30/15 N=839
5
Closed as of 9/30/15 N=804
8
Requested Written Feedback N=814
7
Under review 9/30/15 N=10
9
Other Closures as of 9/30/15 N=194
Email/Fax (N=76) Cnl*/Wtd/Jt/Jp(N=118)**
6
*Including meetings canceled by sponsors when 3-day advance feedback deemed sufficient **Cnl/Wtd/Jt/Jp= Cancelled / Withdrawn / Jurisdiction Transferred / Jurisdiction Pending
Page 266 of 371

3a
4a
2a
5a
7a
6a
1a
CDRH Pre-Submissions - FY 2015As of 9/30/15
Number Pre-Submissions Received
N=2,154 1
Requested Mfg/Tcon N=1,308
2
Closed as of 9/30/15 N=1,015
3
Under Review 9/30/15 N=293
4
Mtg/Tcon held as of 9/30/15 N=844
5
Closed as of 9/30/15 N=689
8
Requested Written Feedback N=846
7
Under review 9/30/15 N=157
9
Other Closures as of 9/30/15 N=171
Email/Fax (N=53) Cnl*/Wtd/Jt/Jp(N=118)**
6
*Including meetings canceled by sponsors when 3-day advance feedback deemed sufficient **Cnl/Wtd/Jt/Jp= Cancelled / Withdrawn / Jurisdiction Transferred / Jurisdiction Pending
Page 267 of 371

Page intentionally left blank
Page 268 of 371
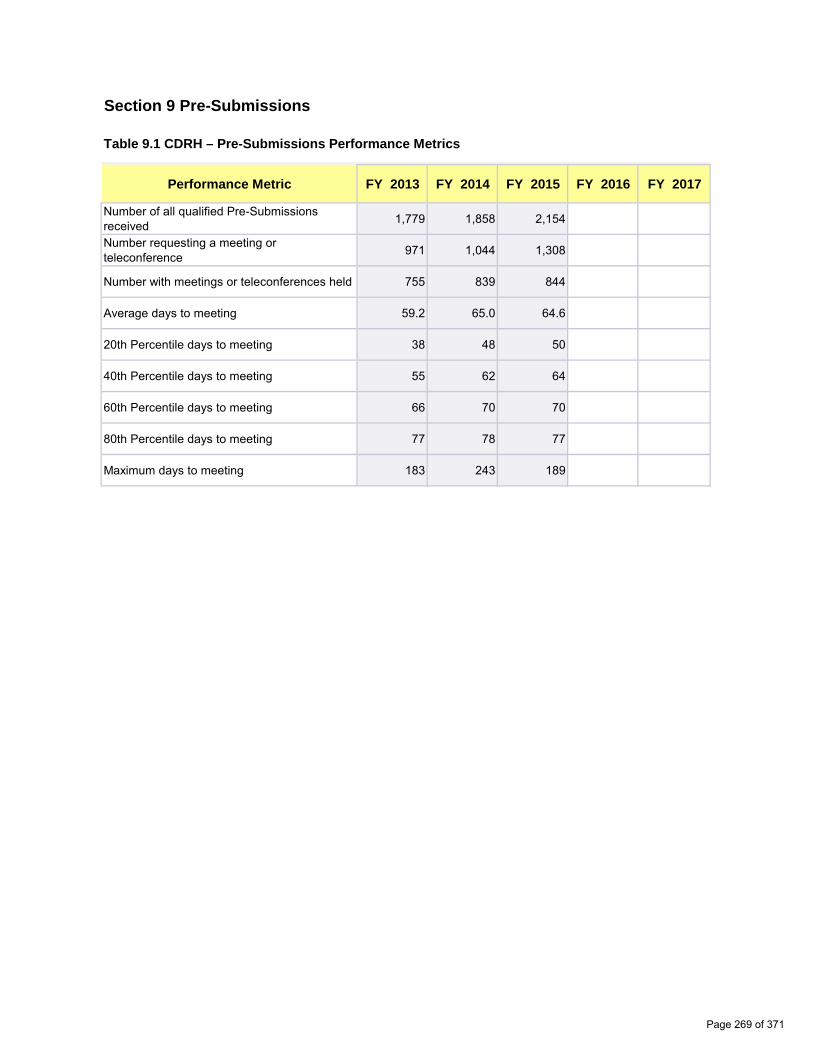
0 0
0 0
0 0
0 0
0 0
0 0
0 0
0 0
0 0
Section 9 Pre-Submissions
Table 9.1 CDRH – Pre-Submissions Performance Metrics
Performance Metric FY 2013 FY 2014 FY 2015 FY 2016 FY 2017
Number of all qualified Pre-Submissions received 1,779 1,858 2,154
Number requesting a meeting or teleconference 971 1,044 1,308
Number with meetings or teleconferences held 755 839 844
Average days to meeting 59.2 65.0 64.6
20th Percentile days to meeting 38 48 50
40th Percentile days to meeting 55 62 64
60th Percentile days to meeting 66 70 70
80th Percentile days to meeting 77 78 77
Maximum days to meeting 183 243 189
Page 269 of 371

0 0
0 0
0 0
0 0
0 0
0 0
0 0
0 0
0 0
Section 9 Pre-Submission Office Level Metrics
Table 9.1.ODE - CDRH – Pre-Submissions Performance Metrics
Performance Metric FY 2013 FY 2014 FY 2015 FY 2016 FY 2017
Number of all qualified Pre-Submissions received 981 1,141 1,352
Number requesting a meeting or teleconference 611 698 865
Number with meetings or teleconferences held 455 555 540
Average days to meeting 61.8 67.8 67.3
20th Percentile days to meeting 40 49 51
40th Percentile days to meeting 57 63 65
60th Percentile days to meeting 67 72 72
80th Percentile days to meeting 79 83 81
Maximum days to meeting 183 243 189
Page 270 of 371
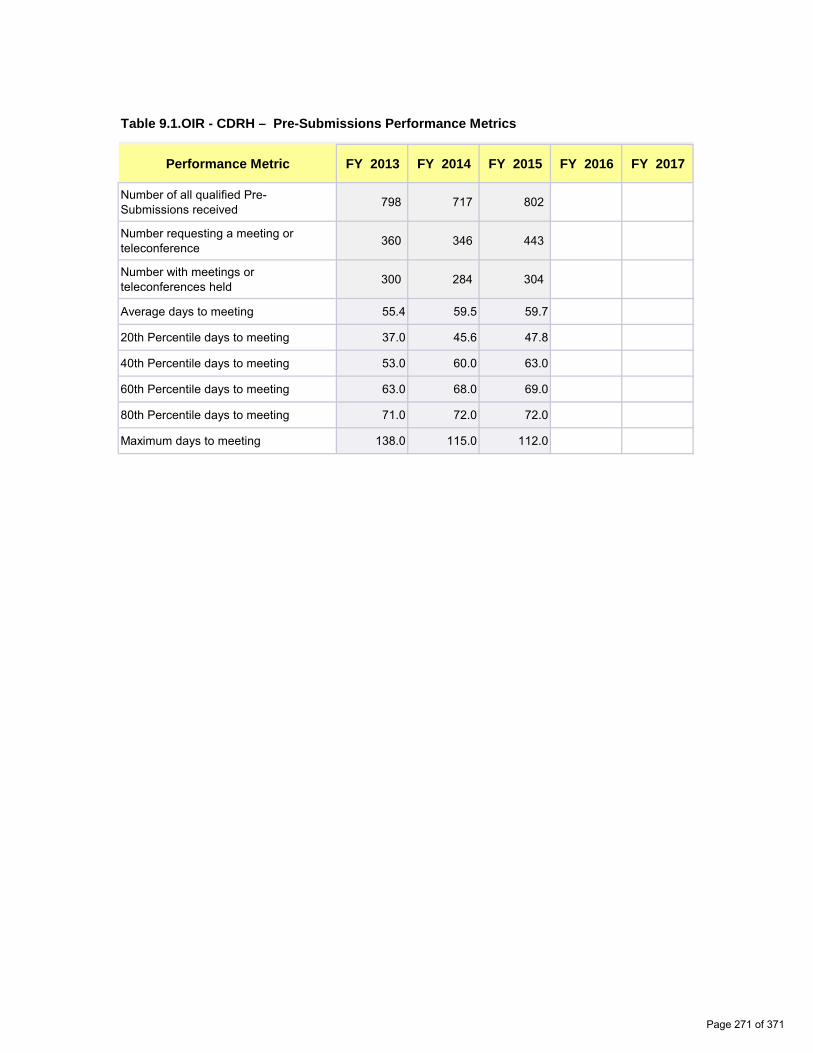
Table 9.1OIR
0 0
0 0
0 0
0 0
0 0
0 0
0 0
0 0
0 0
Table 9.1.OIR - CDRH – Pre-Submissions Performance Metrics
Performance Metric FY 2013 FY 2014 FY 2015 FY 2016 FY 2017
Number of all qualified Pre-Submissions received 798 717 802
Number requesting a meeting or teleconference 360 346 443
Number with meetings or teleconferences held 300 284 304
Average days to meeting 55.4 59.5 59.7
20th Percentile days to meeting 37.0 45.6 47.8
40th Percentile days to meeting 53.0 60.0 63.0
60th Percentile days to meeting 63.0 68.0 69.0
80th Percentile days to meeting 71.0 72.0 72.0
Maximum days to meeting 138.0 115.0 112.0
Page 271 of 371

Table 9.1DAGRID
0 0
0 0
0 0
0 0
0 0
0 0
0 0
0 0
0 0
Section 9 Pre-Submission Division Level Metrics
Table 9.1.DAGRID - ODE - Pre-Submissions Performance Metrics
Performance Metric FY 2013 FY 2014 FY 2015 FY 2016 FY 2017
Number of all qualified Pre-Submissions received 156 204 232
Number requesting a meeting or teleconference 82 110 138
Number with meetings or teleconferences held 58 82 83
Average days to meeting 68.3 70.7 73.3
20th Percentile days to meeting 52.0 54.6 61.2
40th Percentile days to meeting 65.4 65.0 70.0
60th Percentile days to meeting 75.0 74.8 76.0
80th Percentile days to meeting 83.0 85.4 85.0
Maximum days to meeting 121.0 149.0 142.0
Page 272 of 371
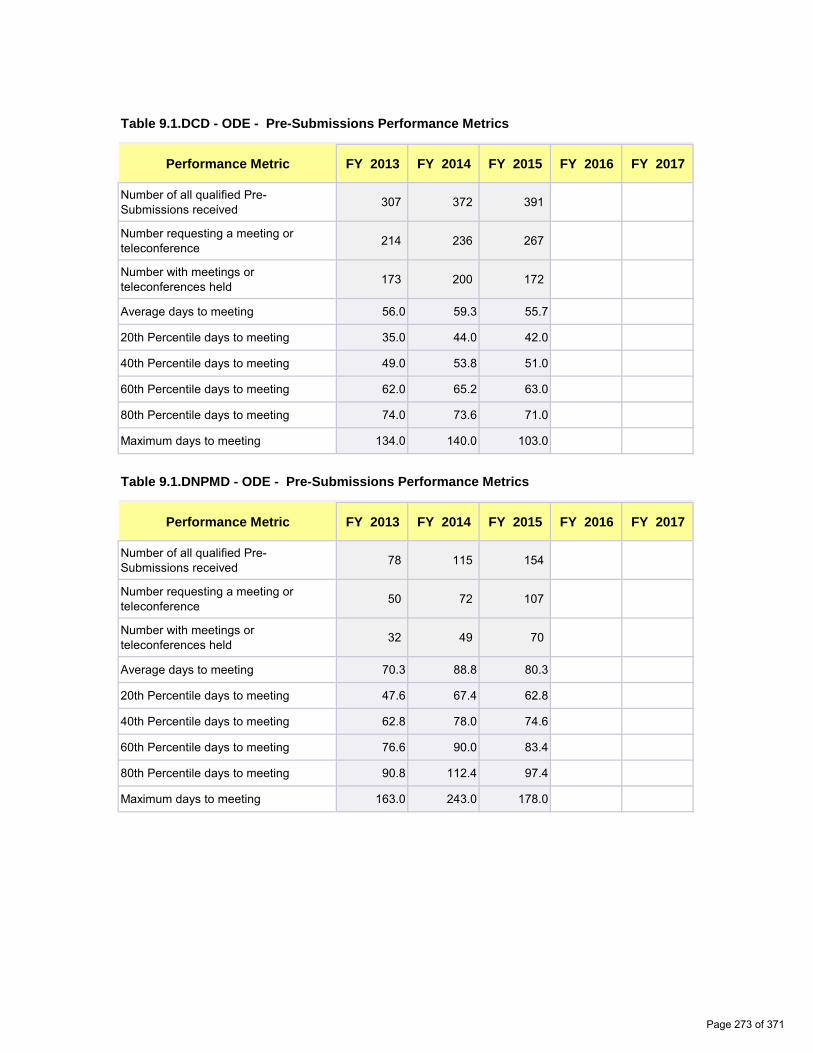
0 0
0 0
0 0
0 0
0 0
0 0
0 0
0 0
0 0
0 0
0 0
0 0
0 0
0 0
0 0
0 0
0 0
0 0
Table 9.1.DCD - ODE - Pre-Submissions Performance Metrics
Performance Metric FY 2013 FY 2014 FY 2015 FY 2016 FY 2017
Number of all qualified Pre-Submissions received 307 372 391
Number requesting a meeting or teleconference 214 236 267
Number with meetings or teleconferences held 173 200 172
Average days to meeting 56.0 59.3 55.7
20th Percentile days to meeting 35.0 44.0 42.0
40th Percentile days to meeting 49.0 53.8 51.0
60th Percentile days to meeting 62.0 65.2 63.0
80th Percentile days to meeting 74.0 73.6 71.0
Maximum days to meeting 134.0 140.0 103.0
Table 9.1.DNPMD - ODE - Pre-Submissions Performance Metrics
Performance Metric FY 2013 FY 2014 FY 2015 FY 2016 FY 2017
Number of all qualified Pre-Submissions received 78 115 154
Number requesting a meeting or teleconference 50 72 107
Number with meetings or teleconferences held 32 49 70
Average days to meeting 70.3 88.8 80.3
20th Percentile days to meeting 47.6 67.4 62.8
40th Percentile days to meeting 62.8 78.0 74.6
60th Percentile days to meeting 76.6 90.0 83.4
80th Percentile days to meeting 90.8 112.4 97.4
Maximum days to meeting 163.0 243.0 178.0
Page 273 of 371
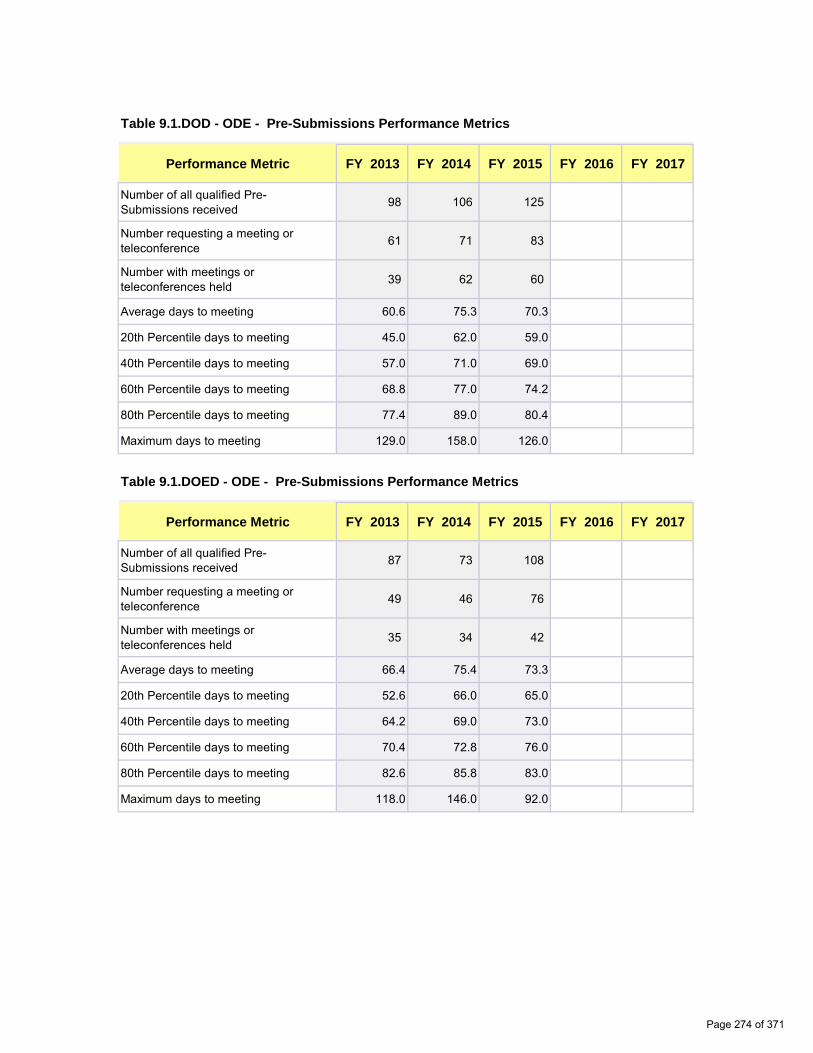
0 0
0 0
0 0
0 0
0 0
0 0
0 0
0 0
0 0
0 0
0 0
0 0
0 0
0 0
0 0
0 0
0 0
0 0
Table 9.1.DOD - ODE - Pre-Submissions Performance Metrics
Performance Metric FY 2013 FY 2014 FY 2015 FY 2016 FY 2017
Number of all qualified Pre-Submissions received 98 106 125
Number requesting a meeting or teleconference 61 71 83
Number with meetings or teleconferences held 39 62 60
Average days to meeting 60.6 75.3 70.3
20th Percentile days to meeting 45.0 62.0 59.0
40th Percentile days to meeting 57.0 71.0 69.0
60th Percentile days to meeting 68.8 77.0 74.2
80th Percentile days to meeting 77.4 89.0 80.4
Maximum days to meeting 129.0 158.0 126.0
Table 9.1.DOED - ODE - Pre-Submissions Performance Metrics
Performance Metric FY 2013 FY 2014 FY 2015 FY 2016 FY 2017
Number of all qualified Pre-Submissions received 87 73 108
Number requesting a meeting or teleconference 49 46 76
Number with meetings or teleconferences held 35 34 42
Average days to meeting 66.4 75.4 73.3
20th Percentile days to meeting 52.6 66.0 65.0
40th Percentile days to meeting 64.2 69.0 73.0
60th Percentile days to meeting 70.4 72.8 76.0
80th Percentile days to meeting 82.6 85.8 83.0
Maximum days to meeting 118.0 146.0 92.0
Page 274 of 371

0 0
0 0
0 0
0 0
0 0
0 0
0 0
0 0
0 0
0 0
0 0
0 0
0 0
0 0
0 0
0 0
0 0
0 0
Table 9.1.DRGUD - ODE - Pre-Submissions Performance Metrics
Performance Metric FY 2013 FY 2014 FY 2015 FY 2016 FY 2017
Number of all qualified Pre-Submissions received 131 136 160
Number requesting a meeting or teleconference 76 83 90
Number with meetings or teleconferences held 60 66 51
Average days to meeting 60.0 59.8 65.1
20th Percentile days to meeting 47.0 44.0 52.0
40th Percentile days to meeting 60.0 57.0 63.0
60th Percentile days to meeting 67.0 67.0 70.0
80th Percentile days to meeting 71.0 75.0 76.0
Maximum days to meeting 132.0 119.0 106.0
Table 9.1.DSD - ODE - Pre-Submissions Performance Metrics
Performance Metric FY 2013 FY 2014 FY 2015 FY 2016 FY 2017
Number of all qualified Pre-Submissions received 124 135 182
Number requesting a meeting or teleconference 79 80 104
Number with meetings or teleconferences held 58 62 62
Average days to meeting 67.5 71.8 71.6
20th Percentile days to meeting 41.0 62.6 59.0
40th Percentile days to meeting 63.6 69.0 68.4
60th Percentile days to meeting 72.8 76.8 71.6
80th Percentile days to meeting 84.8 89.4 79.6
Maximum days to meeting 183.0 111.0 189.0
Page 275 of 371

0 0
0 0
0 0
0 0
0 0
0 0
0 0
0 0
0 0
0 0
0 0
0 0
0 0
0 0
0 0
0 0
0 0
0 0
Table 9.1.DCTD - OIR - Pre-Submissions Performance Metrics
Performance Metric FY 2013 FY 2014 FY 2015 FY 2016 FY 2017
Number of all qualified Pre-Submissions received 219 178 232
Number requesting a meeting or teleconference 107 99 149
Number with meetings or teleconferences held 91 88 107
Average days to meeting 51.3 57.0 54.6
20th Percentile days to meeting 36.0 42.0 35.0
40th Percentile days to meeting 49.0 55.0 57.0
60th Percentile days to meeting 59.0 65.0 65.0
80th Percentile days to meeting 68.0 70.0 71.0
Maximum days to meeting 90.0 112.0 97.0
Table 9.1.DIHD - OIR - Pre-Submissions Performance Metrics
Performance Metric FY 2013 FY 2014 FY 2015 FY 2016 FY 2017
Number of all qualified Pre-Submissions received 130 127 118
Number requesting a meeting or teleconference 66 72 64
Number with meetings or teleconferences held 54 67 53
Average days to meeting 61.1 65.0 67.3
20th Percentile days to meeting 41.4 55.8 61.8
40th Percentile days to meeting 64.0 66.6 67.8
60th Percentile days to meeting 70.0 71.0 70.2
80th Percentile days to meeting 81.0 73.0 73.0
Maximum days to meeting 99.0 113.0 93.0
Page 276 of 371
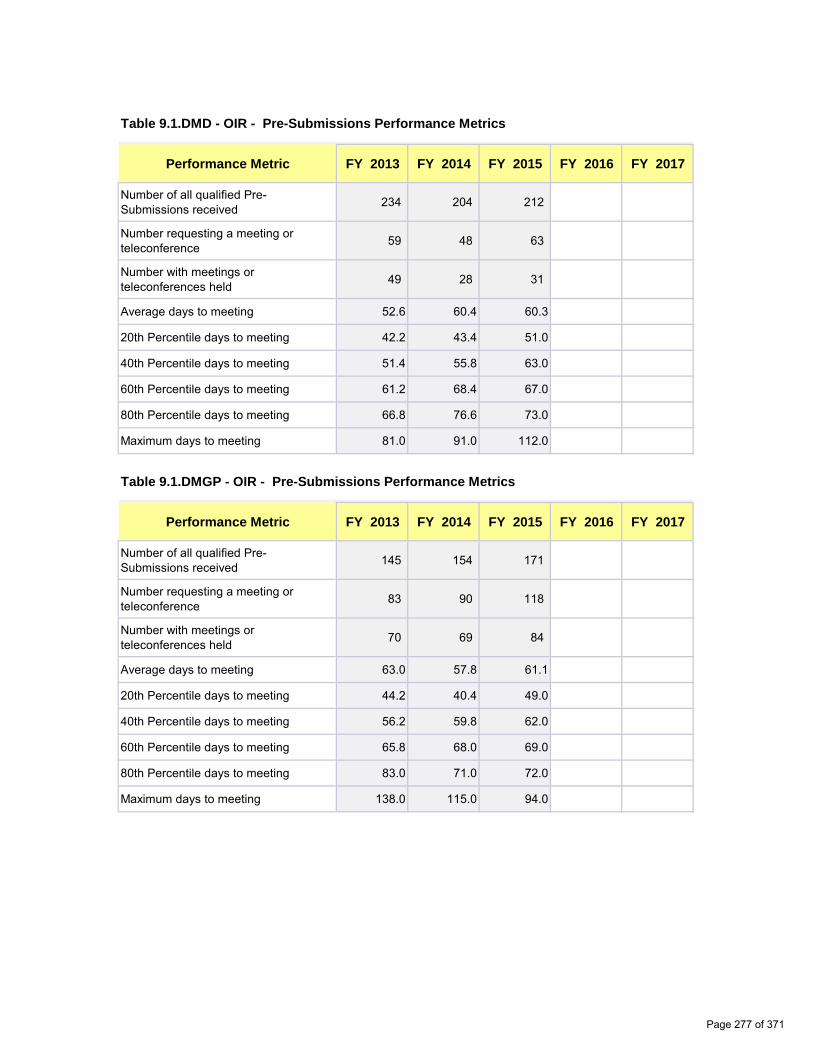
0 0
0 0
0 0
0 0
0 0
0 0
0 0
0 0
0 0
0 0
0 0
0 0
0 0
0 0
0 0
0 0
0 0
0 0
Table 9.1.DMD - OIR - Pre-Submissions Performance Metrics
Performance Metric FY 2013 FY 2014 FY 2015 FY 2016 FY 2017
Number of all qualified Pre-Submissions received 234 204 212
Number requesting a meeting or teleconference 59 48 63
Number with meetings or teleconferences held 49 28 31
Average days to meeting 52.6 60.4 60.3
20th Percentile days to meeting 42.2 43.4 51.0
40th Percentile days to meeting 51.4 55.8 63.0
60th Percentile days to meeting 61.2 68.4 67.0
80th Percentile days to meeting 66.8 76.6 73.0
Maximum days to meeting 81.0 91.0 112.0
Table 9.1.DMGP - OIR - Pre-Submissions Performance Metrics
Performance Metric FY 2013 FY 2014 FY 2015 FY 2016 FY 2017
Number of all qualified Pre-Submissions received 145 154 171
Number requesting a meeting or teleconference 83 90 118
Number with meetings or teleconferences held 70 69 84
Average days to meeting 63.0 57.8 61.1
20th Percentile days to meeting 44.2 40.4 49.0
40th Percentile days to meeting 56.2 59.8 62.0
60th Percentile days to meeting 65.8 68.0 69.0
80th Percentile days to meeting 83.0 71.0 72.0
Maximum days to meeting 138.0 115.0 94.0
Page 277 of 371

0 0
0 0
0 0
0 0
0 0
0 0
0 0
0 0
0 0
Table 9.1.DRH - OIR - Pre-Submissions Performance Metrics
Performance Metric FY 2013 FY 2014 FY 2015 FY 2016 FY 2017
Number of all qualified Pre-Submissions received 70 54 69
Number requesting a meeting or teleconference 45 37 49
Number with meetings or teleconferences held 36 32 29
Average days to meeting 46.7 57.5 60.6
20th Percentile days to meeting 31.0 47.2 50.2
40th Percentile days to meeting 43.0 59.4 61.4
60th Percentile days to meeting 57.0 68.0 66.6
80th Percentile days to meeting 63.0 71.8 70.0
Maximum days to meeting 98.0 107.0 91.0
Page 278 of 371
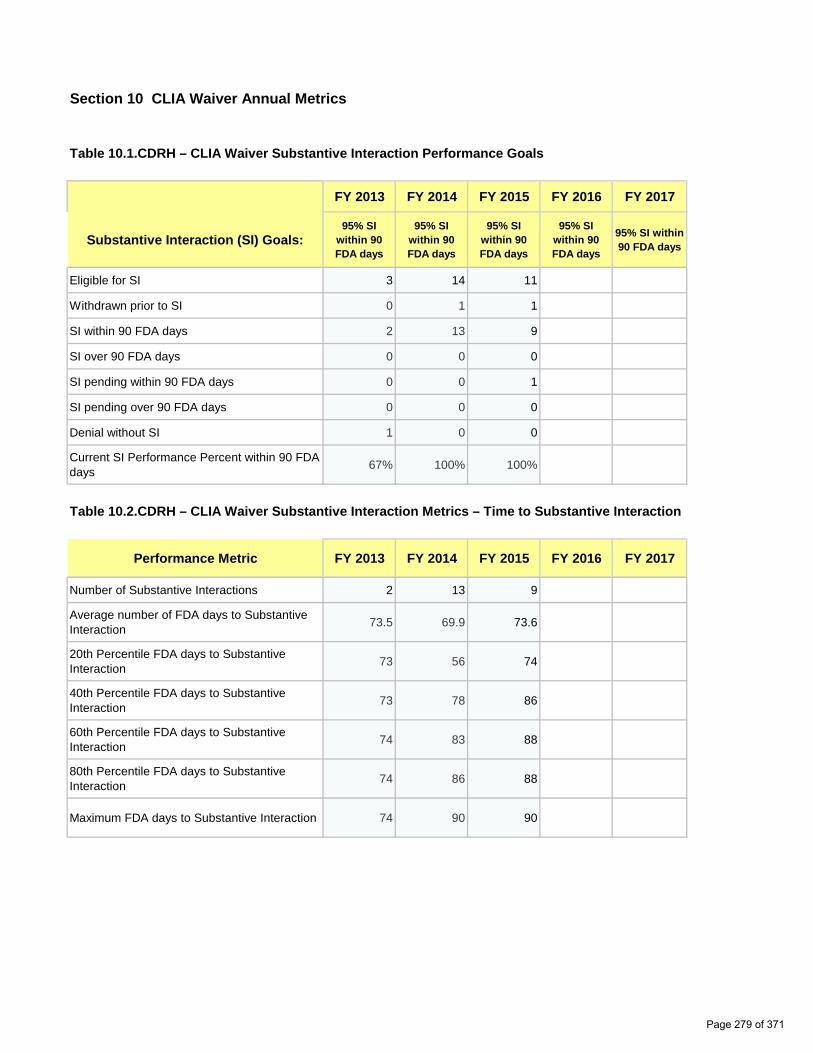
0 0
0 0
0 0
0 0
0 0
0 0
0 0
0.0% 0.0%
0 0
0.00 0.00
0 0
0 0
0 0
0 0
0 0
Section 10 CLIA Waiver Annual Metrics
Table 10.1.CDRH – CLIA Waiver Substantive Interaction Performance Goals
Substantive Interaction (SI) Goals:
FY 2013 FY 2014 FY 2015 FY 2016 FY 2017
95% SI within 90 FDA days
95% SI within 90 FDA days
95% SI within 90 FDA days
95% SI within 90 FDA days
95% SI within 90 FDA days
Eligible for SI 3 14 11
Withdrawn prior to SI 0 1 1
SI within 90 FDA days 2 13 9
SI over 90 FDA days 0 0 0
SI pending within 90 FDA days 0 0 1
SI pending over 90 FDA days 0 0 0
Denial without SI 1 0 0
Current SI Performance Percent within 90 FDA days 67% 100% 100%
Table 10.2.CDRH – CLIA Waiver Substantive Interaction Metrics – Time to Substantive Interaction
Performance Metric FY 2013 FY 2014 FY 2015 FY 2016 FY 2017
Number of Substantive Interactions 2 13 9
Average number of FDA days to Substantive Interaction 73.5 69.9 73.6
20th Percentile FDA days to Substantive Interaction 73 56 74
40th Percentile FDA days to Substantive Interaction 73 78 86
60th Percentile FDA days to Substantive Interaction 74 83 88
80th Percentile FDA days to Substantive Interaction 74 86 88
Maximum FDA days to Substantive Interaction 74 90 90
Page 279 of 371

0 0
0 0
0 0
0 0
0 0
0 0
0.00% 0.00%
0 0
0 0
0 0
0 0
0 0
0 0
0.00% 0.00%
Table 10.3.CDRH – CLIA Waiver (without Panel Review) MDUFA Decision Performance Goals
Performance Metric FY 2013 FY 2014 FY 2015 FY 2016 FY 2017
CLIA Waiver Applications accepted 3 14 11
Non-MDUFA III Decisions 0 0 0
MDUFA III Decisions 3 14 5
MDUFA III Decisions within 180 FDA Days 3 14 5
CLIA Waiver Applications pending MDUFA III Decision 0 0 6
CLIA Waiver Applications pending MDUFA III Decision over 180 FDA days 0 0 0
Current Performance Percent within 180 FDA Days 100% 100% 100%
Table 10.4.CDRH – CLIA Waiver with Panel Review MDUFA Decision Performance Goals
Performance Metric FY 2013 FY 2014 FY 2015 FY 2016 FY 2017
CLIA Waiver Applications accepted 0 0 0
Non-MDUFA III Decisions 0 0 0
MDUFA III Decisions 0 0 0
MDUFA III Decisions within 330 FDA Days 0 0 0
CLIA Waiver Applications pending MDUFA III Decision 0 0 0
CLIA Waiver Applications pending MDUFA III Decision over 330 FDA days 0 0 0
Current Performance Percent within 330 FDA Days N/A N/A N/A
Page 280 of 371
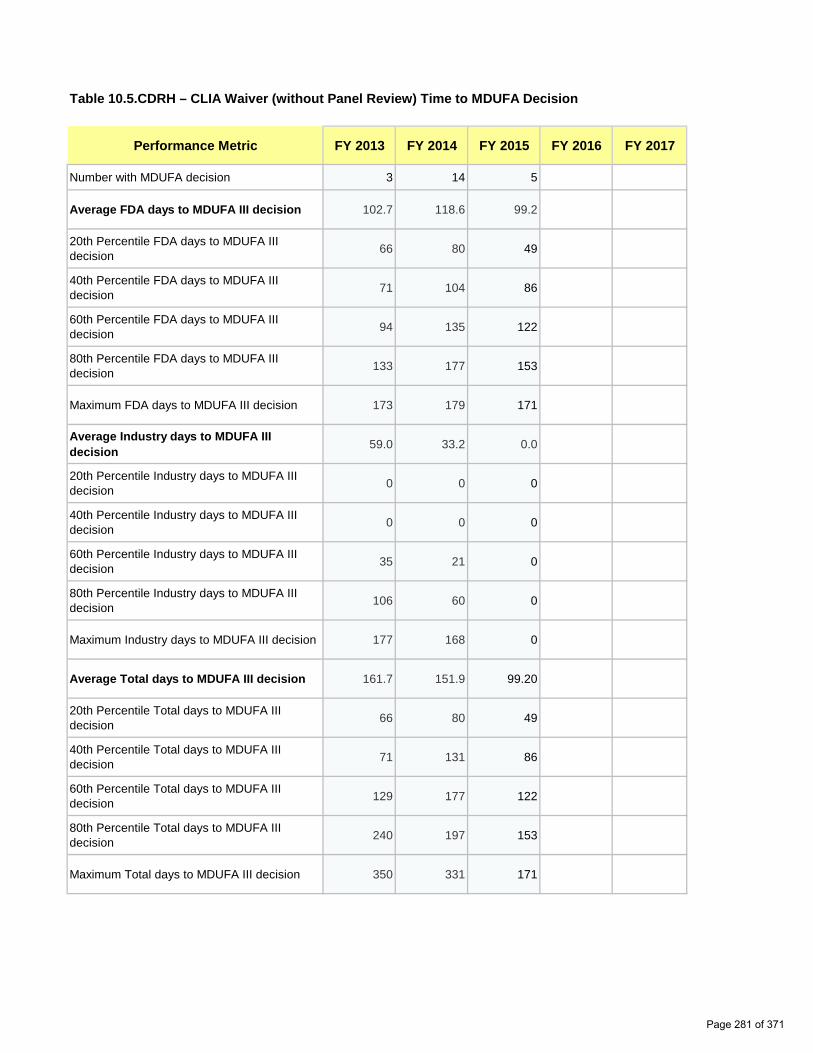
0 0
0.00 0.00
0 0
0 0
0 0
0 0
0 0
0.00 0.00
0 0
0 0
0 0
0 0
0 0
0.00 0.00
0 0
0 0
0 0
0 0
0 0
Table 10.5.CDRH – CLIA Waiver (without Panel Review) Time to MDUFA Decision
Performance Metric FY 2013 FY 2014 FY 2015 FY 2016 FY 2017
Number with MDUFA decision 3 14 5
Average FDA days to MDUFA III decision 102.7 118.6 99.2
20th Percentile FDA days to MDUFA III decision 66 80 49
40th Percentile FDA days to MDUFA III decision 71 104 86
60th Percentile FDA days to MDUFA III decision 94 135 122
80th Percentile FDA days to MDUFA III decision 133 177 153
Maximum FDA days to MDUFA III decision 173 179 171
Average Industry days to MDUFA III decision 59.0 33.2 0.0
20th Percentile Industry days to MDUFA III decision 0 0 0
40th Percentile Industry days to MDUFA III decision 0 0 0
60th Percentile Industry days to MDUFA III decision 35 21 0
80th Percentile Industry days to MDUFA III decision 106 60 0
Maximum Industry days to MDUFA III decision 177 168 0
Average Total days to MDUFA III decision 161.7 151.9 99.20
20th Percentile Total days to MDUFA III decision 66 80 49
40th Percentile Total days to MDUFA III decision 71 131 86
60th Percentile Total days to MDUFA III decision 129 177 122
80th Percentile Total days to MDUFA III decision 240 197 153
Maximum Total days to MDUFA III decision 350 331 171
Page 281 of 371
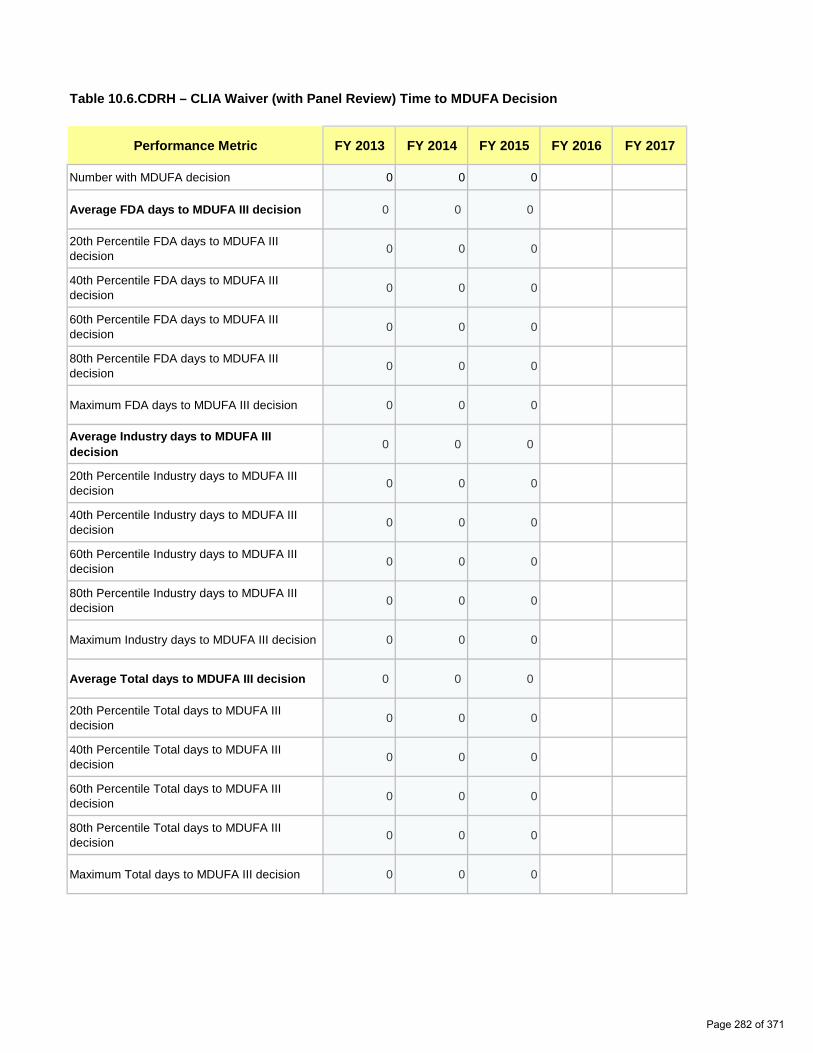
0 0
0.00 0.00
0 0
0 0
0 0
0 0
0 0
0.00 0.00
0 0
0 0
0 0
0 0
0 0
0.00 0.00
0 0
0 0
0 0
0 0
0 0
Table 10.6.CDRH – CLIA Waiver (with Panel Review) Time to MDUFA Decision
Performance Metric FY 2013 FY 2014 FY 2015 FY 2016 FY 2017
Number with MDUFA decision 0 0 0
Average FDA days to MDUFA III decision 0 0 0
20th Percentile FDA days to MDUFA III decision 0 0 0
40th Percentile FDA days to MDUFA III decision 0 0 0
60th Percentile FDA days to MDUFA III decision 0 0 0
80th Percentile FDA days to MDUFA III decision 0 0 0
Maximum FDA days to MDUFA III decision 0 0 0
Average Industry days to MDUFA III decision 0 0 0
20th Percentile Industry days to MDUFA III decision 0 0 0
40th Percentile Industry days to MDUFA III decision 0 0 0
60th Percentile Industry days to MDUFA III decision 0 0 0
80th Percentile Industry days to MDUFA III decision 0 0 0
Maximum Industry days to MDUFA III decision 0 0 0
Average Total days to MDUFA III decision 0 0 0
20th Percentile Total days to MDUFA III decision 0 0 0
40th Percentile Total days to MDUFA III decision 0 0 0
60th Percentile Total days to MDUFA III decision 0 0 0
80th Percentile Total days to MDUFA III decision 0 0 0
Maximum Total days to MDUFA III decision 0 0 0
Page 282 of 371

2a1a
3a
4a
7a
5a
8a 9a
14a
13a
15a 15a
6a
18a
17a
CDRH IDEs - FY 2014As of 9/30/15Number Received
N=248 1
1st Cycle Review Completed
N=248 2
Approved 1st Cycle
N=129 4
Under Review N=0
3
Disapproved 1st Cycle
N=68 5
Other* Decisions 1st Cycle
N=51 6
No Response Received as of 9/30/15
N=17 8
Approved 2nd Cycle
N=39 9
Disapproved 2nd Cycle
N=11 10
Under Review 2nd Cycle N=0
11
No Response Received as of 9/30/15
N=2 13
Approved 3rd Cycle
N=7 14
Disapproved 3rd Cycle
N=1 15
Under Review 3rd Cycle N=0
16
Withdrawn after 1st Cycle N=1
7
Withdrawn after 2nd Cycle N=1
12
Withdrawn after 3rd Cycle N=0
17
No Response Received as of 9/30/15
N=0 18
* Other decisions include withdrawn (N=34), RTA (N=2), nonsignificant risk device (N=9), exempt (N=3), product jurisdition pending (N=0), or product jurisdiction transferred (N=3).
Page 283 of 371

20a
19a
15a
CDRH IDEs - FY 2014As of 9/30/15
Approved 4th Cycle
N=0 19
Disapproved 4th Cycle
N=1 20
Under Review 4th Cycle N=0
21
Page 284 of 371
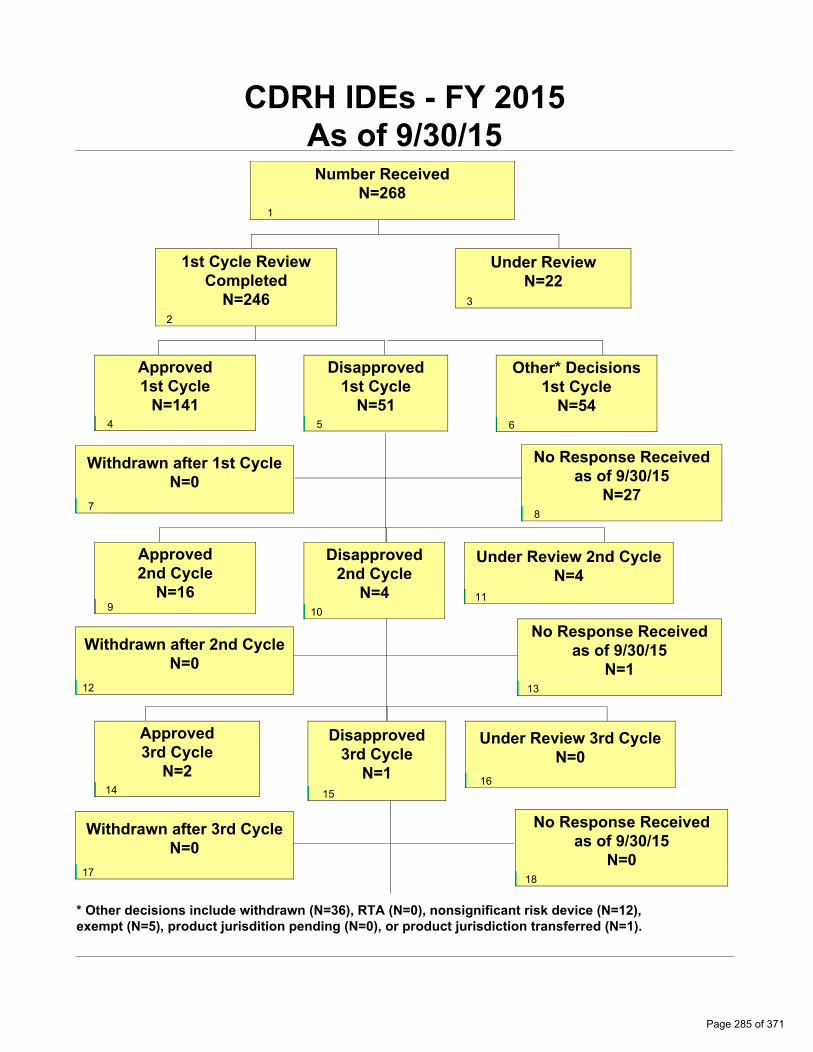
2a1a
3a
4a
7a
5a
8a 9a
14a
13a
15a 15a
6a
18a
17a
CDRH IDEs - FY 2015As of 9/30/15Number Received
N=268 1
1st Cycle Review Completed
N=246 2
Approved 1st Cycle
N=141 4
Under Review N=22
3
Disapproved 1st Cycle
N=51 5
Other* Decisions 1st Cycle
N=54 6
No Response Received as of 9/30/15
N=27 8
Approved 2nd Cycle
N=16 9
Disapproved 2nd Cycle
N=4 10
Under Review 2nd Cycle N=4
11
No Response Received as of 9/30/15
N=1 13
Approved 3rd Cycle
N=2 14
Disapproved 3rd Cycle
N=1 15
Under Review 3rd Cycle N=0
16
Withdrawn after 1st Cycle N=0
7
Withdrawn after 2nd Cycle N=0
12
Withdrawn after 3rd Cycle N=0
17
No Response Received as of 9/30/15
N=0 18
* Other decisions include withdrawn (N=36), RTA (N=0), nonsignificant risk device (N=12), exempt (N=5), product jurisdition pending (N=0), or product jurisdiction transferred (N=1).
Page 285 of 371

20a
19a
15a
CDRH IDEs - FY 2015As of 9/30/15
Approved 4th Cycle
N=0 19
Disapproved 4th Cycle
N=1 20
Under Review 4th Cycle N=0
21
Page 286 of 371
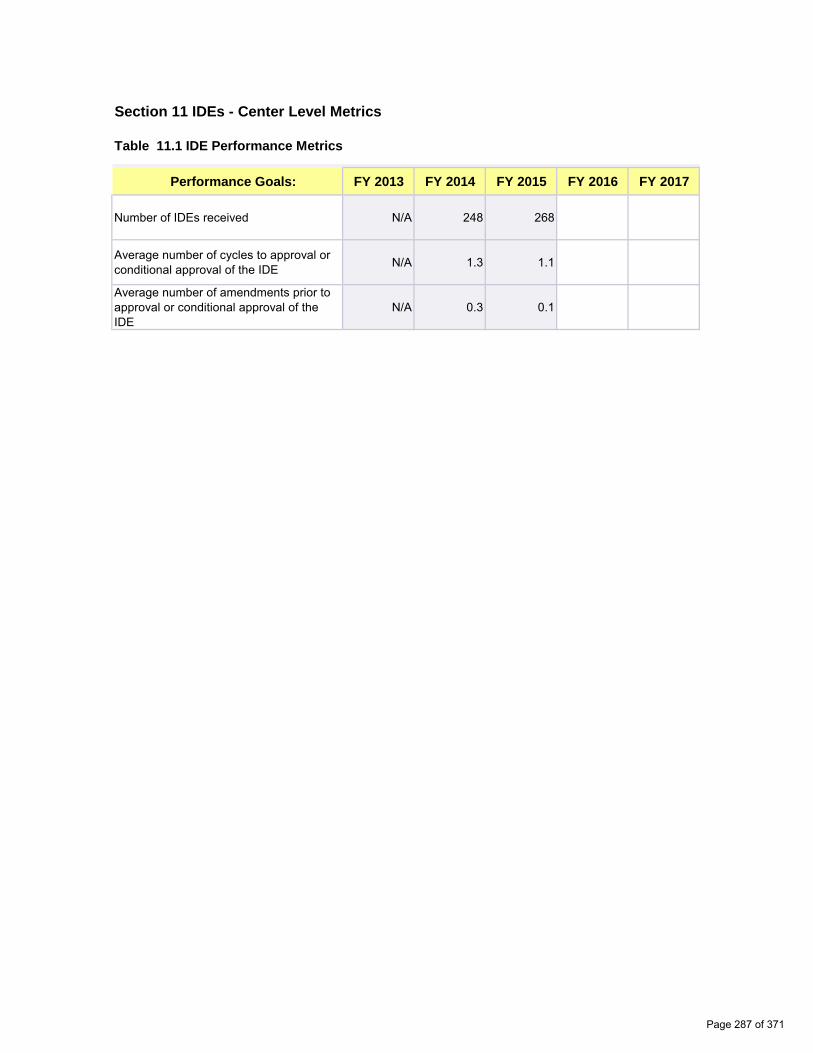
0.00 0.00
0.00 0.00
Section 11 IDEs - Center Level Metrics
Table 11.1 IDE Performance Metrics
Performance Goals: FY 2013 FY 2014 FY 2015 FY 2016 FY 2017
Number of IDEs received N/A 248 268
Average number of cycles to approval or conditional approval of the IDE N/A 1.3 1.1
Average number of amendments prior to approval or conditional approval of the IDE
N/A 0.3 0.1
Page 287 of 371
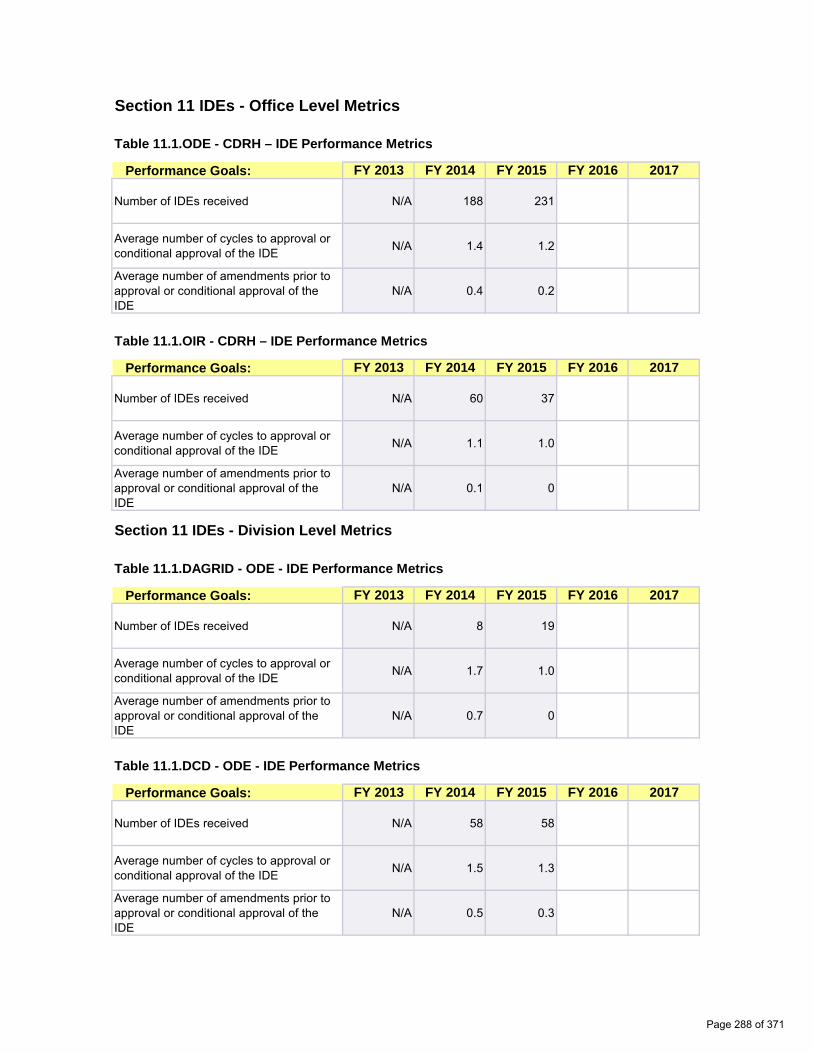
0.00
0.00
0.00
0.00
0.00
0.00
0.00
0.00
Section 11 IDEs - Office Level Metrics
Table 11.1.ODE - CDRH – IDE Performance Metrics
Performance Goals: FY 2013 FY 2014 FY 2015 FY 2016 2017
Number of IDEs received N/A 188 231
Average number of cycles to approval or conditional approval of the IDE N/A 1.4 1.2
Average number of amendments prior to approval or conditional approval of the IDE
N/A 0.4 0.2
Table 11.1.OIR - CDRH – IDE Performance Metrics
Performance Goals: FY 2013 FY 2014 FY 2015 FY 2016 2017
Number of IDEs received N/A 60 37
Average number of cycles to approval or conditional approval of the IDE N/A 1.1 1.0
Average number of amendments prior to approval or conditional approval of the IDE
N/A 0.1 0
Section 11 IDEs - Division Level Metrics
Table 11.1.DAGRID - ODE - IDE Performance Metrics
Performance Goals: FY 2013 FY 2014 FY 2015 FY 2016 2017
Number of IDEs received N/A 8 19
Average number of cycles to approval or conditional approval of the IDE N/A 1.7 1.0
Average number of amendments prior to approval or conditional approval of the IDE
N/A 0.7 0
Table 11.1.DCD - ODE - IDE Performance Metrics
Performance Goals: FY 2013 FY 2014 FY 2015 FY 2016 2017
Number of IDEs received N/A 58 58
Average number of cycles to approval or conditional approval of the IDE N/A 1.5 1.3
Average number of amendments prior to approval or conditional approval of the IDE
N/A 0.5 0.3
Page 288 of 371

0.00
0.00
0.00
0.00
0.00
0.00
0.00
0.00
Table 11.1.DNPMD - ODE - IDE Performance Metrics
Performance Goals: FY 2013 FY 2014 FY 2015 FY 2016 2017
Number of IDEs received N/A 35 39
Average number of cycles to approval or conditional approval of the IDE N/A 1.3 1.0
Average number of amendments prior to approval or conditional approval of the IDE
N/A 0.3 0
Table 11.1.DOD - ODE - IDE Performance Metrics
Performance Goals: FY 2013 FY 2014 FY 2015 FY 2016 2017
Number of IDEs received N/A 13 13
Average number of cycles to approval or conditional approval of the IDE N/A 1.2 1.10
Average number of amendments prior to approval or conditional approval of the IDE
N/A 0.2 0.10
Table 11.1.DOED - ODE - IDE Performance Metrics
Performance Goals: FY 2013 FY 2014 FY 2015 FY 2016 2017
Number of IDEs received N/A 18 26
Average number of cycles to approval or conditional approval of the IDE N/A 1.2 1.1
Average number of amendments prior to approval or conditional approval of the IDE
N/A 0.2 0.1
Table 11.1.DRGUD - ODE - IDE Performance Metrics
Performance Goals: FY 2013 FY 2014 FY 2015 FY 2016 2017
Number of IDEs received N/A 31 43
Average number of cycles to approval or conditional approval of the IDE N/A 1.5 1.3
Average number of amendments prior to approval or conditional approval of the IDE
N/A 0.5 0
Page 289 of 371
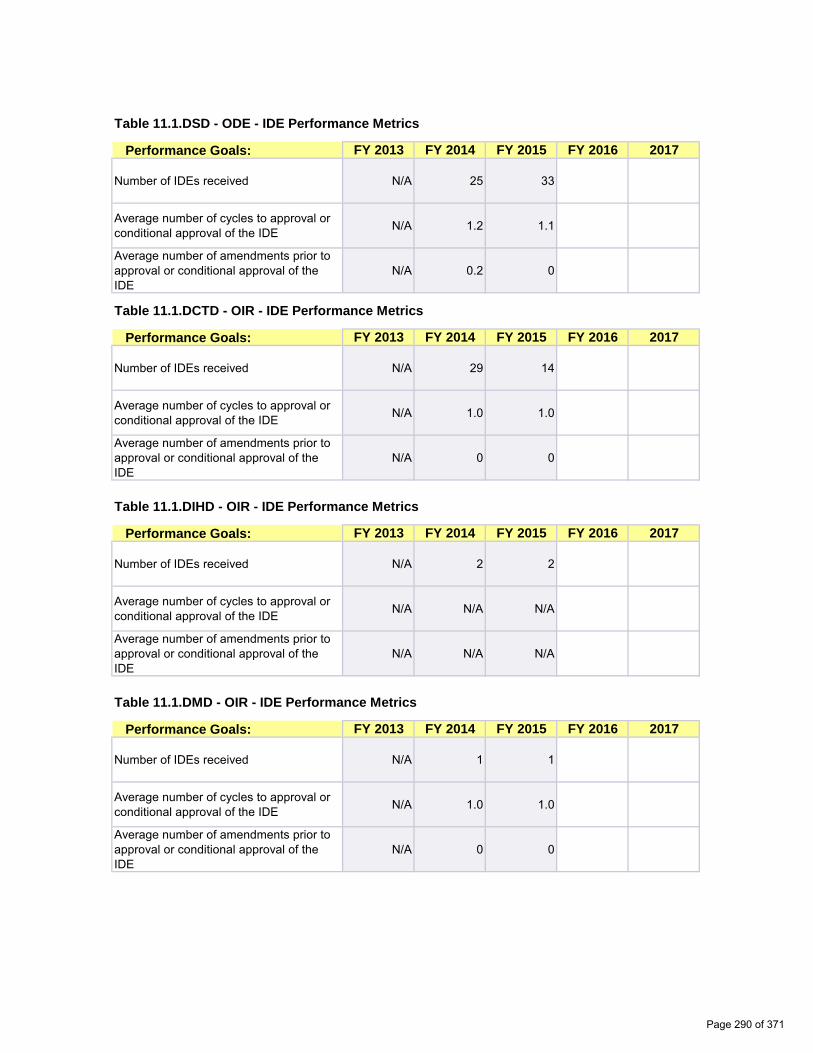
0 0
0.00 0.00
0.00 0.00
0.00
0.00
0.00
0.00
0.00
0.00
Table 11.1.DSD - ODE - IDE Performance Metrics
Performance Goals: FY 2013 FY 2014 FY 2015 FY 2016 2017
Number of IDEs received N/A 25 33
Average number of cycles to approval or conditional approval of the IDE N/A 1.2 1.1
Average number of amendments prior to approval or conditional approval of the IDE
N/A 0.2 0
Table 11.1.DCTD - OIR - IDE Performance Metrics
Performance Goals: FY 2013 FY 2014 FY 2015 FY 2016 2017
Number of IDEs received N/A 29 14
Average number of cycles to approval or conditional approval of the IDE N/A 1.0 1.0
Average number of amendments prior to approval or conditional approval of the IDE
N/A 0 0
Table 11.1.DIHD - OIR - IDE Performance Metrics
Performance Goals: FY 2013 FY 2014 FY 2015 FY 2016 2017
Number of IDEs received N/A 2 2
Average number of cycles to approval or conditional approval of the IDE N/A N/A N/A
Average number of amendments prior to approval or conditional approval of the IDE
N/A N/A N/A
Table 11.1.DMD - OIR - IDE Performance Metrics
Performance Goals: FY 2013 FY 2014 FY 2015 FY 2016 2017
Number of IDEs received N/A 1 1
Average number of cycles to approval or conditional approval of the IDE N/A 1.0 1.0
Average number of amendments prior to approval or conditional approval of the IDE
N/A 0 0
Page 290 of 371
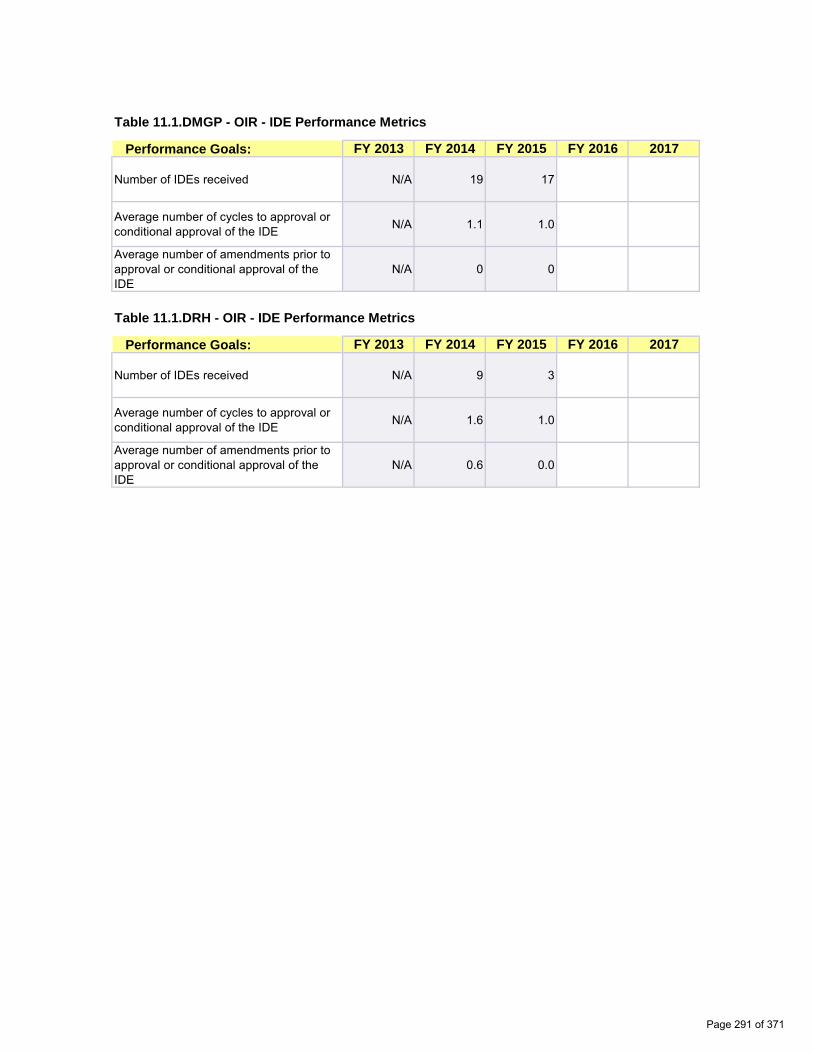
0.00
0.00
0.00
0.00
Table 11.1.DMGP - OIR - IDE Performance Metrics
Performance Goals: FY 2013 FY 2014 FY 2015 FY 2016 2017
Number of IDEs received N/A 19 17
Average number of cycles to approval or conditional approval of the IDE N/A 1.1 1.0
Average number of amendments prior to approval or conditional approval of the IDE
N/A 0 0
Table 11.1.DRH - OIR - IDE Performance Metrics
Performance Goals: FY 2013 FY 2014 FY 2015 FY 2016 2017
Number of IDEs received N/A 9 3
Average number of cycles to approval or conditional approval of the IDE N/A 1.6 1.0
Average number of amendments prior to approval or conditional approval of the IDE
N/A 0.6 0.0
Page 291 of 371

Page intentionally left blank
Page 292 of 371
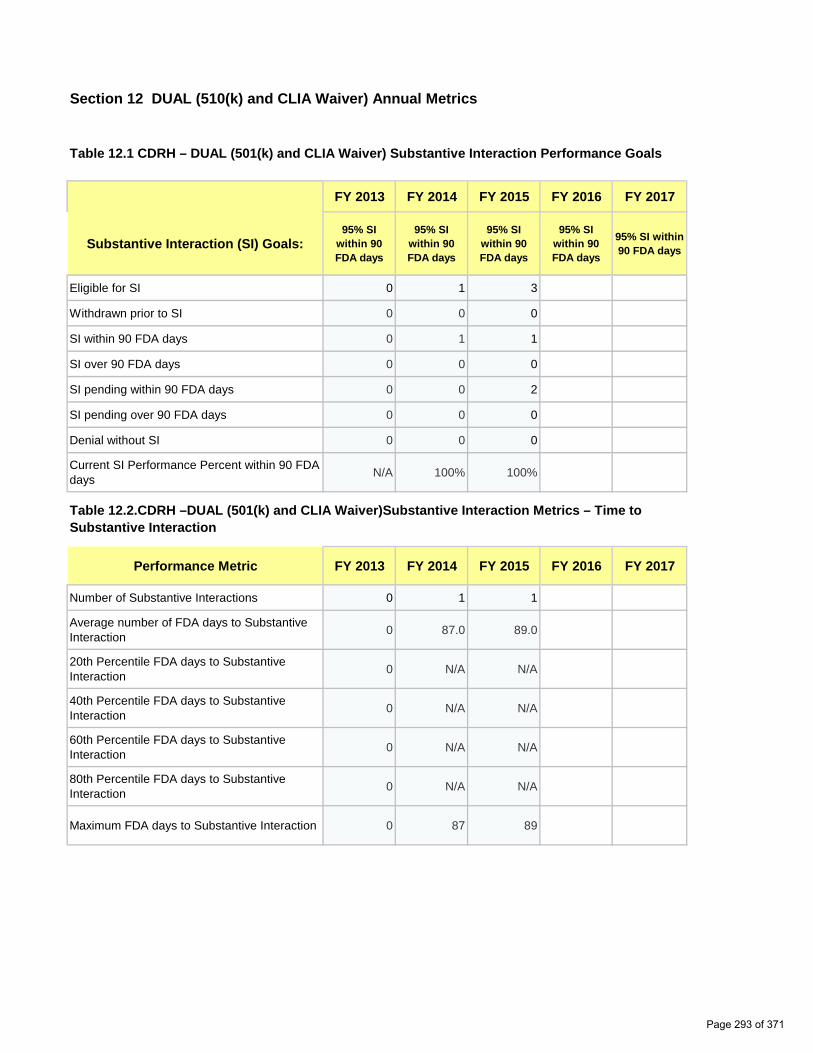
0 0
0 0
0 0
0 0
0 0
0 0
0 0
0.0% 0.0%
0 0
0.00 0.00
0 0
0 0
0 0
0 0
0 0
Section 12 DUAL (510(k) and CLIA Waiver) Annual Metrics
Table 12.1 CDRH – DUAL (501(k) and CLIA Waiver) Substantive Interaction Performance Goals
Substantive Interaction (SI) Goals:
FY 2013 FY 2014 FY 2015 FY 2016 FY 2017
95% SI within 90 FDA days
95% SI within 90 FDA days
95% SI within 90 FDA days
95% SI within 90 FDA days
95% SI within 90 FDA days
Eligible for SI 0 1 3
Withdrawn prior to SI 0 0 0
SI within 90 FDA days 0 1 1
SI over 90 FDA days 0 0 0
SI pending within 90 FDA days 0 0 2
SI pending over 90 FDA days 0 0 0
Denial without SI 0 0 0
Current SI Performance Percent within 90 FDA days N/A 100% 100%
Table 12.2.CDRH –DUAL (501(k) and CLIA Waiver)Substantive Interaction Metrics – Time to Substantive Interaction
Performance Metric FY 2013 FY 2014 FY 2015 FY 2016 FY 2017
Number of Substantive Interactions 0 1 1
Average number of FDA days to Substantive Interaction 0 87.0 89.0
20th Percentile FDA days to Substantive Interaction 0 N/A N/A
40th Percentile FDA days to Substantive Interaction 0 N/A N/A
60th Percentile FDA days to Substantive Interaction 0 N/A N/A
80th Percentile FDA days to Substantive Interaction 0 N/A N/A
Maximum FDA days to Substantive Interaction 0 87 89
Page 293 of 371
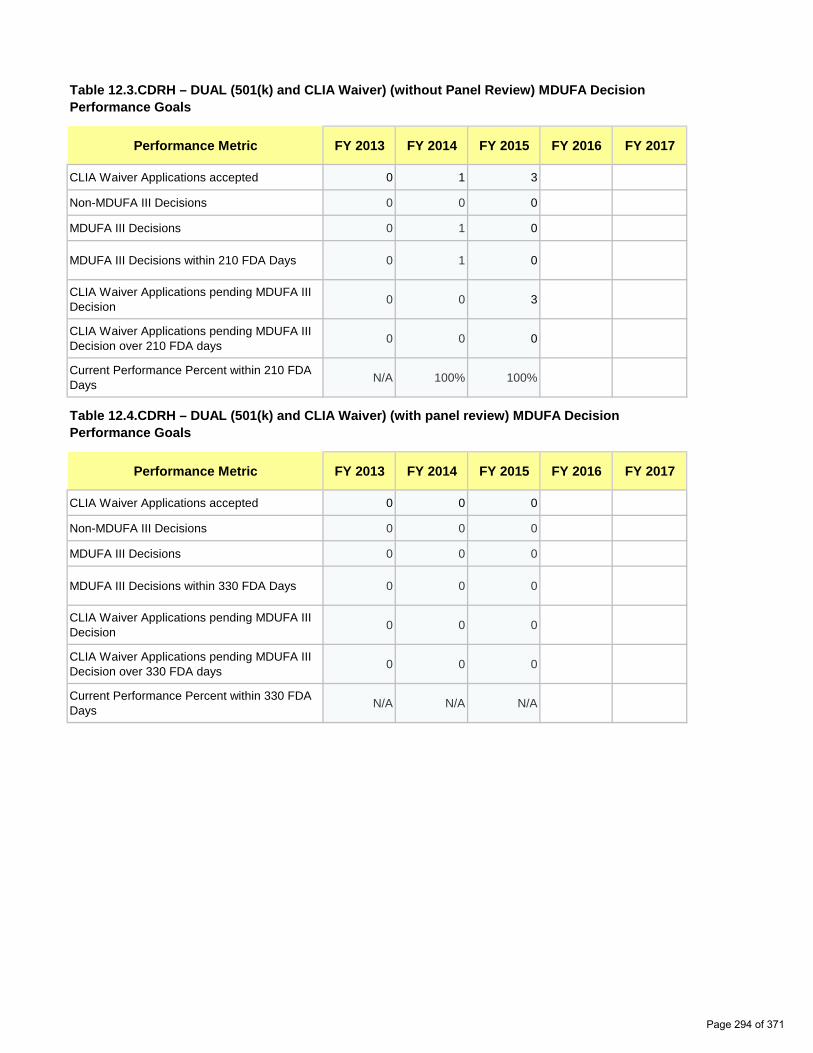
0 0
0 0
0 0
0 0
0 0
0 0
0.00% 0.00%
0 0
0 0
0 0
0 0
0 0
0 0
0.00% 0.00%
Table 12.3.CDRH – DUAL (501(k) and CLIA Waiver) (without Panel Review) MDUFA Decision Performance Goals
Performance Metric FY 2013 FY 2014 FY 2015 FY 2016 FY 2017
CLIA Waiver Applications accepted 0 1 3
Non-MDUFA III Decisions 0 0 0
MDUFA III Decisions 0 1 0
MDUFA III Decisions within 210 FDA Days 0 1 0
CLIA Waiver Applications pending MDUFA III Decision 0 0 3
CLIA Waiver Applications pending MDUFA III Decision over 210 FDA days 0 0 0
Current Performance Percent within 210 FDA Days N/A 100% 100%
Table 12.4.CDRH – DUAL (501(k) and CLIA Waiver) (with panel review) MDUFA Decision Performance Goals
Performance Metric FY 2013 FY 2014 FY 2015 FY 2016 FY 2017
CLIA Waiver Applications accepted 0 0 0
Non-MDUFA III Decisions 0 0 0
MDUFA III Decisions 0 0 0
MDUFA III Decisions within 330 FDA Days 0 0 0
CLIA Waiver Applications pending MDUFA III Decision 0 0 0
CLIA Waiver Applications pending MDUFA III Decision over 330 FDA days 0 0 0
Current Performance Percent within 330 FDA Days N/A N/A N/A
Page 294 of 371
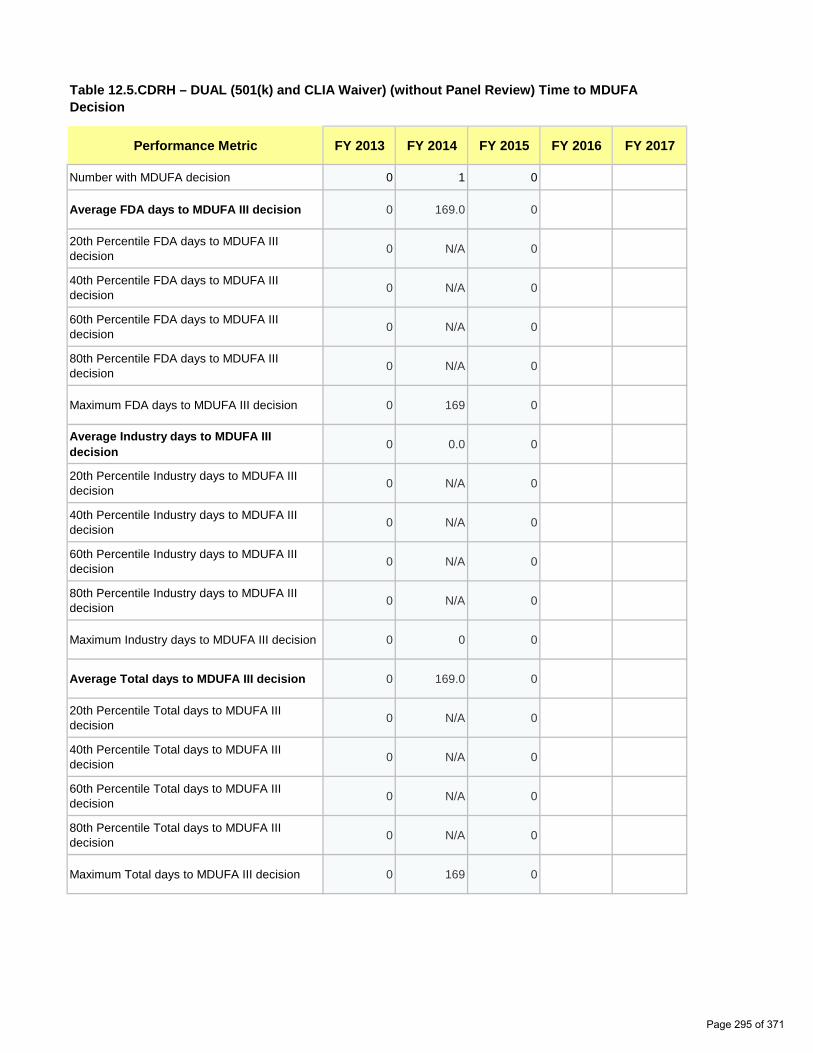
0 0
0.00 0.00
0 0
0 0
0 0
0 0
0 0
0.00 0.00
0 0
0 0
0 0
0 0
0 0
0.00 0.00
0 0
0 0
0 0
0 0
0 0
Table 12.5.CDRH – DUAL (501(k) and CLIA Waiver) (without Panel Review) Time to MDUFA Decision
Performance Metric FY 2013 FY 2014 FY 2015 FY 2016 FY 2017
Number with MDUFA decision 0 1 0
Average FDA days to MDUFA III decision 0 169.0 0
20th Percentile FDA days to MDUFA III decision 0 N/A 0
40th Percentile FDA days to MDUFA III decision 0 N/A 0
60th Percentile FDA days to MDUFA III decision 0 N/A 0
80th Percentile FDA days to MDUFA III decision 0 N/A 0
Maximum FDA days to MDUFA III decision 0 169 0
Average Industry days to MDUFA III decision 0 0.0 0
20th Percentile Industry days to MDUFA III decision 0 N/A 0
40th Percentile Industry days to MDUFA III decision 0 N/A 0
60th Percentile Industry days to MDUFA III decision 0 N/A 0
80th Percentile Industry days to MDUFA III decision 0 N/A 0
Maximum Industry days to MDUFA III decision 0 0 0
Average Total days to MDUFA III decision 0 169.0 0
20th Percentile Total days to MDUFA III decision 0 N/A 0
40th Percentile Total days to MDUFA III decision 0 N/A 0
60th Percentile Total days to MDUFA III decision 0 N/A 0
80th Percentile Total days to MDUFA III decision 0 N/A 0
Maximum Total days to MDUFA III decision 0 169 0
Page 295 of 371
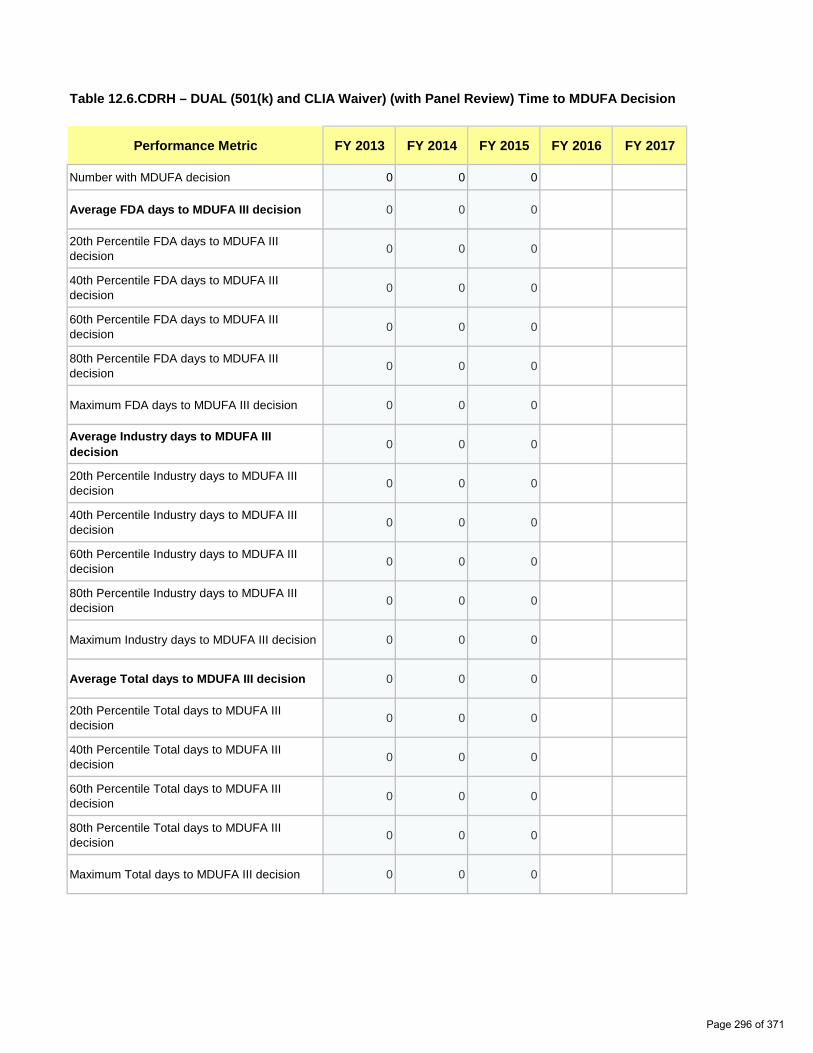
0 0
0.00 0.00
0 0
0 0
0 0
0 0
0 0
0.00 0.00
0 0
0 0
0 0
0 0
0 0
0.00 0.00
0 0
0 0
0 0
0 0
0 0
Table 12.6.CDRH – DUAL (501(k) and CLIA Waiver) (with Panel Review) Time to MDUFA Decision
Performance Metric FY 2013 FY 2014 FY 2015 FY 2016 FY 2017
Number with MDUFA decision 0 0 0
Average FDA days to MDUFA III decision 0 0 0
20th Percentile FDA days to MDUFA III decision 0 0 0
40th Percentile FDA days to MDUFA III decision 0 0 0
60th Percentile FDA days to MDUFA III decision 0 0 0
80th Percentile FDA days to MDUFA III decision 0 0 0
Maximum FDA days to MDUFA III decision 0 0 0
Average Industry days to MDUFA III decision 0 0 0
20th Percentile Industry days to MDUFA III decision 0 0 0
40th Percentile Industry days to MDUFA III decision 0 0 0
60th Percentile Industry days to MDUFA III decision 0 0 0
80th Percentile Industry days to MDUFA III decision 0 0 0
Maximum Industry days to MDUFA III decision 0 0 0
Average Total days to MDUFA III decision 0 0 0
20th Percentile Total days to MDUFA III decision 0 0 0
40th Percentile Total days to MDUFA III decision 0 0 0
60th Percentile Total days to MDUFA III decision 0 0 0
80th Percentile Total days to MDUFA III decision 0 0 0
Maximum Total days to MDUFA III decision 0 0 0
Page 296 of 371
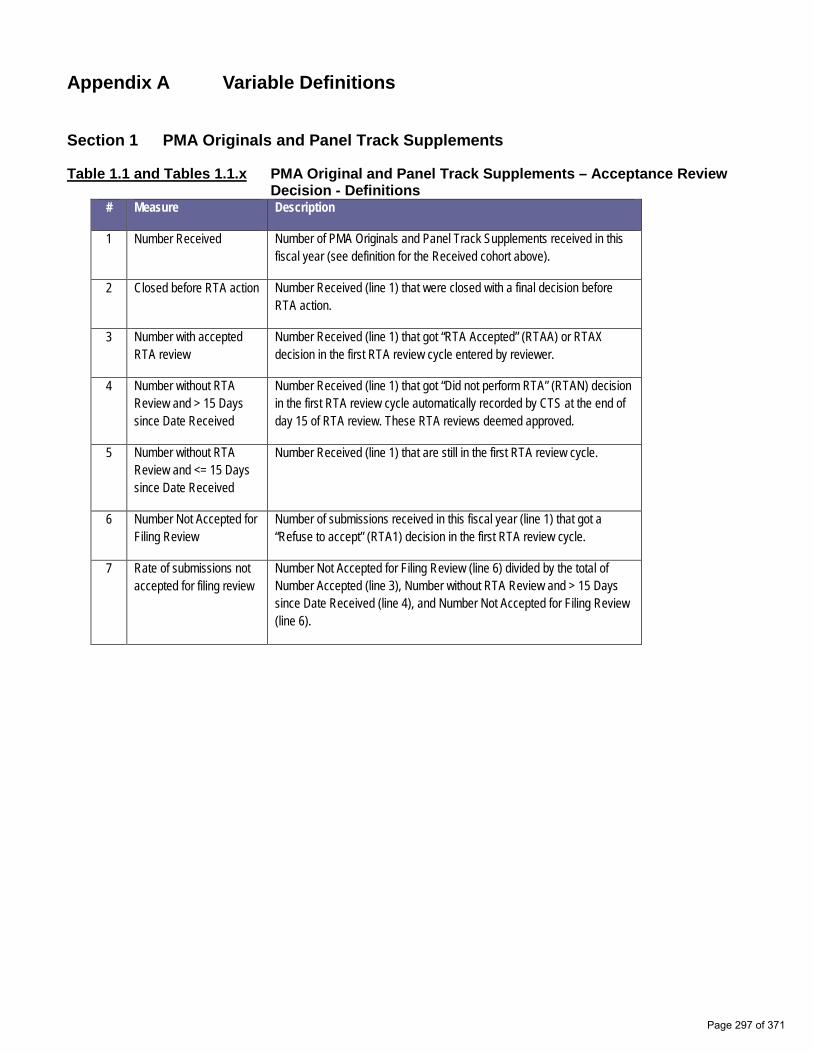
Appendix A Variable Definitions
Section 1 PMA Originals and Panel Track Supplements
Table 1.1 and Tables 1.1.x PMA Original and Panel Track Supplements – Acceptance ReviewDecision - Definitions
# Measure Description
1 Number Received Number of PMA Originals and Panel Track Supplements received in this fiscal year (see definition for the Received cohort above).
2 Closed before RTA action Number Received (line 1) that were closed with a final decision before RTA action.
3 Number with accepted RTA review
Number Received (line 1) that got “RTA Accepted” (RTAA) or RTAX decision in the first RTA review cycle entered by reviewer.
4 Number without RTA Review and > 15 Days since Date Received
Number Received (line 1) that got “Did not perform RTA” (RTAN) decision in the first RTA review cycle automatically recorded by CTS at the end of day 15 of RTA review. These RTA reviews deemed approved.
5 Number without RTA Review and <= 15 Days since Date Received
Number Received (line 1) that are still in the first RTA review cycle.
6 Number Not Accepted for Filing Review
Number of submissions received in this fiscal year (line 1) that got a “Refuse to accept” (RTA1) decision in the first RTA review cycle.
7 Rate of submissions not accepted for filing review
Number Not Accepted for Filing Review (line 6) divided by the total of Number Accepted (line 3), Number without RTA Review and > 15 Days since Date Received (line 4), and Number Not Accepted for Filing Review (line 6).
Page 297 of 371
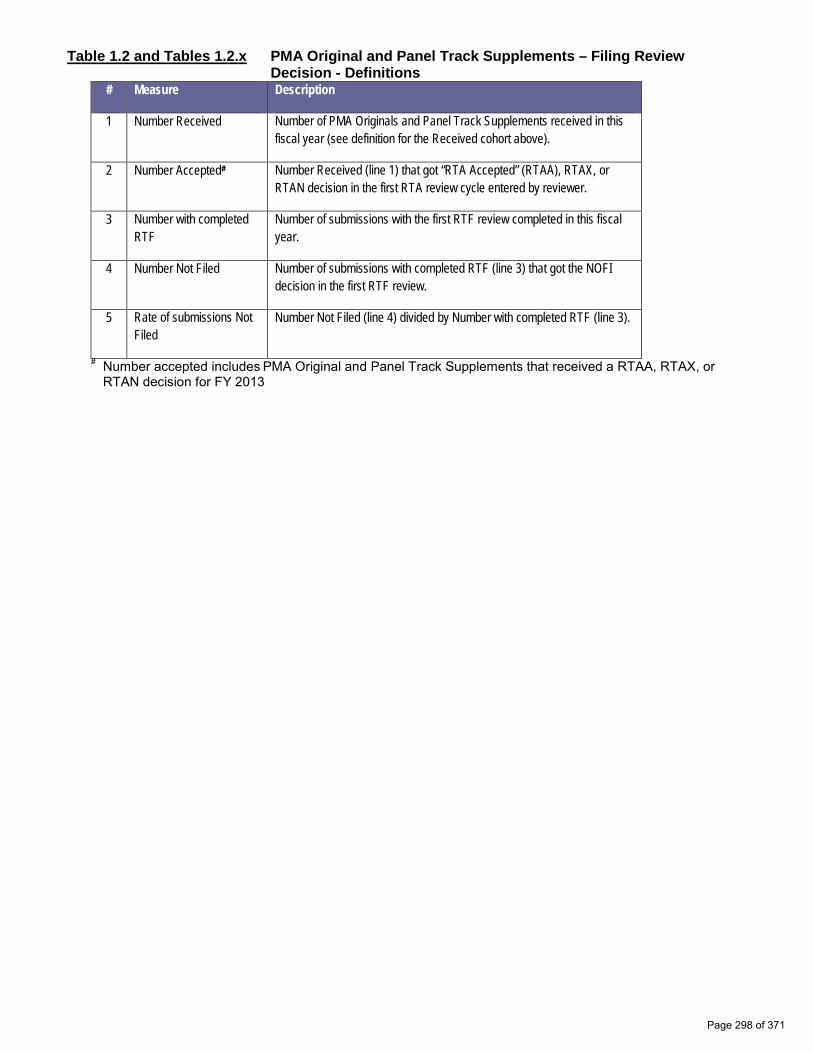
Table 1.2 and Tables 1.2.x PMA Original and Panel Track Supplements – Filing ReviewDecision - Definitions
#
# Measure Description
1 Number Received Number of PMA Originals and Panel Track Supplements received in this fiscal year (see definition for the Received cohort above).
2 Number Accepted# Number Received (line 1) that got “RTA Accepted” (RTAA), RTAX, or RTAN decision in the first RTA review cycle entered by reviewer.
3 Number with completed RTF
Number of submissions with the first RTF review completed in this fiscal year.
4 Number Not Filed Number of submissions with completed RTF (line 3) that got the NOFI decision in the first RTF review.
5 Rate of submissions Not Filed
Number Not Filed (line 4) divided by Number with completed RTF (line 3).
Number accepted includes PMA Original and Panel Track Supplements that received a RTAA, RTAX, or RTAN decision for FY 2013
Page 298 of 371

Table 1.3 and Tables 1.3.x PMA Originals & Panel Track Supplements Substantive InteractionPerformance Goals - Definitions
# Measure Description
1 Eligible for SI Number of PMA Original submissions and Panel Track supplements that were filed in this fiscal year.
2 SI Goal Met Number of submissions with SI action within goal.
3 SI Goal Not Met Number of submissions with SI action taken past goal.
4 SI Pending Within Goal Number of submissions that are under review with no SI within goal.
5 SI Pending Past Goal Number of submissions that are under with no SI past goal.
6 Closed without SI Number of submissions that are closed with a MDUFA or final decision that does not qualify as SI and that did not have an SI prior to that decision (i.e., converted and withdrawn).
7 Current SI Performance Percent Goal Met
Number of submissions with SI within goal (line 2) divided by the total number of submissions that either had an SI (line 2 and line 3) or did not have an SI but failed the SI goal (line 5).
Page 299 of 371

Table 1.4 and Tables 1.4.x PMA Originals and Panel Track Supplements Substantive Interaction Metrics – Time to Substantive Interaction - Definitions
# Measure Description
1 Number of Substantive Interactions
Number of PMA Originals and Panel Track Supplements filed in this fiscal year that had an SI.
2 Average number of FDA days to Substantive Interaction
Average number of FDA days across all PMA Originals and Panel Track Supplements with SI (line 1).
3 20th Percentile FDA days to Substantive Interaction
20th percentile FDA days to Substantive Interaction for submissions with SI (line 1).
4 40th Percentile FDA days to Substantive Interaction
40th percentile FDA days to Substantive Interaction for submissions with SI (line 1).
5 60th Percentile FDA days to Substantive Interaction
60th percentile FDA days to Substantive Interaction for submissions with SI (line 1).
6 80th Percentile FDA days to Substantive Interaction
80th percentile FDA days to Substantive Interaction for submissions with SI (line 1).
7 Maximum FDA days to Substantive Interaction
Maximum FDA days (100th percentile) to Substantive Interaction for submissions with SI (line 1).
Page 300 of 371
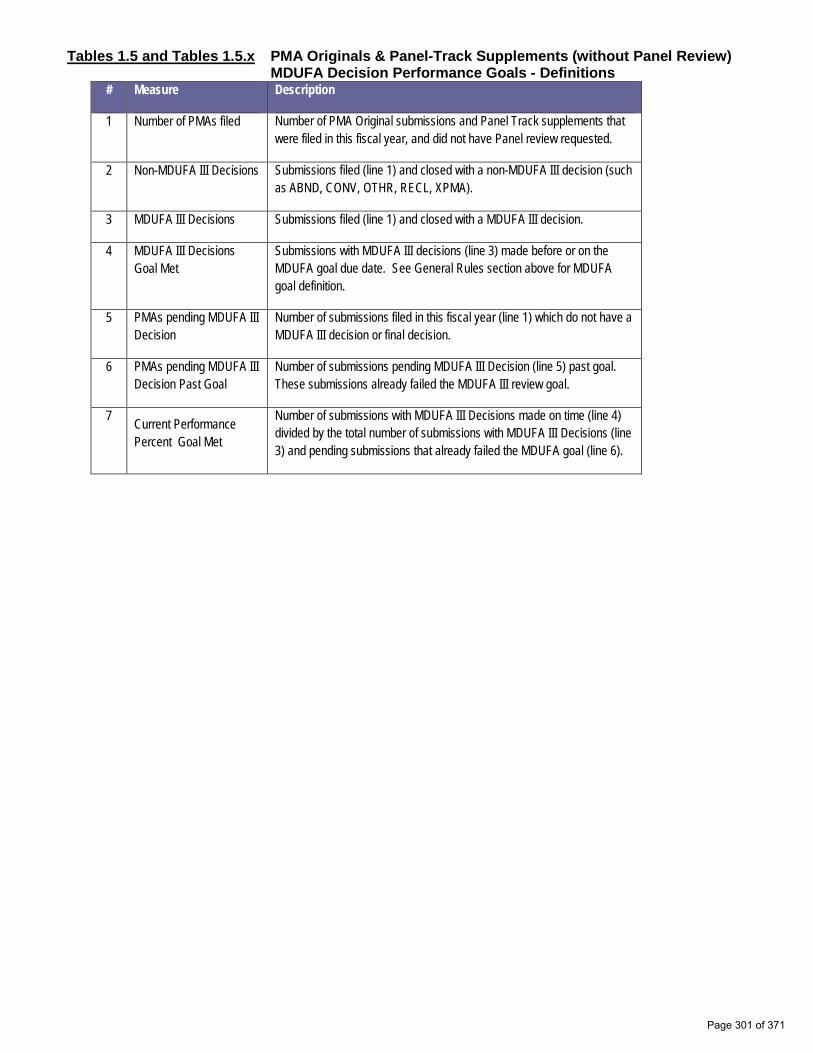
Tables 1.5 and Tables 1.5.x PMA Originals & Panel-Track Supplements (without Panel Review)MDUFA Decision Performance Goals - Definitions
# Measure Description
1 Number of PMAs filed Number of PMA Original submissions and Panel Track supplements that were filed in this fiscal year, and did not have Panel review requested.
2 Non-MDUFA III Decisions Submissions filed (line 1) and closed with a non-MDUFA III decision (such as ABND, CONV, OTHR, RECL, XPMA).
3 MDUFA III Decisions Submissions filed (line 1) and closed with a MDUFA III decision.
4 MDUFA III Decisions Goal Met
Submissions with MDUFA III decisions (line 3) made before or on the MDUFA goal due date. See General Rules section above for MDUFA goal definition.
5 PMAs pending MDUFA III Decision
Number of submissions filed in this fiscal year (line 1) which do not have a MDUFA III decision or final decision.
6 PMAs pending MDUFA III Decision Past Goal
Number of submissions pending MDUFA III Decision (line 5) past goal. These submissions already failed the MDUFA III review goal.
7 Current Performance Percent Goal Met
Number of submissions with MDUFA III Decisions made on time (line 4) divided by the total number of submissions with MDUFA III Decisions (line 3) and pending submissions that already failed the MDUFA goal (line 6).
Page 301 of 371

Table 1.6 and Tables 1.6.x PMA Originals & Panel Track Supplements (with Panel Review)MDUFA Decision Performance Goals - Definitions
# Measure Description
1 Number of PMAs filed Number of PMA Original submissions and Panel Track supplements that were filed in this fiscal year, and had a Panel review requested.
2 Non-MDUFA III Decisions Submissions filed (line 1) and closed with a non-MDUFA III decision (such as ABND, CONV, OTHR, RECL, XPMA).
3 MDUFA III Decisions Submissions filed (line 1) and closed with a MDUFA III decision.
4 MDUFA III Decisions Goal Met
Submissions with MDUFA III decisions (line 3) made before or on the MDUFA goal due date. See General Rules section above for MDUFA goal definition.
5 PMAs pending MDUFA III Decision
Number of submissions filed in this fiscal year (line 1) which do not have a MDUFA III decision or final decision.
6 PMAs pending MDUFA III Decision Past Goal
Number of submissions pending MDUFA III Decision (line 5) past goal. These submissions already failed the MDUFA III review goal.
7 Current Performance Percent Goal Met
Number of submissions with MDUFA III Decisions made on time (line 4) divided by the total number of submissions with MDUFA III Decisions (line 3) and pending submissions that already failed the MDUFA goal (line 6).
Table 1.7 and Tables 1.7.x PMA Original and Panel Track Supplements (without Panel Review)Performance Metrics – Time to MDUFA Decision - Definitions
# Measure Description
1 Number with MDUFA III Decision
Number of PMA Original submissions and Panel Track supplements that were filed in this fiscal year, did not have Panel review requested, and had a MDUFA decision made before or on the report cutoff date.
Days to MDUFA Decision Table shall show Average Days to MDUFA III decision as well as quintiles (20th, 40th, 60th, 80th percentiles) and the Maximum Days (100th percentile) for FDA days, Industry days, and Total days.
Page 302 of 371

Table 1.8 and Tables 1.8.x PMA Original and Panel Track Supplements (with Panel Review)Performance Metrics – Time to MDUFA Decision - Definitions
# Measure Description
1 Number with MDUFA III Decision
Number of PMA Original submissions and Panel Track supplements that were filed in this fiscal year, had Panel review requested, and had a MDUFA decision made before or on the report cutoff date.
Days to MDUFA Decision Table shall show Average Days to MDUFA III decision as well as quintiles (20th, 40th, 60th, 80th percentiles) and the Maximum Days (100th percentile) for FDA days, Industry days, and Total days.
Table 1.9 and Tables 1.9.x PMA Originals and Panel Track Supplements (without Panel Review) Performance Metrics – Rate of Withdrawal and Not Approvable Definitions
# Measure Description
1 Number Filed Number of PMA Originals and Panel Track Supplements that were filed in this fiscal year, and did not have Panel Review requested.
2 Number with MDUFA decision
Number submissions filed (line 1) that also had a MDUFA decision.
3 Number of Withdrawals Number of submissions filed (line 1) with MDUFA decision of WTDR (Withdrawn).
4 Number of Not Approvable
Number of submissions filed (line 1) with MDUFA decision of NOAP (Not Approvable).
5 Rate of Withdrawals Number of Withdrawals (line 3) divided by Number with MDUFA decision (line 2).
6 Rate of Not Approvable Number of Not Approvable (line 4) divided by Number with MDUFA decision (line 2).
Page 303 of 371

Table 1.10 and Tables 1.10.x PMA Original and Panel Track Supplements (with Panel Review)Performance Metrics – Rate of Withdrawal and Not Approvable Definitions
# Measure Description
1 Number Filed Number of PMA Originals and Panel Track Supplements that were filed in this fiscal year, and had Panel Review requested.
2 Number with MDUFA decision
Number submissions filed (line 1) that also had a MDUFA decision.
3 Number of Withdrawals Number of submissions filed (line 1) with MDUFA decision of WTDR (Withdrawn).
4 Number of Not Approvable
Number of submissions filed (line 1) with MDUFA decision of NOAP (Not Approvable).
5 Rate of Withdrawals Number of Withdrawals (line 3) divided by Number with MDUFA decision (line 2).
6 Rate of Not Approvable Number of Not Approvable (line 4) divided by Number with MDUFA decision (line2).
Page 304 of 371

Table 1.11 and Tables 1.11.x PMA Original and Panel Track Supplements (without Panel Review)Performance Metrics – Submissions Missing Performance Goals Definitions
# Measure Description
1 Number of submissions that missed the goal
Number of PMA Originals and Panel Track Supplements, filed in this fiscal year, without Panel Review, with number FDA days to MDUFA III decision exceeding number of goal days.
2 Mean FDA days for submissions that missed goal
Mean FDA days for submissions that missed the goal (line 1).
3 Mean industry days for submissions that missed goal
Mean industry days for submissions that missed the goal (line 1).
Table 1.12 and Tables 1.12.x PMA Original and Panel Track Supplements (with Panel Review)Performance Metrics – Submissions Missing Performance Goals Definitions
# Measure Description
1 Number of submissions that missed the goal
Number of PMA Originals and Panel Track Supplements, filed in this fiscal year, with Panel Review, with number FDA days to MDUFA III decision exceeding number of goal days.
2 Mean FDA days for submissions that missed goal
Mean FDA days for submissions that missed the goal (line 1).
3 Mean industry days for submissions that missed goal
Mean industry days for submissions that missed the goal (line 1).
Page 305 of 371

Section 2 PMA 180 Day Supplements
Table 2.1 and Tables 2.1.x PMA 180 Day Supplements Substantive Interaction Goals Definitions
# Measure Description
1 Eligible for SI Number of 180 day PMA supplements received in this fiscal year. See definition of the received cohort above.
2 SI Goal Met Number of submissions with an SI action taken within goal.
3 SI Goal Not Met Number of submissions with an SI action taken past goal.
4 SI Pending Within Goal Submissions that are under review within goal.
5 SI Pending Past Goal Submissions that are under review past goaI.
6 Closed without SI Number of submissions that are closed with a MDUFA or NON-MDUFA decision but without an SI.
7 Current SI Performance Percent Goal Met
Number of submissions with SI within goal (line 2) divided by the total number of submissions that either had an SI (line 2 and line 3) or did not have an SI but failed the SI goal (line 5).
Table 2.2 and Tables 2.2.x PMA 180 Day Supplements MDUFA Decision Performance Goals Definitions
# Measure Description
1 Supplements filed Number of 180 day PMA supplements received in this fiscal year.
2 Non-MDUFA III Decisions Supplements received (line 1) and closed with a non-MDUFA III decision (such as ABND, CONV, OTHR, RECL, WTDR, XPMA).
3 MDUFA III Decisions Supplements received (line 1) and closed with a MDUFA III decision.
4 MDUFA III Decisions Goal Met
Submissions with MDUFA III decisions (line 3) made before or on the MDUFA goal due date. See General Rules section above for MDUFA goal definition.
5 Supplements pending MDUFA III Decision
Number of supplements received (line 1) that do not have a MDUFA III decision or a final decision.
6 Supplements pending MDUFA III Decision Past Goal
Number of supplements pending MDUFA III Decision (line 5) past goal. These supplements already failed the MDUFA III review goal.
7 Current Performance Percent Goal Met
Number of supplements with MDUFA III Decisions made on time (line 4) divided by the total number of supplements with MDUFA III Decisions (line 3) and pending supplements that already failed the MDUFA goal (line 6).
Page 306 of 371

Table 2.3 and Tables 2.3.x PMA 180 Day Supplements Performance Metrics – Rate of NotApprovable - Definitions
# Measure Description
1 Number Received Number of PMA 180 Day Supplements received in this fiscal year.
2 Number with MDUFA decision
Number supplements received (line 1) and closed with a MDUFA decision.
3 Number of Not Approvable
Number of supplements received (line 1) and closed with MDUFA decision of NOAP (Not Approvable).
4 Rate of Not Approvable Number of Not Approvable (line 3) divided by Number with MDUFA decision (line2).
Table 2.4 and Tables 2.4.x PMA 180 Day Supplements Performance Metrics – Submissions Missing Performance Goals - Definitions
# Measure Description
1 Number of submissions that missed the goal
Number of 180 Day supplements, received in this fiscal year, with number FDA days to MDUFA III decision exceeding number of goal days.
2 Mean FDA days for submissions that missed goal
Mean FDA days for supplements that missed the goal (line 1).
3 Mean industry days for submissions that missed goal
Mean industry days for supplements that missed the goal (line 1).
Page 307 of 371

Section 3 PMA Real Time Supplements
Table 3.1 and Tables 3.1.x Real Time PMA Supplements MDUFA Performance Goals –Definitions
# Measure Description
1 Supplements received Number of Real Time PMA supplements that were received in this fiscal year. See the Received cohort definition above.
2 Non-MDUFA III Decisions Supplements received in this fiscal year (line 1) and closed with a non-MDUFA III decision (such as ABND, CONV, OTHR, RECL, WTDR, XPMA).
3 MDUFA III Decisions Supplements received in this fiscal year (line 1) and closed with a MDUFA III decision.
4 MDUFA III Decisions Goal Met
Submissions with MDUFA III decisions (line 3) within goal.
5 Supplements pending MDUFA III Decision
Number of supplements received in this fiscal year (line 1) that do not have a MDUFA III decision and are not closed with a final decision.
6 Supplements pending MDUFA III Decision Past Goal
Number of supplements pending MDUFA III Decision (line 5) past goal. These supplements already failed the MDUFA III review goal.
7 Current Performance Percent Goal Met
Number of supplements with MDUFA III Decisions made on time (line 4) divided by the total number of supplements with MDUFA III Decisions (line 3) and pending supplements that already failed the MDUFA goal (line 6).
Table 3.2 and Tables 3.2.x Real Time PMA Supplements Performance Metrics – Rate of NotApprovable - Definitions
# Measure Description
1 Number Received Number of PMA Real Time Supplements received in this fiscal year.
2 Number with MDUFA decision
Number supplements received (line 1) and closed with a MDUFA decision.
3 Number of Not Approvable
Number of supplements received (line 1) and closed with MDUFA decision of NOAP (Not Approvable).
4 Rate of Not Approvable Number of Not Approvable (line 3) divided by Number with MDUFA decision (line 2).
Page 308 of 371

Table 3.3 and Tables 3.3.x Real Time PMA Supplements Performance Metrics – Submissions Missing Performance Goals - Definitions
# Measure Description
1 Number of submissions that missed the goal
Number of Real Time Supplements, received in this fiscal year, that also have a MDUFA decision, with number of FDA days to MDUFA decision exceeding number of goal days.
2 Mean FDA days for submissions that missed goal
Mean FDA days for supplements that missed the goal (line 1).
3 Mean industry days for submissions that missed goal
Mean industry days for supplements that missed the goal (line 1).
Page 309 of 371
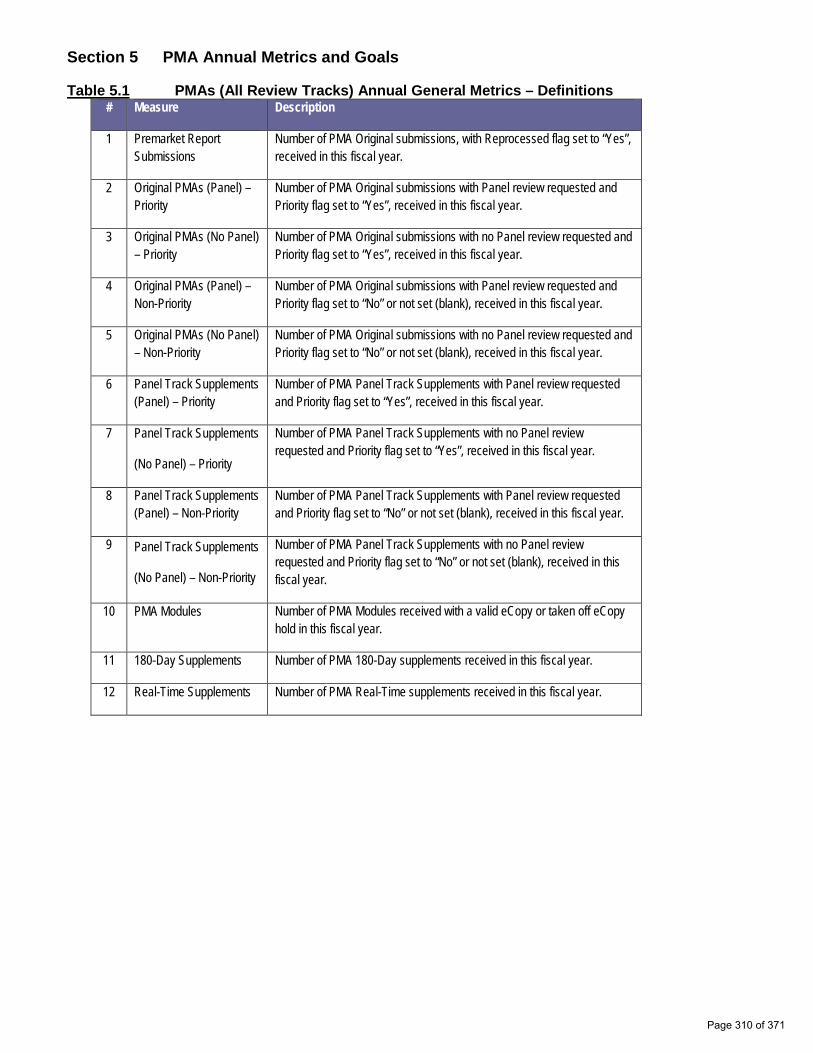
Section 5 PMA Annual Metrics and Goals
Table 5.1 PMAs (All Review Tracks) Annual General Metrics – Definitions # Measure Description
1 Premarket Report Submissions
Number of PMA Original submissions, with Reprocessed flag set to “Yes”, received in this fiscal year.
2 Original PMAs (Panel) – Priority
Number of PMA Original submissions with Panel review requested and Priority flag set to “Yes”, received in this fiscal year.
3 Original PMAs (No Panel) – Priority
Number of PMA Original submissions with no Panel review requested and Priority flag set to “Yes”, received in this fiscal year.
4 Original PMAs (Panel) – Non-Priority
Number of PMA Original submissions with Panel review requested and Priority flag set to “No” or not set (blank), received in this fiscal year.
5 Original PMAs (No Panel) – Non-Priority
Number of PMA Original submissions with no Panel review requested and Priority flag set to “No” or not set (blank), received in this fiscal year.
6 Panel Track Supplements (Panel) – Priority
Number of PMA Panel Track Supplements with Panel review requested and Priority flag set to “Yes”, received in this fiscal year.
7 Panel Track Supplements
(No Panel) – Priority
Number of PMA Panel Track Supplements with no Panel review requested and Priority flag set to “Yes”, received in this fiscal year.
8 Panel Track Supplements (Panel) – Non-Priority
Number of PMA Panel Track Supplements with Panel review requested and Priority flag set to “No” or not set (blank), received in this fiscal year.
9 Panel Track Supplements
(No Panel) – Non-Priority
Number of PMA Panel Track Supplements with no Panel review requested and Priority flag set to “No” or not set (blank), received in this fiscal year.
10 PMA Modules Number of PMA Modules received with a valid eCopy or taken off eCopy hold in this fiscal year.
11 180-Day Supplements Number of PMA 180-Day supplements received in this fiscal year.
12 Real-Time Supplements Number of PMA Real-Time supplements received in this fiscal year.
Page 310 of 371
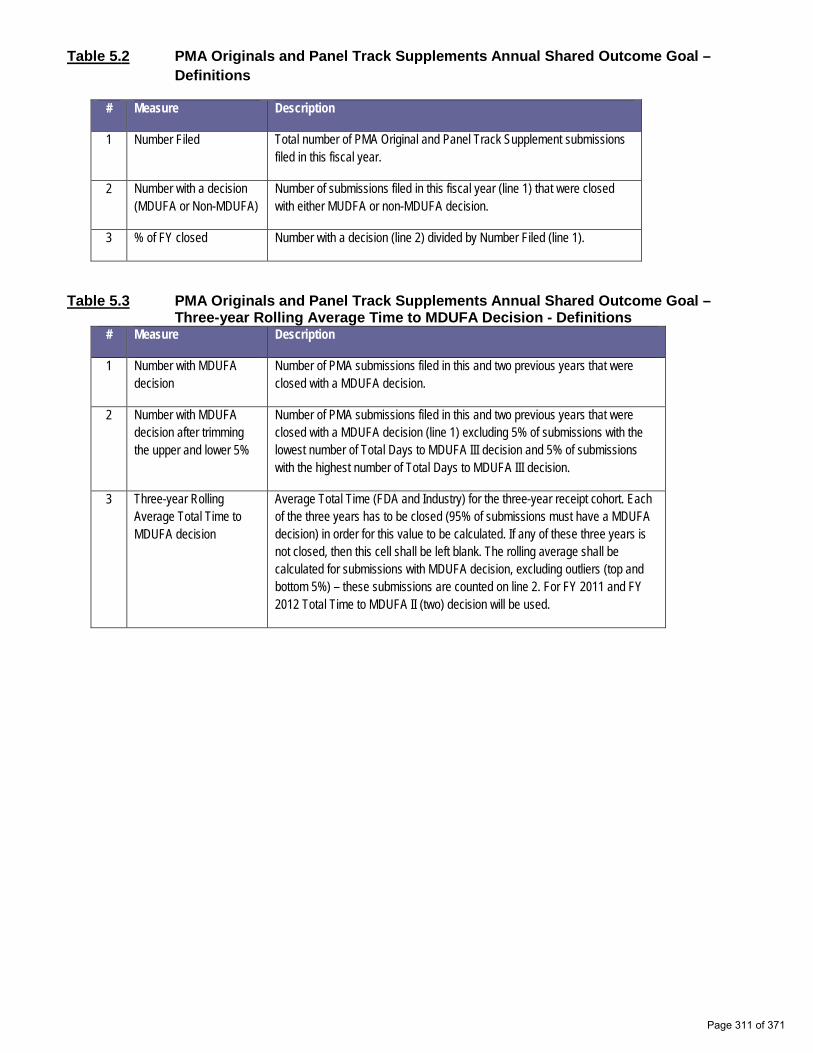
Table 5.2 PMA Originals and Panel Track Supplements Annual Shared Outcome Goal – Definitions
# Measure Description
1 Number Filed Total number of PMA Original and Panel Track Supplement submissions filed in this fiscal year.
2 Number with a decision (MDUFA or Non-MDUFA)
Number of submissions filed in this fiscal year (line 1) that were closed with either MUDFA or non-MDUFA decision.
3 % of FY closed Number with a decision (line 2) divided by Number Filed (line 1).
Table 5.3 PMA Originals and Panel Track Supplements Annual Shared Outcome Goal –Three-year Rolling Average Time to MDUFA Decision - Definitions
# Measure Description
1 Number with MDUFA decision
Number of PMA submissions filed in this and two previous years that were closed with a MDUFA decision.
2 Number with MDUFA decision after trimming the upper and lower 5%
Number of PMA submissions filed in this and two previous years that were closed with a MDUFA decision (line 1) excluding 5% of submissions with the lowest number of Total Days to MDUFA III decision and 5% of submissions with the highest number of Total Days to MDUFA III decision.
3 Three-year Rolling Average Total Time to MDUFA decision
Average Total Time (FDA and Industry) for the three-year receipt cohort. Each of the three years has to be closed (95% of submissions must have a MDUFA decision) in order for this value to be calculated. If any of these three years is not closed, then this cell shall be left blank. The rolling average shall be calculated for submissions with MDUFA decision, excluding outliers (top and bottom 5%) – these submissions are counted on line 2. For FY 2011 and FY 2012 Total Time to MDUFA II (two) decision will be used.
Page 311 of 371
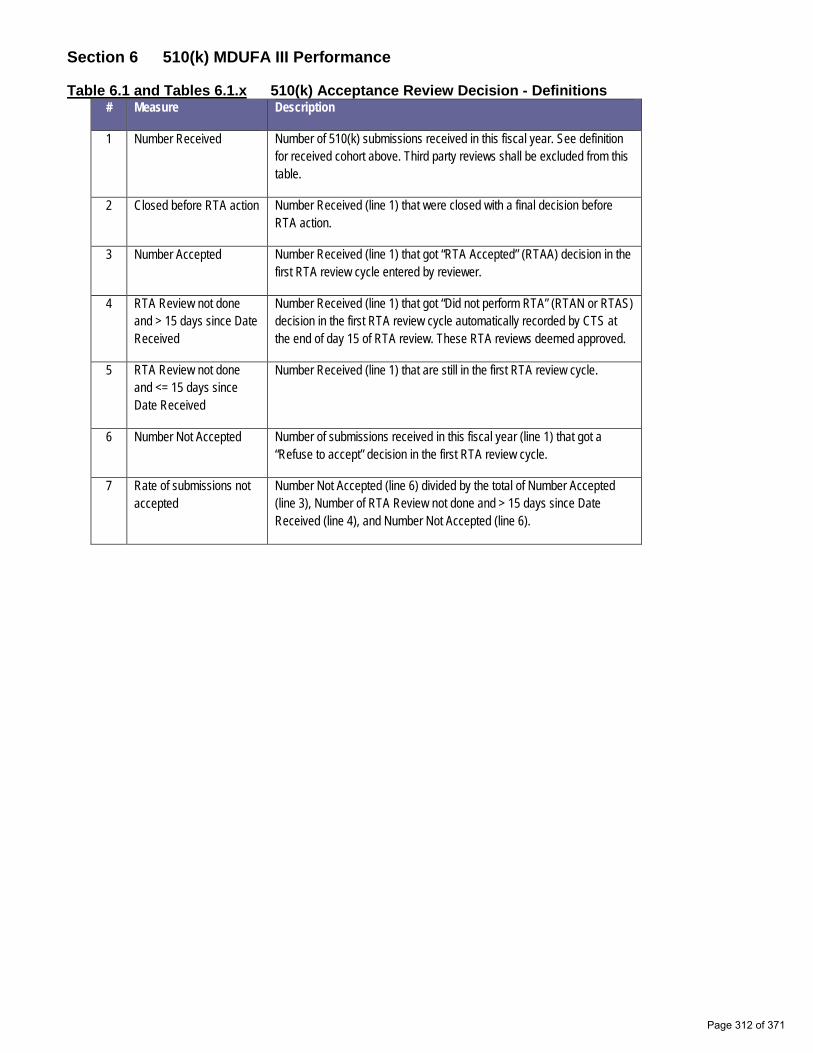
Section 6 510(k) MDUFA III Performance
Table 6.1 and Tables 6.1.x 510(k) Acceptance Review Decision - Definitions # Measure Description
Number of 510(k) submissions received in this fiscal year. See definition for received cohort above. Third party reviews shall be excluded from this table.
1 Number Received
Number Received (line 1) that were closed with a final decision before RTA action.
2 Closed before RTA action
Number Received (line 1) that got “RTA Accepted” (RTAA) decision in the first RTA review cycle entered by reviewer.
3 Number Accepted
RTA Review not done Number Received (line 1) that got “Did not perform RTA” (RTAN or RTAS) and > 15 days since Date
4 decision in the first RTA review cycle automatically recorded by CTS at
Received the end of day 15 of RTA review. These RTA reviews deemed approved.
RTA Review not done 5 Number Received (line 1) that are still in the first RTA review cycle. and <= 15 days since Date Received
Number of submissions received in this fiscal year (line 1) that got a “Refuse to accept” decision in the first RTA review cycle.
6 Number Not Accepted
Rate of submissions not Number Not Accepted (line 6) divided by the total of Number Accepted accepted
7 (line 3), Number of RTA Review not done and > 15 days since Date Received (line 4), and Number Not Accepted (line 6).
Page 312 of 371
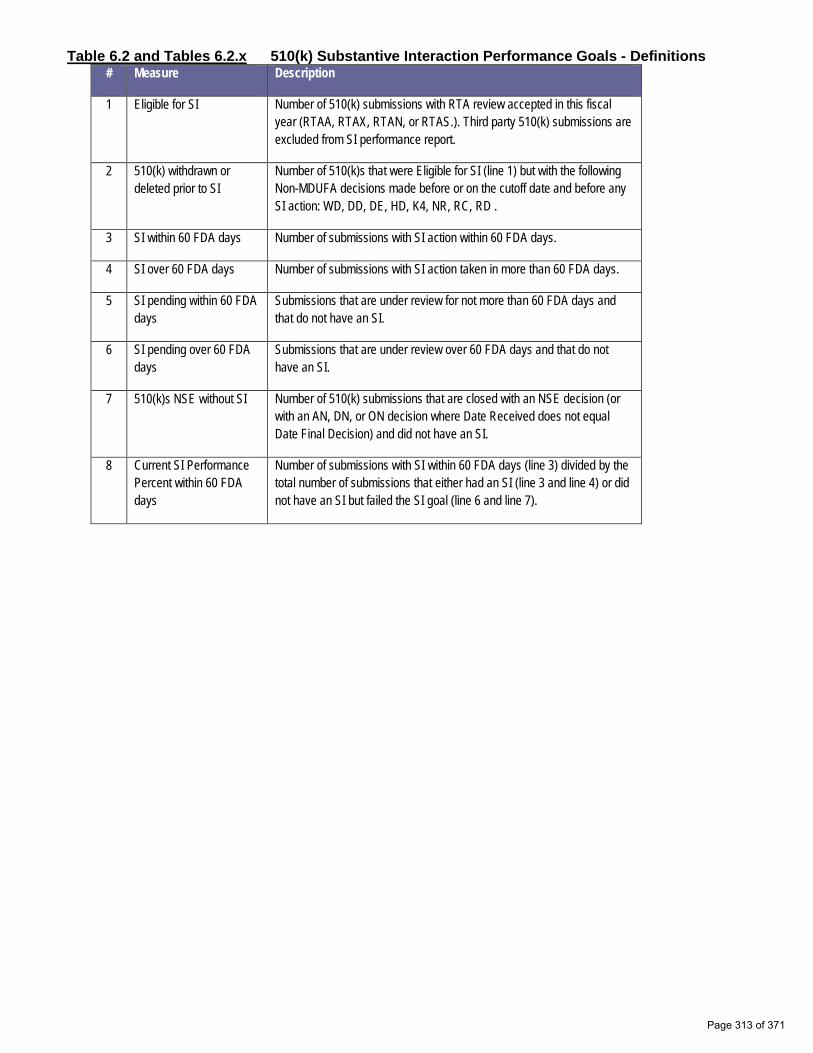
Table 6.2 and Tables 6.2.x 510(k) Substantive Interaction Performance Goals - Definitions # Measure Description
1 Eligible for SI Number of 510(k) submissions with RTA review accepted in this fiscal year (RTAA, RTAX, RTAN, or RTAS.). Third party 510(k) submissions are excluded from SI performance report.
2 510(k) withdrawn or deleted prior to SI
Number of 510(k)s that were Eligible for SI (line 1) but with the following Non-MDUFA decisions made before or on the cutoff date and before any SI action: WD, DD, DE, HD, K4, NR, RC, RD .
3 SI within 60 FDA days Number of submissions with SI action within 60 FDA days.
4 SI over 60 FDA days Number of submissions with SI action taken in more than 60 FDA days.
5 SI pending within 60 FDA days
Submissions that are under review for not more than 60 FDA days and that do not have an SI.
6 SI pending over 60 FDA days
Submissions that are under review over 60 FDA days and that do not have an SI.
7 510(k)s NSE without SI Number of 510(k) submissions that are closed with an NSE decision (or with an AN, DN, or ON decision where Date Received does not equal Date Final Decision) and did not have an SI.
8 Current SI Performance Percent within 60 FDA days
Number of submissions with SI within 60 FDA days (line 3) divided by the total number of submissions that either had an SI (line 3 and line 4) or did not have an SI but failed the SI goal (line 6 and line 7).
Page 313 of 371

Table 6.3 and Tables 6.3.x 510(k) Substantive Interaction Metrics – Time to Substantive Interaction - Definitions
# Measure Description
1 Number of Substantive Interactions
Number of 510(k) submissions accepted in this fiscal year that had an SI. Third party 510(k) submissions shall be excluded from this report.
2 Average number of FDA days to Substantive Interaction
Average number of FDA days across all 510(k) submissions with SI (line 1).
3 20th Percentile FDA days to Substantive Interaction
20th percentile FDA days to Substantive Interaction for submissions with SI (line 1).
4 40th Percentile FDA days to Substantive Interaction
40th percentile FDA days to Substantive Interaction for submissions with SI (line 1).
5 60th Percentile FDA days to Substantive Interaction
60th percentile FDA days to Substantive Interaction for submissions with SI (line 1).
6 80th Percentile FDA days to Substantive Interaction
80th percentile FDA days to Substantive Interaction for submissions with SI (line 1).
7 Maximum FDA days to Substantive Interaction
Maximum FDA days (100th percentile) to Substantive Interaction for submissions with SI (line 1).
Page 314 of 371
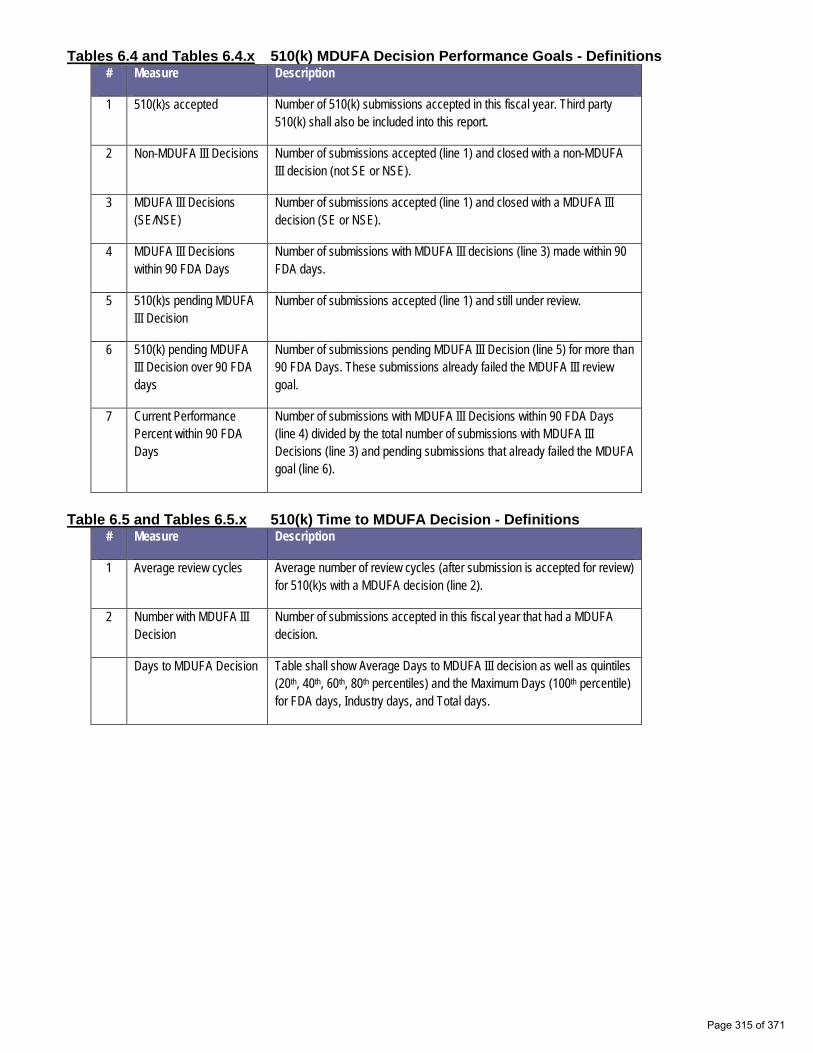
Tables 6.4 and Tables 6.4.x 510(k) MDUFA Decision Performance Goals - Definitions # Measure Description
1 510(k)s accepted Number of 510(k) submissions accepted in this fiscal year. Third party 510(k) shall also be included into this report.
2 Non-MDUFA III Decisions Number of submissions accepted (line 1) and closed with a non-MDUFA III decision (not SE or NSE).
3 MDUFA III Decisions (SE/NSE)
Number of submissions accepted (line 1) and closed with a MDUFA III decision (SE or NSE).
4 MDUFA III Decisions within 90 FDA Days
Number of submissions with MDUFA III decisions (line 3) made within 90 FDA days.
5 510(k)s pending MDUFA III Decision
Number of submissions accepted (line 1) and still under review.
6 510(k) pending MDUFA III Decision over 90 FDA days
Number of submissions pending MDUFA III Decision (line 5) for more than 90 FDA Days. These submissions already failed the MDUFA III review goal.
7 Current Performance Percent within 90 FDA Days
Number of submissions with MDUFA III Decisions within 90 FDA Days (line 4) divided by the total number of submissions with MDUFA III Decisions (line 3) and pending submissions that already failed the MDUFA goal (line 6).
Table 6.5 and Tables 6.5.x 510(k) Time to MDUFA Decision - Definitions # Measure Description
1 Average review cycles Average number of review cycles (after submission is accepted for review) for 510(k)s with a MDUFA decision (line 2).
2 Number with MDUFA III Decision
Number of submissions accepted in this fiscal year that had a MDUFA decision.
Days to MDUFA Decision Table shall show Average Days to MDUFA III decision as well as quintiles (20th, 40th, 60th, 80th percentiles) and the Maximum Days (100th percentile) for FDA days, Industry days, and Total days.
Page 315 of 371
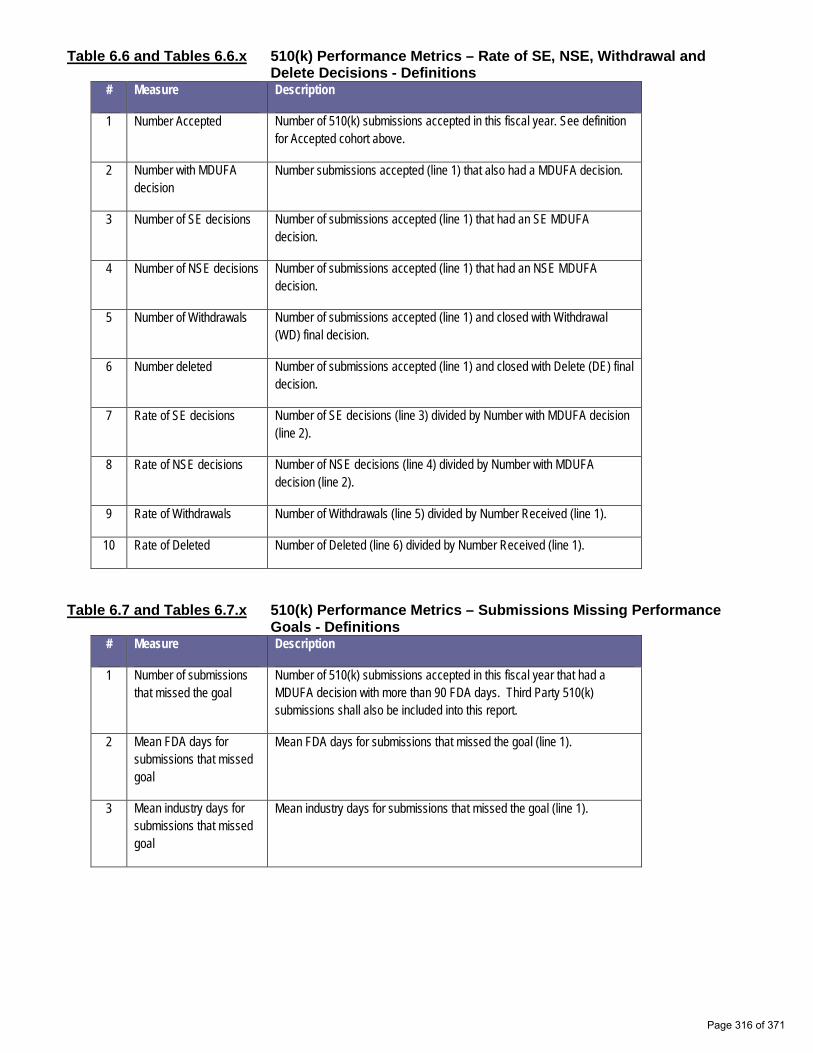
Table 6.6 and Tables 6.6.x 510(k) Performance Metrics – Rate of SE, NSE, Withdrawal andDelete Decisions - Definitions
# Measure Description
1 Number Accepted Number of 510(k) submissions accepted in this fiscal year. See definition for Accepted cohort above.
2 Number with MDUFA decision
Number submissions accepted (line 1) that also had a MDUFA decision.
3 Number of SE decisions Number of submissions accepted (line 1) that had an SE MDUFA decision.
4 Number of NSE decisions Number of submissions accepted (line 1) that had an NSE MDUFA decision.
5 Number of Withdrawals Number of submissions accepted (line 1) and closed with Withdrawal (WD) final decision.
6 Number deleted Number of submissions accepted (line 1) and closed with Delete (DE) final decision.
7 Rate of SE decisions Number of SE decisions (line 3) divided by Number with MDUFA decision (line 2).
8 Rate of NSE decisions Number of NSE decisions (line 4) divided by Number with MDUFA decision (line 2).
9 Rate of Withdrawals Number of Withdrawals (line 5) divided by Number Received (line 1).
10 Rate of Deleted Number of Deleted (line 6) divided by Number Received (line 1).
Table 6.7 and Tables 6.7.x 510(k) Performance Metrics – Submissions Missing Performance Goals - Definitions
# Measure Description
1 Number of submissions that missed the goal
Number of 510(k) submissions accepted in this fiscal year that had a MDUFA decision with more than 90 FDA days. Third Party 510(k) submissions shall also be included into this report.
2 Mean FDA days for submissions that missed goal
Mean FDA days for submissions that missed the goal (line 1).
3 Mean industry days for submissions that missed goal
Mean industry days for submissions that missed the goal (line 1).
Page 316 of 371
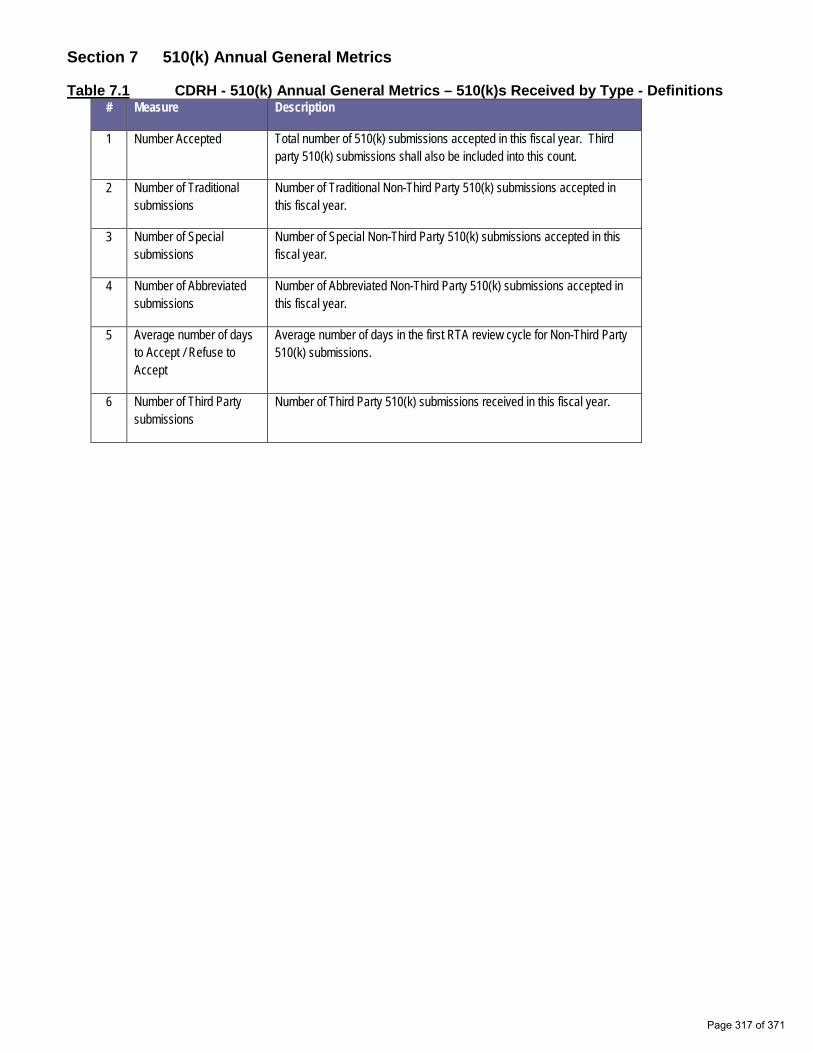
Section 7 510(k) Annual General Metrics
Table 7.1 CDRH - 510(k) Annual General Metrics – 510(k)s Received by Type - Definitions # Measure Description
1 Number Accepted Total number of 510(k) submissions accepted in this fiscal year. Third party 510(k) submissions shall also be included into this count.
2 Number of Traditional submissions
Number of Traditional Non-Third Party 510(k) submissions accepted in this fiscal year.
3 Number of Special submissions
Number of Special Non-Third Party 510(k) submissions accepted in this fiscal year.
4 Number of Abbreviated submissions
Number of Abbreviated Non-Third Party 510(k) submissions accepted in this fiscal year.
5 Average number of days to Accept / Refuse to Accept
Average number of days in the first RTA review cycle for Non-Third Party 510(k) submissions.
6 Number of Third Party submissions
Number of Third Party 510(k) submissions received in this fiscal year.
Page 317 of 371
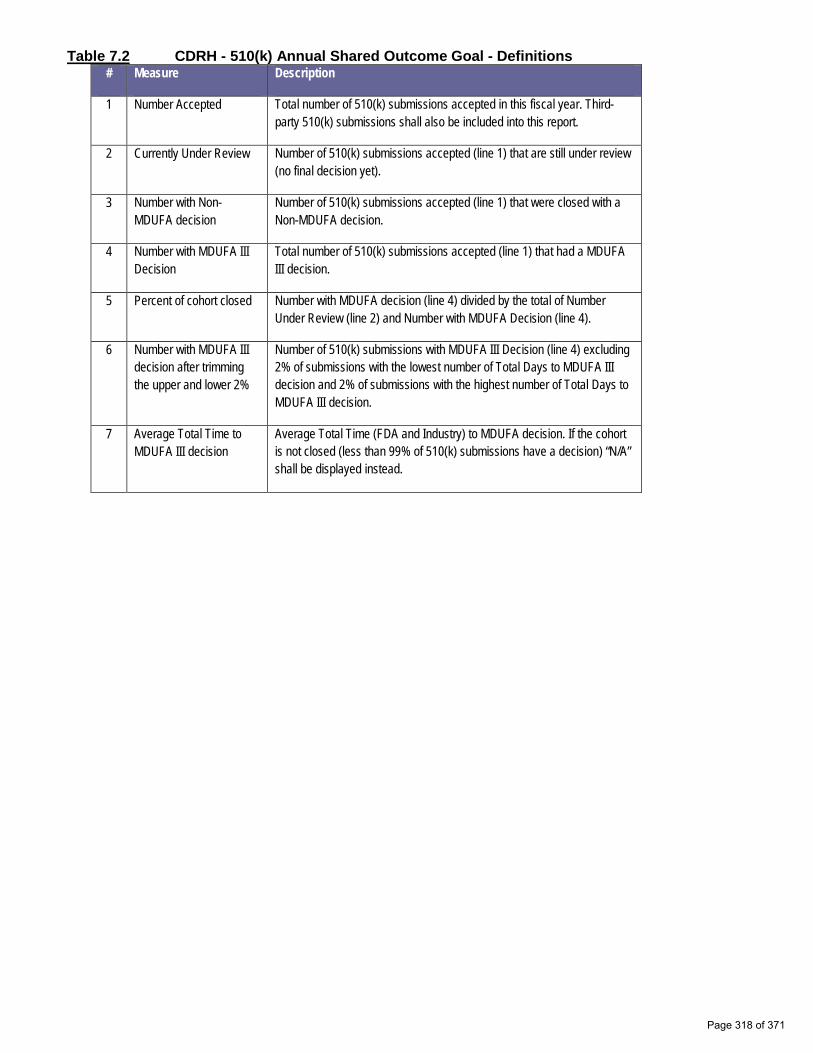
Table 7.2 CDRH - 510(k) Annual Shared Outcome Goal - Definitions # Measure Description
1 Number Accepted Total number of 510(k) submissions accepted in this fiscal year. Thirdparty 510(k) submissions shall also be included into this report.
2 Currently Under Review Number of 510(k) submissions accepted (line 1) that are still under review (no final decision yet).
3 Number with Non-MDUFA decision
Number of 510(k) submissions accepted (line 1) that were closed with a Non-MDUFA decision.
4 Number with MDUFA III Decision
Total number of 510(k) submissions accepted (line 1) that had a MDUFA III decision.
5 Percent of cohort closed Number with MDUFA decision (line 4) divided by the total of Number Under Review (line 2) and Number with MDUFA Decision (line 4).
6 Number with MDUFA III decision after trimming the upper and lower 2%
Number of 510(k) submissions with MDUFA III Decision (line 4) excluding 2% of submissions with the lowest number of Total Days to MDUFA III decision and 2% of submissions with the highest number of Total Days to MDUFA III decision.
7 Average Total Time to MDUFA III decision
Average Total Time (FDA and Industry) to MDUFA decision. If the cohort is not closed (less than 99% of 510(k) submissions have a decision) “N/A” shall be displayed instead.
Page 318 of 371
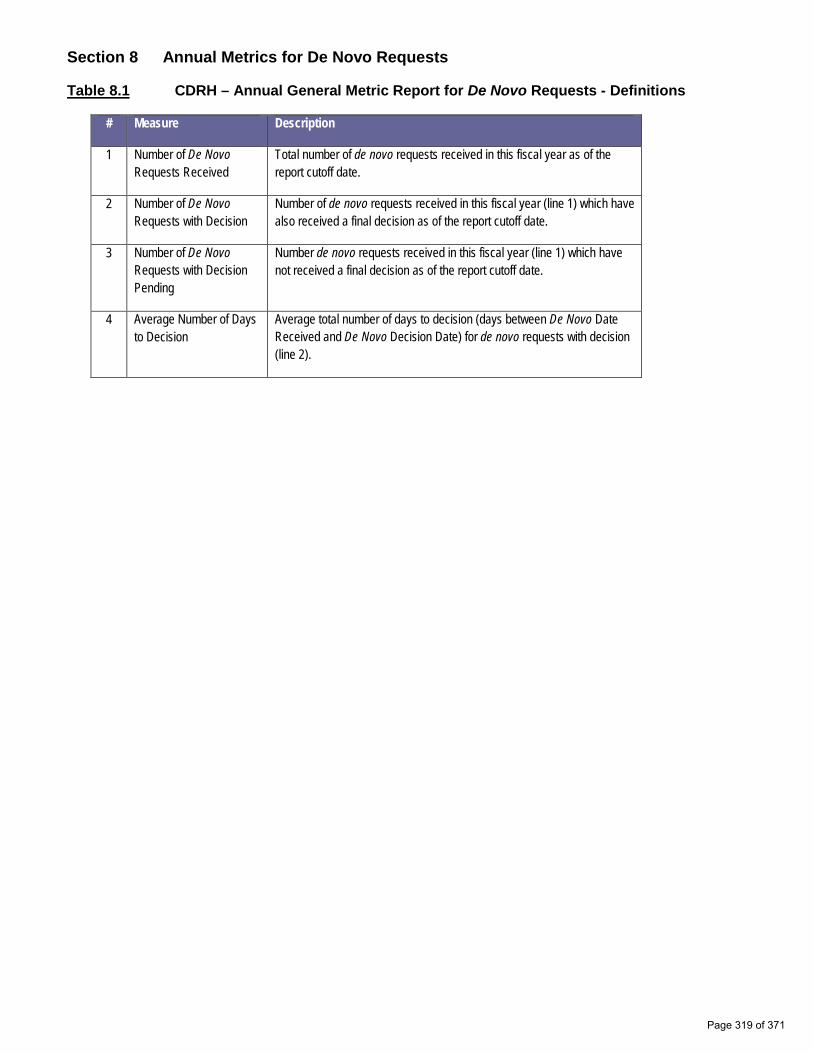
Section 8 Annual Metrics for De Novo Requests
Table 8.1 CDRH – Annual General Metric Report for De Novo Requests - Definitions
# Measure Description
1 Number of De Novo Requests Received
Total number of de novo requests received in this fiscal year as of the report cutoff date.
2 Number of De Novo Requests with Decision
Number of de novo requests received in this fiscal year (line 1) which have also received a final decision as of the report cutoff date.
3 Number of De Novo Requests with Decision Pending
Number de novo requests received in this fiscal year (line 1) which have not received a final decision as of the report cutoff date.
4 Average Number of Days to Decision
Average total number of days to decision (days between De Novo Date Received and De Novo Decision Date) for de novo requests with decision (line 2).
Page 319 of 371

Section 9 Pre-Submissions
Table 9.1 and Tables 9.1.x Pre-Submissions Performance Metrics - Definitions # Measure Description
1 Number of all qualified Number of all qualified Pre-Submissions received. This include those with a type=“pre-sub” either with a meeting request or written feedback
Pre-Submissions requested in the fiscal year. received
Number requesting a2 Number of qualified Pre-submission received (line 1) with the Sub-Type meeting or of “Pre-Sub Meeting Request”. teleconference
Number with meetings3 Number requesting a meeting or teleconference (line 2) with or teleconferences held
Actual Meeting Date populated with a value prior to the cutoff date.
Table shall show average days from Date FDA Initial Clock Start to Actual Meeting Date as well as quintiles (20th, 40th, 60th, 80th percentiles) and the Maximum Days (100th percentile) for days to meeting days, Industry days, and Total days. The calculation includes meetings where the Actual Meeting Date is greater than the Date FDA Initial Clock Start and the Actual Meeting Date is prior to as of the cutoff date.
4 Days to meeting
Section 10 CLIA Waiver Annual Metrics
Table 10.1 CLIA Waiver Substantive Interaction Performance Goals – Definitions # Measure Description
Eligible for SI 1 Number of CLIA Waiver by Applications that were filed in this fiscal year
Number of submissions with MDUFA Decision WTDR within 90 FDA 2 Withdrawn prior to SI
days
SI within 90 FDA days 3 Number of submissions with SI action within 90 FDA days
SI over 90 FDA days 4 Number of submissions with SI action taken in more than 90 FDA days
SI pending within 90 FDA 5 Number of submissions that are under review for not more than 90 FDA days days and with no SI
SI pending over 90 FDA 6 Number of submissions that are under review for more than 90 FDA days days with no SI
7 Number of submissions closed with a Denial decision and that did not Denial without SI have an SI prior
Current SI Performance 8 Number of submissions with SI within 90 FDA days (line 3) divided by the Percent within 90 FDA total number of submissions Eligible for SI (line 1), except those days withdrawn before an SI was made or due (line 2)
Table 10.2 CLIA Waiver Substantive Interaction Metrics – Time to Substantive Interaction –
Page 320 of 371
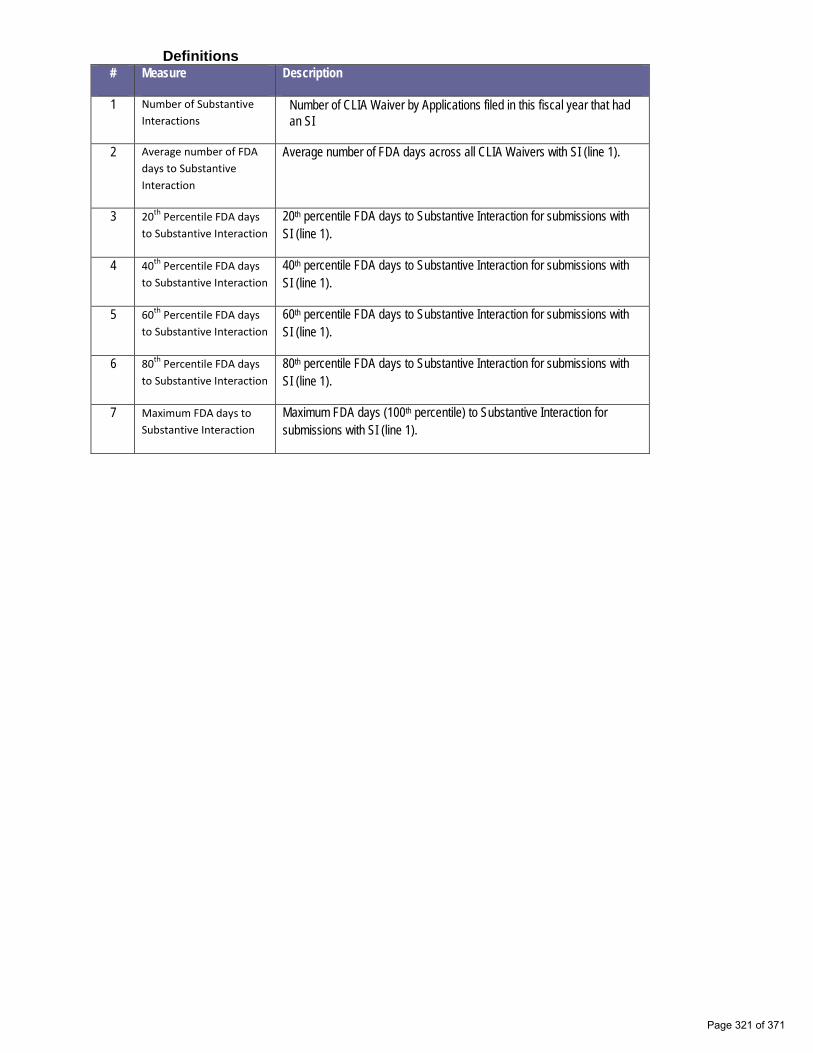
Definitions # Measure Description
1 Number of Substantive Interactions
Number of CLIA Waiver by Applications filed in this fiscal year that had an SI
2 Average number of FDA days to Substantive Interaction
Average number of FDA days across all CLIA Waivers with SI (line 1).
3 20th Percentile FDA days to Substantive Interaction
20th percentile FDA days to Substantive Interaction for submissions with SI (line 1).
4 40th Percentile FDA days to Substantive Interaction
40th percentile FDA days to Substantive Interaction for submissions with SI (line 1).
5 60th Percentile FDA days to Substantive Interaction
60th percentile FDA days to Substantive Interaction for submissions with SI (line 1).
6 80th Percentile FDA days to Substantive Interaction
80th percentile FDA days to Substantive Interaction for submissions with SI (line 1).
7 Maximum FDA days to Substantive Interaction
Maximum FDA days (100th percentile) to Substantive Interaction for submissions with SI (line 1).
Page 321 of 371
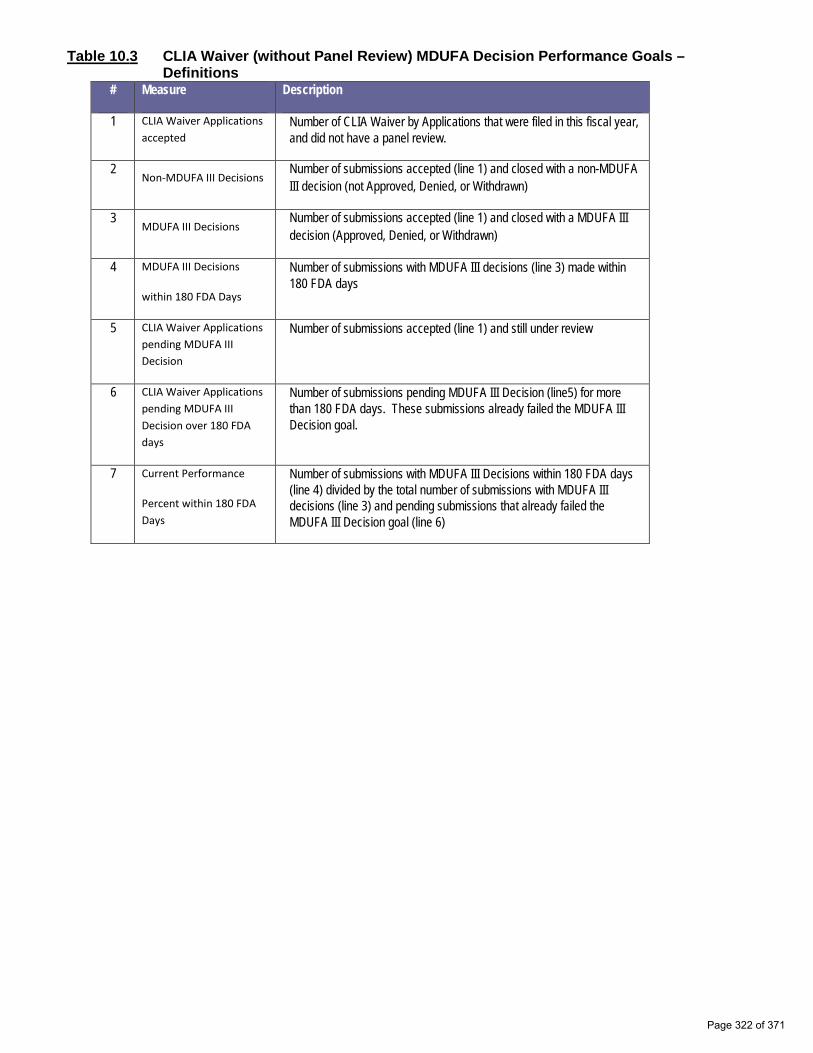
Table 10.3 CLIA Waiver (without Panel Review) MDUFA Decision Performance Goals –Definitions
# Measure Description
1 CLIA Waiver Applications accepted
Number of CLIA Waiver by Applications that were filed in this fiscal year, and did not have a panel review.
2 Non-MDUFA III Decisions
Number of submissions accepted (line 1) and closed with a non-MDUFA III decision (not Approved, Denied, or Withdrawn)
3 MDUFA III Decisions
Number of submissions accepted (line 1) and closed with a MDUFA III decision (Approved, Denied, or Withdrawn)
4 MDUFA III Decisions
within 180 FDA Days
Number of submissions with MDUFA III decisions (line 3) made within 180 FDA days
5 CLIA Waiver Applications pending MDUFA III Decision
Number of submissions accepted (line 1) and still under review
6 CLIA Waiver Applications pending MDUFA III Decision over 180 FDA days
Number of submissions pending MDUFA III Decision (line5) for more than 180 FDA days. These submissions already failed the MDUFA III Decision goal.
7 Current Performance
Percent within 180 FDA Days
Number of submissions with MDUFA III Decisions within 180 FDA days (line 4) divided by the total number of submissions with MDUFA III decisions (line 3) and pending submissions that already failed the MDUFA III Decision goal (line 6)
Page 322 of 371

Table 10.4 CLIA Waiver (with Panel Review) MDUFA Decision Performance Goals) – Definitions # Measure Description
1 CLIA Waiver Applications accepted
Number of CLIA Waiver by Applications that were filed in this fiscal year, and had a panel review.
2 Non-MDUFA III Decisions
Number of submissions accepted (line 1) and closed with a non-MDUFA III decision (not Approved, Denied, or Withdrawn)
3 MDUFA III Decisions
Number of submissions accepted (line 1) and closed with a MDUFA III decision (Approved, Denied, or Withdrawn)
4 MDUFA III Decisions
within 330 FDA Days
Number of submissions with MDUFA III decisions (line 3) made within 330 FDA days
5 CLIA Waiver Applications pending MDUFA III Decision
Number of submissions accepted (line 1) and still under review
6 CLIA Waiver Applications pending MDUFA III Decision over 330 FDA days
Number of submissions pending MDUFA III Decision (line5) for more than 330 FDA days. These submissions already failed the MDUFA III Decision goal.
7 Current Performance
Percent within 330 FDA Days
Number of submissions with MDUFA III Decisions within 330 FDA days (line 4) divided by the total number of submissions with MDUFA III decisions (line 3) and pending submissions that already failed the MDUFA III Decision goal (line 6)
Table 10.5 CLIA Waiver (without Panel Review) Time to MDUFA Decision – Definitions # Measure Description
1 Number with MDUFA decision
Number of submissions accepted in this fiscal year that had a MDUFA III decision (Approved, Denied, or Withdrawn), and did not have a panel review.
Days to MDUFA Decision Table shall show Average Days to MDUFA III decision as well as quintiles (20th, 40th, 60th, 80th percentiles) and the Maximum Days (100th percentile) for FDA days, Industry days, and Total days.
Table 10.6 CLIA Waiver (with Panel Review) Time to MDUFA Decision - Definitions # Measure Description
1 Number with MDUFA decision
Number of submissions accepted in this fiscal year that had a MDUFA III decision (Approved, Denied, or Withdrawn), and had a panel review.
Days to MDUFA Decision Table shall show Average Days to MDUFA III decision as well as quintiles (20th, 40th, 60th, 80th percentiles) and the Maximum Days (100th percentile) for FDA days, Industry days, and Total days.
Page 323 of 371

Section 11 IDE Performance Metrics
Table 11.1 IDE Performance Metrics
# Measure Description
1 Number of IDEs received Number of IDEs received in the fiscal year.
2 Average number of cycles to approval or conditional approval of the IDE
The average number of cycles including the original submission and amendments that were submitted prior to the approval or conditional approval of an IDE.
3 Average number of amendments prior to approval or conditional approval of the IDE
The average number of amendments, to include only those amendments that were submitted to address deficiencies in the disapproval letter.
Section 12 Dual 510(k) and CLIA Waiver Annual Metrics
Table 12.1 Dual 510(k) and CLIA Waiver Substantive Interaction Performance Goals –Definitions
# Measure Description
1 Eligible for SI Number of Dual 510(k) and CLIA Waiver by Applications with 510(k) RTA review accepted in this fiscal year
2 Withdrawn prior to SI Number of submissions that were withdrawn or deleted prior to 90 days
3 SI within 90 FDA days Number of submissions with SI action within 90 FDA days
4 SI over 90 FDA days Number of submissions with SI action taken in more than 90 FDA days
5 SI pending within 90 FDA days
Number of submissions that are under review for not more than 90 FDA days and with no SI
6 SI pending over 90 FDA days
Number of submissions that are under review for more than 90 FDA days with no SI
7 Denial without SI Number of submissions closed with a Denial decision and that did not have an SI prior
8 Current SI Performance Percent within 90 FDA days
Number of submissions with SI within 90 FDA days (line 3) divided by the total number of submissions Eligible for SI (line 1), except those withdrawn before an SI was made or due (line 2)
Page 324 of 371

Table 12.2 Dual 510(k) and CLIA Waiver Substantive Interaction Metrics – Time to Substantive Interaction – Definitions
# Measure Description
1 Number of Substantive Interactions
Number of Dual 510(k) and CLIA Waiver by Applications filed in this fiscal year that had an SI
2 Average number of FDA days to Substantive Interaction
Average number of FDA days across all Dual 510(k) and CLIA Waivers with SI (line 1).
3 20th Percentile FDA days to Substantive Interaction
20th percentile FDA days to Substantive Interaction for submissions with SI (line 1).
4 40th Percentile FDA days to Substantive Interaction
40th percentile FDA days to Substantive Interaction for submissions with SI (line 1).
5 60th Percentile FDA days to Substantive Interaction
60th percentile FDA days to Substantive Interaction for submissions with SI (line 1).
6 80th Percentile FDA days to Substantive Interaction
80th percentile FDA days to Substantive Interaction for submissions with SI (line 1).
7 Maximum FDA days to Substantive Interaction
Maximum FDA days (100th percentile) to Substantive Interaction for submissions with SI (line 1).
Page 325 of 371

Table 12.3 Dual 510(k) and CLIA Waiver (without panel review) MDUFA Decision PerformanceGoals – Definitions
# Measure Description
1 Dual 510(k) and CLIA Waiver Applications accepted
Number of Dual 510(k) and CLIA Waiver by Applications that were filed in this fiscal year, and did not have a panel review.
2 Non-MDUFA III Decisions
Number of submissions accepted (line 1) and closed with a non-MDUFA III decision (not Approved, Denied, or Withdrawn)
3 MDUFA III Decisions
Number of submissions accepted (line 1) and closed with a MDUFA III decision (Approved, Denied, or Withdrawn)
4 MDUFA III Decisions within 210 FDA Days
Number of submissions with MDUFA III decisions (line 3) made within 210 FDA days
5 Dual 510(k) and CLIA Waiver Applications pending MDUFA III Decision
Number of submissions accepted (line 1) and still under review
6 Dual 510(k) and CLIA Waiver Applications pending MDUFA III Decision over 210 FDA days
Number of submissions pending MDUFA III Decision (line5) for more than 210 FDA days. These submissions already failed the MDUFA III Decision goal.
7 Current Performance Percent within 210 FDA Days
Number of submissions with MDUFA III Decisions within 210 FDA days (line 4) divided by the total number of submissions with MDUFA III decisions (line 3) and pending submissions that already failed the MDUFA III Decision goal (line 6)
Page 326 of 371

Table 12.4 Dual 510(k) and CLIA Waiver (with panel review) MDUFA Decision Performance Goals – Definitions
# Measure Description
1 Dual 510(k) and CLIA Waiver Applications accepted
Number of Dual 510(k) and CLIA Waiver by Applications that were filed in this fiscal year, and had a panel review.
2 Non-MDUFA III Decisions
Number of submissions accepted (line 1) and closed with a non-MDUFA III decision (not Approved, Denied, or Withdrawn)
3 MDUFA III Decisions
Number of submissions accepted (line 1) and closed with a MDUFA III decision (Approved, Denied, or Withdrawn)
4 MDUFA III Decisions within 210 FDA Days
Number of submissions with MDUFA III decisions (line 3) made within 210 FDA days
5 Dual 510(k) and CLIA Waiver Applications pending MDUFA III Decision
Number of submissions accepted (line 1) and still under review
6 Dual 510(k) and CLIA Waiver Applications pending MDUFA III Decision over 330 FDA days
Number of submissions pending MDUFA III Decision (line5) for more than 330 FDA days. These submissions already failed the MDUFA III Decision goal.
7 Current Performance Percent within 330 FDA Days
Number of submissions with MDUFA III Decisions within 330 FDA days (line 4) divided by the total number of submissions with MDUFA III decisions (line 3) and pending submissions that already failed the MDUFA III Decision goal (line 6)
Page 327 of 371

Table 12.5 Dual 510(k) and CLIA Waiver (without panel review) Time to MDUFA Decision – Definitions
# Measure Description
1 Number with MDUFA decision
Number of submissions accepted in this fiscal year that had a MDUFA III decision (Approved, Denied, or Withdrawn), and did not have a panel review.
Days to MDUFA Decision Table shall show Average Days to MDUFA III decision as well as quintiles (20th, 40th, 60th, 80th percentiles) and the Maximum Days (100th percentile) for FDA days, Industry days, and Total days.
Table 12.6 Dual 510(k) and CLIA Waiver (with panel review) Time to MDUFA Decision – Definitions # Measure Description
1 Number with MDUFA decision
Number of submissions accepted in this fiscal year that had a MDUFA III decision (Approved, Denied, or Withdrawn), and had a panel review.
Days to MDUFA Decision Table shall show Average Days to MDUFA III decision as well as quintiles (20th, 40th, 60th, 80th percentiles) and the Maximum Days (100th percentile) for FDA days, Industry days, and Total days.
Page 328 of 371

Quarterly Update on Medical Device Performance Goals
----MDUFA III CBER Performance Data ---Action through 30 September 2015
Page 329 of 371
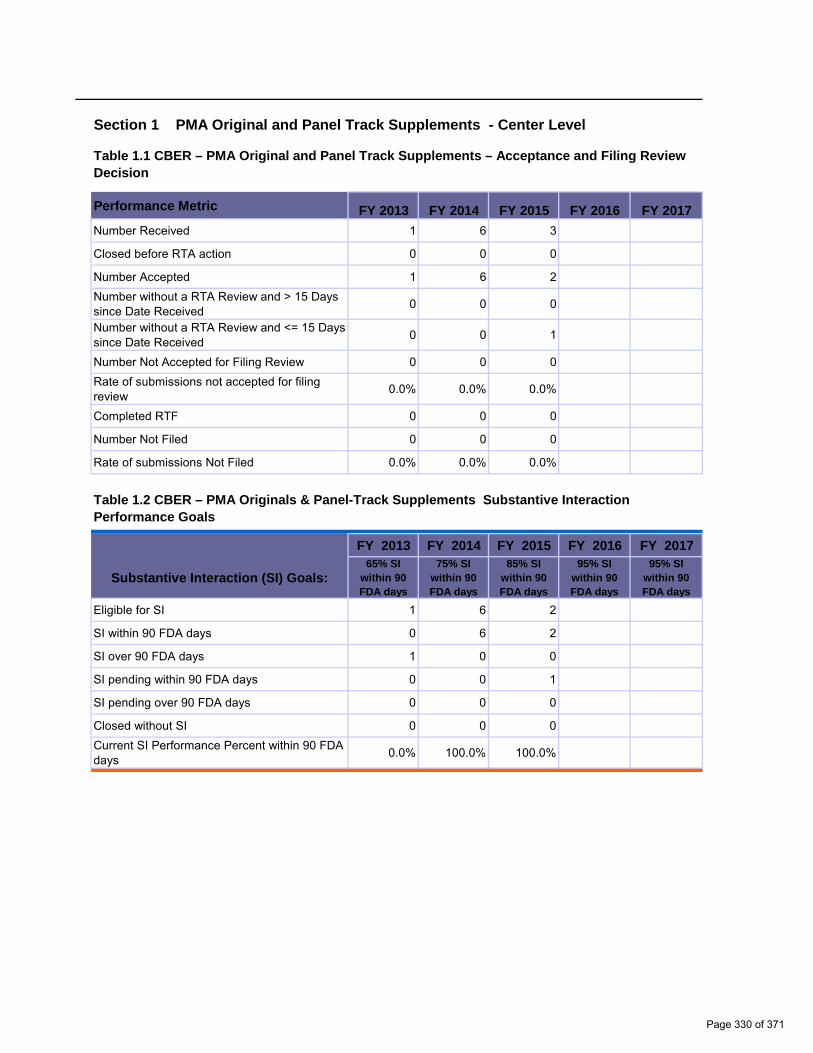
0 0
0 0
0 0 0 0
0 0
0 0 0.0% 0.0%
0 0
0 0
0.0% 0.0%
0 0
0 0
0 0
0 0
0 0
0 0 0.0% 0.0%
Section 1 PMA Original and Panel Track Supplements - Center Level
Table 1.1 CBER – PMA Original and Panel Track Supplements – Acceptance and Filing Review Decision
Performance Metric FY 2013 FY 2014 FY 2015 FY 2016 FY 2017 Number Received 1 6 3
Closed before RTA action 0 0 0
Number Accepted 1 6 2 Number without a RTA Review and > 15 Days since Date Received 0 0 0
Number without a RTA Review and <= 15 Days since Date Received 0 0 1
Number Not Accepted for Filing Review 0 0 0 Rate of submissions not accepted for filing review 0.0% 0.0% 0.0%
Completed RTF 0 0 0
Number Not Filed 0 0 0
Rate of submissions Not Filed 0.0% 0.0% 0.0%
Table 1.2 CBER – PMA Originals & Panel-Track Supplements Substantive Interaction Performance Goals
Substantive Interaction (SI) Goals:
FY 2013 FY 2014 FY 2015 FY 2016 FY 2017 65% SI
within 90 FDA days
75% SI within 90 FDA days
85% SI within 90 FDA days
95% SI within 90 FDA days
95% SI within 90 FDA days
Eligible for SI 1 6 2
SI within 90 FDA days 0 6 2
SI over 90 FDA days 1 0 0
SI pending within 90 FDA days 0 0 1
SI pending over 90 FDA days 0 0 0
Closed without SI 0 0 0 Current SI Performance Percent within 90 FDA days 0.0% 100.0% 100.0%
Page 330 of 371
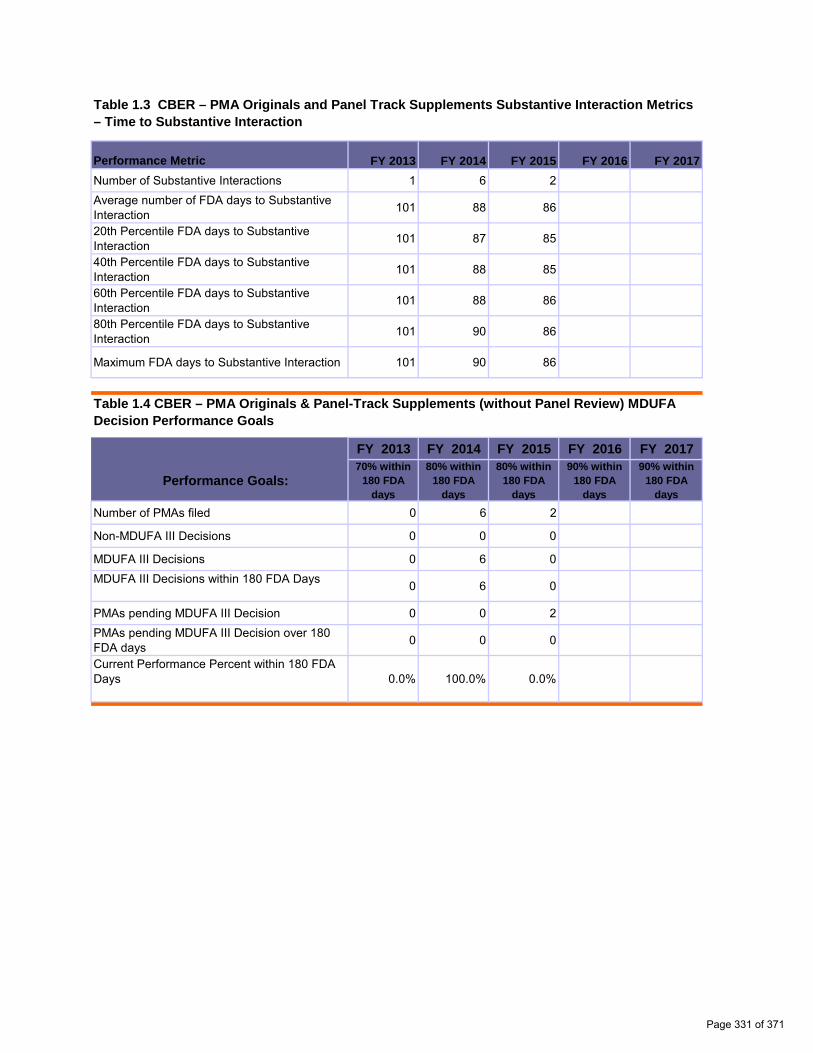
P080003/S001 1
0 0
0 0
0 0 0 0
0 0
0 0
0.0% 0.0%
Table 1.3 CBER – PMA Originals and Panel Track Supplements Substantive Interaction Metrics – Time to Substantive Interaction
Performance Metric FY 2013 FY 2014 FY 2015 FY 2016 FY 2017 Number of Substantive Interactions 1 6 2 Average number of FDA days to Substantive Interaction 101 88 86
20th Percentile FDA days to Substantive Interaction 101 87 85
40th Percentile FDA days to Substantive Interaction 101 88 85
60th Percentile FDA days to Substantive Interaction 101 88 86
80th Percentile FDA days to Substantive Interaction 101 90 86
Maximum FDA days to Substantive Interaction 101 90 86
Table 1.4 CBER – PMA Originals & Panel-Track Supplements (without Panel Review) MDUFA Decision Performance Goals
Performance Goals:
FY 2013 FY 2014 FY 2015 FY 2016 FY 201770% within
180 FDA days
80% within 180 FDA
days
80% within 180 FDA
days
90% within 180 FDA
days
90% within 180 FDA
days
Number of PMAs filed 0 6 2
Non-MDUFA III Decisions 0 0 0
MDUFA III Decisions 0 6 0 MDUFA III Decisions within 180 FDA Days 0 6 0
PMAs pending MDUFA III Decision 0 0 2 PMAs pending MDUFA III Decision over 180 FDA days 0 0 0
Current Performance Percent within 180 FDA Days 0.0% 100.0% 0.0%
Page 331 of 371
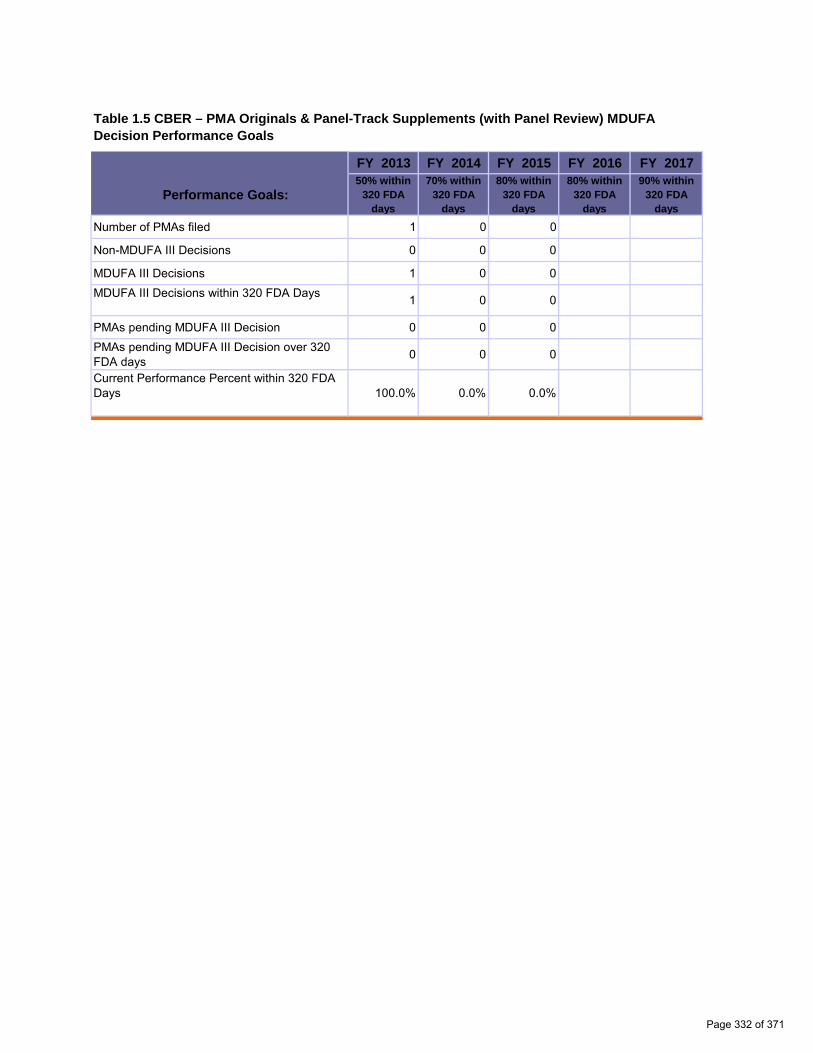
0 0
0 0
0 0 0 0
0 0
0 0
0.0% 0.0%
Table 1.5 CBER – PMA Originals & Panel-Track Supplements (with Panel Review) MDUFA Decision Performance Goals
Performance Goals:
FY 2013 FY 2014 FY 2015 FY 2016 FY 201750% within
320 FDA days
70% within 320 FDA
days
80% within 320 FDA
days
80% within 320 FDA
days
90% within 320 FDA
days
Number of PMAs filed 1 0 0
Non-MDUFA III Decisions 0 0 0
MDUFA III Decisions 1 0 0 MDUFA III Decisions within 320 FDA Days 1 0 0
PMAs pending MDUFA III Decision 0 0 0 PMAs pending MDUFA III Decision over 320 FDA days 0 0 0
Current Performance Percent within 320 FDA Days 100.0% 0.0% 0.0%
Page 332 of 371
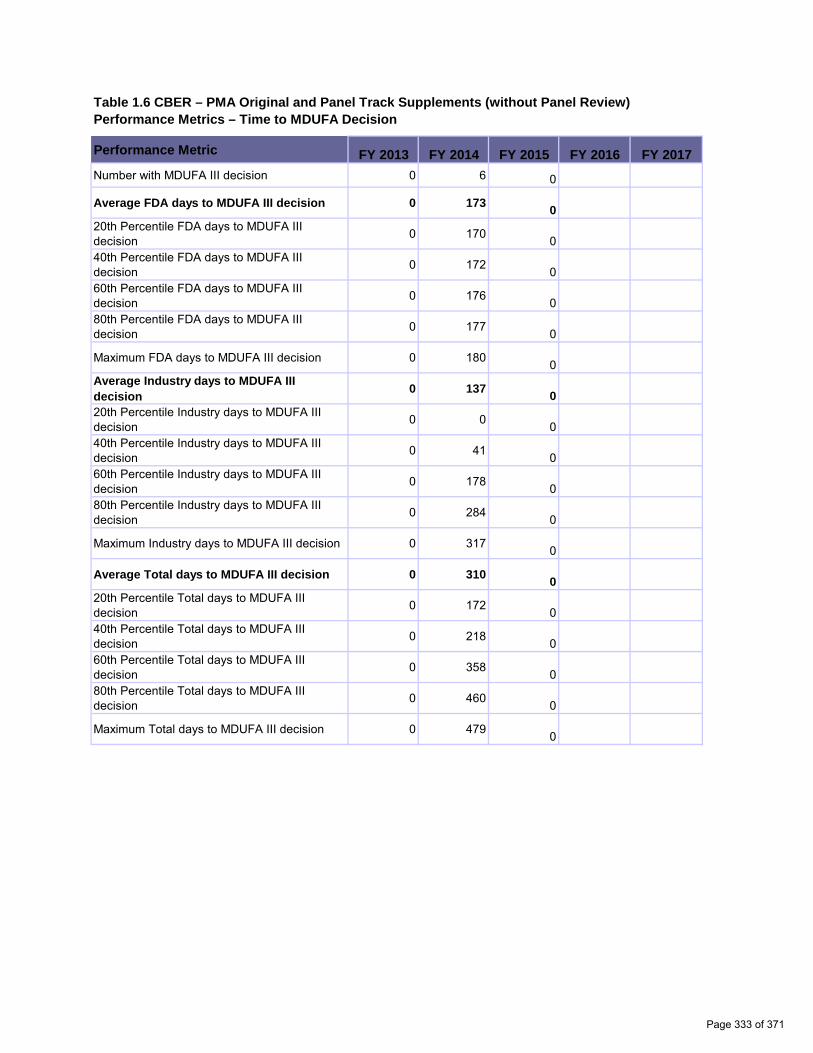
Table 1.6 CBER – PMA Original and Panel Track Supplements (without Panel Review) Performance Metrics – Time to MDUFA Decision
Performance Metric FY 2013 FY 2014 FY 2015 FY 2016 FY 2017 Number with MDUFA III decision 0 6 0
Average FDA days to MDUFA III decision 0 173 0 20th Percentile FDA days to MDUFA III decision 0 170 0 40th Percentile FDA days to MDUFA III decision 0 172 0 60th Percentile FDA days to MDUFA III decision 0 176 0 80th Percentile FDA days to MDUFA III decision 0 177 0
Maximum FDA days to MDUFA III decision 0 180 0 Average Industry days to MDUFA III decision 0 137 0 20th Percentile Industry days to MDUFA III decision 0 0 0 40th Percentile Industry days to MDUFA III decision 0 41 0 60th Percentile Industry days to MDUFA III decision 0 178 0 80th Percentile Industry days to MDUFA III decision 0 284 0
Maximum Industry days to MDUFA III decision 0 317 0
Average Total days to MDUFA III decision 0 310 0 20th Percentile Total days to MDUFA III decision 0 172 0 40th Percentile Total days to MDUFA III decision 0 218 0 60th Percentile Total days to MDUFA III decision 0 358 0 80th Percentile Total days to MDUFA III decision 0 460 0
Maximum Total days to MDUFA III decision 0 479 0
Page 333 of 371

Table 1.7 CBER – PMA Original and Panel Track Supplements (with Panel Review) Performance Metrics – Time to MDUFA Decision
Performance Metric FY 2013 FY 2014 FY 2015 FY 2016 FY 2017 Number with MDUFA III decision 1 0 0
Average FDA days to MDUFA III decision 303 0 0 20th Percentile FDA days to MDUFA III decision 303 0 0 40th Percentile FDA days to MDUFA III decision 303 0 0 60th Percentile FDA days to MDUFA III decision 303 0 0 80th Percentile FDA days to MDUFA III decision 303 0 0
Maximum FDA days to MDUFA III decision 303 0 0 Average Industry days to MDUFA III decision 41 0 0 20th Percentile Industry days to MDUFA III decision 41 0 0 40th Percentile Industry days to MDUFA III decision 41 0 0 60th Percentile Industry days to MDUFA III decision 41 0 0 80th Percentile Industry days to MDUFA III decision 41 0 0
Maximum Industry days to MDUFA III decision 41 0 0
Average Total days to MDUFA III decision 344 0 0 20th Percentile Total days to MDUFA III decision 344 0 0 40th Percentile Total days to MDUFA III decision 344 0 0 60th Percentile Total days to MDUFA III decision 344 0 0 80th Percentile Total days to MDUFA III decision 344 0 0
Maximum Total days to MDUFA III decision 344 0 0
Page 334 of 371
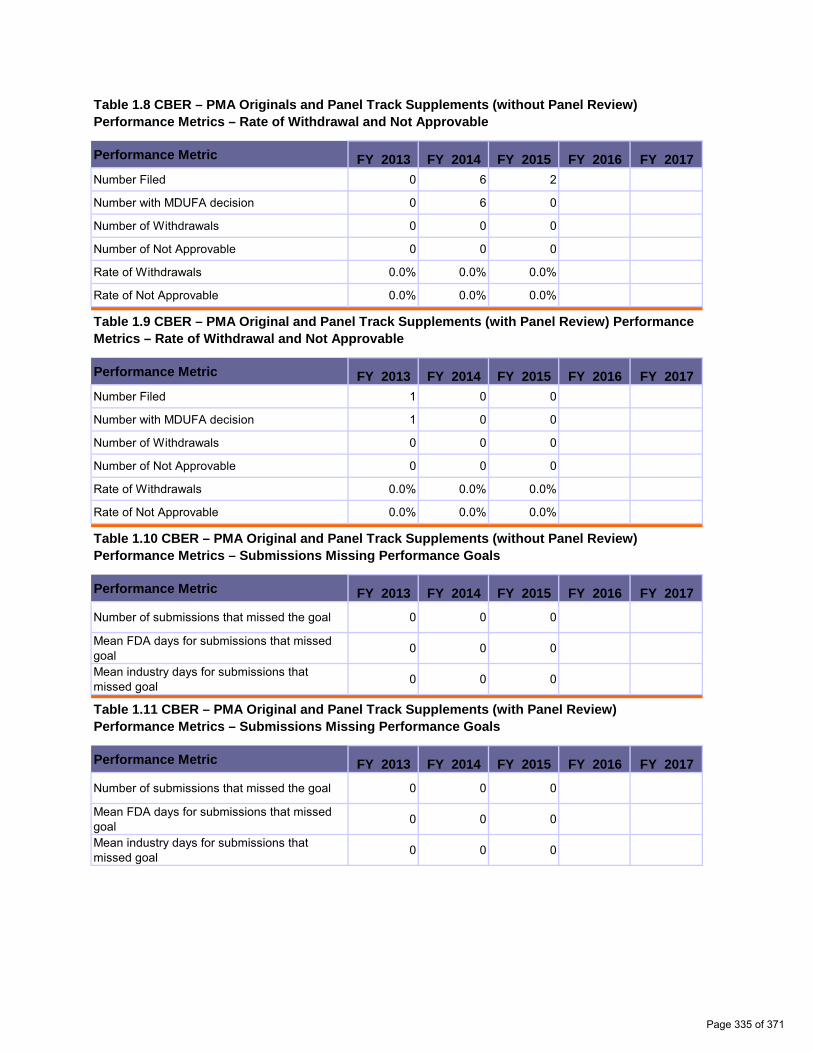
0 0
0 0
0 0
0 0
0.0% 0.0%
0.0% 0.0%
0 0
0 0
0 0
0 0
0.0% 0.0%
0.0% 0.0%
0 0
0 0
0 0
0 0
0 0
0 0
Table 1.8 CBER – PMA Originals and Panel Track Supplements (without Panel Review) Performance Metrics – Rate of Withdrawal and Not Approvable
Performance Metric FY 2013 FY 2014 FY 2015 FY 2016 FY 2017 Number Filed 0 6 2
Number with MDUFA decision 0 6 0
Number of Withdrawals 0 0 0
Number of Not Approvable 0 0 0
Rate of Withdrawals 0.0% 0.0% 0.0%
Rate of Not Approvable 0.0% 0.0% 0.0%
Table 1.9 CBER – PMA Original and Panel Track Supplements (with Panel Review) Performance Metrics – Rate of Withdrawal and Not Approvable
Performance Metric FY 2013 FY 2014 FY 2015 FY 2016 FY 2017 Number Filed 1 0 0
Number with MDUFA decision 1 0 0
Number of Withdrawals 0 0 0
Number of Not Approvable 0 0 0
Rate of Withdrawals 0.0% 0.0% 0.0%
Rate of Not Approvable 0.0% 0.0% 0.0%
Table 1.10 CBER – PMA Original and Panel Track Supplements (without Panel Review) Performance Metrics – Submissions Missing Performance Goals
Performance Metric FY 2013 FY 2014 FY 2015 FY 2016 FY 2017
Number of submissions that missed the goal 0 0 0
Mean FDA days for submissions that missed goal 0 0 0
Mean industry days for submissions that missed goal 0 0 0
Table 1.11 CBER – PMA Original and Panel Track Supplements (with Panel Review) Performance Metrics – Submissions Missing Performance Goals
Performance Metric FY 2013 FY 2014 FY 2015 FY 2016 FY 2017
Number of submissions that missed the goal 0 0 0
Mean FDA days for submissions that missed goal 0 0 0
Mean industry days for submissions that missed goal 0 0 0
Page 335 of 371
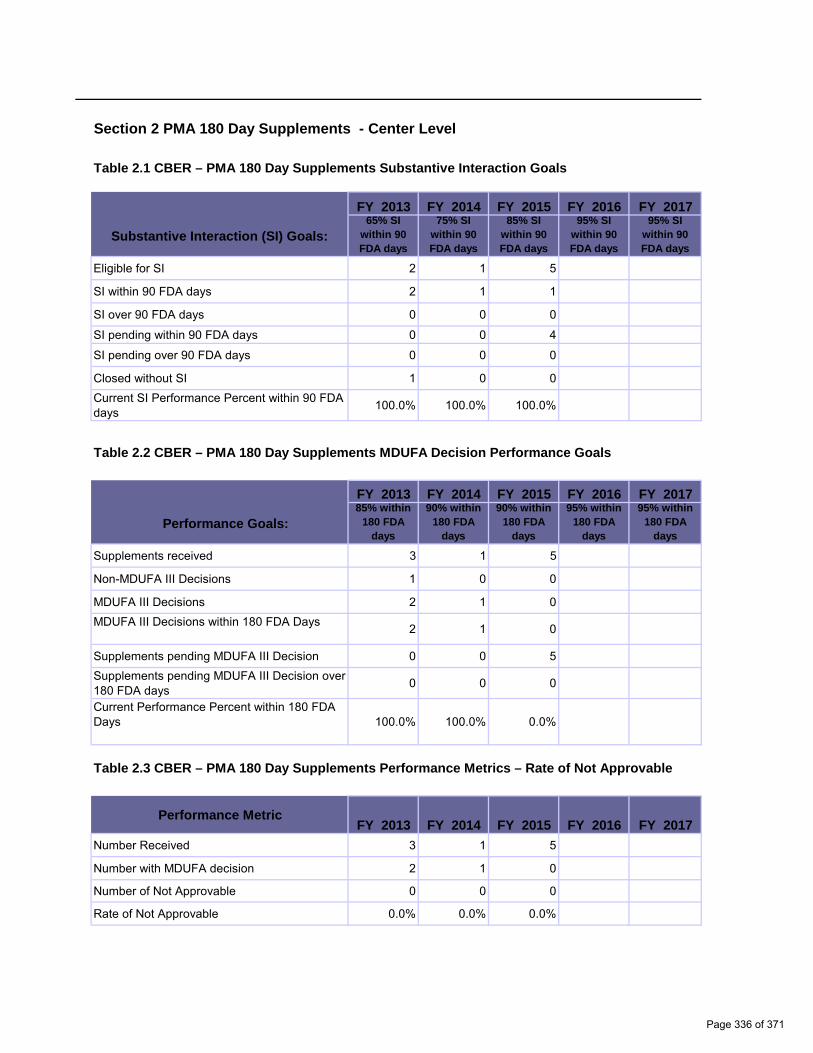
0 0
0 0
0 0
0 0
0 0
0 0 0.0% 0.0%
0 0
0 0
0 0 0 0
0 0
0.0% 0.0%
0 0
0 0
0.0% 0.0%
Section 2 PMA 180 Day Supplements - Center Level
Table 2.1 CBER – PMA 180 Day Supplements Substantive Interaction Goals
Substantive Interaction (SI) Goals:
FY 2013 FY 2014 FY 2015 FY 2016 FY 2017 65% SI
within 90 FDA days
75% SI within 90 FDA days
85% SI within 90 FDA days
95% SI within 90 FDA days
95% SI within 90 FDA days
Eligible for SI 2 1 5
SI within 90 FDA days 2 1 1
SI over 90 FDA days 0 0 0
SI pending within 90 FDA days 0 0 4
SI pending over 90 FDA days 0 0 0
Closed without SI 1 0 0 Current SI Performance Percent within 90 FDA days 100.0% 100.0% 100.0%
Table 2.2 CBER – PMA 180 Day Supplements MDUFA Decision Performance Goals
Performance Goals:
FY 2013 FY 2014 FY 2015 FY 2016 FY 201785% within
180 FDA days
90% within 180 FDA
days
90% within 180 FDA
days
95% within 180 FDA
days
95% within 180 FDA
days
Supplements received 3 1 5
Non-MDUFA III Decisions 1 0 0
MDUFA III Decisions 2 1 0 MDUFA III Decisions within 180 FDA Days 2 1 0
Supplements pending MDUFA III Decision 0 0 5 Supplements pending MDUFA III Decision over 180 FDA days 0 0 0
Current Performance Percent within 180 FDA Days 100.0% 100.0% 0.0%
Table 2.3 CBER – PMA 180 Day Supplements Performance Metrics – Rate of Not Approvable
Performance Metric FY 2013 FY 2014 FY 2015 FY 2016 FY 2017
Number Received 3 1 5
Number with MDUFA decision 2 1 0
Number of Not Approvable 0 0 0
Rate of Not Approvable 0.0% 0.0% 0.0%
Page 336 of 371

0 0
0 0
0 0
Table 2.4 CBER – PMA 180 Day Supplements Performance Metrics – Submissions Missing Performance Goals
Performance Metric FY 2013 FY 2014 FY 2015 FY 2016 FY 2017
Number of submissions that missed the goal 0 0 0
Mean FDA days for submissions that missed goal 0 0 0
Mean Industry days for submissions that missed goal 0 0 0
Page 337 of 371
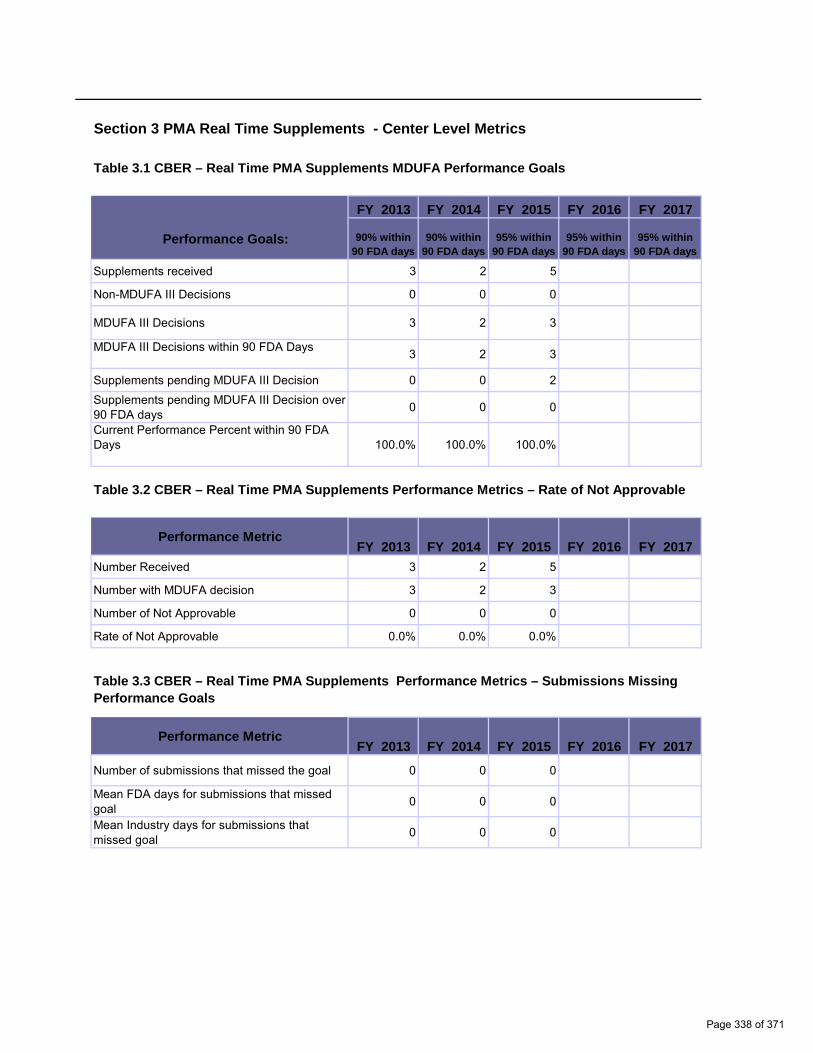
0 0
0 0
0 0
0 0
0 0
0.0% 0.0%
0 0
0 0
0 0
0.0% 0.0%
0 0
0 0
0 0
Section 3 PMA Real Time Supplements - Center Level Metrics
Table 3.1 CBER – Real Time PMA Supplements MDUFA Performance Goals
Performance Goals:
FY 2013 FY 2014 FY 2015 FY 2016 FY 2017
90% within 90 FDA days
90% within 90 FDA days
95% within 90 FDA days
95% within 90 FDA days
95% within 90 FDA days
Supplements received 3 2 5
Non-MDUFA III Decisions 0 0 0
MDUFA III Decisions 3 2 3
MDUFA III Decisions within 90 FDA Days 3 2 3
Supplements pending MDUFA III Decision 0 0 2 Supplements pending MDUFA III Decision over 90 FDA days 0 0 0
Current Performance Percent within 90 FDA Days 100.0% 100.0% 100.0%
Table 3.2 CBER – Real Time PMA Supplements Performance Metrics – Rate of Not Approvable
Performance Metric FY 2013 FY 2014 FY 2015 FY 2016 FY 2017
Number Received 3 2 5
Number with MDUFA decision 3 2 3
Number of Not Approvable 0 0 0
Rate of Not Approvable 0.0% 0.0% 0.0%
Table 3.3 CBER – Real Time PMA Supplements Performance Metrics – Submissions Missing Performance Goals
Performance Metric FY 2013 FY 2014 FY 2015 FY 2016 FY 2017
Number of submissions that missed the goal 0 0 0
Mean FDA days for submissions that missed goal 0 0 0
Mean Industry days for submissions that missed goal 0 0 0
Page 338 of 371

0 0 0 0
0.0% 0.0%
Section 5 PMA Annual Metrics and Goals
Table 5.1 CBER – PMAs (All Review Tracks) Annual General Metrics – PMAs Received by Type
PMA Submissions Received FY 2013 FY 2014 FY 2015 FY 2016 FY 2017
Premarket Report Submissions 0 0 0
Original PMAs (Panel) – Priority 0 0 0
Original PMAs (No Panel) – Priority 0 0 0
Original PMAs (Panel) – Non-Priority 1 0 0
Original PMAs (No Panel) – Non-Priority 0 5 2
Panel-Tracked Supplements (Panel) – Priority 0 0 0
Panel-Tracked Supplements (No Panel) – Priority 0 0 0
Panel-Tracked Supplements (Panel) – Non-Priority 0 0 0
Panel-Tracked Supplements (No Panel) – Non-Priority 0 1 1
PMA Modules 7 1 4 180-Day Supplements 3 1 5
Real-Time Supplements 3 2 5
Table 5.2 CBER – PMA Originals and Panel Tracked Supplements Annual Shared Outcome Goal – Percent Cohorts Closed
Performance Metric FY 2013 FY 2014 FY 2015 FY 2016 FY 2017
Number Filed 1 6 2 Number with a decision (MDUFA or Non-MDUFA) 1 6 0
% of FY closed 100.0% 100.0% 0.0%
Page 339 of 371

0 0
0 0 0 0
0 0
0 0
0.0% 0.0%
0 0
0 0
0 0
0 0
0 0
0 0 0.0% 0.0%
K113126K122100
Section 6 510(k) Center Level Metrics
Table 6.1 CBER – 510(k) Acceptance Review Decision
Performance Metric FY 2013 FY 2014 FY 2015 FY 2016 FY 2017 Number Received 59 57 56
Closed before RTA action 1 4 4
Number Accepted 40 50 46 Number without a RTA Review and > 15 Days since Date Received 0 0 0
Number without a RTA Review and <= 15 Days since Date Received 0 0 1
Number Not Accepted 19 7 9
Rate of submissions not accepted for review 32.2% 12.3% 16.4%
Table 6.2 CBER – 510(k) Substantive Interaction Performance Goals
Substantive Interaction (SI) Performance Goals:
FY 2013 FY 2014 FY 2015 FY 2016 FY 2017 65% SI
within 60 FDA days
75% SI within 60 FDA days
85% SI within 60 FDA days
95% SI within 60 FDA days
95% SI within 60 FDA days
Eligible for SI 47 50 46
SI within 60 FDA days 41 49 39
SI over 60 FDA days 6 1 1
SI pending within 60 FDA days 0 0 5
SI pending over 60 FDA days 0 0 0
510(k)s NSE without SI 0 0 0 Current SI Performance Percent within 60 FDA days 87.2% 98.0% 97.5%
Table 6.3 CBER – 510(k) Substantive Interaction Metrics – Time to Substantive Interaction
Performance Metric FY 2013 FY 2014 FY 2015 FY 2016 FY 2017 Number of Substantive Interactions 47 50 40 Average number of FDA days to Substantive Interaction 49 49 48
20th Percentile FDA days to Substantive Interaction 30 34 30
40th Percentile FDA days to Substantive Interaction 46 54 54
60th Percentile FDA days to Substantive Interaction 58 56 58
80th Percentile FDA days to Substantive Interaction 59 59 59
Maximum FDA days to Substantive Interaction 90 90 62
Page 340 of 371

0 0
0 0
0 0
0 0
0 0
0.0% 0.0%
Table 6.4 CBER – 510(k) MDUFA Decision Performance Goals
Performance Goals:
FY 2013 FY 2014 FY 2015 FY 2016 FY 2017
91% within 90 FDA days
93% within 90 FDA days
95% within 90 FDA days
95% within 90 FDA days
95% within 90 FDA days
510(k)s accepted 47 50 46
Non-MDUFA III Decisions 8 2 3
MDUFA III Decisions (SE/NSE) 39 41 25 MDUFA III Decisions within 90 FDA Days 37 41 25
510(k)s pending MDUFA III Decision 0 7 18 510(k) pending MDUFA III Decision over 90 FDA days 0 0 0
Current Performance Percent within 90 FDA Days 94.9% 100.0% 100.0%
Page 341 of 371
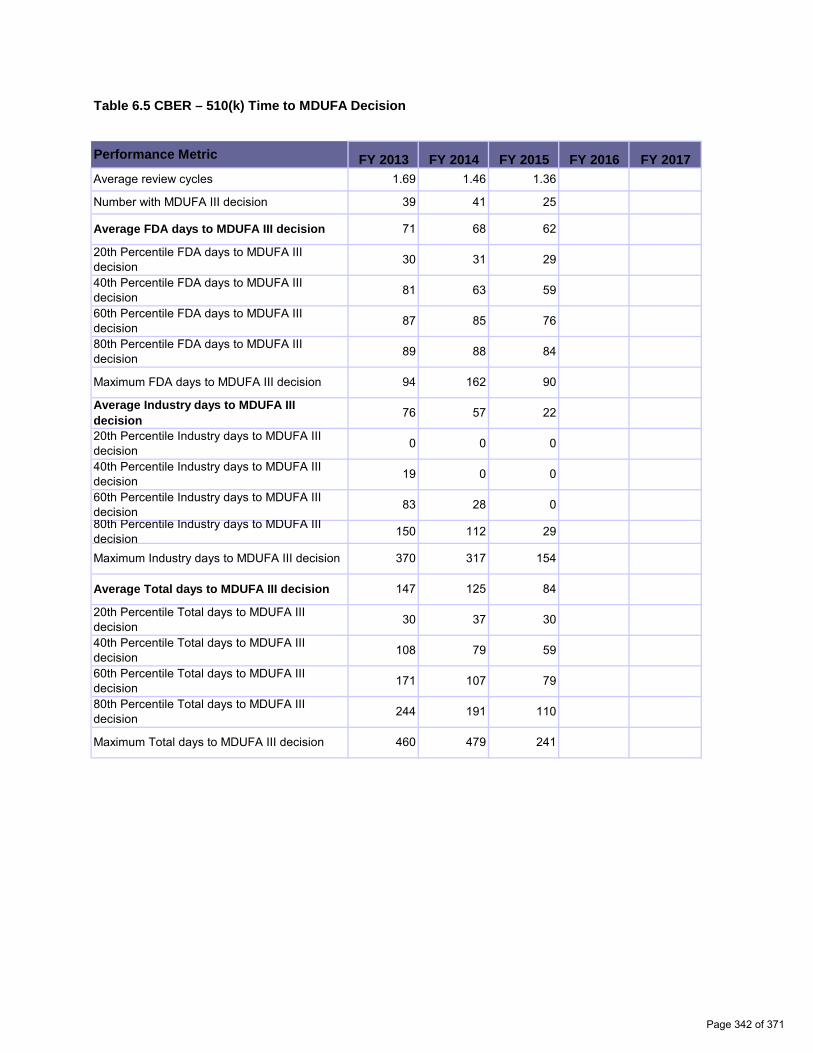
K122917K123021K123056K123065K123066K123068K123080
Table 6.5 CBER – 510(k) Time to MDUFA Decision
Performance Metric FY 2013 FY 2014 FY 2015 FY 2016 FY 2017 Average review cycles 1.69 1.46 1.36
Number with MDUFA III decision 39 41 25
Average FDA days to MDUFA III decision 71 68 62
20th Percentile FDA days to MDUFA III decision 30 31 29
40th Percentile FDA days to MDUFA III decision 81 63 59
60th Percentile FDA days to MDUFA III decision 87 85 76
80th Percentile FDA days to MDUFA III decision 89 88 84
Maximum FDA days to MDUFA III decision 94 162 90
Average Industry days to MDUFA III decision 76 57 22
20th Percentile Industry days to MDUFA III decision 0 0 0
40th Percentile Industry days to MDUFA III decision 19 0 0
60th Percentile Industry days to MDUFA III decision 83 28 0 80th Percentile Industry days to MDUFA III decision 150 112 29
Maximum Industry days to MDUFA III decision 370 317 154
Average Total days to MDUFA III decision 147 125 84
20th Percentile Total days to MDUFA III decision 30 37 30
40th Percentile Total days to MDUFA III decision 108 79 59
60th Percentile Total days to MDUFA III decision 171 107 79
80th Percentile Total days to MDUFA III decision 244 191 110
Maximum Total days to MDUFA III decision 460 479 241
Page 342 of 371
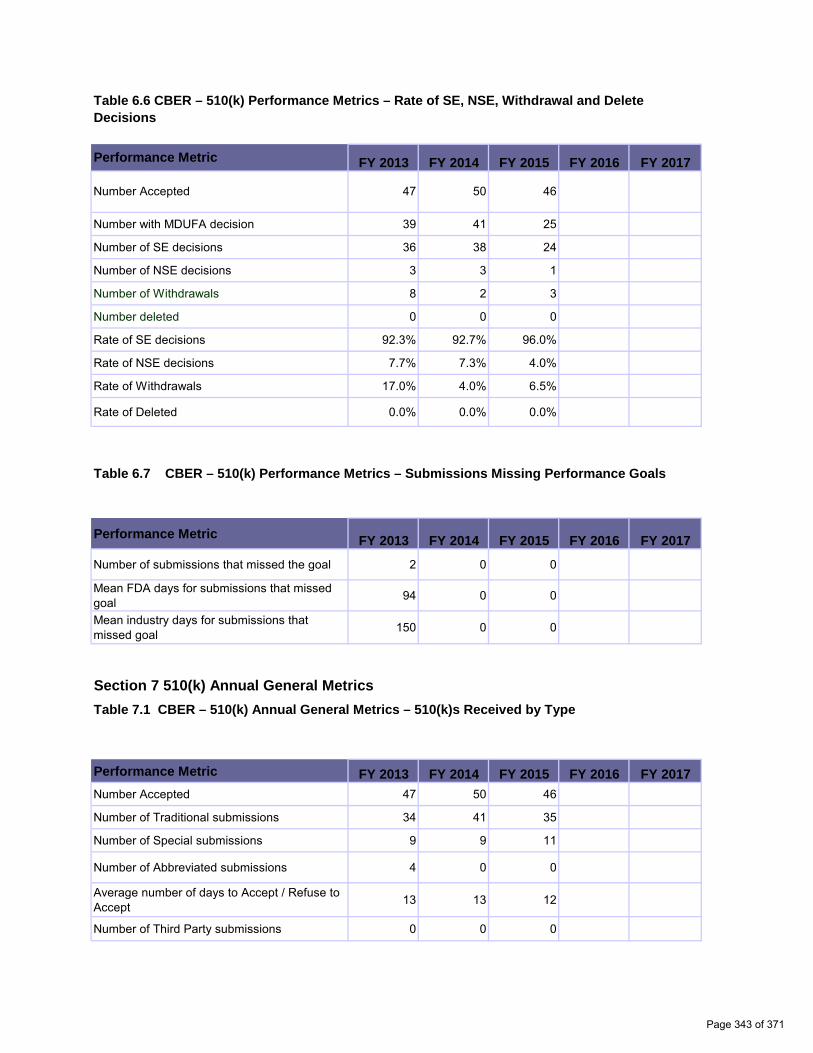
0 0
0 0
0.0% 0.0%
0.0% 0.0%
0.0% 0.0%
0.0% 0.0%
0 0
0 0
0 0
Table 6.6 CBER – 510(k) Performance Metrics – Rate of SE, NSE, Withdrawal and Delete Decisions
Performance Metric FY 2013 FY 2014 FY 2015 FY 2016 FY 2017
Number Accepted 47 50 46
Number with MDUFA decision 39 41 25
Number of SE decisions 36 38 24
Number of NSE decisions 3 3 1
Number of Withdrawals 8 2 3
Number deleted 0 0 0
Rate of SE decisions 92.3% 92.7% 96.0%
Rate of NSE decisions 7.7% 7.3% 4.0%
Rate of Withdrawals 17.0% 4.0% 6.5%
Rate of Deleted 0.0% 0.0% 0.0%
Table 6.7 CBER – 510(k) Performance Metrics – Submissions Missing Performance Goals
Performance Metric FY 2013 FY 2014 FY 2015 FY 2016 FY 2017
Number of submissions that missed the goal 2 0 0
Mean FDA days for submissions that missed goal 94 0 0
Mean industry days for submissions that missed goal 150 0 0
Section 7 510(k) Annual General Metrics Table 7.1 CBER – 510(k) Annual General Metrics – 510(k)s Received by Type
Performance Metric FY 2013 FY 2014 FY 2015 FY 2016 FY 2017 Number Accepted 47 50 46
Number of Traditional submissions 34 41 35
Number of Special submissions 9 9 11
Number of Abbreviated submissions 4 0 0
Average number of days to Accept / Refuse to Accept 13 13 12
Number of Third Party submissions 0 0 0
Page 343 of 371
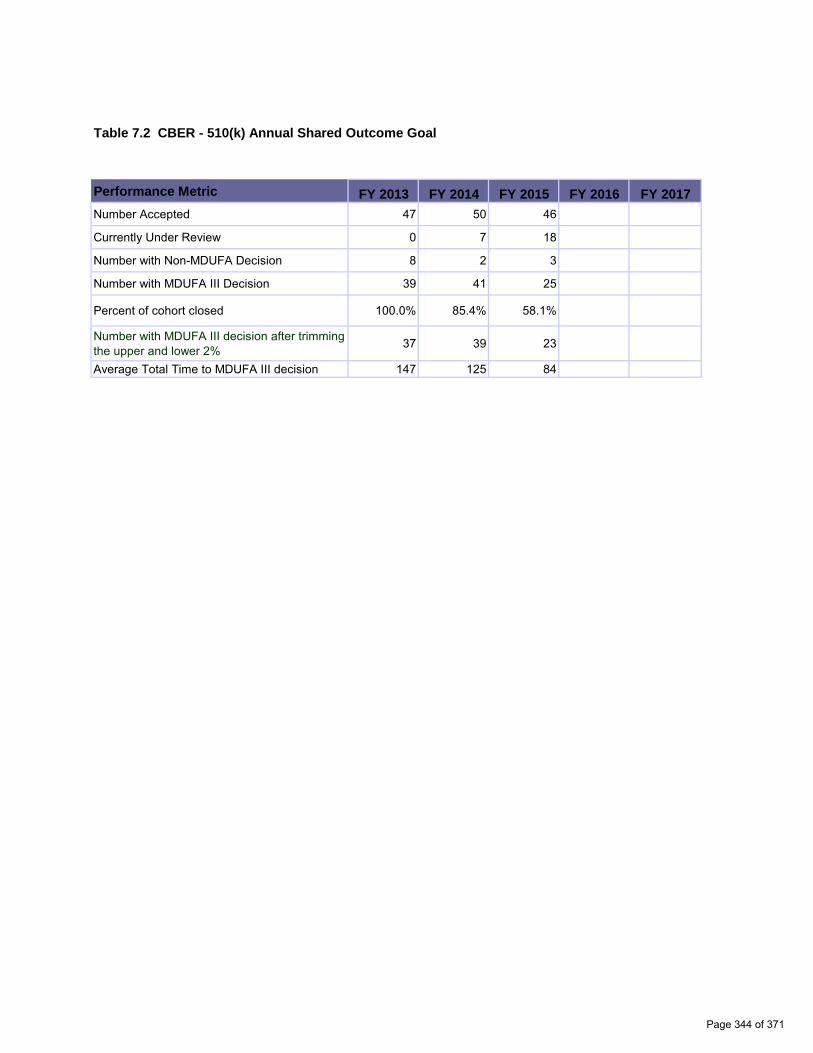
0 0
0 0
0 0
0% 0%
94 94
0 0
Table 7.2 CBER - 510(k) Annual Shared Outcome Goal
Performance Metric FY 2013 FY 2014 FY 2015 FY 2016 FY 2017 Number Accepted 47 50 46
Currently Under Review 0 7 18
Number with Non-MDUFA Decision 8 2 3
Number with MDUFA III Decision 39 41 25
Percent of cohort closed 100.0% 85.4% 58.1%
Number with MDUFA III decision after trimming the upper and lower 2% 37 39 23
Average Total Time to MDUFA III decision 147 125 84
Page 344 of 371
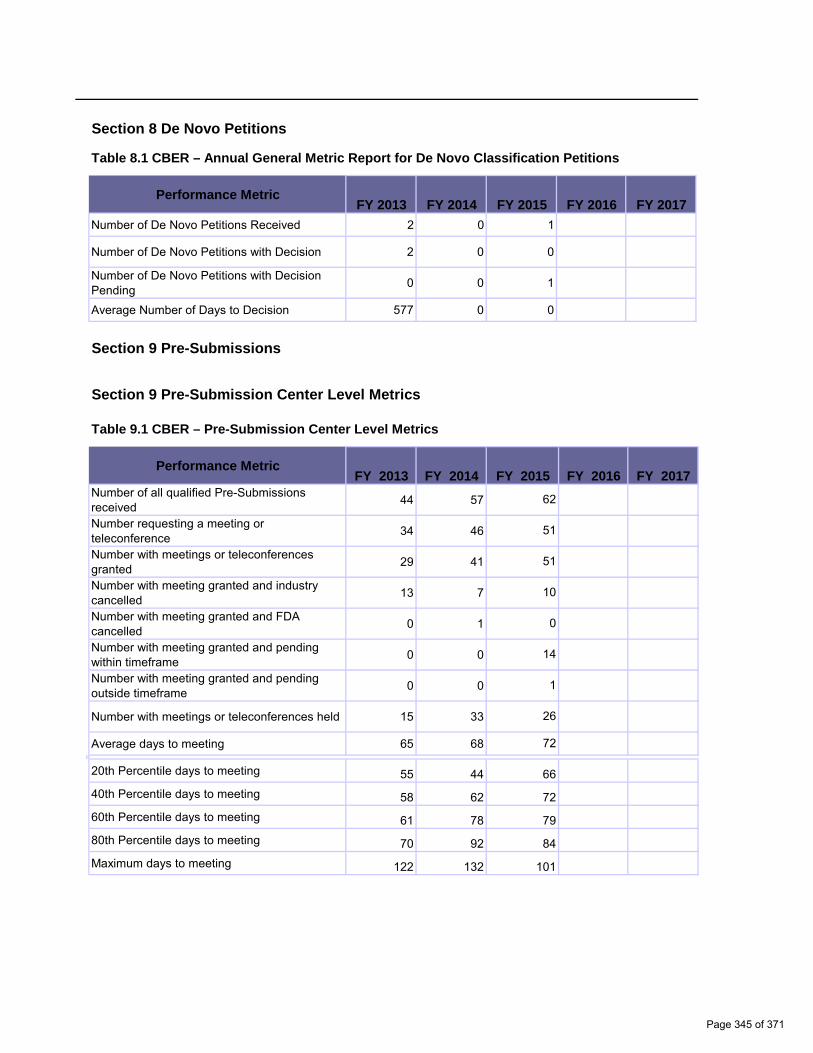
0 0
0 0
0 0
0 0
0 0
0 0
0 0
0 0
0 0
0 0
0 0
0 0
FY 2015 FY 2016 FY 2017
Section 8 De Novo Petitions
Table 8.1 CBER – Annual General Metric Report for De Novo Classification Petitions
Performance Metric FY 2013 FY 2014 FY 2015 FY 2016 FY 2017
Number of De Novo Petitions Received 2 0 1
Number of De Novo Petitions with Decision 2 0 0
Number of De Novo Petitions with Decision Pending 0 0 1
Average Number of Days to Decision 577 0 0
Section 9 Pre-Submissions
Section 9 Pre-Submission Center Level Metrics
Table 9.1 CBER – Pre-Submission Center Level Metrics
Performance Metric FY 2013 FY 2014 FY 2015 FY 2016 FY 2017
Number of all qualified Pre-Submissions received 44 57 62
Number requesting a meeting or teleconference 34 46 51
Number with meetings or teleconferences granted 29 41 51
Number with meeting granted and industry cancelled 13 7 10
Number with meeting granted and FDA cancelled 0 1 0
Number with meeting granted and pending within timeframe 0 0 14
Number with meeting granted and pending outside timeframe 0 0 1
Number with meetings or teleconferences held 15 33 26
Average days to meeting 65 68 72
20th Percentile days to meeting 55 44 66 40th Percentile days to meeting 58 62 72 60th Percentile days to meeting 61 78 79 80th Percentile days to meeting 70 92 84 Maximum days to meeting 122 132 101
Page 345 of 371
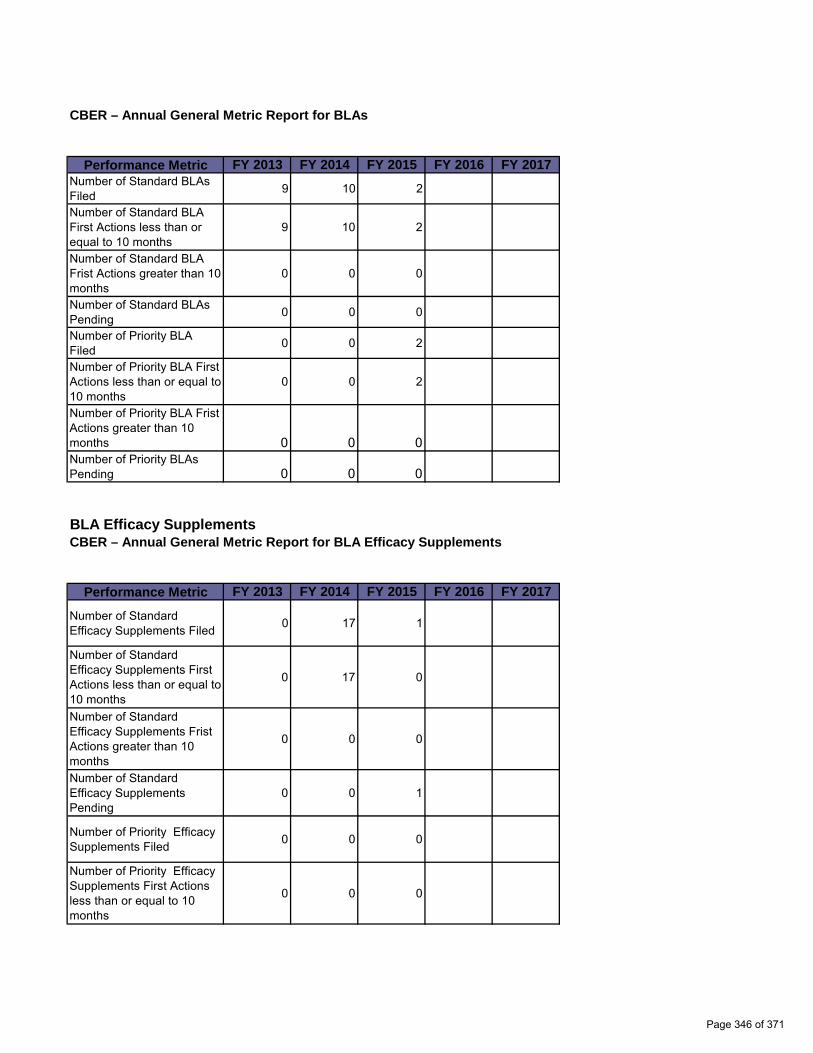
0 0
0 0
0 0
0 0
0 0
0 0
0 0
0 0
CBER – Annual General Metric Report for BLAs
Performance Metric FY 2013 FY 2014 FY 2015 FY 2016 FY 2017 Number of Standard BLAs Filed 9 10 2
Number of Standard BLA First Actions less than or equal to 10 months
9 10 2
Number of Standard BLA Frist Actions greater than 10 months
0 0 0
Number of Standard BLAs Pending 0 0 0
Number of Priority BLA Filed 0 0 2
Number of Priority BLA First Actions less than or equal to 10 months
0 0 2
Number of Priority BLA Frist Actions greater than 10 months 0 0 0 Number of Priority BLAs Pending 0 0 0
BLA Efficacy Supplements CBER – Annual General Metric Report for BLA Efficacy Supplements
Performance Metric FY 2013 FY 2014 FY 2015 FY 2016 FY 2017
Number of Standard Efficacy Supplements Filed 0 17 1
Number of Standard Efficacy Supplements First Actions less than or equal to 10 months
0 17 0
Number of Standard Efficacy Supplements Frist Actions greater than 10 months
0 0 0
Number of Standard Efficacy Supplements Pending
0 0 1
Number of Priority Efficacy Supplements Filed 0 0 0
Number of Priority Efficacy Supplements First Actions less than or equal to 10 months
0 0 0
Page 346 of 371

Number of Priority Efficacy Supplements Frist Actions greater than 10 months 0 0 0
Number of Priority Efficacy Supplements Pending 0 0 0
Page 347 of 371

0 0
0 0
0 0
0 0
0 0
0 0
BLA Prior Approval Manufacturing Supplements CBER – Annual General Metric Report for BLA PAS Supplements
Performance Metric FY 2013 FY 2014 FY 2015 FY 2016 FY 2017 Number of Standard PAS Supplements Filed 20 6 18
Number of Standard PAS Supplements First Actions less than or equal to 4months
20 6 18
Number of Standard PAS Supplements First Actions greater than 4 months
0 0 0
Number of Standard PAS Supplements Pending 0 0 0
BLA/BLA Resubmissions CBER – Annual General Metric Report for BLA/BLA Resubmissions
Performance Metric FY 2013 FY 2014 FY 2015 FY 2016 FY 2017
Number of Class 1 Resubmissions Received 10 6 1
Number of Class 1 Resubmission Actions less than or equal to 2 months
10 6 1
Number of Standard Class 1 Resubmission Frist Actions greater than 2 months
0 0 0
Number of Class 1 Resbumssions Pending 0 0 0
Number of Class 2 Resubmissions Received 0 2 16
Number of Class 2 Resubmission Actions less than or equal to 6 months
0 2 0
Number of Class 2 Resubmission Actions greater than 6 months 0 0 0 Number of Class 2 Resubmissions Pending 0 0 16
Page 348 of 371
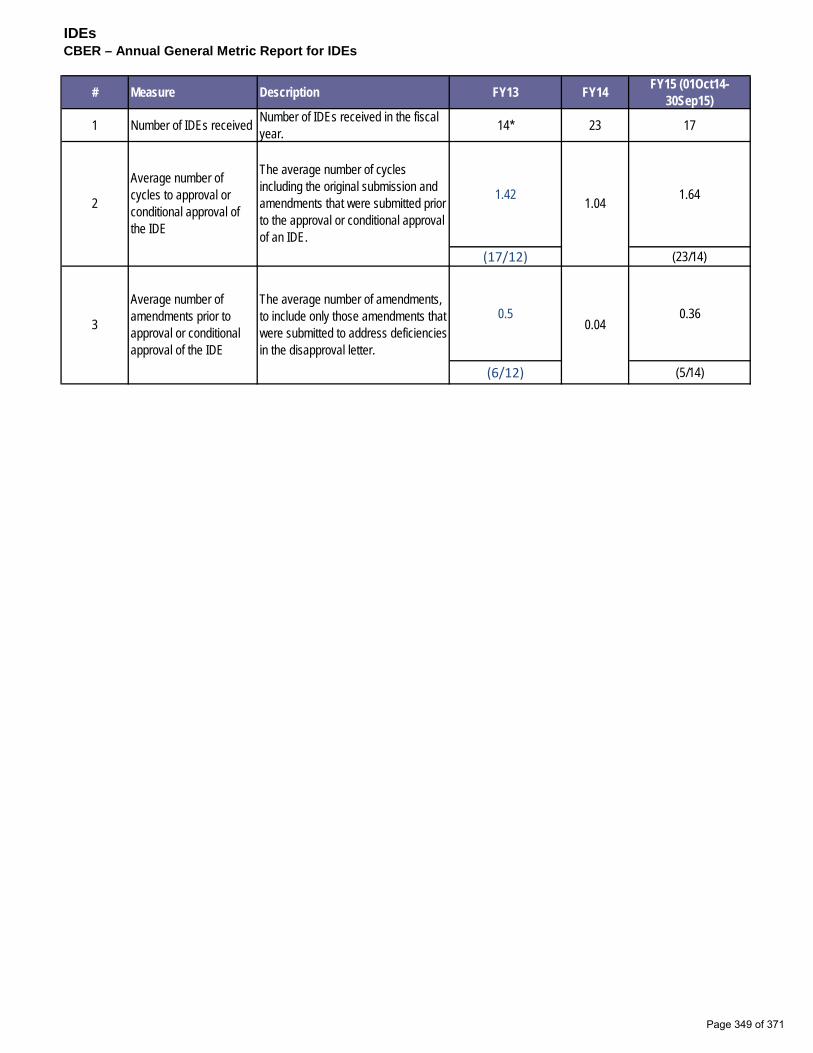
IDEs CBER – Annual General Metric Report for IDEs
# Measure Description FY13 FY14 FY15 (01Oct1430Sep15)
1 Number of IDEs received Number of IDEs received in the fiscal year. 14* 23 17
2
Average number of cycles to approval or conditional approval of the IDE
The average number of cycles including the original submission and amendments that were submitted prior to the approval or conditional approval of an IDE.
1.42 1.04 1.64
(17/12) (23/14)
3
Average number of amendments prior to approval or conditional approval of the IDE
The average number of amendments, to include only those amendments that were submitted to address deficiencies in the disapproval letter.
0.5 0.04
0.36
(6/12) (5/14)
Page 349 of 371

Page intentionally left blank
Page 350 of 371

FY 2015 Medical Device User Fee Collections as of September 30th, 2015
Excludes Unearned Fees
Receipts Refunds Net Authorized % of
Authorized Registration
Fees $91,517,506 $465,335 $91,052,171 Application
Fees $43,275,276 $887,769 $42,387,507 Total $134,792,782 $1,353,104 $133,439,678 $131,195,000 102%
Medical Device User Fee Collection History Excludes Unearned Fees, Includes Refunds
MD I FY 2003 FY 2004 FY 2005 FY 2006 FY 2007
$21,620,549 $26,281,779 $31,676,833 $34,469,732 $27,798,431
MD II FY 2008 FY 2009 FY 2010 FY 2011 FY 2012
$47,710,791 $56,940,552 $63,415,722 $69,545,537 $65,159,593
MD III FY 2013 FY 2014 FY 2015 FY 2016 FY 2017
$99,966,647 $120,333,158 $133,439,678
Page 351 of 371

Page intentionally left blank
Page 352 of 371
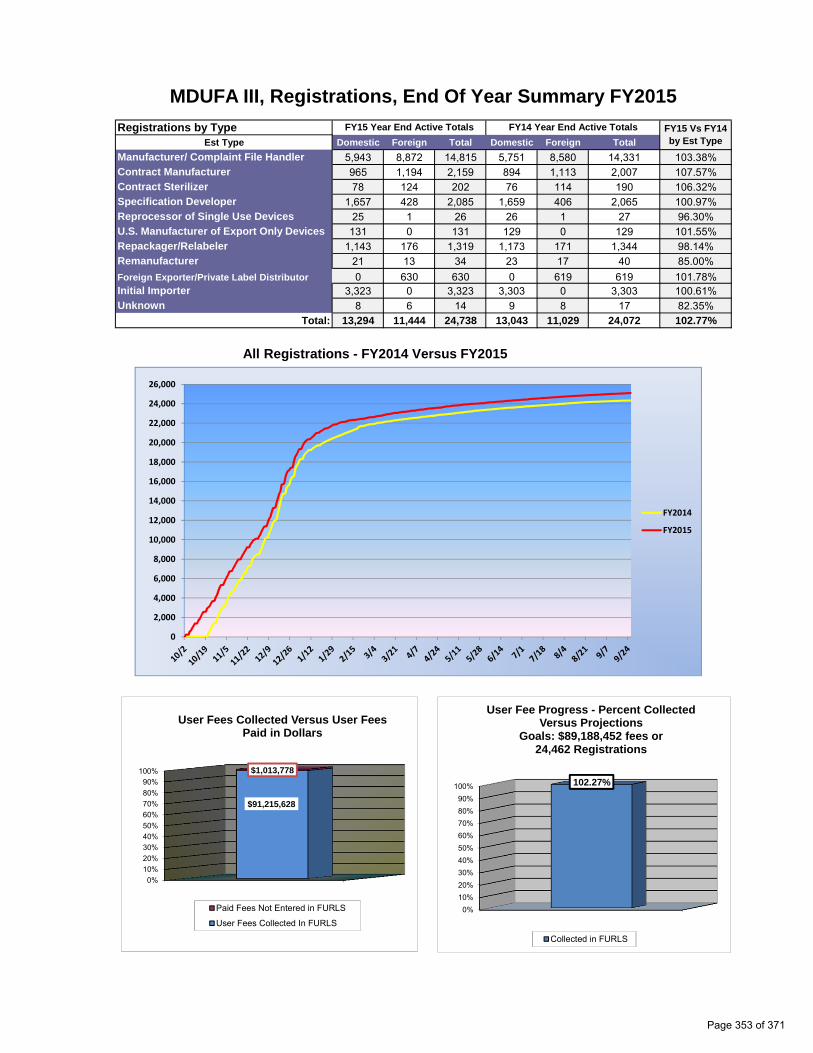
1
1
MDUFA III, Registrations, End Of Year Summary FY2015
Registrations by Type FY15 Year End Active Totals FY14 Year End Active Totals FY15 Vs FY14 by Est Type Est Type Domestic Foreign Total Domestic Foreign Total
Manufacturer/ Complaint File Handler Contract Manufacturer Contract Sterilizer Specification Developer Reprocessor of Single Use Devices U.S. Manufacturer of Export Only Devices Repackager/Relabeler Remanufacturer Foreign Exporter/Private Label Distributor Initial Importer Unknown
5,943 8,872 14,815 5,751 8,580 14,331 103.38% 965 1,194 2,159 894 1,113 2,007 107.57% 78 124 202 76 114 190 106.32%
1,657 428 2,085 1,659 406 2,065 100.97% 25 1 26 26 1 27 96.30% 131 0 131 129 0 129 101.55%
1,143 176 1,319 1,173 171 1,344 98.14% 21 13 34 23 17 40 85.00% 0 630 630 0 619 619 101.78%
3,323 0 3,323 3,303 0 3,303 100.61% 8 6 14 9 8 17 82.35%
Total: 13,294 11,444 24,738 13,043 11,029 24,072 102.77%
All Registrations - FY2014 Versus FY2015
0% 10% 20% 30% 40% 50% 60% 70% 80% 90%
100%
$91,215,628
$1,013,778
User Fees Collected Versus User Fees Paid in Dollars
Paid Fees Not Entered in FURLS
User Fees Collected In FURLS 0%
10% 20% 30% 40% 50% 60% 70% 80% 90%
100% 102.27%
User Fee Progress - Percent Collected Versus Projections
Goals: $89,188,452 fees or 24,462 Registrations
Collected in FURLS
0
2,000
4,000
6,000
8,000
10,000
12,000
14,000
16,000
18,000
20,000
22,000
24,000
26,000
FY2014
FY2015
Page 353 of 371

Page intentionally left blank
Page 354 of 371

MDUFA III Quarterly Performance Update
Independent Assessment of Medical Device Review Process 4th Quarter FY 2015 Status – November 9, 2015
Objectives
Pursuant to the Performance Goals and Procedures adopted under the 2012 Medical Device User Fee Amendments (MDUFA III), FDA agreed to participate with the device industry in a comprehensive assessment of the process for the review of device applications.
This requirement is to conduct a comprehensive assessment of FDA premarket review processes for medical devices and to identify opportunities for improvement that will significantly impact the review of device premarket applications. Primary objectives include:
Phase 1: • Identification of best practices and prioritization of process improvements for conducting
predictable, efficient, and consistent premarket reviews that meet regulatory review standards
• In-depth analyses of the elements of the review process in order to identify best practices and opportunities for improvement, including root cause analyses of selected significant factors
• Assessment of resource allocation to premarket device reviews across FDA • Development of implementation plans for selected recommendations • Development of metrics to ensure successful implementation of recommendations and
demonstrate achievement of expected results Phase 2:
• Evaluation of the implementation of selected recommendations
Timeline
Milestone Planned Status FY 2013
Publish Federal Register notice December 2012 Completed December 2012
Award contract May 2013 Completed June 2013
Contract kickoff meeting between FDA and contractor June 2013 Completed July 2013
Final workplan for Phase 1 July 2013 Completed August 2013
FY 2014 Report on preliminary findings and high-priority recommendations December 2013 Completed December 2013
Implementation plan for high-priority recommendations June 2014 Completed June 2014
Final report on complete findings and recommendations June 2014 Completed June 2014
Page 355 of 371
Progress from 4th Quarter FY 2015:
• BAH continued to meet with FDA implementation project teams in order to complete analysis of the projects – Ongoing
Planned Progress in 1st Quarter FY 2016:
• BAH plans to engage with industry stakeholders - November 2015 • Contractual progress reports and updates from BAH assessment team – Ongoing • BAH plans to submit a preliminary evaluation report to FDA for a factual review – December
2015
Page 356 of 371
Center for Devices and Radiological Health Internal Training Summary Report
Q4 FY15October 2014 – September 2015
Prepared by: The Division of Employee Training and Development (DETD)
As of: 10 /21/2015
Page 357 of 371
FDA continues to invest in internal and external training opportunities supporting the medical device review process. The Division of Employee Training and Development (DETD) is CDRH’s internal resource for scientific, regulatory, and leadership training,career development programs, and customized learning opportunities. We help further the Center’s mission of regulating medical devices and radiation-emitting products bychampioning employee growth across the Center’s eight Offices. Our approach to improving performance combines classroom, experiential, and online learning withmentoring, self-study initiatives, and specialty programs. We are committed to providing CDRH employees with the knowledge and skills needed to maximize their organizationaland individual potential.
Table X provides a summary of internal training conducted in CDRH between October 1,2014 and September 30, 2015. DETD offered 499 learning events, addressing reviewertraining, new scientific technologies, law, regulation and guidance updates, and leadershipand professional development. This training was designed to improve the device reviewprocess and support MDUFA goals and program activities.
Page 358 of 371

Table of Contents
Table X - FY15 CDRH Internal Training Conducted Between: .............................................. Internal Training Conducted Between: October 1, 2014 – September 30, 2015 ...............
Premarket Reviewer Training - RCP ......................................................................................... Reviewer Certification Program: ................................................................................................ RCP Training Completed: October 2014 – September 30, 2015 .......................................RCP Training by Cohort, Completed: September 2014 – September 30, 2015 .................
Premarket Reviewer Training - ELP ..........................................................................................Experiential Learning Program (ELP): .......................................................................................ELP Training Completed: October 2014 – September 30, 2015 ........................................
Booz Allen Hamilton (BAH) Independent Recommendation Update: ....................................BAH Independent Assessment Training Recommendation Update: ..........................................
Leadership Training - LEAD.......................................................................................................Leadership Enhancement and Development (LEAD) Program: ................................................LEAD Training Completed: October 2014 – September 30, 2015 ....................................LEAD Training for ODE and OIR Completed: October 2014 – September 30, 2015 .......
Leadership Training for Non-Managers ..................................................................................Leadership Readiness Program (LRP):.....................................................................................LRP Participant Data ................................................................................................................
CDRH Training Courses by Category: ....................................................................................Regulatory and Law (LAW) Training: .....................................................................................Leadership Development Training for Managers and Non-Managers: ....................................Professional Development (PRO) Training: .............................................................................Science (SCI) Training: ............................................................................................................
Page 359 of 371

Table X - FY15 CDRH Internal Training Conducted by DETD:
October 1, 2014 – September 30, 2015
Category Program # of Learning Events
Total # of Completions
Total Training Hours
Regulatory and Law (LAW) Training
MDUFA III 6 272 654
ELP 27 398 4892
Other LAW 89 2478 13848
LAW Subtotal: 119 3148 19394
Leadership Development Training (LED)
LEAD: Leadershipfor Managers
47 789 2837
Leadership forNon-Managers 18 331 1951
LED Subtotal: 65 1120 4788
Professional Development (PRO) Training
New Employee Orientation (NEO)
4 104 728
Other PRO 104 1860 13730
PRO Subtotal: 108 1964 14458
Science (SCI) Training All SCI 182 5286 20914
*Center-Specific Information Technology (CIT) Training
All CIT 25 1510 933
Grand Total: 499 13028 60487
* CIT is a new category that was added to Table X as of Q2FY15.
Page 360 of 371
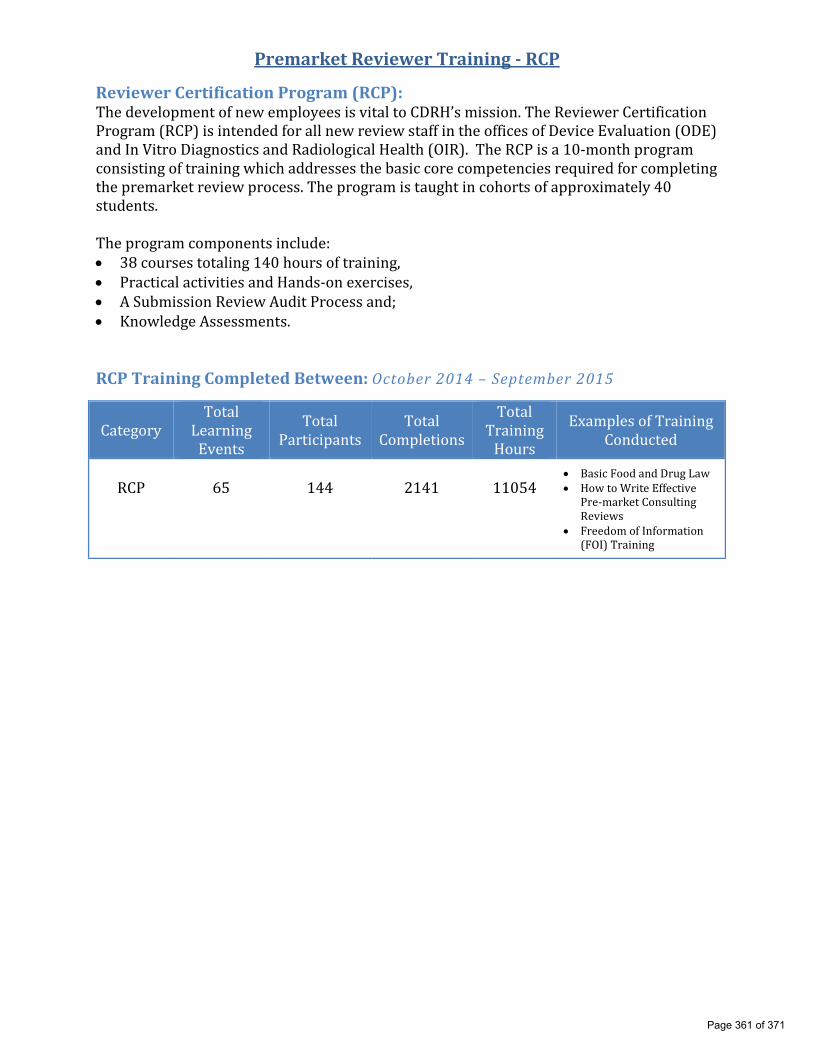
Premarket Reviewer Training - RCP
Reviewer Certification Program (RCP):The development of new employees is vital to CDRH’s mission. The Reviewer Certification Program (RCP) is intended for all new review staff in the offices of Device Evaluation (ODE)and In Vitro Diagnostics and Radiological Health (OIR). The RCP is a 10-month programconsisting of training which addresses the basic core competencies required for completingthe premarket review process. The program is taught in cohorts of approximately 40students.
The program components include: • 38 courses totaling 140 hours of training, • Practical activities and Hands-on exercises, • A Submission Review Audit Process and; • Knowledge Assessments.
RCP Training Completed Between: October 2014 – September 2015
Category Total
LearningEvents
Total Participants
Total Completions
Total Training
Hours
Examples of TrainingConducted
RCP 65 144 2141 11054 • Basic Food and Drug Law • How to Write Effective
Pre-market ConsultingReviews
• Freedom of Information (FOI) Training
Page 361 of 371
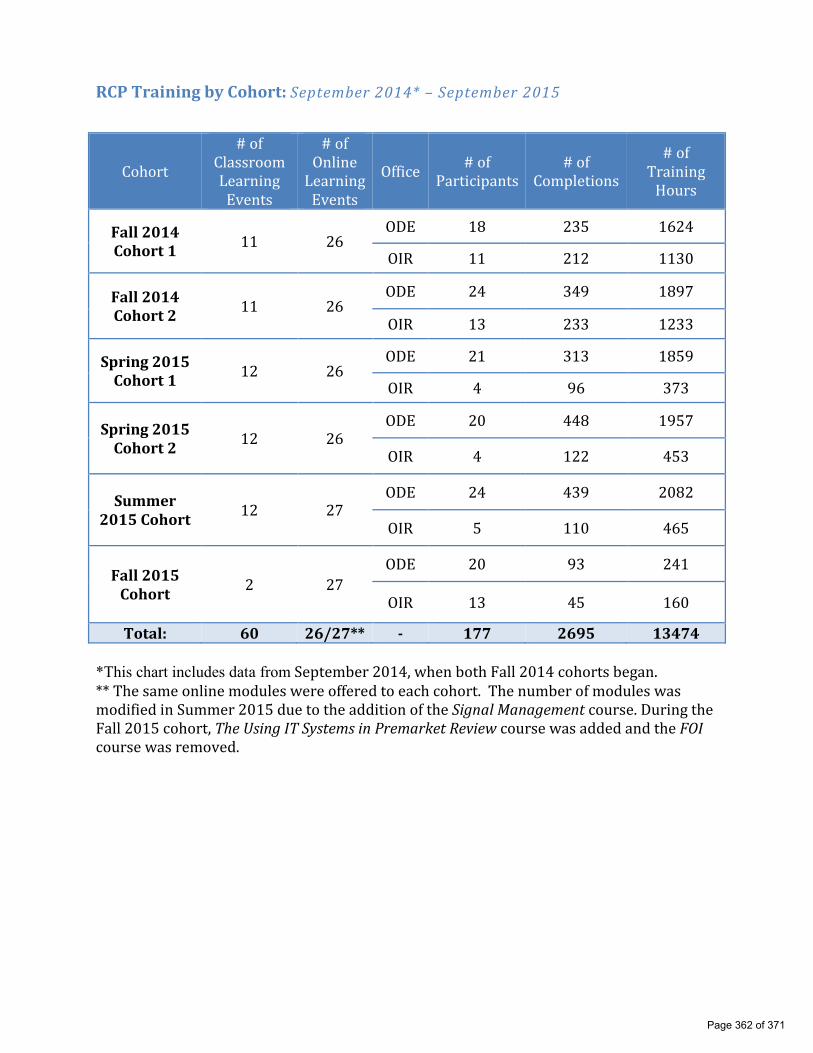
RCP Training by Cohort: S ept em b er 2014 * – S ept em b er 2015
Cohort
# of Classroom Learning
Events
# of Online
LearningEvents
Office # of Participants
# of Completions
# of Training
Hours
Fall 2014 Cohort 1 11 26
ODE 18 235 1624
OIR 11 212 1130
Fall 2014 Cohort 2 11 26
ODE 24 349 1897
OIR 13 233 1233
Spring 2015 Cohort 1 12 26
ODE 21 313 1859
OIR 4 96 373
Spring 2015 Cohort 2 12 26
ODE 20 448 1957
OIR 4 122 453
Summer 2015 Cohort 12 27
ODE 24 439 2082
OIR 5 110 465
Fall 2015 Cohort 2 27
ODE 20 93 241
OIR 13 45 160
Total: 60 26/27** - 177 2695 13474
*This chart includes data from September 2014, when both Fall 2014 cohorts began.** The same online modules were offered to each cohort. The number of modules was modified in Summer 2015 due to the addition of the Signal Management course. During the Fall 2015 cohort, The Using IT Systems in Premarket Review course was added and the FOI course was removed.
Page 362 of 371

Premarket Reviewer Training - ELP
Experiential Learning Program (ELP):CDRH offers an innovative learning opportunity for new and experienced review staff. The Experiential Learning Program (ELP) is a collaborative approach to closing the knowledge gap between emerging and innovative technology and the pre-market review of the resulting medical devices. The program fosters the premarket reviewers’ understanding ofhow medical devices are developed, clinically tested, manufactured, and utilized.
ELP Training Completed: October 2014 – September 2015
Office # of Site Visits # of Attendees
Total Training
Hours Focus Area
ODE 25 374 4564 • Endosseous Implants • Refractive lasers • Electrophysiology catheters for
diagnostic and therapeuticindications
• Hemodialysis used in the homeenvironment
OIR 2 24 328 • Good manufacturing practicesunder regulation 820
• Observation of clinical mass spectrometers HPLC
Total: 27 398 4892
Page 363 of 371

Booz Allen Hamilton (BAH) Independent Assessment Training Recommendation Update
Evaluation of IT Infrastructure and Workload Tools The Office of Communication and Education (OCE) collaborated with the Office of Device Evaluation (ODE) and Office of In Vitro Diagnostics and Radiological Health (OIR) to develop training for CDRH’s three primary premarket IT systems: CTS, DocMan andImage2000+. The training is delivered in an online format and will be evaluated usingKirkpatrick’s Level 1 and 2 evaluations. Training launched in July and was mandatory for staff involved in premarket review. To date, over 85% of ODE and OIR staff have completedthe training.
Evaluation of Training ProgramsOCE continues to implement Kirkpatrick’s evaluation Levels 1-4. Specifically, OCE hasimplemented a revised Level 1 evaluation, and has implemented the Level 2 evaluation data collection process for the Reviewer Certification Program. OCE, ODE and OIR are working together to develop a process for conducting the Level 3 and 4 training evaluation.Additionally, OCE developed a standardized process for conducting an annual needsassessment.
Promotion of Informal TrainingOCE has a senior ODE reviewer documenting all internal training conducted by the Premarket Offices (which is not currently identified as formal training and is not reflectedon a reviewer’s official transcript). OCE piloted a standardized process and form to collectinformal training not conducted by OCE. The pilot included a participant survey. Overallparticipants have responded favorability to the developed tracking process.
Page 364 of 371

Leadership Training - LEAD
Leadership Enhancement and Development (LEAD) Program:The LEAD Program is a Mandatory Supervisory Training Program targeting all CDRHSupervisors, Managers, and Non-Bargaining Unit Team Leaders. The LEAD curriculum supports the CDRH Management Competencies and addresses the supervisory trainingrequirements as mandated in 5 CFR 412.
LEAD Training Completed: October 2014 – September 2015
Category # of
LearningEvents
Total # of Completions
Total Training
Hours
Examples of TrainingConducted
LEAD 47 789 2837
• Building Strong Customer Relations • Critical Thinking for Better
Decision Making • Nonverbal Communication for
Managers
LEAD Training for ODE and OIR Completed: October 2014 – September 2015
Office Total # of Managers/Supervisors
# of Training
Participants
TrainingHours
Completed
TrainingHours
Required
% of RequiredTraining Hours
Completed
ODE 64 56 584 1600 37%
OIR 36 27 152 1056 15%
Total: 100 83 736 2656 26%
Page 365 of 371
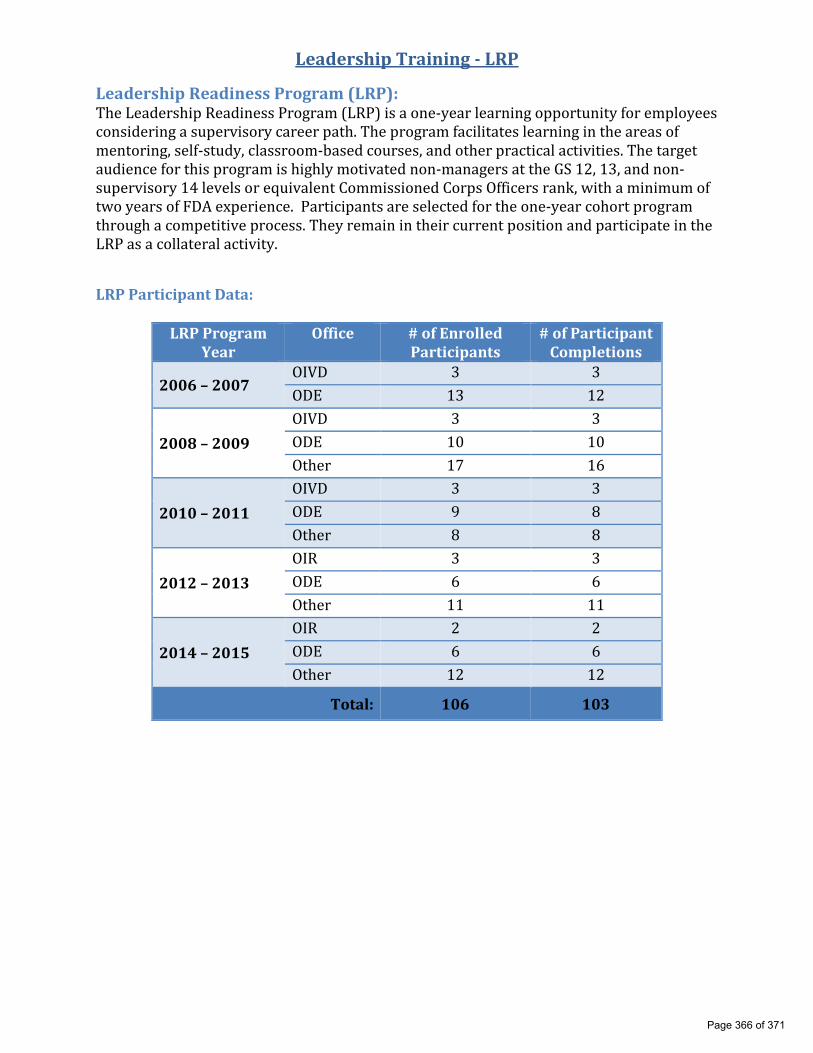
Leadership Training - LRP
Leadership Readiness Program (LRP):The Leadership Readiness Program (LRP) is a one-year learning opportunity for employeesconsidering a supervisory career path. The program facilitates learning in the areas ofmentoring, self-study, classroom-based courses, and other practical activities. The target audience for this program is highly motivated non-managers at the GS 12, 13, and non-supervisory 14 levels or equivalent Commissioned Corps Officers rank, with a minimum of two years of FDA experience. Participants are selected for the one-year cohort programthrough a competitive process. They remain in their current position and participate in the LRP as a collateral activity.
LRP Participant Data:
LRP Program Year
Office # of Enrolled Participants
# of Participant Completions
2006 – 2007 OIVD 3 3 ODE 13 12
2008 – 2009 OIVD 3 3 ODE 10 10 Other 17 16
2010 – 2011 OIVD 3 3 ODE 9 8 Other 8 8
2012 – 2013 OIR 3 3 ODE 6 6 Other 11 11
2014 – 2015 OIR 2 2 ODE 6 6 Other 12 12
Total: 106 103
Page 366 of 371
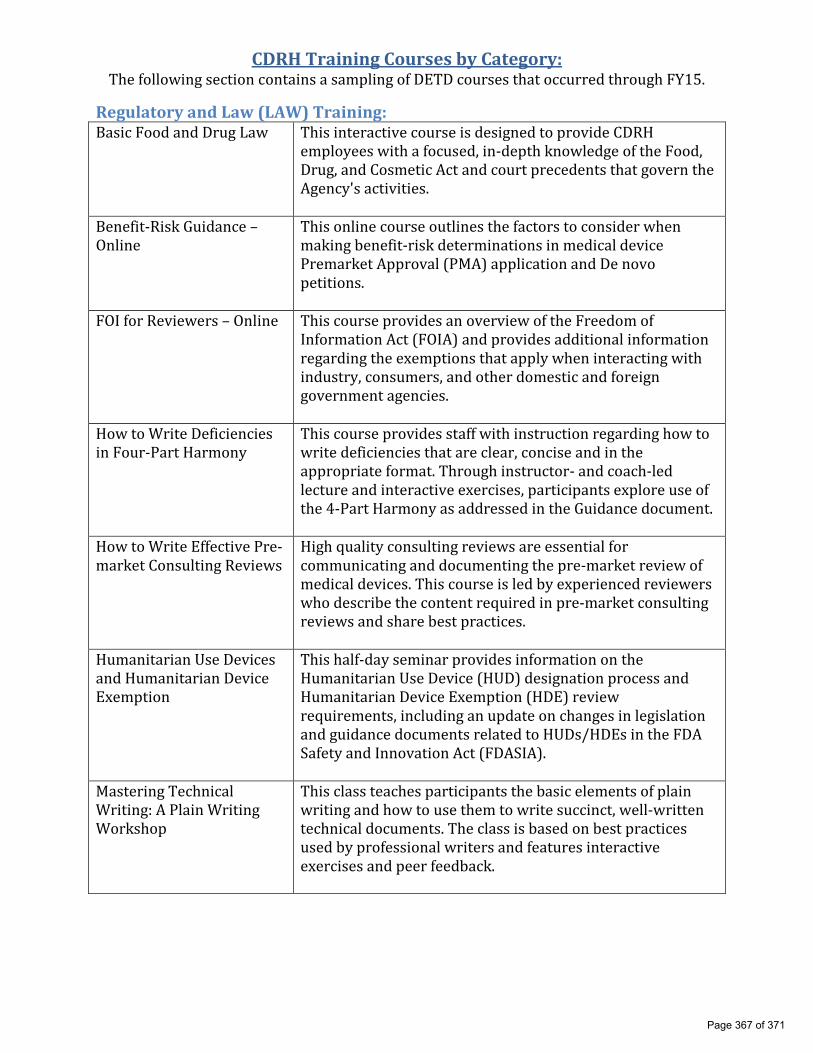
CDRH Training Courses by Category:The following section contains a sampling of DETD courses that occurred through FY15.
Regulatory and Law (LAW) Training:Basic Food and Drug Law This interactive course is designed to provide CDRH
employees with a focused, in-depth knowledge of the Food,Drug, and Cosmetic Act and court precedents that govern the Agency's activities.
Benefit-Risk Guidance – Online
This online course outlines the factors to consider when making benefit-risk determinations in medical device Premarket Approval (PMA) application and De novopetitions.
FOI for Reviewers – Online This course provides an overview of the Freedom ofInformation Act (FOIA) and provides additional information regarding the exemptions that apply when interacting withindustry, consumers, and other domestic and foreign government agencies.
How to Write Deficiencies This course provides staff with instruction regarding how toin Four-Part Harmony write deficiencies that are clear, concise and in the
appropriate format. Through instructor- and coach-led lecture and interactive exercises, participants explore use ofthe 4-Part Harmony as addressed in the Guidance document.
How to Write Effective Pre- High quality consulting reviews are essential formarket Consulting Reviews communicating and documenting the pre-market review of
medical devices. This course is led by experienced reviewerswho describe the content required in pre-market consultingreviews and share best practices.
Humanitarian Use Devices and Humanitarian Device Exemption
This half-day seminar provides information on the Humanitarian Use Device (HUD) designation process andHumanitarian Device Exemption (HDE) reviewrequirements, including an update on changes in legislation and guidance documents related to HUDs/HDEs in the FDA Safety and Innovation Act (FDASIA).
Mastering Technical This class teaches participants the basic elements of plain Writing: A Plain Writing writing and how to use them to write succinct, well-written Workshop technical documents. The class is based on best practices
used by professional writers and features interactive exercises and peer feedback.
Page 367 of 371
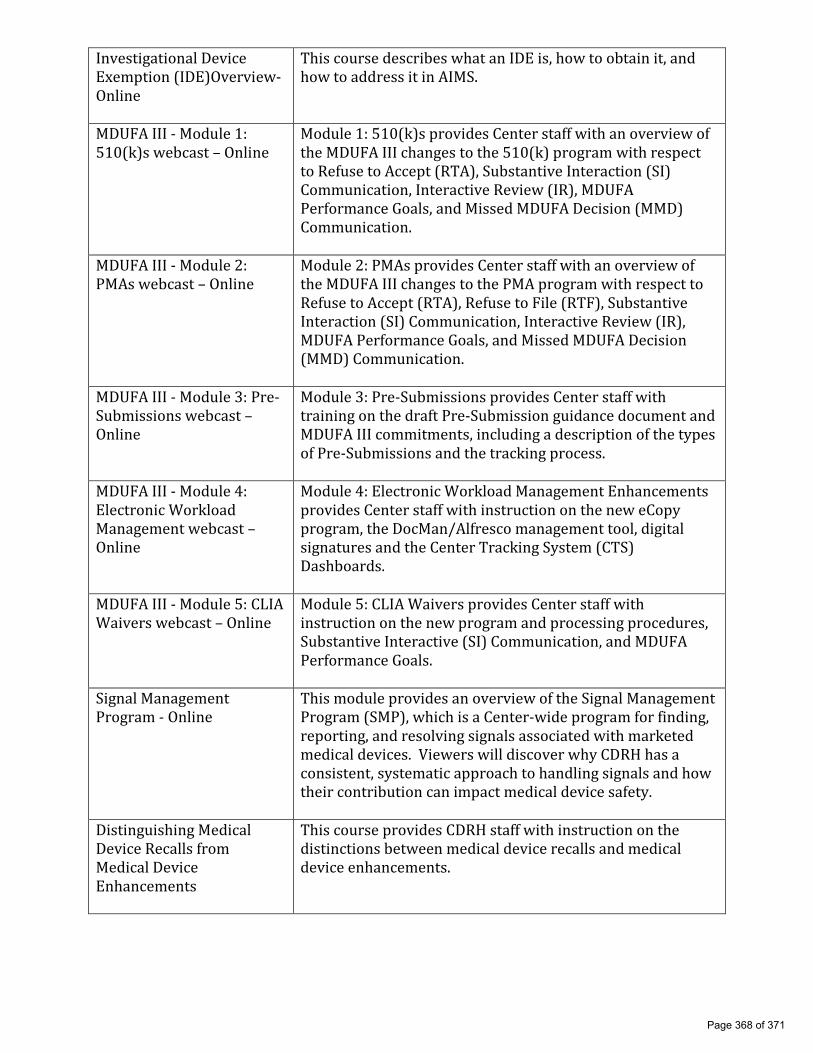
Investigational Device This course describes what an IDE is, how to obtain it, andExemption (IDE)Overview- how to address it in AIMS. Online
MDUFA III - Module 1: Module 1: 510(k)s provides Center staff with an overview of510(k)s webcast – Online the MDUFA III changes to the 510(k) program with respect
to Refuse to Accept (RTA), Substantive Interaction (SI)Communication, Interactive Review (IR), MDUFAPerformance Goals, and Missed MDUFA Decision (MMD)Communication.
MDUFA III - Module 2: Module 2: PMAs provides Center staff with an overview ofPMAs webcast – Online the MDUFA III changes to the PMA program with respect to
Refuse to Accept (RTA), Refuse to File (RTF), Substantive Interaction (SI) Communication, Interactive Review (IR),MDUFA Performance Goals, and Missed MDUFA Decision (MMD) Communication.
MDUFA III - Module 3: Pre- Module 3: Pre-Submissions provides Center staff withSubmissions webcast – training on the draft Pre-Submission guidance document andOnline MDUFA III commitments, including a description of the types
of Pre-Submissions and the tracking process.
MDUFA III - Module 4: Module 4: Electronic Workload Management EnhancementsElectronic Workload provides Center staff with instruction on the new eCopyManagement webcast – program, the DocMan/Alfresco management tool, digitalOnline signatures and the Center Tracking System (CTS)
Dashboards.
MDUFA III - Module 5: CLIA Module 5: CLIA Waivers provides Center staff withWaivers webcast – Online instruction on the new program and processing procedures,
Substantive Interactive (SI) Communication, and MDUFAPerformance Goals.
Signal Management This module provides an overview of the Signal Management Program - Online Program (SMP), which is a Center-wide program for finding,
reporting, and resolving signals associated with marketedmedical devices. Viewers will discover why CDRH has a consistent, systematic approach to handling signals and howtheir contribution can impact medical device safety.
Distinguishing Medical This course provides CDRH staff with instruction on the Device Recalls from distinctions between medical device recalls and medical Medical Device device enhancements. Enhancements
Page 368 of 371

Leadership Development Training for Managers and Non-Managers:Handling People with Employees will learn the critically important big-picture Diplomacy & Tact mentality of their work, a blueprint for mega productivity,
and a brand new sense of unity. Participants will also learn techniques to empower their team, and make each teammember responsible and accountable for their actions.
LEAD: CDRH Customer Customer service is one of CDRH’s 2014-2015 StrategicService Training Priorities. Providing excellent customer service improves our
interactions with stakeholders and colleagues and supportsbetter regulatory outcomes, which improves public health.As part of this strategic priority implementation, CDRH hasadopted Standards of Excellence.
LEAD: CDRH ManagerOrientation Program
To provide managers with detailed resources to accessprofessional development and HR information forthemselves as well as the employees they supervise.
LEAD: Crucial Conversations
This course teaches participants the skills and tools necessary for stepping up to and holding conversations that occur when stakes are high, opinions differ, and emotionsrun strong.
LEAD: The Successful Mentor
This workshop provides the participants with a learningexperience that will enable them to maximize the mentoringexperience.
LEAD: Time Management for Leaders
This training provides managers with the skills needed tomonitor where their time goes, set priorities, manage tasks,and distinguish urgent from important activities in order toachieve their goals.
Professional Development (PRO) Training: Briefing and PublicSpeaking Skills
This workshop will review a systematic approach to planning and delivering effective, focused presentations tosmall or large groups. It will cover techniques forestablishing objectives, remaining on target, and respondingto difficult questions or challenges.
Critical Thinking andProblem Solving
This one-day workshop develops critical thinking skills forpractical everyday use. Participants learn to assist workteams in understanding complex problems, methods forevaluating the possibilities of various decisions and increase their productivity and confidence for the constructive resolution of problems.
Page 369 of 371

Critical TOP Thinking This training provides an overview and tools for Thought Optimized Processing (TOP) Thinking. Participants willlearn how to get more accomplished in a better andpragmatic way while maintaining precision and accuracy.Instruction will also address the ability to think creativelyand critically and ensure that reasoning is objective.
Emotional Intelligence This training provides participants with a proven set of skills in four areas of competency: self-awareness, self-management, social awareness, and social adeptness.
Event-Driven Leadership This class supports organizational leadership in developingthe competencies to deal with ongoing changes and eventsthat impact the professional environment.
Influencing Other for HighImpact
This seminar focuses on the skills and strategies necessary to increase the likelihood that others will say "yes". Instruction includes the opportunity to translate theory into practice.
Sparking Creativity andInnovation
This class offers strategies and techniques to help the participant harness innovative thinking, find solutions to problems and enhance their own and others' ability to think more clearly and make better decisions.
Science (SCI) Training: Basics of Flow Cytometry Flow cytometry is used as a powerful technique in many
fields, including diagnosis of hematological malignancy,detection of minimal residual disease (MRD), determination of CD4/CD8 ratio in HIV, and nanotechnology.
Basics of Human Factors Engineering and DeviceDesign
Human factors engineering is a discipline that blends engineering design with human psychology, kinesiology, andbiomechanics. The goal is to apply knowledge of human cognition and physical limitations to the design of systems,such as tools, tasks, devices, software, work areas, etc.
CDRH Laboratory Waste This course gives an overview of the requirements for waste Management – online handling in CDRH laboratories, as well as a brief description
of Emergency Procedures for the laboratory. These requirements are in place to establish regulatory compliance with entities such as EPA, Maryland Department of the Environment (MDE), and Montgomery County.
Page 370 of 371

Regenerative Medicine The Regenerative Medicine Seminar Series offers a variety ofSeries thought-provoking seminars that examine restoration and
function of the human form within the context of translational research involving medical devices andbiologics.
Center-Specific IT (CIT) Training Center Ad Hoc ReportingSystems (CARS): Overview
This course provides the participants with a functional overview of the system, a survey of the TPLC universe, and examples of office-specific foundational reports.
Learning about SharePoint This training provides participants with a basic overview ofSharePoint, examples of how it is used in CDRH and how tofind additional resources. The relationship between SharePoint and Knowledge Management is also discussed.
Page 371 of 371

![Premarket Notification [510(k)] Submissions for Chemical](https://static.cupdf.com/doc/110x72/61fca0c29d50e757a521d4e5/premarket-notification-510k-submissions-for-chemical.jpg)