Citation: Yang, W.; Yu, Q.; Pei, C.; Liao, C.; Liu, J.; Zhang, J.; Zhang, Y.; Qiu, X.; Zhang, T.; Zhang, Y.; et al. Characteristics of Volatile Organic Compounds in the Pearl River Delta Region, China: Chemical Reactivity, Source, and Emission Regions. Atmosphere 2022, 13, 9. https:// doi.org/10.3390/atmos13010009 Academic Editor: Jianyin Xiong Received: 6 November 2021 Accepted: 18 December 2021 Published: 21 December 2021 Publisher’s Note: MDPI stays neutral with regard to jurisdictional claims in published maps and institutional affil- iations. Copyright: © 2021 by the authors. Licensee MDPI, Basel, Switzerland. This article is an open access article distributed under the terms and conditions of the Creative Commons Attribution (CC BY) license (https:// creativecommons.org/licenses/by/ 4.0/). atmosphere Article Characteristics of Volatile Organic Compounds in the Pearl River Delta Region, China: Chemical Reactivity, Source, and Emission Regions Weiqiang Yang 1 , Qingqing Yu 2 , Chenglei Pei 3,4,5,6, *, Chenghao Liao 1 , Jianjun Liu 1 , Jinpu Zhang 3,4,5,6 , Yanli Zhang 3,4,5 , Xiaonuan Qiu 6 , Tao Zhang 3,4,5,7 , Yongbo Zhang 1 and Xinming Wang 3,4,5 1 Guangdong Provincial Academy of Environmental Science, Guangzhou 510450, China; [email protected] (W.Y.); [email protected] (C.L.); [email protected] (J.L.); [email protected] (Y.Z.) 2 School of Chemical Engineering and Technology, Guangdong Industry Polytechnic, Guangzhou 510300, China; [email protected] 3 State Key Laboratory of Organic Geochemistry and Guangdong Key Laboratory of Environmental Protection and Resources Utilization, Guangzhou Institute of Geochemistry, Chinese Academy of Sciences, Guangzhou 510640, China; [email protected] (J.Z.); [email protected] (Y.Z.); [email protected] (T.Z.);[email protected] (X.W.) 4 CAS Center for Excellence in Deep Earth Science, Guangzhou 510640, China 5 University of Chinese Academy of Sciences, Beijing 100049, China 6 Guangzhou Sub-Branch of Guangdong Ecological and Environmental Monitoring Center, Guangzhou 510060, China; [email protected] 7 Ecological and Environmental Monitoring Center of Guangdong Province, Guangzhou 510308, China * Correspondence: [email protected] Abstract: Volatile organic compounds (VOCs) are important precursors of photochemical ozone and secondary organic aerosol (SOA). Here, hourly variations of ambient VOCs were monitored with an online system at an urban site (Panyu, PY) in the Pearl River Delta region during August–September of 2020 in order to identify reactive VOC species and major sources of VOCs, OH loss rate (L OH ), SOA formation potential (SOAFP), and corresponding emission source regions. The average concentration of VOCs at PY was 31.80 ± 20.82 ppbv during the campaign. The C 2 –C 5 alkanes, aromatics, and ≥C 6 alkanes contributed for the majority of VOC, alkenes and aromatics showed the highest contri- bution to L OH and SOAFP. Further, m/p-xylene, propene, and toluene were found to be the top three most reactive anthropogenic VOC species, with respective contributions of 11.6%, 6.1%, and 5.8% to total L OH . Toluene, m/p-xylene, and o-xylene constituted a large fraction of calculated SOAFP. Seven major sources were identified by using positive matrix factorization model. Vehicle exhaust made the most significant contribution to VOCs, followed by liquefied petroleum gas and combustion sources. However, industrial-related sources (including industrial solvent use and industrial process emission) had the largest contribution to L OH and SOAFP. By combining source contribution with wind direction and wind speed, the regions of different sources were further identified. Based on high-resolution observation data during ozone pollution, this study clearly exhibits key reactive VOC species and the major emission regions of different VOC sources, and thus benefits the accurate emission control of VOCs in the near future. Keywords: volatile organic compounds; chemical reactivity; secondary organic aerosol formation potential; source apportionment; emission region 1. Introduction Volatile organic compounds (VOCs) are important precursors of ozone and secondary organic aerosols (SOA) [1–6]. Ozone has long been known to cause adverse effects on human health [7–9] and has the potential to damage crops and vegetation [10–12]. It is also an important tropospheric greenhouse gas, with an estimated globally averaged Atmosphere 2022, 13, 9. https://doi.org/10.3390/atmos13010009 https://www.mdpi.com/journal/atmosphere

Welcome message from author
This document is posted to help you gain knowledge. Please leave a comment to let me know what you think about it! Share it to your friends and learn new things together.
Transcript
�����������������
Citation: Yang, W.; Yu, Q.; Pei, C.;
Liao, C.; Liu, J.; Zhang, J.; Zhang, Y.;
Qiu, X.; Zhang, T.; Zhang, Y.; et al.
Characteristics of Volatile Organic
Compounds in the Pearl River Delta
Region, China: Chemical Reactivity,
Source, and Emission Regions.
Atmosphere 2022, 13, 9. https://
doi.org/10.3390/atmos13010009
Academic Editor: Jianyin Xiong
Received: 6 November 2021
Accepted: 18 December 2021
Published: 21 December 2021
Publisher’s Note: MDPI stays neutral
with regard to jurisdictional claims in
published maps and institutional affil-
iations.
Copyright: © 2021 by the authors.
Licensee MDPI, Basel, Switzerland.
This article is an open access article
distributed under the terms and
conditions of the Creative Commons
Attribution (CC BY) license (https://
creativecommons.org/licenses/by/
4.0/).
atmosphere
Article
Characteristics of Volatile Organic Compounds in the PearlRiver Delta Region, China: Chemical Reactivity, Source, andEmission Regions
Weiqiang Yang 1, Qingqing Yu 2, Chenglei Pei 3,4,5,6,*, Chenghao Liao 1, Jianjun Liu 1, Jinpu Zhang 3,4,5,6,Yanli Zhang 3,4,5, Xiaonuan Qiu 6, Tao Zhang 3,4,5,7, Yongbo Zhang 1 and Xinming Wang 3,4,5
1 Guangdong Provincial Academy of Environmental Science, Guangzhou 510450, China;[email protected] (W.Y.); [email protected] (C.L.); [email protected] (J.L.);[email protected] (Y.Z.)
2 School of Chemical Engineering and Technology, Guangdong Industry Polytechnic,Guangzhou 510300, China; [email protected]
3 State Key Laboratory of Organic Geochemistry and Guangdong Key Laboratory of Environmental Protectionand Resources Utilization, Guangzhou Institute of Geochemistry, Chinese Academy of Sciences,Guangzhou 510640, China; [email protected] (J.Z.); [email protected] (Y.Z.);[email protected] (T.Z.); [email protected] (X.W.)
4 CAS Center for Excellence in Deep Earth Science, Guangzhou 510640, China5 University of Chinese Academy of Sciences, Beijing 100049, China6 Guangzhou Sub-Branch of Guangdong Ecological and Environmental Monitoring Center,
Guangzhou 510060, China; [email protected] Ecological and Environmental Monitoring Center of Guangdong Province, Guangzhou 510308, China* Correspondence: [email protected]
Abstract: Volatile organic compounds (VOCs) are important precursors of photochemical ozone andsecondary organic aerosol (SOA). Here, hourly variations of ambient VOCs were monitored with anonline system at an urban site (Panyu, PY) in the Pearl River Delta region during August–Septemberof 2020 in order to identify reactive VOC species and major sources of VOCs, OH loss rate (LOH), SOAformation potential (SOAFP), and corresponding emission source regions. The average concentrationof VOCs at PY was 31.80 ± 20.82 ppbv during the campaign. The C2–C5 alkanes, aromatics, and≥C6 alkanes contributed for the majority of VOC, alkenes and aromatics showed the highest contri-bution to LOH and SOAFP. Further, m/p-xylene, propene, and toluene were found to be the top threemost reactive anthropogenic VOC species, with respective contributions of 11.6%, 6.1%, and 5.8% tototal LOH. Toluene, m/p-xylene, and o-xylene constituted a large fraction of calculated SOAFP. Sevenmajor sources were identified by using positive matrix factorization model. Vehicle exhaust madethe most significant contribution to VOCs, followed by liquefied petroleum gas and combustionsources. However, industrial-related sources (including industrial solvent use and industrial processemission) had the largest contribution to LOH and SOAFP. By combining source contribution withwind direction and wind speed, the regions of different sources were further identified. Based onhigh-resolution observation data during ozone pollution, this study clearly exhibits key reactiveVOC species and the major emission regions of different VOC sources, and thus benefits the accurateemission control of VOCs in the near future.
Keywords: volatile organic compounds; chemical reactivity; secondary organic aerosol formationpotential; source apportionment; emission region
1. Introduction
Volatile organic compounds (VOCs) are important precursors of ozone and secondaryorganic aerosols (SOA) [1–6]. Ozone has long been known to cause adverse effects onhuman health [7–9] and has the potential to damage crops and vegetation [10–12]. Itis also an important tropospheric greenhouse gas, with an estimated globally averaged
Atmosphere 2022, 13, 9. https://doi.org/10.3390/atmos13010009 https://www.mdpi.com/journal/atmosphere
Atmosphere 2022, 13, 9 2 of 18
radiative forcing of 0.40 ± 0.20 W m−2, and directly contributes to global warming [13].SOA is the main component of particulate matter with an aerodynamic diameter lessthan 2.5 µm (PM2.5) [14,15], and contributes up to 20–35% of PM2.5 during extreme hazeevent in megacities [16–18]. High mass concentration of PM2.5 and its impacts on publichealth and visibility have become the most pressing air quality problem in China in recentyears [19,20]. Thus, as the important precursors of ozone and SOA, VOCs play an importantrole in photochemical smog, particulate pollution, and human health impacts.
China has experienced rapid economization and industrialization in recent decades,accompanied by a serious air quality issues. Since 2013, significant efforts have beendevoted to the battle against air pollution, in particular following the implementationof the Action Plan on the Prevention and Control of Air Pollution [21]. Although theemission of air pollutants, including sulfur dioxide (SO2) and nitrogen oxides (NOx), hasdecreased year by year [22,23], the emission of VOCs has increased [22,24], which leadsto ozone concentration levels frequently exceeding the Chinese national ozone air qualitystandard [25–29]. The maximum daily 8 h average concentrations of ozone increasedfrom approximately 69.5 ppbv in 2013 to 75.0 ppbv in 2015 in 74 Chinese cities, and thepercentage of non-compliant cities increased from 22% to 38%, respectively [30]. The sameis true for the Pearl River Delta (PRD) region, the largest urban agglomeration in southernChina. In 2020, the number of days that ozone ranked as the primary pollutant accountedfor 66.8% of the total non-attainment days in the PRD region, and ozone pollution hasbeen considered a long-term challenge for the PRD region [31]. Ozone formation presentsa complex non-linear relationship with precursors including VOCs and NOx [1,5], andnumerous studies with different approaches show that ozone formation in the PRD regionis predominantly VOC-limited [32–35]. In-depth study of VOCs is essential in order toreduce the concentrations of ozone in the PRD region.
As key precursors of ozone, VOCs are composed of hundreds of species, and they aredirectly emitted into the atmosphere from a variety of anthropogenic sources [36,37]. Thecontribution of different VOCs to ozone formation potential varies significantly based onchanges in their OH radical reaction rates [38]. Moreover, some VOCs (such as aromaticsand alkanes) are important precursors of SOA [4,39], which is the main component ofPM2.5. Consequently, identification of the key precursors of ozone and SOA as well as themajor sources of these precursors is critical for the prevention and control of ozone andPM2.5 pollution. To date, tremendous research efforts have been devoted to investigatingambient VOCs in the PRD region, and the main sources and spatio-temporal distributionof VOCs have been obtained [40–44]. However, most of these observations were based onoff-line monitoring with canister sampling [45,46], and few studies have focused on VOCsduring long-term ozone pollution. Moreover, the sources of VOCs have changed greatlydue to pollutant emission control in the past ten years [20,22]. Consequently, the latestobservation-based online monitoring of VOCs with high resolution, in particular duringheavy ozone pollution, can provide better understanding of the key VOC species and theirmajor emission sources, which is essential for PM2.5 and O3 pollution control.
In this study, ambient VOCs were monitored with an online monitoring system duringlong-term ozone pollution at an urban site in the PRD region in order to determine themixing ratio levels of VOCs, and the OH loss rate (LOH) and SOA formation potential(SOAFP) methods were used to calculate the reactivity of VOCs. Furthermore, positivematrix factorization (PMF) was used to identify the major sources of VOCs, and the LOHand SOAFP source apportionment results were further combined with wind speed andwind direction to explore the emission regions of different sources.
2. Materials and Methods2.1. Field Sampling
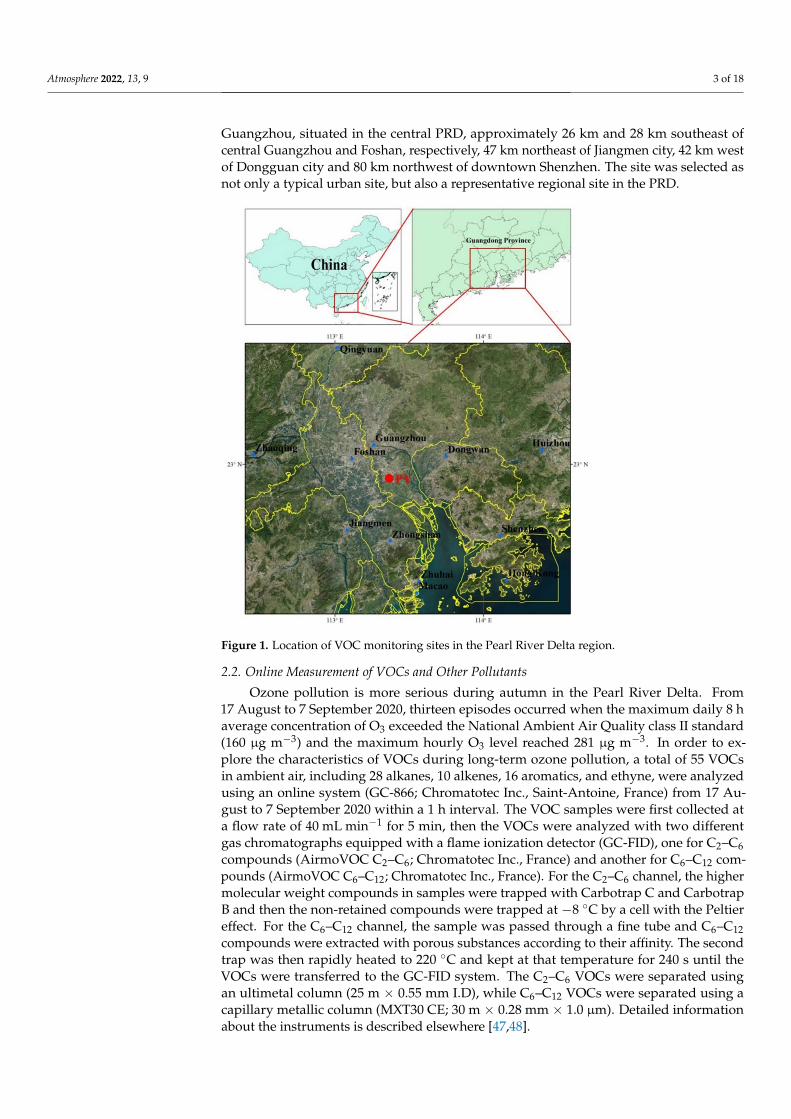
The ambient VOC samples were taken at an urban site in Guangzhou located on theroof of the six-story building of Panyu (PY) middle school (Figure 1; 113.366◦ E, 22.913◦ N).The sampling site location was in the mixed residential and commercial area of PY district,
Atmosphere 2022, 13, 9 3 of 18
Guangzhou, situated in the central PRD, approximately 26 km and 28 km southeast ofcentral Guangzhou and Foshan, respectively, 47 km northeast of Jiangmen city, 42 km westof Dongguan city and 80 km northwest of downtown Shenzhen. The site was selected asnot only a typical urban site, but also a representative regional site in the PRD.
Figure 1. Location of VOC monitoring sites in the Pearl River Delta region.
2.2. Online Measurement of VOCs and Other Pollutants
Ozone pollution is more serious during autumn in the Pearl River Delta. From17 August to 7 September 2020, thirteen episodes occurred when the maximum daily 8 haverage concentration of O3 exceeded the National Ambient Air Quality class II standard(160 µg m−3) and the maximum hourly O3 level reached 281 µg m−3. In order to ex-plore the characteristics of VOCs during long-term ozone pollution, a total of 55 VOCsin ambient air, including 28 alkanes, 10 alkenes, 16 aromatics, and ethyne, were analyzedusing an online system (GC-866; Chromatotec Inc., Saint-Antoine, France) from 17 Au-gust to 7 September 2020 within a 1 h interval. The VOC samples were first collected ata flow rate of 40 mL min−1 for 5 min, then the VOCs were analyzed with two differentgas chromatographs equipped with a flame ionization detector (GC-FID), one for C2–C6compounds (AirmoVOC C2–C6; Chromatotec Inc., France) and another for C6–C12 com-pounds (AirmoVOC C6–C12; Chromatotec Inc., France). For the C2–C6 channel, the highermolecular weight compounds in samples were trapped with Carbotrap C and CarbotrapB and then the non-retained compounds were trapped at −8 ◦C by a cell with the Peltiereffect. For the C6–C12 channel, the sample was passed through a fine tube and C6–C12compounds were extracted with porous substances according to their affinity. The secondtrap was then rapidly heated to 220 ◦C and kept at that temperature for 240 s until theVOCs were transferred to the GC-FID system. The C2–C6 VOCs were separated usingan ultimetal column (25 m × 0.55 mm I.D), while C6–C12 VOCs were separated using acapillary metallic column (MXT30 CE; 30 m × 0.28 mm × 1.0 µm). Detailed informationabout the instruments is described elsewhere [47,48].
Atmosphere 2022, 13, 9 4 of 18
Other air pollutants including SO2, NO2, CO, and O3 were measured by 43i pulsedfluorescence, 42i chemiluminescence, 48i infrared radiation and the 49i UV photometricmethod using Thermo Environmental Instruments (Thermo Fisher Scientific, Boston, MA,USA) during a campaign with a 1 h interval, respectively. The hourly concentrations ofPM2.5 were measured by the β-absorption method using a BAM 1020 instrument (Met OneInstrument, Grants Pass, OR, USA).
2.3. Quality Control and Quality Assurance
Stringent quality control and quality assurance measures were taken for the onlinesystem during the campaign. The calibration standards were generated by dynamicallydiluting the Photochemical Assessment Monitoring Station (PAMS, Spectra Gases Inc.,Kearny, NJ, USA) gas mixture. Then, the calibration curves were generated by analyzingabove standards the same way as the filed samples and verified every two weeks. Theresponses of the GC-866 system were auto-calibrated every day with a 5 ppbv mixedstandard in order to ensure that responses were lower than ±10% of the calibration curve.The method detection limits (MDLs) for VOC species ranged from 0.01 to 0.56 ppbv.
2.4. Data Analysis2.4.1. The OH Loss Rate of VOCs
The LOH of VOCs represents the chemical reactivity of each VOC species, and iscalculated by multiplying the mixing ratio level of VOCs by its OH radical rate constant, asshown in Equation (1):
LOHi = [VOC]i × KOHi (1)
where LOHi represents the loss rates of i VOC species that react with OH radical, VOCirepresents the concentration levels of i VOC species, and KOH
i represents the rate constantfor the reaction of the i VOC species with OH radical; the KOH
i for 56 VOCs species wereobtained from the results of Carter [49].
2.4.2. Secondary Organic Aerosol Formation Potential (SOAFP)
Some VOC species are important precursors of SOA, and the SOAFPs from VOCspecies were estimated in the present study as shown in Equation (2):
SOAFPi = VOCi/(1 − FVOCri
)× FACi (2)
where SOAFPi represents the SOA formed from i VOC species, VOCi represents the con-centration levels of i VOC species in ambient air, FVOCri represents the fraction of reacted iVOC species, and FACi denotes the fractional aerosol coefficient for i VOC species [50–52].
2.4.3. Positive Matrix Factorization
PMF is a multivariate factor analysis tool that decomposes a matrix of sample datainto two matrices, factor contributions (g) and factor profiles (f). The method is reviewedbriefly here and described in greater detail elsewhere [53,54]. VOC sources were resolvedaccording to the data matrix, X, which decomposes observed VOCs to g (factor contribu-tions) and f (factor profiles) as represented in Equation (3). The PMF solution minimizesthe objective function based on uncertainties, as shown in Equation (4).
Xij =p
∑k=1
gik fkj+eij (3)
Q =n
∑i=1
m
∑j=1
[xij − ∑
pk=1 gik fkj
uij
]2
(4)
The input files of PMF included the concentration of VOCs and user-provided uncer-tainty associated with the observed VOCs. Data values below the MDL were substituted
Atmosphere 2022, 13, 9 5 of 18
with MDL/2; missing data values were substituted with median concentrations. If theconcentration was less than or equal to the MDL provided, the uncertainty was calculatedusing the equation Unc = 5/6 MDL; if the concentration was greater than the MDL provided,the uncertainty was calculated as Unc = [(Error faction × mixing ratio)2 + (MDL)2]1/2. Thenumber of factors in PMF was selected based on Q/Qexp, as shown in Section 3.5 [55].
3. Results3.1. Characteristics of O3 and Ambient VOCs
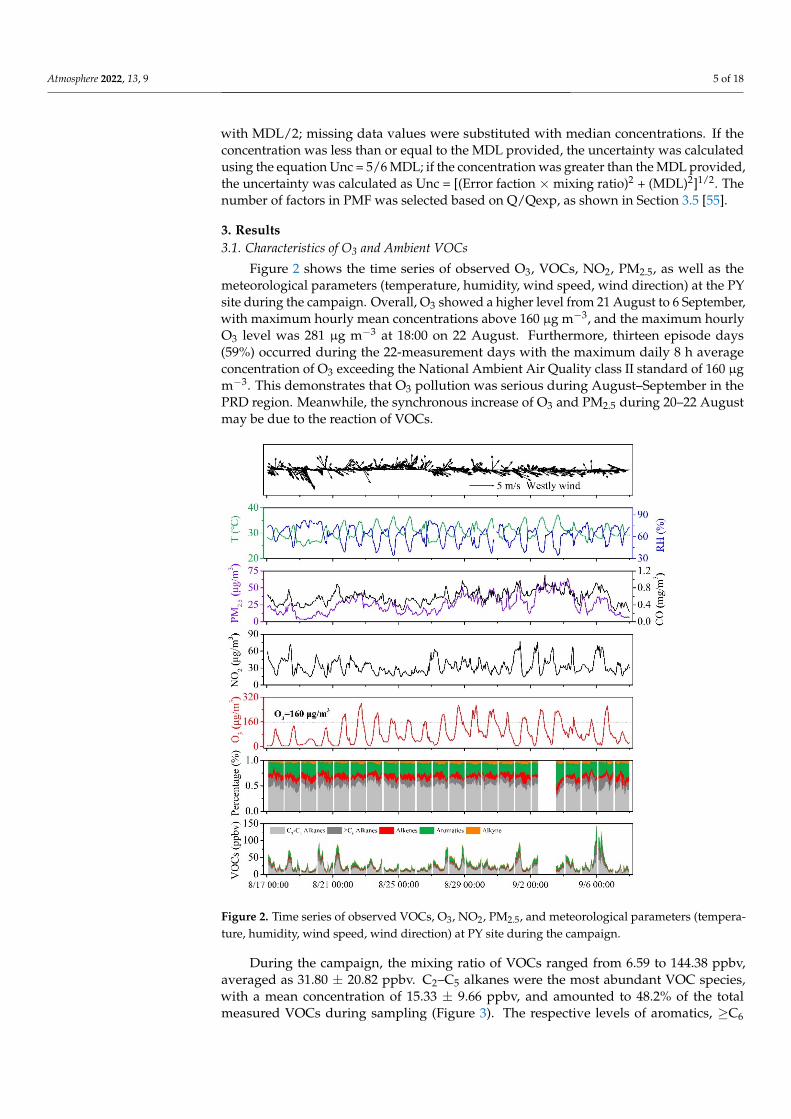
Figure 2 shows the time series of observed O3, VOCs, NO2, PM2.5, as well as themeteorological parameters (temperature, humidity, wind speed, wind direction) at the PYsite during the campaign. Overall, O3 showed a higher level from 21 August to 6 September,with maximum hourly mean concentrations above 160 µg m−3, and the maximum hourlyO3 level was 281 µg m−3 at 18:00 on 22 August. Furthermore, thirteen episode days(59%) occurred during the 22-measurement days with the maximum daily 8 h averageconcentration of O3 exceeding the National Ambient Air Quality class II standard of 160 µgm−3. This demonstrates that O3 pollution was serious during August–September in thePRD region. Meanwhile, the synchronous increase of O3 and PM2.5 during 20–22 Augustmay be due to the reaction of VOCs.
Figure 2. Time series of observed VOCs, O3, NO2, PM2.5, and meteorological parameters (tempera-ture, humidity, wind speed, wind direction) at PY site during the campaign.
During the campaign, the mixing ratio of VOCs ranged from 6.59 to 144.38 ppbv,averaged as 31.80 ± 20.82 ppbv. C2–C5 alkanes were the most abundant VOC species,with a mean concentration of 15.33 ± 9.66 ppbv, and amounted to 48.2% of the totalmeasured VOCs during sampling (Figure 3). The respective levels of aromatics, ≥C6
Atmosphere 2022, 13, 9 6 of 18
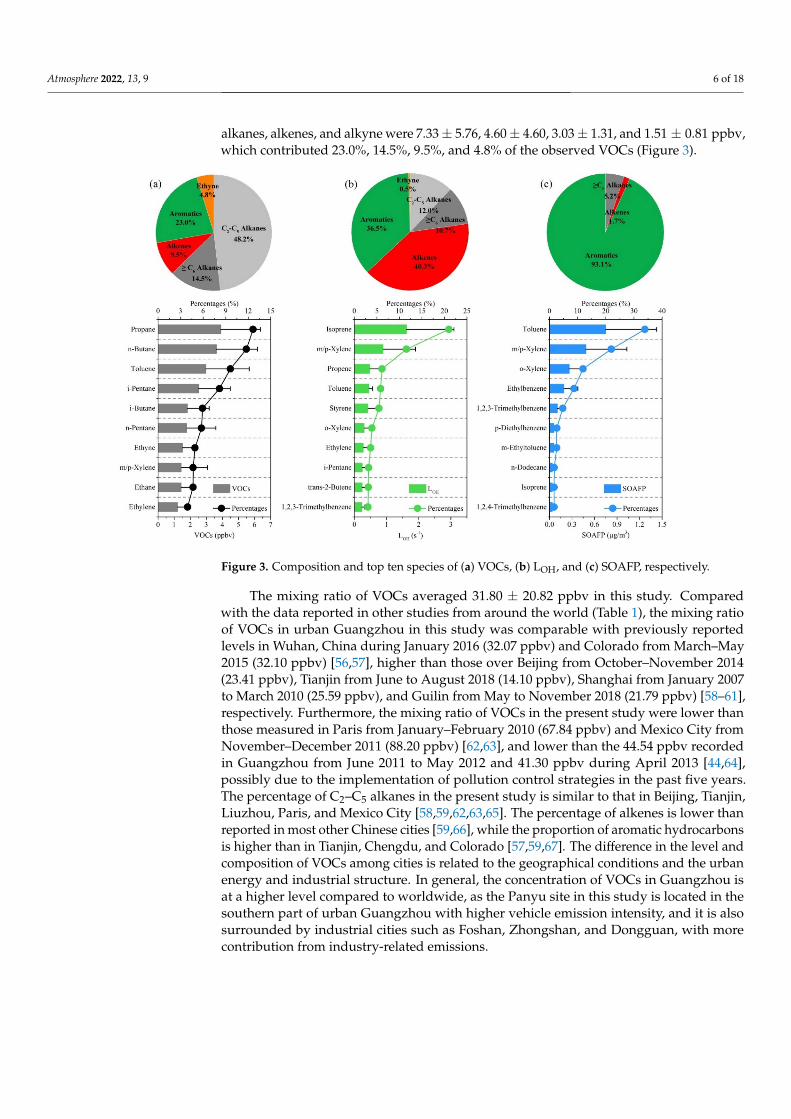
alkanes, alkenes, and alkyne were 7.33 ± 5.76, 4.60 ± 4.60, 3.03 ± 1.31, and 1.51 ± 0.81 ppbv,which contributed 23.0%, 14.5%, 9.5%, and 4.8% of the observed VOCs (Figure 3).
Figure 3. Composition and top ten species of (a) VOCs, (b) LOH, and (c) SOAFP, respectively.
The mixing ratio of VOCs averaged 31.80 ± 20.82 ppbv in this study. Comparedwith the data reported in other studies from around the world (Table 1), the mixing ratioof VOCs in urban Guangzhou in this study was comparable with previously reportedlevels in Wuhan, China during January 2016 (32.07 ppbv) and Colorado from March–May2015 (32.10 ppbv) [56,57], higher than those over Beijing from October–November 2014(23.41 ppbv), Tianjin from June to August 2018 (14.10 ppbv), Shanghai from January 2007to March 2010 (25.59 ppbv), and Guilin from May to November 2018 (21.79 ppbv) [58–61],respectively. Furthermore, the mixing ratio of VOCs in the present study were lower thanthose measured in Paris from January–February 2010 (67.84 ppbv) and Mexico City fromNovember–December 2011 (88.20 ppbv) [62,63], and lower than the 44.54 ppbv recordedin Guangzhou from June 2011 to May 2012 and 41.30 ppbv during April 2013 [44,64],possibly due to the implementation of pollution control strategies in the past five years.The percentage of C2–C5 alkanes in the present study is similar to that in Beijing, Tianjin,Liuzhou, Paris, and Mexico City [58,59,62,63,65]. The percentage of alkenes is lower thanreported in most other Chinese cities [59,66], while the proportion of aromatic hydrocarbonsis higher than in Tianjin, Chengdu, and Colorado [57,59,67]. The difference in the level andcomposition of VOCs among cities is related to the geographical conditions and the urbanenergy and industrial structure. In general, the concentration of VOCs in Guangzhou isat a higher level compared to worldwide, as the Panyu site in this study is located in thesouthern part of urban Guangzhou with higher vehicle emission intensity, and it is alsosurrounded by industrial cities such as Foshan, Zhongshan, and Dongguan, with morecontribution from industry-related emissions.
Atmosphere 2022, 13, 9 7 of 18
Table 1. Mixing ratio and composition of VOCs in Guangzhou and comparison of results with thoseof other studies.
Cities PeriodsVOCs(ppbv)
Percentages (%)ReferencesC2–C5
Alkanes≥C6
Alkanes Alkenes Aromatics Alkyne
Beijing October–November 2014 23.41 45.5% 8.5% 12.0% 21.0% 13.0% [58]Tianjin June–August 2018 14.10 49.6% 0.0% 31.2% 10.6% 8.5% [59]
Shanghai January 2007–March 2010 25.59 35.1% 19.4% 7.6% 38.0% 0.0% [60]Wuhan January 2016 32.07 58.7% - 18.4% 15.2% 7.6% [56]
Liuzhou March 2019 22.83 49.3% 6.0% 19.4% 11.2% 14.1% [65]
Chengdu October 2016–September2017 41.70 56.6% - 19.7% 17.3% 6.5% [67]
Guilin May–November 2018 21.79 18.2% 2.6% 4.4% 71.4% 3.4% [61]Jiangmen July–August 2016 8.47 34.6% 8.3% 17.1% 35.1% 5.0% [66]
Guangzhou June 2011–May 2012 44.54 38.1% 20.7% 16.5% 24.8% 0.0% [64]Guangzhou April 2013 41.30 38.1% 22.4% 9.4% 24.0% 6.1% [44]Paris, French January–February 2010 67.84 49.4% 2.6% 5.4% 41.6% 1.1% [62]Mexico City,
MexicoNovember–December
2011 88.20 46.7% 12.0% 10.3% 25.4% 5.6% [63]
Colorado,USA March–May 2015 32.10 93.8% 3.7% 0.2% 1.7% 0.6% [57]
Colorado,USA July–September 2015 46.49 94.0% 3.1% 1.2% 1.3% 0.4% [57]
Guangzhou August–September 2020 31.80 48.2% 14.5% 9.5% 23.1% 4.7%
Propane, n-butane, and toluene were the three highest VOC species, with mixingratios of 3.90 ± 2.46 ppbv, 3.62 ± 2.57 ppbv, and 2.97 ± 2.70 ppbv, respectively. Othertop ten VOC species included i-pentane (2.52 ± 1.96 ppbv), i-butane (1.82 ± 1.35 ppbv),n-pentane (1.78 ± 1.81 ppbv), ethyne (1.51 ± 0.81 ppbv), m/p-xylene (1.44 ± 1.63 ppbv),ethane (1.43 ± 0.73 ppbv), and ethylene (1.21 ± 0.65 ppbv), and the sum of the top tenVOCs contributed 68.9% of the total VOCs. Among the above-mentioned VOCs, propane,i-butane, and n-butanes are the three most prominent species from liquefied petroleumgas (LPG) emission [68], toluene and m/p-xylene are mainly from industrial solvents andvehicle exhaust [37], i-pentane and n-pentane are typical tracers of oil evaporation [69], andethyne, ethane, and ethylene are mainly obtained from the emissions of various combustionsources [70]. Consequently, VOCs in Guangzhou are closely related to the use of LPG andindustrial solvents, vehicle exhaust, oil evaporation, and combustion sources.
3.2. Diurnal Variations in VOCs
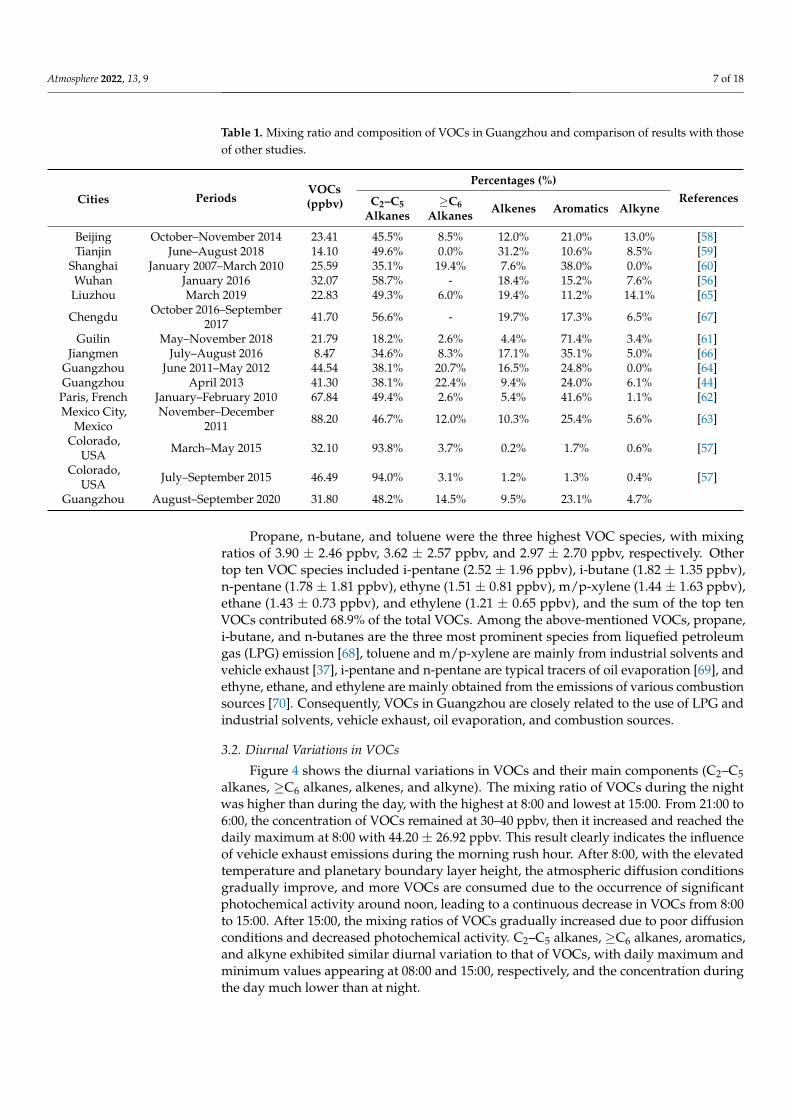
Figure 4 shows the diurnal variations in VOCs and their main components (C2–C5alkanes, ≥C6 alkanes, alkenes, and alkyne). The mixing ratio of VOCs during the nightwas higher than during the day, with the highest at 8:00 and lowest at 15:00. From 21:00 to6:00, the concentration of VOCs remained at 30–40 ppbv, then it increased and reached thedaily maximum at 8:00 with 44.20 ± 26.92 ppbv. This result clearly indicates the influenceof vehicle exhaust emissions during the morning rush hour. After 8:00, with the elevatedtemperature and planetary boundary layer height, the atmospheric diffusion conditionsgradually improve, and more VOCs are consumed due to the occurrence of significantphotochemical activity around noon, leading to a continuous decrease in VOCs from 8:00to 15:00. After 15:00, the mixing ratios of VOCs gradually increased due to poor diffusionconditions and decreased photochemical activity. C2–C5 alkanes, ≥C6 alkanes, aromatics,and alkyne exhibited similar diurnal variation to that of VOCs, with daily maximum andminimum values appearing at 08:00 and 15:00, respectively, and the concentration duringthe day much lower than at night.
Atmosphere 2022, 13, 9 8 of 18
Figure 4. Diurnal variations of VOCs and the main components.
Alkenes exhibited different diurnal patterns compared with VOCs. Owing to theinfluence of vehicle exhaust emissions during the morning rush hour, the mixing ratioof alkenes increased rapidly from 2.31 ± 1.32 ppbv at 06:00 to 3.84 ± 2.39 ppbv at 09:00,then gradually decreased to 2.53 ± 0.80 ppbv. Except for the period from 6:00 to 12:00, themixing ratio of alkenes was maintained at 2.00–2.40 ppbv. The photochemical reactivityof alkenes is faster than those of alkanes and aromatics [38]; however, the concentrationof alkenes did not decrease around noon, which indicates that there may be more alkeneemissions during the day in Guangzhou or nearby regions.
3.3. LOH and SOAFP
VOCs are composed of a variety of species, and their atmospheric reactivity variessignificantly. The reactivity of VOCs refers to the ability of VOCs to participate in atmo-spheric chemical reactions, and the reaction of VOCs with OH radical is the key factoraffecting ozone formation in polluted atmosphere [38,71]. Therefore, in this study, the LOHwas calculated, and the reactivity of VOC species was identified. Some VOC species arealso important precursors of SOA; thus, the SOAFP was calculated and the important VOCspecies capable of forming SOA were identified.
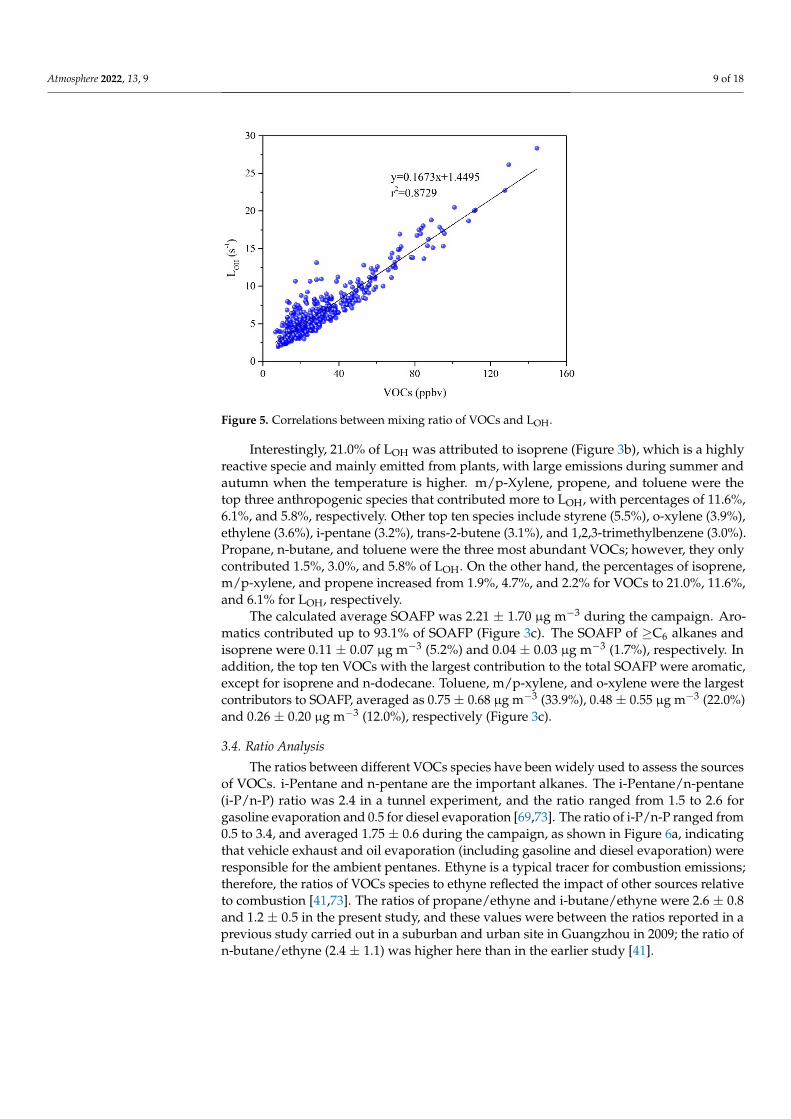
Figure 5 exhibits the correlation between VOCs and LOH. During the campaign,VOCs were significantly correlated with LOH (r2 = 0.87), and LOH increased with in-creased VOC mixing ratio. The LOH/VOC ratio was 0.1673, as shown in Figure 5; fur-thermore, the average OH radical reaction rate constant of VOCs was calculated to be6.25 × 10−12 cm3 molecule−1 s−1, which was higher than that of toluene (5.63 × 10⁻¹² cm3
molecule−1 s−1) [38]. This result indicates that the reactivity of the atmosphere was rela-tively strong during autumn in Guangzhou; however, it was lower than that of Shanghaiduring summer (8.11 × 10⁻¹² cm3 molecule−1 s−1) [72].
LOH ranged from 1.96 to 28.34 s−1 during the campaign, with an average LOH of7.71 ± 3.73 s−1. Alkenes contributed 40.3% of LOH, followed by aromatics (36.5%), C2–C5alkanes (12.0%), and ≥C6 alkanes (10.7%) (Figure 3b). Compared with the composition ofVOCs, the percentages of alkenes and aromatics increased from 9.5% and 23.0% for VOCsto 40.3% and 36.5% for LOH, respectively. However, the percentages of C2–C5 alkanesand ≥C6 alkanes decreased, from 48.2% and 14.5% for VOCs to 12.0% and 10.7% forLOH, indicating that alkenes and aromatics contributed more to ozone formation; therefore,priority control of reactive alkenes and aromatics is key to ozone pollution control. However,it is noteworthy that 22.7% of total LOH was attributed to alkanes; even though the reactivitywas relatively low, emission control of alkanes cannot be ignored.
Atmosphere 2022, 13, 9 9 of 18
Figure 5. Correlations between mixing ratio of VOCs and LOH.
Interestingly, 21.0% of LOH was attributed to isoprene (Figure 3b), which is a highlyreactive specie and mainly emitted from plants, with large emissions during summer andautumn when the temperature is higher. m/p-Xylene, propene, and toluene were thetop three anthropogenic species that contributed more to LOH, with percentages of 11.6%,6.1%, and 5.8%, respectively. Other top ten species include styrene (5.5%), o-xylene (3.9%),ethylene (3.6%), i-pentane (3.2%), trans-2-butene (3.1%), and 1,2,3-trimethylbenzene (3.0%).Propane, n-butane, and toluene were the three most abundant VOCs; however, they onlycontributed 1.5%, 3.0%, and 5.8% of LOH. On the other hand, the percentages of isoprene,m/p-xylene, and propene increased from 1.9%, 4.7%, and 2.2% for VOCs to 21.0%, 11.6%,and 6.1% for LOH, respectively.
The calculated average SOAFP was 2.21 ± 1.70 µg m−3 during the campaign. Aro-matics contributed up to 93.1% of SOAFP (Figure 3c). The SOAFP of ≥C6 alkanes andisoprene were 0.11 ± 0.07 µg m−3 (5.2%) and 0.04 ± 0.03 µg m−3 (1.7%), respectively. Inaddition, the top ten VOCs with the largest contribution to the total SOAFP were aromatic,except for isoprene and n-dodecane. Toluene, m/p-xylene, and o-xylene were the largestcontributors to SOAFP, averaged as 0.75 ± 0.68 µg m−3 (33.9%), 0.48 ± 0.55 µg m−3 (22.0%)and 0.26 ± 0.20 µg m−3 (12.0%), respectively (Figure 3c).
3.4. Ratio Analysis
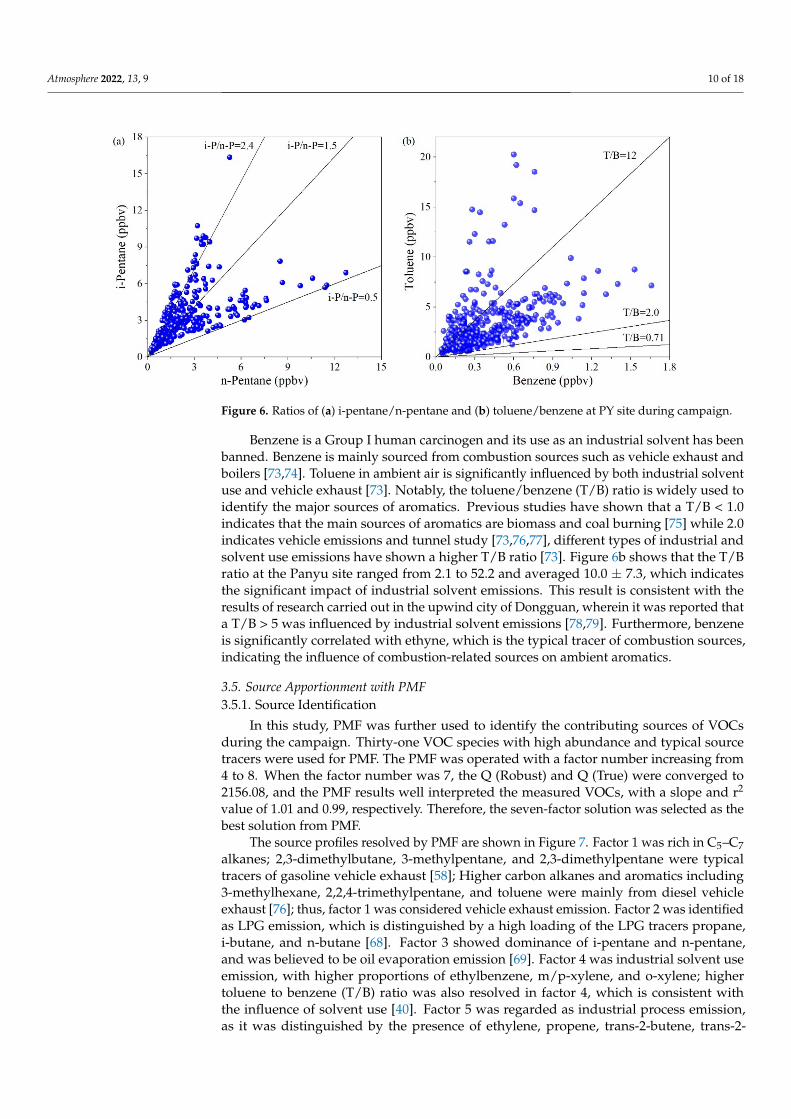
The ratios between different VOCs species have been widely used to assess the sourcesof VOCs. i-Pentane and n-pentane are the important alkanes. The i-Pentane/n-pentane(i-P/n-P) ratio was 2.4 in a tunnel experiment, and the ratio ranged from 1.5 to 2.6 forgasoline evaporation and 0.5 for diesel evaporation [69,73]. The ratio of i-P/n-P ranged from0.5 to 3.4, and averaged 1.75 ± 0.6 during the campaign, as shown in Figure 6a, indicatingthat vehicle exhaust and oil evaporation (including gasoline and diesel evaporation) wereresponsible for the ambient pentanes. Ethyne is a typical tracer for combustion emissions;therefore, the ratios of VOCs species to ethyne reflected the impact of other sources relativeto combustion [41,73]. The ratios of propane/ethyne and i-butane/ethyne were 2.6 ± 0.8and 1.2 ± 0.5 in the present study, and these values were between the ratios reported in aprevious study carried out in a suburban and urban site in Guangzhou in 2009; the ratio ofn-butane/ethyne (2.4 ± 1.1) was higher here than in the earlier study [41].
Atmosphere 2022, 13, 9 10 of 18
Figure 6. Ratios of (a) i-pentane/n-pentane and (b) toluene/benzene at PY site during campaign.
Benzene is a Group I human carcinogen and its use as an industrial solvent has beenbanned. Benzene is mainly sourced from combustion sources such as vehicle exhaust andboilers [73,74]. Toluene in ambient air is significantly influenced by both industrial solventuse and vehicle exhaust [73]. Notably, the toluene/benzene (T/B) ratio is widely used toidentify the major sources of aromatics. Previous studies have shown that a T/B < 1.0indicates that the main sources of aromatics are biomass and coal burning [75] while 2.0indicates vehicle emissions and tunnel study [73,76,77], different types of industrial andsolvent use emissions have shown a higher T/B ratio [73]. Figure 6b shows that the T/Bratio at the Panyu site ranged from 2.1 to 52.2 and averaged 10.0 ± 7.3, which indicatesthe significant impact of industrial solvent emissions. This result is consistent with theresults of research carried out in the upwind city of Dongguan, wherein it was reported thata T/B > 5 was influenced by industrial solvent emissions [78,79]. Furthermore, benzeneis significantly correlated with ethyne, which is the typical tracer of combustion sources,indicating the influence of combustion-related sources on ambient aromatics.
3.5. Source Apportionment with PMF3.5.1. Source Identification
In this study, PMF was further used to identify the contributing sources of VOCsduring the campaign. Thirty-one VOC species with high abundance and typical sourcetracers were used for PMF. The PMF was operated with a factor number increasing from4 to 8. When the factor number was 7, the Q (Robust) and Q (True) were converged to2156.08, and the PMF results well interpreted the measured VOCs, with a slope and r2
value of 1.01 and 0.99, respectively. Therefore, the seven-factor solution was selected as thebest solution from PMF.
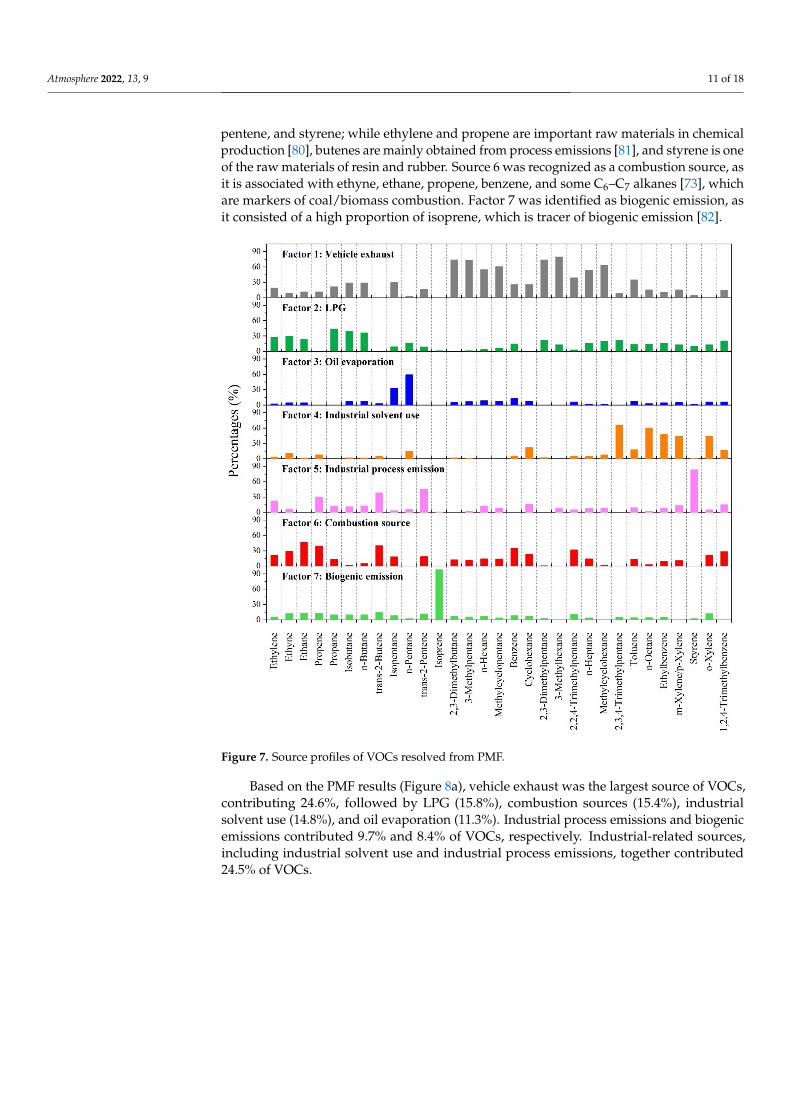
The source profiles resolved by PMF are shown in Figure 7. Factor 1 was rich in C5–C7alkanes; 2,3-dimethylbutane, 3-methylpentane, and 2,3-dimethylpentane were typicaltracers of gasoline vehicle exhaust [58]; Higher carbon alkanes and aromatics including3-methylhexane, 2,2,4-trimethylpentane, and toluene were mainly from diesel vehicleexhaust [76]; thus, factor 1 was considered vehicle exhaust emission. Factor 2 was identifiedas LPG emission, which is distinguished by a high loading of the LPG tracers propane,i-butane, and n-butane [68]. Factor 3 showed dominance of i-pentane and n-pentane,and was believed to be oil evaporation emission [69]. Factor 4 was industrial solvent useemission, with higher proportions of ethylbenzene, m/p-xylene, and o-xylene; highertoluene to benzene (T/B) ratio was also resolved in factor 4, which is consistent withthe influence of solvent use [40]. Factor 5 was regarded as industrial process emission,as it was distinguished by the presence of ethylene, propene, trans-2-butene, trans-2-
Atmosphere 2022, 13, 9 11 of 18
pentene, and styrene; while ethylene and propene are important raw materials in chemicalproduction [80], butenes are mainly obtained from process emissions [81], and styrene is oneof the raw materials of resin and rubber. Source 6 was recognized as a combustion source, asit is associated with ethyne, ethane, propene, benzene, and some C6–C7 alkanes [73], whichare markers of coal/biomass combustion. Factor 7 was identified as biogenic emission, asit consisted of a high proportion of isoprene, which is tracer of biogenic emission [82].
Figure 7. Source profiles of VOCs resolved from PMF.
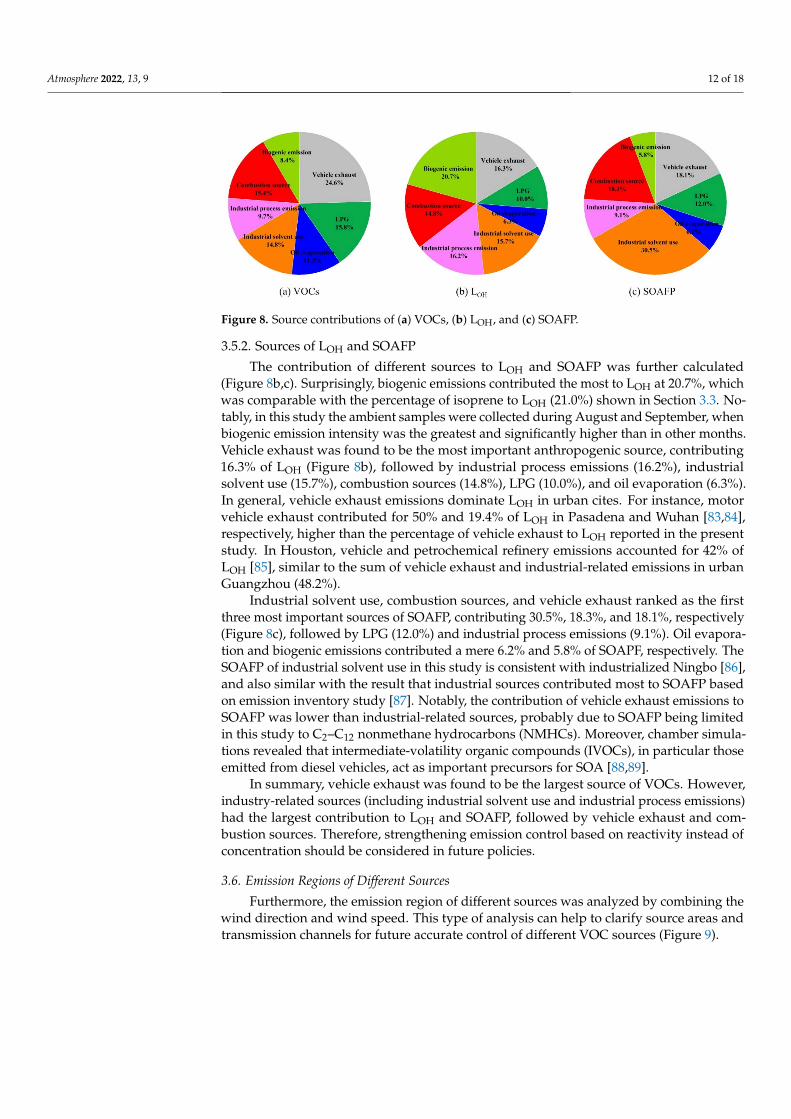
Based on the PMF results (Figure 8a), vehicle exhaust was the largest source of VOCs,contributing 24.6%, followed by LPG (15.8%), combustion sources (15.4%), industrialsolvent use (14.8%), and oil evaporation (11.3%). Industrial process emissions and biogenicemissions contributed 9.7% and 8.4% of VOCs, respectively. Industrial-related sources,including industrial solvent use and industrial process emissions, together contributed24.5% of VOCs.
Atmosphere 2022, 13, 9 12 of 18
Figure 8. Source contributions of (a) VOCs, (b) LOH, and (c) SOAFP.
3.5.2. Sources of LOH and SOAFP
The contribution of different sources to LOH and SOAFP was further calculated(Figure 8b,c). Surprisingly, biogenic emissions contributed the most to LOH at 20.7%, whichwas comparable with the percentage of isoprene to LOH (21.0%) shown in Section 3.3. No-tably, in this study the ambient samples were collected during August and September, whenbiogenic emission intensity was the greatest and significantly higher than in other months.Vehicle exhaust was found to be the most important anthropogenic source, contributing16.3% of LOH (Figure 8b), followed by industrial process emissions (16.2%), industrialsolvent use (15.7%), combustion sources (14.8%), LPG (10.0%), and oil evaporation (6.3%).In general, vehicle exhaust emissions dominate LOH in urban cites. For instance, motorvehicle exhaust contributed for 50% and 19.4% of LOH in Pasadena and Wuhan [83,84],respectively, higher than the percentage of vehicle exhaust to LOH reported in the presentstudy. In Houston, vehicle and petrochemical refinery emissions accounted for 42% ofLOH [85], similar to the sum of vehicle exhaust and industrial-related emissions in urbanGuangzhou (48.2%).
Industrial solvent use, combustion sources, and vehicle exhaust ranked as the firstthree most important sources of SOAFP, contributing 30.5%, 18.3%, and 18.1%, respectively(Figure 8c), followed by LPG (12.0%) and industrial process emissions (9.1%). Oil evapora-tion and biogenic emissions contributed a mere 6.2% and 5.8% of SOAPF, respectively. TheSOAFP of industrial solvent use in this study is consistent with industrialized Ningbo [86],and also similar with the result that industrial sources contributed most to SOAFP basedon emission inventory study [87]. Notably, the contribution of vehicle exhaust emissions toSOAFP was lower than industrial-related sources, probably due to SOAFP being limitedin this study to C2–C12 nonmethane hydrocarbons (NMHCs). Moreover, chamber simula-tions revealed that intermediate-volatility organic compounds (IVOCs), in particular thoseemitted from diesel vehicles, act as important precursors for SOA [88,89].
In summary, vehicle exhaust was found to be the largest source of VOCs. However,industry-related sources (including industrial solvent use and industrial process emissions)had the largest contribution to LOH and SOAFP, followed by vehicle exhaust and com-bustion sources. Therefore, strengthening emission control based on reactivity instead ofconcentration should be considered in future policies.
3.6. Emission Regions of Different Sources
Furthermore, the emission region of different sources was analyzed by combining thewind direction and wind speed. This type of analysis can help to clarify source areas andtransmission channels for future accurate control of different VOC sources (Figure 9).
Atmosphere 2022, 13, 9 13 of 18
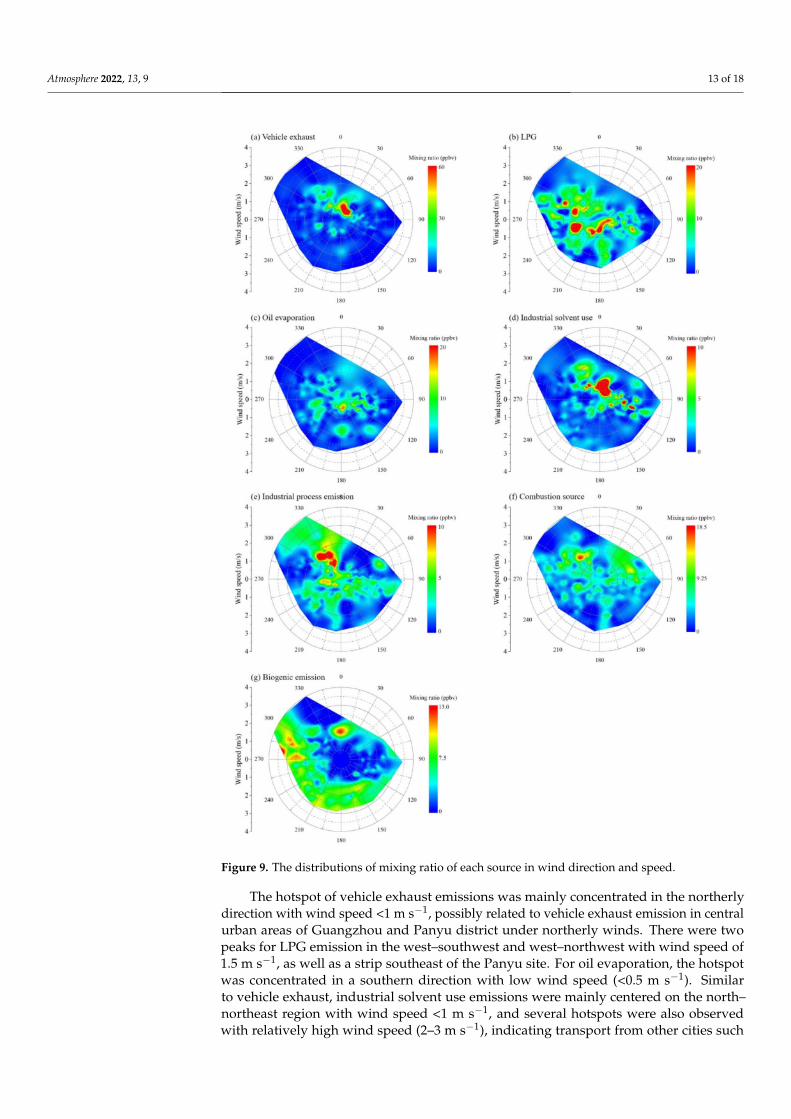
Figure 9. The distributions of mixing ratio of each source in wind direction and speed.
The hotspot of vehicle exhaust emissions was mainly concentrated in the northerlydirection with wind speed <1 m s−1, possibly related to vehicle exhaust emission in centralurban areas of Guangzhou and Panyu district under northerly winds. There were twopeaks for LPG emission in the west–southwest and west–northwest with wind speed of1.5 m s−1, as well as a strip southeast of the Panyu site. For oil evaporation, the hotspotwas concentrated in a southern direction with low wind speed (<0.5 m s−1). Similarto vehicle exhaust, industrial solvent use emissions were mainly centered on the north–northeast region with wind speed <1 m s−1, and several hotspots were also observedwith relatively high wind speed (2–3 m s−1), indicating transport from other cities such
Atmosphere 2022, 13, 9 14 of 18
as Dongguan and Foshan, the most important manufacturing centers of furniture andcommodity products in the PRD region. The industrial process emissions region wasdistributed in the northwest with wind speed of 0.5–2 m s−1, indicating the joint influenceof local emissions and regional transport in the northwest. A hotspot was observed inthe northwest for combustion sources. Different from other sources, biogenic emissionswere distributed in multiple directions with high wind speed, and mainly emitted from thesurrounding forest-covered areas.
4. Conclusions
To explore the reactive VOC species and identify the major sources of VOCs, LOH,SOAFP, and corresponding emission regions in the urban PRD during severe ozone pollu-tion, the ambient VOCs were monitored with a high-resolution online system in centralPRD (PY site) from August to September 2020. The results showed that the average mixingratio of VOCs during the campaign was (31.80 ± 20.82) ppbv. Furthermore, C2–C5 alkanes,aromatics, ≥C6 alkanes, alkenes, and alkyne contributed 48.2%, 23.0%, 14.5%, 9.5%, and4.8% of the measured VOCs, respectively; propane, n-butane and toluene were the threemost abundant VOC species.
The chemical reactivity of VOCs in Guangzhou was equivalent to that of toluene,with calculated average OH radical reaction rate constants of VOCs of 6.25 × 10⁻¹² cm3
molecule−1 s−1. Alkenes and aromatics showed the highest contribution to LOH, and thekey active anthropogenic compounds were m/p-xylene, propene, and toluene. Aromaticsattributed 93.1% of SOAFP, and toluene, m/p-xylene, o-xylene, ethylbenzene, and 1,2,3-trimethylbenzene were the most abundant species. Consequently, priority control ofreactive alkenes and aromatics is key to ozone and PM2.5 pollution prevention and control.
The sources of VOCs were investigated using PMF. Vehicle exhaust, LPG, and combus-tion emission were three most important sources at the PY site, accounting for 24.6%, 15.8%,and 15.4% of observed VOCs, followed by industrial solvent use (14.8%), oil evaporation(11.3%), industrial process emissions (9.7%), and biogenic emissions (8.4%), respectively.Moreover, the LOH and SOAFP were mostly contributed by industry-related sources (in-cluding industrial solvent use and industrial process emissions), vehicle exhaust, andcombustion sources, indicating that control of industry-related sources and vehicle exhaustemissions are key to reducing the chemical reactivity of VOCs in Guangzhou. The transportchannels and emission regions of different sources were further identified by combiningsource contribution with wind direction and wind speed, and different hotspot areas fordifferent sources were explored. Based on high resolution observed VOC data, this studydemonstrated the key reactive VOC species and identified the major sources and corre-sponding emission regions. It is thus of benefit for the accurate emission control of VOCsin the PRD region, and aids in the formulation of an emission control strategy for VOCs insimilar cities around the world.
Author Contributions: Investigation, C.L., J.L. and Y.Z. (Yongbo Zhang); Methodology, W.Y.; dataanalysis and curation, Q.Y., J.Z., X.Q. and T.Z.; writing—original draft preparation, W.Y.; writing—review and editing, C.P., Y.Z. (Yanli Zhang) and X.W.; discussion of the results, C.L., J.L., Y.Z. (YanliZhang) and Y.Z. (Yongbo Zhang). All authors have read and agreed to the published version of themanuscript.
Funding: This research was supported by the National Natural Science Foundation of China(Grant No. 41907196), Key-Area Research and Development Program of Guangdong Province(Grant No. 2020B1111360003), State Key Laboratory of Organic Geochemistry, GIGCAS (Grant No.SKLOG202003), and the Director’s Fund of Guangzhou Institute of Geochemistry, CAS (2019SZJJ-04).
Institutional Review Board Statement: Not applicable.
Informed Consent Statement: Not applicable.
Data Availability Statement: Data are available upon request on the official website of Departmentof Guangzhou Sub-branch of Guangdong Ecological and Environmental Monitoring Center.
Atmosphere 2022, 13, 9 15 of 18
Acknowledgments: We would like to express our immense gratitude to the reviewers and editorswho have contributed valuable comments that helped us to improve the quality of the paper.
Conflicts of Interest: The authors declare that they have no conflict of interest.
References1. Chameides, W.L.; Fehsenfeld, F.; Rodgers, M.O.; Cardelino, C.; Martinez, J.; Parrish, D.; Lonneman, W.; Lawson, D.R.; Rasmussen,
R.A.; Zimmerman, P.; et al. Ozone precursor relationships in the ambient atmosphere. J. Geophys. Res. Atmos. 1992, 97, 6037–6055.[CrossRef]
2. Forstner, H.J.L.; Flagan, R.C.; Seinfeld, J.H. Secondary organic aerosol from the photooxidation of aromatic hydrocarbons:Molecular composition. Environ. Sci. Technol. 1997, 31, 1345–1358. [CrossRef]
3. O’Dowd, C.D.; Aalto, P.; Hameri, K.; Kulmala, M.; Hoffmann, T. Aerosol formation—Atmospheric particles from organic vapours.Nature 2002, 416, 497–498. [CrossRef] [PubMed]
4. Odum, J.R.; Jungkamp, T.P.W.; Griffin, R.J.; Flagan, R.C.; Seinfeld, J.H. The atmospheric aerosol-forming potential of wholegasoline vapor. Science 1997, 276, 96–99. [CrossRef] [PubMed]
5. Atkinson, R. Atmospheric chemistry of VOCs and NOx. Atmos. Environ. 2000, 34, 2063–2101. [CrossRef]6. Sato, K.; Takami, A.; Isozaki, T.; Hikida, T.; Shimono, A.; Imamura, T. Mass spectrometric study of secondary organic aerosol
formed from the photo-oxidation of aromatic hydrocarbons. Atmos. Environ. 2010, 44, 1080–1087. [CrossRef]7. FinlaysonPitts, B.J.; Pitts, J.N. Tropospheric air pollution: Ozone, airborne toxics, polycyclic aromatic hydrocarbons, and particles.
Science 1997, 276, 1045–1052. [CrossRef]8. West, J.J.; Fiore, A.M.; Horowitz, L.W.; Mauzerall, D.L. Global health benefits of mitigating ozone pollution with methane emission
controls. Proc. Natl. Acad. Sci. USA 2006, 103, 3988–3993. [CrossRef]9. Alexis, N.E.; Carlsten, C. Interplay of air pollution and asthma immunopathogenesis: A focused review of diesel exhaust and
ozone. Int. Immunopharmacol. 2014, 23, 347–355. [CrossRef]10. Bhatia, A.; Tomer, R.; Kumar, V.; Singh, S.D.; Pathak, H. Impact of tropospheric ozone on crop growth and productivity—A
review. J. Sci. Ind. Res. 2012, 71, 97–112.11. Feng, Z.; Hu, E.; Wang, X.; Jiang, L.; Liu, X. Ground-level O3 pollution and its impacts on food crops in China: A review. Environ.
Pollut. 2015, 199, 42–48. [CrossRef] [PubMed]12. Monks, P.S.; Archibald, A.T.; Colette, A.; Cooper, O.; Coyle, M.; Derwent, R.; Fowler, D.; Granier, C.; Law, K.S.; Mills, G.E.; et al.
Tropospheric ozone and its precursors from the urban to the global scale from air quality to short-lived climate forcer. Atmos.Chem. Phys. 2015, 15, 8889–8973. [CrossRef]
13. IPCC. Climate Change 2013: The Assessment Reports of the Intergovernmental Panel on Climate Change; Cambridge University Press:Cambridge, UK, 2013; p. 1552.
14. Cabada, J.C.; Pandis, S.N.; Subramanian, R.; Robinson, A.L.; Polidori, A.; Turpin, B. Estimating the secondary organic aerosolcontribution to PM2.5 using the EC tracer method. Aerosol Sci. Technol. 2004, 38, 140–155. [CrossRef]
15. Lonati, G.; Giugliano, M.; Butelli, P.; Romele, L.; Tardivo, R. Major chemical components of PM2.5 in Milan (Italy). Atmos. Environ.2005, 39, 1925–1934. [CrossRef]
16. Guo, S.; Hu, M.; Zamora, M.L.; Peng, J.; Shang, D.; Zheng, J.; Du, Z.; Wu, Z.; Shao, M.; Zeng, L.; et al. Elucidating severe urbanhaze formation in China. Proc. Natl. Acad. Sci. USA 2014, 111, 17373–17378. [CrossRef]
17. Huang, R.J.; Zhang, Y.L.; Bozzetti, C.; Ho, K.F.; Cao, J.J.; Han, Y.M.; Daellenbach, K.R.; Slowik, J.G.; Platt, S.M.; Canonaco, F.; et al.High secondary aerosol contribution to particulate pollution during haze events in China. Nature 2014, 514, 218–222. [CrossRef]
18. Zhang, J.K.; Sun, Y.; Liu, Z.R.; Ji, D.S.; Hu, B.; Liu, Q.; Wang, Y.S. Characterization of submicron aerosols during a month ofserious pollution in Beijing, 2013. Atmos. Chem. Phys. 2014, 14, 2887–2903. [CrossRef]
19. Chang, D.; Song, Y.; Liu, B. Visibility trends in six megacities in China 1973–2007. Atmos. Res. 2009, 94, 161–167. [CrossRef]20. Zhang, Q.; He, K.B.; Huo, H. Policy: Cleaning China’s air. Nature 2012, 484, 161–162. [CrossRef] [PubMed]21. Ministry of Environmental Protection, Peopele’s Republic of China. The State Council Issues Action Plan on Prevention and
Control of Air Pollution Introducing Ten Measures to Improve Air Quality. 2013. Available online: http://www.gov.cn/jrzg/2013-09/12/content_2486918.htm (accessed on 14 September 2021).
22. Zheng, B.; Tong, D.; Li, M.; Liu, F.; Hong, C.; Geng, G.; Li, H.; Li, X.; Peng, L.; Qi, J.; et al. Trends in China’s anthropogenicemissions since 2010 as the consequence of clean air actions. Atmos. Chem. Phys. 2018, 18, 14095–14111. [CrossRef]
23. Bian, Y.; Huang, Z.; Ou, J.; Zhong, Z.; Xu, Y.; Zhang, Z.; Xiao, X.; Ye, X.; Wu, Y.; Yin, X.; et al. Evolution of anthropogenic airpollutant emissions in Guangdong Province, China, from 2006 to 2015. Atmos. Chem. Phys. 2019, 19, 11701–11719. [CrossRef]
24. Li, M.; Zhang, Q.; Zheng, B.; Tong, D.; Lei, Y.; Liu, F.; Hong, C.; Kang, S.; Yan, L.; Zhang, Y.; et al. Persistent growth ofanthropogenic non-methane volatile organic compound (NMVOC) emissions in China during 1990–2017: Drivers, speciation andozone formation potential. Atmos. Chem. Phys. 2019, 19, 8897–8913. [CrossRef]
25. Lu, X.; Hong, J.Y.; Zhang, L.; Cooper, O.R.; Schultz, M.G.; Xu, X.B.; Wang, T.; Gao, M.; Zhao, Y.H.; Zhang, Y.H. Severe surfaceozone pollution in China: A global perspective. Environ. Sci. Technol. Lett. 2018, 5, 487–494. [CrossRef]
26. Wang, T.; Xue, L.; Brimblecombe, P.; Lam, Y.F.; Li, L.; Zhang, L. Ozone pollution in China: A review of concentrations,meteorological influences, chemical precursors, and effects. Sci. Total Environ. 2017, 575, 1582–1596. [CrossRef]
Atmosphere 2022, 13, 9 16 of 18
27. Wang, W.N.; Cheng, T.H.; Gu, X.F.; Chen, H.; Guo, H.; Wang, Y.; Bao, F.W.; Shi, S.Y.; Xu, B.R.; Zuo, X.; et al. Assessing spatial andtemporal patterns of observed ground-level ozone in China. Sci. Rep. 2017, 7, 3651. [CrossRef] [PubMed]
28. Sun, L.; Xue, L.; Wang, T.; Gao, J.; Ding, A.; Cooper, O.R.; Lin, M.; Xu, P.; Wang, Z.; Wang, X.; et al. Significant increase ofsummertime ozone at Mount Tai in Central Eastern China. Atmos. Chem. Phys. 2016, 16, 10637–10650. [CrossRef]
29. Ma, Z.; Xu, J.; Quan, W.; Zhang, Z.; Lin, W.; Xu, X. Significant increase of surface ozone at a rural site, north of eastern China.Atmos. Chem. Phys. 2016, 16, 3969–3977. [CrossRef]
30. Ministry of Ecology and Environment of the Peopele’s Republic of China. China Environment Situation Bulletin 2013 and 2015.Available online: http://www.mee.gov.cn/hjzl/sthjzk/zghjzkgb/ (accessed on 14 September 2021).
31. Department of Ecology and Environment of Guangdong Province. 2020 Report on the State of Guangdong Provincial Ecologyand Environment. 2021. Available online: http://gdee.gd.gov.cn/gkmlpt/content/3/3266/post_3266052.html#3185 (accessed on14 September 2021).
32. Shao, M.; Lu, S.H.; Liu, Y.; Xie, X.; Chang, C.C.; Huang, S.; Chen, Z.M. Volatile organic compounds measured in summer inBeijing and their role in ground-level ozone formation. J. Geophys. Res. Atmos. 2009, 114, 13. [CrossRef]
33. Cheng, H.; Guo, H.; Wang, X.; Saunders, S.M.; Lam, S.H.M.; Jiang, F.; Wang, T.; Ding, A.; Lee, S.; Ho, K.F. On the relationshipbetween ozone and its precursors in the Pearl River Delta: Application of an observation-based model (OBM). Environ. Sci. Pollut.Res. 2010, 17, 547–560. [CrossRef]
34. Xue, L.; Wang, T.; Louie, P.K.K.; Luk, C.W.Y.; Blake, D.R.; Xu, Z. Increasing external effects negate local efforts to control ozoneair pollution: A case study of Hong Kong and implications for other Chinese cities. Environ. Sci. Technol. 2014, 48, 10769–10775.[CrossRef] [PubMed]
35. Xue, L.K.; Wang, T.; Gao, J.; Ding, A.J.; Zhou, X.H.; Blake, D.R.; Wang, X.F.; Saunders, S.M.; Fan, S.J.; Zuo, H.C.; et al. Ground-level ozone in four Chinese cities: Precursors, regional transport and heterogeneous processes. Atmos. Chem. Phys. 2014, 14,13175–13188. [CrossRef]
36. Zhang, Q.; Streets, D.G.; Carmichael, G.R.; He, K.B.; Huo, H.; Kannari, A.; Klimont, Z.; Park, I.S.; Reddy, S.; Fu, J.S.; et al. Asianemissions in 2006 for the NASA INTEX-B mission. Atmos. Chem. Phys. 2009, 9, 5131–5153. [CrossRef]
37. Li, M.; Zhang, Q.; Streets, D.G.; He, K.B.; Cheng, Y.F.; Emmons, L.K.; Huo, H.; Kang, S.C.; Lu, Z.; Shao, M.; et al. Mapping Asiananthropogenic emissions of non-methane volatile organic compounds to multiple chemical mechanisms. Atmos. Chem. Phys.2014, 14, 5617–5638. [CrossRef]
38. Atkinson, R.; Arey, J. Atmospheric degradation of volatile organic compounds. Chem Rev. 2003, 103, 4605–4638. [CrossRef]39. Claeys, M.; Graham, B.; Vas, G.; Wang, W.; Vermeylen, R.; Pashynska, V.; Cafmeyer, J.; Guyon, P.; Andreae, M.O.; Artaxo, P.; et al.
Formation of secondary organic aerosols through photooxidation of isoprene. Science 2004, 303, 1173–1176. [CrossRef] [PubMed]40. Zhang, Y.L.; Wang, X.M.; Blake, D.R.; Li, L.F.; Zhang, Z.; Wang, S.Y.; Guo, H.; Lee, F.S.C.; Gao, B.; Chan, L.Y.; et al. Aromatic
hydrocarbons as ozone precursors before and after outbreak of the 2008 financial crisis in the Pearl River Delta region, southChina. J. Geophys. Res. Atmos. 2012, 117, 16. [CrossRef]
41. Zhang, Y.L.; Wang, X.M.; Barletta, B.; Simpson, I.J.; Blake, D.R.; Fu, X.; Zhang, Z.; He, Q.; Liu, T.; Zhao, X.; et al. Source attributionsof hazardous aromatic hydrocarbons in urban, suburban and rural areas in the Pearl River Delta (PRD) region. J. Hazard. Mater.2013, 250–251, 403–411. [CrossRef]
42. Zhang, Y.L.; Wang, X.M.; Zhang, Z.; Lü, S.; Huang, Z.; Li, L. Sources of C2–C4 alkenes, the most important ozone nonmethanehydrocarbon precursors in the Pearl River Delta region. Sci. Total Environ. 2015, 502, 236–245. [CrossRef] [PubMed]
43. Chen, H.W.; Li, G.K.; Li, H.; Zhang, Z.X. Characteristics of volatile organic compounds in Guangzhou. Environ Chem. 2003, 22,89–92. (In Chinese with English Abstract)
44. Zhou, Y.; Yue, D.L.; Zhang, T. Source apportionment of spring ambient volatile Organic compounds in Guangzhou. Environ.Monit. Forew. 2017, 9, 42–47. (In Chinese with English Abstract)
45. Wu, F.K.; Yu, Y.; Sun, J.; Zhang, J.; Wang, J.; Tang, G.; Wang, Y. Characteristics, source apportionment and reactivity of ambientvolatile organic compounds at Dinghu Mountain in Guangdong Province, China. Sci. Total Environ. 2016, 548, 347–359. [CrossRef]
46. Zhang, Z.; Zhang, Y.L.; Wang, X.M.; Lu, S.J.; Huang, Z.H.; Huang, X.Y.; Yang, W.Q.; Wang, Y.S.; Zhang, Q. Spatiotemporal patternsand source implications of aromatic hydrocarbons at six rural sites across China’s developed coastal regions. J. Geophys. Res.Atmos. 2016, 121, 6669–6687. [CrossRef]
47. Amiet, F.; Robert, M.; Martin, N.A. Gas Chromatography: MCERTS certification for ambient air analysis on benzene and VOCs.Int. Environ. Technol. 2013, 23, 46–47.
48. Wang, H.L.; Chen, C.H.; Wang, Q.; Huang, C.; Su, L.Y.; Huang, H.Y.; Lou, S.R.; Zhou, M.; Li, L.; Qiao, L.P.; et al. Chemical loss ofvolatile organic compounds and its impact on the source analysis through a two-year continuous measurement. Atmos. Environ.2013, 80, 488–498. [CrossRef]
49. Carter, W.P.L. Update Maximum Incremental Reactivity Scale and Hydrocarbon Bin Reactivities for Regulatory Application. Calif.Air Resour Board Contact 07-339. 2009. Available online: https://ww2.arb.ca.gov/sites/default/files/barcu/regact/2009/mir2009/mir10.pdf (accessed on 15 December 2021).
50. Chen, W.T.; Shao, M.; Yuan, B.; Wang, M.; Lu, S.H. Parameterization of contribution to secondary organic aerosol (SOA) formationfrom ambient volatile organic compounds (VOCs). Acta Sci. Circumst. 2013, 33, 163–172. (In Chinese with English Abstract)
51. Grosjean, D.; Seinfeld, J.H. Parameterization of the formation potential of secondary organic aerosols. Atmos. Environ. 1989, 23,1733–1747. [CrossRef]
Atmosphere 2022, 13, 9 17 of 18
52. Grosjean, D. In situ organic aerosol formation during a smog episode: Estimated production and chemical functionality. Atmos.Environ. 1992, 26, 953–963. [CrossRef]
53. Paatero, P. Least squares formulation of robust non-negative factor analysis. Chemom. Intell. Lab. Syst. 1997, 37, 23–35. [CrossRef]54. Paatero, P.; Tapper, U. Positive matrix factorization: A non-negative factor model with optimal utilization of error estimates of
data values. Environmetrics 1994, 5, 111–126. [CrossRef]55. Yuan, B.; Shao, M.; de Gouw, J.; Parrish, D.D.; Lu, S.; Wang, M.; Zeng, L.; Zhang, Q.; Song, Y.; Zhang, J.; et al. Volatile organic
compounds (VOCs) in urban air: How chemistry affects the interpretation of positive matrix factorization (PMF) analysis. J.Geophys. Res. Atmos. 2012, 117, D24302. [CrossRef]
56. Hui, L.; Liu, X.; Tan, Q.; Feng, M.; An, J.; Qu, Y.; Zhang, Y.; Cheng, N. VOC characteristics, sources and contributions to SOAformation during haze events in Wuhan, Central China. Sci. Total Environ. 2019, 650, 2624–2639. [CrossRef] [PubMed]
57. Abeleira, A.; Pollack, I.B.; Sive, B.; Zhou, Y.; Fischer, E.V.; Farmer, D.K. Source characterization of volatile organic compoundsin the Colorado Northern Front Range Metropolitan Area during spring and summer 2015. J. Geophys. Res. Atmos. 2017, 122,3595–3613. [CrossRef]
58. Yang, W.Q.; Zhang, Y.L.; Wang, X.M.; Li, S.; Zhu, M.; Yu, Q.Q.; Li, G.H.; Huang, Z.H.; Zhang, H.N.; Wu, Z.F.; et al. Volatile organiccompounds at a rural site in Beijing: Influence of temporary emission control and wintertime heating. Atmos. Chem. Phys. 2018,18, 12663–12682. [CrossRef]
59. Luo, R.X.; Liu, B.S.; Liang, D.N.; Bi, X.H.; Zhang, Y.F.; Feng, Y.C. Characteristics of ozone and source apportionment of theprecursor VOCs in Tianjin suburbs in summer. Environ. Sci. 2021, 42, 75–87. (In Chinese with English Abstract)
60. Cai, C.; Geng, F.; Tie, X.; Yu, Q.; An, J. Characteristics and source apportionment of VOCs measured in Shanghai, China. Atmos.Environ. 2010, 44, 5005–5014. [CrossRef]
61. Zhang, X.; Yin, Y.; Wen, J.; Huang, S.; Han, D.; Chen, X.; Cheng, J. Characteristics, reactivity and source apportionment of ambientvolatile organic compounds (VOCs) in a typical tourist city. Atmos. Environ. 2019, 215, 116898. [CrossRef]
62. Baudic, A.; Gros, V.; Sauvage, S.; Locoge, N.; Sanchez, O.; Sarda-Estève, R.; Kalogridis, C.; Petit, J.E.; Bonnaire, N.; Baisnée, D.Seasonal variability and source apportionment of volatile organic compounds (VOCs) in the Paris megacity (France). Atmos.Chem. Phys. 2017, 16, 11961–11989. [CrossRef]
63. Garzón, J.P.; Huertas, J.I.; Magaña, M.; Huertas, M.E.; Cárdenas, B.; Watanabe, T.; Maeda, T.; Wakamatsu, S.; Blanco, S. Volatileorganic compounds in the atmosphere of Mexico City. Atmos. Environ. 2015, 119, 415–429. [CrossRef]
64. Zou, Y.; Deng, X.J.; Zhu, D.; Gong, D.C.; Wang, H.; Li, F.; Tan, H.B.; Deng, T.; Mai, B.R.; Liu, X.T.; et al. Characteristics of 1 yearof observational data of VOCs, NOx and O3 at a suburban site in Guangzhou, China. Atmos. Chem. Phys. 2015, 15, 6625–6636.[CrossRef]
65. Liu, Q.; Lu, X.L.; Zeng, P.; Yu, S. Characteristics and source apportionment of ambient VOCs in spring in Liuzhou. Environ. Sci.2021, 42, 65–74. (In Chinese with English Abstract)
66. Zhang, T.; Zhou, Y.; Yue, D.L.; Chen, D.H.; Ou, Y.B.; Wang, X.M. Seasonal variation characteristics of concentration andchemical reactivity of VOCs in typical areas of the Pearl River Delta. Environ. Pollut. Control 2021, 43, 1–7. (In Chinese withEnglish Abstract)
67. Song, M.D.; Tan, Q.W.; Feng, M.; Qu, Y.; Liu, X.G.; An, J.L.; Zhang, Y.H. Source apportionment and secondary transformation ofatmospheric nonmethane hydrocarbons in Chengdu, Southwest China. J. Geophys. Res. Atmos. 2018, 123, 9741–9763. [CrossRef]
68. Feng, J.; Zhang, Y.; Song, W.; Deng, W.; Zhu, M.; Fang, Z.; Ye, Y.; Fang, H.; Wu, Z.; Lowther, S.; et al. Emissions of nitrogen oxidesand volatile organic compounds from liquefied petroleum gas-fueled taxis under idle and cruising modes. Environ. Pollut. 2020,267, 115623. [CrossRef]
69. Zhang, Y.L.; Wang, X.M.; Zhang, Z.; Lu, S.; Shao, M.; Lee, F.S.C.; Yu, J. Species profiles and normalized reactivity of volatileorganic compounds from gasoline evaporation in China. Atmos. Environ. 2013, 79, 110–118. [CrossRef]
70. Fang, Z.; Deng, W.; Zhang, Y.L.; Ding, X.; Tang, M.J.; Liu, T.Y.; Hu, Q.H.; Zhu, M.; Wang, Z.Y.; Yang, W.Q.; et al. Open burning ofrice, corn and wheat straws: Primary emissions, photochemical aging, and secondary organic aerosol formation. Atmos. Chem.Phys. 2017, 17, 14821–14839. [CrossRef]
71. Tang, X.Y.; Zhang, Y.H.; Shao, M. Atmospheric Environmental Chemistry, 2nd ed.; Higher Education Press: Beijing, China, 2006;pp. 75–721.
72. Wang, H.L.; Chen, C.H.; Huang, C.; Li, L.; Cheng, Z.; Chen, M.H.; Zheng, X.H. Characterization of volatile organic compounds(VOCs) around the Chinese Spring Festival and International Labour Day in the urban area of Shanghai, China. Acta Sci. Circumst.2010, 30, 1749–1757. (In Chinese with English Abstract)
73. Liu, Y.; Shao, M.; Fu, L.L.; Lu, S.H.; Zeng, L.M.; Tang, D.G. Source profiles of volatile organic compounds (VOCs) measured inChina: Part I. Atmos. Environ. 2008, 42, 6247–6260. [CrossRef]
74. Zhang, Z.; Wang, X.M.; Zhang, Y.L.; Lü, S.; Huang, Z.; Huang, X.; Wang, Y. Ambient air benzene at background sites in China’smost developed coastal regions: Exposure levels, source implications and health risks. Sci. Total Environ. 2015, 511, 792–800.[CrossRef]
75. Liu, C.T.; Zhang, C.L.; Mu, Y.J.; Liu, J.; Zhang, Y. Emission of volatile organic compounds from domestic coal stove with the actualalternation of flaming and smoldering combustion processes. Environ. Pollut. 2017, 221, 385–391. [CrossRef] [PubMed]
Atmosphere 2022, 13, 9 18 of 18
76. Zhang, Y.L.; Yang, W.Q.; Simpson, I.; Huang, X.Y.; Yu, J.Z.; Huang, Z.H.; Wang, Z.Y.; Zhang, Z.; Liu, D.; Huang, Z.Z.; et al.Decadal changes in emissions of volatile organic compounds (VOCs) from on-road vehicles with intensified automobile pollutioncontrol: Case study in a busy urban tunnel in south China. Environ. Pollut. 2018, 233, 806–819. [CrossRef] [PubMed]
77. Araizaga, A.E.; Mancilla, Y.; Mendoza, A. Volatile organic compound emissions from Light-Duty Vehicles in Monterrey, Mexico:A Tunnel Study. Int. J. Environ. Res. 2013, 7, 277–292.
78. Barletta, B.; Meinardi, S.; Simpson, I.J.; Zou, S.; Sherwood Rowland, F.; Blake, D.R. Ambient mixing ratios of nonmethanehydrocarbons (NMHCs) in two major urban centers of the Pearl River Delta (PRD) region: Guangzhou and Dongguan. Atmos.Environ. 2008, 42, 4393–4408. [CrossRef]
79. Chan, L.Y.; Chu, K.W.; Zou, S.C.; Chan, C.Y.; Wang, X.M.; Barletta, B.; Blake, D.R.; Guo, H.; Tsai, W.Y. Characteristics ofnonmethane hydrocarbons (NMHCs) in industrial, industrial-urban, and industrial-suburban atmospheres of the Pearl RiverDelta (PRD) region of south China. J. Geophys. Res. Atmos. 2006, 111, D11304. [CrossRef]
80. McDonald, B.C.; de Gouw, J.A.; Gilman, J.B.; Jathar, S.H.; Akherati, A.; Cappa, C.D.; Jimenez, J.L.; Lee-Taylor, J.; Hayes, P.L.;McKeen, S.A.; et al. Volatile chemical products emerging as largest petrochemical source of urban organic emissions. Science 2018,359, 760–764. [CrossRef]
81. Tsai, J.H.; Lin, K.H.; Chen, C.Y.; Lai, N.; Ma, S.Y.; Chiang, H.L. Volatile organic compound constituents from an integrated ironand steel facility. J. Hazard. Mater. 2008, 157, 569–578. [CrossRef]
82. Zhang, Y.; Zhang, R.; Yu, J.; Zhang, Z.; Yang, W.; Zhang, H.; Lyu, S.; Wang, Y.; Dai, W.; Wang, Y.; et al. Isoprene mixing ratiosmeasured at twenty sites in China during 2012–2014: Comparison with model simulation. J. Geophys. Res. Atmos. 2020, 125,e2020JD033523. [CrossRef]
83. Borbon, A.; Gilman, J.B.; Kuster, W.C.; Grand, N.; Chevaillier, S.; Colomb, A.; Dolgorouky, C.; Gros, V.; Lopez, M.; Sarda-Esteve,R.; et al. Emission ratios of anthropogenic volatile organic compounds in northern mid-latitude megacities: Observations versusemission inventories in Los Angeles and Paris. J. Geophys. Res. Atmos. 2013, 118, 2041–2057. [CrossRef]
84. Zheng, H.; Kong, S.; Chen, N.; Niu, Z.; Zhang, Y.; Jiang, S.; Yan, Y.; Qi, S. Source apportionment of volatile organic compounds:Implications to reactivity, ozone formation, and secondary organic aerosol potential. Atmos. Res. 2021, 249, 105344. [CrossRef]
85. Gilman, J.B.; Kuster, W.C.; Goldan, P.D.; Herndon, S.C.; Zahniser, M.S.; Tucker, S.C.; Brewer, W.A.; Lerner, B.M.; Williams, E.J.;Harley, R.A.; et al. Measurements of volatile organic compounds during the 2006 TexAQS/GoMACCS campaign: Industrialinfluences, regional characteristics, and diurnal dependencies of the OH reactivity. J. Geophys. Res. Atmos. 2009, 114, D00F06.[CrossRef]
86. Mo, Z.W.; Shao, M.; Lu, S.H.; Niu, H.; Zhou, M.Y.; Sun, J. Characterization of non-methane hydrocarbons and their sources in anindustrialized coastal city, Yangtze River Delta, China. Sci. Total Environ. 2017, 593, 641–653. [CrossRef] [PubMed]
87. Wu, R.; Xie, S. Spatial Distribution of Ozone Formation in China Derived from Emissions of Speciated Volatile Organic Compounds.Environ. Sci. Technol. 2017, 51, 2574–2583. [CrossRef] [PubMed]
88. Zhao, Y.L.; Nguyen, N.T.; Presto, A.A.; Hennigan, C.J.; May, A.A.; Robinson, A.L. Intermediate Volatility Organic CompoundEmissions from On-Road Diesel Vehicles: Chemical Composition, Emission Factors, and Estimated Secondary Organic AerosolProduction. Environ. Sci. Technol. 2015, 49, 11516–11526. [CrossRef] [PubMed]
89. Deng, W.; Hu, Q.H.; Liu, T.Y.; Wang, X.M.; Zhang, Y.L.; Song, W.; Sun, Y.; Bi, X.H.; Yu, J.Z.; Yang, W.Q.; et al. Primary particulateemissions and secondary organic aerosol (SOA) formation from idling diesel vehicle exhaust in China. Sci. Total Environ. 2017,593–594, 462–469. [CrossRef] [PubMed]
Related Documents