lubricants Article Effect of Plastic Deformation and Damage Development during Friction of fcc Metals in the Conditions of Boundary Lubrication Alexey Moshkovich, Vladislav Perfilyev and Lev Rapoport * Department of Science, Holon Institute of Technology, 52 Golomb St., P.O. Box 305, Holon 5810201, Israel; [email protected] (A.M.);[email protected] (V.P.) * Correspondence: [email protected]; Tel.: +972-544-403-657 Received: 8 March 2019; Accepted: 20 May 2019; Published: 23 May 2019 Abstract: The main goal of the presented work was the analysis of the interaction between deformed microstructures and friction and the wear properties of four face centered cubic (fcc) metals. Pure fcc metals such as Ag, Cu, Ni, and Al with different values of stacking fault energy (SFE) were chosen for pin-on-disk tests in lubricated conditions. Friction properties of the four fcc metals are presented herein as their Stribeck curves. The transition from elasto-hydrodynamic lubrication (EHL) to boundary lubrication (BL) regions depends mainly on the values of SFE, hardness, and contact temperature. The acoustic emission (AE) parameters were analyzed in the transition from the EHL to the BL region. The models of friction in different lubricant conditions related to the AE waveforms were proposed. The nanocrystalline top surface layers characterized the deformed structure during friction of Ag in the BL region. The lamellar cross-sectional microstructure was formed in the subsurface layers of Ag, Cu, and Ni in the friction direction. Steady state friction and wear in the BL conditions were explained by a balance between the hardening and the dynamic recovery, which was strongly dependent on the SFE and the temperature. The interaction between the deformed structure, the friction, and the wear properties of the studied metals rubbed in the BL region is discussed herein. Keywords: microstructure; dislocations; friction; acoustic emission wear; lubrication 1. Introduction Friction and wear processes are very complex phenomena based on the deep understanding of multidisciplinary and multiscale effects of contact interaction, plastic deformation, and damage development in different environmental conditions. If theoretical and experimental models of asperity contact are widely studied, the number of publications concerning the effect of plastic deformation and damage development during friction is limited. Excellent analysis of modeling and simulation in tribology was recently presented in the review from [1], where different models based on the contact mechanics were carefully discussed, as was the importance of developing new models with consideration to the dislocation dynamic during friction. The authors conclude that, “Tribologists still need to identify key elementary processes specific to rough contacts under shear, and associated, for example, to crack nucleation and propagation, chemical reactions, or fluid-solid interactions.” The dislocation structure of surface layers under dry friction was originally studied by Rigney with colleagues [2–5] and Garbar [6,7]. A strong gradient of grain sizes with depth and formation of nanocrystalline structure was observed in the surface layers. The mechanisms of plastic deformation during friction were considered by Kulhmann-Wilsdorf [8]. A plateau range of high-deformed layers was reached at the end of the running-in process of steel and was preserved in the steady friction state. [9] The structure of the high-deformed layers of the top surface layers during friction and wear was Lubricants 2019, 7, 45; doi:10.3390/lubricants7050045 www.mdpi.com/journal/lubricants

Welcome message from author
This document is posted to help you gain knowledge. Please leave a comment to let me know what you think about it! Share it to your friends and learn new things together.
Transcript

lubricants
Article
Effect of Plastic Deformation and DamageDevelopment during Friction of fcc Metalsin the Conditions of Boundary Lubrication
Alexey Moshkovich, Vladislav Perfilyev and Lev Rapoport *
Department of Science, Holon Institute of Technology, 52 Golomb St., P.O. Box 305, Holon 5810201, Israel;[email protected] (A.M.); [email protected] (V.P.)* Correspondence: [email protected]; Tel.: +972-544-403-657
Received: 8 March 2019; Accepted: 20 May 2019; Published: 23 May 2019�����������������
Abstract: The main goal of the presented work was the analysis of the interaction between deformedmicrostructures and friction and the wear properties of four face centered cubic (fcc) metals. Pure fccmetals such as Ag, Cu, Ni, and Al with different values of stacking fault energy (SFE) were chosen forpin-on-disk tests in lubricated conditions. Friction properties of the four fcc metals are presented hereinas their Stribeck curves. The transition from elasto-hydrodynamic lubrication (EHL) to boundarylubrication (BL) regions depends mainly on the values of SFE, hardness, and contact temperature.The acoustic emission (AE) parameters were analyzed in the transition from the EHL to the BL region.The models of friction in different lubricant conditions related to the AE waveforms were proposed.The nanocrystalline top surface layers characterized the deformed structure during friction of Ag inthe BL region. The lamellar cross-sectional microstructure was formed in the subsurface layers of Ag,Cu, and Ni in the friction direction. Steady state friction and wear in the BL conditions were explainedby a balance between the hardening and the dynamic recovery, which was strongly dependent on theSFE and the temperature. The interaction between the deformed structure, the friction, and the wearproperties of the studied metals rubbed in the BL region is discussed herein.
Keywords: microstructure; dislocations; friction; acoustic emission wear; lubrication
1. Introduction
Friction and wear processes are very complex phenomena based on the deep understandingof multidisciplinary and multiscale effects of contact interaction, plastic deformation, and damagedevelopment in different environmental conditions. If theoretical and experimental models of asperitycontact are widely studied, the number of publications concerning the effect of plastic deformationand damage development during friction is limited. Excellent analysis of modeling and simulationin tribology was recently presented in the review from [1], where different models based on thecontact mechanics were carefully discussed, as was the importance of developing new models withconsideration to the dislocation dynamic during friction. The authors conclude that, “Tribologistsstill need to identify key elementary processes specific to rough contacts under shear, and associated,for example, to crack nucleation and propagation, chemical reactions, or fluid-solid interactions.”The dislocation structure of surface layers under dry friction was originally studied by Rigney withcolleagues [2–5] and Garbar [6,7]. A strong gradient of grain sizes with depth and formation ofnanocrystalline structure was observed in the surface layers. The mechanisms of plastic deformationduring friction were considered by Kulhmann-Wilsdorf [8]. A plateau range of high-deformed layerswas reached at the end of the running-in process of steel and was preserved in the steady frictionstate. [9] The structure of the high-deformed layers of the top surface layers during friction and wear was
Lubricants 2019, 7, 45; doi:10.3390/lubricants7050045 www.mdpi.com/journal/lubricants

Lubricants 2019, 7, 45 2 of 18
close to the severe plastic deformation (SPD) obtained during different processes of refinement [10–17],including fatigue and cyclic creep [18–20].
The dislocation dynamic in surface layers during friction was simulated [21–24]. Applicationof preliminary hardening by grain refinement before the friction tests significantly improved thetribological properties of rubbed surfaces [25–30]. Different SPD methods of refinement providedthe formation of ultrafine grained (UFG) and nanocrystalline (NC) structure (d = 100–200 nm) withrelatively high strength [31–42]. It was shown that the shear stresses during fatigue were increasedup to the maximum value, and then a plateau range was clearly exhibited in the high-deformedlayers. Since the contact stress was cyclically varied in the contact spots, the fatigue models of frictionwere proposed [43–45]. Unfortunately, these models did not reflect the real contact conditions—theinterrelation between the structural and the geometrical parameters of contact. Different friction modelswere developed in order to evaluate the transitions from one contact region to another. The critical pointsof transition from elastic to plastic contact were proposed according to a critical number of cycles [46–55].The problems in the application of the mechanical properties of contact materials in the evaluation ofcritical deformation during friction under different contact conditions were considered [56]. It wasshown that the asperity contacts models could not take into account the structural variations and thedamage development in thin surface layers. The interaction between contact parameters, deformation,and temperature was proposed by Lim and Ashby as the wear maps [57,58], where different mechanismsof friction and wear were considered as the wear modes [59,60]. Furthermore, various wear maps fordifferent contact materials were considered. In order to evaluate the application of the wear modesfor real contact pairs, friction and wear experiments for steel using Lim’s and Ashby’s map wereperformed [61]. Unfortunately, the results of friction and wear tests of steel were not confirmed.It was clear that such complex phenomena as the interaction of rubbed bodies, especially in lubricatedconditions, could not be described by the simple parameters used in these wear maps.
If the critical points of transition from elastic to plastic contact are mainly determined bymechanical properties, pressure, and temperature of contact surfaces in dry friction, the transitionsin lubricated conditions are usually related to mechanical properties, contact pressure, asperitydistribution, and thickness of lubricant film. The effect of surface roughness on the transition betweenmixed lubrication (ML) and elastohydrodynamic lubrication (EHL) were simulated [62,63]. A statisticaldescription was requested for the description of multi-scale texture. A mathematical model containingthe Reynolds equation, the particle load carrying equation, the asperity contact equation, and theheat balance equation was constructed for simulation of the mixed liquid–solid lubrication [64].A thermal model of mixed lubrication in point contacts was proposed and used to study the roughnesseffect [65,66].
An algorithm based on the load-sharing concept was proposed, which assumed that the totaltransmitted load was carried by the asperities as well as the fluid film [67]. Interestingly, many existingmodels and simulations are related to the transition from EHL to ML conditions only, whereas there arefew descriptions of the transition from ML to boundary lubrication (BL). It is reasonably clear that thetransition to the ML region is mainly determined by the contact pressure, the roughness parameters,and the thickness of lubricant film when the number of direct contact spots is limited. However,when the number of direct contact spots is significantly increased in the transition to the BL region,the roles of the mechanical properties, the deformed microstructure, and the damage developmentincrease dramatically. The analysis of friction and wear in the BL region associated with the effectsof asperity interaction, tribochemistry, thickness of lubricant film, and mechanical properties of realcontact spots is a very complex problem. Nowadays, the problems of contact interaction and thestructural state of surface layers during friction with wear are considered separately.
The object of the presented work was to analyze the effects of the deformed structure, the hardening,and the damage development on the friction and wear properties of some four face centered cubic(fcc) metals with different stacking fault energy (SFE) values. The simplistic model of deformationand damage development of contact surfaces was based on the request that deformation and damage

Lubricants 2019, 7, 45 3 of 18
development occurred mainly in the soft body. Since the roughness parameters play an important rolein the formation of contact surfaces, the smooth surface of a hard counterbody was used. In order todiminish adhesion and tribochemistry due to additives in oils, the lubricated conditions with base oilwere used. Likewise, the tribochemistry/mixing and a third body’s effects on the damage developmentin the BL region were not considered in these experiments. These assumptions were based on ourprevious experiments, where the friction and the wear of copper rubbed in a wide range of loadsand sliding velocities were studied [29,68,69]. The results of friction and wear experiments in PAO-4lubricant are presented herein as the Stribeck curve where the boundary, the mixed, and the EHL wereconsidered. Friction of Cu in lubricated conditions was characterized by the formation of layeredlamellar structures in the direction of friction. The hardness of thin surface layers was saturated duringrepeated sliding.
Recently, the effect of grain refinement by equal channel angular pressing (ECAP) and the structuralevolution of Cu subsurface layers on friction and wear were evaluated [29]. It was shown that thetransitions from one lubricant region to another depend on the virgin grain size. The smaller the grainsize of Cu is, the more severe the condition of the transition to BL region will be. The mechanisms ofdamage and failure of Cu samples under friction in the EHL region are similar to the damage andfailure mechanisms in very high cycle fatigue. Friction in the EHL region is accompanied by initiationand coalescence of pores and microcracks [68]. A lot of ploughing tracks and large delaminated regionsappear on the surface after friction with the higher loading rates. To better understand the mechanismsof friction and wear, systematic research of the deformed structure, the hardening, and the chemicalcomposition of surface layers of fcc metals after friction in the BL region have been studied [69–71].Based on these experimental results, the effects of the deformed structure and hardening during frictionin the lubricated conditions are summarized in the presented work.
2. Materials and Methods
2.1. Friction and Wear Tests due to Acoustic Emission (AE) Measurements
Pure fcc metals such as Ag, Cu, Ni, and Al with different values of SFE were chosen as thematerials for pins. Application of pure metals allowed us to avoid the effect of solute atoms onplastic deformation, grain size, and hardness. All friction tests were conducted using a pin-on-disk rigdescribed in our previous publications [66–68]. Importantly, flat-shape pins and long-time running-inprocess provided the constant pressure with a time of test at each load. The pins rubbed against thesteel disks (AISI 1040) hardened up to HRc = 45. The effects of load on friction and wear coefficientsand average temperature near the interface were studied. Sliding velocity was constant at 0.37 m/s(300 rpm). In order to evaluate the transition from the EHL to the BL region, the effect of load onfriction and wear properties was studied. The same values of the friction coefficient (µ) (µ ~0.1) withloading indicated the friction in the BL region. To evaluate the average values of friction and wearparameters, the tests were repeated five times at each load. The details of acoustic emission (AE)measurements are presented in work [70]. An AE probe [model R30-ALPHA (MISTRAS HoldingCompany Physical Acoustic Corporation, Princeton, NJ, USA)] with peak frequency of 300 kHz, 40 dBpreamplification, and 42 dB filter threshold level was used and then transferred to the PC-controlledAE recording system with a sample rate of 1 MSPS (mega samples per second).
2.2. The Analysis of the Deformation Structure after Friction of Four Fcc Metals
Diffraction measurements were carried out in reflection geometry using a TTRAX III (Rigaku,Tokyo, Japan) diffractometer equipped with a rotating Cu anode operating at 50 kV/200 mA. The detailsof grain size analysis by XRD are presented in work [71]. Friction surfaces were carefully examinedwith a field emission scanning electron microscope (FE-SEM, Helios 460 F1Lite, FEI, Hillsboro, OR,USA). The cross-sectional TEM lamellae were prepared from the pins using a focused ion beam (FIB)(Helios 460 F1 Lite, FEI). Cross-sectioning of the specimens was done in the longitudinal and the
Lubricants 2019, 7, 45 4 of 18
transverse directions (parallel and perpendicular to the direction of friction). The details of structuralmeasurements are in publication [72,73].
3. Results
3.1. Friction and Wear
The Stribeck curves of the studied metals are shown in Figure 1 [71].
Lubricants 2018, 6, x FOR PEER REVIEW 4 of 18
longitudinal and the transverse directions (parallel and perpendicular to the direction of friction). The details of structural measurements are in publication [72,73].
3. Results
3.1. Friction and Wear
The Stribeck curves of the studied metals are shown in Figure 1 [71].
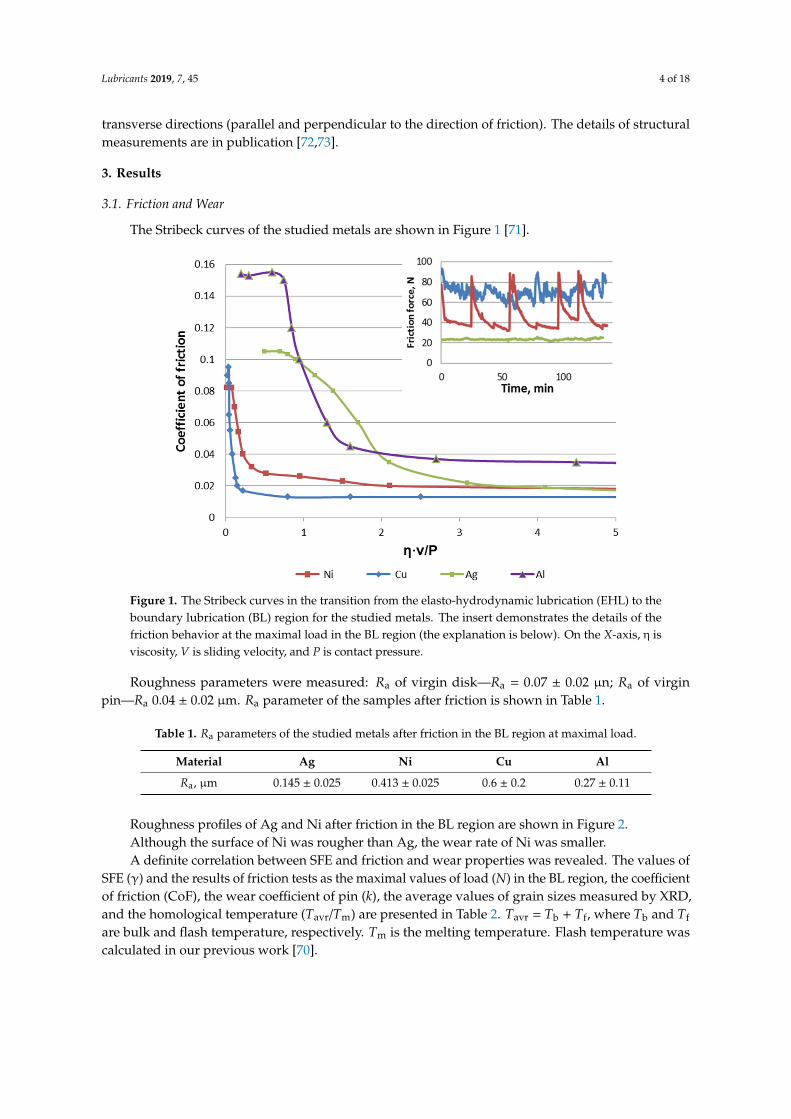
Figure 1. The Stribeck curves in the transition from the elasto-hydrodynamic lubrication (EHL) to the boundary lubrication (BL) region for the studied metals. The insert demonstrates the details of the friction behavior at the maximal load in the BL region (the explanation is below). On the X-axis, η is
viscosity, V is sliding velocity, and P is contact pressure.
Roughness parameters were measured: Ra of virgin disk—Ra = 0.07 ± 0.02 μn; Ra of virgin pin—Ra 0.04 ± 0.02 μm. Ra parameter of the samples after friction is shown in Table 1.
Table 1. Ra parameters of the studied metals after friction in the BL region at maximal load.
Material Ag Ni Cu Al Ra, μm 0.145±0.025 0.413±0.025 0.6±0.2 0.27±0.11
Roughness profiles of Ag and Ni after friction in the BL region are shown in Figure 2.
(a)
Figure 1. The Stribeck curves in the transition from the elasto-hydrodynamic lubrication (EHL) to theboundary lubrication (BL) region for the studied metals. The insert demonstrates the details of thefriction behavior at the maximal load in the BL region (the explanation is below). On the X-axis, η isviscosity, V is sliding velocity, and P is contact pressure.
Roughness parameters were measured: Ra of virgin disk—Ra = 0.07 ± 0.02 µn; Ra of virginpin—Ra 0.04 ± 0.02 µm. Ra parameter of the samples after friction is shown in Table 1.
Table 1. Ra parameters of the studied metals after friction in the BL region at maximal load.
Material Ag Ni Cu Al
Ra, µm 0.145 ± 0.025 0.413 ± 0.025 0.6 ± 0.2 0.27 ± 0.11
Roughness profiles of Ag and Ni after friction in the BL region are shown in Figure 2.Although the surface of Ni was rougher than Ag, the wear rate of Ni was smaller.A definite correlation between SFE and friction and wear properties was revealed. The values of
SFE (γ) and the results of friction tests as the maximal values of load (N) in the BL region, the coefficientof friction (CoF), the wear coefficient of pin (k), the average values of grain sizes measured by XRD,and the homological temperature (Tavr/Tm) are presented in Table 2. Tavr = Tb + Tf, where Tb and Tf
are bulk and flash temperature, respectively. Tm is the melting temperature. Flash temperature wascalculated in our previous work [70].

Lubricants 2019, 7, 45 5 of 18
Lubricants 2018, 6, x FOR PEER REVIEW 4 of 18
longitudinal and the transverse directions (parallel and perpendicular to the direction of friction). The details of structural measurements are in publication [72,73].
3. Results
3.1. Friction and Wear
The Stribeck curves of the studied metals are shown in Figure 1 [71].
Figure 1. The Stribeck curves in the transition from the elasto-hydrodynamic lubrication (EHL) to the boundary lubrication (BL) region for the studied metals. The insert demonstrates the details of the friction behavior at the maximal load in the BL region (the explanation is below). On the X-axis, η is
viscosity, V is sliding velocity, and P is contact pressure.
Roughness parameters were measured: Ra of virgin disk—Ra = 0.07 ± 0.02 μn; Ra of virgin pin—Ra 0.04 ± 0.02 μm. Ra parameter of the samples after friction is shown in Table 1.
Table 1. Ra parameters of the studied metals after friction in the BL region at maximal load.
Material Ag Ni Cu Al Ra, μm 0.145±0.025 0.413±0.025 0.6±0.2 0.27±0.11
Roughness profiles of Ag and Ni after friction in the BL region are shown in Figure 2.
(a)
Lubricants 2018, 6, x FOR PEER REVIEW 5 of 18
(b)
Figure 2. Roughness parameter Ra after friction of Ag (a) and Ni (b).
Although the surface of Ni was rougher than Ag, the wear rate of Ni was smaller. A definite correlation between SFE and friction and wear properties was revealed. The values of
SFE (γ) and the results of friction tests as the maximal values of load (N) in the BL region, the coefficient of friction (CoF), the wear coefficient of pin (k), the average values of grain sizes measured by XRD, and the homological temperature (Tavr/Tm) are presented in Table 2. Tavr = Tb + Tf, where Tb and Tf are bulk and flash temperature, respectively. Tm is the melting temperature. Flash temperature was calculated in our previous work [70].
Table 2. The values of stacking fault energy (SFE), maximal values of load (N) in the BL region, the coefficient of friction (CoF), the wear coefficient of pin (k), the hardness after friction (Hs), the average grain size (d), and the homological temperature (Tavr/Tm). Wear coefficient is k = W × H, where W is wear loss (mm3/Nm) and H is hardness after friction.
SFE, γ mJ/m2 [74,75]
Load, N CoF Wear coefficient, k
Hardness, Hs, GPa
Grain size, d, nm, XRD Tavr/Tm
Al 166 194 ± 34 0.16 ± 0.02 1.05 ×·10−6 0.28 ± 0.03 440 ± 75 0.36 Ag 16 223 ± 23 0.1 ± 0.02 7.05 ×·10−7 0.78 ± 0.12 33 ± 3 0.26 Cu 45 1273 ± 57 0.09 ± 0.01 2.99 ×·10−7 1.5 ± 0.2 63 ± 1 0.28 Ni 125 1820 ± 200 0.08 ± 0.02 1.88 ×·10−8 2.63 ± 0.25 140 ± 3 0.31
It was seen that the transition from the EHL to the BL region occurred at different loads and correlated with the SFE, excluding Al; the lower the SFE was, the lower the load of the transition region and the maximal load of friction in the BL region was. Interestingly, for Cu and Ni (middle and high SFE), the maximal load in the BL region was significantly larger than the load for Ag (low SFE). An inverse proportional connection was observed between the wear coefficient and the non-dimensional SFE parameter; the larger the SFE was, the smaller the value of the wear coefficient was, excluding Al (Figure 3). This suggested that the dependences were determined by the structural evolution depending on the contact pressure and the SFE at a definite homological temperature. Although the maximal loads in the BL region were different for studied materials, the homological temperature was about the same (~0.3) for all studied metals except Al (>0.3).
Figure 2. Roughness parameter Ra after friction of Ag (a) and Ni (b).
Table 2. The values of stacking fault energy (SFE), maximal values of load (N) in the BL region, thecoefficient of friction (CoF), the wear coefficient of pin (k), the hardness after friction (Hs), the averagegrain size (d), and the homological temperature (Tavr/Tm). Wear coefficient is k = W × H, where W iswear loss (mm3/Nm) and H is hardness after friction.
SFE, γ mJ/m2 [74,75] Load, N CoF Wear coefficient, k Hardness, Hs, GPa Grain size, d, nm, XRD Tavr/Tm
Al 166 194 ± 34 0.16 ± 0.02 1.05 × 10⁻⁶ 0.28 ± 0.03 440 ± 75 0.36
Ag 16 223 ± 23 0.1 ± 0.02 7.05 × 10⁻⁷ 0.78 ± 0.12 33 ± 3 0.26
Cu 45 1273 ± 57 0.09 ± 0.01 2.99 × 10⁻⁷ 1.5 ± 0.2 63 ± 1 0.28
Ni 125 1820 ± 200 0.08 ± 0.02 1.88 × 10⁻⁸ 2.63 ± 0.25 140 ± 3 0.31
It was seen that the transition from the EHL to the BL region occurred at different loads andcorrelated with the SFE, excluding Al; the lower the SFE was, the lower the load of the transitionregion and the maximal load of friction in the BL region was. Interestingly, for Cu and Ni (middleand high SFE), the maximal load in the BL region was significantly larger than the load for Ag(low SFE). An inverse proportional connection was observed between the wear coefficient and thenon-dimensional SFE parameter; the larger the SFE was, the smaller the value of the wear coefficientwas, excluding Al (Figure 3). This suggested that the dependences were determined by the structuralevolution depending on the contact pressure and the SFE at a definite homological temperature.Although the maximal loads in the BL region were different for studied materials, the homologicaltemperature was about the same (~0.3) for all studied metals except Al (>0.3).
The effect of steady-state grain size, ds, on the wear coefficient is outlined in Figure 4.It could be seen that Ag with a minimal value of SFE was refined up to a minimal value of grain
size during severe plastic deformation in the BL region, while the maximal value of grain size appearedfor Al with a maximal value of SFE. It should be noted that all fcc metals—except Al—rubbed atclose to the same homological temperature (≤0.3) in the BL region, and thus friction and wear weredetermined by the evolution of deformed structure and damage development in our simplified model.Since SFE strongly affected plastic deformation and thus grain size, the interaction between theseparameters was considered (Figure 5).

Lubricants 2019, 7, 45 6 of 18Lubricants 2018, 6, x FOR PEER REVIEW 6 of 18
Figure 3. The effect of the non-dimensional SFE parameter, γ/bG, on the wear coefficient.
The effect of steady-state grain size, ds, on the wear coefficient is outlined in Figure 4.
Figure 4. The effect of the steady-state grain size, ds (XRD), on the wear coefficient.
It could be seen that Ag with a minimal value of SFE was refined up to a minimal value of grain size during severe plastic deformation in the BL region, while the maximal value of grain size appeared for Al with a maximal value of SFE. It should be noted that all fcc metals—except Al—rubbed at close to the same homological temperature (≤0.3) in the BL region, and thus friction and wear were determined by the evolution of deformed structure and damage development in our simplified model. Since SFE strongly affected plastic deformation and thus grain size, the interaction between these parameters was considered (Figure 5).
Figure 3. The effect of the non-dimensional SFE parameter, γ/bG, on the wear coefficient.
Lubricants 2018, 6, x FOR PEER REVIEW 6 of 18
Figure 3. The effect of the non-dimensional SFE parameter, γ/bG, on the wear coefficient.
The effect of steady-state grain size, ds, on the wear coefficient is outlined in Figure 4.
Figure 4. The effect of the steady-state grain size, ds (XRD), on the wear coefficient.
It could be seen that Ag with a minimal value of SFE was refined up to a minimal value of grain size during severe plastic deformation in the BL region, while the maximal value of grain size appeared for Al with a maximal value of SFE. It should be noted that all fcc metals—except Al—rubbed at close to the same homological temperature (≤0.3) in the BL region, and thus friction and wear were determined by the evolution of deformed structure and damage development in our simplified model. Since SFE strongly affected plastic deformation and thus grain size, the interaction between these parameters was considered (Figure 5).
Figure 4. The effect of the steady-state grain size, ds (XRD), on the wear coefficient.Lubricants 2018, 6, x FOR PEER REVIEW 7 of 18
Figure 5. The interaction between the grain size of the studied metals after friction in the BL region and SFE.
A strong correlation between non-dimensional grain size and SFE was observed.
3.2. Analysis of Acoustic Emission in the Transition from EHL to BL Conditions
To better understand the mechanisms of friction in the EHL and the BL regions, the AE signals were evaluated for metals with low and high SFE (Ag and Ni, [70]). The AE waveforms were evaluated in the EHL and the BL regions (Figure 6).
(a) (b)
(c) (d)
Figure 6. The acoustic emissions (AE) under EHL (a, b) and BL (c, d) friction regions for Ag (a, c) and Ni (b, d).
Large amplitude (Am) and low frequency (fm) were observed during friction in the EHL region of Ag and Ni (Figure 6a,b). Low frequency (~2.5 kHz) appeared both for Ag and Ni. Interestingly, the contact loads were principally different during friction in the EHL region. High frequency AE signals (Aμ) were also evaluated in the EHL region. Small Aμ values were revealed just under friction of Ni (Figure 6b). Friction in the BL region was accompanied by an increase in Am and Aμ, especially during friction of Ni (Figure 6d). It was expected that two different amplitudes characterized different processes of plastic deformation and damage development. At this stage, it was reasonable to anticipate that low-frequency AE signals mainly characterized the shearing in macroscale, while high-frequency signals indicated the plastic deformation in microscale. The AE waveforms during friction in the EHL and the BL regions were carefully analyzed. If the same low-frequency ranges (8–
Figure 5. The interaction between the grain size of the studied metals after friction in the BL regionand SFE.
A strong correlation between non-dimensional grain size and SFE was observed.

Lubricants 2019, 7, 45 7 of 18
3.2. Analysis of Acoustic Emission in the Transition from EHL to BL Conditions
To better understand the mechanisms of friction in the EHL and the BL regions, the AE signalswere evaluated for metals with low and high SFE (Ag and Ni, [70]). The AE waveforms were evaluatedin the EHL and the BL regions (Figure 6).
Lubricants 2018, 6, x FOR PEER REVIEW 7 of 18
Figure 5. The interaction between the grain size of the studied metals after friction in the BL region and SFE.
A strong correlation between non-dimensional grain size and SFE was observed.
3.2. Analysis of Acoustic Emission in the Transition from EHL to BL Conditions
To better understand the mechanisms of friction in the EHL and the BL regions, the AE signals were evaluated for metals with low and high SFE (Ag and Ni, [70]). The AE waveforms were evaluated in the EHL and the BL regions (Figure 6).
(a) (b)
(c) (d)
Figure 6. The acoustic emissions (AE) under EHL (a, b) and BL (c, d) friction regions for Ag (a, c) and Ni (b, d).
Large amplitude (Am) and low frequency (fm) were observed during friction in the EHL region of Ag and Ni (Figure 6a,b). Low frequency (~2.5 kHz) appeared both for Ag and Ni. Interestingly, the contact loads were principally different during friction in the EHL region. High frequency AE signals (Aμ) were also evaluated in the EHL region. Small Aμ values were revealed just under friction of Ni (Figure 6b). Friction in the BL region was accompanied by an increase in Am and Aμ, especially during friction of Ni (Figure 6d). It was expected that two different amplitudes characterized different processes of plastic deformation and damage development. At this stage, it was reasonable to anticipate that low-frequency AE signals mainly characterized the shearing in macroscale, while high-frequency signals indicated the plastic deformation in microscale. The AE waveforms during friction in the EHL and the BL regions were carefully analyzed. If the same low-frequency ranges (8–
Figure 6. The acoustic emissions (AE) under EHL (a,b) and BL (c,d) friction regions for Ag (a,c) andNi (b,d).
Large amplitude (Am) and low frequency (f m) were observed during friction in the EHL region ofAg and Ni (Figure 6a,b). Low frequency (~2.5 kHz) appeared both for Ag and Ni. Interestingly, thecontact loads were principally different during friction in the EHL region. High frequency AE signals(Aµ) were also evaluated in the EHL region. Small Aµ values were revealed just under friction ofNi (Figure 6b). Friction in the BL region was accompanied by an increase in Am and Aµ, especiallyduring friction of Ni (Figure 6d). It was expected that two different amplitudes characterized differentprocesses of plastic deformation and damage development. At this stage, it was reasonable to anticipatethat low-frequency AE signals mainly characterized the shearing in macroscale, while high-frequencysignals indicated the plastic deformation in microscale. The AE waveforms during friction in theEHL and the BL regions were carefully analyzed. If the same low-frequency ranges (8–12 kHz) wereobserved during friction of Ag and Ni in the EHL region, the principal difference was revealed in theBL region: 8–16 kHz and 8–512 kHz for Ag and Ni, respectively.
The interesting phenomenon of jumps in the friction force during tests in the BL region for Ni andCu (see insert in Figure 1) was carefully studied. The friction coefficient for Ni was decreased from themaximal value (µ = 0.08) at a relatively high average temperature (103 ◦C) compared to that at thelow friction point (µ = 0.05). At this point, the temperature was decreased to about 50 ◦C, leading toincreased viscosity and the transition to mixed lubrication (ML). Interestingly, the height of jumps wasdecreased with the SFE decreasing (Cu) and was diminished for Ag. It was assumed that a frictionforce decreasing in the range of jumps was determined by the softening of high-deformed thin layers.In order to evaluate the process of softening occurring in the relatively high temperature during frictionof Ni in the BL region, the samples were heated after friction in steps of 20 ◦C with measurements ofthe hardness values taken at each temperature. It was found that the hardness of Ni after friction in theBL and following annealing at the contact temperature, T = 240 ◦C (~0.14Tm), was decreased from2700 MPa to 1700 MPa. A similar phenomenon of dynamic recrystallization of the grain refined Cuwas observed at T = 153 ◦C [76]. In order to better understand the transition from one lubricant regionto another, the sliding velocity in the BL region was increased from 300 rpm to 800 rpm (Figure 7).At the maximal sliding velocity, the friction coefficient was decreased practically to the same shape asthe EHL waveform (µ = 0.02), which confirmed the relative ease of shearing in the direct contact spots(Figure 6b). In the BL region of Ni, the number of contact spots increased, and the values of the lowfrequency waves (f m) were also increased.

Lubricants 2019, 7, 45 8 of 18
Lubricants 2018, 6, x FOR PEER REVIEW 8 of 18
12 kHz) were observed during friction of Ag and Ni in the EHL region, the principal difference was revealed in the BL region: 8–16 kHz and 8–512 kHz for Ag and Ni, respectively.
The interesting phenomenon of jumps in the friction force during tests in the BL region for Ni and Cu (see insert in Figure 1) was carefully studied. The friction coefficient for Ni was decreased from the maximal value (μ = 0.08) at a relatively high average temperature (103 °C) compared to that at the low friction point (μ = 0.05). At this point, the temperature was decreased to about 50 °C, leading to increased viscosity and the transition to mixed lubrication (ML). Interestingly, the height of jumps was decreased with the SFE decreasing (Cu) and was diminished for Ag. It was assumed that a friction force decreasing in the range of jumps was determined by the softening of high-deformed thin layers. In order to evaluate the process of softening occurring in the relatively high temperature during friction of Ni in the BL region, the samples were heated after friction in steps of 20 °C with measurements of the hardness values taken at each temperature. It was found that the hardness of Ni after friction in the BL and following annealing at the contact temperature, T = 240 °C (~0.14Tm), was decreased from 2700 MPa to 1700 MPa. A similar phenomenon of dynamic recrystallization of the grain refined Cu was observed at T = 153 °C [76]. In order to better understand the transition from one lubricant region to another, the sliding velocity in the BL region was increased from 300 rpm to 800 rpm (Figure 7). At the maximal sliding velocity, the friction coefficient was decreased practically to the same shape as the EHL waveform (μ = 0.02), which confirmed the relative ease of shearing in the direct contact spots (Figure 6b). In the BL region of Ni, the number of contact spots increased, and the values of the low frequency waves (fm) were also increased.
(a) (b)
Figure 7. (a) The AE waveforms after friction of Ni in the mixed lubrication (ML) region (n = 300 rpm, N = 1710 N) and (b) the transition to the EHL region (n = 800 rpm, N = 1710 N).
Thus, it was suggested that the jumps in the friction force of metals with relatively high SFE were associated with deformation hardening and dynamic recovery in the BL region.
3.3. Deformed Structure of Studied fcc Metals after Friction in the BL Region
Cross-sectional images of deformed surface layers after friction in the BL region were studied parallel and perpendicular to the direction of friction [72,73]. The TEM cross-sectional images of thin surface layers parallel to the direction of friction are shown in Figure 8.
(a) (b)
Figure 7. (a) The AE waveforms after friction of Ni in the mixed lubrication (ML) region (n = 300 rpm,N = 1710 N) and (b) the transition to the EHL region (n = 800 rpm, N = 1710 N).
Thus, it was suggested that the jumps in the friction force of metals with relatively high SFE wereassociated with deformation hardening and dynamic recovery in the BL region.
3.3. Deformed Structure of Studied fcc Metals after Friction in the BL Region
Cross-sectional images of deformed surface layers after friction in the BL region were studiedparallel and perpendicular to the direction of friction [72,73]. The TEM cross-sectional images of thinsurface layers parallel to the direction of friction are shown in Figure 8.
Lubricants 2018, 6, x FOR PEER REVIEW 8 of 18
12 kHz) were observed during friction of Ag and Ni in the EHL region, the principal difference was revealed in the BL region: 8–16 kHz and 8–512 kHz for Ag and Ni, respectively.
The interesting phenomenon of jumps in the friction force during tests in the BL region for Ni and Cu (see insert in Figure 1) was carefully studied. The friction coefficient for Ni was decreased from the maximal value (μ = 0.08) at a relatively high average temperature (103 °C) compared to that at the low friction point (μ = 0.05). At this point, the temperature was decreased to about 50 °C, leading to increased viscosity and the transition to mixed lubrication (ML). Interestingly, the height of jumps was decreased with the SFE decreasing (Cu) and was diminished for Ag. It was assumed that a friction force decreasing in the range of jumps was determined by the softening of high-deformed thin layers. In order to evaluate the process of softening occurring in the relatively high temperature during friction of Ni in the BL region, the samples were heated after friction in steps of 20 °C with measurements of the hardness values taken at each temperature. It was found that the hardness of Ni after friction in the BL and following annealing at the contact temperature, T = 240 °C (~0.14Tm), was decreased from 2700 MPa to 1700 MPa. A similar phenomenon of dynamic recrystallization of the grain refined Cu was observed at T = 153 °C [76]. In order to better understand the transition from one lubricant region to another, the sliding velocity in the BL region was increased from 300 rpm to 800 rpm (Figure 7). At the maximal sliding velocity, the friction coefficient was decreased practically to the same shape as the EHL waveform (μ = 0.02), which confirmed the relative ease of shearing in the direct contact spots (Figure 6b). In the BL region of Ni, the number of contact spots increased, and the values of the low frequency waves (fm) were also increased.
(a) (b)
Figure 7. (a) The AE waveforms after friction of Ni in the mixed lubrication (ML) region (n = 300 rpm, N = 1710 N) and (b) the transition to the EHL region (n = 800 rpm, N = 1710 N).
Thus, it was suggested that the jumps in the friction force of metals with relatively high SFE were associated with deformation hardening and dynamic recovery in the BL region.
3.3. Deformed Structure of Studied fcc Metals after Friction in the BL Region
Cross-sectional images of deformed surface layers after friction in the BL region were studied parallel and perpendicular to the direction of friction [72,73]. The TEM cross-sectional images of thin surface layers parallel to the direction of friction are shown in Figure 8.
(a) (b) Lubricants 2018, 6, x FOR PEER REVIEW 9 of 18
(c) (d)
Figure 8. Cross-sectional TEM images of top surface layers of Ag (a), Cu (b), Ni (c), and Al (d) after friction. Directions of friction for Ag and iron wear particles in surface layers of Al are shown by
arrows.
The size of grains and the thickness of high-deformed layers after friction depended mainly on the SFE. With SFE increasing from Ag to Cu and Ni, the thickness of these layers decreased. The average grain size increased from ~20 nm for Ag to 100–300 nm for Cu and Ni (Figure 8b,c). The subgrains in the top layers of Cu and Ni were confined by well-developed boundaries and a large amount of dislocation tangles in their interior. The average grain size of the top surface layers increased from ~100–200 nm for Cu and Ni to 1–3 μm below the damaged layer for Al. Friction of Al was accompanied by strong oxidation of the top surface layers [71]. It was shown that these layers could present well-pressed and sheared Al oxidized wear particles and some penetrated wear iron particles (Figure 8d). The size of noted wear particles was ~0.5–1 μm. Therefore, the behavior of Al during friction was different in comparison to other studied metals. Frequency distributions of grain sizes in the depth close to 500 nm for Ag and Ni (minimal and maximal SFE) are shown in Figure 9 [72].
(a) (b)
Figure 9. Frequency distribution of grain sizes in the depth of 500 nm for Ag (a) and Ni (b) after friction in the BL region.
The maximal amount of grains for Ag with sizes 30–60 nm was observed in the depth of 500 nm (Figure 9a), while friction of Ni was characterized by a much larger range of grain sizes (~170–370 nm) (Figure 9b). With depth of deformation, a transition to lamellar structure for Ag, Cu, and Ni was revealed (Figure 10).
Figure 8. Cross-sectional TEM images of top surface layers of Ag (a), Cu (b), Ni (c), and Al (d) afterfriction. Directions of friction for Ag and iron wear particles in surface layers of Al are shown by arrows.
The size of grains and the thickness of high-deformed layers after friction depended mainly on theSFE. With SFE increasing from Ag to Cu and Ni, the thickness of these layers decreased. The averagegrain size increased from ~20 nm for Ag to 100–300 nm for Cu and Ni (Figure 8b,c). The subgrains in the

Lubricants 2019, 7, 45 9 of 18
top layers of Cu and Ni were confined by well-developed boundaries and a large amount of dislocationtangles in their interior. The average grain size of the top surface layers increased from ~100–200 nmfor Cu and Ni to 1–3 µm below the damaged layer for Al. Friction of Al was accompanied by strongoxidation of the top surface layers [71]. It was shown that these layers could present well-pressed andsheared Al oxidized wear particles and some penetrated wear iron particles (Figure 8d). The size ofnoted wear particles was ~0.5–1 µm. Therefore, the behavior of Al during friction was different incomparison to other studied metals. Frequency distributions of grain sizes in the depth close to 500 nmfor Ag and Ni (minimal and maximal SFE) are shown in Figure 9 [72].
Lubricants 2018, 6, x FOR PEER REVIEW 9 of 18
(c) (d)
Figure 8. Cross-sectional TEM images of top surface layers of Ag (a), Cu (b), Ni (c), and Al (d) after friction. Directions of friction for Ag and iron wear particles in surface layers of Al are shown by
arrows.
The size of grains and the thickness of high-deformed layers after friction depended mainly on the SFE. With SFE increasing from Ag to Cu and Ni, the thickness of these layers decreased. The average grain size increased from ~20 nm for Ag to 100–300 nm for Cu and Ni (Figure 8b,c). The subgrains in the top layers of Cu and Ni were confined by well-developed boundaries and a large amount of dislocation tangles in their interior. The average grain size of the top surface layers increased from ~100–200 nm for Cu and Ni to 1–3 μm below the damaged layer for Al. Friction of Al was accompanied by strong oxidation of the top surface layers [71]. It was shown that these layers could present well-pressed and sheared Al oxidized wear particles and some penetrated wear iron particles (Figure 8d). The size of noted wear particles was ~0.5–1 μm. Therefore, the behavior of Al during friction was different in comparison to other studied metals. Frequency distributions of grain sizes in the depth close to 500 nm for Ag and Ni (minimal and maximal SFE) are shown in Figure 9 [72].
(a) (b)
Figure 9. Frequency distribution of grain sizes in the depth of 500 nm for Ag (a) and Ni (b) after friction in the BL region.
The maximal amount of grains for Ag with sizes 30–60 nm was observed in the depth of 500 nm (Figure 9a), while friction of Ni was characterized by a much larger range of grain sizes (~170–370 nm) (Figure 9b). With depth of deformation, a transition to lamellar structure for Ag, Cu, and Ni was revealed (Figure 10).
Figure 9. Frequency distribution of grain sizes in the depth of 500 nm for Ag (a) and Ni (b) after frictionin the BL region.
The maximal amount of grains for Ag with sizes 30–60 nm was observed in the depth of 500 nm(Figure 9a), while friction of Ni was characterized by a much larger range of grain sizes (~170–370 nm)(Figure 9b). With depth of deformation, a transition to lamellar structure for Ag, Cu, and Ni wasrevealed (Figure 10).Lubricants 2018, 6, x FOR PEER REVIEW 10 of 18
(a) (b)
Figure 10. Cross-sectional TEM images demonstrate the transitions from practically equiaxial to lamellar microstructure of Ag (a) and from the inhomogeneous to the lamellar microstructure of Ni (b). Direction of friction is indicated by the arrow.
The lamellar structure consisted of strongly elongated subgrain/cells containing a high number of dislocations separated by sharp grain boundaries. The microcracks appeared in some grain boundaries. The lamellar structure was absent in Al surface layers.
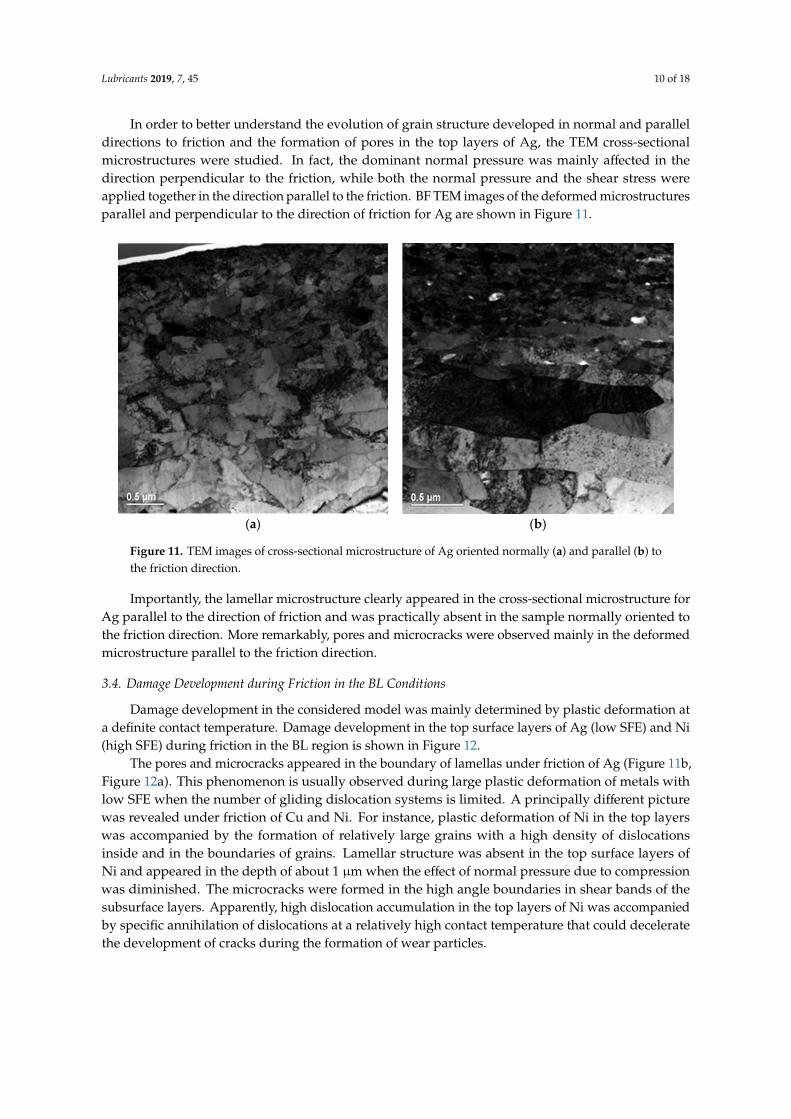
In order to better understand the evolution of grain structure developed in normal and parallel directions to friction and the formation of pores in the top layers of Ag, the TEM cross-sectional microstructures were studied. In fact, the dominant normal pressure was mainly affected in the direction perpendicular to the friction, while both the normal pressure and the shear stress were applied together in the direction parallel to the friction. BF TEM images of the deformed microstructures parallel and perpendicular to the direction of friction for Ag are shown in Figure 11.
(a) (b)
Figure 11. TEM images of cross-sectional microstructure of Ag oriented normally (a) and parallel (b) to the friction direction.
Importantly, the lamellar microstructure clearly appeared in the cross-sectional microstructure for Ag parallel to the direction of friction and was practically absent in the sample normally oriented to the friction direction. More remarkably, pores and microcracks were observed mainly in the deformed microstructure parallel to the friction direction.
Figure 10. Cross-sectional TEM images demonstrate the transitions from practically equiaxial tolamellar microstructure of Ag (a) and from the inhomogeneous to the lamellar microstructure of Ni (b).Direction of friction is indicated by the arrow.
The lamellar structure consisted of strongly elongated subgrain/cells containing a high number ofdislocations separated by sharp grain boundaries. The microcracks appeared in some grain boundaries.The lamellar structure was absent in Al surface layers.
Lubricants 2019, 7, 45 10 of 18
In order to better understand the evolution of grain structure developed in normal and paralleldirections to friction and the formation of pores in the top layers of Ag, the TEM cross-sectionalmicrostructures were studied. In fact, the dominant normal pressure was mainly affected in thedirection perpendicular to the friction, while both the normal pressure and the shear stress wereapplied together in the direction parallel to the friction. BF TEM images of the deformed microstructuresparallel and perpendicular to the direction of friction for Ag are shown in Figure 11.
Lubricants 2018, 6, x FOR PEER REVIEW 10 of 18
(a) (b)
Figure 10. Cross-sectional TEM images demonstrate the transitions from practically equiaxial to lamellar microstructure of Ag (a) and from the inhomogeneous to the lamellar microstructure of Ni (b). Direction of friction is indicated by the arrow.
The lamellar structure consisted of strongly elongated subgrain/cells containing a high number of dislocations separated by sharp grain boundaries. The microcracks appeared in some grain boundaries. The lamellar structure was absent in Al surface layers.
In order to better understand the evolution of grain structure developed in normal and parallel directions to friction and the formation of pores in the top layers of Ag, the TEM cross-sectional microstructures were studied. In fact, the dominant normal pressure was mainly affected in the direction perpendicular to the friction, while both the normal pressure and the shear stress were applied together in the direction parallel to the friction. BF TEM images of the deformed microstructures parallel and perpendicular to the direction of friction for Ag are shown in Figure 11.
(a) (b)
Figure 11. TEM images of cross-sectional microstructure of Ag oriented normally (a) and parallel (b) to the friction direction.
Importantly, the lamellar microstructure clearly appeared in the cross-sectional microstructure for Ag parallel to the direction of friction and was practically absent in the sample normally oriented to the friction direction. More remarkably, pores and microcracks were observed mainly in the deformed microstructure parallel to the friction direction.
Figure 11. TEM images of cross-sectional microstructure of Ag oriented normally (a) and parallel (b) tothe friction direction.
Importantly, the lamellar microstructure clearly appeared in the cross-sectional microstructure forAg parallel to the direction of friction and was practically absent in the sample normally oriented tothe friction direction. More remarkably, pores and microcracks were observed mainly in the deformedmicrostructure parallel to the friction direction.
3.4. Damage Development during Friction in the BL Conditions
Damage development in the considered model was mainly determined by plastic deformation ata definite contact temperature. Damage development in the top surface layers of Ag (low SFE) and Ni(high SFE) during friction in the BL region is shown in Figure 12.
The pores and microcracks appeared in the boundary of lamellas under friction of Ag (Figure 11b,Figure 12a). This phenomenon is usually observed during large plastic deformation of metals withlow SFE when the number of gliding dislocation systems is limited. A principally different picturewas revealed under friction of Cu and Ni. For instance, plastic deformation of Ni in the top layerswas accompanied by the formation of relatively large grains with a high density of dislocationsinside and in the boundaries of grains. Lamellar structure was absent in the top surface layers ofNi and appeared in the depth of about 1 µm when the effect of normal pressure due to compressionwas diminished. The microcracks were formed in the high angle boundaries in shear bands of thesubsurface layers. Apparently, high dislocation accumulation in the top layers of Ni was accompaniedby specific annihilation of dislocations at a relatively high contact temperature that could deceleratethe development of cracks during the formation of wear particles.
Lubricants 2019, 7, 45 11 of 18
Lubricants 2018, 6, x FOR PEER REVIEW 11 of 18
3.4. Damage Development during Friction in the BL Conditions
Damage development in the considered model was mainly determined by plastic deformation at a definite contact temperature. Damage development in the top surface layers of Ag (low SFE) and Ni (high SFE) during friction in the BL region is shown in Figure 12.
(a) (b)
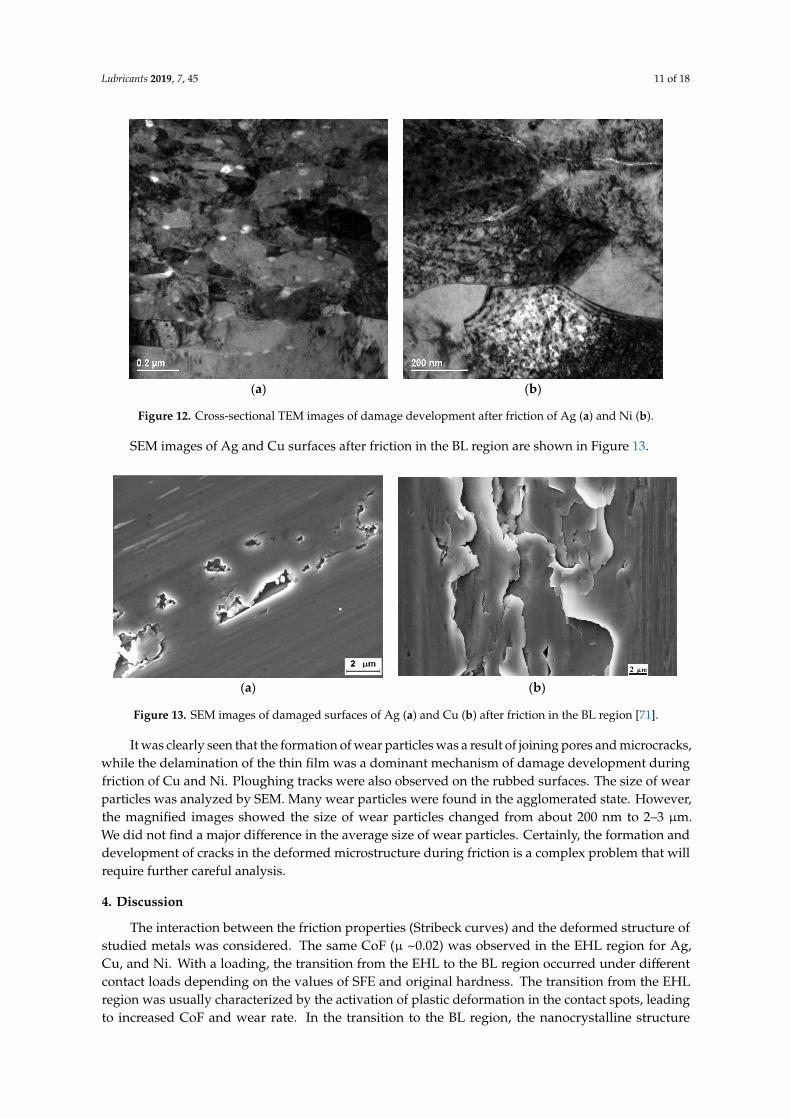
Figure 12. Cross-sectional TEM images of damage development after friction of Ag (a) and Ni (b).
The pores and microcracks appeared in the boundary of lamellas under friction of Ag (Figures 11b, 12a). This phenomenon is usually observed during large plastic deformation of metals with low SFE when the number of gliding dislocation systems is limited. A principally different picture was revealed under friction of Cu and Ni. For instance, plastic deformation of Ni in the top layers was accompanied by the formation of relatively large grains with a high density of dislocations inside and in the boundaries of grains. Lamellar structure was absent in the top surface layers of Ni and appeared in the depth of about 1 μm when the effect of normal pressure due to compression was diminished. The microcracks were formed in the high angle boundaries in shear bands of the subsurface layers. Apparently, high dislocation accumulation in the top layers of Ni was accompanied by specific annihilation of dislocations at a relatively high contact temperature that could decelerate the development of cracks during the formation of wear particles.
(a) (b)
Figure 13. SEM images of damaged surfaces of Ag (a) and Cu (b) after friction in the BL region [71].
SEM images of Ag and Cu surfaces after friction in the BL region are shown in Figure 13. It was clearly seen that the formation of wear particles was a result of joining pores and
microcracks, while the delamination of the thin film was a dominant mechanism of damage
Figure 12. Cross-sectional TEM images of damage development after friction of Ag (a) and Ni (b).
SEM images of Ag and Cu surfaces after friction in the BL region are shown in Figure 13.
Lubricants 2018, 6, x FOR PEER REVIEW 11 of 18
3.4. Damage Development during Friction in the BL Conditions
Damage development in the considered model was mainly determined by plastic deformation at a definite contact temperature. Damage development in the top surface layers of Ag (low SFE) and Ni (high SFE) during friction in the BL region is shown in Figure 12.
(a) (b)
Figure 12. Cross-sectional TEM images of damage development after friction of Ag (a) and Ni (b).
The pores and microcracks appeared in the boundary of lamellas under friction of Ag (Figures 11b, 12a). This phenomenon is usually observed during large plastic deformation of metals with low SFE when the number of gliding dislocation systems is limited. A principally different picture was revealed under friction of Cu and Ni. For instance, plastic deformation of Ni in the top layers was accompanied by the formation of relatively large grains with a high density of dislocations inside and in the boundaries of grains. Lamellar structure was absent in the top surface layers of Ni and appeared in the depth of about 1 μm when the effect of normal pressure due to compression was diminished. The microcracks were formed in the high angle boundaries in shear bands of the subsurface layers. Apparently, high dislocation accumulation in the top layers of Ni was accompanied by specific annihilation of dislocations at a relatively high contact temperature that could decelerate the development of cracks during the formation of wear particles.
(a) (b)
Figure 13. SEM images of damaged surfaces of Ag (a) and Cu (b) after friction in the BL region [71].
SEM images of Ag and Cu surfaces after friction in the BL region are shown in Figure 13. It was clearly seen that the formation of wear particles was a result of joining pores and
microcracks, while the delamination of the thin film was a dominant mechanism of damage
Figure 13. SEM images of damaged surfaces of Ag (a) and Cu (b) after friction in the BL region [71].
It was clearly seen that the formation of wear particles was a result of joining pores and microcracks,while the delamination of the thin film was a dominant mechanism of damage development duringfriction of Cu and Ni. Ploughing tracks were also observed on the rubbed surfaces. The size of wearparticles was analyzed by SEM. Many wear particles were found in the agglomerated state. However,the magnified images showed the size of wear particles changed from about 200 nm to 2–3 µm.We did not find a major difference in the average size of wear particles. Certainly, the formation anddevelopment of cracks in the deformed microstructure during friction is a complex problem that willrequire further careful analysis.
4. Discussion
The interaction between the friction properties (Stribeck curves) and the deformed structure ofstudied metals was considered. The same CoF (µ ~0.02) was observed in the EHL region for Ag,Cu, and Ni. With a loading, the transition from the EHL to the BL region occurred under differentcontact loads depending on the values of SFE and original hardness. The transition from the EHLregion was usually characterized by the activation of plastic deformation in the contact spots, leadingto increased CoF and wear rate. In the transition to the BL region, the nanocrystalline structure

Lubricants 2019, 7, 45 12 of 18
was formed in the top surface layers of Ag. This deformation structure with fairly equal grainsand a large number of pores mainly in grain boundaries was preserved during loading in the BLregion. Dynamic recovery was not observed in the top surface layers of Ag. Apparently, the dynamicrecovery was limited due to cross-slip and splitting of full dislocations into partials containing a widestacking fault ribbon during friction of Ag, similar to the SPD processes in metal and alloys with lowSFE [76–78]. The limited dynamic recovery indicated a large hardening rate in the surface layers ofAg, thus explaining the low load in the transition from the EHL to the BL region. In comparison toAg, the loads of transition to the BL region were significantly larger for Cu and Ni (Table 2). Frictionof Cu and Ni was accompanied by the formation of inhomogeneous microstructures with large andsmall grains in the top surface layers. This was similar to the microstructure achieved due to thermallyactivated processes of rearrangement and annihilation of dislocations for fcc metals with relatively highvalues of SFE and contact temperature (382 and 540 K for Cu and Ni, respectively). Formation of theinhomogeneous structures indicated the dynamic recovery occurring during friction of Cu and Ni in theBL region. In fact, the hardness of the deformed layers of Ni was significantly decreased after annealingof the deformed structure of the surface layers at a relatively low temperature (0.14Tm), similar tothat observed during annealing of refined Cu after refinement [79]. The hardness decrease and theformation of inhomogeneous structures with large and small grain structures at a low temperatureindicated the dynamic recovery in the surface layers.
It was shown that the inhomogeneous structure provided both the high strength and the ductilityof deformed metals and alloys [36,40]. Therefore, it was reasonable to anticipate that high wearresistance of Cu and Ni in relation to Ag was obtained due to the high strength and the ductility of theinhomogeneous structure.
Friction in the BL region was characterized by a steady-friction state when a constant value ofCoF was preserved with loading. This steady-state region was determined by the balance betweenaccumulation and annihilation of dislocations or balance between hardening and softening [70–73].This balance strongly depended on SFE and contact temperature.
High hardness indicated localization of the deformation in the thin surface layers, while definitesoftening led to ease shearing. The presented simplified model was based on the simultaneousdeformation hardening and softening during friction in the BL region. Based on the analysis of thedeformed microstructure of four fcc metals during friction in the BL region, it was concluded [71] that:
Hs − Hv = ∆H = Hhardening − Hsoftening (1)
where Hs is the hardness after friction, and Hv is the hardness before the friction. Remarkably, the finalvalue of hardness was determined both by the maximal value of hardening, Hhardening, and the specificvalue of softening, Hsoftening, at close to the same homological temperatures. Again, this simplifiedmodel was based on the dominant role of plastic deformation and damage development during frictionin the BL region when the effect of tribochemistry in a smooth contact asperity was limited.
The results of wear experiments for four fcc metals indicated much lower values of wear coefficientsfor the metals with higher values of SFE (Cu and Ni), excluding Al. The main problem in the applicationof the presented model was a difficulty in the evaluation of the structural parameters determining thedeformation hardening and the dynamic recovery.
Friction and wear were determined both by the normal pressure and the shear stress. In orderto better understand the effect of shear stress and normal pressure on the deformed microstructure,cross-sectional TEM images, oriented normally and parallel to the direction of friction, were compared.Formation of the lamellar structure in the direction of friction indicated the dominant role of shearstress in the direction of friction. Lamellar structure and shear bands ultimately led to instability anddamage development during friction and wear. From the other side, the dynamic recovery responsiblefor ease shearing improved the lubricity of the surface layers.
The main dominant mechanisms of damage development during friction of Ag, Cu, and Ni weredelamination and ploughing. It was expected that the size of single wear particles would be close

Lubricants 2019, 7, 45 13 of 18
to the grain size. In our evaluation, the single wear particles were close to 200 nm. However, manywear particles were in the agglomerated state. Recent analysis of wear particles during friction ofsteel–brass and steel–steel sliding pairs in the BL region showed wear particles close to 200 nm [80].TEM analysis of the grain sizes in the deformed surface layers varied from 20 to 400 nm. Therefore,it could be suggested that the wear particles corresponded to the sizes of grain in the studied metalsduring friction in the BL conditions.
Friction and wear properties of Al, as well as the damage development, were different incomparison to Ag, Cu, and Ni and were determined by strong oxidation of surface layers with theformation of a thick third body of pressed wear particles [73].
In order to evaluate the transition from one lubricant region to another, AE signals were estimated.Noise signals appeared just in the point of mechanical interaction of the contact spots. The models ofcontact interaction during friction in the EHL and the BL conditions were considered based on theanalysis of the AE parameters (Figures 14–16) [70].
Lubricants 2018, 6, x FOR PEER REVIEW 13 of 18
during friction in the BL region when the effect of tribochemistry in a smooth contact asperity was limited.
The results of wear experiments for four fcc metals indicated much lower values of wear coefficients for the metals with higher values of SFE (Cu and Ni), excluding Al. The main problem in the application of the presented model was a difficulty in the evaluation of the structural parameters determining the deformation hardening and the dynamic recovery.
Friction and wear were determined both by the normal pressure and the shear stress. In order to better understand the effect of shear stress and normal pressure on the deformed microstructure, cross-sectional TEM images, oriented normally and parallel to the direction of friction, were compared. Formation of the lamellar structure in the direction of friction indicated the dominant role of shear stress in the direction of friction. Lamellar structure and shear bands ultimately led to instability and damage development during friction and wear. From the other side, the dynamic recovery responsible for ease shearing improved the lubricity of the surface layers.
The main dominant mechanisms of damage development during friction of Ag, Cu, and Ni were delamination and ploughing. It was expected that the size of single wear particles would be close to the grain size. In our evaluation, the single wear particles were close to 200 nm. However, many wear particles were in the agglomerated state. Recent analysis of wear particles during friction of steel–brass and steel–steel sliding pairs in the BL region showed wear particles close to 200 nm [80]. TEM analysis of the grain sizes in the deformed surface layers varied from 20 to 400 nm. Therefore, it could be suggested that the wear particles corresponded to the sizes of grain in the studied metals during friction in the BL conditions.
Friction and wear properties of Al, as well as the damage development, were different in comparison to Ag, Cu, and Ni and were determined by strong oxidation of surface layers with the formation of a thick third body of pressed wear particles [73].
In order to evaluate the transition from one lubricant region to another, AE signals were estimated. Noise signals appeared just in the point of mechanical interaction of the contact spots. The models of contact interaction during friction in the EHL and the BL conditions were considered based on the analysis of the AE parameters (Figures 14–16) [70].
Figure 14. The macroscale model of the EHL region and the corresponding waveform.
At the points of direct contact, the level of AE signals increased. An absence of high frequency signals indicated the limited plastic deformation in the EHL conditions. During friction of Ag in the BL region, the low frequency wave was just increased from 2.5 kHz in the EHL to 5 kHz under the BL conditions (Figure 15).
Figure 14. The macroscale model of the EHL region and the corresponding waveform.Lubricants 2018, 6, x FOR PEER REVIEW 14 of 18
Figure 15. Macroscale model of the BL region and the corresponding waveform under friction of Ag.
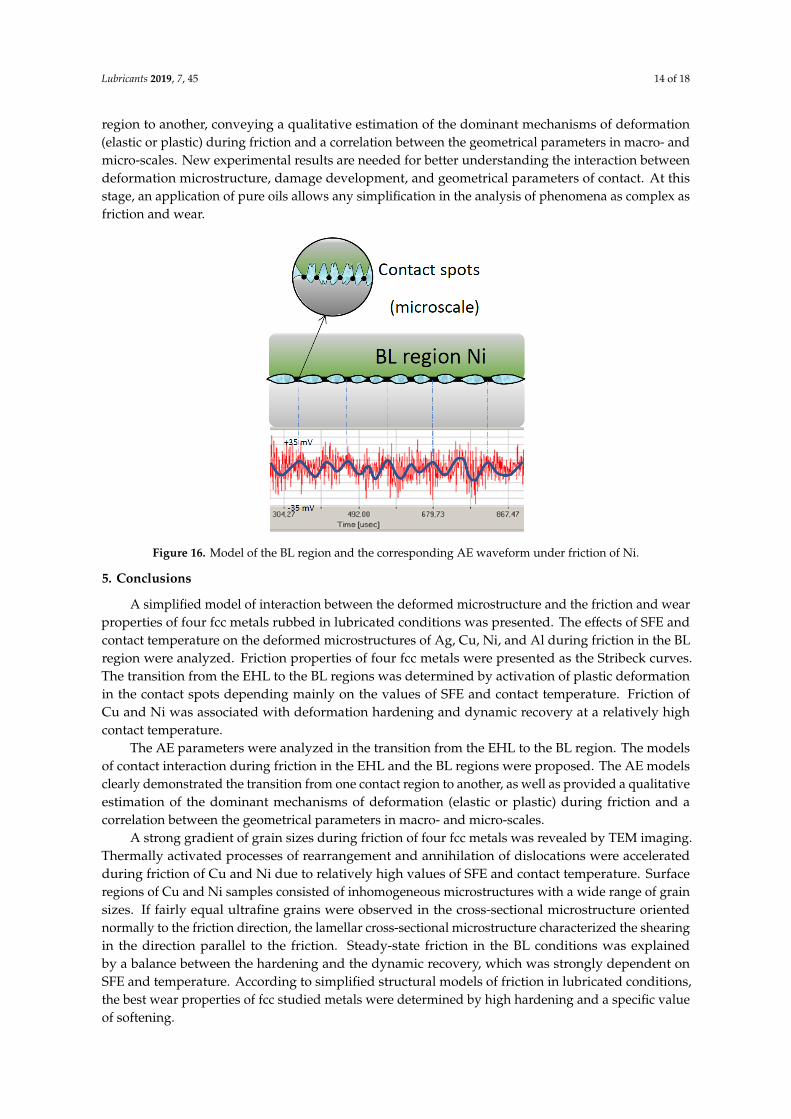
Figure 16. Model of the BL region and the corresponding AE waveform under friction of Ni.
Friction of Cu and Ni in the BL region occurred at relatively high loads, leading to a larger number of contact spots and therefore to an increase in low-frequency AE signals (Figure 16). In the insert, the direct contact of a single contact spot at the microscale level is presented.
High-frequency AE signals (red color) indicated severe plastic deformation during friction of Ni in the BL region. Thus, the AE analysis clearly demonstrated the transition from one contact region to another, conveying a qualitative estimation of the dominant mechanisms of deformation (elastic or plastic) during friction and a correlation between the geometrical parameters in macro- and micro-scales. New experimental results are needed for better understanding the interaction between deformation microstructure, damage development, and geometrical parameters of contact. At this stage, an application of pure oils allows any simplification in the analysis of phenomena as complex as friction and wear.
5. Conclusions
A simplified model of interaction between the deformed microstructure and the friction and wear properties of four fcc metals rubbed in lubricated conditions was presented. The effects of SFE and contact temperature on the deformed microstructures of Ag, Cu, Ni, and Al during friction in the BL region were analyzed. Friction properties of four fcc metals were presented as the Stribeck curves. The transition from the EHL to the BL regions was determined by activation of plastic deformation in the contact spots depending mainly on the values of SFE and contact temperature.
Figure 15. Macroscale model of the BL region and the corresponding waveform under friction of Ag.
At the points of direct contact, the level of AE signals increased. An absence of high frequencysignals indicated the limited plastic deformation in the EHL conditions. During friction of Ag in theBL region, the low frequency wave was just increased from 2.5 kHz in the EHL to 5 kHz under the BLconditions (Figure 15).
Friction of Cu and Ni in the BL region occurred at relatively high loads, leading to a larger numberof contact spots and therefore to an increase in low-frequency AE signals (Figure 16). In the insert,the direct contact of a single contact spot at the microscale level is presented.
High-frequency AE signals (red color) indicated severe plastic deformation during friction ofNi in the BL region. Thus, the AE analysis clearly demonstrated the transition from one contact
Lubricants 2019, 7, 45 14 of 18
region to another, conveying a qualitative estimation of the dominant mechanisms of deformation(elastic or plastic) during friction and a correlation between the geometrical parameters in macro- andmicro-scales. New experimental results are needed for better understanding the interaction betweendeformation microstructure, damage development, and geometrical parameters of contact. At thisstage, an application of pure oils allows any simplification in the analysis of phenomena as complex asfriction and wear.
Lubricants 2018, 6, x FOR PEER REVIEW 14 of 18
Figure 15. Macroscale model of the BL region and the corresponding waveform under friction of Ag.
Figure 16. Model of the BL region and the corresponding AE waveform under friction of Ni.
Friction of Cu and Ni in the BL region occurred at relatively high loads, leading to a larger number of contact spots and therefore to an increase in low-frequency AE signals (Figure 16). In the insert, the direct contact of a single contact spot at the microscale level is presented.
High-frequency AE signals (red color) indicated severe plastic deformation during friction of Ni in the BL region. Thus, the AE analysis clearly demonstrated the transition from one contact region to another, conveying a qualitative estimation of the dominant mechanisms of deformation (elastic or plastic) during friction and a correlation between the geometrical parameters in macro- and micro-scales. New experimental results are needed for better understanding the interaction between deformation microstructure, damage development, and geometrical parameters of contact. At this stage, an application of pure oils allows any simplification in the analysis of phenomena as complex as friction and wear.
5. Conclusions
A simplified model of interaction between the deformed microstructure and the friction and wear properties of four fcc metals rubbed in lubricated conditions was presented. The effects of SFE and contact temperature on the deformed microstructures of Ag, Cu, Ni, and Al during friction in the BL region were analyzed. Friction properties of four fcc metals were presented as the Stribeck curves. The transition from the EHL to the BL regions was determined by activation of plastic deformation in the contact spots depending mainly on the values of SFE and contact temperature.
Figure 16. Model of the BL region and the corresponding AE waveform under friction of Ni.
5. Conclusions
A simplified model of interaction between the deformed microstructure and the friction and wearproperties of four fcc metals rubbed in lubricated conditions was presented. The effects of SFE andcontact temperature on the deformed microstructures of Ag, Cu, Ni, and Al during friction in the BLregion were analyzed. Friction properties of four fcc metals were presented as the Stribeck curves.The transition from the EHL to the BL regions was determined by activation of plastic deformationin the contact spots depending mainly on the values of SFE and contact temperature. Friction ofCu and Ni was associated with deformation hardening and dynamic recovery at a relatively highcontact temperature.
The AE parameters were analyzed in the transition from the EHL to the BL region. The modelsof contact interaction during friction in the EHL and the BL regions were proposed. The AE modelsclearly demonstrated the transition from one contact region to another, as well as provided a qualitativeestimation of the dominant mechanisms of deformation (elastic or plastic) during friction and acorrelation between the geometrical parameters in macro- and micro-scales.
A strong gradient of grain sizes during friction of four fcc metals was revealed by TEM imaging.Thermally activated processes of rearrangement and annihilation of dislocations were acceleratedduring friction of Cu and Ni due to relatively high values of SFE and contact temperature. Surfaceregions of Cu and Ni samples consisted of inhomogeneous microstructures with a wide range of grainsizes. If fairly equal ultrafine grains were observed in the cross-sectional microstructure orientednormally to the friction direction, the lamellar cross-sectional microstructure characterized the shearingin the direction parallel to the friction. Steady-state friction in the BL conditions was explainedby a balance between the hardening and the dynamic recovery, which was strongly dependent onSFE and temperature. According to simplified structural models of friction in lubricated conditions,the best wear properties of fcc studied metals were determined by high hardening and a specific valueof softening.
Lubricants 2019, 7, 45 15 of 18
Author Contributions: A.M. studied friction and wear properties of fcc metals in lubricated conditions.V.P. evaluated the signals of acoustic emission and their connection to friction and wear. L.R analyzed theresults of all experiments.
Funding: This research received no external funding.
Acknowledgments: The authors wish to gratefully thank Inna Popov for the TEM investigations.
Conflicts of Interest: The authors declare no conflict of interest.
References
1. Vakis, A.; Yastrebov, V.; Scheibert, J.; Nicola, L.; Dini, D.; Minfray, C.; Almqvist, A.; Paggi, M.; Lee, S.;Limbert, G.; et al. Modeling and simulation in tribology across scales: An overview. Tribol. Int. 2018, 125,169–199. [CrossRef]
2. Rigney, D. On the mechanical properties of near-surface material in friction and wear. In Fundamentalof Tribology, Proceedings of International Conference on the Fundamentals of Tribology; Suh, N., Saka, N., Eds.;The MIT Press: Cambridge, MA, USA, 1978; pp. 119–126.
3. Heilmann, P.; Rigney, D. Runnig-in process affecting friction and wear. In The Running–in Process in Tribology,Proceedings 8th Leeds–Lyon Symposium on Tribology; Dowson, D., Taylor, C., Godet, M., Berthe, D., Eds.;Butterworth-Heinemann Ltd.: Oxford, UK, 1981; pp. 25–33.
4. Hirth, J.; Rigney, D. Crystal plasticity and the delamination theory of wear. Wear 1976, 39, 133–141. [CrossRef]5. Hirth, J.; Rigney, D. The application of dislocation conceptions in Friction and Wear. In Dislocations in Solids;
Nabarro, F., Ed.; Elsevier: Amsterdam, The Netherlands, 1983; pp. 1–54.6. Garbar, I. Structure-based selection of wear-resistant materials. Wear 1995, 181–183, 50–55. [CrossRef]7. Garbar, I. Fragmentation of low-carbon steel and copper surface layers during fatigue and adhesive wear.
Wear 1986, 7, 1043–1053.8. Kulhmann-Wilsdorf, D. Dislocation concepts in friction and wear. In Fundamentals of Friction and Wear
of Materials; Rigney, D., Ed.; American Society of Metals, Ohio, Metals Park: Novelty, OH, USA, 1980;pp. 119–186.
9. Rapoport, L.; Rybakova, L. The influence of surface layer structure state on friction and wear processes(in Russian). Frict. Wear (Trenie i Iznos Mash) 1987, 8. part I, 888–894, part II, 1038–1043.
10. Alpas, A.; Hu, H.; Zhang, J. Plastic deformation and damage accumulation below the worn surfaces. Wear1993, 162–164, 188–195. [CrossRef]
11. Rainforth, W.; Stevens, R.; Nutting, J. Deformation structures induced by sliding contact. Phylos. Mag. 1992,66, 621–641. [CrossRef]
12. Rigney, D.; Fu, X.; Hammerberg, J.; Holian, B.; Falk, M. Examples of structural evolution during sliding andshear of ductile materials. Scr. Mater. 2003, 49, 977–983. [CrossRef]
13. Walker, J.; Ross, I.; Rainforth, W.; Lieblich, M. TEM characterisation of near surface deformation resultingfrom lubricated sliding wear of aluminium alloy and composites. Wear 2007, 263, 707–718. [CrossRef]
14. Moshkovich, A.; Perfilyev, V.; Bendikov, T.; Lapsker, I.; Cohen, H.; Rapoport, L. Structural evolution in copperlayers during sliding under different lubricant conditions. Acta Mater. 2010, 58, 4685–4692. [CrossRef]
15. Meshi, L.; Samuha, S.; Cohen, S.; Laikhtman, A.; Moshkovich, A.; Perfilyev, V.; Lapsker, I.; Rapoport, L.Dislocation structure and hardness of surface layers under friction of copper in different lubricant conditions.Acta Mater. 2011, 59, 342–348. [CrossRef]
16. Shockley, J.; Rauch, E.; Chromik, R.; Descartes, S. TEM microanalysis of interfacial structures after dry slidingof cold sprayed Al–Al2O3. Wear 2017, 376–377, 1411–1417. [CrossRef]
17. Agribay, N.; Chandross, M.; Cheng, S.; Michael, J. Linking microstructural evolution and macroscale frictionbehavior in metals. J. Mater. Sci. 2017, 52, 2780–2799.
18. Feltner, C.; Laird, C. Cyclic stress–strain response of FCC metals and alloys—I phenomenological experiments.Acta Metall. 1967, 15, 1621–1632. [CrossRef]
19. Mughrabi, H.; Hezz, K.; Stark, X. Cyclic deformation and fatigue behaviour of α-iron mono-and-polycrystals.Int. J. Fract. 1981, 17, 193–220. [CrossRef]
20. Laird, C. The applications of dislocation concepts in fatigue. In Dislocations in Solids; Nabarro, F., Ed.; Elsevier:Amsterdam, The Netherlands, 1983; pp. 55–120.

Lubricants 2019, 7, 45 16 of 18
21. Merkle, A.; Marks, L. A predictive analytical friction model from basic theories of interfaces, contacts anddislocations. Tribol. Lett. 2007, 26, 73–84. [CrossRef]
22. M’ndange-Pfupfu, A.; Marks, L. A dislocation-based analytical model for the nanoscale processes of shearand plowing friction. Tribol. Lett. 2010, 39, 163–167. [CrossRef]
23. Sun, F.; Vander Giessen, E.; Nicola, L. Plastic flattening of a sinusoidal metal surface: A discrete dislocationplasticity study. Wear 2012, 296, 672–680. [CrossRef]
24. Gagel, J.; Weygand, D.; Gumbsch, P. Discrete dislocation dynamics simulations of dislocation transportduring sliding. Acta Mater. 2018, 156, 215–227. [CrossRef]
25. Kong, X.; Liu, Y.; Qiao, L. Dry sliding tribological behaviors of nanocrystalline Cu–Zn surface layer afterannealing in air. Wear 2004, 256, 747–753. [CrossRef]
26. Zhang, Y.; Han, Z.; Wang, K.; Lu, K. Friction and wear behaviors of nanocrystalline surface layer of purecopper. Wear 2006, 260, 942–948. [CrossRef]
27. Kato, H.; Sasase, M.; Suiya, N. Friction-induced ultra-fine and nanocrystalline structures on metal surfaces indry sliding. Tribol. Int. 2010, 43, 925–928. [CrossRef]
28. Yao, B.; Han, Z.; Li, Y.; Tao, N.; Lu, K. Dry sliding tribological properties of nanostructured copper subjectedto dynamic plastic deformation. Wear 2011, 271, 1609–1616. [CrossRef]
29. Moshkovich, A.; Perfilyev, V.; Gorni, D.; Lapsker, I.; Rapoport, L. The effect of Cu grain size on transitionfrom EHL to BL regime (Stribeck curve). Wear 2011, 271, 1726–1732. [CrossRef]
30. Wasekar, N.; Haridoss, P.; Seshadri, S.; Sundararajan, G. Sliding wear behavior of nanocrystalline nickelcoatings: Influence of grain size. Wear 2012, 296, 536–546. [CrossRef]
31. Filippov, A.; Tarasov, S.; Fortuna, S.; Podgornykh, O.; Shamarin, N.; Rubtsov, V. Microstructural, mechanicaland acoustic emission-assisted wear characterization of equal channel angular pressed (ECAP) low stackingfault energy brass. Tribol. Int. 2018, 123, 273–285. [CrossRef]
32. Figueroa, C.; Schouwenaars, R.; Cortés-Péreza, J.; Petrov, R.; Kestens, L. Ultrafine gradient microstructureinduced by severe plastic deformation under sliding contact conditions in copper. Mater. Charact. 2018, 138,263–273. [CrossRef]
33. Valiev, R.; Estrin, Y.; Horita, Z.; Langdon, T.; Zechetbauer, M.; Zhu, Y. Producing bulk ultrafine-grainedmaterials by severe plastic deformation. JOM 2006, 58, 33–39. [CrossRef]
34. Valiev, R.; Islamgaliev, R.; Alexandrov, I. Bulk nanostructured materials from severe plastic deformation.Prog. Mater. Sci. 2000, 45, 103–189. [CrossRef]
35. Zhilyaev, A.; Langdon, T. Using high-pressure torsion for metal processing: Fundamentals and applications.Prog. Mater. Sci. 2008, 53, 893–979. [CrossRef]
36. Edalati, K.; Horita, Z. High pressure torsion of pure metals: Influence of atomic bond parameters andstacking fault energy of grain size and correlation with hardness. Acta Mater. 2011, 59, 6831–6836. [CrossRef]
37. Mishra, A.; Kad, B.; Gregori, F.; Meyers, M. Microstructural evolution in copper subjected to severe plasticdeformation: Experiments and analysis. Acta Mater. 2007, 55, 13–28. [CrossRef]
38. Gubicza, J.; Chinh, N.; Csanadi, T.; Langdon, T.; Ungar, T. Microstructure and strength of severely deformedfcc metals. Mater. Sci. Eng. 2007, A462, 86–90. [CrossRef]
39. Brown, T.; Saldana, C.; Murthy, T.; Mann, J.; Guo, Y.; Allard, L.; King, A.; Compton, W.; Trumble, K.;Chandrasekar, S. A study of the interactive effects of strain, strain rate and temperature in severe plasticdeformation of copper. Acta Mater. 2009, 57, 5491–5500. [CrossRef]
40. Mei, Q.; Tsuchiya, K.; Gao, H. Different stages in the continuous microstructural evolution of copper deformedto ultrahigh plastic strains. Scr. Mater. 2012, 67, 1003–1006. [CrossRef]
41. Starink, M.; Qiao, X.; Zhang, J.; Gao, N. Predicting grain refinement by cold severe plastic deformation inalloys using volume averaged dislocation generation. Acta Mater. 2009, 57, 5796–5811. [CrossRef]
42. Zhang, P.; An, X.; Zhang, Z.; Wu, S.; Li, S.; Zhang, Z.; Figueiredo, R.; Gao, N.; Langdon, T. Optimizingstrength and ductility of Cu–Zn alloys through severe plastic deformation. Scr. Mater. 2012, 67, 871–874.[CrossRef]
43. Franklin, F.; Widiyart, I.; Kapoor, A. Computer simulation of wear and rolling contact fatigue. Wear 2001,251, 949–955. [CrossRef]
44. Widiyarta, I.; Franklin, F.; Kapoor, A. Modelling thermal effects in ratcheting-led wear and rolling contactfatigue. Wear 2008, 265, 1325–1331. [CrossRef]

Lubricants 2019, 7, 45 17 of 18
45. Bohera, C.; Barrau, O.; Gras, R.; Rezai-Aria, F. A wear model based on cumulative cyclic plastic straining.Wear 2009, 267, 1087–1094. [CrossRef]
46. Bhagwat, P.; Sista, B.; Vemaganti, K. A Computational study of the effects of strain hardening in micro-asperityfriction models. Tribol. Lett. 2017, 65, 154. [CrossRef]
47. Archard, J. Elastic deformation and the laws of friction. Proc. R. Soc. Lond. Ser. A 1957, 243, 190–205.48. Johnson, K.L.; Greenwood, J.; Higginson, J. The contact of elastic regular wavy surfaces. Int. J. Mech. Sci.
1985, 27, 383–396. [CrossRef]49. Chang, W.; Etsion, I.; Bogy, D. An elastic–plastic model for the contact of rough surfaces. ASME J. Tribol.
1987, 109, 257–263. [CrossRef]50. Majumdar, A.; Bhushan, B. Fractal model of elastic–plastic contact between rough surfaces. ASME J. Tribol.
1991, 113, 1–11. [CrossRef]51. Kogut, L.; Etsion, I. A finite element based elastic–plastic model for the contact of rough surfaces. Tribol. Trans.
2003, 46, 383–390. [CrossRef]52. Jackson, R.; Green, I. A statistical model of elasto-plastic asperity contact between rough surfaces. Tribol. Int.
2006, 39, 906–914. [CrossRef]53. Jackson, R.; Streator, J. A multi-scale model for contact between rough surfaces. Wear 2006, 261, 1337–1347.
[CrossRef]54. Kragelsky, I. Friction and Wear; Butterworths: London, UK, 1965.55. Persson, B. Sliding Friction; Springer: Berlin, Germany, 2000.56. Rapoport, L. Steady friction state and contact models of asperity interaction. Wear 2009, 267, 1305–1310.
[CrossRef]57. Lim, S.; Ashby, M. Wear-mechanism maps. Acta Metall. 1987, 35, 1–24. [CrossRef]58. Ashby, M.; Lim, S. Wear-mechanism maps. Scripta Metall. 1990, 24, 805–810. [CrossRef]59. Williams, J. Wear modeling: Analytical, computational and mapping: A continuum mechanics approach.
Wear 1999, 225, 1–17. [CrossRef]60. Williams, J. Wear and wear particles—some fundamentals. Tribol. Int. 2005, 38, 863–870. [CrossRef]61. Rapoport, L. The competing wear mechanisms and wear maps for steels. Wear 1995, 181–183, 280–289.
[CrossRef]62. Larsson, R. Modelling the effect of surface roughness on lubrication in all regimes. Tribol. Int. 2009, 42,
512–516. [CrossRef]63. Bonaventure, J.; Cayer-Barrioz, J.; Mazuyer, D. Transition between mixed lubrication and elastohydrodynamic
lubrication with randomly rough surfaces. Tribol. Lett. 2016, 64, 44. [CrossRef]64. Wang, W.; Liu, K.; Jiao, M. Thermal and non-Newtonian analysis on mixed liquid–solid lubrication. Tribol. Int.
2007, 40, 1067–1074. [CrossRef]65. Wang, W.; Chen, H.; Hu, Y.; Wang, H. Effect of surface roughness parameters on mixed lubrication
characteristics. Tribol. Int. 2006, 39, 522–527. [CrossRef]66. Faraon, C.; Schipper, D. Stribeck curve for starved line contacts. J. Tribol. 2007, 129, 181–187. [CrossRef]67. Akbarzadeh, S.; Khonsari, M. Effect of surface pattern on Stribeck curve. Tribol. Lett. 2010, 37, 477–486.
[CrossRef]68. Moshkovich, A.; Perfilyev, V.; Meshi, L.; Samuha, S.; Cohen, S.; Cohen, H.; Laikhtman, A.; Rapoport, L.
Friction, wear and structure of Cu samples in the lubricated steady friction state. Tribol. Int. 2012, 46, 154–160.[CrossRef]
69. Moshkovich, A.; Lapsker, I.; Laikhtman, A.; Perfilyev, V.; Rapoport, L. The failure and damage mechanismsunder friction of copper in the EHL and mixed EHL regions. Tribol. Lett. 2013, 51, 57–64. [CrossRef]
70. Moshkovich, A.; Perfilyev, V.; Lapsker, I.; Feldman, Y.; Rapoport, L. Study of the transition from EHL toBL regions under friction of Ag and Ni. I. Analysis of acoustic emission. Tribol. Int. 2017, 113, 189–196.[CrossRef]
71. Moshkovich, A.; Lapsker, I.; Feldman, Y.; Rapoport, L. Severe plastic deformation of four FCC metals duringfriction under lubricated conditions. Wear 2017, 386–387, 49–57. [CrossRef]
72. Popov, I.; Moshkovich, A.; Cohen, S.; Perfilyev, V.; Vakahy, A.; Rapoport, L. Microstructure and nanohardnessof Ag and Ni under friction in boundary lubrication. Wear 2018, 404–405, 62–70. [CrossRef]
73. Popov, I.; Moshkovich, A.; Bendikov, T.; Rapoport, L. Deformation microstructure and chemical compositionof surface layers of Cu and Al under friction in lubricated conditions. Tribol. Lett. 2018, 66, 78. [CrossRef]

Lubricants 2019, 7, 45 18 of 18
74. Murr, L.E. Interfacial Phenomena in Metals and Alloys; Addison-Wesley: Boston, MA, USA, 1975.75. Gallagher, P. The influence of alloying, temperature and related effects on the stacking fault energy.
Metall. Trans. 1970, 1, 2429–2461.76. An, X.; Wu, S.; Zhang, Z.; Figueiredo, R.; Gao, N.; Langdon, T. Evolution of microstructural homogeneity in
copper processed by high-pressure torsion. Scr. Mater. 2010, 63, 560–563. [CrossRef]77. Kaschner, G.; Gibeling, J. Evolution of dislocation glide kinetics during cyclic deformation of copper.
Acta Mater. 2002, 50, 653–662. [CrossRef]78. Hong, S. Cyclic stress-strain response and slip mode modification in fatigue of FCC solid solutions. Scr. Mater.
2001, 44, 995–1001. [CrossRef]79. Wang, Y.; Lapovok, R.; Wang, J.; Qi, Y.; Estrin, Y. Thermal behavior of copper processed by ECAP with and
without back pressure. Mater. Sci. Eng. A 2015, 628, 21–29. [CrossRef]80. Akchurin, A.; Bosman, R.; Lugt, P.; Van Drogen, M. Analysis of wear particles formed in boundary-lubricated
sliding contacts. Tribol. Lett. 2016, 63, 16–30. [CrossRef]
© 2019 by the authors. Licensee MDPI, Basel, Switzerland. This article is an open accessarticle distributed under the terms and conditions of the Creative Commons Attribution(CC BY) license (http://creativecommons.org/licenses/by/4.0/).
Related Documents


