Welcome message from author
This document is posted to help you gain knowledge. Please leave a comment to let me know what you think about it! Share it to your friends and learn new things together.
Transcript
agronomy
Article
Optimizing Potassium Application for Hybrid Rice(Oryza sativa L.) in Coastal Saline Soils of WestBengal, India
Hirak Banerjee 1, Krishnendu Ray 2 , Sudarshan Kumar Dutta 3,* , Kaushik Majumdar 4,Talatam Satyanarayana 5 and Jagadish Timsina 6
1 Bidhan Chandra Krishi Viswavidyalaya, Regional Research Station (CSZ), Kakdwip 743347,South 24 Parganas, West Bengal, India; [email protected]
2 Ramakrishna Mission Vivekananda Educational and Research Institute, Sasya Shyamala Krishi VigyanKendra, Narendrapur, Kolkata 700103, West Bengal, India; [email protected]
3 International Plant Nutrition Institute, South Asia (East India and Bangladesh) Program,36 Gorakshabasi Road, Kolkata 700028, West Bengal, India
4 International Plant Nutrition Institute, Asia and Africa Programs, Palm Drive, B-1602, Golf CourseExtension Road, Sector-66, Gurgaon 122001, Haryana, India; [email protected]
5 International Plant Nutrition Institute, South Asia Program, 354, Sector 21, Gurgaon 122016, Haryana, India;[email protected]
6 Soils and Environment Research Group, Faculty of Veterinary and Agricultural Sciences,University of Melbourne, Melbourne, VIC 3010, Australia; [email protected]
* Correspondence: [email protected]; Tel.: +91-9836293999
Received: 23 October 2018; Accepted: 27 November 2018; Published: 4 December 2018�����������������
Abstract: The present study assesses the response of hybrid rice (variety Arize 6444) to potassium (K)application during rainy (wet) seasons of 2016 and 2017 in coastal saline soils of West Bengal, India.The study was conducted at the Regional Research Farm, Bidhan Chandra Krishi Viswavidyalaya,Kakdwip, West Bengal. The soil is clayeywith acidic pH (5.91), saline (Electrical conductivity/EC1.53 dS m−1) and of high K fertility (366 kg ha−1). The experimental plots were laid out in arandomized complete block design with five (5) K treatments (0, 30, 60, 90, and 120 kg K2O ha−1)with four replications. Plant height, dry matter (DM) in different plant parts, number of tillers, andgrain yield were measured in each treatment for the determination of optimum K dose. The studyrevealed that the stem, leaf, and grain dry matter production at 60 days after transplanting (DAT)and harvest were significantly (p ≤ 0.05) higher at 90 kg K2O ha−1 application. The number of tillershill−1 was also higher (p ≤ 0.05) in plants fertilized with 90 kg K2O ha−1 over K omission. At harvest,grain K concentration improved (p ≤ 0.05) with K fertilization at 90 kg K2O ha−1, 116% more than thezero-K. Omission of K application from the best treatment (90 kg K2O ha−1) reduced grain yield by3.5 t ha−1 even though the available K content was high. Potassium uptake restriction due to higherMg content in the soil may have caused reduced uptake of K leading to yield losses. The presentstudy also showed higher profits with 90 kg K2O ha−1 with higher net returns (US$ 452 ha−1) andbenefit:cost ratio (1.75) over other treatments from hybrid rice (var. Arize 6444). From the regressionequation, the economic optimum level of K (Kopt) was derived as 101.5 kg K2O ha−1 that couldimprove productivity of hybrid rice during the wet season in coastal saline soils of West Bengal.
Keywords: hybrid rice; K use efficiency; potassium; saline tract
1. Introduction
With growing population and urbanization, the total area under rice cultivation in India as wellas in the state of West Bengal is decreasing at a rapid rate. However, the demand for rice in the
Agronomy 2018, 8, 292; doi:10.3390/agronomy8120292 www.mdpi.com/journal/agronomy
Agronomy 2018, 8, 292 2 of 14
future is bound to increase with the growing population [1]. Predominantly medium and low lands inthe eastern part of India leave no other option for farmers but to go for rice cultivation in the rainy(khairf /wet) season. Rice is grown in about 1 million hectares under the coastal ecosystem of WestBengal, accounting for nearly 17% of the net ricearea in the state. The farmers usually grow lowyielding, long duration (145–150 days) traditional rice cultivars during the kharif (rainy) season, whilethe landsremainfallow during the rabi (winter) season [2].
Salinity is a major yield-reducing factor in thecoastal ecosystems for rice [3]. Rice experiencesosmotic stress in saline soils that result in reduced osmotic potential and water stress [4]. Salinityreduces dry matter, grain yield, and the harvest index, and thus affects bothvegetative and reproductivestages of the crop [5]. The productivity of rice is not satisfactory in the coastal areas due to aberrantclimatic conditionsand non-availability of hybrid varieties [6]. Water stagnation (medium-deep,25–50 cm) for most of the crop growing season, flash floods (complete submergence for 1–2 weeks),and water and soil salinity [7] are typical deterrents to high productivity. The South 24-Parganas districtranks 12th amongst all rice growing districts of West Bengal in rice productivity [8]. Considering thedemand–supply gap of rice, adoption of superior rice varieties could be effective for narrowing yieldgap, and for breaking the yield ceiling in the coastal ecosystem.
Large scale adoption of hybrid rice during wet season in the coastal area could boost rice yieldby about 15–20% with the same level of input [6,9]. The hybrid seeds are also tolerant to biotic andabiotic stresses [10]. Along with the improved seeds, a good nutrient management plan is also neededto make the higher production sustainable.
Hybrid rice varieties were already introduced to the region to augment the rice production.However, lack of awareness about the recommended package of practices was the main barrier toits adoption [11]. Consequently, an inadequate nutrient management strategy failed to produce thedesired result. The use of nutrient rates suitable for high yielding varieties (HYVs) did not produce thehigher yields expected from hybrid rice varieties [12]. Hybrid varieties with higher yield potentialrequire larger quantities of nutrients compared to HYVs. Studies in West Bengal have shown thatintegrated and adequate use of chemical fertilizers and organic sources of fertilizers can result inimproved soil fertility, higher nutrient-use efficiency, and better crop growth, translating into higheryield and profit [13,14].
Potassium is a key nutrient required for optimum yield of hybrid rice. Hybrid rice with highyield potential per unit area and time requires higher amount of K than HYVs. On an average, thecrop accumulates 27–36 kg K ha−1 to produce a ton of grain, with an equal amount of straw duringwet season [15]. A K management strategy based only on attainable yield potential of HYVs are notsufficient to supply the requirement of hybrid rice [9]. Hybrid rice was reported to absorb 79% of totalK requirement from soil and remainder from the fertilizer, and utilized 28.1% of the applied K [16].For improved K use efficiency (KUE) of hybrid rice, appropriate K fertilization strategies should beadopted to fine tune the supply–demand balance of crop and soil. A regular application of K to the cropincreased total tillers, dry matter accumulation, effective tillers, number and weight of filled grainsand KUE, and enhanced the grain yield besides improving soil properties [17,18]. It was also reportedthat greater K uptake improved carbohydrate metabolism in plants [18], and adequate K increases thetranslocation of N to the grain during grain filling period, increasing efficiency of N. Potassium helpsto overcome stresses common in this region, and high K uptake in the panicle, especially at the earlydevelopmental stage, mitigates the negative effect of sodium uptake by the panicles [3].
For exploiting the full heterotic potential of hybrids, it is necessary to assess the performanceof promising rice hybrids at graded levels of K when other management practices are optimum.A quantitative understanding of the crop response to K fertilizer is crucial to optimize K input forhigher productivity. Reports on yield performance of superior hybrid rice cultivars under properK management in the coastal saline soils are limited. The present study evaluates the effects of Kfertilization on growth, yield and K-acquisition pattern to estimate appropriate K rates for achievingoptimum yield and KUE in hybrid rice cultivation.
Agronomy 2018, 8, 292 3 of 14
2. Materials and Methods
2.1. Field Site
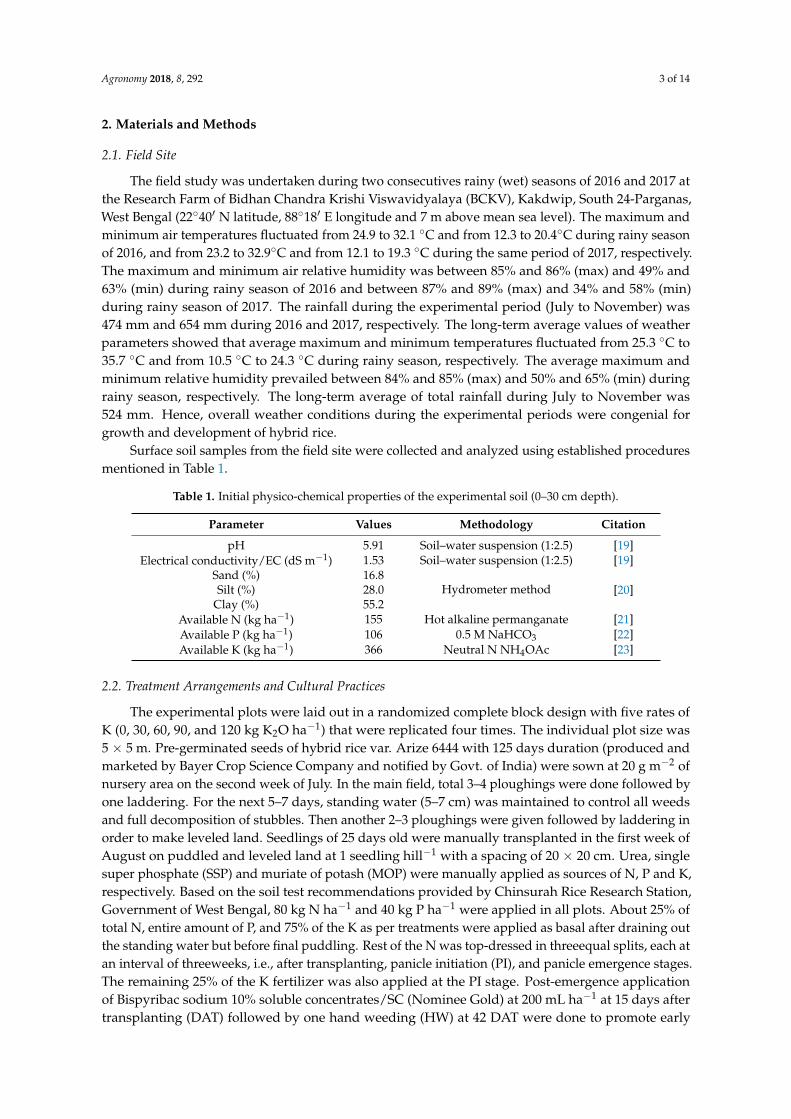
The field study was undertaken during two consecutives rainy (wet) seasons of 2016 and 2017 atthe Research Farm of Bidhan Chandra Krishi Viswavidyalaya (BCKV), Kakdwip, South 24-Parganas,West Bengal (22◦40′ N latitude, 88◦18′ E longitude and 7 m above mean sea level). The maximum andminimum air temperatures fluctuated from 24.9 to 32.1 ◦C and from 12.3 to 20.4◦C during rainy seasonof 2016, and from 23.2 to 32.9◦C and from 12.1 to 19.3 ◦C during the same period of 2017, respectively.The maximum and minimum air relative humidity was between 85% and 86% (max) and 49% and63% (min) during rainy season of 2016 and between 87% and 89% (max) and 34% and 58% (min)during rainy season of 2017. The rainfall during the experimental period (July to November) was474 mm and 654 mm during 2016 and 2017, respectively. The long-term average values of weatherparameters showed that average maximum and minimum temperatures fluctuated from 25.3 ◦C to35.7 ◦C and from 10.5 ◦C to 24.3 ◦C during rainy season, respectively. The average maximum andminimum relative humidity prevailed between 84% and 85% (max) and 50% and 65% (min) duringrainy season, respectively. The long-term average of total rainfall during July to November was524 mm. Hence, overall weather conditions during the experimental periods were congenial forgrowth and development of hybrid rice.
Surface soil samples from the field site were collected and analyzed using established proceduresmentioned in Table 1.
Table 1. Initial physico-chemical properties of the experimental soil (0–30 cm depth).
Parameter Values Methodology Citation
pH 5.91 Soil–water suspension (1:2.5) [19]Electrical conductivity/EC (dS m−1) 1.53 Soil–water suspension (1:2.5) [19]
Sand (%) 16.8Hydrometer method [20]Silt (%) 28.0
Clay (%) 55.2Available N (kg ha−1) 155 Hot alkaline permanganate [21]Available P (kg ha−1) 106 0.5 M NaHCO3 [22]Available K (kg ha−1) 366 Neutral N NH4OAc [23]
2.2. Treatment Arrangements and Cultural Practices
The experimental plots were laid out in a randomized complete block design with five rates ofK (0, 30, 60, 90, and 120 kg K2O ha−1) that were replicated four times. The individual plot size was5 × 5 m. Pre-germinated seeds of hybrid rice var. Arize 6444 with 125 days duration (produced andmarketed by Bayer Crop Science Company and notified by Govt. of India) were sown at 20 g m−2 ofnursery area on the second week of July. In the main field, total 3–4 ploughings were done followed byone laddering. For the next 5–7 days, standing water (5–7 cm) was maintained to control all weedsand full decomposition of stubbles. Then another 2–3 ploughings were given followed by laddering inorder to make leveled land. Seedlings of 25 days old were manually transplanted in the first week ofAugust on puddled and leveled land at 1 seedling hill−1 with a spacing of 20 × 20 cm. Urea, singlesuper phosphate (SSP) and muriate of potash (MOP) were manually applied as sources of N, P and K,respectively. Based on the soil test recommendations provided by Chinsurah Rice Research Station,Government of West Bengal, 80 kg N ha−1 and 40 kg P ha−1 were applied in all plots. About 25% oftotal N, entire amount of P, and 75% of the K as per treatments were applied as basal after draining outthe standing water but before final puddling. Rest of the N was top-dressed in threeequal splits, each atan interval of threeweeks, i.e., after transplanting, panicle initiation (PI), and panicle emergence stages.The remaining 25% of the K fertilizer was also applied at the PI stage. Post-emergence applicationof Bispyribac sodium 10% soluble concentrates/SC (Nominee Gold) at 200 mL ha−1 at 15 days aftertransplanting (DAT) followed by one hand weeding (HW) at 42 DAT were done to promote early
Agronomy 2018, 8, 292 4 of 14
crop growth by controlling weeds. Other agronomic management practices were followed based onrecommended standards for the coastal region of West Bengal [24] and were applied uniformly acrossall treatments. The crop was harvested in the first week of November when 80% of the grains in thepanicles were ripe, and later dried, winnowed, and weighed for yield estimation.
2.3. Field Measurements
At harvest maturity, plants from 25 hills (1 m2 area) were harvested and grains were separatedto estimate grain yield, while the moisture content of grain was adjusted to 0.15 g H2O g−1. Growthattributes and yield components were measured from randomly harvested 10 plants. The plants werethen partitioned into leaf, stem and panicles. Production of stem, leaf and grain dry matter (DM) wasrecorded at 60 DAT and harvest. Panicles were hand-threshed, and the filled and unfilled seeds wereseparated by submerging them into water. Light weight unfilled seeds floating on the water surfacewere removed, while filled seeds settled down. Filled seeds were further sun-dried to 14% moisture.Dry weight of different plant parts, after oven-drying at 70 ◦C until constant weight, was determinedto estimate above-ground biomass. The grain weight was determined from filled grains per panicle.
2.4. Potassium Determination and Performance Indicators
For K analysis, plant samples (stem, leaf, and grain) were digested with tri-acid mixture(HNO3:H2SO4:HClO4, 9:1:4), and the K concentration (K%) in plant was determined using a flamephotometer [25].
Total K uptake was first calculated by the following formula [26].
K Uptake(
kg ha−1)=
K %×Dry matter(
kg ha−1)
100(1)
To measure the re-translocation efficiency of absorbed K from vegetative plant parts to grain andalso to measure K partitioning in plant, K harvest index (KHI) was estimated as per the followingformula [27].
KHI (%) =Uptake of K in grain
(kg ha−1
)Uptake of K in total above ground biomass
(kg ha−1
) × 100 (2)
K mobilization efficiency index (KMEI) of applied K was calculated using the followingexpressions [28].
KMEI (%) =K concentration in grain
(mg kg−1
)K concentration in stem + leaf
(mg kg−1
) × 100 (3)
KUE was calculated using following formulae [29].
Partial factor productivity of K (PFPK) =Grain yield
(kg ha−1
)Applied fertilizer K
(kg ha−1
) (4)
Agronomic efficiency of K (AEK) =YK − YC
Ka(5)
Physiological efficiency of K (PEK) =YK − YC
UK −UC(6)
where, Y and U refer to grain yield and K uptake by hybrid rice and subscripts K and C refer to Kfertilized and control plots, respectively. Ka refers to applied fertilizer K. All values are in kg ha−1.
Agronomy 2018, 8, 292 5 of 14
2.4.1. Dose–Response Curve
Dose–response curves were drawn to evaluate the changes in grain yieldwith increasing doseof K fertilization. The curve was drawn by fitting the following quadratic response model to grainyield data
y = a + bK + cK2 (7)
where a, b, and c are the regression co-efficient of the quadratic equation; y is the grain yield (kg ha−1);K is the applied fertilizer K (kg ha−1).
The economic optimum for K (Kopt) was estimated from the above quadratic regression by usingthe formula [29]
Kopt
(kg ha−1
)=
[q− (p× b)]2× p× c
(8)
where, q is price per kg of K, and p is price per kg of grain.
2.4.2. Sustainable Yield Index (SYI)
In this study, the SYI for each treatment was calculated from the ratio of minimum assured grainyield to maximum observed yield [28].
Sustainable yield index (SYI) =(Ya − σ)
Ym(9)
where, Ya = mean yield achieved with the treatment, σ = standard deviation of yield, Ym = maximumyield achieved with the treatment. The SYI is a quantitative measure to judge sustainability of anagricultural practice [30]. Under SYI concept, low value of σ suggests sustainability of anagriculturalsystem. Conversely, if the σ value is large then SYI will be low indicating unsustainable agriculturalpractice. The value of SYI varies between zero and unity. The best technology is one where σ is zeroand mean = maximum observed yield (Ym), indicating SYI = 1, hence, the practice gives consistentlymaximum yield over the years.
2.5. Potassium Balance
The post-harvest pH, EC, and available K contents were assessed for each of the treatments andthe extent of change of these values as compared to the initial soil values were estimated. The Kbalance sheet was prepared according to nutrient balance sheet model [31]. Expected balance wasderived from the equation
Expected K balance = Total K available− Total K uptake (10)
where total K available is the sum of initial K content and K applied through fertilizer. Total K uptakeis the sum of K uptake in stem, leaf, and grain at harvest. Actual K balance represents the valuesderived from post-harvest soil analysis. Finally, net K gain (+) or loss (−) in post-harvest soil wasestimated by subtracting actual balance from expected balance.
2.6. Economic Analysis
Common cost of hybrid rice cultivation was derived from summing all expenditure, excludingfertilizer cost. The cost of fertilizer (treatment cost) was estimated on the basis of average retail price inWest Bengal. The gross returns from the crop were calculated based on minimum procurement priceof the Government of West Bengal. The following equations were used for calculating gross returns,net returns and benefit:cost ratio [28].
Agronomy 2018, 8, 292 6 of 14
GR = Yt × Pt (11)
NR = GR−Cp (12)
BCR =GRCp
(13)
where GR is gross returns (US$ ha−1); NR is net returns (US$ ha−1); BCR is benefit: cost ratio; Yt
is grain yield (t ha−1); Pt is the minimum support price of grain (US$ t−1) and Cp is total cost ofproduction. All economic data were converted into US$ using an exchange rate of 1 US$ = INR 64.56.
2.7. Statistical Analysis
Experimental data were subjected to analysis of variance (ANOVA) as randomized completeblock design and the mean values were adjudged by Tukey’s HSD (honest significant difference) testmethod using SPSS (Version 23.0, IBM SPSS Statistics for Windows, IBM Corporation, Armonk, NY,USA) software. Bartlett’s chi-square test was performed to test the homogeneity of variance overboth the years and pooled values of observations are given to explain the results logically. The Excelsoftware (version 2007, Microsoft Inc., Redmond, WA, USA) was used to draw graphs and figures.
3. Results
3.1. Grain and Straw Yield and Yield Components of Hybrid Rice
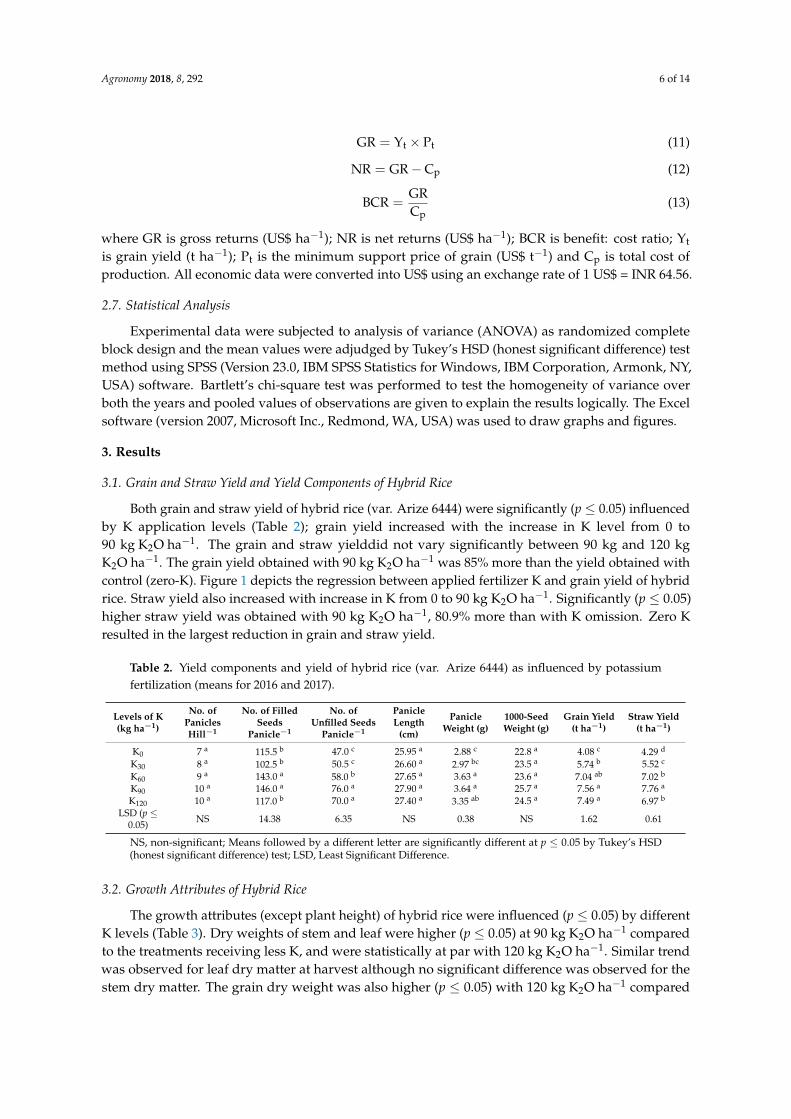
Both grain and straw yield of hybrid rice (var. Arize 6444) were significantly (p ≤ 0.05) influencedby K application levels (Table 2); grain yield increased with the increase in K level from 0 to90 kg K2O ha−1. The grain and straw yielddid not vary significantly between 90 kg and 120 kgK2O ha−1. The grain yield obtained with 90 kg K2O ha−1 was 85% more than the yield obtained withcontrol (zero-K). Figure 1 depicts the regression between applied fertilizer K and grain yield of hybridrice. Straw yield also increased with increase in K from 0 to 90 kg K2O ha−1. Significantly (p ≤ 0.05)higher straw yield was obtained with 90 kg K2O ha−1, 80.9% more than with K omission. Zero Kresulted in the largest reduction in grain and straw yield.
Table 2. Yield components and yield of hybrid rice (var. Arize 6444) as influenced by potassiumfertilization (means for 2016 and 2017).
Levels of K(kg ha−1)
No. ofPaniclesHill−1
No. of FilledSeeds
Panicle−1
No. ofUnfilled Seeds
Panicle−1
PanicleLength
(cm)
PanicleWeight (g)
1000-SeedWeight (g)
Grain Yield(t ha−1)
Straw Yield(t ha−1)
K0 7 a 115.5 b 47.0 c 25.95 a 2.88 c 22.8 a 4.08 c 4.29 d
K30 8 a 102.5 b 50.5 c 26.60 a 2.97 bc 23.5 a 5.74 b 5.52 c
K60 9 a 143.0 a 58.0 b 27.65 a 3.63 a 23.6 a 7.04 ab 7.02 b
K90 10 a 146.0 a 76.0 a 27.90 a 3.64 a 25.7 a 7.56 a 7.76 a
K120 10 a 117.0 b 70.0 a 27.40 a 3.35 ab 24.5 a 7.49 a 6.97 b
LSD (p ≤0.05) NS 14.38 6.35 NS 0.38 NS 1.62 0.61
NS, non-significant; Means followed by a different letter are significantly different at p ≤ 0.05 by Tukey’s HSD(honest significant difference) test; LSD, Least Significant Difference.
3.2. Growth Attributes of Hybrid Rice
The growth attributes (except plant height) of hybrid rice were influenced (p ≤ 0.05) by differentK levels (Table 3). Dry weights of stem and leaf were higher (p ≤ 0.05) at 90 kg K2O ha−1 comparedto the treatments receiving less K, and were statistically at par with 120 kg K2O ha−1. Similar trendwas observed for leaf dry matter at harvest although no significant difference was observed for thestem dry matter. The grain dry weight was also higher (p ≤ 0.05) with 120 kg K2O ha−1 compared
Agronomy 2018, 8, 292 7 of 14
to the lower application rates. The number of tillers hill−1 increased significantly (p ≤ 0.05) with120 kg K2O ha−1, accounting for 64.3% more tillers than that with K omission.Agronomy 2018, 8, x FOR PEER REVIEW 7 of 16
Figure 1. Dose–response curve showing the regression between applied K (kg ha−1) and grain yield
(kg ha−1) (Optimum dose of potassium/Kopt = 101.5 kg ha−1).
3.2. Growth Attributes of Hybrid Rice
The growth attributes (except plant height) of hybrid rice were influenced (p ≤ 0.05) by different
K levels (Table 3). Dry weights of stem and leaf were higher (p ≤ 0.05) at 90 kg K2O ha−1 compared to
the treatments receiving less K, and were statistically at par with 120 kg K2O ha−1. Similar trend was
observed for leaf dry matter at harvest although no significant difference was observed for the stem
dry matter. The grain dry weight was also higher (p ≤ 0.05) with 120 kg K2O ha−1 compared to the
lower application rates. The number of tillers hill−1 increased significantly (p ≤ 0.05) with 120 kg K2O
ha−1, accounting for 64.3% more tillers than that with K omission.
Table 3. Growth attributes of hybrid rice (var. Arize 6444) as influenced by potassium fertilization
(means for 2016 and 2017)
Levels of K (kg
ha-1)
Plant Height
(cm)
Dry Weight (g plant−1) No. of Tillers
Hill−1 At 60 DAT At Harvest
Stem Leaf Stem Leaf Grain
K0 84a 24.15bc 1.38c 10.14a 23.57c 24.80d 14c
K30 87a 17.69c 1.25c 10.65a 26.32bc 27.79cd 16bc
K60 87a 27.06b 1.88b 11.47a 27.33bc 30.78bc 20ab
K90 89a 32.78a 2.71a 11.75a 30.82ab 32.91ab 21a
K120 89a 33.86a 2.54a 12.88a 32.96a 33.29ab 23a
LSD (p≤ 0.05) NS 7.48 0.19 NS 4.43 3.90 4.00
NS, non-significant; DAT, days after transplanting; Means followed by a different letter within a
column are significantly different at p ≤ 0.05 by Tukey’s HSD (honest significant difference) test; LSD,
Least Significant Difference.
K fertilization significantlyaffected (p ≤ 0.05) yield components of hybrid rice, such as, number
of filled seeds panicle−1, number of unfilled seeds panicle−1 and panicle weight, while the effect was
non-significant (p ≥ 0.05) for number of panicles hill−1, panicle length and 1000-seed weight (Table 3).
K application @ 90 kg K2O ha−1 produced higher number of filled seeds panicle−1 accounting for 26.4%
more than that with K omission. Panicle weight increased with increase in K dose up to 60 kg ha−1,
remained at par at K dose of 90 kg ha−1, and decreased with further increase in K rate. Plants in the
control plot produced the lowest panicle weight.
y = -0.336x2 + 69.18x + 4048.R² = 0.998
3500
4000
4500
5000
5500
6000
6500
7000
7500
8000
0 30 60 90 120
Gra
in y
ield
(k
g h
a-1)
Applied K (kg ha-1)
Figure 1. Dose–response curve showing the regression between applied K (kg ha−1) and grain yield(kg ha−1) (Optimum dose of potassium/Kopt = 101.5 kg ha−1).
Table 3. Growth attributes of hybrid rice (var. Arize 6444) as influenced by potassium fertilization(means for 2016 and 2017).
Levels of K(kg ha−1)
Plant Height(cm)
Dry Weight (g plant−1)No. of Tillers
Hill−1At 60 DAT At Harvest
Stem Leaf Stem Leaf Grain
K0 84 a 24.15 bc 1.38 c 10.14 a 23.57 c 24.80 d 14 c
K30 87 a 17.69 c 1.25 c 10.65 a 26.32 bc 27.79 cd 16 bc
K60 87 a 27.06 b 1.88 b 11.47 a 27.33 bc 30.78 bc 20 ab
K90 89 a 32.78 a 2.71 a 11.75 a 30.82 ab 32.91 ab 21 a
K120 89 a 33.86 a 2.54 a 12.88 a 32.96 a 33.29 ab 23 a
LSD (p ≤ 0.05) NS 7.48 0.19 NS 4.43 3.90 4.00
NS, non-significant; DAT, days after transplanting; Means followed by a different letter within a columnare significantly different at p ≤ 0.05 by Tukey’s HSD (honest significant difference) test; LSD, LeastSignificant Difference.
K fertilization significantlyaffected (p ≤ 0.05) yield components of hybrid rice, such as, number offilled seeds panicle−1, number of unfilled seeds panicle−1 and panicle weight, while the effect wasnon-significant (p ≥ 0.05) for number of panicles hill−1, panicle length and 1000-seed weight (Table 3).K application at 90 kg K2O ha−1 produced higher number of filled seeds panicle−1 accounting for 26.4%more than that with K omission. Panicle weight increased with increase in K dose up to 60 kg ha−1,remained at par at K dose of 90 kg ha−1, and decreased with further increase in K rate. Plants in thecontrol plot produced the lowest panicle weight.
3.3. K Accumulation in Different Plant Parts
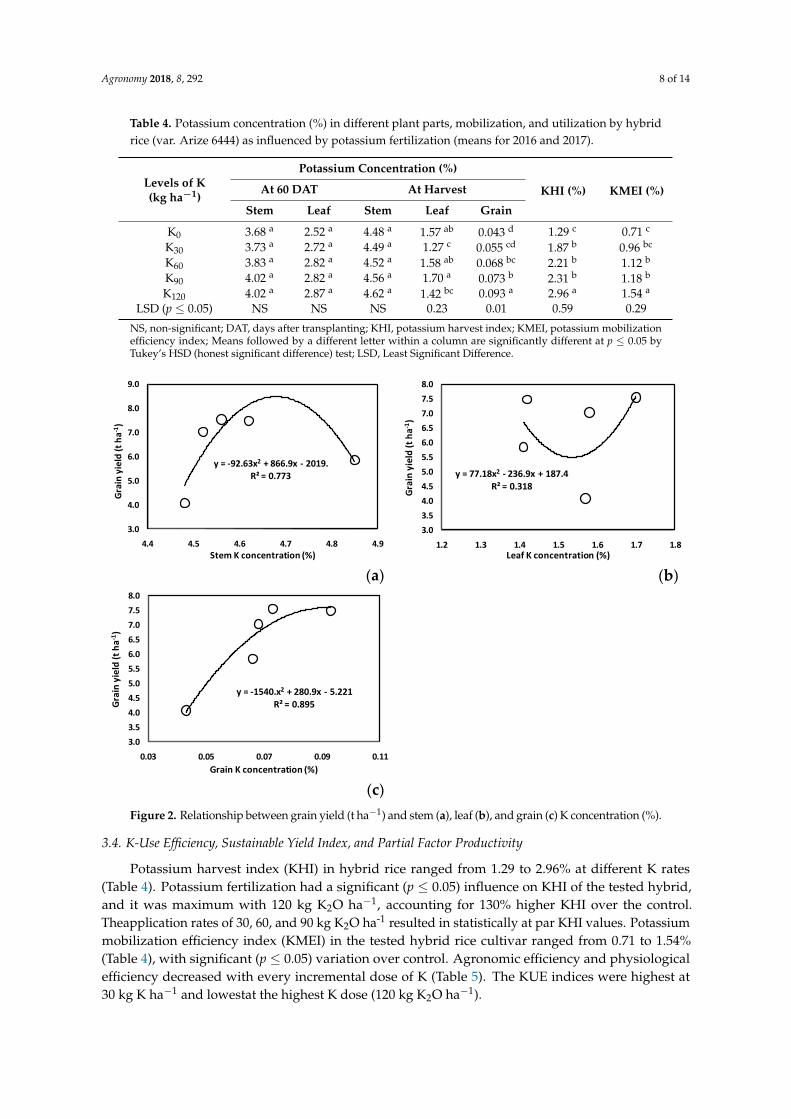
The K concentration (%) in stem at peak growth stage, i.e., 60 DAT, increased steadily upto90 kg K2O ha−1 although the difference is statistically non-significant (p ≥ 0.05) (Table 4). The leafK concentration also increased up to 60 kg K2O ha−1, although insignificantly. A similar trend ofK concentration was observed for stem, leaf, and grain at harvest (Table 4). As expected, the Kaccumulation in grain was lower than in stem or leaf. The relationships between grain yield and stem(R2 = 0.77) as well as grain K concentration (R2 = 0.89) were significant (p ≤ 0.05), while between grainyield and leaf K concentration was non-significant (R2 = 0.32) (Figure 2).
Agronomy 2018, 8, 292 8 of 14
Table 4. Potassium concentration (%) in different plant parts, mobilization, and utilization by hybridrice (var. Arize 6444) as influenced by potassium fertilization (means for 2016 and 2017).
Levels of K(kg ha−1)
Potassium Concentration (%)
KHI (%) KMEI (%)At 60 DAT At Harvest
Stem Leaf Stem Leaf Grain
K0 3.68 a 2.52 a 4.48 a 1.57 ab 0.043 d 1.29 c 0.71 c
K30 3.73 a 2.72 a 4.49 a 1.27 c 0.055 cd 1.87 b 0.96 bc
K60 3.83 a 2.82 a 4.52 a 1.58 ab 0.068 bc 2.21 b 1.12 b
K90 4.02 a 2.82 a 4.56 a 1.70 a 0.073 b 2.31 b 1.18 b
K120 4.02 a 2.87 a 4.62 a 1.42 bc 0.093 a 2.96 a 1.54 a
LSD (p ≤ 0.05) NS NS NS 0.23 0.01 0.59 0.29
NS, non-significant; DAT, days after transplanting; KHI, potassium harvest index; KMEI, potassium mobilizationefficiency index; Means followed by a different letter within a column are significantly different at p ≤ 0.05 byTukey’s HSD (honest significant difference) test; LSD, Least Significant Difference.
Agronomy 2018, 8, x FOR PEER REVIEW 8 of 16
3.3. K Accumulation in Different Plant Parts
The K concentration (%) in stem at peak growth stage, i.e., 60 DAT, increased steadily upto 90
kg K2O ha−1 although the difference is statistically non-significant (p ≥ 0.05) (Table4). The leaf K
concentration also increased up to 60 kg K2O ha−1, although insignificantly. A similar trend of K
concentration was observed for stem, leaf, and grain at harvest (Table 4). As expected, the K
accumulation in grain was lower than in stem or leaf. The relationships between grain yield and stem
(R2= 0.77) as well as grain K concentration (R2=0.89) were significant (p ≤ 0.05), while between grain
yield and leaf K concentration was non-significant (R2= 0.32) (Figure 2).
Table 4. Potassium concentration (%) in different plant parts, mobilization, and utilization by hybrid
rice (var. Arize 6444) as influenced by potassium fertilization (means for 2016 and 2017)
Levels of K (kg ha−1)
Potassium Concentration (%)
KHI (%) KMEI (%) At 60 DAT At Harvest
Stem Leaf Stem Leaf Grain
K0 3.68a 2.52a 4.48a 1.57ab 0.043d 1.29c 0.71c
K30 3.73a 2.72a 4.49a 1.27c 0.055cd 1.87b 0.96bc
K60 3.83a 2.82a 4.52a 1.58ab 0.068bc 2.21b 1.12b
K90 4.02a 2.82a 4.56a 1.70a 0.073b 2.31b 1.18b
K120 4.02a 2.87a 4.62a 1.42bc 0.093a 2.96a 1.54a
LSD (p≤ 0.05) NS NS NS 0.23 0.01 0.59 0.29
NS, non-significant; DAT, days after transplanting; KHI, potassium harvest index; KMEI, potassium
mobilization efficiency index; Means followed by a different letter within a column are significantly
different at p ≤ 0.05 by Tukey’s HSD (honest significant difference) test; LSD, Least Significant
Difference.
(a) (b)
(c)
y = -92.63x2 + 866.9x - 2019.R² = 0.773
3.0
4.0
5.0
6.0
7.0
8.0
9.0
4.4 4.5 4.6 4.7 4.8 4.9
Gra
in y
ield
(t
ha-1
)
Stem K concentration (%)
y = 77.18x2 - 236.9x + 187.4
R² = 0.318
3.0
3.5
4.0
4.5
5.0
5.5
6.0
6.5
7.0
7.5
8.0
1.2 1.3 1.4 1.5 1.6 1.7 1.8
Gra
in y
ield
(t
ha-1
)
Leaf K concentration (%)
y = -1540.x2 + 280.9x - 5.221
R² = 0.895
3.0
3.5
4.0
4.5
5.0
5.5
6.0
6.5
7.0
7.5
8.0
0.03 0.05 0.07 0.09 0.11
Gra
in y
ield
(t h
a-1
)
Grain K concentration (%)
Figure 2. Relationship between grain yield (t ha−1) and stem (a), leaf (b), and grain (c) K concentration (%).
3.4. K-Use Efficiency, Sustainable Yield Index, and Partial Factor Productivity
Potassium harvest index (KHI) in hybrid rice ranged from 1.29 to 2.96% at different K rates(Table 4). Potassium fertilization had a significant (p ≤ 0.05) influence on KHI of the tested hybrid,and it was maximum with 120 kg K2O ha−1, accounting for 130% higher KHI over the control.Theapplication rates of 30, 60, and 90 kg K2O ha-1 resulted in statistically at par KHI values. Potassiummobilization efficiency index (KMEI) in the tested hybrid rice cultivar ranged from 0.71 to 1.54%(Table 4), with significant (p ≤ 0.05) variation over control. Agronomic efficiency and physiologicalefficiency decreased with every incremental dose of K (Table 5). The KUE indices were highest at30 kg K ha−1 and lowestat the highest K dose (120 kg K2O ha−1).
Agronomy 2018, 8, 292 9 of 14
Table 5. Potassium use efficiency, sustainable yield index, and partial factor productivity of hybrid riceas influenced by potassium fertilization (means for 2016 and 2017).
Levels of K(kg ha−1)
AgronomicEfficiency
(kg Grain kg−1 K)
PhysiologicalEfficiency
(kg Grain kg−1 K)
SustainableYield Index
Partial FactorProductivity
(kg Grain kg−1 K)
K30 55.33 48.64 0.83 191.33K60 49.33 48.14 0.71 117.33K90 38.66 53.35 0.65 84.00K120 28.42 53.35 0.64 62.42
Overall trend shows that the SYI varied from 0.64 to 0.83 due to changes in K rates from 30 to120 kg K2O ha−1 (Table 5). The highest value of SYI (0.83) was obtained with 30 kg K2O ha−1. Partialfactor productivity (PFPK) decreased as the K ratesincreased from 30 to 120 kg K2O ha−1. As expected,the highest PFPK (191.33 kg grain kg−1 of K fertilizer) was recorded in plots with 30 kg K2O ha−1 andthe lowest (62.42 kg grain kg−1 of K-fertilizer) was found at 120 kg K2O ha−1.
3.5. Post-Harvest Soil Status and K Balance Sheet
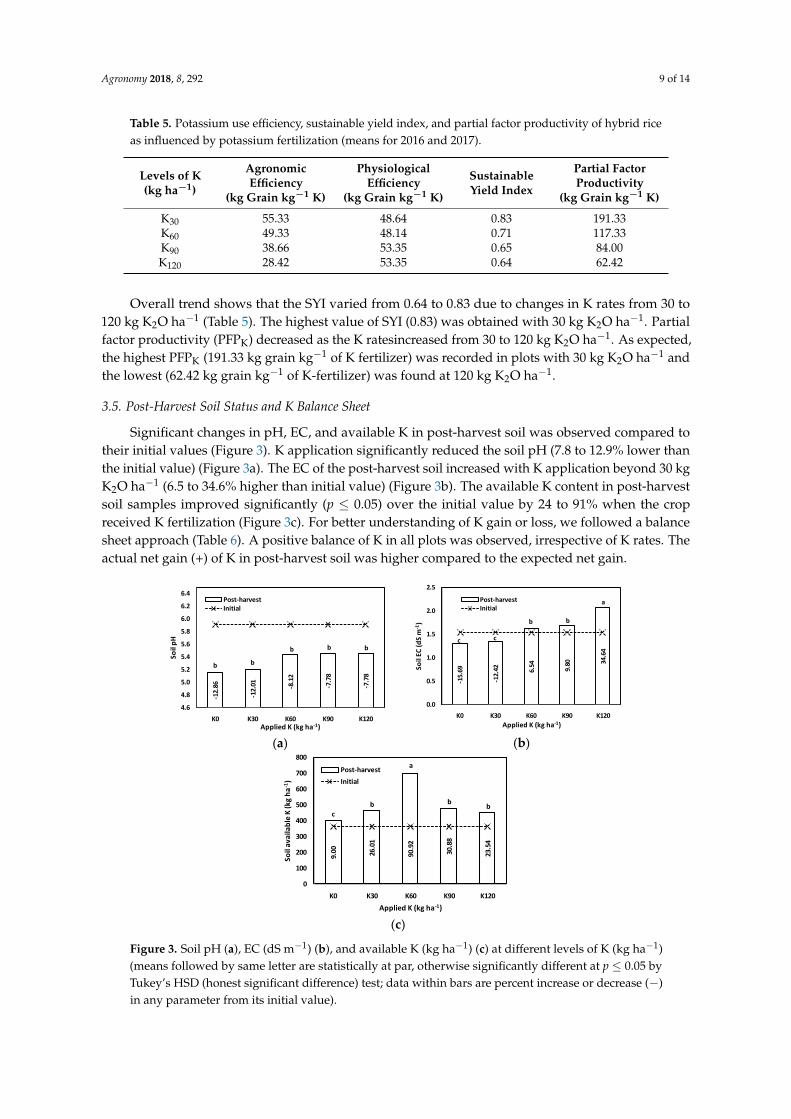
Significant changes in pH, EC, and available K in post-harvest soil was observed compared totheir initial values (Figure 3). K application significantly reduced the soil pH (7.8 to 12.9% lower thanthe initial value) (Figure 3a). The EC of the post-harvest soil increased with K application beyond 30 kgK2O ha−1 (6.5 to 34.6% higher than initial value) (Figure 3b). The available K content in post-harvestsoil samples improved significantly (p ≤ 0.05) over the initial value by 24 to 91% when the cropreceived K fertilization (Figure 3c). For better understanding of K gain or loss, we followed a balancesheet approach (Table 6). A positive balance of K in all plots was observed, irrespective of K rates. Theactual net gain (+) of K in post-harvest soil was higher compared to the expected net gain.
Agronomy 2018, 8, x FOR PEER REVIEW 10 of 16
3.4. K-Use Efficiency, Sustainable Yield Index, and Partial Factor Productivity
Potassium harvest index (KHI) in hybrid rice ranged from 1.29 to 2.96% at different K rates
(Table 4). Potassium fertilization had a significant (p ≤ 0.05) influence on KHI of the tested hybrid,
and it was maximum with 120 kg K2O ha−1, accounting for 130% higher KHI over the control.
Theapplication rates of 30, 60, and 90 kg K2O ha-1 resulted in statistically at par KHI values. Potassium
mobilization efficiency index (KMEI) in the tested hybrid rice cultivar ranged from 0.71 to 1.54%
(Table 4), with significant (p ≤ 0.05) variation over control. Agronomic efficiency and physiological
efficiency decreased with every incremental dose of K (Table 5). The KUE indices were highest at 30
kg K ha−1 and lowestat the highest K dose (120 kg K2O ha−1).
Table 5. Potassium use efficiency, sustainable yield index, and partial factor productivity of hybrid
rice as influenced by potassium fertilization (means for 2016 and 2017)
Levels of K
(kg ha−1)
Agronomic
Efficiency (kg
Grain kg−1 K)
Physiological
Efficiency (kg Grain
kg−1 K)
Sustainable
Yield Index
Partial Factor
Productivity (kg
Grainkg−1 K)
K30 55.33 48.64 0.83 191.33
K60 49.33 48.14 0.71 117.33
K90 38.66 53.35 0.65 84.00
K120 28.42 53.35 0.64 62.42
Overall trend shows that the SYI varied from 0.64 to 0.83 due to changes in K rates from 30 to
120 kg K2O ha−1 (Table 5). The highest value of SYI (0.83) was obtained with 30 kg K2O ha−1. Partial
factor productivity (PFPK) decreased as the K ratesincreased from 30 to 120 kg K2O ha−1. As expected,
the highest PFPK (191.33 kg grain kg−1 of K fertilizer) was recorded in plots with 30 kg K2O ha−1 and
the lowest (62.42 kg grain kg−1 of K-fertilizer) was found at 120 kg K2O ha−1.
3.5. Post-Harvest Soil Status and K Balance Sheet
Significant changes in pH, EC, and available K in post-harvest soil was observed compared to
their initial values (Figure 3). K application significantly reduced the soil pH (7.8 to 12.9% lower than
the initial value) (Figure 3a). The EC of the post-harvest soil increased with K application beyond 30
kg K2O ha−1 (6.5 to 34.6% higher than initial value) (Figure 3b). The available K content in post-harvest
soil samples improved significantly (p 0.05) over the initial value by 24 to 91% when the crop
received K fertilization (Figure 3c). For better understanding of K gain or loss, we followed a balance
sheet approach (Table 6). A positive balance of K in all plots was observed, irrespective of K rates.
The actual net gain (+) of K in post-harvest soil was higher compared to the expected net gain.
(a) (b)
-12.
86
-12.
01 -8.1
2
-7.7
8
-7.7
8
4.6
4.8
5.0
5.2
5.4
5.6
5.8
6.0
6.2
6.4
K0 K30 K60 K90 K120
Soil
pH
Applied K (kg ha-1)
Post-harvestInitial
bb
b b
b
-15.
69
-12.
42 6.54
9.80 34
.64
0.0
0.5
1.0
1.5
2.0
2.5
K0 K30 K60 K90 K120
Soil
EC (d
S m
-1)
Applied K (kg ha-1)
Post-harvestInitial
c
a
b b
c
Agronomy 2018, 8, x FOR PEER REVIEW 11 of 16
(c)
Figure 3. Soil pH (a), EC (dS m−1) (b), and available K (kg ha−1) (c) at different levels of K (kg ha−1)
(means followed by same letter are statistically at par, otherwise significantly different at p ≤ 0.05 by
Tukey’s HSD (honest significant difference) test; data within bars are percent increase or decrease (−)
in any parameter from its initial value).
Table 6. Potassium balance in soil after harvesting of hybrid rice (var. Arize 6444) as influenced by
potassium fertilization (means for 2016 and 2017)
Levels of
K(kg ha−1)
Initial
Soil K
Status
(kg ha−1)
(a)
K Added
through
Fertilizer
(kg ha−1) (b)
Total K
(kg ha−1)
(c = a + b)
Crop K
Uptake
(kg ha−1)
(d)
Expected
Balance (kg
ha−1) (e = c
− d)
Actual K
Balance
*(kg ha−1)
(f)
Net K Gain
(+) or Loss
(−) (kg ha−1)
(f − e)
K0 343.6 0 343.6 208.7 134.9 398.8 263.9
K30 343.6 30 373.6 243.2 130.4 451.0 320.6
K60 343.6 60 403.6 270.2 133.4 461.0 327.6
K90 343.6 90 433.6 273.9 159.6 498.8 339.2
K120 343.6 120 463.6 272.7 190.9 698.5 507.6
Crop K uptake was calculated by multiplying total plant K concentration (%) with dry matter (kg
ha−1); *Represents data on available K content in post-harvest soil.
3.7. Economic Returns
Higher profitability from hybrid rice was achieved with 90 kg K2O ha−1 due to higher net returns
(US$ 452 ha−1) and BCRs (1.75) over other treatments (Table 7). Both higher (120 kg ha−1) and lower K
rates (30 kg K2O ha−1) resulted in decline in net return and BCR. Both net return and BCR showed a
sharp decline in the K omission treatment.
Table 7. Economic analysis of hybrid rice (var. Arize 6444) cultivation as influenced by potassium
fertilization (means for 2016 and 2017)
Levels of K
(kg ha−1)
Common Cost
(US$ ha−1)
Treatment Cost *
(US$ ha−1)
Total Cost
(US$ ha−1)
Gross Return
(US$ ha−1)
Net Return
(US$ ha−1) BCR
K0 517 47 564 569 12 1.01
K30 517 60 577 800 416 1.39
K60 517 73 590 981 476 1.66
K90 517 86 603 1054 452 1.75
K120 517 99 616 1044 208 1.69
BCR, benefit:cost ratio; *Treatment cost varies only due to difference in fertilizer levels; 1 US$ = ̀ 65.00.
9.00 26
.01
90.9
2
30.8
8
23.5
4
0
100
200
300
400
500
600
700
800
K0 K30 K60 K90 K120
Soil
avai
lab
le K
(kg
ha
-1)
Applied K (kg ha-1)
Post-harvest
Initial
a
b bb
c
Figure 3. Soil pH (a), EC (dS m−1) (b), and available K (kg ha−1) (c) at different levels of K (kg ha−1)(means followed by same letter are statistically at par, otherwise significantly different at p ≤ 0.05 byTukey’s HSD (honest significant difference) test; data within bars are percent increase or decrease (−)in any parameter from its initial value).
Agronomy 2018, 8, 292 10 of 14
Table 6. Potassium balance in soil after harvesting of hybrid rice (var. Arize 6444) as influenced bypotassium fertilization (means for 2016 and 2017).
Levels of K(kg ha−1)
Initial SoilK Status
(kg ha−1) (a)
K AddedthroughFertilizer
(kg ha−1) (b)
Total K(kg ha−1)(c = a + b)
Crop KUptake
(kg ha−1)(d)
ExpectedBalance
(kg ha−1)(e = c − d)
Actual KBalance *
(kg ha−1) (f)
Net K Gain (+) orLoss (−)
(kg ha−1) (f − e)
K0 343.6 0 343.6 208.7 134.9 398.8 263.9K30 343.6 30 373.6 243.2 130.4 451.0 320.6K60 343.6 60 403.6 270.2 133.4 461.0 327.6K90 343.6 90 433.6 273.9 159.6 498.8 339.2K120 343.6 120 463.6 272.7 190.9 698.5 507.6
Crop K uptake was calculated by multiplying total plant K concentration (%) with dry matter (kg ha−1); * Representsdata on available K content in post-harvest soil.
3.6. Economic Returns
Higher profitability from hybrid rice was achieved with 90 kg K2O ha−1 due to higher net returns(US$ 452 ha−1) and BCRs (1.75) over other treatments (Table 7). Both higher (120 kg ha−1) and lower Krates (30 kg K2O ha−1) resulted in decline in net return and BCR. Both net return and BCR showed asharp decline in the K omission treatment.
Table 7. Economic analysis of hybrid rice (var. Arize 6444) cultivation as influenced by potassiumfertilization (means for 2016 and 2017).
Levels of K(kg ha−1)
Common Cost(US$ ha−1)
Treatment Cost* (US$ ha−1)
Total Cost(US$ ha−1)
Gross Return(US$ ha−1)
Net Return(US$ ha−1) BCR
K0 517 47 564 569 12 1.01K30 517 60 577 800 416 1.39K60 517 73 590 981 476 1.66K90 517 86 603 1054 452 1.75K120 517 99 616 1044 208 1.69
BCR, benefit:cost ratio; * Treatment cost varies only due to difference in fertilizer levels; 1 US$ = 65.00.
4. Discussion
The cultivation of hybrid rice using K rates applicable to high yielding varieties (HYVs) has failedto realize higher yields under any given conditions [12]. Thus, improved K management (particularlytiming and splitting) for superior cultivarsis required to increase yield and KUE of hybrid rice. Anuninterrupted supply of K during the entire crop growth period was found to be more effective as itincreased growth parameters, yield attributes, yield, and KUE of rice hybrids [17]. The present studyquantified the impact of K fertilization on growth, development, and yield of var. Arize 6444. In this study,leaf and grain dry matter (DM) at harvest and number of tillers hill−1 were highest at 120 kg K2O ha−1,followed by 90 kg K2O ha−1. This finding is supported by a previous study indicating improved growthparameters due to increase in K level [32]. Higher uptake of K in above-ground biomass with highdose of K might have resulted in larger canopy of the hybrid cultivar [33]. Another study has shownthat macro and micronutrient uptake increased considerably under higher K application rates. Hence,increased apparent recovery of N, P, S, and Ca with higher K application rates could improve growth ofrice hybrids [12]. Other investigators opined that significant (p ≥ 0.05) increase in total photosyntheticrate and net assimilation rate at heading and maturing stages with high K application might have led togreater DM production [34]. On the other hand, plants in control plots had lower DM accumulation. Thisresult is in conformity with the findings of other investigators who observed increased total tillers, drymatter accumulation, and effective tillers with 75 kg K2O ha−1 [17].
We observed significant (p≤ 0.05) beneficial effect of K fertilization on yield components of hybridrice, mainly on number of filled and unfilled grains panicle−1 and panicle weight, and K application at90 kg ha−1 had the best result. In line with our results, other investigators found that high levels of K
Agronomy 2018, 8, 292 11 of 14
significantly increased (p≥ 0.05) panicle weight due to higher number of filled grains panicle−1 [35,36].Potassium appeared to help enhance grain weight by delaying abscisic acid (ABA) peak by fourtofivedays, thereby delaying maturation and increasing carbohydrate translocation to the seeds [37]. Thesame study also reported that K application markedly reduced the number of unfilled spikelets due toits promoting effect on cytokinin synthesis, which resulted in less zygote degeneration.
The present study highlights that the number of filled grains panicle−1 and panicle weight werestrongly associated with grain yield. This finding again confirms that productivity of crop is collectivelydetermined by vegetative growth and its yield components. Better vegetative growth coupled withhigher yield components might have resulted in higher grain and straw yield of hybrid rice [9,13,14,38].In addition, limited supply of assimilates to the grains might be responsible for the reduced panicleweight at lower doses of K. The panicle length and test weight had non-significant contribution to grainyield. Several investigators identified the number of grains panicle−1 as the key yield componentsfor higher grain yield in hybrids, rather than panicle number and panicle length [39]. Similar to thepresent study, other researchers also did not find any relation between test weight and grain yield ofhybrid rice grown in the wet season [1].
The regression between K and grain yield indicated that the relationship was highly significant inthe observed quadratic relationship (Figure 1). From the regression equation, the economic optimumlevel of K (Kopt) was derived as 101.5 kg K2O ha−1. Other investigators also used a similar approach fordetermining Kopt and found 80 kg K2O ha−1 as the best dose for hybrid rice in summer season at redand lateritic soils of Orissa [40]. Results are in accordance with earlier reports [17], wherein higher yieldresponse of hybrid rice to K nutrition was found at 75 kg ha−1. However, in the salt affected soil the Krequirement is higher as the soil salinity caused a reduction in growth and yield of rice and higher K isrequired for alleviation [41]. A study in a coastal saline soil of Bangladesh reported that the requiredK dose is more than 100 kg ha−1 to achieve hybrid rice yield of 4 t ha−1 [41], which is similar to thepresent study.
The K content of rice plant is an important index for obtaining higher grain yield of hybrid rice [42].The regression study with grain yield as a dependent variable showed that the stem (R2 = 0.77) andgrain K concentrations (R2 = 0.89) had positive significant relationship with yield. Strategies to increasestem and grain K concentration can thereby enhance grain yield. However, leaf K concentrationwas not a good indicator of the response of hybrid rice to K fertilization. Information regardingincrease of both grain yield and KUE, as well as their relationship with K accumulation and utilizationcharacteristics is limited. Only few earlier studies revealed higher K accumulation during the periodfrom primary branch initiation to spikelet initiation [43]. About 45–67% of total K accumulationwas observed from panicle initiation (PI) to heading stage. In addition, 50% of the K in leaf sheathmight had been translocated to spikelets after heading which accounted for two-thirds of grain Kconcentration [43]. In the present study, Arize 6444 had high K accumulation both in vegetative(particularly leaf) and reproductive part (grain) at harvest with 90 and 120 kg K2O ha−1 that mighthave contributed significantly to high yield. Additionally, the higher K accumulation in its stems bothat 60 DAT and harvest helped increase lodging resistance [44]. The present work has also shown thatK omission treatment decreased K uptake, transfer and efficiency.
The KUE indices (agronomic efficiency and physiological efficiency) for the tested hybrid cultivardecreased with the increase in K from 30 to 120 kg ha−1, being maximum and minimum at 30 and120 kg K2O ha−1, respectively. There was not much difference in SYI of hybrid rice due to variationin K fertilization. The fertilizer productivity, estimated as PFP, decreased with the increasing levelof K fertilization. This indicates poor rate of K utilization at higher application rates. This might bedue to the curvilinear return to the conversion of K to seed as yield approaches the ceiling at higherK-levels [24,45]. The fertilizer productivity decreased to a greater degree passing from 30 to 60 kgK2O ha−1 (PFP 117.33 kg grain kg−1 of K-fertilizer) than passing from 60 to 90 (PFP 84.00 kg grainkg−1 K) or 90 to 120 (PFP 62.42 kg grain kg−1 K). The results point to the advantage of using anoptimum K rate that creates the right balance between efficiency and effectivity of applied K fertilizer.
Agronomy 2018, 8, 292 12 of 14
The K balance in the post-harvest soil was positive for all the treatments. Interestingly, the netK balance was positive even for the K omission plots. Thepositive balance was driven by the highinitial K level of the experimental soil (366 kg K2O ha−1). A recent study [46] from the same arearevealed that the soils of the area are rich in illitic clays and are expected to release non-exchangeable K(NEK)effectively when under stress. The same study, through sequential extraction with boiling 1MHNO3, showed that the NEK release could be triggered at a relatively high activity coefficient (ARK) ofK [46]. Such NEK release could augment the already high native K level in the soil and may explain thepositive net K balance observed in our study. Crop response to K fertilizer application in soils with suchhigh initial K level is not expected. However, every incremental dose of K over the zero-K treatmentproduced significant yield increases in this study, and the best yield was achieved at 90 kg K2O ha−1.This suggest that hybrid rice was unable to use the native K till K fertilizer application increased theactivity of K to a sufficiently high level. Such K uptake restriction may happen when soils have highmagnesium concentration relative to K concentration. The Mg-induced K deficiency in crops is welldocumented and can occur in soils with an available K/Mg concentration below 0.32 [47]. A recentassessment of K+/(Ca2+ + Mg2+) ratios in soils from two similar locations nearby our experimentalsites indicated values less than 0.17 [46]. Such low values of the said ratio in our study area may createrestriction to K uptake leading to hybrid rice yield losses when K fertilizer was not applied.
Application of 90 kg K2O ha−1 has been found to be economically effective, mainly because ofincreased grain yield realized at this K application rate. However, the economic optimum level of Kopt
was derived from regression study as 101.5 kg K2O ha−1. On the contrary, the lowest net returns andBCR were found in K-omitted plots because of lower grain yield, resulting from a smaller number offilled grains panicle−1, short length of panicle and reduced panicle weight. This result corroborates theearlier studies that hybrid rice cultivars responded to K application appreciably, although economicefficiency of K declined at higher levels of application [9,32,33].
5. Conclusions
In the main rice growing areas of the coastal saline belt of West Bengal (India), productivity, andprofitability of hybrid rice (var. Arize 6444) could be increased through site-specific K managementpractice. Our research confirms that adequate K application is necessary to obtain high grain yieldin hybrid rice even though the soils of the coastal areas are high in illitic clay and high available Kcontent. This explains why a K management strategy appropriate for HYVs may not work for hybridrice. Our results also confirm that the present recommended level (40 kg K2O ha−1) is inadequate tosupport attainable yield potentials of hybrid rice. A rate of 101.5 kg K2O ha−1 (through muriate ofpotash/MOP) may be recommended to achieve higher productivity of hybrid rice during wet seasonin coastal region of West Bengal (India).
Author Contributions: H.B. and S.K.D. conceived and designed the experiment; H.B. and S.K.D. conducted theexperiments; H.B. recorded the data; H.B. and K.R. analyzed the data; H.B. and K.R. wrote the paper; S.K.D., K.M.,T.S., and J.T. reviewed, edited, and approved the final manuscript.
Funding: This work was funded by International Plant Nutrition Institute (IPNI), South-Asia Program.
Acknowledgments: Authors pay special thanks to Bidhan Chandra KrishiViswavidyalaya (BCKV), India, forgiving the opportunity to conduct field experiment in their Research Farm. We are grateful to Pravat KumarMaity, Ajay Kar, and GurupadaKhanra for managing the field experiments at Kakdwip, West Bengal. We alsothank BiswanathHalder who carried out the chemical analysis for plant and soil samples at BCKV.
Conflicts of Interest: The authors declare no conflict of interest.
References
1. Banerjee, H.; Pal, S. Effect of planting geometry and different levels of nitrogen on hybrid rice. Oryza 2011,48, 274–275.
2. Banerjee, H.; Chatterjee, S.; Sarkar, S.; Gantait, S.; Samanta, S. Evaluation of rapeseed-mustard cultivarsunder late sown condition in coastal ecosystem of West Bengal. J. Appl. Natl. Sci. 2017, 9, 940–949. [CrossRef]
Agronomy 2018, 8, 292 13 of 14
3. Asch, F.; Dingkuhn, M.; Wittstock, C.; Doerffling, K. Sodium and potassium uptake of rice panicles as affectedby salinity andseason in relation to yield and yield components. Plant Soil 1999, 207, 133–145. [CrossRef]
4. Castillo, E.G.; Tuong, T.P.; Ismail, A.M.; Inubushi, K. Response to Salinity in Rice: Comparative Effects ofOsmotic and Ionic Stresses. Plant Prod. Sci. 2007, 10, 159–170. [CrossRef]
5. Aslam, M.; Qureshi, R.H.; Ahmad, N. A rapid screening technique for salt tolerance in rice (Oryza sativa L.).Plant Soil 1993, 150, 99–107. [CrossRef]
6. Mondal, P.; Pal, S.; Alipatra, A.; Mandal, J.; Banerjee, H. Comparative study on growth and yield of promisingrice cultivars during wet and dry season. Plant Arch. 2012, 12, 659–662.
7. Islam, M.R.; Sarker, M.R.A.; Sharma, N.; Rahman, M.A.; Collard, B.C.Y.; Gregorio, G.B.; Ismail, A.M.Assessment of adaptability of recently released salt tolerant rice varieties in coastal regions of SouthBangladesh. Field Crop. Res. 2016, 190, 34–43. [CrossRef]
8. Adhikari, B.; Bag, M.K.; Bhowmick, M.K.; Kundu, C. Status Paper on Rice in West Bengal. In Rice KnowledgeManagement Portal (RKMP); Directorate of Rice Research: Hyderabad, India, 2011.
9. Banerjee, H.; Pal, S. Response of hybrid rice to nutrient management during wet season. Oryza 2012, 49,108–111.
10. Khandkar, V.; Gandhi, V.P. Post-adoption experience of hybrid rice in India: Farmers’ satisfaction andwillingness to grow. Agric. Econ. Res. Rev. 2018, 31, 95–104. [CrossRef]
11. Singh, A.; Kumar, B.; Baghel, R.; Singh, R. Sustainability of hybrid rice technology vis a vis inbred rice inUttar Pradesh. Ind. Res. J. Ext. Educ. 2009, 9, 22–25.
12. Pattanayak, S.K.; Mukhi, S.K.; Majumdar, K. Potassium unlocks the potential for hybrid rice. Better Crop.2008, 92, 8–9.
13. Mondal, S.; Mallikarjun, M.; Ghosh, M.; Ghosh, D.C.; Timsina, J. Effect of Integrated Nutrient Managementon Growth and Productivity of Hybrid Rice. J. Agric. Sci. Technol. 2015, 297–308.
14. Mondal, S.; Mallikarjun, M.; Ghosh, M.; Ghosh, D.C.; Timsina, J. Influence of integrated nutrient management(INM) on nutrient use efficiency, soil fertility and productivity of hybrid rice. Arch. Agron. Soil Sci. 2016.[CrossRef]
15. Fageria, N.K.; Sant’ana, E.P.; Morais, O.P.; de Morais, O.P. Response of promising upland rice genotypes tosoil fertility. Pesqui. Agropecu. Bras. 1995, 30, 1155–1161.
16. Shi, H.; Zhang, X.H.; Pan, X.H.; Guo, J.Y.; Zhang, P. Studies on the characteristics of potassium absorptionand yield formation on early hybrid rice. Acta Agric. Univ. JiangXiensis 1990, 12, 54–59.
17. Meena, S.L.; Singh, S.; Shivay, Y.S. Response of hybrid rice (Oryza sativa) to nitrogen and potassiumapplication. Ind. J. Agron. 2002, 47, 207–211.
18. Prasad, K.; Chauhan, R.P.S. Efficiency of potassium under rainfed lowland rice. Ann. Plant Soil Res. 1999, 1,52–57.
19. Jackson, M.L. Soil Chemical Analysis; Prentice Hall of India Pvt. Ltd.: New Delhi, India, 1967.20. Dewis, J.; Freitas, F. Physical and Chemical Methods of Soil and Water Analysis. In Soil Bulletin; FAO: Rome,
Italy, 1984.21. Subbiah, B.; Asija, G.L. A rapid procedure for the estimation of available N in soils. Curr. Sci. 1956, 25,
259–260.22. Olsen, S.R.; Cole, C.V.; Watanale, F.S.; Dean, L.A. Estimation of Available Phosphorus in Phosphorus in Soils by
Extraction with Sodium Bicarbonate; United States Department of Agriculture: Washington, DC, USA, 1954.23. Hanway, J.J.; Heidel, H. Soil analysis methods as used in Iowa State College Soil Testing Laboratory. Iowa
Agric. 1952, 57, 1–13.24. Sarangi, S.K.; Maji, B.; Singh, S.; Sharma, D.K.; Burman, D.; Mandal, S.; Haefele, S.M. Using improved variety
and management enhances rice productivity in stagnant flood-affected tropical coastal zones. Field Crop. Res.2016, 190, 70–81. [CrossRef]
25. Jackson, M.L. Soil Chemical Analysis; Prentice Hall of India Pvt. Ltd.: New Delhi, India, 1973; pp. 38–56.26. Sharma, N.K.; Singh, R.J.; Kumar, K. Dry matter accumulation and nutrient uptake by wheat
(Triticumaestivum L.) under poplar (Populusdeltoides) based agroforestry system. ISRN Agron. 2012, 2012,359673.
27. Fageria, N.K. Nitrogen harvest index and its association with crop yields. J. Plant Nutr. 2014, 37, 795–810.[CrossRef]
Agronomy 2018, 8, 292 14 of 14
28. Sarkar, S.; Banerjee, H.; Ray, K.; Ghosh, D. Boron fertilization effects in processing grade potato on aninceptisol of West Bengal, India. J. Plant Nutr. 2018, 41, 1456–1470. [CrossRef]
29. Mozumder, M.; Banerjee, H.; Ray, K.; Paul, T. Evaluation of potato (Solanumtuberosum) cultivars forproductivity, N requirement and eco-friendly indices under different nitrogen levels. Ind. J. Agron. 2014, 59,327–335.
30. Vittal, K.P.R.; MaruthiSankar, G.R.; Singh, H.P.; Samra, J.S. Sustainability of Practices of Dryland Agriculture:Methodology and Assessment. Available online: http://www.crida.in/AICRPDA/Sustainability.pdf(accessed on 4 October 2018).
31. Rana, R.; Banerjee, H.; Dutta, S.K.; Ray, K.; Majumdar, K.; Sarkar, S. Management practices of macronutrientsfor potato for smallholder farming system at alluvial soil (Entisols) of India. Arch. Agron. Soil Sci. 2017, 63,1963–1976. [CrossRef]
32. Maiti, S.; Saha, M.; Banerjee, H.; Pal, S. Integrated nutrient management under hybrid rice—Hybrid rice(Oryza sativa) cropping sequence. Ind. J. Agron. 2006, 51, 157–159.
33. Banerjee, H.; Pal, S. Integrated nutrient management for rice-rice cropping system. Oryza 2009, 46, 32–36.34. Fan, M.; Ge, D.Z. Potassium nutrition in hybrid rice. Int. Rice Res. Newsl. 1987, 12, 21.35. Thakur, R.B.; Pandey, S.K.; Singh, H. Contribution of production factors on yield of midland rice. Oryza 1994,
31, 271–293.36. Bhowmick, N.; Nayak, R.L. Response of hybrid rice (Oryza sativa L.) varieties to nitrogen, phosphorus and
potassium fertilizers during dry (boro) season in West Bengal. Ind. J. Agron. 2000, 45, 323–326.37. Yuan, L.; Huang, J.G. Effects of potassium on the variation of plant hormones in developing seeds of hybrid
rice. J. South West Agric. Univ. 1993, 15, 38–41.38. Dwivedi, A.P.; Dixit, R.S.; Singh, G.R. Effect of nitrogen, phosphorus and potassium levels on growth, yield
and quality of hybrid rice (Oryza sativa L.). Oryza 2006, 43, 64–66.39. Om, H.; Katyal, S.K.; Dhiman, S.D. Effect of time of transplanting and rice (Oryza sativa) hybrids on growth
and yield. Ind. J. Agron. 1997, 42, 261–264.40. Das, L.K.; Panda, S.C. Economics of hybrid rice cultivation as influenced by nitrogen and potassium levels.
J. Res. Orissa Univ. Agric. Technol. 2002, 20, 50–52.41. Kibria, M.G.; Farhad; Hoque, M.A. Alleviation of soil salinity in rice by potassium and zinc fertilization.
Int. J. Exp. Agric. 2015, 5, 15–21.42. Li, M.; Zhang, H.; Yang, X.; Ge, M.; Ma, Q.; Wei, H.; Dai, Q.; Huo, Z.; Xu, K.; Luo, D. Accumulation, and
utilization of nitrogen, phosphorus and potassium of irrigated rice cultivars with high productivities andhigh N use efficiencies. Field Crop. Res. 2014, 161, 55–63. [CrossRef]
43. Huang, Y.M.; Li, Y.Z.; Zheng, J.S.; Zhung, Z.L. Studies on the NPK accumulation and transfer of high yieldingcolony of hybrid rice. J. Fujian Acad. Agric. Sci. 1997, 12, 1–6.
44. Yang, C.; Yang, L.; Yan, T.; Ou-Yang, Z. Effects of nutrient and water regimes on lodging resistance of rice.Chin. J. Appl. Ecol. 2004, 15, 646–650. (In Chinese with English abstract)
45. Premi, O.P.; Rathore, S.S.; Shekhawat, K.; Kandpal, B.K.; Chauhan, J.S. Sustainability of fallow-Indianmustard (Brassica juncea) system as influenced by green manure, mustard straw cycling and fertilizerapplication. Ind. J. Agron. 2012, 57, 229–234.
46. Sarkar, G.K.; Chattopadhyay, A.P.; Sanyal, S.K. Release pattern of non-exchangeable potassium reserves inAlfisols, Inceptisols and Entisols of West Bengal, India. Geoderma 2013, 207–208, 8–14. [CrossRef]
47. Hannan, J.M. Potassium-Magnesium Antagonism in High Magnesium Vineyard Soils. Available online:https://lib.dr.iastate.edu/etd/12096 (accessed on 24 May 2018).
© 2018 by the authors. Licensee MDPI, Basel, Switzerland. This article is an open accessarticle distributed under the terms and conditions of the Creative Commons Attribution(CC BY) license (http://creativecommons.org/licenses/by/4.0/).
Related Documents