UC MercedUC Merced Electronic Theses and Dissertations
TitleThe Sensory Structure of the English Lexicon
Permalinkhttps://escholarship.org/uc/item/885849k9
AuthorWinter, Bodo
Publication Date2016
Copyright InformationThis work is made available under the terms of a Creative Commons Attribution License, availalbe at https://creativecommons.org/licenses/by/4.0/ Peer reviewed|Thesis/dissertation
eScholarship.org Powered by the California Digital LibraryUniversity of California

UNIVERSITY OF CALIFORNIA, MERCED
The Sensory Structure of the English Lexicon
by Bodo Winter
A dissertation submitted in partial satisfaction of the requirements for the Doctor of Philosophy in Cognitive Science
Committee in charge:
Professor Teenie Matlock, Chair Professor Michael Spivey
Professor Rick Dale

© 2016 Bodo Winter All rights reserved
iii
The dissertation of Bodo Winter is approved, and it is acceptable in quality and form for publication on microfilm and electronically:
Professor Teenie Matlock
Professor Michal Spivey
Professor Rick Dale
University of California, Merced 2016
iv
TABLE OF CONTENTS
Signature page iii
Table of contents iv List of figures vi List of tables vii
Acknowledgments viii Abstract x
1. Introduction 1 1.1. A note on the five-senses folk model 10 1.2. Overview of the dissertation 13
2. Methods 17 2.1. Using modality norms to characterize the senses 17 2.2. Statistical analysis 27
3. Visual dominance in the English lexicon 31 3.1. Visual dominance 31 3.2. Differential lexicalization 34 3.3. Differences in semantic complexity 37 3.4. Word frequency asymmetries 39 3.5. Word processing 44 3.6. Discussion 47
4. Taste and smell words are more affectively loaded 53 4.1. Olfaction, gustation and human emotions 53 4.2. Characterizing odor and taste words 57 4.3. Taste and smell words in context 63 4.4. Taste and smell words are more emotionally variable 69 4.5. Discussion 73
5. Affect and words for roughness/hardness 79 5.1. Affective touch 79 5.2. Words for roughness/hardness and valence 81 5.3. Discussion 89

v
6. Non-arbitrary sound structures in the sensory lexicon 91 6.1. Background on iconicity 91 6.2. The tug of war between iconicity and arbitrariness 97 6.3. The sensory dimension of iconicity 99 6.4. Testing the iconicity of sensory words 103 6.5. Sound structure maps onto tactile properties 113 6.6. What explains the association between roughness and /r/? 120 6.7. Discussion 125
7. The structure of multimodality 130 7.1. Interrelations between the senses 130 7.2. Modality correlations in adjective-noun pairs 134 7.3. Discussion 137
8. Cross-modal metaphors 140 8.1. A hierarchy of cross-modal metaphors 140 8.2. Methodological problems of cross-modal metaphor research 148 8.3. Modality similarity, affect and iconicity 153 8.4. A closer look at the cross-modal metaphor hierarchy 157 8.5. Discussion 165
9. Conclusions 171 9.1. Summary of empirical findings 171 9.2. Predictions for novel experiments 176 9.3. Perception and language 178
References 184
Appendix A: Details on statistical analyses 211

vi
LIST OF FIGURES
Figure 1. Kernel density estimates of adjective norms 35
Figure 2. Dictionary meanings as a function of modality 38 Figure 3. Word frequency as a function of modality 40 Figure 4. Modality-specific word frequencies over time 43
Figure 5. Valence norms as a function of modality 59 Figure 6. Twitter valence data as a function of modality 61 Figure 7. Subjectivity of movie reviews by modality 66
Figure 8. Context valence by modality 69 Figure 9. Valence variability by modality 72 Figure 10. Valence as a function of tactile surface properties 84
Figure 11. Context valence by surface properties 85 Figure 12. Dictionary meanings as a function of surface properties 88 Figure 13. Kernel density estimates of iconicity norms 105
Figure 14. Iconicity ratings by sensory experience ratings 107 Figure 15. Iconicity as a function of dominant modality 108 Figure 16. Indirect effect of tactile strength on iconicity 109
Figure 17. Most important phonemes for predicting tactile properties 117 Figure 18. English words that match the /r/ pattern over time 124 Figure 19. The correlational structure of multimodality 135
Figure 20. The sensory metaphor hierarchy according Williams (1976: 463) 143 Figure 21. Kernel density estimates of cosine modality similarity 155 Figure 22. Valence and iconicity as a function of modality similarity 156
Figure 23. Metaphor use as a function of valence and iconicity 165

vii
LIST OF TABLES
Table 1. Modality norms for yellow and harsh 19
Table 2. Example adjectives by sensory modality 20 Table 3. Example nouns by sensory modality 20 Table 4. Example verbs by sensory modality 23
Table 5. Word counts for adjectives, nouns and verbs 34 Table 6. Cumulative frequency counts per modality 40 Table 7. Overview of the experimental literature on iconicity 100
Table 8. Most and least iconic forms per modality 110 Table 9. Phonestheme counts by sensory modality 111 Table 10. OED etymologies by modality 112
Table 11. Decomposing words into their phonemes 115 Table 12. /r/ presence and roughness/hardness 118 Table 13. Stimuli used in the pseudoword experiment 119
Table 14. Roughness and /r/ in Proto-Indo-European (Watkins, 2000) 123 Table 15. Cross-modal metaphors used by Lord Byron 149 Table 16. Cosine similarity for abrasive contact and fragrant music 154
Table 17. Type counts of metaphorical sources and targets 160 Table 18. Proportion of mapped words by modality 161 Table 19. Summary of results 172
viii
Acknowledgments
I would like to thank my dissertation committee, Teenie Matlock, Rick Dale, and
Michael Spivey. I specifically want to thank my advisor, Teenie Matlock, for her
generous support and for giving me the best learning environment one could
wish for.
Much of the ideas presented in this dissertation were developed during an
inspiring visit to Wisconsin-Madison, where Marcus Perlman was a constant
source of inspiration and knowledge. The background work behind the iconicity
ratings used in Chapter 6 was also conducted during this visit, and I thank Lynn
Perry, Marcus Perlman, Gary Lupyan and Dominic Massaro for their help, and
for allowing me to use these norms in the dissertation. Dave Ardell has helped
by processing the MacMillan data used in Chapters 3 and 5. Bryan Kerster
supported me with Python and SQL. For helpful comments and suggestions I
want to thank Andre Coneglian, Timo Röttger, Mark Dingemanse, Martine
Grice, Francesca Strik Lievers, Damian Blasi, Diane Pecher, René Zeelenberg,
Rolf Zwaan, Christiane Schmitt, Roman Auriga, Julius Hassemer, the members
of the Institute of Phonetics, Cologne, the members of the Zurich Center for
Linguistics, and the members of Asifa Majid’s group at the Center for Language
Studies in Nijmegen (in particular Lila San Roque and Laura Speed).
None of this work would have been possible without the data collected
and made publicly available by Louise Connell and Dermot Lynott, for which I
am eternally thankful. I also want to thank Mark Davies for making COCA
available, my favorite corpus. Finally, special thanks belong to Guy Jackson at
MacMillan for generously sharing data of dictionary meaning counts.
ix
Special thanks goes to my father, Clive Winter, for helping me generously
with proofreading. Lastly, I thank my Mum, Ellen Schepp-Winter, and my
partner, Christian Mayer, for continuous support and feedback.
Institutional acknowledgments
Chapter 3 has been submitted for publication to Cognitive Linguistics, co-authored
with Marcus Perlman. The dissertation author was the primary investigator and
author.
Chapter 4 has been submitted for publication and accepted to Language, Cognition
and Neuroscience.
x
DISSERTATION ABSTRACT
Language vividly connects to the world around us by encoding sensory
information. For example, the words fragrant and silky evoke smell and touch,
whereas hazy, beeping and salty evoke vision, hearing and taste. This dissertation
shows that the sensory modality that a word evokes is highly predictive of a
word’s linguistic behavior in a way that supports embodied cognition theories.
That is, perceptual differences between the senses result in linguistic differences,
and interrelations in perception result in interrelations in language.
Chapter 3 provides evidence that the English language exhibits visual
dominance, with visual words such as bright, purple and shiny being more
frequent, less contextually restricted and more semantically complex. These
linguistic patterns are argued to follow from the perceptual dominance of vision.
Chapters 4 and 5 show that taste, smell and touch words form an
affectively loaded part of the English lexicon. It is argued that the precise way in
which these sensory words engage in emotional language follows from how the
corresponding senses are tied to emotional processes in perception and in the
brain.
Chapter 6 addresses phonological differences between classes of sensory
words, arguing that tactile and auditory words are particularly prone to sound
symbolism. A look at tactile sound symbolism reveals that “r is for rough”, with
many words for rough surfaces (bristly, prickly, abrasive) containing the sound /r/.
Chapters 7 and 8 look at how sensory words can be combined with each
other. In particular, these chapters address the question: Why is it that touch and
taste adjectives (soft, sweet) are those most likely to be used to describe other
sensory impressions (soft color, sweet sound)? And why is it that auditory
adjectives (loud, squealing, muffled) are not used much at all in comparable
xi
expressions? It is shown that whether or not a word can be used in such so-called
“synesthetic metaphors” is partly due to the affective dimension of language,
and partly due to frequency and sound symbolism: Highly frequent and affective
words with little sound symbolism are most likely to occur in metaphors.
Together, the empirical analyses presented throughout the chapters of this
dissertation provide a quantitative description of English sensory words that
ultimately leads to a view of the English lexicon as thoroughly embodied, with
profuse connections between language and sensory perception.

1
Chapter 1. Introduction
We experience the world through our senses, through vision, hearing, touch,
taste and smell. At the same time, we use language to share our sensory
experiences with others. This dissertation investigates the intersection of
sensory experience and language.
The key proposal is that the linguistic behavior of “sensory words”
(Diederich, 2015) such as salty and fuzzy can be partially explained by how the
senses differ from each other in perceptual processes, and by how the senses
interact with each other in the brain and behavior. It is argued that perceptual
differences result in linguistic differences, and that perceptual associations
result in linguistic associations. The fundamental idea that lies at the core of
this dissertation is nicely summarized in the following quote from Lawrence
Marks’s book The Unity of the Senses:
“[P]roperties of sensory experience wend their way through language—
permeating that most human manifestation and expression of thought.”
(Marks, 1978: 3)
An example of this principle is the idea that because “vision is the
dominant human sense”, language is more “attuned to visual discriminations”
(Levinson & Majid, 2014: 416). The language-independent dominance of vision
is thought to explain patterns within language, such as visual words being
more frequent (Viberg, 1993; San Roque et al., 2015). Thus an asymmetry
between the senses comes to be reflected in an asymmetry between words.
Correspondences between perception and language are frequently
covered in the literature on embodied cognition. Embodied approaches see

2
language and the mind as being influenced by and deriving structure from
bodily processes and sensory systems (e.g., Barsalou, 1999; 2008; Glenberg,
1997; Wilson, 2002; Anderson, 2003; Gallese & Lakoff, 2005; Gibbs, 2005). An
example of an “embodied” correspondence between perception and language
is the “tactile disadvantage” in conceptual processing: Connell and Lynott
(2010) asked participants to verify whether a word presented very briefly on a
computer screen belonged to a particular modality or not: “Is the word crimson
visual?” “Is bleeping auditory?” They found that when participants verified
whether words such as chilly and stinging belong to what they call the tactile
modality, they were less accurate compared to making similar verifications in
the other sensory modalities. This was despite the fact that participants
allocated sustained attention to the tactile modality, which suggests that there
is a “tactile disadvantage” in conceptual processing.
Importantly, it is the case that prior to the study conducted by Connell
and Lynott (2010), other researchers have found that participants experience
difficulty in keeping sustained attention to tactile stimuli in purely perceptual
tasks (Spence, Nicholls, & Driver, 2001; Turatto, Galfano, Bridgemann, &
Umiltà, 2004; see also Karns & Knight, 2009). In these studies, participants were
slower at detecting a tactile sensation than a light flash or a noise burst—even
when focusing attention on the tactile modality. Crucially, the “tactile
disadvantage” was first demonstrated for perceptual stimuli; it was
subsequently shown to characterize conceptual processing in a task that only
involves linguistic items (Connell & Lynott, 2010). The key feature of the study
conducted by Connell and Lynott (2010) is that a perceptual disadvantage
carries over to a linguistic disadvantage.
3
Another example of the close correspondence between relatively “high-
level” phenomena and perceptual processes arises in property verification
experiments. In this experimental paradigm, participants are asked to verify
whether an object has a certain property, for example a blender can be loud (true)
versus an oven can be baked (false). Pecher, Zeelenberg and Barsalou (2003)
found that when participants verified a property in one modality, such as the
auditory one (blender-loud), they were subsequently slower when performing a
judgment in a different modality (cranberries-tart) as opposed to performing a
judgment in the same modality (leaves-rustling). Thus, the trial sequence
“blender-loud → leaves-rustling” resulted in faster responses than the trial
sequence “blender-loud → cranberries-tart” (Lynott & Connell, 2009; van
Dantzig, Pecher, Zeelenberg, & Barsalou, 2008; van Dantzig, Cowell,
Zeelenberg, & Pecher, 2011; Connell & Lynott, 2011; Louwerse & Connell,
2011). Importantly, this “modality switching cost” is not confined to just
words; it was previously shown to characterize switching between perceptual
modalities in a purely non-linguistic task (Spence et al., 2001; Turatto et al.,
2004). For instance, hearing a beep after seeing a light flash results in slower
detection of the light flash compared to seeing two light flashes in a row. Thus,
there is a “modality switching cost” in perception as well as in the linguistic
processing of perceptual words.
Results such as the “tactile disadvantage” (Lynott & Connell, 2010) and
the “modality switching cost” (Pecher et al., 2003) in the processing of sensory
words are generally taken as evidence that comprehending these words
involves mentally accessing the corresponding perceptual modalities. Thus,
understanding property words such as loud and tart involves “simulating” or
“re-enacting” what the experiences of loudness and tartness are like (Barsalou,

4
1999, 2008; Glenberg, 1997; Gallese & Lakoff, 2005). Neuroimaging studies
support this view: Goldberg, Perfetti and Schneider (2006a) showed that in the
property verification task, blood flow increases in brain areas associated with
the sensory modality that is being evaluated. Similarly, when participants
make judgments on fruit terms, taste and smell areas of the brain show
increased blood flow, as opposed to judgments on body part and clothing
terms, which involves increased blood flow in brain areas associated with body
perception (Goldberg, Perfetti, & Schneider, 2006b). Moreover, reading odor-
related words, such as cinnamon, garlic and jasmine, leads to increased blood
flow in the olfactory system of the brain (González, Barros-Loscertales,
Pulvermüller, Meseguer, Sanjuán, Belloch, & Ávila, 2006). Thus, language and
the senses appear to be intimately connected, so much that language triggers
the activation of sensory brain areas, and so much that perceptual effects such
as the “tactile disadvantage” or the “modality switching cost” carry over to
linguistic processing.
This dissertation supports this connection between language and the
senses, but rather than focusing on issues of linguistic processing, it focuses on
linguistic structure. It will be shown that several patterns of linguistic structure
correspond to results from perceptual processing and brain functioning. The
dissertation will present an array of empirical findings that support this
position. These correspondences show that linguistic structure and language
use are at least partially motivated by forces that some researchers consider to
be external to language.
Linguists have already covered some of those correspondences dealt
with in this dissertation. For example, there is existing linguistic work on such
topics as visual dominance (e.g., Viberg, 1983; Levinson & Majid, 2014; San

5
Roque et al., 2015) and taste and smell language (e.g., Buck, 1949: 1022-1032;
Dubois, 2000; Allan & Burridge, 2006: Ch. 8; Krifka, 2010). So how does this
dissertation contribute to the existing literature on sensory language? The
uniqueness of the present work lies in its methodological approach, and this
difference in methodology naturally comes with novel theoretical conclusions.
To give just one example of the importance of methodology in the
domain of sensory language, consider expressions such as sharp taste and loud
color. Ullman (1959), Williams (1976), Shen (1997) and others proposed a
hierarchy of the senses with respect to such so-called “synesthetic” metaphors.
In this hierarchy, the olfactory modality is ranked higher than the gustatory
modality. This relative ranking of taste and smell is thought to explain why the
expression sweet fragrance sounds more natural than the expression fragrant
sweetness, something that Shen and Gil (2007) confirmed experimentally.
However, the particular expression sweet fragrance only supports the idea of a
synesthetic metaphor hierarchy if one considers it a “synesthetic” metaphor to
begin with, that is, a linguistic mapping between two distinct sensory
modalities. Sweet fragrance can only be such a mapping if the word sweet is
clearly gustatory and if the word fragrance is clearly olfactory. However,
looking at a linguistic corpus, such as the Corpus of Contemporary American
English (Davies, 2008), reveals an abundance of examples in which the
adjective sweet modifies non-gustatory nouns, such as sweet whiff, sweet rose,
sweet balsam and sweet cologne. The objects described by these nouns are more
commonly smelled than tasted, nevertheless, taste terms readily apply to them.
Participants generally accept taste words in olfactory contexts (Rozin, 1982),
and some smells are described more frequently with taste words than with
proper odor terms (Dravnieks, 1985).

6
Food language in general is highly multimodal (Diederich, 2015;
Jurafsky, 2014: Ch. 7), and taste and smell in particular are highly integrated
perceptual modalities, so much in fact that the “flavor” of food is a concept
that cannot be separated from either taste or smell (Spence, Smith, & Auvray,
2015). So, is sweet fragrance then really a “synesthetic metaphor”, a mapping of
one sense onto another? Or is it perhaps an intra-sense mapping, with an
adjective that is at least partially olfactory (sweet) modifying an olfactory noun
(fragrance)?
This is one example that highlights that objective criteria are needed to
establish whether a word corresponds to a particular modality or not: The
interpretation of sweet fragrance as a synesthetic metaphor, and with it the
theoretical idea of a hierarchy of synesthetic metaphors hinges on one’s
classification of the word sweet. Depending on how one classifies this word,
sweet fragrance is or is not a synesthetic metaphor, which then determines
whether this expression does or does not contribute to the evidence for a
“hierarchy of synesthetic metaphors” (as proposed by Ullman, 1959, Shen 1997
and many others).
A related methodological issue is multimodality: Can words accurately
be treated as corresponding to one and only one modality (Goldberg et al.,
2006b; Lynott & Connell, 2009; Paradis & Eeg-Olofsson, 2013)? This
assumption is implicit in many linguistic studies of sensory language. Because
perception is inherently multimodal (e.g., Spence & Bayne, 2015), one has to
find an approach where words can have multiple modalities.
To address these methodological issues, a set of modality norms will be
employed, partly drawn from existing data (Lynott & Connell, 2009, 2013; van
Dantzig et al., 2011), partly collected for this dissertation (see Ch. 2). In these

7
norms, native English speakers judged whether a word corresponds to a
specific modality. For this, they used a continuous scale ranging from 0 to 5,
which allows for gradations of the senses. With this approach, a word can
correspond “more” or “less” to a sensory modality, and it can also
simultaneously belong to multiple modalities.
Although clearly not without flaws (especially because they are based
on subjective intuitions), these norms provide a more principled approach for
making decisions about a word’s modality. In particular, the decision as to
whether a word does or does not correspond to a particular modality is out of
the researcher’s hands and thus cannot be influenced by prior theoretical
knowledge. Moreover, the norms allow a principled way of dealing with the
issue of multimodality because a word can have high ratings for several
modalities. For instance, in the norms by Lynott and Connell (2009) (which will
be introduced in more detail in the following chapter), the word sweet receives
a gustatory rating of 4.86 and an olfactory rating of 3.9, indicating that indeed,
English speakers interpret the word sweet to be partially olfactory and not
exclusively gustatory.
With these modality norms, previous claims —such as vision being
linguistically dominant— can be tested for the English language on a large
scale. Take, for example, the study of perception verbs conducted by San
Roque et al. (2015). This group of researchers assembled conversational data
from 13 different languages and looked at basic perception verbs such as to see,
to hear, to feel, to taste and to smell. The group found that visual verbs are more
frequent than verbs for the other senses across the languages studied. It has to
be recognized, however, that the researchers had to trade cross-linguistic
breadth with intra-linguistic depth: Many languages were investigated, but
8
only five verbs. Using the modality norms, the idea of visual dominance can be
tested for many more words, at the expense of only working within a single
language, English. So, using modality norms permits a larger descriptive
coverage for a given language.
Overall, the dissertation aims to make several novel contributions. First,
a descriptive contribution: Characterizing the sensory vocabulary of English,
how it is composed and how it is used. Second, a theoretical contribution:
Showing that many linguistic phenomena (including many of which are
previously unattested) can at least partially be explained by looking at
language-external, embodied factors. Third, a methodological contribution:
Showing how sensory language can be studied objectively, using a mixture of
norms, corpora, and experiments. This methodological contribution means that
old claims can be put onto a firmer quantitative footing. But sometimes the
increased descriptive coverage and the more principled methodology means
that old ideas have to be qualified or abandoned.
The empirical results obtained throughout the dissertation lend further
support to the view that language and the mind are —at least in part—
embodied. Obtaining converging evidence for embodied cognition theories is
still relevant because embodied cognition results are still being criticized (e.g.,
Mahon & Caramazza, 2008). In a critique of the role of embodiment in
cognitive science, Goldinger and colleagues (Goldinger, Papesh, Barnhart,
Hansen, & Hout, in press) argue that many or most of the important results in
cognitive science do not require researchers to invoke the notion of
embodiment, which is thus argued to be only a poor explanatory principle.
Their critique, however, focuses almost exclusively on experimental studies of
embodied cognition, ignoring the large literature within the field of “cognitive
9
linguistics” which shows that linguistic structures too (not just linguistic
processing) can be explained by recourse to embodied principles (e.g.,
Langacker, 1987, 2008; Talmy, 1988; Evans & Green, 2006). For example,
prepositions (such as the English words to, on, and from) in many of the world’s
languages can be shown to be derived from body part terms (Heine & Kuteva,
2002) and temporal language frequently derives from spatial language (e.g.,
Haspelmath, 1997) presumably because of the embodied correlation of
experiencing a lapse of time when moving through space (see, e.g., Lakoff &
Johnson, 1980; Lakoff, 1987; Evans, 2004). Thus, when Goldinger and
colleagues ask the question “What can you do with embodied cognition?” (p. 6,
italics in original), they are missing a large part of the linguistic literature that
has successfully shown the significance of embodied principles when
analyzing linguistic patterns rather than just linguistic processing.
The present dissertation can be seen as being loosely affiliated with the
tradition of cognitive linguistics. However, in contrast to many cognitive
linguistic studies, the focus here is on large-scale quantitative aspects of lexical
structure. The analyses presented in this dissertation provide one additional
answer to the question Goldinger and colleagues pose; they show one more
thing that researchers can “do with embodied cognition”, namely, explaining
patterns (such as frequency distributions) within naturally occurring language
data, as well as explaining aspects of the structure of the mental lexicon of
English.
The relevance of this approach within the larger cognitive sciences is
nicely exemplified by considering word frequency. Within psycholinguistics,
one of the most basic and most frequently replicated findings is that relatively
more frequent words are produced and understood more easily (Solomon &
10
Postman, 1952; Postman & Conger, 1954; Oldfield & Wingfield, 1965; Balota &
Chumbley, 1985; Jescheniak & Levelt, 1994). However, in their focus on
explaining patterns in linguistic processing, psycholinguistic studies rarely ask
the question why some words are more frequent than others to begin with.
Chapter 3 will show that knowing about a word’s sensory modality allows one
to predict how frequent a word is, thus showing the import of a
bodily/perceptual factor onto a classic psycholinguistic variable. In particular,
words for visual concepts (such as shiny, bright and purple) are shown to be
relatively more frequent than words for concepts from the other senses (see
also San Roque et al., 2015). This frequency asymmetry then has ramifications
for linguistic processing, because it means that visual words will also be
processed more quickly. Thus, although core embodied principles may not
always be needed to explain each and every particular finding within the
cognitive sciences (Goldinger et al., in press), a more holistic perspective that
recognizes the role of sensory and bodily factors ultimately leads to a richer
understanding of linguistic patterns and the processing effects that these
structural patterns entail.
1.1. A note on the five-senses folk model
This dissertation is structured around the five senses of vision, hearing, touch,
taste and smell. These are sometimes called the “common” or “Aristotelian”
senses. One has to acknowledge, however, that this way of carving up the
sensory space does not correspond to what is known from neurophysiology;
modern sensory science does not stick to the division of the sensorium into five
senses, recognizing many subdivisions that do not fall neatly into the
categories of vision, hearing, touch, taste and smell (Carlson, 2010: Ch. 7;
11
Møller, 2012). Classen (1993: 2) remarks that “even in the West itself, there has
not always been agreement on the number of the senses” (Classen, 1993: 2),
and cross-cultural research shows that many cultures do not adhere to the five-
senses model (Howes, 1991). In general, counting senses is a philosophically
thorny issue that is at present unresolved (Casati, Dokic, & Le Corre, 2015) and
perhaps even unresolvable. As McBurney (1986: 123) says, the senses “did not
evolve to satisfy our desire for tidiness”.
The way the five-senses folk model is used in this dissertation is
perhaps best seen as a “useful fiction”. When looking at mappings between the
senses and language, one has to start somewhere. As the empirical chapters
will show, the fivefold division of the sensorium already permits the
explanation of a number of different linguistic phenomena. Using this five-
senses folk model also is justified because the dissertation focuses on the
English language, and within Western culture, people generally count five
senses (Nudds, 2004; Casati et al., 2015). Thus, working with this model means
working with culturally endemic categories that are recognized by the
speakers of the language this study analyzes.
It should be specified, however, what is regarded as a specific sense in
this dissertation and what is not. Following the folk model, the senses are each
associated with one sensory organ, the eye for vision, the ear for hearing
(ignoring the vestibular system), the skin for touch, the tongue for taste, and
the nose for smell. In this dissertation, the word “touch” is used as a cover term
for many different sensory systems. It encompasses everything that Carlson
(2010: 237-249) calls the “somatosenses”, including mechanical stimulation of
the skin, thermal stimulation, pain, itching, kinesthesia and proprioception.
The label “tactile modality” will be used for this set of sensory systems because
12
most of the words dealt with in this dissertation do indeed directly relate to the
tactile exploration of surfaces, such as the words rough, smooth, hard, soft, silky,
sticky and gooey. However, following the deliberately broad definition used
here, words such as aching and tingly are also subsumed under the tactile
modality. One motivation for classifying words such as aching and tingly as
“tactile” is that English speakers report that these words are more strongly
connected to “feeling by touch” than to the other senses (Lynott & Connell,
2009).
The sensory modalities of taste and smell also warrant special attention:
The folk model distinguishes these two senses, attributing the perception of
“flavor” to the mouth and the tongue, even though “flavor” in fact arises from
the interaction of taste and smell (Auvray & Spence, 2008; Spence et al., 2015).
The smell of food reaches the olfactory bulb through the nose, the so-called
orthonasal pathway, as well as through an opening to the nasal cavity at the
back of the nose, the so-called retronasal pathway (Spence et al., 2015). Without
smell, the perception of flavor is severely diminished, something which many
of us have experienced when suffering from a cold. However, when the terms
“taste” and “smell” (and correspondingly “gustatory” and “olfactory”) are
used in this dissertation, the folk sense is implied. With this, words such as
citrusy, savory and tasty are classified as “gustatory” even though the
perception of these properties in fact also involves smell. Chapters 7 and 8 will
relax this classification, looking at the linguistic integration of taste and smell.
So, although not without its flaws, the five-senses folk model provides a
useful starting point for the investigation of sensory words in English. The
dissertation thus demonstrates how far one can go with the five-senses model,

13
and it shows that considerable descriptive and theoretical leverage can be
gained from this.
1.2. Overview of the dissertation
The dissertation is structured as follows. First, the general methodology will be
introduced. To explore the idea that the English language is infused with
sensory information, a large set of words that are classified with respect to the
senses is needed, i.e., there needs to be a dataset in which yellow is coded as
being considerably more visual than loud. In the context of automated natural
language processing techniques, Tekiroğlu, Özbal and Strapparava (2014)
claim that “Connecting words with senses (…) is a straightforward task for
humans by using commonsense knowledge”. In contrast to this, Chapter 2
argues that classifying words according to senses is not a straightforward task
even for humans. Chapter 2 outlines some of the difficulties that are associated
with classifying words according to senses, and the chapter details the
approach that forms the methodological foundation on which the remaining
parts of the dissertation rest, a set of modality norms collected by human
raters.
Chapter 3 shows a first application of these modality norms, using the
norms together with word frequency data and dictionary data to show that
language exhibits a considerable degree of visual dominance, i.e., visual words
are shown to be relatively more frequent, relatively more contextually diverse,
and semantically richer. In line with the central thesis that properties of
perception “wend their way through language” (Marks, 1978: 3), it is argued
that this linguistic visual dominance is a reflection of an underlying perceptual
visual dominance.
14
Even though vision might be dominant when looked at in terms of
large-scale corpora that aggregate over various different linguistic contexts
(Chapter 3), vision is not dominant across the board. Chapter 4 explores one
particular context in which words closely connected to taste and smell (such as
fragrant and salty) have an edge, namely, in emotional language. It is shown
that taste and smell words form an affectively loaded part of the English
lexicon: Various techniques to quantify “emotionality” in language will be
used to demonstrate that taste and smell words are highly evaluative and
occur in more emotionally valenced contexts. Moreover, taste and smell words
are also shown to be more emotionally variable. For instance, the relatively
positive taste word sweet can be used in conjunction with both positive and
negative words, such as sweet sunset and sweet death. Both the heightened
emotionality and the increased emotional malleability of taste and smell words
are argued to be direct reflections of how taste and smell function as
perceptual modalities, highlighting another way in which linguistic structures
mirror perceptual structures.
Chapter 5 serves two purposes. On the methodological side, it
introduces a set of norms for texture surfaces that are relevant for later
chapters. It is argued that a primary dimension of texture perception is
“roughness”, and that this textural dimension is reflected in the corresponding
touch words. In line with perceptual studies of the hedonic dimension of
touch, the roughness implied by touch words maps onto their emotional
valence, i.e., rougher words such as rough, harsh and jagged have more negative
connotations than smoother words such as smooth, silky and feathered.
Up to this point, the dissertation will have mainly dealt with the word
as the unit of analysis, showing that words are distributed differently as a

15
function of the sensory modality they evoke (e.g., in terms of frequency and
emotional valence). Chapter 6 goes one step further by showing that the very
sound structure of words relates to the senses, demonstrating that sensory
information affects language at a level below the structure of lexical
distributions. First, Chapter 6 argues that the study of sound symbolism
(defined as direct correspondences between sound and meaning) is the study
of the senses (cf. Marks, 1978: Ch. 7). Then, the chapter delves into differences
in sound symbolism between the five senses, arguing that particularly sound
words and touch words tend to have non-arbitrary sound-meaning
correspondences. The chapter then uses touch words to explore what
phonological features directly relate to sensory structure, finding that the
presence of the phoneme /r/ is associated with semantic roughness.
The final two chapters, Chapter 7 and 8 look at inter-relations between
the senses. Chapter 7 shows that within running texts, vision and touch are
associated with each other, and so are taste and smell. This finding replicates
and extends a set of findings by Louwerse and Connell (2011) and gives a
glimpse at the “structure of multimodality” in language. Chapter 8 deals with
figurative language use and shows how sensory words from one modality can
be used to describe perceptual impressions in another modality, i.e.,
expressions such as smooth taste (touch/taste) or rough sound (touch/sound). The
chapter incorporates insights from previous chapters and uses a multifactorial
approach to argue against the notion that there is a strict “hierarchy of the
senses” that governs these figurative expressions.
Thus, through these empirical chapters, an array of different findings
related to perception and language will be presented. More than just being a
descriptive exercise, these empirical chapters slowly build up the main
16
proposal, which is the idea that the English language is thoroughly infused
with sensory information. These and other conclusions will be drawn in
Chapter 9, where the results from the dissertation are reviewed from the
perspective of embodied cognition. Overall, the findings suggest that language
and the senses form an inseparable unity.
17
Chapter 2. Methods
2.1. Using modality norms to characterize the senses
Sensory words are words that directly appeal to the human senses (cf.
Diederich, 2015: 4). A sensory word can be an adjective, such as yellow, which
describes the sensory impression of a color. A sensory word can also be a verb,
such as to see, which describes the act of perceiving through vision. Finally,
nouns too can be high in sensory content, for example, the noun cinnamon is a
highly gustatory noun compared to the much more visual nouns mirror and
glitter, or compared to the highly auditory nouns noise and laughter.
To study sensory language empirically, one first needs to construct a
sizeable list of sensory terms (Strik Lievers, 2015). To study differences
between the five senses, these words need to be classified according to which
sensory modality they relate to. The latter step is made difficult through the
fact that some sensory words are highly multimodal (Lynott & Connell, 2009;
Paradis & Eeg-Olofsson, 2013; Diederich, 2015), i.e., they evoke more than just
one sensory modality. A case in point is the word harsh, which can readily be
used to talk about perceptual impressions from several senses, such as harsh
sound and harsh taste. Similarly, are adjectives such as barbecued and fishy
gustatory, olfactory, or both? When such words are classified by the researcher
himself/herself, the criteria for making decisions about a word’s modality are
often not made explicit (e.g., Ullman, 1945; Williams, 1976; Shen, 1997; Yu,
2003).
Many researchers use dictionaries to generate a list of sensory terms
(e.g., Bhushan, Rao, & Lohse, 1999; Strik Lievers, 2015). With this approach, a
set of seed words that appear to clearly correspond to a particular modality is
selected, such as the verb to hear for audition. Then, this initial set is enlarged

18
by considering all the synonyms of the seed words. For example, the Collins
Dictionary lists to listen to and to eavesdrop as synonyms of to hear. Thus,
eavesdrop and listen are added to the list of auditory terms. For this approach to
always yield a reliable modality classification, synonyms of a perceptual word
from one particular sensory modality need to always be from the same sensory
modality. However, this is clearly not always the case. For instance, Collins
lists to attend to as a synonym of to hear, even though this word does not
actually strongly relate to the auditory modality—one can attend to the
subjective impression of taste and smell just as much as one can attend to a
sound. In general, the thesaurus-based approach always needs an additional
step of modality classification because not all words unequivocally belong to a
particular modality.
A more systematic approach is to generate a list of sensory words with
the help of thesaurus lists and to subsequently norm the words by native
speakers. Aggregating over intuitions from many different speakers yields a
more fine-grained measure of how much a word corresponds to a specific
modality. This is precisely the approach pioneered by Lynott and Connell
(2009), who asked fifty-five native speakers of British English to rate how much
a given property is experienced “by seeing”, “by hearing”, “by feeling through
touch”, “by smelling” and “by tasting”. For each of the modalities, participants
responded on a scale from 0 to 5. This not only allows quantifying the degree
to which a word corresponds to a specific sense, but it also offers ways of
quantifying the multimodality of a word.
Lynott and Connell (2009) collected norms for a total of 423 object
properties. The word with the highest visual, auditory, tactile, gustatory and
olfactory strength ratings are bright, barking, smooth, citrusy and fragrant,
19
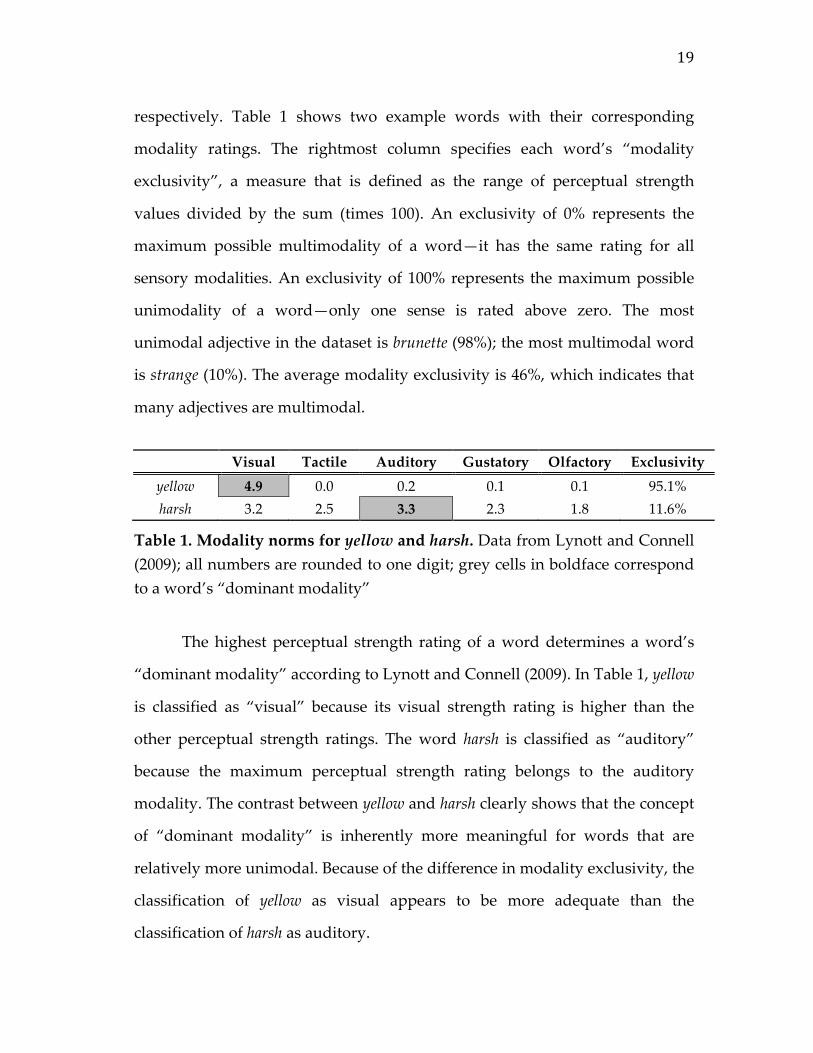
respectively. Table 1 shows two example words with their corresponding
modality ratings. The rightmost column specifies each word’s “modality
exclusivity”, a measure that is defined as the range of perceptual strength
values divided by the sum (times 100). An exclusivity of 0% represents the
maximum possible multimodality of a word—it has the same rating for all
sensory modalities. An exclusivity of 100% represents the maximum possible
unimodality of a word—only one sense is rated above zero. The most
unimodal adjective in the dataset is brunette (98%); the most multimodal word
is strange (10%). The average modality exclusivity is 46%, which indicates that
many adjectives are multimodal.
Visual Tactile Auditory Gustatory Olfactory Exclusivity
yellow 4.9 0.0 0.2 0.1 0.1 95.1% harsh 3.2 2.5 3.3 2.3 1.8 11.6%
Table 1. Modality norms for yellow and harsh. Data from Lynott and Connell (2009); all numbers are rounded to one digit; grey cells in boldface correspond to a word’s “dominant modality”
The highest perceptual strength rating of a word determines a word’s
“dominant modality” according to Lynott and Connell (2009). In Table 1, yellow
is classified as “visual” because its visual strength rating is higher than the
other perceptual strength ratings. The word harsh is classified as “auditory”
because the maximum perceptual strength rating belongs to the auditory
modality. The contrast between yellow and harsh clearly shows that the concept
of “dominant modality” is inherently more meaningful for words that are
relatively more unimodal. Because of the difference in modality exclusivity, the
classification of yellow as visual appears to be more adequate than the
classification of harsh as auditory.
20
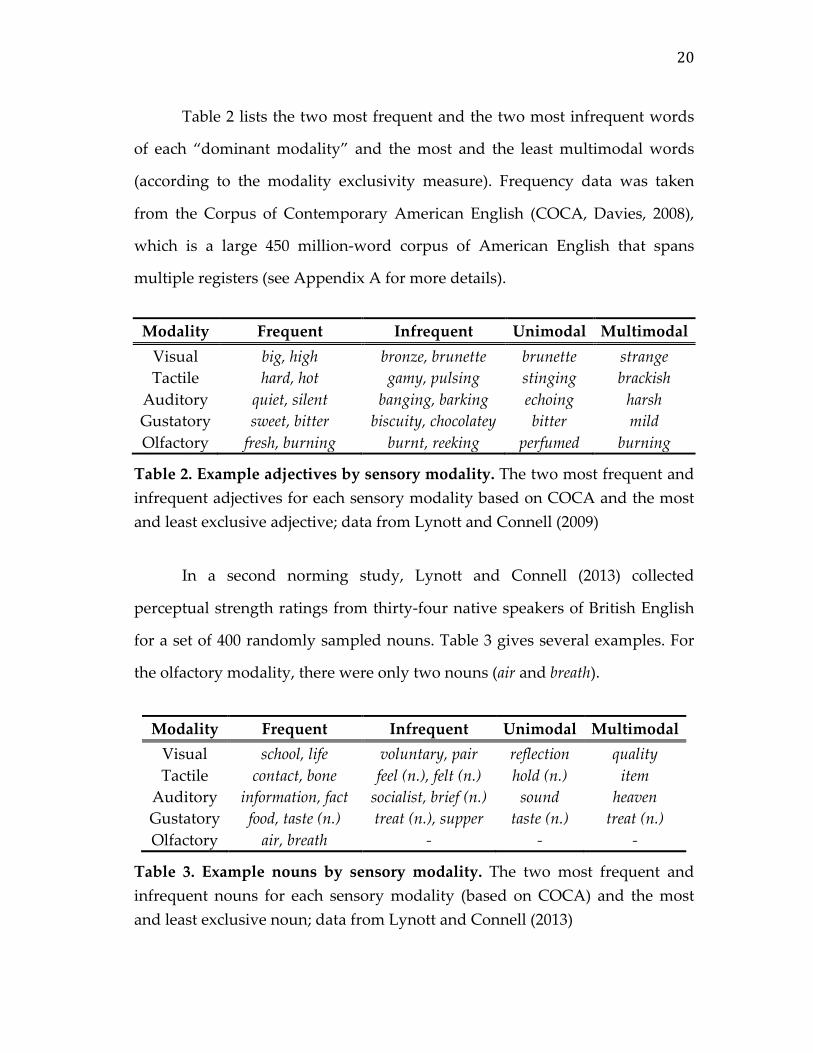
Table 2 lists the two most frequent and the two most infrequent words
of each “dominant modality” and the most and the least multimodal words
(according to the modality exclusivity measure). Frequency data was taken
from the Corpus of Contemporary American English (COCA, Davies, 2008),
which is a large 450 million-word corpus of American English that spans
multiple registers (see Appendix A for more details).
Modality Frequent Infrequent Unimodal Multimodal Visual big, high bronze, brunette brunette strange Tactile hard, hot gamy, pulsing stinging brackish
Auditory quiet, silent banging, barking echoing harsh Gustatory sweet, bitter biscuity, chocolatey bitter mild Olfactory fresh, burning burnt, reeking perfumed burning
Table 2. Example adjectives by sensory modality. The two most frequent and infrequent adjectives for each sensory modality based on COCA and the most and least exclusive adjective; data from Lynott and Connell (2009)
In a second norming study, Lynott and Connell (2013) collected
perceptual strength ratings from thirty-four native speakers of British English
for a set of 400 randomly sampled nouns. Table 3 gives several examples. For
the olfactory modality, there were only two nouns (air and breath).
Modality Frequent Infrequent Unimodal Multimodal
Visual school, life voluntary, pair reflection quality Tactile contact, bone feel (n.), felt (n.) hold (n.) item
Auditory information, fact socialist, brief (n.) sound heaven Gustatory food, taste (n.) treat (n.), supper taste (n.) treat (n.) Olfactory air, breath - - -
Table 3. Example nouns by sensory modality. The two most frequent and infrequent nouns for each sensory modality (based on COCA) and the most and least exclusive noun; data from Lynott and Connell (2013)
21
With an average exclusivity of 39%, the nouns are more multimodal
than the adjectives (46%), a difference that is statistically reliable (Wilcoxon
rank sum test: W = 103270, p < 0.0001). Lynott and Connell (2013) argue that
this is because nouns are used to refer to objects and actions, which can
generally be perceived through multiple modalities. For example, food can
readily be seen, smelled, and tasted. Adjectives on the other hand highlight
specific properties of objects and actions, and as such, they are more likely to
single out specific content from a particular modality. Whereas the noun food is
highly multimodal (18% exclusivity), the expressions shimmering food, fragrant
food and tasty food highlight modality-specific sensory aspects of the food.
Another potential reason for the lower exclusivity score might have to do with
abstractness: In table 3, nouns such as information, fact, and socialist denote
concepts that cannot easily be experienced directly through any of the senses.
With these highly abstract concepts, the dominant modality classification is
often questionable. For instance, the noun welfare is listed in Lynott and
Connell (2013) as having vision as its dominant modality, but this word
received overall relatively low perceptual strength ratings. Because it is not a
very sensory word to begin with, the question as to which modality it belongs
to does not really pose itself.
One has to be careful, however, in comparing the noun and adjective
norms. The nouns were randomly sampled (Lynott & Connell, 2013), but the
adjectives were not. Instead, the Lynott and Connell (2009) adjectives were
selected from thesaurus lists specifically with experiments such as the property
verification task in mind (Dermot Lynott, personal communication). Because of
this, the Lynott and Connell (2009) adjectives are high in sensory content and
specificity, compared to many adjectives that are not in the dataset, such as

22
stupid, intelligent, rich and poor. It is thus not entirely clear whether the
diminished modality exclusivity of the nouns is indeed due to a difference in
lexical category, or due to a difference in sampling.
To complement the adjective and noun norms, a set of verb norms was
collected for this dissertation. Two separate lists of adjectives were constructed.
The first list followed the approach of Lynott and Connell (2009) and Strik
Lievers (2015), using dictionaries to find sensory verbs. The verbs see, look, hear,
listen, sound, feel, touch, taste and smell were used as seed words to find
synonyms, consulting thesaurus lists from macmillandictionary.com,
collinsdictionary.com, wordreference.com, thesaurus.yourdictionary.com, and
thesaurus.com. The second list followed the approach of Lynott and Connell
(2013) by sampling verbs randomly. For this, the English Lexicon Project
(Balota, Yap, Hutchison, Cortese, Kessler, Loftis, Neely, Nelson, Simpson, &
Treiman, 2007) was used. 113 verbs were chosen that were above the median
word frequency from the American English SUBTLEX subtitle corpus
(Brysbaert & New, 2009). The manually constructed list contained 187 verbs;
the randomly sampled list contained 113 verbs. Thus, a total of 300 verbs were
normed.
The 300 verbs were randomly ordered and split into 10 lists with 30
verbs each. The norming task was implemented using the Qualtrics survey
design interface. Ninety-one native speakers of American English (40 female,
51 male, average age 31), recruited via Amazon Mechanical Turk, received 0.65
USD reimbursement to norm one list each (completion rate was 85%; average
survey duration was 9 minutes). Only data from participants who completed at
least 80% of the survey was analyzed; yielding a dataset with a total of
23
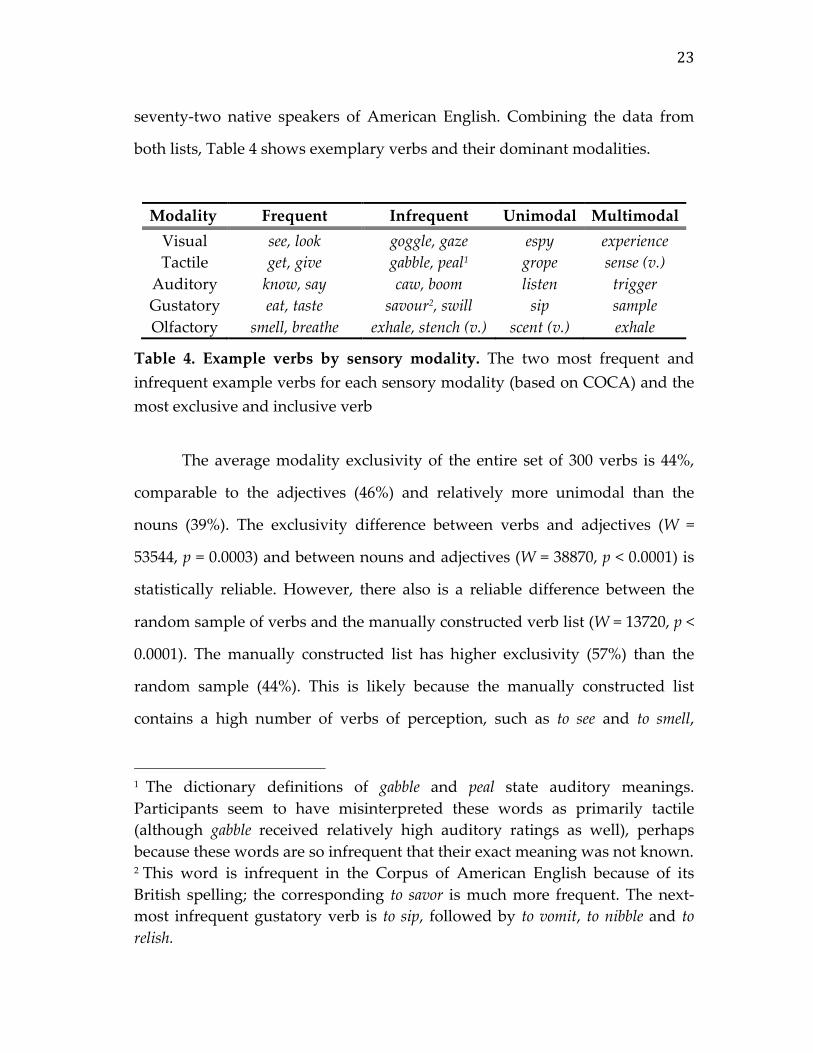
seventy-two native speakers of American English. Combining the data from
both lists, Table 4 shows exemplary verbs and their dominant modalities.
Modality Frequent Infrequent Unimodal Multimodal Visual see, look goggle, gaze espy experience Tactile get, give gabble, peal1 grope sense (v.)
Auditory know, say caw, boom listen trigger Gustatory eat, taste savour2, swill sip sample Olfactory smell, breathe exhale, stench (v.) scent (v.) exhale
Table 4. Example verbs by sensory modality. The two most frequent and infrequent example verbs for each sensory modality (based on COCA) and the most exclusive and inclusive verb
The average modality exclusivity of the entire set of 300 verbs is 44%,
comparable to the adjectives (46%) and relatively more unimodal than the
nouns (39%). The exclusivity difference between verbs and adjectives (W =
53544, p = 0.0003) and between nouns and adjectives (W = 38870, p < 0.0001) is
statistically reliable. However, there also is a reliable difference between the
random sample of verbs and the manually constructed verb list (W = 13720, p <
0.0001). The manually constructed list has higher exclusivity (57%) than the
random sample (44%). This is likely because the manually constructed list
contains a high number of verbs of perception, such as to see and to smell,
1 The dictionary definitions of gabble and peal state auditory meanings. Participants seem to have misinterpreted these words as primarily tactile (although gabble received relatively high auditory ratings as well), perhaps because these words are so infrequent that their exact meaning was not known. 2 This word is infrequent in the Corpus of American English because of its British spelling; the corresponding to savor is much more frequent. The next-most infrequent gustatory verb is to sip, followed by to vomit, to nibble and to relish.
24
which are fairly modality-specific. This difference between the random and the
non-random sample lends further support to the idea that the modality
exclusivity difference between adjectives and nouns reported in Lynott and
Connell (2013) may be at least in part due to the sampling method, rather than
due to a difference in lexical category. In all subsequent analyses, the randomly
sampled subset of the verbs will be used, unless otherwise noted.
The use of modality norms is considerably better than relying on a
single linguist’s intuition. However, it should be noted that modality norms are
not without their own flaws. Some problems include straightforward
misunderstandings. For example, firm (n.) in Lynott and Connell (2013)
received the highest perceptual strength rating for the tactile modality,
presumably because participants were not thinking of the noun firm (as in
meaning ‘company’) but of the adjective firm, which relates more directly to a
tactile impression. Similarly, in the newly collected verb norms, gabble and peal
were interpreted as being primarily tactile even though the dictionary
definitions of both words list auditory meanings. In Lynott and Connell (2009),
participants rated clamorous to be higher in tactile strength (2.9) than in
auditory strength (2.4), even though most dictionary definitions emphasize the
auditory meaning of this word. These misclassifications presumably have to do
with the fact that the involved words are relatively infrequent and thus not
familiar enough to some of the participants in these studies. However, all in all,
these minor misclassifications do not pose a threat to the conclusions reported
elsewhere in this dissertation because all statistical analyses are based on a
large set of words (423 adjectives + 400 nouns + 300 verbs = 1,123 words).
Because of this, a few isolated cases are unlikely going to skew the results
considerably.

25
A bigger methodological issue has to do with the following question:
How do participants perform the rating task? What are they basing their
modality judgments on? In Lynott and Connell (2009), participants were asked
how much a given property, say yellow, was experienced “through vision” or
“through hearing” and so on. In simple cases of making judgments on clearly
unimodal words this appears to be straightforward, i.e., yellow appears to be
straightforwardly visual. But in the case of relatively more multimodal words,
how did participants decide how each modality should be rated? One likely
strategy that participants might adopt is to generate linguistic examples: For
instance, to determine what the modality of harsh should be, a participant may
think of examples such as harsh sound or harsh taste. If one can easily think of
these examples, the word hash is probably auditory and also somewhat
gustatory.
If such a strategy were adopted, the modality norms would be
influenced by the linguistic contexts that each word frequently occurs in,
which is potentially problematic for such analyses as the context analysis in
Chapter 7. For instance, the finding that the visual strength of an adjective is
strongly correlated with the tactile strength of the noun it modifies (see also
Louwerse & Connell, 2011) could, in part, be due to the fact that participants in
the norming studies frequently thought of highly tactile linguistic contexts
when they evaluated visual words. This introduces an element of circularity,
where correlations between modality norms in naturally occurring language
may in fact be due to the process through which these norms were derived.
A modality norming study conducted by van Dantzig and colleagues
(2011) partially addresses these concerns. These authors presented properties
in conjunction with objects. For the word abrasive, for instance, participants

26
were either asked “To what extent do you experience sandpaper being
abrasive?” or they were asked “To what extent do you experience lava being
abrasive?”. Pairing adjectives with nouns gives participants specific examples
to consider, thus binding their property ratings to particular objects. The data
thus generated is highly similar to the data by Lynott and Connell (2009): For
those words that are represented in both datasets (365 words), the mean
perceptual strength ratings3 of the two studies correlate reliably (all p’s < 0.05)
with high correlation coefficients, ranging from r = 0.81 for vision to r = 0.92 for
audition. Also, an overall measure of similarity (cosine similarity, discussed in
Chapter 8 and Appendix A) indicates that the modality profiles of the words
normed by the two different approaches are highly similar (average cosine
similarity = 0.96). The fact that the two datasets are so highly similar suggests
that the concern that participants might adopt a context-retrieval strategy
cannot be too much of an issue, since the van Dantzig study provided
particular contexts. Throughout the dissertation, the Lynott and Connell (2009)
norms will be used because they have a larger coverage of the sensory lexicon
(423 as opposed to 387 words), but it should be noted that all results replicate
with the van Dantzig et al. (2011) norms.
Since the Lynott and Connell (2009, 2013) norms are so important for all
subsequent chapters, it is worth pointing out that there are several
psycholinguistic experiments that use the modality norms successfully to
predict human behavior. For example, Connell and Lynott (2012) showed that
the maximum perceptual strength value of the norms is a better predictor of 3 For the van Dantzig et al. (2011) norms, the average of the responses for the two contexts was computed. In the case of the tactile modality and abrasive, for example, this would be 3.59, based on the mean of abrasive sandpaper 4.81 and abrasive lava 2.37.

27
word processing times than comparable concreteness ratings. Connell and
Lynott (2010) show a “tactile disadvantage” for processing sensory words
related to touch, using dominant modality classifications based on the norms.
Finally, Connell and Lynott (2011) showed a modality switching cost (Pecher et
al., 2003) in a concept creation task with words classified according to the
norms considered here. These studies serve to show that the modality norms
do meaningfully relate to psycholinguistic behavior. This is different from the
Sensicon modality norms created by Tekiroğlu and colleagues (2014). These
norms were generated using a semi-automatic approach with insights from
natural language processing techniques—however, the usefulness of these
norms critically has not been established through independent
psycholinguistic studies.
2.2. Statistical analyses
Throughout this dissertation, the sensory norms introduced in this chapter will
be analyzed statistically. As described by Keuleers and Balota (2015: 1458),
“many research questions can now be answered by statistical analysis of
already available data”. The modality norms by Lynott and Connell (2009,
2013) and the newly collected verb norms will be correlated with various
linguistic measures, such as word frequency (Chapter 3) and emotional valence
measures (Chapter 4). Using a variety of datasets from various sources (to be
introduced within each chapter), the basic idea that the English lexicon is
embodied with respect to sensory structure will be explored and substantiated
in a quantitative fashion. Each dataset and each analysis will highlight a
different facet of this “sensory-specific embodiment” of English words.
28
All statistical analyses were conducted with R (R Core Team, 2015) and
the packages listed in Appendix A. Because each chapter studies a different
phenomenon, different methods are required for each chapter. Details on the
analyses can be found within each chapter, with additional information
provided in Appendix A. In line with standards for reproducible research
(Gentleman & Lang, 2007; Mesirov, 2010; Peng, 2011), all data and analysis
code is made publically available and can be retrieved on the following Github
repository:
http://www.github.com/bodowinter/phd_thesis
The analyses throughout most of the dissertation use the dominant
modality classification, rather than treating a word’s association to a particular
modality as a continuous variable (visual strength ratings, auditory strength
ratings etc.). This is essentially straightjacketing words into distinct sensory
modalities, for example, the word harsh (see Table 1) is treated as an auditory
word even though it also has high ratings on the other senses as well. This
approach seemingly stands against the notion that words are multimodal,
introduced in Chapter 1 and dealt with more extensively in Chapters 7 and 8.
The categorical classification was chosen over the continuous perceptual
strength measure for several reasons. First, using discrete modality
assignments allows comparing the results of this dissertation with past
research in the domain of sensory language, for example when it comes to the
“synesthetic metaphors” discussed in Chapter 8. Second, the approach greatly
simplifies the description and interpretation of the main results, for example,
one can only count how many words there are for each different modality
29
(as is done in Chapter 3) if one assigns discrete modality classifications to
words. Importantly, the main findings presented in this dissertation do not rest
on this discrete classification scheme because qualitatively similar results are
obtained when the continuous perceptual strength ratings are used. Moreover,
Chapter 7 and Chapter 8 specifically address the issue of multimodality. In
these chapters, the assumption that words distinctly belong to one sensory
modality will be relaxed and the continuous perceptual strength ratings will be
used.
When the categorical analysis approach based on a word’s “dominant
modality” is employed throughout this dissertation, a single factor MODALITY
will be entered into each statistical model. This factor embodies the five-fold
distinction between the senses (see Chapter 1.2) and crucially assumes no
ordering between the senses (the issue of “hierarchies of the senses” will be
addressed in Chapter 8). If the factor MODALITY is statistically reliable in the
analyses reported below, this is equivalent to performing an “omnibus test” of
sensory differences, assessing whether knowing about a word’s modality
explains any variance at all. At times, specific post-hoc tests of theoretically
relevant comparisons will be performed, such as visual words versus non-
visual words (Chapter 3) or taste and smell words versus vision-hearing-touch
words (Chapter 4). Due to the conceptual issues involved in multiple
comparisons correction (such as Bonferroni correction, Nakagawa, 2004; Cabin
& Mitchell, 2000), multiple testing situations will be avoided from the outset:
After the factor MODALITY has been found to be statistically reliable, no tests of
all 10 possible pairwise comparisons between the senses will be performed,
especially since for the hypotheses discussed in this dissertation, it is often not
specifically relevant which sensory modalities are reliably different from each
30
other. For the present purposes, plots of each model’s predictions (with 95%
confidence intervals), effect sizes and targeted post-hoc tests for theoretically
relevant comparisons are enough to base sound theoretical conclusions on the
data.
In contrast to experimental studies, there is no straightforward way to
“replicate” a statistical analysis for already existing data. To assure that the
results obtained throughout this dissertation are robust, findings will be
substantiated with multiple different analyses that use different data sources.
For example, the result that visual words are more frequent than words for the
other modalities is demonstrated for multiple corpora (Chapter 3), and the
result that taste and smell words are more affectively loaded is demonstrated
with multiple valence datasets (Chapter 4). Hence, for each phenomenon, the
emphasis is on presenting multiple converging lines of evidence.
31
Chapter 3. Visual dominance in the English lexicon
3.1. Visual dominance
Visual dominance, narrowly defined, refers to the idea that vision is able to
influence perceptual content from the other modalities, more so than the other
way round (Stokes & Biggs, 2015). When vision is pitted against the tactile
modality, several experiments found that the visual system recalibrates the
perception of shapes perceived through touch (Rock & Victor, 1964; Hay &
Pick, 1966): How something is seen modulates how something is felt. How
something is felt does not modulate how something is seen as strongly. In the
so-called “ventriloquist effect” (Pick, Warren, & Hay, 1969; Welch & Warren,
1980; Alais & Burr, 2004), participants see somebody talk, but the voice is
actually emanating from a sound source at a different spatial location (e.g., as
in a movie theatre). The perceived origin of the sound coincides with the visual
percept, not the auditory one. Morrot, Brochet and Dubourdieu (2001)
conducted a wine tasting study where white wine was stained red with a
neutral-tasting dye, which led a group of oenology undergraduate students to
describe the taste using words generally associated with red wines. Similarly,
Hidaka and Shimoda (2014) showed that the coloring of a sweet solution
affects sweetness judgments (see also Shermer & Levitan, 2014).
Visual dominance, broadly construed, is any advantage that the visual
modality has compared to the other modalities. For example, compared to
vision, people have difficulty allocating sustained attention to the tactile
modality (Spence et al., 2001; Turatto et al., 2004) and the olfactory modality
(e.g., Mahmut & Stevenson, 2015). Furthermore, vision arguably takes up the
largest area of the human cortex (Drury, Van Essen, Anderson, Lee, Coogan, &
Lewis, 1996). Finally, vision is also culturally dominant, at least in the modern

32
West. Cultural historians and anthropologists think of the modern West as a
vision-centric cultural complex (Classen, 1993, 1997). Vision has been regarded
as a “higher” sense by Western scholars since antiquity (Le Guérer, 2002).
In linguistics the notion of visual dominance is expressed by Viberg’s
hierarchy of perception verbs. Viberg (1983) analyzed perception verbs from 53
different languages and proposed that there is a hierarchy of sensory
modalities, as follows:
(1) SIGHT > HEARING > TOUCH > TASTE & SMELL
This typological hierarchy characterizes differential lexicalization across
the world’s languages. English follows this pattern by making agency
distinctions for the visual modality (to see, to look, to look at) and the auditory
modality (to hear, to sound, to listen) that have no reflection in the gustatory and
olfactory modalities (see also Buck, 1949: Ch. 15). In English, for instance, one
needs to use two different words (to see and to look) when saying the two
sentences He saw the flower and The flower looks good. But parallel sentences in
the olfactory modality only require one word: He smelled the flower and The
flower smells good. Especially when compared to smell, there appear to be many
more words for visual concepts in the English language (Majid & Burenhult,
2014; Levinson & Majid, 2014: 415).
Viberg (1983) also thought of the hierarchy as describing the
directionality of semantic change. Evans and Wilkins (2000) followed up on
this idea and showed that visual verbs in Australian languages tend to become
extended to also describe sensory perception in the other modalities. For
example, in the Australian language Walpiri, the verb nyanyi meaning ‘see,
33
look at’ occurs in modified variants to describe the act of smelling, such as
parnti-nyanyi, which is analogous to ‘stink-see = smell’. Others have stated that
vision is particularly prone to acquiring metaphorical meanings denoting
mental content (Caplan, 1973; Matlock, 1989; Sweetser, 1990; Caballero &
Ibarretxe-Antuñano, 2014; though see Evans & Wilkins, 2000), as in the English
expression I see meaning ‘I understand’. Finally, Viberg (1993) argued that
visual dominance can also be found when looking at word frequencies, with
the basic perception verb of vision being more frequent. This point was
followed up by San Roque and colleagues (2015), who showed that in 13
different languages (many of them non-European), the basic perception verb of
vision (to see and its translational equivalents) is more frequent than the
corresponding basic perception verbs of the other modalities.
This chapter will demonstrate visual dominance at multiple levels of
linguistic analysis. First, it is shown that there are more words associated with
the visual modality than with the other modalities, i.e., there are asymmetries
in the lexical differentiation of the senses. This is a claim made frequently (e.g.,
Buck, 1949: Ch. 15; Levinson & Majid, 2014), but it has never been tested in a
quantitative fashion. Then, it is shown that visual words are also more
semantically complex. This follows from the claimed metaphoric potential of
the visual modality (e.g., Sweetser, 1990). However, this, too, has never been
assessed quantitatively. Finally, visual words are shown to be more frequent
and more contextually diverse. This follows up on the investigation of San
Roque et al. (2015), however, in contrast to them, a larger set of words and
lexical categories (also nouns and adjectives) will be analyzed, rather than just
a small set of perception verbs.

34
3.2. Differential lexicalization
This section will show that the modality norms introduced in Chapter 2
provide an effective way of demonstrating the role of visual dominance in the
English lexicon. Table 5 lists word counts according to the “dominant
modality” of each word. This table is based on 936 data points, including the
423 adjectives from Lynott and Connell (2009), the 400 nouns from Lynott and
Connell (2013), and the newly collected 113 verbs (random sample).
Vision Touch Hearing Taste Smell χ2 tests Adjectives 205 70 68 54 26 χ2(4) = 228.78, p < 0.0001
Nouns 336 14 42 6 2 χ2(4) = 1036.2, p < 0.0001 Verbs 49 42 21 1 0 χ2(4) = 90.85, p < 0.0001
Table 5. Word counts for adjectives, nouns and verbs.
For each lexical category, the largest proportion of words is classified as
visual. Of the Lynott and Connell (2009) adjectives, the proportion of visual
words is 49%. Of the Lynott and Connell (2013) nouns, 84% are visual. Of the
newly collected verb norms, 43% are visual. If all senses were characterized by
equal lexical differentiation, a proportion of 20% would be expected. The
present proportion of visual words is substantially in excess of that. Chi-Square
tests (Table 5, rightmost column) show that there are reliable word count
differences between the senses.
It is important to recognize that the word counts in Table 5 impose a
categorical classification onto a set of continuous variables, i.e., the continuous
modality strength ratings. Figure 1 shows the distributions of the perceptual
strength ratings for each modality (adjectives only). In this figure, the x-axis
corresponds to the perceptual strength scale (from 0 to 5), and the y-axis
corresponds to the number of words for that value of the scale.

35
Figure 1. Kernel density estimates of adjective norms. Five modalities from Lynott and Connell (2009); the x-axis represents the rating scale, the y-axis represents the estimated proportion of words for a given perceptual strength value; density curves are restricted to the observed range; solid vertical lines indicate means
Figure 1 shows that the visual strength ratings are clearly skewed
toward the right, with the bulk of adjectives having very high visual strength
ratings. Moreover, not a single adjective has a zero rating for visual strength,
showing that participants thought that all adjectives engaged the visual
modality to some extent. The ratings for the other four modalities include zero,
and particularly for the auditory, gustatory and olfactory modality, the
distributions are skewed toward the left. Thus, for the non-visual modalities,
the perceptual strength ratings of most words are located at the lower end of
(a)
Visual Strength
0 1 2 3 4 50.0
0.2
0.4
0.6
Density
chubby
yellow
(b)
Tactile Strength
0 1 2 3 4 5
scratchy
weightless
(c)
Auditory Strength
0 1 2 3 4 5
quiet
mumbling
(d)
Gustatory Strength
0 1 2 3 4 50.0
0.2
0.4
0.6
Density
fresh
tasteless
(e)
Olfactory Strength
0 1 2 3 4 5
sweaty
musky
36
the scale. A linear mixed effects model on the perceptual strength ratings (0 to
5) with the fixed factors MODALITY (five levels) and LEXICAL CATEGORY (three
levels) reveals that across the total set of 936 words, there is a main effect of
MODALITY (χ2(4) = 1229, p < 0.0001, marginal R2 = 0.34)4, with visual words
predicted to have the highest perceptual strength ratings.
The distribution of the visual strength ratings in Figure 1 only has one
peak. The distributions of the non-visual modalities have two peaks, i.e., they
are bimodal. This means that for the non-visual modalities, there always is a
set of words with high perceptual strength ratings, and also a set of words with
low perceptual strength ratings. This bimodality can be interpreted as showing
that the non-visual modalities are relatively more restricted to specific clusters
of dedicated linguistic material. For instance, the adjectives mumbling and quiet
are very auditory (they are located within the peak to the right in Fig. 1c).
However, most other adjectives (yellow, shiny, rough, smooth) are located in the
peak to the left of the distribution of auditory strength ratings. Thus, there is a
small set of highly auditory words, but a much larger set of non-auditory
words. The fact that all non-visual distributions of perceptual strength ratings
are bimodal can be quantified using Hartigan’s dip test (Hartigan & Hartigan,
1985). Doing this for each modality and lexical category shows that vision is
the only modality that is not reliably bimodal for all three lexical categories
(adjectives, nouns, verbs). All other modalities exhibit bimodality for at least
one of the lexical categories, indicating restriction to small pockets of the
lexicon. 4 The model included a random effect for WORD and by-MODALITY slopes. There also was a main effect of LEXICAL CATEGORY (χ2(2) = 184.04, p < 0.0001, marginal R2 = 0.02), with adjectives receiving overall higher perceptual strength ratings than nouns, which themselves received higher ratings than the verbs.
37
3.3. Differences in semantic complexity
As was discussed above, vision was frequently claimed to be a sensory
modality particularly prone to semantic extension (e.g., Evans & Wilkins,
2000), including metaphorical extension (e.g., Sweetser, 1990). Because
metaphor is one of the primary ways through which words become
semantically extended, visual words should thus be more semantically
complex than non-visual words. One way to operationalize the notion of
sematic complexity in a quantitative fashion is to count the number of
dictionary meanings a word has (Zipf, 1945; Thorndike, 1948; Baker, 1950;
Köhler, 1986; Baayen & del Prado Martín, 2005; Piantadosi, Tily, & Gibson,
2012). For instance, the verb to see has eleven dictionary meanings5 listed in the
MacMillan Online Dictionary, including such meanings as “to notice someone
or something using your eyes” and “to meet or visit someone who you know
by arrangement”. On the other hand, the verb to smell has only six dictionary
meanings, including “to have a particular smell” and “to notice or recognize
the smell of something”. Although dictionary meanings do not directly
correspond to semantic structure in the mind (e.g., Croft & Cruse, 2004; Elman,
2004), they nevertheless provide a coarse measure of semantic complexity that
is meaningfully related to real psycholinguistic behavior (see, e.g.,
Jastrzembski & Stanners, 1975; Johnson-Laird & Quinn, 1976; Gernsbacher,
1984; Jorgensen, 1990).
Counts from WordNet (Miller, 1995; Fellbaum, 1998) and MacMillan
Online Dictionary were analyzed using negative binomial regression (see
Appendix A). Controlling for part-of-speech differences, there was a reliable
5 Dictionaries often distinguish between “major” and “minor” meanings. Here, only the “major” meanings were counted.

38
effect of MODALITY onto dictionary meaning counts from WordNet
(χ2(4) = 87.02, p < 0.0001, R2 = 0.028) and from MacMillan (χ2(4) = 48.21,
p < 0.0001, R2 = 0.027). The auditory, gustatory and olfactory modality are
characterized by less semantic complexity (see Figure 2). Overall, the factor
MODALITY accounted for 2.8% unique variance in WordNet sense counts and
2.7% unique variance in MacMillan sense count. Post-hoc tests of visual words
versus non-visual words (controlling for lexical category differences) reveal a
reliable effect of VISION for WordNet (χ2(1) = 12.57, p = 0.0004, R2 = 0.01), but not
for MacMillan (χ2(1) = 2.43, p = 0.12, R2 = 0.003).
Figure 2. Dictionary meanings as a function of modality. Predicted meaning counts and 95% confidence intervals from negative binomial analyses for (a) the WordNet and (b) the MacMillan dictionary data; the tactile and visual modalities have more dictionary meanings
The fact that the tactile modality is equal to or higher than the visual on
this semantic complexity measure is noteworthy. The high number of
dictionary meanings for words relating to the tactile modality is partly caused
by verbs such as to hold, to give and to get. These verbs were presumably rated
(a)
Vis Tac Aud Gus OlfN=587 N=123 N=130 N=61 N=28
0
2
4
6
8
10
Dic
tiona
ry m
eani
ngs
WordNet
(b)
Vis Tac Aud Gus OlfN=587 N=123 N=130 N=61 N=28
MacMillan
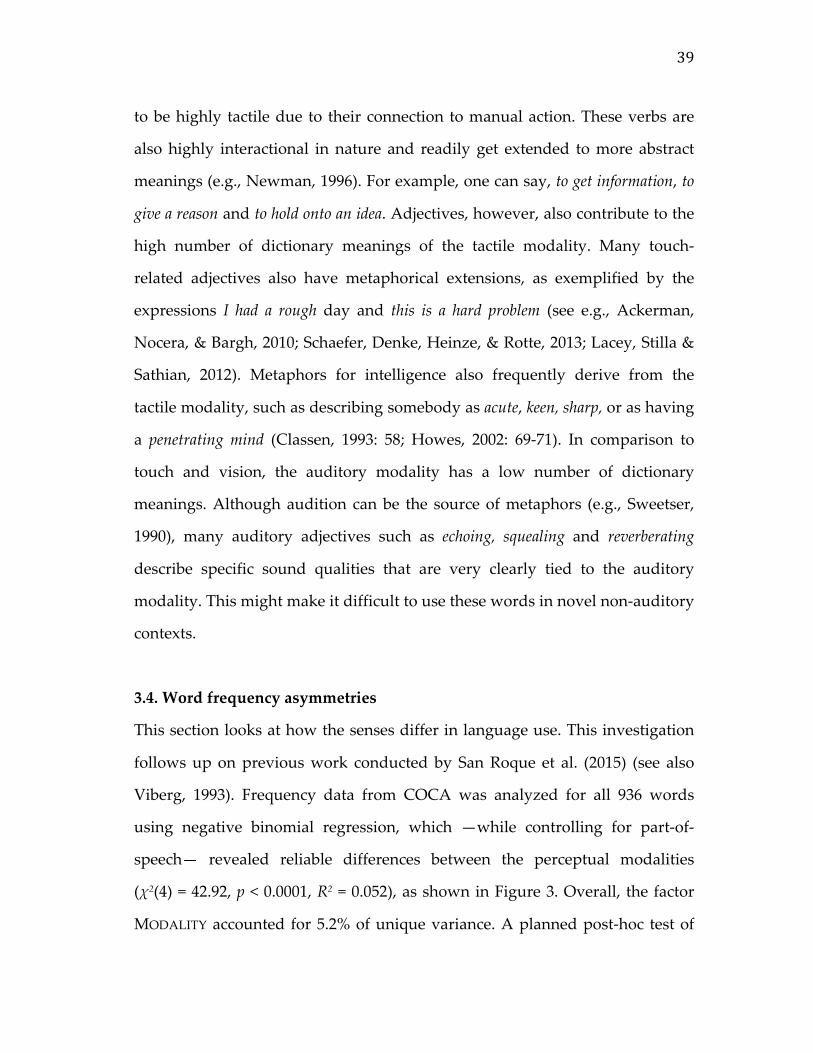
39
to be highly tactile due to their connection to manual action. These verbs are
also highly interactional in nature and readily get extended to more abstract
meanings (e.g., Newman, 1996). For example, one can say, to get information, to
give a reason and to hold onto an idea. Adjectives, however, also contribute to the
high number of dictionary meanings of the tactile modality. Many touch-
related adjectives also have metaphorical extensions, as exemplified by the
expressions I had a rough day and this is a hard problem (see e.g., Ackerman,
Nocera, & Bargh, 2010; Schaefer, Denke, Heinze, & Rotte, 2013; Lacey, Stilla &
Sathian, 2012). Metaphors for intelligence also frequently derive from the
tactile modality, such as describing somebody as acute, keen, sharp, or as having
a penetrating mind (Classen, 1993: 58; Howes, 2002: 69-71). In comparison to
touch and vision, the auditory modality has a low number of dictionary
meanings. Although audition can be the source of metaphors (e.g., Sweetser,
1990), many auditory adjectives such as echoing, squealing and reverberating
describe specific sound qualities that are very clearly tied to the auditory
modality. This might make it difficult to use these words in novel non-auditory
contexts.
3.4. Word frequency asymmetries
This section looks at how the senses differ in language use. This investigation
follows up on previous work conducted by San Roque et al. (2015) (see also
Viberg, 1993). Frequency data from COCA was analyzed for all 936 words
using negative binomial regression, which —while controlling for part-of-
speech— revealed reliable differences between the perceptual modalities
(χ2(4) = 42.92, p < 0.0001, R2 = 0.052), as shown in Figure 3. Overall, the factor
MODALITY accounted for 5.2% of unique variance. A planned post-hoc test of
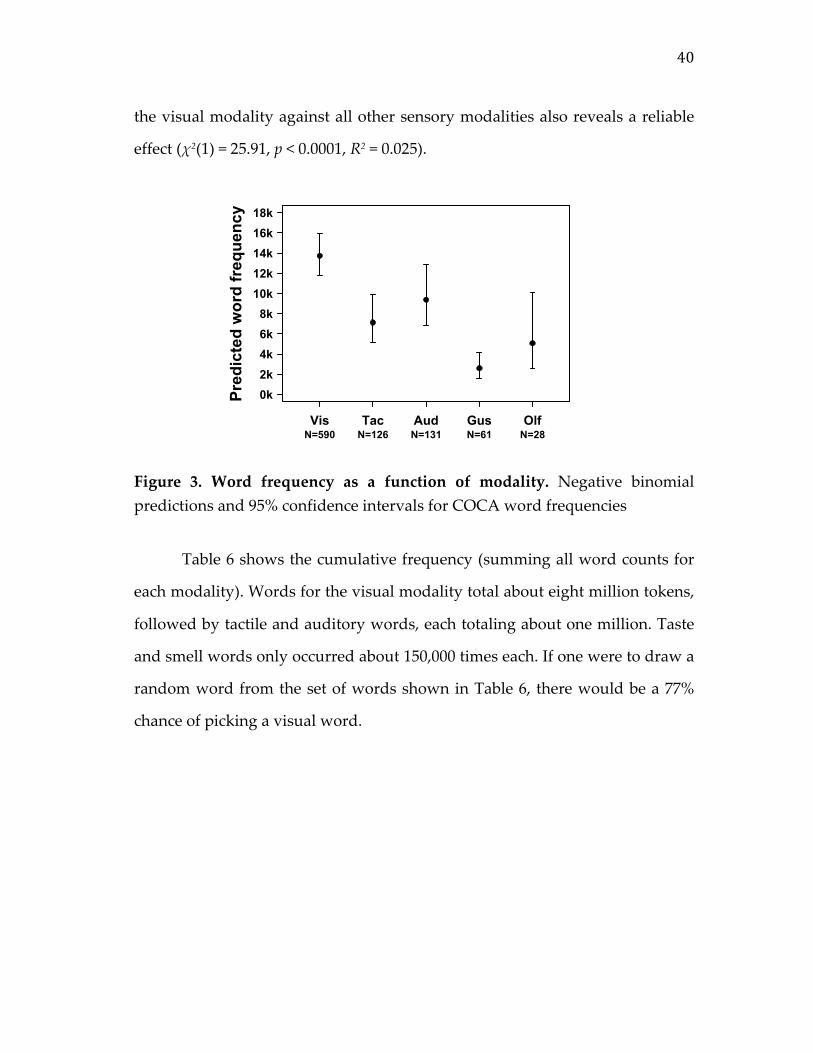
40
the visual modality against all other sensory modalities also reveals a reliable
effect (χ2(1) = 25.91, p < 0.0001, R2 = 0.025).
Figure 3. Word frequency as a function of modality. Negative binomial predictions and 95% confidence intervals for COCA word frequencies
Table 6 shows the cumulative frequency (summing all word counts for
each modality). Words for the visual modality total about eight million tokens,
followed by tactile and auditory words, each totaling about one million. Taste
and smell words only occurred about 150,000 times each. If one were to draw a
random word from the set of words shown in Table 6, there would be a 77%
chance of picking a visual word.
Vis Tac Aud Gus OlfN=590 N=126 N=131 N=61 N=28
0k2k4k6k8k10k12k14k16k18k
Pre
dict
ed w
ord
freq
uenc
y
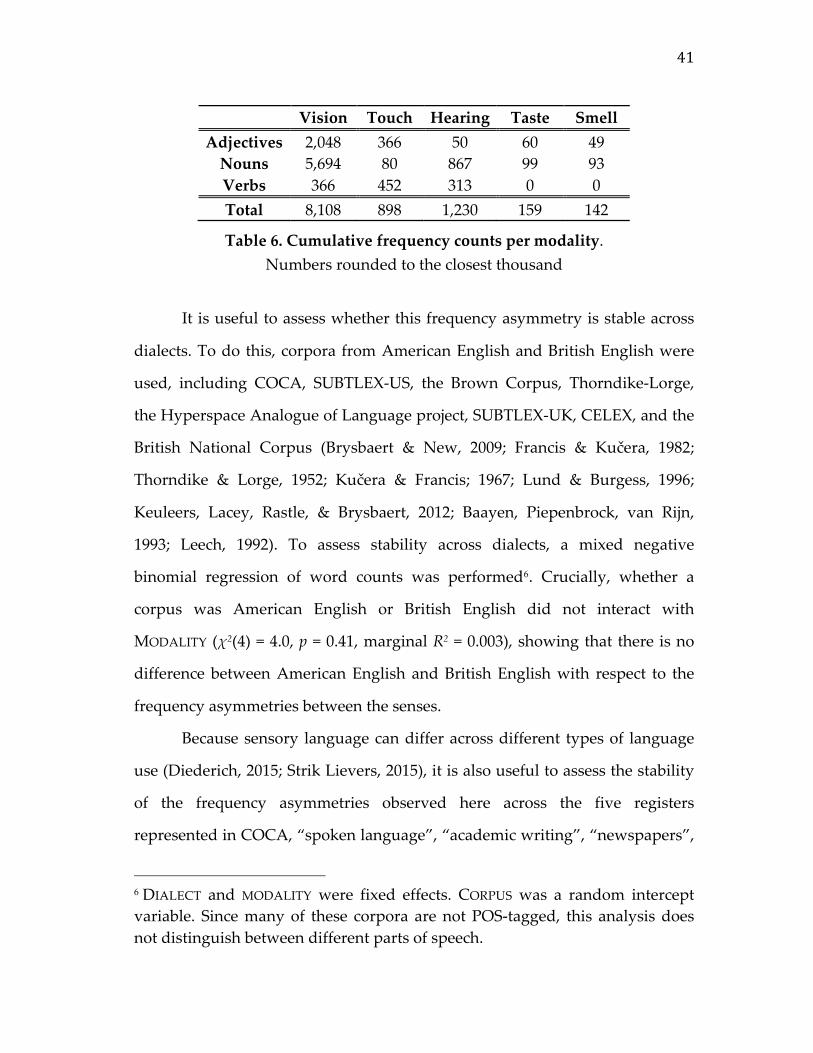
41
Vision Touch Hearing Taste Smell
Adjectives 2,048 366 50 60 49 Nouns 5,694 80 867 99 93 Verbs 366 452 313 0 0 Total 8,108 898 1,230 159 142
Table 6. Cumulative frequency counts per modality. Numbers rounded to the closest thousand
It is useful to assess whether this frequency asymmetry is stable across
dialects. To do this, corpora from American English and British English were
used, including COCA, SUBTLEX-US, the Brown Corpus, Thorndike-Lorge,
the Hyperspace Analogue of Language project, SUBTLEX-UK, CELEX, and the
British National Corpus (Brysbaert & New, 2009; Francis & Kučera, 1982;
Thorndike & Lorge, 1952; Kučera & Francis; 1967; Lund & Burgess, 1996;
Keuleers, Lacey, Rastle, & Brysbaert, 2012; Baayen, Piepenbrock, van Rijn,
1993; Leech, 1992). To assess stability across dialects, a mixed negative
binomial regression of word counts was performed6. Crucially, whether a
corpus was American English or British English did not interact with
MODALITY (χ2(4) = 4.0, p = 0.41, marginal R2 = 0.003), showing that there is no
difference between American English and British English with respect to the
frequency asymmetries between the senses.
Because sensory language can differ across different types of language
use (Diederich, 2015; Strik Lievers, 2015), it is also useful to assess the stability
of the frequency asymmetries observed here across the five registers
represented in COCA, “spoken language”, “academic writing”, “newspapers”,
6 DIALECT and MODALITY were fixed effects. CORPUS was a random intercept variable. Since many of these corpora are not POS-tagged, this analysis does not distinguish between different parts of speech.
42
“magazines” and “fiction” (see Appendix A). The frequency ranking of the
adjectives never changes with respect to vision (most frequent) and touch
(second most frequent). In spoken language and fiction, audition ranks third.
In magazines, newspapers and academic language, olfactory adjectives are
more frequent than auditory adjectives. Thus, a look at register-specific
frequencies suggests that visual dominance is a property of different types of
language use.
Finally, because the importance of particular senses can change over
time (e.g., Classen, 1993; Senft, 2011; de Sousa, 2011) and because the frequency
of sensory terms can shift even in relatively short time scales (see Danescu-
Niculescu-Mizil, West, Jurafsky, Leskovec and Pott 2013 on aroma versus smell),
it is useful to assess the diachronic stability of the frequency asymmetries
observed in this chapter. Google Ngram frequencies of adjectives (Michel et al.,
2011) are shown in Figure 4 for 300 years of the English language (collapsing
across British and American English). As can be seen, adjectives for visual
concepts (such as pale, faint and yellow) are the most frequent, and this pattern
persists throughout the 300-year period shown. Interestingly, the average
frequency of the olfactory words has declined relative to the other modalities
from about 1900 onwards7. This coincides with Classen’s analysis of “the
decline in the importance of odour and the rise in visualism in the West”
(Classen, 1993: 7). Alongside a shift in cultural values, the spread of writing,
7 Pechenick, Danforth and Dodds (2015) express justified concerns for using Google Ngram for making inferences on patterns of cultural change. It is not entirely clear that the relative changes within each modality in Figure 4 are due to differences in register composition for different time periods. However, the fact that vision continuously outranks the other senses for a 300 year period suggests that this is unlikely a strong concern in this case.
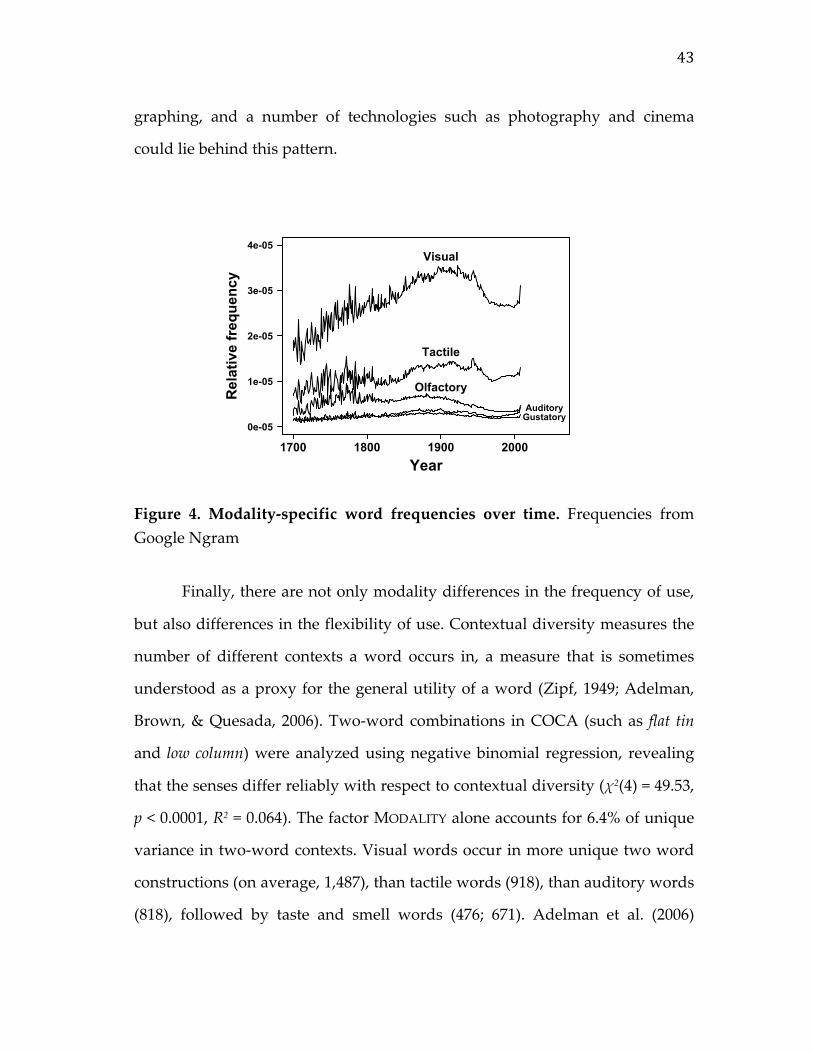
43
graphing, and a number of technologies such as photography and cinema
could lie behind this pattern.
Figure 4. Modality-specific word frequencies over time. Frequencies from Google Ngram
Finally, there are not only modality differences in the frequency of use,
but also differences in the flexibility of use. Contextual diversity measures the
number of different contexts a word occurs in, a measure that is sometimes
understood as a proxy for the general utility of a word (Zipf, 1949; Adelman,
Brown, & Quesada, 2006). Two-word combinations in COCA (such as flat tin
and low column) were analyzed using negative binomial regression, revealing
that the senses differ reliably with respect to contextual diversity (χ2(4) = 49.53,
p < 0.0001, R2 = 0.064). The factor MODALITY alone accounts for 6.4% of unique
variance in two-word contexts. Visual words occur in more unique two word
constructions (on average, 1,487), than tactile words (918), than auditory words
(818), followed by taste and smell words (476; 671). Adelman et al. (2006)
1700 1800 1900 2000
0e-05
1e-05
2e-05
3e-05
4e-05
Year
Rel
ativ
e fr
eque
ncy
Visual
Tactile
OlfactoryAuditoryGustatory
44
quantify contextual diversity by considering the number of different movies
that a word occurs in. A negative binomial regression of movie counts from the
SUBTLEX corpus of English subtitles (Brysbaert & New, 2009) reveals a
reliable effect of MODALITY (χ2(4) = 33.84, p < 0.0001, R2 = 0.016). Visual words
occurred on average in 1,226 movies, followed by auditory (1,042), tactile (943),
gustatory (377), and olfactory (357) words. Here, the factor MODALITY
accounted for 1.6% of unique variance.
3.5. Word processing
The finding that visual words are more frequent than words for the other
modalities is a fact about the sensory part of the English lexicon. This linguistic
pattern likely has ramifications for linguistic processing, that is, the in-the-
moment comprehension and production of language. Visual words, by virtue
of their frequency, should be processed more quickly—this is because word
frequency generally facilitates language processing (Solomon & Postman, 1952;
Postman & Conger, 1954; Oldfield & Wingfield, 1965; Balota & Chumbley,
1985; Jescheniak & Levelt, 1994). In addition, it is known that relatively more
polysemous words, such as words with many dictionary meanings, tend to
have an advantage in processing (Jastrzembski & Stanners, 1975; Gernsbacher,
1984), what is sometimes called the “ambiguity advantage”. The frequency and
semantic richness of visual words is thus likely going to lead to faster reaction
times for these words in psycholinguistic studies.
This idea can be tested by looking at the English Lexicon Project (Balota
et al., 2007), which contains reaction times from two psycholinguistic
experiments for 40,481 English words. A total of 444 participants performed a
speeded naming task; a total of 816 participants performed a lexical decision
45
task. The resulting reaction times can be analyzed as a “virtual experiment”
(Kuperman, 2015; Keuleers & Balota, 2015) for differences between words
associated with sight, sound, touch, taste and smell. As a first step in this
analysis, a simple model was built with the fixed factors MODALITY and
LEXICAL CATEGORY, separately for the word naming reaction times and the
lexical decision times (all reaction times were log-transformed). For both of
these dependent measures, there was a reliable effect of MODALITY (word
naming: F(4, 873) = 7.49, p < 0.0001, R2 = 0.025; lexical decision: F(4, 873) = 5.49,
p = 0.0002, R2 = 0.019). The factor MODALITY alone accounted for 2.5% of the
variance in the word naming times and for 1.9% of the variance in lexical
decision times. These R2 values are relatively low, which is unsurprising given
the fact that word processing speed is influenced by a whole number of
different linguistic variables (e.g., Gernsbacher, 1984; Adelman et al., 2006;
Keuleers & Balota, 2015). However, the low explanatory power of the factor
MODALITY might also have to with the fact that many words are highly
multimodal. A stronger MODALITY effect might be obtained if one looks at the
more modality-specific part of the sensory lexicon. If one tests for MODALITY
differences in reaction times of words that are above the median modality
exclusivity (41%), then R2 values raise to 5.4% of the variance in word naming
times and 5.9% of the variance in lexical decision times.
For the full dataset (all words, regardless of modality exclusivity), the
mean word naming times are 635ms for visual words, 641ms for tactile words,
645ms for auditory words, 667ms for gustatory words, and 680ms for olfactory
words. The mean lexical decision times are 653ms for visual words, 673ms for
tactile words, 680ms for gustatory words, 684ms for auditory words, and
708ms for olfactory words. Thus, visual words are processed most quickly in

46
both datasets, followed by tactile words, auditory/gustatory words and finally
olfactory words, which are processed the slowest. Binary comparisons (vision
versus rest) reveal that visual words are on average processed 28ms faster than
non-visual words in the lexical decision ask (t(878) = 4.7, p < 0.0001; Cohen’s d =
0.33) and 14ms faster in the speeded naming task (t(878) = 3.24, p = 0.001,
Cohen’s d = 0.23).
These analyses clearly show that words are processed differently
depending on sensory modality. However, the cognitive mechanism that
explains the reaction time differences might not have anything to do with
sensory modality per se, but with the differences in linguistic variables such as
frequency or polysemy associated with sensory modality (see above). Note that
if reaction times were only indirectly depended on modality (e.g., mediated
through word frequency), this would still characterize an embodied effect on
processing because the ultimate explanatory factor would still be “perceptual
modality”, a language-external variable. However, to assess the extent to
which the reaction time differences reported above are driven by potential
confounding variables, the virtual experiment was expanded to include several
variables that are known to influence reaction times, including word
frequency, age of acquisition (e.g., Lachman, Shaffer, & Hennrikus, 1974),
concreteness (e.g., Gernsbacher, 1984), and the number of dictionary meanings
(Jastrzembski & Stanners, 1975; Gernsbacher, 1984). A model with MODALITY
and all of these additional control variables8 still yields reliable differences
8 Word frequency was taken from SUBTLEX (Brysbaert & New, 2009). Age of acquisition ratings were taken from Kuperman, Stadthagen-Gonzalez and Brysbaert (2012). Concreteness norms were taken from Brysbaert, Warriner and Kuperman (2014). Finally, both the WordNet and Macmillan dictionary counts (discussed above) were entered in separate models as log-transformed
47
between the senses for both naming times (F(4, 786) = 9.29, p < 0.0001, R2 = 0.01)
and lexical decision times (F(4, 786) = 9.53, p < 0.0001, R2 = 0.001). In comparison
to the simple analysis of MODALITY reported above, the very small R2 values in
this analysis (naming: 1%; lexical decision: 0.1%) indicate that the major share
of reaction time differences between different modalities results from the
patterns that the perceptual modalities create within the lexicon (i.e., frequency
asymmetries), rather than from a direct effect of perceptual modality9.
3.6. Discussion
Across the different sub-results, several general patterns emerged. First, there
was a clear pattern of visual dominance, with visual words being more
lexically differentiated, less restricted to a small subpart of the lexicon (i.e., less
bimodality), more semantically complex, and used more frequently and in
more diverse contexts. Second, tactile words repeatedly ranked second,
perhaps contra to Viberg (1983), who ranks the tactile modality behind the
auditory one. This cannot solely be due to the fact that highly general verbs
such as to give or to get were classified as tactile because tactile dominance over
audition was also found for the adjectives, where the auditory modality was
particularly infrequent. Thus, the tactile modality is perhaps more dominant in predictors. Because both dictionary count variables produced the same results, only the models with the WordNet predictor are discussed in the body of the text. 9 Imageability is another factor that could play a role, however, the norming data that exists for imageability is considerably sparser than the data that exists for concreteness (e.g., 40,000 words for concreteness in Brysbaert et al., 2014, as opposed to only 3,000 words for imageability in Cortese & Fugett, 2004). Only 31% of the 936 words analyzed here are represented in Corte and Fugett (2004). Moreover, Connell and Lynott (2012) showed that imageability ratings and concreteness ratings tap into similar latent constructs.

48
English than Viberg’s hierarchy would acknowledge10. Third, the olfactory
modality consistently ranked last or second-to-last, together with taste.
Olfactory and gustatory words tended to be less lexically differentiated, more
restricted to a smaller subpart of the lexicon (i.e., stark bimodality), less
semantically complex, less frequent, and used in less diverse contexts. Fourth
and finally, the differences found in the lexical patterns (frequency, dictionary
meanings etc.) were found to have ramifications in word processing, with the
finding that visual words were processed on average most quickly, and
olfactory words most slowly.
The results can be seen as confirming the idea that language-external
factors such as the visual dominance in perception influences language-
internal patterns. However, an alternative explanation is possible, an account
based on differential ineffability. This concept is defined by Levinson and
Majid (2014) as “the difficulty or impossibility of putting certain experiences
into words” (p. 408). Lexical ineffability is best exemplified by the sense of
smell: Speakers find it difficult to verbally label smells, even smells of
everyday objects and food items (Engen & Ross, 1973; Cain, 1979; de Wijk &
Cain, 1994; Levinson & Majid, 2014; Croijmans & Majid, 2015). Olofsson and
Gottfried (2015) argue that the “persistent challenges” of “mapping odors to
names” (Olofsson & Gottfried, 2015: 319) are not due to odor inferiority per se,
but due to “inherent properties of the designated [brain] network for olfactory
language” (p. 318). Olofsson and Gottfried (2015) and Yeshurun and Sobel
(2010) mention that people are only bad at verbally identifying smells, not at
10 Tsur (2012: 227), echoing Ullmann (1959: 282), calls touch “the lowest level of sensorium” and notes that it has “the poorest vocabulary”—something that is contradicted by the data presented in this chapter (see also Chapter 8).

49
recognizing smells and discriminating between different smells (see also de
Wijk & Cain, 1994). This suggests that humans do not necessarily have an
overall impoverished sense of smell, just an impoverished connection between
language and smell (see also Yeshurun & Sobel, 2010, pp. 223-227; Croijmans &
Majid, 2015; Majid & Burenhult, 2014). In contrast, vision in the brain appears
to have excellent connections to language (e.g., the ventral visual pathway for
object naming).
Taking the concept of differential ineffability to its full conclusion means
that the linguistic dominance of vision reported above would not be seen as
stemming from perceptual visual dominance at all. Instead, it would stem from
the relative difficulty of putting non-visual experiences into words. To clarify
the distinction between these proposals, one may consider a hypothetical
world in which olfaction is, in fact, the dominant human sense. In this world,
odor guides everyday behavior and decision-making, locomotion and esthetic
preferences—more so than any other sense. However, given the established
difficulty of encoding odor impressions into language, smell would still not
make it into linguistic utterances as often—despite being the most important
sense in this hypothetical world. Thus, the linguistic ineffability of odors
would guise the fact that olfaction is in fact a salient and important human
sense.
Differential ineffability can account for differences in word counts, i.e.,
there being more vision words than smell words. The idea of ineffability does
not, however, account for the full pattern of results presented in this chapter.
The English language does have a small but limited set of odor and taste terms.
If taste and smell were indeed so important to English speakers, then one
would expect this limited set of words to be disproportionately more frequent,
50
so that in the cumulative frequency analysis reported above, they could
compete with vision. However, this was not found to be the case. Despite there
being more visual words, each and every visual word is also on average more
frequent11. What this suggests is that English speakers can talk about tastes and
smells (albeit only with a limited vocabulary), but they choose to do so very
rarely. The low frequency of auditory, gustatory and olfactory terms suggests
that English speakers do not as frequently verbalize the detailed qualities
perceived through the corresponding modalities. This renders words such as
squealing, citrusy and aromatic relatively infrequent, compared to visual words.
As Smeets and Dijksterhuis (2014: 7) write, “Most people show a natural
inclination to pay more attention to visual than olfactory attributes of the
environment” (Smeets & Dijksterhuis, 2014: 7). This differential attention to the
visual modality comes to be expressed in how frequently the corresponding
sensory words are used.
However, yet another account of the data is consistent with both the
word frequency findings and the differential lexicalization. This account is
based on pragmatics: The objects of visual perception are relatively more stable
(e.g., compare looking at a picture to the transience of a sound) and in dyads or
larger groups of speakers, humans can easily direct joint attention (Tomasello,
1995) to them. This allows us to use shared visual experience to establish
common ground (Clark, 1996: Ch. 4; cf. Dingemanse, 2009: 2131). Joint
attention and common ground are presumably more easily established with
11 But perhaps the visual words are used to describe content from the other modalities? In this case, the high frequency of “visual” words might be misleading with respect to visual dominance. It has been argued that metaphors can be used to “help out” sensory domains that lack terminology (e.g., Ullmann, 1959). This will be addressed in Ch. 8.
51
vision than with gustation, olfaction and the tactile modality, which are more
private and less intersubjectively sharable (cf. San Roque et al., 2015: 50). For
example, English speakers agree much more on color terms than they agree on
smells (Majid & Burenhult, 2014; Croijmans & Majid, 2015), which are
considerably more subjective, at least in Western cultures. Thus, a pragmatics-
based explanation of visual dominance assumes that vision is dominant in
human language because talking about visual percepts allows for coordinated
and reliable conversations. This account, too, does not require vision to be
dominant outside of communicative contexts.
This pragmatics-based account can easily explain the frequency results:
If speakers find it easier to establish common ground with visual words, they
should use them more frequently. However, the pragmatics-based approach
has nothing to say about the psychological and neurophysiological evidence
for visual dominance, which, crucially, exists even without considering
language. For accounts that are based solely on ineffability or pragmatics, the
match between the language-external evidence for visual dominance (cultural,
behavioral and neuropsychological) and the language-internal evidence is
coincidental. This close match is most plausibly understood from an embodied
and culturally situated perspective that sees linguistic asymmetries as
stemming from perceptual and cultural asymmetries. Language comes to
reflect asymmetries that exist independently in cognition, culture and the
brain.
Ultimately, the three factors considered here —perceptual visual
dominance, differential ineffability, pragmatics— are not mutually exclusive.
For example, it might be that the physiological and psychological dominance
of vision is the ultimate cause of differential ineffability: From an evolutionary
52
perspective, it appears to be plausible that a sense that is not important does
not need special neural pathways to language. On the other hand, differential
ineffability might actually influence language-external visual dominance: It is
conceivable that speakers would regard a sense that cannot easily be talked
about as less important, which would lead to a diminished cultural importance
and perhaps also to diminished attention devoted to that modality. From this
perspective, the different explanatory accounts can be seen as mutually
reinforcing.
It is important to emphasize that even though this chapter has presented
evidence for visual dominance, ultimately all senses matter to experience.
Seeing, hearing, feeling, tasting and smelling all contribute complementary
aspects to our perceptual impressions and interactions with the world. The use
of large-scale corpora allows aggregating over several sensory contexts,
painting a picture in which the English language obeys the principle of visual
dominance at large. However, particular senses may be locally inflated in
importance, e.g., taste and smell in the context of food, or hearing when
listening to a concert. The next chapter explores one particular local context
where taste and smell words may have an edge over visual words, namely, in
emotional language.

53
Chapter 4. Taste and smell words are more affectively loaded
4.1. Olfaction, gustation and human emotions
Describing something as yellow is fairly neutral. Something can be yellow
without necessarily being attractive or unattractive. However, describing
something as fragrant or smelly appears to have an inherent evaluative
component. This was already observed by Buck (1949: 1022) in his dictionary
of Indo-European synonyms:
“Words for ‘smell’ are apt to carry a strong emotional value, which is
felt to a less degree in words for ‘taste’ and hardly at all in those for the
other senses.”
There clearly are emotionally valenced terms for the other senses as
well, for instance, the word ugly describes a negative visual quality. However,
for olfaction and gustation, the evaluative component appears to be more
obligatory (cf. Majid & Levinson, 2014: 411), whereas it is optional for vision,
audition and touch.
The idea that the so-called “chemical senses” (gustation and olfaction)
are connected to emotions has to some extent been explored within linguistics.
Krifka (2010) points out that in German, a sentence such as Der Käse schmeckt
(literally: ‘the cheese tastes’) means something positive, whereas Der Käse riecht
(‘the cheese smells’) means something negative, even though the verbs
involved are arguably the basic perception verbs for those two modalities, the
German equivalents of to taste and to smell (cf. Dam-Jensen & Zethsen, 2007:
1614; Classen, 1993: 53). Many researchers have noted that languages exhibit
negative differentiation with respect to smell (Rouby & Bensafi, 2002: 148-149;

54
Jurafsky, 2014: 96): There are more words for malodors (such as body odors
and the odors of rotten things) than words for pleasant smells, such as the
smell of fresh food. Multi-dimensional scaling studies repeatedly find that
participants spontaneously group odors according to pleasantness and
unpleasantness (Berglund, Berglund, Engen, & Ekman, 1973; Schiffman,
Robinson, & Erickson, 1997; Dubois, 2000), including participants who speak
languages that have large vocabularies of genuinely descriptive smell terms
(Wnuk & Majid, 2014).
Dubois (2000) furthermore found that odors are often described with
fairly personal language, highlighting the speaker’s own involvement rather
than an objective description of the odor. Allan and Burridge (2006: Ch. 8) note
how taste and smell are inextricably linked with the culturally loaded domain
of food, which gives the terminology associated with the chemical senses
special social value. An example of this is the use of taste words to express
sexual desire: “Both food and bodies whet the appetite, stimulate the juices, make
the mouth water, activate the taste buds, excite, smell good, titillate, allure, seduce” (p.
194). Similarly, Jurafsky (2014: 102) points to the use of sexual words to talk
about food, such as when describing a molten chocolate as “an orgasm on a plate”,
or marshmallows as “nearly pornographic”.
These linguistic observations correspond to the physiology of the
chemical senses. In the brain, taste is deeply linked with the human reward
system (Volkow, Wang, & Baler, 2011; see also Rolls, 2008). Both taste and
smell —which behaviorally and neurally are quite integrated (e.g., De Araujo,
Rolls, Kringelbach, McGlone, & Phillips, 2003; Delwiche & Heffelfinger, 2005;
Rolls, 2008; Auvray & Spence, 2008; Spence, Smith, & Auvray, 2015)— share
close connections with brain areas for emotional processing (Phillips &
55
Heining, 2002; Royet, Plailly, Delon-Martin, Kareken, & Segebarth, 2000; Rolls,
2008; Yeshurun & Sobel, 2010). The amygdala, an area known to be involved in
emotional processes (e.g., Halgren, 1992; Richardson, Strange, & Dolan, 2004),
is also involved in olfaction. The olfactory bulb projects directly to the
amygdala (Price, 1987; Turner, Mishkin, & Knapp, 1980), and perceiving
pleasant or unpleasant odors and tastes is associated with increased blood flow
in the amygdala (Zald & Pardo, 1997; Zald, Lee, Fluegel, & Pardo, 1998).
Moreover, the amygdala exhibits increased blood flow for olfactory, but not for
a similar set of visual and auditory stimuli (Royet, Zald, Versace, Costes,
Lavenne, Koenig, Gervais, 2000). Phillips and Heining (2002: 204) review the
neural evidence and conclude…
“… that emotion processing and perception of odors and flavors have
similar neural bases and that olfactory and gustatory stimuli seem to be
processed to a significant extent in terms of their emotional content,
even if not presented in an emotional context.”
On the behavioral side, studies of odor memories also find close
cognitive ties between olfaction and emotions (Herz & Engen, 1996; Herz, 2002,
2007). Odors are particularly strong cues for autobiographical memories
(Willander & Larsson, 2006; Chu & Downes, 2000; Herz & Schooler, 2002; Herz,
2004). Waskul, Vannini and Wilson (2009) link odor to the feeling of nostalgia,
noting that when people are asked to describe their favorite smell, about 70%
of participants spontaneously relate their responses to their personal
biographical history. Herz (2002: 169) says that “memories evoked by odors are

56
distinguished by their emotional potency, as compared with memories cued by
other modalities”.
This chapter adds to the existing literature on olfactory and gustatory
language in the following ways: First, the basic result that words for taste and
smell are more strongly emotional is replicated using more objective ways of
quantifying what it means for a word to be “emotional”. In the past, judgments
about whether a sensory word has a positive or negative connotation were
made subjectively by the researcher. But the generality of such judgments is
questionable because different people have different intuitions12. Second, the
analysis is then extended to the contexts in which gustatory and olfactory
words occur. Particularly, it is shown that taste and smell adjectives modify
more emotionally valenced nouns. Finally, it is shown that taste and smell
words are more emotionally variable, that is, the very same word can occur in
both positive and negative contexts—something that is much less pronounced
for words from the other modalities.
12 For instance, the word banker was rated to be neutral by the participants of Warriner et al. (2013), but it is one of the most negative words in the Twitter Emotion Corpus (Mohammad, 2012).
57
4.2. Characterizing odor and taste words
Before dealing with the senses in relation to emotional language, the gustatory
and olfactory words from Lynott and Connell (2009) need to be reviewed:
acidic, alcoholic, astringent, barbecued, beery, biscuity, bitter, bland, briny,
buttery, caramelized, cheesy, chewy, chocolatey, citrusy, cloying, coconutty,
creamy, delicious, eggy, fatty, flavorsome, fruity, garlicky, herby, honeyed,
jammy, juicy, lemony, malty, meaty, mild, minty, mushroomy, nutty, oniony,
orangey, palatable, peachy, peppery, ripe, roasted, salty, savory, sour, spicy,
stale, sweet, tangy, tart, tasteless, tasty, unpalatable, vinegary
Many of the gustatory adjectives are denominal. The Oxford English
Dictionary (OED) indicates that only about 30% of the gustatory adjectives
above have verbal or adjectival origins; 70% derive from nouns. Most of these
denominal adjectives have a transparent connection to the food item from
which they are derived, as is the case for words such as cheesy, lemony, and
mushroomy, which directly derive from the nouns cheese, lemon and mushroom,
respectively. On the other hand, there are some terms that directly describe
food quality, such as tasty, palatable, tasteless and unpalatable. There are also
words for four of the five basic tastes, namely, sour, bitter, sweet and salty. The
basic taste umami is missing from this list.
The olfactory adjectives from Lynott and Connell (2009) are:
acrid, antiseptic, aromatic, burning, burnt, fishy, fetid, fragrant, fresh, musky,
musty, noxious, odorous, perfumed, pungent, putrid, rancid, reeking, scented,
scentless, smelly, smoky, stenchy, stinky, sweaty, whiffy
58
OED indicates that eight of these words have nominal origins (44%).
This means that there are only few smell adjectives in this data set that directly
identify the source of the smell, with exceptions such as fishy (from fish), smoky
(from smoke) and sweaty (from sweat). Many of the olfactory adjectives describe
negative aspects of smell, such as pungent, putrid, rancid and reeking. Some of
them also describe positive aspects of smell, such as aromatic, fragrant, and
scented.
How does one quantify the positive or negative evaluative component
of taste and smell words? There are several ways of getting valence measures
for words (Pang & Lee, 2008: Ch. 7; Liu, 2012: Ch. 6), and this chapter will use
three different datasets to address this problem. One approach works with
native speaker judgments. Warriner, Kuperman and Brysbaert (2013) asked
native speakers of English to rate on a scale from 1 to 9 whether a word made
them feel “happy, pleased, satisfied, contended, hopeful” or “unhappy,
annoyed, unsatisfied, melancholic, despaired, bored”. Norms were collected
for 13,915 English lemmas. The word with the highest valence is vacation (8.53),
followed by happiness (8.48) and happy (8.47); the word with the lowest value is
pedophile (1.26), preceded by rapist (1.30) and AIDS (1.33). Of the 936 words
used in this study, 748 can be found in the Warriner et al. (2013) dataset (~80%).
For this valence measure, a linear model revealed no reliable differences
between modalities (F(4, 743) = 2.31, p = 0.056, R2 = 0.007). A comparison
between gustatory and olfactory words showed no reliable effect of gustatory
words being more positive than olfactory words (t(45) = 1.76, p = 0.086, Cohen’s
d = 0.54). However, as Figure 5a shows, there was a trend for olfactory words
to be more negative than words for the other modalities, and Cohen’s d

59
indicated a medium effect size (d = 0.54). On average, gustatory words had a
valence of 5.5 (SD = 1.6); olfactory words had a valence of 4.65 (SD = 1.7).
Figure 5. Valence norms as a function of modality. Linear model fits and 95% confidence intervals for (a) valence and (b) absolute valence from Warriner et al. (2013)
Figure 5b shows an absolute valence measure (computed by centering
the valence distribution and taking the absolute value), which focuses on
affective content irrespective of whether a word is positive or negative. With
this measure, the words happiness and guillotine have the same “absolute
valence” (3.42), even though these words focus on opposite ends of the valence
spectrum. A simple linear model on these absolute valence scores revealed
reliable differences between the senses (F(4, 743) = 6.2, p < 0.0001, R2 = 0.027),
with the factor MODALITY alone accounting for 2.7% of the variance. A post-hoc
comparison of the chemical senses (gustation and olfaction) versus the
remaining senses revealed a reliable difference (t(746) = 4.01, p < 0.0001,
Cohen’s d = 0.60), with taste and smell words having an average absolute
(a)
Vis Tac Aud Gus OlfN=590 N=126 N=131 N=61 N=28
Warriner et al. (2013)
3.5
4.5
5.5
6.5
Valence
(b)
Vis Tac Aud Gus OlfN=590 N=126 N=131 N=61 N=28
Abs
olut
e V
alen
ce
0.8
1.2
1.6
2.0
Warriner et al. (2013)

60
valence of 1.5 (SD = 0.74), and the other sensory words having an average
absolute valence of 1.06 (SD = 0.76).
A second way to compute emotional valence exploits the fact that many
Twitter users specify the emotional content of their tweets using hashtags, such
as in the following tweet:
We are fighting for the 99% that have been left behind. #OWS #anger
In this example from Mohammad (2012: 246), #anger specifies the
emotional tone of the message. Words that frequently occur in tweets together
with negative emotional hashtags, such as #sadness or #disgust, are likely
negative. Words that frequently occur in tweets together with positive
emotional hashtags, such as #joy, are likely positive. In the Twitter Emotion
Corpus Lexicon (TEC Lexicon, Mohammad, 2012) that was computed based on
these co-occurrences, the most positive lexical item is a hashtag, #fabulous
(7.53). The most positive full word is elegant (5.67), followed by excellence (5.42)
and bicycles (5.21). The most negative hashtag is #unacceptable (-6.93), and the
most negative full word is ipad2 (-6.62), preceded by fuckface (-4.9) and ticketing
(-4.9). There was valence data for 799 of the 936 words considered (~85%).
With this valence data, there were no reliable differences between
modalities (F(4, 794) = 2.27, p = 0.06, R2 = 0.006). A post-hoc test comparing
gustatory and olfactory words did not indicate a reliable difference in
emotional valence (t(54) = 1.77, p = 0.08, Cohen’s d = 0.51), however, there was a
trend for gustatory words to be more positive and for olfactory words to be
more negative (see Figure 6a). On average, gustatory words had a valence
score of 0.43 (SD = 1.15); olfactory words had a valence score of -0.2 (SD = 1.37).

61
Absolute valence, however, did show reliable differences between modalities
(F(4, 794) = 4.07, p = 0.0028, R2 = 0.015), indicating that taste and smell words
are overall more affectively loaded (see Figure 6b). Post-hoc tests comparing
words for the chemical senses to words for the other senses revealed a reliable
difference (t(797) = 3.54, p = 0.0004, d = 0.49). Words for gustation and olfaction
together had an absolute valence rating of 0.91 (SD = 0.85), compared to the
absolute valence of 0.60 (SD = 0.62) for the other senses.
Figure 6. Twitter valence data as a function of modality. Linear model fits and 95% confidence intervals for (a) valence and (b) absolute valence calculated using the corpus-driven approach based on emotional tweets presented in Mohammad (2012)
The third and final valence data set used here comes from
SentiWordNet 3.0 (Esuli & Sebastiani, 2006; Baccianella, Esuli, & Sebastiani,
2010), a set of valence norms that were calculated in a semi-automated fashion
based on WordNet (Miller, 1995; Fellbaum, 1998). A set of paradigmatically
positive and negative words, such as good and bad were taken as seeds for an
algorithm which then expanded this set by considering the semantic relations
(a)
Vis Tac Aud Gus OlfN=590 N=126 N=131 N=61 N=28
-0.8
-0.4
0.0
0.4
0.8
Valence
TEC lexicon(b)
Vis Tac Aud Gus OlfN=590 N=126 N=131 N=61 N=28
Abs
olut
e V
alen
ce
0.0
0.5
1.0
1.5TEC lexicon
62
of these words to other words. For instance, antonyms of bad are likely going to
have positive emotional valence, and so do synonyms of good. For each word,
SentiWordNet yields two affect-related scores: A positivity and a negativity
index (see Appendix A for details on the processing of the SentiWordNet data).
The word ranking highest on the positivity index was unsurpassable (positivity:
1.0), the word ranking highest on the negativity index was abject (negativity:
1.0). Here, the difference score (positivity minus negativity) will be analyzed.
Such a difference score is most comparable to the valence norms from Warriner
et al. (2013) and the Twitter Emotion Corpus (Mohammad, 2012). The
SentiWordNet data exists for 773 of the 936 sensory words (~83%).
With this valence data, there was a reliable MODALITY effect for the
valence measure (positivity minus negativity; F(4, 768) = 8.2, p < 0.0001,
R2 = 0.036), but no statistically reliable difference between gustatory and
olfactory words (t(62) = 1.11, p = 0.27, d = 0.29). Gustatory words had an
average valence score of -0.11 (SD = 0.19); olfactory words -0.18 (SD = 3.5). To
compute a word’s overall emotional valence (regardless of the sign), the
maximum of a word’s positivity and negativity was taken. For example, the
adjective fragrant has a positivity score of 0.75 and a negativity score of 0.125,
and hence a maximum valence of 0.75. With this measure, there were reliable
differences between sensory modalities (F(4, 768) = 11.71, p < 0.0001, R2 = 0.053).
Post-hoc tests of chemical versus non-chemical senses revealed a reliable
difference (t(771) = 5.87, p < 0.0001, d = 0.77), with taste and smell words having
an average maximum valence of 0.24 (SD = 0.22) compared to 0.11 (SD = 0.16)
for words for the non-chemical senses.
These results show that olfactory and gustatory words are more
emotionally valenced. Crucially, this result could be obtained for three entirely
63
different ways of computing valence, namely, a method based on human
annotators (Warriner et al., 2013), a method based on automatic dictionary
processing (Esuli & Sebastiani, 2006; Baccianella et al., 2010), and a corpus-
driven approach using emotional tweets (Mohammad, 2012). For all of these
different measures, taste and smell words received higher absolute valence
scores, disregarding the sign of the emotional valence. At least numerically,
there was indication that gustatory words were more positive than olfactory
words (supporting Buck, 1949; Krifka, 2010; Allan & Burridge, 2006: Ch. 8;
Jurafsky, 2014: 98), but this did not reach statistical significance for any of the
three datasets.
4.3. Taste and smell words in context
The past section showed that taste and smell words are more affectively
loaded. Given this, one would expect that taste and smell words occur in more
emotionally valenced contexts as well. This is a slightly different claim from
saying that the word itself is valenced. The adjective sweaty for example,
classified as olfactory in Lynott and Connell (2009), has about average valence
in the Warriner et al. (2013) norms, which characterizes sweaty as a relatively
neutral word in this dataset. But regardless of this, the word sweaty occurs in
such heavily valenced contexts as sweaty love (positive) and sweaty prison
(negative). This section tests whether the valence results shown for words in
the preceding section carry over to the words’ contexts. This section thus deals
with what some people have called the ‘semantic prosody’ (Sinclair, 2004;
Hunston, 2007) or ‘evaluative harmony’ (Morley & Partington, 2009) of words.
As a first step toward characterizing the linguistic contexts within which
taste and smell words are used, a dataset from Pang and Lee (2004) will be

64
used. In their analysis of movie review data from rottentomatoes.com, Pang and
Lee (2004) operationally defined objective sentences in terms of movie
synopses (which describe movie plots in a matter-of-fact style) and subjective
sentences in terms of movie reviews (which contain value statements). An
example of an objective statement from their corpus is:
David is a painter with painter’s block who takes a job as a waiter to get some
inspiration
An example of a subjective statement is:
Works both as an engaging drama and an incisive look at the difficulties facing
native Americans
The dataset by Pang and Lee (2004) contains 5,000 objective and 5,000
subjective sentences. For each of the 10,000 sentences, the number of sensory
words per modality was counted. For instance, in the evaluative sentence it’s
sweet and romantic without being cloying or melodramatic, there are two gustatory
words, sweet and cloying. In the evaluative sentence you’d be hard put to find a
movie character more unattractive or odorous, the word odorous appears as an
olfactory word in the Lynott and Connell (2009) data.
These counts were subjected to a negative binomial regression analysis,
looking to see whether there are reliable differences in word counts between
objective and subjective sentences. A separate model with the factor
SUBJECTIVITY was constructed for each sensory modality. Figure 7 depicts each
model’s slope, with positive values indicating that words are more likely to
65
occur in subjective as opposed to objective text snippets. As can be seen,
gustatory words (χ2(1) = 49.0, p < 0.0001, R2 = 0.004) and olfactory words
(χ2(1) = 8.06, p = 0.004, R2 = 0.0007) are more frequent in subjective as opposed
to objective texts. The same holds for tactile words (χ2(1) = 44.9, p < 0.0001,
R2 = 0.004). On the other hand, visual words (χ2(1) = 200.59, p < 0.0001,
R2 = 0.017) and auditory words (χ2(1) = 9.18, p = 0.002, R2 = 0.0008) are more
likely to occur in objective rather than in subjective texts13. Incidentally, this
result is also interesting because it mirrors the traditional Western
preconception of vision and audition being “objective” senses (cf. Classen,
1993, 1997).
13It should be noted, however, that the R2 values of the analyses of the to be largely due to other factors that are not accounted for in the model rottentomatoes.com dataset are all very low, indicating that although SUBJECTIVITY was reliably associated with the frequency of certain sensory words, the frequencies seem.

66
Figure 7. Subjectivity of movie reviews by modality. Slopes of negative binomial models of the single predictor SUBJECTIVITY (subjective versus objective) from separate models for each modality; higher values indicate a higher likelihood for words from that modality being used in subjective as opposed to objective texts; the slopes are in log space
The analysis so far looked at the counts of tokens (particular instances of
a given word), ignoring whether these tokens all come from the same word
type or not. This potentially biases the results, for instance, most of the
gustatory words that occur in subjective text could just be repeated occurrences
of the word sweet. To address this concern, we may ask the question: Of the
adjectives in Lynott and Connell (2009), how many are used in subjective texts
at all—disregarding how often they are used? And how many adjectives are
used in objective texts at all? Doing such an analysis reveals that of the
olfactory adjectives, only 3 are used in objective texts and 13 are used in
subjective texts (binomial test: p = 0.02). Similarly, gustatory words have a
strong bias to be used in subjective texts, with 24 adjectives used in reviews as
Vis Tac Aud Gus Olf
Subjectivity vs. Objectivity
-0.5
0.0
0.5
1.0
1.5
2.0
Log
Slo
pe
67
opposed to only 8 in synopses. In this analysis of word types rather than word
tokens, visual and auditory adjectives have no statistically reliable preference
(vision: 105 versus 129; audition: 15 versus 20). Tactile words, on the other
hand, are also more likely to be used in subjective texts (45 adjectives used)
than in objective texts (27 adjectives used) (p = 0.04). Thus, even in an analysis
of types rather than tokens, words associated with the chemical senses show a
strong preference for subjectivity.
The results so far considered “context” at a relatively global scale.
Adjective-noun pairs are a way to assess the role of context at a more local
scale. For example, the nouns in the adjective-noun pairs fragrant kiss and
sweaty prison are more valenced than the nouns in yellow house and large
installation. To test the idea that taste and smell adjectives are more likely to be
paired with valenced nouns, every two-word combination for all Lynott and
Connell (2009) adjectives was extracted from the COCA corpus. The valences
of the nouns were then averaged, e.g., the adjective cloying occurred together
with the noun smell (valence = 6.39) seven times in COCA, and with the noun
sweetness eight times (valence = 7.37). These noun valences were averaged,
yielding a new number, in this case 6.06, the valence of the noun contexts.
These means are weighted for frequency, i.e., adjective-noun pairs that are
more frequent contribute more towards an adjective’s average “context
valence”. In this analysis, it is possible to compute the valence of the contexts
even if there is no valence for the word itself—the word cloying, for instance, is
not represented in Warriner et al. (2013) but has a context valence score
because there are valence values associated for many of the nouns that the
word cloying co-occurs with. A total of 149,385 adjective-noun pairs were
analyzed. These were all the adjective-noun pairs in which an adjective from

68
Lynott and Connell (2009) occurred. The Warriner norms exist for ~80% of the
nouns in these pairs; the Twitter Emotion Corpus norms exist for ~82%; the
SentiWordNet 3.0 norms exist for ~79%.
Sensory modalities differed reliably for this valence context measure,
which was the case for all three valence datasets considered (Warriner: F(4,
400) = 17.03, p < 0.0001, R2 = 0.14; Twitter Emotion Corpus: F(4, 400) = 9.33, p <
0.0001, R2 = 0.08; SentiWordNet 3.0: F(4, 400) = 7.94, p < 0.0001, R2 = 0.06).
Moreover, post-hoc tests indicate that specifically, olfactory adjectives were
more likely to pattern with negative nouns, compared to gustatory adjectives,
which patterned with relatively more positive nouns. This was the case for the
Warriner norms (t(70) = 4.33, p < 0.0001, d = 1.07), however not as reliably for
the SentiWordNet valence data (t(70) = 1.94, p = 0.056, d = 0.48) and the valence
data from the Twitter Emotion Corpus (t(70) = 0.12, p = 0.90, d = -0.03).
Compared to the effect sizes of the analyses on the valence of just the words
themselves (Ch. 4.2), there are stronger valence differences between olfaction
and gustation when contexts are analyzed. The context data more strongly
suggest that olfactory words are used more frequently in negative contexts
than gustatory words.
These are all results about the noun’s valences. What about overall
valence, i.e., the absolute valence measure that disregards the sign of the
valence? Figure 8 shows differences in the absolute valence of the contexts for
two of the three datasets. Linear models indicate reliable differences between
the senses for noun absolute valences from the Warriner et al. (2013) norms
(F(4, 400) = 25.06, p < 0.0001, R2 = 0.19), the Twitter-based emotion lexicon (F(4,
400) = 13.05, p < 0.0001, R2 = 0.08) and SentiWordNet 3.0 (F(4, 400) = 7.36, p <
0.0001, R2 = 0.06). Post-hoc tests comparing the chemical versus the non-
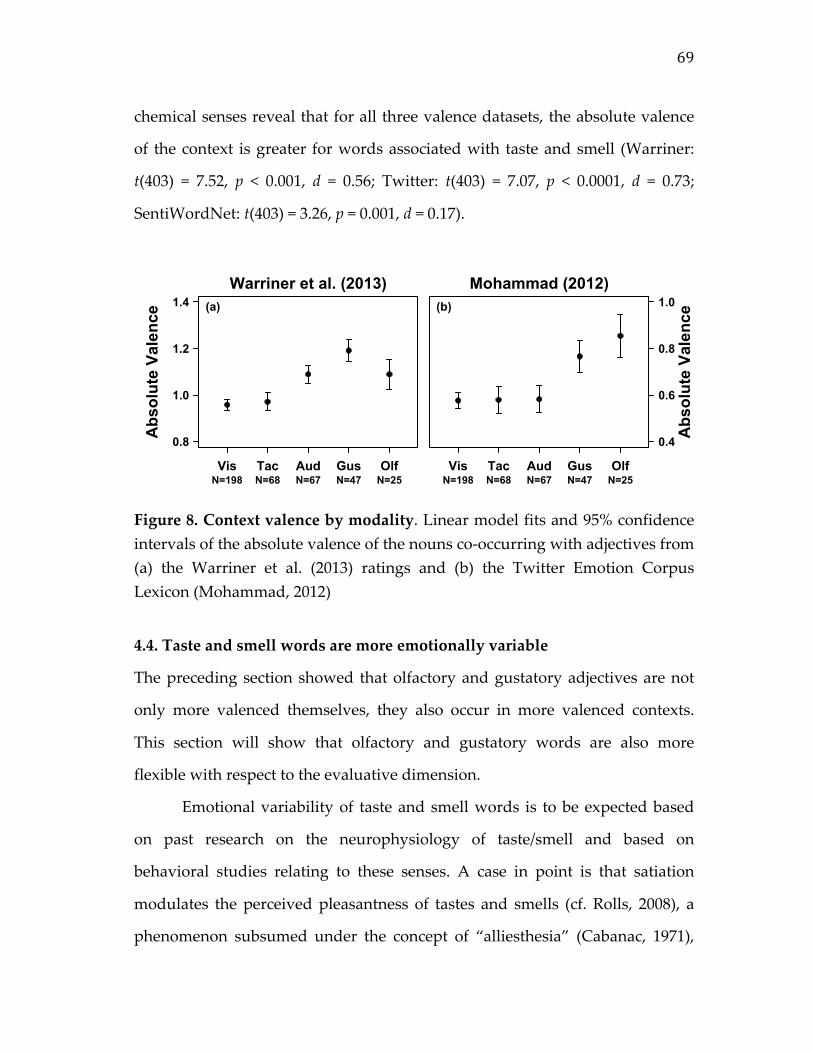
69
chemical senses reveal that for all three valence datasets, the absolute valence
of the context is greater for words associated with taste and smell (Warriner:
t(403) = 7.52, p < 0.001, d = 0.56; Twitter: t(403) = 7.07, p < 0.0001, d = 0.73;
SentiWordNet: t(403) = 3.26, p = 0.001, d = 0.17).
Figure 8. Context valence by modality. Linear model fits and 95% confidence intervals of the absolute valence of the nouns co-occurring with adjectives from (a) the Warriner et al. (2013) ratings and (b) the Twitter Emotion Corpus Lexicon (Mohammad, 2012)
4.4. Taste and smell words are more emotionally variable
The preceding section showed that olfactory and gustatory adjectives are not
only more valenced themselves, they also occur in more valenced contexts.
This section will show that olfactory and gustatory words are also more
flexible with respect to the evaluative dimension.
Emotional variability of taste and smell words is to be expected based
on past research on the neurophysiology of taste/smell and based on
behavioral studies relating to these senses. A case in point is that satiation
modulates the perceived pleasantness of tastes and smells (cf. Rolls, 2008), a
phenomenon subsumed under the concept of “alliesthesia” (Cabanac, 1971),
(a)
Vis Tac Aud Gus OlfN=198 N=68 N=67 N=47 N=25
0.8
1.0
1.2
1.4
Abs
olut
e V
alen
ce
Warriner et al. (2013)(b)
Vis Tac Aud Gus OlfN=198 N=68 N=67 N=47 N=25
Mohammad (2012)
Abs
olut
e V
alen
ce
0.4
0.6
0.8
1.0

70
which describes differences in the valuation of a sensory stimulus resulting
from differences in body states. For example, participants that initially rated a
sweet smell as positive perceived it to be less pleasant after being injected with
glucose (Cabanac, Pruvost, & Fantino, 1973). Thus, the perception of flavor
(which is constituted by both taste and smell, Auvray & Spence, 2008; Spence,
Smith, & Auvray, 2015) is highly variable: it is modulated by body-internal
states, even by body temperature (Russek, Fantino, & Cabanac, 1979).
Because the hedonic dimension of most specific odors is learned rather
than innate (Herz, 2002), there also is cultural and individual variability in
which odors are perceived as pleasant and which odors are perceived as
unpleasant: “An individual’s personal history with particular odorants tends
to shape that individual’s responses to those odors for life” (p. 161). A clear
demonstration of inter-individual variation is skunk smell, which most people
abhor, but some people seem to enjoy (cf. Herz, 2002: 161). Herz (2002: 162)
furthermore discusses how experiments with US and UK participants show
that the smell of wintergreen is valued positively in the US (as the smell of
“mint” candy), but it is valued more negatively in the UK, where it is often
mentally associated with medicine14. Odor learning is highly associative (Herz,
2002; Hermans & Baeyens, 2002; Köster, 2002: 32) and hence, odor valences can
easily change through learning or depending on context.
The valuation of tastes and smells is furthermore easily modified
through verbal labels and packaging. For example, Liem, Miremadi, Zandstra
and Keast (2012) showed that the same product, when it is labeled as having
reduced sodium content, actually tastes less salty, as evidenced by
14 This result apparently only obtains for older people due to a particular medicine used in the Second World War.
71
participants’ increased desire to put salt on the food. The chemical substance
indole was reported to smell more pleasant when it was labeled countryside
farm as opposed to human feces (Djordjevic, Lundstrom, Clement, Boyle, Poulio,
& Jones-Gotman, 2008). Lee, Frederick and Ariely (2006) gave participants beer
with added vinegar; those participants who knew that vinegar was added in
advance to tasting the beer had less of a preference for the beer compared to
those who received the information afterwards.
What all of this suggests is that taste and smell exhibit high variability
with respect to emotional valence. Given this, and given the idea that sensory
language reflects perception, taste and smell language should also be more
emotionally variable. An example of this would be the common saying sweet
stink of success, where the positive word sweet is combined with the negative
word stink. If taste and smell words are indeed more emotionally variable, one
should expect to see phrases such as sweet stink more often than comparative
expressions such as ugly beauty (visual) and noisy harmony (auditory). Highly
valenced words that are auditory or visual, such as ugly, should be less likely
to occur in both positive and negative contexts. For words relating more
strongly to the chemical senses, such as sweaty (classified as olfactory), it
should be possible to occur in both positive and negative contexts, as in sweaty
love (positive) versus sweaty prison (negative).
To show that this is indeed the case, the standard deviation of the noun
valences that co-occur with a specific adjective can be computed. Consider the
gustatory word sweet, which occurs in the expressions sweet delight (8.21), sweet
joy (8.21) and sweet sunshine (8.14), but also sweet death (1.89), sweet disaster
(1.71) and sweet nausea (1.68). Computing the standard deviation across all of
these noun valences (8.21, 8.14 etc.) yields a measure of how much an adjective
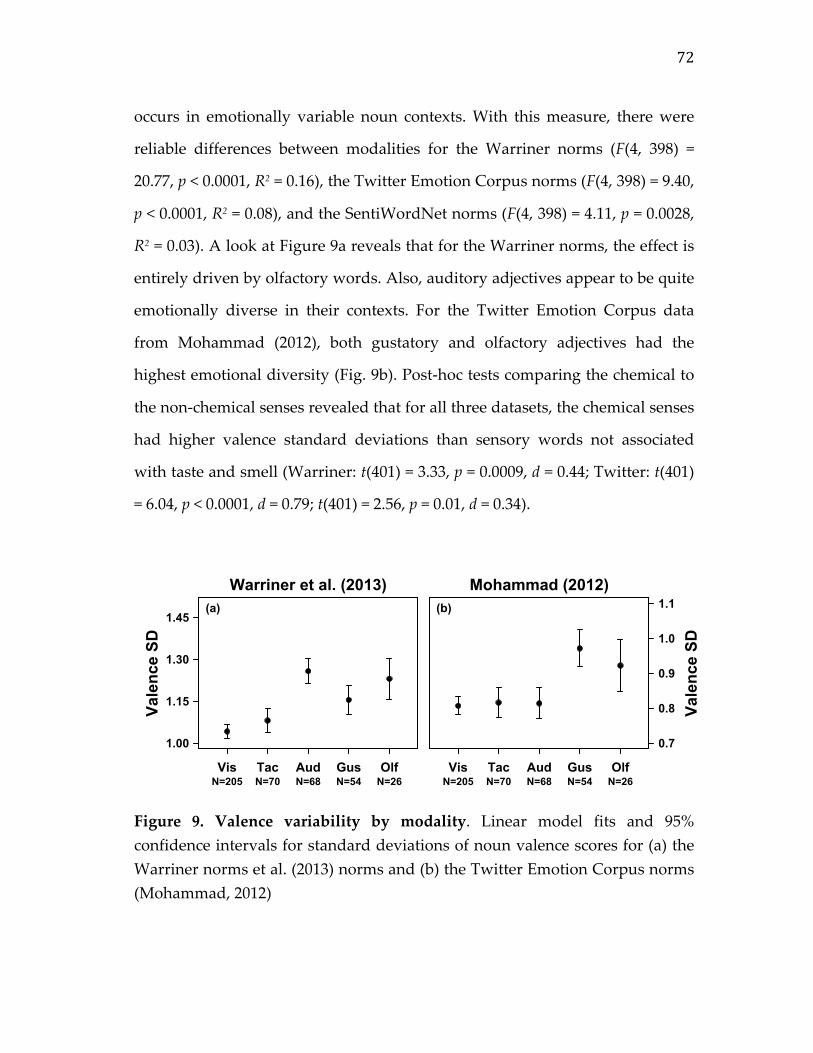
72
occurs in emotionally variable noun contexts. With this measure, there were
reliable differences between modalities for the Warriner norms (F(4, 398) =
20.77, p < 0.0001, R2 = 0.16), the Twitter Emotion Corpus norms (F(4, 398) = 9.40,
p < 0.0001, R2 = 0.08), and the SentiWordNet norms (F(4, 398) = 4.11, p = 0.0028,
R2 = 0.03). A look at Figure 9a reveals that for the Warriner norms, the effect is
entirely driven by olfactory words. Also, auditory adjectives appear to be quite
emotionally diverse in their contexts. For the Twitter Emotion Corpus data
from Mohammad (2012), both gustatory and olfactory adjectives had the
highest emotional diversity (Fig. 9b). Post-hoc tests comparing the chemical to
the non-chemical senses revealed that for all three datasets, the chemical senses
had higher valence standard deviations than sensory words not associated
with taste and smell (Warriner: t(401) = 3.33, p = 0.0009, d = 0.44; Twitter: t(401)
= 6.04, p < 0.0001, d = 0.79; t(401) = 2.56, p = 0.01, d = 0.34).
Figure 9. Valence variability by modality. Linear model fits and 95% confidence intervals for standard deviations of noun valence scores for (a) the Warriner norms et al. (2013) norms and (b) the Twitter Emotion Corpus norms (Mohammad, 2012)
(a)
Vis Tac Aud Gus OlfN=205 N=70 N=68 N=54 N=26
1.00
1.15
1.30
1.45
Vale
nce
SD
Warriner et al. (2013)(b)
Vis Tac Aud Gus OlfN=205 N=70 N=68 N=54 N=26
Vale
nce
SD
0.7
0.8
0.9
1.0
1.1Mohammad (2012)

73
In Ch. 3, it was demonstrated that visual words had higher average
contextual diversity than taste and smell words. This result still holds, but this
chapter uncovered one particular aspect in which taste and smell words are in
fact more diverse, namely in contextual diversity with respect to emotional
valence.
4.5. Discussion
Rachel Herz (2002: 171) said about smell that “no other sensory system makes
this kind of direct, dynamic contact with the neural substrates for emotion.”
The present chapter provided evidence that this fact carries over to words
about smells, and to words about tastes. The fact that the words themselves
(Ch. 4.2) and the contexts in which they occur (Ch. 4.3) are overall more
emotionally valenced suggests that taste and smell words form an affectively
loaded part of the English lexicon. On the other hand, the data shows that taste
and smell words also form an emotionally variable part of the English lexicon
(Ch. 4.4). Whereas a visual word such as ugly is quite fixed in its emotional
valence (strongly negative), language users can play more with words such as
fragrant, sweaty or tasty: A positive taste or smell word can be used in a
negative context, and vice versa for negative words. The other sensory
modalities were found to be more restricted in this regard.
It is particularly noteworthy that the “affective loading” of taste and
smell words also carries over to the movie review dataset of Pang and Lee
(2004). Cinema is an audiovisual medium, yet, when English speakers describe
the quality of movies, that is, when they evaluate them, they frequently resort
to words such as sweet, cloying, bland, stale and fresh. Here are some example
74
phrases that contain taste and smell-related words (underlined) from the
movie review dataset:
with few moments of joy rising above the stale material
the bland outweighs the nifty
scored to perfection with some tasty boogaloo beats
just a string of stale gags, with no good inside dope, and no particular bite
so putrid it is not worth the price of the match that should be used to burn
every print of the film
These examples serve to emphasize that taste and smell words form part
of a generalized evaluation vocabulary—the focus of these words is so much
on emotional valence that they can be used in contexts that have nothing to do
with the actual perceptual basis of these words. One reason why taste and
smell words appear to be so readily usable in the context of cinema may be that
films, just like food, are supposed to be enjoyed. In fact, the Pang and Lee
(2004) dataset contains many examples where movies are metaphorically
talked about in terms of food, as the following examples show:
Watching Trouble Every Day, at least if you don’t know what’s coming, is like
biting into what looks like a juicy, delicious plum on a hot summer day and
coming away with your mouth full of rotten pulp and living worms
Just like the deli sandwich: lots of ham, lots of cheese, with a sickly sweet
coating to disguise its excrescence until just after (or during) consumption of
its second half
75
Manipulative and as bland as wonder bread dipped in milk
Like a can of 2-day old coke. You can taste it, but there's no fizz.
Thus, whenever language is primarily about subjective evaluation,
vocabulary associated with taste and smell is used, including explicit
comparisons to food.
How does the analysis presented in this chapter go beyond what is
already contained in dictionaries, which sometimes specify whether a taste and
smell word is positive or negative? For example, the MacMillan dictionary
definition of fragrant is “with a pleasant smell”. The present analyses go
beyond such statements because many words have semantic prosodies that are
too subtle to be encoded in a dictionary (Dam-Jensen & Zethsen, 2007). Of the
gustatory and olfactory words considered in this chapter, 57% of them have
dictionary entries in the MacMillan Online Dictionary that do not mention any
evaluative connotation. Minty (positive valence: 7.0, absolute valence: 1.94) and
fruity (positive: 6.71, 1.65) are two examples of words that are valenced by the
measures considered here but that do not have emotional connotations listed
in a standard dictionary, such as MacMillan. Similarly, the highly negative
adjectives fatty (2.38, absolute valence: 2.68) and alcoholic (2.49, absolute
valence: 2.57) have descriptive dictionary entries such as “containing a lot of
fat”. Thus, the approach used in this chapter is able to get at subtle affective
meaning. Moreover, distributional patterns such as the fact that taste and smell
words occur in more emotionally variable contexts are not encoded in
dictionaries either.
76
Crucially, the involvement of taste and smell words in emotional
language directly follows from the close connection of the gustatory and
olfactory systems to emotion processes: For the linguistic results presented in
this section, a language-external, embodied explanation appears most likely.
That is, differences in how the human body is structured with respect to taste
and smell, and differences in how humans use these two senses lead to
differences in the English lexicon.
Although there was strong evidence for gustatory and olfactory
language being affectively loaded, the evidence for gustation specializing into
positive language and olfaction specializing into negative language was
weaker. Why was this the case? There was affective polarization (gustation
good, olfaction bad) when considering the valence norms of the noun contexts,
but not when considering the valence norms of the adjectives themselves.
There is a simple statistical explanation for this: For many of the adjectives
from Lynott and Connell (2009), there is no corresponding valence data in the
Warriner, Twitter, or SentiWordNet datasets, e.g., the words acrid and cloying
have no norms in any of these datasets. However, valence data exists for many
of the nouns co-occurring with acrid and cloying, and so it turns out that these
words have a contextual valence value for each of the three datasets. Thus, the
number of words considered in the analyses of the contexts is larger than the
number of words considered in the analyses of the words themselves. This
gives the context analysis more statistical power to detect reliable valence
differences between gustation and olfaction. This is an interesting
methodological point: To get a better estimate of how good or bad a word is, it
is best to look at which words it patterns with.
77
Why would it be that smell is more negatively valenced than taste?
Classen (1993: 53) explains this as follows: “We can choose our food, but we
cannot as readily close our noses to bad smells” (see also Krifka, 2010). This
would entail that on average, humans are more likely to be exposed to
unpleasant smells than to unpleasant tastes. Moreover, it is generally the case
that things that we can exert control over are more liked than things that evade
our control (see e.g., Casasanto & Chrysikou, 2011). Finally, scholars in the
West have long since regarded smell as an “animalistic” or “primitive” sense
(Le Guérer, 2002) and part of these cultural preconceptions might be shared
with laymen, hence tainting smell negative.
However, despite some negative differentiation for odors and positive
differentiation for tastes, both modalities are ultimately associated with both
positively and negatively valenced words, e.g., the gustatory word sweet is
positive; stale is not. Given that communicating the distinction between good
and bad tastes and smells is quite important (e.g., telling a family member that
something tastes moldy), both good and bad words should exist for both
sensory modalities.
The findings presented in this chapter also have methodological
implications with respect to studies of linguistic processing and embodied
cognition, for example with respect to the modality switching cost effect
discussed in Ch. 1. The basic finding of Pecher et al. (2003) and follow-up
studies was that participants are slower to verify a property in one modality if
they previously verified a property from a different modality. It is similarly
known that participants are slower to process a positive word after having
been primed with a negative word, so-called “affective priming” (Fazio,
Sanbonmatsu, Powell, & Kardes, 1986). Because of this affective priming effect,
78
and because this chapter clearly showed affective differences between the
modalities, affect is a factor that needs to be controlled for in future modality
switching cost studies. At least part of the modality switching cost could be
due to concomitant affect changes rather than to changes in the sensory
modality per se. For instance, switching from putrid to sweet might be slow not
because of a switch from olfaction to taste, but because of a switch from
negative to positive valence.
For another methodological implication of the present findings, consider
Citron and Goldberg’s (2014) fMRI study which finds that “metaphorical
sentences are more emotionally engaging than their literal counterparts”—
however, all of their metaphorical sentences were taste-related such as She
received a sweet compliment. This invites the possibility that the observed
amygdala activation is due to the particular sensory words used rather than
due to the metaphorical nature of the stimulus sentences. These examples
highlight how the present findings call for considering modality and the
affective dimension together when designing studies that use sensory words.
More generally, this chapter showed that issues relating to the senses cannot be
separated from issues relating to emotional valence.
79
Chapter 5. Affect and words for roughness/hardness
5.1. Affective touch
Morley and Partington (2009: 139) call evaluative meaning an “elemental type
of meaning”. Expressing evaluation is one of the major things humans do with
language (Dam-Jensen & Zethsen, 2007; Morley & Partington, 2009). Chapter 4
showed that taste and smell words are more affectively loaded. This chapter
will show that words for tactile properties also participate in evaluative
language.
Researchers working on touch commonly distinguish between
discriminative touch and affective touch (Essick, McGlone, Dancer, Fabricant,
Ragin, Phillips, Jones, & Guest, 2010). People use discriminative touch to
distinguish between different objects or surface properties; affective touch
serves more social and emotional purposes. Studies of touch hedonics
repeatedly find that rough textures (such as an abrasive sponge) are perceived
as unpleasant, whereas smooth and soft textures (such as satin) are perceived
as pleasant (Major, 1895: 75-77; Ripin & Lazarsfeld, 1937; Ekman, Hosman, &
Lindstrom, 1965; Essick, James, & McGlone, 1999; Essick et al., 2010; Etzi,
Spence & Gallace, 2014).
Whether touch is perceived as pleasant or unpleasant depends on a
whole range of factors, such as the exerted force (Essick et al., 2010), the
velocity (Essick, James, & McGlone, 1999; Essick et al., 2010), which body part
is being touched (Essick et al., 1999, 2010; Etzi, Spence, & Gallace, 2014), or
whether the touch originates from oneself or from somebody else (Guest,
Essick, Dessirier, Blot, Lopetcharat, & McGlone, 2009; Etzi et al., 2014). These
factors cannot be investigated with words alone. Sticking to the linguistic focus
of this dissertation, this chapter focuses on tactile surface properties because
80
these become encoded in words such as rough and smooth. But what are the
relevant tactile dimensions to investigate?
Studies on touch generally find that “roughness/smoothness” and
“hardness/softness” are two salient dimensions of texture perception (Yoshida,
1968; Hollins, Faldowski, Rao, & Young, 1993; Picard, Dacremont, Valentin, &
Giboreau, 2003); any additional dimensions of texture perception are less clear
(see discussion in Guest, Dessirier, Mehrabyan, McGlone, Essick, Gescheider,
Fontana, Xiong, Ackerley, & Blot, 2011: 531-532). Thus, this chapter will
explore whether words describing rough and smooth surfaces are valenced in
line with past research on the affective dimension of touch: Are rough words
more positive than smooth words? Similarly, how is valence modulated by the
implied hardness/softness of words?
Some research already exists on the affective dimension of words for
surfaces. Guest et al. (2011) analyze touch words and find evidence for separate
sensory and emotional dimensions, but they do not specifically relate the
sensory aspects (such as roughness) to the emotional aspects of words.
Rough/hard and smooth/soft words have also been studied with respect to
metaphorical meanings such as in the expressions she had a rough day and he
made a coarse remark (Classen, 1993: Ch. 3; Howes, 2002: 69-71; Ackerman et al.,
2010; Lacey et al., 2012). Roughness is “metaphorically associated with the
concepts of difficulty and harshness” (Schaefer et al., 2013: 1653). Metaphors
involving the tactile modality usually can connote positive meaning (e.g., the
talk went smoothly) or negative meaning (e.g., rough day), thus, these metaphors
express evaluation. Moreover, tactile metaphors relate to socially laden
interpersonal meanings (Ackerman et al., 2010; Schaefer et al., 2013), such as in
81
the expression he has an abrasive personality. This lends support to the idea that
tactile words serve many expressive and affective functions.
5.2. Words for roughness/hardness and valence
Stadtlander and Murdoch (2000) normed surface descriptors (mostly
adjectives) for the tactile dimensions of roughness/smoothness and
hardness/softness. They asked 120 participants to generate as many terms as
possible for describing objects. Most of the terms listed by participants
included adjectives, but some of them also included nouns, such as cotton,
nylon, steel, metal and bark. Participants were then asked to go over the list and
classify each word according to the five common senses. The words that
closely corresponded to touch were subsequently rated for
roughness/smoothness and hardness/softness on a scale from -7 to +7. The
resulting set contains 123 words that range from rough to smooth, and 102
words that range from hard to soft. Only a few words (59) were rated for both
dimensions. The entire set contains 166 unique words. The list below shows the
twenty words with the highest roughness ratings, starting with the property
that was rated highest in roughness (+6.3), abrasive.
abrasive, barbed, jagged, rough, spiky, thorny, harsh, coarse, prickly, scratchy,
stubbly, rocky, bristly, gnarled, bark, callused, firm, gravelly, rugged, serrated
The word with the lowest roughness rating (-6.9) was smooth. The
twenty words with the smoothest ratings were:
82
smooth, lubricated, oily, slippery, silky, slick, polished, satiny, velvety, fine,
glass, slimy, greasy, gooey, creamy, feathered, fluid, sleek, glassy, icy
For the hardness ratings, the word indestructible received the highest
rating (+6.4). The twenty words with the highest hardness ratings were:
indestructible, hard, solid, brick, nonbreakable, steel, metal, inflexible, rigid,
stiff, icy, tough, rocky, bony, abrasive, spiky, wooden, barbed, prickly, sharp
Finally, the word with the lowest hardness rating (-6.3) was the
adjective soft. The twenty words with the lowest ratings on this dimension
were:
soft, fluffy, silky, furry, mushy, puffy, velvety, plush, smooshy, cuddly, satiny,
tender, comfortable, creamy, feathered, fluid, cushy, squishy, foamy, cushiony
The hardness and roughness dimensions partially overlap, e.g., barbed,
prickly and abrasive occur in both lists and are rated to be high in roughness and
high in hardness. Although Hollins et al. (1993) find roughness and hardness
to be two orthogonal dimensions in their multidimensional scaling study of
touch perception, newer evidence by Bergmann Tiest and Kappers (2006) and
Guest et al. (2011) suggests that hardness and roughness are not, in fact,
orthogonal. In the present dataset, this is reflected by the fact that the two
dimensions are correlated with each other, with r = 0.70 (t(57) = 7.47,
p < 0.0001). Thus, words with high roughness ratings also have high hardness
ratings. Conversely, smooth words tend to also be softer.
83
Following the approach employed in the preceding chapter, three sets of
valence norms will be used: The Warriner et al. (2013) norms, the
SentiWordNet 3.0 data (Esuli & Sebastiani, 2006; Baccianella, Esuli, &
Sebastiani, 2010), and the Twitter Emotion Corpus norms (Mohammad, 2012).
For the total set of 166 words normed for roughness/smoothness and
hardness/softness, 55% are also represented in Warriner et al. (2013), 64% are
represented in SentiWordNet 3.0 and 67% are represented in the Twitter
Emotion Corpus.
As predicted, the roughness/smoothness dimension is associated with
valence. This was the case for the Warriner norms (F(1, 61) = 20.45, p < 0.0001,
R2 = 0.24), and the SentiWordNet 3.0 norms (F(1, 81) = 16.63, p < 0.0001,
R2 = 0.16), but not for the Twitter Emotion Corpus norms (F(1, 77) = 0.30,
p = 0.59, R2 = -0.009). Words that are rated to be smoother are also rated to be
more positive for at least two of the three valence datasets. For the
hardness/softness dimension, the results are less consistent. Here, only for the
Warriner norms was there a reliable effect (F(1, 62) = 14.04, p = 0.0004,
R2 = 0.17). There was no influence of hardness on the valence data from
SentiWordNet (F(1,66) = 2.35, p = 0.13, R2 = 0.02), and there was no influence of
hardness on the Twitter Emotion Corpus data either (F(1, 67) = 1.48, p = 0.23,
R2 = 0.007). Figure 10 shows the results for the Warriner norms for the
roughness and hardness dimensions.

84
Figure 10. Valence as a function of tactile surface properties. The valence from Warriner et al. (2013) is modeled as a function of the (a) roughness norms and (b) hardness norms from Stadtlander and Murdoch (2000); lines indicate linear model fits with 95% confidence regions
Chapter 4 showed that taste and smell words tend to pattern with more
emotionally valenced nouns. Similarly, we can investigate the semantic
prosody of rough/smooth and hard/soft words, i.e., do smooth and soft words
occur in more positive contexts than rough and hard words? For this, 36,016
adjective-noun pairs from COCA were analyzed (all the words from
Stadtlander and Murdoch and their noun collocates). The valence scores of the
co-occurring nouns were averaged (weighted by the frequency of the adjective-
noun pair). For example, the soft word flabby patterns with nouns that have an
average Twitter Emotion Corpus valence of -0.2. This value derives from the
emotional valences of co-occurring nouns such as flabby ass (-0.582), flabby flesh
(-0.514) and flabby belly (-0.218).
The context analysis produced much less consistent results than the by-
word analysis. For the Warriner norms, there were no reliable effects for
roughness (F(1, 68) = 1.06, p = 0.31, R2 = 0.0009) or hardness (F(1, 61) = 2.32,
(a)
0123456789
Valence
-7 -3.5 0 +3.5 +7
Roughness Ratings
(b)
-7 -3.5 0 +3.5 +7
Hardness Ratings
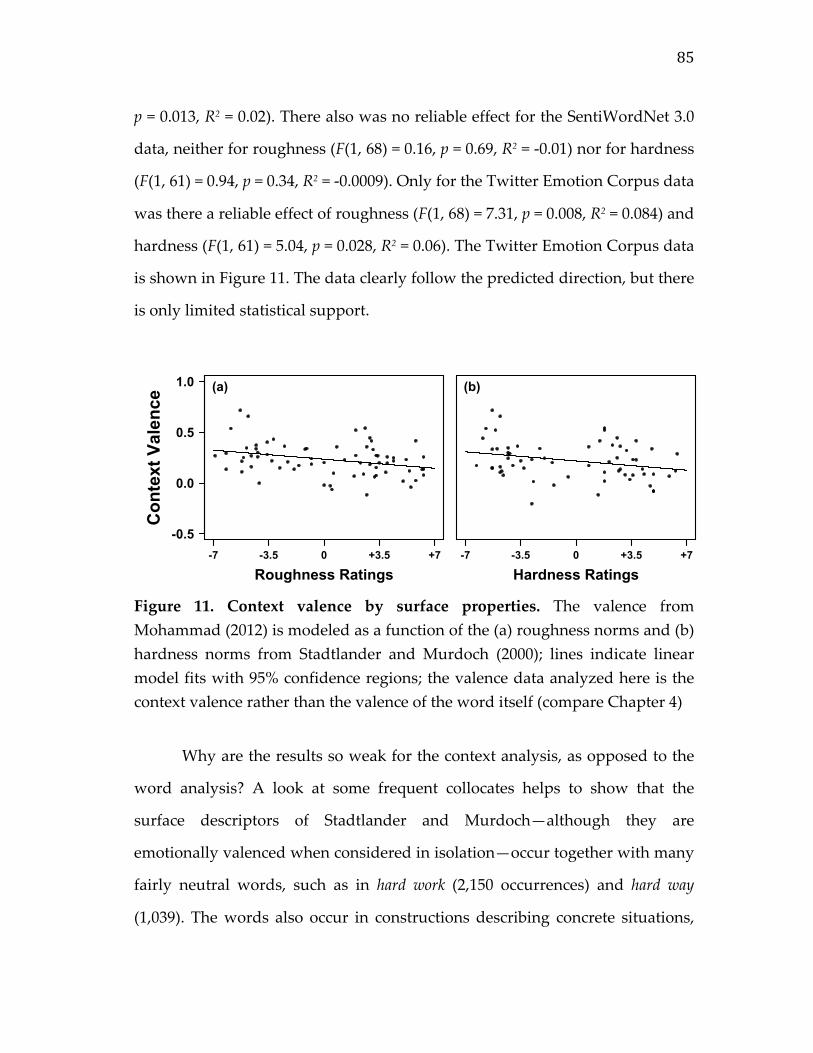
85
p = 0.013, R2 = 0.02). There also was no reliable effect for the SentiWordNet 3.0
data, neither for roughness (F(1, 68) = 0.16, p = 0.69, R2 = -0.01) nor for hardness
(F(1, 61) = 0.94, p = 0.34, R2 = -0.0009). Only for the Twitter Emotion Corpus data
was there a reliable effect of roughness (F(1, 68) = 7.31, p = 0.008, R2 = 0.084) and
hardness (F(1, 61) = 5.04, p = 0.028, R2 = 0.06). The Twitter Emotion Corpus data
is shown in Figure 11. The data clearly follow the predicted direction, but there
is only limited statistical support.
Figure 11. Context valence by surface properties. The valence from Mohammad (2012) is modeled as a function of the (a) roughness norms and (b) hardness norms from Stadtlander and Murdoch (2000); lines indicate linear model fits with 95% confidence regions; the valence data analyzed here is the context valence rather than the valence of the word itself (compare Chapter 4)
Why are the results so weak for the context analysis, as opposed to the
word analysis? A look at some frequent collocates helps to show that the
surface descriptors of Stadtlander and Murdoch—although they are
emotionally valenced when considered in isolation—occur together with many
fairly neutral words, such as in hard work (2,150 occurrences) and hard way
(1,039). The words also occur in constructions describing concrete situations,
(a)
-0.5
0.0
0.5
1.0
Con
text
Val
ence
-7 -3.5 0 +3.5 +7
Roughness Ratings
(b)
-7 -3.5 0 +3.5 +7
Hardness Ratings

86
such as barbed wire (1,001), wooden spoon (470) and rough terrain (196
occurrences). Such concrete uses do not appear to be highly valenced.
It appears to be the case that the surface descriptors considered in this
chapter carry the evaluative component themselves, and that there is less
evaluative harmony over the context. For instance, in the construction hard
way, the noun way is neutral, but the modification by hard results in a negative
reading. The same applies to abstract uses of the words, such as abrasive
personality, rough day, and harsh remark—these expressions are all clearly
negative, but the nouns personality, day and remark do not convey negativity
themselves. As was argued in Chapter 3 based on counts of dictionary
meanings, tactile words have a fairly high number of metaphorical uses
(Classen, 1993: Ch. 3; Howes, 2002: 69-71; Ackerman et al., 2010; Lacey et al.,
2012), much more so than gustatory and olfactory words—in these
metaphorical uses, the rough/hard and smooth/soft adjectives themselves
evidently are the dominant factor in coloring the connotation of the overall
adjective-noun pair.
To show in a data-driven fashion that the roughness/smoothness and
hardness/softness dimensions indeed relate to metaphoricity and abstract
language, the semantic complexity measure introduced in Chapter 3 can be
used, i.e., the number of dictionary meanings. If the roughness and hardness
dimensions relate to metaphoricity, it is expected that extremely rough and
extremely smooth words (as well as extremely hard and extremely soft words)
are the most metaphoric. That is, dictionary meanings should cluster around
the extreme ends of the roughness/smoothness and hardness/softness
dimensions.
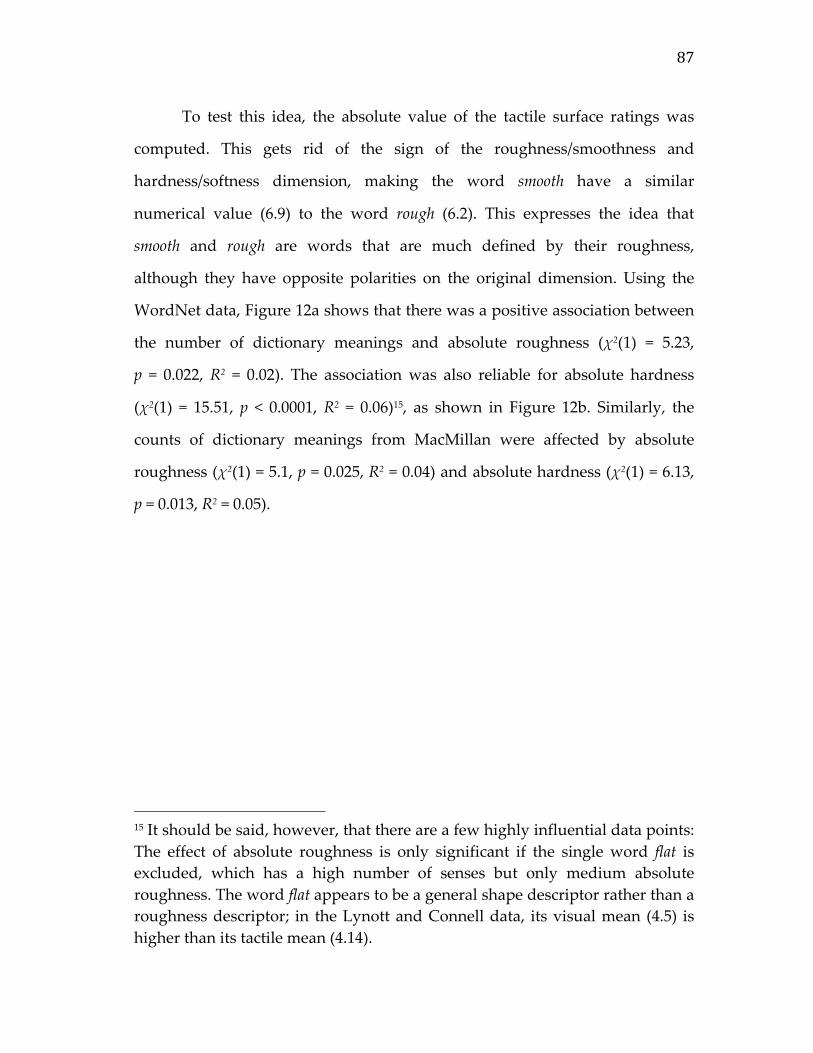
87
To test this idea, the absolute value of the tactile surface ratings was
computed. This gets rid of the sign of the roughness/smoothness and
hardness/softness dimension, making the word smooth have a similar
numerical value (6.9) to the word rough (6.2). This expresses the idea that
smooth and rough are words that are much defined by their roughness,
although they have opposite polarities on the original dimension. Using the
WordNet data, Figure 12a shows that there was a positive association between
the number of dictionary meanings and absolute roughness (χ2(1) = 5.23,
p = 0.022, R2 = 0.02). The association was also reliable for absolute hardness
(χ2(1) = 15.51, p < 0.0001, R2 = 0.06)15, as shown in Figure 12b. Similarly, the
counts of dictionary meanings from MacMillan were affected by absolute
roughness (χ2(1) = 5.1, p = 0.025, R2 = 0.04) and absolute hardness (χ2(1) = 6.13,
p = 0.013, R2 = 0.05).
15 It should be said, however, that there are a few highly influential data points: The effect of absolute roughness is only significant if the single word flat is excluded, which has a high number of senses but only medium absolute roughness. The word flat appears to be a general shape descriptor rather than a roughness descriptor; in the Lynott and Connell data, its visual mean (4.5) is higher than its tactile mean (4.14).
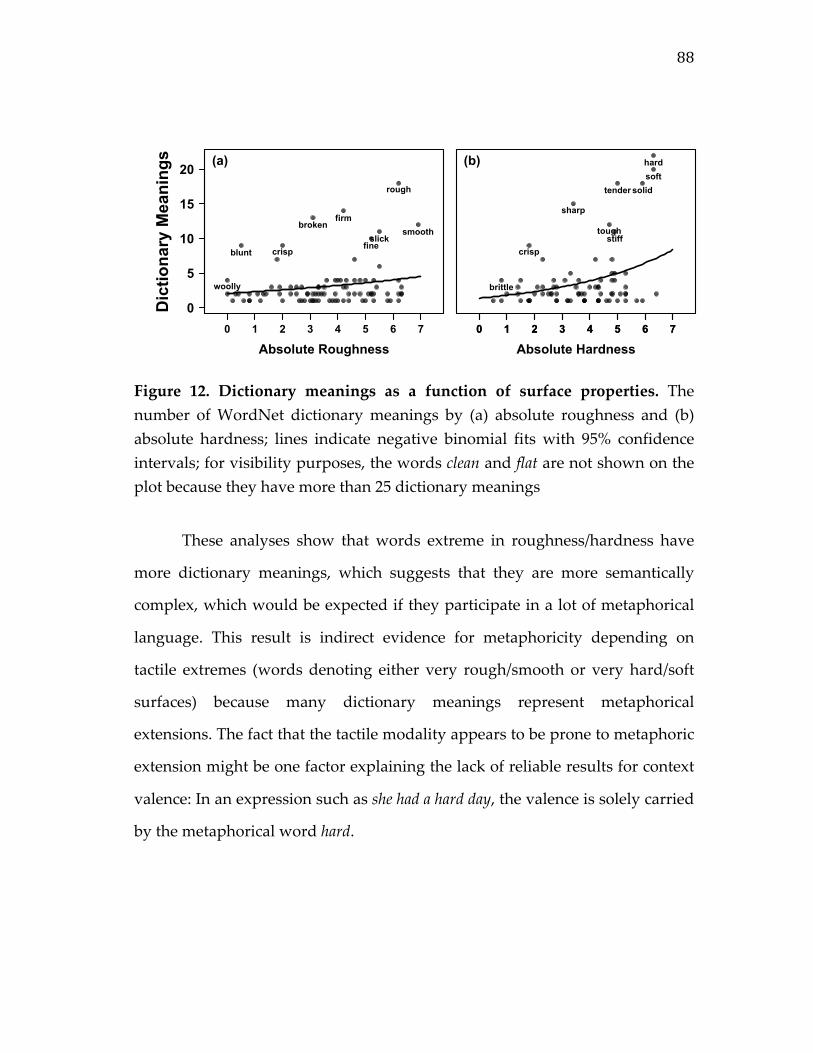
88
Figure 12. Dictionary meanings as a function of surface properties. The number of WordNet dictionary meanings by (a) absolute roughness and (b) absolute hardness; lines indicate negative binomial fits with 95% confidence intervals; for visibility purposes, the words clean and flat are not shown on the plot because they have more than 25 dictionary meanings
These analyses show that words extreme in roughness/hardness have
more dictionary meanings, which suggests that they are more semantically
complex, which would be expected if they participate in a lot of metaphorical
language. This result is indirect evidence for metaphoricity depending on
tactile extremes (words denoting either very rough/smooth or very hard/soft
surfaces) because many dictionary meanings represent metaphorical
extensions. The fact that the tactile modality appears to be prone to metaphoric
extension might be one factor explaining the lack of reliable results for context
valence: In an expression such as she had a hard day, the valence is solely carried
by the metaphorical word hard.
(a)
blunt
broken
crisp fine
firm
rough
slicksmooth
woolly
0
5
10
15
20D
ictio
nary
Mea
ning
s
0 1 2 3 4 5 6 7
Absolute Roughness
(b)
brittle
crisp
hard
sharp
soft
solid
stiff
tender
tough
0 1 2 3 4 5 6 70 1 2 3 4 5 6 7
Absolute Hardness

89
5.3. Discussion
Chapter 4 showed that taste and smell words carry evaluative content and
participate in evaluative harmony. This chapter showed that rough and hard
words carry relatively more negative evaluative connotation than smooth and
soft words. In contrast to the findings from Chapter 4, the evaluative
connotation was not evident when looking at the noun contexts that co-occur
with rough and smooth adjectives. Instead, the evaluation appears to be driven
by the tactile word itself.
Why should it be the case that rough surfaces are judged to be more
negative? It could be because rough surfaces are potentially harmful, i.e.,
irritating or even damaging the skin, or it could be an effect of exposure—
people preferring the surfaces they encounter most frequently (which are
presumably smooth surfaces) (Etzi et al., 2014: 182). Regardless of what is the
ultimate cause of the perceived pleasantness difference between rough and
smooth surfaces, the linguistic results presented here follow from how pleasant
and unpleasant humans judge the corresponding tactile experiences. People
commonly perceive rough and hard surfaces as less pleasant than smooth and
soft surfaces and this is reflected in the valence associated with the
corresponding words. Thus, the results here showcase another way through
which sensory words mirror the perceptual phenomenon they encode.
More direct evidence for a role of embodiment in tactile vocabulary
comes from a neuroimaging study conducted by Lacey and colleagues (2012).
In this study, participants heard sentences such as She had a rough day (tactile
metaphor) and She had a bad day (literal control). The sentences with tactile
metaphors led to increased blood flow in texture-selective regions of
somatosensory cortex, such as the parietal operculum, above and beyond

90
blood flow associated with the control sentences. This suggests that the
negative meaning of metaphorical phrases such as She had a rough day is
actually grounded in our embodied understanding of what it means to be
interacting with rough or smooth surfaces (Lacey et al., 2012). Thus, rough
words are negative and smooth words positive by virtue of their embodied
connections to somatosensory brain areas.
The claim made here is different from the claim made about the
evaluative dimension of taste and smell words in Chapter 4. It is not that tactile
words are generally more emotionally valenced than words from the other
sensory modalities. The analyses presented in this chapter are only about a
subset of the tactile words—those that correspond to the dimensions of
roughness and hardness, and here, it is particularly the extremes of these
continua (i.e., very rough/hard and very smooth/soft words) that are more
valenced. This distribution was predicted on the basis of our language-external
experience of surfaces.
91
Chapter 6. Non-arbitrary sound structures in the sensory lexicon
6.1. Background on iconicity
So far, the dissertation focused on how the sensory lexicon is composed, and
how sensory words are used. This chapter analyzes how the five common
senses are connected to the internal structure of words, that is, their
phonological composition. To illustrate this, consider the sixty-eight auditory
adjectives from Lynott and Connell (2009):
audible, banging, barking, beeping, blaring, bleeping, booming, buzzing,
cooing, crackling, creaking, crunching, crying, deafening, echoing, giggling,
groaning, growling, gurgling, harsh, hissing, hoarse, howling, hushed, husky,
jingling, laughing, loud, melodious, meowing, moaning, muffled, mumbling,
murmuring, mute, muttering, noisy, popping, purring, quiet, raspy, raucous,
resounding, reverberating, rhythmic, rumbling, rustling, screaming,
screeching, shrieking, shrill, silent, snarling, snorting, sonorous, soundless,
squeaking, squealing, thudding, thumping, thunderous, tinkling, wailing,
warbling, whimpering, whining, whispering, whistling
It is quite obvious that there are many deverbal adjectives (OED: 74%),
many of which appear to reference sounds through some form of imitation.
This phenomenon is generally called iconicity, which refers to a “direct linkage
between sound and meaning” (Hinton, Nichols, & Ohala, 1994: 1). The
iconicity of sensory words will be the focus of this chapter.
There are many different concepts that relate to iconicity (for reviews,
see Perniss, Thompson, & Vigliocco, 2010; Perlman & Cain, 2014; Schmidtke,
Conrad, & Jacobs, 2014; Lockwood & Dingemanse, 2015; Dingemanse, Blasi,
92
Lupyan, Christiansen, & Monaghan, 2015). Here, five phenomena need to be
distinguished: onomatopoeia, ideophones, phonological iconicity, phonetic
iconicity and phonesthemes. It should be stated from the outset, however, that
these phenomena are not mutually exclusive, i.e., these types of vocal iconicity
are partially overlapping.
Onomatopoeia exclusively deals with meanings that relate to sound, i.e.,
sound-to-sound mappings such as cuckoo and bang. This makes onomatopoeia
the most restricted type of iconicity (Schmidtke et al., 2014), but it may be
prevalent in some domains where the expression of sound concepts is relevant,
such as instrument names (Patel & Iverson, 2003) and bird names (Berlin &
O’Neill, 1981). Crucially, onomatopoeia is not direct imitation, but imitation
mediated through the language-specific patterns of phonology (cf. Marchand,
1959: 152-153; Ahlner & Zlatev, 2012: 312). Thus, the same sound source can
have different iconic forms in different languages, such as English cock-a-doodle-
doo versus German kickeriki.
Ideophones are a special class of words that “depict sensory imagery”
(Dingemanse, 2012). These words, also sometimes called “expressives” or
“mimetics”, are quite frequent in many languages outside of Europe, but they
appear to be less common in Indo-European languages (Nuckolls, 2004). An
example of a language that has ideophones is Japanese. There are thousands of
ideophones in this language, some of which are sara-sara for smooth surfaces,
zara-zara for rough surfaces, puru-puru for soft surfaces and kachi-kachi for hard
surfaces (Watanabe, Utsunomiya, Tsukurimichi, & Sakamoto, 2012: 2518).
These forms “depict” a sensory impression rather than “describe” it
(Dingemanse, 2012). Ideophones often exhibit iconic sound-meaning
correspondences.

93
Phonological iconicity (Schmidtke et al., 2014) is sometimes called sound
symbolism (Hinton, Nichols, & Ohala, 1994; see Ahlner & Zlatev, 2010 for a
critique of the term sound symbolism). This type of iconicity relates to the
phonological structure of words, in that specific phonemes are linked directly
to meanings. Examples include the finding that languages tend to form
demonstratives for near space with /i/ and demonstratives for far space with
/u/ (Ultan, 1978). Another example of phonological iconicity is the finding that
words for nose- and mouth-related concepts tend to contain nasals, such as /m/
or /n/ (Marchand, 1959: 259; Blust, 2003; Wichmann, Holman, & Brown, 2010;
Urban, 2011). Size sound symbolism is a well-studied aspect of phonological
iconicity. Here high and front vowels, such as /i/, are associated with small
objects or animals; low and back vowels are associated with large objects or
animals (Sapir, 1929; Marchand, 1959: 146; Ultan, 1978; Ohala, 1984, 1994;
Diffloth, 1994; Fitch, 1994: Appendix 1; Berlin, 2006; Thompson & Estes, 2011;
see also Tsur, 2006, 2012: Ch. 11).
Probably the most well known example of phonological iconicity is an
extensive series of studies which showed that speakers of English, German and
other languages are more likely to associate the pseudoword kiki with jagged
and pointy shapes and the pseudoword bouba with smooth and round shapes
(Maurer, Pathman, & Mondloch, 2006; Ahlner & Zlatev, 2010; Kovic, Plunkett,
& Westermann, 2010; Monaghan, Mattock, & Walker, 2012; Nielsen & Rendall,
2011, 2012, 2013; Bremner, Caparos, de Fockert, Linnell, & Spence, 2013). This
kiki / bouba effect was popularized by Ramachandran and Hubbard (2001) and
goes back to studies conducted by Usnadze (1924), Fischer (1922) and Köhler
(1929) (for a summary of the early literature on this phenomenon, see Cuskley
& Kirby, 2013: 885-888). In Köhler’s study, participants showed a strong bias to

94
associate the word form takete with pointy shapes and maluma with rounded
shapes.
In contrast to phonological iconicity, phonetic iconicity, as it is
understood here, is a more gradient form of iconicity that does not have to be
part of a word’s lexical representation. Instead, phonetic iconicity can be
thought of as a feature that may be added onto words while they are being
vocalized; it is “iconicity in the dynamic production of speech” (Perlman &
Cain, 2014: 328). An example of phonetic iconicity would be lengthening the
adjective long, such as when saying it was a loooong journey (Perlman, 2010;
Perlman, Clark, & Johansson Falck, 2014). Similarly, when speakers describe a
moving dot, they talk more quickly when the dot is moving faster, and they
use higher pitch if the dot is moving upwards (Shintel, Nusbaum, & Okrent,
2006; Shintel & Nusbaum, 2007).
Phonesthemes are recurring form-meaning pairings below the level of
the morpheme (Hutchins, 1997, 1998; Bergen, 2004; for detailed discussion, see
Kwon & Round, 2015). As will be discussed below, phonesthemes are often
iconic only in an indirect fashion. Take, for example the cluster gl–. According
to Bergen (2004), 60% of the gl–initial word tokens in the Brown Corpus
(Francis & Kučera, 1982) refer to light or vision, such as glimmer, glisten, glitter,
gleam, and glow. Crucially, phonesthemes do not participate in regular
morphological compositions (cf. Marchand, 1959: 154-155), i.e., deleting the gl–
cluster in the above words yields –immer, –isten, –itter, –eam and –ow, word
pieces that are themselves not meaningful. Thus, a phonestheme is more than a
phoneme but less than a morpheme: it carries some meaning, but it cannot be
used contrastively in a fully compositional fashion, like actual morphemes.
95
In an extensive review, Hutchins (1998) assembles a list of 145 English
phonesthemes from various sources. Many of these phonesthemes are only
conjectured by individual authors on very speculative grounds. A large
number of the phonesthemes listed by Hutchins (1998) are initial clusters, but
even more are word-final phonesthemes. For example, –ash, occurs in words
denoting violent collisions, such as bash, clash, crash, gnash, mash, slash, smash,
and splash. The statistical support for phonesthemic patterns varies strongly,
with some sound-meaning correspondences being barely recurrent and only
attested for a few word forms (Drellishak, 2006; Otis & Sagi, 2008; Abramova,
Fernández, & Sangati, 2013). At the extreme end are patterns such as the
Swedish word-initial fn– cluster, which is associated with pejorative meanings
in 100% of the words of which it occurs, according to Abelin (1999).
An important distinction that crosscuts these different forms of iconicity
is the distinction between absolute iconicity and relative iconicity (Gasser,
Sethuraman, & Hockema, 2010). With absolute iconicity, the form-meaning
resemblance is directly grounded in a fact about the world or a fact about
human perception, such as a perceived cross-modal correspondence between
angular shapes and voiceless stop consonants, as is the case with the kiki/bouba
effect. Another example of absolute iconicity is size sound symbolism, the
mental association of large size with low resonance frequencies and low pitch
(Ohala, 1984, 1994). This size sound symbolism is directly motivated (absolute
iconicity) because large objects and animals tend to emit lower-pitched sounds
with lower resonance frequencies (e.g., the sound of a trombone versus a
clarinet, or the sound of a lion versus a cat).
Relative iconicity, on the other hand, is iconicity only with respect to
other linguistic symbols, also sometimes called “secondary iconicity” or
96
“associative iconicity” (Fischer, 1999). This type of iconicity falls under
Haiman’s (1980) principle of isomorphism, which states that similar meanings
are expressed by similar forms. Relative iconicity does not have to be directly
grounded in something language-external or in a perceived cross-modal
correspondence. An example would be the above-mentioned phonestheme gl–.
There is no obvious perceptual connection between the cluster gl– and the
meaning of ‘denoting light and vision’ (Bergen, 2004; Cuskley & Kirby, 2013:
879-880), i.e., there is no readily apparent absolute iconicity. However, the
presence of the phonestheme gl– means that within the English language, some
forms that are similar in sound (by virtue of being formed of gl–) are also
similar in meaning (by virtue of referring to light and vision). This statistical
regularizing property of relative iconicity has also been discussed under the
banner of “systematicity” by Monaghan et al. (2014) and Dingemanse et al.
(2015).
Absolute and relative iconicity interact with each other. For example,
the phonesthemic cluster sn– is used in many nose-related words, such as
snore, sniff, sneeze and snout. This pattern is motivated in an absolute fashion,
through the direct connection between nasal concepts and the corresponding
place of articulation. But because this phonesthemic pattern characterizes
several words of the English lexicon (30% of word types that begin with sn–,
Bergen, 2004), the presence of this phonestheme increases the relative iconicity
with respect to the English lexicon as a whole. Precisely the fact that sn–
characterizes many words that have similar meanings creates a reliable
statistical association within the lexicon. This shows that absolute iconicity (if it
is also a recurrent form of absolute iconicity) often leads to an increase in
relative iconicity.

97
6.2. The tug of war between iconicity and arbitrariness
Traditionally, language is assumed to be dominated by arbitrary convention
(e.g., Pinker & Bloom, 1990; Newmeyer, 1992). Ferdinand de Saussure
(1959 [1916]: 74) famously said that “because the sign is arbitrary, it follows no
law other than that of tradition, and because it is based on tradition, it is
arbitrary”. In a seminal article contrasting animal communication and human
language, Hockett (1982 [1960]: 6) wrote:
“In a semantic communication system the ties between meaningful
message-elements and their meanings can be arbitrary and
nonarbitrary. In language the ties are arbitrary. The word “salt” is not
salty nor granular; “dog” is not “canine”; “whale” is a small word for a
large object; “microorganism” is the reverse.”
The issue with this statement and many other arguments against
iconicity being an important feature of language is that it is always easy to find
counter-examples that disobey iconic principles. At stake is not whether the
lexicon as a whole is characterized by arbitrariness or by iconicity; the question
is how and to what degree do arbitrariness and iconicity together shape human
language. Researchers to this day make statements such as “the words of a
language are arbitrary social conventions” for which “there is no inherent
reason why particular words refer to particular objects” (Sutherland &
Cimpian, 2015: 228), or “the linguistic system itself should still be characterized
as an arbitrary form of representation (…) because linguistic forms (…) are
unrelated in meaning to their referents” (Louwerse & Connell, 2011: 393). But
this view of language is increasingly becoming supplanted by a view that
98
recognizes that language is also characterized by iconicity (Perniss et al., 2010;
Cuskley & Kirby, 2013; Perry, Perlman, & Lupyan, 2015; Dingemanse et al.,
2015). The lexicon is now frequently seen as exhibiting both arbitrariness and
iconicity (Waugh, 1994; Perry, Perlman, & Lupyan, 2015; Dingemanse et al.,
2015), rather than being wholly arbitrary or wholly iconic. Lockwood and
Dingemanse (2015) say that arbitrariness and iconicity “are clearly happy
enough to co-exist within language” (p. 11).
The reason for the co-existence of arbitrariness and iconicity is that both
principles appear to be useful. Vocal iconicity has been demonstrated to be
useful to bootstrap new communication systems (Perlman & Cain, 2014;
Perlman, Dale, & Lupyan, 2015). Moreover, vocal iconicity facilitates word
learning (Nygaard, Cook & Namy, 2009; Imai, Kita, Nagumo, & Okada, 2008;
Monaghan, Mattock, & Walker, 2012; Imai & Kita, 2014), in part because
children are sensitive to forms of absolute iconicity, such as the kiki/bouba
phenomenon (Maurer et al., 2006; Ozturk, Krehm, & Vouloumanos, 2012). On
the other hand, computational and experimental work has also shown
advantages for arbitrariness in learning (Gasser, 2004; Monaghan,
Christiansen, & Fitneva, 2011; Dingemanse et al., 2015). In particular, abundant
iconicity may increase the potential for confusion (Gasser, 2004), because it
means that many forms that are close to each other in meaning also sound very
similar to each other. Thus, from a design perspective, the English lexicon
should balance arbitrariness and iconicity. As Ahlner and Zlatev (2010: 333)
conclude, “both extreme sides in the age-long (and continuing) debate have
been in error”. The question of whether language is arbitrary or iconic is
clearly not a question of “either/or” anymore.

99
6.3. The sensory dimension of iconicity
Iconicity is deeply connected to the senses (Marks, 1978: Ch. 7; Cuskley &
Kirby, 2013). Hinton et al. (1994: 10) note that iconicity in language expresses
“salient characteristics of objects and activities, such as movement, size, shape,
color, and texture”. Table 7 provides an overview of the experimental literature
on iconicity (see also Lockwood & Dingemanse, 2015), with a focus on what
meanings are expressed by iconicity.
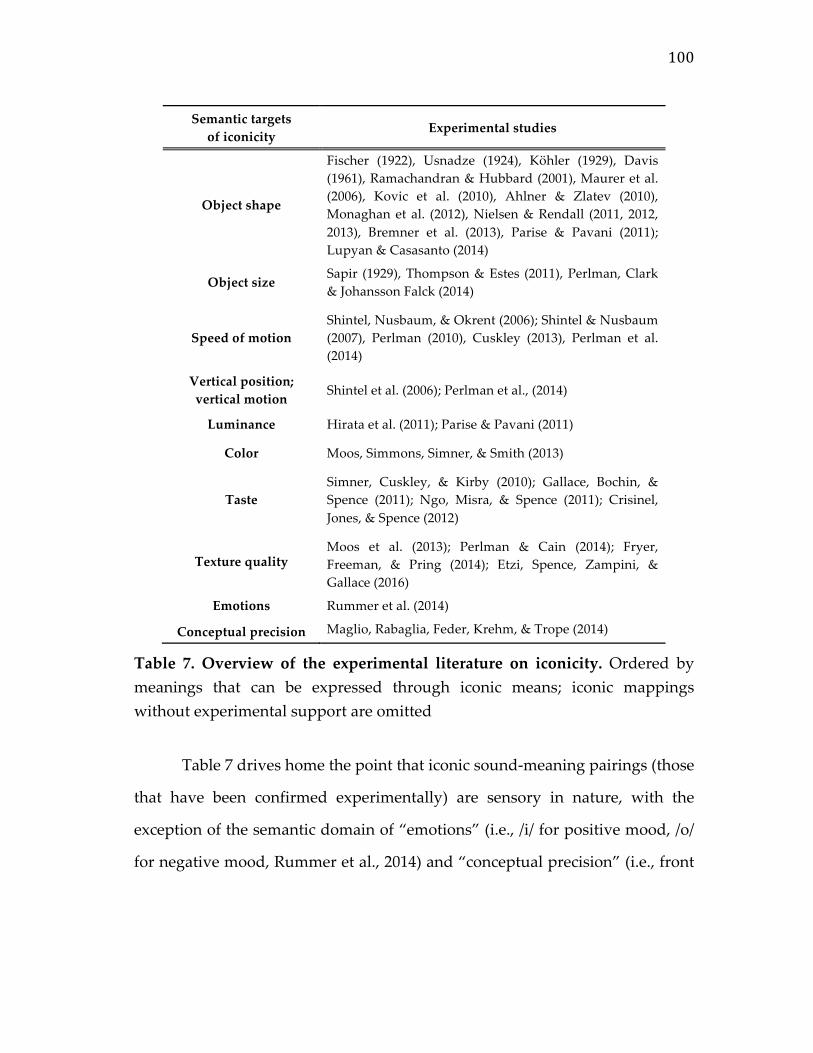
100
Semantic targets of iconicity
Experimental studies
Object shape
Fischer (1922), Usnadze (1924), Köhler (1929), Davis (1961), Ramachandran & Hubbard (2001), Maurer et al. (2006), Kovic et al. (2010), Ahlner & Zlatev (2010), Monaghan et al. (2012), Nielsen & Rendall (2011, 2012, 2013), Bremner et al. (2013), Parise & Pavani (2011); Lupyan & Casasanto (2014)
Object size
Sapir (1929), Thompson & Estes (2011), Perlman, Clark & Johansson Falck (2014)
Speed of motion
Shintel, Nusbaum, & Okrent (2006); Shintel & Nusbaum (2007), Perlman (2010), Cuskley (2013), Perlman et al. (2014)
Vertical position; vertical motion
Shintel et al. (2006); Perlman et al., (2014)
Luminance
Hirata et al. (2011); Parise & Pavani (2011)
Color
Moos, Simmons, Simner, & Smith (2013)
Taste
Simner, Cuskley, & Kirby (2010); Gallace, Bochin, & Spence (2011); Ngo, Misra, & Spence (2011); Crisinel, Jones, & Spence (2012)
Texture quality
Moos et al. (2013); Perlman & Cain (2014); Fryer, Freeman, & Pring (2014); Etzi, Spence, Zampini, & Gallace (2016)
Emotions
Rummer et al. (2014)
Conceptual precision Maglio, Rabaglia, Feder, Krehm, & Trope (2014)
Table 7. Overview of the experimental literature on iconicity. Ordered by meanings that can be expressed through iconic means; iconic mappings without experimental support are omitted
Table 7 drives home the point that iconic sound-meaning pairings (those
that have been confirmed experimentally) are sensory in nature, with the
exception of the semantic domain of “emotions” (i.e., /i/ for positive mood, /o/
for negative mood, Rummer et al., 2014) and “conceptual precision” (i.e., front
101
vowels for precision, Maglio et al., 2014)16. Thus, iconicity is overarchingly
used in connection to highly perceptual meanings.
The connection between sensory systems and iconicity is also apparent
when looking at phonesthemes. Among the semantic targets listed in Kwon
and Round (2015) and Hutchins (1998), one finds a range of sensory meanings,
such as ‘moving light’ (flash, flare, flame), ‘falling or sliding movement’ (slide,
slither, slip), ‘denoting sound’ (cluck, click, clap), ‘twisting’ (twist, twirl, twinge),
‘circular’ (twirl, curl, whirl), and ‘visual’ (glow, glance, glare).
Another connection between iconicity and the senses is the emerging
evidence that the processing of sound symbolic words engages sensory brain
areas more strongly than the processing of arbitrary words (Osaka, Osaka,
Morishita, Kondo, & Fukuyama, 2004; Hashimoto, Usui, Taira, Nose, Haji, &
Kojima, 2006; Arata, Imai, Okuda, Okuda, & Matsuda, 2010; cf. discussion in
Lockwood & Dingemanse, 2015: 11).
Finally, the connection between the senses and iconicity is also apparent
for ideophones. Dingemanse (2012) proposes the following typological
hierarchy (p. 663) with respect to the meanings that ideophones like to express:
16 Both of these studies may actually indirectly associate with the senses. The association between /i/ and positive mood is thought to have to do with the fact that the pronunciation of /i/ involves the same muscles that are involved in smiling (Rummer et al., 2014). And, as highlighted in Lockwood and Dingemanse (2015: 6), the association of front vowels with conceptual precision may have to do with an additional association between smallness and precision, which is also attested in gesture (Kendon, 2004: Ch. 12; Lempert, 2011; Winter, Perlman, & Matlock, 2014).
102
(2) SOUND < MOVEMENT < VISUAL PATTERNS <
OTHER SENSORY PERCEPTIONS <
INNER FEELINGS AND COGNITIVE STATES
Sound-to-sound mappings are predicted to be most common in
ideophone systems, followed by sound-to-movement mappings, followed by
mappings to other, non-motion visual patterns and so on. Mirroring the
ideophone hierarchy to some extent, Perry et al. (2015) find that in English and
Spanish, onomatopoetic words and interjections are more iconic than verbs
and adjectives than nouns. This mirrors the fact that if ideophones exist in a
language, they most likely express sound concepts. Verbs (which often express
actions and movement) are furthermore more iconic than nouns in the dataset
by Perry et al. (2015). This appears to be related to the fact that ideophone
systems often express movement concepts17.
Based on the preceding discussion, two predictions can be made: First,
words that express strongly perceptual meanings should statistically be more
likely to have iconic form-meaning correspondences. Second, given
Dingemanse’s hierarchy and the observation that onomatopoeia is one of the
most basic forms of iconicity, words that express auditory meanings should be
particularly likely to have iconic form-meaning correspondences. As noted by
Perlman and Cain (2014: 340), “the most obvious strength of vocalizations for
iconic representation would seem to be the imitation of sound (lexicalized in
17 It should be noted that movements, like actions, are temporally extended. This might make iconic expression in the domain of speech (inherently a temporal medium) particularly easy.
103
onomatopoeia)”—this chapter tests this idea for a large part of the sensory
vocabulary of English, alongside assessing the role of the other sensory
modalities in iconicity.
6.4. Testing the iconicity of sensory words
A way of quantifying iconicity is needed. One approach is to use native
speaker judgments about whether a word is iconic or not, which was
pioneered by Vinson, Cormier, Denmark, Schembri and Vigliocco (2008) for
British Sign Language. Following up on this, Perry, Perlman and Lupyan
(2015) collected iconicity ratings for 592 English and Spanish words from the
MacArthur Bates Developmental Inventory (Fenson, Dale, Reznick, Bates,
Thal, Pethick, Tomasello, Mervis, & Stiles, 1994). These norms will be used here
together with newly collected norms (in collaboration with Lynn Perry, Marcus
Perlman, Dominic Massaro and Gary Lupyan), leading to a total set of 3,002
words. To collect the norms, a total set of 1,593 native speakers were recruited
via Amazon Mechanical Turk for a 0.35 USD reimbursement (each rated 25-26
words, average time was 4 minutes), using Qualtrics. Because laymen cannot
be expected to know the concept of iconicity, the following set of examples was
presented to them:
“Some English words sound like what they mean. For example, SLURP
sounds like the noise made when you perform this kind of drinking
action. An example that does not relate to the sound of an action is
TEENY, which sounds like something very small (compared to HUGE
which sounds big). These words are iconic. You might be able to guess
these words’ meanings even if you did not know English. Words can
104
also sound like the opposite of what they mean. For example,
MICROORGANISM is a large word that means something very small.
And WHALE is a small word that means something very large. And
finally, many words are not iconic or opposite at all. For example there
is nothing canine or feline sounding about the words DOG or CAT.
These words are arbitrary. If you did not know English, you would not
be able to guess the meanings of these words.” 18
Participants rated each word on a scale from -5 (“words that sound like
the opposite of what they mean”) to +5 (“words that sound like what they
mean”). Examples of words with high iconicity ratings are humming (+4.47),
click (+4.46), and hissing (+4.46). Examples of words with low iconicity ratings
are miniature19 (-1.83), hamster (-1.9) and innocuous (-1.92). Figure 13 shows the
distribution of the collected ratings. As in Perry et al. (2015), participants
tended toward the positive end of the scale, with a mean iconicity rating of +0.9
(one-sample t-test against zero, t(3001) = 44.27, p < 0.0001, Cohen’s d = 0.81).
18 It might be thought that these examples unduly bias participants to attend to particular types of iconicity, such as word length ~ size iconicity. To counteract these concerns, Perry et al. (2015) conducted a study asking participants to indicate whether a “space alien” “could guess the meaning of each word based only on its sound” (p. 6). The resulting data correlated strongly with the iconicity ratings considered here. 19 The fact that miniature was rated to be one of the least iconic forms is surprising given that the morpheme mini– has to high front vowels, which could be taken as an instance of size sound symbolism, especially when contrasted with the form macro–. This is one of the few words where the iconicity examples given to participants at the beginning of the experiment probably played a role. The demonstration of iconicity emphasized word length, using Hockett’s example (1982 [1960]: 6) of microorganism being a long word for a small concept, which is analogous to miniature.
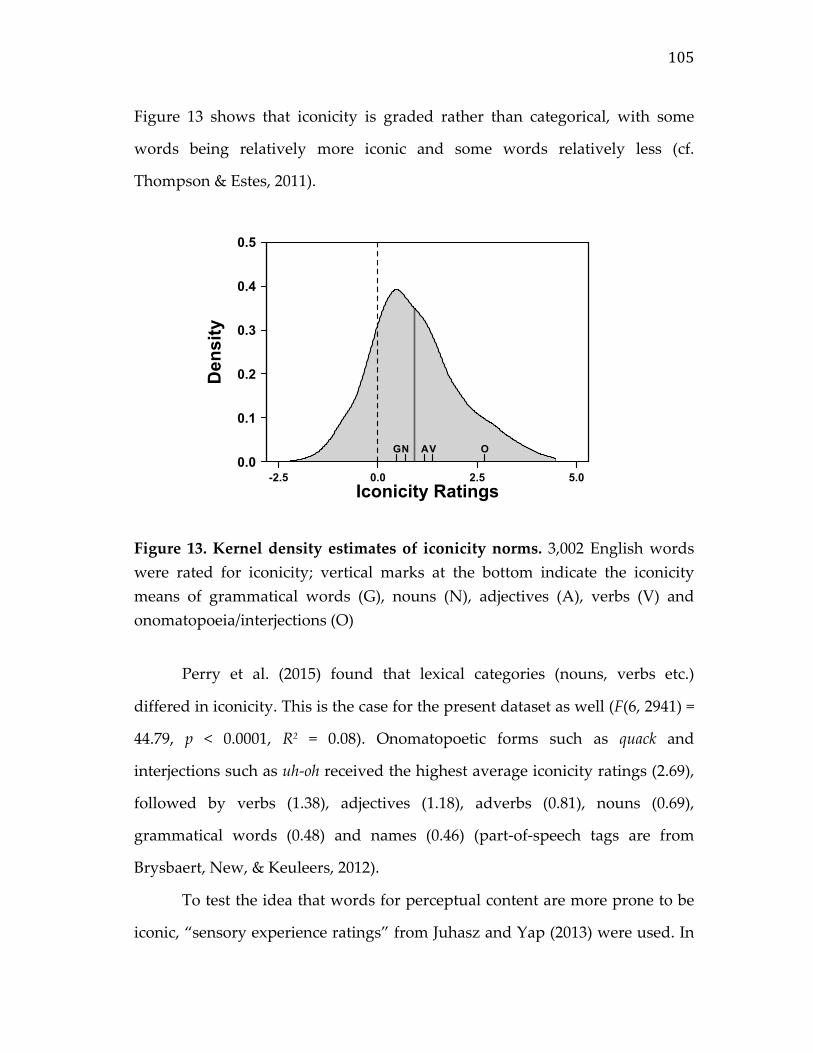
105
Figure 13 shows that iconicity is graded rather than categorical, with some
words being relatively more iconic and some words relatively less (cf.
Thompson & Estes, 2011).
Figure 13. Kernel density estimates of iconicity norms. 3,002 English words were rated for iconicity; vertical marks at the bottom indicate the iconicity means of grammatical words (G), nouns (N), adjectives (A), verbs (V) and onomatopoeia/interjections (O)
Perry et al. (2015) found that lexical categories (nouns, verbs etc.)
differed in iconicity. This is the case for the present dataset as well (F(6, 2941) =
44.79, p < 0.0001, R2 = 0.08). Onomatopoetic forms such as quack and
interjections such as uh-oh received the highest average iconicity ratings (2.69),
followed by verbs (1.38), adjectives (1.18), adverbs (0.81), nouns (0.69),
grammatical words (0.48) and names (0.46) (part-of-speech tags are from
Brysbaert, New, & Keuleers, 2012).
To test the idea that words for perceptual content are more prone to be
iconic, “sensory experience ratings” from Juhasz and Yap (2013) were used. In
0.0
0.1
0.2
0.3
0.4
0.5
Density
-2.5 0.0 2.5 5.0Iconicity Ratings
OVANG

106
this norming study, sixty-three native English speakers rated whether a word
“evokes a sensory experience” on a scale from 1 to 7. The instructions of Juhasz
and Yap (2013) emphasized all of the five common senses, mentioning taste,
touch, sight, sound and smell. The word with the highest sensory experience
rating is garlic (6.56), followed by walnut (6.5) and water (6.33). The lowest
sensory experience rating (1.0) is shared between many words, including an, for
and hence. These are mostly function words, but there are also some nouns
with very low sensory experience ratings, such as choice (1.0), guide (1.09) and
bane (1.10). There are 1,780 words for which both sensory experience ratings
and iconicity ratings exist (59% of all words normed for iconicity). Figure 14
shows that the two measures are correlated with each other (r = 0.18,
t(1778) = 7.52, p < 0.0001, R2 = 0.03). A model incorporating additional
predictors, namely, AGE-OF-ACQUISITION (Kuperman et al., 2012), PART-OF-
SPEECH and LOG FREQUENCY (both from SUBTLEX-US, Brysbaert & New, 2009),
shows that SENSORY EXPERIENCE RATINGS still has a reliable influence on
iconicity (F(1, 1754) = 59.6, p < 0.0001, unique R2 = 0.01).
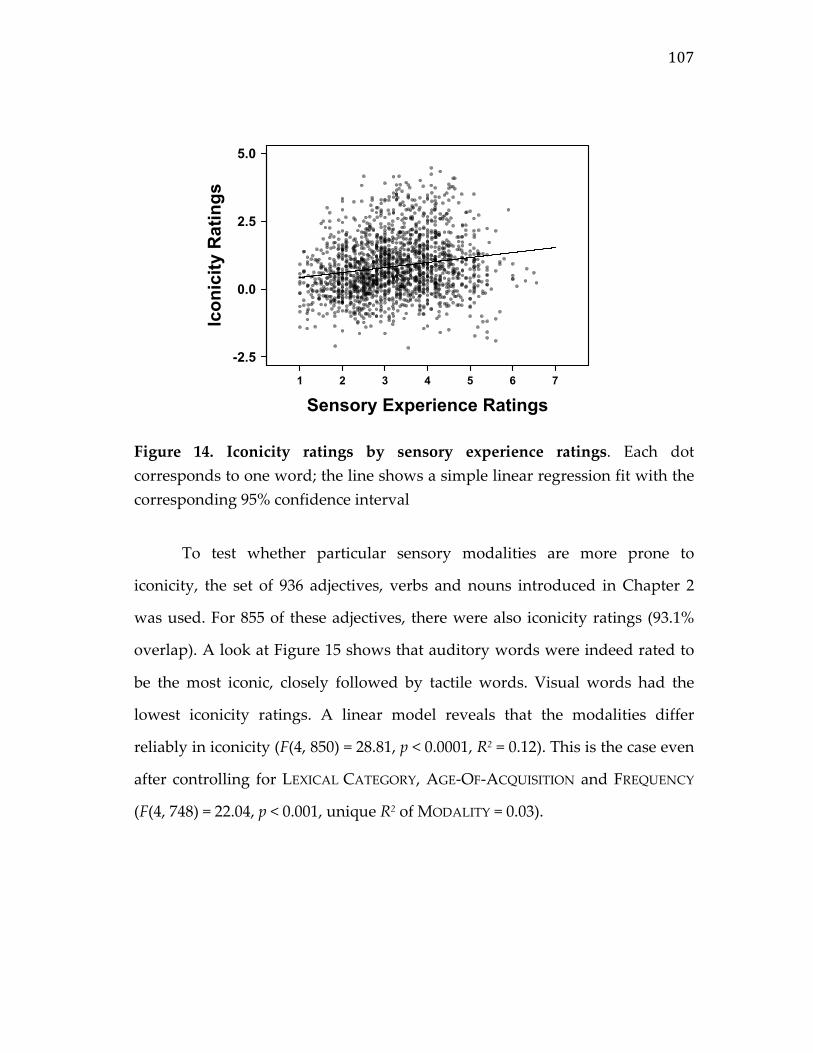
107
Figure 14. Iconicity ratings by sensory experience ratings. Each dot corresponds to one word; the line shows a simple linear regression fit with the corresponding 95% confidence interval
To test whether particular sensory modalities are more prone to
iconicity, the set of 936 adjectives, verbs and nouns introduced in Chapter 2
was used. For 855 of these adjectives, there were also iconicity ratings (93.1%
overlap). A look at Figure 15 shows that auditory words were indeed rated to
be the most iconic, closely followed by tactile words. Visual words had the
lowest iconicity ratings. A linear model reveals that the modalities differ
reliably in iconicity (F(4, 850) = 28.81, p < 0.0001, R2 = 0.12). This is the case even
after controlling for LEXICAL CATEGORY, AGE-OF-ACQUISITION and FREQUENCY
(F(4, 748) = 22.04, p < 0.001, unique R2 of MODALITY = 0.03).
-2.5
0.0
2.5
5.0
Icon
icity
Rat
ings
1 2 3 4 5 6 7
Sensory Experience Ratings
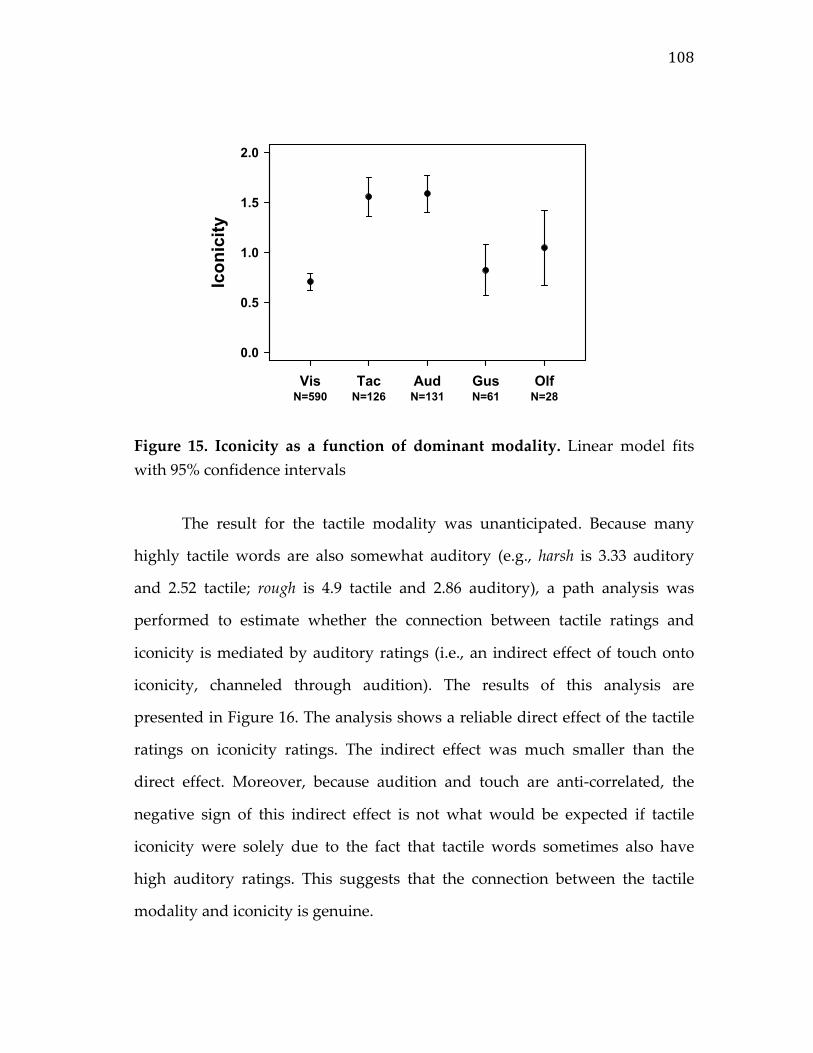
108
Figure 15. Iconicity as a function of dominant modality. Linear model fits with 95% confidence intervals
The result for the tactile modality was unanticipated. Because many
highly tactile words are also somewhat auditory (e.g., harsh is 3.33 auditory
and 2.52 tactile; rough is 4.9 tactile and 2.86 auditory), a path analysis was
performed to estimate whether the connection between tactile ratings and
iconicity is mediated by auditory ratings (i.e., an indirect effect of touch onto
iconicity, channeled through audition). The results of this analysis are
presented in Figure 16. The analysis shows a reliable direct effect of the tactile
ratings on iconicity ratings. The indirect effect was much smaller than the
direct effect. Moreover, because audition and touch are anti-correlated, the
negative sign of this indirect effect is not what would be expected if tactile
iconicity were solely due to the fact that tactile words sometimes also have
high auditory ratings. This suggests that the connection between the tactile
modality and iconicity is genuine.
Vis Tac Aud Gus OlfN=590 N=126 N=131 N=61 N=28
0.0
0.5
1.0
1.5
2.0
Iconicity

109
Figure 16. Mediation analysis of tactile and auditory strength on iconicity. Asterisks indicate statistically reliable paths; these results are based on the 423 adjectives only, but they are qualitatively the same when all 936 words are considered; significance of the indirect effect is based on bootstrapping (Preacher & Hayes, 2008)
The most iconic and least iconic words of each modality are displayed in
Table 8. The most iconic words for the auditory modality all have
onomatopoetic character. Two of the most iconic words for the tactile modality
contain the phonestheme cr–, which has several meanings listed in Hutchins
(1998, Appendix A), among them ‘clumsy, cloggy, ungainly, sticky’ (from
Firth, 1930), ‘crooked, opposite of straight’ (from Firth, 1935), and ‘harsh or
unpleasant noises’ (from Marchand, 1959). Interestingly, many of the olfactory
words that rank high in iconicity are verbs, and they also contain recognized
phonesthemes, namely the initial sn– cluster, listed by Firth (1930: 58) as
referring to ‘nasal words’, and the final –iff phonestheme, listed by Marchand
(1960: 336, cited in Hutchins, 1998) as referring to ‘noise of breath or liquor’.
Thus, iconicity in the olfactory domain does not specifically relate to odors, but
to the act of smelling. It is furthermore noteworthy that many of the low-
iconicity words in English have Latinate origins, such as permission, palatable
and scent.

110
Highest iconicity ratings Lowest iconicity ratings Auditory hissing, buzzing, clank silent, soundless, permission Tactile mushy, crash, crisp weightless, get, try Olfactory sniff, whiff, whiffy scentless, antiseptic, scent Gustatory juicy, suck, chewy palatable, unpalatable, cloying Visual murky, tiny, quick miniature, quality, welfare20
Table 8. Most and least iconic forms per modality. Based on participants’ ratings; modalities are ordered by average iconicity
Several of the least iconic words in Table 8 are nouns, such as quality for
vision, scent for olfaction, and permission for audition. Because iconicity differs
by lexical category, the effect of modality was tested separately for each lexical
category. There were reliable differences between modalities for the set of
adjectives (F(4, 417) = 21.42, p < 0.0001, R2 = 0.16), but not for the verbs (F(3, 29)
= 2.74, p = 0.06, R2 = 0.14) and the nouns (F(4, 395) = 2.15, p = 0.07, R2 = 0.01).
This suggests that modality differences in iconicity are more expressed for
adjectives. The following discussion will focus on these adjectives.
To triangulate the results, each adjective was coded for the presence or
absence of a phonestheme listed in Hutchins (1998, Appendix A). It should be
reiterated though, that these phonestheme counts largely tap into relative
iconicity, since many phonesthemes are not motivated by true absolute
iconicity (e.g., the cluster gl– is not directly motivated through a sound-
meaning correspondence). A look at Table 9 shows that the number of
phonesthemes differs by modality (χ2(4) = 57.87, p < 0.001). In fact, 63% of the
auditory adjectives contain at least one of the phonesthemes listed in Hutchins 20 The fact that welfare was classified as visual is not particularly meaningful here, since it has low perceptual strength ratings overall. As discussed in Ch. 2, the “dominant modality” classification is less informative for highly abstract concepts.
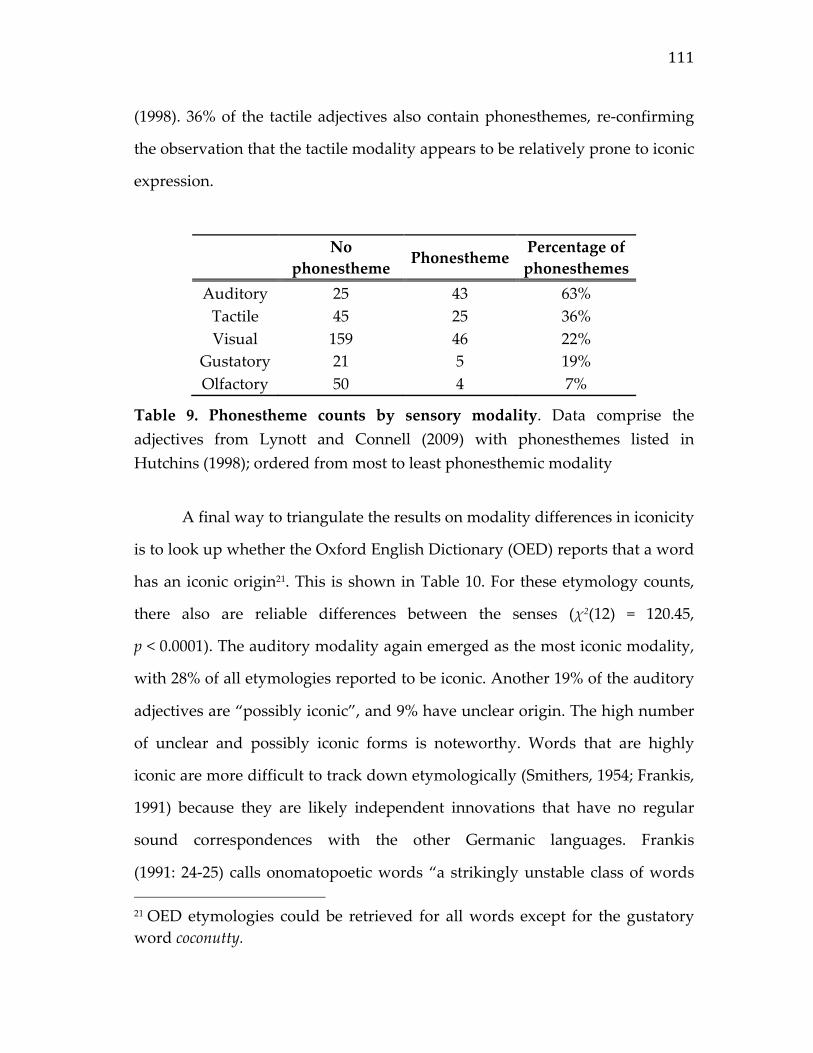
111
(1998). 36% of the tactile adjectives also contain phonesthemes, re-confirming
the observation that the tactile modality appears to be relatively prone to iconic
expression.
No
phonestheme Phonestheme Percentage of phonesthemes
Auditory 25 43 63% Tactile 45 25 36% Visual 159 46 22%
Gustatory 21 5 19% Olfactory 50 4 7%
Table 9. Phonestheme counts by sensory modality. Data comprise the adjectives from Lynott and Connell (2009) with phonesthemes listed in Hutchins (1998); ordered from most to least phonesthemic modality
A final way to triangulate the results on modality differences in iconicity
is to look up whether the Oxford English Dictionary (OED) reports that a word
has an iconic origin21. This is shown in Table 10. For these etymology counts,
there also are reliable differences between the senses (χ2(12) = 120.45,
p < 0.0001). The auditory modality again emerged as the most iconic modality,
with 28% of all etymologies reported to be iconic. Another 19% of the auditory
adjectives are “possibly iconic”, and 9% have unclear origin. The high number
of unclear and possibly iconic forms is noteworthy. Words that are highly
iconic are more difficult to track down etymologically (Smithers, 1954; Frankis,
1991) because they are likely independent innovations that have no regular
sound correspondences with the other Germanic languages. Frankis
(1991: 24-25) calls onomatopoetic words “a strikingly unstable class of words 21 OED etymologies could be retrieved for all words except for the gustatory word coconutty.
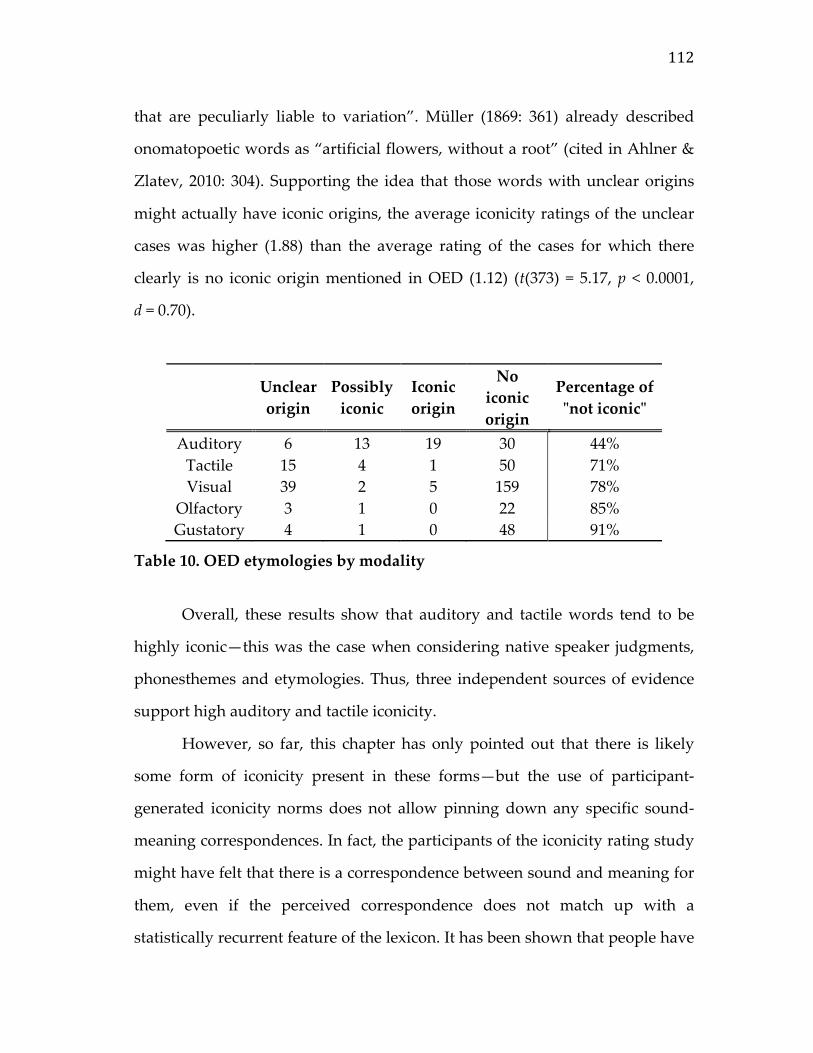
112
that are peculiarly liable to variation”. Müller (1869: 361) already described
onomatopoetic words as “artificial flowers, without a root” (cited in Ahlner &
Zlatev, 2010: 304). Supporting the idea that those words with unclear origins
might actually have iconic origins, the average iconicity ratings of the unclear
cases was higher (1.88) than the average rating of the cases for which there
clearly is no iconic origin mentioned in OED (1.12) (t(373) = 5.17, p < 0.0001,
d = 0.70).
Unclear origin
Possibly iconic
Iconic origin
No iconic origin
Percentage of "not iconic"
Auditory 6 13 19 30 44% Tactile 15 4 1 50 71% Visual 39 2 5 159 78%
Olfactory 3 1 0 22 85% Gustatory 4 1 0 48 91%
Table 10. OED etymologies by modality
Overall, these results show that auditory and tactile words tend to be
highly iconic—this was the case when considering native speaker judgments,
phonesthemes and etymologies. Thus, three independent sources of evidence
support high auditory and tactile iconicity.
However, so far, this chapter has only pointed out that there is likely
some form of iconicity present in these forms—but the use of participant-
generated iconicity norms does not allow pinning down any specific sound-
meaning correspondences. In fact, the participants of the iconicity rating study
might have felt that there is a correspondence between sound and meaning for
them, even if the perceived correspondence does not match up with a
statistically recurrent feature of the lexicon. It has been shown that people have
113
a bias toward assuming that words fit their referents (Sutherland & Cimpian,
2015). To counteract this concern, the next section will use the tactile modality
to show that there are indeed actual correlates of sensory properties in sound
structure.
6.5. Sound structure maps onto tactile properties
This section uses tactile adjectives to analyze actual instances of specific sound-
meaning correspondences. Looking at the tactile modality —rather than the
auditory one— is motivated because there are established categories of tactile
perception (e.g., Hollins, Faldowski, Rao, & Young, 1993; Picard, Dacremont,
Valentin, & Giboreau, 2003) for which word norms exist (Stadtlander &
Murdoch, 2000). There are no comparable norms for the auditory modality and
it is not necessarily clear what dimension one should investigate (cf. Dubois,
2000), especially because auditory adjectives such as squealing tend to encode
multiple acoustic properties simultaneously, such as loudness, pitch and
timbre (though see Rhodes, 1994 for some classificatory attempts). The full list
of seventy tactile adjectives from Lynott and Connell (2009) is:
114
abrasive, aching, adhesive, blunt, bouncy, brackish, bristly, brittle, bumpy,
chilly, clammy, clamorous22, cold, cool, crisp, damp, dry, elastic, feverish, flaky,
fluffy, freezing, gamy, gooey, grainy, greasy, gritty, hard, heavy, hot, humid,
itchy, jagged, leathery, lukewarm, lumpy, moist, mushy, painful, prickly,
pulsing, rough, rubbery, scaly, scratchy, sharp, silky, slimy, slippery, smooth,
soft, soggy, solid, sore, spiky, sticky, stinging, sturdy, tender, tepid, thorny,
ticklish, tight, tingly, tough, warm, waxy, weightless, wet, woolly
Several of these words contain phoneme sequences that resemble
known phonesthemes in their formal characteristics (Hutchins, 1998, Appendix
A). The words abrasive, brackish, bristly and brittle contain br–, thought to be
‘expressive of unpleasant noise’ (Marchand, 1959: 161). The word crisp and
scratchy contain cr– clusters, thought to denote ‘jarring, harsh, or grating
sounds’ (ibid. 164). The words slimy and slippery start with sl–, thought to be
associated with ‘sliding movement’ (ibid. 260) and ‘slimy, slushy matter’
(ibid. 261). Interestingly, the phonesthemes br– and cr– are listed to have sound
meanings, but they occur in words associated with the tactile modality.
To test relations between tactile properties and sound structure, the
Stadtlander and Murdoch (2000) norms introduced in Chapter 5 were used,
which includes 123 words normed for roughness/smoothness, and 102 words
normed for the hardness/softness dimension. Each word was decomposed into
phonemes23, with a separate column for each phoneme. This is exemplified for
22 Since clamorous usually denotes a loud noise, it is not clear why the participants of Lynott and Connell (2009) rated this word to be higher in tactile strength than in auditory strength. 23 In this analysis, only the adjectives from Stadtlander and Murdoch (2000) are considered (a total of 123 words).

115
a subset of phonemes with the two words filmy and bony shown in Table 11.
Decomposing words into their constituent components like this results in a
data frame with 38 columns, one for each phoneme24.
/f/ /b/ /m/ /n/ /l/ /i/ /o/ /s/
filmy 1 0 1 0 1 1 0 0 bony 0 1 0 1 0 1 1 0
Table 11. Decomposing words into their phonemes. Each phoneme is associated with a numerical variable (specifying the phoneme count)
A random forest algorithm was used to assess which phonemes were
most predictive of the rough/smooth and the hard/soft distinction. For this
analysis, the two tactile dimensions were analyzed categorically, which is
motivated because both roughness (Hartigan’s dip test D = 0.047, p = 0.045) and
hardness (D = 0.068, p = 0.0009) exhibit strong bimodality.
In principle, any classification algorithm could be used to predict
whether a word is “rough” or “smooth” (or “hard” or “soft) as a function of its
phonological properties. Random forests (Breiman, 2001; Strobl, Malley, &
Tutz, 2009) were chosen here because this data mining algorithm has been
argued to be especially good for “low N, high p” situations—small datasets for 24 The number of phonemes depends on which dialect is considered, since English dialects exhibit both mergers and splits, especially with respect to the vowel system. To assure that this does not impact the results, the pronunciation transcriptions from the English Lexicon Project (Balota et al., 2007) were used. These are based on the Unisyn Lexicon from the Centre for Speech Technology Research at the University of Edinburgh and contain dialect-neutral labels for the vowels, which subsume several vowel categories. This choice unlikely impacts the results, especially —as will be shown below— since vowels do not appear to correlate strongly with the roughness and hardness dimensions. Several examples had to be hand-coded since they were not represented in the Unisyn lexicon.

116
which lots of different variables are potential predictors/parameters to
consider. This is precisely the case here, where the roughness dataset consists
of only 122 words (or 100 words for “hardness”) in which 38 different
phonological variables are potential predictors (“presence of /b/”, “presence of
/d/” etc.). These phonological variables may furthermore be correlated with
each other, and random forests have also been argued to be good for situations
where predictors may be collinear to help disentangling the relative
importance of each variable. Random forests have already successfully been
applied to linguistic datasets (e.g., Tagliamonte & Baayen, 2012; Brown,
Winter, Idemaru, & Grawunder, 2014).
The random forest (see detailed specifications in Appendix A) can
predict whether a word is “rough” or “smooth” with 72 % accuracy. For the
“hard” versus “soft” distinction, the accuracy is 75%. Random forests can also
be used to create a variable importance measure, which indicates how
predictive a feature is for assigning data points to the categories “rough” and
“smooth” (or “hard” and “soft”). These variable importances are shown in
Figure 17, with values toward the right being relatively more important than
values toward the left. The plots reveal that the presence of the phoneme /r/
was the single most important predictor for both roughness and hardness.
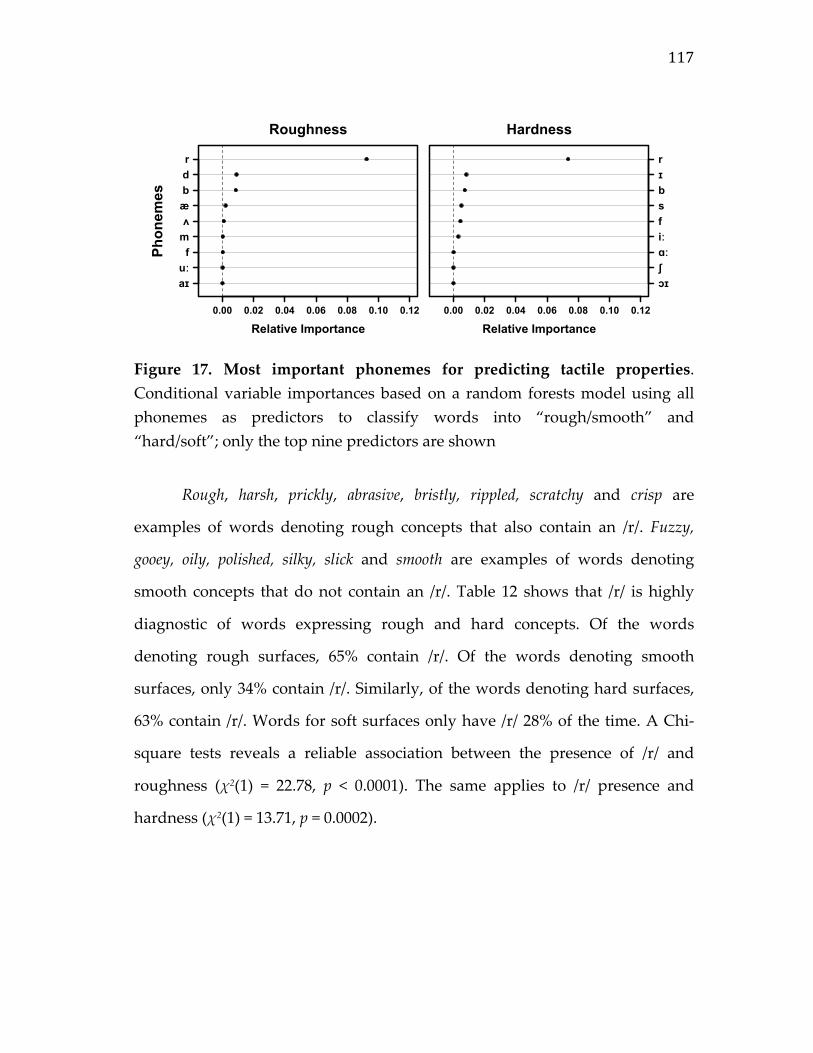
117
Figure 17. Most important phonemes for predicting tactile properties. Conditional variable importances based on a random forests model using all phonemes as predictors to classify words into “rough/smooth” and “hard/soft”; only the top nine predictors are shown
Rough, harsh, prickly, abrasive, bristly, rippled, scratchy and crisp are
examples of words denoting rough concepts that also contain an /r/. Fuzzy,
gooey, oily, polished, silky, slick and smooth are examples of words denoting
smooth concepts that do not contain an /r/. Table 12 shows that /r/ is highly
diagnostic of words expressing rough and hard concepts. Of the words
denoting rough surfaces, 65% contain /r/. Of the words denoting smooth
surfaces, only 34% contain /r/. Similarly, of the words denoting hard surfaces,
63% contain /r/. Words for soft surfaces only have /r/ 28% of the time. A Chi-
square tests reveals a reliable association between the presence of /r/ and
roughness (χ2(1) = 22.78, p < 0.0001). The same applies to /r/ presence and
hardness (χ2(1) = 13.71, p = 0.0002).
aɪuːfmʌæbdr
0.00 0.02 0.04 0.06 0.08 0.10 0.12
Phonemes
Relative Importance
Roughness
ɔɪʃɑːiːfsbɪr
0.00 0.02 0.04 0.06 0.08 0.10 0.12
Relative Importance
Hardness
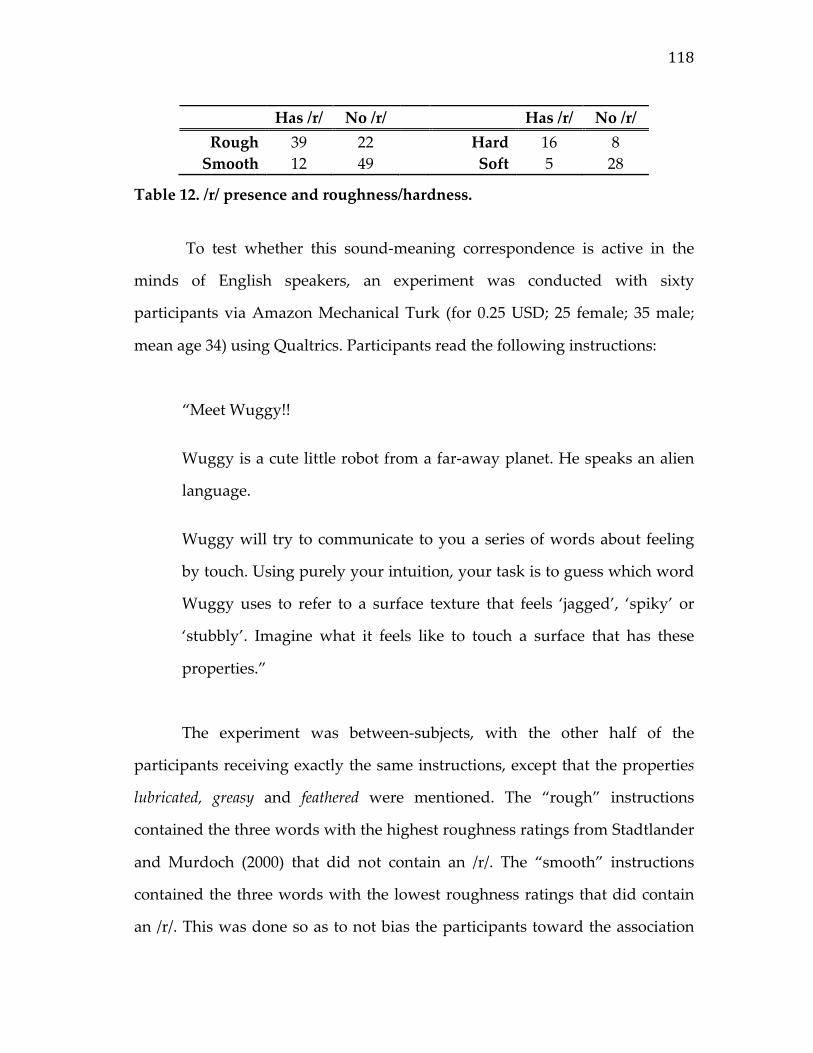
118
Has /r/ No /r/ Has /r/ No /r/ Rough 39 22
Hard 16 8
Smooth 12 49 Soft 5 28
Table 12. /r/ presence and roughness/hardness.
To test whether this sound-meaning correspondence is active in the
minds of English speakers, an experiment was conducted with sixty
participants via Amazon Mechanical Turk (for 0.25 USD; 25 female; 35 male;
mean age 34) using Qualtrics. Participants read the following instructions:
“Meet Wuggy!!
Wuggy is a cute little robot from a far-away planet. He speaks an alien
language.
Wuggy will try to communicate to you a series of words about feeling
by touch. Using purely your intuition, your task is to guess which word
Wuggy uses to refer to a surface texture that feels ‘jagged’, ‘spiky’ or
‘stubbly’. Imagine what it feels like to touch a surface that has these
properties.”
The experiment was between-subjects, with the other half of the
participants receiving exactly the same instructions, except that the properties
lubricated, greasy and feathered were mentioned. The “rough” instructions
contained the three words with the highest roughness ratings from Stadtlander
and Murdoch (2000) that did not contain an /r/. The “smooth” instructions
contained the three words with the lowest roughness ratings that did contain
an /r/. This was done so as to not bias the participants toward the association
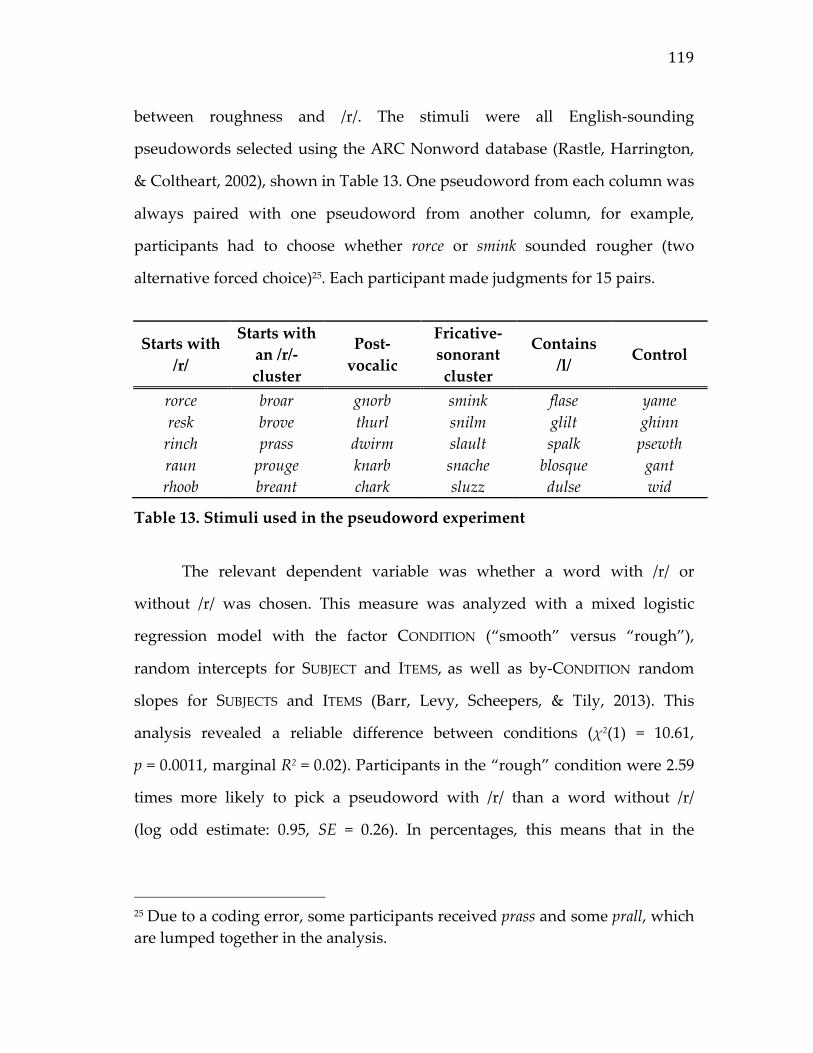
119
between roughness and /r/. The stimuli were all English-sounding
pseudowords selected using the ARC Nonword database (Rastle, Harrington,
& Coltheart, 2002), shown in Table 13. One pseudoword from each column was
always paired with one pseudoword from another column, for example,
participants had to choose whether rorce or smink sounded rougher (two
alternative forced choice)25. Each participant made judgments for 15 pairs.
Starts with /r/
Starts with an /r/-cluster
Post-vocalic
Fricative-sonorant cluster
Contains /l/
Control
rorce broar gnorb smink flase yame resk brove thurl snilm glilt ghinn
rinch prass dwirm slault spalk psewth raun prouge knarb snache blosque gant rhoob breant chark sluzz dulse wid
Table 13. Stimuli used in the pseudoword experiment
The relevant dependent variable was whether a word with /r/ or
without /r/ was chosen. This measure was analyzed with a mixed logistic
regression model with the factor CONDITION (“smooth” versus “rough”),
random intercepts for SUBJECT and ITEMS, as well as by-CONDITION random
slopes for SUBJECTS and ITEMS (Barr, Levy, Scheepers, & Tily, 2013). This
analysis revealed a reliable difference between conditions (χ2(1) = 10.61,
p = 0.0011, marginal R2 = 0.02). Participants in the “rough” condition were 2.59
times more likely to pick a pseudoword with /r/ than a word without /r/
(log odd estimate: 0.95, SE = 0.26). In percentages, this means that in the
25 Due to a coding error, some participants received prass and some prall, which are lumped together in the analysis.

120
“rough” condition, participants picked /r/-containing pseudowords 59% of the
time; in the “smooth” condition it was only 36% of the time.
After the experiment, participants were asked what three other words
would come to mind when reading “jagged, spiky, stubbly”, and what three
words would come to mind when reading “lubricated, greasy, feathered”. The
lexical associates listed contained /r/ only 25% of the time for “lubricated,
greasy, feathered” as opposed to 46% of the time for “jagged, spiky, stubbly”
(binomial test: p = 0.003). Thus, participants were clearly thinking of lexical
associates that followed the pattern investigated. This suggests that the effect
could be due to relative iconicity, i.e., participants either consciously or
subconsciously accessed the reliable statistical association between /r/ and
roughness that exists within the tactile vocabulary. However, there also might
be a more direct connection between /r/ and perceived roughness (absolute
iconicity). Potential explanations of the /r/ pattern will be explored in the next
section.
6.6. What explains the association between roughness and /r/?
Critically, the present results fit with various studies that investigated the
iconicity of /r/. Lupyan and Casasanto (2014) showed that English speakers
mapped the novel pseudoword crelch to attributes such as ‘pointy’, ‘spikey’,
and ‘sharp’; they were more likely to map the novel pseudoword foove to such
attributes as ‘round’ and ‘smooth’. Otis and Sagi (2008) list the phonesthemes
dr–, scr–, spr–, str–, and wr–, many of which have meanings denoting irregular
things. Of the ten phonesthemes listed in Abramova et al. (2013), four contain
clusters with /r/, namely, gr– ‘threatening noise’, scr– ‘unpleasant sound,
irregular movement’, str– ‘linear, forceful action, effort’, and wr– ‘irregular
121
motion, twist’ (ibid. 1698). Marchand (1959: 149) talks about /r/ as symbolizing
“continuously vibrating sounds”. Rhodes (1994: 280) discusses /r/ as indicating
irregular sounds, citing such forms as rattle, roll, rip and racket. Fónagy (1961)
observed that /r/, together with /t/ and /k/, is more frequent in poems he
classified as “aggressive”, whereas /l/, /m/ and /n/ are more frequent in
“tender” poems. Greenberg and Jenkins (1966) actually normed phonemes on
different semantic dimensions. They found that /r/ was rated to be rough and
hard. It semantically patterned together with the stops despite its phonological
status as a liquid. Moreover, /r/ was semantically most distant from the
phonemes /s/ and /l/, both of which are common in words for smooth surfaces,
such as smooth and slippery. Already Plato discussed the properties of /r/,
describing it as naturally expressing ‘rapidity’ and ‘motion’ (Ahlner & Zlatev,
2010: 301).
It is possible that the relationship between /r/ and roughness (and to
some extent hardness) is motivated through absolute iconicity. For most of the
history of English, /r/ has been a trill (Thomas, 1958: Ch. 8; Gimson, 1962: 205;
Prins, 1972: 229). Trills are formed by repeated interruption of the airflow, and
they are also relatively difficult to produce, requiring detailed coordination of
air pressure, tongue position and tongue stiffness. The repeated interruption of
the airstream might be thought of as analogous to the gaps between the
elements of a rough surface. The relative difficulty of producing these sounds
might also be associated with the valence that rough and hard words imply
(see Ch. 5). However, without further experiments, any motivation of the
pattern in terms of absolute iconicity remains speculative.
Nevertheless, it is clear that the pattern at a bare minimum represents a
form of relative iconicity. The presence of the statistical association between
122
/r/ sounds and rough/hard meanings entails that many words that denote
similar surface properties have similar sound structures. If the pattern had
truly nothing to do with absolute iconicity, it might be an accident of language
history, for example, an instance of Hopper’s ‘phonogenesis’ (Hopper, 1994),
where earlier morphemes become purely phonological material, with their old
morphemic origins being obscured. Another potential explanation has to do
with word forms being historically related. With respect to the phonestheme
gl–, Cuskley and Kirby (2013: 879-880) say that “rather than the form being
cross-modally motivated by the meaning (…) the observed relationship may be
the result of a particularly productive branch of words that goes as far as Proto
Indo-European”. Historical contingencies may also play a role in the present
dataset, for at least some of the forms. For instance, consider the words slick,
slimy and slippery, all of which denote rather smooth surfaces and do not
contain /r/. Watkins (2000) lists the single root *(s)lei– for all of these forms.
Thus, these three forms do not contain /r/ by virtue of their shared history.
Importantly, the association between /r/ and roughness can be traced
back all the way back to Proto Indo-European (PIE). Table 14 combines
reconstructed PIE roots from Watkins (2000) as a function of whether the
present-day reflexes of these words are categorized as “rough” or “smooth” in
Stadtlander and Murdoch (2000). Indeed, for these PIE roots, there already is a
statistical association between the presence of /r/ and roughness (χ2(1) = 16.77,
p < 0.0001).
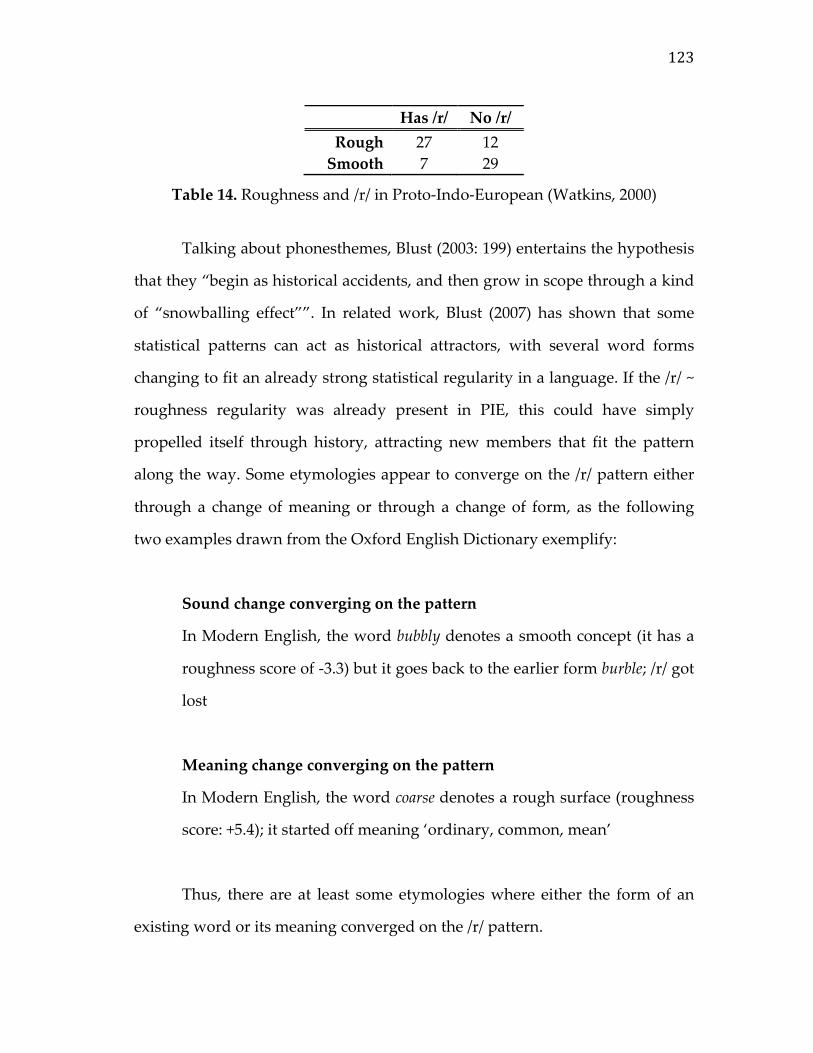
123
Has /r/ No /r/ Rough 27 12
Smooth 7 29
Table 14. Roughness and /r/ in Proto-Indo-European (Watkins, 2000)
Talking about phonesthemes, Blust (2003: 199) entertains the hypothesis
that they “begin as historical accidents, and then grow in scope through a kind
of “snowballing effect””. In related work, Blust (2007) has shown that some
statistical patterns can act as historical attractors, with several word forms
changing to fit an already strong statistical regularity in a language. If the /r/ ~
roughness regularity was already present in PIE, this could have simply
propelled itself through history, attracting new members that fit the pattern
along the way. Some etymologies appear to converge on the /r/ pattern either
through a change of meaning or through a change of form, as the following
two examples drawn from the Oxford English Dictionary exemplify:
Sound change converging on the pattern
In Modern English, the word bubbly denotes a smooth concept (it has a
roughness score of -3.3) but it goes back to the earlier form burble; /r/ got
lost
Meaning change converging on the pattern
In Modern English, the word coarse denotes a rough surface (roughness
score: +5.4); it started off meaning ‘ordinary, common, mean’
Thus, there are at least some etymologies where either the form of an
existing word or its meaning converged on the /r/ pattern.
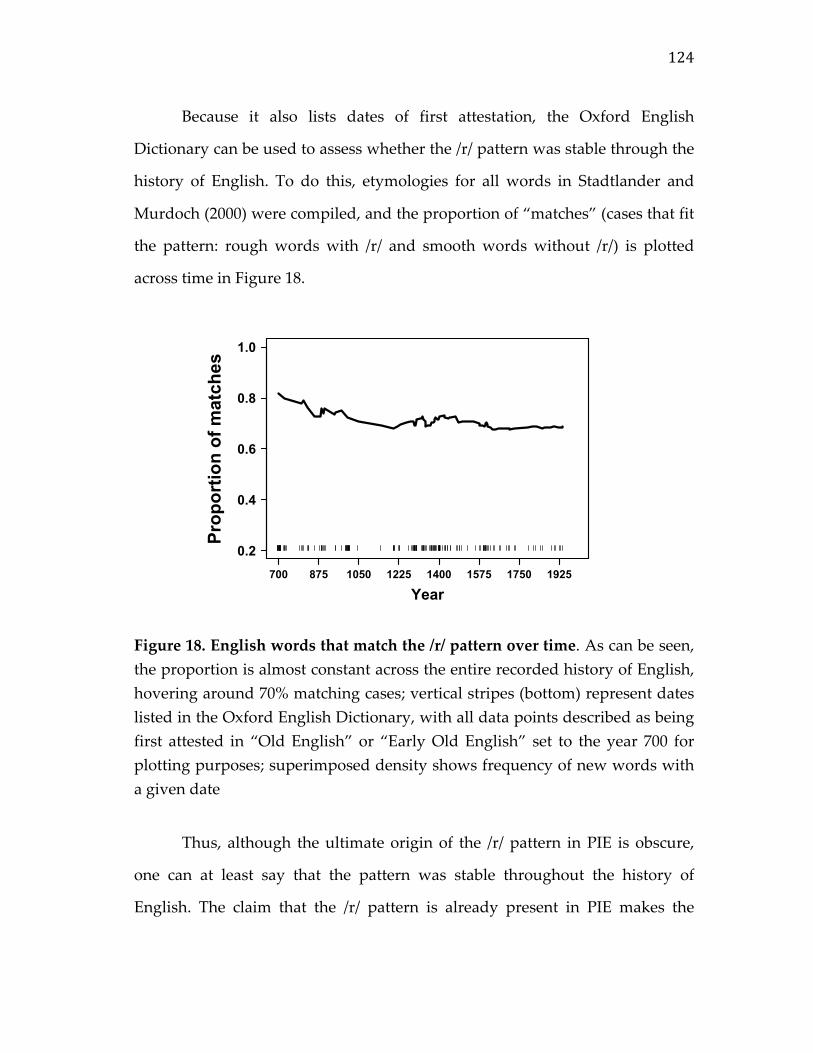
124
Because it also lists dates of first attestation, the Oxford English
Dictionary can be used to assess whether the /r/ pattern was stable through the
history of English. To do this, etymologies for all words in Stadtlander and
Murdoch (2000) were compiled, and the proportion of “matches” (cases that fit
the pattern: rough words with /r/ and smooth words without /r/) is plotted
across time in Figure 18.
Figure 18. English words that match the /r/ pattern over time. As can be seen, the proportion is almost constant across the entire recorded history of English, hovering around 70% matching cases; vertical stripes (bottom) represent dates listed in the Oxford English Dictionary, with all data points described as being first attested in “Old English” or “Early Old English” set to the year 700 for plotting purposes; superimposed density shows frequency of new words with a given date
Thus, although the ultimate origin of the /r/ pattern in PIE is obscure,
one can at least say that the pattern was stable throughout the history of
English. The claim that the /r/ pattern is already present in PIE makes the
700 875 1050 1225 1400 1575 1750 1925
Year
0.2
0.4
0.6
0.8
1.0
Pro
port
ion
of m
atch
es
125
testable prediction that the phoneme should be similarly associated with
roughness in other European languages. A cursory look at German, a closely
related language to English, suggests that this may indeed be the case, with
word forms such as krass, schroff, kratzig and rau for rough surfaces and word
forms such as glatt, geschmeidig and sanft for smooth surfaces. Future research
needs to test the /r/ pattern across Indo-European and non-Indo-European
languages.
6.7. Discussion
Within spoken language, some meanings are more expressible via iconic
means than others. In line with this, the present chapter showed that iconicity
is more dominant in specific pockets of the English lexicon, such as auditory
and tactile words. This means that iconicity is not distributed evenly across the
English lexicon; it characterizes some semantic categories more than others.
Overall, this chapter found that meanings high in sensory content are
more likely to be rated as iconic, suggesting that iconicity preferentially
encodes sensory meanings. The correlation between the sensory experience
ratings from Juhasz and Yap (2013) and the iconicity ratings appears intuitively
plausible: Highly abstract concepts may not give vocal iconicity enough
sensory “material” to work with. Furthermore, the results presented in this
chapter showed that within a sensory modality (specifically, the tactile one), it
is possible to reliably relate sensory dimensions to sound structure, such as
“roughness” and “hardness”. This directly contradicts statements made by
Louwerse and Connell (2011: 393), who, in the context of sensory words, claim
that linguistic forms are “unrelated in meaning to their referents” and do not
contain “meaning or knowledge in their own right”. In contrast to these claims,

126
this chapter has clearly demonstrated that at least some aspects of sensory
structure are directly reflected in sound structure. The fact that the English
lexicon harbors a considerable degree of iconicity in its sound structure—at
least for some pockets of meaning—can no longer be neglected.
But why were audition and the tactile modality the most iconic
modalities? It appears intuitively plausible that meanings that describe sound
qualities should be most codable in the vocal modality. Spoken language is an
acoustic medium, which makes it possible to express concepts from the
domain of sound by using sound itself. That auditory words should be highest
in iconicity was predicted by the ideophone hierarchy proposed by
Dingemanse (2012: 663), which lists “sound” as the primary semantic target of
ideophone systems. Whereas iconicity in signed language focuses primarily on
visual meanings (cf. Vinson et al., 2008), iconicity in spoken languages focuses
primarily on auditory meanings. Similarly, talking about gestures, Perlman
and Cain (2014: 336) state that “[m]anual gesture is likely better suited for some
domains of iconic expression, and vocalization for others”. Thus, iconicity is
most pronounced when encoding a meaning from a particular modality within
a communication system that is based on the same modality.
The visual modality received the lowest iconicity ratings. This might be
surprising, given that vision is ranked above the tactile modality in
Dingemanse’s hierarchy. Moreover, this is surprising because the experimental
literature has predominantly focused on visual concepts such as shape, size
and motion. To understand this apparent discrepancy to past research, one
needs to look at the specific sensory meanings that are featured in this study. A
quick look at the 205 visual adjectives in the Lynott and Connell (2009) data
reveals that 18 (~9%) of them are color words (e.g., crimson, yellow, purple).
127
These are less likely to be iconic because they describe a relatively static
perceptual impression (they have no temporal dimension that can easily be
mapped onto the temporally extended speech stream), and because hue has a
dimensionality that may not be expressed easily in terms of dimensions such
as loudness and pitch. In line with this, color words have the lowest iconicity
rating (0.58) among the visual words (non-color words: 1.29).
Excluding color terms from the main analysis brings the mean iconicity
ratings of vision closer to the highly iconic modality of touch, but it still does
not change the overall ranking, i.e., vision still has the lowest iconicity rating if
color terms are excluded. Another factor that could explain the low iconicity of
this modality is that the Lynott and Connell (2009) dataset does not contain
adjectives related to motion, such as slow, fast and quick. Given that movement
is easily expressed iconically (Perlman, 2010; Cuskley, 2013; Imai et al., 2008)
and given that the temporal structure of movement is mappable onto the
temporal format of speech, the absence of such adjectives might further lower
the iconicity ratings for the visual modality. As noted by Perlman and Cain
(2014: 338), vocal iconicity may be particularly useful in highlighting such
aspects as manner of motion and physical properties of objects that relate to
action—which would seem to include concepts such as fast, slow, hard, soft,
rough, smooth, big and large, but not necessarily color.
What explains the fact that the tactile modality ranks so highly? First of
all, it has to be noted that several ideophone systems of the World’s languages
are reported to have dedicated touch ideophones, such as Japanese (Imai et al.,
2008; Watanabe e al., 2012: 2518; Watanabe & Sakamoto, 2012; Yoshino et al.,
2013) and several African languages (e.g., Dingemanse, 2011a; 2011b;
Dingemanse & Majid, 2012; Essegbey, 2013). Outside the domain of
128
ideophones, Fryer et al. (2014) showed that when blindfolded participants
haptically explored spiky or rounded shapes, they were more likely to
associate kiki with the spiky shape and bouba with the rounded one. Similarly,
Etzi et al. (2016) showed that English participants judge rough surfaces such as
sandpaper as more kiki and ruki than smooth surfaces such as satin, which are
judged to be more bouba and lula (these stimuli also contain an r/l contrast,
giving another example of the relation between /r/ and roughness). Fontana
(2013) showed that participants associate jagged movement trajectories on the
skin with takete, as opposed to round trajectories, which were associated with
maluma.
These studies on touch-based iconicity need to be evaluated with
respect to the fact that there is abundant evidence for audiotactile integration
in cognition and the brain. Surface roughness can be perceived using audition
alone (Lederman, 1979), and auditory stimuli directly affect roughness
perception (Guest, Catmur, Lloyd, & Spence, 2002; Suzuki, Gyoba, &
Sakamoto, 2008). In the so-called “parchment-skin illusion”, participants report
to have dryer hands when the sound of their hands rubbing against each other
is amplified in the high-frequency components (Jousmäki & Hari, 1998). Sound
perception is furthermore influenced by touch (Schürmann, Caetano,
Jousmäki, & Hari, 2004), showing that audiotactile interactions in behavior are
bidirectional. Single-cell recordings of neurons in the macaque auditory cortex
show that some neurons directly respond to both somatosensory and auditory
stimuli (Schroeder, Lindsley, Specht, Marcovici, Smiley, & Javitt, 2001). Finally,
auditory cortex may become co-opted to process vibrotactile stimuli in deaf
humans (Levänen, Jousmäki, & Hari, 1998).
129
In the context of audiotactile integration, it is important to emphasize
that the iconicity of tactile words may actually be iconicity of the sounds that
the relevant surfaces would produce if they were haptically explored. As
mentioned above, /r/ was noted by Rhodes (1994) to indicate irregular sounds
and many of the phonesthemes occurring in tactile words are listed as having
sound meanings in Hutchins (1998) and other sources.
Given the rich literature on audiotactile integration and various reports
of touch-based sound symbolism, it does not appear wholly unexpected that
the tactile modality should have relatively high iconicity. Moreover, the way
humans experience surfaces is very dynamic, having an intrinsic temporal
dimension that is lacking from many—but not at all—visual properties, such as
color. As Bartley (1953: 401) noted, “tactile exploration is a piecemeal affair”.
Carlson (2010: 248) mentions that “[u]nless the skin is moving, tactile sensation
provides little information about the nature of objects we touch.” This intrinsic
connection between touch and time may be one of the meeting points for vocal
iconicity and the tactile modality. Thus, there are many reasons that render the
high iconicity of tactile words plausible. However, because this was ultimately
an essentially unanticipated result, further research is necessary.
To conclude, this chapter showed that vocal iconicity characterizes some
parts of the English language more than others. Iconicity is concentrated in
sensory meanings, especially those relating to the auditory and tactile senses.
Thus, this chapter showed that distinctions between the five common senses
influence language all the way down to phonological structure.
130
Chapter 7. The structure of multimodality
7.1. Interrelations between the senses
So far, all chapters focused on comparing the senses, highlighting their
differences. This chapter is the first of two chapters looking specifically at
interrelations between the senses. This follows up on the idea, expressed by
Marks (1978: 3), that “interrelations among the senses that appear in perception
will also find their way into speech and writing” (Marks, 1978: 3). Humans are
exposed to a complex “amalgam of sensory inputs” (Blake, Sobel, & James,
2004: 397). Because perception is inherently multimodal (Spivey, 2007; Spence
& Bayne, 2015; O’Callaghan, 2015), it is to be expected that the words that
describe those perceptions are multimodal as well. Moreover, if sensory
processes truly carry over to language, the structure of multimodality in
sensory perception should have linguistic reflections, i.e., specific relations
between particular sensory modalities should be expressed in concomitant
linguistic associations between the corresponding sensory words.
The field of cross-modal perception is large, and ultimately, all senses
can be shown to interact in some way or another, at least under certain
conditions (Spence, 2011). However, certain dominant patterns exist. One such
pattern is integration between vision and touch. Touching generally also
involves seeing (Walsh, 2000). Reaching for an object, for example, involves a
concerted interplay between vision and touch. There is abundant evidence for
a neural and behavioral integration between these two senses:
The parieto-occipital cortex shows increased blood flow when making
visual and tactile judgments of grating orientation and shape (Sergent, Ohta, &
MacDonald, 1992; Sathian, Zangaladze, Hoffman, & Grafton, 1997; Alivisatos,
Jacobson, Hendler, Malach, & Zohary, 2002). Interfering with the function of

131
the occipital cortex interferes with both visual and tactile perception
(Amassian, Cracco, Maccabee, Cracco, Rudell & Eberle, 1989; Zangaladze,
Epstein, Grafton, & Sathian, 1999; see also Sathian & Zangaladze, 2002). The
intraparietal sulcus shows increased blood flow when performing mental
rotation in both the visual domain and the tactile domain (Cohen, Kosslyn,
Breiter, DiGirolamo, Thompson, Anderson, Bookheimer, Rosen, & Belliveau,
1996; Prather, Votaw, & Sathian, 2004). More generally, large regions of the
visual cortex respond to somatosensory stimuli (Hagen, Franzén, McGlone,
Essick, Dancer, & Pardo, 2002; Haenny, Maunsell, & Schiller, 1998; Casagrande,
1994). Overall, this neuroscientific evidence shows that tactile tasks “recruit
cortical regions that are active during corresponding visual tasks” (Prather et
al., 2004: 1079).
Integration between vision and touch is also evidenced behaviorally.
For example, vision and touch interact with each other developmentally, with
touch calibrating visual perception regarding size perception and vision
calibrating touch regarding orientation perception (Gori, Del Viva, Sandini, &
Burr, 2008; Gori, Sandini, Martinoli, & Burr, 2010). Picard (2006) and others
have furthermore argued that there is partial perceptual equivalence between
touch and vision. Finally, determining shape via touch appears to involve
visual mental imagery (Klatzky, Lederman, & Reed, 1987).
Another dominant connection between the senses is between taste and
smell (see also Ch. 1 and Ch. 4). Eating necessarily involves smelling (Mojet,
Köster, & Prinz, 2005). In fact, in food research, it is difficult to construct pure
tastants that cannot be smelled (Spence et al., 2015). Food in the mouth is
smelled through the retronasal pathway, a passage to the olfactory bulb at the
back of the oral cavity. This form of smell, together with the smell coming from
132
the nose, interacts with taste to determine flavor. For instance, a caramel odor
can suppress the sour taste of citric acid (Stevenson, Prescott, & Boakes, 1999).
Taste and smell are furthermore neurally integrated, sharing overlapping brain
networks (De Araujo et al., 2003; Delwiche & Heffelfinger, 2005; Rolls, 2008).
And, as discussed in Chapter 4, taste and smell are also quite similar to each
other with respect to a shared involvement in emotional processes. In fact, taste
and smell are so integrated and mutually dependent, that one may ask
whether they are adequately considered to be distinct senses at all (e.g., Spence
et al., 2015).
Another dominant pattern of multi-sensory integration is between
audition and vision. In face-to-face encounters, vision and hearing interact in
determining the outcome of language comprehension, i.e., understanding a
spoken sentence involves “lip reading” as well as listening to speech (McGurk
& MacDonald, 1976). Audiovisual interaction is also evidenced by the
“ventriloquist effect”, discussed in Chapter 3. In this phenomenon, vision pulls
audition toward a particular spatial percept (Alais & Burr, 2004). There are
similar experimental effects where audition pulls vision toward a particular
temporal percept, sometimes called “temporal ventriloquism” (Morein-Zamir,
Soto-Faraco, & Kingstone, 2003). In the phenomenon known as the “sound-
induced flash illusion”, participants are presented with a single light flash
while simultaneously playing two short beeps. Participants report to see two
beeps, rather than one (Shams, Kamitani, & Shimojo, 2002). The list of
behavioral tasks where audition and vision interact is long (Spence, 2007), with
behavioral interactions emerging particularly in tasks that have to do with
space or time (as opposed to such properties as colors and contrast; cf. Evans &
Treisman, 2010). For example, motion perception is one of the primary ways

133
vision and audition interact, and several brain areas typically associated with
visual motion perception actually process audiovisual stimuli as well
(Baumann & Greenlee, 2007).
Given these studies, two sets of predictions can be formed. First, the
multimodality of perception predicts that sensory words should be flexible
when it comes to their association with words for the other senses. That is,
sensory words for a given modality should be applicable to contexts that
invoke other sensory modalities. This prediction can also be formed based on
past research on so-called “synesthetic metaphors” (see Chapter 8), which are
verbal expressions that combine the senses. Second, following the assumption
that language reflects perceptual structures (Marks, 1978), the evidence for
vision/touch, vision/hearing and taste/smell integration predicts that the
corresponding words should also be associated with each other.
When it comes to the connection between vision and hearing, however,
a caveat has to be mentioned: Lynott and Connell (2009, 2013) already showed
that words for the auditory concepts in their norming set appear to be the most
“exclusive”. Specifically, auditory words receive overall lower ratings for the
non-auditory modalities. Similarly, Louwerse and Connell (2011) found that in
the modality norms of Lynott and Connell (2009), perceptual strength ratings
of vision/touch and taste/smell are correlated with each other, but audition is
anti-correlated with all other modalities.

134
7.2. Modality correlations in adjective-noun pairs
Adjective-noun pairs were extracted from COCA for which both the Lynott
and Connell (2009) adjective norms and the Lynott and Connell (2013) noun
norms exist. This yielded a total of 13,685 adjective-noun pairs. Pairwise
correlations between the adjective modality ratings and the noun modality
ratings were performed. For example, the tactile strength of the adjective
abrasive was correlated with the visual strength of the nouns that abrasive
modifies. To do this, the average noun modality strength was computed for
each adjective. In COCA, the adjective abrasive occurs in such combinations as
abrasive contact, abrasive dust and abrasive paper. In the Lynott and Connell (2009)
data, the nouns contact, dust, and paper have the visual strengths 3.4, 4.2, and
4.4, respectively. The mean of these numbers is 4.0, which was taken as the
“mean visual strength” of the nouns co-occurring with abrasive. This mean was
computed in a frequency-weighted fashion, i.e. more frequent adjective-noun
pairs contribute more to the mean. Then, across all words, adjective and noun
perceptual strength values were correlated with each other. Because there are
five times five possible pairwise comparisons (5 adjective modalities, 5 noun
modalities), p-values were Bonferroni-corrected for performing 25 tests.
Figure 19 visualizes the correlations between adjectives and nouns. Only
statistically reliable correlations (p < 0.05) are depicted. The direction of the
arrows is to be interpreted as follows: An arrow that points from vision to
touch, for instance, describes the correlation between the visual strength of the
adjective and the tactile strength of the noun (in this case, r = 0.37). Conversely,
an arrow pointing from touch to vision describes the correlation between the
tactile strength of the adjective and the visual strength of the noun (in this case,
r = 0.33). In other words, each arrow points “from the adjective to the noun”.

135
Figure 19. The correlational structure of multimodality. Data from 13,685 adjective-noun pairs; solid arrows indicate statistically reliable correlations (corrected for performing 25 comparisons), dotted arrows indicate statistically reliable anti-correlations; the arrow heads point “from the adjective to the noun”, i.e., the vision-to-touch arrow indicates that the visual strength of an adjective is, on average, correlated with the tactile strength of the noun with r = 0.37
First, it should be noted that every modality exhibits a reliable positive
correlation with itself, shown by the curly arrows that point from each
modality to itself. This means that adjectives like to pair with nouns that have
high perceptual strength ratings for the same modalities. The highest intra-
modal correlation was for audition (r = 0.77), followed by gustation (r = 0.66),
vision (r = 0.56), olfaction (r = 0.46) and the tactile modality (r = 0.33). However,
the correlation coefficients are all far away from 1, indicating that the modality
of the adjective does not perfectly correlate with the modality of the noun. This
means that adjectives are frequently used with nouns that do not match the
136
adjective’s modality perfectly. This is direct evidence for the multimodality of
sensory words.
When it comes to vision and touch, there are arrows pointing both
ways. This means the following: First, visual adjectives modify nouns that can
also be felt, such as is the case with shiny belt, shiny body and shiny glass, all of
which are adjective-noun pairs found in COCA. Second, touch adjectives
modify nouns that can also be seen, such as rough blanket, rough cotton, and
rough landscape.
A similar bidirectional relationship characterizes taste and smell words.
Classen (1993: 52) already wrote that “gustatory terms, such as sour, sweet, or
pungent, usually double for olfactory terms.” The fact that the taste and smell
ratings of adjectives and nouns are positively correlated with each other is a
direct quantitative confirmation of this idea. For example, the highly olfactory
word smoky (which is also quite gustatory) occurs in such expressions as smoky
taste, smoky food, and smoky sauce. Thus, taste and smell adjectives behave
similarly with respect to the nouns they attach to. Rozin (1982) already found
that participants accept taste-related words in smell-related contexts. The
findings presented in this chapter can be argued to be a direct reflection of
Rozin’s results with respect to naturally occurring language.
The negative correlations with audition indicate that auditory adjectives
are not used frequently to modify non-auditory nouns, and likewise that
adjectives from the other modalities are not frequently used to modify auditory
nouns. The auditory adjective booming, for instance, tends to modify such
auditory nouns as sound and music. It cannot easily be applied to nouns such as
smell (olfaction), sauce (gustation), cotton (touch) and picture (vision). Similarly,
137
highly auditory nouns such as music and sound are predominantly described
using auditory adjectives; much less so using non-auditory adjectives.
The only unidirectional connection in Figure 22 is between vision and
taste: Visual adjectives are not used frequently in highly olfactory contexts.
This is perhaps surprising because visual descriptors and color terms such as
yellow can clearly be used in food-related contexts, such as the following
expressions that occurred in COCA: yellow food, yellow liquid, and yellow sauce.
However, visual words appear much more frequently in contexts that have
nothing to do with taste, such as yellow shirt, yellow hat and yellow eye. Clearly,
English speakers use visual words in the context of food to describe how food
looks, but the frequency of these food contexts does not outweigh the
frequency of non-food contexts. Because of this, the visual strength of the
adjective is anti-correlated with the gustatory strength of the noun.
7.3. Discussion
This brief chapter showed that sensory words are multimodal, and that this
multimodality is structured. In particular, visual adjectives modify tactile
nouns and vice versa. And, gustatory adjectives modify olfactory nouns and
vice versa. The only modality that stands out is audition, which was found to
be anti-correlated with all other modalities. Words such as purring, hoarse, and
growling can easily be applied to describing auditory phenomena, but not so
much to describe phenomena relating to the other modalities (see also Chapter
8). Similarly, highly auditory nouns such as laughter, voice and harmony cannot
easily be described using non-auditory words such as yellow, oniony or odorous.
The difference between the results obtained here and the results
obtained in Louwerse and Connell (2011) need to be clarified. Louwerse and

138
Connell (2011) used the same data—the adjective norms by Lynott and Connell
(2009)—to uncover essentially the same correlational structure, with
associations between vision and touch and between taste and smell. The key
difference is that their analysis focused on the sensory words themselves,
whereas the present analysis focused on sensory words in adjective-noun pair
contexts. The fact that the present results are so similar to what was found in
Louwerse and Connell (2011) suggests that the correlational structure of the
modality norms within words is reflected in the correlational structure of how
these words are used in context.
There can be several reasons for the fact that vision and audition are
highly inter-related in perception (i.e., “audiovisual integration”) but not so
much in the correlation structure reported above. First, this may have to do
with the ecology of language use. Louwerse and Connell (2011: 384) write that
“Any object that can be touched can be seen, and any object that has a taste
also has a smell”—thus, real-world situations in which a touch adjective can be
used to describe a visual noun often arise, and so do situations in which a
visual adjective can be used to describe a noun that is strongly associated with
touch (such as cotton). The same happens with gustatory and olfactory words,
which have a natural context to which they both apply, the context of food.
There simply may not be many contexts in which auditory words apply to
non-auditory concepts. Alternatively, their iconicity might be the reason why
auditory words are not as applicable to non-auditory contexts. Chapter 6
showed that many auditory adjectives tend to be composed in such a way that
they directly reflect aspects of the sound they refer to. This would seem to tie
them very strongly to the auditory modality (cf. Classen, 1993: 55), an idea that
will be further explored in Chapter 8.
139
This chapter looked at the structure of multimodality in the English
language, arguing that linguistically, modalities combine with other modalities
in a way that mirrors their environmental and perceptual coordination.
Sometimes, however, sensory words are used clearly outside of the context of
their own modality. Such uses are called “synesthetic metaphors” and will be
the focus of the next chapter.
140
Chapter 8. Cross-modal metaphors
8.1. A hierarchy of cross-modal metaphors
To many, the term “metaphor” evokes the idea of “poetic” or “fanciful”
language. Quite to the contrary, metaphor is nowadays seen by many linguists
and cognitive scientists as a basic cognitive device that allows people to reason
about one conceptual domain in terms of another. From this perspective, a
metaphor is simply a mental mapping between two distinct conceptual
domains. For example, English speakers readily talk about time in terms of
space. This is reflected in such linguistic expressions as Wednesday comes before
Monday, This took a long time, or, The future lies ahead of us, all of which use
spatial terms to describe temporal properties. Experimental evidence shows
that such linguistic expressions are reflections of an underlying conceptual
mapping between space and time (Boroditsky & Ramscar, 2002; Casasanto &
Boroditsky, 2008; Matlock, Holmes, Srinivasan, & Ramscar, 2012; for reviews,
see Bonato, Zorzi, & Umiltà, 2012; Winter, Marghetis, & Matlock, 2015). The
view that metaphors are primarily conceptual and only secondarily linguistic
is a central tenet of “Conceptual Metaphor Theory” (Lakoff & Johnson, 1980;
Lakoff, 1987; Gibbs, 1994; Kövecses, 2002). Within this framework, metaphors
are not seen merely as literary devices, but rather as everyday cognitive
phenomena that figure prominently in natural language. Some have estimated
that about 11.5% to 18.5% of words used in newspaper texts are used
metaphorically (Pragglejaz Group, 2007), which serves to highlight the
ubiquity of metaphor.
The topic of metaphor is relevant to the study of sensory language
because people frequently use metaphors when describing sensory experiences
(Barten, 1998; Porcello, 2004; Caballero, 2007; Paradis & Eeg-Olofsson, 2013). In
141
wine reviews, sommeliers might liken wines to old mountains or fresh paintings
(Lehrer, 1978: 111), or they might say that a wine has razor sharp flavor (Paradis
& Eeg-Olofsson, 2013: 28). In the latter example, the word used to describe the
flavor of wine relates to the tactile modality. Such an expression is frequently
considered to be a “synesthetic metaphor”, a verbal description of a sensory
experience in one modality using descriptors from another modality (Ullmann,
1959; Yu, 2003).
Such synesthetic metaphors need to be distinguished from synesthesia
proper (see Tsur, 2012: Ch. 12), which is a neurological condition characterized
by an automatic, vivid and reproducible sensory experience in one modality
when experiencing a trigger from a different modality (Ramachandran &
Hubbard, 2001). Synesthesia is a perceptual phenomenon; synesthetic
metaphor a linguistic one. Because nobody, so far, has shown that verbal
synesthesia is actually related to synesthesia as a neurological condition, the
term “cross-modal metaphor” was chosen here. Since all humans have cross-
modal mental associations (Marks, 1978; Spence, 2011), but not all humans are
synesthetes (Deroy & Spence, 2013), “cross-modality” is a theoretically more
neutral term to apply to these linguistic constructions.
Cross-modal metaphors as understood here may be used in relatively
poetic language, but also in everyday linguistic expressions. Most of the work
on this topic focuses on adjective-noun pairs such as bitter cold and soft sound.
In these constructions, the adjective represents the conceptual source, which is
used to describe the conceptual target, the noun. Cross-modal metaphors are,
however, not restricted to this grammatical construction and can also occur in
possessive constructions such as the music of caressing (Shen & Gadir, 2009) and
in more complex expressions such as “the music was light and bright, exquisite
142
and emotive, stroking people’s faces like a gentle breeze in warm and flowery March”
(Yu, 2003: 24).
Cross-modal metaphors have attracted a considerable amount of
attention in cognitive linguistics, metaphor research, literature studies and the
field of “cognitive poetics” (e.g., Erzsébet, 1974; Williams, 1976; Tsur, 2008,
2012; Sadamitsu, 2003; Iwahashi, 2009, 2013; Werning, Fleischhauer, &
Beseoglu, 2006; Paradis & Eeg-Olofsson, 2013; Sakamoto & Utsumi, 2014; Strik
Lievers, 2015). One reason for this attraction is that very early on in this
literature, Ullmann (1945, 1959) put forth the intriguing proposal that there is a
hierarchy that determines which senses can be mapped onto which other
senses:
(3) TOUCH < HEAT < TASTE < SMELL < SOUND < SIGHT
This hierarchy is read as follows: Sensory domains toward the left can
be used to talk about the sensory domains toward the right. Touch is the most
likely source of cross-modal metaphors; sight the most likely target. Ullmann
analyzed English, French and Hungarian poetry, concluding that metaphorical
transfers “tend to mount from the lower to the higher reaches of the sensorium,
from the less differentiated sensations to the more differentiated ones, and not
vice versa” (Ullmann, 1959: 280; italics in original). Thus, expressions such as
warm color and cold blue follow the hierarchy (heat→sight), but colorful warmth
and blue cold do not (sight→heat). Shen and colleagues (Shen, 1997, 1998; Shen
& Gil, 2007; Shen & Aisenman, 2007) showed that metaphorical constructions
in line with the directionality imposed by the hierarchy are more easily
interpreted and remembered than metaphorical constructions violating the
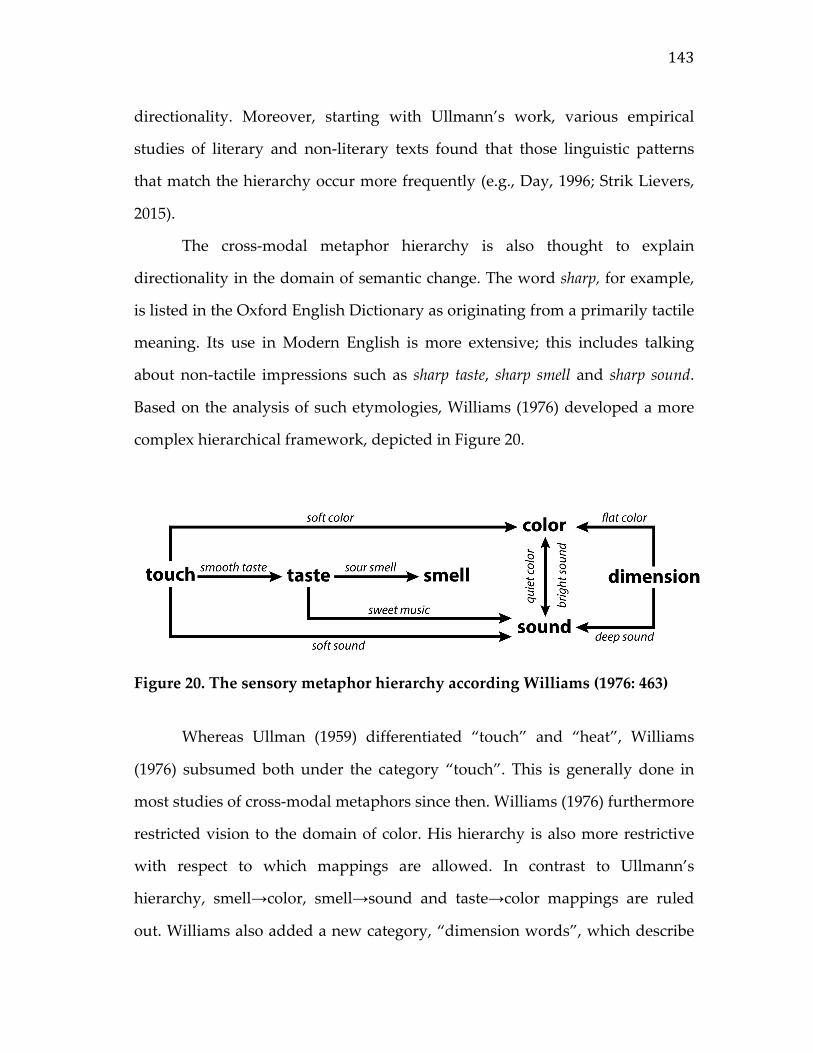
143
directionality. Moreover, starting with Ullmann’s work, various empirical
studies of literary and non-literary texts found that those linguistic patterns
that match the hierarchy occur more frequently (e.g., Day, 1996; Strik Lievers,
2015).
The cross-modal metaphor hierarchy is also thought to explain
directionality in the domain of semantic change. The word sharp, for example,
is listed in the Oxford English Dictionary as originating from a primarily tactile
meaning. Its use in Modern English is more extensive; this includes talking
about non-tactile impressions such as sharp taste, sharp smell and sharp sound.
Based on the analysis of such etymologies, Williams (1976) developed a more
complex hierarchical framework, depicted in Figure 20.
Figure 20. The sensory metaphor hierarchy according Williams (1976: 463)
Whereas Ullman (1959) differentiated “touch” and “heat”, Williams
(1976) subsumed both under the category “touch”. This is generally done in
most studies of cross-modal metaphors since then. Williams (1976) furthermore
restricted vision to the domain of color. His hierarchy is also more restrictive
with respect to which mappings are allowed. In contrast to Ullmann’s
hierarchy, smell→color, smell→sound and taste→color mappings are ruled
out. Williams also added a new category, “dimension words”, which describe

144
spatial extent and shapes, such as thin, thick, large and small. Interestingly, most
work on cross-modal metaphors follows the hierarchy of Ullmann—even
though the Williams hierarchy makes much stronger (i.e., more falsifiable)
predictions: It not only predicts the existence of specific inter-sensory
connections, it also predicts the absence of a larger set of connections than any
of the other cross-modal hierarchies.
Within this chapter, the term “cross-modal metaphor hierarchy” will be
used to refer to a simplified version of the Ullman (1959) hierarchy, namely
touch > taste > smell > sight/hearing. This version is most commonly adopted
by researchers in this literature, particularly Shen and his colleagues (Shen,
1996, 1997; Shen & Gil, 2007; Shen & Aisenman, 2008; Shen & Gadir, 2009).
However, it should be pointed out that this particular instantiation of the
hierarchy is a broader, less detailed and less restrictive account of cross-modal
mappings than the hierarchy proposed by Williams (1976).
What explains the cross-modal metaphor hierarchy? Shen seeks to
ground the metaphorical asymmetries in a notion that in his body of work is
variously referred to as “cognitive accessibility”, “conceptual preference”,
“concreteness” or “salience” (Shen, 1996, 1997; Shen & Gil, 2007; Shen &
Aisenman, 2008; Shen & Gadir, 2009). Theoretically, the defining feature of this
proposal is that there is only a small set of principles that is thought to account
for the entire hierarchy. Thus, rather than focusing on binary mappings
(e.g., taste→smell might need a different explanation from vision→sound), a
monolithic account of the hierarchy is presented. Touch, taste and smell are
called “lower” senses and argued to be more “concrete” and “accessible” than
the “higher” senses of vision and hearing. Mappings then follow the direction
from “low to high”, from the more accessible sensory modality to the less
145
accessible one. As outlined in Shen and Aisenman (2008: 111-113),
“accessibility” is understood to mean the following: Touching, tasting or
smelling an object entails being close to it26. Vision and audition on the other
hand are relatively more “distal”, i.e., humans can use them to experience
objects from very far away. On top of the criterion of distance, Shen and
colleagues allude to a distinction in the subjective experience of these
modalities. Experiencing something through vision and hearing is argued to be
more “object-based”, i.e., the object external to one’s body is understood by the
experiencer as the cause of his or her sensation. Touch, taste and smell, on the
other hand, are argued to be relatively more subjective and experienced
through physiological sensations that are consciously experienced as being
directly connected to one’s body.
Various other accounts of the hierarchy exist. Ullmann (1959: 283)
thought that at least part of the observed tendencies could be explained
through lexical differentiation, i.e., the fact that there are less lexical
distinctions for some sensory modalities. To explain Ullman’s reasoning, it is
useful to consider the connection between vision and audition. Ullmann (1959)
observed in his data that “the acoustic field emerges as the main recipient” in
cross-modal metaphors (p. 283). He specifically observed that more visual
terms are used to talk about auditory concepts (e.g., bright sound, pale sound,
dark voice) than the other way round (e.g., loud color). His explanation of this
fact is as follows (p. 283):
26 Smell takes an intermediate position here, and the distance argument has been contested with respect to smell (Sadamitsu, 2003; Strik Lievers, 2015: 72).

146
“Visual terminology is incomparably richer than its auditional counter-
part, and has also far more similes and images at its command. Of the
two sensory domains at the top end of the scale, sound stands more in
need of external support than light, form, or colour; hence the greater
frequency of the intrusion of outside elements into the description of
acoustic phenomena.”
Tsur (2012: 227) calls Ullmann's explanation “not very convincing”
because “poverty of terminology is not the only (or even the main) reason for
using metaphors in poetry”. However, in support of lexical differentiation
playing a strong role, at least in non-literary language, Strik Lievers (2015: 86-
88) shows that for her dataset, those modalities that have more nouns are more
likely to be the targets of cross-modal metaphors, and those modalities that
have more adjectives are more likely to be the sources. This is direct evidence
for the idea that differential lexicalization at last place some role in explaining
observed metaphorical asymmetries. This chapter will show that the
composition of the lexicon can account for some of the directional tendencies in
cross-modal metaphor.
Because the adjectives occurring in cross-modal metaphors frequently
have strong evaluative connotations (e.g., sweet melody and loud colors), many
researchers have also argued for a role of affect and evaluation (e.g., Marks,
1978: 216-218; Lehrer, 1978; Osgood, 1981; Popova, 2005; Sakamoto & Utsumi,
2014). For example, Tsur (2012: 230) argues that in loud perfume, the connotation
of obtrusiveness is more salient than the sensory impression of loudness.
Expressing evaluation is one of the major functions of language (Dam-Jensen &
Zethsen, 2007; Morley & Partington, 2009), and it is plausible that cross-modal

147
metaphors might also serve evaluative purposes. Emotional valence does not
explain the entire hierarchy (i.e., Shen’s simplified version) all by itself, but it
may explain the relative positioning of sensory modalities that are particularly
prone to being used in emotional language, namely taste and smell (Ch. 4). The
fact that taste and smell have many affectively loaded words might be one
factor that makes them good metaphorical sources.
Finally, a potential role for sound structure also has to be
acknowledged. In her book Worlds of Sense, Classen (1993: 55) proposed that
“auditory terms are too echoic or suggestive of the sounds they represent to be
used to characterize other sensory phenomena”. And indeed, Ch. 6 presented
quantitative evidence for the view that words for auditory concepts are more
iconic than words for concepts from the other modalities. Hence, it is possible
that the strong onomatopoetic character of words such as squealing, hissing, and
booming prevents them from being used in cross-modal metaphors. For
example, the made-up cross-modal metaphors squealing color, hissing taste and
booming smell do not appear to be natural (and they do not occur in COCA
either). Thus, auditory words, by virtue of their sound symbolism, might be
too strongly tied to their own modality. This principle, too, cannot explain the
entire hierarchy, but it may in part explain the relative position of audition
with respect to the other modalities: The high proportion of iconic words
makes audition an unlikely source.
Thus, the question as to what explains the empirical asymmetries
observed with respect to cross-modal metaphors is at present unresolved. It
should be pointed out, however, that it is not at all clear that there should be
one and only one explanatory account anyway (cf. Strik Lievers, 2015).
Complex phenomena are generally constrained by multiple competing factors
148
(e.g., Mitchell, 2004), something that is especially the case with such complex
faculties as language and cognition (Spivey, 2007; Beckner et al., 2009). Hence,
rather than there being a one-size-fits-all principle, factors such as lexical
differentiation, affect and iconicity could all simultaneously play a role. Thus,
this chapter argues for moving on from a monolithic account of the cross-
modal metaphor hierarchy to a more multifactorial one. Before evidence for
this view is presented, the methodological approach taken here needs to be
contrasted with past approaches in cross-modal metaphor research. This is
done in the following section.
8.2. Methodological problems of cross-modal metaphor research
The methodological choices made in cross-modal metaphor research have far-
reaching theoretical implications. This section discusses some methodological
problems in this domain, which the later sections aim to address. Table 15
shows a common way to present cross-modal metaphor counts, taken from
Ullmann (1945: 814). The data is based on Ullmann’s analysis of metaphors in
Lord Byron’s writings. The rows indicate source modalities; the columns
indicate target modalities. By first looking at the row totals, one can see that
touch is by far the most prolific source domain, being mapped onto other
sensory domains 121 times. Comparatively, it is a much less frequent target
domain (N = 8). By comparing column totals to row totals, one can also see that
sound is a far more frequent target domain (N = 118) than source domain
(N = 11). It is insightful to calculate a source / target ratio for this table, which is
121 / 8 = 15.1 for touch, 2.2 for heat, 3.5 for taste, exactly 1 for smell, 0.09 for
sound and 0.49 for sight. This shows that in this dataset, touch, heat and taste
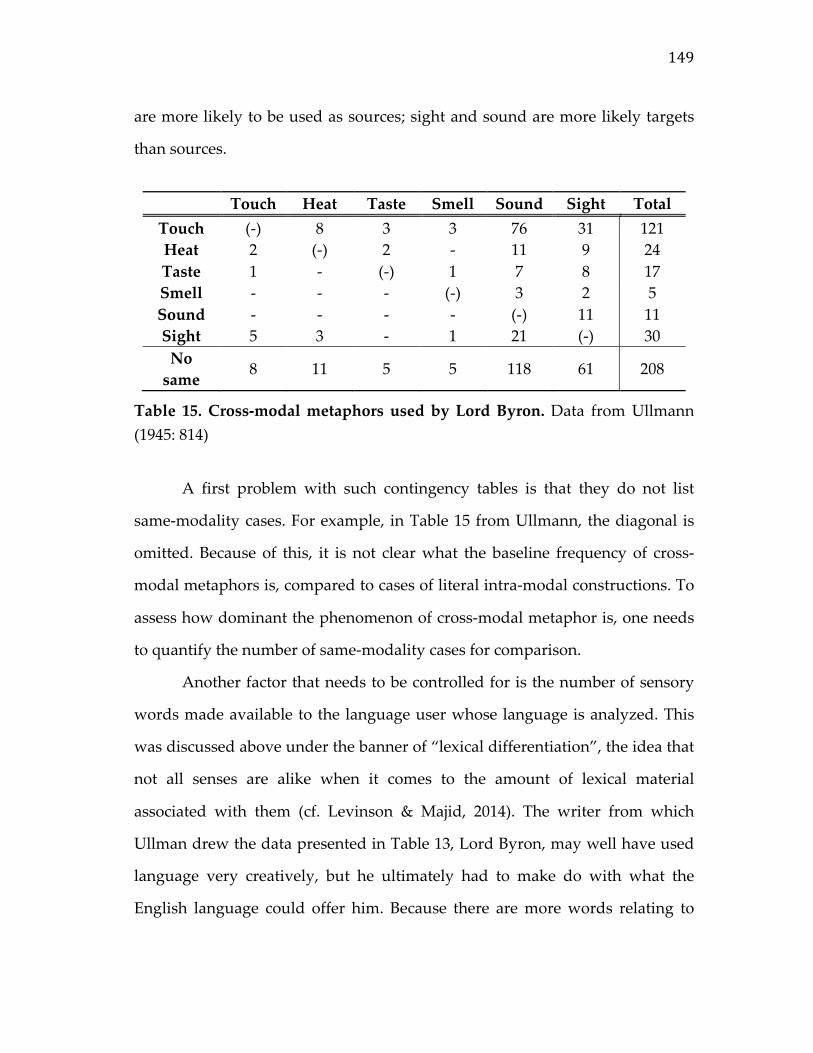
149
are more likely to be used as sources; sight and sound are more likely targets
than sources.
Touch Heat Taste Smell Sound Sight Total
Touch (-) 8 3 3 76 31 121 Heat 2 (-) 2 - 11 9 24 Taste 1 - (-) 1 7 8 17 Smell - - - (-) 3 2 5 Sound - - - - (-) 11 11 Sight 5 3 - 1 21 (-) 30
No same
8 11 5 5 118 61 208
Table 15. Cross-modal metaphors used by Lord Byron. Data from Ullmann (1945: 814)
A first problem with such contingency tables is that they do not list
same-modality cases. For example, in Table 15 from Ullmann, the diagonal is
omitted. Because of this, it is not clear what the baseline frequency of cross-
modal metaphors is, compared to cases of literal intra-modal constructions. To
assess how dominant the phenomenon of cross-modal metaphor is, one needs
to quantify the number of same-modality cases for comparison.
Another factor that needs to be controlled for is the number of sensory
words made available to the language user whose language is analyzed. This
was discussed above under the banner of “lexical differentiation”, the idea that
not all senses are alike when it comes to the amount of lexical material
associated with them (cf. Levinson & Majid, 2014). The writer from which
Ullman drew the data presented in Table 13, Lord Byron, may well have used
language very creatively, but he ultimately had to make do with what the
English language could offer him. Because there are more words relating to
150
some senses, “it is important to take into consideration the composition of the
vocabulary of perception” (Strik Lievers, 2015: 86). The reason for considering
lexical differentiation is that it can create apparent asymmetrical patterns. For
example, in Table 15, sight maps to sound 21 times; sound to sight only 11
times. This might be a genuine asymmetry between audition and vision as
perceptual modalities, however, it might also be an indirect reflection of the
fact that there are more words for vision than for audition (Ch. 3). Another
dimension along which the senses differ is word frequency. This, too, can affect
conclusions about the cross-modal metaphor hierarchy, because statistically
speaking, more frequent words are more likely to come up in cross-modal
metaphors. Because of this, modalities that are associated with highly frequent
words (such as vision and touch) are more likely to be used as sources in cross-
modal metaphors.
Related to the problem of frequency is the importance of considering
types versus tokens. For instance, if the cross-modal metaphor dark voice is
used twenty times, this would contribute a total of 20 different tokens to the
mapping “vision→sound”. However, it would only contribute one unique type
(instantiated by 20 tokens). Keeping the type versus token distinction in mind
is crucial, because otherwise high frequencies of certain mappings might be
driven entirely by high token counts of particular adjective-noun pairs, and
these pairs may be highly idiosyncratic or conventionalized. The elevated
frequency of these expressions may thus bias the overall results.
On top of these considerations, there is the problem of classifying words
according to modalities. As argued in Chapter 2 in detail, decisions about
which words belong to which sensory modality need to be made in a
principled manner. To take just a few examples of modality classifications in
151
cross-modal metaphor research that are perhaps questionable, consider Day
(1996), who lists heavy explosion as a touch to sound mapping—even though
heavy is a general magnitude term and even though an explosion can also be
seen, felt and smelled. As a second example, consider Sakamoto and Utsumi
(2014: 2) who consider the adjective open as not being perceptual at all, even
though the property “openness” can clearly be perceived through vision and
touch. More generally, treating words as unimodal entities goes against
established evidence that perception is highly multimodal (Spivey, 2007;
Spence & Bayne, 2015; Spence et al., 2015; O’Callaghan, 2015) and that sensory
words are multimodal as well (Goldberg et al., 2006b; Lynott & Connell, 2009;
see also Chapters 2 and 7).
A final methodological concern relates to a disconnect between
theoretical accounts of the cross-modal metaphor hierarchy and the
conclusions that linguistic data affords. All too often, evidence for linguistic
asymmetries is counted as direct evidence for a particular explanatory account
of these asymmetries—even though multiple mechanisms could account for
the observed linguistic patterns. As discussed above, there are different
explanations of the observed asymmetries, including explanations grounded in
“cognitive accessibility” or “concreteness” (Shen, 1997; Shen & Aisenman,
2008; Shen & Gadir, 2009), explanations based on the poverty of terminology in
certain sensory domains (Ullman, 1959: 238), and explanations based on
valence (e.g., Marks, 1978; Lehrer, 1978; Tsur, 2012), among many others. The
arguments for or against a given account that are given in the literature on
cross-modal metaphors are always purely verbal, for example, Williams (1976)
argues for a role of evolutionary asymmetries by referring to the relevant
biological literature (e.g., the chemical senses and touch are older could be
152
considered more “primitive” than vision). However, the data presented by all
of these authors is just linguistic data of metaphorical asymmetries, and this
data is ultimately neutral with respect to what is the cause of these
asymmetries. In fact, Shen and Gadir (2009) interpret the evidence for
asymmetries in the linguistic data and in their experiments as direct evidence
for their proposed principle of “accessibility/salience” (p. 359) although no
language-independent measure of accessibility or salience is provided. Just
stating that the majority of metaphors fit the proposed hierarchy cannot be
direct evidence for any particular account of the hierarchy without additional
measures. To address this concern, and to assess different explanatory
accounts of the hierarchy, additional data sources need to be used. That is,
counts of cross-modal metaphors need to be related to information about
valence to test the valence-based explanation of the hierarchy, or to
information about differential lexicalization to test explanations grounded in
“poverty of terminology”.
The rest of this chapter aims to address the large list of methodological
concerns raised in this section. Using a novel methodological approach, three
predictions will be tested: First, the role of affect will be evaluated. Following
the idea that part of the content that is mapped in cross-modal metaphors is
evaluative rather than perceptual, it is predicted that adjectives used in cross-
modal metaphors are more emotionally valenced than adjectives not used in
cross-modal metaphors. Second, the prediction that iconicity in sound
structure biases against inter-sensory mappings (Classen, 1993: 55) will be
tested. Finally, based on the established evidence that the senses vary with
respect to lexical differentiation (e.g., Ch. 3; Levinson & Majid, 2014) and word
frequency (e.g., Ch. 3; San Roque et al., 2015), it is predicted that those sensory
153
modalities that have more words and more frequent words should feature
more dominantly in cross-modal metaphors.
8.3. Modality similarity, affect and iconicity
149,387 adjective-noun pairs were extracted from COCA. This set represents all
of the COCA adjective-noun pairs that contained an adjective from the Lynott
and Connell (2009) dataset. From this total set, 13,685 adjective-noun pairs
were extracted for which there also was information on the modality of the
noun (Lynott & Connell, 2013).
To test the role of lexical differentiation, iconicity and affect, one first
needs an objective criterion to define what a cross-modal metaphor is. Rather
than making a preset distinction between what is and what is not a cross-
modal metaphor, “cross-modality” is treated here as a continuous variable. The
key methodological insight is that cross-modality can be addressed by looking
at the match between the modality profiles of adjectives to their corresponding
nouns. For example, in the cross-modal metaphor fragrant music, two words of
highly dissimilar modalities are combined. On the other hand, the much more
literal-sounding expression abrasive contact combines two words that both
relate strongly to the tactile modality. To quantify the degree of “modality
match”, a similarity metric is needed. Such a metric is provided by the cosine
similarity (defined in Appendix A), which ranges from 0 to 1. If the adjective
and noun have exactly the same ratings on all five modalities, their cosine
similarity is 1 (maximally similar); if they have opposite ratings on all five
modalities, their cosine similarity is 0 (maximally different).
The modality profiles of abrasive contact and fragrant music are shown in
Table 16, together with the corresponding cosine similarities. As can be seen,
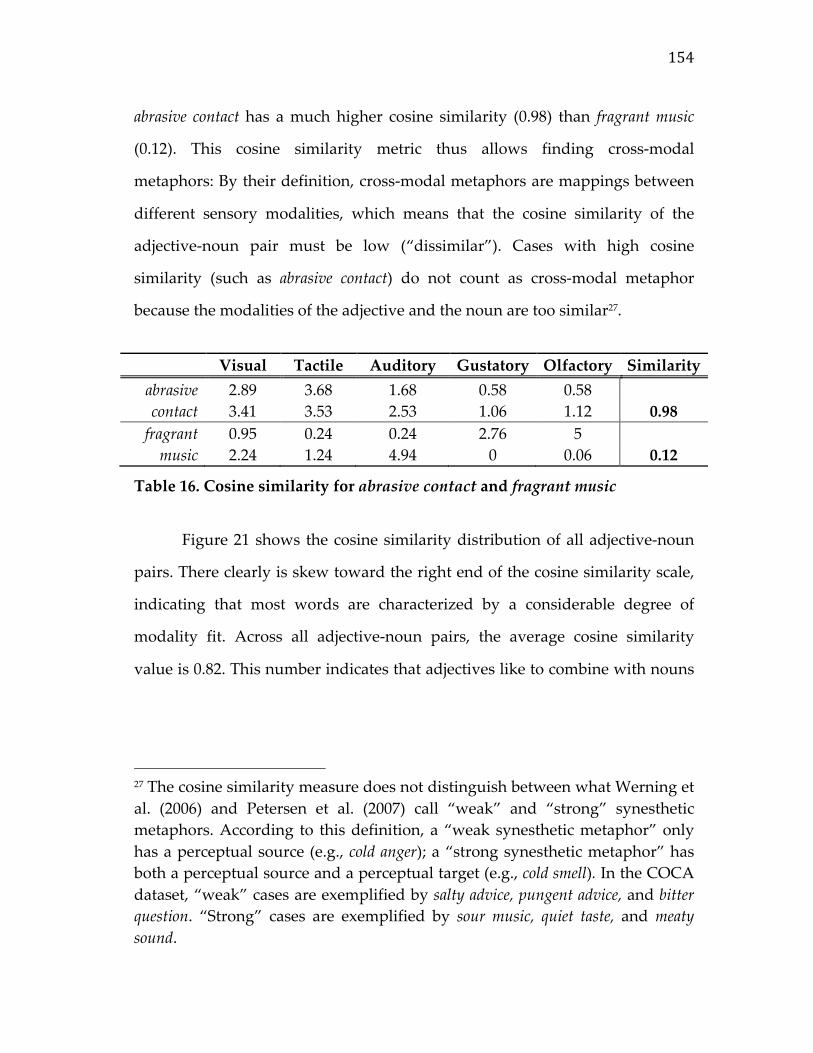
154
abrasive contact has a much higher cosine similarity (0.98) than fragrant music
(0.12). This cosine similarity metric thus allows finding cross-modal
metaphors: By their definition, cross-modal metaphors are mappings between
different sensory modalities, which means that the cosine similarity of the
adjective-noun pair must be low (“dissimilar”). Cases with high cosine
similarity (such as abrasive contact) do not count as cross-modal metaphor
because the modalities of the adjective and the noun are too similar27.
Visual Tactile Auditory Gustatory Olfactory Similarity
abrasive 2.89 3.68 1.68 0.58 0.58 contact 3.41 3.53 2.53 1.06 1.12 0.98
fragrant 0.95 0.24 0.24 2.76 5 music 2.24 1.24 4.94 0 0.06 0.12
Table 16. Cosine similarity for abrasive contact and fragrant music
Figure 21 shows the cosine similarity distribution of all adjective-noun
pairs. There clearly is skew toward the right end of the cosine similarity scale,
indicating that most words are characterized by a considerable degree of
modality fit. Across all adjective-noun pairs, the average cosine similarity
value is 0.82. This number indicates that adjectives like to combine with nouns
27 The cosine similarity measure does not distinguish between what Werning et al. (2006) and Petersen et al. (2007) call “weak” and “strong” synesthetic metaphors. According to this definition, a “weak synesthetic metaphor” only has a perceptual source (e.g., cold anger); a “strong synesthetic metaphor” has both a perceptual source and a perceptual target (e.g., cold smell). In the COCA dataset, “weak” cases are exemplified by salty advice, pungent advice, and bitter question. “Strong” cases are exemplified by sour music, quiet taste, and meaty sound.

155
that have similar modality profiles28. On the other hand, cases such as fragrant
music, i.e., cross-modal metaphors that have low cosines, are comparatively
rare.
Figure 21. Kernel density estimates of cosine modality similarity. Data from 13,685 adjective-noun pairs; density curve is restricted to observed range
The cosine measure can now be used to test the role of affect and
iconicity. Specifically, it was predicted that cross-modal metaphors should be
more valenced overall, and that they should also be less likely to contain iconic
forms. When “cross-modality” is conceived of as something continuous, this
28 To compute a baseline against which to evaluate the average similarity, adjectives and nouns from the corpus were randomly paired 10,000 times. The random process was constrained so that an adjective could not be paired with a noun that it actually occurred with together in the corpus. For instance, the adjective pale occurred with alabaster in the corpus. Because of this, if the word pale was randomly chosen, alabaster was deleted from the set of potential combinants. The average cosine value of these random adjective-noun pairs was 0.79, which is significantly lower than the attested cosine average of 0.82 (Wilcoxon rank sum, W = 59029000, p < 0.0001)
0
1
2
3
4
5Density
Modality Compatibility
0.00 0.25 0.50 0.75 1.00
Cosine Similarity
abrasive contact
fragrant music
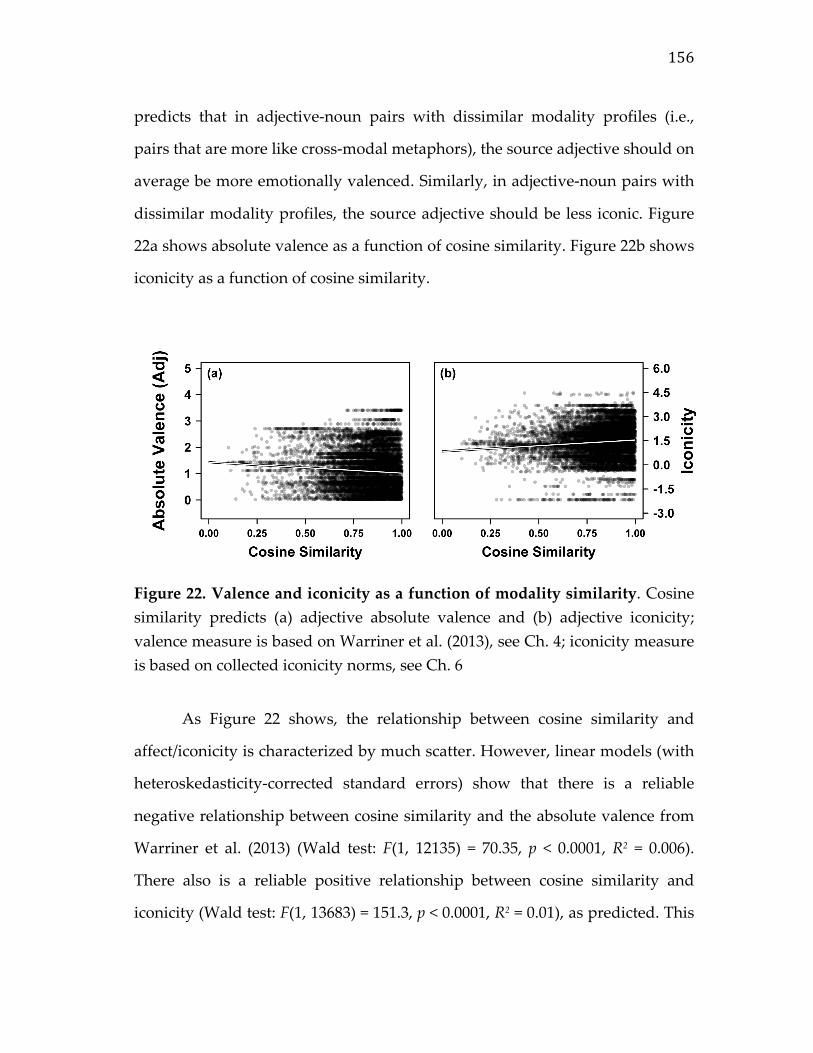
156
predicts that in adjective-noun pairs with dissimilar modality profiles (i.e.,
pairs that are more like cross-modal metaphors), the source adjective should on
average be more emotionally valenced. Similarly, in adjective-noun pairs with
dissimilar modality profiles, the source adjective should be less iconic. Figure
22a shows absolute valence as a function of cosine similarity. Figure 22b shows
iconicity as a function of cosine similarity.
Figure 22. Valence and iconicity as a function of modality similarity. Cosine similarity predicts (a) adjective absolute valence and (b) adjective iconicity; valence measure is based on Warriner et al. (2013), see Ch. 4; iconicity measure is based on collected iconicity norms, see Ch. 6
As Figure 22 shows, the relationship between cosine similarity and
affect/iconicity is characterized by much scatter. However, linear models (with
heteroskedasticity-corrected standard errors) show that there is a reliable
negative relationship between cosine similarity and the absolute valence from
Warriner et al. (2013) (Wald test: F(1, 12135) = 70.35, p < 0.0001, R2 = 0.006).
There also is a reliable positive relationship between cosine similarity and
iconicity (Wald test: F(1, 13683) = 151.3, p < 0.0001, R2 = 0.01), as predicted. This
157
shows that in those adjective-noun pairs that are more like cross-modal
metaphors (low cosines), adjectives indeed tend to be more emotionally
valenced and less iconic. The cross-modal metaphor fragrant melody is a good
example of this because fragrant is very positive and also not at all iconic.
Crucially, these results are obtained without pre-defining what a cross-modal
metaphor is in a categorical fashion. Rather, the continuous similarity /
dissimilarity of modalities is associated with affect and iconicity.
8.4. A closer look at the cross-modal metaphor hierarchy
This section provides an additional test of the results presented in the
preceding section. The main goal is to create a cross-tabulation of metaphorical
sources and targets, as is generally done in this literature (e.g., Ullman, 1959;
Day, 1996; Strik Lievers, 2015). To achieve this, cross-modal metaphors will be
treated as something categorical, i.e., the “dominant modality” classification
from Lynott and Connell (2009) will be used (see Ch. 2). For the approach
presented in this section, a large-enough set of modality-specific nouns is
needed. Unfortunately, the noun data from Lynott and Connell (2013) is
inadequate for this because there are too few purely olfactory words and
because many of the words in the dataset are either very multimodal (see
Ch. 2) or very abstract (e.g., welfare). Thus, the nouns do not relate strongly
enough to a particular modality to permit a look at cross-modal metaphors. So,
another dataset will be used here, taken from Strik Lievers (2015), who
compiled a list of 219 nouns, including 133 auditory nouns (e.g., voice, whirr,
rattle), 49 visual nouns (e.g., glitter, scarlet, shadow), 15 olfactory nouns (e.g.,
perfume, stench, noseful), 14 gustatory nouns (e.g., savor, sapidity, flavor) and
8 tactile nouns (e.g., touch, coldness, itch).
158
It proved possible to obtain a match between the Lynott and Connell
(2009) norms and the Strik Lievers (2015) dataset for a total of 4,704 adjective-
noun pairs. Several of those adjective-noun pair types occurred multiple times,
yielding a cumulative token frequency (all instances) of 33,139. This dataset
was further pared down as follows: Dimension words (e.g., little, high, low)
were excluded from the adjectives29. Instruments (e.g., lute, viola, piano) were
excluded from the nouns30. The final set of adjectives contained 3,686 unique
adjective-noun pair types that had a cumulative token frequency of 21,547.
There is considerable noise in this dataset, for example, the pair sharp eye
is coded as a “touch→vision” mapping and it is thus treated as a cross-modal
metaphor (with 148 instances in the total corpus), even though it is a highly
conventionalized metaphorical expression that is not about a visual impression
as such, but about somebody who is very discerning. Similarly, for this data,
highly conventionalized expressions such as bitter taste (occurring 124 times)
(which may be “dead” or “frozen” metaphors) are treated the same way as
other, less conventionalized expressions. There also is the problem that some
adjective-noun pairs clearly are not cross-modal metaphors, such as the
29 This was done for several reasons. First, many dimension words occur in constructions where the adjective is not used in a perceptual sense, e.g., a little touch of hope. Second, many other dimension words are used in primary metaphors (e.g., high sound, low sound; cf. Grady, 1997; 1999), which are distinct from cross-modal metaphors. Third, dimension words do not feature in Ullmann’s or Shen’s hierarchy. Finally, since most dimension words are rated as visual in Lynott and Connell (2009), including dimension words would just amplify the visual bias that is already present in the data. 30 Instruments were included as auditory nouns in Strik Lievers (2015). However, instruments do not refer to purely auditory concepts and excluding them serves to exclude cases such as red lute and black piano, which are simple literal descriptions of visual characteristics rather than cross-modal metaphors.
159
expression black music. Finally, several adjective-noun pairs are “primary
metaphors” (Grady, 1997, 1999) rather than cross-modal metaphors. These are
metaphors based on real-world associations rather than on genuine inter-
sensory mappings, such as is the case with warm color (27 occurrences) and cool
color (16 occurrences). In these cases, there is an association between
coldness/warmth and blue/red colors in the world (e.g., ice versus fire) (cf.
Marks, 1978: Ch. 8), and this real-world correlation appears to be the
motivating factor behind these expressions.
Thus, the data covered below is inherently noisy. However, hand-
classifying the 21,641 tokens for what are distinct uses of cross-modal
metaphors is beyond the scope of this dissertation, and it would work against
the purpose of trying to keep individual researcher decisions as much out of
the picture as possible. The research question investigated here thus becomes:
How are sensory words in general used to talk about words from other
modalities—ignoring important differences in exactly how these words are
used (i.e., whether they are abstract metaphorical uses, primary metaphors,
frozen conventionalized expressions etc.). To the extent that the results below
replicate major findings from past research, we can be certain that despite the
noisiness of the data, the present analyses tap into similar underlying
constructs to what is discussed in the literature on “synesthetic metaphors”.
Moreover, the large token number (21,641 tokens, considerably larger than in
past research on cross-modal metaphors) means that a low degree of noise is
tolerable. With these caveats in mind, Table 17 cross-tabulates the frequency of
source/target pairings for all modalities.
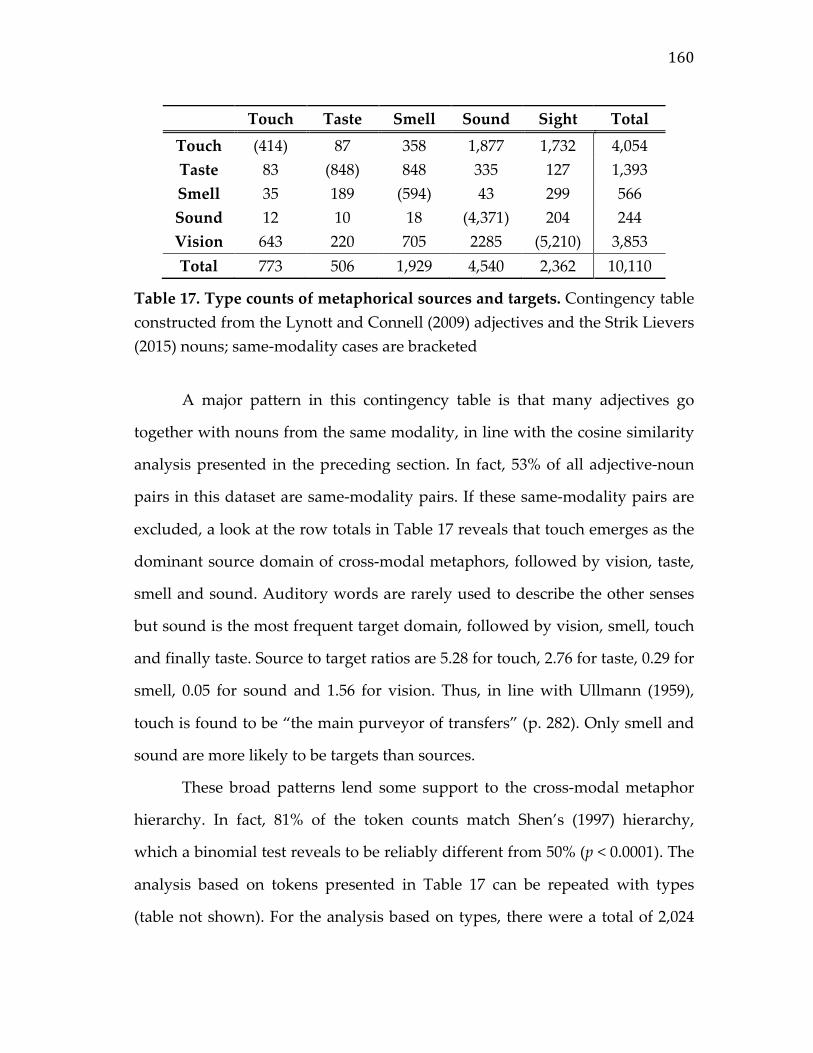
160
Touch Taste Smell Sound Sight Total
Touch (414) 87 358 1,877 1,732 4,054 Taste 83 (848) 848 335 127 1,393 Smell 35 189 (594) 43 299 566 Sound 12 10 18 (4,371) 204 244 Vision 643 220 705 2285 (5,210) 3,853 Total 773 506 1,929 4,540 2,362 10,110
Table 17. Type counts of metaphorical sources and targets. Contingency table constructed from the Lynott and Connell (2009) adjectives and the Strik Lievers (2015) nouns; same-modality cases are bracketed
A major pattern in this contingency table is that many adjectives go
together with nouns from the same modality, in line with the cosine similarity
analysis presented in the preceding section. In fact, 53% of all adjective-noun
pairs in this dataset are same-modality pairs. If these same-modality pairs are
excluded, a look at the row totals in Table 17 reveals that touch emerges as the
dominant source domain of cross-modal metaphors, followed by vision, taste,
smell and sound. Auditory words are rarely used to describe the other senses
but sound is the most frequent target domain, followed by vision, smell, touch
and finally taste. Source to target ratios are 5.28 for touch, 2.76 for taste, 0.29 for
smell, 0.05 for sound and 1.56 for vision. Thus, in line with Ullmann (1959),
touch is found to be “the main purveyor of transfers” (p. 282). Only smell and
sound are more likely to be targets than sources.
These broad patterns lend some support to the cross-modal metaphor
hierarchy. In fact, 81% of the token counts match Shen’s (1997) hierarchy,
which a binomial test reveals to be reliably different from 50% (p < 0.0001). The
analysis based on tokens presented in Table 17 can be repeated with types
(table not shown). For the analysis based on types, there were a total of 2,024

161
different mappings, for which the proportion of hierarchy-matching cases was
also 81% (binomial test: p < 0.0001).
Contrasting with predictions from the hierarchy, however, is the fact
that vision has a source/target ratio that is above one (1.56), indicating that it is
a more likely source than target—even though it should (as one of the “higher
senses”) predominantly be a target of metaphorical transfer. This exception
could be driven entirely by the fact that the visual modality is associated with
more words (as Ch. 3 showed). To control for lexical composition, Table 18
presents the same cross-modal metaphor counts again, but this time in terms of
proportion of words mapped from Lynott and Connell (2009). Thus, a value of
1.0 in this table would mean that all the words associated with a particular
modality are used in a cross-modal metaphor. A value of zero would mean
that none of the available words are mapped. This way of presenting the data
treats the 423 sensory words from Lynott and Connell (2009) as a “baseline”
against which to evaluate the number of adjectives that occur in cross-modal
metaphors.
Touch Taste Smell Sound Sight Mean Touch (.54) .39 .45 .70 .72 .45 Taste .28 (.65) .67 .43 .46 .37 Smell .46 .50 (.81) .31 .38 .33 Sound .09 .04 .07 (.94) .32 .11 Vision .34 .26 .31 .66 (.74) .31 Mean .23 .24 .30 .42 .38
Table 18. Proportion of mapped words by modality. Each cell lists the proportion of words from Lynott and Connell (2009) per modality that are used at all to talk about metaphor (type rather than token); target nouns are taken from the noun set presented in Strik Lievers (2015)
162
The diagonal of the table, representing same-modality cases, is
characterized by large numbers. Thus, adjectives are frequently used with
nouns from the source modality. This characterizes particularly the auditory
domain: 94% of all auditory adjectives are used to modify auditory nouns. This
fits the observation that auditory words are very exclusive and tend to
associate with other auditory words (see Ch. 7).
Once the same-modality cases are excluded, the mean proportion of
adjectives that occur in cross-modal metaphors (rightmost column) mirrors the
basic pattern of the cross-modal metaphor hierarchy: 45% of all tactile
adjectives from Lynott and Connell (2009) are used in cross-modal metaphors,
followed by 37% of all gustatory adjectives, 33% of all olfactory adjectives, 31%
of all visual adjectives and only 11% of all auditory adjectives. When it comes
to the targets, the bottom row shows that across the board, 42% of all adjectives
from Lynott and Connell (2009) appear in a construction that describes
auditory concepts. This is followed by 38% for vision, 30% for smell, 24% for
taste and 23% for touch. These orders mirror the hierarchy very closely, with
vision and audition being frequent targets but infrequent sources. The fact that
the ranking of vision changes so drastically when incorporating the “baseline
frequency” of visual words (as estimated by the Lynott and Connell, 2009 data)
shows how important it is to consider the composition of the lexicon (cf. Strik
Lievers, 2015).
On the surface, the fact that auditory nouns are the most frequent target
of cross-modal metaphors would appear to contradict the finding from
Chapter 7 that the auditory modality is anti-correlated with all other
modalities. However, this is not in fact a contradiction. Chapter 7 looked at
163
overall correlations; the analysis considered in this chapter focuses specifically
on the subset of cases where mappings between distant modalities are
performed, i.e., cross-modal metaphors. Within this subset of cross-modal
metaphors, audition is frequently described by other modalities—even though
generally, auditory words have a strong preference for combining with other
auditory words.
How does word frequency affect whether a word is or is not used in a
cross-modal metaphor? In the following analysis, the presence or absence of an
adjective in a cross-modal metaphor is modeled as a function of the base
frequency of each adjective, using logistic regression. To avoid circularity,
frequencies were computed that did not include the metaphor counts. For
example, the word white occurred 9 times in white silence—the frequency of
white used in the following analyses excludes these 9 occurrences. Thus, the
FREQUENCY predictor encodes information about an adjective’s base frequency
disregarding all the occurrences of cross-modal metaphors in our sample.
There was a reliable effect of frequency on metaphor participation (logit
estimate: 0.57, SE = 0.19, p = 0.003, R2 = 0.07), with more frequent adjectives
being more likely to occur in cross-modal metaphors. This by itself is evidence
for the importance of controlling for baseline lexical asymmetries when
studying cross-modal metaphor.
The role of affect and iconicity can now be tested while simultaneously
controlling for frequency. A logistic regression with the factors LOG FREQUENCY
and ABSOLUTE VALENCE31 revealed that overall more valenced adjectives are
31 Because Ch. 4 showed that using context valence (rather than the valence of the word itself) permits the analysis of a larger set of words, the context valence is used in these analyses.

164
more likely to be used in cross-modal metaphors. This is statistically reliable
for the valence norms from the Twitter Emotion Corpus (logit estimate: 5.26,
SE = 1.84, p = 0.004, R2 = 0.08) and SentiWordNet 3.0 (logit: 31.47, SE = 11.6, p =
0.007, R2 = 0.08), but not for the valence data from Warriner et al. (2013) (logit:
1.86, SE = 1.09, p = 0.09, R2 = 0.02) (see Chapter 4 for description of valence
norms). ICONICITY only shows a numeric trend in the right direction (more
iconic words are less likely used in cross-modal metaphors), but no reliable
effect (logit estimate: -0.15, SE = 0.17, p = 0.38, R2 = 0.007). Figure 23 shows the
predicted proportion of words occurring in cross-modal metaphor (lines) as a
function of absolute valence and iconicity. The figure clearly shows that
absolute valence is positively associated with metaphor participation, and it
suggests that iconicity may be negatively associated with metaphor
participation to some degree (albeit not reliably so). Taken together, the factors
FREQUENCY, ABSOLUTE VALENCE and ICONICITY account for about 15% of the
variance in metaphor participation.

165
Figure 23. Metaphor use as a function of valence and iconicity. Whether a sensory word was “mapped” to another sense (i.e., it occurred in a cross-modal metaphor) or not as a function of (a) the word’s absolute valence (context valence, from Mohammad, 2012) and (b) the word’s iconicity; lines show logistic regression fits with 95% confidence intervals; random scatter was added to the binary variable to increase the visibility of each word data point
8.5. Discussion
In line with the results from Chapter 7, the analyses presented in this chapter
support the idea that sensory words first and foremost prefer to pair with
words from similar modalities. Although there is clear evidence for
multimodality, and although cross-modal metaphors do occur in everyday
language (e.g., sharp smell is quite frequent), many words are used
preferentially in the context of words that relate to their own modality.
Mappings between extremely dissimilar modalities, such as in cross-modal
metaphor, are clearly the relatively more infrequent case.
The present results also lend some support to the view that the cross-
modal metaphor hierarchy is influenced by various interacting forces and
perhaps—if more factors are taken into account in future work—the hierarchy
(a)
Not mapped
Mapped
0.0
Absolute Valence
(b)
-2.5 0.0 2.5
Iconicity
166
can be seen as fully composed of a number of smaller-scale principles. In the
present analyses, it was shown that lexical differentiation and word frequency
play a role in cross-modal metaphors. Second, it was shown that affectively
loaded words are preferred in cross-modal metaphors. Finally, there was some
suggestive evidence for highly iconic words being dispreferred in cross-modal
metaphors.
The asymmetries that are commonly observed in empirical studies of
cross-modal metaphor may be partly due to these factors. In particular, the fact
that auditory words are iconic but not particularly frequent and not
particularly emotionally valenced makes them unlikely sources of cross-modal
metaphors, thus pushing audition toward the top of the hierarchy32. On the
other hand, the fact that taste and smell words are highly evaluative will tend
to push these modalities further down the hierarchy because, as the analysis
presented above showed, emotionally valenced adjectives are preferred in
cross-modal metaphors.
The fact that touch words are generally fairly iconic, as Chapter 6
showed, would predict that touch is not a likely source—this, however, was
not found to be the case. Here, it should be mentioned that the type of iconicity
is very different for tactile words than for auditory words: Whereas auditory
words such as squealing directly imitate a particular sound using multiple
phonemes (i.e., the entire word has onomatopoetic character), iconicity in
tactile words appears to be of a more vague and abstract kind. For example,
32 One should also note that many auditory adjectives, such as squealing, hissing and buzzing, denote non-scalar properties, and Petersen et al. (2007) argue that cross-modal metaphors are more likely to contain scalar adjectives. This is a further disadvantage of auditory words in respect of the frequency of their use in cross-modal metaphors.
167
Chapter 6 showed that /r/ is found in many rough words, but /r/ generally
occurs in phonesthemes that describe “irregularity” (e.g., Hutchins, 1998,
Appendix A), and /r/ has also been described as “aggressive” (Fónagy, 1961),
as well as “harsh, rough, heavy, masculine, and rugged” (Greenberg & Jenkins,
1966: 212). So, /r/ has many potential meanings; squealing can really only mean
one thing. The type of iconicity in tactile words may be schematic enough not
to bias against being used in cross-modal metaphors.
The fact that adjectives occurring in cross-modal metaphors had
comparatively higher absolute valence supports the view that at least part of
what cross-modal metaphors do is to express an evaluation about the target
domain. This is in line with the emerging evidence that using cross-modal
metaphors as opposed to literal expressions has strong effects on the perceived
emotional valence of the corresponding adjective-noun pair (e.g., Sakamoto &
Utsumi, 2014), and that more generally, that metaphors engage emotional
processes (e.g., Citron & Goldberg, 2014). Thus, when the word sour is used to
describe a musical note, sour note, “it is not because the note sounds as if it
would taste sour”, but because sour lends its evaluative connotation of
“displeasing to the senses” to the auditory domain (Lehrer, 1978: 121). Thus,
when words such as sweet and sour are used in cross-modal metaphors, they
may lend their affective content, rather than modality-specific perceptual
content. This does not necessarily make adjective-noun pairs such as sour note
less metaphorical. Rather, the evaluative component might be foregrounded in
such metaphors, and the modality-specific sensory content may be
backgrounded. Marks (1978: 217) said that “there is little doubt that the
gustatory adjectives sweet and bitter often are used in a cross-modal fashion at
least partly because they connote pleasantness and unpleasantness”. The

168
emphasis of this quote should be on “partly”, highlight that affect is one of
many factors that determines cross-modal metaphor usage.
The fact that frequency, affect and to some degree iconicity were shown
to play a role is one piece of evidence for a more integrated perspective of the
cross-modal metaphor hierarchy. On this note, it should be emphasized that it
seems quite unlikely on a priori grounds that a one-size-fits-all principle such
as “conceptual preference” or “accessibility” (e.g., Shen & Aisenman, 2008)
should explain all asymmetries between the senses: With five sensory
modalities, there are twenty different directional mappings between the
modalities. Because each sense is unique, each combination of two senses is
unique. That such a complex network could be captured by one principle has
been contested by many scholars (e.g., Sadamitsu, 2003). Paradis and Eeg-
Olofsson (2013: 37) rightly point out, “the notions of lower and higher
modalities are not defined or agreed upon in the literature” (see also San
Roque et al., 2015). Thus, theoretically, the a priori plausibility of a single
principle that applies uniformly to all senses is quite low (Paradis & Eeg-
Olofsson, 2013; Caballero & Paradis, 2015).
Shen’s claim that taste and smell are more “accessible” than vision and
hearing contrasts with the evidence that people have difficulty naming tastes
and smells (see Ch. 4). Similarly, the purported “accessibility” of touch
compared to vision and audition does not to mesh with the finding that people
are quicker to process visual and auditory information than tactile information
(Spence et al., 2001; Turatto et al., 2004; Connell & Lynott, 2010). Moreover, the
notion of “cognitive accessibility” alluded to in Shen’s proposal deviates from
how this term is generally used in psycholinguistics, where it is thought of as
“speed of accessing information”. As shown in Chapter 3, visual words are
169
actually processed more quickly than words for the other modalities (including
words for touch), and processing speed is generally thought to reflect
accessibility in psycholinguistic terms. Other problems with the accessibility
notion are raised by Paradis and Eeg-Olofsson (2013: 37), who note that the
hierarchy contradicts similar hierarchies proposed in studies of evidentiality
(see also, Caballero & Paradis, 2015), i.e., in evidential systems of the world’s
languages, it is usually the visual modality that is regarded as the most reliable
and valuable.
Although the data presented in this chapter could in principle be used
to come up with a new and modified version of the cross-modal metaphor
hierarchy, a deliberate decision was made to refrain from such an update.
Various researchers have argued for or against specific instantiations of the
hierarchy (for a review see Shinohara & Nakayama, 2011). This could either
mean that the right hierarchy has not been found yet, or it could mean that the
search for a hierarchy is not the right approach to begin with. Much research in
anthropology (e.g., Howes, 1991; Classen, 1993, 1997) and linguistics (San
Roque et al., 2015) shows that it is difficult to “line up” the senses in a linear
fashion, as is done when Shen and colleagues (e.g., Shen, 1997; Shen &
Aisenmann, 2008) argue that the senses can be ordered directionally with
respect to “lower” and “higher” modalities. Rather than assuming a monolithic
hierarchy, one can reverse the question and ask: What are the factors that
determine whether words are used in cross-modal metaphors? Here, three
factors —word frequency, emotional valence, iconicity— were shown to play a
partial role. Future research can work on uncovering additional factors that
determine directional tendencies in cross-modal metaphors. This will
170
ultimately lead to a fuller understanding of cross-modal metaphors, one that
stays true to the complexity of metaphor usage.

171
Chapter 9. Conclusions
9.1. Summary of empirical findings
This chapter takes stock of the empirical findings presented in this dissertation.
With respect to the central idea that language and the senses are tightly
connected, several of the observed linguistic patterns presented throughout
Chapters 3 to 8 mirror phenomena that are independently found outside of
linguistic contexts. The mappings between language-external and language-
internal findings are summarized in Table 19, which highlights that the
connections between language-external factors and language-internal patterns
are manifold. Chapter 6 is the only chapter not represented in the table because
it does not deal directly with a mapping between something extra-linguistic
onto language, but rather with the phonological characteristics of different
classes of sensory words.
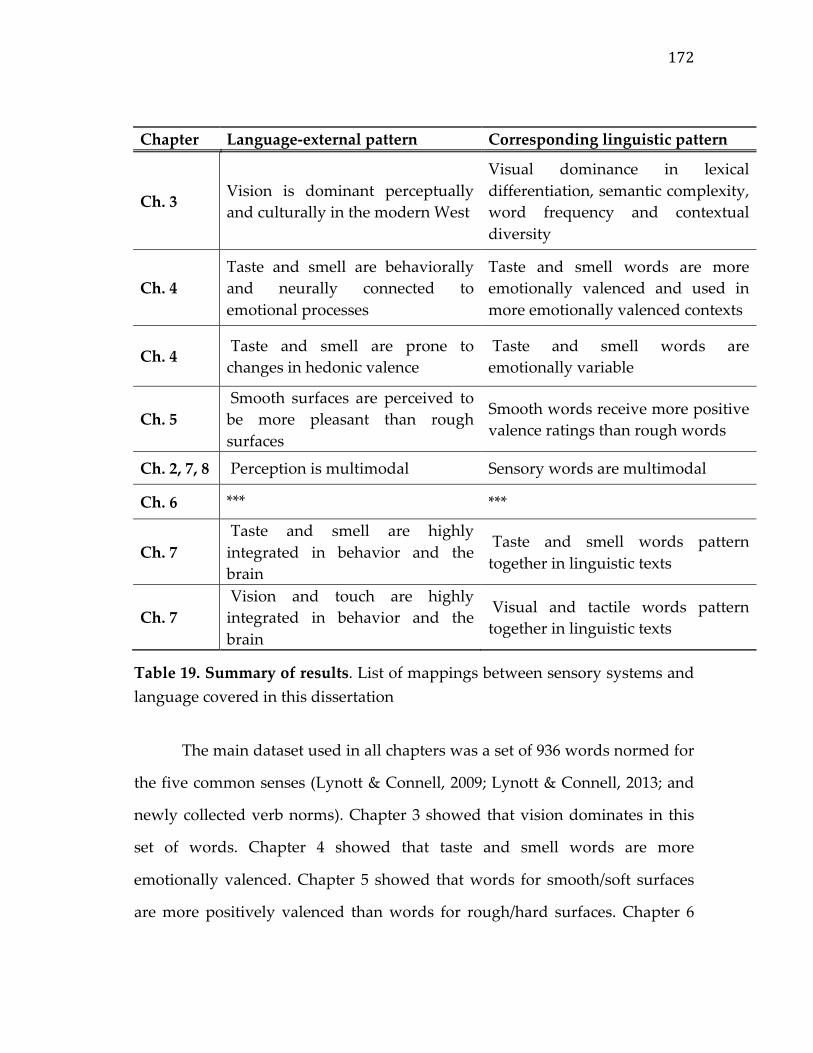
172
Chapter Language-external pattern Corresponding linguistic pattern
Ch. 3 Vision is dominant perceptually and culturally in the modern West
Visual dominance in lexical differentiation, semantic complexity, word frequency and contextual diversity
Ch. 4 Taste and smell are behaviorally and neurally connected to emotional processes
Taste and smell words are more emotionally valenced and used in more emotionally valenced contexts
Ch. 4 Taste and smell are prone to changes in hedonic valence
Taste and smell words are emotionally variable
Ch. 5 Smooth surfaces are perceived to be more pleasant than rough surfaces
Smooth words receive more positive valence ratings than rough words
Ch. 2, 7, 8 Perception is multimodal
Sensory words are multimodal
Ch. 6
***
***
Ch. 7 Taste and smell are highly integrated in behavior and the brain
Taste and smell words pattern together in linguistic texts
Ch. 7 Vision and touch are highly integrated in behavior and the brain
Visual and tactile words pattern together in linguistic texts
Table 19. Summary of results. List of mappings between sensory systems and language covered in this dissertation
The main dataset used in all chapters was a set of 936 words normed for
the five common senses (Lynott & Connell, 2009; Lynott & Connell, 2013; and
newly collected verb norms). Chapter 3 showed that vision dominates in this
set of words. Chapter 4 showed that taste and smell words are more
emotionally valenced. Chapter 5 showed that words for smooth/soft surfaces
are more positively valenced than words for rough/hard surfaces. Chapter 6

173
showed that the phonological details of words differ depending on which
sensory modality they relate to. Particularly, auditory and tactile words were
found to have more iconic sound-meaning correspondences. Furthermore,
words for rough and hard surfaces were found to be marked by the phoneme
/r/. Chapter 7 focused on interrelations between the senses, pointing out that
vision/touch and taste/smell are associated with each other in natural
language. Chapter 8 used results from the preceding chapters to address
questions surrounding the idea of a cross-modal metaphor hierarchy. This
chapter argued against the view that there is a linear hierarchy of the senses
and concluded that lexical asymmetries, emotional valence and iconicity are
three factors affecting the use of cross-modal metaphors.
One can view the set of results from a variety of perspectives. One is the
perspective of visual dominance. In this regard, Chapter 3 showed that vision
is more lexically differentiated, less restricted to small pockets of linguistic
material (less bimodality of perceptual strength ratings), more semantically
complex, more frequent and more contextually diverse. Chapter 4 furthermore
showed that the visual modality has words that can express evaluative content
(e.g., attractive, ugly, beautiful, pretty), but it is not confined to such words, as are
taste and smell. From this perspective, the involvement of taste and smell
words in emotional language can be seen as a restriction that vision does not
have. Similarly, there may be iconicity in the visual domain (e.g., the visual
word tiny was rated to be highly iconic), but unlike audition, the visual
modality does not have to rely as much on iconic means of expressing
perceptual content (Ch. 6). Finally, the asymmetries in cross-modal metaphors
discussed in Ch. 8 can also be interpreted as an instance of visual dominance:
Vision, being a very important modality that is frequently talked about

174
(see Ch. 3), is frequently talked about with descriptors from other sensory
modalities. That is, the other modalities “lend” their lexical material to the
description of visual impressions.
Another way to summarize the results is by viewing them from the
perspective of different levels of linguistic analysis, including the level of the
word unit (Ch. 3-5), the level of sound structure (Ch. 6) and the level of multi-
word units (Ch. 7 and 8). The different levels of linguistic analysis interact at
multiple points. This was demonstrated most clearly with respect to cross-
modal metaphors, which Chapter 8 showed to be influenced by lexical
differentiation and word frequency, affect, and iconicity. Thus, although it is
sometimes useful to treat the different levels of linguistic analysis separately,
they play together when it comes to explaining some higher-level phenomena,
such as cross-modal metaphors. Here, it is particularly noteworthy that
iconicity correlated with a word’s participation in cross-modal metaphors—at
least to some degree. This shows how low-level phonological structures affect
high-level structures.
The chapters can also be viewed from the perspective of linguistic
hierarchies, such as those proposed by Ullmann (1959), Viberg (1983) and Shen
(1997). These hierarchies generally treat vision and hearing as the “highest”
senses, relegating taste, smell and touch to the “lower” end of the sensorium.
In line with the cross-linguistic results presented in San Roque et al. (2015), the
major patterns presented in this dissertation do not allow a strict ranking of the
senses with the notable exception of visual dominance. In particular, touch and
audition were generally about equal to each other with respect to many
linguistic measures, and so were taste and smell. Thus, the evidence presented
in this dissertation cannot be used to support existing “universal” hierarchies,
175
nor can it be used to develop a new one. This vibes with findings from Strik
Lievers (2015), who in her analysis of cross-modal metaphors finds that the
network of intersensorial relationships differs between different kinds of text.
To further assess the degree of relativity and the degree of universality, the
analyses presented in this dissertation should be extended to other cultural
complexes, particularly to those cultures that are reported to put relatively
more weight on smell (Wnuk & Majid, 2014; Majid & Burenhult, 2014) or
sound (e.g., Lewis, 2009). It would particularly be interesting to investigate the
linguistic phenomena studied in this dissertation with populations that have
different sensory systems, such as blind people or deaf sign language speakers.
The techniques discussed in this dissertation can also be applied to groups that
specialize into particular sensory domains, such as coffee experts (Croijmans &
Majid, 2015), beer experts (Danescu-Niculescu-Mizil et al., 2013) and wine
experts (Lehrer, 1975; Lehrer, 2009).
Another perspective from which the results can be viewed is from the
perspective of emotional language. Majid (2012: 433) reviews “aspects of
linguistic structure where emotion might reveal itself”, however, among these
aspects, sensory language is not highlighted. In multiple chapters, this
dissertation has shown that the issue of sensory modality is deeply connected
to the issue of affect. Ch. 4 and 5 showed that taste/smell words and tactile
words relating to roughness and hardness participate in evaluative language.
Chapter 8 showed that the issue of emotional valence partly determines
asymmetries between the senses that were previously thought to require a
purely perceptual explanation (e.g., in terms of “accessibility”, Shen, 1997;
Shen & Aisenmann, 2008). Thus, affect is an integral dimension of sensory
language.
176
A final perspective from which to view the results is that of
methodology. This dissertation made several methodological contributions.
First, topics such as lexical composition (Majid & Levinson, 2014), visual
dominance (San Roque et al., 2015) and cross-modal metaphors (Ullmann,
1959) were addressed with the help of modality norms (Ch. 2), providing a
principled approach to classifying words according to sensory modalities.
Second, whereas the emotional dimension of words such as rancid and pungent
was previously only intuited, this was addressed quantitatively using valence
norms. Third, iconicity —in the past often just argued for or against by listing
isolated examples— was approached quantitatively for hundreds of English
words using iconicity norms. Finally, more objective criteria were introduced
to the study of cross-modal metaphor, which previously relied on small-scale
corpus analyses where individual metaphors had to be hand-labeled.
9.2. Predictions for novel experiments
The empirical results discussed throughout this dissertation are largely based
on the analysis of sensory words in relation to existing databases (e.g., valence
norms) or corpora (e.g., COCA). However, the findings discussed make
testable predictions for psycholinguistic and cognitive experiments, such as the
following:
• According to what one might call the “sweet stink effect”, taste and
smell words are more emotionally malleable (Chapter 4). This predicts
that creating novel expressions that combine positive and negative
taste/smell words should be more acceptable than expressions that
similarly combine positive and negative words in the other modalities.
177
For example, the expressions rancid aroma (olfactory) and noisy harmony
(auditory) combine negatively valenced words (rancid, noisy) with
positively valenced words (aroma, harmony). Both expressions are
unattested in COCA, but given the finding that taste and smell are more
emotionally malleable, native English speakers should rate rancid aroma
to be more acceptable than noisy harmony.
• The structure of multimodality discussed in Chapter 7 predicts that in
modality switching tasks (Pecher et al., 2003), switches between vision
and touch, and switches between taste and smell should be less
interfering with processing than switches between the other modalities.
• The cross-modal metaphor results discussed in Chapter 8 allow the
formation of novel unattested metaphors with specific predictions
regarding their acceptability. For example, both squealing violet and loud
violet are unattested in COCA, but loud is predicted to be much more
acceptable in this context based on the fact that it is more frequent and
less iconic.
These three examples highlight how the findings uncovered in this
dissertation lead to novel, and testable, experimental predictions that can be
assessed in future lab-based work.
178
9.3. Perception and language
The linguistic patterns observed throughout this dissertation are best
understood as language-external influences on language. This view is
thoroughly in line with the notion that language and the mind are embodied
(Glenberg, 1997; Barsalou, 1999, 2008; Anderson, 2003; Gallese & Lakoff, 2005).
There are many versions of this view (Wilson, 2002), but broadly defined, the
embodied cognition framework treats language as something that is
interconnected with the rest of cognition and perception. Gallese and Lakoff
(2005: 456), for instance, view cognition and language as being “structured by
our constant encounter and interaction with the world via our bodies and
brains”, which includes interaction with the world as it is mediated through
the senses.
A specific line of research within the embodied cognition framework
that is particularly relevant for the topics discussed in this dissertation relates
to mental simulation, the idea that language users mentally simulate what a
piece of language is about (Barsalou, 1999; Fischer & Zwaan, 2008; Zwaan,
2009; Bergen, 2012). Mental simulation entails that understanding language
engages brain areas associated with perception and action (Hauk, Johnsrude, &
Pulvermüller, 2004; Pulvermüller, 2005). And, by extension, it also means that
when language users process sensory language, they mentally activate specific
sensory content, relating to vision, touch, hearing, taste and smell (Pecher et al.,
2003; Goldberg et al., 2006a, 2006b; González et al., 2006).
If words such as salty and shiny are intimately tied to the brain areas that
are associated with actively perceiving saltiness and shininess (as by the
perceptual simulation account), it is to be expected that the language system
reflects perceptual structures. The empirical data presented in this dissertation
179
support this view. Linguistic structure mirrors asymmetries between the
senses (e.g., visual dominance) and interrelations between the senses (e.g., taste
and smell integration). However, the mapping between perception and
language is far from complete. Language and perception clearly are not
isomorphic. Compared to our multimodal experience of the world, language is
a medium that is relatively more unidimensional, forcing the language user to
carve up the sensory space into smaller pieces and packages.
In the transduction process from the senses to language, two things can
happen: First, information may get lost. Second, some information may get
added on. The loss of information is most easily exemplified by the poverty of
English smell vocabulary (see Ch. 3; Majid & Burenhult, 2014). Humans are
able to recognize thousands of different smells, and they are very good at
discriminating between them even at fairly low concentration levels (Yeshurun
& Sobel, 2010). But despite these perceptual capacities, the smell vocabularies
that languages have to offer only represent a small fraction of that perceptual
space. This is the case even for languages with more elaborate smell
vocabularies (Majid & Burenhult, 2014). Another example is the domain of
color, where languages tend to focus on a small number of color terms (Berlin
& Kay, 1969), even though there are many more colors that can be
distinguished perceptually. A final and more specific example is the word
umami, which describes a meaty protein-rich flavor (the taste of monosodium
glutamate). Like sweet, sour, bitter and salty, the word umami actually refers to a
basic taste that is associated with its own taste receptors (see Carlson,
2010: 250)—but this particular taste had no name in the English language until,
fairly recently, the Japanese word was borrowed. The very fact that languages
differ in their sensory vocabulary means that every language only encodes a
180
small subset of the sensory impressions that humans can perceive (Malt &
Majid, 2013), and that the mapping between perception and language must
therefore be incomplete.
Information loss also happens with respect to the multimodality of
perceptual experience. For instance, the experience of eating a taco chip
involves perceiving its shape and color visually, perceiving its taste and smell
through the chemical senses, and perceiving its crunchiness (Diederich, 2015)
through tactile and auditory sensations. The experience of eating a taco chip is
a vastly multimodal endeavor. But when one subsequently describes this
experience verbally, the English language forces its user to package this
information into words such as spicy, salty, crunchy and red—words that single
out different aspects of the original multimodal perceptual experience. To
describe the full multisensory impression of eating a taco chip, many different
words need to be strung together, e.g., the red chip was really crunchy and spicy.
And even this does not capture the full extent of the original experience, nor
does the linear format of language adequately represent the simultaneity with
which the different sensory impressions may be perceived. Language enforces
a linear encoding which compresses the multidimensionality of multimodal
perception. This is not to say that words are not multimodal (they clearly are,
as Chapters 2, 7 and 8 showed), but the multimodality of linguistic units is a
more indirect one, for example, mediated through associations with other
words (Chapter 7, 8). Thus, multimodality is retained, but only to some extent.
In all the examples discussed so far, language was seen as a passive
reflection of perceptual content. However, language clearly also plays a more
active role in sensory cognition, a view that is also expressed by Louwerse’s
Symbol Interdependency Theory (Louwerse, 2011). In this theory, Louwerse
181
distinguishes between “embodied cognition” (which involves perceptual
simulation) and “symbolic cognition” (which involves processing of lexical
associations, for example nurse→doctor). Both types of processing are assumed
to act simultaneously, for example, in the modality switching paradigm
(Ch. 1), a switch from an auditory trial (leaves-rustling) to another auditory one
(blender-loud) is thought to be easy not just because accessing words such as
rustling and loud activates the corresponding embodied auditory concepts, but
also because words such as loud and rustling are linguistically associated with
each other (Louwerse & Connell, 2011). Thus, the fact that linguistic items are
associated with each other influences language understanding, above and
beyond what comes from embodiment alone. However, it should be noted that
Louwerse’s “symbolic cognition” is essentially just embodied cognition
channeled through language. After all, the theory can only explain
experimental results from the domain of embodied cognition if language
mirrors embodied structures (Louwerse, 2011). Thus, embodiment influences
processing two ways. First, directly through the activation of sensorimotor
content. Second, through feedback from the linguistic system. For language to
influence processing in an embodied fashion, it needs to mirror embodied
relations in the first place. Thus, only because words linguistically cluster
together in a way that mirrors perceptual distinctions (e.g., auditory words
cluster with auditory words) can language explain some of the results in
embodied tasks such as the modality switching paradigm. This principle was
highlighted in Ch. 3, which argued that the effects of visual dominance onto
the English lexicon have ramifications for the processing of visual words, i.e.,
they are processed more quickly because frequency reflects visual dominance.
182
So, within Louwerse’s theory, the encoding of perceptual structures into
language is the primary step; processing effects result from this.
When it comes to cases where language “adds” something new, cross-
modal metaphor is the prime example. As stated by Marks (1978: 254), “the
synesthetic, like the metaphoric in general, expands the horizon of knowledge
by making actual what were before only potential meanings.” Cross-modal
metaphors create novelty, i.e., language users have a wide range of sensory
terms available to them that afford creative re-combination. Creativity surely is
a driving force behind such metaphors as fragrant melody or the music of
caressing (Shen & Gadir, 2009), which is also why much of cross-modal
metaphor research has been discussed in the domain of literature studies and
poetics (Ullman, 1945; Erzsébet, 1974; Yu, 2003; Tsur, 2008, 2012).
However, this creativity is constrained by many cognitive and linguistic
factors, including affect, iconicity and lexical differentiation. The latter point —
that there are more words for some sensory modalities— is especially
interesting because it shows how lack a of terminology to describe certain
sensory impressions leads to the necessity of cross-modal metaphors. Auditory
sensations, for example, are fairly difficult to put into words (cf. Dubois, 2000;
Porcello, 2004), and thus, other sensory modalities are recruited to describe
them, as in such expressions as bright sound, dark sound, pale sound, sharp sound,
blunt sound, low sound, high sound, hollow sound, full sound, thin sound, rough
sound, smooth sound, and sweet sound—all of which are attested in COCA. The
example of cross-modal metaphor thus highlights how language has a life of
its own, with bottlenecks at one part in the linguistic system creating the need
for novelty in another part of the system. Linguistic structures play together,
creating a network of inter-sensory relationships in the process.
183
To conclude, language filters perceptual content, but it also embellishes
it. Language serves to channel multimodal sensory experiences into words,
and in the process where the sensory becomes the linguistic, language creates a
whole new world of sensory relations. By means of various empirical studies,
this dissertation showed that the English lexicon is thoroughly infused with
sensory information, with the senses influencing all kinds of linguistic
structures, ranging from phonology to metaphor. Language vividly connects to
the way we experience the world around us and provides a mirror into the
world of the senses, revealing a complex web of perception, meaning, and
emotions, or as Marks (1979: 255) put it, “the fabric of mental tapestry richly
woven in form and color, sound, taste, touch, and scent.”

184
References
Abelin, Å. (1999). Studies in Sound Symbolism. Göteborg: Göteborg University dissertation.
Abramova, E., Fernández, R., & Sangati, F. (2013). Automatic labeling of phonesthemic senses. In M. Knauff, M. Pauen, N. Sebanz, & I. Wachsmuth (Eds.), Proceedings of the 35th Annual Conference of the Cognitive Science Society (pp. 1696-1701). Austin, TX: Cognitive Science Society.
Ackerman, J. M., Nocera, C. C., & Bargh, J. A. (2010). Incidental haptic sensations influence social judgments and decisions. Science, 328, 1712-1715.
Adelman, J. S., Brown, G. D., & Quesada, J. F. (2006). Contextual diversity, not word frequency, determines word-naming and lexical decision times. Psychological Science, 17, 814-823.
Ahlner, F., & Zlatev, J. (2010). Cross-modal iconicity: A cognitive semiotic approach to sound symbolism. Sign Systems Studies, 1, 298-348.
Alais, D., & Burr, D. (2004). The ventriloquist effect results from near-optimal bimodal integration. Current Biology, 14, 257-262.
Alivisatos, A., Jacobson, G., Hendler, T., Malach, R., & Zohary, E. (2002). Convergence of visual and tactile shape processing in the human lateral occipital cortex. Cerebral Cortex, 12, 1202-1212.
Allan, K., & Burridge, K. (2006). Forbidden Words: Taboo and the Censoring of Language. Cambridge: Cambridge University Press.
Amassian, V. E., Cracco, R. Q., Maccabee, P. J., Cracco, J. B., Rudell, A., & Eberle, L. (1989). Suppression of visual perception by magnetic coil stimulation of human occipital cortex. Electroencephalography and Clinical Neurophysiology, 74, 458-462.
Arata, M., Imai, M., Okuda, J., Okada, H., & Matsuda, T. (2010). Gesture in language: How sound symbolic words are processed in the brain. In R. Camtrabone & S. Ohlsson (Eds.), Proceedings of the 32nd Annual Meeting of the Cognitive Science Society (pp. 1374-1379). Austin, TX: Cognitive Science Society.
de Araujo, I. E., Rolls, E. T., Kringelbach, M. L., McGlone, F., & Phillips, N. (2003). Taste-olfactory convergence, and the representation of the pleasantness of flavour, in the human brain. European Journal of Neuroscience, 18, 2059-2068.
Auvray, M., & Spence, C. (2008). The multisensory perception of flavor. Consciousness and Cognition, 17, 1016-1031.
Baayen, R. H., & del Prado Martín, F. M. (2005). Semantic density and past-tense formation in three Germanic languages. Language, 81, 666-698.
Baayen, R. H., Piepenbrock, R., & van Rijn, H. (1993). The {CELEX} lexical data base on {CD-ROM}. 1993.
185
Baccianella, S., Esuli, A., & Sebastiani, F. (2010). SentiWordNet 3.0: An Enhanced Lexical Resource for Sentiment Analysis and Opinion Mining. Proceedings of the 7th Conference on Language Resources and Evaluation, 10, 2200-2204.
Baker, S. J. (1950). The pattern of language. The Journal of General Psychology, 42, 25-66.
Balota, D. A., & Chumbley, J. I. (1985). The locus of word-frequency effects in the pronunciation task: Lexical access and/or production? Journal of Memory and Language, 24, 89-106.
Balota, D. A., Yap, M. J., Hutchison, K. A., Cortese, M. J., Kessler, B., Loftis, B., Neely, J. H., Nelson, D. L., Simpson, G. B., & Treiman, R. (2007). The English lexicon project. Behavior Research Methods, 39, 445-459.
Barr, D. J., Levy, R., Scheepers, C., & Tily, H. J. (2013). Random effects structure for confirmatory hypothesis testing: Keep it maximal. Journal of Memory and Language, 68, 255-278.
Barsalou, L. W. (1999). Perceptual symbol systems. Behavioral and Brain Sciences, 22, 577-660.
Barsalou, L. W. (2008). Grounded cognition. Annual Review of Psychology, 59, 617-645.
Barten, S. S. (1998). Speaking of music: The use of motor-affective metaphors in music instruction. Journal of Aesthetic Education, 32, 89-97.
Bartley, S. H. (1953). The perception of size or distance based on tactile and kinesthetic data. The Journal of Psychology, 36, 401-408.
Bartoń, K. (2015). MuMIn: Multi-model inference. R package version 1.15.1.
Bates, D., Maechler, M., Bolker, B., & Walker, S. (2015a). lme4: Linear mixed-effects models using Eigen and S4. R package version 1.1-9.
Bates, D., Maechler, M., Bolker, B., & Walker, S. (2015b). Fitting Linear Mixed-Effects Models using lme4. Journal of Statistical Software, 67, 1-48.
Baumann, O., & Greenlee, M. W. (2007). Neural correlates of coherent audiovisual motion perception. Cerebral Cortex, 17, 1433-1443.
Beckner, C., Blythe, R., Bybee, J., Christiansen, M. H., Croft, W., Ellis, N. C., Holland, J., Ke, J., Larsen-Freeman, D., & Schoenemann, T. (2009). Language is a complex adaptive system: Position paper. Language Learning, 59, 1-26.
Bergen, B. K. (2004). The psychological reality of phonesthemes. Language, 80, 290-311.
Bergen, B. K. (2012). Louder than Words: The New Science of how the Mind Makes Meaning. New York: Basic Books.
Berglund, B., Berglund, U., Engen, T., & Ekman, G. (1973). Multidimensional analysis of twenty-one odors. Scandinavian Journal of Psychology, 14, 131-137.
186
Bergmann Tiest, W. M., & Kappers, A. M. (2006). Analysis of haptic perception of materials by multidimensional scaling and physical measurements of roughness and compressibility. Acta Psychologica, 121, 1-20.
Berlin, B. (2006). The first congress of ethnozoological nomenclature. Journal of the Royal Anthropological Institute, 12, S23-S44.
Berlin, B., & O’Neill, J. P. (1981). The pervasiveness of onomatopoeia in Aguaruna and Huambisa bird names. Journal of Ethnobiology, 1, 238-261.
Berlin, B., & Kay, P. (1969). Basic Color Terms: Their Universality and Evolution. Berkeley: University of California Press.
Bhushan, N., Rao, A. R., & Lohse, G. L. (1997). The texture lexicon: Understanding the categorization of visual texture terms and their relationship to texture images. Cognitive Science, 21, 219-246.
Blake, R., Sobel, K. V., & James, T. W. (2004). Neural synergy between kinetic vision and touch. Psychological Science, 15, 397-402.
Blust, R. (2003). The phonestheme NG in Austronesian languages. Oceanic Linguistics, 42, 187-212.
Blust, R. (2007). Disyllabic attractors and anti-antigemination in Austronesian sound change. Phonology, 24, 1-36.
Bolker, B. M., Brooks, M. E., Clark, C. J., Geange, S. W., Poulsen, J. R., Stevens, M. H. H., & White, J. S. S. (2009). Generalized linear mixed models: a practical guide for ecology and evolution. Trends in Ecology & Evolution, 24, 127-135.
Bonato, M., Zorzi, M., & Umiltà, C. (2012). When time is space: evidence for a mental time line. Neuroscience & Biobehavioral Reviews, 36, 2257-2273.
Boroditsky, L., & Ramscar, M. (2002). The roles of body and mind in abstract thought. Psychological Science, 13, 185-188.
Bremner, A. J., Caparos, S., Davidoff, J., de Fockert, J., Linnell, K. J., & Spence, C. (2013). “Bouba” and “Kiki” in Namibia? A remote culture make similar shape–sound matches, but different shape–taste matches to Westerners. Cognition, 126, 165-172.
Brown, L., Winter, B., Idemaru, K., & Grawunder, S. (2014). Phonetics and politeness: Perceiving Korean honorific and non-honorific speech through phonetic cues. Journal of Pragmatics, 66, 45-60.
Brysbaert, M., & New, B. (2009). Moving beyond Kučera and Francis: A critical evaluation of current word frequency norms and the introduction of a new and improved word frequency measure for American English. Behavior Research Methods, 41, 977-990.
Brysbaert, M., New, B., & Keuleers, E. (2012). Adding part-of-speech information to the SUBTLEX-US word frequencies. Behavior Research Methods, 44, 991-997

187
Brysbaert, M., Warriner, A. B., & Kuperman, V. (2014). Concreteness ratings for 40 thousand generally known English word lemmas. Behavior Research Methods, 46, 904-911.
Buck, C. D. (1949). A Dictionary of Selected Synonyms in the Principal Indo-European Languages: A Contribution to the History of Ideas. Chicago: University of Chicago Press.
Caballero, R. (2007). Manner-of-motion verbs in wine description. Journal of Pragmatics, 39, 2095-2114.
Caballero, R., & Ibarretxe-Antuñano, I. (2014). Ways of perceiving, moving, and thinking: Revindicating culture in conceptual metaphor research. Cognitive Semiotics, V, 268-290.
Caballero, R., & Paradis, C. (2015). Making sense of sensory perceptions across languages and cultures. Functions of Language, 22, 1-19.
Cabanac, M. (1971). Physiological role of pleasure. Science, 173, 1103-1107.
Cabanac, M., Pruvost, M., & Fantino, M. (1973). Alliesthesie negative pour des stimulus sucres apres diverses ingestions de glucose. Physiology & Behavior, 11, 345-348.
Cabin, R. J., & Mitchell, R. J. (2000). To Bonferroni or not to Bonferroni: when and how are the questions. Bulletin of the Ecological Society of America, 81, 246-248.
Cain, W. S. (1979). To know with the nose: keys to odor identification. Science, 203, 467-470.
Caplan, D. (1973). A note on the abstract readings of verbs of perception. Cognition, 2, 269-277.
Carlson, N. R. (2010). Physiology of Behavior (10th Edition). Boston: Allyn & Bacon.
Carmody, S. (2014). ngramr: Retrieve and plot Google n-gram data. R package version 1.4.5.
Casagrande, V. A. (1994). A third parallel visual pathway to primate area V1. Trends in Neurosciences, 17, 305-310.
Casati, R., Dokic, J., & Le Corre, F. (2015). Distinguishing the commonsense senses. In D. Stokes, M. Matthen & S. Biggs (Eds.), Perception and its Modalities (pp. 462-479). Oxford: Oxford University Press.
Casasanto, D., & Boroditsky, L. (2008). Time in the mind: Using space to think about time. Cognition, 106, 579-593.
Casasanto, D., & Chrysikou, E.G. (2011). When left is "right": Motor fluency shapes abstract concepts. Psychological Science, 22, 419-422.
Chu, S., & Downes, J. J. (2000). Long live Proust: The odour-cued autobiographical memory bump. Cognition, 75, B41-B50.
Citron, F. M., & Goldberg, A. E. (2014). Metaphorical sentences are more emotionally engaging than their literal counterparts. Journal of Cognitive Neuroscience, 26, 2585-2595.
Clark, H. (1996). Using Language. Cambridge: Cambridge University Press.
Classen, C. (1993). Worlds of Sense: Exploring the Senses in History and across Cultures. London: Routledge.
188
Classen, C. (1997). Foundations for an anthropology of the senses. International Social Science Journal, 49, 401-412.
Cohen, M. S., Kosslyn, S. M., Breiter, H. C., DiGirolamo, G. J., Thompson, W. L., & Anderson, A. K., Rosen, B. R., & Belliveau, J. W. (1996). Changes in the cortical activity during mental rotation, a mapping study using functional MRI. Brain, 119, 89-100.
Connell, L., & Lynott, D. (2010). Look but don’t touch: Tactile disadvantage in processing modality-specific words. Cognition, 115, 1-9.
Connell, L., & Lynott, D. (2011). Modality switching costs emerge in concept creation as well as retrieval. Cognitive Science, 35, 763-778.
Connell, L., & Lynott, D. (2012). Strength of perceptual experience predicts word processing performance better than concreteness or imageability. Cognition, 125, 452-465.
Cortese, M. J., & Fugett, A. (2004). Imageability ratings for 3,000 monosyllabic words. Behavior Research Methods, Instruments, & Computers, 36, 384-387.
Crisinel, A. S., Jones, S., & Spence, C. (2012). ‘The sweet taste of maluma’: Crossmodal associations between tastes and words. Chemosensory Perception, 5, 266-273.
Croft, W., & Cruse, D. A. (2004). Cognitive Linguistics. Cambridge: Cambridge University Press.
Croijmans, I., & Majid, A. (2015). Odor naming is difficult, even for wine and coffee experts. In D. Noelle, R. Dale, A. Warlaumont, J. Yoshimi, T. Matlock, C. Jennings & P. Maglio (Eds.), 37th Annual Conference of the Cognitive Science Society (pp. 483-488). Austin, TX: Cognitive Science Society.
Cuskley, C. (2013). Mappings between linguistic sound and motion. Public Journal of Semiotics, 5, 39-62.
Cuskley, C., & Kirby, S. (2013). Synaesthesia, cross-modality and language evolution. In Simner, J. & Hubbard E.M. (Eds), Oxford Handbook of Synaesthesia (pp. 869-907). Oxford: Oxford University Press.
Dam-Jensen, H., & Zethsen, K. K. (2007). Pragmatic patterns and the lexical system—A reassessment of evaluation in language. Journal of Pragmatics, 39, 1608-1623.
Danescu-Niculescu-Mizil, C., West, R., Jurafsky, D., Leskovec, J., & Potts, C. (2013). No country for old members: User lifecycle and linguistic change in online communities. In Proceedings of the 22nd International Conference on World Wide Web (pp. 307-318). International World Wide Web Conferences Steering Committee.
Davies, M. (2008) The Corpus of Contemporary American English: 450 million words, 1990-present. Available online at http://corpus.byu.edu/coca/
Davis, R. (1961). The fitness of names to drawings: A cross-cultural study in Tanganyika. British Journal of Psychology, 52, 259-268.
Day, S. (1996). Synaesthesia and synaesthetic metaphors. Psyche, 2, 1-16.
189
Delwiche, J. F., & Heffelfinger, A. L. (2005). Cross-modal additivity of taste and smell. Journal of Sensory Studies, 20, 512-525.
Deroy, O., & Spence, C. (2013). Why we are not all synesthetes (not even weakly so). Psychonomic Bulletin & Review, 20, 643-664.
de Sousa, H. (2011). Changes in the language of perception in Cantonese. The Senses and Society, 6, 38-47.
de Wijk, R. A., & Cain, W. S. (1994). Odor quality: discrimination versus free and cued identification. Perception & Psychophysics, 56, 12-18.
Diederich, C. (2015). Sensory Adjectives in the Discourse of Food: A Frame-Semantic Approach to Language and Perception. Amsterdam: John Benjamins.
Diffloth, G. (1994). i: big, a: small. In L. Hinton, J. Nichols, & J. J. Ohala (Eds.), Sound Symbolism (pp. 107-114). Cambridge: Cambridge University Press.
Dingemanse, M. (2009). The selective advantage of body-part terms. Journal of Pragmatics, 41, 2130-2136.
Dingemanse, M. (2011a). Ideophones and the aesthetics of everyday language in a West-African society. The Senses and Society, 6, 77-85.
Dingemanse, M. (2011b). The meaning and use of ideophones in Siwu. PhD dissertation. Radboud University, Nijmegen.
Dingemanse, M. (2012). Advances in the Cross-Linguistic Study of Ideophones. Language and Linguistics Compass, 6, 654-672.
Dingemanse, M. (to appear). Expressiveness and system integration: On the typology of ideophones, with special reference to Siwu.
Dingemanse, M., Blasi, D. E., Lupyan, G., Christiansen, M. H., & Monaghan, P. (2015). Arbitrariness, Iconicity, and Systematicity in Language. Trends in Cognitive Sciences, 19, 603-615.
Dingemanse, M., & Majid, A. (2012). The semantic structure of sensory vocabulary in an African language. In N. Miyake, D. Peebles, & R. P. Cooper (Eds.), Proceedings of the 34th Annual Meeting of the Cognitive Science Society (pp. 300-305). Austin, TX: Cognitive Science Society.
Djordjevic, J., Lundstrom, J. N., Clement, F., Boyle, J. A., Pouliot, S., & Jones-Gotman, M. (2008). A rose by any other name: would it smell as sweet?. Journal of Neurophysiology, 99, 386-393.
Dragulescu, A. A. (2014). xlsx: Read, write, format Excel 2007 and Excel 97/2000/XP/2003 files. R package version 0.5.7.
Dravnieks, A. (1985). Atlas of Odor Character Profiles. Philadelphia, PA: American Society for Testing and Materials.

190
Drellishak, S. (2006). Statistical techniques for detecting and validating phonesthemes. Unpublished masters thesis, University of Washington, 2006.
Drury, H. A., Van Essen, D. C., Anderson, C. H., Lee, C. W., Coogan, T. A., & Lewis, J. W. (1996). Computerized mappings of the cerebral cortex: a multiresolution flattening method and a surface-based coordinate system. Journal of Cognitive Neuroscience, 8, 1-28.
Dubois, D. (2000). Categories as acts of meaning: The case of categories in olfaction and audition. Cognitive Science Quarterly, 1, 35-68.
Elman, J. L. (2004). An alternative view of the mental lexicon. Trends in Cognitive Sciences, 8, 301-306.
Ekman, G., Hosman, J., & Lindstrom, B. (1965). Roughness, smoothness, and preference: A study of quantitative relations in individual subjects. Journal of Experimental Psychology, 70, 18-26.
Engen, T., & Ross, B. M. (1973). Long-term memory of odors with and without verbal descriptions. Journal of Experimental Psychology, 100, 221-227.
Erzsébet, P. D. (1974). Synaesthesia and poetry. Poetics, 3, 23-44.
Essegbey, J. (2013). Touch Ideophones in Nyagbo. In O. O. Orie, & K. W. Sanders (Eds.), Selected Proceedings of the 43rd Annual Conference on African Linguistics (pp. 235-243). Somerville, MA: Cascadilla Proceedings Project.
Essick, G. K., James, A., & McGlone, F. P. (1999). Psychophysical assessment of the affective components of non-painful touch. Neuroreport, 10, 2083-2087.
Essick, G. K., McGlone, F., Dancer, C., Fabricant, D., Ragin, Y., Phillips, N., Jones, T., & Guest, S. (2010). Quantitative assessment of pleasant touch. Neuroscience & Biobehavioral Reviews, 34, 192-203.
Esuli, A., & Sebastiani, F. (2006). Sentiwordnet: A publicly available lexical resource for opinion mining. In Proceedings of 5th Conference on Language Resources and Evaluation (Vol. 6, pp. 417-422).
Etzi, R., Spence, C., & Gallace, A. (2014). Textures that we like to touch: An experimental study of aesthetic preferences for tactile stimuli. Consciousness and Cognition, 29, 178-188.
Etzi, R., Spence, C., Zampini, M., & Gallace, A. (2016). When sandpaper is ‘kiki’ and satin is ‘bouba’: An exploration of the associations between words, emotional states, and the tactile attributes of everyday materials. Multisensory Research, 29, 133-155.
Evans, K. K., & Treisman, A. (2010). Natural cross-modal mappings between visual and auditory features. Journal of Vision, 10, 1-12.
Evans, N., & Wilkins, D. (2000). In the mind's ear: The semantic extensions of perception verbs in Australian languages. Language, 76, 546-592.
191
Evans, V. (2004). The Structure of Time: Language, Meaning and Temporal Cognition. Amsterdam: John Benjamins.
Evans, V., & Green, M. (2006). Cognitive Linguistics: An Introduction. Mahwah: Lawrence Erlbaum Associates Publishers.
Fazio, R. H., Sanbonmatsu, D. M., Powell, M. C., & Kardes, F. R. (1986). On the automatic activation of attitudes. Journal of Personality and Social Psychology, 50, 229-238.
Fellbaum, C. (1998). WordNet: An Electronic Lexical Database. Cambridge: MIT Press.
Fenson, L., Dale, P. S., Reznick, J. S., Bates, E., Thal, D. J., Pethick, S. J., Tomasello, M., Mervis, C. B., & Stiles, J. (1994). Variability in early communicative development. Monographs of the Society for Research in Child Development (Vol. 59), pp. i+iii-v+1-185.
Fitch, T. (1994). Vocal tract length perception and the evolution of language. B.A. Thesis, Brown University.
Firth, J. R. (1930). Speech. London: Ernest Benn.
Firth, J. R. (1935). The use and distribution of certain English sounds. English Studies, 17, 8-18.
Fischer, A. (1999). What, if anything, is phonological iconicity? In O. Fischer & M. Nänny (Eds.), Form Miming Meaning: Iconicity in Language and Literature (pp. 123-134). Amsterdam: John Benjamins.
Fischer, S. (1922). Über das Entstehen und Verstehen von Namen. Archiv für die gesamte Psychologie, 42, 335-368.
Fischer, M. H., & Zwaan, R. A. (2008). Embodied language: A review of the role of the motor system in language comprehension. The Quarterly Journal of Experimental Psychology, 61, 825-850.
Fónagy, I. (1961). Communication in poetry. Word, 17, 194–218.
Fontana, F. (2013). Association of haptic trajectories with takete and maluma. In I. Oakley, & S. Brewster (Eds.), Haptic and Audio Interaction Design (pp. 60-68). Berlin: Springer.
Francis, W. N., & Kučera, H. (1982). Frequency Analysis of English Usage: Lexicon and Grammar. Boston: Houghton Mifflin.
Frankis, J. (1991). Middle English ideophones and the evidence of manuscript variants: xplorations in the lunatic fringe of language. In I. T. van Ostade (Ed.), Language Usage and Description: Studies Presented to N.E. Osselto on the Occasion of his Retirement (pp. 17-25). Amsterdam: Rodopi.
Fryer, L., Freeman, J., & Pring, L. (2014). Touching words is not enough: How visual experience influences haptic–auditory associations in the “Bouba–Kiki” effect. Cognition, 132, 164-173.
Gallace, A., Boschin, E., & Spence, C. (2011). On the taste of “Bouba” and “Kiki”: An exploration of word–food associations in neurologically normal participants. Cognitive Neuroscience, 2, 34-46.
192
Gallese, V., & Lakoff, G. (2005). The brain’s concepts: The role of the sensory-motor system in reason and language. Cognitive Neuropsychology, 22, 455-479.
Gasser, M. (2004). The origins of arbitrariness in language. In K. Forbus, D. Gentner, & T. Regier (Eds.), Proceedings of the Cognitive Science Society Conference (pp. 434-439). Austin, Texas: Cognitive Science Society.
Gasser, M., Sethuraman, N., & Hockema, S. (2010). Iconicity in expressives: an empirical investigation. In S. Rice & J. Newman (Eds.), Experimental and Empirical Methods in the Study of Conceptual Structure, Discourse, and Language (pp. 163-180). Stanford, CA: CSLI Publications.
Gentleman, R., & Lang, D. (2007). Statistical analyses and reproducible research. Journal of Computational and Graphical Statistics, 16, 1-23.
Gernsbacher, M. A. (1984). Resolving 20 years of inconsistent interactions between lexical familiarity and orthography, concreteness, and polysemy. Journal of Experimental Psychology: General, 113, 256-281.
Gibbs, R. W. (1994). The Poetics of Mind: Figurative Thought, Language, and Understanding. New York: Cambridge University Press.
Gibbs, R. W. (2005). Embodiment and Cognitive Science. Cambridge: Cambridge University Press.
Gimson, A. C. (1962). An Introduction to the Pronunciation of English. London: Edward Arnold Publishers.
Glenberg, A. M. (1997). What memory is for. Behavioral and Brain Sciences, 20, 1-55.
Goldberg, R. F., Perfetti, C. A., & Schneider, W. (2006a). Perceptual knowledge retrieval activates sensory brain regions. The Journal of Neuroscience, 26, 4917-4921.
Goldberg, R. F., Perfetti, C. A., & Schneider, W. (2006b). Distinct and common cortical activations for multimodal semantic categories. Cognitive, Affective, & Behavioral Neuroscience, 6, 214-222.
Goldinger, S. D., Papesh, M. H., Barnhart, A. S., Hansen, W. A., & Hout, M. C. (in press). The poverty of embodied cognition. Psychonomic Bulletin and Review.
González, J., Barros-Loscertales, A., Pulvermüller, F., Meseguer, V., Sanjuán, A., Belloch, V., & Ávila, C. (2006). Reading cinnamon activates olfactory brain regions. Neuroimage, 32, 906-912.
Gori, M., Del Viva, M., Sandini, G., & Burr, D. C. (2008). Young children do not integrate visual and haptic form information. Current Biology, 18, 694-698.
Gori, M., Sandini, G., Martinoli, C., & Burr, D. (2010). Poor haptic orientation discrimination in nonsighted children may reflect disruption of cross-sensory calibration. Current Biology, 20, 223-225.
Grady, J. (1997). THEORIES ARE BUILDINGS revisited. Cognitive Linguistics, 8, 267-290.
193
Grady, J. (1999). A typology of motivation for conceptual metaphor: correlation vs. resemblance. In R. Gibbs & G. Steen (Eds.), Metaphor in Cognitive Linguistics (pp. 79-100). Amsterdam: John Benjamins.
Greenberg, J. H., & Jenkins, J. J. (1966). Studies in the psychological correlates of the sound system of American English. Word, 22, 207-242.
Guest, S., Catmur, C., Lloyd, D., & Spence, C. (2002). Audiotactile interactions in roughness perception. Experimental Brain Research, 146, 161-171.
Guest, S., Dessirier, J. M., Mehrabyan, A., McGlone, F., Essick, G., Gescheider, G., Fontana, A., Xiong, R., Ackerley, R., & Blot, K. (2011). The development and validation of sensory and emotional scales of touch perception. Attention, Perception, & Psychophysics, 73, 531-550.
Guest, S., Essick, G., Dessirier, J. M., Blot, K., Lopetcharat, K., & McGlone, F. (2009). Sensory and affective judgments of skin during inter-and intrapersonal touch. Acta Psychologica, 130, 115-126.
Haenny, P. E., Maunsell, J. H. R., & Schiller, P. H. (1988). State dependent activity in monkey visual cortex II: Retinal and extraretinal factors in V4. Experimental Brain Research, 69, 245-259.
Hagen, M. C., Franzén, O., McGlone, F., Essick, G., Dancer, C., & Pardo, J. V. (2002). Tactile motion activates the human middle temporal/V5 (MT/V5) complex. European Journal of Neuroscience, 16, 957-964.
Haiman, J. (1980). The iconicity of grammar: Isomorphism and motivation. Language, 56, 515-540.
Halgren, E. (1992). Emotional neurophysiology of the amygdala within the context of human cognition. In J. P. Aggleton (Ed.), The Amygdala: Neurobiological Aspects of Emotion, Memory and Mental Dysfunction (pp. 191-228). New York: Wiley-Liss.
Hartigan, J. A., & Hartigan, P. M. (1985). The dip test of unimodality. The Annals of Statistics, 70-84.
Hashimoto, T., Usui, N., Taira, M., Nose, I., Haji, T., & Kojima, S. (2006). The neural mechanism associated with the processing of onomatopoeic sounds. Neuroimage, 31, 1762-1770.
Hauk, O., Johnsrude, I., & Pulvermüller, F. (2004). Somatotopic representation of action words in human motor and premotor cortex. Neuron, 41, 301-307.
Haspelmath, M. (1997). From Space to Time: Temporal Adverbials in the World’s Languages. Munich & Newcastle: Lincom Europa.
Hay, J. C., & Pick, H. L. (1966). Visual and proprioceptive adaptation to optical displacement of the visual stimulus. Journal of Experimental Psychology, 71, 150-158.
Heine, B., & Kuteva, T. (2002). World Lexicon of Grammaticalization. Cambridge: Cambridge University Press.
194
Hermans, D., & Baeyens, F. (2002). Acquisition and activation of odor hedonics in everyday situations: Conditioning and priming studies. In C. Rouby, B. Schaal, D. Dubois, R. Gervais, & A. Holley (Eds.), Olfaction, Taste, and Cognition (pp. 119-139). Cambridge: Cambridge University Press.
Herz, R. S. (2002). Influences of odors on mood and affective cognition. In C. Rouby, B. Schaal, D. Dubois, R. Gervais, & A. Holley (Eds.), Olfaction, Taste, and Cognition (pp. 160-177). Cambridge: Cambridge University Press.
Herz, R. S. (2004). A naturalistic analysis of autobiographical memories triggered by olfactory visual and auditory stimuli. Chemical Senses, 29, 217–24.
Herz, R. (2007). The Scent of Desire: Discovering Our Enigmatic Sense of Smell. New York: Harper Collins.
Herz, R. S., & Engen, T. (1996). Odor memory: Review and analysis. Psychonomic Bulletin & Review, 3, 300-313.
Herz, R. S., & Schooler, J. W. (2002). A naturalistic study of autobiographical memories evoked by olfactory and visual cues: Testing the Proustian hypothesis. American Journal of Psychology, 115, 21–32.
Hidaka, S., & Shimoda, K. (2014). Investigation of the effects of color on judgments of sweetness using a taste adaptation method. Multisensory Research, 27, 189-205.
Hinton, L., Nichols, J., & Ohala, J. (1994). Introduction: sound-symbolic processes. In L. Hinton, J. Nichols, & J. Ohala (Eds.), Sound Symbolism (pp. 1-12). Cambridge: Cambridge University Press.
Hirata, S., Ukita, J., & Kita, S. (2011). Implicit phonetic symbolism in voicing of consonants and visual lightness using Garner's speeded classification task. Perceptual Motor Skills, 113, 929-940.
Hockett, C. F. (1982 [1960]). The origin of speech. Scientific American, 203, 88–111. Reprinted in: W. S-Y Wang. (1982), Human Communication: Language and Its Psychobiological Bases (pp. 4–12). San Francisco: W. H. Freeman.
Hollins, M., Faldowski, R., Rao, S., & Young, F. (1993). Perceptual dimensions of tactile surface texture: A multidimensional scaling analysis. Perception & Psychophysics, 54, 697-705.
Hopper, P. J. (1991). Phonogenesis. In W. Pagliuca (Ed.), Perspectives on Grammaticalization (pp. 27-45). Amsterdam: John Benjamins.
Hothorn, T., Hornik, K., & Zeileis, A. (2006). Unbiased recursive partitioning: A conditional inference framework. Journal of Computational and Graphical Statistics, 15, 651-674.
Howes, D. (1991) (Ed.). The Varieties of Sensory Experience: A Sourcebook in the Anthropology of the Senses. Toronto: University of Toronto Press.
Howes, D. (2002). Nose-wise: Olfactory metaphors in mind. In C. Rouby, B. Schaal, D. Dubois, R. Gervais, & A. Holley (Eds.), Olfaction, Taste, and Cognition (pp. 67-81). Cambridge: Cambridge University Press.
195
Hunston, S. (2007). Semantic prosody revisited. International Journal of Corpus Linguistics, 12, 249-268.
Hutchins, S. S. (1997). What Sound Symbolism, Functionalism, and Cognitive Linguistics Can Offer One Another. Annual Meeting of the Berkeley Linguistics Society, 23, 1, 148-160.
Hutchins, S. S. (1998). The psychological reality, variability, and compositionality of English phonesthemes. Atlanta: Emory University dissertation.
Imai, M., & Kita, S. (2014). The sound symbolism bootstrapping hypothesis for language acquisition and language evolution. Philosophical Transactions of the Royal Society of London: Series B, Biological Sciences, 369, 20130298.
Imai, M., Kita, S., Nagumo, M., & Okada, H. (2008). Sound symbolism facilitates early verb learning. Cognition, 109, 54–65.
Iwahashi, K. (2009). On metaphorical meanings of sensory adjectives: How are they classified? Osaka University Papers in English Linguistics, 14, 1-21.
Iwahashi, K. (2013). The mental representation of metapholical [!sic] meanings of sensory adjectives. Osaka University Papers in English Linguistics, 16, 99-126.
Jackman, S. (2015). pscl: Classes and methods for R developed in the political science computational laboratory, Stanford University. R package version 1.4.9.
Jastrzembski, J. E., & Stanners, R. F. (1975). Multiple word meanings and lexical search speed. Journal of Verbal Learning and Verbal Behavior, 14, 534-537.
Jescheniak, J. D., & Levelt, W. J. (1994). Word frequency effects in speech production: Retrieval of syntactic information and of phonological form. Journal of Experimental Psychology: Learning, Memory, and Cognition, 20, 824-843.
Johnson-Laird, P. N., & Quinn, J. G. (1976). To define true meaning. Nature, 264, 635-636.
Jorgensen, J. C. (1990). The psychological reality of word senses. Journal of Psycholinguistic Research, 19, 167-190.
Jousmäki, V., & Hari, R. (1998). Parchment-skin illusion: sound-biased touch. Current Biology, 8, R190-R191.
Juhasz, B. J., & Yap, M. J. (2013). Sensory experience ratings for over 5,000 mono-and disyllabic words. Behavior Research Methods, 45, 160-168.
Jurafsky, D. (2014). The Language of Food. New York: W. W. Norton.
Karns, C. M., & Knight, R. T. (2009). Intermodal auditory, visual, and tactile attention modulates early stages of neural processing. Journal of Cognitive Neuroscience, 21, 669-683.
Kendon, A. (2004). Gesture: Visible Action as Utterance. Cambridge: Cambridge University Press.

196
Keuleers, E., & Balota, D. A. (2015). Megastudies, crowdsourcing, and large datasets in psycholinguistics: An overview of recent developments. The Quarterly Journal of Experimental Psychology, 68, 1457-1468.
Keuleers, E., Lacey, P., Rastle, K., & Brysbaert, M. (2012). The British Lexicon Project: Lexical decision data for 28,730 monosyllabic and disyllabic English words. Behavior Research Methods, 44, 287-304.
Kirkham, N. Z., Slemmer, J. A., & Johnson, S. P. (2002). Visual statistical learning in infancy: Evidence for a domain general learning mechanism. Cognition, 83, B35-B42.
Kirkham, N. Z., Slemmer, J.A., Richardson, D. C., & Johnson, S. P. (2007). Location, Location, Location: Development of Spatiotemporal Sequence Learning in Infancy. Child Development, 78, 1559-1571.
Klatzky, R. L., Lederman, S. J., & Reed, C. (1987). There's more to touch than meets the eye: The salience of object attributes for haptics with and without vision. Journal of Experimental Psychology: General, 116, 356-369.
Köhler, R. (1986). Zur Linguistischen Synergetik: Struktur und Dynamik der Lexik. Bochum: Brockmeyer.
Köhler, W. (1929). Gestalt Psychology. New York: Liveright.
Köster, E. P. (20002). The specific characeristics of the sense of smell. In C. Rouby, B. Schaal, D. Dubois, R. Gervais, & A. Holley (Eds.), Olfaction, Taste, and Cognition (pp. 27-43). Cambridge: Cambridge University Press.
Kövecses, Z. (2002). Metaphor: A Practical Introduction. Oxford: Oxford University Press.
Kovic, V., Plunkett, K., & Westermann, G. (2010). The shape of words in the brain. Cognition, 114, 19-28.
Krifka, M. (2010). A note on the asymmetry in the hedonic implicatures of olfactory and gustatory terms. In S. Fuchs, P. Hoole, C. Mooshammer & M. Zygis (Eds.), Between the Regular and the Particular in Speech and Language (pp. 235-245). Frankfurt am Main: Peter Lang.
Kučera, H., & Francis, W. (1967). Computational Analysis of Present Day American English. Providence, RI: Brown University Press.
Kuperman, V., Stadthagen-Gonzalez, H., & Brysbaert, M. (2012). Age-of-acquisition ratings for 30,000 English words. Behavior Research Methods, 44, 978-990.
Kuperman, V. (2015). Virtual experiments in megastudies: A case study of language and emotion. The Quarterly Journal of Experimental Psychology, 68, 1693-1710.
Kwon, N., & Round, E. R. (2015). Phonesthemes in morphological theory. Morphology, 25, 1-27.
Lachman, R., Shaffer, J. P., & Hennrikus, D. (1974). Language and cognition: Effects of stimulus codability, name-word frequency, and age of acquisition on lexical reaction time. Journal of Verbal Learning and Verbal Behavior, 13, 613-625.
197
Lacey, S., Stilla, R., & Sathian, K. (2012). Metaphorically feeling: comprehending textural metaphors activates somatosensory cortex. Brain and Language, 120, 416-421.
Lakoff, G. (1987). Women, Fire, and Dangerous Things: What Categories Reveal About the Mind. Chicago: University of Chicago Press.
Lakoff, G., & Johnson, M. (1980). Metaphors We Live By. Chicago: University of Chicago Press.
Landau, M. J., Meier, B. P., & Keefer, L. A. (2010). A metaphor-enriched social cognition. Psychological Bulletin, 136, 1045-1067.
Langacker, R. W. (1987). Foundations of Cognitive Grammar: Theoretical Prerequisites (Vol. 1). Stanford, CA: Stanford university press.
Langacker, R. W. (2008). Cognitive Grammar: A Basic Introduction. Oxford: Oxford University Press.
Lederman, S. J. (1979). Auditory texture perception. Perception, 8, 93-103.
Lee, L., Frederick, S., & Ariely, D. (2006). Try it, you'll like it: The influence of expectation, consumption, and revelation on preferences for beer. Psychological Science, 17, 1054-1058.
Leech, G. (1992). 100 million words of English: the British National Corpus (BNC). Language Research, 28, 1-13.
Le Guérer, A. (2002). Olfaction and cognition: A philosophical and psychoanalytic view. In C. Rouby, B. Schaal, D. Dubois, R. Gervais, & A. Holley (Eds.), Olfaction, Taste, and Cognition (pp. 196-208). Cambridge: Cambridge University Press.
Lehrer, A. (1975). Talking about wine. Language, 51, 901-923.
Lehrer, A. (2009). Wine and Conversation (Second Edition). Oxford: Oxford University Press.
Lehrer, A. (1978). Structures of the lexicon and transfer of meaning. Lingua, 45, 95-123.
Lempert, M. (2011). Barack Obama, being sharp: Indexical order in the pragmatics of precision-grip gesture. Gesture, 11, 241-270.
Levänen, S., Jousmäki, V., & Hari, R. (1998). Vibration-induced auditory-cortex activation in a congenitally deaf adult. Current Biology, 8, 869-872.
Levinson, S. C., & Majid, A. (2014). Differential ineffability and the senses. Mind & Language, 29, 407-427.
Lewis, J. (2009). As well as words: Congo Pygmy hunting, mimicry, and play. In R. Botha & C. Knight (Ed.), The Cradle of Language (pp. 236-256). Oxford: Oxford University Press.
Liem, D. G., Miremadi, F., Zandstra, E. H., & Keast, R. S. (2012). Health labelling can influence taste perception and use of table salt for reduced-sodium products. Public Health Nutrition, 15, 2340-2347.
Liu, B. (2012). Sentiment Analysis and Opinion Mining. Morgan & Claypool Publishers.

198
Lockwood, G., & Dingemanse, M. (2015). Iconicity in the lab: a review of behavioral, developmental, and neuroimaging research into sound-symbolism. Frontiers in Psychology, 6, 1246.
Louwerse, M. M. (2011). Symbol interdependency in symbolic and embodied cognition. Topics in Cognitive Science, 3, 273-302.
Louwerse, M., & Connell, L. (2011). A taste of words: Linguistic context and perceptual simulation predict the modality of words. Cognitive Science, 35, 381-398.
Lund, K., & Burgess, C. (1996). Producing high-dimensional semantic spaces from lexical co-occurrence. Behavior Research Methods, Instruments, & Computers, 28, 203-208.
Lupyan, G., & Casasanto, D. (2015). Meaningless words promote meaningful categorization. Language and Cognition, 7, 167-193.
Lynott, D., & Connell, L. (2009). Modality exclusivity norms for 423 object properties. Behavior Research Methods, 41, 558-564.
Lynott, D., & Connell, L. (2013). Modality exclusivity norms for 400 nouns: The relationship between perceptual experience and surface word form. Behavior Research Methods, 45, 516-526.
Maechler, M. (2015). diptest: Hartigan's dip test statistic for unimodality - corrected. R package version 0.75-7.
Mahmut, M. K., & Stevenson, R. J. (2015). Failure to obtain reinstatement of an olfactory representation. Cognitive Science, 39, 1940-1949.
Majid, A. (2012). Current emotion research in the language sciences. Emotion Review, 4, 432-443.
Majid, A., & Burenhult, N. (2014). Odors are expressible in language, as long as you speak the right language. Cognition, 130, 266-270.
Maglio, S. J., Rabaglia, C. D., Feder, M. A., Krehm, M., & Trope, Y. (2014). Vowel sounds in words affect mental construal and shift preferences for targets. Journal of Experimental Psychology: General, 143, 1082-1096.
Mahon, B. Z., & Caramazza, A. (2008). A critical look at the embodied cognition hypothesis and a new proposal for grounding conceptual content. Journal of Physiology, 102, 59-70.
Major, D. R. (1895). On the affective tone of simple snse-impressions. American Journal of Psychology, 7, 57-77.
Malt, B. C., & Majid, A. (2013). How thought is mapped into words. Wiley Interdisciplinary Reviews: Cognitive Science, 4, 583-597.
Marchand, H. (1959). Phonetic symbolism in English word formations. Indogermanische Forschungen, 64, 146-168.
Marchand, H. (1960). The Categories and Types of Present-Day English Word Formation. University of Alabama Press.
199
Marks, L. E. (1978). The Unity of the Senses: Interrelations Among the Modalities. New York: Academic Press.
Matlock, T. (1989). Metaphor and the grammaticalization of evidentials. In Proceedings of the 15th Annual Meeting of the Berkeley Linguistics Society (pp. 215-225). Berkeley: Berkeley Linguistics Society.
Matlock, T., Holmes, K.J., Srinivasan, M., & Ramscar, M. (2011). Even abstract motion influences the understanding of time. Metaphor and Symbol, 26, 260-271.
Maurer, D., Pathman, T., & Mondloch, C. J. (2006). The shape of boubas: sound-shape correspondences in toddlers and adults. Developmental Science, 9, 316-322.
Mesirov, J. P. (2010). Computer science. Accessible reproducible research. Science, 327, 5964.
Michel, J. B., Shen, Y. K., Aiden, A. P., Veres, A., Gray, M. K., Pickett, J. P., Hoiberg, D., Clancy, D., Norvig, P., Orwant, J., Pinker, S., & Nowak, M. A., & Aiden, E. L. (2011). Quantitative analysis of culture using millions of digitized books. Science, 331, 176-182.
Miller, G. A. (1995). WordNet: a lexical database for English. Communications of the ACM, 38, 39-41.
Mitchell, S. D. (2004). Why integrative pluralism? E:CO, 6:1-2, 81-91.
McBurney, D. H. (1986). Taste, smell, and flavor terminology: Taking the confusion out of the fusion. In H. L. Meiselman, & R. S. Rivkin (Eds.), Clinical Measurement of Taste and Smell (pp. 117-125). New York: Macmillan.
McGurk, H., & MacDonald, J. (1976). Hearing lips and seeing voices. Nature, 264, 746-748.
Mojet, J., Köster, E. P., & Prinz, J. F. (2005). Do tastants have a smell?. Chemical Senses, 30, 9-21.
Mohammad, S. M. (2012). #Emotional tweets. In Proceedings of the First Joint Conference on Lexical and Computational Semantics-Volume 1: Proceedings of the main conference and the shared task, and Volume 2: Proceedings of the Sixth International Workshop on Semantic Evaluation (pp. 246-255). Association for Computational Linguistics.
Moos, A., Simmons, D., Simner, J., & Smith, R. (2013). Color and texture associations in voice-induced synesthesia. Frontiers in Psychology, 4.
Møller, A. (2012). Sensory Systems: Anatomy and Physiology (2nd Edition). Richardson: A. R. Møller Publishing.
Monaghan, P., Christiansen, M. H., & Fitneva, S. A. (2011). The arbitrariness of the sign: Learning advantages from the structure of the vocabulary. Journal of Experimental Psychology: General, 140, 325-347.
Monaghan, P., Mattock, K., & Walker, P. (2012). The role of sound symbolism in language learning. Journal of Experimental Psychology: Learning, Memory, and Cognition, 38, 1152-1164.
200
Monaghan, P., Shillcock, R. C., Christiansen, M. H., & Kirby, S. (2014). How arbitrary is English? Philosophical Transactions of the Royal Society of London: Series B, Biological Sciences, 369, 20130299.
Morein-Zamir, S., Soto-Faraco, S., & Kingstone, A. (2003). Auditory capture of vision: examining temporal ventriloquism. Cognitive Brain Research, 17, 154-163.
Morley, J., & Partington, A. (2009). A few Frequently Asked Questions about semantic—or evaluative—prosody. International Journal of Corpus Linguistics, 14, 139-158.
Morrot, G., Brochet, F., & Dubourdieu, D. (2001). The color of odors. Brain and Language, 79, 309-320.
Müller, M. (1869). Lectures on the science of language, vol. 2. New York: Charles Scribner and Company.
Nakagawa, S. (2004). A farewell to Bonferroni: the problems of low statistical power and publication bias. Behavioral Ecology, 15, 1044-1045.
Nakagawa, S., & Schielzeth, H. (2013). A general and simple method for obtaining R2 from generalized linear mixed-effects models. Methods in Ecology and Evolution, 4, 133-142.
Navarro, D. J. (2015) Learning statistics with R: A tutorial for psychology students and other beginners. (Version 0.5) University of Adelaide.
Newman, J. (1996). Give: A Cognitive Linguistic Study. Berlin: de Gruyter.
Newmeyer, F. J. (1992). Iconicity and generative grammar. Language, 68, 756-796.
Ngo, M. K., Misra, R., & Spence, C. (2011). Assessing the shapes and speech sounds that people associate with chocolate samples varying in cocoa content. Food Quality and Preference, 22, 567-572.
Nielsen, A., & Rendall, D. (2011). The sound of round: Evaluating the sound-symbolic role of consonants in the classic Takete-Maluma phenomenon. Canadian Journal of Experimental Psychology, 65, 115-124.
Nielsen, A., & Rendall, D. (2012). The source and magnitude of sound-symbolic biases in processing artificial word material and their implications for language learning and transmission. Language and Cognition, 4, 115-125.
Nielsen, A. K., & Rendall, D. (2013). Parsing the role of consonants versus vowels in the classic Takete-Maluma phenomenon. Canadian Journal of Experimental Psychology, 67, 153-163.
Nuckolls, J. B. (2004). To be or to be not ideophonically impoverished. In W. F. Chiang, E. Chun, L. Mahalingappa, & S. Mehus (Eds.), SALSA XI: Proceedings of the Eleventh Annual Symposium about Language and Society (pp. 131-142). Austin: Texas Linguistics Forum.
Nudds, M. (2004). The significance of the senses. Proceedings of the Aristotelian Society, 104, 31-51.
201
Nygaard, L. C., Cook, A. E., & Namy, L. L. (2009). Sound to meaning correspondences facilitate word learning. Cognition, 112, 181-186.
O'Callaghan, C. (2015). Not all perceptual experience is modality specific. In D. Stokes, M. Matthen & S. Biggs (Eds.), Perception and its Modalities (pp. 133-165). Oxford: Oxford University Press.
Ohala, J. J. (1984). An ethological perspective on common cross-language utilization of F0 of voice. Phonetica, 41, 1-16.
Ohala, J. J. (1994). The frequency code underlies the sound symbolic use of voice pitch. In L. Hinton, J. Nichols, & J. J. Ohala (Eds.), Sound Symbolism (pp. 325-347). Cambridge: Cambridge University Press.
Olofsson, J. K., & Gottfried, J. A. (2015). The muted sense: neurocognitive limitations of olfactory language. Trends in Cognitive Sciences, 19, 314-321.
Oldfield, R. C., & Wingfield, A. (1965). Response latencies in naming objects. Quarterly Journal of Experimental Psychology, 17, 273-281.
Otis, K., & Sagi, E. (2008). Phonesthemes: A corpus-based analysis. In V. Sloutsky, B. Love, & K. McRae (Eds.), Proceedings of the 30th Annual Conference of the Cognitive Science Society (pp. 65-70). Austin, TX: Cognitive Science Society.
Osaka, N., Osaka, M., Morishita, M., Kondo, H., & Fukuyama, H. (2004). A word expressing affective pain activates the anterior cingulate cortex in the human brain: an fMRI study. Behavioural Brain Research, 153, 123-127.
Osgood, C. E. (1981). The cognitive dynamics of synesthesia and metaphor. In Review of Research in Visual Arts Education (pp. 56-80). Champaign, IL: University of Illinois Press.
Ozturk, O., Krehm, M., & Vouloumanos, A. (2012). Sound symbolism in infancy: evidence for sound-shape correspondences in 4-month-olds. Journal of Experimental Child Psychology, 114, 173-186.
Pang, B., & Lee, L. (2004). A sentimental education: Sentiment analysis using subjectivity summarization based on minimum cuts. In Proceedings of the 42nd Annual Meeting on Association for Computational Linguistics (article 271). Association for Computational Linguistics.
Pang, B., & Lee, L. (2008). Opinion mining and sentiment analysis. Foundations and Trends in Information Retrieval, 2, 1-135.
Paradis, C., & Eeg-Olofsson, M. (2013). Describing sensory experience: The genre of wine reviews. Metaphor and Symbol, 28, 22-40.
Parise, C. V., & Pavani, F. (2011). Evidence of sound symbolism in simple vocalizations. Experimental Brain Research, 214, 373-380.
Patel, A. D., & Iversen, J. R. (2003). Acoustic and perceptual comparison of speech and drum sounds in the north indian tabla tradition: An empirical study of sound symbolism. In
202
M. J. Solé, D. Recansens, & J. Romero (Eds.), Proceedings of the 15th International Congress of Phonetic Sciences (pp. 925-928). Barcelona.
Pechenick, E. A., Danforth, C. M., & Dodds, P. S. (2015). Characterizing the Google Books corpus: Strong limits to inferences of socio-cultural and linguistic evolution. PLoS ONE, 10, e0137041.
Pecher, D., Zeelenberg, R., & Barsalou, L. W. (2003). Verifying different-modality properties for concepts produces switching costs. Psychological Science, 14, 119-124.
Peng, R. D. (2011). Reproducible research in computational science. Science, 334, 1226-1227.
Perlman, M. (2010). Talking fast: The use of speech rate as iconic gesture. In F. Perrill, V. Tobin, & M. Turner (Eds.), Meaning, Form, and Body. Stanford: CSLI Publications.
Perlman, M., & Cain, A. (2014). Iconicity in vocalization, comparisons with gesture, and implications for theories on the evolution of language. Gesture, 14, 321-351.
Perlman, M., Clark, N., & Johansson Falck, M. (2014). Iconic prosody in story reading. Cognitive Science, 39, 1348-1368.
Perlman, M., Dale, R., & Lupyan, G. (2015). Iconicity can ground the creation of vocal symbols. Royal Society Open Science, 2, 150152.
Perniss, P., Thompson, R., & Vigliocco, G. (2010). Iconicity as a general property of language: evidence from spoken and signed languages. Frontiers in Psychology, 1, 227.
Perry, L. K., Perlman, M., & Lupyan, G. (2015). Iconicity in English and Spanish and its relation to lexical category and age of acquisition. PloS ONE, 10, e0137147.
Petersen, W., Fleischhauer, J., Beseoglu, H., & Bücker, P. (2008). A frame-based analysis of synaesthetic metaphors. Baltic International Yearbook of Cognition, Logic and Communication, 3, 8, 1-22.
Phillips, M. L., & Heining, M. (2002). Neural correlates of emotion perception: From faces to taste. In C. Rouby, B. Schaal, D. Dubois, R. Gervais, & A. Holley (Eds.), Olfaction, Taste, and Cognition (pp. 196-208). Cambridge: Cambridge University Press.
Piantadosi, S. T., Tily, H., & Gibson, E. (2012). The communicative function of ambiguity in language. Cognition, 122, 280-291.
Picard, D. (2006). Partial perceptual equivalence between vision and touch for texture information. Acta Psychologica, 121, 227-248.
Picard, D., Dacremont, C., Valentin, D., & Giboreau, A. (2003). Perceptual dimensions of tactile textures. Acta Psychologica, 114, 165-184.
Pick, H. L., Warren, D. H., & Hay, J. C. (1969). Sensory conflict in judgments of spatial direction. Perception & Psychophysics, 6, 203-205.
Pinker, S., & Bloom, P. (1990). Natural language and natural selection. Behavioral and Brain Sciences, 13, 707-784.
203
Popova, Y. (2005). Image schemas and verbal synaesthesia. In B. Hampe (Ed.), From Perception to Meaning: Image Schemas in Cognitive Linguistics (pp. 395-420). Berlin: de Gruyter.
Porcello, T. (2004). Speaking of sound: Language and the professionalization of sound-recording engineers. Social Studies of Science, 34, 733-758.
Postman, K., & Conger, B. (1954). Verbal habits and the visual recognition of words. Science, 119, 671-673.
Pragglejaz Group, P. (2007). MIP: A method for identifying metaphorically used words in discourse. Metaphor and Symbol, 22, 1-39.
Prather, S. C., Votaw, J. R., & Sathian, K. (2004). Task-specific recruitment of dorsal and ventral visual areas during tactile perception. Neuropsychologia, 42, 1079-1087.
Preacher, K. J., & Hayes, A. F. (2008). Asymptotic and resampling strategies for assessing and comparing indirect effects in multiple mediator models. Behavior Research Methods, 40, 879-891.
Price, J. L. (1987). The central and accessory olfactory systems. In T. E. Finger & W. L. Silver (Eds.), Neurobiology of Taste and Smell (pp. 179-204). New York: Wiley.
Prins, A. A. (1972). A History of English Phonemes: From Indo-European to Present-Day English. Leiden: Leiden University Press.
Pulvermüller, F. (2005). Brain mechanisms linking language and action. Nature Reviews Neuroscience, 6, 576-582.
Ramachandran, V. S., & Hubbard, E. M. (2001). Synaesthesia—a window into perception, thought and language. Journal of Consciousness Studies, 8, 3-34.
Rastle, K., Harrington, J., & Coltheart, M. (2002). 358,534 nonwords: The ARC nonword database. The Quarterly Journal of Experimental Psychology, 55, 1339-1362.
R Core Team (2015). R: A language and environment for statistical computing. R Foundation for Statistical Computing, Vienna, Austria.
Rhodes, R. (1994). Aural images. In L. Hinton, J. Nichols, & J. J. Ohala (Eds.), Sound Symbolism (pp. 276-292). Cambridge: Cambridge University Press.
Richardson, M. P., Strange, B. A., & Dolan, R. J. (2004). Encoding of emotional memories depends on amygdala and hippocampus and their interactions. Nature Neuroscience, 7, 278-285.
Ripin, R., & Lazarsfeld, P. F. (1937). The tactile-kinaesthetic perception of fabrics with emphasis on their relative pleasantness. Journal of Applied Psychology, 21, 198-224.
Rock, I., & Victor, J. (1964). Vision and touch: An experimentally created conflict between the two senses. Science, 143, 594-596.
Rolls, E. (2008). Functions of the orbitofrontal and pregenual cingulate cortex in taste, olfaction, appetite and emotion. Acta Physiologica Hungarica, 95, 131-164.

204
Rosseel, Y. (2012). lavaan: An R Package for Structural Equation Modeling. Journal of Statistical Software, 48, 1-36.
Rouby, C., & Bensafi, M. (2002). Is there a hedonic dimension to odors? In C. Rouby, B. Schaal, D. Dubois, R. Gervais, & A. Holley (Eds.), Olfaction, Taste, and Cognition (pp. 140-159). Cambridge: Cambridge University Press.
Royet, J. P., Plailly, J., Delon-Martin, C., Kareken, D. A., & Segebarth, C. (2003). fMRI of emotional responses to odors: influence of hedonic valence and judgment, handedness, and gender. Neuroimage, 20, 713-728.
Royet, J. P., Zald, D., Versace, R., Costes, N., Lavenne, F., Koenig, O., & Gervais, R. (2000). Emotional responses to pleasant and unpleasant olfactory, visual, and auditory stimuli: a positron emission tomography study. The Journal of Neuroscience, 20, 7752-7759.
Rozin, P. (1982). “Taste-smell confusions” and the duality of the olfactory sense. Attention, Perception, & Psychophysics, 31, 397-401.
Rummer, R., Schweppe, J., Schlegelmilch, R., & Grice, M. (2014). Mood is linked to vowel type: The role of articulatory movements. Emotion, 14, 246-250.
Russek, M., Fantino, M., & Cabanac, M. (1979). Effect of environmental temperature on pleasure ratings of odors and tastes. Physiology & Behavior, 22, 251-256.
Sadamitsu, M. (2003). Synaesthesia re-examined: an alternative treatment of smell related concepts. Osaka University Papers in English Linguistics, 8, 109-125.
Sakamoto, M., & Utsumi, A. (2014). Adjective Metaphors Evoke Negative Meanings. PloS ONE, 9, e89008.
Sapir, E. (1929). A study in phonetic symbolism. Journal of Experimental Psychology, 12, 225-239.
San Roque, L., Kendrick, K. H., Norcliffe, E., Brown, P., Defina, R., Dingemanse, M., Dirksmeyer, T., Enfield, N., Floyd, S., Hammond, H., Rossi, G., Tufvesson, S., van Putten, S., & Majid, A. (2014). Vision verbs dominate in conversation across cultures, but the ranking of non-visual verbs varies. Cognitive Linguistics, 26, 31-60.
Sathian, K., & Zangaladze, A. (2002). Feeling with the mind’s eye: contribution of visual cortex to tactile perception. Behavioural Brain Research, 135, 127-132.
Sathian, K., Zangaladze, A., Hoffman, J. M., & Grafton, S. T. (1997). Feeling with the mind’s eye. Neuroreport, 8, 3877-3881.
de Saussure, F. (1959) [1916]. Course in General Linguistics. New York: The philosophical library.
Schaefer, M., Denke, C., Heinze, H. J., & Rotte, M. (2013). Rough primes and rough conversations: evidence for a modality-specific basis to mental metaphors. Social Cognitive and Affective Neuroscience, 9, 1653-1659.
205
Schiffman, S., Robinson, D. E., & Erickson, R. P. (1977). Multidimensional scaling of odorants: Examination of psychological and physicochemical dimensions. Chemical Senses, 2, 375-390.
Schmidtke, D. S., Conrad, M., & Jacobs, A. M. (2014). Phonological iconicity. Frontiers in Psychology, 5.
Schroeder, C. E., Lindsley, R. W., Specht, C., Marcovici, A., Smiley, J. F., & Javitt, D. C. (2001). Somatosensory input to auditory association cortex in the macaque monkey. Journal of Neurophysiology, 85, 1322-1327.
Schürmann, M., Caetano, G., Jousmäki, V., & Hari, R. (2004). Hands help hearing: facilitatory audiotactile interaction at low sound-intensity levels. The Journal of the Acoustical Society of America, 115, 830-832.
Senft, G. (2011). Talking about color and taste on the Trobriand islands: A diachronic study. The Senses and Society, 6, 48-56.
Sergent, J., Ohta, S., & MacDonald, B. (1992). Functional neuroanatomy of face and object processing. A positron emission tomography study. Brain, 115, 15-36.
Shams, L., Kamitani, Y., & Shimojo, S. (2002). Visual illusion induced by sound. Cognitive Brain Research, 14, 147-152.
Shen, Y. (1997). Cognitive constraints on poetic figures. Cognitive Linguistics, 8, 33-71.
Shen, Y. (1998). How come silence is sweet but sweetness is not silent: a cognitive account of directionality in poetic synaesthesia. Language and Literature, 7, 123-140.
Shen, Y., & Aisenman, R. (2008). Heard melodies are sweet, but those unheard are sweeter: Synaesthetic metaphors and cognition. Language and Literature, 17, 107-121.
Shen, Y., & Gil, D. (2007). Sweet fragrances from Indonesia: A universal principle governing directionality in synaesthetic Metaphors. In W. van Peer, & J. Auracher (Eds.), New Beginnings in Literary Studies (pp. 49-71). Newcastle: Cambridge Scholars Publishing.
Shen, Y., & Gadir, O. (2009). How to interpret the music of caressing: Target and source assignment in synaesthetic genitive constructions. Journal of Pragmatics, 41, 357-371.
Shermer, D. Z., & Levitan, C. A. (2014). Red hot: The crossmodal effect of color intensity on perceived piquancy. Multisensory Research, 27, 207-223.
Shinohara, K., & Nakayama, A. (2011). Modalities and directions in synaesthetic metaphors in Japanese. Cognitive Studies, 18, 491-507.
Shintel, H., & Nusbaum, H. C. (2007). The sound of motion in spoken language: Visual information conveyed by acoustic properties of speech. Cognition, 105, 681-690.
Shintel, H., Nusbaum, H. C., & Okrent, A. (2006). Analog acoustic expression in speech communication. Journal of Memory and Language, 55, 167-177.
Simner, J., Cuskley, C., & Kirby, S. (2010). What sound does that taste? Cross-modal mappings across gustation and audition. Perception, 39, 553-569.
206
Sinclair, J. (2004). Trust the Text: Language, Corpus and Discourse. London: Routledge.
Skaug, H., Fournier, D., Bolker, B., Magnusson, A., & Nielsen, A. (2015). Generalized linear mixed models using ‘AD Model Builder’. R package version 0.8.3.1.
Smeets, M. A. M., & Dijksterhuis, G. B. (2014). Smelly primes–when olfactory primes do or do not work. Frontiers in Psychology, 5.
Smithers, G. V. (1954). Some English Ideophones. Archivum Linguisticum, 6, 73–111.
Solomon, R. L., & Postman, L. (1952). Frequency of usage as a determinant of recognition thresholds for words. Journal of Experimental Psychology, 43, 195-201.
Spence, C. (2007). Audiovisual multisensory integration. Acoustical Science and Technology, 28, 61-70.
Spence, C. (2011). Crossmodal correspondences: A tutorial review. Attention, Perception, & Psychophysics, 73, 971-995.
Spence, C. (2015). Eating with our ears: Assessing the importance of the sounds of consumption to our perception and enjoyment of multisensory flavour experiences. Flavour, 4, 3.
Spence, C., & Bayne, T. (2015). Is consciousness multisensory? In D. Stokes, M. Matthen & S. Biggs (Eds.), Perception and its Modalities (pp. 95-132). Oxford: Oxford University Press.
Spence, C., Hobkinson, C., Gallace, A., & Fiszman, B. P. (2013). A touch of gastronomy. Flavour, 2, 14.
Spence, C., Nicholls, M. E., & Driver, J. (2001). The cost of expecting events in the wrong sensory modality. Perception & Psychophysics, 63, 330-336.
Spence, C., Smith, B., & Auvray, M. (2015). Confusing tastes and flavours. In D. Stokes, M. Matthen, & S. Biggs (Eds.), Perception and its Modalities (pp. 247-274). Oxford: Oxford University Press.
Spivey, M. (2007). The Continuity of Mind. Oxford: Oxford University Press.
Stadtlander, L. M., & Murdoch, L. D. (2000). Frequency of occurrence and rankings for touch-related adjectives. Behavior Research Methods, Instruments, & Computers, 32, 579-587.
Stevenson, R. J., Prescott, J., & Boakes, R. A. (1999). Confusing tastes and smells: how odours can influence the perception of sweet and sour tastes. Chemical Senses, 24, 627-635.
Stokes, D., & Biggs, S. (2015). The dominance of the visual. In D. Stokes, M. Matthen & S. Biggs (Eds.), Perception and its Modalities (pp. 350-378). Oxford: Oxford University Press.
Strik Lievers, F. (2015). Synaesthesia: A corpus-based study of cross-modal directionality. In R. Caballero, & C. Paradis (Eds.), Functions of Language, Sensory Perceptions in Language and Cognition (pp. 69-95). Amsterdam: John Benjamins.
Strobl, C., Boulesteix, A.-L., Kneib, T., Augustin, T., & Zeileis, A. (2008). Conditional variable importance for random forests. BMC Bioinformatics, 9.

207
Strobl, C., Boulesteix, A.-L., Zeileis, A., & Hothorn, T. (2007). Bias in random forest variable importance measures: Illustrations, sources and a solution. BMC Bioinformatics, 8.
Strobl, C., Malley, J., & Tutz, G. (2009). An introduction to recursive partitioning: Rationale, application and characteristics of classification and regression trees, bagging and random forests. Psychological Methods, 14, 323-348.
Sutherland, S. L., & Cimpian, A. (2015). An explanatory heuristic gives rise to the belief that words are well suited for their referents. Cognition, 143, 228-240.
Suzuki, Y., Gyoba, J., & Sakamoto, S. (2008). Selective effects of auditory stimuli on tactile roughness perception. Brain Research, 1242, 87-94.
Sweetser, E. (1990). From Etymology to Pragmatics: Metaphorical and Cultural Aspects of Semantic Structure. Cambridge: Cambridge University Press.
Tagliamonte, S. A., & Baayen, R. H. (2012). Models, forests, and trees of York English: Was/were variation as a case study for statistical practice. Language Variation and Change, 24, 135-178.
Talmy, L. (1988). Force dynamics in language and cognition. Cognitive Science, 12, 49-100.
Tekiroğlu, S. S., Özbal, G., & Strapparava, C. (2014). A computational approach to generate a sensorial lexicon. In Proceedings of the COLING 2014 Workshop on Cognitive Aspects of the Lexicon (CogALex), August 2014, Dublin, Ireland.
Thomas, C. K. (1958). An Introduction to the Phonetics of American English. New York: The Ronald Press Company.
Thompson, P. D., & Estes, Z. (2011). Sound symbolic naming of novel objects is a graded function. The Quarterly Journal of Experimental Psychology, 64, 2392-2404.
Thorndike, E. L. (1948). On the frequency of semantic changes in modern English. The Journal of General Psychology, 39, 23-27.
Thorndike, E. L., & Lorge, I. (1952). The Teacher’s Word Book of 30,000 Words. New York: Bureau of Publications, Teachers College.
Tomasello, M. (1995). Joint attention and social cognition. In C. Moore, & P. J. Dunham (Eds.), Joint Attention: Its Origins and Role in Development (pp. 103-130). New York: Taylor & Francis.
Torchiano, M. (2015). effsize: Efficient effect size computation. R package version 0.5.4.
Tsur, R. (2006). Size–sound symbolism revisited. Journal of Pragmatics, 38, 905-924.
Tsur, R. (2008). Toward a Theory of Cognitive Poetics (2nd Edition). Brighton: Sussex Academic Press.
Tsur, R. (2012). Playing by Ear and the Tip of the Tongue: Precategorical Information in Poetry. Amsterdam: John Benjamins.
208
Turatto, M., Galfano, G., Bridgeman, B., & Umiltà, C. (2004). Space-independent modality-driven attentional capture in auditory, tactile and visual systems. Experimental Brain Research, 155, 301-310.
Turner, B. H., Mishkin, M., & Knapp, M. (1980). Organization of the amygdalopetal projections from modality-specific cortical association areas in the monkey. Journal of Comparative Neurology, 191, 515-543.
Ullmann, S. (1945). Romanticism and synaesthesia: A comparative study of sense transfer in Keats and Byron. Publications of the Modern Language Association of America, 60, 811-827.
Ullmann, S. (1959). The Principles of Semantics (2nd Edition). Glasgow: Jackson, Son & Co.
Ultan, R. (1978). Size-sound symbolism. In J. H. Greenberg, C. A. Ferguson, & E. A. Moravcsik (Eds.), Universals of Human Language, Vol 2: Phonology (pp. 525-568). Stanford, CA: Stanford University Press.
Urban, M. (2011). Conventional sound symbolism in terms for organs of speech: A cross-linguistic study. Folia Linguistica, 45, 1, 199–213.
Usnadze, D. (1924). Ein experimentller Beitrag zum Problem der psychologischen Grundlagen der Namengebung. Psychologische Forschung, 5, 24-43.
van Dantzig, S., Cowell, R. A., Zeelenberg, R., & Pecher, D. (2011). A sharp image or a sharp knife: Norms for the modality-exclusivity of 774 concept-property items. Behavior Research Methods, 43, 145-154.
van Dantzig, S., Pecher, D., Zeelenberg, R., & Barsalou, L. W. (2008). Perceptual processing affects conceptual processing. Cognitive Science, 32, 579-590.
Venables, W. N. & Ripley, B. D. (2002). Modern Applied Statistics with S. New York: Springer.
Viberg, Å. (1983). The verbs of perception: a typological study. Linguistics, 21, 123-162.
Viberg, Å. (1993). Crosslinguistic perspectives on lexical organization and lexical progression. In K. Hyltenstam, & Å. Viberg (Eds.), Progression and Regression in Language: Sociocultural, Neuropsychological and Linguistic Perspectives (pp. 340–385). Cambridge: Cambridge University Press.
Vinson, D. P., Cormier, K., Denmark, T., Schembri, A., & Vigliocco, G. (2008). The British Sign Language (BSL) norms for age of acquisition, familiarity, and iconicity. Behavior Research Methods, 40, 1079–1087.
Volkow, N. D., Wang, G. J., & Baler, R. D. (2011). Reward, dopamine and the control of food intake: implications for obesity. Trends in Cognitive Sciences, 15, 37-46.
Walsh, V. (2000). Neuropsychology: The touchy, feely side of vision. Current Biology, 10, R34-R35.
Warriner, A.B., Kuperman, V., & Brysbaert, M. (2013). Norms of valence, arousal, and dominance for 13,915 English lemmas. Behavior Research Methods, 45, 1191-1207.
209
Waskul, D. D., Vannini, P., & Wilson, J. (2009). The aroma of recollection: Olfaction, nostalgia, and the shaping of the sensuous self. The Senses and Society, 4, 5-22.
Watanabe, J., & Sakamoto, M. (2012). Comparison between onomatopoeias and adjectives for evaluating tactile sensations. Proc. SCIS-ISIS2012, 2346-2348.
Watanabe, J., Utsunomiya, Y., Tsukurimichi, H., & Sakamoto, M. (2012). Relationship between Phonemes and Tactile-emotional Evaluations in Japanese Sound Symbolic Words. In N. Miyake, D. Peebles, & R. P. Cooper (Eds.), Proceedings of the 34th Annual Meeting of the Cognitive Science Society (pp. 2517-2522). Austin, TX: Cognitive Science Society.
Watkins, C. (2000). The American Heritage Dictionary of Indo-European Roots (2nd Edition). Boston: Houghton Mifflin.
Waugh, L. R. (1994). Degrees of iconicity in the lexicon. Journal of Pragmatics, 22, 55-70.
Welch, R. B., & Warren, D. H. (1980). Immediate perceptual response to intersensory discrepancy. Psychological Bulletin, 88, 638-667.
Werning, M., Fleischhauer, J., & Beseoglu, H. (2006). The cognitive accessibility of synaesthetic metaphors. In R. Sun, & N. Miyake (Eds.), Proceedings of the 28th Annual Conference of the Cognitive Science Society (pp. 2365-2370). London: Lawrence Erlbaum.
Wichmann, S., Holman, E. W., & Brown, C. H. (2010). Sound symbolism in basic vocabulary. Entropy, 12, 844-858.
Wickham, H. (2007). Reshaping Data with the reshape Package. Journal of Statistical Software, 21, 1-20.
Wickham, H. (2015). stringr: Simple, Consistent Wrappers for Common String Operations. R package version 1.0.0.
Wickham, H., & Francois, R. (2015). dplyr: A Grammar of Data Manipulation. R package version 0.4.2.
Wieling, M., Montemagni, S., Nerbonne, J., & Baayen, R. H. (2014). Lexical differences between Tuscan dialects and standard Italian: Accounting for geographic and socio-demographic variation using generalized additive mixed modeling. Language, 90, 669-692.
Willander, J., & Larsson, M. (2006). Smell your way back to childhood: Autobiographical odor memory. Psychonomic Bulletin & Review, 13, 240-244.
Williams, J. (1976). Synaesthetic adjectives: A possible law of semantic change. Language, 52, 461-478.
Wilson, M. (2002). Six views of embodied cognition. Psychonomic Bulletin & Review, 9, 625-636.
Winter, B., Marghetis, T., & Matlock, T. (2015). Of magnitudes and metaphors: Explaining cognitive interactions between space, time, and number. Cortex, 64, 209-224.
Winter, B., Perlman, M., & Matlock, T. (2014). Using space to talk and gesture about numbers: Evidence from the TV News Archive. Gesture, 13, 377-408.

210
Wnuk, E., & Majid, A. (2014). Revisiting the limits of language: The odor lexicon of Maniq. Cognition, 131, 125-138.
Yeshurun, Y., & Sobel, N. (2010). An odor is not worth a thousand words: from multidimensional odors to unidimensional odor objects. Annual Review of Psychology, 61, 219-241.
Yoshida, M. (1968). Dimensions of tactile impressions. Japanese Psychological Research, 10, 123–137.
Yoshino, J., Yakata, A., Shimizu, Y., Haginoya, M., & Sakamoto, M. (2013). Method of evaluating metal textures by the sound symbolism of onomatopoeia. In The Second Asian Conference on Information Systems (pp. 618-624).
Yu, N. (2003). Synesthetic metaphor: A cognitive perspective. Journal of Literary Semantics, 32, 19-34.
Zald, D. H., Lee, J. T., Fluegel, K. W., & Pardo, J. V. (1998). Aversive gustatory stimulation activates limbic circuits in humans. Brain, 121, 1143-1154.
Zald, D. H., & Pardo, J. V. (1997). Emotion, olfaction, and the human amygdala: amygdala activation during aversive olfactory stimulation. Proceedings of the National Academy of Sciences, 94, 4119-4124.
Zangaladze, A., Epstein, C. M., Grafton, S. T., & Sathian, K. (1999). Involvement of visual cortex in tactile discrimination of orientation. Nature, 401, 587-590.
Zeileis, A. (2004). Econometric computing with HC and HAC covariance matrix estimators. Journal of Statistical Software, 11, 1-17.
Zeileis, A., & Hothorn, T. (2002). Diagnostic checking in regression relationships. R News, 2, 7-10.
Zipf, G. K. (1945). The meaning-frequency relationship of words. The Journal of General Psychology, 33, 251-256.
Zipf, G. K. (1949). Human Behavior and the Principle of Least Effort. New York: Addison-Wesley.
Zuur, A. F., Ieno, E. N., Walker, N. J., Saveliev, A. A., & Smith, G. M. (2009). Mixed Effects Models and Extensions in Ecology with R. New York: Springer.
Zwaan, R. A. (2009). Mental simulation in language comprehension and social cognition. European Journal of Social Psychology, 39, 1142-1150.
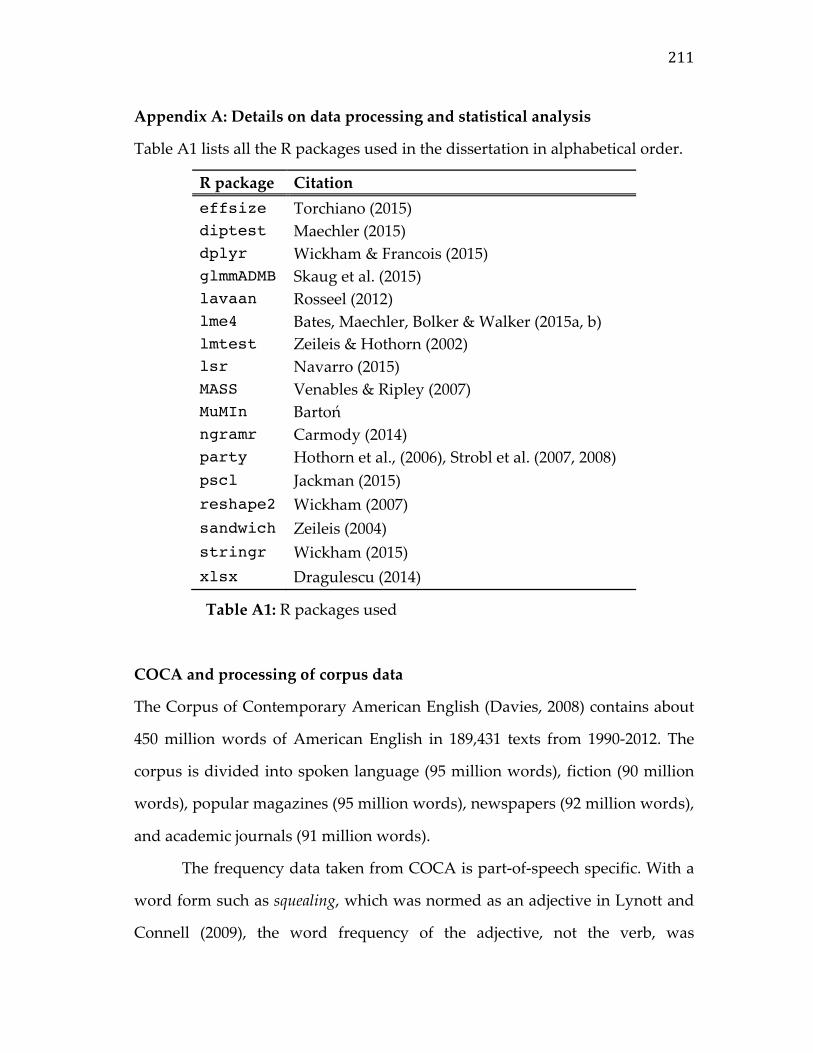
211
Appendix A: Details on data processing and statistical analysis
Table A1 lists all the R packages used in the dissertation in alphabetical order.
R package Citation effsize Torchiano (2015) diptest Maechler (2015) dplyr Wickham & Francois (2015) glmmADMB Skaug et al. (2015) lavaan Rosseel (2012) lme4 Bates, Maechler, Bolker & Walker (2015a, b) lmtest Zeileis & Hothorn (2002) lsr Navarro (2015) MASS Venables & Ripley (2007) MuMIn Bartoń ngramr Carmody (2014) party Hothorn et al., (2006), Strobl et al. (2007, 2008) pscl Jackman (2015) reshape2 Wickham (2007) sandwich Zeileis (2004) stringr Wickham (2015) xlsx Dragulescu (2014)
Table A1: R packages used
COCA and processing of corpus data
The Corpus of Contemporary American English (Davies, 2008) contains about
450 million words of American English in 189,431 texts from 1990-2012. The
corpus is divided into spoken language (95 million words), fiction (90 million
words), popular magazines (95 million words), newspapers (92 million words),
and academic journals (91 million words).
The frequency data taken from COCA is part-of-speech specific. With a
word form such as squealing, which was normed as an adjective in Lynott and
Connell (2009), the word frequency of the adjective, not the verb, was
212
analyzed. This methodological choice carries over to words that occurred in
multiple norming sets in different lexical categories, e.g., hold (v.) and hold (n.).
In this case, the verb hold (50,299) and the noun hold (6,688) are each associated
with their own frequency values. When matching the COCA data with the
various norming datasets (e.g., Lynott and Connell, 2009; Juhasz & Yap, 2013),
the match was performed at the level of the word form, rather than at the level
of the lemma. For example, the noun glass in Lynott and Connell (2013) was
matched with the uses of glass as a noun, disregarding the plural form glasses.
This is justified because the participants in the norming studies also considered
specific word forms.
Processing of SentiWordNet 3.0 data
Adopting the structure of WordNet (Fellbaum, 1998; Miller, 1999),
SentiWordNet 3.0 is organized at the level of “synsets” (synonym sets), with
each synset representing one dictionary meaning of a word. For example, the
word rancid occurs in two synsets—one all by itself, another one together with
the word sour. To get a single valence value for each word, the mean across all
the synsets in which a word occurs in was computed, e.g., for the two synsets
of rancid, the “negativity scores” were 0.375 and 0.625, yielding a mean of 0.5.
This value was taken as a word’s overall “negativity score”. Thus, valence is
averaged across the multiple dictionary meanings of a word.
Statistical analyses
In many cases, the analyses use the dominant modality classification of a word
rather than the continuous perceptual strength measures. This was done
purely for the ease of visualization/discussion. The reported conclusions do not
213
change if the continuous data is analyzed instead of the categorical
classification. Chapters 7 and 8 analyzed modality in a continuous fashion.
All count data was analyzed using negative binomial regression (Zuur
et al., 2009), using the function glm.nb from the MASS package. Negative
binomial regression rather than Poisson regression was chosen as the default
analysis approach for count data because early analyses of the data showed
that there was statistically reliable overdispersion (established using odTest
from the pscl package) with most datasets analyzed in this dissertation.
Unless they come directly from Chi-square tests, all reported p-values
that list Chi-square values are from likelihood ratio tests of the full model
against a null model without the predictor in question (for discussion see,
Bolker, Brooks, Clark, Geange, Poulsen, Stevens & White, 2009; Barr, Levy,
Scheepers & Tily, 2013). When performing likelihood ratio tests, models were
fitted with maximum likelihood (see Bolker et al., 2009; Zuur, Ieno, Walker,
Saveliev, & Smith, 2009).
R-squared for negative binomial models
Nakagawa and Schielzeth (2013) present a simple and general technique for
computing R2 for generalized linear models, implemented in the MuMIn
package in R (Bartoń, 2015). For mixed models, marginal R2 (of the fixed effects
component) is reported rather than conditional R2 (fixed + random effects)
since the random effects are theoretically not of interest in the situations
covered in this dissertation. However, the implementation in MuMIn
unfortunately does not cover negative binomial models and frequently leads to
unreasonably small values for Poisson models. Hence, all reported R2 values
for count data are based on the corresponding linear models that use log
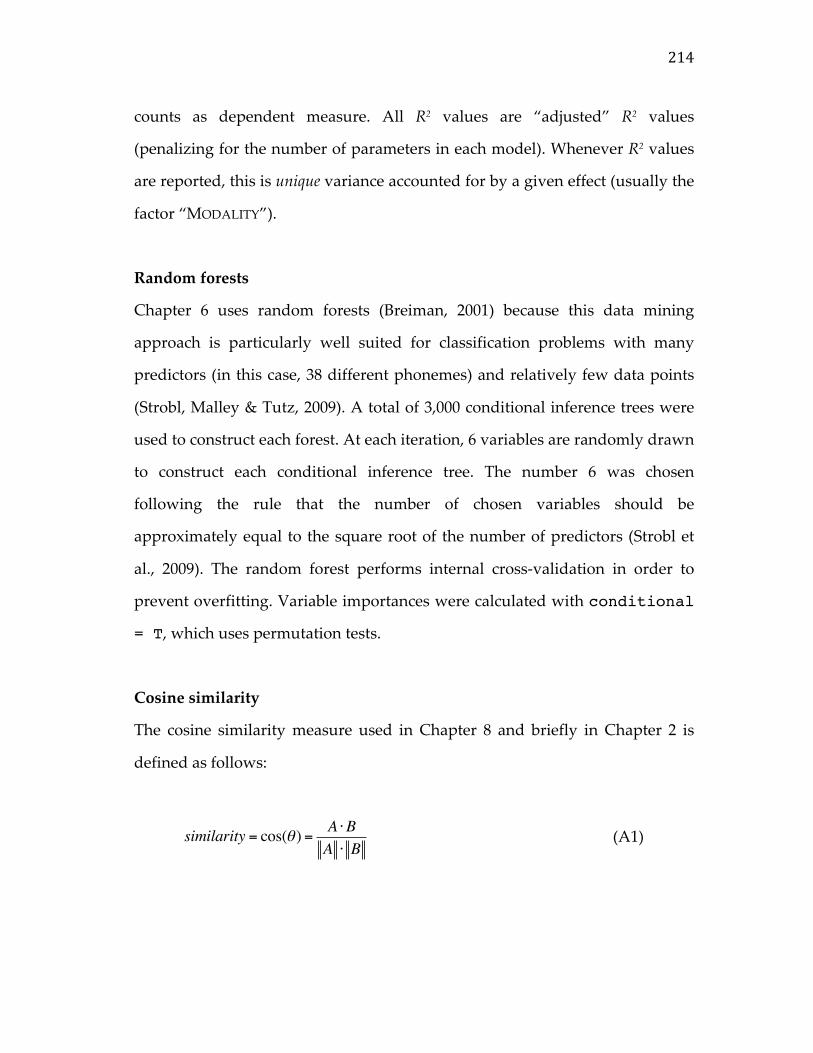
214
counts as dependent measure. All R2 values are “adjusted” R2 values
(penalizing for the number of parameters in each model). Whenever R2 values
are reported, this is unique variance accounted for by a given effect (usually the
factor “MODALITY”).
Random forests
Chapter 6 uses random forests (Breiman, 2001) because this data mining
approach is particularly well suited for classification problems with many
predictors (in this case, 38 different phonemes) and relatively few data points
(Strobl, Malley & Tutz, 2009). A total of 3,000 conditional inference trees were
used to construct each forest. At each iteration, 6 variables are randomly drawn
to construct each conditional inference tree. The number 6 was chosen
following the rule that the number of chosen variables should be
approximately equal to the square root of the number of predictors (Strobl et
al., 2009). The random forest performs internal cross-validation in order to
prevent overfitting. Variable importances were calculated with conditional
= T, which uses permutation tests.
Cosine similarity
The cosine similarity measure used in Chapter 8 and briefly in Chapter 2 is
defined as follows:
(A1)
similarity = cos(θ ) = A ⋅BA ⋅ B

215
A and B are the modality vectors for the two words that are being
compared (i.e., a numerical perceptual strength value for each of the five
common senses). Thus, a word is conceived of as a vector in the five-
dimensional “modality space”. In this space, words with dissimilar modality
profiles point into different directions. Words with similar modality profiles
point into similar directions, which is quantified by the angle between the two
vectors (using the cosine).