UC San Diego UC San Diego Electronic Theses and Dissertations Title Elucidation of redox metabolism control points in highly proliferative cells Permalink https://escholarship.org/uc/item/5p65m061 Author Badur, Mehmet Publication Date 2018 Peer reviewed|Thesis/dissertation eScholarship.org Powered by the California Digital Library University of California

Welcome message from author
This document is posted to help you gain knowledge. Please leave a comment to let me know what you think about it! Share it to your friends and learn new things together.
Transcript
UC San DiegoUC San Diego Electronic Theses and Dissertations
TitleElucidation of redox metabolism control points in highly proliferative cells
Permalinkhttps://escholarship.org/uc/item/5p65m061
AuthorBadur, Mehmet
Publication Date2018 Peer reviewed|Thesis/dissertation
eScholarship.org Powered by the California Digital LibraryUniversity of California

UNIVERSITY OF CALIFORNIA SAN DIEGO
Elucidation of redox metabolism control points in highly proliferative cells
A dissertation submitted in partial satisfaction of therequirements for the degree
Doctor of Philosophy
in
Bioengineering
by
Mehmet Gultekin Badur
Committee in charge:
Professor Christian Metallo, ChairProfessor Kun-Liang GuanProfessor Terence HwaProfessor Prashant MaliProfessor Bernhard Palsson
2018

Copyright
Mehmet Gultekin Badur, 2018
All rights reserved.
The dissertation of Mehmet Gultekin Badur is approved, and
it is acceptable in quality and form for publication on micro-
film and electronically:
Chair
University of California San Diego
2018
iii

DEDICATION
For my family, as none of this would be possible without their infinite patience
and unwavering support
iv
TABLE OF CONTENTS
Signature Page . . . . . . . . . . . . . . . . . . . . . . . . . . . . . . . . . . . . . . . iii
Dedication . . . . . . . . . . . . . . . . . . . . . . . . . . . . . . . . . . . . . . . . . . iv
Table of Contents . . . . . . . . . . . . . . . . . . . . . . . . . . . . . . . . . . . . . . v
List of Figures . . . . . . . . . . . . . . . . . . . . . . . . . . . . . . . . . . . . . . . . x
List of Tables . . . . . . . . . . . . . . . . . . . . . . . . . . . . . . . . . . . . . . . . xii
Acknowledgements . . . . . . . . . . . . . . . . . . . . . . . . . . . . . . . . . . . . . xiii
Vita . . . . . . . . . . . . . . . . . . . . . . . . . . . . . . . . . . . . . . . . . . . . . xv
Abstract of the Dissertation . . . . . . . . . . . . . . . . . . . . . . . . . . . . . . . . . xvii
Chapter 1 Reverse engineering the cancer metabolic network using flux analysis tounderstand drivers of human disease . . . . . . . . . . . . . . . . . . . . . 11.1 Abstract . . . . . . . . . . . . . . . . . . . . . . . . . . . . . . . . . 11.2 Introduction . . . . . . . . . . . . . . . . . . . . . . . . . . . . . . 2
1.2.1 Renewed interest in metabolism . . . . . . . . . . . . . . . 21.2.2 Thermodynamics and topology of metabolism . . . . . . . . 3
1.3 Methods of quantifying fluxes . . . . . . . . . . . . . . . . . . . . 51.3.1 Need of metabolic tracing . . . . . . . . . . . . . . . . . . 51.3.2 Stable isotope tracing . . . . . . . . . . . . . . . . . . . . . 6
1.4 Cancer . . . . . . . . . . . . . . . . . . . . . . . . . . . . . . . . . . 111.4.1 Renewed appreciation of metabolic dysregulation in cancer . . 111.4.2 Glutamine metabolism . . . . . . . . . . . . . . . . . . . . 141.4.3 Redox metabolism . . . . . . . . . . . . . . . . . . . . . . 181.4.4 Serine biosynthesis and one carbon metabolism . . . . . . . 20
1.5 Emerging links between metabolism and epigenetics . . . . . . . . 231.6 Observations from in vivo studies . . . . . . . . . . . . . . . . . . . 241.7 Conclusion . . . . . . . . . . . . . . . . . . . . . . . . . . . . . . 271.8 Acknowledgements . . . . . . . . . . . . . . . . . . . . . . . . . . 281.9 References . . . . . . . . . . . . . . . . . . . . . . . . . . . . . . 28
Chapter 2 Enzymatic passaging of human embryonic stem cells alters central carbonmetabolism and glycan abundance . . . . . . . . . . . . . . . . . . . . . 492.1 Abstract . . . . . . . . . . . . . . . . . . . . . . . . . . . . . . . . 492.2 Introduction . . . . . . . . . . . . . . . . . . . . . . . . . . . . . . 502.3 Materials and Methods . . . . . . . . . . . . . . . . . . . . . . . . . 51
2.3.1 Cell culture . . . . . . . . . . . . . . . . . . . . . . . . . . . 51
v
2.3.2 Enzymatic passaging experiments . . . . . . . . . . . . . . 522.3.3 Metabolite Extraction and GC-MS Analysis . . . . . . . . . 532.3.4 Mass isotopomer distributions, isotopomer spectral analysis
(ISA), and flux analysis . . . . . . . . . . . . . . . . . . . . 552.3.5 Statistical analyses . . . . . . . . . . . . . . . . . . . . . . 55
2.4 Results . . . . . . . . . . . . . . . . . . . . . . . . . . . . . . . . 562.4.1 Enzymatic passaging decreases glucose oxidation and fatty
acid synthesis in hESCs . . . . . . . . . . . . . . . . . . . 562.4.2 Rapid quantitation of total glycan pools and synthesis in hESCs 612.4.3 Glycan and carbohydrate pools are significantly depleted upon
enzymatic passaging . . . . . . . . . . . . . . . . . . . . . 652.4.4 Biosynthetic fluxes to nucleotides and glycans are similar in
cultured hESCs . . . . . . . . . . . . . . . . . . . . . . . . 652.5 Discussion . . . . . . . . . . . . . . . . . . . . . . . . . . . . . . . 68
2.5.1 Potential pitfalls in advanced hESC culture methods . . . . 682.5.2 Potential selective pressure of enzymatic passaging through
altered metabolism . . . . . . . . . . . . . . . . . . . . . . 702.5.3 Glycocalyx is a significant biomass pool in cultured hESCs . 702.5.4 Concluding thoughts . . . . . . . . . . . . . . . . . . . . . . 71
2.6 Acknowledgements . . . . . . . . . . . . . . . . . . . . . . . . . . 722.7 References . . . . . . . . . . . . . . . . . . . . . . . . . . . . . . 72
Chapter 3 Distinct metabolic states can support self-renewal and lipogenesis in humanpluripotent stem cells under different culture conditions . . . . . . . . . . 783.1 Abstract . . . . . . . . . . . . . . . . . . . . . . . . . . . . . . . . 783.2 Introduction . . . . . . . . . . . . . . . . . . . . . . . . . . . . . . 793.3 Materials and Methods . . . . . . . . . . . . . . . . . . . . . . . . . 81
3.3.1 Human pluripotent stem cell culture . . . . . . . . . . . . . . 813.3.2 Immunocytochemistry . . . . . . . . . . . . . . . . . . . . . 813.3.3 Metabolite extraction and derivatization . . . . . . . . . . . 823.3.4 Gas chromatography/mass spectrometry analysis . . . . . . 833.3.5 Metabolite quantification and isotopomer spectral analysis . 833.3.6 Mole percent enrichment measurement . . . . . . . . . . . 843.3.7 Extracellular flux and oxidative pentose phosphate pathway
flux measurements . . . . . . . . . . . . . . . . . . . . . . 843.3.8 Cell dry weight measurements . . . . . . . . . . . . . . . . 853.3.9 ATP-linked oxygen consumption rate measurements . . . . 853.3.10 Gene expression analysis . . . . . . . . . . . . . . . . . . . 853.3.11 Statistical analyses . . . . . . . . . . . . . . . . . . . . . . 85
3.4 Results . . . . . . . . . . . . . . . . . . . . . . . . . . . . . . . . 863.4.1 Medium choice influences hESC metabolic states . . . . . . 863.4.2 Media-dependent reprogramming of amino acid and NADPH
metabolism . . . . . . . . . . . . . . . . . . . . . . . . . . 89
vi
3.4.3 Chemically defined medium dramatically increaseslipogenesis . . . . . . . . . . . . . . . . . . . . . . . . . . 96
3.4.4 Lipid supplementation mitigates hESC metabolicreprogramming . . . . . . . . . . . . . . . . . . . . . . . . 97
3.5 Discussion . . . . . . . . . . . . . . . . . . . . . . . . . . . . . . . 1003.6 Acknowledgements . . . . . . . . . . . . . . . . . . . . . . . . . . 1033.7 References . . . . . . . . . . . . . . . . . . . . . . . . . . . . . . 105
Chapter 4 Lipid availability influences the metabolic maturation of hPSC-derivedcardiomyocytes . . . . . . . . . . . . . . . . . . . . . . . . . . . . . . . 1124.1 Introduction . . . . . . . . . . . . . . . . . . . . . . . . . . . . . . 1124.2 Materials and Methods . . . . . . . . . . . . . . . . . . . . . . . . 114
4.2.1 Human pluripotent stem cell (hPSC) culture . . . . . . . . . 1144.2.2 Cardiomyocyte differentiation . . . . . . . . . . . . . . . . 1144.2.3 13C metabolic tracing . . . . . . . . . . . . . . . . . . . . . 1154.2.4 Metabolite extraction and derivatization . . . . . . . . . . . 1164.2.5 GC/MS analysis . . . . . . . . . . . . . . . . . . . . . . . 1174.2.6 Mole percent enrichment calculation . . . . . . . . . . . . . 1174.2.7 Isotopomer spectral analysis (ISA) . . . . . . . . . . . . . . 1184.2.8 Oxygen Consumption Measurement . . . . . . . . . . . . . 1184.2.9 Gene expression analysis . . . . . . . . . . . . . . . . . . . 1204.2.10 Immunocytochemistry . . . . . . . . . . . . . . . . . . . . . 1214.2.11 Statistical analyses . . . . . . . . . . . . . . . . . . . . . . . 121
4.3 Results . . . . . . . . . . . . . . . . . . . . . . . . . . . . . . . . . 1214.3.1 Cardiac differentiation increases glucose oxidation of hPSCs . 1214.3.2 Nutrient consumption of hPSC-derived cardiomyocytes . . . 1224.3.3 Metabolic activation during hPSC cardiac differentiation . . 1244.3.4 Changes in lipid metabolism during hPSC cardiac
differentiation . . . . . . . . . . . . . . . . . . . . . . . . . 1294.3.5 Immature metabolic features of hPSC-derived cardiomyocytes
cultured in lipid insufficient environment . . . . . . . . . . . 1314.3.6 Nutrient lipids improve metabolic maturation of hPSC-derived
cardiomyocytes . . . . . . . . . . . . . . . . . . . . . . . . 1324.4 Discussion . . . . . . . . . . . . . . . . . . . . . . . . . . . . . . . 1334.5 Acknowledgements . . . . . . . . . . . . . . . . . . . . . . . . . . 1364.6 References . . . . . . . . . . . . . . . . . . . . . . . . . . . . . . 136
Chapter 5 Combinatorial CRISPR-Cas9 metabolic screens reveal critical redox controlpoints dependent on the KEAP1-NRF2 regulatory axis . . . . . . . . . . 1435.1 Abstract . . . . . . . . . . . . . . . . . . . . . . . . . . . . . . . . 1435.2 Introduction . . . . . . . . . . . . . . . . . . . . . . . . . . . . . . 1445.3 Materials and Methods . . . . . . . . . . . . . . . . . . . . . . . . 145
5.3.1 Cell lines and culture conditions . . . . . . . . . . . . . . . 145
vii

5.3.2 Dual-gRNA library design and cloning . . . . . . . . . . . 1465.3.3 Lentivirus production . . . . . . . . . . . . . . . . . . . . . 1465.3.4 CRISPR/Cas9 dual-gRNA screening . . . . . . . . . . . . . 1475.3.5 Quantification of dual gRNAs abundance . . . . . . . . . . 1475.3.6 Computation of single and double gene knockout fitness and
genetic interaction scores . . . . . . . . . . . . . . . . . . . 1485.3.7 Single-gRNA construct cloning . . . . . . . . . . . . . . . . 1515.3.8 Competitive cell growth assay . . . . . . . . . . . . . . . . . 1515.3.9 RNA sequencing data analysis . . . . . . . . . . . . . . . . 1535.3.10 Stable isotope tracing . . . . . . . . . . . . . . . . . . . . . 1535.3.11 Metabolite Extraction and GC-MS Analysis . . . . . . . . . 1545.3.12 Metabolite integration and isotopomer spectral analysis (ISA) 1555.3.13 Immunoblotting . . . . . . . . . . . . . . . . . . . . . . . . 1555.3.14 RT-PCR . . . . . . . . . . . . . . . . . . . . . . . . . . . . 1565.3.15 Glutathione measurement . . . . . . . . . . . . . . . . . . 1565.3.16 Statistical analyses . . . . . . . . . . . . . . . . . . . . . . 156
5.4 Results . . . . . . . . . . . . . . . . . . . . . . . . . . . . . . . . 1575.4.1 Combinatorial CRISPR-Cas9 screening to probe metabolic
networks . . . . . . . . . . . . . . . . . . . . . . . . . . . 1575.4.2 Mapping metabolic gene dependencies in glucose catabolism 1605.4.3 Validation of significant SKO and DKO results on cellular
fitness and metabolic fluxes . . . . . . . . . . . . . . . . . 1645.4.4 Comparison of metabolic liabilities across cell lines reveals
key role of KEAP1-NRF2 . . . . . . . . . . . . . . . . . . 1675.5 Discussion . . . . . . . . . . . . . . . . . . . . . . . . . . . . . . . 1725.6 Acknowledgements . . . . . . . . . . . . . . . . . . . . . . . . . . 1745.7 References . . . . . . . . . . . . . . . . . . . . . . . . . . . . . . 175
Chapter 6 Oncogenic R132 IDH1 mutations limit NADPH for de novo lipogenesisthrough (D)2-hydroxyglutarate production in fibrosarcoma cells . . . . . 1806.1 Abstract . . . . . . . . . . . . . . . . . . . . . . . . . . . . . . . . 1806.2 Introduction . . . . . . . . . . . . . . . . . . . . . . . . . . . . . . . 1816.3 Materials and Methods . . . . . . . . . . . . . . . . . . . . . . . . 183
6.3.1 Cell culture and stable isotope tracing . . . . . . . . . . . . 1836.3.2 Delipidation of FBS . . . . . . . . . . . . . . . . . . . . . 1836.3.3 Metabolite Extraction and GC-MS Analysis . . . . . . . . . 1846.3.4 Metabolite integration and isotopomer spectral analysis (ISA) 1856.3.5 Measurement of extracellular and intracellular fluxes . . . . 1856.3.6 NADPH consumption . . . . . . . . . . . . . . . . . . . . 1876.3.7 RT-PCR . . . . . . . . . . . . . . . . . . . . . . . . . . . . 1876.3.8 Quantification and Statistical Analysis . . . . . . . . . . . . 188
6.4 Results . . . . . . . . . . . . . . . . . . . . . . . . . . . . . . . . 188
viii
6.4.1 Use of genetically-engineered HT1080 fibrosarcoma cell linesto dissect enzymatic functions of IDH1 and mutant IDH1 . . 188
6.4.2 Cytosolic NADPH contributes to D2HG production fromIDH1+/R132C cells . . . . . . . . . . . . . . . . . . . . . . . . 191
6.4.3 2HG production contributes significantly to cellular NADPHdemands . . . . . . . . . . . . . . . . . . . . . . . . . . . 193
6.4.4 De novo lipogenesis competes with D2HG production forNADPH . . . . . . . . . . . . . . . . . . . . . . . . . . . . 195
6.5 Discussion . . . . . . . . . . . . . . . . . . . . . . . . . . . . . . . 1986.6 Acknowledgements . . . . . . . . . . . . . . . . . . . . . . . . . . 1996.7 References . . . . . . . . . . . . . . . . . . . . . . . . . . . . . . 200
Chapter 7 Conclusions . . . . . . . . . . . . . . . . . . . . . . . . . . . . . . . . . 207
Chapter S1 Supplement to Chapter 1 . . . . . . . . . . . . . . . . . . . . . . . . . . . 211S1.1 Abbreviations . . . . . . . . . . . . . . . . . . . . . . . . . . . . . . 211
Chapter S2 Supplement to Chapter 2 . . . . . . . . . . . . . . . . . . . . . . . . . . 212S2.1 Abbreviations . . . . . . . . . . . . . . . . . . . . . . . . . . . . . 212
Chapter S3 Supplement to Chapter 3 . . . . . . . . . . . . . . . . . . . . . . . . . . 215S3.1 Abbreviations . . . . . . . . . . . . . . . . . . . . . . . . . . . . . 215S3.2 Supplemental Methods . . . . . . . . . . . . . . . . . . . . . . . . 215
S3.2.1 Cell culture and media . . . . . . . . . . . . . . . . . . . . 215S3.2.2 Detection of 2-hydroxyglutarate isoforms . . . . . . . . . . 217
S3.3 Supplemental Tables and Figures . . . . . . . . . . . . . . . . . . . 217S3.4 Supplementary References . . . . . . . . . . . . . . . . . . . . . . 229
Chapter S5 Supplement to Chapter 5 . . . . . . . . . . . . . . . . . . . . . . . . . . . 231S5.1 Supplemental Figures . . . . . . . . . . . . . . . . . . . . . . . . . . 231
Chapter S6 Supplement to Chapter 6 . . . . . . . . . . . . . . . . . . . . . . . . . . 240S6.1 Supplemental Tables and Figures . . . . . . . . . . . . . . . . . . . 240
ix
LIST OF FIGURES
Figure 1.1: MFA applied to biological systems at different scales comes with a tradeoffin molecular resolution versus physiologic relevance . . . . . . . . . . . . 7
Figure 1.2: Stable isotope tracing paradigm . . . . . . . . . . . . . . . . . . . . . . . 8Figure 1.3: Tracing TCA metabolism using 13C glucose and glutamine . . . . . . . . . 12Figure 1.4: Metabolic pathways dysregulated in the context of disease . . . . . . . . . 15
Figure 2.1: Enzymatic passaging alters central carbon metabolism . . . . . . . . . . . 58Figure 2.2: Quantitation of glycan residue abundance and labeling in cellular biomass . 63Figure 2.3: Enzymatic passaging alters glycan abundance of hESCs . . . . . . . . . . 66Figure 2.4: Biosynthetic fluxes to glycans and nucleotides are similar in cultured hESCs 69
Figure 3.1: Distinct metabolic states exist in hESCs adapted to MEF-CM versus chemi-cally defined media . . . . . . . . . . . . . . . . . . . . . . . . . . . . . . 87
Figure 3.2: Media choice influences glucose, glutamine, and NADPH metabolism . . . . 91Figure 3.3: HESCs adapted to chemically defined media upregulate lipid biosynthesis . 94Figure 3.4: Lipid supplementation mitigates media-induced metabolic flux alterations . 98Figure 3.5: Lipid supplementation mitigates media-induced metabolic enzyme expres-
sion and mitochondrial state alterations . . . . . . . . . . . . . . . . . . . . 101Figure 3.6: Nutrient availability reprograms intermediary metabolism in hPSCs . . . . 104
Figure 4.1: hPSC-derived cardiomyocytes primarily oxidize glucose . . . . . . . . . . 123Figure 4.2: hPSC-derived cardiomyocytes are metabolically immature . . . . . . . . . 125Figure 4.3: Day-by-day tracing reveals metabolic pathway activation and suppression
during cardiac differentiation . . . . . . . . . . . . . . . . . . . . . . . . . 127Figure 4.4: De novo lipogenesis is suppressed during cardiac differentiation . . . . . . 130Figure 4.5: Lipid supplementation activates mitochondrial activity . . . . . . . . . . . 132Figure 4.6: Lipid supplementation increases intracellular fatty acid availability and β -
oxidation . . . . . . . . . . . . . . . . . . . . . . . . . . . . . . . . . . . 134
Figure 5.1: Experimental design . . . . . . . . . . . . . . . . . . . . . . . . . . . . . 158Figure 5.2: Combinatorial CRISPR screens reveal metabolic network dependencies . . . 161Figure 5.3: Screening results validated through targeted fitness and metabolic flux mea-
surements . . . . . . . . . . . . . . . . . . . . . . . . . . . . . . . . . . . 165Figure 5.4: KEAP1 mutational status alters redox metabolism and impact of oxPPP gene
knockouts on cellular fitness . . . . . . . . . . . . . . . . . . . . . . . . . 170
Figure 6.1: Metabolic characterization of isogenic IDH1-expressing HT1080 cell lines 190Figure 6.2: Tracing NAD(P)H regeneration and 2HG production in HT1080-IDH1 cell
lines . . . . . . . . . . . . . . . . . . . . . . . . . . . . . . . . . . . . . . 192Figure 6.3: D2HG production and secretion increases NADPH demands in IDH1+/R132C
cells . . . . . . . . . . . . . . . . . . . . . . . . . . . . . . . . . . . . . . 194Figure 6.4: D2HG production limits NADPH for DNL in lipid-deficient conditions . . 196
x

Figure S2.1: Polar metabolite labeling and abundances . . . . . . . . . . . . . . . . . . 213Figure S2.2: Biomass metabolite abundances. . . . . . . . . . . . . . . . . . . . . . . 214
Figure S3.1: Atom transition maps of labeled glutamine species . . . . . . . . . . . . . 219Figure S3.2: Metabolic alterations in hESCs adapted to MEF-CM versus chemically de-
fined media . . . . . . . . . . . . . . . . . . . . . . . . . . . . . . . . . . . 221Figure S3.3: Mass isotopomer distributions from [1,2-13C]glucose . . . . . . . . . . . . 223Figure S3.4: Mass isotopomer distributions from [U-13C5]glutamine . . . . . . . . . . . 225Figure S3.5: HESCs adapted to chemically defined media upregulate lipid biosynthesis . 227Figure S3.6: Oxygen consumption traces of hPSCs in different culture conditions . . . . 230
Figure S5.1: Schematic of dual-gRNA-library construction and quality control of screens 232Figure S5.2: CRISPR screening results reveal metabolic network dependencies . . . . . 234Figure S5.3: Screening results validated through metabolic flux measurements and fitness
assays . . . . . . . . . . . . . . . . . . . . . . . . . . . . . . . . . . . . . 236Figure S5.4: KEAP1 mutational status alters redox metabolism and impact of oxPPP gene
knockouts on cellular fitness . . . . . . . . . . . . . . . . . . . . . . . . . 238
Figure S6.1: Central carbon isotopologue distribution in mtIDH cells . . . . . . . . . . 242Figure S6.2: Metabolic alterations induced by lipid deficiency . . . . . . . . . . . . . . 243
xi

LIST OF TABLES
Table 2.1: Metabolite fragments used for GC/MS analysis . . . . . . . . . . . . . . . 56
Table 4.1: Metabolite fragments used for GC/MS analysis . . . . . . . . . . . . . . . 119Table 4.2: RT-PCR primers . . . . . . . . . . . . . . . . . . . . . . . . . . . . . . . . 120Table 4.3: Fatty acid concentrations in commonly used albumin media supplements . . . 131
Table S2.1: MIDs for unlabeled hydrosylate fragments . . . . . . . . . . . . . . . . . . 212Table S2.2: MIDs for labeled hydrosylate fragments . . . . . . . . . . . . . . . . . . . 214
Table S3.1: Metabolite fragments used for GC/MS analysis . . . . . . . . . . . . . . . 218Table S3.2: Primers used for gene expression analysis . . . . . . . . . . . . . . . . . . 218
Table S6.1: Metabolite fragments . . . . . . . . . . . . . . . . . . . . . . . . . . . . . . 241Table S6.2: RT-PCR primers . . . . . . . . . . . . . . . . . . . . . . . . . . . . . . . . . 241
xii
ACKNOWLEDGEMENTS
Thank you to everyone who has supported me through this work. You’ve been instrumental
in its completion and I’m incredibly grateful for the ways in which you’ve influenced my success.
I thank my advisor, Christian M. Metallo, for all of his efforts in shaping my thesis and my
development as a scientist. I could not have achieved so much without his mentorship and the
opportunities he afforded me. I thank Martina Wallace for her guidance through the scientific and
personal challenges of graduate school. I thank the current and former members of the Metallo
lab for their camaraderie and helpful discussions throughout the years: Seth Parker, Nate Vacanti,
Chris Ahn, Thekla Cordes, Le You, Selvam Muthusamy, Esther Lim, and Michal Handzlik. I
thank my numerous collaborators throughout the years for expanding my knowledge of biology
and metabolism, especially Dongxin Zhao and Prashant Mali.
I would also like to thank my friends and family that have provided constant support
through my time in UCSD. I have been incredibly fortunate to befriend new people in San Diego
and forge stronger bonds with old friends. Finally, I want to acknowledge Jessica Ungerleider for
being the constant source of happiness in my life.
Chapter 1, in full, is a reprint of the material as it appears in ”Reverse engineering the
cancer metabolic network using flux analysis to understand drivers of human disease,” Metabolic
Engineering, vol. 45, 2018. Mehmet G. Badur is the primary author of this publication. Christian
M. Metallo is the corresponding author of this publication.
Chapter 2, in full, is a reprint of the material as it appears in ”Enzymatic passaging of
human embryonic stem cells alters central carbon metabolism and glycan abundance,” Biotech-
nology Journal, vol. 10, 2015. Mehmet G. Badur is the primary author of this publication. Hui
Zhang is a co-author of this publication. Christian M. Metallo is the corresponding author of this
publication.
Chapter 3, in full, is a reprint of the material as it appears in ”Distinct metabolic states
can support self-renewal and lipogenesis in human pluripotent stem cells under different culture
xiii

conditions,” Cell Reports, vol. 16, 2016. Mehmet G. Badur and Hui Zhang are the co-primary
authors of this publication. Ajit S. Divakaruni, Seth J. Parker, Christian Jager, Karsten Hiller, and
Anne N. Murphy are co-authors of this publication. Christian M. Metallo is the corresponding
author of this publication.
Chapter 4 is currently being prepared for submission for publication. Mehmet G. Badur,
Hui Zhang, Sean Spierling, Ajit Divakaruni, Noah E. Meurs, Anne N. Murphy, and Mark
Mercola are co-authors of this material. Christian M. Metallo is the corresponding author of this
publication.
Chapter 5, in full, is a reprint of the material as it appears in ”Combinatorial CRISPR-
Cas9 Metabolic Screens Reveal Critical Redox Control Points Dependent on the KEAP1-NRF2
Regulatory Axis,” Molecular Cell, vol. 69, 2018. Mehmet G. Badur and Dongxin Zhao are the
co-primary authors of this publication. Jens Luebeck, Jose H. Magana, Amanda Birmingham,
Roman Sasik, Christopher S. Ahn, and Trey Ideker are co-authors of this publication. Christian
M. Metallo and Prashant Mali are the co-corresponding authors of this publication.
Chapter 6, in full, has been submitted for publication of the material as it may appear
in ”Oncogenic R132 IDH1 mutations limit NADPH for de novo lipogenesis through (D)2-
hydroxyglutarate production in fibrosarcoma cells,” Cell Reports, 2018. Mehmet G. Badur is the
primary author of this publication. Thangaselvam Muthusamy, Seth J. Parker, Shenghong Ma,
Thekla Cordes, Jose H. Magana, Kun-Liang Guan are co-authors of this publication. Christian M.
Metallo is the corresponding author of this publication.
xiv

VITA
2018 Ph.D. in Bioengineering, University of California San Diego
2013 B.S. in Chemical Engineering, University of Wisconsin-Madison
PUBLICATIONS
Zhao D*, Badur MG*, Luebeck J, Magana JH, Birmingham A, Sasik R, Ahn CS, Ideker T,Metallo CM, Mali P. (2018) Combinatorial CRISPR-Cas9 metabolic screens reveal critical redoxcontrol points dependent on the KEAP1-NRF2 regulatory axis. Mol Cell 69(4): 699-708.
Badur MG & Metallo CM. (2018) Reverse engineering the cancer metabolic network using fluxanalysis to understand drivers of human disease. Met Eng 45:95-108
Zhang H*, Badur MG*, Divakaruni AS, Parker SJ, Jager C, Hiller K, Murphy AN, Metallo CM.(2016) Distinct metabolic states can support self-renewal and lipogenesis in human pluripotentstem cells under different culture conditions. Cell Rep 16(6):1536-47
Badur MG, Zhang H, Metallo CM. (2015) Enzymatic passaging of human embryonic stem cellsalters central carbon metabolism and glycan abundance. Biotechnol J 10(10):1600-11
Hazeltine LB, Badur MG, Lian X, Das A, Han W, Palecek SP. (2013) Temporal impact ofsubstrate mechanics on differentiation of human embryonic stem cells to cardiomyocytes. ActaBiomater 10(2):604-12
Hazeltine LB, Simmons CS, Salick MR, Lian X, Badur MG, Han W, Delgado SM, WakatsukiT, Crone WC, Pruitt BL, Palecek SP. (2012) Effects of substrate mechanics on contractility ofcardiomyocytes generated from human pluripotent stem cells. Int J Cell Biol 2012:508294
CONFERENCE PRESENTATIONS
Badur MG*, Zhao D*, et al. (2018) Interrogation of critical metabolic pathways for compartment-specific redox homeostasis in cancer cells. American Chemical Society, New Orleans, LA.Oral.
Badur MG*, Zhao D*, et al. (2018) Interrogation of critical metabolic pathways for compartment-specific redox homeostasis in cancer cells. Keystone Symposium: Tumor Metabolism, Snowbird,UT. Poster.
Badur MG*, Zhang H*, et al. (2016) Distinct metabolic states in hPSC culture conditions.American Chemical Society, San Diego, CA. Oral.
xv

Badur MG*, Zhang H*, et al. (2016) Distinct metabolic states support pluripotent stem cellself-renewal. Keystone Symposium: Tumor Metabolism, Banff, BC. Poster.
Badur MG, et al. (2013) Stiffness-dependent differentiation of human pluripotent stem cells tocardiomyocytes. American Chemical Society, New Orleans, LA. Oral.
xvi
ABSTRACT OF THE DISSERTATION
Elucidation of redox metabolism control points in highly proliferative cells
by
Mehmet Gultekin Badur
Doctor of Philosophy in Bioengineering
University of California San Diego, 2018
Professor Christian Metallo, Chair
Metabolism is essential for cellular homeostasis as cells import nutrients as substrates for
biosynthetic reactions or as energy to power the cell. However, maintenance of this homeostasis in
the face of environmental or genetic insults requires altering metabolic fluxes to achieve a desired
behavior. Redox metabolism is a critical subsystem within the metabolic network and must be
finely tuned to support growth in highly proliferative cells. The chapters of this dissertation are
independent bodies of work that explore how redox metabolism is altered to support stem cell
and cancer cell growth. Chapter 1, titled "Reverse engineering the cancer metabolic network
using flux analysis to understand drivers of human disease," is a review on the utility of applying
metabolic flux analysis (MFA) to study cancer biology. The chapter first introduces techniques
xvii

required for MFA and then highlights recent advances in cancer metabolism that required the
application of MFA. Chapter 2, titled "Enzymatic passaging of human embryonic stem cells
alters central carbon metabolism and glycan abundance," explores how routine enzymatic passage
methods alters metabolism to support increased hexosamine biosynthesis after cleavage of the
glycolayx. Chapter 3, titled "Distinct metabolic states can support self-renewal and lipogenesis in
human pluripotent stem cells under different culture conditions," examines how disparate media
conditions routinely used in stem cell culture maintain pluripotency in distinct metabolic states.
Chemically-defined media forces the cell to reside in an increased biosynthetic state to support
de novo lipogenesis that can be reversed with lipid supplementation. Chapter 4, titled "Lipid
availability influences the metabolic maturation of hPSC-derived cardiomyocytes," describes
how gold-standard culture conditions for cardiomyocyte differentiation present a roadblock
for metabolic maturation. Chapter 5, titled "Combinatorial CRISPR-Cas9 metabolic screens
reveal critical redox control points dependent on the KEAP1-NRF2 regulatory axis," describes
using novel combinatorial CRISPR screening technology to understand glycolytic network
topology and enzyme compensation in cancer cells. Examination of dispensability of redox
genes across cell types revealed a counterintuitive regulation of redox metabolism function and
essentiality controlled by KEAP1-NRF2. Chapter 6, titled "Oncogenic R132 IDH1 mutations
limit NADPH for de novo lipogenesis through (D)2-hydroxyglutarate production in fibrosarcoma
cells," describes how oncogenic mutations in IDH1 reprogram NAD(P)H metabolism to support
2HG production. While the mutation is generally tolerated, 2HG production competes with de
novo lipogenesis for NADPH when cells are placed in lipid-deficient conditions. Taken together,
these collective studies demonstrate the importance of understanding redox-specific metabolic flux
regulation in highly proliferative cells. These findings have impact on bioprocess development of
stem cells and therapeutic targeting of cancer cells.
xviii

Chapter 1
Reverse engineering the cancer metabolic
network using flux analysis to understand
drivers of human disease
1.1 Abstract
Metabolic dysfunction has reemerged as an essential hallmark of tumorigenesis, and
metabolic phenotypes are increasingly being integrated into pre-clinical models of disease. The
complexity of these metabolic networks requires systems-level interrogation, and metabolic flux
analysis (MFA) with stable isotope tracing present a suitable conceptual framework for such
systems. Here we review efforts to elucidate mechanisms through which metabolism influences
tumor growth and survival, with an emphasis on applications using stable isotope tracing and
MFA. Through these approaches researchers can now quantify pathway fluxes in various in
vitro and in vivo contexts to provide mechanistic insights at molecular and physiological scales
respectively. Knowledge and discoveries in cancer models are paving the way toward applications
in other biological contexts and disease models. In turn, MFA approaches will increasingly help
1
to uncover new therapeutic opportunities that enhance human health.
1.2 Introduction
1.2.1 Renewed interest in metabolism
A largely forgotten vestige of biochemistry coursework, metabolism is once again being
appreciated as a driver of human disease rather than a downstream effect of some genetic or
transcriptional changes. Since the advent of the genomics revolution, biomedical research has
largely focused on the roles of DNA and RNA dysregulation in disease. This information has
led to an international, multidisciplinary effort to catalog, sequence, and interpret large amounts
of genomics data from various sources [1]. While these efforts have generated large amounts of
publically-available, highly-curated data and new insights into a range of diseases, the next steps
often require researchers to look beyond the mutational or allelic status of disease-associated
genes and gain a more mechanistic understanding of these changes. As such, higher level activities
of the cell are now coming into focus as drivers of pathological phenotype - e.g. transcriptional
and translational regulation, epigenetic states, and systems-level metabolic activities.
Indeed, recent work in cancer, metabolic syndrome, and regenerative medicine has
highlighted situations where metabolic alterations precede other canonical modes of biological
control (e.g. transcriptional activation), demonstrating its importance in biomedicine. Metabolism,
or the biochemical reactions executed by cells, is essential for the maintenance of cellular
function and the response to extrinsic and intrinsic cues. To control such a complex network,
mammalian metabolism has evolved a regulatory framework and interconnectivity that ensures
robust functionality. Advanced methods are required (and are now becoming available) to
decipher the regulation of these processes and their dysfunction in disease settings [2]. In this
review, we will establish the critical need for studying metabolism at a systems-level, introduce
methodological advances that have enabled interrogation of mammalian metabolism, and highlight
2
recent work that has utilized stable isotope tracing and MFA to better understand human disease.
1.2.2 Thermodynamics and topology of metabolism
Metabolic reactions can largely be broken down into three main components or functions
- bioenergetics, biosynthesis, and redox balance - with each component having a unique network
behavior requiring systems-level interrogation.
The thermodynamic reality of a cell is the constant need to generate energy that can be
coupled to unfavorable reactions with a positive Gibbs free energy [3–5]. In practice, nutrients are
imported into cells then catabolized to regenerate adenosine triphosphate (ATP), the metabolic
currency of cells. Due to the high energy stored in its phosphoanhydride bonds, ATP hydrolysis is
required to drive thermodynamically unfavorable reactions and allow them to proceed at sufficient
rates. The use of ATP regeneration and hydrolysis in disparate metabolic pathways is a prime
example of how metabolic interconnectivity facilitates life and highlights the importance of the
first law of thermodynamics in understanding metabolic function [6–8].
This connection results in two axioms of bioenergetics: (1) If a cell is consuming large
amounts of ATP, a concomitant production of ATP molecules is needed. A cell can turnover its
ATP pool over six times per minute [9], and ATP levels are "nearly universally homeostatic"
[10]. Therefore, the proper biological unit of measure is the ATP regeneration rate (flux) rather
than a metabolite level or ratio (i.e. nucleotide pool ratios). (2) Cells have evolved enough
production capacity and storage (e.g. glycolysis, oxidative phosphorylation, creatine kinase,
adenylate cyclase) to meet this demand in the face of various insults (e.g. substrate deprivation,
hypoxia). This results in a topological reality where many pathways are connected by ATP,
resulting in highly interdependent nodes within the metabolic network. More complex cells
like eukaryotes have evolved further to compartmentalize reactions to facilitate (and complicate)
pathway function further.
In addition to maintenance of energetic homeostasis, an important role of metabolism is
3

to provide biosynthetic precursors. Highly proliferative cells - such as immune cells, tumor cells,
and transit-amplifying stem cells - require a doubling of cellular biomass each time they divide. In
addition, all somatic cells have established rates of lipid and protein turnover/nucleotide synthesis
that require constant production of biosynthetic intermediates [11]. While unique mammalian
auxotrophies exist that contribute to large portions of cellular biomass (i.e. essential amino acids
for protein biosynthesis), cells can choose to either synthesize or uptake macronutrients for the
remaining portion of needed biomass. While the "cheapest" route for a cell would be to uptake
all macromolecules, network topology might dictate the need for flux through a pathway to
provide substrates for a different pathway. This interdependency results in a coupling of catabolic
and anabolic reactions. Biological (and electrical) energy flow is coordinated by the movement
of electrons, and these transfers are mediated by oxidoreductases and reducing equivalents
(e.g. nicotinamide adenine dinucleotide (NAD+), nicotinamide adenine dinucleotide phosphate
(NADP+), and flavin adenine dinucleotide (FAD)). At a high level, cells extract electrons from
reduced substrates (e.g. carbohydrates, fatty acids) and secrete oxidized byproducts (e.g. lactate,
CO2). Therefore, flux through oxidative pathways consumes electron carriers and produces
reducing equivalents. Cells in turn must consume electrons and regenerate electron carriers to
maintain proper redox balance. For example, to maintain glycolytic rates and/or tricarboxylic
acid (TCA) cycle flux, cells must constantly consume electrons via lactate dehydrogenase (LDH)
or respiration to regenerate NAD+ and FAD. This point highlights one potential reason why
rapidly proliferating cells exhibit high glycolytic rates (i.e. the Warburg effect). For example,
diversion of glycolytic intermediates for serine biosynthesis can cause redox fluctuations or
imbalances such that NAD+ is not regenerated at sufficient rates by LDH to maintain glycolytic
flux. Alternate NAD+ recycling pathways such as the malate-aspartate shuttle and glycerol-
phosphate shunt are active in proliferating cells but may be similarly blunted as aspartate and
glycerol-3-phosphate are used for biosynthesis. By maintaining high flux through glycolysis such
redox fluctuations are minimized. Redox balance in cells also extends to environmental stresses
4

through the consumption of reducing equivalents to regenerate antioxidants (i.e. the cycling of
reduced (GSH) and oxidized (GSSG) glutathione). This redox control in cells demonstrates how
cells have evolved metabolic interconnections to maintain homeostasis.
1.3 Methods of quantifying fluxes
1.3.1 Need of metabolic tracing
The interconnectivity, redundancies, and cross-dependencies that exist within metabolic
pathways manifest themselves in classic emergent network behavior, where changes in one
node can result in far-reaching and unforeseen states. For example, altering one pathway by
modulating substrate availability or through molecular and pharmacological interventions can
lead to system-wide changes in metabolic pathway fluxes as cells attempt to maintain homeostasis
[12]. Historically, technological limitations forced scientists to interrogate metabolism at the
resolution of individual enzymes. While this approach led to the elucidation of fundamental
metabolic pathways, like the TCA cycle, a critical need for systems-level analyses has now
emerged.
With technological advances such as gas chromatography-coupled mass spectrometry
(GC/MS), liquid chromatography-coupled mass spectrometry (LC/MS), and nuclear magnetic
resonance spectroscopy (NMR), researchers now have the ability to rapidly and simultaneously
quantify large numbers of metabolites in a given biological setting [13]. These developments
have been essential in driving both the rapid growth in new information about metabolic con-
trol/function and the metabolic basis of human disease [14–16]. In addition to the inherent
complexities of studying any network, mammalian metabolism has unique features and must
be studied at multiple length scales (Figure 1.1) For example, many metabolic pathways have
many redundant, compartment-specific forms that can be regulated independently (e.g. TCA
cycle enzymes in the mitochondria, cytosol, and/or peroxisome), or cells can reside in local
5
cellular communities that interact to elicit a broader function (e.g. beta cells within islets or
stromal-epithelial interactions). On the other hand, diseases manifest themselves throughout
the body, where dysregulated insulin secretion by the pancreas in diabetes affects distal muscle
microvascular, liver, adipose tissue, and neurological functions.
With these realities of network and length-scale complexity, recent work has focused on
the use of systems biology to parse through and integrate all available "omics" data - genomics,
transcriptomics, and metabolomics. However, sequencing data is better used for identification of
novel mutations in metabolic disease [1, 17] and pathway activation [18], as germline mutations
and transcript level changes do not always directly map to changes in a specific metabolic pathway.
Additionally, metabolomics studies have been successfully used to identify metabolic shifts and
implicate potentially altered metabolic pathways [19]. However, rapid metabolomics platforms
serve as a hypothesis generating methodology because one cannot necessarily infer metabolic
flux alterations a priori through metabolite level changes. Since the primary driver of metabolic
phenotypes is alteration of flux, stable isotope tracing and metabolic flux analysis (MFA) have
emerged as critically important tools for interrogating metabolism [20].
1.3.2 Stable isotope tracing
Modeling approaches have been applied to metabolic systems for some time and center
around the need to conserve mass in the context of network stoichiometry and cellular needs [21].
These systems are often highly underdetermined, and fluxes are resolved to varying extents by the
application of constraints, which may include uptake/secretion from media, transcriptomics or
proteomics data, and/or isotopic labeling [22]. The most detailed information is often provided by
the use of stable isotope tracing and metabolomics, whereby a given atom of interest is "tracked"
throughout the metabolic network by culturing cells with a tracer (e.g. [1-13C]glutamine where
13C isotope is in the 1 position of the glutamine molecule). Analogous to a dye mixing through a
continuously-stirred tank reactor, stable isotopes (e.g. 13C, 2H, and 15N) within a given substrate
6
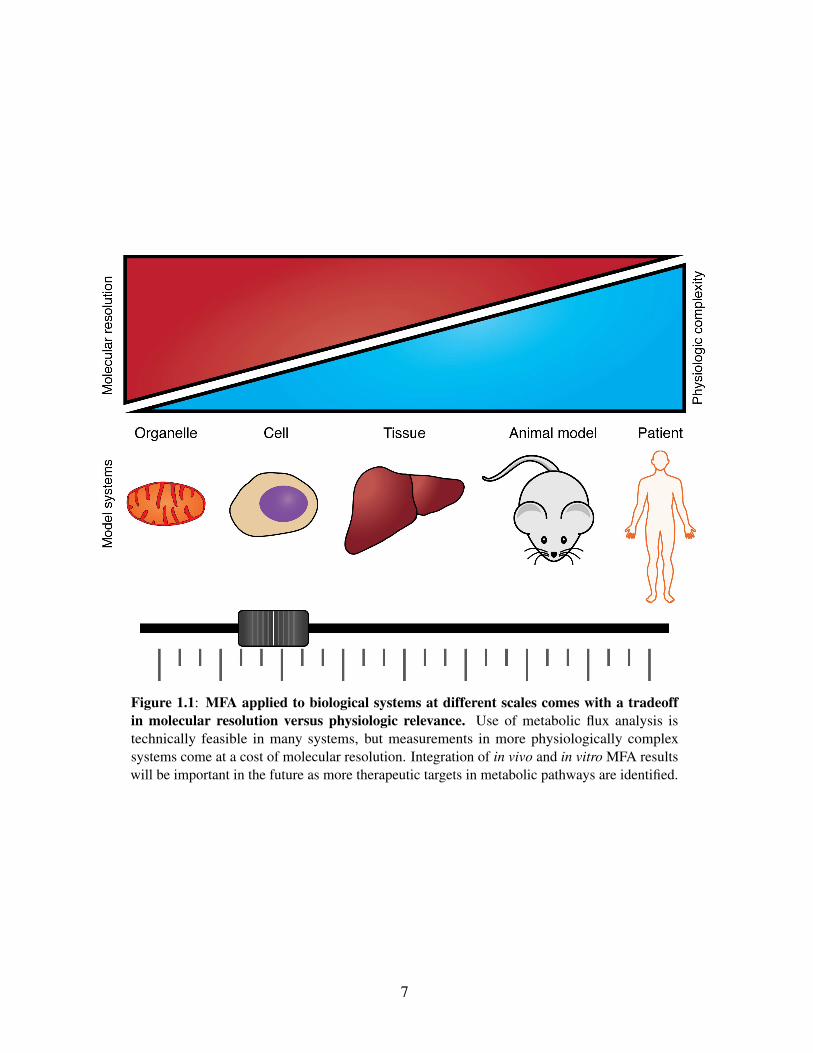
Figure 1.1: MFA applied to biological systems at different scales comes with a tradeoffin molecular resolution versus physiologic relevance. Use of metabolic flux analysis istechnically feasible in many systems, but measurements in more physiologically complexsystems come at a cost of molecular resolution. Integration of in vivo and in vitro MFA resultswill be important in the future as more therapeutic targets in metabolic pathways are identified.
7

are fed to cells, tissues, or animals which then consume the "heavy" metabolite of interest and
metabolize it in various downstream reactions (Figure 1.2). By then measuring the presence
of an isotopologue-a metabolite with a different molecular weight due to the presence of the
stable isotope-the fraction of an individual molecule coming from a tracer can be quantified using
knowledge of atom transitions throughout the metabolic network (Figure 1.2).
Figure 1.2: Stable isotope tracing paradigm. Isotopologue or mass isotopomer distributions(MIDs) are the central measurement in metabolic flux analysis. Stable isotope variants (i.e.13C, 15N, 2H) of carbohydrates, fatty acids, or amino acids are introduced into a biologicalsystem of interest. The labeled atoms of interest propagate throughout the metabolic network,and the biological matrix is sampled as needed. Mass spectrometry is used to measure isotopeenrichment within individual metabolite pools to determine MIDs for all compounds of interest.
As an example, when cells metabolize [U-13C6]glucose the fully-labeled pyruvate gener-
ated from glycolysis may be oxidized and/or carboxylated in mitochondria (Figure 1.3). When
the cell oxidizes pyruvate, the 13C carbon in the first position of pyruvate will be lost during the
8
decarboxylation step of pyruvate dehydrogenase (PDH), yielding an M+2 labeled AcCoA. When
pyruvate is metabolized by pyruvate carboxylase (PC) all three 13C atoms will be present on the
resulting M+3 oxaloacetate. These metabolites condense to form citrate, resulting in a pool of
labeled species with mass increments from 0 to 6, depending on the relative contribution of PC,
PDH, and other pathways that produce or consume AcCoA, oxaloacetate, and citrate (Figure 1.3).
This isotopologue or mass isotopomer distribution (MID) subsequently allows for inference of
flux through certain metabolic reactions (Figure 1.2). In this simplified metabolite network, the
ratio of the M+2 portion of the citrate pool vs the M+3 portion is a proxy of how many pyruvate
molecules were catalyzed by PDH vs PC. However, data generated in real metabolic networks is
more complex than that presented here due to TCA cycling and additional inputs into the citrate
pool. Since many input and output fluxes influence labeling in well-connected metabolite pools,
computational tools are often necessary to resolve information on fluxes for such systems [23].
MIDs therefore contain detailed information on relative fluxes, and these data are in-
corporated into models that estimate fluxes and associated confidence intervals within a given
biological system [24]. The choice of tracer(s) will impact the specific pathways and fluxes to be
resolved and should be considered carefully [25, 26]. Ultimately, MFA integrates extracellular
flux measurements (e.g. glucose uptake and lactate secretion), biomass composition, growth rates,
and intracellular steady state labeling data to estimate intracellular fluxes [27, 28]. By constraining
potential flux measurements with physiological biomass demands and metabolite fluxes in and
out of the system, MFA solves the inverse problem - where intracellular fluxes are estimated,
theoretical labeling patterns calculated, error between theoretical and experimental data calculated,
and estimated fluxes iterated through error minimization until a best fit is achieved [29]. Long
applied to study microbial and prokaryote metabolic networks [24], advances in computational
frameworks [30, 31] and software packages [32–36] have made mammalian applications far
more tractable. Exchange fluxes (i.e. the minimum of the forward and reverse flux for a given
reaction) can be the most difficult to resolve [37]. Compartmentation also complicates analyses
9
and interpretation of labeling data [29] and indeed MFA can help to resolve such information in
certain settings [38–40]. Most MFA applications rely on the resolution of fluxes in a scaled-down,
user-defined subset of the metabolic network, such as glycolysis, the oxPPP, and the TCA cycle
[24]. Researchers have begun to apply genome-wide metabolic reaction networks in MFA studies
of microbes more recently [41, 42].
Better resolution of intracellular fluxes can be achieved by incorporating dynamic labeling
and pool size information into non-stationary MFA (NS-MFA) models. Steady-state labeling
provides a relative measure of fluxes into and out of metabolic pools but requires the system to
be at both metabolic and isotopic steady-state [43]. Such data are often not very informative
for the analysis of linear pathways (e.g. glycolysis) or exchange fluxes. NS-MFA provides
an alternative computational framework for integration of labeling data, extracellular fluxes,
and biomass demands [44]. Unlike traditional MFA which relies on algebraic solutions, the
transient labeling data and pool size data are incorporated into an ODE-based model [45]. While
increased precision is achieved by incorporation of more experimental data, more care is needed
on experimental design (e.g. sampling and quenching) and more data acquisition/analysis is
required [44, 46]. This review will focus almost exclusively on steady-state MFA and basic
tracing applications; however, use of NS-MFA has been reviewed extensively [47], and numerous
protocols are available [44, 48, 49]. This approach is increasingly being applied to mammalian
systems [50–52].
When applied in a coordinated fashion, stable isotope tracing, metabolomics, and com-
putational modeling can effectively resolve metabolic flux alterations in the context of both
microenvironmental cues and pathophysiological alterations. In short, stable isotopes can inform
on aspects of metabolism that cannot be learned through other measurements. The remainder of
this review will focus on recent examples in biomedicine of how stable isotope tracing and MFA
have been used to understand the metabolic mechanisms driving human disease and associated
pathologies. A primary (and still emerging) area of focus is applications to cancer biology, though
10

additional examples will be included to highlight the versatility of these approaches.
1.4 Cancer
1.4.1 Renewed appreciation of metabolic dysregulation in cancer
A desire to resolve the metabolic differences between normal tissue, tumors, and metastatic
cells has re-invigorated interest in metabolic tracing and flux analysis over the last decade.
Metabolism is tightly linked to the pathophysiology of a cancer cell, an observation first described
by Otto Warburg in the early 20th century. He noted that rat tumors were susceptible to glucose
deprivation (rather than oxygen deprivation) and exhibited higher than normal "fermentation"
(glycolysis) to meet their ATP demands [53]. He later extended these observations to postulate
mitochondrial dysfunction as the cause of neoplasia, since mitochondrial "poisons" are carcino-
genic and cancer cells increased fermentation in response to irreversible low respiration rates
[54]. Although at that time others (correctly) questioned whether mitochondrial dysfunction
was a driver of neoplasia, in part due to radioactive isotope tracing indicating that mitochondria
respiration was still active in cancer cells [55], the phenomenon that cancer cells are highly
glycolytic was widely accepted [56]. Over time, however, the idea of metabolism as a driver of
tumorigenesis largely fell to way side.
Cancer has now been reappreciated as a disease of metabolism [57, 58]. Recent work has
succeeded in reinvigorating the study of metabolism as a means to both detect and study cancer
growth [59, 60]. For example, since the late 1990s, accumulation of 2-deoxy-2-[18F]fluoro-D-
glucose (FDG) and subsequent imaging through positron emission tomography (PET) has been
an FDA-approved method (FDG-PET) for the noninvasive detection of tumors [61]. Related
approaches now aim to study consumption of other nutrients or specific metabolic rates using novel
tracer compounds or hyperpolarized NMR [62–65]. In addition to these diagnostic approaches,
significant effort is now being applied to elucidate how metabolic pathways contribute to cancer
11

Figure 1.3: Tracing TCA metabolism using 13C glucose and glutamine. In this example, la-beling on citrate and other intermediates from fully labeled [U-13C6]glucose changes dependingon routes used for anaplerosis and AcCoA generation. Oxidation of glucose-derived pyruvateby PDH results in M+2 citrate. Carboxylation through PC results in M+3 or M+5 citrate.[U-13C5]glutamine oxidation or reduction results in M+4 and M+5 citrate, respectively. Takentogether, relative flux changes in well-connected nodes (e.g. TCA cycles) result in measureabledifferences in labeling. Open circles depict 12C carbon atoms, filled circles depict 13C carbonatoms.
12
initiation and progression [66].
Beyond the metabolic reprogramming required for proliferation, the discovery of mu-
tations in genes encoding metabolic enzymes that directly impact tumorigenesis has been an
important catalyst driving this resurgence in metabolic research [67, 68]. For example, the
first widely characterized metabolic mutations were the loss of succinate dehydrogenase (SDH)
and fumarate hydratase (FH), which are associated with development of paragangliomas and
leiomyosarcomas, respectively [69]. These loss-of-function mutations lead to increases in succi-
nate or fumarate levels within tumors, which are thought to inhibit aKG-dependent dioxygenases
that impact HIF1α stabilization and other biological processes [70–72]. Metabolic modeling
was used to understand how a FH-null cancer cell could operate without a functional TCA cycle,
elucidating a critical dependency on heme biosynthesis [73]. More generally, these findings
highlighted critical links between metabolism and tumor formation while offering potential new
avenues for therapeutic intervention.
Another critical demonstration of metabolic alterations in cancer is the discovery of mutant
isocitrate dehydrogenase (mtIDH) tumors. First identified via exome sequencing of gliomas [74,
75], both IDH1 and IDH2 are now known to be mutated somewhat frequently in acute myeloid
leukemia, low-grade gliomas, and chondrosarcomas [76]. These mutations are characterized by a
gain-of-function, where D-2-hydroxyglutarate (2HG) is produced at millimolar concentrations
intracellularly [77]. Mutant IDH1 and IDH2 reduce aKG to 2HG by consuming an NADPH
reducing equivalent, either in the cytosol or mitochondria [78]. Similar to SDH and FH-null
tumors, 2HG can disrupt aKG-dependent dioxygenase activity, in particular those regulating
DNA and histone demethylation, and tumors often present with hypermethylation phenotype [79–
83]. This mutation connects a fundamental node in the metabolic network with deep biological
perturbations that are associated with tumor progression. Due to the highly compartment-specific
and cofactor-dependent nature of this class of mutations, metabolic tracing is uniquely situated
to understand the underlying metabolic features in these tumors [84]. However, cells harboring
13
such mutations exhibit only minor metabolic changes under normal physiological conditions,
but under hypoxic or pharmacological redox stresses that impact mitochondrial function more
tractable changes have emerged [85–87].
While these examples demonstrate how mutations in TCA cycle enzymes directly con-
tribute to tumorigenesis, cancers in general hijack different metabolic pathways to fuel their
proliferative needs (Figure 1.4). These pathways vary with environment, tissue of origin, and the
genetic landscape of that cell. Therefore, a critical need exists to extend these MFA methods to
understand how diverse cancers alter their metabolism to survive and what metabolic features can
be therapeutically targeted.
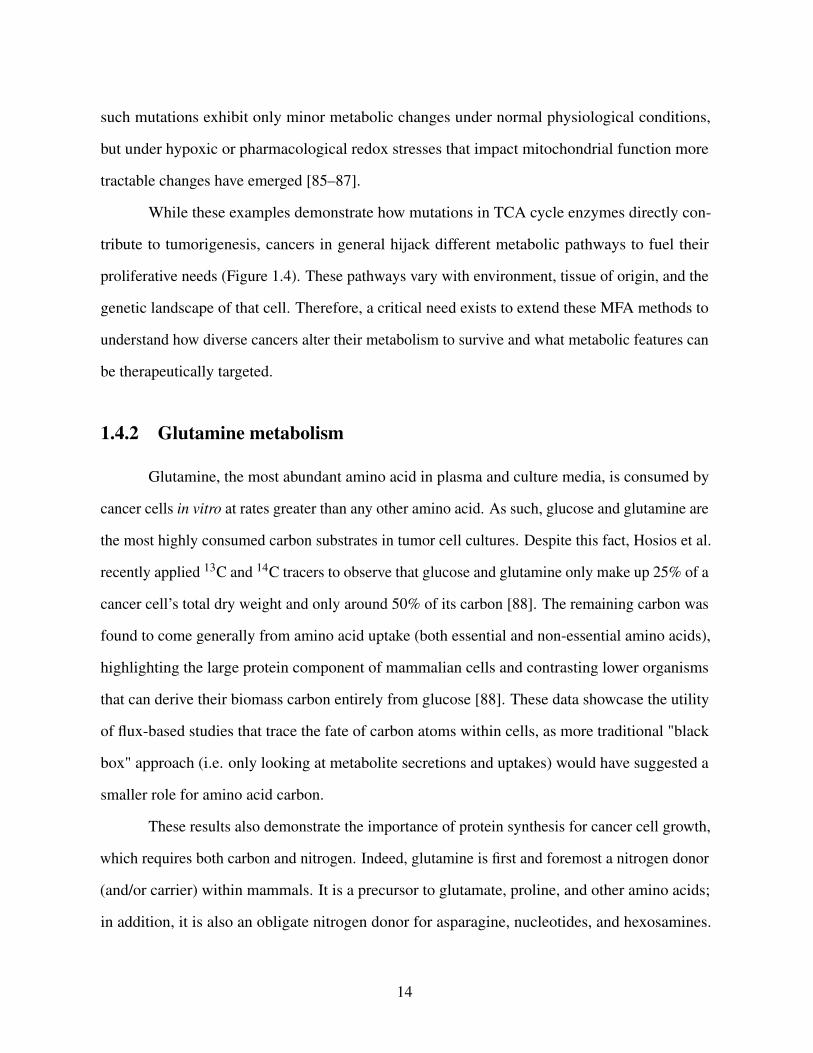
1.4.2 Glutamine metabolism
Glutamine, the most abundant amino acid in plasma and culture media, is consumed by
cancer cells in vitro at rates greater than any other amino acid. As such, glucose and glutamine are
the most highly consumed carbon substrates in tumor cell cultures. Despite this fact, Hosios et al.
recently applied 13C and 14C tracers to observe that glucose and glutamine only make up 25% of a
cancer cell’s total dry weight and only around 50% of its carbon [88]. The remaining carbon was
found to come generally from amino acid uptake (both essential and non-essential amino acids),
highlighting the large protein component of mammalian cells and contrasting lower organisms
that can derive their biomass carbon entirely from glucose [88]. These data showcase the utility
of flux-based studies that trace the fate of carbon atoms within cells, as more traditional "black
box" approach (i.e. only looking at metabolite secretions and uptakes) would have suggested a
smaller role for amino acid carbon.
These results also demonstrate the importance of protein synthesis for cancer cell growth,
which requires both carbon and nitrogen. Indeed, glutamine is first and foremost a nitrogen donor
(and/or carrier) within mammals. It is a precursor to glutamate, proline, and other amino acids;
in addition, it is also an obligate nitrogen donor for asparagine, nucleotides, and hexosamines.
14
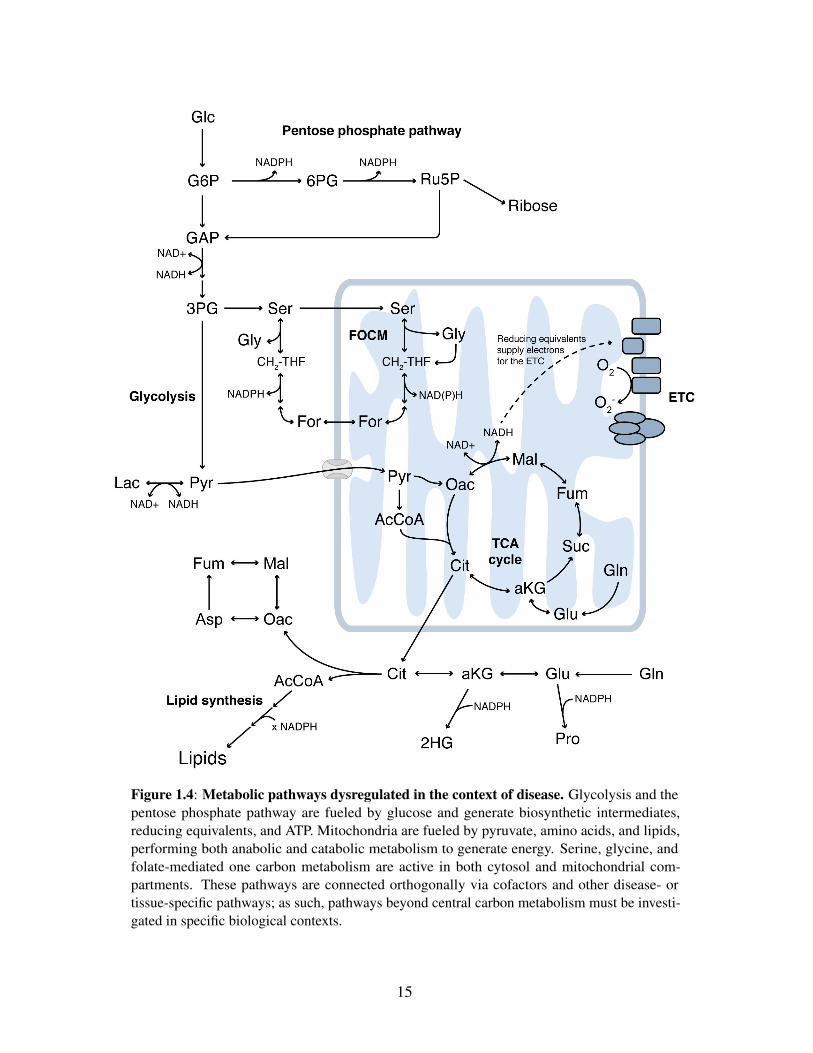
Figure 1.4: Metabolic pathways dysregulated in the context of disease. Glycolysis and thepentose phosphate pathway are fueled by glucose and generate biosynthetic intermediates,reducing equivalents, and ATP. Mitochondria are fueled by pyruvate, amino acids, and lipids,performing both anabolic and catabolic metabolism to generate energy. Serine, glycine, andfolate-mediated one carbon metabolism are active in both cytosol and mitochondrial com-partments. These pathways are connected orthogonally via cofactors and other disease- ortissue-specific pathways; as such, pathways beyond central carbon metabolism must be investi-gated in specific biological contexts.
15
Several studies have highlighted the importance of glutamine availability in driving these processes
[89–91]. In fact, hexosamine biosynthetic fluxes in cultured cells are similar those measured for
nucleotide (i.e., ribose) synthesis in proliferating stem cells [92]. Glutathione is an antioxidant
present at high concentrations within cells, and recent studies have highlighted the role of
glutaminase and the xCT transporter in coordinating glutamine uptake, glutamate secretion, and
cystine consumption from culture medium in cancer cells [93, 94]. Indeed, the high rates of
glutaminolysis that occur in cultured tumor cells is at least partially attributable to the need for
cystine uptake.
In the absence of glutamine, cancer cells can become on dependent on non-essential
amino acid or protein uptake from stroma or the microenvironment, respectively. Tracer-based
studies have described the importance of macropinocytosis and autophagy in allowing tumors to
acquire proteinogenic amino acids under such nutrient-limiting conditions [95–97]. Alternatively,
pancreatic tumor stroma use autophagy to provide alanine for cancer cell growth [98]. Yang et
al. performed MFA modeling to delineate the role of cancer-associated fibroblasts (CAFs) in
providing glutamine to ovarian cancer cells [99]. Although it remains challenging to deconvolute
labeling results and decipher cell-specific fluxes [100], analysis of systems containing multiple
cell types will continue to grow in importance as we gain a better understanding of tumor
heterogeneity and immune cell interactions.
Some tumor cells rewire their mitochondria such that alternate substrates are used to fuel
TCA metabolism. For example, the mitochondrial pyruvate carrier (MPC) is often expressed
at lower levels in colorectal cancer and over-expression of MPC mitigates cell growth under
anchorage-independence or as xenografts [101]. Notably, respiration is unchanged upon inhibition
or knockdown of MPC [102], suggesting mitochondria remain functional and active. MFA studies
on cells with reduced MPC activity or expression have highlighted how cells compensate when
pyruvate flux into mitochondria is compromised [38, 103]. Under these conditions, glutaminolysis
is significantly increased to maintain anaplerotic flux and biosynthesis of amino acids (e.g.
16

aspartate), nucleotides, and fatty acids. -oxidation of fatty acids was increased nearly 10-fold in
Mpc2 knockdown cells, and additional evidence indicated that BCAA catabolism was elevated
upon MPC inhibition [38]. These studies highlight how mitochondria adapt to MPC inhibition.
While this rewiring may benefit tumor growth, therapeutic benefits in diseases such as metabolic
syndrome and neurodegeneration may also emerge [104–107].
Oxidative stress also causes rewiring of glutamine metabolism within mitochondria.
Indeed, in response to hypoxic insult pyruvate oxidation is decreased [108] and cells rely on
glutamine to support proliferation [109]. Glutaminolytic flux is increased to support oxidative
TCA metabolism [85, 110, 111], since respiration remains active in low oxygen conditions. Thus,
oxidation of aKG sustains respiration. However, NADP-dependent IDHs are reversible and
have the capacity to reductively carboxylate aKG in mammals [112, 113], offering cells another
pathway to generate AcCoA and reducing equivalents. Detailed tracer studies and MFA have
more recently been applied to better understand how this pathway is controlled. Indeed, hypoxia
reprograms TCA metabolism such that reductive carboxylation is the major route through which
cells produce citrate and lipogenic AcCoA [114, 115]. Similar changes occur in "pseudohypoxic"
renal carcinoma cells (RCC) that are deficient in the Von Hippel-Lindau tumor suppressor [114,
115]; tumors where this pathway may be therapeutically relevant. Indeed, evidence from in
vivo tumor models and patient samples suggest this mode of TCA metabolism is active in VHL-
deficient RCC downstream of HIFs [116, 117]. This pathway also seems critical for aspartate
production upstream of the pyrimidine synthesis pathway [118].
At the same time, mitochondrial redox stress caused by mutations in mitochondrial
Complex I or III induce cells to activate the reductive carboxylation pathway, with similar
changes occurring using pharmacological inhibitors of the electron transport chain (ETC) [119].
Roles for the mitochondrial nicotinamide nucleotide transhydrogenase (NNT) enzyme in driving
this metabolic state have also been established [120, 121]. These findings have all suggesting
that the cellular redox state and pyridine nucleotides influence reductive carboxylation activity.
17
Indeed, modulation of NAD+/NADH ratio and citrate abundance are critical drivers of reductive
carboxylation flux [122]. As such, activity in this pathway seems to be driven by redox stress
caused by many different physiological conditions, including hypoxia, mitochondrial inhibitors,
and lipid deficiency.
1.4.3 Redox metabolism
Reducing equivalents in the cell are transported between reactions using pyridine nu-
cleotides, NAD+ and NADP+. These cofactors are essential for the various oxidoreductase
reactions required for proper biosynthesis and redox control, with NADPH selectively required
for cellular anabolism (i.e. fatty acid and proline synthesis) and antioxidant response (i.e. regen-
eration of GSH) [3]. A major contributor to cytosolic NADPH production is the oxPPP [123],
extensively studied with a variety of 13C glucose tracers [25, 124]. However, these tracers cannot
establish cofactor specificity and do not directly measure reducing equivalent pool.
Instead, because the transfer of electrons occurs through the transfer of a hydride anion,
use of 3H (tritium) [125, 126] and 2H (deuteurium) [127, 128] glucose tracers provides deep
insight into cellular electron pools. Through the use of [1-2H] and [3-2H]glucose tracers, labeling
of cytosolic NADPH was achieved through oxPPP enzymes, G6PD and PGD respectively [51,
129]. Total cellular NADPH production flux was estimated to be 10 nmol L-1 hr-1 (5-20% of
glucose uptake rate) by estimation of oxPPP contribution to NADPH and measurement oxPPP
flux [51]. Concomitant analysis of NADPH consumption (i.e. fatty acid, DNA, and proline
synthesis) revealed that biosynthetic demands of NADPH was only 80% of production with the
rest presumably used in redox defense [51]. Hydride transfer from NADPH to lipids can also be
used as an indirect measure of cytosolic NADPH labeling, such that ISA-based modeling allows
estimation of tracer contributions to this metabolic pool [129]. The importance of the oxidative
pentose phosphate pathway in pluripotent stem cells (greater than many cancer cells) [130] and
malic enzyme in adipocytes [130] have been elucidated using this approach.
18

Reducing equivalents cannot be directly transported across intracellular membranes (e.g.
mitochondria) and these reactions are highly compartmentalized [123]. Instead, the cell relies on
futile metabolic cycles to transport reducing equivalents into organelles (e.g. malate-aspartate
shuttle) and maintain proper, compartmental redox homeostasis [131]. Use of [4-2H]glucose
was able to label both cytosolic and mitochondrial NADH pools, through GAPDH and malate-
aspartate shuttle respectively [129]. To better elucidate compartment-specific redox metabolism,
an endogenous redox reporter system was developed through low-level, ecotopic expression of
mtIDH in cytosol or mitochondria [129]. Examination of labeling on 2HG found that the oxPPP
contributed significantly to cytosolic NADPH but the mitochondrial NADPH pool was mostly
labeled by hydride anions from NADH [129]. Taken together, these results highlight the powerful
application of positional deuterium labels as donors for compartment-specific electron pools.
Somatic cells have evolved their metabolism to reside within distinct niches. Normal cells
reside in close contact with the extracellular matrix (ECM). For a cancerous cell to metastasize to
a distant site, the cell must depart its ECM-rich niche and survive in atypical microenvironments.
Cancer cells undergoing metastasis must therefore reprogram metabolic pathways to overcome
such stresses. Previous studies have shown that ECM-detachment induces increased levels
of cellular reactive oxygen species (ROS) and can lead to anoikis in non-transformed cells
[132]. Activation of the PI(3)K pathway in this context led to higher glucose consumption and
increased cell survival after ECM detachment, due to increased oxPPP flux and which maintains
β -oxidation and ATP levels [132, 133]. More recently, Piskounova et al. observed that metastatic
cells increased expression of enzymes in one carbon metabolism (discussed below) and more
specifically the mitochondrial NADPH producing enzyme, ALDH1L2 [134]. These enzymes
increase survival of ECM-detached cancer cells and enhance metastatic potential of tumor cells
in vivo [134].
Stable isotope tracing has recently been used to elucidate the specific directionality of how
some cellular metabolic pathways are perturbed to enable NADPH production under anchorage
19

independent stress. Using both 13C glucose and glutamine tracers, cells grown in anchorage-
independent conditions were found to oxidize less glucose and exhibited increased reductive
carboxylation activity [39]. However, unlike previous studies of reductive carboxylation, these
effects were not due to any HIF-mediated changes to the cell, did not change the contribution
of glutamine carbon to fatty acid synthesis, and could be reversed by simply re-attaching the
cells to ECM [39]. Instead, reductive carboxylation flux coordinated metabolic shuttling of
cytosolic NADPH into the mitochondrial matrix to enhance cell survival [39]. Furthermore,
CRISPR knockouts of both IDH1 and IDH2 and [3-2H]glucose tracing confirmed that reductive
carboxylation flux occurred in the cytosol but used to generate mitochondrial NADPH [39].
This leaves a model where cells protect against increased mitochondrial oxidative stress after
detachment by using the futile cycle of IDH1 and IDH2 to transport NADPH into the mitochondria
and regenerate mitochondrial GSH.
1.4.4 Serine biosynthesis and one carbon metabolism
Serine is a critically important metabolite for proliferating cells given its role in biosyn-
thetic and redox-associated pathways [135]. Indeed, phosphoglycerate dehydrogenase (PHGDH)
catalyzes one of the initial steps of serine synthesis and is amplified in some breast cancers and
melanomas [136, 137]. Glycine lies immediately downstream of serine and is important for cell
growth due to its use in purine metabolism and glutathione synthesis [138]. Serine also con-
tributes to folate-mediated one carbon metabolism (FOCM), which lies at a critical biosynthetic
node supporting nucleotide synthesis as well as methylation [139, 140]. Intriguingly, several
enzymes within these pathways are expressed at higher levels in aggressive tumors, including the
mitochondrial enzyme methylene tetrahydrofolate dehydrogenase 2 (MTHFD2) [141]. And this
pathway is classically targeted in cancer and autoimmune diseases using the chemotherapeutics
methotrexate or Pemetrexed [142]. However, even with the wealth of evidence demonstrating
its importance, the specific mechanisms through which this pathway supports tumor growth and
20
survival is still not definitively clear.
Analysis of tumor cell responses to serine and glycine deprivation has identified specific
susceptibilities in cells as a function of their genotype. In particular, loss of p53 sensitized
colon cancer cells to serine/glycine starvation by arresting cells in the G1 phase of the cell cycle
[143]. Additionally, p53 deficiency induced shunting of serine to glycine for glutathione synthesis
to support antioxidant functions [143]. Various other stress (often associated with redox) can
modulate sensitivity to serine and/or glycine deprivation as well as the serine synthesis pathway,
including metformin and hypoxia [144, 145]. More recently, serine and glycine deprivation
was shown to reduce tumor growth in several genetically-engineered mouse models of cancer
[146]. These results highlight the importance of serine availability for tumor growth, though the
metabolic driver of this sensitization downstream of serine is not fully clear. To this end, Jain et
al. applied extracellular flux analysis of metabolites consumed and secreted by the NCI-60 panel
of cell lines and observed that glycine uptake correlated most tightly with cell growth rate [138].
Tracing with [13C]glycine was then used to suggest that the glycine is directly used to support de
novo purine synthesis rather supplying 1C units [138]. However, glycine alone does not rescue
cell growth in serine-deprived conditions [143, 147]. Extensive tracing of serine and glycine
conversion to nucleotides in HCT116 cells has indicated that glycine cannot replace serine due to
the required consumption of 1C units and its impact on purine nucleotides [147], suggesting that
cells selectively uptake serine to generate both glycine and 1C units.
Notably, removal of dietary serine and glycine was not effective in Kras mutant tumors,
presumably due to the upregulation of serine biosynthesis in tumors of this genotype [146].
Other oncogenic pathways have also been associated with this metabolic pathway. For example,
NRF2 is the master transcriptional regulator of the cellular antioxidant response and regulates
expression of serine biosynthesis enzymes in non-small cell lung cancer [148]. Through a
mechanism driven by the transcription factor ATF4, NRF2 expression was found to contribute
to tumorigenesis by activating serine biosynthesis and supporting FOCM and transsulfuration
21

reactions (glutathione) [148]. Similar mechanisms mediated through mTORC1 have also been
implicated to upregulate de novo purine biosynthesis [149]. Consistent with the amplification
of PHGDH in breast cancers and activation by ATF4, these pathways are important for breast
cancer cell in anchorage-independent conditions and as xenografts. Taken together, these results
highlight an important role for serine metabolism in tumor growth, in particular downstream of
cellular stresses.
Beyond nucleotide biosynthesis, serine has an established role in supplying mitochondrial
glycine/1C units through FOCM, with the former contributing to heme biosynthesis. Importantly,
FOCM can supply mitochondrial reducing equivalents through 1C oxidation enzymes (e.g.
MTHFD2, MTHFD2L, ALDH1L1) [139, 140] or glycine cleavage [150], and flux balance analysis
(FBA) modeling has suggested this pathway coordinates ATP regeneration along with glycolysis
[151]. Experimental evidence has also recently supported a role for this pathway in generating
reducing equivalents in proliferating cells. Indeed, only knockdown of oxPPP and FOCM
enzymes perturbed cellular redox state [51]. Additionally, glycine oxidation measured with 14C
tracers was found to be greater than purine synthesis rates, further suggesting a role in redox
homeostasis [51]. Through the use of mutant IDH2 reporters and 2H serine tracers (section 3.3),
FOCM was demonstrated to contribute significantly to mitochondrial reducing equivalent pools
[129]. Importantly, minimal label from serine was observed in cytosolic reporters or on palmitate,
suggesting mitochondrial oxidation of 1C units MTHFD2 or MTHFD2L was the predominant
route of NAD(P)H regeneration in this pathway [129]. In fact, as previously suggested by Herbig
et al. [152], most cells were found to supply cytosolic 1C units through mitochondrial FOCM
flux, even to the point of secreting excess formate [153, 154]. Loss of mitochondrial FOCM
enzymes made cells dependent on extracellular serine/glycine and retarded growth of xenografts,
but compensatory reversal of FOCM flux was observed both in vitro and in vivo [154]. Several
studies have also connected these pathways to cancer through hypoxia and "stemness" [141, 145,
155], highlighting the need to study flux through this pathway in various microenvironments and
22
biological contexts.
1.5 Emerging links between metabolism and epigenetics
Finally, recent studies have established critical links between metabolic pathways and
cellular epigenetics. Canonical epigenetic "marks" (e.g. methylation, acetylation) on DNA, RNA,
and proteins are all metabolic intermediates and demonstrate a powerful relationship between
metabolic pathway flux and epigenetic regulation [156]. In this manner, altered metabolic pathway
activity can influence gene expression in the context of disease (reviewed extensively for cancer
in [157]). Many metabolites (e.g. AcCoA, NAD+, aKG) also moonlight as substrates for the
enzymatic addition and removal of epigenetic "marks" and other post-translational modifications
[158]. In turn, numerous studies have elucidated how availability and/or localization of these
metabolites can control histone acetylation [159, 160], enzyme acetylation [161, 162], and
histone/nucleotide methylation (see section 3.1. discussion on aKG-dependent dioxygenases).
For example, modulation of acetyl-CoA synthetase expression within the hippocampus decreased
availability of AcCoA for histone acetylation and impaired long-term spatial memory [163].
While these studies have effectively demonstrated the causal link between metabolism and
epigenetics, how dysregulation of distal metabolic pathways can modulate epigenetics remains
poorly understood in many contexts. The widely studied epigenetic signature, methylation,
connects amino acid metabolism (methionine and serine) to nucleotides through transfer of
methyl groups [164] and provides one such example of distal metabolic reprogramming of
epigenetics.
While methionine is considered the primary methylation donor through S-adenosyl methio-
nine (SAM) pools [165], generation of 1C units from serine and remethylation of homocysteine
provides an alternate source that links glycolytic flux to methylation [166]. Indeed in vivo tracer
analysis of whole-body SAM pools confirmed that methionine was the primary donor of methyl
23

groups ( 70% of methyl group flux), though 1C units needed for re-methylation came solely
from serine (estimated to be 3% of total serine flux) [167]. Loss of the nutrient sensor LKB1
increased serine biosynthesis and cycling that led to enhanced DNA methylation and retrotrans-
poson silencing in a mouse-model of pancreatic cancer [168]. In addition, methionine deprivation
reversibly altered histone methylation (e.g. H3K4me3) and expression of 1C-consuming enzymes
to presumably reduce SAM consumption [169]. On the other hand, in vitro analysis of cellular
DNA and RNA found that serine provided 1C units for methylation only under methionine
starvation conditions [170]. Serine, however, was found to support methylation through purine
synthesis (i.e. ATP) for SAM production [170]. These findings highlight yet another set of
pathways and biological functions through which serine influences cancer biology.
1.6 Observations from in vivo studies
Many of the studies discussed above applied MFA and related approaches to cancer
cells cultured in vitro. Clearly, in vivo models better recapitulate the physiologic conditions of
human tumors; as such, increasing efforts have focused on in vivo tracing methods to characterize
metabolism in these settings. However, the design, execution, and interpretation of such studies is
complicated by a number of different factors: 1) administration of tracer may impact metabolism
and downstream signaling, which is particularly important for glucose and insulin signaling, 2)
labeling is quickly scrambled due to cross-tissue metabolic activity, and 3) multiple cell types
exist within each tissue (e.g. epithelia, stroma). As such, comprehensive models that incorporate
isotope labeling data from in vivo studies may have limited impact. On the other hand, analyses
that focus on specific pathways/reactions have yielded insights into the metabolism of tumors in
vivo.
As noted above, glutamine’s role as a major substrate fueling TCA metabolism in cancer
cells is well documented [171]. The concept of decreased glucose oxidation and increased
24
glutamine anaplerosis has largely been studied using in vitro models [91, 114, 116]. More
recently, in vivo studies have challenged the concept that glutamine rather than glucose is
the predominant supporting the TCA cycle in tumors. While some early studies highlighted
a potential role for glutamine synthase (GS) in supporting breast cancer growth [172], more
definitive evidence of GS supporting tumor growth has come from in vivo tracing studies. Using
15N tracing, Tardito et al. observed that glioblastoma cell lines sustained growth in physiological
and glutamine-free conditions through the amination of glutamate to provide glutamine for purine
synthesis [173]. Subsequently, infusion of mice (or human patients) with either 13C glucose
or 13C glutamine followed by enrichment analysis demonstrated that both GBM xenografts
and contralateral primary brain tissues synthesized glutamine de novo from glucose, with little
evidence of high glutaminolysis activity [173].
If glutamine is not required for anaplerosis, what pathways take its place in vivo? To
this end, early studies on the mitochondrial metabolism of non-small-cell lung cancer (NSCLC)
tumors noted increased PC activity in human tumor biopsies that were infused with 13C glucose
prior to surgery and analyzed by NMR [174]. These results and additional studies with tumor
slices incubated with 13C glucose and glutamine tracers demonstrated that pyruvate carboxylase
(PC) was an important anaplerotic path used by tumor cells to support mitochondrial metabolism
[174]. Subsequently, knockdown of PC in lung cancer cell lines severely limited biosynthesis
and growth of these cells as xenografts [174]. Similar results were previously noted in cell-
based tracer studies using glutamine-free conditions [175]. Indeed, PC may emerge as a more
critical enzyme in tumors with defective TCA metabolism. For example, PC flux is critical for
supporting aspartate synthesis in cultured SDH-null cells [176, 177]. However how these rare
tumors metabolize glucose and glutamine in vivo is not well characterized.
Detailed tracer studies in genetically engineered mouse models (GEMMs) of lung cancer
as well as human patients have further supported the importance of glucose oxidation and
anaplerosis in tumors [174, 178, 179]. Infusion of glucose tracers and enrichment analysis in
25
three independent NSCLC GEMMs demonstrated that all tumor types exhibited increased glucose
oxidation through PDH and PC as compared to adjacent normal lung tissue [178]. However, when
cells derived from the GEMMs are placed in vitro, there is an increased reliance on glutamine,
and Gls1 knockout cell lines could not be expanded in culture [178]. Conversely, knockout
cell lines of both Pdh1a and Pcx in GEMM cells were successfully isolated in vitro but could
not form xenografts [178]. The importance of mitochondrial glucose metabolism has also been
demonstrated in human lung tumors [179]. After first examining tumor characteristics such
as grade, stage, stromal fraction, mutation status, and perfusion, Hensley et al. infused 13C
glucose before quantifying isotope enrichment within tumor biopsies and normal lung tissue
[179]. Interestingly, lactate labeling suggested catabolism of lactate itself contributed significantly
more to tumors, and this was confirmed using a 13C lactate tracer in syngenic mouse xenograft
models [179]. Finally, by correlating enrichment results with tumor perfusion data, a model
where highly perfused tumors consumed more alternative fuels from the circulation (e.g. lactate)
and less perfused tumors more exclusively used glucose as a primary fuel source was constructed
[179]. These findings challenge Warburg’s notion of defective mitochondria and the concept that
tumors preferentially use glycolysis which pervades the literature.
Beyond mitochondrial metabolism, the routes through which tumors acquire lipids are also
of great interest to the research community. Fatty acids can be taken up through the circulation
or synthesized de novo. In fact, some cancer cell populations upregulate expression of CD36, a
fatty acid scavenger that is also important for the survival of metastatic cells [180–182]. While
some cell types preferentially consume lipids from their environment [130, 183], many tumors
upregulate fatty acid biosynthetic machinery [184–186]. In human cancers, aggressiveness is
correlated with upregulation of fatty acid synthesis machinery (FASN) but different cell types
show varying sensitivity to FASN inhibition [187]. While sensitivity to FASN inhibition could not
be explained by the relative rate of palmitate synthesis, application of 13C glucose and lipidomics
to quantify synthesis of intact lipids indicated that FASN inhibitor sensitivity correlated with
26
the synthesis of signaling lipids [187]. However, lipids are significantly more abundant in the
body compared to cell culture media, so questions remained about the importance of de novo
lipogenesis for tumor progression. To this end, fatty acid synthesis is readily quantified in
vivo using 2H2O, as deuterons are incorporated into fatty acids through numerous pathways
[188]. Administration of 2H2O to tumor-bearing mice indicated that tumor lipids contained large
fractions of newly synthesized fatty acids [189]. Similar results were obtained in both xenografts
and GEMMs, which are better vascularized and likely to have adequate circulating lipids available
[189]. Furthermore, treatment of these animal models with an AcCoA carboxylase inhibitor
impeded growth and synergized with co-treatment carboplatin [189]. Taken together, while cell
culture-based experiments will continue to be important for defining metabolic processes at the
cellular and sub-cellular levels, these studies highlight the importance and utility of analyzing
tumors in their physiologic microenvironment.
1.7 Conclusion
Metabolomics, stable isotope tracing, and metabolic flux analysis are powerful platform
technologies that facilitate the study of human disease. Through careful design and execution
of MFA experiments, researchers now have the ability to interrogate metabolic fluxes in a
variety of biological contexts. Simplified systems provide molecular-level resolution but lack
physiological relevance; in vivo models and patient studies have more clinical significance but
provide less mechanistic insight (Figure 1.1). A wealth of new knowledge into the metabolic
basis of tumorigenesis and cancer cell proliferation has now emerged over the past decade. Since
each tissue and disease state involves distinct metabolic pathways, application of MFA to various
biological systems offers a path that will be rich in new discoveries. For example, with a well-
described role of metabolism [190], MFA is increasingly being applied to study unique features of
hPSCs and their regenerative medicine applications [130, 191]. Established metabolic pathways
27
are now being observed to have distinct functions in certain tissues or cell types [192, 193], and
new pathways are being discovered that modulate immune cell function [194, 195]. In all these
situations, elucidation of metabolic fluxes will be essential to fully appreciate the mechanisms
through which metabolism contributes to human disease.
1.8 Acknowledgements
We thank Mari Gartner and members of the Metallo Lab for their helpful feedback and
apologize to those researchers whose work we were unable to cite. This work was supported
by the California Institute of Regenerative Medicine (RB5-07356), an NSF CAREER Award
(1454425), NIH grant (R01-CA188652), and a Camile and Henry Dreyfus Teacher-Scholar Award
(all to C.M.M.). M.G.B. is supported by a NSF Graduate Research Fellowship (DGE-1144086).
Chapter 1, in full, is a reprint of the material as it appears in ”Reverse engineering the
cancer metabolic network using flux analysis to understand drivers of human disease,” Metabolic
Engineering, vol. 45, 2018. Mehmet G. Badur is the primary author of this publication. Christian
M. Metallo is the corresponding author of this publication.
1.9 References1. Cancer Genome Atlas Research, N., Weinstein, J. N., Collisson, E. A., Mills, G. B., Shaw,
K. R., Ozenberger, B. A., Ellrott, K., Shmulevich, I., Sander, C. & Stuart, J. M. The CancerGenome Atlas Pan-Cancer analysis project. Nat Genet 45, 1113–20 (2013).
2. Cordes, T. & Metallo, C. M. Tracing insights into human metabolism using chemicalengineering approaches. Curr Opin Chem Eng 14, 72–81 (2016).
3. Lunt, S. Y. & Vander Heiden, M. G. Aerobic glycolysis: meeting the metabolic require-ments of cell proliferation. Annu Rev Cell Dev Biol 27, 441–64 (2011).
4. Park, J. O., Rubin, S. A., Xu, Y. F., Amador-Noguez, D., Fan, J., Shlomi, T. & Rabinowitz,J. D. Metabolite concentrations, fluxes and free energies imply efficient enzyme usage.Nat Chem Biol 12, 482–9 (2016).
28

5. Bennett, B. D., Kimball, E. H., Gao, M., Osterhout, R., Van Dien, S. J. & Rabinowitz,J. D. Absolute metabolite concentrations and implied enzyme active site occupancy inEscherichia coli. Nat Chem Biol 5, 593–9 (2009).
6. Nagrath, D., Avila-Elchiver, M., Berthiaume, F., Tilles, A. W., Messac, A. & Yarmush,M. L. Integrated energy and flux balance based multiobjective framework for large-scalemetabolic networks. Ann Biomed Eng 35, 863–85 (2007).
7. Beard, D. A., Liang, S. D. & Qian, H. Energy balance for analysis of complex metabolicnetworks. Biophys J 83, 79–86 (2002).
8. Beard, D. A. & Qian, H. Thermodynamic-based computational profiling of cellular regu-latory control in hepatocyte metabolism. Am J Physiol Endocrinol Metab 288, E633–44(2005).
9. Jacobus, W. E. Respiratory control and the integration of heart high-energy phosphatemetabolism by mitochondrial creatine kinase. Annu Rev Physiol 47, 707–25 (1985).
10. Hochachka, P. W. & McClelland, G. B. Cellular metabolic homeostasis during large-scalechange in ATP turnover rates in muscles. J Exp Biol 200, 381–6 (1997).
11. Lemons, J. M., Feng, X. J., Bennett, B. D., Legesse-Miller, A., Johnson, E. L., Raitman, I.,Pollina, E. A., Rabitz, H. A., Rabinowitz, J. D. & Coller, H. A. Quiescent fibroblastsexhibit high metabolic activity. PLoS Biol 8, e1000514 (2010).
12. Hackett, S. R., Zanotelli, V. R., Xu, W., Goya, J., Park, J. O., Perlman, D. H., Gibney, P. A.,Botstein, D., Storey, J. D. & Rabinowitz, J. D. Systems-level analysis of mechanismsregulating yeast metabolic flux. Science 354 (2016).
13. Fiehn, O., Kopka, J., Dormann, P., Altmann, T., Trethewey, R. N. & Willmitzer, L. Metabo-lite profiling for plant functional genomics. Nat Biotechnol 18, 1157–61 (2000).
14. Mitsuishi, Y., Taguchi, K., Kawatani, Y., Shibata, T., Nukiwa, T., Aburatani, H., Yamamoto,M. & Motohashi, H. Nrf2 redirects glucose and glutamine into anabolic pathways inmetabolic reprogramming. Cancer Cell 22, 66–79 (2012).
15. Lunt, S. Y., Muralidhar, V., Hosios, A. M., Israelsen, W. J., Gui, D. Y., Newhouse, L.,Ogrodzinski, M., Hecht, V., Xu, K., Acevedo, P. N., Hollern, D. P., Bellinger, G., Dayton,T. L., Christen, S., Elia, I., Dinh, A. T., Stephanopoulos, G., Manalis, S. R., Yaffe, M. B.,Andrechek, E. R., Fendt, S. M. & Vander Heiden, M. G. Pyruvate kinase isoform expressionalters nucleotide synthesis to impact cell proliferation. Mol Cell 57, 95–107 (2015).
16. Park, T. J., Reznick, J., Peterson, B. L., Blass, G., Omerbasic, D., Bennett, N. C., Kuich,P., Zasada, C., Browe, B. M., Hamann, W., Applegate, D. T., Radke, M. H., Kosten, T.,Lutermann, H., Gavaghan, V., Eigenbrod, O., Begay, V., Amoroso, V. G., Govind, V.,
29

Minshall, R. D., Smith, E. S. J., Larson, J., Gotthardt, M., Kempa, S. & Lewin, G. R.Fructose-driven glycolysis supports anoxia resistance in the naked mole-rat. Science 356,307–311 (2017).
17. Lewis, N. E., Schramm, G., Bordbar, A., Schellenberger, J., Andersen, M. P., Cheng, J. K.,Patel, N., Yee, A., Lewis, R. A., Eils, R., Konig, R. & Palsson, B. O. Large-scale in silicomodeling of metabolic interactions between cell types in the human brain. Nat Biotechnol28, 1279–85 (2010).
18. Lackey, D. E., Lynch, C. J., Olson, K. C., Mostaedi, R., Ali, M., Smith, W. H., Karpe, F.,Humphreys, S., Bedinger, D. H., Dunn, T. N., Thomas, A. P., Oort, P. J., Kieffer, D. A.,Amin, R., Bettaieb, A., Haj, F. G., Permana, P., Anthony, T. G. & Adams, S. H. Regulationof adipose branched-chain amino acid catabolism enzyme expression and cross-adiposeamino acid flux in human obesity. Am J Physiol Endocrinol Metab 304, E1175–87 (2013).
19. Johnson, C. H., Ivanisevic, J. & Siuzdak, G. Metabolomics: beyond biomarkers andtowards mechanisms. Nat Rev Mol Cell Biol (2016).
20. Hellerstein, M. K. New stable isotope-mass spectrometric techniques for measuring fluxesthrough intact metabolic pathways in mammalian systems: introduction of moving picturesinto functional genomics and biochemical phenotyping. Metab Eng 6, 85–100 (2004).
21. Stephanopoulos, G. Metabolic fluxes and metabolic engineering. Metab Eng 1, 1–11(1999).
22. Sauer, U. High-throughput phenomics: experimental methods for mapping fluxomes. CurrOpin Biotechnol 15, 58–63 (2004).
23. Buescher, J. M., Antoniewicz, M. R., Boros, L. G., Burgess, S. C., Brunengraber, H., Clish,C. B., DeBerardinis, R. J., Feron, O., Frezza, C., Ghesquiere, B., Gottlieb, E., Hiller, K.,Jones, R. G., Kamphorst, J. J., Kibbey, R. G., Kimmelman, A. C., Locasale, J. W., Lunt,S. Y., Maddocks, O. D., Malloy, C., Metallo, C. M., Meuillet, E. J., Munger, J., Noh, K.,Rabinowitz, J. D., Ralser, M., Sauer, U., Stephanopoulos, G., St-Pierre, J., Tennant, D. A.,Wittmann, C., Vander Heiden, M. G., Vazquez, A., Vousden, K., Young, J. D., Zamboni, N.& Fendt, S. M. A roadmap for interpreting (13)C metabolite labeling patterns from cells.Curr Opin Biotechnol 34, 189–201 (2015).
24. Sauer, U. Metabolic networks in motion: 13C-based flux analysis. Mol Syst Biol 2, 62(2006).
25. Metallo, C. M., Walther, J. L. & Stephanopoulos, G. Evaluation of 13C isotopic tracers formetabolic flux analysis in mammalian cells. J Biotechnol 144, 167–74 (2009).
30
26. Crown, S. B., Ahn, W. S. & Antoniewicz, M. R. Rational design of (1)(3)C-labelingexperiments for metabolic flux analysis in mammalian cells. BMC Syst Biol 6, 43 (2012).
27. Wiechert, W. 13C metabolic flux analysis. Metab Eng 3, 195–206 (2001).
28. Stephanopoulos, G., Aristidou, A. A. & Nielsen, J. H. Metabolic engineering : principlesand methodologies xxi, 725 p. ISBN: 0126662606 (Academic Press, San Diego, 1998).
29. Zamboni, N. 13C metabolic flux analysis in complex systems. Curr Opin Biotechnol 22,103–8 (2011).
30. Antoniewicz, M. R., Kelleher, J. K. & Stephanopoulos, G. Elementary metabolite units(EMU): a novel framework for modeling isotopic distributions. Metab Eng 9, 68–86(2007).
31. Antoniewicz, M. R., Kelleher, J. K. & Stephanopoulos, G. Determination of confidenceintervals of metabolic fluxes estimated from stable isotope measurements. Metab Eng 8,324–37 (2006).
32. Young, J. D. INCA: a computational platform for isotopically non-stationary metabolicflux analysis. Bioinformatics 30, 1333–5 (2014).
33. Quek, L. E., Wittmann, C., Nielsen, L. K. & Kromer, J. O. OpenFLUX: efficient modellingsoftware for 13C-based metabolic flux analysis. Microb Cell Fact 8, 25 (2009).
34. Zamboni, N., Fischer, E. & Sauer, U. FiatFlux–a software for metabolic flux analysis from13C-glucose experiments. BMC Bioinformatics 6, 209 (2005).
35. Weitzel, M., Noh, K., Dalman, T., Niedenfuhr, S., Stute, B. & Wiechert, W. 13CFLUX2–high-performance software suite for (13)C-metabolic flux analysis. Bioinformatics 29,143–5 (2013).
36. Young, J. D., Walther, J. L., Antoniewicz, M. R., Yoo, H. & Stephanopoulos, G. Anelementary metabolite unit (EMU) based method of isotopically nonstationary flux analysis.Biotechnol Bioeng 99, 686–99 (2008).
37. Wiechert, W. The thermodynamic meaning of metabolic exchange fluxes. Biophys J 93,2255–64 (2007).
38. Vacanti, N. M., Divakaruni, A. S., Green, C. R., Parker, S. J., Henry, R. R., Ciaraldi, T. P.,Murphy, A. N. & Metallo, C. M. Regulation of substrate utilization by the mitochondrialpyruvate carrier. Mol Cell 56, 425–35 (2014).
39. Jiang, L., Shestov, A. A., Swain, P., Yang, C., Parker, S. J., Wang, Q. A., Terada, L. S.,Adams, N. D., McCabe, M. T., Pietrak, B., Schmidt, S., Metallo, C. M., Dranka, B. P.,
31
Schwartz, B. & DeBerardinis, R. J. Reductive carboxylation supports redox homeostasisduring anchorage-independent growth. Nature 532, 255–8 (2016).
40. Jiang, L., Boufersaoui, A., Yang, C., Ko, B., Rakheja, D., Guevara, G., Hu, Z. & DeBer-ardinis, R. J. Quantitative metabolic flux analysis reveals an unconventional pathway offatty acid synthesis in cancer cells deficient for the mitochondrial citrate transport protein.Metab Eng (2016).
41. McCloskey, D., Young, J. D., Xu, S., Palsson, B. O. & Feist, A. M. Modeling Method forIncreased Precision and Scope of Directly Measurable Fluxes at a Genome-Scale. AnalChem 88, 3844–52 (2016).
42. Gopalakrishnan, S. & Maranas, C. D. 13C metabolic flux analysis at a genome-scale.Metab Eng 32, 12–22 (2015).
43. Noh, K., Gronke, K., Luo, B., Takors, R., Oldiges, M. & Wiechert, W. Metabolic fluxanalysis at ultra short time scale: isotopically non-stationary 13C labeling experiments. JBiotechnol 129, 249–67 (2007).
44. Jazmin, L. J. & Young, J. D. Isotopically nonstationary 13C metabolic flux analysis.Methods Mol Biol 985, 367–90 (2013).
45. Young, J. D., Shastri, A. A., Stephanopoulos, G. & Morgan, J. A. Mapping photoau-totrophic metabolism with isotopically nonstationary (13)C flux analysis. Metab Eng 13,656–65 (2011).
46. Noh, K. & Wiechert, W. Experimental design principles for isotopically instationary 13Clabeling experiments. Biotechnol Bioeng 94, 234–51 (2006).
47. Wiechert, W. & Noh, K. Isotopically non-stationary metabolic flux analysis: complex yethighly informative. Curr Opin Biotechnol 24, 979–86 (2013).
48. Nanchen, A., Fuhrer, T. & Sauer, U. Determination of metabolic flux ratios from 13C-experiments and gas chromatography-mass spectrometry data: protocol and principles.Methods Mol Biol 358, 177–97 (2007).
49. Yuan, J., Bennett, B. D. & Rabinowitz, J. D. Kinetic flux profiling for quantitation ofcellular metabolic fluxes. Nat Protoc 3, 1328–40 (2008).
50. Munger, J., Bennett, B. D., Parikh, A., Feng, X. J., McArdle, J., Rabitz, H. A., Shenk, T. &Rabinowitz, J. D. Systems-level metabolic flux profiling identifies fatty acid synthesis as atarget for antiviral therapy. Nat Biotechnol 26, 1179–86 (2008).
32

51. Fan, J., Ye, J., Kamphorst, J. J., Shlomi, T., Thompson, C. B. & Rabinowitz, J. D. Quanti-tative flux analysis reveals folate-dependent NADPH production. Nature 510, 298–302(2014).
52. Maier, K., Hofmann, U., Bauer, A., Niebel, A., Vacun, G., Reuss, M. & Mauch, K.Quantification of statin effects on hepatic cholesterol synthesis by transient (13)C-fluxanalysis. Metab Eng 11, 292–309 (2009).
53. Warburg, O., Wind, F. & Negelein, E. The Metabolism of Tumors in the Body. J GenPhysiol 8, 519–30 (1927).
54. Warburg, O. On the origin of cancer cells. Science 123, 309–14 (1956).
55. Weinhouse, S. On respiratory impairment in cancer cells. Science 124, 267–9 (1956).
56. Burk, D. & Schade, A. L. On respiratory impairment in cancer cells. Science 124, 270–2(1956).
57. Hanahan, D. & Weinberg, R. A. Hallmarks of cancer: the next generation. Cell 144, 646–74(2011).
58. Pavlova, N. N. & Thompson, C. B. The Emerging Hallmarks of Cancer Metabolism. CellMetab 23, 27–47 (2016).
59. Boroughs, L. K. & DeBerardinis, R. J. Metabolic pathways promoting cancer cell survivaland growth. Nat Cell Biol 17, 351–9 (2015).
60. Vander Heiden, M. G. & DeBerardinis, R. J. Understanding the Intersections betweenMetabolism and Cancer Biology. Cell 168, 657–669 (2017).
61. Farwell, M. D., Pryma, D. A. & Mankoff, D. A. PET/CT imaging in cancer: currentapplications and future directions. Cancer 120, 3433–45 (2014).
62. Choi, C., Ganji, S. K., DeBerardinis, R. J., Hatanpaa, K. J., Rakheja, D., Kovacs, Z., Yang,X. L., Mashimo, T., Raisanen, J. M., Marin-Valencia, I., Pascual, J. M., Madden, C. J.,Mickey, B. E., Malloy, C. R., Bachoo, R. M. & Maher, E. A. 2-hydroxyglutarate detectionby magnetic resonance spectroscopy in IDH-mutated patients with gliomas. Nat Med 18,624–9 (2012).
63. Chaumeil, M. M., Larson, P. E., Woods, S. M., Cai, L., Eriksson, P., Robinson, A. E.,Lupo, J. M., Vigneron, D. B., Nelson, S. J., Pieper, R. O., Phillips, J. J. & Ronen, S. M.Hyperpolarized [1-13C] glutamate: a metabolic imaging biomarker of IDH1 mutationalstatus in glioma. Cancer Res 74, 4247–57 (2014).
33
64. Venneti, S., Dunphy, M. P., Zhang, H., Pitter, K. L., Zanzonico, P., Campos, C., Carlin,S. D., La Rocca, G., Lyashchenko, S., Ploessl, K., Rohle, D., Omuro, A. M., Cross, J. R.,Brennan, C. W., Weber, W. A., Holland, E. C., Mellinghoff, I. K., Kung, H. F., Lewis,J. S. & Thompson, C. B. Glutamine-based PET imaging facilitates enhanced metabolicevaluation of gliomas in vivo. Sci Transl Med 7, 274ra17 (2015).
65. Rodrigues, T. B., Serrao, E. M., Kennedy, B. W., Hu, D. E., Kettunen, M. I. & Brindle,K. M. Magnetic resonance imaging of tumor glycolysis using hyperpolarized 13C-labeledglucose. Nat Med 20, 93–7 (2014).
66. Weinberg, F. & Chandel, N. S. Mitochondrial metabolism and cancer. Ann N Y Acad Sci1177, 66–73 (2009).
67. DeBerardinis, R. J., Lum, J. J., Hatzivassiliou, G. & Thompson, C. B. The biology ofcancer: metabolic reprogramming fuels cell growth and proliferation. Cell Metab 7, 11–20(2008).
68. Gasparre, G., Porcelli, A. M., Bonora, E., Pennisi, L. F., Toller, M., Iommarini, L., Ghelli,A., Moretti, M., Betts, C. M., Martinelli, G. N., Ceroni, A. R., Curcio, F., Carelli, V.,Rugolo, M., Tallini, G. & Romeo, G. Disruptive mitochondrial DNA mutations in complexI subunits are markers of oncocytic phenotype in thyroid tumors. Proc Natl Acad Sci U SA 104, 9001–6 (2007).
69. King, A., Selak, M. A. & Gottlieb, E. Succinate dehydrogenase and fumarate hydratase:linking mitochondrial dysfunction and cancer. Oncogene 25, 4675–82 (2006).
70. MacKenzie, E. D., Selak, M. A., Tennant, D. A., Payne, L. J., Crosby, S., Frederiksen,C. M., Watson, D. G. & Gottlieb, E. Cell-permeating alpha-ketoglutarate derivativesalleviate pseudohypoxia in succinate dehydrogenase-deficient cells. Mol Cell Biol 27,3282–9 (2007).
71. Xiao, M., Yang, H., Xu, W., Ma, S., Lin, H., Zhu, H., Liu, L., Liu, Y., Yang, C., Xu, Y.,Zhao, S., Ye, D., Xiong, Y. & Guan, K. L. Inhibition of alpha-KG-dependent histone andDNA demethylases by fumarate and succinate that are accumulated in mutations of FHand SDH tumor suppressors. Genes Dev 26, 1326–38 (2012).
72. Selak, M. A., Armour, S. M., MacKenzie, E. D., Boulahbel, H., Watson, D. G., Mansfield,K. D., Pan, Y., Simon, M. C., Thompson, C. B. & Gottlieb, E. Succinate links TCA cycledysfunction to oncogenesis by inhibiting HIF-alpha prolyl hydroxylase. Cancer Cell 7,77–85 (2005).
73. Frezza, C., Zheng, L., Folger, O., Rajagopalan, K. N., MacKenzie, E. D., Jerby, L.,Micaroni, M., Chaneton, B., Adam, J., Hedley, A., Kalna, G., Tomlinson, I. P., Pollard,P. J., Watson, D. G., Deberardinis, R. J., Shlomi, T., Ruppin, E. & Gottlieb, E. Haem
34
oxygenase is synthetically lethal with the tumour suppressor fumarate hydratase. Nature477, 225–8 (2011).
74. Yan, H., Parsons, D. W., Jin, G., McLendon, R., Rasheed, B. A., Yuan, W., Kos, I., Batinic-Haberle, I., Jones, S., Riggins, G. J., Friedman, H., Friedman, A., Reardon, D., Herndon,J., Kinzler, K. W., Velculescu, V. E., Vogelstein, B. & Bigner, D. D. IDH1 and IDH2mutations in gliomas. N Engl J Med 360, 765–73 (2009).
75. Balss, J., Meyer, J., Mueller, W., Korshunov, A., Hartmann, C. & von Deimling, A. Analysisof the IDH1 codon 132 mutation in brain tumors. Acta Neuropathol 116, 597–602 (2008).
76. Dang, L., Yen, K. & Attar, E. C. IDH mutations in cancer and progress toward developmentof targeted therapeutics. Ann Oncol 27, 599–608 (2016).
77. Parker, S. J. & Metallo, C. M. Metabolic consequences of oncogenic IDH mutations.Pharmacol Ther 152, 54–62 (2015).
78. Dang, L., White, D. W., Gross, S., Bennett, B. D., Bittinger, M. A., Driggers, E. M., Fantin,V. R., Jang, H. G., Jin, S., Keenan, M. C., Marks, K. M., Prins, R. M., Ward, P. S., Yen,K. E., Liau, L. M., Rabinowitz, J. D., Cantley, L. C., Thompson, C. B., Vander Heiden,M. G. & Su, S. M. Cancer-associated IDH1 mutations produce 2-hydroxyglutarate. Nature462, 739–44 (2009).
79. Ma, S., Jiang, B., Deng, W., Gu, Z. K., Wu, F. Z., Li, T., Xia, Y., Yang, H., Ye, D., Xiong,Y. & Guan, K. L. D-2-hydroxyglutarate is essential for maintaining oncogenic propertyof mutant IDH-containing cancer cells but dispensable for cell growth. Oncotarget 6,8606–20 (2015).
80. Figueroa, M. E., Abdel-Wahab, O., Lu, C., Ward, P. S., Patel, J., Shih, A., Li, Y., Bhagwat,N., Vasanthakumar, A., Fernandez, H. F., Tallman, M. S., Sun, Z., Wolniak, K., Peeters,J. K., Liu, W., Choe, S. E., Fantin, V. R., Paietta, E., Lowenberg, B., Licht, J. D., Godley,L. A., Delwel, R., Valk, P. J., Thompson, C. B., Levine, R. L. & Melnick, A. LeukemicIDH1 and IDH2 mutations result in a hypermethylation phenotype, disrupt TET2 function,and impair hematopoietic differentiation. Cancer Cell 18, 553–67 (2010).
81. Lu, C., Ward, P. S., Kapoor, G. S., Rohle, D., Turcan, S., Abdel-Wahab, O., Edwards, C. R.,Khanin, R., Figueroa, M. E., Melnick, A., Wellen, K. E., O’Rourke, D. M., Berger, S. L.,Chan, T. A., Levine, R. L., Mellinghoff, I. K. & Thompson, C. B. IDH mutation impairshistone demethylation and results in a block to cell differentiation. Nature 483, 474–8(2012).
82. Turcan, S., Rohle, D., Goenka, A., Walsh, L. A., Fang, F., Yilmaz, E., Campos, C., Fabius,A. W., Lu, C., Ward, P. S., Thompson, C. B., Kaufman, A., Guryanova, O., Levine, R.,Heguy, A., Viale, A., Morris, L. G., Huse, J. T., Mellinghoff, I. K. & Chan, T. A. IDH1
35

mutation is sufficient to establish the glioma hypermethylator phenotype. Nature 483,479–83 (2012).
83. Xu, W., Yang, H., Liu, Y., Yang, Y., Wang, P., Kim, S. H., Ito, S., Yang, C., Wang, P., Xiao,M. T., Liu, L. X., Jiang, W. Q., Liu, J., Zhang, J. Y., Wang, B., Frye, S., Zhang, Y., Xu,Y. H., Lei, Q. Y., Guan, K. L., Zhao, S. M. & Xiong, Y. Oncometabolite 2-hydroxyglutarateis a competitive inhibitor of alpha-ketoglutarate-dependent dioxygenases. Cancer Cell 19,17–30 (2011).
84. Izquierdo-Garcia, J. L., Viswanath, P., Eriksson, P., Cai, L., Radoul, M., Chaumeil, M. M.,Blough, M., Luchman, H. A., Weiss, S., Cairncross, J. G., Phillips, J. J., Pieper, R. O. &Ronen, S. M. IDH1 Mutation Induces Reprogramming of Pyruvate Metabolism. CancerRes 75, 2999–3009 (2015).
85. Grassian, A. R., Parker, S. J., Davidson, S. M., Divakaruni, A. S., Green, C. R., Zhang, X.,Slocum, K. L., Pu, M., Lin, F., Vickers, C., Joud-Caldwell, C., Chung, F., Yin, H., Handly,E. D., Straub, C., Growney, J. D., Vander Heiden, M. G., Murphy, A. N., Pagliarini, R. &Metallo, C. M. IDH1 mutations alter citric acid cycle metabolism and increase dependenceon oxidative mitochondrial metabolism. Cancer Res 74, 3317–31 (2014).
86. Chan, S. M., Thomas, D., Corces-Zimmerman, M. R., Xavy, S., Rastogi, S., Hong, W. J.,Zhao, F., Medeiros, B. C., Tyvoll, D. A. & Majeti, R. Isocitrate dehydrogenase 1 and 2mutations induce BCL-2 dependence in acute myeloid leukemia. Nat Med 21, 178–84(2015).
87. Tateishi, K., Wakimoto, H., Iafrate, A. J., Tanaka, S., Loebel, F., Lelic, N., Wiederschain,D., Bedel, O., Deng, G., Zhang, B., He, T., Shi, X., Gerszten, R. E., Zhang, Y., Yeh, J. R.,Curry, W. T., Zhao, D., Sundaram, S., Nigim, F., Koerner, M. V., Ho, Q., Fisher, D. E.,Roider, E. M., Kemeny, L. V., Samuels, Y., Flaherty, K. T., Batchelor, T. T., Chi, A. S. &Cahill, D. P. Extreme Vulnerability of IDH1 Mutant Cancers to NAD+ Depletion. CancerCell 28, 773–84 (2015).
88. Hosios, A. M., Hecht, V. C., Danai, L. V., Johnson, M. O., Rathmell, J. C., Steinhauser,M. L., Manalis, S. R. & Vander Heiden, M. G. Amino Acids Rather than Glucose Accountfor the Majority of Cell Mass in Proliferating Mammalian Cells. Dev Cell 36, 540–9(2016).
89. Wellen, K. E., Lu, C., Mancuso, A., Lemons, J. M., Ryczko, M., Dennis, J. W., Rabinowitz,J. D., Coller, H. A. & Thompson, C. B. The hexosamine biosynthetic pathway couplesgrowth factor-induced glutamine uptake to glucose metabolism. Genes Dev 24, 2784–99(2010).
90. Zhang, J., Fan, J., Venneti, S., Cross, J. R., Takagi, T., Bhinder, B., Djaballah, H., Kanai,M., Cheng, E. H., Judkins, A. R., Pawel, B., Baggs, J., Cherry, S., Rabinowitz, J. D.
36

& Thompson, C. B. Asparagine plays a critical role in regulating cellular adaptation toglutamine depletion. Mol Cell 56, 205–18 (2014).
91. DeBerardinis, R. J., Mancuso, A., Daikhin, E., Nissim, I., Yudkoff, M., Wehrli, S. &Thompson, C. B. Beyond aerobic glycolysis: transformed cells can engage in glutaminemetabolism that exceeds the requirement for protein and nucleotide synthesis. Proc NatlAcad Sci U S A 104, 19345–50 (2007).
92. Badur, M. G., Zhang, H. & Metallo, C. M. Enzymatic passaging of human embryonic stemcells alters central carbon metabolism and glycan abundance. Biotechnol J 10, 1600–11(2015).
93. Shin, C. S., Mishra, P., Watrous, J. D., Carelli, V., D’Aurelio, M., Jain, M. & Chan, D. C.The glutamate/cystine xCT antiporter antagonizes glutamine metabolism and reducesnutrient flexibility. Nat Commun 8, 15074 (2017).
94. Muir, A., Danai, L. V., Gui, D. Y., Waingarten, C. Y., Lewis, C. A. & Vander Heiden,M. G. Environmental cystine drives glutamine anaplerosis and sensitizes cancer cells toglutaminase inhibition. Elife 6 (2017).
95. Commisso, C., Davidson, S. M., Soydaner-Azeloglu, R. G., Parker, S. J., Kamphorst, J. J.,Hackett, S., Grabocka, E., Nofal, M., Drebin, J. A., Thompson, C. B., Rabinowitz, J. D.,Metallo, C. M., Vander Heiden, M. G. & Bar-Sagi, D. Macropinocytosis of protein is anamino acid supply route in Ras-transformed cells. Nature 497, 633–7 (2013).
96. Kamphorst, J. J., Nofal, M., Commisso, C., Hackett, S. R., Lu, W., Grabocka, E., VanderHeiden, M. G., Miller, G., Drebin, J. A., Bar-Sagi, D., Thompson, C. B. & Rabinowitz,J. D. Human pancreatic cancer tumors are nutrient poor and tumor cells actively scavengeextracellular protein. Cancer Res 75, 544–53 (2015).
97. Davidson, S. M., Jonas, O., Keibler, M. A., Hou, H. W., Luengo, A., Mayers, J. R.,Wyckoff, J., Del Rosario, A. M., Whitman, M., Chin, C. R., Condon, K. J., Lammers, A.,Kellersberger, K. A., Stall, B. K., Stephanopoulos, G., Bar-Sagi, D., Han, J., Rabinowitz,J. D., Cima, M. J., Langer, R. & Vander Heiden, M. G. Direct evidence for cancer-cell-autonomous extracellular protein catabolism in pancreatic tumors. Nat Med 23, 235–241(2017).
98. Sousa, C. M., Biancur, D. E., Wang, X., Halbrook, C. J., Sherman, M. H., Zhang, L.,Kremer, D., Hwang, R. F., Witkiewicz, A. K., Ying, H., Asara, J. M., Evans, R. M.,Cantley, L. C., Lyssiotis, C. A. & Kimmelman, A. C. Pancreatic stellate cells supporttumour metabolism through autophagic alanine secretion. Nature 536, 479–83 (2016).
99. Yang, L., Achreja, A., Yeung, T. L., Mangala, L. S., Jiang, D., Han, C., Baddour, J.,Marini, J. C., Ni, J., Nakahara, R., Wahlig, S., Chiba, L., Kim, S. H., Morse, J., Pradeep,
37
S., Nagaraja, A. S., Haemmerle, M., Kyunghee, N., Derichsweiler, M., Plackemeier, T.,Mercado-Uribe, I., Lopez-Berestein, G., Moss, T., Ram, P. T., Liu, J., Lu, X., Mok, S. C.,Sood, A. K. & Nagrath, D. Targeting Stromal Glutamine Synthetase in Tumors DisruptsTumor Microenvironment-Regulated Cancer Cell Growth. Cell Metab 24, 685–700 (2016).
100. Gebreselassie, N. A. & Antoniewicz, M. R. (13)C-metabolic flux analysis of co-cultures:A novel approach. Metab Eng 31, 132–9 (2015).
101. Schell, J. C., Olson, K. A., Jiang, L., Hawkins, A. J., Van Vranken, J. G., Xie, J., Egnatchik,R. A., Earl, E. G., DeBerardinis, R. J. & Rutter, J. A role for the mitochondrial pyruvatecarrier as a repressor of the Warburg effect and colon cancer cell growth. Mol Cell 56,400–13 (2014).
102. Divakaruni, A. S., Wiley, S. E., Rogers, G. W., Andreyev, A. Y., Petrosyan, S., Loviscach,M., Wall, E. A., Yadava, N., Heuck, A. P., Ferrick, D. A., Henry, R. R., McDonald, W. G.,Colca, J. R., Simon, M. I., Ciaraldi, T. P. & Murphy, A. N. Thiazolidinediones are acute,specific inhibitors of the mitochondrial pyruvate carrier. Proc Natl Acad Sci U S A 110,5422–7 (2013).
103. Yang, C., Ko, B., Hensley, C. T., Jiang, L., Wasti, A. T., Kim, J., Sudderth, J., Calvaruso,M. A., Lumata, L., Mitsche, M., Rutter, J., Merritt, M. E. & DeBerardinis, R. J. Glu-tamine oxidation maintains the TCA cycle and cell survival during impaired mitochondrialpyruvate transport. Mol Cell 56, 414–24 (2014).
104. McCommis, K. S., Chen, Z., Fu, X., McDonald, W. G., Colca, J. R., Kletzien, R. F.,Burgess, S. C. & Finck, B. N. Loss of Mitochondrial Pyruvate Carrier 2 in the Liver Leadsto Defects in Gluconeogenesis and Compensation via Pyruvate-Alanine Cycling. CellMetab 22, 682–94 (2015).
105. Gray, L. R., Sultana, M. R., Rauckhorst, A. J., Oonthonpan, L., Tompkins, S. C., Sharma,A., Fu, X., Miao, R., Pewa, A. D., Brown, K. S., Lane, E. E., Dohlman, A., Zepeda-Orozco,D., Xie, J., Rutter, J., Norris, A. W., Cox, J. E., Burgess, S. C., Potthoff, M. J. & Taylor,E. B. Hepatic Mitochondrial Pyruvate Carrier 1 Is Required for Efficient Regulation ofGluconeogenesis and Whole-Body Glucose Homeostasis. Cell Metab 22, 669–81 (2015).
106. Ghosh, A., Tyson, T., George, S., Hildebrandt, E. N., Steiner, J. A., Madaj, Z., Schulz, E.,Machiela, E., McDonald, W. G., Escobar Galvis, M. L., Kordower, J. H., Van Raamsdonk,J. M., Colca, J. R. & Brundin, P. Mitochondrial pyruvate carrier regulates autophagy,inflammation, and neurodegeneration in experimental models of Parkinson’s disease. SciTransl Med 8, 368ra174 (2016).
107. Divakaruni, A. S., Wallace, M., Buren, C., Martyniuk, K., Andreyev, A. Y., Li, E., Fields,J. A., Cordes, T., Reynolds, I. J., Bloodgood, B. L., Raymond, L. A., Metallo, C. M. &
38
Murphy, A. N. Inhibition of the mitochondrial pyruvate carrier protects from excitotoxicneuronal death. J Cell Biol 216, 1091–1105 (2017).
108. Eales, K. L., Hollinshead, K. E. & Tennant, D. A. Hypoxia and metabolic adaptation ofcancer cells. Oncogenesis 5, e190 (2016).
109. Weinberg, F., Hamanaka, R., Wheaton, W. W., Weinberg, S., Joseph, J., Lopez, M., Kalya-naraman, B., Mutlu, G. M., Budinger, G. R. & Chandel, N. S. Mitochondrial metabolismand ROS generation are essential for Kras-mediated tumorigenicity. Proc Natl Acad Sci US A 107, 8788–93 (2010).
110. Fan, J., Kamphorst, J. J., Mathew, R., Chung, M. K., White, E., Shlomi, T. & Rabinowitz,J. D. Glutamine-driven oxidative phosphorylation is a major ATP source in transformedmammalian cells in both normoxia and hypoxia. Mol Syst Biol 9, 712 (2013).
111. Le, A., Lane, A. N., Hamaker, M., Bose, S., Gouw, A., Barbi, J., Tsukamoto, T., Rojas, C. J.,Slusher, B. S., Zhang, H., Zimmerman, L. J., Liebler, D. C., Slebos, R. J., Lorkiewicz, P. K.,Higashi, R. M., Fan, T. W. & Dang, C. V. Glucose-independent glutamine metabolism viaTCA cycling for proliferation and survival in B cells. Cell Metab 15, 110–21 (2012).
112. Des Rosiers, C., Di Donato, L., Comte, B., Laplante, A., Marcoux, C., David, F., Fernandez,C. A. & Brunengraber, H. Isotopomer analysis of citric acid cycle and gluconeogenesis inrat liver. Reversibility of isocitrate dehydrogenase and involvement of ATP-citrate lyase ingluconeogenesis. J Biol Chem 270, 10027–36 (1995).
113. Yoo, H., Antoniewicz, M. R., Stephanopoulos, G. & Kelleher, J. K. Quantifying reductivecarboxylation flux of glutamine to lipid in a brown adipocyte cell line. J Biol Chem 283,20621–7 (2008).
114. Metallo, C. M., Gameiro, P. A., Bell, E. L., Mattaini, K. R., Yang, J., Hiller, K., Jewell,C. M., Johnson, Z. R., Irvine, D. J., Guarente, L., Kelleher, J. K., Vander Heiden, M. G.,Iliopoulos, O. & Stephanopoulos, G. Reductive glutamine metabolism by IDH1 mediateslipogenesis under hypoxia. Nature 481, 380–4 (2012).
115. Wise, D. R., Ward, P. S., Shay, J. E., Cross, J. R., Gruber, J. J., Sachdeva, U. M., Platt,J. M., DeMatteo, R. G., Simon, M. C. & Thompson, C. B. Hypoxia promotes isocitratedehydrogenase-dependent carboxylation of alpha-ketoglutarate to citrate to support cellgrowth and viability. Proc Natl Acad Sci U S A 108, 19611–6 (2011).
116. Gameiro, P. A., Yang, J., Metelo, A. M., Perez-Carro, R., Baker, R., Wang, Z., Arreola, A.,Rathmell, W. K., Olumi, A., Lopez-Larrubia, P., Stephanopoulos, G. & Iliopoulos, O. Invivo HIF-mediated reductive carboxylation is regulated by citrate levels and sensitizesVHL-deficient cells to glutamine deprivation. Cell Metab 17, 372–85 (2013).
39

117. Hakimi, A. A., Reznik, E., Lee, C. H., Creighton, C. J., Brannon, A. R., Luna, A., Aksoy,B. A., Liu, E. M., Shen, R., Lee, W., Chen, Y., Stirdivant, S. M., Russo, P., Chen, Y. B.,Tickoo, S. K., Reuter, V. E., Cheng, E. H., Sander, C. & Hsieh, J. J. An Integrated MetabolicAtlas of Clear Cell Renal Cell Carcinoma. Cancer Cell 29, 104–16 (2016).
118. Okazaki, A., Gameiro, P. A., Christodoulou, D., Laviollette, L., Schneider, M., Chaves, F.,Stemmer-Rachamimov, A., Yazinski, S. A., Lee, R., Stephanopoulos, G., Zou, L. & Iliopou-los, O. Glutaminase and poly(ADP-ribose) polymerase inhibitors suppress pyrimidinesynthesis and VHL-deficient renal cancers. J Clin Invest 127, 1631–1645 (2017).
119. Mullen, A. R., Wheaton, W. W., Jin, E. S., Chen, P. H., Sullivan, L. B., Cheng, T., Yang, Y.,Linehan, W. M., Chandel, N. S. & DeBerardinis, R. J. Reductive carboxylation supportsgrowth in tumour cells with defective mitochondria. Nature 481, 385–8 (2012).
120. Gameiro, P. A., Laviolette, L. A., Kelleher, J. K., Iliopoulos, O. & Stephanopoulos, G. Co-factor balance by nicotinamide nucleotide transhydrogenase (NNT) coordinates reductivecarboxylation and glucose catabolism in the tricarboxylic acid (TCA) cycle. J Biol Chem288, 12967–77 (2013).
121. Mullen, A. R., Hu, Z., Shi, X., Jiang, L., Boroughs, L. K., Kovacs, Z., Boriack, R.,Rakheja, D., Sullivan, L. B., Linehan, W. M., Chandel, N. S. & DeBerardinis, R. J.Oxidation of alpha-ketoglutarate is required for reductive carboxylation in cancer cellswith mitochondrial defects. Cell Rep 7, 1679–90 (2014).
122. Fendt, S. M., Bell, E. L., Keibler, M. A., Olenchock, B. A., Mayers, J. R., Wasylenko,T. M., Vokes, N. I., Guarente, L., Vander Heiden, M. G. & Stephanopoulos, G. Reductiveglutamine metabolism is a function of the alpha-ketoglutarate to citrate ratio in cells. NatCommun 4, 2236 (2013).
123. Stincone, A., Prigione, A., Cramer, T., Wamelink, M. M., Campbell, K., Cheung, E., Olin-Sandoval, V., Gruning, N., Kruger, A., Tauqeer Alam, M., Keller, M. A., Breitenbach, M.,Brindle, K. M., Rabinowitz, J. D. & Ralser, M. The return of metabolism: biochemistryand physiology of the pentose phosphate pathway. Biol Rev Camb Philos Soc (2014).
124. Lee, W. N., Boros, L. G., Puigjaner, J., Bassilian, S., Lim, S. & Cascante, M. Mass iso-topomer study of the nonoxidative pathways of the pentose cycle with [1,2-13C2]glucose.Am J Physiol 274, E843–51 (1998).
125. Katz, J., Rognstad, R. & Kemp, R. G. Isotope Discrimination Effects in the Metabolism ofTritiated Glucose. J Biol Chem 240, PC1484–6 (1965).
126. Rendina, A. R., Hermes, J. D. & Cleland, W. W. Use of multiple isotope effects to studythe mechanism of 6-phosphogluconate dehydrogenase. Biochemistry 23, 6257–62 (1984).
40
127. Ben-Yoseph, O., Kingsley, P. B. & Ross, B. D. Metabolic loss of deuterium from isotopi-cally labeled glucose. Magn Reson Med 32, 405–9 (1994).
128. Ruhl, M., Le Coq, D., Aymerich, S. & Sauer, U. 13C-flux analysis reveals NADPH-balancing transhydrogenation cycles in stationary phase of nitrogen-starving Bacillussubtilis. J Biol Chem 287, 27959–70 (2012).
129. Lewis, C. A., Parker, S. J., Fiske, B. P., McCloskey, D., Gui, D. Y., Green, C. R., Vokes,N. I., Feist, A. M., Vander Heiden, M. G. & Metallo, C. M. Tracing compartmentalizedNADPH metabolism in the cytosol and mitochondria of mammalian cells. Mol Cell 55,253–63 (2014).
130. Zhang, H., Badur, M. G., Divakaruni, A. S., Parker, S. J., Jager, C., Hiller, K., Murphy, A. N.& Metallo, C. M. Distinct Metabolic States Can Support Self-Renewal and Lipogenesis inHuman Pluripotent Stem Cells under Different Culture Conditions. Cell Rep 16, 1536–47(2016).
131. LaNoue, K. F. & Schoolwerth, A. C. Metabolite transport in mitochondria. Annu RevBiochem 48, 871–922 (1979).
132. Schafer, Z. T., Grassian, A. R., Song, L., Jiang, Z., Gerhart-Hines, Z., Irie, H. Y., Gao,S., Puigserver, P. & Brugge, J. S. Antioxidant and oncogene rescue of metabolic defectscaused by loss of matrix attachment. Nature 461, 109–13 (2009).
133. Grassian, A. R., Metallo, C. M., Coloff, J. L., Stephanopoulos, G. & Brugge, J. S. Erkregulation of pyruvate dehydrogenase flux through PDK4 modulates cell proliferation.Genes Dev 25, 1716–33 (2011).
134. Piskounova, E., Agathocleous, M., Murphy, M. M., Hu, Z., Huddlestun, S. E., Zhao, Z.,Leitch, A. M., Johnson, T. M., DeBerardinis, R. J. & Morrison, S. J. Oxidative stressinhibits distant metastasis by human melanoma cells. Nature 527, 186–91 (2015).
135. Parker, S. J. & Metallo, C. M. Chasing One-Carbon Units to Understand the Role of Serinein Epigenetics. Mol Cell 61, 185–6 (2016).
136. Locasale, J. W., Grassian, A. R., Melman, T., Lyssiotis, C. A., Mattaini, K. R., Bass,A. J., Heffron, G., Metallo, C. M., Muranen, T., Sharfi, H., Sasaki, A. T., Anastasiou, D.,Mullarky, E., Vokes, N. I., Sasaki, M., Beroukhim, R., Stephanopoulos, G., Ligon, A. H.,Meyerson, M., Richardson, A. L., Chin, L., Wagner, G., Asara, J. M., Brugge, J. S., Cantley,L. C. & Vander Heiden, M. G. Phosphoglycerate dehydrogenase diverts glycolytic fluxand contributes to oncogenesis. Nat Genet 43, 869–74 (2011).
137. Possemato, R., Marks, K. M., Shaul, Y. D., Pacold, M. E., Kim, D., Birsoy, K., Sethumad-havan, S., Woo, H. K., Jang, H. G., Jha, A. K., Chen, W. W., Barrett, F. G., Stransky, N.,
41

Tsun, Z. Y., Cowley, G. S., Barretina, J., Kalaany, N. Y., Hsu, P. P., Ottina, K., Chan, A. M.,Yuan, B., Garraway, L. A., Root, D. E., Mino-Kenudson, M., Brachtel, E. F., Driggers,E. M. & Sabatini, D. M. Functional genomics reveal that the serine synthesis pathway isessential in breast cancer. Nature 476, 346–50 (2011).
138. Jain, M., Nilsson, R., Sharma, S., Madhusudhan, N., Kitami, T., Souza, A. L., Kafri, R.,Kirschner, M. W., Clish, C. B. & Mootha, V. K. Metabolite profiling identifies a key rolefor glycine in rapid cancer cell proliferation. Science 336, 1040–4 (2012).
139. Tibbetts, A. S. & Appling, D. R. Compartmentalization of Mammalian folate-mediatedone-carbon metabolism. Annu Rev Nutr 30, 57–81 (2010).
140. Fox, J. T. & Stover, P. J. Folate-mediated one-carbon metabolism. Vitam Horm 79, 1–44(2008).
141. Nilsson, R., Jain, M., Madhusudhan, N., Sheppard, N. G., Strittmatter, L., Kampf, C.,Huang, J., Asplund, A. & Mootha, V. K. Metabolic enzyme expression highlights a keyrole for MTHFD2 and the mitochondrial folate pathway in cancer. Nat Commun 5, 3128(2014).
142. Locasale, J. W. Serine, glycine and one-carbon units: cancer metabolism in full circle. NatRev Cancer 13, 572–83 (2013).
143. Maddocks, O. D., Berkers, C. R., Mason, S. M., Zheng, L., Blyth, K., Gottlieb, E. &Vousden, K. H. Serine starvation induces stress and p53-dependent metabolic remodellingin cancer cells. Nature 493, 542–6 (2013).
144. Gravel, S. P., Hulea, L., Toban, N., Birman, E., Blouin, M. J., Zakikhani, M., Zhao, Y.,Topisirovic, I., St-Pierre, J. & Pollak, M. Serine deprivation enhances antineoplastic activityof biguanides. Cancer Res 74, 7521–33 (2014).
145. Ye, J., Fan, J., Venneti, S., Wan, Y. W., Pawel, B. R., Zhang, J., Finley, L. W., Lu, C.,Lindsten, T., Cross, J. R., Qing, G., Liu, Z., Simon, M. C., Rabinowitz, J. D. & Thompson,C. B. Serine catabolism regulates mitochondrial redox control during hypoxia. CancerDiscov 4, 1406–17 (2014).
146. Maddocks, O. D. K., Athineos, D., Cheung, E. C., Lee, P., Zhang, T., van den Broek,N. J. F., Mackay, G. M., Labuschagne, C. F., Gay, D., Kruiswijk, F., Blagih, J., Vincent,D. F., Campbell, K. J., Ceteci, F., Sansom, O. J., Blyth, K. & Vousden, K. H. Modulatingthe therapeutic response of tumours to dietary serine and glycine starvation. Nature 544,372–376 (2017).
42

147. Labuschagne, C. F., van den Broek, N. J., Mackay, G. M., Vousden, K. H. & Maddocks,O. D. Serine, but not glycine, supports one-carbon metabolism and proliferation of cancercells. Cell Rep 7, 1248–58 (2014).
148. DeNicola, G. M., Chen, P. H., Mullarky, E., Sudderth, J. A., Hu, Z., Wu, D., Tang, H.,Xie, Y., Asara, J. M., Huffman, K. E., Wistuba, I., Minna, J. D., DeBerardinis, R. J. &Cantley, L. C. NRF2 regulates serine biosynthesis in non-small cell lung cancer. Nat Genet47, 1475–81 (2015).
149. Ben-Sahra, I., Hoxhaj, G., Ricoult, S. J., Asara, J. M. & Manning, B. D. mTORC1 inducespurine synthesis through control of the mitochondrial tetrahydrofolate cycle. Science 351,728–33 (2016).
150. Zhang, W. C., Shyh-Chang, N., Yang, H., Rai, A., Umashankar, S., Ma, S., Soh, B. S.,Sun, L. L., Tai, B. C., Nga, M. E., Bhakoo, K. K., Jayapal, S. R., Nichane, M., Yu, Q.,Ahmed, D. A., Tan, C., Sing, W. P., Tam, J., Thirugananam, A., Noghabi, M. S., Pang,Y. H., Ang, H. S., Mitchell, W., Robson, P., Kaldis, P., Soo, R. A., Swarup, S., Lim, E. H. &Lim, B. Glycine decarboxylase activity drives non-small cell lung cancer tumor-initiatingcells and tumorigenesis. Cell 148, 259–72 (2012).
151. Vazquez, A., Markert, E. K. & Oltvai, Z. N. Serine biosynthesis with one carbon catabolismand the glycine cleavage system represents a novel pathway for ATP generation. PLoSOne 6, e25881 (2011).
152. Herbig, K., Chiang, E. P., Lee, L. R., Hills, J., Shane, B. & Stover, P. J. Cytoplasmic serinehydroxymethyltransferase mediates competition between folate-dependent deoxyribonu-cleotide and S-adenosylmethionine biosyntheses. J Biol Chem 277, 38381–9 (2002).
153. Meiser, J., Tumanov, S., Maddocks, O., Labuschagne, C. F., Athineos, D., Van Den Broek,N., Mackay, G. M., Gottlieb, E., Blyth, K., Vousden, K., Kamphorst, J. J. & Vazquez, A.Serine one-carbon catabolism with formate overflow. Sci Adv 2, e1601273 (2016).
154. Ducker, G. S., Chen, L., Morscher, R. J., Ghergurovich, J. M., Esposito, M., Teng, X.,Kang, Y. & Rabinowitz, J. D. Reversal of Cytosolic One-Carbon Flux Compensates forLoss of the Mitochondrial Folate Pathway. Cell Metab 23, 1140–53 (2016).
155. Samanta, D., Park, Y., Andrabi, S. A., Shelton, L. M., Gilkes, D. M. & Semenza, G. L.PHGDH Expression Is Required for Mitochondrial Redox Homeostasis, Breast CancerStem Cell Maintenance, and Lung Metastasis. Cancer Res 76, 4430–42 (2016).
156. Metallo, C. M. & Vander Heiden, M. G. Metabolism strikes back: metabolic flux regulatescell signaling. Genes Dev 24, 2717–22 (2010).
43
157. Kinnaird, A., Zhao, S., Wellen, K. E. & Michelakis, E. D. Metabolic control of epigeneticsin cancer. Nat Rev Cancer 16, 694–707 (2016).
158. Su, X., Wellen, K. E. & Rabinowitz, J. D. Metabolic control of methylation and acetylation.Curr Opin Chem Biol 30, 52–60 (2016).
159. Zhao, S., Torres, A., Henry, R. A., Trefely, S., Wallace, M., Lee, J. V., Carrer, A., Sengupta,A., Campbell, S. L., Kuo, Y. M., Frey, A. J., Meurs, N., Viola, J. M., Blair, I. A., Weljie,A. M., Metallo, C. M., Snyder, N. W., Andrews, A. J. & Wellen, K. E. ATP-Citrate LyaseControls a Glucose-to-Acetate Metabolic Switch. Cell Rep 17, 1037–1052 (2016).
160. Wellen, K. E., Hatzivassiliou, G., Sachdeva, U. M., Bui, T. V., Cross, J. R. & Thompson,C. B. ATP-citrate lyase links cellular metabolism to histone acetylation. Science 324,1076–80 (2009).
161. Wang, Q., Zhang, Y., Yang, C., Xiong, H., Lin, Y., Yao, J., Li, H., Xie, L., Zhao, W., Yao,Y., Ning, Z. B., Zeng, R., Xiong, Y., Guan, K. L., Zhao, S. & Zhao, G. P. Acetylation ofmetabolic enzymes coordinates carbon source utilization and metabolic flux. Science 327,1004–7 (2010).
162. Starai, V. J., Celic, I., Cole, R. N., Boeke, J. D. & Escalante-Semerena, J. C. Sir2-dependentactivation of acetyl-CoA synthetase by deacetylation of active lysine. Science 298, 2390–2(2002).
163. Mews, P., Donahue, G., Drake, A. M., Luczak, V., Abel, T. & Berger, S. L. Acetyl-CoAsynthetase regulates histone acetylation and hippocampal memory. Nature 546, 381–386(2017).
164. Gut, P. & Verdin, E. The nexus of chromatin regulation and intermediary metabolism.Nature 502, 489–98 (2013).
165. Cantoni, G. L. S-Adenosylmethionine - a New Intermediate Formed Enzymatically fromL-Methionine and Adenosinetriphosphate. Journal of Biological Chemistry 204, 403–416(1953).
166. Lane, A. N. & Fan, T. W. Regulation of mammalian nucleotide metabolism and biosynthe-sis. Nucleic Acids Res 43, 2466–85 (2015).
167. Davis, S. R., Stacpoole, P. W., Williamson, J., Kick, L. S., Quinlivan, E. P., Coats, B. S.,Shane, B., Bailey, L. B. & Gregory J. F., 3. Tracer-derived total and folate-dependenthomocysteine remethylation and synthesis rates in humans indicate that serine is the mainone-carbon donor. Am J Physiol Endocrinol Metab 286, E272–9 (2004).
168. Kottakis, F., Nicolay, B. N., Roumane, A., Karnik, R., Gu, H., Nagle, J. M., Boukhali, M.,Hayward, M. C., Li, Y. Y., Chen, T., Liesa, M., Hammerman, P. S., Wong, K. K., Hayes,
44

D. N., Shirihai, O. S., Dyson, N. J., Haas, W., Meissner, A. & Bardeesy, N. LKB1 losslinks serine metabolism to DNA methylation and tumorigenesis. Nature 539, 390–395(2016).
169. Mentch, S. J., Mehrmohamadi, M., Huang, L., Liu, X., Gupta, D., Mattocks, D., GomezPadilla, P., Ables, G., Bamman, M. M., Thalacker-Mercer, A. E., Nichenametla, S. N. &Locasale, J. W. Histone Methylation Dynamics and Gene Regulation Occur through theSensing of One-Carbon Metabolism. Cell Metab 22, 861–73 (2015).
170. Maddocks, O. D., Labuschagne, C. F., Adams, P. D. & Vousden, K. H. Serine MetabolismSupports the Methionine Cycle and DNA/RNA Methylation through De Novo ATP Syn-thesis in Cancer Cells. Mol Cell 61, 210–21 (2016).
171. DeBerardinis, R. J. & Cheng, T. Q’s next: the diverse functions of glutamine in metabolism,cell biology and cancer. Oncogene 29, 313–24 (2010).
172. Kung, H. N., Marks, J. R. & Chi, J. T. Glutamine synthetase is a genetic determinant ofcell type-specific glutamine independence in breast epithelia. PLoS Genet 7, e1002229(2011).
173. Tardito, S., Oudin, A., Ahmed, S. U., Fack, F., Keunen, O., Zheng, L., Miletic, H., Sakari-assen, P. O., Weinstock, A., Wagner, A., Lindsay, S. L., Hock, A. K., Barnett, S. C.,Ruppin, E., Morkve, S. H., Lund-Johansen, M., Chalmers, A. J., Bjerkvig, R., Niclou, S. P.& Gottlieb, E. Glutamine synthetase activity fuels nucleotide biosynthesis and supportsgrowth of glutamine-restricted glioblastoma. Nat Cell Biol 17, 1556–68 (2015).
174. Sellers, K., Fox, M. P., Bousamra M., 2., Slone, S. P., Higashi, R. M., Miller, D. M., Wang,Y., Yan, J., Yuneva, M. O., Deshpande, R., Lane, A. N. & Fan, T. W. Pyruvate carboxylaseis critical for non-small-cell lung cancer proliferation. J Clin Invest 125, 687–98 (2015).
175. Cheng, T., Sudderth, J., Yang, C., Mullen, A. R., Jin, E. S., Mates, J. M. & DeBerardinis,R. J. Pyruvate carboxylase is required for glutamine-independent growth of tumor cells.Proc Natl Acad Sci U S A 108, 8674–9 (2011).
176. Lussey-Lepoutre, C., Hollinshead, K. E., Ludwig, C., Menara, M., Morin, A., Castro-Vega, L. J., Parker, S. J., Janin, M., Martinelli, C., Ottolenghi, C., Metallo, C., Gimenez-Roqueplo, A. P., Favier, J. & Tennant, D. A. Loss of succinate dehydrogenase activityresults in dependency on pyruvate carboxylation for cellular anabolism. Nat Commun 6,8784 (2015).
177. Cardaci, S., Zheng, L., MacKay, G., van den Broek, N. J., MacKenzie, E. D., Nixon,C., Stevenson, D., Tumanov, S., Bulusu, V., Kamphorst, J. J., Vazquez, A., Fleming, S.,Schiavi, F., Kalna, G., Blyth, K., Strathdee, D. & Gottlieb, E. Pyruvate carboxylation
45
enables growth of SDH-deficient cells by supporting aspartate biosynthesis. Nat Cell Biol17, 1317–26 (2015).
178. Davidson, S. M., Papagiannakopoulos, T., Olenchock, B. A., Heyman, J. E., Keibler, M. A.,Luengo, A., Bauer, M. R., Jha, A. K., O’Brien, J. P., Pierce, K. A., Gui, D. Y., Sullivan,L. B., Wasylenko, T. M., Subbaraj, L., Chin, C. R., Stephanopolous, G., Mott, B. T., Jacks,T., Clish, C. B. & Vander Heiden, M. G. Environment Impacts the Metabolic Dependenciesof Ras-Driven Non-Small Cell Lung Cancer. Cell Metab 23, 517–28 (2016).
179. Hensley, C. T., Faubert, B., Yuan, Q., Lev-Cohain, N., Jin, E., Kim, J., Jiang, L., Ko, B.,Skelton, R., Loudat, L., Wodzak, M., Klimko, C., McMillan, E., Butt, Y., Ni, M., Oliver,D., Torrealba, J., Malloy, C. R., Kernstine, K., Lenkinski, R. E. & DeBerardinis, R. J.Metabolic Heterogeneity in Human Lung Tumors. Cell 164, 681–94 (2016).
180. Pascual, G., Avgustinova, A., Mejetta, S., Martin, M., Castellanos, A., Attolini, C. S.,Berenguer, A., Prats, N., Toll, A., Hueto, J. A., Bescos, C., Di Croce, L. & Benitah, S. A.Targeting metastasis-initiating cells through the fatty acid receptor CD36. Nature 541,41–45 (2017).
181. Hale, J. S., Otvos, B., Sinyuk, M., Alvarado, A. G., Hitomi, M., Stoltz, K., Wu, Q.,Flavahan, W., Levison, B., Johansen, M. L., Schmitt, D., Neltner, J. M., Huang, P., Ren, B.,Sloan, A. E., Silverstein, R. L., Gladson, C. L., DiDonato, J. A., Brown, J. M., McIntyre, T.,Hazen, S. L., Horbinski, C., Rich, J. N. & Lathia, J. D. Cancer stem cell-specific scavengerreceptor CD36 drives glioblastoma progression. Stem Cells 32, 1746–58 (2014).
182. Nath, A., Li, I., Roberts, L. R. & Chan, C. Elevated free fatty acid uptake via CD36promotes epithelial-mesenchymal transition in hepatocellular carcinoma. Sci Rep 5, 14752(2015).
183. Yao, C. H., Fowle-Grider, R., Mahieu, N. G., Liu, G. Y., Chen, Y. J., Wang, R., Singh, M.,Potter, G. S., Gross, R. W., Schaefer, J., Johnson, S. L. & Patti, G. J. Exogenous FattyAcids Are the Preferred Source of Membrane Lipids in Proliferating Fibroblasts. CellChem Biol 23, 483–93 (2016).
184. Hatzivassiliou, G., Zhao, F., Bauer, D. E., Andreadis, C., Shaw, A. N., Dhanak, D., Hingo-rani, S. R., Tuveson, D. A. & Thompson, C. B. ATP citrate lyase inhibition can suppresstumor cell growth. Cancer Cell 8, 311–21 (2005).
185. Brusselmans, K., De Schrijver, E., Verhoeven, G. & Swinnen, J. V. RNA interference-mediated silencing of the acetyl-CoA-carboxylase-alpha gene induces growth inhibitionand apoptosis of prostate cancer cells. Cancer Res 65, 6719–25 (2005).
46

186. Milgraum, L. Z., Witters, L. A., Pasternack, G. R. & Kuhajda, F. P. Enzymes of the fattyacid synthesis pathway are highly expressed in in situ breast carcinoma. Clin Cancer Res3, 2115–20 (1997).
187. Benjamin, D. I., Li, D. S., Lowe, W., Heuer, T., Kemble, G. & Nomura, D. K. Diacylglyc-erol Metabolism and Signaling Is a Driving Force Underlying FASN Inhibitor Sensitivityin Cancer Cells. ACS Chem Biol 10, 1616–23 (2015).
188. Previs, S. F., McLaren, D. G., Wang, S. P., Stout, S. J., Zhou, H., Herath, K., Shah, V.,Miller, P. L., Wilsie, L., Castro-Perez, J., Johns, D. G., Cleary, M. A. & Roddy, T. P. Newmethodologies for studying lipid synthesis and turnover: looking backwards to enablemoving forwards. Biochim Biophys Acta 1842, 402–13 (2014).
189. Svensson, R. U., Parker, S. J., Eichner, L. J., Kolar, M. J., Wallace, M., Brun, S. N.,Lombardo, P. S., Van Nostrand, J. L., Hutchins, A., Vera, L., Gerken, L., Greenwood, J.,Bhat, S., Harriman, G., Westlin, W. F., Harwood H. J., J., Saghatelian, A., Kapeller, R.,Metallo, C. M. & Shaw, R. J. Inhibition of acetyl-CoA carboxylase suppresses fatty acidsynthesis and tumor growth of non-small-cell lung cancer in preclinical models. Nat Med22, 1108–1119 (2016).
190. Vacanti, N. M. & Metallo, C. M. Exploring metabolic pathways that contribute to the stemcell phenotype. Biochim Biophys Acta 1830, 2361–9 (2013).
191. Gu, W., Gaeta, X., Sahakyan, A., Chan, A. B., Hong, C. S., Kim, R., Braas, D., Plath,K., Lowry, W. E. & Christofk, H. R. Glycolytic Metabolism Plays a Functional Role inRegulating Human Pluripotent Stem Cell State. Cell Stem Cell 19, 476–490 (2016).
192. Green, C. R., Wallace, M., Divakaruni, A. S., Phillips, S. A., Murphy, A. N., Ciaraldi, T. P.& Metallo, C. M. Branched-chain amino acid catabolism fuels adipocyte differentiationand lipogenesis. Nat Chem Biol 12, 15–21 (2016).
193. Mayers, J. R., Torrence, M. E., Danai, L. V., Papagiannakopoulos, T., Davidson, S. M.,Bauer, M. R., Lau, A. N., Ji, B. W., Dixit, P. D., Hosios, A. M., Muir, A., Chin, C. R.,Freinkman, E., Jacks, T., Wolpin, B. M., Vitkup, D. & Vander Heiden, M. G. Tissue oforigin dictates branched-chain amino acid metabolism in mutant Kras-driven cancers.Science 353, 1161–5 (2016).
194. Cordes, T., Wallace, M., Michelucci, A., Divakaruni, A. S., Sapcariu, S. C., Sousa, C.,Koseki, H., Cabrales, P., Murphy, A. N., Hiller, K. & Metallo, C. M. ImmunoresponsiveGene 1 and Itaconate Inhibit Succinate Dehydrogenase to Modulate Intracellular SuccinateLevels. J Biol Chem 291, 14274–84 (2016).
195. Lampropoulou, V., Sergushichev, A., Bambouskova, M., Nair, S., Vincent, E. E., Loginicheva,E., Cervantes-Barragan, L., Ma, X., Huang, S. C., Griss, T., Weinheimer, C. J., Khader, S.,
47

Randolph, G. J., Pearce, E. J., Jones, R. G., Diwan, A., Diamond, M. S. & Artyomov,M. N. Itaconate Links Inhibition of Succinate Dehydrogenase with Macrophage MetabolicRemodeling and Regulation of Inflammation. Cell Metab 24, 158–66 (2016).
48
Chapter 2
Enzymatic passaging of human embryonic
stem cells alters central carbon metabolism
and glycan abundance
2.1 Abstract
To realize the potential of human embryonic stem cells (hESCs) in regenerative medicine
and drug discovery applications, large numbers of cells that accurately recapitulate cell and tissue
function must be robustly produced. Previous studies have suggested that genetic instability
and epigenetic changes occur as a consequence of enzymatic passaging. However, the potential
impacts of such passaging methods on the metabolism of hESCs have not been described. Using
stable isotope tracing and mass spectrometry-based metabolomics we have explored how different
passaging reagents impact hESC metabolism. Enzymatic passaging caused significant decreases
in glucose utilization throughout central carbon metabolism along with attenuated de novo lipoge-
nesis. In addition, we developed and validated a method for rapidly quantifying glycan abundance
and isotopic labeling in hydrolyzed biomass. Enzymatic passaging reagents significantly altered
49

levels of glycans immediately after digestion but surprisingly glucose contribution to glycans was
not affected. These results demonstrate that there is an immediate effect on hESC metabolism
after enzymatic passaging in both central carbon metabolism and biosynthesis. HESCs subjected
to enzymatic passaging are routinely placed in a state requiring re-synthesis of biomass compo-
nents, subtly influencing their metabolic needs in a manner that may impact cell performance in
regenerative medicine applications.
2.2 Introduction
Human embryonic stem cells (hESCs) are characterized by their ability to differentiate
into the three terminal germ layers and self-renew indefinitely. This makes them ideal cell types
for regenerative medicine and drug discovery applications. However, the impact of in vitro culture
conditions on cell performance and stability must be monitored and validated to ensure these
cells recapitulate actual tissue functions. Since the initial isolation and expansion of hESC lines
on feeder layer conditions [1], more recently developed, chemically-defined culture conditions
have become commonly used for the isolation and culture of hESCs and induced pluripotent
stem cells (iPSCs) [2]. Along with the engineering of defined culture conditions, a concomitant
development of enzymatic passaging methods to replace laborious mechanical passaging methods
also occurred. Analysis of cells cultivated using these enzymatic passaging techniques has
suggested these approaches increase karyotypic instability of hESCs [3–5]. Another recent study
has indicated that enzymatic passaging may cause increased genetic instability and differential
DNA methylation [6]. While these studies have addressed the effects of enzymatic passaging
on cellular genetics and epigenetic alterations, the impacts of passaging method on cellular
metabolism have not been examined.
HESC metabolism is characterized by a greater reliance on glycolysis compared to
cells in the differentiated state [7–9]. Glycolytic flux is essential for maintenance of the stem
50

cell phenotype, as evidenced by the impact of inhibitors of glycolysis on pluripotency marker
expression and cellular reprogramming [10, 11]. While glucose metabolism provides cellular
energy by producing adenosine triphosphate (ATP) and reducing equivalents, glucose is also the
primary carbon source for a myriad of biosynthetic precursors, including ribose for nucleotides,
non-essential amino acids, and acetyl-coenzyme A (AcCoA) for lipids. Though commonly
overlooked in studies of intermediary metabolism, glucose (in addition to glutamine) also provides
the necessary building blocks for the synthesis of glycan moieties, which are essential for protein
function and trafficking. Glycans are also the key components that comprise the glycocalyx,
which surrounds the cell membrane of some cells [12]. Through the cleavage of extracellular
proteins and their associated glycans, enzymatic digestion could affect the phenotype of hESCs by
impacting their metabolic demands or ability to respond to extracellular signaling cues [13–17].
To understand the influence of enzymatic passaging on hESC metabolism we utilized
stable isotope tracing and mass spectrometry-based metabolomics to characterize central carbon
metabolism after passaging. We developed and applied a method for rapid quantitation of glycan,
nucleotide, and amino acid pools to explore the impact of passaging reagents on hESC biomass.
Finally, we determined how enzymatic passaging affects biosynthetic flux to lipids, nucleotides
and carbohydrates. Our results demonstrate that enzymatic passaging alters hESC metabolism
and the cell’s ability to synthesize biosynthetic intermediates while highlighting the quantitative
importance of metabolic flux to glycan pools.
2.3 Materials and Methods
2.3.1 Cell culture
WA09 hESCs (H9s) were maintained on Synthemax II-SC coated (Corning, Corning, NY)
plates in mTESR1 (Stem Cell Technologies, Vancouver, BC). hESCs were passaged every 5 days
by exposure to Versene (Gibco, Grand Island, NY) for 10 min at 37◦C. Synthemax II-SC coating
51

was performed by dispensing 2 mL of working dilution (25 µg/mL) to each well of a 6-well of a
tissue culture polystyrene plate and incubating for 2 hours. For isotopic labeling experiments, cells
were maintained in mTESR1 media with uniformly-labeled glucose (tracer mTESR) by adding
5x mTESR1 supplement to custom DMEM/F-12. Custom DMEM/F-12 (Hyclone Laboratories,
Logan, UT) without amino acids, D-glucose, sodium pyruvate, sodium bicarbonate, and phenol
red was supplemented with all amino acids, sodium pyruvate, sodium bicarbonate (14 mM;
Sigma-Aldrich, St. Louis, MO), HEPES (15mM; from 1M stock, Gibco, Grand Island, NY), and
[U-13C6] Glucose (99%; Cambridge Isotopes, Cambridge, MA) at DMEM/F-12 levels.
2.3.2 Enzymatic passaging experiments
H9s (p29-35) were grown on Synthemax II-SC coated plates to 50-70% confluency. Cells
were rinsed with 1 mL PBS and then exposed at 37◦C to either 1 mL Versene for 10 minutes,
Accutase (Innovative Cell Technology, San Diego, CA) for 5 minutes, or Trypsin-EDTA (0.25%;
Gibco, Grand Island, NY) for 5 minutes. Versene-treated cells were then split to 3 wells by
aspirating Versene and resuspending in 6 mL mTESR. Accutase-treated cells were split to 3 wells
by adding 9 mL PBS to Accutase solution, centrifuging at 300g for 5 min, and resuspending in
6 mL mTESR after aspiration. Trypsin-treated cells were split to 3 wells by adding 9 mL PBS
to Trypsin solution, centrifuging at 300g for 5 min, and resuspending pellet in 6 mL mTESR
after aspiration. Cells traced immediately after passaging were resuspended in tracer mTESR.
Cells traced 24 hours after passaging were resuspended in mTESR1 immediately after passaging,
rinsed with PBS 24 hours later, and changed into tracer mTESR before extracting 4 hours later.
For experiments with ROCK inhibitor, 5 µM of Y-27632 (Tocris, Avon, UK) was added to media.
For quantitation of biomass abundances after passaging, cells in triplicate were rinsed
with 1 mL PBS and exposed at 37◦C to 1mL Versene for 10 minutes, TrypLE Express (Gibco,
Grand Island, NY) for 5 minutes, Accutase for 5 minutes, or Trypsin-EDTA for 5 minutes. 1
mL of PBS was immediately added after incubation to quench enzymatic digestion and then
52
transferred to 15 mL conical tube containing 7 mL PBS. Each well was then washed with 1 mL
PBS and added to the respective conical tube. Cells were then centrifuged at 300g for 5 minutes
and supernatant was aspirated. Cells were then washed twice by resuspension of the pellet in 1
mL 0.9% (w/v) saline, centrifugation at 300g for 5 minutes, and aspiration of supernatant. Pellets
were then stored at -20◦C for metabolite extraction.
2.3.3 Metabolite Extraction and GC-MS Analysis
Polar metabolites and fatty acids were extracted using methanol/water/chloroform as
previously described [18]. Briefly, cells were rinsed with 0.9% (w/v) saline and 250 µL of
-80◦C MeOH was added to quench metabolic reactions. 100 µL of ice-cold water supplemented
with 10 µg/mL norvaline was then added to each well and cells were collected by scraping.
The lysate was moved to a fresh 1.5 mL eppendorf tube and 250 µL of -20◦C chloroform
supplemented with 10 µg/mL heptadecanoate was added. After vortexing and centrifugation,
the top aqueous layer and bottom organic layer were collected and dried under airflow. The
remaining "interface" layer containing biomass was washed twice by addition of -80◦C 500 µL of
MeOH, centrifugation at 21,000g, and decanting of supernatant. Interface layers were then dried
by ambient air overnight and stored at -20◦C. For cell pellets, a similar procedure was performed
as previously described, except the cell pellet was resuspended in ice cold MeOH/water solution
with norvaline by pipetting and then cells were lysed by vortexing for 1 min. Chloroform was
then added and polar/non-polar fractions were collected. To prepare biomass components for
relative quantitation and isotopomer analysis, acid hydrolysis of interface layer was performed by
first drying the rinsed interface under airflow then incubating in 500 µL of 6M HCl at 80◦C for 2
hours. Hydrolyzed biomass solution was split to five aliquots and dried by airflow overnight for
subsequent GC/MS analysis.
Fatty acids and polar metabolites were derivatized as previously described [18]. For
fatty acids, dried nonpolar fraction was saponified and esterified to form fatty acid methyl esters
53

(FAMEs) by addition of 500 µL of 2% (w/v) H2SO4 in MeOH and incubated at 50◦C for 120
minutes. FAMEs were then extracted by addition of saturated NaCl and hexane before collection
and drying of the inorganic layer. For polar metabolites, methoxime-tBDMS derivatives were
formed by addition of 15 µL 2% (w/v) methoxylamine hydrochloride (MP Biomedicals, Solon,
OH) in pyridine and incubated at 45◦C for 60 minutes. Samples were then silylated by addition
of 15 µL of N-tert-butyldimethylsily-N-methyltrifluoroacetamide (MTBSTFA) with 1% tert-
butyldimethylchlorosilane (tBDMS) (Regis Technologies, Morton Grove, IL) and incubated at
45◦C for 30 minutes. For biomass analysis of sugars and glycan residues that were too large for
tBDMS derivatization, methoxime-trimethylsilyl (TMS) derivatives were formed by addition
of 15 µL 2% (w/v) methoxylamine hydrochloride (MP Biomedicals, Solon, OH) in pyridine
and incubated at 37◦C for 60 minutes. Samples were then silylated by addition of 15 µL of
N-methyltrimethylsilyltrifluoroacetamide (MSTFA; Regis Technologies, Morton Grove, IL) and
incubated at 45◦C for 30 minutes.
Polar and interface samples were analyzed by GC-MS using a DB-35MS column (30m
x 0.25mm i.d. x 0.25µm, Agilent J&W Scientific, Santa Clara, CA) in an Agilent 7890B gas
chromatograph (GC) interfaced with a 5977C mass spectrometer (MS). Electron impact ionization
was performed with the MS scanning over the range of 100-650 m/z for polar metabolites and
70-850 m/z for biomass metabolites. For separation of polar metabolites the GC oven was held at
100◦C for 1 min after injection, increased to 255◦C at 3.5◦C/min, and finally increased to 320◦C
at 15◦C/min and held for 3 min. For separation of the biomass metabolites the GC oven was held
at 80◦C for 6 min after injection, increased to 300◦C at 6◦C/min and held for 10 min, and finally
increased to 325◦C at 10◦C/min and held for 4 min.
Derivatized fatty acids were analyzed by GC-MS using a select FAME column (100m
x 0.25mm i.d. x 0.25µm; Agilent J&W Scientific, Santa Clara, CA) as above, with the MS
scanning over the range 120-400 m/z. For separation the GC oven was held at 80◦C for 1 min after
injection, increased to 160◦C at 20◦C/min, increased to 198◦C at 1◦C/min, and finally increased
54
to 250◦C at 5◦C/min and held for 15 min.
2.3.4 Mass isotopomer distributions, isotopomer spectral analysis (ISA),
and flux analysis
Mass isotopomer distributions and total abundances were determined by integration of
mass fragments (Table 1) and correcting for natural abundances using in-house algorithms [18].
Total abundances were normalized by counts of adenine and guanine. Isotopomer spectral analysis
(ISA) was performed as previously described [18]. ISA compares experimental labeling of fatty
acids to simulated labeling using a reaction network where C14:0 is condensation of 7 AcCoAs,
C16:0 is condensation of 8 AcCoAs, C16:1c is condensation of 8 AcCoAs, C18:0 is condensation
of 9 AcCoAs, and C18:1n9c is condensation of 9 AcCoAs. Parameters for contribution of glucose
to lipogenic AcCoA (D value) and percentage of newly synthesized fatty acid (g(t) value) and
their 95% confidence intervals are then calculated using best-fit model from INCA MFA software
[19]. Per biomass molar quantitation of glucose, galactose, glucosamine, mannosamine, serine,
ribose, and leucine was accomplished by determining the ratio of each and comparing to the
molar amount of leucine in mammalian cells per gram dry weight [20]. Amino acid fragments
were taken from previously described work and validated [21].
2.3.5 Statistical analyses
All results shown as averages of triplicates presented as mean ± SD. P values were
calculated using a Student’s two-tailed t test; *, P value between 0.01 and 0.05; **, P value
between 0.001 and 0.01; ***, P value <0.001. All errors associated with ISA are 95% confidence
intervals determined via confidence interval analysis [22].
55
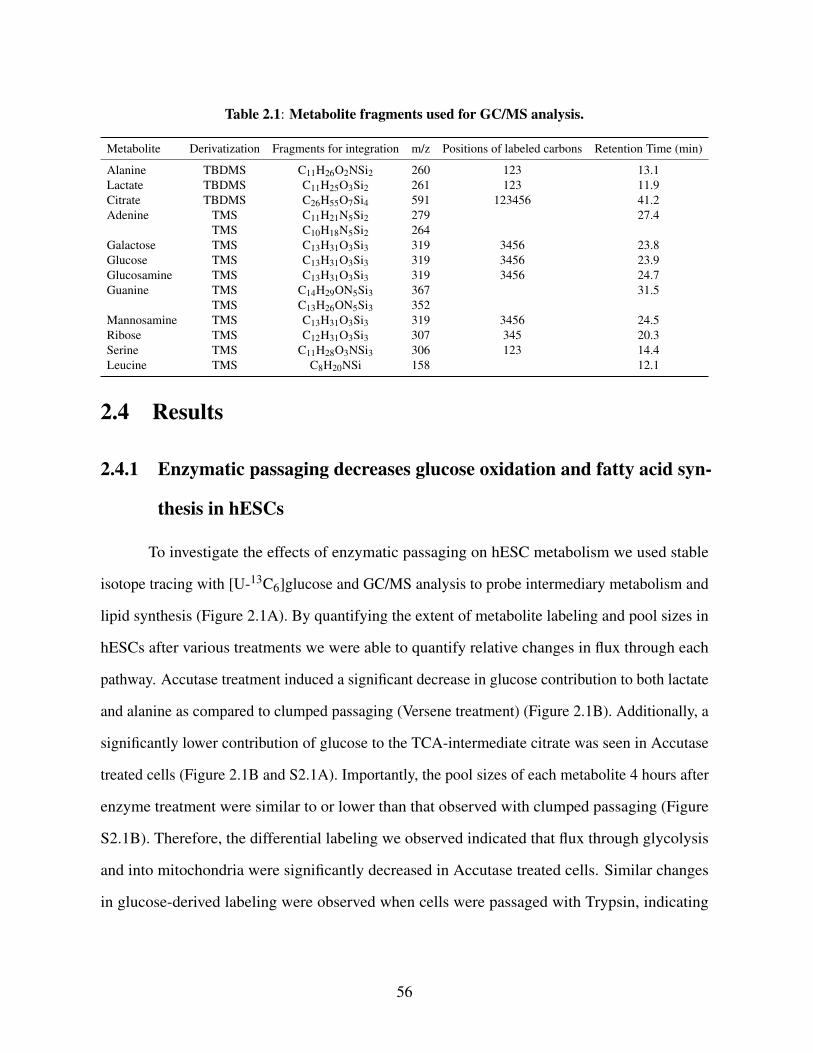
Table 2.1: Metabolite fragments used for GC/MS analysis.
Metabolite Derivatization Fragments for integration m/z Positions of labeled carbons Retention Time (min)
Alanine TBDMS C11H26O2NSi2 260 123 13.1Lactate TBDMS C11H25O3Si2 261 123 11.9Citrate TBDMS C26H55O7Si4 591 123456 41.2Adenine TMS C11H21N5Si2 279 27.4
TMS C10H18N5Si2 264Galactose TMS C13H31O3Si3 319 3456 23.8Glucose TMS C13H31O3Si3 319 3456 23.9Glucosamine TMS C13H31O3Si3 319 3456 24.7Guanine TMS C14H29ON5Si3 367 31.5
TMS C13H26ON5Si3 352Mannosamine TMS C13H31O3Si3 319 3456 24.5Ribose TMS C12H31O3Si3 307 345 20.3Serine TMS C11H28O3NSi3 306 123 14.4Leucine TMS C8H20NSi 158 12.1
2.4 Results
2.4.1 Enzymatic passaging decreases glucose oxidation and fatty acid syn-
thesis in hESCs
To investigate the effects of enzymatic passaging on hESC metabolism we used stable
isotope tracing with [U-13C6]glucose and GC/MS analysis to probe intermediary metabolism and
lipid synthesis (Figure 2.1A). By quantifying the extent of metabolite labeling and pool sizes in
hESCs after various treatments we were able to quantify relative changes in flux through each
pathway. Accutase treatment induced a significant decrease in glucose contribution to both lactate
and alanine as compared to clumped passaging (Versene treatment) (Figure 2.1B). Additionally, a
significantly lower contribution of glucose to the TCA-intermediate citrate was seen in Accutase
treated cells (Figure 2.1B and S2.1A). Importantly, the pool sizes of each metabolite 4 hours after
enzyme treatment were similar to or lower than that observed with clumped passaging (Figure
S2.1B). Therefore, the differential labeling we observed indicated that flux through glycolysis
and into mitochondria were significantly decreased in Accutase treated cells. Similar changes
in glucose-derived labeling were observed when cells were passaged with Trypsin, indicating
56

the impact on central carbon metabolism is not specific to Accutase (Figure S2.1D). Previous
work has demonstrated that addition of a Rho-associated kinase (ROCK) inhibitor can prevent
single cell dissociation-induced apoptosis [23]. To account for these effects we also investigated
whether the addition of Y-27632 could rescue defects in glucose metabolism. While addition
of ROCK inhibitor rescued labeling in lactate and citrate, flux to alanine only increased slightly
(Figure 2.1B and S2.1A). Taken together, these results suggest that enzymatic passaging lowered
flux through glycolysis and into the TCA cycle, and addition of ROCK inhibitor only partially
rescued this metabolic phenotype.
57

Figure 2.1: Enzymatic passaging alters central carbon metabolism. (A) Atom-transitionmap depicting flow of [U-13C6]glucose (UGlc) carbon through central carbon metabolismand lipid biosynthesis. Green circles depict 13C atoms and open circles depict 12C atoms.(B) Percentage of labeled metabolites from UGlc 4 hours after non-enzymatic or enzymaticpassaging. Higher labeling indicates greater glucose usage for glycolysis, non-essential aminoacid synthesis, and TCA metabolism. (C) Percentage of labeled metabolites from UGlc one dayafter non-enzymatic or enzymatic passaging (i.e., labeled from 24-28 hours after passaging).Defects in glucose catabolism mediated through enzymatic passaging are still present. (D)Relative abundance of fatty acid species after enzymatic or non-enzymatic passaging. (E)Contribution of UGlc to lipogenic AcCoA as determined by ISA model. Decrease in contributionis consistent with decreased labeling in the lipogenic metabolite citrate. (F) Normalized fatty acidflux for synthesized fatty acid species calculated using total pool size and fractional synthesisfrom ISA model. Error bars represent SD (B-D) or 95% CI (E-F) for three replicates. *, P valuebetween 0.01 and 0.05; **, P value between 0.001 and 0.01; ***, P value <0.001 by Student’stwo-tailed t test; or, * indicates significance by nonoverlapping 95% confidence intervals
58
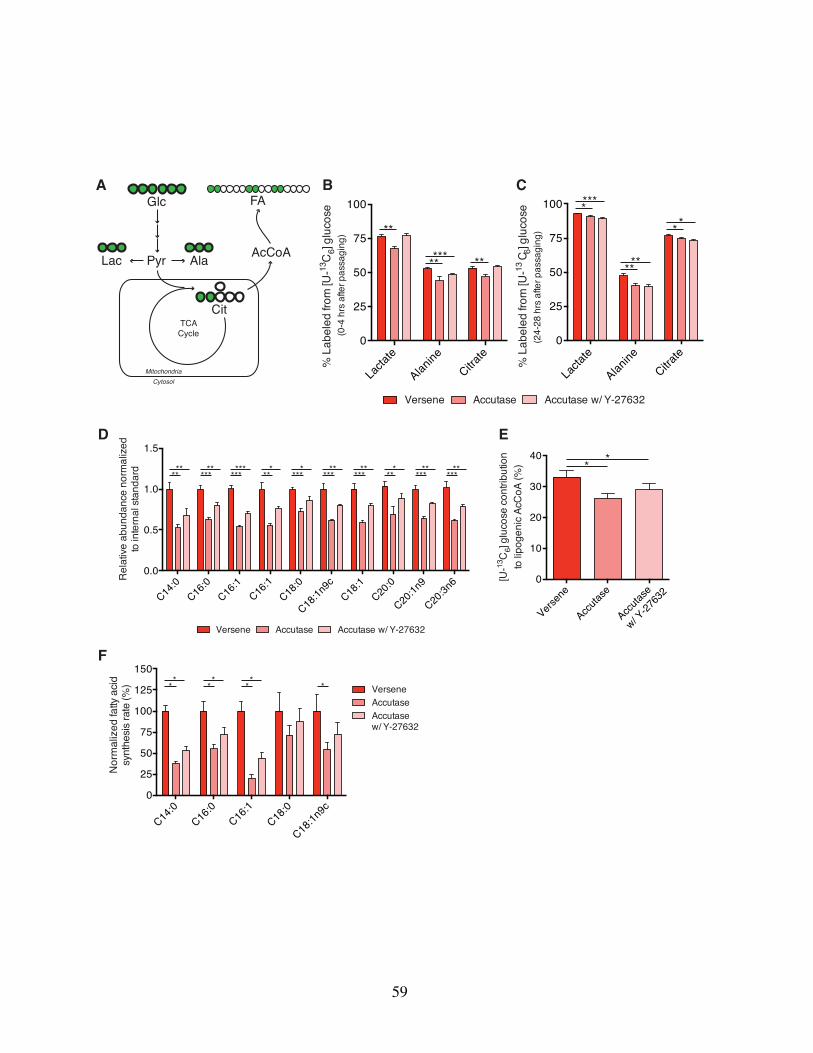
Versen
e
Accutas
e
Accutas
e
w/ Y-27
632
0
10
20
30
40
[U-13
C6]
gluc
ose
cont
ribut
ion
to lip
ogen
ic A
cCoA
(%)
VerseneAccutaseAccutase w/ Y-27632
Glc
AlaLac Pyr AcCoA
FAA
CitTCA
Cycle
MitochondriaCytosol
* *
E
F
C14:0
C16:0
C16:1
C18:0
C18:1n
9c0
25
50
75
100
125
150
Nor
mal
ized
fatty
acid
sy
nthe
sis ra
te (%
) ** ** ** *
D
C14:0
C16:0
C16:1
C16:1
C18:0
C18:1n
9cC18
:1C20
:0
C20:1n
9
C20:3n
60.0
0.5
1.0
1.5
Rel
ativ
e ab
unda
nce
norm
aliz
edto
inte
rnal
sta
ndar
d **** ***** ****** *** **** ***** ***** *** ***** *****
Versene Accutase Accutase w/ Y-27632
Versene Accutase Accutase w/ Y-27632
B C
**
***** **
****
****
**
Lacta
te
Alanine
Citrate
0
25
50
75
100
% L
abel
ed fr
om [U
-13C
6] gl
ucos
e(0
-4 h
rs a
fter p
assa
ging
)
Lacta
te
Alanine
Citrate
0
25
50
75
100
% L
abel
ed fr
om [U
-13C 6]
gluc
ose
(24-
28 h
rs a
fter p
assa
ging
)
59
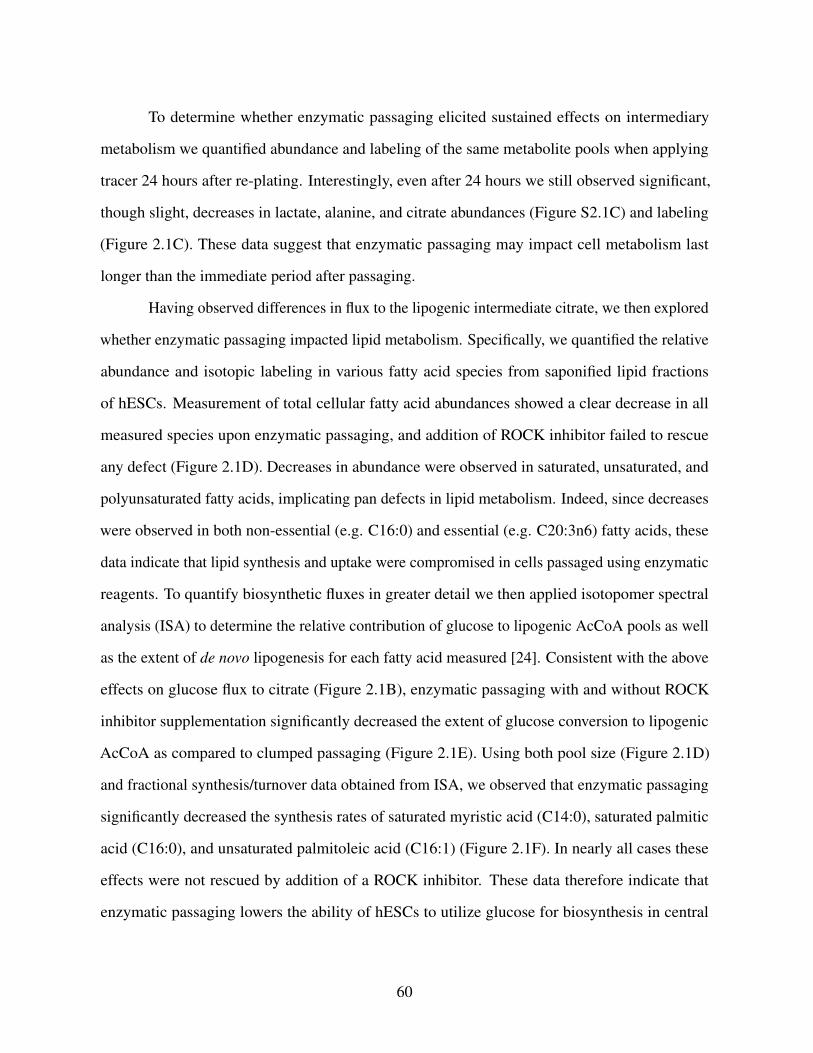
To determine whether enzymatic passaging elicited sustained effects on intermediary
metabolism we quantified abundance and labeling of the same metabolite pools when applying
tracer 24 hours after re-plating. Interestingly, even after 24 hours we still observed significant,
though slight, decreases in lactate, alanine, and citrate abundances (Figure S2.1C) and labeling
(Figure 2.1C). These data suggest that enzymatic passaging may impact cell metabolism last
longer than the immediate period after passaging.
Having observed differences in flux to the lipogenic intermediate citrate, we then explored
whether enzymatic passaging impacted lipid metabolism. Specifically, we quantified the relative
abundance and isotopic labeling in various fatty acid species from saponified lipid fractions
of hESCs. Measurement of total cellular fatty acid abundances showed a clear decrease in all
measured species upon enzymatic passaging, and addition of ROCK inhibitor failed to rescue
any defect (Figure 2.1D). Decreases in abundance were observed in saturated, unsaturated, and
polyunsaturated fatty acids, implicating pan defects in lipid metabolism. Indeed, since decreases
were observed in both non-essential (e.g. C16:0) and essential (e.g. C20:3n6) fatty acids, these
data indicate that lipid synthesis and uptake were compromised in cells passaged using enzymatic
reagents. To quantify biosynthetic fluxes in greater detail we then applied isotopomer spectral
analysis (ISA) to determine the relative contribution of glucose to lipogenic AcCoA pools as well
as the extent of de novo lipogenesis for each fatty acid measured [24]. Consistent with the above
effects on glucose flux to citrate (Figure 2.1B), enzymatic passaging with and without ROCK
inhibitor supplementation significantly decreased the extent of glucose conversion to lipogenic
AcCoA as compared to clumped passaging (Figure 2.1E). Using both pool size (Figure 2.1D)
and fractional synthesis/turnover data obtained from ISA, we observed that enzymatic passaging
significantly decreased the synthesis rates of saturated myristic acid (C14:0), saturated palmitic
acid (C16:0), and unsaturated palmitoleic acid (C16:1) (Figure 2.1F). In nearly all cases these
effects were not rescued by addition of a ROCK inhibitor. These data therefore indicate that
enzymatic passaging lowers the ability of hESCs to utilize glucose for biosynthesis in central
60
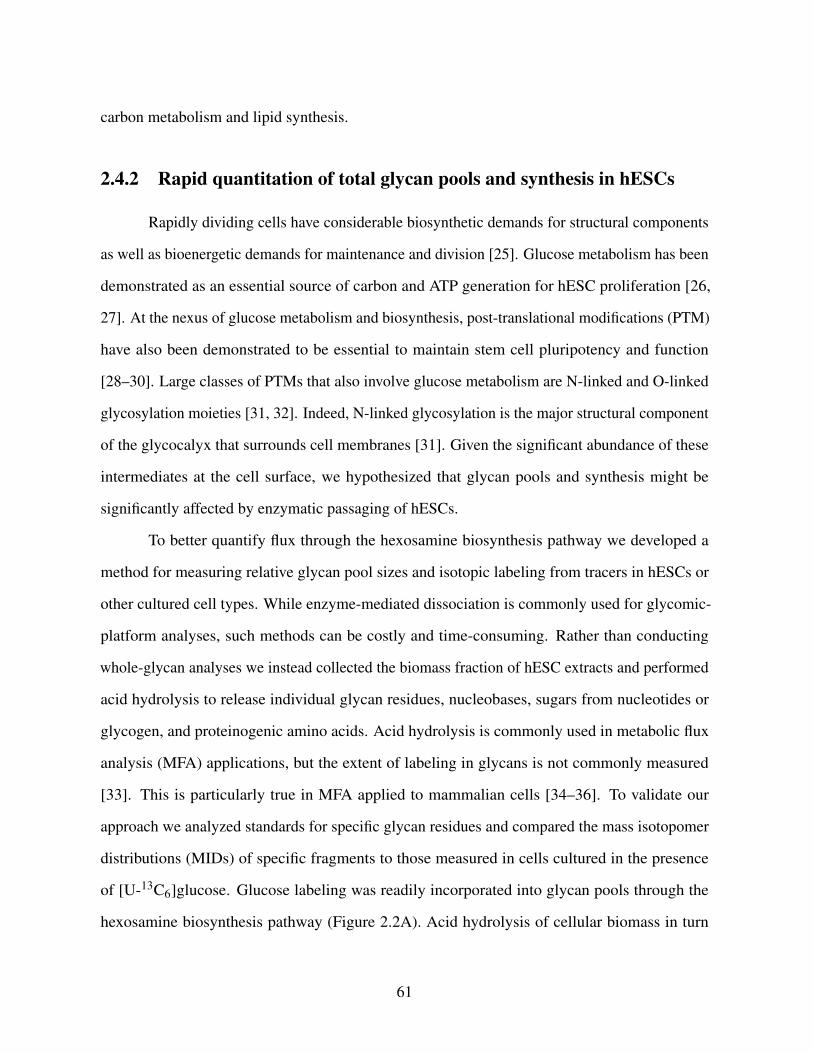
carbon metabolism and lipid synthesis.
2.4.2 Rapid quantitation of total glycan pools and synthesis in hESCs
Rapidly dividing cells have considerable biosynthetic demands for structural components
as well as bioenergetic demands for maintenance and division [25]. Glucose metabolism has been
demonstrated as an essential source of carbon and ATP generation for hESC proliferation [26,
27]. At the nexus of glucose metabolism and biosynthesis, post-translational modifications (PTM)
have also been demonstrated to be essential to maintain stem cell pluripotency and function
[28–30]. Large classes of PTMs that also involve glucose metabolism are N-linked and O-linked
glycosylation moieties [31, 32]. Indeed, N-linked glycosylation is the major structural component
of the glycocalyx that surrounds cell membranes [31]. Given the significant abundance of these
intermediates at the cell surface, we hypothesized that glycan pools and synthesis might be
significantly affected by enzymatic passaging of hESCs.
To better quantify flux through the hexosamine biosynthesis pathway we developed a
method for measuring relative glycan pool sizes and isotopic labeling from tracers in hESCs or
other cultured cell types. While enzyme-mediated dissociation is commonly used for glycomic-
platform analyses, such methods can be costly and time-consuming. Rather than conducting
whole-glycan analyses we instead collected the biomass fraction of hESC extracts and performed
acid hydrolysis to release individual glycan residues, nucleobases, sugars from nucleotides or
glycogen, and proteinogenic amino acids. Acid hydrolysis is commonly used in metabolic flux
analysis (MFA) applications, but the extent of labeling in glycans is not commonly measured
[33]. This is particularly true in MFA applied to mammalian cells [34–36]. To validate our
approach we analyzed standards for specific glycan residues and compared the mass isotopomer
distributions (MIDs) of specific fragments to those measured in cells cultured in the presence
of [U-13C6]glucose. Glucose labeling was readily incorporated into glycan pools through the
hexosamine biosynthesis pathway (Figure 2.2A). Acid hydrolysis of cellular biomass in turn
61

releases proteinogenic amino acids, ribose, sugars, and aminosugars for GC/MS analysis (Figure
2.2B). However, since several glycan species are labile in the conditions used for release, in
some cases (e.g. acetylated glycan moieties) we relied on the measurement of proxy molecules
(Figure 2.2C). The MIDs of specific glycan sugars from standards and hydrolyzed hESCs are
depicted in Figure 2.2D-E and tabulated in Tables S2.1, S2.2; all of which were corrected for
natural isotope abundance using in-house algorithms and calculated fragment formulae (Table 1).
In each case the corrected MID matched that of the standards. Notably, some glycan sugars were
not present at detectable levels to include here (e.g. fucose, xylose, mannose, galactosamine),
and the relatively low abundance of mannosamine caused some deviation from unity in the
measured and corrected MID. Furthermore, labeling from [U-13C6]glucose indicated the number
of carbons present from the parent molecule (Figure 2.2F). Although free metabolites were
removed from the biomass interface prior to hydrolysis and derivatization, we conducted parallel
treatments and quantitation on the free, polar metabolites present in our extract to the quantities
in each subcellular pool. While serine, ribose, glucose, and glucosamine were 5-10-fold more
abundant in biomass compared to free metabolites (including those present as nucleotide-sugars
or phosphorylated intermediates), the abundance of galactose and mannosamine from biomass
hydrolysates was only 2-fold higher than that quantified from free metabolites (Figure S2.2A).
Therefore, this method allowed for the measurement of relative glycan residue abundance and
labeling from cellular biomass pools (Figure 2.2B). Previous methods focusing on biomass pools
have relied on targeted digestion of nucleotides, proteins, and glycans individually [37–39]. Our
method instead allows profiling of all three classes of biosynthetic intermediates simultaneously.
62

Figure 2.2: Quantitation of glycan residue abundance and labeling in cellular biomass.(A) Atom-transition map depicting flow of [U-13C6]glucose (UGlc) into ribose, galactose, andhexosamines. Green circles depict carbon atoms and orange circles depict nitrogen atoms.(B) Schematic of biomass hydrolysis method. Insoluble interface layer is isolated from initialmethanol/water/chloroform quench/extraction, rinsed twice with methanol, and acid hydrolyzed.(C) Diagram of detectable metabolites after acid hydrolysis. Major macromolecules (nucleotides,protein, glycans) are broken down into primary components (ribose/nucleobases, amino acids,sugars/amino-sugars, respectively), which can be measured on GC/MS. (D) Corrected massisotopomer distribution (MID) of each metabolite standard. Corrected M+0 peak equal to unityensures accuracy of MIDs. (E) Corrected MID of metabolites from unlabeled cell hydrolysates.Corrected M+0 peak deviation from unity is informative of MID accuracy and potential contam-inating fragments in hydrolysates. (F) Corrected MID of metabolites measured in hydrolysatesfrom hESCs labeled using UGlc. Glucose, galactose, glucosamine, and mannosamine fragmentshave four carbons labeled from glucose. Ribose has three carbons labeled from glucose. Errorbars represent SD (E-F) for three independent hydrolysates.
63
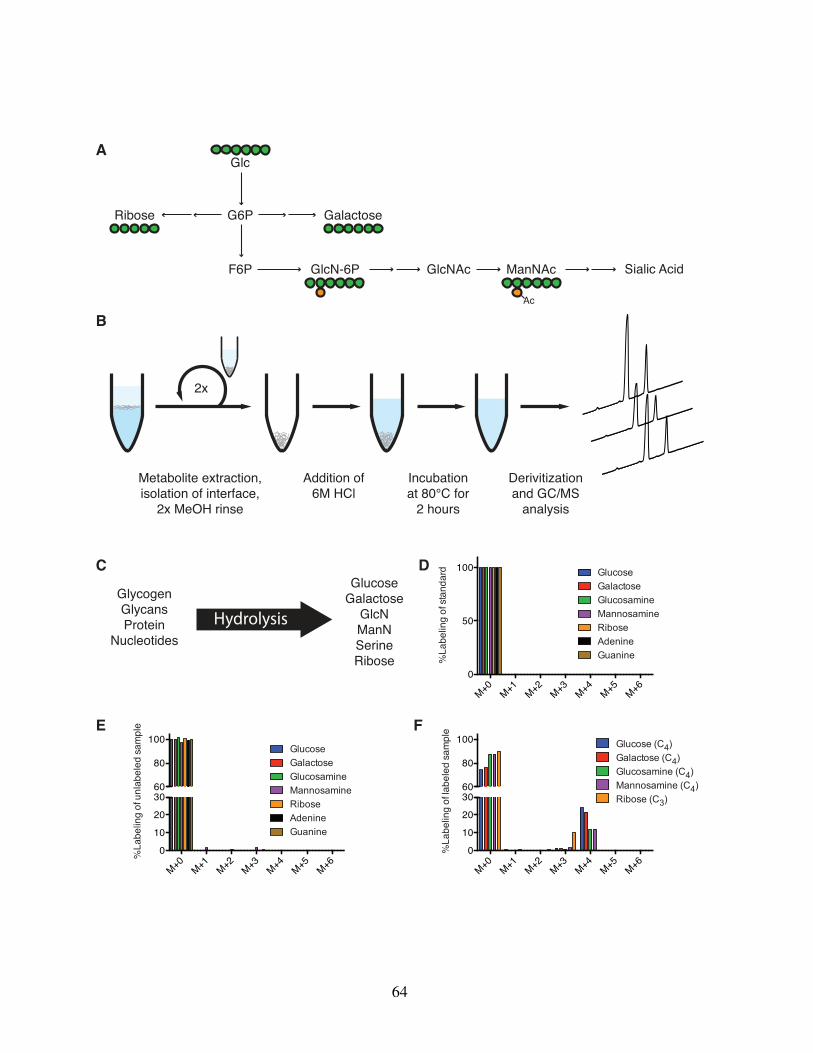
GlycogenGlycansProtein
Nucleotides
GlucoseGalactose
GlcNManNSerineRibose
Hydrolysis
Metabolite extraction,isolation of interface,
2x MeOH rinse
Addition of6M HCl
Incubationat 80°C for
2 hours
Derivitizationand GC/MS
analysis
2x
Glc
G6P
F6P GlcNAc Sialic Acid
Ribose
GlcN-6P ManNAc
Ac
Galactose
A
B
C D
E F
M+0M+1
M+2M+3
M+4M+5
M+60
50
100
%La
belin
g of
stan
dard
GalactoseGlucosamineMannosamineRiboseAdenineGuanine
Glucose
GalactoseGlucosamineMannosamineRiboseAdenineGuanine
GlucoseGalactose (C4)Glucosamine (C4)Mannosamine (C4)Ribose (C3)
Glucose (C4)
M+0M+1
M+2M+3
M+4M+5
M+60
10
20
3060
80
100
%La
belin
g of
unl
abel
ed s
ampl
e
M+0M+1
M+2M+3
M+4M+5
M+60
10
20
3060
80
100
%La
belin
g of
labe
led
sam
ple
64
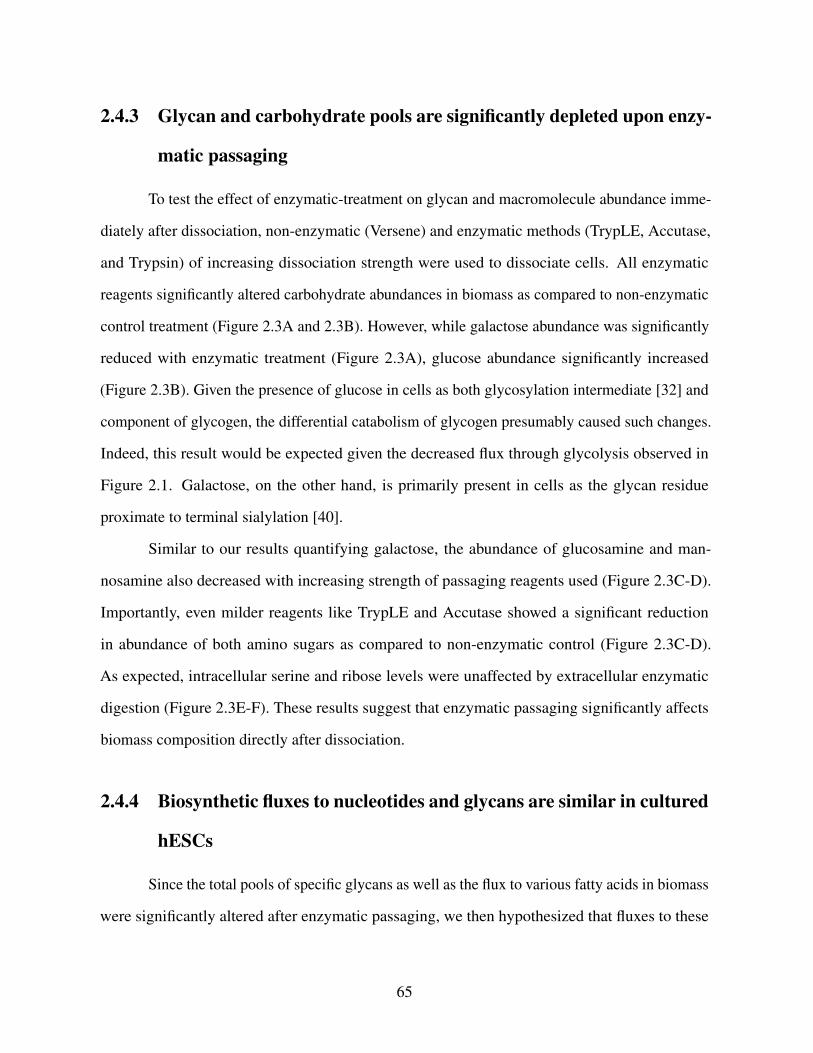
2.4.3 Glycan and carbohydrate pools are significantly depleted upon enzy-
matic passaging
To test the effect of enzymatic-treatment on glycan and macromolecule abundance imme-
diately after dissociation, non-enzymatic (Versene) and enzymatic methods (TrypLE, Accutase,
and Trypsin) of increasing dissociation strength were used to dissociate cells. All enzymatic
reagents significantly altered carbohydrate abundances in biomass as compared to non-enzymatic
control treatment (Figure 2.3A and 2.3B). However, while galactose abundance was significantly
reduced with enzymatic treatment (Figure 2.3A), glucose abundance significantly increased
(Figure 2.3B). Given the presence of glucose in cells as both glycosylation intermediate [32] and
component of glycogen, the differential catabolism of glycogen presumably caused such changes.
Indeed, this result would be expected given the decreased flux through glycolysis observed in
Figure 2.1. Galactose, on the other hand, is primarily present in cells as the glycan residue
proximate to terminal sialylation [40].
Similar to our results quantifying galactose, the abundance of glucosamine and man-
nosamine also decreased with increasing strength of passaging reagents used (Figure 2.3C-D).
Importantly, even milder reagents like TrypLE and Accutase showed a significant reduction
in abundance of both amino sugars as compared to non-enzymatic control (Figure 2.3C-D).
As expected, intracellular serine and ribose levels were unaffected by extracellular enzymatic
digestion (Figure 2.3E-F). These results suggest that enzymatic passaging significantly affects
biomass composition directly after dissociation.
2.4.4 Biosynthetic fluxes to nucleotides and glycans are similar in cultured
hESCs
Since the total pools of specific glycans as well as the flux to various fatty acids in biomass
were significantly altered after enzymatic passaging, we then hypothesized that fluxes to these
65
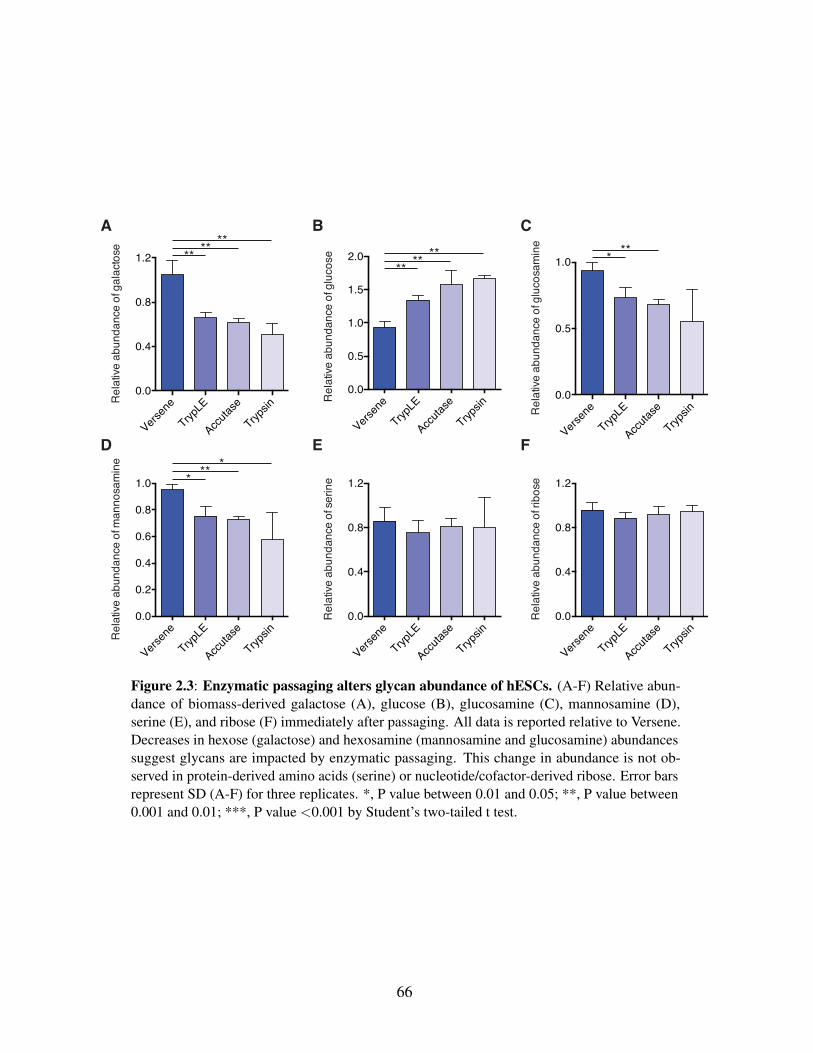
Versen
e
TrypLE
Accutas
e
Trypsin
0.0
0.4
0.8
1.2
Rel
ative
abu
ndan
ce o
f ser
ine
Versen
e
TrypLE
Accutas
e
Trypsin
0.0
0.4
0.8
1.2
Rel
ativ
e ab
unda
nce
of ri
bose
Versen
e
TrypLE
Accutas
e
Trypsin
0.0
0.4
0.8
1.2
Rel
ative
abu
ndan
ce o
f gal
acto
se
** ** **
Versen
e
TrypLE
Accutas
e
Trypsin
0.0
0.5
1.0
1.5
2.0
Rel
ative
abu
ndan
ce o
f glu
cose
** ** **
Versen
e
TrypLE
Accutas
e
Trypsin
0.0
0.5
1.0
Rel
ative
abu
ndan
ce o
f glu
cosa
min
e
* **
Versen
e
TrypLE
Accutas
e
Trypsin
0.0
0.2
0.4
0.6
0.8
1.0
Rel
ative
abu
ndan
ce o
f man
nosa
min
e
* ** *
A B C
D E F
Figure 2.3: Enzymatic passaging alters glycan abundance of hESCs. (A-F) Relative abun-dance of biomass-derived galactose (A), glucose (B), glucosamine (C), mannosamine (D),serine (E), and ribose (F) immediately after passaging. All data is reported relative to Versene.Decreases in hexose (galactose) and hexosamine (mannosamine and glucosamine) abundancessuggest glycans are impacted by enzymatic passaging. This change in abundance is not ob-served in protein-derived amino acids (serine) or nucleotide/cofactor-derived ribose. Error barsrepresent SD (A-F) for three replicates. *, P value between 0.01 and 0.05; **, P value between0.001 and 0.01; ***, P value <0.001 by Student’s two-tailed t test.
66

and other (e.g. nucleotides, protein) biomass pools of hESCs cells would be affected in a similar
manner. We again employed stable isotope tracing with [U-13C6]glucose and GC/MS analysis to
quantify labeling of hydrolyzed hESC biomass, focusing on components that are representative
of protein (serine), nucleotide (ribose), and hexosamine synthesis (Figure 2.2A-C). Cells treated
with Accutase and ROCK inhibitor exhibited a slight decrease in labeling of proteinogenic serine
(Figure 2.4A), although this measurement is impacted by changes in serine synthesis and uptake
from the culture medium. Ribose labeling indicated that enzymatic passaging also decreased the
extent of ribose labeling with or without ROCK inhibitor (Figure 2.4A).
Surprisingly, upon examining labeling from glucose in glycan moieties we observed
minimal effects when comparing non-enzymatic to enzymatic passaging (Figure 2.4B). While
a slight decrease in labeling of biomass-derived glucose was noted upon Accutase treatment,
this result was likely due to the increased pool size maintained in enzyme treated cells after
passaging (Figure 2.3B). Since routine passaging using enzymatic reagents is an extremely
common and frequent insult experienced by hESCs cultivated in vitro, we calculated the flux to
each biomass compartments using pool size and labeling information. Glucose and serine were
not included in these calculations to avoid convoluting effects of glycogen turnover and serine
uptake. While molar fluxes associated with galactose, glucosamine, and mannosamine synthesis
were significantly lower than that observed for ribose in hESCs (Figure 2.4C), flux to glycans in
aggregate were similar to that observed for nucleotides (Figure 2.4D). These results highlight
the significance of glucose flux to galactose and through the hexosamine biosynthesis pathway
(Figure 2.4D). Notably, the flux of glucose to glycans was unaffected by enzymatic digestion
(Figure 2.4C) due to the rapid recovery of pool sizes after the initial 4 hours of growth (Figure
S2.2B). This finding is perhaps not surprising due to long term selection experienced by hESCs
in standard culture. On the other hand, these calculations demonstrate how high the flux to glycan
moieties is in standard culture conditions. Although nucleotides are routinely considered a large
biosynthetic pool, our measurements indicate that flux to glycans is approximately the same as
67
that of ribose, which is a component of RNA and various cofactors (e.g. ATP, NAD+) (Figure
2.4D).
Taking these results together, although abundance of glycan moieties is significantly
altered after enzymatic digestion, the flux through these pathways is high enough to recover
from these cleavage events. However, the contribution of glucose to fatty acids, proteinogenic
amino acids, and nucleotides remains diminished, suggesting that such passaging methods impact
metabolism for at least several hours after hESC subculture.
2.5 Discussion
We have demonstrated that the use of enzymatic reagents of hESCs has an immediate and
significant impact on metabolic activity after passaging. Through the use of 13C MFA we have
demonstrated that glucose flux through glycolysis and the TCA cycle as well as lipid biosynthesis
are decreased after splitting cells using enzyme-based passaging methods. Using a method that
can rapidly probe the abundance and labeling of glycans in hydrolyzed biomass, we observed that
enzymatic passaging significantly impacts the abundance of glycan moieties in hESCs.
2.5.1 Potential pitfalls in advanced hESC culture methods
For the past decade efforts in stem cell bioprocess engineering have focused on the
development of well-defined but less laborious methods of cell expansion. While there is a clear
need to streamline processes and assimilate current good manufacturing practices (cGMPs) [41],
these advances come at the expense of compromising the stem cell niche. Widely used stem cells
lines (H1, H9, etc.) were isolated in fully undefined conditions derived from mESC engineering
from the early 1980s [1, 42, 43]. Here we demonstrate that the transition to more "modern"
passaging methods has direct consequences on cell function and behavior.
68

VerseneAccutaseAccutase w/ Y-27632
Serine
Ribose
01234789
1011
%La
bele
d fro
m[U
-13C
6] gl
ucos
e
Galacto
se
Glucos
e
Glucos
amine
Manno
samine
0
10
20
30
%La
bele
d fro
m[U
-13C
6] gl
ucos
e
VerseneAccutaseAccutase w/ Y-27632
VerseneAccutaseAccutase w/ Y-27632
*****
*
*
A B
C
Ribose
Glycan
s0.00
0.01
0.02
0.03
0.04
0.05
Bios
ynth
etic flu
x(m
mol
/gD
W-h
r)
VerseneAccutaseAccutase w/ Y-27632
D
Ribose
Galacto
se
Glucos
amine
Manno
samine
0.00
0.01
0.02
0.03
0.04
0.05
Bios
ynth
etic flu
x(m
mol
/gD
W-h
r)
Figure 2.4: Biosynthetic fluxes to glycans and nucleotides are similar in cultured hESCs.(A) Percentage of labeled serine and ribose in cells cultured for 4 hours after passaging inthe presence of [U-13C6]glucose (UGlc). (B) Percentage of labeled glycan moieties frombiomass in cells treated as in (A). (C) Quantitation of biosynthetic flux to different metabolitescalculated using MIDs and molar pool sizes. (D) Comparison of fluxes to ribose versus glycansdemonstrates similar biosynthetic needs in hESCs. Error bars represent SD (A-D) for threereplicates. *, P value between 0.01 and 0.05; **, P value between 0.001 and 0.01; ***, P value<0.001 by Student’s two-tailed t test.
69

2.5.2 Potential selective pressure of enzymatic passaging through altered
metabolism
Presumably, treatment with enzymatic reagents leads to proteolytic cleavage of various
receptors and other proteoglycans at the cell surface. In turn, the decreased receptor abundance
mitigates the responsiveness of cells to endogenous signaling factors and exogenous growth factors
in hESC media. A wide range of cell surface proteins may drive this phenotype, including solute
carriers, glucose transporters, and receptor tyrosine kinases. Indeed, the increased abundance of
glucose within enzyme-passaged cells indicates that cells may even be compromised with respect
to their ability to access glycogen pools. Energetic stress has previously been associated with
cells cultured for 24 hours under non-adherent conditions (i.e., detachment from the matrix) [44,
45], but the immediate impacts on metabolism after dissociation were not previously appreciated.
Although cells presumably recover rapidly to replenish glycan and biosynthetic intermediate pools,
even a temporary selective pressure like that observed here will have lasting and significant effects
on cell populations. Such effects may impact cells from the time of isolation (i.e., blastocyst
or primary cell isolation) throughout passaging in vitro. Indeed, any functional application that
makes use of hESCs or their derivatives requires that they accurately represent the metabolic
activity of the somatic tissues that one attempts to model. For example, the metabolic behavior of
hPSC-derived cardiomyocytes is known to significantly differ compared to adult heart cells with
respect to their capacity for fatty acid oxidation [46, 47]. The extent of developmental maturation
and selective pressures due to in vitro culture on such phenomena must both be considered.
2.5.3 Glycocalyx is a significant biomass pool in cultured hESCs
We also developed an analytical method for quantifying the overall abundance and isotopic
labeling of glycan residues, proteinogenic amino acids, and ribose moieties from nucleotides and
cofactors in cell cultures. This approach highlighted the profound impact of enzyme passaging
70
on carbohydrate and glycan abundances in cells. While this method contrasts traditional methods
of enzyme-mediated digestion of glycans from their protein cores and direct analysis of their
structures (i.e., glycomics), the rapid nature of our methods makes it attractive for studying
general effects on hexosamine metabolism. Furthermore, analysis of glycan biomass affords
reliable quantitation of overall synthesis rates compared to measurements of sugar nucleotides.
The glycocalyx and glycosylation profile is particularly important for cell signaling and protein
function [48, 49]. Recent studies also suggest that modulation of flux through the hexosamine
biosynthesis pathway directly impacts the glycoprofile of cells [50]. Consistent with this concept,
we demonstrate that glucose flux to glycans is similar to that observed for flux to ribose, which
contributes to nucleotide synthesis and maintenance of cellular redox [51, 52]. As such, hex-
osamine biosynthesis is an underappreciated biomass sink in metabolic studies. Indeed, studies
on the metabolism of cancer cells and stem cells commonly ignore the importance of glycan
production while focusing primarily on the importance of nucleotide, lipid, and amino acid
metabolism [53–57]. Far fewer studies address or attempt to quantify or modulate flux to glycans
[17, 58].
2.5.4 Concluding thoughts
These results and other recent studies [6, 59] are beginning to illustrate how the in vitro
culture environment influences hESC phenotype. Cells are routinely subjected to periods of
starvation during incubation with passaging reagents as well as cleavage of their glycocalyx
and cell surface proteins. As cultures age, changes to gene expression and epigenetic markers
will be selected for to deal with these stresses. In this context, upregulation of flux through the
hexosamine biosynthesis pathway is to be expected. Future engineering strategies must identify
and address sources of cellular stresses at the genomic, transcriptional, signaling, and metabolic
levels in order to mitigate the deleterious effects of in vitro culture in regenerative medicine
applications.
71
2.6 Acknowledgements
This research was supported by the California Institute of Regenerative Medicine (RB5-
07356), NIH grant (5 R01 CA188652-02), and a Searle Scholar Award to C.M.M. M.G.B. is
supported by a NSF Graduate Research Fellowship (DGE-1144086).
Chapter 2, in full, is a reprint of the material as it appears in ”Enzymatic passaging of
human embryonic stem cells alters central carbon metabolism and glycan abundance,” Biotech-
nology Journal, vol. 10, 2015. Mehmet G. Badur is the primary author of this publication. Hui
Zhang is a co-author of this publication. Christian M. Metallo is the corresponding author of this
publication.
2.7 References1. Thomson, J. A., Itskovitz-Eldor, J., Shapiro, S. S., Waknitz, M. A., Swiergiel, J. J., Marshall,
V. S. & Jones, J. M. Embryonic stem cell lines derived from human blastocysts. Science282, 1145–7 (1998).
2. Ludwig, T. E., Levenstein, M. E., Jones, J. M., Berggren, W. T., Mitchen, E. R., Frane, J. L.,Crandall, L. J., Daigh, C. A., Conard, K. R., Piekarczyk, M. S., Llanas, R. A. & Thomson,J. A. Derivation of human embryonic stem cells in defined conditions. Nat Biotechnol 24,185–7 (2006).
3. Buzzard, J. J., Gough, N. M., Crook, J. M. & Colman, A. Karyotype of human ES cellsduring extended culture. Nat Biotechnol 22, 381–2, author reply 382 (2004).
4. Draper, J. S., Smith, K., Gokhale, P., Moore, H. D., Maltby, E., Johnson, J., Meisner, L.,Zwaka, T. P., Thomson, J. A. & Andrews, P. W. Recurrent gain of chromosomes 17q and12 in cultured human embryonic stem cells. Nat Biotechnol 22, 53–4 (2004).
5. Mitalipova, M. M., Rao, R. R., Hoyer, D. M., Johnson, J. A., Meisner, L. F., Jones, K. L.,Dalton, S. & Stice, S. L. Preserving the genetic integrity of human embryonic stem cells.Nat Biotechnol 23, 19–20 (2005).
6. Garitaonandia, I., Amir, H., Boscolo, F. S., Wambua, G. K., Schultheisz, H. L., Sabatini,K., Morey, R., Waltz, S., Wang, Y. C., Tran, H., Leonardo, T. R., Nazor, K., Slavin, I.,Lynch, C., Li, Y., Coleman, R., Gallego Romero, I., Altun, G., Reynolds, D., Dalton, S.,Parast, M., Loring, J. F. & Laurent, L. C. Increased risk of genetic and epigenetic instability
72
in human embryonic stem cells associated with specific culture conditions. PLoS One 10,e0118307 (2015).
7. Panopoulos, A. D., Yanes, O., Ruiz, S., Kida, Y. S., Diep, D., Tautenhahn, R., Herrerias, A.,Batchelder, E. M., Plongthongkum, N., Lutz, M., Berggren, W. T., Zhang, K., Evans, R. M.,Siuzdak, G. & Izpisua Belmonte, J. C. The metabolome of induced pluripotent stem cellsreveals metabolic changes occurring in somatic cell reprogramming. Cell Res 22, 168–77(2012).
8. Shyh-Chang, N., Daley, G. Q. & Cantley, L. C. Stem cell metabolism in tissue developmentand aging. Development 140, 2535–47 (2013).
9. Zhang, J., Khvorostov, I., Hong, J. S., Oktay, Y., Vergnes, L., Nuebel, E., Wahjudi, P. N.,Setoguchi, K., Wang, G., Do, A., Jung, H. J., McCaffery, J. M., Kurland, I. J., Reue, K.,Lee, W. N., Koehler, C. M. & Teitell, M. A. UCP2 regulates energy metabolism anddifferentiation potential of human pluripotent stem cells. EMBO J 30, 4860–73 (2011).
10. Folmes, C. D., Nelson, T. J., Martinez-Fernandez, A., Arrell, D. K., Lindor, J. Z., Dzeja,P. P., Ikeda, Y., Perez-Terzic, C. & Terzic, A. Somatic oxidative bioenergetics transitionsinto pluripotency-dependent glycolysis to facilitate nuclear reprogramming. Cell Metab14, 264–71 (2011).
11. Zhang, J., Nuebel, E., Daley, G. Q., Koehler, C. M. & Teitell, M. A. Metabolic regulation inpluripotent stem cells during reprogramming and self-renewal. Cell Stem Cell 11, 589–95(2012).
12. Reitsma, S., Slaaf, D. W., Vink, H., van Zandvoort, M. A. & oude Egbrink, M. G. Theendothelial glycocalyx: composition, functions, and visualization. Pflugers Arch 454, 345–59 (2007).
13. Fang, M., Shen, Z., Huang, S., Zhao, L., Chen, S., Mak, T. W. & Wang, X. The ER UDPaseENTPD5 promotes protein N-glycosylation, the Warburg effect, and proliferation in thePTEN pathway. Cell 143, 711–24 (2010).
14. Lau, K. S., Partridge, E. A., Grigorian, A., Silvescu, C. I., Reinhold, V. N., Demetriou, M.& Dennis, J. W. Complex N-glycan number and degree of branching cooperate to regulatecell proliferation and differentiation. Cell 129, 123–34 (2007).
15. Lauzier, B., Vaillant, F., Merlen, C., Gelinas, R., Bouchard, B., Rivard, M. E., Labarthe, F.,Dolinsky, V. W., Dyck, J. R., Allen, B. G., Chatham, J. C. & Des Rosiers, C. Metaboliceffects of glutamine on the heart: anaplerosis versus the hexosamine biosynthetic pathway.J Mol Cell Cardiol 55, 92–100 (2013).
73
16. Metallo, C. M. & Vander Heiden, M. G. Metabolism strikes back: metabolic flux regulatescell signaling. Genes Dev 24, 2717–22 (2010).
17. Wellen, K. E., Lu, C., Mancuso, A., Lemons, J. M., Ryczko, M., Dennis, J. W., Rabinowitz,J. D., Coller, H. A. & Thompson, C. B. The hexosamine biosynthetic pathway couplesgrowth factor-induced glutamine uptake to glucose metabolism. Genes Dev 24, 2784–99(2010).
18. Grassian, A. R., Parker, S. J., Davidson, S. M., Divakaruni, A. S., Green, C. R., Zhang, X.,Slocum, K. L., Pu, M., Lin, F., Vickers, C., Joud-Caldwell, C., Chung, F., Yin, H., Handly,E. D., Straub, C., Growney, J. D., Vander Heiden, M. G., Murphy, A. N., Pagliarini, R. &Metallo, C. M. IDH1 mutations alter citric acid cycle metabolism and increase dependenceon oxidative mitochondrial metabolism. Cancer Res 74, 3317–31 (2014).
19. Young, J. D. INCA: a computational platform for isotopically non-stationary metabolicflux analysis. Bioinformatics 30, 1333–5 (2014).
20. Sheikh, K., Forster, J. & Nielsen, L. K. Modeling hybridoma cell metabolism using ageneric genome-scale metabolic model of Mus musculus. Biotechnology Progress 21,112–121 (2005).
21. Wegner, A., Weindl, D., Jager, C., Sapcariu, S. C., Dong, X., Stephanopoulos, G. & Hiller,K. Fragment formula calculator (FFC): determination of chemical formulas for fragmentions in mass spectrometric data. Anal Chem 86, 2221–8 (2014).
22. Antoniewicz, M. R., Kelleher, J. K. & Stephanopoulos, G. Determination of confidenceintervals of metabolic fluxes estimated from stable isotope measurements. Metab Eng 8,324–37 (2006).
23. Watanabe, K., Ueno, M., Kamiya, D., Nishiyama, A., Matsumura, M., Wataya, T., Taka-hashi, J. B., Nishikawa, S., Nishikawa, S., Muguruma, K. & Sasai, Y. A ROCK inhibitorpermits survival of dissociated human embryonic stem cells. Nat Biotechnol 25, 681–6(2007).
24. Kharroubi, A. T., Masterson, T. M., Aldaghlas, T. A., Kennedy, K. A. & Kelleher, J. K.Isotopomer spectral analysis of triglyceride fatty acid synthesis in 3T3-L1 cells. Am JPhysiol 263, E667–75 (1992).
25. Metallo, C. M. & Vander Heiden, M. G. Understanding metabolic regulation and itsinfluence on cell physiology. Mol Cell 49, 388–98 (2013).
26. Vacanti, N. M. & Metallo, C. M. Exploring metabolic pathways that contribute to the stemcell phenotype. Biochim Biophys Acta 1830, 2361–9 (2013).
74
27. Xu, X., Duan, S., Yi, F., Ocampo, A., Liu, G. H. & Izpisua Belmonte, J. C. Mitochondrialregulation in pluripotent stem cells. Cell Metab 18, 325–32 (2013).
28. Folmes, C. D., Dzeja, P. P., Nelson, T. J. & Terzic, A. Metabolic plasticity in stem cellhomeostasis and differentiation. Cell Stem Cell 11, 596–606 (2012).
29. Wang, Y. C., Lin, V., Loring, J. F. & Peterson, S. E. The ’sweet’ spot of cellular pluripotency:protein glycosylation in human pluripotent stem cells and its applications in regenerativemedicine. Expert Opin Biol Ther, 1–9 (2015).
30. Wang, Y. C., Peterson, S. E. & Loring, J. F. Protein post-translational modifications andregulation of pluripotency in human stem cells. Cell Res 24, 143–60 (2014).
31. Dennis, J. W., Nabi, I. R. & Demetriou, M. Metabolism, cell surface organization, anddisease. Cell 139, 1229–41 (2009).
32. Moremen, K. W., Tiemeyer, M. & Nairn, A. V. Vertebrate protein glycosylation: diversity,synthesis and function. Nat Rev Mol Cell Biol 13, 448–62 (2012).
33. Long, C. P. & Antoniewicz, M. R. Quantifying Biomass Composition by Gas Chromatog-raphy/Mass Spectrometry. Analytical Chemistry 86, 9423–9427 (2014).
34. Hofmann, U., Maier, K., Nicbel, A., Vacun, G., Reuss, M. & Mauch, K. Identificationof metabolic fluxes in hepatic cells from transient C-13-labeling experiments: Part I.Experimental observations. Biotechnology and Bioengineering 100, 344–354 (2008).
35. Munger, J., Bennett, B. D., Parikh, A., Feng, X. J., McArdle, J., Rabitz, H. A., Shenk, T. &Rabinowitz, J. D. Systems-level metabolic flux profiling identifies fatty acid synthesis as atarget for antiviral therapy. Nature Biotechnology 26, 1179–1186 (2008).
36. Murphy, T. A., Dang, C. V. & Young, J. D. Isotopically nonstationary 13C flux analysis ofMyc-induced metabolic reprogramming in B-cells. Metab Eng 15, 206–17 (2013).
37. Fountoulakis, M. & Lahm, H. W. Hydrolysis and amino acid composition of proteins. JChromatogr A 826, 109–34 (1998).
38. Jang-Lee, J., North, S. J., Sutton-Smith, M., Goldberg, D., Panico, M., Morris, H., Haslam,S. & Dell, A. Glycomic profiling of cells and tissues by mass spectrometry: fingerprintingand sequencing methodologies. Methods Enzymol 415, 59–86 (2006).
39. Miranda-Santos, I., Gramacho, S., Pineiro, M., Martinez-Gomez, K., Fritz, M., Hollemeyer,K., Salvador, A. & Heinzle, E. Mass isotopomer analysis of nucleosides isolated fromRNA and DNA using GC/MS. Anal Chem 87, 617–23 (2015).
75
40. Tomiya, N., Narang, S., Lee, Y. C. & Betenbaugh, M. J. Comparing N-glycan processingin mammalian cell lines to native and engineered lepidopteran insect cell lines. Glycocon-jugate Journal 21, 343–360 (2004).
41. Unger, C., Skottman, H., Blomberg, P., Dilber, M. S. & Hovatta, O. Good manufacturingpractice and clinical-grade human embryonic stem cell lines. Hum Mol Genet 17, R48–53(2008).
42. Evans, M. J. & Kaufman, M. H. Establishment in culture of pluripotential cells from mouseembryos. Nature 292, 154–6 (1981).
43. Martin, G. R. Isolation of a pluripotent cell line from early mouse embryos cultured inmedium conditioned by teratocarcinoma stem cells. Proc Natl Acad Sci U S A 78, 7634–8(1981).
44. Grassian, A. R., Metallo, C. M., Coloff, J. L., Stephanopoulos, G. & Brugge, J. S. Erkregulation of pyruvate dehydrogenase flux through PDK4 modulates cell proliferation.Genes Dev 25, 1716–33 (2011).
45. Schafer, Z. T., Grassian, A. R., Song, L., Jiang, Z., Gerhart-Hines, Z., Irie, H. Y., Gao,S., Puigserver, P. & Brugge, J. S. Antioxidant and oncogene rescue of metabolic defectscaused by loss of matrix attachment. Nature 461, 109–13 (2009).
46. Kim, C., Wong, J., Wen, J., Wang, S., Wang, C., Spiering, S., Kan, N. G., Forcales, S.,Puri, P. L., Leone, T. C., Marine, J. E., Calkins, H., Kelly, D. P., Judge, D. P. & Chen, H. S.Studying arrhythmogenic right ventricular dysplasia with patient-specific iPSCs. Nature494, 105–10 (2013).
47. Lopaschuk, G. D. & Jaswal, J. S. Energy metabolic phenotype of the cardiomyocyteduring development, differentiation, and postnatal maturation. J Cardiovasc Pharmacol56, 130–40 (2010).
48. Hoosdally, S. J., Andress, E. J., Wooding, C., Martin, C. A. & Linton, K. J. The HumanScavenger Receptor CD36: glycosylation status and its role in trafficking and function. JBiol Chem 284, 16277–88 (2009).
49. Schmid-Schonbein, G. W. An emerging role of degrading proteinases in hypertension andthe metabolic syndrome: autodigestion and receptor cleavage. Curr Hypertens Rep 14,88–96 (2012).
50. Almaraz, R. T., Aich, U., Khanna, H. S., Tan, E., Bhattacharya, R., Shah, S. & Yarema,K. J. Metabolic oligosaccharide engineering with N-Acyl functionalized ManNAc analogs:cytotoxicity, metabolic flux, and glycan-display considerations. Biotechnol Bioeng 109,992–1006 (2012).
76
51. Fan, J., Ye, J., Kamphorst, J. J., Shlomi, T., Thompson, C. B. & Rabinowitz, J. D. Quanti-tative flux analysis reveals folate-dependent NADPH production. Nature 510, 298–302(2014).
52. Lewis, C. A., Parker, S. J., Fiske, B. P., McCloskey, D., Gui, D. Y., Green, C. R., Vokes,N. I., Feist, A. M., Vander Heiden, M. G. & Metallo, C. M. Tracing compartmentalizedNADPH metabolism in the cytosol and mitochondria of mammalian cells. Mol Cell 55,253–63 (2014).
53. Benjamin, D. I., Li, D. S., Lowe, W., Heuer, T., Kemble, G. & Nomura, D. K. Diacylglyc-erol Metabolism and Signaling Is a Driving Force Underlying FASN Inhibitor Sensitivityin Cancer Cells. ACS Chem Biol (2015).
54. Jain, M., Nilsson, R., Sharma, S., Madhusudhan, N., Kitami, T., Souza, A. L., Kafri, R.,Kirschner, M. W., Clish, C. B. & Mootha, V. K. Metabolite profiling identifies a key rolefor glycine in rapid cancer cell proliferation. Science 336, 1040–4 (2012).
55. Metallo, C. M., Gameiro, P. A., Bell, E. L., Mattaini, K. R., Yang, J., Hiller, K., Jewell,C. M., Johnson, Z. R., Irvine, D. J., Guarente, L., Kelleher, J. K., Vander Heiden, M. G.,Iliopoulos, O. & Stephanopoulos, G. Reductive glutamine metabolism by IDH1 mediateslipogenesis under hypoxia. Nature 481, 380–4 (2012).
56. Moussaieff, A., Rouleau, M., Kitsberg, D., Cohen, M., Levy, G., Barasch, D., Nemirovski,A., Shen-Orr, S., Laevsky, I., Amit, M., Bomze, D., Elena-Herrmann, B., Scherf, T.,Nissim-Rafinia, M., Kempa, S., Itskovitz-Eldor, J., Meshorer, E., Aberdam, D. & Nahmias,Y. Glycolysis-mediated changes in acetyl-CoA and histone acetylation control the earlydifferentiation of embryonic stem cells. Cell Metab 21, 392–402 (2015).
57. Shiraki, N., Shiraki, Y., Tsuyama, T., Obata, F., Miura, M., Nagae, G., Aburatani, H., Kume,K., Endo, F. & Kume, S. Methionine metabolism regulates maintenance and differentiationof human pluripotent stem cells. Cell Metab 19, 780–94 (2014).
58. Almaraz, R. T., Tian, Y., Bhattarcharya, R., Tan, E., Chen, S. H., Dallas, M. R., Chen, L.,Zhang, Z., Zhang, H., Konstantopoulos, K. & Yarema, K. J. Metabolic flux increasesglycoprotein sialylation: implications for cell adhesion and cancer metastasis. Mol CellProteomics 11, M112 017558 (2012).
59. Laurent, L. C., Ulitsky, I., Slavin, I., Tran, H., Schork, A., Morey, R., Lynch, C., Harness,J. V., Lee, S., Barrero, M. J., Ku, S., Martynova, M., Semechkin, R., Galat, V., Gottesfeld,J., Izpisua Belmonte, J. C., Murry, C., Keirstead, H. S., Park, H. S., Schmidt, U., Laslett,A. L., Muller, F. J., Nievergelt, C. M., Shamir, R. & Loring, J. F. Dynamic changes inthe copy number of pluripotency and cell proliferation genes in human ESCs and iPSCsduring reprogramming and time in culture. Cell Stem Cell 8, 106–18 (2011).
77

Chapter 3
Distinct metabolic states can support
self-renewal and lipogenesis in human
pluripotent stem cells under different
culture conditions
3.1 Abstract
Recent studies have suggested that human pluripotent stem cells (hPSCs) depend primarily
on glycolysis and only increase oxidative metabolism during differentiation. Here we demonstrate
that both glycolytic and oxidative metabolism can support hPSC growth, and the metabolic
phenotype of hPSCs is largely driven by nutrient availability. We comprehensively characterized
hPSC metabolism using 13C/2H stable isotope tracing and flux analysis to define the metabolic
pathways supporting hPSC bioenergetics and biosynthesis. Whereas glycolytic flux consistently
supported hPSC growth, chemically-defined media strongly influenced that state of mitochondrial
respiration and fatty acid metabolism. Lipid deficiency dramatically reprogramed pathways
78
associated with fatty acid biosynthesis and NADPH regeneration, altering the mitochondrial
function of cells and driving flux through the oxidative pentose phosphate pathway. Lipid
supplementation mitigates this metabolic reprograming and increases oxidative metabolism.
These results demonstrate that self-renewing hPSCs can present distinct metabolic states and
highlight the importance of medium nutrients on mitochondrial function and development.
3.2 Introduction
Given their virtually unlimited expansion potential and differentiation capacity, human
pluripotent stem cells (hPSCs) offer unique opportunities in the study of human development,
biochemical screening in specific lineages, and regenerative medicine. Successful establishment of
culture conditions able to maintain human embryonic stem cells (hESCs) and induced pluripotent
stem cells (iPSCs) in the undifferentiated state represented critical steps in advancing these
technologies to practice [1, 2]. However, the large quantity of cells needed for screening and
tissue engineering applications poses a challenge that must still be addressed [3]. Initial protocols
for hPSC self-renewal mimicked the in vivo microenvironment by using feeder cell co-culture or
medium conditioned by feeder cells to support hPSC expansion [3, 4]. However, current good
manufacturing practices (cGMP) and FDA guidelines that encourage the use of xenobiotic-free
systems in clinical applications of hPSCs have driven efforts to develop chemically defined and/or
xenobiotic-free media and substrates for hPSC maintenance [5–7]. In recent years such chemically
defined formulations have supplanted undefined conditions as the gold standard for expansion
of hPSCs [8, 9]. However, the metrics for evaluation of such media have often been limited
to proliferation, pluripotency, and gene expression analyses, an established challenge which
must still be overcome [10]. Indeed, recent studies now suggest that culture and/or passaging
conditions can influence the genetic stability, metabolism, and differentiation potential of hPSCs
[11–13]. The specific metabolic features of hPSCs adapted to chemically defined media must be
79

elucidated in greater detail to develop improved hPSC models and related biomedical products.
Several recent studies have identified critical metabolic pathways necessary for cellular
reprogramming and/or maintaining pluripotency, evoking a broader interest in applying hPSCs to
study nutrition, development, and metabolic disease [14]. Glycolytic flux is commonly high in
hPSC cultures, and inhibition of glucose metabolism potently limits reprogramming efficiency
[15–17]. Metabolites that serve as substrates for epigenetic markers such as acetylation and
methylation have also emerged as critical regulators of pluripotency [18–21]. Broader characteri-
zation of the hPSC metabolome has also identified key differences in mitochondrial function and
lipid metabolism between hPSCs, mESCs, and their derivatives [16, 22]. In addition, compounds
that promote mitochondrial metabolism can negatively influence cellular reprogramming [15–17],
leading to the generalized concept that oxidative mitochondrial metabolism is "antagonistic"
to the pluripotent state [23]. However, some evidence suggests that mitochondria are active in
hESCs [24]. Similar to recent developments in tumor biology [25], critical roles for mitochondria
in hPSC growth are likely to emerge.
Here we have conducted a comprehensive analysis of metabolic fluxes in hPSCs. Us-
ing an array of 13C and 2H tracers we have investigated the metabolic pathways that support
hPSC biosynthesis and growth. Surprisingly, we have observed that distinct metabolic states
marked by high mitochondrial flux and governed by nutrient availability can maintain hESC
self-renewal, challenging the notion that mitochondrial function is dispensable for stem cell func-
tion. Chemically defined medium drives hPSCs to regulate mitochondrial pathways to support
lipid biosynthesis at the expense of oxidative metabolism. Media containing lipid supplements
maintain pluripotency while augmenting respiration and mitochondrial metabolism. Taken to-
gether, these results demonstrate that nutrient availability and the microenvironment (in particular,
medium choice) profoundly impacts hPSC metabolism.
80
3.3 Materials and Methods
3.3.1 Human pluripotent stem cell culture
Human embryonic stem cell lines, HUES9 and WA09 (H9), and human induced pluripo-
tent stem cell line, iPS(IMR90)-c4, were maintained on plates coated with Matrigel (Corning Life
Sciences) at 8.8 µg/cm2 and adapted to murine embryonic fibroblast-conditioned medium (MEF-
CM), Essential 8 medium (Life Technologies), and mTeSR1 medium (Stem Cell Technologies)
for at least three passages before experiments. All hPSCs were passaged every 5 days by exposure
to Accutase (Innovative Cell Technology) for 5 to 10 min at 37◦C. For metabolic flux experiments,
1X MEM non-essential amino acid solution was added into E8 media to control for amino acid
levels. Tracer MEF-CM consisted of low glucose or glutamine free MEF-CM supplemented with
either [13C]glucose or [13C]glutamine tracers, respectively. Tracer chemically defined media con-
sisted of glucose or glutamine-free E8 medium supplemented with [13C]glutamine, [13C]glucose
or [2H]glucose, or E8 medium supplemented with [13C]palmitate. All tracers were purchased
from Cambridge Isotopes. Additional details described in Supplemental Procedure.
3.3.2 Immunocytochemistry
HESCs were harvested and resuspended in 1% (v/v) paraformaldehyde and then fixed in
90% cold methanol. Cell pellets were incubated with a 1:100 dilution of human OCT-3/4 primary
mouse antibody (Santa Cruz; C-10) and a 1:1000 dilution of the secondary antibody conjugated
with Alexa Fluor 488 (Molecular Probes). The OCT4+ cells were detected by BD flow cytometry
and results were analyzed by FlowJo. For microscopy image, the adherent cells were fixed in
4% (v/v) paraformaldehyde. Cells were incubated with the 1:100 dilution of human OCT-3/4
primary mouse antibody and the 1:1000 dilution of the secondary antibody conjugated with Alexa
Fluor 488. Cells were subsequently washed and incubated with Hoechst 33342 nucleus staining
solution.
81

3.3.3 Metabolite extraction and derivatization
Polar metabolites and fatty acids were extracted using methanol/water/chloroform. Briefly,
spent media was removed, and cells were rinsed with 0.9% (w/v) saline and 250 µL of -80◦C
methanol was added to quench metabolism. 100 µL of ice-cold water containing 1 µg norvaline
internal standard was added to each well. Both solution and cells were collected via scraping.
Cell lysates were transferred to fresh sample tubes and 250 µL of -20◦C chloroform containing 1
µg heptadecanoate (internal standard for fatty acids) and 1 µg coprostan-3-ol (internal standard
for cholesterol) was added. After vortexing and centrifugation, the top aqueous layer (polar
metabolites) and bottom organic layer (lipids) were collected and dried under airflow. All reagents
were purchased from Sigma-Aldrich.
Derivatization of polar metabolites was performed using the Gerstel MultiPurpose Sampler
(MPS 2XL). Dried polar metabolites were dissolved in 20 µL of 2% (w/v) methoxyamine
hydrochloride (MP Biomedicals) in pyridine and held at 37◦C for 60 minutes. Subsequent
conversion to their tert-butyldimethylsilyl (tBDMS) derivatives was accomplished by adding 30
µL N-methyl-N-(tert-butyldimethylsilyl) trifluoroacetamide + 1% tert-butyldimethylchlorosilane
(Regis Technologies) and incubating at 37◦C for 30 minutes. Fatty acid methyl esters (FAMEs)
were generated by dissolving dried fatty acids in 0.5 mL 2% (v/v) methanolic sulfuric acid
(Sigma-Aldrich) and incubating at 50◦C for 2 hours. FAMEs were subsequently extracted in 1 mL
hexane with 0.1 mL saturated sodium chloride. FAME samples subsequently were aliquoted to
two tubes for direct analysis or cholesterol derivatization. One dried FAME extract was converted
to cholesterol trimethylsilyl (TMS) derivatives by adding 30 µL N-Methyl-N-(trimethylsilyl)
trifluoroacetamide (Regis Technologies) and incubating at 37◦C for 30 minutes.
82
3.3.4 Gas chromatography/mass spectrometry analysis
Gas chromatography/mass spectrometry (GC/MS) analysis was performed using an
Agilent 7890A with a 30 m DB-35MS capillary column (Agilent Technologies) connected to
an Agilent 5975C MS. GC/MS was operated under electron impact (EI) ionization at 70 eV. In
splitless mode, 1 µL sample was injected at 270◦C, using helium as the carrier gas at a flow
rate of 1 mL/min. For analysis of organic and amino acid derivatives, the GC oven temperature
was held at 100◦C for 2 minutes, increased to 255◦C at 3.5◦C/min, then ramped to 320◦C at
15◦C/min for a total run time of approximately 50 minutes. For measurement of FAMEs, the
GC oven temperature was held at 100◦C for 3 minutes, then to 205◦C at 25◦C/min, further
increased to 230◦C at 5◦C/min and ramped up to 300◦C at 25◦C/min for a total run time of
approximately 15 minutes. For measurement of cholesterol, the GC oven temperature was held at
150◦C for 1 minute, then to 260◦C at 20◦C/min, then held for 3 minutes, and further increased
to 280◦C at 10◦C/min and held for 15 minutes, finally ramped up to 325◦C for a total run time
of approximately 30 minutes. The MS source and quadrupole were held at 230◦C and 150◦C,
respectively, and the detector was operated in scanning mode, recording ion abundance in the
range of 100-650 m/z.
3.3.5 Metabolite quantification and isotopomer spectral analysis
For quantification of metabolites and mass isotopomer distributions, selected ion fragments
were integrated and corrected for natural isotope abundance using an in-house, MATLAB-
based algorithm and metabolite fragments listed in Supplemental Table. Total abundances
were normalized by counts of internal standard control. Isotopomer spectral analysis (ISA)
for quantitation of [1,2-13C]glucose and [U-13C6]glucose contribution to lipogenic AcCoA and
[3-2H]glucose contribution to lipogenic NADPH were calculated as previously described [26, 27].
Specifically, the relative enrichment of the lipogenic AcCoA and NADPH pools from a given
83

tracer and the percentage of newly synthesized fatty acids were estimated from a best-fit model
using the INCA MFA software package [28]. The 95% confidence intervals for both parameters
were determined by evaluating the sensitivity of the sum of squared residuals between measured
and simulated palmitate mass isotopomer distributions to small flux variations [29].
3.3.6 Mole percent enrichment measurement
Mole percent enrichment (MPE) of isotopes was calculated as the percent of all atoms
within the metabolite pool that are labeled:
∑ni=1 Mi · i
n
where n is the number of carbon atoms in the metabolite and Mi is the relative abundance of the
ith mass isotopomer.
3.3.7 Extracellular flux and oxidative pentose phosphate pathway flux
measurements
Per protein extracellular fluxes, including glucose/glutamine uptake and lactate/glutamate
secretion, were calculated by subtracting final spent medium from initial medium substrate
concentrations measured using a Young Springs Instrument 2950 and normalized by the integral
dry weights of hPSCs over 24 hours [26]. Quantification of oxidative pentose phosphate pathway
(PPP) flux was determined by extracellular glucose uptake flux times the ratio of M+1(M+1)+(M+2)
pyruvate or lactate derived from [1,2-13C]glucose.
84
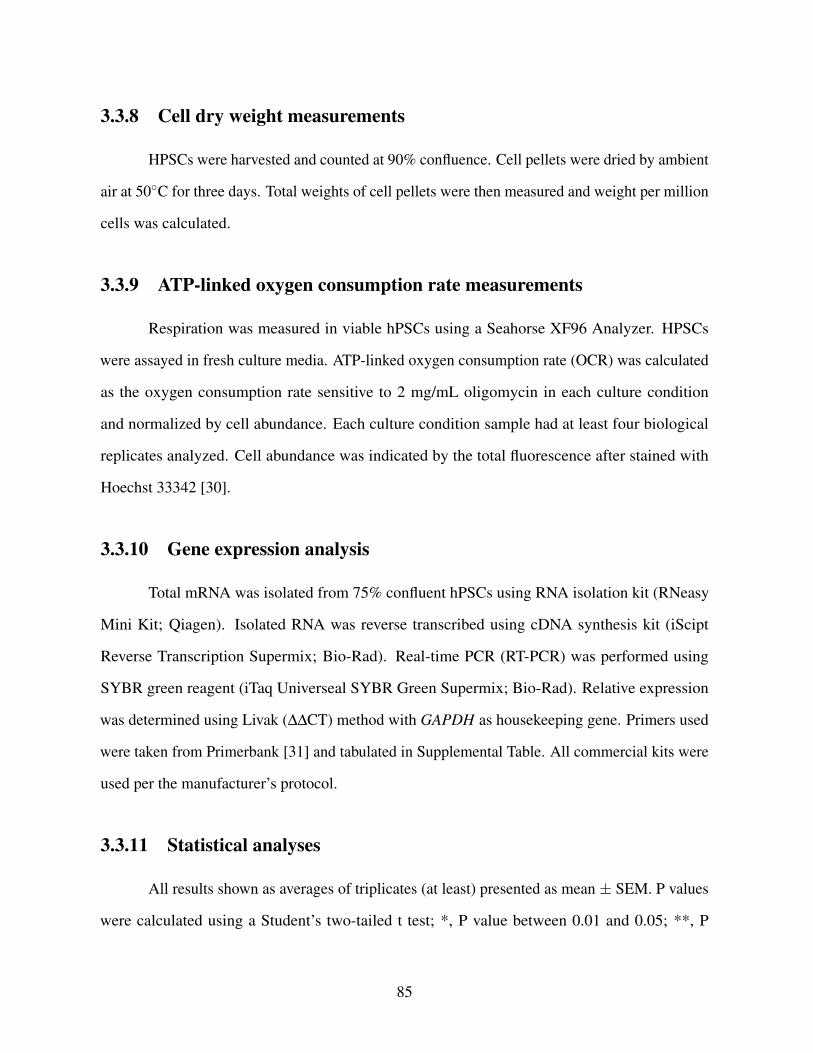
3.3.8 Cell dry weight measurements
HPSCs were harvested and counted at 90% confluence. Cell pellets were dried by ambient
air at 50◦C for three days. Total weights of cell pellets were then measured and weight per million
cells was calculated.
3.3.9 ATP-linked oxygen consumption rate measurements
Respiration was measured in viable hPSCs using a Seahorse XF96 Analyzer. HPSCs
were assayed in fresh culture media. ATP-linked oxygen consumption rate (OCR) was calculated
as the oxygen consumption rate sensitive to 2 mg/mL oligomycin in each culture condition
and normalized by cell abundance. Each culture condition sample had at least four biological
replicates analyzed. Cell abundance was indicated by the total fluorescence after stained with
Hoechst 33342 [30].
3.3.10 Gene expression analysis
Total mRNA was isolated from 75% confluent hPSCs using RNA isolation kit (RNeasy
Mini Kit; Qiagen). Isolated RNA was reverse transcribed using cDNA synthesis kit (iScipt
Reverse Transcription Supermix; Bio-Rad). Real-time PCR (RT-PCR) was performed using
SYBR green reagent (iTaq Universeal SYBR Green Supermix; Bio-Rad). Relative expression
was determined using Livak (∆∆CT) method with GAPDH as housekeeping gene. Primers used
were taken from Primerbank [31] and tabulated in Supplemental Table. All commercial kits were
used per the manufacturer’s protocol.
3.3.11 Statistical analyses
All results shown as averages of triplicates (at least) presented as mean ± SEM. P values
were calculated using a Student’s two-tailed t test; *, P value between 0.01 and 0.05; **, P
85

value between 0.001 and 0.01; ***, P value <0.001. All errors associated with ISA were 95%
confidence intervals determined via confidence interval analysis.
3.4 Results
3.4.1 Medium choice influences hESC metabolic states
To define the critical metabolic features of self-renewing hPSC we quantified intracellular
metabolite abundances, nutrient uptake, and byproduct secretion in undifferentiated HUES 9 and
H9 cells. As researchers employ a variety of validated media formulations to maintain hPSCs
[1, 9], we compared the metabolic state of hESCs in murine embryonic fibroblast conditioned
medium (MEF-CM) or more chemically defined, commercially available media such as Essential
8 (E8). We employed this strategy to deconvolute media-specific metabolic pathway functions
from cellular pluripotency. HESCs were maintained in each media formulation for at least
three passages. Consistent with previous observations establishing during the establishment of
these media [1, 9], hESCs in all conditions exhibited robust expression of Oct4 (Figure 3.1A-
B). Notably, we observed a more compact, flattened colony morphology of hESCs cultured
in chemically defined media and a larger non-nuclear area of hESCs cultured in MEF-CM,
suggesting a difference in the quantity of cytosolic biomass between both pluripotent cells (Figure
3.1B). We also noted striking differences in the dry cell weight of hESCs adapted to chemically
defined media, which was nearly 50% lower than that observed in MEF-CM cells (Figure 3.1C
and S3.2A).
86
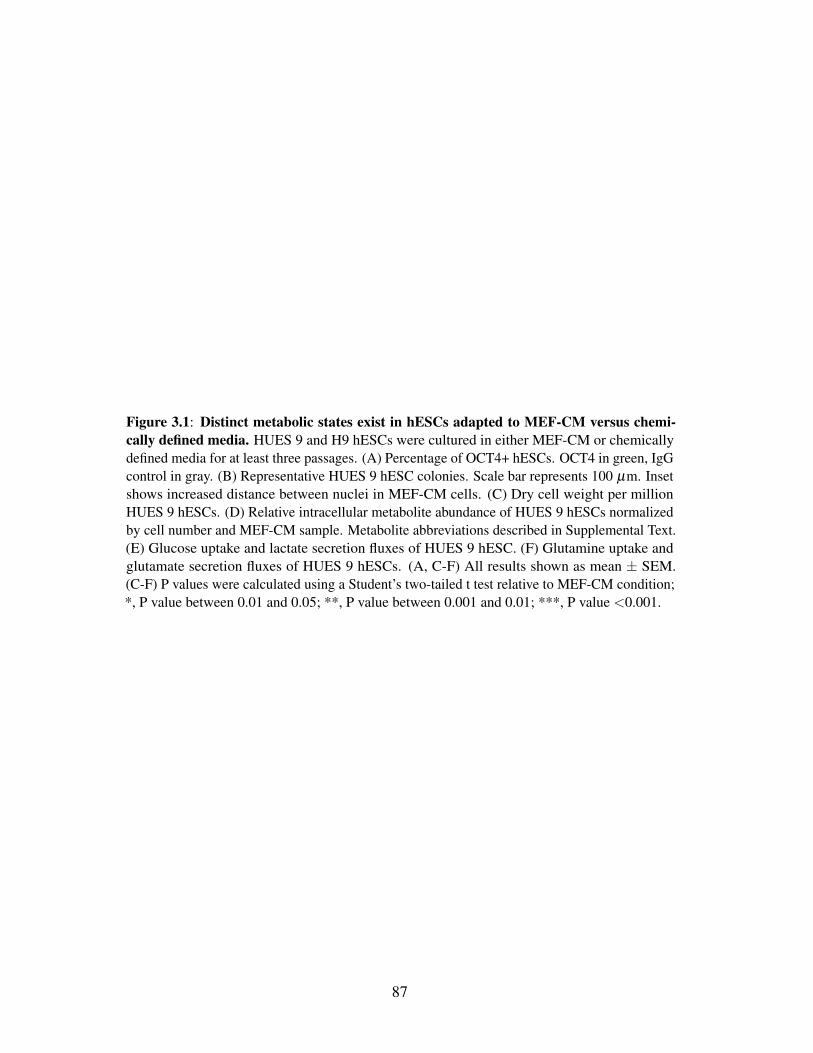
Figure 3.1: Distinct metabolic states exist in hESCs adapted to MEF-CM versus chemi-cally defined media. HUES 9 and H9 hESCs were cultured in either MEF-CM or chemicallydefined media for at least three passages. (A) Percentage of OCT4+ hESCs. OCT4 in green, IgGcontrol in gray. (B) Representative HUES 9 hESC colonies. Scale bar represents 100 µm. Insetshows increased distance between nuclei in MEF-CM cells. (C) Dry cell weight per millionHUES 9 hESCs. (D) Relative intracellular metabolite abundance of HUES 9 hESCs normalizedby cell number and MEF-CM sample. Metabolite abbreviations described in Supplemental Text.(E) Glucose uptake and lactate secretion fluxes of HUES 9 hESC. (F) Glutamine uptake andglutamate secretion fluxes of HUES 9 hESCs. (A, C-F) All results shown as mean ± SEM.(C-F) P values were calculated using a Student’s two-tailed t test relative to MEF-CM condition;*, P value between 0.01 and 0.05; **, P value between 0.001 and 0.01; ***, P value <0.001.
87

88
To gain more insights into pathway-specific differences across these conditions we next
quantified the abundance of intracellular organic and amino acids in each hESC population. In
chemically defined media we observed consistent increases in the per cell abundance of pyruvate,
lactate, and most tricarboxylic acid (TCA) intermediates (Figure 3.1D and S3.2B), despite the
smaller cell size (Figure 3.1C and S3.2A). A major exception to these trends was citrate, which
was present at significantly lower levels in E8 media. Consistent with these differences, glycolytic
flux in E8 was significantly higher on a per protein basis (Figure 3.1E). Additionally, glutamine
consumption was markedly elevated in chemically defined media, and net glutamine anaplerosis
(i.e., glutamine uptake minus glutamate secretion or entry of glutamine carbon into the TCA
cycle) was increased 4 fold (Figure 3.1F). These results suggest that different hPSC media drive
metabolic reprogramming of hESCs independent of pluripotency.
3.4.2 Media-dependent reprogramming of amino acid and
NADPH metabolism
The inherent redundancy of metabolic networks allows for multiple pathways and sub-
strates to support cellular bioenergetics and biosynthesis. Indeed, the differences observed in
the above metabolic characterizations suggests that intermediary metabolic fluxes are altered in
hESCs cultured in MEF-CM versus chemically defined media. To investigate these changes in
greater detail we cultured HUES 9 and H9 cells in the presence of [13C]glucose, [2H]glucose,
or [13C]glutamine tracers and quantified isotopic labeling to probe central carbon metabolism
(see Figure S4.1 for atom transition maps). With the exception of serine, the contribution of
glucose carbon to glycolytic and TCA intermediates was not dramatically impacted by media
choice (Figure 3.2A and S3.3). On the other hand, flux of glucose through the oxidative pentose
phosphate pathway (PPP) was increased 3-fold in E8 media as compared to MEF-CM (Figure
3.2B). To better quantify how oxidative PPP flux contributes to NADPH regeneration we quanti-
fied label transfer from [3-2H]glucose to palmitate and performed isotopomer spectral analysis
89
(ISA) [27]. In E8 medium the oxidative PPP accounted for 52±2% and 67±1% of cytosolic
NADPH pool H9 and HUES 9 hESCs, respectively (Figure 3.2C). As the oxidative PPP is often
upregulated in highly proliferative cells, such as tumors, to support nucleotide and fatty acid
synthesis [32], we also performed the same tests in multiple established stable cancer cell lines.
We found the contribution of PPP flux to NADPH production to be significantly higher in hPSCs
than that observed in all cancer cell lines tested (Figure 3.2C, Supplemental Procedure), even
when growing cancer cells in E8 media rather than DMEM + FBS (Figure S3.2C).
90

Figure 3.2: Media choice influences glucose, glutamine, and NADPH metabolism. (A)Mole percent enrichment (MPE) from [1,2-13C]glucose in HUES 9 hESCs throughout inter-mediary metabolism. (B) Absolute flux through the oxidative PPP in HUES 9 hESCs. (C)Contribution of oxidative PPP to lipogenic NADPH as determined by ISA in hESCs and cancercells. (D) MPE from [U-13C5]glutamine in HUES 9 hESCs throughout intermediary metabolism.(E) MPE of TCA intermediates from [1-13C]glutamine (normalized by MPE of aKG) in HUES9 hESCs. (F) Relative abundance of 2HG in HUES 9 hESCs normalized by cell number andMEF-CM sample. (A-B, D-F) All results shown as mean ± SEM. P values were calculatedusing a Student’s two-tailed t test relative to MEF-CM condition; *, P value between 0.01 and0.05; **, P value between 0.001 and 0.01; ***, P value <0.001. (C) Results shown as mean and95% CI. *, Significance indicated by non-overlapping 95% confidence intervals.
91
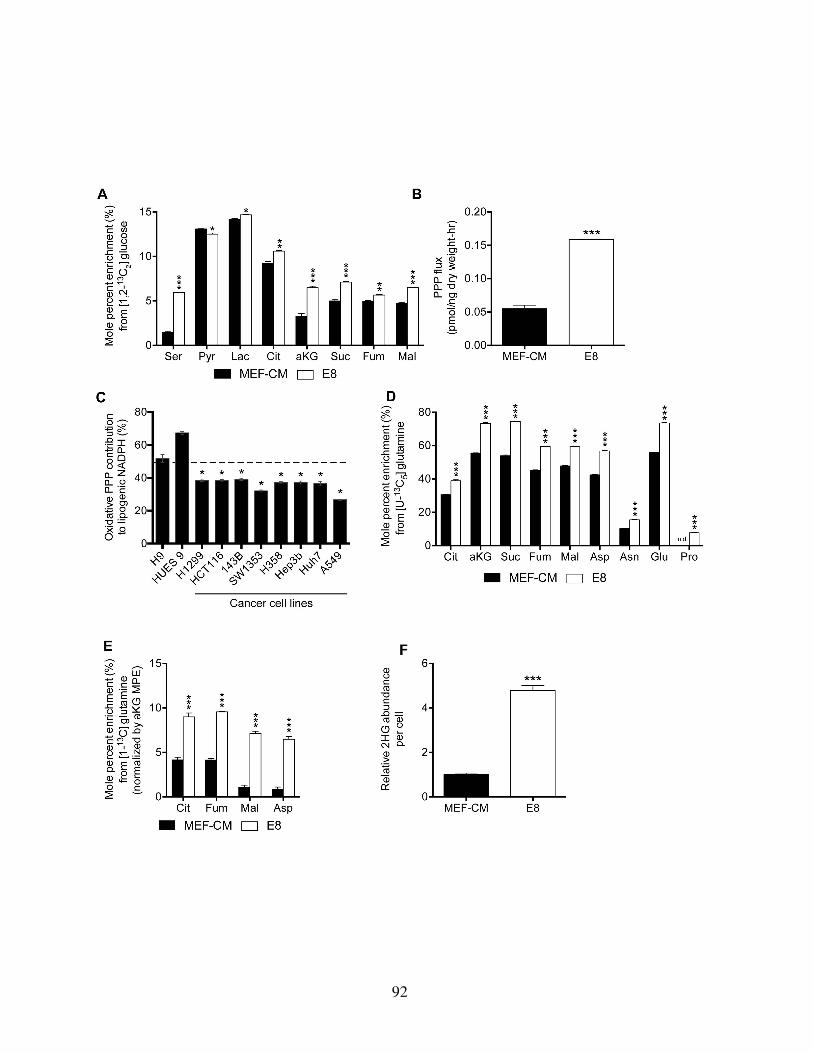
92
Glutamine is another important substrate that fuels mitochondrial metabolism in prolifer-
ating cells [33, 34]. When culturing HUES 9 or H9 hESCs in the presence of [U-13C5]glutamine
we observed significant changes in the overall contribution and labeling patterns of various TCA
intermediates and amino acids in MEF-CM versus E8 media (Figure 3.2D, S3.2D, and S3.4).
These data indicated that glutaminolysis was highly active in hESCs cultured on all media to
support TCA cycle anaplerosis but significantly higher in defined media (Figure 3.2D, S3.2D, and
S3.4). Notably, cells became cytostatic upon glutamine withdrawal (data not shown), in contrast
to murine ESCs which can proliferate in the absence of available glutamine [35]. Increased
M+3 labeling of citrate, malate, fumarate, and aspartate suggested that reductive carboxylation
and ATP-citrate lyase activity (in the case of citrate) were both elevated in cells cultured in E8
(Figure S3.4). We confirmed that glutamine-mediated reductive carboxylation flux was increased
in chemically defined culture media by tracing the contribution of [1-13C]glutamine to various
intermediates (Figure 3.2E). This NADPH-dependent pathway can fuel lipid biosynthesis via
citrate and is particularly active under conditions of oxidative stress or hypoxia inducible factor
(HIF) stabilization [36–39]. In addition, we observed elevated levels of 2HG in cells grown
in chemically defined medium (Figure 3.2F). We confirmed this metabolite as the (R)-2HG
enantiomer via chiral chromatography (Figure S3.2E, supplemental methods), suggesting this
2HG was produced by IDH1. However, levels present in all conditions were significantly lower
than that required for modulation of aKG-dependent dioxygenase activity [40, 41]. These results
suggest that the TCA cycle, the central hub of mitochondrial oxidative energy generation, resides
in distinct states within hESCs depending on the nutritional environment of cells.
93

Figure 3.3: HESCs adapted to chemically defined media upregulate lipid biosynthesis. (A)Relative fatty acid abundance in cells adapted to MEF-CM, E8, and mTeSR1 normalized byMEF-CM sample. Left and right panel are HUES 9 and H9 hESCs respectively. (B) Percentageof newly synthesized palmitate and cholesterol after 24 hours. Left and right panel are HUES 9and H9 hESCs respectively. (C) Schematic diagram of [U-13C16]palmitate metabolism. Opencircles depict 12C and filled circles depict 13C atoms. Metabolite abbreviations described inSupplemental Text. (D) Percentage of M+16 fatty acids in HUES 9 hESCs cultured in E8+ BSA-bound [U-13C16]palmitate and 1 mM carnitine (E) Mass isotopomer distribution of palmitateand stearate in HUES 9 hESCs cultured in E8 with BSA-bound [U-13C16]palmitate and 1 mMcarnitine. (F) Expression of genes encoding various metabolic enzymes in HUES 9 hESCsadapted to E8 relative to cells in MEF-CM. (A, D-F) All results shown as mean Âs SEM. (A,F) P values were calculated using a Student’s two-tailed t test relative to MEF-CM condition;*, P value between 0.01 and 0.05; **, P value between 0.001 and 0.01; ***, P value <0.001.(B) Results shown as mean and 95% CI. *, Significance indicated by non-overlapping 95%confidence intervals.
94
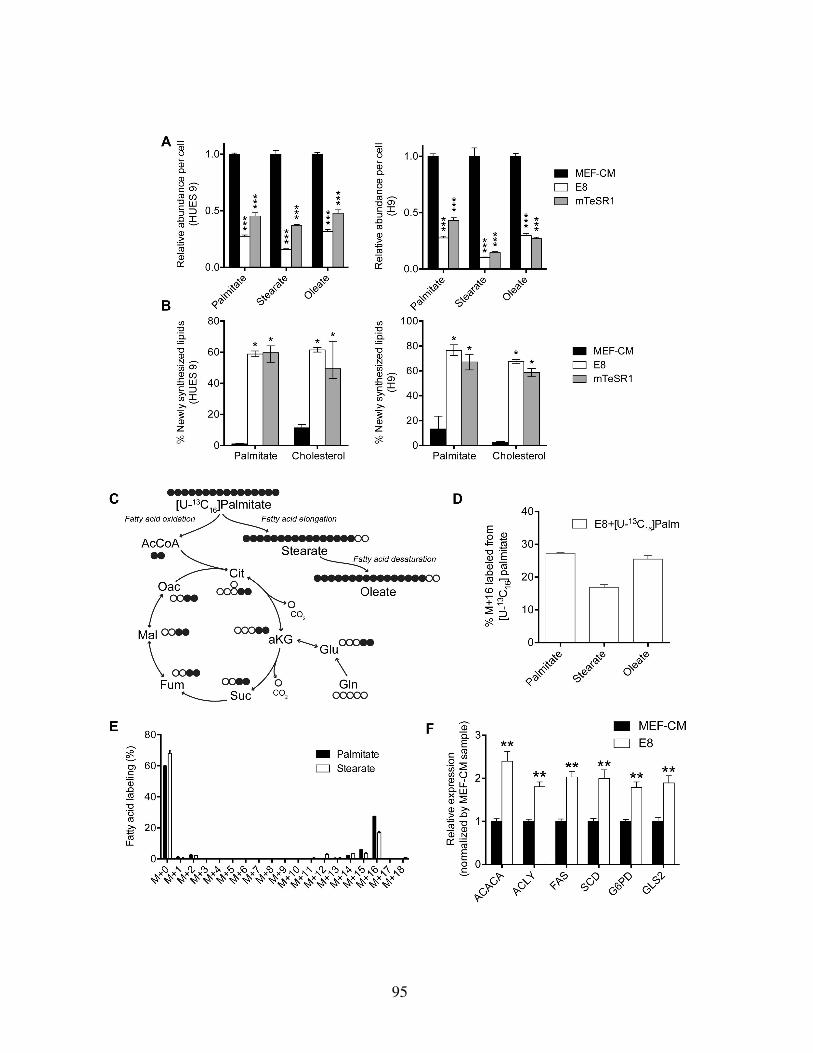
95
3.4.3 Chemically defined medium dramatically increases lipogenesis
The increased reductive carboxylation and 2HG production noted above provides some
mechanistic insight into why oxidative PPP flux is elevated in defined media. However, in addition
to the changes in intermediary metabolism, we observed significant decreases in per cell fatty
acid abundances in HUES 9 and H9 hESCs maintained in more defined media such as E8 and
mTeSR1 versus MEF-CM (Figure 3.3A), consistent with our observation of decreased dry cell
weight of hESCs in the latter (Figure 3.1C and S3.2A). We next employed [U-13C6]glucose and
ISA to quantify de novo lipogenesis in hESCs cultured in the same media panel. This analysis
highlighted drastic changes in the extent that hESCs synthesized fatty acids and cholesterol in
different media. Whereas hESCs exhibited minimal lipogenesis in MEF-CM over 24 hours,
HUES 9 and H9 cells synthesized 50-80% of their palmitate and cholesterol in E8 or mTESR1
over the same time period (Figure 3.3B). Notably, the contribution of glucose to lipogenic AcCoA
pools did not change appreciably in different media, consistent with glucose labeling of citrate
under each condition (Figure S3.5A-B). These results demonstrate that hESCs exhibit marked
differences in lipid biosynthesis when cultured in different media.
Both MEF-CM and mTeSR1 formulations contain exogenous lipid supplements (Albu-
MAX and Chemically Defined Lipid Concentrate, respectively) that may support hPSC growth,
though our results indicate the levels present in mTeSR1 are insufficient. To further dissect how
exogenous lipids are used and metabolized in chemically defined media we supplemented E8
with albumin-bound [U-13C16]palmitate (U-Palm E8) as the sole source of fatty acids (Figure
3.3C). After 24 hours we quantified fatty acid and TCA intermediate labeling in hESCs. No
appreciable isotope enrichment was detected in citrate or other TCA metabolites (data not shown),
indicating β -oxidation is not employed by self-renewing hESCs to generate AcCoA. However,
M+16 labeling of C16:0 palmitate and C18:0 stearate was observed, suggesting exogenous fatty
acids are readily utilized and elongated in hESCs cultured in chemically defined medium (Figure
3.3D-E).
96
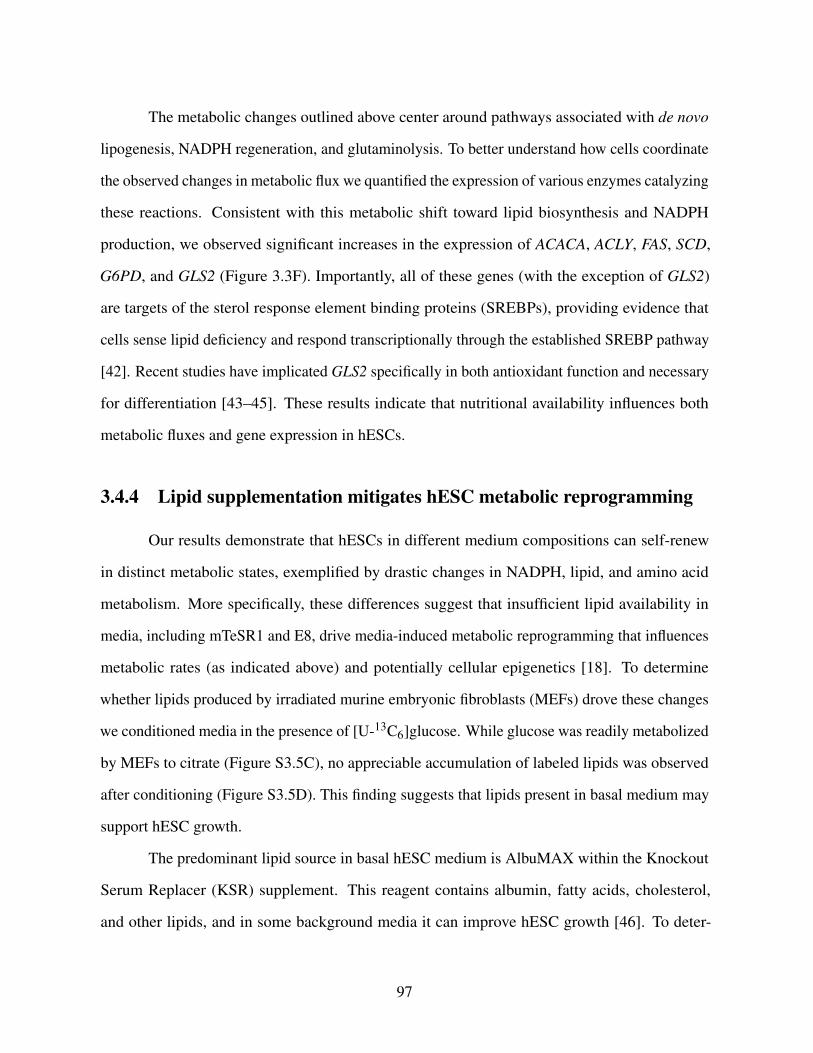
The metabolic changes outlined above center around pathways associated with de novo
lipogenesis, NADPH regeneration, and glutaminolysis. To better understand how cells coordinate
the observed changes in metabolic flux we quantified the expression of various enzymes catalyzing
these reactions. Consistent with this metabolic shift toward lipid biosynthesis and NADPH
production, we observed significant increases in the expression of ACACA, ACLY, FAS, SCD,
G6PD, and GLS2 (Figure 3.3F). Importantly, all of these genes (with the exception of GLS2)
are targets of the sterol response element binding proteins (SREBPs), providing evidence that
cells sense lipid deficiency and respond transcriptionally through the established SREBP pathway
[42]. Recent studies have implicated GLS2 specifically in both antioxidant function and necessary
for differentiation [43–45]. These results indicate that nutritional availability influences both
metabolic fluxes and gene expression in hESCs.
3.4.4 Lipid supplementation mitigates hESC metabolic reprogramming
Our results demonstrate that hESCs in different medium compositions can self-renew
in distinct metabolic states, exemplified by drastic changes in NADPH, lipid, and amino acid
metabolism. More specifically, these differences suggest that insufficient lipid availability in
media, including mTeSR1 and E8, drive media-induced metabolic reprogramming that influences
metabolic rates (as indicated above) and potentially cellular epigenetics [18]. To determine
whether lipids produced by irradiated murine embryonic fibroblasts (MEFs) drove these changes
we conditioned media in the presence of [U-13C6]glucose. While glucose was readily metabolized
by MEFs to citrate (Figure S3.5C), no appreciable accumulation of labeled lipids was observed
after conditioning (Figure S3.5D). This finding suggests that lipids present in basal medium may
support hESC growth.
The predominant lipid source in basal hESC medium is AlbuMAX within the Knockout
Serum Replacer (KSR) supplement. This reagent contains albumin, fatty acids, cholesterol,
and other lipids, and in some background media it can improve hESC growth [46]. To deter-
97
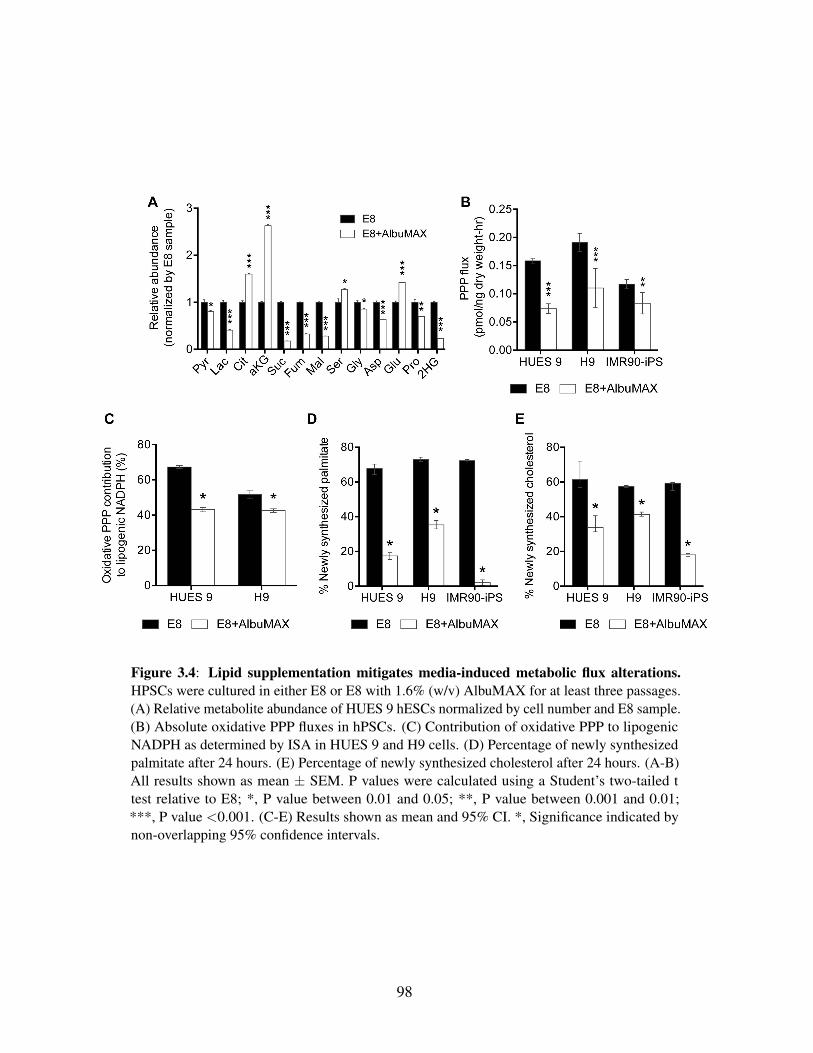
Figure 3.4: Lipid supplementation mitigates media-induced metabolic flux alterations.HPSCs were cultured in either E8 or E8 with 1.6% (w/v) AlbuMAX for at least three passages.(A) Relative metabolite abundance of HUES 9 hESCs normalized by cell number and E8 sample.(B) Absolute oxidative PPP fluxes in hPSCs. (C) Contribution of oxidative PPP to lipogenicNADPH as determined by ISA in HUES 9 and H9 cells. (D) Percentage of newly synthesizedpalmitate after 24 hours. (E) Percentage of newly synthesized cholesterol after 24 hours. (A-B)All results shown as mean ± SEM. P values were calculated using a Student’s two-tailed ttest relative to E8; *, P value between 0.01 and 0.05; **, P value between 0.001 and 0.01;***, P value <0.001. (C-E) Results shown as mean and 95% CI. *, Significance indicated bynon-overlapping 95% confidence intervals.
98
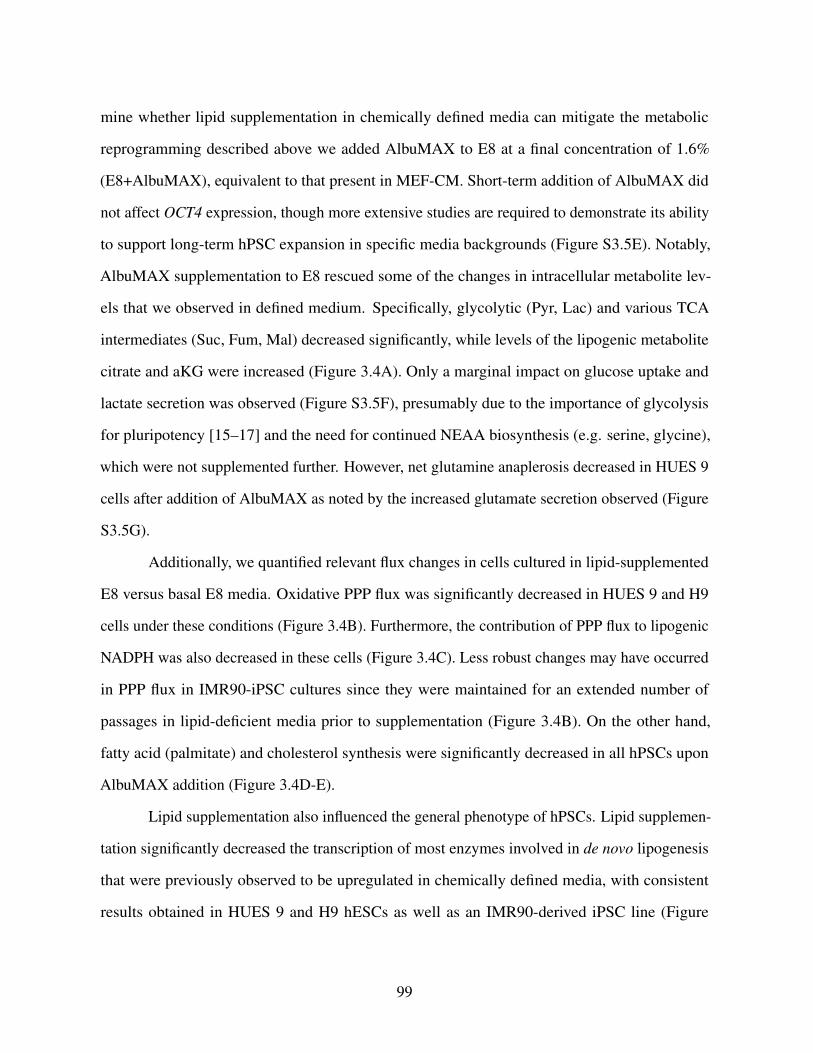
mine whether lipid supplementation in chemically defined media can mitigate the metabolic
reprogramming described above we added AlbuMAX to E8 at a final concentration of 1.6%
(E8+AlbuMAX), equivalent to that present in MEF-CM. Short-term addition of AlbuMAX did
not affect OCT4 expression, though more extensive studies are required to demonstrate its ability
to support long-term hPSC expansion in specific media backgrounds (Figure S3.5E). Notably,
AlbuMAX supplementation to E8 rescued some of the changes in intracellular metabolite lev-
els that we observed in defined medium. Specifically, glycolytic (Pyr, Lac) and various TCA
intermediates (Suc, Fum, Mal) decreased significantly, while levels of the lipogenic metabolite
citrate and aKG were increased (Figure 3.4A). Only a marginal impact on glucose uptake and
lactate secretion was observed (Figure S3.5F), presumably due to the importance of glycolysis
for pluripotency [15–17] and the need for continued NEAA biosynthesis (e.g. serine, glycine),
which were not supplemented further. However, net glutamine anaplerosis decreased in HUES 9
cells after addition of AlbuMAX as noted by the increased glutamate secretion observed (Figure
S3.5G).
Additionally, we quantified relevant flux changes in cells cultured in lipid-supplemented
E8 versus basal E8 media. Oxidative PPP flux was significantly decreased in HUES 9 and H9
cells under these conditions (Figure 3.4B). Furthermore, the contribution of PPP flux to lipogenic
NADPH was also decreased in these cells (Figure 3.4C). Less robust changes may have occurred
in PPP flux in IMR90-iPSC cultures since they were maintained for an extended number of
passages in lipid-deficient media prior to supplementation (Figure 3.4B). On the other hand,
fatty acid (palmitate) and cholesterol synthesis were significantly decreased in all hPSCs upon
AlbuMAX addition (Figure 3.4D-E).
Lipid supplementation also influenced the general phenotype of hPSCs. Lipid supplemen-
tation significantly decreased the transcription of most enzymes involved in de novo lipogenesis
that were previously observed to be upregulated in chemically defined media, with consistent
results obtained in HUES 9 and H9 hESCs as well as an IMR90-derived iPSC line (Figure
99

3.5A-C). Additionally, per cell dry weight increased significantly in E8+AlbuMAX HUES 9, H9,
and IMR90-iPSC cultures (Figure 3.5D). In our hands HUES 9 cell growth was not affected by
growth in E8+AlbuMAX when additional BSA was included in the formulation; however, some
growth suppression was observed in H9 and IMR90-iPS hPSCs (data not shown), indicating
additional optimization of lipid supplement-background media combinations may be needed. To
more functionally characterize mitochondria under these conditions we conducted respirome-
try analysis. Basal, ATP-linked oxygen consumption was significantly lower in HUES 9 cells
cultured in E8 compared to those maintained in MEF-CM (Figure 3.5E and S3.6A). Consistent
with the rescue experiments above, supplementation of AlbuMAX to E8 significantly increased
respiration of HUES 9, H9, and IMR90-iPSCs (Figure 3.5F and S3.6A-C). Taken together, these
data indicate that lipid deficiency of chemically defined media induced a profound reliance on
biosynthetic fluxes, owing to the need for structural lipids in proliferating hESCs. In turn, this
metabolic reprogramming influences the respiratory state, gene expression profile, and mitochon-
drial function of hPSCs. These data strongly contrast the concept of mitochondrial inactivity
as a key requirement for pluripotency-associated metabolic reprogramming and illustrate the
confounding effects of nutrient-availability in hPSC metabolic studies.
3.5 Discussion
The prevailing view of hPSC metabolism is highly reminiscent of tumor cell metabolism
in that aerobic glycolysis is thought to be favored over oxidative mitochondrial metabolism
[23, 47–49]. These findings are supported by metabolic studies predominantly conducted in
chemically defined media and/or the impact of metabolic inhibitors on reprogramming efficiency
in fast-growing cultures [15–17]. In other studies using MEF-CM as the primary maintenance
condition metabolic analysis was limited to respirometry with little focus on pathways involved
in biosynthesis [50, 51]. Our results demonstrate that distinct metabolic states can support
100
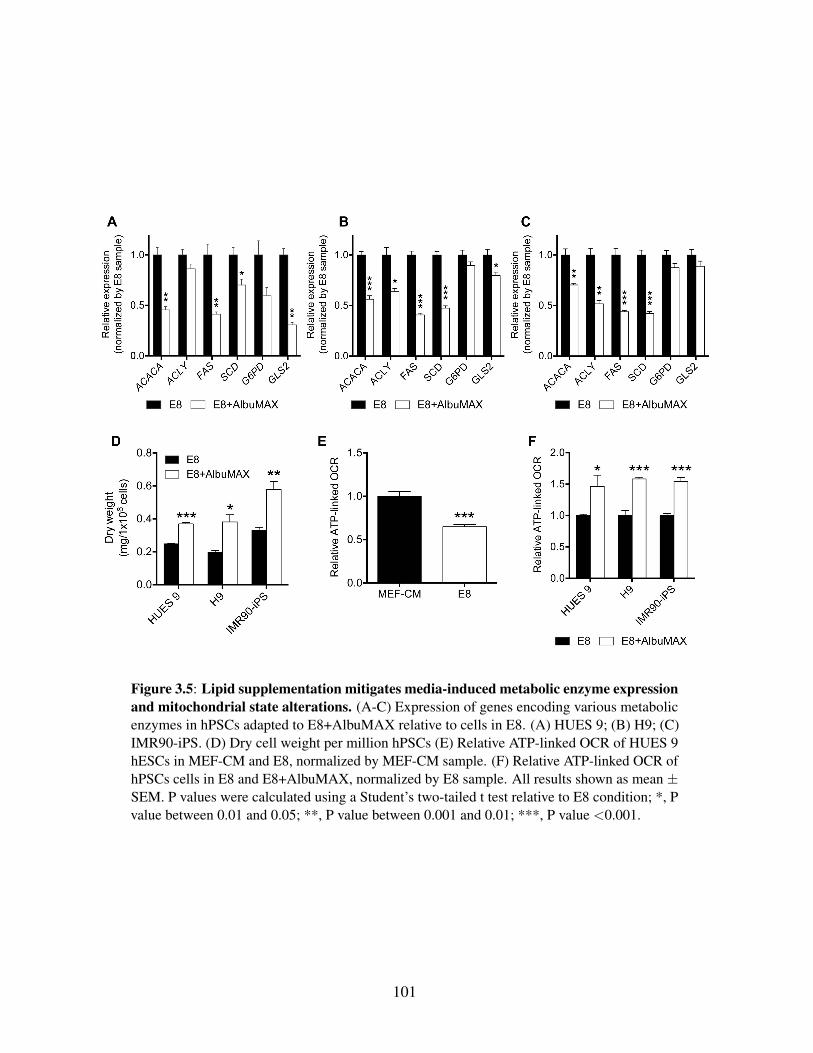
Figure 3.5: Lipid supplementation mitigates media-induced metabolic enzyme expressionand mitochondrial state alterations. (A-C) Expression of genes encoding various metabolicenzymes in hPSCs adapted to E8+AlbuMAX relative to cells in E8. (A) HUES 9; (B) H9; (C)IMR90-iPS. (D) Dry cell weight per million hPSCs (E) Relative ATP-linked OCR of HUES 9hESCs in MEF-CM and E8, normalized by MEF-CM sample. (F) Relative ATP-linked OCR ofhPSCs cells in E8 and E8+AlbuMAX, normalized by E8 sample. All results shown as mean ±SEM. P values were calculated using a Student’s two-tailed t test relative to E8 condition; *, Pvalue between 0.01 and 0.05; **, P value between 0.001 and 0.01; ***, P value <0.001.
101

self-renewing hESCs when cultured in different nutrient conditions (Figure 3.6). In cancer
biology recent studies have shed light on the importance of mitochondria for tumor cell growth
and survival as well as the potential efficacy of mitochondrial inhibitors as therapies [25, 52].
Although glycolysis similarly supports hESC growth in all conditions, our data suggests that
oxidative mitochondrial metabolism is highly active in hESCs when lipids are present and
sustained by glutamine anaplerosis. Amino acid availability also presumably affected serine,
glycine, asparagine, and proline metabolism in our system, as each of these metabolites was
differentially labeled in MEF-CM chemically defined media.
While numerous studies have demonstrated that pluripotency and proliferation are robustly
maintained in both MEF-CM and chemically defined media alternatives [8, 9], our MFA experi-
ments indicate that hPSCs are capable of adapting metabolism to different nutrient conditions
while maintaining their self-renewal capacity. In particular, medium lipid deficiency influences
the metabolic state of hESCs such that they strongly upregulate pathways involved in lipid
biosynthesis and NADPH regeneration (i.e., the oxidative PPP). This metabolic state may render
cells more susceptible to oxidative stresses. For example, high NADPH consumption fueling
lipid synthesis in cancer cells can increase their susceptibility to metabolic or environmental
stresses [53] . Additionally, G6PD deficiency is a relatively common inborn error of metabolism
(IEM) in the human population [54]. As such, mutations in G6PD may affect the efficiency of
iPSC reprogramming in some populations or potentially impact the genetic stability and redox
sensitivity of hPSCs cultured in chemically defined or more specifically lipid-free media.
HPSC applications in disease-modeling, drug screening, and regenerative medicine all
require the robust production of differentiated lineages that correctly recapitulate the metabolic
functions of somatic tissue. Organogenesis is a complex, multistep process that requires significant
energy, biomass, and signaling cues; metabolism plays an essential role in all aspects of these
processes. Subjecting hPSCs to selective pressures in vitro such as medium lipid deficiency
may limit their ability to accurately represent normal tissue function in subsequent applications
102
without giving rise to "harmful" genetic alterations [55]. Furthermore, culture and passaging
conditions as well as time can influence the genetic and epigenetic stability of hPSCs [11, 56]
or metabolic rates after subculture [12]. Our MFA results provide potential mechanisms that
may be exploited to alleviate some of the stresses associated with long-term in vitro expansion.
Specifically, addition of particular lipids may enhance or better control hPSC expansion and
differentiation. As such, pluripotency analysis (e.g. teratoma formation) and proliferation alone
may not be suitable metrics for the evaluation of hPSC culture media and intracellular metabolic
fluxes should also be considered. MFA is an ideal and underutilized tool for such applications.
Numerous studies have recently implicated metabolites or culture conditions in regulating
cellular epigenetics and differentiation propensity of pluripotent stem cells. Metabolites that
impact methylation [19, 20, 35] and acetylation [18] can influence differentiation but likely
play more critical roles in cellular bioenergetics and biosynthesis. Indeed, it is unclear how
global changes in the abundance of SAM or AcCoA can impact the specific epigenetic state of
pluripotency genes. Other studies have recently identified key differences in the predisposition
of cells to differentiate to neural or hematopoietic lineages when culturing or priming cells in
MEF-CM versus more nutrient-limited media such as E8 or mTeSR1 [13, 57]. Finally, the
mitochondrial state and lipid profile of cells changes significantly during the course of mESC and
hESC differentiation [22]. Our results therefore demonstrate the importance of considering the
broader nutritional environment and intracellular metabolic state of hPSCs when characterizing
metabolic regulation in stem cells and designing hPSC media.
3.6 Acknowledgements
HUES 9 hESC was provided by Prof. Shyni Varghese (University of California, San
Diego). H9 hESC and IMR90 iPSC were provided by Prof. Sean Palecek (University of
Wisconsin-Madison).
103
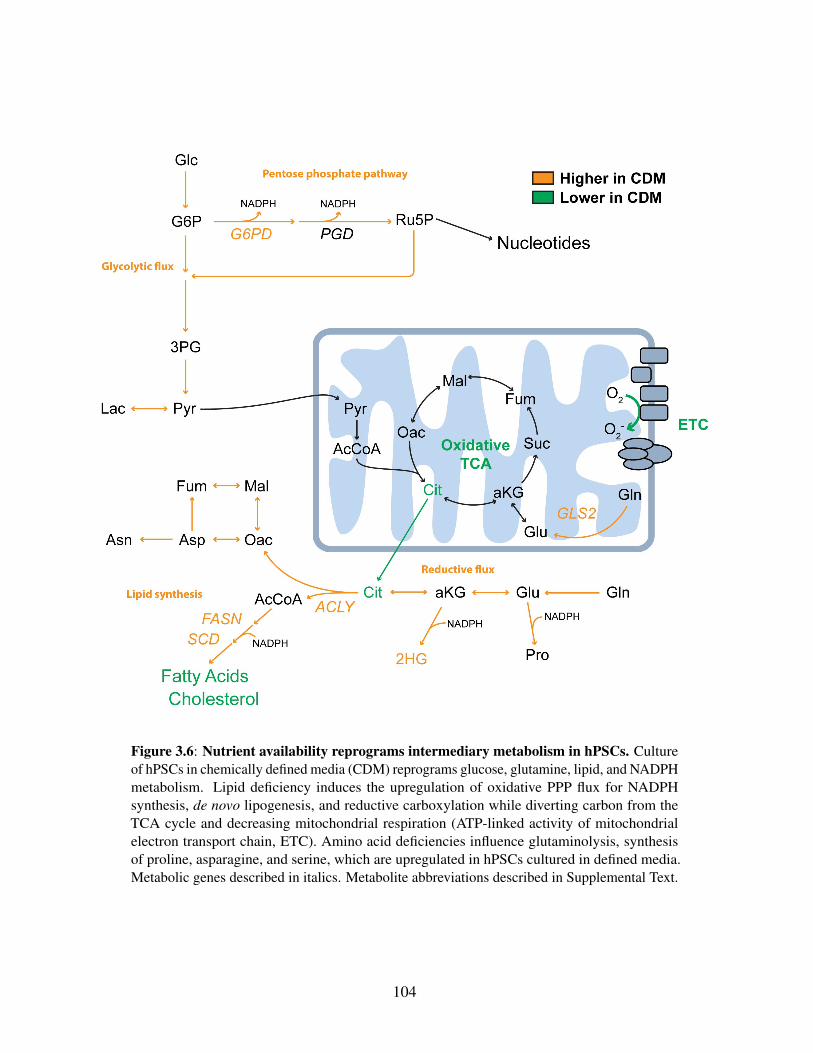
Figure 3.6: Nutrient availability reprograms intermediary metabolism in hPSCs. Cultureof hPSCs in chemically defined media (CDM) reprograms glucose, glutamine, lipid, and NADPHmetabolism. Lipid deficiency induces the upregulation of oxidative PPP flux for NADPHsynthesis, de novo lipogenesis, and reductive carboxylation while diverting carbon from theTCA cycle and decreasing mitochondrial respiration (ATP-linked activity of mitochondrialelectron transport chain, ETC). Amino acid deficiencies influence glutaminolysis, synthesisof proline, asparagine, and serine, which are upregulated in hPSCs cultured in defined media.Metabolic genes described in italics. Metabolite abbreviations described in Supplemental Text.
104
The authors acknowledge Yongsung Hwang, Shyni Varghese, and members of the Met-
allo lab for technical assistance and helpful discussions. This research was supported by the
California Institute of Regenerative Medicine grant (RB5-07356), National Institutes of Health
grant (R01CA188652), a Searle Scholar Award to C.M.M, a NSF CAREER Award (1454425)
to C.M.M., and a NSF Graduate Research fellowship (DGE-1144086) to M.G.B. The authors
declare no financial or commercial conflict of interest.
Chapter 3, in full, is a reprint of the material as it appears in ”Distinct metabolic states
can support self-renewal and lipogenesis in human pluripotent stem cells under different culture
conditions,” Cell Reports, vol. 16, 2016. Mehmet G. Badur and Hui Zhang are the co-primary
authors of this publication. Ajit S. Divakaruni, Seth J. Parker, Christian Jager, Karsten Hiller, and
Anne N. Murphy are co-authors of this publication. Christian M. Metallo is the corresponding
author of this publication.
3.7 References1. Thomson, J. A., Itskovitz-Eldor, J., Shapiro, S. S., Waknitz, M. A., Swiergiel, J. J., Marshall,
V. S. & Jones, J. M. Embryonic stem cell lines derived from human blastocysts. Science282, 1145–7 (1998).
2. Takahashi, K. & Yamanaka, S. Induction of pluripotent stem cells from mouse embryonicand adult fibroblast cultures by defined factors. Cell 126, 663–76 (2006).
3. Desai, N., Rambhia, P. & Gishto, A. Human embryonic stem cell cultivation: historicalperspective and evolution of xeno-free culture systems. Reprod Biol Endocrinol 13, 9(2015).
4. Villa-Diaz, L. G., Ross, A. M., Lahann, J. & Krebsbach, P. H. Concise review: Theevolution of human pluripotent stem cell culture: from feeder cells to synthetic coatings.Stem Cells 31, 1–7 (2013).
5. Kirouac, D. C. & Zandstra, P. W. The systematic production of cells for cell therapies. CellStem Cell 3, 369–81 (2008).
6. Hyun, I., Lindvall, O., Ahrlund-Richter, L., Cattaneo, E., Cavazzana-Calvo, M., Cossu, G.,De Luca, M., Fox, I. J., Gerstle, C., Goldstein, R. A., Hermeren, G., High, K. A., Kim,
105
H. O., Lee, H. P., Levy-Lahad, E., Li, L., Lo, B., Marshak, D. R., McNab, A., Munsie, M.,Nakauchi, H., Rao, M., Rooke, H. M., Valles, C. S., Srivastava, A., Sugarman, J., Taylor,P. L., Veiga, A., Wong, A. L., Zoloth, L. & Daley, G. Q. New ISSCR guidelines underscoremajor principles for responsible translational stem cell research. Cell Stem Cell 3, 607–9(2008).
7. Carpenter, M. K. & Couture, L. A. Regulatory considerations for the development ofautologous induced pluripotent stem cell therapies. Regen Med 5, 569–79 (2010).
8. Ludwig, T. E., Bergendahl, V., Levenstein, M. E., Yu, J., Probasco, M. D. & Thomson,J. A. Feeder-independent culture of human embryonic stem cells. Nat Methods 3, 637–46(2006).
9. Chen, G., Gulbranson, D. R., Hou, Z., Bolin, J. M., Ruotti, V., Probasco, M. D., Smuga-Otto, K., Howden, S. E., Diol, N. R., Propson, N. E., Wagner, R., Lee, G. O., Antosiewicz-Bourget, J., Teng, J. M. & Thomson, J. A. Chemically defined conditions for human iPSCderivation and culture. Nat Methods 8, 424–9 (2011).
10. Ungrin, M., O’Connor, M., Eaves, C. & Zandstra, P. W. Phenotypic analysis of humanembryonic stem cells. Curr Protoc Stem Cell Biol Chapter 1, Unit 1B 3 (2007).
11. Laurent, L. C., Ulitsky, I., Slavin, I., Tran, H., Schork, A., Morey, R., Lynch, C., Harness,J. V., Lee, S., Barrero, M. J., Ku, S., Martynova, M., Semechkin, R., Galat, V., Gottesfeld,J., Izpisua Belmonte, J. C., Murry, C., Keirstead, H. S., Park, H. S., Schmidt, U., Laslett,A. L., Muller, F. J., Nievergelt, C. M., Shamir, R. & Loring, J. F. Dynamic changes inthe copy number of pluripotency and cell proliferation genes in human ESCs and iPSCsduring reprogramming and time in culture. Cell Stem Cell 8, 106–18 (2011).
12. Badur, M. G., Zhang, H. & Metallo, C. M. Enzymatic passaging of human embryonic stemcells alters central carbon metabolism and glycan abundance. Biotechnol J (2015).
13. Lee, J. B., Graham, M., Collins, T. J., Lee, J. H., Hong, S. H., McNicol, A. J., Shapovalova,Z. & Bhatia, M. Reversible lineage-specific priming of human embryonic stem cells canbe exploited to optimize the yield of differentiated cells. Stem Cells 33, 1142–52 (2015).
14. Ben-Zvi, D. & Melton, D. A. Modeling human nutrition using human embryonic stemcells. Cell 161, 12–7 (2015).
15. Folmes, C. D., Nelson, T. J., Martinez-Fernandez, A., Arrell, D. K., Lindor, J. Z., Dzeja,P. P., Ikeda, Y., Perez-Terzic, C. & Terzic, A. Somatic oxidative bioenergetics transitionsinto pluripotency-dependent glycolysis to facilitate nuclear reprogramming. Cell Metab14, 264–71 (2011).
106

16. Panopoulos, A. D., Yanes, O., Ruiz, S., Kida, Y. S., Diep, D., Tautenhahn, R., Herrerias, A.,Batchelder, E. M., Plongthongkum, N., Lutz, M., Berggren, W. T., Zhang, K., Evans, R. M.,Siuzdak, G. & Izpisua Belmonte, J. C. The metabolome of induced pluripotent stem cellsreveals metabolic changes occurring in somatic cell reprogramming. Cell Res 22, 168–77(2012).
17. Zhu, S., Li, W., Zhou, H., Wei, W., Ambasudhan, R., Lin, T., Kim, J., Zhang, K. & Ding, S.Reprogramming of human primary somatic cells by OCT4 and chemical compounds. CellStem Cell 7, 651–5 (2010).
18. Moussaieff, A., Rouleau, M., Kitsberg, D., Cohen, M., Levy, G., Barasch, D., Nemirovski,A., Shen-Orr, S., Laevsky, I., Amit, M., Bomze, D., Elena-Herrmann, B., Scherf, T.,Nissim-Rafinia, M., Kempa, S., Itskovitz-Eldor, J., Meshorer, E., Aberdam, D. & Nahmias,Y. Glycolysis-mediated changes in acetyl-CoA and histone acetylation control the earlydifferentiation of embryonic stem cells. Cell Metab 21, 392–402 (2015).
19. Shiraki, N., Shiraki, Y., Tsuyama, T., Obata, F., Miura, M., Nagae, G., Aburatani, H., Kume,K., Endo, F. & Kume, S. Methionine metabolism regulates maintenance and differentiationof human pluripotent stem cells. Cell Metab 19, 780–94 (2014).
20. Wang, J., Alexander, P., Wu, L., Hammer, R., Cleaver, O. & McKnight, S. L. Dependenceof mouse embryonic stem cells on threonine catabolism. Science 325, 435–9 (2009).
21. Shyh-Chang, N., Locasale, J. W., Lyssiotis, C. A., Zheng, Y., Teo, R. Y., Ratanasirintrawoot,S., Zhang, J., Onder, T., Unternaehrer, J. J., Zhu, H., Asara, J. M., Daley, G. Q. & Cantley,L. C. Influence of threonine metabolism on S-adenosylmethionine and histone methylation.Science 339, 222–6 (2013).
22. Yanes, O., Clark, J., Wong, D. M., Patti, G. J., Sanchez-Ruiz, A., Benton, H. P., Trauger,S. A., Desponts, C., Ding, S. & Siuzdak, G. Metabolic oxidation regulates embryonic stemcell differentiation. Nat Chem Biol 6, 411–7 (2010).
23. Zhang, J., Nuebel, E., Daley, G. Q., Koehler, C. M. & Teitell, M. A. Metabolic regulation inpluripotent stem cells during reprogramming and self-renewal. Cell Stem Cell 11, 589–95(2012).
24. Zhang, J., Khvorostov, I., Hong, J. S., Oktay, Y., Vergnes, L., Nuebel, E., Wahjudi, P. N.,Setoguchi, K., Wang, G., Do, A., Jung, H. J., McCaffery, J. M., Kurland, I. J., Reue, K.,Lee, W. N., Koehler, C. M. & Teitell, M. A. UCP2 regulates energy metabolism anddifferentiation potential of human pluripotent stem cells. EMBO J 30, 4860–73 (2011).
25. Viale, A., Pettazzoni, P., Lyssiotis, C. A., Ying, H., Sanchez, N., Marchesini, M., Carugo,A., Green, T., Seth, S., Giuliani, V., Kost-Alimova, M., Muller, F., Colla, S., Nezi, L.,Genovese, G., Deem, A. K., Kapoor, A., Yao, W., Brunetto, E., Kang, Y., Yuan, M., Asara,
107
J. M., Wang, Y. A., Heffernan, T. P., Kimmelman, A. C., Wang, H., Fleming, J. B., Cantley,L. C., DePinho, R. A. & Draetta, G. F. Oncogene ablation-resistant pancreatic cancer cellsdepend on mitochondrial function. Nature 514, 628–32 (2014).
26. Vacanti, N. M., Divakaruni, A. S., Green, C. R., Parker, S. J., Henry, R. R., Ciaraldi, T. P.,Murphy, A. N. & Metallo, C. M. Regulation of substrate utilization by the mitochondrialpyruvate carrier. Mol Cell 56, 425–35 (2014).
27. Lewis, C. A., Parker, S. J., Fiske, B. P., McCloskey, D., Gui, D. Y., Green, C. R., Vokes,N. I., Feist, A. M., Vander Heiden, M. G. & Metallo, C. M. Tracing compartmentalizedNADPH metabolism in the cytosol and mitochondria of mammalian cells. Mol Cell 55,253–63 (2014).
28. Young, J. D. INCA: a computational platform for isotopically non-stationary metabolicflux analysis. Bioinformatics 30, 1333–5 (2014).
29. Antoniewicz, M. R., Kelleher, J. K. & Stephanopoulos, G. Determination of confidenceintervals of metabolic fluxes estimated from stable isotope measurements. Metab Eng 8,324–37 (2006).
30. Divakaruni, A. S., Paradyse, A., Ferrick, D. A., Murphy, A. N. & Jastroch, M. Analysis andinterpretation of microplate-based oxygen consumption and pH data. Methods Enzymol547, 309–54 (2014).
31. Wang, X., Spandidos, A., Wang, H. & Seed, B. PrimerBank: a PCR primer database forquantitative gene expression analysis, 2012 update. Nucleic Acids Res 40, D1144–9 (2012).
32. Patra, K. C. & Hay, N. The pentose phosphate pathway and cancer. Trends Biochem Sci39, 347–54 (2014).
33. DeBerardinis, R. J., Mancuso, A., Daikhin, E., Nissim, I., Yudkoff, M., Wehrli, S. &Thompson, C. B. Beyond aerobic glycolysis: transformed cells can engage in glutaminemetabolism that exceeds the requirement for protein and nucleotide synthesis. Proc NatlAcad Sci U S A 104, 19345–50 (2007).
34. Ahn, C. S. & Metallo, C. M. Mitochondria as biosynthetic factories for cancer proliferation.Cancer Metab 3, 1 (2015).
35. Carey, B. W., Finley, L. W., Cross, J. R., Allis, C. D. & Thompson, C. B. Intracellularalpha-ketoglutarate maintains the pluripotency of embryonic stem cells. Nature 518, 413–6(2015).
36. Metallo, C. M., Gameiro, P. A., Bell, E. L., Mattaini, K. R., Yang, J., Hiller, K., Jewell,C. M., Johnson, Z. R., Irvine, D. J., Guarente, L., Kelleher, J. K., Vander Heiden, M. G.,
108
Iliopoulos, O. & Stephanopoulos, G. Reductive glutamine metabolism by IDH1 mediateslipogenesis under hypoxia. Nature 481, 380–4 (2012).
37. Mullen, A. R., Wheaton, W. W., Jin, E. S., Chen, P. H., Sullivan, L. B., Cheng, T., Yang, Y.,Linehan, W. M., Chandel, N. S. & DeBerardinis, R. J. Reductive carboxylation supportsgrowth in tumour cells with defective mitochondria. Nature 481, 385–8 (2012).
38. Wise, D. R., Ward, P. S., Shay, J. E., Cross, J. R., Gruber, J. J., Sachdeva, U. M., Platt,J. M., DeMatteo, R. G., Simon, M. C. & Thompson, C. B. Hypoxia promotes isocitratedehydrogenase-dependent carboxylation of alpha-ketoglutarate to citrate to support cellgrowth and viability. Proc Natl Acad Sci U S A 108, 19611–6 (2011).
39. Fendt, S. M., Bell, E. L., Keibler, M. A., Olenchock, B. A., Mayers, J. R., Wasylenko,T. M., Vokes, N. I., Guarente, L., Vander Heiden, M. G. & Stephanopoulos, G. Reductiveglutamine metabolism is a function of the alpha-ketoglutarate to citrate ratio in cells. NatCommun 4, 2236 (2013).
40. Xu, W., Yang, H., Liu, Y., Yang, Y., Wang, P., Kim, S. H., Ito, S., Yang, C., Wang, P., Xiao,M. T., Liu, L. X., Jiang, W. Q., Liu, J., Zhang, J. Y., Wang, B., Frye, S., Zhang, Y., Xu,Y. H., Lei, Q. Y., Guan, K. L., Zhao, S. M. & Xiong, Y. Oncometabolite 2-hydroxyglutarateis a competitive inhibitor of alpha-ketoglutarate-dependent dioxygenases. Cancer Cell 19,17–30 (2011).
41. Grassian, A. R., Parker, S. J., Davidson, S. M., Divakaruni, A. S., Green, C. R., Zhang, X.,Slocum, K. L., Pu, M., Lin, F., Vickers, C., Joud-Caldwell, C., Chung, F., Yin, H., Handly,E. D., Straub, C., Growney, J. D., Vander Heiden, M. G., Murphy, A. N., Pagliarini, R. &Metallo, C. M. IDH1 mutations alter citric acid cycle metabolism and increase dependenceon oxidative mitochondrial metabolism. Cancer Res 74, 3317–31 (2014).
42. Porstmann, T., Santos, C. R., Griffiths, B., Cully, M., Wu, M., Leevers, S., Griffiths, J. R.,Chung, Y. L. & Schulze, A. SREBP activity is regulated by mTORC1 and contributes toAkt-dependent cell growth. Cell Metab 8, 224–36 (2008).
43. Hu, W., Zhang, C., Wu, R., Sun, Y., Levine, A. & Feng, Z. Glutaminase 2, a novel p53target gene regulating energy metabolism and antioxidant function. Proc Natl Acad Sci US A 107, 7455–60 (2010).
44. Suzuki, S., Tanaka, T., Poyurovsky, M. V., Nagano, H., Mayama, T., Ohkubo, S., Lokshin,M., Hosokawa, H., Nakayama, T., Suzuki, Y., Sugano, S., Sato, E., Nagao, T., Yokote,K., Tatsuno, I. & Prives, C. Phosphate-activated glutaminase (GLS2), a p53-inducibleregulator of glutamine metabolism and reactive oxygen species. Proc Natl Acad Sci U S A107, 7461–6 (2010).
109
45. Velletri, T., Romeo, F., Tucci, P., Peschiaroli, A., Annicchiarico-Petruzzelli, M., Niklison-Chirou, M. V., Amelio, I., Knight, R. A., Mak, T. W., Melino, G. & Agostini, M. GLS2 istranscriptionally regulated by p73 and contributes to neuronal differentiation. Cell Cycle12, 3564–73 (2013).
46. Garcia-Gonzalo, F. R. & Izpisua Belmonte, J. C. Albumin-associated lipids regulate humanembryonic stem cell self-renewal. PLoS One 3, e1384 (2008).
47. Vander Heiden, M. G., Locasale, J. W., Swanson, K. D., Sharfi, H., Heffron, G. J., Amador-Noguez, D., Christofk, H. R., Wagner, G., Rabinowitz, J. D., Asara, J. M. & Cantley, L. C.Evidence for an alternative glycolytic pathway in rapidly proliferating cells. Science 329,1492–9 (2010).
48. Vacanti, N. M. & Metallo, C. M. Exploring metabolic pathways that contribute to the stemcell phenotype. Biochim Biophys Acta 1830, 2361–9 (2013).
49. Prigione, A., Fauler, B., Lurz, R., Lehrach, H. & Adjaye, J. The senescence-relatedmitochondrial/oxidative stress pathway is repressed in human induced pluripotent stemcells. Stem Cells 28, 721–33 (2010).
50. Zhou, W., Choi, M., Margineantu, D., Margaretha, L., Hesson, J., Cavanaugh, C., Blau,C. A., Horwitz, M. S., Hockenbery, D., Ware, C. & Ruohola-Baker, H. HIF1alpha inducedswitch from bivalent to exclusively glycolytic metabolism during ESC-to-EpiSC/hESCtransition. EMBO J 31, 2103–16 (2012).
51. Folmes, C. D., Dzeja, P. P., Nelson, T. J. & Terzic, A. Metabolic plasticity in stem cellhomeostasis and differentiation. Cell Stem Cell 11, 596–606 (2012).
52. Wheaton, W. W., Weinberg, S. E., Hamanaka, R. B., Soberanes, S., Sullivan, L. B., Anso,E., Glasauer, A., Dufour, E., Mutlu, G. M., Budigner, G. S. & Chandel, N. S. Metformininhibits mitochondrial complex I of cancer cells to reduce tumorigenesis. Elife 3, e02242(2014).
53. Jeon, S. M., Chandel, N. S. & Hay, N. AMPK regulates NADPH homeostasis to promotetumour cell survival during energy stress. Nature 485, 661–5 (2012).
54. Stanton, R. C. Glucose-6-phosphate dehydrogenase, NADPH, and cell survival. IUBMBLife 64, 362–9 (2012).
55. Peterson, S. E. & Loring, J. F. Genomic instability in pluripotent stem cells: implicationsfor clinical applications. J Biol Chem 289, 4578–84 (2014).
56. Garitaonandia, I., Amir, H., Boscolo, F. S., Wambua, G. K., Schultheisz, H. L., Sabatini,K., Morey, R., Waltz, S., Wang, Y. C., Tran, H., Leonardo, T. R., Nazor, K., Slavin, I.,Lynch, C., Li, Y., Coleman, R., Gallego Romero, I., Altun, G., Reynolds, D., Dalton, S.,
110

Parast, M., Loring, J. F. & Laurent, L. C. Increased risk of genetic and epigenetic instabilityin human embryonic stem cells associated with specific culture conditions. PLoS One 10,e0118307 (2015).
57. Lippmann, E. S., Estevez-Silva, M. C. & Ashton, R. S. Defined human pluripotent stemcell culture enables highly efficient neuroepithelium derivation without small moleculeinhibitors. Stem Cells 32, 1032–42 (2014).
111

Chapter 4
Lipid availability influences the metabolic
maturation of hPSC-derived
cardiomyocytes
4.1 Introduction
The promise of stem-cell derived cardiomyocytes (CMs) has been driven by a critical need
for durable cell sources for tissue engineering or toxicity screening applications [1–4]. With the
limited regenerative capacity of the adult heart, research efforts have focused on the development
of protocols that allow for relatively homogeneous cardiac differentiation. Recent protocols now
allow purities approaching >90% without the use of growth factors in partially- or fully-defined
conditions [5, 6]. However these protocols generate functionally immature cardiomyocytes which
lack the proper electrical connectivity, force generation, and metabolic phenotype to properly
mimic their in vivo counterparts [7, 8]. Preclinical models of CM transplantation have shown
potential increased arrhythmia risk and demonstrated the need for functional maturation [9,
10]. Recapitulation of native mitochondrial function and bioenergetics will be essential to drive
112

maturation.
While simple aging of cells has generated some success [11], this is impractical for
bioprocess scale up and quantities needed eventually in vivo after myocardial infarction (i.e.
delivery of up to 109 cells) [2, 12]. Efforts to speed up functional maturation of CMs in vitro have
focused on physical cues [13], electrical stimulation [14, 15], and physical microenvironment
[16–18] but metabolic manipulation through media provides a promising potential avenue [19].
The bioenergetic demands of the developing and adult heart require a dramatic upregula-
tion of ATP production, which is a marked by a transition from a highly glycolytic pluripotent
stem cell to a somatic cell relying primarily on oxidative phosphorylation [20]. Recent work
has demonstrated that this mitochondrial shift is necessary for proper CM development [21].
Moreover, the increase in mitochondrial activity is marked by the catabolism a diverse set of
carbon sources in the adult heart that drives proper CM function in the fasted and fed states (e.g.
fatty acids, ketone bodies, branched-chain amino acids) [22, 23]. As with other measures of
CM function, the metabolism of hPSC-derived CMs is fetal-like with heavy reliance on glycol-
ysis and glucose oxidation and presents a roadblock for their utility [24, 25]. However recent
work has definitively demonstrated that activating mitochondrial function through galactose
supplementation induces a more mature CM metabolism (i.e. fatty acid oxidation) and better
function in hPSC-derived CMs [26]. However, the role of mitochondrial substrate switching
during CM differentiation and the role of fatty acid biosynthesis/oxidation during maturation
remains unknown.
We hypothesized that by examining CM metabolism during differentiation we could
identify key pathways that modulate CM function. Indeed, we found that immature hPSC-
derived CMs suppress glutaminolysis as compared to hPSCs themselves. However, these cells
fail to activate fatty acid oxidation (FAO) during differentiation. Day-by-day tracing revealed
an activation of enzyme expression and mitochondrial catabolism of key substrates during
differentiation, suggesting a correct differentiation program and some other obstacle to proper
113

CM function. Examination of lipid metabolism gene expression revealed aberrant fatty acid
oxidation and synthesis pathway expression, leading us to hypothesize that lack of fatty acid
supplementation in gold-standard differentiation medias forces CMs to synthesize structural
lipids instead of oxidizing them for fuel. Supplementation of complex fatty acid mixtures
improves mitochondrial function and substrate oxidation. Together this suggests that nutritional
microenvironments must be considered when designing maintenance conditions as improper
reprogramming of the metabolic network can prevent other physiologic functions.
4.2 Materials and Methods
4.2.1 Human pluripotent stem cell (hPSC) culture
Human embryonic stem cell line WA09 (H9) and induced pluripotent stem cell line
iPS(IMR90iPS)-c4 were supplied by WiCell Research Institute. HPSCs were routinely maintained
in mTeSR1 media (Stem Cell Technologies) on growth factor-reduced Matrigel (Corning Life
Sciences) at 8.8 µg/cm2 and passaged every 4 days using ReLeSR (Stem Cell Technologies). All
hPSCs experiments were conducted with cells ranging from 40 and 70 passages. For metabolic
tracing experiment, hPSCs were adapted to chemically defined media TeSR-E8 media (Stem Cell
Technologies) for at least one passage, and all hPSCs were detached and plated by exposure to
Accutase (Innovative Cell Technology).
4.2.2 Cardiomyocyte differentiation
All hPSCs were cultured for at least five passages post thaw before beginning differentia-
tion. HPSCs were differentiated by the adapted chemically defined cardiomyocyte generation
protocol [6]. Briefly, hPSCs were dissociated using a 0.5 mM EDTA (Life Technologies) in PBS
without CaCl2 or MgCl2 (Corning Life Sciences) for 7 minutes at room temperature. HPSCs
114
were plated at 3.0x10⁵ cells per well in mTeSR1 or TeSR-E8 media (Stem Cell Technologies)
supplemented with 2 µM Thiazovivin (Selleck Chemicals) for the first 24 hours after passage.
HPSCs were fed for 3-5 days until they reached >90% confluence. To initiate differentiate,
cells were washed with PBS 1X and the culture medium was changed to CDM3, consisting of
RPMI 1640 medium (Life Technologies), 500 µg/mL O. sativa-derived recombinant human
albumin (A0237, Sigma-Aldrich), and 213 µg/mL L-ascorbic acid 2-phosphate (49752, Sigma-
Aldrich), with 6 µM CHIR 99021 (Selleck Chemicals) for 48 hours. Media was then changed
to CDM3 with 2 µM Wnt Inhibitor C59 (Selleck Chemicals) for 48 hours. Cells were then
dissociated with TrypLE Express (Life Technologies) and plated onto Matrigel coated plates
in CDM3 supplemented with 200 nM Thiazovivin at a density of 1x10⁶ cells per well. After
cardiomyocyte beating was observed (on day 7 to 8), Glucose free CDM3 medium with 10 mM
sodium DL-lactate (Sigma-Aldrich), were used for further in vitro cardiomyocyte purification (2
to 4 days). Cardiomyocytes were then maintained in CDM3 with media changes every 48 hours.
For hPSCs-derived CMs cultured with nutrient lipid supplement, CDM3 containing AlbuMAX
(1.6% w/v; Life Technologies) were added in after day 8. Media was completely replaced every
48 hours thereafter.
4.2.3 13C metabolic tracing
For tracer experiments, culture medium was removed, cells were rinsed with PBS, and
tracer media was added to wells. Tracer media consisted of glutamine, glucose, amino acid
free RPMI1640 (US Biologics) supplemented with proper levels of 12C amino acids, organic
acids, and carbohydrates not being traced. If a more replete condition was being tested (i.e.
additional nutrients added to basal media), 12C metabolites were added to other tracer arms to
ensure equivalent nutrient state (i.e. add 12C lactate to a 13C glucose trace). The following tracers
were used: [U-13C5]glutamine (Cambridge Isotope Laboratory), [U-13C6]glucose (Cambridge
Isotope Laboratory), [3-13C]pyruvate (2mM; Cambridge Isotope Laboratory), [3-13C]lactate
115
(2mM; Cambridge Isotope Laboratory), [U-13C6]leucine (Cambridge Isotope Laboratory), [U-
13C4]β -hydroxybutyrate (2mM; Sigma), [U-13C8]octanoate, or [U-13C16]palmitate (Cambridge
Isotope Laboratory). [U-13C]palmitate was first non-covalently conjugated to ultra fatty acid
free BSA (Roche) as previously described [27]. BSA conjugated [U-13C16]palmitate was added
to each culture medium along with additional L-carnitine at 50 µM (5% v/v) and 0.5 mM,
respectively.
4.2.4 Metabolite extraction and derivatization
Cellular metabolites and fatty acids were extracted using methanol/water/chloroform.
Briefly, spent media was removed, and cells were rinsed with 0.9% (w/v) saline and 500 µL of
-80ÂrC MeOH was added to quench metabolism. 200 ÎijL of ice-cold water containing 5 µg/mL
norvaline (internal standard for organic acids and amino acids) was added to each well. Both
solution and cells were collected via scraping. Cell lysates were transferred to fresh Eppendorf
tube and 500 ÎijL of -20ÂrC CHCl3 containing 2 µg/mL D31-palmitic acid (internal standard
for fatty acids) was added. After vortexing and centrifugation, the top aqueous layer and bottom
organic layer were collected and dried.
Derivatization of aqueous metabolites was performed using the Gerstel MultiPurpose Sam-
pler (MPS 2XL). Dried aqueous metabolites were dissolved in 20 µL of 2% (w/v) methoxyamine
hydrochloride (MP Biomedicals) in pyridine and held at 37◦C for 60 minutes. Subsequent
conversion to their tert-butyldimethylsilyl derivatives was accomplished by adding 30 µL N-
methyl-N-(tert-butyldimethylsilyl) trifluoroacetamide + 1% tert-butyldimethylchlorosilane (Regis
Technologies) and incubating at 37◦C for 30 minutes. Fatty acid methyl esters (FAMEs) were
generated by dissolving dried fatty acids in 0.5 mL 2% (v/v) methanolic sulfuric acid (Sigma-
Aldrich) and incubating at 50◦C for 2 hours. FAMEs were subsequently extracted in 1 mL hexane
with 0.1 mL saturated NaCl. Cholesterol was derivatized from dried FAME fraction by first dis-
solving in 20 µL pyridine and then adding 30 µL N-methyl-N-trimethylsilyl-trifluoroacetamide
116
(Macherey-Nagel) at 37◦C for 30 minutes.
4.2.5 GC/MS analysis
Gas chromatography/mass spectrometry (GC/MS) analysis was performed using an
Agilent 7890A with a 30 m DB-35MS capillary column (Agilent Technologies) connected to
an Agilent 5975C MS. GC/MS was operated under electron impact (EI) ionization at 70 eV.
One microliter sample was injected in splitless mode at 270◦C, using helium as the carrier gas
at a flow rate of 1 ml/min. For analysis of organic and amino acid derivatives, the GC oven
temperature was held at 100◦C for 2 minutes, increased to 255◦C at 3.5◦C/min, then ramped
to 320◦C at 15◦C/min for a total run time of approximately 50 minutes. For measurement of
FAMEs, the GC oven temperature was held at 100◦C for 3 minutes, then to 205◦C at 25◦C/min,
further increased to 230◦C at 5◦C/min and ramped up to 300◦C at 25◦C/min for a total run time
of approximately 15 minutes. For measurement of cholesterol, the GC oven temperature was held
at 150◦C for 1 minute, then to 260◦C at 20◦C/min, then held for 3 minutes, and further increased
to 280◦C at 10◦C/min and held for 15 minutes, finally ramped up to 325◦C for a total run time
of approximately 30 minutes. The MS source and quadrupole were held at 230◦C and 150◦C,
respectively, and the detector was operated in scanning mode, recording ion abundance in the
range of 100 - 650 m/z.
4.2.6 Mole percent enrichment calculation
Mole percent enrichment (MPE) of isotopes was calculated as the percent of all atoms
within the metabolite pool that are labeled:
∑ni=1 Mi · i
n
117
where n is the number of carbon atoms in the metabolite and Mi is the relative abundance of the
ith mass isotopomer. Citrate MPE derived from different nutrient tracers represent the flux of
labeled nutrients into cellular central carbon metabolism.
4.2.7 Isotopomer spectral analysis (ISA)
For quantification of metabolites and mass isotopomer distributions, selected ion fragments
were integrated and corrected for natural isotope abundance using MATLAB-based algorithm
and metabolite fragments listed in Table 4.1. Total abundances were normalized by counts of
internal standard control. Isotopomer spectral analysis (ISA) for quantitation of 13C contribution
to lipogenic AcCoA was calculated as previously described [27]. Specifically, the relative
enrichment of the lipogenic AcCoA pools from a given tracer and the percentage of newly
synthesized fatty acids were estimated from a best-fit model using the INCA MFA software
package [28]. The 95% confidence intervals for both parameters were determined by evaluating
the sensitivity of the sum of squared residuals between measured and simulated palmitate mass
isotopomer distributions to small flux variations [29].
4.2.8 Oxygen Consumption Measurement
Respiration was measured in viable hPSC-derived cardiomyocytes using a Seahorse XF96
Analyzer. HPSC-derived cardiomyocytes were assayed in fresh culture media. ATP-linked
respiration was calculated as the oxygen consumption rate sensitive to 2 mg/mL oligomycin in
each culture condition and normalized by cell abundance. Each culture condition sample had at
least four biological replicates analyzed. Cell abundance was indicated by the total fluorescence
after stained with Hoechst 33342 [30].
118

Table 4.1: Metabolite fragments used for GC/MS analysis.
Metabolite m/z Fragments for integration
α-Ketoglutarate 346 C14H28O5NSi2Alanine 260 C11H26O2NSi2Aspartate 418 C18H40O4NSi3Lactate 261 C11H25O3Si2
233 C10H25O2Si2Citrate 459 C20H39O6Si3Fumarate 287 C12H23O4Si2Glutamate 432 C19H42O4NSi3Glutamine 431 C19H43O3N2Si3Glycine 246 C10H24O2NSi2Malate 419 C18H39O5Si3Norvaline 288 C13H30O2NSi2Proline 330 C16H36O2NSi2Pyruvate 174 C6H12O3NSiSerine 390 C17H40O3NSi3Succinate 289 C12H25O4Si2Myristate 242 C15H30O2Palmitate 270 C17H34O2Stearate 298 C19H38O2Oleate 296 C19H36O2Cholesterol 458 C33H54OSi
119
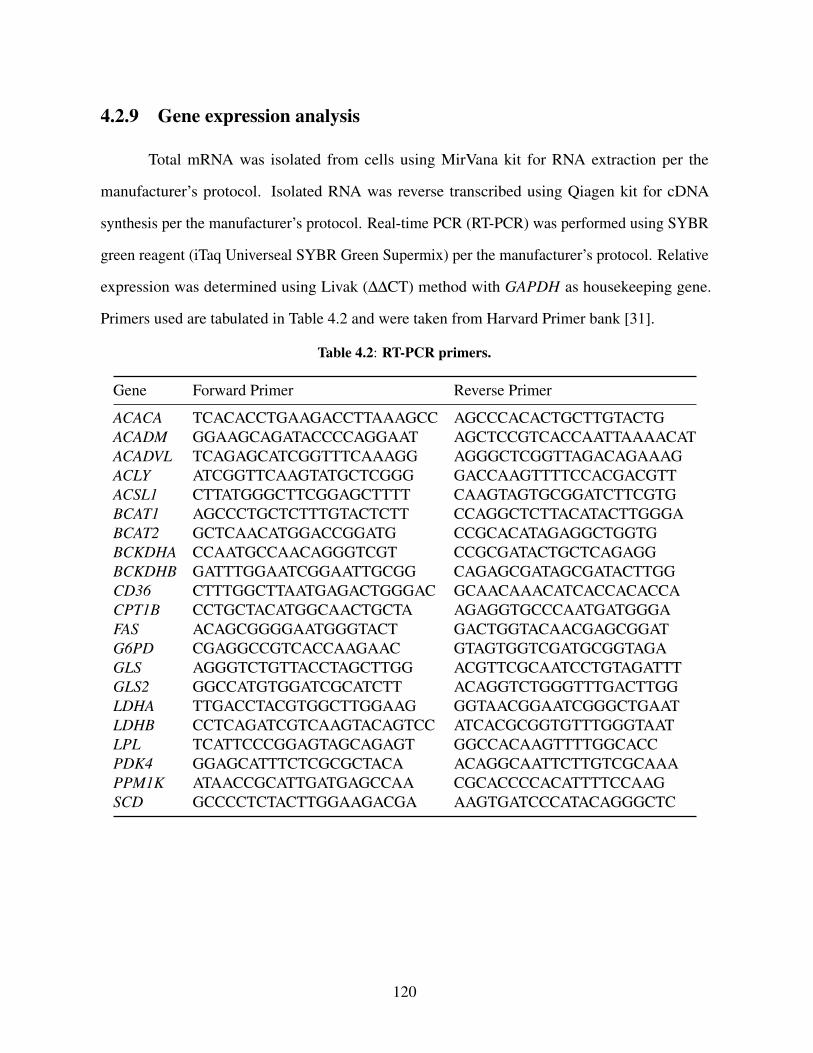
4.2.9 Gene expression analysis
Total mRNA was isolated from cells using MirVana kit for RNA extraction per the
manufacturer’s protocol. Isolated RNA was reverse transcribed using Qiagen kit for cDNA
synthesis per the manufacturer’s protocol. Real-time PCR (RT-PCR) was performed using SYBR
green reagent (iTaq Universeal SYBR Green Supermix) per the manufacturer’s protocol. Relative
expression was determined using Livak (∆∆CT) method with GAPDH as housekeeping gene.
Primers used are tabulated in Table 4.2 and were taken from Harvard Primer bank [31].
Table 4.2: RT-PCR primers.
Gene Forward Primer Reverse Primer
ACACA TCACACCTGAAGACCTTAAAGCC AGCCCACACTGCTTGTACTGACADM GGAAGCAGATACCCCAGGAAT AGCTCCGTCACCAATTAAAACATACADVL TCAGAGCATCGGTTTCAAAGG AGGGCTCGGTTAGACAGAAAGACLY ATCGGTTCAAGTATGCTCGGG GACCAAGTTTTCCACGACGTTACSL1 CTTATGGGCTTCGGAGCTTTT CAAGTAGTGCGGATCTTCGTGBCAT1 AGCCCTGCTCTTTGTACTCTT CCAGGCTCTTACATACTTGGGABCAT2 GCTCAACATGGACCGGATG CCGCACATAGAGGCTGGTGBCKDHA CCAATGCCAACAGGGTCGT CCGCGATACTGCTCAGAGGBCKDHB GATTTGGAATCGGAATTGCGG CAGAGCGATAGCGATACTTGGCD36 CTTTGGCTTAATGAGACTGGGAC GCAACAAACATCACCACACCACPT1B CCTGCTACATGGCAACTGCTA AGAGGTGCCCAATGATGGGAFAS ACAGCGGGGAATGGGTACT GACTGGTACAACGAGCGGATG6PD CGAGGCCGTCACCAAGAAC GTAGTGGTCGATGCGGTAGAGLS AGGGTCTGTTACCTAGCTTGG ACGTTCGCAATCCTGTAGATTTGLS2 GGCCATGTGGATCGCATCTT ACAGGTCTGGGTTTGACTTGGLDHA TTGACCTACGTGGCTTGGAAG GGTAACGGAATCGGGCTGAATLDHB CCTCAGATCGTCAAGTACAGTCC ATCACGCGGTGTTTGGGTAATLPL TCATTCCCGGAGTAGCAGAGT GGCCACAAGTTTTGGCACCPDK4 GGAGCATTTCTCGCGCTACA ACAGGCAATTCTTGTCGCAAAPPM1K ATAACCGCATTGATGAGCCAA CGCACCCCACATTTTCCAAGSCD GCCCCTCTACTTGGAAGACGA AAGTGATCCCATACAGGGCTC
120
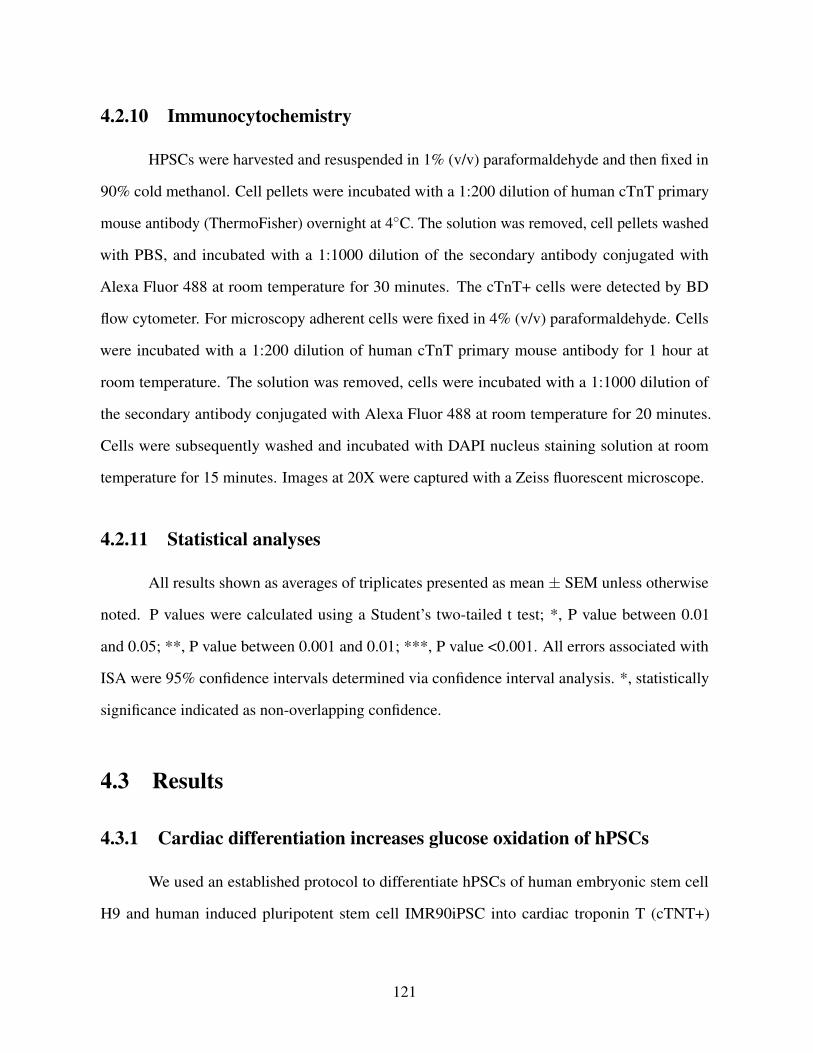
4.2.10 Immunocytochemistry
HPSCs were harvested and resuspended in 1% (v/v) paraformaldehyde and then fixed in
90% cold methanol. Cell pellets were incubated with a 1:200 dilution of human cTnT primary
mouse antibody (ThermoFisher) overnight at 4◦C. The solution was removed, cell pellets washed
with PBS, and incubated with a 1:1000 dilution of the secondary antibody conjugated with
Alexa Fluor 488 at room temperature for 30 minutes. The cTnT+ cells were detected by BD
flow cytometer. For microscopy adherent cells were fixed in 4% (v/v) paraformaldehyde. Cells
were incubated with a 1:200 dilution of human cTnT primary mouse antibody for 1 hour at
room temperature. The solution was removed, cells were incubated with a 1:1000 dilution of
the secondary antibody conjugated with Alexa Fluor 488 at room temperature for 20 minutes.
Cells were subsequently washed and incubated with DAPI nucleus staining solution at room
temperature for 15 minutes. Images at 20X were captured with a Zeiss fluorescent microscope.
4.2.11 Statistical analyses
All results shown as averages of triplicates presented as mean ± SEM unless otherwise
noted. P values were calculated using a Student’s two-tailed t test; *, P value between 0.01
and 0.05; **, P value between 0.001 and 0.01; ***, P value <0.001. All errors associated with
ISA were 95% confidence intervals determined via confidence interval analysis. *, statistically
significance indicated as non-overlapping confidence.
4.3 Results
4.3.1 Cardiac differentiation increases glucose oxidation of hPSCs
We used an established protocol to differentiate hPSCs of human embryonic stem cell
H9 and human induced pluripotent stem cell IMR90iPSC into cardiac troponin T (cTNT+)
121

cardiomyocytes. hPSC cardiomyocytes were differentiated and maintained in chemically defined
CDM3 medium (RPMI1640 containing 500 µg/mL O. sativa-derived recombinant human albumin
(rHA) and 213 µg/mL L-ascorbic acid 2-phosphate) and either CHIR99021 or WntC59 to
modulate Wnt/β -catenin signaling to promote cardiac lineage specific differentiation. To obtain
high purity cardiomyocyte cultures glucose was replaced with lactate for one week to select
for cardiac cells. We achieved high efficiency cardiomyocyte differentiation, with over 80%
cTNT+ cells after 21 days of differentiation (Figure 4.1A), which increased further upon lactate
selection (Figure 4.1B). As proper metabolic function is critical for in vitro development of hPSC-
derived cardiomyocytes, we subsequently investigated the metabolic features of cardiomyocytes
continually cultured in serum free CDM3 media.
We recently applied 13C/2H metabolic tracing to demonstrate that hPSCs primarily fuel
TCA metabolism using glutamine rather than glucose, as the latter is shunted toward lipid
biosynthetic pathways under most hPSC culture conditions [32]. Here we similarly quantified how
[13C]glucose contributed to TCA intermediates in hPSCs versus hPSC-derived cardiomyocytes.
Upon terminal differentiation to the cardiac lineage we observed a significant increase in glucose
oxidation within mitochondria (Figure 4.1C). Therefore, while glutamine-mediated anaplerosis
is important for maintaining hPSCs in the undifferentiated state, differentiated cardiomyocytes
exhibit increased mitochondrial glucose metabolism. However, the dependence on glucose
oxidation to generate citrate (above 50%) also suggested that hPSC-cardiomyocytes differentiated
using this approach are metabolically immature, since human adult cardiomyocytes only exhibit
limited glucose contribution to TCA substrates [24, 33].
4.3.2 Nutrient consumption of hPSC-derived cardiomyocytes
Cardiac tissue is metabolically active and requires efficient nutrient consumption to meet
the significant bioenergetic demands of beating cardiomyocytes (with full ATP turnover occurring
over 6 times per minute) [34]. Mature cardiac cells are able to produce energy from multiple
122
Figure 4.1: hPSC-derived cardiomyocytes primarily oxidize glucose. (A) cTNT+ flowcytometry of D21 differentiating CMs. (B) Immunofluorescent images of lactate-selectedCMs. (C) Central carbon metabolite enrichment from [U-13C6]glucose in undifferentiated anddifferentiated H9 (left) and IMR90-iPS (right) cells.
123
substrates, including fatty acids, glucose, lactate, pyruvate, ketone bodies and branched chain
amino acids [35, 36]. As such, hPSC-derived cardiomyocyte should exhibit activation of these
specific pathways upon differentiation. Importantly, the nutritional microenvironment in vivo
is vastly different than that of in vitro culture conditions used for hPSC-derived cardiomyocyte
differentiation, which could limit the metabolic maturation of these cells [37]. Notably, consistent
with reports from ex vivo rat hearts, hPSC-cardiomyocytes in CDM3 media utilized glucose
rather than glutamine to generate TCA intermediates (Figure 4.2A) [38].
We next evaluated whether these derivatives would efficiently consume other substrates
that commonly fuel cardiac metabolism by tracing individual cultures with 13C-labeled glucose,
pyruvate, lactate, glutamine, leucine, β -hydroxybutyrate and palmitate tracers. We formulated
CDM3 media with these nutrients to measure [13C]nutrient fluxes into citrate and observed
significant incorporation from most nutrients (Figure 4.2B). Notably, β -hydroxybutyrate was
significant and supplanted a significant quantify of glucose flux into the TCA cycle. However, the
efficiency of fatty acid oxidation was relatively low, as [13C]palmitate contributed minimally to
citrate in these cultures (Figure 4.2B). Since lipid oxidation is a feature of mature cardiomyocytes
[39], our results suggested that hPSC-derived cardiomyocytes may genetically activate metabolic
enzymes, but the further energetic activation of the metabolic pathways may be restricted.
4.3.3 Metabolic activation during hPSC cardiac differentiation
To further investigate how metabolic pathway flux and transcription changed during
hPSC-derived cardiomyocyte differentiation we quantified substrate contributions to citrate and
pathway-specific gene expression during the first 12 days of hPSC cardiac differentiation. Specif-
ically, cells were maintained in CDM3 media and cells were traced with designated substrates for
24 hours prior to collection of samples for transcriptional and metabolomics analyses at designed
time points (Figure 4.3). As expected in our more replete culture condition, we observed a signifi-
cant decrease of glucose and glutamine consumption over time (Figure 4.3A-B). On the other
124

Figure 4.2: hPSC-derived cardiomyocytes are metabolically immature. (A) Central carbonmetabolite enrichment from [U-13C6]glucose and [U-13C5]glutamine in H9-derived (left) andIMR90-iPS-derived (right) CMs. (B) Citrate mole percent enrichment from various 13C tracersin complex media; H9-derived (top) and IMR90-iPS-derived (bottom) CMs.
125
hand, differentiating hPSCs significantly increased oxidation of leucine and β -hydroxybutyrate
throughout the cardiac differentiation program (Figure 4.3C-D). Consistent with the observed
changes in substrate oxidation to citrate, the gene expression results showed similar trends for spe-
cific enzyme isoforms. We found expression of glycolytic enzyme LDHs significantly decreased
but not the pentose phosphate pathway enzyme G6PD (Figure 4.3E). Although the expression
level of both LDH isozymes was slightly decreased, the heart isoform LDHB exhibited higher
levels than LDHA (Figure 4.3E). The glutamine consumption gene GLSs showed an isoform
specific change, GLS gene expression increased but GLS2 significantly dropped to extremely low
level (Figure 4.3F). Importantly, our recent study comparing hPSC adapted to different nutrient
conditions found GLS2 specifically upregulated in hPSCs maintained in chemically defined media
[32]. In contrast to glutamine metabolism, branched chain amino acid (BCAA) consumption
showed an increased trend as leucine contribution to citrate was increased over time. Expression
of enzymes involved in BCAA catabolism were upregulated with increases in mitochondrial
isoform BCAT2 but not cytosolic isoform BCAT1 observed (Figure 4.3G). In addition, the mito-
chondrial phosphatase PPM1K, which promotes branched chain keto acid dehydrogenase complex
(BCKDHC) activity through dephosphorylation, was also significantly upregulated (Figure 4.3G).
Furthermore, the significant increase in β -hydroxybutyrate consumption indicated that ketone
body metabolism was highly upregulated during cardiogenesis (Figure 4.3D). Comparing to the
decrease of glucose oxidation (Figure 4.3A), these results suggested the lower efficiency of cells
to produce acetyl-coenzyme A (AcCoA) via pyruvate dehydrogenase (PDH). Importantly, PDK4,
which negatively regulates PDHC through phosphorylation, was highly upregulated (Figure 4.3H).
All these results indicated that hPSCs during cardiac lineage specific differentiation exhibited
upregulation of multiple metabolic pathway enzyme gene expressions, but the in fact metabolic
contribution relied on the present of specific nutrients such as ketone bodies.
126
Figure 4.3: Day-by-day tracing reveals metabolic pathway activation and suppressionduring cardiac differentiation. Citrate mole percent enrichment from (A) [U-13C6]glucose, (B)[U-13C5]glutamine, (C) [U-13C6]leucine, and (D) [U-13C4]β -hydroxybutryrate during cardiacdifferentiation. Tracer added at specified day and metabolites extracted after 24 hours. (E-H)Metabolic gene expression during cardiac differentiation.
127
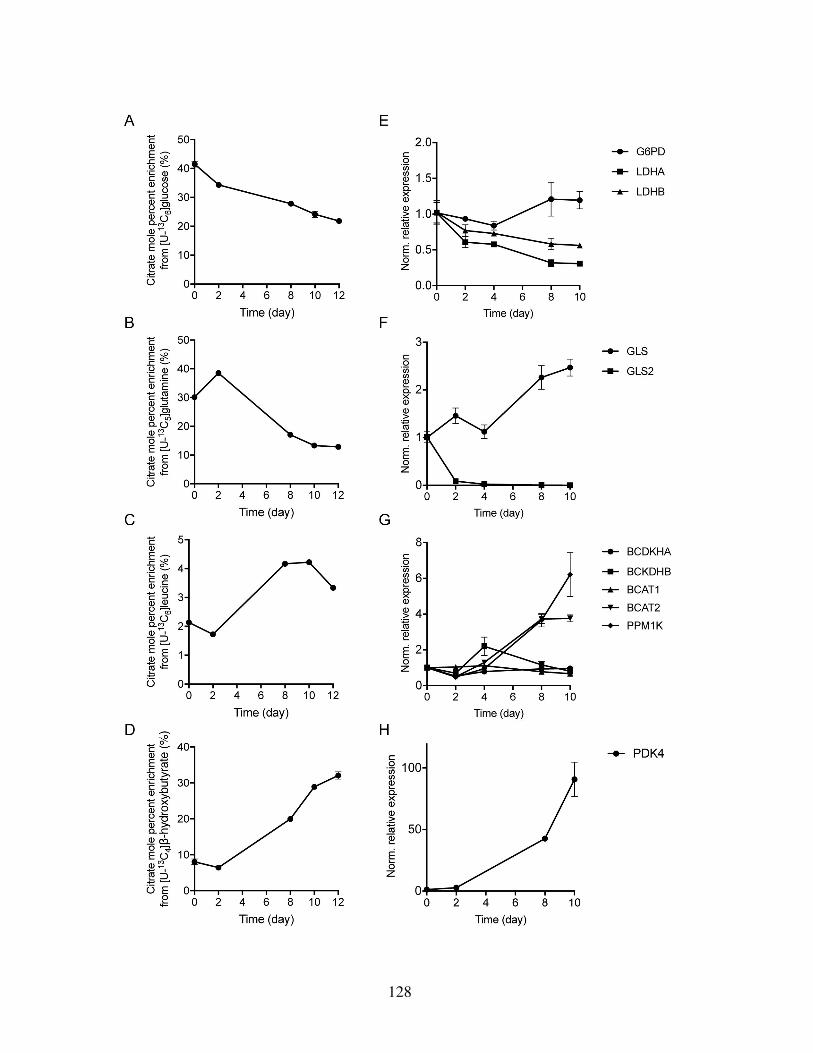
128
4.3.4 Changes in lipid metabolism during hPSC cardiac differentiation
We previously described high rates of de novo lipogenesis in hPSCs cultured in defined
media, and hPSC cardiac differentiation is commonly performed in similarly defined culture
media [32]. We therefore hypothesized that lipid metabolism might change significantly during
cardiogenesis. We first quantified the extent of fatty acid synthesis during differentiation. We
observed a dramatic decrease in de novo fatty acid synthesis as cells committed to the cardiac
lineage (Figure 4.4A). Consistent with this observation, we also found significant less contribution
of the glucose-derived AcCoA into lipid synthesis when the ketone body, β -hydroxybutyrate, is
added (Figure 4.4B). This indicates differentiating hPSCs may more efficiently oxidize ketone
bodies for de novo fatty acid synthesis, consistent with trends observed in citrate MPE (Figure
4.3A-D).
Since nutrient lipids were very limited in serum free media, hPSC highly relied on de novo
lipid synthesis for growth and survival (Figure 4.4C), the suppression of de novo lipid synthesis,
especially for unsaturated fatty acid oleate, would negatively affect the growth and development
of cardiac differentiating hPSCs [40]. Although limited lipids were present in CDM3 media,
the gene expression of enzymes involved in lipid consumption were significantly upregulated
in cardiac differentiating hPSCs (Figure 4.4D). We found cardiac specific isoform CPT1B (the
rate-limit enzyme of long-chain fatty acid β -oxidation pathway), ACADVL (the first step enzyme
in β -oxidation), and ACADM (enzyme in medium fatty acid oxidation) were all significantly
upregulated. At the same time, expression of the fatty acid transporter CD36 was and ACSL1,
which plays important role in lipid biosynthesis and degradation, also increased. In contrast,
genes encoding lipogenic enzymes did not change appreciably, including FASN, ACLY, ACACA
and SCD.
These results suggested that hPSC-cardiomyocytes differentiate in lipid-deficient con-
ditions and are unable to adequately synthesize or oxidize lipids necessary for maturation or
energy generation consistent with developmental studies [41]. As such, cells genetically activated
129

Figure 4.4: De novo lipogenesis is suppressed during cardiac differentiation. (A) Percentnewly synthesized fatty acid in 24 hours during cardiac differentiation. (B) Contribution of [U-13C6]glucose to lipogenic AcCoA during cardiac differentiation. (C) Percent newly synthesizedpalmitate and cholesterol in 24 hours in hPSCs. (D-G) Fatty acid synthesis and β -oxidationgene expression during cardiac differentiation.
130
lipid oxidation without sufficient nutrient lipid supplement from either de novo synthesis or
extracellular uptake. Consequently, the development of hPSC-derived cardiomyocyte, especially
maturation process might be artificially suppressed in serum-free CDM3 media.
4.3.5 Immature metabolic features of hPSC-derived cardiomyocytes cul-
tured in lipid insufficient environment
To test the above hypothesis, we supplied nutrient lipid mixture AlbuMAX into hP-
SCs cardiac differentiating culture on day 10 of differentiation and subsequently compared the
metabolic phenotypes of hPSC-derived cardiomyocytes with or without lipid addition on day 28
of differentiation. AlbuMAX is a lipid-rich bovine serum albumin compromising of a complex
mixture of mostly free fatty acids [42]. We quantified the fatty acid concentrations in AlbuMAX
and commonly used cell culture albumins, BSA and rHA, to determine what fatty acids were
being supplied to CMs (Table 4.3). AlbuMAX supplementation provides an exogenous source of
saturated, monounsaturated, and polyunsaturated fatty acids relative to albumin alone.
Table 4.3: Fatty acid concentrations in commonly used albumin media supplements. Datapresented as mean ± SD of technical triplicates (pmol/mg albumin).
Albumax BSA rHA
Myristate (C14:0) 570 ± 40 1 ± 2 0 ± 0Pentadecanoate (C15:0) 200 ± 30 0.65 ± 0.03 0.7 ± 0.9Palmitate (C16:0) 6200 ± 600 240 ± 30 120 ± 30Palmitoleate (C16:1n7) 64 ± 8 0 ± 0 0 ± 0Heptadecanoate (C17:0) 360 ± 40 9.9 ± 0.8 0.6 ± 0.7Stearate (C18:0) 6500 ± 700 240 ± 30 38 ± 19Oleate (C18:1n9) 650 ± 80 6.1 ± 0.4 5.3 ± 1.2
Importantly, lipid supplementation did not impact cardiomyocyte purity after differentia-
tion (Figure 4.5A). We also observed a moderate increase of energetic oxidative phosphorylation
(Figure 4.5B). As lipid accumulation and mitochondrial maturation are typical signs of cardiomy-
ocyte development, our results demonstrated that nutrient lipids are a crucial factor to regulate
131
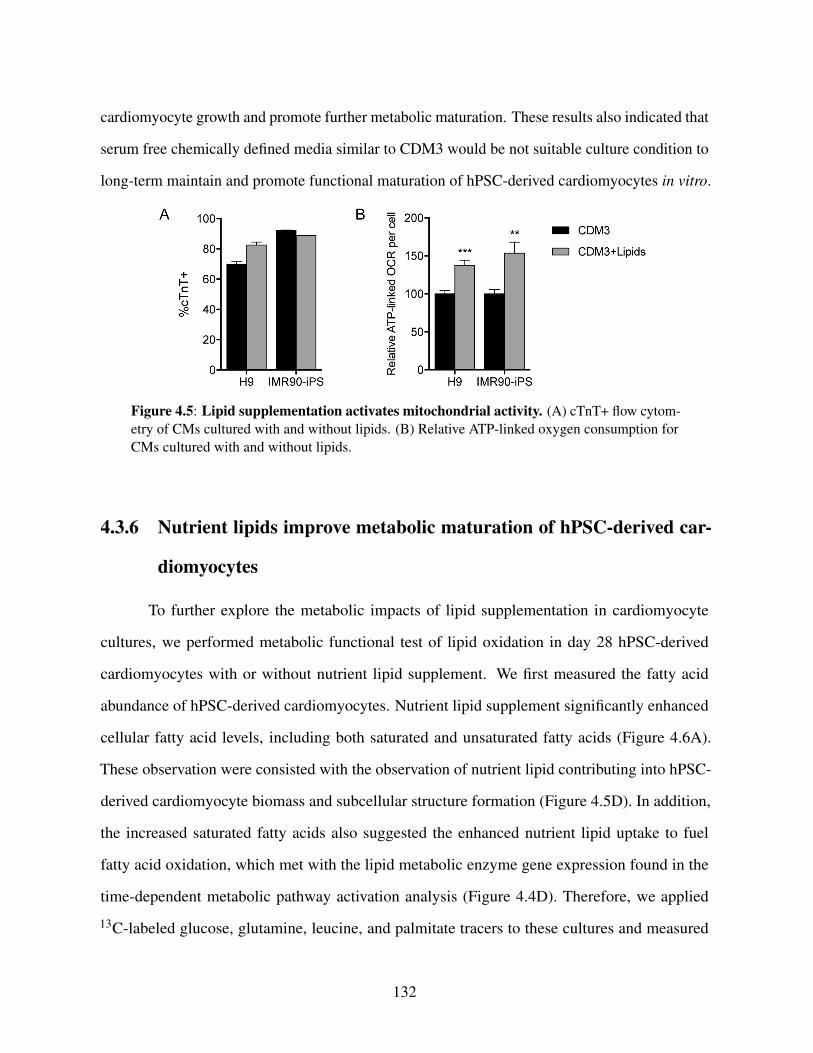
cardiomyocyte growth and promote further metabolic maturation. These results also indicated that
serum free chemically defined media similar to CDM3 would be not suitable culture condition to
long-term maintain and promote functional maturation of hPSC-derived cardiomyocytes in vitro.
Figure 4.5: Lipid supplementation activates mitochondrial activity. (A) cTnT+ flow cytom-etry of CMs cultured with and without lipids. (B) Relative ATP-linked oxygen consumption forCMs cultured with and without lipids.
4.3.6 Nutrient lipids improve metabolic maturation of hPSC-derived car-
diomyocytes
To further explore the metabolic impacts of lipid supplementation in cardiomyocyte
cultures, we performed metabolic functional test of lipid oxidation in day 28 hPSC-derived
cardiomyocytes with or without nutrient lipid supplement. We first measured the fatty acid
abundance of hPSC-derived cardiomyocytes. Nutrient lipid supplement significantly enhanced
cellular fatty acid levels, including both saturated and unsaturated fatty acids (Figure 4.6A).
These observation were consisted with the observation of nutrient lipid contributing into hPSC-
derived cardiomyocyte biomass and subcellular structure formation (Figure 4.5D). In addition,
the increased saturated fatty acids also suggested the enhanced nutrient lipid uptake to fuel
fatty acid oxidation, which met with the lipid metabolic enzyme gene expression found in the
time-dependent metabolic pathway activation analysis (Figure 4.4D). Therefore, we applied
13C-labeled glucose, glutamine, leucine, and palmitate tracers to these cultures and measured
132
[13C]nutrient fluxes into citrate. We found the nutrient lipid supplement specifically decreased the
glucose oxidation and enhanced fatty acid oxidation dramatically (Figure 4.6B). Furthermore, we
also used [1-13C]octanoate and showed short chain fatty acid oxidation also increased in the hPSC-
derived cardiomyocytes cultured with nutrient lipids (Figure 4.6C). All these results suggested
that nutrient lipids improve general activation of cellular fatty acid metabolism, including both
biomass synthesis and energetic oxidation.
4.4 Discussion
Taken together, our study for first time comprehensively investigated the metabolic features
of hPSC-derived cardiomyocytes during differentiation and maturation in vitro. We demonstrated
that hPSC-derived cardiomyocytes are metabolically immature but possess the ability to oxidize
some expected substrates (i.e. ketone bodies but not fatty acids). Examination of the metabolic
state during differentiation revealed the correct phenotype of functional substrate oxidation and
required enzyme expression. However, while we observed expected downregulation of de novo
lipogenesis and upregulation of FAO enzyme expression, maintenance of DNL enzyme expression
suggested a critical need for lipid synthesis. Exogenous supplementation of fatty acids and lipids
improved cardiac mitochondrial activity and importantly FAO.
The pursuit of chemically-defined media for hPSC maintenance and differentiation inad-
vertently motivated the development of minimal medias. And while these conditions can support
the generation of proper marker expression and some desired phenotypes, the lack of exogenous
supplementation requires biosynthetic flux activation uncharacteristic of a somatic cell. Hallmarks
of a maturing CM include rapid hypertrophy after birth, acquisition of sarcoplasmic reticulum for
proper calcium handling, and maturation of mitochondrial networks, which all require increased
membrane abundance and structural lipid biogenesis [43]. However, as CMs differentiate and
mature, increased CPT1B expression requires decreased DNL to prevent malonyl-CoA-mediated
133

Figure 4.6: Lipid supplementation increases intracellular fatty acid availability and β -oxidation. (A) Relative intracellular fatty acid abundance per cell in H9 (left) and IMR90-iPS(right) CMs cultured with and without lipids. (B) Citrate mole percent enrichment from specific13C tracer in H9 (left) and IMR90-iPS (right) CMs. β -oxidation of fatty acids is increased whenCMs are cultured with lipids. (C) Citrate mole percent enrichment from [1-13C]octanoate inCMs cultured with and without lipids.
134
suppression of FAO [44, 45]. This is exemplified in the heart by the dramatic decrease in ACC
and increase in MCD activity during post-natal development [43, 46]. Therefore FAO and DNL
are antagonistic processes in the maturing heart and CMs are reliant on exogenous fat sources in
vivo. Additionally CDM3 utilized in this study lacks essential ω-3 and ω-6 fatty acids needed for
proper lipid composition and cardiac function [47, 48]. These essential fatty acids are needed for
cardiolipin production, important for proper mitochondrial biogenesis/fusion, and could prevent
increased oxidative metabolism [49]. Again demonstrating that CMs cannot properly mature in
vitro given nutrients supplied by gold standard media conditions.
Our approach of providing exogenous nutrients through complex, animal-derived sup-
plements provides one potential avenue to address these issues. Other works have successfully
used more replete conditions in CM differentiation through defined cocktail addition [5, 50].
Cellular physiology must guide the development of new nutrient conditions that promote desired
cell performance. Metabolic flux analysis has long been used to identify industrially-relevant
cellular bottlenecks [51] and now is being applied to understand alterations in hPSCs [32, 52]
and cancer [37]. Metabolic requirements of non-traditional substrates to support cellular growth
is an emerging concept [53, 54] and has already been used to improve cellular differentiation
[55]. For example immature hPSC-derived CMs showed a preference for oxidation of βHB when
supplied in our culture conditions, consistent with the pathophysiology of the heart, and should
be explored as potential maturation agent [56, 57]. Indeed galactose and fatty acid supplemen-
tation has already been utilized to functional mature CMs and demonstrates the utility of these
approaches [26]. These results demonstrate that environmental nutrient conditions can drive in
vitro maturation of hPSC-derived cardiomyocytes and proper metabolic phenotypes are necessary
for development.
135
4.5 Acknowledgements
The authors acknowledge members of the Metallo lab for technical assistance and helpful
discussions. This research was supported by the California Institute of Regenerative Medicine
grant (RB5-07356), National Institutes of Health grant R01CA188652, and a Searle Scholar
Award to C.M.M and a NSF Graduate Research fellowship (DGE-1144086) to M.G.B. The
authors declare no financial or commercial conflict of interest.
Chapter 4 is currently being prepared for submission for publication. Mehmet G. Badur,
Hui Zhang, Sean Spierling, Ajit Divakaruni, Noah E. Meurs, Anne N. Murphy, and Mark
Mercola are co-authors of this material. Christian M. Metallo is the corresponding author of this
publication.
4.6 References1. Ye, L., Chang, Y. H., Xiong, Q., Zhang, P., Zhang, L., Somasundaram, P., Lepley, M.,
Swingen, C., Su, L., Wendel, J. S., Guo, J., Jang, A., Rosenbush, D., Greder, L., Dutton,J. R., Zhang, J., Kamp, T. J., Kaufman, D. S., Ge, Y. & Zhang, J. Cardiac repair in a porcinemodel of acute myocardial infarction with human induced pluripotent stem cell-derivedcardiovascular cells. Cell Stem Cell 15, 750–61 (2014).
2. Chong, J. J., Yang, X., Don, C. W., Minami, E., Liu, Y. W., Weyers, J. J., Mahoney, W. M.,Van Biber, B., Cook, S. M., Palpant, N. J., Gantz, J. A., Fugate, J. A., Muskheli, V.,Gough, G. M., Vogel, K. W., Astley, C. A., Hotchkiss, C. E., Baldessari, A., Pabon, L.,Reinecke, H., Gill, E. A., Nelson, V., Kiem, H. P., Laflamme, M. A. & Murry, C. E. Humanembryonic-stem-cell-derived cardiomyocytes regenerate non-human primate hearts. Nature510, 273–7 (2014).
3. Takeda, M., Miyagawa, S., Fukushima, S., Saito, A., Ito, E., Harada, A., Matsuura, R.,Iseoka, H., Sougawa, N., Mochizuki-Oda, N., Matsusaki, M., Akashi, M. & Sawa, Y.Development of In Vitro Drug-Induced Cardiotoxicity Assay by Using Three-DimensionalCardiac Tissues Derived from Human Induced Pluripotent Stem Cells. Tissue Eng Part CMethods 24, 56–67 (2018).
4. Matsa, E., Burridge, P. W. & Wu, J. C. Human stem cells for modeling heart disease andfor drug discovery. Sci Transl Med 6, 239ps6 (2014).
136

5. Lian, X., Hsiao, C., Wilson, G., Zhu, K., Hazeltine, L. B., Azarin, S. M., Raval, K. K.,Zhang, J., Kamp, T. J. & Palecek, S. P. Robust cardiomyocyte differentiation from humanpluripotent stem cells via temporal modulation of canonical Wnt signaling. Proc Natl AcadSci U S A 109, E1848–57 (2012).
6. Burridge, P. W., Matsa, E., Shukla, P., Lin, Z. C., Churko, J. M., Ebert, A. D., Lan, F.,Diecke, S., Huber, B., Mordwinkin, N. M., Plews, J. R., Abilez, O. J., Cui, B., Gold, J. D.& Wu, J. C. Chemically defined generation of human cardiomyocytes. Nat Methods 11,855–60 (2014).
7. Yang, X., Pabon, L. & Murry, C. E. Engineering adolescence: maturation of humanpluripotent stem cell-derived cardiomyocytes. Circ Res 114, 511–23 (2014).
8. Kolanowski, T. J., Antos, C. L. & Guan, K. Making human cardiomyocytes up to date:Derivation, maturation state and perspectives. Int J Cardiol 241, 379–386 (2017).
9. Liao, S. Y., Liu, Y., Siu, C. W., Zhang, Y., Lai, W. H., Au, K. W., Lee, Y. K., Chan, Y. C.,Yip, P. M., Wu, E. X., Wu, Y., Lau, C. P., Li, R. A. & Tse, H. F. Proarrhythmic riskof embryonic stem cell-derived cardiomyocyte transplantation in infarcted myocardium.Heart Rhythm 7, 1852–9 (2010).
10. Zhang, Y. M., Hartzell, C., Narlow, M. & Dudley S. C., J. Stem cell-derived cardiomyocytesdemonstrate arrhythmic potential. Circulation 106, 1294–9 (2002).
11. Lundy, S. D., Zhu, W. Z., Regnier, M. & Laflamme, M. A. Structural and functionalmaturation of cardiomyocytes derived from human pluripotent stem cells. Stem Cells Dev22, 1991–2002 (2013).
12. Behfar, A., Crespo-Diaz, R., Terzic, A. & Gersh, B. J. Cell therapy for cardiac repair–lessons from clinical trials. Nat Rev Cardiol 11, 232–46 (2014).
13. Ronaldson-Bouchard, K., Ma, S. P., Yeager, K., Chen, T., Song, L., Sirabella, D., Morikawa,K., Teles, D., Yazawa, M. & Vunjak-Novakovic, G. Advanced maturation of human cardiactissue grown from pluripotent stem cells. Nature 556, 239–243 (2018).
14. Radisic, M., Park, H., Shing, H., Consi, T., Schoen, F. J., Langer, R., Freed, L. E. & Vunjak-Novakovic, G. Functional assembly of engineered myocardium by electrical stimulation ofcardiac myocytes cultured on scaffolds. Proc Natl Acad Sci U S A 101, 18129–34 (2004).
15. Nunes, S. S., Miklas, J. W., Liu, J., Aschar-Sobbi, R., Xiao, Y., Zhang, B., Jiang, J., Masse,S., Gagliardi, M., Hsieh, A., Thavandiran, N., Laflamme, M. A., Nanthakumar, K., Gross,G. J., Backx, P. H., Keller, G. & Radisic, M. Biowire: a platform for maturation of humanpluripotent stem cell-derived cardiomyocytes. Nat Methods 10, 781–7 (2013).
137
16. Ribeiro, A. J., Ang, Y. S., Fu, J. D., Rivas, R. N., Mohamed, T. M., Higgs, G. C., Srivastava,D. & Pruitt, B. L. Contractility of single cardiomyocytes differentiated from pluripotentstem cells depends on physiological shape and substrate stiffness. Proc Natl Acad Sci U SA 112, 12705–10 (2015).
17. Shadrin, I. Y., Allen, B. W., Qian, Y., Jackman, C. P., Carlson, A. L., Juhas, M. E. &Bursac, N. Cardiopatch platform enables maturation and scale-up of human pluripotentstem cell-derived engineered heart tissues. Nat Commun 8, 1825 (2017).
18. Ulmer, B. M., Stoehr, A., Schulze, M. L., Patel, S., Gucek, M., Mannhardt, I., Funcke, S.,Murphy, E., Eschenhagen, T. & Hansen, A. Contractile Work Contributes to Maturation ofEnergy Metabolism in hiPSC-Derived Cardiomyocytes. Stem Cell Reports 10, 834–847(2018).
19. Tohyama, S., Hattori, F., Sano, M., Hishiki, T., Nagahata, Y., Matsuura, T., Hashimoto, H.,Suzuki, T., Yamashita, H., Satoh, Y., Egashira, T., Seki, T., Muraoka, N., Yamakawa, H.,Ohgino, Y., Tanaka, T., Yoichi, M., Yuasa, S., Murata, M., Suematsu, M. & Fukuda, K.Distinct metabolic flow enables large-scale purification of mouse and human pluripotentstem cell-derived cardiomyocytes. Cell Stem Cell 12, 127–37 (2013).
20. Gaspar, J. A., Doss, M. X., Hengstler, J. G., Cadenas, C., Hescheler, J. & Sachinidis, A.Unique metabolic features of stem cells, cardiomyocytes, and their progenitors. Circ Res114, 1346–60 (2014).
21. Hom, J. R., Quintanilla, R. A., Hoffman, D. L., de Mesy Bentley, K. L., Molkentin,J. D., Sheu, S. S. & Porter G. A., J. The permeability transition pore controls cardiacmitochondrial maturation and myocyte differentiation. Dev Cell 21, 469–78 (2011).
22. Lloyd, S. G., Wang, P., Zeng, H. & Chatham, J. C. Impact of low-flow ischemia on substrateoxidation and glycolysis in the isolated perfused rat heart. Am J Physiol Heart Circ Physiol287, H351–62 (2004).
23. Kolwicz S. C., J., Purohit, S. & Tian, R. Cardiac metabolism and its interactions withcontraction, growth, and survival of cardiomyocytes. Circ Res 113, 603–16 (2013).
24. Lopaschuk, G. D. & Spafford, M. A. Energy substrate utilization by isolated workinghearts from newborn rabbits. Am J Physiol 258, H1274–80 (1990).
25. Razeghi, P., Young, M. E., Alcorn, J. L., Moravec, C. S., Frazier, O. H. & Taegtmeyer, H.Metabolic gene expression in fetal and failing human heart. Circulation 104, 2923–31(2001).
138

26. Correia, C., Koshkin, A., Duarte, P., Hu, D., Teixeira, A., Domian, I., Serra, M. & Alves,P. M. Distinct carbon sources affect structural and functional maturation of cardiomyocytesderived from human pluripotent stem cells. Sci Rep 7, 8590 (2017).
27. Vacanti, N. M., Divakaruni, A. S., Green, C. R., Parker, S. J., Henry, R. R., Ciaraldi, T. P.,Murphy, A. N. & Metallo, C. M. Regulation of substrate utilization by the mitochondrialpyruvate carrier. Mol Cell 56, 425–35 (2014).
28. Young, J. D. INCA: a computational platform for isotopically non-stationary metabolicflux analysis. Bioinformatics 30, 1333–5 (2014).
29. Antoniewicz, M. R., Kelleher, J. K. & Stephanopoulos, G. Determination of confidenceintervals of metabolic fluxes estimated from stable isotope measurements. Metab Eng 8,324–37 (2006).
30. Divakaruni, A. S., Paradyse, A., Ferrick, D. A., Murphy, A. N. & Jastroch, M. Analysis andinterpretation of microplate-based oxygen consumption and pH data. Methods Enzymol547, 309–54 (2014).
31. Wang, X., Spandidos, A., Wang, H. & Seed, B. PrimerBank: a PCR primer database forquantitative gene expression analysis, 2012 update. Nucleic Acids Res 40, D1144–9 (2012).
32. Zhang, H., Badur, M. G., Divakaruni, A. S., Parker, S. J., Jager, C., Hiller, K., Murphy, A. N.& Metallo, C. M. Distinct Metabolic States Can Support Self-Renewal and Lipogenesis inHuman Pluripotent Stem Cells under Different Culture Conditions. Cell Rep 16, 1536–1547 (2016).
33. Lopaschuk, G. D., Spafford, M. A. & Marsh, D. R. Glycolysis is predominant sourceof myocardial ATP production immediately after birth. Am J Physiol 261, H1698–705(1991).
34. Jacobus, W. E. Respiratory control and the integration of heart high-energy phosphatemetabolism by mitochondrial creatine kinase. Annu Rev Physiol 47, 707–25 (1985).
35. Li, T., Zhang, Z., Kolwicz S. C., J., Abell, L., Roe, N. D., Kim, M., Zhou, B., Cao, Y.,Ritterhoff, J., Gu, H., Raftery, D., Sun, H. & Tian, R. Defective Branched-Chain AminoAcid Catabolism Disrupts Glucose Metabolism and Sensitizes the Heart to Ischemia-Reperfusion Injury. Cell Metab 25, 374–385 (2017).
36. Bartelds, B., Gratama, J. W., Knoester, H., Takens, J., Smid, G. B., Aarnoudse, J. G.,Heymans, H. S. & Kuipers, J. R. Perinatal changes in myocardial supply and flux of fattyacids, carbohydrates, and ketone bodies in lambs. Am J Physiol 274, H1962–9 (1998).
37. Cantor, J. R., Abu-Remaileh, M., Kanarek, N., Freinkman, E., Gao, X., Louissaint A., J.,Lewis, C. A. & Sabatini, D. M. Physiologic Medium Rewires Cellular Metabolism and
139
Reveals Uric Acid as an Endogenous Inhibitor of UMP Synthase. Cell 169, 258–272 e17(2017).
38. Lauzier, B., Vaillant, F., Merlen, C., Gelinas, R., Bouchard, B., Rivard, M. E., Labarthe, F.,Dolinsky, V. W., Dyck, J. R., Allen, B. G., Chatham, J. C. & Des Rosiers, C. Metaboliceffects of glutamine on the heart: anaplerosis versus the hexosamine biosynthetic pathway.J Mol Cell Cardiol 55, 92–100 (2013).
39. Khairallah, M., Labarthe, F., Bouchard, B., Danialou, G., Petrof, B. J. & Des Rosiers, C.Profiling substrate fluxes in the isolated working mouse heart using 13C-labeled substrates:focusing on the origin and fate of pyruvate and citrate carbons. Am J Physiol Heart CircPhysiol 286, H1461–70 (2004).
40. Ben-David, U., Gan, Q. F., Golan-Lev, T., Arora, P., Yanuka, O., Oren, Y. S., Leikin-Frenkel, A., Graf, M., Garippa, R., Boehringer, M., Gromo, G. & Benvenisty, N. Selectiveelimination of human pluripotent stem cells by an oleate synthesis inhibitor discovered ina high-throughput screen. Cell Stem Cell 12, 167–79 (2013).
41. Joshi, V. C. & Sidbury J. B., J. Fatty acid synthesis in chick embryonic heart and liverduring development. Dev Biol 42, 282–71 (1975).
42. Garcia-Gonzalo, F. R. & Izpisua Belmonte, J. C. Albumin-associated lipids regulate humanembryonic stem cell self-renewal. PLoS One 3, e1384 (2008).
43. Lopaschuk, G. D. & Jaswal, J. S. Energy metabolic phenotype of the cardiomyocyteduring development, differentiation, and postnatal maturation. J Cardiovasc Pharmacol56, 130–40 (2010).
44. Saggerson, D. Malonyl-CoA, a key signaling molecule in mammalian cells. Annu RevNutr 28, 253–72 (2008).
45. Van Weeghel, M., Abdurrachim, D., Nederlof, R., Argmann, C. A., Houtkooper, R. H.,Hagen, J., Nabben, M., Denis, S., Ciapaite, J., Kolwicz S. C., J., Lopaschuk, G. D., Auwerx,J., Nicolay, K., Des Rosiers, C., Wanders, R. J., Zuurbier, C. J., Prompers, J. J. & Houten,S. M. Increased cardiac fatty acid oxidation in a mouse model with decreased malonyl-CoAsensitivity of CPT1B. Cardiovasc Res (2018).
46. Reszko, A. E., Kasumov, T., David, F., Thomas, K. R., Jobbins, K. A., Cheng, J. F.,Lopaschuk, G. D., Dyck, J. R., Diaz, M., Des Rosiers, C., Stanley, W. C. & Brunengraber,H. Regulation of malonyl-CoA concentration and turnover in the normal heart. J BiolChem 279, 34298–301 (2004).
140
47. Duda, M. K., O’Shea, K. M. & Stanley, W. C. omega-3 polyunsaturated fatty acid supple-mentation for the treatment of heart failure: mechanisms and clinical potential. CardiovascRes 84, 33–41 (2009).
48. Spector, A. A. & Yorek, M. A. Membrane lipid composition and cellular function. J LipidRes 26, 1015–35 (1985).
49. Paradies, G., Paradies, V., De Benedictis, V., Ruggiero, F. M. & Petrosillo, G. Functionalrole of cardiolipin in mitochondrial bioenergetics. Biochim Biophys Acta 1837, 408–17(2014).
50. Pei, F., Jiang, J., Bai, S., Cao, H., Tian, L., Zhao, Y., Yang, C., Dong, H. & Ma, Y. Chemical-defined and albumin-free generation of human atrial and ventricular myocytes from humanpluripotent stem cells. Stem Cell Res 19, 94–103 (2017).
51. Long, C. P., Gonzalez, J. E., Feist, A. M., Palsson, B. O. & Antoniewicz, M. R. Dissectingthe genetic and metabolic mechanisms of adaptation to the knockout of a major metabolicenzyme in Escherichia coli. Proc Natl Acad Sci U S A 115, 222–227 (2018).
52. Badur, M. G., Zhang, H. & Metallo, C. M. Enzymatic passaging of human embryonic stemcells alters central carbon metabolism and glycan abundance. Biotechnol J 10, 1600–11(2015).
53. Pavlova, N. N., Hui, S., Ghergurovich, J. M., Fan, J., Intlekofer, A. M., White, R. M.,Rabinowitz, J. D., Thompson, C. B. & Zhang, J. As Extracellular Glutamine LevelsDecline, Asparagine Becomes an Essential Amino Acid. Cell Metab 27, 428–438 e5(2018).
54. Sousa, C. M., Biancur, D. E., Wang, X., Halbrook, C. J., Sherman, M. H., Zhang, L.,Kremer, D., Hwang, R. F., Witkiewicz, A. K., Ying, H., Asara, J. M., Evans, R. M.,Cantley, L. C., Lyssiotis, C. A. & Kimmelman, A. C. Pancreatic stellate cells supporttumour metabolism through autophagic alanine secretion. Nature 536, 479–83 (2016).
55. Beyer, B. A., Fang, M., Sadrian, B., Montenegro-Burke, J. R., Plaisted, W. C., Kok, B. P. C.,Saez, E., Kondo, T., Siuzdak, G. & Lairson, L. L. Metabolomics-based discovery of ametabolite that enhances oligodendrocyte maturation. Nat Chem Biol 14, 22–28 (2018).
56. Nagao, M., Toh, R., Irino, Y., Mori, T., Nakajima, H., Hara, T., Honjo, T., Satomi-Kobayashi, S., Shinke, T., Tanaka, H., Ishida, T. & Hirata, K. beta-Hydroxybutyrateelevation as a compensatory response against oxidative stress in cardiomyocytes. BiochemBiophys Res Commun 475, 322–8 (2016).
57. Gormsen, L. C., Svart, M., Thomsen, H. H., Sondergaard, E., Vendelbo, M. H., Christensen,N., Tolbod, L. P., Harms, H. J., Nielsen, R., Wiggers, H., Jessen, N., Hansen, J., Botker,
141

H. E. & Moller, N. Ketone Body Infusion With 3-Hydroxybutyrate Reduces MyocardialGlucose Uptake and Increases Blood Flow in Humans: A Positron Emission TomographyStudy. J Am Heart Assoc 6 (2017).
142
Chapter 5
Combinatorial CRISPR-Cas9 metabolic
screens reveal critical redox control points
dependent on the KEAP1-NRF2 regulatory
axis
5.1 Abstract
The metabolic pathways fueling tumor growth have been well characterized, but the
specific impact of transforming events on network topology and enzyme essentiality remains
poorly understood. To this end, we performed combinatorial CRISPR-Cas9 screens on a set of 51
carbohydrate metabolism genes that represent glycolysis and the pentose phosphate pathway. This
high-throughput methodology enabled systems-level interrogation of metabolic gene dispensabil-
ity, interactions, and compensation across multiple cell types. The metabolic impact of specific
combinatorial knockouts were validated using 13C and 2H isotope tracing, and, these assays
together revealed key nodes controlling redox homeostasis along the KEAP1-NRF2 signaling axis.
143

Specifically, targeting KEAP1 in combination with oxidative PPP enzymes mitigated the delete-
rious effects of these knockouts on growth rates. These results demonstrate how our integrated
framework, combining genetic, transcriptomic, and flux measurements, can improve elucidation
of metabolic network alterations, and guide precision targeting of metabolic vulnerabilities based
on tumor genetics.
5.2 Introduction
Cancer cells are characterized by unchecked cellular proliferation and the ability to move
into distant cellular niches, requiring a rewiring of metabolism to increase biosynthesis and
maintain redox homeostasis. This reprogramming of cellular metabolism is now considered an
essential hallmark of tumorigenesis [1]. Since the metabolic network is highly redundant at the
isozyme and pathway-levels, reprogramming is an emergent behavior of the network and manifests
itself in non-obvious ways. For instance, a unique metabolic feature of tumor cells is a reliance
on aerobic glycolysis to satisfy biosynthetic and ATP demands [2]. This metabolic rewiring is
coordinated, in part, by the selective expression of distinct isozymes, which may benefit the cell
by offering different kinetics or modes of regulation [3–5]. However, isozyme switching is not
solely a consequence of genomic instability and instead can be a coordinated step in tumorigenesis
that facilitates cancer cell growth and survival [6, 7]. Therefore, understanding which isozymes
and pathway branch points are important and how they interact with and compensate for one
another is necessary to effectively target metabolism in cancer cells.
In this regard, the advent of CRISPR screening technology now provides a rapid, high-
throughput means to functionally characterize large gene sets [8, 9]. This analysis has led to
greater annotation of essential genes in human cancers and context-dependent dispensability
[10, 11]. Correspondingly, single-gene knockout (SKO) CRISPR screens have been able to
identify important genes in redox homeostasis and oxidative phosphorylation in conjunction
144

with metabolic perturbations [12, 13]. However, in the context of mammalian metabolism the
SKO CRISPR approach comes with limitations, as redundancies and plasticity of the metabolic
network may allow the system to remodel around a SKO, thereby confounding analyses of
impact on cellular fitness. To overcome this challenge, our group and others recently developed
combinatorial gene knockout screening approaches which may provide a more suitable platform
to study gene dispensability and also systematically map their interactions [14–18].
Utilizing this combinatorial CRISPR genetic screening format, coupled with interrogation
of metabolic fluxes, we systematically studied the dispensability and interactions within a set
of genes encoding enzymes involved in carbohydrate metabolism, including glycolysis and the
pentose phosphate pathway. We illustrated functional relationships between dominant and minor
isozymes in various families and discovered multiple genetic interactions within and across
glucose catabolic pathways. Aldolase and enzymes in the oxidative pentose phosphate pathway
(oxPPP) emerged as critical drivers of fitness in two cancer cell lines, HeLa and A549. Distinctions
in this dependence are influenced by the KEAP1-NRF2 signaling axis, which coordinates the
cellular antioxidant pathway in response to redox stress. We found loss or mutation of KEAP1
E3-ubiquitin ligase upregulates NRF2-mediated transcription of genes involved in glutathione
synthesis and NADPH regeneration, making the oxPPP less important for NADPH production
and less critical for cell growth in these contexts. Thus, mutation status of the KEAP1-NRF2
regulatory axis should be considered when designing therapeutic strategies that target redox
pathways in cancer cells.
5.3 Materials and Methods
5.3.1 Cell lines and culture conditions
HEK293T, A549, HeLa-AAVS-Cas9-Hygro, A549-AAVS-Cas9-Hygro cells were grown
in DMEM supplemented with 10% FBS, 2 mM L-glutamine, 100 units/mL of penicillin, 100
145
µg/mL of streptomycin, and 0.25 µg/mL of Amphotericin B. HeLa-AAVS-Cas9-Hygro and
A549-AAVS-Cas9-Hygro cells were purchased from GeneCopoeia.
5.3.2 Dual-gRNA library design and cloning
A set of 51 genes, encompassing glycolysis, gluconeogenesis, pentose phosphate pathway,
and glucose entry into the TCA cycle were selected for this study. Three unique 20-bp sgRNAs
were designed for each target gene and three scrambled, non-targeting sequence absent from
the genome were used as control. The dual sgRNA construct library comprised all pairwise
gRNA combinations between either two genes or a gene and a scramble, resulting in 11,475
double-gene-knockout constructs and 459 single-gene-knockout constructs. The dual-gRNA
library was generated as previously described (Figure S5.1A) [17]. Briefly, the oligonucleotides
with dual-gRNA spacers were synthesized by CustomArray Inc., amplified and assembled into
the LentiGuide-Puro vector (Addgene 52963). Independent bacterial clones obtained in step
I library were counted to ensure 50ÃU library coverage. Subsequently, the step I library was
digested by BsmBI and an insert contained a gRNA scaffold and a mouse U6 promoter were
cloned in the middle of two spacers. Again, 50x library coverage was ensured.
5.3.3 Lentivirus production
One 15cm dish of HEK293T cells at 60% confluent were transfected with 3 µg PMD2.G,
12 µg of lenti-gag/pol/PCMVR8.2, and 9 µg of lentiviral vector (library or single constructs)
using 36 µ l of Lipofectamine 2000. Medium containing viral particles were harvested 48 hrs and
72 hrs after transfection, then concentrated with Centricon Plus-20 100,000 NMWL centrifugal
ultrafilters, divided into aliquots and frozen at âLŠ80◦C.
146
5.3.4 CRISPR/Cas9 dual-gRNA screening
CRISPR Cas9 nuclease stable expressing HeLa and A549 cells were obtained from
GeneCopoeia and grown in DMEM medium with 10% FBS and Antibiotic-Antimycotic. Hy-
gromycin B was added at the concentrations of 200 µg/ml or 100 µg/ml for HeLa and A549
cells, respectively. For each screen, cells were seeded in three 15cm dishes at a density of 1x10⁷
per ml and transduced with the lentiviral dual gRNA library at a low MOI of 0.1-0.3. Puromycin
was added at 48 h after transduction at a concentration of 5 µg/ml. Then the cells were cultured
and passaged for every 3-4 days while 1x10⁷ cells were sampled at days 3, 14, 21 and 28 and
stored at -80◦C until extraction of genomic DNA. Two biological replicates of the screens were
performed for each cell line.
5.3.5 Quantification of dual gRNAs abundance
Genomic DNA of the cells were purified using Qiagen DNeasy Blood and Tissue Kits. To
amplify the dual gRNAs from each sample, we used 20 µg of genomic DNA as template across
ten 50 µL PCR reactions with Kapa Hifi polymerase. By testing the amplification efficiency, we
used 22 - 24 cycles at an annealing temperature of 55 ◦C with the following primers:
Forward: ACACTCTTTCCCTACACGACGCTCTTCCGATCTTATATATCTTGTGGAA-
AGGACGAAACACCG;
Reverse: GACTGGAGTTCAGACGTGTGCTCTTCCGATCTCCTTATTTTAACTTGC-
TATTTCTAGCTCTA.
The amplicons were pooled and purified with Agencourt AMPure XP bead at a double
selection of 0.55x and then 0.8x. The samples were quantified with Qubit dsDNA High Sensitivity
Kit. To attach Illumina sequencing adaptors and indexes, we used 50 ng of purified step I PCR
product as template across four 50-µL PCR reactions with Kapa Hifi polymerase using primers of
Next Multiplex Oligos for Illumina (New England Biosciences). 7 or 8 PCR cycles were carried
147
out at an annealing temperature of 72 ◦C. The PCR product were purified twice with Agencourt
AMPure XP bead at 0.8x ratio, quantified, pooled and sequenced on an Illumina HiSeq rapid-run
mode for 75 cycles paired-end runs.
5.3.6 Computation of single and double gene knockout fitness and genetic
interaction scores
Analysis was performed with a previously reported software pipeline constructed from
Python, R and Jupyter Notebooks (https://github.com/ucsd-ccbb/mali-dual-crispr-pipeline). The
following details are adapted from our published paper [17]. Briefly, the two gRNA sequences
were extracted and trimmed to 19bp from 3’ end, and then aligned to the known library sequences
with one mismatch allowed. We determined a minimum threshold for read counts based on the
histograms and masked out pairwise gRNA constructs that have read counts below the threshold.
The read counts were used for analysis of fitness and genetic interaction scores as follows:
1. Estimation of fitness of each pairwise gRNA construct. The logarithmic transformation of
the frequency of each pairwise gRNA construct in the population is:
xc = log2Nc
∑c Nc
where Nc is the number of cells in the population expressing construct c. We assume that
each cell subpopulation grows exponentially:
Nc(t) = Nc(0)x2( fc+ f0)t
where t is a given time point; fc is the fitness of construct c; f0 is the absolute fitness of
148

reference cells which don’t express any constructs. Combining these two equations, we get:
xc(t) = ac + fct− log2 ∑c
2ac+ fct
where ac ≡ xc(0) as the initial condition and ∑c 2xc = 1 in the whole population. Fitting to
this equation from experimental data of frequencies Xc(t), we minimize the sum of squares:
E(ac, fc) = ∑c
∑t[Xc(t)− xc(t)]2
Here E is invariant under the substitution fc→ fc + δ , where δ is an arbitrary constant,
which can be fixed by setting the mean non-targeting gRNA fitness to zero. To resolve this,
one should find the minimum of the function:
Eλ ≡ E−λ (∑c
2ac−1)
where λ is the Lagrange multiplier. This solution equals:
∂Eλ
∂ac=
∂Eλ
∂ fc=
∂Eλ
∂λ= 0
When the number of constructs is large, ∑c 1 >> 1, the approximation solution is:
fc =Cov(Xc, t)
Var(t)+δ
and
ac = Xc− fct− log2 ∑c
2Xc− fct
where the bars indicate means over time points. The ac values do not depend on the choice
of δ .
149
2. Estimation of single gRNA fitness and gRNA-gRNA interactions. For each construct contain-
ing gRNAs g and g′, we define:
fc = fg + fg′+πgg′
where πgg′ is the gRNA-gRNA interaction scores. fc is calculated from step (1). fg values
are found by robust fitting of this equation. The gRNA-level πgg′ scores are the residuals of
the robust fit.
3. Computation of gene level fitness based on weighted average of gRNA fitness. We ranked
the three gRNAs targeting to the same gene as r(g)ε0,1,2 in ascending order of | fg |. The
gene-level fitness values are calculated as the weighted means of gRNA fitness values with
weights given by the squares of gRNA ranks, r2(g). The gene-level interaction scores are
calculated as the weighted means of gRNA-gRNA interaction scores with weights given by
the products of gRNA ranks, r(g)r(g′).
4. Correction by replicates. As we performed biological replicates for each experiment, we
combine replicates for more power rather than looking for two fc separately. We fit a single
optimal fc from all data points excludes those below the threshold, with the assumption that
fc does not change across experiments while the initial conditions ac may be different. The
raw P value associate to each fc is:
tc =fc
SE( fc)
where SE( fc) is the standard error of fc:
SE( fc) =
√∑t [Xc(t)− xc(t)]2√(nc−2)∑t(t2− t2)
The raw P values then are transformed into posterior probabilities, PPc, according to the
150

theory of Storey. To scale the genetic interaction scores for comparison across different
experiments, we calculated a genetic interaction z score by dividing the πgg′ of each two
genes by s.d. =√
n−2SE( fc) of genetic interaction pairs in a given experiment. We
consider an interaction to be a meaningful candidate if it has an absolute z score above 3.
5. Calculation of false discovery rates by numerical Bayesian ensemble of experiments. We
assign a fitness value to each construct c on the basis of change in fitness relative to the
standard deviation of repeated measurements. The assigned value is either 0 with probability
(1−PPc), or a random number within f c± s.d. We perform 1000 permutations and reported
gene level fg and πgg′ for each permutation. The false discovery rate (FDR) of genetic
interactions (π) is calculated as the odds ratio between the observed and permuted results in
the null model, which is obtained by mean-centering of the marginal distribution of every
πgg′ .
5.3.7 Single-gRNA construct cloning
The LentiGuide-Puro vector were linearized using restriction enzyme BsmBI at 55◦C
for 3 hours. For each individual gRNA, two oligonucleotides containing the spacer sequences
were synthesized as listed in Supplemental Table S1 in [19]. The two oligos were annealed and
extended to make a double stranded DNA fragment using Kapa Hifi polymerase. The fragment
was purified and subjected to Gibson assembly (New England Biolabs) with the linearized
LentiGuide-Puro vector.
5.3.8 Competitive cell growth assay
We developed a competitive cell growth assay to assess the effect of gene perturbations
by mixing control tdTomato+ cells with tdTomato- cells expressing a gRNA of interest (Figure
5.3A) and sampling relative growth rates through time by flow cytometry. Cas9-expressing cells
151

were transduced with EF1A- tdTomato-T2A-puromycin lentivirus and cultured under puromycin
selection for stable expression of tdTomato. To measure the negative impact of a gRNA introduced
gene perturbation on the cellular proliferation rate, the Cas9-expressing cells were cultured in 12-
well-plate and transduced with gRNA lentivirus at a high MOI (>5) . The day after transduction,
the Cas9-expressing cells were resuspended, counted, mixed with tdTomato+ Cas9-expressing
cells, and re-seed into 12-well-plate. The cells were sampled every 3 or 4 days to score the
tdTomato+/tdTomato- ratio by longitudinal flow cytometric analysis. By assuming the exponential
growth of the cells, from time t1 to t2, the growth of cells (tdTomato+ or gRNA expressing) in the
mixture population fits to the equation:
NC(t2) = Nc(t1)x2( f0+∆ fc)(t2−t1)
where Nc is the cell number of the certain cell subtype, f0 is the absolute fitness of reference
cells which in this case is the tdTomato+ cells, and ∆ fc is fitness measurements of the certain
cell subtype. For a certain gRNA (or a pair of gRNA), the ∆ fgRNA is able to be calculated easily
according to the equation without measuring the absolutely fitness of reference cells f0:
NgRNA(t2)N0(t2)
=Nc(t1)x2( f0+∆ fgRNA)(t2−t1)
N0(t1)x2( f0)(t2−t1)
Although the percentage of tdTomato+ cells in the mixtures with the cells expressing non-targeting
control gRNAs was stable over time, we normalize the fitness of gRNA of interest to non-targeting
control gRNAs for side by side comparisons. The cell viability of a gRNA of interest (non-log
transformed fitness) relative to non-targeting controls showed in Figure 5.3 is as follows:
FgRNA =2(∆ fgRNA)(t2−t1)
2(∆ fgNTC)(t2−t1)x100%
152
The expected cell viability of a pair of gRNAs calculated according to:
FgRNA1,gRNA2 = FgRNA1xFgRNA2
In addition, f0 is able to be measured by counting of the absolute cell number over time base
on the equation (1). Then the effects of a gene perturbation (eg. PGD) relative to non-targeting
controls (NTC) in a certain cell subtype (eg. KEAP1 mutations) are calculable as follows:
RPGD,KEAP1 =( f0 +∆ fPGD,KEAP1)− ( f0 +∆ fNTC,KEAP1)
f0 +∆ fPGD,KEAP1
5.3.9 RNA sequencing data analysis
RNA sequencing data were obtained from the ENCODE project (GSE30567, sample
GSM765402 and GSM758564 for HeLa and A549 cell lines respectively). The results were
expressed as the average value of reads per kilobase of transcript per million mapped reads
(RPKM) across two biological replicates. The average RPKM values were log2 transformed for
Pearson correlation analysis.
5.3.10 Stable isotope tracing
For isotopic labeling experiments, cells were cultured in glucose- and glutamine-free
media (Gibco) supplemented with 10% dialyzed FBS, 100 U/mL penicillin/streptomycin, 4mM
glutamine (Sigma), and 20 mM of either [3-2H]glucose (98%, Cambridge Isotope Laboratories),
[U-13C6]glucose (99%, Cambridge Isotope Laboratories), or [1,2-13C]glucose (99%, Cambridge
Isotope Laboratories).
Cells were rinsed with PBS before addition of tracing media. For glycolytic measurements,
basal media was changed 1hr before addition of tracer media and extracted at indicated time
intervals. For measurement of shunting through oxPPP, cells were traced for 4hrs. For estimation
153
of PGD contribution to cytosolic NADPH, cells were traced for 48hrs.
5.3.11 Metabolite Extraction and GC-MS Analysis
Cells were rinsed with 0.9% (w/v) saline and 250 µL of -80◦C MeOH was added to
quench metabolic reactions. 100 µL of ice-cold water supplemented with 10 µg/mL norvaline
was then added to each well and cells were collected by scraping. The lysate was moved to a
fresh 1.5 mL eppendorf tube and 250 µL of -20 ◦C chloroform supplemented with 4 µg/mL
D31 palmitate was added. After vortexing and centrifugation, the top aqueous layer and bottom
organic layer were collected and dried under airflow.
Derivatization of aqueous metabolites was performed using the Gerstel MultiPurpose
Sampler (MPS 2XL). Methoxime-tBDMS derivatives were formed by addition of 15 µL 2%
(w/v) methoxylamine hydrochloride (MP Biomedicals) in pyridine and incubated at 45◦C for
60 minutes. Samples were then silylated by addition of 15 µL of N-tert-butyldimethylsily-N-
methyltrifluoroacetamide (MTBSTFA) with 1% tert-butyldimethylchlorosilane (tBDMS) (Regis
Technologies) and incubated at 45◦C for 30 minutes. Aqueous metabolites were analyzed by
GC-MS using a DB-35MS column (30 m x 0.25 mm i.d. x 0.25 µm, Agilent J&W Scientific,
Santa Clara, CA) in an Agilent 7890B gas chromatograph (GC) interfaced with a 5977C mass
spectrometer (MS). Electron impact ionization was performed with the MS scanning over the
range of 100-650 m/z for polar metabolites. For separation of aqueous metabolites the GC oven
was held at 100◦C for 1 min after injection, increased to 255◦C at 3.5◦C/min, and finally increased
to 320◦C at 15◦C/min and held for 3 min.
Dried organic fraction was saponified and esterified to form fatty acid methyl esters
(FAMEs) by addition of 500 µL of 2% (w/v) H2SO4 in MeOH and incubated at 50◦C for 120
minutes. FAMEs were then extracted by addition of saturated NaCl and hexane before collection
and drying of the inorganic layer. Derivatized fatty acids were analyzed by GC-MS using a select
FAME column (100 m x 0.25 mm i.d. x 0.25 µm; Agilent J&W Scientific) as above, with the
154
MS scanning over the range 120-400 m/z. For separation the GC oven was held at 80◦C for 1
min after injection, increased to 160◦C at 20◦C/min, increased to 198◦C at 1◦C/min, and finally
increased to 250◦C at 5◦C/min and held for 15 min.
5.3.12 Metabolite integration and isotopomer spectral analysis (ISA)
Mass isotopomer distributions and total abundances were determined by integration of
mass fragments (Supplemental Table S1 in [19]) and correcting for natural abundances using
MATLAB-based algorithm. Glycolytic flux was estimated by normalizing pyruvate, lactate,
or alanine abundance by the sum of intracellular branched-chain amino acids abundance and
M+3 label. Oxidative PPP shunting was estimated by M+1(M+1)+(M+2) labeling on pyruvate from
[1,2-13C]glucose [20]. Isotopomer spectral analysis (ISA) was performed to estimate contribution
of oxPPP to cytosolic NADPH as previously described [21]. ISA compares experimental labeling
of fatty acids to simulated labeling using a reaction network where C16:0 is condensation of 14
NADPHs. Parameters for contribution of PGD to lipogenic NADPH (D value) and percentage of
newly synthesized fatty acid (g(t) value) and their 95% confidence intervals are then calculated
using best-fit model from INCA MFA software [22].
5.3.13 Immunoblotting
Cultured cells were washed with cold PBS and harvested on ice with mPER (Pierce
Biotechnology) with freshly added 1x HALT inhibitor (Thermo Fisher Scientific). Protein
concentration was determined by BCA assay and equal amounts of protein were resolved on
SDS-PAGE gel and transferred to nitrocellulose membrane. Membrane was blocked with 5%
milk in TBST (Tris-buffered saline with 0.1% Tween 20) for 2-3hrs and incubated overnight at
4◦C with primary antibody: anti-Vinculin (Abcam), anti-G6PD (Cell Signaling Technologies),
anti-PGD (Santa Cruz Biotechnology), anti-KEAP1 (Proteintech), anti-HA (Abcam), or anti-Nrf2
155
(Cell Signaling Technology). Blots were then incubated with secondary antibody for 1hr at room
temp, Anti-Rabbit HRP-conjugate (Cell Signaling Technology) or Anti-Mouse HRP-conjugate
(Cell Signaling Technology). Finally blots were incubated with ECL substrate (BioRad) and
imaged.
5.3.14 RT-PCR
Total mRNA was isolated from cells using RNA isolation kit (RNeasy Mini Kit; Qiagen).
Isolated RNA was reverse transcribed using cDNA synthesis kit (High-capacity cDNA Reverse
Transcription Kit; Thermo Fisher Scientific). Real-time PCR was performed using SYBR green
reagent (iTaq Universeal SYBR Green Supermix; Bio-Rad). Relative expression was determined
using Livak (∆∆CT) method with RPL27 and RPLP0 as housekeeping genes. Primers used were
taken from Primerbank [23] and tabulated in Supplemental Table S1 in [19]. All commercial kits
were used per the manufacturer’s protocol.
5.3.15 Glutathione measurement
Intracellular glutathione was measure using Glutathione Assay Kit (Sigma) per manu-
facturer’s protocol. Ten centimeter dishes of cells were assayed in quintuplicate and cells were
counted in parallel for normalization.
5.3.16 Statistical analyses
Unless indicated, all results shown as mean ± SEM of biological triplicates. P values
were calculated using a Student’s two-tailed t test; *, P value between 0.01 and 0.05; **, P value
between 0.001 and 0.01; ***, P value <0.001
156

5.4 Results
5.4.1 Combinatorial CRISPR-Cas9 screening to probe metabolic networks
To systematically study the dispensability and interactions of genes underlying carbohy-
drate metabolism, we applied a combinatorial CRISPR screening approach [17] to interrogate
singly and in combination a set of 51 genes, encompassing glycolysis, gluconeogenesis, pentose
phosphate pathway, and glucose entry into the TCA cycle (Figure 5.1A). We generated 3 sgRNAs
per gene such that 9 unique constructs were present for every gene-pair, resulting in a dual-sgRNA
library consisting of 459 elements targeting genes individually, as well as 11,475 unique elements
targeting two different genes simultaneously (Table S1 in [19]). The dual-sgRNA constructs were
synthesized from oligonucleotide arrays, cloned into a lentiviral vector, and then transduced into
HeLa or A549 cells stably expressing Cas9 (Figure 5.1B, S5.1A-B). Through sampling of sgRNA
frequencies at days 3, 14, 21, and 28 (Figure S5.1C-D), both robust gene-level fitness values
(fg) and also interaction scores (πgg) were computed. Finally, impact of SKOs and dual-gene
knockouts (DKOs) on cellular growth and metabolic fluxes were validated in a targeted fashion.
157
Figure 5.1: Experimental design. (A) Schematic pathway diagram of carbohydratemetabolism, and list of 51 targeted enzymes. (B) Schematic overview of the combinato-rial CRISPR-Cas9 screening approach. A dual-gRNA library in which each element targetseither gene-gene pairs or gene-scramble pairs, to assay dual and single gene perturbations, wasconstructed from array-based oligonucleotide pools. Competitive growth based screens wereperformed, and the relative abundance of dual-gRNAs were sampled over multiple time points.The fitness and genetic interactions were computed via a numerical Bayes model and key hitswere validated using both competitive cell growth assays and measurement of metabolic fluxes.
158

159

5.4.2 Mapping metabolic gene dependencies in glucose catabolism
Upon analyzing fitness scores for individual gene knockouts across the metabolic network
(Table S2 in [19]), we noted that for most (but not all) isozyme families, a dominant gene
showed the greatest indispensability (Figure 5.2A and S5.2A). Consistent with the notion of
a "cancer-specific" isozyme [24], HK2, ALDOA, PGK1, and PFKL all showed a fitness defect
greater than two-fold higher as compared to other isozymes. However not all families exemplified
this dynamic, with ENO1/ENO3 and the lactate dehydrogenase (LDH) family showing similar
dispensability across gene members (Figure 5.2A and S5.2A). The general dispensability of
SKOs within the LDH family is notable given the critical role of glycolysis in the maintenance
of cancer cell homeostasis and concomitant need to regenerate cytosolic NAD+ when relying
on glycolytic flux [25]. Importantly nodes central to the regeneration of reducing equivalents
(NADH and NADPH) - GAPDH, G6PD, and PGD - were found to be critical for cellular growth
(Figure 5.2A and S5.2A).
We hypothesized that gene expression could explain why certain genes were less dispens-
able and why certain families did not display a dominant member. Indeed, lower fitness score
may be associated with higher gene expression (R = -0.461, p-value = 6.7e-04 and R = -0.429,
p-value = 1.7e-03, for HeLa and A549 cells respectively). These expression-driven differences
also partially explained dynamics within isozyme families. For instance, ALDOA had a much
lower fitness score and higher gene expression as compared to ALDOB and ALDOC (Figure 5.2B).
ENO1 and ENO3 both displayed negative fitness scores and both were more highly expressed
than ENO2 (Figure 5.2B-C). However, the dispensable isozyme families LDH and PDH (key
for maintenance of glycolytic flux and oxidation of pyruvate respectively) were also found to
be highly expressed in both cell types (Figure 5.2B-C). With each family having more than two
member enzymes, this result demonstrates that vital functions of cell metabolism can be carried
out by multiple genes and show surprising resiliency through isozyme compensation or network
behavior.
160
Figure 5.2: Combinatorial CRISPR screens reveal metabolic network dependencies. (A)SKO fitness scores for HeLa cells, plotted as fg (day-1), with a more negative score representinga loss in fitness with SKO. Plotted as mean ± SD. (B) Multi-isoform family member fitnessscores and gene expression for HeLa (top) and A549 (bottom) cells. (C) Relative comparison ofSKO fitness scores (fg) across both cells. (D) Relative comparison of genetic interaction scores(πgg) across both cell lines. (E) Combined genetic interaction map of both cell lines. Green solidline represents interactions observed in both cell lines. Red and blue lines represent significantgenetic interactions in A549 and HeLa cells respectively.
161
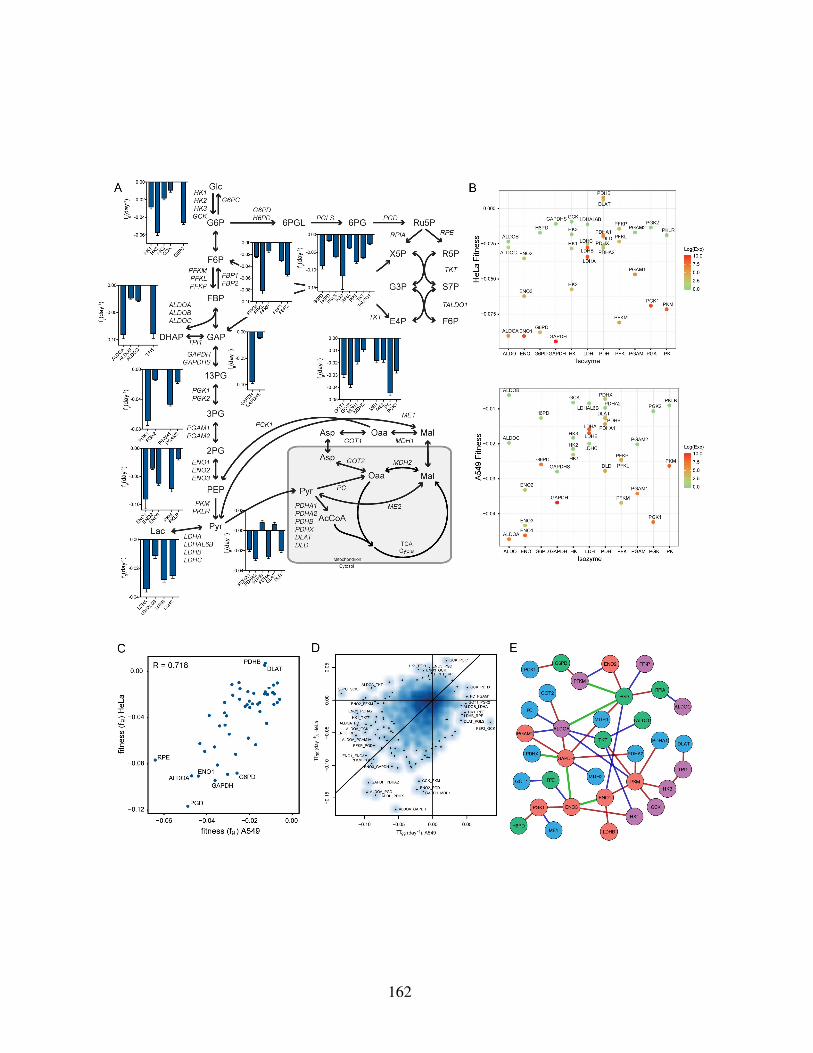
162
To this end, SKO knockouts correlated well (R = 0.718, p-value = 3.1e-09) across both
cell lines (Figure 5.2C). This correlation extended to expression of all enzymes (R = 0.938,
p-value < 2.2e-16). Furthermore, HeLa fitness scores correlated well with previously published
HeLa screening data (R = 0.664, p-value = 1.435e-07) [10]. However, these results exemplify the
challenge in understanding metabolic topology through screening individual genes: few metabolic
genes are essential, and essential elements are typically conserved across all cell types.
We subsequently hypothesized that gene interactions could provide information on
metabolic network topology and cell-specific adaptations in these pathways. Indeed, a no-
table number of gene pairs were found to significantly interact (Figure 5.2D-E, Table S3 in [19]).
Specifically, after filtering for genes with RPKM<0.15, we observed 35 interactions (z-score <
-3) in the combined HeLa and A549 interaction network (Figure S5.2B and Table S4 in [19]), of
which 10 ( 30%) have been previously reported as protein-protein interactions [26]. Five gene
pair interactions were shared across both cell types.
Notably, the conserved interaction of ENO1/ENO3 demonstrates the possible compensa-
tion observed in SKO results (Figure 5.2A). Previous results have demonstrated that passenger
deletion of ENO1 in glioblastoma (GBM) cell lines increases their dependence on ENO2 and
generates a GBM synthetic lethality [27]. As ENO2 is only expressed in neural tissues, our results
suggest that ENO1 and ENO3 may compensate for one another in these cell lines. Additionally,
redox-associated genes, GAPDH and PGD, had many interacting partners, consistent with their
negative SKO fitness scores and metabolic functions (Figure 5.2E). As NAD(P)H is required for
both bioenergetics and biosynthetic reactions, alteration of cofactor balance or regeneration fluxes
could have large impacts on distal reactions within the network.
163
5.4.3 Validation of significant SKO and DKO results on cellular fitness
and metabolic fluxes
Next, to functionally validate the screening results, competition assays and metabolic
flux measurements were conducted in the presence of SKO and DKO pairs. Competition assays
were performed by mixing control tdTomato+ cells expressing an empty vector, with tdTomato-
cells expressing a gRNA of interest (Figure 5.3A), and relative growth rates were assayed by
quantifying the ratio of +/- cells in the mixture via flow cytometry (Figure 5.3B). Dominant
family member isozyme fitness was observed in the ALDO family (Figure 5.3C), and significant
gene interactions over additive SKO effects were observed in multiple gene pairs (Figure 5.3D-
E). Correspondingly, perturbations in glycolytic flux were observed through dynamic labeling
of metabolites (i.e. pyruvate, lactate, alanine) from 13C-labeled glucose ([U-13C6]glucose)
(Figure 5.3F). Notably, DKO of ENO1 and ENO3 significantly decreased flux through glycolysis
compared to control and SKOs (Figure 5.3G, S5.3A-B) and also displayed significantly lower
fitness (Figure 5.3H). Finally, we applied specific 13C and 2H tracers to quantify how the oxPPP
contributed to NADPH regeneration (Figure 5.3I) [20, 21]. SKO knockout of oxPPP enzymes
was indeed observed to lower flux (Figure 5.3J-K) and fitness (Figure 5.3L and S5.3C) through
this pathway.
164

Figure 5.3: Screening results validated through targeted fitness and metabolic flux mea-surements. (A) Schematic of cell competition assay used to validate growth. A Cas9-expressingcell is transduced with a sgRNA lentivirus of interest (tdTomato-) and mixed with a controlCas9-expressing cell transduced with a tdTomato lentivirus (tdTomato+). The cells are growntogether and the percentage of control (tdTomato+) cells is used to assess relative fitness of SKO.(B) Non-targeting control (top) is stable for duration of experiment and shows no fitness changes.SKO of ALDOA (bottom) shows decreased fitness over time as control cells take over population.(C) SKO competition assay of ALDO isozyme family. ALDOA shows greatest loss of fitness. (D)Growth validation of PFKM/PGD genetic interaction. DKO (green) shows significantly greaterdecrease in fitness over additive SKO effect (black). (E) Growth validation of ALDOA/GAPDHinteraction. (F) Atom transition map depicting glycolysis. Fully labeled ([U-13C6]glucose) leadsto fully labeled pyruvate, lactate, and alanine. (G) Metabolic validation of DKO interactionin ENO1/ENO3. DKO significantly lowered flux through glycolysis over control or SKOs. †indicates statistical significance (p<0.05) for all conditions as compared to DKO (H) Growthvalidation of ENO1/ENO3 interaction. (I) Atom transition map depicting oxPPP tracing. [3-2H]glucose labels cytosolic NADPH through oxPPP. Labeling on glycolytic intermediates from[1,2-13C]glucose is changed by shunting of glucose through oxPPP. (J) Metabolic validationof PGD SKO at day 4. oxPPP contributes less NADPH with PGD knockout. Plotted as mean± 95% CI. * indicates statistical significance by non-overlapping confidence intervals. (K)Metabolic validation of G6PD SKO at day 7. Less glucose is shunted through oxPPP with G6PDknockout. (L) SKO competition assay of oxPPP enzymes. All experiments were performed inHeLa cells. (C-E, G-H, K-L) Data plotted as mean ± SEM.
165

166
5.4.4 Comparison of metabolic liabilities across cell lines reveals key role
of KEAP1-NRF2
We next focused on differences in the screens of these two cell lines to explore how
oncogenic status contributes to metabolic reprogramming. By conducting screens in A549 and
HeLa cells and comparing fitness results, we could also gain insights into the impact of SKO
results in combination with endogenous mutations. Notably, screening results suggested and we
validated that SKO of oxPPP genes (i.e., G6PD and PGD) impacted the growth and survival of
HeLa cells more dramatically than A549 cells (Figure 5.4A, S5.4A, and S5.3C) with observed
editing rates in each cell line 95% (Figure S5.3D). Intriguingly, the expression of G6PD and
PGD in these cell lines showed the opposite trend, with A549 cells expressing these genes
at significantly higher levels but having a lower dependence on them to maintain growth and
viability (Figure 5.4A and S5.4A). As the oxPPP is critical for maintaining redox homeostasis (i.e.
NAPDH regeneration) [28], mutations within control points of redox metabolism could drive this
differential sensitivity and further extend the interactions of metabolic genes to known oncogenes
or tumor suppressors.
In this regard, A549 NSCLC cells harbor a loss of function mutation in KEAP1 while this
regulatory axis is functional in HeLa cells. Loss of function mutation of KEAP1 is observed in
20-50% of non-small-cell lung cancers (NSCLCs) [29]. KEAP1 is a redox-sensitive E3 ubiquitin
ligase that targets oxidized NRF2, the master transcriptional regulator of the cellular antioxidant
response [30–32] and previous work has demonstrated an ability of NRF2 to alter metabolic fluxes
[33–35]. Consequently, we hypothesized that the mutational status of this pathway potentially
influenced oxPPP sensitivity.
Knockout of KEAP1 in HeLa cells significantly increased NRF2 levels and expression
of oxPPP enzymes G6PD and PGD (Figure S5.3E and S5.4B) consistent with the increased
expression levels observed in A549 cells (KEAP1-deficient) relative to HeLa cells (KEAP1
167

WT) (Figure S5.5A, bottom left). We next determined how oxPPP flux contributed to cytosolic
NADPH pools using [3-2H]glucose in KEAP1 KO cells [21]. For all sgRNAs we observed a
significant decrease in labeling (Figure 5.4C), which indicates higher pathway flux and loss
of label via glutathione-mediated H-D exchange [36]. This enhanced glutathione buffering
capacity is consistent with the greater dispensability of oxPPP enzymes observed in A549 cells as
compared to HeLa cells (Figure 5.4A).
We next hypothesized that KEAP1 mutational status could directly alter sensitivity to
SKO of oxPPP enzymes and quantified the impact of such SKOs on the fitness and metabolism of
an isogenic panel of A549 cells. Ectopic expression of wild type (WT) KEAP1 decreased NRF2
stabilization as compared to constitutively active C273S mutant KEAP1 [37] (Figure S5.4B).
Interestingly, overexpression of either mutant or WT KEAP1 increased NRF2 levels as compared
to parental cells (Figure S5.4B). Re-expression of WT KEAP1 in A549 cells increased cell
sensitivity to PGD knockout as compared to C273S KEAP1 mutant cells (Figure 5.4D and S5.4C),
highlighting the role of KEAP1 in regulating oxPPP enzyme expression and flux. Consistent with
these fitness results and the above metabolic measurements, WT KEAP1 expression increased the
contribution of PGD to cytosolic NADPH regeneration (Figure 5.4E) and decreased expression of
oxPPP enzymes (Figure 5.4F).
Finally, we hypothesized that KEAP1 remodels redox metabolism due to its canonical
role in the cellular antioxidant response. Indeed, expression of WT KEAP1 was found to
both decrease expression of NADPH-regenerating enzymes and those involved in glutathione
(GSH) synthesis (Figure 5.4G). Consistent with decreased expression of GSH synthesis enzymes,
intracellular glutathione levels were decreased by 45% upon expression of WT KEAP1 (Figure
5.4H). Presumably, the decreased buffering capacity by GSH and lower expression of other
NADPH regenerating contributes to the increased dependence on oxPPP flux observed in cells
expressing WT KEAP1. A model therefore emerges from our screening results, whereby KEAP1
mutational status alters the relative importance of the oxPPP by modulating expression of the
168

redox network to drive GSH synthesis and regeneration (Figure 5.4I).
169

Figure 5.4: KEAP1 mutational status alters redox metabolism and impact of oxPPP geneknockouts on cellular fitness. (A) Plot of cell-specific fitness scores for expressed genes.Positive scores are SKOs that are essential in A549s and negative scores are SKOs more essentialin HeLa cells. The cell-specific essentiality scores respond to the z-score transformed residualsof linear regression of HeLa and A549 SKO fitness, shown in Figure S5.4A. (B) Immunoblot ofKEAP1 SKO in HeLa cells. (C) Contribution of oxPPP to cytosolic NADPH with KEAP1 SKOin HeLa cells. Plotted as mean ± 95% CI. * indicates statistical significance by non-overlappingconfidence intervals. (D) Relative PGD SKO effect in A549s with KEAP1 mutant panel. (E)Contribution of oxPPP to cytosolic NADPH in A549s with KEAP1 mutant panel. Plotted asmean ± 95% CI. * indicates statistical significance by non-overlapping confidence intervals. (F)Immunoblot of A549s with KEAP1 mutant panel. (G) Normalized relative gene expression ofA549s with KEAP1 mutant panel. (H) Glutathione measurement in A549 with KEAP1 mutantpanel (n=5). (I) Schematic of how KEAP1 mutational status alters relative metabolism andoxPPP dispensability. (D, G, H) Data plotted as mean ± SEM.
170
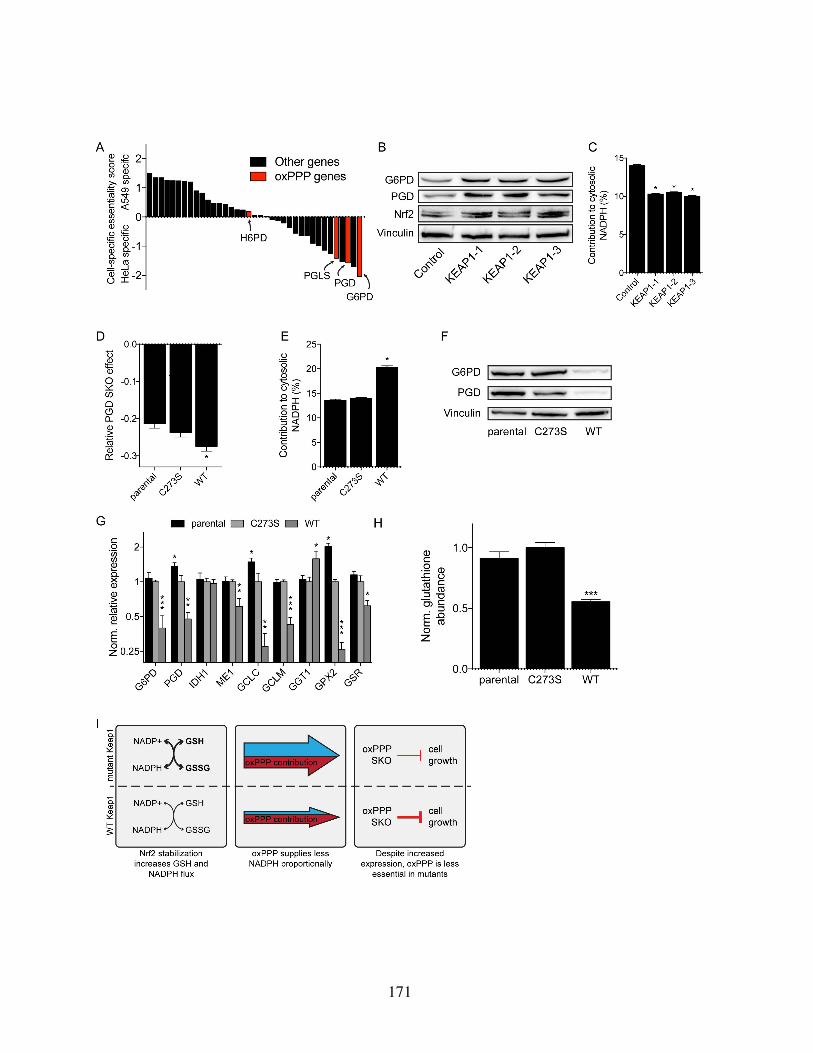
171
5.5 Discussion
While it is clear that cancer cells rely on aerobic glycolysis to maintain biosynthetic fluxes
and ATP demands [38], how the underlying metabolic network topology changes in response
to specific oncogenic events is not fully clear. In this study, we comprehensively interrogated
metabolic gene dispensability, interaction, and compensation through a combinatorial CRISPR-
Cas9 screening approach. Key nodes within glycolysis were found to significantly interact with
one another (e.g. ALDOA and PGD) in an emergent network behavior. Many of these interactions
were conserved across cells of different origin, implying such enzyme interaction pairs harbor
some function that warrant future interrogation.
Other interactions were demonstrative of metabolic compensation within isozyme families
(e.g. ENO1 and ENO3) and consistent with previously described mechanisms of metabolic
synthetic lethality [27, 39]. These observed network features present a new opportunity through
combinatorial (pairwise) screening to understand if/how cells can adapt around loss of a metabolic
enzyme. Knowing if a solid tumor of interest is pharmacologically vulnerable to a metabolic
inhibitor a priori will allow for future precision medicine applications.
In fact, by comparing relative SKO scores across cell types, we were able to elucidate a
paradoxical resistance to targeting the oxPPP along the KEAP1-NRF2 axis. Even though cells
potently upregulated expression of oxPPP enzymes upon loss of KEAP1, cells were less vulnerable
to KO of enzymes in this metabolic pathway. In this case, alternate NADPH regeneration
pathways and increased antioxidant buffering by GSH pools provides compensation and survival
benefits to cells. Our NAPDH tracing data demonstrated that cells lacking functional KEAP1
exhibit higher oxPPP flux, as evidenced by reduced labeling due to increased H-D exchange
through glutathione-related pathways [36]. Indeed, elevated oxPPP enzyme levels and increased
glutathione pools would specifically increase exchange flux, resulting in the observed decrease in
labeling downstream of [3-2H]glucose. The integration of such functional measurements with
172

genetic screening and transcriptional results provides better context to interpret the observed
metabolic reprogramming downstream of KEAP1-NRF2.
Our results suggest that KEAP1 mutational status must be considered when targeting
the oxPPP therapeutically. In fact, recent work has implicated KEAP1 mutational status as a
driver of metabolic reprograming and potential targeting of glutaminase in pre-clinical models of
lung adenocarcinoma [40]. Consistent with our findings, KEAP1 mutation increases intracellular
glutathione levels and need for cysteine, causing an increased need for glutamine anaplerosis
to support glutamate/cysteine antiporter flux (SLC7A11) [40, 41]. Other recent work has also
implicated KEAP1 mutational status as a driver of chemotherapeutic resistance in preclinical
models of lung cancer and further demonstrates the need for new paradigms connecting oncogenic
mutations to cancer cell survival [42].
Moving forward, it will be important to perform such screens across a larger number of
cell types to elucidate a more comprehensive picture of metabolic network reprogramming. The
high throughput methodology presented here increases the feasibility of such studies. We note
also that comparing the absolute fitness values in screens across cell lines can be confounded
by various factors. These include differences in relative cell growth and expression of CRISPR
effectors among others, and thus devising new strategies for normalization will be valuable
to improve the utility of future screening data sets. We also note the critical importance of
sgRNA efficacy, and anticipate that continued improvements in sgRNA design [43–45] will be
critical to improving consistency and signal-to-noise in the assays. Finally, layering in data from
complementary perturbation strategies such as CRISPR activation/inhibition and small molecule
inhibition should enable charting of more comprehensive networks underlying cellular function
and transformation.
Discovery of the unique metabolic features in transformed cells has spurred much interest
in exploiting metabolic vulnerabilities for drug discovery [46]. In fact, metabolic inhibitors have
been developed as single agent therapeutics and combination therapeutics for many different
173
cancer types [47]. However, these agents have found varying success in the clinic due an inability
to determine proper cancer types in preclinical development. While cancer cells share common
hallmarks of metabolic reprogramming, cell-of-origin and tumorigenic drivers uniquely influence
the direction and extent of metabolic reprogramming. The new paradigm of incorporating
combinatorial CRISPR screening, transcriptomic information, and metabolic flux measurements
presented here will provide a new platform to address this limitation. By interrogating metabolism
at the network-level, new therapeutic targets may be identified, and clinicians may become better
equipped at identifying the most responsive patient populations.
5.6 Acknowledgements
We would like to acknowledge members of the Mali and Metallo labs for their helpful
discussions, Alex Thomas and Nathan Lewis for help with sgRNA designs, and Eric Ben-
nett for KEAP1 vectors. This work was supported by the California Institute of Regenerative
Medicine (RB5-07356 to C.M.M.), NIH grant (R01CA188652 to C.M.M.), Camille and Henry
Dreyfus Teacher-Scholar (to C.M.M.), NSF CAREER (to C.M.M.), Searle Scholar Award (to
C.M.M.), UCSD Institutional Funds (to P.M.), NIH grant (R01HG009285 to P.M.), NIH grant
(R01CA222826 to P.M.), the Burroughs Wellcome Fund (1013926 to P.M.), the March of Dimes
Foundation (5-FY15-450 to P.M.), and the Kimmel Foundation (SKF-16-150 to P.M). M.G.B. is
supported by a NSF Graduate Research Fellowship (DGE-1144086).
Chapter 5, in full, is a reprint of the material as it appears in ”Combinatorial CRISPR-
Cas9 Metabolic Screens Reveal Critical Redox Control Points Dependent on the KEAP1-NRF2
Regulatory Axis,” Molecular Cell, vol. 69, 2018. Mehmet G. Badur and Dongxin Zhao are the
co-primary authors of this publication. Jens Luebeck, Jose H. Magana, Amanda Birmingham,
Roman Sasik, Christopher S. Ahn, and Trey Ideker are co-authors of this publication. Christian
M. Metallo and Prashant Mali are the co-corresponding authors of this publication.
174
5.7 References1. Pavlova, N. N. & Thompson, C. B. The Emerging Hallmarks of Cancer Metabolism. Cell
Metab 23, 27–47 (2016).
2. Hensley, C. T., Faubert, B., Yuan, Q., Lev-Cohain, N., Jin, E., Kim, J., Jiang, L., Ko, B.,Skelton, R., Loudat, L., Wodzak, M., Klimko, C., McMillan, E., Butt, Y., Ni, M., Oliver,D., Torrealba, J., Malloy, C. R., Kernstine, K., Lenkinski, R. E. & DeBerardinis, R. J.Metabolic Heterogeneity in Human Lung Tumors. Cell 164, 681–94 (2016).
3. Chaneton, B., Hillmann, P., Zheng, L., Martin, A. C., Maddocks, O. D., Chokkathukalam,A., Coyle, J. E., Jankevics, A., Holding, F. P., Vousden, K. H., Frezza, C., O’Reilly, M.& Gottlieb, E. Serine is a natural ligand and allosteric activator of pyruvate kinase M2.Nature 491, 458–62 (2012).
4. Christofk, H. R., Vander Heiden, M. G., Harris, M. H., Ramanathan, A., Gerszten, R. E.,Wei, R., Fleming, M. D., Schreiber, S. L. & Cantley, L. C. The M2 splice isoform ofpyruvate kinase is important for cancer metabolism and tumour growth. Nature 452, 230–3(2008).
5. Patra, K. C., Wang, Q., Bhaskar, P. T., Miller, L., Wang, Z., Wheaton, W., Chandel, N.,Laakso, M., Muller, W. J., Allen, E. L., Jha, A. K., Smolen, G. A., Clasquin, M. F., Robey,B. & Hay, N. Hexokinase 2 is required for tumor initiation and maintenance and itssystemic deletion is therapeutic in mouse models of cancer. Cancer Cell 24, 213–228(2013).
6. Castaldo, G., Calcagno, G., Sibillo, R., Cuomo, R., Nardone, G., Castellano, L., DelVecchio Blanco, C., Budillon, G. & Salvatore, F. Quantitative analysis of aldolase AmRNA in liver discriminates between hepatocellular carcinoma and cirrhosis. Clin Chem46, 901–6 (2000).
7. Guzman, G., Chennuri, R., Chan, A., Rea, B., Quintana, A., Patel, R., Xu, P. Z., Xie, H. &Hay, N. Evidence for heightened hexokinase II immunoexpression in hepatocyte dysplasiaand hepatocellular carcinoma. Dig Dis Sci 60, 420–6 (2015).
8. Shalem, O., Sanjana, N. E., Hartenian, E., Shi, X., Scott, D. A., Mikkelsen, T. S., Heckl,D., Ebert, B. L., Root, D. E., Doench, J. G. & Zhang, F. Genome-scale CRISPR-Cas9knockout screening in human cells. Science 343, 84–7 (2014).
9. Wang, T., Wei, J. J., Sabatini, D. M. & Lander, E. S. Genetic screens in human cells usingthe CRISPR-Cas9 system. Science 343, 80–4 (2014).
10. Hart, T., Chandrashekhar, M., Aregger, M., Steinhart, Z., Brown, K. R., MacLeod, G., Mis,M., Zimmermann, M., Fradet-Turcotte, A., Sun, S., Mero, P., Dirks, P., Sidhu, S., Roth,
175

F. P., Rissland, O. S., Durocher, D., Angers, S. & Moffat, J. High-Resolution CRISPRScreens Reveal Fitness Genes and Genotype-Specific Cancer Liabilities. Cell 163, 1515–26 (2015).
11. Wang, T., Birsoy, K., Hughes, N. W., Krupczak, K. M., Post, Y., Wei, J. J., Lander, E. S. &Sabatini, D. M. Identification and characterization of essential genes in the human genome.Science 350, 1096–101 (2015).
12. Arroyo, J. D., Jourdain, A. A., Calvo, S. E., Ballarano, C. A., Doench, J. G., Root, D. E.& Mootha, V. K. A Genome-wide CRISPR Death Screen Identifies Genes Essential forOxidative Phosphorylation. Cell Metab 24, 875–885 (2016).
13. Birsoy, K., Wang, T., Chen, W. W., Freinkman, E., Abu-Remaileh, M. & Sabatini, D. M.An Essential Role of the Mitochondrial Electron Transport Chain in Cell Proliferation Isto Enable Aspartate Synthesis. Cell 162, 540–51 (2015).
14. Boettcher, M., Tian, R., Blau, J., Markegard, E., Wu, D., Biton, A., Zaitlen, N., McCormick,F., Kampmann, M. & McManus, M. T. Decoding directional genetic dependencies throughorthogonal CRISPR/Cas screens. bioRxiv (2017).
15. Chow, R. D., Wang, G., Codina, A., Ye, L. & Chen, S. Mapping in vivo genetic interac-tomics through Cpf1 crRNA array screening. bioRxiv (2017).
16. Han, K., Jeng, E. E., Hess, G. T., Morgens, D. W., Li, A. & Bassik, M. C. Synergistic drugcombinations for cancer identified in a CRISPR screen for pairwise genetic interactions.Nat Biotechnol (2017).
17. Shen, J. P., Zhao, D., Sasik, R., Luebeck, J., Birmingham, A., Bojorquez-Gomez, A., Licon,K., Klepper, K., Pekin, D., Beckett, A. N., Sanchez, K. S., Thomas, A., Kuo, C. C., Du, D.,Roguev, A., Lewis, N. E., Chang, A. N., Kreisberg, J. F., Krogan, N., Qi, L., Ideker, T. &Mali, P. Combinatorial CRISPR-Cas9 screens for de novo mapping of genetic interactions.Nat Methods (2017).
18. Wong, A. S., Choi, G. C., Cui, C. H., Pregernig, G., Milani, P., Adam, M., Perli, S. D., Kazer,S. W., Gaillard, A., Hermann, M., Shalek, A. K., Fraenkel, E. & Lu, T. K. Multiplexedbarcoded CRISPR-Cas9 screening enabled by CombiGEM. Proc Natl Acad Sci U S A 113,2544–9 (2016).
19. Zhao, D., Badur, M. G., Leubeck, J., Magana, J., Birmingham, A., Sasik, R., Ahn, C. S.,Ideker, T., Metallo, C. M. & Mali, P. Combinatorial CRISPR-Cas9 Metabolic ScreensReveal Critical Redox Control Points Dependent on the KEAP1-NRF2 Regulatory Axis.Mol Cell 69, 699–708 (2018).
176
20. Lee, W. N., Boros, L. G., Puigjaner, J., Bassilian, S., Lim, S. & Cascante, M. Mass iso-topomer study of the nonoxidative pathways of the pentose cycle with [1,2-13C2]glucose.Am J Physiol 274, E843–51 (1998).
21. Lewis, C. A., Parker, S. J., Fiske, B. P., McCloskey, D., Gui, D. Y., Green, C. R., Vokes,N. I., Feist, A. M., Vander Heiden, M. G. & Metallo, C. M. Tracing compartmentalizedNADPH metabolism in the cytosol and mitochondria of mammalian cells. Mol Cell 55,253–63 (2014).
22. Young, J. D. INCA: a computational platform for isotopically non-stationary metabolicflux analysis. Bioinformatics 30, 1333–5 (2014).
23. Wang, X., Spandidos, A., Wang, H. & Seed, B. PrimerBank: a PCR primer database forquantitative gene expression analysis, 2012 update. Nucleic Acids Res 40, D1144–9 (2012).
24. Hay, N. Reprogramming glucose metabolism in cancer: can it be exploited for cancertherapy? Nat Rev Cancer 16, 635–49 (2016).
25. Vander Heiden, M. G., Cantley, L. C. & Thompson, C. B. Understanding the Warburgeffect: the metabolic requirements of cell proliferation. Science 324, 1029–33 (2009).
26. Stark, C., Breitkreutz, B. J., Reguly, T., Boucher, L., Breitkreutz, A. & Tyers, M. BioGRID:a general repository for interaction datasets. Nucleic Acids Res 34, D535–9 (2006).
27. Muller, F. L., Colla, S., Aquilanti, E., Manzo, V. E., Genovese, G., Lee, J., Eisenson, D.,Narurkar, R., Deng, P., Nezi, L., Lee, M. A., Hu, B., Hu, J., Sahin, E., Ong, D., Fletcher-Sananikone, E., Ho, D., Kwong, L., Brennan, C., Wang, Y. A., Chin, L. & DePinho, R. A.Passenger deletions generate therapeutic vulnerabilities in cancer. Nature 488, 337–42(2012).
28. Kuehne, A., Emmert, H., Soehle, J., Winnefeld, M., Fischer, F., Wenck, H., Gallinat, S.,Terstegen, L., Lucius, R., Hildebrand, J. & Zamboni, N. Acute Activation of OxidativePentose Phosphate Pathway as First-Line Response to Oxidative Stress in Human SkinCells. Mol Cell 59, 359–71 (2015).
29. Singh, A., Misra, V., Thimmulappa, R. K., Lee, H., Ames, S., Hoque, M. O., Herman, J. G.,Baylin, S. B., Sidransky, D., Gabrielson, E., Brock, M. V. & Biswal, S. DysfunctionalKEAP1-NRF2 interaction in non-small-cell lung cancer. PLoS Med 3, e420 (2006).
30. DeNicola, G. M., Karreth, F. A., Humpton, T. J., Gopinathan, A., Wei, C., Frese, K.,Mangal, D., Yu, K. H., Yeo, C. J., Calhoun, E. S., Scrimieri, F., Winter, J. M., Hruban,R. H., Iacobuzio-Donahue, C., Kern, S. E., Blair, I. A. & Tuveson, D. A. Oncogene-inducedNrf2 transcription promotes ROS detoxification and tumorigenesis. Nature 475, 106–9(2011).
177
31. Ishii, T., Itoh, K., Takahashi, S., Sato, H., Yanagawa, T., Katoh, Y., Bannai, S. & Yamamoto,M. Transcription factor Nrf2 coordinately regulates a group of oxidative stress-induciblegenes in macrophages. J Biol Chem 275, 16023–9 (2000).
32. Thimmulappa, R. K., Mai, K. H., Srisuma, S., Kensler, T. W., Yamamoto, M. & Biswal, S.Identification of Nrf2-regulated genes induced by the chemopreventive agent sulforaphaneby oligonucleotide microarray. Cancer Res 62, 5196–203 (2002).
33. DeNicola, G. M., Chen, P. H., Mullarky, E., Sudderth, J. A., Hu, Z., Wu, D., Tang, H.,Xie, Y., Asara, J. M., Huffman, K. E., Wistuba, I., Minna, J. D., DeBerardinis, R. J. &Cantley, L. C. NRF2 regulates serine biosynthesis in non-small cell lung cancer. Nat Genet47, 1475–81 (2015).
34. Mitsuishi, Y., Taguchi, K., Kawatani, Y., Shibata, T., Nukiwa, T., Aburatani, H., Yamamoto,M. & Motohashi, H. Nrf2 redirects glucose and glutamine into anabolic pathways inmetabolic reprogramming. Cancer Cell 22, 66–79 (2012).
35. Thimmulappa, R. K., Lee, H., Rangasamy, T., Reddy, S. P., Yamamoto, M., Kensler, T. W.& Biswal, S. Nrf2 is a critical regulator of the innate immune response and survival duringexperimental sepsis. J Clin Invest 116, 984–95 (2006).
36. Zhang, Z., Chen, L., Liu, L., Su, X. & Rabinowitz, J. D. Chemical Basis for DeuteriumLabeling of Fat and NADPH. J Am Chem Soc 139, 14368–14371 (2017).
37. Zhang, D. D. & Hannink, M. Distinct cysteine residues in Keap1 are required for Keap1-dependent ubiquitination of Nrf2 and for stabilization of Nrf2 by chemopreventive agentsand oxidative stress. Mol Cell Biol 23, 8137–51 (2003).
38. Hsu, P. P. & Sabatini, D. M. Cancer cell metabolism: Warburg and beyond. Cell 134, 703–7(2008).
39. Dey, P., Baddour, J., Muller, F., Wu, C. C., Wang, H., Liao, W. T., Lan, Z., Chen, A.,Gutschner, T., Kang, Y., Fleming, J., Satani, N., Zhao, D., Achreja, A., Yang, L., Lee, J.,Chang, E., Genovese, G., Viale, A., Ying, H., Draetta, G., Maitra, A., Wang, Y. A., Nagrath,D. & DePinho, R. A. Genomic deletion of malic enzyme 2 confers collateral lethality inpancreatic cancer. Nature 542, 119–123 (2017).
40. Romero, R., Sayin, V. I., Davidson, S. M., Bauer, M. R., Singh, S. X., LeBoeuf, S. E.,Karakousi, T. R., Ellis, D. C., Bhutkar, A., Sanchez-Rivera, F. J., Subbaraj, L., Martinez,B., Bronson, R. T., Prigge, J. R., Schmidt, E. E., Thomas, C. J., Goparaju, C., Davies,A., Dolgalev, I., Heguy, A., Allaj, V., Poirier, J. T., Moreira, A. L., Rudin, C. M., Pass,H. I., Vander Heiden, M. G., Jacks, T. & Papagiannakopoulos, T. Keap1 loss promotesKras-driven lung cancer and results in dependence on glutaminolysis. Nat Med (2017).
178
41. Muir, A., Danai, L. V., Gui, D. Y., Waingarten, C. Y., Lewis, C. A. & Vander Heiden,M. G. Environmental cystine drives glutamine anaplerosis and sensitizes cancer cells toglutaminase inhibition. Elife 6 (2017).
42. Krall, E. B., Wang, B., Munoz, D. M., Ilic, N., Raghavan, S., Niederst, M. J., Yu, K.,Ruddy, D. A., Aguirre, A. J., Kim, J. W., Redig, A. J., Gainor, J. F., Williams, J. A., Asara,J. M., Doench, J. G., Janne, P. A., Shaw, A. T., McDonald Iii, R. E., Engelman, J. A.,Stegmeier, F., Schlabach, M. R. & Hahn, W. C. KEAP1 loss modulates sensitivity to kinasetargeted therapy in lung cancer. Elife 6 (2017).
43. Chari, R., Mali, P., Moosburner, M. & Church, G. M. Unraveling CRISPR-Cas9 genomeengineering parameters via a library-on-library approach. Nat Methods 12, 823–6 (2015).
44. Doench, J. G., Fusi, N., Sullender, M., Hegde, M., Vaimberg, E. W., Donovan, K. F., Smith,I., Tothova, Z., Wilen, C., Orchard, R., Virgin, H. W., Listgarten, J. & Root, D. E. OptimizedsgRNA design to maximize activity and minimize off-target effects of CRISPR-Cas9. NatBiotechnol 34, 184–91 (2016).
45. Erard, N., Knott, S. R. V. & Hannon, G. J. A CRISPR Resource for Individual, Combina-torial, or Multiplexed Gene Knockout. Mol Cell 67, 348–354 e3 (2017).
46. Vander Heiden, M. G. Targeting cancer metabolism: a therapeutic window opens. Nat RevDrug Discov 10, 671–84 (2011).
47. Tennant, D. A., Duran, R. V. & Gottlieb, E. Targeting metabolic transformation for cancertherapy. Nat Rev Cancer 10, 267–277 (2010).
179

Chapter 6
Oncogenic R132 IDH1 mutations limit
NADPH for de novo lipogenesis through
(D)2-hydroxyglutarate production in
fibrosarcoma cells
6.1 Abstract
Neomorphic mutations in NADP-dependent isocitrate dehydrogenases (IDH1 and IDH2)
contribute to tumorigenesis in several cancers. While significant research has focused on the epi-
genetic phenotypes associated with (D)2-hydroxyglutarate (D2HG) accumulation, the metabolic
consequences of these mutations may also provide therapeutic opportunities. Here we apply
flux-based approaches to genetically-engineered sarcoma cell lines with an endogenous IDH1
mutation to examine the metabolic impacts of increased D2HG production and altered IDH flux
as a function of IDH1 mutation or expression. We demonstrate that R132 IDH1 mutations alter
glutamine metabolism to support D2HG production and secretion, which consumes NADPH
180

at rates similar to that required for de novo lipogenesis. In turn, IDH1 R132C+/- cells exhibit
increased dependence on exogenous lipid sources for growth, as removal of medium lipids slows
cellular growth more dramatically in IDH1 mutant cells compared to those expressing wild-type
or enzymatically inactive alleles. NADPH regeneration may be limiting for lipogenesis and
potentially redox homeostasis in IDH1 mutant tumors, highlighting critical links between cellular
biosynthesis and redox metabolism.
6.2 Introduction
Mutations in isocitrate dehydrogenase 1 (IDH1) and 2 (IDH2) drive tumorigenesis in
acute myeloid leukemias, gliomas, sarcomas, and other tumors [1–4]. These gain-of-function
mutations modify the activity of IDH1 and IDH2 such that the major reaction catalyzed is the
NADPH-mediated reduction of a-ketoglutarate (aKG) to (D)2-hydroxyglutarate (D2HG) [5, 6].
In addition, mutant IDH1 and IDH2 exhibit decreased activity for the wild-type (WT) reaction,
which reversibly interconverts isocitrate and NADP+ with aKG, CO2, and NADPH [6]. Therefore,
cells harboring such IDH mutations exhibit metabolic reprogramming to compensate for these
changes in enzyme activity.
Under hypoxic conditions, IDH1 mutant cells exhibit increased oxidative TCA flux,
respiration, and decreased growth [7]. While IDH1 mutant cells do not increase reductive
carboxylation in hypoxia to the same extent as cells expressing only WT IDH1, mitochondrial
metabolism and redox pathways are re-wired to support the growth of mutant IDH1 cells in culture
and in vivo [8, 9]. More generally, IDH1 mutant cells exhibit various defects in mitochondrial
metabolism which may be therapeutically exploited by targeting NAMPT, BCL2, or other targets
[10–13]. These results demonstrate that IDH1 mutant cells exhibit similar metabolism to cells
expressing WT IDH1 under basal conditions but altered metabolic states under conditions of
bioenergetic or redox stress.
181
IDH1 is not thought to be a major source of NADPH in mammals [14]. IDH1-/- mice
exhibit phenotypes only in select tissues or in response to specific stresses (i.e. nutrient depriva-
tion) [15]. In culture, overall IDH-mediated exchange flux is high, and the reverse reaction can
support lipogenesis or compartment-specific redox maintenance in cancer cells under conditions
of metabolic stress [16–18]. The oxidative pentose phosphate pathway (oxPPP) is classically
thought to be the primary pathway through which NADPH is regenerated in the cytosol [19].
Recent studies using 2H tracing support this concept, where the oxidative PPP exhibits the high-
est contribution to cytosolic NADPH regeneration supporting biosynthesis [20, 21]. Cell lines
engineered to express mutant IDH1 enzymes exhibit increased oxPPP flux and differential lipid
synthesis [22], highlighting the importance of this pathway. On the other hand, knockout of
oxPPP enzymes is particularly deleterious for cancer cell growth [23].
To better understand how mutations in IDH1 impact NADPH metabolism we applied 13C
and 2H metabolic flux analysis to an isogenic panel of fibrosarcoma cell lines that endogenously
express IDH1+/R132C or were engineered to express a WT, R132C mutant, or enzymatically dead
IDH1 enzyme after knocking out the original mutant allele [24]. These cell lines recapitulate
changes in anchorage-independent growth driven by mutant IDH1 [24] as well as the metabolic
defects documented to occur under hypoxia. 2HG production and secretion were a major sink
of NADPH in IDH1+/R132C cells, though cells could sufficiently compensate by upregulating
oxidative PPP flux. However, in lipid-deficient conditions D2HG production and secretion
presented a metabolic liability that negatively impacted de novo lipogenic flux and in vitro cell
growth. These results demonstrate that IDH1 R132 mutations may be considered a significant
redox liability in tumors, rendering them susceptible to metabolic stress.
182
6.3 Materials and Methods
6.3.1 Cell culture and stable isotope tracing
HT1080 and HCT116 cells were grown in DMEM supplemented with 10% FBS and
100 U/mL penicillin/streptomycin. HT1080 parental cells were obtained from ATCC. HCT116
parental and IDH1 knock-in clones (+/R132C; 2H1 and 2A9) were obtained from Horizon
Discovery. Cells were maintained in humidified incubator at 5% CO2. For hypoxia experiments,
cells were maintained in humidified glove box (Coy) at 5% CO2 and 1% O2.
For delipidated cell growth experiments, cells were plated in basal DMEM media. Cells
were then allowed to adhere for 4 hours and then media was exchanged to delipidated media.
Final cell counts were obtained after 48 hours.
For isotopic labeling experiments, cells were plated in basal growth experiments and then
rinsed with PBS before addition of tracing media. Cells were cultured in glucose- and glutamine-
free media (Gibco) supplemented with 10% dialyzed FBS, 100 U/mL penicillin/streptomycin,
4mM glutamine, and 25mM glucose. For glutamine tracing, cells were supplied 12C glucose
(Sigma) and [U-13C5]glutamine (99%, Cambridge Isotope Laboratories). For glucose tracing,
cells were supplied 12C glutamine (Sigma) and either [3-2H]glucose (99%, Cambridge Isotope
Laboratories), [4-2H]glucose (99%, Omicron Biochemicals), [U-13C6]glucose (99%, Cambridge
Isotope Laboratories), or [1,2-13C]glucose (99%, Cambridge Isotope Laboratories). For delip-
idated tracing experiments, media was prepared in same way except using 10% dialyzed and
delipidated FBS.
6.3.2 Delipidation of FBS
Normal or dialyzed FBS (Gibco) was delipidated by first stirring 20 mg/mL fumed silica
(Sigma) for 3 hrs in ambient conditions. FBS slurry was then clarified by repeated centrifugation
at 2000 g for 20 min. Supernatant was then sterile filtered (0.2 m), aliquoted, and stored for at
183

-20◦C for future use.
6.3.3 Metabolite Extraction and GC-MS Analysis
Cells were rinsed with 0.9% (w/v) saline and 250 µL of -80◦C MeOH was added to
quench metabolic reactions. 100 µL of ice-cold water supplemented with 10 µg/mL norvaline
was then added to each well and cells were collected by scraping. The lysate was moved to a fresh
1.5 mL sample tube and 250 µL of -20◦C chloroform supplemented with 4 µg/mL D31 palmitate
was added. After vortexing and centrifugation, the top aqueous layer and bottom organic layer
were collected and dried under airflow.
Derivatization of aqueous metabolites was performed using the Gerstel MultiPurpose
Sampler (MPS 2XL). Methoxime- derivatives were formed by addition of 15 µL 2% (w/v)
methoxylamine hydrochloride (MP Biomedicals) in pyridine and incubated at 45◦C for 60
minutes. Samples were then silylated by addition of 15 µL of N-tert-butyldimethylsily-N-
methyltrifluoroacetamide (MTBSTFA) with 1% tert-butyldimethylchlorosilane (tBDMS) (Regis
Technologies) and incubated at 45◦C for 30 minutes. Aqueous metabolites were analyzed by
GC-MS using a DB-35MS column (30 m x 0.25 mm i.d. x 0.25 µm, Agilent J&W Scientific,
Santa Clara, CA) installed in an Agilent 7890B gas chromatograph (GC) interfaced with a 5977C
mass spectrometer (MS). For separation of aqueous metabolites, the GC oven was held at 100◦C
for 1 min after injection, increased to 255◦C at 3.5◦C/min, and finally increased to 320◦C at
15◦C/min and held for 3 min. Electron impact ionization was performed with the MS scanning
over the range of 100-650 m/z.
Dried organic fraction was saponified and esterified to form fatty acid methyl esters
(FAMEs) by addition of 500 µL of 2% (w/v) H2SO4 in MeOH and incubated at 50◦C for 120
minutes. FAMEs were then extracted by addition of saturated NaCl and hexane before collection
and drying of the inorganic layer. Derivatized fatty acids were analyzed by GC-MS using a select
FAME column (100 m x 0.25 mm i.d. x 0.25 µm; Agilent J&W Scientific) installed in an Agilent
184

7890A gas chromatograph (GC) interfaced with a 5975C mass spectrometer (MS). For separation
the GC oven was held at 80◦C for 1 min after injection, increased to 160◦C at 20◦C/min, increased
to 198◦C at 1◦C/min, and finally increased to 250◦C at 5◦C/min and held for 15 min. Electron
impact ionization was performed with the MS scanning over the range of 120-400 m/z.
6.3.4 Metabolite integration and isotopomer spectral analysis (ISA)
Isotopologue distributions and total abundances were determined by integration of mass
fragments (Table S6.1) and correcting for natural abundances using in-house MATLAB-based
algorithm.
Isotopomer spectral analysis (ISA) was performed to estimate contribution of oxPPP to
cytosolic NADPH as previously described [25]. ISA compares experimental labeling of palmitate
after 72 hr trace with [3-2H]glucose to simulated labeling using a reaction network where C16:0 is
condensation of 14 NADPHs. Parameters for contribution of PGD to lipogenic NADPH (D value)
and percentage of newly synthesized fatty acid (g(t) value) and their 95% confidence intervals are
then calculated using best-fit model from INCA MFA software [26]. Contribution of oxPPP was
then estimated by doubling D value to account for stoichiometry of the oxPPP pathway.
Estimation of contribution of glucose and glutamine to lipogenic AcCoA was conducted
as similar method to oxPPP contribution. Experimental fatty acid labeling from [U-13C6]glucose
or [U-13C5]glutamine after 72 hr trace was compared to simulated labeling using a reaction
network where C16:0 is condensation of 8 AcCoA. ISA data plotted as mean ± 95% CI. *
indicates statistical significance by non-overlapping confidence intervals.
6.3.5 Measurement of extracellular and intracellular fluxes
Initial and final concentrations of extracellular glucose, lactate, glutamine, and glutamate
were determined by Yellow Springs Analyzer 2950 instrument. In parallel, cells were plated for
185

initial and final cell counts. Plated cells were pre-adapted to delipidated DMEM media for 24 hrs
before experiment.
The extracellular fluxes were described by the following differential equations:
dXdt
= µX
dNi
dt= qiX
dNgln
dt= qiX− kNgln
where, X is concentration of cells, µ is cellular growth (hr-1), N is extracellular moles of metabolite
i present, qi is cell-specific consumption rate of metabolite i (mol/cell-hr), and k is first-order
degradation rate of glutamine in cell culture (hr-1). k was set to 0.0045 hr-1 as determined in
literature [27].
Solution of ODEs yielded the following equations which we used to find extracellular
fluxes:
X = X0eµt
qi =µ(Ni−Ni,0)
( 1µ+k)(X−X0e−kt)
qgln =Ngln−Ngln,0e−kt
( 1µ+k)(X−X0e−kt)
where subscript 0 signifies initial concentration.
For oxPPP measurement, glucose uptake measurement was coupled to ratio of M1(M1+M2)
lactate label from [1,2-13C]glucose tracer.
186
6.3.6 NADPH consumption
For fatty acid synthesis, consumption was defined as NADPH flux required to support
biosynthesis of myristate (C14:0), palmitate (C16:0), stearate (C18:0), and oleate (C18:1) as these
are predominantly synthesized species [14]. Cells were traced with [U-13C6]glucose for 24 hrs
and extracted for intracellular metabolites. In parallel, initial and final cell counts were taken.
Per cell molar abundance of fatty acid species was determined by GC/MS. Percentage newly
synthesized fatty acid determined by ISA with reaction network where C14:0 is condensation of
7 AcCoA, C16:0 is condensation of 8 AcCoA, C18:0 is condensation of 9 AcCoA, and C18:1
is condensation of 9 AcCoA. Molar fatty acid synthesis flux was then calculated by dividing
molar newly synthesized fatty acids by integral viable cell density over experimental time period.
NADPH flux was then calculated by stoichiometric requirement of 12 NADPH per myristate, 14
NADPH per palmitate, 16 NADPH per stearate, and 17 NADPH per oleate.
For 2HG production fluxes, consumption was defined as NADPH flux required to support
2HG efflux and maintenance of intracellular abundance. Initial and final concentrations of
extracellular 2HG were determined by GCMS analysis and use of external standard curves.
Per cell molar abundance of 2HG was determined by GCMS at final time point. Efflux was
then calculated similarly as above and dilutive flux was calculated by dividing intracellular
concentration by specific growth rate. NADPH flux was then calculated by stoichiometric
requirement of one NADPH per 2HG.
6.3.7 RT-PCR
Total mRNA was isolated from cells using RNA isolation kit (RNeasy Mini Kit; QIAGEN).
Isolated RNA was reverse transcribed using cDNA synthesis kit (High-capacity cDNA Reverse
Transcription Kit; Thermo Fisher Scientific). Real-time PCR was performed using SYBR green
reagent (iTaq Universal SYBR Green Supermix; Bio-Rad). Relative expression was determined
187
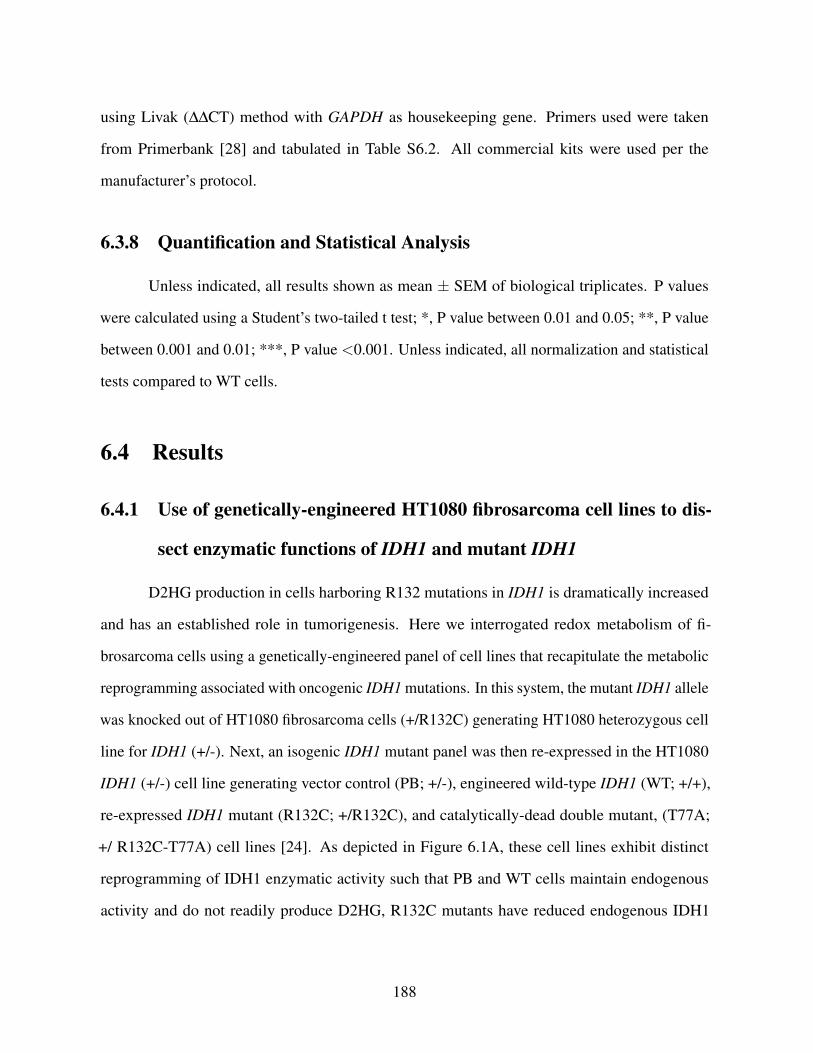
using Livak (∆∆CT) method with GAPDH as housekeeping gene. Primers used were taken
from Primerbank [28] and tabulated in Table S6.2. All commercial kits were used per the
manufacturer’s protocol.
6.3.8 Quantification and Statistical Analysis
Unless indicated, all results shown as mean ± SEM of biological triplicates. P values
were calculated using a Student’s two-tailed t test; *, P value between 0.01 and 0.05; **, P value
between 0.001 and 0.01; ***, P value <0.001. Unless indicated, all normalization and statistical
tests compared to WT cells.
6.4 Results
6.4.1 Use of genetically-engineered HT1080 fibrosarcoma cell lines to dis-
sect enzymatic functions of IDH1 and mutant IDH1
D2HG production in cells harboring R132 mutations in IDH1 is dramatically increased
and has an established role in tumorigenesis. Here we interrogated redox metabolism of fi-
brosarcoma cells using a genetically-engineered panel of cell lines that recapitulate the metabolic
reprogramming associated with oncogenic IDH1 mutations. In this system, the mutant IDH1 allele
was knocked out of HT1080 fibrosarcoma cells (+/R132C) generating HT1080 heterozygous cell
line for IDH1 (+/-). Next, an isogenic IDH1 mutant panel was then re-expressed in the HT1080
IDH1 (+/-) cell line generating vector control (PB; +/-), engineered wild-type IDH1 (WT; +/+),
re-expressed IDH1 mutant (R132C; +/R132C), and catalytically-dead double mutant, (T77A;
+/ R132C-T77A) cell lines [24]. As depicted in Figure 6.1A, these cell lines exhibit distinct
reprogramming of IDH1 enzymatic activity such that PB and WT cells maintain endogenous
activity and do not readily produce D2HG, R132C mutants have reduced endogenous IDH1
188
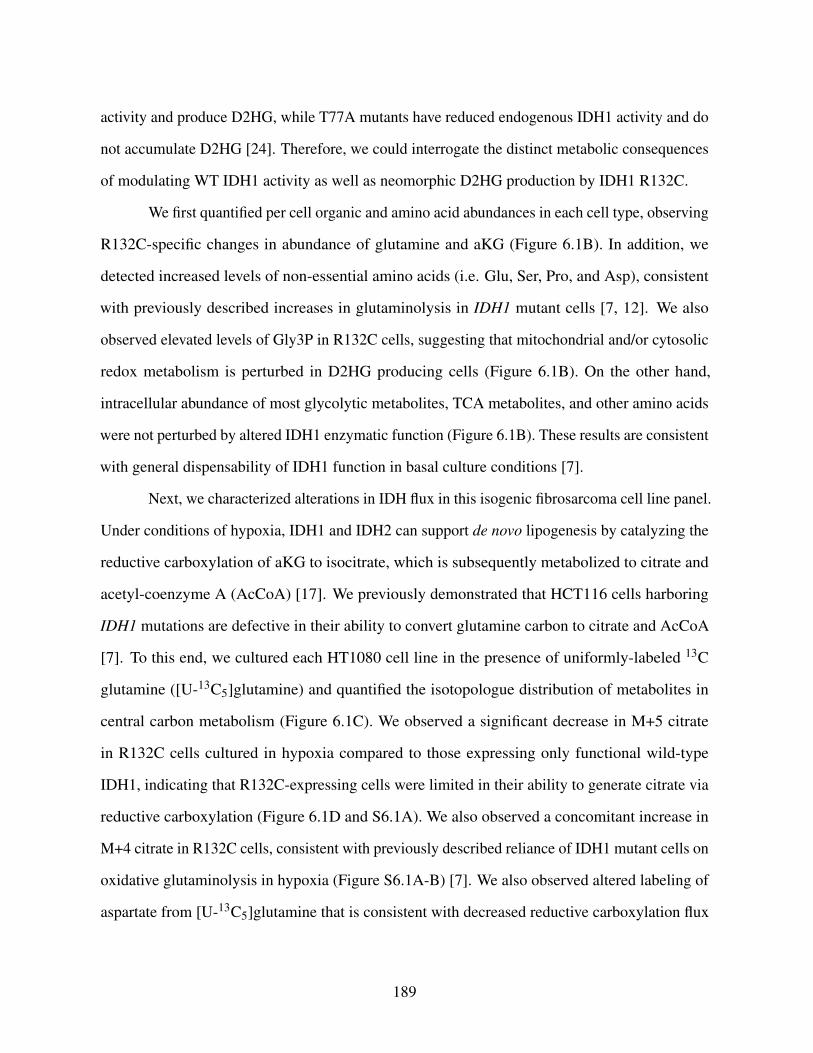
activity and produce D2HG, while T77A mutants have reduced endogenous IDH1 activity and do
not accumulate D2HG [24]. Therefore, we could interrogate the distinct metabolic consequences
of modulating WT IDH1 activity as well as neomorphic D2HG production by IDH1 R132C.
We first quantified per cell organic and amino acid abundances in each cell type, observing
R132C-specific changes in abundance of glutamine and aKG (Figure 6.1B). In addition, we
detected increased levels of non-essential amino acids (i.e. Glu, Ser, Pro, and Asp), consistent
with previously described increases in glutaminolysis in IDH1 mutant cells [7, 12]. We also
observed elevated levels of Gly3P in R132C cells, suggesting that mitochondrial and/or cytosolic
redox metabolism is perturbed in D2HG producing cells (Figure 6.1B). On the other hand,
intracellular abundance of most glycolytic metabolites, TCA metabolites, and other amino acids
were not perturbed by altered IDH1 enzymatic function (Figure 6.1B). These results are consistent
with general dispensability of IDH1 function in basal culture conditions [7].
Next, we characterized alterations in IDH flux in this isogenic fibrosarcoma cell line panel.
Under conditions of hypoxia, IDH1 and IDH2 can support de novo lipogenesis by catalyzing the
reductive carboxylation of aKG to isocitrate, which is subsequently metabolized to citrate and
acetyl-coenzyme A (AcCoA) [17]. We previously demonstrated that HCT116 cells harboring
IDH1 mutations are defective in their ability to convert glutamine carbon to citrate and AcCoA
[7]. To this end, we cultured each HT1080 cell line in the presence of uniformly-labeled 13C
glutamine ([U-13C5]glutamine) and quantified the isotopologue distribution of metabolites in
central carbon metabolism (Figure 6.1C). We observed a significant decrease in M+5 citrate
in R132C cells cultured in hypoxia compared to those expressing only functional wild-type
IDH1, indicating that R132C-expressing cells were limited in their ability to generate citrate via
reductive carboxylation (Figure 6.1D and S6.1A). We also observed a concomitant increase in
M+4 citrate in R132C cells, consistent with previously described reliance of IDH1 mutant cells on
oxidative glutaminolysis in hypoxia (Figure S6.1A-B) [7]. We also observed altered labeling of
aspartate from [U-13C5]glutamine that is consistent with decreased reductive carboxylation flux
189
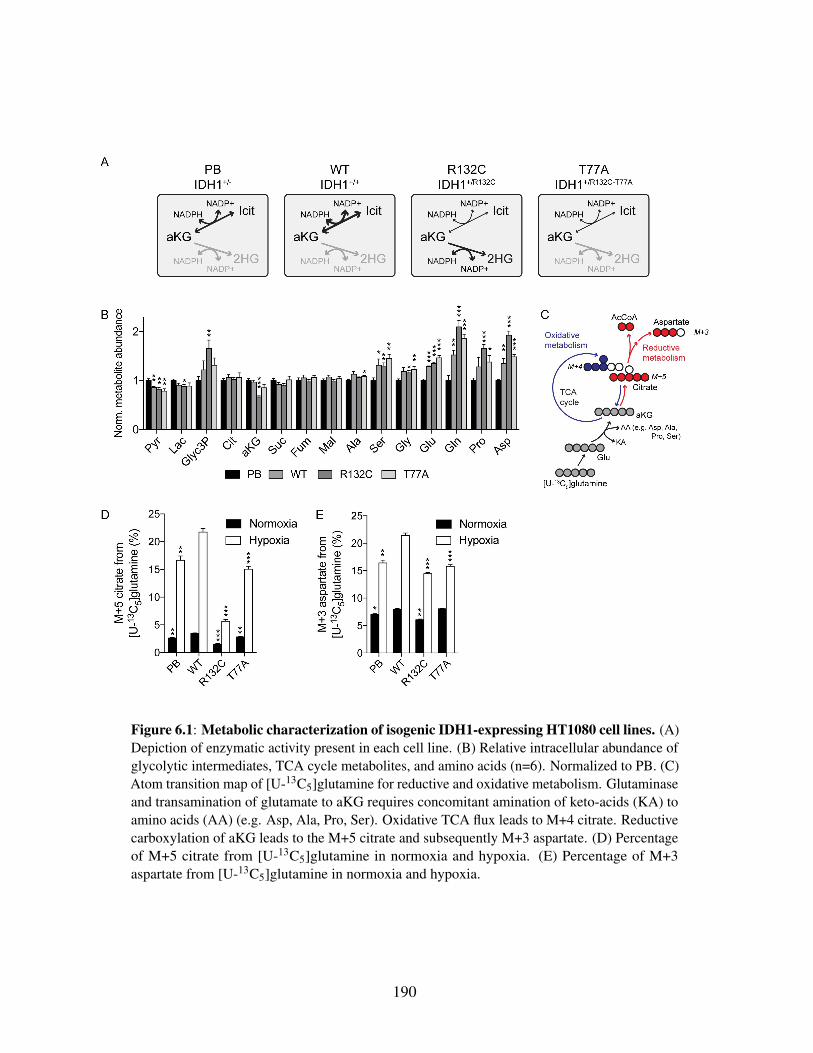
Figure 6.1: Metabolic characterization of isogenic IDH1-expressing HT1080 cell lines. (A)Depiction of enzymatic activity present in each cell line. (B) Relative intracellular abundance ofglycolytic intermediates, TCA cycle metabolites, and amino acids (n=6). Normalized to PB. (C)Atom transition map of [U-13C5]glutamine for reductive and oxidative metabolism. Glutaminaseand transamination of glutamate to aKG requires concomitant amination of keto-acids (KA) toamino acids (AA) (e.g. Asp, Ala, Pro, Ser). Oxidative TCA flux leads to M+4 citrate. Reductivecarboxylation of aKG leads to the M+5 citrate and subsequently M+3 aspartate. (D) Percentageof M+5 citrate from [U-13C5]glutamine in normoxia and hypoxia. (E) Percentage of M+3aspartate from [U-13C5]glutamine in normoxia and hypoxia.
190
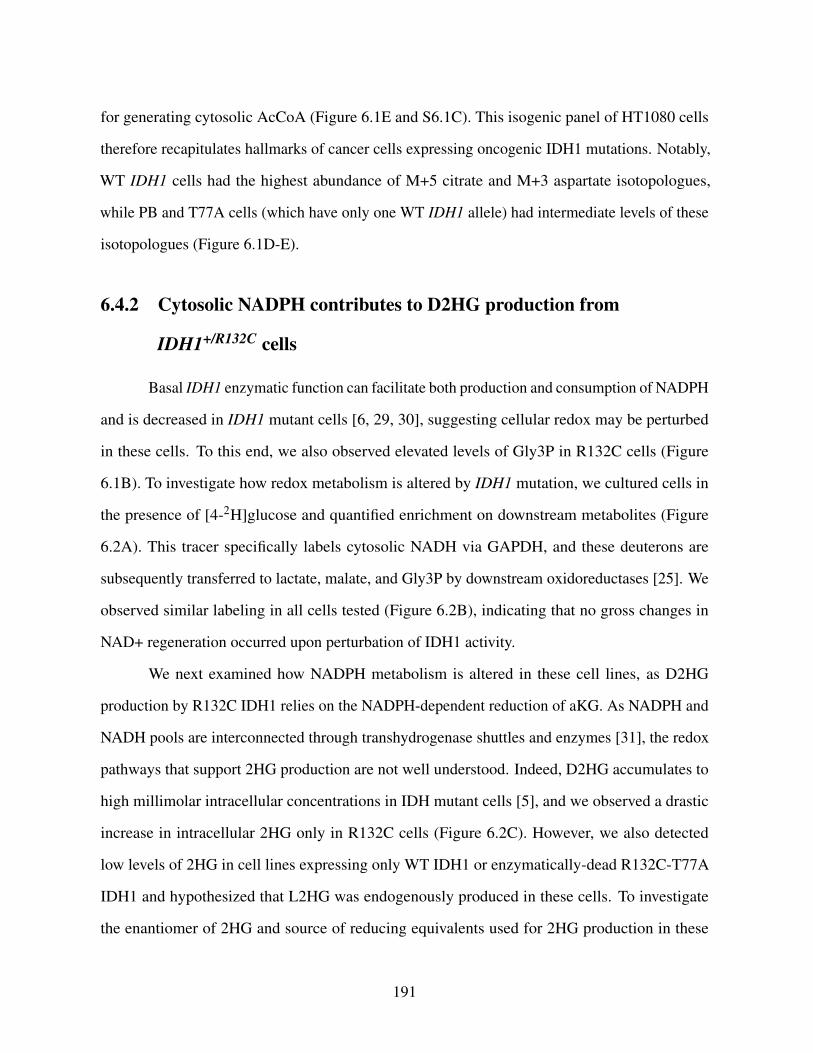
for generating cytosolic AcCoA (Figure 6.1E and S6.1C). This isogenic panel of HT1080 cells
therefore recapitulates hallmarks of cancer cells expressing oncogenic IDH1 mutations. Notably,
WT IDH1 cells had the highest abundance of M+5 citrate and M+3 aspartate isotopologues,
while PB and T77A cells (which have only one WT IDH1 allele) had intermediate levels of these
isotopologues (Figure 6.1D-E).
6.4.2 Cytosolic NADPH contributes to D2HG production from
IDH1+/R132C cells
Basal IDH1 enzymatic function can facilitate both production and consumption of NADPH
and is decreased in IDH1 mutant cells [6, 29, 30], suggesting cellular redox may be perturbed
in these cells. To this end, we also observed elevated levels of Gly3P in R132C cells (Figure
6.1B). To investigate how redox metabolism is altered by IDH1 mutation, we cultured cells in
the presence of [4-2H]glucose and quantified enrichment on downstream metabolites (Figure
6.2A). This tracer specifically labels cytosolic NADH via GAPDH, and these deuterons are
subsequently transferred to lactate, malate, and Gly3P by downstream oxidoreductases [25]. We
observed similar labeling in all cells tested (Figure 6.2B), indicating that no gross changes in
NAD+ regeneration occurred upon perturbation of IDH1 activity.
We next examined how NADPH metabolism is altered in these cell lines, as D2HG
production by R132C IDH1 relies on the NADPH-dependent reduction of aKG. As NADPH and
NADH pools are interconnected through transhydrogenase shuttles and enzymes [31], the redox
pathways that support 2HG production are not well understood. Indeed, D2HG accumulates to
high millimolar intracellular concentrations in IDH mutant cells [5], and we observed a drastic
increase in intracellular 2HG only in R132C cells (Figure 6.2C). However, we also detected
low levels of 2HG in cell lines expressing only WT IDH1 or enzymatically-dead R132C-T77A
IDH1 and hypothesized that L2HG was endogenously produced in these cells. To investigate
the enantiomer of 2HG and source of reducing equivalents used for 2HG production in these
191
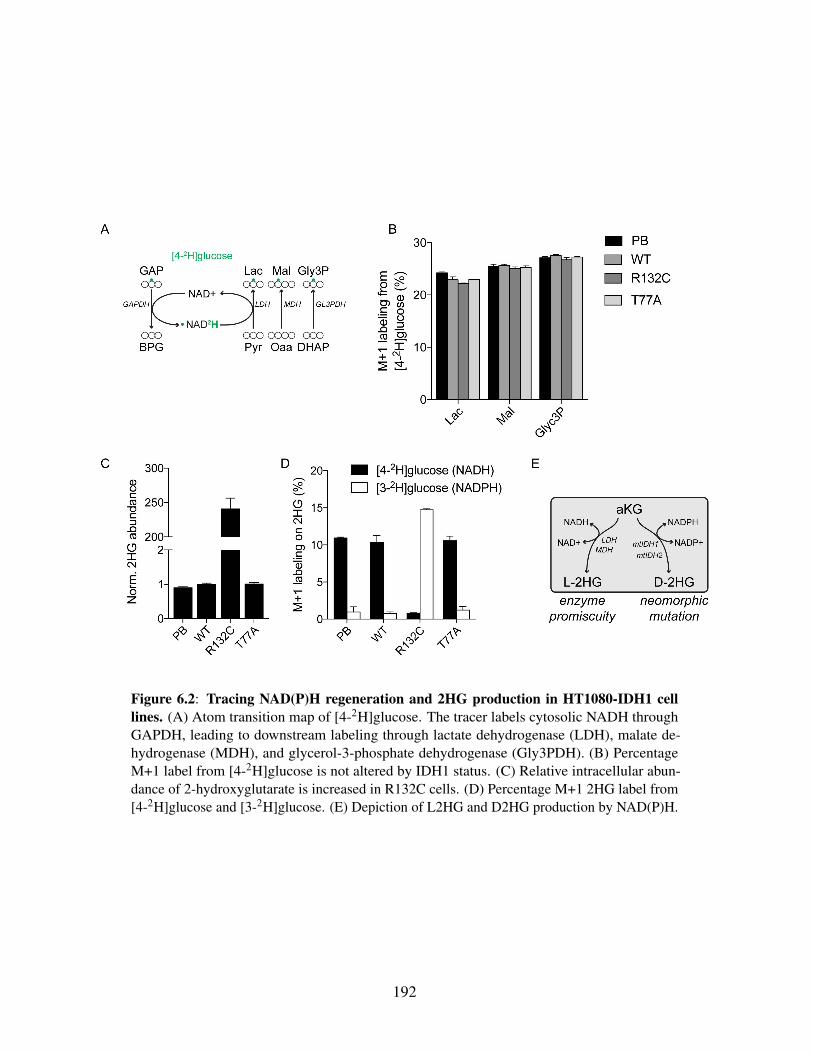
Figure 6.2: Tracing NAD(P)H regeneration and 2HG production in HT1080-IDH1 celllines. (A) Atom transition map of [4-2H]glucose. The tracer labels cytosolic NADH throughGAPDH, leading to downstream labeling through lactate dehydrogenase (LDH), malate de-hydrogenase (MDH), and glycerol-3-phosphate dehydrogenase (Gly3PDH). (B) PercentageM+1 label from [4-2H]glucose is not altered by IDH1 status. (C) Relative intracellular abun-dance of 2-hydroxyglutarate is increased in R132C cells. (D) Percentage M+1 2HG label from[4-2H]glucose and [3-2H]glucose. (E) Depiction of L2HG and D2HG production by NAD(P)H.
192
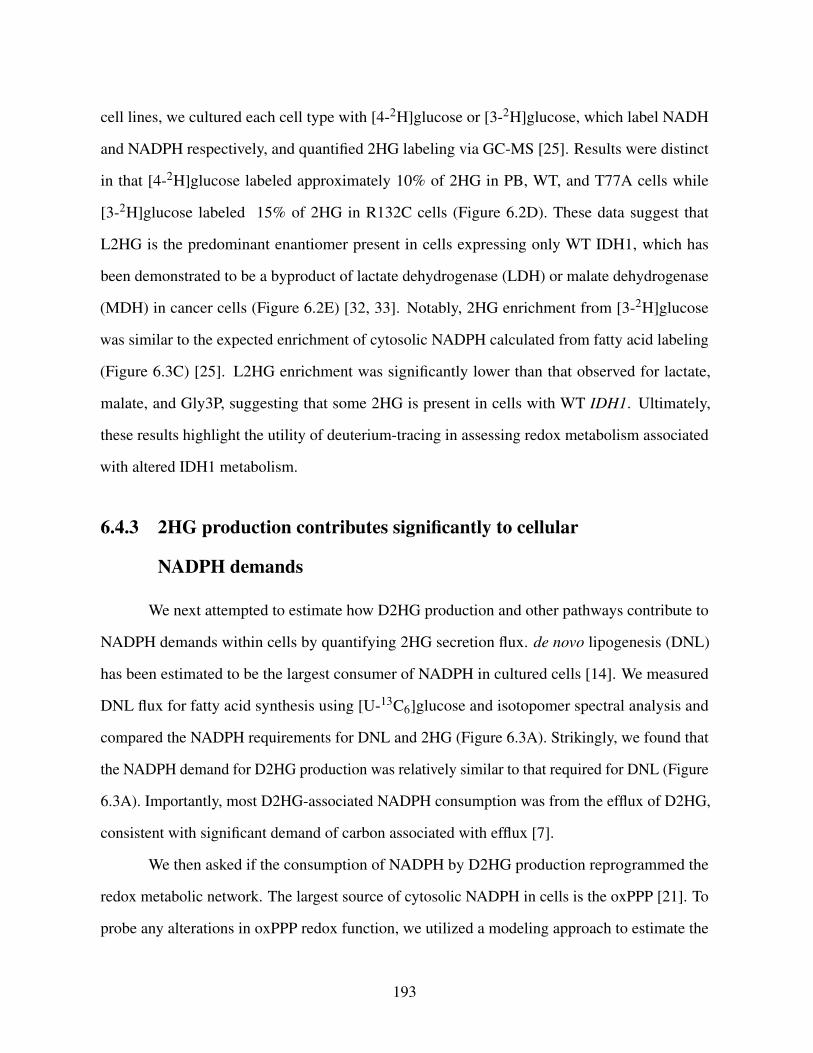
cell lines, we cultured each cell type with [4-2H]glucose or [3-2H]glucose, which label NADH
and NADPH respectively, and quantified 2HG labeling via GC-MS [25]. Results were distinct
in that [4-2H]glucose labeled approximately 10% of 2HG in PB, WT, and T77A cells while
[3-2H]glucose labeled 15% of 2HG in R132C cells (Figure 6.2D). These data suggest that
L2HG is the predominant enantiomer present in cells expressing only WT IDH1, which has
been demonstrated to be a byproduct of lactate dehydrogenase (LDH) or malate dehydrogenase
(MDH) in cancer cells (Figure 6.2E) [32, 33]. Notably, 2HG enrichment from [3-2H]glucose
was similar to the expected enrichment of cytosolic NADPH calculated from fatty acid labeling
(Figure 6.3C) [25]. L2HG enrichment was significantly lower than that observed for lactate,
malate, and Gly3P, suggesting that some 2HG is present in cells with WT IDH1. Ultimately,
these results highlight the utility of deuterium-tracing in assessing redox metabolism associated
with altered IDH1 metabolism.
6.4.3 2HG production contributes significantly to cellular
NADPH demands
We next attempted to estimate how D2HG production and other pathways contribute to
NADPH demands within cells by quantifying 2HG secretion flux. de novo lipogenesis (DNL)
has been estimated to be the largest consumer of NADPH in cultured cells [14]. We measured
DNL flux for fatty acid synthesis using [U-13C6]glucose and isotopomer spectral analysis and
compared the NADPH requirements for DNL and 2HG (Figure 6.3A). Strikingly, we found that
the NADPH demand for D2HG production was relatively similar to that required for DNL (Figure
6.3A). Importantly, most D2HG-associated NADPH consumption was from the efflux of D2HG,
consistent with significant demand of carbon associated with efflux [7].
We then asked if the consumption of NADPH by D2HG production reprogrammed the
redox metabolic network. The largest source of cytosolic NADPH in cells is the oxPPP [21]. To
probe any alterations in oxPPP redox function, we utilized a modeling approach to estimate the
193
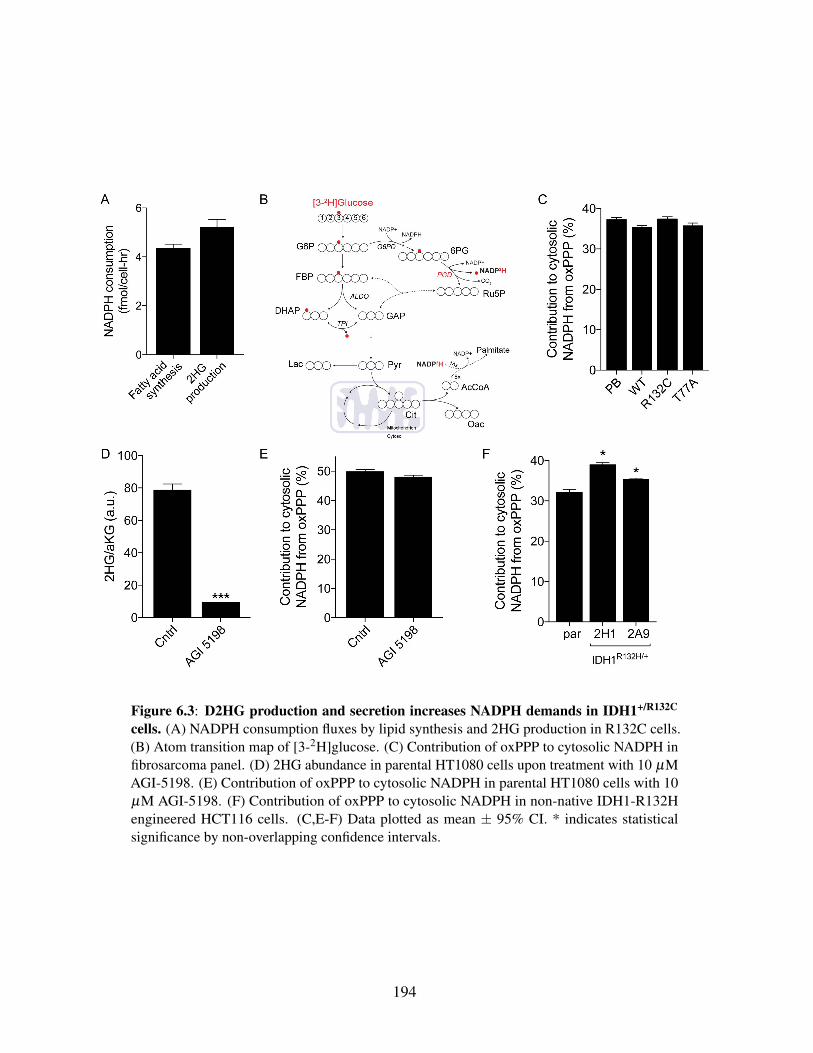
Figure 6.3: D2HG production and secretion increases NADPH demands in IDH1+/R132C
cells. (A) NADPH consumption fluxes by lipid synthesis and 2HG production in R132C cells.(B) Atom transition map of [3-2H]glucose. (C) Contribution of oxPPP to cytosolic NADPH infibrosarcoma panel. (D) 2HG abundance in parental HT1080 cells upon treatment with 10 µMAGI-5198. (E) Contribution of oxPPP to cytosolic NADPH in parental HT1080 cells with 10µM AGI-5198. (F) Contribution of oxPPP to cytosolic NADPH in non-native IDH1-R132Hengineered HCT116 cells. (C,E-F) Data plotted as mean ± 95% CI. * indicates statisticalsignificance by non-overlapping confidence intervals.
194

fraction of NADPH supplied by oxPPP (Figure 6.3B) [25]. Despite the increased R132C-specific
consumption of NAPDH by D2HG production, we found no change in the relative proportion of
NADPH supplied by the oxPPP across these cell lines (Figure 6.3C). To control for any clonal
effects associated with production of the cell line panel, we then inhibited D2HG production in
the parental HT1080 cell line using AGI-5198, a pharmacological inhibitor of mutant IDH1 [34].
We observed a 90% reduction in 2HG/aKG levels with AGI-5198 addition, implying a reduction
in NADPH consumption by D2HG production (Figure 6.3D). However, inhibition of NADPH
consumption did not alter NADPH supplied by oxPPP (Figure 6.3E). Taken together our data
indicate that D2HG production does not alter the contribution of oxPPP flux to redox homeostasis,
as cells are able to sufficiently rewire pathways to compensate for the increased NADPH demand.
Indeed, we also quantified the contribution of oxPPP flux to lipogenic NADPH using engineered
HCT116 cells with knock-in of mutant IDH1. IDH1+/R132H HCT116 cells exhibited increased
contributions of oxPPP to lipogenic NADPH pools (Figure 6.3F), highlighting the ability of cells
to reprogram redox pathways to meet the increased demands for NADPH caused by oncogenic
D2HG production.
6.4.4 De novo lipogenesis competes with D2HG production for NADPH
Our results suggest that R132C cells are able to compensate for NADPH consumed by
D2HG production under normal growth conditions. However, this metabolic defect could become
a liability in the context of altered nutrient conditions. Recent work has demonstrated the utility
in altering extracellular nutrient conditions to understand cancer-specific metabolic liabilities and
sparked an interest in engineering more physiologic media [35]. The tumor microenvironment is
generally considered to be nutrient-deficient, and tumor cells upregulate DNL to synthesize lipids
necessary for growth [36]. Indeed, lipogenesis is necessary for in vitro and in vivo tumor growth,
and limitations in this pathway renders tumor cells more susceptible to chemotherapeutics [37].
To this end, we hypothesized that removal of exogenous lipids from cell culture media could alter
195
R132C-specific growth by limiting the NADPH available for DNL flux. We observed that R132C
cell growth was specifically decreased in delipidated culture conditions (Figure 6.4A). We also
confirmed that R132C cells exhibited decreased molar palmitate synthesis flux, suggesting the
observed growth defect was mediated by an inability to synthesize enough lipids (due to limited
NADPH) (Figure 6.4B).
Figure 6.4: D2HG production limits NADPH for DNL in lipid-deficient conditions. (A)Relative cell number after 48 hrs of cell growth in delipidated conditions. (B) Normalized molarpalmitate synthesis flux. (C) Normalized desaturation index (C18:1/C18:0). (D) Extracellularglucose uptake and lactate efflux. (E) Normalized oxPPP flux in delipidated conditions.
We then asked what specific metabolic liability could be causing DNL-defect in R132C
cells. DNL is critical biosynthetic process that requires the coordination of many enzymes
196
and sufficient anabolic substrates (i.e. AcCoA and NADPH). As many possible factors could
decrease DNL, we investigated potential drivers of this observed growth defect (Figure 6.4A).
We observed no alteration in the contribution of oxPPP flux to lipogenic NADPH, indicating
that other pathways were not distinctly compensating (Figure S6.2A). 2HG has been widely
characterized as an inhibitor of aKG-dependent dioxygenase class enzymes that include important
epigenetic modifiers [38–41]. We also observed that expression of genes associated with fatty
acid synthesis was not altered in R132C cells, implying that the production of D2HG, rather than
a downstream epigenetic modification, was causing defect (Figure S6.2B). We detected a slight
increase in glucose contribution to lipogenic AcCoA, consistent with 2HG production shunting
glutamine carbon away from DNL (Figure S6.2C). We also observed a concomitant increase in
net glutamine anaplerosis in R132C cells cultured under delipidated conditions that could support
2HG production without limiting carbon for DNL (Figure S6.2D). However, these changes are
unlikely to account for the increased NADPH demand in R132C cells.
On the other hand, the desaturation index (C18:1/C18:0) quantified from total fatty acids in
each cell line was significantly decreased in R132C cells (Figure 6.4B). Production of desaturated
fatty acid species requires SCD activity, molecular oxygen, and NADPH [42, 43]. Since we
did not detect changes in SCD expression (Figure S6.2B) and molecular oxygen is not limiting
under normoxic conditions, this result suggests that NADPH was limiting R132C cells and could
explain the decreased palmitate synthesis observed in R132C cells (Figure 6.4B).
Finally, to better understand how NADPH regeneration fluxes were altered, flux through
glycolysis and the oxPPP were quantified across the cell panel. We observed increased glycolytic
fluxes in both R132C and T77A cells as compared to WT (Figure 6.4D). Increased glycolytic flux
is generally associated with altered mitochondrial state, but our data suggests that mitochondrial
pathways are maintained by reprogramming of glutamine metabolism [7]. However, increased
glucose uptake can also result in elevated oxPPP flux if branching is unchanged. We cultured
cells in the presence of [1,2-13C]glucose tracer to understand the relative shunting of glucose
197

carbon through glycolysis and the oxPPP [44]. We observed no difference in relative shunting
to the oxPPP across the cell lines (Figure S6.2E). However, when combined with the increased
glucose uptake and lactate efflux detected in R132C cells, these data indicate that oxPPP flux is
significantly increased to meet the additional NADPH demands for D2HG production (Figure
6.4E). Importantly, R132C cells increase glucose uptake and oxPPP flux to a greater extent than
T77A cells, implying that oxPPP flux and NADPH production is further increased to support
D2HG production (Figure 6.4E). In turn, the cells are unable to fully compensate for these
NADPH demands and growth is reduced in lipid-deficient conditions.
6.5 Discussion
The unique nature of IDH mutant tumors has motivated a large research effort to identify
potential targets within their signaling and metabolic networks [45–48]. The dramatic accu-
mulation of 2HG in these tumors has focused much attention on the role of aKG-dependent
dioxygenases in driving tumorigenesis [49]. However, as IDH1 and IDH2 play critical roles in
TCA metabolism and redox homeostasis, a greater understanding of the metabolic reprogramming
required to support this unique liability may yield clues to additional therapeutic opportunities
[50].
Maintenance of redox homeostasis is essential for proper cell function, as pyridine
nucleotides orthogonally connect bioenergetic and biosynthetic metabolic pathways [51]. Specifi-
cally, the regeneration of NADPH is required for anabolism of lipids, DNA, and proline as well
as maintenance of reduced glutathione pools [14]. However, the role of IDH1 in the maintenance
of redox homeostasis has been underappreciated. IDH1 can functionally participate in a redox
shuttle that interconnects mitochondrial and cytosolic NAD(P)H pools [52]. Indeed, this shuttle
has been demonstrated to be critical for redox homeostasis in anchorage-independent conditions
[16]. Upregulation of IDH1 can promote the survival of pancreatic cancer cell lines under nutrient-
198
limited conditions [53]. However, the largest source of NADPH in the cell is the oxPPP [14, 21,
25]. Targeting of oxPPP enzymes is particularly deleterious to growth of cancer cell lines [23, 54,
55], and coordinated therapeutic strategies that promote redox stress (e.g. nutrient modulation,
radiation) while targeting redox pathway may become attractive options in future [56].
Our work demonstrates the potential for such strategies (albeit in cell culture). We found
that D2HG production is a major sink of NADPH, but redox metabolism is reprogrammed to
support production. However, when cells are challenged by lipid-deficiency that drives cells to
upregulate DNL flux, D2HG production becomes a metabolic liability that limits growth. Similar
findings have recently been reported using engineered HCT116 cells [22]. Other pathways have
also been described to compensate for such redox defects. For example, IDH1 mutant glioma
cells maintain redox homeostasis by enhancing the mitochondrial production of proline [57].
Metabolic profiling of low grade gliomas has also correlated tumor progression with altered
redox state [58]. Our results and others highlight potential therapeutic efficacy in targeting redox
metabolism for mutant IDH tumors.
6.6 Acknowledgements
This work was supported by the California Institute of Regenerative Medicine (RB5-07356
to C.M.M.), NIH grant (R01CA188652 to C.M.M.), Camille and Henry Dreyfus Teacher-Scholar
(to C.M.M.), NSF CAREER (1454425 to C.M.M.), and NIH grant (R01CA196878 to K.L.G.).
M.G.B. is supported by a NSF Graduate Research Fellowship (DGE-1144086).
Chapter 6, in full, has been submitted for publication of the material as it may appear
in ”Oncogenic R132 IDH1 mutations limit NADPH for de novo lipogenesis through (D)2-
hydroxyglutarate production in fibrosarcoma cells,” Cell Reports, 2018. Mehmet G. Badur is the
primary author of this publication. Thangaselvam Muthusamy, Seth J. Parker, Shenghong Ma,
Thekla Cordes, Jose H. Magana, Kun-Liang Guan are co-authors of this publication. Christian M.
199

Metallo is the corresponding author of this publication.
6.7 References1. Mardis, E. R., Ding, L., Dooling, D. J., Larson, D. E., McLellan, M. D., Chen, K., Koboldt,
D. C., Fulton, R. S., Delehaunty, K. D., McGrath, S. D., Fulton, L. A., Locke, D. P.,Magrini, V. J., Abbott, R. M., Vickery, T. L., Reed, J. S., Robinson, J. S., Wylie, T.,Smith, S. M., Carmichael, L., Eldred, J. M., Harris, C. C., Walker, J., Peck, J. B., Du, F.,Dukes, A. F., Sanderson, G. E., Brummett, A. M., Clark, E., McMichael, J. F., Meyer,R. J., Schindler, J. K., Pohl, C. S., Wallis, J. W., Shi, X., Lin, L., Schmidt, H., Tang, Y.,Haipek, C., Wiechert, M. E., Ivy, J. V., Kalicki, J., Elliott, G., Ries, R. E., Payton, J. E.,Westervelt, P., Tomasson, M. H., Watson, M. A., Baty, J., Heath, S., Shannon, W. D.,Nagarajan, R., Link, D. C., Walter, M. J., Graubert, T. A., DiPersio, J. F., Wilson, R. K. &Ley, T. J. Recurring mutations found by sequencing an acute myeloid leukemia genome. NEngl J Med 361, 1058–66 (2009).
2. Parsons, D. W., Jones, S., Zhang, X., Lin, J. C., Leary, R. J., Angenendt, P., Mankoo, P.,Carter, H., Siu, I. M., Gallia, G. L., Olivi, A., McLendon, R., Rasheed, B. A., Keir, S.,Nikolskaya, T., Nikolsky, Y., Busam, D. A., Tekleab, H., Diaz L. A., J., Hartigan, J., Smith,D. R., Strausberg, R. L., Marie, S. K., Shinjo, S. M., Yan, H., Riggins, G. J., Bigner, D. D.,Karchin, R., Papadopoulos, N., Parmigiani, G., Vogelstein, B., Velculescu, V. E. & Kinzler,K. W. An integrated genomic analysis of human glioblastoma multiforme. Science 321,1807–12 (2008).
3. Sjoblom, T., Jones, S., Wood, L. D., Parsons, D. W., Lin, J., Barber, T. D., Mandelker,D., Leary, R. J., Ptak, J., Silliman, N., Szabo, S., Buckhaults, P., Farrell, C., Meeh, P.,Markowitz, S. D., Willis, J., Dawson, D., Willson, J. K., Gazdar, A. F., Hartigan, J., Wu, L.,Liu, C., Parmigiani, G., Park, B. H., Bachman, K. E., Papadopoulos, N., Vogelstein, B.,Kinzler, K. W. & Velculescu, V. E. The consensus coding sequences of human breast andcolorectal cancers. Science 314, 268–74 (2006).
4. Yan, H., Parsons, D. W., Jin, G., McLendon, R., Rasheed, B. A., Yuan, W., Kos, I., Batinic-Haberle, I., Jones, S., Riggins, G. J., Friedman, H., Friedman, A., Reardon, D., Herndon,J., Kinzler, K. W., Velculescu, V. E., Vogelstein, B. & Bigner, D. D. IDH1 and IDH2mutations in gliomas. N Engl J Med 360, 765–73 (2009).
5. Dang, L., White, D. W., Gross, S., Bennett, B. D., Bittinger, M. A., Driggers, E. M., Fantin,V. R., Jang, H. G., Jin, S., Keenan, M. C., Marks, K. M., Prins, R. M., Ward, P. S., Yen,K. E., Liau, L. M., Rabinowitz, J. D., Cantley, L. C., Thompson, C. B., Vander Heiden,M. G. & Su, S. M. Cancer-associated IDH1 mutations produce 2-hydroxyglutarate. Nature462, 739–44 (2009).
200
6. Ward, P. S., Patel, J., Wise, D. R., Abdel-Wahab, O., Bennett, B. D., Coller, H. A., Cross,J. R., Fantin, V. R., Hedvat, C. V., Perl, A. E., Rabinowitz, J. D., Carroll, M., Su, S. M.,Sharp, K. A., Levine, R. L. & Thompson, C. B. The common feature of leukemia-associatedIDH1 and IDH2 mutations is a neomorphic enzyme activity converting alpha-ketoglutarateto 2-hydroxyglutarate. Cancer Cell 17, 225–34 (2010).
7. Grassian, A. R., Parker, S. J., Davidson, S. M., Divakaruni, A. S., Green, C. R., Zhang, X.,Slocum, K. L., Pu, M., Lin, F., Vickers, C., Joud-Caldwell, C., Chung, F., Yin, H., Handly,E. D., Straub, C., Growney, J. D., Vander Heiden, M. G., Murphy, A. N., Pagliarini, R. &Metallo, C. M. IDH1 mutations alter citric acid cycle metabolism and increase dependenceon oxidative mitochondrial metabolism. Cancer Res 74, 3317–31 (2014).
8. Carbonneau, M., L, M. G., Lalonde, M. E., Germain, M. A., Motorina, A., Guiot, M. C.,Secco, B., Vincent, E. E., Tumber, A., Hulea, L., Bergeman, J., Oppermann, U., Jones,R. G., Laplante, M., Topisirovic, I., Petrecca, K., Huot, M. E. & Mallette, F. A. Theoncometabolite 2-hydroxyglutarate activates the mTOR signalling pathway. Nat Commun7, 12700 (2016).
9. Fack, F., Tardito, S., Hochart, G., Oudin, A., Zheng, L., Fritah, S., Golebiewska, A.,Nazarov, P. V., Bernard, A., Hau, A. C., Keunen, O., Leenders, W., Lund-Johansen, M.,Stauber, J., Gottlieb, E., Bjerkvig, R. & Niclou, S. P. Altered metabolic landscape inIDH-mutant gliomas affects phospholipid, energy, and oxidative stress pathways. EMBOMol Med 9, 1681–1695 (2017).
10. Chan, S. M., Thomas, D., Corces-Zimmerman, M. R., Xavy, S., Rastogi, S., Hong, W. J.,Zhao, F., Medeiros, B. C., Tyvoll, D. A. & Majeti, R. Isocitrate dehydrogenase 1 and 2mutations induce BCL-2 dependence in acute myeloid leukemia. Nat Med 21, 178–84(2015).
11. Izquierdo-Garcia, J. L., Viswanath, P., Eriksson, P., Cai, L., Radoul, M., Chaumeil, M. M.,Blough, M., Luchman, H. A., Weiss, S., Cairncross, J. G., Phillips, J. J., Pieper, R. O. &Ronen, S. M. IDH1 Mutation Induces Reprogramming of Pyruvate Metabolism. CancerRes 75, 2999–3009 (2015).
12. Seltzer, M. J., Bennett, B. D., Joshi, A. D., Gao, P., Thomas, A. G., Ferraris, D. V.,Tsukamoto, T., Rojas, C. J., Slusher, B. S., Rabinowitz, J. D., Dang, C. V. & Riggins, G. J.Inhibition of glutaminase preferentially slows growth of glioma cells with mutant IDH1.Cancer Res 70, 8981–7 (2010).
13. Tateishi, K., Wakimoto, H., Iafrate, A. J., Tanaka, S., Loebel, F., Lelic, N., Wiederschain,D., Bedel, O., Deng, G., Zhang, B., He, T., Shi, X., Gerszten, R. E., Zhang, Y., Yeh, J. J.,Curry, W. T., Zhao, D., Sundaram, S., Nigim, F., Koerner, M. V. A., Ho, Q., Fisher, D. E.,Roider, E. M., Kemeny, L. V., Samuels, Y., Flaherty, K. T., Batchelor, T. T., Chi, A. S. &
201
Cahill, D. P. Extreme Vulnerability of IDH1 Mutant Cancers to NAD+ Depletion. CancerCell 28, 773–784 (2015).
14. Fan, J., Ye, J., Kamphorst, J. J., Shlomi, T., Thompson, C. B. & Rabinowitz, J. D. Quanti-tative flux analysis reveals folate-dependent NADPH production. Nature 510, 298–302(2014).
15. Ye, J., Gu, Y., Zhang, F., Zhao, Y., Yuan, Y., Hao, Z., Sheng, Y., Li, W. Y., Wakeham, A.,Cairns, R. A. & Mak, T. W. IDH1 deficiency attenuates gluconeogenesis in mouse liver byimpairing amino acid utilization. Proc Natl Acad Sci U S A 114, 292–297 (2017).
16. Jiang, L., Shestov, A. A., Swain, P., Yang, C., Parker, S. J., Wang, Q. A., Terada, L. S.,Adams, N. D., McCabe, M. T., Pietrak, B., Schmidt, S., Metallo, C. M., Dranka, B. P.,Schwartz, B. & DeBerardinis, R. J. Reductive carboxylation supports redox homeostasisduring anchorage-independent growth. Nature 532, 255–8 (2016).
17. Metallo, C. M., Gameiro, P. A., Bell, E. L., Mattaini, K. R., Yang, J., Hiller, K., Jewell,C. M., Johnson, Z. R., Irvine, D. J., Guarente, L., Kelleher, J. K., Vander Heiden, M. G.,Iliopoulos, O. & Stephanopoulos, G. Reductive glutamine metabolism by IDH1 mediateslipogenesis under hypoxia. Nature 481, 380–4 (2011).
18. Wise, D. R., Ward, P. S., Shay, J. E., Cross, J. R., Gruber, J. J., Sachdeva, U. M., Platt,J. M., DeMatteo, R. G., Simon, M. C. & Thompson, C. B. Hypoxia promotes isocitratedehydrogenase-dependent carboxylation of alpha-ketoglutarate to citrate to support cellgrowth and viability. Proc Natl Acad Sci U S A 108, 19611–6 (2011).
19. Stincone, A., Prigione, A., Cramer, T., Wamelink, M. M., Campbell, K., Cheung, E., Olin-Sandoval, V., Gruning, N. M., Kruger, A., Tauqeer Alam, M., Keller, M. A., Breitenbach,M., Brindle, K. M., Rabinowitz, J. D. & Ralser, M. The return of metabolism: biochemistryand physiology of the pentose phosphate pathway. Biol Rev Camb Philos Soc 90, 927–63(2015).
20. Zhang, H., Badur, M. G., Divakaruni, A. S., Parker, S. J., Jager, C., Hiller, K., Murphy, A. N.& Metallo, C. M. Distinct Metabolic States Can Support Self-Renewal and Lipogenesis inHuman Pluripotent Stem Cells under Different Culture Conditions. Cell Rep 16, 1536–1547 (2016).
21. Zhang, Z., Chen, L., Liu, L., Su, X. & Rabinowitz, J. D. Chemical Basis for DeuteriumLabeling of Fat and NADPH. J Am Chem Soc 139, 14368–14371 (2017).
22. Gelman, S. J., Naser, F., Mahieu, N. G., McKenzie, L. D., Dunn, G. P., Chheda, M. G.& Patti, G. J. Consumption of NADPH for 2-HG Synthesis Increases Pentose PhosphatePathway Flux and Sensitizes Cells to Oxidative Stress. Cell Rep 22, 512–522 (2018).
202
23. Zhao, D., Badur, M. G., Luebeck, J., Magana, J. H., Birmingham, A., Sasik, R., Ahn, C. S.,Ideker, T., Metallo, C. M. & Mali, P. Combinatorial CRISPR-Cas9 Metabolic ScreensReveal Critical Redox Control Points Dependent on the KEAP1-NRF2 Regulatory Axis.Mol Cell 69, 699–708 e7 (2018).
24. Ma, S., Jiang, B., Deng, W., Gu, Z. K., Wu, F. Z., Li, T., Xia, Y., Yang, H., Ye, D., Xiong,Y. & Guan, K. L. D-2-hydroxyglutarate is essential for maintaining oncogenic propertyof mutant IDH-containing cancer cells but dispensable for cell growth. Oncotarget 6,8606–20 (2015).
25. Lewis, C. A., Parker, S. J., Fiske, B. P., McCloskey, D., Gui, D. Y., Green, C. R., Vokes,N. I., Feist, A. M., Vander Heiden, M. G. & Metallo, C. M. Tracing compartmentalizedNADPH metabolism in the cytosol and mitochondria of mammalian cells. Mol Cell 55,253–63 (2014).
26. Young, J. D. INCA: a computational platform for isotopically non-stationary metabolicflux analysis. Bioinformatics 30, 1333–5 (2014).
27. Tritsch, G. L. & Moore, G. E. Spontaneous decomposition of glutamine in cell culturemedia. Exp Cell Res 28, 360–4 (1962).
28. Wang, X., Spandidos, A., Wang, H. & Seed, B. PrimerBank: a PCR primer database forquantitative gene expression analysis, 2012 update. Nucleic Acids Res 40, D1144–9 (2012).
29. Geisbrecht, B. V. & Gould, S. J. The human PICD gene encodes a cytoplasmic andperoxisomal NADP(+)-dependent isocitrate dehydrogenase. J Biol Chem 274, 30527–33(1999).
30. Zhao, S., Lin, Y., Xu, W., Jiang, W., Zha, Z., Wang, P., Yu, W., Li, Z., Gong, L., Peng, Y.,Ding, J., Lei, Q., Guan, K. L. & Xiong, Y. Glioma-derived mutations in IDH1 dominantlyinhibit IDH1 catalytic activity and induce HIF-1alpha. Science 324, 261–5 (2009).
31. Cracan, V., Titov, D. V., Shen, H., Grabarek, Z. & Mootha, V. K. A genetically encodedtool for manipulation of NADP(+)/NADPH in living cells. Nat Chem Biol 13, 1088–1095(2017).
32. Intlekofer, A. M., Dematteo, R. G., Venneti, S., Finley, L. W., Lu, C., Judkins, A. R.,Rustenburg, A. S., Grinaway, P. B., Chodera, J. D., Cross, J. R. & Thompson, C. B.Hypoxia Induces Production of L-2-Hydroxyglutarate. Cell Metab 22, 304–11 (2015).
33. Intlekofer, A. M., Wang, B., Liu, H., Shah, H., Carmona-Fontaine, C., Rustenburg,A. S., Salah, S., Gunner, M. R., Chodera, J. D., Cross, J. R. & Thompson, C. B. L-2-Hydroxyglutarate production arises from noncanonical enzyme function at acidic pH. NatChem Biol 13, 494–500 (2017).
203
34. Rohle, D., Popovici-Muller, J., Palaskas, N., Turcan, S., Grommes, C., Campos, C., Tsoi, J.,Clark, O., Oldrini, B., Komisopoulou, E., Kunii, K., Pedraza, A., Schalm, S., Silverman, L.,Miller, A., Wang, F., Yang, H., Chen, Y., Kernytsky, A., Rosenblum, M. K., Liu, W., Biller,S. A., Su, S. M., Brennan, C. W., Chan, T. A., Graeber, T. G., Yen, K. E. & Mellinghoff,I. K. An inhibitor of mutant IDH1 delays growth and promotes differentiation of gliomacells. Science 340, 626–30 (2013).
35. Cantor, J. R., Abu-Remaileh, M., Kanarek, N., Freinkman, E., Gao, X., Louissaint A., J.,Lewis, C. A. & Sabatini, D. M. Physiologic Medium Rewires Cellular Metabolism andReveals Uric Acid as an Endogenous Inhibitor of UMP Synthase. Cell 169, 258–272 e17(2017).
36. Ackerman, D. & Simon, M. C. Hypoxia, lipids, and cancer: surviving the harsh tumormicroenvironment. Trends Cell Biol 24, 472–8 (2014).
37. Svensson, R. U., Parker, S. J., Eichner, L. J., Kolar, M. J., Wallace, M., Brun, S. N.,Lombardo, P. S., Van Nostrand, J. L., Hutchins, A., Vera, L., Gerken, L., Greenwood, J.,Bhat, S., Harriman, G., Westlin, W. F., Harwood H. J., J., Saghatelian, A., Kapeller, R.,Metallo, C. M. & Shaw, R. J. Inhibition of acetyl-CoA carboxylase suppresses fatty acidsynthesis and tumor growth of non-small-cell lung cancer in preclinical models. Nat Med22, 1108–1119 (2016).
38. Figueroa, M. E., Abdel-Wahab, O., Lu, C., Ward, P. S., Patel, J., Shih, A., Li, Y., Bhagwat,N., Vasanthakumar, A., Fernandez, H. F., Tallman, M. S., Sun, Z., Wolniak, K., Peeters,J. K., Liu, W., Choe, S. E., Fantin, V. R., Paietta, E., Lowenberg, B., Licht, J. D., Godley,L. A., Delwel, R., Valk, P. J., Thompson, C. B., Levine, R. L. & Melnick, A. LeukemicIDH1 and IDH2 mutations result in a hypermethylation phenotype, disrupt TET2 function,and impair hematopoietic differentiation. Cancer Cell 18, 553–67 (2010).
39. Lu, C., Ward, P. S., Kapoor, G. S., Rohle, D., Turcan, S., Abdel-Wahab, O., Edwards, C. R.,Khanin, R., Figueroa, M. E., Melnick, A., Wellen, K. E., O’Rourke, D. M., Berger, S. L.,Chan, T. A., Levine, R. L., Mellinghoff, I. K. & Thompson, C. B. IDH mutation impairshistone demethylation and results in a block to cell differentiation. Nature 483, 474–8(2012).
40. Turcan, S., Rohle, D., Goenka, A., Walsh, L. A., Fang, F., Yilmaz, E., Campos, C., Fabius,A. W., Lu, C., Ward, P. S., Thompson, C. B., Kaufman, A., Guryanova, O., Levine, R.,Heguy, A., Viale, A., Morris, L. G., Huse, J. T., Mellinghoff, I. K. & Chan, T. A. IDH1mutation is sufficient to establish the glioma hypermethylator phenotype. Nature 483,479–83 (2012).
41. Xu, W., Yang, H., Liu, Y., Yang, Y., Wang, P., Kim, S. H., Ito, S., Yang, C., Wang, P., Xiao,M. T., Liu, L. X., Jiang, W. Q., Liu, J., Zhang, J. Y., Wang, B., Frye, S., Zhang, Y., Xu,Y. H., Lei, Q. Y., Guan, K. L., Zhao, S. M. & Xiong, Y. Oncometabolite 2-hydroxyglutarate
204

is a competitive inhibitor of alpha-ketoglutarate-dependent dioxygenases. Cancer Cell 19,17–30 (2011).
42. Kamphorst, J. J., Cross, J. R., Fan, J., de Stanchina, E., Mathew, R., White, E. P., Thompson,C. B. & Rabinowitz, J. D. Hypoxic and Ras-transformed cells support growth by scavengingunsaturated fatty acids from lysophospholipids. Proc Natl Acad Sci U S A 110, 8882–7(2013).
43. Young, R. M., Ackerman, D., Quinn, Z. L., Mancuso, A., Gruber, M., Liu, L., Giannoukos,D. N., Bobrovnikova-Marjon, E., Diehl, J. A., Keith, B. & Simon, M. C. DysregulatedmTORC1 renders cells critically dependent on desaturated lipids for survival under tumor-like stress. Genes Dev 27, 1115–31 (2013).
44. Lee, W. N., Boros, L. G., Puigjaner, J., Bassilian, S., Lim, S. & Cascante, M. Mass iso-topomer study of the nonoxidative pathways of the pentose cycle with [1,2-13C2]glucose.Am J Physiol 274, E843–51 (1998).
45. Chaumeil, M. M., Larson, P. E., Yoshihara, H. A., Danforth, O. M., Vigneron, D. B.,Nelson, S. J., Pieper, R. O., Phillips, J. J. & Ronen, S. M. Non-invasive in vivo assessmentof IDH1 mutational status in glioma. Nat Commun 4, 2429 (2013).
46. Salamanca-Cardona, L., Shah, H., Poot, A. J., Correa, F. M., Di Gialleonardo, V., Lui, H.,Miloushev, V. Z., Granlund, K. L., Tee, S. S., Cross, J. R., Thompson, C. B. & Keshari, K. R.In Vivo Imaging of Glutamine Metabolism to the Oncometabolite 2-Hydroxyglutarate inIDH1/2 Mutant Tumors. Cell Metab 26, 830–841 e3 (2017).
47. Turcan, S., Makarov, V., Taranda, J., Wang, Y., Fabius, A. W. M., Wu, W., Zheng, Y.,El-Amine, N., Haddock, S., Nanjangud, G., LeKaye, H. C., Brennan, C., Cross, J., Huse,J. T., Kelleher, N. L., Osten, P., Thompson, C. B. & Chan, T. A. Mutant-IDH1-dependentchromatin state reprogramming, reversibility, and persistence. Nat Genet 50, 62–72 (2018).
48. Venteicher, A. S., Tirosh, I., Hebert, C., Yizhak, K., Neftel, C., Filbin, M. G., Hovestadt,V., Escalante, L. E., Shaw, M. L., Rodman, C., Gillespie, S. M., Dionne, D., Luo, C. C.,Ravichandran, H., Mylvaganam, R., Mount, C., Onozato, M. L., Nahed, B. V., Wakimoto,H., Curry, W. T., Iafrate, A. J., Rivera, M. N., Frosch, M. P., Golub, T. R., Brastianos,P. K., Getz, G., Patel, A. P., Monje, M., Cahill, D. P., Rozenblatt-Rosen, O., Louis,D. N., Bernstein, B. E., Regev, A. & Suva, M. L. Decoupling genetics, lineages, andmicroenvironment in IDH-mutant gliomas by single-cell RNA-seq. Science 355 (2017).
49. Losman, J. A. & Kaelin W. G., J. What a difference a hydroxyl makes: mutant IDH,(R)-2-hydroxyglutarate, and cancer. Genes Dev 27, 836–52 (2013).
50. Parker, S. J. & Metallo, C. M. Metabolic consequences of oncogenic IDH mutations.Pharmacol Ther 152, 54–62 (2015).
205
51. Badur, M. G. & Metallo, C. M. Reverse engineering the cancer metabolic network usingflux analysis to understand drivers of human disease. Metab Eng 45, 95–108 (2018).
52. Sazanov, L. A. & Jackson, J. B. Proton-translocating transhydrogenase and NAD- andNADP-linked isocitrate dehydrogenases operate in a substrate cycle which contributesto fine regulation of the tricarboxylic acid cycle activity in mitochondria. FEBS Lett 344,109–16 (1994).
53. Zarei, M., Lal, S., Parker, S. J., Nevler, A., Vaziri-Gohar, A., Dukleska, K., Mambelli-Lisboa, N. C., Moffat, C., Blanco, F. F., Chand, S. N., Jimbo, M., Cozzitorto, J. A.,Jiang, W., Yeo, C. J., Londin, E. R., Seifert, E. L., Metallo, C. M., Brody, J. R. & Winter,J. M. Posttranscriptional Upregulation of IDH1 by HuR Establishes a Powerful SurvivalPhenotype in Pancreatic Cancer Cells. Cancer Res 77, 4460–4471 (2017).
54. Lin, R., Elf, S., Shan, C., Kang, H. B., Ji, Q., Zhou, L., Hitosugi, T., Zhang, L., Zhang, S.,Seo, J. H., Xie, J., Tucker, M., Gu, T. L., Sudderth, J., Jiang, L., Mitsche, M., DeBerardinis,R. J., Wu, S., Li, Y., Mao, H., Chen, P. R., Wang, D., Chen, G. Z., Hurwitz, S. J., Lonial,S., Arellano, M. L., Khoury, H. J., Khuri, F. R., Lee, B. H., Lei, Q., Brat, D. J., Ye, K.,Boggon, T. J., He, C., Kang, S., Fan, J. & Chen, J. 6-Phosphogluconate dehydrogenaselinks oxidative PPP, lipogenesis and tumour growth by inhibiting LKB1-AMPK signalling.Nat Cell Biol 17, 1484–96 (2015).
55. Rao, X., Duan, X., Mao, W., Li, X., Li, Z., Li, Q., Zheng, Z., Xu, H., Chen, M., Wang, P. G.,Wang, Y., Shen, B. & Yi, W. O-GlcNAcylation of G6PD promotes the pentose phosphatepathway and tumor growth. Nat Commun 6, 8468 (2015).
56. Conklin, K. A. Chemotherapy-associated oxidative stress: impact on chemotherapeuticeffectiveness. Integr Cancer Ther 3, 294–300 (2004).
57. Hollinshead, K. E. R., Munford, H., Eales, K. L., Bardella, C., Li, C., Escribano-Gonzalez,C., Thakker, A., Nonnenmacher, Y., Kluckova, K., Jeeves, M., Murren, R., Cuozzo, F., Ye,D., Laurenti, G., Zhu, W., Hiller, K., Hodson, D. J., Hua, W., Tomlinson, I. P., Ludwig, C.,Mao, Y. & Tennant, D. A. Oncogenic IDH1 Mutations Promote Enhanced Proline Synthesisthrough PYCR1 to Support the Maintenance of Mitochondrial Redox Homeostasis. CellRep 22, 3107–3114 (2018).
58. Jalbert, L. E., Elkhaled, A., Phillips, J. J., Neill, E., Williams, A., Crane, J. C., Olson, M. P.,Molinaro, A. M., Berger, M. S., Kurhanewicz, J., Ronen, S. M., Chang, S. M. & Nelson,S. J. Metabolic Profiling of IDH Mutation and Malignant Progression in Infiltrating Glioma.Sci Rep 7, 44792 (2017).
206
Chapter 7
Conclusions
The works presented in this thesis highlight the complex regulation of metabolic pathways
that support redox homeostasis. Cells must maintain the proper balance of oxidized and reduced
forms of pyridine nucleotides [NAD(P)+] for biosynthetic and bioenergetic needs. However,
the pathways that supply reducing equivalents also supply critical metabolic intermediates for
other processes. Moreover, altered consumption of compartment-specific reducing equivalents or
metabolic intermediates can reprogram metabolic pathways at a network-level. These phenomena
demonstrate the critical need to understand how microenvironment and genotype affect redox-
specific cell behavior.
The first chapter, ”Reverse engineering the cancer metabolic network using flux analysis
to understand drivers of human disease,” examines the emerging field of cancer metabolism. This
work introduces the theoretical frameworks and technological advancements that have enabled
the development of metabolic flux analysis for biomedical studies. Then the work reviews the
recent developments in the field that have required this technique. Probing metabolic network
function will further elucidate phenotypes that are found in cancer subsets and hopefully generate
new therapeutic windows.
The second chapter, ”Enzymatic passaging of human embryonic stem cells alters central
207
carbon metabolism and glycan abundance,” explores how routine passage methods alter the
metabolism of human pluripotent stem cells. Enzymatic passaging was found to perturb glucose
metabolism in the period immediately after passaging. Detailed tracing and mass spectrometry
revealed that high rates of hexosamine biosynthesis supports repair of the cleaved glycolayx. This
illustrates a repeated insult to stem cell cultures that could drive drift in vitro. Future work will
be to engineer better passaging conditions that can supply requisite nutrients while maintaining
proper performance for stem cell-applications.
The third chapter, ”Distinct metabolic states can support self-renewal and lipogenesis
in human pluripotent stem cells under different culture conditions,” investigates the metabolic
reprogramming of human pluripotent stem cell metabolism due to culture conditions. Chemically-
defined medias have largely supplemented more replete, feeder cell-supported conditions in stem
cell culture due to ease of use and reduced variability. However, while all commercially available
medias can maintain pluripotency, the effect on metabolism and cellular performance remained
understudied. We found that these chemically-defined conditions force cells to reside in increased
biosynthetic states to support increased de novo lipogenesis and reprogram the metabolic network.
These results demonstrate that human pluripotent stem cells can maintain pluripotency in distinct
metabolic states. Future work will be to understand how these distinct states affect stem cell
function and ability to differentiate into useful cell products.
The fourth chapter, ”Lipid availability influences the metabolic maturation of hPSC-
derived cardiomyocytes,” extends the work from Chapter 3 to stem cell-dervied cardiomyocytes.
Stem cell-derived cardiomyocytes are characterized by an immature phenotype presenting an
obstacle to their utility in drug toxicity and regenerative medicine applications. Metabolic flux
analysis revealed that stem cell-derived cardiomyocytes can oxidize some expected cardiac sub-
strates but lack the ability to activate fatty acid oxidation - demonstrating their immaturity. Tracing
throughout differentiation revealed that these cardiomyocytes acquire the correct metabolic "pro-
gram" during lineage specification but have abnormal lipid metabolism. Reminiscient of the stem
208
cell work, nutrient-poor media conditions force cardiomyocytes into abnormal lipid biosynthetic
state that prevents fatty acid oxidation. By supplying complex sources of fat, cardiomyocytes can
undergo metabolic maturation while maintaining proper electrophysiology. Development of more
defined fat sources and cardiac-specific nutrient cocktails will be necessary to further this work.
The fifth chapter, ”Combinatorial CRISPR-Cas9 metabolic screens reveal critical redox
control points dependent on the KEAP1-NRF2 regulatory axis,” investigates how the oncogenic
status of a cell controls the dispensability and interaction of metabolic enzymes. Metabolic
networks are highly redundant with many genes catalyzing the same reaction and many parallel
pathways. To probe glucose metabolism in a unbiased, network-level, we utilized combinatorial
CRISPR screening technology to rapidly assess the growth defects associated with single- and
dual-gene knockouts. While gene expression mainly drove the essentiality of a gene, the oxidative
pentose phosphate genes were more highly expressed but less essential in A549 cells as compared
to HeLa cells. We hypothesized that this differential sensitivity could be driven by a mutation in
KEAP1, a key tumor suppressor that controls redox metabolism. Modulation of KEAP1 altered the
oxidative pentose phosphate pathway function and sensitivity to targeting by reprogramming the
cellular antioxidant response. These results suggest that KEAP1 tumors status must be considered
when targeting redox-associated pathways. Future work will be to utilize this platform technology
on other metabolic sets to understand how metabolic genes work together to drive cancer survival.
The sixth chapter, ”Oncogenic R132 IDH1 mutations limit NADPH for de novo li-
pogenesis through (D)2-hydroxyglutarate production in fibrosarcoma cells,” interrogates how
mutations in IDH1 alter redox metabolism and NADPH availability. These neomorphic mutations
modify the activity of isocitate dehydrogenase to favor the NADPH-dependant reduction of
alpha-ketoglutarate to 2-hydroxyglutarate, the latter reaching millimolar concentrations in the cell.
We found that NADPH consumption for 2-hydroxyglutrate synthesis approached similar levels to
that for de novo lipogenesis. Surprisingly the IDH mutant cells were generally found to tolerate
this NADPH sink by reprogramming the oxidative pentose phosphate pathway. IDH mutation
209
only represented a redox liability when removing exogenous sources of fat and forcing the cell
to maximize de novo lipogenesis. These results demonstrate that IDH mutant is a considerable
redox liability in the cell only when the redox metabolic network is stressed. Future work will be
to connect these in vitro findings to preclincal models by modulating availability of fat through
dietary modulation or pharmacological inhibition of de novo lipogenesis.
Cellular metabolism is one of the highest levels of phenotypic function, dynamically
integrating microenvironmental and genetic cues. However probing these deep cellular phenotypes
require systems-level analysis and network-level integration of orthogonal data types. Taken
together these chapters demonstrate the utility in studying functional metabolic networks and
suitable methodologies (i.e. CRISPR screening and metabolic flux analysis) for this kind of
work. Understanding the key metabolic and genetic regulators of compartment-specific redox
metabolism should enable discovery of mechanistic drivers of disease and allow researchers
exploit these redox liabilities for novel treatment modalities.
210

Chapter S1
Supplement to Chapter 1
S1.1 Abbreviations
BCAA - branched-chain amino acid; ETC - electron transport chain; FOCM - folate-
mediated one carbon metabolism; HIFs - hypoxia-induced factors; ISA - isotopomer spectral anal-
ysis; ODE - ordinary differential equation; oxPPP - oxidative pentose phosphate pathway; 2HG -
2-hydroxyglutarate; 3PG - 3-phosphoglycerate; 6PG - 6-phosphogluconate; AcCoA - acetyl coen-
zyme A; aKG - alpha-ketoglutarate; Asp - aspartate; CH2-THF - 5,10-methylenetetrahydrofolate;
Cit - citrate; For - formate; Fum - fumarate; G6P - glucose 6-phosphate; GAP - glyceraldehyde
3-phosphate; Glc - glucose; Glu - glutamate; Gln - glutamine; Gly - glycine; Lac - lactate; Mal
- malate; Oac - oxaloacetate; Pro - proline; Pyr - pyruvate; Ru5P - ribulose 5-phosphate; Ser -
serine; Suc - succinate;
211
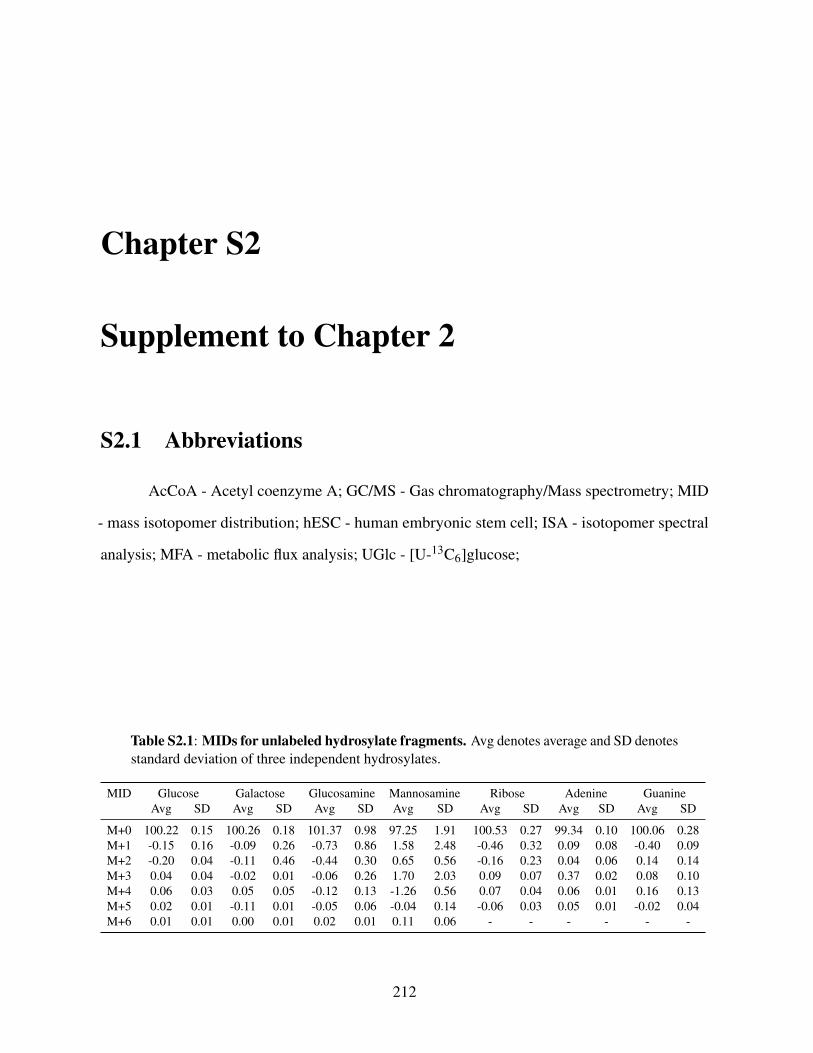
Chapter S2
Supplement to Chapter 2
S2.1 Abbreviations
AcCoA - Acetyl coenzyme A; GC/MS - Gas chromatography/Mass spectrometry; MID
- mass isotopomer distribution; hESC - human embryonic stem cell; ISA - isotopomer spectral
analysis; MFA - metabolic flux analysis; UGlc - [U-13C6]glucose;
Table S2.1: MIDs for unlabeled hydrosylate fragments. Avg denotes average and SD denotesstandard deviation of three independent hydrosylates.
MID Glucose Galactose Glucosamine Mannosamine Ribose Adenine GuanineAvg SD Avg SD Avg SD Avg SD Avg SD Avg SD Avg SD
M+0 100.22 0.15 100.26 0.18 101.37 0.98 97.25 1.91 100.53 0.27 99.34 0.10 100.06 0.28M+1 -0.15 0.16 -0.09 0.26 -0.73 0.86 1.58 2.48 -0.46 0.32 0.09 0.08 -0.40 0.09M+2 -0.20 0.04 -0.11 0.46 -0.44 0.30 0.65 0.56 -0.16 0.23 0.04 0.06 0.14 0.14M+3 0.04 0.04 -0.02 0.01 -0.06 0.26 1.70 2.03 0.09 0.07 0.37 0.02 0.08 0.10M+4 0.06 0.03 0.05 0.05 -0.12 0.13 -1.26 0.56 0.07 0.04 0.06 0.01 0.16 0.13M+5 0.02 0.01 -0.11 0.01 -0.05 0.06 -0.04 0.14 -0.06 0.03 0.05 0.01 -0.02 0.04M+6 0.01 0.01 0.00 0.01 0.02 0.01 0.11 0.06 - - - - - -
212

VerseneAccutaseAccutase w/ Y-27632
M+0M+1
M+2M+3
M+4M+5
M+60
20
40
60
Labe
ling
of c
itrat
e fro
m [U
-13C
6] gl
ucos
e (%
)
A B C
***
Lacta
te
Alanine
Citrate
0
25
50
75
100
% L
abel
ed fr
om[U
-13C
6] gl
ucos
e
Versene Trypsin
**
**
**
Versene Accutase Accutase w/ Y-27632
D
****
Lacta
te
Alanine
Citrate
0.0
0.5
1.0
1.5
2.0
Rel
ative
abu
ndan
ce
Lacta
te
Alanine
Citrate
0.0
0.5
1.0
1.5
Rel
ative
abu
ndan
ce
Figure S2.1: Polar metabolite labeling and abundances. (A) Mass isotopomer distribution(MID) of citrate from [U-13C6]glucose (UGlc). (B) Relative abundances of lactate, alanine,and citrate 4 hours after passaging. (C) Relative abundances of lactate, alanine, and citrate oneday after passaging (i.e., labeled from 24-28 hours after passaging). (D) Percentage of labeledmetabolites from UGlc 0-4 hours after passaging with Versene or trypsin. Error bars representSD (A-D) for three replicates. *, P value between 0.01 and 0.05; **, P value between 0.001 and0.01; ***, P value <0.001 by Student’s two-tailed t test.
213
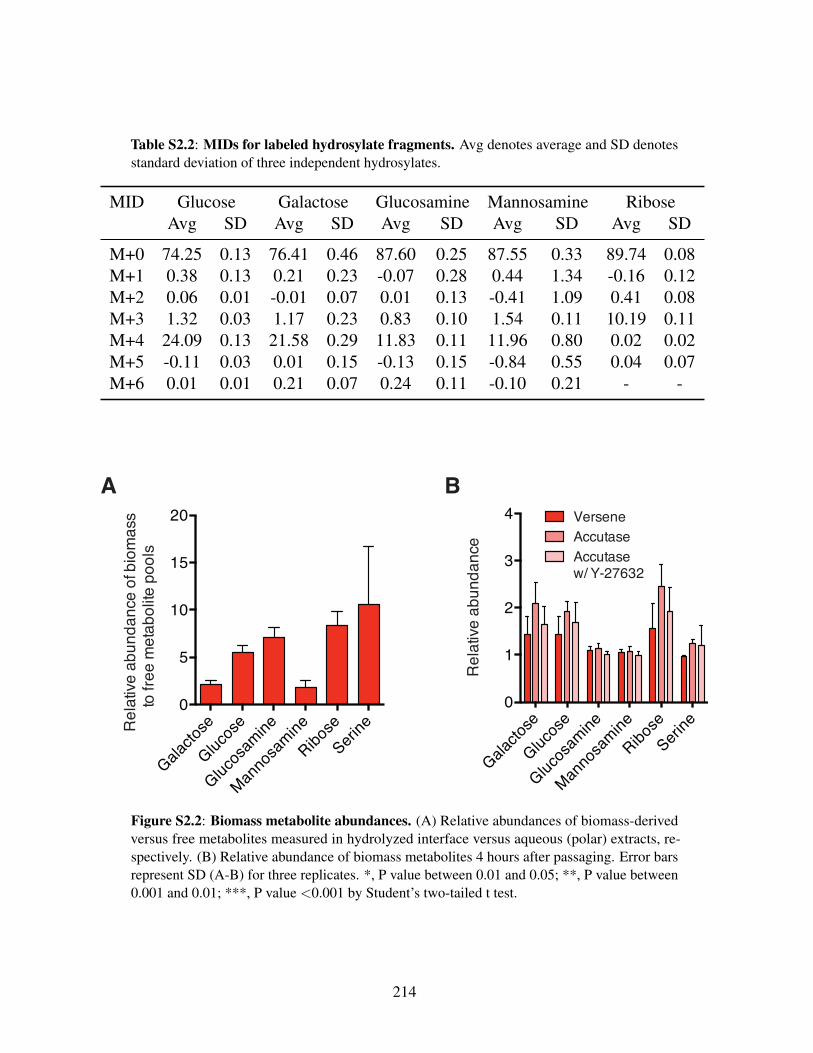
Table S2.2: MIDs for labeled hydrosylate fragments. Avg denotes average and SD denotesstandard deviation of three independent hydrosylates.
MID Glucose Galactose Glucosamine Mannosamine RiboseAvg SD Avg SD Avg SD Avg SD Avg SD
M+0 74.25 0.13 76.41 0.46 87.60 0.25 87.55 0.33 89.74 0.08M+1 0.38 0.13 0.21 0.23 -0.07 0.28 0.44 1.34 -0.16 0.12M+2 0.06 0.01 -0.01 0.07 0.01 0.13 -0.41 1.09 0.41 0.08M+3 1.32 0.03 1.17 0.23 0.83 0.10 1.54 0.11 10.19 0.11M+4 24.09 0.13 21.58 0.29 11.83 0.11 11.96 0.80 0.02 0.02M+5 -0.11 0.03 0.01 0.15 -0.13 0.15 -0.84 0.55 0.04 0.07M+6 0.01 0.01 0.21 0.07 0.24 0.11 -0.10 0.21 - -
Galacto
se
Glucos
e
Glucos
amine
Manno
samine
Ribose
Serine
0
1
2
3
4
Rel
ativ
e ab
unda
nce
VerseneAccutaseAccutase w/ Y-27632
BA
Galacto
se
Glucos
e
Glucos
amine
Manno
samine
Ribose
Serine
0
5
10
15
20
Rel
ative
abu
ndan
ce o
f bio
mas
sto
free
met
abol
ite p
ools
Figure S2.2: Biomass metabolite abundances. (A) Relative abundances of biomass-derivedversus free metabolites measured in hydrolyzed interface versus aqueous (polar) extracts, re-spectively. (B) Relative abundance of biomass metabolites 4 hours after passaging. Error barsrepresent SD (A-B) for three replicates. *, P value between 0.01 and 0.05; **, P value between0.001 and 0.01; ***, P value <0.001 by Student’s two-tailed t test.
214
Chapter S3
Supplement to Chapter 3
S3.1 Abbreviations
AcCoA - acetyl-CoA; ÎsKG - Îs-ketoglutarate; Ala - alanine; Asp - aspartate; Asn -
asparagine; Lac - lactate; Cit - citrate; Fum - fumarate; Glc - glucose; Glu - glutamate; Gln -
glutamine; Gly - glycine; 2HG - 2-hydroxyglutarate; Mal - malate; Oac - oxaloacetate; Olea -
oleate; Palm - palmitate; 3PG - 3-phosphoglyceric acid; Pro - proline; Pyr - pyruvate; Ru5P -
ribulose-5-phosphate; Ser - serine; Suc - succinate
S3.2 Supplemental Methods
S3.2.1 Cell culture and media
Human embryonic stem cell lines HUES9 and WA09 (H9) were provided by Prof. Shyni
Varghese (University of California, San Diego) and Prof. Sean Palecek (University of Wisconsin-
Madison), respectively. HESCs were originally maintained on a layer of irradiated CF-1 murine
embryonic fibroblasts (P3, MEFs) (MTI-GlobalStem) in DMEM/F12 medium with 20% knockout
serum replacement (KSR), 1X MEM non-essential amino acid solution (NEAA), 1 mM L-
215

glutamine, 1X 2-mercaptoethanol (2-ME), and 4 ng/mL basic fibroblast growth factor recombinant
human protein (bFGF). All components were purchased from Life Technologies. Induced
pluripotent stem cell line iPS(IMR90)-c4 was also provided by Prof. Sean Palecek. IPSCs were
originally cultured in mTeSR1 medium (Stem Cell Technologies). All hPSCs experiments were
conducted with cells ranging from 30 and 70 passages.
MEF-conditioned medium was produced by culturing 1 million P3 irradiated CF-1 MEF
(MTI-GlobalStem) in 10 mL DMEM/F12 medium with 20% KSR, 1X NEAA, 1 mM L-Glutamine
and 1X 2-ME The conditioned medium was collected every 24 hours from day 2 to day 7 and
pooled. Before culturing hESC, the conditioned medium was supplemented with fresh 10 ng/mL
bFGF. All components were purchased from Life Technologies.
AlbuMAX media was made by dissolving AlbuMAX I Lipid-Rich BSA (Life Technolo-
gies; 1-1.6% w/v) and ultra-fatty acid free BSA (Roche; 1% w/v) into E8 basal media or tracer
E8 basal media. E8 supplement was then freshly added to lipid-containing basal media.
In [U-13C16]palmitate tracer experiments, [U-13C16]palmitate was first non-covalently
conjugated to ultra-fatty acid free BSA (Roche) by dissolving [U-13C16]sodium palmitate (Cam-
bridge Isotopes) to a concentration of 2.5 mM in 150 mM sodium chloride solution at 70◦C
and adding 40 mL palmitate solution into 50 mL of 0.34 mM BSA solution at 37ÂrC. A 1 mM
working BSA-conjugated [U-13C16]palmitate solution was prepared by adjusting the pH to 7.4
and diluting to a final volume of 100 mL with 150 mM sodium chloride. In experiments, 50 µM
BSA-conjugated [U-13C16] palmitate and 1 mM carnitine were added to culture medium.
Human cancer cell lines, H1299, HCT116, 143B, SW1353, H358, Hep3b, Huh7 and A549,
were maintained in DMEM supplemented with 10% fetal bovine serum (FBS). For measurement
of oxidative PPP contribution to lipogenic NADPH, tracer media consisted of either glucose
free DMEM medium with 10% dialyzed FBS or glucose free E8 medium, supplemented with
[3-2H]glucose (Cambridge Isotopes). All components were purchased from Life Technologies.
For tracer experiments, culture medium was removed, cells were rinsed with PBS, and
216
tracer media were added to wells. Cells were maintained in tracer media for 24 hours before
metabolite extraction.
All cells were maintained in a humidified, 37◦C incubator at 5% CO2.
S3.2.2 Detection of 2-hydroxyglutarate isoforms
Derivatization of 2-hydroxyglutarate (2HG) with methanol/methyl chloroformate (Sigma-
Aldrich) was performed following essentially the protocol described previously [1]. The deriva-
tives were extracted by the addition of 70 µL of chloroform. To check the enantiomer separation
and to evaluate retention times, standard solutions of both R-α-hydroxyglutaric acid disodium
salt and S-α-hydroxyglutaric acid disodium salt (Sigma-Aldrich) were prepared and derivatized
in the same way.
A sample volume of 2 µL was injected into a split/splitless inlet, operating in pulsed
splitless mode at 230◦C. The injection pulse pressure was set to 15 psi until 1 minute. The gas
chromatograph was equipped with a Rt-ÎsDEXsa (length: 30 m, I.D.: 0.25 mm, film: 0.25 µm)
capillary column (Restek). The GC oven temperature was held at 70◦C for 1 minute and increased
at 4◦C/min to 150◦C. After 5 minutes, the temperature was increased at 3◦C/min to 190◦C, then
held at that temperature for 5 minutes. The total run time for each sample was about 40 minutes
[2]. The transfer line temperature was set constantly to 280◦C. Full-scan mass spectra were
acquired from m/z 70 to 500. Other conditions are same as for other metabolite detection. For
quantification, measurements of the derivatives were performed in SIM mode using the following
masses: m/z 159, m/z 175.1 (quantification ion) and m/z 202.1. The dwell time for each ion was
set to 150 ms. All GC-MS chromatograms were processed using MetaboliteDetector [3].
S3.3 Supplemental Tables and Figures
217
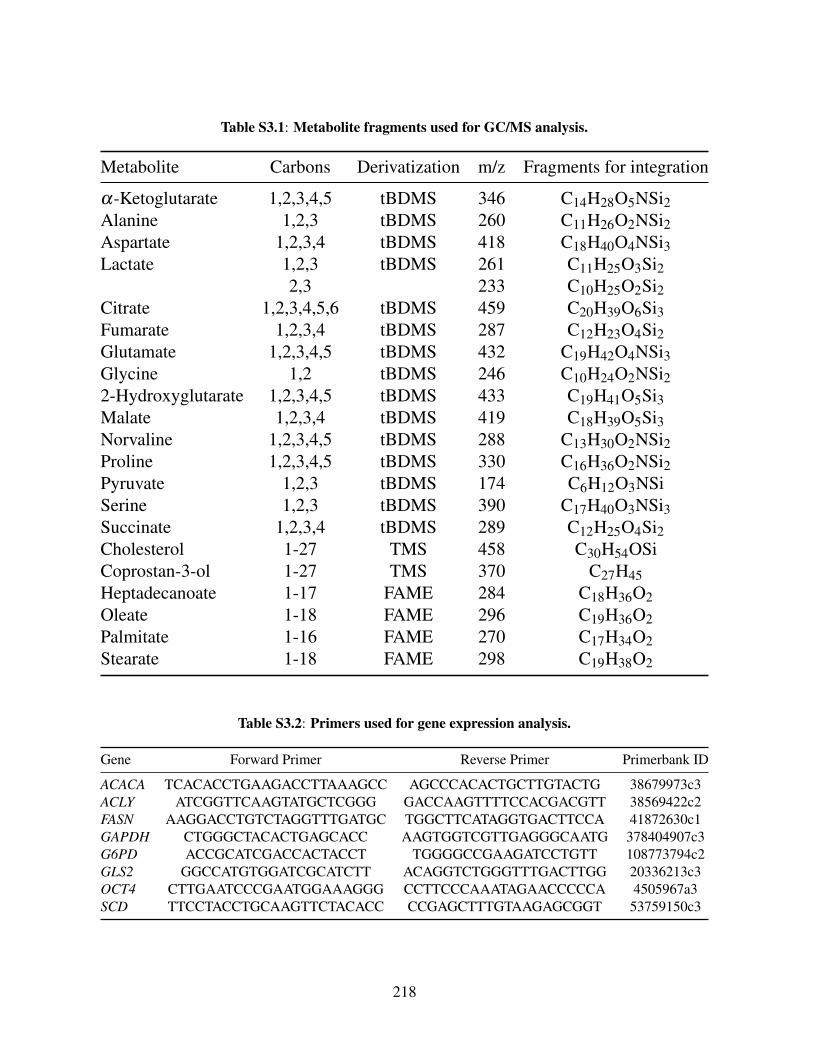
Table S3.1: Metabolite fragments used for GC/MS analysis.
Metabolite Carbons Derivatization m/z Fragments for integration
α-Ketoglutarate 1,2,3,4,5 tBDMS 346 C14H28O5NSi2Alanine 1,2,3 tBDMS 260 C11H26O2NSi2Aspartate 1,2,3,4 tBDMS 418 C18H40O4NSi3Lactate 1,2,3 tBDMS 261 C11H25O3Si2
2,3 233 C10H25O2Si2Citrate 1,2,3,4,5,6 tBDMS 459 C20H39O6Si3Fumarate 1,2,3,4 tBDMS 287 C12H23O4Si2Glutamate 1,2,3,4,5 tBDMS 432 C19H42O4NSi3Glycine 1,2 tBDMS 246 C10H24O2NSi22-Hydroxyglutarate 1,2,3,4,5 tBDMS 433 C19H41O5Si3Malate 1,2,3,4 tBDMS 419 C18H39O5Si3Norvaline 1,2,3,4,5 tBDMS 288 C13H30O2NSi2Proline 1,2,3,4,5 tBDMS 330 C16H36O2NSi2Pyruvate 1,2,3 tBDMS 174 C6H12O3NSiSerine 1,2,3 tBDMS 390 C17H40O3NSi3Succinate 1,2,3,4 tBDMS 289 C12H25O4Si2Cholesterol 1-27 TMS 458 C30H54OSiCoprostan-3-ol 1-27 TMS 370 C27H45Heptadecanoate 1-17 FAME 284 C18H36O2Oleate 1-18 FAME 296 C19H36O2Palmitate 1-16 FAME 270 C17H34O2Stearate 1-18 FAME 298 C19H38O2
Table S3.2: Primers used for gene expression analysis.
Gene Forward Primer Reverse Primer Primerbank ID
ACACA TCACACCTGAAGACCTTAAAGCC AGCCCACACTGCTTGTACTG 38679973c3ACLY ATCGGTTCAAGTATGCTCGGG GACCAAGTTTTCCACGACGTT 38569422c2FASN AAGGACCTGTCTAGGTTTGATGC TGGCTTCATAGGTGACTTCCA 41872630c1GAPDH CTGGGCTACACTGAGCACC AAGTGGTCGTTGAGGGCAATG 378404907c3G6PD ACCGCATCGACCACTACCT TGGGGCCGAAGATCCTGTT 108773794c2GLS2 GGCCATGTGGATCGCATCTT ACAGGTCTGGGTTTGACTTGG 20336213c3OCT4 CTTGAATCCCGAATGGAAAGGG CCTTCCCAAATAGAACCCCCA 4505967a3SCD TTCCTACCTGCAAGTTCTACACC CCGAGCTTTGTAAGAGCGGT 53759150c3
218
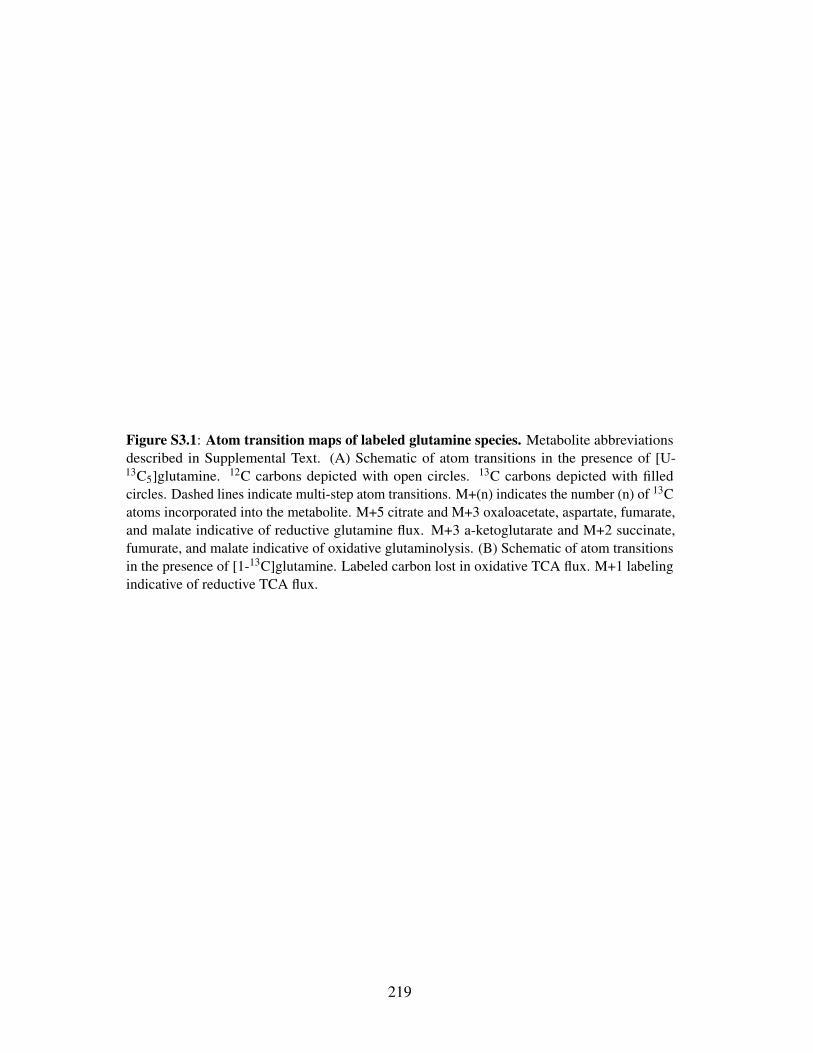
Figure S3.1: Atom transition maps of labeled glutamine species. Metabolite abbreviationsdescribed in Supplemental Text. (A) Schematic of atom transitions in the presence of [U-13C5]glutamine. 12C carbons depicted with open circles. 13C carbons depicted with filledcircles. Dashed lines indicate multi-step atom transitions. M+(n) indicates the number (n) of 13Catoms incorporated into the metabolite. M+5 citrate and M+3 oxaloacetate, aspartate, fumarate,and malate indicative of reductive glutamine flux. M+3 a-ketoglutarate and M+2 succinate,fumurate, and malate indicative of oxidative glutaminolysis. (B) Schematic of atom transitionsin the presence of [1-13C]glutamine. Labeled carbon lost in oxidative TCA flux. M+1 labelingindicative of reductive TCA flux.
219

220
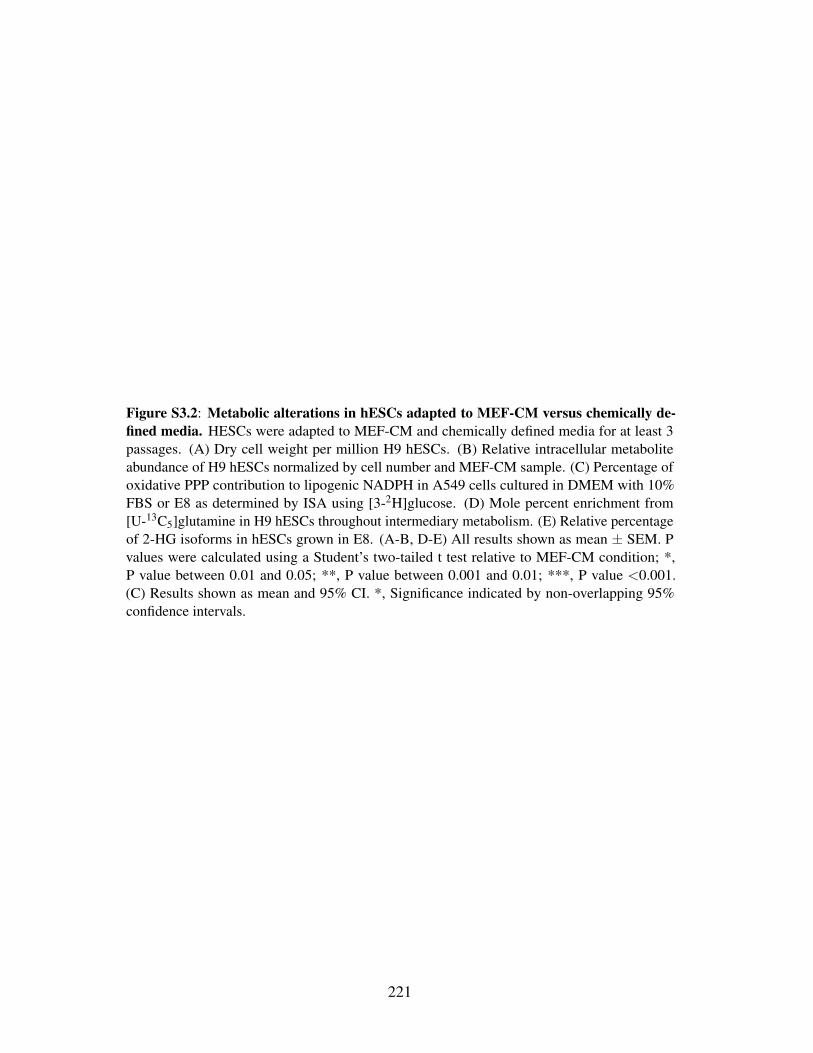
Figure S3.2: Metabolic alterations in hESCs adapted to MEF-CM versus chemically de-fined media. HESCs were adapted to MEF-CM and chemically defined media for at least 3passages. (A) Dry cell weight per million H9 hESCs. (B) Relative intracellular metaboliteabundance of H9 hESCs normalized by cell number and MEF-CM sample. (C) Percentage ofoxidative PPP contribution to lipogenic NADPH in A549 cells cultured in DMEM with 10%FBS or E8 as determined by ISA using [3-2H]glucose. (D) Mole percent enrichment from[U-13C5]glutamine in H9 hESCs throughout intermediary metabolism. (E) Relative percentageof 2-HG isoforms in hESCs grown in E8. (A-B, D-E) All results shown as mean ± SEM. Pvalues were calculated using a Student’s two-tailed t test relative to MEF-CM condition; *,P value between 0.01 and 0.05; **, P value between 0.001 and 0.01; ***, P value <0.001.(C) Results shown as mean and 95% CI. *, Significance indicated by non-overlapping 95%confidence intervals.
221

222

Figure S3.3: Mass isotopomer distributions from [1,2-13C]glucose. HUES 9 cells wereadapted to MEF-CM and chemically defined media for at least 3 passages. Steady state massisotopomer distributions (labeling) of metabolites throughout central carbon metabolism in cellscultured with a 1:1 mixture of unlabeled glucose and [1,2-13C]glucose over 24 hours. All resultsshown as mean ± SEM. M+(n) indicates the number (n) of 13C atoms incorporated into themetabolite. Metabolite abbreviations described in Supplemental Text.
223
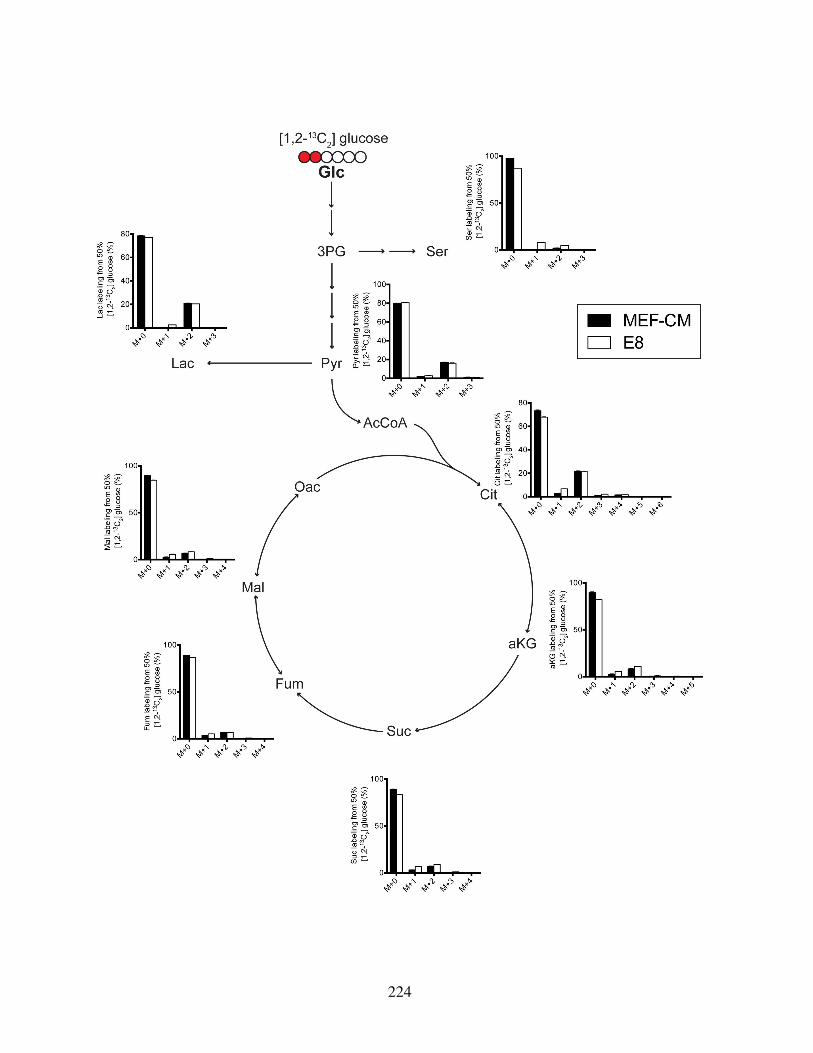
224
Figure S3.4: Mass isotopomer distributions from [U-13C5]glutamine. HUES 9 cells wereadapted to MEF-CM and chemically defined media for at least 3 passages. Steady state massisotopomer distributions (labeling) of TCA metabolites and amino acids from [U-13C5]glutamineafter 24 hours. All results shown as mean ± SEM. M+(n) indicates the number (n) of 13C atomsincorporated into the metabolite. Metabolite abbreviations described in Supplemental Text.
225

226
Figure S3.5: HESCs adapted to chemically defined media upregulate lipid biosynthesis.(A) Glucose contribution to lipogenic AcCoA in HUES 9 hESCs in the presence 50% enriched[U-13C6]glucose. (B) Mass isotopomer distribution (labeling) of citrate in HUES 9 hESCs in thepresence of 50% enriched [U-13C6]glucose over 24 hours. (C) Mass isotopomer distribution ofcitrate in irradiated CF-1 MEFs in the presence of 50% enriched [U-13C6]glucose after 24 hoursof media conditioning. (D) Mass isotopomer distribution of palmitate in irradiated CF-1 MEFsin the presence of 50% enriched [U-13C6]glucose over 24 hours. (E) Expression of OCT4 inhPSCs adapted to E8+AlbuMAX relative to cells in E8. (F-G) Glucose uptake, lactate secretion,glutamine uptake and glutamate secretion fluxes of hESCs adapted to E8 or E8+AlbuMAX.Cells were adapted to E8 and E8+AlbuMAX for at least 3 passages. (A) Results shown as meanwith 95% CI. *, significance determined by non-overlapping confidence intervals. (B-G) Allresults shown as mean ± SEM. P values were calculated using a Student’s two-tailed t testrelative to MEF-CM condition; *, P value between 0.01 and 0.05; **, P value between 0.001and 0.01; ***, P value <0.001.
227
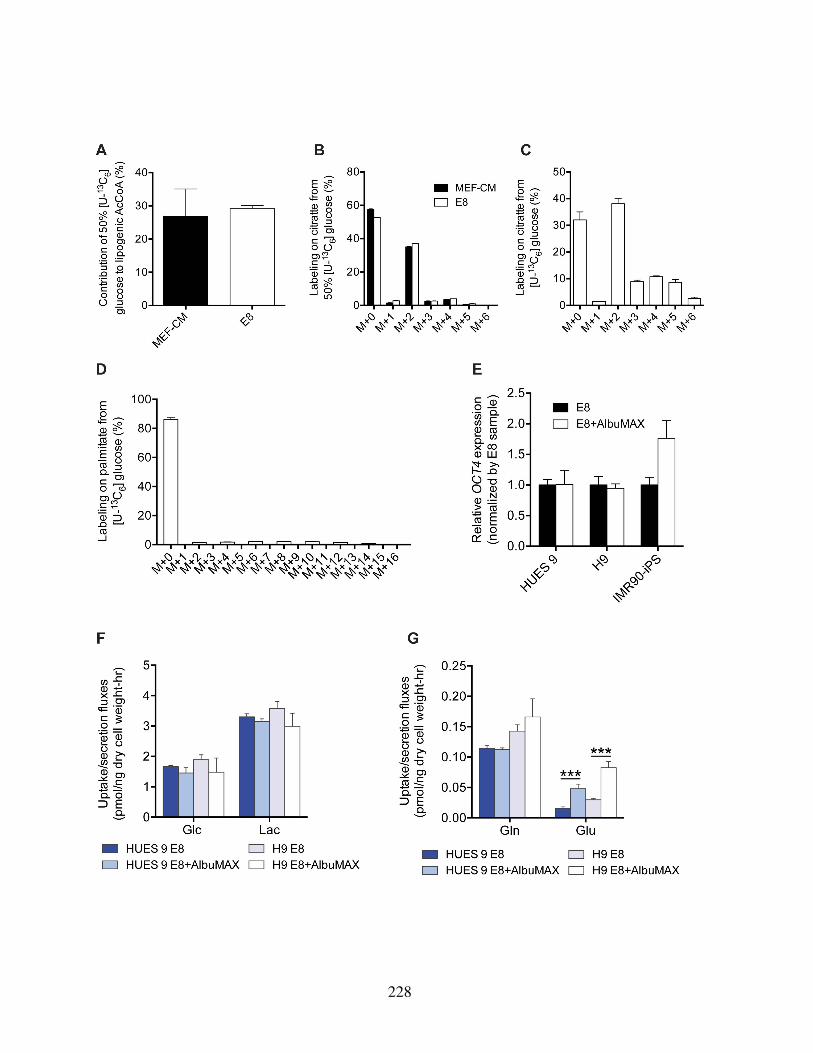
228
S3.4 Supplementary References1. Villas-Boas, S. G., Delicado, D. G., Akesson, M. & Nielsen, J. Simultaneous analysis
of amino and nonamino organic acids as methyl chloroformate derivatives using gaschromatography-mass spectrometry. Anal Biochem 322, 134–8 (2003).
2. Waldhier, M. C., Dettmer, K., Gruber, M. A. & Oefner, P. J. Comparison of derivatiza-tion and chromatographic methods for GC-MS analysis of amino acid enantiomers inphysiological samples. J Chromatogr B Analyt Technol Biomed Life Sci 878, 1103–12(2010).
3. Hiller, K., Hangebrauk, J., Jager, C., Spura, J., Schreiber, K. & Schomburg, D. Metabo-liteDetector: comprehensive analysis tool for targeted and nontargeted GC/MS basedmetabolome analysis. Anal Chem 81, 3429–39 (2009).
229
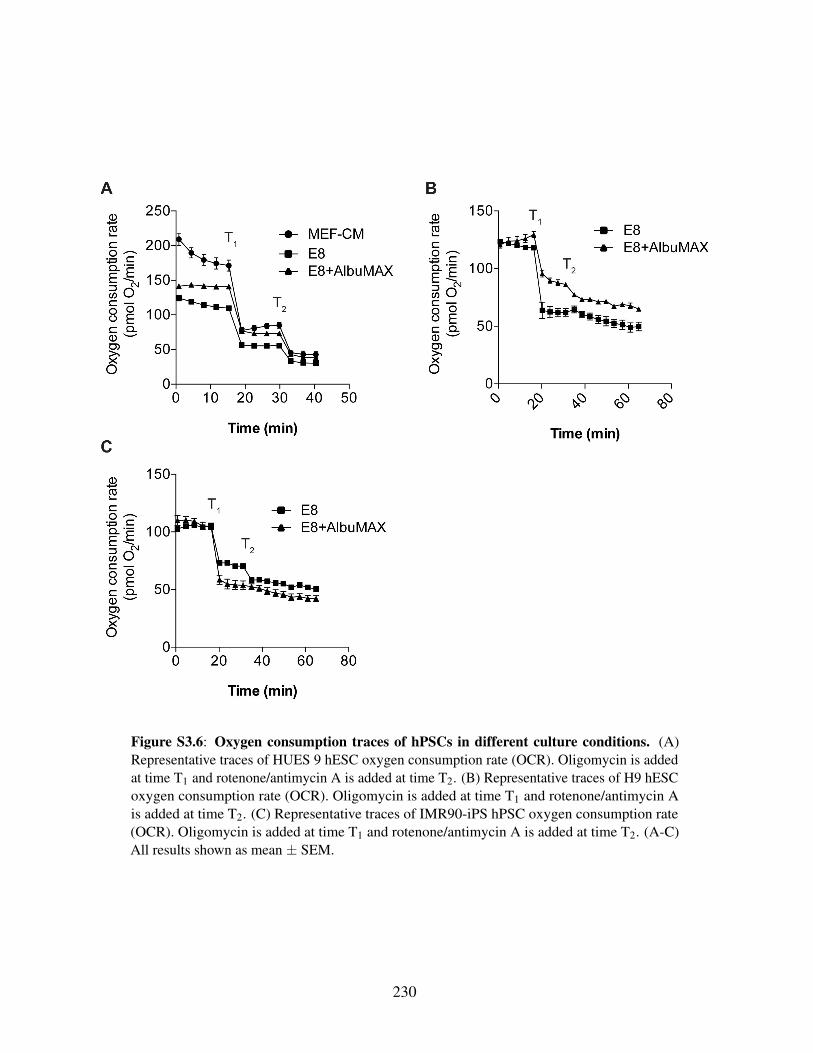
Figure S3.6: Oxygen consumption traces of hPSCs in different culture conditions. (A)Representative traces of HUES 9 hESC oxygen consumption rate (OCR). Oligomycin is addedat time T1 and rotenone/antimycin A is added at time T2. (B) Representative traces of H9 hESCoxygen consumption rate (OCR). Oligomycin is added at time T1 and rotenone/antimycin Ais added at time T2. (C) Representative traces of IMR90-iPS hPSC oxygen consumption rate(OCR). Oligomycin is added at time T1 and rotenone/antimycin A is added at time T2. (A-C)All results shown as mean ± SEM.
230
Chapter S5
Supplement to Chapter 5
S5.1 Supplemental Figures
231

Figure S5.1: Schematic of dual-gRNA-library construction and quality control of screens.(A) Oligonucleotides bearing two sgRNA spacers were synthesized, amplified, and cloned intoa lentiviral gRNA cloning vector. Next, a fragment containing a sgRNA scaffold and the mouseU6 promoter was inserted between the two spacers to yield the final dual-gRNA expressionconstruct. A pair of primer matching sites labeled in blue were designed for enrichment ofthe two spacer regions prior to deep sequencing analysis. (B) Frequency distribution of themetabolism dual-gRNA plasmid library. (C) Principle component analysis (PCA) of the dual-gRNA read count distributions. (D) Cumulative frequency of dual-gRNA constructs by deepsequencing. Shift in the curves at days 14, 21, and 28 represents the depletion of dual-gRNAconstructs. Each time point was measured in duplicates.
232
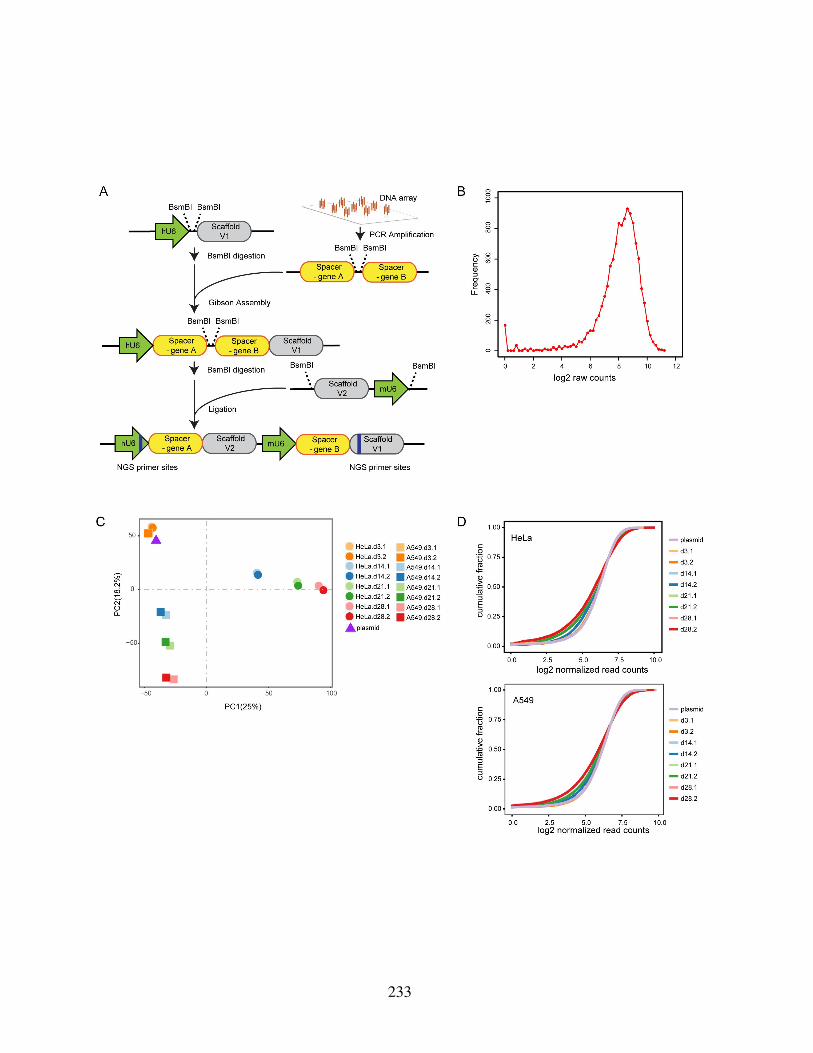
233
Figure S5.2: CRISPR screening results reveal metabolic network dependencies. (A) SKOfitness scores for A549 cells, plotted as fg (day-1), with a more negative score representing adecrease in fitness with SKO. Plotted as mean ± SD. (B) Gene pairs with significant geneticinteraction scores (z-score < -3) are shown. Conserved interactions cross HeLa and A549 areindicated in blue. Previously reported interactions are indicated in red. Purple indicates theconserved interactions which have been previously reported.
234

235
Figure S5.3: Screening results validated through metabolic flux measurements and fitnessassays. (A, B) Metabolic validation of DKO interaction in ENO1/ENO3. DKO significantlylowered flux through glycolysis over control or SKOs. A, measurement of labeled Lactate. B,measurement of labeled Alanine. † indicates statistical significance (p<0.05) for all conditionsas compared to DKO. (C) SKO competition assay of oxPPP genes in HeLa (left) and A549(right) cells. HeLa data replicated from Figure 4.3L and log transformed for comparison. (D)Deep sequencing analysis of indels (insertions and deletions) introduced by CRISPR-Cas9 at 10days after transduction of G6PD or PGD gRNA constructs. (E) Deep sequencing analysis ofindels introduced by CRISPR-Cas9 at two weeks after transduction of KEAP1 gRNA constructsin HeLa cells. Ordinate shows the read counts of indels at each corresponding location. Mostcells were successfully targeted after transduction of gRNAs, while only a background levelof mutagenesis was observed in the cells transduced with non-targeting control gRNAs. Theseexperiments suggest high targeting efficiency in both the A549 and HeLa Cas9-stable cell lines.
236

237

Figure S5.4: KEAP1 mutational status alters redox metabolism and impact of oxPPP geneknockouts on cellular fitness. (A) Scatter plots (left) of SKO fitness and gene expression inHeLa versus A549. Residual plots (right) of linear regressions showing the outliers betweenHeLa and A549. oxPPP genes (G6PD and PGD) showed more essentiality in HeLa cells versusA549, while their mRNA expression levels are lower in HeLa cells versus A549. (B) Immunoblotof A549s with KEAP1 mutant panel. (C) Measurement of relative PGD perturbation effect inA549 cells across KEAP1 mutant panel. Growth curve of the reference cells, which is tdtomato+cells in this case, and its absolute fitness ( f0) was extracted by counting average cell numbers inthree independent experiments for three days. The fitness of PGD perturbation (∆ fPGD,KEAP1)relative to non-targeting controls (NTC) in KEAP1 mutation cells were measured by competitiveassay. Finally, by incorporating also the absolute fitness of reference cells, the relative effects ofPGD perturbation (RPGD,KEAP1) in KEAP1 mutant cells was calculated.
238
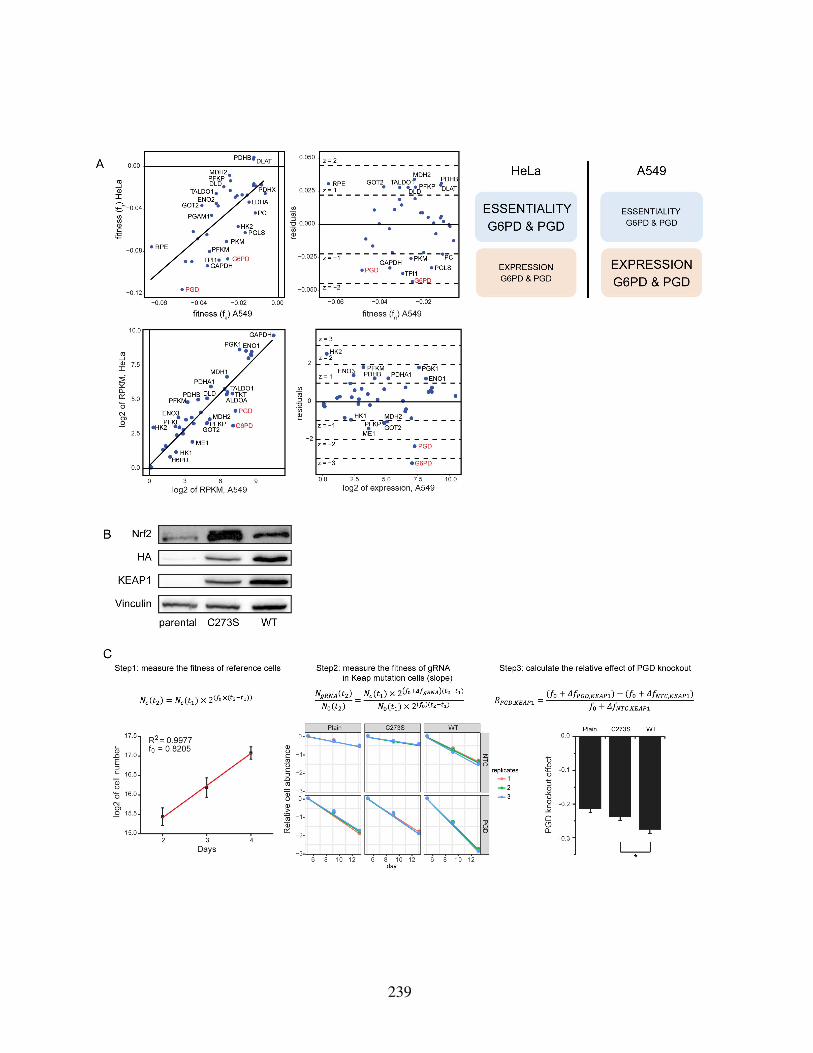
239
Chapter S6
Supplement to Chapter 6
S6.1 Supplemental Tables and Figures
240

Table S6.1: Metabolite fragments.
Metabolite m/z Fragments for integration
α-Ketoglutarate 346 C14H28O5NSi2Alanine 260 C11H26O2NSi2Aspartate 418 C18H40O4NSi3Lactate 261 C11H25O3Si2
233 C10H25O2Si2Citrate 459 C20H39O6Si3Fumarate 287 C12H23O4Si2Glutamate 432 C19H42O4NSi3Glutamine 431 C19H43O3N2Si3Glycerol-3-phosphate 571 C23H56O6Si4PGlycine 246 C10H24O2NSi22-Hydroxyglutarate 433 C19H41O5Si3Malate 419 C18H39O5Si3Norvaline 288 C13H30O2NSi2Proline 330 C16H36O2NSi2Pyruvate 174 C6H12O3NSiSerine 390 C17H40O3NSi3Succinate 289 C12H25O4Si2Myristate 242 C15H30O2Palmitate 270 C17H34O2Stearate 298 C19H38O2Oleate 296 C19H36O2
Table S6.2: RT-PCR primers.
Gene Forward Reverse Primerbank ID
G6PD ACCGCATCGACCACTACCT TGGGGCCGAAGATCCTGTT 108773794c2PGD ATGGCCCAAGCTGACATCG AAAGCCGTGGTCATTCATGTT 40068517c1FAS AAGGACCTGTCTAGGTTTGATGC TGGCTTCATAGGTGACTTCCA 41872630c1SCD TTCCTACCTGCAAGTTCTACACC CCGAGCTTTGTAAGAGCGGT 53759150c3ACACA TCACACCTGAAGACCTTAAAGCC AGCCCACACTGCTTGTACTG 38679973c3ACLY ATCGGTTCAAGTATGCTCGGG GACCAAGTTTTCCACGACGTT 38569422c2ELOVL6 AACGAGCAAAGTTTGAACTGAGG TCGAAGAGCACCGAATATACTGA 195539341c1GAPDH CTGGGCTACACTGAGCACC AAGTGGTCGTTGAGGGCAATG 378404907c3
241

Figure S6.1: Central carbon isotopologue distribution in mtIDH cells. (A) Isotopologuedistribution of citrate from [U-13C5]glutamine. (B) Percentage of M+4 citrate isotopologue from[U-13C5]glutamine in normoxia and hypoxia. (C) Isotopologue distribution of aspartate from[U-13C5]glutamine.
242
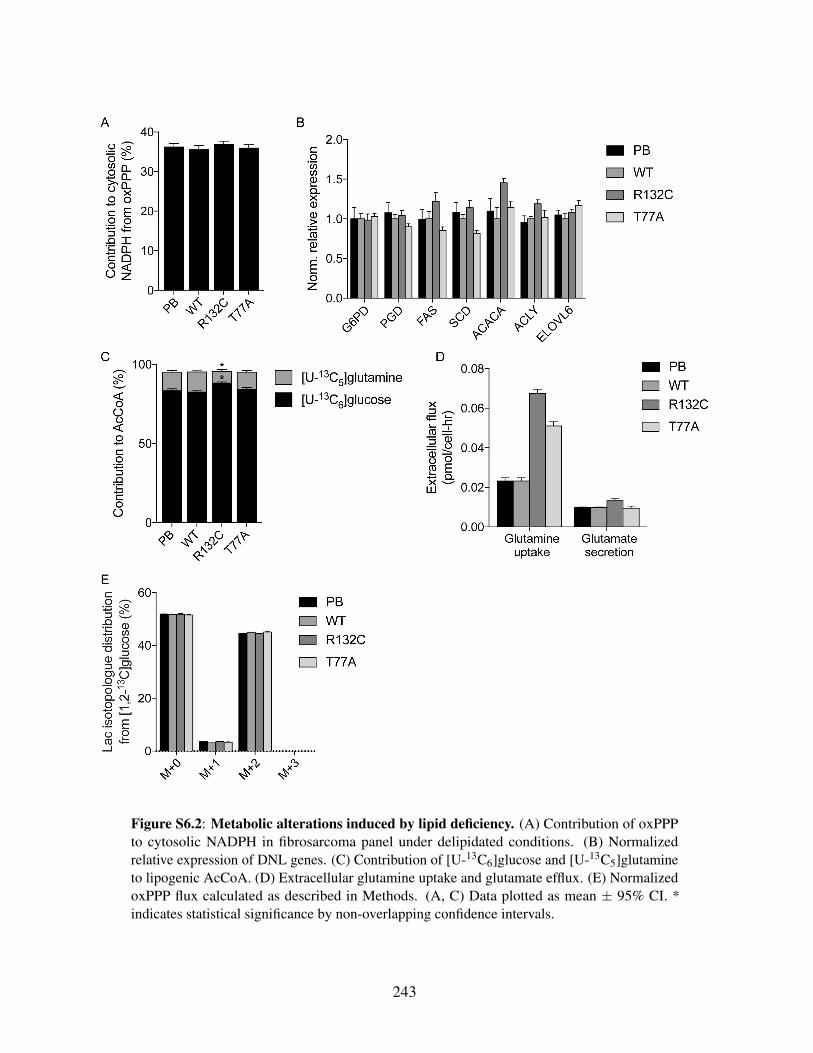
Figure S6.2: Metabolic alterations induced by lipid deficiency. (A) Contribution of oxPPPto cytosolic NADPH in fibrosarcoma panel under delipidated conditions. (B) Normalizedrelative expression of DNL genes. (C) Contribution of [U-13C6]glucose and [U-13C5]glutamineto lipogenic AcCoA. (D) Extracellular glutamine uptake and glutamate efflux. (E) NormalizedoxPPP flux calculated as described in Methods. (A, C) Data plotted as mean ± 95% CI. *indicates statistical significance by non-overlapping confidence intervals.
243
Related Documents