UNIVERSITY OF CALIFORNIA, MERCED Understanding the Impacts of Sub-Inhibitory Concentrations and Clinical Use of Beta-lactam Antibiotics on the Evolution of Beta-lactamase Resistance Genes A DISSERTATION SUBMITTED IN PARITAL SATISFACTION OF THE REQUIREMENTS FOR THE DEGREE DOCTOR OF PHILOSOPHY in Quantitative and Systems Biology by Portia M. Mira Committee in charge Dr. Juan C. Meza, Chair Dr. David Ardell Dr. Manel Camps Dr. Miriam Barlow Spring 2018

Welcome message from author
This document is posted to help you gain knowledge. Please leave a comment to let me know what you think about it! Share it to your friends and learn new things together.
Transcript

UNIVERSITY OF CALIFORNIA, MERCED
Understanding the Impacts of Sub-Inhibitory Concentrations and Clinical Use of Beta-lactam Antibiotics on the Evolution of Beta-lactamase Resistance Genes
A DISSERTATION SUBMITTED IN PARITAL SATISFACTION OF THE REQUIREMENTS FOR THE DEGREE DOCTOR OF PHILOSOPHY
in
Quantitative and Systems Biology
by
Portia M. Mira Committee in charge Dr. Juan C. Meza, Chair Dr. David Ardell Dr. Manel Camps Dr. Miriam Barlow
Spring 2018

ii
Copyright
Portia Mira, 2018
All rights reserved

iii
Signature Page The Dissertation of Portia Mira is approved, and it is acceptable in quality and form for publication on microfilm and electronically: Dr. Miriam Barlow Dr. Manel Camps Dr. David Ardell Dr. Juan C. Meza, Chair Date

iv
Dedication I would like to dedicate my work to my husband, Jairo, you have given me unconditional support, love and patience. I would not have been able to make it this far without you. To my children, Briana and Andres, you both are my motivation and have kept life interesting throughout this journey. To my foster parents, Mario and Lucia, you have given me unconditional love and care and provided me with the strong foundation needed to continue my education. And to my mother-in-law, Blanca Vargas, no puedo decir con palabras cuanto te agradezco por toda la ayuda me has dado.
v
Table of Contents Signature Page ................................ ................................ ......... iiiVita ................................ ................................ .......................... viiList of Figures ................................ ................................ .......... viiiList of Tables ................................ ................................ ............ ixAcknowledgments ................................ ................................ ...... xiAbstract of the Dissertation ................................ ....................... xiiiChapter 1: Introduction ................................ ............................... 1
Why is Antibiotic Resistance a Problem? ... . . . . . . . . . . . . . . . . . . . . . . . . . . . . . . . . . . . . . . . . . 1 History of Antibiotics and Antibiotic Resistance .. . . . . . . . . . . . . . . . . . . . . . . . . . . . . . . . . . 2 Antibiotic Classes and Mechanisms of Action .. . . . . . . . . . . . . . . . . . . . . . . . . . . . . . . . . . . . . 4 Sub-inhibitory Concentrations of Antibiotics and the Effects on the Evolution of Antibiotic Resistance .. . . . . . . . . . . . . . . . . . . . . . . . . . . . . . . . . . . . . . . . . . . . . . . . . . . . . 5 β-Lactam Antibiotics and the Evolution of β-lactamase Resistance Genes .. . . . . . . . . . . . . . . . . . . . . . . . . . . . . . . . . . . . . . . . . . . . . . . . . . . . . . . . . . . . . . . . . . . . . . . . . . . . . . . . . . . . . . . . . . . . . . . . . . . . . . 6
Chapter 2: Adaptive Landscapes of Resistance Genes Change as Antibiotic Concentrations Change ................................ .............. 10
Introduction .. . . . . . . . . . . . . . . . . . . . . . . . . . . . . . . . . . . . . . . . . . . . . . . . . . . . . . . . . . . . . . . . . . . . . . . . . . . . . . . . . . 10 Results .. . . . . . . . . . . . . . . . . . . . . . . . . . . . . . . . . . . . . . . . . . . . . . . . . . . . . . . . . . . . . . . . . . . . . . . . . . . . . . . . . . . . . . . . . 13 Discussion .. . . . . . . . . . . . . . . . . . . . . . . . . . . . . . . . . . . . . . . . . . . . . . . . . . . . . . . . . . . . . . . . . . . . . . . . . . . . . . . . . . . . 25 Materials and Methods .. . . . . . . . . . . . . . . . . . . . . . . . . . . . . . . . . . . . . . . . . . . . . . . . . . . . . . . . . . . . . . . . . . . 27
Chapter 3: Rational Design of Antibiotic Treatment Plans: A treatment strategy for managing evolution and reversing resistance ................................ ................................ ............................... 30
Introduction .. . . . . . . . . . . . . . . . . . . . . . . . . . . . . . . . . . . . . . . . . . . . . . . . . . . . . . . . . . . . . . . . . . . . . . . . . . . . . . . . . . 30 Results .. . . . . . . . . . . . . . . . . . . . . . . . . . . . . . . . . . . . . . . . . . . . . . . . . . . . . . . . . . . . . . . . . . . . . . . . . . . . . . . . . . . . . . . . . 33 Discussion .. . . . . . . . . . . . . . . . . . . . . . . . . . . . . . . . . . . . . . . . . . . . . . . . . . . . . . . . . . . . . . . . . . . . . . . . . . . . . . . . . . . . 51 Methods .. . . . . . . . . . . . . . . . . . . . . . . . . . . . . . . . . . . . . . . . . . . . . . . . . . . . . . . . . . . . . . . . . . . . . . . . . . . . . . . . . . . . . . . 52
Chapter 4: Statistical Package for Growth Rates Made Easy ........ 56 Introduction .. . . . . . . . . . . . . . . . . . . . . . . . . . . . . . . . . . . . . . . . . . . . . . . . . . . . . . . . . . . . . . . . . . . . . . . . . . . . . . . . . . 56 Methods and Results .. . . . . . . . . . . . . . . . . . . . . . . . . . . . . . . . . . . . . . . . . . . . . . . . . . . . . . . . . . . . . . . . . . . . . 57 Conclusions .. . . . . . . . . . . . . . . . . . . . . . . . . . . . . . . . . . . . . . . . . . . . . . . . . . . . . . . . . . . . . . . . . . . . . . . . . . . . . . . . . . 69
Chapter 5: Does Antibiotic Resistance Evolve in Hospitals? ......... 71 Introduction .. . . . . . . . . . . . . . . . . . . . . . . . . . . . . . . . . . . . . . . . . . . . . . . . . . . . . . . . . . . . . . . . . . . . . . . . . . . . . . . . . . 71 Results .. . . . . . . . . . . . . . . . . . . . . . . . . . . . . . . . . . . . . . . . . . . . . . . . . . . . . . . . . . . . . . . . . . . . . . . . . . . . . . . . . . . . . . . . . 75 Discussion .. . . . . . . . . . . . . . . . . . . . . . . . . . . . . . . . . . . . . . . . . . . . . . . . . . . . . . . . . . . . . . . . . . . . . . . . . . . . . . . . . . . . 84 Conclusion .. . . . . . . . . . . . . . . . . . . . . . . . . . . . . . . . . . . . . . . . . . . . . . . . . . . . . . . . . . . . . . . . . . . . . . . . . . . . . . . . . . . . 86
Chapter 6: A Comparative Analysis of the Genetic Interactions Between Amino Acid Substitutions within blaTEM-50 and blaTEM-85 .... 90
Introduction .. . . . . . . . . . . . . . . . . . . . . . . . . . . . . . . . . . . . . . . . . . . . . . . . . . . . . . . . . . . . . . . . . . . . . . . . . . . . . . . . . . 90

vi
Results and Discussion .. . . . . . . . . . . . . . . . . . . . . . . . . . . . . . . . . . . . . . . . . . . . . . . . . . . . . . . . . . . . . . . . . . 91 Conclusion .. . . . . . . . . . . . . . . . . . . . . . . . . . . . . . . . . . . . . . . . . . . . . . . . . . . . . . . . . . . . . . . . . . . . . . . . . . . . . . . . . . . 102 Materials and Methods .. . . . . . . . . . . . . . . . . . . . . . . . . . . . . . . . . . . . . . . . . . . . . . . . . . . . . . . . . . . . . . . . . . 103
Conclusion ................................ ................................ .............. 104 Prospectus ................................ ................................ .............. 106 Appendix ................................ ................................ ................ 108
vii
Vita EDUCATION 2011 Associates in Science, Merced Community College 2013 Bachelors in Science, University of California Merced 2018 Doctor of Philosophy, University of California Merced PUBLICATIONS Mira P, Barlow M, Meza JC, Hall BG. “Statistical Package for Growth Rates Made Easy.” September 2017 Molecular Biology and Evolution. Seigal, A. Mira, P. Sturmfels, B.,Barlow, M. “Does Antibiotic Resistance Evolve in Hospitals?” November 2, 2016. Bulletin of Mathematical Biology DOI: 10.1007/s11538-016-0232-7. Mira P, Crona K, Greene D, Meza J, Sturmfels B, Barlow M.“Rational Design of Antibiotic Treatment Plans” May 6, 2015, PLOS ONE 10.1371/journal.pone.0122283. Mira P, Nandipati A, Barlow M, Meza J C. “Adaptive Landscapes of Resistance Genes Change as Antibiotic Concentrations Change” July 12 2015 Molecular Biology and Evolution. AWARDS GradSLAM! UC Merced Campus Champion Ford Foundation Fellow Outstanding Graduate Student Award President’s Dissertation year Fellowship AAUW Dissertation Year Fellowship Graduate Dean’s Dissertation Fellowship QSB Leadership Award GradSLAM! Finalist Dean’s Distinguished Scholar Fellowship QSB Summer Fellowship QSB Travel Award Graduate Student Research Poster Winner
viii
ListofFiguresFigure 1-1 Targets, mode of action, and mechanisms of the main classes of
antibiotics ........................................................................................................ 4Figure 1-2: History of antibiotic development and sequence of antibiotic
resistance. ...................................................................................................... 5Figure 1-3: Ribbon structure of TEM-50 enzyme. .................................................. 8Figure 1-4: Ribbon structure of TEM-85 enzyme. .................................................. 9Figure 2-1: Adaptive Landscapes for Cefprozil (CPR) at various concentrations.
...................................................................................................................... 14Figure 2-2: Bar plot of the frequency of the fastest and slowest TEM-50
genotypes ..................................................................................................... 15Figures 3-1 through 3-15: TEM-50 Adaptive Landscapes ................................... 39Figure 3-16: Summary of Highest CPM probabilities ........................................... 42Figure 3-17: Summary of Optimal Six Step Sequences (EPM and CPM) ........... 49Figure 3-18: Summary of Steps Included in Optimal Two, Four, and Six Step
CPM Antibiotic Cycles .................................................................................. 51Figure 4-1: Illustration of effects of O.D. readings at 20 minute intervals vs 60
minute intervals. ........................................................................................... 58Figure 4-2: Distribution of mean V-scores of TEM-85 2014 data. ........................ 62Figure 4-3: Comparison scores vs number of bootstrap replicates. .................... 65Figure 4-4: An example of an Adaptive Landscape. ............................................ 67Figure 4-5: An example of a consensus bootstrap landscape. ............................ 68Figure 5-1: Best fitting graphical model. .............................................................. 77Figure 5-2: Change in relative cumulative resistance of three antibiotics over
time. .............................................................................................................. 86Figure 6-1: Adaptive Landscapes for Cefotaxime (CTX) at various
concentrations. ............................................................................................. 94Figure 6-2: Frequency of the three fastest and three slowest growing blaTEM-85
genotypes. .................................................................................................... 96Figure 6-3: Frequency of the ratio of new substitutions to reversions within blaTEM-
85 and blaTEM-50 adaptive landscapes. ........................................................... 99Figure 6-4: Pairwise epistasis means for blaTEM-50 and blaTEM-85. ....................... 101
ix
ListofTablesTable 2-1 List of the ratios, new substitutions (S): reversions (R), for each
antibiotic treatment and concentration used. ................................................ 17Table 2-2 Frequency distribution and growth rates of the top five ranked alleles in
the Cefotaxime (0.123 µg/mL) competition. .................................................. 19Table 2-3 Ratios of beneficial over detrimental effects of each of the four
substitutions within TEM-50 (using binary code). ......................................... 20Table 2-4 Similarity matrices for five treatments. ................................................. 23Table 2-5 Similarity matrices of different β-lactam antibiotics with similar
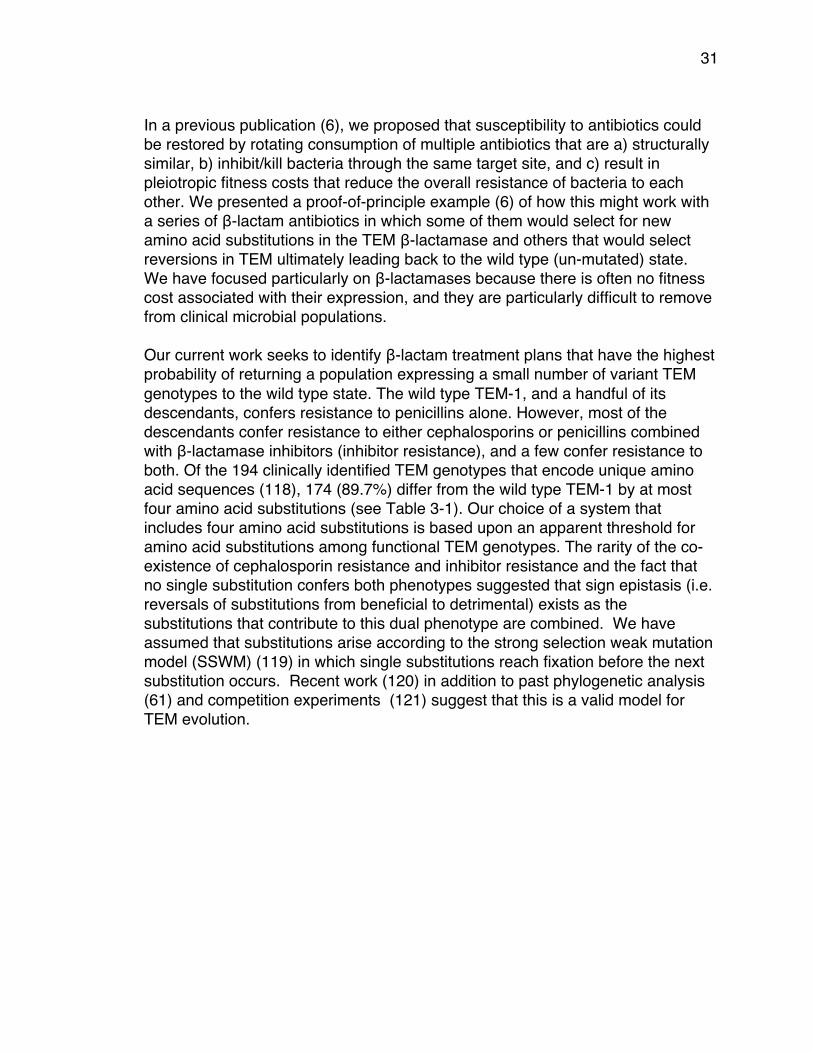
concentrations. ............................................................................................. 24Table 2-6 Constructs containing all of the possible substitutions in blaTEM-50. ..... 29Table 3-1 Frequency of clinically identified TEM genotypes with specified number
of amino acid substitutions ........................................................................... 32Table 3-2 Variant Genotypes Created, Binary Codes, Substitutions and (Names
of Genotypes Identified in Clinical Isolates) .................................................. 33Table 3-3 β-lactam Antibiotics used for this study .............................................. 34Table 3-4 Average Growth Rates ( x 10-3): the rows are the fitness landscapes . 35Table 3-5 Rank Order of Genotypes in Each β-Lactam Antibiotic (Derived From
Table 3-4) ..................................................................................................... 40Table 3-6 Maximum Probability and Number of Paths Using CPM ..................... 43Table 3-7 Maximum Probability and Number of Paths Using EPM ..................... 44Table 3-8 CPM Additions of Substitutions And Associated β-lactam Antibiotics
From Optimal Six Step Treatment Plans ...................................................... 45Table 3-9 CPM Reversions of Substitutions And Associated β-lactam Antibiotics
From Optimal Six Step Treatment Plans ...................................................... 46Table 3-10 EPM Additions of Substitutions and Associated β-lactam Antibiotics
From Optimal Six Step Treatment Plans ...................................................... 47Table 3-11 EPM Reversions of Substitutions and Associated β-lactam
Antibiotics From Optimal Six Step Treatment Plans ..................................... 48Table 3-12 Cyclical Treatment Paths showing Substitutions and Associated β-
lactam Antibiotics .......................................................................................... 50Table 4-1 Effects of changing the reading interval from 20 minutes to 60 minutes
...................................................................................................................... 60Table 4-2 V-scores of acceptable experiments that were repeated because of
high V-scores ................................................................................................ 62Table 4-3 Mean V-scores of accepted experiments ............................................ 69Table 4-4 Reproducibility of adaptive landscapes for the accepted experiments
shown in Table 4-3. ...................................................................................... 69Table 5-1 Summary of Susceptibility Testing Results. ......................................... 74Table 5-2 Information from clonal outbreaks and mean/variance computations . 80Table 5-3 Empirical probabilities for Ampicillin/Sulbactam .................................. 82

x
Table 5-4 Expected probabilities for Ampicillin/Sulbactam under the null hypothesis .................................................................................................... 82
Table 5-5 Hypothesis test p-value results. ........................................................... 84Table 6-1 Constructs containing all of the possible combinations of substitutions
in blaTEM-85. .................................................................................................... 92Table 6-2 List of the β-lactam antibiotic treatments used. ................................... 93Table 6-3 List of antibiotic treatments that had genotypes with positive slopes. . 97

xi
Acknowledgments I would like to acknowledge my advisor, Miriam Barlow, for her boundless support, not only as a scientist, but also as a woman in science. Through hours and hours of mentoring and guidance, you have provided me with the foundation needed to build a career in science. My accomplishments are because of your support as a mentor, advisor and friend. I would like to acknowledge my co-advisor and committee chair, Juan C. Meza. To begin with, thank you for being the main reason I became a graduate student. Thank you for your challenging (sometimes frustrating) but necessary advice. This has helped me in countless ways to grow as an individual as well as a woman in science. I would like to acknowledge David Ardell and Manel Camps for serving on my committee and providing me with the guidance and advice throughout the years. I am grateful for your time and support and feel very fortunate to have had the opportunity to work with each of you. Chapter 2 in full is a reprint of the material as it appears in Molecular Biology and Evolution 2015. Portia M. Mira, Juan C. Meza, Anna Nandipati, Miriam Barlow 2013. The dissertation author was the primary investigator and author of this paper. Juan C. Meza provided statistical consultation. Anna Nandipati helped develop the growth rate assay method. Miriam Barlow was the advisor throughout. Chapter 3, in full, is a reprint of the material as it appears in PLOS One 2015. Portia M. Mira, Kristina Crona, Devin Greene, Juan C. Meza, Bernd Sturmfels, Miriam Barlow 2015. The dissertation author was the primary investigator and author of this paper. Kristina Crona directed the generation of Figures##. Devin Greene provided statistical consultation. Juan C. Meza was intellectually involved in the development of this project. Bernd Sturmfels developed the TimeMachine model and ran it. Miriam Barlow was the advisor throughout. Chapter 4, in full, is a reprint of the material as it appears in Molecular Biology and Evolution 2017. Portia M. Mira, Miriam Barlow, Juan C. Meza, Barry G. Hall 2017. The dissertation author was the primary investigator and author of this paper. Miriam Barlow was the advisor throughout. Juan C. Meza provided statistical consultation. Barry G. Hall wrote the statistical software.

xii
Chapter 5, in full, is a reprint of the material as it appears in Bulletin of Mathematical Biology 2016. Anna Seigal, Portia Mira, Bernd Sturmfels, Miriam Barlow 2016. Anna Seigal developed the N.E.R.D. method in collaboration with Miriam Barlow and Bernd Sturmfels. Portia Mira collected hospital isolates, antibiogram and patient data and provided statistical analyses.
xiii
Abstract of the Dissertation Understanding the Impacts of Sub-Inhibitory Concentrations and Clinical Use of Beta-lactam Antibiotics on the Evolution of Beta-lactamase Resistance Genes
by
Portia M. Mira Doctor of Philosophy in Evolutionary Biology
University of California, Merced 2018
Committee Chair Juan C. Meza
Antibiotic resistance continues to be a major challenge we face today. Scientists and medical professionals are competing against a microbial evolutionary time bomb. The alarming increase in the number of deaths caused by multi-drug resistant infections (1) and the decrease in development of reliable treatment regimens is disturbing. Historically, most studies focus on the effects of fatal concentrations of antibiotics on the evolution of antibiotic resistance (2). Focusing on high antibiotic concentrations limits our understanding of antibiotic resistance and how its evolution is established. Especially since it has been shown that there is a greater selection of resistant bacteria at sub-lethal concentrations of antibiotics (3). Our main goal is to further investigate the impacts of sub-inhibitory concentrations of antibiotics on antibiotic resistance evolution. To do this, we studied two genes that confer resistance to β-lactam antibiotics,blaTEM-50 and blaTEM-85. We created adaptive landscapes from each of the 16 alleles of every combination of the four amino acid substitutions in each gene using bacterial growth rates as a measurement of fitness. We have shown that the topography of these adaptive landscapes depend on the type, and concentration, of the β-lactam antibiotic treatment (4). We also developed a rational design of antibiotic treatment plans based on mathematical models of the adaptive landscape data. We found that by cycling between structurally similar antibiotics, there is a 60%-100% probability of returning to a more-susceptible state. This is a favorable result for laying a foundation to use antibiotic cycling to help alleviate the effects of antibiotic resistance, which has recently shown promising (5) (6). Furthermore, we investigated the evolution of resistance within a local hospital by studying the trends in resistant phenotypes of patient isolates (7). We found there was no significant trend in antibiotic resistance occurring in the hospital, and suspect that the community contributes the majority of the selective pressures leading to multidrug resistant pathogens. Using our novel mathematical models, we were able to successfully predict the resistance genes that were present in the hospital and, by using genomic sequencing data; we confirmed the presence of these resistance genes. These studies show that sub-inhibitory concentrations of

xiv
antibiotics, present in the environment, accelerate the diversity of antibiotic resistance genes. Also, we found that antibiotics used within the hospital do not impact the evolution of antibiotic resistance within the hospital. Altogether, we have 1) shown that sub-lethal concentrations of β-lactam antibiotics have an effect on the evolution of β-lactamase resistance genes, 2) developed mathematical models that can be used to lay a foundation for antibiotic cycling, and 3) developed a tool for hospitals to assess the transmission of antibiotic resistance trends using phenotypic data.
1
Chapter 1: Introduction Why is Antibiotic Resistance a Problem?
Antibiotic resistance is an emerging public health concern (8, 9). From an economic and an agricultural standpoint, antibiotic resistance has been a major problem across the board (10). First, antibiotic resistant infections have become increasingly fatal. In 2007, a study showed the emergence of extensively drug-resistant tuberculosis (XDR-TB) in 47 countries worldwide, meaning the strains were resistant to over three out of the six available classes of antibiotics available to treat tuberculosis (11). Currently, antibiotic resistance claims the lives of over 50,000 people annually across Europe and the U.S. If there are no additional precautionary measures taken, this number is estimated to skyrocket to over 10 million people annually worldwide by the year 2050 (12).
Secondly, antibiotics are being misused and over-prescribed. The Centers for Disease Control and Prevention (CDC) report that the overuse of antibiotics heavily contribute to the development of antibiotic resistance (13) and it has been shown that over half of all antibiotics are mis-prescribed (14). One U.S. study reported that a pathogen was tested in only 7.6% of 17,435 patients hospitalized with community-acquired pneumonia (15), yet all had been treated with antibiotics. This means that only 7.6% of the patients even had a bacterial infection to begin with. In many countries outside of the United States, antibiotics can be purchased without a prescription. A study in 2010 showed that up to 95% of adults who live in or have traveled to India, Pakistan or the UK, carry a multi-drug resistant Enterobacteriaceae that contain a resistance gene called New Delhi metallo-β-lactamase-1 (NDM-1)(16). Most of the isolates they identified carried the NDM-1 gene on a plasmid, which means that it is easily transferable to other bacteria. Finally, antibiotics are used in agriculture to promote growth and prevent disease (17). Although agricultural use of antibiotics has decreased over the past few years, it has been a major driving force of resistance worldwide. A public health review gives four reasons for this; 1) agriculture is the largest consumer of antibiotics worldwide, 2) most of the use of antibiotics in agriculture results in bacteria being exposed to sub-inhibitory concentrations, 3) antibiotics of every significant class are used in agriculture, and 4) humans are exposed to the antibiotic-resistant pathogens through the consumption of animal products (18).
Another public health study explains that antibiotic resistant bacteria, such as Escherichia coli, Salmonella spp. and enterococci from livestock can colonize and infect humans through occupational contact or consumption (19). Even with the recent push for organic foods, it has been shown that there is an increase in
2
antibiotic residues and antibiotic resistance genes found in manure-based commercial organic fertilizers used on agricultural crops (20).
In part for the reasons stated here, and the recent emergence of life threatening diseases caused by multi-drug resistant bacteria (21, 22), there is renewed interest on studies of the development and evolution of antibiotic resistance. In particular, scientists are now focusing on ways we can prevent resistance and preserve the effectiveness of antibiotics. In 2007, a study highlighted the need for regular monitoring of antibiotic susceptibility rates in various populations of humans and animals, which would help identify applicable factors that contribute to the diversification of resistant pathogens (23-25). A two-part review released in 2005, summarizes the global trends of antibiotic resistance and presents several containment strategies, such as antibiotic cycling or combination therapy, and programs such as the Integrated Management of Childhood Illnesses and Directly Observed Short-Course Therapy that have shown to positively influence the decrease in resistance prevalence (24, 25).
History of Antibiotics and Antibiotic Resistance The story of antibiotics has its start in ancient times (26). Traces of
tetracycline have been found in human skeletal remains dating back to 350 – 550 A.D. from ancient Sudanese Nubia (27). Another study showed evidence of tetracycline present in human femoral samples dating back to the late Roman period (28). However, it wasn’t until 1928 that Sir Alexander Fleming discovered the miracle drug, Penicillin, that would make human and medical history (29). Dr. Fleming found that the mold Penicillium naturally produced a substance that killed the bacteria around it, thus naming this naturally produced substance, Penicillin (30).
Many living organisms, including humans, naturally produce antimicrobial
agents to defend and protect themselves from pathogenic bacteria. For example, peptides that have the ability to inhibit growth of pathogenic bacteria have been identified in the mammalian innate immune response system act as natural antibiotics and signaling molecules that activate host cell processes (31). Another antimicrobial peptide, human β-defensin-3 (hBD-3) isolated from human skin, demonstrates broad-spectrum antimicrobial activity again many pathogenic bacteria, including multi-resistant staphylococcus aerus (MRSA) and vancomycin-resistant Enterococcus faecium (32). Even bacteria themselves produce antibiotics to fight off other bacteria that are trying to evade or jeopardize their populations. An example of this is a marine bacteria that produce antibiotics that fight against fish pathogens (33). The presence of antibiotics adds selective pressures for the expression and evolution of antibiotic resistance genes. Phylogenetic reconstruction of antibiotic resistance genes has shown the
3
presence of serine and metallo-β-lactamases originating over two billion years ago (34, 35).
Although the purification and mass production of Penicillin did not come
about until 1943, bacterial populations conferring resistance to penicillin had already existed (36). In fact, it has been shown that many antibiotic resistance genes have a long evolutionary history, dating back to before this new ‘antibiotic era’ (26, 37). Antibiotic resistance is a natural part of evolution. It is survival of the fittest. Many life-threatening resistant infections today, are simply bacterial populations that are evolving the ability to survive in the environments they are exposed to (21, 22). Even though antibiotic resistance has been around for centuries, the majority of the human population is unaware of how dire this potentially fatal health crisis is.
4
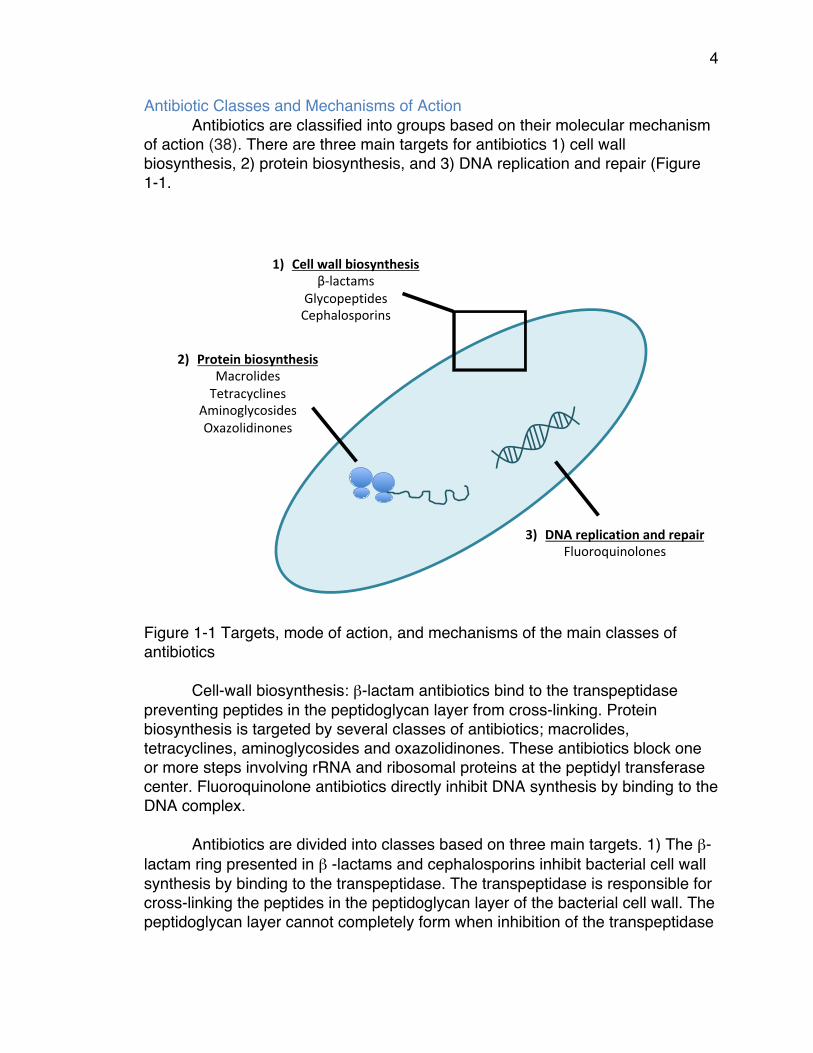
Antibiotic Classes and Mechanisms of Action Antibiotics are classified into groups based on their molecular mechanism
of action (38). There are three main targets for antibiotics 1) cell wall biosynthesis, 2) protein biosynthesis, and 3) DNA replication and repair (Figure 1-1.
Figure 1-1 Targets, mode of action, and mechanisms of the main classes of antibiotics
Cell-wall biosynthesis: β-lactam antibiotics bind to the transpeptidase preventing peptides in the peptidoglycan layer from cross-linking. Protein biosynthesis is targeted by several classes of antibiotics; macrolides, tetracyclines, aminoglycosides and oxazolidinones. These antibiotics block one or more steps involving rRNA and ribosomal proteins at the peptidyl transferase center. Fluoroquinolone antibiotics directly inhibit DNA synthesis by binding to the DNA complex.
Antibiotics are divided into classes based on three main targets. 1) The β-lactam ring presented in β -lactams and cephalosporins inhibit bacterial cell wall synthesis by binding to the transpeptidase. The transpeptidase is responsible for cross-linking the peptides in the peptidoglycan layer of the bacterial cell wall. The peptidoglycan layer cannot completely form when inhibition of the transpeptidase
1) Cellwallbiosynthesisβ-lactams
GlycopeptidesCephalosporins
2) ProteinbiosynthesisMacrolidesTetracyclines
AminoglycosidesOxazolidinones
3) DNAreplicationandrepairFluoroquinolones
5
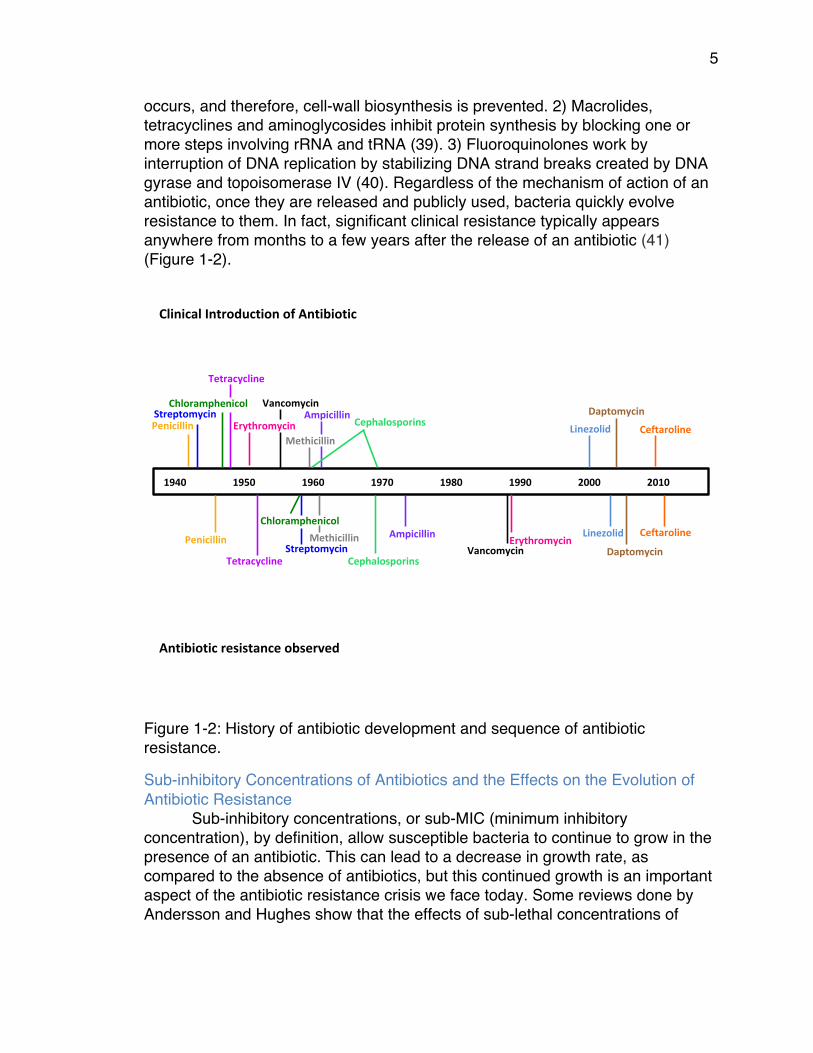
occurs, and therefore, cell-wall biosynthesis is prevented. 2) Macrolides, tetracyclines and aminoglycosides inhibit protein synthesis by blocking one or more steps involving rRNA and tRNA (39). 3) Fluoroquinolones work by interruption of DNA replication by stabilizing DNA strand breaks created by DNA gyrase and topoisomerase IV (40). Regardless of the mechanism of action of an antibiotic, once they are released and publicly used, bacteria quickly evolve resistance to them. In fact, significant clinical resistance typically appears anywhere from months to a few years after the release of an antibiotic (41) (Figure 1-2).
Figure 1-2: History of antibiotic development and sequence of antibiotic resistance.
Sub-inhibitory Concentrations of Antibiotics and the Effects on the Evolution of Antibiotic Resistance
Sub-inhibitory concentrations, or sub-MIC (minimum inhibitory concentration), by definition, allow susceptible bacteria to continue to grow in the presence of an antibiotic. This can lead to a decrease in growth rate, as compared to the absence of antibiotics, but this continued growth is an important aspect of the antibiotic resistance crisis we face today. Some reviews done by Andersson and Hughes show that the effects of sub-lethal concentrations of
2000
ClinicalIntroductionofAntibiotic
Antibioticresistanceobserved
Penicillin
Penicillin
Streptomycin
Streptomycin
Chloramphenicol
Chloramphenicol
Tetracycline
Tetracycline
Erythromycin
Erythromycin
Vancomycin
Vancomycin
Methicillin
Methicillin
Ampicillin
Ampicillin
Cephalosporins
Cephalosporins
Linezolid
Linezolid
Daptomycin
Daptomycin
Ceftaroline
Ceftaroline
2010199019801970196019501940
6
antibiotics have a greater impact on the evolution of antibiotic resistance as compared to lethal concentrations of antibiotics. (2,3,43). This is important because sub-lethal concentrations (typically ranging from 0.0029 µg/mL up to 19.2 µg/mL, depending on the type of antibiotic) have been identified in many natural environments such as wastewater treatment plants and soil (44-47); effluent water supplies from hospitals (48, 49); swine, poultry, beef, tilapia (50, 51) (52); and even humans (51) (53). These sub-lethal concentrations of antibiotics present in the environment and the food we eat can accelerate the emergence and evolution of resistant bacteria (54).
Emerging studies also show the impact of sub-inhibitory concentrations of
antibiotics present in the environment. For example, because of the prophylactic use of antibiotics in aquaculture, resistance genes in pathogenic bacteria in fish have been found to harbor resistance genes pathogenic to humans as well (55). Tetracycline resistance genes have also been identified in fish farming environments (56). In 2003, bacteria carrying resistance to β-lactam antibiotics have even been found in wastewater, surface water and drinking water biofilms (57). These studies highlight the importance of understanding the effects of sub-lethal concentrations of antibiotics in the environment, not only on resistant bacteria, but also on individual resistance genes that confer the resistance.
β-Lactam Antibiotics and the Evolution of β-lactamase Resistance Genes The class of β-lactam antibiotics is characterized by their β-lactam ring,
which inhibits bacterial cell wall synthesis. The β-lactam ring irreversibly binds to the transpeptidase that cross-links the peptidoglycan layer in the cell wall. β-lactam antibiotics are the most heavily used antibiotics due to their low toxicity to the human body, high efficacy, and low cost. This class includes penicillins, penicillin + inhibitor combination treatments, and cephalosporins, which can be further divided by generations (1st- 4th) based on their spectrum of activity against gram-negative bacteria. Because of the widespread use of β-lactam antibiotics, bacteria have evolved β-lactamase gene encoding – an enzyme that hydrolyzes the β-lactam ring of the antibiotics rendering them inactive (58). β-lactamases are the most thoroughly studied antibiotic resistance genes today and are widely distributed among gram-negative and gram-positive bacteria (6, 59-68). These genes have been around for centuries, but have been relatively rare, until the introduction of penicillin and other β-lactam antibiotics (69).
There are many varieties of the β-lactamase enzyme, which are divided
into three groups based on their phenotype and catalytic activity (70). Group 1 is cephalopsorinases, which are encoded onto the chromosome of Enterobacteriaceae and a few other organisms. Group 1 β-lactamases are more active at hydrolyzing cephalosporins and are typically resistant to inhibitors. Plasmid-mediated β-lactamases within group 1 include: CMY (71), FOX (72) and
7
MIR (73) among others. Group 2 are serine β-lactamases and represent the largest group of β-lactamases due to the increasing identification of extended-spectrum β-lactamases (ESBL) over the past two decades. Group 2 is further sub-divided into over 10 groups based on their inhibition activity and include some of the most common plasmid-mediated β-lactamase genes such as TEM (60), CTX-M (66), SHV (74) and OXA (75). Group 3 are the metallo-β-lactamases (MBL’s), which are unique in that they are typically produced in combination with a second or third β-lactamase and require a zinc ion at their active site (70). Some plasmid-mediated MBL’s that have been globally isolated are IMP (76) and VIM (77).
TEM β-lactamases belong to Group 2 serine β-lactamases and originated
in Greece in 1963. This family of β-lactamases was named after Temoneira, the woman from whom the first penicillin-resistant organism carrying the gene, TEM-1, was isolated (35). TEM β-lactamases are the most abundant resistant gene found in gram-negative bacteria today and have evolved to over 220 variants (78). TEM-1 originally conferred resistance to only penicillin, but variants have evolved resistance to cephalosporins (ESBL’s), such as TEM-85 (isolated in 2005), and are even inhibitor resistant. In fact, TEM-50, originally isolated in 1997 from a leukemic patient, is considered the first complex mutant TEM (CMT), meaning that it contains mutations that confer resistance to both cephalosporins and inhibitors (79).
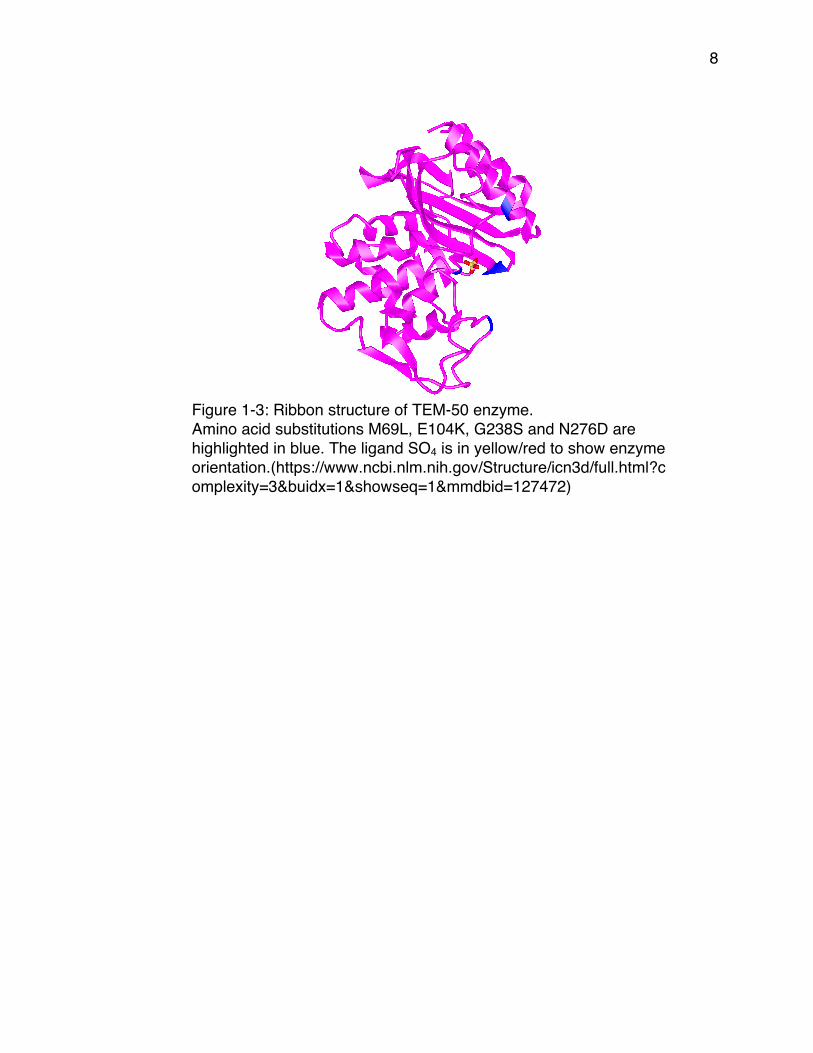
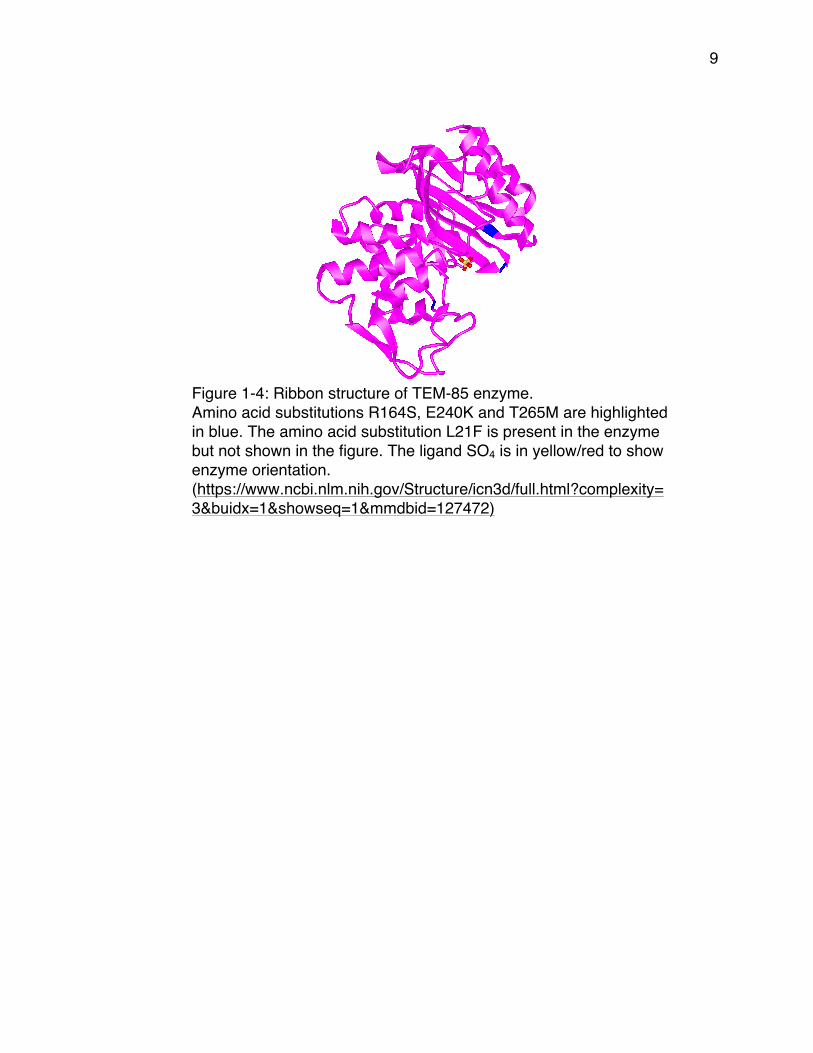
TEM-50 and TEM-85 are unique in that they both are four amino acid substitutions different than TEM-1 (Figures 1-3 and 1-4). In addition, more than half of the combinations of the four amino acid substitutions in each gene have been clinically isolated, making them ideal candidates for evolutionary studies.
8
Figure 1-3: Ribbon structure of TEM-50 enzyme. Amino acid substitutions M69L, E104K, G238S and N276D are highlighted in blue. The ligand SO4 is in yellow/red to show enzyme orientation.(https://www.ncbi.nlm.nih.gov/Structure/icn3d/full.html?complexity=3&buidx=1&showseq=1&mmdbid=127472)
9
Figure 1-4: Ribbon structure of TEM-85 enzyme. Amino acid substitutions R164S, E240K and T265M are highlighted in blue. The amino acid substitution L21F is present in the enzyme but not shown in the figure. The ligand SO4 is in yellow/red to show enzyme orientation. (https://www.ncbi.nlm.nih.gov/Structure/icn3d/full.html?complexity=3&buidx=1&showseq=1&mmdbid=127472)
10
Chapter 2: Adaptive Landscapes of Resistance Genes Change as Antibiotic Concentrations Change Introduction Bacteria are routinely exposed to a broad range of antibiotics that are present in a wide spectrum of concentrations due to their differential accessibility in the tissues of patients undergoing antibiotic therapy and in the environment outside the human body from the breakdown of antibiotics and their presence in agricultural runoff, wastewater, and food (80). This occurrence has been heavily documented (81, 82). For example, antibiotics, along with other organic wastewater contaminants, have been found in 98.7% of water samples collected outside of suburban areas in the United States (83). Sub-lethal concentrations of antibiotics are present in wastewater throughout the world, ranging from 1μg/L to 64 μg/L in wastewater treatment plants and hospital effluent water supplies (84), (83). The antibiotics cannot be completely filtered out of the water before it is used for agriculture, which delivers low concentrations of antibiotics to crops and farmland (84). Also, some ranchers and farmers use antibiotics to promote lean muscle production in animals, which accounts for up to 13% of antibiotic use (81, 82). Considering the extensive use of antibiotics in clinical and agricultural environments, it is not surprising to find evidence that sub-lethal concentrations of antibiotics are important selective pressures acting upon bacteria (85). There is abundant evidence that sub-lethal concentrations of antibiotics in the environment contribute to the increased frequency of antibiotic resistance mutations among microbial populations. Since sub-lethal concentrations of antibiotics have been established as important environmental selective pressures upon antibiotic resistant bacteria, we questioned how varying concentrations of β-lactam antibiotics would affect the genetic outcome of the evolving TEM resistance genes. The β-lactam antibiotics were first introduced in 1943, with penicillin being the first. Since then, the world has been flooded with β-lactam antibiotics because of their high efficiency and low toxicity to the human body (86). This includes cephalosporins, which have the same mode of action as penicillin, but are less susceptible to penicillinases. All β-lactam antibiotics disrupt the synthesis of the peptidoglycan layer of the bacterial cell wall. Because of extensive exposure to β-lactam antibiotics, bacteria have evolved to produce an enzyme, called a β-lactamase, which has the ability to hydrolyze and inactivate the β-lactam ring of these antibiotics. One of the most frequently occurring genes in Gram-negative bacteria that encode a β-lactamase is the blaTEM-1 gene (87).
11
In 1963, the TEM β-lactamase (TEM-1) gene emerged among Gram-negative bacteria, and it rapidly increased in frequency to become the most frequent β-lactamase in most pathogenic Gram-negative populations. TEM β-lactamases have been found in Escherichia coli and other Gram-negative bacteria. The TEM resistance gene is a well-known model system. Among the TEM family members, TEM-1 is considered the wild type. Over 219 TEM variants have been found clinically, where forty-one have single amino acid substitutions and 89% have four or fewer amino acid substitutions. TEM-3, reported in 1987 (88), was the first Extended-Spectrum β-lactamase (ESBL); as such it was able to hydrolyze extended spectrum β-lactams, in which cephalosporins are mainly categorized. Because of the widespread use of β-lactam antibiotics, there have been additional approaches to fight against β-lactamases that utilize a combination of mechanisms including inhibitors for β-lactamases such as clavulanic acid, sulbactam and tazobactam (89). To avoid β-lactamase activity, some antibiotics are given in conjunction with these β-lactamase inhibitors, resulting in a more effective treatment. These inactivators destroy the β-lactamase activity, which enhances the ability of the β-lactam to destroy the cell wall. An inhibitor-resistant TEM is a bacterial strain that produces an inhibitor-resistant enzyme that breaks down these β-lactamase inhibitors. TEM-30, reported in 1992 (90), was the first inhibitor-resistant TEM (IRT), which means that it could continue to hydrolyze penicillins in the presence of a β-lactamase inhibitor. Cephalosporin resistance is usually separate from inhibitor resistance among TEM β-lactamases but TEM-50 reported in 1997 (91), was the first Complex Mutant TEM (CMT), where both cephalosporin and inhibitor resistance substitutions and phenotypes appear simultaneously (92). Epistasis, or non-additive interactions between mutations, also plays a major role in antibiotic resistance. Epistatic interactions can be used to study the topography of fitness landscapes and the dynamics of adaptation (93, 94). Many studies show these patterns of epistasis among large and small-effect beneficial substitutions occurring in TEM-1 (6, 61, 95, 96). It has been suggested (97, 98) that there are major epistatic interactions among the mutations within TEM-1 depending on which combination of the four mutations are present in the presence of just one antibiotic, cefotaxime. Poon and Chao showed that epistasis occurs more frequently among mutations within the same gene (97). Due to the delayed emergence of CMT type TEMs, we anticipated that epistasis (non-additive interactions between substitutions) and sign epistasis (when substitutions change from being beneficial to detrimental and vise versa) would be dominant features of the TEM-50 adaptive landscape. In this study, we focus on TEM-50, which is one of the clinically isolated variants with four substitutions
12
(87). We have created all 16 possible variations of those substitutions using site directed mutagenesis (6). The environment can also affect the fitness contributions of substitutions and their epistatic interactions. Genotype-by-Environment (GxE) interactions are defined as the change in the performance of two or more genotypes measured in two or more environments. Changes in rank order for different genotypes and changes in the magnitude of genetic, environmental and phenotypic variances can be evident between environments (99). Previous studies on GxE interactions have measured fitness on genotypes that differ by numerous unknown mutations and most recently (100) investigated the effects of 26 genotypes in four environments measuring fitness relative to a common progenitor. Here we present a study of GxE interactions on sixteen genotypes that differ by up to four substitutions with 10 different β-lactam antibiotics at three different concentrations using growth rates as a measurement of fitness. Other studies have used minimum inhibitory concentrations (MICs) (96) to determine rough measurements of relative fitness. While MICs are clearly useful in this regard, in 2008, (101) showed that growth rates are a more sensitive measurement of resistance than MICs.
There are ~105 different β-lactams (http://www.whocc.no/atc_ddd_index/) that have selected for the resistance phenotypes contributed by the approximately 223 TEM genotypes that exist today (102). The specific effects of each β-lactam and the within-gene epistatic interactions have surely shaped the evolutionary landscapes of the TEM family. However, they have not been thoroughly investigated. At the most basic level, we reasoned that there might be differences in adaptive landscapes as antibiotic concentrations changed. Additionally we reasoned that changes in concentration of antibiotics are a biologically relevant occurrence worthy of investigation because 1) β-lactam concentrations may vary widely throughout the tissues of a patient undergoing β-lactam therapies and 2)β-lactam concentrations can also change rapidly as antibiotics waste breaks down in the environment. To study within-gene epistasis and GxE effects on the TEM-1 to TEM-50 adaptive landscapes, we investigated the interactions of penicillins, cephalosporins, and β-lactamase inhibitors with 16 TEM genotypes to determine the combined effect of genotype and environment upon fitness outcomes. We looked at how the concentration of β-lactam antibiotics affects the composition of each landscape by taking into consideration the ratio between new substitutions (forward arrows) and reversions (backward arrows). With this information we were able to calculate similarity matrices to study how much each antibiotic treatment (a specific antibiotic at a given concentration), differs from the others that we tested. We also examined the global optimum within each landscape for
13
each treatment. The global optimum is the genotype that has the highest growth rate (or can be considered the most fit) among all 16 genotypes.
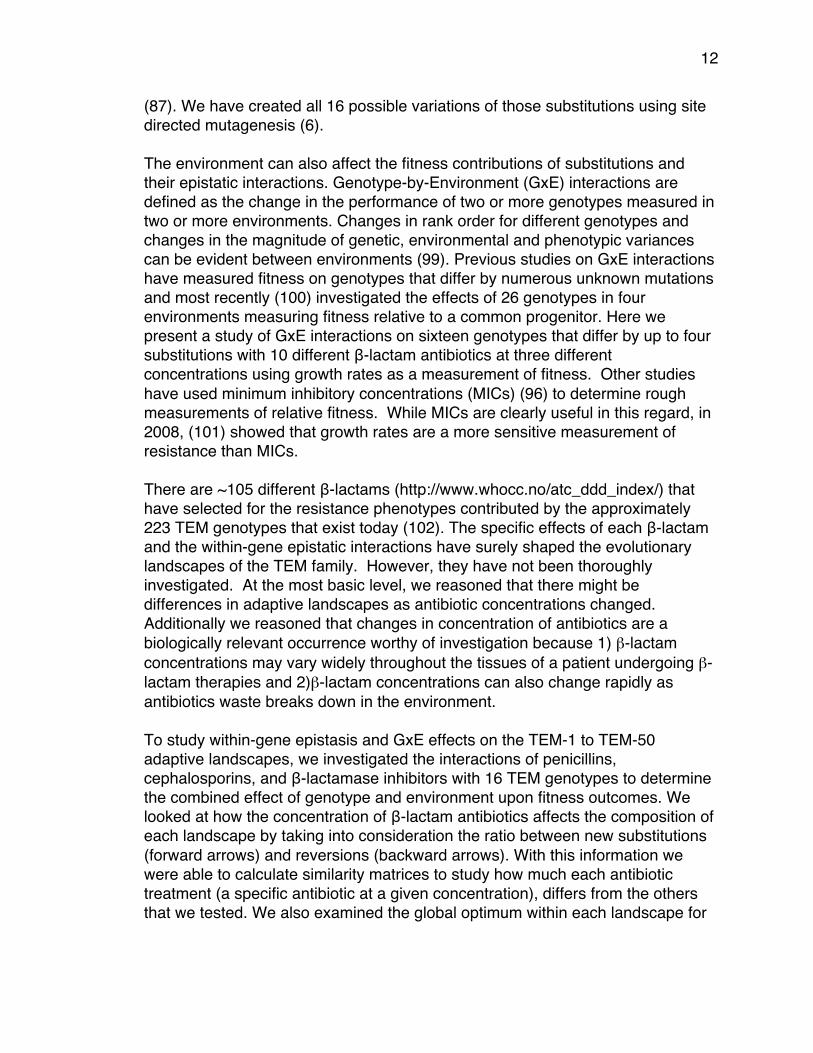
Results We measured the growth rates of the 16 genotypes that can be generated from all combination of the four substitutions in TEM-50. We verified that there were no spontaneous mutations occurring for the duration of the experiment by sequencing 50 samples of the genotype E104K after one experiment treated with cefprozil 128 µg/mL. We confirmed that, in fact, there were no spontaneous mutations except for one sample that accrued a synonymous mutation at the codon position 263. After measuring the growth rates of the 16 genotypes, we created adaptive landscapes for each concentration of each β-lactam antibiotic. These adaptive landscapes compare the growth rates of strains expressing adjacent genotypes that differ by a single amino acid substitution and indicate the genotype that resulted in the highest growth rate (Figure 2-1). In the case of each comparison, the arrows point towards the higher growth rate. The arrows directed towards the genotype with more substitutions signify selection for new substitutions and arrows directed towards genotypes with fewer substitutions signify selection for reversions, depending on which growth rate was higher. Solid arrows represent a significant difference between growth rates as determined by one-way ANOVA (p-value ≤ 0.05) and dashed arrows represent no significant difference between genotypes (p-value ≥ 0.05). Using these arrows we identified evolutionary pathways in which adaptation occurs through either the acquisition of new substitutions or the loss of substitutions through reversions. In each instance, we assume that substitutions and reversions are only selected if their occurrence results in a higher growth rate than the previous genotype (103).
14
A
B
C
D
Figure 2-1: Adaptive Landscapes for Cefprozil (CPR) at various concentrations. A) 80μg/mL, B) 100μg/mL, C) 128μg/mL. Forward arrows signify new substitutions and backward arrows signify reversions. Solid arrows represent significance with a p-value ≤ 0.05. Dashed arrows represent non-significance, p-value ≥ 0.05. The global optimum genotype is highlighted in bold D) Composite of all concentrations, showing only the arrows that remain in the same direction throughout the three concentrations. We see a genotype with three substitutions as the optimum at the highest concentration and a genotype with two substitutions as optima at the two lower concentrations. We also observed the largest number of significant differences in growth rates at the middle concentration (100 μg/mL). In each landscape found that there is one genotype that proves to be the ‘most fit’, referred to as the global optimum. As the concentration of each antibiotic change, the global optimum also changes in each β-lactam treatment. Overall, TEM-50 appeared as the global optimum in 17% of all treatments (including twice in cefotaxime, and once in ampicillin, cefepime and ampicillin/sulbactam). Genotypes with three substitutions appeared as the global optima in 40% of all treatments, and at least once in each of the 15 β-lactams, sometimes at multiple
0000
1000 0100 0010 0001
1100 1010 1001 0110 0101 0011
1110 1101 1011 0111
1111
0000
1000 0100 0010 0001
1100 1010 1001 0110 0101 0011
1110 1101 1011 0111
1111
0000
1000 0100 0010 0001
1100 1010 1001 0110 0101 0011
1110 1101 1011 0111
1111
0000
1000 0100 0010 0001
1100 1010 1001 0110 0101 0011
1110 1101 1011 0111
1111
15
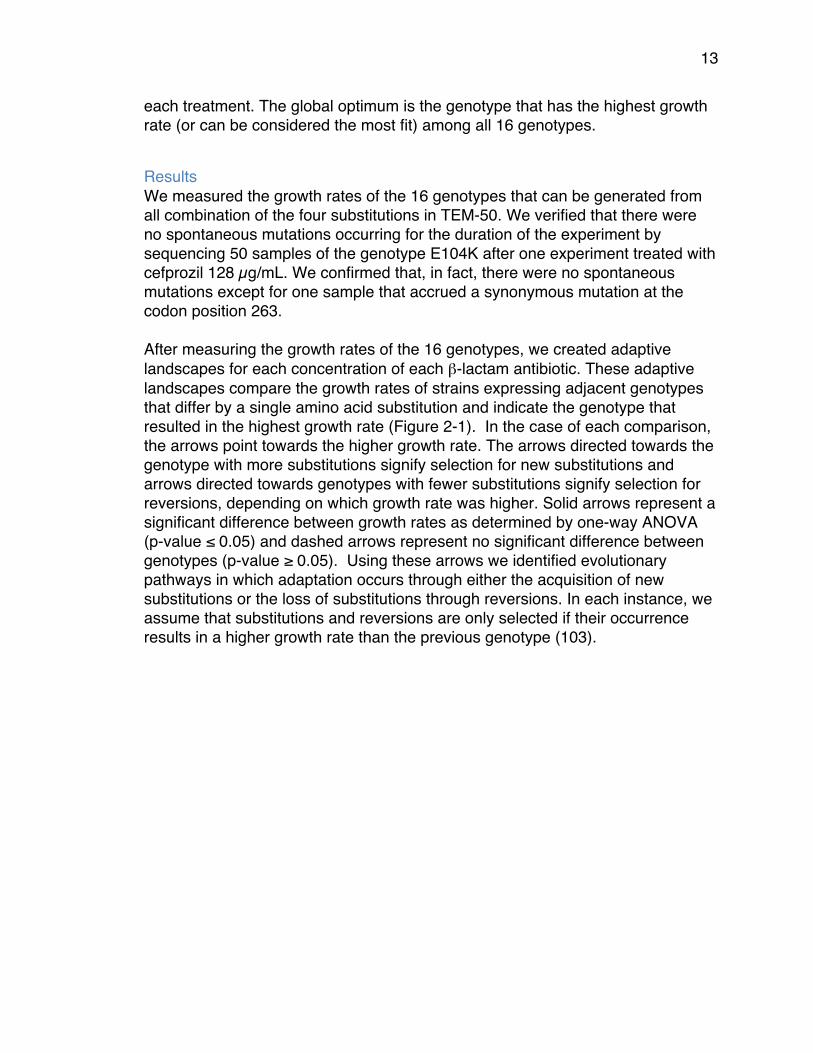
concentrations. The genotype 1101, was the global optimum for four out of the nine penicillin/inhibitor treatments: It appeared twice as the global optimum in ampicillin/sulbactam at 32/8 μg/mL and 64/8 μg/mL. It appeared once in amoxicillin/clavulanic acid at 512/8 μg/mL, and once in piperacillin/tazobactam at 512/8 μg/mL. This result was surprising because none of the genotypes with three substitutions have been clinically isolated, however they may exist in the environment where very low concentrations of β-lactams are more common. Genotypes with two substitutions appeared as the global optima in 33% of all treatments and in all β-lactams except ampicillin and cefepime. Genotypes with one substitution appeared as the global optima in 10% of all treatments (only those with the β-lactams ampicillin, ceftazidime, or amoxicillin). TEM-1 did not appear as the global optimum in any of the treatments tested. However, it did appear within the top three genotypes for one treatment (Figure 2-2). Interestingly, we observed at least one pathway from the wild-type (TEM-1) to the global optimum in all landscapes, with the exception of amoxicillin at 1024 µg/mL.
Figure 2-2: Bar plot of the frequency of the fastest and slowest TEM-50 genotypes Bar plot that depicts the frequency of each TEM-50 variant appearing as one of the top three maxima or bottom three minima across all concentrations of the 15 β-lactam treatments. Overall we found that the number of times the addition of an amino acid substitution was selected for was greater than the number of times a reversion of an amino acid substitution was selected (Table 2-1); 66.7% of the time the addition of an amino acid substitution was selected for in penicillin treatments
0
5
10
15
20
25
0000
1000
0100
0010
0001
1100
1010
1001
0110
0101
0011
1110
1101
0111
1011
1111
Frequency
Alleles
FrequencyofGrowthRateRankings
Maximum
Minimum

16
and 80% in cephalosporin treatments. However, for the nine penicillin plus inhibitor treatments, the results were more variable. In four treatments, more amino acid substitutions were selected than reversions; in three treatments more reversions were selected than substitutions, and in two treatments, the number of selected substitutions and reversions were equal.
17
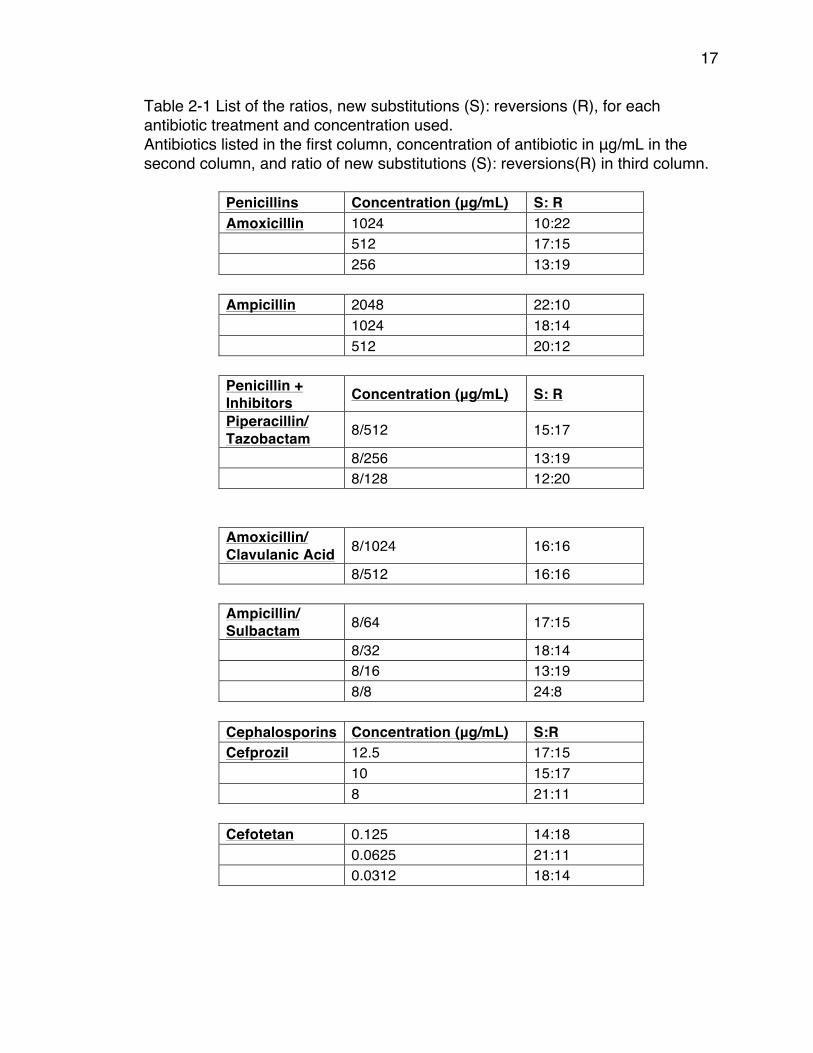
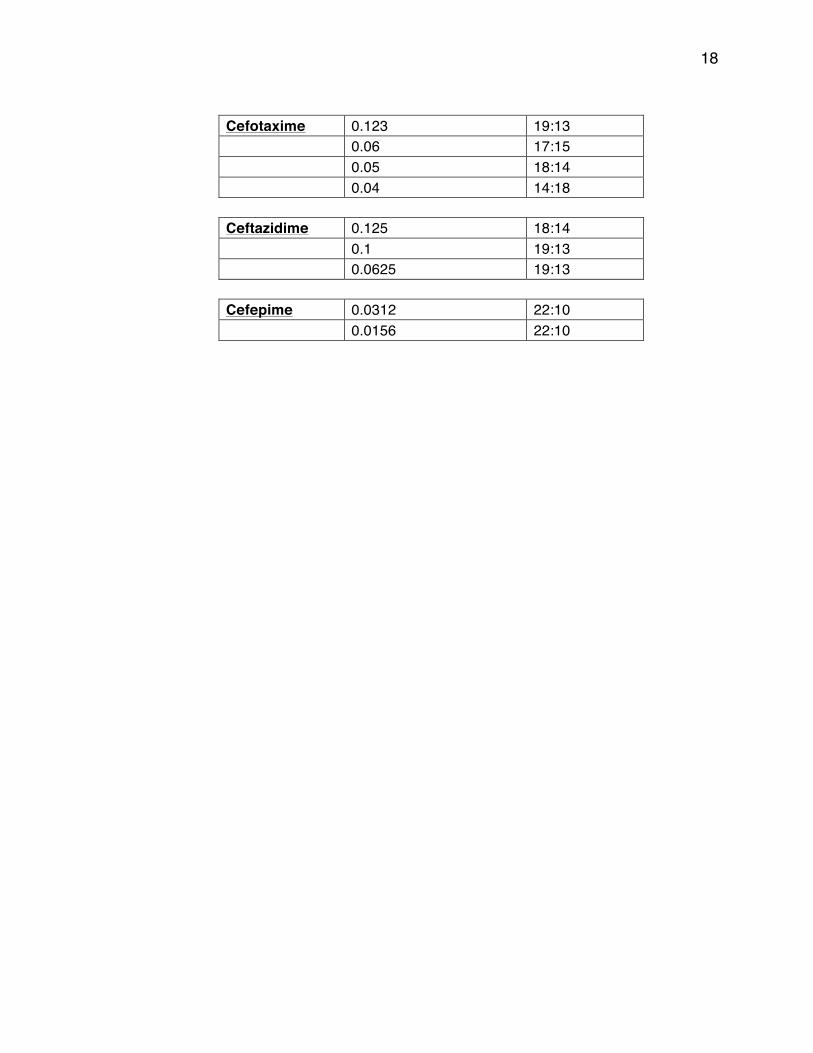
Table 2-1 List of the ratios, new substitutions (S): reversions (R), for each antibiotic treatment and concentration used. Antibiotics listed in the first column, concentration of antibiotic in μg/mL in the second column, and ratio of new substitutions (S): reversions(R) in third column.
Penicillins Concentration (μg/mL) S: R Amoxicillin 1024 10:22
512 17:15
256 13:19
Ampicillin 2048 22:10
1024 18:14
512 20:12
Penicillin + Inhibitors Concentration (μg/mL) S: R Piperacillin/ Tazobactam 8/512 15:17
8/256 13:19
8/128 12:20
Amoxicillin/ Clavulanic Acid 8/1024 16:16
8/512 16:16
Ampicillin/ Sulbactam 8/64 17:15
8/32 18:14
8/16 13:19
8/8 24:8
Cephalosporins Concentration (μg/mL) S:R Cefprozil 12.5 17:15
10 15:17
8 21:11
Cefotetan 0.125 14:18
0.0625 21:11
0.0312 18:14
18
Cefotaxime 0.123 19:13
0.06 17:15
0.05 18:14
0.04 14:18
Ceftazidime 0.125 18:14
0.1 19:13
0.0625 19:13
Cefepime 0.0312 22:10
0.0156 22:10

19
We then identified the three genotypes with the highest fitness in each landscape, and found that the genotypes 1101 and TEM-50 (1111) were selected the most frequently (Figure 2-2). Out of all treatments, these genotypes appeared among the top three genotypes the most frequently when treated with a penicillin/inhibitor. We also identified the three genotypes with the lowest fitness rankings in each landscape, and found that the genotypes 0111, 1011, and 1001 were the lowest ranked (Figure 2-2), with 0111 appearing in twenty-one landscapes among the lowest three rankings. To validate the predictability of our adaptive landscapes, we performed competition experiments. A library of all 16 variant genotypes in approximately equal proportions was inoculated simultaneously in culture treated with cefotaxime at 0.123 µg/mL and incubated at 25 degrees for 22 hours. Twenty-nine samples from this culture were then sequenced to determine which genotypes displayed a competitive advantage in this environment. We found that 93% of the samples were ranked within the top 5 highest growth rate rankings, and 100% of the samples were ranked within the top 6 highest growth rates. We also found that frequency distribution of alleles qualitatively follows the prediction made by our model (Table 2-2). The agreement between growth rate and competition data validates growth rates as a sensitive method for measuring fitness. These results support our findings within the adaptive landscapes. Table 2-2 Frequency distribution and growth rates of the top five ranked alleles in the Cefotaxime (0.123 µg/mL) competition.
Rank Allele Frequency (n=29) Average Growth Rate 1 1110 9 0.003623333 2 0010 7 0.003455 3 0011 4 0.003359167 4 0110 5 0.0033525 5 1010 2 0.002994167 6 1111 2 0.002528333
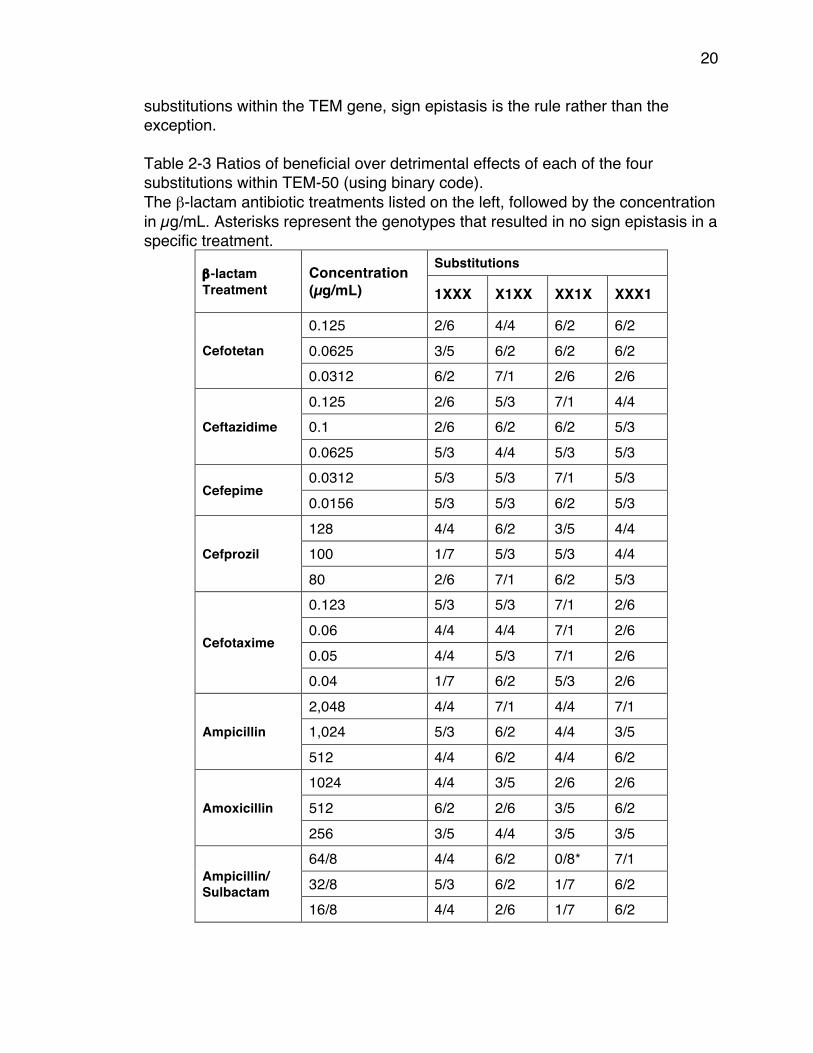
While we created the complete adaptive landscapes, we considered both inhibitor resistant substitutions and cephalosporin hydrolysis substitutions. We observed that combinations of these two types of substitutions routinely result in sign epistasis. Throughout all 30 landscapes, we found sign epistasis in the majority of β-lactam antibiotic treatments (Table 2-3). There were just four cases in which no sign epistasis occurred and all were in penicillin/inhibitor treatments. We observed that the genotype 0010 had all detrimental effects in the treatments piperacillin/tazobactam (512/8 µg/mL and 128/8 µg/mL) and ampicillin/sulbactam (64/8 µg/mL). Also the genotype 1000 had all beneficial effects in the treatment ampicillin/sulbactam (8/8 µg/mL). Despite the exceptions it is clear that for the combining of inhibitor resistant substitutions with cephalosporin hydrolysis
20
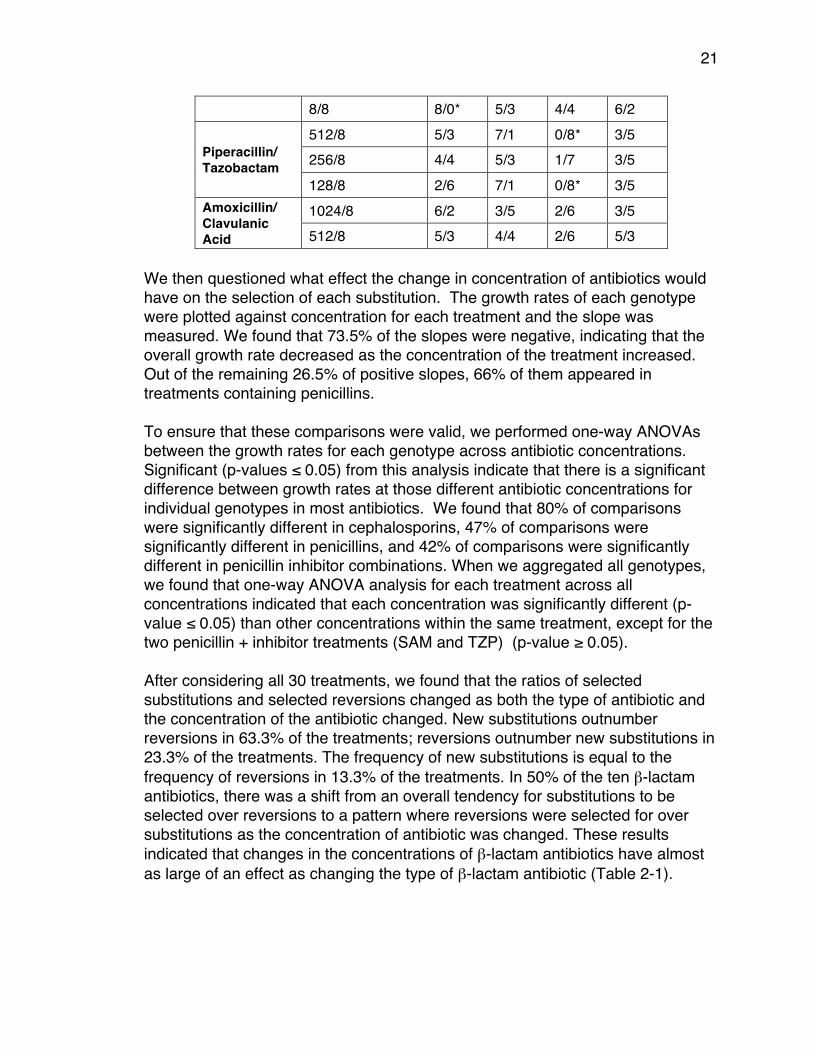
substitutions within the TEM gene, sign epistasis is the rule rather than the exception. Table 2-3 Ratios of beneficial over detrimental effects of each of the four substitutions within TEM-50 (using binary code). The β-lactam antibiotic treatments listed on the left, followed by the concentration in µg/mL. Asterisks represent the genotypes that resulted in no sign epistasis in a specific treatment.
β-lactam Treatment
Concentration (µg/mL)
Substitutions
1XXX X1XX XX1X XXX1
Cefotetan
0.125 2/6 4/4 6/2 6/2 0.0625 3/5 6/2 6/2 6/2 0.0312 6/2 7/1 2/6 2/6
Ceftazidime
0.125 2/6 5/3 7/1 4/4 0.1 2/6 6/2 6/2 5/3 0.0625 5/3 4/4 5/3 5/3
Cefepime 0.0312 5/3 5/3 7/1 5/3 0.0156 5/3 5/3 6/2 5/3
Cefprozil
128 4/4 6/2 3/5 4/4 100 1/7 5/3 5/3 4/4 80 2/6 7/1 6/2 5/3
Cefotaxime
0.123 5/3 5/3 7/1 2/6 0.06 4/4 4/4 7/1 2/6 0.05 4/4 5/3 7/1 2/6 0.04 1/7 6/2 5/3 2/6
Ampicillin
2,048 4/4 7/1 4/4 7/1 1,024 5/3 6/2 4/4 3/5 512 4/4 6/2 4/4 6/2
Amoxicillin
1024 4/4 3/5 2/6 2/6 512 6/2 2/6 3/5 6/2 256 3/5 4/4 3/5 3/5
Ampicillin/ Sulbactam
64/8 4/4 6/2 0/8* 7/1 32/8 5/3 6/2 1/7 6/2 16/8 4/4 2/6 1/7 6/2
21
8/8 8/0* 5/3 4/4 6/2
Piperacillin/ Tazobactam
512/8 5/3 7/1 0/8* 3/5 256/8 4/4 5/3 1/7 3/5 128/8 2/6 7/1 0/8* 3/5
Amoxicillin/ Clavulanic Acid
1024/8 6/2 3/5 2/6 3/5 512/8 5/3 4/4 2/6 5/3
We then questioned what effect the change in concentration of antibiotics would have on the selection of each substitution. The growth rates of each genotype were plotted against concentration for each treatment and the slope was measured. We found that 73.5% of the slopes were negative, indicating that the overall growth rate decreased as the concentration of the treatment increased. Out of the remaining 26.5% of positive slopes, 66% of them appeared in treatments containing penicillins. To ensure that these comparisons were valid, we performed one-way ANOVAs between the growth rates for each genotype across antibiotic concentrations. Significant (p-values ≤ 0.05) from this analysis indicate that there is a significant difference between growth rates at those different antibiotic concentrations for individual genotypes in most antibiotics. We found that 80% of comparisons were significantly different in cephalosporins, 47% of comparisons were significantly different in penicillins, and 42% of comparisons were significantly different in penicillin inhibitor combinations. When we aggregated all genotypes, we found that one-way ANOVA analysis for each treatment across all concentrations indicated that each concentration was significantly different (p-value ≤ 0.05) than other concentrations within the same treatment, except for the two penicillin + inhibitor treatments (SAM and TZP) (p-value ≥ 0.05). After considering all 30 treatments, we found that the ratios of selected substitutions and selected reversions changed as both the type of antibiotic and the concentration of the antibiotic changed. New substitutions outnumber reversions in 63.3% of the treatments; reversions outnumber new substitutions in 23.3% of the treatments. The frequency of new substitutions is equal to the frequency of reversions in 13.3% of the treatments. In 50% of the ten β-lactam antibiotics, there was a shift from an overall tendency for substitutions to be selected over reversions to a pattern where reversions were selected for over substitutions as the concentration of antibiotic was changed. These results indicated that changes in the concentrations of β-lactam antibiotics have almost as large of an effect as changing the type of β-lactam antibiotic (Table 2-1).
22
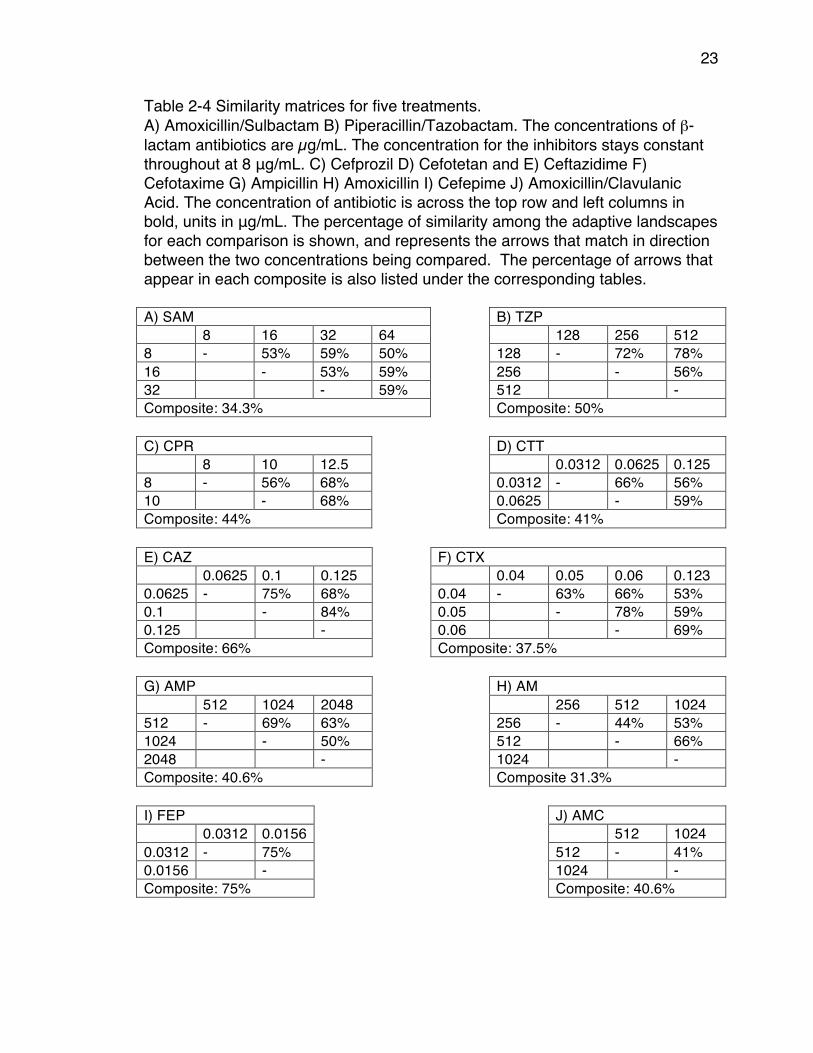
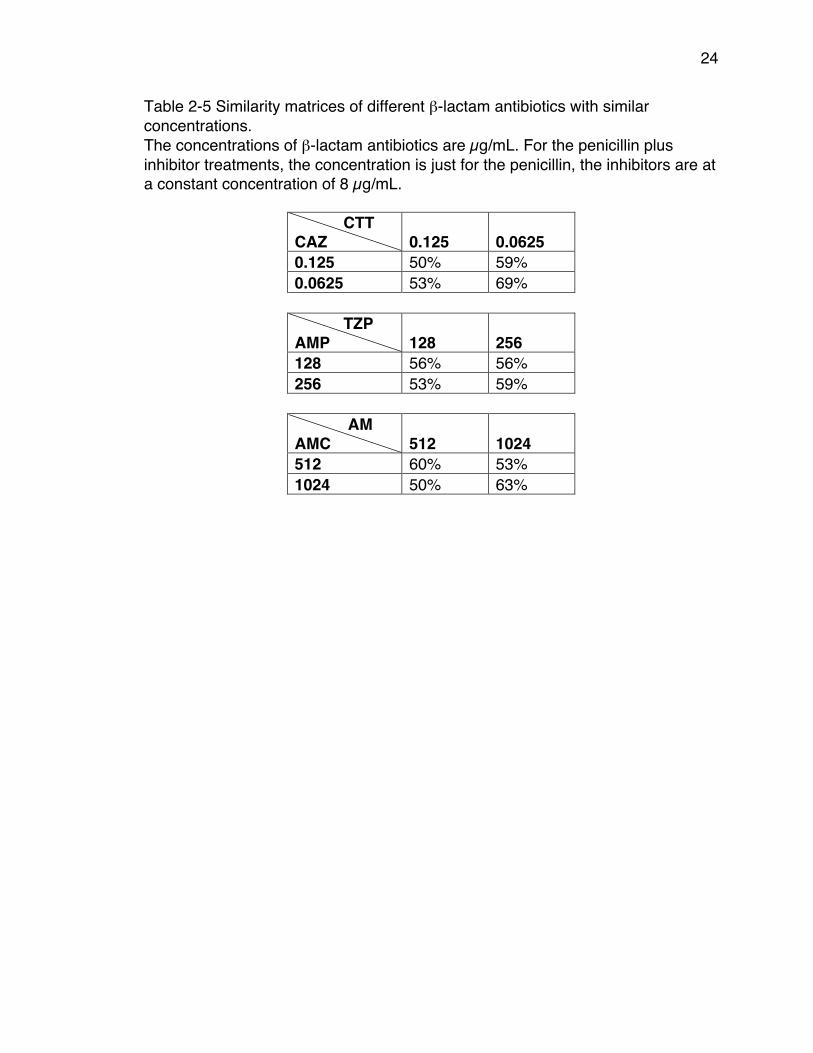
We further investigated the variation in ratios across concentrations by creating similarity matrices (Tables 2-4 and 2-5). In each matrix, we calculated the percent similarity of arrow direction among treatments. The overall range of similarity scores was 41%-84% similar when concentrations were changed but the β-lactam antibiotic remained the same. The range of similarity scores between treatments where the β-lactam varied and the concentration of antibiotic remained constant was for comparison of two cephalosporins (ceph vs. ceph) 50-69% and for comparison of a penicillin with a penicillin + inhibitor treatments were (pen vs. pen inh) 50%-63%. These numbers are well within the range of similarity between treatments when concentration is varied, but the β-lactam remained constant (41%-84%). This result indicates that changes in the concentrations of β-lactam have as large of an effect on evolutionary outcome as changes in the types of β-lactam.
23
Table 2-4 Similarity matrices for five treatments. A) Amoxicillin/Sulbactam B) Piperacillin/Tazobactam. The concentrations of β-lactam antibiotics are µg/mL. The concentration for the inhibitors stays constant throughout at 8 μg/mL. C) Cefprozil D) Cefotetan and E) Ceftazidime F) Cefotaxime G) Ampicillin H) Amoxicillin I) Cefepime J) Amoxicillin/Clavulanic Acid. The concentration of antibiotic is across the top row and left columns in bold, units in μg/mL. The percentage of similarity among the adaptive landscapes for each comparison is shown, and represents the arrows that match in direction between the two concentrations being compared. The percentage of arrows that appear in each composite is also listed under the corresponding tables. A) SAM B) TZP 8 16 32 64 128 256 512 8 - 53% 59% 50% 128 - 72% 78% 16 - 53% 59% 256 - 56% 32 - 59% 512 - Composite: 34.3% Composite: 50% C) CPR D) CTT 8 10 12.5 0.0312 0.0625 0.125 8 - 56% 68% 0.0312 - 66% 56% 10 - 68% 0.0625 - 59% Composite: 44% Composite: 41% E) CAZ F) CTX 0.0625 0.1 0.125 0.04 0.05 0.06 0.123 0.0625 - 75% 68% 0.04 - 63% 66% 53% 0.1 - 84% 0.05 - 78% 59% 0.125 - 0.06 - 69% Composite: 66% Composite: 37.5% G) AMP H) AM 512 1024 2048 256 512 1024 512 - 69% 63% 256 - 44% 53% 1024 - 50% 512 - 66% 2048 - 1024 - Composite: 40.6% Composite 31.3% I) FEP J) AMC 0.0312 0.0156 512 1024 0.0312 - 75% 512 - 41% 0.0156 - 1024 - Composite: 75% Composite: 40.6%
24
Table 2-5 Similarity matrices of different β-lactam antibiotics with similar concentrations. The concentrations of β-lactam antibiotics are µg/mL. For the penicillin plus inhibitor treatments, the concentration is just for the penicillin, the inhibitors are at a constant concentration of 8 µg/mL.
CTT CAZ 0.125 0.0625 0.125 50% 59% 0.0625 53% 69%
TZP AMP 128 256 128 56% 56% 256 53% 59%
AM AMC 512 1024 512 60% 53% 1024 50% 63%
25
Additionally, we performed a more conservative analysis, since many of the arrows in the adaptive landscapes were not significant. We computed the average similarity matrix across all 30 treatments comparing the position of growth rate mean of each individual genotype to the grand mean. We only counted changes for the fitness effect of a genotype when it moved across the grand mean. The similarity scores ranged from 6% similar to 100% similar when comparing each treatment with the other 29. When looking among the same type of β-lactam antibiotic, the similarity ranged from 44%-100% with penicillin + inhibitors, 63%-88% with penicillins, and 25%-94% with cephalosporins. When comparing across different types of β-lactam antibiotics (i.e. penicillin + inhibitors, penicillins, cephalosporins), the similarity decreased (6%-88%), with penicillin + inhibitor and penicillins being least similar to cephalosporins (6% similar). While there is less of a tendency for the fitness effects of genotypes to change across concentrations using this metric, that tendency is still apparent.
Discussion We considered four substitutions within the TEM-50 gene and have analyzed 30 adaptive landscapes generated at multiple concentrations of ten different antibiotics. We found that GxE interactions are numerous and complex. As each of the treatments change, whether by type or concentration, not only do the similarity scores between landscapes change, but the global optima likewise change. Different antibiotic types and concentrations select for different genotypes. While cephalosporins and penicillins tend to select for new substitutions, penicillin + inhibitor combinations tend to select for reversions (Table 2-1). Interestingly, across all landscapes some substitutions are selected in many environments while others are not. This indicates that GxE effects may be stronger for some substitutions than for others depending on which treatments they are exposed to. GxE effects can also be seen clearly through consideration of changes in the global optimum in each landscape. While it may not be surprising that the overall tendency to select for new substitutions or reversions would change between β-lactam treatments, we were quite surprised that the overall effects of the genotypes under investigation could become substantially more detrimental or substantially more beneficial simply as the antibiotic concentration changes. In addition, the global optima change as the type of β-lactam or as the concentration of a β-lactam changes. TEM-50 is the most frequent global optimum (40% of the time) throughout all 30 landscapes, whereas TEM-1 does not appear at all as a global optimum. It is unsurprising that TEM-1 is not the global optimum in these landscapes because this study is focused much more upon penicillin + inhibitor combinations and
26
cephalosporins than upon the early generation penicillins that TEM-1 hydrolyzed throughout the 1960’s and 1970’s. When we considered just the penicillin + inhibitor treatments, the global optima consistently carried at least one of the two inhibitor resistant substitutions in penicillin + inhibitor treatments. This signifies that β-lactamase inhibitors are an important selective pressure. In treatments where penicillins were used alone (amoxicillin and ampicillin), single substitutions were selected as global optima. This can be explained because amoxicillin and ampicillin are some of the earlier β-lactam antibiotics and early TEM β-lactamases are able to hydrolyze them very well. Interestingly, we found pathways throughout all of these adaptive landscapes that lead to the global optima, except for one (amoxicillin at 1024 µg/mL). For the treatments that selected TEM-50 as the global optimum (cefepime 0.0156 µg/mL, cefotaxime 0.04 and 0.05 µg/mL, and, amoxicillin/sulbactam 8/8 µg/mL, ampicillin 2,048 µg/mL), there are multiple pathways through the landscapes from TEM-1 to TEM-50, which pass through many of the other genotypes. However, for the treatments that did not select TEM-50 as the global optimum, there were no complete pathways from TEM-1 to TEM-50. Although in each of those landscapes, pathways from TEM-1 to the global optimum existed for every treatment except amoxicillin 1024 µg/mL. This is interesting because TEM-1 is often thought to be most efficient at hydrolyzing early penicillins such as amoxicillin. This may not be the case at every concentration, but there may not be a path to the optimum so TEM-1 may persist even in those conditions. We also noticed many other examples of GxE interactions. Depending on which β-lactam antibiotic and what particular concentration was used, the same substitution can have different effects. For example, in the landscapes with amoxicillin + clavulanic acid, we note that the genotype 1000 was beneficial when treated at 1024/8 μg/mL amoxicillin + clavulanic acid, but detrimental when amoxicillin is lowered to 512 μg/mL. This is also evident for genotype 1001, which exclusively contains inhibitor resistant substitutions. In the amoxicillin + clavulanic acid treatment at 1024/8 μg/mL this genotype is the global optimum, however, when amoxicillin is lowered to 512 μg/mL it is not beneficial at all when compared to adjacent genotypes. There are many similar examples throughout each of the adaptive landscapes. Another interesting finding was abundant sign epistasis within all 30 adaptive landscapes as well as when looking at the position of each genotype mean compared to the grand mean. A good example of this is the substitutions E104K (0100) and G238S (0010). The high fitness of G238S is also seen in (86, 95) both do exceptionally well individually, even more so when they are combined to
27
the doublet E104K/G238S (0110). However when a third substitution is added N276D (0001), creating the genotype G238S/N276D/E104K (0111), the number of genotype means drop from 24 to only 5 above the grand mean. For the examples of substitutions in environments for which sign epistasis did not exist, it was likely because the treatment highly selected for inhibitor-resistant phenotypes. Surprisingly, we also found that concentration seems to have as large of an effect on variance between adaptive landscapes as changes in the type of β-lactam. This result can be seen where 80% of cephalosporins, 47% of penicillins and 42% of penicillin + inhibitor treatments are different at a significance level of 0.05 when comparing each genotype across concentrations. This result means that the degradation of antibiotics distributed in hospital settings and in the environment may contribute as much to the evolution of variant genotypes of resistance genes as the introduction of new β-lactams. We found that an abundance of readily available evolutionary trajectories appear across antibiotic type and concentration, which shows that varied, residual concentrations of antibiotics can select many evolutionary outcomes within the TEM β-lactamase gene, and likely increase the allelic diversity of the TEM β-lactamase. This is important because antibiotic concentrations fluctuate in vivo and are present in the environment. By using growth rates, we are able to see the effect that antibiotic concentration has on the genotypes within TEM β-lactamase, something that MIC-measurements can fall short. The complex environments available in microfluidic devices allow this hypothesis to be tested. Future studies will determine whether this pattern holds across other antibiotic resistance genes and to what extent the evolutionary potentials of resistance genes are expanded through residual amounts of antibiotic in the environment.
Materials and Methods Strains and Cultures We expressed all 16 TEM variant genotypes from the pBR322 plasmid (6) in E. coli strain DH5-αE, which were then incubated in 5 mL of Luria Broth with Tetracycline (5mL tetracycline/ 1 Liter of LB) overnight in oxygen limited cultures and then diluted them to a concentration of 1.9 X 10⁵ cells per mL. After dilution, 80μL of each liquid culture were transferred to a 384-well plate, with each well holding a maximum of 100 μL. Twelve replicates of each culture were then incubated with or without (control) antibiotic treatment. Once the samples had all been plated, a breathable membrane was placed over the plate and the plate was placed in the Eon Microplate Spectrophotometer. The temperature was set at 25.1°C and the experiment was run for 22 hours. The

28
O.D. measurements at 600 nanometers are read every 20 minutes for the entire 22 hours (104). The antibiotic solution is made by dissolving 10.24 mg of antibiotic per 1 mL of solvent (either pH 6 or pH 8 phosphate-buffer or water depending on the solubility of the antibiotic). Growth Rates The data obtained from the plate reader is exported and run through the ‘GrowthRates’ program, which calculates the growth rate. The growth rates are derived from the calculated slope of the line at the exponential phase of each growth curve. This technique is justified because bacterial cultures grow exponentially so the growth rate increases as a function of the natural log of the O.D., and not of O.D. itself (104). The growth rate is the change in the number of cells per minute or can be viewed as the change in the number of cells per unit of O.D. This can be written as !"!"= 𝛼𝑁, (2)
where N is the number of cells at time, t, and α is the first order growth rate constant in reciprocal time units (2). Equation (2) can also be written as !"!= 𝛼𝑑𝑡. (3)
Integrating (3) from t=0 to t=tmax yields 𝑙𝑛 !!
!!= 𝛼(𝑡 − 𝑡!), (4)
where N0 equals the initial number of cells present at t0. When the exponential phase of the growth curve is fit by linear regression, we can see that α is equal to the slope of the regression line (104). Statistical Analysis A One-Way Analysis of Variance (ANOVA) was used to compare the means of the growth rates we obtained and to determine if there were significant differences between the growth rates of each genotype. We compared each of the genotypes with those that were adjacent, (differed by a single amino acid substitution), going from the wild type, TEM-1, to TEM-50 (Table 2-6). We were working with a 95% confidence interval, which translates to a p-value of less than or equal to 0.05. In addition to comparing the experimental data (the data obtained from the treated genotypes), we also compared the growth rates from controls with the growth rates from the treated genotypes to confirm that the
29
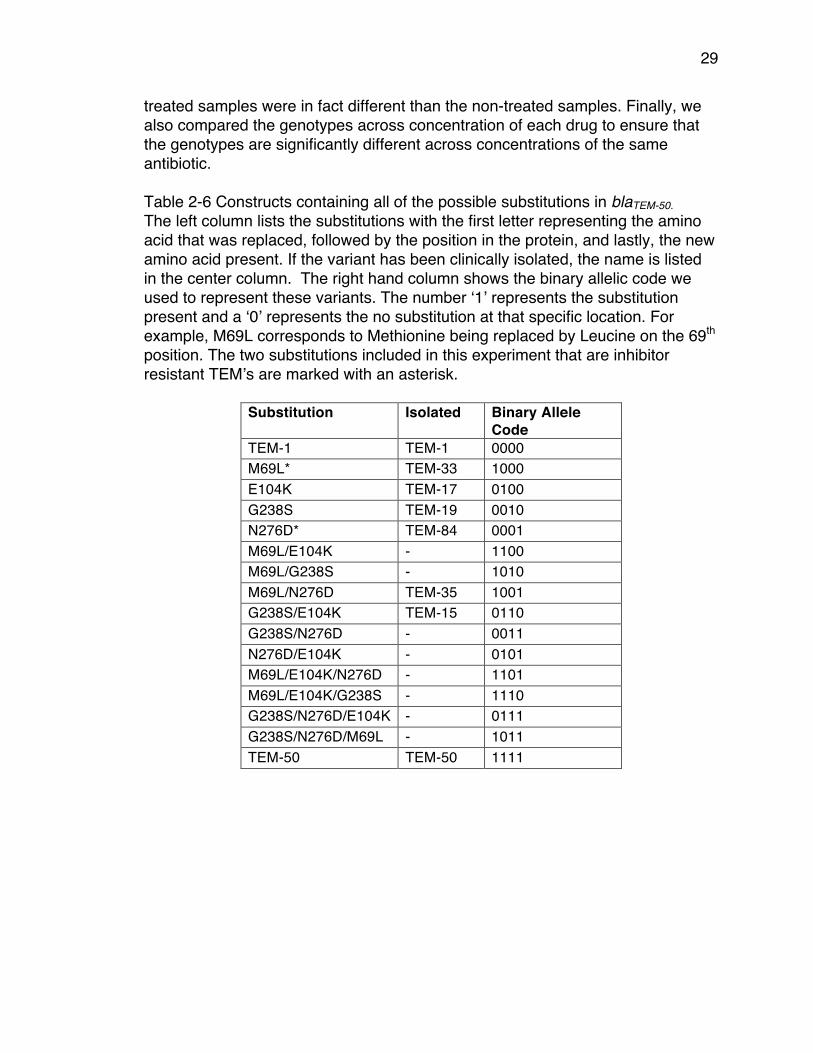
treated samples were in fact different than the non-treated samples. Finally, we also compared the genotypes across concentration of each drug to ensure that the genotypes are significantly different across concentrations of the same antibiotic. Table 2-6 Constructs containing all of the possible substitutions in blaTEM-50. The left column lists the substitutions with the first letter representing the amino acid that was replaced, followed by the position in the protein, and lastly, the new amino acid present. If the variant has been clinically isolated, the name is listed in the center column. The right hand column shows the binary allelic code we used to represent these variants. The number ‘1’ represents the substitution present and a ‘0’ represents the no substitution at that specific location. For example, M69L corresponds to Methionine being replaced by Leucine on the 69th position. The two substitutions included in this experiment that are inhibitor resistant TEM’s are marked with an asterisk.
Substitution Isolated Binary Allele Code
TEM-1 TEM-1 0000 M69L* TEM-33 1000 E104K TEM-17 0100 G238S TEM-19 0010 N276D* TEM-84 0001 M69L/E104K - 1100 M69L/G238S - 1010 M69L/N276D TEM-35 1001 G238S/E104K TEM-15 0110 G238S/N276D - 0011 N276D/E104K - 0101 M69L/E104K/N276D - 1101 M69L/E104K/G238S - 1110 G238S/N276D/E104K - 0111 G238S/N276D/M69L - 1011 TEM-50 TEM-50 1111
30
Chapter 3: Rational Design of Antibiotic Treatment Plans: A treatment strategy for managing evolution and reversing resistance Introduction Antibiotic resistance is an inevitable outcome whenever antibiotics are used. There are many reasons for this: 1) As humans (also as eukaryotes), we are vastly outnumbered by bacteria in nearly all measures, including total population size, biomass, genetic diversity, emigration, and immigration (105); 2) bacteria can use horizontal gene transfer to share resistance genes across distantly related species of bacteria, including non-pathogens (106); 3) compared to humans, bacteria have relatively few vulnerable target sites (107); 4) microbes are the sources of nearly all antibiotics that are used by humans (108). Given the overwhelming numbers of bacteria, the limited number of target sites, the numerous ways that they can infect humans, and that they have been exposed to naturally occurring antibiotics for billions of years, resistance to antibiotics used by human populations is unavoidable. Once resistance is present in a bacterial population, it is exceedingly difficult to remove for several reasons. If any amount of antibiotic is present in the environment, antibiotic resistance genes will confer a large fitness advantage (109), and even when antibiotics are not present in an environment, the fitness costs for carrying and expressing resistance genes are small to non-existent (110). In addition to it being difficult to remove antibiotics from the environment (111), even if humans were to completely abandon the use of antibiotics, resistance would persist for years (112). Efforts to remove resistance genes from clinical environments by either discontinuing or reducing the use of specific antibiotics for some period of time, either through general reduction of antibiotic consumption or periodic rotations of antibiotics (cycling) have not worked in any reliable or reproducible manner (113); indeed it would have been surprising if they had worked (114),(115). Since antibiotic resistance is unavoidable, it only makes sense to accept its inevitability and develop methods for mitigating the consequences. One reasonable approach is to rotate the use of antibiotics. This has been implemented in many ways and there are recent studies to model the optimal duration, mixing versus cycling, and how relaxed antibiotic cycles may be and still function as planned (116, 117). However, none of those models have focused on developing a method for designing an optimal succession of antibiotics.
31
In a previous publication (6), we proposed that susceptibility to antibiotics could be restored by rotating consumption of multiple antibiotics that are a) structurally similar, b) inhibit/kill bacteria through the same target site, and c) result in pleiotropic fitness costs that reduce the overall resistance of bacteria to each other. We presented a proof-of-principle example (6) of how this might work with a series of β-lactam antibiotics in which some of them would select for new amino acid substitutions in the TEM β-lactamase and others that would select reversions in TEM ultimately leading back to the wild type (un-mutated) state. We have focused particularly on β-lactamases because there is often no fitness cost associated with their expression, and they are particularly difficult to remove from clinical microbial populations. Our current work seeks to identify β-lactam treatment plans that have the highest probability of returning a population expressing a small number of variant TEM genotypes to the wild type state. The wild type TEM-1, and a handful of its descendants, confers resistance to penicillins alone. However, most of the descendants confer resistance to either cephalosporins or penicillins combined with β-lactamase inhibitors (inhibitor resistance), and a few confer resistance to both. Of the 194 clinically identified TEM genotypes that encode unique amino acid sequences (118), 174 (89.7%) differ from the wild type TEM-1 by at most four amino acid substitutions (see Table 3-1). Our choice of a system that includes four amino acid substitutions is based upon an apparent threshold for amino acid substitutions among functional TEM genotypes. The rarity of the co-existence of cephalosporin resistance and inhibitor resistance and the fact that no single substitution confers both phenotypes suggested that sign epistasis (i.e. reversals of substitutions from beneficial to detrimental) exists as the substitutions that contribute to this dual phenotype are combined. We have assumed that substitutions arise according to the strong selection weak mutation model (SSWM) (119) in which single substitutions reach fixation before the next substitution occurs. Recent work (120) in addition to past phylogenetic analysis (61) and competition experiments (121) suggest that this is a valid model for TEM evolution.
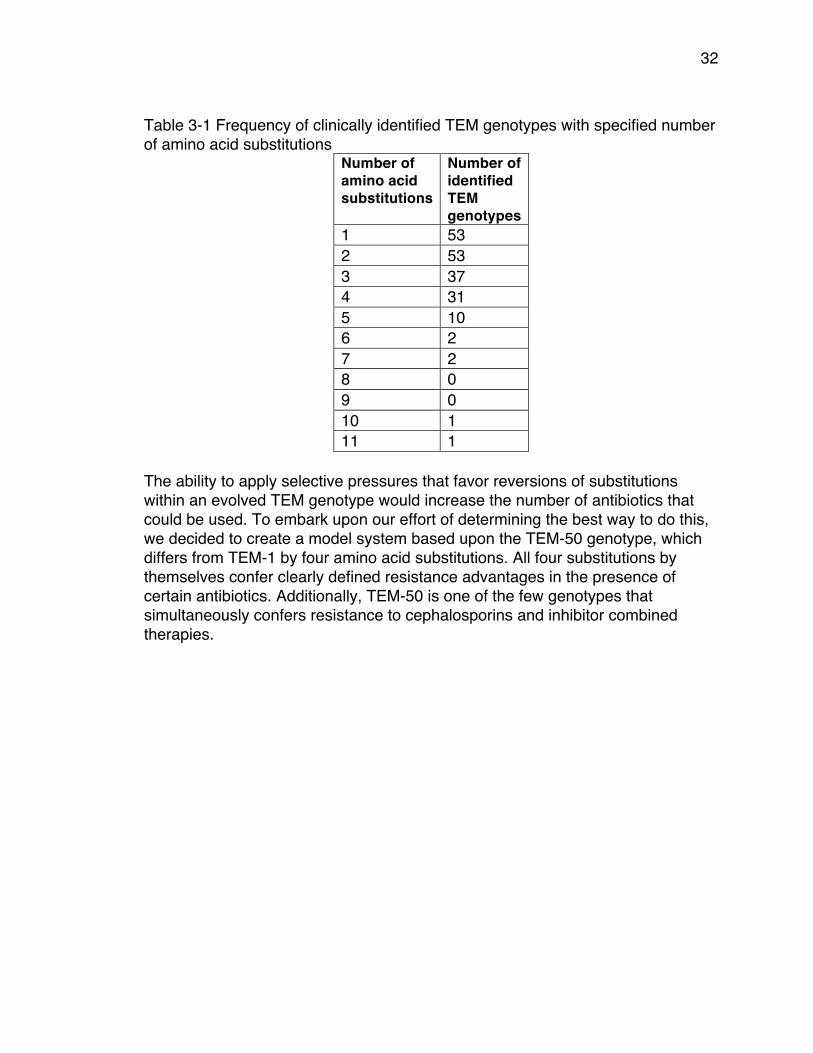
32
Table 3-1 Frequency of clinically identified TEM genotypes with specified number of amino acid substitutions
Number of amino acid substitutions
Number of identified TEM genotypes
1 53 2 53 3 37 4 31 5 10 6 2 7 2 8 0 9 0 10 1 11 1
The ability to apply selective pressures that favor reversions of substitutions within an evolved TEM genotype would increase the number of antibiotics that could be used. To embark upon our effort of determining the best way to do this, we decided to create a model system based upon the TEM-50 genotype, which differs from TEM-1 by four amino acid substitutions. All four substitutions by themselves confer clearly defined resistance advantages in the presence of certain antibiotics. Additionally, TEM-50 is one of the few genotypes that simultaneously confers resistance to cephalosporins and inhibitor combined therapies.
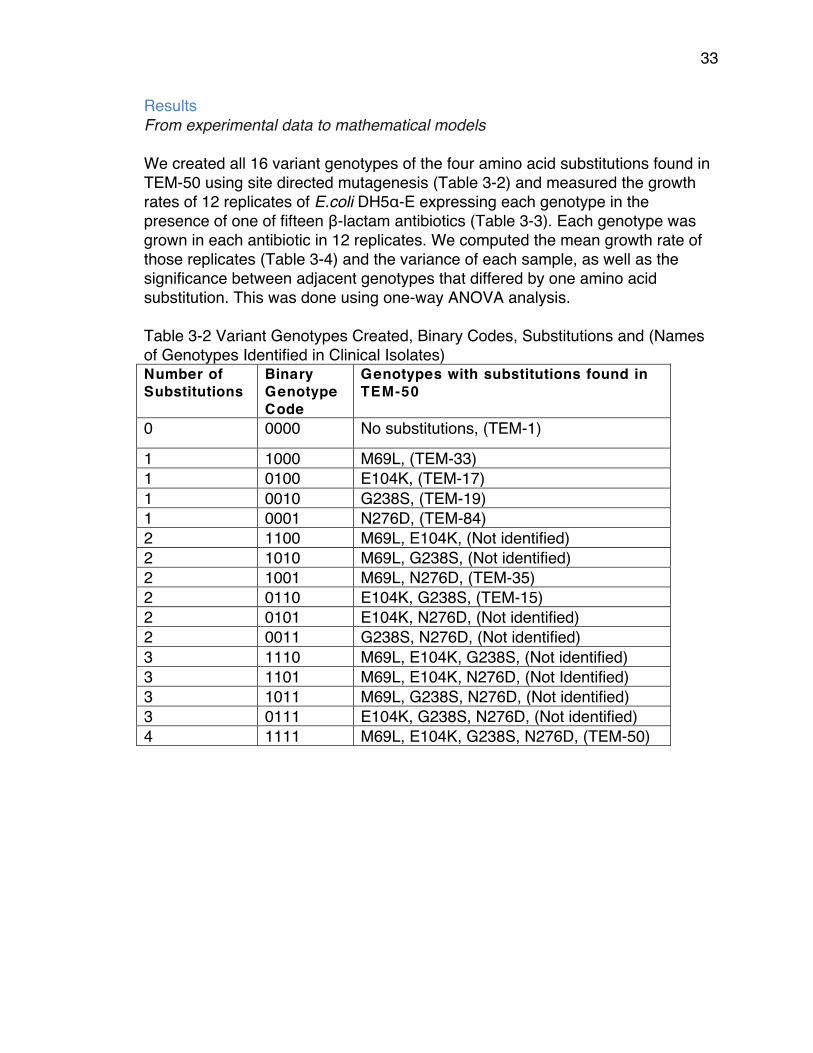
33
Results From experimental data to mathematical models We created all 16 variant genotypes of the four amino acid substitutions found in TEM-50 using site directed mutagenesis (Table 3-2) and measured the growth rates of 12 replicates of E.coli DH5α-E expressing each genotype in the presence of one of fifteen β-lactam antibiotics (Table 3-3). Each genotype was grown in each antibiotic in 12 replicates. We computed the mean growth rate of those replicates (Table 3-4) and the variance of each sample, as well as the significance between adjacent genotypes that differed by one amino acid substitution. This was done using one-way ANOVA analysis. Table 3-2 Variant Genotypes Created, Binary Codes, Substitutions and (Names of Genotypes Identified in Clinical Isolates) Number of Substitutions
Binary Genotype Code
Genotypes with substitutions found in TEM-50
0 0000 No substitutions, (TEM-1)
1 1000 M69L, (TEM-33) 1 0100 E104K, (TEM-17) 1 0010 G238S, (TEM-19) 1 0001 N276D, (TEM-84) 2 1100 M69L, E104K, (Not identified) 2 1010 M69L, G238S, (Not identified) 2 1001 M69L, N276D, (TEM-35) 2 0110 E104K, G238S, (TEM-15) 2 0101 E104K, N276D, (Not identified) 2 0011 G238S, N276D, (Not identified) 3 1110 M69L, E104K, G238S, (Not identified) 3 1101 M69L, E104K, N276D, (Not Identified) 3 1011 M69L, G238S, N276D, (Not identified) 3 0111 E104K, G238S, N276D, (Not identified) 4 1111 M69L, E104K, G238S, N276D, (TEM-50)
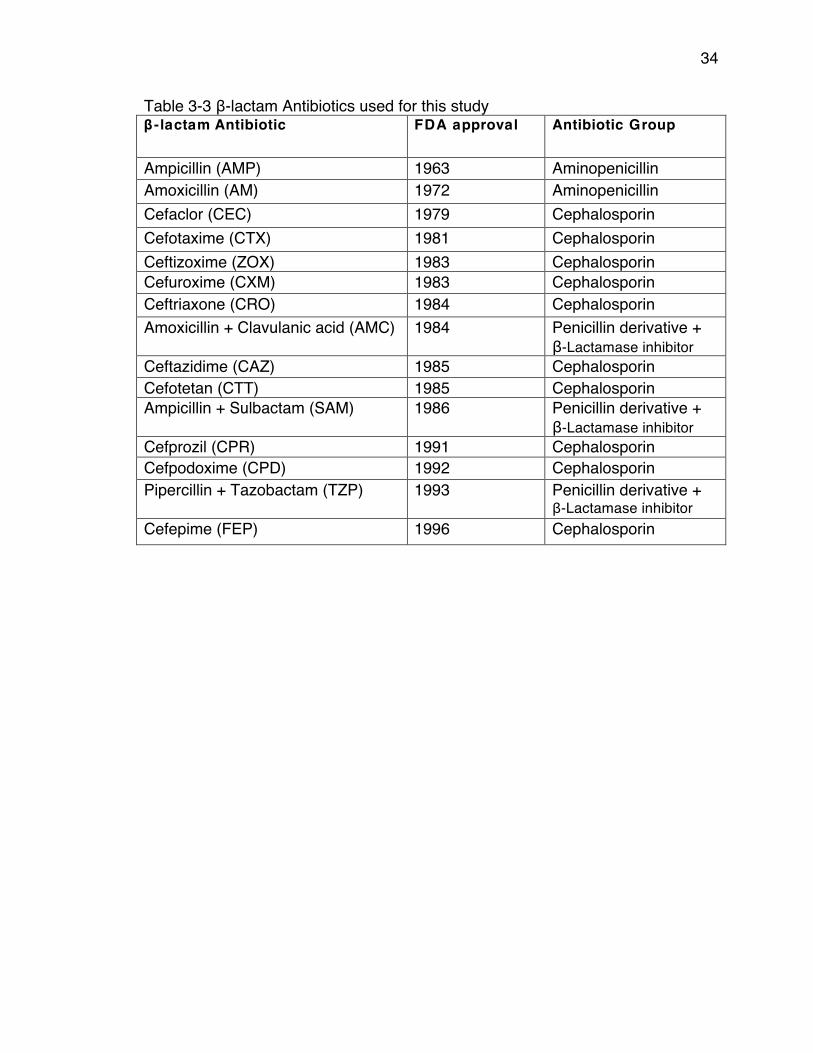
34
Table 3-3 β-lactam Antibiotics used for this study β -lactam Antibiotic FDA approval Antibiotic Group
Ampicillin (AMP) 1963 Aminopenicillin Amoxicillin (AM) 1972 Aminopenicillin Cefaclor (CEC) 1979 Cephalosporin Cefotaxime (CTX) 1981 Cephalosporin Ceftizoxime (ZOX) 1983 Cephalosporin Cefuroxime (CXM) 1983 Cephalosporin Ceftriaxone (CRO) 1984 Cephalosporin Amoxicillin + Clavulanic acid (AMC) 1984 Penicillin derivative +
β-Lactamase inhibitor Ceftazidime (CAZ) 1985 Cephalosporin Cefotetan (CTT) 1985 Cephalosporin Ampicillin + Sulbactam (SAM) 1986 Penicillin derivative +
β-Lactamase inhibitor Cefprozil (CPR) 1991 Cephalosporin Cefpodoxime (CPD) 1992 Cephalosporin Pipercillin + Tazobactam (TZP) 1993 Penicillin derivative +
β-Lactamase inhibitor Cefepime (FEP) 1996 Cephalosporin
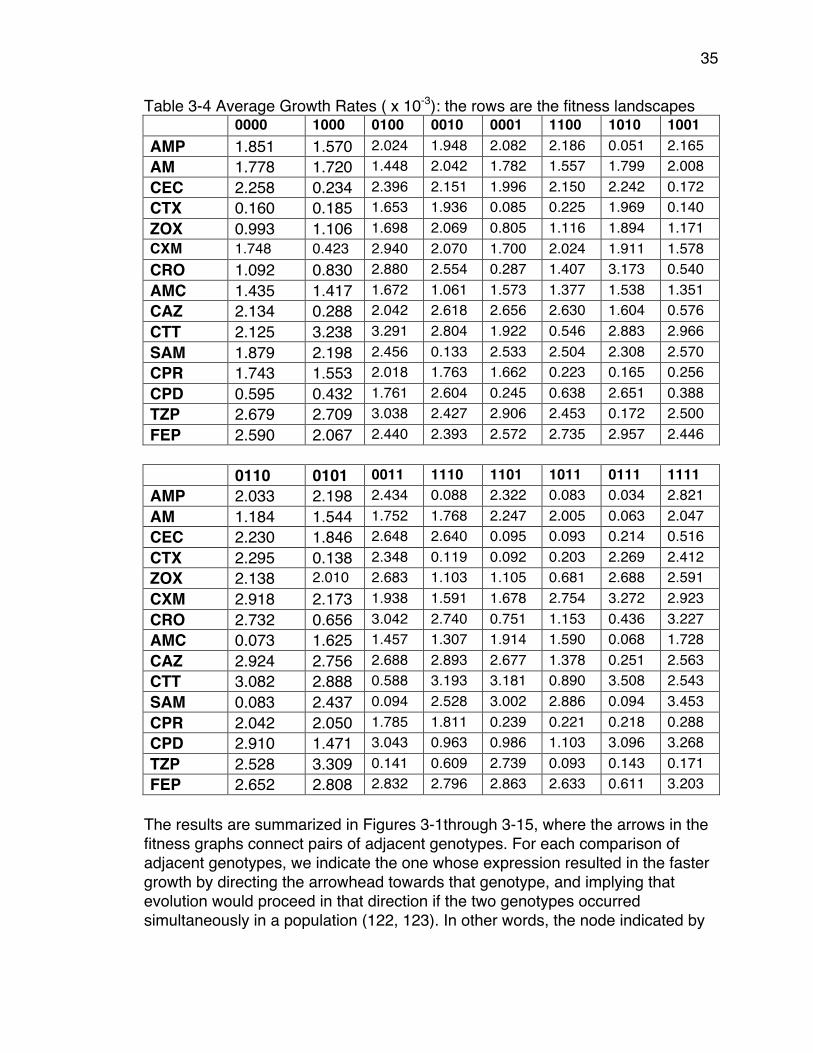
35
Table 3-4 Average Growth Rates ( x 10-3): the rows are the fitness landscapes 0000 1000 0100 0010 0001 1100 1010 1001 AMP 1.851 1.570 2.024 1.948 2.082 2.186 0.051 2.165 AM 1.778 1.720 1.448 2.042 1.782 1.557 1.799 2.008 CEC 2.258 0.234 2.396 2.151 1.996 2.150 2.242 0.172 CTX 0.160 0.185 1.653 1.936 0.085 0.225 1.969 0.140 ZOX 0.993 1.106 1.698 2.069 0.805 1.116 1.894 1.171 CXM 1.748 0.423 2.940 2.070 1.700 2.024 1.911 1.578 CRO 1.092 0.830 2.880 2.554 0.287 1.407 3.173 0.540 AMC 1.435 1.417 1.672 1.061 1.573 1.377 1.538 1.351 CAZ 2.134 0.288 2.042 2.618 2.656 2.630 1.604 0.576 CTT 2.125 3.238 3.291 2.804 1.922 0.546 2.883 2.966 SAM 1.879 2.198 2.456 0.133 2.533 2.504 2.308 2.570 CPR 1.743 1.553 2.018 1.763 1.662 0.223 0.165 0.256 CPD 0.595 0.432 1.761 2.604 0.245 0.638 2.651 0.388 TZP 2.679 2.709 3.038 2.427 2.906 2.453 0.172 2.500 FEP 2.590 2.067 2.440 2.393 2.572 2.735 2.957 2.446
0110 0101 0011 1110 1101 1011 0111 1111 AMP 2.033 2.198 2.434 0.088 2.322 0.083 0.034 2.821 AM 1.184 1.544 1.752 1.768 2.247 2.005 0.063 2.047 CEC 2.230 1.846 2.648 2.640 0.095 0.093 0.214 0.516 CTX 2.295 0.138 2.348 0.119 0.092 0.203 2.269 2.412 ZOX 2.138 2.010 2.683 1.103 1.105 0.681 2.688 2.591 CXM 2.918 2.173 1.938 1.591 1.678 2.754 3.272 2.923 CRO 2.732 0.656 3.042 2.740 0.751 1.153 0.436 3.227 AMC 0.073 1.625 1.457 1.307 1.914 1.590 0.068 1.728 CAZ 2.924 2.756 2.688 2.893 2.677 1.378 0.251 2.563 CTT 3.082 2.888 0.588 3.193 3.181 0.890 3.508 2.543 SAM 0.083 2.437 0.094 2.528 3.002 2.886 0.094 3.453 CPR 2.042 2.050 1.785 1.811 0.239 0.221 0.218 0.288 CPD 2.910 1.471 3.043 0.963 0.986 1.103 3.096 3.268 TZP 2.528 3.309 0.141 0.609 2.739 0.093 0.143 0.171 FEP 2.652 2.808 2.832 2.796 2.863 2.633 0.611 3.203
The results are summarized in Figures 3-1through 3-15, where the arrows in the fitness graphs connect pairs of adjacent genotypes. For each comparison of adjacent genotypes, we indicate the one whose expression resulted in the faster growth by directing the arrowhead towards that genotype, and implying that evolution would proceed in that direction if the two genotypes occurred simultaneously in a population (122, 123). In other words, the node indicated by

36
the arrowhead would increase in frequency and reach fixation in the population, while the other would be lost. Red arrows indicate significance, and black arrows indicate differences that were not statistically significant by ANOVA, but that may still exist if a more sensitive assay was used.

37
Figure 3-1 AMP: Ampicillin 2048 µg/ml
Figure 3-2 AM: Amoxicillin 512 µg/ml
Figure 3-3 CEC: Cefaclor 1 µg/ml Figure 3-4 CTX: Cefotaxime 0.05
µg/ml
Figure 3-5 ZOX: Ceftizoxime 0.03 µg/ml
Figure 3-6 CXM: Cefuroxime 1.5 µg/ml
0000
1000 0100 0010 0001
1100 1010 1001 0110 0101 0011
1110 1101 1011 0111
1111
0000
1000 0100 0010 0001
1100 1010 1001 0110 0101 0011
1110 1101 1011 0111
1111
0000
1000 0100 0010 0001
1100 1010 1001 0110 0101 0011
1110 1101 1011 0111
1111
0000
1000 0100 0010 0001
1100 1010 1001 0110 0101 0011
1110 1101 1011 0111
1111
0000
1000 0100 0010 0001
1100 1010 1001 0110 0101 0011
1110 1101 1011 0111
1111
0000
1000 0100 0010 0001
1100 1010 1001 0110 0101 0011
1110 1101 1011 0111
1111
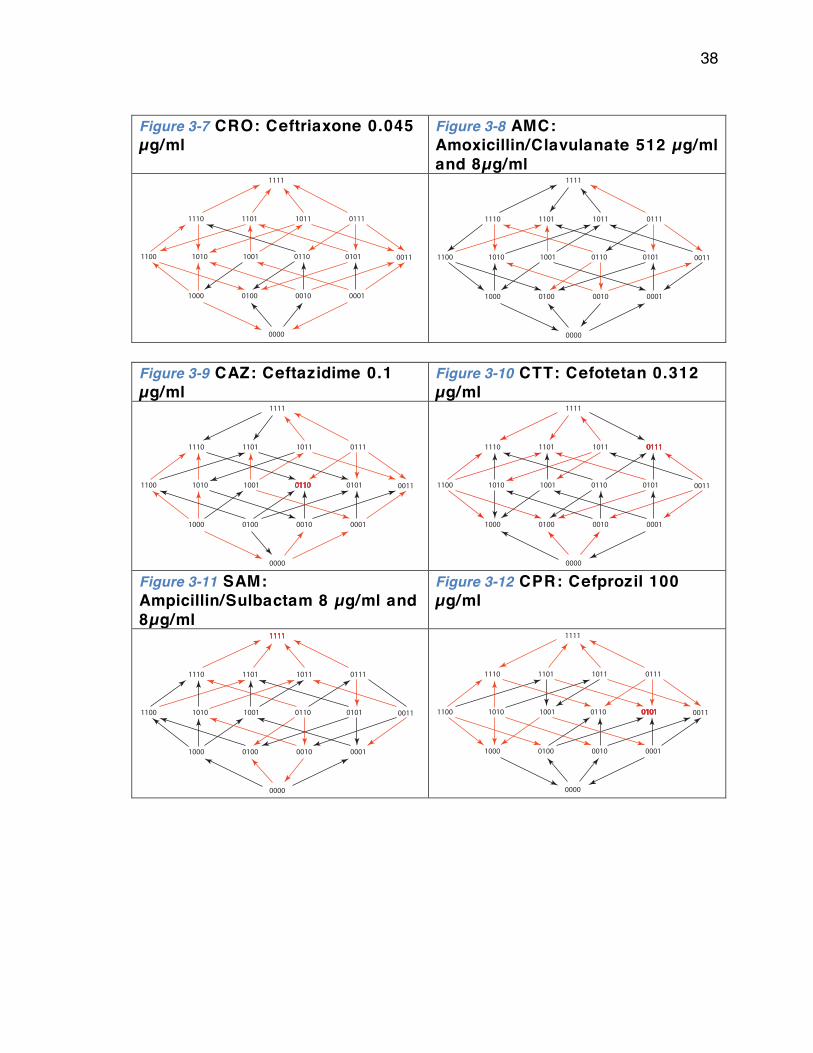
38
Figure 3-7 CRO: Ceftriaxone 0.045 µg/ml
Figure 3-8 AMC: Amoxicillin/Clavulanate 512 µg/ml and 8µg/ml
Figure 3-9 CAZ: Ceftazidime 0.1 µg/ml
Figure 3-10 CTT: Cefotetan 0.312 µg/ml
Figure 3-11 SAM: Ampicillin/Sulbactam 8 µg/ml and 8µg/ml
Figure 3-12 CPR: Cefprozil 100 µg/ml
0000
1000 0100 0010 0001
1100 1010 1001 0110 0101 0011
1110 1101 1011 0111
1111
0000
1000 0100 0010 0001
1100 1010 1001 0110 0101 0011
1110 1101 1011 0111
1111
0000
1000 0100 0010 0001
1100 1010 1001 0110 0101 0011
1110 1101 1011 0111
1111
0000
1000 0100 0010 0001
1100 1010 1001 0110 0101 0011
1110 1101 1011 0111
1111
0000
1000 0100 0010 0001
1100 1010 1001 0110 0101 0011
1110 1101 1011 0111
1111
0000
1000 0100 0010 0001
1100 1010 1001 0110 0101 0011
1110 1101 1011 0111
1111
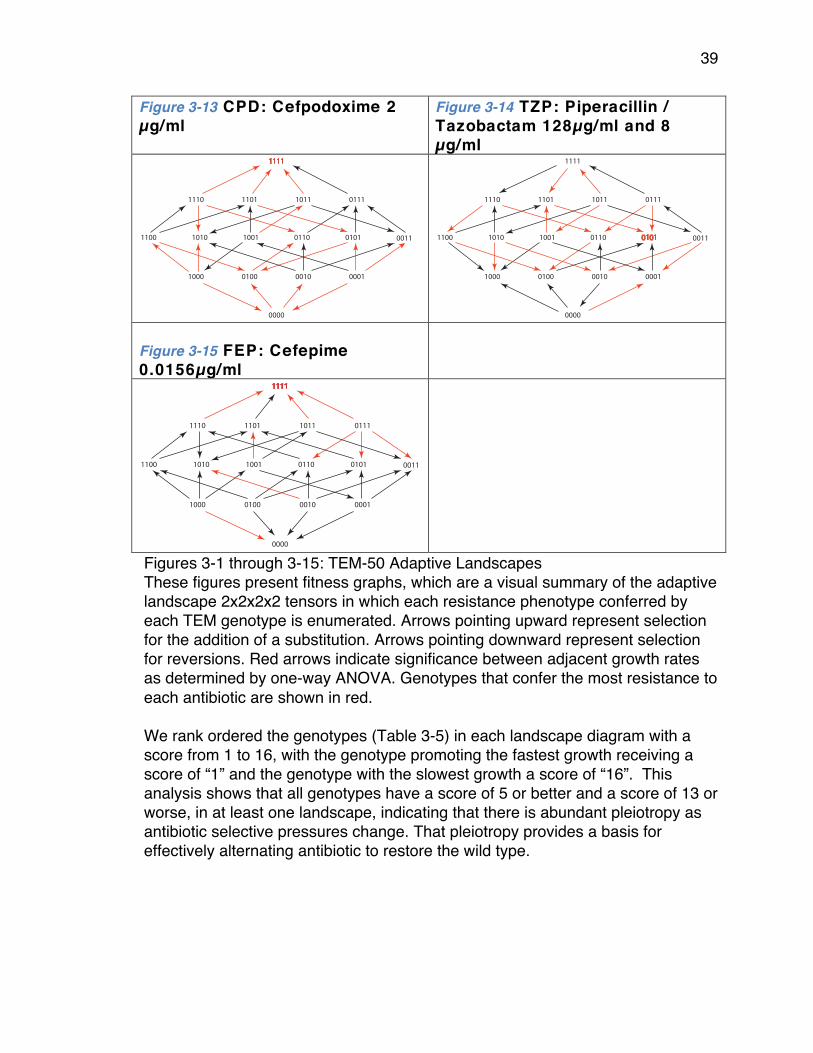
39
Figure 3-13 CPD: Cefpodoxime 2 µg/ml
Figure 3-14 TZP: Piperacillin / Tazobactam 128µg/ml and 8 µg/ml
Figure 3-15 FEP: Cefepime 0.0156µg/ml
Figures 3-1 through 3-15: TEM-50 Adaptive Landscapes These figures present fitness graphs, which are a visual summary of the adaptive landscape 2x2x2x2 tensors in which each resistance phenotype conferred by each TEM genotype is enumerated. Arrows pointing upward represent selection for the addition of a substitution. Arrows pointing downward represent selection for reversions. Red arrows indicate significance between adjacent growth rates as determined by one-way ANOVA. Genotypes that confer the most resistance to each antibiotic are shown in red. We rank ordered the genotypes (Table 3-5) in each landscape diagram with a score from 1 to 16, with the genotype promoting the fastest growth receiving a score of “1” and the genotype with the slowest growth a score of “16”. This analysis shows that all genotypes have a score of 5 or better and a score of 13 or worse, in at least one landscape, indicating that there is abundant pleiotropy as antibiotic selective pressures change. That pleiotropy provides a basis for effectively alternating antibiotic to restore the wild type.
0000
1000 0100 0010 0001
1100 1010 1001 0110 0101 0011
1110 1101 1011 0111
1111
0000
1000 0100 0010 0001
1100 1010 1001 0110 0101 0011
1110 1101 1011 0111
1111
0000
1000 0100 0010 0001
1100 1010 1001 0110 0101 0011
1110 1101 1011 0111
1111
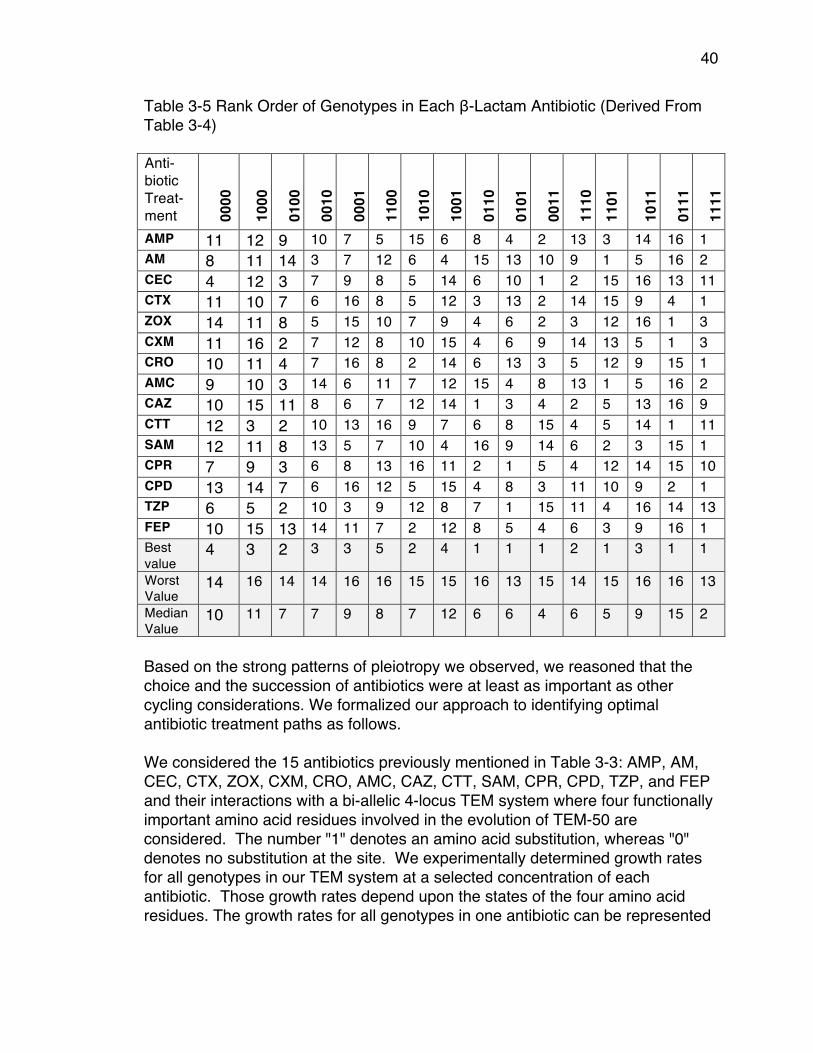
40
Table 3-5 Rank Order of Genotypes in Each β-Lactam Antibiotic (Derived From Table 3-4)
Based on the strong patterns of pleiotropy we observed, we reasoned that the choice and the succession of antibiotics were at least as important as other cycling considerations. We formalized our approach to identifying optimal antibiotic treatment paths as follows. We considered the 15 antibiotics previously mentioned in Table 3-3: AMP, AM, CEC, CTX, ZOX, CXM, CRO, AMC, CAZ, CTT, SAM, CPR, CPD, TZP, and FEP and their interactions with a bi-allelic 4-locus TEM system where four functionally important amino acid residues involved in the evolution of TEM-50 are considered. The number "1" denotes an amino acid substitution, whereas "0" denotes no substitution at the site. We experimentally determined growth rates for all genotypes in our TEM system at a selected concentration of each antibiotic. Those growth rates depend upon the states of the four amino acid residues. The growth rates for all genotypes in one antibiotic can be represented
Anti-biotic Treat-ment 00
00
1000
0100
0010
0001
1100
1010
1001
0110
0101
0011
1110
11
01
1011
0111
1111
AMP 11 12 9 10 7 5 15 6 8 4 2 13 3 14 16 1 AM 8 11 14 3 7 12 6 4 15 13 10 9 1 5 16 2 CEC 4 12 3 7 9 8 5 14 6 10 1 2 15 16 13 11 CTX 11 10 7 6 16 8 5 12 3 13 2 14 15 9 4 1 ZOX 14 11 8 5 15 10 7 9 4 6 2 3 12 16 1 3 CXM 11 16 2 7 12 8 10 15 4 6 9 14 13 5 1 3 CRO 10 11 4 7 16 8 2 14 6 13 3 5 12 9 15 1 AMC 9 10 3 14 6 11 7 12 15 4 8 13 1 5 16 2 CAZ 10 15 11 8 6 7 12 14 1 3 4 2 5 13 16 9 CTT 12 3 2 10 13 16 9 7 6 8 15 4 5 14 1 11 SAM 12 11 8 13 5 7 10 4 16 9 14 6 2 3 15 1 CPR 7 9 3 6 8 13 16 11 2 1 5 4 12 14 15 10 CPD 13 14 7 6 16 12 5 15 4 8 3 11 10 9 2 1 TZP 6 5 2 10 3 9 12 8 7 1 15 11 4 16 14 13 FEP 10 15 13 14 11 7 2 12 8 5 4 6 3 9 16 1 Best value
4 3 2 3 3 5 2 4 1 1 1 2 1 3 1 1
Worst Value
14 16 14 14 16 16 15 15 16 13 15 14 15 16 16 13
Median Value
10 11 7 7 9 8 7 12 6 6 4 6 5 9 15 2

41
by a real tensor , where 𝑓(𝑎!) is the fitness landscape for the antibiotic 𝑟. We can identify 𝑓(𝑎!) with a vector whose coordinates are indexed by 0,1 !. The resulting 15 vectors, one for each antibiotic, are the rows in Table 3-4. Our substitution model 𝑀(𝑓) is a function that assigns a transition matrix to each fitness landscape. The rows and columns of 𝑀(𝑓) are labeled by the genotypes {0,1}! according to the degree lexicographic order. The entries in 𝑀(𝑓(𝑎!))!,! represent the probability that that genotype 𝑢 is replaced by genotype 𝑣 under the presence of antibiotic 𝑎!. For that reason, the rows of our transition matrices have nonnegative entries and their rows sum to 1. We require that our transition matrices respect the adjacency structure of the 4-cube, that is, 𝑀(𝑓)!,! = 0 unless 𝑢 and 𝑣 are vectors in {0,1}! that differ in at most one coordinate. In other words, we reasoned that resistant strains are most likely to be in competition with those that express resistance genotypes that are immediately adjacent (vary by a single amino acid substitution). The combined effect of a sequence of 𝑘 antibiotics is described by a new transition matrix obtained as the product of the transition matrices for each drug. For any genotype u other than 0000, our goal is to find a sequence of antibiotics, which maximizes the probability of returning to the wild type. In other words, if we restrict to sequences of length k our goal is to find a sequence of antibiotics 𝑎!,… ,𝑎! which maximizes the matrix entry 𝑀 𝑓 𝑎! ∙𝑀 𝑓 𝑎! ∙… ∙𝑀(𝑓 𝑎! )!,!!!!. For each 𝑢 this requires searching over all antibiotic sequences of length 𝑘. Finding optimal sequences of antibiotics We used two substitution models to determine the optimal (highest probability) sequences of β-lactams for returning TEM genotypes back to their wild type state. Briefly, the Correlated Probability Model (CPM) allows probabilities to be based upon the actual growth rates. It is given by applying equation (3) to the growth rates in Table 3-4. The Equal Probability Model (EPM) assumes that beneficial substitutions are equally likely and that only the direction of the arrows in Figures 3-1 through 3-15 is important. This means that the matrix entry 𝑀(𝑓)!,! is 1/𝑁 if genotype 𝑢 has 𝑁 outgoing arrows and there is an arrow from 𝑢 to 𝑣. A visual summary of the highest probabilities according to the CPM is provided in
2 × 2 × 2 × 2
M :16 → 16×16
M fa1( ) ⋅M fa2( ).....M fak( )
15k
𝑓 = (𝑓!"#$)
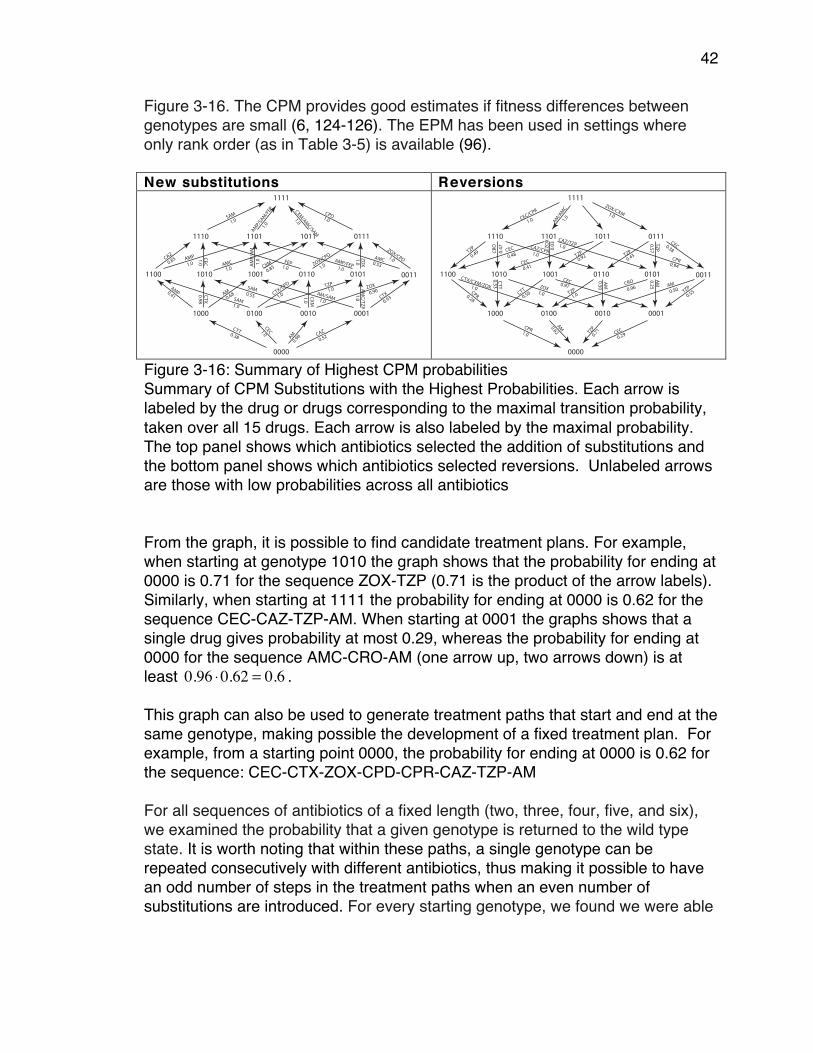
42
Figure 3-16. The CPM provides good estimates if fitness differences between genotypes are small (6, 124-126). The EPM has been used in settings where only rank order (as in Table 3-5) is available (96). New substitutions Reversions
Figure 3-16: Summary of Highest CPM probabilities Summary of CPM Substitutions with the Highest Probabilities. Each arrow is labeled by the drug or drugs corresponding to the maximal transition probability, taken over all 15 drugs. Each arrow is also labeled by the maximal probability. The top panel shows which antibiotics selected the addition of substitutions and the bottom panel shows which antibiotics selected reversions. Unlabeled arrows are those with low probabilities across all antibiotics From the graph, it is possible to find candidate treatment plans. For example, when starting at genotype 1010 the graph shows that the probability for ending at 0000 is 0.71 for the sequence ZOX-TZP (0.71 is the product of the arrow labels). Similarly, when starting at 1111 the probability for ending at 0000 is 0.62 for the sequence CEC-CAZ-TZP-AM. When starting at 0001 the graphs shows that a single drug gives probability at most 0.29, whereas the probability for ending at 0000 for the sequence AMC-CRO-AM (one arrow up, two arrows down) is at least . This graph can also be used to generate treatment paths that start and end at the same genotype, making possible the development of a fixed treatment plan. For example, from a starting point 0000, the probability for ending at 0000 is 0.62 for the sequence: CEC-CTX-ZOX-CPD-CPR-CAZ-TZP-AM For all sequences of antibiotics of a fixed length (two, three, four, five, and six), we examined the probability that a given genotype is returned to the wild type state. It is worth noting that within these paths, a single genotype can be repeated consecutively with different antibiotics, thus making it possible to have an odd number of steps in the treatment paths when an even number of substitutions are introduced. For every starting genotype, we found we were able
0000
1000 0100 0010 0001
1100 1010 1001 0110 0101 0011
1110 1101 1011 0111
1111
0.38
CTT 1.0CEC
0.98AM CAZ
0.52
0.41
AMP 0.98CTX 0.6
8AM
1.0SAM
1.0CTX/C
PD1.0
TZP
0.55SAM
CXM1.0
0.90ZOX
1.0AM/SAM
1.0AM
C/TZP 0.93CT
X
0.85CA
ZAMP 1.0
CEC
1.0AMC 1.
0AM
P/AM
0.85CXM 1.0
FEP1.0
ZOX/CP
D
1.0
AMP/FEP
1.0ZO
X 0.53AMC 1.0
ZOX/CPD
1.0SAM
AMP/SAM/FEP
1.0
1.01.0CXM/AMC/SAM
CPD
1.0
0000
1000 0100 0010 0001
1100 1010 1001 0110 0101 0011
1110 1101 1011 0111
1111
CPR1.0
0.62AM
TZP
0.71 CEC
0.29
CPR0.28
1.0
CTX/CXM/ZOX
CTT0.53
1.0ZOX
0.56CT
T0.97CEC
1.0TZP
0.50AM
0.96CRO
0.25AM
0.50AM
0.55TZ
P
0.49TZ
P
0.47
CRO
1.0CAZ/CPR
0.48CEC 0.
03ZOX CAZ/TZP1.0
0.41CEC
0.92TZP
0.94CPR0.4
3TZP
0.57TZP 0.38
CEC
1.0 1.0
1.0CEC/CP
R
AM/AMC
ZOX/CXM
0.96 ⋅0.62 = 0.6

43
to return to the wild type genotype with a probability between 0.6 and 1.0 when using the CPM model and a probability of 0.375 and 1.0 when using the EPM model. These results are summarized in Tables 3-6 through 3-9 and Figure 3-17. These results show the number of paths and their probabilities (Tables 3-6 and 3-7) and the substitutions selected through the optimal treatment plans (Tables 3-8 through 3-11) for returning to the wild type state from various starting points. Table 3-6 Maximum Probability and Number of Paths Using CPM
Starting Geno- type
1 Step
Paths 2 Step
Paths 3 Step
Paths 4 Step
Paths 5 Step
Paths 6 Step
Paths
1000 1.0 1 1.0 3 1.0 7 1.0 15 1.0 31 1.0 63 0100 0.617 1 0.617 6 0.617 36 0.617 219 0.617 1360 0.617 8568 0010 0.715 1 0.715 2 0.715 3 0.715 4 0.715 5 0.715 6 0001 0.287 1 0.287 1 0.592 2 0.592 8 0.726 2 0.726 4 1100 - 0.617 3 0.617 18 0.617 108 0.617 657 0.617 4110 1010 - 0.715 1 0.715 6 0.715 27 0.715 112 0.715 453 1001 - 0.559 1 0.559 4 0.726 1 0.726 2 0.729 1 0110 - 0.617 1 0.617 10 0.617 78 0.617 555 0.617 3805 0101 - 0.592 1 0.592 9 0.612 1 0.612 9 0.617 34 0011 - 0.361 1 0.361 9 0.586 2 0.600 2 0.617 8 1110 - - 0.617 2 0.617 24 0.617 215 0.617 1720 1101 - - 0.592 2 0.592 24 0.617 12 0.617 252 1011 - - 0.532 1 0.532 1 0.684 1 0.690 1 0111 - - 0.586 1 0.600 1 0.617 4 0.617 84 1111 - - - - 0.617 4 0.617 72 0.617 906
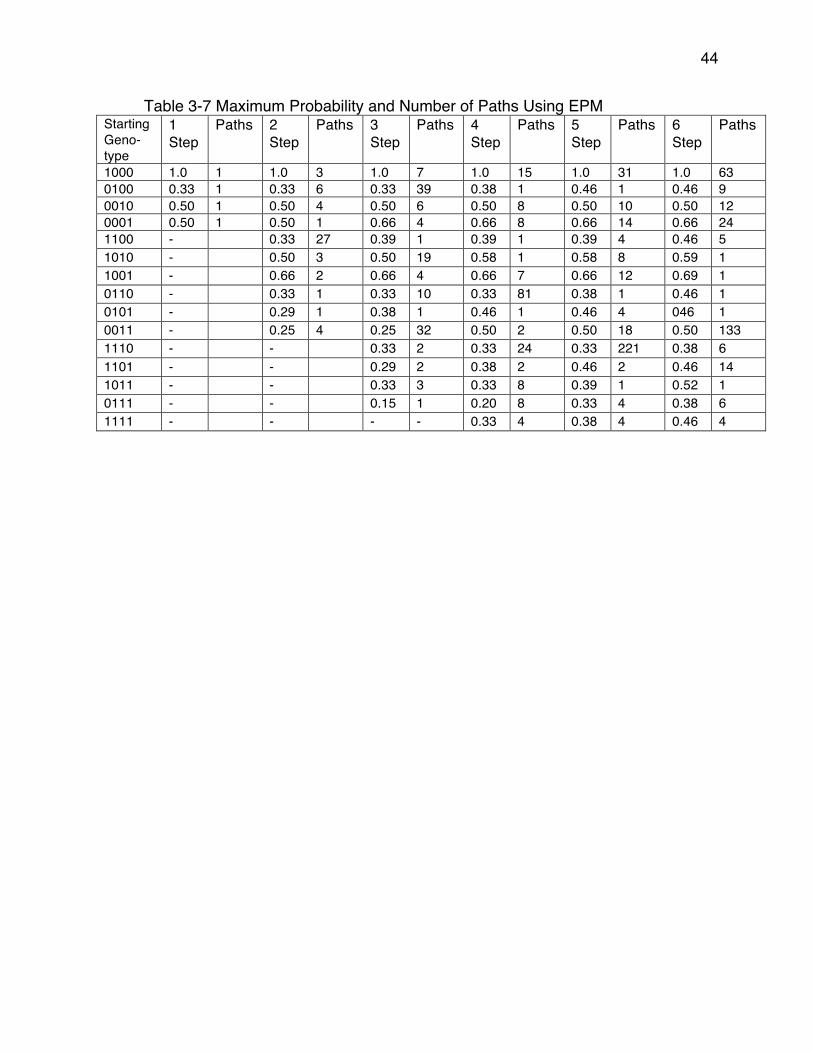
44
Table 3-7 Maximum Probability and Number of Paths Using EPM Starting Geno- type
1 Step
Paths 2 Step
Paths 3 Step
Paths 4 Step
Paths 5 Step
Paths 6 Step
Paths
1000 1.0 1 1.0 3 1.0 7 1.0 15 1.0 31 1.0 63 0100 0.33 1 0.33 6 0.33 39 0.38 1 0.46 1 0.46 9 0010 0.50 1 0.50 4 0.50 6 0.50 8 0.50 10 0.50 12 0001 0.50 1 0.50 1 0.66 4 0.66 8 0.66 14 0.66 24 1100 - 0.33 27 0.39 1 0.39 1 0.39 4 0.46 5 1010 - 0.50 3 0.50 19 0.58 1 0.58 8 0.59 1 1001 - 0.66 2 0.66 4 0.66 7 0.66 12 0.69 1 0110 - 0.33 1 0.33 10 0.33 81 0.38 1 0.46 1 0101 - 0.29 1 0.38 1 0.46 1 0.46 4 046 1 0011 - 0.25 4 0.25 32 0.50 2 0.50 18 0.50 133 1110 - - 0.33 2 0.33 24 0.33 221 0.38 6 1101 - - 0.29 2 0.38 2 0.46 2 0.46 14 1011 - - 0.33 3 0.33 8 0.39 1 0.52 1 0111 - - 0.15 1 0.20 8 0.33 4 0.38 6 1111 - - - - 0.33 4 0.38 4 0.46 4
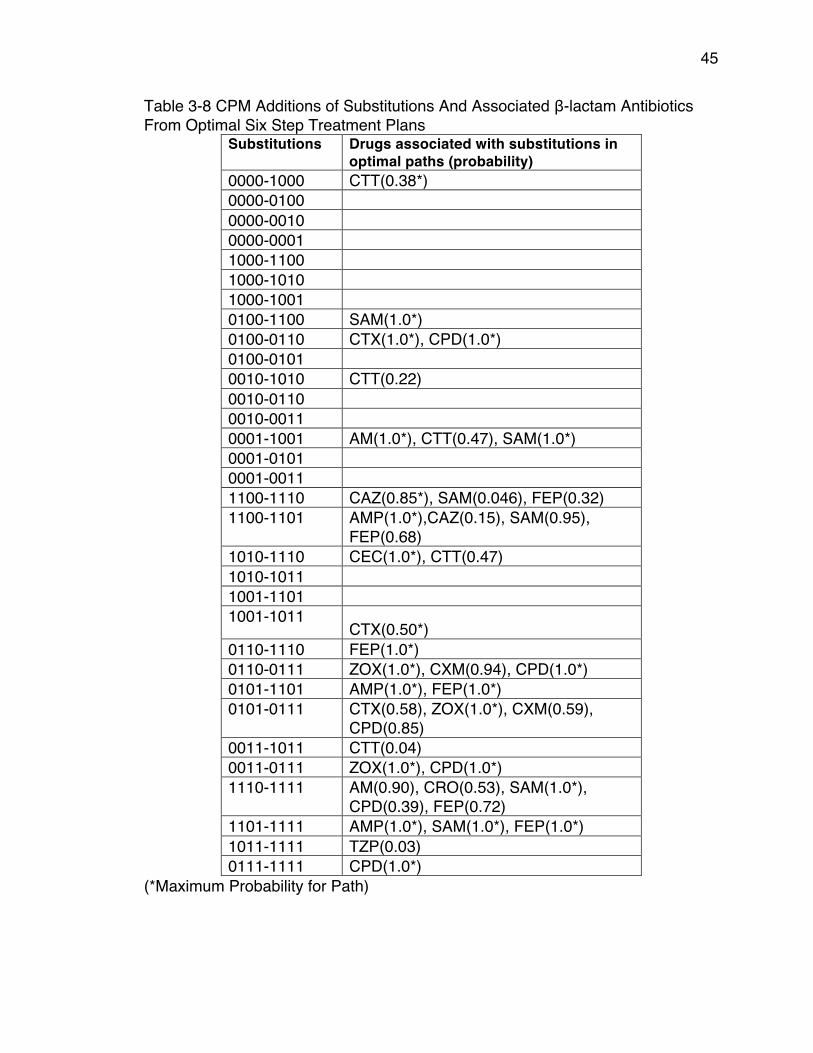
45
Table 3-8 CPM Additions of Substitutions And Associated β-lactam Antibiotics From Optimal Six Step Treatment Plans
Substitutions Drugs associated with substitutions in optimal paths (probability)
0000-1000 CTT(0.38*) 0000-0100 0000-0010 0000-0001 1000-1100 1000-1010 1000-1001 0100-1100 SAM(1.0*) 0100-0110 CTX(1.0*), CPD(1.0*) 0100-0101 0010-1010 CTT(0.22) 0010-0110 0010-0011 0001-1001 AM(1.0*), CTT(0.47), SAM(1.0*) 0001-0101 0001-0011 1100-1110 CAZ(0.85*), SAM(0.046), FEP(0.32) 1100-1101 AMP(1.0*),CAZ(0.15), SAM(0.95),
FEP(0.68) 1010-1110 CEC(1.0*), CTT(0.47) 1010-1011 1001-1101 1001-1011
CTX(0.50*) 0110-1110 FEP(1.0*) 0110-0111 ZOX(1.0*), CXM(0.94), CPD(1.0*) 0101-1101 AMP(1.0*), FEP(1.0*) 0101-0111 CTX(0.58), ZOX(1.0*), CXM(0.59),
CPD(0.85) 0011-1011 CTT(0.04) 0011-0111 ZOX(1.0*), CPD(1.0*) 1110-1111 AM(0.90), CRO(0.53), SAM(1.0*),
CPD(0.39), FEP(0.72) 1101-1111 AMP(1.0*), SAM(1.0*), FEP(1.0*) 1011-1111 TZP(0.03) 0111-1111 CPD(1.0*)
(*Maximum Probability for Path)
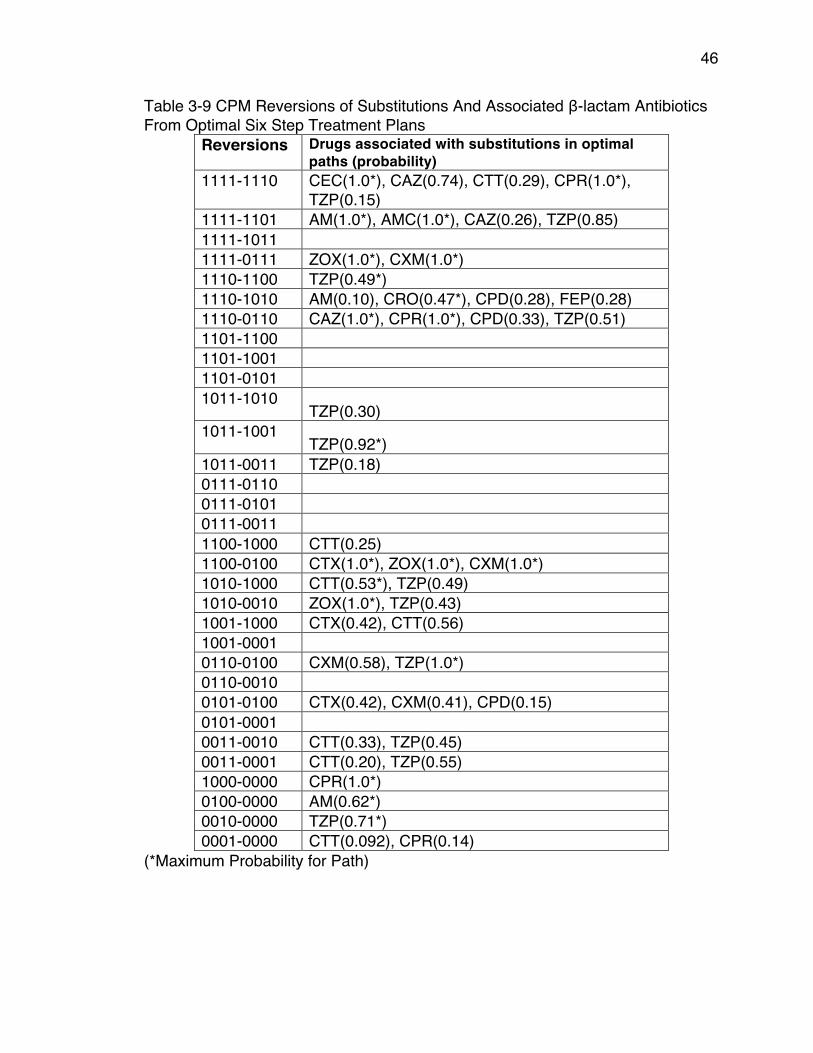
46
Table 3-9 CPM Reversions of Substitutions And Associated β-lactam Antibiotics From Optimal Six Step Treatment Plans
Reversions Drugs associated with substitutions in optimal paths (probability)
1111-1110 CEC(1.0*), CAZ(0.74), CTT(0.29), CPR(1.0*), TZP(0.15)
1111-1101 AM(1.0*), AMC(1.0*), CAZ(0.26), TZP(0.85) 1111-1011 1111-0111 ZOX(1.0*), CXM(1.0*) 1110-1100 TZP(0.49*) 1110-1010 AM(0.10), CRO(0.47*), CPD(0.28), FEP(0.28) 1110-0110 CAZ(1.0*), CPR(1.0*), CPD(0.33), TZP(0.51) 1101-1100 1101-1001 1101-0101 1011-1010
TZP(0.30) 1011-1001
TZP(0.92*) 1011-0011 TZP(0.18) 0111-0110 0111-0101 0111-0011 1100-1000 CTT(0.25) 1100-0100 CTX(1.0*), ZOX(1.0*), CXM(1.0*) 1010-1000 CTT(0.53*), TZP(0.49) 1010-0010 ZOX(1.0*), TZP(0.43) 1001-1000 CTX(0.42), CTT(0.56) 1001-0001 0110-0100 CXM(0.58), TZP(1.0*) 0110-0010 0101-0100 CTX(0.42), CXM(0.41), CPD(0.15) 0101-0001 0011-0010 CTT(0.33), TZP(0.45) 0011-0001 CTT(0.20), TZP(0.55) 1000-0000 CPR(1.0*) 0100-0000 AM(0.62*) 0010-0000 TZP(0.71*) 0001-0000 CTT(0.092), CPR(0.14)
(*Maximum Probability for Path)
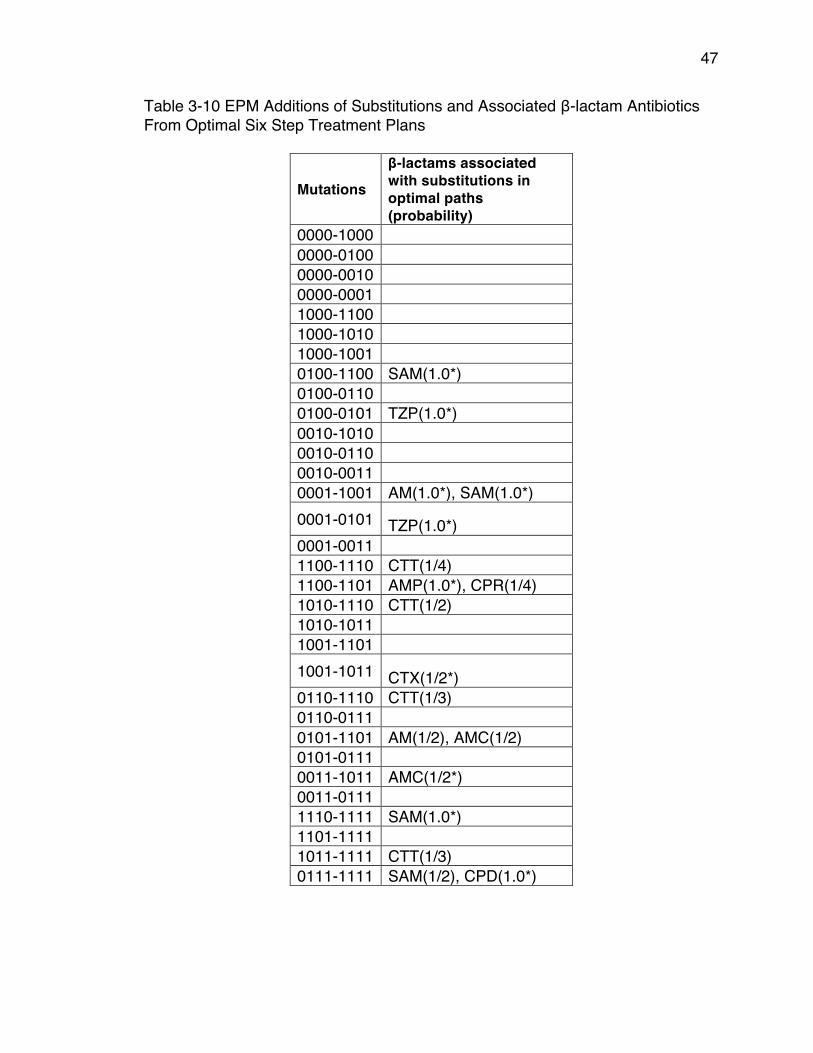
47
Table 3-10 EPM Additions of Substitutions and Associated β-lactam Antibiotics From Optimal Six Step Treatment Plans
Mutations β-lactams associated with substitutions in optimal paths (probability)
0000-1000 0000-0100 0000-0010 0000-0001 1000-1100 1000-1010 1000-1001 0100-1100 SAM(1.0*) 0100-0110 0100-0101 TZP(1.0*) 0010-1010 0010-0110 0010-0011 0001-1001 AM(1.0*), SAM(1.0*) 0001-0101 TZP(1.0*) 0001-0011 1100-1110 CTT(1/4) 1100-1101 AMP(1.0*), CPR(1/4) 1010-1110 CTT(1/2) 1010-1011 1001-1101 1001-1011 CTX(1/2*) 0110-1110 CTT(1/3) 0110-0111 0101-1101 AM(1/2), AMC(1/2) 0101-0111 0011-1011 AMC(1/2*) 0011-0111 1110-1111 SAM(1.0*) 1101-1111 1011-1111 CTT(1/3) 0111-1111 SAM(1/2), CPD(1.0*)
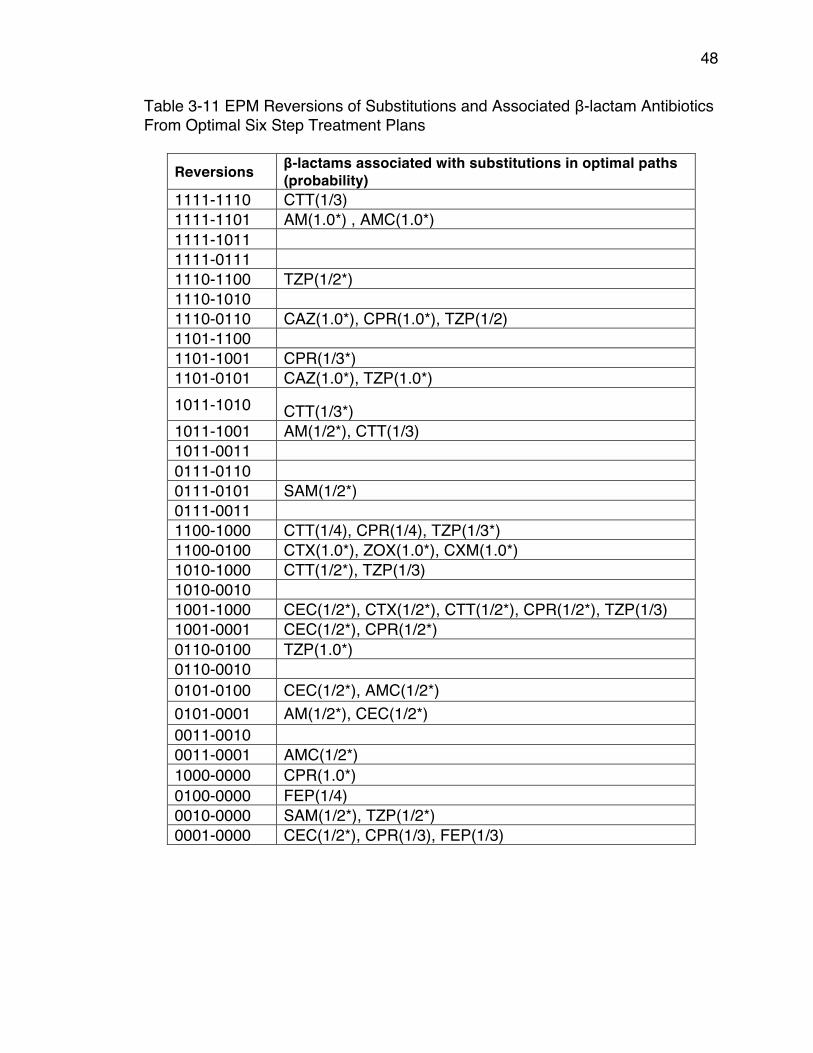
48
Table 3-11 EPM Reversions of Substitutions and Associated β-lactam Antibiotics From Optimal Six Step Treatment Plans
Reversions β-lactams associated with substitutions in optimal paths (probability)
1111-1110 CTT(1/3) 1111-1101 AM(1.0*) , AMC(1.0*) 1111-1011 1111-0111 1110-1100 TZP(1/2*) 1110-1010 1110-0110 CAZ(1.0*), CPR(1.0*), TZP(1/2) 1101-1100 1101-1001 CPR(1/3*) 1101-0101 CAZ(1.0*), TZP(1.0*) 1011-1010 CTT(1/3*) 1011-1001 AM(1/2*), CTT(1/3) 1011-0011 0111-0110 0111-0101 SAM(1/2*) 0111-0011 1100-1000 CTT(1/4), CPR(1/4), TZP(1/3*) 1100-0100 CTX(1.0*), ZOX(1.0*), CXM(1.0*) 1010-1000 CTT(1/2*), TZP(1/3) 1010-0010 1001-1000 CEC(1/2*), CTX(1/2*), CTT(1/2*), CPR(1/2*), TZP(1/3) 1001-0001 CEC(1/2*), CPR(1/2*) 0110-0100 TZP(1.0*) 0110-0010 0101-0100 CEC(1/2*), AMC(1/2*) 0101-0001 AM(1/2*), CEC(1/2*) 0011-0010 0011-0001 AMC(1/2*) 1000-0000 CPR(1.0*) 0100-0000 FEP(1/4) 0010-0000 SAM(1/2*), TZP(1/2*) 0001-0000 CEC(1/2*), CPR(1/3), FEP(1/3)
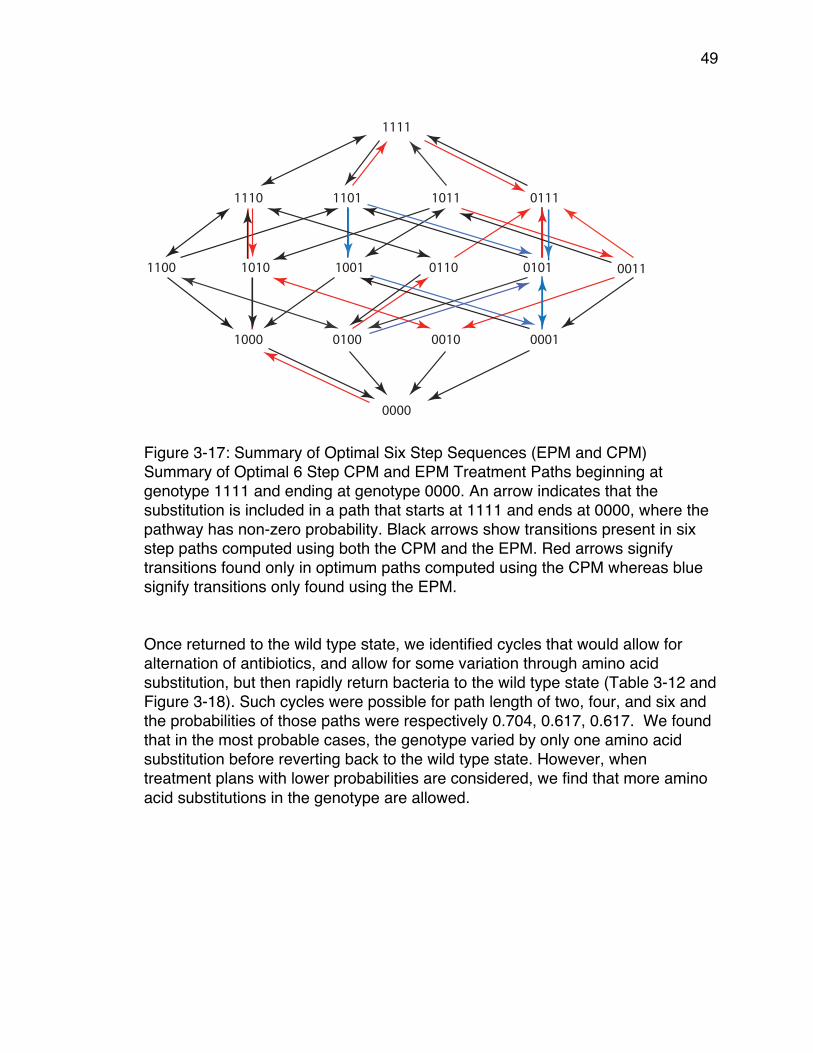
49
Figure 3-17: Summary of Optimal Six Step Sequences (EPM and CPM) Summary of Optimal 6 Step CPM and EPM Treatment Paths beginning at genotype 1111 and ending at genotype 0000. An arrow indicates that the substitution is included in a path that starts at 1111 and ends at 0000, where the pathway has non-zero probability. Black arrows show transitions present in six step paths computed using both the CPM and the EPM. Red arrows signify transitions found only in optimum paths computed using the CPM whereas blue signify transitions only found using the EPM. Once returned to the wild type state, we identified cycles that would allow for alternation of antibiotics, and allow for some variation through amino acid substitution, but then rapidly return bacteria to the wild type state (Table 3-12 and Figure 3-18). Such cycles were possible for path length of two, four, and six and the probabilities of those paths were respectively 0.704, 0.617, 0.617. We found that in the most probable cases, the genotype varied by only one amino acid substitution before reverting back to the wild type state. However, when treatment plans with lower probabilities are considered, we find that more amino acid substitutions in the genotype are allowed.
0000
1000 0100 0010 0001
1100 1010 1001 0110 0101 0011
1110 1101 1011 0111
1111
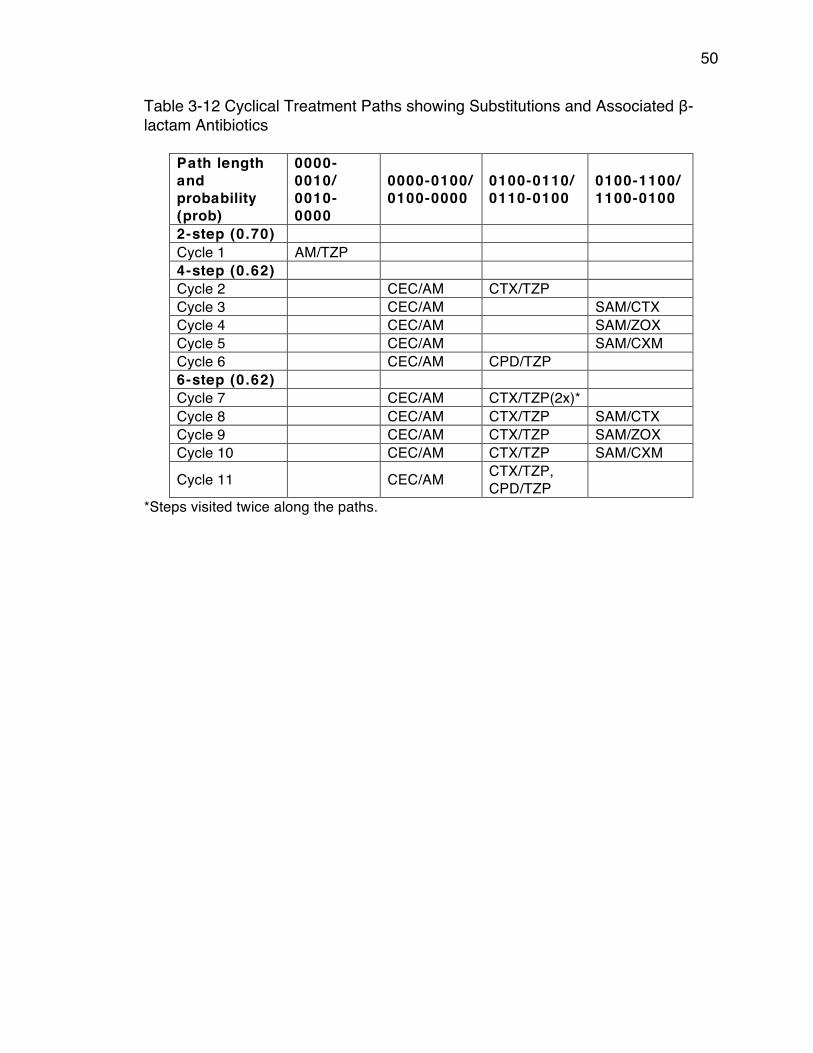
50
Table 3-12 Cyclical Treatment Paths showing Substitutions and Associated β-lactam Antibiotics
Path length and probability (prob)
0000-0010/ 0010-0000
0000-0100/ 0100-0000
0100-0110/ 0110-0100
0100-1100/ 1100-0100
2-step (0.70) Cycle 1 AM/TZP 4-step (0.62) Cycle 2 CEC/AM CTX/TZP Cycle 3 CEC/AM SAM/CTX Cycle 4 CEC/AM SAM/ZOX Cycle 5 CEC/AM SAM/CXM Cycle 6 CEC/AM CPD/TZP 6-step (0.62) Cycle 7 CEC/AM CTX/TZP(2x)* Cycle 8 CEC/AM CTX/TZP SAM/CTX Cycle 9 CEC/AM CTX/TZP SAM/ZOX Cycle 10 CEC/AM CTX/TZP SAM/CXM
Cycle 11 CEC/AM CTX/TZP, CPD/TZP
*Steps visited twice along the paths.
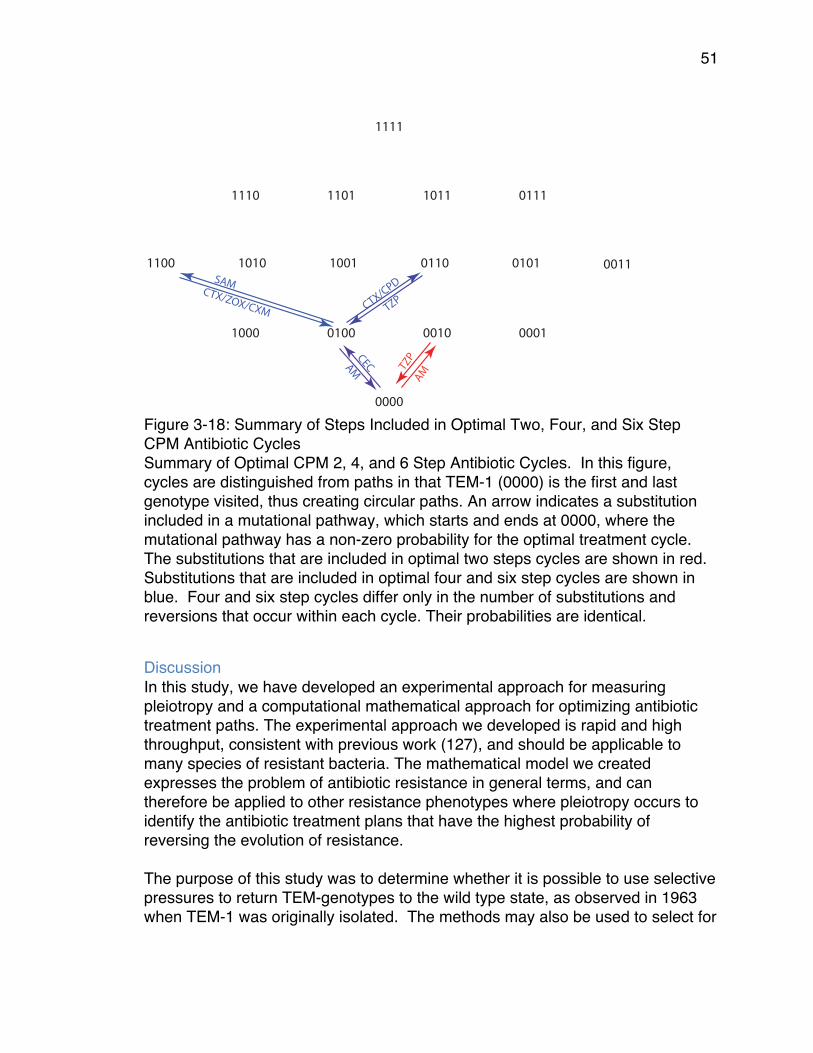
51
Figure 3-18: Summary of Steps Included in Optimal Two, Four, and Six Step CPM Antibiotic Cycles Summary of Optimal CPM 2, 4, and 6 Step Antibiotic Cycles. In this figure, cycles are distinguished from paths in that TEM-1 (0000) is the first and last genotype visited, thus creating circular paths. An arrow indicates a substitution included in a mutational pathway, which starts and ends at 0000, where the mutational pathway has a non-zero probability for the optimal treatment cycle. The substitutions that are included in optimal two steps cycles are shown in red. Substitutions that are included in optimal four and six step cycles are shown in blue. Four and six step cycles differ only in the number of substitutions and reversions that occur within each cycle. Their probabilities are identical.
Discussion In this study, we have developed an experimental approach for measuring pleiotropy and a computational mathematical approach for optimizing antibiotic treatment paths. The experimental approach we developed is rapid and high throughput, consistent with previous work (127), and should be applicable to many species of resistant bacteria. The mathematical model we created expresses the problem of antibiotic resistance in general terms, and can therefore be applied to other resistance phenotypes where pleiotropy occurs to identify the antibiotic treatment plans that have the highest probability of reversing the evolution of resistance. The purpose of this study was to determine whether it is possible to use selective pressures to return TEM-genotypes to the wild type state, as observed in 1963 when TEM-1 was originally isolated. The methods may also be used to select for
0000
1000 0100 0010 0001
1100 1010 1001 0110 0101 0011
1110 1101 1011 0111
1111
TZP
AM
CEC
CTX/C
PD
TZP
AM
SAMCTX/ZOX/CXM
52
any particular genotype within our data set. As such, we may select with reasonably high probabilities, resistance genotypes that existed at some prior point in time. To highlight this feature, we have named our software package “Time Machine”. Once given growth rates of adjacent genotypes, Time Machine returned treatment plans that restored the wild type state as observed in 1963 with probabilities greater than 0.6 when using the CPM model and greater than 3/8 (>0.375) when using EPM. These results suggest that when possible it is desirable to use actual growth rates rather than rough ranking data. While these treatment methods may have clinical value, we have yet to determine the ideal duration of each therapy. Additionally the antibiotics included in our study may have different applications in the clinic. A further issue is that if new genotypes arise, the treatment plan may fail. The inclusion of more resistance genes in this type of approach may aid in the creation of robust treatment plans that are effective even when unexpected genotypes arise. The discrete optimization problem motivated by our goal to reverse resistance, or the challenge to build a better time machine, is of independent mathematical interest. Tables 6 and 7 suggest that the maximum probabilities in each row stagnate after a limited number of steps. This is not always the case. We have created an example of two substitution matrices on a 3-locus system where the maximum probabilities can be increased indefinitely. These results show that great potential exists for remediation of antibiotic resistance through antibiotic treatment plans when pleiotropic fitness costs are known for an appropriate set of antibiotics. While developed using a model of Gram-negative antibacterial resistance, this approach could also be used for Gram-positive bacteria and HIV treatment plans.
Methods Experimental methods Strains and Cultures We expressed 16 mutant constructs of the blaTEM gene in plasmid pBR322 from strain DH5-αE. The 16 genotypes differ at all combinations of four amino acid residues and have been previously described (6). We grew them overnight (16 hours) in standing cultures and diluted them to a concentration of 1.9X10⁵ as described elsewhere (6). We transferred 80 µl of each culture to a 384-well plate with one genotype present in each of the 16 rows. The first 12 wells of each row were antibiotic free (controls) and the last 12 wells contained a single antibiotic at an inhibitory, sub-
53
lethal concentration. We tested many concentrations and used those that maximized our ability to make comparisons between alleles. After plating, a membrane is placed over the plate and simultaneously incubated/measured in the Eon Microplate Spectrophotometer at a temperature of 25.1°C for 22 hours. This relatively cool (<37º) temperature is used because degradation of the antibiotics is much slower, while the growth rate of the bacteria is still sufficient to capture the complete exponential period of growth over the duration of the experiment. Overall, we have found that a temperature ~25ºC yields more reliable and consistent measurement of growth rates in the presence of antibiotics. Measurements of cell density (light scattering) at a wavelength of 600 nanometers were automatically collected every 20 minutes after brief agitation to homogenize and oxygenate the culture. Growth Rates The data obtained from the microplate spectrophotometer is exported to the GrowthRates program to derive the growth rates. In essence, by measuring the optical density at frequent intervals the GrowthRates program can estimate the growth rate,α, through a linear regression algorithm fitting the data from the exponential growth phase. Details can be found in (128) in the section entitled “The Growth Curve” located on pages 233-4. There is not a direct or simple correlation between this method and other methods such as minimum inhibitory (MIC) or disk diffusion testing. The output of this program for the data we collected was a list 𝑓 𝑎! , 𝑓 𝑎! ,… , 𝑓(𝑎!) of 15 tensors, each of format.2×2×2×2 These are the rows in Table 3-4. So if is a genotype, then 𝑓(𝑎!)! is the fitness of genotype 𝑢 in the presence of antibiotic 𝑎!. This fitness is a growth rate, so we are here using the letter 𝑓 for a quantity often denoted by α . One-Way Analysis of Variance (ANOVA) was then used to compare the means of the growth rates obtained, and to determine if there were significant differences between the growth rates of adjacent genotypes. Correlated Probability Model (CPM) Once the growth rates have been determined under various experimental conditions, the next step is to use them to compute fixation probabilities. If the (multiplicative) absolute fitnesses 𝑊! and 𝑊! of two neighboring genotypes
u and v, differ by a small quantity then the (additive) relative fitness
can be approximated by
u ∈ 0,1{ }4
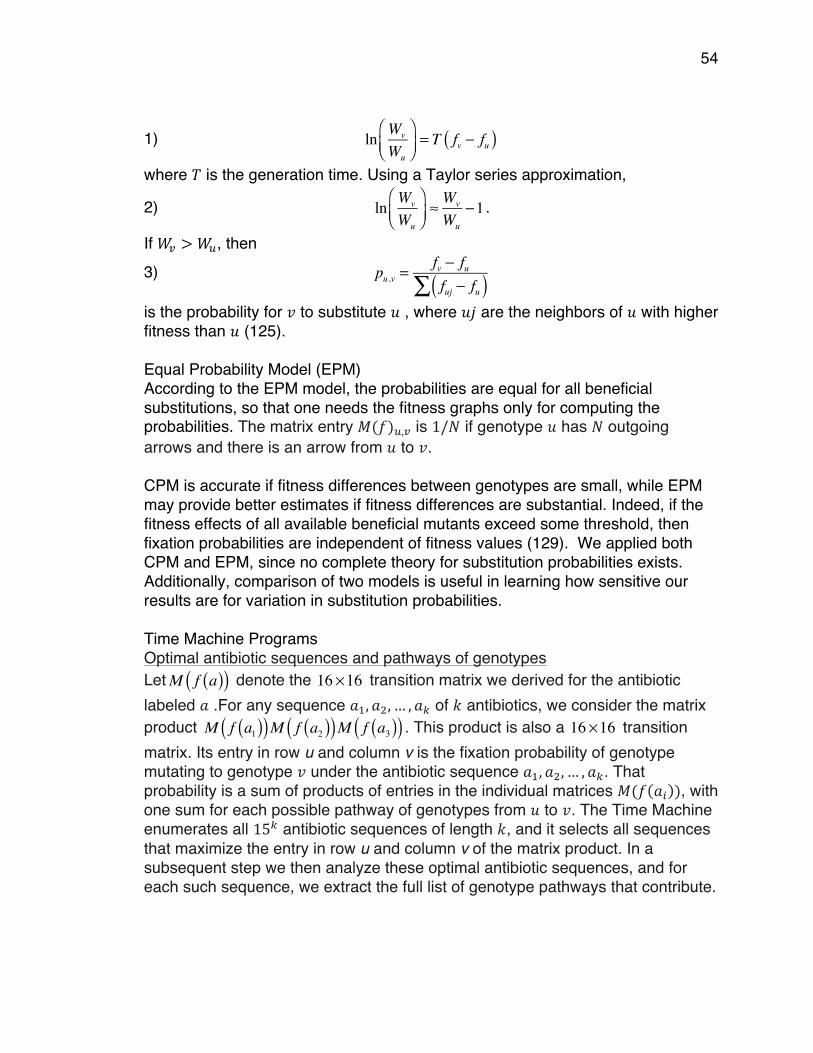
54
1)
where 𝑇 is the generation time. Using a Taylor series approximation,
2) .
If 𝑊! >𝑊!, then
3)
is the probability for 𝑣 to substitute 𝑢 , where 𝑢𝑗 are the neighbors of 𝑢 with higher fitness than 𝑢 (125). Equal Probability Model (EPM) According to the EPM model, the probabilities are equal for all beneficial substitutions, so that one needs the fitness graphs only for computing the probabilities. The matrix entry 𝑀(𝑓)!,! is 1/𝑁 if genotype 𝑢 has 𝑁 outgoing arrows and there is an arrow from 𝑢 to 𝑣. CPM is accurate if fitness differences between genotypes are small, while EPM may provide better estimates if fitness differences are substantial. Indeed, if the fitness effects of all available beneficial mutants exceed some threshold, then fixation probabilities are independent of fitness values (129). We applied both CPM and EPM, since no complete theory for substitution probabilities exists. Additionally, comparison of two models is useful in learning how sensitive our results are for variation in substitution probabilities. Time Machine Programs Optimal antibiotic sequences and pathways of genotypes Let denote the transition matrix we derived for the antibiotic labeled 𝑎 .For any sequence 𝑎!,𝑎!,… ,𝑎! of 𝑘 antibiotics, we consider the matrix product . This product is also a transition matrix. Its entry in row u and column v is the fixation probability of genotype mutating to genotype 𝑣 under the antibiotic sequence 𝑎!,𝑎!,… ,𝑎!. That probability is a sum of products of entries in the individual matrices 𝑀(𝑓 𝑎! ), with one sum for each possible pathway of genotypes from 𝑢 to 𝑣. The Time Machine enumerates all 15! antibiotic sequences of length 𝑘, and it selects all sequences that maximize the entry in row u and column v of the matrix product. In a subsequent step we then analyze these optimal antibiotic sequences, and for each such sequence, we extract the full list of genotype pathways that contribute.
ln Wv
Wu
⎛⎝⎜
⎞⎠⎟= T fv − fu( )
ln Wv
Wu
⎛⎝⎜
⎞⎠⎟≈ Wv
Wu
−1
pu ,v =fv − fufuj − fu( )∑
M f a( )( ) 16 ×16
M f a1( )( )M f a2( )( )M f a3( )( ) 16 ×16

55
We implemented this algorithm in the computer algebra software Maple, and we ran it for 𝑘 = 2,3,4,5,6. The running time of the program is slow because of the exponential growth in the number of sequences. At present we do not know whether an efficient algorithm exists for solving our optimization problem for larger values of 𝑘. Cycles of antibiotics We also used this method to compute cyclical treatment paths in which the starting and ending genotypes were the wild type 0000. The problem we solved was somewhat different from the previous one, in that we focused on obtaining the maximal probabilities of a cycle that includes some substitutions and then returns to the wild type without halting. Halting means that adjacent genotypes in a mutational pathway coincide, which is undesirable.
56
Chapter 4: Statistical Package for Growth Rates Made Easy Introduction Growth rates have become increasingly useful in microbiology and are often used to quantify phenotypic properties in microorganisms (130). Growth rates are used in a variety of areas; including proteomics (131), population dynamics (132), genomic mutation rates (133), and mathematical modeling (134). Studies in experimental evolution use growth rates as a measurement of fitness (130) and measure the responses of microorganisms to various environmental factors (e.g. antibiotics) (135). Growth rates are calculated using the natural log of the optical density (O.D.) of a cell culture over time (136). Automatic plate readers that can measure the O.D. of up to 384 cultures simultaneously have made the collection of growth rate data very efficient. A software package, GrowthRates has allowed rapid high throughput analyses of growth rate data (136). GrowthRates has been used in diverse scientific areas, e.g. to create antibiotic cycling strategies to combat antibiotic resistance (134), to design programs for age phenotyping in yeast (137) and to develop smart food packaging that helps prevent spoilage (138) among others. The power of modern growth rate experiments comes from the ability to have many replicate cultures in a plate reader, and the ability to measure growth under many conditions simultaneously. The conditions may be varied by the genotype of the organism or by environmental conditions (nutrient source, antibiotic and inhibitor concentrations, etc.) or both. The growth rates can then be used to assess fitness differences. However, a challenge presented by the use of a plate reader is that while their sensitivity makes it possible to identify both large and subtle differences, variance in replicate growth rates can make it difficult to determine the confidence of those comparisons. When growth rates are too similar, it can be difficult to determine the fittest genotype. In this study, we have focused on strains that have been cultured in sub-lethal concentrations of antibiotics because the resulting inhibition of growth creates a situation where variance is a source of concern. We have developed statistical methods for handling this variation and have automated the use of those statistics with a series of computer programs. Here, we present a statistical package for GrowthRates, CompareGrowthRates or CGR, that can measure the amount of variation within replicates. CGR is a solution to the problem of measuring variation and the effect of variation on reliability.

57
Methods and Results The purpose of any statistical analysis is to evaluate the confidence we have in the data obtained and in the conclusions drawn from experiments. Confidence in the reliability of data is measured by the correlation coefficient, R, of the best fit line to the natural log of the optical density (ln(O.D.)) over time. Growth rates are calculated by taking the slope of that line. Confidence in the conclusions of an experiment depends upon the variability in the growth rates among members of a set of replicate cultures, which we will refer to hereafter as a set. Variability is measured by the V-score for a set, where the V-score is defined to be the ratio of the standard error of the mean to the mean growth rate for that set, 𝑉 = !.!.
!"#$.
The lower the V-score, the less variable were the growth rates within the given set. GrowthRates reports the growth rate and the correlation coefficient (R) for each culture. R can be interpreted as a measure of the reliability of the growth rate. For each set of replicate cultures, CGR reports the mean growth rate, the mean R and the V-score. CGR analysis of 45 experiments where the culture conditions were various concentrations of antibiotics showed that when the mean growth rate was very low, the maximum O.D. and the mean R were also quite low (R <0.9). In general, those low and unreliable growth rates were also highly variable, resulting in high V-scores. We concluded that the growth rates were unreliable in wells in which growth was very slow and maximum O.D.s were very low. Reliability of a single growth rate estimate The GrowthRates program estimates growth rates by identifying the highest slope among all the slopes of 5 successive time points (136). For that set of points GrowthRates then, if possible, extends the number of points while the slope of the extended line remains above 95% of the slope of the initial highest slope. The reported growth rate is based on the slope of that extended line. Figure 1, based on data collected in 2017, illustrates that when there is very little growth over those 5 points the scatter in the readings can result in low correlation coefficients.
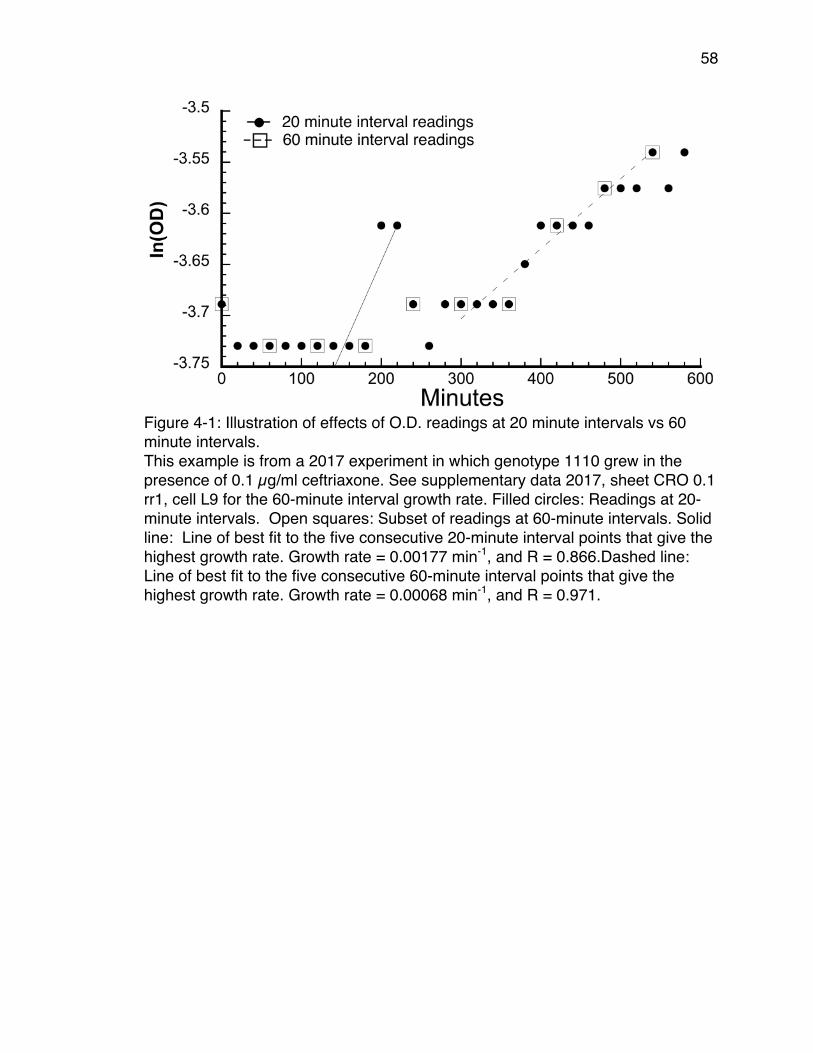
58
Figure 4-1: Illustration of effects of O.D. readings at 20 minute intervals vs 60 minute intervals. This example is from a 2017 experiment in which genotype 1110 grew in the presence of 0.1 µg/ml ceftriaxone. See supplementary data 2017, sheet CRO 0.1 rr1, cell L9 for the 60-minute interval growth rate. Filled circles: Readings at 20-minute intervals. Open squares: Subset of readings at 60-minute intervals. Solid line: Line of best fit to the five consecutive 20-minute interval points that give the highest growth rate. Growth rate = 0.00177 min-1, and R = 0.866.Dashed line: Line of best fit to the five consecutive 60-minute interval points that give the highest growth rate. Growth rate = 0.00068 min-1, and R = 0.971.
59
Figure 4-1 shows many instances where O.D. did not change over several successive readings. That pattern is typical when the sampling interval is too frequent relative to the growth rate. The solid line shows the regression line through the points from 140 to 220 minutes; the line that has the highest slope among all sequential 5-point lines at 20-minute intervals. The slope of that line (growth rate) is 0.00177 min-1, and the correlation coefficient R = 0.866. Squares show the subset of those points at 60-minute intervals, and the dashed line shows the regression line through those points from 300 to 540 minutes; the line that had the highest slope among all sequential 60-minute points. The slope of that line (growth rate) is 0.00068 min-1, and the correlation coefficient R = 0.971. The CGR program package includes a program, EditReadingIntervals, that facilitates easy editing of an input file for GrowthRates so that the input file only includes points at greater intervals than in the original input file. To test the hypothesis that reading too frequently can decrease the reliability of growth rate estimates, we edited the GrowthRates input files of several experiments to delete readings so that the remaining readings were at 60-minute intervals. We then compared the mean growth rates, mean R, and V-scores of readings at 20-minute intervals with those of readings at 60-minute intervals. Table 4-1 shows the result of modifying the reading intervals for one of those 2014 experiments in which the treatment was cefotetan (CTT) at 0.063 μg/ml.
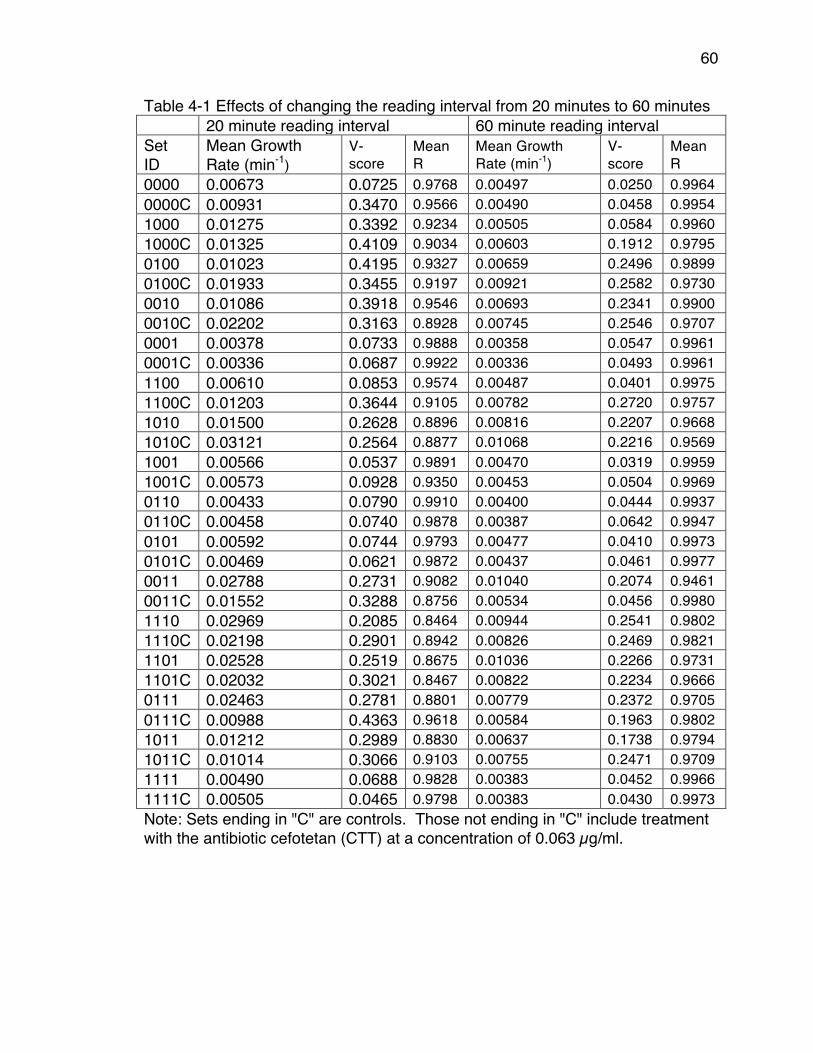
60
Table 4-1 Effects of changing the reading interval from 20 minutes to 60 minutes 20 minute reading interval 60 minute reading interval Set ID
Mean Growth Rate (min-1)
V-score
Mean R
Mean Growth Rate (min-1)
V-score
Mean R
0000 0.00673 0.0725 0.9768 0.00497 0.0250 0.9964 0000C 0.00931 0.3470 0.9566 0.00490 0.0458 0.9954 1000 0.01275 0.3392 0.9234 0.00505 0.0584 0.9960 1000C 0.01325 0.4109 0.9034 0.00603 0.1912 0.9795 0100 0.01023 0.4195 0.9327 0.00659 0.2496 0.9899 0100C 0.01933 0.3455 0.9197 0.00921 0.2582 0.9730 0010 0.01086 0.3918 0.9546 0.00693 0.2341 0.9900 0010C 0.02202 0.3163 0.8928 0.00745 0.2546 0.9707 0001 0.00378 0.0733 0.9888 0.00358 0.0547 0.9961 0001C 0.00336 0.0687 0.9922 0.00336 0.0493 0.9961 1100 0.00610 0.0853 0.9574 0.00487 0.0401 0.9975 1100C 0.01203 0.3644 0.9105 0.00782 0.2720 0.9757 1010 0.01500 0.2628 0.8896 0.00816 0.2207 0.9668 1010C 0.03121 0.2564 0.8877 0.01068 0.2216 0.9569 1001 0.00566 0.0537 0.9891 0.00470 0.0319 0.9959 1001C 0.00573 0.0928 0.9350 0.00453 0.0504 0.9969 0110 0.00433 0.0790 0.9910 0.00400 0.0444 0.9937 0110C 0.00458 0.0740 0.9878 0.00387 0.0642 0.9947 0101 0.00592 0.0744 0.9793 0.00477 0.0410 0.9973 0101C 0.00469 0.0621 0.9872 0.00437 0.0461 0.9977 0011 0.02788 0.2731 0.9082 0.01040 0.2074 0.9461 0011C 0.01552 0.3288 0.8756 0.00534 0.0456 0.9980 1110 0.02969 0.2085 0.8464 0.00944 0.2541 0.9802 1110C 0.02198 0.2901 0.8942 0.00826 0.2469 0.9821 1101 0.02528 0.2519 0.8675 0.01036 0.2266 0.9731 1101C 0.02032 0.3021 0.8467 0.00822 0.2234 0.9666 0111 0.02463 0.2781 0.8801 0.00779 0.2372 0.9705 0111C 0.00988 0.4363 0.9618 0.00584 0.1963 0.9802 1011 0.01212 0.2989 0.8830 0.00637 0.1738 0.9794 1011C 0.01014 0.3066 0.9103 0.00755 0.2471 0.9709 1111 0.00490 0.0688 0.9828 0.00383 0.0452 0.9966 1111C 0.00505 0.0465 0.9798 0.00383 0.0430 0.9973 Note: Sets ending in "C" are controls. Those not ending in "C" include treatment with the antibiotic cefotetan (CTT) at a concentration of 0.063 µg/ml.
61
In each set, a reading interval of 60 minutes improved the correlation coefficient R by an average of 0.053 across all sets. In all but one set, a reading interval of 60 minutes improved the V-score, and the average improvement was two fold. We conclude that reading too frequently relative to the growth rate reduces the reliability of the growth rate estimates and increases the variability. We applied CGR to the 45 experiments performed in 2014, one of which is referenced in Table 4-1. One experiment consists of growth rates measured from 16 variant genotypes grown with and without an antibiotic treatment. For each genotype there were 12 experimental replicate growth rate measurements with one antibiotic at one concentration, and 12 control replicate growth rate measurements, without treatment. The 16 genotypes we used were TEM β-lactamase variants expressed in Escherichia coli K12. We performed 45 separate experiments in different antibiotic treatments. This design requires that we have confidence in the reliability of the mean growth rates of all 16 experimental and control sets in each experiment. We used a reading interval of 60 minutes and a minimum mean correlation coefficient of 0.95 for each set, as a standard for growth rate reliability. Fourteen of the 45 experiments were acceptable, meaning that none of the 16 genotypes in any of those 14 experiments had unreliable growth rates either in the presence or absence of antibiotics. Repetitions in 2017 brought the number of acceptable experiments up to 29. Measuring variation within growth rate replicates (V-score) The first source of variation we consider is variation among replicates within a single set. We measure that variation using a Variability-score, or V-score (V= s.e./mean) where s.e. is the standard error of the mean. For example, if the mean growth rate is 0.02 per minute, then a s.e. of 0.0001 (V = 0.005) is considered small and indicates that there is little variation among replicates. However, if the mean growth rate is 0.0005 per minute, then a s.e. of 0.0001 (V = 0.2) indicates that there is high variation among replicates. The s.e. alone is insufficient to give a clear picture of the extent of the variation. The lower V-score clearly implies less variation. Thus the lower the V-score, the tighter the fit around the mean growth rate of each data set. After determining the accepted experiments based on a minimum correlation coefficient of 0.95, we wanted to determine a threshold of variation within a group in which we can use to accept or reject an experiment. We plotted the frequency of control group V-scores from the 2014 experiments and determined the best-fit distribution (Figure 4-2). Based on the Kolmogorov-Smirnov test, a statistical test that measures the fit of a dataset to a distribution, the Weibull distribution was the most significant fit to our data. (It is important to note that one would need to

62
calculate one’s own threshold of variation based on her data). Using the Weibull distribution, we calculated an upper 95% confidence limit (0.053) and determined that any experiments with V-scores above 0.053 should be repeated because of high variation within groups.
Figure 4-2: Distribution of mean V-scores of TEM-85 2014 data. This TEM-85 2014 data has been accepted based on the correlation coefficient thresholds (R > 0.95). Data was fit to three distributions; exponential distribution in a dashed line (p-value 0.007), Weibull distribution in a solid line (p-value 9.1 X 10⁻⁵), and normal distribution in a dotted line (p-value 0.0253). Based on the V-score threshold from the Weibull distribution, two of the 14 acceptable experiments needed to be repeated (Table 4-2). Although the 2014 experiments in Table 2 were acceptable by the criterion of having all correlation coefficients ≥ 0.95, they were repeated because the mean V-scores exceeded the threshold of 0.053. The experiments that were repeated in 2017 had V-scores below the 95% confidence limit threshold. Table 4-2 V-scores of acceptable experiments that were repeated because of high V-scores 2014 2017
Repeat 1 2017 Repeat 2
Treatment (µg/mL)
Control Experimental Control Experimental Control Experimental
CTT 0.125 0.0739 0.1433 0.0195 0.0296 0.0173 0.0249 CXM 3 0.1187 0.0818 0.0209 0.0167 0.0159 0.0166 Note: CTT = Cefotetan, CXM = Cefuroxime.
63
Based on our 29 reliable experiments, we found that for control data (no antibiotic present) the mean V-score was 0.0189 ±0.00099 with a range of 0.0121 to 0.0321. Since the control conditions involve no antibiotic, we judge that this level of variation reflects random variation in day-to-day conditions and variation in growth rates for each genotype. The mean V-score for experimental data (antibiotic present) was 0.0293 ±0.00198 with a range of 0.0124 to 0.0502. The presence of an antibiotic (or other growth inhibitor) significantly increases variability, and hence increases V-scores. The experiment shown in Table 4-1 was among those rejected because of correlation coefficients <0.95. In that experiment the mean V-score (including control sets and experimental sets) was 0.1437. Table 4-1 shows that many of the experimental sets had V-scores between 0.2 and 0.25. Many of the other rejected experiments had mean V-scores > 0.1 as well, more than twice of what was seen for the accepted experiments. This is consistent with the earlier observation that low correlation coefficients are associated with high V-scores. Of the thirty-one 2014 experiments that were rejected because of correlation coefficients < 0.95, nineteen would also have been rejected on the basis of their V-scores. Bootstrapping: Confidence levels when comparing growth rates Variation within a set of growth rate replicates also contributes to uncertainty when sets of growth rates are compared, e.g. when trying to determine the fittest strain or the optimum condition. When comparing two sets the objective is to determine which one grows faster. If the growth rates of all the members of set 1 are greater than the growth rates of all the members of set 2 (there is no overlap in growth rates) then we can assume that the cultures in set 1 will always grow faster than the cultures in set 2. But, if the distributions of growth rates overlap, we are less confident, and the more the distributions overlap the less confident we are. If we were to do another experiment, how likely is it that those cultures in set 1 will be favored? We could repeat the experiment many times and count the number of times that the mean growth rate of set 1 is greater than that of set 2, but that is time consuming and expensive. Alternatively, we can accomplish the same objective statistically by bootstrap sampling. Let's consider an example in which the two "conditions" are two different strains of the same species growing in identical media. Suppose that each set has 10 replicate cultures. We randomly sample, with replacement, 10 growth rates from set 1 to make up a new "bootstrap sample" (139). We do the same for set 2. We
64
do this thousands of times keeping track of how many times set 1 grows faster than set 2 and vice versa. Let’s assume that set 1 grows faster in 90% of the bootstrap samples and set 2 grows faster in 10% of the samples. We can now say with 90% confidence that set 1 cultures grow faster than set 2 cultures. If set 1 grows faster in only 50.01% of the samples then we might still say that set 1 grows faster than set 2, but our confidence is much lower (i.e. only 50.01% confident). It would be more accurate to say that the growth rates of the two strains are indistinguishable. In practice, we always use an odd number of bootstrap samples so that there can never be an exact tie between the two sets. Thus we can determine which strain grows faster and the confidence that supports that statement. This same approach can be extended to compare more than two sets. Using the bootstrap approach we can do all possible pairwise comparisons in each bootstrap replicate. We define a group as a group of sets that have some property in common. Often members of a group are to be compared in order to determine which set grows fastest. For instance, among a group of 10 sets we might find that set 4 grows fastest in 45% of the bootstrap replicates, set 7 grows fastest in 35% of the replicates, set 2 grows fastest in 20% of the replicates, and none of the remaining sets ever grow fastest. Using the "comparison score" to determine the number of bootstrap replicates to use. Because of the stochastic element in bootstrap sampling, different bootstrap runs on the same data are not identical. CGR does pairwise comparisons of all of the bootstrap runs to assess their reproducibility. Each bootstrap run determines the fraction of bootstrap replicates in which each set grew fastest and saves that information in Table 4-1 of a report file for that bootstrap run. The comparison score is the sum of the absolute value of the differences of the values in those tables of the runs being compared. For instance, if a set grew fastest in 0.9 of the replicates in one run, but grew fastest in only 0.83 of the replicates in the other run the absolute values of the differences is 0.07. The comparison score for that pair of runs is the sum of those differences over all sets. If the results of the different runs were identical, the differences would be zero; because the values in each table sum to 1.0 the upper limit of the score is 2.0. Thus, the lower the comparison score the more similar are the two bootstrap runs being compared. Because of stochastic variation, the more bootstrap replicates in a run, the more similar are the results of the runs. Figure 4-3 shows that as the number of bootstrap replicates per run increases the comparison score decreases (i.e. the runs become more similar), but increasing the number of bootstrap replicates beyond 10,001 results in very little improvement in comparison scores.
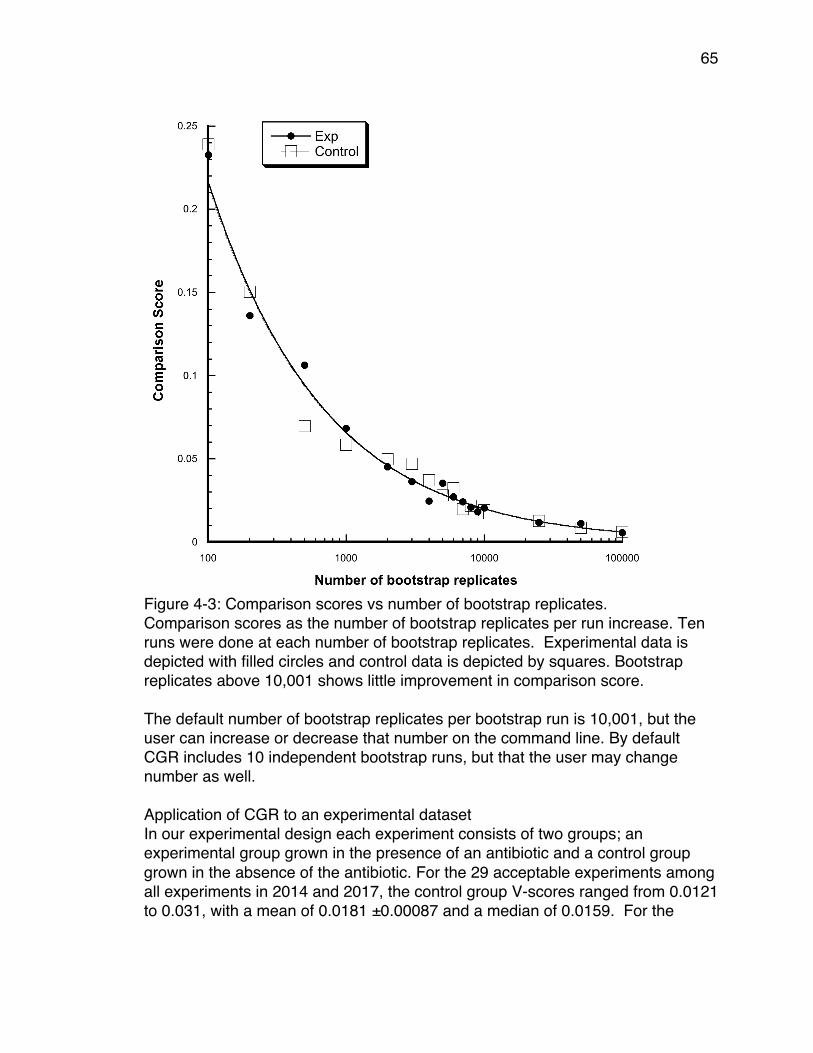
65
Figure 4-3: Comparison scores vs number of bootstrap replicates. Comparison scores as the number of bootstrap replicates per run increase. Ten runs were done at each number of bootstrap replicates. Experimental data is depicted with filled circles and control data is depicted by squares. Bootstrap replicates above 10,001 shows little improvement in comparison score. The default number of bootstrap replicates per bootstrap run is 10,001, but the user can increase or decrease that number on the command line. By default CGR includes 10 independent bootstrap runs, but that the user may change number as well. Application of CGR to an experimental dataset In our experimental design each experiment consists of two groups; an experimental group grown in the presence of an antibiotic and a control group grown in the absence of the antibiotic. For the 29 acceptable experiments among all experiments in 2014 and 2017, the control group V-scores ranged from 0.0121 to 0.031, with a mean of 0.0181 ±0.00087 and a median of 0.0159. For the
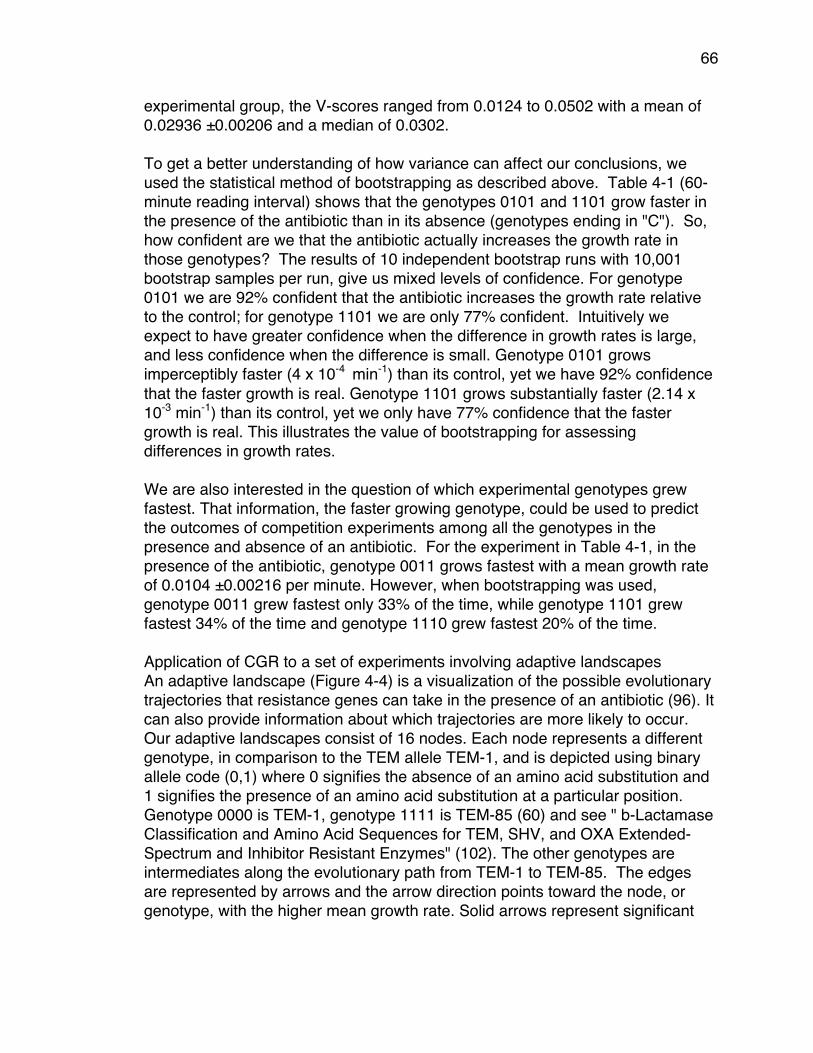
66
experimental group, the V-scores ranged from 0.0124 to 0.0502 with a mean of 0.02936 ±0.00206 and a median of 0.0302. To get a better understanding of how variance can affect our conclusions, we used the statistical method of bootstrapping as described above. Table 4-1 (60-minute reading interval) shows that the genotypes 0101 and 1101 grow faster in the presence of the antibiotic than in its absence (genotypes ending in "C"). So, how confident are we that the antibiotic actually increases the growth rate in those genotypes? The results of 10 independent bootstrap runs with 10,001 bootstrap samples per run, give us mixed levels of confidence. For genotype 0101 we are 92% confident that the antibiotic increases the growth rate relative to the control; for genotype 1101 we are only 77% confident. Intuitively we expect to have greater confidence when the difference in growth rates is large, and less confidence when the difference is small. Genotype 0101 grows imperceptibly faster (4 x 10⁻⁴ min-1) than its control, yet we have 92% confidence that the faster growth is real. Genotype 1101 grows substantially faster (2.14 x 10⁻³ min-1) than its control, yet we only have 77% confidence that the faster growth is real. This illustrates the value of bootstrapping for assessing differences in growth rates. We are also interested in the question of which experimental genotypes grew fastest. That information, the faster growing genotype, could be used to predict the outcomes of competition experiments among all the genotypes in the presence and absence of an antibiotic. For the experiment in Table 4-1, in the presence of the antibiotic, genotype 0011 grows fastest with a mean growth rate of 0.0104 ±0.00216 per minute. However, when bootstrapping was used, genotype 0011 grew fastest only 33% of the time, while genotype 1101 grew fastest 34% of the time and genotype 1110 grew fastest 20% of the time. Application of CGR to a set of experiments involving adaptive landscapes An adaptive landscape (Figure 4-4) is a visualization of the possible evolutionary trajectories that resistance genes can take in the presence of an antibiotic (96). It can also provide information about which trajectories are more likely to occur. Our adaptive landscapes consist of 16 nodes. Each node represents a different genotype, in comparison to the TEM allele TEM-1, and is depicted using binary allele code (0,1) where 0 signifies the absence of an amino acid substitution and 1 signifies the presence of an amino acid substitution at a particular position. Genotype 0000 is TEM-1, genotype 1111 is TEM-85 (60) and see " b-Lactamase Classification and Amino Acid Sequences for TEM, SHV, and OXA Extended-Spectrum and Inhibitor Resistant Enzymes" (102). The other genotypes are intermediates along the evolutionary path from TEM-1 to TEM-85. The edges are represented by arrows and the arrow direction points toward the node, or genotype, with the higher mean growth rate. Solid arrows represent significant
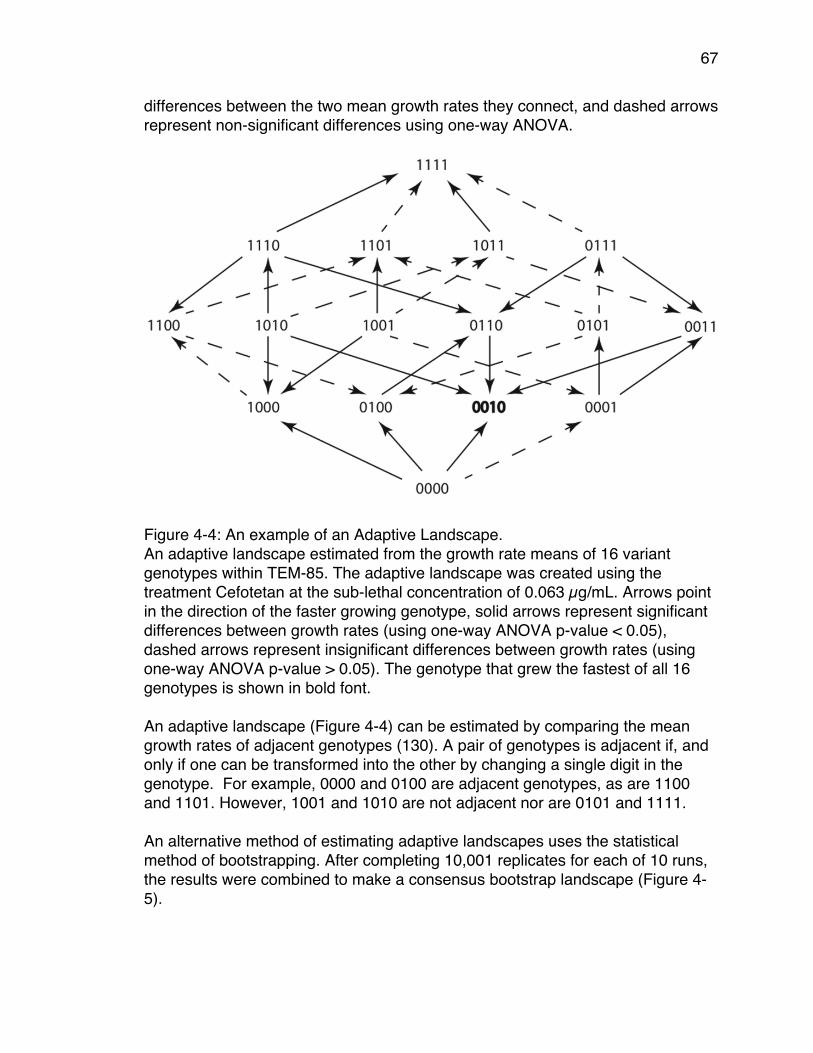
67
differences between the two mean growth rates they connect, and dashed arrows represent non-significant differences using one-way ANOVA.
Figure 4-4: An example of an Adaptive Landscape. An adaptive landscape estimated from the growth rate means of 16 variant genotypes within TEM-85. The adaptive landscape was created using the treatment Cefotetan at the sub-lethal concentration of 0.063 µg/mL. Arrows point in the direction of the faster growing genotype, solid arrows represent significant differences between growth rates (using one-way ANOVA p-value < 0.05), dashed arrows represent insignificant differences between growth rates (using one-way ANOVA p-value > 0.05). The genotype that grew the fastest of all 16 genotypes is shown in bold font. An adaptive landscape (Figure 4-4) can be estimated by comparing the mean growth rates of adjacent genotypes (130). A pair of genotypes is adjacent if, and only if one can be transformed into the other by changing a single digit in the genotype. For example, 0000 and 0100 are adjacent genotypes, as are 1100 and 1101. However, 1001 and 1010 are not adjacent nor are 0101 and 1111. An alternative method of estimating adaptive landscapes uses the statistical method of bootstrapping. After completing 10,001 replicates for each of 10 runs, the results were combined to make a consensus bootstrap landscape (Figure 4-5).
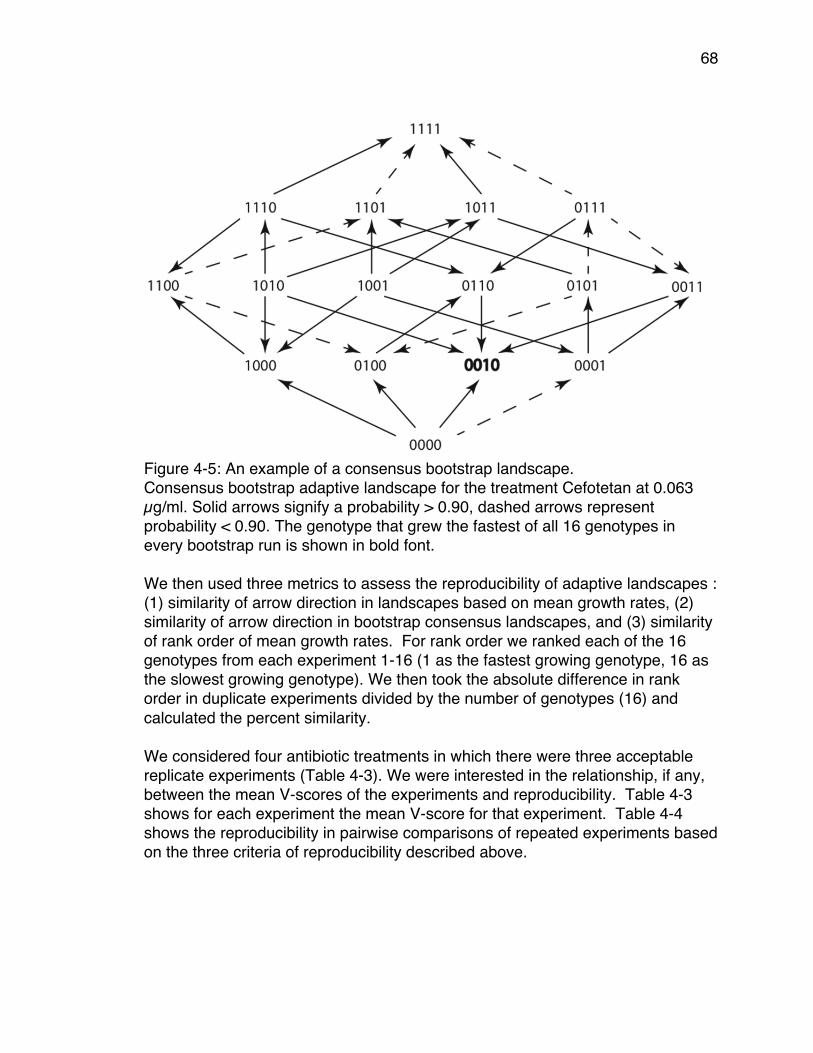
68
Figure 4-5: An example of a consensus bootstrap landscape. Consensus bootstrap adaptive landscape for the treatment Cefotetan at 0.063 µg/ml. Solid arrows signify a probability > 0.90, dashed arrows represent probability < 0.90. The genotype that grew the fastest of all 16 genotypes in every bootstrap run is shown in bold font. We then used three metrics to assess the reproducibility of adaptive landscapes : (1) similarity of arrow direction in landscapes based on mean growth rates, (2) similarity of arrow direction in bootstrap consensus landscapes, and (3) similarity of rank order of mean growth rates. For rank order we ranked each of the 16 genotypes from each experiment 1-16 (1 as the fastest growing genotype, 16 as the slowest growing genotype). We then took the absolute difference in rank order in duplicate experiments divided by the number of genotypes (16) and calculated the percent similarity. We considered four antibiotic treatments in which there were three acceptable replicate experiments (Table 4-3). We were interested in the relationship, if any, between the mean V-scores of the experiments and reproducibility. Table 4-3 shows for each experiment the mean V-score for that experiment. Table 4-4 shows the reproducibility in pairwise comparisons of repeated experiments based on the three criteria of reproducibility described above.
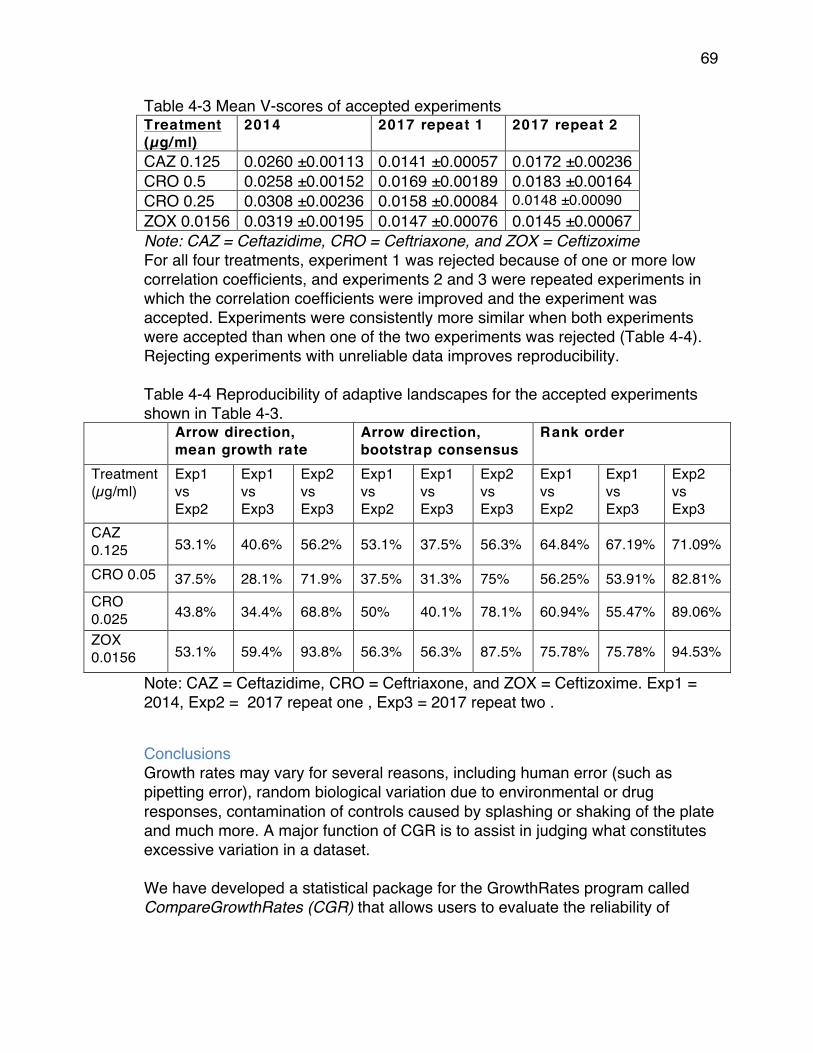
69
Table 4-3 Mean V-scores of accepted experiments Treatment (µg/ml)
2014 2017 repeat 1 2017 repeat 2
CAZ 0.125 0.0260 ±0.00113 0.0141 ±0.00057 0.0172 ±0.00236 CRO 0.5 0.0258 ±0.00152 0.0169 ±0.00189 0.0183 ±0.00164 CRO 0.25 0.0308 ±0.00236 0.0158 ±0.00084 0.0148 ±0.00090 ZOX 0.0156 0.0319 ±0.00195 0.0147 ±0.00076 0.0145 ±0.00067 Note: CAZ = Ceftazidime, CRO = Ceftriaxone, and ZOX = Ceftizoxime For all four treatments, experiment 1 was rejected because of one or more low correlation coefficients, and experiments 2 and 3 were repeated experiments in which the correlation coefficients were improved and the experiment was accepted. Experiments were consistently more similar when both experiments were accepted than when one of the two experiments was rejected (Table 4-4). Rejecting experiments with unreliable data improves reproducibility. Table 4-4 Reproducibility of adaptive landscapes for the accepted experiments shown in Table 4-3.
Arrow direction, mean growth rate
Arrow direction, bootstrap consensus
Rank order
Treatment (µg/ml)
Exp1 vs Exp2
Exp1 vs Exp3
Exp2 vs Exp3
Exp1 vs Exp2
Exp1 vs Exp3
Exp2 vs Exp3
Exp1 vs Exp2
Exp1 vs Exp3
Exp2 vs Exp3
CAZ 0.125 53.1% 40.6% 56.2% 53.1% 37.5% 56.3% 64.84% 67.19% 71.09%
CRO 0.05 37.5% 28.1% 71.9% 37.5% 31.3% 75% 56.25% 53.91% 82.81% CRO 0.025 43.8% 34.4% 68.8% 50% 40.1% 78.1% 60.94% 55.47% 89.06%
ZOX 0.0156 53.1% 59.4% 93.8% 56.3% 56.3% 87.5% 75.78% 75.78% 94.53%
Note: CAZ = Ceftazidime, CRO = Ceftriaxone, and ZOX = Ceftizoxime. Exp1 = 2014, Exp2 = 2017 repeat one , Exp3 = 2017 repeat two .
Conclusions Growth rates may vary for several reasons, including human error (such as pipetting error), random biological variation due to environmental or drug responses, contamination of controls caused by splashing or shaking of the plate and much more. A major function of CGR is to assist in judging what constitutes excessive variation in a dataset. We have developed a statistical package for the GrowthRates program called CompareGrowthRates (CGR) that allows users to evaluate the reliability of

70
growth rates and to measure the amount of variation within their growth rate datasets. Even on a data set consisting of 384 individual growth rates CGR requires less than 3 minutes to complete its analysis on a mid-2011 iMac with an Intel i7 processor and 16 GB of RAM. The program CGR provides a broader view of the population dynamics of a set of co-existing and competing genotypes than does just examination of the mean growth rates of the individual sets. That broader view is likely to provide more realistic understanding of experimental outcomes. CGR is freely available as a package for Mac OS X, Linux, and Windows at https://sourceforge.net/projects/growthrates/, the same site that provides the GrowthRates program itself. The package includes the CGR executable for all three platforms, a detailed User Guide, the python source code, and an example folder. The correlation coefficient is an effective way to measure the reliability of mean growth rates of a set. We used a minimum mean correlation coefficient of 0.95 to consider the mean growth rate of a set of replicate cultures to be reliable. Other investigators may well use different minimum correlation coefficients. Our experimental design required us to reject an experiment if any of the sets of replicates fell below that minimum of R < 0.95. That will certainly not always be the case. Many designs will permit rejection and replication of just those sets that are unreliable. The V-score metric is an effective way to measure the amount of variation within a set of replicate growth rate data points. We find that even when the data are reliable, high mean V-scores reduce the reproducibility of experiments (Table 4-4). High V-scores are often associated with low correlation coefficients, but that is not always the case. Excessive variation can also arise from other unknown factors. The V-score metric is a descriptive statistic, but it can also be used as a criterion for rejecting and repeating experiments that are acceptable on the basis of correlation coefficients. In the laboratory, and in the real world, there is no way to completely account for random biological variation. By reading O.D.s at intervals appropriate to the slowest growth rates we were able to increase correlation coefficients of slow-growing sets. By using CGR, and rejecting experiments with unreliable data or excessive variation we were able to lower the variability in our results and as a consequence, increase the reliability of our interpretations. By using a bootstrap statistic, it becomes possible to compute the robustness of our interpretations of data. We recommend that users of the GrowthRates program use this statistical package to assess the quality of their data and to assist in their interpretations.
71
Chapter 5: Does Antibiotic Resistance Evolve in Hospitals? Introduction Antibiotic resistance is a global problem that results from selective pressures imposed by antibiotic consumption on an industrial scale (43). Most antibiotic consumption occurs in agricultural, clinical, and outpatient settings. Immigration of resistant strains throughout the world has made the emergence of resistance to antibiotics a global problem (140, 141). However, regional differences in the first appearance of resistant genotypes and their subsequent frequencies indicate the importance of local factors (142). It is unclear whether global population dynamics, regional factors, or immediate proximity to antibiotics determines the frequencies of specific resistance phenotypes in a defined location, such as a hospital. Any insight into this problem could have major effects on public health policy. The success of a hospital-centered effort to reduce antibiotic resistance depends on whether antibiotic resistance is actually evolving in hospitals. Anecdotal evidence supports this assumption. For example, in 2011 the U.S. National Institutes of Health Clinical Center experienced an outbreak of carbapenam-resistant K. pneumonia that affected 18 patients, 11 of whom died (143). This scenario illustrates that a specific bacterial strain from a single patient can become endemic within hospitals, and likely evolve within the hospital environment. Typically when evolution of antibiotic resistance is studied within a hospital, it is either with respect to clonal outbreaks (144), or to evolution in individual patients with long-term infections (145). While important, these studies do not address the majority of transmission events in hospitals. For less virulent strains, the associated transmission of antibiotic resistance goes undetected. Such transmission is harder to track and deserves attention. Many hospitals have attempted to reduce the frequencies of resistant isolates, with mixed success. Cycling antibiotics in individual spinal cord patients has shown promising results for preventing the emergence of multi-drug resistant urinary tract infections (146). In a review article (147) analyzing the efficacy of cycling, the results showed that decreasing consumption of aminoglycosides in hospitals tends to reduce resistance to them. However, for β-lactam antibiotics there is no clear trend of reduced resistance in response to reduced consumption. This may be due to many factors, including the choice of
72
antibiotics, the duration of therapies, and outside factors such as immigration into the hospital from the surrounding community. There have also been attempts to ameliorate the resistance problem at larger scales than a single hospital. These too have delivered mixed results. Despite a nationwide effort to reduce β-lactam prescriptions in Turkey, β-lactam resistance increased, except for carbapenam resistance in Pseudomonas and Acinetobacter. The frequency of Methicillin Resistant Staphylococcus aureus (MRSA) also decreased (148). Efforts in agricultural settings have seemed promising. In Denmark, an agricultural ban of growth promoting antibiotics resulted in a significant decrease in the frequency of ampicillin, nalidixic acid, sulfonamide, tetracycline, erythromycin, and streptomycin resistant bacteria in food animals (149). The ban also resulted in a decrease in Vancomycin Resistant Enterococci (VRE) in both animal and human populations (150). We seek to answer the question of whether evolution of antibiotic resistance occurs in a hospital. By “evolution”, we mean that the historical resistance phenotypes present in the hospital have a causative effect on the resistance phenotypes that are subsequently present in the hospital. The alternative is that antibiotic resistance is due to immigration into the hospital from the surrounding area. If resistance is due to immigration, then the distribution of resistance phenotypes in the hospital will be the proportions present in the wider population. On the other hand, if resistance evolves in the hospital, the distribution will deviate from such proportions. The relevant dynamics are discussed in Section 4. Transmission of resistance in the hospital can occur via horizontal gene transfer between strains of bacteria that are either infectious or commensal (151, 152). It can also occur via transfer of bacteria between individuals, both patients and health care workers, through either direct or indirect contact. Various mathematical models have been created to test the influences of different elements in the hospital (153-155). Testing resistance trends using such models requires a hospital to gather extra data. We develop a simpler model, based on data that hospitals typically gather, for determining whether transmission of resistance occurs in the hospital. We conducted a case study with the Dignity Health Mercy Medical Center, a small community hospital in the Central Valley of California. Collaboration with a hospital was critical for this study because HIPAA patient privacy laws prevent patient data from becoming publicly available. We had access to de-identified patient data associated with ESBL strains for a 2.5 year interval. We developed a mathematical model and hypothesis test for the emergence of resistance. This is available as a statistical software package in R. We analyzed temporal data of
73
the resistance phenotypes of patient isolates. The unit of analysis in this study is the resistance phenotypes of patient isolates. Although there may be multiple resistance genes that confer each phenotype, aggregating based on phenotype allows us to see that one of the resistance genes was present (63, 156-158). While it would be ideal to have genomic sequence data to accompany resistance data, those data are not currently available to us, nor are they commonly available to most hospitals, particularly those in developing nations. Additionally, despite the widespread use of sequencing, it has not replaced resistance phenotype assays because the presence of a gene does not ensure its expression. Therefore, we use resistance phenotype as a less exact way of detecting transmission of resistance within a hospital. This article is organized as follows. In Section 2 we describe the data for our study: 592 multi-drug resistant isolates along with patient records from the community hospital. In Section 3 we examine the dependence of antibiotic resistance on factors other than time, by estimating a graphical model (159). We found no association between resistance and other patient factors (age, gender, infectious species, and sample type).This reduces each patient record to a pair consisting of the date of isolation and resistance phenotype. In Section 4 we introduce a mathematical model of transmission that assigns weights to pairs of such pairs. It uses the negative binomial distribution and is inspired by existing infection models. Parameters are learned from the medical literature. Section 5 is the heart of this paper. We introduce the NERD method, which tests whether the time course data are random or not, relative to our transmission model. The p-values of this hypothesis test are computed for 16 antibiotics. For 13 antibiotics we found no significance, but for 3 antibiotics (Cefepime, Ceftazidime and Gentamicin) we did find significance. These findings are interpreted and analyzed further in Section 6. Section 7 offers a broader discussion of the meaning of our results, and whether it can say something about bacterial evolution in hospitals under drug pressure. Patient Data and Resistance Phenotypes A total of 592 Extended Spectrum β-lactamases (ESBLs) samples were collected from patients seen at Dignity Health Mercy Medical Center in Merced, California, between June 24, 2013 and January 23, 2016. ESBL strains are particularly interesting because they usually contain Class A β-lactamases that evolve very quickly and very specifically in response to clinical consumption of β-lactam antibiotics (160). In a previous study (134), we identified β-lactam treatment plans that could reverse the evolution of ESBL resistant bacteria to penicillin and narrow spectrum β-lactam antibiotic. In this study we wanted to determine whether such a treatment plan makes sense in a hospital environment, or
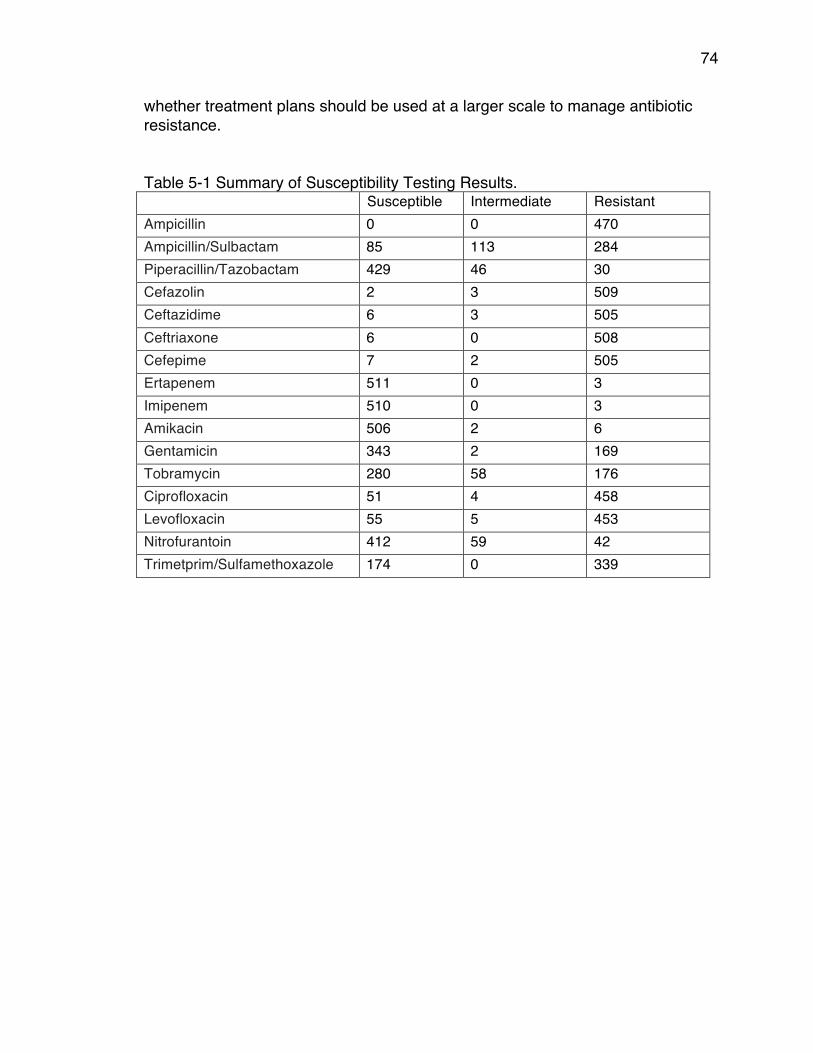
74
whether treatment plans should be used at a larger scale to manage antibiotic resistance. Table 5-1 Summary of Susceptibility Testing Results. Susceptible Intermediate Resistant Ampicillin 0 0 470 Ampicillin/Sulbactam 85 113 284 Piperacillin/Tazobactam 429 46 30 Cefazolin 2 3 509 Ceftazidime 6 3 505 Ceftriaxone 6 0 508 Cefepime 7 2 505 Ertapenem 511 0 3 Imipenem 510 0 3 Amikacin 506 2 6 Gentamicin 343 2 169 Tobramycin 280 58 176 Ciprofloxacin 51 4 458 Levofloxacin 55 5 453 Nitrofurantoin 412 59 42 Trimetprim/Sulfamethoxazole 174 0 339
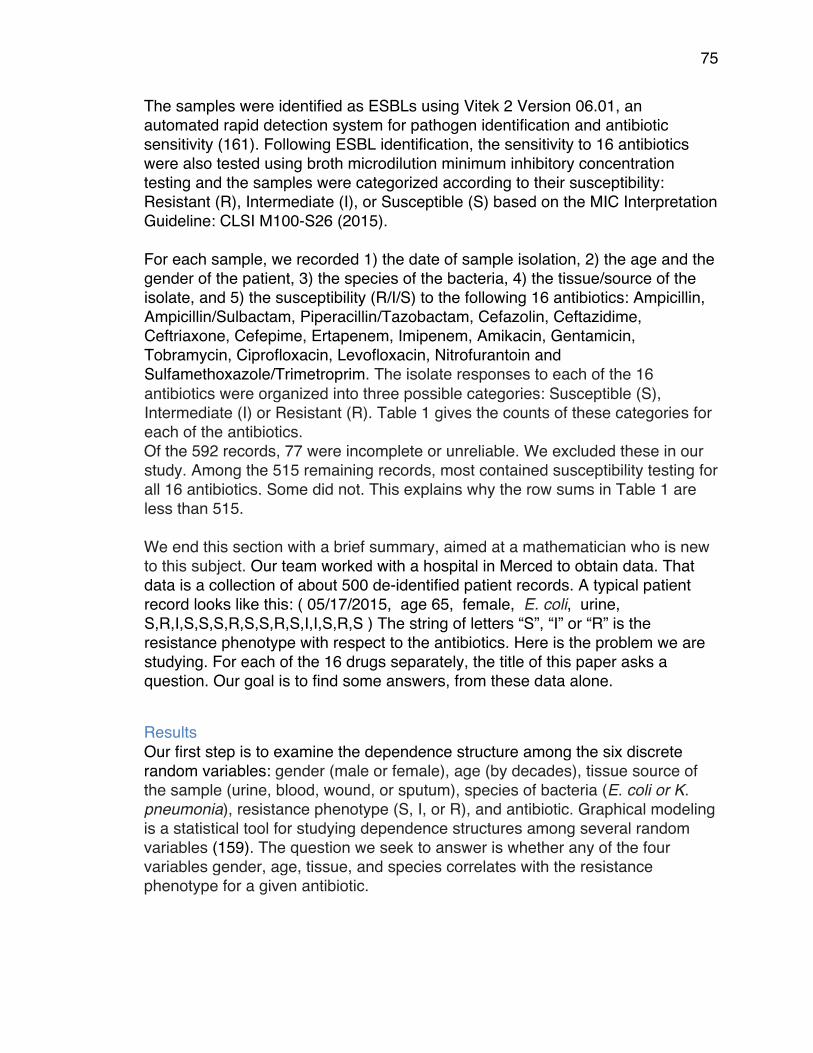
75
The samples were identified as ESBLs using Vitek 2 Version 06.01, an automated rapid detection system for pathogen identification and antibiotic sensitivity (161). Following ESBL identification, the sensitivity to 16 antibiotics were also tested using broth microdilution minimum inhibitory concentration testing and the samples were categorized according to their susceptibility: Resistant (R), Intermediate (I), or Susceptible (S) based on the MIC Interpretation Guideline: CLSI M100-S26 (2015). For each sample, we recorded 1) the date of sample isolation, 2) the age and the gender of the patient, 3) the species of the bacteria, 4) the tissue/source of the isolate, and 5) the susceptibility (R/I/S) to the following 16 antibiotics: Ampicillin, Ampicillin/Sulbactam, Piperacillin/Tazobactam, Cefazolin, Ceftazidime, Ceftriaxone, Cefepime, Ertapenem, Imipenem, Amikacin, Gentamicin, Tobramycin, Ciprofloxacin, Levofloxacin, Nitrofurantoin and Sulfamethoxazole/Trimetroprim. The isolate responses to each of the 16 antibiotics were organized into three possible categories: Susceptible (S), Intermediate (I) or Resistant (R). Table 1 gives the counts of these categories for each of the antibiotics. Of the 592 records, 77 were incomplete or unreliable. We excluded these in our study. Among the 515 remaining records, most contained susceptibility testing for all 16 antibiotics. Some did not. This explains why the row sums in Table 1 are less than 515. We end this section with a brief summary, aimed at a mathematician who is new to this subject. Our team worked with a hospital in Merced to obtain data. That data is a collection of about 500 de-identified patient records. A typical patient record looks like this: ( 05/17/2015, age 65, female, E. coli, urine, S,R,I,S,S,S,R,S,S,R,S,I,I,S,R,S ) The string of letters “S”, “I” or “R” is the resistance phenotype with respect to the antibiotics. Here is the problem we are studying. For each of the 16 drugs separately, the title of this paper asks a question. Our goal is to find some answers, from these data alone.
Results Our first step is to examine the dependence structure among the six discrete random variables: gender (male or female), age (by decades), tissue source of the sample (urine, blood, wound, or sputum), species of bacteria (E. coli or K. pneumonia), resistance phenotype (S, I, or R), and antibiotic. Graphical modeling is a statistical tool for studying dependence structures among several random variables (159). The question we seek to answer is whether any of the four variables gender, age, tissue, and species correlates with the resistance phenotype for a given antibiotic.
76
To this end, we organize the hospital data from Section 2 in a contingency table of format 2 x 10 x 4 x 2 x 3 x 16. We fit a graphical model to that table using the methods in the book Graphical Models in R (162). We use the algorithm described in Section 2.4 of this book. The algorithm searches through the space of all graphs and terminates when it has locally maximized the Akaike Information Criterion (AIC). It does not assign p-values to edges in the resulting graph. The algorithm proceeds as follows. Starting from the full independence model (the graph with no edges), we compute the AIC at each stage of edge insertion. This was done using the function forward in the “gRim” package for the statistics software “R” (163). This aims to ascertain the correct balance between numbers of edges (parameters) and fit to the data. We also ran the algorithm that starts from the saturated model (the graph with all edges), and uses the backward function to compute the AIC of successive edge deletions. Both the forward algorithm and the backward algorithm terminated with the graph with six nodes and seven edges that is shown in Figure 5-1. This preliminary analysis with graphical models suggests that Age, Tissue, Species and Gender are not correlated to the emergence of resistance. We therefore disregarded those variables in the subsequent analysis. For our study of the evolution of resistance, we used only the date of isolation, the antibiotic and the resistance information.
77
Figure 5-1: Best fitting graphical model. Each node is a discrete random variable. An edge between two nodes indicates statistical dependence. The first four nodes, (age, gender, tissues and species) have no edges to the last two nodes (antibiotics, R/I/S). The disconnectedness indicates statistical independence.

78
Hospital Transmission Model Our study and hypothesis test rest on a probabilistic model we introduce for hospital-based transmission of antibiotic resistance between patients. We seek a model for patient interactions at the hospital, either direct or indirect, that have a causal effect on the resistance phenotype of the latter patient. In what follows, “transmission” is taken to mean “hospital-based transmission of antibiotic resistance from one patient to another”. The image we have in mind for our model is the following. There is a relationship between the resistance mechanisms carried by individual patient isolates and those carried by endemic bacteria at the hospital. When patients arrive, they are exposed to the endemic hospital bacteria. Resistance genes and/or the bacteria may then be transmitted to the patients, possibly after undergoing some evolution. When the resistance information of an individual patient isolate is measured, it gives an indication as to the resistance phenotype of the surrounding hospital bacteria. Our study uses the phenotypes of patient isolates as a proxy for understanding the resistance mechanisms of the hospital bacteria. There are many complicated patterns of causality at play here. The model identifies those that are consistent with a change that takes place in the hospital. Single outbreak: Our model is based on the distribution of subsequent patient infections following a single bacterial clonal outbreak in a hospital. In such cases, whether the initial outbreak strain affects a patient depends on the time that has elapsed since the introduction of that strain. If the infectious strain of a latter patient is checked just hours after the outbreak strain’s arrival, it is unlikely that there has been transmission. Likewise, transmission is unlikely if the latter patient visits the hospital several years after the original outbreak. Between these extreme time-points, likelihood of contamination is higher. We discretize the temporal information in units of “days”. The random variable X is the number of days before a subsequent infection. We assume that X follows the negative binomial distribution. We do not restrict to patients affected directly by the original patient, but rather all subsequently affected patients. Note that often the negative binomial distribution is used to model the number of secondary patient infections, as in (164). The justification for the use of the distribution in the present context is given below. The negative binomial distribution is a discrete probability distribution on the set of non-negative integers k. It has two parameters p and r. The probability mass function is
𝑃 𝑥 = 𝑘 = 𝑘 + 𝑟 − 1𝑘 𝑝!(1− 𝑝)! .
79
Each trial can be either a success (with probability 𝑝) or a failure (with probability 1− 𝑝). The distribution models the number of successes before 𝑟 failures. The parameter r is known as the over-dispersion parameter. The mean of the distribution is 𝑚 = !"
!!!.
The negative binomial distribution is applied to the random variable 𝑋, the number of days before a subsequent infection, according to the following rationale. Each day is a trial. Failure in a trial represents contact between a patient and endemic sources of resistance that day. The success probability p is the probability there is no contact. On the 𝑟’th instance of contact with a patient, transmission of endemic resistance occurs. Transmission of antibiotic resistance: We extend the scope of applicability of the negative binomial model to the set-up of our study. Starting at an initial patient isolate, the random variable 𝑋 is the number of days before a transmission causes a latter isolate to have resistance phenotype caused by the first patient isolate. Transmission of antibiotic resistance may also involve a change in phenotype. General transmission cases are harder to detect than single outbreaks; our assumption is that the distribution is the same. The “single outbreak” case above is the specialization to where the first patient possesses a deadly bacterial strain, and we model the number of days until transmission of the strain to a latter patient occurs. The two parameters in the negative binomial distribution affect the probabilities of the states of the random variable. The scale at which the process is being studied affects these probabilities. Transmission over larger scales than the hospital can occur after a larger number of days. At a global scale, transmission can sometimes be detected years later in another location (165). The choice of parameters in our distribution specializes the set-up to hospital-based transmission. We collected information from the medical literature to estimate the values of the parameters for our study. Table 5-2 gives observed statistical parameters for the occurrence of antibiotic resistance following a hospital outbreak. This is likely to depend on many factors about a hospital, some of which are included below. We also note that the variance far exceeds the mean, and as such the data are over-dispersed.
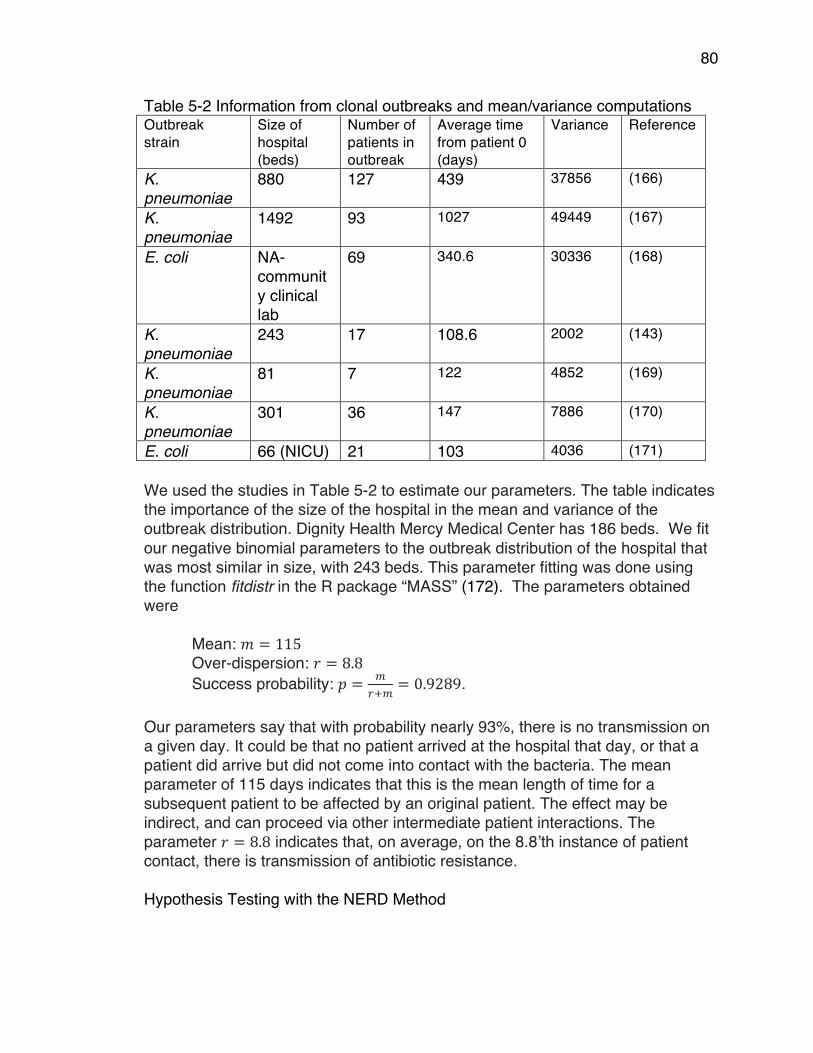
80
Table 5-2 Information from clonal outbreaks and mean/variance computations Outbreak strain
Size of hospital (beds)
Number of patients in outbreak
Average time from patient 0 (days)
Variance Reference
K. pneumoniae
880 127 439 37856 (166)
K. pneumoniae
1492 93 1027 49449 (167)
E. coli NA-community clinical lab
69 340.6 30336 (168)
K. pneumoniae
243 17 108.6 2002 (143)
K. pneumoniae
81 7 122 4852 (169)
K. pneumoniae
301 36 147 7886 (170)
E. coli 66 (NICU) 21 103 4036 (171) We used the studies in Table 5-2 to estimate our parameters. The table indicates the importance of the size of the hospital in the mean and variance of the outbreak distribution. Dignity Health Mercy Medical Center has 186 beds. We fit our negative binomial parameters to the outbreak distribution of the hospital that was most similar in size, with 243 beds. This parameter fitting was done using the function fitdistr in the R package “MASS” (172). The parameters obtained were
Mean: 𝑚 = 115 Over-dispersion: 𝑟 = 8.8 Success probability: 𝑝 = !
!!!= 0.9289.
Our parameters say that with probability nearly 93%, there is no transmission on a given day. It could be that no patient arrived at the hospital that day, or that a patient did arrive but did not come into contact with the bacteria. The mean parameter of 115 days indicates that this is the mean length of time for a subsequent patient to be affected by an original patient. The effect may be indirect, and can proceed via other intermediate patient interactions. The parameter 𝑟 = 8.8 indicates that, on average, on the 8.8’th instance of patient contact, there is transmission of antibiotic resistance. Hypothesis Testing with the NERD Method
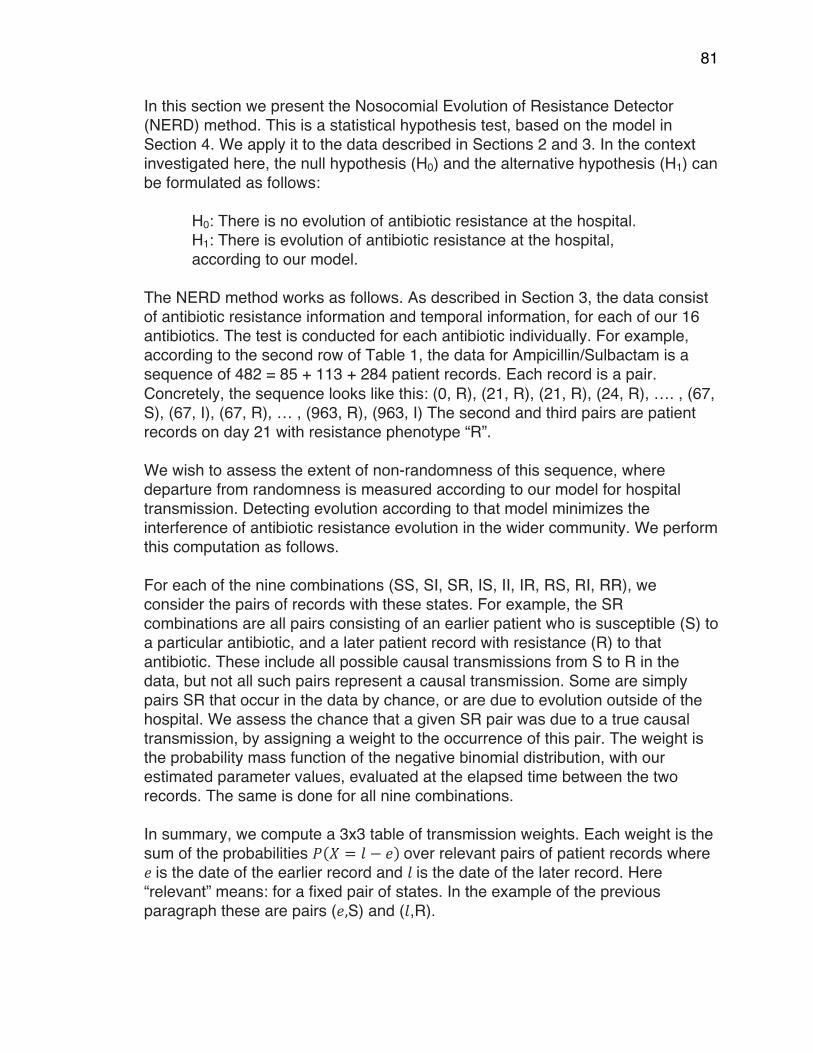
81
In this section we present the Nosocomial Evolution of Resistance Detector (NERD) method. This is a statistical hypothesis test, based on the model in Section 4. We apply it to the data described in Sections 2 and 3. In the context investigated here, the null hypothesis (H0) and the alternative hypothesis (H1) can be formulated as follows:
H0: There is no evolution of antibiotic resistance at the hospital. H1: There is evolution of antibiotic resistance at the hospital, according to our model.
The NERD method works as follows. As described in Section 3, the data consist of antibiotic resistance information and temporal information, for each of our 16 antibiotics. The test is conducted for each antibiotic individually. For example, according to the second row of Table 1, the data for Ampicillin/Sulbactam is a sequence of 482 = 85 + 113 + 284 patient records. Each record is a pair. Concretely, the sequence looks like this: (0, R), (21, R), (21, R), (24, R), …. , (67, S), (67, I), (67, R), … , (963, R), (963, I) The second and third pairs are patient records on day 21 with resistance phenotype “R”. We wish to assess the extent of non-randomness of this sequence, where departure from randomness is measured according to our model for hospital transmission. Detecting evolution according to that model minimizes the interference of antibiotic resistance evolution in the wider community. We perform this computation as follows. For each of the nine combinations (SS, SI, SR, IS, II, IR, RS, RI, RR), we consider the pairs of records with these states. For example, the SR combinations are all pairs consisting of an earlier patient who is susceptible (S) to a particular antibiotic, and a later patient record with resistance (R) to that antibiotic. These include all possible causal transmissions from S to R in the data, but not all such pairs represent a causal transmission. Some are simply pairs SR that occur in the data by chance, or are due to evolution outside of the hospital. We assess the chance that a given SR pair was due to a true causal transmission, by assigning a weight to the occurrence of this pair. The weight is the probability mass function of the negative binomial distribution, with our estimated parameter values, evaluated at the elapsed time between the two records. The same is done for all nine combinations. In summary, we compute a 3x3 table of transmission weights. Each weight is the sum of the probabilities 𝑃 𝑋 = 𝑙 − 𝑒 over relevant pairs of patient records where 𝑒 is the date of the earlier record and 𝑙 is the date of the later record. Here “relevant” means: for a fixed pair of states. In the example of the previous paragraph these are pairs (𝑒,S) and (𝑙,R).
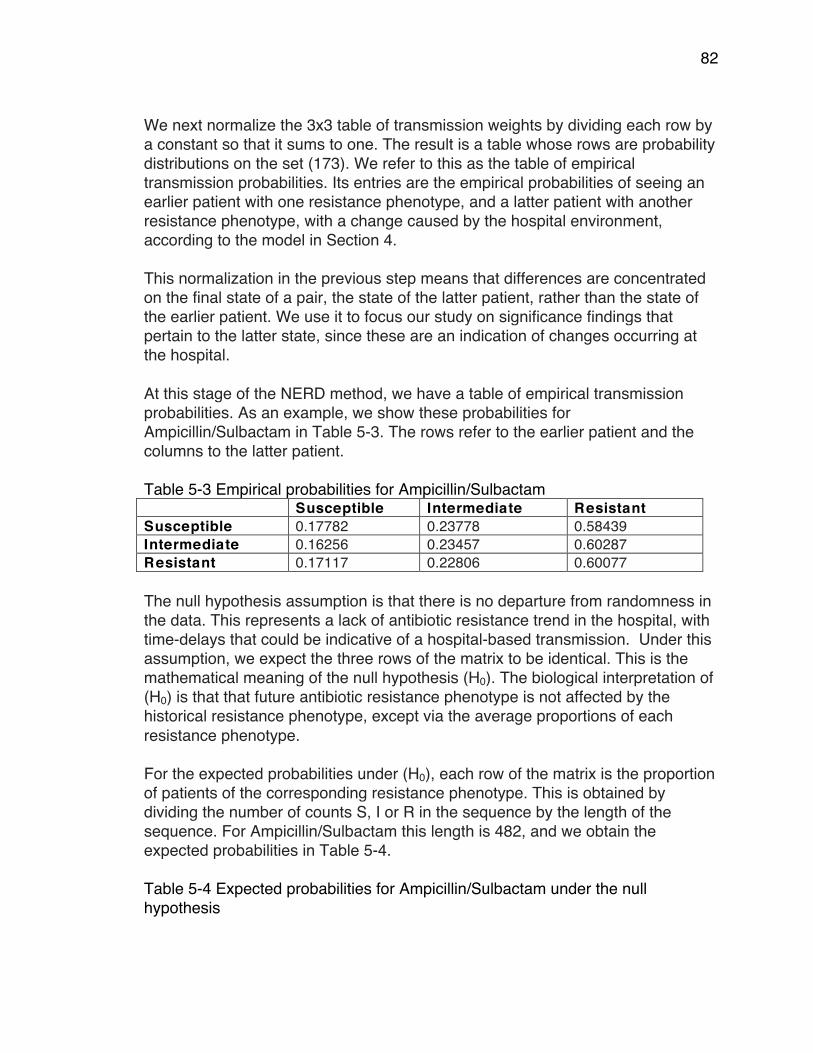
82
We next normalize the 3x3 table of transmission weights by dividing each row by a constant so that it sums to one. The result is a table whose rows are probability distributions on the set (173). We refer to this as the table of empirical transmission probabilities. Its entries are the empirical probabilities of seeing an earlier patient with one resistance phenotype, and a latter patient with another resistance phenotype, with a change caused by the hospital environment, according to the model in Section 4. This normalization in the previous step means that differences are concentrated on the final state of a pair, the state of the latter patient, rather than the state of the earlier patient. We use it to focus our study on significance findings that pertain to the latter state, since these are an indication of changes occurring at the hospital. At this stage of the NERD method, we have a table of empirical transmission probabilities. As an example, we show these probabilities for Ampicillin/Sulbactam in Table 5-3. The rows refer to the earlier patient and the columns to the latter patient. Table 5-3 Empirical probabilities for Ampicillin/Sulbactam Susceptible Intermediate Resistant Susceptible 0.17782 0.23778 0.58439 Intermediate 0.16256 0.23457 0.60287 Resistant 0.17117 0.22806 0.60077 The null hypothesis assumption is that there is no departure from randomness in the data. This represents a lack of antibiotic resistance trend in the hospital, with time-delays that could be indicative of a hospital-based transmission. Under this assumption, we expect the three rows of the matrix to be identical. This is the mathematical meaning of the null hypothesis (H0). The biological interpretation of (H0) is that that future antibiotic resistance phenotype is not affected by the historical resistance phenotype, except via the average proportions of each resistance phenotype. For the expected probabilities under (H0), each row of the matrix is the proportion of patients of the corresponding resistance phenotype. This is obtained by dividing the number of counts S, I or R in the sequence by the length of the sequence. For Ampicillin/Sulbactam this length is 482, and we obtain the expected probabilities in Table 5-4. Table 5-4 Expected probabilities for Ampicillin/Sulbactam under the null hypothesis
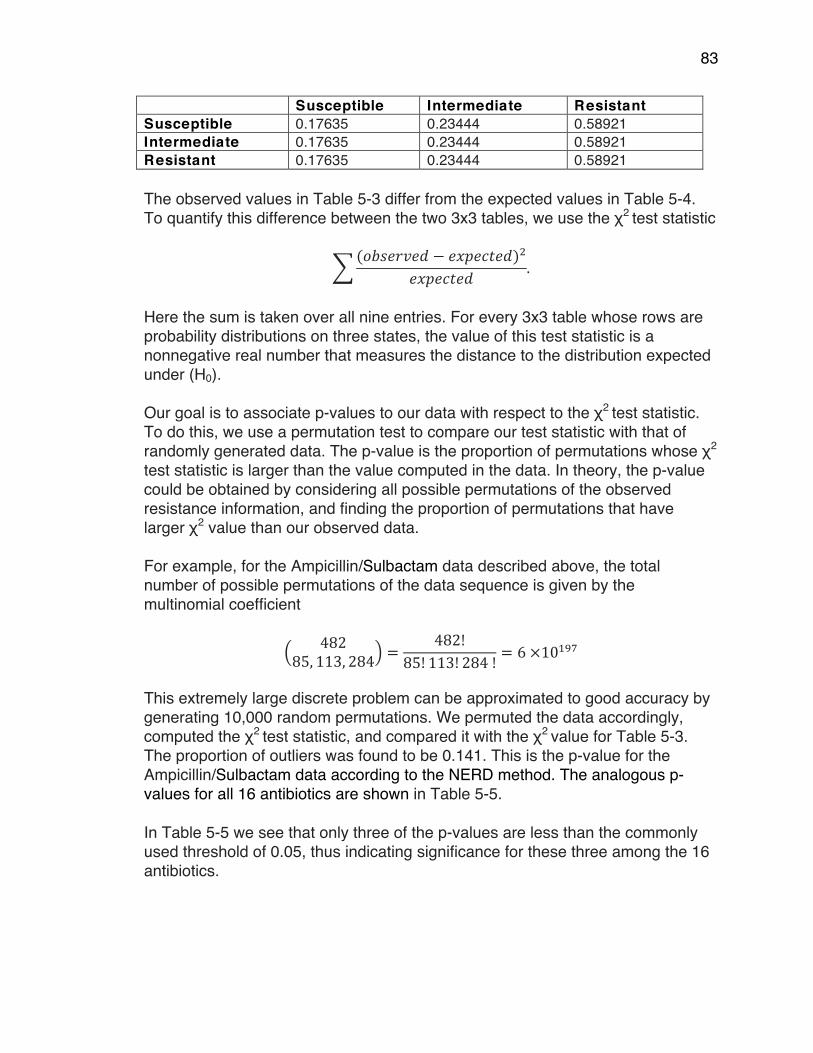
83
Susceptible Intermediate Resistant Susceptible 0.17635 0.23444 0.58921 Intermediate 0.17635 0.23444 0.58921 Resistant 0.17635 0.23444 0.58921 The observed values in Table 5-3 differ from the expected values in Table 5-4. To quantify this difference between the two 3x3 tables, we use the χ2 test statistic
(𝑜𝑏𝑠𝑒𝑟𝑣𝑒𝑑 − 𝑒𝑥𝑝𝑒𝑐𝑡𝑒𝑑)!
𝑒𝑥𝑝𝑒𝑐𝑡𝑒𝑑 .
Here the sum is taken over all nine entries. For every 3x3 table whose rows are probability distributions on three states, the value of this test statistic is a nonnegative real number that measures the distance to the distribution expected under (H0). Our goal is to associate p-values to our data with respect to the χ2 test statistic. To do this, we use a permutation test to compare our test statistic with that of randomly generated data. The p-value is the proportion of permutations whose χ2 test statistic is larger than the value computed in the data. In theory, the p-value could be obtained by considering all possible permutations of the observed resistance information, and finding the proportion of permutations that have larger χ2 value than our observed data. For example, for the Ampicillin/Sulbactam data described above, the total number of possible permutations of the data sequence is given by the multinomial coefficient
48285, 113, 284 =
482!85! 113! 284 ! = 6 ×10!"#
This extremely large discrete problem can be approximated to good accuracy by generating 10,000 random permutations. We permuted the data accordingly, computed the χ2 test statistic, and compared it with the χ2 value for Table 5-3. The proportion of outliers was found to be 0.141. This is the p-value for the Ampicillin/Sulbactam data according to the NERD method. The analogous p-values for all 16 antibiotics are shown in Table 5-5. In Table 5-5 we see that only three of the p-values are less than the commonly used threshold of 0.05, thus indicating significance for these three among the 16 antibiotics.
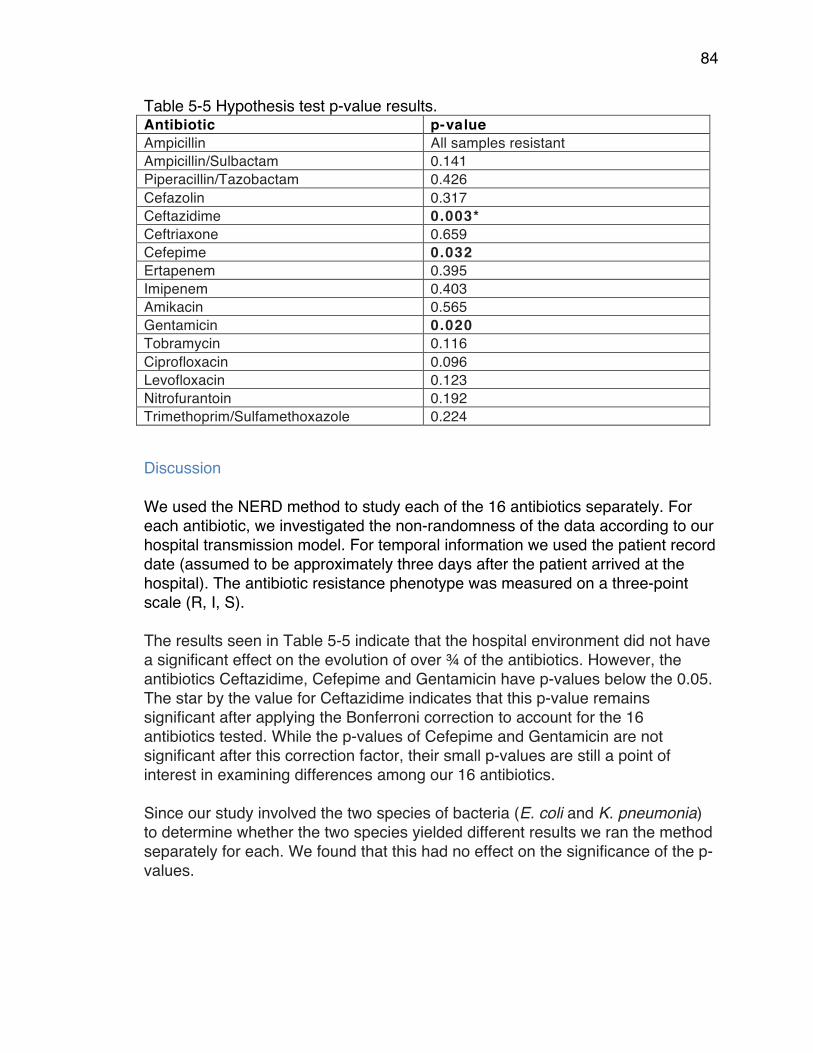
84
Table 5-5 Hypothesis test p-value results. Antibiotic p-value Ampicillin All samples resistant Ampicillin/Sulbactam 0.141 Piperacillin/Tazobactam 0.426 Cefazolin 0.317 Ceftazidime 0.003* Ceftriaxone 0.659 Cefepime 0.032 Ertapenem 0.395 Imipenem 0.403 Amikacin 0.565 Gentamicin 0.020 Tobramycin 0.116 Ciprofloxacin 0.096 Levofloxacin 0.123 Nitrofurantoin 0.192 Trimethoprim/Sulfamethoxazole 0.224
Discussion We used the NERD method to study each of the 16 antibiotics separately. For each antibiotic, we investigated the non-randomness of the data according to our hospital transmission model. For temporal information we used the patient record date (assumed to be approximately three days after the patient arrived at the hospital). The antibiotic resistance phenotype was measured on a three-point scale (R, I, S). The results seen in Table 5-5 indicate that the hospital environment did not have a significant effect on the evolution of over ¾ of the antibiotics. However, the antibiotics Ceftazidime, Cefepime and Gentamicin have p-values below the 0.05. The star by the value for Ceftazidime indicates that this p-value remains significant after applying the Bonferroni correction to account for the 16 antibiotics tested. While the p-values of Cefepime and Gentamicin are not significant after this correction factor, their small p-values are still a point of interest in examining differences among our 16 antibiotics. Since our study involved the two species of bacteria (E. coli and K. pneumonia) to determine whether the two species yielded different results we ran the method separately for each. We found that this had no effect on the significance of the p-values.

85
Having assessed the extent of departure from non-randomness under our model, we return to the data to examine the implications of this conclusion. The NERD method does not preferentially look for antibiotic resistance transmission of a particular kind. It does not preferentially detect changes from Susceptible to Resistant. Therefore, if there is a trend in antibiotic resistance over time, it remains to determine the directionality of this trend. We do so by introducing the notion of relative cumulative resistance. The cumulative resistance at a given time point t is the number of resistant isolates plus half the number of intermediate isolates recorded up to time t. We computed the actual curve from the data. The expected curve would be a straight line between zero resistance in June 2013, and the total cumulative resistance score in January 2016. The relative cumulative resistance is obtained by subtracting the expected cumulative resistance from the observed cumulative resistance. If there are more susceptible patients near the start of the timeframe, and more resistant patients near the end, then the cumulative resistance curve is below the expected line, having a positive second derivative. Conversely, more resistant patients at the start of the time-window result in the cumulative resistance increasing more sharply at the start, before flattening off at the end of the timeframe. It will sit above the expected line and have a negative second derivative. This analysis rests only on our data and does not depend upon any parameter choices. Since we consider all antibiotics across the same time frame, and we study qualitative comparisons between the trends, we do not worry about normalization of the y-axis: we do not wish to interpret particular values on the y-axis. Figure 5-2 shows trend information for the three antibiotics with p-values less than 0.05. It demonstrates that the directionality of the resistance change does not match that of global trends. From Figure 5-2, we conclude that trends in the frequencies of antibiotic resistant isolates in hospitals are not always increasing; they can indeed decrease as a result of evolution over time. The robust departure from randomness in our results indicates that the hospital environment can influence the frequencies of antibiotic resistant bacteria. The prescription of specific antibiotics may be relevant.
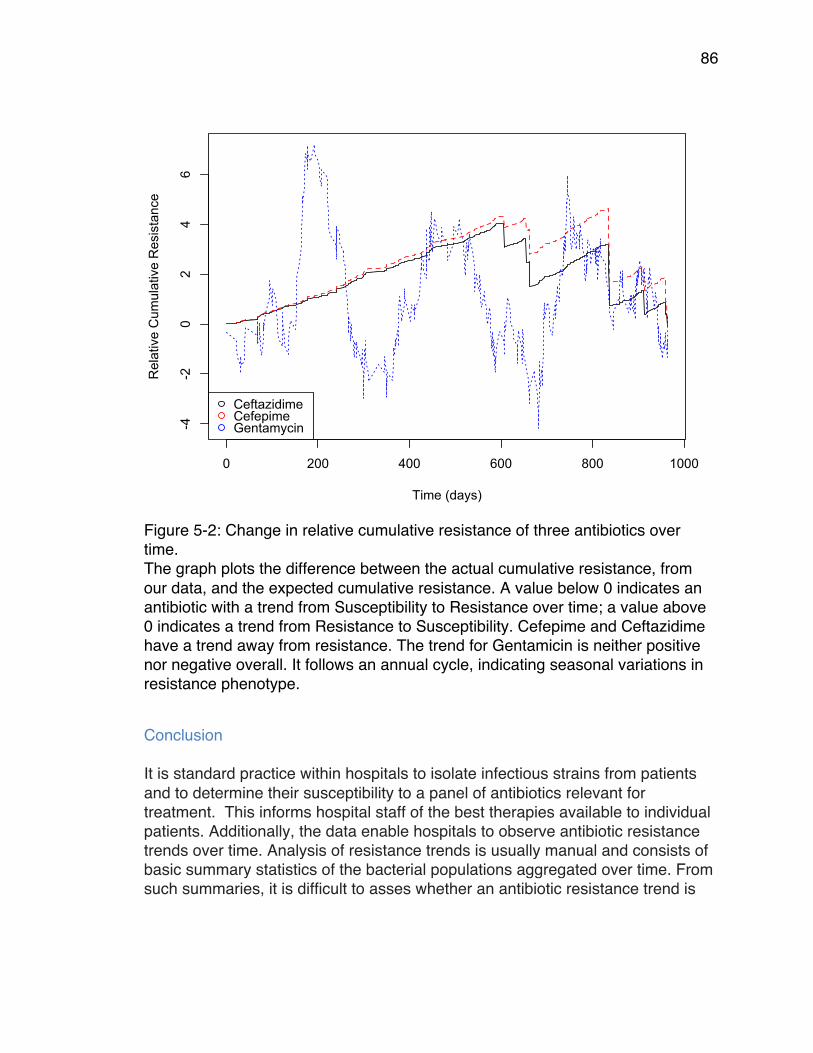
86
Figure 5-2: Change in relative cumulative resistance of three antibiotics over time. The graph plots the difference between the actual cumulative resistance, from our data, and the expected cumulative resistance. A value below 0 indicates an antibiotic with a trend from Susceptibility to Resistance over time; a value above 0 indicates a trend from Resistance to Susceptibility. Cefepime and Ceftazidime have a trend away from resistance. The trend for Gentamicin is neither positive nor negative overall. It follows an annual cycle, indicating seasonal variations in resistance phenotype.
Conclusion
It is standard practice within hospitals to isolate infectious strains from patients and to determine their susceptibility to a panel of antibiotics relevant for treatment. This informs hospital staff of the best therapies available to individual patients. Additionally, the data enable hospitals to observe antibiotic resistance trends over time. Analysis of resistance trends is usually manual and consists of basic summary statistics of the bacterial populations aggregated over time. From such summaries, it is difficult to asses whether an antibiotic resistance trend is
0 200 400 600 800 1000
-4-2
02
46
Time (days)
Rel
ativ
e C
umul
ativ
e R
esis
tanc
e
CeftazidimeCefepimeGentamycin

87
significant or not, and whether it is caused by immigration of bacteria into hospitals from the surrounding community. We developed an automated quantitative method that produces a p-value to assess the significance of hospital-transmission trends while minimizing the effect of day-to-day variation in infectious strains brought in by patients. The method is based on the data that is often gathered by hospitals, and as such does not require them to expend resources gathering new data. The method incorporates a model of hospital transmission to determine whether resistance rates are a function of the hospital environment. We called this method the Nosocomial Evolution of Resistance Detector (NERD). It is available in the open-source R package “NERD”, at https://github.com/seigal/NERD/. We applied NERD to all 16 antibiotics in our study, and we drew conclusions independently for each of them. Since we did not specifically focus on those antibiotics that have low p-values, our p-values have not been adjusted to correct for multiple hypothesis testing. However, we note that one antibiotic remains significant after this correction factor, with significance implications. Future users of NERD who apply the method to search for antibiotics with evolving resistance will want to correct for multiply hypotheses using the Bonferroni correction. For 13 of the 16 antibiotics, resistance phenotypes did not differ significantly from the antibiotic resistance phenotypes generated under the null hypothesis. This means that the hospital environment did not contribute to the evolution of antibiotic resistance more than outside factors. The histories of these antibiotics provide some context. β-lactams (penicillins, cephalosporins, penicillin/inhibitors, carbapenems) were the most heavily used class of antibiotics for ~60 years, and they continue to be popular. Penicillins similar to amoxicillin are heavily used by the agricultural industry (174), and cephalosporin (Cefazolin and Ceftriaxone) consumption is far greater outside of the hospital than inside. Penicillin/inhibitor combinations are widely used in outpatient and hospital settings, but some such as Pipercillin/Tazobactam are mainly administered within hospitals. Consumption of carbapenems is more restricted than other β-lactams and mainly occurs within hospitals. Fluoroquinolones (Ciprofloxacin and Levofloxacin) became the most heavily used antibiotics in the USA after the 2001 anthrax attacks (175). Ciprofloxacin was the only antibiotic that had FDA approval for the treatment of anthrax. Their popularity has persisted, and their resistance has increased. They all share resistance mechanisms. Outpatient use of ciprofloxacin is at a much larger scale than hospital consumption.
88
Aminoglycosides (Tobramycin) received FDA approval in the 1970s and some have been used heavily in agriculture. Nitrofurantoin received FDA approval in 1953. Trimethoprim/Sulfamethoxazole received FDA approval in 1973. It can be used as an outpatient drug. For the above antibiotics, large-scale consumption outside of the hospital probably limits the effect of hospital consumption. Resistance rates appear to be driven by bacterial populations outside the hospital. This accounts for their insignificant p-values. Three of the antibiotics in our study were affected by the hospital environment. The evolution of Cefepime and Ceftazidime resistance is particularly striking. The similarities in relative cumulative resistance of Cefepime and Ceftazidime suggest that a single resistance gene is responsible for their resistance trends. There are not many resistance genes that simultaneously confer these two resistance phenotypes. Cefepime is a cephalosporin type antibiotic that was introduced in 1994 for the treatment of moderate to severe infections such as pneumonia and urinary tract infections. It is only administered through injection and has no outpatient applications. Since Cefepime became widely used, resistant organisms have appeared. One of the first resistance genes found to hydrolyze Cefepime efficiently was CTX-M (66). Numerous clinical strains of E. coli (176, 177) and K. pneumonia (178, 179) are resistant to Cefepime as a result of CTX-M expression. Additionally CTX-M has increased in frequency in clinical populations of bacteria and is now replacing other genes as the most commonly encountered. At the time of its first discovery, CTX-M did not confer Ceftazidime resistance, but subsequent mutations conferred this effect. In particular, the CTX-M-15 variant confers resistance to both Cefepime and Ceftazidime and is commonly detected in hospitals. In a study for future publication (180) we confirmed that presence of the CTX-M-15 gene is correlated with phenotype resistance to Cefepime and Ceftadizime. This demonstrates the strength of the NERD method in monitoring resistance genotypes. We performed whole genome sequencing for 48 isolates. For 39 of isolates (81.3%), resistance phenotype for ceftazidime and cefepime aligns with the status of CTX-M-15: 26 isolates had the CTX-M-15 gene and were resistant or intermediate to both antibiotics, while 13 isolates had neither CTX-M-15 nor phenotype resistance. For 42 of isolates (87.5%), resistance aligns with status of any CTX-M variant: 32 isolates had a CTX-M gene and resistance to ceftazidime

89
and cefepime, while 10 had neither. The correlation demonstrates that the NERD method can be used as a proxy for monitoring resistance genes. Gentamicin is an aminoglycoside that has been available since the 1970s. Despite heavy use in agriculture, resistance rates for this antibiotic are moderate. It is also used in the treatment of urinary tract infections. Since the emergence of CTX-M resistance genes and Carbapenem resistant Enterobacteriaceae in urinary tract infections, non-β-lactam antibiotics have become necessary as primary treatment options for UTIs, and this may explain the significant Gentamicin resistance trend we observed. Our results highlight that an individual hospital is an important but small piece of the overall resistance problem. Factors such as agricultural consumption of antibiotics, outpatient prescriptions and a high frequency of resistance genes in bacterial populations throughout the world also have a strong effect. Our results highlight the necessity of addressing antibiotic resistance at a larger scale. This may be at a community, regional, national, or global scale. Efforts at all levels are likely to help. For detection of trends within hospitals, from data that is routinely collected, the NERD method can be helpful.
90
Chapter 6: A Comparative Analysis of the Genetic Interactions Between Amino Acid Substitutions within blaTEM-50 and blaTEM-85 Introduction
Antibiotic resistance is a natural phenomenon and was present long before the human production, use, and spread of antibiotics (3, 26). While it is evident that high concentrations of antibiotics select for antibiotic resistant bacteria, it is now understood that low levels of antibiotics, i.e. sub-lethal concentrations, can enrich for resistant mutants even more so than high concentrations of antibiotics (50, 54, 181). Resistant bacteria have been shown to be highly selected for at low concentrations (0.047 µg/mL – 1024µg/mL) of commonly used antibiotics (181). Another study shows that the presence of sub-lethal concentrations of streptomycin (0.2 µg/mL – 2 µg/mL) increased the rate of phage resistance evolution (182). This potential is important because sub-lethal concentrations of antibiotics, ranging from 0.0078 µg/mL to 3072 µg/mL, have been identified in many natural environments such as wastewater treatment plants, soil, effluent water supplies from hospitals, livestock, aquaculture, and humans (44-53). Recently, it has been shown that both the type, and sub-lethal concentration, of 15 commonly used β-lactam antibiotics play a major role in the evolutionary possibilities within the TEM β-lactamase resistance gene (4, 6). This is crucial because the TEM β-lactamase resistance gene is the most common plasmid-mediated β-lactamase in gram-negative bacteria (64, 183, 184) and is found around the world (165). In fact, TEM β-lactamases are found in almost all species of Enterobacteriaceae world-wide (183, 185, 186). This is due to an increasing number of them being discovered on plasmids, integrons, and transposable elements within bacteria (50, 67, 71, 72, 171, 187-190). Interestingly, many studies show patterns of epistasis and major epistatic interactions among mutations within the blaTEM-1 (4, 6, 61, 97, 190). The strong selection, weak mutation model (SSWM) is commonly used to study epistatic interactions within adaptive landscapes and suggests that substitutions and reversions are only selected if their occurrence results in a greater fitness (103). Epistatic interactions between substitutions have been studied across genome-wide adaptive landscapes and show that epistatic interactions cause large fluctuations of accessibility within landscapes (191). However, the effect that
91
epistasis has on the accessibility of the global optima for naturally occurring mutations across multiple selective pressures has not been previously studied. We wanted to compare the effects of the sub-lethal concentrations of β-lactam antibiotics, similar to those concentrations identified in the environment, on the evolution of two TEM variants, blaTEM-85 and blaTEM-50. The TEM variant blaTEM-85 has evolved to confer resistance to cephalosporins, and blaTEM-50, the first complex mutant TEM, has evolved to confer resistance to both cephalosporins and inhibitors (79). Inhibitor resistance and cephalosporin resistance typically do not co-occur (102). We hypothesized that the substitutions within blaTEM-50 would result in more rugged adaptive landscapes, i.e. contain more epistatic interactions, than blaTEM-85. Indeed, we were able to show not only that this is the case, but we also found multiple pathways that selected for every genotype throughout the adaptive landscapes of blaTEM-85, similar to those previously published for blaTEM-50 (4).
Results and Discussion
Antibiotic type and concentration select for different genotypes within blaTEM-85 . We measured the growth rates of the 16 genotypes that can be generated from all combinations of the four amino acid substitutions within blaTEM-85 (Table 6-1). After measuring the growth rates, we created adaptive landscapes for each treatment, where one treatment consists of one antibiotic at a single concentration. We used 12 antibiotics at three concentrations, and one antibiotic at two concentrations, resulting in a total of 38 treatments (Table 6-2). To resolve variation resulting from experimental error, we duplicated some treatments (192). The generated adaptive landscapes compare the mean growth rates of adjacent genotypes, where adjacent genotypes are defined to be those that differ by only one amino acid substitution. In each case, arrow direction points toward the genotype with the higher mean growth rate. The arrow direction can signify either selection for new substitutions (when the genotype with more substitutions has a greater mean growth rate), or it can signify selection for reversions (when the genotype with fewer substitutions has a greater mean growth rate). Adaptive landscapes were analyzed using One-way Analysis of Variance (ANOVA), where solid arrows represent a statistically significant difference between growth rates (p-value < 0.05), and dashed arrows represent non-significant differences between growth rates (p-value ≥ 0.05). An example of these adaptive landscapes for one antibiotic at three concentrations is shown in Figure 6-1.
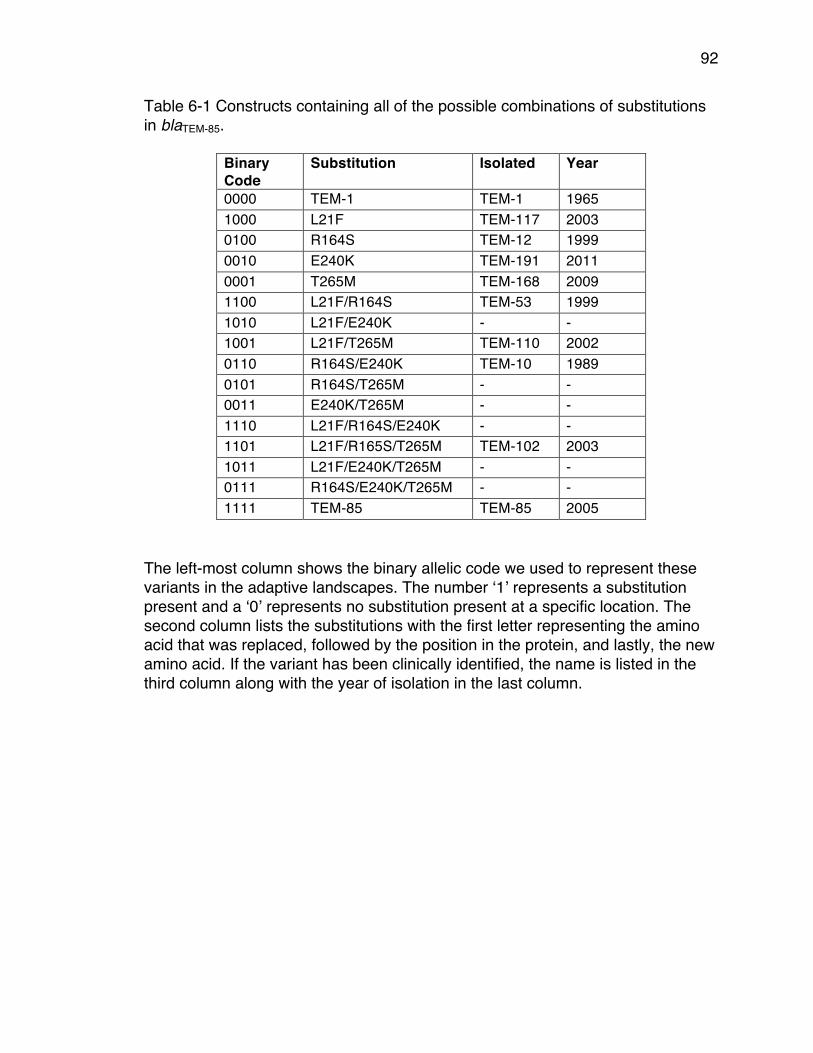
92
Table 6-1 Constructs containing all of the possible combinations of substitutions in blaTEM-85.
Binary Code
Substitution Isolated Year
0000 TEM-1 TEM-1 1965 1000 L21F TEM-117 2003 0100 R164S TEM-12 1999 0010 E240K TEM-191 2011 0001 T265M TEM-168 2009 1100 L21F/R164S TEM-53 1999 1010 L21F/E240K - - 1001 L21F/T265M TEM-110 2002 0110 R164S/E240K TEM-10 1989 0101 R164S/T265M - - 0011 E240K/T265M - - 1110 L21F/R164S/E240K - - 1101 L21F/R165S/T265M TEM-102 2003 1011 L21F/E240K/T265M - - 0111 R164S/E240K/T265M - - 1111 TEM-85 TEM-85 2005
The left-most column shows the binary allelic code we used to represent these variants in the adaptive landscapes. The number ‘1’ represents a substitution present and a ‘0’ represents no substitution present at a specific location. The second column lists the substitutions with the first letter representing the amino acid that was replaced, followed by the position in the protein, and lastly, the new amino acid. If the variant has been clinically identified, the name is listed in the third column along with the year of isolation in the last column.
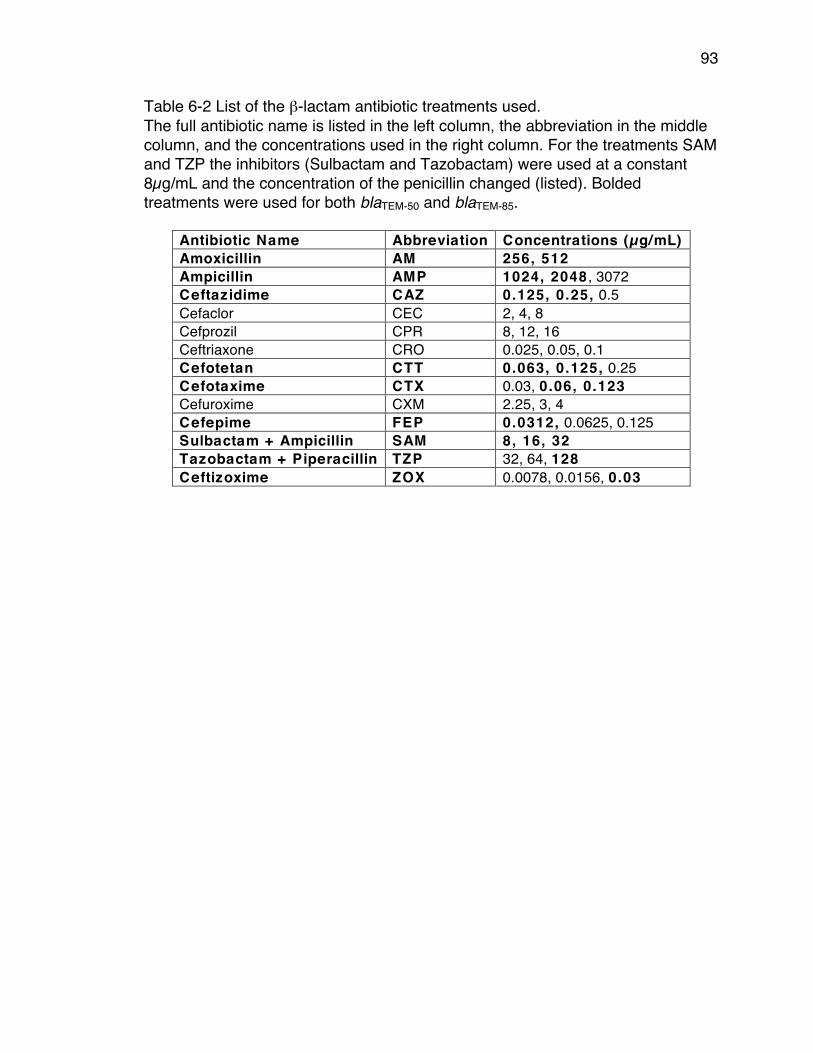
93
Table 6-2 List of the β-lactam antibiotic treatments used. The full antibiotic name is listed in the left column, the abbreviation in the middle column, and the concentrations used in the right column. For the treatments SAM and TZP the inhibitors (Sulbactam and Tazobactam) were used at a constant 8µg/mL and the concentration of the penicillin changed (listed). Bolded treatments were used for both blaTEM-50 and blaTEM-85.
Antibiotic Name Abbreviation Concentrations (µg/mL) Amoxicillin AM 256, 512 Ampicillin AMP 1024, 2048 , 3072 Ceftazidime CAZ 0.125, 0.25, 0.5 Cefaclor CEC 2, 4, 8 Cefprozil CPR 8, 12, 16 Ceftriaxone CRO 0.025, 0.05, 0.1 Cefotetan CTT 0.063, 0.125, 0.25 Cefotaxime CTX 0.03, 0.06, 0.123 Cefuroxime CXM 2.25, 3, 4 Cefepime FEP 0.0312, 0.0625, 0.125 Sulbactam + Ampicillin SAM 8, 16, 32 Tazobactam + Piperacillin TZP 32, 64, 128 Ceftizoxime ZOX 0.0078, 0.0156, 0.03
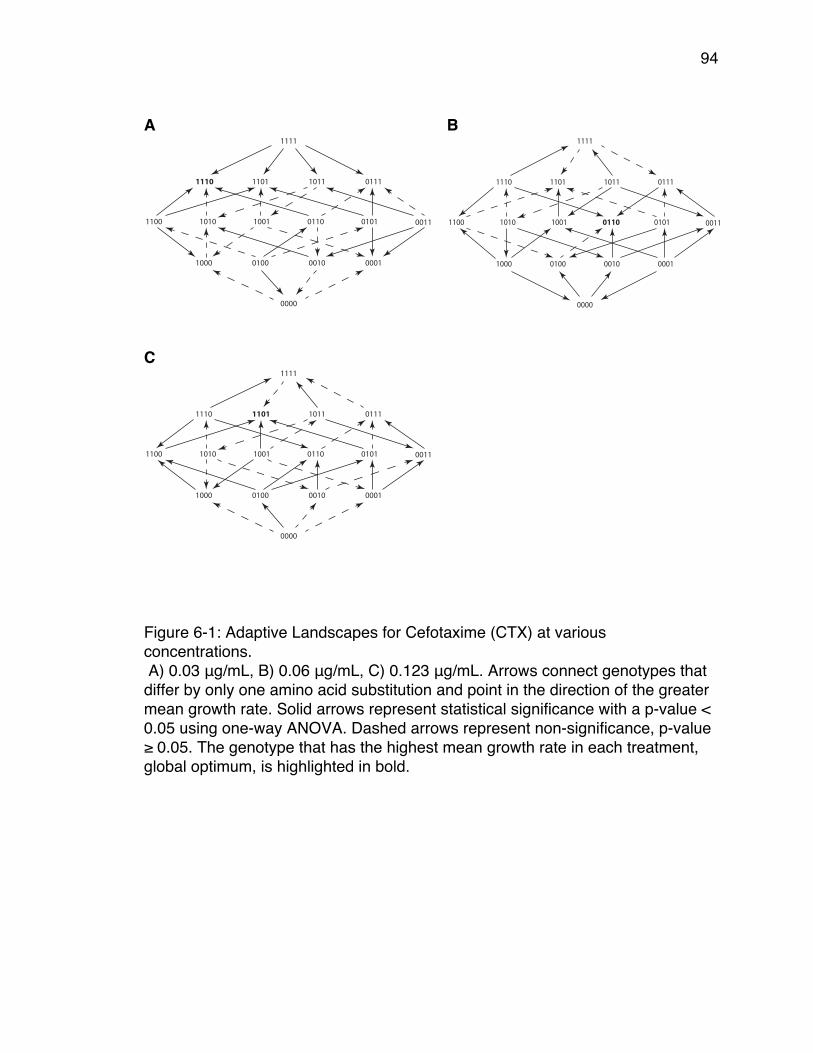
94
A
B
C
Figure 6-1: Adaptive Landscapes for Cefotaxime (CTX) at various concentrations. A) 0.03 μg/mL, B) 0.06 μg/mL, C) 0.123 μg/mL. Arrows connect genotypes that differ by only one amino acid substitution and point in the direction of the greater mean growth rate. Solid arrows represent statistical significance with a p-value < 0.05 using one-way ANOVA. Dashed arrows represent non-significance, p-value ≥ 0.05. The genotype that has the highest mean growth rate in each treatment, global optimum, is highlighted in bold.
0000
1000 0100 0010 0001
1100 1010 1001 0110 0101 0011
1110 1101 1011 0111
1111
0000
1000 0100 0010 0001
1100 1010 1001 0110 0101 0011
1110 1101 1011 0111
1111
0000
1000 0100 0010 0001
1100 1010 1001 0110 0101 0011
1110 1101 1011 0111
1111
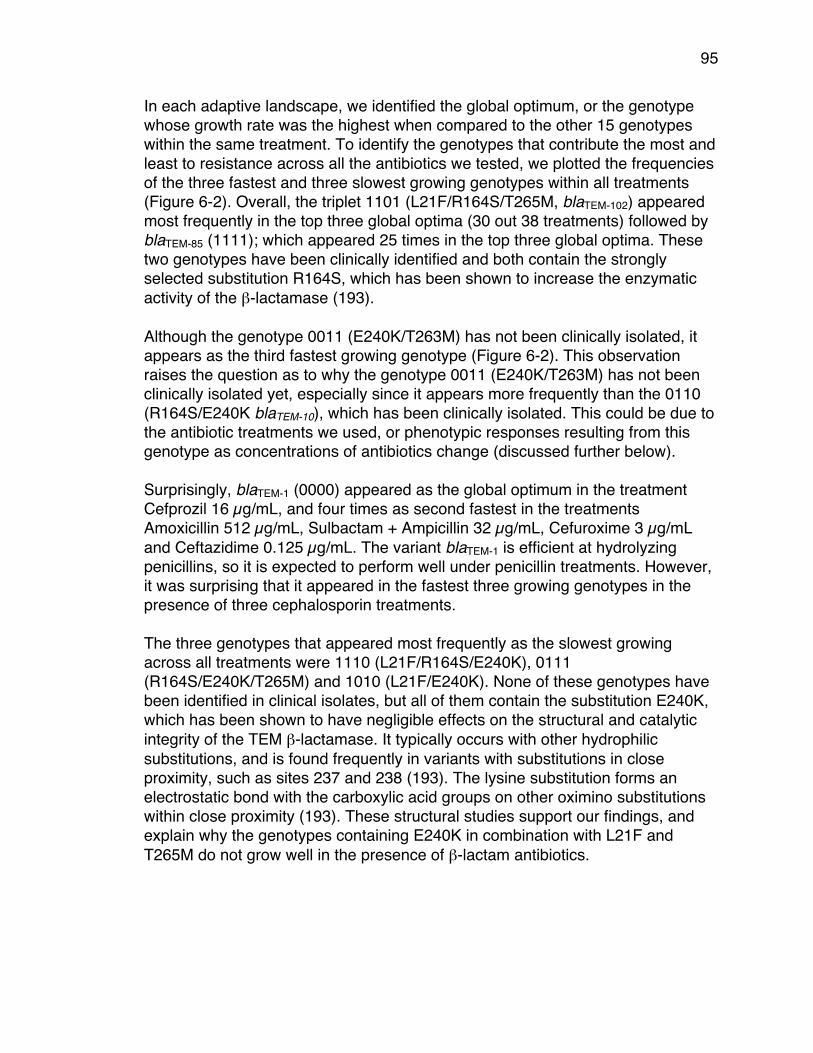
95
In each adaptive landscape, we identified the global optimum, or the genotype whose growth rate was the highest when compared to the other 15 genotypes within the same treatment. To identify the genotypes that contribute the most and least to resistance across all the antibiotics we tested, we plotted the frequencies of the three fastest and three slowest growing genotypes within all treatments (Figure 6-2). Overall, the triplet 1101 (L21F/R164S/T265M, blaTEM-102) appeared most frequently in the top three global optima (30 out 38 treatments) followed by blaTEM-85 (1111); which appeared 25 times in the top three global optima. These two genotypes have been clinically identified and both contain the strongly selected substitution R164S, which has been shown to increase the enzymatic activity of the β-lactamase (193). Although the genotype 0011 (E240K/T263M) has not been clinically isolated, it appears as the third fastest growing genotype (Figure 6-2). This observation raises the question as to why the genotype 0011 (E240K/T263M) has not been clinically isolated yet, especially since it appears more frequently than the 0110 (R164S/E240K blaTEM-10), which has been clinically isolated. This could be due to the antibiotic treatments we used, or phenotypic responses resulting from this genotype as concentrations of antibiotics change (discussed further below). Surprisingly, blaTEM-1 (0000) appeared as the global optimum in the treatment Cefprozil 16 µg/mL, and four times as second fastest in the treatments Amoxicillin 512 µg/mL, Sulbactam + Ampicillin 32 µg/mL, Cefuroxime 3 µg/mL and Ceftazidime 0.125 µg/mL. The variant blaTEM-1 is efficient at hydrolyzing penicillins, so it is expected to perform well under penicillin treatments. However, it was surprising that it appeared in the fastest three growing genotypes in the presence of three cephalosporin treatments. The three genotypes that appeared most frequently as the slowest growing across all treatments were 1110 (L21F/R164S/E240K), 0111 (R164S/E240K/T265M) and 1010 (L21F/E240K). None of these genotypes have been identified in clinical isolates, but all of them contain the substitution E240K, which has been shown to have negligible effects on the structural and catalytic integrity of the TEM β-lactamase. It typically occurs with other hydrophilic substitutions, and is found frequently in variants with substitutions in close proximity, such as sites 237 and 238 (193). The lysine substitution forms an electrostatic bond with the carboxylic acid groups on other oximino substitutions within close proximity (193). These structural studies support our findings, and explain why the genotypes containing E240K in combination with L21F and T265M do not grow well in the presence of β-lactam antibiotics.
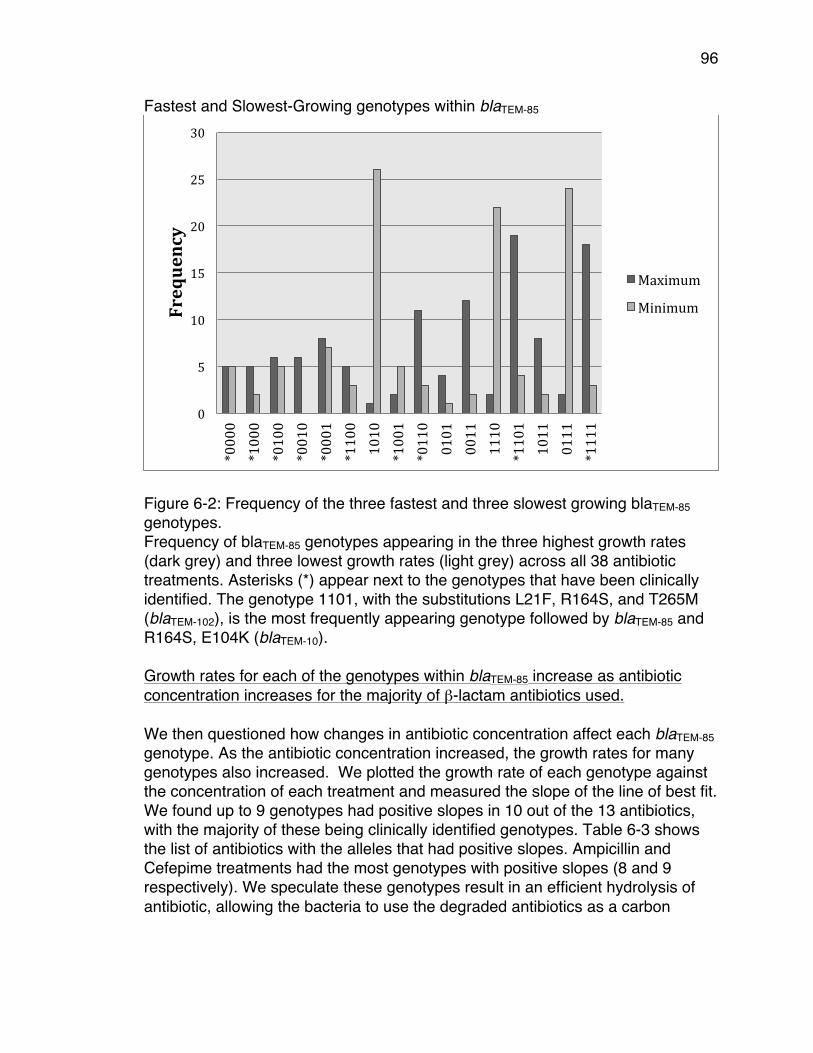
96
Fastest and Slowest-Growing genotypes within blaTEM-85
Figure 6-2: Frequency of the three fastest and three slowest growing blaTEM-85 genotypes. Frequency of blaTEM-85 genotypes appearing in the three highest growth rates (dark grey) and three lowest growth rates (light grey) across all 38 antibiotic treatments. Asterisks (*) appear next to the genotypes that have been clinically identified. The genotype 1101, with the substitutions L21F, R164S, and T265M (blaTEM-102), is the most frequently appearing genotype followed by blaTEM-85 and R164S, E104K (blaTEM-10). Growth rates for each of the genotypes within blaTEM-85 increase as antibiotic concentration increases for the majority of β-lactam antibiotics used. We then questioned how changes in antibiotic concentration affect each blaTEM-85 genotype. As the antibiotic concentration increased, the growth rates for many genotypes also increased. We plotted the growth rate of each genotype against the concentration of each treatment and measured the slope of the line of best fit. We found up to 9 genotypes had positive slopes in 10 out of the 13 antibiotics, with the majority of these being clinically identified genotypes. Table 6-3 shows the list of antibiotics with the alleles that had positive slopes. Ampicillin and Cefepime treatments had the most genotypes with positive slopes (8 and 9 respectively). We speculate these genotypes result in an efficient hydrolysis of antibiotic, allowing the bacteria to use the degraded antibiotics as a carbon
0
5
10
15
20
25
30
*0000
*1000
*0100
*0010
*0001
*1100
1010
*1001
*0110
0101
0011
1110
*1101
1011
0111
*1111
Frequency
Maximum
Minimum
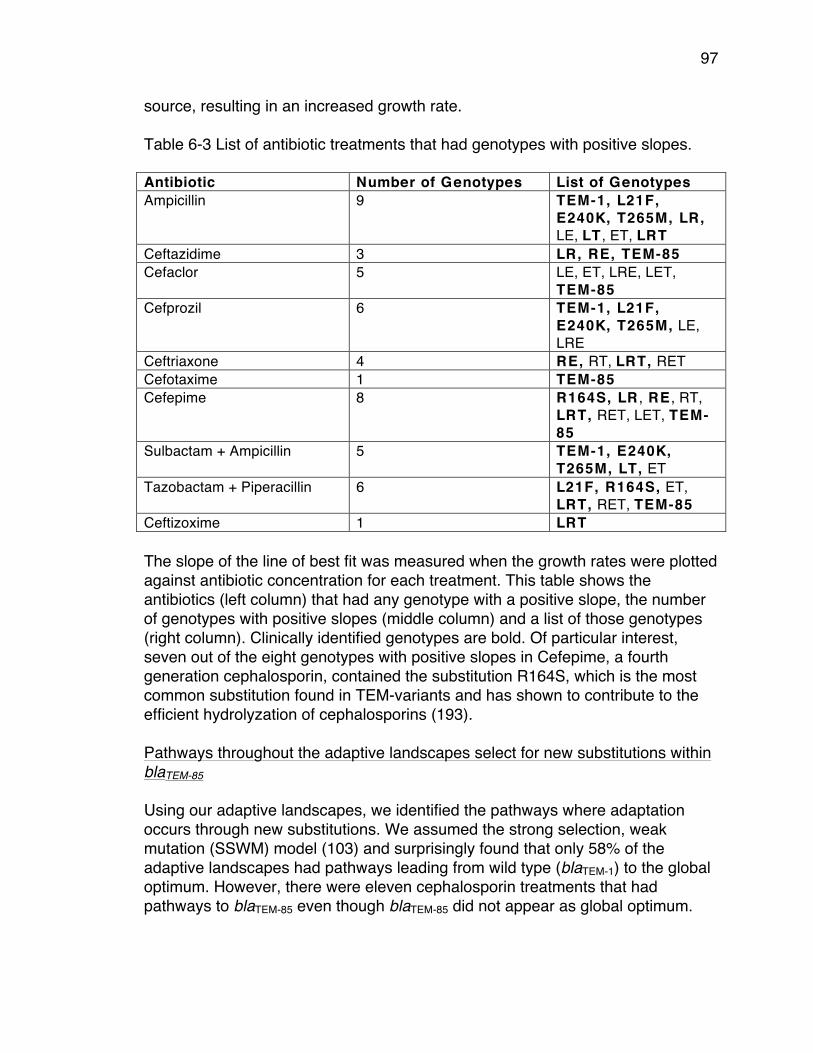
97
source, resulting in an increased growth rate. Table 6-3 List of antibiotic treatments that had genotypes with positive slopes. Antibiotic Number of Genotypes List of Genotypes Ampicillin 9 TEM-1, L21F,
E240K, T265M, LR, LE, LT , ET, LRT
Ceftazidime 3 LR, RE, TEM-85 Cefaclor 5 LE, ET, LRE, LET,
TEM-85 Cefprozil 6 TEM-1, L21F,
E240K, T265M, LE, LRE
Ceftriaxone 4 RE, RT, LRT, RET Cefotaxime 1 TEM-85 Cefepime 8 R164S, LR , RE , RT,
LRT, RET, LET, TEM-85
Sulbactam + Ampicillin 5 TEM-1, E240K, T265M, LT, ET
Tazobactam + Piperacillin 6 L21F, R164S, ET, LRT, RET, TEM-85
Ceftizoxime 1 LRT The slope of the line of best fit was measured when the growth rates were plotted against antibiotic concentration for each treatment. This table shows the antibiotics (left column) that had any genotype with a positive slope, the number of genotypes with positive slopes (middle column) and a list of those genotypes (right column). Clinically identified genotypes are bold. Of particular interest, seven out of the eight genotypes with positive slopes in Cefepime, a fourth generation cephalosporin, contained the substitution R164S, which is the most common substitution found in TEM-variants and has shown to contribute to the efficient hydrolyzation of cephalosporins (193). Pathways throughout the adaptive landscapes select for new substitutions within blaTEM-85 Using our adaptive landscapes, we identified the pathways where adaptation occurs through new substitutions. We assumed the strong selection, weak mutation (SSWM) model (103) and surprisingly found that only 58% of the adaptive landscapes had pathways leading from wild type (blaTEM-1) to the global optimum. However, there were eleven cephalosporin treatments that had pathways to blaTEM-85 even though blaTEM-85 did not appear as global optimum.
98
This result supports the fact that blaTEM-85 has evolved to efficiently hydrolyze cephalosporins. In our previously published study of blaTEM-50 adaptive landscapes, 97% (29/30) of the adaptive landscapes had pathways to the global optimum. This supports our hypothesis that there is more sign epistasis within the blaTEM-50 landscapes as opposed to those for blaTEM-85 (4). We were interested in comparing the effects of identical antibiotic treatments (bolded in Table 6-2) on all possible combinations of substitutions within blaTEM-85 and blaTEM-50. In an effort to understand the fitness differences between the blaTEM-50 and blaTEM-85 landscapes, we focused on the epistatic interactions between the amino acid substitutions present within each gene. Selection for new substitutions depends on antibiotic type. To investigate whether the different types of β-lactam antibiotics selected more for the substitutions within blaTEM-50 than blaTEM-85, we counted the number of new substitutions and reversions selected in each adaptive landscape and calculated this ratio. If this ratio was greater than 1, there was a stronger selection for new substitutions (Figure 6-3). We found that for both blaTEM-85 and blaTEM-50, new substitutions were favored in cephalosporin treatments. Interestingly, new substitutions were not favored for blaTEM-50 in penicillin + inhibitor treatments. This is surprising because blaTEM-50 has two amino acid substitutions that confer inhibitor resistance. This can be explained by negative sign epistasis with the other two substitutions. The substitutions in blaTEM-50 contribute either to cephalosporin resistance or inhibitor resistance, often through mutually exclusive changes in the binding pocket. While cephalosporin resistance results from a looser more open binding pocket, inhibitor resistance usually results from a more rigid and compact binding pocket (193). The occurrence of these opposing types of substitutions in a single enzyme probably reduces the number of genotypes where new substitutions are selected.

99
Figure 6-3: Frequency of the ratio of new substitutions to reversions within blaTEM-
85 and blaTEM-50 adaptive landscapes. The frequency of the ratios of new substitutions: reversions within the adaptive landscapes of blaTEM-50 (left) and blaTEM-85 (right). The ratios were calculated based on the number of forward arrows (N - new substitutions) to reverse arrows (R - reversions). If this ratio was greater than 1, then new substitutions were favored (N>R). If this ratio was less than 1, then reversions were favored (N<R). If the number of new substitutions was equal to the number of reversions, then N=R. Cephalosporin treatments are colored light grey, Penicillin + Inhibitor treatments are colored dark grey and Penicillin treatments are colored black.
The adaptive landscapes of blaTEM-50 are more rugged than the adaptive landscapes of blaTEM-85.
Because blaTEM-85 does not carry any substitutions that confer resistance to inhibitors, we questioned whether this meant more or less epistasis compared to blaTEM-50. This leads us naturally to investigate the relative frequencies of epistatic interactions within the blaTEM-85 landscapes compared to the blaTEM-50 landscapes. The pair-wise epistasis mean (PWEM) was calculated as the average epistasis between all possible pairs of substitutions:
𝑃𝑊𝐸𝑀 = 𝑙𝑜𝑔!"𝑊!" ∗ 𝑊!
𝑊! ∗𝑊! ,
where 𝑊! is the mean growth rate of the unmutated genotype, blaTEM-1. 𝑊! and 𝑊! are the mean growth rates of the genotypes with single substitutions, and 𝑊!" is the mean growth rate of the genotype with the double substitutions (194).
0
1
2
3
4
5
6
7
8
9
N>R N<R N=R N>R N<R N=R
TEM50 TEM85
Frequency
Cephalosporins
Penicillin+Inhibitors
Penicillins

100
Defining epistasis this way allows the measure normalization to be invariant, which allows for a straightforward comparison among different genotypes and their growth rates.
As suspected, we found that blaTEM-50 had greater pair-wise epistasis means in 11 out of the16 treatments, meaning that the adaptive landscapes for blaTEM-50 were more rugged (i.e. more epistatic interactions between the amino acid substitutions present) as compared to blaTEM-85. We found that blaTEM-85 did have more epistatic interactions in both of the Amoxicillin treatments, two Cephalosporin treatments (Cefotetan 0.063 µg/mL and Ceftizoxime 0.03 µg/mL) and one Penicillin + Inhibitor treatment (Tazobactam + Piperacillin 128 µg/mL) (Figure 6-4).
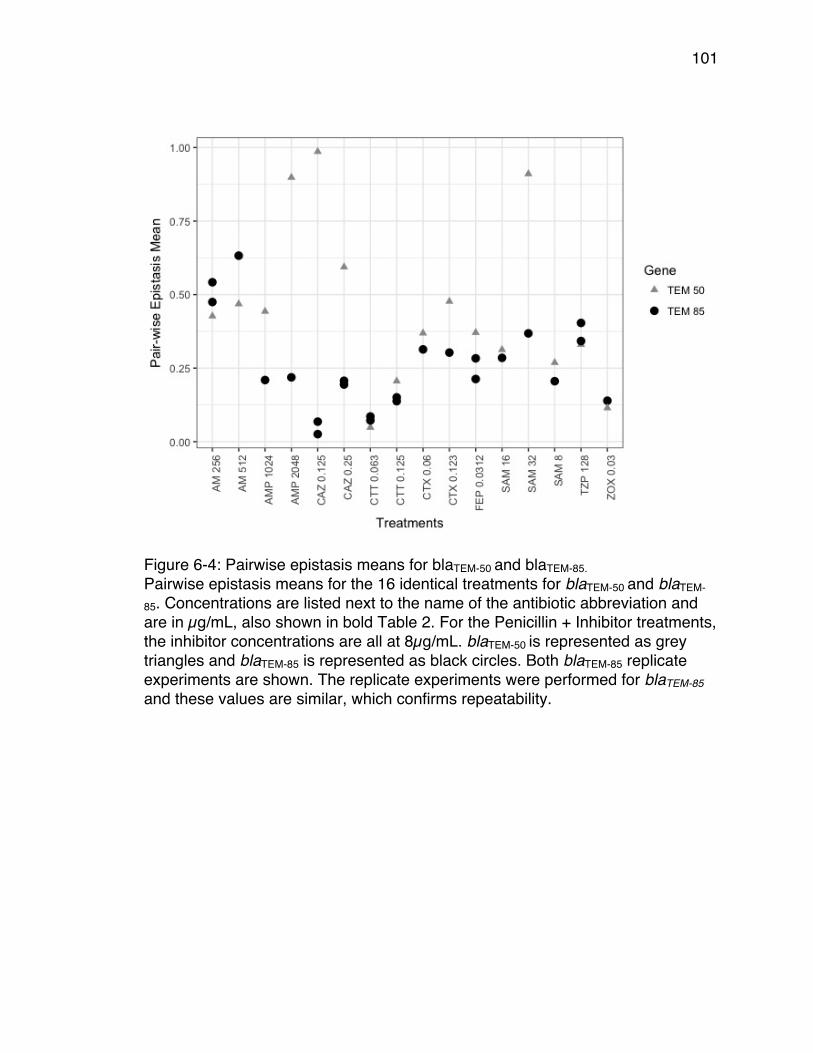
101
Figure 6-4: Pairwise epistasis means for blaTEM-50 and blaTEM-85. Pairwise epistasis means for the 16 identical treatments for blaTEM-50 and blaTEM-
85. Concentrations are listed next to the name of the antibiotic abbreviation and are in µg/mL, also shown in bold Table 2. For the Penicillin + Inhibitor treatments, the inhibitor concentrations are all at 8µg/mL. blaTEM-50 is represented as grey triangles and blaTEM-85 is represented as black circles. Both blaTEM-85 replicate experiments are shown. The replicate experiments were performed for blaTEM-85 and these values are similar, which confirms repeatability.
102
Conclusion
The numerous instances of sub-lethal concentrations of antibiotics in the environment have been shown to increase the selection and diversification of antibiotic resistance genes (37, 54, 57, 195-197). Epistasis, or non-additive interactions among substitutions, also plays a major role in the evolution of antibiotic resistance. Although it has been shown that epistasis influences the evolution of the TEM β-lactamase (190, 198-200), the epistatic interactions of the individual substitutions that produce higher evolved TEM’s, have only been studied for blaTEM-50 (4). Here, we wanted to investigate the impacts of sub-lethal concentrations on a second variant of TEM with four substitutions, blaTEM-85, and compare those to blaTEM-50 (4). We have found that similar to blaTEM-50, the change in type and concentration of β-lactam antibiotics selects for almost every genotype within blaTEM-85, This is important because it demonstrates the pliable effects of antibiotics in the environment and how the presence of sub-lethal concentrations of antibiotics can increase the diversity of resistance genes present in a bacterial population. We also found that the topography of the adaptive landscapes of blaTEM-50 is more rugged, i.e. contains more epistatic interactions between amino acid substitutions, than the adaptive landscapes of blaTEM-85. This is consistent with evolutionary theory that states that sign epistasis contributes to multi-peaked fitness landscapes (201). We have shown that epistasis increases the accessibility of adaptive peaks, including the global optimum (200). Of particular significance is the finding that in some landscapes as the concentration increases, the fitness of the bacteria also increases. The genotypes for which this is the case are more likely to be found among clinical isolates. We also found evidence that the epistatic interactions that occur across antibiotic concentrations are a good predictor of the genotypes that have been naturally isolated.

103
Materials and Methods
Materials and Methods are taken from (4). Briefly, we expressed all 16 TEM variant genotypes from the pBR322 plasmid in E. coli strain DH5-αE, which were then incubated in 5 mL of Luria Broth with Tetracycline (5mL tetracycline/ 1 Liter of LB) overnight in oxygen limited cultures. Initial O.D. readings were taken at the beginning of the experiment and diluted to 1.9 * 109 cells in 5 mL of Mueller Hinton broth. The 16 variant genotypes were then aliquotted down the 16 rows of the 384-well plate. The first 12 columns treated with one antibiotic at one concentration, and the last 12 columns serving as a control, with no antibiotic treatment. The optical density was measured over a 22-hour period at 25.1*C. The growth rates and statistical analyses were run using Growthrates program (136) and CompareGrowthRates (192). There were two replicate experimental runs for some blaTEM-85 data. Fresh antibiotic stock solutions (10.2g/mL) were made prior to the start of each set of experiments and stored in -4* C until use. Statistical Analysis Based on results from CGR (192), we confirmed the amount of variation in the growth rate data was minimal and the time intervals between readings were optimal (60-minutes). We reanalyzed the blaTEM-50 data from (4) using CGR with the optimal time intervals (60-minutes) and used the data to create the adaptive landscapes. To create the adaptive landscapes, a One-Way Analysis of Variance (ANOVA) was used to compare the means of the growth rates we obtained and to determine if there were significant differences between the growth rates of each genotype. We compared each of the genotypes with those that were adjacent, (differed by a single amino acid substitution), going from the wild type, blaTEM-1, to blaTEM-85. We used a 95% confidence interval, which translates to a p-value of less than or equal to 0.05.
104
Conclusion The overuse of antibiotics has resulted in an abundance of antibiotic residues disposed in our environment, soil, wastewater, river water and food (17, 20, 48, 49, 195, 202). These sub-lethal concentrations of antibiotics have influenced the rate of evolution of antibiotic resistance genes present in many pathogenic and non-pathogenic bacteria (43, 53, 54, 182, 195). However, the effects of specific sub-lethal concentrations of multiple antibiotics that have been identified in the environment have not been investigated on individual resistance genes. Here, I show that the abundance of sub-inhibitory concentrations of antibiotics in the environment can contribute to the evolution and diversification of antibiotic resistance genes. Using the β-lactamase enzyme, TEM, as a model system, I have been able to show the effects of multiple sub-inhibitory concentrations of β-lactam antibiotics on the evolutionary pathways leading from TEM-1 to TEM-50 and TEM-85. We were able to quantify the effects of antibiotic concentrations on all genotype combinations of the four amino acid substitutions present within TEM-50 and TEM-85, something that can be difficult to do with MIC-measurements. We show that the type and concentration of β-lactam antibiotics affect the evolutionary trajectories within each gene. In addition, we have developed statistical methods, v-scores and bootstrapping, to measure the amount of variation within growth rate data and quantify the repeatability of the adaptive landscapes created. Also, using mathematical models we have been able to provide a framework that allows one to identify optimized treatment plans using bacterial growth rates as a measurement of fitness. Although these results are in vitro and only look into the effect of antibiotics on individual resistance genes, the results can be used as a foundation to study similar effects at a larger genomic scale. Finally, we were able to show that a hospital environment has an influence on the prevalence of antibiotic resistance genes in a community and that an individual hospital is an important but small piece of the overall resistance problem. Further pharmaceutical data would be necessary to fully understand the impacts of the hospital environment on antibiotic resistance evolution. Other factors such as agricultural consumption of antibiotics and outpatient prescriptions also have a strong effect on antibiotic resistance. As part of this research, we also developed a tool, the Nosocomial Evolution of Resistance Detector (N.E.R.D.), which can be used with phenotypic data at any scale, to monitor antibiotic resistance trends and predict the prevalence of antibiotic resistance genes.
105
Overall, this dissertation work enhances the field of microbial evolution by 1) showing evidence that sub-inhibitory concentrations of multiple antibiotics accelerate the evolutionary possibilities within individual resistance genes, which as a result increases diversification within resistant bacterial populations, 2) provides methods that can be used with any bacterial growth rate data to calculate transition probabilities, 3) provides tools that hospital and clinics can use for assessing resistance trends, and 4) provides a statistical tool, CompareGrowthRates (CGR) that allows users of Growth Rates Made Easy to calculate variation within their growth rate data sets.

106
Prospectus This body of work points towards many important questions that remain unanswered. First, this work focuses heavily on with-gene epistasis and epistatic interactions among substitutions present within the same resistance gene. It would be interesting to expand this work to across-gene epistasis among bacteria that carry multiple resistance genes. Also, this work briefly covers the effects that multiple β-lactam antibiotics have on the selection of different genotypes within the TEM β-lactamase resistance gene. It would be interesting to understand the biochemical properties of certain antibiotics, such as Cefaclor, on the TEM β-lactamase. Cefaclor, a first generation cephalosporin, has unusual selection in comparison to the other cephalosporins used in these studies. Genotypes that typically grow poorly in the presence of the other cephalosporins grow well in the presence of Cefaclor. I would hypothesize this is heavily influenced by the chemical properties and structure of the antibiotic and the catalytic activity of the genotypes it selects for. This work has also laid a foundation for identifying antibiotic cycling plans using transition probabilities throughout adaptive landscapes of antibiotic resistance genes. An important part of identifying antibiotic cycling plans is to determine the amount of time required for each transition. This would depend on many factors. To start, the resistance gene(s) present, the selection strength of the substitutions at each transition, and within- and across-gene epistasis. Since this work was done only on in vitro bacterial populations, one can also investigate the natural environment these selective pressures and bacterial populations are in. With this in mind, many additional factors would need to be taken into consideration, such as the species-species interactions and the multiple selective pressures present in the environment, i.e. antibiotics and carbon-sources. Within the same area, another avenue this work can take is by applying the predictions of TimeMachine transition probabilities on clinical isolates that have been identified carrying variants of the TEM β-lactamase. This work would be interesting because it would take the theory of antibiotic cycling and apply it to organisms that have been naturally isolated. This work would have the potential to have promising results in translational research.

107
Another area this work has not covered completely and can expand on is identifying any correlations of antibiotic use and resistance present in the hospital environment. Here, we have used the N.E.R.D. method on patient isolate data but lack the pharmaceutical data that can provide information on which antibiotic treatments are prescribed to patients, in which the resistant bacteria have been isolated, and can be used to detect any correlations of prescriptions and resistance trends.
108
Appendix Growth Rate Assay The growth rate data were measured and calculated based on the following protocol. 1) The TEM variant genotypes were expressed from the pBR322 plasmid in E. coli strain DH5-αE. The cultures were incubated in 5 mL of Luria Broth (LB) with Tetracycline (5mL tetracycline/ 1 Liter LB) overnight in oxygen-limited cultures. 2) The samples were then diluted to a concentration of 1.9 X 10⁵ cells per mL in 5 mL Mueller Hinton (MH). This was done using the following equation: C1V1 = C2V2 Where C1 is the starting concentration measured by the initial optical density (O.D.) measurements. V1 is the volume of overnight culture needed to transfer to obtain the final concentration, C2 (1.9 X 10⁵ cells per mL). V2 is the final volume (5 mL MH). With these variables set, we solve for V1 for each culture used. 3) After dilutions, 80μL of each liquid culture was transferred to a 384-well plate. The last twelve columns of each row were aliquotted with just the liquid culture, serving as the control. The first twelve columns were aliquotted with the liquid culture plus the antibiotic solution. The antibiotic solutions were freshly prepared by dissolving 10.24 mg of antibiotic per 1 mL of solvent (either pH 6 or pH 8 phosphate-buffer or water based on their solubility guidelines). These served as stock solutions and the treatments used were diluted from these stock solutions. 4) Once the samples have all been plated, a breathable membrane was pressed onto the plate and placed in an Eon Microplate Spectrophotometer. The temperature was set at 25.1°C and the O.D. were measured every 20 minutes for 22 hours. The growthrates program was used to calculate the growth rates from the raw O.D. output as described in the methods section of Chapter 2.
109
109
References1. LaxminarayanR,DuseA,WattalC,ZaidiAK,WertheimHF,SumpraditN,etal.Antibioticresistance-theneedforglobalsolutions.LancetInfectDis.2013;13(12):1057-98.2. HughesD,AnderssonDI.Selectionofresistanceatlethalandnon-lethalantibioticconcentrations.CurrOpinMicrobiol.2012;15(5):555-60.3. AnderssonDI,HughesD.Evolutionofantibioticresistanceatnon-lethaldrugconcentrations.DrugResistUpdat.2012;15(3):162-72.4. MiraPM,MezaJC,NandipatiA,BarlowM.AdaptiveLandscapesofResistanceGenesChangeasAntibioticConcentrationsChange.MolBiolEvol.2015.5. Sarraf-YazdiS,SharpeM,BennettKM,DotsonTL,AndersonDJ,VaslefSN.A9-Yearretrospectivereviewofantibioticcyclinginasurgicalintensivecareunit.JSurgRes.2012;176(2):e73-8.6. GoulartCP,MahmudiM,CronaKA,JacobsSD,KallmannM,HallBG,etal.Designingantibioticcyclingstrategiesbydeterminingandunderstandinglocaladaptivelandscapes.PLoSOne.2013;8(2):e56040.7. SeigalA,MiraP,SturmfelsB,BarlowM.DoesAntibioticResistanceEvolveinHospitals?BullMathBiol.2017;79(1):191-208.8. ReardonS.Antibioticresistancesweepingdevelopingworld.Nature.2014;509(7499):141-2.9. WiseR,HartT,CarsO,StreulensM,HelmuthR,HuovinenP,etal.Antimicrobialresistance.Isamajorthreattopublichealth.BMJ.1998;317(7159):609-10.10. BarriereSL.Clinical,economicandsocietalimpactofantibioticresistance.ExpertOpinPharmacother.2015;16(2):151-3.11. ShahNS,WrightA,BaiGH,BarreraL,BoulahbalF,Martin-CasabonaN,etal.Worldwideemergenceofextensivelydrug-resistanttuberculosis.EmergInfectDis.2007;13(3):380-7.12. O'neillJ.AntimicrobialResistance:Tacklingacrisisforthehealthandwealthofnations.ReviewonAntimicrobialResistance.2014.13. CentersforDiseaseControlandPreventionC.AntibioticResistanceThreatsintheUnitedStates,2013.2013.14. LuytCE,BrechotN,TrouilletJL,ChastreJ.Antibioticstewardshipintheintensivecareunit.CritCare.2014;18(5):480.15. BartlettJG.Diagnostictestsforagentsofcommunity-acquiredpneumonia.ClinInfectDis.2011;52Suppl4:S296-304.16. KumarasamyKK,TolemanMA,WalshTR,BagariaJ,ButtF,BalakrishnanR,etal.EmergenceofanewantibioticresistancemechanisminIndia,Pakistan,andtheUK:amolecular,biological,andepidemiologicalstudy.LancetInfectDis.2010;10(9):597-602.17. GrahamJP,BolandJJ,SilbergeldE.Growthpromotingantibioticsinfoodanimalproduction:aneconomicanalysis.PublicHealthRep.2007;122(1):79-87.
110
110
18. SilbergeldEK,GrahamJ,PriceLB.Industrialfoodanimalproduction,antimicrobialresistance,andhumanhealth.AnnuRevPublicHealth.2008;29:151-69.19. vandenBogaardAE,StobberinghEE.Antibioticusageinanimals:impactonbacterialresistanceandpublichealth.Drugs.1999;58(4):589-607.20. ZhouX,QiaoM,WangFH,ZhuYG.Useofcommercialorganicfertilizerincreasestheabundanceofantibioticresistancegenesandantibioticsinsoil.EnvironSciPollutResInt.2017;24(1):701-10.21. HidronAI,EdwardsJR,PatelJ,HoranTC,SievertDM,PollockDA,etal.NHSNannualupdate:antimicrobial-resistantpathogensassociatedwithhealthcare-associatedinfections:annualsummaryofdatareportedtotheNationalHealthcareSafetyNetworkattheCentersforDiseaseControlandPrevention,2006-2007.InfectControlHospEpidemiol.2008;29(11):996-1011.22. MayM,ObermaierR,NovotnyA,WagenlehnerFM,Brookman-MaySD.FacetoFacewithMulti-ResistantPathogens:AnUrgentCalltoActionforModernSurgeonsToPioneerinAntibioticStewardship.SurgInfect(Larchmt).2017;18(5):645-6.23. ErbA,SturmerT,MarreR,BrennerH.PrevalenceofantibioticresistanceinEscherichiacoli:overviewofgeographical,temporal,andmethodologicalvariations.EurJClinMicrobiolInfectDis.2007;26(2):83-90.24. OkekeIN,LaxminarayanR,BhuttaZA,DuseAG,JenkinsP,O'BrienTF,etal.Antimicrobialresistanceindevelopingcountries.PartI:recenttrendsandcurrentstatus.LancetInfectDis.2005;5(8):481-93.25. OkekeIN,KlugmanKP,BhuttaZA,DuseAG,JenkinsP,O'BrienTF,etal.Antimicrobialresistanceindevelopingcountries.PartII:strategiesforcontainment.LancetInfectDis.2005;5(9):568-80.26. AminovRI.Abriefhistoryoftheantibioticera:lessonslearnedandchallengesforthefuture.FrontMicrobiol.2010;1:134.27. BassettEJ,KeithMS,ArmelagosGJ,MartinDL,VillanuevaAR.Tetracycline-labeledhumanbonefromancientSudaneseNubia(A.D.350).Science.1980;209(4464):1532-4.28. CookM,MoltoE,AndersonC.FluorochromelabellinginRomanperiodskeletonsfromDakhlehOasis,Egypt.AmJPhysAnthropol.1989;80(2):137-43.29. FlemingA.OntheAntibacterialActionofCulturesofaPenicillium,withSpecialReferencetotheirUseintheIsolationofB.Influenzae.TheBritishJournalofExperimentalPathology.1929:226-36.30. HareR.Newlightonthehistoryofpenicillin.MedHist.1982;26(1):1-24.31. GalloRL,MurakamiM,OhtakeT,ZaiouM.Biologyandclinicalrelevanceofnaturallyoccurringantimicrobialpeptides.JAllergyClinImmunol.2002;110(6):823-31.32. HarderJ,BartelsJ,ChristophersE,SchroderJM.Isolationandcharacterizationofhumanbeta-defensin-3,anovelhumaninduciblepeptideantibiotic.JBiolChem.2001;276(8):5707-13.
111
111
33. DopazoCP,LemosML,LodeirosC,BolinchesJ,BarjaJL,ToranzoAE.Inhibitoryactivityofantibiotic-producingmarinebacteriaagainstfishpathogens.JApplBacteriol.1988;65(2):97-101.34. GarauG,DiGuilmiAM,HallBG.Structure-basedphylogenyofthemetallo-beta-lactamases.AntimicrobAgentsChemother.2005;49(7):2778-84.35. HallBG,BarlowM.Evolutionoftheserinebeta-lactamases:past,presentandfuture.DrugResistUpdat.2004;7(2):111-23.36. AbrahamEP,Chain,E.AnEnzymefromBacteriaabletoDestroyPenicillin.Nature.1940.37. AminovRI,MackieRI.Evolutionandecologyofantibioticresistancegenes.FEMSMicrobiolLett.2007;271(2):147-61.38. WalshC.Molecularmechanismsthatconferantibacterialdrugresistance.Nature.2000;406(6797):775-81.39. ChopraI,RobertsM.Tetracyclineantibiotics:modeofaction,applications,molecularbiology,andepidemiologyofbacterialresistance.MicrobiolMolBiolRev.2001;65(2):232-60;secondpage,tableofcontents.40. HooperDC.Mechanismsofactionofantimicrobials:focusonfluoroquinolones.ClinInfectDis.2001;32Suppl1:S9-S15.41. VentolaCL.Theantibioticresistancecrisis:part1:causesandthreats.PT.2015;40(4):277-83.42. ClatworthyAE,PiersonE,HungDT.Targetingvirulence:anewparadigmforantimicrobialtherapy.NatChemBiol.2007;3(9):541-8.43. Rodriguez-RojasA,Rodriguez-BeltranJ,CouceA,BlazquezJ.Antibioticsandantibioticresistance:abitterfightagainstevolution.IntJMedMicrobiol.2013;303(6-7):293-7.44. NeyestaniMD,Eric;McLain,Jean;Rock,Channah;Gerrity,Daniel.OccurenceandProliferationofAntibioticsandAntibioticResistanceduringWastewaterTreatment.WEFConferenceProceedings.2016;Session500-509::pp.3856-65.45. WatkinsonAJ,MurbyEJ,CostanzoSD.Removalofantibioticsinconventionalandadvancedwastewatertreatment:implicationsforenvironmentaldischargeandwastewaterrecycling.WaterRes.2007;41(18):4164-76.46. WilliamsCF,McLainJE.Soilpersistenceandfateofcarbamazepine,lincomycin,caffeine,andibuprofenfromwastewaterreuse.JEnvironQual.2012;41(5):1473-80.47. WoodsGC,DickensonER.NaturalattenuationofNDMAprecursorsinanurban,wastewater-dominatedwash.WaterRes.2016;89:293-300.48. BrownKD,KulisJ,ThomsonB,ChapmanTH,MawhinneyDB.Occurrenceofantibioticsinhospital,residential,anddairyeffluent,municipalwastewater,andtheRioGrandeinNewMexico.SciTotalEnviron.2006;366(2-3):772-83.49. GrosM,Rodriguez-MozazS,BarceloD.Rapidanalysisofmulticlassantibioticresiduesandsomeoftheirmetabolitesinhospital,urbanwastewaterandriverwaterbyultra-high-performanceliquidchromatographycoupledtoquadrupole-lineariontraptandemmassspectrometry.JChromatogrA.2013;1292:173-88.
112
112
50. LiuYY,WangY,WalshTR,YiLX,ZhangR,SpencerJ,etal.Emergenceofplasmid-mediatedcolistinresistancemechanismMCR-1inanimalsandhumanbeingsinChina:amicrobiologicalandmolecularbiologicalstudy.LancetInfectDis.2016;16(2):161-8.51. ZhaoS,MukherjeeS,ChenY,LiC,YoungS,WarrenM,etal.NovelgentamicinresistancegenesinCampylobacterisolatedfromhumansandretailmeatsintheUSA.JAntimicrobChemother.2015;70(5):1314-21.52. WangH,Ren,L.,Yu,X.,Hu,J.,Chen,Y.,He,G.,Jiang,Q.Antibioticresiduesinmeat,milkandacquaticcproductsinShanghaiandhumanexposureassessment.FoodControl.2017;80(October2017):217-25.53. CorpetDE.Antibioticresiduesanddrugresistanceinhumanintestinalflora.AntimicrobAgentsChemother.1987;31(4):587-93.54. AnderssonDI,HughesD.Microbiologicaleffectsofsublethallevelsofantibiotics.NatRevMicrobiol.2014;12(7):465-78.55. SorumH.Mobiledrugresistancegenesamongfishbacteria.APMISSuppl.1998;84:74-6.56. SchmidtAS,BruunMS,DalsgaardI,LarsenJL.Incidence,distribution,andspreadoftetracyclineresistancedeterminantsandintegron-associatedantibioticresistancegenesamongmotileaeromonadsfromafishfarmingenvironment.ApplEnvironMicrobiol.2001;67(12):5675-82.57. SchwartzT,KohnenW,JansenB,ObstU.Detectionofantibiotic-resistantbacteriaandtheirresistancegenesinwastewater,surfacewater,anddrinkingwaterbiofilms.FEMSMicrobiolEcol.2003;43(3):325-35.58. WilkeMS,LoveringAL,StrynadkaNC.Beta-lactamantibioticresistance:acurrentstructuralperspective.CurrOpinMicrobiol.2005;8(5):525-33.59. BabicM,HujerAM,BonomoRA.What'snewinantibioticresistance?Focusonbeta-lactamases.DrugResistUpdat.2006;9(3):142-56.60. BaraniakA,FiettJ,MrowkaA,WaloryJ,HryniewiczW,GniadkowskiM.EvolutionofTEM-typeextended-spectrumbeta-lactamasesinclinicalEnterobacteriaceaestrainsinPoland.AntimicrobAgentsChemother.2005;49(5):1872-80.61. BarlowM,HallBG.Predictingevolutionarypotential:invitroevolutionaccuratelyreproducesnaturalevolutionofthetembeta-lactamase.Genetics.2002;160(3):823-32.62. BarlowM,HallBG.Experimentalpredictionofthenaturalevolutionofantibioticresistance.Genetics.2003;163(4):1237-41.63. BushK.Alarmingbeta-lactamase-mediatedresistanceinmultidrug-resistantEnterobacteriaceae.CurrOpinMicrobiol.2010;13(5):558-64.64. ChanalC,BonnetR,DeChampsC,SirotD,LabiaR,SirotJ.Prevalenceofbeta-lactamasesamong1,072clinicalstrainsofProteusmirabilis:a2-yearsurveyinaFrenchhospital.AntimicrobAgentsChemother.2000;44(7):1930-5.65. DrawzSM,BonomoRA.Threedecadesofbeta-lactamaseinhibitors.ClinMicrobiolRev.2010;23(1):160-201.
113
113
66. TzouvelekisLS,TzelepiE,TassiosPT,LegakisNJ.CTX-M-typebeta-lactamases:anemerginggroupofextended-spectrumenzymes.IntJAntimicrobAgents.2000;14(2):137-42.67. WeldhagenGF.Integronsandbeta-lactamases--anovelperspectiveonresistance.IntJAntimicrobAgents.2004;23(6):556-62.68. ZhouXY,BordonF,SirotD,KitzisMD,GutmannL.EmergenceofclinicalisolatesofEscherichiacoliproducingTEM-1derivativesoranOXA-1beta-lactamaseconferringresistancetobeta-lactamaseinhibitors.AntimicrobAgentsChemother.1994;38(5):1085-9.69. PalumbiSR.Humansastheworld'sgreatestevolutionaryforce.Science.2001;293(5536):1786-90.70. BushK,JacobyGA.Updatedfunctionalclassificationofbeta-lactamases.AntimicrobAgentsChemother.2010;54(3):969-76.71. WinokurPL,VonsteinDL,HoffmanLJ,UhlenhoppEK,DoernGV.EvidencefortransferofCMY-2AmpCbeta-lactamaseplasmidsbetweenEscherichiacoliandSalmonellaisolatesfromfoodanimalsandhumans.AntimicrobAgentsChemother.2001;45(10):2716-22.72. BouG,OliverA,OjedaM,MonzonC,Martinez-BeltranJ.MolecularcharacterizationofFOX-4,anewAmpC-typeplasmid-mediatedbeta-lactamasefromanEscherichiacolistrainisolatedinSpain.AntimicrobAgentsChemother.2000;44(9):2549-53.73. JacobyGA,TranJ.SequenceoftheMIR-1beta-lactamasegene.AntimicrobAgentsChemother.1999;43(7):1759-60.74. YanJJ,WuSM,TsaiSH,WuJJ,SuIJ.PrevalenceofSHV-12amongclinicalisolatesofKlebsiellapneumoniaeproducingextended-spectrumbeta-lactamasesandidentificationofanovelAmpCenzyme(CMY-8)inSouthernTaiwan.AntimicrobAgentsChemother.2000;44(6):1438-42.75. EvansBA,AmyesSG.OXAbeta-lactamases.ClinMicrobiolRev.2014;27(2):241-63.76. ChuYW,Afzal-ShahM,HouangET,PalepouMI,LyonDJ,WoodfordN,etal.IMP-4,anovelmetallo-beta-lactamasefromnosocomialAcinetobacterspp.collectedinHongKongbetween1994and1998.AntimicrobAgentsChemother.2001;45(3):710-4.77. LaurettiL,RiccioML,MazzariolA,CornagliaG,AmicosanteG,FontanaR,etal.CloningandcharacterizationofblaVIM,anewintegron-bornemetallo-beta-lactamasegenefromaPseudomonasaeruginosaclinicalisolate.AntimicrobAgentsChemother.1999;43(7):1584-90.78. PleissJ.TheLactamaseEngineeringDatabase.79. SirotD,ReculeC,ChaibiEB,BretL,CroizeJ,Chanal-ClarisC,etal.AcomplexmutantofTEM-1beta-lactamasewithmutationsencounteredinbothIRT-4andextended-spectrumTEM-15,producedbyanEscherichiacoliclinicalisolate.AntimicrobAgentsChemother.1997;41(6):1322-5.
114
114
80. GullbergE,CaoS,BergOG,IlbackC,SandegrenL,HughesD,etal.Selectionofresistantbacteriaatverylowantibioticconcentrations.PLoSPathog.2011;7(7):e1002158.81. GustafsonRH.Useofantibioticsinlivestockandhumanhealthconcerns.JDairySci.1991;74(4):1428-32.82. WegenerHC.Antibioticsinanimalfeedandtheirroleinresistancedevelopment.CurrOpinMicrobiol.2003;6(5):439-45.83. KolpinDW,SkopecM,MeyerMT,FurlongET,ZauggSD.Urbancontributionofpharmaceuticalsandotherorganicwastewatercontaminantstostreamsduringdifferingflowconditions.SciTotalEnviron.2004;328(1-3):119-30.84. WatkinsonAJ,MurbyEJ,KolpinDW,CostanzoSD.Theoccurrenceofantibioticsinanurbanwatershed:fromwastewatertodrinkingwater.SciTotalEnviron.2009;407(8):2711-23.85. BlazquezJ,CouceA,Rodriguez-BeltranJ,Rodriguez-RojasA.Antimicrobialsaspromotersofgeneticvariation.CurrOpinMicrobiol.2012;15(5):561-9.86. GuthrieVB,AllenJ,CampsM,KarchinR.NetworkmodelsofTEMbeta-lactamasemutationscoevolvingunderantibioticselectionshowmodularstructureandanticipateevolutionarytrajectories.PLoSComputBiol.2011;7(9):e1002184.87. BradfordPA.Extended-spectrumbeta-lactamasesinthe21stcentury:characterization,epidemiology,anddetectionofthisimportantresistancethreat.ClinMicrobiolRev.2001;14(4):933-51,tableofcontents.88. SirotD,SirotJ,LabiaR,MorandA,CourvalinP,Darfeuille-MichaudA,etal.Transferableresistancetothird-generationcephalosporinsinclinicalisolatesofKlebsiellapneumoniae:identificationofCTX-1,anovelbeta-lactamase.JAntimicrobChemother.1987;20(3):323-34.89. ChaibiEB,SirotD,PaulG,LabiaR.Inhibitor-resistantTEMbeta-lactamases:phenotypic,geneticandbiochemicalcharacteristics.JAntimicrobChemother.1999;43(4):447-58.90. VedelG,BelaaouajA,GillyL,LabiaR,PhilipponA,NevotP,etal.ClinicalisolatesofEscherichiacoliproducingTRIbeta-lactamases:novelTEM-enzymesconferringresistancetobeta-lactamaseinhibitors.JAntimicrobChemother.1992;30(4):449-62.91. SirotD,ReculeC,ChaibiEB,BretL,CroizeJ,Chanal-ClarisC,etal.AcomplexmutantofTEM-1beta-lactamasewithmutationsencounteredinbothIRT-4andextended-spectrumTEM-15,producedbyanEscherichiacoliclinicalisolate.AntimicrobAgentsChemother.1997;41(6):1322-5.92. RobinF,DelmasJ,MachadoE,BouchonB,PeixeL,BonnetR.CharacterizationoftheNovelCMTEnzymeTEM-154.AntimicrobAgentsChemother.2011;55(3):1262-5.93. KondrashovFA,KondrashovAS.Multidimensionalepistasisandthedisadvantageofsex.ProcNatlAcadSciUSA.2001;98(21):12089-92.94. SalverdaML,DellusE,GorterFA,DebetsAJ,vanderOostJ,HoekstraRF,etal.Initialmutationsdirectalternativepathwaysofproteinevolution.PLoSGenet.2011;7(3):e1001321.
115
115
95. SchenkMF,SzendroIG,SalverdaML,KrugJ,deVisserJA.PatternsofEpistasisbetweenbeneficialmutationsinanantibioticresistancegene.MolBiolEvol.2013;30(8):1779-87.96. WeinreichDM,DelaneyNF,DepristoMA,HartlDL.Darwinianevolutioncanfollowonlyveryfewmutationalpathstofitterproteins.Science.2006;312(5770):111-4.97. PoonA,ChaoL.TherateofcompensatorymutationintheDNAbacteriophagephiX174.Genetics.2005;170(3):989-99.98. WatsonRA,WeinreichDM,WakeleyJ.Genomestructureandthebenefitofsex.Evolution.2011;65(2):523-36.99. GillespieJH,TurelliM.Genotype-environmentinteractionsandthemaintenanceofpolygenicvariation.Genetics.1989;121(1):129-38.100. RemoldSK,LenskiRE.Contributionofindividualrandommutationstogenotype-by-environmentinteractionsinEscherichiacoli.ProcNatlAcadSciUSA.2001;98(20):11388-93.101. MroczkowskaJE,BarlowM.FitnesstradeoffsinblaTEMevolution.AntimicrobAgentsChemother.2008.102. JacobyG.Β-LactamaseClassificationandAminoAcidSequencesforTEM,SHV,andOXAExtended-SpectrumandInhibitorResistantEnzymesLaheyClinic2017[updatedNovember8,2016.Availablefrom:http://www.lahey.org/Studies/webt.asp - Ref_TEM_152.103. RokytaDR,BeiselCJ,JoyceP.Propertiesofadaptivewalksonuncorrelatedlandscapesunderstrongselectionandweakmutation.JTheorBiol.2006;243(1):114-20.104. HallBG,AcarH,NandipatiA,BarlowM.GrowthRatesMadeEasy.MolBiolEvol.2013.105. SearsCL.Adynamicpartnership:celebratingourgutflora.Anaerobe.2005;11(5):247-51.106. SyvanenM.Evolutionaryimplicationsofhorizontalgenetransfer.AnnuRevGenet.2012;46:341-58.107. OrrHA.Adaptationandthecostofcomplexity.Evolution.2000;54(1):13-20.108. TiwariK,GuptaRK.Rareactinomycetes:apotentialstorehousefornovelantibiotics.CritRevBiotechnol.2012;32(2):108-32.109. KolarM,UrbanekK,LatalT.Antibioticselectivepressureanddevelopmentofbacterialresistance.IntJAntimicrobAgents.2001;17(5):357-63.110. GillespieSH.Antibioticresistanceintheabsenceofselectivepressure.IntJAntimicrobAgents.2001;17(3):171-6.111. KummererK.Significanceofantibioticsintheenvironment.JAntimicrobChemother.2003;52(1):5-7.112. LiWH.Retentionofcrypticgenesinmicrobialpopulations.MolBiolEvol.1984;1(2):213-9.113. ShojaMM,TubbsRS,AnsarinK,VarshochiM,FarahaniRM.Thetheoryofcyclingantibioticresistance.MedHypotheses.2007;69(2):467-8.
116
116
114. LipsitchM,BergstromCT,LevinBR.Theepidemiologyofantibioticresistanceinhospitals:paradoxesandprescriptions.ProcNatlAcadSciUSA.2000;97(4):1938-43.115. BergstromCT,LoM,LipsitchM.Ecologicaltheorysuggeststhatantimicrobialcyclingwillnotreduceantimicrobialresistanceinhospitals.ProcNatlAcadSciUSA.2004;101(36):13285-90.116. BeardmoreRE,Pena-MillerR.Rotatingantibioticsselectsoptimallyagainstantibioticresistance,intheory.MathBiosciEng.2010;7(3):527-52.117. BeardmoreRE,Pena-MillerR.Antibioticcyclingversusmixing:thedifficultyofusingmathematicalmodelstodefinitivelyquantifytheirrelativemerits.MathBiosciEng.2010;7(4):923-33.118. JacobyGA.ß-LactamaseClassificationandAminoAcidSequencesforTEM,SHVandOXAExtended-SpectrumandInhibitorResistantEnzymes2014[Availablefrom:http://www.lahey.org/Studies/.119. UncklessRL,OrrHA.Thepopulationgeneticsofadaptation:multiplesubstitutionsonasmoothfitnesslandscape.Genetics.2009;183(3):1079-86.120. SchenkMF,WitteS,SalverdaML,Koopmanschap,KrugJ,deVisserJA.RoleofPleiotropyDuringAdaptationofTEM-1Beta-LactamasetoTwoNovelAntibiotics.EvolutionaryApplications.2014.121. MroczkowskaJE,BarlowM.Fitnesstrade-offsinblaTEMevolution.AntimicrobAgentsChemother.2008;52(7):2340-5.122. CronaK,GreeneD,BarlowM.Thepeaksandgeometryoffitnesslandscapes.JTheorBiol.2013;317:1-10.123. deVisserJA,ParkSC,KrugJ.Exploringtheeffectofsexonempiricalfitnesslandscapes.AmNat.2009;174Suppl1:S15-30.124. ChevinLM.Onmeasuringselectioninexperimentalevolution.BiolLett.2011;7(2):210-3.125. GillespieJH.MolecularEvolutionovertheMutationalLandscape.Evolution.1984;38(5):1116-29.126. HaldaneJBS.Amathematicaltheoryofnaturalandartificialselection,PartV:Selectionandmutation.PCambPhilosSoc.1927;23:838-44.127. KimS,LiebermanTD,KishonyR.Alternatingantibiotictreatmentsconstrainevolutionarypathstomultidrugresistance.ProcNatlAcadSciUSA.2014;111(40):14494-9.128. HallBG,AcarH,NandipatiA,BarlowM.Growthratesmadeeasy.MolBiolEvol.2014;31(1):232-8.129. KimuraM.Ontheprobabilityoffixationofmutantgenesinapopulation.Genetics.1962;47:715.130. MiraPM,MezaJC,NandipatiA,BarlowM.AdaptiveLandscapesofResistanceGenesChangeasAntibioticConcentrationsChange.MolBiolEvol.2015;32(10):2707-15.131. KlumppS,HwaT.Bacterialgrowth:globaleffectsongeneexpression,growthfeedbackandproteomepartition.CurrOpinBiotechnol.2014;28:96-102.
117
117
132. SantosSB,CarvalhoC,AzeredoJ,FerreiraEC.PopulationdynamicsofaSalmonellalyticphageanditshost:implicationsofthehostbacterialgrowthrateinmodelling.PLoSOne.2014;9(7):e102507.133. RaynesY,SniegowskiPD.Experimentalevolutionandthedynamicsofgenomicmutationratemodifiers.Heredity(Edinb).2014;113(5):375-80.134. MiraPM,CronaK,GreeneD,MezaJC,SturmfelsB,BarlowM.Rationaldesignofantibiotictreatmentplans:atreatmentstrategyformanagingevolutionandreversingresistance.PLoSOne.2015;10(5):e0122283.135. RossT,McMeekinTA.Predictivemicrobiology.IntJFoodMicrobiol.1994;23(3-4):241-64.136. HallBG,AcarH,NandipatiA,BarlowM.Growthratesmadeeasy.MolBiolEvol.2014;31(1):232-8.137. JungPP,ChristianN,KayDP,SkupinA,LinsterCL.Protocolsandprogramsforhigh-throughputgrowthandagingphenotypinginyeast.PLoSOne.2015;10(3):e0119807.138. CavalloJA,StrumiaMC,GomezCG.Preparationofamilkspoilageindicatoradsorbedtoamodifiedpolypropylenefilmasanattempttobuildasmartpackaging.JFoodEngineering.2014;136:48-55.139. EfronB.BootstrapMethods:AnotherLookattheJackknife.InstMathematicalStatistics.1979;7:1-26.140. ForslundK,SunagawaS,KultimaJR,MendeDR,ArumugamM,TypasA,etal.Country-specificantibioticusepracticesimpactthehumangutresistome.GenomeRes.2013;23(7):1163-9.141. GoossensH.Antibioticconsumptionandlinktoresistance.ClinMicrobiolInfect.2009;15Suppl3:12-5.142. KahlmeterG,AhmanJ,MatuschekE.AntimicrobialResistanceofEscherichiacoliCausingUncomplicatedUrinaryTractInfections:AEuropeanUpdatefor2014andComparisonwith2000and2008.InfectDisTher.2015;4(4):417-23.143. SnitkinES,ZelaznyAM,ThomasPJ,StockF,GroupNCSP,HendersonDK,etal.Trackingahospitaloutbreakofcarbapenem-resistantKlebsiellapneumoniaewithwhole-genomesequencing.SciTranslMed.2012;4(148):148ra16.144. Lopez-CamachoE,Gomez-GilR,TobesR,ManriqueM,LorenzoM,GalvanB,etal.GenomicanalysisoftheemergenceandevolutionofmultidrugresistanceduringaKlebsiellapneumoniaeoutbreakincludingcarbapenemandcolistinresistance.JAntimicrobChemother.2014;69(3):632-6.145. ZhaoJ,SchlossPD,KalikinLM,CarmodyLA,FosterBK,PetrosinoJF,etal.Decade-longbacterialcommunitydynamicsincysticfibrosisairways.ProcNatlAcadSciUSA.2012;109(15):5809-14.146. PoirierC,DinhA,SalomonJ,GrallN,AndremontA,BernardL.Antibioticcyclingpreventsurinarytractinfectionsinspinalcordinjurypatientsandlimitstheemergenceofmultidrugresistantorganism.JInfect.2015;71(4):491-3.147. BrownEM,NathwaniD.Antibioticcyclingorrotation:asystematicreviewoftheevidenceofefficacy.JAntimicrobChemother.2005;55(1):6-9.
118
118
148. AltunsoyA,AypakC,AzapA,ErgonulO,BalikI.TheimpactofanationwideantibioticrestrictionprogramonantibioticusageandresistanceagainstnosocomialpathogensinTurkey.IntJMedSci.2011;8(4):339-44.149. WorldHealthOrganization.ImpactsofAntimicrobialGrowthPromoterTerminationinDenmark2002[Availablefrom:apps.who.int/iris/bitstream/10665/68357/1/WHO_CDS_CPE_ZFK_2003.1.pdf.150. CasewellM,FriisC,MarcoE,McMullinP,PhillipsI.TheEuropeanbanongrowth-promotingantibioticsandemergingconsequencesforhumanandanimalhealth.JAntimicrobChemother.2003;52(2):159-61.151. HamidianM,HallRM.Resistancetothird-generationcephalosporinsinAcinetobacterbaumanniiduetohorizontaltransferofachromosomalsegmentcontainingISAba1-ampC.JAntimicrobChemother.2014;69(10):2865-6.152. MachadoE,CoqueTM,CantonR,SousaJC,PeixeL.CommensalEnterobacteriaceaeasreservoirsofextended-spectrumbeta-lactamases,integrons,andsulgenesinPortugal.FrontMicrobiol.2013;4:80.153. AustinDJ,AndersonRM.Studiesofantibioticresistancewithinthepatient,hospitalsandthecommunityusingsimplemathematicalmodels.PhilosTransRSocLondBBiolSci.1999;354(1384):721-38.154. GandonS,DayT,MetcalfCJ,GrenfellBT.ForecastingEpidemiologicalandEvolutionaryDynamicsofInfectiousDiseases.TrendsEcolEvol.2016;31(10):776-88.155. LipsitchM,BergstromCT,LevinBR.Theepidemiologyofantibioticresistanceinhospitals:paradoxesandprescriptions.ProcNatlAcadSciUSA.2000;97(4):1938-43.156. AppelbaumPC.Theemergenceofvancomycin-intermediateandvancomycin-resistantStaphylococcusaureus.ClinMicrobiolInfect.2006;12Suppl1:16-23.157. RedgraveLS,SuttonSB,WebberMA,PiddockLJ.Fluoroquinoloneresistance:mechanisms,impactonbacteria,androleinevolutionarysuccess.TrendsMicrobiol.2014;22(8):438-45.158. WoodfordN,WardME,KaufmannME,TurtonJ,FaganEJ,JamesD,etal.CommunityandhospitalspreadofEscherichiacoliproducingCTX-Mextended-spectrumbeta-lactamasesintheUK.JAntimicrobChemother.2004;54(4):735-43.159. LauritzenSL.GraphicalModels:OxfordUniversityPress;2004.160. BushK.Proliferationandsignificanceofclinicallyrelevantbeta-lactamases.AnnNYAcadSci.2013;1277:84-90.161. BobenchikAM,DeakE,HindlerJA,CharltonCL,HumphriesRM.PerformanceofVitek2forantimicrobialsusceptibilitytestingofEnterobacteriaceaewithVitek2(2009FDA)and2014CLSIbreakpoints.JClinMicrobiol.2015;53(3):816-23.162. HøjsgaardS,EdwardsD,LauritzenSL.GraphicalModelswithR:Springer;2012.163. RCoreTeam.R:Alanguageandenvironmentforstatisticalcomputing.Vienna,Austria:RFoundationforStatisticalComputing;2013.
119
119
164. Lloyd-SmithJO.Maximumlikelihoodestimationofthenegativebinomialdispersionparameterforhighlyoverdisperseddata,withapplicationstoinfectiousdiseases.PLoSOne.2007;2(2):e180.165. MedeirosAA.Evolutionanddisseminationofbeta-lactamasesacceleratedbygenerationsofbeta-lactamantibiotics.ClinInfectDis.1997;24Suppl1:S19-45.166. ArenaF,GianiT,BecucciE,ConteV,ZanelliG,D'AndreaMM,etal.LargeoligoclonaloutbreakduetoKlebsiellapneumoniaeST14andST26producingtheFOX-7AmpCbeta-lactamaseinaneonatalintensivecareunit.JClinMicrobiol.2013;51(12):4067-72.167. GianiT,ArenaF,VaggelliG,ConteV,ChiarelliA,HenriciDeAngelisL,etal.LargeNosocomialOutbreakofColistin-Resistant,Carbapenemase-ProducingKlebsiellapneumoniaeTracedtoClonalExpansionofanmgrBDeletionMutant.JClinMicrobiol.2015;53(10):3341-4.168. PitoutJD,GregsonDB,ChurchDL,ElsayedS,LauplandKB.Community-wideoutbreaksofclonallyrelatedCTX-M-14beta-lactamase-producingEscherichiacolistrainsintheCalgaryhealthregion.JClinMicrobiol.2005;43(6):2844-9.169. Kassis-ChikhaniN,DecreD,GautierV,BurghofferB,SalibaF,MathieuD,etal.Firstoutbreakofmultidrug-resistantKlebsiellapneumoniaecarryingblaVIM-1andblaSHV-5inaFrenchuniversityhospital.JAntimicrobChemother.2006;57(1):142-5.170. CarrerA,LasselL,FortineauN,MansouriM,AnguelN,RichardC,etal.OutbreakofCTX-M-15-producingKlebsiellapneumoniaeintheintensivecareunitofaFrenchhospital.MicrobDrugResist.2009;15(1):47-54.171. Garcia-FernandezA,VillaL,CartaC,VendittiC,GiordanoA,VendittiM,etal.KlebsiellapneumoniaeST258producingKPC-3identifiedinitalycarriesnovelplasmidsandOmpK36/OmpK35porinvariants.AntimicrobAgentsChemother.2012;56(4):2143-5.172. VenablesWN,RipleyBD.ModernAppliedStatisticswithS.Fourthed.NewYork:Springer;2002.173. AlfredsonDA,KorolikV.AntibioticresistanceandresistancemechanismsinCampylobacterjejuniandCampylobactercoli.FEMSMicrobiolLett.2007;277(2):123-32.174. BailarJC,3rd,TraversK.Reviewofassessmentsofthehumanhealthriskassociatedwiththeuseofantimicrobialagentsinagriculture.ClinInfectDis.2002;34Suppl3:S135-43.175. NavasE.Problemsassociatedwithpotentialmassiveuseofantimicrobialagentsasprophylaxisortherapyofabioterroristattack.ClinMicrobiolInfect.2002;8(8):534-9.176. DoiY,PatersonDL,Adams-HaduchJM,SidjabatHE,O'KeefeA,EndimianiA,etal.ReducedsusceptibilitytocefepimeamongEscherichiacoliclinicalisolatesproducingnovelvariantsofCMY-2beta-lactamase.AntimicrobAgentsChemother.2009;53(7):3159-61.
120
120
177. MansouriM,RamazanzadehR,NorabadiP.CefepimeresistanceandassociatedriskfactorsamongEscherichiacolistrainsisolatedfromclinicalspecimens.Chemotherapy.2011;57(2):134-7.178. AmbrosePG,BhavnaniSM,JonesRN.Pharmacokinetics-pharmacodynamicsofcefepimeandpiperacillin-tazobactamagainstEscherichiacoliandKlebsiellapneumoniaestrainsproducingextended-spectrumbeta-lactamases:reportfromtheARRESTprogram.AntimicrobAgentsChemother.2003;47(5):1643-6.179. WangP,HuF,XiongZ,YeX,ZhuD,WangYF,etal.Susceptibilityofextended-spectrum-beta-lactamase-producingEnterobacteriaceaeaccordingtothenewCLSIbreakpoints.JClinMicrobiol.2011;49(9):3127-31.180. DoscherE,KimJ,MiraPM,ChanP,CampsM,LoweT,etal.MolecularSurveillanceofaSmallCommunityHospital.2016.181. GullbergE,CaoS,BergOG,IlbackC,SandegrenL,HughesD,etal.Selectionofresistantbacteriaatverylowantibioticconcentrations.PLoSPathog.2011;7(7):e1002158.182. CairnsJ,BecksL,JalasvuoriM,HiltunenT.Sublethalstreptomycinconcentrationsandlyticbacteriophagetogetherpromoteresistanceevolution.PhilosTransRSocLondBBiolSci.2017;372(1712).183. PetrosinoJ,CantuC,3rd,PalzkillT.beta-Lactamases:proteinevolutioninrealtime.TrendsMicrobiol.1998;6(8):323-7.184. StifflerMA,HekstraDR,RanganathanR.EvolvabilityasafunctionofpurifyingselectioninTEM-1beta-lactamase.Cell.2015;160(5):882-92.185. MroczkowskaJE,BarlowM.Fitnesstrade-offsinblaTEMevolution.AntimicrobAgentsChemother.2008;52(7):2340-5.186. SalverdaML,DeVisserJA,BarlowM.NaturalevolutionofTEM-1beta-lactamase:experimentalreconstructionandclinicalrelevance.FEMSMicrobiolRev.2010;34(6):1015-36.187. ElwellLP,InamineJM,MinshewBH.Commonplasmidspecifyingtobramycinresistancefoundintwoentericbacteriaisolatedfromburnpatients.AntimicrobAgentsChemother.1978;13(2):312-7.188. PoirelL,KiefferN,LiassineN,ThanhD,NordmannP.Plasmid-mediatedcarbapenemandcolistinresistanceinaclinicalisolateofEscherichiacoli.LancetInfectDis.2016;16(3):281.189. RosenauA,CattierB,GoussetN,HarriauP,PhilipponA,QuentinR.Capnocytophagaochracea:characterizationofaplasmid-encodedextended-spectrumTEM-17beta-lactamaseinthephylumFlavobacter-bacteroides.AntimicrobAgentsChemother.2000;44(3):760-2.190. SchenkMF,SzendroIG,SalverdaML,KrugJ,deVisserJA.PatternsofEpistasisbetweenbeneficialmutationsinanantibioticresistancegene.MolBiolEvol.2013;30(8):1779-87.191. FrankeJ,KlozerA,deVisserJA,KrugJ.Evolutionaryaccessibilityofmutationalpathways.PLoSComputBiol.2011;7(8):e1002134.192. MiraP,BarlowM,MezaJC,HallBG.StatisticalPackageforGrowthRatesMadeEasy.MolBiolEvol.2017.
121
121
193. KnoxJR.Extended-spectrumandinhibitor-resistantTEM-typebeta-lactamases:mutations,specificity,andthree-dimensionalstructure.AntimicrobAgentsChemother.1995;39(12):2593-601.194. OstmanB,HintzeA,AdamiC.Impactofepistasisandpleiotropyonevolutionaryadaptation.ProcBiolSci.2012;279(1727):247-56.195. BaqueroF,NegriMC,MorosiniMI,BlazquezJ.Antibiotic-selectiveenvironments.ClinInfectDis.1998;27Suppl1:S5-11.196. MartinezJL.Antibioticsandantibioticresistancegenesinnaturalenvironments.Science.2008;321(5887):365-7.197. McLainJE,WilliamsCF.Assessingenvironmentalimpactsoftreatedwastewaterthroughmonitoringoffecalindicatorbacteriaandsalinityinirrigatedsoils.EnvironMonitAssess.2012;184(3):1559-72.198. GuthrieVB,AllenJ,CampsM,KarchinR.NetworkmodelsofTEMbeta-lactamasemutationscoevolvingunderantibioticselectionshowmodularstructureandanticipateevolutionarytrajectories.PLoSComputBiol.2011;7(9):e1002184.199. SalverdaML,DellusE,GorterFA,DebetsAJ,vanderOostJ,HoekstraRF,etal.Initialmutationsdirectalternativepathwaysofproteinevolution.PLoSGenet.2011;7(3):e1001321.200. WeinreichDM,WatsonRA,ChaoL.Perspective:Signepistasisandgeneticconstraintonevolutionarytrajectories.Evolution.2005;59(6):1165-74.201. PoelwijkFJ,Tanase-NicolaS,KivietDJ,TansSJ.Reciprocalsignepistasisisanecessaryconditionformulti-peakedfitnesslandscapes.JTheorBiol.2011;272(1):141-4.202. SheaKM.Antibioticresistance:whatistheimpactofagriculturalusesofantibioticsonchildren'shealth?Pediatrics.2003;112(1Pt2):253-8.
Related Documents