SULPHUR AMINO ACID REQUIREMENT AND METABOLISM IN THE TOTAL PARENTERAL NUTRITION (TPN) FED HUMAN NEONATE
By
Glenda Courtney-Martin
A thesis submitted in conformity with the requirements for the degree of PhD
Graduate Department of Nutritional Sciences
University of Toronto
© Copyright by Glenda Courtney-Martin (2009)
ii
SULPHUR AMINO ACID REQUIREMENT AND METABOLISM IN THE TPN FED HUMAN NEONATE
Doctor of Philosophy, 2009
Glenda Courtney-Martin
Graduate Department of Nutritional Sciences
University of Toronto
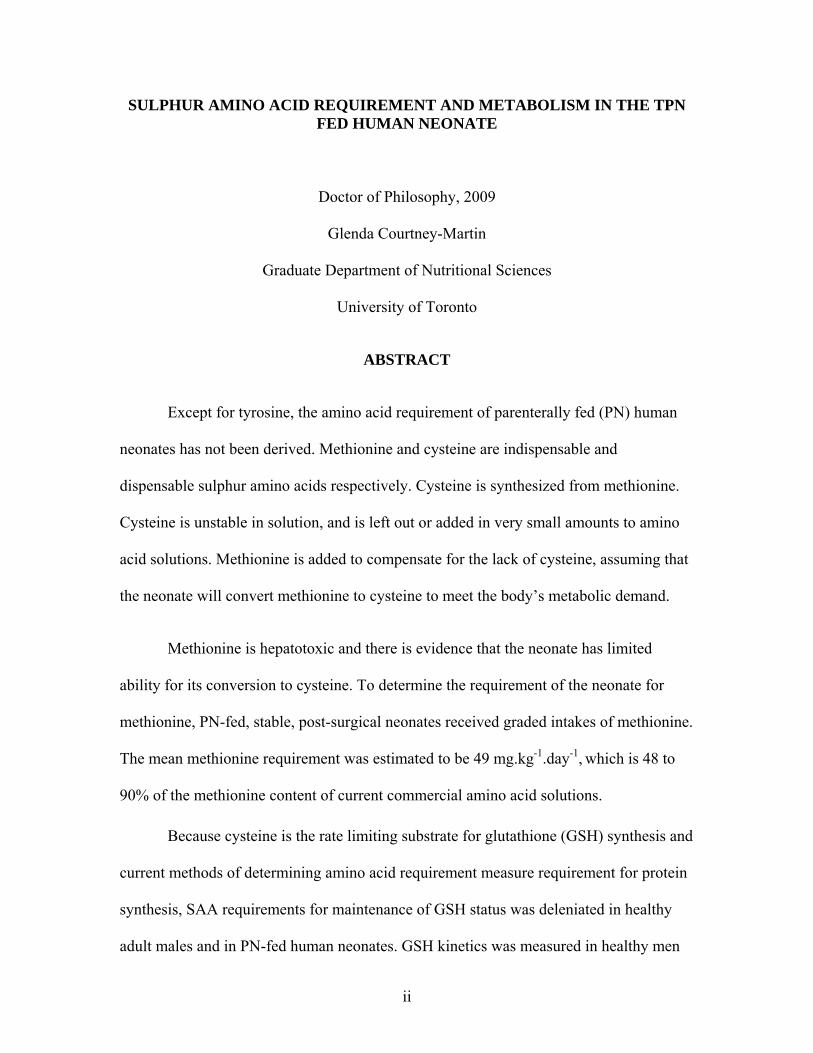
ABSTRACT
Except for tyrosine, the amino acid requirement of parenterally fed (PN) human
neonates has not been derived. Methionine and cysteine are indispensable and
dispensable sulphur amino acids respectively. Cysteine is synthesized from methionine.
Cysteine is unstable in solution, and is left out or added in very small amounts to amino
acid solutions. Methionine is added to compensate for the lack of cysteine, assuming that
the neonate will convert methionine to cysteine to meet the body’s metabolic demand.
Methionine is hepatotoxic and there is evidence that the neonate has limited
ability for its conversion to cysteine. To determine the requirement of the neonate for
methionine, PN-fed, stable, post-surgical neonates received graded intakes of methionine.
The mean methionine requirement was estimated to be 49 mg.kg-1.day-1, which is 48 to
90% of the methionine content of current commercial amino acid solutions.
Because cysteine is the rate limiting substrate for glutathione (GSH) synthesis and
current methods of determining amino acid requirement measure requirement for protein
synthesis, SAA requirements for maintenance of GSH status was deleniated in healthy
adult males and in PN-fed human neonates. GSH kinetics was measured in healthy men

iii
receiving the mean methionine requirement and graded intakes of cysteine. GSH
synthesis did not change with the addition of cysteine. Additionally, PN-fed post-surgical
neonates recieved a methionine-adequate cysteine-free PN followed by cysteine
supplemented PN for two 3-day periods and GSH kinetics measured on days 3 and 6.
There was no change in GSH synthesis in response to cysteine supplementation.
It is concluded that the PN-fed human neonate is capable of synthesizing enough
cysteine from methionine not only for protein synthesis but for GSH synthesis. For both
healthy men and stable post-surgical neonates, the requirement for GSH synthesis is met
at the sulphur amino acid requirement derived using the indicator amino acid technique.

iv
ACKNOWLEDGEMENTS
To my husband, Okan, whose unwavering love and support was beyond heroic. This
accomplishment is as much yours as it is mine. And to my daughter Kimberly, for sure
you keep the wind beneath my wings but you have suffered much for this. I am sorry. I
love you much. Mom.
To Dr. P, Thanks for being the best teacher and mentor I could hope for. I am truly
blessed to have had the opportunity to be your student. May God return to you “pressed
down, shaken together and running over” all that you have so generously given. God’s
blessings always.
To Dr. Ball, Thanks for your sound, always intellectually stimulating and brilliant
guidance.
To Mahroukh, Thanks for helping me achieve one of the primary objectives for this PhD:
to become versed in the methods and machinery that we use in the lab. Thanks for your
enthusiasm with method developing. Much appreciated.
To Rajavel Elango, Arshad Humayun, Karen Chapman, Christopher Tomlinson, Joann
Herridge and Jean Hsu. The camaraderie, support, and variations in humour helped to
make the time fly.
v
To my friend Catharine Rocchi, your support from the beginning to end is most sincerely
appreciated. Thanks for your faithfulness.
To my office mates, Deb Harrison, Marnie Mckenzie, and Julia Maxwell. Thanks so
much for all your support and encouragement.
Heartfelt thanks to all my subjects, NICU nurses and staff especially Nicole daSilva,
Pharmacy staff, especially Mark Bedford and the nurses in the CIU, especially Maria
Mione and Roberta Gardiner.

vi
TABLE OF CONTENTS
ABSTRACT ___________________________________________________________ ii
ACKNOWLEDGEMENTS _______________________________________________ iv
TABLE OF CONTENTS_________________________________________________ vi
LIST OF TABLES ______________________________________________________ x
LIST OF FIGURES_____________________________________________________ xi
PUBLICATIONS AND PRESENTATIONS ARISING FROM THESIS__________xiii
ABBREVIATIONS USED IN THESIS ____________________________________ xiv
1 INTRODUCTION_____________________________________________________ 1
2 LITERATURE REVIEW _______________________________________________ 7 2.1 Sulphur Amino Acid Metabolism___________________________________________ 7
2.1.1 Sulphur Amino Acid Metabolism Using Nitrogen Balance ___________________________ 12 2.1.2 Sulphur Amino Acid Metabolism Using Stable Isotope Tracers _______________________ 13 2.1.3 Sulphur Amino Acid Metabolism Animal Studies __________________________________ 16
2.2 Sulphur Amino Acid Requirement of the Adult Human_______________________ 18 2.2.1 Nitrogen Balance ___________________________________________________________ 18 2.2.2 Sulphur Amino Acid Requirements by Stable Isotope Tracer Kinetic Method ____________ 20
2.3 Sulphur Amino Acid Requirement of the Human Infant_______________________ 26 2.3.1 Nitrogen Balance ___________________________________________________________ 26 2.3.2 Indicator Amino Acid Oxidation (IAAO)_________________________________________ 28
2.4 Sulphur Amino Acid Metabolism: Effect of Route of Feeding __________________ 30 2.5 Is Cysteine a Conditionally Essential Amino Acid in Human Neonates? __________ 34
2.5.1 In Vitro Studies: ____________________________________________________________ 34 2.5.2 Plasma Amino Acids_________________________________________________________ 38 2.5.3 Nitrogen Balance ___________________________________________________________ 39 2.5.4 Stable Isotope Tracer Studies __________________________________________________ 41
2.6 Glutathione ____________________________________________________________ 43 2.6.1 Introduction to Glutathione Metabolism__________________________________________ 43 2.6.3 Glutathione: Turnover and Metabolism __________________________________________ 48 2.6.4 Glutathione Kinetic Measurement: ______________________________________________ 51 2.6.5 Glutathione Metabolism and Synthesis Rates: _____________________________________ 55
2.7 Cysteine Metabolism ____________________________________________________ 64 2.7.1 In Vitro Studies _____________________________________________________________ 64 2.7.2 in Vivo Studies _____________________________________________________________ 67
3 THESIS SCOPE AND MOTIVATION ___________________________________ 72 3.1 Rationale ______________________________________________________________ 72 3.2 Hypothesis and Objectives _______________________________________________ 74

vii
4 THE DEVELOPMENT OF AN AMINO ACID SOLUTION SUITABLE FOR USE IN THE DETERMINATION OF AMINO ACID REQUIREMENT AND METABOLISM IN PARENTERALLY FED HUMANS_______________________ 78
4.1 Abstract_______________________________________________________________ 78 4.2 Introduction ___________________________________________________________ 79 4.3 Methods_______________________________________________________________ 82
4.3.1. Obtain Individual Amino Acid Powders:_________________________________________ 83 4.3.2. The actual making of the amino acid solution under sterile conditions __________________ 84 4.3.3. Test the solutions for sterility, pyrogenicity_______________________________________ 85 4.3.4. Nitrogen analysis ___________________________________________________________ 85 4.3.5. HPLC stability testing _______________________________________________________ 86 4.3.6 Heavy metal testing and testing for breakdown products of isotopes ____________________ 86 4.3.7 Statistical analysis___________________________________________________________ 87
4.4. Results _______________________________________________________________ 87
4.5 Discussion _____________________________________________________________ 93 5. TOTAL SULPHUR AMINO ACID REQUIREMENT AND METABOLISM IN THE PARENTERALLY FED POST-SURGICAL HUMAN NEONATE. _________ 97
5.1 Abstract_______________________________________________________________ 97 5.2 Introduction ___________________________________________________________ 98 5.3. Subjects and method___________________________________________________ 100
5.3.1 Subjects__________________________________________________________________ 100 5.3.2 Experimental Design________________________________________________________ 103 5.3.3 Study Diets _______________________________________________________________ 108 5.3.4 Tracer Protocol ____________________________________________________________ 113 5.3.5 Sample Collection and Analysis _______________________________________________ 114 5.3.6 Tracer Kinetics ____________________________________________________________ 116 5.3.7 Statistical analysis__________________________________________________________ 117
5.4 Results _______________________________________________________________ 118 5.4.1 Clinical Characteristics and nutrient intake ______________________________________ 118 5.4.2 Urinary amino acid and expired CO2 enrichment __________________________________ 119 5.4.3 Phenylalanine Kinetics ______________________________________________________ 119 5.4.4 Plasma amino acid concentration ______________________________________________ 124
5.5 Discussion ____________________________________________________________ 130 6 METHIONINE-ADEQUATE CYSTEINE-FREE DIET DOES NOT LIMIT ERYTHROCYTE GLUTATHIONE SYNTHESIS IN YOUNG HEALTHY ADULT MALES_____________________________________________________________ 136
6.1 Abstract______________________________________________________________ 136 6.2 Introduction __________________________________________________________ 137 6.3 Subjects and Method ___________________________________________________ 139
6.3.1 Subjects__________________________________________________________________ 139 6.3.2 Study design and dietary intervention___________________________________________ 142 6.3.3 Tracer protocol ____________________________________________________________ 151 6.3.4 Sample analysis____________________________________________________________ 152 6.3.5 Calculations ______________________________________________________________ 156 6.3.6 Statistical analysis__________________________________________________________ 157

viii
6.4 Results _______________________________________________________________ 157 6.5 Discussion ____________________________________________________________ 164
7. DOES THE ADDITION OF CYSTEINE TO THE TOTAL SULPHUR AMINO ACID REQUIREMENT (METHIONINE ONLY) INCREASE ERYTHROCYTES GLUTATHIONE SYNTHESIS IN THE TPN FED HUMAN NEONATE: A PILOT STUDY._____________________________________________________________ 169
7.1 Abstract______________________________________________________________ 169 7.2 Introduction __________________________________________________________ 170 7.3 Subjects and Methods __________________________________________________ 173
7.3.1 Subjects__________________________________________________________________ 173 7.3.2 Experimental design ________________________________________________________ 175 7.3.3 Study Diets _______________________________________________________________ 179 7.3.4 Tracer Protocol.____________________________________________________________ 183 7.3.5 Sample Collection__________________________________________________________ 183 7.3.6 Sample Analysis ___________________________________________________________ 184 7.3.7 Calculations ______________________________________________________________ 186 7.3.8 Statistical Analysis _________________________________________________________ 187
7.4 Results _______________________________________________________________ 188 7.4.1 Clinical characteristics and nutrient intake _______________________________________ 188 7.4.2 Intracellular glycine enrichment _______________________________________________ 188 7.4.3 Glutathione kinetics ________________________________________________________ 191
7.5 Discussion ____________________________________________________________ 197 8 GENERAL DISCUSSION, CONCLUSION AND FUTURE DIRECTIONS ____ 201
8.1 General Discussion and Conclusions______________________________________ 201 8.2 Future Directions ______________________________________________________ 208
9 REFERENCES _____________________________________________________ 210
10 APPENDICES ____________________________________________________ 227 10.1: Mean plasma cysteine concentration of adult males who participated in study number 3 (chapter 6) in response to increasing cysteine intake. ___________________ 227 10.2: Mean plasma homocysteine intake of adult males in response to increasing cysteine intake___________________________________________________________________ 228 10.3 CONSENT FORMS___________________________________________________ 229
10.4 STUDY DAY CALCULATIONS _______________________________________ 240 10.5 Amino Acid Composition of PN Solution__________________________________ 242 10.6 Study day list of events ________________________________________________ 243 10.7 Order form for TPN Research Pharmacy: Total SAA requirement of the TPN-fed post-surgical human neonate. _______________________________________________ 245 10.8 Study day calculations: Methionine-adequate cysteine-free diet does not limit glutathione synthesis in young healthy adult males. _____________________________ 247 10.9 Study day calculations: Methionine-adequate cysteine-free diet does not limit glutathione synthesis in young healthy adult males. _____________________________ 255

ix
11. Composition of crystalline L-amino acid mixtures used to determine “Does the addition of cysteine to the total sulphur amino acid requirement (methionine only) increase erythrocyte glutathione synthesis in the TPN fed human neonate. _________ 263 11.1 calculation form for study “Does the addition of cysteine to the total sulphur amino acid requirement (methionine only) increase erythrocyte glutathione synthesis in the TPN-fed human neonate. Study days 1 & 2____________________________________ 265 11.2 calculation form for study “Does the addition of cysteine to the total sulphur amino acid requirement (methionine only) increase erythrocyte glutathione synthesis in the TPN-fed human neonate. Study day 3.________________________________________ 267 11.3 calculation form for study “Does the addition of cysteine to the total sulphur amino acid requirement (methionine only) increase erythrocyte glutathione synthesis in the TPN-fed human neonate. Study days 4 & 5. ___________________________________ 269 11.4 calculation form for study “Does the addition of cysteine to the total sulphur amino acid requirement (methionine only) increase erythrocyte glutathione synthesis in the TPN-fed human neonate. Study day 6.________________________________________ 271 11.5 Comparison of breakpoint _____________________________________________ 273
11.5.1 Breakpoint determination ___________________________________________________ 273

x
LIST OF TABLES
Table 4. 1 HPLC stability analysis of TPN bulk solution................................................ 89 Table 4. 2 HPLC stability analysis of individual amino acids......................................... 91
Table 5. 1 Subject characteristics of TPN fed neonates.................................................. 102 Table 5. 2 Amino acid composition of PN solution administered to neonates............... 106 Table 5. 3 Nutrient intake of neonates who participated in methionine requirement study
................................................................................................................................. 111
Table 6. 1 Subject characteristics of adult men .............................................................. 141 Table 6. 2 Composition of protein free powder and flavoured crystals.......................... 147 Table 6. 3 Amino acid composition................................................................................ 149 Table 6. 4 Individual FSR at varying cysteine intake levels........................................... 162
Table 7. 1 Subject characteristics of TPN-fed neonates studied on TPN with and without cysteine ................................................................................................................... 174
Table 7. 2 Amino acid composition of amino acid solutions administered to neonates
studied on TPN with and without cysteine ............................................................. 177 Table 7. 3 Individual nutrient intakes of neonates studied on TPN with and without
cysteine ................................................................................................................... 182
Table 8. 1 Comparison between methionine concentrations in currently available commercial solutions and proposed concentration based on requirement estimate 204

xi
LIST OF FIGURES
Figure 2. 1 Structure of the sulphur amino acids methionine and cysteine ....................... 8 Figure 2. 2 Pathways of methionine metabolism.............................................................. 11 Figure 2. 3 Glutathione metabolism.................................................................................. 45 Figure 2. 4 Structure of reduced glutathione (GSH)......................................................... 46 Figure 2. 5 Structure of glutathione disulfide (GSSH) (Oxidized form of GSH)............. 46 Figure 2. 6 Pathways to cysteine metabolism................................................................... 65
Figure 4. 1 HPLC chromatogram...................................................................................... 92
Figure 5. 1 Parenteral methionine requirement. The effect of methionine intake on
phenylalanine oxidation in the TPN fed human neonate ........................................ 122 Figure 5. 2 Parenteral methionine requirement. The effect of increasing methionine intake
on F 13CO2 in the TPN fed human neonate............................................................. 123 Figure 5. 3 Plasma methionine concentration in response to graded intakes of methionine
................................................................................................................................. 126 Figure 5. 4 Plasma homocysteine concentration in response to graded intakes of
methionine............................................................................................................... 127 Figure 5. 5 Plasma cystathionine concentration in response to graded intakes of
methionine............................................................................................................... 129
Figure 6. 1 Mean tracer-to-tracee molar ratio (mol % above baseline) of erythrocyte free glycine..................................................................................................................... 159
Figure 6. 2 Glutathione kinetect in respone to graded intakes of cysteine ..................... 161 Figure 6. 3 Urinary sulphate excretion in response to graded cysteine intakes.............. 163
Figure 7. 1 Net tracer/tracee molar ratio of erythrocyte free glycine ............................. 190 Figure 7. 2 Glutathione kinetice in neonates fed TPN with and without cysteine.......... 193 Figure 7. 3 Glutathione FSR of neonates fed TPN with and without cysteine............... 194 Figure 7. 4 Individual glutathione synthesis rates of neonates fed TPN with and without
cysteine ................................................................................................................... 195

xii
Figure 7. 5 Plasma cysteine concentration of neonates fed TPN with and without added cysteine ................................................................................................................... 196
Figure 10. 1 Mean plasma cysteine concentration of adult males in response to graded
cysteine intakes ....................................................................................................... 227 Figure 10. 2 Mean plasma homocysteine concentration of adult males in response to
graded cysteine intakes ........................................................................................... 228

xiii
PUBLICATIONS AND PRESENTATIONS ARISING FROM THESIS Publications:
Glenda Courtney-Martin, Karen P. Chapman, Aideen M. Moore, Jae H. Kim, Ronald O. Ball, and Paul B. Pencharz. Total sulphur amino acid requirement and metabolism in the parenterally fed post-surgical human neonate. Am. J Clin Nutr. 2008; 88:115-24. (Chapter 5) Glenda Courtney-Martin, Mahroukh Rafii, Linda J. Wykes, Ronald O. Ball, and Paul B. Pencharz. Methionine-adequate cysteine-free diet does not limit erythrocyte glutathione synthesis in young healthy adult males. J Nutr 138: 2172-2178, 2008 (Chapter 6) Presentation and abstract: Glenda Courtney-Martin, Mahroukh Rafii, Linda J Wykes, Ronald O Ball, Paul B Pencharz. Glutathione (GSH) Synthesis in Healthy Adult Males: Effects of Varying Cysteine Intake. FASEB J. 2007; 21 (5) : 539.17 (Chapter 6)

xiv
ABBREVIATIONS USED IN THESIS AA Amino acid/s
AdoMet S-Adenosylmethionine
ALT Alanine aminotransferase
ANOVA Analysis of variance
APE Atom percent excess
ASR Absolute synthesis rate
AST Aspartate aminotransferase
BSO Buthionine-SR-sulfoximine
CDO Cysteine dioxygenase
CI Continuos infusion
CSDC Cysteinesulfinate decarboxylase
DAAO Direct amino acid oxidation
FSR Fractional synthesis rate
GCMS Gas chromatography mass spectrometry
GCS γ-glutamylcysteine synthetase
GGT Gamma glutamyl transferase
GSH Glutathione
GSSH Glutathione disulfide
HPLC High performance liquid chromatography
IAAO Indicator amino acid oxidation
ID Intraduodenal
IV Intravenous

xv
LCMS/MS Liquid chromatography mass spectrometry/mass spectrometry
N Nitrogen
NAC N-acetyl cysteine
PN Parenteral nutrition
RDA Recommended dietary allowance
RM Remethylation
SAA Sulphur amino acids
TM Transmethylation
TPN Total parenteral nutrition
TS Transsulphuration
TSAA Total sulphur amino acids
1
1 INTRODUCTION
Total parenteral nutrition (TPN) as the words imply, is the provision of an
individual’s entire nutrient requirement via the intravenous route. The state of the art
depicts that the first requirement for TPN is the provision of a source of α- amino
nitrogen in the form of both dispensable and indispensable amino acids (Heird and
Winters 1975). In this current day, the α-amino nitrogen source is provided as a mixture
of crystalline amino acids. The second requirement is the provision of sufficient non-
protein calories to meet the total energy requirement. These non-protein calories are
provided in the form of dextrose, and lipids, with the lipids also serving as a source of
essential fatty acids. Vitamins and minerals are provided in the form of additives
specially formulated for use in intravenous nutrition. Finally electrolytes are also
provided, usually in an amount consistent with maintenance requirement (Heird and
Driscoll 1975).
The first documented report on the attempted use of complete intravenous
nutrition was in 1944 by Helfrick and Abelson in an infant with Hirschsprung’s disease
(Helfrick 1944). However, the successful implementation of TPN as depicted by
appropriated growth and development took another twenty years to occur. Building on
the work of Wretlind and co-workers (Shenkin 1978), in 1968 Dudrick and his co-
workers published on the successful growth and development of beagle puppies
(Dudrick, Wilmore et al. 1968) as well as a human infant fed solely by TPN (Wilmore
and Dudrick 1968).
This successful implementation of parenteral nutrition (PN) forty years ago
provided a major therapeutic break-through that has improved survival rates among

2
children and adults with gastrointestinal diseases and feeding intolerance. However, the
neonate who is unable to tolerate enteral feeding, particularly the surgical neonate
presents a special challenge to the clinician. Depending on the extent of the
gastrointestinal failure and the length of time to recovery, a neonate could be managed on
TPN for an extended length of time. Under such circumstances in particular, but in any
neonate requiring TPN, it becomes obvious that despite its contribution to the
management of these patients PN is not benign. It is associated with several
complications including metabolic imbalances, sepsis, thromboembolism and total
parenteral nutrition (TPN) associated cholestasis. All of these are potentially life
threatening, but it is cholestasis, and its associated liver failure that is the most common
cause of death in that population (Fisher 1989).
TPN cholestasis is a progressive disease characterized by a sequential pattern of
histological changes in the liver of individuals on TPN (Moss, Das et al. 1993). In the
infant, a series of abnormal changes occur beginning with biliary stasis as early as 5 days
after the initiation of TPN. This is followed by portal inflammation, bile duct
proliferation and finally fibrosis (Moss, Das et al. 1993). Resolution of TPN cholestatic
changes is expected once TPN therapy is withdrawn (Spivak and Grand 1983). However,
depending on the extent of liver damage, death can occur as a result of liver failure.
In the clinical setting, TPN-associated liver disease is monitored and sometimes
diagnosed using measurements of serum transaminases namely; aspartate
aminotransferase (AST), alanine aminotransferase (ALT), and gamma glutamyl
transferase (GGT), as well as markers of cholestasis namely, alkaline phosphatase and
conjugated bilirubin concentrations. Using a rat model of TPN cholestasis Demiracan et

3
al. (Demircan, Ergun et al. 1999) correlated histological degree of cholestasis with
routine laboratory values. They found no correlation between liver histology and any of
the routine tests. In an effort to find a more representative test, they correlated liver
histology with serum bile salts. The results showed a direct correlation between bile salts
and degree of cholestatic changes in the liver. Bile salts, being a relatively expensive test,
is not routinely used in the clinical setting.
Although the sequela of liver damage in TPN cholestasis has now been
characterized from liver biopsies (Moss, Das et al. 1993), the pathophysiology of TPN
cholestasis remains unclear. Nevertheless, many risk factors have been identified such as
immaturity of liver function, and low gestational age (Beath, Davies et al. 1996), early
exposure to TPN (Beath, Davies et al. 1996), sepsis, (Beath, Davies et al. 1996),
intestinal stasis and bacterial overgrowth (Kubota, Yonekura et al. 2000), prolonged
starvation, intestinal disease, surgical resection and the duration of TPN (Belli, Albrecht
et al. 2003). None of these factors have proved to be causal (Loff, Waag et al. 1998),
hence the role of specific components of the TPN solution: amino acids (Belli, Fournier
et al. 1987; Brown, Thunberg et al. 1989; Moss, Haynes et al. 1999), dextrose (Belli,
Albrecht et al. 2003), lipids (La Scala, Le Coultre et al. 1993), minerals, and the
deficiency of certain micronutrients (Whalen, Shamberger et al. 1990) have been studied.
Of the three macronutrients used for TPN, amino acids have attracted the most attention.
Direct toxicity of the amino acids has been shown in vitro (Belli, Fournier et al. 1987;
Moss, Haynes et al. 1999). In rats receiving two different amino acid solutions (Vamin
vs. Travasol) for 5 days, Belli et al. (Belli, Fournier et al. 1987) showed that animals
infused with Travasol had a decreased bile flow when compared to animals infused with

4
Vamin. They attributed this to the difference in the amino acid pattern of the two
solutions. The increased cholestatic effect of Travasol was attributed to its higher
concentration of the methyl donor amino acid (methionine).
A number of studies have shown that methionine levels are elevated during TPN
(Bell, Filer et al. 1983; Moss, Das et al. 1993). Moss et al. (Moss, Das et al. 1993)
showed that the TPN solution was directly hepatotoxic and that toxicity was mediated by
one or more sulphur-containing amino acids. In that study, the serum concentration of
methionine was markedly elevated in animals on TPN compared to controls. Young
infants fed TPN (Travasol) showed higher plasma methionine and lower plasma serine
concentrations than orally fed infants (Bell, Filer et al. 1983).
In a follow-up study designed to test whether infusion of methionine into
normally fed rabbits injure the liver in a manner similar to TPN, Moss et al (Moss,
Haynes et al. 1999) infused methionine via a central venous catheter into rabbits fed
rabbit chow ad libitum. Two other groups served as controls: a TPN-fed group and a
standard rabbit chow-fed group. After 14 days on the diets, the administration of
intravenous methionine to normally fed animals injured the liver in a similar manner to
that seen in the liver of animals receiving TPN. This led the authors to propose that the
methionine levels in current TPN solutions may be too high for the neonate and could
precipitate liver damage associated with TPN. In addition to high methionine levels, the
TPN-fed neonate has been found to have a low plasma cysteine concentrations (Malloy,
Rassin et al. 1984; Miller, Jahoor et al. 1995). Low plasma cysteine has been related to
the decrease in transsulfuration due to the immaturity of the enzymes responsible for
transsulfuration in the neonatal liver (Gaull, Sturman et al. 1972; Zlotkin and Anderson
5
1982). Low glutathione concentration and synthesis rates have also been reported in the
neonate (Vina, Vento et al. 1995). High methionine together with low cysteine and
consequent deficiency of glutathione could act synergistically to potentate liver damage
and contribute to TPN cholestasis.
Except for tyrosine (Roberts, Ball et al. 2001) the amino acid requirements of the
human neonate during TPN feeding have not been experimentally derived.
Our group has developed a neonatal piglet model (Wykes, Ball et al. 1993) for the study
of amino acid requirement and metabolism in TPN feeding. Using this model, we have
determined that the requirement of several amino acids is lower with TPN feeding than
with enteral feeding. The requirement for methionine, in particular, was found to be 30%
lower in TPN feeding compared to enteral feeding. If this is also true for the human
neonate, it may be possible to formulate a TPN solution that does not damage the liver if
an appropriate and lower intake of methionine is identified. Given the extensive
morbidity of TPN-related liver disease and the corresponding increased cost to the health
care system, it is a high priority to develop such a TPN solution.
The purpose of this thesis is to determine the total sulphur amino acid requirement
(methionine only) for the TPN-fed human neonate and to study the metabolism of
glutathione in response to cysteine intake, first in adult males and then in the TPN-fed
neonate. The thesis is organized into several chapters: chapter two presents a thorough
literature background on sulphur amino acid metabolism, requirement, and glutathione
metabolism. Chapter three outlines and discusses the objectives of the thesis. Chapter
four outlines the methods and processes involved in the development of TPN solutions de
novo along with the validation process for the appropriate use of such solutions. The

6
three other studies presented in this thesis will be presented in chapters five to seven.
Chapter eight is the conclusion chapter for the thesis with suggestions for future research.

7
2 LITERATURE REVIEW
The sulphur amino acids are methionine and cysteine (Figure 2.1, P8). They are
so named because of the presence of a sulphur atom in their molecule. These two amino
acids and one of their metabolites; glutathione, are the focus of this thesis. This thesis
attempts to bridge a number of important gaps in the literature; firstly it will provide
novel an unprecedented information on the total sulphur amino requirement of the TPN-
fed human neonate. In addition, using sophisticated stable isotope techniques, it will
provide further clarification on an ongoing debate in the literature as to whether cysteine
is a conditionally essential amino acid in the TPN-fed human neonate. The development
and validation of the piglet model as a surrogate for the study of amino acid requirements
and metabolism in the human neonate provided the base from which we were able to
launch into this work with confidence. We chose to begin our series of experiments in the
human neonate with the sulphur amino acids because of the evidence which suggests that
methionine is the most toxic of all the amino acids with implications in TPN-associated
liver disease. The interest in TPN-associated liver disease and its relationship with
methionine stems out of my career as a clinical dietitian.
2.1 Sulphur Amino Acid Metabolism
Methionine is a dietary indispensable amino acid (AA) required for normal
growth and development of humans (Rose 1938; Holt and Snyderman 1961; Snyderman,
Boyer et al. 1964; Holt 1968; Fomon, Ziegler et al. 1986), other mammals

8
Figure 2. 1 Structure of the sulphur amino acids methionine and cysteine

9
(Finkelstein, Martin et al. 1988) as well as avian species. Methionine is metabolized via
three major metabolic pathways; transmethylation, remethylation and transsulfuration
(Figure 2.2). It is a substrate for protein synthesis and it serves as the major methyl group
donor in vivo (Stipanuk 1986; Griffith 1987) ); serving as a source of the methyl group
for DNA and RNA intermediates. Methionine is a methyl acceptor for 5-
methyltetrahydrofolate homocysteine methyl transferase (methionine synthase), the only
reaction which allows for the recycling of this form of folate. As well, it serves as a
methyl acceptor for the catabolism of betaine and choline and is required for synthesis of
cysteine.
Although methionine is a metabolic precursor for cysteine (DU Vigneaud 1944),
only the sulphur atom from methionine is transferred to cysteine, the carbon skeleton is
donated by serine (DU Vigneaud 1944). Cysteine is not a precursor for methionine
because of the irreversibility of the cystathionine-β-synthase reaction (Rose 1938)
(Figure 2.2). “Consequently, any substitution by cysteine for dietary methionine
requirement can only be via inhibition of the sulphur amino acid pathway that leads to
synthesis of the transsulphuration metabolites, including cysteine itself” (Ball, Courtney-
Martin et al. 2006).
Womak and Rose (Womack 1941), and Rose and Wixon, (Rose and Wixom
1955) were the first to demonstrate a sparing effect of cysteine on the methionine
requirements; first in rats, then in humans. More recently, the sparing effect of cysteine
on the methionine requirements in rats have been convincingly substantiated by the
elegant work of Finkelstein et al (Finkelstein, Martin et al. 1986; Finkelstein, Martin et
al. 1988). In food and companion animals (e.g.,

101
RM
NADPH
5-10 Methylene THF
Serine
THF
5-Methyl-THF NADBetaine Choline
Homocystiene
Methionine ATP
Cystathione
Serine B6
Cysteine
Adenosine
Proteins
Cystine Taurine
Proteins
Glutathione
Dimethyl-glycine
1
3
TM 2
14
1112
13
4
5B6
TS
S- Adenosyl - Methionine Polyamines Creatine
CH3 + Acceptor = Methylated Acceptor
S-Adenosyl-Homocysteine
15
B12glycine
67 8 Cysteinesulfinate
910
Suphate
11
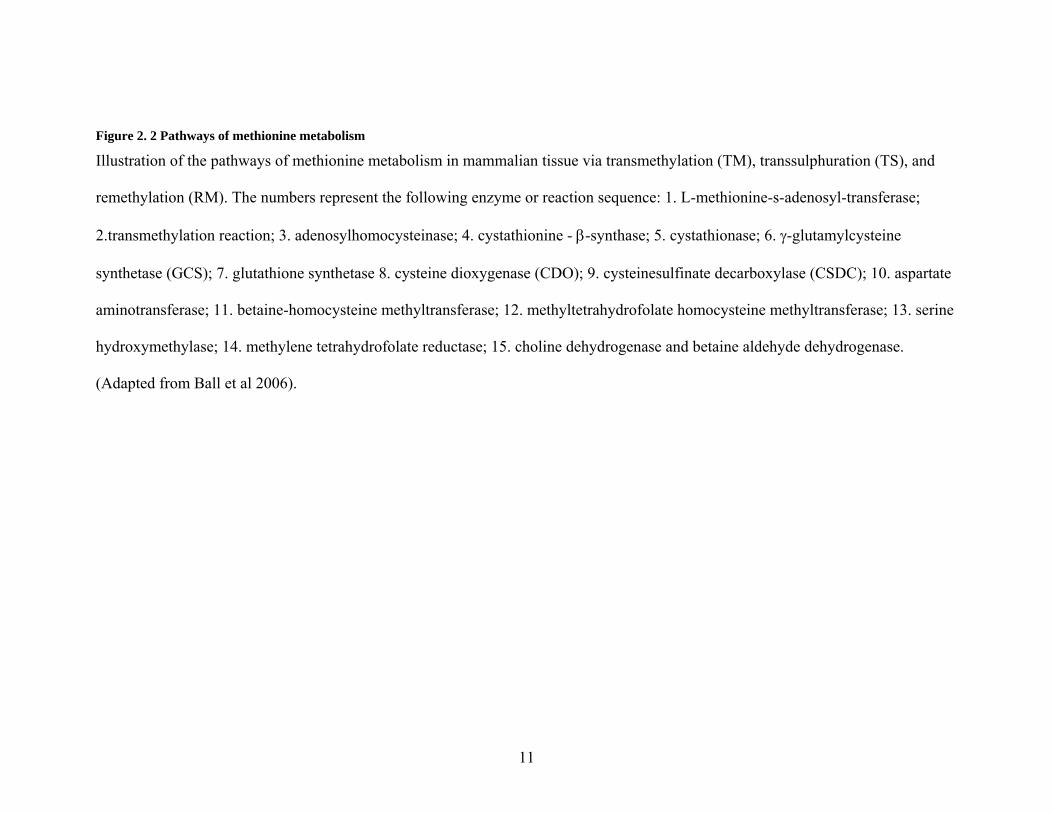
Figure 2. 2 Pathways of methionine metabolism
Illustration of the pathways of methionine metabolism in mammalian tissue via transmethylation (TM), transsulphuration (TS), and
remethylation (RM). The numbers represent the following enzyme or reaction sequence: 1. L-methionine-s-adenosyl-transferase;
2.transmethylation reaction; 3. adenosylhomocysteinase; 4. cystathionine - β-synthase; 5. cystathionase; 6. γ-glutamylcysteine
synthetase (GCS); 7. glutathione synthetase 8. cysteine dioxygenase (CDO); 9. cysteinesulfinate decarboxylase (CSDC); 10. aspartate
aminotransferase; 11. betaine-homocysteine methyltransferase; 12. methyltetrahydrofolate homocysteine methyltransferase; 13. serine
hydroxymethylase; 14. methylene tetrahydrofolate reductase; 15. choline dehydrogenase and betaine aldehyde dehydrogenase.
(Adapted from Ball et al 2006).

12
poultry, pigs, cats, dogs), it has been shown that cysteine can reduce the amount of
dietary methionine required (Baker 2006).
Functions of cysteine include protein synthesis, the biosynthesis of taurine,
sulphate (Griffith 1987), and the antioxidant glutathione (Lyons, Rauh-Pfeiffer et al.
2000; Badaloo, Reid et al. 2002; Jackson, Gibson et al. 2004). The functions of cysteine
regarding protein and glutathione synthesis and its relationship to methionine are of
paramount importance to the TPN-fed human neonate. While it is well documented that
the total sulphur amino acid could be adequately provided as methionine only in the adult
human (DU Vigneaud 1944), and that cysteine is capable of providing a sparing effect on
the methionine requirement in both adults (Rose and Wixom 1955) and neonates
(Albanese 1949; Fomon, Ziegler et al. 1986; Shoveller, Brunton et al. 2003), controversy
exists as to whether the TPN-fed human neonate is capable of adequate cysteine synthesis
from methionine when the total sulphur amino acid is provided as methionine only.
2.1.1 Sulphur Amino Acid Metabolism Using Nitrogen Balance
The metabolic significance of the sulphur amino acids (SAAs) began with the
classic work of William C. Rose and his colleagues in the first half of the 20th century.
Using positive nitrogen balance as the criterion of adequacy, Rose et al. (Rose 1950),
were the first to demonstrate qualitatively that methionine was an indispensable AA in
humans. In a follow-up study, the quantitative methionine requirement was determined
(Rose, Coon et al. 1955). Rose et al designated a minimal tentative requirement of

13
1.1g.day-1 and twice that; 2.2g.day-1 as the safe daily intake. Less than one year later,
Rose and Wixom (Rose and Wixom 1955) published their report which has led to much
controversy in the ensuing years. That report summarized the results of three experiments
in which the methionine requirement was first determined in the absence of cysteine
followed by the requirement determination in the presence of a set dietary excess of
cysteine. Those results showed that L-cysteine was capable of replacing 80-89% of the
methionine requirement of adult men and provided evidence for a regulatory mechanism
not only in rats (Womack 1941), but also in humans. Those studies however, despite
being ground breaking in nature, did not delineate the mechanisms, quantify substrate or
isolate precursors in vivo.
2.1.2 Sulphur Amino Acid Metabolism Using Stable Isotope Tracers
Mudd et al. (Mudd and Poole 1975; Mudd, Ebert et al. 1980) were the first to
establish a method (the methyl balance approach method) with which to identify and
quantify different aspects of methionine metabolism in humans. That approach, although
useful, measured turnover of substrates. Because these substrates turnover relatively
slowly, measurement of turnover was insensitive since acute changes could go
undetected. Therefore, that approach was considered problematic in terms of quantifying
methyl group excretion and oxidation (Storch, Wagner et al. 1988).
In an effort to alleviate those problems, Storch et al. (Storch, Wagner et al. 1988)
successfully developed a stable isotope tracer method for quantifying the various aspects
of methionine metabolism in humans. In that study, various aspects of methionine
metabolism were examined in both the fed and fasted states after a 5-day adaptation

14
period to an adequate diet in which methionine and cysteine were provided at intakes of ~
30 and 29 mg.kg-1.day-1 respectively. On the concluding morning of the 5th day, the
tracers were administered via a primed constant intravenous (IV) infusion of [methyl –
2H3] and [1-13C]methionine.
In the fed state, plasma methionine levels rose more significantly than that
compared with the fasted state. Also, there was a significant increase in methionine flux
during the fed state compared with the fasted state reflective of fed state increases in
methionine intake. Feeding resulted in a decrease in methionine release from protein
breakdown as well as an increase in transmethylation, transsulphuration and
remethylation. Although transsulphuration was increased, this was accompanied by an
increased efficiency of methionine recycling via remethylation relative to
transsulphuration. Thus in the fed state, methionine metabolism is regulated towards
anabolism with an increased flux partly accounted for by enhanced flow of methionine
into transmethylation and remethylation relative to the fasted state.
In the fasted state, the rate of methionine utilization for protein synthesis was
increased relative to its use for transmethylation. This suggests that in the fasted state,
methionine is conserved through the process of protein synthesis and that protein
synthesis takes precedence when sulphur amino acid (SAA) availability is low.
In a subsequent experiment, using the same design as above and a doubly labeled
methionine (L-[1-13C;methyl-2H3]methionine) instead of two different tracers, Storch et
al (Storch, Wagner et al. 1990) went on the further explore other regulatory aspects of
methionine metabolism; this time by altering both methionine and cysteine intakes. A

15
further intent of the study was to explore the mechanism whereby cysteine might exert a
sparing effect on the methionine requirement. Eight healthy adult males were adapted for
5 days to one of 3 diets providing either 25 mg.kg-1 methionine without cysteine
(adequate diet), a TSAA free diet, or zero methionine and 20 mg.kg-1 cysteine. The
isotope tracer study was performed on the 6th day in the fed state.
Plasma methionine levels were significantly lower with ingestion of the SAA-free
diet compared with the adequate diet whereas plasma cysteine did not differ significantly
across diets. The response to the diet free of SAA showed a significant decrease in all
aspects of the methionine cycle. There was a significant increase in the incorporation of
methionine into protein synthesis relative to transmethylation confirming previous results
that methionine is conserved via protein synthesis when SAA intakes are low or absent
(Storch, Wagner et al. 1988). With the addition of cysteine to the SAA-free diet, there
was a significant decline in the rates of transsulphuration with a trend toward increased
remethylation relative to transsulphuration. One of the obvious suggestions from that
study and a conclusion drawn by the authors is that the sparing effect of cysteine on the
methionine requirement was achieved by a reduction in the transsulphuration rate.
These studies (Storch, Wagner et al. 1988; Storch, Wagner et al. 1990) are
important as they provide valuable information on the different aspects of SAA
metabolism in vivo. It shows that in the presence of a SAA-free diet, methionine is highly
directed toward protein synthesis relative to transmethylation, and that homocysteine is
also partitioned toward remethylation relative to transsulphuration. These all serve to
conserve methionine by decreasing oxidation (Ball, Courtney-Martin et al. 2006).
However, it would have been of greater benefit if they had included a group in which

16
they studied the SAA metabolism at a low but not devoid methionine intake in the
presence of excess cysteine.
2.1.3 Sulphur Amino Acid Metabolism Animal Studies
The elegant work of Finkelstein et al. (Finkelstein, Martin et al. 1986; Finkelstein,
Martin et al. 1988) has served to provide some further clarification as well as
confirmation on the mechanisms involved in the SAA metabolism. In an in vivo
experiment (Finkelstein, Martin et al. 1988), rats were fed an adequate diet for 7 day with
varying content of methionine and cysteine. In the first group, animals were fed a diet
containing 1% methionine for 7 day (control group) or 1% methionine to which 0.8%
cysteine was added (experimental group). The only statistically significant result from all
of the parameters measured was a 30% lower level of S-adenosyl-homocysteine
(AdoHcy) in liver. However, when the same cysteine supplement of 0.8% was added to a
diet containing 0.25% methionine and 0.5% cysteine, there was a significant decrease in
the hepatic concentration of s-Adenosylmethionine (AdoMet) and serine to the level of
28 and 33% respectively, and an 88% increase in cysteine. In addition, there was a
significant increase in cystathione synthase activity.
Using an in vitro system, Finkelstein et al. (Finkelstein, Martin et al. 1986)
demonstrated a 44% decrease in cystathionine synthesis, when 0.8% cysteine was
supplemented to the 0.25% methionine and 0.5% cysteine diet. There was no change in
transsulphuration when 0.8% cysteine was added to the 1% methionine diet.
17
These results demonstrate that cysteine supplementation to a diet marginal in
TSAA ( 0.2 and 0.5 % methionine) resulted in decreased hepatic cystathionine synthase
whereas there was no change in cystathionine synthase activity when a diet with excess
methionine (1 %) was further supplemented with a 0.8% cysteine resulting in an excess
of methionine and TSAA. A significant result was only observed when 0.8% cysteine
was added to a marginal but adequate methionine and TSAA. This suggest that the
availability of cysteine in order to spare methionine “must allow for the efficient
conservation of a limited methionine pool by means of augmenting homocysteine
remethylation and or decreased cystathionine synthesis (transsulphuration)” (Finkelstein,
Martin et al. 1986) .
The various aspects of methionine metabolism has been summarized by
Finkelstein et al. (Finkelstein, Martin et al. 1988) as follows. (The reader is referred to
Figure 2.2. p 10-11).
1. In growing animals, the net flow of methionine is in the direction
of protein synthesis, which removes methionine from the cycle.
2. The utilization of Adomet (SAM) in the formation of poly amines
is the second outlet.
3. The irreversible cystathionine synthase reaction is the final outlet
since homocysteine used in this way is committed to
transsulphuration- these 3 outlets represent the 3 essential
functions of methionine.
4. The reactions of the cycle itself fulfill 3 additional requirements:
(1) transmethylation reaction, (2) the recycling of

18
methyltetrahydrofolate and (3) the catabolism of choline (betaine)
via remethylation.
5. Cysteine can spare methionine in only one of these functions; the
synthesis of cysteine and its derivatives by means of
transsulphuration.
6. The residual methionine requirement after cysteine
supplementation represents the need for protein synthesis, the
obligatory synthesis of cystathionine (if relevant) and methionine
used in the process of remethylation secondary to inefficient
conservation (since these two enzymes are utilized in
homocysteine conservation)
The methionine-sparing effect of cysteine is based on the redistribution of
homocysteine between competing reactions, notably an increase in remethylation relative
to transsulphuration. While the absolute rates of remethylation remain unchanged, there
is a marked decrease in transsulphuration as the rates of flow of metabolites through
cystathionine synthase reaction decrease. The determinant of this metabolic pattern is
represented by a reduction in the liver enzymes together with a decrease in Adomet
which is an effector of cystathionine synthase (Finkelstein, Martin et al. 1988).
2.2 Sulphur Amino Acid Requirement of the Adult Human
2.2.1 Nitrogen Balance
Using nitrogen balance technique, the requirement for methionine was first
determined by Rose et al. in 6 young men (Rose 1950). A range of 0.8 to 1.1 g of

19
racemic methionine in the absence of cysteine was required by these subjects to
maintain positive nitrogen balance. As was his custom, Rose suggested the tentative
minimum requirement as the maximum, amount (1.1g = 13.25 mg.kg-1.day-1) required to
keep all subjects in positive nitrogen balance and with a suggestion of twice that amount
(2.2 g.day-1) to be taken as the safe intake level.
In a later study (Rose and Wixom 1955), Rose and Wixon varied the dietary
content of D-L methionine on a set L-cysteine intake of 0.8 g.day-1, and found the
methionine requirement to be considerably reduced to 0.1 to 0.2 g.day-1. The authors
concluded that cysteine spared 89 and 80% of the methionine requirements of these two
subjects.
Nitrogen balance technique was later applied by other investigators first in women
(Reynolds, Steel et al. 1958), and later in men, (Clark, Howe et al. 1970), to study
methionine and cysteine requirements by varying the intakes of both amino acids. The
results were variable and disappointing largely because of the failure of these
investigators to understand some of the fundamental principles governing the sparing
effect of cysteine. A sparing effect can only occur when the methionine intake is within a
certain range that is less than the total sulphur amino acid requirement but more than the
minimal methionine requirement (Ball, Courtney-Martin et al. 2006). Failure to abide by
those principles in the design of the above experiments led to results that were sometimes
confusing, or to results from which the wrong conclusions were sometimes drawn.
The problems with nitrogen balance have been well reviewed (Young and Bier
1987; Fuller and Garlick 1994). A chief concern is that nitrogen balance underestimates
losses and overestimates intake with on overestimation of true rates of nitrogen retention.

20
All of these errors result in an underestimation of the true requirement. In addition, a
very small number of subjects were used in the studies by Rose and colleagues.
2.2.2 Sulphur Amino Acid Requirements by Stable Isotope Tracer Kinetic Method
2.2.2.1 Direct Indicator Amino Acid Oxidation Technique (DAAO)
The most important contribution to our current knowledge of the SAA
requirement using stable isotope tracer kinetics have been by the MIT group headed by
the late V.R. Young and his collaborators in India, namely Kurpad et al, and our group;
the combined Toronto/Alberta group headed by P. Pencharz and R. Ball. These two
groups have employed the techniques of DAAO and Indicator Amino Acid Oxidation
(IAAO) to determine the total SAA requirement and the effect of cysteine on these
requirements with similar results with respect to the total SAA requirement, but have
come to seemingly opposite conclusions as to the existence of a sparing effect or lack
thereof of cysteine on the methionine requirement.
This valuable series of investigations began with a study by Young et al. (Young,
Wagner et al. 1991) designed with the purpose of exploring the methionine metabolism
and body methionine balance of five young men fed a diet supplying methionine (without
cysteine) at 13 mg.kg-1.day-1 which represents the current FAO/WHO/UNU
recommended requirement for TSAA intake. As in their previous studies (Storch,
Wagner et al. 1988; Storch, Wagner et al. 1990) L-[2H3-methyl-1-13C]methionine was
used as tracer. The tracer was infused via the intravenous (IV) route on the 5th and 7th day
in the fed and fasted states after a period of adaptation.
21
Compared to the data of Storch et al. (Storch, Wagner et al. 1990) in which the
methionine intake was 25 mg.kg-1.day-1, the methionine flux was much lower in this
study at a methionine intake of 13 mg.kg-1.day-1. Also synthesis rates were about 30%
lower with breakdown being also lower ~16%. This decreased flux and breakdown along
with the reduced synthesis suggest a conservation of methionine at an insufficient intake
and invites the conclusion that 13 mg.kg-1.day-1 is lower than the true methionine
requirement. In addition, the flow of methionine via the transmethylation and
transsulphuration pathway was reduced when compared to the data of Storch et al
(Storch, Wagner et al. 1990).
Based on their estimation of methionine balance which relies on a number of
assumptions, one subject was in positive methionine balance, 2 were in negative balance
and 2 were close to methionine equilibrium. The conclusion made by Young et al.
(Young, Wagner et al. 1991) based on these results with particular emphasis on the
methionine balance data was that “a methionine intake of 13 mg.kg.-1.day-1 in the absence
of dietary cysteine approximates the mean requirement for the healthy young adult male
but the upper range of the requirement (RDA) is probably below ~25 mg.kg.-1.day-1”.
Such a conclusion is flawed as it is based on one intake level of methionine; a design
from which accurate estimation about the requirement of an amino acid cannot be made.
In order to accurately determine an amino acid requirement, the amino acid of interest
must be fed at intakes both below and above the requirement so that a change in endpoint
could be accurately measured and the estimate so derived would be representative of the
true requirement. The data presented in the Young et al study (Young, Wagner et al.

22
1991) is insufficient to make a conclusion regarding methionine requirement since it was
designed to test only one intake level of methionine.
2.2.2.2 Indicator Amino Acid Oxidation Technique (IAAO)
Using IAAO technique, our group has contributed six reports (Di Buono, Wykes
et al. 2001; Di Buono, Wykes et al. 2001; Di Buono, Wykes et al. 2003; Shoveller,
Brunton et al. 2003; Shoveller, Brunton et al. 2003; Shoveller, House et al. 2004) as part
of our contribution to increasing the current knowledge on SAA metabolism. Three of
those reports were conducted in adult males whereas the other 3 were conducted in the
neonatal piglet which has been used as a surrogate for the neonatal human infant. This
model has been found to be appropriate for the human infant (Roberts, Ball et al. 2001).
Using L-[1-13C]phenylalanine as an indicator, our group conducted our first
study in 6 men who were randomized to receive 6 graded intakes of methionine in the
absence of cysteine after a 2-day adaptation to a prescribed diet. This study was designed
to determine the TSAA requirement as supplied by methionine only. Using F13CO2 as the
main outcome measure, we identified a breakpoint in the F13CO2 oxidation curve by two
phase linear regression analysis. The results showed that the mean total SAA requirement
of adult males was 12.6 mg.kg-1.day-1 with a safe population estimate (RDA) of 21
mg.kg-1.day-1.
This mean estimate was almost identical to that obtained by Rose et al (Rose
1950) using nitrogen balance and that confirmed by Young et al. (Young, Wagner et al.
1991) to at least represent a mean requirement. It was also however the suggested RDA
23
set by the FAO/WHO/UNO (FAO/WHO/UNU 1985). Such an RDA therefore, would
have to be too low.
The second study of the series by our group was conducted in an effort to shed
light on the topic of cysteine sparing of methionine (Di Buono, Wykes et al. 2001). The
group considered that “to detect a sparing effect of cysteine on the methionine
requirement, cysteine must be supplied in amounts adequate to completely or largely
arrest the flow of methionine through the transsulphuration pathway, whereas methionine
must be present in amounts adequate to meet all its other metabolic functions, including
protein synthesis, transmethylation and remethylation necessary for folate and betaine
metabolism”. We recognized that “unless the TSAA needs of all subjects are met,
addition of cysteine will lead to an immeasurably small sparing effect on methionine
requirement” as observed by others (Raguso, Ajami et al. 1997; Fukagawa, Yu et al.
1998).
With these concerns in mind, the group used a similar design as previously
described (Di Buono, Wykes et al. 2001). We fed graded intakes of methionine on a set
cysteine intake of 21 mg.kg-1.day-1 which represents the RDA for the TSAA requirement.
In that study, a breakpoint was identified in the F13CO2 in response to L-[1-
13C]phenylalanine oxidation which was much less than the previous breakpoint
estimated in the absence of cysteine. This present breakpoint was 4.5 mg.kg-1.day-1 which
represented a decrease in the methionine requirement when an excess cysteine was
present in the diet. The authors concluded that based on their data, dietary cysteine was
able to exert a sparing effect on the methionine requirement to the extent of 64%.
24
A third study was conducted by our group to look at various aspects of sulphur
amino acid metabolism when the ratio of methionine and cysteine were varied to
represent the ratios present in common foods (Di Buono, Wykes et al. 2003). Using the
model of Storch et al. (Storch, Wagner et al. 1988), five healthy men were fed 3 different
diets in random order after a 56-hour adaptation period to a crystalline L-amino acid diet.
Methionine kinetics was measured in the fed state using an orally administered L-[1-
13Cmethyl 2H3]methionine. The 3 diets were diet A; 24 mg.kg-1 methionine without
cysteine, diet B; 13 mg methionine plus 11 mg.kg-1 cysteine and diet C; 5 mg.kg-1
methionine plus 19 mg.kg-1 cysteine.
The results show a significant decrease in transsulphuration when the diets
containing cysteine were given (diets B and C) compared to diet A. There was also a
significant decrease in transmethylation rates between diet A and diet B and C. This
decrease in transmethylation rates translated into a decreased availability of
homocysteine for remethylation, which was also decreased, but only significantly so in
the case of diet C when methionine was further decreased and cysteine intakes increased
to levels almost equal to the RDA for the TSAA. There was an almost 40% decrease in
transsulphuration rates compared to transmethylation which translated into a 2.5 fold
increase in remethylation rate relative to transsulphuration.
The authors concluded from this study that the ratio of cysteine to methionine
regulates whole body SAA metabolism in adult humans. When TSAA intake is adequate
and held constant at 24 mg.kg-1.day-1, replacement of methionine with cysteine results in
increased remethylation at the expense of transsulphuration, whereas at high methionine
intakes, the methionine pool is regulated by high rates of transsulphuration.

25
2.2.2.3 Twenty four IAAO and Balance Technique
The MIT group together with their collaborators in India have extended the IAAO
technique by infusion of the isotope over a 24-hour period instead of 8 hrs and
measuring AA balance as have been done in the past.
Using the 24-hour IAAO and balance technique, Kurpad et al. (Kurpad, Regan et
al. 2003; Kurpad, Regan et al. 2004) conducted two studies on SAA metabolism and
requirement. In the 1st experiment, (Kurpad, Regan et al. 2003), 21 healthy Indian men
were studied during 3 randomly assigned 7-day periods in which methionine intakes
(without cysteine) were varied. Twenty four hour indicator AA oxidation studies were
conducted on day 7 using an IV administration of L-[13C]leucine as the indicator AA).
The results identified a breakpoint in the F13CO2 response curve of 14 mg.kg-1.day-1.
However, using indicator AA balance, the suggested mean TSAA requirement in the
absence of cysteine was 15 mg.kg-1.day-1. This was in agreement with the requirement
estimate derived by Di Buono et al. (Di Buono, Wykes et al. 2001) using short term
IAAO technique.
In order to assess a sparing effect of cysteine on this requirement, they went on to
design a follow-up study (Kurpad, Regan et al. 2004) in which the effect of 2 different
intakes of cysteine (5 and 12 mg.kg-1.day-1) were assessed. The design and isotope were
similar to that used in the previous experiment (Kurpad, Regan et al. 2003).
With a cysteine intake of 5 mg.kg-1.day-1, the breakpoint was identified at a methionine
intake of 20 mg.kg-1.day-1, whereas at a cysteine intake of 12 mg.kg-1.day-1, the
methionine breakpoint was 10 mg.kg-1.day-1. This was compared to their previous study
in which the methionine requirement without cysteine was 15 mg.kg-1.day-1. The authors

26
concluded based on the overall results obtained that cysteine may spare methionine
requirement in healthy men but that the amount of sparing is difficult to quantify. A
more likely explanation is that at a cysteine intake of 5 mg.kg-1.day-1, cysteine intake
was inadequate to stop the flow of methionine through the transsulphuration pathway.
At a cysteine intake of 12 mg.kg-1.day-1, the methionine breakpoint was less than their
previous estimate, showing a small sparing effect of cysteine.
The fundamental problem with the above study is again a failure to appreciate the
importance of the balance of the intake of methionine cysteine and the impact of this
balance on cysteine’s ability to spare a portion of the methionine requirement. Since
cysteine does not spare methionine on an equimolar basis, the amount of cysteine
present has to be in excess of the methionine it is supposed to spare (Finkelstein, Martin
et al. 1986; Di Buono, Wykes et al. 2001; Di Buono, Wykes et al. 2003).
2.3 Sulphur Amino Acid Requirement of the Human Infant
2.3.1 Nitrogen Balance
Using nitrogen balance and growth as the criteria of adequacy, Albanese et al.
investigated the sulphur amino acid (SAA) requirement of five infants between the ages
of 4 to 11 months (Albanese 1949). Infants were fed 100 kcals.kg-1 and protein of 3.5
g.kg-1.day-1 in the form of a casein hydrolysate. At the start of the experiment the
subjects were maintained on a complete diet. The subjects were then fed a sulphur amino
acid-deficient (15 and 25 mg.kg-1 cysteine and methionine respectively) diet adequate in
all other nutrients for a total of 3 weeks. Methionine was added in graded amounts after

27
the first of the 3 week period followed by a period where the diet was supplemented
with cysteine alone, then cysteine at 1% with graded intakes of methionine. This last
part of the experiment was done to determine the sparing effect of cysteine on the total
sulphur amino acid requirement.
The result of the study showed that the total SAA requirement when provided
mainly as methionine was 85 mg.kg-1.day-1 and 15 mg.kg-1.day-1 cysteine. When
cysteine was provided in the amount of 50 mg.kg-1.day-1, the amount of methionine
required to restore adequate growth and nitrogen balance was 65 mg.kg-1.day-1. Thus the
authors concluded that 35 mg of cysteine can spare approximately 20 mg of methionine
and that in terms of the sulphur atom, 9 mg of cysteine sulphur are equivalent to about 4
mg of methionine sulphur. They also added that 22% of the methionine requirement of
the infant can be met by cysteine (Albanese 1949).
In a later study, Snyderman et al. (Snyderman et al, 1964) estimated the total
SAA requirement of the enterally fed human infant in the presence of cysteine. The diet
was a completely synthetic diet and the amino acid composition was patterned after
human milk. Seven male infants ranging in age from 2 weeks to 2 months were included
in the study. Adequate growth and nitrogen balance was achieved at a methionine intake
of 32 to 49 mg.kg-1.day-1 in the presence of cysteine about 50 mg.kg-1.day-1.
Subsequently, Fomon et al. (Fomon et al, 1986) estimated the total SAA
requirement of the human infant fed a soy based formula by N balance and found it to be
between 80-88 mg.kg-1.day-1. The methionine requirement alone (in the presence of
cysteine) was estimated to be 36 - 39 mg.kg-1.day-1. This suggests that cysteine provided
between 44 to 49 mg.kg-1.day-1 of the total SAA requirement.

28
It is difficult to estimate the sparing effect of cysteine from the design of the
Fomon study (Fomon, Ziegler et al. 1986), however looking at the three studies
presented, it’s safe to say that the enteral total SAA requirement is very similar across
studies and is in the region of 80 mg.kg-1.day-1. Subsequent studies on SAA requirement
if the enterally fed human infants have not been published.
2.3.2 Indicator Amino Acid Oxidation (IAAO)
One of the major scientific contributions of our group has been the development
of the piglet model as a surrogate for the human neonate (Wykes, Ball et al. 1993) to
study amino acid requirement and metabolism. Using the piglet model as a surrogate of
the human neonate, Shoveller et al. (Shoveller, Brunton et al. 2003) determined the total
SAA as methionine only (methionine in the absence of cysteine) of the enterally and
parenterally fed neonatal piglet. Using IAAO technique and 14C-phenylalanine as the
indicator, the mean methionine requirement (in the presence of zero cysteine) for the
enterally and parenterally fed neonatal piglet were estimated to be 0.42 and 0.26 mg.kg-
1.day-1 respectively. Importantly, the methionine requirement in the TPN fed piglet was
30% lower than the enteral requirement. Using these requirement estimates derived from
the piglet model the total SAA requirement of the human neonate can be predicted. Since
piglets grow at 5 times the rate of the human infant, the total SAA requirement estimates
of the human neonate is predicted to be 84 and 52 mg.kg-1.day-1 for enteral and parenteral
feeding respectively. The predicted enteral requirement of 84 mg.kg-1.day-1 using the
piglet model is surprisingly similar to that derived by using nitrogen balance.
29
In a follow-up study looking at the minimum methionine requirement (methionine
in the presence of excess cysteine), the methionine requirement was reduced to 0.25 and
0.18 g.kg-1.day-1 for enterally and parenterally fed piglets respectively (Shoveller,
Brunton et al. 2003). Again, the requirement for the human neonate can be predicted
from these estimates to be 50 and 36 mg.kg-1.day-1 for enteral and parenteral feeding
respectively when cysteine is present in excess. In that study cysteine was fed in excess,
and the intake of methionine was varied until requirement was reached. In the presence of
an excess of cysteine the methionine requirement was reduced by 40 % in both the
enterally and parenterally fed piglet (Shoveller, Brunton et al. 2003). This shows that
dietary cysteine is equally effective in producing a sparing effect on the total SAA
requirement whether fed enterally or parenterally.
Of note is that when the percent of the dose of phenylalanine oxidized was
compared between the two studies (Shoveller, Brunton et al. 2003; Shoveller, Brunton et
al. 2003), there was no difference in the amount of 14C-phenylalanine oxidized between
the study when cysteine was absent from the diet (Shoveller, Brunton et al. 2003) or in
the study when cysteine was provided in excess (Shoveller, Brunton et al. 2003). This
provides evidence that cysteine is not an essential amino acid for the neonatal piglet and
possibly for the human neonate as well.
As part of these series of investigations in the neonatal piglet, Shoveller et al.
published a study in which they showed the impact of SAA intake and route of feeding
on plasma homocysteine concentrations (Shoveller, House et al. 2004). Piglets were fed
an elemental diet enterally or parenterally with or without cysteine. The methionine
intake was then varied from deficient to excess and the plasma homocysteine

30
concentration measured at each intake level of methionine. Plasma homocysteine showed
a linear response to increasing methionine intake in all treatment groups, whether diets
were fed enterally or parenterally or whether methionine was increased in the presence or
absence of cysteine. However, plasma homocysteine concentrations were highest in the
group that was fed enterally with increase in methionine intake in the absence of cysteine.
These data shows that both routes of feeding and dietary supply of methionine and
cysteine affect plasma homocysteine concentration in the neonate. Since high plasma
homocysteine is a risk factor for hemorrhagic and ischemic stroke in infants and children
(van Beynum, Smeitink et al. 1999; Hogeveen, Blom et al. 2002) investigation in the
human neonate is needed. The suggestion is also that providing the SAA as a balance
between methionine and cysteine with the minimum amount as methionine for all the
functions of methionine only, would be of benefit to the neonate. This is likely to be of
benefit in light of evidence that excess cysteine results in decreasd transmethylation and a
decreased amount of homocysteine for remethylation (Di Buono, Wykes et al. 2003).
Certainly the primary outcome results of this study provide evidence that could
have important implication for cardiovascular risk, as well as for children and adults that
are dependant of enteral and parenteral nutrition. Therefore, the impact of route of
feeding on SAA metabolism deserves further review.
2.4 Sulphur Amino Acid Metabolism: Effect of Route of Feeding
Data from Rose et al. (Rose and Wixom 1955) suggest that in the normal healthy
adult, up to 90% of ingested methionine can be converted to cysteine via the
transsulfuration pathway (fig 2.2), making cysteine a non essential amino acid in adult

31
humans. More recent studies using stable isotopes technology have shown approximately
65% of the total SAA requirement can be converted to cysteine via the transsulphuration
pathway (Di Buono, Wykes et al. 2001; Di Buono, Wykes et al. 2001). The enzymes of
transsulfuration are found mainly in the liver with some enzyme activity being present in
the kidney and adrenals (Zlotkin and Anderson 1982). With the successful introduction of
TPN feeding in the 60s, and its frequent use in patients, along with evidence that the
enzymes of transsulfuration were underdeveloped in the human fetus, premature and
newborn infant, Stegink et al. set out to evaluate whether route of feeding affected
cysteine synthesis from methionine in healthy adults (Stegink and Den Besten 1972).
Eight healthy men participated in the study. They received a baseline normal diet
for 3 days followed by a cysteine-free protein hydrolysate, and dextrose infusion, which
was fat free for 2 weeks via the intravenous or enteral route in a random cross-over
design. Plasma samples were obtained daily at the same time each day from each subject.
The results of the study showed that when the protein hydrolysate dextrose
mixture was administered parenterally, plasma cysteine concentrations dropped markedly
within 12 hours and remained depressed for the entire 2-week period. When the identical
solution was administered enterally by nasogastric tube, the plasma cysteine rose
immediately, and remained almost constant for the entire 2-week period. Nitrogen
balance was not measured in that study. However, the weight of the subjects varied less
than 1.5 kg during the entire 4 weeks of the study suggesting that subjects were in
nitrogen balance throughout the study period. The results however, suggest that extra-
hepatic tissues have a limited capacity to synthesize cysteine from methionine and that
the transsulfuration pathway is mainly active in the liver of even adult humans. The

32
minimal changes in weight however, suggest that such limited synthesis of the extra
hepatic tissues may still be adequate for maintenance of protein synthesis even though
inadequate for normal plasma concentrations. Nevertheless, the question of whether
adequate cysteine is synthesized for glutathione synthesis in the intravenously fed human
is a legitimate one in this scenario. Regrettably, plasma homocysteine was not measured
in the study mentioned above.
The results of the above study, though important, do not explain the various
pathways of methionine metabolism that result in lower plasma cysteine concentration in
the intravenously fed individual when compared to the enterally fed. Using stable isotope
technology, Riedijk et al. were able to quantify the various aspects of methionine
metabolism in the piglet’s gastrointestinal tract (Riedijk, Stoll et al. 2007). The results of
the Riedijk’s study serves to provide some explanation as to why there was a difference
in plasma cysteine concentration in the study by Stegink et al.
The goal of the Riedijk’s study was to investigate the metabolic fate of
methionine in the gut and the contributions to the whole body rates of transsulphuration
and transmethylation (Riedijk, Stoll et al. 2007). This was done using an established
stable isotope tracer approach with [1-13C and methyl-2H3]methionine. Fourteen day old
piglets were adapted for 7 days to a liquid milk based diet providing a daily intake of
methionine and cysteine of 0.25 and 0.31g.kg-1. day-1 respectively. At 20 days of age the
piglets were surgically implanted with intraduodenal (ID) and intravenous catheters. The
piglets were fed via the ID catheters and the isotopes infusion was administered via the
IV catheters. Isotope tracers were infused via a primed continuous infusion for a period

33
of 8 hours. Portal blood flow was monitored by ultrasonography. Arterial and portal
blood samples were collected starting at 0 hours and at varying time points up to 8 hours.
The results of the study (Riedijk, Stoll et al. 2007) show that 20% of the total
methionine intake was utilized by the gut but that there was no first-pass metabolism of
dietary methionine in the gut. Based on the ID methionine tracer absorbed into the portal
blood after correction for recycling and arterial uptake, the results showed that the gut
preferentially metabolized systemic rather than dietary methionine. Transmethylation as
measured by the release of [13C]homocysteine accounted for 67% of the methionine
tracer uptake. Transsulphuration, measured by the 13CO2 release by the portal drained
viscera accounted for 38% of the methionine tracer uptake. The overall contribution of
the gut to whole body methionine metabolism is as follows: twenty percent of the dietary
methionine intake is taken up by the gut, 27 and 23% of the whole-body rates of
transmethylation and transsulphuration occurs in the gut. On the other hand, 32 and 49%
of dietary methionine intake was metabolized in the whole body.
These results demonstrate that the gut is a significant site of methionine
transsulphuration and transmethylation, producing significant amounts of homocysteine
for net release into the circulation. This data then, explains why enteral nutrition results in
higher plasma homocysteine concentrations than TPN (Shoveller, House et al. 2004).
This supports the idea that sulphur amino acids are best provided as a balance between
methionine and cysteine, with only the minimum amounts of methionine being provided
to provide for the particular functions of that amino acid.
In consideration of this form of SAA provision in the diet, it is important to be
clear of the role of each of the SAA in particular cysteine as there has been many

34
suggestions in the literature that it might be conditionally indispensable especially in the
neonate. This issue therefore needs further discussion.
2.5 Is Cysteine a Conditionally Essential Amino Acid in Human Neonates?
2.5.1 In Vitro Studies:
Sturman and Gaull were among the first to report on the absence of cystathionase
activity in the livers of premature and newborn infants (Sturman, Gaull et al. 1970), and
to make the suggestion that cysteine is an essential amino acid in the newborn until
sometime after birth. Cystathionase is the second enzyme in the transsulfuration pathway
(figure 2.2). When that enzyme is absent or underdeveloped, cystathionine concentrations
are elevated. When the livers of fetuses and premature newborns were analyzed for
cystathionase activity (Sturman, Gaull et al. 1970), it was completely absent. In addition,
cystathionine concentration was very high when compared to controls (adults and
children 2 ½ years old). On the other hand when the livers of mature newborns were
analyzed for cystathionase activity it was found to be 7% of that present in controls
(Sturman, Gaull et al. 1970). This led the authors to propose that cysteine is an
indispensable amino acid in premature and new born term infants.
The proposed absence of cystathionase enzyme from fetal liver was further
investigated by the same group (Gaull, Sturman et al. 1972; Pascal, Gillam et al. 1972),
with similar conclusions drawn, that cystathionas activity was limited to absent from

35
human fetal liver making cysteine an indispensable amino acid for newborn infants
especially those born prematurely.
Ten years later, this story was picked up by Zlotkin et al. (Zlotkin and Anderson
1982), who designed a study with the goal of quantifying the development of
cystathionase activity in premature and full-term infants during the first year of life and to
identify the factors affecting its maturation. They hypothesized that the preterm infant
may have sufficient cystathionase capacity to produce cysteine in amounts adequate to
meet estimated needs. This hypothesis was based on the results of a prior study by the
same group (Zlotkin, Bryan et al. 1981) in which they found that premature infants on
cysteine-free TPN had adequate growth and nitrogen retention which was not improved
by adding cysteine to cysteine-free TPN formulation.
In order to measure cystathionase activity, 22 samples of human liver tissue were
obtained during post-mortem examination of infants who died prior to 1 year of age;
premature and full term. A control group consisted of samples of children who died older
than 1 year of age (Zlotkin and Anderson 1982). The results of the study show that
cystathionase activity in the liver is dependent of both gestational age and postnatal age.
In addition, kidney and adrenals have considerable activity which is not affected by
postnatal age. Cystathionase activity was also detected in the pancreas although to a
lesser extent than kidneys and adrenals. In the full-term infant there is a gradual increase
in liver cystathionase activity during the first few months of life whereas in the premature
infant there is a more marked increase during the first 2 weeks of life. The authors
concluded that cystathionase activity in the term and premature infant is considerably

36
greater than previously appreciated and that if the total SAA was provided as methionine
only, cysteine may not be a concern.
Studies discussed so far have shown opposite and conflicting results on the
presence of cystathionase activity in fetal liver. The group of Gaull et al. (Sturman, Gaull
et al. 1970; Gaull, Sturman et al. 1972; Pascal, Tallan et al. 1972) has reported on the
absence of cystathionase activity in premature infants thus raising the possibility of
cysteine becoming an essential amino acid for premature and newborn infants. On the
other hand, Zlotkin and Anderson (Zlotkin and Anderson 1982), reported that
cystathionase activity may be sufficient to provide an adequate rate of cysteine synthesis
from methionine making cysteine a nonessential amino acid.
In an effort to shed some light on this controversial topic, Vina et al. (Vina,
Vento et al. 1995), designed a study to determine if low cystathionase activity was
sufficient to maintain normal cysteine status in premature infants and to measure the in
vitro rate of glutathione synthesis from methionine in erythrocytes of these infants.
Infants were divided into 3 groups: group 1; ≤ 32 weeks gestation, group 2; 33-36 weeks
gestation and a control group consisting of term infants. Venous blood samples were
extracted in the first 24 hours of life before any oral and parenteral feeding for the
determination of SAA concentrations. Glutathione synthesis was also determined from
erythrocytes by incubating the cells with amino acid precursors of glutathione. Cells were
incubated with glutamine, glycine, methionine and serine or with glutamine, glycine, and
N acetyl cysteine. The rate of glutathione synthesis was calculated from the glutathione
concentration at various incubating times.

37
The results of the study (Vina, Vento et al. 1995) showed that plasma
cystathionine concentrations were higher in infants in group 1 than in group 2 or controls.
On the other hand, plasma cysteine concentrations were lower in groups 1 and 2
premature infants than in mature infants. Also, erythrocytes from group 1 premature
infants synthesized glutathione from L-methionine at a much slower rate that did
erythrocytes from group 2 premature infants or full-term infants. However the rates of
glutathionine synthesis from N-acetyl cysteine were similar in all three groups.
The results are nevertheless difficult to interpret as the current understanding of
physiology states that the transsulphuration pathway for the conversion of methionine to
cysteine is not present in erythrocytes. Testing of glutathione synthesis in erythrocytes
may be the wrong medium from which to assess the functioning of the transsulphuration
pathway and draw conclusions regarding the essentiality of cysteine in neonates. These
confusing results suggest that cystathionase reaction may be limiting cysteine synthesis
from methionine especially when the gestational age is ≤ 32 weeks and if anything
supports the observation by Zlotkin and Anderson (Zlotkin and Anderson 1982), that
cysteine synthesis although slow in this study (Vina, Vento et al. 1995), may still be able
to provide adequate cysteine for its functions. The observation that glutathione synthesis
is also slower in group 1 premature infants raises a question as to whether premature
infants will be more subject to oxidative stress as a result of deficient glutathione
availability as a result of inadequate amounts of cysteine made via the transsulphuration
pathway when the total SAA is provided as methionine only. If such is the case, neonates
especially those that are premature who are fed cysteine free TPN could be at risk of
increased oxidative stress or a decrease in their ability to recover from such stressors.

38
2.5.2 Plasma Amino Acids
There have been many published reports of low plasma cysteine in infants
receiving TPN (Pohlandt 1974; Winters 1977; Kanaya, Nose et al. 1984), when compared
to the plasma cysteine concentration of breastfed infants (Wu, Edwards et al. 1986).
These observed low plasma cysteine concentrations in premature and newborn infants
have led investigators to suggest that cysteine is an essential amino acid in the premature
and newborn infant. It must be remembered that breast milk contains a relatively high
cysteine content providing 60% of the total SAA in breast milk with methionine
providing 40%. On the other hand, the plasma cysteine concentrations reported from
these infants studied are based on the provision of a TPN solution that is usually devoid
of cysteine or containing only minimal cysteine.
In 1974, Pohlandt designed a study to test the hypothesis that cysteine is an
essential amino acid in newborn premature and full-term infants (Pohlandt 1974). He did
this by measuring the plasma cysteine concentrations in response to a 5% dextrose
infusion over the first 2 days of life and again in response to an L-amino acid mixture
free of cysteine. The results show that in premature newborns, the plasma cysteine
concentrations decreased markedly within the first 12 hours of life and remained low
thereafter. Also for the full-term infants plasma cysteine concentrations decreased in a
similar fashion. In response to the cysteine-free, methionine-containing amino acid
solution, cysteine concentrations remained low in both term and premature infants,
despite elevated methionine concentrations. This led Pohlandt to suggest that cysteine is a
semi-essential amino acid in the newborn infant.

39
Earlier studies conducted by Stegink et al (Stegink and Baker 1971), also showed
low plasma cysteine/cysteine concentrations in infants receiving intravenous parenteral
solutions with protein source as casein and beef fibrin hydrolysates.
These reports along with others, have been used as evidence that cysteine is an
essential amino acid in the newborn infant. Plasma amino acid concentrations have been
shown to be relatively insensitive in both animal (Ball and Bayley 1984), and humans
(Young, Tontisirin et al. 1972). It has been discussed that while plasma amino acids may
give valuable information about some aspects of amino acid metabolism, it is not a
sensitive endpoint from which the requirement for an amino acid should be determined.
2.5.3 Nitrogen Balance
In an effort to determine if cysteine is an essential amino acid for the
intravenously fed newborn infant, growth, nitrogen balance and plasma sulphur amino
acid concentrations were measured in term and preterm infants on cysteine free and
cysteine supplemented TPN (Zlotkin, Bryan et al. 1981). Twenty-eight infants were
studied; 17 premature and 11 full-term. Infants were alternatively assigned into a control
and experimental group. Both groups received adequate protein and calories with the
experimental group receiving cysteine of 77 mg.kg-1.day-1 (the only difference in the
diet). Each study was conducted over a 5-day period, with the first 3 days serving as the
adaptation days.
The results of the study (Zlotkin, Bryan et al. 1981) show that there was no
difference in the nitrogen retention between the un-supplemented and cysteine-

40
supplemented group. Both groups showed similar positive nitrogen retention of 282
mg.kg-1.day-1 which was 56% of nitrogen infused. These retentions also paralleled the
expected nitrogen in utero retention. In addition, there was no difference in the weight
change between groups. As expected, plasma cysteine concentrations were higher in the
cysteine supplemented group. Nitrogen retention and plasma cysteine were not affected
by postnatal age.
Zlotkin et al. later published another syudy (Zlotkin and Anderson 1982) in which
they reported on the sulphur balance in the cysteine supplemented and un-supplemented
groups of infants discussed above (Zlotkin, Bryan et al. 1981). They were able to account
for 99% of the sulphur infused into the un-supplemented group but only 95% of the
sulphur infused into the supplemented group. Of the sulphur retained in the cysteine
supplemented group 75% was calculated to be retained in lean tissue and total body
sulphate whereas the other 25% remained unaccounted for. They interpreted the failure to
account for all of the sulphate infused in the cysteine supplemented group as errors in the
balance technique. This line of argument is not substantiated by their ability to account
for all of the sulphate infused into the un-supplemented group. Rather, it is possible that
the unaccounted for sulphate was packaged into glutathione as the supplemented cysteine
was used for glutathione synthesis in that group of neonates (Zlotkin and Anderson
1982).
The results of Zlotkin et al. (Zlotkin, Bryan et al. 1981), were validated in a later
study of similar design with a goal of determining if cysteine supplementation improved
nitrogen retention and weigh gain in neonates on TPN (Malloy, Rassin et al. 1984).
Cysteine was supplemented at 72 mg.kg-1.day-1 (cysteine-HCL) at two different levels of

41
nitrogen intakes 240 and 400 mg.kg-1.day-1. The results, as that of Malloy et al., showed
no difference in nitrogen retention or weight gain in the cysteine supplemented group
when compared to the cysteine un-supplemented group. Unlike Zlotkin et al., the authors
postulated that the lack of effect of cysteine supplementation, on nitrogen balance could
be related to the concentration of cysteine being held as glutathione in the liver.
2.5.4 Stable Isotope Tracer Studies
In 1995, Miller et al. published a stable isotope tracer technique to assess human
neonatal amino acid synthesis using D-[U-13C]glucose (Miller, Jahoor et al. 1995). With
this technique the conversion of glucose carbon into seven nonessential amino acids was
assessed by measuring their isotopic enrichments in plasma using gas
chromatography/mass spectrometry (GC/MS). Using this technique they were unable to
detect significant 13C enrichment in plasma cysteine (Miller, Jahoor et al. 1995; Miller,
Jahoor et al. 1995). This led them to suggest that cysteine is an essential amino acid in
parenterally fed premature neonates.
Ten years later, the same group using the same method but a more sensitive end
point, apo B-100, were able to detect 13C labeled cysteine in hepatically derived apo B-
100 (Shew, Keshen et al. 2005). The tracer/tracee ratios of the M+1 isotopomer of
cysteine derived from apo B-100 were significantly greater after the [13C6]glucose than at
baseline. They also found a direct correlation between the increase in cysteine synthesis
and birth weight. They concluded that a functional pathway exists for cysteine synthesis
in premature neonates and that the minimum synthetic capacity of this pathway is directly

42
related to neonatal maturity. The question left to be answered is whether this minimum
synthetic capacity is sufficient to sustain normal protein and glutathione homeostasis.
From the data of Zlotkin (Zlotkin, Bryan et al. 1981; Zlotkin and Anderson 1982) and
Malloy et al. (Malloy and Rassin 1984), it seems that the synthetic capacity for cysteine
is sufficient to sustain normal protein homeostasis. The ability to promote and sustain
glutathione homeostasis remains in question.
The latest study to address the question of the indispensability of cysteine was
recently published and was conducted in the enterally fed preterm neonate (Riedijk, van
Beek et al. 2007). The study was designed to determine the cysteine requirement of the
enterally fed preterm neonate and was based on the assumption that cysteine was an
essential amino acid in the preterm neonate. Twenty five formula fed neonates between
the ages of 32 to 34 weeks gestation were randomized to receive graded intakes of
cysteine ranging from 11 to 65 mg.kg-1 in the presence of a methionine intake of 70
mg.kg-1.day-1. The oxidation of [1-13C]phenylalanine was measured in response to graded
intakes of cysteine. The results of the oxidation data showed that there was no change in
the oxidation of phenylalanine in response to changes in the intake of cysteine. The
results of this study provided clear evidence that cysteine is not a conditionally essential
amino acid in the preterm neonate.
Since all of these data previously discussed used endpoints aimed at measuring
cysteine adequacy for protein synthesis, there is clearly an identified need to measure the
adequacy of cysteine for antioxidant status; namely glutathionine synthesis. But first, a
review of glutathione metabolism, functions and synthesis is clearly required.

43
2.6 Glutathione
2.6.1 Introduction to Glutathione Metabolism
The tripeptide glutathione (gama-glutamyl-cysteinyl-glycine:GSH) is synthesized
de novo within all cells from glycine, cysteine and glutamate (Reid and Jahoor 2000).
Although synthesized within all cells, the liver is the major producer and exporter of
GSH. It is synthesized primarily if not exclusively in the cytoplasm (Smith, Jones et al.
1996). Therefore, most of the cellular GSH (85-90%) is also present in the cytosol.
Unlike the synthesis of larger peptides, no RNA template is involved in GSH synthesis
(Beutler 1989).
There are two steps in the synthesis of GSH: first the enzyme γ -glutamyl cysteine
synthetase catalyzes the formation of a peptide bond between the γ -carboxyl group of
glutamic acid and the amino group of cysteine (Figure 2.3). This is the rate limiting step
in GSH synthesis (Meister and Anderson 1983). In the next step, glycine is joined to γ -
glutamyl cysteine (figure 2.3) to form GSH. This reaction is catalyzed by glutathione
synthetase (Beutler 1989). Glutathione has an inhibitory influence on the first enzyme γ -
glutamyl cysteine synthetase, which acts as feedback control for the regulation of GSH
synthesis. In rare cases of hereditary deficiency of glutathione synthetase, the second
reaction in GSH synthesis is halted and large amounts of γ -glutamyl cysteine
accumulates, which is then catabolized to 5-oxyproline and excreted in the urine (Beutler
1989).
Most of the functions of GSH require its reduced form, (figure 2.3) in which state
it has a free sulfhydryl group and is designated GSH. However, the cysteine residue is

44
easily oxidized nonenzymatically to glutathione disulfide (GSSG). Because most of the
functions of glutathione require its reduced form, an active enzyme mechanism exists, in
the form of glutathione reductase for the reduction of GSSG to GSH (figure 2.3). This
enzyme uses NADPH or NADH as the hydrogen donor. Hence the activity of glutathione
is very dependant on the intake of riboflavin (Beutler 1989). Not only is the activity of
GSH dependant on the intake of riboflavin, but it is worth noting that the concentration of
GSH itself, as well as the enzymes involved in its metabolism, is markedly influenced by
diet (Beutler 1989).
Glutathione disulfide consists of two glutathione molecules joined by a disulfide
bond at the cysteine sulfhydryl groups. This oxidized form of glutathione is designated
GSSG (Figure 2.5).
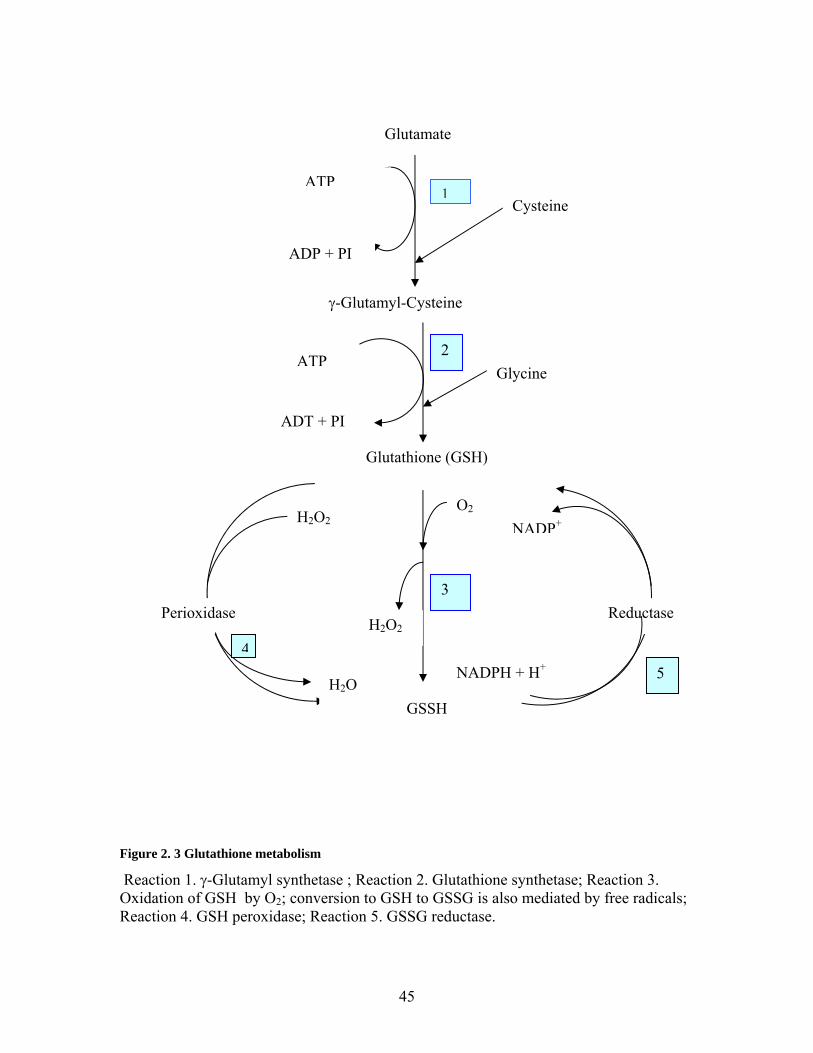
45
Figure 2. 3 Glutathione metabolism
Reaction 1. γ-Glutamyl synthetase ; Reaction 2. Glutathione synthetase; Reaction 3. Oxidation of GSH by O2; conversion to GSH to GSSG is also mediated by free radicals; Reaction 4. GSH peroxidase; Reaction 5. GSSG reductase.
Glutamate
Cysteine ATP
ADP + PI
γ-Glutamyl-Cysteine
Glutathione (GSH)
Glycine ATP
ADT + PI
GSSH
O2
H2O2 Perioxidase
H2O
H2O2
Reductase
NADPH + H+
NADP+
1
2
3
45

46
Figure 2. 4 Structure of reduced glutathione (GSH)
The tripeptide is composed of glutamic acid, cysteine and glycine.
O
HN
HO
O
SS
NH
NH2
HO
O O
NH
HO
O
O
HN
H2N
OH
OO
glutathione
Figure 2. 5 Structure of glutathione disulfide (GSSH) (Oxidized form of GSH)
HOOCCHCH2CH2CO - NH
HSCH2CHCO – NHCH2COOH
GLYCINE
CYSTEINE
NH2
GLUTAMIC ACID

47
2.6.2 Functions of Glutathione: The intracellular concentration of GSH in mammalian cells is in the millimolar
range (0.5-10 mM) with 85-90% being present in the cytosol. The extracellular
concentration (with the exception of bile acids which contain up to 10 mM. L-1) is
typically in the micromolar range e.g. 2-20 µM. L-1 ((Meister and Anderson 1983)).
Glutathione is therefore regarded as the most prevalent intracellular thiol (Meister and
Anderson 1983) and the most important endogenous antioxidant and scavenger
(Wernerman and Hammarqvist 1999). The [GSH]:[GSSG] ratio is often used as an
indicator of the cellular redox state and is >10 under normal physiological conditions.
Glutathione is consumed in the detoxification of electrophylic metabolites and
xenobiotics, and is an effective free radical scavenger, protecting cells from the toxic
effects of reactive oxygen compounds (Reid and Jahoor 2000). Through the enzyme
glutathione peroxidase (figure 2.3), GSH removes peroxides that could oxidize
sulfhydrils and participates in several reactions that serve to prevent oxidation of SH
groups or to reduce them once they have become oxidized (Beutler 1989). This function
is important to promote and protect the normal functioning of proteins.
Glutathione is also important for its role in detoxification, converting the first step
in the conversion of formaldehyde (a toxic product of methanol oxidation) to formic acid
(Beutler 1989). Glutathione is needed for the synthesis of leukotrienes, making GSH an
important mediator of inflammation (Beutler 1989). Glutathione plays an important role
in amino acid transport and is a source of cysteine reserve during food deprivation, and a
major source of cysteine for lymphocytes (Malmezat, Breuille et al. 2000).

48
Irreversible cell damage occurs when the cell is no longer able to maintain its
content of GSH (Reid and Jahoor 2000). Indeed poor prognosis is associated with
decreasing GSH concentration in certain disease states. Consequently an understanding
of GSH metabolism and kinetics with particular emphasis/knowledge of substrate needs
for its synthesis is of importance in health as well as in disease states.
2.6.3 Glutathione: Turnover and Metabolism
Although GSH is synthesized primarily in the cytoplasm, it is utilized in other
compartments (e.g. nucleus, mitochondria, endoplasmic reticulum and in the extra
cellular space) for a variety of functions as previously discussed (Smith, Jones et al.
1996).
Glutathione is supplied to the mitochondria through an energy dependant
transport system that couples GSH uptake to efflux of metabolic anions (Smith, Jones et
al. 1996). Supply to the nucleus involves passive diffusion whereas the supply to
extracellular compartments like plasma depends on efflux of GSH and redox control
mechanisms that allow extracellular reduction of GSSG (Smith, Jones et al. 1996).
Extracellular GSH pools, particularly the plasma pool, have been studied extensively in
humans with decreased GSH concentration observed in HIV, cirrhosis, malnutrition and
premature infants (Vina, Vento et al. 1995; Bianchi, Bugianesi et al. 1997; Jahoor,
Jackson et al. 1999; Bianchi, Brizi et al. 2000; Reid, Badaloo et al. 2000). The enzyme
glutamyl transpeptidase is of major importance in GSH metabolism, as it initiates GSH
degradation (Meister and Anderson 1983). This enzyme is located on the external surface
of certain cells especially renal cells. Glutathione is translocated out of cells, and cells

49
that have membrane bound γ -glutamyl transpeptidase can utilize translocated GSH (renal
cells) whereas GSH exported from cells that do not have appreciable transpeptidase (e.g.
liver cells) enters the blood stream. Glutathione is removed from the plasma by the
kidney and other cells that have transpeptidase.
In a study looking at GSH turnover and metabolism in rats, (Griffith and Meister
1979) plasma and tissue levels of GSH were measured after acute as well as chronic
treatment of rats with DL-buthionine-SR-sulfoximine (BSO) a potent selective inhibitor
of γ -glutamyl- cysteine synthase and therefore GSH synthesis. Two hours after BSO
injection, there was a 72%, 65%, 54% and 33% decrease in GSH concentration in the
kidney, liver, pancreas and muscle respectively. The greater decrease in GSH
concentration in the kidney compared to the liver reflects a more rapid turnover of GSH
in kidney compared to liver. Despite a more rapid turnover of GSH in the kidney
compared to liver, after the single dose of BSO the decline in GSH concentration in
kidney and liver was smooth rather than biphasic. There was a more rapid return of the
GSH content in the liver which may reflect an increased rate of enzyme synthesis or an
increased capacity of liver to metabolize BSO. Nevertheless, the similar pattern of
response in GSH concentration provides evidence for a single pool of GSH between the
tissues which turnover at very similar rates, or rather different pools between tissues
which turn over at similar rates (Griffith and Meister 1979).
In addition to decreased levels of tissue GSH, the plasma levels of GSH also
decreased by 67% 2 hrs after BSO injection. This rapid turnover of plasma GSH supports
the conclusion that the plasma pool of GSH is derived from the tissue in which GSH
turns over rapidly and which have relatively little transpeptidase (Griffith and Meister

50
1979). The GSH levels of brain, lung and spleen were not significantly different 2 hrs
after BSO injection when compared to controls. This led the authors to conclude that the
results reflected the high erythrocyte content of these tissues because erythrocyte GSH
has a very low rate of turnover. This statement should be viewed only in the context in
which it is made and that is; erythrocyte GSH turnover compared with hepatocyte or
renal cell GSH turnover. On the other hand the unchanged GSH level in brain and lung
may be only partly, if at all related to the erythrocyte content of these tissues.
Nevertheless, it must be noted that this statement is contrary to results in human studies
(Lyons, Rauh-Pfeiffer et al. 2000) in which the FSR of GSH in healthy adult males was
65%, suggesting that all the GSH is completely replaced by 1.5 days. This translates into
a half life of 18 hrs suggesting that erythrocyte GSH has a relatively high turnover rate.
In that same study (Griffith and Meister 1979) mice were given BSO orally for 15 days to
look at the effect of chronic administration of BSO on GSH metabolism. The tissue GSH
levels were much lower than those found after 2 hrs: with the exception of liver which
showed a 44% decrease compared to the 65% decrease previously shown after the 2 hr
BSO treatment.
In an effort to prove the importance of the kidney in GSH metabolism the same
authors in a separate experiment (Griffith and Meister 1979) measured the plasma GSH
concentrations at baseline, and again in unilaterally and bilaterally nephrectomized rats.
The results were 17-18 µM, 22 µM and 33 µM respectively. When bilaterally
nephrectomized animals were given a transpeptidase inhibitor, the plasma GSH was
increased to 170 µM. This suggests that the transpeptidase present in extra renal tissues
uses the GSH released into the plasma from various tissues. Through a series of

51
experiments the authors calculated that 2/3 of the plasma GSH is removed by the kidney
with the remaining 1/3 being removed by the extrarenal transpeptidase.
It is clear from these experiments that the highest turnover rate of GSH occurs in
the kidney, followed by liver, pancreas and skeletal muscles. Nevertheless, the liver
possesses a higher synthetic capacity for GSH.
2.6.4 Glutathione Kinetic Measurement:
2.6.4.1 Concentration Measurement
In the biological compartments, changes in GSH concentration are affected if
there is a difference between the rates of synthesis and the rates of disposal of GSH (Reid
and Jahoor 2000). A single concentration measure therefore, while it gives a static
measure of previous kinetics and of amounts of GSH available or lacking in that
compartment and possible surrounding tissues, tells us nothing about the rates of
synthesis and loss of GSH. Consequently, kinetic measures using radio and stable isotope
tracers provide an opportunity to make meaningful interpretation of concentration
measurements.
2.6.4.2 Kinetic Measurement
The first report in which GSH kinetics was measured was by (Dimant, Landsberg
et al. 1955). They used the rate of incorporation of orally administered 15N glycine to
estimate GSH synthesis in erythrocytes. This provided the first evidence that erythrocytes
synthesize GSH de novo. Recent reports suggest that erythrocyte contribute up to 10% of

52
whole body GSH synthesis in humans (Wu, Fang et al. 2004). Subsequent to the Dimant
report in 1955, kinetic studies used intravenous (IV) injections of supraphysiologic doses
of GSH with measurement of loss from the plasma compartment; still others measured
incorporation of radio labeled precursors of GSH into in vitro systems. These methods
were flawed because they suggested that plasma GSH reflected inter-organ, particularly
hepatic GSH efflux. It must be noted that venous plasma GSH concentration is higher
than arterial GSH concentration suggesting a limited role for plasma GSH in inter-organ
GSH homeostasis (Reid and Jahoor 2000). In addition, plasma GSH in vivo is much less
than intracellular concentration (µmol versus mmol) (Reid and Jahoor 2000), not to
mention the fact that plasma GSH is highly unstable, readily undergoing auto-oxidation
to GSSG or protein GSH disulphides (Reid and Jahoor 2000).
In 1995, with the development of a stable isotope precursor product model for
measuring GSH synthesis in vivo, (Jahoor, Wykes et al. 1995), there began an
opportunity for the more effective characterization of various aspects of GSH metabolism
and improvement in this body of knowledge.
2.6.4.3 The Precursor Product Model
The precursor product model for measuring GSH kinetics was developed by
Jahoor et al., 1995 (Jahoor, Wykes et al. 1995). The minimum requirement for the
calculation of the rate of synthesis of a protein or peptide with this model is the
measurement of the isotopic enrichment at two time points during the quasilinear portion
of the exponential increase in peptide-bound amino acid labeling (Reid and Jahoor 2000).
In addition, an estimate of the enrichment of amino acid (AA) tracer in the precursor pool

53
(the free pool of the tissue being studied) is necessary since the AA tracer should be at
isotopic steady state before a measurement of its incorporation into the protein/peptide is
made.
2.6.4.3.1 Infusion Protocol: A primed continuous infusion (CI) of either 13C2 or 2H2 glycine is administered
intravenously or intragastrically for 6 hrs in neonates and 7 - 8 hrs in adults (Reid and
Jahoor 2000). 13C2 glycine is used for glycine flux measurements because of the loss of
one or two of the deuterium when 2H2 glycine is used as the tracer (Reid and Jahoor
2000). Blood samples are collected at baseline and hourly during the infusion, with
sampling restricted to the last 3 hrs of infusion in neonates and small children (Reid and
Jahoor 2000). The rate of synthesis of erythrocyte GSH is obtained from the rate of
incorporation of 13C2 or 2H2 glycine into the GSH. Erythrocyte-free glycine isotopic
enrichment is used to represent the enrichment of the glycine precursor pool from which
erythrocytes make GSH (Reid and Jahoor 2000).
2.6.4.3.2 Sample Analysis: As part of the sample analysis for the method developed by Jahoor et al., 1995,
the erythrocyte GSH is first isolated on HPLC. This is done by an elution process using a
fraction collector. The eluted GSH molecule is then dried and hydrolyzed to each of its
individual amino acids. The glycine (or the amino acid tracer used) is then converted to
the n-propyl ester, heptafluorobutyramide derivative and the tracer to tracee ratio

54
determined by GCMS. This process is very complex, involving several steps and more
than one instrument for analysis.
Recently our collaborator, Dr. Linda Wykes, developed a simpler method in our
laboratory for analyzing the complete tripeptide molecule, which bypasses the isolation
and fractionation steps. For this method she was able to analyze the derivatized GSH
molecule as isolated from erythrocytes by LCMS/MS (Tandem mass spectrometry).
Since the whole molecule is analyzed, the use of an M+2 isotope tracer is not possible
due to the high background enrichments. Therefore, an M + 3 tracer has to be used if the
samples are to be analyzed by this method.
2.6.4.3.3 Calculations:
• The fractional synthesis rate (FSR) of erythrocyte GSH is calculated as follows:
o FSR GSH (%/h) = PEt2 – PE t1 / IEpl x (t2-t1) X 100
o Where PEt2 – PE t1 = the increase in the enrichment of GSH bound glycine
over the period PEt2 – PE t1 of the infusion.
o IEpl = isotopic enrichment at plateau of erythrocyte- free glycine
• Absolute synthesis rate (ASR) of GSH is calculated as follows
o ASR = GSH mass X FSR GSH
o Where GSH mass = the product of the cell volume (or cell number or cell
protein) and the concentration of GSH in the cell.
55
2.6.5 Glutathione Metabolism and Synthesis Rates:
2.6.5.1 In Healthy States:
The availability of cysteine is believed to be the most important nutrient rate -
limiting factor for GSH synthesis. To determine the importance of dietary cysteine
availability for GSH synthesis Lyons et al. (Lyons, Rauh-Pfeiffer et al. 2000) measured
the fractional and ASR of GSH during 2 separate 10-day periods following a 10-day
adaptation to an L-AA diet supplying adequate (1 g.kg-1) protein (AP) or a sulphur amino
acid (SAA) (methionine and cysteine) free mixture. After the adaptation period, GSH
kinetics was measured in the fasted state via a primed continuous infusion (CI) of L [1-
13C]cysteine at 3 µmol.kg-1.h-1 for 6 hrs. The result of that study (Lyons, Rauh-Pfeiffer et
al. 2000) showed that cysteine oxidation accounted for 15% of the cysteine disposal
when the AP diet was consumed falling to 5% with the SAA free diet reflecting,
supposedly, a conservation of methionine and cysteine.
The FSR of GSH was 0.65 for the AP diet and 0.49 for the SAA free diet. The
ASR was 747 ± 216 and 579 ± 135 µmol. L -1.day-1 for the adequate and SAA free diet
respectively. This represented a significant difference between the groups for fractional
and ASR. Nevertheless there was no difference in GSH concentration between the groups
with GSH concentration being 1142 ± 242 and 1216 ± 162 µM in the adequate and SAA
free diet respectively. This demonstrates that in healthy adult subjects, a restricted SAA
intake slows the rate of GSH synthesis. However the decrease in GSH synthesis did not
translate into a decrease in GSH concentration. This therefore suggests that there was
decrease in GSH turnover at the deficient sulphur amino acid intake and provides further

56
evidence that GSH concentration alone cannot be used as an isolated marker of GSH
metabolism, since it does not reflect changes in GSH synthesis within the cell.
In addition to decreasing synthesis of GSH with a SAA free diet, a decrease in
GSH synthesis has also been observed in response to 30% decrease in protein intake in
healthy adults (Jackson, Gibson et al. 2004). Using a prime CI of 13C2 glycine tracer (20
µmol.kg-1 and 15 µmol.kg-1.hr-1) the erythrocyte GSH synthesis was measured in 12
young adults (6 males, 6 females). Each subject underwent a 7- hour infusion protocol to
measure the rate of erythrocyte GSH synthesis on 3 occasions: at baseline while
consuming their habitual protein intake (1.13g.kg-1.day-1), and on day 3 and 10 of
consumption of a diet that provided the safe WHO-recommended amount of dietary
protein of 0.75 g.kg.-1day-1 (FAO/WHO/UNU 1985). The results showed that FSR on day
3 was significantly lower than at baseline and remained decreased at day 10. Similarly
ASR decreased significantly (22%) from baseline on day 3 but was not different from
baseline on day 10 (Jackson, Gibson et al. 2004). Similar to the findings by Lyons et al.,
2000, the mean GSH concentration on day 10 had recovered to baseline levels and was
not significantly different on day 10 from that observed at baseline. However, the GSH
concentration on day 3 was significantly lower than that observed at baseline. It is
unclear if these changes occurred in the study by Lyons et al., 2000 because GSH
concentration was only measured on day 10. There was no significant changes in
enzymes associated with GSH cycling and the concentrations of amino acids (AA) on
day 3. However, by day 10 erythrocyte concentrations of glycine, glutamate and
glutamine increased significantly. These findings suggest that despite the body’s ability
to adapt and possibly regain nitrogen (N) equilibrium by day 10, low protein and hence

57
low AA intake may cause functional loss leading to metabolic consequences such as
decreased ability of the host to synthesize important non-protein substances like GSH
(Jackson, Gibson et al. 2004). The results also provide evidence that the WHO
recommended protein intake of 0.75 g.kg-1 is too low for the healthy adult. This is in
agreement with a study recently published by our group which shows that the protein
requirement of the adult human is 1.0 g.kg-1.day-1 (Humayun, Elango et al. 2007).
The results of Jackson’s study (Jackson, Gibson et al. 2004) begs the question
whether the cysteine requirement for protein synthesis is a fraction of the total required
for the synthesis of protein, plus non-protein substances like GSH? This question was
partly answered in a study by Hiramatsu et al., (Hiramatsu, Fukagawa et al. 1994) in
which the tracer-derived estimate of cysteine flux was considerably higher than that
predicted from estimates of protein turnover. In order to further understand the
components of cysteine flux, the same group conducted a follow-up study (Fukagawa,
Ajami et al. 1996), in 7 healthy adults (3 males, 4 females). The subjects received three
different isotope tracer infusions of L- [methyl-2H3;1-13C] methionine, L [3,3 -2H2]
cysteine and L – [methyl -2H2]Leucine for almost 8 hrs. After a 3 hour baseline period,
GSH was infused at 32 µmol. kg-1. h-1 until the end of the study. In the final hour of GSH
administration, cysteine flux was increased significantly by ~60% from 55 to 88 µmol.
kg-1. h-1. In addition, remethylation rates increased whereas transsulfuration rates were
significantly reduced during GSH administration. The authors concluded that, based on
the data, GSH breakdown accounts for 50% of cysteine flux in the basal state and for all
of the increase in measured cysteine turnover during exogenous GSH infusion
(Fukagawa, Ajami et al. 1996). This study also shows that in healthy adults, the
58
endogenous disappearance rate of GSH (into cysteine) is ~26 µmol.kg.-1.hr.-1, supporting
the view that GSH is a major transport/storage form of cysteine in the body.
In a study designed to validate the method of using urinary sulphur (S) excretion
to measure whole body SAA catabolism and explore the use of whole body nitrogen
/sulphur (N/S) balance ratio as a non-invasive indicator of non-protein SAA storage
under different nutritional conditions in growing pigs (Hou, Wykes et al. 2003), animals
were randomized to receive an adequate protein (AP) or a low protein (LP) diet (50%
NRC requirements) for 10 days. On day 10, L-methionine (1.2 mmol.kg-1) was infused
into the animals over a 2 hour period. In that study, (Hou, Wykes et al. 2003) the rate of
weight gain in the pigs was not significantly different between groups 79.4 g.kg-1.day-1
and 70.5 g.kg-1.day-1 in the AP and LP group respectively. Sulphate excretion from
methionine infusion was significantly lower in the LP than the AP group. Before
methionine infusion, nitrogen (N) balance was significantly lower in the LP than in the
AP group and further decreased slightly in both groups following methionine infusion.
However, in the AP group the S balance and N/S balance ratio was not different from
baseline (before infusion) after the methionine infusion whereas in the LP group the S
balance became more positive after methionine infusion with a further decrease in the
N/S balance ratio. The results also suggest that the composition of body weight gain was
different in the LP and AP fed piglets. Whereas 79% of weight gain in the AP piglets was
lean tissue, only 36% of the weight gain in the LP piglets was lean tissue. In the AP
piglets the entire methionine load was catabolized and excreted in the urine whereas only
69% of the infused methionine was excreted in the LP piglets. This S retention was not
due to increased methionine uptake for protein synthesis because there was no increase in

59
N balance in the face of the increased S balance. This indicates that an improvement in
SAA balance can be achieved even in the presence of worsening N balance suggesting
that methionine was retained in a non protein form, possibly GSH (Hou, Wykes et al.
2003).
2.6.5.2 In Stress/Disease:
It has long been known that GSH concentration is reduced in several disease
states including HIV infection (Jahoor, Jackson et al. 1999), liver cirrhosis, (Bianchi,
Bugianesi et al. 1997; Bianchi, Brizi et al. 2000), diabetes (Ghosh, Ting et al. 2004),
Sickle cell disease (Reid, Badaloo et al. 2006) and Alzheimer’s disease (Liu, Harrell et al.
2005). Glutathione concentration is also found to be reduced in surgical trauma (Luo,
Hammarqvist et al. 1998) septic patients (Lyons, Rauh-Pfeiffer et al. 2001), premature
infants (Vina, Vento et al. 1995) as well as in children with severe protein energy
malnutrition (Reid, Badaloo et al. 2000; Badaloo, Reid et al. 2002). The mechanism
surrounding this decreased concentration was believed to be increased utilization.
However, protein deficient animals subject to the stress of inflammation are unable to
maintain GSH homeostasis and ASR, while piglets fed adequate protein maintained GSH
homeostasis even when subjected to the stress of inflammation (Jahoor, Wykes et al.
1995). In addition, cysteine and methionine supplementation was shown to modulate the
effect of TNF- α on protein and GSH synthesis in animals fed a low protein diet (Hunter
and Grimble 1994). Additionally, survival of guinea pig pups subjected to oxidative
stress was improved by feeding nutritional substrate for GSH synthesis (Chessex, Lavoie
et al. 1999).

60
To determine the mechanism of decreased GSH concentration in HIV a primed,
continuous infusion (CI) of 2H2 glycine was used to measure fractional and ASR of GSH
in 5 healthy and 5 symptom-free HIV infected subjects before and after supplementation
with N-acetylcysteine (NAC) (Jahoor, Jackson et al. 1999). N-acetylcysteine was
supplemented at 20 mg.kg-1.day-1 (15 mg.kg-1.day-1 cysteine). The 2H2 glycine was
infused by a primed (15 µmol. kg-1) and CI (15 µmol. kg-1) for 5 hours. After one week
of supplementation, there was a significant increase in the erythrocyte cysteine
concentration in the HIV group (NAC supplemented), to a value not different from
control group. Baseline plasma GSH concentration which was lower in the HIV group
than control group significantly increased after supplementation with NAC but not to a
value that was higher than the control group. Although the baseline ASR of GSH was
lower in the HIV than in the control group, after one week of NAC supplementation, both
fractional and ASR of GSH experienced a significant increase in the HIV group. The
authors concluded that the GSH deficiency in HIV infection is due in part, to reduced
synthesis, secondary to cysteine deficiency (Jahoor, Jackson et al. 1999).
A study by Reid et al., (Reid, Badaloo et al. 2000) in a group of malnourished
Jamaican children showed that those with edematous protein energy malnutrition (PEM)
had significantly lower plasma and erythrocyte GSH concentrations than those with
non-edematous PEM. In order to delineate the mechanism of this GSH deficiency, a
prime continuous infusion of 2H2 glycine (40 µumol kg-1and 40 µumol.kg-1.hour-1) was
infused over 6 hours via nasogastric infusion. Three isotope infusion studies were
conducted: study1, shortly after admission to hospital, study 2, 7-10 days after admission
and study 3, at recovery, just before discharge. Children with edematous malnutrition had

61
significantly lower ASR of erythrocyte GSH than children with nonedematous
malnutrition, both shortly after admission and at day10, than at recovery. Plasma cysteine
concentrations were also significantly lower in the edematous group at studies 1 and 2
than at recovery. In contrast, erythrocyte GSH concentration, rates of GSH synthesis and
plasma and erythrocytes free glycine concentrations of the nonedematous group were
similar at all times and greater at studies 1 and 2 than in the edematous group (Reid,
Badaloo et al. 2000).
In a follow-up study conducted by the same group in a similar population of
patients in the same hospital and country (Jamaica), Badaloo et al., (Badaloo, Reid et al.
2002), used a similar study design, except for the introduction of cysteine
supplementation in the form of NAC at 81.6 mg.kg-1day-1 of NAC (~60 mg.kg-1.day-1
cysteine) or alanine (control group) which was started immediately after period 1 and
continued until recovery. They (Badaloo, Reid et al. 2002) found that GSH concentration
almost doubled from period 1 to period 2 in the NAC supplemented group and that the
ASR also doubled in the NAC supplemented group. Importantly, the time taken to lose
the edema was significantly less (9 days) in the NAC supplemented group compared to
control group (14 days). This study shows that increasing the substrate for GSH synthesis
promotes not only an increased GSH synthesis, but that increased synthesis and therefore
availability of GSH leads to a quicker recovery at least in children with edematous PEM.
It would seem also from these results that there is a partitioning of available resources
between protein synthesis and GSH synthesis such that only in the presence of additional
substrate is there an increase in GSH synthesis with decreased morbidity measured by
shorter recovery time. This is obvious because in the control group, positive N balance

62
was attained (weight gain) with no significant difference in weight gain between either
groups in either periods. Nevertheless only in the group receiving NAC supplementation
was there increased GSH synthesis and shortened recovery time. Hence, an adequate
protein intake to promote N balance and protein synthesis may not be all that is necessary
for the total well being of the host.
This hypothesis was partly addressed in a study conducted by Hunter & Grimble,
(Hunter and Grimble 1994) in rats. The study was designed to examine the essentiality of
an adequate supply of SAA during a response to TNF-α. Rats were fed a LP diet (8%)
supplemented with cysteine and alanine, methionine and alanine or alanine alone, or a
normal diet (20% protein), for 8 days before injection of TNF or saline. A second
experiment was conducted to serve as the control group in which animals were fed the
same but received no treatment. The results showed that supplementation of the low
protein diet with either cysteine or methionine improved growth and increased liver and
lung GSH concentration, zinc concentration, protein concentration and protein synthesis
compared with the alanine supplemented group. Most importantly the changes in the
protein synthesis and GSH concentration of the liver in response to the TNF showed that
SAA may be partitioned to a greater extent into hepatic protein than into GSH when SAA
intake is low (Hunter and Grimble 1994).
The results from all the above studies suggest an increased need for SAA
particularly cysteine during illness, infection, disease. This increased need for cysteine
can be partly explained by the increased need for GSH synthesis; a lack of which can lead
to slower recovery time and prolonged illness (Badaloo, Reid et al. 2002).

63
Malmezat et al., (Malmezat, Breuille et al. 2000) conducted a study in rats to
determine GSH concentration and kinetics as well as enzyme activity in various tissues of
infected rats. Pair-fed rats were used as controls because of knowledge that infection
leads to anorexia in these animals. Rats were fed ad libitum for 5 days and then injected
with live E. Coli or saline. Glutathione synthesis rates were determined by a 4 or 6 hr 15N
glycine infusion. Animals were sacrificed and blood, liver, spleen, lung, heart, small and
large intestine and muscle from hind leg were excised and analyzed. The results show
that GSH concentration was significantly greater in septic rats in all tissues than in pair-
fed controls except for small intestine and blood (Malmezat, Breuille et al. 2000). There
was no difference in small intestine GSH concentration between the two groups whereas
blood GSH concentration was significantly lower in infected rats than in pair-fed rats.
Glutathione synthesis rates were significantly greater in liver, spleen, large intestine,
lung, muscle and heart of infected rats compared with pair-fed controls. The activity of γ
-glutamyl cysteine synthetase, and glutathione reductase were significantly greater in
livers of infected rats than of pair-fed controls. Cysteine flux was also greater in infected
rats. Based on the results the authors estimated that GSH synthesis accounts for at least
40% of the enhanced cysteine utilization during inflammation, and that increased
utilization may be the primary cause for an increased cysteine requirement during
infection (Malmezat, Breuille et al. 2000).
This increased cysteine requirement in infection was further substantiated in
another study by the same group (Malmezat, Breuille et al. 2000), in which they found
increased methionine transsulfuration during sepsis in rats using a similar model as that
discussed above. Infection also increased methionine flux by 16% but less than cysteine

64
flux which was increased 38%. The plasma cysteine flux was also higher than predicted
form estimates of protein turnover based on methionine data. This was similar to the
findings of Hiramatsu et al., 1994. The present authors (Malmezat, Breuille et al. 2000),
suggested that the increased cysteine flux was probably due to enhanced GSH turnover, a
logical conclusion when assessed in conjunction with their previous findings and that of
Hiramatsu et al., 1994 as well as Fukagawa et al., 1996.
2.7 Cysteine Metabolism
Cysteine is required for protein synthesis and for the synthesis of nonprotein
compounds including taurine, sulphate and glutathione (GSH). The key regulatory
enzymes of cysteine metabolism are cysteine-sulfinate decarboxylase (CSDC), cysteine
dioxygenase (CDO) and γ-glutamyl-cysteine synthetase (GCS) (Bella, Hahn et al. 1999;
Stipanuk, Dominy et al. 2006) (Figure 2.6).
2.7.1 In Vitro Studies
In order to explore the utilization of cysteine relative to methionine for the
formation of its metabolites, a study was conducted in cultured rat hepatocytes (Stipanuk,
Coloso et al. 1992). Rat hepatocytes were cultured with graded concentrations of cysteine
and methionine and the production of glutathione, sulphate and taurine were measured in
response. The results show that the production of each metabolite was affected by
cysteine concentration and availability. Glutathione formation was favoured when
cysteine availability was low whereas sulphate and taurine were favoured when cysteine
availability was high (Stipanuk, Coloso et al. 1992).

65
Figure 2. 6 Pathways to cysteine metabolism
Reaction 1; γ-Glutamylcysteine Synthetase (GCS), Reaction 2; Cysteine Dioxygenase (CDO), Reaction 3; Cysteinesulfinate Decarboxylase (CSDC), Reaction 4; Aspartate Aminotransferase.
Methionine + Serine
Cysteine
Proteins
Glutathione
1
ATP ADP + Pi ADP + Pi
ATP
Pyruvate + HS1-
SO42-
Cysteinesulfinate-independent Pathways
O2
2
Cysteinesulfinate
Hypotaurine
CO2
3
Taurine
½ O2
α-Ketogluterate
Glutamate
4
[β-Sulfinylpyruvate]
Pyruvate + SO32-
SO42-

66
Cysteine supplied as such and cysteine formed from methionine was equally partitioned
demonstrating that methionine is not a superior substrate to cysteine for hepatic
glutathione synthesis. The results also demonstrated that cysteine concentration is an
important factor in the determine the partitioning of cysteine into varying substrates
(Stipanuk, Coloso et al. 1992).
To further understand the particular sulphur amino acid or their metabolites that
act as a signal for regulatory changes in enzyme activity, rat hepatocytes were cultured
with methionine, cysteine or one of their metabolites (Kwon and Stipanuk 2001). Enzyme
activity, expression and mRNA analysis were conducted on the key enzymes of cysteine
metabolism (figure 2.6). Rat hepatocytes cultured for 3 days in basal medium had low
levels of CDO and high levels of GCS. When the medium was supplemented with 2
mmol.L-1 methionine or cysteine, CDO activity and CDO protein increased by >10-fold.
In addition, CDO mRNA increased 1.5 to 3.2 fold. On the other hand, GCS activity
decreased to 51 or 29% of basal. GCH heavy subunits (GCS-HS) protein decreased 89 or
58% of basal and GCS mRNA decreased to 79 or 37% of basal for methionine or
cysteine supplementation respectively. The results show that supplementation with
cysteine consistently resulted in a greater decrease than supplementation with the same
amounts of methionine.
These results are in agreement with the previous results by Stipanuk and Coloso
(Stipanuk, Coloso et al. 1992). Taken together the suggestion is that cysteine is an
important signal for upregulation of CDO and downregulation of GCS.
Cysteine dioxygenase therefore has been shown to play a dominant role in
cysteine catabolism. It catalyzes the oxidation of the sulphydryl group of cysteine to form
67
cysteinesulphinate which is the precursor for synthesis of taurine as well as substrate for
transamination to yield pyruvate and inorganic sulphate (figure 2.6). γ-Glutamylcysteine
synthetase (GCS) catalyzes the rate-limiting step in GSH synthesis and therefore
competes with CDO for cysteine as a substrate (Stipanuk, Londono et al. 2002).
2.7.2 In Vivo Studies
In order to further explore the role of CDO, CSD and GCS on cysteine
metabolism the effect of diet on the regulation of these enzymes was investigated in liver
as well as non-hepatic tissues namely kidney, lung and brain (Stipanuk, Londono et al.
2002). Rats were adapted to a casein base diet for 1 week before being fed the
experimental diet. After 1 week rats were randomized to receive a low protein (LP), high
protein (HP), low protein plus cysteine (LP +C), or low protein plus methionine (LP +M)
diet for 2 weeks. At the end of the 2 weeks rats were killed and liver, kidney, brain and
lung removed for analysis. CDO, CSD and GCS activities, concentrations and mRNA
levels and the concentrations of cysteine, taurine and GSH were measured in the
collected tissue. The results (Stipanuk, Londono et al. 2002) show that all 3 enzymes in
liver responded to the differences in protein and sulphur amino acid intake. However,
only CSD in the kidney and none of the enzymes in the lung and brain responded. Based
on the results from the liver, the authors concluded that the change in cysteine
concentration was consistent with cysteine-mediated regulation of hepatic CDO activity
and changes in cysteine concentration and CDO activity. Changes in renal and lung
cysteine, taurine and GSH concentrations were not associated with similar pattern or
change in CDO, CSD or GCS activity. The authors concluded that the results confirm the
68
importance of the liver in the maintenance of cysteine homeostasis (Stipanuk, Londono et
al. 2002).
In order to confirm the in vitro findings that cysteine mediates upregulation of
CDO and downregulation of GCS, rats were fed a LP basal diet (100g casein.kg-1 diet)
with or without supplemental sulphur amino acids (8 g cystine, 9 g homocysteine, or 10 g
methionine.kg-1 diet) and with or without proparglycine (PPG) and irreversible inhibitor
of GCS (Cresenzi, Lee et al. 2003). Rats were fed the diets for 2 days after which they
were killed and the livers collected. The results show that rats fed the PPG containing
diets had hepatic GCS activities that were ~ 16% lower than those that were not fed PPG.
PPG treatment lowered the CDO activity and increased the GCS activity in the
homocysteine and methionine supplemented groups but not in the cysteine supplemented
groups or the unsupplemented groups. In addition, the GSH concentrations were not
affected by PPG treatment in any of the groups. The authors concluded that the results are
consistence with a role for cysteine as opposed to a precursor or metabolite of cysteine, in
the metabolic signaling responsible for diet-induced regulation of CDO and GCS
(Cresenzi, Lee et al. 2003).
To determine the role of non-sulphur compared to sulphur amino acids in the
regulation of cysteine metabolism rats were fed a basal diet or a diet supplemented with a
mixture of nonsulphur amino acids, sulphur amino acids, or both for 3 weeks after which
they were killed and the hepatic CDO, CSDC, GCS activity, concentration and mRNA
abundance measured (Bella, Hahn et al. 1999). Based on the results, supplementation of
the basal diet with SAA with or without nonsulphur AA resulted in a higher CDO
concentration (32 – 45 times basal), a lower CSDC mRNA levels (49-65% of basal) and a

69
lower GCS-HS of mRNA level (70-76%). This suggests a partitioning of SAA towards
sulphate production when intakes are high. Both SAA and nonsulphur AA played a role
in the regulation of the enzymes of cysteine metabolism but SAA had the dominant effect
and effects of nonsulphur AA was not observed in the absence of SAA (Bella, Hahn et al.
1999).
In order to examine the time-course of changes in CDO and GCS activity,
catalytic subunits and protein and mRNA levels were assessed in rats previously adapted
to a low or high protein (HP) diet, switched to the opposite diet and then followed for 6
days after which they were killed and the above parameters measured in liver (Lee,
Londono et al. 2004). The results show that hepatic CDO activity and amount but not
mRNA level increased in response to higher protein diet and that the t1/2 of the change for
CDO activity or protein level was 22 hours for rats switched from the low protein (LP) to
the HP diet and 8 hours for rats switched from HP to LP diet. This suggests that the HP
diet decreased the turnover of CDO (Lee, Londono et al. 2004). Regarding GCS, its
activity, catalytic subunits and mRNA levels decreased in response to a HP intake. The
change in GCS activity in rats switched from a LP to a HP diet was faster that that for
rats switched from a HP to a LP diet (16 vs 7 hours). Liver cysteine and GSH
concentrations reached new steady states within 12 hours in rats switched from a LP to a
HP and 24 hours in rats switched from a HP to a LP. CDO activity in the current study
was regulated at the level of protein, possibly by decreased turnover of CDO in response
to HP intake or cysteine levels whereas GCS activity appeared to be regulated at the
mRNA level in response to changes in protein and cysteine availability. These findings
support the role of cysteine as a mediator in its own metabolism. When cysteine

70
concentrations and availability is high, cysteine is partitioned towards catabolism
whereas when availability is low cysteine is partitioned towards GSH synthesis.
In order to evaluate the mechanisms regulating hepatic CDO, GCS and CSDC
activities in response to dietary protein or sulphur amino acids, enzyme activity and
mRNA analysis were conducted on liver samples from rats fed a basal LP diet or diets
with graded levels of protein or methionine for 2 weeks (Bella, Hirschberger et al. 1999).
The results show that higher levels of CDO activity and CDO protein but not of CDO
mRNA were observed in liver of rats fed the protein or methionine supplemented diets.
This suggests that CDO activity is regulated by changes in enzyme concentration.
Additionally, lower concentrations of GCS-HS, mRNA and protein as well as lower
GCS-HS were observed in rats fed protein or methionine supplemented diets. The
suggestion is that GSC is regulated by both pre-translational and post-translational
mechanisms.
Regarding CSDC, there was lower activity; lower protein concentration and lower
mRNA observed in the livers of rats fed the highest level of protein. The authors
concluded that regulation of CSDC appeared to be related to changes in mRNA
concentrations.
The overall summation from this experiment is again showing a similar pattern as
that previously observed. Essentially cysteine metabolism responds to changes in protein,
methionine and cysteine intake and the enzymes of central importance CDP, GCS and
CSDC respond based on cysteine availability with a greater proportion being partitioned
towards oxidation and sulphate production in the presence of high cysteine
concentrations and a greater proportion being channeled towards GSH synthesis when

71
cysteine concentrations are lower. Thus GSH acts a storage form of cysteine and can be
broken down to supply cysteine to the free amino acid pool when intake is low (Cho,
Sahyoun et al. 1981). It is therefore clear that the liver plays a most important role in
cysteine metabolism with the key enzymes acting to keep cysteine concentrations within
a tightly regulated normal range. The purpose of keeping cysteine within tightly
controlled levels has been looked at from two perspectives; the first is to support the need
for protein synthesis and the production of other essential molecules including GSH, the
other it to keep cysteine below the level of cytotoxicity (Stipanuk, Dominy et al. 2006).
72
3 THESIS SCOPE AND MOTIVATION
3.1 Rationale
An appropriate amino acid pattern for the TPN fed neonate that promotes optimal
protein synthesis and growth while minimizing overload of the immature catabolic
enzyme pathways has yet to be developed. The pattern of amino acid in currently
available TPN solutions is based on human milk, egg protein or cord blood and reflects
the amino acid requirement of the enterally fed neonate. In the neonatal piglet model it
has been demonstrated that the requirement for several amino acids are lower with
parenteral feedings compared to enteral feedings. One such amino acid methionine, has
demonstrated toxic effects on the livers, having been shown to promote cholestatic
changes in animal models similar to that observed in neonates on TPN. If methionine is
hepatotoxic to the human neonate it might be possible to design a TPN solution that is
non-toxic with the correct balance of methionine and cysteine especially in light of recent
evidence that 40% of the methionine requirement can be replaced by cysteine.
Glutathionine, the most important intracellular scavenger and antioxidant is
synthesized from the amino acids glutamate acid, cysteine and glycine. Of these three
amino acids, cysteine is found to be the amino acid which has the greatest impact on
limiting GSH synthesis.
Decreased GSH synthesis rates have been shown in healthy adults consuming
diets low in sulphur amino acids as well as low in dietary protein. This decreased
synthesis is observed in parallel with a lack of change in GSH concentration; an
observation which suggests a decrease in GSH turnover.

73
Low concentrations of GSH have been observed in humans with different
diseases. In addition, animal data show that in protein and amino acid deficiency animals
are unable to maintain GSH status despite an increase in synthesis rates. Animal data
also show an overall increase in cysteine requirement during stress/disease/illness. This
increased requirement is partly explained by the increase in the synthesis of GSH under
these circumstances. This increase in cysteine requirement seems to be at a level higher
than that present in protein for nitrogen balance.
Because it is common knowledge that current TPN solutions are limiting in
cysteine there is a need to measure GSH synthesis rates in the TPN fed neonate. In
addition, since the TPN fed neonate is stressed, due to a variety of illnesses, or congenital
anomalies requiring surgical intervention, it seems logical to suggest that such an
individual may have an increased requirement for cysteine. It is important therefore to
measure the amount of cysteine required for adequate GSH synthesis in the TPN fed
neonate.
Additionally, since current methods of determining amino acid requirement
measures the need for protein synthesis, it is important to determine if the sulphur amino
acid required for protein synthesis is also equivalent to that required for provision of
adequate antioxidant status. Since the requirement for total sulphur amino acid in healthy
adults is the same as that required in chronically malnourished adults, a determination of
whether the previously derived total sulphur amino acid requirement is also sufficient to
maintain antioxidant status in healthy adults will be important to determine in order to
provide a starting point of reference for further determination in the TPN fed human
neonate.

74
3.2 Hypothesis and Objectives
In order to address the gaps mentioned above, this thesis was divided into four main
studies. The first study was to develop a TPN solution de novo in our laboratory that was
sterile, pyrogen free and stable to be used for the conduction of the studies in the TPN-fed
human neonate. The second, third and fourth parts are the three specific studies designed
to answer the questions raised herein. The objectives and hypothesis are outlined below.
Experiment 1: The development of an amino acid solution suitable for use in
the determination of amino acid requirement and metabolism
in the TPN fed human neonate
Hypothesis
• A TPN solution that is sterile, pyrogen free and stable for at least six weeks could
be developed for use in the TPN fed neonate for the determination of amino acid
requirement and metabolism.
Objectives
• To obtain a suitable grade amino acid which was sterile and pyrogen free
• To prepare an amino acid under sterile conditions to avoid contamination
• To test the solutions once prepared, using nitrogen analysis and HPLC to verify
stability of the nitrogen and amino acid content.
Experiment 2: The total sulphur amino acid requirement and metabolism of
the TPN-fed post-surgical neonate.

75
Hypothesis
• The total sulphur amino acid requirement of the TPN-fed post-surgical neonate
will be approximately 52 mg.kg-1.d-1.
Objectives
• To determine the total sulphur amino acid requirement (methionine in the absence
of cysteine) of the TPN-fed human neonate using the indicator amino acid
oxidation technique
• To measure the concentration of the amino acids involved in sulphur amino acid
metabolism in response to feeding graded intakes of methionine
Experiment 3: Methionine-adequate cysteine-free diet does not limit
glutathione synthesis in young healthy adult males
Hypothesis
• The total sulphur amino acid required to achieve the highest level of glutathione
synthesis would be higher than that required for protein synthesis
Objectives
• To measure the concentration, fractional and absolute synthesis rates of
glutathione in erythrocytes of healthy adult males
• To determine if feeding graded intakes of cysteine will affect the parameters listed
above.

76
Experiment 4: Does the addition of cysteine to the experimentally derived
total sulphur amino acid requirement (methionine only)
increase glutathione synthesis in erythrocytes of the TPN-fed
human neonate: a pilot study.
Hypothesis
• The provision of additional cysteine to the TPN, (in addition to the total sulphur
amino acid requirement) will not increase erythrocyte GSH synthesis in the TPN
fed stable post surgical human neonate.
Objectives
• To measure erythrocyte GSH concentration, fractional and absolute synthesis in
the TPN fed human neonate in response to cysteine free methionine adequate
TPN and in response to methionine-adequate, cysteine-supplemented TPN.
• To determine if cysteine supplementation increase GSH synthesis and
concentration in the TPN-fed human neonate.

77
The following chapter has been submitted to the European Journal of Clinical Nutrition
Glenda Courtney-Martin, Karen P. Chapman, Ronald O. Ball, and Paul B. Pencharz. The development of an amino acid solution suitable for use in the determination of amino acid requirement and metabolism in parenterally fed humans

78
4 THE DEVELOPMENT OF AN AMINO ACID SOLUTION SUITABLE FOR
USE IN THE DETERMINATION OF AMINO ACID REQUIREMENT AND
METABOLISM IN PARENTERALLY FED HUMANS
4.1 Abstract
Current available amino acid solutions used for parenteral nutrition (PN) feeding
contain mixtures of amino acid that are in set, predetermined concentrations. On the other
hand, an amino acid solution appropriate for use in the determination of amino acid
requirement and metabolism must allow for the adjustment of the level of the amino acid
being studied. Such a solution has never been developed for use in humans and is not
available for current use. The purpose of the current manuscript is to present the methods
used in the development of amino acid solutions suitable for use in the determination of
amino acid requirement and metabolism in the PN-fed, human subject. The criteria as
established a-priori for these solutions were sterility and pyrogen free, and stability of
individual amino acids over a 6-week to 3-month period. Pharmacy grade amino acid
powders were obtained and solutions prepared under sterile conditions in our research
laboratory. Solutions were filter sterilized and tested for pyrogens using standard
procedures. Nitrogen analysis and high performance liquid chromatography (HPLC)
testing were conducted to verify amino acid concentrations and stability. Solutions were
found to be sterile and pyrogen free and individual amino acids were stable for up to 3
months in solution. The results of this study confirmed the possibility of safely and
accurately making amino acid solutions for use in the conduct of amino acid requirement
and metabolism studies in PN fed subjects.

79
4.2 Introduction
The amino acid profiles of current commercial amino acid solutions used for
parenteral nutrition (PN) feeding are patterned after reference proteins consumed
enterally (Endres, Lewandowski et al. 1982; Bertolo, Pencharz et al. 1999), or based on
the amino acid composition of umbilical cord blood (Rigo and Senterre 1987), and
plasma amino acids concentrations (Heird, Dell et al. 1987; Roberts, Ball et al. 1998).
During the early 1990s, our group initiated a program of research in which we developed
a piglet model (as a surrogate for the human neonate) for the determination of amino acid
requirements in parenteral nutrition (PN) feeding (Wykes, Ball et al. 1993). Using this
model, we determined the amino acid requirement for most of the essential amino acid
(House, Pencharz et al. 1997; House, Pencharz et al. 1997; Bertolo, Chen et al. 1998;
Elango, Pencharz et al. 2002; Shoveller, Brunton et al. 2003; Shoveller, Brunton et al.
2003; Cvitkovic, Bertolo et al. 2004). In parallel, we determined the enteral as well as
parenteral requirement for the same amino acid in the same group of piglets (Bertolo,
Pencharz et al. 1999; Elango, Goonewardene et al. 2004). This valuable extension to our
existing model allowed us to make a most interesting discovery: that the amino acid
requirement of enterally fed piglets was between 30 to 50 % higher than that of PN fed
piglets. Our observations were supported by the work of Stoll et al. who showed that
approximately 30% of enterally fed dietary essential amino acids are consumed by the
gut on first pass metabolism (Stoll, Henry et al. 1998). Thus we concluded that the
current PN solutions that are available on the commercial market may be inadequate
(Brunton, Ball et al. 2000) for the PN fed neonate.

80
The suitability of the piglet model as an appropriate surrogate for the human
neonate was partially validated in a study on tyrosine requirement in the PN-fed human
neonate (Roberts, Ball et al. 2001). The piglet model proved to be appropriate in that the
requirement so derived was as predicted using the requirement estimate from the piglet
study (House, Pencharz et al. 1997). Initial studies used commercial amino acid mixtures.
Subsequently, we moved to parenteral amino acid mixtures made from crystalline amino
acids and hence were able to vary as needed the amino acid under study (the test amino
acid). Our previous extensive body of work in the neonatal piglet provided the knowledge
and experience needed to pursue our goal of determining all the essential amino acid
requirements of the PN-fed human neonate: with an ultimate goal of generating a
scientifically derived amino acid pattern for PN feeding for that population.
We recently published a report in which we determined the first ever sulphur
amino acid requirement in the PN fed human neonate using amino acids mixtures made
from crystalline amino acids in a research laboratory (Courtney-Martin, Chapman et al.
2008). In order to be able to determine the total sulphur amino acid requirement as
methionine only, we needed to prepare amino acid solutions devoid of all sulphur amino
acids and then vary the methionine intake at levels both below and above the estimated
requirement. Before we could do that we needed to develop amino acid solutions that met
the requirements for human as stipulated by the Research Pharmacy at The Hospital for
Sick Children, Toronto. Specifically, solutions needed to be sterile, pyrogen free and
stable for at least six weeks.
The goal of the current manuscript therefore is to present the details of the
methods used in the development of amino acid solutions for determination of the total

81
sulphur amino acid requirement and metabolism in the PN fed human neonate (Courtney-
Martin, Chapman et al. 2008). We anticipate that other groups interested in the study of
amino acid requirement and metabolism will benefit from our experience.

82
4.3 Methods
There were a number of steps to be followed to accomplish the goals of this study.
The various tasks to be undertaken were as follows:
1. Obtain individual amino acid powders that were of a pharmacy grade, sterile and
pyrogen free and suitable for use in the making of an amino acid solution that was
stable for at least a six week period. Amino acids once obtained needed to be stored
in a cool place away from direct light.
2. Making of the amino acid solution under sterile conditions
3. Test the solutions for sterility and pyrogenicity
4. Nitrogen analysis for the confirmation of the nitrogen content of the amino acid
solution
5. Six-week and three-month high performance liquid chromatography (HPLC)
stability testing for the identification and quantification of each individual amino
acid present in the solutions (observed from HPLC) compared with amount added
(expected amount).
6. The isotopes that were going to be used (L-[1-13C]phenylalanine, and [U-13C2 –
15N]glycine) in future amino acid requirement studies required additional testing as
requested by The Research Pharmacy at The Hospital for Sick Children. These
testing were required to ensure limited exposure of the babies in the study to heavy
metals. In addition every 6 months, we were required by pharmacy to conduct
HPLC testing on the isotopes to check for breakdown products of phenylalanine
and glycine. Isotopes were delivered to the Research Pharmacy immediately upon

83
receipt from the manufacturer in sealed unopened bottles. Pharmacy prepared all
isotopes and was responsible for the storage under refrigerator conditions at 4ºC.
4.3.1. Obtain Individual Amino Acid Powders:
Individual L- amino acids were obtained from Ajinomoto (Ajinomoto Aminoscience
LLC, 4020 Ajinomoto Drive, Raleigh, North Carolina 27610), through its distributor L.V
Lomas Ltd (75 Summerlea Road, Brampton ON, L6T 4V2, Canada). Each amino acid was
received in individually wrapped air tight containers, with a specific lot number,
manufacture and expiry date. Amino acids were then stored in airtight containers, in a cool
environment (18.5 to 21ºC) away from direct sunlight. Individual certificates of analysis
were received with each amino acid and were reviewed and approved by the research
pharmacy at The Hospital for Sick Children before the amino acid powder was used.

84
4.3.2. Preparation of the amino acid solution
The composition of the amino acid solution used was patterned after cord blood
(Primene, Baxter Laboratories, Mississauga, Ontario); the pediatric amino acid solution
used for PN feeding of neonates at The Hospital for Sick Children. Specific amino acid
composition could then be adjusted to accommodate the changes in the amino acid under
study. A bulk amino acid solution was made along with individual stock solutions of the
test amino acid as well as alanine, which is the amino acid used to balance the nitrogen
content of the PN solution.
Each solution was prepared under sterile conditions in glass containers that had
been previously autoclaved. All utensils used in the weighing of amino acids were also
autoclaved. Utensils and glass containers were autoclaved at 270 - 273ºC for four
minutes, followed by a cooling period of 30 minutes. Amino acids were added and
dissolved in sterile water (Baxter Corporation, Toronto, ON). Amino acids were added
individually, from the least to the most soluble and stirred continually with stirring
magnets until dissolved. The prepared solution was then poured into autoclaved
volumetric flasks and sterile water added to the desired volume.
Parenteral nutrition solutions were prepared by two different individuals. One
individual weighed and added the powder to the sterile water while the other individual
checked the lot number, expiry date, weight and addition of each amino acid to the sterile
water. Each individual wore sterile gown, gloves mask and hair nets during solution
preparation.

85
Once the preparation of the solution was completed it was then taken to the
Research Pharmacy in the sterile volumetric flask for sterilization, pyrogen check and
aliquoting for future use.
4.3.3. Test the solutions for sterility and pyrogenicity
Solutions were filter sterilized in the Research Pharmacy at The Hospital for Sick
Children by passing through a 0.22 μm filter. Solutions were subsequently demonstrated
to be sterile and free of bacterial growth over 7 days in culture and to be proven pyrogen-
free by the limulus amebocyte lysate test (Pearson 1979).
4.3.4. Nitrogen analysis
After the preparation of the PN bulk and test solutions in the laboratory, a sample
of each of the solutions was analyzed for determination of the total nitrogen content
within 24 to 48 hours after preparation. The ANTEK 7000 Elemental Analyzer, (Mandel
Scientific Company Ltd. Houston, TX) was used to determine the nitrogen content of
each sample. Nitrogen concentrations were determined against a standard curve prepared
using a know concentration of nitrogen. For each sample analyzed, the concentration
observed from the machine was checked against the expected concentration of nitrogen in
the total sample using the formula: (Expected – Observed / Expected)*100. A difference
in nitrogen concentration between expected and observed of ≤ 5% was the pre-
determined accepted range.
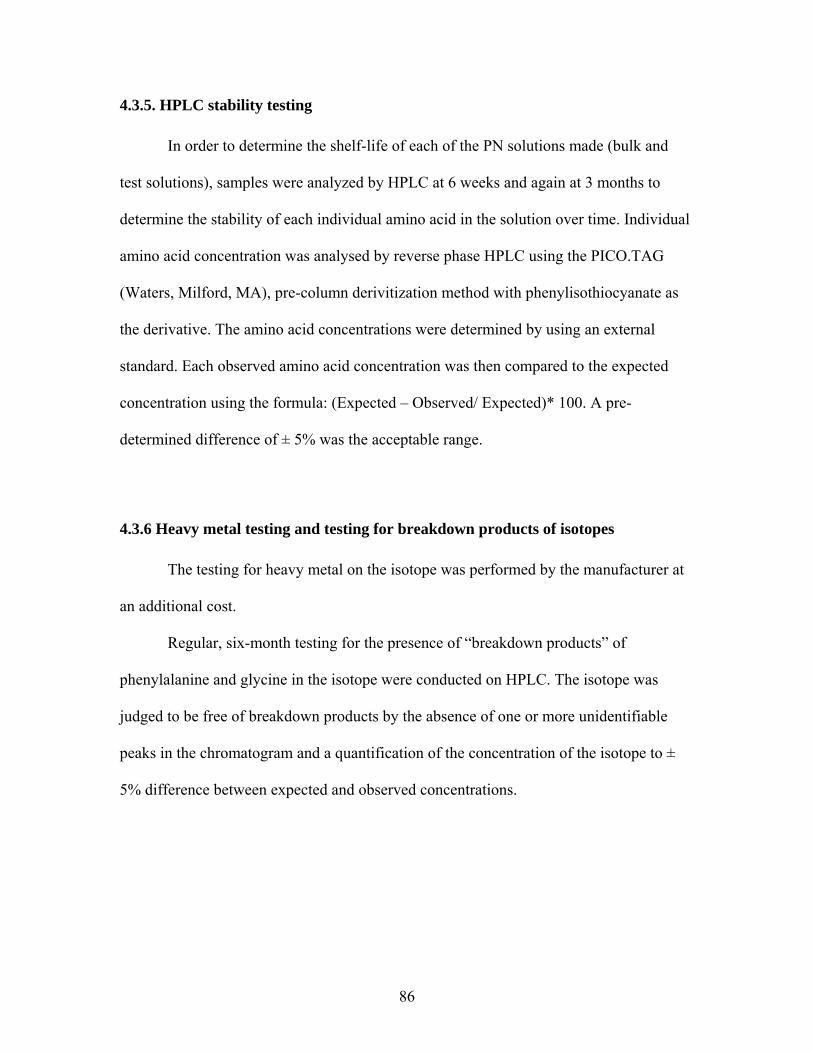
86
4.3.5. HPLC stability testing
In order to determine the shelf-life of each of the PN solutions made (bulk and
test solutions), samples were analyzed by HPLC at 6 weeks and again at 3 months to
determine the stability of each individual amino acid in the solution over time. Individual
amino acid concentration was analysed by reverse phase HPLC using the PICO.TAG
(Waters, Milford, MA), pre-column derivitization method with phenylisothiocyanate as
the derivative. The amino acid concentrations were determined by using an external
standard. Each observed amino acid concentration was then compared to the expected
concentration using the formula: (Expected – Observed/ Expected)* 100. A pre-
determined difference of ± 5% was the acceptable range.
4.3.6 Heavy metal testing and testing for breakdown products of isotopes
The testing for heavy metal on the isotope was performed by the manufacturer at
an additional cost.
Regular, six-month testing for the presence of “breakdown products” of
phenylalanine and glycine in the isotope were conducted on HPLC. The isotope was
judged to be free of breakdown products by the absence of one or more unidentifiable
peaks in the chromatogram and a quantification of the concentration of the isotope to ±
5% difference between expected and observed concentrations.

87
4.3.7 Statistical analysis
The acceptable difference between expected and observed concentrations of
nitrogen and amino acids were set a priori at ± 5%. The expected nitrogen concentration
in each amino acid solution was determined by finding the sum of the total nitrogen
content of each amino acid in the solution. The difference in nitrogen and amino acid
concentrations as measured by nitrogen and HPLC analysis respectively was calculated
using the following equation:
(expected concentration – observed concentration / expected concentration) * 100. All
calculations were performed using Microsoft EXCEL for Windows Version 2002
(Microsoft Corporation). Mean and SD were calculated on all samples analyzed by
nitrogen analysis. These calculations were done on the results obtained from the injection
of each sample three times into the nitroen analyzer.
4.4. Results
All samples prepared except for one initial batch passed the sterility and
pyrogenicy tests. The total nitrogen content of the solutions as measured within 24 to 48
hours after preparation was confirmed to be within ± 5% of the expected nitrogen
content. The observed nitrogen content of the bulk solution prepared was -0.9 ± 1.7
(mean ± SD) mg.nitrogen/litre. The observed nitrogen content of the test amino acids
methionine and alanine were also within the expected acceptable range. The observed
nitrogen content for methionine and alanine were -0.4 ± 2.5 and -0.2 ± 3.1 (mean ± SD)

88
mg.nitrogen/litre. Also the observed nitrogen content of the (L-[1-13C]phenylalanine used
in the study was -0.9 ± 2.0 (mean ± SD) mg.nitrogen/litre.
The amino acids were found to be stable in solution at 6 weeks and again after 3
months as verified by a predetermined difference between expected and observed
concentration of ± 5%. Solutions were therefore given an initial shelf life of 6 weeks
which was extended to a 3 month shelf life after the 3-month testing. The results of a
typical batch of samples tested by HPLC after 6 weeks and 3 months are presented in
Tables 4.1 and 4.2.
The isotope powder met the specifications required by the Research Pharmacy
with regard to heavy metal content, and was deemed acceptable for use in human infants.
The isotope was tested for over 60 metals including silver, nickel, tin, gold and lead. In
addition, there were no breakdown products observed from the isotope during the
periodic 6 month testing by HPLC. Figures 4.1 presents a typical chromatogram obtained
from HPLC for (L-[1-13C]phenylalanine.
There were no adverse events associated with the use of any of the solutions in
any of the babies studied.

89
Table 4. 1 HPLC stability analysis of TPN bulk solution Results of HPLC analysis on bulk PN solution made for conduction of stability analysis1:
Typical 6-week and 3-month results
Amino acid
Name
Total amino
acid
Expected
(nmoles)
Total amino acid
Observed
(nmoles)
Percentage (%) difference
between expected and
observed
Isoleucine 127.7 128.74 -0.82
Leucine 188.69 194.33 -2.99
Valine 162.19 163.15 -0.59
Lysine 186.4 189.43 -1.62
Methionine2
Cysteine2
Phenylalanine 36.32 36.13 0.53
Tyrosine2
Glycyl-tyrosine 42.77 42.62 0.35
Threonine 38.83 38.58 0.62
Tryptophan3
Histidine 61.23 63.39 -3.53
Arginine 60.28 57.35 4.86
Glycine 45.22 46.22 -2.22
Alanine 110.84 115.98 -4.64
Aspartate 56.35 59.11 -4.90

90
Glutamate 84.11 85.42 -1.55
Proline 65.14 66.63 -2.29
Serine 47.58 49.24 -3.50
Taurine 5.99 5.70
4.92
1Original PN bulk solution prepared as a 5% solution. During sample preparation, solution diluted to a 1 in 2 and 1 in 4 solution, derivitized, then 2.5, 5.0, or 10ul injected into the HPLC.
2These amino acids not used in making the bulk solution. These amino acids were initially made as separate test solutions. Tyrosine was replaced by glycyl-tyrosine.
3Not accurately quantifiable on our HPLC because tryptophan is light sensitive and our HPLC uses a UV detector.

91
Table 4. 2 HPLC stability analysis of individual amino acids
Results of HPLC analysis on individual amino acids prepared for conduction of stability
analysis: Typical 6 weeks and 3 month results
Amino Acid Original
concentration
(mg/ml)
Dilution
parameters
Amino acid
expected in
diluted
sample
(nmoles)
Amino acid
observed from
HPLC
(nmoles)
Percentage
(%)
difference
between
expected
and
observed
Alanine
50
1 in 200 19.64
19.31
1.71
Methionine
20
1 in 50 18.77
18.91
-0.75
(L-[1-
13C]phenylalanine
15
1 in 40 15.80
16.39
-3.74
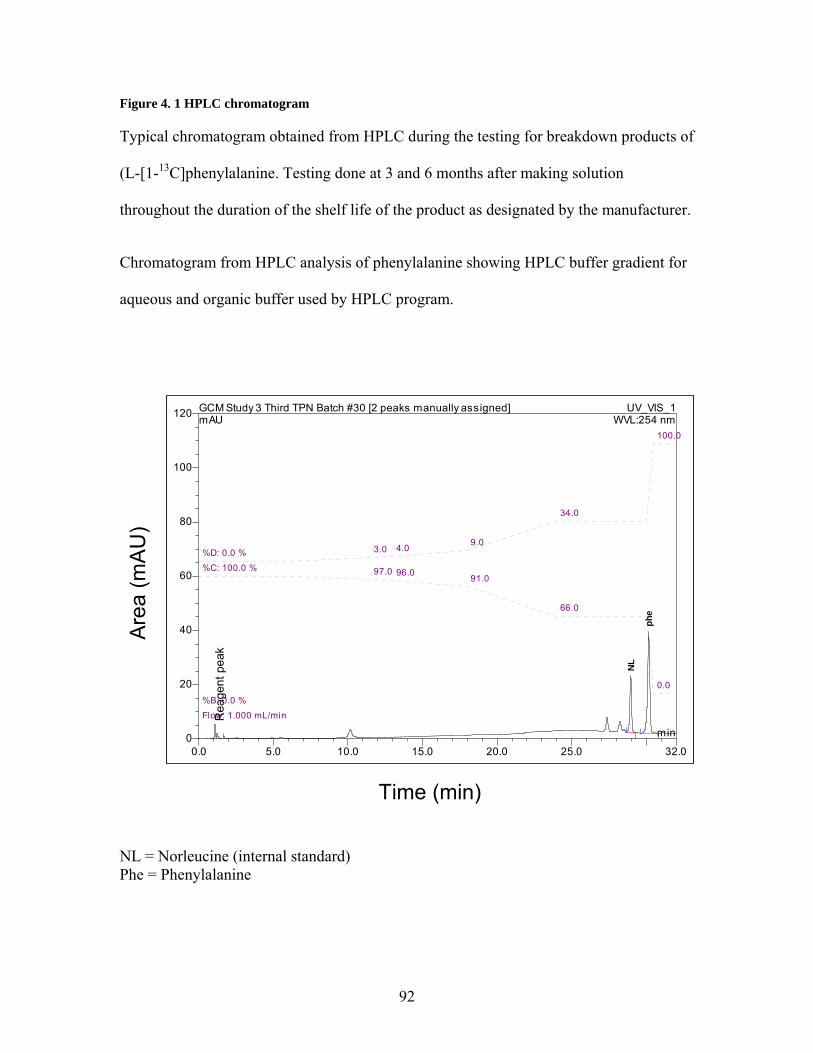
92
Figure 4. 1 HPLC chromatogram
Typical chromatogram obtained from HPLC during the testing for breakdown products of
(L-[1-13C]phenylalanine. Testing done at 3 and 6 months after making solution
throughout the duration of the shelf life of the product as designated by the manufacturer.
Chromatogram from HPLC analysis of phenylalanine showing HPLC buffer gradient for
aqueous and organic buffer used by HPLC program.
0.0 5.0 10.0 15.0 20.0 25.0 32.00
20
40
60
80
100
120 GCM Study 3 Third TPN Batch #30 [2 peaks manually assigned] UV_VIS_1mAU
min
NL
phe
WVL:254 nm
Flow: 1.000 mL/min
%B: 0.0 %
%C: 100.0 % 97.0 96.0 91.0
66.0
0.0
%D: 0.0 % 3.0 4.0 9.0
34.0
100.0
Time (min)
Are
a (m
AU
)
Rea
gent
pea
k
NL = Norleucine (internal standard) Phe = Phenylalanine

93
4.5 Discussion
Herein we have presented the details of the methods used to successfully prepare
PN solutions from scratach in a research laboratory in order to determine the total sulphur
amino acid requirement in the PN fed human neonate (Courtney-Martin, Chapman et al.
2008). This is the first report to our knowledge in which PN solutions have been
successfully made de novo in a research laboratory for use in humans for the study of
amino acid requirements and metabolism in PN feeding. Our previous work in the PN
neonatal piglet model (Wykes, Ball et al. 1993; Wykes, House et al. 1994; House,
Pencharz et al. 1997; House, Pencharz et al. 1997; Bertolo, Chen et al. 1998; Bertolo,
Pencharz et al. 1999; Elango, Pencharz et al. 2002; Cvitkovic, Bertolo et al. 2004;
Elango, Goonewardene et al. 2004) provided us with the knowledge and experience
required to embark on such an endeavor.
In order to determine the requirement for an amino acid, a study should be so
designed that the amino acid of interest is fed at varying intake levels from deficient to
excess. (Di Buono, Wykes et al. 2001; Ball, Courtney-Martin et al. 2006). The
determination of amino acid requirement in subjects that are PN fed therefore requires the
development of a PN solution in which the intake of the amino acid of interest as well as
a dispensable amino acid used for balancing the nitrogen content of the solution (usually
alanine) could be varied across a wide range.
The results of the current study show that it is possible to design amino acid
solutions de novo in a laboratory for use in PN feeding that are sterile and pyrogen free,
as well as stable. Of all the solutions made, only one batch failed sterility testing, which
accounted for about a 4% failure rate. The solution was promptly discarded and an
94
evaluation of the preparation process carried out. This happened very early on in the
process and was most likely due to the failure of one of the individuals making the
solution to wear sterile gloves. This was rectified in the making of subsequent batches
and all subsequent solutions passed sterility and pyrogenicity testing. In addition, there
were no adverse effects in any of the babies in response to the PN solutions used in the
study.
We undertook a very rigorous and painstaking process to assess stability and
preparation accuracy of the solutions. Thus we performed nitrogen analysis on all
samples within 24 to 48 hours after preparation in order to assess the accuracy of
weighing of all individual amino acids. The observed results of the nitrogen analysis were
within the predetermined acceptable range and provided proof of accuracy of the
weighing process.
Nitrogen analysis however, was not considered adequate to judge the stability of
individual amino acids in solution after prolonged periods, therefore subsequent analysis
were conducted using HPLC to determine the concentration of each individual amino
acid in solution after 6 weeks and again after 3 months. The results in tables 4.1 and 4.2
typifies the results obtained from each batch of solution prepared and provided the
evidence required to judge the stability of the individual amino acids and assign a shelf
life and expiry date to each batch of solution made.
Also to judge the stability of the isotopes, HPLC testing was conducted to look
for breakdown products of (L-[1-13C]phenylalanine . There was never any breakdown
products found as judged from the lack of additional unidentified peaks in the

95
chromatograms (figure 4.1), and accurate quantification of the observed concentrations to
within ± 5% of expected.
The current report clearly shows that if amino acid powders are obtained from a
credible source providing powders that are pharmacy grade, and the powders are weighed
carefully and made into solutions using sterile water, under sterile technique, it is
possible to make safe and appropriate solutions for conducting studies in PN-fed subjects.
This information herein are novel, and provided the base from which we were able to
conduct the first ever amino acid requirement study in the PN fed human neonate using
an amino acid solution made from scratch in a research laboratory (Courtney-Martin,
Chapman et al. 2008). They also provide a basis from which all future studies on amino
acid requirements and metabolism can be conducted in PN-fed human subjects.
96
The following study presented in chapter 5 has been published in The American Journal
of Clinical Nutrition.
Glenda Courtney-Martin, Karen P Chapman, Aideen M Moore, Jae H Kim, Ronald O Ball, and Paul B Pencharz. Total sulfur amino acid requirement and metabolism in parenterally fed postsurgical human neonates. Am J Clin Nutr 2008;88:115-24

97
5. TOTAL SULPHUR AMINO ACID REQUIREMENT AND METABOLISM IN
THE PARENTERALLY-FED POST-SURGICAL HUMAN NEONATE.
5.1 Abstract
Except for tyrosine, the amino acid requirements of the parenterally (PN) fed,
human neonate have never been experimentally derived. The objectives were to
determine the total sulphur amino acid requirement (TSAA) requirement (methionine in
the absence of cysteine) of the PN-fed post-surgical human neonate using the Indicator
amino acid oxidation (IAAO) technique with L-[1-13C]phenylalanine as the indicator.
Fifteen post-surgical neonates were randomly assigned to receive one of 18 levels of
methionine intake ranging from 10 to 120 mg. kg-1.d-1; delivered in a customized,
cysteine-free amino acid solution. Breath and urine samples were collected for 13CO2 and
amino acid enrichment. Blood samples were collected at baseline and after the test
methionine infusion for measurement of plasma methionine, homocysteine,
cystathionine, and cysteine concentrations. Using breakpoint analysis the mean and 95%
CI of the TSAA requirement were determined to be 47.4 (38.7 – 56.1) and 49.0 (39.9 –
58.0) mg. kg-1.d-1, using oxidation and F13CO2 respectively. This is the first study to
report on the TSAA requirement of the PN fed post-surgical human neonate. The
estimated methionine requirement expressed as a proportion of the methionine content of
current commercial pediatric PN solutions was 90% (range 48 – 90%) of that found in the
lowest methionine-containing PN solution.

98
5.2 Introduction
Except for tyrosine, the amino acid requirements for parenteral feeding have
never been experimentally determined in humans. Instead, the amino acid profile of
current commercial amino acid solutions are patterned after reference proteins consumed
enterally (Endres, Lewandowski et al. 1982; Bertolo, Pencharz et al. 1999), or on the
amino acid concentrations of plasma or cord blood (Heird, Dell et al. 1987; Roberts, Ball
et al. 1998).
Our laboratory developed a neonatal piglet model (Wykes, Ball et al. 1993) to
study amino acid requirement which was later validated in the human neonate for the
determination of the tyrosine requirement during parenteral (PN) feeding (Roberts, Ball
et al. 2001). Results from the piglet studies have shown that the requirements for several
amino acids are lower during parenteral feeding compared with enteral feeding (Bertolo,
Chen et al. 1998; Elango, Pencharz et al. 2002; Shoveller, Brunton et al. 2003). This
suggests that the amino acid profiles of some currently available commercial amino acid
solutions are potentially too high. In addition, existing evidence suggest that the
inadequate amino acid profile of current parenteral nutrition (PN) solutions contributes to
the liver cholestasis observed in neonates on long term PN feeding (Belli, Fournier et al.
1987; Brown, Thunberg et al. 1989; Moss, Das et al. 1993).
Methionine is an indispensable sulphur amino acid which donates its sulphur
atom to form cysteine during the process of transsulfuration (Stipanuk 1986). Methionine
is also the most important methyl donor in vivo and a precursor for DNA and RNA
synthesis (Griffith 1987). However, methionine has been shown to be the most toxic of

99
all amino acids (Hardwick, Applegarth et al. 1970; Benevenga 1974); producing
cholestatic changes in the liver of animals similar to that observed in human neonates
receiving PN feeding (Moss, Haynes et al. 1999). Commercial amino acid solutions have
a high methionine content; this in an effort to provide cysteine via the transsulfuration
pathway because of the instability of cysteine in solution. This practice, although
resulting in high plasma methionine, has not served to normalize the plasma cysteine of
the PN fed neonate, which appears low based on current data (Dale, Panter-Brick et al.
1976; Malloy, Rassin et al. 1984; Miller, Jahoor et al. 1995). In addition, data from our
piglet studies show that the methionine requirement of the PN-fed neonate is 30% less
than the enteral requirement (Shoveller, Brunton et al. 2003).
The goals of this study were to determine the total sulphur amino acid
requirement (methionine in the absence of cysteine) in the PN fed human neonate using
the indicator amino acid oxidation technique (IAAO) and to measure the plasma amino
acid concentrations of several amino acids involved in sulphur amino acid metabolism in
response to feeding graded intakes of methionine. Based on results from our piglet data,
we predicted that the total sulphur amino acid requirement of the PN fed human would be
about 52 mg.kg-1.d-1.

100
5.3. Subjects and method
5.3.1 Subjects
Fifteen neonates treated during the months of July 2005 to December 2006, in the
Neonatal Intensive Care Unit, at The Hospital for Sick Children, Toronto, Canada were
enrolled in this study. The following inclusion criteria were used to determine eligibility:
born at ≥ 34 weeks gestation and ≤ 28 days chronological age at the time of the study,
birth weight and length appropriate for gestational age, medically stable as determined by
normal blood results and lack of a fever or infection, at least 3 days post operatively, and
on PN providing adequate protein and calories as determined by attending physicians and
dietitians. Exclusion criteria included: mechanical ventilation, small for gestational age
status, presence of disease or on medications known to affect protein and amino acid
metabolism, documented infection, fever, unstable medical condition, and receiving
enteral feeding providing greater than 10% of protein intake.
Neonates were studied at least 3 days post operatively for a number of reasons.
(1) Jones et al (Jones, Pierro et al. 1993) have shown that the increase in resting energy
expenditure (REE) experienced by post surgical neonates peaks at 2 to 4 hours
postoperatively and returns to baseline by 12 to 24 hours post surgery. They also showed
that substrate utilization was not altered by operation. Whereas they showed that the
increase in REE was greater in infants having a major surgery, there still was a return to
baseline by 24 hours. (2) Zlotkin et al. (Zlotkin, Bryan et al. 1981) have shown that
provision of protein and energy intakes of 2.7 to 3.5 g.kg-1 and 81 kcals.kg-1 respectively
resulted in nitrogen retention and growth rates similar to in utero values in post surgical

101
premature infants when studied 4 days post surgery. (3) We had previously reported
similar amino nitrogen flux rates in post surgical infants (1 to 4 days post surgery) (Duffy
and Pencharz 1986) on TPN as that observed in a similar group of infants on TPN who
had not undergone surgery (Duffy, Gunn et al. 1981). Based on this evidence, the
suggestion is that at 3 days post operatively, protein metabolism of the post surgical
neonate should not differ from non post surgical neonates.
Ethical approval for the study was obtained from The Research Ethics Board at
The Hospital for Sick Children. Permission was obtained from the attending physician
before approaching parents, and written informed consent was obtained from at least one
parent before enrolling subjects into the study. Study characteristics of the neonates
included in the study are presented in Table 5. 1.
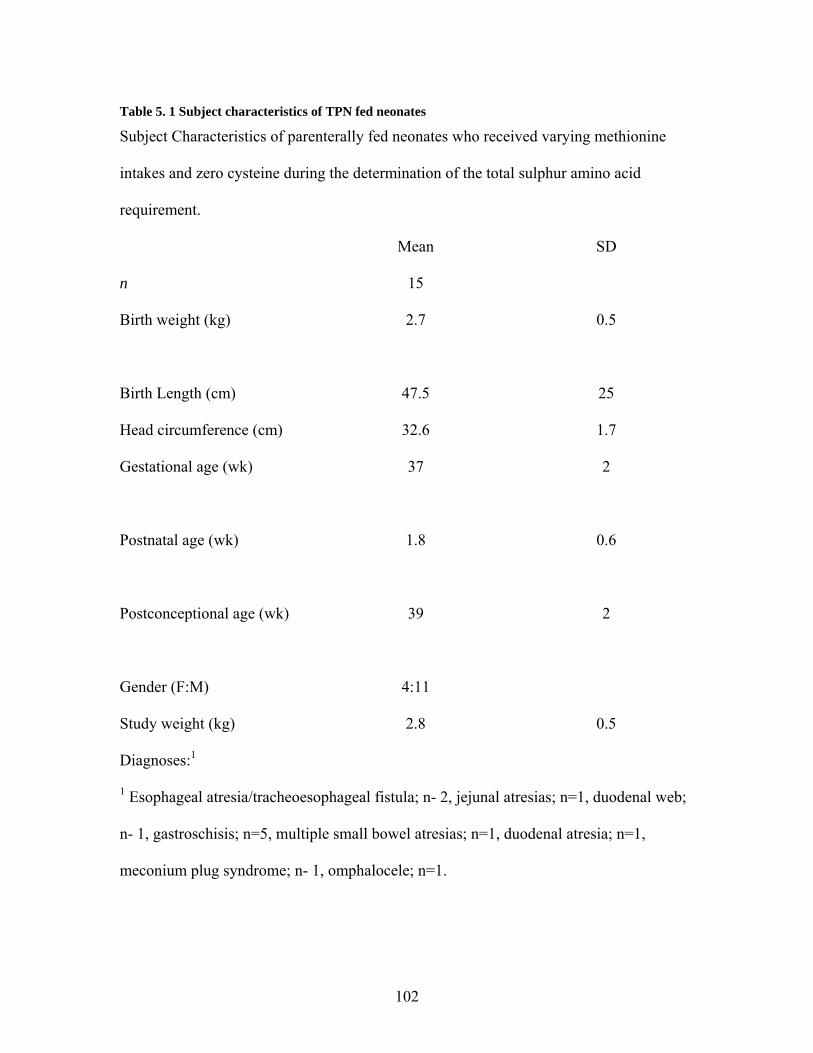
102
Table 5. 1 Subject characteristics of TPN fed neonates
Subject Characteristics of parenterally fed neonates who received varying methionine
intakes and zero cysteine during the determination of the total sulphur amino acid
requirement.
Mean SD
n 15
Birth weight (kg) 2.7
0.5
Birth Length (cm) 47.5 25
Head circumference (cm) 32.6 1.7
Gestational age (wk) 37
2
Postnatal age (wk) 1.8 0.6
Postconceptional age (wk) 39
2
Gender (F:M) 4:11
Study weight (kg) 2.8 0.5
Diagnoses:1
1 Esophageal atresia/tracheoesophageal fistula; n- 2, jejunal atresias; n=1, duodenal web;
n- 1, gastroschisis; n=5, multiple small bowel atresias; n=1, duodenal atresia; n=1,
meconium plug syndrome; n- 1, omphalocele; n=1.

103
5.3.2 Experimental Design
The indicator amino acid oxidation (IAAO) technique (Zello, Wykes et al. 1995)
was used for the determination of the total sulphur amino acid requirement TSAA
requirement. The indicator amino acid oxidation (IAAO) technique is based on the
observation that the partitioning of any indispensable amino acid between oxidation and
protein synthesis is sensitive to the level of the most limiting amino acid in the diet (Ball
and Bayley 1986). Since amino acids are not stored in the body, when an indispensable
amino acid is limiting in the diet for protein synthesis, all other amino acids are in excess
and are therefore oxidized. Therefore, increasing the level of the limiting amino acid in
graded amounts from deficient to excess will also increase the uptake of all dietary amino
acids for protein synthesis. As their uptake for protein synthesis is increased, the portion
of the indicator that is oxidized will decrease until the requirement of the test amino acid
(in this case methionine) is reached. Once the requirement of the test amino acid is
reached, further increase in its intake will have no further effect on the indicator amino
acid. The first point after which increasing the test amino acid has no further effect on the
oxidation of the indicator is the breakpoint or the mean requirement; the point at which
the test amino acid is no longer limiting for protein synthesis. The inverse relationship
between phenylalanine oxidation and protein synthesis is supported by the experiment of
Ball and Bayley (Ball and Bayley 1986) in which L-[1-14C]phenylalanine was used as an
indicator of protein requirement in young pigs. The results show that the recovery of
radioactivity in breath was inversely related to the recovery of radioactivity in liver tissue
when the dietary protein was increased from deficient to adequate, demonstrating that the

104
oxidation of the indicator was inversely related to protein synthesis. In addition, we have
demonstrated in humans that the requirement for tyrosine determined by the IAAO
method using lysine as an indicator was similar to that determined by measuring the
hydroxylation of phenylalanine to tyrosine in Apo-B100 (Rafii, McKenzie et al. 2008).
Blood samples were drawn from each subject for the determination of amino acid
concentration. Each study lasted for a total of 48 hours. During the first 24 hours, each
subject received a commercial amino acid solution (Primene, Baxter Laboratories,
Mississauga, Ontario) (Table 5.2), plus dextrose, and a 20% lipid solution (Intralipid;
Fresenius Kabi, Uppsala, Sweden) for provision of adequate protein, and non protein
energy. Standard amounts of vitamin and minerals were provided in the form of a liquid
supplement (Multi-12/K1, providing a mixture of fat and water-soluble vitamins)
formulated for use in intravenous feeding. All vitamins and minerals met current DRI
recommendations. The sulphur amino acid intake of subjects during the first 24 hours
(day 1) was 52.97 ± 9.04 and 69.42 ± 4.17 (mean ± SD) for cysteine and methionine
respectively, for a total of 122.39 ± 8.93 (mean ± SD) mg.kg-1.day-1 total sulphur amino
acid intake. The base amino acid solution as indicated above was chosen for a number of
reasons; (1) it is the amino acid used in the NICU at our hospital (The Hospital for Sick
Children, Toronto), and has been the amino acid solution in use for over 10 years. (2) It is
also used in NICUs in Europe (Van Goudoever, Sulkers et al. 1994; Saenz de Pipaon,
Quero et al. 2005). When the plasma amino acid concentration of neonates on the amino
acid solution used in this study were compared to that of breast fed infants (Wu, Edwards
et al. 1986), most of the amino acids were within the reference range with only two
indispensable amino acids; valine, and lysine being higher and tyrosine being lower (Van

105
Goudoever, Sulkers et al. 1994). This low tyrosine concentration suggest that tyrosine is
limiting in the amino acid solution used, an observation which was confirmed by our
group (Roberts, Ball et al. 1998). Subsequently we determined the tyrosine requirement
of the TPN-fed human neonate (Roberts, Ball et al. 2001) which formed the basis for the
amount of tyrosine used in the solutions made for this study. We used glycyl-tyrosine as
our tyrosine source instead of N-acetyl-tyrosine because glycyl-tyrosine has been found
to be an available source of tyrosine for the neonate (Roberts, Ball et al. 2001) unlike N-
acetyl-tyrosine (Heird, Dell et al. 1987; Heird, Hay et al. 1988). Additionally, we used
data from our piglet work to make adjustments to the arginine content of the amino acid
base solution. Our piglet data suggest that the arginine requirement is greater with IV
compared with enteral feeding (Bertolo, Brunton et al. 2003).
During the second 24 hour period, subjects were randomly assigned to receive
one of 18 levels of methionine intake ranging from 10 to 120 mg. kg-1.day-1, (with zero
cysteine). Hence a separate amino acid solution was prepared for this part of the study
(Table 5.2). In order to control the methionine intake, both methionine and cysteine were
removed from this solution. Methionine was added back on the study day in an amount
consistent with the intake level being studied on that day. Again, grams of fat, protein and
total calories delivered were determined by the attending physician and dietitians. Each
subject was intravenously fed via a central line and received a fluid intake between 140 to
160 mL. kg-1.day-1.

106
Table 5. 2 Amino acid composition of PN solution administered to neonates
Amino acid concentration of parenteral solutions administered to neonates on day 1
(adaptation day) and day 2 (study day).
Amino Acid Day 1
g/100 g
Day 2
g/100 g
Isoleucine 6.7 6.7
Leucine 9.9 9.9
Valine 7.6 7.6
Lysine (lysine-HCL) 10.9 13.62
Methionine 2.4 Variable (based on test
intake level)
Cysteine 1.9 0
Phenylalanine 4.2 3.7
Tyrosine 0.9 0
Glycyl-tyrosine 0 5.25
Threonine 3.7 3.7
Tryptophan 2.0 2.0
Histidine 3.8 3.8
Arginine 8.4 9.66
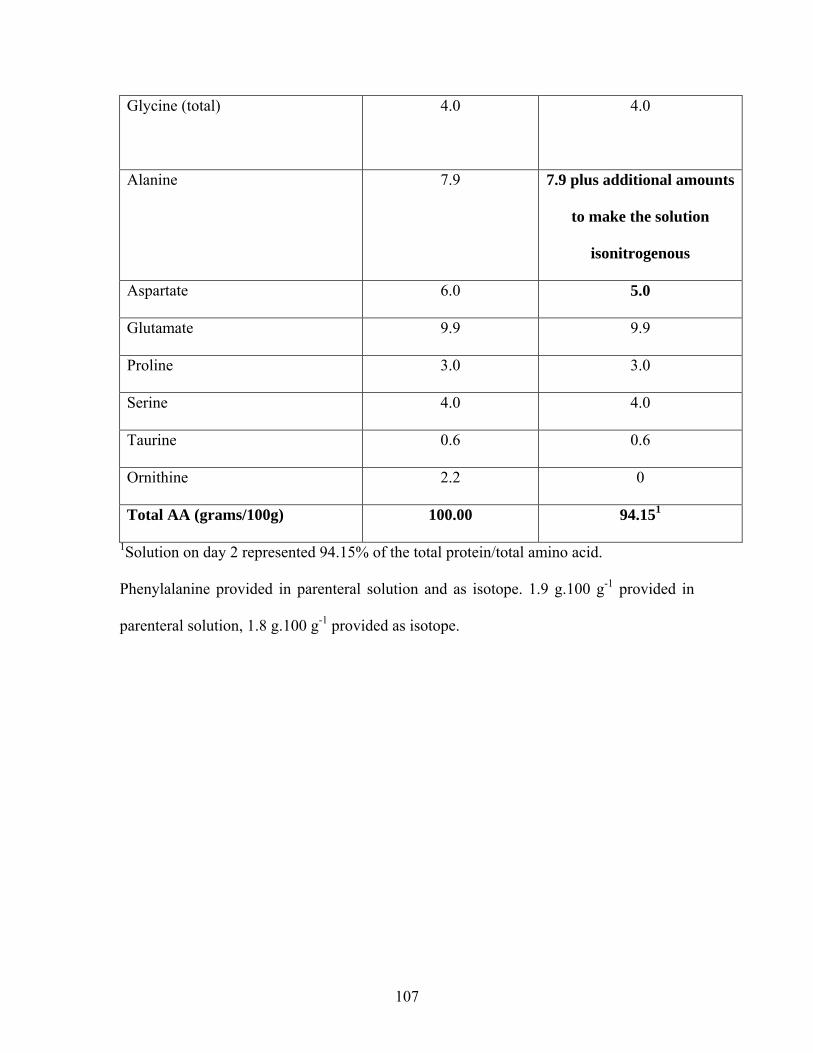
107
Glycine (total)
4.0 4.0
Alanine 7.9 7.9 plus additional amounts
to make the solution
isonitrogenous
Aspartate 6.0 5.0
Glutamate 9.9 9.9
Proline 3.0 3.0
Serine 4.0 4.0
Taurine 0.6 0.6
Ornithine 2.2 0
Total AA (grams/100g) 100.00 94.151
1Solution on day 2 represented 94.15% of the total protein/total amino acid.
Phenylalanine provided in parenteral solution and as isotope. 1.9 g.100 g-1 provided in
parenteral solution, 1.8 g.100 g-1 provided as isotope.
108
5.3.3 Study Diets
The base amino acid profile of the amino acid solutions used on day 1 (adaptation
period) and day 2 (test period) is presented in Table 5.2. The amino acid profile of the
base amino acid solution used was based on the amino acid composition of cord blood.
The amino acid solution used on day 2 (test period) was prepared using human parenteral
grade amino acids (Ajinomoto Company Inc., Japan via L.V Lomas, Brampton, Ontario )
in our research laboratory, under sterile conditions. The profile of the base amino acid,
was followed with some modifications; methionine was varied to meet the level of the
test intake for each neonate, cysteine was removed, tyrosine was provided in excess as
the dipeptide glycyl- tyrosine at a level of 4 g.100 g-1 (Roberts, Ball et al. 2001). The
excess tyrosine was provided to facilitate the channelling toward oxidation of any
tyrosine synthesized from phenylalanine (Shiman and Gray 1998) thereby making
phenylalanine a more sensitive indicator. Phenylalanine was provided at a total amount of
3.7 g.100 g-1 and the amount used for tracer infusion was subtracted from the base
solution. Arginine was increased from 8.4 to 9.66 g.100 g-1 (Bertolo, Brunton et al. 2003;
Wilkinson, Bertolo et al. 2004) and aspartate was decreased from 6.0 g.100 g-1 to 5.0
g.100 g-1 to accommodate for the increased amount of nitrogen provided by arginine.
Alanine was used to balance the nitrogen and make the solution isonitrogenous.
Methionine and alanine were prepared as separate solutions in concentrations of 20 and
50 mg.mL-1 respectively. All prepared solutions were filter sterilized in the Research
Pharmacy at The Hospital for Sick Children by being passed though a 0.22 μm filter.
Solutions were subsequently demonstrated to be sterile and free of bacterial growth over

109
7 days in culture and to be proven pyrogen-free by the limulus amebocyte lysate test
(Pearson 1979). The chemical composition of the solutions was verified by amino acid
analysis using HPLC and analysis of total nitrogen.
On each study day, vitamins and minerals were added to the solutions before
delivery to the baby. All vitamins were supplied in a commercial solution Multi-12K1
(Baxter Corporation, Mississauga Ontario), which provides a combination of fat and
water-soluble vitamins, formulated for use in pediatric parenteral solutions. Co-factors
involved in methionine metabolism; vitamin B-12, B-6 and folic acid were provided in
the Multi-12K1 solution at 1.2 to 1.5 times requirement (Medicine 2006). The mineral
solution provided calcium, phosphorus, magnesium, zinc, copper, manganese, iodine,
chromium and selenium. Nutrient intake for each individual neonate was prescribed by
the attending physician and dietitian. All subjects were receiving adequate protein and
calories (Zlotkin, Bryan et al. 1981; Zlotkin 1984). Non-protein calories were provided as
dextrose and a 20% lipid solution Table 5.3.
The study began with each neonate receiving the base TPN/lipid solution for a
total of 24 hours to ensure that all neonates started the test infusion with similar amino
acid profiles. For the 2nd 24 hour period, neonates received the test solution containing a
randomly assigned level of methionine ranging from 10 to 120 mg.kg-1day-1 with zero
cysteine. The test level of methionine was added to the test solution on the study day. All
neonates received the test TPN solution until the end of the study at which time they were
returned to the TPN they were receiving prior to the study.
Baseline blood work performed for clinical monitoring was reviewed on each
subject before the start of the study. All subjects had normal sodium, potassium, calcium,

110
phosphorous and pH. Five subjects had high chloride levels between 107-113, (normal
range 96-106). This was corrected by replacing the chloride with acetate in the TPN
solution.
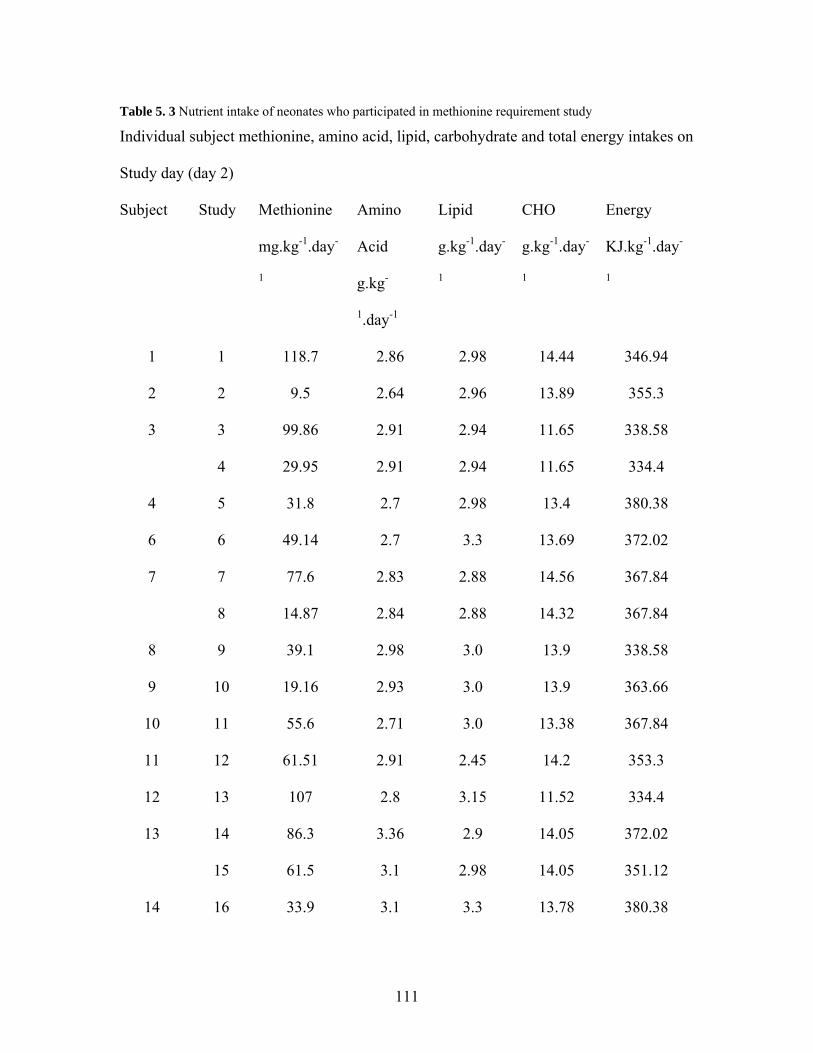
111
Table 5. 3 Nutrient intake of neonates who participated in methionine requirement study
Individual subject methionine, amino acid, lipid, carbohydrate and total energy intakes on
Study day (day 2)
Subject Study Methionine
mg.kg-1.day-
1
Amino
Acid
g.kg-
1.day-1
Lipid
g.kg-1.day-
1
CHO
g.kg-1.day-
1
Energy
KJ.kg-1.day-
1
1 1 118.7 2.86 2.98 14.44 346.94
2 2 9.5 2.64 2.96 13.89 355.3
3 3 99.86 2.91 2.94 11.65 338.58
4 29.95 2.91 2.94 11.65 334.4
4 5 31.8 2.7 2.98 13.4 380.38
6 6 49.14 2.7 3.3 13.69 372.02
7 7 77.6 2.83 2.88 14.56 367.84
8 14.87 2.84 2.88 14.32 367.84
8 9 39.1 2.98 3.0 13.9 338.58
9 10 19.16 2.93 3.0 13.9 363.66
10 11 55.6 2.71 3.0 13.38 367.84
11 12 61.51 2.91 2.45 14.2 353.3
12 13 107 2.8 3.15 11.52 334.4
13 14 86.3 3.36 2.9 14.05 372.02
15 61.5 3.1 2.98 14.05 351.12
14 16 33.9 3.1 3.3 13.78 380.38
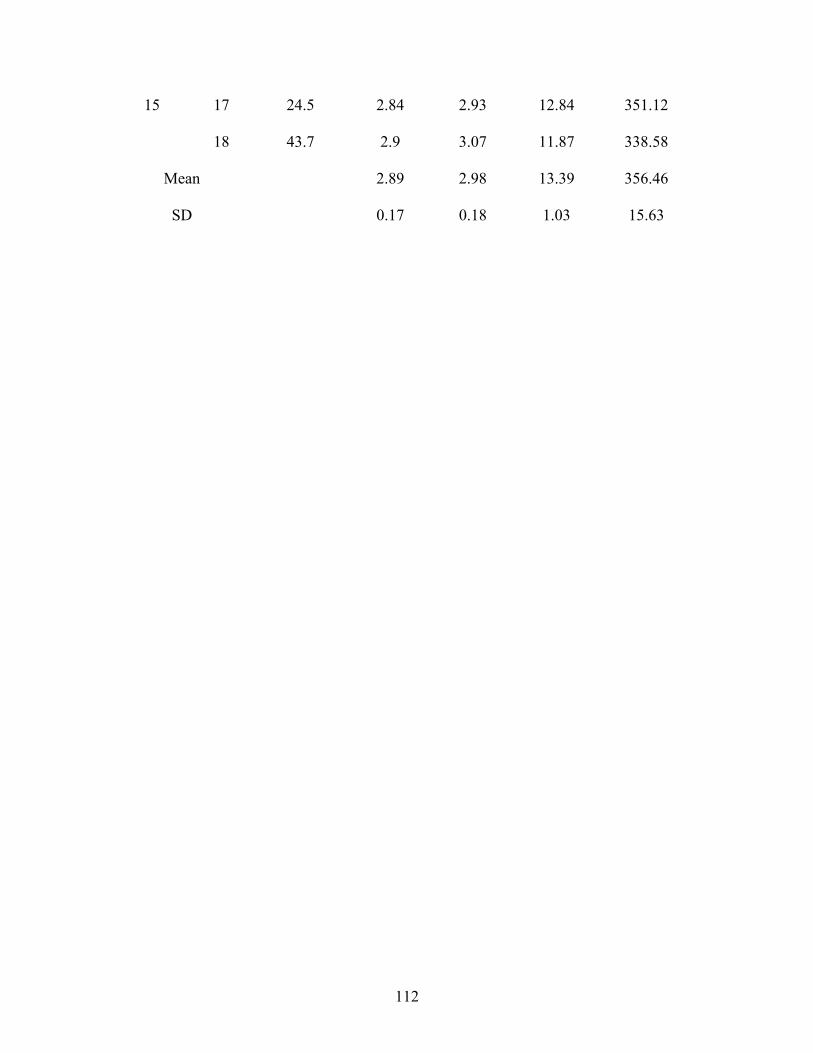
112
15 17 24.5 2.84 2.93 12.84 351.12
18 43.7 2.9 3.07 11.87 338.58
2.89 2.98 13.39 356.46 Mean
SD 0.17 0.18 1.03 15.63

113
5.3.4 Tracer Protocol
The tracer protocol was started at the beginning of the second 24 hour period, at
the time the test bag of PN was hung. Phenylalanine was used as the indicator amino acid
with L-[1-13C]phenylalanine, [99 atom percent excess (APE),Cambridge Isotope
Laboratories, Woburn, MA] as the isotope for the measurement of phenylalanine kinetics.
An intravenous priming dose of L-[1-13C]phenylalanine was given at 15.6 μmol. kg-1 over
15 minutes followed by a continuous intravenous infusion of 13 μmol. kg-1.hr-1 for the
remainder of the 23.75 hours. The amount of L-[1-13C]phenylalanine given was
subtracted from the phenylalanine provided in the PN solution to maintain a total
phenylalanine intake of 111 mg. kg-1.day-1 (3.7 g.100g-1). Tyrosine was provided at 120
mg. kg-1.day-1 (to ensure an excess of tyrosine) (House, Pencharz et al. 1997; House,
Pencharz et al. 1997). L-[1-13C]phenylalanine was analyzed by LCMS/MS using a chiral
column for the presence of D-[1-13C]phenylalanine. There was no detectable D-[1-
13C]phenylalanine in the tracer.
The infusion time of the tracer was extended to 23.75 hours for practical reasons.
Given our goal to make these studies as least invasive as possible, an extended tracer
infusion time was necessary to allow enough time for urine collection since babies do not
void on demand. We had previously found that we needed at least 3 hours to get a urine
sample. Although some babies in our study had lots of urine, it took up to 4 hours to get
the required sample in other babies.

114
The phenylalanine solutions were prepared in the Manufacturing Pharmacy at the
Hospital for Sick Children, and were sterilized and tested for bacteria and pyrogens as
described above. Solutions were kept at 4ºC until use.
5.3.5 Sample Collection and Analysis
Urine samples were collected from cotton pads placed on the inside of the diapers,
for the measurement of baseline and steady state tracer amino acid enrichment. Three
baseline urine samples were collected before the start of the intravenous isotope infusion.
Three to 5 samples were collected beginning 12 hours after the start of the isotope
infusion until the end. Urine was stored at -20ºC until analysis.
Expired CO2 was collected at baseline and at isotopic steady state from a
ventilated hood system using a portable CO2 analyzer (1400 series, Servomex, Westech
Industrial Ltd., Mississauga, Ontario) and mass flowmeter (5860 series, Brooks, Trillium
Measurement and Control, Stouffville, Ontario). Briefly, a clear plastic hood was placed
over the baby’s head through which the baby had access to room air. The CO2
concentration in the hood was monitored and expired CO2 was sampled when the
concentration was between 0.2 to 0.5%. In order to minimize the variability in the ratio of
12CO2: 13CO2 we kept the CO2 concentration within the hood between 0.35 to 0.45%
during the measurements. Three baseline samples were collected before the start of the
intravenous isotope infusion and five samples were collected at 2-hour intervals, starting
from 12 hours after the start of the isotope infusion. Each sample was collected over a
period of 10 minutes by bubbling the sampled CO2 into 10 mL of NaOH through a reflux
115
condenser to form NaHCO3. The NaHCO3 was then injected into Vacuutainers (Beckton
Dickson and Company, Franklyn Lakes, NJ) and stored at -20ºC until analysis. Carbon
dioxide production rate (VC02) was measured between 18 to 23 hours after the start of
the intravenous isotope infusion.
Two 0.5 ml samples of blood were collected; one at the end of the first 24 hour
period before the start of the test PN solution and the other, at the end of the 2nd day when
subjects had received the test methionine intake. Blood was analyses for plasma amino
acids, homocysteine, and cystathionine concentration.
The enrichment of L-[1-13C]phenylalanine in urine was analyzed using a triple
quadrupole mass analyzer (API 4000; Applied Biosystems/MDS SCIEX, Concord,
Canada) coupled to an Agilent 1100 HPLC system (Agilent, Mississauga, Canada), as
previously described (Turner 2006). We used a Chirobiotic T, Chiral Column purchased
from Sigma-Aldrich in order to separate the D-[1-13C]phenylalanine from L-[1-
13C]phenylalanine . Isotopic enrichment was expressed as mole percent excess and was
calculated from peak area ratios at isotopic steady state at baseline and plateau. The use
of urine as a surrogate of plasma enrichment has been used by our group in an effort to
make our studies less invasive for vulnerable groups like women, children and neonates.
The urine enrichments have been found to be highly correlated with the plasma
enrichments (Bross, Ball et al. 1998) and gives similar results except in cases where the
presence of the D-isomer in the isotope infused is in excess of 0.2% or within any
detectable range (Darling, Bross et al. 1999).
For the analysis of 13C enrichment in breath, samples were prepared by liberating
the CO2 from the NaHCO3 by mixing 200μL of sample (NaHCO3 ) with 200μL of H3PO4

116
into an evacuated tube. Enrichment of 13C in breath was analyzed by continuous-flow
isotope ratio mass spectrometer (20/20 isotope analyzer; PDZ Europa Ltd, Cheshire,
United Kingdom). Enrichments were expressed as APE compared with a reference
standard of compressed CO2 gas.
Plasma was separated from whole blood within 10 minutes of the blood being
drawn from each subject. Plasma amino acid concentration was analysed by reverse
phase HPLC using the PICO.TAG (Waters, Milford, MA), pre-column derivitization
method with phenylisothiocyanate as the derivative. The amino acid concentrations were
determined by using an external standard. Plasma total homocysteine, total cysteine and
cystathionine concentrations were determined by LCMS/MS, using a bench top triple
quadrupole mass spectrometer API 4000 (Applied Biosystems/MDS SCIEX) operated in
positive ionization mode with the TurboIonSpray ionization probe source (operated at
5.8KV). This was coupled to an Agilent 1100 HPLC system (Rafii, Elango et al. 2007) .
5.3.6 Tracer Kinetics
The model of amino acid kinetics used in this study is based on the model of
Matthews et al. (Matthews, Motil et al. 1980). Isotopic steady state in the L-[1-
13C]phenylalanine enrichment in the urine and 13CO2 in breath, was represented by
unchanging values in each of the data points at baseline and plateau. Phenylalanine flux
(in μmol.kg-1.hour-1) was calculated from the dilution of the intravenously administered
L-[1-13C]phenylalanine into the metabolic pool at isotopic steady state using urinary
enrichment of L-[1-13C]phenylalanine as a representation of plasma enrichment (Bross,

117
Ball et al. 1998). The rate of phenylalanine oxidation, represented by the rate of
appearance of 13CO2 in breath (F13CO2), in (μmol.kg-1.hour-1) was calculated according to
the model of Matthews et al. (Matthews, Motil et al. 1980). A correction factor of 0.82
was used to account for the retention of 13CO2 in the body’s bicarbonate pool in the fed
state (Van Aerde, Sauer et al. 1985). This individual correction factor was used instead of
the algorithm because we calculated the F13CO2 using the algorithm as well as using the
set correction factor of 0.82 and found the results to be the same. Since the range in
energy intakes was narrow, we judged it simpler if we presented our data using a constant
correction factor.
Phenylalanine oxidation (in μmol.kg-1.hour-1 ) was calculated from the F13CO2
data and the urinary L-[1-13C]phenylalanine enrichment (Matthews, Motil et al. 1980).
5.3.7 Statistical analysis
The first and second level of methionine intake studied were the highest and
lowest intake levels as a means of bracketing the predicted breakpoint to determine if the
correct range of intakes were chosen. Subsequent levels of methionine intake were
completely randomized with methionine serving as the main treatment effect.
The effect of methionine intake on phenylalanine flux, oxidation and F13CO2 was
tested using ANOVA with the PROC GLM procedure (SAS version 9.1; SAS Institute
Inc, Cary, NC).
Determination of the methionine mean requirement (breakpoint) was performed
using a two-phase linear regression crossover model (Seber 1977) as previously

118
described (Zello, Pencharz et al. 1990). Regression analysis variables were dietary
methionine intake as the independent variable, and F13CO2 and phenylalanine oxidation
as the dependent variables. Selection of the best model was determined by factors relating
to fit (significance of the model and r2) and estimate of variation about the model
(coefficient of variation and SE of the estimate). The safe population intake was
estimated by determining the upper 95% confidence limits of the breakpoint estimate
(Seber 1977).
The effect of methionine intake on plasma amino acid concentration was tested
using ANOVA. Because the baseline plasma amino acid concentration were variable and
the babies did not each receive the same protein intake as was planned, we chose to use
the difference in amino acid concentration between baseline and after subjects received
the test methionine intake as the main dependent variable. Independent variables tested
were age, subject and methionine intake.
All statistical analyses were performed by SAS version 9.1 for Windows (SAS
Institute Inc, Cary, NC). Statistical significance was established at p ≤ 0.05.
5.4 Results
5.4.1 Clinical Characteristics and nutrient intake
Clinical characteristics and diagnoses for the 15 subjects studied are presented in
Table 5.1. Four of the fifteen infants were above birth weight, 10 infants had just
regained birth weight, and 1 infant who was one week old had not yet regained birth

119
weight. Three subjects received 2 intake levels of methionine for a total of 18 indicator
oxidation studies in 15 subjects. Since parenteral nutrition was prescribed by the
attending physician and dietitian, the exact nutrient intakes were dependent on the total
volume of parenteral nutrition infused. The average energy and protein intakes were
356.46 ± 15.63 kJ.kg-1.day-1 (85 ± 3.74 kcal.kg-1.day-1) and 2.89 ± 0.17 g.kg-1.day-1,
respectively (Table 5.3). Average grams of lipids and carbohydrate provided were 2.98 ±
0.18 and 13.39 ± 1.03 (mean ± SD) respectively (Table 5.3).
5.4.2 Urinary amino acid and expired CO2 enrichment
Isotopic steady state (plateau) was achieved for all neonates by 12 hours after the
start of the isotope infusion and was defined by the absence of a significant slope
between the data points at plateau. The variation in urinary L-[1-13C]phenylalanine at
plateau was <10% whereas the variation in expired 13CO2 enrichment within the plateau
was <1%.
5.4.3 Phenylalanine Kinetics
The phenylalanine flux of these TPN fed human neonates was 108.7 ± 9.8
μmol.kg-1.hour-1 (mean ± SD). Using ANOVA, there was no significant relationship
between methionine intake and phenylalanine flux (p = 0.34). This lack of change in flux
in response to changes in methionine intake indicates that differences observed in
phenylalanine oxidation and F13CO2 in response to methionine intake were related to a

120
partitioning of amino acids between oxidation and protein synthesis. One of the strengths
and key criterion of the indicator amino acid oxidation (IAAO) method is that the flux of
the indicator amino acid (phenylalanine in this study) does not change in response to
feeding graded intakes of the test amino acid, in this case methionine. The flux of the
indicator amino acid remains constant because the total intake remains constant at all
levels of intake of the test amino acid. We kept phenylalanine intake exactly the same at
all levels of methionine intake by deducting the amount of the tracer from the total
dietary intake and making up the difference in the TPN solution. Because the intake of
the indicator amino acid remains constant at all levels of intake of the test amino acid the
pool size does not change. This is an advantage over the direct amino acid oxidation
(DAAO) method in which the free amino acid pool size of the test amino acid changes
with each increment of the test amino acid resulting in variable dilution of the tracer
within the pool, thus increasing the variation and decreasing the sensitivity of the
estimate.
Methionine intake had a significant effect on both phenylalanine oxidation and
F13CO2 (p <0. 001). As methionine intake increased from 9.5 to 47.4 mg.kg-1.day-1,
phenylalanine oxidation decreased (p < 0. 001); further increases in methionine intake did
not affect phenylalanine oxidation Figure 5.1. Similarly, there was a decrease in the
F13CO2 in response to methionine intake to the level of 49.0 mg.kg-1.day-1 of methionine,
after which further increase in methionine intake produced no change in the F13CO2
Figure 5. 2. The decline in phenylalanine oxidation and F13CO2 until the breakpoint,
were similar for both endpoints used and reflects the sensitivity of the urine measurement
when compared to the more direct F13CO2 estimate. The lack of change in phenylalanine

121
oxidation after the breakpoint indicates that, under the conditions of the study, the test
amino acid (methionine) was no longer limiting for protein synthesis. It is possible that
other amino acids were then limiting for protein synthesis. However, as detailed in the
method section, the amino acid concentrations of the TPN solutions used in the current
study met or exceeded the concentrations derived from our piglet studies (Bertolo, Chen
et al. 1998; Elango, Pencharz et al. 2002; Bertolo, Brunton et al. 2003; Wilkinson,
Bertolo et al. 2004) and our prior human neonatal studies (Roberts, Ball et al. 1998;
Roberts, Ball et al. 2001).
To determine the methionine requirements, the data were partitioned between two
distinct regression lines (Figures 5.1 and 5.2) using the two-phase linear regression cross-
over model. A breakpoint was identified in phenylalanine oxidation at 47.4 mg.kg-1.day-1
(p < 0. 001, r2 = 0.81; Figure 5.1) and F13CO2 at 49.0 mg.kg-1.day-1 (p < 0. 001, r2 = 0.82;
Figure 5.2). The 95% confidence limits of phenylalanine oxidation and F13CO2 were
determined to be 38.7 to 56.1 and 39.9 to 58.0 mg.kg-1.day-1 respectively (Figures 5.1
and 5.2).

122
0 25 50 75 100 1250
5
10
15
20
25
Methionine intake (mg.kg-1.day-1)Phen
ylal
anin
e ox
idat
ion
( μm
ol.k
g-1.h
our-1
)
Figure 5.1 Parenteral methionine requirement. The effect of methionine intake on phenylalanine oxidation in the TPN fed human neonate
Parenteral methionine requirement. The effect of increasing methionine intake on
phenylalanine oxidation in the TPN-fed human neonate (n = 18). By ANOVA,
methionine intake had a significant effect on phenylalanine oxidation (p < 0.001, r2 =
0.81). Using a two-phase linear regression crossover model the breakpoint (mean
methionine requirement) was estimated to be 47.4 mg.kg-1.day-1. The safe population
intake estimated by determining the upper 95% confidence limits of the breakpoint
estimate was 56.1 mg.kg-1.day-1 with a lower confidence interval of 38.7 mg.kg-1.day-1.
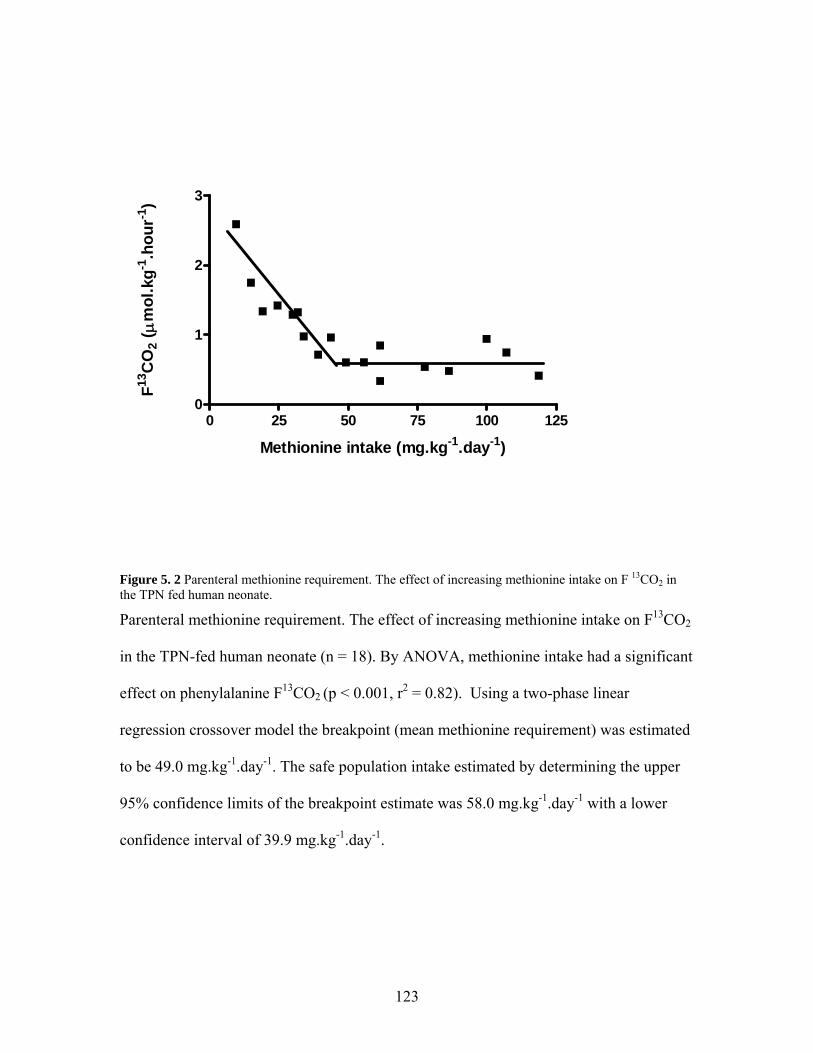
123
0 25 50 75 100 1250
1
2
3
Methionine intake (mg.kg-1.day-1)
F13C
O2
( μm
ol.k
g-1.h
our-1
)
Figure 5. 2 Parenteral methionine requirement. The effect of increasing methionine intake on F 13CO2 in the TPN fed human neonate.
Parenteral methionine requirement. The effect of increasing methionine intake on F13CO2
in the TPN-fed human neonate (n = 18). By ANOVA, methionine intake had a significant
effect on phenylalanine F13CO2 (p < 0.001, r2 = 0.82). Using a two-phase linear
regression crossover model the breakpoint (mean methionine requirement) was estimated
to be 49.0 mg.kg-1.day-1. The safe population intake estimated by determining the upper
95% confidence limits of the breakpoint estimate was 58.0 mg.kg-1.day-1 with a lower
confidence interval of 39.9 mg.kg-1.day-1.

124
5.4.4 Plasma amino acid concentration
Using ANOVA, with the difference between plasma methionine concentrations at
baseline, and in response to graded intakes of methionine as the dependant variable,
methionine intake had a significant effect on plasma methionine concentration (p =
0.0439). The difference in plasma methionine showed a linear response to methionine
intake; at lower intakes of methionine, plasma methionine decreased but with graded
intakes of methionine, plasma methionine concentration showed a linear increase (r2 =
0.277) Figure 5.3.
The difference between plasma homocysteine concentration at baseline and in
response to graded intakes of methionine was significantly affected by methionine intake
(p < 0.0001). Plasma homocysteine concentration increased linearly in response to graded
intakes of methionine, with 68% of the difference in homocysteine concentration being
account for by changes in methionine intake (r2 = 0.677) Figure 5.4.
There was a significant effect of methionine intake on the difference in plasma
cystathionine concentration between baseline and in response to graded intakes of
methionine (p = 0.0003). The difference in plasma cystathionine concentration also
showed a linear response to graded intakes of methionine with 59% of the difference in
plasma cystathionine concentration being explained by changes in methionine intake (r2 =
0.586) Figure 5.5.
Plasma cysteine concentration significantly decreased from baseline in response
to providing the total sulphur amino acid intake as methionine only (p < 0.0001). The
decrease in plasma cysteine concentration ranged from -51.5 μmol/L at the lowest
methionine intake to -141.0 μmol/L at the highest methionine intake, with a mean

125
decrease of -65.5 μmol/L. However, there was no effect of graded intakes of methionine
on plasma cysteine concentration.

126
14.87 24.5 31.8 39.1 49.14 61.5 77.6 99.86 118.7
-30
-20
-10
0
10
20
Methionine intake (mg.kg-1.day-1)
Diff
eren
ce in
pla
sma
met
hion
ine
conc
entr
atio
n ( μ
mol
/L)
Figure 5. 3 Plasma methionine concentration in response to graded intakes of methionine
Difference between plasma methionine concentration at baseline and in response to
graded intakes of methionine (n=15 due to technical problems in 3 studies with the
methionine measurement). Using ANOVA with the Proc GLM procedure methionine
intake had a significant effect on the difference in plasma methionine concentration (p =
0.0439), with 28 % of the difference in methionine concentration being explained by
methionine intake (r2 = 0.277). The regression equation for the calculation of the
difference from baseline in plasma methionine concentration in response to increasing
methionine intake is given by y = -18.39 + 0.206x. The 95% confidence intervals of the
estimate were -13.43 to -0.65.

127
14.87 24.5 31.8 39.1 49.14 61.5 77.6 99.86 118.7
-3-2-10123456
Diff
eren
ce in
pla
sma
hom
ocys
tein
e co
ncen
tratio
n ( μ
mol
/L)
Methionine intake (mg.kg-1.day-1)
Figure 5. 4 Plasma homocysteine concentration in response to graded intakes of methionine
Difference between plasma homocysteine concentration at baseline and in response to
graded intakes of methionine (n=18). Using ANOVA with the Proc GLM procedure
methionine intake had a significant effect on the difference in plasma homocysteine
concentration (p < 0.0001). There was a linear increase in the difference in plasma
homocysteine concentration in response to graded intakes of methionine with 68% of the
difference in plasma homocysteine concentration being explained by the changes in
methionine intake (r2 = 0.677). The regression equation for the calculation of the
difference from baseline in plasma homocysteine concentration in response to methionine

128
intake is given by y = -1.104 + 0.055x. The 95% confidence interval of the estimate was
0.76 to 2.94.

129
14.87 24.5 31.8 39.1 49.14 61.5 77.6 99.86 118.7
-1
0
1
2
Methionine intake (mg.kg-1.day-1)
Diff
eren
ce in
pla
sma
cyst
athi
onin
e co
ncen
trat
ion
( μm
ol/L
)
Figure 5. 5 Plasma cystathionine concentration in response to graded intakes of methionine
Difference between plasma cystathionine concentration at baseline and in response to
graded intakes of methionine (n=18). Using ANOVA with the Proc GLM procedure
methionine intake had a significant effect on the difference in plasma cystathionine
concentration (p < 0.0003), with 59% of the change in plasma cystathionine
concentration being explained by changes in methionine intake (r2 = 0.586). The
regression equation for the calculation of the difference from baseline in plasma
cystathionine concentration in response to methionine intake is given by y = -0.69 +
0.01x. The 95% confidence interval of the estimate was - 0.36 to 0.07.

130
5.5 Discussion
This is the first report in which complete parenteral amino acid (AA) solutions
were prepared in a research laboratory for use in human infants to determine amino acid
needs. Our test AA solution was based on one particular pediatric solution whose AA
balance differs in part from others on the market (Brunton, Ball et al. 2000), hence our
results must be viewed in light of the test conditions used. Our experience in making such
solutions for parenterally fed neonatal piglets (Bertolo, Chen et al. 1998; Elango,
Pencharz et al. 2002; Shoveller, Brunton et al. 2003) provided the knowledge required to
embark on these complex human studies. We chose to study total sulphur amino acid
needs as methionine, because methionine is considered the most toxic of parenteral
amino acids (13). Earlier we showed in piglets that parenteral methionine requirements
were 69% of those in enterally fed piglets (Shoveller, Brunton et al. 2003). The total
sulphur amino acid requirement estimated from our piglet study was 0.26 g.kg-1.day-1
(Shoveller, Brunton et al. 2003). Piglets were fed at a protein intake of 15 g.kg-1.day-1.
Because piglets grow at approximately 5 times the rate of human neonates we estimated
that at a protein intake of 3 g.kg-1day-1, the total sulphur amino acid requirement of the
PN fed human neonate would be approximately 52 mg.kg-1.day-1.
The mean and 95% confidence estimates (RDA) of the total sulphur amino acid
requirement were determined in the current experiment to be 49 and 58 mg.kg-1.day-1
respectively. Given the inherent errors of converting piglet estimates to human infants,
mean predicted requirement estimates of 52 mg.kg-1.day-1 (piglet) and 49 mg.kg-1.day-1
(infant) must be considered as remarkably similar. Because the values obtained for the
infant are so close to the values we predicted from the piglet studies we believe that this

131
further validates the use of the piglet TPN model to determine the pattern of amino acids
needed to optimize protein synthesis and hence growth in the human neonate (Roberts,
Ball et al. 1998; Brunton, Ball et al. 2000; Roberts, Ball et al. 2001).
The lack of change in phenylalanine flux with varying methionine intakes in the
current study provides evidence that the differences in oxidation and F13CO2 reflects a
shift in the partitioning of amino acids between oxidation and protein synthesis. This
indicates that at a mean methionine intake of 49 mg.kg-1.day-1, methionine was no longer
limiting for protein synthesis. Indeed, in previous studies in which cysteine was
supplemented to cysteine free TPN, cysteine supplementation did not enhance nitrogen
retention in infants (Zlotkin, Bryan et al. 1981; Malloy, Rassin et al. 1984). In addition, in
our piglet studies in which methionine requirements were determined with and without
cysteine (Shoveller, Brunton et al. 2003; Shoveller, Brunton et al. 2003), a comparison of
phenylalanine oxidation between the two studies showed no difference in oxidation,
demonstrating that there was no difference in whole body protein synthesis with or
without dietary cysteine. These data along with those of others (Shew, Keshen et al.
2005; Riedijk, van Beek et al. 2007) clearly show that cysteine is not a dietary
indispensable amino acid in either the human neonate or the piglet.
The mean plasma methionine concentration of 34.8 ± 12.5 μmol/L observed when
babies were adapted to the baseline TPN solution was very similar to that previously
reported in breast and TPN fed babies (Zlotkin, Bryan et al. 1981; Wu, Edwards et al.
1986; Heird, Dell et al. 1987). Plasma methionine showed an overall significant decrease
in response to graded intakes of methionine, which was mainly due to the decrease
observed below the methionine requirement. Once requirement was reached, the

132
difference in plasma methionine was closer to zero (figure 5.3). This pattern of response
was similar to that observed by Tontisirin et al (Tontisirin, Young et al. 1973), when
plasma tryptophan was used to determine tryptophan requirement in the elderly.
The increase in plasma homocysteine in response to graded intakes of methionine
(figure 5.4) was similar to that observed in our piglet study (Shoveller, House et al.
2004).These and our piglet data (Shoveller, House et al. 2004), clearly show that
methionine intake in TPN feeding has a significant positive effect on plasma
homocysteine concentration. Plasma homocysteine is of concern because mean
homocysteine concentration of >8.5 μmol.L-1 has been linked to ischemic and
hemorrhagic stroke in infants and children (van Beynum, Smeitink et al. 1999;
Hogeveen, Blom et al. 2002). Although the mean plasma homocysteine concentration did
not reach such high levels in the current study, it is possible that PN solutions with higher
methionine content could result in more undesirable homocysteine concentrations. The
provision of the total sulphur amino acids as a balance of methionine and cysteine is
recommended because the provision of a portion of the total sulphur amino acids as
cysteine was found to decrease transmethylation of methionine to homocysteine and
increase remethylation of homocysteine to methionine (Di Buono, Wykes et al. 2003).
More importantly, provision of cysteine reduces the total amount of methionine required
in the diet (Di Buono, Wykes et al. 2001) .
Plasma cystathionine also responded linearly to graded intakes of methionine;
however the difference in cystathionine concentration from baseline was only positive at
the higher intakes of methionine. At methionine intakes below 61.5 mg.kg-1.day-1, the
difference in plasma cystathione was negative (figure 5.5). This was surprising because

133
it is generally accepted that the enzyme cystathionase is underdeveloped in the human
neonate (Gaull, Sturman et al. 1972; Zlotkin and Anderson 1982) and elevations in
plasma cystathionine has been reported in the preterm (<32 weeks gestation) neonate
(Vina, Vento et al. 1995). The plasma cystathionine concentration observed in the current
study however is consistent with that observed in a cohort of over 4000 neonates, which
ranged from 0.2 to 1.53 μmol/L (Refsum, Grindflek et al. 2004).
Plasma cysteine concentration showed a significant decrease from baseline in
response to feeding the test TPN solution devoid of cysteine. The decrease in plasma
cysteine especially at the higher methionine intakes is likely due in part to the mode of
feeding since it has been found that the gastrointestinal tract is a significant site of
transsulfuration (Riedijk, Stoll et al. 2007), and that extrahepatic tissues have limited
capacity for transsulfuration (Stegink and Den Besten 1972). However, the observed
concentrations were higher than that of the term breastfed infant in whom concentrations
of 153 μmol/L were reported (Wu, Edwards et al. 1986). Zlotkin et al (Zlotkin, Bryan et
al. 1981) reported plasma methionine and cysteine concentrations of 105.0 and 59.6
μmol/L in neonates receiving cysteine free PN providing 127mg.kg-1 of methionine. The
lower cysteine concentrations observed by Zlotkin et al (Zlotkin, Bryan et al. 1981) could
be related to the use of amino acid automated amino acid analysis method which has been
shown to underestimate cysteine concentrations in plasma and urine (Malloy, Rassin et
al. 1983) .
Although cysteine was not provided in this study, our flux oxidation and F13CO2
data provide evidence that at a mean intake of 49 mg.kg-1.day-1 of methionine, protein
synthesis was no longer limiting in the subjects and hence cysteine availability was most

134
likely adequate. This is supported by evidence that neonates fed cysteine free TPN are
able to maintain adequate growth and nitrogen balance (Zlotkin, Bryan et al. 1981;
Malloy, Rassin et al. 1984).
We conclude that the TSAA (as methionine only) requirement of the PN fed post-
surgical human neonate is lower that than present in current commercially available PN
solutions. We observed that plasma methionine and homocysteine concentrations
increase in response to feeding high intakes of methionine. Since methionine produces
cholestatic changes in the liver of animals, and high homocysteine concentration is
implicated in stroke in infants and children, we believe that the current commercial PN
solutions need to be reconsidered and revised to include a lower SAA content.

135
The following study presented in chapter 6 has been published by The Journal of
Nutrition.
Glenda Courtney-Martin, Mahorukh Rafii, Linda J. Wykes, Ronald O. Ball and Paul B.
Pencharz. Methionine-adequate, cysteine-free diet does not limit erythrocyte
glutathione synthesis in young healthy adult males. J. Nutr. 138:2172-2178, 2008
136
6 METHIONINE-ADEQUATE CYSTEINE-FREE DIET DOES NOT LIMIT
ERYTHROCYTE GLUTATHIONE SYNTHESIS IN YOUNG HEALTHY ADULT
MALES
6.1 Abstract
Most methods of determining amino acid requirements are based on endpoints
that determine adequacy for protein synthesis. However, the sulfur amino acid (SAA)
cysteine is believed to be the rate-limiting substrate for synthesis of the most abundant
intracellular antioxidant; glutathione (GSH). Our objectives were: to determine if
supplementation of cysteine to a diet containing adequate SAA for protein synthesis, as
methionine, increased GSH synthesis, by measuring the fractional and absolute synthesis
rates, and if concentration of glutathione changed in response to feeding 5 graded intakes
of cysteine (0, 10, 20, 30 and 40 mg.kg-1.day-1), in a random order with a fixed
methionine intake of 14 mg.kg-1.day-1, and a protein intake of 1 g.kg-1.day-1. Each subject
received a multivitamin and choline supplement during the study. Four healthy adult
males each underwent five isotope infusion studies of 7 hour duration after a 2-day
adaptation to the level of cysteine intake being studied on the isotope infusion day. The
isotope used was [U-13C2 –15N]glycine. Analyses included erythrocyte glutathione
synthesis rates and concentration and urinary sulfate excretion. The glutathione synthesis
rates and concentration, measured at a methionine intake of 14 mg.kg-1.day-1, did not
change with increasing intakes of cysteine. Urinary sulfate excretion showed a significant
positive relationship with cysteine intake. In conclusion, this study provides preliminary

137
evidence that consumption of SAA adequate to meet the requirement for protein
synthesis does not limit GSH synthesis in healthy adult males receiving an otherwise
adequate diet.
6.2 Introduction
Methods for determining amino acid (AA) requirements, including nitrogen
balance and carbon oxidation methods, use endpoints that reflect uptake of the amino
acid for protein synthesis. In addition to their roles for protein synthesis, the sulfur amino
acids (SAA); methionine and cysteine are required for DNA and RNA methylation
(Stipanuk 1986; Griffith 1987), creatine, epinephrine and carnitine synthesis
(methionine), and for maintenance of the body’s redox status, which is mediated by the
body’s most abundant antioxidant and free radical scavenger; glutathione (GSH) (Meister
and Anderson 1983) (cysteine).
Glutathione status has been shown to be very sensitive to changes in cysteine
intake (Stipanuk, Coloso et al. 1992; Kwon and Stipanuk 2001) and cysteine is
considered the rate-limiting substrate for GSH synthesis (Lyons, Rauh-Pfeiffer et al.
2000; Badaloo, Reid et al. 2002; Jackson, Gibson et al. 2004). Cysteine deficiency, as
measured by changes in GSH synthesis and concentration, has been observed in healthy
adults consuming a SAA free diet (Lyons, Rauh-Pfeiffer et al. 2000), as well as healthy
adults consuming a calorie-adequate, low-protein diet.
In addition, cysteine deficiency has been observed in stress and disease states
including children with edematous malnutrition (Reid, Badaloo et al. 2000), adults with

138
HIV (Jahoor, Jackson et al. 1999), and Sickle Cell Disease (Reid, Badaloo et al. 2006).
The cysteine deficiency, as reflected by decreased GSH synthesis and concentrations in
those studies, was mainly attributed to an increase in cysteine requirement due to an
increased utilization of cysteine for GSH synthesis. The short term supplementation of N-
acetyl-cysteine to subjects in those studies (Jahoor, Jackson et al. 1999; Badaloo, Reid et
al. 2002) led to significant improvement in GSH synthesis and concentration.
There is some evidence from animal and human data that GSH synthesis is not
adequate at SAA intakes adequate for protein synthesis and maintenance of nitrogen
balance (Stipanuk, Coloso et al. 1992; Hunter and Grimble 1994; Badaloo, Reid et al.
2002; Jackson, Gibson et al. 2004). These data have been interpreted to mean that protein
synthesis has a higher priority for cysteine than does GSH synthesis (Stipanuk, Dominy
et al. 2006). The findings by Kurpad et al (Kurpad, Regan et al. 2004), that
undernourished Indian men have the same requirement for total SAA (as provided by
methionine alone without cysteine) as their well nourished Indian counterparts and well
nourished North American men, therefore begs the question as to whether the SAA
requirements as determined using currently available methods, which reflect the needs for
protein synthesis, underestimates the SAA intake necessary to maintain a normal GSH
status.
The goal of the present study was to determine if GSH synthesis would increase
following supplementation of the level of TSAA intake that supported maximum protein
synthesis. This was determined by measuring erythrocyte GSH fractional and absolute
synthesis rates as well as erythrocyte GSH concentration in healthy adult males fed an

139
diet providing 1g.kg-1 protein in the presence of the mean population requirement for
TSAA (as methionine only) of 14 mg.kg-1.day-1 and a varying additional cysteine intake.
6.3 Subjects and Method
6.3.1 Subjects
Ethical approval for the study was obtained from The Research Ethics Board at
The Hospital for Sick Children. Written informed consent was obtained from each
subject after the protocol was explained to them fully. Four young healthy adult males
participated in this study. To participate in the study, each subject had to be in good
health as determined by medical history and blood test which included normal cell count
and no evidence of anemia as determined by white and red cell count, hemoglobin,
hematocrit, mean cell volume and mean cell hemoglobin concentration within the normal
range for age. Exclusion criteria were: presence of diseases known to affect GSH
concentration (e.g. HIV and diabetes), anemia, medications known to affect protein and
amino acid metabolism ( e.g. steroids), significant weight loss during the past month,
consumption of weight reducing diets, inability to tolerate the experimental diet,
unwillingness to have blood drawn from a venous access during the study, significant
caffeine consumption (equivalent to more than 2 cups of coffee per day), or significant
alcohol consumption (more than one drink per day, e.g.1 beer, ½ glass of wine).

140
Before the commencement of the study, height, weight and body composition
were measured for each individual. The subject’s characteristics are presented in Table
6.1.

141
Table 6. 1 Subject characteristics of adult men
Physical characteristics of the 4 adult male subjects who participated in the study
Mean SD
Age (y) 20.3 1.5
Weight (kg) 67.8 5.6
Height (m) 1.73 0.1
BMI (kg.m2) 22.7 1.6
Lean Body mass (kg) 51.2 5.5

142
6.3.2 Study design and dietary intervention
The 4 subjects each underwent 5 stable isotope infusion studies of 7-hour
duration, in a repeated measures design, to measure glutathione synthesis in response to 5
different intakes of dietary cysteine, assigned in random order. The decision to use 4
subjects and 5 levels of cysteine intake per subject was carefully made. A repeated
measures design, in which each subject acts as their own control, is a powerful design to
reduce the impact of subject variability, and this approach is also more sensitive to
treatment differences than the alternative designs. In addition, we had predicted, based
upon observations reported in the literature, that a curvilinear response was probable.
The choice of 5 cysteine intakes was made to ensure that we could adequately detect and
prove a curvilinear response, if it occurred. Alternatively, with 5 increasing intakes of
cysteine per subject, if there was a linear response in any of our measured parameters this
would be clearly established.
Each individual study was carried out over a period of 3 days and individuals
completed all their studies within a 3 month period. The first 2 days were the adaptation
days during which subjects were adapted to the level of cysteine administered for that
study. The third day was the isotope infusion study day. A two-day adaptation period was
chosen` because Lyons et al. (Lyons, Rauh-Pfeiffer et al. 2000) showed that the fractional
glutathione synthesis rate in blood was 65%, suggesting that the half-life of GSH in red
blood cells was 18 hours. In addition, data from Stipanuk’s group (Lee, Londono et al.
2004), showed that the activity of the rate limiting enzyme for GSH synthesis reached a
new steady state in liver within 16 hours of changing from a low to a high protein diet

143
and that liver GSH and cysteine concentrations reached a new steady state within 12
hours. In addition, Jackson et al. (Jackson, Gibson et al. 2004) were able to show a
significant decrease in GSH FSR on the 3rd day after switching healthy subjects from
their habitual protein intake to the WHO recommended intake of 0.75 g.kg-1.day-1. In the
same study, after a nine day adaptation on the WHO 0.75 g.kg-1.day-1 protein intake, the
FRS was the same as that measured on the 3rd day of the diet. The suggestion is that the
amino acid pool had already undergone an adequate adaptation after 2 days. Based on
these data, a 48 hour adaptation period was judged to be adequate to achieve equilibration
of GSH in erythrocyte after each individual change in cysteine intake.
The diet was provided as an experimental formula and protein-free cookies
developed for amino acid kinetic studies (Zello, Pencharz et al. 1990). Briefly, a liquid
formula (protein-free powder, Product 80056, Mead Johnson, Evansville, IN) flavored
with orange and fruit crystals (Tang and Kool-Aid respectively; Kraft Foods, Toronto,
Canada) and protein-free cookies supplied the main source of energy in the diet. The
composition of the protein free powder and fruit crystals is presented in Table 6.2. The
nitrogen content of the diet was provided as a crystalline amino acid mixture (1.0 g.kg-
1.day-1), based on the amino acid pattern of egg protein (Geigy 1970). The reason for
using egg protein composition is because most studies on amino acid requirement have
used this pattern. Certainly, all studies from which the total sulphur amino acid
requirement was based for this current study used egg protein. For consistency and to
allow comparisons to be drawn, the same amino acid pattern was chosen (Geigy 1970).
The adaptation diet for the two days before the tracer infusion study provided calorie
content for resting energy expenditure (REE) x 1.7, whereas the energy content of the
144
diet on the isotope infusion day was provided as REE x 1.5. REE was measured by open
circuit indirect calorimetry (Deltatrac; SensorMedics, Yorba Linda CA USA). The
macronutrient content of the experimental diet, expressed as a percentage of dietary
energy, was 53% carbohydrate, 37% fat and 10% protein. The diet was weighed
(Sartorius Balance model BP110 S; Sartorius, Mississauga, ON, Canada) and prepared in
the research kitchen at The Hospital for Sick Children.
Subjects also consumed a daily multivitamin supplement (Centrum Forte;
Whitehall Robins Inc, Mississauga, ON, Canada) containing 0.6 mg folic acid, 5 mg
Vitamin B-6, and 20μg Vitamin B-12 beginning two weeks before the start of the study
and continuing for the entire duration of the 5 studies. In addition, a choline supplement
of 500 mg was provided daily beginning one week before the start of the first experiment
and continuing for the entire three month study duration. The multivitamin supplement
was provided to ensure adequate supply of all cofactors involved in sulphur amino acid
metabolism. The choline supplement was provided because the experimental diet is low
in choline about 150 to 200 mg choline.day-1, while the adequate intake (AI) for choline
is 550 mg.day-1 for adult males (Food and Nutrition Board 1998). It also provided
consistency among studies on sulphur amino acid metabolism as previous studies had
also given 500 mg choline.day-1 to the subjects (Storch, Wagner et al. 1988; Kurpad,
Regan et al. 2003).
During the adaptation days, the diet was provided as four equal meals per day to
be consumed at the same time each day. Subjects were allowed water in their desired
quantity but caffeinated beverage, alcohol, or any other drinks except that provided by
the diet were not allowed. On the isotope infusion day the diet was provided as 10

145
isoenergetic, isonitrogenous meals each representing 1/12 of the subject total daily
requirement. Subjects had free access to water on the study day.
Methionine was provided at an intake of 14 mg.kg-1.day-1, which is an average of
the two mean published estimates (using carbon oxidation techniques) for TSAA
requirement in adult humans (Di Buono, Wykes et al. 2001; Kurpad, Regan et al. 2003).
We chose this level of methionine because it represented the mean estimated total sulphur
amino acid requirement for protein synthesis as estimated by nitrogen balance (Rose,
Coon et al. 1955), indicator amino acid oxidation technique (Di Buono, Wykes et al.
2001), and 24-hour indicator oxidation-balance technique (Kurpad, Regan et al. 2003).
The levels of cysteine studied were 0, 10, 20, 30 and 40 mg.kg-1.day-1. The 0 mg.kg-1.day-
1 allowed for the estimation of GSH kinetics at the mean TSAA requirement of 14 mg.kg-
1.day-1. The cysteine intake of 10 mg.kg-1.day-1 combined with the methionine of 14
mg.kg-1.day-1 provided the total sulfur amino acid intake of 24 mg.kg-1.day-1; the
estimated RDA for total sulfur amino acid requirement (Di Buono, Wykes et al. 2001;
Kurpad, Regan et al. 2003). The cysteine intake of 20 , 30 and 40 mg.kg-1.day-1 provided
cysteine in an amount typically consumed in the western diet by individuals consuming a
mixed protein diet providing protein in an amount > 1.0 g.kg-1.day-1 (Jahoor, Jackson et
al. 1999; Jackson, Gibson et al. 2004). These intakes also represented 30, 50 and 65%,
respectively, of the amount given in a supplementation study of children with
malnutrition (Badaloo, Reid et al. 2002). The 40 mg.kg-1.day-1 of cysteine was chosen to
represent the possible highest level beyond which increases in GSH synthesis would be
unlikely in healthy subjects.

146
Glycine was provided at an intake of 69.5 mg.kg-1.day-1 which is twice that found
in the high quality egg protein at a protein intake of 1 g-1.kg-1. This was judged to be
adequate to prevent it being deficient for GSH synthesis. The amount of [15N –
13C2]glycine provided on the study day was subtracted from the dietary provision to
maintain the intake at 69.5 mg.kg-1.day-1. The glycine content of the diet was increased to
ensure glycine was not limiting for GSH synthesis. The glycine content of egg protein is
3.8% whereas the glycine content of human tissue protein is 7.2%. We chose to increase
the glycine content to make it more comparable to the composition in human tissue. The
amino acid composition of the amino acid mixture used in the study is presented in Table
6. 3.
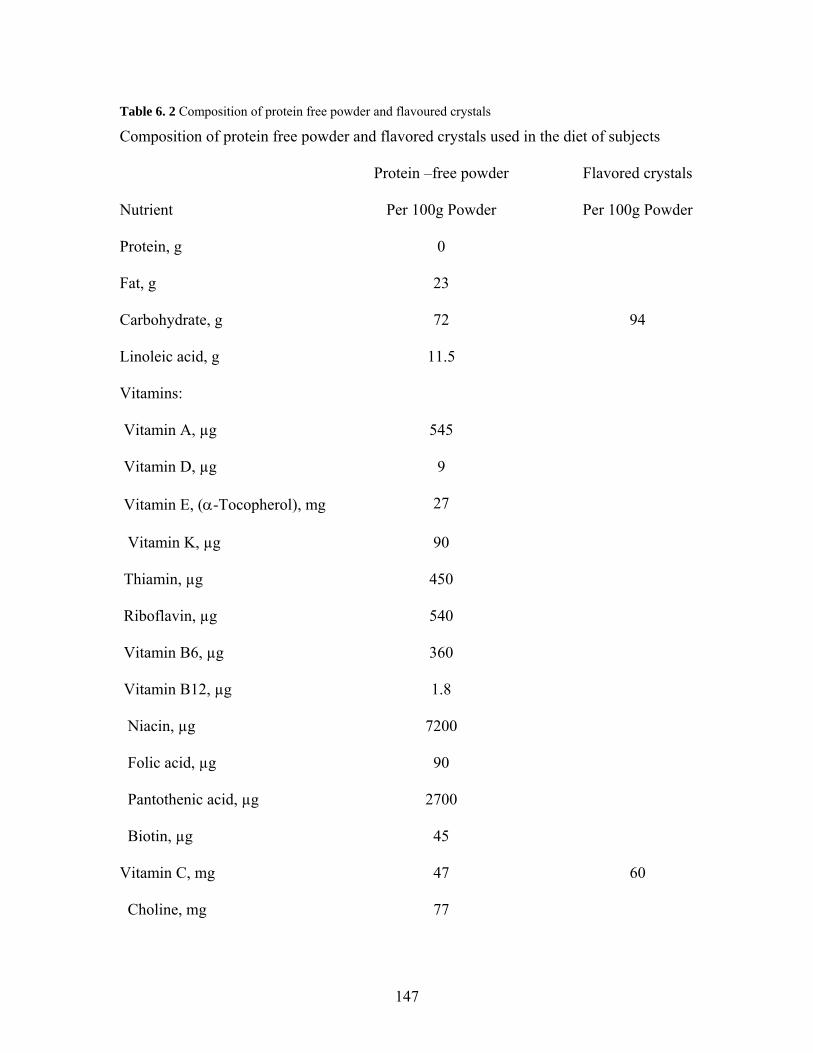
147
Table 6. 2 Composition of protein free powder and flavoured crystals
Composition of protein free powder and flavored crystals used in the diet of subjects
Protein –free powder Flavored crystals
Nutrient Per 100g Powder Per 100g Powder
Protein, g 0
Fat, g 23
Carbohydrate, g 72 94
Linoleic acid, g 11.5
Vitamins:
Vitamin A, µg 545
Vitamin D, µg 9
Vitamin E, (α-Tocopherol), mg 27
Vitamin K, µg 90
Thiamin, µg 450
Riboflavin, µg 540
Vitamin B6, µg 360
Vitamin B12, µg 1.8
Niacin, µg 7200
Folic acid, µg 90
Pantothenic acid, µg 2700
Biotin, µg 45
Vitamin C, mg 47 60
Choline, mg 77

148
Inositol, mg 27
Minerals:
Calcium, mg 540 60
Phosphorus, mg 300
Magnesium, mg 63
Iron, mg 10.8
Zinc, mg 4.5
Manganese, µg 180
Copper, µg 540
Iodine, µg 40
Selenium, µg 16.1
Sodium, mg 72
Potassium, mg 340
Chloride, mg 135

149
Table 6. 3 Amino acid composition
Amino acid composition of the amino acid mixture used in the study.
Amino Acid g/kg
L-Alanine
L-Arginine-HCL 74.5
L-Asparagine 33.0
L-Aspartic Acid 33.0
L-Cysteine
L-Glutamine 56.2
L-Glutamic Acid 56.2
L-Glycine 76.0
L-Histidine 22.5
L-Isoleucine 62.4
L-Leucine 82.6
L-Lysine-HCL 75.12
L-Methionine 14.0
L-Phenylalanine 54.2
L-Proline 41.6
L-Serine 83.2
L-Threonine 46.7
L-Tryptophan 15.5
L-Tyrosine 40.4

150
L-Valine 69.7
1Alanine contet of AA mixture varied to make mixture isonitrogenous with varying cysteine intakes 2L-cysteine intake varied based on dietary cysteine intake being studied
3L-Glycine intake made up from diet and isotope on isotope infusion day and from dietary glycine only on adaptation days.

151
6.3.3 Tracer protocol
[U-13C2 –15N]glycine (98% 13C2, 98%
15N ), was purchased from Cambridge
Isotope Laboratories, Andover, MA. Stock solutions were prepared in 0.9 % sodium
chloride (10 mg.ml-1) by the Research Pharmacy at the Hospital and were confirmed to
be sterile and pyrogen free. We chose to use an M+3 glycine tracer as the GSH precursor
to determine its incorporation into the GSH molecular ion by LCMS/MS. In preliminary
studies with M+2 glycine we were unable to accurately detect the enrichment in the
whole GSH molecule above background because of the high baseline M+2 GSH
enrichment.
Each tracer infusion study was conducted on day 3, after completion of the 2-day
adaptation on the liquid amino acid based diet, subjects arrived at the Clinical Research
Centre at the Hospital for Sick Children after a 12 hour overnight fast. Ten hourly,
isoenergetic, isonitrogenous meals were consumed beginning 3 hours before the start of
the intravenous isotope infusion. The cysteine content of each meal was dependent on the
test level being studied. Because the amount of cysteine in the diet was manipulated, L-
alanine was adjusted to keep the nitrogen content of the diet constant.
After consumption of the first two meals, intravenous catheters were inserted into
superficial veins of both arms, one for continuous infusion of the tracer solution and the
other for repeated blood sampling. Baseline blood (2.0 mL) was collected after the 3rd
hourly meal. At the beginning of the 4th meal, a priming dose of [U-13C2 –15N]glycine (40
µmol.kg-1) was given over a 15 minute period, followed immediately by a continuous
infusion of [U-13C2 –15N]glycine (15 µmol.kg-1.hour-1) for 7 hours. Blood samples (1.5

152
mL) were taken hourly from the 3rd hour of the infusion until the 5th hour and then every
0.5 hour until the end. To ensure arterialized blood, the hand was heated inside a
thermostatic chamber maintained at 60 ºC for ≥ 15 min before the blood was sampled
(Zello, Smith et al. 1990).
Urine samples were collected after each void for the 10 hours of the study day.
Samples were pooled and 2 x 2 mL aliquots were stored at -20 ºC for urinary sulphate
analysis in order to relate changes in cysteine intake to sulphate excretion.
6.3.4 Sample analysis
Blood (0.5 mL) for hematocrit was collect into tubes containing Na2EDTA and
immediately sent to the Clinical Biochemistry lab at the Hospital for Sick Children for
analysis. Briefly, the red cells were analyzed using an Abbott CELL-DYN Sapphire
Hematology Analyzer. Hematocrit was then calculated using the formula; HCT (L/L) =
(RBC x MCV) / 1000, where HCT = hematocrit, RBC = red blood cell and MCV =
mean corpuscular volume.
6.3.4.1 Erythrocyte glutathione concentration and enrichment
All chemicals were purchased from Sigma-Aldrich Canada Ltd., Oakville,
Ontario. A 0.5 mL aliquot of each blood sample collected in Na2EDTA was centrifuged
for 2 minutes at 13,000 x g (Beckman Microfuge-TM 11, Beckman Coulter Canada Inc.)
within 5 minutes of collection. Each tube was weighed before and after blood collection

153
to determine the volume of blood because GSH concentration was normalized to
hematocrit. After centrifugation the plasma was immediately removed. Two hundred µL
of 100 mmol/L N-ethylmaleimide, and 20 μL of 5 mmol/L gamma-glutamyl-leucine
(internal standard) were added to the separated red blood cells. The sample was then
capped, vortexed and left for 10 minutes at room temperature. Cells were then lysed with
50 μL 0.4 M ZnSO4, and the protein precipitated with 1 mL ice cold methanol. The
sample was then vortexed, centrifuged for 2 minutes, the supernatant removed and stored
at -80 ºC until analysis.
Glutathione concentration and enrichment were analyzed using a triple
quadrupole mass spectrometer API 4000 (Applied Biosystems/MDS SCIEX, Concord,
Canada) operated in positive ionization mode with the Turbo Ion Spray ionization probe
source (operated at 5.8 KV). This was coupled to an Agilent 1100 HPLC system
(Agilent, Mississauga, Canada). All aspects of system operation and data acquisition
were controlled using The Analyst NT v 1.4.1 software. Glutathione concentration was
measured using an external standard curve and the ratio of the analyte (GSH) to the
internal standard (Gamma-glutamyl-leucine). The parent to daughter transition measured
for GSH and the internal standard were 433.4 to 304.3 and 261.4 to 132.0 respectively.
GSH concentration was determined in the whole GSH molecule (as the tripeptide). There
was no fractionation and hydrolysis step prior to measurement of enrichment. Glutathione
enrichment was calculated as a ratio of the (enriched) M+3 to (unenriched) M peaks of
the tripeptide molecule of glutathione by measuring the transition of parent to daughter
ions of 436.4 to 307.0 (m+3) and 433.4 to 304.3 (M+0) and was expressed as mole
percent excess calculated from peak area ratios at isotopic steady state of erythrocyte

154
glycine in the last 2 hours of isotope infusion. Inter-assay precision for GSH
concentration was between 2.3 to 4.8% whereas inter-assay precision for GSH
enrichment was 3.7 ± 7.3%. The accuracy of the instrument for GSH concentration was
measured by spiking samples with a know amount of GSH and comparing to the
unspiked sample. Concentrations were determined using a standard curve. Accuracy of
GSH concentration was between 90 to 108% of expected. Accuracy for GSH enrichment
was measured using enrichment curves. Enrichment curves were linear within the ranges
of expected sample enrichment. The results of the enrichment curve was y = 0.94x +
0.097, r2 = 0.99.
6.3.4.2 Erythrocyte free glycine enrichment
Each sample was collected and centrifuged as above. Plasma was quickly
removed and the cells washed twice with 300 μL iced cold saline on each occasion.
Samples were vortexed between each wash. Cells were then lysed and de-proteinated as
above, vortexed, centrifuged for 2 minutes at 13,000 x g and the supernatant stored at -80
ºC until analysis.
Fifty μL of each sample was then dried under nitrogen at 35 ºC. One hundred μL
of butanol.HCl (Sigma-Aldrich Canada Ltd., Oakville, Ontario), was then added and the
sample vortexed, topped with nitrogen and heated for 20 minutes at 55 ºC. The sample
was again dried under nitrogen, and reconstituted in 0.1% formic acid (Sigma-Aldrich
Canada Ltd., Oakville, Ontario). Samples were then analyzed using a triple quadrupole
mass analyzer as described above. Glycine enrichment was calculated as the ratio of the

155
(enriched) M+3 to (unenriched) M peaks of glycine after derivitization with
butanol.HCL. The masses of the parent to daughter transitions of butylated glycine
monitored were 135.2 to 79.0 (M + 3) and 132.2 to 76.0 (M).
The intra-assay precision of the triple quadrupole mass analyzer for
measurements of erythrocyte free glycine enrichment was between 3 to 5 %. Accuracy
for erythrocyte free glycine enrichment was measured using enrichment curves.
Enrichment curves were linear within the ranges of expected sample enrichment. The
results of the enrichment curve was y = 0.732x + 0.042, r2 = 0.99 for glycine enrichment.
6.3.4.3 Urinary Sulphate
Urinary sulphate was measured using the method of Swaroop (Swaroop 1973).
Briefly, a standard curve was made using known concentrations of Ba2+ with sodium
rhodizonate to form a red coloured complex which was measured at 520 nm against
water. A known amount of sulphate was then added, to form a BaSO4 precipitate, which
resulted in a diminished colour and absorbance. The standard curve was obtained by
plotting concentration of sulphate on the x-axis and differences in absorbance between
blank (water) and corresponding standard on the y-axis. One ml of each urine sample was
then diluted to 200 ml with distilled water from which 0.05 ml was removed and 2.0 ml
of ethanol added and vortexed. To each tube, BaCl2, sodium rhodizonate was added and
the tubes vortexed. The tubes were then allowed to stand for 10 minutes in the dark after
which the red color produced was measured at 520 nm against water. The difference of

156
absorbance between blank and sample was read on the graph and corrected for the
dilution.
6.3.5 Calculations
6.3.5.1 Fractional synthesis rate of erythrocyte glutathione
The fractional synthesis rate (FSR) of erythrocyte glutathione (FSRGSH) was
calculated using the precursor-product method of Jahoor et al (Jahoor, Wykes et al.
1995):
FSRGSH (%/d) = (Et7 – Et5)/ERBC X (24 x 100)/ (t7- t5) (1)
Where (Et7 – Et5) was the increase in the isotopic enrichment of erythrocyte glutathione
between the fifth and seventh hours of infusion as a result of the incorporation of the
labeled glycine, ERBC was the intracellular glycine enrichment at isotopic steady state,
and (t7- t5) was the time interval between the fifth and seventh hour when the
incorporation of glycine into glutathione is measured.
ASR = GSH mass X FSR GSH (2)
Where GSH mass = the product of the cell volume (or cell number or cell protein) and
the concentration of GSH in the cell. Hematocrit was calculated using the formula;
HCT (L/L) = (RBC x MCV) / 1000.

157
6.3.6 Statistical analysis
The data was analyzed by repeated measures ANOVA with the PROC MIXED
procedure to assess the effects of cysteine intake on glutathione FRS, ASR and
concentration. Other independent variables tested were cysteine intake, subject and order
of cysteine intake as well as the interaction between cysteine intake and order.
Repeated measures ANOVA with the PROC MIXED and PROC GLM
procedures were also used to assess the effect of cysteine intake on urinary sulphate
excretion.
When significant differences were identified, individual differences were assessed
by post hoc analysis with Bonferroni correction for multiple comparisons. Statistical
significance was established at p ≤ 0.05. Data was analyzed using SAS version 9.1 for
Windows (SAS Institute Inc, Cary, NC).
6.4 Results
The age and physical characteristics of the 4 healthy male subjects who
participated in the study are presented in Table 6.1. Isotopic steady state was achieved in
the erythrocyte free intracellular glycine pool by 5 hours after the start of the isotope
infusion. This was determined by the absence of a significant slope between data points
from 5 to 7 hours using ANOVA (Figure 6.1). Therefore, FSR was calculated based on
the linear incorporation of glycine into glutathione during the last two hours of the
infusion.
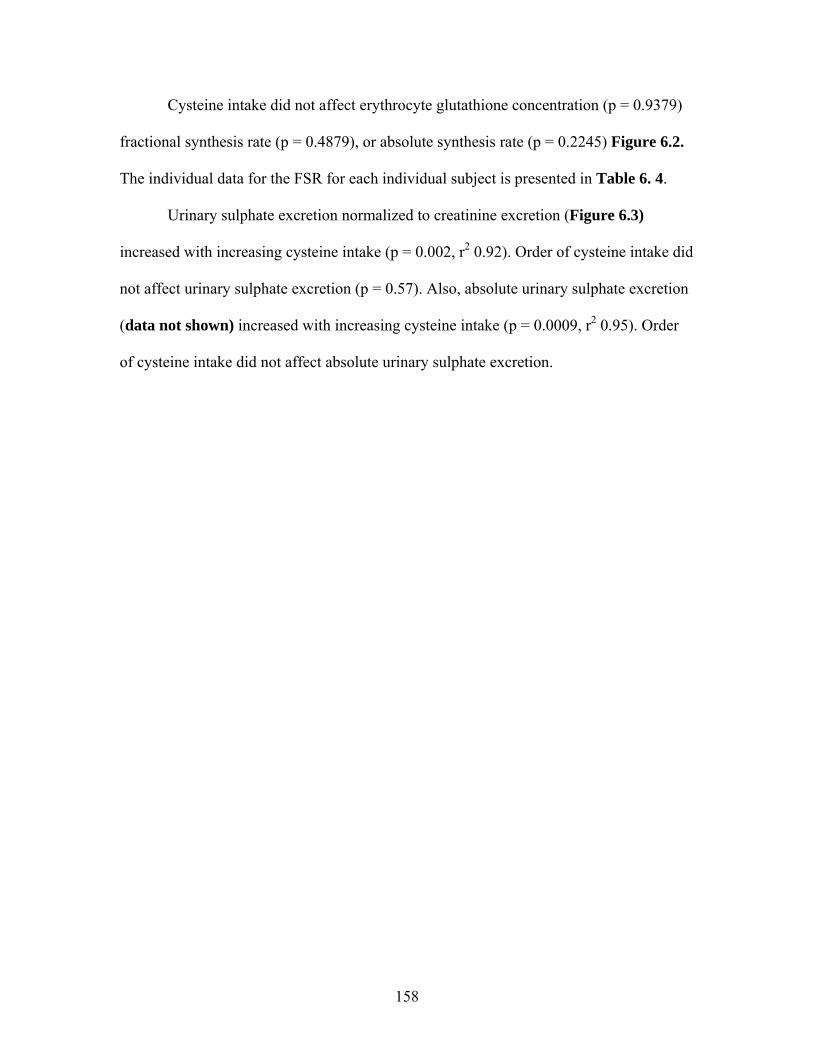
158
Cysteine intake did not affect erythrocyte glutathione concentration (p = 0.9379)
fractional synthesis rate (p = 0.4879), or absolute synthesis rate (p = 0.2245) Figure 6.2.
The individual data for the FSR for each individual subject is presented in Table 6. 4.
Urinary sulphate excretion normalized to creatinine excretion (Figure 6.3)
increased with increasing cysteine intake (p = 0.002, r2 0.92). Order of cysteine intake did
not affect urinary sulphate excretion (p = 0.57). Also, absolute urinary sulphate excretion
(data not shown) increased with increasing cysteine intake (p = 0.0009, r2 0.95). Order
of cysteine intake did not affect absolute urinary sulphate excretion.

159
A
B
Figure 6. 1 Mean tracer-to-tracee molar ratio (mol % above baseline) of erythrocyte free glycine
The mean net tracer-to-tracee molar ratio (mol% above baseline) of erythrocyte free
glycine (A) and the net tracer-to tracee enrichment of erythrocyte glutathione (B) during
a 7-hour continuous infusion of [U-13C2 –15N]glycine in young healthy adult males. There
was no difference among the erythrocyte free glycine enrichment at plateau at the
0 2 4 6 80.00.51.01.52.02.53.03.54.0
Time (h)
Mea
n in
trac
ellu
lar
glyc
ine
trac
er-t
race
e ra
tio (m
ol%
)
0 2 4 6 80.2
0.3
0.4
0.5
Time (h)
Mea
n gl
utat
hion
e en
richm
ent (
mol
%)

160
different time points from 5 to 7 hours determined by repeated measures ANOVA (p =
0.43).

161
0 10 20 30 400.0
0.5
1.0
1.5
2.0
2.5
3.0
3.5
Cysteine intake (mg.kg -1.day-1)
GSH
con
cent
ratio
n (m
mol
.L-1
)
0 10 20 30 400
10
20
30
40
50
60
70
Cysteine intake (mg.kg-1.day-1)
FSR
GSH
(%.d
ay-1
)
0 10 20 30 400.0
0.5
1.0
1.5
2.0
2.5
Cysteine intake (mg.kg -1.day-1)
ASR
GSH
(mm
ol.L
-1.d
ay-1
)
Figure 6. 2 Glutathione kinetics in response to graded intakes of cysteine
Mean (± SEM) effect of 5 levels of cysteine intake on glutathione concentration,
fractional synthesis rates of glutathione, and the absolute synthesis rates of glutathionine
for all 4 subjects who participated in the study at a set methionine intake of 14 mg.kg-
1.day-1. Using repeated measures ANOVA with the PROC MIXED procedure, cysteine
intake had no effect on GSH concentration (p = 0.9379), FRSGSH ( p = 0.4879), or
ASRGSH ( p = 0.2245 ).

162
Table 6. 4 Individual FSR at varying cysteine intake levels
Glutathione fractional synthesis rate (%/d) for each individual subject at each level of
cysteine intake
Subjects Cysteine intake (mg.kg-1.day-1)
0 10 20 30 40
GSH FSR %/d
1 64.2 67.73 62.74 62.95 59.42
2 25.91 58.76 72.62 54.49 32.73
3 22.11 45.97 18.15 24.75 23.56
4 60.02 72.06 33.54 31.28 31.06
Mean 43.06 61.13 46.76 43.37 36.69
SD 22.11 11.52 25.28 18.26 15.66
By ANOVA, cysteine intake had no significant effect on glutathione synthesis, but
subject did (p = 0.01)

163
Figure 6. 3 Urinary sulphate excretion in response to graded cysteine intakes
Mean (± SEM) effect of varying cysteine intake on urinary sulphate excretion
(normalized to creatinine) of all 4 subjects. Using repeated measures ANOVA, cysteine
intake had a significant effect on sulphate excretion (p = 0.002, r2 0.92). Means with
different superscript are significantly different from each other (repeated-measures
ANOVA followed by post hoc analysis with Bonferroni correction).
0 10 20 30 400
1
2
c
cb
abab
a
Cysteine intake (mg.kg-1.day -1 )
Sulphate excretion (mM/mM of creatinine)

164
6.5 Discussion
This is the first study to our knowledge, to report on the erythrocyte glutathione
kinetics in healthy adult males in response to varying cysteine intake levels in the
presence of an adequate protein and energy intake and the mean methionine requirement
of 14 mg.kg-1.day-1. These results suggest that in the presence of an adequate protein
intake of 1 g.kg.-1.day-1, and the mean methionine requirement of 14 mg.kg-1.day-1 (Di
Buono, Wykes et al. 2001; Kurpad, Regan et al. 2003) , further increases in the sulphur
amino acid (SAA) intake in the form of cysteine, did not affect erythrocyte glutathione
metabolism (Figure 6.2). The glutathione synthesis rates and concentrations observed in
the current study were similar to those observed in previous studies of glutathione
kinetics in healthy adults (Lyons, Rauh-Pfeiffer et al. 2000; Jackson, Gibson et al. 2004).
The inability to measure GSH kinetics in liver or muscle due to practical and
ethical considerations is a potential limitation of in vivo studies with healthy subjects.
However, erythrocyte GSH kinetics have been shown to respond to dietary changes in
disease (Jahoor, Jackson et al. 1999; Reid, Badaloo et al. 2006), malnutrition (Badaloo,
Reid et al. 2002) and even to small decreases in protein intake (Jackson, Gibson et al.
2004), demonstrating that erythrocyte GSH is a sensitive pool from which to detect
changes in GSH metabolism. At a protein intake of 0.75 g.kg-1.day-1, set by WHO as the
safe intake (FAO/WHO/UNU 1985), Jackson et al. (Jackson, Gibson et al. 2004) showed
decreased erythrocyte GHS synthesis when compared to a habitual protein intake of 1.13
g.kg-1.day-1. In fact this higher protein requirement was recently confirmed by our group
showing that a safe intake of protein is closer to 1 g.kg-1.day-1 (Humayun, Elango et al.

165
2007). In addition, cysteine supplementation at only 15 mg.kg-1.day-1 produced
significantly increased GSH synthesis in symptom-free HIV individuals (Jahoor, Jackson
et al. 1999) suggesting that at the cysteine intakes used in the current study significant
changes in GSH metabolism should have been observed, had they occurred.
Although we did not observe changes in GSH metabolism in response to feeding
graded intakes of cysteine to healthy adults receiving the previously derived mean
methionine (TSAA) requirement (figure 6.2), we observed a significant linear increase in
urinary sulphate production in response to graded cysteine intakes (figure 6.3). The
precise mechanisms governing all aspects of sulphur amino acid metabolism are not yet
completely understood. However the increases in urinary sulphate excretion observed in
the current study can be partly explained by work conducted by Stipanuk et al. Because
excess cysteine is considered toxic (Stipanuk, Dominy et al. 2006), the liver regulates
cysteine concentration within a small range and maintains a plasma concentration within
a 2.5-fold range (Stipanuk, Dominy et al. 2006). Cysteine concentration has been found
to be the key regulator of it own metabolism (Stipanuk, Coloso et al. 1992; Bella, Hahn et
al. 1999; Kwon and Stipanuk 2001; Stipanuk, Londono et al. 2002; Lee, Londono et al.
2004). When protein and/or SAA intake is low, γ-glutamylcysteine synthetase (GCS), the
rate-limiting enzyme for GSH synthesis is upregulated resulting in a greater partitioning
of SAA towards GSH synthesis. On the other hand, when protein and/or SAA intake in
increased, cysteine dioxygenase (CDO) the enzyme which catalyzes cysteine to sulphate
and taurine, is upregulated resulting in greater partitioning of cysteine towards sulphate
production. Thus, increasing urinary sulphate observed in the present study appears to be

166
due to increased partitioning of dietary cysteine toward catabolism in response to graded
intakes of cysteine.
However, a closer look at the pattern of the isotope results reveals a similar rate of
erythrocyte GSH synthesis at cysteine intakes of 0, 20, 30 and 40 mg.kg-1.day-1 , with an
almost 45% increase from 0 at a cysteine intake of 10 mg.kg-1.day-1. This increase in
GSH synthesis although not significant (p = 0.49), may be of biological importance
especially because other investigators have shown significant results at lower changes in
synthesis rates (Lyons, Rauh-Pfeiffer et al. 2000; Jackson, Gibson et al. 2004). The
observed similar GSH synthesis rates at cysteine intakes of 20 mg.kg-1.day-1 and above to
that observed at a zero cysteine intake, suggest a return to baseline at the higher cysteine
intakes and is supported by previous data which show that increasing the level of protein
(soy and casein), as well as the SAA methionine and cysteine, in the diets of rats, or the
addition of SAA to the culture medium of primary rat hepatocyte results in a rise in
cysteine dioxygenase (CDO) and a decrease in γ-Glutamylcysteine (GCS) activity (Bella,
Hahn et al. 1999; Bella, Hirschberger et al. 1999; Kwon and Stipanuk 2001). In healthy
humans, a deficient protein and or sulphur amino acid intake has been shown to
significantly decrease GSH synthesis (Lyons, Rauh-Pfeiffer et al. 2000; Jackson, Gibson
et al. 2004). Although no comparison studies of graded protein or sulphur amino acid
intake has been published, supplemental cysteine has been found to restore GSH
synthesis to that of controls in diseased individuals (Jahoor, Jackson et al. 1999; Badaloo,
Reid et al. 2002).
A potential limitation of our study is the number of subjects studied. There is a
possibility that the small sample size could have given rise to a type II error, especially

167
with regard to the seeming biologically important increase in GSH synthesis at a cysteine
intake of 10 mg.kg-1. Other investigators have found significant results with a
considerably lower change in GSH synthesis rate (Lyons, Rauh-Pfeiffer et al. 2000;
Jackson, Gibson et al. 2004) (15 to 27% compared to 45% in the current study). Because
the change in GSH synthesis at the other intakes of cysteine was clearly not different, we
think the results from the current study provided preliminary data to suggest that at the
recommended daily allowance for SAA (24 mg.kg-1.day-1), GSH synthesis may not be
limiting. To prove a real biologically important effect at a cysteine intake of 10 mg.kg-
1.day-1, a subsequent study is needed that uses cysteine intakes in the range of 5 to 15
mg.kg-1.day-1 in addition to a methionine intake of 14 mg.kg-1.day-1.
This is the first study to our knowledge, to report on GSH kinetics in response to
varying cysteine intake in healthy adult men. These data provide a point of focus for the
design of future experiments on adequate SAA requirement for the maintenance of
whole-body antioxidant status. These data also provide preliminary evidence that the
currently derived TSAA requirement for healthy adults, when provided in the presence of
an adequate protein intake (Humayun, Elango et al. 2007) does not limit GSH synthesis
in that population. Nevertheless, the need for TSAA may be higher in disease states
where there is increased oxidative stress. Studies in rats have suggested an increase in
cysteine requirement in septic rats compared to controls as evidenced by an increase in
methionine transsulfuration and an increase in both methionine and cysteine flux
compared with controls (Malmezat, Breuille et al. 2000). A later study showing increased
GSH synthesis in septic compared with control rats was used as a possible explanation
for the increased cysteine requirement in sepsis (Malmezat, Breuille et al. 2000). In

168
humans with HIV and malnutrition, decreased GSH metabolism was ameliorated by
cysteine supplementation which served to increase GSH synthesis and concentration to
that of control subjects. However, our current results show that typical cysteine intake is
not rate limiting for glutathione synthesis in healthy adult men, but rather that GSH
synthesis is maximized at a protein and TSAA intakes equivalent to those required for
adequate protein synthesis in healthy adult subjects.

169
7. DOES THE ADDITION OF CYSTEINE TO THE TOTAL SULPHUR AMINO
ACID REQUIREMENT (METHIONINE ONLY) INCREASE ERYTHROCYTES
GLUTATHIONE SYNTHESIS IN THE TPN-FED HUMAN NEONATE? A PILOT
STUDY.
7.1 Abstract
Controversy exists as to whether the TPN-fed human neonate is capable of
synthesizing adequate cysteine from methionine if the total sulphur amino acid is
provided as methionine only. Our recent study, in which we determined the total sulphur
amino acid requirement as methionine only, provided evidence that the TPN-fed human
neonate is capable of synthesizing adequate cysteine from methionine at least for protein
synthesis. However, there is evidence that protein synthesis takes presidence over
glutathione synthesis when sulphur amino acid supply is limiting. The goal of this pilot
study was to gather preliminary data on whether glutathione synthesis is maximized at a
methionine intake adequate for protein synthesis in the TPN-fed human neonate. We
measured glutathione concentration, fractional and absolute synthesis rate in 5 TPN-fed
human neonates. Each neonate underwent two isotope infusion studies of 7 hour duration
after a 2-day adaptation to the total sulphur amino acid requirement (methionine only)
and again after further 2-day adaptation to the same methionine intake supplemented with
cysteine at 10 mg.kg-1.day-1. The isotope used was [U-13C2 –15N]glycine. Cysteine
supplementation did not increase glutathionine kinetics. Further studies with a larger
sample size and a higher cysteine intake are needed in order to make a more definitive
conclusion.

170
7.2 Introduction
The suggestion that cysteine might be an indispensable amino acid in preterm and
term neonates was first introduced by Gaull and colleagues (Sturman, Gaull et al. 1970),
who showed absence of cystathionase activity in the liver of premature foetuses and
newborns. This report was later confirmed by the same investigators in subsequent
experiments (Gaull, Sturman et al. 1972; Pascal, Gillam et al. 1972). Other investigators
using differing endpoints have come to similar conclusions. For example, Vina et al.
(Vina, Vento et al. 1995), using plasma cysteine concentrations and in vitro erythrocyte
glutathione (GSH) synthesis concluded that neonates ≤ 32 weeks gestational age had
lower plasma cysteine and slower GSH synthesis than neonates above 33 weeks
gestation. In addition others have reported low plasma cysteine and high plasma
methionine in neonates fed low to cysteine-free TPN (Pohlandt 1974; Winters 1977;
Kanaya, Nose et al. 1984). These observations have been used by these authors as
evidence that cysteine is an indispensable amino acid for the human neonate.
Contrary to the data from Gaull and colleagues, later studies evaluating
cystathionase activity in liver, kidney, adrenals and pancreas of infants who died prior to
1 year of age concluded that cystathionase activity in the term and premature infant is
considerably greater than previously appreciated and that if the total SAA was adequate
and provided as methionine only, cysteine may not be a concern (Zlotkin and Anderson
1982). The same group (Zlotkin, Bryan et al. 1981) as well as others (Malloy, Rassin et
al. 1984) also found that when cysteine was supplemented to cysteine free-TPN there was
no improvement in growth and nitrogen balance in the supplemented group with both
groups achieving similar to in utero nitrogen retention. More recent stable isotope data

171
showed a significant transfer of label from D-[U-13C]glucose into (apo) B-100 derived
cysteine of preterm infants fed cysteine free TPN (Shew, Keshen et al. 2005). This
clearly showed that even preterm infants had the ability to synthesis cysteine de novo.
However, the synthetic capacity of these neonates was positively related to neonatal
maturity. More recently, data in enterally fed neonates have provided additional
convincing evidence that cysteine is not indispensable in the neonate (Riedijk, van Beek
et al. 2007). All of these data however, relates to the neonates ability to synthesize
cysteine for protein synthesis and does not extend to cysteine synthesis in amounts
adequate for antioxidant status.
Vina et al. (Vina, Vento et al. 1995) have shown that GSH synthesis is slow in the
preterm neonate. Zlotkin et al. (Zlotkin and Anderson 1982) were unable to account for
all of the cysteine supplemented to neonates receiving cysteine-free TPN. Shew et al.
(Shew, Keshen et al. 2005) although able to show cysteine synthesis in preterm neonates
also showed that there was a significant positive relationship between synthesis and
neonatal age, providing evidence that the pathway is underdeveloped in the neonate
especially those who are premature. The unanswered question therefore, is whether the
minimum synthetic capacity for cysteine observed in the neonate is sufficient to maintain
GSH status when sulphur amino acids are provided as methionine only. This question
was partly answered in a recent study showing no difference in GSH synthesis between
neonates receiving intravenous (IV) glucose or those receiving glucose plus amino acids
(Te Braake, Schierbeek et al. 2008). The amino acid source used contained significant
cysteine.
172
The goal of the current study therefore was to determine whether supplemental
cysteine could further stimulate GSH synthesis above that observed when the total
sulphur amino acids are provided at requirement (Courtney-Martin, Chapman et al. 2008)
but as methionine only in the TPN-fed human neonates.

173
7.3 Subjects and Methods
7.3.1 Subjects
Five neonates treated during the months of November 2007 to June 2008, in the
Neonatal Intensive Care Unit at The Hospital for Sick Children, Toronto, Canada were
enrolled in this study. The following inclusion criteria were used to determine eligibility:
lack of chromosomal anomalies, born at ≥ 34 weeks gestation and ≤ 28 days
chronological age at the time of the study, birth weight and length appropriate for
gestational age, medically stable as determined by normal blood results and lack of a
fever or infection, at least 3 days post operatively, and on TPN providing adequate
protein and calories as determined by attending physicians and dietitians. Exclusion
criteria included: small for gestational age status, presence of disease or on medications
known to affect protein and amino acid metabolism, documented infection, fever,
unstable medical condition, and receiving enteral feeding providing greater than 10% of
protein intake.
Ethical approval for the study was obtained from The Research Ethics Board at
The Hospital for Sick Children. Permission was obtained from the attending physician
before approaching parents, and written informed consent was obtained from at least one
parent before enrolling subjects into the study. Study characteristics of the neonates
included in the study is presented in Table 7. 1.

174
Table 7. 1 Subject characteristics of TPN-fed neonates studied on TPN with and without cysteine
Subject Characteristics of parenterally fed neonates at entrance into the study for
determination of glutathione kinetics on TPN without and with cysteine but adequate
methionine.
Mean SD
n 5
Birth weight (kg) 2.35
0.65
Birth Length (cm) 45 3.6
Head circumference (cm) 32 2.3
Gestational age (wk) 36.5
2.3
Postnatal age (wk) 1.8 0.69
Postconceptional age (wk) 38.3
2.4
Gender (F:M) 2:3
Study weight (kg)-Day 1 2.4 0.6
Diagnoses:1
1 Jejunal atresias; n=1, gastroschisis; n=2, malrotation and duodenal web; n=1, post-
necrotizing enterocolitis (NEC) colonic stricture; n=1.

175
7.3.2 Experimental design
The precursor product model developed by Jahoor et al. (Jahoor, Wykes et al.
1995) was the method used to determine GSH kinetics in this study. Each neonate was
studied over a period of 6 days. The study was divided in two parts. In part 1, subjects
received a parenteral amino acid solution devoid of cysteine, with the total sulphur amino
acid requirements provided as methionine only. In part 2, the solution was similar to that
used in part 1 but contained a supplemental amount of cysteine at 10 mg.kg-1. We did not
randomize the subjects to the order of cysteine intake because of the length of the study.
From our past experience, it was likely that the introduction of some form of enteral feeds
would occur during the course of a 6-day study. In order to ensure the cysteine free part
of the study remained as such, we chose not to use a random design.
During the first 3 days of the experiment, neonates received an amino acid
solution ( Bulk Solution #1) patterned after a commercial amino acid base solution
(Primene, Baxter Laboratories, Mississauga, Ontario) (Table 7.2), plus dextrose, and a
20% lipid solution (Intralipid; Fresenius Kabi, Uppsala, Sweden) for provision of
adequate protein, and non protein energy. Standard amounts of vitamin and minerals
were provided in the form of a liquid supplement (Multi-12/K1, providing a mixture of fat
and water-soluble vitamins) formulated for use in intravenous feeding. All vitamins and
minerals met current DRI recommendations. The sulphur amino acid in this solution was
provided as methionine only at the requirement (RDA = 58 mg.kg-1) as previously
derived from experiment 2 (Courtney-Martin, Chapman et al. 2008). On the third day, a
primed, continuous 7-hourr tracer infusion was carried out to measure GSH metabolism.

176
On days 4 to day 6, neonates were switched to a similar amino acid solution as
that received on days 1 to 3 but the new solution contained cysteine in the form of
cysteine.HCL and provide cysteine at an intake of 10 mg.kg.-1.day-1 (Bulk Solution #2)
(Table 7.2). Intakes of dextrose, lipid, vitamins, minerals, total calories and protein were
kept the same as on the previous three days. On the 6th day, a second primed, continuous
7-hour tracer infusion study was conducted for the comparison of GSH kinetics in the
presence of additional sulphur amino acid as cysteine compared to that obtained with
adequate sulphur amino acids as methionine only without cysteine.
Given the complexity and length of this study, it was very difficult to recruit
babies and in fact, it took almost one year to complete this study with only 5 subjects
completing the full protocol. The task of enrolling babies that would be stable post-
operatively for 6 days on TPN and not advance to significant amounts of enteral feeds (>
10% of protein intake enterally) was enormous. Two additional babies had to be
withdrawn from the study because of advancement to large volumes of enteral feeds.

177
Table 7. 2 Amino acid composition of amino acid solutions administered to neonates studied on TPN with and without cysteine
Amino acid composition of the base commercial amino acid solution and the amino acid
composition of the two bulk solutions used in the study of GHS kinetics in the TPN fed
human neonate
Amino Acid Commercial amino acid composition (g/100g)
Bulk #1 (g/100g)1
Bulk #2 (g/100g)2
Isoleucine 6.7 6.7 6.7 Leucine 9.9 9.9 9.9 Valine 7.6 7.6 7.6 Lysine (lysine-HCL)
10.9 10.9 (13.62)
10.9 (13.62)
Methionine 2.4 1.93 1.93 Cysteine Cysteine-HCL
1.9 0 0.33 0.48
Phenylalanine 4.2 4.2 4.2 Tyrosine 0.9 0 0 tyrosine Glycly-tyrosine (GT) Glycyl-L-Tyrosine Dihydrate
0 4.0 (5.25) 6.06
4.0 (5.25) 6.06
Threonine 3.7 3.7 3.7 Tryptophan 2.0 2.0 2.0 Histidine 3.8 3.8 3.8 Arginine: base amino acid solution (increase of 20% based on piglet data)
8.4 9.66 9.66
Glycine (total) (From GT) Glycine to be added
4.0 4.0 total 1.66 from GT 2.34 from Glycine
4.0 total 1.66 from GT 2.34 from Glycine
Alanine 7.9 7.9 Additional Variable amt added (to make solution isonitrogenous)
7.9 Additional Variable amt added (to make solution isonitrogenous)
Aspartate 6.0 5.0 5.0 Glutamate 9.9 9.9 9.9 Proline 3.0 3.0 3.0 Serine 4.0 4.0 4.0 Taurine 0.6 0.6 0.6 Ornathine (excluded because decreases the PH of the solution)
2.2 (0) (0)
Total AA (grams/100g) 100.00 98.38 98.71

178
1Bulk #1 represents 98.38% of the total protein/total AA 2Bulk #2 represents 98.71% of the total protein/total AA

179
7.3.3 Study Diets
The amino profile of the amino acid solution used in the study (Bulk solution 1 &
2) is presented in Table 7.2. The composition was patterned after a commercial amino
acid solution with an amino acid composition of cord blood (base amino acid solution).
The amino acid solutions used (Bulk 1 & 2) were prepared using human pharmacy grade
amino acids (Ajinomoto Company Inc., Japan via L.V Lomas, Brampton, Ontario) in our
research laboratory, under sterile conditions. The profile of the base amino acid, was
followed with some modifications; methionine was altered to provide the requirement
estimate from study 2 (56 mg.kg-1.day-1) (Courtney-Martin, Chapman et al. 2008),
cysteine was removed from Bulk #1 but added to Bulk #2 at 10 mg.kg-1, tyrosine was
provided as the dipeptide glycyl- tyrosine at a level of 4 g.100g-1 (Roberts, Ball et al.
2001). Arginine was increased from 8.4 to 9.66 g.100g-1 based on our studies in piglets
(Bertolo, Brunton et al. 2003; Wilkinson, Bertolo et al. 2004) and aspartate was
decreased from 6.0 g.100g-1 to 5.0 g.100g-1 to accommodate for the increased amount of
nitrogen provided by arginine. Alanine was used to balance the nitrogen and make the
solutions isonitrogenous. Alanine was prepared as a separate test solution at a
concentration of 50 mg.mL-1. All prepared solutions were filter sterilized in the Research
Pharmacy at The Hospital for Sick Children by being passed though a 0.22 μm filter.
Solutions were subsequently demonstrated to be sterile and free of bacterial growth over
7 days in culture and to be proven pyrogen-free by the limulus amebocyte lysate test
(Pearson 1979). The chemical composition of the solutions was verified by amino acid

180
analysis using high performance liquid chromatography (HPLC) and analysis of total
nitrogen.
On each study day, vitamins and minerals were added to the solutions before
delivery to the baby. All vitamins were supplied in a commercial solution Multi-12K1
(Baxter Corporation, Mississauga Ontario), which provides a combination of fat and
water-soluble vitamins, formulated for use in pediatric parenteral solutions. The mineral
solution provided calcium, phosphorus, magnesium, zinc, copper, manganese, iodine,
chromium and selenium. Nutrient intake for each individual neonate was prescribed by
the attending physician and dietitian. All subjects were receiving adequate protein and
energy (Zlotkin, Bryan et al. 1981; Zlotkin 1984). Non-protein energy was provided as
dextrose and a 20% lipid solution Table 7.3. All calculations of nutrient intake for phase
1 of the study (days 1 to 3) were done using body weight on day 1 of the study whereas
calculation of nutrient intake for phase 2 (days 4 to 6) were done using weight on day 4
of the study (Table 7.3).
At the start of the study, each neonate was switched from the commercial amino
acid solution to Bulk solution #1, which they each received for the first 3 days. On day 3
the first isotope infusion study was conducted then on day 4 subjects were switched to
Bulk solution #2 which was continued until day 6 at which point the subjects underwent
the second isotope infusion study. On the 7th day, subjects were returned to the
commercial amino acid solution which they were receiving before the start of the study.
All subjects were prescribed a methionine intake of 58 mg.kg-1.day-1 on days 1 to 3 and
the same methionine intake with a supplemental cysteine intake of 10 mg.kg-1.day-1 on
days 4 to 6. However, the actual intake of the subject differed slightly from the

181
prescription because the volume of solution prescribed is not always that which is
delivered in a real clinical environment (Table 7.3). The mean nutrient intake of each
subject during phase 1 and phase 2 along with the overall group mean is presented in
Table 7.3.
Baseline blood work performed for clinical monitoring was reviewed on each
subject before the start of the study. All subjects had normal sodium, potassium, calcium,
phosphorous and pH.

182
Table 7. 3 Individual nutrient intakes of neonates studied on TPN with and without cysteine
Mean Individual subject’s nutrient intake during study of GSH kinetics for part 1(no cysteine) and part 2 (cysteine supplementation)
Part 1 of Study (no cysteine) Part 2 of study (cysteine supplementation)
Subjects Wt
(kg)
day1
Methionine
intake
(mg/kg)
Cysteine
intake
(mg/kg)
Protein
intake
(g/kg)
Carbohydrate
intake
(g/kg/d)
Fat
intake
(g/kg)
Total
energy
(kcals/d)
Energy
(kcals/kg)
Wt
(kg)
day4
Methionine
intake
(mg/kg)
Cysteine
intake
(mg/kg)
Protein
intake
(g/kg)
Carbohydrate
intake
(g/kg/d)
Fat
intake
(g/kg)
Total
Energy
(kcals/d)
Energy
(kcals/kg)
1 3.18 58.4 0 3.03 13.2 2.98 276 87 3.28 58.2 10 3.05 13.8 2.97 292 89
2 2.5 66.6 0 3.4 12.5 2.94 214 85 2.76 62.7 10.8 3.24 13.1 2.9 238 86
3 1.9 57.3 0 2.98 12.1 2.72 152 80 1.9 62.6 10.5 3.2 13.2 2.99 167 88
4 1.71 60.2 0 3.14 11.1 3.01 137 80 1.71 59.8 10.1 3.13 13.2 2.13 133 78
5 2.5 58.8 0 3.0 14.0 2.85 220 88 2.5 59.3 10.2 3.1 14.0 2.83 218 87
Mean 2.36 60.26 0 3.11 12.6 2.9 200 84 2.43 60.52 10.32 3.14 13.4 2.76 210 86
SD 0.58 3.69 0 0.17 1.1 0.12 56 4.0 0.64 2.03 0.33 0.08 0.4 0.36 62 4.0
183
7.3.4 Tracer Protocol.
The tracer infusion studies were conducted on the 3rd and 6th day at the end of the
first period without cysteine and at the end of the second period with cysteine
supplementation. [U-13C2 –15N]glycine (98% 13C2, 98% 15N ), purchased from Cambridge
Isotope Laboratories, Andover, MA was the isotope used for the measurement of
erythrocyte GSH synthesis. Stock solutions were prepared in 0.9% sodium chloride (10
mg/ml) by the Research Pharmacy at the Hospital for Sick Children, Toronto and were
confirmed to be sterile and pyrogen free. Solution was aliquoted into sterile bottles and
kept in the Research Pharmacy at the Hospital for Sick Children, Toronto, at 4 º C until
use.
An intravenous priming dose of [U-13C2 –15N]glycine was given at 50 µmol.kg-1
over 15 minutes followed by a continuous intravenous infusion of 40 μmol.kg.-1.hr-1 for
the remainder of the 6.75 hours for a total of 7 hours isotope infusion time.
We chose to use an M+3 glycine tracer as the GSH precursor to determine its
incorporation into the GSH molecular ion by LCMS/MS. Details are as described in
chapter 6.
7.3.5 Sample Collection
Blood samples were collected on day 3 and 6 at baseline before the start of the
isotope infusion for analysis of background enrichment. A total of 0.7 ml of blood was
collected at each time point; 0.5 ml for measurement of erythrocyte GSH concentration

184
and enrichment and plasma amino acid concentration, and 0.2 ml for the measurement of
erythrocyte intracellular glycine enrichment (the precursor pool from which glycine is
drawn for GSH synthesis). Having previously established that isotopic steady state was
reached in the precursor pool at 5 hours, two subsequent blood samples were taken at
approximately 5 ½ and 6 ½ hours. Blood was drawn from a central line if the baby had
central venous access, or from a heel prick if central access was not available. For heel
prick sampling, the heel was warmed with a warm cloth before the blood was drawn. To
minimize the amount of blood taken, hematocrit was obtained from blood samples
collected for clinical monitoring on the same day of the isotope study.
7.3.6 Sample Analysis
7.3.6.1 Erythrocyte glutathione concentration and enrichment
All chemicals were purchased from Sigma-Aldrich Canada Ltd., Oakville,
Ontario. A 0.5 mL aliquot of each blood sample collected in Na2EDTA was centrifuged
for 2 minutes within 5 minutes of collection. Each tube was weighed pre and post blood
collection to determine the volume of blood for normalization of the GSH concentration
per litre of blood. After centrifugation the plasma was immediately removed. Two
hundred µL of 100 mM N-ethylmaleimide, and 20 μL of 5 mM gamma-glutamyl-leucine
(internal standard) were added to the separated red blood cells. The sample was then
caped, vortex and left for 10 minutes at room temperature. Cells were then lysed with 50
μL 0.4 M ZnSO4, and the protein precipitated with 1 mL ice cold methanol. The sample
was then vortexed, centrifuged for 2 minutes, the supernatant removed and stored at -80
ºC until analyzed.

185
Glutathione concentration and enrichment were analyzed by using a triple
quadrupole mass spectrometer API 4000 (Applied Biosystems/MDS SCIEX, Concord,
Canada) operated in positive ionization mode with the Turbo Ion Spray ionization probe
source (operated at 5.8KV). This was coupled to an Agilent 1100 HPLC system
(Agilent, Mississauga, Canada). All aspects of system operation and data acquisition
were controlled using The Analyst NT v 1.4.1 software. Glutathione concentration was
measured using an external standard curve and the ratio of the analyte (GSH) to the
internal standard (Gamma-glutamyl-leucine). Glutathione enrichment was calculated as a
ratio of the (enriched) M+3 to (unenriched) M peaks of the tripeptide molecule of
glutathione and was expressed as mole percent excess and was calculated from peak area
ratios at the isotopic steady state of glycine in the last 2 hours of isotope infusion.
7.3.6.2 Erythrocyte free glycine enrichment
Each sample was collected and centrifuged as above. Plasma was quickly
removed and the cells washed twice with iced cold saline on each occasion. Samples
were vortexed between each wash. Cells were then lysed and de-proteinated as above,
vortexed, centrifuged for 2 minutes and the supernatant stored at -80 ºC until analysis.
Fifty μL of each sample was then dried under nitrogen at 35 ºC. One hundred μL
of butanol.HCl (Sigma-Aldrich Canada Ltd., Oakville, Ontario), was then added and the
sample vortexed, topped with nitrogen and heated for 20 minutes at 55 ºC. The sample
was again dried under nitrogen, and reconstituted in 0.1% formic acid (Sigma-Aldrich
Canada Ltd., Oakville, Ontario). Samples were then analyzed using a triple quadrupole
mass analyzer as described above. Glycine enrichment was calculated as a ratio of the

186
(enriched) M+3 to (unenriched) M peaks and was expressed as mole percent excess
above baseline and was calculated from peak area ratios at isotopic steady state.
7.3.6.3 Plasma amino acid concentration
Plasma total cysteine concentration was determined by LCMS/MS, using a bench
top triple quadrupole mass spectrometer API 4000 (Applied Biosystems/MDS SCIEX)
operated in positive ionization mode with the TurboIonSpray ionization probe source
(operated at 5.8KV). This was coupled to an Agilent 1100 HPLC system (Rafii, Elango et
al. 2007).
7.3.7 Calculations
7.3.7.1 Fractional and absolute synthesis rate of erythrocyte glutathione
The fractional synthesis rate (FSR) of erythrocyte glutathione (FSRGSH) was
calculated using the precursor-product method of Jahoor et al. (Jahoor, Wykes et al.
1995).
FSRGSH (%/d) = (Et7 – Et5)/ERBC X (24 x 100)/ (t7- t5) (1)
Where (Et7 – Et5) was the increase in the isotopic enrichment of erythrocyte glutathione
between the fifth and seventh hours of infusion as a result of the incorporation of the
labeled glycine, ERBC was the intracellular glycine enrichment at isotopic steady state,
and (t7- t5) was the time interval between the fifth and seventh hour when the
incorporation of glycine into glutathione is measured.
187
ASR = GSH mass X FSR GSH (2)
Where GSH mass = the product of the cell volume (or cell number or cell protein) and
the concentration of GSH in the cell. Haematocrit was calculated using the formula;
HCT (L/L) = (RBC x MCV) / 1000.
7.3.8 Statistical Analysis
7.3.8.1 Sample Size Consideration
Using glutathione FSR as the main outcome variable, a post-hoc sample size
calculation was conducted using the mean and standard deviation of the difference
between means obtained from the current study. The result obtained from the four
subjects in whom the FSR was measured at isotopic steady state was used. Using p =
0.05, with a 80% power and two-tailed analysis, a sample size of 13 subjects with 2
studies per subject is required to detect a significant difference in FRS at a cysteine
supplementation of 10 mg.kg-1.
The data was analyzed by repeated measures ANOVA with the PROC GLM
procedure to assess the effect of cysteine intake on glutathione concentration, FSR, ASR
and cysteine concentration. Independent variables tested were cysteine intake and subject.
Since order of cysteine intake was not randomly assigned, order was not included in the
model. Statistical significance was established at p ≤ 0.05. Data was analyzed by SAS
version 9.1 for Windows (SAS Institute Inc., Cary, NC).

188
7.4 Results
7.4.1 Clinical characteristics and nutrient intake
The clinical characteristics and diagnosis of the 5 subjects studied are presented in
Table 7.1. Each subject was studied in a repeated measures design first without cysteine
followed by a cysteine supplemental period. The methionine intake was based on the
RDA as previously determined from experiment 2 and was prescribed at 58 mg.kg-1.day-1
for the both parts of the experiment. Cysteine was not provided in part 1 of the
experiment but was prescribed at 10 mg.kg-1 during part 2 of the experiment (the cysteine
supplementation part). The total nutrient intake was however dependent on the total
volume of parenteral nutrition infused. The average methionine intake for phase 1 and 2
was 60.26 ± 3.69 and 60.52 ± 2.03 mg.kg-1.day-1 respectively while the cysteine intake in
phase 1 was 0 mg.kg-1.day-1 by design and 10.32 mg.kg-1.day-1 in phase 2 Table 7.3. The
average energy and protein intake for phase 1 was 84 ± 4.0 kcals.kg-1 and 3.11 ± 0.17
g.kg-1.day-1 respectively and was very similar for phase 2 with energy intake being 86 ±
4.0 kcals.kg-1.day-1 and protein being 3.14 ± 0.08 g.kg-1.day-1 Table 7.3.
7.4.2 Intracellular glycine enrichment
Isotopic steady state (plateau) in the intracellular glycine pool was achieved for all
neonates by 5 hours after the start of the isotope infusion and was defined by the absence

189
of a significant slope between the data points at plateau. A typical study day isotopic
enrichment in the intracellular glycine pool is presented in Figure 7.1.

190
Baseline 5.5h 6.5h 7.0h0
1
2
3
4
5
6
7
Eryt
hroc
yte-
free
glyc
ine
net t
race
r-tra
cee
mol
ar ra
tio(m
ole
% a
bove
bas
elin
e)
Time (hour)
Figure 7. 1 Net tracer/tracee molar ratio of erythrocyte free glycine
Net tracer/tracee molar ratio (mol % above baseline) of free glycine from deproteinated
extracts of erythrocytes

191
7.4.3 Glutathione kinetics
During the isotope infusion study on subject number 5, unfortunately the father
refused to allow more than one blood sample to be taken at isotopic steady state. As a
result, we were unable to calculate the linear incorporation of glycine into GSH for
subject number 5 at isotopic steady. Rather, we calculated GSH fractional and absolute
synthetic rate in two different ways; for the first 4 subjects at isotopic steady state and
again for all 5 subjects as the incorporation over the first 5 ½ h of the infusion.
Glutathione concentration was measured once for all 5 subjects.
There was no effect of cysteine supplementation on GSH concentration (n = 5, p
= 0.19). The mean GSH concentration was 2.37 ± 0.52 and 2.14 ± 0.51 mmol/L without
and with cysteine supplementation respectively (Figure 7.2). Similarly, cysteine
supplementation did not affect GSH FSR (n = 4, p = 0.18) when FSR was measured at
isotopic steady state, or when measured as incorporation over 5 ½ h (n = 5, p = 0.88)
(Figure 7.2 & 7.3). Fractional synthesis rate when assessed at steady state in the 4
subjects was 35.2 ± 12.1 and 32.3 ± 13.2 %/d without and with cysteine supplementation
and 16.3 ± 7.7 and 16.7 ± 3.2 %/d in all 5 subjects without and with cysteine
supplementation respectively when assessed during the first 5 ½ hours of tracer infusion.
Cysteine supplementation did not affect GSH ASR whether measured in the 4 subjects at
isotopic steady state (p = 0.16) or in all 5 subjects (p = 0.83) when measured over the first
5 ½ hours of tracer infusion (Figure 7.2 & 7.3). Absolute synthesis rate measured at
steady state in the 4 subjects was 0.75 ± 0.18 and 0.6 ± 0.1 mmol/L/d and 0.36 ± 0.097
and 0.34 ± 0.046 mmol/l/d in all 5 subjects measured over the first 5 ½ hours of isotope

192
infusion. The individual data for FSR is presented in (Figure 7.4) for the 4 subjects
measured at isotopic steady state 4A, and for all 5 subjects measured over 5 ½ hours 4B.

193
0 100
1
2
3
Cysteine Intake (mg.kg -1.day-1)
Eryt
hroc
yte
Glu
tath
ione
con
cent
raito
n (m
mol
/L)
0 100
10
20
30
40
50
cysteine intake (mg.kg. -1day-1)
Ertth
rocy
te g
luta
tione
FSR
(%/d
)
0 100.00
0.25
0.50
0.75
1.00
*
cysteine intake (mg.kg. -1day.-1)Eryt
hroc
yte
glut
athi
one
ASR
(mm
ol/L
)
Figure 7. 2 Glutathione kinetics in neonates fed TPN with and without cysteine Mean (± SD) effect of cysteine supplementation on glutathione concentration (n = 5),
fractional synthesis rate of glutathione and the absolute synthesis rates of glutathione for
4 of 5 subjects who participated in the study, measured at isotopic steady state. Using
repeated measures two way ANOVA with PROC GLM procedure, cysteine
supplementation had not effect on GSH concentration (0.19), FSRGSH (p = 0.18), or
ASRGSH (p = 0.16).

194
0 100
5
10
15
20
25
Cys Intake (mg.kg-1.day-1)
Eryt
hroc
yte
glut
athi
one
FSR
(%/d
)
Figure 7. 3 Glutathione FSR of neonates fed TPN with and without cysteine
Mean (± SD) effect of cysteine supplementation on glutathione concentration (n = 5),
fractional synthesis rate of glutathione and the absolute synthesis rates of glutathione for
5 subjects who participated in the study, measured during the first 5 ½ hours of isotope
infusion. Using repeated measures two way ANOVA with PROC GLM procedure,
cysteine supplementation had not effect on GSH concentration (p = 0.19), FSRGSH (p =
0.88), or ASRGSH (p = 0.83).
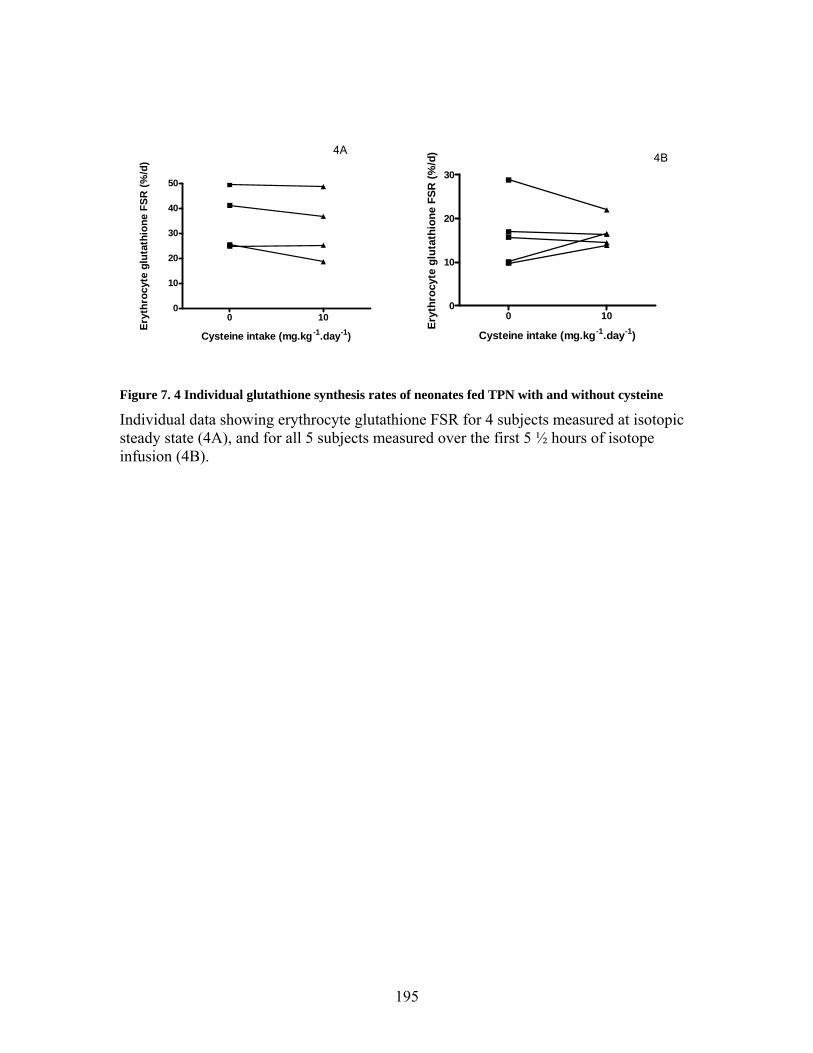
195
0 100
10
20
30
40
50
Cysteine intake (mg.kg-1.day-1)
Eryt
hroc
yte
glut
athi
one
FSR
(%/d
)
0 100
10
20
30
Cysteine intake (mg.kg-1.day-1)
Eryt
hroc
yte
glut
athi
one
FSR
(%/d
)4A4B
Figure 7. 4 Individual glutathione synthesis rates of neonates fed TPN with and without cysteine
Individual data showing erythrocyte glutathione FSR for 4 subjects measured at isotopic steady state (4A), and for all 5 subjects measured over the first 5 ½ hours of isotope infusion (4B).
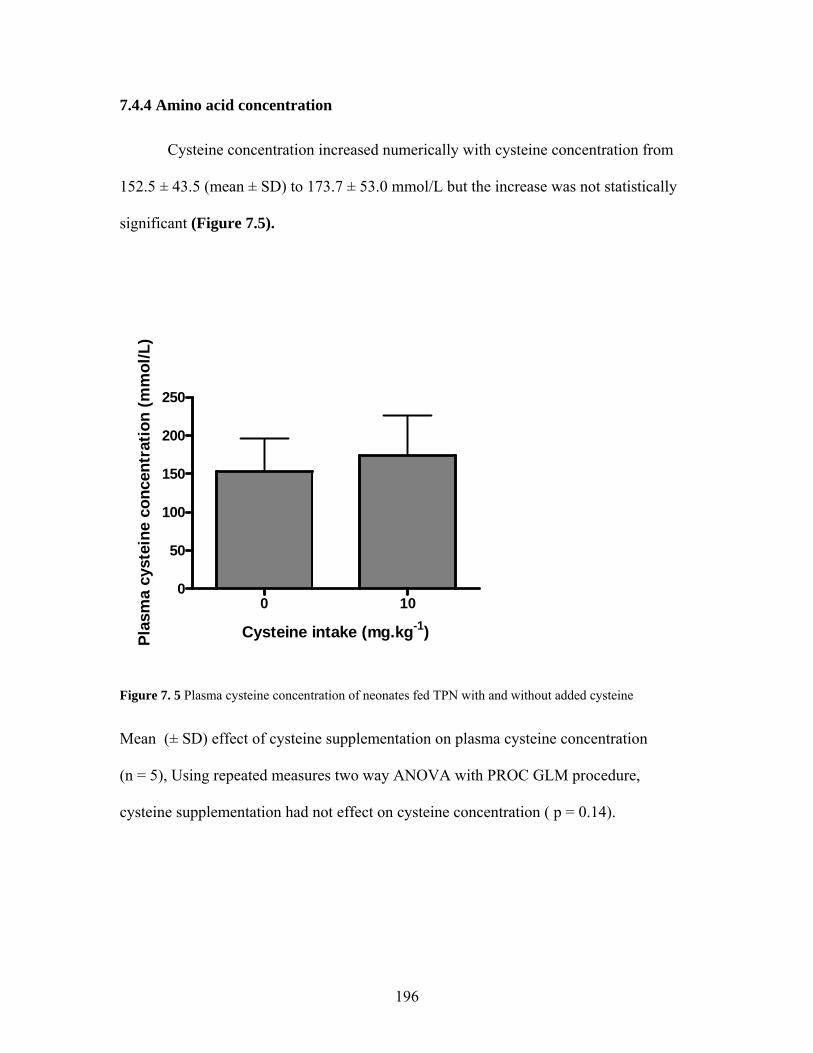
196
7.4.4 Amino acid concentration Cysteine concentration increased numerically with cysteine concentration from
152.5 ± 43.5 (mean ± SD) to 173.7 ± 53.0 mmol/L but the increase was not statistically
significant (Figure 7.5).
0 100
50
100
150
200
250
Cysteine intake (mg.kg-1)Plas
ma
cyst
eine
con
cent
ratio
n (m
mol
/L)
Figure 7. 5 Plasma cysteine concentration of neonates fed TPN with and without added cysteine
Mean (± SD) effect of cysteine supplementation on plasma cysteine concentration
(n = 5), Using repeated measures two way ANOVA with PROC GLM procedure,
cysteine supplementation had not effect on cysteine concentration ( p = 0.14).

197
7.5 Discussion
This is the first study to our knowledge, conducted in the TPN-fed human neonate
to determine whether the total sulphur amino acid requirement (Courtney-Martin,
Chapman et al. 2008) (provided as methionine only) needed for adequate protein
synthesis is also adequate for maintenance of antioxidant status. The main goal was to
directly determine whether adding supplemental cysteine to a TPN solution providing the
total sulphur amino acids requirement as methionine only will stimulate an increase in
GSH synthesis and concentration. Indirectly, the secondary goal was to assess whether
the transsulfuration pathway is capable of synthesizing adequate cysteine from
methionine, thereby providing further clarification as to whether cysteine is an
indispensable amino acid in the TPN-fed human neonate.
The results show that GSH concentration did not differ with cysteine
supplementation from that observed when the sulphur amino acids were provided as
methionine only (figure 7.2). Further it was comparable to that obtained in neonates
receiving PN (Te Braake, Schierbeek et al. 2008) as well as that obtained from venous
blood taken from the umbilical cord immediately after delivery in term babies, but was
slightly lower than that observed in 20-month old enterally fed children treated for and
recovered from malnutrition (Reid, Badaloo et al. 2000).
There was no data upon which to base a sample size calculation. Hence we chose
a within subject repeated measures design as the best approach to show the effect of
cysteine supplementation, should one occur. Because of the anticipated difficulty in
conducting such a study, we chose to recruit 5 infants as a means of obtaining pilot data
for a future supplemental trial. Unfortunately, we were unable to measure GSH synthesis

198
at steady state in one of the five subjects. As a result we measured GSH synthesis in two
different ways; in 4 of the 5 subjects at steady state and in all 5 subjects as incorporation
over 5 ½ hours. At steady state the GSH synthesis rates was higher than that measured
over the course of the 5 ½ hours (Figures 7.2 and 7.3) but synthesis rates were not
increased with cysteine supplementation regardless of the method used for measuring
synthesis rates (figures 7.2 and 7.3). A more recent study suggested that a total of ≥ 3
subjects would be sufficient to detect a difference in GHS synthesis in the TPN-fed
neonate (Te Braake, Schierbeek et al. 2008).
This data is supported by previous isotope data which showed that preterm
neonates are capable of cysteine synthesis as evidenced by incorporation of 13C label
form [13C6] glucose into apo B-100 cysteine (Shew, Keshen et al. 2005), and more recent
isotope data showing that there is significant transsulphuration of methionine in the
neonate (Thomas, Gruca et al. 2008) whether fed enterally or parenterally. From the
results of the current study it seems likely that not only are they capable of cysteine
synthesis for adequate growth and nitrogen balance (Zlotkin, Bryan et al. 1981; Malloy,
Rassin et al. 1984), but that cysteine synthesis from methionine is also adequate for
maintenance of antioxidant status.
One of the important limitations of this study is the small sample size, thereby
limiting the confidence required to draw definitive conclusions. Because of the difficulty
inherent in the current design, a future design in which babies are randomized to cysteine
supplementation or no supplementation in the presence of the current methionine intake
should be more feasible. However, a look at the individual data (figure 7.4) shows no
sign of any trend towards an increase in GSH FSR. Another important consideration was
199
whether at 10 mg.kg-1.day-1 the level of cysteine supplementation was adequate to detect
a significant change in GSH kinetics if one occurred. This level was chosen because of
the concern for acid base balance in the babies with the form of cysteine being
cysteine.HCL. A prior cysteine supplementation study was able to show a statistically
significant 25% increase in GSH FSR when cysteine was supplemented at 15 mg.kg-
1.day-1 (Jahoor, Jackson et al. 1999). With the total sulphur amino acid requirement
provided at the RDA as methionine (Courtney-Martin, Chapman et al. 2008), and
knowledge that babies are able to synthesize adequate cysteine for proteins synthesis
from methionine (Zlotkin, Bryan et al. 1981; Malloy and Rassin 1984), the addition of
cysteine as a supplement therefore, would only be required for GSH synthesis.
Consequently we felt that a supplemental intake of 10 mg.kg-1.day-1 was adequate to
detect a change in GSH FSR if one occurred.
An important finding in this study was the plasma cysteine concentration without
cysteine and with cysteine supplementation. The plasma cysteine concentrations were
152.5 ± 43.7 mmol/L and 173.7 ± 53.0 mmol/L (figure 7.4) without and with cysteine
supplementation respectively which was not a statistically significant difference. Further,
plasma cysteine concentration without cysteine was higher than that observed in term
breast fed babies (Wu, Edwards et al. 1986), and suggest that when the sulphur amino
acids are provided as methionine only TPN-fed human neonates are able to synthesize
adequate cysteine from methionine for cysteine homeostasis.
This is the first study to our knowledge, in which the definition of the requirement
of an amino acid has been extended to include requirement for antioxidant status in
addition to that required for protein synthesis. The results suggest that the total sulphur

200
amino acid requirement when provided as methionine only is adequate to meet the needs
of the TPN-fed human neonate for antioxidant synthesis as well as protein synthesis.
Further studies with larger numbers and an increased cysteine intake are needed for more
conclusive results.
While the TPN-fed human neonate might be capable of synthesizing adequate
cysteine for GSH synthesis, it has been shown that providing the total sulphur amino acid
as methionine only leads to increased homocysteine concentration (Shoveller, House et
al. 2004; Courtney-Martin, Chapman et al. 2008) in the neonate. Therefore, consideration
should be given to providing the total sulphur amino acids as a balance between
methionine and cysteine particularly since methionine has been implicated in
TPN cholestasis (Moss, Haynes et al. 1999).
The neonates in this study were stable, post operative and did not have any
clinical evidence of TPN cholestasis. They may not be representative of sicker neonates
that are TPN-fed for prolonged periods. Further studies are needed to determine if
neonates on long term TPN with clinical evidence of TPN cholestasis have an increased
requirement for cysteine for GSH synthesis.

201
8 GENERAL DISCUSSION, CONCLUSION AND FUTURE DIRECTIONS
8.1 General Discussion and Conclusions
In the first study presented in this thesis (chapter 4), a safe and stable amino acid
solution appropriate for use in the study of amino acid metabolism in humans was
developed. The development of such a solution allows for the variation of any amino acid
of interest so that its metabolism and requirement could be determined. This work was
therefore crucial as it provided the foundation needed for subsequent studies in this thesis
(chapters 5 and 7) as well as for other studies in our laboratory and the laboratories of
others who study amino acid metabolism in TPN-fed humans.
In the second experiment in this thesis (chapter 5), the total sulphur amino acid
requirement in the TPN-fed human neonate was determined directly using Indicator
Amino Acid Oxidation technique. This is the first human study ever published using this
novel approach. It is also the first of what we hope to be a series of amino acid
requirement estimates in the neonate aimed at formulating an appropriate amino acid
pattern for the TPN-fed human neonate.
Based on our previous piglet work (Shoveller, Brunton et al. 2003); we
hypothesized that the mean requirement for methionine would be ~52 mg.kg-1.day-1. The
mean requirement estimate and a 95% confidence interval were 49.0 and 58.0 mg.kg-
1.day-1 respectively. This remarkably similar estimate to that predicted from the piglet
data serves to further validate the piglet model as a suitable model for estimation of
amino acid requirement in the human neonate. We propose that the total sulphur amino

202
acid requirement be set at 58 mg.kg-1.day-1 (RDA) of methionine to avoid compromise in
protein synthesis and growth in TPN-fed neonates.
Nevertheless, because methionine is the most toxic of all amino acids
(Hardwick, Applegarth et al. 1970; Benevenga 1974), with implications in TPN-
associated liver disease, we recommend that the minimum methionine requirement be
determined and the sulphur amino acids be provided in TPN solutions as a balance
between methionine and cysteine. The provision of a minimum methionine requirement
with the balance of the sulphur amino acids supplied as cysteine is important for two
reasons:
1. There is a direct relationship between methionine intake and plasma
homocysteine concentrations (chapter 5) (Shoveller, House et al. 2004;
Courtney-Martin, Chapman et al. 2008), which can be reduced by
supplying a portion of the sulphur amino acids as cysteine (Di Buono,
Wykes et al. 2003).
2. Intravenous methionine is associated with TPN-associated liver disease
(Moss, Haynes et al. 1999).
Because the requirement estimate calculated from our piglet data (52 mg.kg-1.day-
1) was almost identical to that estimated in our current work (49 mg.kg-1.day-1 ) (chapter
5), we propose that until a formal study is conducted to determine the minimum
methionine requirement in the TPN-fed human neonates, that an estimate of 36 mg.kg-
1.day-1 based on our piglet data (Shoveller, Brunton et al. 2003) be accepted as the
tentative minimum methionine requirement to be provided in the presence of an excess of
cysteine (58 mg.kg-1.day-1). Table 8.1 presents the methionine concentrations of current

203
pediatric amino acid solutions compared with the proposed concentration based on our
current results and the predicted minimum methionine requirement based on the data
from our piglet study (Shoveller, Brunton et al. 2003). The information presented in table
8.1 show that with the exception of Aminosyn-PF, current pediatric amino acid solutions
have methionine content between 24 to 76% in excess of the true methionine
requirement. Such high methionine concentrations could be a contributing factor in the
etiology of TPN-associated liver disease in babies on TPN.
Current methods of determining TSAA requirement measures the requirement
for net protein synthesis. It is unclear whether the requirement estimate includes a
proportion needed for GSH synthesis. This is especially important in the human neonate
in light of evidence which suggest that cysteine is conditionally indispensable in the
human neonate, because the transsulphuration pathway is underdeveloped. Since most
commercial amino acid solutions contain little to no cysteine, it is important to know
whether the human neonate can synthesize adequate cysteine for both protein and GSH
synthesis from methionine. The fourth study therefore (chapter 7), was a pilot study
conducted to begin to address this gap in the literature. The results, although not
conclusive because of the small sample size, strongly suggest that cysteine
supplementation did not increase GSH synthesis, and that TPN-fed neonates are capable
of synthesizing adequate cysteine from methionine for protein synthesis as well as
antioxidant synthesis. The plasma cysteine concentration of the neonates on the cysteine-
free TPN also suggest that they were capable of synthesizing adequate cysteine from
methionine.

204
Table 8. 1 Comparison between methionine concentrations in currently available commercial solutions and proposed concentration based on requirement estimate
A comparison of the methionine concentration in currently available pediatric amino acid
solutions with the proposed concentration obtained for our current requirement estimate
Commercial Pediatric Amino Acid
Solutions
Methionine Concentration (g.100g-1)
Primene 2.4
TrophAmine 3.4
Aminosyn-PF 1.8
Proposed Methionine Concentration1 1.93
Proposed Methionine Concentration2 1.2
1 Total methionine requirement without dietary cysteine (TSAA requirement) (chapter 5)
2 Minimum proposed methionine requirement in the presence of excess dietary cysteine,
calculated from our piglet data (Shoveller, Brunton et al. 2003).

205
A post-hoc sample size calculation using FSR as the main outcome variable suggest an
adequate sample size of 13 to detect a change in FSR with cysteine supplementation.
Although a sample size of 13 was impractical for the purposes of this thesis, it may also
be impractical as a future endeavor given the tremendous difficulty inherent in obtaining
subjects on TPN for a 6-day study, or obtaining consent from parents when blood taking
is required, not only on one but on two separate days. Therefore the possibility of
conducting a trial, with babies randomly assigned to receive cysteine or no cysteine
should also be considered. Such a study will allow each baby to be studied for only a 3
instead of a 6-day period. However, a larger sample size would be required. A theoretical
sample size calculation using the means and standard deviation generated from the
current study estimate for 80% power and p = 0.05, a total of 326 subject will be required
in each group.
In the third study (chapter 6), a repeated-measures design was applied to
determine whether the mean total sulphur amino acid requirement for protein synthesis
was adequate for antioxidant synthesis in healthy adult males. We found that with 4
subjects and 5 different levels of cysteine intake a statistically significant result was not
obtained. Rather, we saw no significant increase in GSH metabolism as we varied the
cysteine intake from 0, 10, 20, 30 and 40 mg.kg-1.day-1. At an intake of 10 mg.kg-1.day-1
we saw a numerical increase in GSH FSR equivalent to about 45% higher than that
observed at the zero cysteine intakes. At cysteine intakes above 10 mg.kg-1.day-1, we
observed a return to baseline in GSH synthesis rates. The lack of statistical significance
on the change in GSH synthesis rate at a cysteine intake of 10 mg.kg-1.day-1 might be
partly but not fully explained by an inadequate sample size. The inability to use the

206
inadequate sample size as the whole explanation is mainly because of the return to
baseline of the GSH synthesis rates at all cysteine intakes above 10 mg.kg-1.day-1. This
return to baseline is an interesting phenomenon requiring further study, as it suggests a
suppression of GSH synthesis at higher intakes of cysteine. It has been previously
suggested that GSH has a strong inhibitory influence on the rate limiting enzyme γ-
glutamylcysteine acting as an effective feedback control for the regulation of GSH
synthesis (Beutler 1989). Further study into this potential mechanism is warranted in light
of our current findings.
The current thesis has presented two studies in which cysteine supplementation
failed to produce a response in GSH synthesis first in healthy adult males and second in
TPN-fed neonates. The results are in opposition to results previously reported in adults
and children in which variation in sulphur amino acid intake led to a significant change in
GSH synthesis (Jahoor, Jackson et al. 1999; Lyons, Rauh-Pfeiffer et al. 2000; Badaloo,
Reid et al. 2002; Jackson, Gibson et al. 2004). The results presented in the current adult
study (chapter 6), may differ from that of other adult studies in a number of important
ways;
1. Deficient dietary protein intake. Healthy subjects experienced a
significant decrease in GSH kinetics in response to a switch from a
habitual to a deficient protein intake (Jackson, Gibson et al. 2004).
2. Deficient sulphur amino acid intake. Healthy subjects experienced a
significant decrease in GSH synthesis in response to a sulphur amino
acid-free diet when compared to a complete diet (Lyons, Rauh-Pfeiffer et
al. 2000).
207
3. The presence of disease. Subjects with sickle cell disease had decreased
GSH concentration and increased synthesis. Decreased concentration is
related to increased consumption (Reid, Badaloo et al. 2000). In HIV
infection decreased GSH concentration and synthesis was ameliorated by
cysteine supplementation (Jahoor, Jackson et al. 1999), with similar
findings in children with protein energy malnutrition (Reid, Badaloo et
al. 2000; Badaloo, Reid et al. 2002).
Contrary to the above characteristics, the subjects in our study were healthy, and
fed a diet sufficient in protein, energy, sulphur amino acids as well as vitamins and
minerals. Hence they were neither stressed nor deficient in sulphur amino acids. At a
cysteine intake of 10 mg.kg-1.day-1, we observed a physiological increase in GSH
synthesis that was not statistical significant. This would not be a particularly surprising
result, since methionine was provided at the mean intake and an additional cysteine
intake of 10 mg.kg-1.day-1 would be closer to the RDA for the total sulphur amino acids.
The return to baseline at intakes of cysteine above 10 mg.kg-1.day-1, we believe is
evidence that cysteine is not needed for GSH synthesis at intakes above the total sulphur
amino acid requirement in a healthy population.
The neonates studies (chapter 7), also showed no evidence of increase in GSH
synthesis with cysteine supplementation. It is possible that because subjects were not
randomized to the cysteine supplementation, that there could have been an order effect.
There was however no change in the infants clinical condition during the course of the
study and we had previously reported similar amino nitrogen flux rates in post surgical

208
infants (1 to 4 days post surgery) (Duffy and Pencharz 1986) on TPN as that observed in
a similar group of infants on TPN who had not had surgery (Duffy, Gunn et al. 1981).
It is possible that these stable neonates were not unduly stressed and that the
previous studies which showed no change in nitrogen balance with cysteine
supplementation can also be extended to include no change in GSH synthesis with
cysteine supplementation.
8.2 Future Directions
As an extension of study two in this thesis, a future study should determine the
minimum methionine requirement in the presence of excess cysteine, so that the total
sulphur amino acid could be provided as a balance between methionine and cysteine.
Future studies are needed to conclusively determine if healthy adults need
additional cysteine in addition to the mean methionine requirement to maintain adequate
antioxidant status. A larger sample size and a focus on lower intake levels of cysteine that
would allow a conclusive decision are necessary. This means that cysteine intakes should
be studied between 5 and 20 mg.kg-1.day-1. In addition mechanistic studies are needed to
determine if a true suppression of GSH at higher cysteine intakes actually occurs.
As a follow-up to the fourth study (chapter 7), a larger number of subjects (n =
13) need to be studied to determine if GSH synthesis is truly unaffected by cysteine
supplementation. A clinical trial in which babies are randomized to receive cysteine or
no cysteine supplementation on a base methionine intake should also be considered, but
the required sample size may be prohibitive. In light of the possibility that GSH synthesis
is suppressed at higher cysteine intakes, a cysteine supplementation of 10 mg.kg-1.day-1
should be repeated with the addition 20 mg.kg-1.day-1 s in a larger number of subjects (n

209
= 13). Further studies into neonates on long term TPN, having clinical symptoms of TPN
cholestasis is also required to determine if cysteine supplementation is beneficial in that
population.

210
9 REFERENCES
Albanese, A. A., Holt, L. E., Davis, V. I., Snyderman, S. E., Lein, M., Smetak, E. M (1949). "The sulfur amino acid reqirement of the infant." Journal of Nutrition 37: 511-.
Badaloo, A., M. Reid, et al. (2002). "Cysteine supplementation improves the erythrocyte glutathione synthesis rate in children with severe edematous malnutrition." Am J Clin Nutr 76(3): 646-52.
Baker, D. H. (2006). "Comparative species utilization and toxicity of sulfur amino acids." J Nutr 136(6 Suppl): 1670S-1675S.
Ball, R. O. and H. S. Bayley (1984). "Tryptophan requirement of the 2.5-kg piglet determined by the oxidation of an indicator amino acid." J Nutr 114(10): 1741-6.
Ball, R. O. and H. S. Bayley (1986). "Influence of dietary protein concentration on the oxidation of phenylalanine by the young pig." Br J Nutr 55(3): 651-8.
Ball, R. O., G. Courtney-Martin, et al. (2006). "The in vivo sparing of methionine by cysteine in sulfur amino acid requirements in animal models and adult humans." J Nutr 136(6 Suppl): 1682S-1693S.
Beath, S. V., P. Davies, et al. (1996). "Parenteral nutrition-related cholestasis in postsurgical neonates: multivariate analysis of risk factors." J Pediatr Surg 31(4): 604-6.
Bell, E. F., L. J. Filer, Jr., et al. (1983). "Effects of a parenteral nutrition regimen containing dicarboxylic amino acids on plasma, erythrocyte, and urinary amino acid concentrations of young infants." Am J Clin Nutr 37(1): 99-107.
Bella, D. L., C. Hahn, et al. (1999). "Effects of nonsulfur and sulfur amino acids on the regulation of hepatic enzymes of cysteine metabolism." Am J Physiol 277(1 Pt 1): E144-53.
Bella, D. L., L. L. Hirschberger, et al. (1999). "Mechanisms involved in the regulation of key enzymes of cysteine metabolism in rat liver in vivo." Am J Physiol 276(2 Pt 1): E326-35.

211
Belli, D. C., R. Albrecht, et al. (2003). "Homocysteine prevents total parenteral nutrition (TPN)-induced cholestasis without changes in hepatic oxidative stress in the rat." J Pediatr Gastroenterol Nutr 36(2): 200-5.
Belli, D. C., L. A. Fournier, et al. (1987). "Total parenteral nutrition-associated cholestasis in rats: comparison of different amino acid mixtures." JPEN J Parenter Enteral Nutr 11(1): 67-73.
Benevenga, N. J. (1974). "Toxicities of methionine and other amino acids." J Agric Food Chem 22(1): 2-9.
Bertolo, R. F., J. A. Brunton, et al. (2003). "Arginine, ornithine, and proline interconversion is dependent on small intestinal metabolism in neonatal pigs." Am J Physiol Endocrinol Metab 284(5): E915-22.
Bertolo, R. F., C. Z. Chen, et al. (1998). "Threonine requirement of neonatal piglets receiving total parenteral nutrition is considerably lower than that of piglets receiving an identical diet intragastrically." J Nutr 128(10): 1752-9.
Bertolo, R. F., P. B. Pencharz, et al. (1999). "A comparison of parenteral and enteral feeding in neonatal piglets, including an assessment of the utilization of a glutamine-rich, pediatric elemental diet." JPEN J Parenter Enteral Nutr 23(2): 47-55.
Beutler, E. (1989). "Nutritional and metabolic aspects of glutathione." Annu Rev Nutr 9: 287-302.
Bianchi, G., M. Brizi, et al. (2000). "Synthesis of glutathione in response to methionine load in control subjects and in patients with cirrhosis." Metabolism 49(11): 1434-9.
Bianchi, G., E. Bugianesi, et al. (1997). "Glutathione kinetics in normal man and in patients with liver cirrhosis." J Hepatol 26(3): 606-13.
Bross, R., R. O. Ball, et al. (1998). "Development of a minimally invasive protocol for the determination of phenylalanine and lysine kinetics in humans during the fed state." J Nutr 128(11): 1913-9.

212
Brown, M. R., B. J. Thunberg, et al. (1989). "Decreased cholestasis with enteral instead of intravenous protein in the very low-birth-weight infant." J Pediatr Gastroenterol Nutr 9(1): 21-7.
Brunton, J. A., R. O. Ball, et al. (2000). "Current total parenteral nutrition solutions for the neonate are inadequate." Curr Opin Clin Nutr Metab Care 3(4): 299-304.
Chessex, P., J. C. Lavoie, et al. (1999). "Survival of guinea pig pups in hyperoxia is improved by enhanced nutritional substrate availability for glutathione production." Pediatr Res 46(3): 305-10.
Cho, E. S., N. Sahyoun, et al. (1981). "Tissue glutathione as a cyst(e)ine reservoir during fasting and refeeding of rats." J Nutr 111(5): 914-22.
Clark, H. E., J. M. Howe, et al. (1970). "Requirements of adult human subjects for methionine and cystine." Am J Clin Nutr 23(6): 731-8.
Courtney-Martin, G., K. P. Chapman, et al. (2008). "Total sulfur amino acid requirement and metabolism in parenterally fed postsurgical human neonates." Am J Clin Nutr 88(1): 115-24.
Cresenzi, C. L., J. I. Lee, et al. (2003). "Cysteine is the metabolic signal responsible for dietary regulation of hepatic cysteine dioxygenase and glutamate cysteine ligase in intact rats." J Nutr 133(9): 2697-702.
Cvitkovic, S., R. F. Bertolo, et al. (2004). "Enteral tryptophan requirement determined by oxidation of gastrically or intravenously infused phenylalanine is not different from the parenteral requirement in neonatal piglets." Pediatr Res 55(4): 630-6.
Dale, G., M. Panter-Brick, et al. (1976). "Plasma amino acid changes in the postsurgical newborn during intravenous nutrition with a synthetic amino acid solution." J Pediatr Surg 11(1): 17-22.
Darling, P. B., R. Bross, et al. (1999). "Isotopic enrichment of amino acids in urine following oral infusions of L-[1-(13)C]phenylalanine and L-[1-(13)C]lysine in humans: confounding effect of D-[13C]amino acids." Metabolism 48(6): 732-7.

213
Demircan, M., O. Ergun, et al. (1999). "Determination of serum bile acids routinely may prevent delay in diagnosis of total parenteral nutrition-induced cholestasis." J Pediatr Surg 34(4): 565-7.
Di Buono, M., L. J. Wykes, et al. (2001). "Dietary cysteine reduces the methionine requirement in men." Am J Clin Nutr 74(6): 761-6.
Di Buono, M., L. J. Wykes, et al. (2001). "Total sulfur amino acid requirement in young men as determined by indicator amino acid oxidation with L-[1-13C]phenylalanine." Am J Clin Nutr 74(6): 756-60.
Di Buono, M., L. J. Wykes, et al. (2003). "Regulation of sulfur amino acid metabolism in men in response to changes in sulfur amino acid intakes." J Nutr 133(3): 733-9.
Dimant, E., E. Landsberg, et al. (1955). "The metabolic behavior of reduced glutathione in human and avian erythrocytes." J Biol Chem 213(2): 769-76.
DU Vigneaud, V., Kilmer, G. W., Rachele, J. R., Cohn, M. (1944). "On the mechanism of the conversion in vivo of methionine to cysteine." Journal of Biological Chemistry 155(Oct): 645-651.
Dudrick, S. J., D. W. Wilmore, et al. (1968). "Long-term total parenteral nutrition with growth, development, and positive nitrogen balance." Surgery 64(1): 134-42.
Duffy, B., T. Gunn, et al. (1981). "The effect of varying protein quality and energy intake on the nitrogen metabolism of parenterally fed very low birthweight (less than 1600 g) infants." Pediatr Res 15(7): 1040-4.
Duffy, B. and P. Pencharz (1986). "The effect of feeding route (i.v. or oral) on the protein metabolism of the neonate." Am J Clin Nutr 43(1): 108-11.
Elango, R., L. A. Goonewardene, et al. (2004). "Parenteral and enteral routes of feeding in neonatal piglets require different ratios of branched-chain amino acids." J Nutr 134(1): 72-8.
Elango, R., P. B. Pencharz, et al. (2002). "The branched-chain amino acid requirement of parenterally fed neonatal piglets is less than the enteral requirement." J Nutr 132(10): 3123-9.

214
Endres, W., I. Lewandowski, et al. (1982). "Parenteral nutrition with a "breast milk adapted" solution of amino acids in infants and children after abdominal surgery." Z Kinderchir 36(1): 3-11.
FAO/WHO/UNU (1985). "Energy and protein requirements. Report of a joint FAO/WHO/UNU expert consultation. World Health Organization Technical Report Service." 724: 1-206.
Finkelstein, J. D., J. J. Martin, et al. (1986). "Effect of dietary cystine on methionine metabolism in rat liver." J Nutr 116(6): 985-90.
Finkelstein, J. D., J. J. Martin, et al. (1988). "Methionine metabolism in mammals. The methionine-sparing effect of cystine." J Biol Chem 263(24): 11750-4.
Fisher, R. L. (1989). "Hepatobiliary abnormalities associated with total parenteral nutrition." Gastroenterol Clin North Am 18(3): 645-66.
Fomon, S. J., E. E. Ziegler, et al. (1986). "Requirement for sulfur-containing amino acids in infancy." J Nutr 116(8): 1405-22.
Food and Nutrition Board, I. o. M. (1998). Dietary Reference Intakes: Thiamin, Riboflavin, Niacin, Vitamin B-6, Vitamin B-12, Pantothenic Acid, Biotin, and Choline. . Washington, DC National Academy Press.
Fukagawa, N. K., A. M. Ajami, et al. (1996). "Plasma methionine and cysteine kinetics in response to an intravenous glutathione infusion in adult humans." Am J Physiol 270(2 Pt 1): E209-14.
Fukagawa, N. K., Y. M. Yu, et al. (1998). "Methionine and cysteine kinetics at different intakes of methionine and cysteine in elderly men and women." Am J Clin Nutr 68(2): 380-8.
Fuller, M. F. and P. J. Garlick (1994). "Human amino acid requirements: can the controversy be resolved?" Annu Rev Nutr 14: 217-41.
Gaull, G., J. A. Sturman, et al. (1972). "Development of mammalian sulfur metabolism: absence of cystathionase in human fetal tissues." Pediatr Res 6(6): 538-47.

215
Geigy, C. (1970). Scientific Tables. Basle, Switzerland, Ciba-Geigy Limited.
Ghosh, S., S. Ting, et al. (2004). "Increased efflux of glutathione conjugate in acutely diabetic cardiomyocytes." Can J Physiol Pharmacol 82(10): 879-87.
Griffith, O. W. (1987). "Mammalian sulfur amino acid metabolism: an overview." Methods Enzymol 143: 366-76.
Griffith, O. W. and A. Meister (1979). "Glutathione: interorgan translocation, turnover, and metabolism." Proc Natl Acad Sci U S A 76(11): 5606-10.
Griffith, O. W. and A. Meister (1979). "Translocation of intracellular glutathione to membrane-bound gamma-glutamyl transpeptidase as a discrete step in the gamma-glutamyl cycle: glutathionuria after inhibition of transpeptidase." Proc Natl Acad Sci U S A 76(1): 268-72.
Hardwick, D. F., D. A. Applegarth, et al. (1970). "Pathogenesis of methionine-induced toxicity." Metabolism 19(5): 381-91.
Heird, W. C., R. B. Dell, et al. (1987). "Amino acid mixture designed to maintain normal plasma amino acid patterns in infants and children requiring parenteral nutrition." Pediatrics 80(3): 401-8.
Heird, W. C. and J. M. Driscoll, Jr. (1975). "Use of intravenously administered lipid in neonates." Pediatrics 56(1): 5-7.
Heird, W. C., W. Hay, et al. (1988). "Pediatric parenteral amino acid mixture in low birth weight infants." Pediatrics 81(1): 41-50.
Heird, W. C. and R. W. Winters (1975). "Total parenteral nutrition. The state of the art." J Pediatr 86(1): 2-16.
Helfrick, F. W., Abelson, Neva M. (1944). "Intravenous Feeding of a Complete Diet in a Child." Journal of Pediatrics 25: 400-403.
Hiramatsu, T., N. K. Fukagawa, et al. (1994). "Methionine and cysteine kinetics at different intakes of cystine in healthy adult men." Am J Clin Nutr 60(4): 525-33.

216
Hogeveen, M., H. J. Blom, et al. (2002). "Hyperhomocysteinemia as risk factor for ischemic and hemorrhagic stroke in newborn infants." J Pediatr 141(3): 429-31.
Holt, L. E., Jr. (1968). "Some problems in dietary amino acid requirements." Am J Clin Nutr 21(5): 367-75.
Holt, L. E., Jr. and S. E. Snyderman (1961). "The amino acid requirements of infants." Jama 175: 100-3.
Hou, C., L. J. Wykes, et al. (2003). "Urinary sulfur excretion and the nitrogen/sulfur balance ratio reveal nonprotein sulfur amino acid retention in piglets." J Nutr 133(3): 766-72.
House, J. D., P. B. Pencharz, et al. (1997). "Phenylalanine requirements determined by using L-[1-14C]phenylalanine in neonatal piglets receiving total parenteral nutrition supplemented with tyrosine." Am J Clin Nutr 65(4): 984-93.
House, J. D., P. B. Pencharz, et al. (1997). "Tyrosine kinetics and requirements during total parenteral nutrition in the neonatal piglet: the effect of glycyl-L-tyrosine supplementation." Pediatr Res 41(4 Pt 1): 575-83.
Humayun, M. A., R. Elango, et al. (2007). "Reevaluation of the protein requirement in young men with the indicator amino acid oxidation technique." Am J Clin Nutr 86(4): 995-1002.
Hunter, E. A. and R. F. Grimble (1994). "Cysteine and methionine supplementation modulate the effect of tumor necrosis factor alpha on protein synthesis, glutathione and zinc concentration of liver and lung in rats fed a low protein diet." J Nutr 124(12): 2319-28.
Jackson, A. A., N. R. Gibson, et al. (2004). "Synthesis of erythrocyte glutathione in healthy adults consuming the safe amount of dietary protein." Am J Clin Nutr 80(1): 101-7.
Jahoor, F., A. Jackson, et al. (1999). "Erythrocyte glutathione deficiency in symptom-free HIV infection is associated with decreased synthesis rate." Am J Physiol 276(1 Pt 1): E205-11.

217
Jahoor, F., L. J. Wykes, et al. (1995). "Protein-deficient pigs cannot maintain reduced glutathione homeostasis when subjected to the stress of inflammation." J Nutr 125(6): 1462-72.
Jones, M. O., A. Pierro, et al. (1993). "The metabolic response to operative stress in infants." J Pediatr Surg 28(10): 1258-62; discussion 1262-3.
Kanaya, S., O. Nose, et al. (1984). "Total parenteral nutrition with a new amino acid solution for infants." J Pediatr Gastroenterol Nutr 3(3): 440-5.
Kubota, A., T. Yonekura, et al. (2000). "Total parenteral nutrition-associated intrahepatic cholestasis in infants: 25 years' experience." J Pediatr Surg 35(7): 1049-51.
Kurpad, A. V., M. M. Regan, et al. (2004). "Effect of cystine on the methionine requirement of healthy Indian men determined by using the 24-h indicator amino acid balance approach." Am J Clin Nutr 80(6): 1526-35.
Kurpad, A. V., M. M. Regan, et al. (2004). "Daily requirement for total sulfur amino acids of chronically undernourished Indian men." Am J Clin Nutr 80(1): 95-100.
Kurpad, A. V., M. M. Regan, et al. (2003). "Daily methionine requirements of healthy Indian men, measured by a 24-h indicator amino acid oxidation and balance technique." Am J Clin Nutr 77(5): 1198-205.
Kwon, Y. H. and M. H. Stipanuk (2001). "Cysteine regulates expression of cysteine dioxygenase and gamma-glutamylcysteine synthetase in cultured rat hepatocytes." Am J Physiol Endocrinol Metab 280(5): E804-15.
La Scala, G. C., C. Le Coultre, et al. (1993). "The addition of lipids increases the total parenteral nutrition-associated cholestasis in the rat." Eur J Pediatr Surg 3(4): 224-7.
Lee, J. I., M. Londono, et al. (2004). "Regulation of cysteine dioxygenase and gamma-glutamylcysteine synthetase is associated with hepatic cysteine level." J Nutr Biochem 15(2): 112-22.
Liu, H., L. E. Harrell, et al. (2005). "Gender differences in glutathione metabolism in Alzheimer's disease." J Neurosci Res 79(6): 861-7.

218
Loff, S., K. L. Waag, et al. (1998). "Long-term total parenteral nutrition-induced hepatobiliary dysfunction in a rabbit model." J Pediatr Surg 33(5): 694-9.
Luo, J. L., F. Hammarqvist, et al. (1998). "Surgical trauma decreases glutathione synthetic capacity in human skeletal muscle tissue." Am J Physiol 275(2 Pt 1): E359-65.
Lyons, J., A. Rauh-Pfeiffer, et al. (2001). "Cysteine metabolism and whole blood glutathione synthesis in septic pediatric patients." Crit Care Med 29(4): 870-7.
Lyons, J., A. Rauh-Pfeiffer, et al. (2000). "Blood glutathione synthesis rates in healthy adults receiving a sulfur amino acid-free diet." Proc Natl Acad Sci U S A 97(10): 5071-6.
Malloy, M. H. and D. K. Rassin (1984). "Cysteine supplementation of total parenteral nutrition: the effect in beagle pups." Pediatr Res 18(8): 747-51.
Malloy, M. H., D. K. Rassin, et al. (1983). "Cyst(e)ine measurements during total parenteral nutrition." Am J Clin Nutr 37(2): 188-91.
Malloy, M. H., D. K. Rassin, et al. (1984). "Total parenteral nutrition in sick preterm infants: effects of cysteine supplementation with nitrogen intakes of 240 and 400 mg/kg/day." J Pediatr Gastroenterol Nutr 3(2): 239-44.
Malmezat, T., D. Breuille, et al. (2000). "Glutathione turnover is increased during the acute phase of sepsis in rats." J Nutr 130(5): 1239-46.
Malmezat, T., D. Breuille, et al. (2000). "Methionine transsulfuration is increased during sepsis in rats." Am J Physiol Endocrinol Metab 279(6): E1391-7.
Matthews, D. E., K. J. Motil, et al. (1980). "Measurement of leucine metabolism in man from a primed, continuous infusion of L-[1-3C]leucine." Am J Physiol 238(5): E473-9.
Medicine, I. o. (2006). Dietary Reference Intakes. The Essential Guide to Nutrient Requirement, National Acadamy Press.
Meister, A. and M. E. Anderson (1983). "Glutathione." Annu Rev Biochem 52: 711-60.

219
Miller, R. G., F. Jahoor, et al. (1995). "Decreased cysteine and proline synthesis in parenterally fed, premature infants." J Pediatr Surg 30(7): 953-7; discussion 957-8.
Miller, R. G., F. Jahoor, et al. (1995). "A new stable isotope tracer technique to assess human neonatal amino acid synthesis." J Pediatr Surg 30(9): 1325-9.
Moss, R. L., J. B. Das, et al. (1993). "Hepatobiliary dysfunction during total parenteral nutrition is caused by infusate, not the route of administration." J Pediatr Surg 28(3): 391-6; discussion 396-7.
Moss, R. L., J. B. Das, et al. (1993). "Total parenteral nutrition-associated cholestasis: clinical and histopathologic correlation." J Pediatr Surg 28(10): 1270-4; discussion 1274-5.
Moss, R. L., A. L. Haynes, et al. (1999). "Methionine infusion reproduces liver injury of parenteral nutrition cholestasis." Pediatr Res 45(5 Pt 1): 664-8.
Mudd, S. H., M. H. Ebert, et al. (1980). "Labile methyl group balances in the human: the role of sarcosine." Metabolism 29(8): 707-20.
Mudd, S. H. and J. R. Poole (1975). "Labile methyl balances for normal humans on various dietary regimens." Metabolism 24(6): 721-35.
Pascal, T. A., B. M. Gillam, et al. (1972). "Cystathionase: immunochemical evidence for absence from human fetal liver." Pediatr Res 6(10): 773-8.
Pascal, T. A., H. H. Tallan, et al. (1972). "Hepatic cystathionase: immunochemical and electrophoretic studies of the human and rat forms." Biochim Biophys Acta 285(1): 48-59.
Pearson, F. C. (1979). "The Limulus amebocyte lysate endotoxin assay: current status." Am J Med Technol 45(8): 704-9.
Pohlandt, F. (1974). "Cystine: a semi-essential amino acid in the newborn infant." Acta Paediatr Scand 63(6): 801-4.

220
Rafii, M., R. Elango, et al. (2007). "High-throughput and simultaneous measurement of homocysteine and cysteine in human plasma and urine by liquid chromatography-electrospray tandem mass spectrometry." Anal Biochem 371(1): 71-81.
Rafii, M., J. M. McKenzie, et al. (2008). "In vivo regulation of phenylalanine hydroxylation to tyrosine, studied using enrichment in apoB-100." Am J Physiol Endocrinol Metab 294(2): E475-9.
Raguso, C. A., A. M. Ajami, et al. (1997). "Effect of cystine intake on methionine kinetics and oxidation determined with oral tracers of methionine and cysteine in healthy adults." Am J Clin Nutr 66(2): 283-92.
Refsum, H., A. W. Grindflek, et al. (2004). "Screening for serum total homocysteine in newborn children." Clin Chem 50(10): 1769-84.
Reid, M., A. Badaloo, et al. (2006). "In vivo rates of erythrocyte glutathione synthesis in adults with sickle cell disease." Am J Physiol Endocrinol Metab 291(1): E73-9.
Reid, M., A. Badaloo, et al. (2000). "In vivo rates of erythrocyte glutathione synthesis in children with severe protein-energy malnutrition." Am J Physiol Endocrinol Metab 278(3): E405-12.
Reid, M. and F. Jahoor (2000). "Methods for measuring glutathione concentration and rate of synthesis." Curr Opin Clin Nutr Metab Care 3(5): 385-90.
Reynolds, M. S., D. L. Steel, et al. (1958). "Nitrogen balances of women maintained on various levels of methionine and cystine." J Nutr 64(1): 99-111.
Riedijk, M. A., B. Stoll, et al. (2007). "Methionine transmethylation and transsulfuration in the piglet gastrointestinal tract." Proc Natl Acad Sci U S A 104(9): 3408-13.
Riedijk, M. A., R. H. van Beek, et al. (2007). "Cysteine: a conditionally essential amino acid in low-birth-weight preterm infants?" Am J Clin Nutr 86(4): 1120-5.
Rigo, J. and J. Senterre (1987). "Significance of plasma amino acid pattern in preterm infants." Biol Neonate 52 Suppl 1: 41-9.

221
Roberts, S. A., R. O. Ball, et al. (1998). "Phenylalanine and tyrosine metabolism in neonates receiving parenteral nutrition differing in pattern of amino acids." Pediatr Res 44(6): 907-14.
Roberts, S. A., R. O. Ball, et al. (2001). "The effect of graded intake of glycyl-L-tyrosine on phenylalanine and tyrosine metabolism in parenterally fed neonates with an estimation of tyrosine requirement." Pediatr Res 49(1): 111-9.
Rose, W. C. (1938). "The nutritive significance of the amino acids." Physiol. Rev. 18: 109-133.
Rose, W. C., M. J. Coon, et al. (1955). "The amino acid requirements of man. XI. The threonine and methionine requirements." J Biol Chem 215(1): 101-10.
Rose, W. C., Johnson, J. E., Haines, W. J. (1950). "The amino acid requirements of man I. The role of valine and methionine." Journal of Biological Chemistry 182: 541-546.
Rose, W. C. and R. L. Wixom (1955). "The amino acid requirements of man. XIII. The sparing effect of cystine on the methionine requirement." J Biol Chem 216(2): 753-73.
Saenz de Pipaon, M., J. Quero, et al. (2005). "Effect of two amino acid solutions on leucine turnover in preterm infants." Biol Neonate 87(4): 236-41.
Seber, G. A. F. (1977). Linear Regression Analysis New york.
Shenkin, A. a. W., Arvid, Ed. (1978). Parenteral Nutrition. World Review of Nutrition and Dietetics. Printed in Switzerland, Basel, S. Karger.
Shew, S. B., T. H. Keshen, et al. (2005). "Assessment of cysteine synthesis in very low-birth weight neonates using a [13C6]glucose tracer." J Pediatr Surg 40(1): 52-6.
Shiman, R. and D. W. Gray (1998). "Formation and fate of tyrosine. Intracellular partitioning of newly synthesized tyrosine in mammalian liver." J Biol Chem 273(52): 34760-9.
222
Shoveller, A. K., J. A. Brunton, et al. (2003). "Dietary cysteine reduces the methionine requirement by an equal proportion in both parenterally and enterally fed piglets." J Nutr 133(12): 4215-24.
Shoveller, A. K., J. A. Brunton, et al. (2003). "The methionine requirement is lower in neonatal piglets fed parenterally than in those fed enterally." J Nutr 133(5): 1390-7.
Shoveller, A. K., J. D. House, et al. (2004). "The balance of dietary sulfur amino acids and the route of feeding affect plasma homocysteine concentrations in neonatal piglets." J Nutr 134(3): 609-12.
Smith, C. V., D. P. Jones, et al. (1996). "Compartmentation of glutathione: implications for the study of toxicity and disease." Toxicol Appl Pharmacol 140(1): 1-12.
Snyderman, S. E., A. Boyer, et al. (1964). "The Essential Amino Acid Requirements of Infants. X. Methionine." Am J Clin Nutr 15: 322-30.
Spivak, W. and R. J. Grand (1983). "General configuration of cholestasis in the newborn." J Pediatr Gastroenterol Nutr 2(2): 381-92.
Stegink, L. D. and G. L. Baker (1971). "Infusion of protein hydrolysates in the newborn infant: plasma amino acid concentrations." J Pediatr 78(4): 595-602.
Stegink, L. D. and L. Den Besten (1972). "Synthesis of cysteine from methionine in normal adult subjects: effect of route of alimentation." Science 178(60): 514-6.
Stipanuk, M. H. (1986). "Metabolism of sulfur-containing amino acids." Annu Rev Nutr 6: 179-209.
Stipanuk, M. H., R. M. Coloso, et al. (1992). "Cysteine concentration regulates cysteine metabolism to glutathione, sulfate and taurine in rat hepatocytes." J Nutr 122(3): 420-7.
Stipanuk, M. H., J. E. Dominy, Jr., et al. (2006). "Mammalian cysteine metabolism: new insights into regulation of cysteine metabolism." J Nutr 136(6 Suppl): 1652S-1659S.

223
Stipanuk, M. H., M. Londono, et al. (2002). "Enzymes and metabolites of cysteine metabolism in nonhepatic tissues of rats show little response to changes in dietary protein or sulfur amino acid levels." J Nutr 132(11): 3369-78.
Stoll, B., J. Henry, et al. (1998). "Catabolism dominates the first-pass intestinal metabolism of dietary essential amino acids in milk protein-fed piglets." J Nutr 128(3): 606-14.
Storch, K. J., D. A. Wagner, et al. (1988). "Quantitative study in vivo of methionine cycle in humans using [methyl-2H3]- and [1-13C]methionine." Am J Physiol 255(3 Pt 1): E322-31.
Storch, K. J., D. A. Wagner, et al. (1990). "[1-13C; methyl-2H3]methionine kinetics in humans: methionine conservation and cystine sparing." Am J Physiol 258(5 Pt 1): E790-8.
Sturman, J. A., G. Gaull, et al. (1970). "Absence of cystathionase in human fetal liver: is cystine essential?" Science 169(940): 74-6.
Swaroop, A. (1973). "A micromethod for the determination of urinary inorganic sulfates." Clin Chim Acta 46(3): 333-6.
Te Braake, F. W., H. Schierbeek, et al. (2008). "Glutathione synthesis rates after amino acid administration directly after birth in preterm infants." Am J Clin Nutr 88(2): 333-9.
Thomas, B., L. L. Gruca, et al. (2008). "Metabolism of Methionine in the Newborn Infant: Response to the Parenteral and Enteral Administration of Nutrients." Pediatr Res.
Tontisirin, K., V. R. Young, et al. (1973). "Plasma tryptophan response curve and tryptophan requirements of elderly people." J Nutr 103(8): 1220-8.
Turner, J., Humayun, A., Elango, R., Rafii, M., Langos, V., Geary, D., Ball, R.O., and Pencharz, P. B. (2006). "Total sulphur amino acid requirement of children with end-stage renal disease." FASEB J. 20: A1042-A1043.

224
Van Aerde, J. E., P. J. Sauer, et al. (1985). "The effect of energy intake and expenditure on the recovery of 13CO2 in the parenterally fed neonate during a 4-hour primed constant infusion of NAH13CO3." Pediatr Res 19(8): 806-10.
van Beynum, I. M., J. A. Smeitink, et al. (1999). "Hyperhomocysteinemia: a risk factor for ischemic stroke in children." Circulation 99(16): 2070-2.
Van Goudoever, J. B., E. J. Sulkers, et al. (1994). "Amino acid solutions for premature neonates during the first week of life: the role of N-acetyl-L-cysteine and N-acetyl-L-tyrosine." JPEN J Parenter Enteral Nutr 18(5): 404-8.
Vina, J., M. Vento, et al. (1995). "L-cysteine and glutathione metabolism are impaired in premature infants due to cystathionase deficiency." Am J Clin Nutr 61(5): 1067-9.
Wernerman, J. and F. Hammarqvist (1999). "Modulation of endogenous glutathione availability." Curr Opin Clin Nutr Metab Care 2(6): 487-92.
Whalen, G. F., R. C. Shamberger, et al. (1990). "A proposed cause for the hepatic dysfunction associated with parenteral nutrition." J Pediatr Surg 25(6): 622-6.
Wilkinson, D. L., R. F. Bertolo, et al. (2004). "Arginine synthesis is regulated by dietary arginine intake in the enterally fed neonatal piglet." Am J Physiol Endocrinol Metab 287(3): E454-62.
Wilmore, D. W. and S. J. Dudrick (1968). "Growth and development of an infant receiving all nutrients exclusively by vein." Jama 203(10): 860-4.
Winters, R. W., Heird, W.C., Dell, R. B et al (1977). plasma amino acids i infants receiving parenteral nutrition Clinical Nutrition Update: Amino Acids. H. L. Greene, Holliday, M. A., Munro, M.A. Chicago, American Medical Association: pp 147-157.
Womack, M., and Rose W. C. (1941). "The partial replacement of dietary methionine by cystine for purposes of growth." Journal of Biological Chemistry 141(2): 375-379.
Wu, G., Y. Z. Fang, et al. (2004). "Glutathione metabolism and its implications for health." J Nutr 134(3): 489-92.

225
Wu, P. Y., N. Edwards, et al. (1986). "Plasma amino acid pattern in normal term breast-fed infants." J Pediatr 109(2): 347-9.
Wykes, L. J., R. O. Ball, et al. (1993). "Development and validation of a total parenteral nutrition model in the neonatal piglet." J Nutr 123(7): 1248-59.
Wykes, L. J., J. D. House, et al. (1994). "Aromatic amino acid metabolism of neonatal piglets receiving TPN: effect of tyrosine precursors." Am J Physiol 267(5 Pt 1): E672-9.
Young, V. R. and D. M. Bier (1987). "Amino acid requirements in the adult human: how well do we know them?" J Nutr 117(8): 1484-7.
Young, V. R., K. Tontisirin, et al. (1972). "Plasma amino acid response curve and amino acid requirements in young men: valine and lysine." J Nutr 102(9): 1159-69.
Young, V. R., D. A. Wagner, et al. (1991). "Methionine kinetics and balance at the 1985 FAO/WHO/UNU intake requirement in adult men studied with L-[2H3-methyl-1-13C]methionine as a tracer." Am J Clin Nutr 54(2): 377-85.
Zello, G. A., P. B. Pencharz, et al. (1990). "The design and validation of a diet for studies of amino acid metabolism in adult humans." Nutrition Research 10(12): 1353-1365.
Zello, G. A., P. B. Pencharz, et al. (1990). "Phenylalanine flux, oxidation, and conversion to tyrosine in humans studied with L-[1-13C]phenylalanine." Am J Physiol 259(6 Pt 1): E835-43.
Zello, G. A., J. M. Smith, et al. (1990). "Development of a heating device for sampling arterialized venous blood from a hand vein." Ann Clin Biochem 27 ( Pt 4): 366-72.
Zello, G. A., L. J. Wykes, et al. (1995). "Recent advances in methods of assessing dietary amino acid requirements for adult humans." J Nutr 125(12): 2907-15.
Zlotkin, S. H. (1984). "Intravenous nitrogen intake requirements in full-term newborns undergoing surgery." Pediatrics 73(4): 493-6.

226
Zlotkin, S. H. and G. H. Anderson (1982). "The development of cystathionase activity during the first year of life." Pediatr Res 16(1): 65-8.
Zlotkin, S. H. and G. H. Anderson (1982). "Sulfur balances in intravenously fed infants: effects of cysteine supplementation." Am J Clin Nutr 36(5): 862-7.
Zlotkin, S. H., M. H. Bryan, et al. (1981). "Cysteine supplementation to cysteine-free intravenous feeding regimens in newborn infants." Am J Clin Nutr 34(5): 914-23.
Zlotkin, S. H., M. H. Bryan, et al. (1981). "Intravenous nitrogen and energy intakes required to duplicate in utero nitrogen accretion in prematurely born human infants." J Pediatr 99(1): 115-20.

227
10 APPENDICES
10.1: Mean plasma cysteine concentration of adult males who participated in study
number 3 (chapter 6) in response to increasing cysteine intake.
0 10 20 30 400
100
200
300
cysteine Intake (mg/kg)
Mea
n Pl
ams
cyst
eine
con
cent
ratio
n (u
mol
/l)
Figure 10. 1 Mean plasma cysteine concentration of adult males in response to graded cysteine intakes
Figure 10.1: Mean plasma cysteine concentration of adult males who participated in study number 3 (chapter 6) in response to increasing cysteine intake.
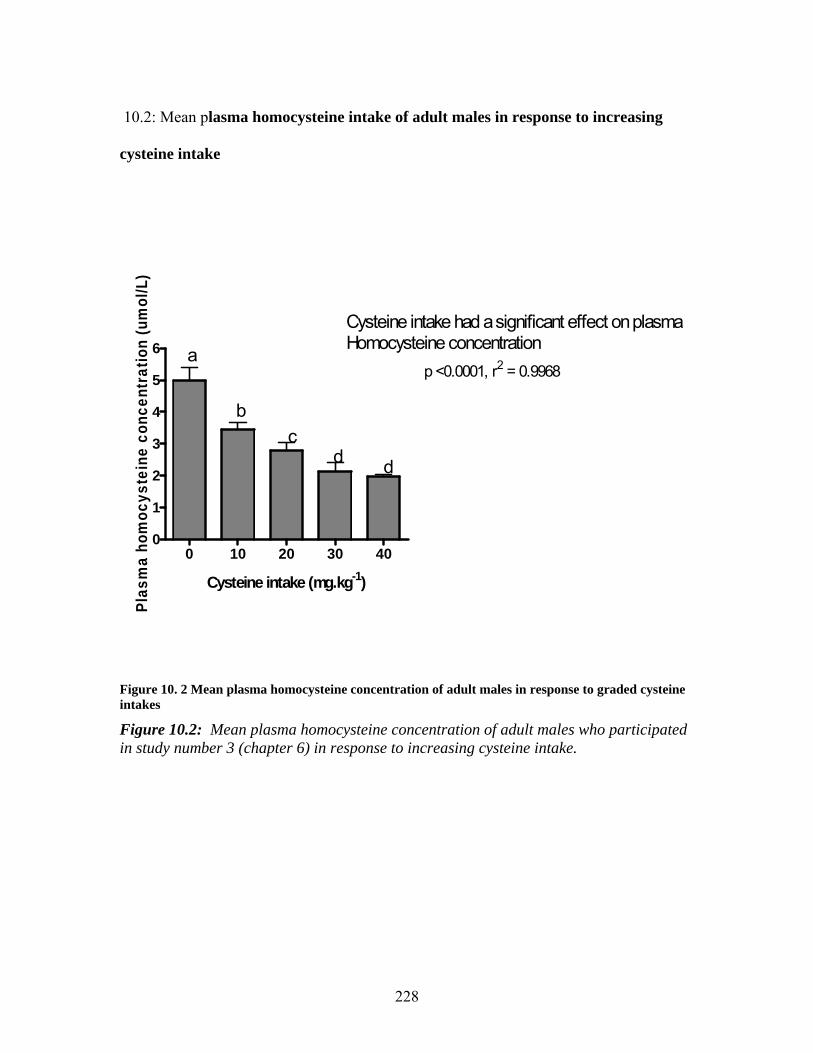
228
10.2: Mean plasma homocysteine intake of adult males in response to increasing
cysteine intake
0 10 20 30 400
1
2
3
4
5
6 a
bc
d d
Cysteine intake had a significant effect on plasmaHomocysteine concentration
p <0.0001, r2 = 0.9968
Cysteine intake (mg.kg-1)
Plas
ma
hom
ocys
tein
e co
ncen
trat
ion
(um
ol/L
)
Figure 10. 2 Mean plasma homocysteine concentration of adult males in response to graded cysteine intakes
Figure 10.2: Mean plasma homocysteine concentration of adult males who participated in study number 3 (chapter 6) in response to increasing cysteine intake.

229
10.3 CONSENT FORMS
Name: Date of Birth: HSC #:
Title of Research Project:
THE METHIONINE REQUIREMENT OF THE TPN FED NEONATE.
Investigators Contact number Contact
Number
Paul Pencharz TPN Program, GI and Nutrition 416-813-7733 Glenda Courtney-Martin Dietitian, PhD Student 416-813-8580 Dr. Aideen Moore Neonatologist 416-813-7331 Dr. Jae Kim Neonatologist Dr. Jacob Langer Surgeon 416-813-6405
Why are we doing this study? This study is being performed to improve the nutrition of infants needing
intravenous nutrition. Infants fed with intravenous nutrition receive their protein needs from a solution made up of a careful balance of amino acids (building blocks of protein). There are currently several solutions available that differ in both the quality and balance of their amino acids. The goal of this study is to determine the best level of one of the 20 amino acids, which will provide optimal growth for infants receiving intravenous nutrition
What will happen during the study?
The purpose of this study is to test the optimal amount of the amino acid
methionine needed by the body. For this study, six levels of methionine will be studied. Each level will be tested over a period of two days. It would be beneficial if your child can participate in two levels for a total of four days. If you choose for your child to participate in the study (s)he will receive a standard pediatric amino acid solution used routinely in the NICU for the first day. On the second day, (s)he will receive the same solution with a different amount of the amino acid under study. In order to see how your
Research Consent Form

230
baby uses this building block (specifically known as phenylalanine), we have specially marked a small amount of an amino acid in the IV solution to see how methionine (the test amino acid) is processed in your infant’s system. This marker is a naturally occurring substance and is completely harmless. We will then look for the appearance of the marker in the babies’ breath and urine. Urine will be collected by placing cotton swabs into the diaper or by using urine bags. Periodically, breath will be collected by placing a clear ventilated hood around your baby’s head. This will take approximately fifteen minutes. Past experience has shown that most babies sleep through this procedure. Throughout much of the study the individual conducting the research (a dietitian) will be helping with the extra attention your child will be receiving.
We will also need to take 0.75mL of blood at the start and at the end of the study to look at the amount of glutathione in your child’s body. Glutathione is a substance which protects the cells from damage and the amount in the blood can be decreased during infection or illness. We aim to coordinate the taking of blood with the regular TPN blood work.
Are there good things and bad things about the study?
There are no known harms associated with participation in this study.
Potential Benefits: This study has no direct benefit to your infant, however it will provide information
that should result in the design of better solutions for future infants in need of intravenous nutrition at The Hospital for Sick Children and in other children’s hospital centres.
Who will know about what I did in the study?
Confidentiality will be respected and no information that discloses the identity of the subject will be released or published without consent unless required by law. This legal obligation includes a number of circumstances, such as suspected child abuse and infectious disease, expression of suicidal ideas where research documents are ordered to be produced by a court of law and where researchers are obligated to report to the appropriate authorities.
For your information, the research consent form will be inserted in the patient health record.
Can I decide if I want to be in the study?
Nobody will be angry or upset if you do not want to be in the study. Participation in research must be voluntary. If you choose not to participate, you and your family will continue to have access to quality care at The Hospital for Sick Children. If you choose on behalf of your child to participate in this study you can withdraw your child from the study at any time. Again, you and your family will continue to have access to quality care at The Hospital for Sick Children.
Consent: By signing this form, I agree that:

231
1) The study has been explained to me. All my questions were answered. 2) The possible harms and discomforts and the possible benefits (if any) of this study have been explained to me. 3) I know about the alternatives to having my child take part in this study. I understand that I have the right to
refuse their participation and the right to stop at any time. My decision about whether or not to participate will not affect my child’s health care at The Hospital for Sick Children.
4) I am free now, and in the future, to ask any questions about the study. 5) I have been told that my child’s medical records will be kept confidential, except where release of
information is required by law, e.g., suspected child abuse, public health. 6) I understand that no information that would identify my child, will be released or printed without asking me first.
I hereby consent for my child to participate. I have read and understood pages 1 to _____of this consent form. The Person who may be contacted Name of Parent about the research is: Glenda Courtney-Martin MSc RD, PhD student. , who may be reached at telephone #: Signature & Date 416-813-5744 or page 416-390-0701 Name of person who obtained consent
Signature & Date
The person whom may be contacted about the research is:
Glenda Courtney-Martin MSc. RD She may be reached at: Tel: 416-813-5744 (HSC) or 416-284-9264 (Home)
Pager: 416-390-0701
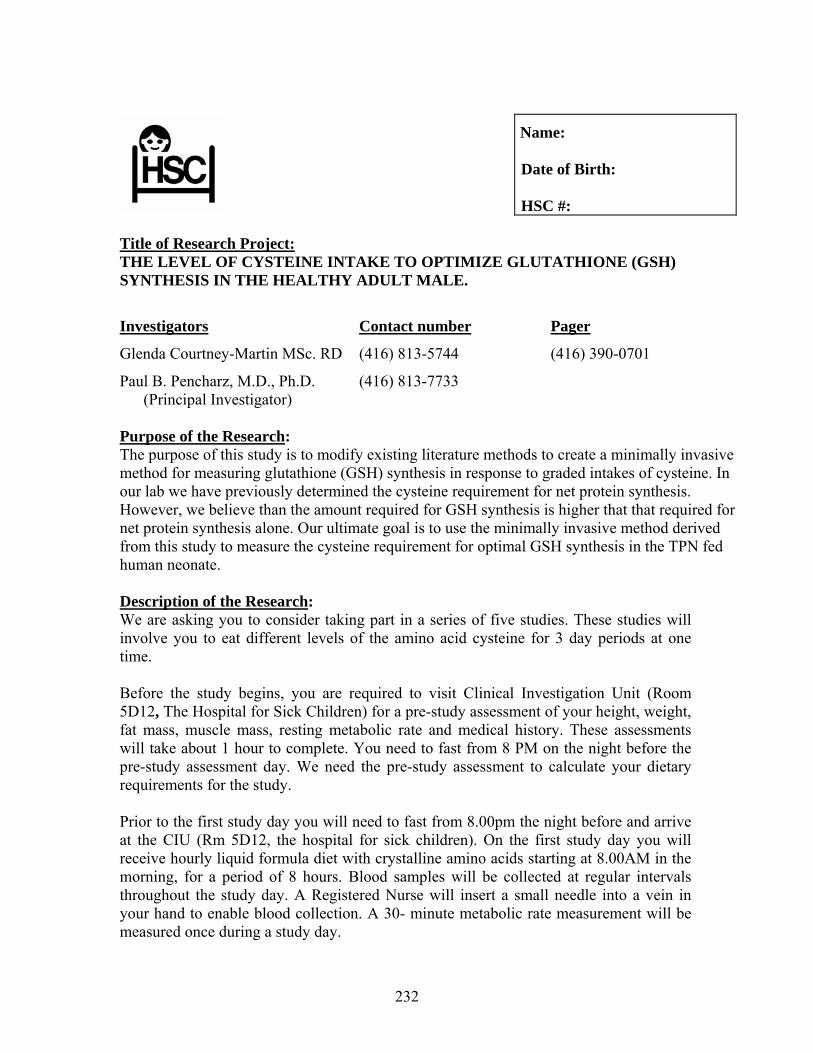
232
Name: Date of Birth: HSC #:
Title of Research Project: THE LEVEL OF CYSTEINE INTAKE TO OPTIMIZE GLUTATHIONE (GSH) SYNTHESIS IN THE HEALTHY ADULT MALE.
Investigators Contact number Pager
Glenda Courtney-Martin MSc. RD (416) 813-5744 (416) 390-0701
Paul B. Pencharz, M.D., Ph.D. (416) 813-7733 (Principal Investigator)
Purpose of the Research: The purpose of this study is to modify existing literature methods to create a minimally invasive method for measuring glutathione (GSH) synthesis in response to graded intakes of cysteine. In our lab we have previously determined the cysteine requirement for net protein synthesis. However, we believe than the amount required for GSH synthesis is higher that that required for net protein synthesis alone. Our ultimate goal is to use the minimally invasive method derived from this study to measure the cysteine requirement for optimal GSH synthesis in the TPN fed human neonate.
Description of the Research: We are asking you to consider taking part in a series of five studies. These studies will involve you to eat different levels of the amino acid cysteine for 3 day periods at one time. Before the study begins, you are required to visit Clinical Investigation Unit (Room 5D12, The Hospital for Sick Children) for a pre-study assessment of your height, weight, fat mass, muscle mass, resting metabolic rate and medical history. These assessments will take about 1 hour to complete. You need to fast from 8 PM on the night before the pre-study assessment day. We need the pre-study assessment to calculate your dietary requirements for the study. Prior to the first study day you will need to fast from 8.00pm the night before and arrive at the CIU (Rm 5D12, the hospital for sick children). On the first study day you will receive hourly liquid formula diet with crystalline amino acids starting at 8.00AM in the morning, for a period of 8 hours. Blood samples will be collected at regular intervals throughout the study day. A Registered Nurse will insert a small needle into a vein in your hand to enable blood collection. A 30- minute metabolic rate measurement will be measured once during a study day.
233
After four hours have gone, we will start to infuse a labeled amino acid into your IV site. This we will infuse until the end of the study. This amino acid occurs naturally and has been used in the past with no adverse effects. We will measure it’s incorporation into glutathione to determine how much cysteine is needed to optimize GSH synthesis. For three days before the study you will be asked to collect all your urine into a container. Also, for two day prior to the study, we will provide the test diet separated into 4 meals to be consumed at 8.00AM, 12 noon, 4.00PM and 8.00PM. Each meal also contains two varieties of cookies (butterscotch and cornflake cherry flavor). The experimental meals are calculated and specific to meet your requirements for all nutrients including, energy and protein. Multi-vitamin tablets will be provided and you are requested to take one per day. You are required to consume all the experimental meals and cookies, and are not allowed to eat other foods or drinks. You are only allowed to drink water. Smoking and alcohol consumption is also prohibited during the study period. You are requested to keep your normal physical activity level but to refrain from participation in competitive sports. All 5 studies will be completed within a 3 month period. Before the start of the study, during consumption of your habitual dietary intake you will be asked to record everything you eat and drink for 2 weekdays and 1 weekend day. If changes are made to the study or new information that might affect your willingness to continue to participate in the research becomes available, you will be informed.
Potential Harms:
There are no known harms associated with participation in this study. There may be a small amount of bleeding when blood is taken from a vein and there may be slight discomfort and bruising or redness that will usually disappear in a few days.
Potential Discomforts or Inconveniences:
There is a significant time commitment associated with participation in this study as you will be required to be at the Hospital for Sick Children on two separate days (one for 1 hour and the other for 8 hours). There is an extra time commitment for getting to the hospital if you do not work at the Hospital for Sick Children. Other inconvenience is that of coming to the hospital fasting if you would normally eat breakfast at home.
Potential Benefits:
You will not benefit directly from participating in this study.
The benefit lies in being able to develop a method for measuring GSH synthesis that is quick, easy and non-invasive (if it is found that measuring in urine is an alternative to plasma) in the TPN fed neonate.

234
Confidentiality:
Confidentiality will be respected and no information that discloses the identity of the subject will be released or published without consent unless required by law. This legal obligation includes a number of circumstances, such as suspected child abuse and infectious disease, expression of suicidal ideas where research documents are ordered to be produced by a court of law and where researchers are obligated to report to the appropriate authorities.
Reimbursement:
Subjects will be reasonably reimbursed for all expenses related to participating in the study. The cost of travel, parking and loss of pay will be covered in the reimbursement as well as a suitable amount for the inconvenience incurred.
Participation:
Participation in research is voluntary. If you choose not to participate, you can withdraw from the study at any time and you and your family will continue to have access to quality care at HSC.
Consent: The following must be the last section on the form and must be reprinted verbatim for participants who can consent for themselves. “By signing this form, I agree that: 1) The study has been explained to me. All my questions were answered. 2) The possible harms and discomforts and the possible benefits (if any) of this study have been explained to me. 3 I know about the alternatives to taking part in this study. I understand that I have the right not to participate and the right to stop at any time. The decision about whether or not to participate will not affect my health care at The Hospital for Sick Children. 4) I am free now, and in the future, to ask any questions about the study. 5) I have been told that my medical records will be kept confidential, except where release of information is required by law, e.g., suspected child abuse, public health. 6) I understand that no information that would identify me will be released or printed without asking me first.” I hereby consent to participate. The Person who may be contacted Name of Patient and Age about the research is: ,

235
who may be reached at telephone #: Signature & Date _________ Name of person who obtained consent
Signature & Date
For answers to questions about research subjects’ rights and research-related injury, please contact the Research Ethics Board Manager at (416) 813-5718.

236
Name: Date of Birth: HSC #:
Title of Research Project: THE EFFECT OF INCREASING CYSTEINE INTAKE ABOVE THE LEVEL OF THE TOTAL SULPHUR AMINO ACID REQUIREMENT ON GSH SYNTHESIS IN THE TPN FED HUMAN NEONATE. Investigator(s): Contact Number Pager Glenda Courtney-Martin MSc. RD 416-813-5744 416- 390-0701 (Dietitain, PhD Student) Paul Pencharz, Principal Investigator 416-813-7733 (Principal Investigator. TPN Program, GI Nutrition) Dr. Jacob Langer 416-813-6405 (Surgeon) Purpose of the Research:
This study is being performed to improve the nutrition of infants needing intravenous nutrition. Infants fed with intravenous nutrition receive their protein needs from a solution made up of a careful balance of amino acids (building blocks of protein). There are currently several solutions available that differ in both the quality and balance of their amino acids. The goal of this study is to determine if giving one of the 20 amino acid at a higher rate than the amount needed for protein synthesis will results in a better antioxidant status for infants receiving intravenous nutrition
Description of the Research:
The purpose of this study is to test whether giving additional cysteine to neonates on TPN will result in an increase in the synthesis of glutathione. Glutathione is a substance which protects the cells from damage and the amount in the blood can be decreased during infection or illness. The amount of glutathione is also found to be low in new born babies. The amount of glutathione that the infant makes will be studied on two different days. If you choose for your child to participate in the study (s)he will receive a modification of a standard pediatric amino acid solution used routinely in the NICU (without cysteine) for the first three days. On the fourth to the sixth day, (s)he will receive the same solution to which cysteine will be added. In order to see how your baby uses cysteine to make the antioxidant glutathione, we have specially marked a small amount of an amino acid in the IV solution to see how cysteine is processed in your infant’s system. This marker is a naturally occurring substance and is completely harmless. We will then look for the appearance of the marker in the babies’ blood. Blood will be collected on two different days. 0.7mls of blood will be collected on each of the 2 days at 4 different time points, for a total of 2.8 mls/day. We aim to coordinate the taking of two blood samples on each of the two

237
days with the regular TPN blood work that is routinely taken for clinical purposes. Blood will be taken from your child’s central line to avoid him/her being poked. Urine will also be collected from cotton placed inside the diaper for 7 hours during the 3rd and 6th day of the study.
Throughout much of the study the individual conducting the research (a dietitian) will be helping with the extra attention your child will be receiving. Potential Harms:
An extra 3mls of blood will be required from your child on 2 separate days within a 6 day period that required for routine clinical practice. This extra 3mls of blood of blood represents less than 2% of your child’s total blood volume and is well within the safety guidelines for blood taking. It is not expected to be harmful to your child.
It is possible that your child could develop and infection by accessing the line for an extra 2 blood samples. A Registered Nurse trained in sterile technique will be employed to draw the blood from your child’s line to minimize the potential risk of infection. Potential Discomforts or Inconvenience:
There is no inconvenience to you or your child from participating in this study since your child is already an in-patient at The Hospital for Sick Children Potential Benefits: This study has no direct benefit to your infant, however it will provide information
that should result in the design of better solutions for future infants in need of intravenous nutrition at The Hospital for Sick Children and in other children’s hospital centres. To individual subjects:
Your child will not benefit directly from participating in this study.
To society: The information from this study would be beneficial to design better TPN solutions for
infants at The Hospital for Sick Children and especially for infants needing TPN for long periods of time. It will also benefit infants on TPN in other hospitals in Canada and around the world. Confidentiality:
Confidentiality will be respected and no information that discloses the identity of the subject will be released or published without consent unless required by law. This legal obligation includes a number of circumstances, such as suspected child abuse and infectious disease, expression of suicidal ideas where research documents are ordered to be produced by a court of law and where researchers are obligated to report to the appropriate authorities. For your information, the research consent form will be inserted in the patient health record.
Reimbursement:

238
There is no compensation for participation in this study since your child will be in hospital at the time of participation. Participation:
Nobody will be angry or upset if you do not want to be in the study. Participation in research must be voluntary. If you choose not to participate, you and your family will continue to have access to quality care at The Hospital for Sick Children. If you choose on behalf of your child to participate in this study you can withdraw your child from the study at
any time. Again, you and your family will continue to have access to quality care at The Hospital for Sick Children.
Sponsorship: The sponsor/funder of this research is The Canadian Institute of Health Research (CIHR) Conflict of Interest: I, and the other research team members have no conflict of interest to declare.

239
Consent : “By signing this form, I agree that: 1) You have explained this study to me. You have answered all my questions. 2) You have explained the possible harms and benefits (if any) of this study. 3) I know what I could do instead of having my child take part in this study. I understand
that I have the right to refuse to let my child take part in the study. I also have the right to take my child out of the study at any time. My decision about my child taking part in the study will not affect my child’s health care at Sick Kids.
4) I am free now, and in the future, to ask questions about the study. 5) I have been told that my child’s medical records will be kept private except as described to me. 6) I understand that no information about my child will be given to anyone or be published without first asking my permission. 7) I agree, or consent, that my child___________________ may take part in this study.” _________________________________ Printed Name of Parent/Legal Guardian Parent/Legal Guardian’s signature & date _________ _________________________________ Printed Name of person who explained consent Signature of Person who explained consent & date _________________________________________________________________________ Printed Witness’ name (if the parent/legal guardian Witness’ signature & date does not read English) If you have any questions about this study, please call
_________________at__________________
If you have questions about your rights as a subject in a study or injuries during a study, please call the Research Ethics Manager at 416-813-5718.”
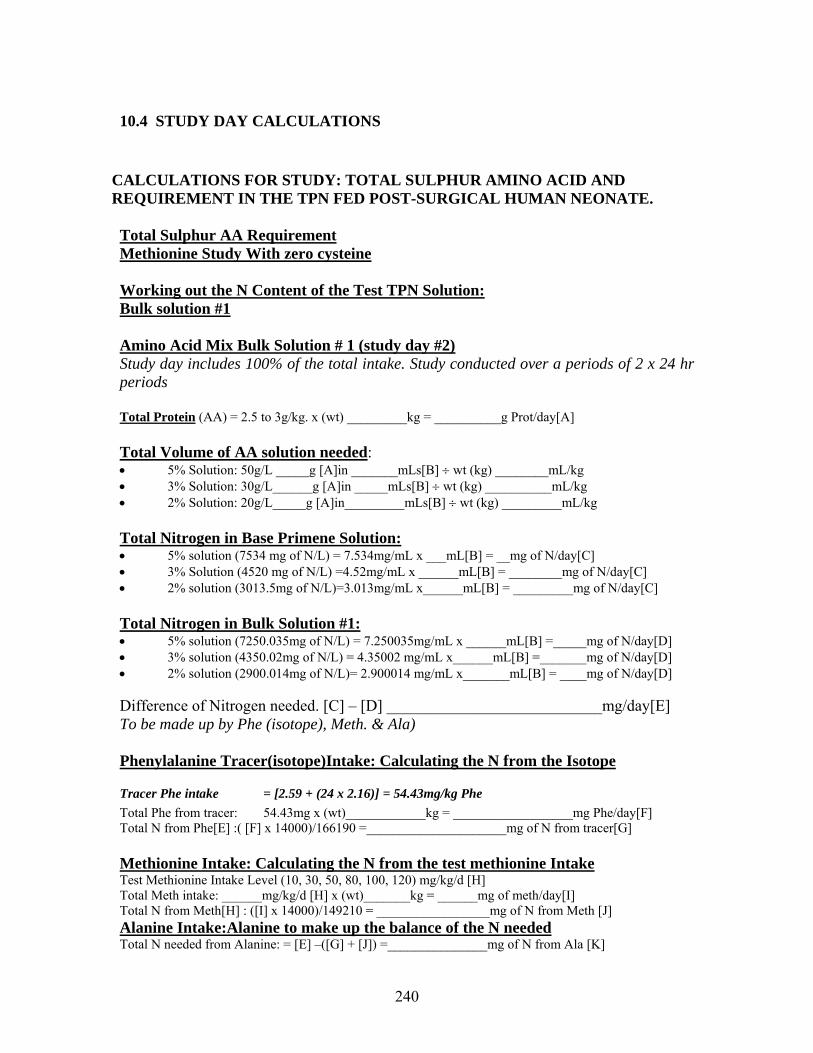
240
10.4 STUDY DAY CALCULATIONS
CALCULATIONS FOR STUDY: TOTAL SULPHUR AMINO ACID AND REQUIREMENT IN THE TPN FED POST-SURGICAL HUMAN NEONATE. Total Sulphur AA Requirement Methionine Study With zero cysteine Working out the N Content of the Test TPN Solution: Bulk solution #1
Amino Acid Mix Bulk Solution # 1 (study day #2) Study day includes 100% of the total intake. Study conducted over a periods of 2 x 24 hr periods Total Protein (AA) = 2.5 to 3g/kg. x (wt) _________kg = __________g Prot/day[A] Total Volume of AA solution needed: • 5% Solution: 50g/L _____g [A]in _______mLs[B] ÷ wt (kg) ________mL/kg • 3% Solution: 30g/L______g [A]in _____mLs[B] ÷ wt (kg) __________mL/kg • 2% Solution: 20g/L_____g [A]in_________mLs[B] ÷ wt (kg) _________mL/kg Total Nitrogen in Base Primene Solution: • 5% solution (7534 mg of N/L) = 7.534mg/mL x ___mL[B] = __mg of N/day[C] • 3% Solution (4520 mg of N/L) =4.52mg/mL x ______mL[B] = ________mg of N/day[C] • 2% solution (3013.5mg of N/L)=3.013mg/mL x______mL[B] = _________mg of N/day[C] Total Nitrogen in Bulk Solution #1: • 5% solution (7250.035mg of N/L) = 7.250035mg/mL x ______mL[B] =_____mg of N/day[D] • 3% solution (4350.02mg of N/L) = 4.35002 mg/mL x______mL[B] =_______mg of N/day[D] • 2% solution (2900.014mg of N/L)= 2.900014 mg/mL x_______mL[B] = ____mg of N/day[D] Difference of Nitrogen needed. [C] – [D] ___________________________mg/day[E] To be made up by Phe (isotope), Meth. & Ala) Phenylalanine Tracer(isotope)Intake: Calculating the N from the Isotope
Tracer Phe intake = [2.59 + (24 x 2.16)] = 54.43mg/kg Phe Total Phe from tracer: 54.43mg x (wt)____________kg = __________________mg Phe/day[F] Total N from Phe[E] :( [F] x 14000)/166190 =_____________________mg of N from tracer[G] Methionine Intake: Calculating the N from the test methionine Intake Test Methionine Intake Level (10, 30, 50, 80, 100, 120) mg/kg/d [H] Total Meth intake: ______mg/kg/d [H] x (wt)_______kg = ______mg of meth/day[I] Total N from Meth[H] : ([I] x 14000)/149210 = _________________mg of N from Meth [J] Alanine Intake:Alanine to make up the balance of the N needed Total N needed from Alanine: = [E] –([G] + [J]) =_______________mg of N from Ala [K]

241
Total Alanine needed in mg: = ([K] x 89090)/14000 = ___________mg Ala/day [L] Total Alanine in grams: [L]/1000 = ___________grams of Ala/day[M] Summary of Protein & AA To be Delivered to Patient
1. Protein (g/day) __________________________[A]
2. Volume of AA Solution (mL/day)________________________[B]
3. Total Phenylalanine (isotope) mg/day _________________________[F]
4. Methionine intake mg/kg ___________________[H]
a. Total methionine (mg/day)________________________[I]
5. Total alanine intake (mg/day)________________________[L]
Volume of Phe (isotope), Meth & Alanine to be added. Phenylalanine: (Vial to be sent separately) Phe (isotope): (Prime = 15.6μmol/kg). (CI = 13μmol/kg) Prime = 2.59 mg/kg x __________kg = ________________mg CI = 2.16 mg/kg/hr __________kg= _____________mg/hr x 24h = ____________mg Total (P + CI) = ____________mg phe = ____________________mg phe/day (isotope) Volume of Phe as Tracer (stock solution 15mg/mL) Prime = ________________mg ÷ ______________mg/mL = ____________mL CI = ____________mg/24hr ÷ ______________mg/mL = ____________mL 13Cphe Infusion Volumes: Prime __________mL (infuse over 15 mins) = Prime volume x 60 mins ÷ 15 mins ________mL/hr CI __________mL (infuse fver 23.75 hrs) = CI ÷ 23.75 hrs __________mL/hr x 23.75 hrs. Add 0.9% Nacl to Prime: Add 0.9% NaCl to CI: Methionine: (To be Added to TPN Bulk Solution #1) Test Methionine intake mg/kg ___________________[H] Total Methionine (mg/day)________________________[I] Volume of Methionine: (stock solution 20mg/mL) Total Methionine_______________mg[I] ÷ ______________mg/mL =__________mL Total Methionine in mg/L of TPN (Bulk solution #1) = ( [I] x 1000) ÷ [B] ________________mg/L methionine Alanine: (To be Added to TPN Bulk Solution #1) Alanine Intake:Alanine to make up the balance of the N needed Total Alanine needed (mg/day)_________________[L] Volume of Alanine: (stock solution 50mg/mL) Total Alanine___________________mg[L] ÷ ______________mg/mL =_________mL Total Alanine in mg/L of TPN (Bulk Solution #1) = ([L] x 1000) ÷ [B] ____________________mg/L alanine

242
10.5 Amino Acid Composition of PN Solution
Composition of crystalline L-amino acid mixture used to determine the total sulphur amino acid requirement of the TPN fed post-surgical human neonate
Amino Acid Primene
Proposed Solution#1 (g/100 g total AA)
Final Solution (g/L total AA)
Ileucine 6.7 6.7 6.7 Leucine 9.9 9.9 9.9 Valine 7.6 7.6 7.6 Lysine (lysine-HCL) 10.9 10.9 (13.62) 10.9 (13.62) Methionine 2.4 Variable Variable Cysteine 1.9 0 0 Phenylalanine(diet + isotope) Phe level decreased from original Primene (see text for reasoning)
4.2 3.7 1.9 + (1.8 not added
in total)
3.7 1.9 + (1.8 not added in total)
Tyrosine 0.9 0 All supplied as GT
Tyrosine (total) (GT)
0 4.0 (5.25)
4.0 (5.25)
Threonine 3.7 3.7 3.7 Tryptophan 2.0 2.0 2.0 Histidine 3.8 3.8 3.8 Arginine: base primene solution (increase of 20% based on piglet data)
8.4 8.4(9.66) 9.66
Glycine (total) Glycine to be added (From GT)
4.0 4.0 2.34 (1.66)
4.0 2.34 (1.66
Alanine 7.9 7.9 Additional Variable amt added (to make
solution isonitrogenous)
Aspartate 6.0 6.0 (5.0) 5.0 Glutamate 9.9 9.9 9.9 Proline 3.0 3.0 3.0 Serine 4.0 4.0 4.0 Taurine 0.6 0.6 0.6 Ornathine (excluded because decreases the PH of the solution)
2.2 (0) 0
Total AA (grams/100g) 100.00 94.15* *Proposed “Bulk Solution #1” represents 94.15% of the total protein/total AA.

243
10.6 Study day list of events
Total sulphur amino acid requirement of the TPN fed post-surgical neonate: Study day List of Event by Time Total Study Time:48 Hrs
Pt Name:___________________________________________ Study #:_____________ Pt Weight:__________________________________________ Pt Height:__________________________________________ Dates of Study:Day 1 Day 2:_______________________________ Pt DOB:_ Pt Age: Phenylalanine Intake as Tracer: (prime = 15.6µmol/kg). (CI=13µmol/kg) Prime = 2.59 mg/kg x _________kg = __________mg CI = 2.16mg/kg/hr x _______kg = _______mg/ hr x 24h = _________mg Total (P + CI) = __________mg phe = ________________mg phe Volume of phe as Tracer (stock solution 20mg/ml) Prime =___________mg ÷ ________mg/ml = _________ml CI = ________ mg/24hr ÷ __________mg/ml = __________ml
Time (Hour:Min) List of Events Breath Collection
13CO2 VCO2
TPN, Isotope Urine, calorimetry
Blood for AA, HcY, GSH Blood for HCT within 24 hrs of starting the study
Pre-study Written informed consent Patient set-up Equipment for breath collection Tubes, Epindorfs Container for urine Machine for breath collection Container and chemicals for blood
Bulk TPN, Test Solution Get Isotope Ready Isotope prime_______mls CI___________mls/ hr
Pre-study Check TPN/Primene Order Contact pharmacy
Get doctor to sign order, Verify with dietitian correct TPN order
3:00pm – Dec 18/06 Obtain pt weight and length,
Start Primene TPN order (to be continued for 24 hrs)
7:00 -8:00 am – Dec 19/06 1st baseline urine collection
1st baseline breath collection
10:00 – 11:00am – Dec 1906 2nd baseline urine collection 2nd baseline breath

244
1:00 – 2:00pm – Dec 19/06 3rd baseline urine collection
Baseline blood collection 3rd baseline breath collection
3:00pm- Dec 19/06 Start Test TPN solution Isotope Prime: mls (infuse over 15 minutes)
3:15pm- Dec 19/06 Start CI isotope CI mls/hr x 23.75hrs = mls (run at a constant rate/hr for the period of 23.75 hrs)
3:00am – Dec 20/06 1st plateau breath collection 1st plateau urine collection
7:00am – Dec 20/06 2nd plateau breath collection 2nd plateau urine collection
11:00p – Dec 208/06 3rd plateau breath collection 3rd plateau urine collection
4rd plateau breath collection 4th plateau urine collection
5rd plateau breath collection
1:00pm – Dec 2006 VCO2 measurement
2:00- 3:00pm Dec 20/06 3:00pm Study Ends
6th plateau breath collection Weight and Length
5th plateau urine collection
2nd blood collection
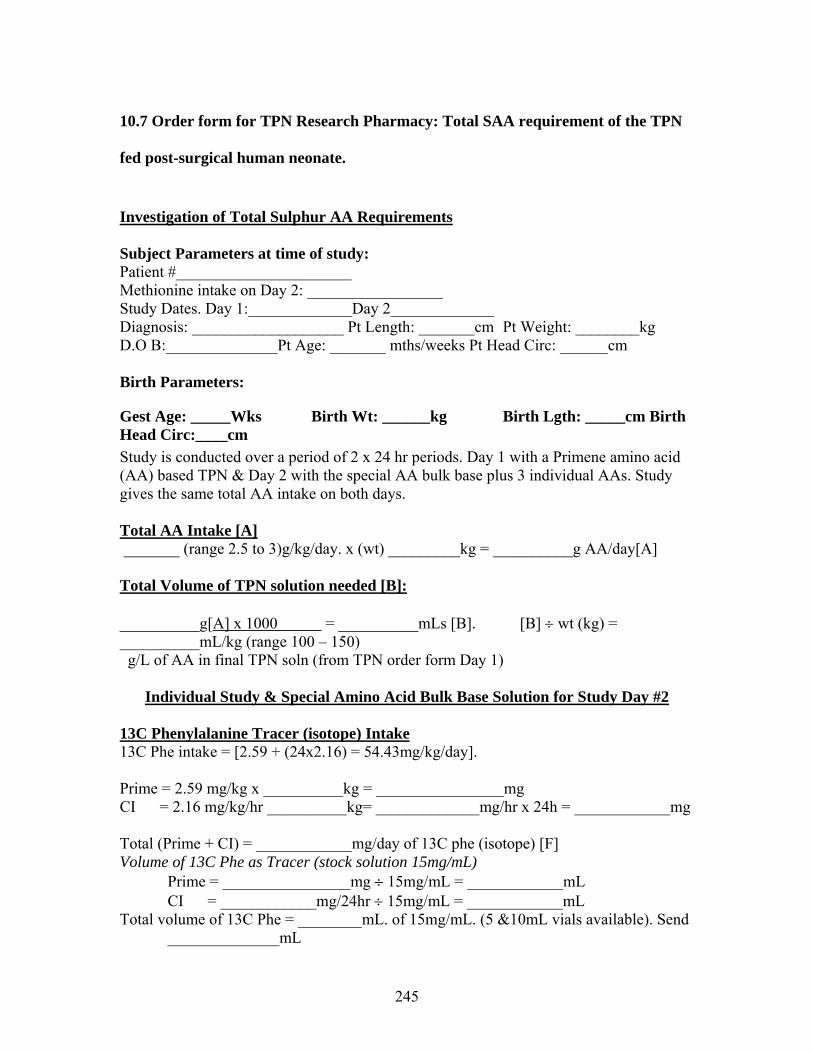
245
10.7 Order form for TPN Research Pharmacy: Total SAA requirement of the TPN
fed post-surgical human neonate.
Investigation of Total Sulphur AA Requirements Subject Parameters at time of study: Patient #______________________ Methionine intake on Day 2: _________________ Study Dates. Day 1:_____________Day 2_____________ Diagnosis: ___________________ Pt Length: _______cm Pt Weight: ________kg D.O B:______________Pt Age: _______ mths/weeks Pt Head Circ: ______cm Birth Parameters:
Gest Age: _____Wks Birth Wt: ______kg Birth Lgth: _____cm Birth Head Circ:____cm Study is conducted over a period of 2 x 24 hr periods. Day 1 with a Primene amino acid (AA) based TPN & Day 2 with the special AA bulk base plus 3 individual AAs. Study gives the same total AA intake on both days. Total AA Intake [A] _______ (range 2.5 to 3)g/kg/day. x (wt) _________kg = __________g AA/day[A] Total Volume of TPN solution needed [B]: __________g[A] x 1000 = __________mLs [B]. [B] ÷ wt (kg) = __________mL/kg (range 100 – 150) g/L of AA in final TPN soln (from TPN order form Day 1)
Individual Study & Special Amino Acid Bulk Base Solution for Study Day #2 13C Phenylalanine Tracer (isotope) Intake 13C Phe intake = [2.59 + (24x2.16) = 54.43mg/kg/day]. Prime = 2.59 mg/kg x __________kg = ________________mg CI = 2.16 mg/kg/hr __________kg= _____________mg/hr x 24h = ____________mg Total (Prime + CI) = ____________mg/day of 13C phe (isotope) [F] Volume of 13C Phe as Tracer (stock solution 15mg/mL) Prime = ________________mg ÷ 15mg/mL = ____________mL CI = ____________mg/24hr ÷ 15mg/mL = ____________mL Total volume of 13C Phe = ________mL. of 15mg/mL. (5 &10mL vials available). Send
______________mL

246
vial(s) to be sent separately (not added to TPN bag). Methionine Intake: (To be Added to Day 2 TPN Solution) Test Methionine Intake Level as randomized (10, 30, 50, 80, 100, 120) mg/kg/day. Column [H] Total Methionine intake: ______mg/kg/d [H] x (wt)_______kg = ______mg of meth/day [I] Concentration of Methionine: Concentration of Methionine in Day 2 study TPN = mg/day [I] x 1000__ Vol of TPN/day = Methionine in Day 2 study TPN = ( [I] x 1000) ÷ [B] =___________mg/L [C].
Methionine TPN Study (with zero cysteine) -Investigation of Total Sulphur AA Requirements Balance Alanine Intake: (To be Added to Day 2 TPN Solution) Balance Alanine Intake: Alanine to make up the balance of the N needed to keep the TPN iso-nitrogenous. As methionine increases, alanine will decrease as laid out in the randomization table, column [J]. Balance Alanine intake:______________mg/kg/day [J] x (wt)_____kg = ________mg of
alanine/day[K]. Concentration of Balance Alanine: Balance Alanine in Day 2 study TPN = ([K] x 1000) ÷ [B] = ______________mg/L [D] Special Bulk Base AA Intake: (To Make Day 2 TPN Solution) Special Bulk Base AA intake = Total AA intake [A] x 1000 – [13C Phenylalanine intake[F] + Methionine intake[I] + Balance alanine intake[K]]. Special Bulk Base AA intake = ________ [A] x 1000 – [________[F] + _________[I] + __________[K]].=_______________ mg/day.[M] [M] ÷ 1000 = _______g/day [N]. Concentration of Special Bulk Base AA: Concentration of Special Bulk Base AA in Day 2 TPN (g/L) = [N] x1000 ÷ .volume of TPN [B] =__________ g/L [E]
Date: _________________ Signature_______________________________ (MD) Time: ________________ Print Name _________________________________

247
10.8 Study day calculations: Methionine-adequate cysteine-free diet does not limit
glutathione synthesis in young healthy adult males.
For Adaptation Days Study #________________________ Study Date :_____________________ Subject _______________________ Height : ___________m Weight : ____________kg Age : _________yrs ________________________________________________________________________ Energy Requirements : kcal/day RMR =___________kcal/day ___________ kcal/day x 1.7 = ____________kcal/day (2 Day Adaptation Diet) ) [A] Diet Constituents: Amino Acids = 10% total energy intake Formula = 65% total energy intake Butterscotch Cookies = 12.5% total energy intake Cornflake Cookies = 12.5% total energy intake Amino Acids = 1.0g Prot/kg/day x ________kg = ________g Prot/day [B] Formula = 0.427ml/kcal x 65% x [A] kcal/day = ________ml/day [C] BS Cookies = 0.234g/kcal x 12.5% x [A] kcal/day = ________g/day [D] CF Cookies = 0.229g/kcal x 12.5% x [A] kcal/day = ________g/day [E]
Amount
Fat (g)
CHO (g)
Prot(g)
Amino Acids
[B]
-
-
Formula
[C]
x 0.1
x 0.36
-
BS Cookies
[D]
x 0.223
x 0.565
-
CF Cookies
[E]
x 0.244
x 0.537
-
Total (g)
Total (kcal)
Actual Energy Intake = __________ kcal/day Energy Distribution = ________% Fat, ________% CHO, ________% Prot
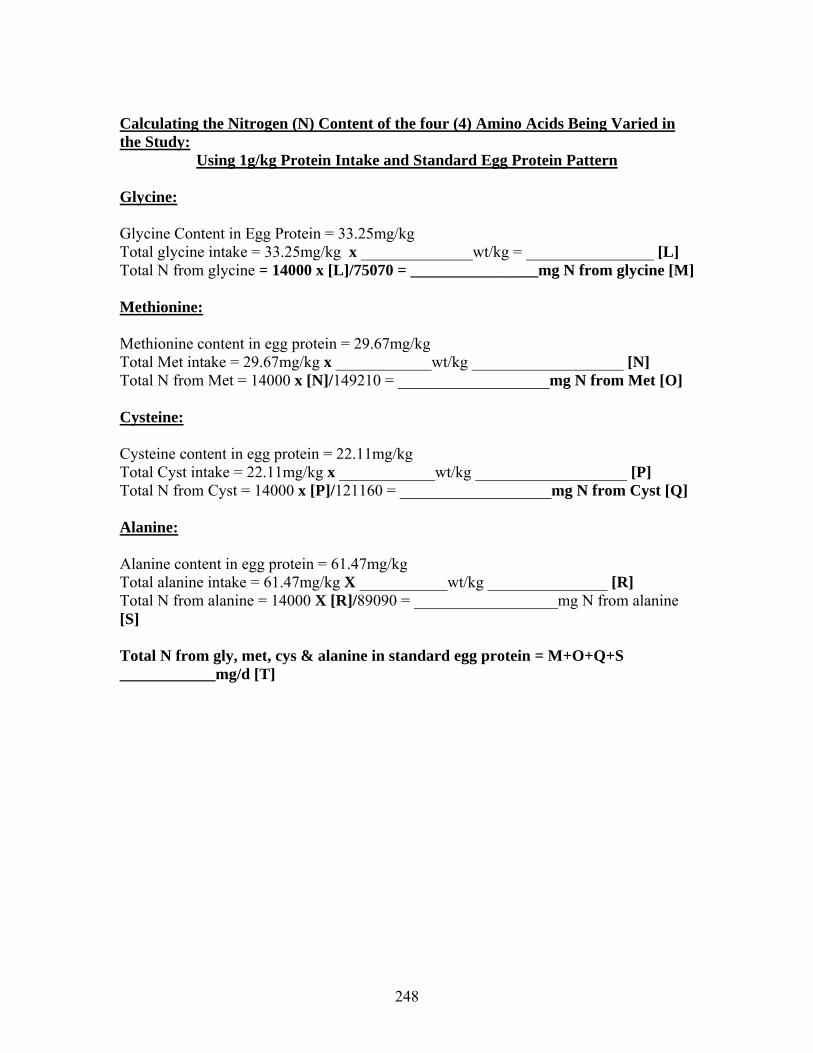
248
Calculating the Nitrogen (N) Content of the four (4) Amino Acids Being Varied in the Study:
Using 1g/kg Protein Intake and Standard Egg Protein Pattern
Glycine:
Glycine Content in Egg Protein = 33.25mg/kg Total glycine intake = 33.25mg/kg x ______________wt/kg = ________________ [L] Total N from glycine = 14000 x [L]/75070 = ________________mg N from glycine [M] Methionine: Methionine content in egg protein = 29.67mg/kg Total Met intake = 29.67mg/kg x ____________wt/kg ___________________ [N] Total N from Met = 14000 x [N]/149210 = ___________________mg N from Met [O] Cysteine: Cysteine content in egg protein = 22.11mg/kg Total Cyst intake = 22.11mg/kg x ____________wt/kg ___________________ [P] Total N from Cyst = 14000 x [P]/121160 = ___________________mg N from Cyst [Q] Alanine: Alanine content in egg protein = 61.47mg/kg Total alanine intake = 61.47mg/kg X ___________wt/kg _______________ [R] Total N from alanine = 14000 X [R]/89090 = __________________mg N from alanine [S] Total N from gly, met, cys & alanine in standard egg protein = M+O+Q+S ____________mg/d [T]

249
Amino Acid Mix # 1 (study day) Each meal represents 1/4 of daily intake (total of 4meals= 100% of daily requirement) ______g Prot/day [B] Mix # 1 represents 85.35% of the total AA reqt = _________g Mix # 1 / study day [Bb] ________g Mix # 1 / study day � 4 meals = ________g Amino acid mix # 1 / meal The total of the other amino acids (gly, met, cys and Ala) = 14.65% of reqt = _________g [BB] Glycine Intake Glycine reqt/day = 66.50 mg/kg x ________kg = ________ mg[F] Dietary Gly/meal = [F] ÷ 4 = ___________mg glycine/meal [H] N from dietary gly = 14000 x [F]/75070 = _______________mg N (dietary glycine [V]

250
Amino Acid Recipe1 Level of Cys Intake _________mg/kg/d First column = mg of amino acids Subject __________________________ Second column = ml of isotope solution
Meal AA Mix (g)
Gly (mg)
Met Intake (mg)
Cys Intake (mg)
Ala Intake(g)
1 2 3 4
Total [Bb] [10] Total: AA mix + gly + met + cys + ala = _________________g/day 14.65% of reqment [BB] =_________________ g/day (Should be same as above) Base Mix (AA mix #1 + Alanine) = A + B____________________
Per Meal = A + B/4 __________________
117/04/98 formula.plt

251
Methionine Intake: = 14mg/kg/day (set level of methionine intake) Met intake/day =_________kg x 14mg/kg/d = ______________mg/d [h] Met intake/meal =[h]/4 = _____________mg/meal [i] N from Met = 14000 x [h]/149210 = _______________mg N (dietary Met) [W] Cys Intake Level ___________________________________ mg/kg/d Cys intake/day = ___ mg/kg/d x _______kg = ______mg [j] Cys intake/meal = [j]/4= ___________mg [k] N from Cyst = 14000 x [j]/121160 = _______________mg N (dietary Cys) [X] Balance Alanine Intake: Alanine to be added to diet = add the N from glycine, met & cys = [V] + [W] + [x] = _________________ _____ = __________________mg N/day [Y] Subtract [Y] from base egg protein N = [T] – [Y] = _____________________= ________________mg N/day [Z] Alanine/day = [Z] x 89090/14000 =__________________mg alanine/day [Z1] ÷ 1000 ___________grams alanine/day [10] _____________________________________________________________________________________________________________

252
Formula Requisition (Study day) Need 100% requirement i.e. 4 meals Formula required per study day = [C] ml = ________ml/day [C] Formula required per meal/d = [C] ml � 4 = ________ml/meal [O] Formula requisition = 4 x ________ml/meal [O] = ________ml/day [P] Formula Recipe
Ingredient
Conc'n (g/ml)
Study day vol(ml) [P]
Study day
amt(g)*
Product #80056
0.281
Orange Tang
0.0832
Koolaid Crystals
0.0832
Corn Oil
0.033
Sterile water
0.64
* Study day amt (g) = Conc'n (g/ml) x study day vol [P] Butterscotch Cookies (study day) BS Cookies required per study day = [D] = ________g/day [D] g BS Cookies required per meal = [D] � 4 = ________g/meal Cornflake Cookies (study day) CF Cookies required per study day = [E] = ________g/day [E] g CF Cookies required per meal = [E] � 4 = ________g/meal ** Each meal is served in a separate plastic bag

253
Diet Requisition Form:
Subject's Name:
Delivery Date:
Formula Recipe: Study Day __________g Product #80056 __________g Orange Tang __________g Koolaid Crystals Flavour:__________ __________g Corn Oil __________g Sterile Water Total volume of formula: __________ml __4__ Bottles __________ml per bottle
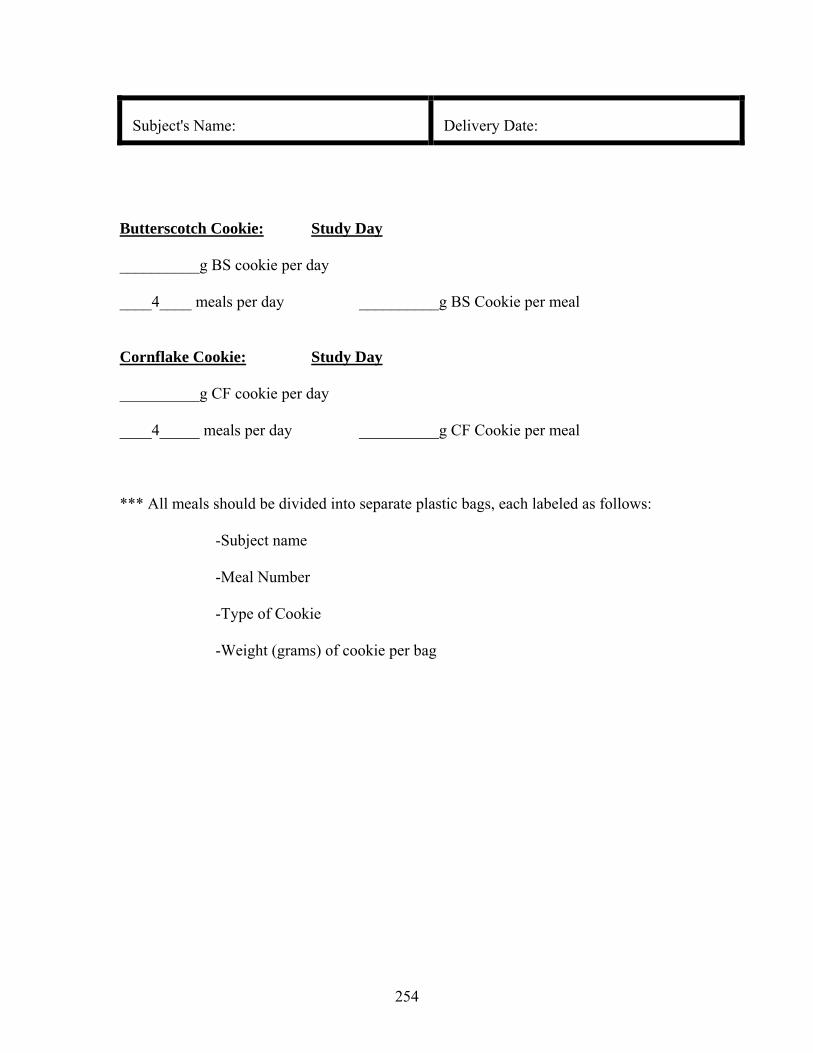
254
Subject's Name:
Delivery Date:
Butterscotch Cookie: Study Day __________g BS cookie per day ____4____ meals per day __________g BS Cookie per meal Cornflake Cookie: Study Day __________g CF cookie per day ____4_____ meals per day __________g CF Cookie per meal *** All meals should be divided into separate plastic bags, each labeled as follows:
-Subject name
-Meal Number
-Type of Cookie
-Weight (grams) of cookie per bag

255
10.9 Study day calculations: Methionine-adequate cysteine-free diet does not limit
glutathione synthesis in young healthy adult males.
For Study Day Study #________________________ Study Date :_____________________ Subject _______________________ Height : ___________m Weight : ____________kg Age : _________yrs ________________________________________________________________________ Energy Requirements : kcal/day RMR =___________kcal/day ___________ kcal/day x 1.5 = ____________kcal/day (for Study Day) [A] Diet Constituents: Amino Acids = 10% total energy intake Formula = 65% total energy intake Butterscotch Cookies = 12.5% total energy intake Cornflake Cookies = 12.5% total energy intake Amino Acids = 1.0g Prot/kg/day x ________kg = ________g Prot/day [B] Formula = 0.427ml/kcal x 65% x [A] kcal/day = ________ml/day [C] BS Cookies = 0.234g/kcal x 12.5% x [A] kcal/day = ________g/day [D] CF Cookies = 0.229g/kcal x 12.5% x [A] kcal/day = ________g/day [E]
Amount
Fat (g)
CHO (g)
Prot(g)
Amino Acids
[B]
-
-
Formula
[C]
x 0.1
x 0.36
-
BS Cookies
[D]
x 0.223
x 0.565
-
CF Cookies
[E]
x 0.244
x 0.537
-
Total (g)
Total (kcal)
Actual Energy Intake = __________ kcal/day Energy Distribution = ________% Fat, ________% CHO, ________% Prot

256
Calculating the Nitrogen (N) Content of the four (4) Amino Acids Being Varied in the Study:
Using 1g/kg Protein Intake and Standard Egg Protein Pattern
Glycine:
Glycine Content in Egg Protein = 33.25mg/kg Total glycine intake = 33.25mg/kg x ______________wt/kg = ________________ [L] Total N from glycine = 14000 x [L]/75070 = ________________mg N from glycine [M] Methionine: Methionine content in egg protein = 29.67mg/kg Total Met intake = 29.67mg/kg x ____________wt/kg ___________________ [N] Total N from Met = 14000 x [N]/149210 = ___________________mg N from Met [O] Cysteine: Cysteine content in egg protein = 22.11mg/kg Total Cyst intake = 22.11mg/kg x ____________wt/kg ___________________ [P] Total N from Cyst = 14000 x [P]/121160 = ___________________mg N from Cyst [Q] Alanine: Alanine content in egg protein = 61.47mg/kg Total alanine intake = 61.47mg/kg X ___________wt/kg _______________ [R] Total N from alanine = 14000 X [R]/89090 = __________________mg N from alanine [S] Total N from gly, met, cys & alanine in standard egg protein = M+O+Q+S ____________mg/d [T]

257
Amino Acid Mix # 1 (study day) Each meal represents 1/12 of daily intake (total of 10 meals= 83.33% of daily requirement) ______g Prot/day [B] Mix # 1 represents 85.35% of the total AA reqt = _________g Mix # 1 / study day ________g Mix # 1 / study day � 12 meals = ________g Amino acid mix # 1 / meal The total of the other amino acids (gly, met, cys and Ala) = 14.65% of reqt = _________g [BB] Glycine Intake Glycine reqt/day = 66.50 mg/kg x ________kg = ________ mg[F] Tracer Gly intake = [3.1228 + (7 x 1.171)] x _____kg = ________mg Gly [G] N from tracer = 14000 x [G]/78070 = ______________mg N (tracer) [U] Dietary Gly = [F] - [G] = ___________mg [H] N from dietary gly = 14000 x [H]/75070 = _______________mg N (dietary glycine [V] The dietary Gly should be distributed between the meals to standardize the intake of each meal. Initially balance the intakes to the highest intake at meal #4. Dietary Gly intake distributed over 12 meals [F] / 12 ____________mg glycine/meal [Ff] Meal # 4 Gly isotope intake = [3.1228 + (1.171)] mg/kg x _______kg = _______mg Gly [a] Meal #4 Dietary Gly = [Ff] – [a] _____________mg Gly [aa] Meal #4 Isotope Prime = (3.1228) mg/kg x _______ kg = __________ mg [ab] Meal #5 - #12 isotope CI = (1.171) mg/kg x ________kg = __________mg/h [b] Meal #5 - #12 balance Gly = [Ff] – [b] = _________ mg / meal #5 - #12 [c] Meal #1 - #3 balance Gly = [Ff] = __________mg / meal #1 - #3 [d] Dietary intake meal #1 - #3 = [d] = __________mg [1] Isotope Intake meal #4 = [a] = __________mg [aa] Isotope Prime = [ab] = __________ mg Isotope CI = [b] = ___________ mg Dietary Intake meal # 4 = [aa]=__________ mg [2] Dietary intake meal #5 - #12 = [c] = _________mg [3]

258
Amino Acid Recipe2 Level of Cys Intake _________mg/kg/d First column = mg of amino acids Subject __________________________ Second column = ml of isotope solution
Meal
AA Mix #1 (g)
Gly Intake (mg)
Met Intake
(mg)
Cys Intake
(mg)
Ala
Intake (mg)
Tracer
Diet
Diet
1
[1]
[i]
[k]
[10]
2
3
4
P
[2]
CI
[aa]
5
[bb]
[3]
6
7
8
9
10
Totals
A
B
Isotope solution concentrations 15N 13C gly 10 mg/ml Base Mix (AA mix #1 + Alanine) = A + B____________________
Per Meal = A + B/10 __________________
217/04/98 formula.plt

259
Methionine Intake: = 14mg/kg/day (set level of methionine intake) Met intake/day =_________kg x 14mg/kg/d = ______________mg/d [h] Met intake/meal =[h]/12 = _____________mg/meal [i] N from Met = 14000 x [h]/149210 = _______________mg N (dietary Met) [W] Cys Intake Level ___________________________________ mg/kg/d Cys intake/day = ___ mg/kg/d x _______kg = ______mg [j] Cys intake/meal = [j]/12= ___________mg [k] N from Cyst = 14000 x [j]/121160 = _______________mg N (dietary Cys) [X] Balance Alanine Intake: Alanine to be added to diet = add the N from glycine (isotope + diet), met & cys = [U] + [V] + [W] + [x] = _________________ mg N/day [Y] Subtract [Y] from base egg protein N = [T] – [Y] = _____________________mg N/day [Z] Alanine/day = [Z] x 89090/14000 =__________________mg alanine/day [Z1] ÷ 1000 ___________grams alanine/day Alanine/meal = [Z1]/12 _________________ mg alanine/meal [10] _____________________________________________________________________________________________________________

260
Formula Requisition (Study day) Need 83.33% requirement i.e. 10 meals Formula required per study day = [C] ml = ________ml/day [C] Formula required per meal/d = [C] ml � 12 = ________ml/meal [O] Formula requisition = 11 x ________ml/meal [O] = ________ml/day [P] Formula Recipe
Ingredient
Conc'n (g/ml)
Study day vol(ml) [P]
Study day
amt(g)*
Product #80056
0.281
Orange Tang
0.0832
Koolaid Crystals
0.0832
Corn Oil
0.033
Sterile water
0.64
* Study day amt (g) = Conc'n (g/ml) x study day vol [P] Butterscotch Cookies (study day) BS Cookies required per study day = [D] = ________g/day [D] g BS Cookies required per meal = [D] � 12 = ________g/meal Cornflake Cookies (study day) CF Cookies required per study day = [E] = ________g/day [E] g CF Cookies required per meal = [E] � 12 = ________g/meal ** Each meal is served in a separate plastic bag

261
Diet Requisition Form:
Subject's Name:
Delivery Date:
Formula Recipe: Study Day __________g Product #80056 __________g Orange Tang __________g Koolaid Crystals Flavour:__________ __________g Corn Oil __________g Sterile Water Total volume of formula: __________ml __11__ Bottles __________ml per bottle

262
Subject's Name:
Delivery Date:
Butterscotch Cookie: Study Day __________g BS cookie per day ____10____ meals per day __________g BS Cookie per meal Cornflake Cookie: Study Day __________g CF cookie per day ____10_____ meals per day __________g CF Cookie per meal *** All meals should be divided into separate plastic bags, each labeled as follows:
-Subject name
-Meal Number
-Type of Cookie
-Weight (grams) of cookie per bag

263
11. Composition of crystalline L-amino acid mixtures used to determine “Does the
addition of cysteine to the total sulphur amino acid requirement (methionine only)
increase erythrocyte glutathione synthesis in the TPN fed human neonate.
Amino Acid Primene
Proposed Solution#1 (g/100 g total AA)
Bulk #1 GSH Study
Bulk #2 GSH Study
Ileucine 6.7 6.7 6.7 6.7 Leucine 9.9 9.9 9.9 9.9 Valine 7.6 7.6 Lysine (lysine-HCL)
10.9 10.9 (13.62)
10.9 (13.62)
10.9 (13.62)
Methionine 2.4 Variable 1.93 1.93 Cysteine Cysteine-HCL
1.9 0 0 0.33 0.48
Phenylalanine 4.2 3.7 4.2 4.2 Tyrosine 0.9 0 0 0 Tyrosine (total) (GT) Glycyl-L-Tyrosine Dihydrate
0 4.0 (5.25)
4.0 (5.25) 6.06
4.0 (5.25) 6.06
Threonine 3.7 3.7 3.7 3.7 Tryptophan 2.0 2.0 2.0 2.0 Histidine 3.8 3.8 3.8 3.8 Arginine: base primene solution (increase of 20% based on piglet data)
8.4 (9.66) 9.66 9.66
Glycine (total) Glycine to be added (From GT)
4.0 4.0 2.34 (1.66)
4.0 total 1.66 from GT 2.34 from Glycine
4.0 total 1.66 from GT 2.34 from Glycine
Alanine 7.9 7.9 7.9 Additional Variable amt added (to make solution isonitrogenous)
7.9 Additional Variable amt added (to make solution isonitrogenous)
Aspartate 6.0 6.0 (5.0) 5.0 5.0 Glutamate 9.9 9.9 9.9 9.9 Proline 3.0 3.0 3.0 3.0 Serine 4.0 4.0 4.0 4.0 Taurine 0.6 0.6 0.6 0.6 Ornathine (excluded because decreases the PH of the solution)
2.2 (0) (0) (0)
Total AA (grams/100g) 100.00 94.15* 98.38 98.71

264
*Proposed “Bulk Solution #1” represents 94.15% of the total protein/total AA. Bulk #1 GSH study represents 98.38% of the total protein/total AA Bulk #2 GSH study represents 98.71% of the total protein/total AA
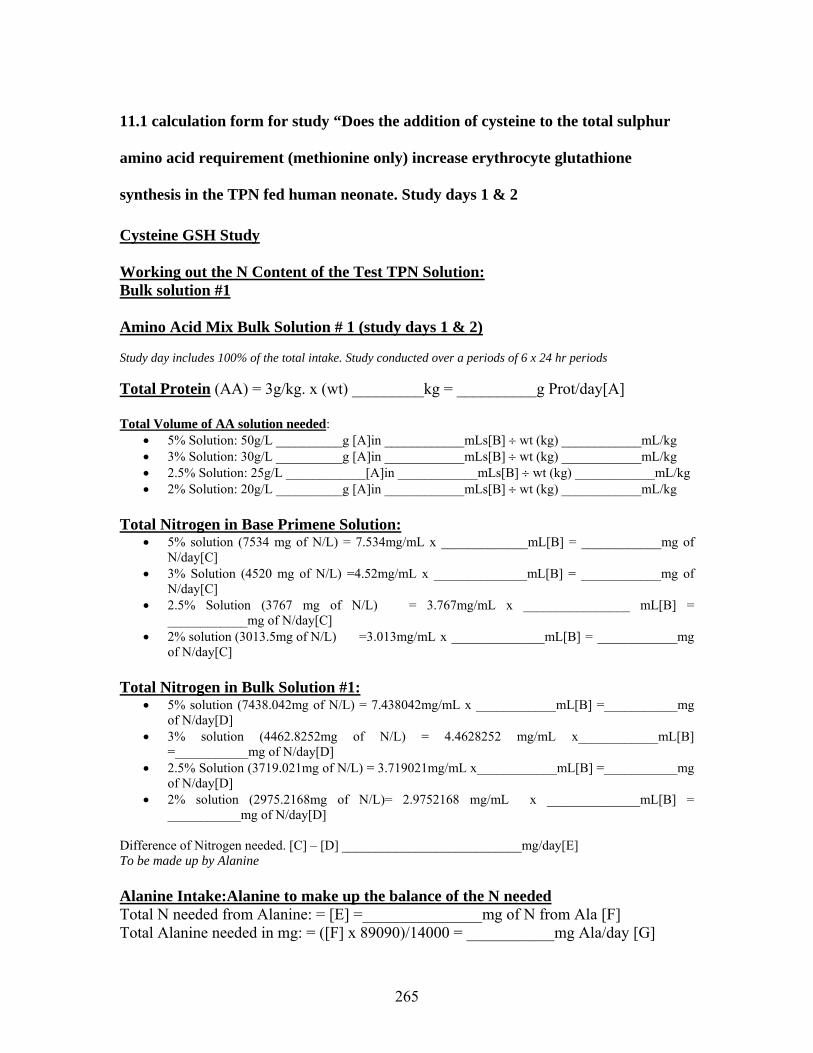
265
11.1 calculation form for study “Does the addition of cysteine to the total sulphur
amino acid requirement (methionine only) increase erythrocyte glutathione
synthesis in the TPN fed human neonate. Study days 1 & 2
Cysteine GSH Study Working out the N Content of the Test TPN Solution: Bulk solution #1
Amino Acid Mix Bulk Solution # 1 (study days 1 & 2) Study day includes 100% of the total intake. Study conducted over a periods of 6 x 24 hr periods Total Protein (AA) = 3g/kg. x (wt) _________kg = __________g Prot/day[A] Total Volume of AA solution needed:
• 5% Solution: 50g/L __________g [A]in ____________mLs[B] ÷ wt (kg) ____________mL/kg • 3% Solution: 30g/L __________g [A]in ____________mLs[B] ÷ wt (kg) ____________mL/kg • 2.5% Solution: 25g/L ____________[A]in ____________mLs[B] ÷ wt (kg) ____________mL/kg • 2% Solution: 20g/L __________g [A]in ____________mLs[B] ÷ wt (kg) ____________mL/kg
Total Nitrogen in Base Primene Solution:
• 5% solution (7534 mg of N/L) = 7.534mg/mL x _____________mL[B] = ____________mg of N/day[C]
• 3% Solution (4520 mg of N/L) =4.52mg/mL x ______________mL[B] = ____________mg of N/day[C]
• 2.5% Solution (3767 mg of N/L) = 3.767mg/mL x ________________ mL[B] = ____________mg of N/day[C]
• 2% solution (3013.5mg of N/L) =3.013mg/mL x ______________mL[B] = ____________mg of N/day[C]
Total Nitrogen in Bulk Solution #1:
• 5% solution (7438.042mg of N/L) = 7.438042mg/mL x ____________mL[B] =___________mg of N/day[D]
• 3% solution (4462.8252mg of N/L) = 4.4628252 mg/mL x____________mL[B] =___________mg of N/day[D]
• 2.5% Solution (3719.021mg of N/L) = 3.719021mg/mL x____________mL[B] =___________mg of N/day[D]
• 2% solution (2975.2168mg of N/L)= 2.9752168 mg/mL x ______________mL[B] = ___________mg of N/day[D]
Difference of Nitrogen needed. [C] – [D] ___________________________mg/day[E] To be made up by Alanine Alanine Intake:Alanine to make up the balance of the N needed Total N needed from Alanine: = [E] =_______________mg of N from Ala [F] Total Alanine needed in mg: = ([F] x 89090)/14000 = ___________mg Ala/day [G]

266
Summary of Protein & AA To be Delivered to Patient
6. Protein (g/day) __________________________[A]
7. Volume of AA Solution (mL/day)________________________[B]
8. Total alanine intake (mg/day)________________________[G]
Volume of Alanine to be added.
Alanine: (To be Added to TPN Bulk Solution #1) Alanine Intake:Alanine to make up the balance of the N needed Total Alanine needed (mg/day)_________________[G] Volume of Alanine: (stock solution 50mg/mL) Total Alanine___________________mg[L] ÷ ______________mg/mL =_________mL Total Alanine in mg/L of TPN (Bulk Solution #1) = ([G] x 1000) ÷ [B] ____________________mg/L alanine

267
11.2 calculation form for study “Does the addition of cysteine to the total sulphur
amino acid requirement (methionine only) increase erythrocyte glutathione
synthesis in the TPN fed human neonate. Study day 3.
Cysteine-GSH Study Page 1 of 2 Today’s Date: ______________________ Subject Parameters at time of study: Patient #______________________ Date:_____________ Study Day:___________________ Diagnosis: ___________________ Pt Weight: ________kg Pt Length: ____cm D.O B:______________ Pt Age: _______ mths/weeks Pt Head Circ: ____cm Birth Parameters:
Gest Age: ________weeks Birth Wt: _____ kg Birth Length: _____cm
Birth Head Circ:____cm Study is conducted over a period of 6 x 24 hr periods. Day 3 “Special Bulk #1” Plus alanine and 15N13C-Glycine
Total AA Intake for each day [A] Using Special Bulk #1 __________ g AA/kg/day (range 2.5 to 3) x _________kg (wt) = __________g AA per day [A](from current intakes) Total Daily Volume of TPN solution needed [ii]: __________g AA [A] x 1000 ÷ _______g/L of AA in final TPN soln= ____________mL [B] (from TPN order form Day 1 & 2) ____________mL [B] ÷ ____________kg (wt) = _______________mL/kg (range 100 – 150) Individual Study & Special Amino Acid Bulk Base Solution for Study Day #3 and 6
only 15N13C-Glycine Tracer (isotope) Intake for Day 3 15N13C-Glycine intake = [3.9035 + (6.75 x 3.1228) = 24.98 mg/kg/day]. 15N13C-Glycine Prime = 3.9035 mg/kg x ___________kg = ____________mg [C] 15N13C-Glycine Continuous Infusion (CI) = 3.1228mg/kg/hr x __________kg= ___________mg/hr x 6.75h = _______mg [D] 15N13C-Glycine (Prime + CI) mg/d = __________mg [C] + __________mg [D] = _________mg/day of 13C Phe [E] Volume of 15N13C-Glycine as Tracer (stock solution 10mg/mL) for pharmacy to send Total volume of 15N13C-Glycine = ________mg/day [E] ÷ 10mg/mL = ____________mL
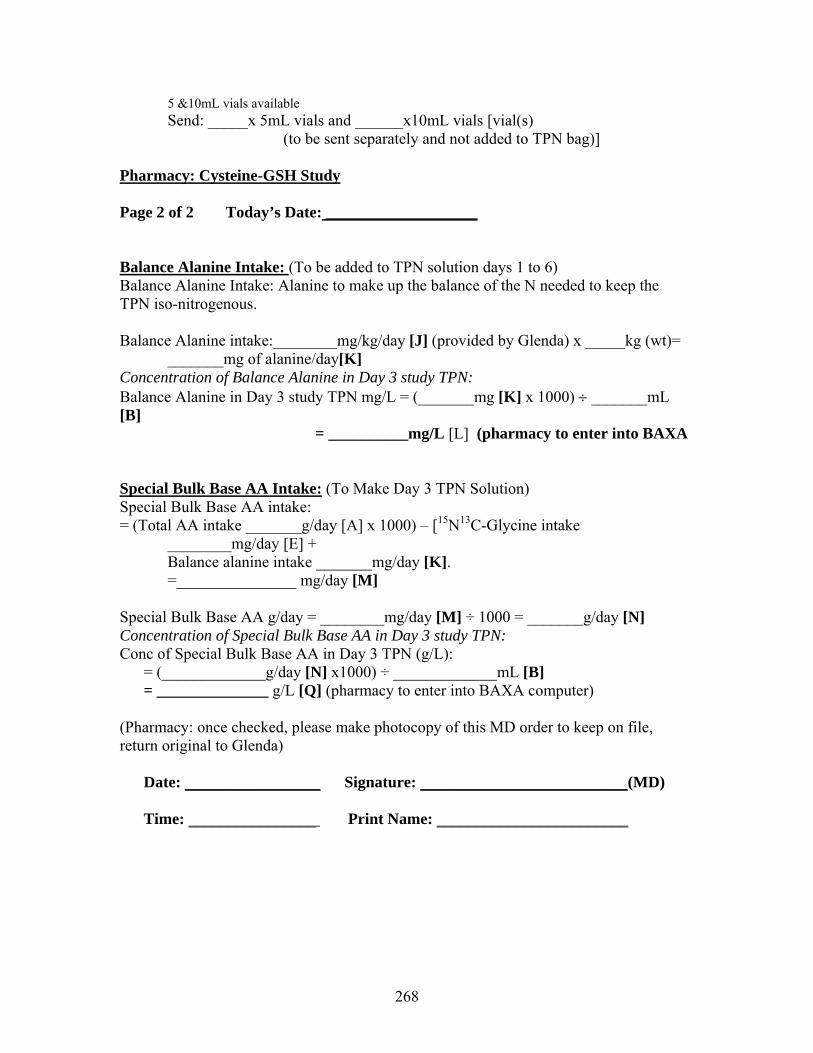
268
5 &10mL vials available Send: _____x 5mL vials and ______x10mL vials [vial(s)
(to be sent separately and not added to TPN bag)]
Pharmacy: Cysteine-GSH Study Page 2 of 2 Today’s Date: ___________________ Balance Alanine Intake: (To be added to TPN solution days 1 to 6) Balance Alanine Intake: Alanine to make up the balance of the N needed to keep the TPN iso-nitrogenous. Balance Alanine intake:________mg/kg/day [J] (provided by Glenda) x _____kg (wt)=
_______mg of alanine/day[K] Concentration of Balance Alanine in Day 3 study TPN: Balance Alanine in Day 3 study TPN mg/L = (_______mg [K] x 1000) ÷ _______mL [B]
= __________mg/L [L] (pharmacy to enter into BAXA
Special Bulk Base AA Intake: (To Make Day 3 TPN Solution) Special Bulk Base AA intake: = (Total AA intake _______g/day [A] x 1000) – [15N13C-Glycine intake
________mg/day [E] + Balance alanine intake _______mg/day [K]. =_______________ mg/day [M]
Special Bulk Base AA g/day = ________mg/day [M] ÷ 1000 = _______g/day [N] Concentration of Special Bulk Base AA in Day 3 study TPN: Conc of Special Bulk Base AA in Day 3 TPN (g/L):
= (_____________g/day [N] x1000) ÷ _____________mL [B] = ______________ g/L [Q] (pharmacy to enter into BAXA computer)
(Pharmacy: once checked, please make photocopy of this MD order to keep on file, return original to Glenda)
Date: _________________ Signature: __________________________(MD) Time: ________________ Print Name: ________________________

269
11.3 calculation form for study “Does the addition of cysteine to the total sulphur
amino acid requirement (methionine only) increase erythrocyte glutathione
synthesis in the TPN fed human neonate. Study days 4 & 5.
Cysteine GSH Study: Days 4 & 5 Using Bulk Solution #2 Working out the N Content of the Test TPN Solution: Bulk solution #2
Amino Acid Mix Bulk Solution # 2 (study days 4 & 5) Study day includes 100% of the total intake. Study conducted over a periods of 6 x 24 hr periods Total Protein (AA) = 3g/kg. x (wt) _________kg = __________g Prot/day[A] Total Volume of AA solution needed:
• 5% Solution: 50g/L __________g [A]in ____________mLs[B] ÷ wt (kg) ____________mL/kg • 3% Solution: 30g/L __________g [A]in ____________mLs[B] ÷ wt (kg) ____________mL/kg • 2.5% Solution: 25g/L ____________[A]in ____________mLs[B] ÷ wt (kg) ____________mL/kg • 2% Solution: 20g/L __________g [A]in ____________mLs[B] ÷ wt (kg) ____________mL/kg
Total Nitrogen in Base Primene Solution:
• 5% solution (7534 mg of N/L) = 7.534mg/mL x _____________mL[B] = ____________mg of N/day[C]
• 3% Solution (4520 mg of N/L) =4.52mg/mL x ______________mL[B] = ____________mg of N/day[C]
• 2.5% Solution (3767 mg of N/L) = 3.767mg/mL x ________________ mL[B] = ____________mg of N/day[C]
• 2% solution (3013.5mg of N/L)=3.013mg/mL x ______________mL[B] = ____________mg of N/day[C]
Total Nitrogen in Bulk Solution #2:
• 5% solution (7457.108mg of N/L) = 7.457108mg/mL x ____________mL[B] =___________mg of N/day[D]
• 3% solution (4474.2648mg of N/L) = 4.4742648 mg/mL x____________mL[B] =___________mg of N/day[D]
• 2.5% Solution (3728.554mg of N/L) = 3.728554mg/mL x____________mL[B] =___________mg of N/day[D]
• 2% solution (2982.8432mg of N/L)= 2.9828432 mg/mL x ______________mL[B] = ___________mg of N/day[D]
Difference of Nitrogen needed. [C] – [D] ___________________________mg/day[E] To be made up by Alanine Alanine Intake:Alanine to make up the balance of the N needed

270
Total N needed from Alanine: = [E] =_______________mg of N from Ala [F] Total Alanine needed in mg: = ([F] x 89090)/14000 = ___________mg Ala/day [G] Summary of Protein & AA To be Delivered to Patient
9. Protein (g/day) __________________________[A]
10. Volume of AA Solution (mL/day)________________________[B]
11. Total alanine intake (mg/day)________________________[G]
Volume of Alanine to be added. Alanine: (To be Added to TPN Bulk Solution #2) Alanine Intake:Alanine to make up the balance of the N needed Total Alanine needed (mg/day)_________________[G] Volume of Alanine: (stock solution 50mg/mL) Total Alanine___________________mg[L] ÷ ______________mg/mL =_________mL Total Alanine in mg/L of TPN (Bulk Solution #2) = ([G] x 1000) ÷ [B] ____________________mg/L alanine
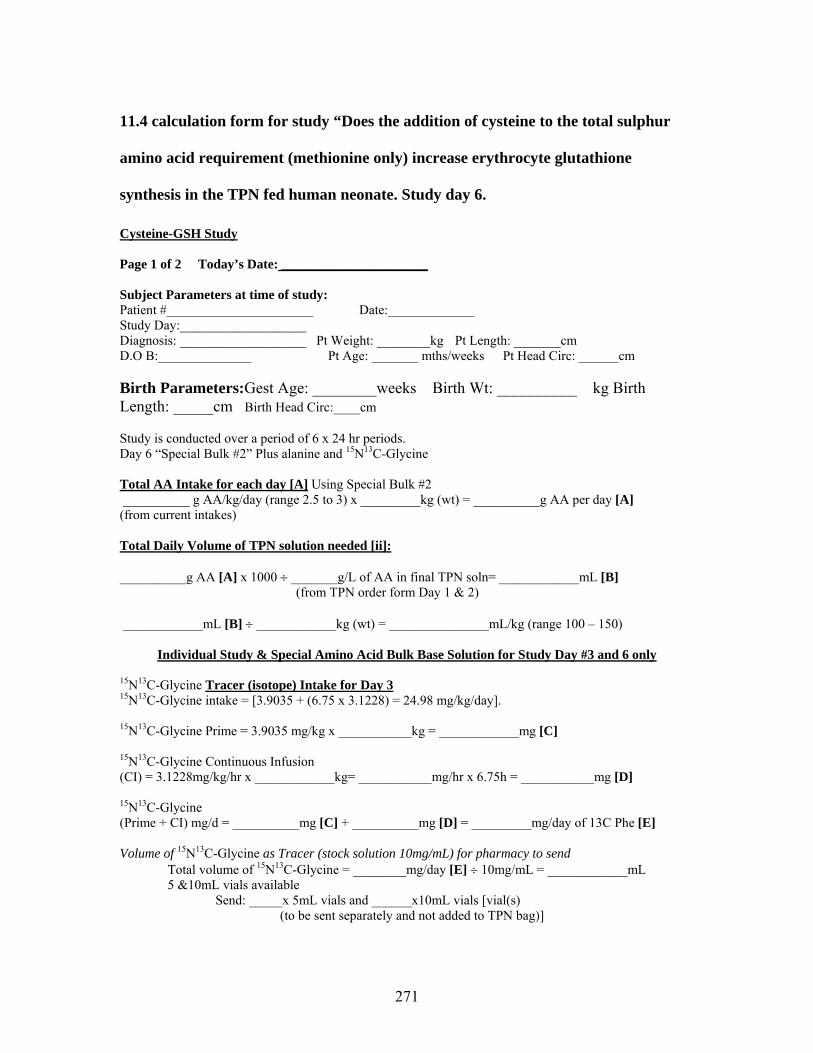
271
11.4 calculation form for study “Does the addition of cysteine to the total sulphur
amino acid requirement (methionine only) increase erythrocyte glutathione
synthesis in the TPN fed human neonate. Study day 6.
Cysteine-GSH Study Page 1 of 2 Today’s Date: ______________________ Subject Parameters at time of study: Patient #______________________ Date:_____________ Study Day:___________________ Diagnosis: ___________________ Pt Weight: ________kg Pt Length: _______cm D.O B:______________ Pt Age: _______ mths/weeks Pt Head Circ: ______cm Birth Parameters:Gest Age: ________weeks Birth Wt: __________ kg Birth Length: _____cm Birth Head Circ:____cm Study is conducted over a period of 6 x 24 hr periods. Day 6 “Special Bulk #2” Plus alanine and 15N13C-Glycine
Total AA Intake for each day [A] Using Special Bulk #2 __________ g AA/kg/day (range 2.5 to 3) x _________kg (wt) = __________g AA per day [A] (from current intakes) Total Daily Volume of TPN solution needed [ii]: __________g AA [A] x 1000 ÷ _______g/L of AA in final TPN soln= ____________mL [B] (from TPN order form Day 1 & 2) ____________mL [B] ÷ ____________kg (wt) = _______________mL/kg (range 100 – 150)
Individual Study & Special Amino Acid Bulk Base Solution for Study Day #3 and 6 only 15N13C-Glycine Tracer (isotope) Intake for Day 3 15N13C-Glycine intake = [3.9035 + (6.75 x 3.1228) = 24.98 mg/kg/day]. 15N13C-Glycine Prime = 3.9035 mg/kg x ___________kg = ____________mg [C] 15N13C-Glycine Continuous Infusion (CI) = 3.1228mg/kg/hr x ____________kg= ___________mg/hr x 6.75h = ___________mg [D] 15N13C-Glycine (Prime + CI) mg/d = __________mg [C] + __________mg [D] = _________mg/day of 13C Phe [E] Volume of 15N13C-Glycine as Tracer (stock solution 10mg/mL) for pharmacy to send Total volume of 15N13C-Glycine = ________mg/day [E] ÷ 10mg/mL = ____________mL 5 &10mL vials available
Send: _____x 5mL vials and ______x10mL vials [vial(s) (to be sent separately and not added to TPN bag)]
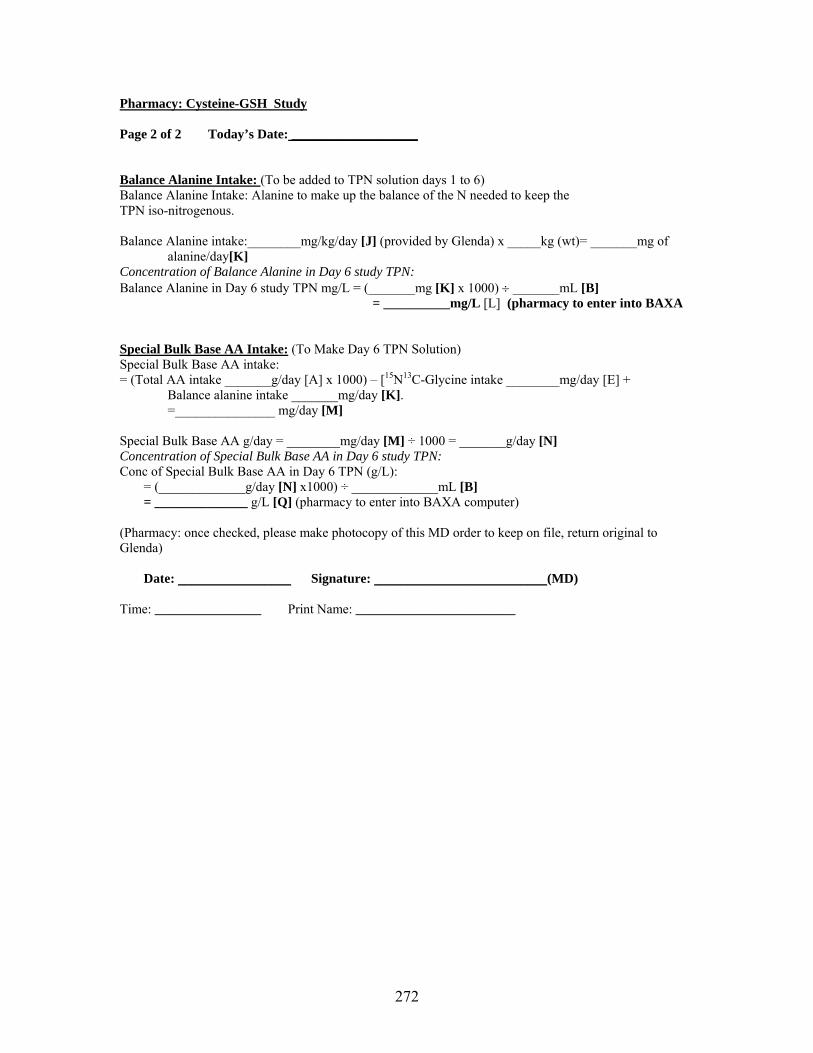
272
Pharmacy: Cysteine-GSH Study Page 2 of 2 Today’s Date: ___________________ Balance Alanine Intake: (To be added to TPN solution days 1 to 6) Balance Alanine Intake: Alanine to make up the balance of the N needed to keep the TPN iso-nitrogenous. Balance Alanine intake:________mg/kg/day [J] (provided by Glenda) x _____kg (wt)= _______mg of
alanine/day[K] Concentration of Balance Alanine in Day 6 study TPN: Balance Alanine in Day 6 study TPN mg/L = (_______mg [K] x 1000) ÷ _______mL [B]
= __________mg/L [L] (pharmacy to enter into BAXA
Special Bulk Base AA Intake: (To Make Day 6 TPN Solution) Special Bulk Base AA intake: = (Total AA intake _______g/day [A] x 1000) – [15N13C-Glycine intake ________mg/day [E] +
Balance alanine intake _______mg/day [K]. =_______________ mg/day [M]
Special Bulk Base AA g/day = ________mg/day [M] ÷ 1000 = _______g/day [N] Concentration of Special Bulk Base AA in Day 6 study TPN: Conc of Special Bulk Base AA in Day 6 TPN (g/L):
= (_____________g/day [N] x1000) ÷ _____________mL [B] = ______________ g/L [Q] (pharmacy to enter into BAXA computer)
(Pharmacy: once checked, please make photocopy of this MD order to keep on file, return original to Glenda)
Date: _________________ Signature: __________________________(MD)
Time: ________________ Print Name: ________________________

273
11.5 Comparison of breakpoint
The mean requirement for methionine was determined for the PN fed human
neonate using a two-phase linear regression crossover model. This model allows a
partitioning of the data between two separate regression lines that minimize the residual
error. This results in a crossover value that is termed the breakpoint. This breakpoint
estimates the amino acid requirement of the sample population.
11.5.1 Breakpoint determination
All individual data points (F13CO2 or Oxidation) are plotted on the y-axis vs.
levels of test amino acid intake (methionine) on the x-axis. Each point on the x-axis is
representative of an individual subject. An estimation of the breakpoint is made by visual
inspection in order to separate the test amino acid intakes into two regression lines. If the
breakpoint cannot be visually determined all possibilities should be analyzed.
The analysis requires that there are at least three points on either side of the
breakpoint to construct a regression line. Sometimes there is an exception and there are
only two points on the right side of the breakpoint. There are four possible models
programmed into SAS:
1. One line has a slope, unweighted regression
2. One line has a slope, weighted regression
3. Both lines have sloped, unweighted regression
4. Both lines have a slow, weighted regression
According to the IAAO concept, the second line should not have a slope or the
slope should be minimal. The purpose of weighting the data is to reduce the numerical
effect such that the points at the end of the line have a similar effect on the slope as the
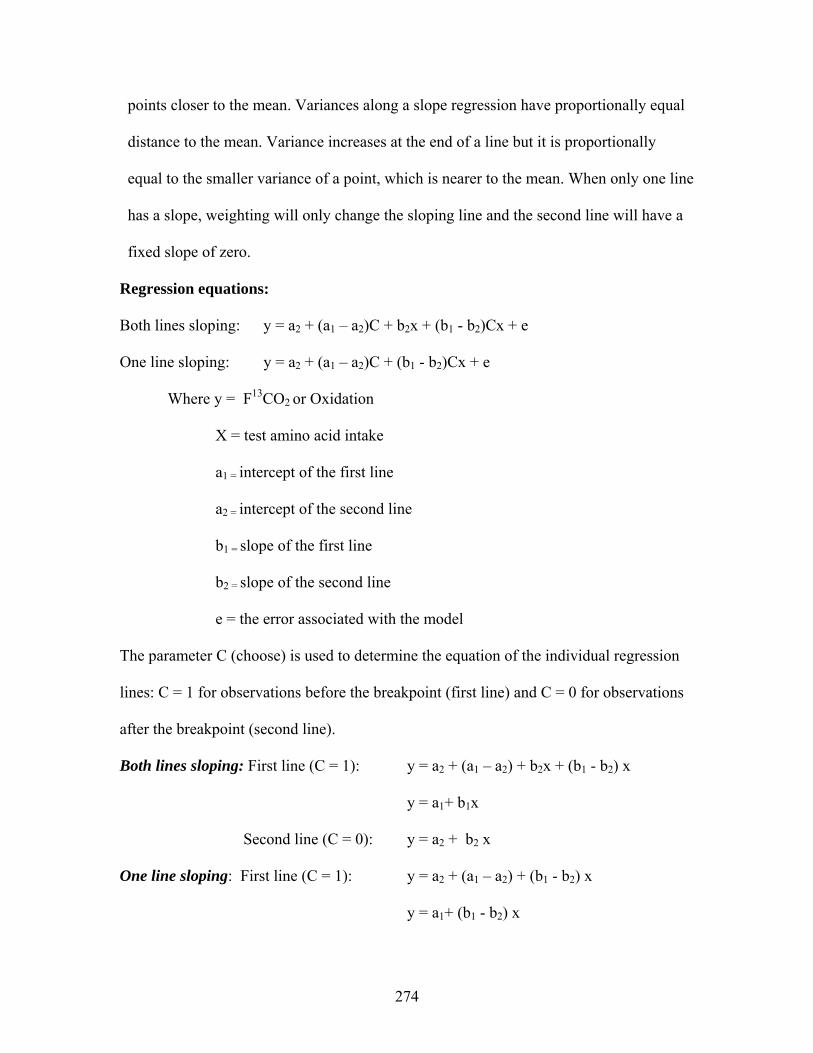
274
points closer to the mean. Variances along a slope regression have proportionally equal
distance to the mean. Variance increases at the end of a line but it is proportionally
equal to the smaller variance of a point, which is nearer to the mean. When only one line
has a slope, weighting will only change the sloping line and the second line will have a
fixed slope of zero.
Regression equations:
Both lines sloping: y = a2 + (a1 – a2)C + b2x + (b1 - b2)Cx + e
One line sloping: y = a2 + (a1 – a2)C + (b1 - b2)Cx + e
Where y = F13CO2 or Oxidation
X = test amino acid intake
a1 = intercept of the first line
a2 = intercept of the second line
b1 = slope of the first line
b2 = slope of the second line
e = the error associated with the model
The parameter C (choose) is used to determine the equation of the individual regression
lines: C = 1 for observations before the breakpoint (first line) and C = 0 for observations
after the breakpoint (second line).
Both lines sloping: First line (C = 1): y = a2 + (a1 – a2) + b2x + (b1 - b2) x
y = a1+ b1x
Second line (C = 0): y = a2 + b2 x
One line sloping: First line (C = 1): y = a2 + (a1 – a2) + (b1 - b2) x
y = a1+ (b1 - b2) x

275
Second line (C = 0): y = a2
(b2 = 0 since the second line does not have a slope
Determine breakpoint:
The breakpoint (estimated mean requirement) is where the two lines intersect.
Both lines sloping: a1 + b1x = a2 + b2x x = - (a1 – a2) (b1 – b2) One line sloping: a1 + (b1- b2)x = a2 x = - (a1 – a2)
(b1 – b2)
(a1 – a2) and (b1 – b2) can be obtained directly from the SAS output as the parameters
choose and met*choose (metchoose).
Choosing the model:
Once all four models are executed (all possibilities of the x-axis to the two
regression lines), the model that best fit the data is chosen. The considered parameters
are:
• The lowest standard error of the largest parameter (choose). The lowest error
ensures that any estimation of the breakpoint will be the most accurate.
• The lowest root mean square error. The aim of linear regression is to minimize the
sum of the squared distances of the points from the line
• The highest r2 should be considered. It indicates that the slopes of the lines most
closely match up to the mean.
SAS program for breakpoint analysis:
Variables:
Sub = subject

276
Met = test amino acid intake (methionine)
f13co2 = individual rate of 13CO2 released from L-[1-13C]phenylalanine
wgt = weighting factor
Parameters of the model are set:
intercept = a2, intercept of the second line
met = b2, slope of the second line
choose = (a1 – a2), difference between the intercept
metchoose = (b1 – b2), difference between the slopes
The estimated position of the breakpoint is entered into the model by defining where
choose = 0 or 1.
For example,
Choose = 0
ptions pagesize=60 nodate nonumber; options formdlim='-'; data study1; input Subj met f13co2 ; wgt = 1/f13co2; cards; 1 9.5 2.5903 2 14.87 1.7494 3 19.16 1.3387 4 24.5 1.4200 5 29.95 1.2868 6 31.8 1.3250 7 33.9 0.9783 8 39.1 0.7152 9 43.7 0.9632 10 49.14 0.6054 11 55.6 0.6066 12 61.5 0.8486 13 61.51 0.3362 14 77.6 0.5368 15 86.3 0.4811 16 99.86 0.9419 17 107.0 0.7467 18 118.7 0.4107 ; proc print data = study1; run;

277
proc glm data = study1; class subj met; model f13co2 = met subj; means met/ duncan tukey; run; proc mixed data = study1; class subj met; model f13co2 = met/ddfm=kr outp=temp; random subj; lsmeans met /pdiff adjust=tukey; run; proc sort data=study1; by subj; run; data bkpt; set study1; run; proc print data=bkpt; var met subj f13co2 ; run; data cutpt49_14; set bkpt; choose = 0; if met le 49.9 then choose =1; metchoose = met * choose; run; proc MIXED data=cutpt49_14; title1 'Met intake 9.5, 14.87, 19.16, 24.5, 29.95, 31.8, 33.9, 39.1, 43.7, 49.14 VS 55.6, 61.5, 61.51, 77.6, 86.3, 99.86, 107.0, 118.7'; title2 ' '; title3 ' '; model f13co2=choose metchoose; Random subj; run; proc reg data = cutpt49_14 outest = param1 covout outsscp =sse ; title1 'Met intake 9.5, 14.87, 19.16, 24.5, 29.95, 31.8, 33.9, 39.1, 43.7, 49.14 VS 55.6, 61.5, 61.51, 77.6, 86.3, 99.86, 107.0, 118.7'; title2 'One line has a Slope'; title3 'Unweighted Regression'; model f13co2 = choose metchoose; run; proc print data=param1; run; proc print data=sse; run;
Example of SAS output of breakpoint
Met intake 9.5, 14.87, 19.16, 24.5, 29.95, 31.8, 33.9, 39.1, 43.7, 49.14 VS 55.6, 61.5,61.51, 77 One line has a Slope Unweighted Regression The REG Procedure Model: MODEL1 Dependent Variable: f13co2 Number of Observations Read 18

278
Number of Observations Used 18 Analysis of Variance Sum of Mean Source DF Squares Square F Value Pr > F Model 2 4.45973 2.22987 38.68 <.0001 Error 15 0.86472 0.05765 Corrected Total 17 5.32445 Root MSE 0.24010 R-Square 0.8376 Dependent Mean 0.99338 Adj R-Sq 0.8159 Coeff Var 24.16987 Parameter Estimates Parameter Standard Variable DF Estimate Error t Value Pr > |t| Intercept 1 0.61357 0.08489 7.23 <.0001 choose 1 1.88183 0.21842 8.62 <.0001 metchoose 1 -0.04053 0.00630 -6.43 <.0001 ------------------------------------------------------------------------------------------------ Met intake 9.5, 14.87, 19.16, 24.5, 29.95, 31.8, 33.9, 39.1, 43.7, 49.14 VS 55.6, 61.5,61.51, 77 One line has a Slope Unweighted Regression Obs _MODEL_ _TYPE_ _NAME_ _DEPVAR_ _RMSE_ Intercept choose metchoose f13co2 1 MODEL1 PARMS f13co2 0.24010 0.61357 1.88183 -0.040531 -1 2 MODEL1 COV Intercept f13co2 0.24010 0.00721 -0.00721 0.000000 . 3 MODEL1 COV choose f13co2 0.24010 -0.00721 0.04771 -0.001175 . 4 MODEL1 COV metchoose f13co2 0.24010 0.00000 -0.00118 0.000040 . ------------------------------------------------------------------------------------------------ Met intake 9.5, 14.87, 19.16, 24.5, 29.95, 31.8, 33.9, 39.1, 43.7, 49.14 VS 55.6, 61.5,61.51, 77 One line has a Slope Unweighted Regression Obs _TYPE_ _NAME_ Intercept choose metchoose f13co2 1 SSCP Intercept 18.000 10.000 295.62 17.881 2 SSCP choose 10.000 10.000 295.62 12.972 3 SSCP metchoose 295.620 295.620 10189.41 324.705 4 SSCP f13co2 17.881 12.972 324.71 23.087 5 N 18.000 18.000 18.00 1