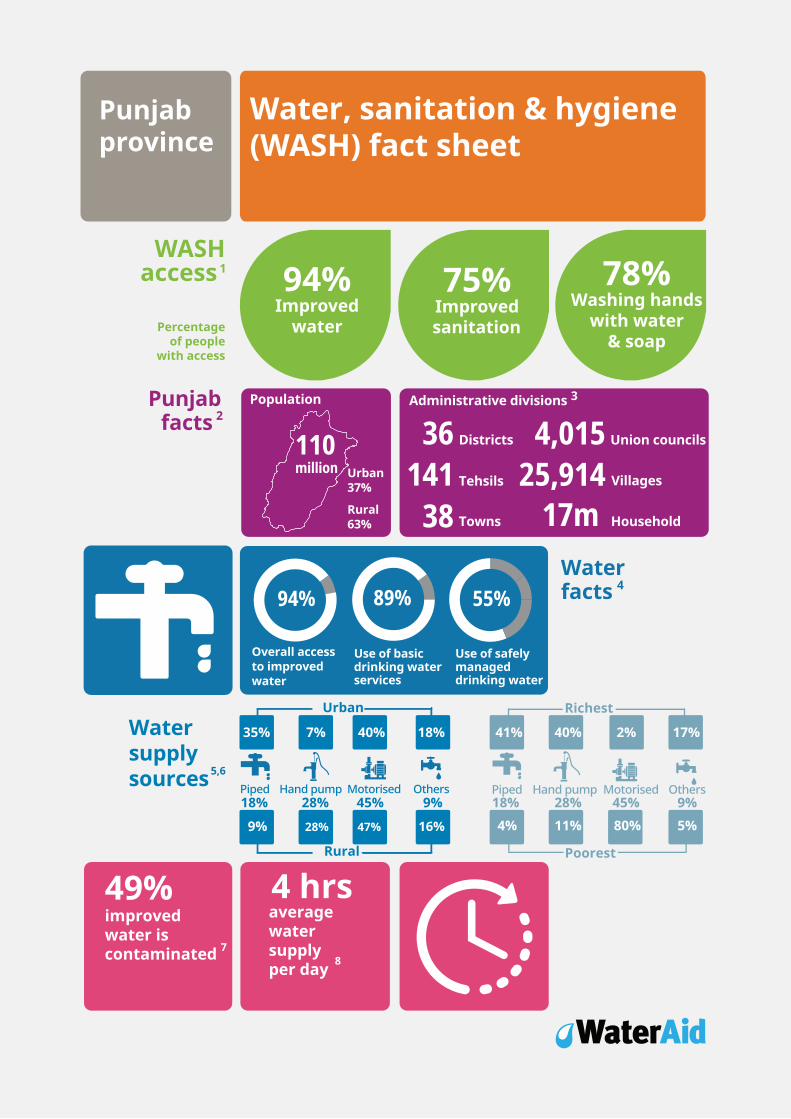
Water, sanitation & hygiene(WASH) fact sheet
WASHaccess
Percentageof people
with access
Punjabfacts
Waterfacts
Watersupplysources
94%Improved
water
75%Improvedsanitation
78%Washing hands
with water& soap
Urban37%
Population Administrative divisions
Rural63%
110 million
Districts
Tehsils
Towns
36141
38
Union councils
Villages
4,01525,914
Household17m
Overall accessto improved water
Use of basic drinking water services
Use of safelymanageddrinking water
improvedwater is contaminated
49%average water supply per day
4 hrs
89%94% 55%
Piped Hand pump Motorised Others
Urban
Rural
9% 28% 47% 16%
35%
18% 28% 45% 9% 18% 28% 45% 9%
7% 40% 18%
Piped Hand pump Motorised Others
Richest
Poorest
4% 11% 80% 5%
41% 40% 2% 17%
Punjabprovince
1
2
4
5,6
78
3
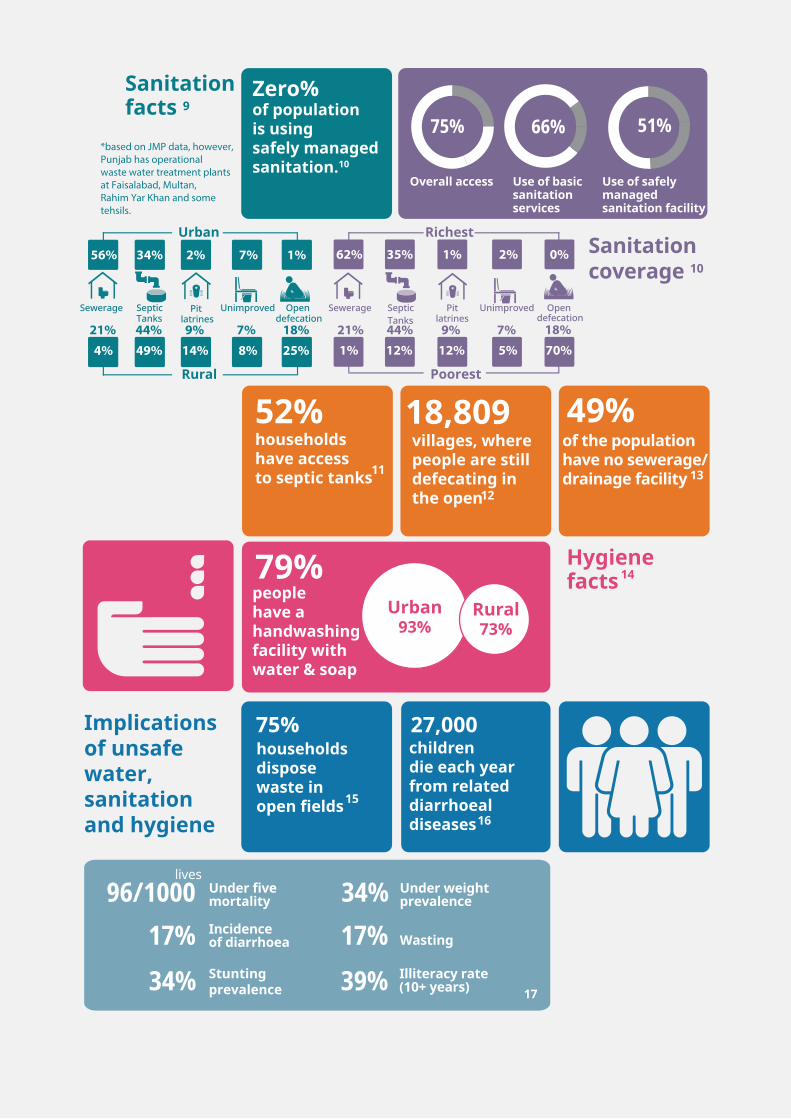
Sanitationcoverage
52% householdshave accessto septic tanks
villages, wherepeople are stilldefecating in the open
of the population have no sewerage/drainage facility
people have a handwashing facility with water & soap
Sanitationfacts
Zero%of populationis using safely managedsanitation.10
Hygienefacts
Implicationsof unsafewater, sanitationand hygiene
27,00075%childrendie each year from related diarrhoealdiseases
*based on JMP data, however, Punjab has operationalwaste water treatment plants at Faisalabad, Multan,Rahim Yar Khan and some tehsils.
Overall access Use of basicsanitationservices
Use of safelymanagedsanitation facility
66% 51%75%
Sewerage Septic Tanks
Pit latrines
Unimproved Open defecation
Urban
Rural
4% 49% 14% 8% 25%21% 44% 9% 7% 18% 21% 44% 9% 7% 18%
56% 34% 2% 7% 1%
Sewerage Septic Tanks
Pitlatrines
Unimproved Open defecation
Richest
Poorest
1% 12% 12% 5% 70%
62% 35% 1% 2% 0%
Under fivemortality
Incidence of diarrhoea
Stuntingprevalence
Under weightprevalence
Wasting
Illiteracy rate(10+ years)
96/1000 17%34%
34%17%39%
lives
Rural73%
Urban93%
79%
18,809 49%
households dispose waste inopen fields
9
10
11
12
14
15
16
17
13
4
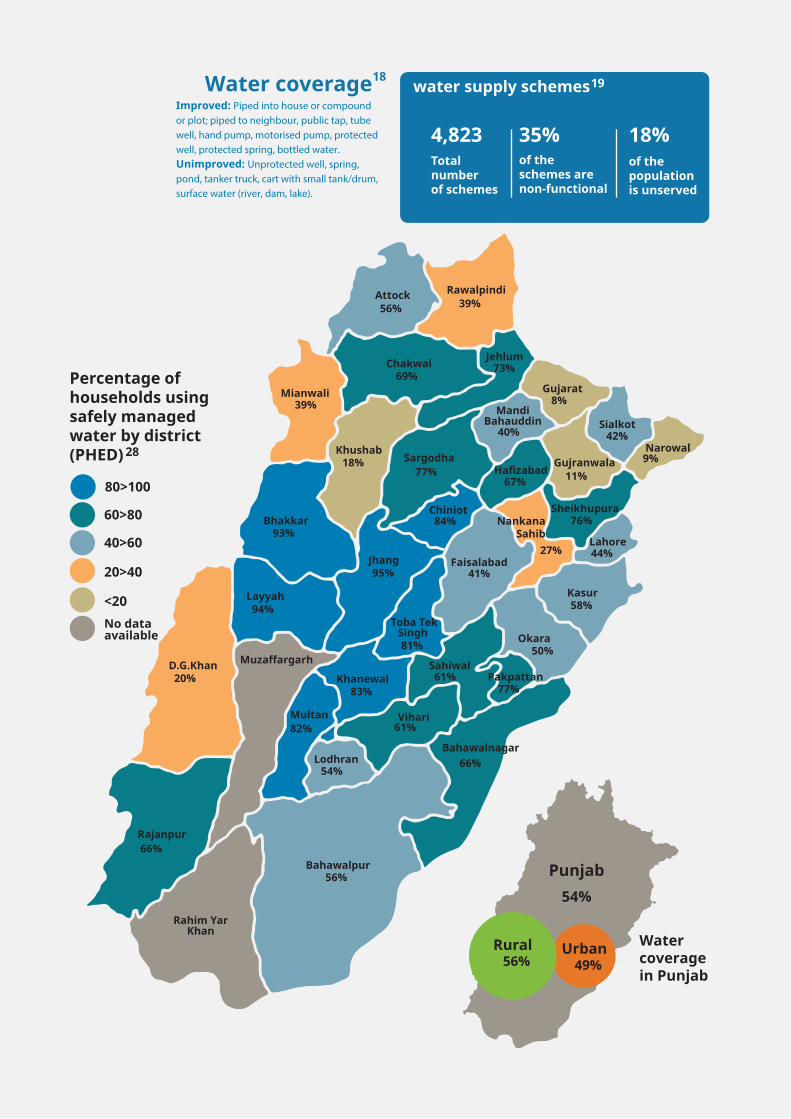
Percentage ofhouseholds usingsafely managedwater by district(PHED)
60>80
40>60
20>40
<20No dataavailable
80>100
58%
61%
95%
Mianwali
NankanaSahib
Khushab
Bhakkar
Layyah
D.G.Khan
Rawalpindi
Chakwal
Gujarat
Jehlum
Attock
Sargodha
Chiniot
Jhang
Khanewal
Multan
Toba Tek Singh
Faisalabad
Rajanpur
Rahim YarKhan
Bahawalpur
Muzaffargarh
Lodhran
Vihari
Bahawalnagar
Pakpattan
Okara
Kasur
Lahore
Sahiwal
Sheikhupura
Hafizabad Gujranwala
MandiBahauddin
Narowal
Sialkot
83%
82%
77%
93%
94%
69%
67%77%
76%
73%
66%
66%
61%
56%
56%
54%
50%
44%
42%
8%
18%
20%
11%
41%
40%
39%
9%
84%
81%
39%
27%
54%
Urban49%
water supply schemes
4,823Totalnumberof schemes
35%of the schemes arenon-functional
Improved: Piped into house or compound or plot; piped to neighbour, public tap, tube well, hand pump, motorised pump, protected well, protected spring, bottled water.Unimproved: Unprotected well, spring, pond, tanker truck, cart with small tank/drum, surface water (river, dam, lake).
18%of thepopulationis unserved
Water coverage
Water coverage in Punjab
18
28
19
Punjab
Rural56%
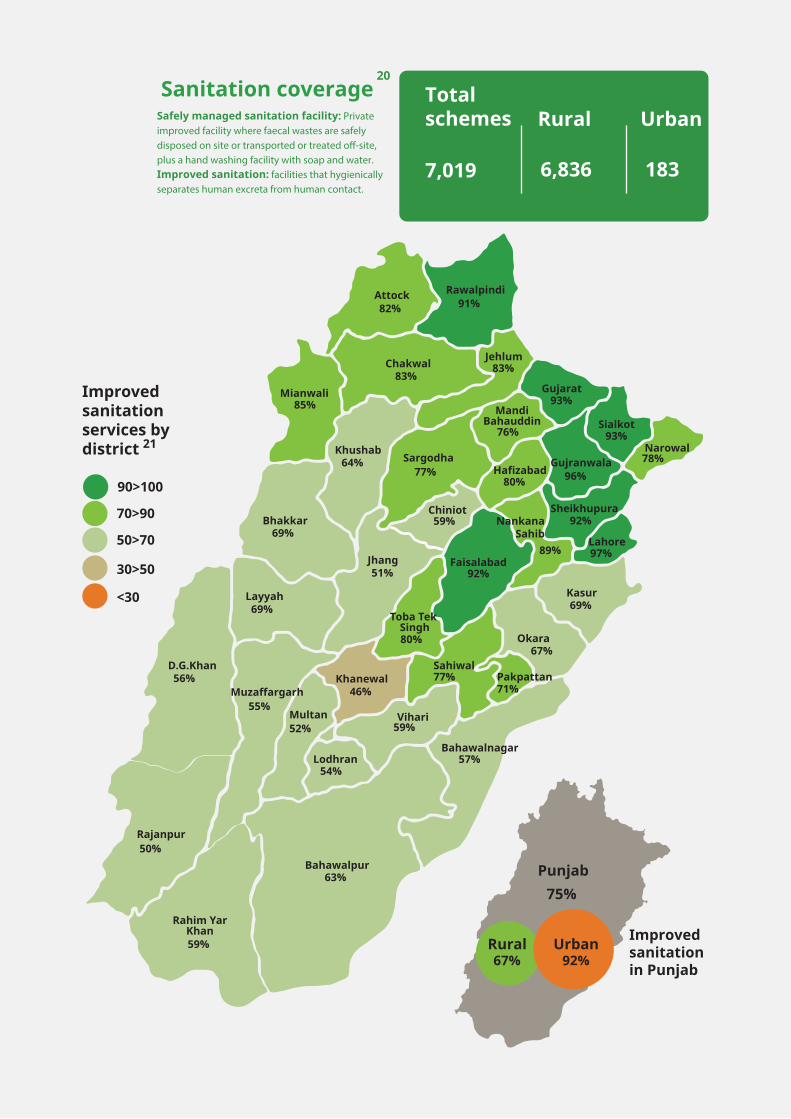
Sanitation coverage
Improvedsanitationservices by district
70>90
50>70
30>50
<30
90>100
69%
77%
51%
Mianwali
NankanaSahib
Khushab
Bhakkar
Layyah
D.G.Khan
Rawalpindi
Chakwal
Gujarat
Jehlum
Attock
Sargodha
Chiniot
Jhang
Khanewal
Multan
Toba Tek Singh
Faisalabad
Rajanpur
Rahim YarKhan
Bahawalpur
Muzaffargarh
Lodhran
Vihari
Bahawalnagar
Pakpattan
Okara
Kasur
Lahore
Sahiwal
Sheikhupura
Hafizabad Gujranwala
MandiBahauddin
Narowal
Sialkot
46%
52%
71%
69%
69%
83%
80%77%
92%
83%
50%
57%
59%
82%
63%
54%
67%
97%
93%
93%
64%
56%
55%
96%
92%
76%
91%
78%
59%
80%
85%
89%
Improved sanitationin Punjab
75%
Rural67%
Urban92%
59%
Urban
Total schemes Rural Urban
20
7,019 1836,836
21
Safely managed sanitation facility: Private improved facility where faecal wastes are safely disposed on site or transported or treated o�-site, plus a hand washing facility with soap and water.Improved sanitation: facilities that hygienically separates human excreta from human contact.
Punjab
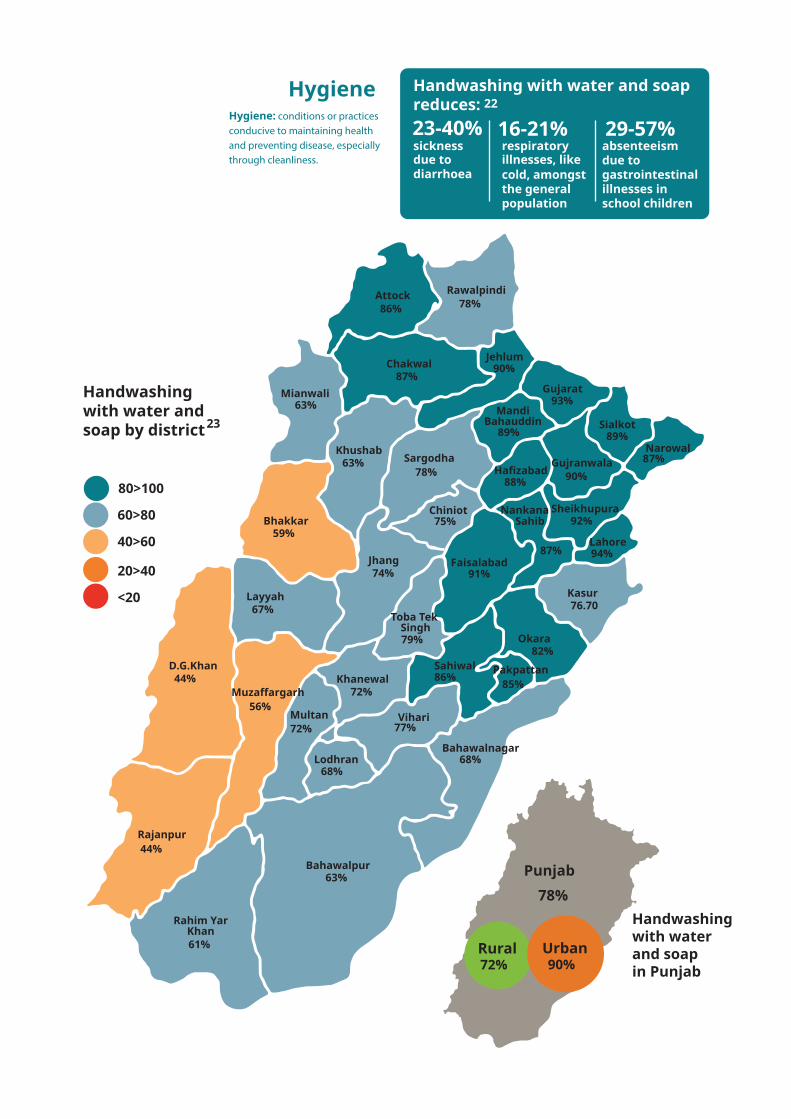
Handwashingwith water andsoap by district
60>80
40>60
20>40
<20
80>100
76.70
86%
74%
Mianwali
NankanaSahib
Khushab
Bhakkar
Layyah
D.G.Khan
Rawalpindi
Chakwal
Gujarat
Jehlum
Attock
Sargodha
Chiniot
Jhang
Khanewal
Toba Tek Singh
Faisalabad
Rajanpur
Rahim YarKhan
Bahawalpur
Muzaffargarh
Lodhran
Vihari
Bahawalnagar
Pakpattan
Okara
Kasur
Lahore
Sahiwal
Sheikhupura
Hafizabad Gujranwala
MandiBahauddin
Narowal
Sialkot
72%85%
59%
67%
87%
88%78%
92%
90%
44%
68%
77%
86%
63%
68%
82%
94%
89%
93%
63%
44%
56%
90%
91%
89%
78%
87%
75%
79%
63%
87%
Handwashing with waterand soapin Punjab
78%
Rural72%
61%
Hygiene
Multan72%
Handwashing with water and soapreduces:23-40%sicknessdue to diarrhoea
16-21%respiratoryillnesses, likecold, amongstthe general population
29-57%absenteeismdue togastrointestinalillnesses inschool children
22
23
Hygiene: conditions or practices conducive to maintaining health and preventing disease, especially through cleanliness.
Punjab
Urban90%
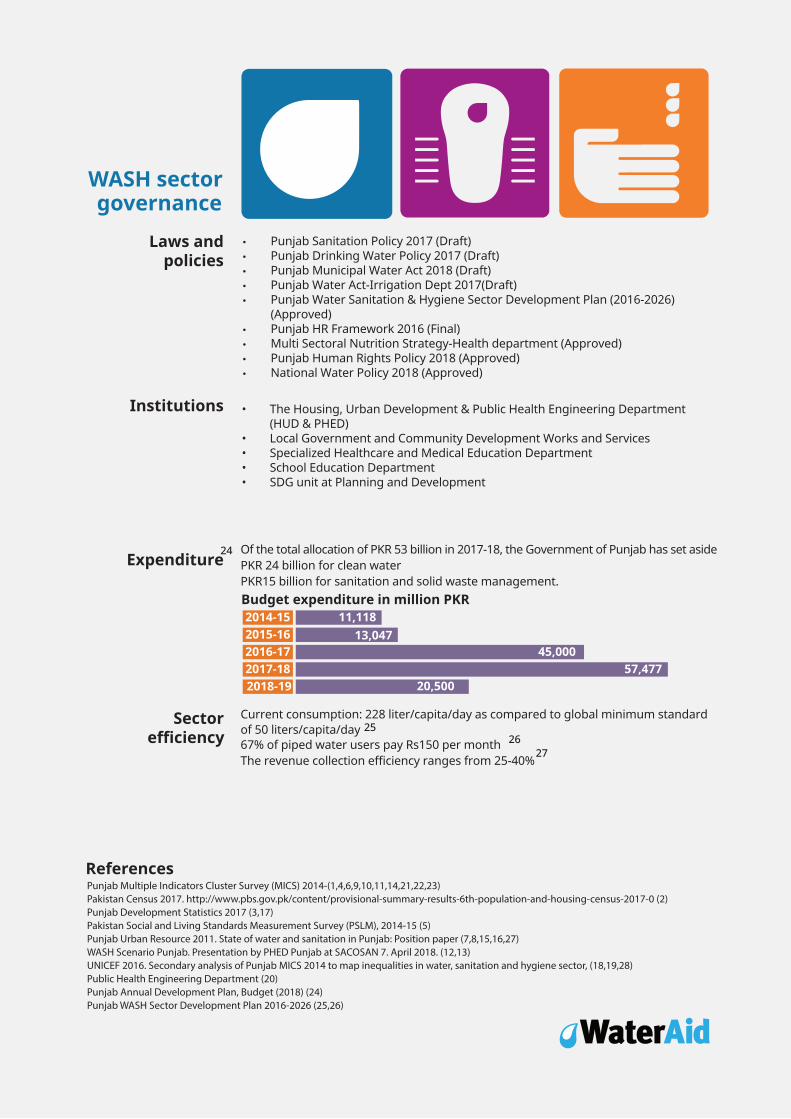
Laws andpolicies
Institutions
Expenditure
WASH sectorgovernance
Sectorefficiency
Current consumption: 228 liter/capita/day as compared to global minimum standard of 50 liters/capita/day67% of piped water users pay Rs150 per monthThe revenue collection efficiency ranges from 25-40%
References
Budget expenditure in million PKR2014-15 11,1182015-16 13,0472016-172017-182018-19
Punjab Multiple Indicators Cluster Survey (MICS) 2014-(1,4,6,9,10,11,14,21,22,23)Pakistan Census 2017. http://www.pbs.gov.pk/content/provisional-summary-results-6th-population-and-housing-census-2017-0 (2)Punjab Development Statistics 2017 (3,17)Pakistan Social and Living Standards Measurement Survey (PSLM), 2014-15 (5)Punjab Urban Resource 2011. State of water and sanitation in Punjab: Position paper (7,8,15,16,27)WASH Scenario Punjab. Presentation by PHED Punjab at SACOSAN 7. April 2018. (12,13)UNICEF 2016. Secondary analysis of Punjab MICS 2014 to map inequalities in water, sanitation and hygiene sector, (18,19,28) Public Health Engineering Department (20)Punjab Annual Development Plan, Budget (2018) (24)Punjab WASH Sector Development Plan 2016-2026 (25,26)
45,00057,477
20,500
• Punjab Sanitation Policy 2017 (Draft)• Punjab Drinking Water Policy 2017 (Draft)• Punjab Municipal Water Act 2018 (Draft)• Punjab Water Act-Irrigation Dept 2017(Draft)• Punjab Water Sanitation & Hygiene Sector Development Plan (2016-2026) (Approved)• Punjab HR Framework 2016 (Final)• Multi Sectoral Nutrition Strategy-Health department (Approved)• Punjab Human Rights Policy 2018 (Approved) • National Water Policy 2018 (Approved)
• The Housing, Urban Development & Public Health Engineering Department (HUD & PHED)• Local Government and Community Development Works and Services • Specialized Healthcare and Medical Education Department• School Education Department• SDG unit at Planning and Development
Of the total allocation of PKR 53 billion in 2017-18, the Government of Punjab has set aside PKR 24 billion for clean waterPKR15 billion for sanitation and solid waste management.
24
2526
27


![Water, Sanitation and Hygiene Education [WASHE] Training ...linked to good personal hygiene and environmental sanitation practices. In this regard, this Water, Sanitation and Hygiene](https://static.cupdf.com/doc/110x72/5e3c600e23b9870736109e00/water-sanitation-and-hygiene-education-washe-training-linked-to-good-personal.jpg)