1
Oil prices, tourism income and economic growth: A Structural VAR Approach for European Mediterranean countries
Ioannis Chatziantoniou1, George Filis2*, Bruno Eeckels3, Alexandros Apostolakis4 Affiliations
1, 4University of Portsmouth Department of Economics and Finance
Richmond Building, Portland Street, PO1 3DE Portsmouth, UK
2Bournemouth University Department of Accounting, Finance and Economics
The Executive Business Centre, 89 Holdenhurst Road, BH8 8EB
Bournemouth, UK
3Les Roches-Gruyère, University of Applied Sciences,
Bluche, 1815, Switzerland
*Corresponding author: [email protected], tel:+44 1202 968739, fax:+44 1202 968833
Abstract
In this study, a Structural VAR model is employed to investigate the relationship among oil
price shocks, tourism variables and economic indicators in four European Mediterranean
countries. In contrast with the current tourism literature, we distinguish between three oil
price shocks, namely, supply-side, aggregate demand and oil specific demand shocks.
Overall, our results indicate that oil specific demand shocks contemporaneously affect
inflation and the tourism sector equity index, whereas these shocks do not seem to have any
lagged effects. By contrast, aggregate demand oil price shocks exercise a lagged effect,
either directly or indirectly, to tourism generated income and economic growth. The paper
does not provide any evidence that supply-side shocks trigger any responses from the
remaining variables. Results are important for tourism agents and policy makers, should they
need to create hedging strategies against future oil price movements or plan for economic
policy developments.
JEL: C32, F43, L83, O14, O52
Keywords: Oil price shocks, tourism income, economic growth, SVAR, European countries

2
1. Introduction and review of the literature
Recent hikes in oil prices have necessitated the investigation of the relationship among
tourism sector developments, economic growth and oil price movements. This investigation
is considered very topical for the tourism industry given its energy-intensive nature (Becken,
2008; Gössling et al., 2005; Patterson and McDonald, 2004). Oil price changes could harm
economic and tourism activities due to the effect they exert on transportation, production
costs, economic uncertainty and disposable income (Becken, 2008). Especially for tourism
dependent countries, income derived from the tourism sector could potentially help them
facilitate future development strategies and goals or help them forge a resilient economy. In
this regard, it is understood that tourism may very well serve as the engine for boosting
aggregate demand and thus leading to economic growth.
In the light of recent developments in economic conditions in Europe that consequently
brought the matters of ‘short-run stability’ and ‘medium-run economic growth’ to the fore,
identifying potential sources of growth constitutes a great challenge for any European
country, but especially for the EMU periphery. The latter countries need to focus on the
aggregate demand side of their economy in order to find ways to increase consumption and
tourism sector could constitute an important driver of economic growth, since it represents
an important component of their economy. Nevertheless, emphasis should be put upon the
fact that countries with a high dependency on tourism activity are unevenly exposed to
sudden fluctuations in oil prices (Becken and Lennox, 2012). This entails careful planning as
potential benefits of the tourism sector’s developments could be diminished by higher oil
prices.
In this regard, the purpose of the following analysis is two-fold. Initially, we review the
literature associated with the relationship between economic growth and the tourism
industry. Next, we highlight past findings related to the effects of oil prices on the economy.
1.1. Tourism and economic growth
Building on the seminal theoretical work of Hazari and Sgrò (1995), Lanza and Pigliaru
(1999), as well as, Copeland (1991), many authors have conducted research in order to
provide empirical findings regarding the interaction between the tourism sector and the
broader economy. Nevertheless, the causality between the tourism sector and economic

3
growth is a matter yet open to question. To be more explicit, research on the field can
empirically support four main views on the said relationship:
First, there is evidence that causality indeed runs from the tourism-sector to the
broader economy – a hypothesis known as the tourism led economic growth (TLEG)
hypothesis (see, inter alia, Fayissa et al., 2011; Schubert, 2011; Brida et al., 2010;
Zortuk, 2009; Lee and Chang, 2008; Croes and Vanegas, 2008; Carrera et al., 2008;
Soukiazis and Proenca, 2008; Kim et al., 2006; Vanegas and Croes, 2003; Blake and
Sinclair, 2003; Balaguer and Catavella-Jorda, 2002).
Then, there is the view that economic growth is instead a crucial factor to the
increase in tourism income – the so called economic-driven tourism growth (EDTG)
hypothesis (Oh, 2005; Narayan, 2004)
A third strand of literature provides evidence that there exists bidirectional causality
between tourism and economic growth (Kassimati, 2011; Chen and Chiou-Wei, 2009;
Cortes-Jimenez et al., 2009; Lee and Chang, 2008; Dritsakis, 2004; Drubary, 2004,
among others).
Finally there are some authors reporting no significant evidence for causality
(Katricioglou, 2009; Eugenio-Martin and Morales, 2004).
In particular, the overriding assumption underpinning the TLEG hypothesis is that rising
tourism income has multiple advantages for a country’s economy, including inter alia, rising
employment in the tourism sector, development of other business sectors related to tourism
activities and a positive effect on the national balance of payments due to higher tourism
receipts.
Pertaining to the view that economic growth leads to tourism growth, the argument is that
any policy initiatives that promote overall economic development should take precedence
over measures that directly promote tourism growth. Under this view, this growth will result
in the expansion of the tourism sector.
Nevertheless, as aforementioned, other findings do not provide support either in favour of
the TLEG or the EDTG, whereas some studies opine in favour of bidirectional causality
between tourism income and economic growth. Table 1 summarises previously reported
empirical results.
[TABLE 1 HERE]

4
1.2. The effects of oil prices
Nevertheless, all aforementioned findings could be significantly influenced by oil price
fluctuations. Previous research has indicated that higher oil prices exert a negative impact on
tourism (Becken and Lennox, 2012; Becken, 2011; Yeoman et al., 2007). In testament to that,
the current global economic turbulence and political events in the Middle East have created
uncertainty in commodity markets and oil prices are expected to peak in the following years.
The United Nations World Tourism Organisation (UNWTO) has also expressed its concern
regarding the negative effects of oil prices on tourism (WTO, 2006). In addition, the UNWTO
has concluded that high oil prices are affecting certain tourism industry segments (e.g.
airlines, cruise lines, etc.) disproportionately more than others.
Furthermore, Becken (2011) distinguishes between macroeconomic and microeconomic
effects of oil prices. For oil-importing countries (such as the countries in our sample) this
translates as follows. With reference to macroeconomic effects, higher oil prices generally
lead to higher inflation, while they negatively influence the country’s income. From a
microeconomic perspective, positive oil price shocks lead to a decline in disposable income.
These developments will have an immediate and negative impact on tourism, mainly due to
the fact that tourism is regarded as a luxury good (Lim et al., 2008; Nicolau, 2008; Dritsakis,
2004).
The oil-literature further distinguishes oil price innovations in virtue of their origin.
Indicatively, we quote Hamilton (2009a,b) who draws a distinctive line between demand-
side oil price shocks (due to the industrialization of countries such as China) and supply-side
shocks (due to interruptions in the supply of oil). Kilian (2009), in addition to Hamilton’s
origins of oil price shocks, further identifies the so-called precautionary oil price shock or oil
specific demand shock (this is a shock associated with the uncertainty about the future
availability of price of oil).
The consideration of the origin of oil price shocks is rather important as the literature has
shown that different shocks impose different effects on economic variables and thus they
may possibly yield different effects on the tourism sector (authors who have considered the
origin of the oil price shock in their studies include Kilian and Lewis (2011), Filis et al. (2011),
Apergis and Miller (2009), Lescaroux and Mignon (2008), Kilian (2008) and Barsky and Kilian
(2004)). In short, the consensus is that supply-side shocks, in general, exert either
insignificant or negative impacts, whereas demand-side shocks appear to have both short-

5
run and long-run positive effects (Baumeister and Peersman, 2012; Hamilton, 2009a,b; Lippi
and Nobili, 2009). This established, Kilian and Park (2009) suggest that only aggregate
demand side shocks exert a positive effect, whereas oil specific demand shocks trigger
negative responses from economic variables.
Given this vast pool of different approaches and findings, the effects of oil price shocks on
countries that heavily rely on tourism have been under-researched (Becken, 2011). In
addition, as tourism is an oil-intensive industry, the literature has remained particularly
silent on this relationship. For this reason, Becken (2011) urges for more research in this
specific area.
1.3. Purpose of study
Having established that the interaction between tourism income and economic growth
should also encompass the effects of oil prices shocks, this paper examines the relationship
between oil price shocks, tourism income and economic growth, taking under consideration
the origin of the oil price shocks (i.e. whether it is a supply-side oil price shock, an aggregate
demand-side oil price shock or an oil specific demand shock).
For this study we consider data from four European economies, namely, France, Italy, Spain
and Greece. The choice of the countries was influenced by the fact that their tourism sector
has a significant contribution to their economy. In addition, Italy, Spain and Greece are the
three main countries that face significant debt problems, while France was chosen as it is the
main core European country that has been hit by the debt crisis, so far.
The results reveal that the origin of the oil price shocks is important in order to understand
the effects of oil on tourism and the economy. More specifically, demand-side oil price
shocks have a significant impact on tourism and economic variables, whereas this does not
hold for the supply-side shocks. In particular, oil specific demand shocks exercise a
contemporaneous effect on inflation (positive) and the tourism sector equity index
(negative). On the other hand aggregate demand oil price shocks tend to favour, either
directly or indirectly, the economic and tourism activity. The latter also affect the
relationship between tourism and economic growth.
These results are of particular importance as they could facilitate tourism agents and policy
makers, should they need to hedge against oil price movements and plan for economic
development, respectively.

6
The rest of the paper is structured as follows. Section 2 provides an overview of the tourism
sector for the countries under investigation. The methodology and data used are presented
in Section 3. Subsequently, empirical results are analysed in Section 4, whereas Section 5
considers policy implications related to empirical findings, before a conclusion is reached in
Section 6.
2. Overview of the tourism sectors in the countries under investigation
As a starting point for the discussion to follow, Table 2 summarises basic industry
measurements and indicators from the four countries under consideration during the period
of 2000-2010. The purpose of this section is to verify the significance of inbound tourism for
the countries under examination.
[TABLE 2 HERE]
In absolute terms, France is the recipient of the majority of inbound tourists, followed by
Spain, Italy, and then Greece. Domestic tourism, as this is measured in terms of overnight
stays, presents a similar picture, only with Italy being second and Spain third. The majority of
tourists arriving in Italy, Spain and Greece are overnight visitors (62%, 60%, and over 90%
respectively). Evidently, all countries in the sample exhibit a peak on inbound overnight
visitors in 2007 (Figure 2). This is followed by a downward trend that can be possibly
attributed to the aftermath of the 2008 credit crunch.
In terms of macro-economic indicators, Spain and Greece exhibit a higher contribution of
inbound tourism expenditure to GDP (4.8% to 5.6% on average, respectively) compared to
that of Italy and France (1.6% and 2.1%, respectively). In addition, the ratio of tourism
expenditure to export of services averages to about 40%-50%.
The mode of transport is an important element of the tourism product. Table 3 shows the
two preferred modes used by inbound tourists over the 2000-2010 period.
[TABLE 3 HERE]
Tourists arriving in France and Italy travelled mainly by land (68% and 70.4% on average
respectively). On the other hand, tourists in Spain and Greece arrived mainly by air (74.2%
and 71.5% on average respectively). This pattern can be explained by the particular
geographical locations of the respective countries, as well as, the different tourism
typologies they serve.

7
Based on the aforementioned statistics we can deduce that the tourism sector is an integral
and important part of all economies under investigation. In addition, due to the oil-intensive
character of the tourism industry, we can further deduce that higher oil prices could have a
negative impact on the four countries’ economic prospects. This impact is further aggravated
given that inbound tourism, which depends on oil-consuming transportation means, is the
main type of tourism in all countries.
3. Methodology and Data Description
3.1. Data Description
We use monthly data from 2000:1 until 2010:12 from four countries, namely France, Italy,
Spain and Greece. The variables under consideration are the world oil production levels,
global economic activity index, crude oil prices, CPI, tourism sector equity index, tourism
income and industrial production index. The global economic activity index is based on the
dry cargo freight rates and it is constructed by Lutz Kilian (see, Kilian, 2009). All prices are
real, seasonally adjusted and are expressed in growth rates. Data have been extracted from
Datastream®.
The paper will make use of world oil production levels, the global economic activity index
and oil prices to identify the three oil price shocks, in the same spirit with Kilian and Park
(2009). Section 3.2 provides a detailed explanation of the identification scheme for the
model.
Furthermore, the tourism sector equity index tracks the stock price movements of the
tourism sector firms, which are listed in the stock markets of the countries under
investigation. The choice of tourism sector equity index is motivated by the fact that
financial markets tend to react immediately to new information, which in our case could be
news related to oil price changes. Thus, the potential effects of oil prices on the tourism
industry could be identified through the behaviour of stocks that are listed in the tourism
sector equity index.
The tourism income series represents income that is generated by inbound tourists. The
choice of tourism income from inbound tourists is justified by the fact that spending from
inbound tourists has a significant contribution to the economies under investigation, as
evidenced in section 2.

8
Finally, economic growth is approximated by the growth rate of the industrial production
index. The relevant literature in the economics area has, rather overwhelmingly, embraced
the use of the industrial production index as a proxy for economic growth (Espinoza, Fornari
and Lombardi, 2012; Lombardi and Van Robays, 2011; Peersman and Van Robays, 2011;
Bjornland and Leitmeno, 2009; Laopodis, 2009, 2006; Kim and Roubini, 2000, among others).
Thus, the inference of the results is not that tourism income could influence the industrial
production per se but rather that the tourism income could influence the economic growth,
as this is approximated by the industrial production.
Figure 1 summarizes the abovementioned series.
[FIGURE 1 HERE]
Figure 1 shows the effect of the 2008 financial crisis, as all industrial production indices,
tourism stock market equity indices, oil prices, as well as, global economic activity exhibit a
significant drop during this period. Furthermore, the tourism income for all countries in the
sample shows a decreasing pattern since 2008, with some evidence of recovery during the
last period of our study.
3.2. Structural VAR framework
We examine the dynamic relationship among oil price shocks, tourism income and economic
growth, using the SVAR framework. In particular, we consider the following variables in our
model: oil production, global economic activity, oil prices, CPI, tourism sector equity index
returns, tourism income and industrial production index.
The structural representation of the VAR model of order p takes the following general form:
t
p
i
itit εyAcyA
1
00 (1)
where, ty is a 7×1 vector of endogenous variables, i.e. tttttttt yimoilpgeaoils , t,s ,,,, y ,
0A represents the 7x7 contemporaneous matrix, iA are 7×7 autoregressive coefficient
matrices, εt is a 7×1 vector of structural disturbances, assumed to have zero covariance and
be serially uncorrelated. The covariance matrix of the structural disturbances takes the
9
following form IDεε 2
7
2
6
2
5
2
4
2
3
2
2
2
1
' ttE . In order to get the reduce form
of our structural model (1) we multiply both sides with 1
0
A , such as that:
t
p
i
itit eyBay
1
0 (2)
where, 0
1
00 cAa ,
ii AAB1
0
, and tt εAe
1
0
, i.e. tt eAε 0 . The reduced form errors
are linear combinations of the structural errors , with a covariance matrix of the form
'1
0
1
0
' DAAee ttE .
The structural disturbances can be derived by imposing suitable restrictions on 0A . The
short-run restrictions that are applied in this model as the following:
y
t
ti
t
smt
t
t
oilp
t
gea
t
oils
t
is
t
ts
t
sms
t
ps
t
sds
t
ads
t
ss
t
e
e
e
e
e
e
e
aaaaa
aaaaa
aaaaaaa
aaaa
aaa
aa
a
,7
,6
,5
,4
,3
,2
,1
7776737271
6664636261
57565554535251
44434241
333231
2221
11
,7
,6
,5
,4
,3
,2
,1
00
00
000
0000
00000
000000
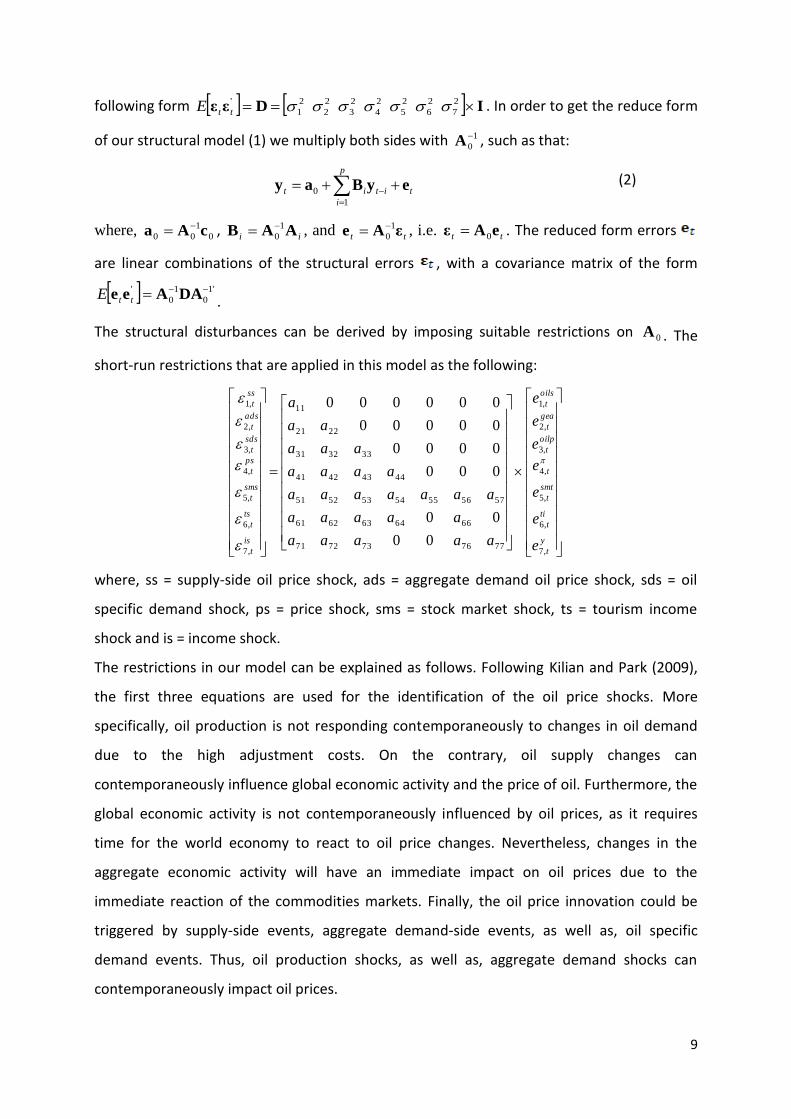
where, ss = supply-side oil price shock, ads = aggregate demand oil price shock, sds = oil
specific demand shock, ps = price shock, sms = stock market shock, ts = tourism income
shock and is = income shock.
The restrictions in our model can be explained as follows. Following Kilian and Park (2009),
the first three equations are used for the identification of the oil price shocks. More
specifically, oil production is not responding contemporaneously to changes in oil demand
due to the high adjustment costs. On the contrary, oil supply changes can
contemporaneously influence global economic activity and the price of oil. Furthermore, the
global economic activity is not contemporaneously influenced by oil prices, as it requires
time for the world economy to react to oil price changes. Nevertheless, changes in the
aggregate economic activity will have an immediate impact on oil prices due to the
immediate reaction of the commodities markets. Finally, the oil price innovation could be
triggered by supply-side events, aggregate demand-side events, as well as, oil specific
demand events. Thus, oil production shocks, as well as, aggregate demand shocks can
contemporaneously impact oil prices.

10
Turning to the responses of the remaining variables in our model, we argue that all three oil
price shocks are imposing inflationary pressures in the economy. As a result, inflation is
contemporaneously influenced by these shocks, but not influenced contemporaneously by
any other variables. Next, the tourism sector equity index responds immediately to all
shocks by all variables. In addition, both tourism income and industrial production do not
receive a contemporaneous effect from the tourism sector index. This model is also designed
to capture any contemporaneous effect running from the tourism income to economic
growth.
We expect that inbound tourism income can contemporaneously assist the economic
growth (as this is approximated by the industrial production) of a country. On the contrary,
we do not expect that the economic growth could exert a contemporaneous impact on
inbound tourism income. We argue that the greater the economic growth, the stronger the
economy is and thus, there are more opportunities to create a stable economic environment
with better infrastructure in an effort to attract more inbound tourists. Nevertheless, these
effects cannot be observed contemporaneously. Finally, industrial production is not affected
contemporaneously by inflation due to the reaction time that is required between changes
in price levels and changes in demand.
To proceed to the estimation of the reduced form of model (2), it is first necessary to
establish the stationarity of the variables. The ADF and PP unit root tests suggest that all
variables are I(0). The order of the VAR model was identified using the Akaike Information
Criterion (AIC). The AIC suggested a VAR model of order two1. The model does not suffer
from autocorrelation or heteroskedasticity, as suggested by the serial autocorrelation LM
test, portmanteau joint test and White heteroscedascitity test2.
4. Empirical Findings
4.1. Contemporaneous relationships
Table 4 summarises the contemporaneous coefficients for the countries under investigation.
It is evident that only the oil specific demand shock is exercising contemporaneous effects
on the economic and tourism variables. More specifically, oil specific demand shocks exert a
negative effect on tourism sector equity indices (coefficients α53 are negative and significant)
1 Results are available upon request.
2 Results are available upon request.

11
and a positive effect on inflation (coefficients α43 are positive and significant), on all
countries in our sample. This is an anticipated result considering that all countries are oil-
importers. Furthermore, the oil specific demand shock has a negative and contemporaneous
effect on tourism income in Italy (see coefficient α63). From this, we deduce that
expectations regarding the future availability of oil that trigger oil specific demand shocks
are very important in contemporaneous terms. In particular, expectations revolving around
oil shortages in the future may lead to market turbulence and thus a reduction in tourism
indicators is observed.
The fact that the economic and tourism indicators are not affected contemporaneously by
supply-side shocks (coefficients α41, α51, α61 and α71 are not significant) and aggregate
demand side shocks (coefficients α42, α52, α62 and α72 are not significant) suggests a delayed
response due to the time that is required for these indicators to reflect changes in oil prices.
[TABLE 4 HERE]
It is worth noting that although the contemporaneous effects of tourism income on the
tourism sector equity index are positive (see coefficient α56); they are not significant. A
plausible explanation of this finding is that tourism income effects to the stock market may
not be direct but may instead be filtered through other channels, such as the performance of
the listed tourism firms, the performance of the overall stock market, etc. Nevertheless, our
model is not designed to capture all these different channels, as they fall outside the
research remit of this paper.
In terms of the effects of economic growth on the tourism sector equity index the results
suggest that these are positive and significant for Italy and Spain (see coefficient α57) only.
Overall, these findings signify the importance of the origin of the oil price shock, as not all of
them affect the economic and tourism variables. Next we turn our focus on the analysis of
the impulse response functions.
4.2. Accumulated Lagged Responses (Impulse responses)
4.2.1. France
The results in Figure 2a suggest that supply-side oil price shocks do not exert any effect on
any economic or tourism variables. On the other hand, the empirical results indicate a
significant impact of the demand-side shocks on inflation (negative) and industrial
production (positive).

12
[FIGURE 2a HERE]
The aggregate demand oil price shock exercises a negative effect on inflation and a positive
effect on industrial production, whereas the oil specific demand shock leads to an increase
on inflation and decrease on industrial production. This finding is anticipated as aggregate
demand oil price shocks suggest a boom in the global economy, which could influence the
individual economies in a positive manner (i.e. lower inflation and higher production levels).
The reverse holds for the oil specific demand shocks, which are considered as negative news
and thus could result in inflationary pressures and lower production levels. We also find
positive bidirectional causality between tourism income and industrial production. The only
other determinant of industrial production, as evidenced from the impulse response
functions, is the tourism sector equity index.
In addition, the tourism sector equity index exhibits a positive response from the industrial
production, which is significant for a very short period of time. We do not report any
response from the tourism sector equity index on a tourism income shock. The forgoing
explanation regarding the contemporaneous effects of tourism income on tourism sector
equity index provides a valid source of explanation for this case, as well.
In retrospect, we find evidence that oil price shocks are important determinants of the
tourism income and the economy, either directly or indirectly. On the one hand, positive
aggregate demand oil price shocks affect inflation favourably (i.e. they cause a reduction of
inflation). On the other hand, positive aggregate demand oil price shocks lead to increased
industrial production, which in turn, it has a positive effect on tourism income. The exact
opposite causalities hold for the oil specific demand shocks. Interestingly enough we find no
relationship between tourism income and the tourism sector equity index.
4.2.2. Italy
The reaction of the economic and tourism indicators to oil price shocks are displayed on
Figure 2b. As evident by the impulse responses, inflation is reacting negatively to a positive
aggregate demand oil price shock, whereas the tourism sector index, tourism income and
industrial production are responding positively to the same shock. Similarly to the situation
described in the French case, a positive oil specific demand shock exerts opposite effects on
inflation (positive) and industrial production (negative). Furthermore, we do not find
evidence that the tourism sector equity index, the tourism income and industrial production
13
respond to any supply-side oil price shocks. In addition, the two tourism indicators do not
respond to the oil specific demand shocks, as well. However, a positive tourism sector equity
index shock is exercising a positive effect on industrial production, yet it fails to trigger a
reaction from the tourism income. Similarly, tourism income and industrial production
shocks do not generate any response from the equity index of the tourism sector, similarly
to the case of France. Finally, the impulse responses suggest a positive unidirectional
causality between tourism sector index and industrial production, running from the earlier
to the latter.
[FIGURE 2b HERE]
Overall, we observe that aggregate demand oil price shocks have a positive impact on
tourism and economic growth, whereas the opposite holds for the oil specific demand shock.
Thus, considering that tourism has a positive impact on industrial production, we argue that
demand-side oil price shocks exercise both direct and indirect effect (via the tourism
income) on economic growth.
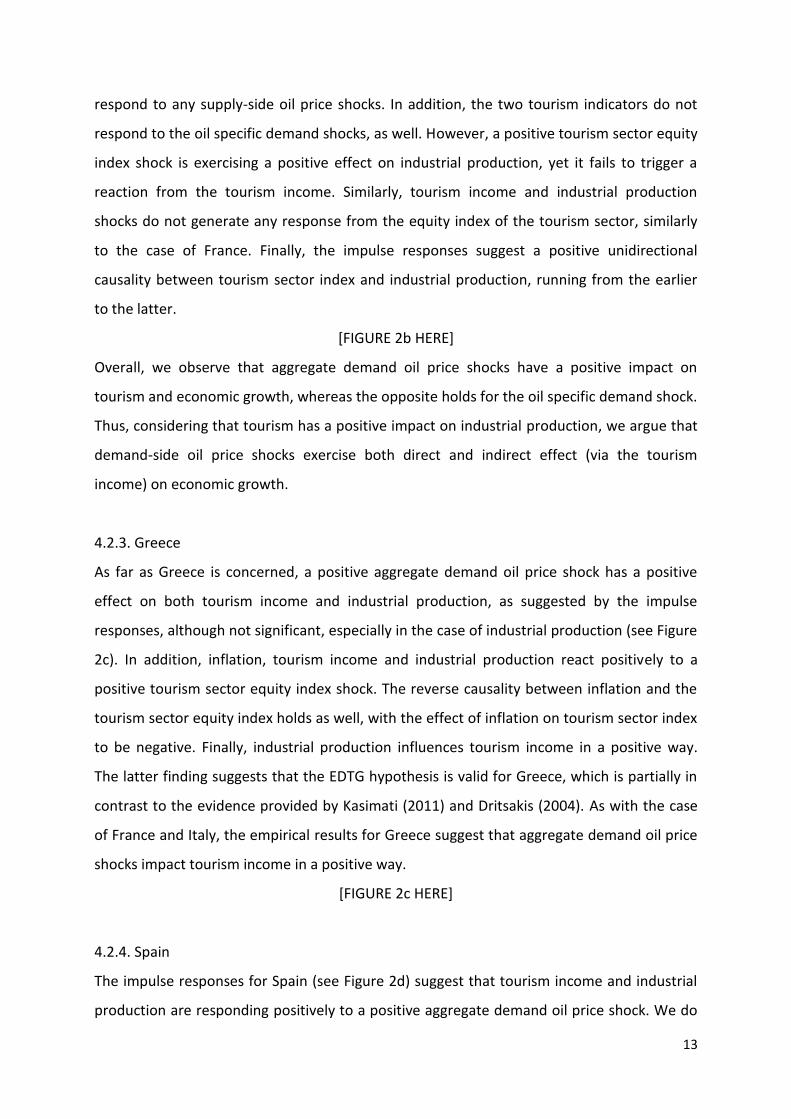
4.2.3. Greece
As far as Greece is concerned, a positive aggregate demand oil price shock has a positive
effect on both tourism income and industrial production, as suggested by the impulse
responses, although not significant, especially in the case of industrial production (see Figure
2c). In addition, inflation, tourism income and industrial production react positively to a
positive tourism sector equity index shock. The reverse causality between inflation and the
tourism sector equity index holds as well, with the effect of inflation on tourism sector index
to be negative. Finally, industrial production influences tourism income in a positive way.
The latter finding suggests that the EDTG hypothesis is valid for Greece, which is partially in
contrast to the evidence provided by Kasimati (2011) and Dritsakis (2004). As with the case
of France and Italy, the empirical results for Greece suggest that aggregate demand oil price
shocks impact tourism income in a positive way.
[FIGURE 2c HERE]
4.2.4. Spain
The impulse responses for Spain (see Figure 2d) suggest that tourism income and industrial
production are responding positively to a positive aggregate demand oil price shock. We do

14
not report any effects of the supply-side and oil specific demand shocks on tourism income,
tourism sector equity index and industrial production. Nevertheless, a positive oil specific
demand shock causes inflationary pressures. Furthermore, the tourism sector equity index
exercises a positive effect on industrial production and tourism income, whereas it does not
respond to any oil price shocks. Practically, the above statement implies that the tourism
sector equity index can be used as a leading indicator of both industrial production and
tourism income. Thus, any positive or negative news related to the industrial production and
tourism income will be immediately incorporated into the tourism sector equity index.
Finally, support to the EDTG hypothesis is provided by the impulse responses, as a positive
industrial production shock triggers a positive response from the tourism income. The latter
finding runs counter to Balaguer and Cantavella-Jorda (2002) suggestions, who found
evidence of bidirectional causality. To summarise, the EDTG hypothesis holds in the case of
Spain. In addition, tourism income receives positive effects from the aggregate demand oil
price shock, as well as, the tourism sector equity index.
[FIGURE 2d HERE]
5. Policy Implications
The findings of this study lead to the following policy implications. First, given inbound
tourism’s significance for all countries in the study sample and its high transportation costs
(e.g. air fares), any oil price increase could lead to a reduction on inbound tourism activity.
Thus, policy makers need to formulate such strategies to counterbalance income losses
deriving from lower inbound tourism, or find ways to alleviate the dependence of these
countries on inbound tourism activity, or even to minimise the cost of inbound tourism. For
example, appropriate marketing strategies are required to boost both domestic and inbound
tourism from neighbour countries. This argument stands to reason as a shorter travel
distance entails lower travel costs. In addition, alternative travel modes should be promoted
(e.g. train or road travel, etc), especially in the case of Spain and Greece, with respect to
neighbouring countries, although this inevitably requires the development of sufficient
infrastructure.
Furthermore, we maintain that government agencies should collaborate with the national
tourism organisations with the view to identify the profile of tourists and evaluate their
behaviour. Having done so, planning should then focus on the types of tourists that exhibit a

15
lower price elasticity of demand. As the tourism product becomes more expensive, due to
the effects of the oil specific demand shocks on the tourism sector, national tourism
organisations can ‘protect’ their tourism balance of payments by focusing on less price
sensitive demand segments. Thus, the change in demand will be significantly lower and
tourism income will not fall considerably. In this regard, emphasis should be put upon the
product’s mix in order for each country to identify its competitive advantage and develop
appropriate promotion strategies. For example, countries can focus on specific types of
tourists, i.e. they can attract more business-type visitors, or they can rejuvenate the tourism
product by offering alternative typologies of products. Thus, places like the countries in our
sample (and especially those countries that have greater tourism dependency) could divert
their attention towards 'soft' tourist products, as opposed to 'hard' tourism offerings. This
implies that these countries could move away from the traditional 3S (sun-sea-sand) tourism
model in order to take advantage of the worldwide movement towards the promotion of
local and authentic activities through the promotion, for example, of local festivals and fairs.
In addition, the tourism product within each country should be insulated against undesirable
oil price movements and should reduce its oil dependency. In this way, countries will be able
to accomplish a twofold goal; that is, to promote domestic tourism and outweigh the
increased travel costs faced by inbound tourists. In the short-run, this can be achieved by
promoting knowledge with regards to hedging strategies against oil price increases, due to
demand-side shocks, that could be adopted by the domestic tourism agents, especially by
major domestic transportation firms and tourist resorts.
Given the recent trends in the hospitality sector towards the exploitation of scale economies
resulting from their operations (emergence of an all – inclusive model), the hospitality sector
could also engage into different hedging strategies in order to alleviate some the pressures
arising from potentially higher oil prices. In the long-run, each country should invest into
alternative energy sources and energy efficiency practices in the sector (for example the
adoption of more energy efficient practices in the hospitality sector, such as water recycling
practices). Such a feat requires a better understanding of the factors that influence the
diffusion and adoption of energy efficient practices in the tourism sector. The latter
accommodates concerns about the future availability of oil, which triggers oil specific
demand shocks that have a significant effect on tourism and the economy, as suggested by
the empirical part of this study.

16
6. Concluding Remarks
This empirical study uses a structural VAR model to investigate the links among oil price
shocks, tourism sector and economic growth in four European Mediterranean countries.
Disentangling oil price shocks into three categories, as suggested by Hamilton (2009a,b) and
Kilian (2009), and using monthly data for the period 2000:1 – 2010:12, we find evidence to
suggest that demand-side oil price shocks appear to exert an impact on tourism and the
economy, whereas supply-side oil price shocks do not. To be more explicit, with reference to
demand-side shocks, we observe that aggregate demand shocks have a significantly positive
influence on tourism income and the economy (either directly or indirectly); nevertheless,
this effect is not contemporaneously but it comes with a lag. On the other hand, oil specific
demand shocks exercise a significant negative impact on tourism sector equity returns and
inflation. This effect is only contemporaneous, though. Turning to the supply-side shocks,
the absence of impact on both tourism industry and economy can be explained by the fact
that changes in oil production do not significantly affect oil prices, as suggested by Kilian and
Park (2009).
Previous research has illustrated a negative effect of oil prices on the tourism sector (see,
Becken and Lennox, 2012; Becken, 2011; Yeoman et al., 2007). Nonetheless, these past
findings give an incomplete picture, as they do not consider the origin of oil price changes.
Overall, this study signifies the importance of the origin of oil price shocks in this area of
research. The empirical results provide evidence to suggest that different oil price shocks
trigger different types of responses.
Future research should concentrate on the effects of oil price shocks on tourism and
economic growth for oil-exporting countries. In addition, it is essential that further studies
examine these relationships in a time-varying environment. Finally, further research needs
to be undertaken with respect to the effect of oil price shocks on different tourism
segments.

17
References
Apergis, N., & Miller, S.M. (2009). Do structural oil-market shocks affect stock prices?
Energy Economics, 31, 569–575.
Baumeister, C., & Peersman, G. (2012). Time-varying effects of oil supply shocks on
the US economy. Bank of Canada Working Paper Series, WP2012-02.
Ballaguer, J., & Cantavella-Jorda, M. (2002). Tourism as a long-run economic growth
factor: the Spanish case. Applied Economics, 34, 877-884.
Barsky, R. B., & Kilian, L. (2004). Oil and the Macroeconomy since the 1970s. Journal
of Economic Perspectives, 18(4), 115–34.
Becken, S. (2008). Developing indicators for managing tourism in the face of peak oil.
Tourism Management, 29, 695-705.
Becken, S. (2011). Oil, the global economy and tourism. Tourism Review, 66, 65 – 72.
Becken, S., & Lennox, J. (2012). Implications of a long-term increase in oil prices for
tourism. Tourism Management, 33, 133-142.
Bjornland, H.C., & Leitemo, K. (2009). Identifying the interdependence between us
monetary policy and the stock market. Journal of Monetary Economics, 56, 275–282.
Blake, A., & Sinclair, M.T. (2003). Tourism crisis management US response to
September 11. Annals of Tourism Research, 30, 813-832.
Brida, J.G., Lanzilotta, B., Lionetti, S., & Risso, W.A. (2010). The tourism-led growth
hypothesis for Uruguay. Tourism Economics, 16, 765-771.
Carrera, E.J.S., Risso, W.A., & Brida, J.G. (2008). Tourism’s Impact on Long-Run
Mexican Economic Growth. Economics Bulletin, 23(21), 1-8.
Chen, C.F., & Chiou-Wei, S.Z. (2009). Tourism expansion, tourism uncertainty and
economic growth: New evidence from Taiwan and Korea. Tourism Management, 30, 812–
818.
Copeland, B.R. (1991). Tourism, Welfare, and De-industrialization in a Small Open
Economy. Economica, 58, 515–29.
Cortes-Jimenez, I., Pulina, M., Prunera, C., & Artis, M. (2009). Tourism and Exports as
a means of Growth. Research Institute of Applied Economics 2009 Working Papers.
Croes, R., & Vanegas, M. (2008). Cointegration and Causality between Tourism and
Poverty Reduction. Journal of Travel Research, 47, 94-103.

18
Dritsakis, N. (2004). Tourism as long-run economic growth factors: an empirical
investigation for Greece using causality analysis. Tourism Economics, 10(3), 305-316.
Durbarry, R. (2004). Tourism and economic growth: the case of Mauritius. Tourism
Economics, 10(4), 389-401.
Espinoza, R., Fornari F., & Lombardi, M.J. (2012). The role of financial variables in
predicting economic activity. Journal of Forecasting, 31, 15-46.
Eugenio-Martin, J., Morales, N., & Scarpa, R. (2004). Tourism and Economic Growth in
Latin American Countries: A Panel Data Approach. FEEM Working Paper No. 26, Trieste, Italy:
Global Network of Environmental Economists.
Fayissa, B., Nsiah, C., & Tadesse, B. (2011). Research note: Tourism and economic
growth in Latin American countries – further empirical evidence. Tourism Economics, 17,
1365-1373.
Filis, G., Degiannakis, S., & Floros, C. (2011). Dynamic correlation between stock
market and oil prices: The case of oil-importing and oil-exporting countries. International
Review of Financial Analysis, 20, 152–164.
Gössling, S., Peeters, P., Ceron, J-P., Dubois, G., Patterson T., & Richardson, R.B.
(2005). The eco-efficiency of tourism. Ecological Economics, 54, 417-434.
Hamilton, J.D. (2009a). Understanding crude oil prices. Energy Journal, 30, 179-206.
Hamilton, J.D. (2009b). Causes and consequences of the oil shock of 2007-08.
Brookings Papers on Economic Activity, Spring 2009, 215-261.
Hazari, B., & Sgro, P. (1995). Tourism and Growth in a Dynamic Model of Trade.
Journal of International Trade and Economic Development, 4, 253–56.
Kassimati, E. (2011). Economic impact of tourism on Greece’s economy:
Cointegration and causality analysis. International Research Journal of Finance and
Economics, 79, 79-85.
Katircioglu, S.T. (2009). Revisiting the tourism-led-growth hypothesis for Turkey using
the bounds test and Johansen approach for cointegration. Tourism Management, 30, 17-20.
Kilian, L. (2008). Exogenous oil supply shocks: how big are they and how much do
they matter for the US economy?. Review of Economics and Statistics, 90, 216–240.
Kilian, L. (2009). Not all oil price shocks are alike: Disentangling demand and supply
shocks in the crude oil market. American Economic Review, 99, 1053–1069.

19
Kilian, L., & Park, C. (2009). The impact of oil price shocks on the U.S. stock market.
International Economic Review, 50, 1267-1287.
Kilian, L. & Lewis, L.T. (2011). Does the Fed Respond to Oil Price Shocks?. Economic
Journal, 121, 1047-1072.
Kim, H.J., Chen, M-H., & Jang, “Shawn” S.C. (2006). Tourism Expansion and Economic
Development: The Case of Taiwan. Tourism Management, 27, 925–33.
Kim, S., & Roubini, N. (2000). Exchange rate anomalies in the industrial countries: A
solution with a structural VAR approach. Journal of Monetary Economics, 45, 561-586.
Lanza, A., & Pigliaru, F. (1999). Why are tourism countries small and fast growing?
Universita' degli Studi di Cagliari, Working Paper No: 356.
Laopodis, N.T. (2006). Dynamic interactions among the stock market, federal funds
rate, inflation, and economic activity. Financial Review, 41, 513–545.
Laopodis, N.T. (2009). Are fundamentals still relevant for European Economies in the
post-Euro period. Economic Modelling, 26, 835-850.
Lee, C.C., & Chang, C.P. (2008). Tourism development and economic growth: a closer
look at panels. Tourism Management, 29, 180-192.
Lescaroux, F., & Mignon, V. (2008). On the influence of oil prices on economic activity
and other macroeconomic and financial variables. Centre d’ Etudes Prospectives et d’
Information Internationales, No 2008-05.
Lim, C., Min, J.C.H., & McAleer, M. (2008). Modelling income effects on long and
short haul international travel from Japan. Tourism Management, 29, 1099-1109.
Lippi, F., & Nobili, A. (2009). Oil and the macroeconomy: A quantitative structural
analysis. Bank of Italy Working Paper Series, No. 704.
Lombardi, M.J., & Van Robays, I. (2011). Do financial investors destabilise the oil
price? European Central Bank, Working Paper 1346.
Narayan, P.K. (2004). Economic impact of tourism on Fiji’s economy: empirical
evidence from the computable general equilibrium model. Tourism Economics, 10, 419-433.
Nicolau, J.L. (2008). Characterizing tourist sensitivity to distance. Journal of Travel
Research, 47, 43-52.
Oh, C.O. (2005). The contribution of tourism development to economic growth in the
Korean Economy. Tourism Management, 26, 39–44.

20
Patterson, M.G., & McDonald, G. (204). How green and clean is New Zealand
tourism? Lifecycle and future environmental impacts. Lincoln: Landcare Research.
Peersman, G., & Van Robays, I. (2011). Cross-country differences in the effects of oil
shocks. Energy Economics, doi:10.1016/j.eneco.2011.11.010
Schubert, S.F., & Brida, J.G. (2011). Dynamic model of economic growth in a small
tourism driven economy. Tourism Economics, 3, 149-168.
Soukiazis, E., & Proenca, S. (2008). Tourism as an alternative source of regional
growth in Portugal: A panel data analysis at NUTS II and III levels. Portuguese Economic
Journal, 7, 43-61.
United Nation World Tourism Organisation. (2006). The impact of rising oil prices on
international tourism. Special report – World Tourism Organisation report, 26, 26-36.
Vanegas, M., & Croes, R. (2003). Growth, Development and Tourism in a Small
Economy: Evidence from Aruba. International Journal of Tourism Research, 5, 315–30.
Yeoman, I., Lennon, J., Blake, A., Galt, M., Greenwood, C., & McMathon-Beattie, U.
(2007). Oil depletion: What does this mean for Scottish tourism? Tourism Management, 28,
1354-1365.
Zortuk, M. (2009). Economic Impact of Tourism on Turkey’s Economy: Evidence from
Cointegration Tests. International Research Journal of Finance and Economics, 25, 231-239.

21
Figures
Figure 1: Macroeconomic and financial series employed in the SVAR model (in logs)
4.45
4.50
4.55
4.60
4.65
4.70
00 01 02 03 04 05 06 07 08 09 10
FRA_CPI
4.40
4.45
4.50
4.55
4.60
4.65
4.70
00 01 02 03 04 05 06 07 08 09 10
FRA_IP
4.0
4.4
4.8
5.2
5.6
00 01 02 03 04 05 06 07 08 09 10
FRA_SMT
14.6
14.7
14.8
14.9
15.0
15.1
00 01 02 03 04 05 06 07 08 09 10
FRA_TI
4.4
4.5
4.6
4.7
4.8
00 01 02 03 04 05 06 07 08 09 10
GR_CPI
4.40
4.45
4.50
4.55
4.60
4.65
4.70
00 01 02 03 04 05 06 07 08 09 10
GR_IP
8.0
8.5
9.0
9.5
10.0
10.5
11.0
00 01 02 03 04 05 06 07 08 09 10
GR_SMT
13.0
13.1
13.2
13.3
13.4
13.5
13.6
00 01 02 03 04 05 06 07 08 09 10
GR_TI
4.45
4.50
4.55
4.60
4.65
4.70
4.75
00 01 02 03 04 05 06 07 08 09 10
ITA_CPI
4.3
4.4
4.5
4.6
4.7
4.8
00 01 02 03 04 05 06 07 08 09 10
ITA_IP
6.8
7.2
7.6
8.0
00 01 02 03 04 05 06 07 08 09 10
ITA_SMT
14.5
14.6
14.7
14.8
14.9
15.0
00 01 02 03 04 05 06 07 08 09 10
ITA_TI
4.4
4.5
4.6
4.7
4.8
00 01 02 03 04 05 06 07 08 09 10
SPA_CPI
4.3
4.4
4.5
4.6
4.7
4.8
00 01 02 03 04 05 06 07 08 09 10
SPA_IP
4.4
4.8
5.2
5.6
6.0
00 01 02 03 04 05 06 07 08 09 10
SPA_SMT
14.5
14.6
14.7
14.8
14.9
15.0
00 01 02 03 04 05 06 07 08 09 10
SPA_TI
2.5
3.0
3.5
4.0
4.5
5.0
00 01 02 03 04 05 06 07 08 09 10
OIL_PRICE
11.08
11.12
11.16
11.20
11.24
00 01 02 03 04 05 06 07 08 09 10
OIL_PRODUCTION
-.8
-.4
.0
.4
.8
00 01 02 03 04 05 06 07 08 09 10
GEA
CPI=consumer price index, IP=industrial production, SMT=tourism stock market index, TI=tourism income,
GEA=global economic activity

22
Figure 2: Accumulated Impulse Responses
The lines represent the accumulated impulse responses of the inflation (R_CPI), tourism sector equity index (R_SMT), tourism income (R_TI) and industrial production (R_IP) to a positive supply-side oil price shock (shock 1), aggregate demand oil price shock (shock 2), oil specific demand shock (shock 3), price shock (shock 4), stock market shock (shock 5), tourism income shock (shock 6) and income shock (shock 7), respectively.
2a. France
-.002
-.001
.000
.001
.002
.003
.004
2 4 6 8 10 12
Accumulated Response of R_CPI to Shock1
-.002
-.001
.000
.001
.002
.003
.004
2 4 6 8 10 12
Accumulated Response of R_CPI to Shock2
-.002
-.001
.000
.001
.002
.003
.004
2 4 6 8 10 12
Accumulated Response of R_CPI to Shock3
-.002
-.001
.000
.001
.002
.003
.004
2 4 6 8 10 12
Accumulated Response of R_CPI to Shock4
-.002
-.001
.000
.001
.002
.003
.004
2 4 6 8 10 12
Accumulated Response of R_CPI to Shock5
-.002
-.001
.000
.001
.002
.003
.004
2 4 6 8 10 12
Accumulated Response of R_CPI to Shock6
-.002
-.001
.000
.001
.002
.003
.004
2 4 6 8 10 12
Accumulated Response of R_CPI to Shock7
-.04
.00
.04
.08
.12
2 4 6 8 10 12
Accumulated Response of R_SMT to Shock1
-.04
.00
.04
.08
.12
2 4 6 8 10 12
Accumulated Response of R_SMT to Shock3
-.04
.00
.04
.08
.12
2 4 6 8 10 12
Accumulated Response of R_SMT to Shock2
-.04
.00
.04
.08
.12
2 4 6 8 10 12
Accumulated Response of R_SMT to Shock4
-.04
.00
.04
.08
.12
2 4 6 8 10 12
Accumulated Response of R_SMT to Shock5
-.04
.00
.04
.08
.12
2 4 6 8 10 12
Accumulated Response of R_SMT to Shock6
-.04
.00
.04
.08
.12
2 4 6 8 10 12
Accumulated Response of R_SMT to Shock7
-.02
.00
.02
.04
.06
2 4 6 8 10 12
Accumulated Response of R_TI to Shock1
-.02
.00
.02
.04
.06
2 4 6 8 10 12
Accumulated Response of R_TI to Shock2
-.02
.00
.02
.04
.06
2 4 6 8 10 12
Accumulated Response of R_TI to Shock3
-.02
.00
.02
.04
.06
2 4 6 8 10 12
Accumulated Response of R_TI to Shock4
-.02
.00
.02
.04
.06
2 4 6 8 10 12
Accumulated Response of R_TI to Shock5
-.02
.00
.02
.04
.06
2 4 6 8 10 12
Accumulated Response of R_TI to Shock6
-.02
.00
.02
.04
.06
2 4 6 8 10 12
Accumulated Response of R_TI to Shock7
-.02
-.01
.00
.01
.02
2 4 6 8 10 12
Accumulated Response of R_IP to Shock1
-.02
-.01
.00
.01
.02
2 4 6 8 10 12
Accumulated Response of R_IP to Shock3
-.02
-.01
.00
.01
.02
2 4 6 8 10 12
Accumulated Response of R_IP to Shock2
-.02
-.01
.00
.01
.02
2 4 6 8 10 12
Accumulated Response of R_IP to Shock4
-.02
-.01
.00
.01
.02
2 4 6 8 10 12
Accumulated Response of R_IP to Shock5
-.02
-.01
.00
.01
.02
2 4 6 8 10 12
Accumulated Response of R_IP to Shock6
-.02
-.01
.00
.01
.02
2 4 6 8 10 12
Accumulated Response of R_IP to Shock7
Accumulated Response to Structural One S.D. Innovations ± 2 S.E.

23
2b. Italy
-.002
-.001
.000
.001
.002
.003
2 4 6 8 10 12
Accumulated Response of R_CPI to Shock1
-.002
-.001
.000
.001
.002
.003
2 4 6 8 10 12
Accumulated Response of R_CPI to Shock2
-.002
-.001
.000
.001
.002
.003
2 4 6 8 10 12
Accumulated Response of R_CPI to Shock3
-.002
-.001
.000
.001
.002
.003
2 4 6 8 10 12
Accumulated Response of R_CPI to Shock4
-.002
-.001
.000
.001
.002
.003
2 4 6 8 10 12
Accumulated Response of R_CPI to Shock5
-.002
-.001
.000
.001
.002
.003
2 4 6 8 10 12
Accumulated Response of R_CPI to Shock6
-.002
-.001
.000
.001
.002
.003
2 4 6 8 10 12
Accumulated Response of R_CPI to Shock7
-.04
.00
.04
.08
.12
2 4 6 8 10 12
Accumulated Response of R_SMT to Shock1
-.04
.00
.04
.08
.12
2 4 6 8 10 12
Accumulated Response of R_SMT to Shock3
-.04
.00
.04
.08
.12
2 4 6 8 10 12
Accumulated Response of R_SMT to Shock2
-.04
.00
.04
.08
.12
2 4 6 8 10 12
Accumulated Response of R_SMT to Shock4
-.04
.00
.04
.08
.12
2 4 6 8 10 12
Accumulated Response of R_SMT to Shock5
-.04
.00
.04
.08
.12
2 4 6 8 10 12
Accumulated Response of R_SMT to Shock6
-.04
.00
.04
.08
.12
2 4 6 8 10 12
Accumulated Response of R_SMT to Shock7
-.02
.00
.02
.04
.06
2 4 6 8 10 12
Accumulated Response of R_TI to Shock1
-.02
.00
.02
.04
.06
2 4 6 8 10 12
Accumulated Response of R_TI to Shock3
-.02
.00
.02
.04
.06
2 4 6 8 10 12
Accumulated Response of R_TI to Shock2
-.02
.00
.02
.04
.06
2 4 6 8 10 12
Accumulated Response of R_TI to Shock4
-.02
.00
.02
.04
.06
2 4 6 8 10 12
Accumulated Response of R_TI to Shock5
-.02
.00
.02
.04
.06
2 4 6 8 10 12
Accumulated Response of R_TI to Shock6
-.02
.00
.02
.04
.06
2 4 6 8 10 12
Accumulated Response of R_TI to Shock7
-.02
-.01
.00
.01
.02
.03
2 4 6 8 10 12
Accumulated Response of R_IP to Shock1
-.02
-.01
.00
.01
.02
.03
2 4 6 8 10 12
Accumulated Response of R_IP to Shock3
-.02
-.01
.00
.01
.02
.03
2 4 6 8 10 12
Accumulated Response of R_IP to Shock2
-.02
-.01
.00
.01
.02
.03
2 4 6 8 10 12
Accumulated Response of R_IP to Shock4
-.02
-.01
.00
.01
.02
.03
2 4 6 8 10 12
Accumulated Response of R_IP to Shock5
-.02
-.01
.00
.01
.02
.03
2 4 6 8 10 12
Accumulated Response of R_IP to Shock6
-.02
-.01
.00
.01
.02
.03
2 4 6 8 10 12
Accumulated Response of R_IP to Shock7
Accumulated Response to Structural One S.D. Innovations ± 2 S.E.

24
2c. Greece
-.002
-.001
.000
.001
.002
.003
.004
2 4 6 8 10 12
Accumulated Response of R_CPI to Shock1
-.002
-.001
.000
.001
.002
.003
.004
2 4 6 8 10 12
Accumulated Response of R_CPI to Shock2
-.002
-.001
.000
.001
.002
.003
.004
2 4 6 8 10 12
Accumulated Response of R_CPI to Shock3
-.002
-.001
.000
.001
.002
.003
.004
2 4 6 8 10 12
Accumulated Response of R_CPI to Shock4
-.002
-.001
.000
.001
.002
.003
.004
2 4 6 8 10 12
Accumulated Response of R_CPI to Shock5
-.002
-.001
.000
.001
.002
.003
.004
2 4 6 8 10 12
Accumulated Response of R_CPI to Shock6
-.002
-.001
.000
.001
.002
.003
.004
2 4 6 8 10 12
Accumulated Response of R_CPI to Shock7
-.10
-.05
.00
.05
.10
.15
2 4 6 8 10 12
Accumulated Response of R_SMT to Shock1
-.10
-.05
.00
.05
.10
.15
2 4 6 8 10 12
Accumulated Response of R_SMT to Shock3
-.10
-.05
.00
.05
.10
.15
2 4 6 8 10 12
Accumulated Response of R_SMT to Shock2
-.10
-.05
.00
.05
.10
.15
2 4 6 8 10 12
Accumulated Response of R_SMT to Shock4
-.10
-.05
.00
.05
.10
.15
2 4 6 8 10 12
Accumulated Response of R_SMT to Shock5
-.10
-.05
.00
.05
.10
.15
2 4 6 8 10 12
Accumulated Response of R_SMT to Shock6
-.10
-.05
.00
.05
.10
.15
2 4 6 8 10 12
Accumulated Response of R_SMT to Shock7
-.02
.00
.02
.04
.06
.08
2 4 6 8 10 12
Accumulated Response of R_TI to Shock1
-.02
.00
.02
.04
.06
.08
2 4 6 8 10 12
Accumulated Response of R_TI to Shock3
-.02
.00
.02
.04
.06
.08
2 4 6 8 10 12
Accumulated Response of R_TI to Shock2
-.02
.00
.02
.04
.06
.08
2 4 6 8 10 12
Accumulated Response of R_TI to Shock4
-.02
.00
.02
.04
.06
.08
2 4 6 8 10 12
Accumulated Response of R_TI to Shock5
-.02
.00
.02
.04
.06
.08
2 4 6 8 10 12
Accumulated Response of R_TI to Shock6
-.02
.00
.02
.04
.06
.08
2 4 6 8 10 12
Accumulated Response of R_TI to Shock7
-.01
.00
.01
.02
.03
2 4 6 8 10 12
Accumulated Response of R_IP to Shock1
-.01
.00
.01
.02
.03
2 4 6 8 10 12
Accumulated Response of R_IP to Shock2
-.01
.00
.01
.02
.03
2 4 6 8 10 12
Accumulated Response of R_IP to Shock3
-.01
.00
.01
.02
.03
2 4 6 8 10 12
Accumulated Response of R_IP to Shock4
-.01
.00
.01
.02
.03
2 4 6 8 10 12
Accumulated Response of R_IP to Shock5
-.01
.00
.01
.02
.03
2 4 6 8 10 12
Accumulated Response of R_IP to Shock6
-.01
.00
.01
.02
.03
2 4 6 8 10 12
Accumulated Response of R_IP to Shock7
Accumulated Response to Structural One S.D. Innovations ± 2 S.E.

25
2d. Spain
-.002
-.001
.000
.001
.002
.003
.004
2 4 6 8 10 12
Accumulated Response of R_CPI to Shock1
-.002
-.001
.000
.001
.002
.003
.004
2 4 6 8 10 12
Accumulated Response of R_CPI to Shock2
-.002
-.001
.000
.001
.002
.003
.004
2 4 6 8 10 12
Accumulated Response of R_CPI to Shock3
-.002
-.001
.000
.001
.002
.003
.004
2 4 6 8 10 12
Accumulated Response of R_CPI to Shock4
-.002
-.001
.000
.001
.002
.003
.004
2 4 6 8 10 12
Accumulated Response of R_CPI to Shock5
-.002
-.001
.000
.001
.002
.003
.004
2 4 6 8 10 12
Accumulated Response of R_CPI to Shock6
-.002
-.001
.000
.001
.002
.003
.004
2 4 6 8 10 12
Accumulated Response of R_CPI to Shock7
-.08
-.04
.00
.04
.08
.12
2 4 6 8 10 12
Accumulated Response of R_SMT to Shock1
-.08
-.04
.00
.04
.08
.12
2 4 6 8 10 12
Accumulated Response of R_SMT to Shock2
-.08
-.04
.00
.04
.08
.12
2 4 6 8 10 12
Accumulated Response of R_SMT to Shock3
-.08
-.04
.00
.04
.08
.12
2 4 6 8 10 12
Accumulated Response of R_SMT to Shock4
-.08
-.04
.00
.04
.08
.12
2 4 6 8 10 12
Accumulated Response of R_SMT to Shock5
-.08
-.04
.00
.04
.08
.12
2 4 6 8 10 12
Accumulated Response of R_SMT to Shock6
-.08
-.04
.00
.04
.08
.12
2 4 6 8 10 12
Accumulated Response of R_SMT to Shock7
-.02
-.01
.00
.01
.02
.03
.04
2 4 6 8 10 12
Accumulated Response of R_TI to Shock1
-.02
-.01
.00
.01
.02
.03
.04
2 4 6 8 10 12
Accumulated Response of R_TI to Shock3
-.02
-.01
.00
.01
.02
.03
.04
2 4 6 8 10 12
Accumulated Response of R_TI to Shock2
-.02
-.01
.00
.01
.02
.03
.04
2 4 6 8 10 12
Accumulated Response of R_TI to Shock4
-.02
-.01
.00
.01
.02
.03
.04
2 4 6 8 10 12
Accumulated Response of R_TI to Shock5
-.02
-.01
.00
.01
.02
.03
.04
2 4 6 8 10 12
Accumulated Response of R_TI to Shock6
-.02
-.01
.00
.01
.02
.03
.04
2 4 6 8 10 12
Accumulated Response of R_TI to Shock7
-.02
-.01
.00
.01
.02
.03
.04
2 4 6 8 10 12
Accumulated Response of R_IP to Shock1
-.02
-.01
.00
.01
.02
.03
.04
2 4 6 8 10 12
Accumulated Response of R_IP to Shock3
-.02
-.01
.00
.01
.02
.03
.04
2 4 6 8 10 12
Accumulated Response of R_IP to Shock2
-.02
-.01
.00
.01
.02
.03
.04
2 4 6 8 10 12
Accumulated Response of R_IP to Shock4
-.02
-.01
.00
.01
.02
.03
.04
2 4 6 8 10 12
Accumulated Response of R_IP to Shock5
-.02
-.01
.00
.01
.02
.03
.04
2 4 6 8 10 12
Accumulated Response of R_IP to Shock6
-.02
-.01
.00
.01
.02
.03
.04
2 4 6 8 10 12
Accumulated Response of R_IP to Shock7
Accumulated Response to Structural One S.D. Innovations ± 2 S.E.

26
Tables:
Table 1: Comparison of the empirical results for tourism and economic growth
Authors (year) Empirical Method Employed Period of study Country / Group Hypothesis Supported
Fayissa et al (2011) Dynamic Panel Data Analysis 1990-2005 18 Heterogenous Latin America Countries
TLEG
Kasimati (2011) VECM 1960-2010 Greece Bidirectional Relationship
Schubert (2011) VECM and Granger Causality test 1970-2008 Antigua, Barbuda TLEG
Brida et al (2010) Cointegration Analysis 1987-2006 Uruguay TLEG
Cortѐs-Jimenez
et al (2009) Cointegration Analysis & GrangerCausality Tests
1954-2000 Italy Bidirectional Relationship
Cortѐs-Jimenez
et al (2009) Cointegration Analysis & GrangerCausality Tests
1964-2000 Spain Bidirectional Relationship
Katricioglu (2009) Johansen Cointegration Analysis 1960-2006 Turkey NO Causality
Zortuk (2009) VECM 1992-2008 Turkey TLEG
Carrera et al (2008) Johansen Cointegration Analysis 1980-2007 Mexico TLEG
Lee & Chang (2008) Panel Cointegration 1990-2002 OECD Countries TLEG
Lee & Chang (2008) Panel Cointegration 1990-2002 Non- OECD Countries
Bidirectional Relationship
Proenca & Soukiazis (2008) Panel Data Analysis 1993-2001 Portugal TLEG
Kim et al. (2006) Granger Causality Test 1971-2003 Taiwan TLEG
Gunduz & Hatemi-J (2005) VAR 1963-2002 Turkey TLEG
Oh (2005) Granger Causality Test 1975-2001 Korea EDTG
Dritsakis (2004) VECM 1960-2000 Greece Bidirectional Relationship
Durbarry (2004) VECM 1952-1999 Mauritius Bidirectional Relationship
Eugenio-Martin & Morales (2004)
Panel GLS 1980-1997 Low and Medium-income Latin America Countries
TLEG
Eugenio-Martin & Morales (2004)
Panel GLS 1980-1997 High-income Latin America Countries
NO Causality
Narayan (2004) VECM 1970-2000 Fiji EDTG

27
Lanza et al. (2003) Almost Ideal Demand System (AIDS)
1977-1992 13 OECD Countries TLEG
Balaguer & Cantavella-Jorda (2002)
VECM 1975-1997 Spain Bidirectional Relationship

28
Table 2: Overview of Tourism Sector for the period 2000-2010
2000 2001 2002 2003 2004 2005 2006 2007 2008 2009 2010 Average
Italy Inbound Tourist Arrivals: Total ('000) 62,702 60,960 63,561 63,026 58,480 59,230 66,353 70,271 70,719 71,692 73,225 65,474
Inbound Tourist Arrivals: Overnight Visitors ('000) 41,181 39,563 39,799 39,604 37,071 36,513 41,058 43,654 42,734 43,239 43,626 40,731
Inbound tourism expenditure over GDP (%) 1.6 1.5 1.5 1.4 1.5 1.5 1.7 1.7 1.7 1.5 1.5 1.6
Inbound tourism expenditure over exports of services (%) 50.8 46.7 46.6 45.4 44.8 43 42.1 41.1 41.6 43.7 40.9 44.2
France Inbound Tourist Arrivals: Total ('000) .. .. .. .. 190,282 185,829 193,882 193,319 193,571 192,369 189,881 191,305
Inbound Tourist Arrivals: Overnight Visitors ('000) 77,190 75,202 77,012 75,048 74,433 74,988 77,916 80,853 79,218 76,764 77,148 76,888
Inbound tourism expenditure over GDP (%) 2.5 2.4 2.4 2.2 2.2 2.1 2.1 2.1 2 1.9 1.8 2.1
Inbound tourism expenditure over exports of services (%) 39.7 39.1 39.5 38.8 39.2 36 36.1 36.2 34.4 34.3 31.7 36.8
Spain Inbound Tourist Arrivals: Total ('000) 74,580 75,564 79,313 82,326 85,981 92,563 96,152 98,907 97,670 91,899 93,729 88,062
Inbound Tourist Arrivals: Overnight Visitors ('000) 46,403 48,565 50,331 50,854 52,430 55,914 58,004 58,666 57,192 52,178 52,677 53,019
Inbound tourism expenditure over GDP (%) 5.6 5.6 5.2 5 4.8 4.7 4.7 4.5 4.4 4.1 4.2 4.8
Inbound tourism expenditure over exports of services (%) 62.3 60.8 58.9 59 58.1 56.1 53.9 50.7 49 48.4 47.6 55
Greece Inbound Tourist Arrivals: Total ('000) 13,567 14,678 14,918 14,785 14,268 15,938 17,284 .. .. .. .. 15,063
Inbound Tourist Arrivals: Overnight Visitors ('000) 13,096 14,057 14,180 13,969 13,313 14,765 16,039 16,165 15,939 14,915 15,007 14,677
Inbound tourism expenditure over GDP (%) 7.3 7 6.8 5.6 5.6 5.6 5.5 5 5.1 4.5 4.1 5.6
Inbound tourism expenditure over exports of services (%) 48.1 47.4 49.7 44.6 38.7 39.7 40.5 36.4 34.8 39.2 33.6 41.2
Source: Adapted from World Tourism Organization

29
Table 3: Mode of transport - Average for period 2000-2010
Table 4: SVAR contemporaneous coefficients
Coefficient Italy France Spain Greece
α11 0.0082 *** 0.0083 *** 0.0081 *** 0.0083 ***
α21 1.5260 2.7486 * 2.5202 3.5445
α22 1.5443 *** 1.536 *** 1.5254 *** 1.4533 ***
α31 0.0086 -0.3252 -0.0227 -0.1702
α32 0.0292 *** 0.0257 *** 0.0274 *** 0.0224 ***
α33 0.1129 *** 0.1134 *** 0.1147 *** 0.1132 ***
α41 0.0205 0.0020 0.0003 0.0054
α42 0.0001 0.0002 0.0000 0.0001
α43 0.0038 ** 0.0071 *** 0.0054 *** 0.0059 ***
α44 0.0020 *** 0.0018 *** 0.0025 *** 0.0025 ***
α51 0.2191 0.4364 1.4185 0.6668
α52 -0.0039 0.0038 -0.0086 -0.0018
α53 -0.0999 * -0.0157 * -0.0627 * -0.1890 ***
α54 -3.8297 1.1513 3.8086 3.9445
α55 0.0620 *** 0.0907 *** 0.0976 *** 0.0753 ***
α56 0.0996 0.0305 0.1874 0.0777
α57 0.6741 * 0.7543 0.4546 * 0.5034
α61 0.3312 -0.4144 0.1976 0.4584
α62 -0.0005 0.0001 0.0001 0.0011
α63 -0.0762 ** -0.0142 -0.0246 -0.0255
α64 -3.5612 * -1.5916 -1.1375 -0.5888
a66 0.0434 *** 0.0493 *** 0.0273 *** 0.0573 ***
a71 -0.0020 -0.0041 0.1046 0.1197
α72 -0.0006 0.0005 -0.0013 -0.0010
α73 -0.0086 -0.0156 -0.0065 0.0139
α76 0.0138 0.0066 0.1253 0.0329
α77 0.0156 *** 0.0122 *** 0.0349 *** 0.0220 ***
*** denotes significance at 1% level.
** denotes significance at 5% level.
*denotes significance at 10% level.
Mode of Transport France Italy Spain Greece
Air (%) 22.8 25.9 74.2 71.5
Land (%) 68.0 70.4 23.2 19.2
Source: Adapted from World Tourism Organization