Welcome message from author
This document is posted to help you gain knowledge. Please leave a comment to let me know what you think about it! Share it to your friends and learn new things together.
Transcript
16 Income and Prices
Introduction
omprehensive data on the level and distribution of family income and expenditures are crucial inputs in the formulation and implementation of development programs for families and communities with the most need. The National Statistics Office (NSO) keeps data users abreast on these “family economics” through its conduct of the Family Income and Expenditure Survey (FIES) every three years.
The 2009 FIES is the most recent survey of NSO that provides information on the levels of living and disparities in income of Filipino families, as well as their spending patterns. During the years when the FIES is not taken, the Annual Poverty Indicators Survey (APIS), a non-income quality of life survey, is conducted in its place. The APIS is designed to provide access and impact indicators that can be used in the assessment of the government programs on poverty alleviation.
Data derived from FIES and APIS provide benchmark information to update weights in the estimation of the consumer price index (CPI) and the country’s poverty threshold and inventory incidence.
This chapter presents the results of the 2009 FIES and 2010 APIS. Data on consumer, wholesale, and retail price indicators for 2010 are also presented in the latter part of this chapter. 16.1 The Family Income and Expenditure Survey
The first FIES was conducted in March 1957 to determine the income distribution and spending patterns of Filipino families. Subsequent surveys were conducted in 1961, 1965, 1971, 1985, and every three years thereafter, until 2003. In 1975, when FIES was merged with the Integrated Census of the Population and its Economic Activities (ICPEA), the primary objective had been to measure the productivity of the household as well as the income and employment generated by the household activities.
The 1957 and 1961 FIES. The March 1957 survey, which covered all income levels in the urban and rural areas of the country, collected data on cash and noncash income received, and on expenditure incurred by families in 1956. Five years later, a survey of the same nature was conducted in 1961 as the reference period. As samples, this survey considered 3,541 and 3,436 families from urban and rural areas of the country, respectively.
C
Income and Prices
The 1965 and 1971 FIES. In the 1965 FIES, a total of 7,747 families located in 37 cities and 489 municipalities were interviewed. The 1971 FIES, on the other hand, had 11,659 samples, 4,199 of which were systematically selected from urban areas and 7,460, from rural areas. Unlike the 1957 and 1966 surveys, whose reference periods were the respective calendar years 1956 and 1965, the 1971 survey covered the period May 1970 to April 1971. Estimates for food, beverage, and tobacco expenditures, however, were based on the week prior to the interview. For the first time since 1956, estimates of family savings and deficits were made. The 1975 FIES. Unlike the data gathered through the aforementioned surveys, the 1975 income-expenditure data were obtained from two separate activities. Family living expenditure was taken from the 1975 FIES, while family income was from Phase II of the 1975 ICPEA. The total number of households covered in FIES, however, was only a portion of ICPEA, that is, of the 454,844 households covered in ICPEA, only 15,832 were taken as subsamples for FIES. Similar to the 1971 survey, the reference period considered by the 1975 FIES on food, beverage, and tobacco expenditures was also the calendar week before the visit of census field workers. The 1985 FIES. In 1985, a new series of FIES in terms of content and methodology had begun and the gap of conducting this survey was reduced to three years from five years. The FIES also became a regular module of the Integrated Survey of Households (ISH) of the NSO. For the 1985 FIES, 17,000 sample households were interviewed, a number considered sufficient to provide reliable estimates of income and expenditures. The survey was conducted in two separate operations using the same questionnaire. The first visit was in July 1985 with the first six months of the year as the reference period, and the second visit, in January 1986, with July to December 1985 as the reference period. For purposes of estimating annual data, the results of the first-visit survey were combined with those of the second visit. The 1988 FIES. Adopting the same questionnaire design, procedures, and processing system used in 1985, the 1988 FIES was also a two-round sample survey conducted nationwide in July 1988 and January 1989. The sample size was increased to 20,000 households. The 1988 estimates as presented in this chapter, however, do not include the data for the province of Rizal. Fire gutted the accomplished questionnaires for the province after the second-visit operation and due to cost and time constraints, no reinter views were made. The results of the 1988 FIES, moreover, served as benchmark information in updating the weighs used in the estimation of the 1988-based CPI. The 1994 FIES. Like the three preceding FIES, the 1994 FIES adopted the “shuttle type” of data collection, in which sample households were interviewed in two separate operations. The scheme aimed at improving the quality of data gathered since it minimized memory bias of respondents and at the same time captured the seasonality of income and expenditure patterns. The first-visit operation of the 1994 survey was carried out nationwide in July 1994 and covered about 25,516 sample households. The second operation took place in January 1995.
NSO 2011 Philippine Yearbook
The 1997 FIES. The ninth FIES, which was conducted in 1997, covered a total of 40,992 sample households in 3,416 barangays throughout the archipelago. The 1997 FIES adopted the master sample (MS) design of the ISH. This design was similar to that of the previous ISH design used in past surveys, but was expanded to include more samples and newly created domains. The “shuttle type” data collection was again adopted. Thus, two major operations were conducted: the first visit in July 1997 (with reference period January to June 1997), followed by the February 1998 visit (covering the second semester of 1997). The 2003 FIES. The sampling design of the 2003 FIES used the 2003 MS constructed from the Enumeration Area Reference File (EARF) of the 2000 Census of Population and Housing. The number of sample households reached about 51,000 households nationwide, which was deemed sufficient to provide precise and reliable estimates at the regional level. In this design, the country’s 17 administrative regions were defined based on Executive Order Nos. 36 and 131. For comparability of results, the 2000 FIES data in this release were generated using the new regional grouping. Further, to compare the 2003 FIES estimates with the 2000 FIES results in real terms, the effects of inflation were removed by using the CPI to deflate the 2003 FIES estimates. The 2006 FIES. The 2006 FIES used four replicates of the 2003 MS created for household surveys on the basis of the 2000 Census of Population and Housing. Enumeration was conducted twice – the first visit was done in July 2006 with the first semester as the reference period; the second visit was made in January 2007 with the second semester of 2006 as reference period. The same set of questions was asked for both visits. A stratified, three-stage sampling design was employed: the selection of Primary Sampling Units (PSUs) for the first stage, sample enumeration areas (EAs) for the second stage, and sampling units for the third stage. The domains were the regions which were stratified by province, highly urbanized city (HUC), independent component city (ICC), and other factors within the geographical strata. The overall sampling fractions varied across regions to generate adequate sample size for each region. Survey weights were used in order to produce valid estimates of the population parameter. Base weights were computed to compensate for the unequal selection probabilities in the sample design. These were adjusted to account for unit nonresponsive and to conform to known population distributions like the projected population counts. The 2009 FIES. The 2009 FIES used four replicates of the 2003 Master Sample (MS) created for household surveys on the basis of the 2000 Census of Population and Housing. Enumeration was conducted twice – the first visit was done in July 2009 with the first semester January to June as the reference period; the second visit was made in January 2010 with the second semester of 2009, that is, July to December as reference period. The same set of questions was asked for both visits. A stratified, three-stage sampling design was employed: the selection of Primary Sampling Units (PSUs) for the first stage, sample enumeration areas (EAs) for the second stage, and sampling units for the third stage. The domains were the regions which were stratified by province, highly urbanized city (HUC), independent component city (ICC), and other factors within the geographical strata. The overall
Income and Prices
sampling fractions vary across regions to generate adequate sample size for each region. Survey weights are used in order to produce valid estimates of the population parameter. Base weights were computed to compensate for the unequal selection probabilities in the sample design. These were adjusted to account for unit nonresponsive and to conform to known population distributions like projected population counts. 16.2 Family Income Definition of Terms
To understand better the concepts presented here, the following are defined:
Family – a group of persons usually living together and composed of the head and other persons related to the head by blood, marriage, or adoption. An individual living alone is also considered a separate family. Throughout the survey, the concept of extended family was followed. Household – includes nonrelatives of the head who live in the same dwelling unit and share the same food. Family income – includes primary income and receipts from other sources received by all family members during the calendar year as participants in any economic activity or as recipients of transfers, pensions, grants, and the like. Sources of primary income – salaries and wages, commissions, tips, bonuses, family and clothing allowances, transportation and representation allowances, honoraria and other forms of compensation, and income from other entrepreneurial activities, such as net receipts of profits derived from the operation of family enterprise and from the practice of a profession or trade. Income – money received from all sources before tax and other deductions for retirement, social security, union dues, insurance premiums, and all other contributions reflected in the payroll. It also includes gifts of food and nonfood items received in kind in the form of support, assistance, or relief. Food items include only those received and consumed by the family during the reference period. These may be from other households, charitable institutions, the government, or from persons abroad, free of charge. Income decile – a grouping of income. Two levels of income deciles are utilized in the FIES: national and regional. The national income decile is obtained by ranking the weighted total family income of all sample families in the country from lowest to highest. Then, these are grouped into tens. The first tenth, referring to those with the lowest income, is called the first decile; the second tenth, second decile; and so on. A similar procedure is implemented for the regional decile, except that, what is arrayed is the weighted total family income of sample families in a given region.
NSO 2011 Philippine Yearbook
Per capita income – income obtained by dividing the total family income by the total number of family members. Expenditure – expense or disbursement made by the family for personal consumption. It excludes all expenses in relation to farms or business operations, investment ventures, purchase of real property, and other disbursement that do not involve personal consumption, gifts, support, assistance or relief in goods and services rendered by the family from friends, relatives, and others. Value consumed from net share of crops, fruits, and vegetables produced or livestock raised by other households, family sustenance, and entrepreneurial activities are also considered as family expenditure. Total Income
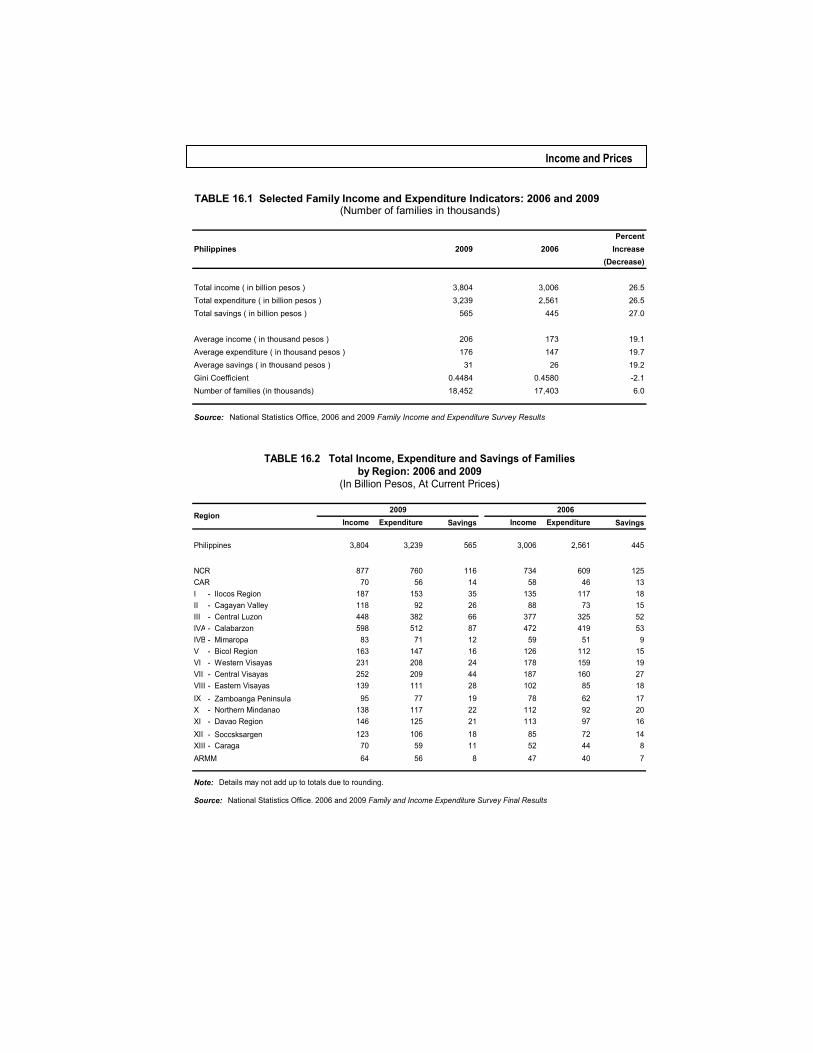
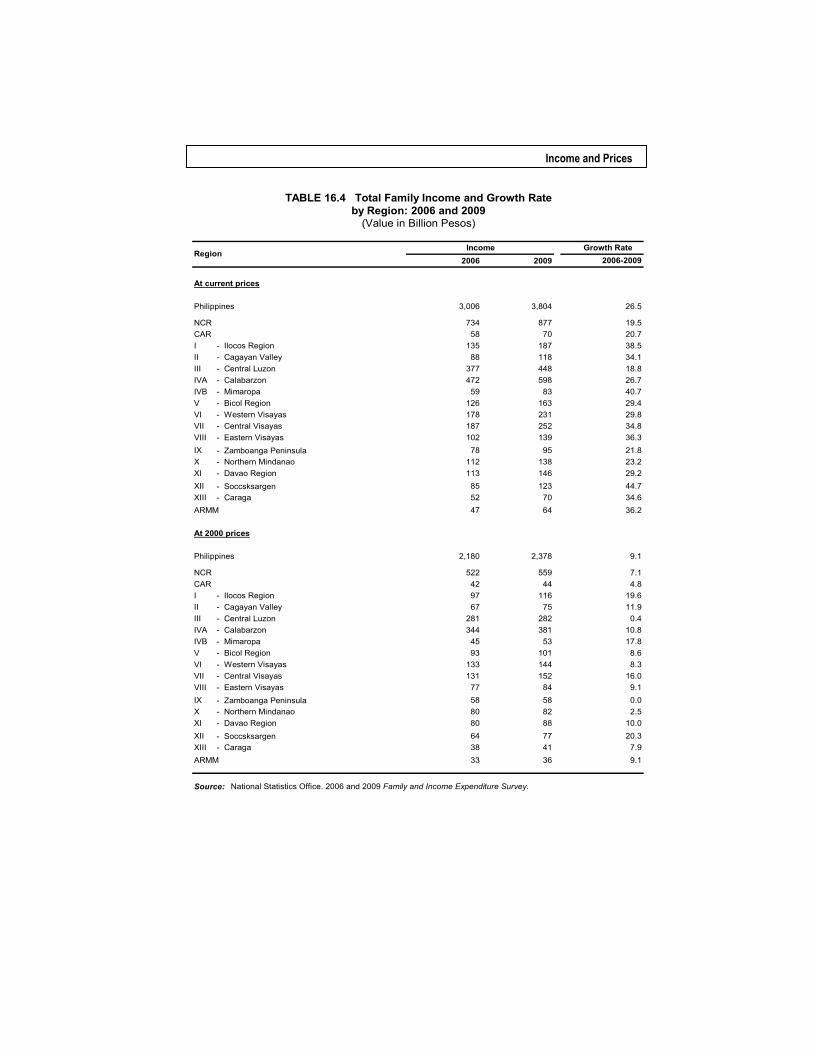
The 2009 FIES registered a total of 18.45 million families. This reflected an increase of 6.0 percent from the 17.40 million families recorded in 2006. In 2009, Filipino families acquired a total income of PhP3.80 trillion, reflecting an increase of 26.5 percent compared to the PhP3.01 trillion earned in 2006. Adjusting for inflation, total family income in 2009 was worth PhP2.38 trillion at 2000 prices. (Refer to Table 16.1.)
National Capital Region (NCR) contributed approximately one fourth (PhP877 billion) of the total income in 2009. Combining NCR’s share with the income share of more than half (50.6%) of the country’s aggregate income for the year. All regions in Luzon accounted for 66.9 percent of the total income; Mindanao regions shared 16.7 percent, while the three regions in the Visayas contributed 16.4 percent. Autonomous Region in Muslim Mindanao (ARMM) had the least share among the regions with only 1.7 percent or PhP64 billion.
All regions exhibited increases in income in 2009. Growths ranged from 18.8 percent in Central Luzon to 44.7 percent in SOCCSKSARGEN. (See Table 16.4 for details.) Average Income
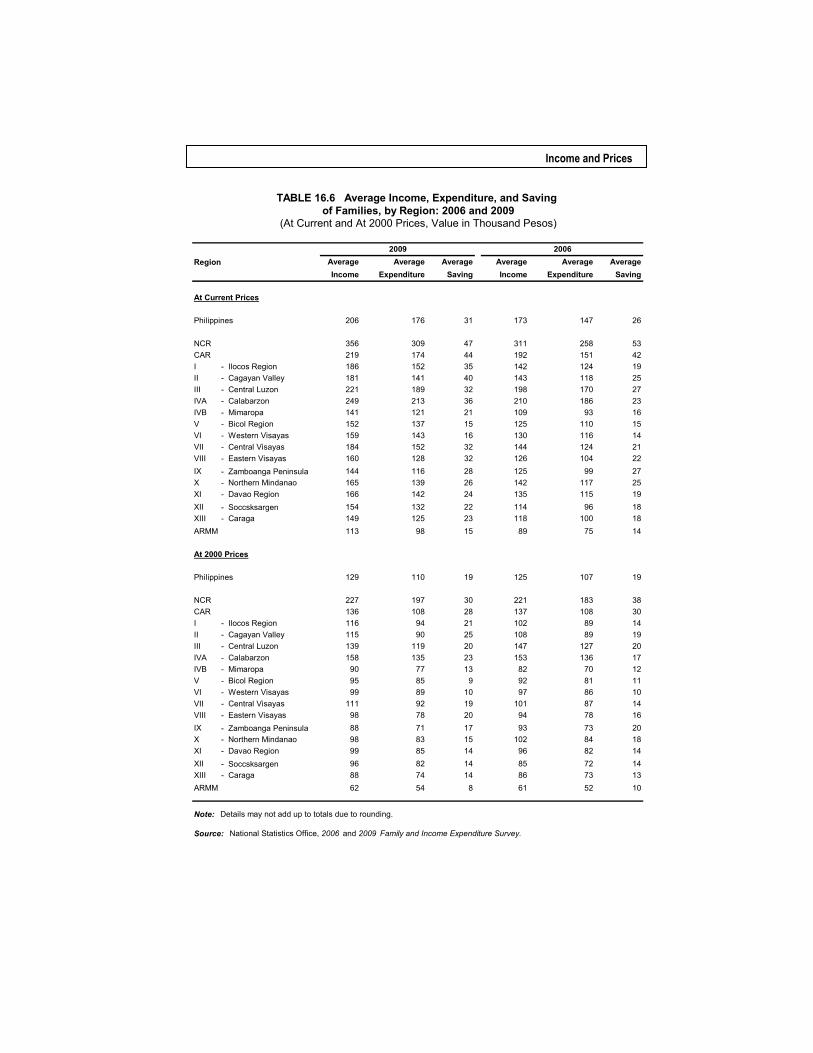
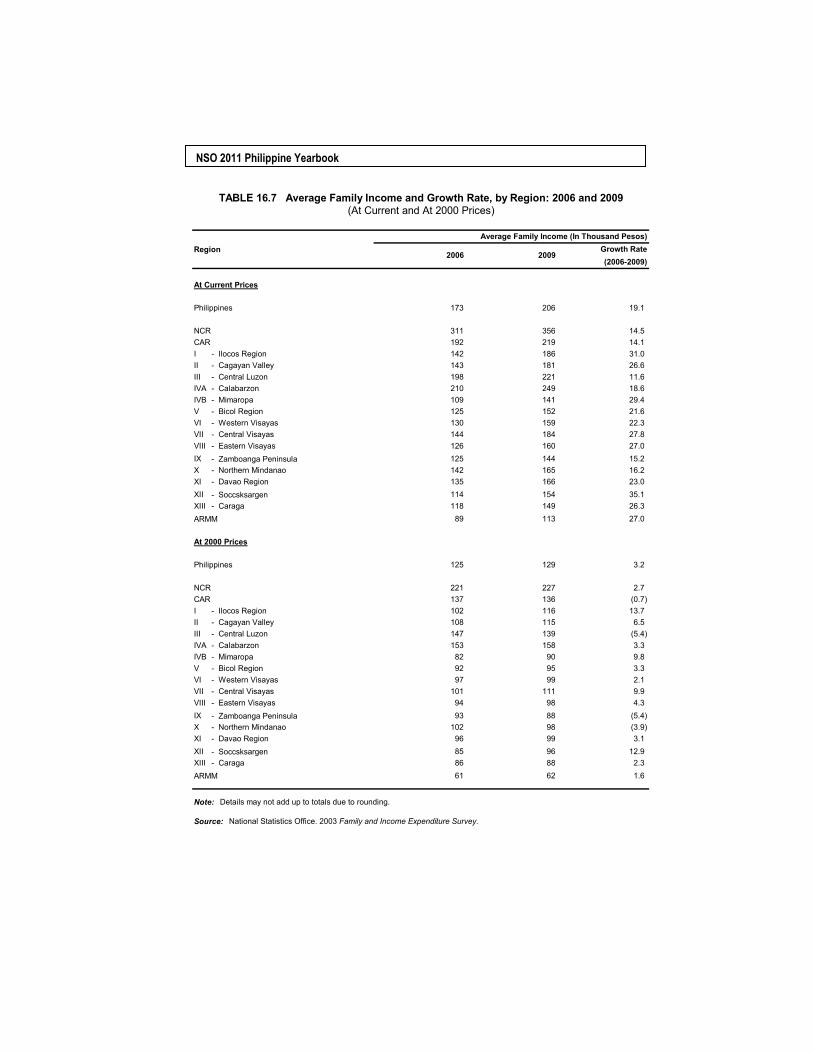
Average income was estimated at PhP206,000 in 2009, representing a 19.1 percent increase compared to the 2006 level of PhP173,000. Removing the effect of inflation, the average income in 2009 was valued at PhP129,000 at 2000 prices. The inflation-adjusted estimate showed an increase of 3.2 percent in average income. (See Table 16.6 for details.)
All regions exhibited increases in average income between 2006 and 2009 at current prices. NCR (PhP356,000), CALABARZON (PhP249,000), Central Luzon (PhP221,000), and the Cordillera Administrative Region or CAR (PhP219,000) posted estimates higher than the national average. The Autonomous Region in Muslim Mindanao (ARRM) registered the lowest average income among the regions with only PhP113,000. This was, however, higher by 27 percent compared to its average income of PhP89,000 in 2006. (See Table 16.6 for details.)
Income and Prices
Income Distribution Trend
There seemed to have less unequal income distribution in 2009. The 2009 Gini coefficient was recorded at 0.4484, slightly lower by -2.1 percent from 0.4580 in 2006.
Six regions registered increases in the Gini coefficient indicating a movement towards a widening income disparity among families. Cagayan Valley showed the biggest increment from 0.4216 in 2006 to 0.4425 in 2009. ARMM had the least income disparity with a Gini coefficient of 0.2948, which is even lower than its 2006 figure of 0.3113.
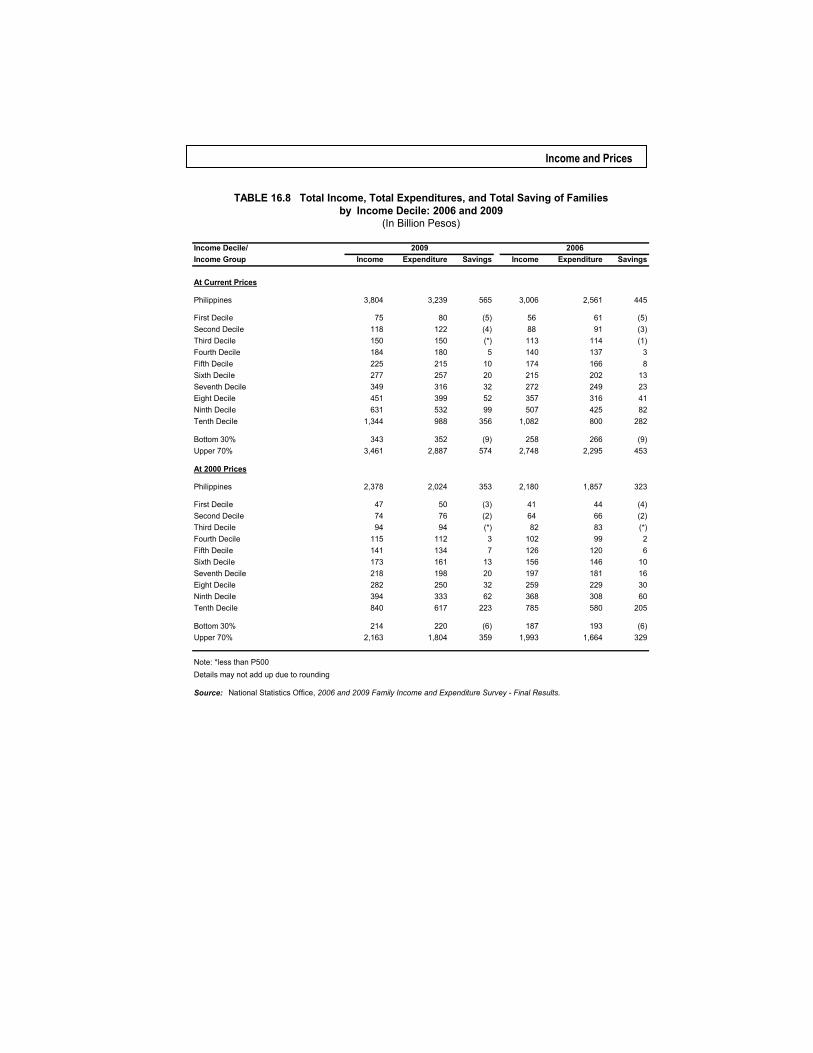
Over decades since 1961, there had been slight but encouraging changes in the structure of the country’s income distribution. Data in Table 16.8 show, however, that the bulk of the nation’s wealth still remains in the hands of few families in higher income groups.
1970s. The FIES generally showed encouraging results during this period. During the 1975 ICPEA, the lower 50 percent posted an all-time high-income share level in over three decades from 1965 to 1994. From 17.6 percent in 1971 FIES, it rose to 20.5 percent in 1975. Complementarily, the top 50 percent registered the lowest income share level at 79.5 percent over the same period. 1980s. Results of the 1985 FIES reflected a slight worsening in the economic situation. In 1985, the 0.2 percentage point lost by the lower 50 percent in the last 1975 ICPEA was absorbed by the upper half of income recipients. As can be gleaned from the 1985 and 1988 FIES data, the share of all income earners, except for the top 20 and top 10 percent of families, remained the same. 1990s. The mid-nineties saw slight reductions in income gaps among families in the country. Between 1991 and 1994, the share of families in the top 10, 20, and 50 percent showed an average reduction of 1.7 percentage points. The lower half, on the other hand, increased by an average of 0.4 percentage point. In 1997, this trend was completely reversed as the top 50 percent bounced back with an average increase of 1.96 percentage points, while the lower half’s share slumped by 0.9 percentage point on the average. 2000s. During the first half of the decade, all deciles, except the tenth decile, posted increases in percentage share to total income. In 2009, however, all deciles registered higher share in total income as compared to the 2006 figures. (See Table 16.8.) 16.3 Family Expenditure
Family expenditure refers to expenses or disbursements made by the family mainly for personal consumption in a given calendar year. These include gifts; support, assistance or relief in goods and services received by the family from friends, relatives, and others; as well as value consumed from net share of crops,
NSO 2011 Philippine Yearbook
fruits, and vegetables produced, or livestock raised by other households; family sustenance; and other entrepreneurial activities.
Excluded are all expenses in relation to farm or business operations, investment ventures, purchase of real property, and other disbursements that do not involve personal consumption. Total Expenditure
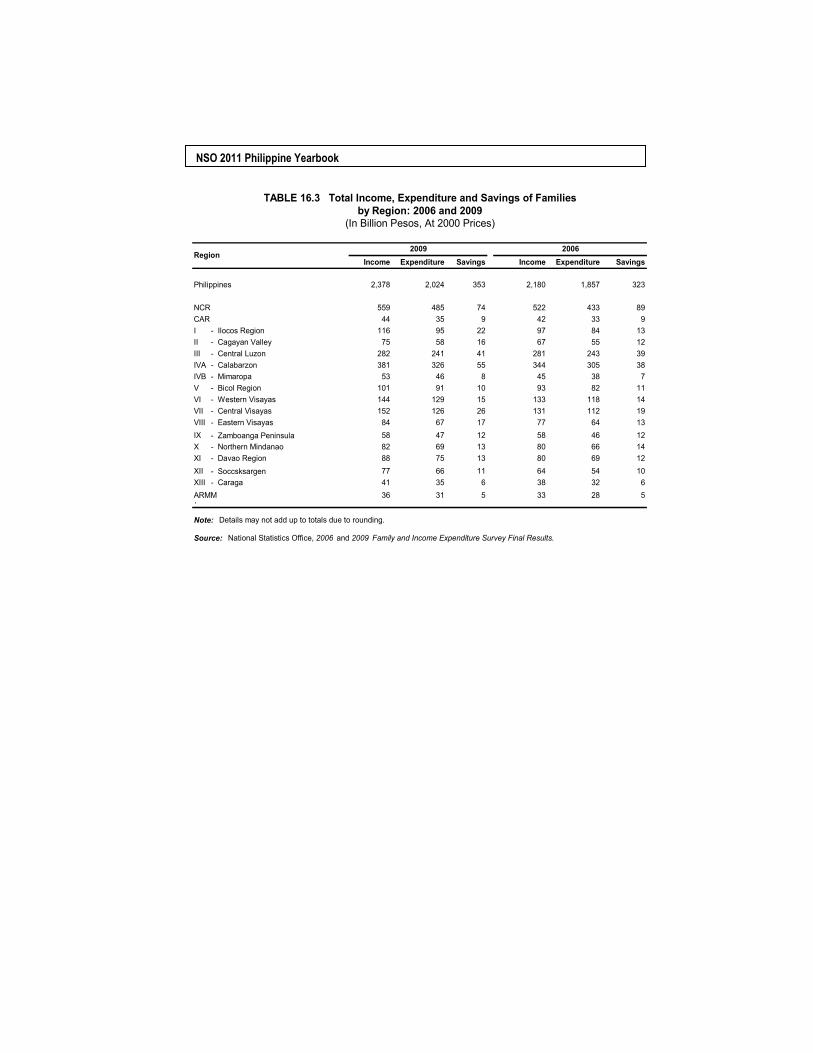
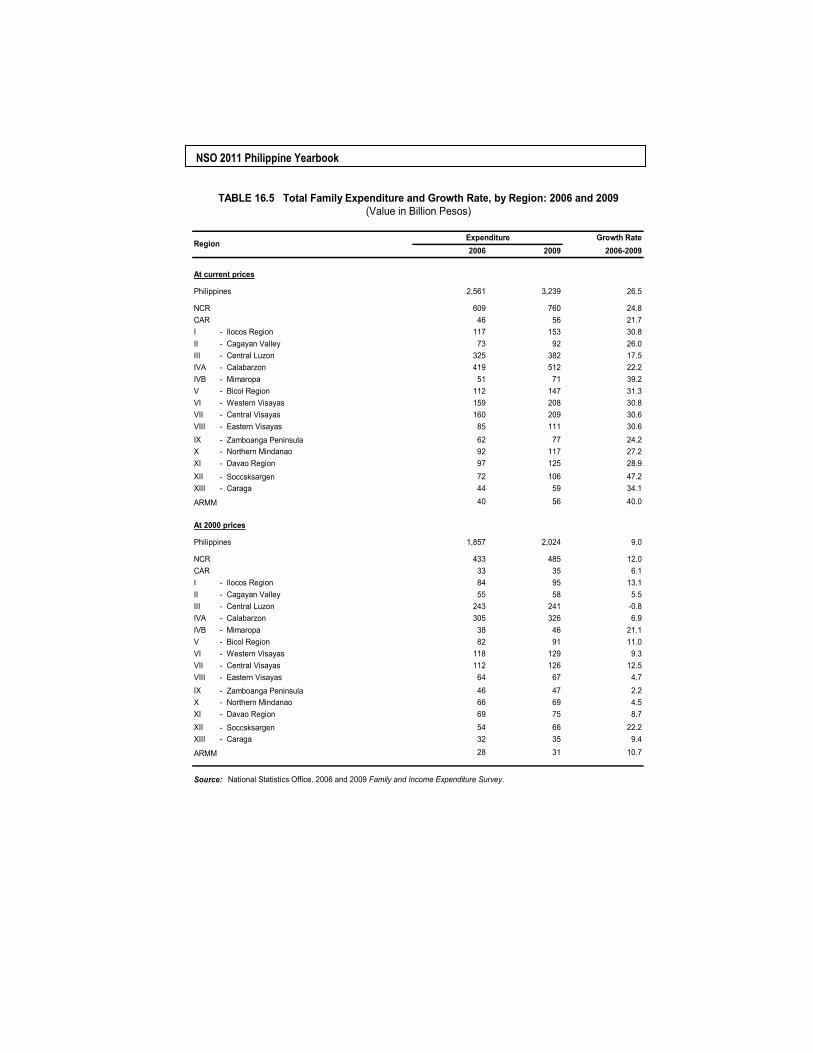
Total family expenditure reached PhP3.24 trillion in 2009. This was 2.7 percent higher than the PhP2.56 trillion spent in 2006. Adjusting for inflation, the total family expenditure for 2009 was valued at PhP2.02 trillion at 2000 prices. By region, the NCR had the biggest share to total family expenditure (PhP485 billion or 24.0 percent), while ARMM posted the least (PhP31 billion or 1.5 percent). (See Tables 16.2 and 16.3 for details.) Average Expenditure
Average expenditure increased by 19.7 percent from PhP147,000 in 2006 to PhP176,000 in 2009. The average expenditure in 2009 was worth only PhP110,000 at 2000 prices when inflationary effect was removed. The inflation adjusted estimates showed a 2.80 percent decline in average expenditure. Family Expenditure Pattern
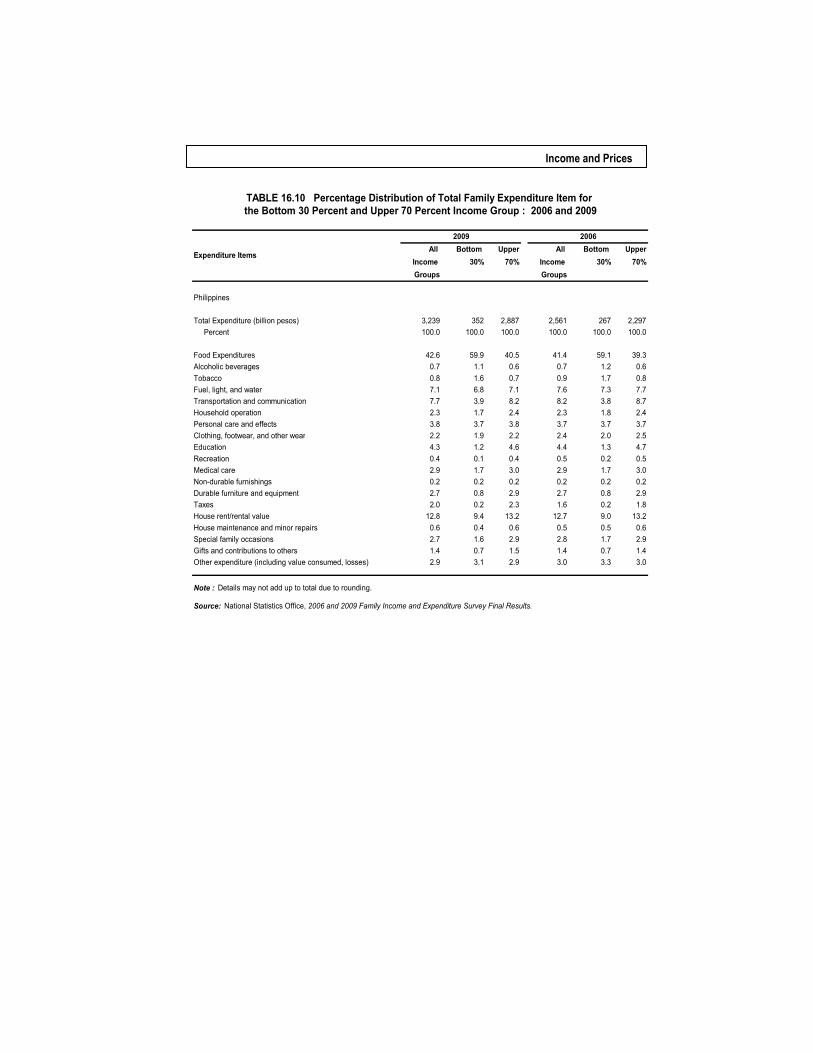
Results of the 2009 FIES revealed that the share of family expenditure on food items goes up, indicating a change in the spending pattern of families. In 2009, the share of food expenditure to total expenditure was 42.6 percent or 1.2 percentage points higher than its 41.4 percentage share in 2006.
Decreases in expenditure were also noted in tobacco, fuel, light and water, transportation and communication, household operations, clothing, footwear and other wear, recreation, special family occasions and other expenditures.
Meanwhile, families spent more on food as this expenditure moved up from 41.4 percent in 2006 to 42.6 percent in 2009. Increases in expenditure were likewise noted in personal care products, taxes, house rental and rent value, house maintenance and house repairs. (Refer to Table 16.10.) 16.4 Family Saving
Saving is derived by getting the difference between income and expenditure. Average saving was measured in 2009 at PhP31,000, up by 19.2 percent from PhP26,000 in 2006. In real terms, this average saving was equivalent to PhP19,000 at 2000 prices. In 2009, families in all regions, on the average, earned more than they spent. Families in NCR recorded the biggest average saving of PhP47,000 while those in Bicol Region and ARMM saved the least with PhP15,000 each. (See Table 16.6.)
Income and Prices
By income decile, the last three deciles registered increases in savings with the tenth decile recording the biggest leap of 26.2 percent from a total savings of PhP282 billion in 2006 to PhP356 billion in 2009. On the other hand, dissaving was observed in the first three deciles. 16.5 Annual Poverty Indicators Survey
In years when the Family Income and Expenditure Survey is not taken, the National Statistics Office undertakes the Annual Poverty Indicators Survey (APIS), a survey designed to provide access and impact indicators that can be used as inputs to the development of an integrated poverty indicator and monitoring system for the assessment of government programs on poverty alleviation and for the use of policymakers and planners. The 2007 APIS is already the fifth in a series. A total of 40,239 sample households were interviewed.
The Minimum Basic Needs (MBN) is the minimum criteria for attaining a decent quality of life, which are the basic needs of a Filipino family for survival, security and empowerment (enabling). Survival needs are the biophysical requirements of the family and the individual to assure life sustenance such as health, food and nutrition, clothing and safe water and sanitation. Security needs are the requirements to protect the family from physical harm such as shelter, peace and order/public safety, and income/livelihood. Empowerment or enabling needs refer to the requirements that facilitate the attainment of survival and protection needs namely basic education and functional literacy, participation in community development, and family and psychosocial care.
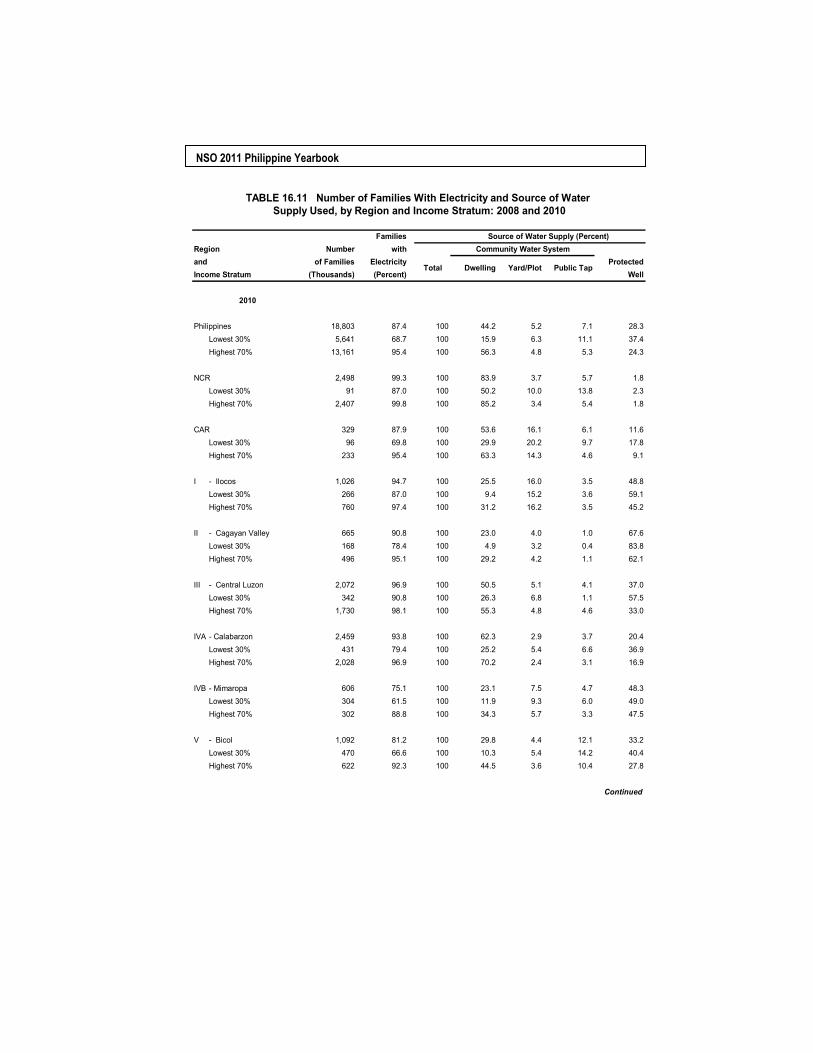
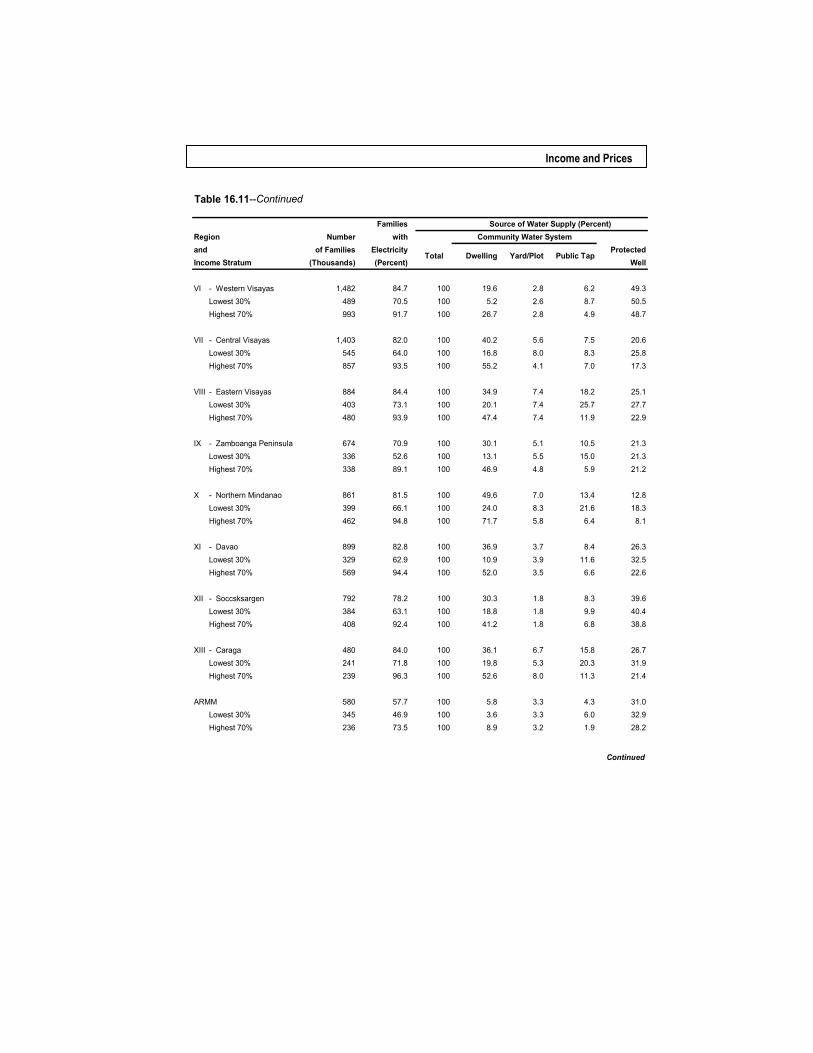
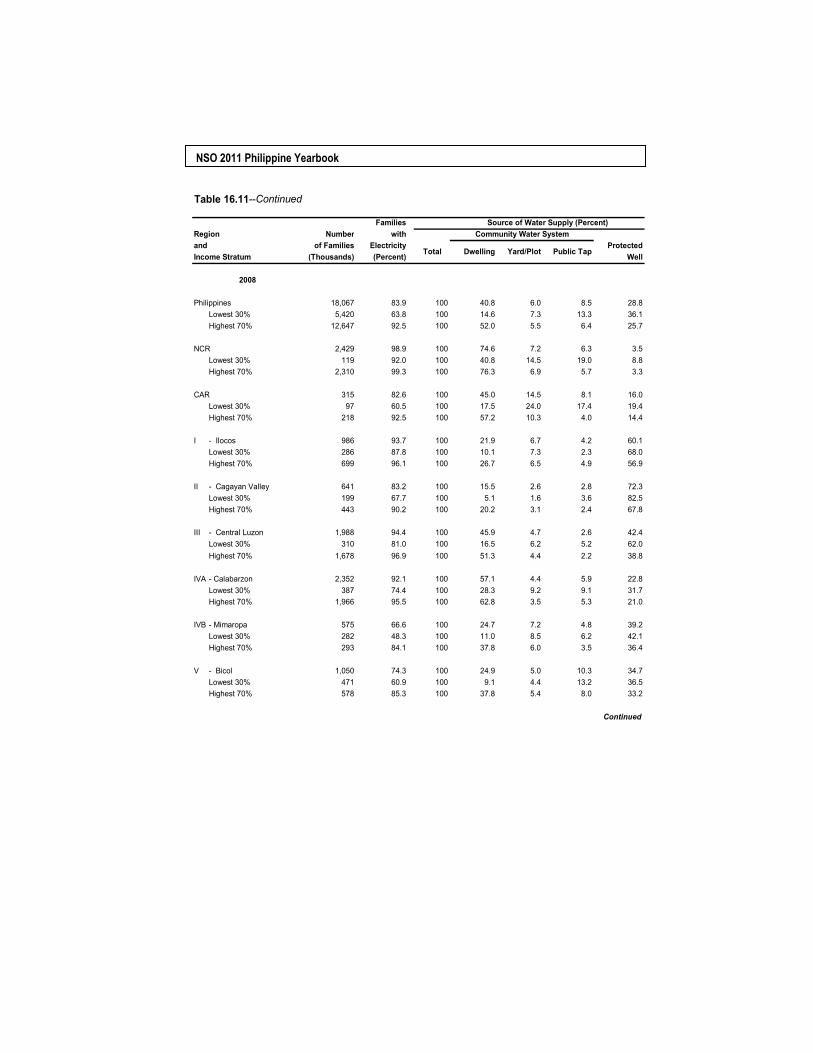
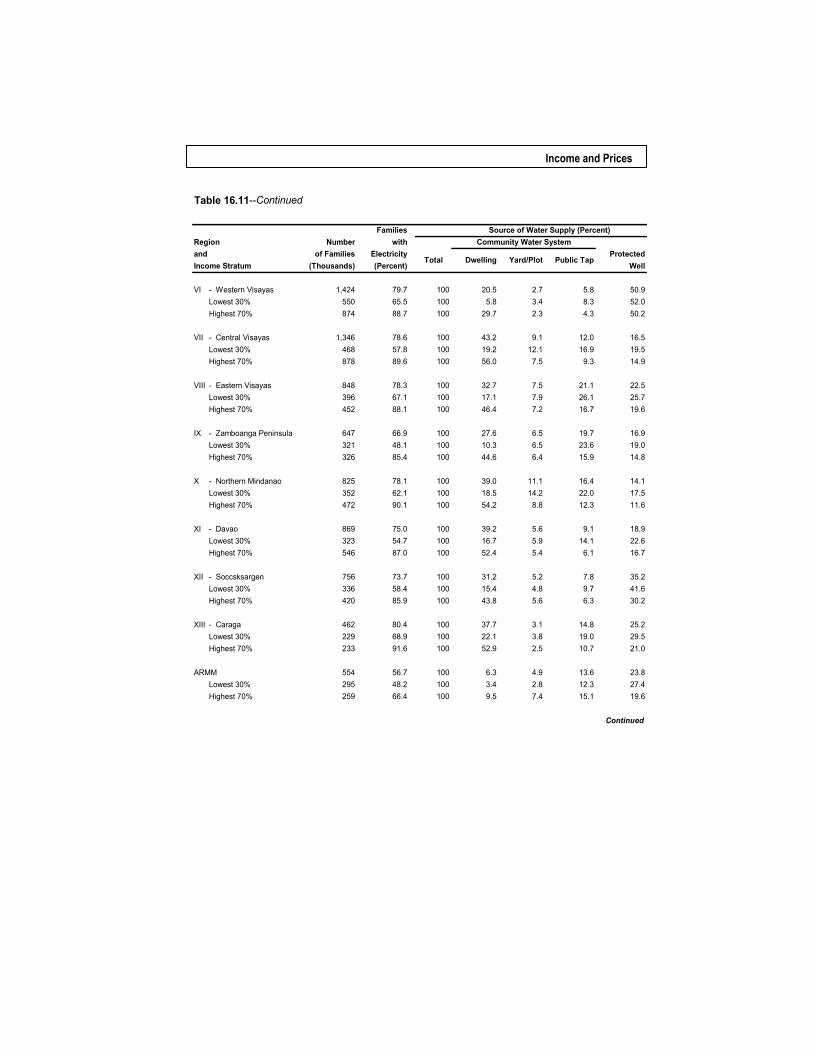
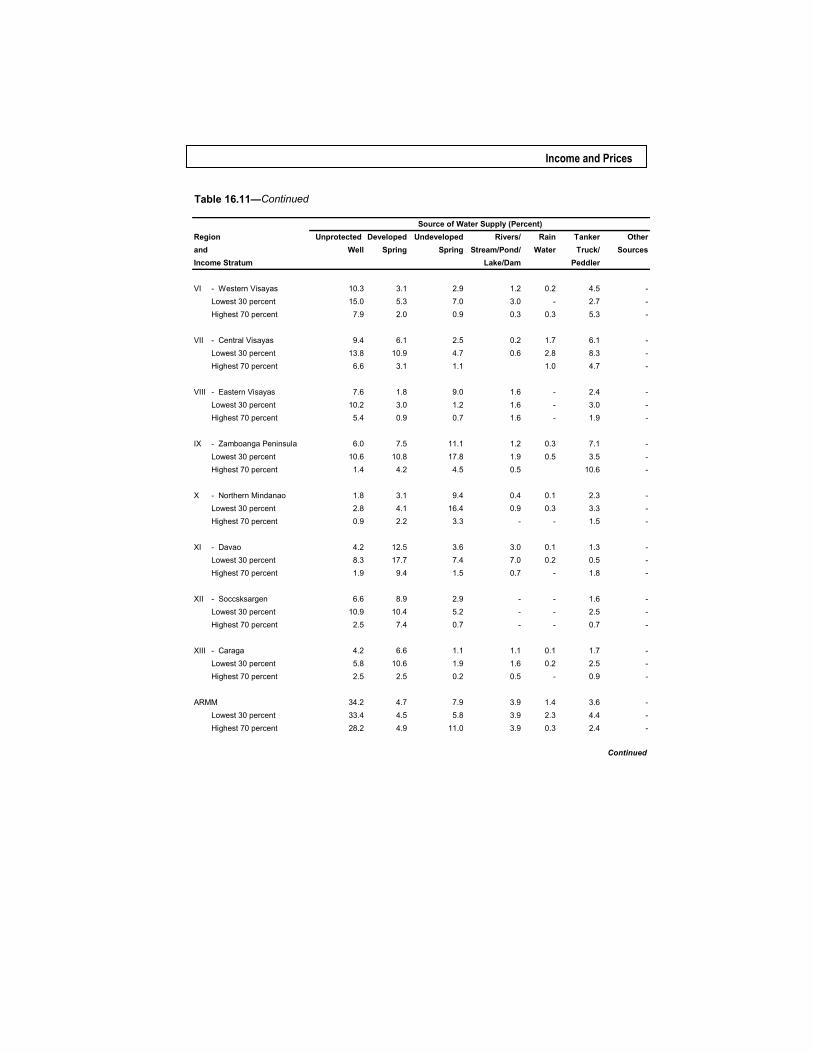
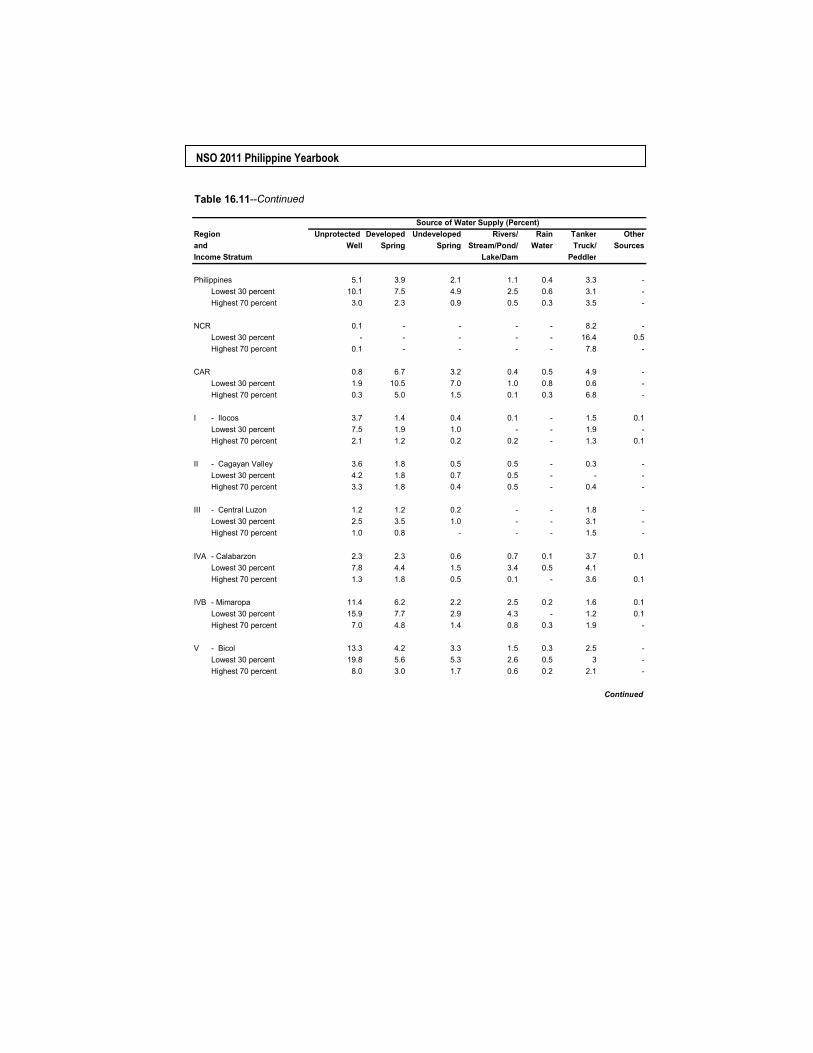
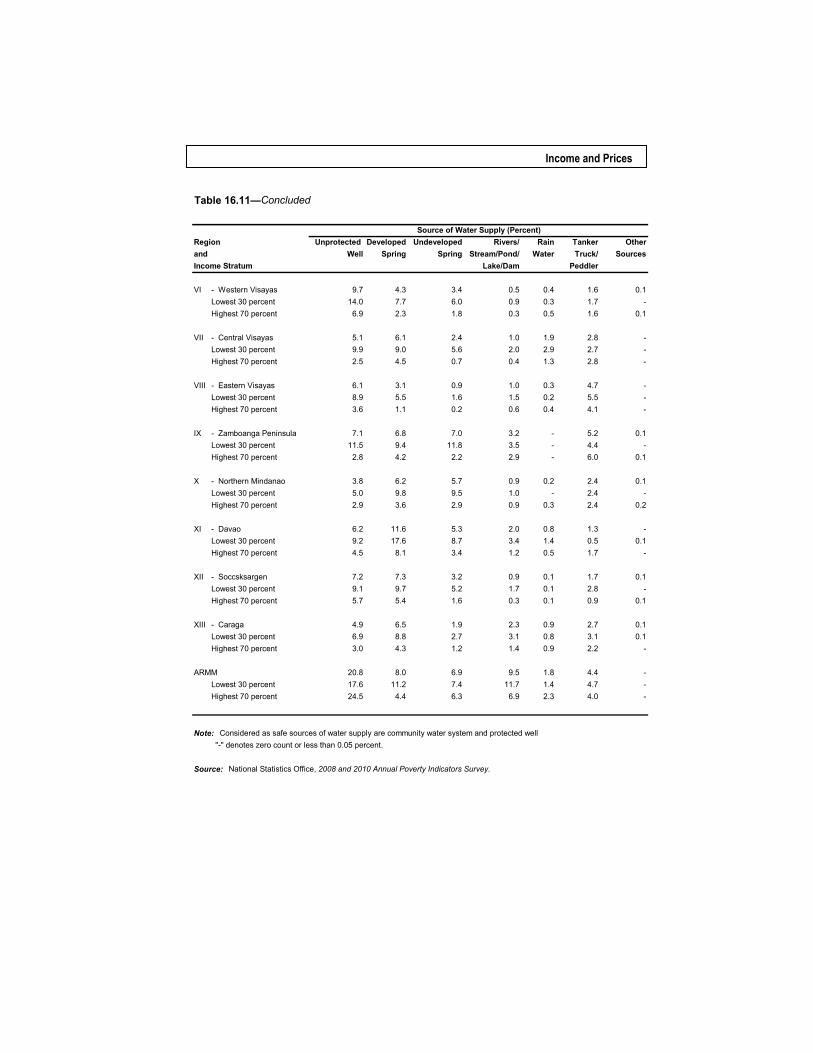
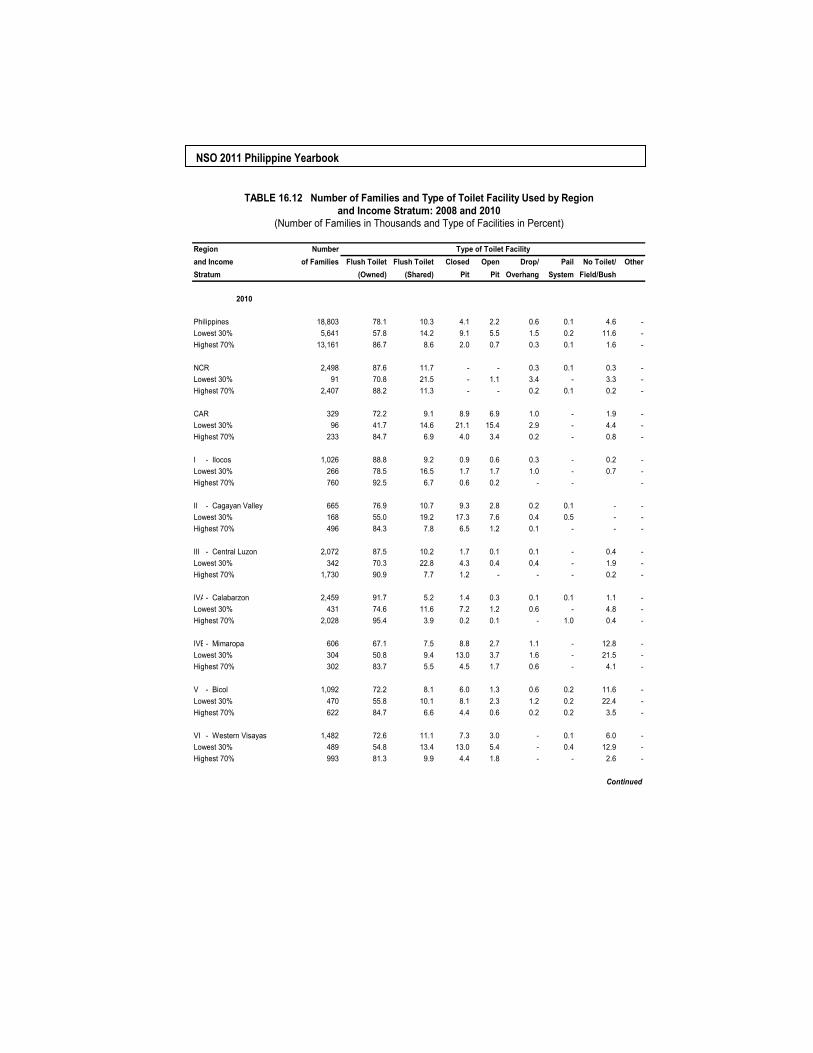
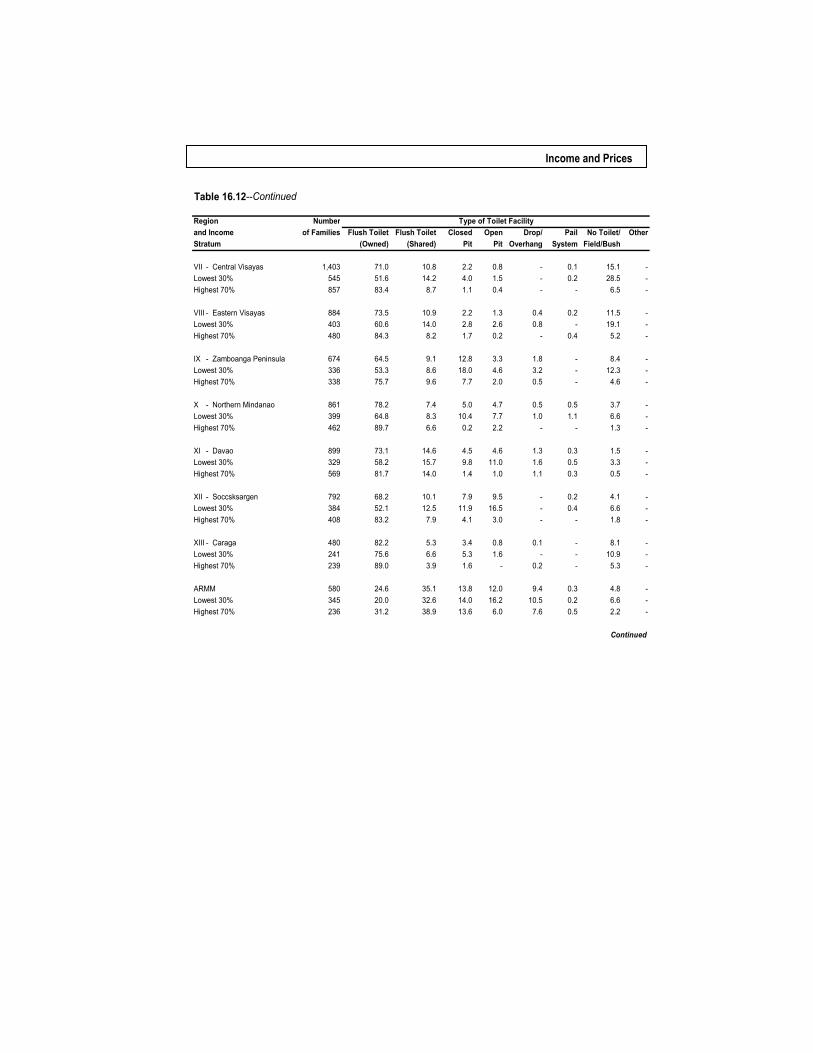
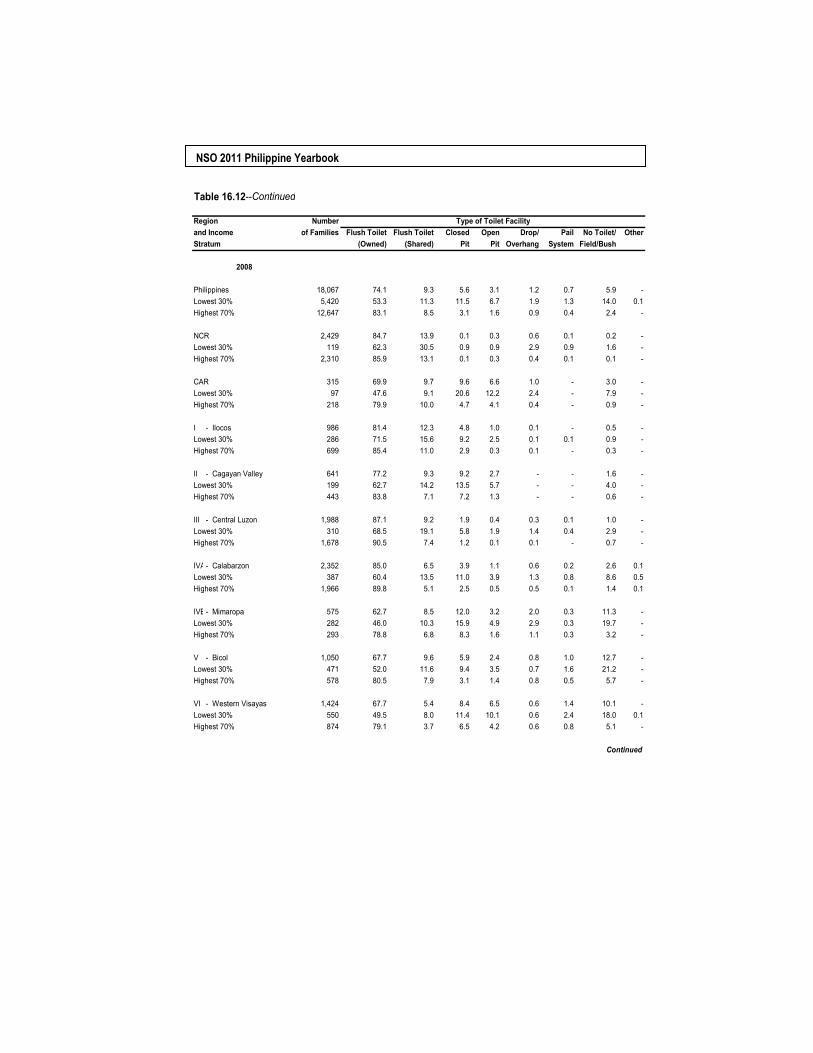
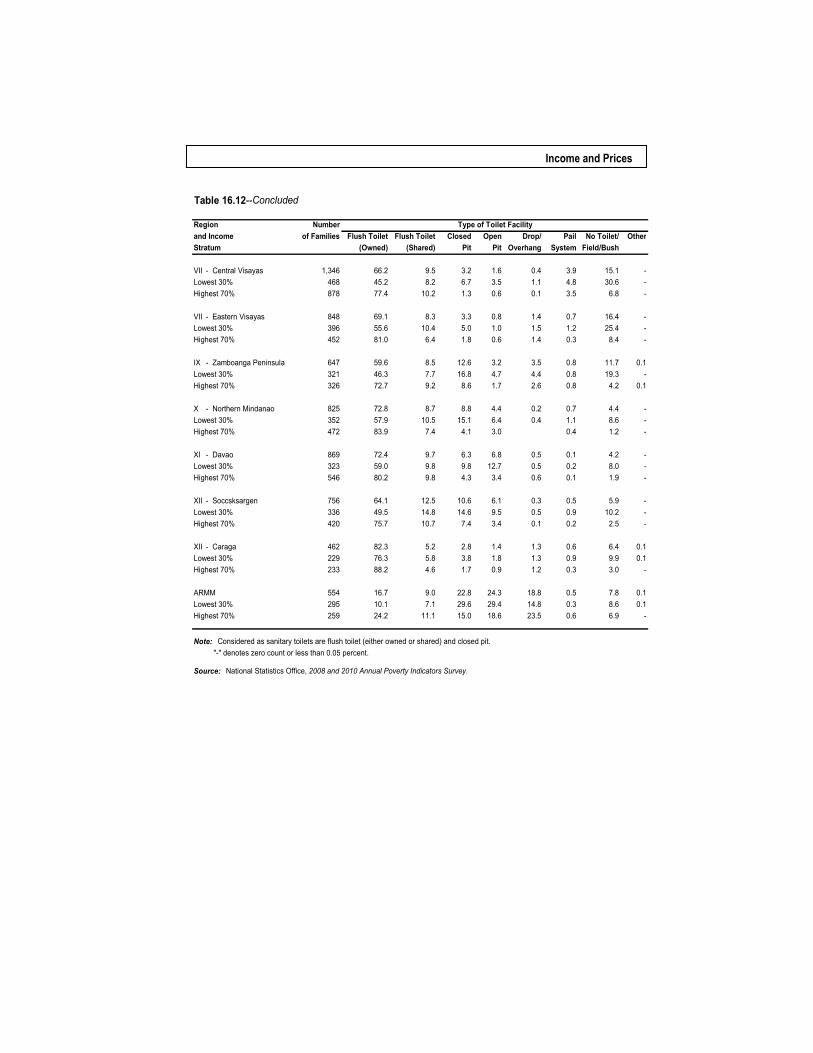
For purposes of reporting, families were grouped into two income strata: the lowest 30 percent and the higher 70 percent. The lowest 30 percent refers to the bottom 30 percent of the total families in the per capita income distribution arranged in descending order. These families represent those considered as poor. On the other hand, the higher 70 percent refers to the upper 70 percent of the total families in the per capita income distribution. These families are considered as non-poor. Highlights of 2010 APIS Results Access to safe drinking water. The percentage of families with access to safe drinking water slightly improved to 84.8 percent in 2010 from 84.1 percent in 2008. The proportion is, as expected, lower for those belonging to the lowest 30 percent income group with seven out of 10 families using clean and safe water, compared to families belonging to highest 70 percent income group. (Refer to Table 16.11.) Access to toilet facilitites. Families with sanitary toilets increased by 3.5 percent from 89.0 in 2008 to 92.5 in 2010. The proportion of families with sanitary toilets was higher in the highest 70 percent income families than in the lowest 30 percent income group. Among the regions, ARMM has 26.5 percent of families without sanitary toilets followed by Central Visayas (16%). (Refer to Table 16.12.) Access to electricity. Of the 18.8 million families in 2010, 87.4 percent families had electricity in their homes. About 95.4 percent of families in the upper 70 percent
NSO 2011 Philippine Yearbook
income stratum had electricity in their homes compared to 68.7 percent in the bottom 30 percent income stratum. Except for NCR and ARMM, proportions of families with electricity in their homes remarkably differ between the two income strata. (Refer to Table 16.11.) Housing. In 2010, majority of Filipino houses had strong roofs and outer walls. Approximately 79.8 percent of families had strong roofs and about 68.8 percent had strong outer walls. As expected, a larger proportion of families in the highest 70 percent income stratum were living in houses with strong roofs (87.5%) and outer walls (79.2%) compared to families in the lowest 30 percent income stratum (61.8 percent and 44.4 percent, respectively). Among the regions, CAR recorded the highest percentage of families living in houses with strong roofs and outer walls (93.8% and 88.5%, respectively). On the other hand, ARMM had the lowest percentage of families living in the houses that used strong materials for their roofs and outer walls (50.8% and 41.8%, respectively). Refer to Tables 16.13 and 16.14.
In terms of tenure status, 68 percent of families in the country owned the house and lot they occupied. The remaining 32 percent occupied houses and lots under the following tenure; own house, rent free lot with consent of the owner (13.5%), rent house/room including lot (7.3%), rent-free house and lot with consent of owner (6.0%), own house, rent-free lot without consent of owner (2.8%), own house, rent lot (2.0%), or rent-free house and lot without consent of owner (less than one percent). (See Table 16.15.) Employment. Four out of five (82%) family heads were gainfully employed. Male heads had a higher rate of employment (88.5%) than female heads (57.9%). Family heads in the bottom 30% income stratum had a higher rate of employment (90%) compared to their counterpart in the upper 70% income stratum (78.5%). (Refer to Table 16.16.) Education. In 2010, a large percentage of family heads did not reach college. Three fourth of family heads were either elementary undergraduates (19.2%), elementary graduates (19.2%), high school undergraduates (11.3%), or high school graduates (22.2%). Only 2.6 percent had no grade completed. Heads of the families belonging to the bottom 30 percent income stratum tend to be less educated compared to heads of families in the upper 70 percent income stratum. Three out of ten (30%) family heads in the upper 70 percent income stratum had attended college or higher level of education. (Refer to Table 16.16.) House and/or lot ownership. In 2010, the percentage of families with at least one member who acquired any house and/or lot thru the assistance of government housing or financing program logged at 2.5 percent. Those families in the highest 70 percent income group exhibited a higher percentage (3.2%) than the lowest 30 percent income group (1.0%).
CALABARZON and NCR recorded the highest number of family members who acquired house and/or lot with 4.6 and 4.3 percent, respectively. (Refer to Table 16.17.)
Income and Prices
16.6 Prices
Prices, as stated in monetary terms, link all kinds of economic activities in a system of free private enterprise. Analyzing the price mechanism, hence, is essential in studying most economic problems.
Assuming that the value of money remains constant, the prices of individual commodities are analyzed on the basis of demand and supply. Changes in price levels, meanwhile, as directed by changes in the value of money or the purchasing power of the peso, are measured by price indices.
Price level changes are closely monitored because they are used to measure inflation. Inflation is an increase in the currency in circulation or a marked expansion of credit, resulting in a fall in currency value or diminished purchasing power of a nation’s money, and a sharp rise in the prices of goods and services. Price level changes alter the income and wealth distributions. They also affect the levels of income, output, and employment. Price Indices
Statistics on prices play an important role not only in the study and analysis of economic activities but also in the formulation of economic policies. The movements of prices, for example, are used as bases for redirecting fiscal and monetary policies, and trade and exchange rate policies. Price statistics are also used as bases to adjust contracts, wage rates, pensions, taxes, and a variety of other transaction flows. As mentioned, these changes are indicated by price indices.
Price indices are measures designed to show the relative changes in prices of a single commodity or group of commodities in relation to prices of a similar commodity or group of commodities in a designated base period and geographical area.
The available price statistics in the country include indices on consumer price, producer price, import and export prices, wholesale price, retail price, and stock price. The following discussion, however focuses only on the following measures of price changes: consumer price index (CPI), retail price index (RPI), wholesale price index (WPI), and producer’s price index (PPI).
Said indices are generated by the NSO and are computed in accordance with the estimation procedures, methodologies, and concepts recommended by the Interagency Committee on Price Statistics as approved by the National Statistical Coordination Board (NSCB).
Terms and concepts. For clear interpretation of price indices, the following terms and concepts are herein defined: Retail price – the actual price at which retailers sell a commodity on the spot or at
earliest delivery, usually in small quantities for consumption, and not for resale. It is confined for transactions on cash basis in the free market and excludes prices in the black market and prices of commodities that are marked down. Retail prices of commodities used in the construction of the RPI and CPI are taken from retail stores and not from buyers or consumers.
NSO 2011 Philippine Yearbook
Wholesale price – the actual transaction price imposed by wholesalers or distributors on the spot. It is the sum of the producer’s price, wholesale trade margin, tax markups, and distribution costs of the wholesaler.
With regard to imports, wholesale price is the sum of cost in freight, custom duties, arrester and wharf age fees, trade margins, costs of transporting the commodity from the port to the place of the importer or wholesaler, and distribution costs of the wholesaler. The wholesale price of export commodities is its freight-on-board price, which is the price received by the exporter.
Producer’s price – the price of the commodity that flows from producers to
wholesalers or other producers (usually called farm gate or ex-plant price). Market basket – a sample of goods and services used to represent all goods and
services produced (in the case of PPI), sold (WPI or RPI), or bought (CPI). Base period – the period, usually a year, at which the index number is set to zero. It
is the reference point of the index number series. Weights – values attached to a commodity or group of commodities to indicate the
relative importance of that commodity or group of commodities in the market basket.
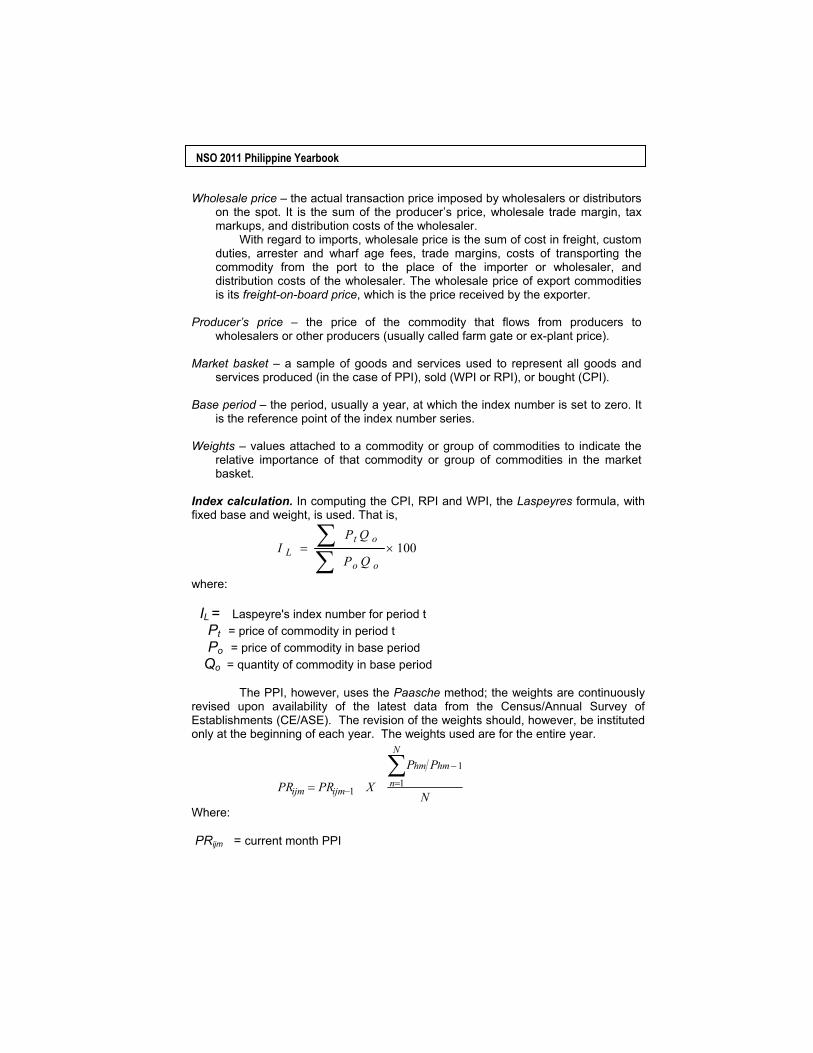
Index calculation. In computing the CPI, RPI and WPI, the Laspeyres formula, with fixed base and weight, is used. That is,
where: IL = Laspeyre's index number for period t Pt = price of commodity in period t Po = price of commodity in base period Qo = quantity of commodity in base period
The PPI, however, uses the Paasche method; the weights are continuously revised upon availability of the latest data from the Census/Annual Survey of Establishments (CE/ASE). The revision of the weights should, however, be instituted only at the beginning of each year. The weights used are for the entire year.
Where: PRijm = current month PPI
100×=∑∑
oo
otL
QP
QPI
N
PP
XPRPR
N
n
hmhm
ijmijm
∑=
−
−= 1
1
1
Income and Prices
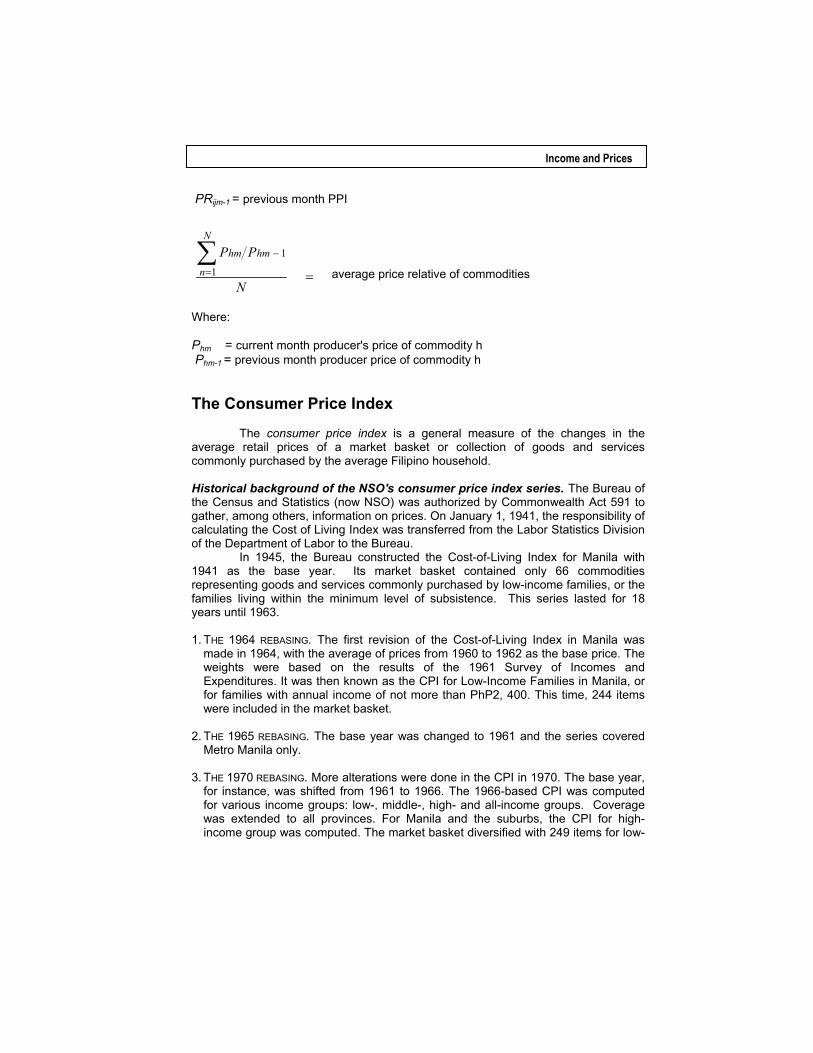
PRijm-1 = previous month PPI
Where: Phm = current month producer's price of commodity h Phm-1 = previous month producer price of commodity h The Consumer Price Index
The consumer price index is a general measure of the changes in the average retail prices of a market basket or collection of goods and services commonly purchased by the average Filipino household.
Historical background of the NSO's consumer price index series. The Bureau of the Census and Statistics (now NSO) was authorized by Commonwealth Act 591 to gather, among others, information on prices. On January 1, 1941, the responsibility of calculating the Cost of Living Index was transferred from the Labor Statistics Division of the Department of Labor to the Bureau.
In 1945, the Bureau constructed the Cost-of-Living Index for Manila with 1941 as the base year. Its market basket contained only 66 commodities representing goods and services commonly purchased by low-income families, or the families living within the minimum level of subsistence. This series lasted for 18 years until 1963. 1. THE 1964 REBASING. The first revision of the Cost-of-Living Index in Manila was
made in 1964, with the average of prices from 1960 to 1962 as the base price. The weights were based on the results of the 1961 Survey of Incomes and Expenditures. It was then known as the CPI for Low-Income Families in Manila, or for families with annual income of not more than PhP2, 400. This time, 244 items were included in the market basket.
2. THE 1965 REBASING. The base year was changed to 1961 and the series covered Metro Manila only.
3. THE 1970 REBASING. More alterations were done in the CPI in 1970. The base year, for instance, was shifted from 1961 to 1966. The 1966-based CPI was computed for various income groups: low-, middle-, high- and all-income groups. Coverage was extended to all provinces. For Manila and the suburbs, the CPI for high-income group was computed. The market basket diversified with 249 items for low-
average price relative of commodities =∑=
−
N
PPN
n
hmhm
1
1
NSO 2011 Philippine Yearbook
income, 368 for middle-income, 242 for high-income, and 479 for all-income groups.
4. THE 1976 REBASING. The next rebasing was done in 1976 when the 1966-based CPI became less meaningful and less relevant to the existing conditions. Unlike the previous index series, the 1972-based CPI was constructed solely for all-income households and covered all provinces and regions, including the NCR.
5. THE 1982 REBASING. The reference period of the index was shifted anew to the recent base year of 1978. The series, which covered all-income households, was computed for the Philippines, by region and by province. A separate CPI was produced for the NCR or the Metro Manila Area. A technical committee (the Interagency Committee on Prices) determined the market basket that contained a total of 407 items. The weights were based on the 1975 FIES adjusted to 1978 prices.
6. THE 1992 REBASING. The CPI was rebased again from 1978 to 1988. The new series featured the use of 13 separate regional market baskets and a new set of weights at the provincial level. The composition of the market basket was determined through the 1985 Commodity and Outlet Survey (COS), which aimed to identify the commodities that a household consumed with regularity and the outlets where these commodities were commonly purchased. The weights attached to these commodities were likewise updated to reflect the household expenditure patterns in 1988.
7. THE 1996 REBASING. In accordance with NSCB Resolution 6 Series of 1994, which requires all indices to have a synchronized base period, the CPI was rebased to 1994. The year 1994 was chosen by the Technical Committee on Price Statistics (TCPS), since, relative to other years, it was perceived as more stable politically, economically, and socially. This was also the year when the FIES, the usual source of weights and basis of drawing up sample households for the COS, was conducted.
Each province or special city of the country was considered a domain so that weights were computed up to the provincial or special city level.
The market basket used in the construction of the 1994-based CPI was drawn from the results of the updating activity done in 1995 where the 1988-based commodities were validated according to their availability and saleability in the area, and the results of the 1994 COS in which the specific items consumed or availed of by the households were ranked and the top items on the list or modal items were selected for inclusion in the market basket. A province or special city was also considered a domain so that market baskets were constructed in a provincial or special city level. Table 16.20 shows the number of commodities in the CPI market basket, by province and special city.
In the process of gathering price data for the CPI computations, the NSO is assisted by the Bureau of Agricultural Statistics (BAS). The BAS is responsible for collecting price data for agricultural commodities in Metro Manila and in provincial capitals where they have offices. The NSO, on the other hand, collects
Income and Prices
price data for nonagricultural commodities throughout the country and all commodities in areas not covered by BAS.
8. THE 2000 REBASING. Updating of the market basket from 1994 to 2000 was done by
interviewing key informants in various outlets as to the availability and saleability of items they sell. Like in the previous rebasing, the year 2000 was chosen as the base year, since relative to other years, it was perceived as more stable politically, economically, and socially. It was also a year when FIES, the usual basis for computation of weights, was conducted. The CPI series with 2000 as base year features the use of separate provincial and city market baskets. A new set of weights was likewise computed at the provincial and city levels using the expenditure data from the 2000 FIES as basis.
Refer to Table 16.18 for the number of items comprising the market basket by province and special city.
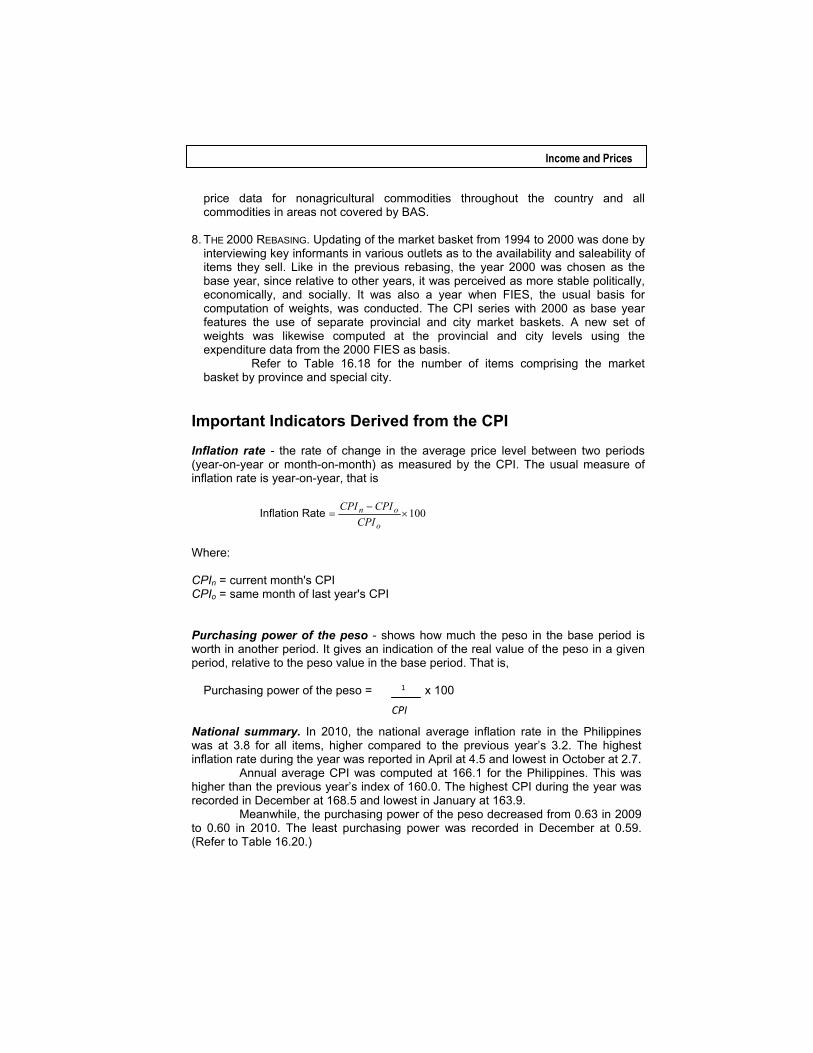
Important Indicators Derived from the CPI Inflation rate - the rate of change in the average price level between two periods (year-on-year or month-on-month) as measured by the CPI. The usual measure of inflation rate is year-on-year, that is
Where: CPIn = current month's CPI CPIo = same month of last year's CPI Purchasing power of the peso - shows how much the peso in the base period is worth in another period. It gives an indication of the real value of the peso in a given period, relative to the peso value in the base period. That is, Purchasing power of the peso = x 100 National summary. In 2010, the national average inflation rate in the Philippines was at 3.8 for all items, higher compared to the previous year’s 3.2. The highest inflation rate during the year was reported in April at 4.5 and lowest in October at 2.7.
Annual average CPI was computed at 166.1 for the Philippines. This was higher than the previous year’s index of 160.0. The highest CPI during the year was recorded in December at 168.5 and lowest in January at 163.9.
Meanwhile, the purchasing power of the peso decreased from 0.63 in 2009 to 0.60 in 2010. The least purchasing power was recorded in December at 0.59. (Refer to Table 16.20.)
1
CPI
100×−
=o
onCPI
CPICPIRate Inflation
NSO 2011 Philippine Yearbook
Regional inflation, price indices and purchasing power. Annual price changes in 2010 for all regions were generally higher than the 2009 rates. Among regions, the highest CPI was recorded in ARMM (191.2) while the lowest was in MIMAROPA (162.5).
The highest inflation rate was marked in ARMM (6.0) and the lowest rate in Ilocos Region (2.5).
Among regions, MIMAROPA had the highest purchasing power of the peso with 0.62, while ARMM with 0.52 had the lowest rate. See Table 16.21 for the details. Commodity groups. Inflation rate for all commodity groups in 2010 generally decreased compared with the records in previous year. All other commodity group indexes went down except fuel, light and water (from -2.6 to 13.4) and services (from -0.2 to 4.5). Items with the highest inflation rate recorded in 2010 are fuel, light and water (13.4), followed by services (4.5), and food, beverage and tobacco (3.0). See Table 16.19 for the details.
Consumer price index for all commodity groups in 2010 generally increased compared with the previous year. The highest CPI was that of fuel, light, and water (214.1), followed by services (188.0) and food, beverages, and tobacco (166.1). See Table 16.22 for the details. All income households in NCR and AONCR. In 2010, CPI in NCR was higher at 163.1 for all items compared to previous year’s 156.9. The highest index rate during the year was in December at 165.5 and lowest in January at 160.2.
In Areas Outside National Capital Region (AONCR), CPI was recorded at 167.3. This is six points higher compared to 2009. The highest index rate was also in December (169.7) and the lowest in January (165.5). See Tables 16.23 and 16.24 for the details. The Retail Price Index (RPI)
The retail price index (RPI) is a measure of the changes in the retail prices at which retailers dispose their goods to the consumers or end users. There are two categories of the RPI: the General Retail Price Index (GRPI) and the Construction Materials Retail Price Index (CMRPI). Background. The RPI was developed by the Statistical Coordination Office (now NSCB) of the National Economic and Development Authority, and was computed by the Economic Research Department of the then Central Bank of the Philippines (ERDCBP), now Bangko Sentral ng Pilipinas, with 1972 as the base year. In January 1981, however, the task of computing was handed over to the NSO using 1978 as base year.
The current RPI still uses 1978 as base year and covers only the National Capital Region or Metro Manila. While the 1972-based RPI was computed using the geometric mean without any weighting pattern, the present series is constructed using the weights based on the 1974 Input-Output Tables of the NSO. These tables show the values of expenditures of goods and services of consumers from the retail
Income and Prices
sector, estimated at 1978 prices. The weighted average of relatives method, basically the Laspeyre's formula, is used in the computation of the index.
The GRPI market basket has 479 commodities while the CMRPI basket contains 117 commodities. The Philippine Standard Community Classification (PSCC) serves as basis in grouping the commodities in both baskets. The retail price index (RPI) in 2010. The average retail price index for NCR in 2010 was 147.3 reflecting an increase of 4.5 percent relative to its previous year’s average of 142.8. By commodity group, the highest index recorded was 251.5 in mineral fuels, lubricants and related materials and the lowest (130.9) in machinery and transport equipment.
In 2010, the average retail price index of construction materials in NCR based on 2000 prices was 159.8. Miscellaneous construction materials showed highest index with 260.3. The lowest index, 133.0, on the other hand, was observed in tinsmithry materials. (Refer to Table 16.25 and 16.26.) The Wholesale Price Index
The wholesale price index (WPI) measures the monthly changes in the general price level of commodities that flow into the wholesale trade intermediaries. There are two categories of the WPI: the General Wholesale Price Index (GWPI) and the Construction Materials Wholesale Price Index (CMWPI).
The current CMWPI series has 1985 as the base year and covers Metro Manila only. There are a total of 115 commodities in the market basket grouped into 25 major categories. The wholesale price index in 2010. Average WPI in the Philippines went up to 202.9 percent in 2010 from 191.6 percent in 2009. Food, beverages and tobacco, chemicals, manufactured goods, miscellaneous and crude materials, minerals fuels and machinery noticed an increase in the wholesale price index. (See Table 16.27.)
Table 16.28 shows the WPI of selected construction materials in Metro Manila with 1985 as the base year. Wholesale price indexes of selected construction materials such as sand, stone and gravel; cement; lumber; glass and glass products; galvanized iron sheets; and plywood demonstrated an ascending trend while tileworks showed a decrease of -1.2 percent. (See Table 16.28 for details) The Producer’s Price Index
The Producer’s Price Index (PPI) is a composite measure of producer prices of key commodities in the manufacturing sector. It aims to measure monthly or yearly changes in producer’s prices (ex-plant) of key commodities. It is used as deflator of production indicators such as the Value of Production Index (VaPI) used to estimate the Volume of Production Index (VoPI), and national accounts estimates of production in the manufacturing sector. Background. Studies on the generation of the Producer’s Price Index (PPI) started in 1980 when the Central Bank stopped preparing the Index of Physical Volume of
NSO 2011 Philippine Yearbook
Production Series. The Central Bank had to transfer the operation and processing of the Monthly Survey of Establishments (MSE).
Work on the original PPI started with 1978 as the base year that was later revised to 1985. Since it was felt that the components of the PPI were no longer reflective of the prevailing production structure of the manufacturing sector, the PPI operations were halted.
From 1992 to 1993, the NSO and the NSCB made studies for improvements in the PPI system to make it more adaptable to the actual situation of the industry. The weights used for the computation of the 1996 PPI were based on data from the 1993 Annual Survey of Establishments (ASE) on Value of Products Sold for all manufacturing establishments. The year 1992 was selected as the base year for which the average monthly producer's prices of commodities were based. The conduct of the Producer Price Survey started as the source of data for the PPI.
Starting with the new base year, the PPI was released simultaneous with the Survey on Key Establishments in Manufacturing (SKEM). (The SKEM was later renamed Monthly Integrated Survey of Selected Indicators or MISSI.) The 1992-based series continued on until December 2001 and discontinued the year after. In 2001 NSO released the series of PPI with 1994 as the base year. The 1994-based series had January 1998 as its earliest series.
Work on the rebasing of PPI to base year 2000 started in 2005. The 2000-based series was released in August 2007 parallel with the 1994-based series. January 2001 was the earliest series of 2000-based PPI data. On the other hand, the 1994-based PPI data series was discontinued beginning January 2008. The producer price index in 2010. The average annual Producer Price Index (PPI) for total manufacturing stood at 164.2 percent in 2010, posting an annual decrease of -5.0 percent from the previous year’s record. See Table 16.29 for details. Sources: 16.1-16.29 National Statistics Office.
Income and Prices
TABLE 16.1 Selected Family Income and Expenditure Indicators: 2006 and 2009
PercentPhilippines 2009 2006 Increase
(Decrease)
Total income ( in billion pesos ) 3,804 3,006 26.5Total expenditure ( in billion pesos ) 3,239 2,561 26.5Total savings ( in billion pesos ) 565 445 27.0
Average income ( in thousand pesos ) 206 173 19.1Average expenditure ( in thousand pesos ) 176 147 19.7Average savings ( in thousand pesos ) 31 26 19.2Gini Coefficient 0.4484 0.4580 -2.1Number of families (in thousands) 18,452 17,403 6.0
Source: National Statistics Office, 2006 and 2009 Family Income and Expenditure Survey Results
(Number of families in thousands)
Income Expenditure Savings Income Expenditure Savings
Philippines 3,804 3,239 565 3,006 2,561 445
NCR 877 760 116 734 609 125CAR 70 56 14 58 46 13I - Ilocos Region 187 153 35 135 117 18II - Cagayan Valley 118 92 26 88 73 15III - Central Luzon 448 382 66 377 325 52IVA - Calabarzon 598 512 87 472 419 53IVB - Mimaropa 83 71 12 59 51 9V - Bicol Region 163 147 16 126 112 15VI - Western Visayas 231 208 24 178 159 19VII - Central Visayas 252 209 44 187 160 27VIII - Eastern Visayas 139 111 28 102 85 18IX - Zamboanga Peninsula 95 77 19 78 62 17X - Northern Mindanao 138 117 22 112 92 20XI - Davao Region 146 125 21 113 97 16XII - Soccsksargen 123 106 18 85 72 14XIII - Caraga 70 59 11 52 44 8ARMM 64 56 8 47 40 7
Note: Details may not add up to totals due to rounding.
Source: National Statistics Office. 2006 and 2009 Family and Income Expenditure Survey Final Results
TABLE 16.2 Total Income, Expenditure and Savings of Families
2009 2006Region
(In Billion Pesos, At Current Prices)by Region: 2006 and 2009
NSO 2011 Philippine Yearbook
Income Expenditure Savings Income Expenditure Savings
Philippines 2,378 2,024 353 2,180 1,857 323
NCR 559 485 74 522 433 89CAR 44 35 9 42 33 9I - Ilocos Region 116 95 22 97 84 13II - Cagayan Valley 75 58 16 67 55 12III - Central Luzon 282 241 41 281 243 39IVA - Calabarzon 381 326 55 344 305 38IVB - Mimaropa 53 46 8 45 38 7V - Bicol Region 101 91 10 93 82 11VI - Western Visayas 144 129 15 133 118 14VII - Central Visayas 152 126 26 131 112 19VIII - Eastern Visayas 84 67 17 77 64 13IX - Zamboanga Peninsula 58 47 12 58 46 12X - Northern Mindanao 82 69 13 80 66 14XI - Davao Region 88 75 13 80 69 12XII - Soccsksargen 77 66 11 64 54 10XIII - Caraga 41 35 6 38 32 6ARMM 36 31 5 33 28 5\
Note: Details may not add up to totals due to rounding.
Source: National Statistics Office, 2006 and 2009 Family and Income Expenditure Survey Final Results.
TABLE 16.3 Total Income, Expenditure and Savings of Families
Region2009 2006
(In Billion Pesos, At 2000 Prices)by Region: 2006 and 2009
Income and Prices
Growth Rate 2006 2009 2006-2009
At current prices
Philippines 3,006 3,804 26.5
NCR 734 877 19.5CAR 58 70 20.7I - Ilocos Region 135 187 38.5II - Cagayan Valley 88 118 34.1III - Central Luzon 377 448 18.8IVA - Calabarzon 472 598 26.7IVB - Mimaropa 59 83 40.7V - Bicol Region 126 163 29.4VI - Western Visayas 178 231 29.8VII - Central Visayas 187 252 34.8VIII - Eastern Visayas 102 139 36.3IX - Zamboanga Peninsula 78 95 21.8X - Northern Mindanao 112 138 23.2XI - Davao Region 113 146 29.2XII - Soccsksargen 85 123 44.7XIII - Caraga 52 70 34.6ARMM 47 64 36.2
At 2000 prices
Philippines 2,180 2,378 9.1
NCR 522 559 7.1CAR 42 44 4.8I - Ilocos Region 97 116 19.6II - Cagayan Valley 67 75 11.9III - Central Luzon 281 282 0.4IVA - Calabarzon 344 381 10.8IVB - Mimaropa 45 53 17.8V - Bicol Region 93 101 8.6VI - Western Visayas 133 144 8.3VII - Central Visayas 131 152 16.0VIII - Eastern Visayas 77 84 9.1IX - Zamboanga Peninsula 58 58 0.0X - Northern Mindanao 80 82 2.5XI - Davao Region 80 88 10.0XII - Soccsksargen 64 77 20.3XIII - Caraga 38 41 7.9ARMM 33 36 9.1
Source: National Statistics Office. 2006 and 2009 Family and Income Expenditure Survey.
RegionIncome
(Value in Billion Pesos)
TABLE 16.4 Total Family Income and Growth Rateby Region: 2006 and 2009
NSO 2011 Philippine Yearbook
Growth Rate2006 2009 2006-2009
At current prices
Philippines 2,561 3,239 26.5
NCR 609 760 24.8CAR 46 56 21.7I - Ilocos Region 117 153 30.8II - Cagayan Valley 73 92 26.0III - Central Luzon 325 382 17.5IVA - Calabarzon 419 512 22.2IVB - Mimaropa 51 71 39.2V - Bicol Region 112 147 31.3VI - Western Visayas 159 208 30.8VII - Central Visayas 160 209 30.6VIII - Eastern Visayas 85 111 30.6IX - Zamboanga Peninsula 62 77 24.2X - Northern Mindanao 92 117 27.2XI - Davao Region 97 125 28.9XII - Soccsksargen 72 106 47.2XIII - Caraga 44 59 34.1
ARMMc 40 56 40.0
At 2000 prices
Philippines 1,857 2,024 9.0
NCR 433 485 12.0CAR 33 35 6.1I - Ilocos Region 84 95 13.1II - Cagayan Valley 55 58 5.5III - Central Luzon 243 241 -0.8IVA - Calabarzon 305 326 6.9IVB - Mimaropa 38 46 21.1V - Bicol Region 82 91 11.0VI - Western Visayas 118 129 9.3VII - Central Visayas 112 126 12.5VIII - Eastern Visayas 64 67 4.7IX - Zamboanga Peninsula 46 47 2.2X - Northern Mindanao 66 69 4.5XI - Davao Region 69 75 8.7XII - Soccsksargen 54 66 22.2XIII - Caraga 32 35 9.4
ARMMc 28 31 10.7
Source: National Statistics Office. 2006 and 2009 Family and Income Expenditure Survey.
TABLE 16.5 Total Family Expenditure and Growth Rate, by Region: 2006 and 2009(Value in Billion Pesos)
RegionExpenditure
Income and Prices
Region Average Average Average Average Average AverageIncome Expenditure Saving Income Expenditure Saving
At Current Prices
Philippines 206 176 31 173 147 26 NCR 356 309 47 311 258 53CAR 219 174 44 192 151 42I - Ilocos Region 186 152 35 142 124 19II - Cagayan Valley 181 141 40 143 118 25III - Central Luzon 221 189 32 198 170 27IVA - Calabarzon 249 213 36 210 186 23IVB - Mimaropa 141 121 21 109 93 16V - Bicol Region 152 137 15 125 110 15VI - Western Visayas 159 143 16 130 116 14VII - Central Visayas 184 152 32 144 124 21VIII - Eastern Visayas 160 128 32 126 104 22IX - Zamboanga Peninsula 144 116 28 125 99 27X - Northern Mindanao 165 139 26 142 117 25XI - Davao Region 166 142 24 135 115 19XII - Soccsksargen 154 132 22 114 96 18XIII - Caraga 149 125 23 118 100 18ARMM 113 98 15 89 75 14
At 2000 Prices
Philippines 129 110 19 125 107 19
NCR 227 197 30 221 183 38CAR 136 108 28 137 108 30I - Ilocos Region 116 94 21 102 89 14II - Cagayan Valley 115 90 25 108 89 19III - Central Luzon 139 119 20 147 127 20IVA - Calabarzon 158 135 23 153 136 17IVB - Mimaropa 90 77 13 82 70 12V - Bicol Region 95 85 9 92 81 11VI - Western Visayas 99 89 10 97 86 10VII - Central Visayas 111 92 19 101 87 14VIII - Eastern Visayas 98 78 20 94 78 16IX - Zamboanga Peninsula 88 71 17 93 73 20X - Northern Mindanao 98 83 15 102 84 18XI - Davao Region 99 85 14 96 82 14XII - Soccsksargen 96 82 14 85 72 14XIII - Caraga 88 74 14 86 73 13ARMM 62 54 8 61 52 10
Note: Details may not add up to totals due to rounding.
Source: National Statistics Office, 2006 and 2009 Family and Income Expenditure Survey.
TABLE 16.6 Average Income, Expenditure, and Saving of Families, by Region: 2006 and 2009
(At Current and At 2000 Prices, Value in Thousand Pesos)
2009 2006
NSO 2011 Philippine Yearbook
Region Growth Rate(2006-2009)
At Current Prices
Philippines 173 206 19.1
NCR 311 356 14.5CAR 192 219 14.1I - Ilocos Region 142 186 31.0II - Cagayan Valley 143 181 26.6III - Central Luzon 198 221 11.6IVA - Calabarzon 210 249 18.6IVB - Mimaropa 109 141 29.4V - Bicol Region 125 152 21.6VI - Western Visayas 130 159 22.3VII - Central Visayas 144 184 27.8VIII - Eastern Visayas 126 160 27.0IX - Zamboanga Peninsula 125 144 15.2X - Northern Mindanao 142 165 16.2XI - Davao Region 135 166 23.0XII - Soccsksargen 114 154 35.1XIII - Caraga 118 149 26.3ARMM 89 113 27.0
At 2000 Prices
Philippines 125 129 3.2
NCR 221 227 2.7CAR 137 136 (0.7)I - Ilocos Region 102 116 13.7II - Cagayan Valley 108 115 6.5III - Central Luzon 147 139 (5.4)IVA - Calabarzon 153 158 3.3IVB - Mimaropa 82 90 9.8V - Bicol Region 92 95 3.3VI - Western Visayas 97 99 2.1VII - Central Visayas 101 111 9.9VIII - Eastern Visayas 94 98 4.3IX - Zamboanga Peninsula 93 88 (5.4)X - Northern Mindanao 102 98 (3.9)XI - Davao Region 96 99 3.1XII - Soccsksargen 85 96 12.9XIII - Caraga 86 88 2.3ARMM 61 62 1.6
Note: Details may not add up to totals due to rounding.
Source: National Statistics Office. 2003 Family and Income Expenditure Survey.
Average Family Income (In Thousand Pesos)
2006 2009
TABLE 16.7 Average Family Income and Growth Rate, by Region: 2006 and 2009(At Current and At 2000 Prices)
Income and Prices
Income Decile/Income Group Income Expenditure Savings Income Expenditure Savings
At Current Prices
Philippines 3,804 3,239 565 3,006 2,561 445
First Decile 75 80 (5) 56 61 (5)Second Decile 118 122 (4) 88 91 (3)Third Decile 150 150 (*) 113 114 (1)Fourth Decile 184 180 5 140 137 3Fifth Decile 225 215 10 174 166 8Sixth Decile 277 257 20 215 202 13Seventh Decile 349 316 32 272 249 23Eight Decile 451 399 52 357 316 41Ninth Decile 631 532 99 507 425 82Tenth Decile 1,344 988 356 1,082 800 282
Bottom 30% 343 352 (9) 258 266 (9)Upper 70% 3,461 2,887 574 2,748 2,295 453
At 2000 Prices
Philippines 2,378 2,024 353 2,180 1,857 323
First Decile 47 50 (3) 41 44 (4)Second Decile 74 76 (2) 64 66 (2)Third Decile 94 94 (*) 82 83 (*)Fourth Decile 115 112 3 102 99 2Fifth Decile 141 134 7 126 120 6Sixth Decile 173 161 13 156 146 10Seventh Decile 218 198 20 197 181 16Eight Decile 282 250 32 259 229 30Ninth Decile 394 333 62 368 308 60Tenth Decile 840 617 223 785 580 205
Bottom 30% 214 220 (6) 187 193 (6)Upper 70% 2,163 1,804 359 1,993 1,664 329
Note: *less than P500Details may not add up due to rounding
Source: National Statistics Office, 2006 and 2009 Family Income and Expenditure Survey - Final Results.
2009 2006
TABLE 16.8 Total Income, Total Expenditures, and Total Saving of Familiesby Income Decile: 2006 and 2009
(In Billion Pesos)

NSO 2011 Philippine Yearbook
Decile Average Average Average Average Average AverageIncome Expenditure Saving Income Expenditure Saving
At current prices
Philippines 206 176 31 173 147 26
First decile 41 43 (3) 32 35 (3)Second decile 64 66 (2) 51 52 (2)Third decile 81 81 (*) 65 66 (*)Fourth decile 100 97 3 81 79 2Fifth decile 122 116 6 100 95 5Sixth decile 150 139 11 124 116 8Seventh decile 189 171 18 156 143 13Eighth decile 244 216 28 205 181 24Ninth decile 342 288 53 292 244 47Tenth decile 728 535 193 622 460 162
Bottom 30% 62 64 (2) 49 51 (2)Upper 70% 268 224 44 226 188 38
At 2000 prices
Philippines 129 110 19 125 107 19
First decile 25 27 (2) 23 26 (2)Second decile 40 41 (1) 37 38 (1)Third decile 51 51 (*) 47 48 (*)Fourth decile 63 61 2 58 57 1Fifth decile 76 73 4 72 69 3Sixth decile 94 87 7 90 84 6Seventh decile 118 107 11 113 104 9Eighth decile 153 135 17 149 132 17Ninth decile 214 180 33 211 177 34Tenth decile 455 334 121 451 333 118
Bottom 30% 39 40 (1) 36 37 (1)Upper 70% 167 140 28 164 136 27
Note: *less than P500
Details may not add up due to rounding.
Source: National Statistics Office, 2006 and 2009 Family Income and Expenditure Survey - Final Results.
TABLE 16.9 Average Income, Expenditure, and Savings of Familiesby National Income Decile: 2006 and 2009
(At Current and at 2000 Prices, Value in Thousand Pesos)
2009 2006
Income and Prices
All Bottom Upper All Bottom UpperIncome 30% 70% Income 30% 70%Groups Groups
Philippines
Total Expenditure (billion pesos) 3,239 352 2,887 2,561 267 2,297 Percent 100.0 100.0 100.0 100.0 100.0 100.0
Food Expenditures 42.6 59.9 40.5 41.4 59.1 39.3Alcoholic beverages 0.7 1.1 0.6 0.7 1.2 0.6Tobacco 0.8 1.6 0.7 0.9 1.7 0.8Fuel, light, and water 7.1 6.8 7.1 7.6 7.3 7.7Transportation and communication 7.7 3.9 8.2 8.2 3.8 8.7Household operation 2.3 1.7 2.4 2.3 1.8 2.4Personal care and effects 3.8 3.7 3.8 3.7 3.7 3.7Clothing, footwear, and other wear 2.2 1.9 2.2 2.4 2.0 2.5Education 4.3 1.2 4.6 4.4 1.3 4.7Recreation 0.4 0.1 0.4 0.5 0.2 0.5Medical care 2.9 1.7 3.0 2.9 1.7 3.0Non-durable furnishings 0.2 0.2 0.2 0.2 0.2 0.2Durable furniture and equipment 2.7 0.8 2.9 2.7 0.8 2.9Taxes 2.0 0.2 2.3 1.6 0.2 1.8House rent/rental value 12.8 9.4 13.2 12.7 9.0 13.2House maintenance and minor repairs 0.6 0.4 0.6 0.5 0.5 0.6Special family occasions 2.7 1.6 2.9 2.8 1.7 2.9Gifts and contributions to others 1.4 0.7 1.5 1.4 0.7 1.4Other expenditure (including value consumed, losses) 2.9 3.1 2.9 3.0 3.3 3.0
Note : Details may not add up to total due to rounding.
Source: National Statistics Office, 2006 and 2009 Family Income and Expenditure Survey Final Results.
2009 2006
TABLE 16.10 Percentage Distribution of Total Family Expenditure Item for
Expenditure Items
the Bottom 30 Percent and Upper 70 Percent Income Group : 2006 and 2009
NSO 2011 Philippine Yearbook
FamiliesRegion Number withand of Families Electricity ProtectedIncome Stratum (Thousands) (Percent) Well
Philippines 18,803 87.4 100 44.2 5.2 7.1 28.3Lowest 30% 5,641 68.7 100 15.9 6.3 11.1 37.4Highest 70% 13,161 95.4 100 56.3 4.8 5.3 24.3
NCR 2,498 99.3 100 83.9 3.7 5.7 1.8Lowest 30% 91 87.0 100 50.2 10.0 13.8 2.3Highest 70% 2,407 99.8 100 85.2 3.4 5.4 1.8
CAR 329 87.9 100 53.6 16.1 6.1 11.6Lowest 30% 96 69.8 100 29.9 20.2 9.7 17.8Highest 70% 233 95.4 100 63.3 14.3 4.6 9.1
I - Ilocos 1,026 94.7 100 25.5 16.0 3.5 48.8Lowest 30% 266 87.0 100 9.4 15.2 3.6 59.1Highest 70% 760 97.4 100 31.2 16.2 3.5 45.2
II - Cagayan Valley 665 90.8 100 23.0 4.0 1.0 67.6Lowest 30% 168 78.4 100 4.9 3.2 0.4 83.8Highest 70% 496 95.1 100 29.2 4.2 1.1 62.1
III - Central Luzon 2,072 96.9 100 50.5 5.1 4.1 37.0Lowest 30% 342 90.8 100 26.3 6.8 1.1 57.5Highest 70% 1,730 98.1 100 55.3 4.8 4.6 33.0
IVA - Calabarzon 2,459 93.8 100 62.3 2.9 3.7 20.4Lowest 30% 431 79.4 100 25.2 5.4 6.6 36.9Highest 70% 2,028 96.9 100 70.2 2.4 3.1 16.9
IVB - Mimaropa 606 75.1 100 23.1 7.5 4.7 48.3Lowest 30% 304 61.5 100 11.9 9.3 6.0 49.0Highest 70% 302 88.8 100 34.3 5.7 3.3 47.5
V - Bicol 1,092 81.2 100 29.8 4.4 12.1 33.2Lowest 30% 470 66.6 100 10.3 5.4 14.2 40.4Highest 70% 622 92.3 100 44.5 3.6 10.4 27.8
Continued
TABLE 16.11 Number of Families With Electricity and Source of Water Supply Used, by Region and Income Stratum: 2008 and 2010
Source of Water Supply (Percent)Community Water System
Total Dwelling Yard/Plot Public Tap
2010
Income and Prices
Table 16.11--Continued
FamiliesRegion Number withand of Families Electricity ProtectedIncome Stratum (Thousands) (Percent) Well
VI - Western Visayas 1,482 84.7 100 19.6 2.8 6.2 49.3Lowest 30% 489 70.5 100 5.2 2.6 8.7 50.5Highest 70% 993 91.7 100 26.7 2.8 4.9 48.7
VII - Central Visayas 1,403 82.0 100 40.2 5.6 7.5 20.6Lowest 30% 545 64.0 100 16.8 8.0 8.3 25.8Highest 70% 857 93.5 100 55.2 4.1 7.0 17.3
VIII - Eastern Visayas 884 84.4 100 34.9 7.4 18.2 25.1Lowest 30% 403 73.1 100 20.1 7.4 25.7 27.7Highest 70% 480 93.9 100 47.4 7.4 11.9 22.9
IX - Zamboanga Peninsula 674 70.9 100 30.1 5.1 10.5 21.3Lowest 30% 336 52.6 100 13.1 5.5 15.0 21.3Highest 70% 338 89.1 100 46.9 4.8 5.9 21.2
X - Northern Mindanao 861 81.5 100 49.6 7.0 13.4 12.8Lowest 30% 399 66.1 100 24.0 8.3 21.6 18.3Highest 70% 462 94.8 100 71.7 5.8 6.4 8.1
XI - Davao 899 82.8 100 36.9 3.7 8.4 26.3Lowest 30% 329 62.9 100 10.9 3.9 11.6 32.5Highest 70% 569 94.4 100 52.0 3.5 6.6 22.6
XII - Soccsksargen 792 78.2 100 30.3 1.8 8.3 39.6Lowest 30% 384 63.1 100 18.8 1.8 9.9 40.4Highest 70% 408 92.4 100 41.2 1.8 6.8 38.8
XIII - Caraga 480 84.0 100 36.1 6.7 15.8 26.7Lowest 30% 241 71.8 100 19.8 5.3 20.3 31.9Highest 70% 239 96.3 100 52.6 8.0 11.3 21.4
ARMM 580 57.7 100 5.8 3.3 4.3 31.0Lowest 30% 345 46.9 100 3.6 3.3 6.0 32.9Highest 70% 236 73.5 100 8.9 3.2 1.9 28.2
Continued
Community Water System
Total Dwelling Yard/Plot Public Tap
Source of Water Supply (Percent)
NSO 2011 Philippine Yearbook
Table 16.11--Continued
FamiliesRegion Number withand of Families Electricity ProtectedIncome Stratum (Thousands) (Percent) Well
Philippines 18,067 83.9 100 40.8 6.0 8.5 28.8Lowest 30% 5,420 63.8 100 14.6 7.3 13.3 36.1Highest 70% 12,647 92.5 100 52.0 5.5 6.4 25.7
NCR 2,429 98.9 100 74.6 7.2 6.3 3.5Lowest 30% 119 92.0 100 40.8 14.5 19.0 8.8Highest 70% 2,310 99.3 100 76.3 6.9 5.7 3.3
CAR 315 82.6 100 45.0 14.5 8.1 16.0Lowest 30% 97 60.5 100 17.5 24.0 17.4 19.4Highest 70% 218 92.5 100 57.2 10.3 4.0 14.4
I - Ilocos 986 93.7 100 21.9 6.7 4.2 60.1Lowest 30% 286 87.8 100 10.1 7.3 2.3 68.0Highest 70% 699 96.1 100 26.7 6.5 4.9 56.9
II - Cagayan Valley 641 83.2 100 15.5 2.6 2.8 72.3Lowest 30% 199 67.7 100 5.1 1.6 3.6 82.5Highest 70% 443 90.2 100 20.2 3.1 2.4 67.8
III - Central Luzon 1,988 94.4 100 45.9 4.7 2.6 42.4Lowest 30% 310 81.0 100 16.5 6.2 5.2 62.0Highest 70% 1,678 96.9 100 51.3 4.4 2.2 38.8
IVA - Calabarzon 2,352 92.1 100 57.1 4.4 5.9 22.8Lowest 30% 387 74.4 100 28.3 9.2 9.1 31.7Highest 70% 1,966 95.5 100 62.8 3.5 5.3 21.0
IVB - Mimaropa 575 66.6 100 24.7 7.2 4.8 39.2Lowest 30% 282 48.3 100 11.0 8.5 6.2 42.1Highest 70% 293 84.1 100 37.8 6.0 3.5 36.4
V - Bicol 1,050 74.3 100 24.9 5.0 10.3 34.7Lowest 30% 471 60.9 100 9.1 4.4 13.2 36.5Highest 70% 578 85.3 100 37.8 5.4 8.0 33.2
Continued
Dwelling Yard/Plot Public Tap
Source of Water Supply (Percent)Community Water System
Total
2008
Income and Prices
Table 16.11--Continued
FamiliesRegion Number withand of Families Electricity ProtectedIncome Stratum (Thousands) (Percent) Well
VI - Western Visayas 1,424 79.7 100 20.5 2.7 5.8 50.9Lowest 30% 550 65.5 100 5.8 3.4 8.3 52.0Highest 70% 874 88.7 100 29.7 2.3 4.3 50.2
VII - Central Visayas 1,346 78.6 100 43.2 9.1 12.0 16.5Lowest 30% 468 57.8 100 19.2 12.1 16.9 19.5Highest 70% 878 89.6 100 56.0 7.5 9.3 14.9
VIII - Eastern Visayas 848 78.3 100 32.7 7.5 21.1 22.5Lowest 30% 396 67.1 100 17.1 7.9 26.1 25.7Highest 70% 452 88.1 100 46.4 7.2 16.7 19.6
IX - Zamboanga Peninsula 647 66.9 100 27.6 6.5 19.7 16.9Lowest 30% 321 48.1 100 10.3 6.5 23.6 19.0Highest 70% 326 85.4 100 44.6 6.4 15.9 14.8
X - Northern Mindanao 825 78.1 100 39.0 11.1 16.4 14.1Lowest 30% 352 62.1 100 18.5 14.2 22.0 17.5Highest 70% 472 90.1 100 54.2 8.8 12.3 11.6
XI - Davao 869 75.0 100 39.2 5.6 9.1 18.9Lowest 30% 323 54.7 100 16.7 5.9 14.1 22.6Highest 70% 546 87.0 100 52.4 5.4 6.1 16.7
XII - Soccsksargen 756 73.7 100 31.2 5.2 7.8 35.2Lowest 30% 336 58.4 100 15.4 4.8 9.7 41.6Highest 70% 420 85.9 100 43.8 5.6 6.3 30.2
XIII - Caraga 462 80.4 100 37.7 3.1 14.8 25.2Lowest 30% 229 68.9 100 22.1 3.8 19.0 29.5Highest 70% 233 91.6 100 52.9 2.5 10.7 21.0
ARMM 554 56.7 100 6.3 4.9 13.6 23.8Lowest 30% 295 48.2 100 3.4 2.8 12.3 27.4Highest 70% 259 66.4 100 9.5 7.4 15.1 19.6
Continued
Source of Water Supply (Percent)Community Water System
Total Dwelling Yard/Plot Public Tap
NSO 2011 Philippine Yearbook
Table 16.11--Continued
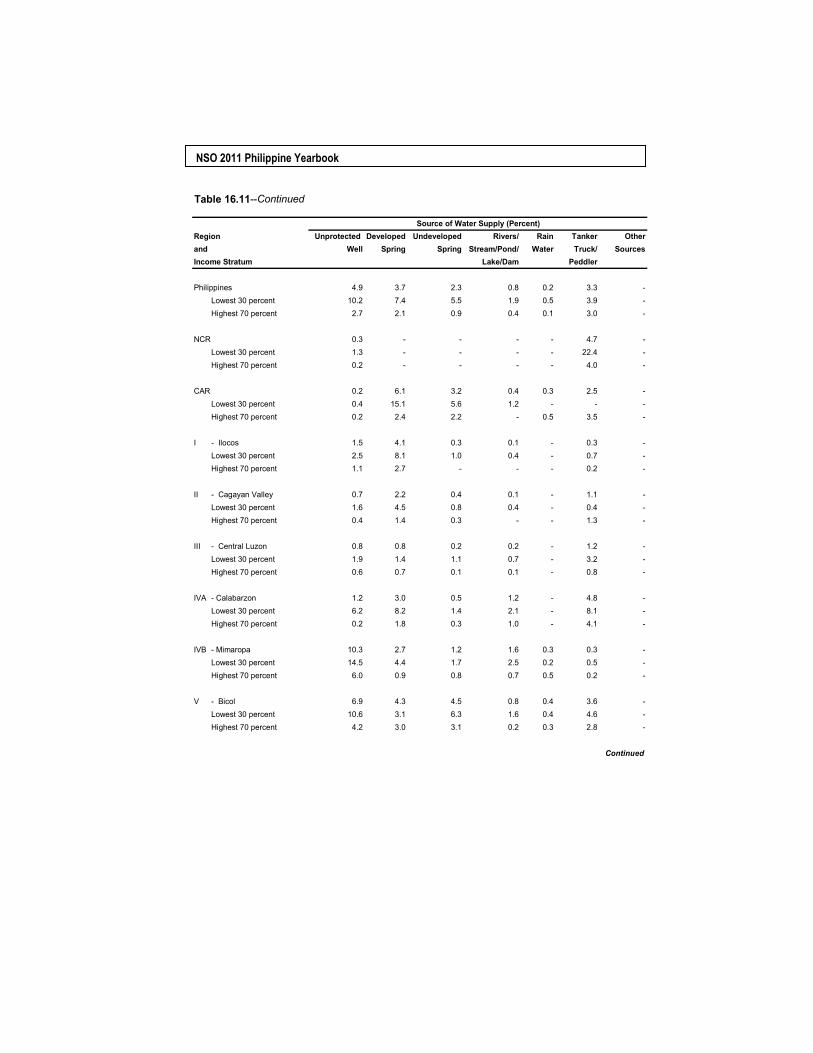
Region Unprotected Developed Undeveloped Rivers/ Rain Tanker Otherand Well Spring Spring Stream/Pond/ Water Truck/ SourcesIncome Stratum Lake/Dam Peddler
Philippines 4.9 3.7 2.3 0.8 0.2 3.3 -Lowest 30 percent 10.2 7.4 5.5 1.9 0.5 3.9 -Highest 70 percent 2.7 2.1 0.9 0.4 0.1 3.0 -
NCR 0.3 - - - - 4.7 -Lowest 30 percent 1.3 - - - - 22.4 -Highest 70 percent 0.2 - - - - 4.0 -
CAR 0.2 6.1 3.2 0.4 0.3 2.5 -Lowest 30 percent 0.4 15.1 5.6 1.2 - - -Highest 70 percent 0.2 2.4 2.2 - 0.5 3.5 -
I - Ilocos 1.5 4.1 0.3 0.1 - 0.3 -Lowest 30 percent 2.5 8.1 1.0 0.4 - 0.7 -Highest 70 percent 1.1 2.7 - - - 0.2 -
II - Cagayan Valley 0.7 2.2 0.4 0.1 - 1.1 -Lowest 30 percent 1.6 4.5 0.8 0.4 - 0.4 -Highest 70 percent 0.4 1.4 0.3 - - 1.3 -
III - Central Luzon 0.8 0.8 0.2 0.2 - 1.2 -Lowest 30 percent 1.9 1.4 1.1 0.7 - 3.2 -Highest 70 percent 0.6 0.7 0.1 0.1 - 0.8 -
IVA - Calabarzon 1.2 3.0 0.5 1.2 - 4.8 -Lowest 30 percent 6.2 8.2 1.4 2.1 - 8.1 -Highest 70 percent 0.2 1.8 0.3 1.0 - 4.1 -
IVB - Mimaropa 10.3 2.7 1.2 1.6 0.3 0.3 -Lowest 30 percent 14.5 4.4 1.7 2.5 0.2 0.5 -Highest 70 percent 6.0 0.9 0.8 0.7 0.5 0.2 -
V - Bicol 6.9 4.3 4.5 0.8 0.4 3.6 -Lowest 30 percent 10.6 3.1 6.3 1.6 0.4 4.6 -Highest 70 percent 4.2 3.0 3.1 0.2 0.3 2.8 -
Continued
Source of Water Supply (Percent)
Income and Prices
Table 16.11—Continued
Region Unprotected Developed Undeveloped Rivers/ Rain Tanker Otherand Well Spring Spring Stream/Pond/ Water Truck/ SourcesIncome Stratum Lake/Dam Peddler
VI - Western Visayas 10.3 3.1 2.9 1.2 0.2 4.5 -Lowest 30 percent 15.0 5.3 7.0 3.0 - 2.7 -Highest 70 percent 7.9 2.0 0.9 0.3 0.3 5.3 -
VII - Central Visayas 9.4 6.1 2.5 0.2 1.7 6.1 -Lowest 30 percent 13.8 10.9 4.7 0.6 2.8 8.3 -Highest 70 percent 6.6 3.1 1.1 1.0 4.7 -
VIII - Eastern Visayas 7.6 1.8 9.0 1.6 - 2.4 -Lowest 30 percent 10.2 3.0 1.2 1.6 - 3.0 -Highest 70 percent 5.4 0.9 0.7 1.6 - 1.9 -
IX - Zamboanga Peninsula 6.0 7.5 11.1 1.2 0.3 7.1 -Lowest 30 percent 10.6 10.8 17.8 1.9 0.5 3.5 -Highest 70 percent 1.4 4.2 4.5 0.5 10.6 -
X - Northern Mindanao 1.8 3.1 9.4 0.4 0.1 2.3 -Lowest 30 percent 2.8 4.1 16.4 0.9 0.3 3.3 -Highest 70 percent 0.9 2.2 3.3 - - 1.5 -
XI - Davao 4.2 12.5 3.6 3.0 0.1 1.3 -Lowest 30 percent 8.3 17.7 7.4 7.0 0.2 0.5 -Highest 70 percent 1.9 9.4 1.5 0.7 - 1.8 -
XII - Soccsksargen 6.6 8.9 2.9 - - 1.6 -Lowest 30 percent 10.9 10.4 5.2 - - 2.5 -Highest 70 percent 2.5 7.4 0.7 - - 0.7 -
XIII - Caraga 4.2 6.6 1.1 1.1 0.1 1.7 -Lowest 30 percent 5.8 10.6 1.9 1.6 0.2 2.5 -Highest 70 percent 2.5 2.5 0.2 0.5 - 0.9 -
ARMM 34.2 4.7 7.9 3.9 1.4 3.6 -Lowest 30 percent 33.4 4.5 5.8 3.9 2.3 4.4 -Highest 70 percent 28.2 4.9 11.0 3.9 0.3 2.4 -
Continued
Source of Water Supply (Percent)
NSO 2011 Philippine Yearbook
Table 16.11--Continued
Region Unprotected Developed Undeveloped Rivers/ Rain Tanker Otherand Well Spring Spring Stream/Pond/ Water Truck/ SourcesIncome Stratum Lake/Dam Peddler
Philippines 5.1 3.9 2.1 1.1 0.4 3.3 -Lowest 30 percent 10.1 7.5 4.9 2.5 0.6 3.1 -Highest 70 percent 3.0 2.3 0.9 0.5 0.3 3.5 -
NCR 0.1 - - - - 8.2 -Lowest 30 percent - - - - - 16.4 0.5Highest 70 percent 0.1 - - - - 7.8 -
CAR 0.8 6.7 3.2 0.4 0.5 4.9 -Lowest 30 percent 1.9 10.5 7.0 1.0 0.8 0.6 -Highest 70 percent 0.3 5.0 1.5 0.1 0.3 6.8 -
I - Ilocos 3.7 1.4 0.4 0.1 - 1.5 0.1Lowest 30 percent 7.5 1.9 1.0 - - 1.9 -Highest 70 percent 2.1 1.2 0.2 0.2 - 1.3 0.1
II - Cagayan Valley 3.6 1.8 0.5 0.5 - 0.3 -Lowest 30 percent 4.2 1.8 0.7 0.5 - - -Highest 70 percent 3.3 1.8 0.4 0.5 - 0.4 -
III - Central Luzon 1.2 1.2 0.2 - - 1.8 -Lowest 30 percent 2.5 3.5 1.0 - - 3.1 -Highest 70 percent 1.0 0.8 - - - 1.5 -
IVA - Calabarzon 2.3 2.3 0.6 0.7 0.1 3.7 0.1Lowest 30 percent 7.8 4.4 1.5 3.4 0.5 4.1Highest 70 percent 1.3 1.8 0.5 0.1 - 3.6 0.1
IVB - Mimaropa 11.4 6.2 2.2 2.5 0.2 1.6 0.1Lowest 30 percent 15.9 7.7 2.9 4.3 - 1.2 0.1Highest 70 percent 7.0 4.8 1.4 0.8 0.3 1.9 -
V - Bicol 13.3 4.2 3.3 1.5 0.3 2.5 -Lowest 30 percent 19.8 5.6 5.3 2.6 0.5 3 -Highest 70 percent 8.0 3.0 1.7 0.6 0.2 2.1 -
Continued
Source of Water Supply (Percent)
Income and Prices
Table 16.11—Concluded
Region Unprotected Developed Undeveloped Rivers/ Rain Tanker Otherand Well Spring Spring Stream/Pond/ Water Truck/ SourcesIncome Stratum Lake/Dam Peddler
VI - Western Visayas 9.7 4.3 3.4 0.5 0.4 1.6 0.1Lowest 30 percent 14.0 7.7 6.0 0.9 0.3 1.7 -Highest 70 percent 6.9 2.3 1.8 0.3 0.5 1.6 0.1
VII - Central Visayas 5.1 6.1 2.4 1.0 1.9 2.8 -Lowest 30 percent 9.9 9.0 5.6 2.0 2.9 2.7 -Highest 70 percent 2.5 4.5 0.7 0.4 1.3 2.8 -
VIII - Eastern Visayas 6.1 3.1 0.9 1.0 0.3 4.7 -Lowest 30 percent 8.9 5.5 1.6 1.5 0.2 5.5 -Highest 70 percent 3.6 1.1 0.2 0.6 0.4 4.1 -
IX - Zamboanga Peninsula 7.1 6.8 7.0 3.2 - 5.2 0.1Lowest 30 percent 11.5 9.4 11.8 3.5 - 4.4 -Highest 70 percent 2.8 4.2 2.2 2.9 - 6.0 0.1
X - Northern Mindanao 3.8 6.2 5.7 0.9 0.2 2.4 0.1Lowest 30 percent 5.0 9.8 9.5 1.0 - 2.4 -Highest 70 percent 2.9 3.6 2.9 0.9 0.3 2.4 0.2
XI - Davao 6.2 11.6 5.3 2.0 0.8 1.3 -Lowest 30 percent 9.2 17.6 8.7 3.4 1.4 0.5 0.1Highest 70 percent 4.5 8.1 3.4 1.2 0.5 1.7 -
XII - Soccsksargen 7.2 7.3 3.2 0.9 0.1 1.7 0.1Lowest 30 percent 9.1 9.7 5.2 1.7 0.1 2.8 -Highest 70 percent 5.7 5.4 1.6 0.3 0.1 0.9 0.1
XIII - Caraga 4.9 6.5 1.9 2.3 0.9 2.7 0.1Lowest 30 percent 6.9 8.8 2.7 3.1 0.8 3.1 0.1Highest 70 percent 3.0 4.3 1.2 1.4 0.9 2.2 -
ARMM 20.8 8.0 6.9 9.5 1.8 4.4 -Lowest 30 percent 17.6 11.2 7.4 11.7 1.4 4.7 -Highest 70 percent 24.5 4.4 6.3 6.9 2.3 4.0 -
Note: Considered as safe sources of water supply are community water system and protected well"-" denotes zero count or less than 0.05 percent.
Source: National Statistics Office, 2008 and 2010 Annual Poverty Indicators Survey.
Source of Water Supply (Percent)
NSO 2011 Philippine Yearbook
Region Numberand Income of Families Flush Toilet Flush Toilet Closed Open Drop/ Pail No Toilet/ OtherStratum (Owned) (Shared) Pit Pit Overhang System Field/Bush
Philippines 18,803 78.1 10.3 4.1 2.2 0.6 0.1 4.6 -Lowest 30% 5,641 57.8 14.2 9.1 5.5 1.5 0.2 11.6 -Highest 70% 13,161 86.7 8.6 2.0 0.7 0.3 0.1 1.6 -
NCR 2,498 87.6 11.7 - - 0.3 0.1 0.3 -Lowest 30% 91 70.8 21.5 - 1.1 3.4 - 3.3 -Highest 70% 2,407 88.2 11.3 - - 0.2 0.1 0.2 -
CAR 329 72.2 9.1 8.9 6.9 1.0 - 1.9 -Lowest 30% 96 41.7 14.6 21.1 15.4 2.9 - 4.4 -Highest 70% 233 84.7 6.9 4.0 3.4 0.2 - 0.8 -
I - Ilocos 1,026 88.8 9.2 0.9 0.6 0.3 - 0.2 -Lowest 30% 266 78.5 16.5 1.7 1.7 1.0 - 0.7 -Highest 70% 760 92.5 6.7 0.6 0.2 - - -
II - Cagayan Valley 665 76.9 10.7 9.3 2.8 0.2 0.1 - -Lowest 30% 168 55.0 19.2 17.3 7.6 0.4 0.5 - -Highest 70% 496 84.3 7.8 6.5 1.2 0.1 - - -
III - Central Luzon 2,072 87.5 10.2 1.7 0.1 0.1 - 0.4 -Lowest 30% 342 70.3 22.8 4.3 0.4 0.4 - 1.9 -Highest 70% 1,730 90.9 7.7 1.2 - - - 0.2 -
IVA- Calabarzon 2,459 91.7 5.2 1.4 0.3 0.1 0.1 1.1 -Lowest 30% 431 74.6 11.6 7.2 1.2 0.6 - 4.8 -Highest 70% 2,028 95.4 3.9 0.2 0.1 - 1.0 0.4 -
IVB- Mimaropa 606 67.1 7.5 8.8 2.7 1.1 - 12.8 -Lowest 30% 304 50.8 9.4 13.0 3.7 1.6 - 21.5 -Highest 70% 302 83.7 5.5 4.5 1.7 0.6 - 4.1 -
V - Bicol 1,092 72.2 8.1 6.0 1.3 0.6 0.2 11.6 -Lowest 30% 470 55.8 10.1 8.1 2.3 1.2 0.2 22.4 -Highest 70% 622 84.7 6.6 4.4 0.6 0.2 0.2 3.5 -
VI - Western Visayas 1,482 72.6 11.1 7.3 3.0 - 0.1 6.0 -Lowest 30% 489 54.8 13.4 13.0 5.4 - 0.4 12.9 -Highest 70% 993 81.3 9.9 4.4 1.8 - - 2.6 -
Continued
TABLE 16.12 Number of Families and Type of Toilet Facility Used by Regionand Income Stratum: 2008 and 2010
(Number of Families in Thousands and Type of Facilities in Percent)
Type of Toilet Facility
2010
Income and Prices
Table 16.12--Continued
Region Numberand Income of Families Flush Toilet Flush Toilet Closed Open Drop/ Pail No Toilet/ OtherStratum (Owned) (Shared) Pit Pit Overhang System Field/Bush
VII - Central Visayas 1,403 71.0 10.8 2.2 0.8 - 0.1 15.1 -Lowest 30% 545 51.6 14.2 4.0 1.5 - 0.2 28.5 -Highest 70% 857 83.4 8.7 1.1 0.4 - - 6.5 -
VIII - Eastern Visayas 884 73.5 10.9 2.2 1.3 0.4 0.2 11.5 -Lowest 30% 403 60.6 14.0 2.8 2.6 0.8 - 19.1 -Highest 70% 480 84.3 8.2 1.7 0.2 - 0.4 5.2 -
IX - Zamboanga Peninsula 674 64.5 9.1 12.8 3.3 1.8 - 8.4 -Lowest 30% 336 53.3 8.6 18.0 4.6 3.2 - 12.3 -Highest 70% 338 75.7 9.6 7.7 2.0 0.5 - 4.6 -
X - Northern Mindanao 861 78.2 7.4 5.0 4.7 0.5 0.5 3.7 -Lowest 30% 399 64.8 8.3 10.4 7.7 1.0 1.1 6.6 -Highest 70% 462 89.7 6.6 0.2 2.2 - - 1.3 -
XI - Davao 899 73.1 14.6 4.5 4.6 1.3 0.3 1.5 -Lowest 30% 329 58.2 15.7 9.8 11.0 1.6 0.5 3.3 -Highest 70% 569 81.7 14.0 1.4 1.0 1.1 0.3 0.5 -
XII - Soccsksargen 792 68.2 10.1 7.9 9.5 - 0.2 4.1 -Lowest 30% 384 52.1 12.5 11.9 16.5 - 0.4 6.6 -Highest 70% 408 83.2 7.9 4.1 3.0 - - 1.8 -
XIII - Caraga 480 82.2 5.3 3.4 0.8 0.1 - 8.1 -Lowest 30% 241 75.6 6.6 5.3 1.6 - - 10.9 -Highest 70% 239 89.0 3.9 1.6 - 0.2 - 5.3 -
ARMM 580 24.6 35.1 13.8 12.0 9.4 0.3 4.8 -Lowest 30% 345 20.0 32.6 14.0 16.2 10.5 0.2 6.6 -Highest 70% 236 31.2 38.9 13.6 6.0 7.6 0.5 2.2 -
Continued
Type of Toilet Facility
NSO 2011 Philippine Yearbook
Table 16.12--Continued
Region Numberand Income of Families Flush Toilet Flush Toilet Closed Open Drop/ Pail No Toilet/ OtherStratum (Owned) (Shared) Pit Pit Overhang System Field/Bush
Philippines 18,067 74.1 9.3 5.6 3.1 1.2 0.7 5.9 -Lowest 30% 5,420 53.3 11.3 11.5 6.7 1.9 1.3 14.0 0.1Highest 70% 12,647 83.1 8.5 3.1 1.6 0.9 0.4 2.4 -
NCR 2,429 84.7 13.9 0.1 0.3 0.6 0.1 0.2 -Lowest 30% 119 62.3 30.5 0.9 0.9 2.9 0.9 1.6 -Highest 70% 2,310 85.9 13.1 0.1 0.3 0.4 0.1 0.1 -
CAR 315 69.9 9.7 9.6 6.6 1.0 - 3.0 -Lowest 30% 97 47.6 9.1 20.6 12.2 2.4 - 7.9 -Highest 70% 218 79.9 10.0 4.7 4.1 0.4 - 0.9 -
I - Ilocos 986 81.4 12.3 4.8 1.0 0.1 - 0.5 -Lowest 30% 286 71.5 15.6 9.2 2.5 0.1 0.1 0.9 -Highest 70% 699 85.4 11.0 2.9 0.3 0.1 - 0.3 -
II - Cagayan Valley 641 77.2 9.3 9.2 2.7 - - 1.6 -Lowest 30% 199 62.7 14.2 13.5 5.7 - - 4.0 -Highest 70% 443 83.8 7.1 7.2 1.3 - - 0.6 -
III - Central Luzon 1,988 87.1 9.2 1.9 0.4 0.3 0.1 1.0 -Lowest 30% 310 68.5 19.1 5.8 1.9 1.4 0.4 2.9 -Highest 70% 1,678 90.5 7.4 1.2 0.1 0.1 - 0.7 -
IVA- Calabarzon 2,352 85.0 6.5 3.9 1.1 0.6 0.2 2.6 0.1Lowest 30% 387 60.4 13.5 11.0 3.9 1.3 0.8 8.6 0.5Highest 70% 1,966 89.8 5.1 2.5 0.5 0.5 0.1 1.4 0.1
IVB- Mimaropa 575 62.7 8.5 12.0 3.2 2.0 0.3 11.3 -Lowest 30% 282 46.0 10.3 15.9 4.9 2.9 0.3 19.7 -Highest 70% 293 78.8 6.8 8.3 1.6 1.1 0.3 3.2 -
V - Bicol 1,050 67.7 9.6 5.9 2.4 0.8 1.0 12.7 -Lowest 30% 471 52.0 11.6 9.4 3.5 0.7 1.6 21.2 -Highest 70% 578 80.5 7.9 3.1 1.4 0.8 0.5 5.7 -
VI - Western Visayas 1,424 67.7 5.4 8.4 6.5 0.6 1.4 10.1 -Lowest 30% 550 49.5 8.0 11.4 10.1 0.6 2.4 18.0 0.1Highest 70% 874 79.1 3.7 6.5 4.2 0.6 0.8 5.1 -
Continued
Type of Toilet Facility
2008
Income and Prices
Table 16.12--Concluded
Region Numberand Income of Families Flush Toilet Flush Toilet Closed Open Drop/ Pail No Toilet/ OtherStratum (Owned) (Shared) Pit Pit Overhang System Field/Bush
VII - Central Visayas 1,346 66.2 9.5 3.2 1.6 0.4 3.9 15.1 -Lowest 30% 468 45.2 8.2 6.7 3.5 1.1 4.8 30.6 -Highest 70% 878 77.4 10.2 1.3 0.6 0.1 3.5 6.8 -
VIII - Eastern Visayas 848 69.1 8.3 3.3 0.8 1.4 0.7 16.4 -Lowest 30% 396 55.6 10.4 5.0 1.0 1.5 1.2 25.4 -Highest 70% 452 81.0 6.4 1.8 0.6 1.4 0.3 8.4 -
IX - Zamboanga Peninsula 647 59.6 8.5 12.6 3.2 3.5 0.8 11.7 0.1Lowest 30% 321 46.3 7.7 16.8 4.7 4.4 0.8 19.3 -Highest 70% 326 72.7 9.2 8.6 1.7 2.6 0.8 4.2 0.1
X - Northern Mindanao 825 72.8 8.7 8.8 4.4 0.2 0.7 4.4 -Lowest 30% 352 57.9 10.5 15.1 6.4 0.4 1.1 8.6 -Highest 70% 472 83.9 7.4 4.1 3.0 0.4 1.2 -
XI - Davao 869 72.4 9.7 6.3 6.8 0.5 0.1 4.2 -Lowest 30% 323 59.0 9.8 9.8 12.7 0.5 0.2 8.0 -Highest 70% 546 80.2 9.8 4.3 3.4 0.6 0.1 1.9 -
XII - Soccsksargen 756 64.1 12.5 10.6 6.1 0.3 0.5 5.9 -Lowest 30% 336 49.5 14.8 14.6 9.5 0.5 0.9 10.2 -Highest 70% 420 75.7 10.7 7.4 3.4 0.1 0.2 2.5 -
XIII - Caraga 462 82.3 5.2 2.8 1.4 1.3 0.6 6.4 0.1Lowest 30% 229 76.3 5.8 3.8 1.8 1.3 0.9 9.9 0.1Highest 70% 233 88.2 4.6 1.7 0.9 1.2 0.3 3.0 -
ARMM 554 16.7 9.0 22.8 24.3 18.8 0.5 7.8 0.1Lowest 30% 295 10.1 7.1 29.6 29.4 14.8 0.3 8.6 0.1Highest 70% 259 24.2 11.1 15.0 18.6 23.5 0.6 6.9 -
Note: Considered as sanitary toilets are flush toilet (either owned or shared) and closed pit."-" denotes zero count or less than 0.05 percent.
Source: National Statistics Office, 2008 and 2010 Annual Poverty Indicators Survey.
Type of Toilet Facility

NSO 2011 Philippine Yearbook
Region Number of Stronga Lightb Salvaged/ Mixed but Mixed but Mixed but Notand Income Families materials materials makeshift predomi- predomi- predomi- appli-Stratum materials nantly nantly nantly cable
strong light salvaged
Philippines 18,803 79.8 11.9 0.5 5.2 2.3 0.2 -Lowest 30% 5,641 61.8 26.4 1.0 6.3 4.1 0.4 -Highest 70% 13,161 87.5 5.7 0.3 4.8 1.6 0.1 -
NCR 2,498 92.1 0.3 0.2 5.9 1.4 0.2 -Lowest 30% 91 81.7 3.5 2.2 6.6 4.9 1.1 -Highest 70% 2,407 92.5 0.2 0.1 5.9 1.2 0.2 -
CAR 329 93.8 4.2 0.4 1.6 0.1 - -Lowest 30% 96 89.1 6.3 0.8 3.3 0.4 - -Highest 70% 233 95.7 3.3 0.2 0.9 - - -
I - Ilocos 1,026 87.0 7.1 3.0 1.5 0.9 0.5 -Lowest 30% 266 75.3 12.4 5.6 2.7 2.7 1.3 -Highest 70% 760 91.0 5.2 2.1 1.1 0.3 0.2 -
II - Cagayan Valley 665 86.0 5.4 0.2 5.8 2.7 - -Lowest 30% 168 73.1 12.1 0.8 11.1 2.9 - -Highest 70% 496 90.4 3.1 - 4.0 2.6 - -
III - Central Luzon 2,072 91.3 4.2 0.3 2.9 1.1 0.2 -Lowest 30% 342 78.9 11.4 0.7 5.1 3.1 0.8 -Highest 70% 1,730 93.8 2.7 0.2 2.5 0.6 0.1 -
IVA - Calabarzon 2,459 93.1 3.6 0.2 2.3 0.6 0.1 -Lowest 30% 431 78.0 13.4 0.8 5.8 1.7 0.3 -Highest 70% 2,028 96.3 1.6 0.1 1.6 0.4 - -
IVB - Mimaropa 606 67.2 26.6 0.6 3.9 1.7 - -Lowest 30% 304 52.4 40.1 0.7 4.7 2.1 - -Highest 70% 302 82.2 12.9 0.5 3.0 1.3 - -
V - Bicol 1,092 64.4 26.6 0.8 5.5 2.5 0.2 -Lowest 30% 470 47.3 40.6 1.0 5.9 4.7 0.4 -Highest 70% 622 77.3 16.0 0.7 5.2 0.9 -
VI - Western Visayas 1,482 69.1 13.0 - 14.2 3.7 - -Lowest 30% 489 50.3 21.3 - 22.0 6.4 - -Highest 70% 993 78.4 8.9 - 10.4 2.4 - -
Continued
TABLE 16.13 Number of Families and Type of Construction Materials of the Roof of the Building they Occupy, by Region and Income Stratum: 2008 and 2010
(Number of Families in Thousands and Construction Materials of the Roof In Percent)
Construction Materials of the Roof
2010
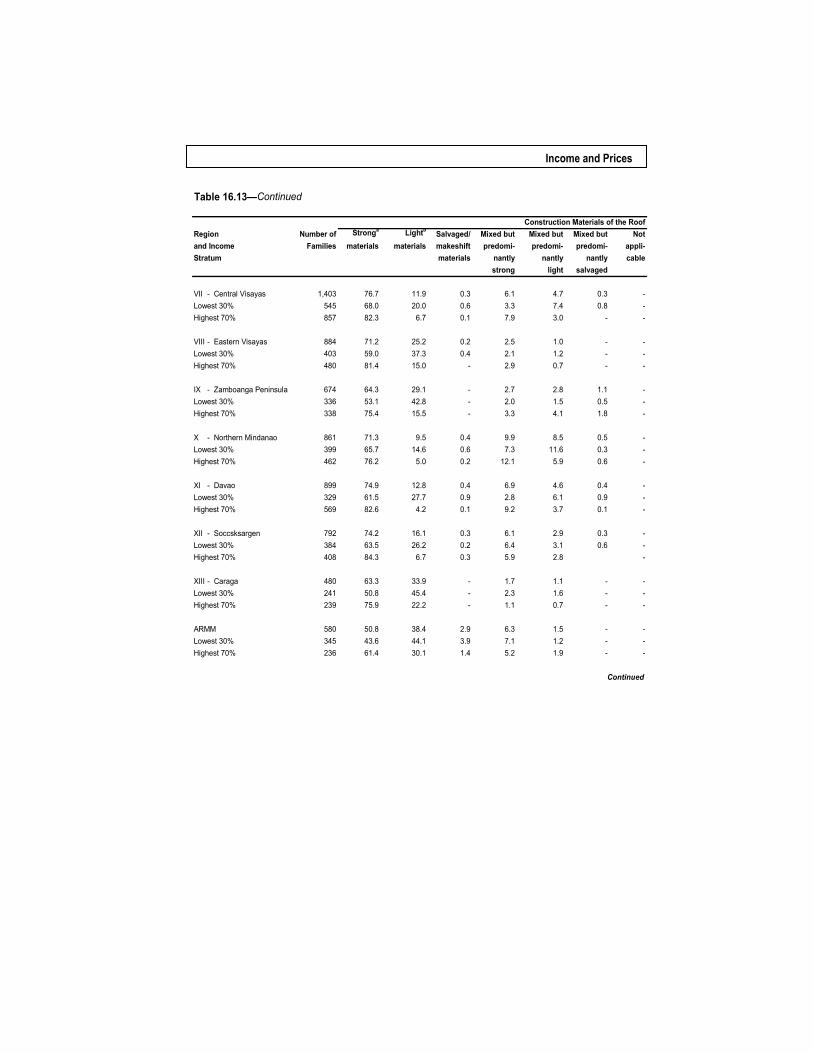
Income and Prices
Table 16.13—Continued
Region Number of Stronga Lightb Salvaged/ Mixed but Mixed but Mixed but Notand Income Families materials materials makeshift predomi- predomi- predomi- appli-Stratum materials nantly nantly nantly cable
strong light salvaged
VII - Central Visayas 1,403 76.7 11.9 0.3 6.1 4.7 0.3 -Lowest 30% 545 68.0 20.0 0.6 3.3 7.4 0.8 -Highest 70% 857 82.3 6.7 0.1 7.9 3.0 - -
VIII - Eastern Visayas 884 71.2 25.2 0.2 2.5 1.0 - -Lowest 30% 403 59.0 37.3 0.4 2.1 1.2 - -Highest 70% 480 81.4 15.0 - 2.9 0.7 - -
IX - Zamboanga Peninsula 674 64.3 29.1 - 2.7 2.8 1.1 -Lowest 30% 336 53.1 42.8 - 2.0 1.5 0.5 -Highest 70% 338 75.4 15.5 - 3.3 4.1 1.8 -
X - Northern Mindanao 861 71.3 9.5 0.4 9.9 8.5 0.5 -Lowest 30% 399 65.7 14.6 0.6 7.3 11.6 0.3 -Highest 70% 462 76.2 5.0 0.2 12.1 5.9 0.6 -
XI - Davao 899 74.9 12.8 0.4 6.9 4.6 0.4 -Lowest 30% 329 61.5 27.7 0.9 2.8 6.1 0.9 -Highest 70% 569 82.6 4.2 0.1 9.2 3.7 0.1 -
XII - Soccsksargen 792 74.2 16.1 0.3 6.1 2.9 0.3 -Lowest 30% 384 63.5 26.2 0.2 6.4 3.1 0.6 -Highest 70% 408 84.3 6.7 0.3 5.9 2.8 -
XIII - Caraga 480 63.3 33.9 - 1.7 1.1 - -Lowest 30% 241 50.8 45.4 - 2.3 1.6 - -Highest 70% 239 75.9 22.2 - 1.1 0.7 - -
ARMM 580 50.8 38.4 2.9 6.3 1.5 - -Lowest 30% 345 43.6 44.1 3.9 7.1 1.2 - -Highest 70% 236 61.4 30.1 1.4 5.2 1.9 - -
Continued
Construction Materials of the Roof
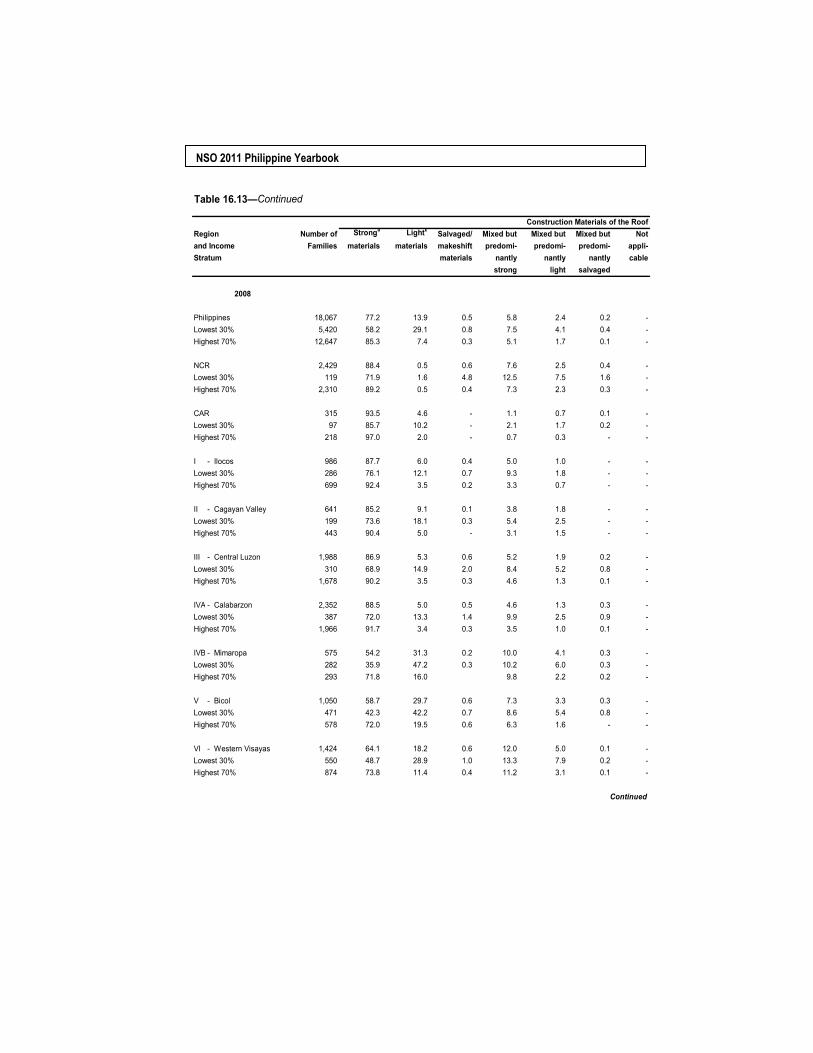
NSO 2011 Philippine Yearbook
Table 16.13—Continued
Region Number of Stronga Lightb Salvaged/ Mixed but Mixed but Mixed but Notand Income Families materials materials makeshift predomi- predomi- predomi- appli-Stratum materials nantly nantly nantly cable
strong light salvaged
Philippines 18,067 77.2 13.9 0.5 5.8 2.4 0.2 -Lowest 30% 5,420 58.2 29.1 0.8 7.5 4.1 0.4 -Highest 70% 12,647 85.3 7.4 0.3 5.1 1.7 0.1 -
NCR 2,429 88.4 0.5 0.6 7.6 2.5 0.4 -Lowest 30% 119 71.9 1.6 4.8 12.5 7.5 1.6 -Highest 70% 2,310 89.2 0.5 0.4 7.3 2.3 0.3 -
CAR 315 93.5 4.6 - 1.1 0.7 0.1 -Lowest 30% 97 85.7 10.2 - 2.1 1.7 0.2 -Highest 70% 218 97.0 2.0 - 0.7 0.3 - -
I - Ilocos 986 87.7 6.0 0.4 5.0 1.0 - -Lowest 30% 286 76.1 12.1 0.7 9.3 1.8 - -Highest 70% 699 92.4 3.5 0.2 3.3 0.7 - -
II - Cagayan Valley 641 85.2 9.1 0.1 3.8 1.8 - -Lowest 30% 199 73.6 18.1 0.3 5.4 2.5 - -Highest 70% 443 90.4 5.0 - 3.1 1.5 - -
III - Central Luzon 1,988 86.9 5.3 0.6 5.2 1.9 0.2 -Lowest 30% 310 68.9 14.9 2.0 8.4 5.2 0.8 -Highest 70% 1,678 90.2 3.5 0.3 4.6 1.3 0.1 -
IVA - Calabarzon 2,352 88.5 5.0 0.5 4.6 1.3 0.3 -Lowest 30% 387 72.0 13.3 1.4 9.9 2.5 0.9 -Highest 70% 1,966 91.7 3.4 0.3 3.5 1.0 0.1 -
IVB - Mimaropa 575 54.2 31.3 0.2 10.0 4.1 0.3 -Lowest 30% 282 35.9 47.2 0.3 10.2 6.0 0.3 -Highest 70% 293 71.8 16.0 9.8 2.2 0.2 -
V - Bicol 1,050 58.7 29.7 0.6 7.3 3.3 0.3 -Lowest 30% 471 42.3 42.2 0.7 8.6 5.4 0.8 -Highest 70% 578 72.0 19.5 0.6 6.3 1.6 - -
VI - Western Visayas 1,424 64.1 18.2 0.6 12.0 5.0 0.1 -Lowest 30% 550 48.7 28.9 1.0 13.3 7.9 0.2 -Highest 70% 874 73.8 11.4 0.4 11.2 3.1 0.1 -
Continued
Construction Materials of the Roof
2008
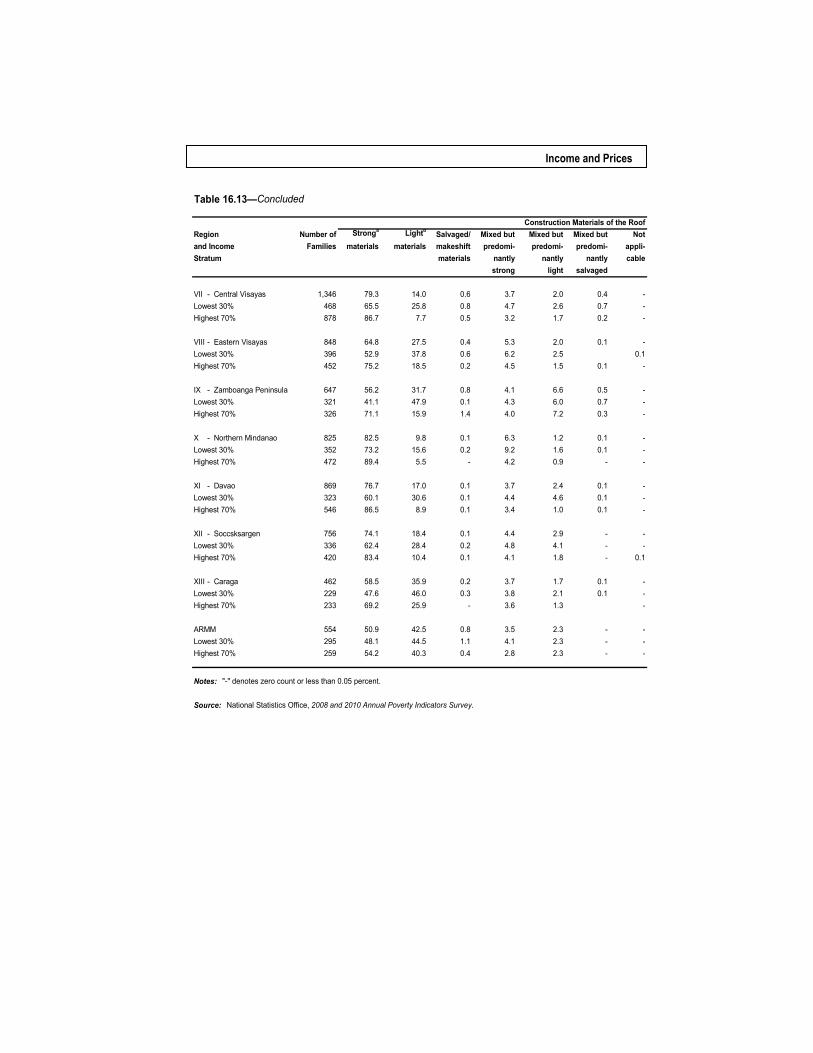
Income and Prices
Table 16.13—Concluded
Region Number of Stronga Lightb Salvaged/ Mixed but Mixed but Mixed but Notand Income Families materials materials makeshift predomi- predomi- predomi- appli-Stratum materials nantly nantly nantly cable
strong light salvaged
VII - Central Visayas 1,346 79.3 14.0 0.6 3.7 2.0 0.4 -Lowest 30% 468 65.5 25.8 0.8 4.7 2.6 0.7 -Highest 70% 878 86.7 7.7 0.5 3.2 1.7 0.2 -
VIII - Eastern Visayas 848 64.8 27.5 0.4 5.3 2.0 0.1 -Lowest 30% 396 52.9 37.8 0.6 6.2 2.5 0.1Highest 70% 452 75.2 18.5 0.2 4.5 1.5 0.1 -
IX - Zamboanga Peninsula 647 56.2 31.7 0.8 4.1 6.6 0.5 -Lowest 30% 321 41.1 47.9 0.1 4.3 6.0 0.7 -Highest 70% 326 71.1 15.9 1.4 4.0 7.2 0.3 -
X - Northern Mindanao 825 82.5 9.8 0.1 6.3 1.2 0.1 -Lowest 30% 352 73.2 15.6 0.2 9.2 1.6 0.1 -Highest 70% 472 89.4 5.5 - 4.2 0.9 - -
XI - Davao 869 76.7 17.0 0.1 3.7 2.4 0.1 -Lowest 30% 323 60.1 30.6 0.1 4.4 4.6 0.1 -Highest 70% 546 86.5 8.9 0.1 3.4 1.0 0.1 -
XII - Soccsksargen 756 74.1 18.4 0.1 4.4 2.9 - -Lowest 30% 336 62.4 28.4 0.2 4.8 4.1 - -Highest 70% 420 83.4 10.4 0.1 4.1 1.8 - 0.1
XIII - Caraga 462 58.5 35.9 0.2 3.7 1.7 0.1 -Lowest 30% 229 47.6 46.0 0.3 3.8 2.1 0.1 -Highest 70% 233 69.2 25.9 - 3.6 1.3 -
ARMM 554 50.9 42.5 0.8 3.5 2.3 - -Lowest 30% 295 48.1 44.5 1.1 4.1 2.3 - -Highest 70% 259 54.2 40.3 0.4 2.8 2.3 - -
Notes: "-" denotes zero count or less than 0.05 percent.
Source: National Statistics Office, 2008 and 2010 Annual Poverty Indicators Survey.
Construction Materials of the Roof
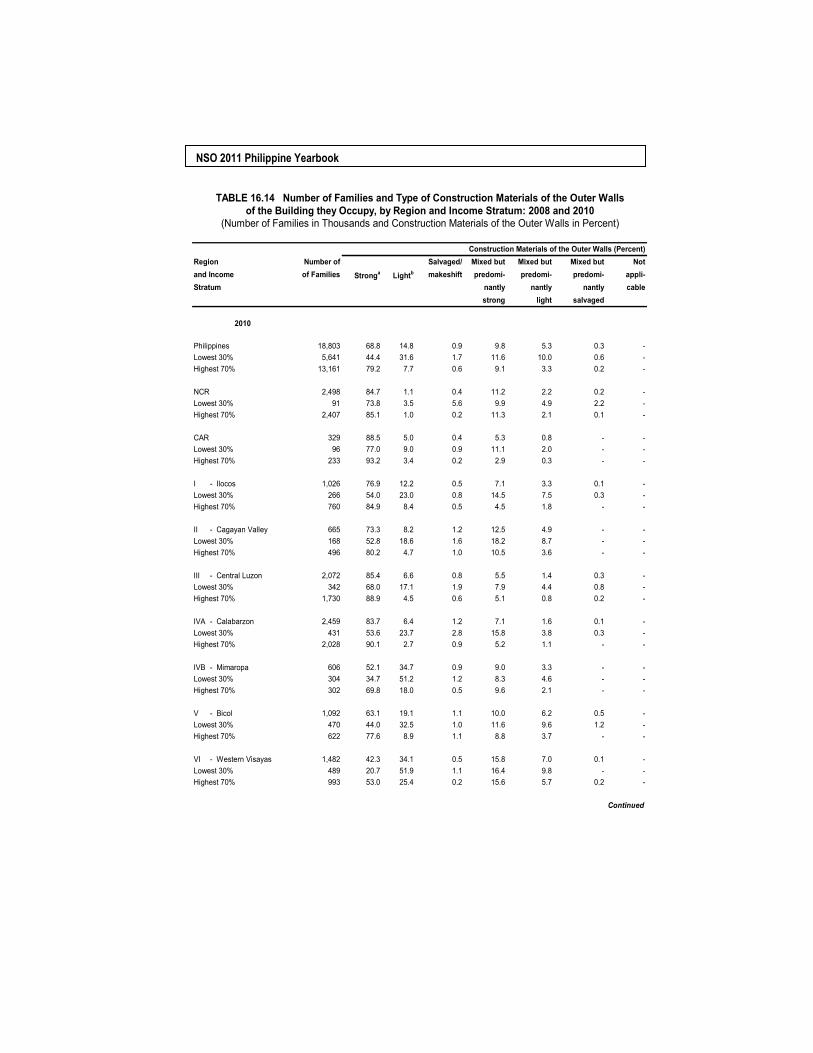
NSO 2011 Philippine Yearbook
Region Number of Salvaged/ Mixed but Mixed but Mixed but Notand Income of Families Stronga Lightb makeshift predomi- predomi- predomi- appli-Stratum nantly nantly nantly cable
strong light salvaged
Philippines 18,803 68.8 14.8 0.9 9.8 5.3 0.3 -Lowest 30% 5,641 44.4 31.6 1.7 11.6 10.0 0.6 -Highest 70% 13,161 79.2 7.7 0.6 9.1 3.3 0.2 -
NCR 2,498 84.7 1.1 0.4 11.2 2.2 0.2 -Lowest 30% 91 73.8 3.5 5.6 9.9 4.9 2.2 -Highest 70% 2,407 85.1 1.0 0.2 11.3 2.1 0.1 -
CAR 329 88.5 5.0 0.4 5.3 0.8 - -Lowest 30% 96 77.0 9.0 0.9 11.1 2.0 - -Highest 70% 233 93.2 3.4 0.2 2.9 0.3 - -
I - Ilocos 1,026 76.9 12.2 0.5 7.1 3.3 0.1 -Lowest 30% 266 54.0 23.0 0.8 14.5 7.5 0.3 -Highest 70% 760 84.9 8.4 0.5 4.5 1.8 - -
II - Cagayan Valley 665 73.3 8.2 1.2 12.5 4.9 - -Lowest 30% 168 52.8 18.6 1.6 18.2 8.7 - -Highest 70% 496 80.2 4.7 1.0 10.5 3.6 - -
III - Central Luzon 2,072 85.4 6.6 0.8 5.5 1.4 0.3 -Lowest 30% 342 68.0 17.1 1.9 7.9 4.4 0.8 -Highest 70% 1,730 88.9 4.5 0.6 5.1 0.8 0.2 -
IVA - Calabarzon 2,459 83.7 6.4 1.2 7.1 1.6 0.1 -Lowest 30% 431 53.6 23.7 2.8 15.8 3.8 0.3 -Highest 70% 2,028 90.1 2.7 0.9 5.2 1.1 - -
IVB - Mimaropa 606 52.1 34.7 0.9 9.0 3.3 - -Lowest 30% 304 34.7 51.2 1.2 8.3 4.6 - -Highest 70% 302 69.8 18.0 0.5 9.6 2.1 - -
V - Bicol 1,092 63.1 19.1 1.1 10.0 6.2 0.5 -Lowest 30% 470 44.0 32.5 1.0 11.6 9.6 1.2 -Highest 70% 622 77.6 8.9 1.1 8.8 3.7 - -
VI - Western Visayas 1,482 42.3 34.1 0.5 15.8 7.0 0.1 -Lowest 30% 489 20.7 51.9 1.1 16.4 9.8 - -Highest 70% 993 53.0 25.4 0.2 15.6 5.7 0.2 -
Continued
TABLE 16.14 Number of Families and Type of Construction Materials of the Outer Wallsof the Building they Occupy, by Region and Income Stratum: 2008 and 2010
(Number of Families in Thousands and Construction Materials of the Outer Walls in Percent)
Construction Materials of the Outer Walls (Percent)
2010
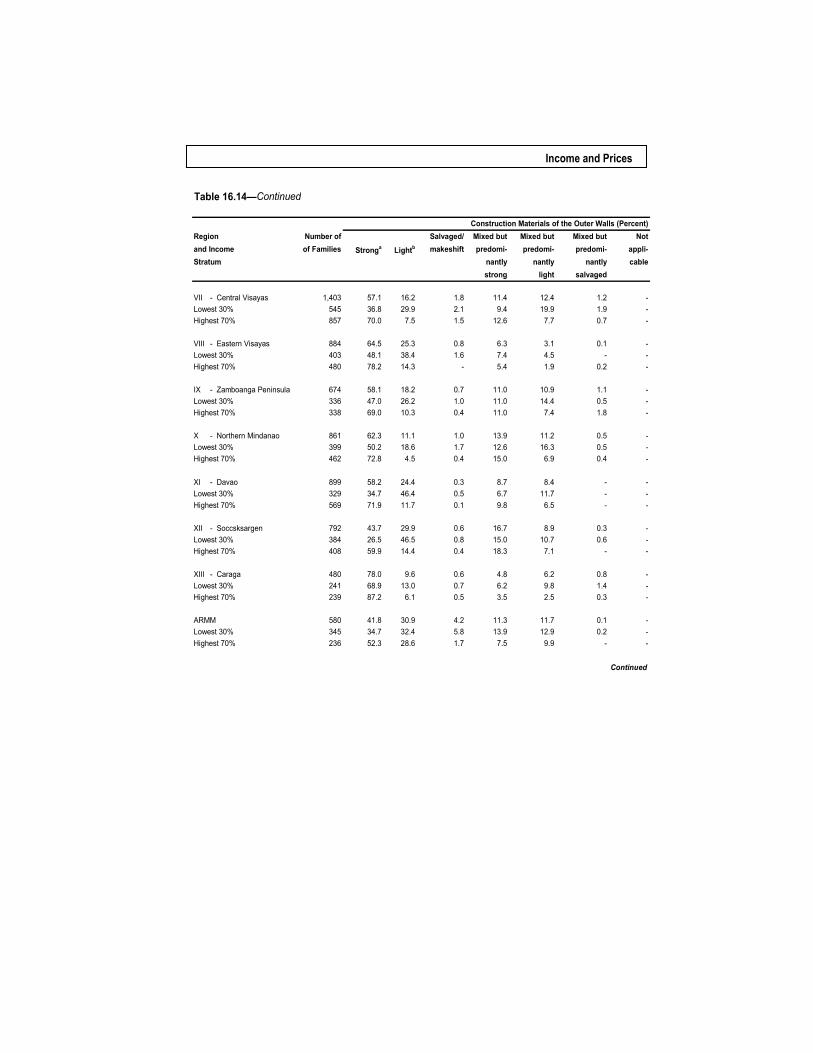
Income and Prices
Table 16.14—Continued
Region Number of Salvaged/ Mixed but Mixed but Mixed but Notand Income of Families Stronga Lightb makeshift predomi- predomi- predomi- appli-Stratum nantly nantly nantly cable
strong light salvaged
VII - Central Visayas 1,403 57.1 16.2 1.8 11.4 12.4 1.2 -Lowest 30% 545 36.8 29.9 2.1 9.4 19.9 1.9 -Highest 70% 857 70.0 7.5 1.5 12.6 7.7 0.7 -
VIII - Eastern Visayas 884 64.5 25.3 0.8 6.3 3.1 0.1 -Lowest 30% 403 48.1 38.4 1.6 7.4 4.5 - -Highest 70% 480 78.2 14.3 - 5.4 1.9 0.2 -
IX - Zamboanga Peninsula 674 58.1 18.2 0.7 11.0 10.9 1.1 -Lowest 30% 336 47.0 26.2 1.0 11.0 14.4 0.5 -Highest 70% 338 69.0 10.3 0.4 11.0 7.4 1.8 -
X - Northern Mindanao 861 62.3 11.1 1.0 13.9 11.2 0.5 -Lowest 30% 399 50.2 18.6 1.7 12.6 16.3 0.5 -Highest 70% 462 72.8 4.5 0.4 15.0 6.9 0.4 -
XI - Davao 899 58.2 24.4 0.3 8.7 8.4 - -Lowest 30% 329 34.7 46.4 0.5 6.7 11.7 - -Highest 70% 569 71.9 11.7 0.1 9.8 6.5 - -
XII - Soccsksargen 792 43.7 29.9 0.6 16.7 8.9 0.3 -Lowest 30% 384 26.5 46.5 0.8 15.0 10.7 0.6 -Highest 70% 408 59.9 14.4 0.4 18.3 7.1 - -
XIII - Caraga 480 78.0 9.6 0.6 4.8 6.2 0.8 -Lowest 30% 241 68.9 13.0 0.7 6.2 9.8 1.4 -Highest 70% 239 87.2 6.1 0.5 3.5 2.5 0.3 -
ARMM 580 41.8 30.9 4.2 11.3 11.7 0.1 -Lowest 30% 345 34.7 32.4 5.8 13.9 12.9 0.2 -Highest 70% 236 52.3 28.6 1.7 7.5 9.9 - -
Continued
Construction Materials of the Outer Walls (Percent)
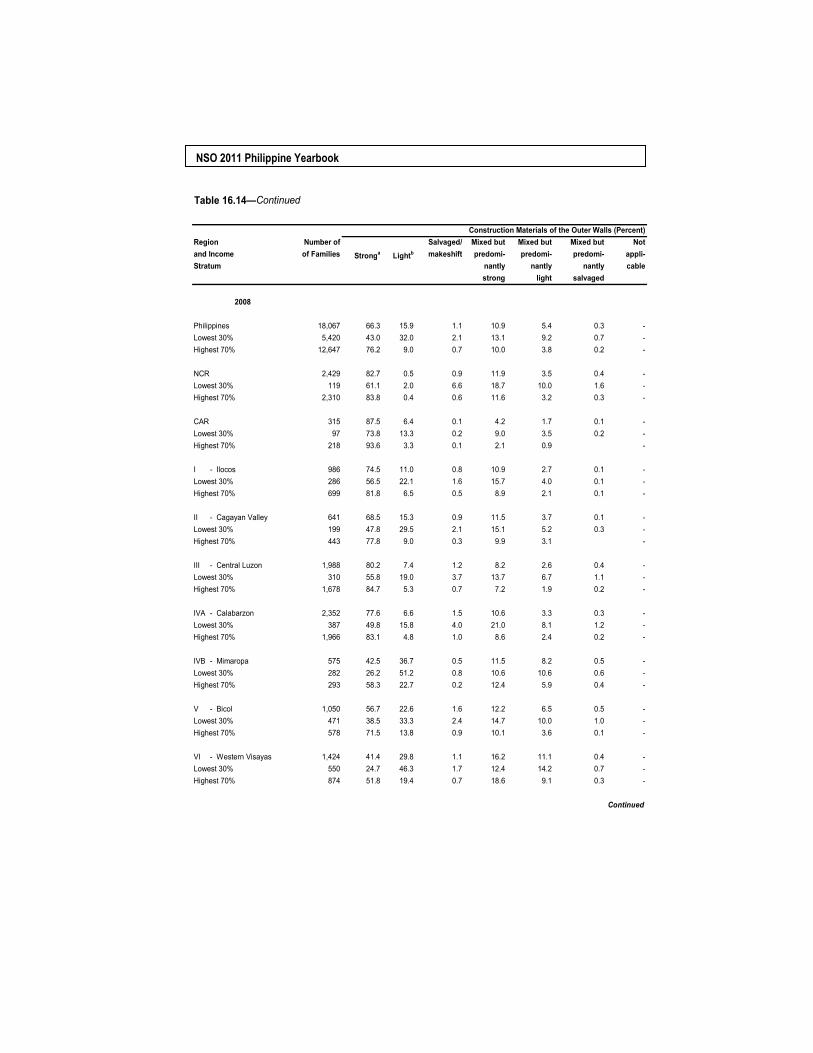
NSO 2011 Philippine Yearbook
Table 16.14—Continued
Region Number of Salvaged/ Mixed but Mixed but Mixed but Notand Income of Families Stronga Lightb makeshift predomi- predomi- predomi- appli-Stratum nantly nantly nantly cable
strong light salvaged
Philippines 18,067 66.3 15.9 1.1 10.9 5.4 0.3 -Lowest 30% 5,420 43.0 32.0 2.1 13.1 9.2 0.7 -Highest 70% 12,647 76.2 9.0 0.7 10.0 3.8 0.2 -
NCR 2,429 82.7 0.5 0.9 11.9 3.5 0.4 -Lowest 30% 119 61.1 2.0 6.6 18.7 10.0 1.6 -Highest 70% 2,310 83.8 0.4 0.6 11.6 3.2 0.3 -
CAR 315 87.5 6.4 0.1 4.2 1.7 0.1 -Lowest 30% 97 73.8 13.3 0.2 9.0 3.5 0.2 -Highest 70% 218 93.6 3.3 0.1 2.1 0.9 -
I - Ilocos 986 74.5 11.0 0.8 10.9 2.7 0.1 -Lowest 30% 286 56.5 22.1 1.6 15.7 4.0 0.1 -Highest 70% 699 81.8 6.5 0.5 8.9 2.1 0.1 -
II - Cagayan Valley 641 68.5 15.3 0.9 11.5 3.7 0.1 -Lowest 30% 199 47.8 29.5 2.1 15.1 5.2 0.3 -Highest 70% 443 77.8 9.0 0.3 9.9 3.1 -
III - Central Luzon 1,988 80.2 7.4 1.2 8.2 2.6 0.4 -Lowest 30% 310 55.8 19.0 3.7 13.7 6.7 1.1 -Highest 70% 1,678 84.7 5.3 0.7 7.2 1.9 0.2 -
IVA - Calabarzon 2,352 77.6 6.6 1.5 10.6 3.3 0.3 -Lowest 30% 387 49.8 15.8 4.0 21.0 8.1 1.2 -Highest 70% 1,966 83.1 4.8 1.0 8.6 2.4 0.2 -
IVB - Mimaropa 575 42.5 36.7 0.5 11.5 8.2 0.5 -Lowest 30% 282 26.2 51.2 0.8 10.6 10.6 0.6 -Highest 70% 293 58.3 22.7 0.2 12.4 5.9 0.4 -
V - Bicol 1,050 56.7 22.6 1.6 12.2 6.5 0.5 -Lowest 30% 471 38.5 33.3 2.4 14.7 10.0 1.0 -Highest 70% 578 71.5 13.8 0.9 10.1 3.6 0.1 -
VI - Western Visayas 1,424 41.4 29.8 1.1 16.2 11.1 0.4 -Lowest 30% 550 24.7 46.3 1.7 12.4 14.2 0.7 -Highest 70% 874 51.8 19.4 0.7 18.6 9.1 0.3 -
Continued
Construction Materials of the Outer Walls (Percent)
2008
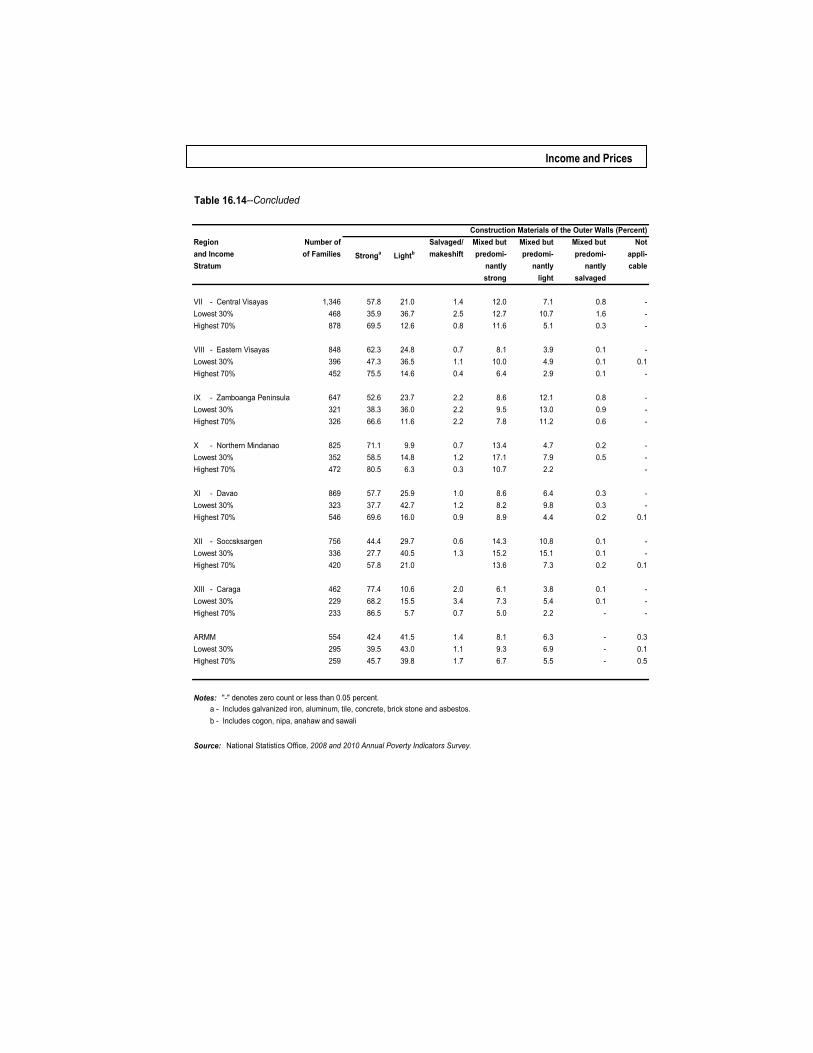
Income and Prices
Table 16.14--Concluded
Region Number of Salvaged/ Mixed but Mixed but Mixed but Notand Income of Families Stronga Lightb makeshift predomi- predomi- predomi- appli-Stratum nantly nantly nantly cable
strong light salvaged
VII - Central Visayas 1,346 57.8 21.0 1.4 12.0 7.1 0.8 -Lowest 30% 468 35.9 36.7 2.5 12.7 10.7 1.6 -Highest 70% 878 69.5 12.6 0.8 11.6 5.1 0.3 -
VIII - Eastern Visayas 848 62.3 24.8 0.7 8.1 3.9 0.1 -Lowest 30% 396 47.3 36.5 1.1 10.0 4.9 0.1 0.1Highest 70% 452 75.5 14.6 0.4 6.4 2.9 0.1 -
IX - Zamboanga Peninsula 647 52.6 23.7 2.2 8.6 12.1 0.8 -Lowest 30% 321 38.3 36.0 2.2 9.5 13.0 0.9 -Highest 70% 326 66.6 11.6 2.2 7.8 11.2 0.6 -
X - Northern Mindanao 825 71.1 9.9 0.7 13.4 4.7 0.2 -Lowest 30% 352 58.5 14.8 1.2 17.1 7.9 0.5 -Highest 70% 472 80.5 6.3 0.3 10.7 2.2 -
XI - Davao 869 57.7 25.9 1.0 8.6 6.4 0.3 -Lowest 30% 323 37.7 42.7 1.2 8.2 9.8 0.3 -Highest 70% 546 69.6 16.0 0.9 8.9 4.4 0.2 0.1
XII - Soccsksargen 756 44.4 29.7 0.6 14.3 10.8 0.1 -Lowest 30% 336 27.7 40.5 1.3 15.2 15.1 0.1 -Highest 70% 420 57.8 21.0 13.6 7.3 0.2 0.1
XIII - Caraga 462 77.4 10.6 2.0 6.1 3.8 0.1 -Lowest 30% 229 68.2 15.5 3.4 7.3 5.4 0.1 -Highest 70% 233 86.5 5.7 0.7 5.0 2.2 - -
ARMM 554 42.4 41.5 1.4 8.1 6.3 - 0.3Lowest 30% 295 39.5 43.0 1.1 9.3 6.9 - 0.1Highest 70% 259 45.7 39.8 1.7 6.7 5.5 - 0.5
Notes: "-" denotes zero count or less than 0.05 percent.a - Includes galvanized iron, aluminum, tile, concrete, brick stone and asbestos.b - Includes cogon, nipa, anahaw and sawali
Source: National Statistics Office, 2008 and 2010 Annual Poverty Indicators Survey.
Construction Materials of the Outer Walls (Percent)
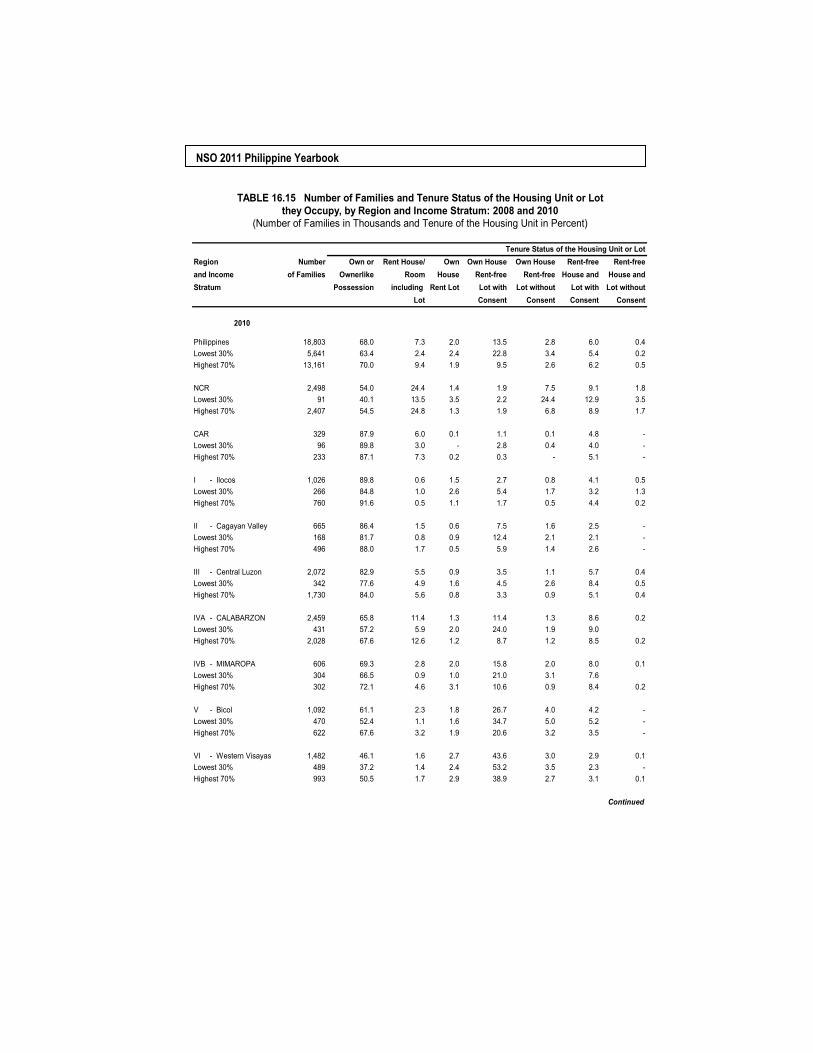
NSO 2011 Philippine Yearbook
Region Number Own or Rent House/ Own Own House Own House Rent-free Rent-freeand Income of Families Ownerlike Room House Rent-free Rent-free House and House andStratum Possession including Rent Lot Lot with Lot without Lot with Lot without
Lot Consent Consent Consent Consent
Philippines 18,803 68.0 7.3 2.0 13.5 2.8 6.0 0.4Lowest 30% 5,641 63.4 2.4 2.4 22.8 3.4 5.4 0.2Highest 70% 13,161 70.0 9.4 1.9 9.5 2.6 6.2 0.5
NCR 2,498 54.0 24.4 1.4 1.9 7.5 9.1 1.8Lowest 30% 91 40.1 13.5 3.5 2.2 24.4 12.9 3.5Highest 70% 2,407 54.5 24.8 1.3 1.9 6.8 8.9 1.7
CAR 329 87.9 6.0 0.1 1.1 0.1 4.8 -Lowest 30% 96 89.8 3.0 - 2.8 0.4 4.0 -Highest 70% 233 87.1 7.3 0.2 0.3 - 5.1 -
I - Ilocos 1,026 89.8 0.6 1.5 2.7 0.8 4.1 0.5Lowest 30% 266 84.8 1.0 2.6 5.4 1.7 3.2 1.3Highest 70% 760 91.6 0.5 1.1 1.7 0.5 4.4 0.2
II - Cagayan Valley 665 86.4 1.5 0.6 7.5 1.6 2.5 -Lowest 30% 168 81.7 0.8 0.9 12.4 2.1 2.1 -Highest 70% 496 88.0 1.7 0.5 5.9 1.4 2.6 -
III - Central Luzon 2,072 82.9 5.5 0.9 3.5 1.1 5.7 0.4Lowest 30% 342 77.6 4.9 1.6 4.5 2.6 8.4 0.5Highest 70% 1,730 84.0 5.6 0.8 3.3 0.9 5.1 0.4
IVA - CALABARZON 2,459 65.8 11.4 1.3 11.4 1.3 8.6 0.2Lowest 30% 431 57.2 5.9 2.0 24.0 1.9 9.0Highest 70% 2,028 67.6 12.6 1.2 8.7 1.2 8.5 0.2
IVB - MIMAROPA 606 69.3 2.8 2.0 15.8 2.0 8.0 0.1Lowest 30% 304 66.5 0.9 1.0 21.0 3.1 7.6Highest 70% 302 72.1 4.6 3.1 10.6 0.9 8.4 0.2
V - Bicol 1,092 61.1 2.3 1.8 26.7 4.0 4.2 -Lowest 30% 470 52.4 1.1 1.6 34.7 5.0 5.2 -Highest 70% 622 67.6 3.2 1.9 20.6 3.2 3.5 -
VI - Western Visayas 1,482 46.1 1.6 2.7 43.6 3.0 2.9 0.1Lowest 30% 489 37.2 1.4 2.4 53.2 3.5 2.3 -Highest 70% 993 50.5 1.7 2.9 38.9 2.7 3.1 0.1
Continued
TABLE 16.15 Number of Families and Tenure Status of the Housing Unit or Lotthey Occupy, by Region and Income Stratum: 2008 and 2010
(Number of Families in Thousands and Tenure of the Housing Unit in Percent)
Tenure Status of the Housing Unit or Lot
2010
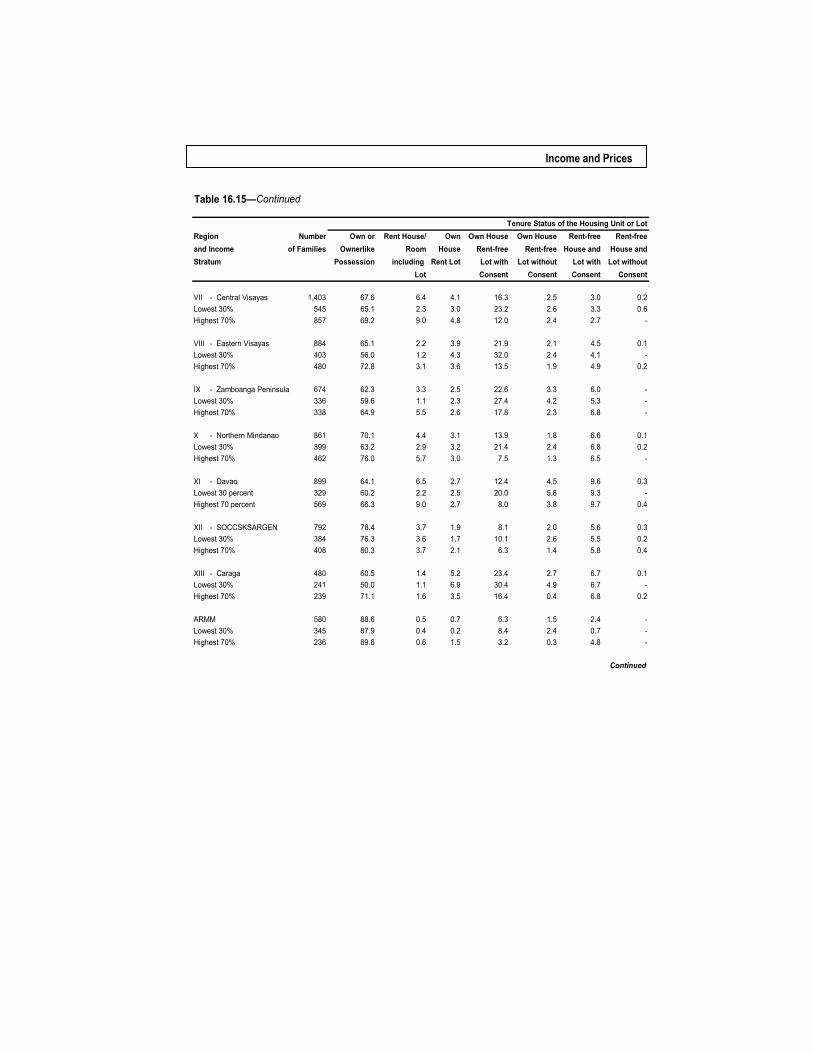
Income and Prices
Table 16.15—Continued
Region Number Own or Rent House/ Own Own House Own House Rent-free Rent-freeand Income of Families Ownerlike Room House Rent-free Rent-free House and House andStratum Possession including Rent Lot Lot with Lot without Lot with Lot without
Lot Consent Consent Consent Consent
VII - Central Visayas 1,403 67.6 6.4 4.1 16.3 2.5 3.0 0.2Lowest 30% 545 65.1 2.3 3.0 23.2 2.6 3.3 0.6Highest 70% 857 69.2 9.0 4.8 12.0 2.4 2.7 -
VIII - Eastern Visayas 884 65.1 2.2 3.9 21.9 2.1 4.5 0.1Lowest 30% 403 56.0 1.2 4.3 32.0 2.4 4.1 -Highest 70% 480 72.8 3.1 3.6 13.5 1.9 4.9 0.2
IX - Zamboanga Peninsula 674 62.3 3.3 2.5 22.6 3.3 6.0 -Lowest 30% 336 59.6 1.1 2.3 27.4 4.2 5.3 -Highest 70% 338 64.9 5.5 2.6 17.8 2.3 6.8 -
X - Northern Mindanao 861 70.1 4.4 3.1 13.9 1.8 6.6 0.1Lowest 30% 399 63.2 2.9 3.2 21.4 2.4 6.8 0.2Highest 70% 462 76.0 5.7 3.0 7.5 1.3 6.5 -
XI - Davao 899 64.1 6.5 2.7 12.4 4.5 9.6 0.3Lowest 30 percent 329 60.2 2.2 2.5 20.0 5.8 9.3 -Highest 70 percent 569 66.3 9.0 2.7 8.0 3.8 9.7 0.4
XII - SOCCSKSARGEN 792 78.4 3.7 1.9 8.1 2.0 5.6 0.3Lowest 30% 384 76.3 3.6 1.7 10.1 2.6 5.5 0.2Highest 70% 408 80.3 3.7 2.1 6.3 1.4 5.8 0.4
XIII - Caraga 480 60.5 1.4 5.2 23.4 2.7 6.7 0.1Lowest 30% 241 50.0 1.1 6.9 30.4 4.9 6.7 -Highest 70% 239 71.1 1.6 3.5 16.4 0.4 6.8 0.2
ARMM 580 88.6 0.5 0.7 6.3 1.5 2.4 -Lowest 30% 345 87.9 0.4 0.2 8.4 2.4 0.7 -Highest 70% 236 89.6 0.6 1.5 3.2 0.3 4.8 -
Continued
Tenure Status of the Housing Unit or Lot

NSO 2011 Philippine Yearbook
Table 16.15—Continued
Region Number Own or Rent House/ Own Own House Own House Rent-free Rent-freeand Income of Families Ownerlike Room House Rent-free Rent-free House and House andStratum Possession including Rent Lot Lot with Lot without Lot with Lot without
Lot Consent Consent Consent Consent
Philippines 18,067 68.6 7.5 2.4 12.3 3.5 5.4 0.2Lowest 30% 5,420 64.7 2.4 2.9 21.2 3.5 4.9 0.3Highest 70% 12,647 70.3 9.6 2.2 8.5 3.5 5.7 0.2
NCR 2,429 48.8 26.5 1.7 2.4 10.4 9.8 0.4Lowest 30% 119 31.0 27.9 1.3 4.8 20.7 13.4 0.9Highest 70% 2,310 49.7 26.4 1.7 2.3 9.8 9.6 0.4
CAR 315 84.7 7.3 0.4 1.7 0.1 5.8 0.1Lowest 30% 97 91.1 2.6 0.4 2.5 - 3.5 -Highest 70% 218 81.9 9.4 0.4 1.4 0.1 6.8 0.1
I - Ilocos 986 89.2 1.1 0.7 4.4 1.4 3.2 -Lowest 30% 286 86.6 0.7 0.4 6.8 2.1 3.4 -Highest 70% 699 90.3 1.2 0.8 3.5 1.1 3.1 -
II - Cagayan Valley 641 89.2 1.0 0.5 5.0 0.4 3.6 0.2Lowest 30% 199 87.0 0.7 1.0 6.9 0.6 3.6 0.2Highest 70% 443 90.2 1.2 0.3 4.2 0.3 3.7 0.1
III - Central Luzon 1,988 80.7 6.1 1.1 5.7 1.8 4.7 -Lowest 30% 310 76.1 3.0 1.7 9.5 3.6 6.1 -Highest 70% 1,678 81.5 6.6 1.0 5.0 1.4 4.4 -
IVA - CALABARZON 2,352 71.2 10.6 1.5 9.1 2.2 5.3 0.1Lowest 30% 387 60.8 4.2 2.7 21.2 4.2 6.9 -Highest 70% 1,966 73.2 11.9 1.3 6.7 1.8 5.0 0.1
IVB - MIMAROPA 575 74.6 2.4 1.1 14.2 2.8 4.6 0.3Lowest 30% 282 70.2 1.5 1.4 17.6 3.7 5.5 0.2Highest 70% 293 78.7 3.3 0.9 11.0 2.0 3.8 0.3
V - Bicol 1,050 70.7 2.0 2.2 16.6 3.5 4.5 0.6Lowest 30% 471 64.3 1.5 2.5 23.5 3.4 4.2 0.6Highest 70% 578 75.9 2.4 2.0 10.9 3.5 4.8 0.5
VI - Western Visayas 1,424 53.6 1.1 3.2 33.5 5.0 3.6 -Lowest 30% 550 48.4 0.5 2.6 41.3 3.9 3.3 0.1Highest 70% 874 56.9 1.5 3.6 28.6 5.7 3.8 -
Continued
2008
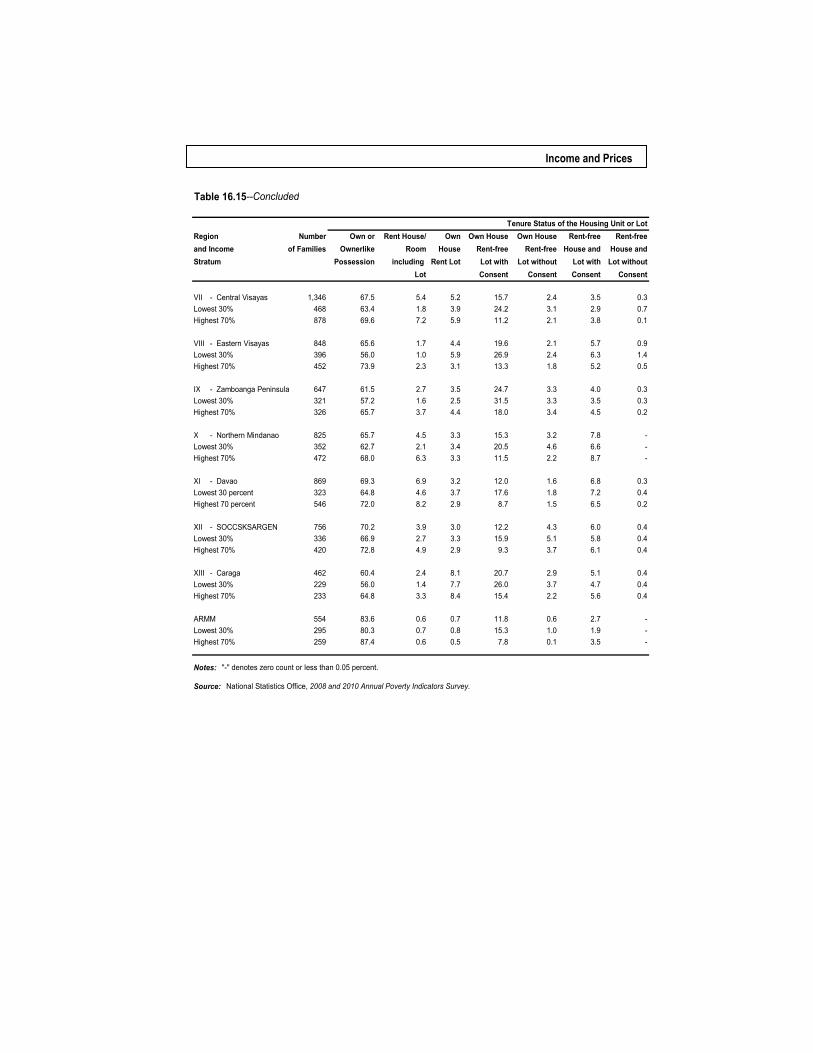
Income and Prices
Table 16.15--Concluded
Region Number Own or Rent House/ Own Own House Own House Rent-free Rent-freeand Income of Families Ownerlike Room House Rent-free Rent-free House and House andStratum Possession including Rent Lot Lot with Lot without Lot with Lot without
Lot Consent Consent Consent Consent
VII - Central Visayas 1,346 67.5 5.4 5.2 15.7 2.4 3.5 0.3Lowest 30% 468 63.4 1.8 3.9 24.2 3.1 2.9 0.7Highest 70% 878 69.6 7.2 5.9 11.2 2.1 3.8 0.1
VIII - Eastern Visayas 848 65.6 1.7 4.4 19.6 2.1 5.7 0.9Lowest 30% 396 56.0 1.0 5.9 26.9 2.4 6.3 1.4Highest 70% 452 73.9 2.3 3.1 13.3 1.8 5.2 0.5
IX - Zamboanga Peninsula 647 61.5 2.7 3.5 24.7 3.3 4.0 0.3Lowest 30% 321 57.2 1.6 2.5 31.5 3.3 3.5 0.3Highest 70% 326 65.7 3.7 4.4 18.0 3.4 4.5 0.2
X - Northern Mindanao 825 65.7 4.5 3.3 15.3 3.2 7.8 -Lowest 30% 352 62.7 2.1 3.4 20.5 4.6 6.6 -Highest 70% 472 68.0 6.3 3.3 11.5 2.2 8.7 -
XI - Davao 869 69.3 6.9 3.2 12.0 1.6 6.8 0.3Lowest 30 percent 323 64.8 4.6 3.7 17.6 1.8 7.2 0.4Highest 70 percent 546 72.0 8.2 2.9 8.7 1.5 6.5 0.2
XII - SOCCSKSARGEN 756 70.2 3.9 3.0 12.2 4.3 6.0 0.4Lowest 30% 336 66.9 2.7 3.3 15.9 5.1 5.8 0.4Highest 70% 420 72.8 4.9 2.9 9.3 3.7 6.1 0.4
XIII - Caraga 462 60.4 2.4 8.1 20.7 2.9 5.1 0.4Lowest 30% 229 56.0 1.4 7.7 26.0 3.7 4.7 0.4Highest 70% 233 64.8 3.3 8.4 15.4 2.2 5.6 0.4
ARMM 554 83.6 0.6 0.7 11.8 0.6 2.7 -Lowest 30% 295 80.3 0.7 0.8 15.3 1.0 1.9 -Highest 70% 259 87.4 0.6 0.5 7.8 0.1 3.5 -
Notes: "-" denotes zero count or less than 0.05 percent.
Source: National Statistics Office, 2008 and 2010 Annual Poverty Indicators Survey.
Tenure Status of the Housing Unit or Lot
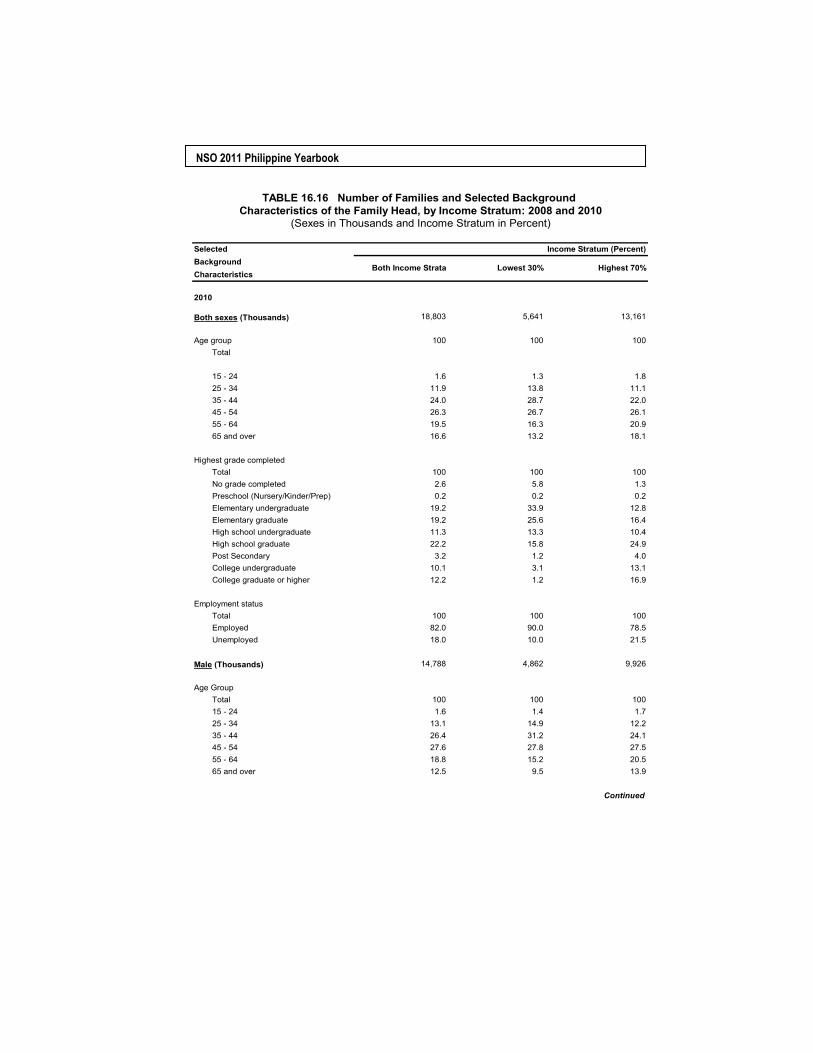
NSO 2011 Philippine Yearbook
SelectedBackgroundCharacteristics
Both sexes (Thousands) 18,803 5,641 13,161
Age group 100 100 100Total
15 - 24 1.6 1.3 1.825 - 34 11.9 13.8 11.135 - 44 24.0 28.7 22.045 - 54 26.3 26.7 26.155 - 64 19.5 16.3 20.965 and over 16.6 13.2 18.1
Highest grade completedTotal 100 100 100No grade completed 2.6 5.8 1.3Preschool (Nursery/Kinder/Prep) 0.2 0.2 0.2Elementary undergraduate 19.2 33.9 12.8Elementary graduate 19.2 25.6 16.4High school undergraduate 11.3 13.3 10.4High school graduate 22.2 15.8 24.9Post Secondary 3.2 1.2 4.0College undergraduate 10.1 3.1 13.1College graduate or higher 12.2 1.2 16.9
Employment statusTotal 100 100 100Employed 82.0 90.0 78.5Unemployed 18.0 10.0 21.5
Male (Thousands) 14,788 4,862 9,926
Age GroupTotal 100 100 10015 - 24 1.6 1.4 1.725 - 34 13.1 14.9 12.235 - 44 26.4 31.2 24.145 - 54 27.6 27.8 27.555 - 64 18.8 15.2 20.565 and over 12.5 9.5 13.9
Continued
TABLE 16.16 Number of Families and Selected Background Characteristics of the Family Head, by Income Stratum: 2008 and 2010
(Sexes in Thousands and Income Stratum in Percent)
Income Stratum (Percent)
Both Income Strata Lowest 30% Highest 70%
2010
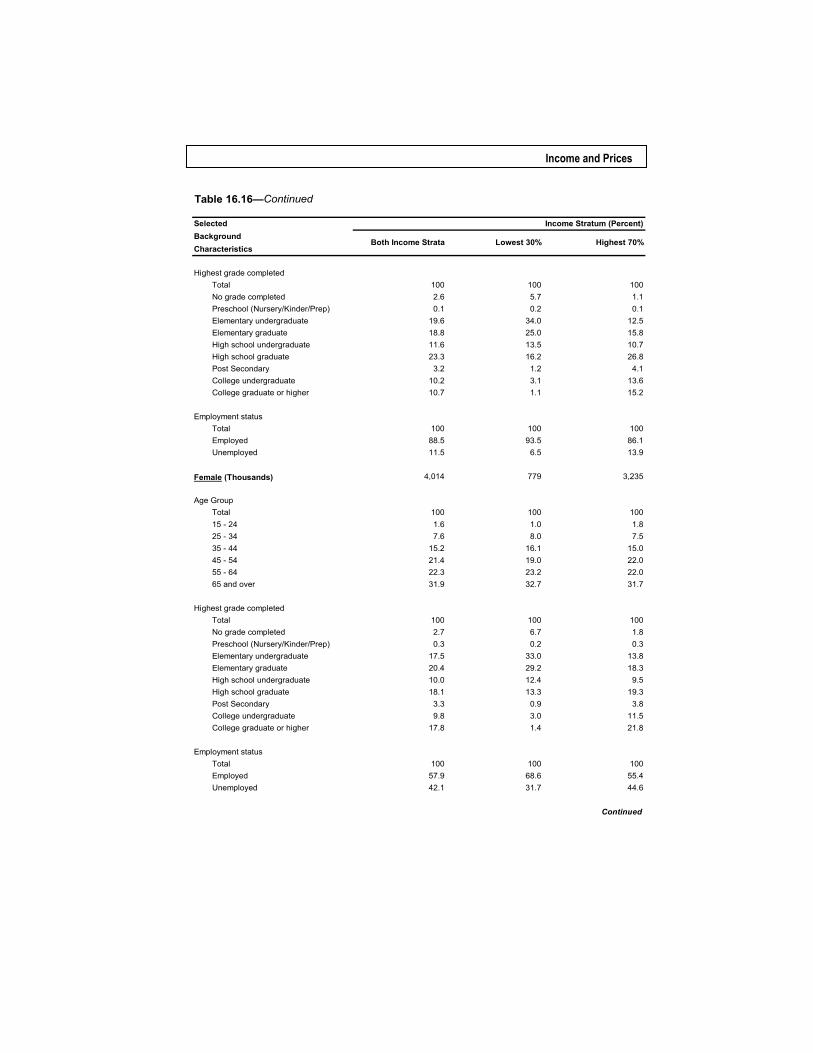
Income and Prices
Table 16.16—Continued
SelectedBackgroundCharacteristics
Highest grade completedTotal 100 100 100No grade completed 2.6 5.7 1.1Preschool (Nursery/Kinder/Prep) 0.1 0.2 0.1Elementary undergraduate 19.6 34.0 12.5Elementary graduate 18.8 25.0 15.8High school undergraduate 11.6 13.5 10.7High school graduate 23.3 16.2 26.8Post Secondary 3.2 1.2 4.1College undergraduate 10.2 3.1 13.6College graduate or higher 10.7 1.1 15.2
Employment statusTotal 100 100 100Employed 88.5 93.5 86.1Unemployed 11.5 6.5 13.9
Female (Thousands) 4,014 779 3,235
Age GroupTotal 100 100 10015 - 24 1.6 1.0 1.825 - 34 7.6 8.0 7.535 - 44 15.2 16.1 15.045 - 54 21.4 19.0 22.055 - 64 22.3 23.2 22.065 and over 31.9 32.7 31.7
Highest grade completedTotal 100 100 100No grade completed 2.7 6.7 1.8Preschool (Nursery/Kinder/Prep) 0.3 0.2 0.3Elementary undergraduate 17.5 33.0 13.8Elementary graduate 20.4 29.2 18.3High school undergraduate 10.0 12.4 9.5High school graduate 18.1 13.3 19.3Post Secondary 3.3 0.9 3.8College undergraduate 9.8 3.0 11.5College graduate or higher 17.8 1.4 21.8
Employment statusTotal 100 100 100Employed 57.9 68.6 55.4Unemployed 42.1 31.7 44.6
Continued
Income Stratum (Percent)
Both Income Strata Lowest 30% Highest 70%
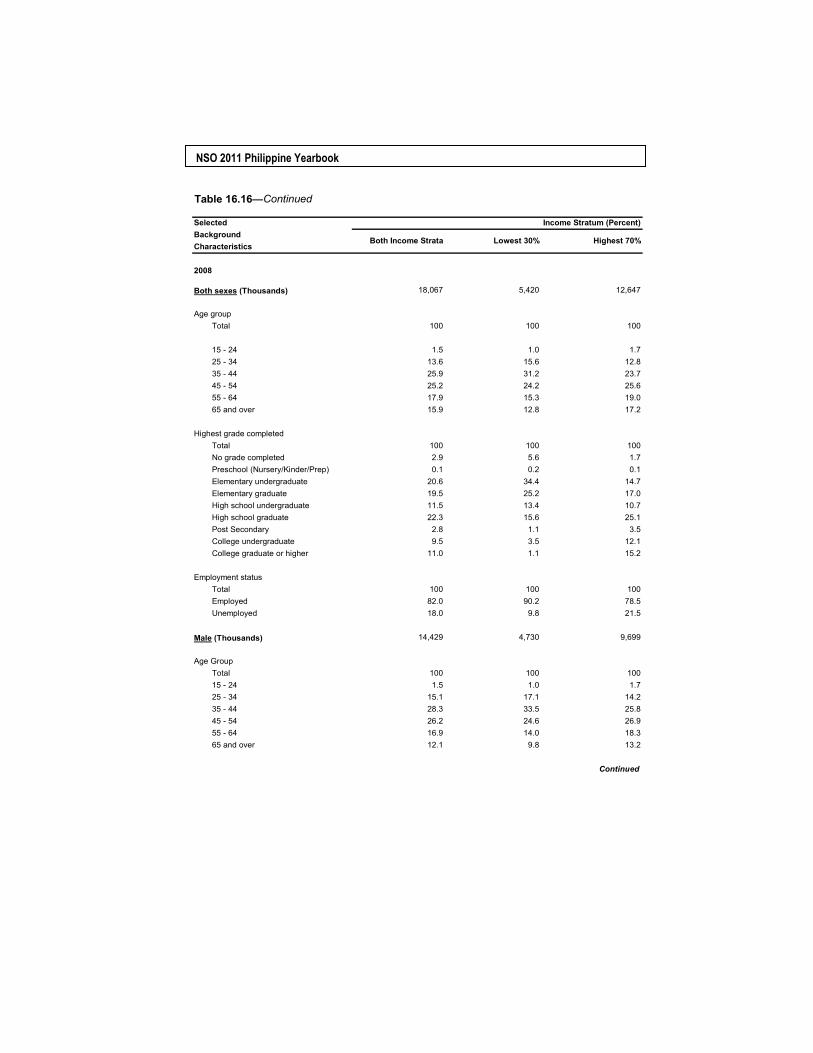
NSO 2011 Philippine Yearbook
Table 16.16—Continued
SelectedBackgroundCharacteristics
Both sexes (Thousands) 18,067 5,420 12,647
Age groupTotal 100 100 100
15 - 24 1.5 1.0 1.725 - 34 13.6 15.6 12.835 - 44 25.9 31.2 23.745 - 54 25.2 24.2 25.655 - 64 17.9 15.3 19.065 and over 15.9 12.8 17.2
Highest grade completedTotal 100 100 100No grade completed 2.9 5.6 1.7Preschool (Nursery/Kinder/Prep) 0.1 0.2 0.1Elementary undergraduate 20.6 34.4 14.7Elementary graduate 19.5 25.2 17.0High school undergraduate 11.5 13.4 10.7High school graduate 22.3 15.6 25.1Post Secondary 2.8 1.1 3.5College undergraduate 9.5 3.5 12.1College graduate or higher 11.0 1.1 15.2
Employment statusTotal 100 100 100Employed 82.0 90.2 78.5Unemployed 18.0 9.8 21.5
Male (Thousands) 14,429 4,730 9,699
Age GroupTotal 100 100 10015 - 24 1.5 1.0 1.725 - 34 15.1 17.1 14.235 - 44 28.3 33.5 25.845 - 54 26.2 24.6 26.955 - 64 16.9 14.0 18.365 and over 12.1 9.8 13.2
Continued
2008
Income Stratum (Percent)
Both Income Strata Lowest 30% Highest 70%
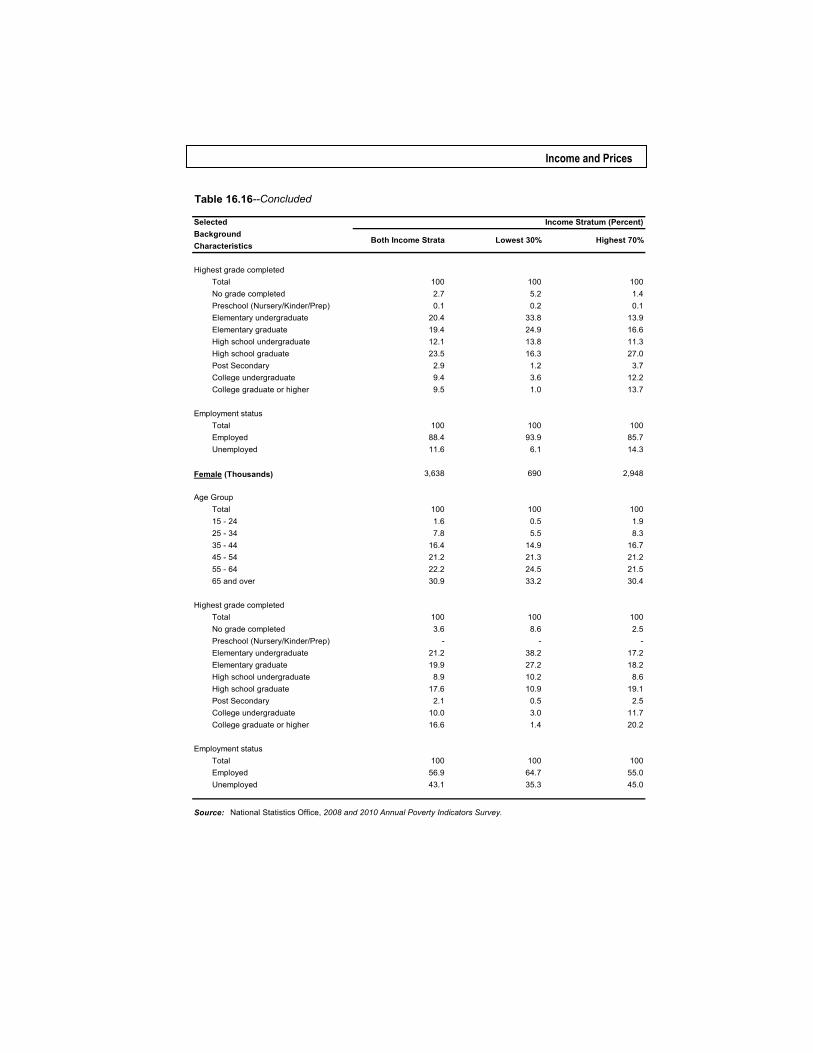
Income and Prices
Table 16.16--Concluded
SelectedBackgroundCharacteristics
Highest grade completedTotal 100 100 100No grade completed 2.7 5.2 1.4Preschool (Nursery/Kinder/Prep) 0.1 0.2 0.1Elementary undergraduate 20.4 33.8 13.9Elementary graduate 19.4 24.9 16.6High school undergraduate 12.1 13.8 11.3High school graduate 23.5 16.3 27.0Post Secondary 2.9 1.2 3.7College undergraduate 9.4 3.6 12.2College graduate or higher 9.5 1.0 13.7
Employment statusTotal 100 100 100Employed 88.4 93.9 85.7Unemployed 11.6 6.1 14.3
Female (Thousands) 3,638 690 2,948
Age GroupTotal 100 100 10015 - 24 1.6 0.5 1.925 - 34 7.8 5.5 8.335 - 44 16.4 14.9 16.745 - 54 21.2 21.3 21.255 - 64 22.2 24.5 21.565 and over 30.9 33.2 30.4
Highest grade completedTotal 100 100 100No grade completed 3.6 8.6 2.5Preschool (Nursery/Kinder/Prep) - - -Elementary undergraduate 21.2 38.2 17.2Elementary graduate 19.9 27.2 18.2High school undergraduate 8.9 10.2 8.6High school graduate 17.6 10.9 19.1Post Secondary 2.1 0.5 2.5College undergraduate 10.0 3.0 11.7College graduate or higher 16.6 1.4 20.2
Employment statusTotal 100 100 100Employed 56.9 64.7 55.0Unemployed 43.1 35.3 45.0
Source: National Statistics Office, 2008 and 2010 Annual Poverty Indicators Survey.
Income Stratum (Percent)
Both Income Strata Lowest 30% Highest 70%
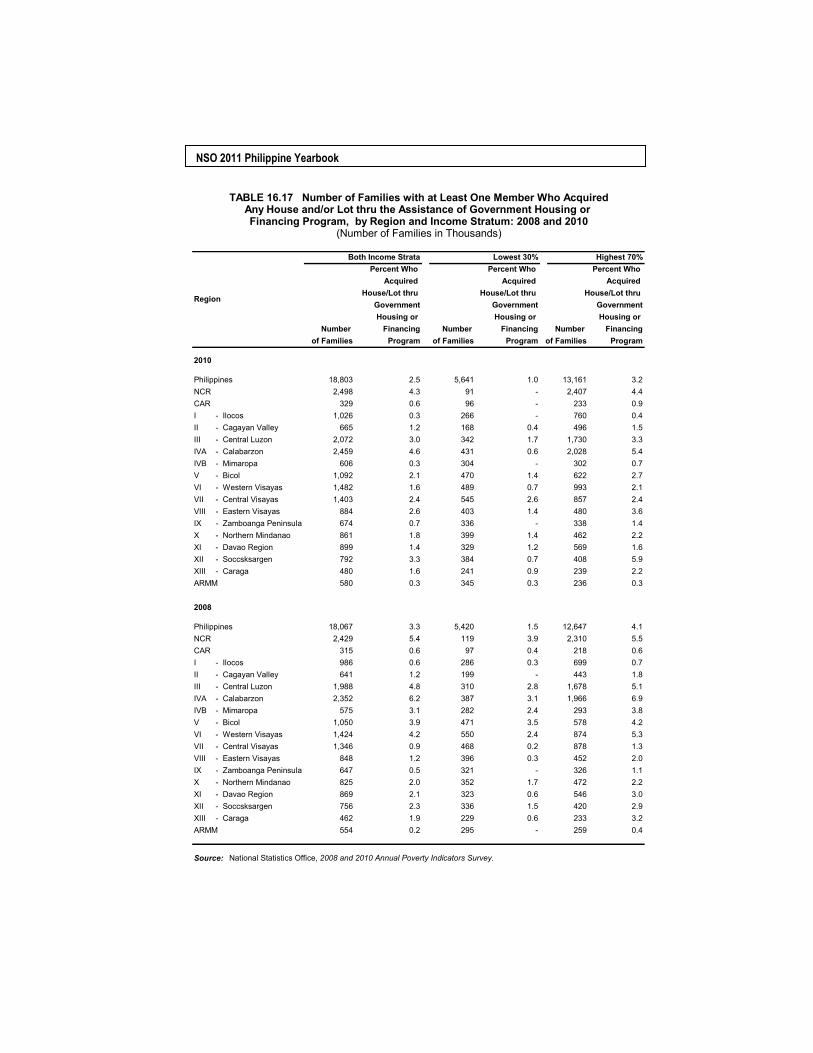
NSO 2011 Philippine Yearbook
Both Income StrataPercent Who Percent Who Percent Who
Acquired Acquired Acquired House/Lot thru House/Lot thru House/Lot thru
Government Government Government Housing or Housing or Housing or
Number Financing Number Financing Number Financingof Families Program of Families Program of Families Program
Philippines 18,803 2.5 5,641 1.0 13,161 3.2NCR 2,498 4.3 91 - 2,407 4.4CAR 329 0.6 96 - 233 0.9I - Ilocos 1,026 0.3 266 - 760 0.4II - Cagayan Valley 665 1.2 168 0.4 496 1.5III - Central Luzon 2,072 3.0 342 1.7 1,730 3.3IVA - Calabarzon 2,459 4.6 431 0.6 2,028 5.4IVB - Mimaropa 606 0.3 304 - 302 0.7V - Bicol 1,092 2.1 470 1.4 622 2.7VI - Western Visayas 1,482 1.6 489 0.7 993 2.1VII - Central Visayas 1,403 2.4 545 2.6 857 2.4VIII - Eastern Visayas 884 2.6 403 1.4 480 3.6IX - Zamboanga Peninsula 674 0.7 336 - 338 1.4X - Northern Mindanao 861 1.8 399 1.4 462 2.2XI - Davao Region 899 1.4 329 1.2 569 1.6XII - Soccsksargen 792 3.3 384 0.7 408 5.9XIII - Caraga 480 1.6 241 0.9 239 2.2ARMM 580 0.3 345 0.3 236 0.3
Philippines 18,067 3.3 5,420 1.5 12,647 4.1NCR 2,429 5.4 119 3.9 2,310 5.5CAR 315 0.6 97 0.4 218 0.6I - Ilocos 986 0.6 286 0.3 699 0.7II - Cagayan Valley 641 1.2 199 - 443 1.8III - Central Luzon 1,988 4.8 310 2.8 1,678 5.1IVA - Calabarzon 2,352 6.2 387 3.1 1,966 6.9IVB - Mimaropa 575 3.1 282 2.4 293 3.8V - Bicol 1,050 3.9 471 3.5 578 4.2VI - Western Visayas 1,424 4.2 550 2.4 874 5.3VII - Central Visayas 1,346 0.9 468 0.2 878 1.3VIII - Eastern Visayas 848 1.2 396 0.3 452 2.0IX - Zamboanga Peninsula 647 0.5 321 - 326 1.1X - Northern Mindanao 825 2.0 352 1.7 472 2.2XI - Davao Region 869 2.1 323 0.6 546 3.0XII - Soccsksargen 756 2.3 336 1.5 420 2.9XIII - Caraga 462 1.9 229 0.6 233 3.2ARMM 554 0.2 295 - 259 0.4
Source: National Statistics Office, 2008 and 2010 Annual Poverty Indicators Survey.
2010
2008
TABLE 16.17 Number of Families with at Least One Member Who AcquiredAny House and/or Lot thru the Assistance of Government Housing or Financing Program, by Region and Income Stratum: 2008 and 2010
(Number of Families in Thousands)
Region
Lowest 30% Highest 70%
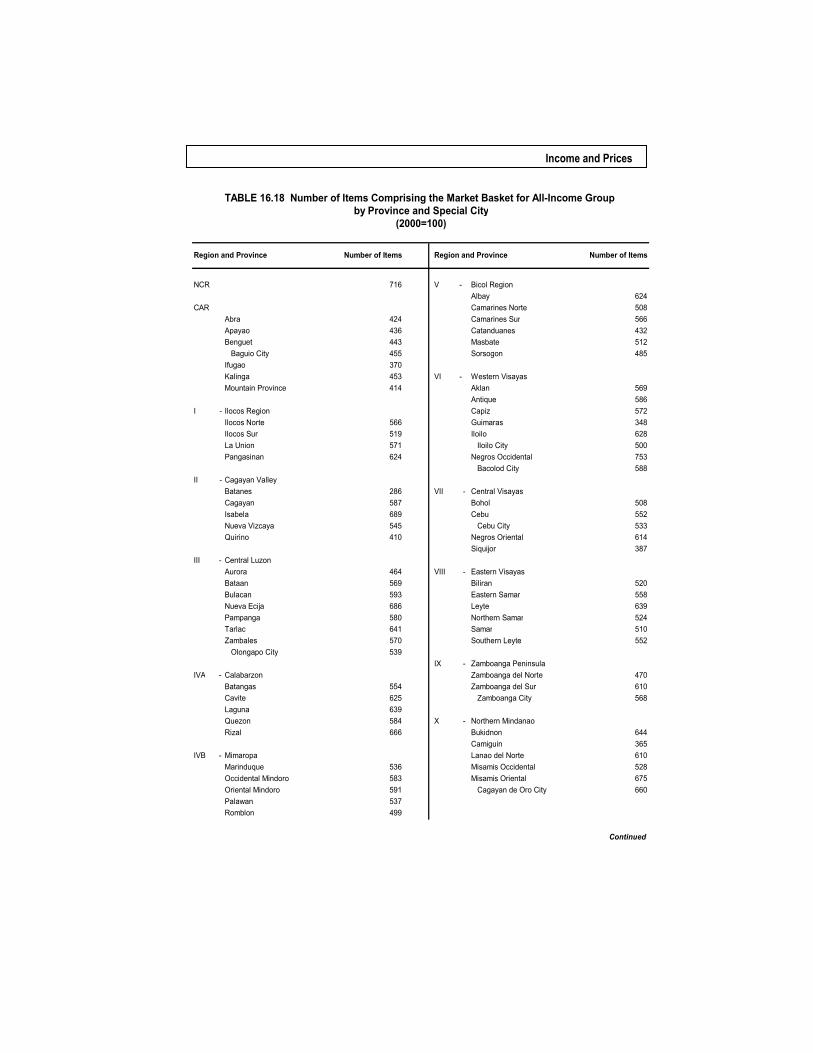
Income and Prices
NCR 716 V - Bicol RegionAlbay 624
CAR Camarines Norte 508Abra 424 Camarines Sur 566Apayao 436 Catanduanes 432Benguet 443 Masbate 512 Baguio City 455 Sorsogon 485Ifugao 370Kalinga 453 VI - Western VisayasMountain Province 414 Aklan 569
Antique 586I - Ilocos Region Capiz 572
Ilocos Norte 566 Guimaras 348Ilocos Sur 519 Iloilo 628La Union 571 Iloilo City 500Pangasinan 624 Negros Occidental 753
Bacolod City 588II - Cagayan Valley
Batanes 286 VII - Central VisayasCagayan 587 Bohol 508Isabela 689 Cebu 552Nueva Vizcaya 545 Cebu City 533Quirino 410 Negros Oriental 614
Siquijor 387III - Central Luzon
Aurora 464 VIII - Eastern VisayasBataan 569 Biliran 520Bulacan 593 Eastern Samar 558Nueva Ecija 686 Leyte 639Pampanga 580 Northern Samar 524Tarlac 641 Samar 510Zambales 570 Southern Leyte 552 Olongapo City 539
IX - Zamboanga PeninsulaIVA - Calabarzon Zamboanga del Norte 470
Batangas 554 Zamboanga del Sur 610Cavite 625 Zamboanga City 568Laguna 639Quezon 584 X - Northern MindanaoRizal 666 Bukidnon 644
Camiguin 365IVB - Mimaropa Lanao del Norte 610
Marinduque 536 Misamis Occidental 528Occidental Mindoro 583 Misamis Oriental 675Oriental Mindoro 591 Cagayan de Oro City 660Palawan 537Romblon 499
Continued
(2000=100)
Number of Items Number of Items
TABLE 16.18 Number of Items Comprising the Market Basket for All-Income Group by Province and Special City
Region and Province Region and Province
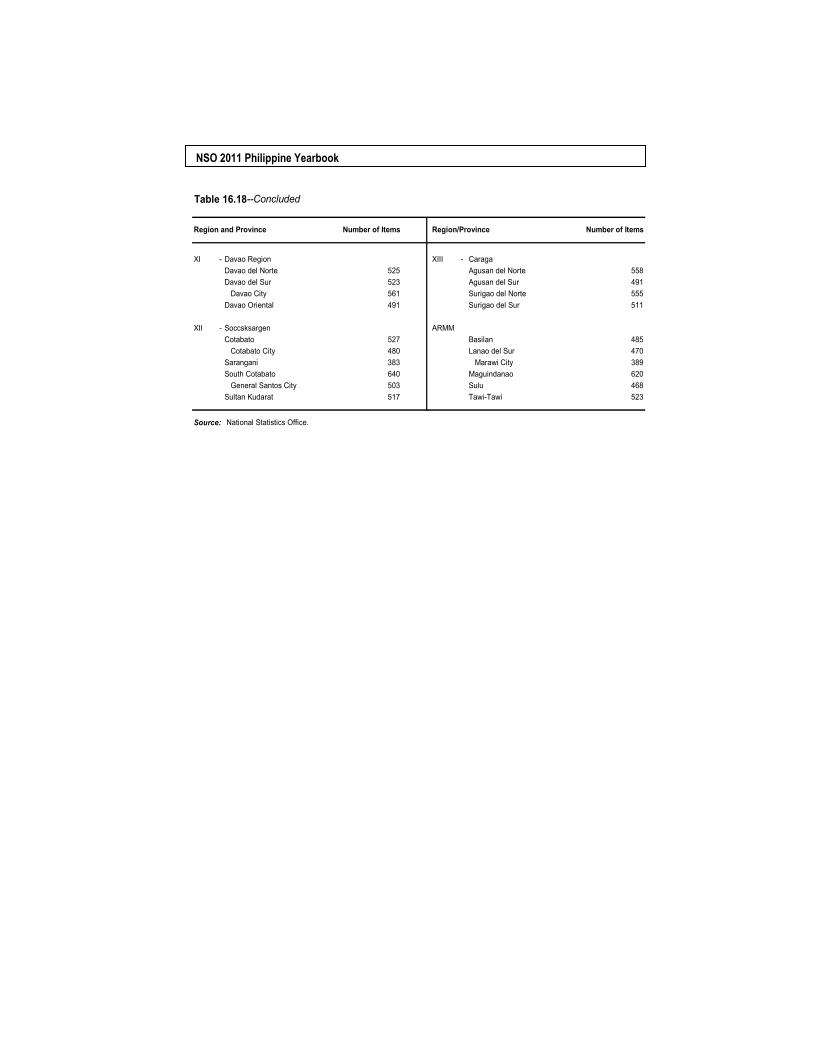
NSO 2011 Philippine Yearbook
Table 16.18--Concluded
XI - Davao Region XIII - CaragaDavao del Norte 525 Agusan del Norte 558Davao del Sur 523 Agusan del Sur 491 Davao City 561 Surigao del Norte 555Davao Oriental 491 Surigao del Sur 511
XII - Soccsksargen ARMMCotabato 527 Basilan 485 Cotabato City 480 Lanao del Sur 470Sarangani 383 Marawi City 389South Cotabato 640 Maguindanao 620 General Santos City 503 Sulu 468Sultan Kudarat 517 Tawi-Tawi 523
Source: National Statistics Office.
Number of Items Number of ItemsRegion and Province Region/Province
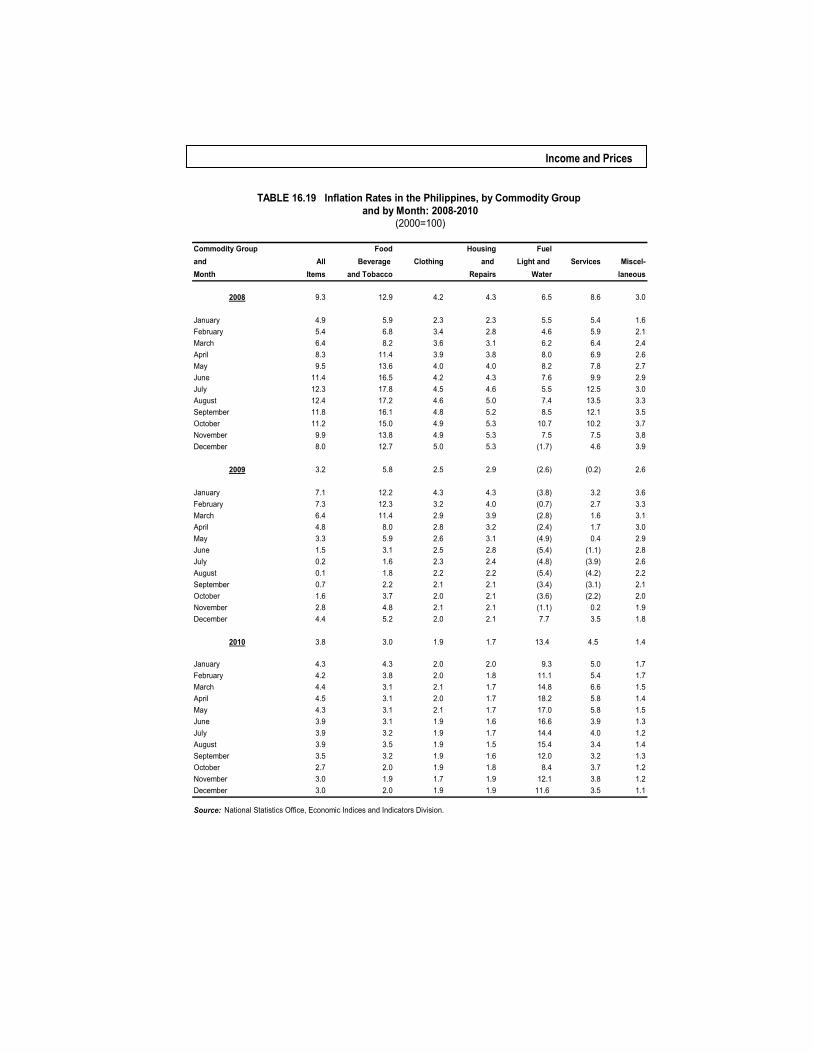
Income and Prices
Commodity Group Food Housing Fueland All Beverage Clothing and Light and Services Miscel-Month Items and Tobacco Repairs Water laneous
2008 9.3 12.9 4.2 4.3 6.5 8.6 3.0
January 4.9 5.9 2.3 2.3 5.5 5.4 1.6February 5.4 6.8 3.4 2.8 4.6 5.9 2.1March 6.4 8.2 3.6 3.1 6.2 6.4 2.4April 8.3 11.4 3.9 3.8 8.0 6.9 2.6May 9.5 13.6 4.0 4.0 8.2 7.8 2.7June 11.4 16.5 4.2 4.3 7.6 9.9 2.9July 12.3 17.8 4.5 4.6 5.5 12.5 3.0August 12.4 17.2 4.6 5.0 7.4 13.5 3.3September 11.8 16.1 4.8 5.2 8.5 12.1 3.5October 11.2 15.0 4.9 5.3 10.7 10.2 3.7November 9.9 13.8 4.9 5.3 7.5 7.5 3.8December 8.0 12.7 5.0 5.3 (1.7) 4.6 3.9
2009 3.2 5.8 2.5 2.9 (2.6) (0.2) 2.6
January 7.1 12.2 4.3 4.3 (3.8) 3.2 3.6February 7.3 12.3 3.2 4.0 (0.7) 2.7 3.3March 6.4 11.4 2.9 3.9 (2.8) 1.6 3.1April 4.8 8.0 2.8 3.2 (2.4) 1.7 3.0May 3.3 5.9 2.6 3.1 (4.9) 0.4 2.9June 1.5 3.1 2.5 2.8 (5.4) (1.1) 2.8July 0.2 1.6 2.3 2.4 (4.8) (3.9) 2.6August 0.1 1.8 2.2 2.2 (5.4) (4.2) 2.2September 0.7 2.2 2.1 2.1 (3.4) (3.1) 2.1October 1.6 3.7 2.0 2.1 (3.6) (2.2) 2.0November 2.8 4.8 2.1 2.1 (1.1) 0.2 1.9December 4.4 5.2 2.0 2.1 7.7 3.5 1.8
2010 3.8 3.0 1.9 1.7 13.4 4.5 1.4
January 4.3 4.3 2.0 2.0 9.3 5.0 1.7February 4.2 3.8 2.0 1.8 11.1 5.4 1.7March 4.4 3.1 2.1 1.7 14.8 6.6 1.5April 4.5 3.1 2.0 1.7 18.2 5.8 1.4May 4.3 3.1 2.1 1.7 17.0 5.8 1.5June 3.9 3.1 1.9 1.6 16.6 3.9 1.3July 3.9 3.2 1.9 1.7 14.4 4.0 1.2August 3.9 3.5 1.9 1.5 15.4 3.4 1.4September 3.5 3.2 1.9 1.6 12.0 3.2 1.3October 2.7 2.0 1.9 1.8 8.4 3.7 1.2November 3.0 1.9 1.7 1.9 12.1 3.8 1.2December 3.0 2.0 1.9 1.9 11.6 3.5 1.1
Source: National Statistics Office, Economic Indices and Indicators Division.
TABLE 16.19 Inflation Rates in the Philippines, by Commodity Group and by Month: 2008-2010
(2000=100)
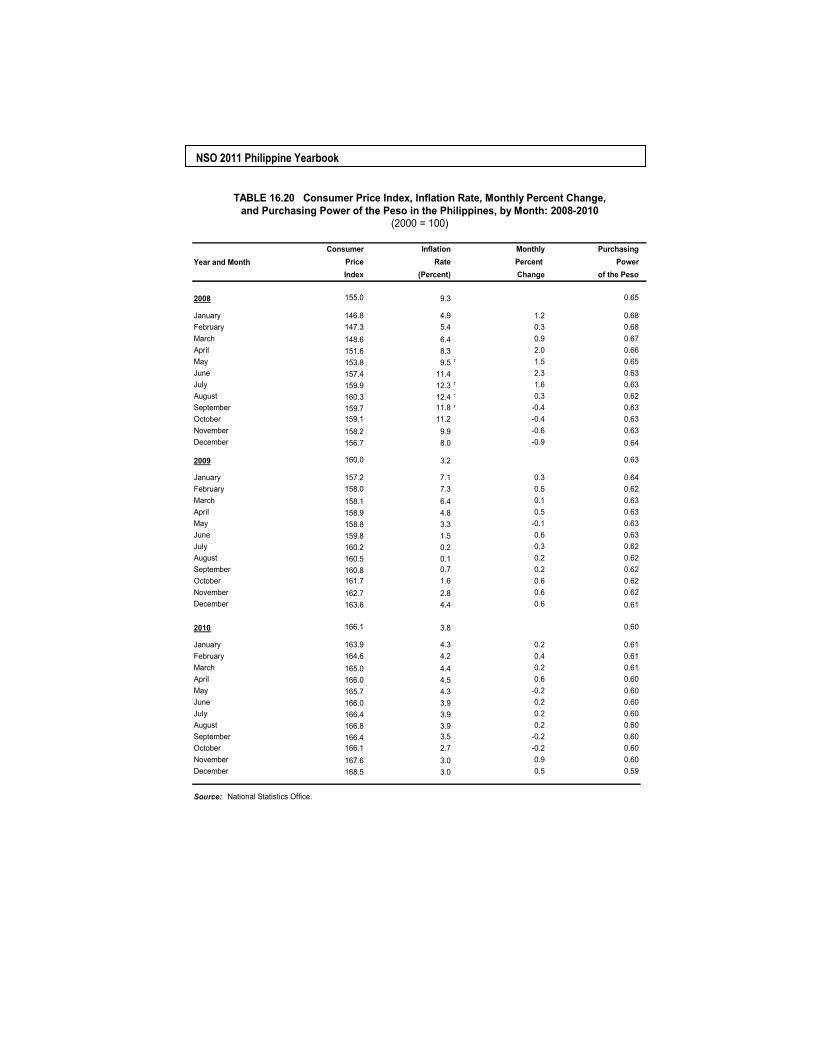
NSO 2011 Philippine Yearbook
Consumer Inflation Monthly PurchasingYear and Month Price Rate Percent Power
Index (Percent) Change of the Peso
2008 155.0 9.3 0.65
January 146.8 4.9 1.2 0.68February 147.3 5.4 0.3 0.68March 148.6 6.4 0.9 0.67April 151.6 8.3 2.0 0.66May 153.8 9.5 r 1.5 0.65June 157.4 11.4 2.3 0.63July 159.9 12.3 r 1.6 0.63August 160.3 12.4 r 0.3 0.62September 159.7 11.8 r -0.4 0.63October 159.1 11.2 -0.4 0.63November 158.2 9.9 -0.6 0.63December 156.7 8.0 -0.9 0.64
2009 160.0 3.2 0.63
January 157.2 7.1 0.3 0.64February 158.0 7.3 0.5 0.62March 158.1 6.4 0.1 0.63April 158.9 4.8 0.5 0.63May 158.8 3.3 -0.1 0.63June 159.8 1.5 0.6 0.63July 160.2 0.2 0.3 0.62August 160.5 0.1 0.2 0.62September 160.8 0.7 0.2 0.62October 161.7 1.6 0.6 0.62November 162.7 2.8 0.6 0.62December 163.6 4.4 0.6 0.61
2010 166.1 3.8 0.60
January 163.9 4.3 0.2 0.61February 164.6 4.2 0.4 0.61March 165.0 4.4 0.2 0.61April 166.0 4.5 0.6 0.60May 165.7 4.3 -0.2 0.60June 166.0 3.9 0.2 0.60July 166.4 3.9 0.2 0.60August 166.8 3.9 0.2 0.60September 166.4 3.5 -0.2 0.60October 166.1 2.7 -0.2 0.60November 167.6 3.0 0.9 0.60December 168.5 3.0 0.5 0.59
Source: National Statistics Office.
TABLE 16.20 Consumer Price Index, Inflation Rate, Monthly Percent Change,and Purchasing Power of the Peso in the Philippines, by Month: 2008-2010
(2000 = 100)
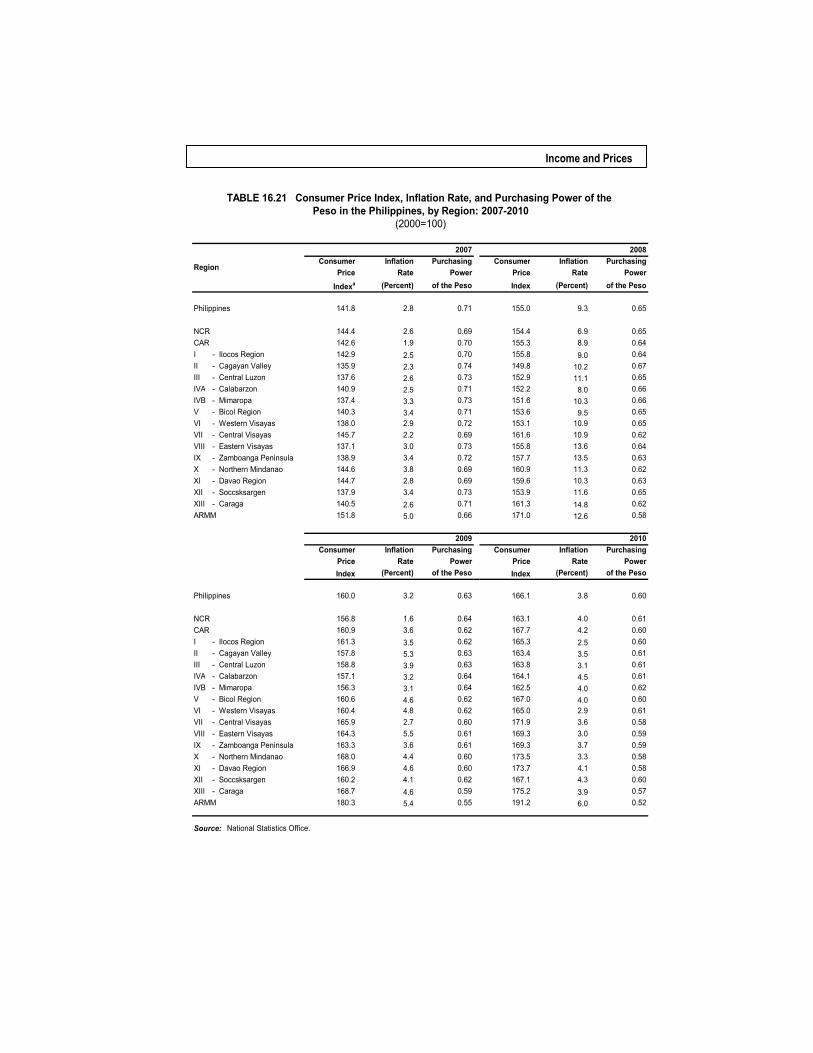
Income and Prices
2007 2008Consumer Inflation Purchasing Consumer Inflation Purchasing
Price Rate Power Price Rate Power
Indexa (Percent) of the Peso Index (Percent) of the Peso
Philippines 141.8 2.8 0.71 155.0 9.3 0.65
NCR 144.4 2.6 0.69 154.4 6.9 0.65CAR 142.6 1.9 0.70 155.3 8.9 0.64I - Ilocos Region 142.9 2.5 0.70 155.8 9.0 0.64II - Cagayan Valley 135.9 2.3 0.74 149.8 10.2 0.67III - Central Luzon 137.6 2.6 0.73 152.9 11.1 0.65IVA - Calabarzon 140.9 2.5 0.71 152.2 8.0 0.66IVB - Mimaropa 137.4 3.3 0.73 151.6 10.3 0.66V - Bicol Region 140.3 3.4 0.71 153.6 9.5 0.65VI - Western Visayas 138.0 2.9 0.72 153.1 10.9 0.65VII - Central Visayas 145.7 2.2 0.69 161.6 10.9 0.62VIII - Eastern Visayas 137.1 3.0 0.73 155.8 13.6 0.64IX - Zamboanga Peninsula 138.9 3.4 0.72 157.7 13.5 0.63X - Northern Mindanao 144.6 3.8 0.69 160.9 11.3 0.62XI - Davao Region 144.7 2.8 0.69 159.6 10.3 0.63XII - Soccsksargen 137.9 3.4 0.73 153.9 11.6 0.65XIII - Caraga 140.5 2.6 0.71 161.3 14.8 0.62ARMM 151.8 5.0 0.66 171.0 12.6 0.58
2009 2010Consumer Inflation Purchasing Consumer Inflation Purchasing
Price Rate Power Price Rate PowerIndex (Percent) of the Peso Index (Percent) of the Peso
Philippines 160.0 3.2 0.63 166.1 3.8 0.60
NCR 156.8 1.6 0.64 163.1 4.0 0.61CAR 160.9 3.6 0.62 167.7 4.2 0.60I - Ilocos Region 161.3 3.5 0.62 165.3 2.5 0.60II - Cagayan Valley 157.8 5.3 0.63 163.4 3.5 0.61III - Central Luzon 158.8 3.9 0.63 163.8 3.1 0.61IVA - Calabarzon 157.1 3.2 0.64 164.1 4.5 0.61IVB - Mimaropa 156.3 3.1 0.64 162.5 4.0 0.62V - Bicol Region 160.6 4.6 0.62 167.0 4.0 0.60VI - Western Visayas 160.4 4.8 0.62 165.0 2.9 0.61VII - Central Visayas 165.9 2.7 0.60 171.9 3.6 0.58VIII - Eastern Visayas 164.3 5.5 0.61 169.3 3.0 0.59IX - Zamboanga Peninsula 163.3 3.6 0.61 169.3 3.7 0.59X - Northern Mindanao 168.0 4.4 0.60 173.5 3.3 0.58XI - Davao Region 166.9 4.6 0.60 173.7 4.1 0.58XII - Soccsksargen 160.2 4.1 0.62 167.1 4.3 0.60XIII - Caraga 168.7 4.6 0.59 175.2 3.9 0.57ARMM 180.3 5.4 0.55 191.2 6.0 0.52
Source: National Statistics Office.
TABLE 16.21 Consumer Price Index, Inflation Rate, and Purchasing Power of the Peso in the Philippines, by Region: 2007-2010
(2000=100)
Region
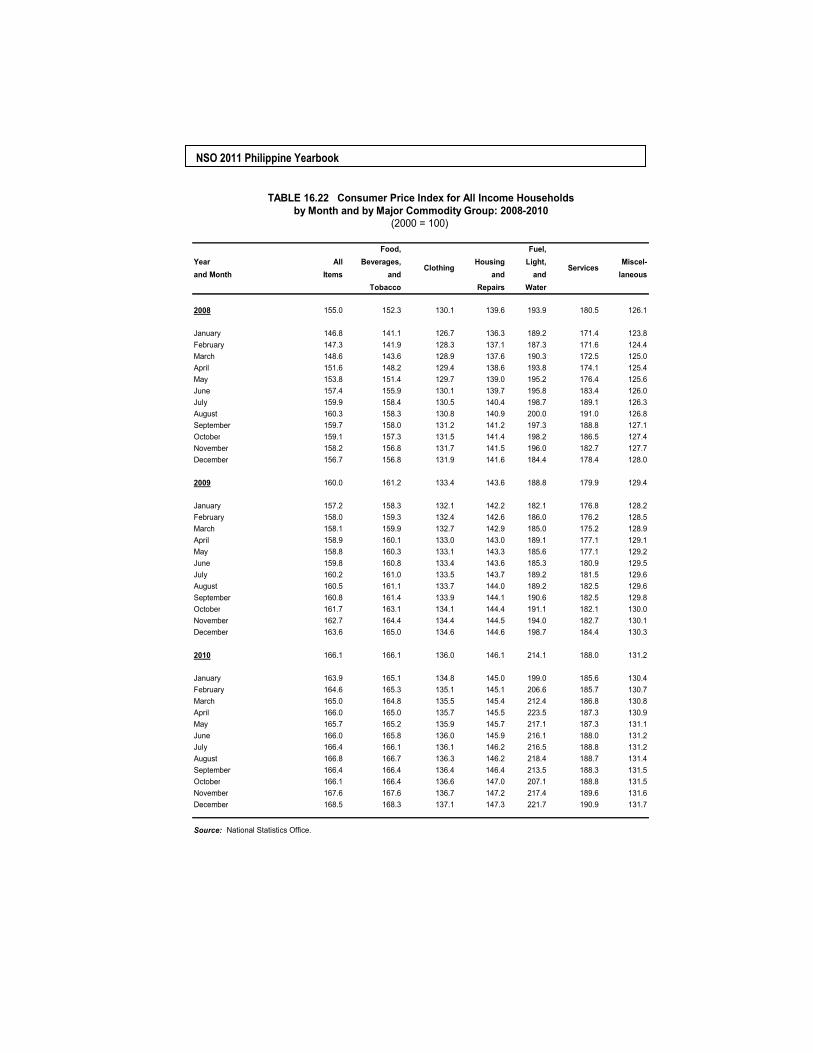
NSO 2011 Philippine Yearbook
Food, Fuel, Year All Beverages, Housing Light, Miscel-and Month Items and and and laneous
Tobacco Repairs Water
2008 155.0 152.3 130.1 139.6 193.9 180.5 126.1
January 146.8 141.1 126.7 136.3 189.2 171.4 123.8February 147.3 141.9 128.3 137.1 187.3 171.6 124.4March 148.6 143.6 128.9 137.6 190.3 172.5 125.0April 151.6 148.2 129.4 138.6 193.8 174.1 125.4May 153.8 151.4 129.7 139.0 195.2 176.4 125.6June 157.4 155.9 130.1 139.7 195.8 183.4 126.0July 159.9 158.4 130.5 140.4 198.7 189.1 126.3August 160.3 158.3 130.8 140.9 200.0 191.0 126.8September 159.7 158.0 131.2 141.2 197.3 188.8 127.1October 159.1 157.3 131.5 141.4 198.2 186.5 127.4November 158.2 156.8 131.7 141.5 196.0 182.7 127.7December 156.7 156.8 131.9 141.6 184.4 178.4 128.0
2009 160.0 161.2 133.4 143.6 188.8 179.9 129.4
January 157.2 158.3 132.1 142.2 182.1 176.8 128.2February 158.0 159.3 132.4 142.6 186.0 176.2 128.5March 158.1 159.9 132.7 142.9 185.0 175.2 128.9April 158.9 160.1 133.0 143.0 189.1 177.1 129.1May 158.8 160.3 133.1 143.3 185.6 177.1 129.2June 159.8 160.8 133.4 143.6 185.3 180.9 129.5July 160.2 161.0 133.5 143.7 189.2 181.5 129.6August 160.5 161.1 133.7 144.0 189.2 182.5 129.6September 160.8 161.4 133.9 144.1 190.6 182.5 129.8October 161.7 163.1 134.1 144.4 191.1 182.1 130.0November 162.7 164.4 134.4 144.5 194.0 182.7 130.1December 163.6 165.0 134.6 144.6 198.7 184.4 130.3
2010 166.1 166.1 136.0 146.1 214.1 188.0 131.2
January 163.9 165.1 134.8 145.0 199.0 185.6 130.4February 164.6 165.3 135.1 145.1 206.6 185.7 130.7March 165.0 164.8 135.5 145.4 212.4 186.8 130.8April 166.0 165.0 135.7 145.5 223.5 187.3 130.9May 165.7 165.2 135.9 145.7 217.1 187.3 131.1June 166.0 165.8 136.0 145.9 216.1 188.0 131.2July 166.4 166.1 136.1 146.2 216.5 188.8 131.2August 166.8 166.7 136.3 146.2 218.4 188.7 131.4September 166.4 166.4 136.4 146.4 213.5 188.3 131.5October 166.1 166.4 136.6 147.0 207.1 188.8 131.5November 167.6 167.6 136.7 147.2 217.4 189.6 131.6December 168.5 168.3 137.1 147.3 221.7 190.9 131.7
Source: National Statistics Office.
TABLE 16.22 Consumer Price Index for All Income Householdsby Month and by Major Commodity Group: 2008-2010
(2000 = 100)
Clothing Services
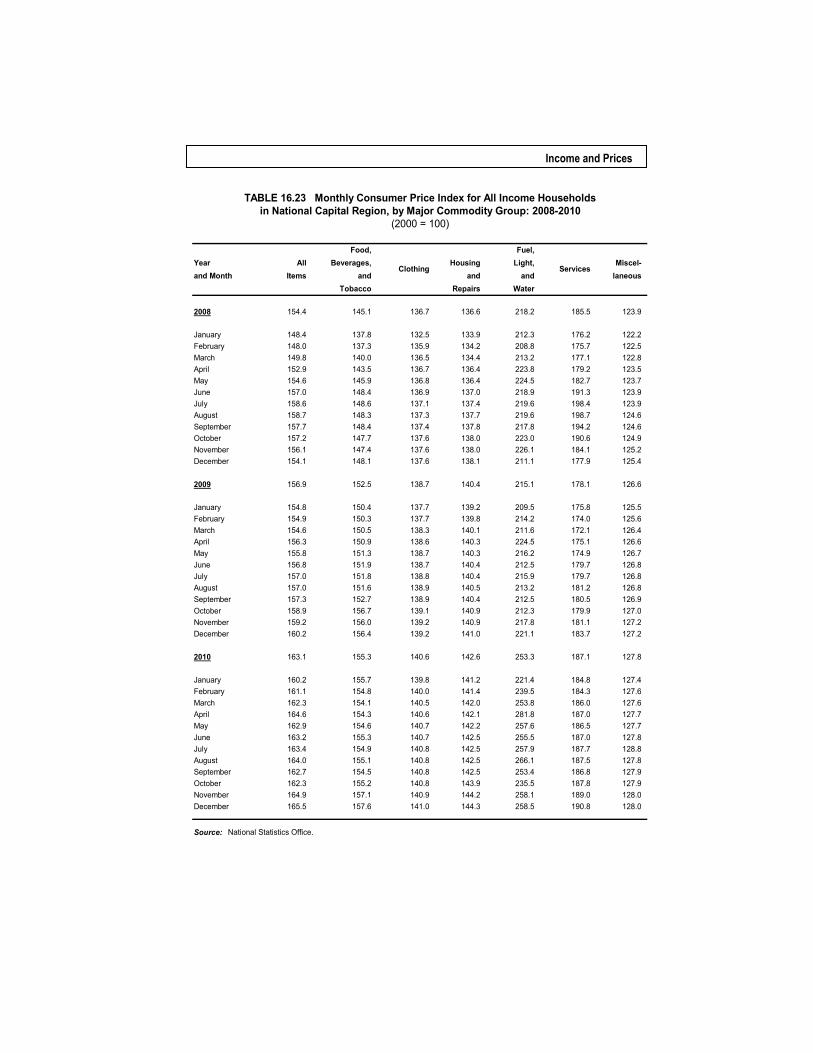
Income and Prices
Food, Fuel, Year All Beverages, Housing Light, Miscel-and Month Items and and and laneous
Tobacco Repairs Water
2008 154.4 145.1 136.7 136.6 218.2 185.5 123.9
January 148.4 137.8 132.5 133.9 212.3 176.2 122.2February 148.0 137.3 135.9 134.2 208.8 175.7 122.5March 149.8 140.0 136.5 134.4 213.2 177.1 122.8April 152.9 143.5 136.7 136.4 223.8 179.2 123.5May 154.6 145.9 136.8 136.4 224.5 182.7 123.7June 157.0 148.4 136.9 137.0 218.9 191.3 123.9July 158.6 148.6 137.1 137.4 219.6 198.4 123.9August 158.7 148.3 137.3 137.7 219.6 198.7 124.6September 157.7 148.4 137.4 137.8 217.8 194.2 124.6October 157.2 147.7 137.6 138.0 223.0 190.6 124.9November 156.1 147.4 137.6 138.0 226.1 184.1 125.2December 154.1 148.1 137.6 138.1 211.1 177.9 125.4
2009 156.9 152.5 138.7 140.4 215.1 178.1 126.6
January 154.8 150.4 137.7 139.2 209.5 175.8 125.5February 154.9 150.3 137.7 139.8 214.2 174.0 125.6March 154.6 150.5 138.3 140.1 211.6 172.1 126.4April 156.3 150.9 138.6 140.3 224.5 175.1 126.6May 155.8 151.3 138.7 140.3 216.2 174.9 126.7June 156.8 151.9 138.7 140.4 212.5 179.7 126.8July 157.0 151.8 138.8 140.4 215.9 179.7 126.8August 157.0 151.6 138.9 140.5 213.2 181.2 126.8September 157.3 152.7 138.9 140.4 212.5 180.5 126.9October 158.9 156.7 139.1 140.9 212.3 179.9 127.0November 159.2 156.0 139.2 140.9 217.8 181.1 127.2December 160.2 156.4 139.2 141.0 221.1 183.7 127.2
2010 163.1 155.3 140.6 142.6 253.3 187.1 127.8
January 160.2 155.7 139.8 141.2 221.4 184.8 127.4February 161.1 154.8 140.0 141.4 239.5 184.3 127.6March 162.3 154.1 140.5 142.0 253.8 186.0 127.6April 164.6 154.3 140.6 142.1 281.8 187.0 127.7May 162.9 154.6 140.7 142.2 257.6 186.5 127.7June 163.2 155.3 140.7 142.5 255.5 187.0 127.8July 163.4 154.9 140.8 142.5 257.9 187.7 128.8August 164.0 155.1 140.8 142.5 266.1 187.5 127.8September 162.7 154.5 140.8 142.5 253.4 186.8 127.9October 162.3 155.2 140.8 143.9 235.5 187.8 127.9November 164.9 157.1 140.9 144.2 258.1 189.0 128.0December 165.5 157.6 141.0 144.3 258.5 190.8 128.0
Source: National Statistics Office.
Services
TABLE 16.23 Monthly Consumer Price Index for All Income Householdsin National Capital Region, by Major Commodity Group: 2008-2010
(2000 = 100)
Clothing
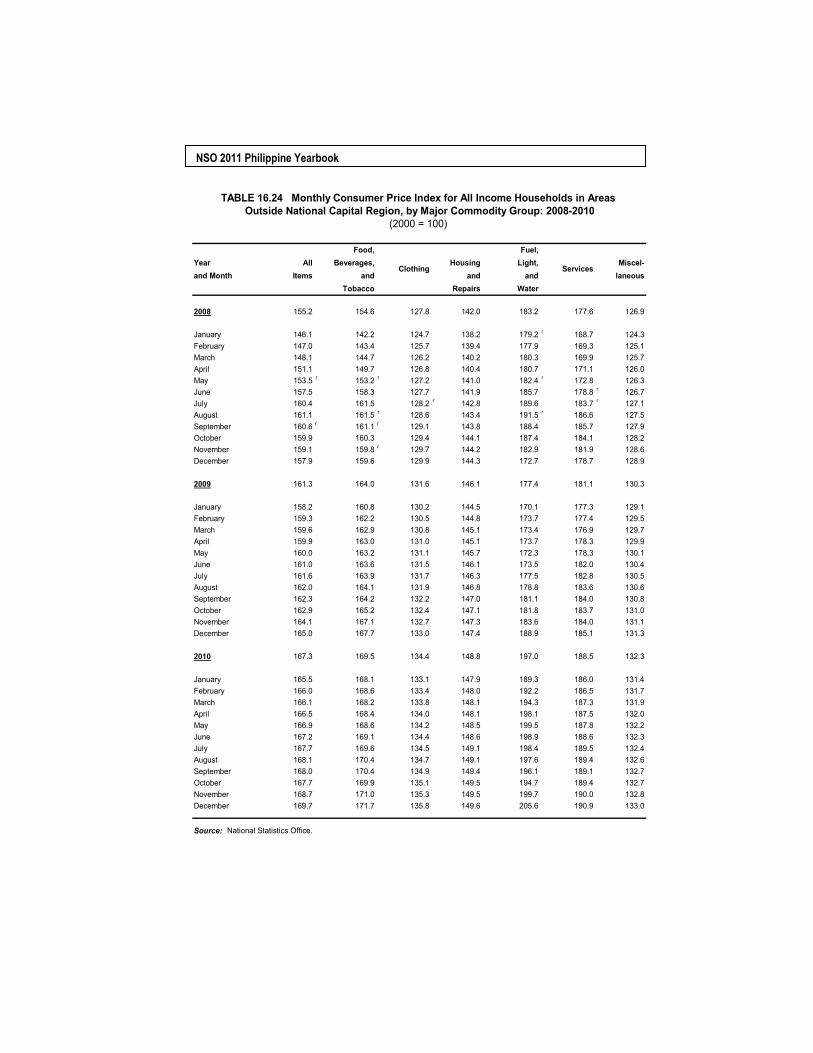
NSO 2011 Philippine Yearbook
Food, Fuel, Year All Beverages, Housing Light, Miscel-and Month Items and and and laneous
Tobacco Repairs Water
2008 155.2 154.6 127.8 142.0 183.2 177.6 126.9
January 146.1 142.2 124.7 138.2 179.2 r 168.7 124.3February 147.0 143.4 125.7 139.4 177.9 169.3 125.1March 148.1 144.7 126.2 140.2 180.3 169.9 125.7April 151.1 149.7 126.8 140.4 180.7 171.1 126.0May 153.5 r 153.2 r 127.2 141.0 182.4 r 172.8 126.3June 157.5 158.3 127.7 141.9 185.7 178.8 r 126.7July 160.4 161.5 128.2 r 142.8 189.6 183.7 r 127.1August 161.1 161.5 r 128.6 143.4 191.5 r 186.6 127.5September 160.6 r 161.1 r 129.1 143.8 188.4 185.7 127.9October 159.9 160.3 129.4 144.1 187.4 184.1 128.2November 159.1 159.8 r 129.7 144.2 182.9 181.9 128.6December 157.9 159.6 129.9 144.3 172.7 178.7 128.9
2009 161.3 164.0 131.6 146.1 177.4 181.1 130.3
January 158.2 160.8 130.2 144.5 170.1 177.3 129.1February 159.3 162.2 130.5 144.8 173.7 177.4 129.5March 159.6 162.9 130.8 145.1 173.4 176.9 129.7April 159.9 163.0 131.0 145.1 173.7 178.3 129.9May 160.0 163.2 131.1 145.7 172.3 178.3 130.1June 161.0 163.6 131.5 146.1 173.5 182.0 130.4July 161.6 163.9 131.7 146.3 177.5 182.8 130.5August 162.0 164.1 131.9 146.8 178.8 183.6 130.6September 162.3 164.2 132.2 147.0 181.1 184.0 130.8October 162.9 165.2 132.4 147.1 181.8 183.7 131.0November 164.1 167.1 132.7 147.3 183.6 184.0 131.1December 165.0 167.7 133.0 147.4 188.9 185.1 131.3
2010 167.3 169.5 134.4 148.8 197.0 188.5 132.3
January 165.5 168.1 133.1 147.9 189.3 186.0 131.4February 166.0 168.6 133.4 148.0 192.2 186.5 131.7March 166.1 168.2 133.8 148.1 194.3 187.3 131.9April 166.5 168.4 134.0 148.1 198.1 187.5 132.0May 166.9 168.6 134.2 148.5 199.5 187.8 132.2June 167.2 169.1 134.4 148.6 198.9 188.6 132.3July 167.7 169.6 134.5 149.1 198.4 189.5 132.4August 168.1 170.4 134.7 149.1 197.6 189.4 132.6September 168.0 170.4 134.9 149.4 196.1 189.1 132.7October 167.7 169.9 135.1 149.5 194.7 189.4 132.7November 168.7 171.0 135.3 149.5 199.7 190.0 132.8December 169.7 171.7 135.8 149.6 205.6 190.9 133.0
Source: National Statistics Office.
TABLE 16.24 Monthly Consumer Price Index for All Income Households in Areas Outside National Capital Region, by Major Commodity Group: 2008-2010
(2000 = 100)
Clothing Services
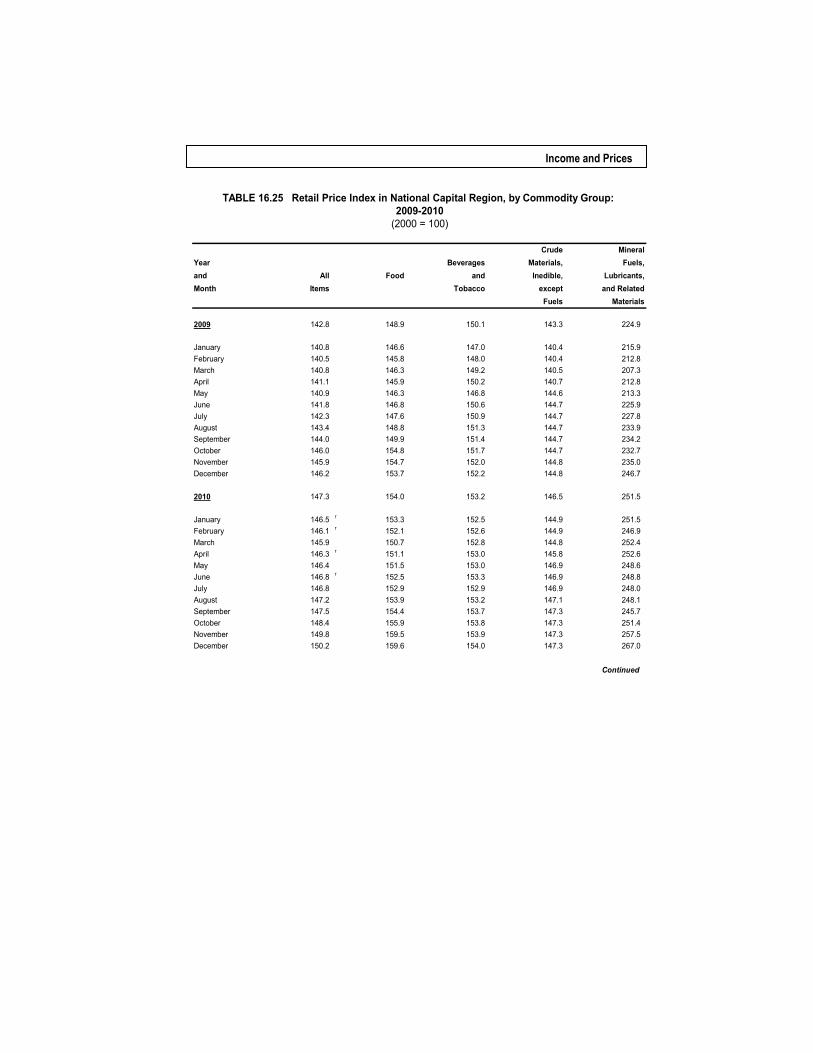
Income and Prices
Crude MineralYear Beverages Materials, Fuels,and All Food and Inedible, Lubricants,Month Items Tobacco except and Related
Fuels Materials
2009 142.8 148.9 150.1 143.3 224.9
January 140.8 146.6 147.0 140.4 215.9February 140.5 145.8 148.0 140.4 212.8March 140.8 146.3 149.2 140.5 207.3April 141.1 145.9 150.2 140.7 212.8May 140.9 146.3 146.8 144.6 213.3June 141.8 146.8 150.6 144.7 225.9July 142.3 147.6 150.9 144.7 227.8August 143.4 148.8 151.3 144.7 233.9September 144.0 149.9 151.4 144.7 234.2October 146.0 154.8 151.7 144.7 232.7November 145.9 154.7 152.0 144.8 235.0December 146.2 153.7 152.2 144.8 246.7
2010 147.3 154.0 153.2 146.5 251.5
January 146.5 r 153.3 152.5 144.9 251.5February 146.1 r 152.1 152.6 144.9 246.9March 145.9 150.7 152.8 144.8 252.4April 146.3 r 151.1 153.0 145.8 252.6May 146.4 151.5 153.0 146.9 248.6June 146.8 r 152.5 153.3 146.9 248.8July 146.8 152.9 152.9 146.9 248.0August 147.2 153.9 153.2 147.1 248.1September 147.5 154.4 153.7 147.3 245.7October 148.4 155.9 153.8 147.3 251.4November 149.8 159.5 153.9 147.3 257.5December 150.2 159.6 154.0 147.3 267.0
Continued
TABLE 16.25 Retail Price Index in National Capital Region, by Commodity Group: 2009-2010
(2000 = 100)
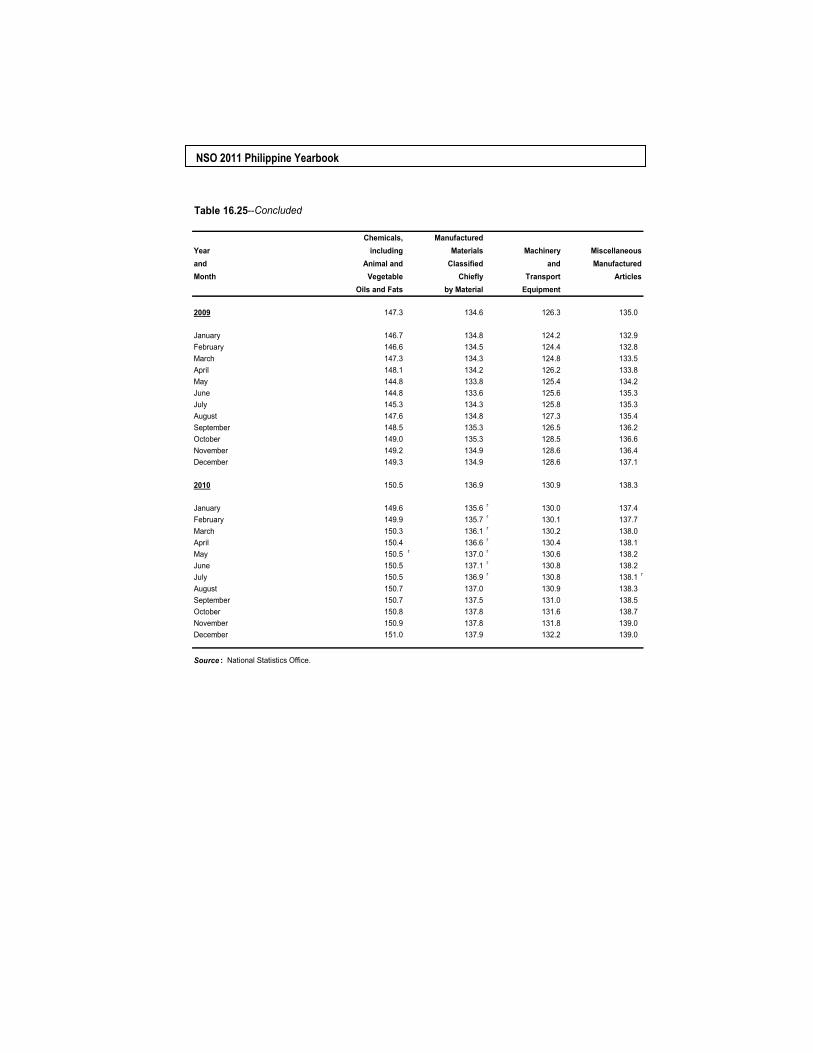
NSO 2011 Philippine Yearbook
Table 16.25--Concluded
Chemicals, ManufacturedYear including Materials Machinery Miscellaneousand Animal and Classified and ManufacturedMonth Vegetable Chiefly Transport Articles
Oils and Fats by Material Equipment
2009 147.3 134.6 126.3 135.0
January 146.7 134.8 124.2 132.9February 146.6 134.5 124.4 132.8March 147.3 134.3 124.8 133.5April 148.1 134.2 126.2 133.8May 144.8 133.8 125.4 134.2June 144.8 133.6 125.6 135.3July 145.3 134.3 125.8 135.3August 147.6 134.8 127.3 135.4September 148.5 135.3 126.5 136.2October 149.0 135.3 128.5 136.6November 149.2 134.9 128.6 136.4December 149.3 134.9 128.6 137.1
2010 150.5 136.9 130.9 138.3
January 149.6 135.6 r 130.0 137.4February 149.9 135.7 r 130.1 137.7March 150.3 136.1 r 130.2 138.0April 150.4 136.6 r 130.4 138.1May 150.5 r 137.0 r 130.6 138.2June 150.5 137.1 r 130.8 138.2July 150.5 136.9 r 130.8 138.1 r
August 150.7 137.0 130.9 138.3September 150.7 137.5 131.0 138.5October 150.8 137.8 131.6 138.7November 150.9 137.8 131.8 139.0December 151.0 137.9 132.2 139.0
Source : National Statistics Office.
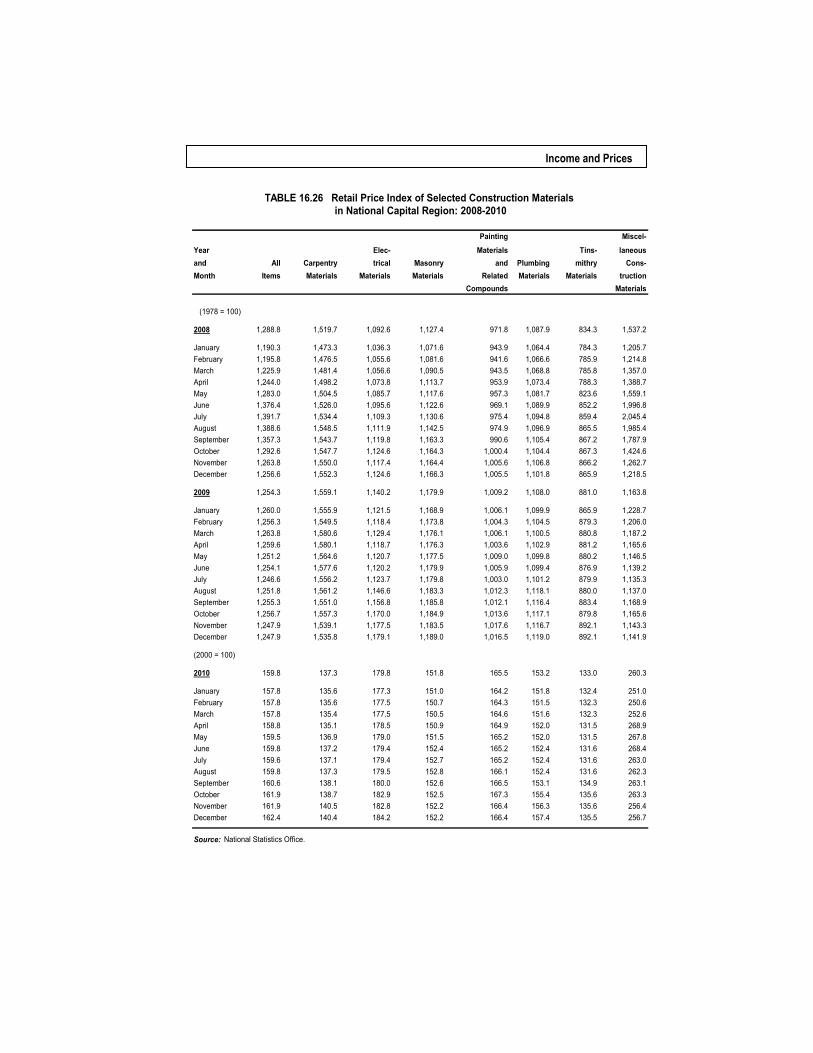
Income and Prices
Painting Miscel-
Year Elec- Materials Tins- laneousand All Carpentry trical Masonry and Plumbing mithry Cons-Month Items Materials Materials Materials Related Materials Materials truction
Compounds Materials
(1978 = 100)
2008 1,288.8 1,519.7 1,092.6 1,127.4 971.8 1,087.9 834.3 1,537.2
January 1,190.3 1,473.3 1,036.3 1,071.6 943.9 1,064.4 784.3 1,205.7February 1,195.8 1,476.5 1,055.6 1,081.6 941.6 1,066.6 785.9 1,214.8March 1,225.9 1,481.4 1,056.6 1,090.5 943.5 1,068.8 785.8 1,357.0April 1,244.0 1,498.2 1,073.8 1,113.7 953.9 1,073.4 788.3 1,388.7May 1,283.0 1,504.5 1,085.7 1,117.6 957.3 1,081.7 823.6 1,559.1June 1,376.4 1,526.0 1,095.6 1,122.6 969.1 1,089.9 852.2 1,996.8July 1,391.7 1,534.4 1,109.3 1,130.6 975.4 1,094.8 859.4 2,045.4August 1,388.6 1,548.5 1,111.9 1,142.5 974.9 1,096.9 865.5 1,985.4September 1,357.3 1,543.7 1,119.8 1,163.3 990.6 1,105.4 867.2 1,787.9October 1,292.6 1,547.7 1,124.6 1,164.3 1,000.4 1,104.4 867.3 1,424.6November 1,263.8 1,550.0 1,117.4 1,164.4 1,005.6 1,106.8 866.2 1,262.7December 1,256.6 1,552.3 1,124.6 1,166.3 1,005.5 1,101.8 865.9 1,218.5
2009 1,254.3 1,559.1 1,140.2 1,179.9 1,009.2 1,108.0 881.0 1,163.8
January 1,260.0 1,555.9 1,121.5 1,168.9 1,006.1 1,099.9 865.9 1,228.7February 1,256.3 1,549.5 1,118.4 1,173.8 1,004.3 1,104.5 879.3 1,206.0March 1,263.8 1,580.6 1,129.4 1,176.1 1,006.1 1,100.5 880.8 1,187.2April 1,259.6 1,580.1 1,118.7 1,176.3 1,003.6 1,102.9 881.2 1,165.6May 1,251.2 1,564.6 1,120.7 1,177.5 1,009.0 1,099.8 880.2 1,146.5June 1,254.1 1,577.6 1,120.2 1,179.9 1,005.9 1,099.4 876.9 1,139.2July 1,246.6 1,556.2 1,123.7 1,179.8 1,003.0 1,101.2 879.9 1,135.3August 1,251.8 1,561.2 1,146.6 1,183.3 1,012.3 1,118.1 880.0 1,137.0September 1,255.3 1,551.0 1,156.8 1,185.8 1,012.1 1,116.4 883.4 1,168.9October 1,256.7 1,557.3 1,170.0 1,184.9 1,013.6 1,117.1 879.8 1,165.6November 1,247.9 1,539.1 1,177.5 1,183.5 1,017.6 1,116.7 892.1 1,143.3December 1,247.9 1,535.8 1,179.1 1,189.0 1,016.5 1,119.0 892.1 1,141.9
(2000 = 100)
2010 159.8 137.3 179.8 151.8 165.5 153.2 133.0 260.3
January 157.8 135.6 177.3 151.0 164.2 151.8 132.4 251.0February 157.8 135.6 177.5 150.7 164.3 151.5 132.3 250.6March 157.8 135.4 177.5 150.5 164.6 151.6 132.3 252.6April 158.8 135.1 178.5 150.9 164.9 152.0 131.5 268.9May 159.5 136.9 179.0 151.5 165.2 152.0 131.5 267.8June 159.8 137.2 179.4 152.4 165.2 152.4 131.6 268.4July 159.6 137.1 179.4 152.7 165.2 152.4 131.6 263.0August 159.8 137.3 179.5 152.8 166.1 152.4 131.6 262.3September 160.6 138.1 180.0 152.6 166.5 153.1 134.9 263.1October 161.9 138.7 182.9 152.5 167.3 155.4 135.6 263.3November 161.9 140.5 182.8 152.2 166.4 156.3 135.6 256.4December 162.4 140.4 184.2 152.2 166.4 157.4 135.5 256.7
Source: National Statistics Office.
TABLE 16.26 Retail Price Index of Selected Construction Materials in National Capital Region: 2008-2010
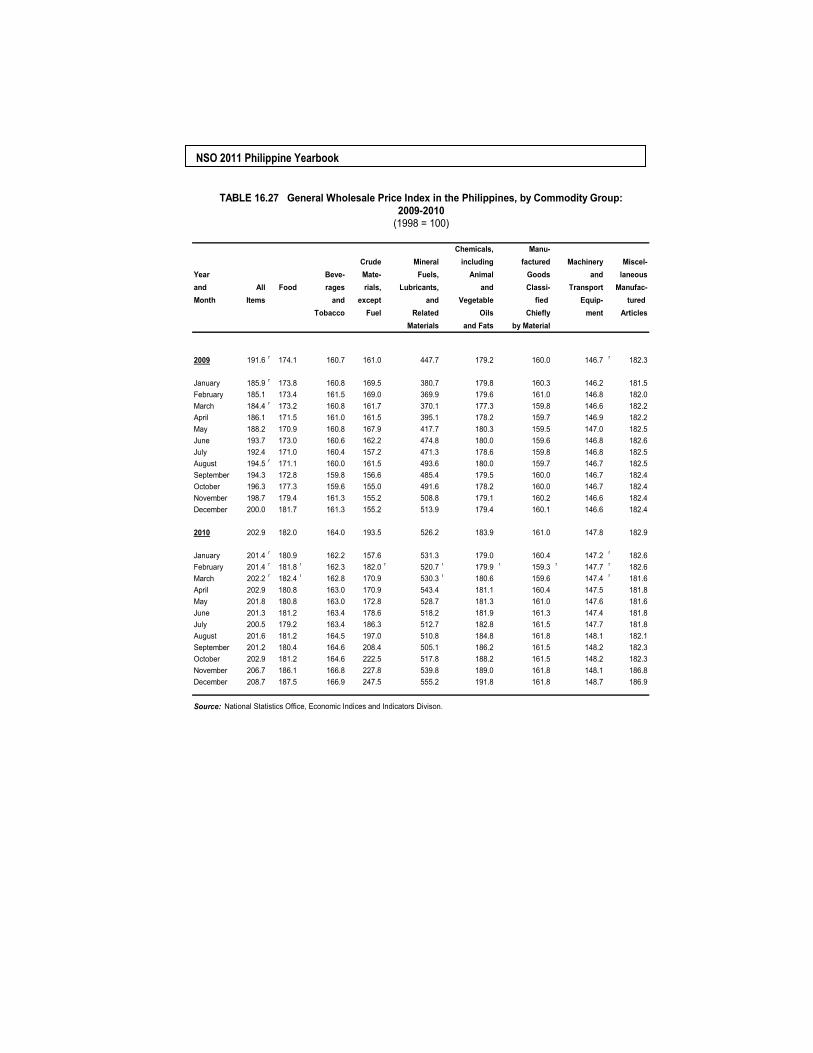
NSO 2011 Philippine Yearbook
Chemicals, Manu-Crude Mineral including factured Machinery Miscel-
Year Beve- Mate- Fuels, Animal Goods and laneousand All Food rages rials, Lubricants, and Classi- Transport Manufac-Month Items and except and Vegetable fied Equip- tured
Tobacco Fuel Related Oils Chiefly ment ArticlesMaterials and Fats by Material
2009 191.6 r 174.1 160.7 161.0 447.7 179.2 160.0 146.7 r 182.3
January 185.9 r 173.8 160.8 169.5 380.7 179.8 160.3 146.2 181.5February 185.1 173.4 161.5 169.0 369.9 179.6 161.0 146.8 182.0March 184.4 r 173.2 160.8 161.7 370.1 177.3 159.8 146.6 182.2April 186.1 171.5 161.0 161.5 395.1 178.2 159.7 146.9 182.2May 188.2 170.9 160.8 167.9 417.7 180.3 159.5 147.0 182.5June 193.7 173.0 160.6 162.2 474.8 180.0 159.6 146.8 182.6July 192.4 171.0 160.4 157.2 471.3 178.6 159.8 146.8 182.5August 194.5 r 171.1 160.0 161.5 493.6 180.0 159.7 146.7 182.5September 194.3 172.8 159.8 156.6 485.4 179.5 160.0 146.7 182.4October 196.3 177.3 159.6 155.0 491.6 178.2 160.0 146.7 182.4November 198.7 179.4 161.3 155.2 508.8 179.1 160.2 146.6 182.4December 200.0 181.7 161.3 155.2 513.9 179.4 160.1 146.6 182.4
2010 202.9 182.0 164.0 193.5 526.2 183.9 161.0 147.8 182.9
January 201.4 r 180.9 162.2 157.6 531.3 179.0 160.4 147.2 r 182.6February 201.4 r 181.8 r 162.3 182.0 r 520.7 r 179.9 r 159.3 r 147.7 r 182.6March 202.2 r 182.4 r 162.8 170.9 530.3 r 180.6 159.6 147.4 r 181.6April 202.9 180.8 163.0 170.9 543.4 181.1 160.4 147.5 181.8May 201.8 180.8 163.0 172.8 528.7 181.3 161.0 147.6 181.6June 201.3 181.2 163.4 178.6 518.2 181.9 161.3 147.4 181.8July 200.5 179.2 163.4 186.3 512.7 182.8 161.5 147.7 181.8August 201.6 181.2 164.5 197.0 510.8 184.8 161.8 148.1 182.1September 201.2 180.4 164.6 208.4 505.1 186.2 161.5 148.2 182.3October 202.9 181.2 164.6 222.5 517.8 188.2 161.5 148.2 182.3November 206.7 186.1 166.8 227.8 539.8 189.0 161.8 148.1 186.8December 208.7 187.5 166.9 247.5 555.2 191.8 161.8 148.7 186.9
Source: National Statistics Office, Economic Indices and Indicators Divison.
TABLE 16.27 General Wholesale Price Index in the Philippines, by Commodity Group:2009-2010
(1998 = 100)
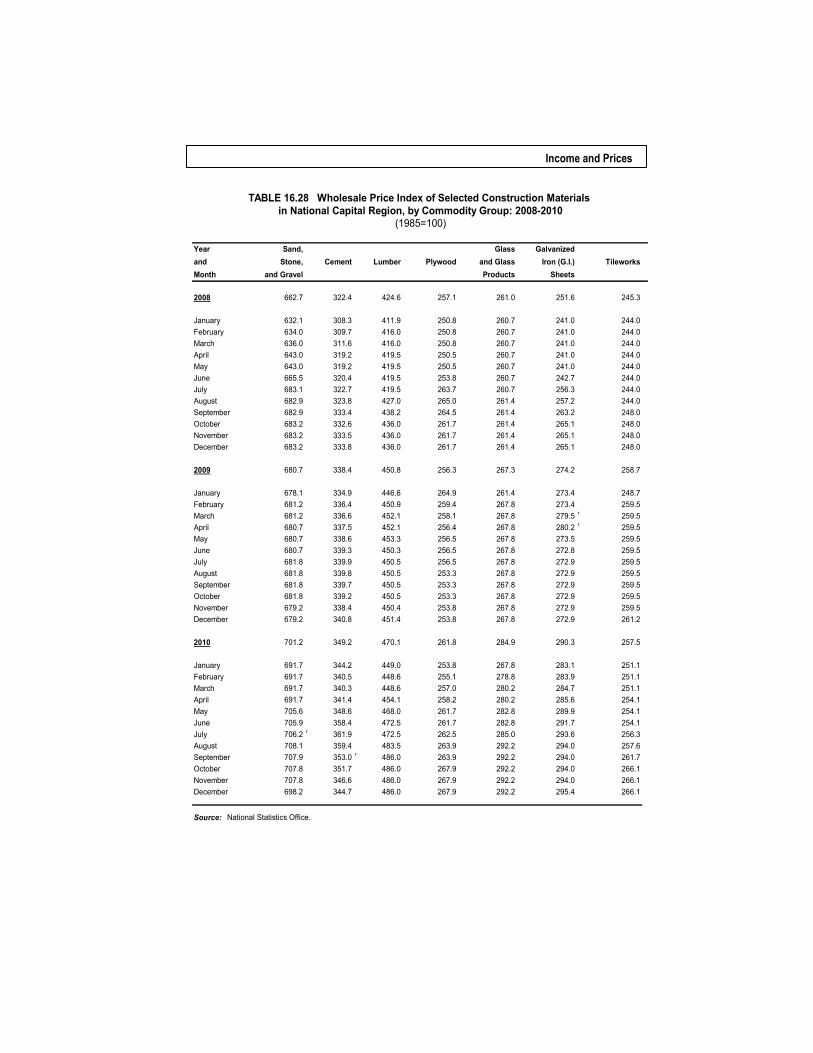
Income and Prices
Year Sand, Glass Galvanizedand Stone, Cement Lumber Plywood and Glass Iron (G.I.) TileworksMonth and Gravel Products Sheets
2008 662.7 322.4 424.6 257.1 261.0 251.6 245.3
January 632.1 308.3 411.9 250.8 260.7 241.0 244.0February 634.0 309.7 416.0 250.8 260.7 241.0 244.0March 636.0 311.6 416.0 250.8 260.7 241.0 244.0April 643.0 319.2 419.5 250.5 260.7 241.0 244.0May 643.0 319.2 419.5 250.5 260.7 241.0 244.0June 665.5 320.4 419.5 253.8 260.7 242.7 244.0July 683.1 322.7 419.5 263.7 260.7 256.3 244.0August 682.9 323.8 427.0 265.0 261.4 257.2 244.0September 682.9 333.4 438.2 264.5 261.4 263.2 248.0October 683.2 332.6 436.0 261.7 261.4 265.1 248.0November 683.2 333.5 436.0 261.7 261.4 265.1 248.0December 683.2 333.8 436.0 261.7 261.4 265.1 248.0
2009 680.7 338.4 450.8 256.3 267.3 274.2 258.7
January 678.1 334.9 446.6 264.9 261.4 273.4 248.7February 681.2 336.4 450.9 259.4 267.8 273.4 259.5March 681.2 336.6 452.1 258.1 267.8 279.5 r 259.5April 680.7 337.5 452.1 256.4 267.8 280.2 r 259.5May 680.7 338.6 453.3 256.5 267.8 273.5 259.5June 680.7 339.3 450.3 256.5 267.8 272.8 259.5July 681.8 339.9 450.5 256.5 267.8 272.9 259.5August 681.8 339.8 450.5 253.3 267.8 272.9 259.5September 681.8 339.7 450.5 253.3 267.8 272.9 259.5October 681.8 339.2 450.5 253.3 267.8 272.9 259.5November 679.2 338.4 450.4 253.8 267.8 272.9 259.5December 679.2 340.8 451.4 253.8 267.8 272.9 261.2
2010 701.2 349.2 470.1 261.8 284.9 290.3 257.5
January 691.7 344.2 449.0 253.8 267.8 283.1 251.1February 691.7 340.5 448.6 255.1 278.8 283.9 251.1March 691.7 340.3 448.6 257.0 280.2 284.7 251.1April 691.7 341.4 454.1 258.2 280.2 285.6 254.1May 705.6 348.6 468.0 261.7 282.8 289.9 254.1June 705.9 358.4 472.5 261.7 282.8 291.7 254.1July 706.2 r 361.9 472.5 262.5 285.0 293.6 256.3August 708.1 359.4 483.5 263.9 292.2 294.0 257.6September 707.9 353.0 r 486.0 263.9 292.2 294.0 261.7October 707.8 351.7 486.0 267.9 292.2 294.0 266.1November 707.8 346.6 486.0 267.9 292.2 294.0 266.1December 698.2 344.7 486.0 267.9 292.2 295.4 266.1
Source: National Statistics Office.
TABLE 16.28 Wholesale Price Index of Selected Construction Materials in National Capital Region, by Commodity Group: 2008-2010
(1985=100)
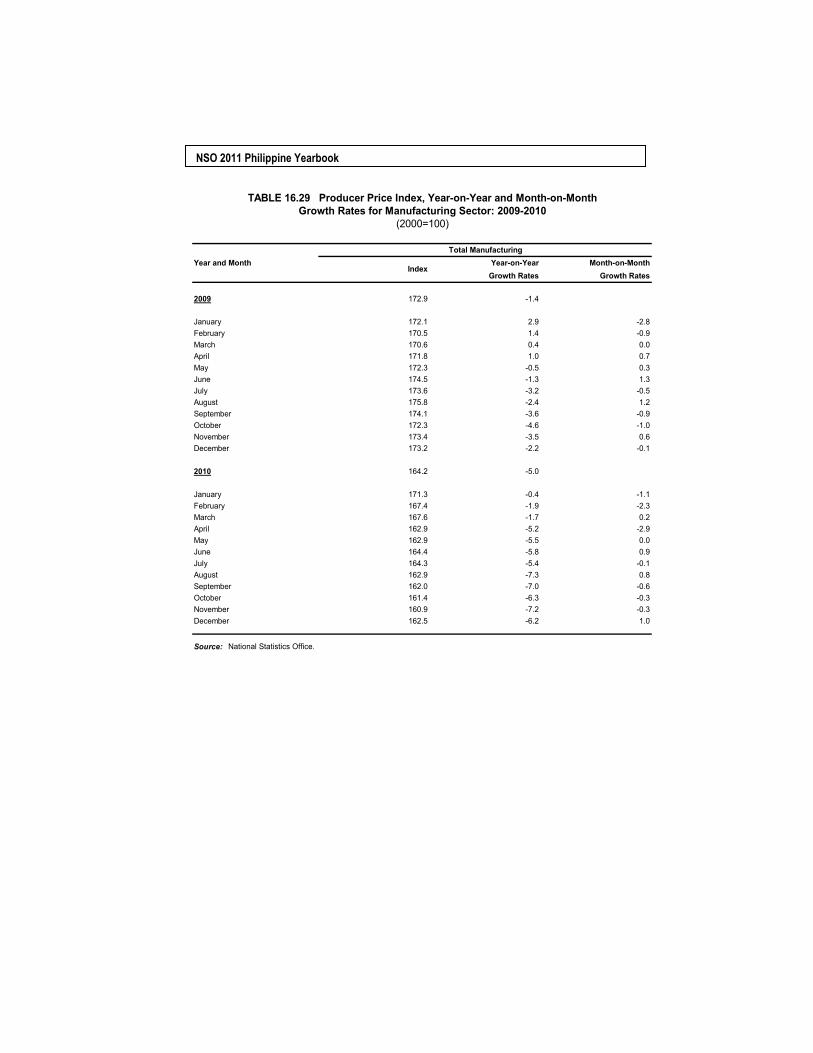
NSO 2011 Philippine Yearbook
Year and Month Year-on-Year Month-on-MonthGrowth Rates Growth Rates
2009 172.9 -1.4
January 172.1 2.9 -2.8February 170.5 1.4 -0.9March 170.6 0.4 0.0April 171.8 1.0 0.7May 172.3 -0.5 0.3June 174.5 -1.3 1.3July 173.6 -3.2 -0.5August 175.8 -2.4 1.2September 174.1 -3.6 -0.9October 172.3 -4.6 -1.0November 173.4 -3.5 0.6December 173.2 -2.2 -0.1
2010 164.2 -5.0
January 171.3 -0.4 -1.1February 167.4 -1.9 -2.3March 167.6 -1.7 0.2April 162.9 -5.2 -2.9May 162.9 -5.5 0.0June 164.4 -5.8 0.9July 164.3 -5.4 -0.1August 162.9 -7.3 0.8September 162.0 -7.0 -0.6October 161.4 -6.3 -0.3November 160.9 -7.2 -0.3December 162.5 -6.2 1.0
Source: National Statistics Office.
TABLE 16.29 Producer Price Index, Year-on-Year and Month-on-MonthGrowth Rates for Manufacturing Sector: 2009-2010
(2000=100)
Total Manufacturing
Index
Related Documents