doi:10.1182/blood-2006-07-036863Prepublished online December 12, 2006;
Fiore, Massimo Massaia, Mario P Colombo, Michele Baccarani and Roberto M. LemoliValentina Salvestrini, Giuseppina Bonanno, Sergio Rutella, Ilaria Durelli, Alberto L Horenstein, Francesca Antonio Curti, Simona Pandolfi, Barbara Valzasina, Michela Aluigi, Alessandro Isidori, Elisa Ferri, the conversion of CD25- into CD25+ T regulatory cellsModulation of tryptophan catabolism by human leukemic cells results in
(4217 articles)Neoplasia � (5022 articles)Immunobiology �
Articles on similar topics can be found in the following Blood collections
http://bloodjournal.hematologylibrary.org/site/misc/rights.xhtml#repub_requestsInformation about reproducing this article in parts or in its entirety may be found online at:
http://bloodjournal.hematologylibrary.org/site/misc/rights.xhtml#reprintsInformation about ordering reprints may be found online at:
http://bloodjournal.hematologylibrary.org/site/subscriptions/index.xhtmlInformation about subscriptions and ASH membership may be found online at:
digital object identifier (DOIs) and date of initial publication. theindexed by PubMed from initial publication. Citations to Advance online articles must include
final publication). Advance online articles are citable and establish publication priority; they areappeared in the paper journal (edited, typeset versions may be posted when available prior to Advance online articles have been peer reviewed and accepted for publication but have not yet
Copyright 2011 by The American Society of Hematology; all rights reserved.20036.the American Society of Hematology, 2021 L St, NW, Suite 900, Washington DC Blood (print ISSN 0006-4971, online ISSN 1528-0020), is published weekly by
For personal use only. by guest on June 12, 2013. bloodjournal.hematologylibrary.orgFrom
1
Modulation Of Tryptophan Catabolism By Human Leukemic Cells Results In The
Conversion Of CD25- Into CD25+ T Regulatory Cells
Short title: Tryptophan catabolism expands Treg cells
Scientific Heading: Immunobiology
Antonio Curti1, Simona Pandolfi1, Barbara Valzasina2, Michela Aluigi1, Alessandro
Isidori1, Elisa Ferri1, Valentina Salvestrini1, Giuseppina Bonanno3, Sergio Rutella3,
Ilaria Durelli4, Alberto L. Horenstein4, Francesca Fiore5, Massimo Massaia5, Mario P.
Colombo2, Michele Baccarani1, Roberto M. Lemoli1
1Institute of Hematology and Medical Oncology “L. & A. Seràgnoli”, University of
Bologna and Stem Cell Center, S.Orsola-Malpighi Hospital, Bologna, Italy;
2Immunotherapy and Gene Therapy Unit, National Cancer Center, Milan, Italy;
3Department of Hematology, Catholic University Medical School, Rome, Italy;
4Department of Genetics, Biology and Biochemistry, Research Center on Experimental
Medicine (CeRMS), University of Turin, Turin, Italy;
5Hematology Unit, University of Turin and Hematological Oncology Laboratory,
CeRMS, Turin, Italy.
This work was supported by Italian Association for the Research against Cancer
(AIRC), Milan, Italy; Consiglio Nazionale delle Ricerche (CNR) (N. CU03.00334),
Italy; Italian Association against Leukemia, Section of Bologna (BolognAIL), Bologna,
Italy.
Blood First Edition Paper, prepublished online December 12, 2006; DOI 10.1182/blood-2006-07-036863
Copyright © 2006 American Society of Hematology
For personal use only. by guest on June 12, 2013. bloodjournal.hematologylibrary.orgFrom
2
Corresponding author: Antonio Curti MD, Institute of Hematology and Medical
Oncology “L.&A. Seràgnoli”, Via Massarenti, 9, 40138, Bologna, Italy. Tel +39-051-
6363680; Fax +39-051-6364037; E-mail: [email protected]
Author contributions are as follows:
AC: design of the research, flow cytometry, human functional tests, statistical analyses,
writing of the manuscript and review of the accuracy of the reported results;
GB, SR, SP, AI, EF, VS: flow cytometry, functional tests, immunocytochemistry,
ELISAs;
MA: molecular biology;
BV: mouse experiments;
ID, FF: HPLC analysis;
MM, ALH, MB: critical review of the manuscript;
MPC: contribution to manuscript writing;
RML: contribution to the research plan and manuscript writing.
For personal use only. by guest on June 12, 2013. bloodjournal.hematologylibrary.orgFrom

3
ABSTRACT
Indoleamine 2,3-dioxygenase (IDO) is a novel immunosuppressive agent expressed in
some subsets of normal and neoplastic cells, including acute myeloid leukemia (AML)
cells. Here, we show that IDO expression correlates with increased circulating
CD4+CD25+Foxp3+ T cells in AML patients at diagnosis. In vitro, IDO+ AML cells
increase the number of CD4+CD25+ T cells expressing surface CTLA-4 and Foxp3
mRNA and this effect is completely abrogated by the IDO-inhibitor, 1-methyl
tryptophan (1-MT). Purified CD4+CD25+ T cells obtained from co-culture with IDO+
AML cells act as T regulatory (Treg) cells as they do not proliferate, do not produce
interleukin (IL)-2 and inhibit naive T-cell proliferation. Co-culture with IDO+ AML
cells results in the conversion of CD4+CD25- into CD4+CD25+ T cells, which is
completely abrogated by 1-MT. Moreover, in mice, intrasplenic injection of IDO+
leukemia/lymphoma A20 cells induces the expansion of bona fide Treg cells by
conversion of CD4+CD25- T cells and this effect is counteracted by 1-MT treatment.
These data indicate that AML cells induce T-cell tolerance by directly converting
CD4+CD25- T cells into CD4+CD25+ Treg cells through an IDO-dependent mechanism.
For personal use only. by guest on June 12, 2013. bloodjournal.hematologylibrary.orgFrom
4
INTRODUCTION
Indoleamine 2,3-dioxygenase (IDO) is a key enzyme in the tryptophan metabolism that
catalyzes the initial rate-limiting step of tryptophan degradation along the kynurenine
pathway.1 Tryptophan starvation by IDO consumption inhibits T cell activation,1,2 while
products of tryptophan catabolism, such as kynurenine derivatives and O2 free radicals,
regulate T-cell proliferation and survival.1,3 Thus, IDO has been shown to exert an
immunosuppressive activity and cell populations, including regulatory dendritic cells
(DCs) and bone marrow (BM)-derived mesenchymal stem cells (MSCs), expressing
IDO have the capacity to suppress T-cell responses to auto- and allo-antigens.4,5
A wide variety of human solid tumors express IDO. 6 More recently, we demonstrated
that also acute myeloid leukemia (AML) cells, but not their normal counterparts, i.e.
CD34+ hematopoietic stem/progenitor cells (HSCs) express an active IDO protein,
which converts tryptophan into kynurenine and inhibits allogeneic T-cell proliferation.7
Naturally arising CD4+CD25+ Foxp3+ T regulatory (Treg) cells are known to suppress
most types of immune response,8,9 including anti-tumor immunity.10-13 IDO is expressed
and is functionally active in placenta, which, in turn, is infiltrated by CD4+CD25+ Treg
cells.14-16 Moreover, Candida Albicans infection increases the number of Treg cells
because of IDO induction in host APCs.17 In human cancers, tumor draining lymph
nodes contain IDO-expressing DCs which enhance Treg function.18 These data suggest
the close relationship between IDO activity and the occurrence of Treg cells,19 but the
mechanism governing the generation of Treg cells by IDO-expressing tumors is presently
unknown.
In the present study, we investigated whether the expression of IDO by AML cells may
play a direct role in the development of Treg cells.
For personal use only. by guest on June 12, 2013. bloodjournal.hematologylibrary.orgFrom
5
MATERIALS AND METHODS
Cells
All human samples were obtained after informed consent was signed, according to
institutional guidelines. Approval was obtained from Bologna Hospital Ethical
Committee. Buffy coats were obtained from healthy adults during the preparation of
transfusion products. BM and/or peripheral blood (PB) samples including at least 70%
leukemic cells were harvested from 76 AML patients at diagnosis. CD3+ and CD4+
cells were purified from the mononuclear cell (MNC) fraction by MiniMacs high-
gradient magnetic separation column (Miltenyi Biotec, Bergisch Gladbach, Germany)
according to manufacturer’s instructions (purity of CD3+ and CD4+ cell populations
was always > 95%). MSCs were generated from BM cells as previously reported.20
Murine A20 and CT26 cell lines were obtained from the American Type Culture
Collection (ATCC; Rockville, MD) and maintained in RPMI 1640 (Whittaker
Bioproducts, Walkersville, MD) or MEM (Whittaker Bioproducts) supplemented with
10% FCS (Sera Lab, Crawley Down, UK), penicillin/streptomycin (50 U/ml), L-
glutamine (2 mM), Hepes buffer (Whittaker Bioproducts), non-essential amino acids
(Whittaker Bioproducts), hereafter referred to as complete medium.
RT-PCR
PCR was performed on cDNA as described elsewhere.21 Human INDO: F 5’-
ATGTGTGGGGCAAAGGTCATGG-3’, R 5’-AAGTGTCCCGTTCTTGCATTTGC-
3’; mouse INDO: F 5’-GTCTGCTGTATGAGGGGGTCT-3’, R 5’-
CATTTGAGGGCTCTTCCGACTTG-3’; Human Foxp3: F 5’-
CCCACTTACAGGCACTCCTC-3’, R 5’-CTTCTCCTTCTCCAGCACCA-3’; As
internal control, human β2-microglobulin (β2m) and mouse glyceraldehyde-3-phosphate
For personal use only. by guest on June 12, 2013. bloodjournal.hematologylibrary.orgFrom
6
dehydrogenase (GAPDH) genes were amplified. PCR products were separated and
visualised on 2% agarose gel stained with ethidium bromide.
IDO expression and activity
Human primary AML cells as well as murine cell lines were tested for IDO expression
both at mRNA and protein level. PCR analysis of human IDO was performed as
described above. For detection of IDO protein, mouse anti-IDO monoclonal antibody
(mAb) (Chemicon, Temecula, CA; clone 10.1) and mouse IgG isotype antibody
(Pharmingen, San Diego, CA) were used. Immunocytochemistry analysis was
performed on cytospins, as previously reported.22 For IDO activity, the amount of L-
tryptophan and L-kynurenine in culture supernatant was measured by high-performance
liquid chromatography (HPLC) using a reverse-phase column as previously reported
with modifications.4 Ten millions of cells/well were cultured in complete medium and
supernatants were collected after 72 hours. After adding N-acetyl-tryptophan and 3-
nitro-L-tyrosine (50 µM final concentration), as internal standard for L-tryptophan and
L-kynurenine respectively, 100 µL of supernatant was injected into a C-18 column. The
absorbance of column effluent was monitored with the UV detector at a wavelength of
270 nm for tryptophan and 360 nm for kynurenine. The calibration curve for the
quantitative analysis was performed injecting the standard molecule at six different
concentrations between 0 and 100 µM for tryptophan and between 0 and 12.5 µM for
kynurenine.
Purification of CD4+CD25+ and CD4+CD25- subsets
CD4+CD25+ and CD4+CD25- cells were isolated by MiniMacs CD4+CD25+ regulatory
T cell isolation kit (Miltenyi) according to manufacturer’s instructions. To achieve
highest purity, positive and negative cell fractions were separated over a second column.
CD4+CD25+ cells obtained in the positive fraction was routinely more than 90% of total
For personal use only. by guest on June 12, 2013. bloodjournal.hematologylibrary.orgFrom
7
cells as evaluated by FACS analysis. CD4+CD25- T cells accounted for more than 98%
of the cells collected in the negative fraction. Purified T cells were used for phenotypic
and functional assays. As positive control sample for CD4+CD25+ T cells, total MNCs
were stimulated for 48 hours with mAbs against CD3 and CD28 (Pharmingen, San
Diego, CA).
In vitro T-cell culture with AML cells
Ten thousand AML cells/ml were cultured in RPMI complete medium with 106/ml
allogeneic CD3+ T cells/ml for 7 days in the presence and absence of optimal
concentrations (1000 µM) of the IDO-inhibitor, 1-methyl-D-tryptophan (1-MT) (Sigma-
Aldrich, St. Louis, MO), as evaluated in preliminary experiments.23 When indicated,
total CD3+, CD4+CD25+ and CD4+CD25- cells were labeled with CFSE (Molecular
Probes, Eugene, OR) by incubation with 2 µM carboxyfluorescein diacetate
succinimidyl ester (CFSE) in PBS containing 5% FCS for 5 minutes at 37°C and then
used as responders. At the end of culture, cells were collected and used for phenotypic
and functional assays. After 24, 48, 72 and 96 hours of culture, T cells were tested for
apoptosis by using human Annexin-V and propidium iodide (Bender Medsystems,
Burlingame, CA).
Conditioned medium experiments
One million IDO+ and IDO- AML cells/ml were cultured in complete medium RPMI
1640 (Whittaker Bioproducts), containing 25 µM L-tryptophan in the presence and
absence of 1-MT (1000 µM). In selected experiments, L-tryptophan (Sigma-Aldrich)
was added to culture medium to a final concentration of 150 µM. After 72 hours,
supernatants (conditioned mediums) were collected and tested by HPLC for L-
tryptophan and L-kynurenine concentrations. One million T cells/ml were cultured in
For personal use only. by guest on June 12, 2013. bloodjournal.hematologylibrary.orgFrom
8
AML-derived conditioned medium with 105/ml IDO- AML cells for 7 days. At the end
of culture, T cells were collected and used for flow cytometry analysis.
T-cell proliferation and in vitro suppression assays
Standard allogeneic mixed lymphocyte reaction (MLR) was performed as previously
described.21 Briefly, naive and leukemic cell-cultured CD3+ cells (105/well) were
incubated with different numbers of irradiated (3000 cGy) stimulators for 5 days. Then,
cells were pulsed with 1 µCi (0.037 MBq) per well of [3H]thymidine (Amersham
Pharmacia Biotech, Piscataway, NJ) and tested as previously described.21 The
stimulation index (SI) was calculated for each individual experiment as follows: SI=
cpm (counts per minute)(T-cell responders+stimulators)/cpm (T-cell responders).
To test their suppressive activity, control naive CD3+ cells and leukemic cell-cultured
T-cell subsets were added to cultures consisting of same donor-derived naive CD3+ T
cells (5 × 10⁴/well) as responders and the same number of irradiated allogeneic T-cell
depleted MNCs (APCs) as stimulators. After 5 days, cultures were pulsed with 1 µCi
per well of [3H]thymidine (Amersham Pharmacia) and tested as previously described.21
Experimental T-cell proliferation was compared to that observed in the presence of
control T cells and expressed as percentage of inhibition.
In vivo experiments
Eight- to 10-week-old BALB/c mice were obtained from Charles River (Calco, Italy)
and maintained at the Istituto Nazionale Tumori under standard conditions according to
institutional guidelines. Female mice were injected intrasplenically with 105 A20 cells
or with PBS. Mice received 1-D,L-MT (Sigma-Aldrich) in the drinking water (3.5
mL/day) at the final concentration of 5mg/ml.6 Twenty-five days after the injection
mice were sacrificed and the percentage of CD4+CD25+ T cells was evaluated in the
For personal use only. by guest on June 12, 2013. bloodjournal.hematologylibrary.orgFrom
9
spleen, pooled lymph nodes and thymus. Intracellular staining of Foxp3 (FJK-16S) was
performed on purified CD4+CD25+ and CD4+ CD25- according to the manufacturer’s
instructions (e-Bioscience, San Diego, CA).
To test Treg suppressive activity, 5x10⁴ CD4+CD25- were cultured with 5x10⁴ accessory
cells (AC), consisting in the whole 3Gy-irradiated spleen, with or without Treg cells at
the indicated ratio, for 72 hrs in complete medium. One µg/ml of anti-CD3
(eBioscience) was added to each well for stimulation. [3H] thymidine (1 µCi/well;
Amersham) was added for the last 10 hrs of culture and measured in a microplate
scintillator counter (Tomtec; Wallac, Turku, Filland). To study in vivo conversion,
10x106 Thy1.1-derived CD4+CD25- cells, previously labeled with 5 µmol/L CFSE for
15 min at 37°C, were transferred by tail vein injection into recipient mice that had been
inoculated intrasplenically 10 days before with 105 A20 cells or subcutaneously with
5x10⁴ CT26 cells. Percentage of converted CD4+CD25+ cells in spleen was assessed
after 10 days. Cells were stained with phycoerythrin (PE)-conjugated anti-CD25, PE-
Cy5 anti-CD4, and APC-Thy1.1 antibodies. The percentage of CD25+ cells over CFSE+
cells was calculated on gated Thy1.1+ CD4+ cells.
Immunophenotype studies
Dual-color immunofluorescence was performed using the following panel of mAbs: PE-
or fluorescein isothiocyanate (FITC)-conjugated anti-human CD3 (Pharmingen; clone
UCHT1); PE- or FITC-conjugated anti-human CD4 (Pharmingen; clone RPA-T4); PE-
or FITC-conjugated anti-human CD8 (Pharmingen; clone HIT8a); PE-conjugated anti-
human CD25 (Pharmingen; clone M-A251); FITC-conjugated anti-human cytotoxic T
lymphocyte-associated antigen (CTLA-4) (Cymbus Biotechnology, Hampshire, UK;
clone CBL 591F); FITC-conjugated anti-human HLA-DR (Pharmingen; clone L242).
PE- or FITC-conjugated anti-human CD45RO (Pharmingen; clone UCHL-1); PE- or
For personal use only. by guest on June 12, 2013. bloodjournal.hematologylibrary.orgFrom
10
FITC-conjugated anti-human CD62L (Pharmingen; clone MEL-14). Negative controls
were isotype-matched irrelevant mAbs (Pharmingen). FITC-conjugated anti-mouse
CD4 (L3T4), PE-conjugated anti-mouse CD25 (PC61) and the relative isotype controls
were all purchased from BD Bioscience (BD Bioscience, San Diego, CA). Cells were
analyzed by using FACScan equipment (Becton Dickinson). A minimum of 10000
events was collected in list mode on FACScan software.
Statistical analysis
Results are expressed as mean ± standard deviation (SD). Where indicated, differences
were compared using Student’s t-test and χ-square analysis.
For personal use only. by guest on June 12, 2013. bloodjournal.hematologylibrary.orgFrom

11
RESULTS
In vivo correlation of IDO expression with increased CD4+CD25+ Foxp3+ T cells
Seventy-six primary AML samples collected at diagnosis were tested for IDO
expression. Forty out of 76 AML patients (52%) were positive for both IDO mRNA
and protein. Moreover, IDO protein was capable to convert tryptophan into kynurenine
and to reduce T-cell alloreactivity (Fig. S1).7
To test whether IDO expression in AML patients correlates, in vivo, with the frequency
of Treg cells, PB samples were collected at diagnosis from AML patients whose
circulating T cells were assessable (9 IDO+ and 12 IDO-) and CD25 expression on gated
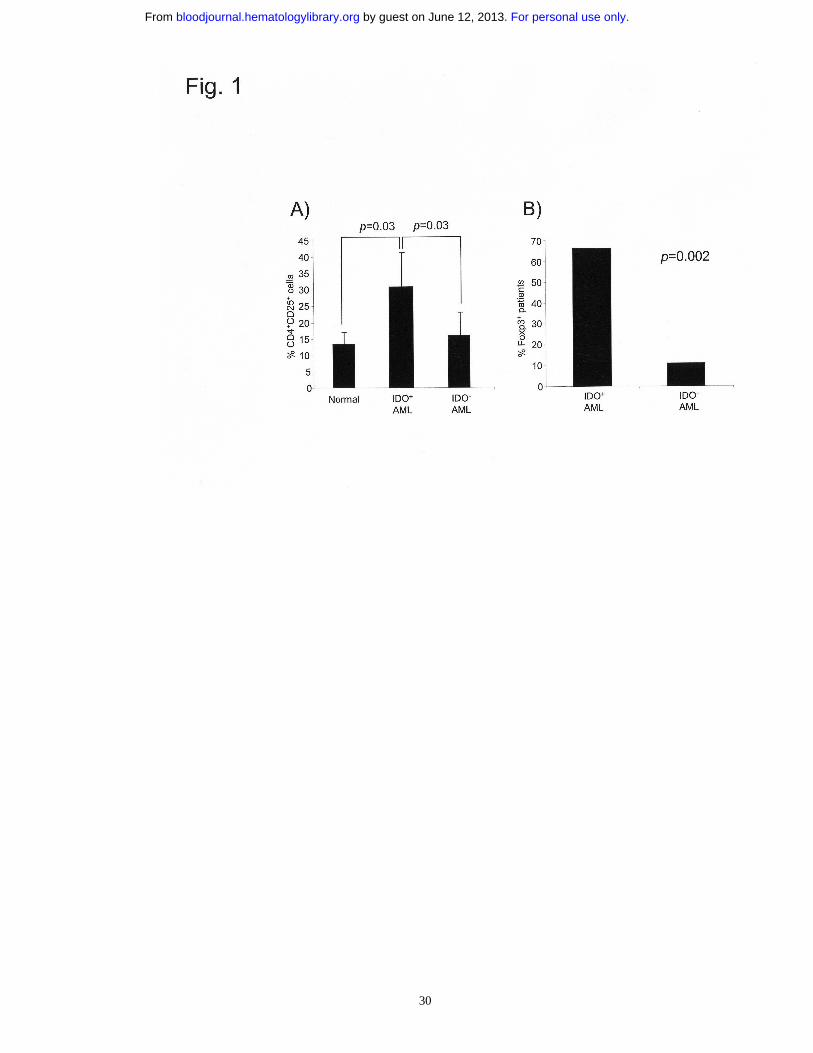
CD4+ cells was evaluated. As shown in Fig. 1A, the percentage of CD4+CD25+ cells
was significantly increased in IDO+ AML samples as compared to IDO- patients or
healthy donors (p=0.03). The Treg nature of CD4+CD25+ cells was evaluated by testing
the expression of the winged-helix/forkhead transcription factor Foxp3, which is a
widely accepted marker for naturally occurring Treg cells.24 In particular, highly purified
CD4+ T cells were obtained from the PB of AML patients and then evaluated for Foxp3
mRNA expression. Figure 1B shows that IDO expression correlates with Foxp3 RT-
PCR positivity (p=0.002). These data reveal a correlation between IDO expression and
increased CD4+CD25+Foxp3+ T cell-frequency in AML patients at diagnosis.
IDO-expressing AML cells increase, in vitro, CD4+CD25+Foxp3+ T cells
To investigate the role of IDO expression by AML cells on Treg cell development, we
co-cultured IDO+ and IDO- AML cells with highly purified allogeneic CD3+ T cells,
obtained from healthy donors, in the presence or absence of the IDO-inhibitor, 1-MT.
The viability of cells cultured in presence of 1-MT was not different from that cultured
in medium alone (79% ± 12 and 82% ± 16, respectively), as well as CD4+ and CD8+ T-
cell frequencies were not modified by the addition of 1-MT (data not shown). Co-
For personal use only. by guest on June 12, 2013. bloodjournal.hematologylibrary.orgFrom
12
culture of T cells with IDO-expressing AML cells increased both the percentage of
CD4+CD25+ T cells and the surface expression of CD25 (mean fluorescence intensity
[MFI] 150 ± 45 and 980 ± 390 before and after co-culture, respectively) (Fig. 2A and B;
p=0.001 and p=0.0003, respectively), whereas co-incubation of T cells with IDO- AML
cells had no effect on CD25 expression (Fig. 2A and B). The addition of 1-MT to co-
cultures of T cells with IDO+ AML cells restored the expression of CD25 to that
observed before culture, whereas 1-MT had no effect on T cells cultured with IDO-
AML cells (Fig. 2A and B). CD4+CD25+ T cells cultured with IDO-expressing AML
cells expressed CTLA-4, which was down-regulated in presence of 1-MT (Fig. 2C) as
well as HLA-DR, CD62L and CD45RO (data not shown). The described pattern of
surface markers suggests that CD4+ T lymphocytes, after co-culture with IDO-
expressing AML cells, acquire a CD4+CD25+ Treg cells phenotype, which was markedly
inhibited in the presence of 1-MT. This conclusion was corroborated by showing that
CD4+CD25+ but not CD4+CD25- cells purified after co-culture with IDO-expressing
AML cells express Foxp3 mRNA (Fig. 2D).
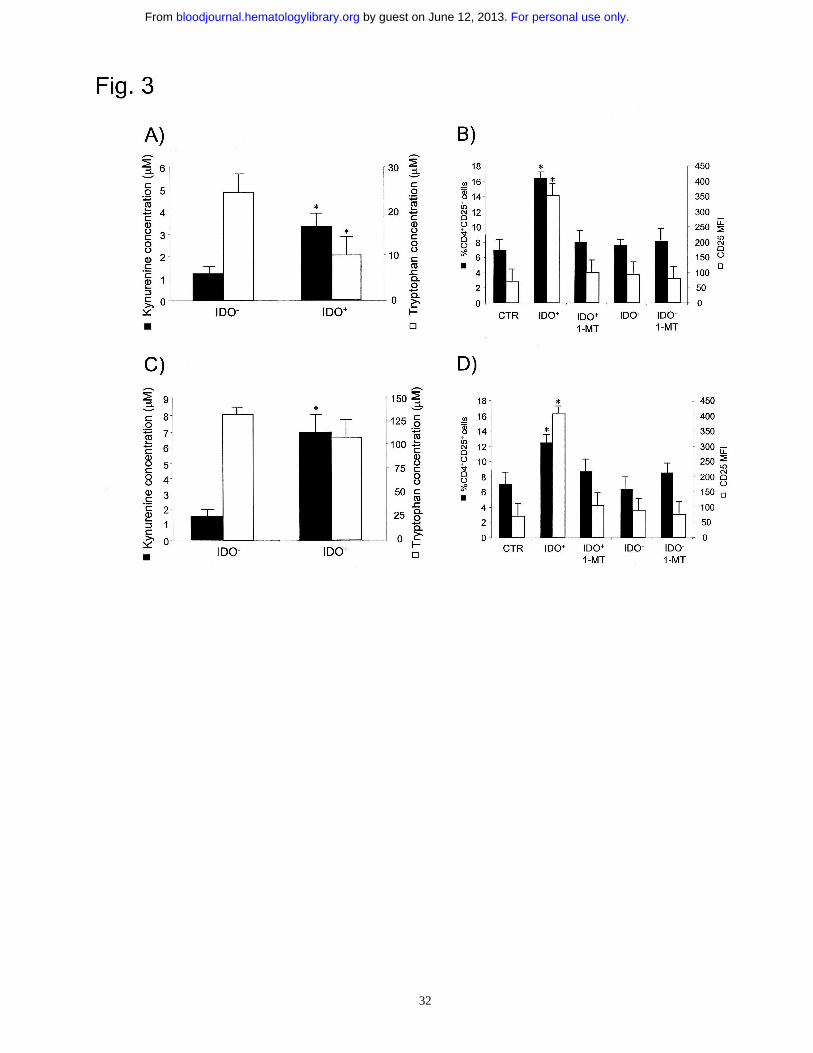
To investigate whether IDO activity in AML cells would result in the generation of a
microenvironment which was capable per se to increase CD4+CD25+ T cells, a
conditioned medium obtained from IDO+ and IDO- AML cell cultures was used to
stimulate naïve CD3+ T cells. Moreover, to test whether the availability of an excess of
L-tryptophan within the conditioned medium could contrast IDO activity resulting in a
differential induction of CD4+CD25+ cells, the conditioned medium was generated both
with standard (25 µM) and increased (150 µM) starting concentrations of L-tryptophan.
Accordingly to IDO expression, only the conditioned medium collected from IDO+
AML cells had decreased tryptophan and increased kynurenine concentrations (Fig. 3A
and C). When we compared the contents of conditioned mediums collected from IDO+
AML cells previously cultured in 25 µM or 150 µM starting L-tryptophan, the amount
For personal use only. by guest on June 12, 2013. bloodjournal.hematologylibrary.orgFrom
13
of kynurenine was comparable, whereas final tryptophan concentration was much
higher when 150 µM concentration was used. As shown in Fig. 3B and D, culture of T
cells in the conditioned medium obtained from IDO+ AML cells resulted in the up-
regulation of CD25 expression on CD4+ T cells, and this effect was abrogated by adding
1-MT to AML cell-cultures, whereas no effect on CD25 expression was observed when
T cells were cultured in IDO- conditioned medium. Interestingly, similar results were
observed with 25 and 150 µM starting L-tryptophan, indicating that tryptophan
depletion from culture medium, which was minimal upon 150 µM concentration, does
not play a major role in increasing CD4+CD25+ T cells. The conditioned medium
experiments show that the microenvironment produced by IDO+, but not by IDO- AML
cells was capable per se to induce the expansion of CD4+CD25+ T cells.
These in vitro data demonstrate that tryptophan catabolism by IDO-expressing AML
cells increases CD4+CD25+Foxp3+ T cells.
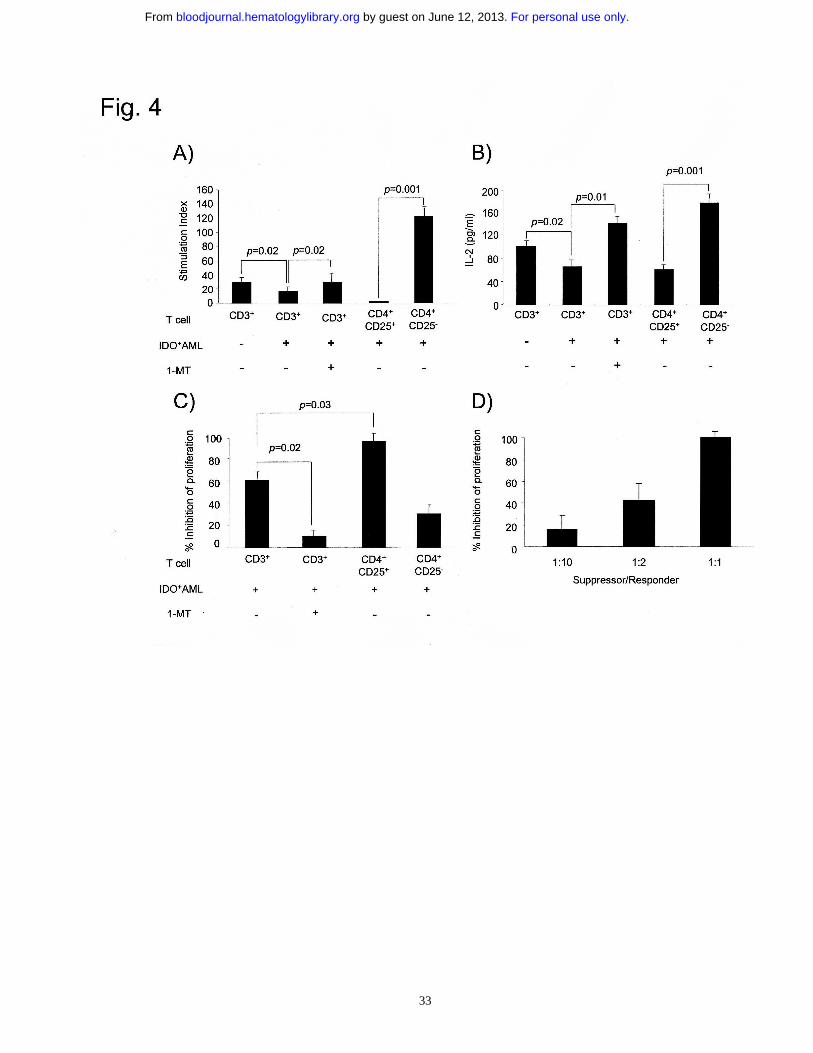
AML-induced CD4+CD25+ T cells have regulatory activity
T cells obtained after primary co-culture with IDO+ AML blasts were compared to
autologous naive counterparts for their ability to respond to allogeneic APCs in a
secondary MLR. As shown in Fig. 4A and B, total T cells showed reduced proliferation
and IL-2 production (p=0.02), which were completely restored by the addition of 1-MT
to the same primary co-culture. Moreover, when highly purified CD4+CD25+ T cells
were used, almost no proliferation and barely detectable IL-2 production were observed
(Fig. 4A and B). Importantly, CD4+CD25- T cells, which had been completely depleted
of CD4+CD25+ cells, showed a marked increase in cell proliferation and IL-2
production as compared to CD25+ counterparts (p=0.001), which was higher than that
of naive, not purified CD3+ T cells. These data point to the functional activity of
For personal use only. by guest on June 12, 2013. bloodjournal.hematologylibrary.orgFrom
14
CD4+CD25+ T cells obtained after culture with IDO-expressing AML cells in reducing
T-cell proliferation and IL-2 production.
An additional set of functional experiments was performed to validate the Treg nature of
the cells induced by IDO-expressing AML cells. Naive CD3+ T cells were stimulated by
allogeneic APCs in the presence of AML-cultured or naive autologous T cells. As
shown in Fig. 4C, T-cell proliferation was markedly reduced when total T cells
previously cultured in absence, but not in presence of 1-MT were used (p=0.02). This
effect was markedly increased when AML-cultured CD4+CD25+ T cells were added to
cell cultures (p=0.03), whereas CD4+CD25- gave a similar effect to that of cells cultured
with 1-MT (Fig. 4C). The suppressive activity of CD4+CD25+ T cells obtained after
culture with IDO-expressing AML cells was dose-dependent (Fig. 4D).
Taken together, these data support the hypothesis that CD4+CD25+ T cells induced by
IDO-expressing AML cells retain immunosuppressive activity and may be considered
bona fide Treg cells.
AML cells convert CD4+CD25- into CD4+CD25+ T cells through an IDO-dependent
mechanism.
Co-culture of IDO-expressing AML cells with CD3+ T cells resulted in the increase of
CD4+CD25+ cells, which was paralleled by the decrease of CD4+CD25- cells (Fig. 5A;
p=0.03). This effect could be alternatively explained considering the expansion of
CD4+CD25+ cells because of active proliferation, the increased tendency to undergo
apoptosis of CD4+CD25- over CD4+CD25+ T cells or the conversion of CD4+ CD25-
into CD4+CD25+ T cells.
To address these points, CD4+ T cells were labelled with CFSE before the co-culture
with AML cells, and then monitored for the dilution of cell-associated fluorescence by
flow cytometry. After co-culture with AML cells, no significant proliferation was
observed for CD25+ and CD25- cells, both in medium alone or supplemented with IL-2
For personal use only. by guest on June 12, 2013. bloodjournal.hematologylibrary.orgFrom
15
(Fig. S2). To assess the tendency of T cells to undergo apoptosis, purified CD4+CD25+
and CD4+CD25- T cells were incubated with IDO+ AML cells and stained with Annexin
V and propidium iodide at different time points. CD4+CD25+ T cells were shown to
have increased apoptosis over CD25- cells, which, however, was not affected by the
addition of 1-MT to cultures (Fig. 5B). Taken together, these data suggest that the
increase of CD4+CD25+ T cells after culture with IDO+ AML cells is neither due to
active proliferation nor to apoptosis.
To test the conversion hypothesis, highly purified CD4+CD25- T cells were used (Fig.
5C). Fig. 5D and S3 show that the percentage of CD25+ cells increased over that
observed after co-culture with IDO- AML cells or with control normal MNCs (p=0.01).
Moreover, the addition of 1-MT to cultures significantly inhibited the increase of
CD25+ cells induced by IDO+ AML cells (p=0.03), but not by IDO- AML cells (Fig.
5D). Similar results were observed by cultivating T cells in the presence of AML-
derived conditioned medium, as previously described (Fig. 5E). In contrast to the results
observed with total CD4+ T cells (Fig. S2), highly purified CD4+CD25- T cells, which
had been depleted of CD4+CD25+ T cells (Fig. 5C), were induced to proliferate by
AML cells and converting CD4+CD25+ T cells showed a significant rate of proliferation
(Fig. S4). Moreover, the effect on proliferation was significantly increased by the
addition of IL-2 in CD4+C25+, but not in CD4+CD25- cells. The conversion of
CD4+CD25- into CD4+CD25+ T cells was stable, since purified CD4+CD25+ T cells
obtained after culture with IDO+ AML cells did not revert to CD25- T cells once IDO+
cells were removed or 1-MT was added to cultures (Fig. S5). However, cultivating T
cells and AML cells in a trans-well resulted in a significant reduction of the conversion
effect, thus suggesting that cell-to-cell contact may be required to induce this
phenomenon under such experimental conditions (Fig. S6). The different results
obtained with AML-derived conditioned medium and those from trans-well experiments
For personal use only. by guest on June 12, 2013. bloodjournal.hematologylibrary.orgFrom
16
may be interpreted in light of the different numbers of stimulating AML cells which
were used.
These data suggest that IDO expressed by AML cells increases Treg cells by converting
CD4+CD25- into CD25+ T cells.
Inhibition of IDO prevents tumor-mediated expansion of CD4+CD25+ T regulatory
cells by blocking the conversion of CD4+CD25- cells
To further explore the capacity of IDO-expressing tumors in converting CD4+CD25-
into CD4+CD25+ Treg cells, we turned to an in vivo murine system. We found that A20
lymphoma/leukemia expresses IDO both at RNA and protein level (Fig. 6A) as well as
reduces the concentration of tryptophan from culture medium (Fig. 6B). Thus, we
assessed whether intrasplenic injection of A20 cells would increase the frequency of
CD4+CD25+ T cells. As shown in Fig. 6C, the percentage of CD4+CD25+ T cells was
higher than that of not tumor-bearing mice. Such increase was time dependent and
maximal at day 25 after tumor challenge (data not shown) and, more importantly, was
reduced by the treatment of tumor-bearing mice with 1-MT (p=0.03). Purified
CD4+CD25+ T cells derived from spleens of tumor-bearing mice were both
phenotypically and functionally Treg cells, as shown by Foxp3 expression and the ability
to suppress anti-CD3-mediated T cell proliferation, respectively (Figure 6D and E). To
investigate whether conversion may be the mechanism of Treg cell expansion in IDO+
tumor-bearing mice, CD4+CD25- T cells, purified from spleen of Thy 1.1 congenic
mice, were labelled with CFSE and inoculated into Thy1.2 mice bearing IDO+ A20
tumor. As control tumor, we used the CT26 colon carcinoma which lacks IDO
expression (data not shown), but has been recently shown to expand a population of
well-characterized Treg cells by conversion of CD4+CD25- into CD25+ T cells.25 In both
cases a group of mice was treated with 1-D,L-MT, as previously described.6 After
about 10 days from tumor challenge, spleens were collected and Thy1.1+ CD4+ donor
For personal use only. by guest on June 12, 2013. bloodjournal.hematologylibrary.orgFrom
17
lymphocytes were analyzed for the expression of CD25 as function of conversion and
for CFSE dilution as function of proliferation. Both A20 and CT26 tumors were capable
to induce the conversion of CD4+CD25- into CD4+CD25+ T cells (Figure 6F). However,
the treatment with 1-MT was effective in blocking conversion of CD4+CD25- into
CD4+CD25+ T cells (p<0.05) only in A20- but not in CT26-bearing mice . Moreover, no
significant difference was observed as for CFSE dilution (data not shown), indicating
that the expansion of Treg cells induced by IDO-expressing tumor cells was due to
conversion of CD25- into CD25+ T cells in absence of proliferation.
Collectively, these data demonstrate that IDO expression by tumor is directly
responsible for in vivo Treg cells expansion by conversion of CD4+CD25- into CD25+
Foxp3+ T cells.
For personal use only. by guest on June 12, 2013. bloodjournal.hematologylibrary.orgFrom
18
DISCUSSION
Since its demonstration as a potent immunosuppressive agent, IDO has been widely
investigated for the induction of immunological tolerance.26 Recently, IDO has been
shown to be expressed in a wide variety of solid tumors and to prevent T-cell mediated
immunity in mouse tumor models.6 However, little is known about the mechanism(s) by
which IDO-expressing tumor cells inhibit anti-tumor immunity. In this report, we show
that IDO, which is constitutively expressed in a significant portion of AML patients at
diagnosis, directly expands CD4+CD25+ Treg cells by the conversion of CD4+CD25- T
cells.
Tumor cells, including leukemia cells, are known to create an inhibitory
microenvironment for the immune system,27 which could be counteracted by the
optimal secretion of immunomodulatory cytokines, such as IL-12.28 Recent
investigations have established the role of IDO in inducing tolerance to tumors.6,18
Published data demonstrate that the anti-tumor effect of IDO blockade was completely
dependent on the presence of a fully competent immune system, thus suggesting that
IDO acts by deregulating the host immune response. In the present study, we show that
in AML patients IDO expression is associated with an increased number of circulating
CD4+CD25+Foxp3+ T cells. Such correlation is physiologic in placenta, where decidua
cells expressing IDO are fully infiltrated by CD4+CD25+ T cells,15 which have a major
role in the induction of maternal tolerance against fetal allo-antigen.16 Accordingly, our
data demonstrate that IDO-expressing leukemia cells expand, in vitro and in vivo, a
population of CD4+CD25+ Foxp3+ T cells, which functionally act as bona fide Treg cells.
Different mechanisms have been proposed for IDO-mediated immunoregulation during
infection, pregnancy, autoimmunity, transplantation and neoplasia.1 Local depletion of
tryptophan and/or the production of pro-apoptotic kynurenines are considered
For personal use only. by guest on June 12, 2013. bloodjournal.hematologylibrary.orgFrom
19
responsible for the multiple effects on lymphocyte proliferation and survival after IDO
induction.1,2,29 In particular, Th1 but not Th2 clones can rapidly undergo cell death in
presence of low concentrations of tryptophan metabolites of the kynurenine pathway,
such as 3-hydroxyanthranilic and quinolinic acids.30 In the present study, we were not
able to demonstrate any role for IDO in the induction of apoptosis of T-cell subsets.
Conversely, we have been able to demonstrate, in vitro, that IDO-expressing AML cells
directly increase Treg cells through a mechanism of conversion from CD4+CD25- T
cells. Moreover, although mice experiments can not definitely rule out the possibility
that Treg cell frequencies may be affected in vivo by several different mechanisms, our
results suggest that conversion may be an important pathway by which IDO-expressing
tumors expand Treg cells.
Originally thought of restricted thymic origin, recent evidences indicate that Treg cells
can also be generated in the periphery upon sub-immunogenic stimuli, i.e. in presence
of sub-optimal dose of antigen and APC activation,31,32 a situation resembling
tumor/host interaction. Accordingly, murine tumors of different histology are capable
to expand Treg cells by converting CD4+CD25- into CD25+ T cells.25 In that paper, it was
postulated that tumor-derived soluble factors, such as transforming growth factor
(TGF)-β1,33,34 that are known to regulate the conversion of CD4+CD25- into
CD4+CD25+ T cells,35 may play a critical role in inducing the conversion into Treg cells.
Although we could not rule out that, in our system, a fraction of converting T cells may
be generated in presence of leukemia-derived production of soluble factors, such as
TGF-β1, we found that T-cell conversion was completely abrogated by IDO blockade in
AML cells. These data point to a direct role of IDO production in the expansion of
converting Treg cells by AML cells and are in agreement with the results by Puccetti and
collaborators demonstrating that in a non-tumoral mouse model tryptophan catabolism
favors the emergence of CD25+Foxp3+ Treg cells by conversion from CD25-Foxp3-
cells.36 It remains to be elucidated how the modulation of tryptophan catabolism by
For personal use only. by guest on June 12, 2013. bloodjournal.hematologylibrary.orgFrom
20
IDO-expressing AML cells may be implicated in the conversion of CD4+CD25- cells
into CD4+CD25+ cells. In particular, the accumulation of small molecules within tumor
microenvironment has been recently demonstrated to affect significantly tumor-
infiltrating cell populations.37 Here, we show that the conditioned medium obtained
from IDO+, but not from IDO- AML cells was capable per se to induce the conversion
of CD4+CD25- T cells. These data suggest that IDO+ AML cells induce a tumor
microenvironment containing reduced concentrations of tryptophan and high
concentrations of kynurenine, which may have a role in AML-induced expansion of Treg
cells by conversion of CD4+CD25- T cells.
In conclusion, IDO production by AML cells directly increase Treg cells through the
conversion of CD25- into CD25+ T cells. IDO expression can be regarded as a novel
mechanism of leukemia escape from immune control and its inhibition may represent a
novel anti-leukemia therapeutic strategy.
For personal use only. by guest on June 12, 2013. bloodjournal.hematologylibrary.orgFrom
21
REFERENCES
1. Mellor AL, Munn DH. Tryptophan catabolism and T-cell tolerance:
immunosuppression by starvation?. Immunol Today. 1999;20:469-473.
2. Frumento G, Rotondo R, Tonetti M, Damonte G, Benatti U, Ferrara GB.
Tryptophan-derived catabolites are responsible for inhibition of T and natural killer
cell proliferation induced by indoleamine 2,3-dioxygenase. J Exp Med.
2002;196:459-468.
3. Grohmann U, Fallarino F, Puccetti P. Tolerance, DCs and tryptophan: much ado
about IDO. Trends Immunol. 2003;24:242-248.
4. Munn DH, Sharma MD, Lee JR, et al. Potential regulatory function of human
dendritic cells expressing indoleamine 2,3-dioxygenase. Science. 2002;297:1867-
1870.
5. Meisel R, Zibert A, Laryea M, Gobel U, Daubener W, Dilloo D. Human bone
marrow stromal cells inhibit allogeneic T-cell responses by indoleamine 2,3-
dioxygenase-mediated tryptophan degradation. Blood. 2004;103:4619-4621.
6. Uyttenhove C, Pilotte L, Théate I, et al. Evidence for a tumoral immune resistance
mechanism based on tryptophan degradation by indoleamine 2,3-dioxygenase. Nat
Med. 2003;9:1269-1274.
7. Curti A, Aluigi M, Pandolfi S, et al. Acute myeloid leukemia cells constitutively
express the immunoregulatory enzyme indoleamine 2,3-dioxygenase. Leukemia. In
press.
8. Shevach EM. CD4+CD25+ suppressor T cells: more questions than answers. Nat
Rev Immunol. 2002;2:389-400.
For personal use only. by guest on June 12, 2013. bloodjournal.hematologylibrary.orgFrom
22
9. O’Garra A, Vieira P. Regulatory T cells and the mechanisms of immune system
control. Nat Med. 2004;10:801-805.
10. Sakaguchi S, Sakaguchi N, Shimizu J, et al. Immunologic tolerance maintained by
CD25+CD4+ regulatory T cells: their common role in controlling autoimmunity,
tumor immunity, and transplantation tolerance. Immunol Rev. 2001;182:18-32.
11. Curiel TJ, Coukos G, Zou L, et al. Specific recruitment of regulatory T cells in
ovarian carcinoma fosters immune privilege and predicts reduced survival. Nat Med.
2004;10:942-949.
12. Wolf AM, Wolf D, Steurer M, Gastl G, Gunsilius E, Grubeck-Loebenstein B.
Increase of regulatory T cells in the peripheral blood of cancer patients. Clin Cancer
Res. 2003;9:606-612.
13. Terabe M, Berzofsky JA. Immunoregulatory T cells in tumor immunity. Curr Opin
Immunol. 2004;16:157-162.
14. Kudo Y, Boyd CA, Spyropoulou I, et al. Indoleamine 2,3-dioxygenase: distribution
and function in the developing human placenta. J Reprod Immunol. 2004;61:87-98.
15. Munn DH, Zhou M, Attwood JT, et al. Prevention of allogeneic fetal rejection by
tryptophan catabolism. Science. 1998;281:1191-1193.
16. Heikkinen J, Mottonen M, Alanen A, Lassila O. Phenotypic characterization of
regulatory T cells in the human decidua. Clin Exp Immunol. 2004;136:373-378.
17. Bozza S, Fallarino F, Pitzurra L, et al. A crucial role for tryptophan catabolism at
the host/Candida albicans interface. J Immunol. 2005;174:2910-2918.
18. Munn DH, Sharma MD, Hou D, et al. Expression of indoleamine 2,3-dioxygenase
by plasmacytoid dendritic cells in tumor-draining lymph nodes. J Clin Invest.
2004;114:280-290.
19. Munn DH, Mellor AL. IDO and tolerance to tumors. Trends Mol Med. 2004;10:15-
18.
For personal use only. by guest on June 12, 2013. bloodjournal.hematologylibrary.orgFrom
23
20. Aluigi M, Fogli M, Curti A, et al. Nucleofection is an efficient non-viral transfection
technique for human bone marrow-derived mesenchymal stem cells. Stem Cells.
2006;24:454-461.
21. Curti A, Ratta M, Corinti S, et al. Interleukin-11 induces Th2 polarization of human
CD4+ T cells. Blood. 2001;97:2758-2763.
22. Pileri S, Gerdes J, Rivano MT, et al. Immunohistochemical determination of growth
fractions in human permanent cell lines and lymphoid tumors: a critical comparison
of the monoclonal antibodies OKT9 and Ki-67. Br J Haematol. 1987;65:271-276.
23. Mellor AL, Keskin DB, Johnson T, Chandler P, Munn DH. Cells expressing
indoleamine 2,3-dioxygenase inhibit T cell responses. J Immunol. 2002;168:3771-
3776.
24. Fontenot JD, Rudensky AY. A well-adapted regulatory contrivance: regulatory T
cell development and the forkhead family transcription factor Foxp3. Nat Immunol.
2005;6:321-337.
25. Valzasina B, Piconese S, Guiducci C, Colombo MP. Tumor-induced expansion of
regulatory T cells by conversion of CD4+CD25- lymphocytes is thymus and
proliferation independent. Cancer Res. 2006;66:4488-4495.
26. Mellor AL, Munn DH. IDO expression by dendritic cells: tolerance and tryptophan
catabolism. Nat Rev Immunol. 2004;4:762-774.
27. Dunn GP, Bruce AT, Ikeda H, Old LJ, Schreiber RD. Cancer immunoediting: from
immunosurveillance to tumor escape. Nat Immunol. 2002;3:991-998.
28. Curti A, Pandolfi S, Aluigi M, et al. Interleukin-12 production by leukemia-derived
dendritic cells counteracts the inhibitory effect of leukemic microenvironment on T
cells. Exp Hematol. 2005;33:1521-1530.
29. Fallarino F, Grohmann U, Hwang KW, et al. Modulation of tryptophan catabolism
by regulatory T cells. Nat Immunol. 2003;4:1206-1212.
For personal use only. by guest on June 12, 2013. bloodjournal.hematologylibrary.orgFrom
24
30. Fallarino F, Grohmann U, Vacca C, et al. T cell apoptosis by tryptophan catabolism.
Cell Death Differ. 2002;9:1069-1077.
31. Mahnke K, Qian Y, Knop J, Enk AH. Induction of CD4+/CD25+ regulatory T cells
by targeting of antigens to immature dendritic cells. Blood. 2003;101:4862-4869.
32. Thorstenson KM, Khoruts A. Generation of anergic and potentially
immunoregulatory CD25+CD4+ T cells in vivo after induction of peripheral
tolerance with intravenous or oral antigen. J Immunol. 2001;167:188-195.
33. Buggins AG, Milojkovic D, Arno MJ, et al. Microenvironment produced by acute
myeloid leukemia cells prevents T cell activation and proliferation by inhibition of
NF-κB, c-Myc, and pRb pathways. J Immunol. 2001;167:6021-6030.
34. Buggins AG, Lea N, Gäken J, et al. Effect of costimulation and the
microenvironment on antigen presentation by leukemic cells. Blood. 1999;94:3479-
3490.
35. Chen W, Jin W, Hardegen N, et al. Conversion of peripheral CD4+CD25- naive T
cells to CD4+CD25+ regulatory T cells by TGF-β induction of transcription factor
Foxp3. J Exp Med. 2003;198:1875-1886.
36. Fallarino F, Grohmann U, You S, et al. The combined effects of tryptophan
starvation and tryptophan catabolites down-regulate T-cell receptor zeta-chain and
induce a regulatory phenotype in naïve T cells. J Immunol. 2006;176:6752-6761.
37. Bronte V, Zanovello P. Regulation of immune responses by L-arginine metabolism.
Nat Rev Immunol. 2005;5:641-654.
For personal use only. by guest on June 12, 2013. bloodjournal.hematologylibrary.orgFrom

25
ACKNOWLEDGMENTS
The authors wish to thank Dr. Milena Piccioli for her skillful preparation in
immunocytochemistry analysis and Prof. Stefano A. Pileri for his critical review of the
manuscript.
For personal use only. by guest on June 12, 2013. bloodjournal.hematologylibrary.orgFrom
26
FIGURE LEGENDS
Figure 1. IDO expression correlates with increased CD4+CD25+Foxp3+ T cells in
AML patients. (A) Percentage of circulating CD4+CD25+ T cells in PB collected from
normal donors and AML patients at diagnosis. (B) Foxp3 mRNA expression in highly
purified CD4+ cells obtained from AML patients. Data are expressed as percentage of
Foxp3+ patients. Normal donors=9. IDO+ patients=9. IDO- patients=12.
Figure 2. IDO expression in AML cells increased CD4+CD25+Foxp3+ T cells. (A
and B) Flow cytometry analysis of CD4+CD25+ T cells before and after culture with
AML cells in the presence and absence of 1-MT (1000 µM). Data are expressed as the
percentage of CD4+CD25+ T cells (A) and as CD25 MFI on gated CD4+ T cells (B).
Results are the mean ± SD of 10 independent experiments. (C) Surface CTLA-4
expression on purified CD4+CD25+ T cells obtained after culture with IDO-expressing
AML cells in the presence and absence of 1-MT. Results are representative of 4
independent experiments. (D) Foxp3 mRNA expression by purified CD4+CD25+ and
CD4+CD25- T cells obtained after culture with IDO-expressing AML cells. Total MNCs
stimulated with monoclonal antibodies against CD3 and CD28 were used as positive
control. Results are representative of 4 independent experiments.
Figure 3. Conditioned medium from IDO+ AML cells is capable to increase
CD4+CD25+ T cells. (A and C) HPLC assessment of L-tryptophan and L-kynurenine in
the conditioned mediums obtained from IDO+ and IDO- AML cells cultured with and
without 1-MT (1000 µM). Starting L-tryptophan concentration was 25 µM (A) and 150
For personal use only. by guest on June 12, 2013. bloodjournal.hematologylibrary.orgFrom
27
µM (C). *p<0.03, IDO+ versus IDO- cells. (B and D) One million CD3+ T cells/ml were
cultured with 105/ml IDO- AML cells in the conditioned mediums, containing 25 µM
(B) and 150 µM (D) starting L-tryptophan. At the end of culture, T cells were collected
and used for flow cytometry analysis of CD25 expression on gated CD4+ cells. As
control sample (CTR), not cultured CD3+ T cells were used. *p<0.03, IDO+ versus CTR
cells.
Figure 4. AML-induced CD4+CD25+ T cells are regulatory T cells. (A and B)
Secondary allogeneic MLRs consisting of APCs and total or purified T cells, previously
cultured with IDO-expressing AML cells in the presence and absence of 1-MT (1000
µM). Naive T cells were used as control sample. APC/T cell ratio=1/10. Proliferation
results are expressed as stimulation index. IL-2 concentration was measured in 24-hour
co-culture supernatants. Data are the mean ± SD of 7 independent experiments. (C and
D) Naive CD3+ T cells were stimulated by allogeneic APCs in the presence of total or
purified T cells previously cultured with IDO-expressing AML cells, and tested for
proliferation (C). Increasing numbers of purified CD4+CD25+ T cells obtained after
culture with IDO-expressing AML cells were added to MLR cultures (D). Responder
and suppressor cells were obtained from the same donor. Experimental T-cell
proliferation was compared to that observed in the presence of control T cells and
expressed as percentage of inhibition. Results are the mean ± SD of 6 independent
experiments.
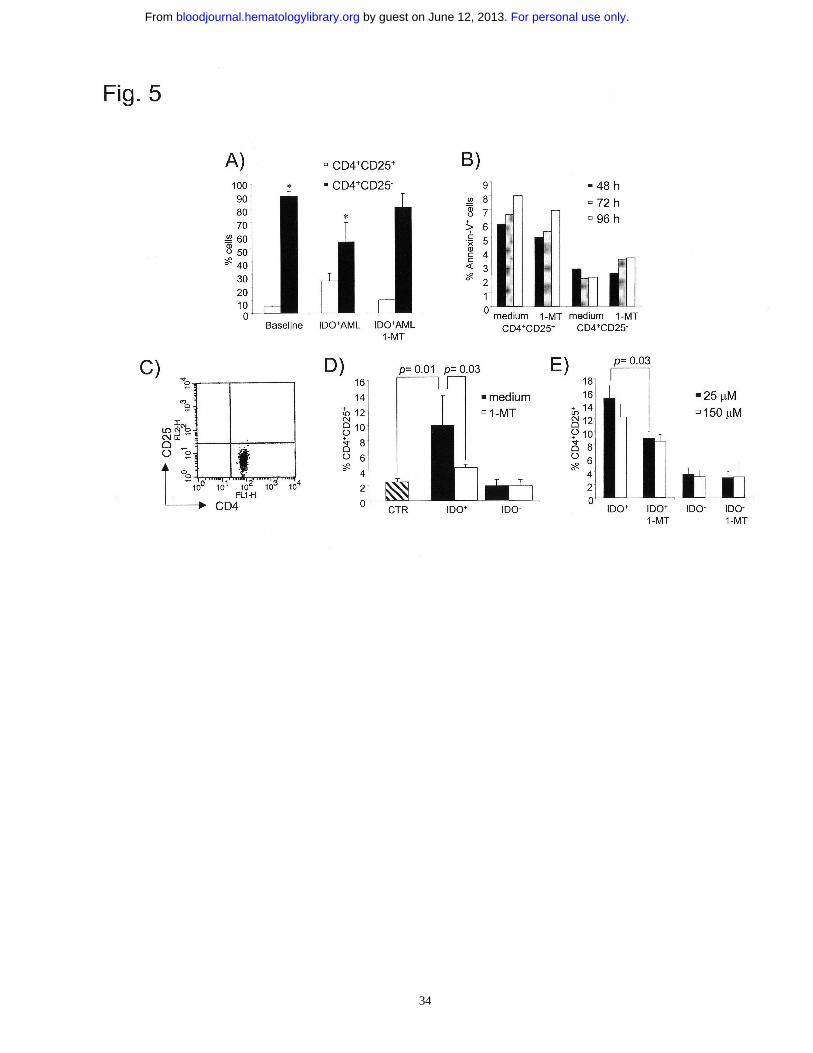
Figure 5. AML cells convert CD4+CD25- into CD4+CD25- T cells through an IDO-
dependent mechanism. (A) Flow cytometry analysis of CD4+CD25+ and CD4+CD25-
T cells before and after culture with allogeneic IDO-expressing AML cells in the
presence and absence of 1-MT (1000 µM). Results are representative of 7 independent
For personal use only. by guest on June 12, 2013. bloodjournal.hematologylibrary.orgFrom
28
experiments. *p=0.03, experimental versus control sample. (B) Annexin-V staining and
flow-cytometry analysis of CD4+CD25+ and CD4+CD25- cells after culture with IDO+
AML cells. Cells were analyzed at different time points. Results are representative of 3
independent experiments. (C) Purity of CD4+CD25- cells. Results are representative of
4 independent experiments. (D) Purified CD4+CD25- T cells were incubated for 7 days
with normal MNCs (CTR) or AML cells in the presence and absence of 1-MT. At the
end of culture, CD4+ cells were gated and analyzed for the presence of converted
CD4+CD25+ cells. Results are the mean ± SD of 4 independent experiments. (E)
Purified CD4+CD25- T cells were resuspended in the conditioned medium collected
from IDO- and IDO+ AML cells and stimulated with IDO- AML cells for 7 days. At the
end of culture, CD4+ cells were gated and analyzed for the presence of converted
CD4+CD25+ cells. Results are representative of 3 independent experiments.
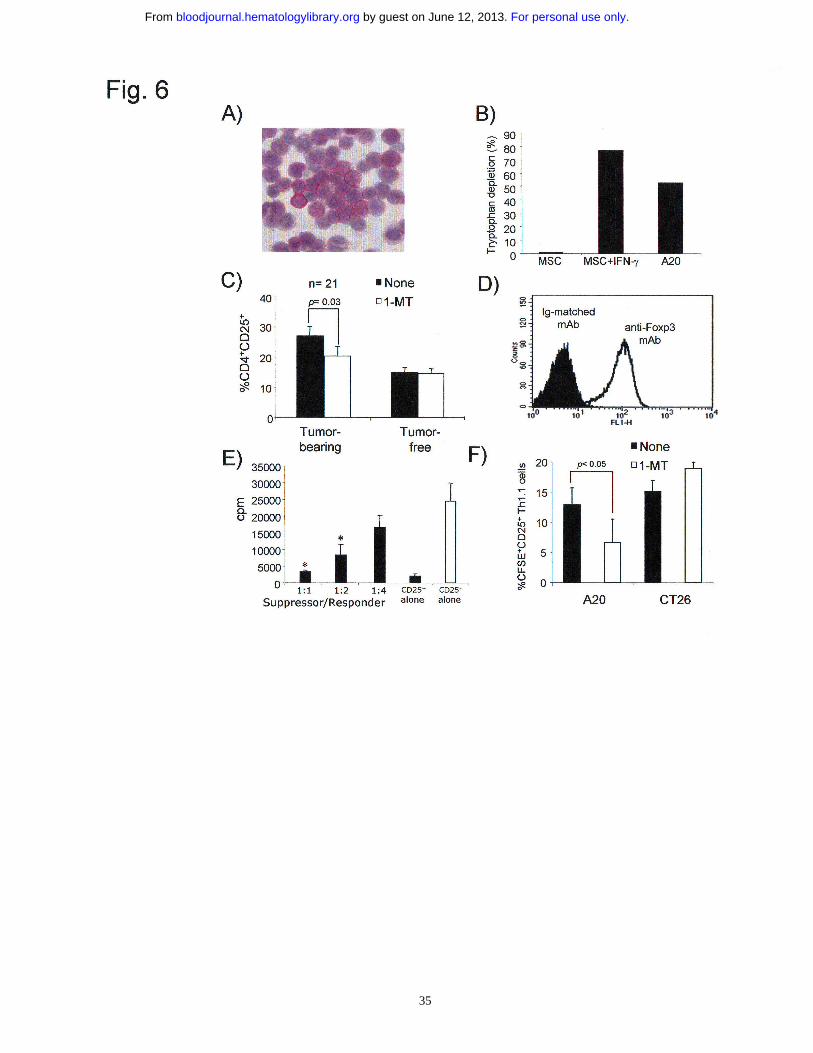
Figure 6. In vivo inhibition of IDO prevents tumor-mediated expansion of
CD4+CD25+ T cells by blocking the conversion of CD4+CD25- cells. (A)
Immunocytochemistry analysis for IDO protein in A20 cells. (B) Functional enzymatic
activity. Depletion of tryptophan from the culture medium (expressed as the percentage
of the starting concentration in fresh medium) by human MSCs with or without IFN-γ
(positive control sample) and A20 cells. Results are representative of 3 independent
experiments. (C) BALB/c mice were injected intrasplenically with 105 A20 cells (tumor
bearing mice=TB) and from the day of tumor injection they were treated or not with 1-
D,L-MT (NT=not treated, n=21;1-MT= 1-MT-treated, n=21). Two groups of mice
(naive, n=15) were not injected with the tumor but received 1-MT. Percentage of
CD4+CD25+ T cells among CD4+ T cells in spleen was assessed by flow cytometry
analysis. Average of data collected from experiments independently performed is
reported. (D) Intracellular Foxp3 expression in purified CD4+CD25+ T cells obtained
from splenocytes of tumor-bearing mice. Results are representative of 4 independent
For personal use only. by guest on June 12, 2013. bloodjournal.hematologylibrary.orgFrom
29
experiments. (E) Anti-CD3 mediated proliferation of naive CD4+CD25- T cells in the
presence of increased numbers of CD4+CD25+ cells obtained from splenocytes of tumor
bearing mice (black bars). As positive control, CD4+CD25- cells were stimulated in
absence of CD4+CD25+ T cells (white bar). Proliferation was evaluated after 3 days by
thymidine incorporation assay. Results are expressed as cpm and represent the mean ±
SD of 4 independent experiments. *p=0.03, experimental versus control sample. (F) In
vivo conversion experiments. Purified Thy1.1+ CD4+CD25- T cells (10x106) were
transferred into BALB/c mice bearing A20 or CT26 tumors. After 10 days spleens were
collected and labeled with Thy1.1, CD4 and CD25; Thy1.1+ CD4+ cells were gated and
analyzed for CD25 and CFSE expression. Cumulative data of the
CFSEhighCD25+Thy1.1+ cells conversion in spleens cells are reported and represent the
mean ± SD of 4 experiments.
For personal use only. by guest on June 12, 2013. bloodjournal.hematologylibrary.orgFrom
30
For personal use only. by guest on June 12, 2013. bloodjournal.hematologylibrary.orgFrom

31
For personal use only. by guest on June 12, 2013. bloodjournal.hematologylibrary.orgFrom
32
For personal use only. by guest on June 12, 2013. bloodjournal.hematologylibrary.orgFrom
33
For personal use only. by guest on June 12, 2013. bloodjournal.hematologylibrary.orgFrom
34
For personal use only. by guest on June 12, 2013. bloodjournal.hematologylibrary.orgFrom
35
For personal use only. by guest on June 12, 2013. bloodjournal.hematologylibrary.orgFrom


![Induction of Erythroid Differentiation in Human Leukemic K ......[CANCER RESEARCH 50, 1231-1236. February 15. 1990] Induction of Erythroid Differentiation in Human Leukemic K-562 Cells](https://static.cupdf.com/doc/110x72/60b088961b1fcf1e2a746f9b/induction-of-erythroid-differentiation-in-human-leukemic-k-cancer-research.jpg)