LABOUR MARKET ADJUSTMENTS AND MIGRATION
1
Labour Market Adjustments and Migration in Europe and the United States: How Different?
Robert C. M. Beyer and Frank Smets Goethe Universität Frankfurt; European Central Bank and KU Leuven
PAPER PRESENTED AT THE 60th PANEL MEETING OF ECONOMIC POLICY IN
OCTOBER 2014
1. INTRODUCTION
Since the outbreak of the financial crisis in 2008, high and diverging unemployment
rates across European countries and regions have become an increasingly important
concern for European policy makers. In 2013 the unemployment rate in Spain was above
25%, but only around 5% in Germany. Heterogeneity is large not only between countries
but also within countries. For example, in France, Belgium and Spain the highest
regional unemployment rates were twice as high as the lowest. In Italy, as an extreme
example, the unemployment rate in Veneto was just a third of the unemployment rates in
Campania or Sardinia. Moreover, this regional heterogeneity has increased since 2008
(Marelli, Patuelli, and Signorelli, 2012).
These persistent differences in unemployment rates across regions and countries have
put the role of migration in labour market adjustment back on the European policy
agenda. Migration can cushion the negative impact of adverse labour demand shocks on
unemployment and thereby smooth the adjustment to heterogeneous macroeconomic
developments. This is particularly important within a monetary union, in which relative
wage adjustments may be slow due to the absence of nominal exchange rate adjustments.
In 2013 the Commission adopted a proposal for a directive on new measures to facilitate
labour mobility and the European Council agreed on measures to fight youth
unemployment aiming, among other things, at increasing the mobility of young workers.
The views expressed in this paper are our own and not necessarily those of the European Central Bank or its
Governing Council. We are grateful to Nicola Fuchs-Schündeln, Michele Lenza, Giuseppe Bertola, Domenico Giannone, Ana Lamo, Jens Suedekum, four anonymous referees, to the participants of the 2013 ECB-CEPR
conference on ‘Heterogeneity in currency areas and macroeconomic policies’ at the European Central Bank,
and to seminar and workshop participants at Goethe Universität, DIW, and Deutsche Bundesbank for helpful comments.

LABOUR MARKET ADJUSTMENTS AND MIGRATION
2
In this paper we contribute to this policy debate by empirically investigating how
labour markets adjust to asymmetric labour demand developments and whether
migration contributes substantially to this adjustment, using a modified version of the
methodology of Blanchard and Katz (1992). In particular, we compare regional and
country labour market adjustment in Europe with state adjustment in the US. The US is a
natural benchmark for such a comparison because it is a large monetary union of similar
size with a well-functioning, quite homogenous labour market. The US benchmark may
therefore give an idea of how much scope there is for increased labour mobility and
migration to play a role in labour market adjustment in Europe.
We are not the first ones to make this comparison. In particular, Decressin and Fatás
(1995) and Obstfeld and Peri (1998) also applied the methodology of Blanchard and
Katz (1992) to compare regional labour market adjustment in Europe and the United
States.1 Overall, they found that the regional adjustment process is faster in the United
States due to higher labour mobility. There are at least three reasons why it is important
to update and refine this analysis.
First, we have a much longer sample (38 years rather than 13 years in Decressin and
Fatás (1995)). This allows us to investigate the robustness of their findings and, more
importantly, whether the adjustment process has changed over time. Since the early
1990s European integration has continued to proceed in a number of areas which should
facilitate the regional adjustment process. There is, for example, evidence that migration
between European countries has increased due to the Schengen Agreement and the
introduction of the euro (Beine et al., 2013). Some of these changes have become quite
visible since the outbreak of the financial crisis. For example, net migration between
Germany and the crisis countries (Spain, Portugal, Italy and Greece) has risen from
minus 10.000 in 2009 to 70.000 in 2012. In contrast, interstate migration in the US has
been decreasing since the 1980s and has dropped during the crisis to the lowest values
since World War II (Frey, 2009). It is therefore interesting to see whether this has led to
a convergence of the regional labour market adjustment process in Europe and the
United States.
Secondly, when comparing Europe and the United States, Decressin and Fatás (1995)
did not make a distinction between regional labour market adjustment within countries
and between countries, while Obstfeld and Peri (1998) only focused on adjustment
within countries. In this paper, we use the common factor methodology of Greenaway-
McGrevy and Hood (2013) to filter out country factors and analyse the adjustment of
countries to national labour demand shocks, which is likely to be hampered by bigger
cultural, language and institutional differences. This allows us to investigate whether any
convergence with the US is due to a smoother working of the adjustment process within
or between countries.
Thirdly, a straightforward comparison of the European and US results was hampered
by the different data sources being used in those studies. We show that the differences
are less pronounced when similar data sources are used.
1 See Section 2 for a more detailed overview of the literature.
LABOUR MARKET ADJUSTMENTS AND MIGRATION
3
The following findings are worth highlighting. First, looking at the full sample we find
that both in Europe and the US labour mobility accounts for about 50% of the long run
adjustment to region-specific labour demand shocks. The other 50% is accounted for by
a reallocation of jobs across regions. But, in Europe it takes longer (10 years) than in the
United States (5 years) for this adjustment process to be completed. And due to the
greater rigidity of labour markets, the temporary response of the unemployment rate is
more important and more persistent in European regional labour market adjustment.
Second, we show that in Europe labour mobility is a less important adjustment
mechanism in response to country-specific labour demand shocks. In this case, both the
unemployment rate and the participation rate play a larger and more persistent role in the
adjustment process. This underlines the remaining cultural, language and institutional
barriers to labour mobility across European countries and provides support to European
policy initiatives to further facilitate migration across countries.
Third, in line with Dao, Furceri and Loungani (2014), we find that the role of
migration in the regional adjustment process has decreased in the US. In contrast, in
Europe migration has become a more powerful adjustment factor in response to both
regional- and country-specific labour demand shocks in the second half of the sample
(1990-2013 versus 1977-1999). This suggests that the acceleration of the European
integration process after the early 1990s has led to more labour mobility across regions
and countries.
In the rest of the paper, we first briefly review in Section 2 how migration is typically
analysed in the literature. Section 3, presenting the Blanchard-Katz methodology and our
modifications, may be skipped by readers only interested in the results. The data is
presented and discussed in Section 4 and Section 5 contains the main empirical analysis.
Section 6 links our results to Blanchard and Katz (1992) and is not relevant for the main
message. Finally, Section 7 discusses some policy implications.
2. Studying Migration
The importance of labour migration in facilitating adjustment to asymmetric shocks in
a monetary union has been recognised at least since the seminal research on optimal
currency areas of Mundell (1961). The empirical analysis of migration has, however,
been hampered by the lack of reliable data. Recently an increasing number of papers
have started to analyse migration patterns directly. Molloy, Smith and Wozniak (2011)
analyse changes in the US over the last 30 years and detect a widespread decline in
movements across all distances and across all population sub-groups. Frey (2009) shows
that in 2007 migration rates in the US reached their lowest value since World War II and

LABOUR MARKET ADJUSTMENTS AND MIGRATION
4
that the decline was strongest for interstate migration. Reasons for the decline in
mobility remain, however, unclear.2
Beine et al. (2013) with a new dataset containing 30 countries and covering the period
1980-2010 come to contrary conclusions regarding migration in Europe. They find that
both the Schengen Agreement and the introduction of the Euro have increased migration
between the member countries. However, migration between countries covers only a
small part of all movements. In Germany, for example, roughly twice as many people
move every year within Germany from one state to another than from Germany to
another country.
Due to a lack of reliable data to analyse regional labour mobility directly, a large part
of the literature has pursued the indirect approach proposed by Blanchard and Katz
(1992). In their seminal paper on regional evolutions they develop a small model of
regional labour markets (in the following: BK model) and suggest estimating the joint
behaviour of the employment growth, the employment rate and the participations rate to
analyse regional labour market adjustments to regional labour demand shocks. The
respective reduced-form vector autoregression model (VAR) that they derive from their
theoretical model offers an indirect approach to study migration because all employment
changes unexplained by either the participation or the employment rate must originate
from a change in population, which is identified with migration.
Applying the methodology to US states, Blanchard and Katz (1992) find that as of the
first year migration plays a dominant role in the adjustment process following a shock to
regional labour demand. Decressin and Fatás (1995) analyse large Western European
regions and compare them to US states and find that in Europe the participation rate is
the major force driving adjustment. Obstfeld and Peri (1998) analyse how regions in the
US, Canada, the UK, Germany and Italy react to asymmetric labour demand shocks and
show, first, that regional real exchange rates play a minor role in the regional adjustment
process and, second, that the US adjustment process is the fastest due to higher labour
mobility.
The methodology of Blanchard and Katz (1992) has been applied in many other
studies and has become the standard model to analyse regional labour market adjustment
mechanisms and to approach migration patterns indirectly.3 Greenaway-McGrevy and
Hood (2013) apply the model to metropolitan areas in the US and find that the
adjustment to location-specific and aggregate shocks differ considerably. Our paper
shares their main modification, namely the use of a factor structure to separate region-
specific from common shocks. Dao, Furceri and Loungani (2014) reassess the
2 Demographics and an aging of the population, increasing home ownership rates and an increasing share of
women in the labour force may matter. Glaesser and Tobio (2007) discuss the role played by very long-term
adjustment processes over many centuries that may have been concluded. Dao, Furceri and Loungani (2014)
point to a decreasing dispersion of regional labour markets. Earlier papers detecting a decline include
Greenwood (1997) and Long (1988). The recent decline in migration in the US may be somewhat
overestimated (Kaplan and Schulhofer-Wohl, 2012). 3 Numerous other papers relied on the BK model: Jimeno and Bentotila (1998) adapt the methodology to study
Spanish regions; Fredriksson (1999) looks at Swedish regions; Fidrmuc (2004), Gács and Huber (2005),
Bornhorst and Commander (2006) focus on regions in Central and Eastern Europe, and Tani (2003) suggests that migration in Europe is higher than expected.
LABOUR MARKET ADJUSTMENTS AND MIGRATION
5
adjustment of US states and find that the contribution of migration has decreased since
1980 and link it to a declining trend in the dispersion of unemployment rates across
states. In addition, they show that migration contributes more in aggregate downturns
and sketch some differences between the US and Europe.
For our purposes there is no alternative to inferring migration indirectly as in the
Blanchard and Katz (1992) methodology. But we acknowledge that the chosen approach
comes with drawbacks, including weak micro-foundations and a debatable identification
of the labour demand shocks. Due to the availability of more and better regional data
economic geography offers an increasingly feasible alternative. Counterfactual analyses
in spatial general equilibrium models – as in Redding (2012), Ahlfeld et al. (2013), or
Behrens et al. (2013) – could be used to understand how individuals relocate after a
shock and where they move. An alternative approach is to look at how mobility response
to well-identified shocks. Both in the US and Germany trade shocks, for example, have
been shown to induce relatively small mobility responses (Autor, Dorn, and Hanson
2013; Dauth, Findeisen, and Südekum 2014).
3. EMPIRICAL STRATEGY
3.1 Intuition of the BK Model
In this section, we provide some intuition behind the BK model. For a full model
description, we refer the interested reader to the original paper of Blanchard and Katz
(1992). Starting from the observation that region-specific labour demand shocks have
permanent effects on employment, but only temporary effects on the employment rate,
the participation rate and wages, Blanchard and Katz (1992) develop a simple model of
regional labour market dynamics that is based on two basic features. First, regions are
assumed to produce distinct bundles of goods that are sold in an aggregate goods market
and, second, labour and capital are assumed to be perfectly mobile in the long run. In
this model, state-specific shocks to labour demand result in short-lived mean deviations
of wages, but cause permanent changes of the employment level. An adverse shock to
labour demand, for example, increases unemployment and lowers wages, which induces
some workers to leave the region. Since workers move out of the region until wages are
back to equilibrium, lost jobs after an adverse demand shock are not fully recovered.
Similarly, when region-specific labour demand increases, relative wages tend to
increase. Thus leads some firms to relocate at least part of their production outside the
region and thus reduces employment compensating for some of the newly created jobs.
However, higher wages also cause inward migration of workers so that some of the
newly created jobs remain permanently in the region. The relative sensitivities of labour
demand and supply determine how large the permanent effect of the labour demand
shock is on regional employment. In the short run, changes in the unemployment and the
participation rate can also contribute to the change in employment.

LABOUR MARKET ADJUSTMENTS AND MIGRATION
6
In order to implement this model empirically and in the absence of reliable regional
wage data, Blanchard and Katz (1992) propose to estimate the joint behaviour of
employment growth, the employment rate and the participation rate. The short and long
run adjustment of the regional labour market can then be analysed by tracing out the
impact of a shock to the employment growth equation.
3.2 Region-Specific Variables
Blanchard and Katz (1992) measure region-specific variables as simple differences
between the regional variables and their aggregate continental counterpart. Let stand
for the number of persons employed, for the labour force in persons and for the
population in persons, in region i, at time t; let
contain the regional employment growth, employment rate and participation rate;
and let stand for the respective continental data. Then the region-specific variables
– denoted by – are given by
(1)
This definition of a region-specific variable boils down to conditioning each of the
variables on one common factor (the continental aggregate variable) and to restricting
the loading on that factor to be equal to one.4 Such a transformation will identify the
adjustment to region-specific shocks, only if all regions respond identically to aggregate
fluctuations. But in a regression of regional variables on their aggregate counterparts
most coefficients are quite different from one, suggesting that regions react quite
heterogeneously to aggregate business cycles (see Hamilton and Owyang 2012).5 In this
case, the simple transformation like in equation (1) will estimate a mixture of the
adjustment to local and aggregate shocks. One advantage of the simple difference
transformation is that one does not need to identify local and aggregate shocks. This may
still be justified if the regional dynamics is independent of the local or aggregate origin
of the shock.
There may, however, be reasons why regions adjust differently following aggregate
versus idiosyncratic shocks. For example, using the BK methodology Dao, Furceri and
Loungani (2014) find that the regional adjustment differs depending on aggregate
conditions. One explanation may be that job-churnings are pro-cyclical, i.e. they
decrease during an economic bust and increase in good times (Fallick and Fleischman
4 For large cross-sections the idiosyncratic components average out so that the aggregate converges to the common factor (Forni and Reichlin 1998 and Pesaran 2006). For a large sample this is hence identical to
including a common time trend. The aggregate most often refers to national variables (as in Blanchard and
Katz 1992 or in Obstfeld and Peri 1998) but continental variables can also be used (as in Decressin and Fatás
1995). 5 Decressin and Fatás (1995) reject a unity reaction of regions to aggregate shocks for most regions as well.
They suggest using the estimated coefficients as weights when differencing, so that regions are allowed to react with a different sign and magnitude to aggregate movements. They thus condition on one common factor per
variable, but allow for different weights. These variables, so called β-differences, are uncorrelated with
aggregate variables and, if there were only one common factor per variable, would indeed enable a separation of regional and aggregate fluctuations.

LABOUR MARKET ADJUSTMENTS AND MIGRATION
7
2004; Caballero and Hammour 2005; Molloy, Smith and Wozniak 2011; Davis et al.
2011). As a result, when a region is hit by an idiosyncratic negative labour demand
shock and the labour market in other regions is not affected, it may be easier to find a job
there and the incentive to migrate may be higher. In contrast, when the whole country is
negatively affected but one region worse than another, it may be more difficult to find a
job in the region that is hit less, dampening the incentives for migration.
Greenaway-McGrevy and Hood (2013) show how a factor model can be embedded
into the structural innovations of the original BK model in order to distinguish between
the adjustment to aggregate and local shocks. Region-specific variables are then defined
as residuals of a factor model:
(2)
),
where , , are the factors and
, , are constant but region-
specific loadings.
Intuitively, regions are allowed to respond to two different processes, namely a
local, idiosyncratic shock process and a set of common or aggregate shock processes,
with potentially different responses. The data is modelled as the sum of these two
processes. Strong-form dependence in the panel allows consistent identification of the
factors justifying their use in linear regressions (Bai and Ng 2006, Bai 2009,
Greenaway-McGrevy and Hood 2013). Greenaway-McGrevy and Hood (2013) show
that the adjustment processes of MSAs are different after location-specific and
aggregate shocks. In the former case migration is rapid but relatively weak. Conversely,
the adjustment after common shocks is driven by more prolonged and larger migration.
3.3 Estimation Procedure
Partly following Greenaway-McGrevy and Hood (2013), our estimation proceeds in
two steps.6 In the first step, we decompose the regional variables in three orthogonal
components: the contribution of a continent-wide factor, of a country factor and a
region-specific variable. This is done by estimating a multi-level factor model. In the
second step, we separately estimate a pooled VAR in the region-specific variables and
the country factors to investigate and compare the labour market response to region-
specific7 and country-specific shocks respectively.
3.3.1 The Factor Model
We estimate a separate multi-level factor model for Europe and the US. We include
one continental factor, one country factor in Europe and one area factor in the US. In
Europe, we include a German (G), French (F), Italian (I), Spanish (SP) and British (GB)
6 Because in this model also the data vector follows a factor structure the factor model can be estimated before
the VAR. For more details regarding the augmented BK model refer to Greenaway-McGrevy and Hood
(2013). 7 We use the terms region-specific, idiosyncratic and local shock interchangeably.
LABOUR MARKET ADJUSTMENTS AND MIGRATION
8
factor, and in the US we include the four US areas Northeast (NE), Midwest (MW),
South (S), and West (W).8 We restrict the loadings so that only regions belonging to a
particular country (area) are able to load on the respective country (area) factor.9
Accordingly, the following factor model is estimated for Europe and the United States
separately:
(3)
Where i denotes the region, c the country in Europe the region belongs to or the area the
state in the US belongs to, and a is the continent (Europe or US). The idiosyncratic
component contains the region-specific variables. The loadings represent the
sensitivity of the regional series to the country, area or continental factors and since they
are region-specific, they allow for heterogeneous effects of those factors.
Since principal-components methods cannot account for a hierarchical factor structure,
we estimate the factors with the quasi-maximum likelihood approach of Doz, Giannone,
and Reichlin (2012). They show that maximum likelihood is suitable to estimate the
common factors in large cross-sections of time series. We implement the QML estimator
using the Kalman smoother and the EM algorithm.10
3.3.2 The Vector Autoregression Model
We then separately estimate the following panel VAR and pool over different
subsamples:
(4)
(5)
8 Different factor structures are, of course, possible. The results are not changing importantly for different
structures. 9 We impose a structure on the factors in order to capture the variables’ pervasive covariation for the different geographical entities. In Europe it is important to account for country factors. Using the ABC criterion of
Alessi, Barigozzi and Capasso (2010), we find indeed strong evidence for more than one common factor per
series. 10 Forni, Hallin, Lippi, and Reichlin (2000) and Stock and Watson (2002) propose to estimate common factors
using principal components. Principal components are indeed easy to compute and consistent for any path of
the cross-section and sample length (Bai and Ng 2002; Forni, Giannone, Lippi, and Reichlin, 2009). Yet, with principal components it is not possible to restrict the factor structure as we intend. Other authors working with
structural factors include: Forni and Reichlin (2001); Bernanke, Boivin, and Eliasz (2005); and Boivin and
Giannoni (2006). Also Kose, Otrok, and Whiteman (2003) apply a likelihood based estimator. The QML
approach of Doz, Giannone, and Reichlin (2012) assumes that all series are I(0). In our case, however, some
series are I(1). Principal components deliver consistent estimates also in this case (Bai and Ng 2004). We re-
estimate the three global factors using principal components and the structural factors of the remaining unexplained fluctuations – that all turn out to be I(0) – with the QML approach. The factors are very similar.
Doing the factor analysis in two steps underestimates the errors, because the QML estimation uses estimated
data. However, in the VAR we treat the factors in any case as observations (Bai 2003, Giannone and Lenza 2009).

LABOUR MARKET ADJUSTMENTS AND MIGRATION
9
where the region- or country-specific constants represent regional or country fixed
effects that allow for different long-term averages.11
Given our large cross-section and
modest sample length the two-step procedure does not cause a generated regressor
problem (Pagan 1984, Bernanke and Boivin 2003, Bai and Ng 2006) so that we can
indeed treat the region- and country-specific variables as observations (Bai 2003,
Giannone and Lenza 2009).
The short and long run adjustment of the regional labour market can then be analysed
by tracing out the impact of a shock to the employment growth equation on the other
variables. The identifying assumption is that this shock captures unexpected changes in
regional labour demand meaning that contemporaneous employment growth is weakly
exogenous in the other equations of the VAR. The Choleski decomposition implies that
current changes in employment affect both employment and participation rates but not
vice versa. There are examples that violate this assumption, for example changing
fertility rates, but we assume these changes are small relative to the labour demand
shocks.12
A region-specific labour demand shock is a change in labour demand in a region that is
uncorrelated with national and continental labour demand. Think for example of a
change in local government spending, the bankruptcy of a big company with many
employees in one particular region, or a regional natural catastrophe like a storm tide.
Examples of shocks to country-specific labour demand could result from a change in
military spending, oil prices, a national banking crisis or changes in national policies.
Note that
(6)
.
Changes of the employment level thus stem either from changes of the employment
rate, the participation rate or the population. With the VAR we can distil the population
response, since any change that is not explained by the employment rate or the
participation rates is attributed to a change of the population. Following Blanchard and
Katz (1992), we will assume that these changes of the population are due to migration.
11 We could also estimate (4) using the original regional variables on the left-hand side and augmenting the
VAR with the continental and country (area) factors. Results are very similar. 12 Dao, Furceri and Loungani (2014) in a recent working paper test the assumption for the US and conclude that identification with an instrument reveals a lower contribution of migration. We are not fully convinced that
the only effect of the IV identification is a clearer demand shock, as it may also change the type of the
adjustment. Because the IV approach is very difficult to implement in Europe also Dao, Furceri and Loungani (2014) rely on our assumption for their European analysis.
LABOUR MARKET ADJUSTMENTS AND MIGRATION
10
4 DATA, DESCRIPTIVE STATISTICS, VARIANCE DECOMPOSITION
4.1 Regional Disaggregation and Data Sources
The regional disaggregation follows Blanchard and Katz (1992) for the US and is
similar to Decressin and Fatás (1995) for Europe. For the US, the disaggregation is
straightforward: we count each state plus the District of Columbia as a region so that
there is a total of 51 US regions. In Europe entities of comparable size refer less strictly
to administrative divisions. Yet, all regions in the sample can be understood as
consisting of one or more NUTS2-regions. We include eight French, seven German,
eleven Italian, seven Spanish, and eight British regions, as well as Belgium, Denmark,
Greece, Ireland, the Netherlands and Portugal. While Decressin and Fatás (1995) classify
the small countries as regions, they are treated as countries in our set-up. For a list of all
regions see Appendix A.
We use data on the population, labour force and employment, from which we compute
the employment growth, the (un)employment rate, as well as the participation rate. Our
time series starts in 1976 and ends in 2013 so that it covers 38 years. The primary
European data sources are the national Labour Force Surveys. We apply some data
modifications to fill in missing data points and replace data of obviously bad quality
using data from different international and national sources. The data from different
sources is linked using adjusted growth rates of the working-age population, the
unemployment and the participation rates. They are then used to extend the most recent
data backwards. We compared different ways to link the data and found that differences
are minor. For European regions we restrict the sample to the working-age population so
that all series cover only persons between 15 and 64 years old.
For the US we use the Current Population Survey (CPS) as our main data source
because it is comparable to the European Labour Force Surveys. In section 6 below, we
also use Local Area Unemployment Statistics (LAUS) from the Bureau of Labor
Statistics as an alternative data source for investigating the US adjustment mechanism
because these are establishment data that are closer to the data used by Blanchard and
Katz (1992). All US series include all persons older than 15 years.
For more details regarding the regional disaggregation as well as data sources and
modifications refer to the data appendix.
4.2 Descriptive Statistics
In 2013 the average regional population in the US was 4.8 million with a standard
deviation of 5.4 million leading to a coefficient of variation of 1.1. With 30 million
California was the biggest region in the US and with less than half a million Wyoming
was the smallest. The average regional working-age population in Europe is very similar
and equal to 4.6 million but the standard deviation is with 2.4 million smaller, resulting
in a smaller coefficient of variation, 0.5. Nordrhein-Westfalen in Germany is the largest
region with a working-age population of 12 million in 2013, whereas Abruzzi-Molise in

LABOUR MARKET ADJUSTMENTS AND MIGRATION
11
Italy is the smallest with only 1 million inhabitants. The total working-age population in
2013 was 240 million in the US and 220 million in Europe.
The average unemployment rate in a US region in 2013 was 6.8% with a standard
deviation of 1.6%. In Europe the average unemployment rate was nearly twice as high,
namely 12.5%, and the regions were much more heterogeneous, as indicated by a
standard deviation of 7.9%. Over the whole sample the average unemployment rate was
6% in the US and 10% in Europe.
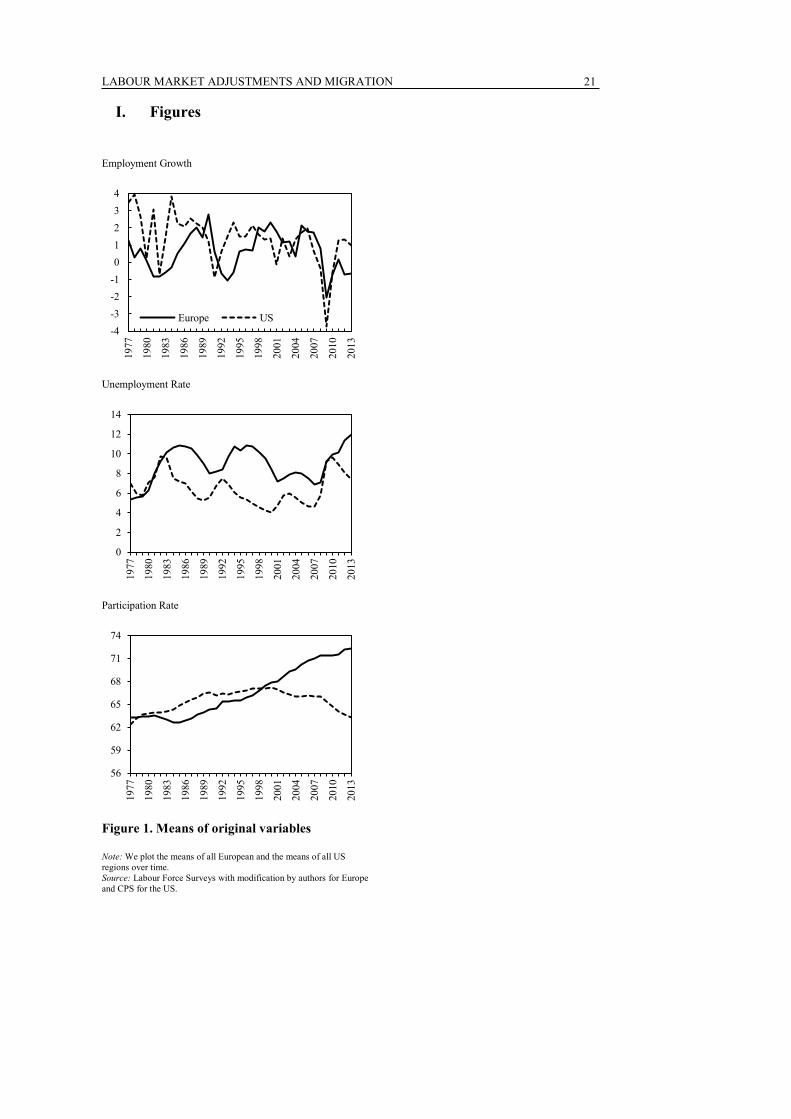
[Insert Figure1 here]
Figure 1 plots the continental means of employment growth, the unemployment rate
and the participation rate over the period 1977 till 2013 in the US and Europe.
Employment growth fluctuates strongly, in particular in the US. While employment
growth was on average higher in the US than in Europe in the earlier part of the sample,
growth rates have become more similar since then. The unemployment rate shown in the
middle panel is less volatile and returns to its mean roughly every ten years. During most
of the sample the unemployment rate is higher in Europe than in the United States.
Finally, the lower panel shows the participation rate, noting that for Europe this only
includes persons below the age of 64. The participation rate in Europe shows a clear
upward trend throughout the sample, whereas in the US the participation rate increased
until 2000, and started to decline afterwards.
[Insert Figure 2 here]
Figure 2 plots the standard deviation of regional unemployment rates over time. In
Europe regions diverged until 1998. Following the introduction of the euro in 1999 they
converged very fast.13
However, since 2008 regional unemployment rates are again
diverging strongly in Europe. As a result, in 2013 the dispersion reached its maximum
over the sample period. In contrast, regional unemployment dispersion is considerably
lower in the US than in Europe, confirming that US regions are more homogenous than
European ones. Also note that in the US regions diverge particularly in recessions: the
three steepest increases of the standard deviation – in the early eighties, the early
nineties, and between 2008 and 2010 – all coincide with recessions.14
13 In the same period the standard deviation of unemployment rates of other developed countries decreased as
well, but less than in Europe (Estrada, Galí and López-Salido, 2013). 14 The connection between increasing standard deviations and recessions is also discussed in Greenaway-McGrevy and Hood (2013) as well as in Dao, Furceri and Loungani (2014).
LABOUR MARKET ADJUSTMENTS AND MIGRATION
12
4.3 Variance Decomposition
Next we estimate the multi-level factor model (3) to extract the common factors from
the data.
[Insert Table 1 here]
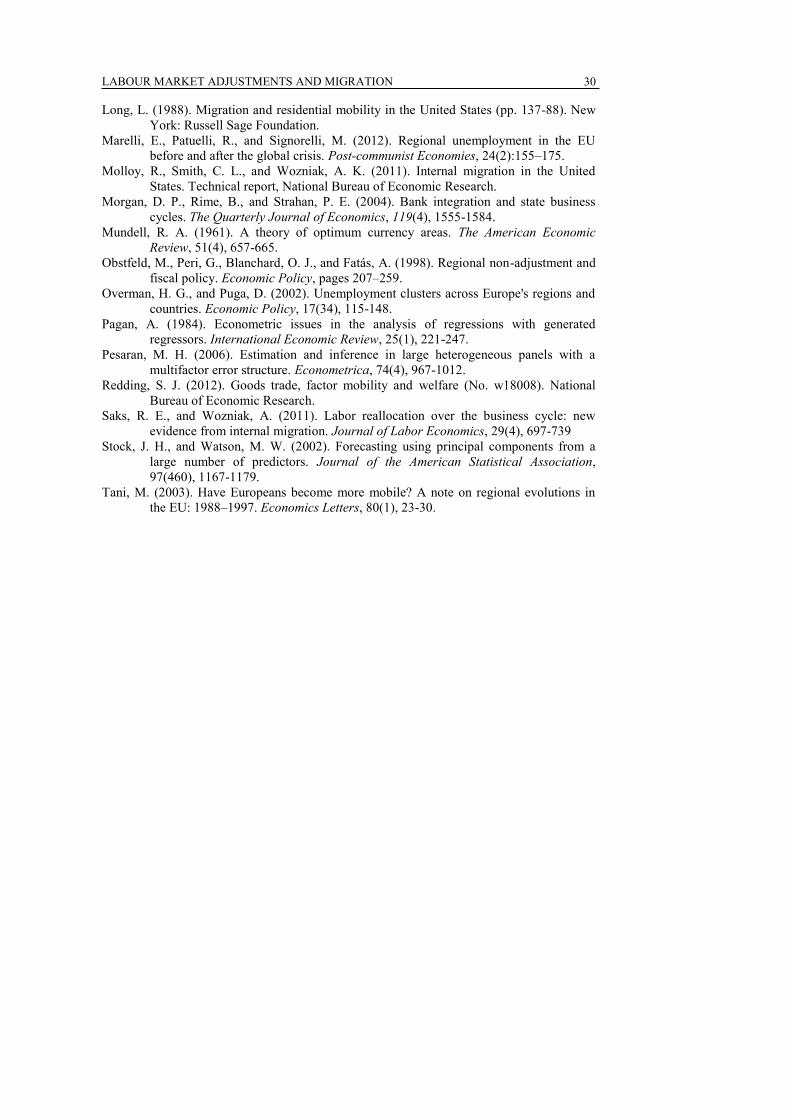
Table 1 reports the proportion of variance explained by each level for each variable.
The common European factor explains 28% of the employment growth fluctuations,
41% of fluctuations in the employment rate and 69% of fluctuations in the participation
rate. Country factors are nearly as important for the first two series, but matter less for
changes in the participation rate. The importance of the country factors in Europe
supports our strategy to estimate a multi-level factor model. Together the EU and
country factors capture between 57% of the variance in employment growth and 85% of
the variance in the participation rate. Idiosyncratic fluctuations are most important (43%)
for the employment growth rate.
The greater homogeneity of the US economy is reflected in the fact that the US factor
plays a more important role in accounting for both employment growth and employment
rate fluctuations. As expected, US states are thus more correlated and their business
cycles more aligned than regions in Europe. The area factors, on the other hand, explain
less than half of the variance that is captured by the country factors, clearly showing that
country factors are more important in Europe. The contributions of region-specific
shocks are similar to the ones in Europe with a slightly lower contribution for the
employment rate.
5 LABOUR MARKET ADJUSTMENTS
In this section, we compare the labour market adjustment of regions to region-specific
shocks in Europe and the US, and analyse as well the country adjustment in Europe.
Moreover, we analyse changes in the role of labour mobility over time.
In each case, the figures below report impulse responses of the employment level, the
employment rate and the participation rate to a positive one standard deviation shock to
labour demand. Note that deviations of the employment rate are approximately equal to
negative deviations of the unemployment rate. The responses show percentage
deviations from region-specific means. In addition, we include a table below the impulse
responses that shows the adjustment in the first five years and in the long run to a
normalised initial increase of 100 jobs. Each table reports in the first line the number of
newly created jobs and in the lines below it decomposes the new jobs. Some of the new
jobs are filled with formerly unemployed, others with people previously not forming part
of the labour force and the remaining jobs are filled with people moving into the region.

LABOUR MARKET ADJUSTMENTS AND MIGRATION
13
5.1 Regional Adjustment to Region-Specific Shocks
First we discuss the adjustment of regions to region-specific changes in labour demand
and compare the adjustment in Europe and the US. We estimate (4) and allow for two
lags.15
We test for unit roots and confirm that all series are stationary so that the model
specification is appropriate.16
[Insert Figure 3 here]
Figure 3 shows the impulse responses for Europe in the left and for the US in the right
panel. Note, first, that following a positive labour demand shock the employment level
increases on impact, then falls back towards its initial level, but remains above it in the
long run. The fact that some but not all of the initial increase in employment remains in
the long run suggests that both labour migration and job destruction or migration play a
role in the adjustment process. If no jobs disappeared, the permanent effect would be the
size of the initial increase. If, on the contrary, no migrants were moving into the region,
the permanent effect on employment would be zero. Since in the long run the
unemployment and participation rates revert to their pre-shock baseline, the permanent
change in employment must stem from migration. The permanent change in employment
relative to the initial increase thus reveals the relative importance of job migration versus
migration of employees. Due to the normalization the number of workers migrating in
the long run reported in the tables can be interpreted as the long-run contribution of
migration as percentage of the initial increase in employment.
A number of points are worth making. First, the adjustment towards the new steady
state is faster in the US than in Europe. Employment reaches its long run level after 10
years in Europe and after five years in the US. After three years both the employment
and participation rate continue to contribute substantially in Europe, but not in the US.
After four years they still contribute more than 20 per cent in Europe, but only five in the
US. The employment rate (or unemployment rate) reacts much stronger in Europe and
contributes a lot more to the adjustment than in the US. Migration, on the other hand,
contributes a bit less in Europe over the whole adjustment period. Overall, a shock
changing employment initially by 100 workers leads to 47 immigrants in Europe and 57
in the US. In other words, due to migration 48% of the initial increase of employment
becomes permanent in Europe and 57% remain in the US. While migration is higher in
the US, the differences are not large.
Summarizing, there are differences between the regional adjustment mechanisms in
Europe and the US – in Europe it is more persistent, employment rates contribute more,
and migration less – but the differences are smaller than previous work suggests.
Compared to Decressin and Fatás (1995), we find a faster adjustment mechanism, a
15 Two lags are usually used in the literature. We estimate the model also with only one and four lags and find
that the results are very similar. 16 We use the panel unit root test of Harris and Tzvalis (1999) and reject a unit root for all series at the 1% level.

LABOUR MARKET ADJUSTMENTS AND MIGRATION
14
more important role for job creation (and consequently a less important role for
migration), and smaller differences between Europe and the US.
5.2 The National Adjustment Mechanisms in Europe
Next we investigate the role of migration in labour market adjustment across countries.
The costs of migrating across countries are likely to be higher than those of migrating
between regions due to the larger distance, greater language and other cultural barriers,
and other institutional obstacles like the limited portability of pension and other social
security rights. We should therefore expect a lower contribution of migration to the
adjustment process following country-specific labour demand shocks.
We use the five country factors from (3) and add our small countries so that we have a
cross-section of 11 countries. We estimate (5) and due to the smaller cross-section now
allow for only one lag. Again we confirm the empirical validity of the VAR
specification.17
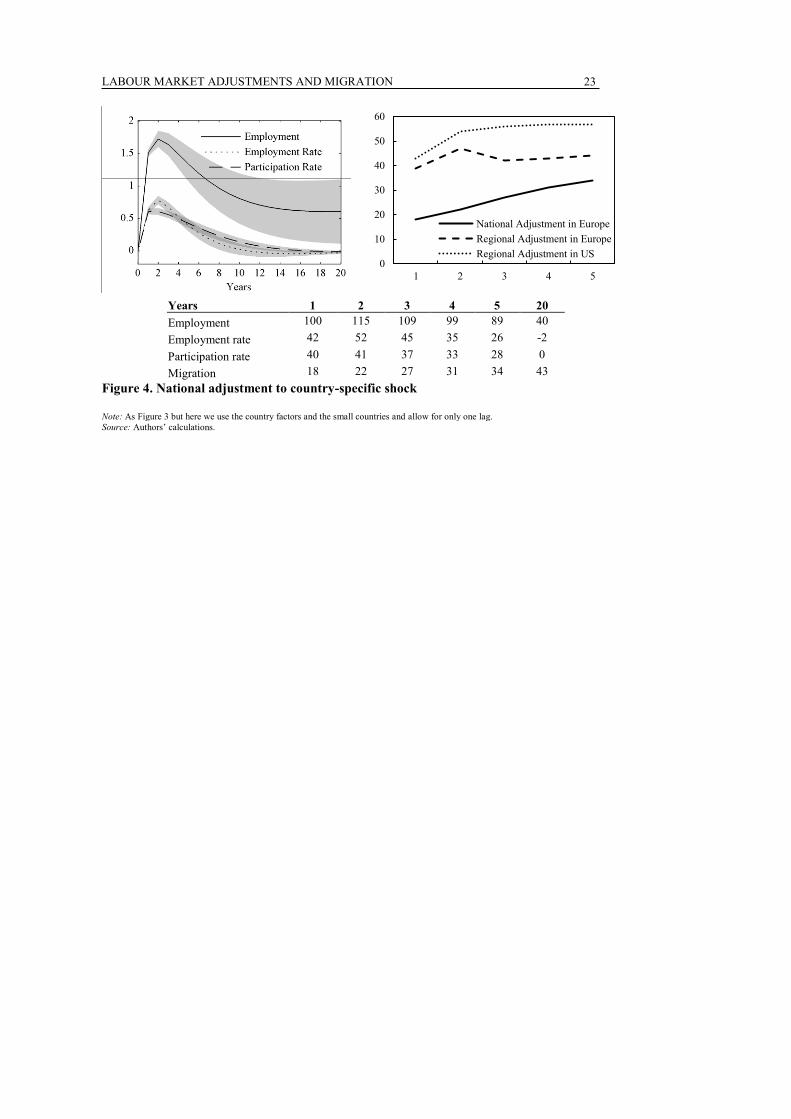
[Insert Figure 4 Here]
The left panel in Figure 4 shows the impulses responses of a one standard error
positive labour demand shock as before. Note that the standard errors are now larger as
the cross-section is smaller. The employment and participation rate contribute nearly
equally in all years and need 15 years to return to their pre-shock level. As a result, the
adjustment process takes longer in response to country-specific shocks than in response
to region-specific shocks. The right panel compares the number of migrants in the first
five years after an initial employment change of 100 workers for the different adjustment
mechanisms. From before we know that the number of migrants is somewhat lower after
a region-specific shock in Europe compared to the US. Migration is much lower after a
country-specific shock, in particular in the first years after the shock. In the first year
only 18 workers migrate to a country experiencing an unexpected increase of the
employment level by 100 jobs, whereas around 40 workers migrate after a region-
specific shock of that size in Europe and the US. These differences become smaller over
time. Migration also contributes less to the change in employment relative to the
participation and employment rate. In the first three years it contributes on average 51%
to the regional employment change in Europe after a local shock but only 21% to the
national adjustment after a country shock.18
Summarizing, we find that migration plays a less important role in the adjustment to
country-specific shocks. Since in section 5.1 we found that the regional adjustment
processes in Europe and the US are not very different, it follows that it is mostly lower
17 Here we test for unit roots using the test developed by Levin, Lin and Chu (2002). A unit root is rejected at
the 1% level for the employment growth, the participation rate, and for the employment rate. 18 We have also estimated the national adjustment mechanism with the country series instead of the factors. Results are very similar.

LABOUR MARKET ADJUSTMENTS AND MIGRATION
15
labour mobility between European countries that slows down adjustment in Europe and
may contribute to the large heterogeneity in labour market pointed out in the
introduction.
5.3 Changes over time
In the previous sections we reported the full-sample results. Given the evidence of
changes in labour mobility discussed in the introduction, in this section we analyse
whether the role of migration has changed over time.
To do so, we estimate the VARs of equations (4) and (5) for two subsamples
separately (1977-1999 and 1990-2013). While this obviously shortens the sample, we
still have 23 observations per subsample and thus nearly twice as many observations as
Blanchard and Katz (1992) and Decressin and Fatás (1995). Still, we reduce the lag
length to one and focus mainly on the first five years in order to minimize issues related
to sample length. Note that our samples overlap so that changes originate in differences
in the adjustment in the first and last 13 years.
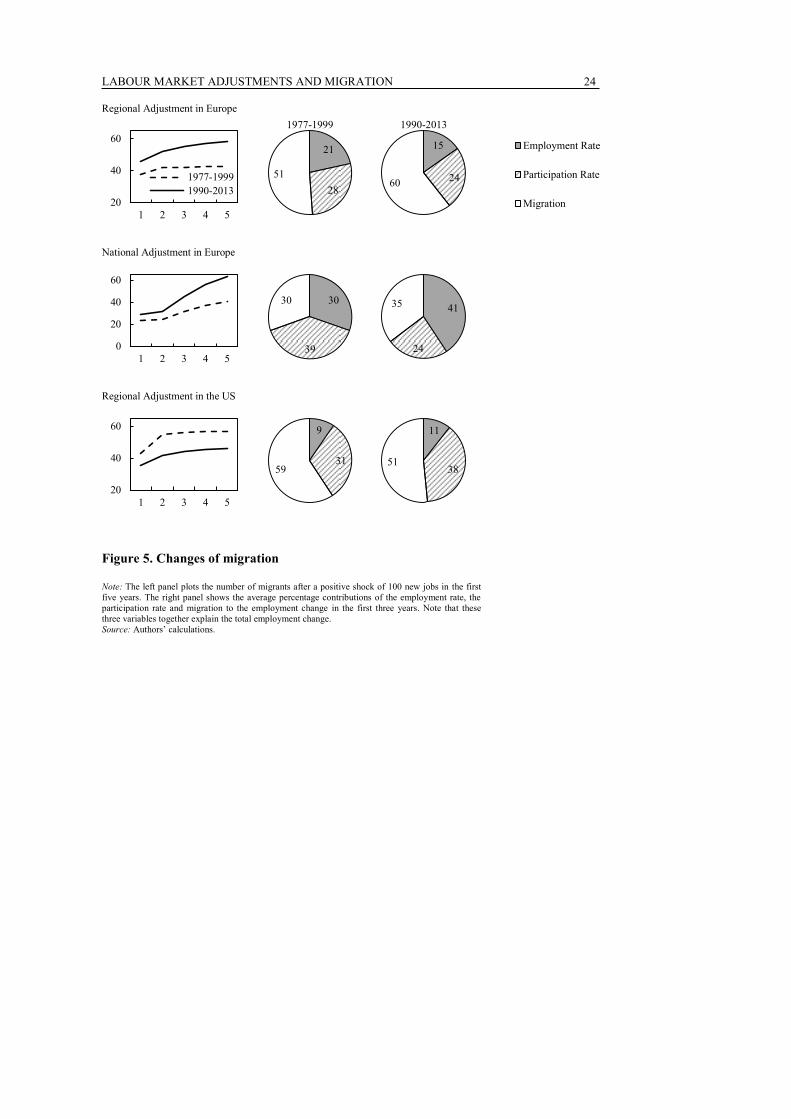
[Insert Figure 5 here]
Figure 5 shows the changes of the regional migration response in Europe and the US,
as well as the national migration response in Europe. The left panel plots the total
number of migrants after a shock of 100 workers in the first five years. The dashed lines
show the numbers of migrants between 1977 and 1999 and the solid lines the numbers
between 1990 and 2013. In addition, we use pie charts to report the average percentage
contributions of the employment and participation rate and of migration to the
employment change in the first three years. This allows us to see whether migration has
become relatively more important or not.
The upper panel reports the changes in the regional adjustment in Europe. The total
number of migrants has risen in all years and also the percentage contribution of
migration has increased. Molloy, Smith and Wozniak (2011) analyse inter-NUTS2
mobility in Europe using a LFS question asking whether respondents moved in the
previous year. In line with our results, they find that mobility rates were either flat or
slightly increasing in the early 2000s.
The increase of migration in Europe detected by Beine et al. (2013) refers to migration
between countries and not regions. As discussed in the introduction, recent divergence in
unemployment rates across European countries has led to increased migration in Europe.
It is thus interesting to see whether we can also detect changes in the adjustment to
country shocks using our methodology. The middle panel of Figure 4 shows the changes
in the country adjustment mechanism. As expected, the total number of migrants in
response to an initial increase in employment of 100 has indeed increased. After three
years, for example, it decreased from 31 in the first subsample to 45 in the second
subsample. And also the permanent effect of a country shock on migration has become
more important. Although not directly comparable, our results therefore qualitatively

LABOUR MARKET ADJUSTMENTS AND MIGRATION
16
confirm the findings of Beine et al. (2013). In sum, we find that in the most recent
subsample country-specific changes in labour demand set in motion more cross-country
movement in workers and that this migration contributes more relative to the
employment and participation rate. At the same time, the role of migration between
countries remains lower than its role between regions.
Finally, the lower panel shows changes in the role of migration in the US. The total
number of migrants after a region-specific shock has notably decreased in all years.
Three years after the shock the number of migrants has decreased from 56 to 44. As the
pie charts show, the percentage contribution has declined as well and is compensated by
a more flexible labour force. For the US our results are thus in line with Dao, Furceri and
Ploungani (2014) and relate nicely to the literature on declining labour mobility in the
US.
6 Relation to Blanchard and Katz (1992)
In this section, we apply the original methodology of Blanchard and Katz (1992) who
defined regional variables as simple differences from the continent-wide mean to our
data. This is useful for two reasons. First, our results differ quite importantly from those
of Blanchard and Katz (1992) and Decressin and Fatás (1995) who found a much slower
adjustment process and a greater role for migration. In this section, we want to
investigate whether these differences are mainly due to the change in methodology or
also due to use of different data sets. Second, one might argue that the policy maker is
interested in the regional adjustment to differences independent of the type of the shock.
This may be captured somewhat better by analysing simple mean differences.
6.1 The adjustment with simple differences
[Insert Figure 6 here]
Figure 6 plots the impulse response functions for Europe and the US using simple
differences computed as specified in (1). While this specification results in stationary
series in the US, in Europe we can reject a unit root neither in the employment rate nor
in the participation rate so that that this filtering strategy is not appropriate for European
regions.19
As discussed before, our factor-based methodology of identifying region-
specific variables results in stationary series.
In Europe, the employment level exhibits a hump-shaped response and migration is
initially lower than for region-specific shocks. The number of migrants in the first years
drops from 39 to 25, but is nearly identical in the long run (47 versus 46). The
19 With Harris-Tzvalis test we reject a unit root in the US for all series at the 1% level. In Europe only the
employment growth is stationary – we reject a unit root at the 1% level – but both for the employment and participation rate we cannot reject the unit root at any level.
LABOUR MARKET ADJUSTMENTS AND MIGRATION
17
participation rate is now much more persistent and is considerably above the pre-shock
level even 20 years after the shock. The employment rate contributes stronger and is
more persistent as well.20
Overall, it looks like the original BK methodology mixes the adjustment to region-
specific shocks with the adjustment to country-specific shocks. This results in a more
persistent adjustment process with a larger role for unemployment and a significantly
smaller role for migration.
Accordingly, in the US the differences are smaller and the responses look generally
similar to the ones after region-specific shocks. But again the process now takes longer
to be completed and in particular the contribution of the participation rate is more
persistent. Using simple differences, migration is a little lower initially, in the first year
we see 37 instead of 43 migrants, and a little higher in the long run with 63 instead of 57
migrants. The general conclusions from Section 5.1 are thus confirmed.
Next, we repeat the estimation for the same subsamples as before with simple
differences. Figure 7 reports again the number of migrants after a shock of 100 workers
in the left panel and the average percentage contributions in the first three years in the
right panel.
[Insert Figure 7 here]
From 1977-1999 to 1990-2013 the total number of migrants has again gone up in
Europe, though only from the third year onwards. The average percentage contribution
in the first three years is nearly the same but would increase if we added more years.
As before, the number of migrants has clearly decreased in the US and also the
percentage contribution in the first three years has gone down. Our results from Section
5.3 are thus also confirmed.
6.2 Local-Area Unemployment Statistics
While using simple differences brings the US impulse responses closer to the ones in
Blanchard and Katz (1992), we still neither observe the strong hump-shaped response
that characterises their responses nor the related permanent effect on migration of around
100%. In this section, we analyse whether the different data source may be the reason for
this. We estimate the adjustment process (4) for the US using simple differences and the
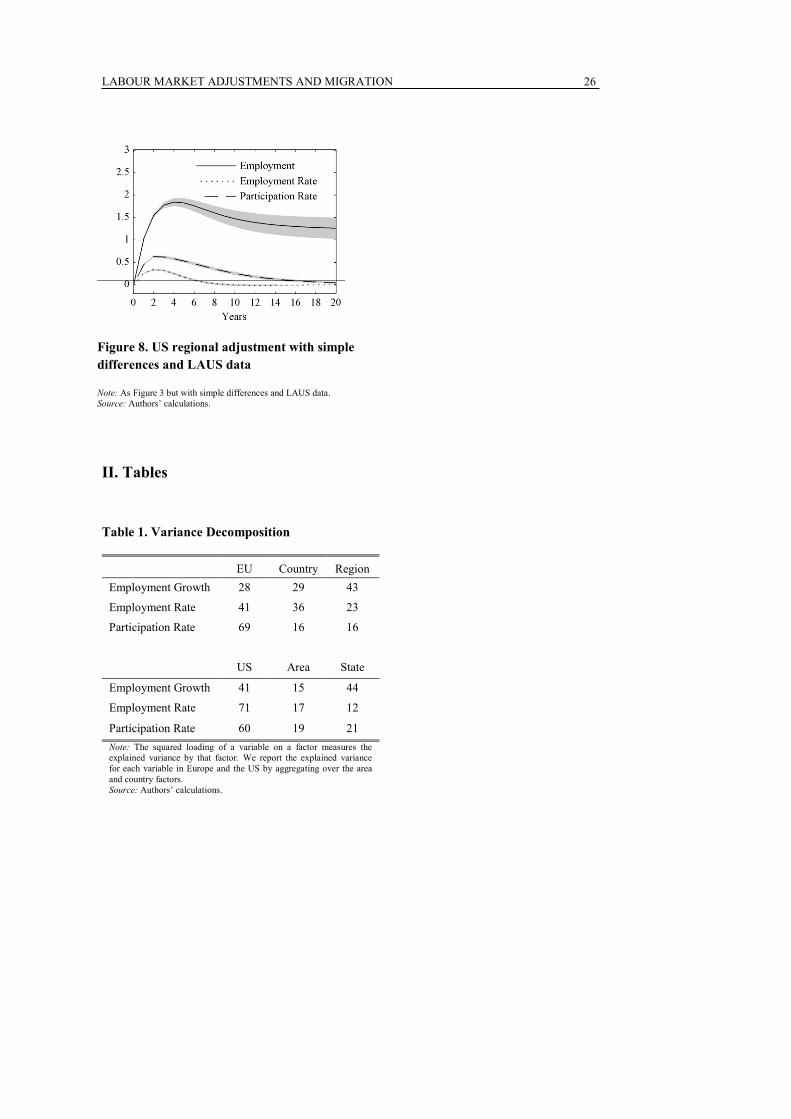
LAUS data set, which is establishment data closer to the data used by Blanchard and
Katz (1992). Figure 8 shows the impulse responses to a positive one standard deviation
shock.21
[Insert Figure 8 here]
20 We also estimated the regional adjustment with β-differences (see footnote 5) and find very similar results. 21 The Harris-Tzvalis test rejects a unit root at 1% for employment growth and the employment rate and at 5%
for the participation rate.

LABOUR MARKET ADJUSTMENTS AND MIGRATION
18
In this case, the impulse responses look very similar to the responses reported in
Blanchard and Katz (1992) and more recently in Dao, Furceri and Loungani (2014).
Above all, the impulse response now is strongly hump-shaped and migration is more
than twice as important in the long run and above 100%.
We can only speculate about the reasons for the large differences with our results and
the larger contribution of migration in the long run. Since migration is identified as the
residual of the VAR, i.e. migration is given by the change of the employment level that
cannot be explained by changes in either the employment or the participation rate, the
quality of the data series may be very important. Inconsistent data series may result in a
larger contribution of the residual and hence of migration. Employment data from LAUS
is based on establishment data and there are important differences between household
and establishment series resulting from different definitions, coverages, and estimation
procedures. For example, CPS employment includes self-employed persons, unpaid
workers in family-operated businesses, and agricultural workers; establishment-based
employment data from the Current Employment Statistics does not. Unpaid absences
from work are differently accounted for and persons working in more than one
establishment are counted more than once with establishment-based data. The latter
inconsistency clearly matters: Blanchard and Katz (1992) overestimate migration
because they rely on establishment-based employment data, but on CPS data for
unemployment and persons out of labour force so that some of the unexplained
employment changes may result from changes in dual job holding and not migration.
With LAUS data the same might happen.
7 CONCLUSION
7.1 Summary
In this paper we revisit the role of labour mobility in regional labour market
adjustments in Europe and the US. We study 41 European and 51 US regions over a
period of 38 years. In line with Greenway-McGrevy and Hood (2013), we use a factor
model to distinguish between the regional adjustment to region-specific idiosyncratic
shocks and the country adjustment to country-specific shocks. We show that
distinguishing between whether migration takes place between regions or between
countries matters for the relative importance of both migration and unemployment.
In particular, we find that, once we control for country factors, the regional adjustment
process in Europe is not that different from the one in the United States. In both areas,
migration plays a relatively important role in the long run, but in European countries the
adjustment process takes somewhat longer and is accompanied by larger changes in
unemployment reflecting more rigid labour markets.
What makes a difference is the cross-country adjustment process in Europe. Due to
remaining differences in language, cultural factors and institutional differences, the role

LABOUR MARKET ADJUSTMENTS AND MIGRATION
19
of migration is much less important when a country is hit by a labour demand shock. At
the same time, changes in the employment rate are more important reflecting different
national labour market institutions. If one does not account for the country factors, the
differences in regional adjustment between Europe and the US become much larger.
Using a much longer data set, we also find that the adjustment processes in Europe and
the US have further converged over the past decades. This reflects both a fall in
interstate migration in the US and a rise in the role of migration in Europe as European
integration proceeds. The latter shows up most strikingly in an increased role of
migration in the cross-country adjustment.
Finally, we show that part of the difference between Europe and the US in previous
studies may in addition be due to the use of different data sources.
7.2 Policy Implications
Our findings can inform the policy debate in at least two dimensions. First, most of the
differences in the role of migration in the regional labour market adjustment process
between the US and Europe are due to remaining barriers connected with country
borders. It is therefore right for European policy makers to focus on how to facilitate
labour mobility across countries in Europe. Our empirical investigation shows that
measures taken in the past such as the Schengen agreement, initiatives to bring down
cultural barriers through exchange programmes such as the Erasmus programme or
efforts like the Bologna process to harmonize educational standards may already have
contributed to a greater role for labour mobility in labour market adjustment. And there
is scope for additional measures to further reduce the persistence of labour market
adjustment to country-specific shocks and alleviate the associated social costs. A
variety of measures can be considered including promoting more flexible housing
markets, increasing the compatibility of school systems, improving language education,
harmonizing pension systems and promoting the portability of pension and other social
security rights, and changing the general attitude towards migrants. The recent
initiatives of the European Commission and Council may hence help to foster
adjustment to country-specific shocks.
However, our analysis also reveals that the differences with the United States, a
monetary union with a quite homogenous culture and a well-functioning labour market,
are not that large. Given that cultural and language barriers are likely to persist in
Europe, it is therefore important to be realistic about what increased labour mobility can
achieve. The differences in the importance of migration in Europe and the US are
smaller than has previously been argued, so that labour mobility might not hamper the
functioning of the Euro Area as strongly as some argue.
To become more specific is difficult given the positive nature of our analysis. This
would require a more structural and normative approach. In this context, one should
also recall that there are also costs to migration, in particular when it involves high-
skilled migration that may tend to exacerbate rather than alleviate regional disparities.

LABOUR MARKET ADJUSTMENTS AND MIGRATION
20
Moreover, large-scale migration in Europe could be socially disruptive (Emerson et al.,
1992; Obstfeld and Peri, 1998). Moreover, from a normative perspective it is not clear
whether adjustment through workers or jobs is preferable. An acceleration of the labour
market adjustment through job creation may in any case often be desirable. It may be
achieved by more flexible wages – also increasing workers’ mobility – and, equally
important, a higher wage elasticity of jobs. In this context, it is also worth mentioning
the role of regional policies and a banking union in Europe. Regional policies may be
used to encourage job-creation in depressed regions, for example by offering tax
deductions to firms moving in. In addition, the implementation of a banking union in
Europe will foster adjustment through job creation. Morgan et al. (2004) show that
increased interstate banking in the US stabilised fluctuations within states and reduced
divergence between them.
LABOUR MARKET ADJUSTMENTS AND MIGRATION
21
I. Figures
Employment Growth
Unemployment Rate
Participation Rate
Figure 1. Means of original variables
Note: We plot the means of all European and the means of all US
regions over time.
Source: Labour Force Surveys with modification by authors for Europe
and CPS for the US.
-4
-3
-2
-1
0
1
2
3
4
19
77
19
80
19
83
19
86
19
89
19
92
19
95
19
98
20
01
20
04
20
07
20
10
20
13
Europe US
0
2
4
6
8
10
12
14
19
77
19
80
19
83
19
86
19
89
19
92
19
95
19
98
20
01
20
04
20
07
20
10
20
13
56
59
62
65
68
71
74
19
77
19
80
19
83
19
86
19
89
19
92
19
95
19
98
20
01
20
04
20
07
20
10
20
13

LABOUR MARKET ADJUSTMENTS AND MIGRATION
22
Figure 2. Standard deviation of
regional unemployment rates
Note: Standard deviations of unemployment rates
shown in the middle panel of Figure 1.
Source: Authors’ calculations.
0
1
2
3
4
5
6
7
8
9
19
77
19
80
19
83
19
86
19
89
19
92
19
95
19
98
20
01
20
04
20
07
20
10
20
13
Europe US
Europe
US
Years 1 2 3 4 5 10
1 2 3 4 5 10
Employment 100 83 73 64 59 50
100 92 72 62 59 57
Employment rate 20 18 16 11 7 1
13 9 5 1 0 0
Participation rate 41 18 15 11 8 2
44 30 12 4 2 0
Migration 39 47 42 43 44 47
43 54 56 57 57 57
Figure 3. Adjustment to region-specific shocks
Note: We plot the impulse responses to a one standard deviation shock to labour demand. The y-axis shows the effect of the shock
in percentage deviations from steady-state and the x-axis shows years. We allow for two lags and estimate the model with least-
squares. The grey area shows confidence bands of 95% bootstrapped with 250 replications. The table normalizes the size of the
employment change to 100 and decomposes the employment response into contributions of the employment rate, the participation
rate and migration, which is the unexplained part of the employment change. Source: Authors’ calculations.
LABOUR MARKET ADJUSTMENTS AND MIGRATION
23
Years 1 2 3 4 5 20
Employment 100 115 109 99 89 40
Employment rate 42 52 45 35 26 -2
Participation rate 40 41 37 33 28 0
Migration 18 22 27 31 34 43
Figure 4. National adjustment to country-specific shock
Note: As Figure 3 but here we use the country factors and the small countries and allow for only one lag. Source: Authors’ calculations.
0
10
20
30
40
50
60
1 2 3 4 5
National Adjustment in Europe
Regional Adjustment in Europe
Regional Adjustment in US
LABOUR MARKET ADJUSTMENTS AND MIGRATION
24
34
38
28
Employment Rate
Participation Rate
Migration
Regional Adjustment in Europe
National Adjustment in Europe
Regional Adjustment in the US
Figure 5. Changes of migration
Note: The left panel plots the number of migrants after a positive shock of 100 new jobs in the first
five years. The right panel shows the average percentage contributions of the employment rate, the
participation rate and migration to the employment change in the first three years. Note that these
three variables together explain the total employment change.
Source: Authors’ calculations.
20
40
60
1 2 3 4 5
1977-1999
1990-2013
21
28
51
1977-1999
15
24 60
1990-2013
0
20
40
60
1 2 3 4 5
30
39
30 41
24
35
20
40
60
1 2 3 4 5
9
31 59
11
38 51

LABOUR MARKET ADJUSTMENTS AND MIGRATION
25
Europe
US
Years 1 2 3 4 5 20
1 2 3 4 5 20
Employment 100 120 127 124 116 56
100 108 99 93 88 63
Employment rate 34 47 50 46 39 -5
16 16 11 7 4 0
Participation rate 41 38 41 39 36 15
47 45 32 27 22 0
Migration 25 35 36 39 41 46
37 48 56 59 61 63
Figure 6. Regional adjustment with simple differences
Note: As Figure 3 but here we estimate the VAR in simple differences as in Blanchard and Katz (1992).
Source: Authors’ calculations.
Europe with simple differences
US with simple differences
Figure 7. Changes of migration with simple differences
Note: As Figure 5.
Source: Authors’ calculations.
20
40
60
1 2 3 4 5
1977-1999
1990-2013 27
40
33
1977-1999
37
33
30
1990-2013
34
38
28
Employment Rate
Participation Rate
Migration
20
40
60
1 2 3 4 5
15
38
47
14
45
41
LABOUR MARKET ADJUSTMENTS AND MIGRATION
26
II. Tables
Figure 8. US regional adjustment with simple
differences and LAUS data
Note: As Figure 3 but with simple differences and LAUS data.
Source: Authors’ calculations.
Table 1. Variance Decomposition
EU Country Region
Employment Growth 28 29 43
Employment Rate 41 36 23
Participation Rate 69 16 16
US Area State
Employment Growth 41 15 44
Employment Rate 71 17 12
Participation Rate 60 19 21
Note: The squared loading of a variable on a factor measures the
explained variance by that factor. We report the explained variance
for each variable in Europe and the US by aggregating over the area
and country factors.
Source: Authors’ calculations.

LABOUR MARKET ADJUSTMENTS AND MIGRATION
27
Appendix A Regions
Germany
Baden-Württemb.
Bayern Hessen
Nieders. & Bremen
Nord.-Westfalen R.-Pfalz & Saarl.
S.Holst. & Hamb.
France
Bassin Parisien
Centre-Est Est
Ile de France
Mediterrane Nord-Pas-de-Cal.
Ouest
Sud-Ouest
Italy
Abruzzi-Molise
Campania Centro
Emilia-Romagna
Lazio Lombardia
Nord-Est
Nord-Ovest Sardegna
Sicilia
Sud
Spain
Canarias
Centro Este
Madrid
Noreste Noroeste
Sur
United Kingdom
East Midlands
East of England Northern Ireland
Scotland
South-West Wales
West Midlands
York and Humb.
US Northeast
Connecticut
Maine
Massachusetts New Hampshire
New Jersey
New York Pennsylvania
Rhode Island
Vermont
US Midwest
Illinois
Indiana
Iowa Kansas
Michigan
Minnesota Missouri
Nebraska
North Dakota Ohio
South Dakota
Wisconsin
US South
Alabama
Arkansas
DC Delaware
Florida
Georgia Kentucky
Louisiana
Maryland Mississippi
North Carolina
Oklahoma South Carolina
Tennessee
Texas Virginia
West Virginia
US West
Alaska
Arizona
California Colorado
Hawaii
Idaho Montana
Nevada
New Mexico Oregon
Utah
Washington Wyoming

LABOUR MARKET ADJUSTMENTS AND MIGRATION
28
References
Alessi L., Barigozzi M., and Capasso, M. (2010). Improved penalization for determining the
number of factors in approximate factor models. Statistics & Probability Letters,
80(23), 1806-1813.
Ahlfeldt, G. M., Redding, S. J., Sturm, D. M., and Wolf, N. (2012). The economics of
density: evidence from the Berlin Wall. CEP Discussion Paper, 1154.
Arellano, M., and Bond, S. (1991). Some tests of specification for panel data: Monte Carlo
evidence and an application to employment equations. The Review of Economic
Studies, 58(2), 277-297. Arellano, M., and Bover, O. (1995). Another look at the instrumental variable estimation of
error-components models. Journal of Econometrics, 68(1), 29-51.
Autor, D. H., Dorn, D., and Hanson, G. H. Forthcoming. The China syndrome: Local labor
market effects of import competition in the United States. American Economic
Review.
Bai, J. and Ng, S. (2002). Determining the number of factors in approximate factor models.
Econometrica, 70(1):191-221.
Bai, J. (2003). Inferential theory for factor models of large dimensions. Econometrica,
71(1), 135-171.
Bai, J., and Ng, S. (2004). A PANIC attack on unit roots and cointegration. Econometrica,
72(4), 1127-1177.
Bai, J. (2009). Panel data models with interactive fixed effects. Econometrica, 77(4), 1229-
1279.
Bai, J., and Ng, S. (2006). Confidence Intervals for Diffusion Index Forecasts and Inference
for Factor Augmented Regressions. Econometrica, 74(4), 1133-1150.
Behrens, K., Mion, G., Murata, Y., and Südekum, J. (2013). Spatial frictions (No. 7175).
Discussion Paper Series, Forschungsinstitut zur Zukunft der Arbeit.
Beine, M., Bourgeon, P., and Bricongne, J. C. (2013). Aggregate Fluctuations and
International Migration (No. 4379). CESifo Working Paper.
Bernanke, B. S., and Boivin, J. (2003). Monetary policy in a data-rich environment. Journal
of Monetary Economics, 50(3), 525-546.
Bernanke, B. S., Boivin, J., and Eliasz, P. (2005). Measuring the effects of monetary policy:
a factor-augmented vector autoregressive (FAVAR) approach. The Quarterly
Journal of Economics, 120(1), 387-422.
Blanchard, O. J., and Katz, L. F. (1992). Regional evolutions. Brookings Papers on
Economic Activity, 1992(1):1–75.
Boivin, J., and Giannoni, M. P. (2006). Has monetary policy become more effective?. The
Review of Economics and Statistics, 88(3), 445-462.
Bornhorst, F. and Commander, S. (2006). Regional unemployment and its persistence in
transition countries. Economics of Transition, 14(2):269–288.
Caballero, R. J., and Hammour, M. L. (2005). The cost of recessions revisited: A reverse-
liquidationist view. The Review of Economic Studies, 72(2), 313-341.
Dao, M., Furceri, D., and Loungani P. (2014). Regional Labor Market Adjustments in the
United States and Europe (No. 14/27). IMF Working Paper.
Dauth, W., Findeisen, S., and Suedekum, J. (2013). The rise of the East and the Far East:
German labor markets and trade integration (No. 127). DICE Discussion Paper.
Davis, S. J., Faberman, J., and Haltiwanger, J. C. (2011). Labor Market Flows in the Cross
Section and Over Time (No. w17294). National Bureau of Economic Research.
Decressin, J. and Fatás, A. (1995). Regional labour market dynamics in Europe. European
Economic Review, 39(9):1627–1655.

LABOUR MARKET ADJUSTMENTS AND MIGRATION
29
Doz, C., Giannone, D., and Reichlin, L. (2012). A Quasi–Maximum Likelihood Approach
for Large, Approximate Dynamic Factor Models. Review of Economics and
Statistics, 94(4): 1014-1024.
Emerson, M. (Ed.). (1992). One Market One Money: An Evaluation of the Potential
Benefits and Costs of Forming an Economic and Monetary Union. Oxford
University Press.
Estrada, Á., Galí, J., and López-Salido, D. (2013). Patterns of convergence and divergence
in the Euro Area. IMF Economic Review, 61(4), 601-630.
Fallick, B., and Fleischman, C. (2001). The importance of employer-to-employer flows in
the US labor market. Federal Reserve Board.
Fidrmuc, J. (2004). Migration and regional adjustment to asymmetric shocks in transition
economies. Journal of Comparative Economics, 32(2):230–247.
Forni, M., and Reichlin, L. (1998). Let's get real: a factor analytical approach to
disaggregated business cycle dynamics. The Review of Economic Studies,65(3),
453-473.
Forni, M., and Reichlin, L. (2001). Federal policies and local economies: Europe and the
US. European Economic Review, 45(1): 109-134.
Forni, M., Giannone, D., Lippi, M., & Reichlin, L. (2009). Opening the black box:
Structural factor models with large cross sections. Econometric Theory, 25(05):
1319-1347.
Forni, M., Hallin, M., Lippi, M., and Reichlin, L. (2000). The generalized dynamic-factor
model: Identification and estimation. Review of Economics and Statistics, 82(4),
540-554.
Fredriksson, P. (1999). The dynamics of regional labour markets and active labour market
policy: Swedish evidence. Oxford Economic Papers, 51(4):623–648.
Frey, W. (2009). The great American migration slowdown. Brookings Institution,
Washington, DC.
Gács, V. and Huber, P. (2005). Quantity adjustments in the regional labour markets of EU
candidate countries. Papers in Regional Science, 84(4):553–574.
Giannone, D., and Lenza, M. (2009). The feldstein-horioka fact (No. w15519). National
Bureau of Economic Research.
Greenaway-McGrevy, R. and Hood K. (2013). How mobile is labor in the United States?.
Manuscript
Greenwood, M. J. (1997). Internal migration in developed countries. Handbook of
Population and Family Economics, 1, 647-720.
Hamilton, J. D., and Owyang, M. T. (2012). The propagation of regional recessions. Review
of Economics and Statistics, 94(4), 935-947.
Harris, R. D., and Tzavalis, E. (1999). Inference for unit roots in dynamic panels where the
time dimension is fixed. Journal of Econometrics, 91(2), 201-226.
Houseman, S. N., and Abraham, K. G. (1993). Labor adjustment under different institutional
structures: A case study of Germany and the United States (No. w4548). National
Bureau of Economic Research.
Jimeno, J. F. and Bentolila, S. (1998). Regional unemployment persistence (Spain, 1976–
1994). Labour Economics, 5(1):25–51.
Kaplan, G. and Schulhofer-Wohl, S. (2012). Interstate migration has fallen less than you
think: Consequences of hot deck imputation in the Current Population Survey.
Demography, 49(3), 1061-1074.
Kose, M. A., Otrok, C., and Whiteman, C. H. (2003). International business cycles: World,
region, and country-specific factors. American Economic Review, 1216-1239.
Levin, A., Lin, C. F., and James Chu, C. S. (2002). Unit root tests in panel data: asymptotic
and finite-sample properties. Journal of Econometrics, 108(1), 1-24.
LABOUR MARKET ADJUSTMENTS AND MIGRATION
30
Long, L. (1988). Migration and residential mobility in the United States (pp. 137-88). New
York: Russell Sage Foundation.
Marelli, E., Patuelli, R., and Signorelli, M. (2012). Regional unemployment in the EU
before and after the global crisis. Post-communist Economies, 24(2):155–175.
Molloy, R., Smith, C. L., and Wozniak, A. K. (2011). Internal migration in the United
States. Technical report, National Bureau of Economic Research.
Morgan, D. P., Rime, B., and Strahan, P. E. (2004). Bank integration and state business
cycles. The Quarterly Journal of Economics, 119(4), 1555-1584.
Mundell, R. A. (1961). A theory of optimum currency areas. The American Economic
Review, 51(4), 657-665.
Obstfeld, M., Peri, G., Blanchard, O. J., and Fatás, A. (1998). Regional non-adjustment and
fiscal policy. Economic Policy, pages 207–259.
Overman, H. G., and Puga, D. (2002). Unemployment clusters across Europe's regions and
countries. Economic Policy, 17(34), 115-148.
Pagan, A. (1984). Econometric issues in the analysis of regressions with generated
regressors. International Economic Review, 25(1), 221-247.
Pesaran, M. H. (2006). Estimation and inference in large heterogeneous panels with a
multifactor error structure. Econometrica, 74(4), 967-1012.
Redding, S. J. (2012). Goods trade, factor mobility and welfare (No. w18008). National
Bureau of Economic Research.
Saks, R. E., and Wozniak, A. (2011). Labor reallocation over the business cycle: new
evidence from internal migration. Journal of Labor Economics, 29(4), 697-739
Stock, J. H., and Watson, M. W. (2002). Forecasting using principal components from a
large number of predictors. Journal of the American Statistical Association,
97(460), 1167-1179.
Tani, M. (2003). Have Europeans become more mobile? A note on regional evolutions in
the EU: 1988–1997. Economics Letters, 80(1), 23-30.