Labour Migration from Rural Odisha Jagannathprasad Block, Ganjam

Welcome message from author
This document is posted to help you gain knowledge. Please leave a comment to let me know what you think about it! Share it to your friends and learn new things together.
Transcript
Labour Migration from Rural OdishaJagannathprasad Block, Ganjam
Labour Migration from Rural Odisha Jagannathprasad Block, Ganjam
July 2021
Funding: Funded under the Infrastructure for Climate Resilient Growth (ICRG), a Technical Assistance programme of Foreign, Commonwealth and Development Office (FCDO) of the Government of United Kingdom, delivered in partnership with the Ministry of Rural Development (MORD), Government of India (GOI)
Design & Layout Bijoy Jacob | [email protected]
Images Ajaya Behera, Gram Vikas
Gram Vikas Plot No. 72/B, Forest Park,
Bhubaneswar, Odisha - 751009, India +91-674-2596366 gramvikas.org [email protected]
Centre for Migration and Inclusive Development PMC.XX/1229, Near Town Hall,
Perumbavoor, Kerala - 683542, India +91-484-2595256 cmid.org.in [email protected]
United Nations Development Programme (UNDP) Post Box #3059, 55 Lodhi Estate,
New Delhi - 110003, India +91-11-46532333 +91-11-24627612 in.undp.org [email protected]
Labour Migration from Rural Odisha
Profiling Labour Migration from Jagannathprasad Block,
Ganjam District
Gram Vikas
Centre for Migration and Inclusive Development
Liby Johnson Executive Director Gram Vikas
Foreword
The opportunities for secure and sustainable livelihoods in the villages of Odisha are limited by a variety of resource constraints. The North-Eastern Ghats and the Western Undulating Lands agro-climatic zone regions, where most of Gram Vikas’ work is focused, are characterised by a mixture of moist and deciduous forests and rain-fed agricultural economy. Gram Vikas has been working with the village communities in Odisha since 1979, helping to build a sustainable and dignified quality of life. Reduced access to forest resources, changes in monsoon patterns, over-exploitation of available land, and limited access to irrigation have resulted in widespread food and nutrition insecurity in these areas. Non-agricultural wage labour is hard to come by, except through public employment generation schemes. Farm labour is available for limited periods and provides very low wages.
At the same time, increased access to education and exposure to new technologies are transforming the aspirations of the younger generation. Under these circumstances, migration for work is seen as an intermediate livelihood option, aiding the transition from a completely primary-sector-based society to a more diversified one. Across Odisha, we find that many communities that Gram Vikas works with have learned how to make the most of migration. It is a choice fraught with many emotional, social and cultural challenges. The two waves of the COVID-19 pandemic and the lockdowns have made life more difficult for the rural populations everywhere. Migration-dependent households face the double whammy of uncertain incomes and higher risk of exposure to the coronavirus.
The need for a programme for safe and dignified migration becomes pertinent in this context. It is our position that whether or not to migrate for work is an individual’s decision as it is the right of every citizen of India to do so. We believe that no one should be without a choice as to be forced to undertake distress migration. We want to ensure that everyone has adequate and appropriate opportunities within his/her native place and the decision to migrate is a conscious and informed one for the benefit of the person and his/her family. Besides, at the destination, the person should be able to pursue his/her job with dignity and social protection. Every migrant worker and his/her family should enjoy occupational, emotional, financial and social security, and should have the capabilities to cope with uncertainties caused by pandemics and other disasters.
CMID and Gram Vikas have been working together to understand and address the issues faced by migrant workers and their families. Subsequent to profiling migration from Thuamul Rampur in Kalahandi in 2020, we have now with the support of UNDP and the UK Government profiled migration from three blocks, viz. Jagannathprasad in Ganjam district, Rayagada in Gajapati district and Baliguda in Kandhamal district. These reports capture the various facets of the migration of people from these areas, in their pursuit to build better lives for themselves and families. The insights from the study will help understand the issues in greater depth and support the development of appropriate programme elements. It will also serve as a baseline to measure the changes that will take place over the next few years. I hope that the report is found useful by all those interested in the issues of rural poverty in general and migration in particular.
Acknowledgements
Migrant workers have been an indispensable part of India’s economy and the backbone of the bustling cities. However, their plight remained invisible till the national lockdown. People from disadvantaged communities form the bulk of the temporary migrants in India. Engaged at lower wages than locals, with limited or no social security, these workers generally are deprived of access to public services and entitlements. The barriers to access get complicated as one crosses the state borders or takes the family along. While the precarious jobs these workers take up thousands of kilometres away from home help their families tide over their crises, alleviate poverty, pay off debts, adapt to changes in the climate, cope with conflicts, break free of the caste discriminations or move up the social ladder, it comes at the cost of the toxic exposure of the worker, impacting his/her health as well as longevity of life.
Migration has played a transformative role in the lives of millions of Indians including most of us. I agree with Liby Johnson, that being home with family and earning a monthly income of ₹10000 locally will remain quite a distant dream for the youth in India’s rural hinterlands. With the second wave of the COVID-19 pandemic compounding rural distress, I am afraid hunger has emerged as a bigger killer, intensifying distress migration. While rural Odisha offers very low wages, with employment hard to come by, safe migration offers a world of opportunities. It is this shared vision that prompted CMID and Gram Vikas to jointly explore the avenues to revive and transform rural economies to be resilient and adaptive. Not only the remittances, the diffusion of social development from destinations to source villages can be a powerful vehicle of social change. Our collaborative inquiries from 2018, including the profiling of migration from Thuamul Rampur block of Kalahandi endorsed and reinforced this vision which motivated us to take up the profiling of migration from one block each in Ganjam, Gajapati and Kandhamal districts.
Gram Vikas and CMID thankfully acknowledge the financial support of the UK Government through UNDP for conducting these studies. We are grateful to Sushil Chaudhary at UNDP for the guidance provided in exploring the issues. I congratulate and thank Gram Vikas for embracing migration as a development agenda and taking a road less travelled to promote safe migration. My heartfelt gratitude to Liby Johnson, Executive Director, Gram Vikas, and an avid development practitioner, for the trust he has placed in CMID and his genuine interest in exploring the dynamics of migration from rural Odisha. Sincere thanks to Joseph Kalassery, Nirmal Mohanty, Jobin Chacko, Varun Namineni, Jaison Jose Thomas and Aravind A.R of Gram Vikas who led the fieldwork, ensuring rigour and process quality. I am grateful to the entire team of research investigators who participated in the laborious process of house listing and conducting interviews. I also acknowledge the contributions of the dedicated staff of Gram Vikas in Ganjam, Gajapati and Kandhamal districts and Bhubaneswar who ensured every support to CMID.
Sincere thanks to Vidya S. Chandran, Government College Mananthavady, Kerala, for her pro bono but meticulous support in copy editing this series of reports and to Bijoy Jacob for his remote but outstanding support in the design and layout of the document. I thank my colleagues Shachi Sanghvi for leading the research and Baishali Goswami for her support in data analysis, estimations and the preparation/review of the reports. I also thank Vishnu Narendran for his valuable inputs in the research design. Finally, on behalf of Gram Vikas and CMID, I thank all our respondents, village heads, panchayat representatives, Key Informants and government officials at the block, district and state levels for the warm hospitality and genuine inputs for the successful completion of this important series of studies that unravel the migration from Jagannathprasad, Rayagada and Baliguda blocks in Odisha.
Sincerely
Benoy Peter, PhD Executive Director Centre for Migration and Inclusive Development
ContentsExecutive Summary 07
Introduction 08
Household Profile 12
Migration from Jagannathprasad 43
Profile of Migrant Workers 56
Summary and Conclusions 83
References 91
Labour Migration from Jagannathprasad Block7
Executive Summary
Ganjam district of Odisha has been historically known for its out-migration. Households in Jagannathprasad block of Ganjam heavily depend on labour migration as a livelihood strategy. Gram Vikas has been engaged in improving the lives of the communities in Ganjam since 1979. The organisation has been closely observing the increasing migration for work from its programme areas in Odisha. As part of its response to COVID‐19 and migration, Gram Vikas, joining hands with UNDP and CMID, conducted a detailed profiling of the migration from Jagannathprasad block through a sample survey. The overall purpose of the study was to gather evidence on the migration scenario in Jagannathprasad so that appropriate interventions to ensure safe migration could be promoted and the household and the village economies be revived leveraging migration as a solution rather than a problem. A sample survey of 421 households was conducted during the period November 10, 2020 to January 04, 2021, randomly selecting 22 villages and 20 households from each selected village.
Findings reveal that socially and economically disadvantaged populations comprise the majority of the households in Jagannathprasad. High prevalence of landlessness, small size of the landholdings, dependence on natural water sources for irrigation and changes in climatic conditions have reduced the dependence on agriculture as a major source of income. Households from Jagannathprasad substantially depend on migration for work, portraying the typical scenario of Ganjam district. The majority of the households in Jagannathprasad have a history of labour migration. Almost three-fifths of the households reported having a person who had migrated for work in the past ten years. At the time of announcement of the lockdown, nearly two-fifths of the households had an inter-district migrant worker. About 12 per cent of the population of Jagannathprasad worked elsewhere outside the district at the time of announcement of the lockdown. The total estimated number of migrant workers from Jagannathprasad was 16245. They were engaged in informal jobs with an average monthly income of ₹12000. A moderate estimate reveals that Jagannathprasad receives nearly two billion rupees annually as wages to migrant workers.
Most migrants were at their workplaces at the time of announcement of the lockdown. Only about one-fifth of the workers reported a loss of employment due to the lockdown. However, half of the workers returned to their native places during or after the lockdown. About 15 per cent of the workers who returned benefited from Shramik trains. Just about four per cent of the workers who returned to their native places benefited from the MGNREGS interventions. The majority of the migrants who had returned to native places went back to workplaces by January 2021. Nearly half of the migrants from Jagannathprasad expressed that they preferred to stay back if there were local opportunities to earn a minimum monthly income of ₹12000.
Households from Jagannathprasad substantially depend on migration for work. The disadvantaged communities tend to have higher migration rates compared to the rest. Inter-state migrant workers from Jagannathprasad were primarily men who moved mostly to Surat, leveraging the social capital created by the historic Ganjam-Surat labour migration corridor. There has also been substantial intra-state migration, predominantly to Bhubaneswar. Migration has been a way of life for men from the households of Jagannathprasad. Unlike the typical labour migration in India to take up unskilled construction work in urban centres, a fair share of migrant workers from Jagannathprasad were skilled and worked in a shop, establishment or a factory. Migration brings more than ₹520 million to Jagannathprasad block annually as remittances, reviving the economy of the block and improving the resilience of the households.
Labour Migration from Jagannathprasad Block
Introduction
f Introduction
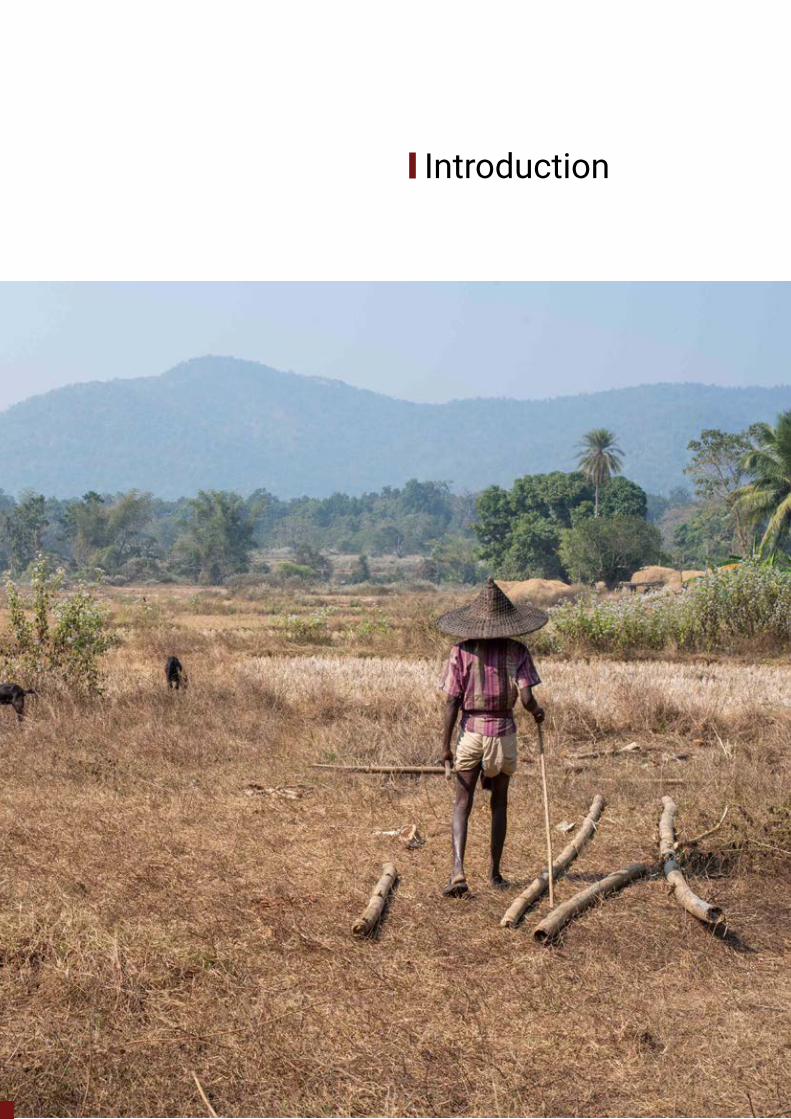
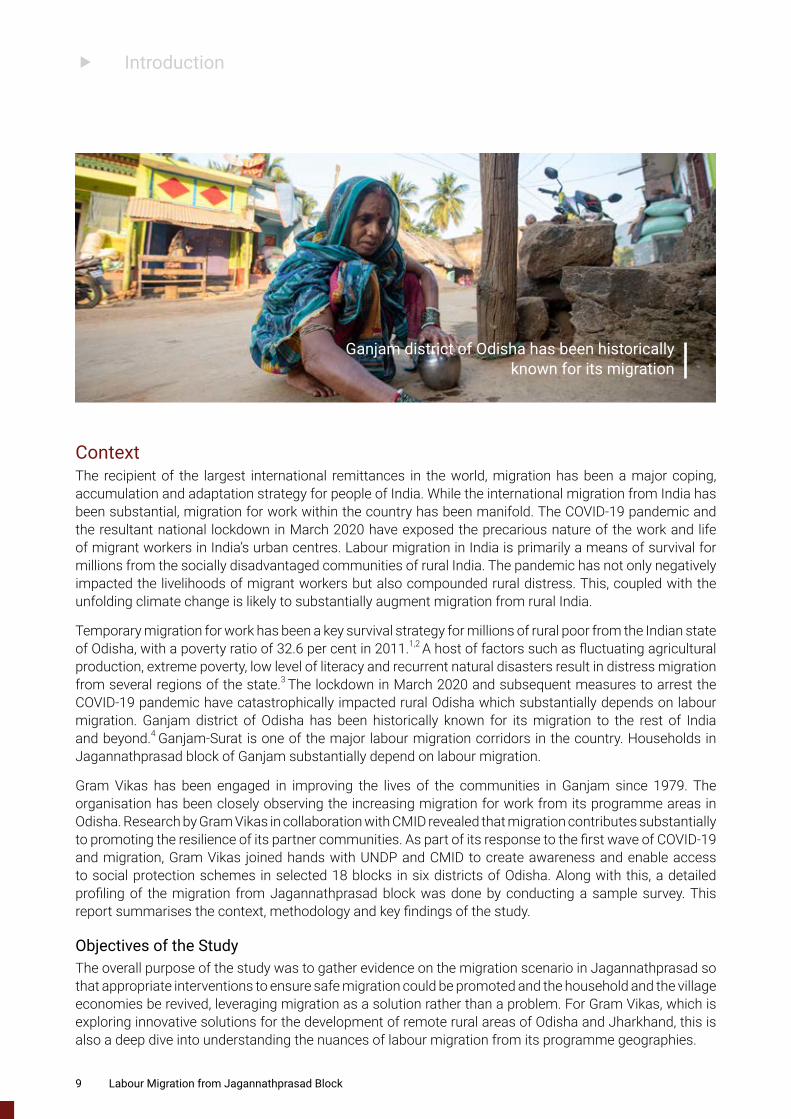
Ganjam district of Odisha has been historically known for its migration
ContextThe recipient of the largest international remittances in the world, migration has been a major coping, accumulation and adaptation strategy for people of India. While the international migration from India has been substantial, migration for work within the country has been manifold. The COVID-19 pandemic and the resultant national lockdown in March 2020 have exposed the precarious nature of the work and life of migrant workers in India’s urban centres. Labour migration in India is primarily a means of survival for millions from the socially disadvantaged communities of rural India. The pandemic has not only negatively impacted the livelihoods of migrant workers but also compounded rural distress. This, coupled with the unfolding climate change is likely to substantially augment migration from rural India.
Temporary migration for work has been a key survival strategy for millions of rural poor from the Indian state of Odisha, with a poverty ratio of 32.6 per cent in 2011.1,2 A host of factors such as fluctuating agricultural production, extreme poverty, low level of literacy and recurrent natural disasters result in distress migration from several regions of the state.3 The lockdown in March 2020 and subsequent measures to arrest the COVID-19 pandemic have catastrophically impacted rural Odisha which substantially depends on labour migration. Ganjam district of Odisha has been historically known for its migration to the rest of India and beyond.4 Ganjam-Surat is one of the major labour migration corridors in the country. Households in Jagannathprasad block of Ganjam substantially depend on labour migration.
Gram Vikas has been engaged in improving the lives of the communities in Ganjam since 1979. The organisation has been closely observing the increasing migration for work from its programme areas in Odisha. Research by Gram Vikas in collaboration with CMID revealed that migration contributes substantially to promoting the resilience of its partner communities. As part of its response to the first wave of COVID‐19 and migration, Gram Vikas joined hands with UNDP and CMID to create awareness and enable access to social protection schemes in selected 18 blocks in six districts of Odisha. Along with this, a detailed profiling of the migration from Jagannathprasad block was done by conducting a sample survey. This report summarises the context, methodology and key findings of the study.
Objectives of the StudyThe overall purpose of the study was to gather evidence on the migration scenario in Jagannathprasad so that appropriate interventions to ensure safe migration could be promoted and the household and the village economies be revived, leveraging migration as a solution rather than a problem. For Gram Vikas, which is exploring innovative solutions for the development of remote rural areas of Odisha and Jharkhand, this is also a deep dive into understanding the nuances of labour migration from its programme geographies.
9 Labour Migration from Jagannathprasad Block
f Introduction
The specific objectives of the study were: � To profile labour migration from Jagannathprasad
� To estimate the household migration rates from the community development block
� To understand the sociodemographic profile of households in Jagannathprasad
MethodologyIn order to obtain a good one-time estimate of household migration rates, a sample size of 400 was determined. Assuming a ten per cent non-response, the sample was inflated to 440. From the villages in Jagannathprasad, 22 villages were randomly selected by probability proportionate to size (PPS) and from each selected village, 20 households were selected by systematic random sampling. In addition to the household survey which aimed to understand the household characteristics and estimate household migration rates, a survey of current migrant workers was also carried out. From among the members in the household sample, who were migrants at the time of the announcement of the lockdown on March 24, 2020, the person who made the largest contribution to the income of the household was selected for the survey of migrant workers.
In order to select 22 Primary Sampling Units (PSU), villages in Jagannathprasad were listed based on the number of households extracted from the Primacy Census Abstract (PCA) from Census 2011 and villages with less than 40 households were merged with adjacent villages to obtain a minimum of 40 households per PSU. The list of PSUs thus prepared was then sorted by panchayat and within panchayat by the percentage of marginal workers to main workers in the PSU. PSUs with a population of 300 or above were segmented into clusters of around 100 households by merging adjacent paras within the PSU. Two such segments were then randomly selected from all segments. In the selected PSUs, a house listing was carried out to obtain the sampling frame for the selection of households. Details on caste, total number of household members, number of inter-district migrants and number of inter-state migrants in each household were collected under the house listing. From each selected PSU, 22 households were selected for the sample survey through systematic random sampling.
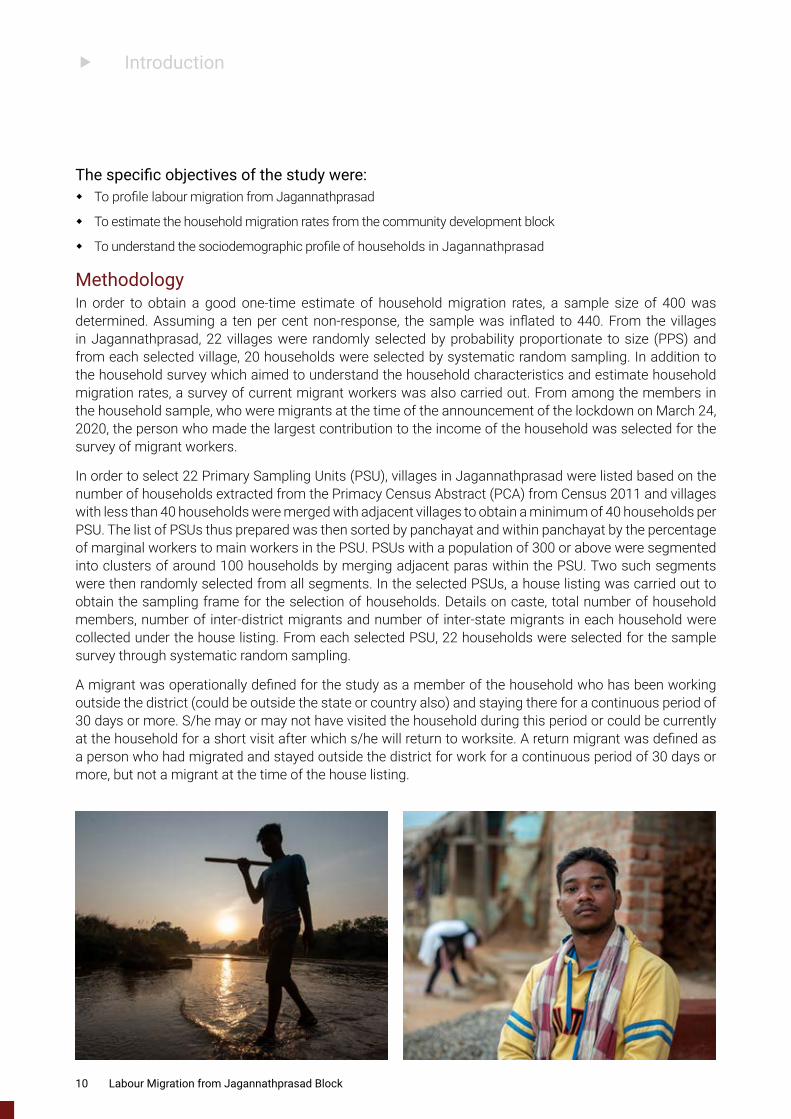
A migrant was operationally defined for the study as a member of the household who has been working outside the district (could be outside the state or country also) and staying there for a continuous period of 30 days or more. S/he may or may not have visited the household during this period or could be currently at the household for a short visit after which s/he will return to worksite. A return migrant was defined as a person who had migrated and stayed outside the district for work for a continuous period of 30 days or more, but not a migrant at the time of the house listing.
10 Labour Migration from Jagannathprasad Block
f Introduction
A semi-structured interview schedule in Odia, digitised using mWater survey platform, was used for data collection. Data regarding the socio-economic profile, agriculture, land use, access to public services, state of financial inclusion, impact of the lockdown and also data relevant to migration including seasonal migration were collected from the households. Data about return migrants were also collected. The migrant survey covered areas such as the sociodemographic profile of the migrant workers, current destination, factors that influenced migration, work profile, wages, living arrangements, income, expenditure, savings and remittances, access to services, social protection and the impact of the lockdown on migrant workers.
A team of eight investigators with a minimum educational qualification of higher secondary and above who were conversant in the local language were recruited and provided one-day training for the house listing. The investigators were provided a five-day residential training at the Rudhapadar facility of Gram Vikas for the household and migrant surveys. The house listing was carried out during the period September 29, 2020 to October 25, 2020. Based on the house listing, the sample households were selected and a household survey was conducted from November 10, 2020 to December 20, 2020. Each household interview took twenty to thirty minutes.
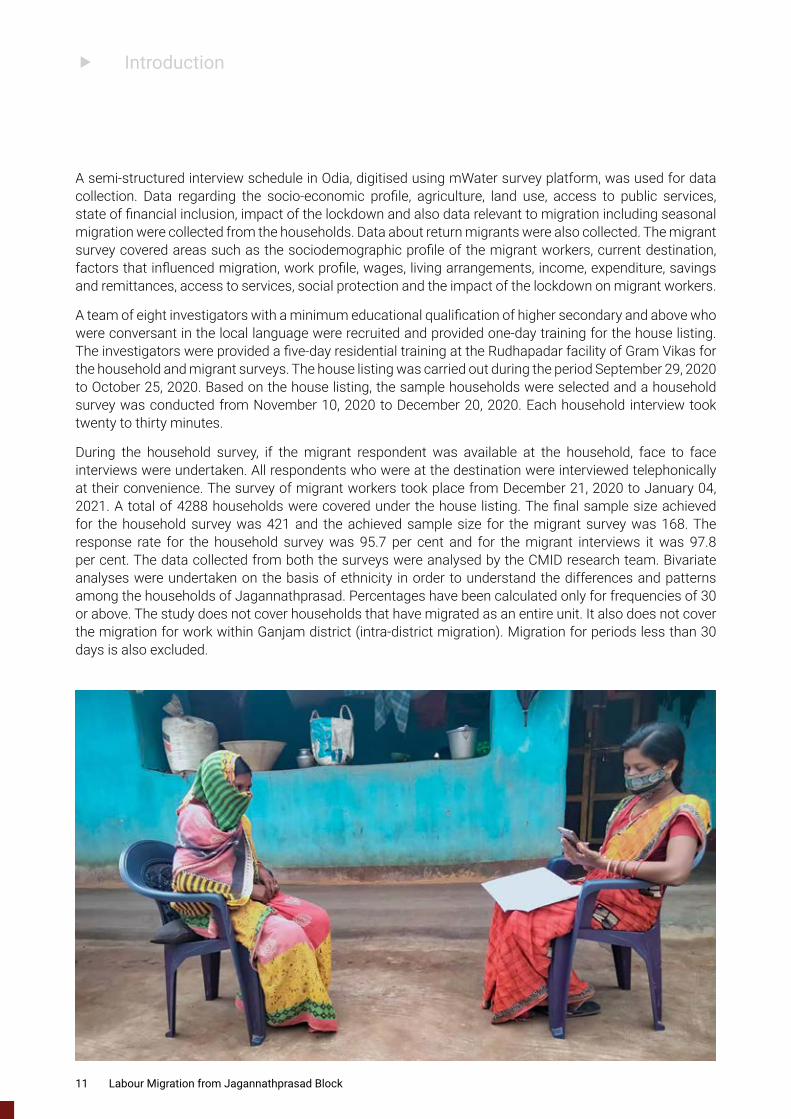
During the household survey, if the migrant respondent was available at the household, face to face interviews were undertaken. All respondents who were at the destination were interviewed telephonically at their convenience. The survey of migrant workers took place from December 21, 2020 to January 04, 2021. A total of 4288 households were covered under the house listing. The final sample size achieved for the household survey was 421 and the achieved sample size for the migrant survey was 168. The response rate for the household survey was 95.7 per cent and for the migrant interviews it was 97.8 per cent. The data collected from both the surveys were analysed by the CMID research team. Bivariate analyses were undertaken on the basis of ethnicity in order to understand the differences and patterns among the households of Jagannathprasad. Percentages have been calculated only for frequencies of 30 or above. The study does not cover households that have migrated as an entire unit. It also does not cover the migration for work within Ganjam district (intra-district migration). Migration for periods less than 30 days is also excluded.
11 Labour Migration from Jagannathprasad Block
Labour Migration from Jagannathprasad Block
Household Profile
f Household Profile
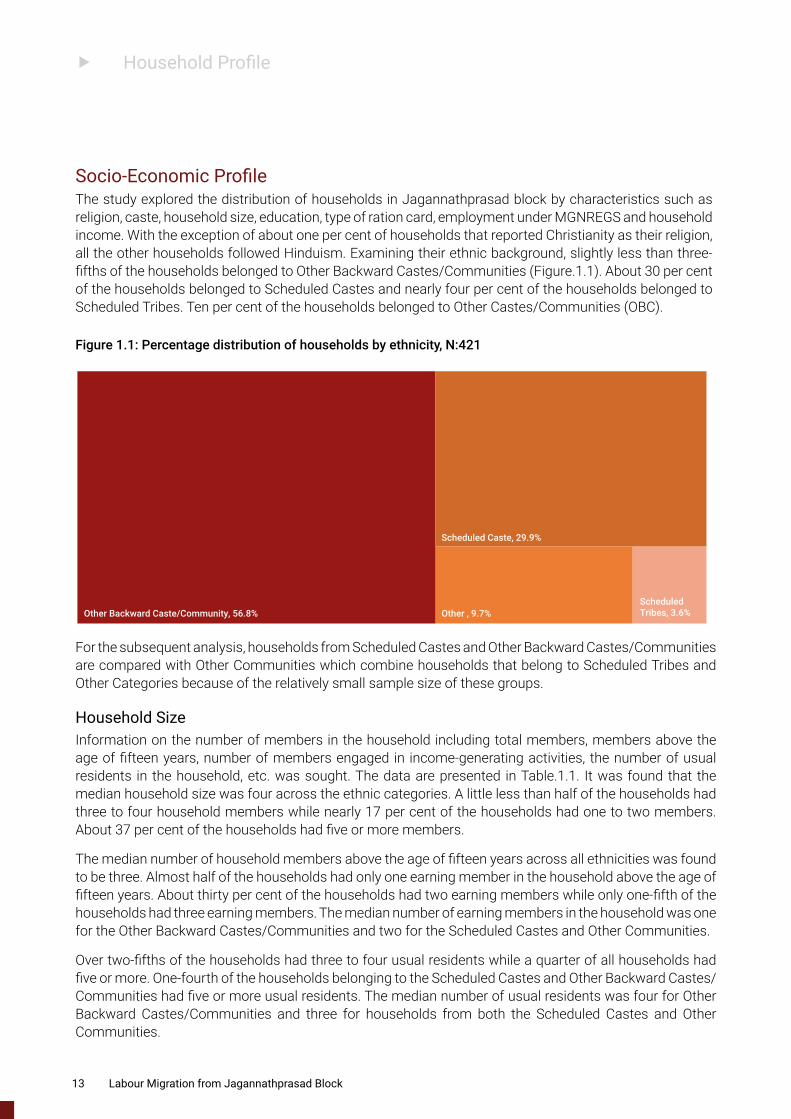
Socio-Economic ProfileThe study explored the distribution of households in Jagannathprasad block by characteristics such as religion, caste, household size, education, type of ration card, employment under MGNREGS and household income. With the exception of about one per cent of households that reported Christianity as their religion, all the other households followed Hinduism. Examining their ethnic background, slightly less than three-fifths of the households belonged to Other Backward Castes/Communities (Figure.1.1). About 30 per cent of the households belonged to Scheduled Castes and nearly four per cent of the households belonged to Scheduled Tribes. Ten per cent of the households belonged to Other Castes/Communities (OBC).
For the subsequent analysis, households from Scheduled Castes and Other Backward Castes/Communities are compared with Other Communities which combine households that belong to Scheduled Tribes and Other Categories because of the relatively small sample size of these groups.
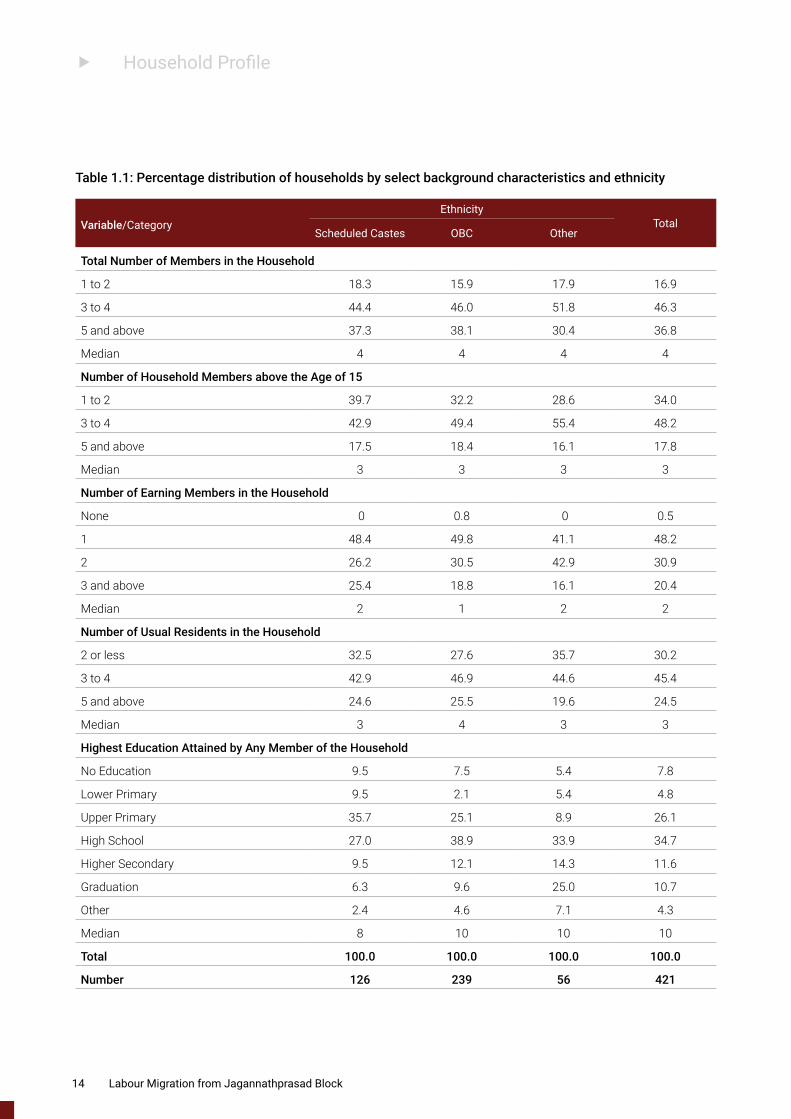
Household SizeInformation on the number of members in the household including total members, members above the age of fifteen years, number of members engaged in income-generating activities, the number of usual residents in the household, etc. was sought. The data are presented in Table.1.1. It was found that the median household size was four across the ethnic categories. A little less than half of the households had three to four household members while nearly 17 per cent of the households had one to two members. About 37 per cent of the households had five or more members.
The median number of household members above the age of fifteen years across all ethnicities was found to be three. Almost half of the households had only one earning member in the household above the age of fifteen years. About thirty per cent of the households had two earning members while only one-fifth of the households had three earning members. The median number of earning members in the household was one for the Other Backward Castes/Communities and two for the Scheduled Castes and Other Communities.
Over two-fifths of the households had three to four usual residents while a quarter of all households had five or more. One-fourth of the households belonging to the Scheduled Castes and Other Backward Castes/Communities had five or more usual residents. The median number of usual residents was four for Other Backward Castes/Communities and three for households from both the Scheduled Castes and Other Communities.
Scheduled Caste, 29.9%
Scheduled Tribes, 3.6%Other Backward Caste/Community, 56.8% Other , 9.7%
Figure 1.1: Percentage distribution of households by ethnicity, N:421
13 Labour Migration from Jagannathprasad Block
f Household Profile
Table 1.1: Percentage distribution of households by select background characteristics and ethnicity
Variable/CategoryEthnicity
TotalScheduled Castes OBC Other
Total Number of Members in the Household
1 to 2 18.3 15.9 17.9 16.9
3 to 4 44.4 46.0 51.8 46.3
5 and above 37.3 38.1 30.4 36.8
Median 4 4 4 4
Number of Household Members above the Age of 15
1 to 2 39.7 32.2 28.6 34.0
3 to 4 42.9 49.4 55.4 48.2
5 and above 17.5 18.4 16.1 17.8
Median 3 3 3 3
Number of Earning Members in the Household
None 0 0.8 0 0.5
1 48.4 49.8 41.1 48.2
2 26.2 30.5 42.9 30.9
3 and above 25.4 18.8 16.1 20.4
Median 2 1 2 2
Number of Usual Residents in the Household
2 or less 32.5 27.6 35.7 30.2
3 to 4 42.9 46.9 44.6 45.4
5 and above 24.6 25.5 19.6 24.5
Median 3 4 3 3
Highest Education Attained by Any Member of the Household
No Education 9.5 7.5 5.4 7.8
Lower Primary 9.5 2.1 5.4 4.8
Upper Primary 35.7 25.1 8.9 26.1
High School 27.0 38.9 33.9 34.7
Higher Secondary 9.5 12.1 14.3 11.6
Graduation 6.3 9.6 25.0 10.7
Other 2.4 4.6 7.1 4.3
Median 8 10 10 10
Total 100.0 100.0 100.0 100.0
Number 126 239 56 421
14 Labour Migration from Jagannathprasad Block
f Household Profile
EducationThe highest educational attainment of any member in the household was ten years taking all the households into consideration. In the case of households from Scheduled Castes, it was eight years while it was ten years in the case of others. About one-third of all the households had a member who had attained education up to high school level. About ten per cent of the Scheduled Caste households had not received any education. Around thirty per cent of all the households had family members who had a lower primary or upper primary level of education. A quarter of the households from other ethnicities had a family member who had completed graduation compared to ten per cent of the households from Other Backward Castes/Communities and about six per cent of households belonging to Scheduled Castes. High school was completed by one family member of almost two-fifths of the households belonging to Other Backward Castes/Communities.
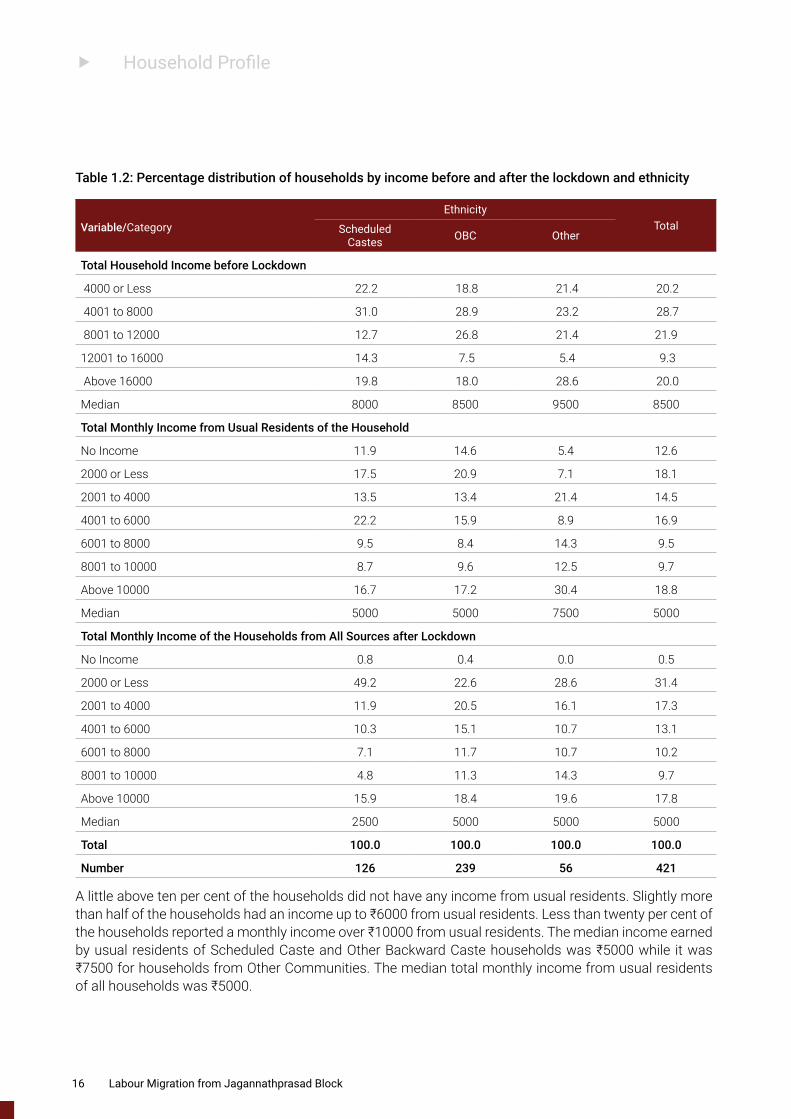
Household IncomeThe income of the household before and after the lockdown was explored through the study based on self-reporting of the households. Total monthly income from all sources and also from usual residents was explored. The data revealed that nearly 30 per cent of the households had a total monthly income between ₹4001 and ₹8000 before the lockdown was announced. Only 20 per cent of the households earned an income above ₹16000. Nearly 30 per cent of the households from Other Communities earned an income above ₹16000 before the lockdown. A little less than a quarter of the households belonging to Scheduled Castes earned an income up to ₹4000. Over a quarter of the households from Other Backward Castes/Communities earned an income between ₹8001 to ₹12000 before the lockdown was announced. The median total monthly income for all households before the lockdown was ₹8500. The median monthly income for Scheduled Caste households was ₹8000. This was ₹8500 for Other Backward Castes/Communities and ₹9500 for households from the rest of the communities.
15 Labour Migration from Jagannathprasad Block
f Household Profile
Table 1.2: Percentage distribution of households by income before and after the lockdown and ethnicity
Variable/CategoryEthnicity
TotalScheduled Castes OBC Other
Total Household Income before Lockdown
4000 or Less 22.2 18.8 21.4 20.2
4001 to 8000 31.0 28.9 23.2 28.7
8001 to 12000 12.7 26.8 21.4 21.9
12001 to 16000 14.3 7.5 5.4 9.3
Above 16000 19.8 18.0 28.6 20.0
Median 8000 8500 9500 8500
Total Monthly Income from Usual Residents of the Household
No Income 11.9 14.6 5.4 12.6
2000 or Less 17.5 20.9 7.1 18.1
2001 to 4000 13.5 13.4 21.4 14.5
4001 to 6000 22.2 15.9 8.9 16.9
6001 to 8000 9.5 8.4 14.3 9.5
8001 to 10000 8.7 9.6 12.5 9.7
Above 10000 16.7 17.2 30.4 18.8
Median 5000 5000 7500 5000
Total Monthly Income of the Households from All Sources after Lockdown
No Income 0.8 0.4 0.0 0.5
2000 or Less 49.2 22.6 28.6 31.4
2001 to 4000 11.9 20.5 16.1 17.3
4001 to 6000 10.3 15.1 10.7 13.1
6001 to 8000 7.1 11.7 10.7 10.2
8001 to 10000 4.8 11.3 14.3 9.7
Above 10000 15.9 18.4 19.6 17.8
Median 2500 5000 5000 5000
Total 100.0 100.0 100.0 100.0
Number 126 239 56 421
A little above ten per cent of the households did not have any income from usual residents. Slightly more than half of the households had an income up to ₹6000 from usual residents. Less than twenty per cent of the households reported a monthly income over ₹10000 from usual residents. The median income earned by usual residents of Scheduled Caste and Other Backward Caste households was ₹5000 while it was ₹7500 for households from Other Communities. The median total monthly income from usual residents of all households was ₹5000.
16 Labour Migration from Jagannathprasad Block
f Household Profile
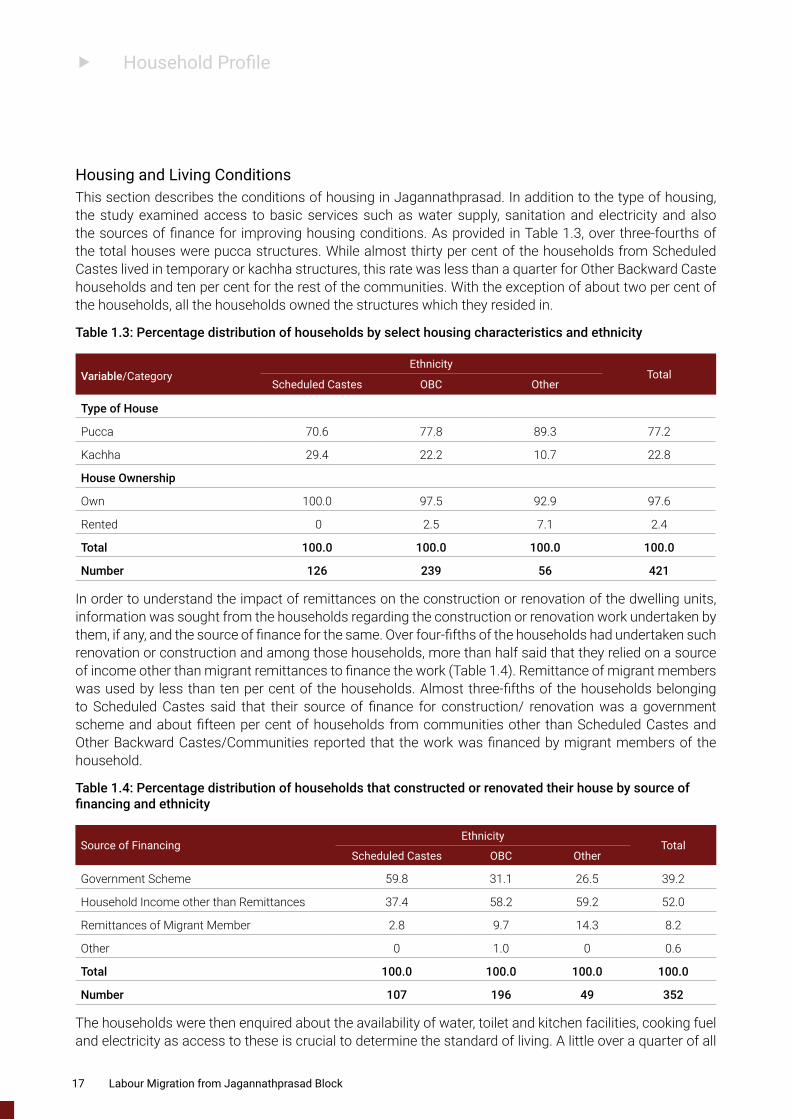
Housing and Living ConditionsThis section describes the conditions of housing in Jagannathprasad. In addition to the type of housing, the study examined access to basic services such as water supply, sanitation and electricity and also the sources of finance for improving housing conditions. As provided in Table 1.3, over three-fourths of the total houses were pucca structures. While almost thirty per cent of the households from Scheduled Castes lived in temporary or kachha structures, this rate was less than a quarter for Other Backward Caste households and ten per cent for the rest of the communities. With the exception of about two per cent of the households, all the households owned the structures which they resided in.
Table 1.3: Percentage distribution of households by select housing characteristics and ethnicity
Variable/CategoryEthnicity
TotalScheduled Castes OBC Other
Type of House
Pucca 70.6 77.8 89.3 77.2
Kachha 29.4 22.2 10.7 22.8
House Ownership
Own 100.0 97.5 92.9 97.6
Rented 0 2.5 7.1 2.4
Total 100.0 100.0 100.0 100.0
Number 126 239 56 421
In order to understand the impact of remittances on the construction or renovation of the dwelling units, information was sought from the households regarding the construction or renovation work undertaken by them, if any, and the source of finance for the same. Over four-fifths of the households had undertaken such renovation or construction and among those households, more than half said that they relied on a source of income other than migrant remittances to finance the work (Table 1.4). Remittance of migrant members was used by less than ten per cent of the households. Almost three-fifths of the households belonging to Scheduled Castes said that their source of finance for construction/ renovation was a government scheme and about fifteen per cent of households from communities other than Scheduled Castes and Other Backward Castes/Communities reported that the work was financed by migrant members of the household.
Table 1.4: Percentage distribution of households that constructed or renovated their house by source of financing and ethnicity
Source of FinancingEthnicity
TotalScheduled Castes OBC Other
Government Scheme 59.8 31.1 26.5 39.2
Household Income other than Remittances 37.4 58.2 59.2 52.0
Remittances of Migrant Member 2.8 9.7 14.3 8.2
Other 0 1.0 0 0.6
Total 100.0 100.0 100.0 100.0
Number 107 196 49 352
The households were then enquired about the availability of water, toilet and kitchen facilities, cooking fuel and electricity as access to these is crucial to determine the standard of living. A little over a quarter of all
17 Labour Migration from Jagannathprasad Block
f Household Profile
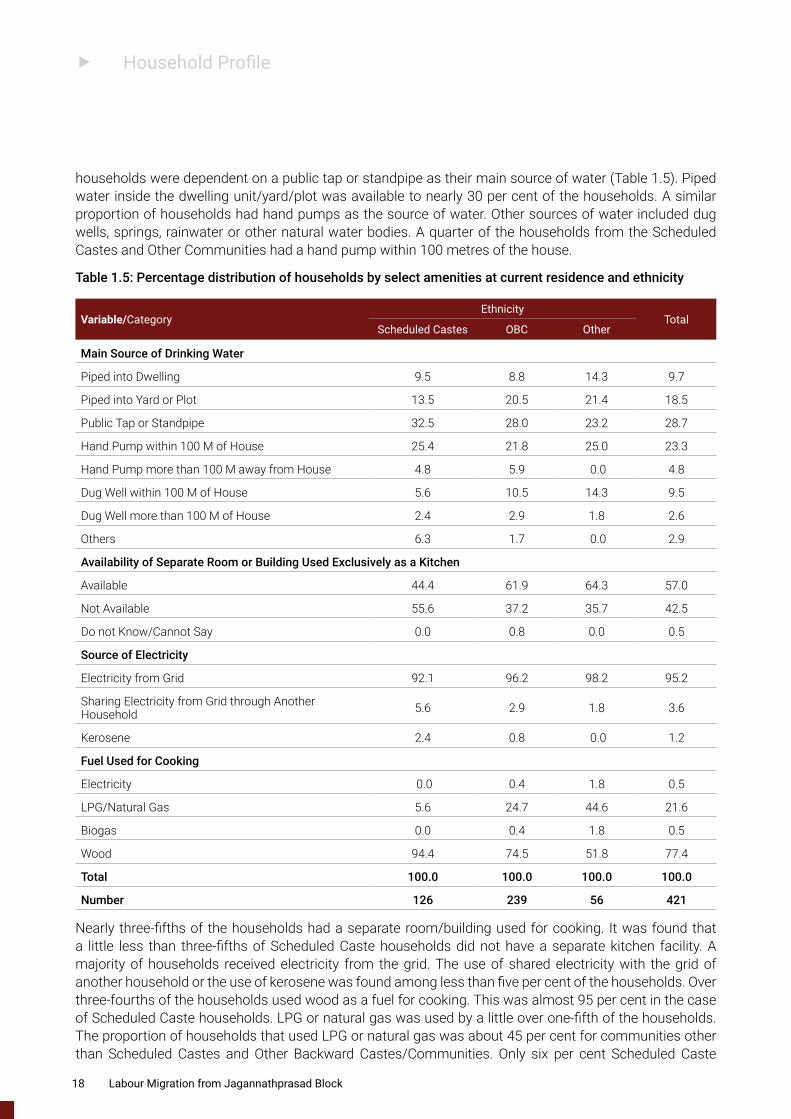
households were dependent on a public tap or standpipe as their main source of water (Table 1.5). Piped water inside the dwelling unit/yard/plot was available to nearly 30 per cent of the households. A similar proportion of households had hand pumps as the source of water. Other sources of water included dug wells, springs, rainwater or other natural water bodies. A quarter of the households from the Scheduled Castes and Other Communities had a hand pump within 100 metres of the house.
Table 1.5: Percentage distribution of households by select amenities at current residence and ethnicity
Variable/CategoryEthnicity
TotalScheduled Castes OBC Other
Main Source of Drinking Water
Piped into Dwelling 9.5 8.8 14.3 9.7
Piped into Yard or Plot 13.5 20.5 21.4 18.5
Public Tap or Standpipe 32.5 28.0 23.2 28.7
Hand Pump within 100 M of House 25.4 21.8 25.0 23.3
Hand Pump more than 100 M away from House 4.8 5.9 0.0 4.8
Dug Well within 100 M of House 5.6 10.5 14.3 9.5
Dug Well more than 100 M of House 2.4 2.9 1.8 2.6
Others 6.3 1.7 0.0 2.9
Availability of Separate Room or Building Used Exclusively as a Kitchen
Available 44.4 61.9 64.3 57.0
Not Available 55.6 37.2 35.7 42.5
Do not Know/Cannot Say 0.0 0.8 0.0 0.5
Source of Electricity
Electricity from Grid 92.1 96.2 98.2 95.2
Sharing Electricity from Grid through Another Household 5.6 2.9 1.8 3.6
Kerosene 2.4 0.8 0.0 1.2
Fuel Used for Cooking
Electricity 0.0 0.4 1.8 0.5
LPG/Natural Gas 5.6 24.7 44.6 21.6
Biogas 0.0 0.4 1.8 0.5
Wood 94.4 74.5 51.8 77.4
Total 100.0 100.0 100.0 100.0
Number 126 239 56 421
Nearly three-fifths of the households had a separate room/building used for cooking. It was found that a little less than three-fifths of Scheduled Caste households did not have a separate kitchen facility. A majority of households received electricity from the grid. The use of shared electricity with the grid of another household or the use of kerosene was found among less than five per cent of the households. Over three-fourths of the households used wood as a fuel for cooking. This was almost 95 per cent in the case of Scheduled Caste households. LPG or natural gas was used by a little over one-fifth of the households. The proportion of households that used LPG or natural gas was about 45 per cent for communities other than Scheduled Castes and Other Backward Castes/Communities. Only six per cent Scheduled Caste
18 Labour Migration from Jagannathprasad Block
f Household Profile
households in Jagannathprasad used LPG or natural gas for cooking. The use of electricity or biogas for cooking was found to be negligible.
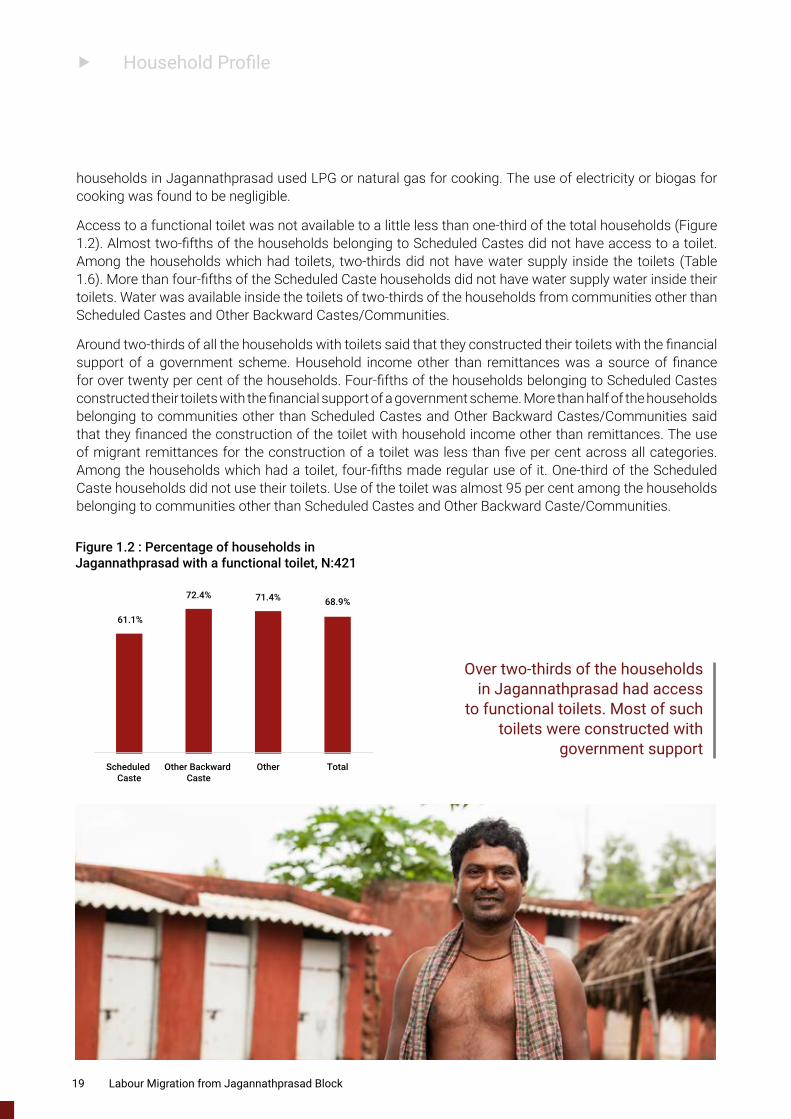
Access to a functional toilet was not available to a little less than one-third of the total households (Figure 1.2). Almost two-fifths of the households belonging to Scheduled Castes did not have access to a toilet. Among the households which had toilets, two-thirds did not have water supply inside the toilets (Table 1.6). More than four-fifths of the Scheduled Caste households did not have water supply water inside their toilets. Water was available inside the toilets of two-thirds of the households from communities other than Scheduled Castes and Other Backward Castes/Communities.
Around two-thirds of all the households with toilets said that they constructed their toilets with the financial support of a government scheme. Household income other than remittances was a source of finance for over twenty per cent of the households. Four-fifths of the households belonging to Scheduled Castes constructed their toilets with the financial support of a government scheme. More than half of the households belonging to communities other than Scheduled Castes and Other Backward Castes/Communities said that they financed the construction of the toilet with household income other than remittances. The use of migrant remittances for the construction of a toilet was less than five per cent across all categories. Among the households which had a toilet, four-fifths made regular use of it. One-third of the Scheduled Caste households did not use their toilets. Use of the toilet was almost 95 per cent among the households belonging to communities other than Scheduled Castes and Other Backward Caste/Communities.
61.1%
72.4% 71.4% 68.9%
Scheduled Caste
Other Backward Caste
Other Total
Figure 1.2 : Percentage of households in Jagannathprasad with a functional toilet, N:421
Over two-thirds of the households in Jagannathprasad had access
to functional toilets. Most of such toilets were constructed with
government support
19 Labour Migration from Jagannathprasad Block
f Household Profile
Table 1.6: Percentage distribution of households with functional toilets by select characteristics and ethnicity
Variable/CategoryEthnicity
TotalScheduled Castes OBC Other
Availability of Water Supply inside Toilet
Water Available 15.6 37.0 65.0 35.2
Water Not Available 84.4 63.0 35.0 64.8
Source of Finance for Construction of Toilet
Government Scheme 80.5 64.2 32.5 64.1
NGO Scheme 9.1 13.3 10.0 11.7
Household Income other than Remittances 10.4 19.1 55.0 21.7
Remittances of Migrant Member 0.0 3.5 2.5 2.4
Regular Use of Toilet by Household Members
Toilet Regularly Used 66.2 87.3 95.0 82.8
Toilet Not in Use 33.8 12.7 5.0 17.2
Total 100.0 100.0 100.0 100.0
Number 77 173 40 290
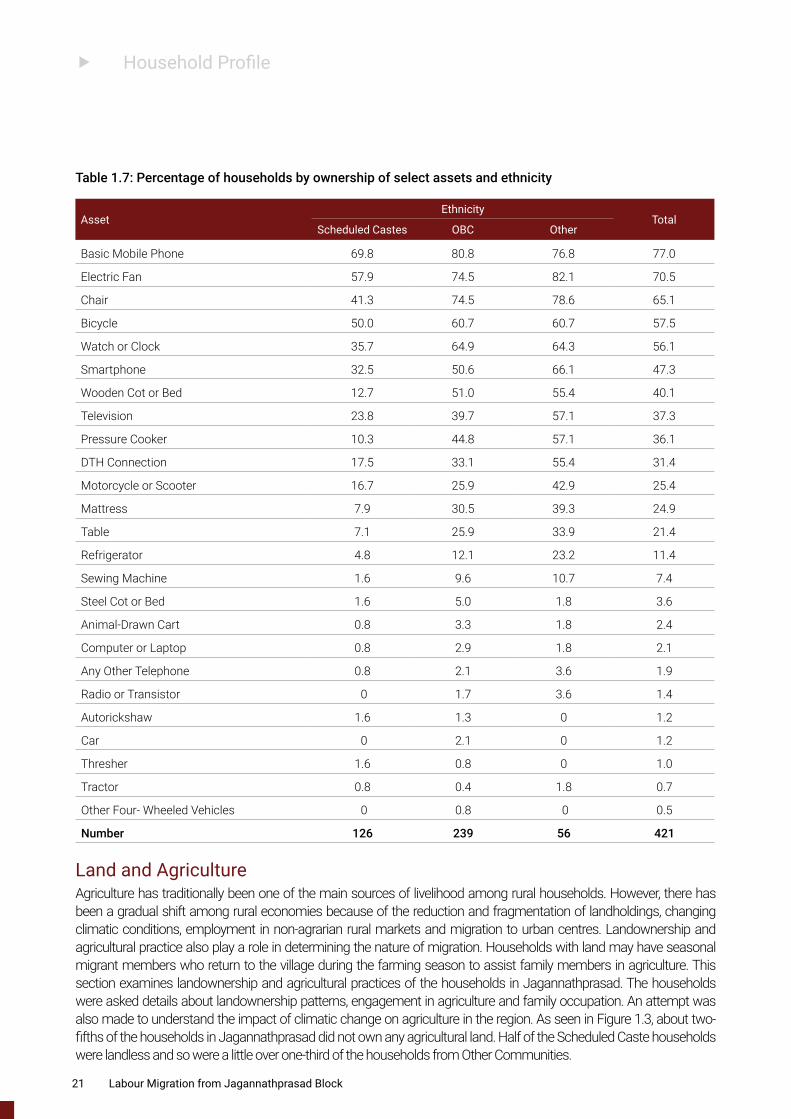
Ownership of Select AssetsOwnership of select assets among the households of Jagannathprasad was explored to understand the standard of living. Assets owned (Table 1.7) indicate the consumption patterns among the households. There is a visible difference between the consumption patterns of households from Scheduled Castes, Other Backward Castes/Communities and Other Communities. A basic mobile phone was the most common asset across ethnic categories. Over 70 per cent of households across ethnic groups had such phones. Trends revealed that communities other than Scheduled Castes and Other Backward Castes/Communities were better off and the households from Scheduled Caste Communities owned fewer assets compared to others.
20 Labour Migration from Jagannathprasad Block
f Household Profile
Table 1.7: Percentage of households by ownership of select assets and ethnicity
AssetEthnicity
TotalScheduled Castes OBC Other
Basic Mobile Phone 69.8 80.8 76.8 77.0
Electric Fan 57.9 74.5 82.1 70.5
Chair 41.3 74.5 78.6 65.1
Bicycle 50.0 60.7 60.7 57.5
Watch or Clock 35.7 64.9 64.3 56.1
Smartphone 32.5 50.6 66.1 47.3
Wooden Cot or Bed 12.7 51.0 55.4 40.1
Television 23.8 39.7 57.1 37.3
Pressure Cooker 10.3 44.8 57.1 36.1
DTH Connection 17.5 33.1 55.4 31.4
Motorcycle or Scooter 16.7 25.9 42.9 25.4
Mattress 7.9 30.5 39.3 24.9
Table 7.1 25.9 33.9 21.4
Refrigerator 4.8 12.1 23.2 11.4
Sewing Machine 1.6 9.6 10.7 7.4
Steel Cot or Bed 1.6 5.0 1.8 3.6
Animal-Drawn Cart 0.8 3.3 1.8 2.4
Computer or Laptop 0.8 2.9 1.8 2.1
Any Other Telephone 0.8 2.1 3.6 1.9
Radio or Transistor 0 1.7 3.6 1.4
Autorickshaw 1.6 1.3 0 1.2
Car 0 2.1 0 1.2
Thresher 1.6 0.8 0 1.0
Tractor 0.8 0.4 1.8 0.7
Other Four- Wheeled Vehicles 0 0.8 0 0.5
Number 126 239 56 421
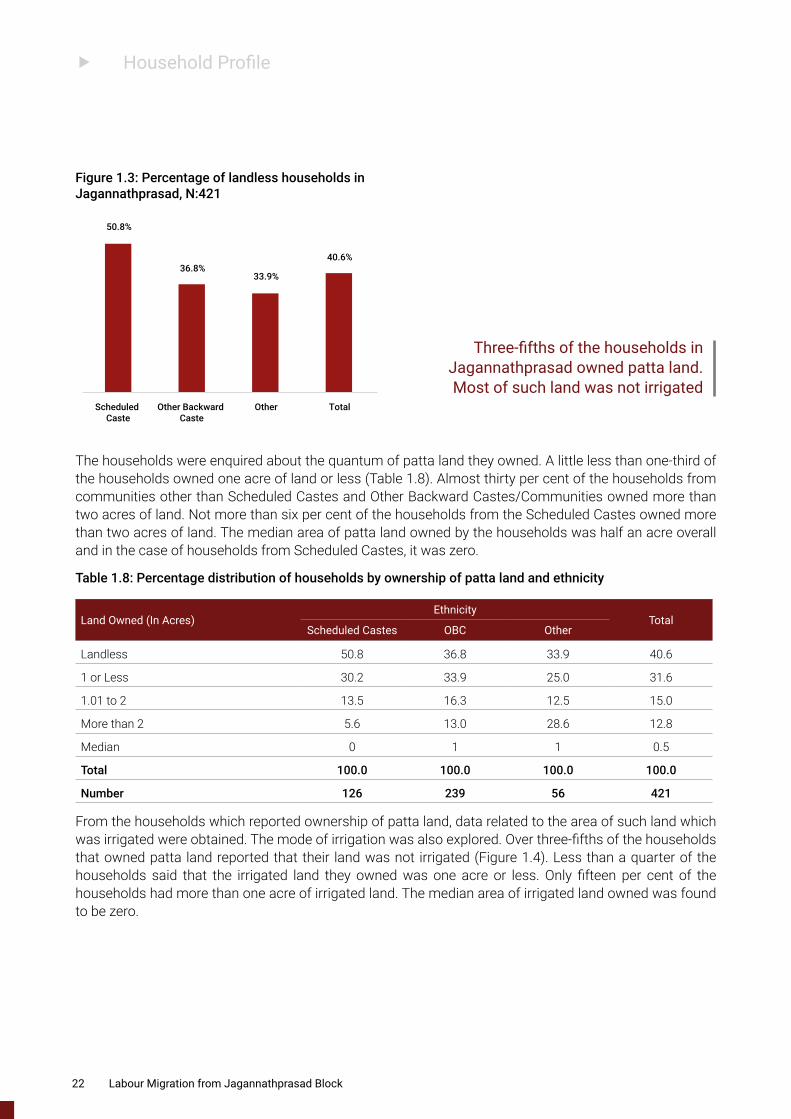
Land and AgricultureAgriculture has traditionally been one of the main sources of livelihood among rural households. However, there has been a gradual shift among rural economies because of the reduction and fragmentation of landholdings, changing climatic conditions, employment in non-agrarian rural markets and migration to urban centres. Landownership and agricultural practice also play a role in determining the nature of migration. Households with land may have seasonal migrant members who return to the village during the farming season to assist family members in agriculture. This section examines landownership and agricultural practices of the households in Jagannathprasad. The households were asked details about landownership patterns, engagement in agriculture and family occupation. An attempt was also made to understand the impact of climatic change on agriculture in the region. As seen in Figure 1.3, about two-fifths of the households in Jagannathprasad did not own any agricultural land. Half of the Scheduled Caste households were landless and so were a little over one-third of the households from Other Communities.
21 Labour Migration from Jagannathprasad Block
f Household Profile
The households were enquired about the quantum of patta land they owned. A little less than one-third of the households owned one acre of land or less (Table 1.8). Almost thirty per cent of the households from communities other than Scheduled Castes and Other Backward Castes/Communities owned more than two acres of land. Not more than six per cent of the households from the Scheduled Castes owned more than two acres of land. The median area of patta land owned by the households was half an acre overall and in the case of households from Scheduled Castes, it was zero.
Table 1.8: Percentage distribution of households by ownership of patta land and ethnicity
Land Owned (In Acres)Ethnicity
TotalScheduled Castes OBC Other
Landless 50.8 36.8 33.9 40.6
1 or Less 30.2 33.9 25.0 31.6
1.01 to 2 13.5 16.3 12.5 15.0
More than 2 5.6 13.0 28.6 12.8
Median 0 1 1 0.5
Total 100.0 100.0 100.0 100.0
Number 126 239 56 421
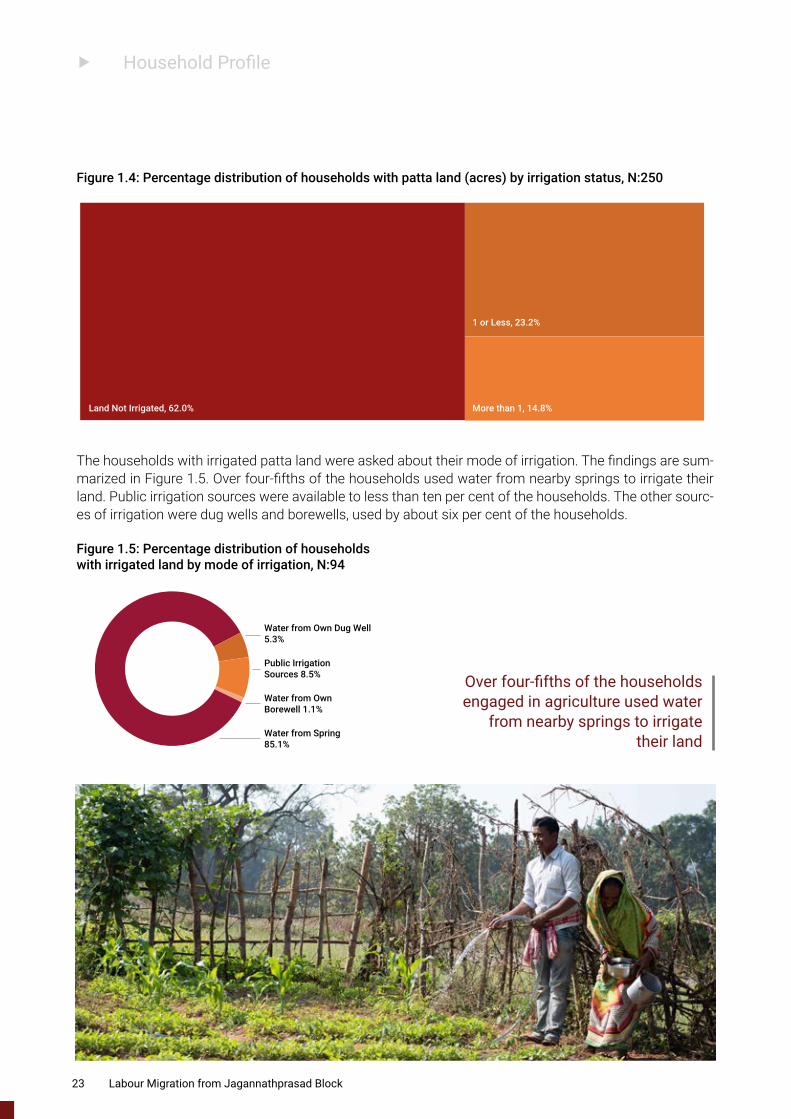
From the households which reported ownership of patta land, data related to the area of such land which was irrigated were obtained. The mode of irrigation was also explored. Over three-fifths of the households that owned patta land reported that their land was not irrigated (Figure 1.4). Less than a quarter of the households said that the irrigated land they owned was one acre or less. Only fifteen per cent of the households had more than one acre of irrigated land. The median area of irrigated land owned was found to be zero.
50.8%
36.8%33.9%
40.6%
Scheduled Caste
Other Backward Caste
Other Total
Figure 1.3: Percentage of landless households in Jagannathprasad, N:421
Three-fifths of the households in Jagannathprasad owned patta land. Most of such land was not irrigated
22 Labour Migration from Jagannathprasad Block
f Household Profile
The households with irrigated patta land were asked about their mode of irrigation. The findings are sum-marized in Figure 1.5. Over four-fifths of the households used water from nearby springs to irrigate their land. Public irrigation sources were available to less than ten per cent of the households. The other sourc-es of irrigation were dug wells and borewells, used by about six per cent of the households.
Land Not Irrigated, 62.0%
1 or Less, 23.2%
More than 1, 14.8%
Figure 1.4: Percentage distribution of households with patta land (acres) by irrigation status, N:250
Water from OwnBorewell 1.1%
Water from Spring85.1%
Water from Own Dug Well5.3%
Public IrrigationSources 8.5%
Figure 1.5: Percentage distribution of households with irrigated land by mode of irrigation, N:94
Over four-fifths of the households engaged in agriculture used water
from nearby springs to irrigate their land
23 Labour Migration from Jagannathprasad Block
f Household Profile
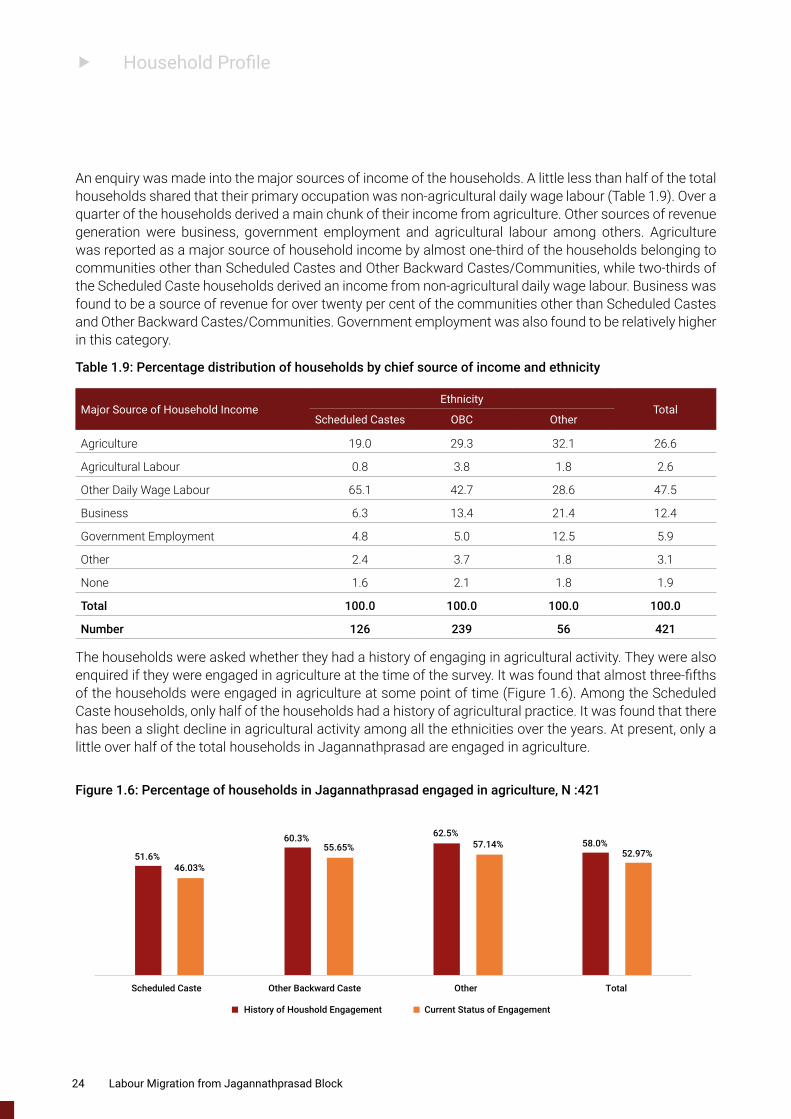
An enquiry was made into the major sources of income of the households. A little less than half of the total households shared that their primary occupation was non-agricultural daily wage labour (Table 1.9). Over a quarter of the households derived a main chunk of their income from agriculture. Other sources of revenue generation were business, government employment and agricultural labour among others. Agriculture was reported as a major source of household income by almost one-third of the households belonging to communities other than Scheduled Castes and Other Backward Castes/Communities, while two-thirds of the Scheduled Caste households derived an income from non-agricultural daily wage labour. Business was found to be a source of revenue for over twenty per cent of the communities other than Scheduled Castes and Other Backward Castes/Communities. Government employment was also found to be relatively higher in this category.
Table 1.9: Percentage distribution of households by chief source of income and ethnicity
Major Source of Household IncomeEthnicity
TotalScheduled Castes OBC Other
Agriculture 19.0 29.3 32.1 26.6
Agricultural Labour 0.8 3.8 1.8 2.6
Other Daily Wage Labour 65.1 42.7 28.6 47.5
Business 6.3 13.4 21.4 12.4
Government Employment 4.8 5.0 12.5 5.9
Other 2.4 3.7 1.8 3.1
None 1.6 2.1 1.8 1.9
Total 100.0 100.0 100.0 100.0
Number 126 239 56 421
The households were asked whether they had a history of engaging in agricultural activity. They were also enquired if they were engaged in agriculture at the time of the survey. It was found that almost three-fifths of the households were engaged in agriculture at some point of time (Figure 1.6). Among the Scheduled Caste households, only half of the households had a history of agricultural practice. It was found that there has been a slight decline in agricultural activity among all the ethnicities over the years. At present, only a little over half of the total households in Jagannathprasad are engaged in agriculture.
51.6%
60.3% 62.5%58.0%
46.03%
55.65% 57.14%52.97%
Scheduled Caste Other Backward Caste Other Total
History of Houshold Engagement Current Status of Engagement
Figure 1.6: Percentage of households in Jagannathprasad engaged in agriculture, N :421
24 Labour Migration from Jagannathprasad Block
f Household Profile
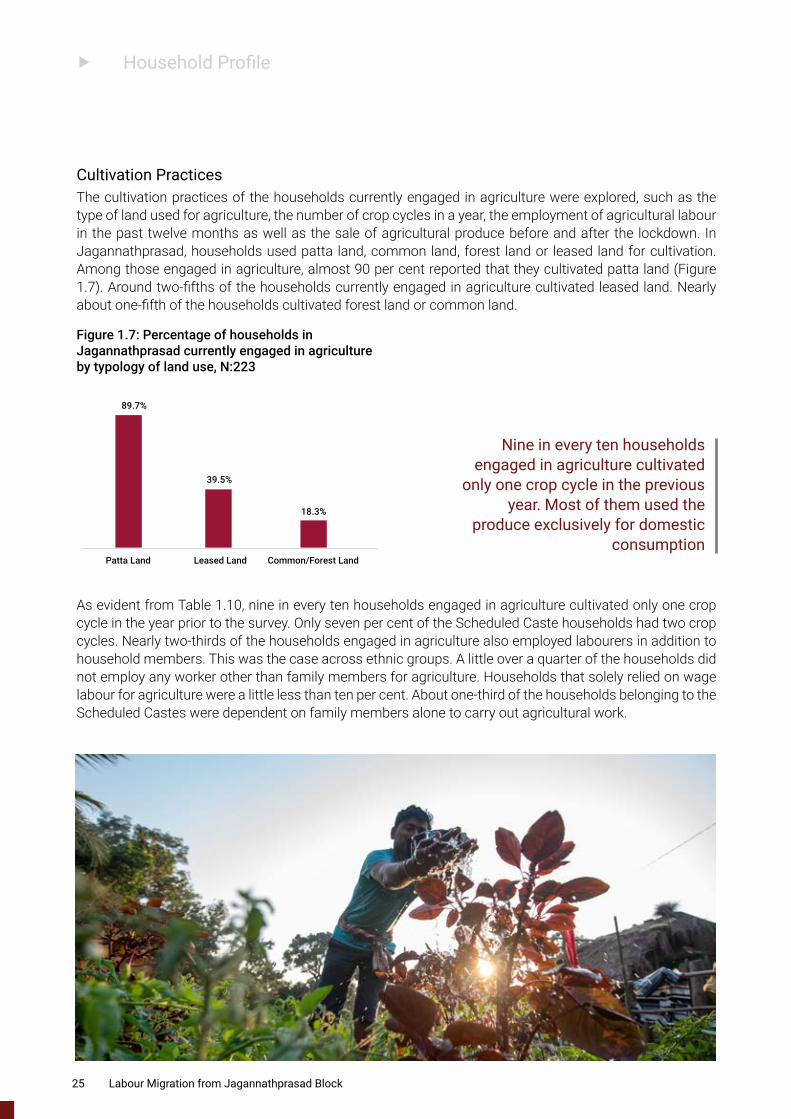
Cultivation PracticesThe cultivation practices of the households currently engaged in agriculture were explored, such as the type of land used for agriculture, the number of crop cycles in a year, the employment of agricultural labour in the past twelve months as well as the sale of agricultural produce before and after the lockdown. In Jagannathprasad, households used patta land, common land, forest land or leased land for cultivation. Among those engaged in agriculture, almost 90 per cent reported that they cultivated patta land (Figure 1.7). Around two-fifths of the households currently engaged in agriculture cultivated leased land. Nearly about one-fifth of the households cultivated forest land or common land.
89.7%
39.5%
18.3%
Patta Land Leased Land Common/Forest Land
Figure 1.7: Percentage of households in Jagannathprasad currently engaged in agriculture by typology of land use, N:223
As evident from Table 1.10, nine in every ten households engaged in agriculture cultivated only one crop cycle in the year prior to the survey. Only seven per cent of the Scheduled Caste households had two crop cycles. Nearly two-thirds of the households engaged in agriculture also employed labourers in addition to household members. This was the case across ethnic groups. A little over a quarter of the households did not employ any worker other than family members for agriculture. Households that solely relied on wage labour for agriculture were a little less than ten per cent. About one-third of the households belonging to the Scheduled Castes were dependent on family members alone to carry out agricultural work.
Nine in every ten households engaged in agriculture cultivated
only one crop cycle in the previous year. Most of them used the
produce exclusively for domestic consumption
25 Labour Migration from Jagannathprasad Block
f Household Profile
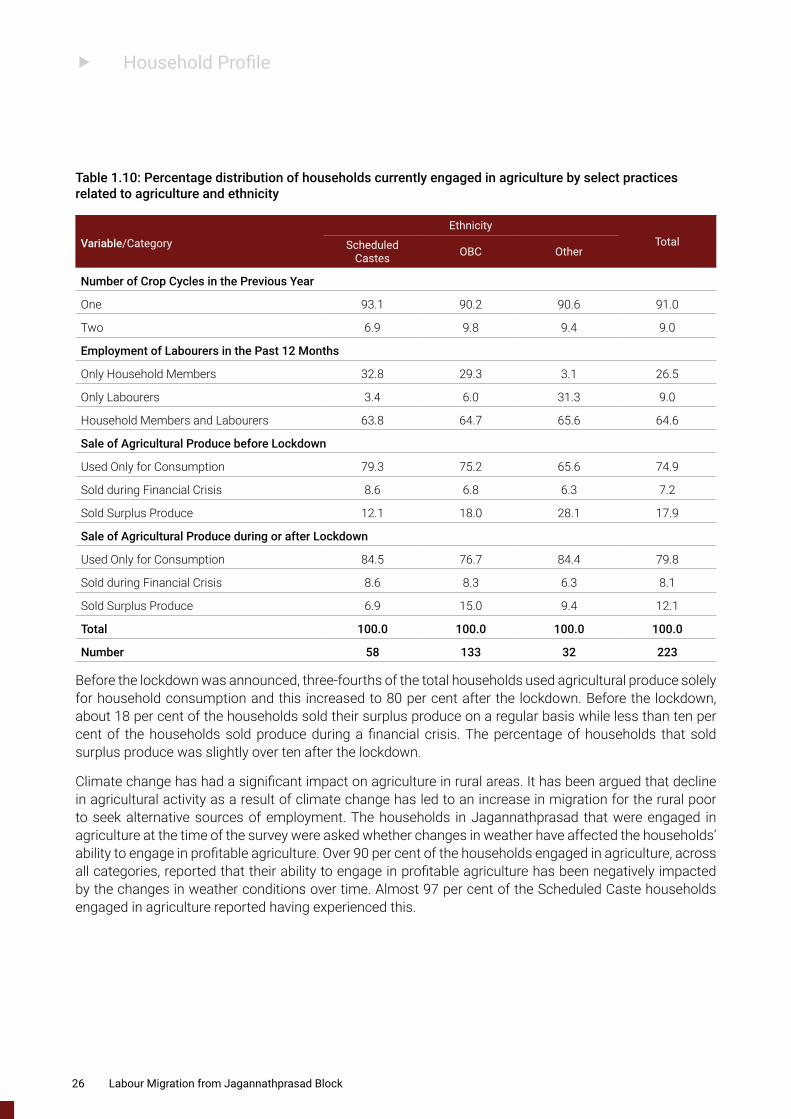
Table 1.10: Percentage distribution of households currently engaged in agriculture by select practices related to agriculture and ethnicity
Variable/CategoryEthnicity
TotalScheduled Castes OBC Other
Number of Crop Cycles in the Previous Year
One 93.1 90.2 90.6 91.0
Two 6.9 9.8 9.4 9.0
Employment of Labourers in the Past 12 Months
Only Household Members 32.8 29.3 3.1 26.5
Only Labourers 3.4 6.0 31.3 9.0
Household Members and Labourers 63.8 64.7 65.6 64.6
Sale of Agricultural Produce before Lockdown
Used Only for Consumption 79.3 75.2 65.6 74.9
Sold during Financial Crisis 8.6 6.8 6.3 7.2
Sold Surplus Produce 12.1 18.0 28.1 17.9
Sale of Agricultural Produce during or after Lockdown
Used Only for Consumption 84.5 76.7 84.4 79.8
Sold during Financial Crisis 8.6 8.3 6.3 8.1
Sold Surplus Produce 6.9 15.0 9.4 12.1
Total 100.0 100.0 100.0 100.0
Number 58 133 32 223
Before the lockdown was announced, three-fourths of the total households used agricultural produce solely for household consumption and this increased to 80 per cent after the lockdown. Before the lockdown, about 18 per cent of the households sold their surplus produce on a regular basis while less than ten per cent of the households sold produce during a financial crisis. The percentage of households that sold surplus produce was slightly over ten after the lockdown.
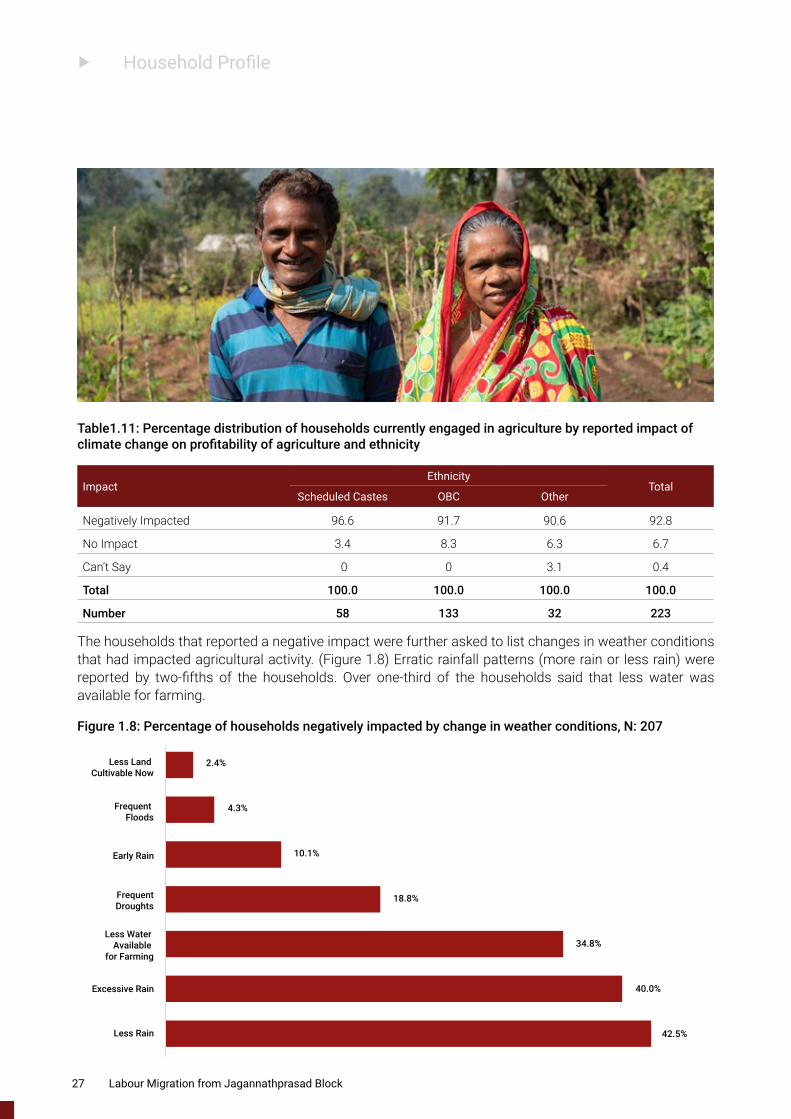
Climate change has had a significant impact on agriculture in rural areas. It has been argued that decline in agricultural activity as a result of climate change has led to an increase in migration for the rural poor to seek alternative sources of employment. The households in Jagannathprasad that were engaged in agriculture at the time of the survey were asked whether changes in weather have affected the households’ ability to engage in profitable agriculture. Over 90 per cent of the households engaged in agriculture, across all categories, reported that their ability to engage in profitable agriculture has been negatively impacted by the changes in weather conditions over time. Almost 97 per cent of the Scheduled Caste households engaged in agriculture reported having experienced this.
26 Labour Migration from Jagannathprasad Block
f Household Profile
Table1.11: Percentage distribution of households currently engaged in agriculture by reported impact of climate change on profitability of agriculture and ethnicity
Impact Ethnicity
TotalScheduled Castes OBC Other
Negatively Impacted 96.6 91.7 90.6 92.8
No Impact 3.4 8.3 6.3 6.7
Can’t Say 0 0 3.1 0.4
Total 100.0 100.0 100.0 100.0
Number 58 133 32 223
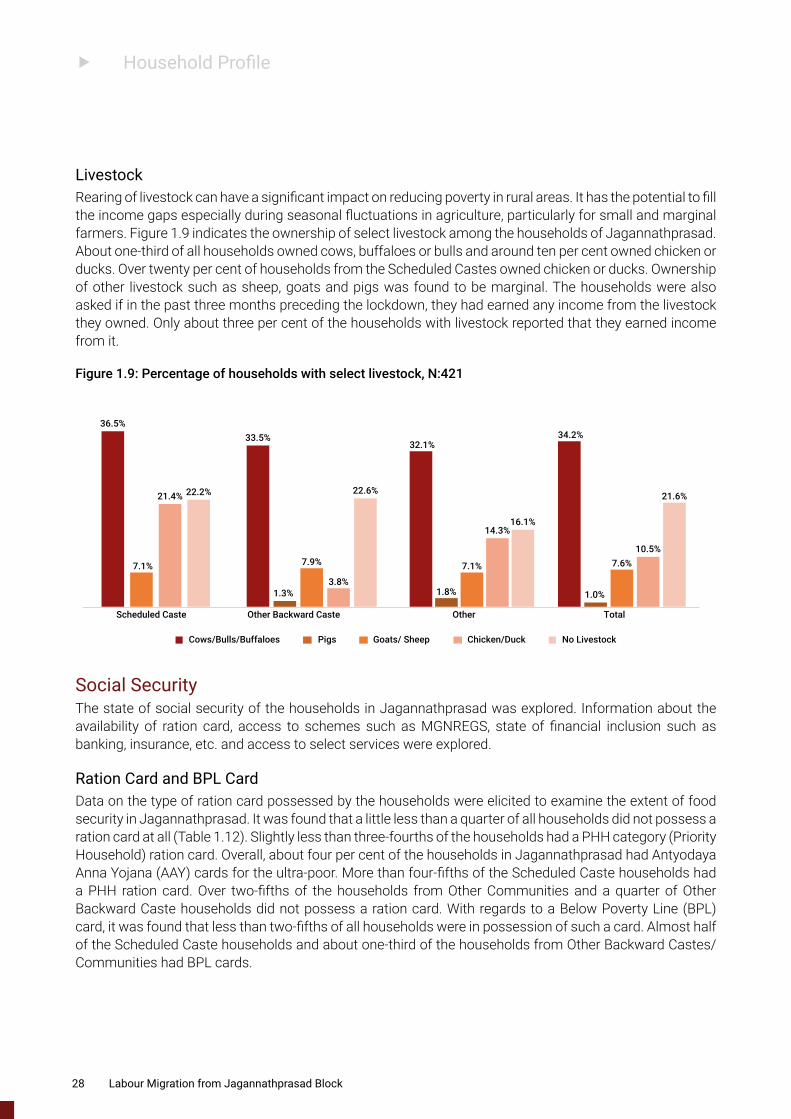
The households that reported a negative impact were further asked to list changes in weather conditions that had impacted agricultural activity. (Figure 1.8) Erratic rainfall patterns (more rain or less rain) were reported by two-fifths of the households. Over one-third of the households said that less water was available for farming.
42.5%
40.0%
34.8%
18.8%
10.1%
4.3%
2.4%
Less Rain
Excessive Rain
Less Water Available
for Farming
FrequentDroughts
Early Rain
Frequent Floods
Less Land Cultivable Now
Figure 1.8: Percentage of households negatively impacted by change in weather conditions, N: 207
27 Labour Migration from Jagannathprasad Block
f Household Profile
LivestockRearing of livestock can have a significant impact on reducing poverty in rural areas. It has the potential to fill the income gaps especially during seasonal fluctuations in agriculture, particularly for small and marginal farmers. Figure 1.9 indicates the ownership of select livestock among the households of Jagannathprasad. About one-third of all households owned cows, buffaloes or bulls and around ten per cent owned chicken or ducks. Over twenty per cent of households from the Scheduled Castes owned chicken or ducks. Ownership of other livestock such as sheep, goats and pigs was found to be marginal. The households were also asked if in the past three months preceding the lockdown, they had earned any income from the livestock they owned. Only about three per cent of the households with livestock reported that they earned income from it.
36.5%33.5%
32.1%34.2%
1.3% 1.8% 1.0%
7.1% 7.9% 7.1% 7.6%
21.4%
3.8%
14.3%
10.5%
22.2% 22.6%
16.1%
21.6%
Scheduled Caste Other Backward Caste Other Total
Cows/Bulls/Buffaloes Pigs Goats/ Sheep Chicken/Duck No Livestock
Figure 1.9: Percentage of households with select livestock, N:421
Social Security The state of social security of the households in Jagannathprasad was explored. Information about the availability of ration card, access to schemes such as MGNREGS, state of financial inclusion such as banking, insurance, etc. and access to select services were explored.
Ration Card and BPL CardData on the type of ration card possessed by the households were elicited to examine the extent of food security in Jagannathprasad. It was found that a little less than a quarter of all households did not possess a ration card at all (Table 1.12). Slightly less than three-fourths of the households had a PHH category (Priority Household) ration card. Overall, about four per cent of the households in Jagannathprasad had Antyodaya Anna Yojana (AAY) cards for the ultra-poor. More than four-fifths of the Scheduled Caste households had a PHH ration card. Over two-fifths of the households from Other Communities and a quarter of Other Backward Caste households did not possess a ration card. With regards to a Below Poverty Line (BPL) card, it was found that less than two-fifths of all households were in possession of such a card. Almost half of the Scheduled Caste households and about one-third of the households from Other Backward Castes/Communities had BPL cards.
28 Labour Migration from Jagannathprasad Block
f Household Profile
Table 1.12: Percentage distribution of households by type of ration card, possession of BPL card and ethnicity
Type of Entitlement CardEthnicity
TotalScheduled Castes OBC Other
Ration Card
No Ration Card 12.7 24.7 42.9 23.5
AAY Card 3.2 3.8 3.6 3.6
PHH Card 84.1 70.7 51.8 72.2
Do Not Know 0 0.8 1.8 0.7
Possession of BPL Card
BPL Card 49.2 34.3 21.4 37.1
No BPL Card/Don’t Know 50.8 65.7 78.6 62.9
Total 100.0 100.0 100.0 100.0
Number 126 239 56 421
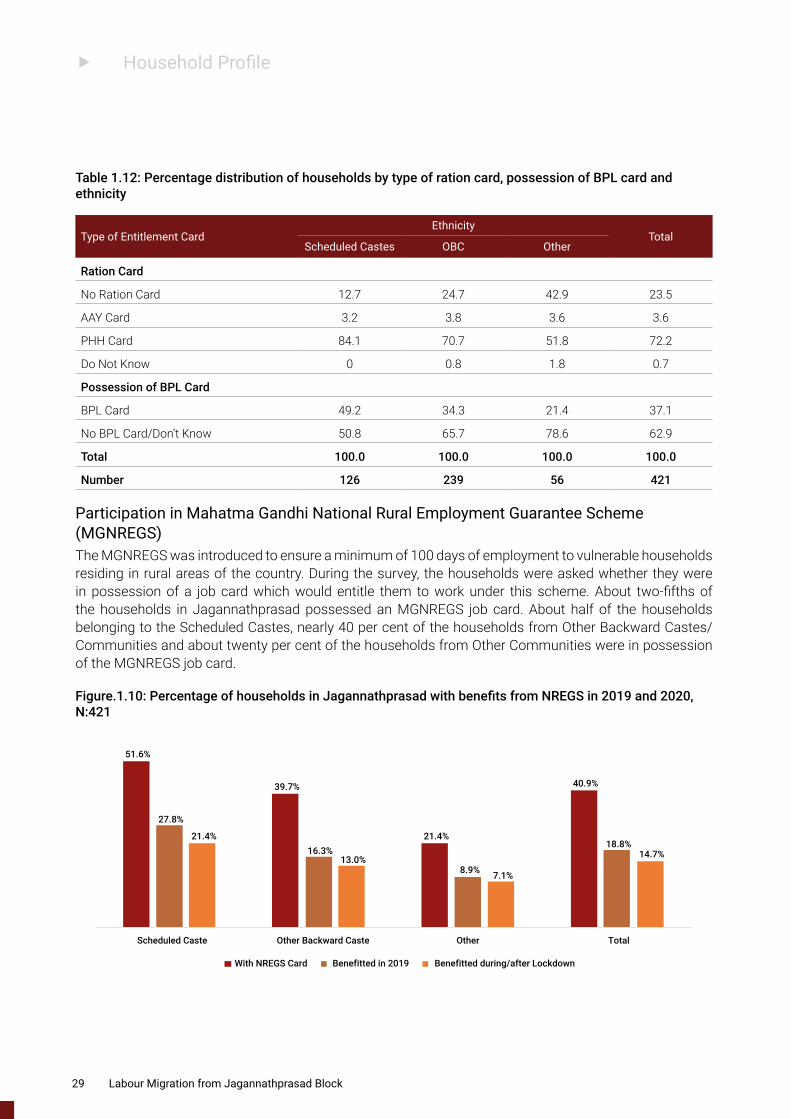
Participation in Mahatma Gandhi National Rural Employment Guarantee Scheme (MGNREGS) The MGNREGS was introduced to ensure a minimum of 100 days of employment to vulnerable households residing in rural areas of the country. During the survey, the households were asked whether they were in possession of a job card which would entitle them to work under this scheme. About two-fifths of the households in Jagannathprasad possessed an MGNREGS job card. About half of the households belonging to the Scheduled Castes, nearly 40 per cent of the households from Other Backward Castes/Communities and about twenty per cent of the households from Other Communities were in possession of the MGNREGS job card.
51.6%
39.7%
21.4%
40.9%
27.8%
16.3%
8.9%
18.8%21.4%
13.0%
7.1%
14.7%
Scheduled Caste Other Backward Caste Other Total
With NREGS Card Benefitted in 2019 Benefitted during/after Lockdown
Figure.1.10: Percentage of households in Jagannathprasad with benefits from NREGS in 2019 and 2020, N:421
29 Labour Migration from Jagannathprasad Block
f Household Profile
Further, the households which had job cards were asked about the number of days of employment received in 2019. Also, the number of work days received after the lockdown was announced was explored among the households with a job card, as MGNREGS is considered to provide livelihood to those who had lost out on their income after the pandemic. Nearly one in every five households in Jagannathprasad benefited from MGNREGS during 2019. During/after the lockdown in 2020, about 15 per cent of all households in Jagannathprasad benefited from MGNREGS. The proportion of Scheduled Caste households benefited during 2019 was about 28 per cent and about 21 per cent of the Scheduled Caste households benefited from MGNREGS during/after the lockdown. While about 16 per cent of Other Backward Caste/Community households in Jagannathprasad had benefited from MGNREGS in 2019, it was 13 per cent during/after the national lockdown.
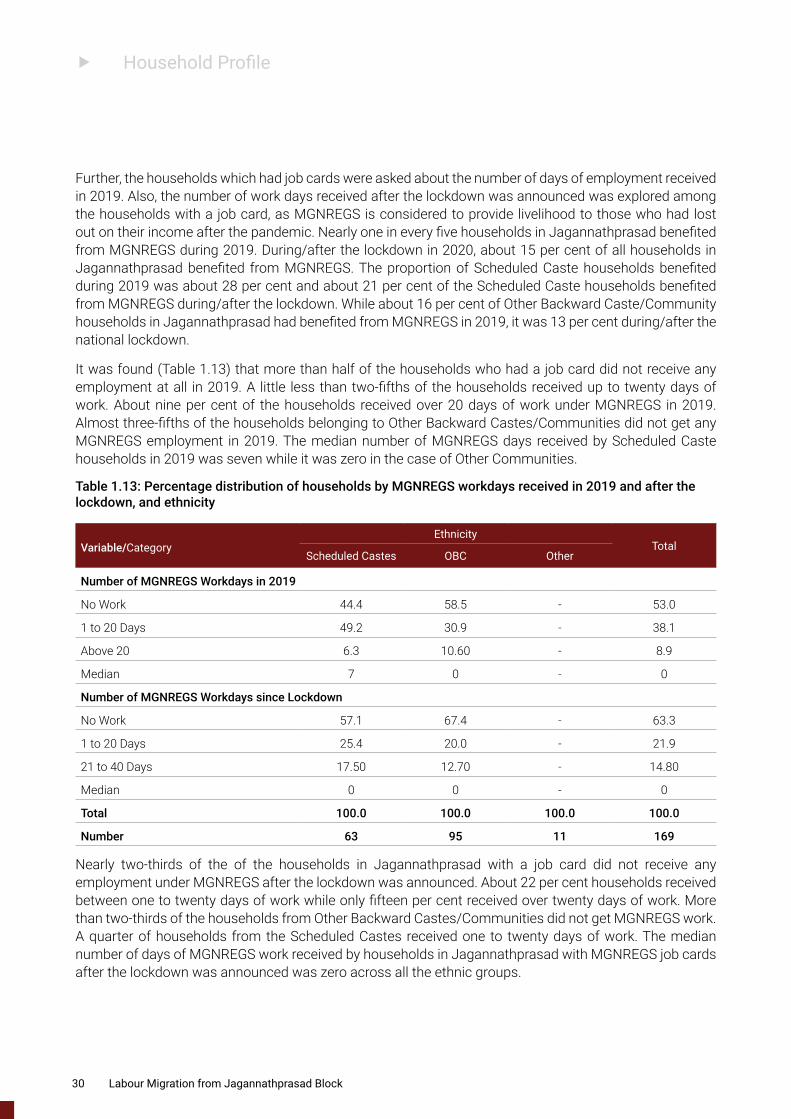
It was found (Table 1.13) that more than half of the households who had a job card did not receive any employment at all in 2019. A little less than two-fifths of the households received up to twenty days of work. About nine per cent of the households received over 20 days of work under MGNREGS in 2019. Almost three-fifths of the households belonging to Other Backward Castes/Communities did not get any MGNREGS employment in 2019. The median number of MGNREGS days received by Scheduled Caste households in 2019 was seven while it was zero in the case of Other Communities.
Table 1.13: Percentage distribution of households by MGNREGS workdays received in 2019 and after the lockdown, and ethnicity
Variable/CategoryEthnicity
TotalScheduled Castes OBC Other
Number of MGNREGS Workdays in 2019
No Work 44.4 58.5 - 53.0
1 to 20 Days 49.2 30.9 - 38.1
Above 20 6.3 10.60 - 8.9
Median 7 0 - 0
Number of MGNREGS Workdays since Lockdown
No Work 57.1 67.4 - 63.3
1 to 20 Days 25.4 20.0 - 21.9
21 to 40 Days 17.50 12.70 - 14.80
Median 0 0 - 0
Total 100.0 100.0 100.0 100.0
Number 63 95 11 169
Nearly two-thirds of the of the households in Jagannathprasad with a job card did not receive any employment under MGNREGS after the lockdown was announced. About 22 per cent households received between one to twenty days of work while only fifteen per cent received over twenty days of work. More than two-thirds of the households from Other Backward Castes/Communities did not get MGNREGS work. A quarter of households from the Scheduled Castes received one to twenty days of work. The median number of days of MGNREGS work received by households in Jagannathprasad with MGNREGS job cards after the lockdown was announced was zero across all the ethnic groups.
30 Labour Migration from Jagannathprasad Block
f Household Profile
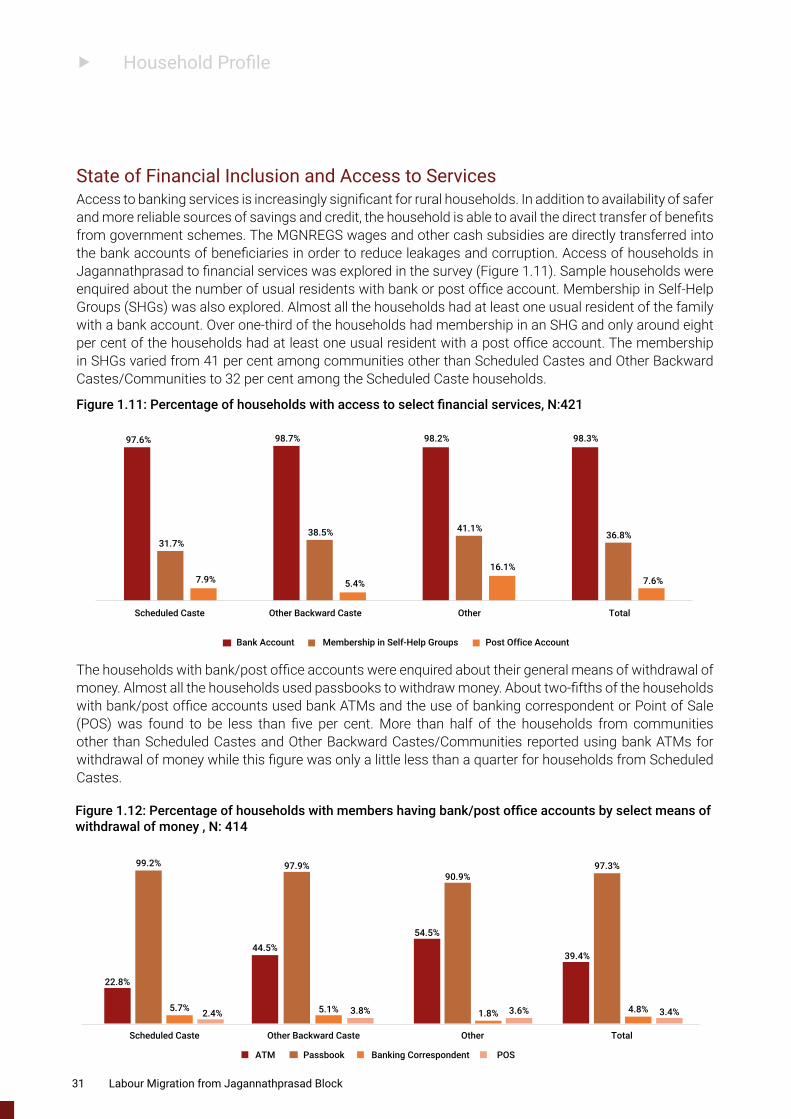
State of Financial Inclusion and Access to ServicesAccess to banking services is increasingly significant for rural households. In addition to availability of safer and more reliable sources of savings and credit, the household is able to avail the direct transfer of benefits from government schemes. The MGNREGS wages and other cash subsidies are directly transferred into the bank accounts of beneficiaries in order to reduce leakages and corruption. Access of households in Jagannathprasad to financial services was explored in the survey (Figure 1.11). Sample households were enquired about the number of usual residents with bank or post office account. Membership in Self-Help Groups (SHGs) was also explored. Almost all the households had at least one usual resident of the family with a bank account. Over one-third of the households had membership in an SHG and only around eight per cent of the households had at least one usual resident with a post office account. The membership in SHGs varied from 41 per cent among communities other than Scheduled Castes and Other Backward Castes/Communities to 32 per cent among the Scheduled Caste households.
97.6% 98.7% 98.2% 98.3%
31.7%38.5% 41.1%
36.8%
7.9% 5.4%
16.1%7.6%
Scheduled Caste Other Backward Caste Other Total
Bank Account Membership in Self-Help Groups Post Office Account
Figure 1.11: Percentage of households with access to select financial services, N:421
The households with bank/post office accounts were enquired about their general means of withdrawal of money. Almost all the households used passbooks to withdraw money. About two-fifths of the households with bank/post office accounts used bank ATMs and the use of banking correspondent or Point of Sale (POS) was found to be less than five per cent. More than half of the households from communities other than Scheduled Castes and Other Backward Castes/Communities reported using bank ATMs for withdrawal of money while this figure was only a little less than a quarter for households from Scheduled Castes.
22.8%
44.5%54.5%
39.4%
99.2% 97.9%90.9%
97.3%
5.7% 5.1% 1.8% 4.8%2.4% 3.8% 3.6% 3.4%
Scheduled Caste Other Backward Caste Other Total
ATM Passbook Banking Correspondent POS
Figure 1.12: Percentage of households with members having bank/post office accounts by select means of withdrawal of money , N: 414
31 Labour Migration from Jagannathprasad Block
f Household Profile
The households were also asked about the time it took to complete a financial transaction including the travel time to and from the bank/post office. The median number of hours taken was four in the case of households from Other Backward Castes/Communities and for the rest of the households it was three hours.
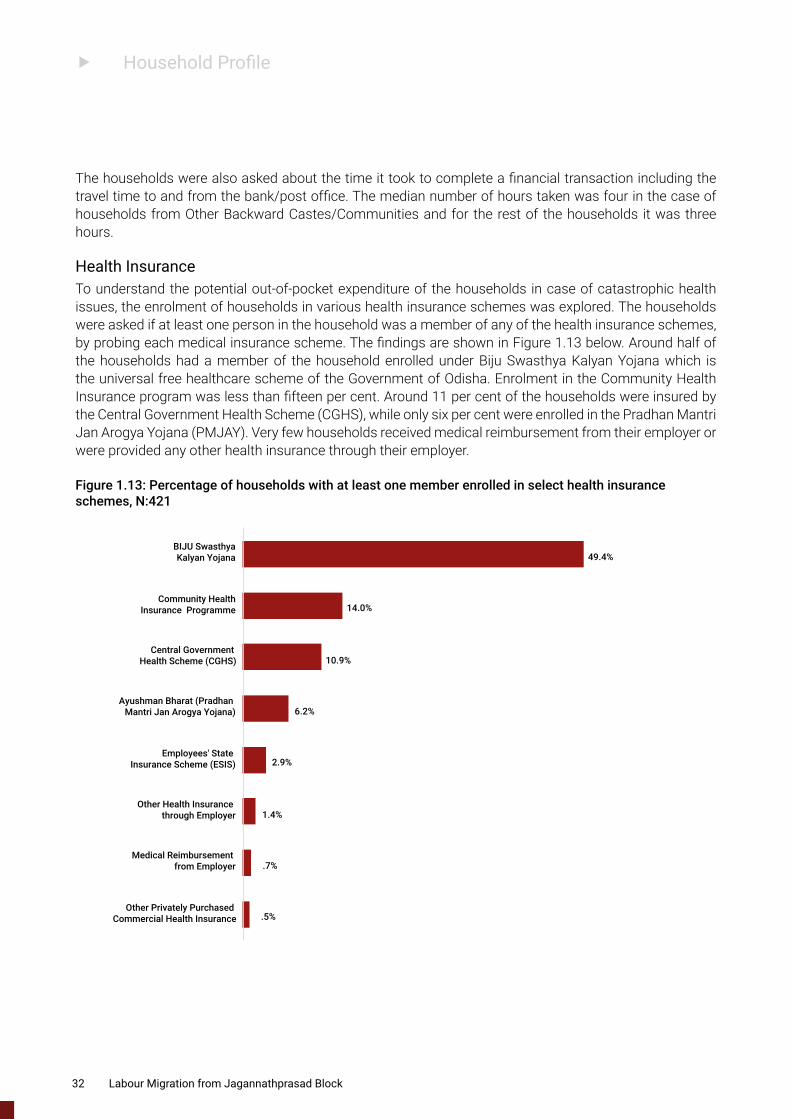
Health Insurance To understand the potential out-of-pocket expenditure of the households in case of catastrophic health issues, the enrolment of households in various health insurance schemes was explored. The households were asked if at least one person in the household was a member of any of the health insurance schemes, by probing each medical insurance scheme. The findings are shown in Figure 1.13 below. Around half of the households had a member of the household enrolled under Biju Swasthya Kalyan Yojana which is the universal free healthcare scheme of the Government of Odisha. Enrolment in the Community Health Insurance program was less than fifteen per cent. Around 11 per cent of the households were insured by the Central Government Health Scheme (CGHS), while only six per cent were enrolled in the Pradhan Mantri Jan Arogya Yojana (PMJAY). Very few households received medical reimbursement from their employer or were provided any other health insurance through their employer.
.5%
.7%
1.4%
2.9%
6.2%
10.9%
14.0%
49.4%
Other Privately Purchased Commercial Health Insurance
Medical Reimbursement from Employer
Other Health Insurance through Employer
Employees' State Insurance Scheme (ESIS)
Ayushman Bharat (Pradhan Mantri Jan Arogya Yojana)
Central Government Health Scheme (CGHS)
Community Health Insurance Programme
BIJU Swasthya Kalyan Yojana
Figure 1.13: Percentage of households with at least one member enrolled in select health insurance schemes, N:421
32 Labour Migration from Jagannathprasad Block
f Household Profile
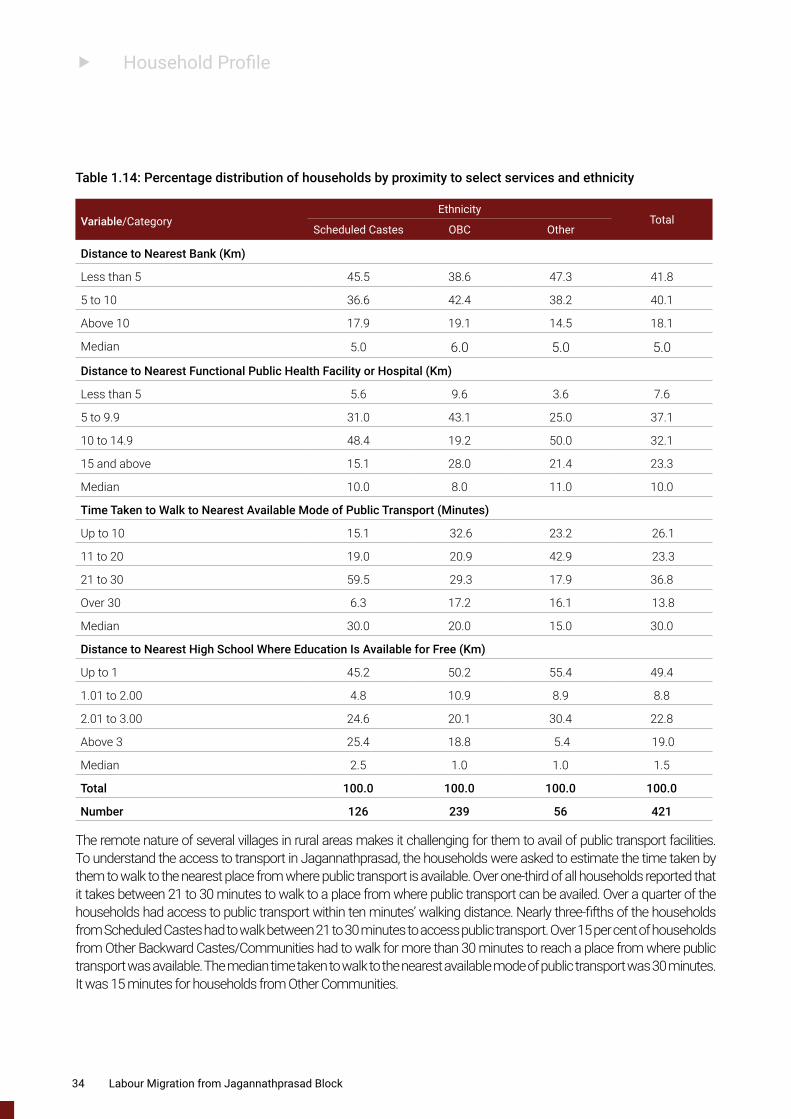
Access to Services
Table 1.14 documents the distance travelled by households to avail essential services such as banks, health facilities or hospitals, schools as well as the time taken to walk to the nearest available mode of public transport. Over two-fifths of the households had the account in a bank which was less than five km away from their house. A little less than twenty per cent of the households had to travel more than ten km to reach a bank where they had accounts. The median distance to the bank was five km for households from the Scheduled Castes and six km for households from Other Backward Castes/Communities. A little less than two-fifths of the households reported that they had to travel a distance of five to nine km to reach the nearest functional health facility or hospital. Almost half of the households belonging to Scheduled Castes and half of the households from communities other than Other Backward Castes/Communities had to travel between 10 to 15 km to reach the nearest functional health facility or hospital. A little less than a quarter of the total households had to travel a distance of 15 km or more. The median distance travelled by households from the Scheduled Castes was 10 km, and in the case of Other Backward Castes/Communities it was eight km. For the rest of the households, this distance was 11 km.
33 Labour Migration from Jagannathprasad Block
f Household Profile
Table 1.14: Percentage distribution of households by proximity to select services and ethnicity
Variable/CategoryEthnicity
TotalScheduled Castes OBC Other
Distance to Nearest Bank (Km)
Less than 5 45.5 38.6 47.3 41.8
5 to 10 36.6 42.4 38.2 40.1
Above 10 17.9 19.1 14.5 18.1
Median 5.0 6.0 5.0 5.0
Distance to Nearest Functional Public Health Facility or Hospital (Km)
Less than 5 5.6 9.6 3.6 7.6
5 to 9.9 31.0 43.1 25.0 37.1
10 to 14.9 48.4 19.2 50.0 32.1
15 and above 15.1 28.0 21.4 23.3
Median 10.0 8.0 11.0 10.0
Time Taken to Walk to Nearest Available Mode of Public Transport (Minutes)
Up to 10 15.1 32.6 23.2 26.1
11 to 20 19.0 20.9 42.9 23.3
21 to 30 59.5 29.3 17.9 36.8
Over 30 6.3 17.2 16.1 13.8
Median 30.0 20.0 15.0 30.0
Distance to Nearest High School Where Education Is Available for Free (Km)
Up to 1 45.2 50.2 55.4 49.4
1.01 to 2.00 4.8 10.9 8.9 8.8
2.01 to 3.00 24.6 20.1 30.4 22.8
Above 3 25.4 18.8 5.4 19.0
Median 2.5 1.0 1.0 1.5
Total 100.0 100.0 100.0 100.0
Number 126 239 56 421
The remote nature of several villages in rural areas makes it challenging for them to avail of public transport facilities. To understand the access to transport in Jagannathprasad, the households were asked to estimate the time taken by them to walk to the nearest place from where public transport is available. Over one-third of all households reported that it takes between 21 to 30 minutes to walk to a place from where public transport can be availed. Over a quarter of the households had access to public transport within ten minutes’ walking distance. Nearly three-fifths of the households from Scheduled Castes had to walk between 21 to 30 minutes to access public transport. Over 15 per cent of households from Other Backward Castes/Communities had to walk for more than 30 minutes to reach a place from where public transport was available. The median time taken to walk to the nearest available mode of public transport was 30 minutes. It was 15 minutes for households from Other Communities.
34 Labour Migration from Jagannathprasad Block
f Household Profile
The households were asked to provide information on the distance to the nearest high school where education was available for free. Half of the households reported that they had access to such a high school within a kilometre from their house. A quarter of the households from Scheduled Castes had to travel a distance of over three kilometres to reach a high school where free education was available. The median distance to a high school where free education was available was 1.5 km. It varied from one km in the case of households from communities other than Scheduled Castes to 2.5 km in the case of households from Scheduled Castes.
Mobile ConnectivityMobile phone connectivity in Jagannathprasad was also explored. Except around six per cent of the households, all had access to mobile phone network in their respective villages. Households without connectivity were enquired about the distance they had to travel to be able to make a phone call. The median distance travelled to make a phone call for households which did not have access to any mobile network was one km. In the case of households from Scheduled Castes without mobile connectivity in the village, the median distance to travel to make phone calls was three km.
Table 1.15: Percentage distribution of households by mobile phone connectivity in the village and ethnicity
Availability of NetworkEthnicity
TotalScheduled Castes OBC Other
Available 93.7 95.0 94.6 94.5
Not Available 6.30 5.0 5.40 5.5
Total 100.0 100.0 100.0 100.0
Number 126 239 56 421
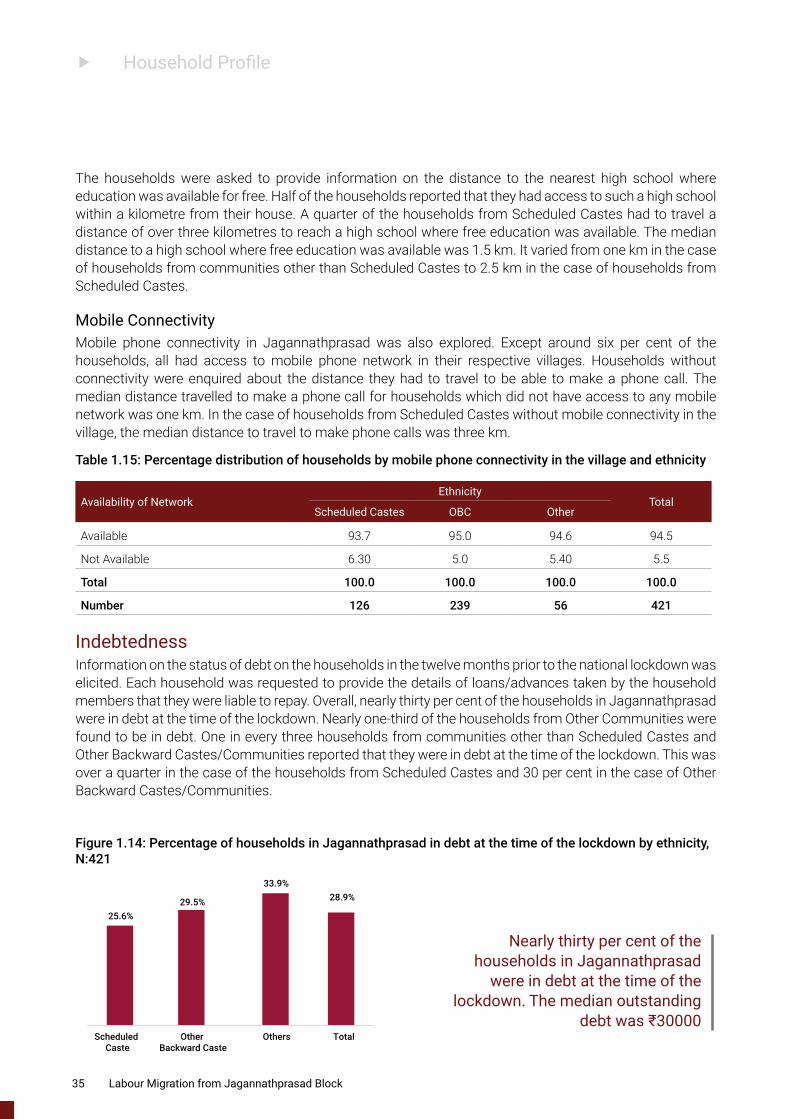
IndebtednessInformation on the status of debt on the households in the twelve months prior to the national lockdown was elicited. Each household was requested to provide the details of loans/advances taken by the household members that they were liable to repay. Overall, nearly thirty per cent of the households in Jagannathprasad were in debt at the time of the lockdown. Nearly one-third of the households from Other Communities were found to be in debt. One in every three households from communities other than Scheduled Castes and Other Backward Castes/Communities reported that they were in debt at the time of the lockdown. This was over a quarter in the case of the households from Scheduled Castes and 30 per cent in the case of Other Backward Castes/Communities.
25.6%29.5%
33.9%28.9%
Scheduled Caste
Other Backward Caste
Others Total
Figure 1.14: Percentage of households in Jagannathprasad in debt at the time of the lockdown by ethnicity, N:421
Nearly thirty per cent of the households in Jagannathprasad
were in debt at the time of the lockdown. The median outstanding
debt was ₹30000
35 Labour Migration from Jagannathprasad Block
f Household Profile
The respondents were then asked about the various reasons for which loans or advances were taken. The data were analysed separately for households from Scheduled Castes and Other Backward Castes/Communities but not from Other Communities due to an insufficient number of respondents for analysis. Nearly two-fifths of the indebted households had taken a loan/advance to meet the expenditure of hospitalization. Over a quarter of all households who had taken a loan reported that it was for agriculture. Nearly a quarter of the households had taken a loan for the construction or renovation of the house. Other common reasons for which loans were taken include marriage expenditure, business investments and purchase of assets.
Table 1.16: Percentage of households by reason for taking a loan and ethnicity
Reason for Taking a LoanEthnicity
TotalScheduled Castes OBC Other
Hospitalization Expenses 34.4 41.4 - 38.0
Death Related Expenses 3.1 2.9 - 2.5
Marriage Expenses 9.4 20.0 - 17.4
Construction / Renovation of House 25.0 22.9 - 23.1
Labour Migration of a Member - 4.3 - -
Loan for Business Investment 25.0 8.6 - 16.5
Purchase of an Asset 12.5 7.1 - 9.1
Natural Disaster - 4.3 - 2.5
Crop Failure - 2.9 - 2.5
Agriculture 18.8 28.6 - 27.3
Purchase of Land 3.1 1.4 - 1.7
Number 32 70 19 121
The indebted households were asked about the amount of debt they had incurred up to the day of the national lockdown which they were liable to repay. Nearly one-third of the households had incurred a debt between ₹30000 to ₹44999. Over a quarter of households had taken loans of an amount of ₹45000 or more. Among the households belonging to Scheduled Castes, over two-fifths of the households had incurred a debt between ₹30000 to ₹44999. It was found that one-third of the households belonging to Other Backward Castes/Communities had taken loans amounting to less than ₹15000. The median amount of debt was ₹30000 overall. The median amount of loan taken was larger in the case of households from communities other than Scheduled Castes and Other Backward Castes/Communities.
36 Labour Migration from Jagannathprasad Block
f Household Profile
Table 1.17: Percentage distribution of indebted households by outstanding debt and ethnicity
Total Outstanding DebtEthnicity
TotalScheduled Castes OBC Other
Less than 15000 18.8 32.9 - 24.8
15000 to 29999 25.0 15.7 - 16.5
30000 to 44999 43.8 27.1 - 32.2
45000 and above 12.5 24.3 26.5
Median 30000 30000 50000 30000
Total 100.0 100.0 - 100.0
Number 32 70 19 121
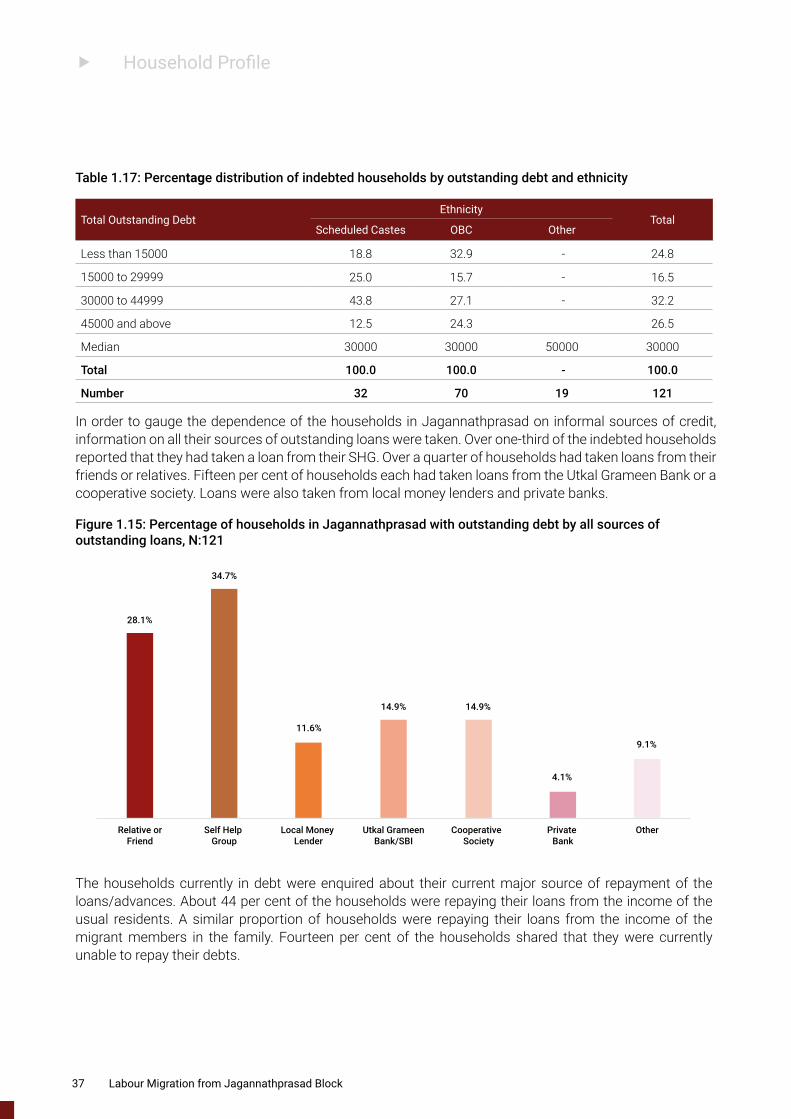
In order to gauge the dependence of the households in Jagannathprasad on informal sources of credit, information on all their sources of outstanding loans were taken. Over one-third of the indebted households reported that they had taken a loan from their SHG. Over a quarter of households had taken loans from their friends or relatives. Fifteen per cent of households each had taken loans from the Utkal Grameen Bank or a cooperative society. Loans were also taken from local money lenders and private banks.
28.1%
34.7%
11.6%
14.9% 14.9%
4.1%
9.1%
Relative orFriend
Local Money Lender
Cooperative Society
OtherSelf Help Group
Utkal GrameenBank/SBI
Private Bank
Figure 1.15: Percentage of households in Jagannathprasad with outstanding debt by all sources of outstanding loans, N:121
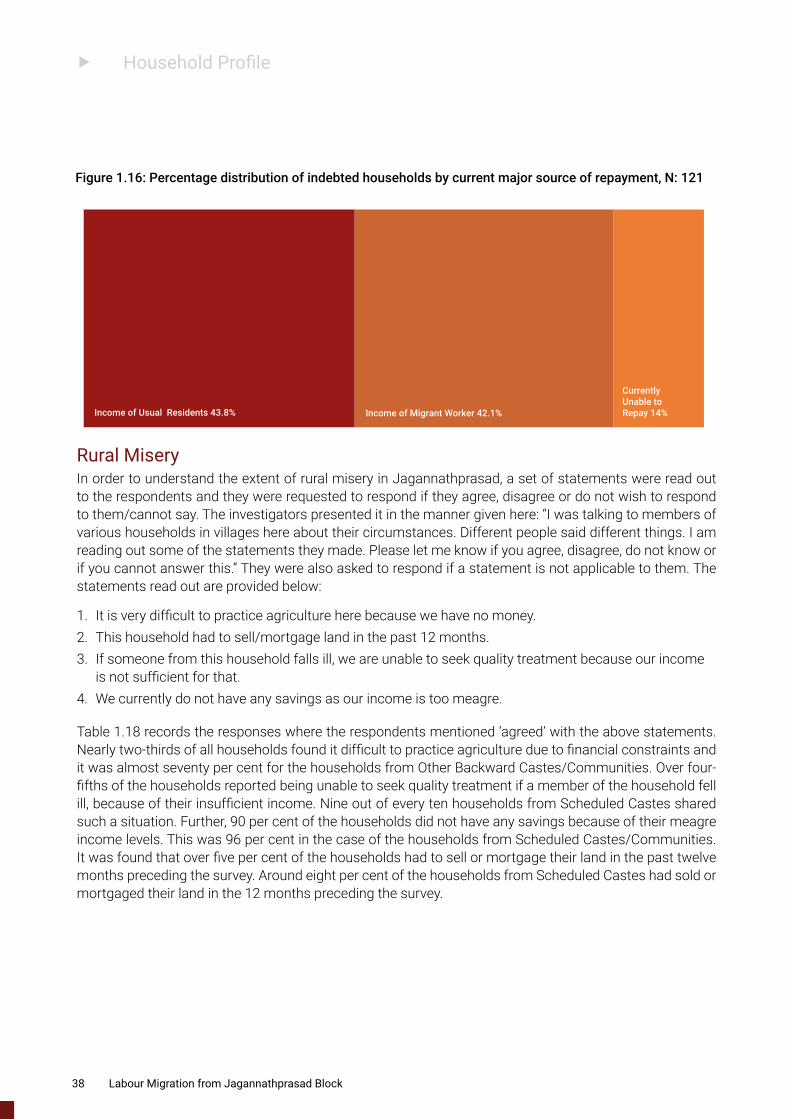
The households currently in debt were enquired about their current major source of repayment of the loans/advances. About 44 per cent of the households were repaying their loans from the income of the usual residents. A similar proportion of households were repaying their loans from the income of the migrant members in the family. Fourteen per cent of the households shared that they were currently unable to repay their debts.
37 Labour Migration from Jagannathprasad Block
f Household Profile
Rural MiseryIn order to understand the extent of rural misery in Jagannathprasad, a set of statements were read out to the respondents and they were requested to respond if they agree, disagree or do not wish to respond to them/cannot say. The investigators presented it in the manner given here: “I was talking to members of various households in villages here about their circumstances. Different people said different things. I am reading out some of the statements they made. Please let me know if you agree, disagree, do not know or if you cannot answer this.” They were also asked to respond if a statement is not applicable to them. The statements read out are provided below:
1. It is very difficult to practice agriculture here because we have no money. 2. This household had to sell/mortgage land in the past 12 months.3. If someone from this household falls ill, we are unable to seek quality treatment because our income
is not sufficient for that.4. We currently do not have any savings as our income is too meagre.
Table 1.18 records the responses where the respondents mentioned ‘agreed’ with the above statements. Nearly two-thirds of all households found it difficult to practice agriculture due to financial constraints and it was almost seventy per cent for the households from Other Backward Castes/Communities. Over four-fifths of the households reported being unable to seek quality treatment if a member of the household fell ill, because of their insufficient income. Nine out of every ten households from Scheduled Castes shared such a situation. Further, 90 per cent of the households did not have any savings because of their meagre income levels. This was 96 per cent in the case of the households from Scheduled Castes/Communities. It was found that over five per cent of the households had to sell or mortgage their land in the past twelve months preceding the survey. Around eight per cent of the households from Scheduled Castes had sold or mortgaged their land in the 12 months preceding the survey.
CurrentlyUnable toRepay 14% Income of Usual Residents 43.8% Income of Migrant Worker 42.1%
Figure 1.16: Percentage distribution of indebted households by current major source of repayment, N: 121
38 Labour Migration from Jagannathprasad Block
f Household Profile
Table 1.18: Percentage of households with select indicators of misery and ethnicity
IndicatorEthnicity
TotalScheduled Castes OBC Other
Difficult to practice agriculture here because we have no money 59.5 68.6 62.5 65.1
This household had to sell/mortgage land in the past 12 months 7.9 5.9 5.4 6.4
If someone from this household falls ill, we are unable to seek quality treatment because our income is insufficient for that
89.7 86.2 76.8 86.0
We currently do not have any savings as our income is too meagre 96.0 88.7 82.1 90.0
Number 126 239 56 421
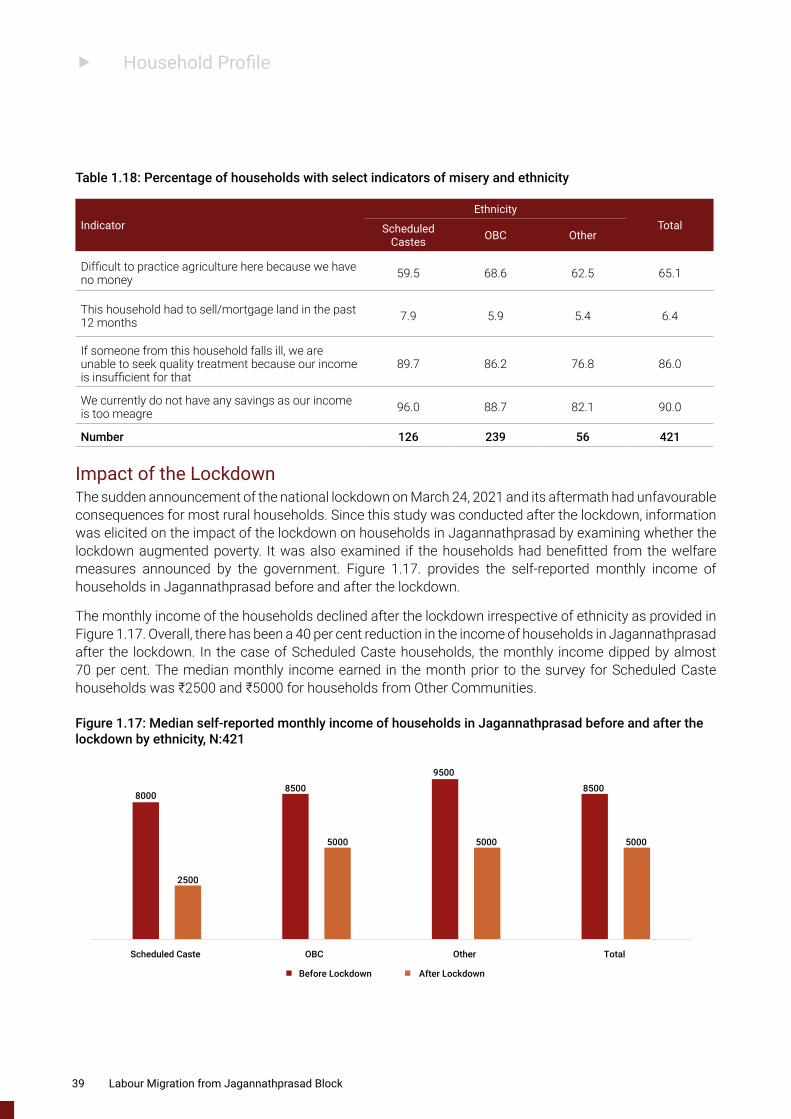
Impact of the LockdownThe sudden announcement of the national lockdown on March 24, 2021 and its aftermath had unfavourable consequences for most rural households. Since this study was conducted after the lockdown, information was elicited on the impact of the lockdown on households in Jagannathprasad by examining whether the lockdown augmented poverty. It was also examined if the households had benefitted from the welfare measures announced by the government. Figure 1.17. provides the self-reported monthly income of households in Jagannathprasad before and after the lockdown.
The monthly income of the households declined after the lockdown irrespective of ethnicity as provided in Figure 1.17. Overall, there has been a 40 per cent reduction in the income of households in Jagannathprasad after the lockdown. In the case of Scheduled Caste households, the monthly income dipped by almost 70 per cent. The median monthly income earned in the month prior to the survey for Scheduled Caste households was ₹2500 and ₹5000 for households from Other Communities.
80008500
9500
8500
2500
5000 5000 5000
Scheduled Caste OBC Other Total
Before Lockdown After Lockdown
Figure 1.17: Median self-reported monthly income of households in Jagannathprasad before and after the lockdown by ethnicity, N:421
39 Labour Migration from Jagannathprasad Block
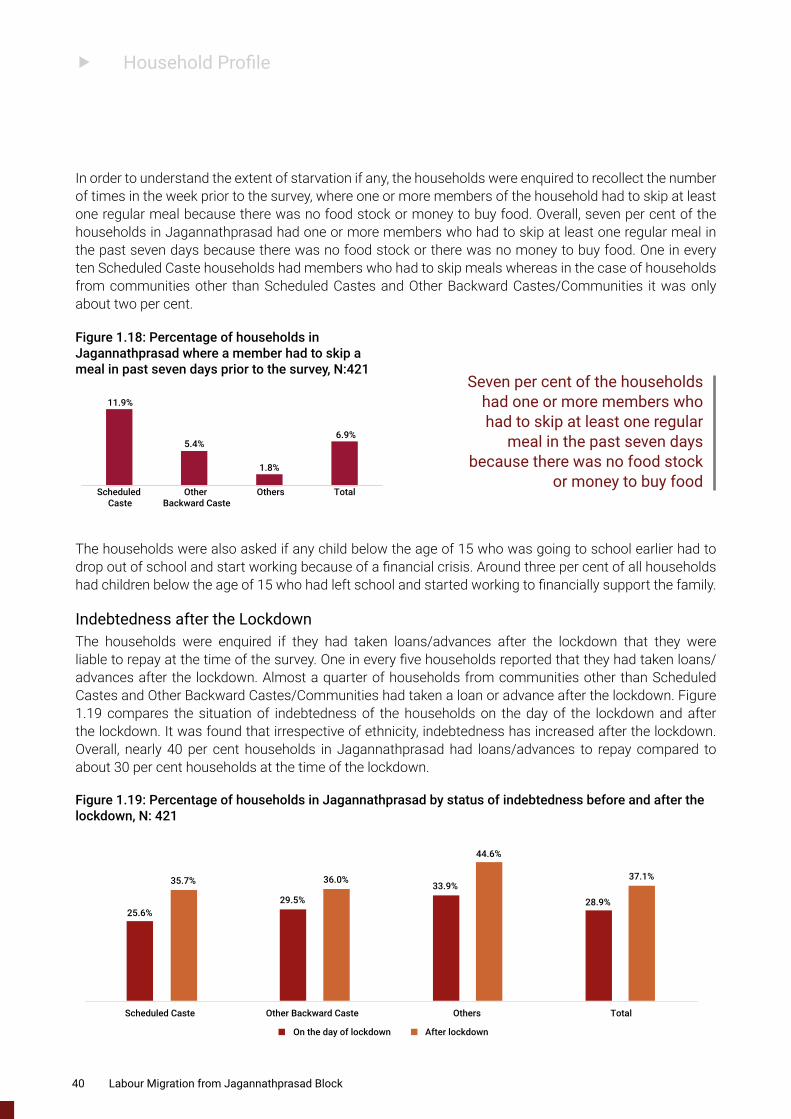
f Household Profile
In order to understand the extent of starvation if any, the households were enquired to recollect the number of times in the week prior to the survey, where one or more members of the household had to skip at least one regular meal because there was no food stock or money to buy food. Overall, seven per cent of the households in Jagannathprasad had one or more members who had to skip at least one regular meal in the past seven days because there was no food stock or there was no money to buy food. One in every ten Scheduled Caste households had members who had to skip meals whereas in the case of households from communities other than Scheduled Castes and Other Backward Castes/Communities it was only about two per cent.
The households were also asked if any child below the age of 15 who was going to school earlier had to drop out of school and start working because of a financial crisis. Around three per cent of all households had children below the age of 15 who had left school and started working to financially support the family.
Indebtedness after the LockdownThe households were enquired if they had taken loans/advances after the lockdown that they were liable to repay at the time of the survey. One in every five households reported that they had taken loans/advances after the lockdown. Almost a quarter of households from communities other than Scheduled Castes and Other Backward Castes/Communities had taken a loan or advance after the lockdown. Figure 1.19 compares the situation of indebtedness of the households on the day of the lockdown and after the lockdown. It was found that irrespective of ethnicity, indebtedness has increased after the lockdown. Overall, nearly 40 per cent households in Jagannathprasad had loans/advances to repay compared to about 30 per cent households at the time of the lockdown.
Figure 1.18: Percentage of households in Jagannathprasad where a member had to skip a meal in past seven days prior to the survey, N:421
11.9%
5.4%
1.8%
6.9%
Scheduled Caste
Other Backward Caste
Others Total
Figure 1.19: Percentage of households in Jagannathprasad by status of indebtedness before and after the lockdown, N: 421
25.6%29.5%
33.9%
28.9%
35.7% 36.0%
44.6%
37.1%
Scheduled Caste Other Backward Caste Others Total
On the day of lockdown After lockdown
Seven per cent of the households had one or more members who had to skip at least one regular
meal in the past seven days because there was no food stock
or money to buy food
40 Labour Migration from Jagannathprasad Block
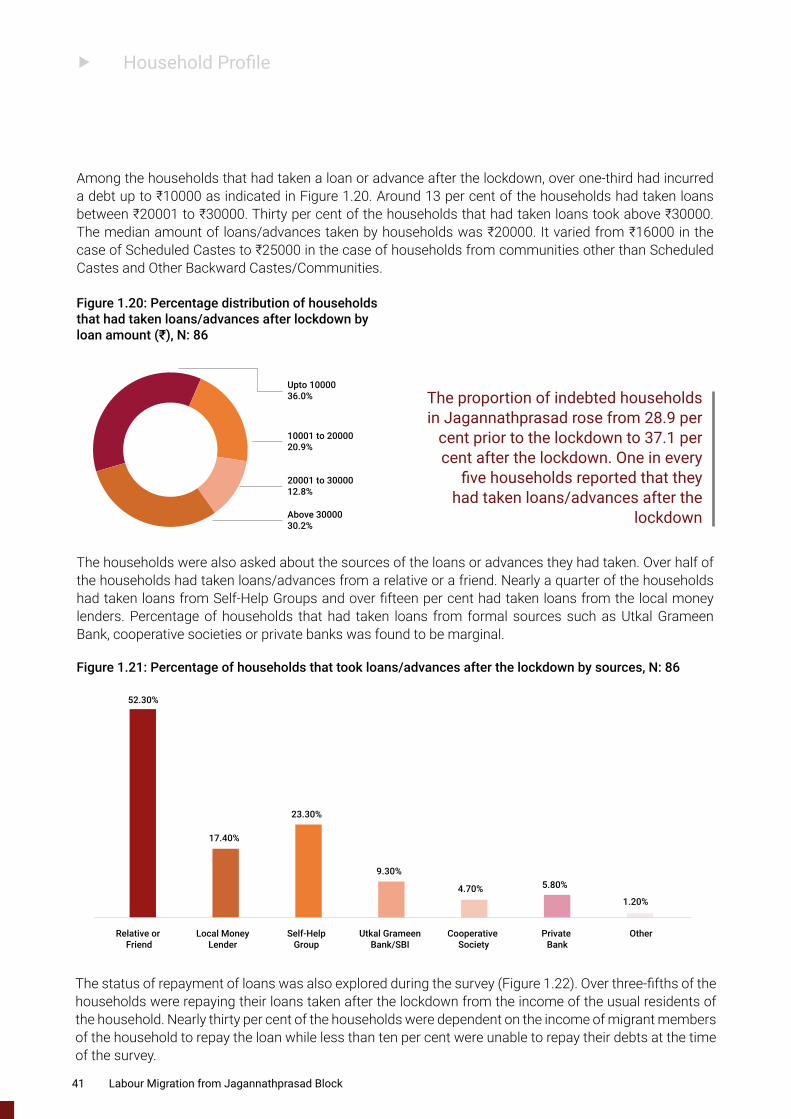
f Household Profile
Among the households that had taken a loan or advance after the lockdown, over one-third had incurred a debt up to ₹10000 as indicated in Figure 1.20. Around 13 per cent of the households had taken loans between ₹20001 to ₹30000. Thirty per cent of the households that had taken loans took above ₹30000. The median amount of loans/advances taken by households was ₹20000. It varied from ₹16000 in the case of Scheduled Castes to ₹25000 in the case of households from communities other than Scheduled Castes and Other Backward Castes/Communities.
Upto 1000036.0%
10001 to 2000020.9%
20001 to 3000012.8%
Above 3000030.2%
Figure 1.20: Percentage distribution of households that had taken loans/advances after lockdown by loan amount (₹), N: 86
The households were also asked about the sources of the loans or advances they had taken. Over half of the households had taken loans/advances from a relative or a friend. Nearly a quarter of the households had taken loans from Self-Help Groups and over fifteen per cent had taken loans from the local money lenders. Percentage of households that had taken loans from formal sources such as Utkal Grameen Bank, cooperative societies or private banks was found to be marginal.
52.30%
17.40%
23.30%
9.30%
4.70% 5.80%
1.20%
Relative or Friend
Local MoneyLender
Self-HelpGroup
Utkal GrameenBank/SBI
Cooperative Society
Private Bank
Other
Figure 1.21: Percentage of households that took loans/advances after the lockdown by sources, N: 86
The status of repayment of loans was also explored during the survey (Figure 1.22). Over three-fifths of the households were repaying their loans taken after the lockdown from the income of the usual residents of the household. Nearly thirty per cent of the households were dependent on the income of migrant members of the household to repay the loan while less than ten per cent were unable to repay their debts at the time of the survey.
The proportion of indebted households in Jagannathprasad rose from 28.9 per
cent prior to the lockdown to 37.1 per cent after the lockdown. One in every
five households reported that they had taken loans/advances after the
lockdown
41 Labour Migration from Jagannathprasad Block
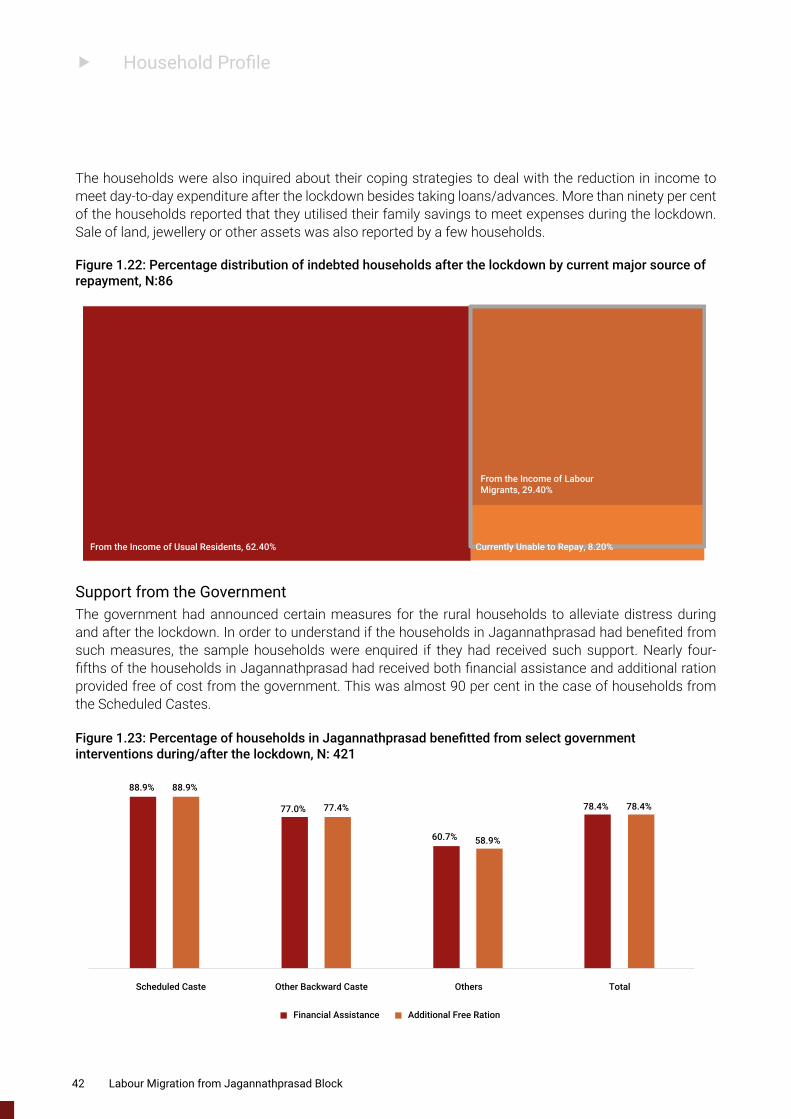
f Household Profile
The households were also inquired about their coping strategies to deal with the reduction in income to meet day-to-day expenditure after the lockdown besides taking loans/advances. More than ninety per cent of the households reported that they utilised their family savings to meet expenses during the lockdown. Sale of land, jewellery or other assets was also reported by a few households.
Support from the GovernmentThe government had announced certain measures for the rural households to alleviate distress during and after the lockdown. In order to understand if the households in Jagannathprasad had benefited from such measures, the sample households were enquired if they had received such support. Nearly four-fifths of the households in Jagannathprasad had received both financial assistance and additional ration provided free of cost from the government. This was almost 90 per cent in the case of households from the Scheduled Castes.
Currently Unable to Repay, 8.20%From the Income of Usual Residents, 62.40%
From the Income of Labour Migrants, 29.40%
Figure 1.22: Percentage distribution of indebted households after the lockdown by current major source of repayment, N:86
88.9%
77.0%
60.7%
78.4%
88.9%
77.4%
58.9%
78.4%
Scheduled Caste Other Backward Caste Others Total
Financial Assistance Additional Free Ration
Figure 1.23: Percentage of households in Jagannathprasad benefitted from select government interventions during/after the lockdown, N: 421
42 Labour Migration from Jagannathprasad Block
Labour Migration from Jagannathprasad Block
Migration from Jagannathprasad
43
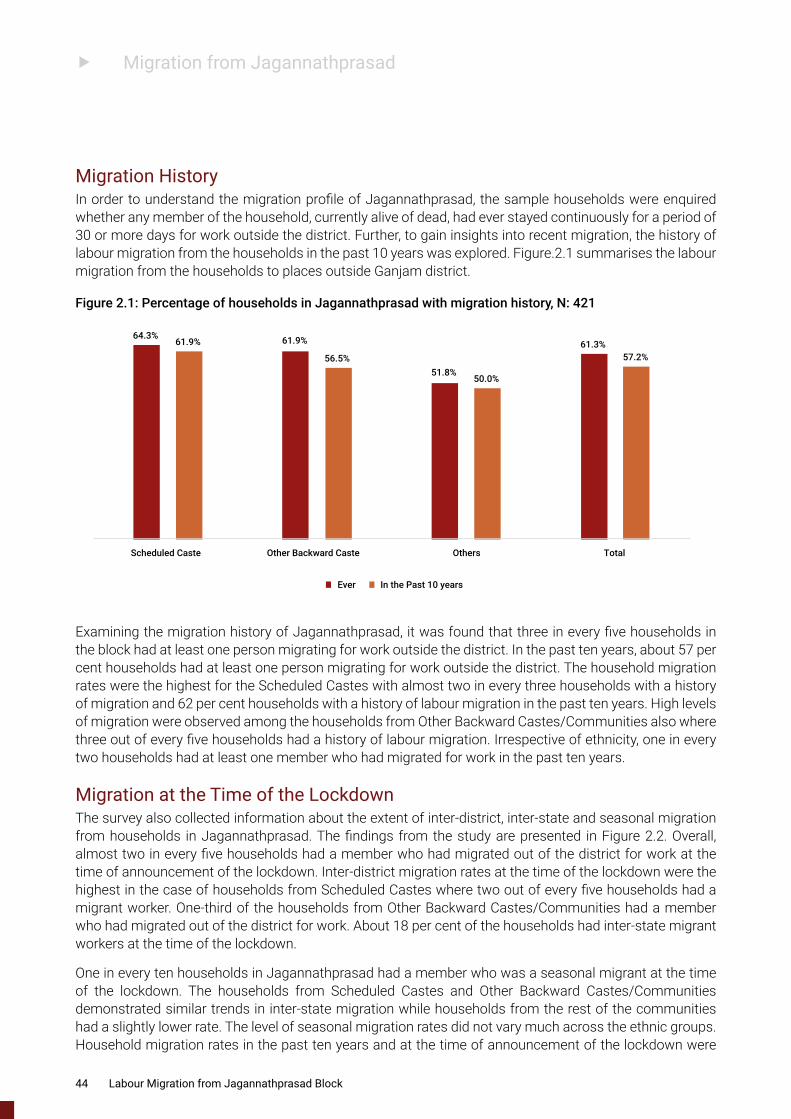
f Migration from Jagannathprasad
Migration History In order to understand the migration profile of Jagannathprasad, the sample households were enquired whether any member of the household, currently alive of dead, had ever stayed continuously for a period of 30 or more days for work outside the district. Further, to gain insights into recent migration, the history of labour migration from the households in the past 10 years was explored. Figure.2.1 summarises the labour migration from the households to places outside Ganjam district.
64.3% 61.9%
51.8%
61.3%61.9%
56.5%
50.0%
57.2%
Scheduled Caste Other Backward Caste Others Total
Ever In the Past 10 years
Figure 2.1: Percentage of households in Jagannathprasad with migration history, N: 421
Examining the migration history of Jagannathprasad, it was found that three in every five households in the block had at least one person migrating for work outside the district. In the past ten years, about 57 per cent households had at least one person migrating for work outside the district. The household migration rates were the highest for the Scheduled Castes with almost two in every three households with a history of migration and 62 per cent households with a history of labour migration in the past ten years. High levels of migration were observed among the households from Other Backward Castes/Communities also where three out of every five households had a history of labour migration. Irrespective of ethnicity, one in every two households had at least one member who had migrated for work in the past ten years.
Migration at the Time of the LockdownThe survey also collected information about the extent of inter-district, inter-state and seasonal migration from households in Jagannathprasad. The findings from the study are presented in Figure 2.2. Overall, almost two in every five households had a member who had migrated out of the district for work at the time of announcement of the lockdown. Inter-district migration rates at the time of the lockdown were the highest in the case of households from Scheduled Castes where two out of every five households had a migrant worker. One-third of the households from Other Backward Castes/Communities had a member who had migrated out of the district for work. About 18 per cent of the households had inter-state migrant workers at the time of the lockdown.
One in every ten households in Jagannathprasad had a member who was a seasonal migrant at the time of the lockdown. The households from Scheduled Castes and Other Backward Castes/Communities demonstrated similar trends in inter-state migration while households from the rest of the communities had a slightly lower rate. The level of seasonal migration rates did not vary much across the ethnic groups. Household migration rates in the past ten years and at the time of announcement of the lockdown were
44 Labour Migration from Jagannathprasad Block
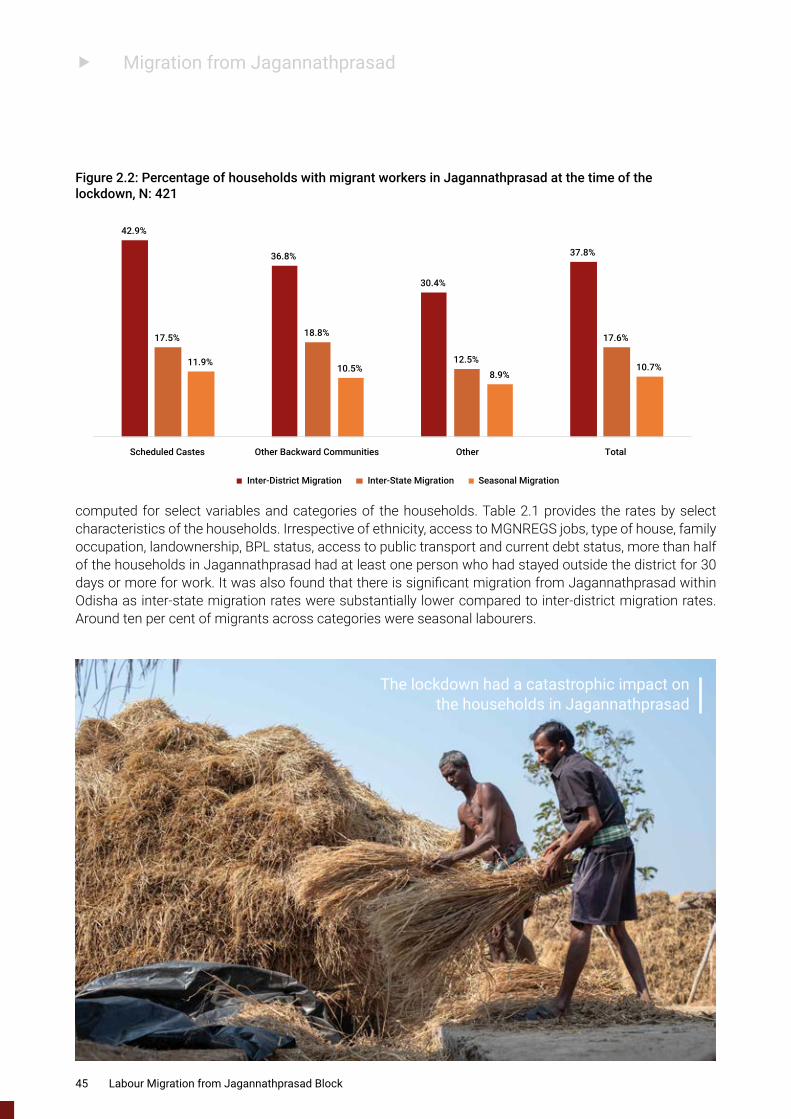
f Migration from Jagannathprasad
computed for select variables and categories of the households. Table 2.1 provides the rates by select characteristics of the households. Irrespective of ethnicity, access to MGNREGS jobs, type of house, family occupation, landownership, BPL status, access to public transport and current debt status, more than half of the households in Jagannathprasad had at least one person who had stayed outside the district for 30 days or more for work. It was also found that there is significant migration from Jagannathprasad within Odisha as inter-state migration rates were substantially lower compared to inter-district migration rates. Around ten per cent of migrants across categories were seasonal labourers.
42.9%
36.8%
30.4%
37.8%
17.5% 18.8%
12.5%
17.6%
11.9%10.5%
8.9%10.7%
Scheduled Castes Other Backward Communities Other Total
Inter-District Migration Inter-State Migration Seasonal Migration
Figure 2.2: Percentage of households with migrant workers in Jagannathprasad at the time of the lockdown, N: 421
The lockdown had a catastrophic impact on the households in Jagannathprasad
45 Labour Migration from Jagannathprasad Block
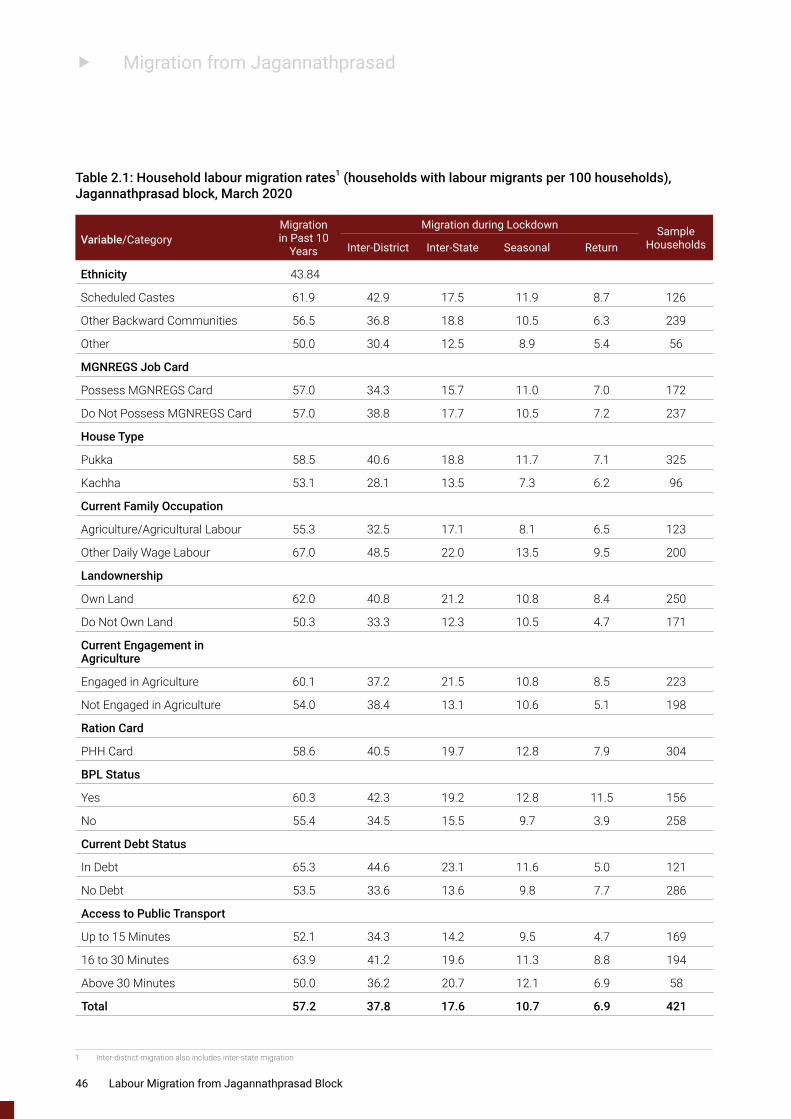
f Migration from Jagannathprasad
Table 2.1: Household labour migration rates1 (households with labour migrants per 100 households), Jagannathprasad block, March 2020
1 Inter-district migration also includes inter-state migration
Variable/CategoryMigration in Past 10
Years
Migration during Lockdown Sample HouseholdsInter-District Inter-State Seasonal Return
Ethnicity 43.84
Scheduled Castes 61.9 42.9 17.5 11.9 8.7 126
Other Backward Communities 56.5 36.8 18.8 10.5 6.3 239
Other 50.0 30.4 12.5 8.9 5.4 56
MGNREGS Job Card
Possess MGNREGS Card 57.0 34.3 15.7 11.0 7.0 172
Do Not Possess MGNREGS Card 57.0 38.8 17.7 10.5 7.2 237
House Type
Pukka 58.5 40.6 18.8 11.7 7.1 325
Kachha 53.1 28.1 13.5 7.3 6.2 96
Current Family Occupation
Agriculture/Agricultural Labour 55.3 32.5 17.1 8.1 6.5 123
Other Daily Wage Labour 67.0 48.5 22.0 13.5 9.5 200
Landownership
Own Land 62.0 40.8 21.2 10.8 8.4 250
Do Not Own Land 50.3 33.3 12.3 10.5 4.7 171
Current Engagement in Agriculture
Engaged in Agriculture 60.1 37.2 21.5 10.8 8.5 223
Not Engaged in Agriculture 54.0 38.4 13.1 10.6 5.1 198
Ration Card
PHH Card 58.6 40.5 19.7 12.8 7.9 304
BPL Status
Yes 60.3 42.3 19.2 12.8 11.5 156
No 55.4 34.5 15.5 9.7 3.9 258
Current Debt Status
In Debt 65.3 44.6 23.1 11.6 5.0 121
No Debt 53.5 33.6 13.6 9.8 7.7 286
Access to Public Transport
Up to 15 Minutes 52.1 34.3 14.2 9.5 4.7 169
16 to 30 Minutes 63.9 41.2 19.6 11.3 8.8 194
Above 30 Minutes 50.0 36.2 20.7 12.1 6.9 58
Total 57.2 37.8 17.6 10.7 6.9 421
46 Labour Migration from Jagannathprasad Block
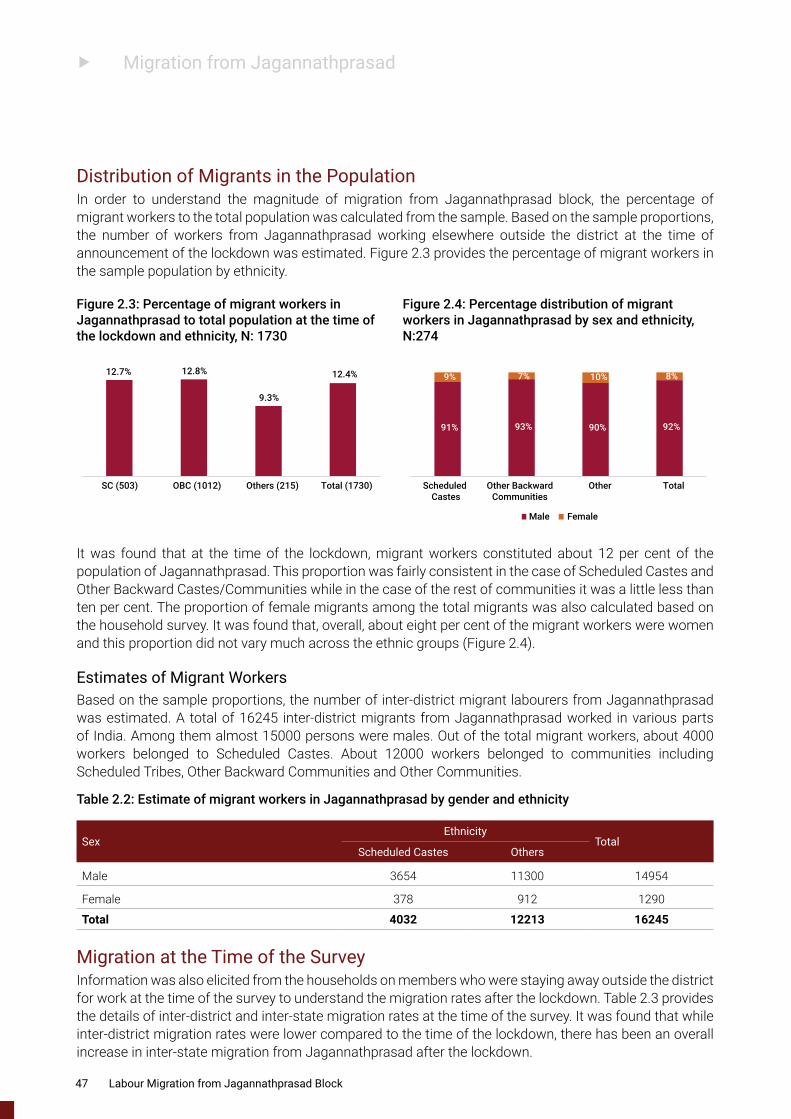
f Migration from Jagannathprasad
Distribution of Migrants in the PopulationIn order to understand the magnitude of migration from Jagannathprasad block, the percentage of migrant workers to the total population was calculated from the sample. Based on the sample proportions, the number of workers from Jagannathprasad working elsewhere outside the district at the time of announcement of the lockdown was estimated. Figure 2.3 provides the percentage of migrant workers in the sample population by ethnicity.
12.7% 12.8%
9.3%
12.4%
SC (503) OBC (1012) Others (215) Total (1730)
Figure 2.3: Percentage of migrant workers in Jagannathprasad to total population at the time of the lockdown and ethnicity, N: 1730
Figure 2.4: Percentage distribution of migrant workers in Jagannathprasad by sex and ethnicity, N:274
It was found that at the time of the lockdown, migrant workers constituted about 12 per cent of the population of Jagannathprasad. This proportion was fairly consistent in the case of Scheduled Castes and Other Backward Castes/Communities while in the case of the rest of communities it was a little less than ten per cent. The proportion of female migrants among the total migrants was also calculated based on the household survey. It was found that, overall, about eight per cent of the migrant workers were women and this proportion did not vary much across the ethnic groups (Figure 2.4).
Estimates of Migrant WorkersBased on the sample proportions, the number of inter-district migrant labourers from Jagannathprasad was estimated. A total of 16245 inter-district migrants from Jagannathprasad worked in various parts of India. Among them almost 15000 persons were males. Out of the total migrant workers, about 4000 workers belonged to Scheduled Castes. About 12000 workers belonged to communities including Scheduled Tribes, Other Backward Communities and Other Communities.
Table 2.2: Estimate of migrant workers in Jagannathprasad by gender and ethnicity
SexEthnicity
TotalScheduled Castes Others
Male 3654 11300 14954
Female 378 912 1290
Total 4032 12213 16245
Migration at the Time of the SurveyInformation was also elicited from the households on members who were staying away outside the district for work at the time of the survey to understand the migration rates after the lockdown. Table 2.3 provides the details of inter-district and inter-state migration rates at the time of the survey. It was found that while inter-district migration rates were lower compared to the time of the lockdown, there has been an overall increase in inter-state migration from Jagannathprasad after the lockdown.
91% 93% 90% 92%
9% 7% 10% 8%
Scheduled Castes
Other BackwardCommunities
Other Total
Male Female
47 Labour Migration from Jagannathprasad Block
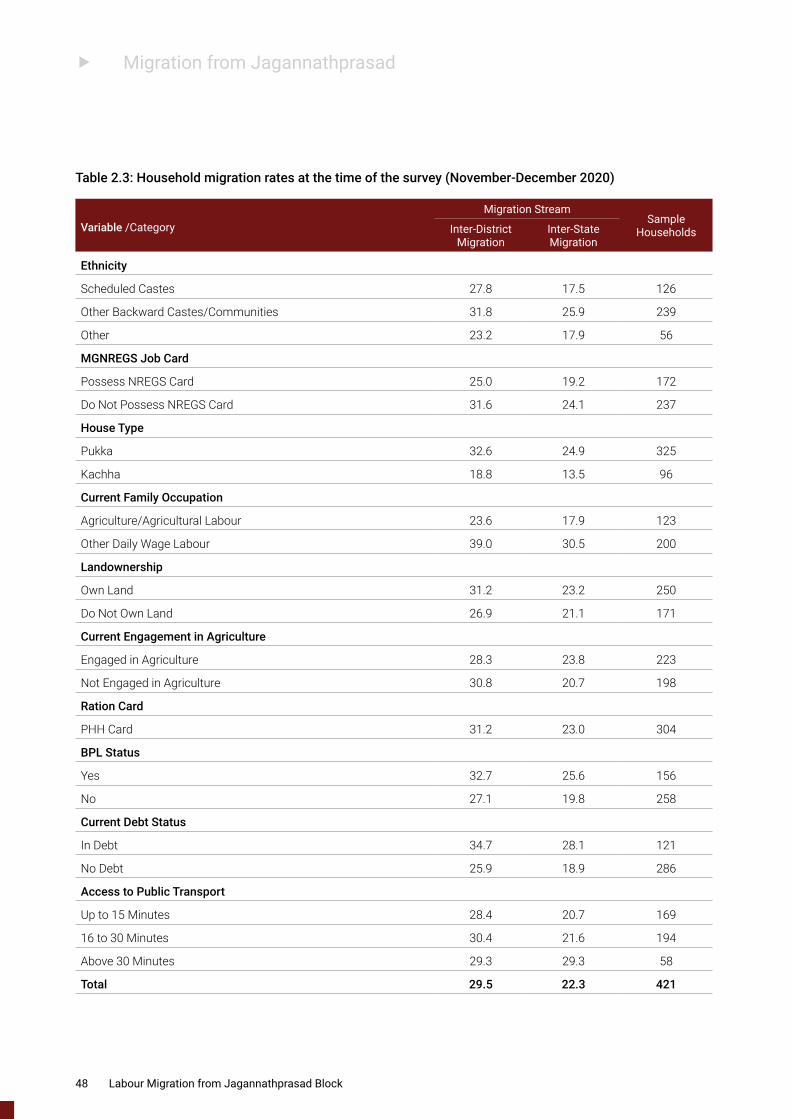
f Migration from Jagannathprasad
Table 2.3: Household migration rates at the time of the survey (November-December 2020)
Variable /CategoryMigration Stream
Sample HouseholdsInter-District
MigrationInter-State Migration
Ethnicity
Scheduled Castes 27.8 17.5 126
Other Backward Castes/Communities 31.8 25.9 239
Other 23.2 17.9 56
MGNREGS Job Card
Possess NREGS Card 25.0 19.2 172
Do Not Possess NREGS Card 31.6 24.1 237
House Type
Pukka 32.6 24.9 325
Kachha 18.8 13.5 96
Current Family Occupation
Agriculture/Agricultural Labour 23.6 17.9 123
Other Daily Wage Labour 39.0 30.5 200
Landownership
Own Land 31.2 23.2 250
Do Not Own Land 26.9 21.1 171
Current Engagement in Agriculture
Engaged in Agriculture 28.3 23.8 223
Not Engaged in Agriculture 30.8 20.7 198
Ration Card
PHH Card 31.2 23.0 304
BPL Status
Yes 32.7 25.6 156
No 27.1 19.8 258
Current Debt Status
In Debt 34.7 28.1 121
No Debt 25.9 18.9 286
Access to Public Transport
Up to 15 Minutes 28.4 20.7 169
16 to 30 Minutes 30.4 21.6 194
Above 30 Minutes 29.3 29.3 58
Total 29.5 22.3 421
48 Labour Migration from Jagannathprasad Block
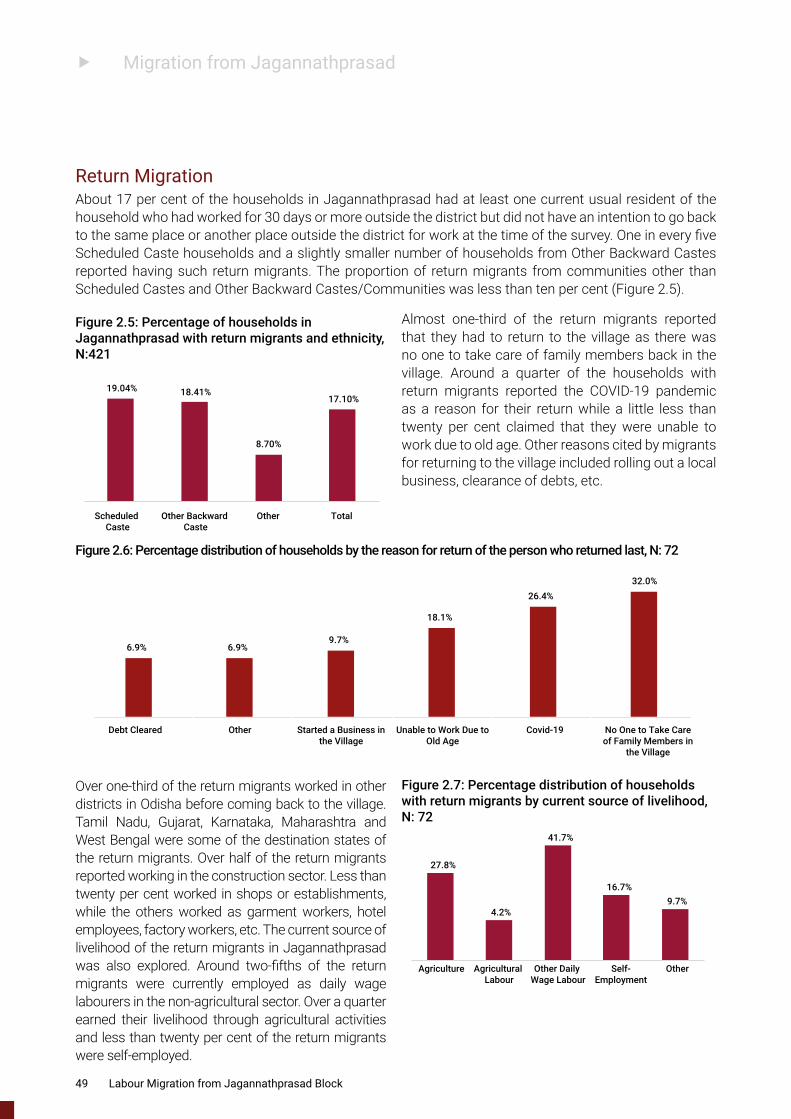
f Migration from Jagannathprasad
Return MigrationAbout 17 per cent of the households in Jagannathprasad had at least one current usual resident of the household who had worked for 30 days or more outside the district but did not have an intention to go back to the same place or another place outside the district for work at the time of the survey. One in every five Scheduled Caste households and a slightly smaller number of households from Other Backward Castes reported having such return migrants. The proportion of return migrants from communities other than Scheduled Castes and Other Backward Castes/Communities was less than ten per cent (Figure 2.5).
19.04% 18.41%
8.70%
17.10%
Scheduled Caste
Other Backward Caste
Other Total
Figure 2.5: Percentage of households in Jagannathprasad with return migrants and ethnicity, N:421
Figure 2.6: Percentage distribution of households by the reason for return of the person who returned last, N: 72
Figure 2.7: Percentage distribution of households with return migrants by current source of livelihood, N: 72
Almost one-third of the return migrants reported that they had to return to the village as there was no one to take care of family members back in the village. Around a quarter of the households with return migrants reported the COVID-19 pandemic as a reason for their return while a little less than twenty per cent claimed that they were unable to work due to old age. Other reasons cited by migrants for returning to the village included rolling out a local business, clearance of debts, etc.
6.9% 6.9%9.7%
18.1%
26.4%32.0%
Debt Cleared Other Started a Business inthe Village
Unable to Work Due toOld Age
Covid-19 No One to Take Careof Family Members in
the Village
Over one-third of the return migrants worked in other districts in Odisha before coming back to the village. Tamil Nadu, Gujarat, Karnataka, Maharashtra and West Bengal were some of the destination states of the return migrants. Over half of the return migrants reported working in the construction sector. Less than twenty per cent worked in shops or establishments, while the others worked as garment workers, hotel employees, factory workers, etc. The current source of livelihood of the return migrants in Jagannathprasad was also explored. Around two-fifths of the return migrants were currently employed as daily wage labourers in the non-agricultural sector. Over a quarter earned their livelihood through agricultural activities and less than twenty per cent of the return migrants were self-employed.
27.8%
4.2%
41.7%
16.7%9.7%
Agriculture Agricultural Labour
Other Daily Wage Labour
Self-Employment
Other
49 Labour Migration from Jagannathprasad Block
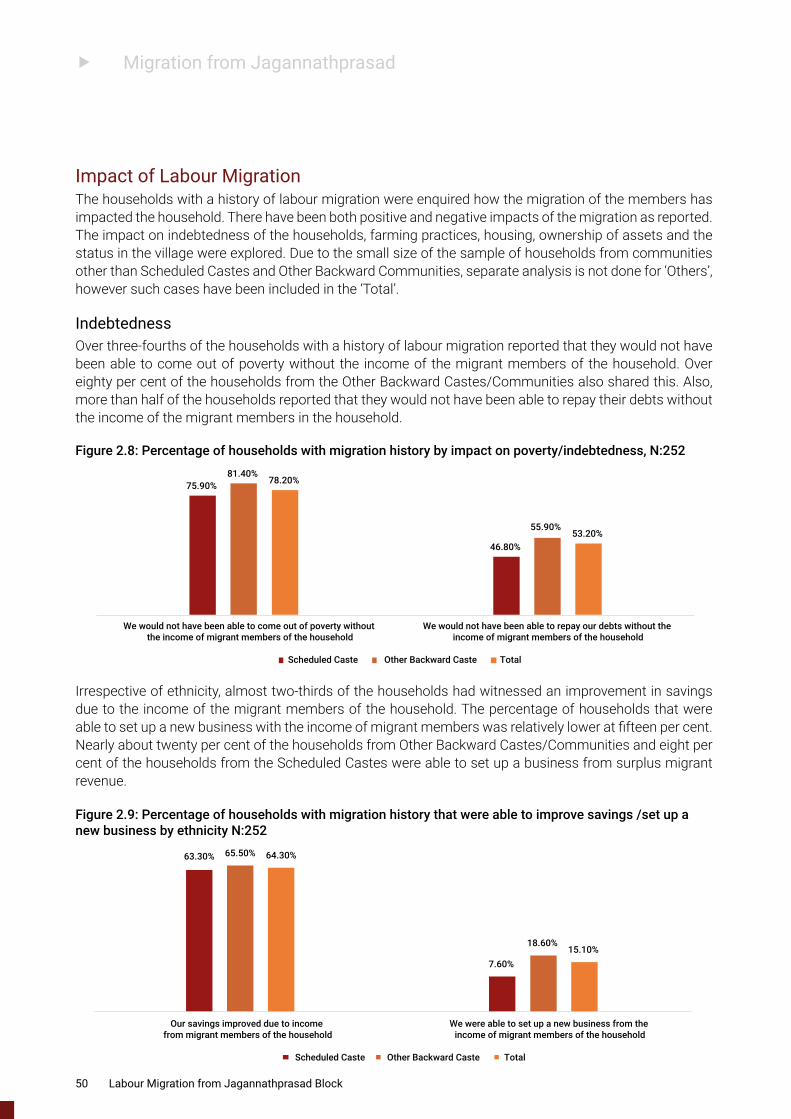
f Migration from Jagannathprasad
Impact of Labour MigrationThe households with a history of labour migration were enquired how the migration of the members has impacted the household. There have been both positive and negative impacts of the migration as reported. The impact on indebtedness of the households, farming practices, housing, ownership of assets and the status in the village were explored. Due to the small size of the sample of households from communities other than Scheduled Castes and Other Backward Communities, separate analysis is not done for ‘Others’, however such cases have been included in the ‘Total’.
IndebtednessOver three-fourths of the households with a history of labour migration reported that they would not have been able to come out of poverty without the income of the migrant members of the household. Over eighty per cent of the households from the Other Backward Castes/Communities also shared this. Also, more than half of the households reported that they would not have been able to repay their debts without the income of the migrant members in the household.
75.90%
46.80%
81.40%
55.90%
78.20%
53.20%
We would not have been able to come out of poverty without the income of migrant members of the household
We would not have been able to repay our debts without the income of migrant members of the household
Scheduled Caste Other Backward Caste Total
Figure 2.8: Percentage of households with migration history by impact on poverty/indebtedness, N:252
Figure 2.9: Percentage of households with migration history that were able to improve savings /set up a new business by ethnicity N:252
Irrespective of ethnicity, almost two-thirds of the households had witnessed an improvement in savings due to the income of the migrant members of the household. The percentage of households that were able to set up a new business with the income of migrant members was relatively lower at fifteen per cent. Nearly about twenty per cent of the households from Other Backward Castes/Communities and eight per cent of the households from the Scheduled Castes were able to set up a business from surplus migrant revenue.
63.30%
7.60%
65.50%
18.60%
64.30%
15.10%
Our savings improved due to income from migrant members of the household
We were able to set up a new business from the income of migrant members of the household
Scheduled Caste Other Backward Caste Total
50 Labour Migration from Jagannathprasad Block
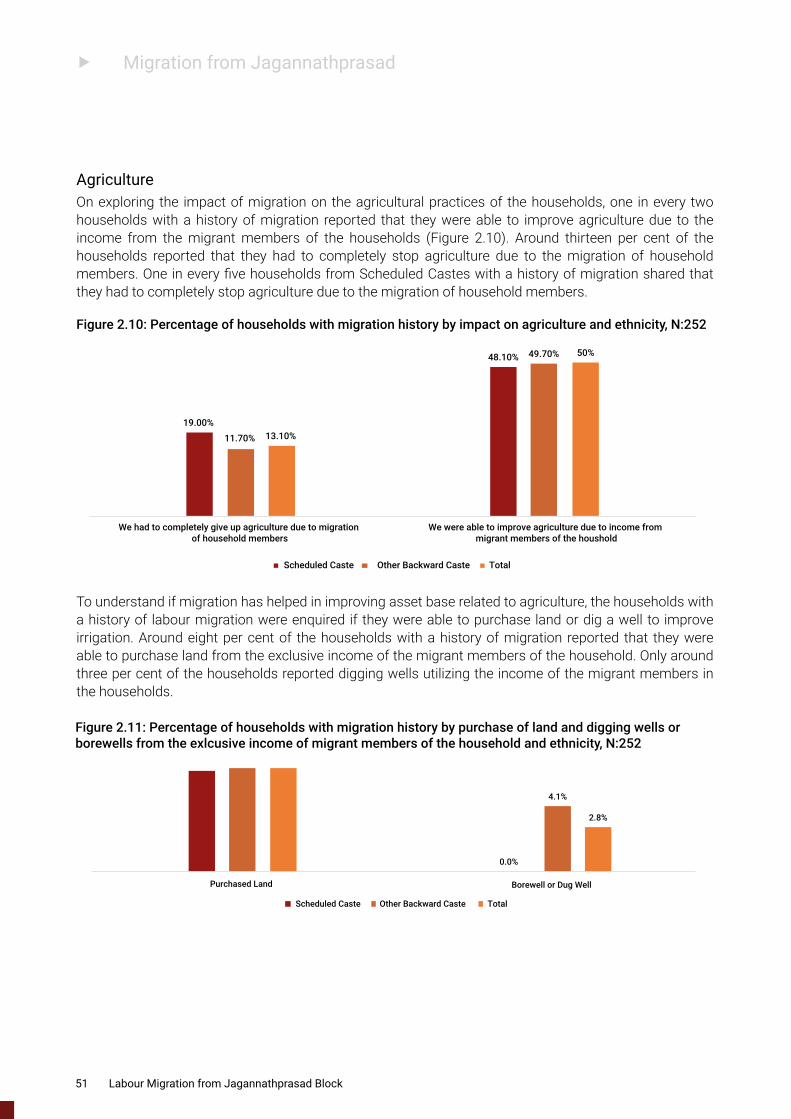
f Migration from Jagannathprasad
AgricultureOn exploring the impact of migration on the agricultural practices of the households, one in every two households with a history of migration reported that they were able to improve agriculture due to the income from the migrant members of the households (Figure 2.10). Around thirteen per cent of the households reported that they had to completely stop agriculture due to the migration of household members. One in every five households from Scheduled Castes with a history of migration shared that they had to completely stop agriculture due to the migration of household members.
19.00%
48.10%
11.70%
49.70%
13.10%
50%
We had to completely give up agriculture due to migration of household members
We were able to improve agriculture due to income from migrant members of the houshold
Scheduled Caste Other Backward Caste Total
Figure 2.10: Percentage of households with migration history by impact on agriculture and ethnicity, N:252
To understand if migration has helped in improving asset base related to agriculture, the households with a history of labour migration were enquired if they were able to purchase land or dig a well to improve irrigation. Around eight per cent of the households with a history of migration reported that they were able to purchase land from the exclusive income of the migrant members of the household. Only around three per cent of the households reported digging wells utilizing the income of the migrant members in the households.
6.3%
0.0%
8.3%
4.1%
7.5%
2.8%
Purchased Land Borewell or Dug Well
Scheduled Caste Other Backward Caste Total
Figure 2.11: Percentage of households with migration history by purchase of land and digging wells or borewells from the exlcusive income of migrant members of the household and ethnicity, N:252
51 Labour Migration from Jagannathprasad Block
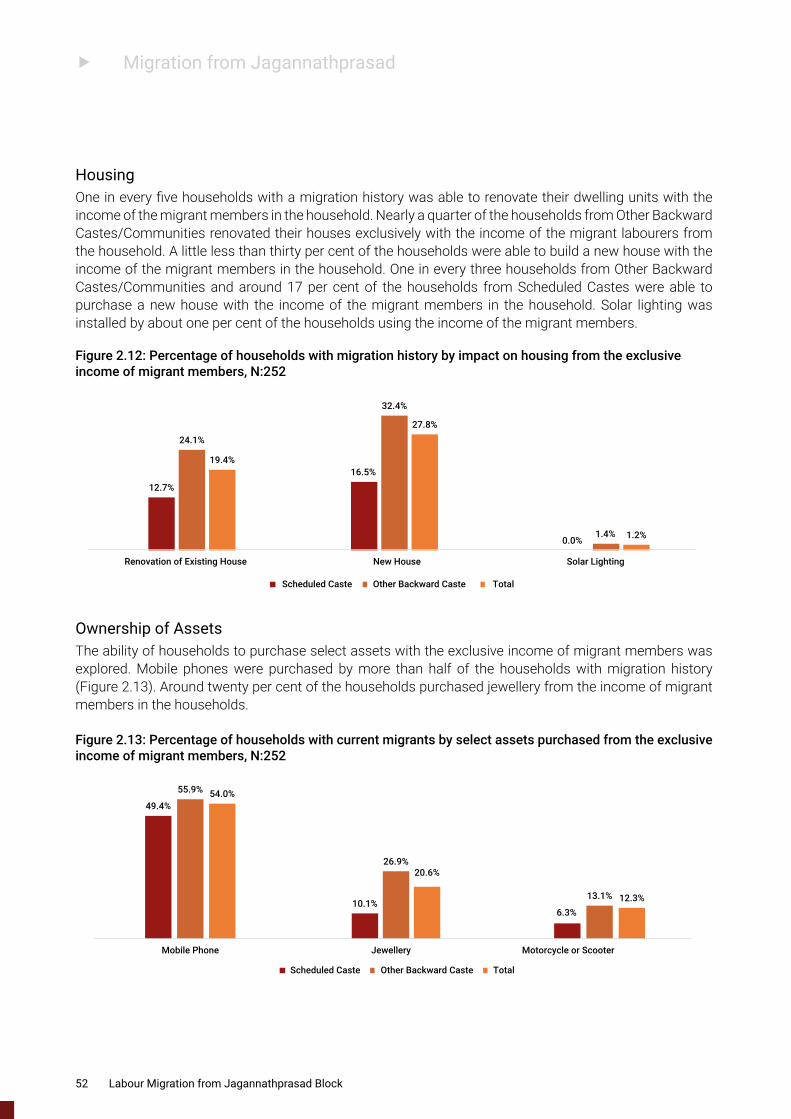
f Migration from Jagannathprasad
HousingOne in every five households with a migration history was able to renovate their dwelling units with the income of the migrant members in the household. Nearly a quarter of the households from Other Backward Castes/Communities renovated their houses exclusively with the income of the migrant labourers from the household. A little less than thirty per cent of the households were able to build a new house with the income of the migrant members in the household. One in every three households from Other Backward Castes/Communities and around 17 per cent of the households from Scheduled Castes were able to purchase a new house with the income of the migrant members in the household. Solar lighting was installed by about one per cent of the households using the income of the migrant members.
12.7%
16.5%
0.0%
24.1%
32.4%
1.4%
19.4%
27.8%
1.2%
Renovation of Existing House New House Solar Lighting
Scheduled Caste Other Backward Caste Total
Figure 2.12: Percentage of households with migration history by impact on housing from the exclusive income of migrant members, N:252
Figure 2.13: Percentage of households with current migrants by select assets purchased from the exclusive income of migrant members, N:252
Ownership of AssetsThe ability of households to purchase select assets with the exclusive income of migrant members was explored. Mobile phones were purchased by more than half of the households with migration history (Figure 2.13). Around twenty per cent of the households purchased jewellery from the income of migrant members in the households.
49.4%
10.1%6.3%
55.9%
26.9%
13.1%
54.0%
20.6%
12.3%
Mobile Phone Jewellery Motorcycle or Scooter
Scheduled Caste Other Backward Caste Total
52 Labour Migration from Jagannathprasad Block
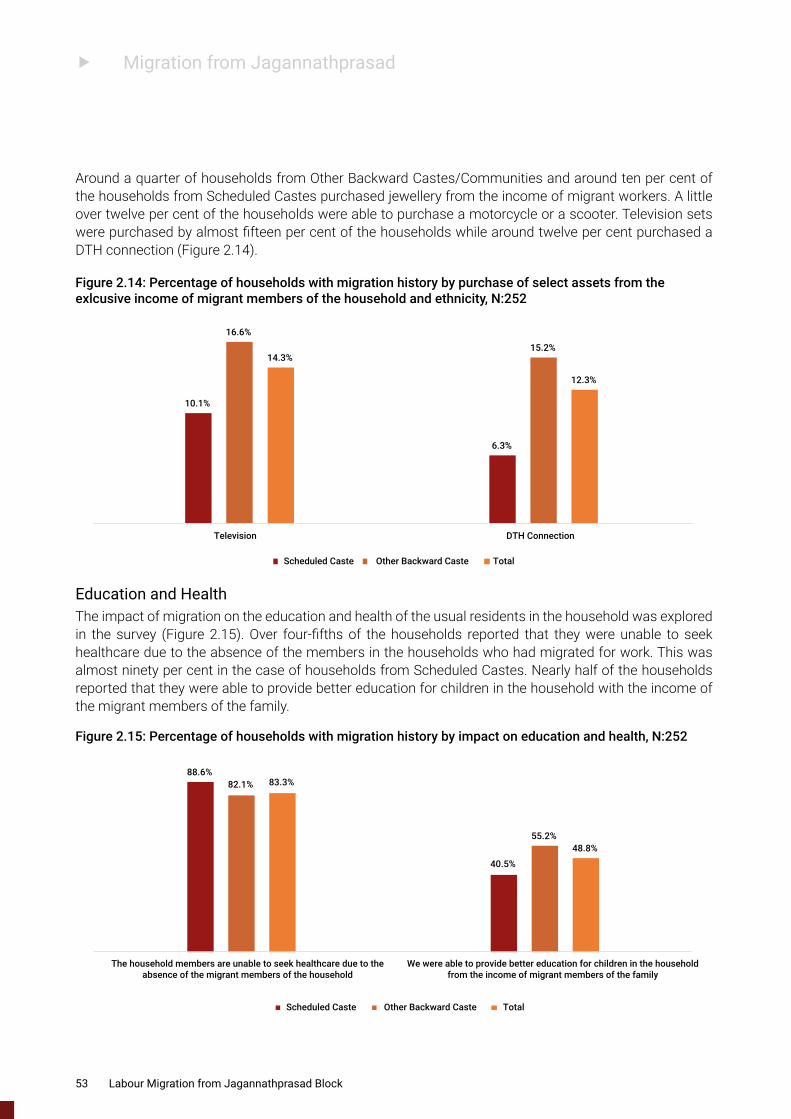
f Migration from Jagannathprasad
Around a quarter of households from Other Backward Castes/Communities and around ten per cent of the households from Scheduled Castes purchased jewellery from the income of migrant workers. A little over twelve per cent of the households were able to purchase a motorcycle or a scooter. Television sets were purchased by almost fifteen per cent of the households while around twelve per cent purchased a DTH connection (Figure 2.14).
10.1%
6.3%
16.6%
15.2%14.3%
12.3%
Television DTH Connection
Scheduled Caste Other Backward Caste Total
Figure 2.14: Percentage of households with migration history by purchase of select assets from the exlcusive income of migrant members of the household and ethnicity, N:252
Figure 2.15: Percentage of households with migration history by impact on education and health, N:252
Education and HealthThe impact of migration on the education and health of the usual residents in the household was explored in the survey (Figure 2.15). Over four-fifths of the households reported that they were unable to seek healthcare due to the absence of the members in the households who had migrated for work. This was almost ninety per cent in the case of households from Scheduled Castes. Nearly half of the households reported that they were able to provide better education for children in the household with the income of the migrant members of the family.
88.6%
40.5%
82.1%
55.2%
83.3%
48.8%
The household members are unable to seek healthcare due to theabsence of the migrant members of the household
We were able to provide better education for children in the householdfrom the income of migrant members of the family
Scheduled Caste Other Backward Caste Total
53 Labour Migration from Jagannathprasad Block

f Migration from Jagannathprasad
Status in the Village and Aspirations Three out of every four households in Jagannathprasad with a history of labour migration in the past ten years reported that their status in the village improved due to the income from the migrant members in the family. The proportion of households that reported this was more or less similar in the case of various ethnic groups.
72.2% 76.6% 75.0%
Our status in the village improved due to income from migrant members of the household
Scheduled Caste Other Backward Caste Total
Over ninety per cent of the households with a history of labour migration shared that if they had earned at least ₹10000 in the village they would not have allowed any family member to go out of the district to work elsewhere (Figure 2.17). This was the case amongst almost all the households from the Scheduled Castes.
Barriers to MigrationOverall, about three-fifths of the households in Jagannathprasad had a history of labour migration as seen in Figure 2.18. The households without a history of labour migration were asked the reason why members of the particular household did not migrate for work. Among the nearly forty per cent of the households who did not migrate, a little less than a quarter did not want to migrate while around fifteen per cent of the households were unable to migrate.
Figure 2.16: Percentage of households with migration history that reported improvement in status in the village due to income from migrant member and ethnicity, N: 252
Figure 2.17: Percentage of households with migration history reporting that they would not have allowed any member to migrate for work if they had a family income of ₹10000 in the village by ethnicity
97.5% 91.7% 92.9%
If we had a monthly family income of at least rs 10,000, we would not have allowed any member of this household
to go out of the district for work
Scheduled Caste Other Backward Caste Total
With History of Migration60.8%
Do Not Want to Migrate23.8%
Unable to Migrate15.4%
Other39.2%
Figure 2.18: Distribution of households in Jagannathprasad by migration status, N:421
Figure 2.19: Percentage of households with members who do not want to migrate by reason, N:100
77.0%
29.0%
6.0%
Sufficient Income Here
Scared of Going Out
Not Sure of Securing Job
54 Labour Migration from Jagannathprasad Block
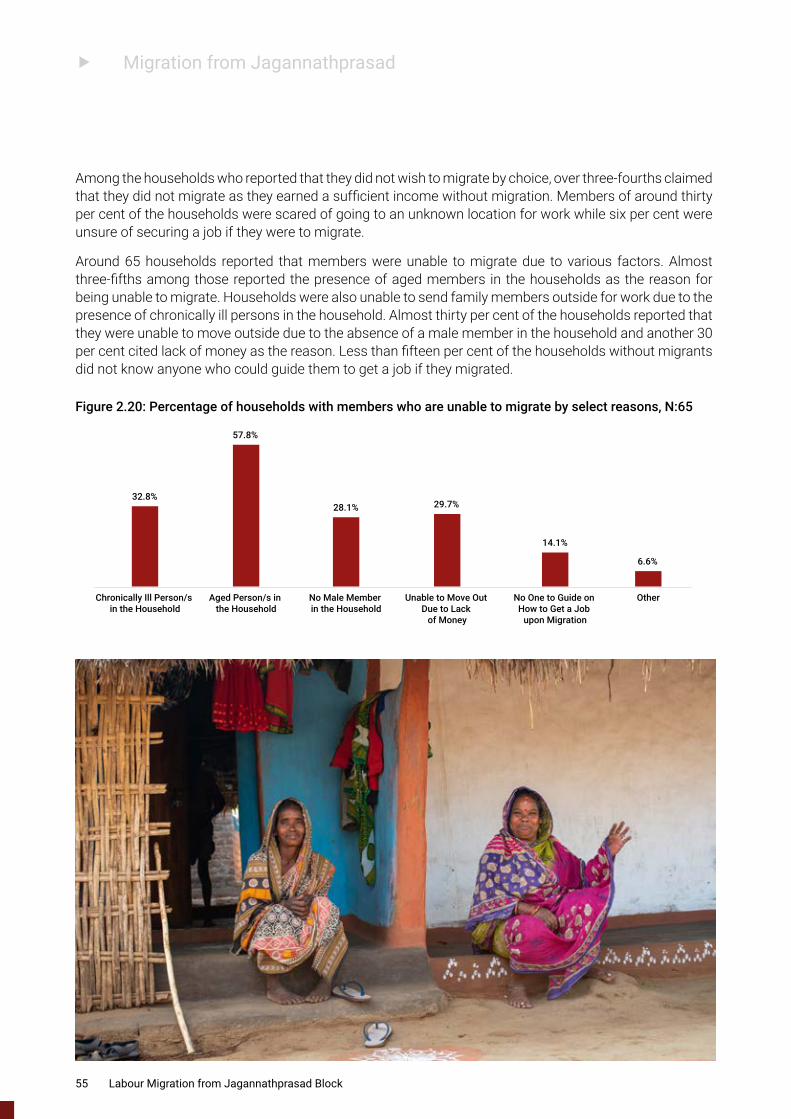
f Migration from Jagannathprasad
Among the households who reported that they did not wish to migrate by choice, over three-fourths claimed that they did not migrate as they earned a sufficient income without migration. Members of around thirty per cent of the households were scared of going to an unknown location for work while six per cent were unsure of securing a job if they were to migrate.
Around 65 households reported that members were unable to migrate due to various factors. Almost three-fifths among those reported the presence of aged members in the households as the reason for being unable to migrate. Households were also unable to send family members outside for work due to the presence of chronically ill persons in the household. Almost thirty per cent of the households reported that they were unable to move outside due to the absence of a male member in the household and another 30 per cent cited lack of money as the reason. Less than fifteen per cent of the households without migrants did not know anyone who could guide them to get a job if they migrated.
32.8%
57.8%
28.1% 29.7%
14.1%
6.6%
Chronically Ill Person/s in the Household
Aged Person/s in the Household
No Male Member in the Household
Unable to Move Out Due to Lack
of Money
No One to Guide on How to Get a Job
upon Migration
Other
Figure 2.20: Percentage of households with members who are unable to migrate by select reasons, N:65
55 Labour Migration from Jagannathprasad Block
Labour Migration from Jagannathprasad Block
Profile of Migrant Workers
56
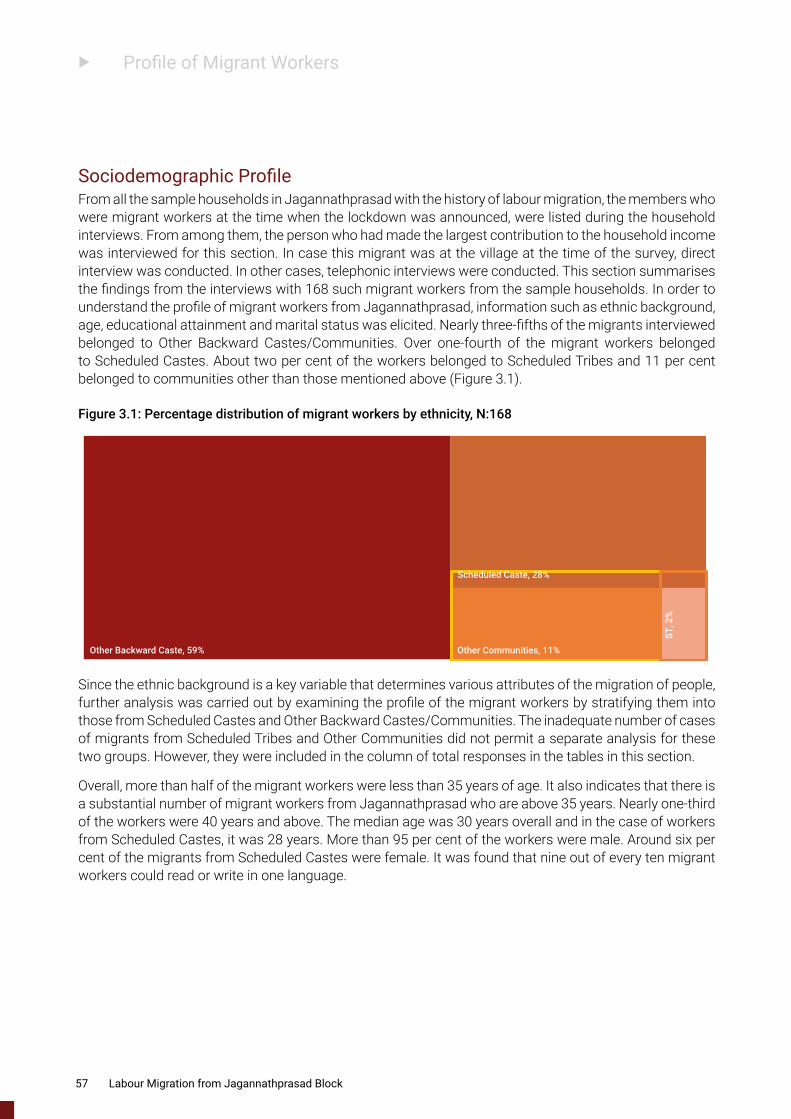
f Profile of Migrant Workers
Sociodemographic ProfileFrom all the sample households in Jagannathprasad with the history of labour migration, the members who were migrant workers at the time when the lockdown was announced, were listed during the household interviews. From among them, the person who had made the largest contribution to the household income was interviewed for this section. In case this migrant was at the village at the time of the survey, direct interview was conducted. In other cases, telephonic interviews were conducted. This section summarises the findings from the interviews with 168 such migrant workers from the sample households. In order to understand the profile of migrant workers from Jagannathprasad, information such as ethnic background, age, educational attainment and marital status was elicited. Nearly three-fifths of the migrants interviewed belonged to Other Backward Castes/Communities. Over one-fourth of the migrant workers belonged to Scheduled Castes. About two per cent of the workers belonged to Scheduled Tribes and 11 per cent belonged to communities other than those mentioned above (Figure 3.1).
Scheduled Caste, 28%
ST, 2
%
Other Backward Caste, 59% Other Communities, 11%
Figure 3.1: Percentage distribution of migrant workers by ethnicity, N:168
Since the ethnic background is a key variable that determines various attributes of the migration of people, further analysis was carried out by examining the profile of the migrant workers by stratifying them into those from Scheduled Castes and Other Backward Castes/Communities. The inadequate number of cases of migrants from Scheduled Tribes and Other Communities did not permit a separate analysis for these two groups. However, they were included in the column of total responses in the tables in this section.
Overall, more than half of the migrant workers were less than 35 years of age. It also indicates that there is a substantial number of migrant workers from Jagannathprasad who are above 35 years. Nearly one-third of the workers were 40 years and above. The median age was 30 years overall and in the case of workers from Scheduled Castes, it was 28 years. More than 95 per cent of the workers were male. Around six per cent of the migrants from Scheduled Castes were female. It was found that nine out of every ten migrant workers could read or write in one language.
57 Labour Migration from Jagannathprasad Block
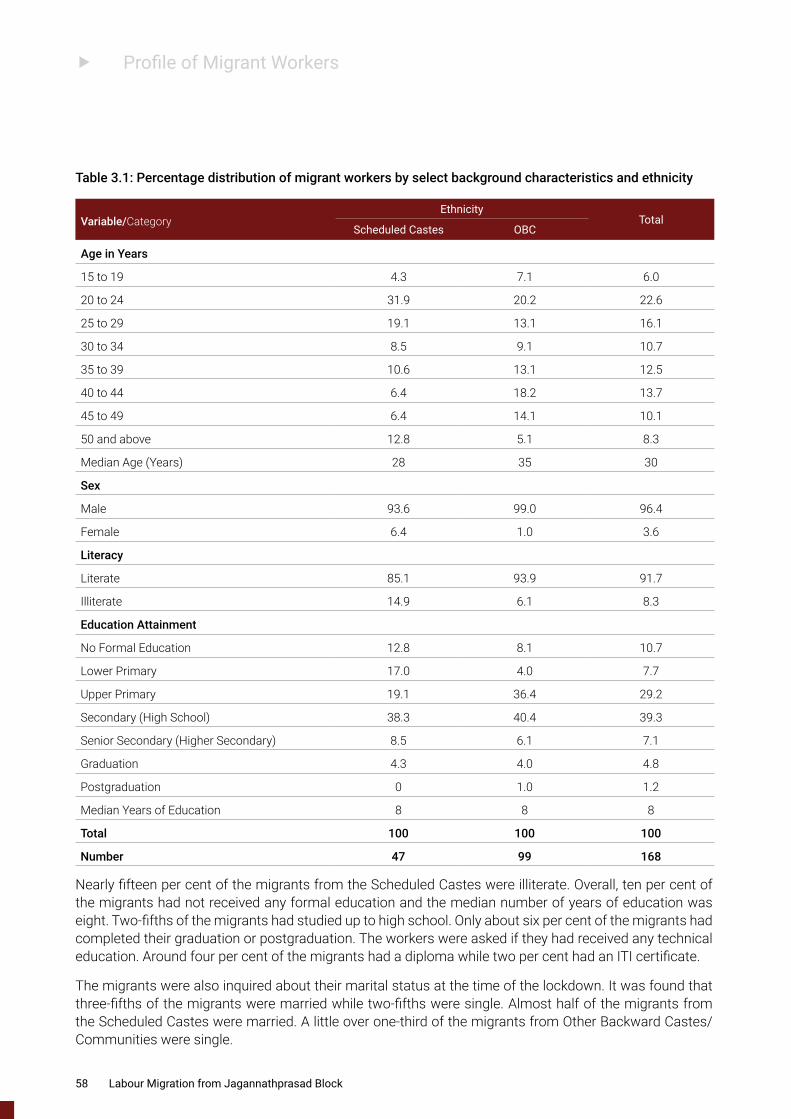
f Profile of Migrant Workers
Table 3.1: Percentage distribution of migrant workers by select background characteristics and ethnicity
Variable/CategoryEthnicity
TotalScheduled Castes OBC
Age in Years
15 to 19 4.3 7.1 6.0
20 to 24 31.9 20.2 22.6
25 to 29 19.1 13.1 16.1
30 to 34 8.5 9.1 10.7
35 to 39 10.6 13.1 12.5
40 to 44 6.4 18.2 13.7
45 to 49 6.4 14.1 10.1
50 and above 12.8 5.1 8.3
Median Age (Years) 28 35 30
Sex
Male 93.6 99.0 96.4
Female 6.4 1.0 3.6
Literacy
Literate 85.1 93.9 91.7
Illiterate 14.9 6.1 8.3
Education Attainment
No Formal Education 12.8 8.1 10.7
Lower Primary 17.0 4.0 7.7
Upper Primary 19.1 36.4 29.2
Secondary (High School) 38.3 40.4 39.3
Senior Secondary (Higher Secondary) 8.5 6.1 7.1
Graduation 4.3 4.0 4.8
Postgraduation 0 1.0 1.2
Median Years of Education 8 8 8
Total 100 100 100
Number 47 99 168
Nearly fifteen per cent of the migrants from the Scheduled Castes were illiterate. Overall, ten per cent of the migrants had not received any formal education and the median number of years of education was eight. Two-fifths of the migrants had studied up to high school. Only about six per cent of the migrants had completed their graduation or postgraduation. The workers were asked if they had received any technical education. Around four per cent of the migrants had a diploma while two per cent had an ITI certificate.
The migrants were also inquired about their marital status at the time of the lockdown. It was found that three-fifths of the migrants were married while two-fifths were single. Almost half of the migrants from the Scheduled Castes were married. A little over one-third of the migrants from Other Backward Castes/Communities were single.
58 Labour Migration from Jagannathprasad Block
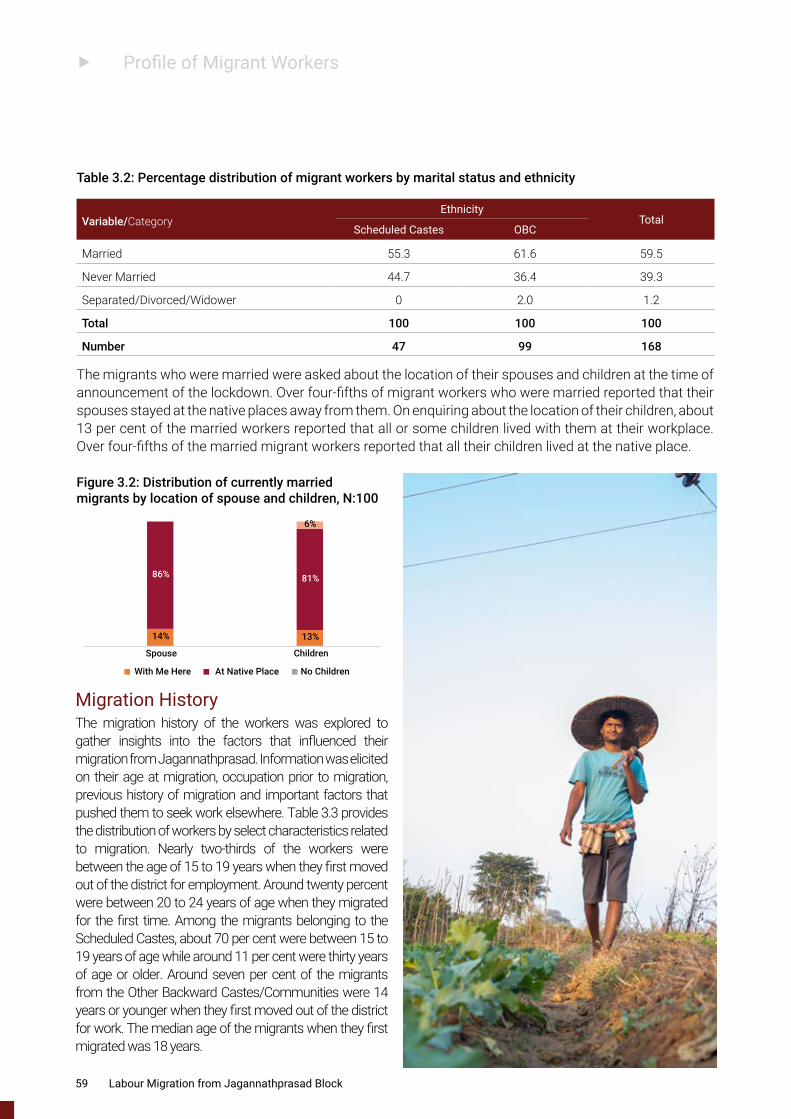
f Profile of Migrant Workers
Table 3.2: Percentage distribution of migrant workers by marital status and ethnicity
Variable/CategoryEthnicity
TotalScheduled Castes OBC
Married 55.3 61.6 59.5
Never Married 44.7 36.4 39.3
Separated/Divorced/Widower 0 2.0 1.2
Total 100 100 100
Number 47 99 168
The migrants who were married were asked about the location of their spouses and children at the time of announcement of the lockdown. Over four-fifths of migrant workers who were married reported that their spouses stayed at the native places away from them. On enquiring about the location of their children, about 13 per cent of the married workers reported that all or some children lived with them at their workplace. Over four-fifths of the married migrant workers reported that all their children lived at the native place.
14% 13%
86% 81%
6%
Spouse Children
With Me Here At Native Place No Children
Figure 3.2: Distribution of currently married migrants by location of spouse and children, N:100
Migration HistoryThe migration history of the workers was explored to gather insights into the factors that influenced their migration from Jagannathprasad. Information was elicited on their age at migration, occupation prior to migration, previous history of migration and important factors that pushed them to seek work elsewhere. Table 3.3 provides the distribution of workers by select characteristics related to migration. Nearly two-thirds of the workers were between the age of 15 to 19 years when they first moved out of the district for employment. Around twenty percent were between 20 to 24 years of age when they migrated for the first time. Among the migrants belonging to the Scheduled Castes, about 70 per cent were between 15 to 19 years of age while around 11 per cent were thirty years of age or older. Around seven per cent of the migrants from the Other Backward Castes/Communities were 14 years or younger when they first moved out of the district for work. The median age of the migrants when they first migrated was 18 years.
59 Labour Migration from Jagannathprasad Block
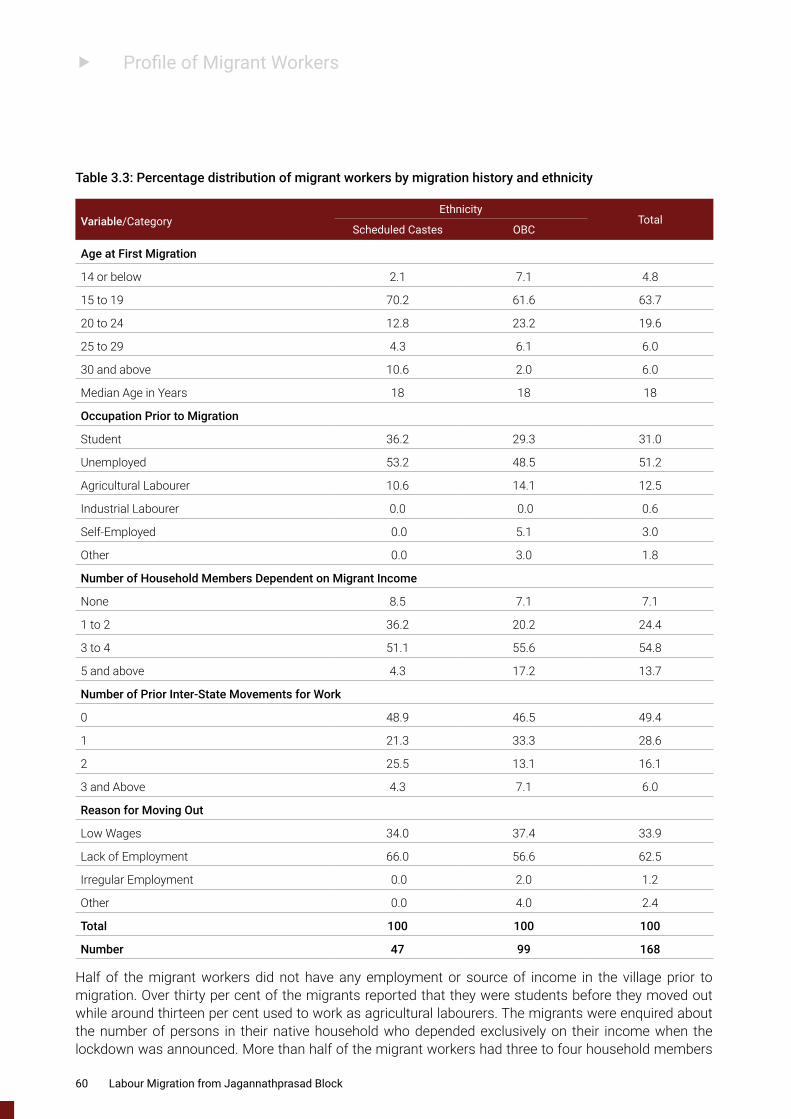
f Profile of Migrant Workers
Table 3.3: Percentage distribution of migrant workers by migration history and ethnicity
Variable/CategoryEthnicity
TotalScheduled Castes OBC
Age at First Migration
14 or below 2.1 7.1 4.8
15 to 19 70.2 61.6 63.7
20 to 24 12.8 23.2 19.6
25 to 29 4.3 6.1 6.0
30 and above 10.6 2.0 6.0
Median Age in Years 18 18 18
Occupation Prior to Migration
Student 36.2 29.3 31.0
Unemployed 53.2 48.5 51.2
Agricultural Labourer 10.6 14.1 12.5
Industrial Labourer 0.0 0.0 0.6
Self-Employed 0.0 5.1 3.0
Other 0.0 3.0 1.8
Number of Household Members Dependent on Migrant Income
None 8.5 7.1 7.1
1 to 2 36.2 20.2 24.4
3 to 4 51.1 55.6 54.8
5 and above 4.3 17.2 13.7
Number of Prior Inter-State Movements for Work
0 48.9 46.5 49.4
1 21.3 33.3 28.6
2 25.5 13.1 16.1
3 and Above 4.3 7.1 6.0
Reason for Moving Out
Low Wages 34.0 37.4 33.9
Lack of Employment 66.0 56.6 62.5
Irregular Employment 0.0 2.0 1.2
Other 0.0 4.0 2.4
Total 100 100 100
Number 47 99 168
Half of the migrant workers did not have any employment or source of income in the village prior to migration. Over thirty per cent of the migrants reported that they were students before they moved out while around thirteen per cent used to work as agricultural labourers. The migrants were enquired about the number of persons in their native household who depended exclusively on their income when the lockdown was announced. More than half of the migrant workers had three to four household members
60 Labour Migration from Jagannathprasad Block
f Profile of Migrant Workers
who depended exclusively on their income. Around a quarter of the migrants had one to two dependent members in the household. A little less than 20 per cent of the households from Other Backward Castes/Communities had five or more household members dependent on their income. The median number of dependents was three.
The migrants were asked if they had any experience of working in other states before migrating to the state they were working in at the time of the lockdown. Half of the migrants did not have any work experience in other states. Around thirty per cent of the migrants had work experience in another state while six per cent of the migrants had worked in three states or more before moving to the state they were in at the time of the lockdown. A quarter of the migrants from the Scheduled Castes had previous work experience in two other states. Nearly two-fifths of the migrants reported that they had moved out of Jagannathprasad due to the lack of employment opportunities within the district. One-third of the migrants moved out of the district because of low wages. Lack of employment was cited as a reason for moving out by two-thirds of the migrants from Scheduled Castes.
Destination at the Time of the Lockdown In order to understand the pull factors of migration, all the migrants were asked about their destination state and district at the time of the lockdown. The reasons for choosing that particular destination and type of destination were also explored. The details are presented in Table 3.4. A little less than one-third of the migrants reported Gujarat as their destination state at the time of the lockdown. Over twenty per cent of the migrants were employed in other districts of Odisha while about one-fifth of the workers were employed in Tamil Nadu. Kerala, Karnataka, Telangana and Maharashtra were some of the other prominent destination states for migrants from Jagannathprasad. Over two-fifths of the migrants from Other Backward Castes/Communities were working in Gujarat at the time when the lockdown was announced while nearly thirty per cent of the migrants from Scheduled Castes were employed in Tamil Nadu.
One in every three workers from Jagannathprasad was employed in Surat at the time of announcement of the lockdown. Nearly half of the workers from Other Backward Castes/Communities worked in Surat whereas the percentage of workers from Scheduled Castes that reported Surat as destination was only 11 per cent. A little less than twenty per cent of the migrants reported Khordha as the destination district. Seven per cent of the migrants worked in Bengaluru while six per cent worked in Chennai. When asked about the exact place of employment, about one-third of the migrants reported Surat as their place of work at the time of the lockdown, while a little over fifteen per cent were employed in Bhubaneswar. Bengaluru, Mumbai and Chennai were reported as other places of employment by the migrants from Jagannathprasad. Over ninety per cent of the migrants worked in cities and urban spaces.
61 Labour Migration from Jagannathprasad Block
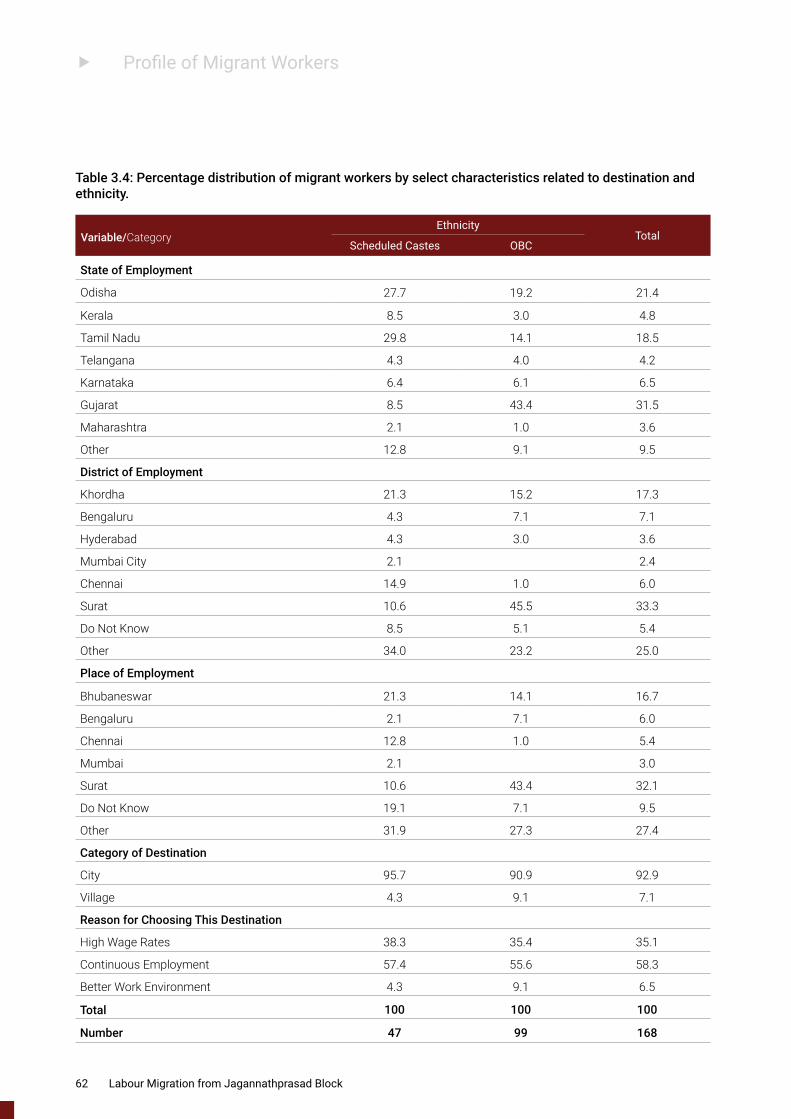
f Profile of Migrant Workers
Table 3.4: Percentage distribution of migrant workers by select characteristics related to destination and ethnicity.
Variable/CategoryEthnicity
TotalScheduled Castes OBC
State of Employment
Odisha 27.7 19.2 21.4
Kerala 8.5 3.0 4.8
Tamil Nadu 29.8 14.1 18.5
Telangana 4.3 4.0 4.2
Karnataka 6.4 6.1 6.5
Gujarat 8.5 43.4 31.5
Maharashtra 2.1 1.0 3.6
Other 12.8 9.1 9.5
District of Employment
Khordha 21.3 15.2 17.3
Bengaluru 4.3 7.1 7.1
Hyderabad 4.3 3.0 3.6
Mumbai City 2.1 2.4
Chennai 14.9 1.0 6.0
Surat 10.6 45.5 33.3
Do Not Know 8.5 5.1 5.4
Other 34.0 23.2 25.0
Place of Employment
Bhubaneswar 21.3 14.1 16.7
Bengaluru 2.1 7.1 6.0
Chennai 12.8 1.0 5.4
Mumbai 2.1 3.0
Surat 10.6 43.4 32.1
Do Not Know 19.1 7.1 9.5
Other 31.9 27.3 27.4
Category of Destination
City 95.7 90.9 92.9
Village 4.3 9.1 7.1
Reason for Choosing This Destination
High Wage Rates 38.3 35.4 35.1
Continuous Employment 57.4 55.6 58.3
Better Work Environment 4.3 9.1 6.5
Total 100 100 100
Number 47 99 168
62 Labour Migration from Jagannathprasad Block
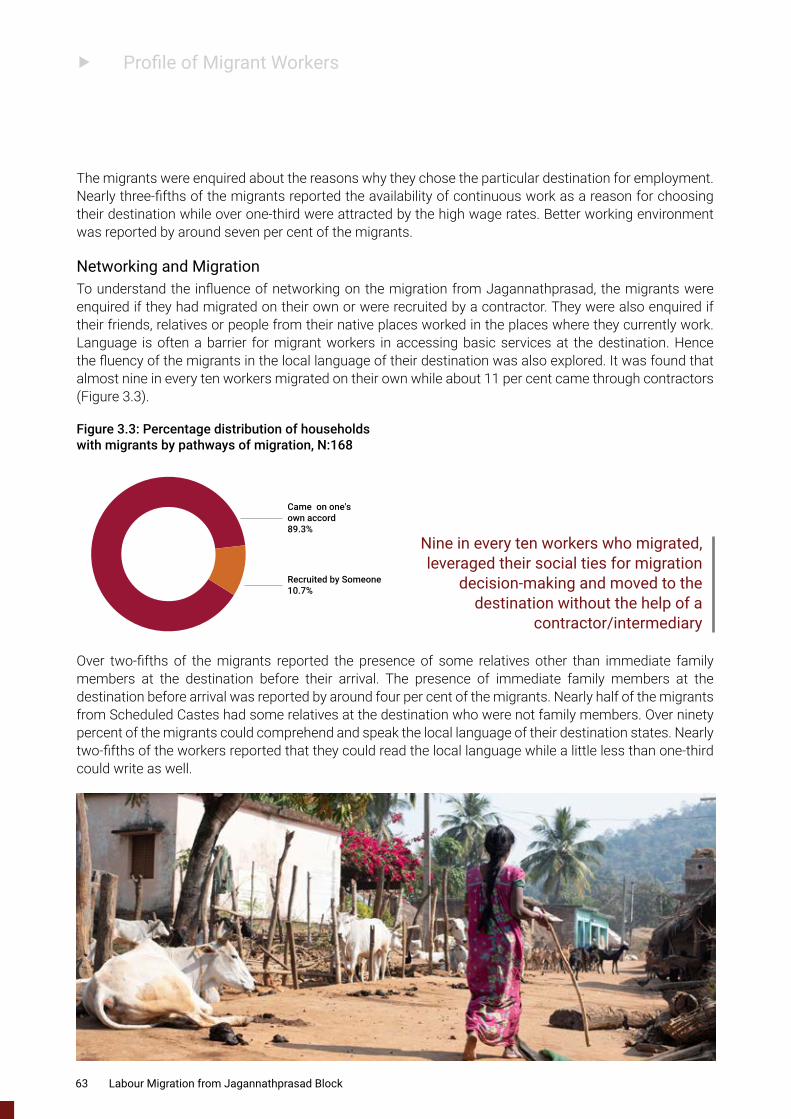
f Profile of Migrant Workers
The migrants were enquired about the reasons why they chose the particular destination for employment. Nearly three-fifths of the migrants reported the availability of continuous work as a reason for choosing their destination while over one-third were attracted by the high wage rates. Better working environment was reported by around seven per cent of the migrants.
Networking and MigrationTo understand the influence of networking on the migration from Jagannathprasad, the migrants were enquired if they had migrated on their own or were recruited by a contractor. They were also enquired if their friends, relatives or people from their native places worked in the places where they currently work. Language is often a barrier for migrant workers in accessing basic services at the destination. Hence the fluency of the migrants in the local language of their destination was also explored. It was found that almost nine in every ten workers migrated on their own while about 11 per cent came through contractors (Figure 3.3).
Came on one's own accord89.3%
Recruited by Someone10.7%
Figure 3.3: Percentage distribution of households with migrants by pathways of migration, N:168
Over two-fifths of the migrants reported the presence of some relatives other than immediate family members at the destination before their arrival. The presence of immediate family members at the destination before arrival was reported by around four per cent of the migrants. Nearly half of the migrants from Scheduled Castes had some relatives at the destination who were not family members. Over ninety percent of the migrants could comprehend and speak the local language of their destination states. Nearly two-fifths of the workers reported that they could read the local language while a little less than one-third could write as well.
Nine in every ten workers who migrated, leveraged their social ties for migration
decision-making and moved to the destination without the help of a
contractor/intermediary
63 Labour Migration from Jagannathprasad Block
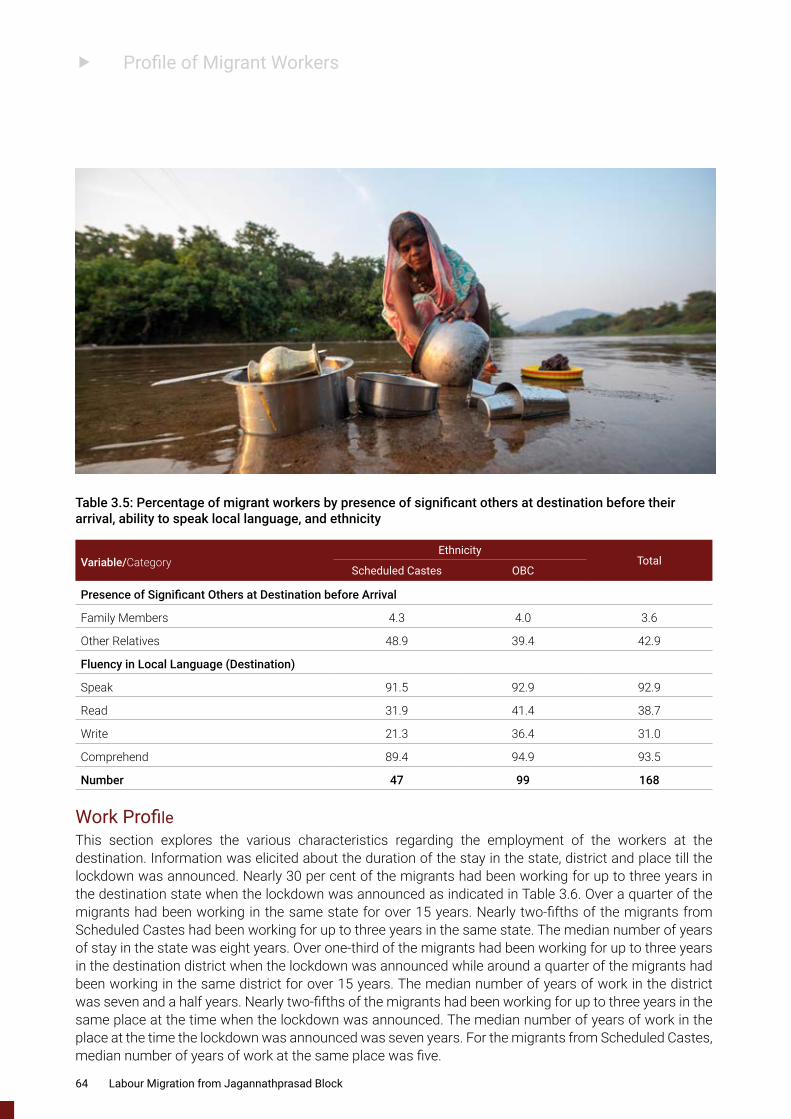
f Profile of Migrant Workers
Table 3.5: Percentage of migrant workers by presence of significant others at destination before their arrival, ability to speak local language, and ethnicity
Variable/CategoryEthnicity
TotalScheduled Castes OBC
Presence of Significant Others at Destination before Arrival
Family Members 4.3 4.0 3.6
Other Relatives 48.9 39.4 42.9
Fluency in Local Language (Destination)
Speak 91.5 92.9 92.9
Read 31.9 41.4 38.7
Write 21.3 36.4 31.0
Comprehend 89.4 94.9 93.5
Number 47 99 168
Work ProfileThis section explores the various characteristics regarding the employment of the workers at the destination. Information was elicited about the duration of the stay in the state, district and place till the lockdown was announced. Nearly 30 per cent of the migrants had been working for up to three years in the destination state when the lockdown was announced as indicated in Table 3.6. Over a quarter of the migrants had been working in the same state for over 15 years. Nearly two-fifths of the migrants from Scheduled Castes had been working for up to three years in the same state. The median number of years of stay in the state was eight years. Over one-third of the migrants had been working for up to three years in the destination district when the lockdown was announced while around a quarter of the migrants had been working in the same district for over 15 years. The median number of years of work in the district was seven and a half years. Nearly two-fifths of the migrants had been working for up to three years in the same place at the time when the lockdown was announced. The median number of years of work in the place at the time the lockdown was announced was seven years. For the migrants from Scheduled Castes, median number of years of work at the same place was five.
64 Labour Migration from Jagannathprasad Block
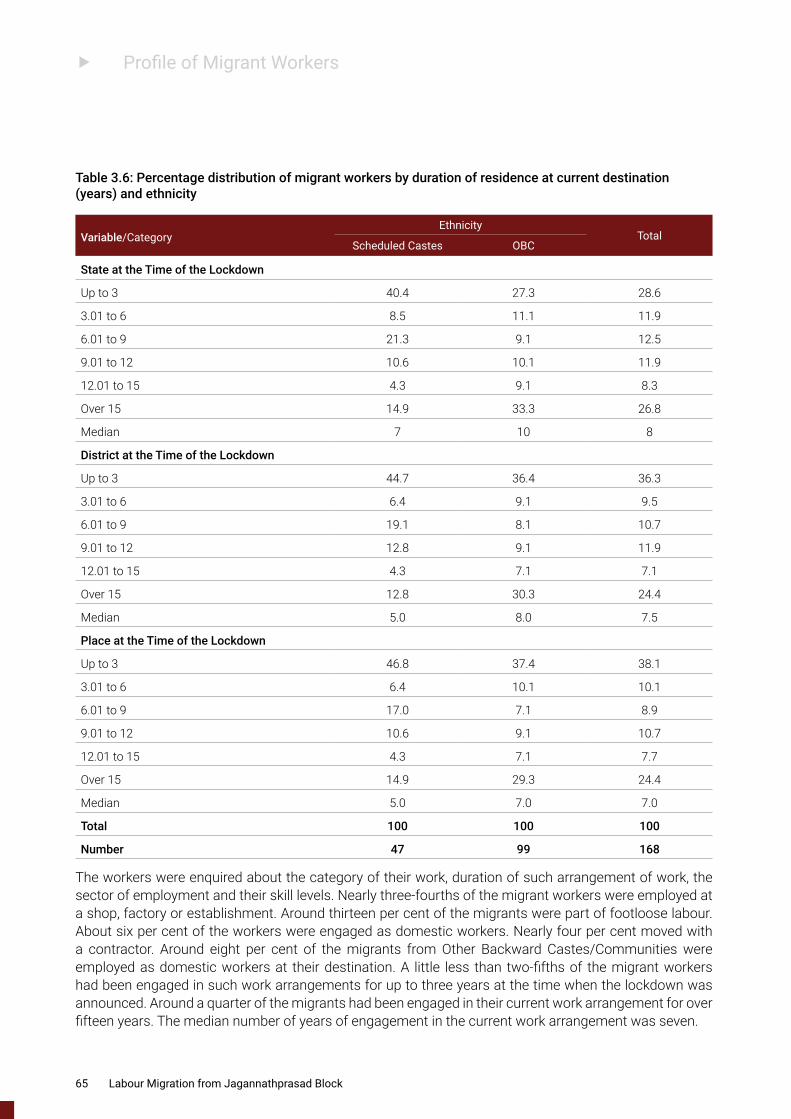
f Profile of Migrant Workers
Table 3.6: Percentage distribution of migrant workers by duration of residence at current destination (years) and ethnicity
Variable/CategoryEthnicity
TotalScheduled Castes OBC
State at the Time of the Lockdown
Up to 3 40.4 27.3 28.6
3.01 to 6 8.5 11.1 11.9
6.01 to 9 21.3 9.1 12.5
9.01 to 12 10.6 10.1 11.9
12.01 to 15 4.3 9.1 8.3
Over 15 14.9 33.3 26.8
Median 7 10 8
District at the Time of the Lockdown
Up to 3 44.7 36.4 36.3
3.01 to 6 6.4 9.1 9.5
6.01 to 9 19.1 8.1 10.7
9.01 to 12 12.8 9.1 11.9
12.01 to 15 4.3 7.1 7.1
Over 15 12.8 30.3 24.4
Median 5.0 8.0 7.5
Place at the Time of the Lockdown
Up to 3 46.8 37.4 38.1
3.01 to 6 6.4 10.1 10.1
6.01 to 9 17.0 7.1 8.9
9.01 to 12 10.6 9.1 10.7
12.01 to 15 4.3 7.1 7.7
Over 15 14.9 29.3 24.4
Median 5.0 7.0 7.0
Total 100 100 100
Number 47 99 168
The workers were enquired about the category of their work, duration of such arrangement of work, the sector of employment and their skill levels. Nearly three-fourths of the migrant workers were employed at a shop, factory or establishment. Around thirteen per cent of the migrants were part of footloose labour. About six per cent of the workers were engaged as domestic workers. Nearly four per cent moved with a contractor. Around eight per cent of the migrants from Other Backward Castes/Communities were employed as domestic workers at their destination. A little less than two-fifths of the migrant workers had been engaged in such work arrangements for up to three years at the time when the lockdown was announced. Around a quarter of the migrants had been engaged in their current work arrangement for over fifteen years. The median number of years of engagement in the current work arrangement was seven.
65 Labour Migration from Jagannathprasad Block
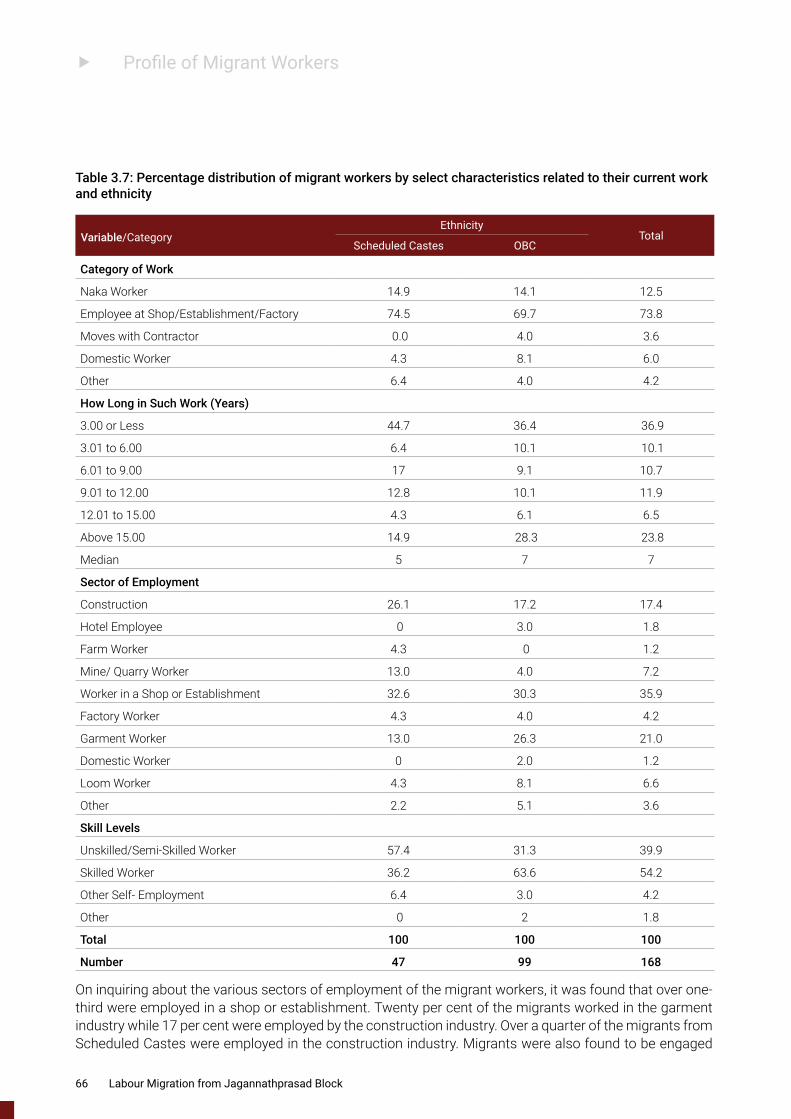
f Profile of Migrant Workers
Table 3.7: Percentage distribution of migrant workers by select characteristics related to their current work and ethnicity
Variable/CategoryEthnicity
TotalScheduled Castes OBC
Category of Work
Naka Worker 14.9 14.1 12.5
Employee at Shop/Establishment/Factory 74.5 69.7 73.8
Moves with Contractor 0.0 4.0 3.6
Domestic Worker 4.3 8.1 6.0
Other 6.4 4.0 4.2
How Long in Such Work (Years)
3.00 or Less 44.7 36.4 36.9
3.01 to 6.00 6.4 10.1 10.1
6.01 to 9.00 17 9.1 10.7
9.01 to 12.00 12.8 10.1 11.9
12.01 to 15.00 4.3 6.1 6.5
Above 15.00 14.9 28.3 23.8
Median 5 7 7
Sector of Employment
Construction 26.1 17.2 17.4
Hotel Employee 0 3.0 1.8
Farm Worker 4.3 0 1.2
Mine/ Quarry Worker 13.0 4.0 7.2
Worker in a Shop or Establishment 32.6 30.3 35.9
Factory Worker 4.3 4.0 4.2
Garment Worker 13.0 26.3 21.0
Domestic Worker 0 2.0 1.2
Loom Worker 4.3 8.1 6.6
Other 2.2 5.1 3.6
Skill Levels
Unskilled/Semi-Skilled Worker 57.4 31.3 39.9
Skilled Worker 36.2 63.6 54.2
Other Self- Employment 6.4 3.0 4.2
Other 0 2 1.8
Total 100 100 100
Number 47 99 168
On inquiring about the various sectors of employment of the migrant workers, it was found that over one-third were employed in a shop or establishment. Twenty per cent of the migrants worked in the garment industry while 17 per cent were employed by the construction industry. Over a quarter of the migrants from Scheduled Castes were employed in the construction industry. Migrants were also found to be engaged
66 Labour Migration from Jagannathprasad Block
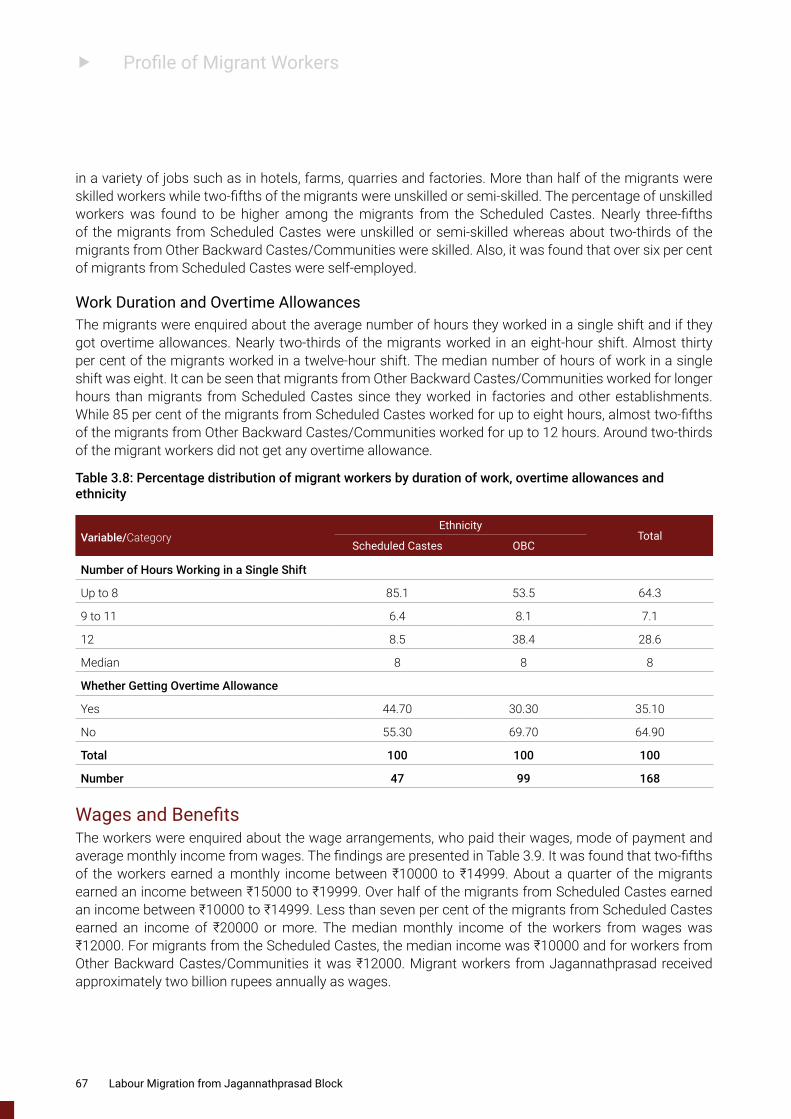
f Profile of Migrant Workers
in a variety of jobs such as in hotels, farms, quarries and factories. More than half of the migrants were skilled workers while two-fifths of the migrants were unskilled or semi-skilled. The percentage of unskilled workers was found to be higher among the migrants from the Scheduled Castes. Nearly three-fifths of the migrants from Scheduled Castes were unskilled or semi-skilled whereas about two-thirds of the migrants from Other Backward Castes/Communities were skilled. Also, it was found that over six per cent of migrants from Scheduled Castes were self-employed.
Work Duration and Overtime AllowancesThe migrants were enquired about the average number of hours they worked in a single shift and if they got overtime allowances. Nearly two-thirds of the migrants worked in an eight-hour shift. Almost thirty per cent of the migrants worked in a twelve-hour shift. The median number of hours of work in a single shift was eight. It can be seen that migrants from Other Backward Castes/Communities worked for longer hours than migrants from Scheduled Castes since they worked in factories and other establishments. While 85 per cent of the migrants from Scheduled Castes worked for up to eight hours, almost two-fifths of the migrants from Other Backward Castes/Communities worked for up to 12 hours. Around two-thirds of the migrant workers did not get any overtime allowance.
Table 3.8: Percentage distribution of migrant workers by duration of work, overtime allowances and ethnicity
Variable/CategoryEthnicity
TotalScheduled Castes OBC
Number of Hours Working in a Single Shift
Up to 8 85.1 53.5 64.3
9 to 11 6.4 8.1 7.1
12 8.5 38.4 28.6
Median 8 8 8
Whether Getting Overtime Allowance
Yes 44.70 30.30 35.10
No 55.30 69.70 64.90
Total 100 100 100
Number 47 99 168
Wages and BenefitsThe workers were enquired about the wage arrangements, who paid their wages, mode of payment and average monthly income from wages. The findings are presented in Table 3.9. It was found that two-fifths of the workers earned a monthly income between ₹10000 to ₹14999. About a quarter of the migrants earned an income between ₹15000 to ₹19999. Over half of the migrants from Scheduled Castes earned an income between ₹10000 to ₹14999. Less than seven per cent of the migrants from Scheduled Castes earned an income of ₹20000 or more. The median monthly income of the workers from wages was ₹12000. For migrants from the Scheduled Castes, the median income was ₹10000 and for workers from Other Backward Castes/Communities it was ₹12000. Migrant workers from Jagannathprasad received approximately two billion rupees annually as wages.
67 Labour Migration from Jagannathprasad Block
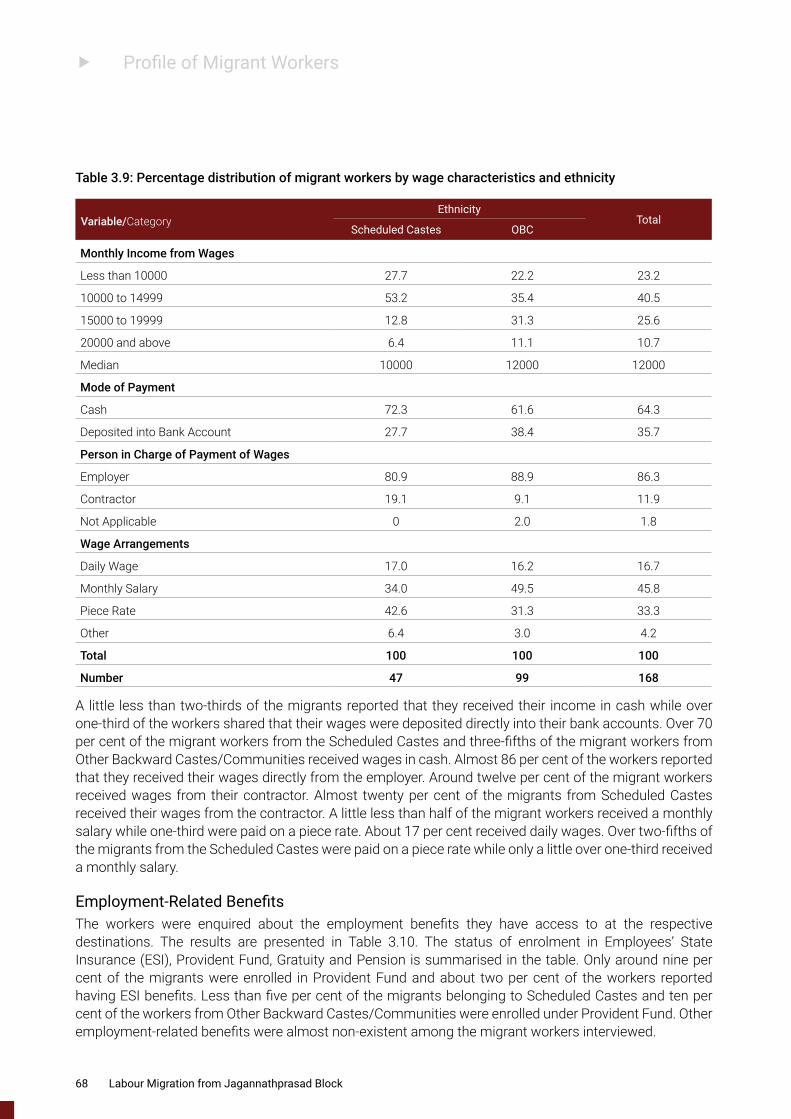
f Profile of Migrant Workers
Table 3.9: Percentage distribution of migrant workers by wage characteristics and ethnicity
Variable/CategoryEthnicity
TotalScheduled Castes OBC
Monthly Income from Wages
Less than 10000 27.7 22.2 23.2
10000 to 14999 53.2 35.4 40.5
15000 to 19999 12.8 31.3 25.6
20000 and above 6.4 11.1 10.7
Median 10000 12000 12000
Mode of Payment
Cash 72.3 61.6 64.3
Deposited into Bank Account 27.7 38.4 35.7
Person in Charge of Payment of Wages
Employer 80.9 88.9 86.3
Contractor 19.1 9.1 11.9
Not Applicable 0 2.0 1.8
Wage Arrangements
Daily Wage 17.0 16.2 16.7
Monthly Salary 34.0 49.5 45.8
Piece Rate 42.6 31.3 33.3
Other 6.4 3.0 4.2
Total 100 100 100
Number 47 99 168
A little less than two-thirds of the migrants reported that they received their income in cash while over one-third of the workers shared that their wages were deposited directly into their bank accounts. Over 70 per cent of the migrant workers from the Scheduled Castes and three-fifths of the migrant workers from Other Backward Castes/Communities received wages in cash. Almost 86 per cent of the workers reported that they received their wages directly from the employer. Around twelve per cent of the migrant workers received wages from their contractor. Almost twenty per cent of the migrants from Scheduled Castes received their wages from the contractor. A little less than half of the migrant workers received a monthly salary while one-third were paid on a piece rate. About 17 per cent received daily wages. Over two-fifths of the migrants from the Scheduled Castes were paid on a piece rate while only a little over one-third received a monthly salary.
Employment-Related BenefitsThe workers were enquired about the employment benefits they have access to at the respective destinations. The results are presented in Table 3.10. The status of enrolment in Employees’ State Insurance (ESI), Provident Fund, Gratuity and Pension is summarised in the table. Only around nine per cent of the migrants were enrolled in Provident Fund and about two per cent of the workers reported having ESI benefits. Less than five per cent of the migrants belonging to Scheduled Castes and ten per cent of the workers from Other Backward Castes/Communities were enrolled under Provident Fund. Other employment-related benefits were almost non-existent among the migrant workers interviewed.
68 Labour Migration from Jagannathprasad Block
f Profile of Migrant Workers
Table 3.10: Percentage of migrant workers who enjoy select employment related benefits and ethnicity
Employment BenefitEthnicity
TotalScheduled Castes OBC
ESI 2.1 1.0 1.8
Provident Fund 4.3 10.1 8.9
Gratuity 0.0 1.0 0.6
Pension 0.0 0.0 0.0
Number 47 99 168
Living ArrangementsThe living arrangements of the workers were examined. Data about accommodation arrangements, type of accommodation, sharing of the room, monthly rent paid, access to basic services at the place of stay and average monthly expenditure at the destination were collected. Three in every four migrants reported that they shared their living space with other workers. Nearly twenty percent of the migrants lived with their family and friends and six per cent lived alone. It was found that eighty per cent of the migrants from Scheduled Castes lived with other workers. A majority of the migrants were found to be living in rented accommodation. More than half of them lived in a rented room while around thirteen per cent had rented an independent house. Twenty per cent of the migrants lived in residential quarters provided by the employer while nine per cent lived at the worksite itself. Three-fifths of the migrants from Other Backward Castes/Communities and over two-fifths of the migrants from Scheduled Castes lived in a rented room at the destination. Worksite was stated as the place of accommodation by 17 per cent of the migrants from the Scheduled Castes. Around two per cent of the migrants from Scheduled Castes also reported living on the streets or under a flyover at the destination.
69 Labour Migration from Jagannathprasad Block
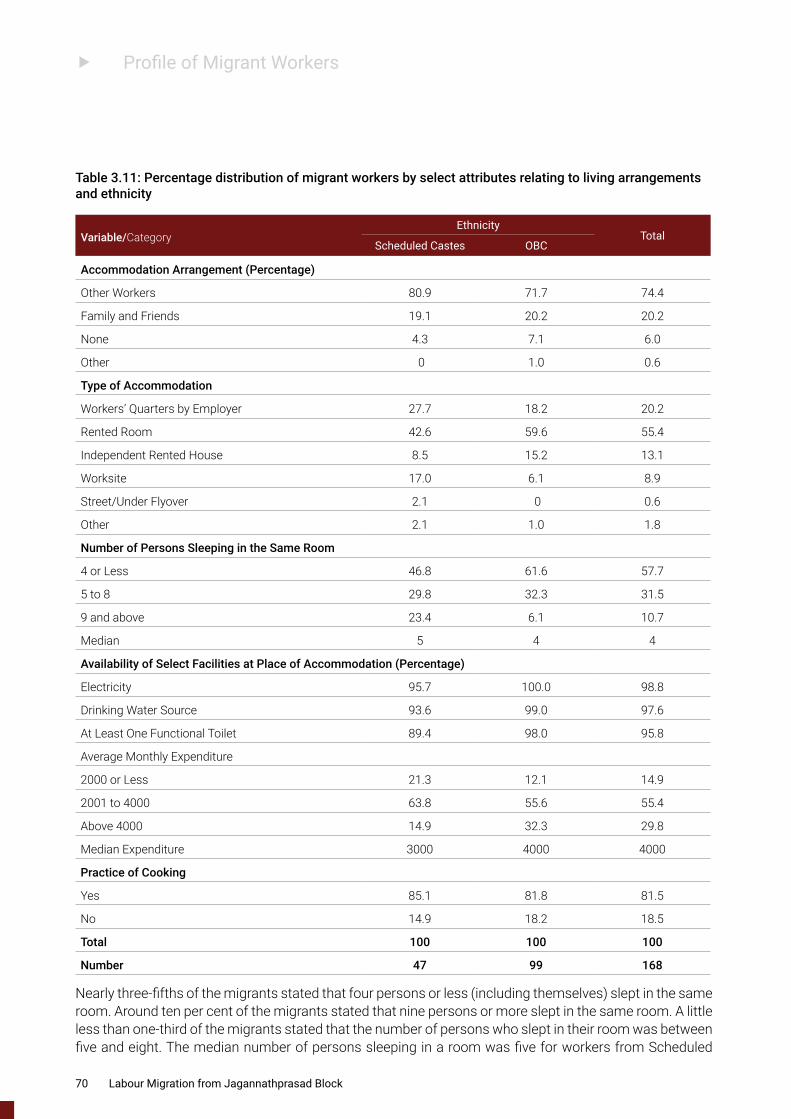
f Profile of Migrant Workers
Table 3.11: Percentage distribution of migrant workers by select attributes relating to living arrangements and ethnicity
Variable/CategoryEthnicity
TotalScheduled Castes OBC
Accommodation Arrangement (Percentage)
Other Workers 80.9 71.7 74.4
Family and Friends 19.1 20.2 20.2
None 4.3 7.1 6.0
Other 0 1.0 0.6
Type of Accommodation
Workers’ Quarters by Employer 27.7 18.2 20.2
Rented Room 42.6 59.6 55.4
Independent Rented House 8.5 15.2 13.1
Worksite 17.0 6.1 8.9
Street/Under Flyover 2.1 0 0.6
Other 2.1 1.0 1.8
Number of Persons Sleeping in the Same Room
4 or Less 46.8 61.6 57.7
5 to 8 29.8 32.3 31.5
9 and above 23.4 6.1 10.7
Median 5 4 4
Availability of Select Facilities at Place of Accommodation (Percentage)
Electricity 95.7 100.0 98.8
Drinking Water Source 93.6 99.0 97.6
At Least One Functional Toilet 89.4 98.0 95.8
Average Monthly Expenditure
2000 or Less 21.3 12.1 14.9
2001 to 4000 63.8 55.6 55.4
Above 4000 14.9 32.3 29.8
Median Expenditure 3000 4000 4000
Practice of Cooking
Yes 85.1 81.8 81.5
No 14.9 18.2 18.5
Total 100 100 100
Number 47 99 168
Nearly three-fifths of the migrants stated that four persons or less (including themselves) slept in the same room. Around ten per cent of the migrants stated that nine persons or more slept in the same room. A little less than one-third of the migrants stated that the number of persons who slept in their room was between five and eight. The median number of persons sleeping in a room was five for workers from Scheduled
70 Labour Migration from Jagannathprasad Block
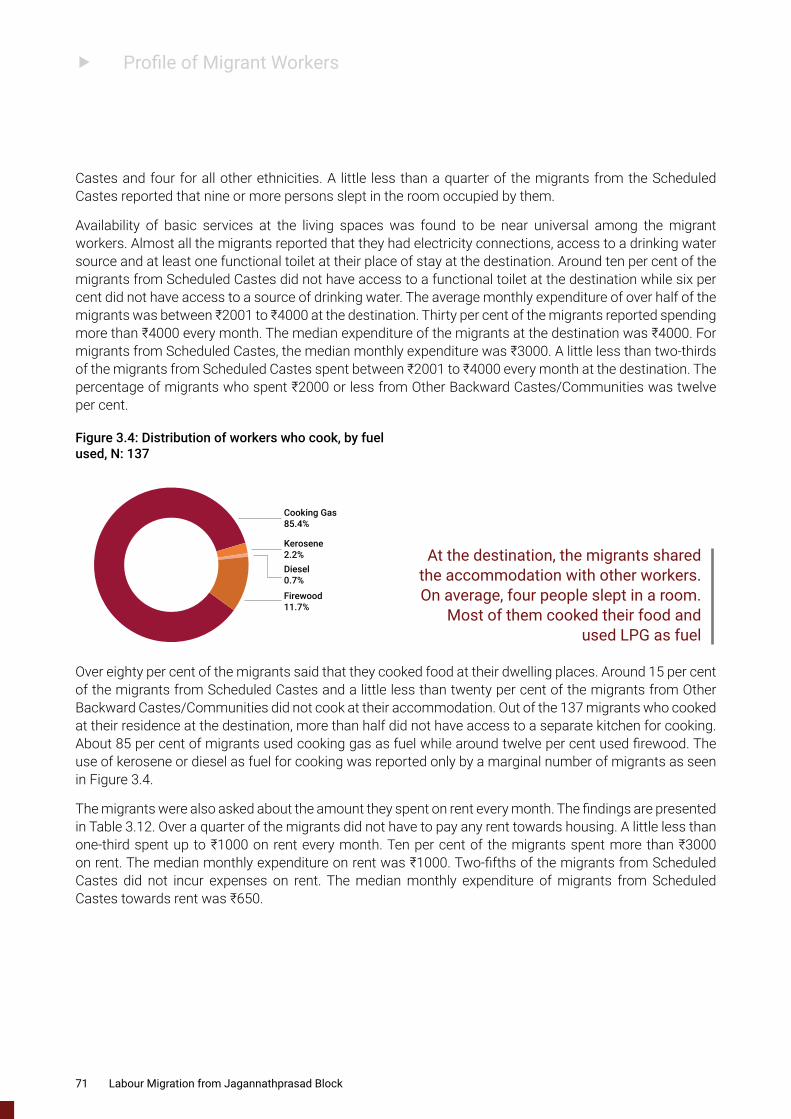
f Profile of Migrant Workers
Castes and four for all other ethnicities. A little less than a quarter of the migrants from the Scheduled Castes reported that nine or more persons slept in the room occupied by them.
Availability of basic services at the living spaces was found to be near universal among the migrant workers. Almost all the migrants reported that they had electricity connections, access to a drinking water source and at least one functional toilet at their place of stay at the destination. Around ten per cent of the migrants from Scheduled Castes did not have access to a functional toilet at the destination while six per cent did not have access to a source of drinking water. The average monthly expenditure of over half of the migrants was between ₹2001 to ₹4000 at the destination. Thirty per cent of the migrants reported spending more than ₹4000 every month. The median expenditure of the migrants at the destination was ₹4000. For migrants from Scheduled Castes, the median monthly expenditure was ₹3000. A little less than two-thirds of the migrants from Scheduled Castes spent between ₹2001 to ₹4000 every month at the destination. The percentage of migrants who spent ₹2000 or less from Other Backward Castes/Communities was twelve per cent.
Cooking Gas85.4%
Kerosene2.2%Diesel0.7%
Firewood11.7%
Figure 3.4: Distribution of workers who cook, by fuel used, N: 137
Over eighty per cent of the migrants said that they cooked food at their dwelling places. Around 15 per cent of the migrants from Scheduled Castes and a little less than twenty per cent of the migrants from Other Backward Castes/Communities did not cook at their accommodation. Out of the 137 migrants who cooked at their residence at the destination, more than half did not have access to a separate kitchen for cooking. About 85 per cent of migrants used cooking gas as fuel while around twelve per cent used firewood. The use of kerosene or diesel as fuel for cooking was reported only by a marginal number of migrants as seen in Figure 3.4.
The migrants were also asked about the amount they spent on rent every month. The findings are presented in Table 3.12. Over a quarter of the migrants did not have to pay any rent towards housing. A little less than one-third spent up to ₹1000 on rent every month. Ten per cent of the migrants spent more than ₹3000 on rent. The median monthly expenditure on rent was ₹1000. Two-fifths of the migrants from Scheduled Castes did not incur expenses on rent. The median monthly expenditure of migrants from Scheduled Castes towards rent was ₹650.
At the destination, the migrants shared the accommodation with other workers. On average, four people slept in a room.
Most of them cooked their food and used LPG as fuel
71 Labour Migration from Jagannathprasad Block
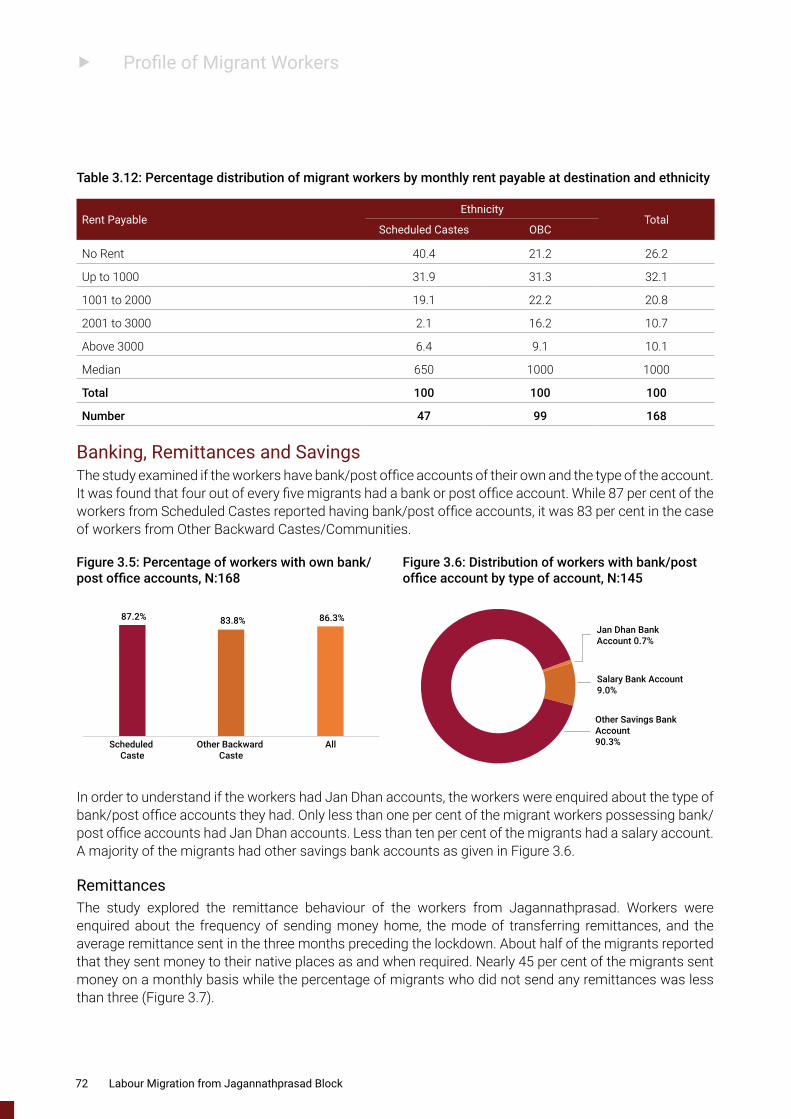
f Profile of Migrant Workers
Table 3.12: Percentage distribution of migrant workers by monthly rent payable at destination and ethnicity
Rent PayableEthnicity
TotalScheduled Castes OBC
No Rent 40.4 21.2 26.2
Up to 1000 31.9 31.3 32.1
1001 to 2000 19.1 22.2 20.8
2001 to 3000 2.1 16.2 10.7
Above 3000 6.4 9.1 10.1
Median 650 1000 1000
Total 100 100 100
Number 47 99 168
Banking, Remittances and SavingsThe study examined if the workers have bank/post office accounts of their own and the type of the account. It was found that four out of every five migrants had a bank or post office account. While 87 per cent of the workers from Scheduled Castes reported having bank/post office accounts, it was 83 per cent in the case of workers from Other Backward Castes/Communities.
Figure 3.5: Percentage of workers with own bank/post office accounts, N:168
Figure 3.6: Distribution of workers with bank/post office account by type of account, N:145
87.2% 83.8% 86.3%
Scheduled Caste
Other Backward Caste
All
Jan Dhan Bank Account 0.7%
Salary Bank Account9.0%
Other Savings BankAccount90.3%
In order to understand if the workers had Jan Dhan accounts, the workers were enquired about the type of bank/post office accounts they had. Only less than one per cent of the migrant workers possessing bank/post office accounts had Jan Dhan accounts. Less than ten per cent of the migrants had a salary account. A majority of the migrants had other savings bank accounts as given in Figure 3.6.
RemittancesThe study explored the remittance behaviour of the workers from Jagannathprasad. Workers were enquired about the frequency of sending money home, the mode of transferring remittances, and the average remittance sent in the three months preceding the lockdown. About half of the migrants reported that they sent money to their native places as and when required. Nearly 45 per cent of the migrants sent money on a monthly basis while the percentage of migrants who did not send any remittances was less than three (Figure 3.7).
72 Labour Migration from Jagannathprasad Block
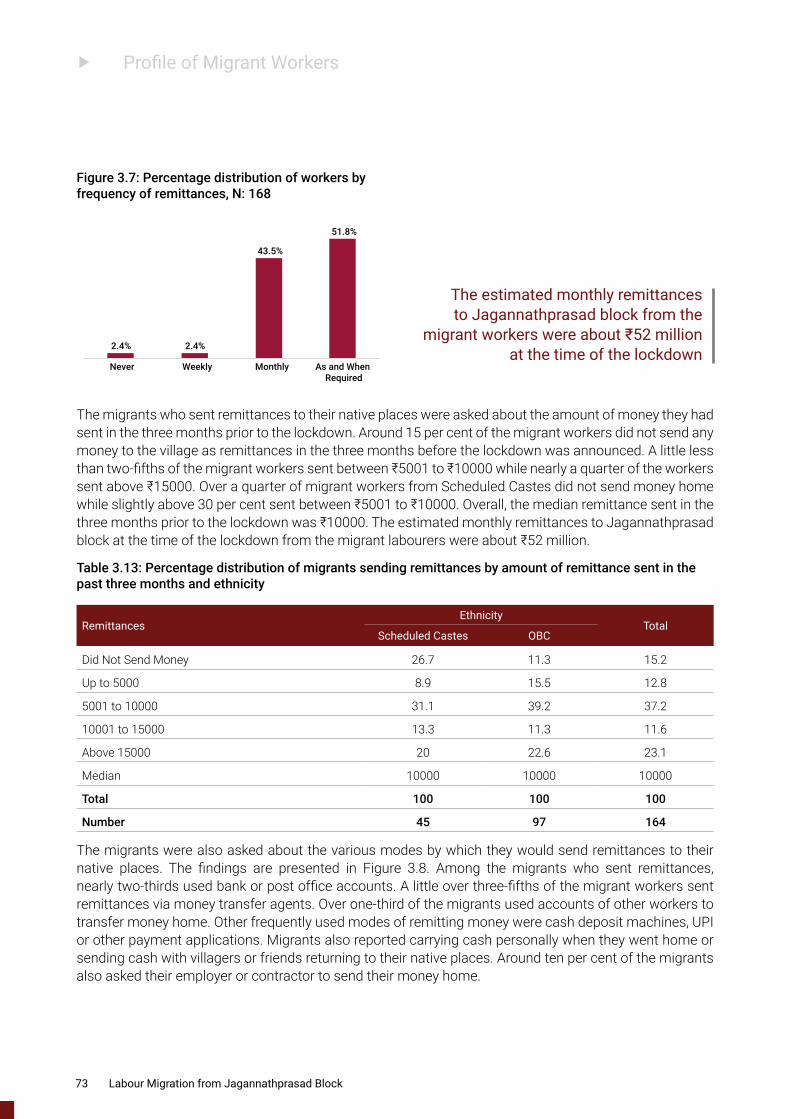
f Profile of Migrant Workers
The migrants who sent remittances to their native places were asked about the amount of money they had sent in the three months prior to the lockdown. Around 15 per cent of the migrant workers did not send any money to the village as remittances in the three months before the lockdown was announced. A little less than two-fifths of the migrant workers sent between ₹5001 to ₹10000 while nearly a quarter of the workers sent above ₹15000. Over a quarter of migrant workers from Scheduled Castes did not send money home while slightly above 30 per cent sent between ₹5001 to ₹10000. Overall, the median remittance sent in the three months prior to the lockdown was ₹10000. The estimated monthly remittances to Jagannathprasad block at the time of the lockdown from the migrant labourers were about ₹52 million.
Table 3.13: Percentage distribution of migrants sending remittances by amount of remittance sent in the past three months and ethnicity
RemittancesEthnicity
TotalScheduled Castes OBC
Did Not Send Money 26.7 11.3 15.2
Up to 5000 8.9 15.5 12.8
5001 to 10000 31.1 39.2 37.2
10001 to 15000 13.3 11.3 11.6
Above 15000 20 22.6 23.1
Median 10000 10000 10000
Total 100 100 100
Number 45 97 164
The migrants were also asked about the various modes by which they would send remittances to their native places. The findings are presented in Figure 3.8. Among the migrants who sent remittances, nearly two-thirds used bank or post office accounts. A little over three-fifths of the migrant workers sent remittances via money transfer agents. Over one-third of the migrants used accounts of other workers to transfer money home. Other frequently used modes of remitting money were cash deposit machines, UPI or other payment applications. Migrants also reported carrying cash personally when they went home or sending cash with villagers or friends returning to their native places. Around ten per cent of the migrants also asked their employer or contractor to send their money home.
Figure 3.7: Percentage distribution of workers by frequency of remittances, N: 168
2.4% 2.4%
43.5%
51.8%
Never Weekly Monthly As and When Required
The estimated monthly remittances to Jagannathprasad block from the
migrant workers were about ₹52 million at the time of the lockdown
73 Labour Migration from Jagannathprasad Block
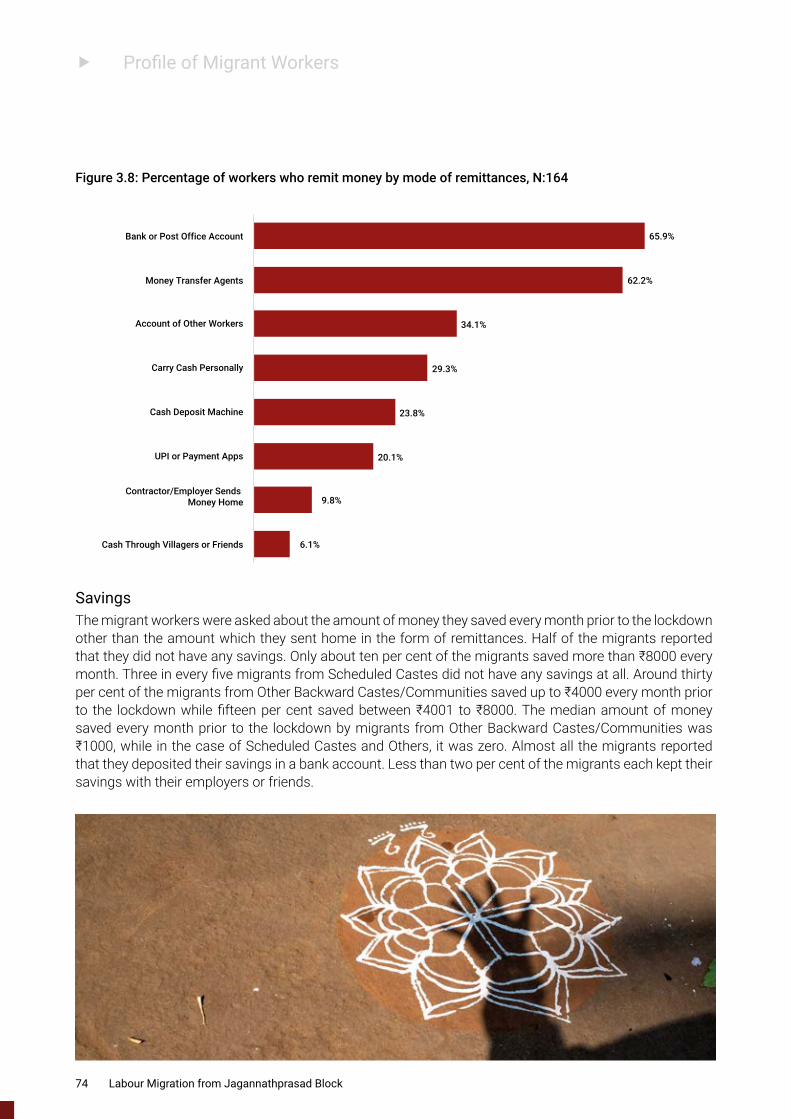
f Profile of Migrant Workers
SavingsThe migrant workers were asked about the amount of money they saved every month prior to the lockdown other than the amount which they sent home in the form of remittances. Half of the migrants reported that they did not have any savings. Only about ten per cent of the migrants saved more than ₹8000 every month. Three in every five migrants from Scheduled Castes did not have any savings at all. Around thirty per cent of the migrants from Other Backward Castes/Communities saved up to ₹4000 every month prior to the lockdown while fifteen per cent saved between ₹4001 to ₹8000. The median amount of money saved every month prior to the lockdown by migrants from Other Backward Castes/Communities was ₹1000, while in the case of Scheduled Castes and Others, it was zero. Almost all the migrants reported that they deposited their savings in a bank account. Less than two per cent of the migrants each kept their savings with their employers or friends.
6.1%
9.8%
20.1%
23.8%
29.3%
34.1%
62.2%
65.9%
Cash Through Villagers or Friends
Contractor/Employer Sends Money Home
UPI or Payment Apps
Cash Deposit Machine
Carry Cash Personally
Account of Other Workers
Money Transfer Agents
Bank or Post Office Account
Figure 3.8: Percentage of workers who remit money by mode of remittances, N:164
74 Labour Migration from Jagannathprasad Block
f Profile of Migrant Workers
Table 3.14 Percentage distribution of migrant workers by average monthly savings prior to the lockdown and ethnicity
Monthly SavingsEthnicity
TotalScheduled Castes OBC
No Savings 61.7 44.4 50.6
Up to 4000 10.6 29.3 22.0
4001 to 8000 21.3 15.2 17.9
Above 8000 6.4 11.1 9.5
Median Savings 0 1000.0 0
Total 100 100 100
Number 47 99 168
Communication with FamilyThe means of communication between the migrant workers and their family members at the native place were explored in the survey. Almost all the migrants reported making regular phone calls to their native places. Video calls on WhatsApp were made by thirty per cent of the migrants. A quarter of the migrants from Scheduled Castes reported making audio calls on WhatsApp. The ownership of mobile phones was also explored. A little less than three-fifths of the migrants possessed a smartphone. Two-fifths of the migrants had access to a basic phone. Less than two per cent of the migrants did not have any mobile phone. Over four per cent of the migrants from Scheduled Castes did not have mobile phones.
Table 3.15: Percentage of migrant workers by methods of communication with family members and ethnicity
Variable/CategoryEthnicity
TotalScheduled Castes OBC
Type of Calls (Percentage)
Regular Audio Call 97.9 98.0 98.2
WhatsApp Audio Call 25.5 18.2 21.4
WhatsApp Video Call 23.4 29.3 30.4
Access to Phone
Smartphone 55.3 54.5 57.1
Basic Phone 40.4 44.4 41.1
No Mobile Phone 4.3 1.0 1.8
Total 100 100 100
Number 47 99 168
Collectivization and Social SecurityIn order to understand how empowered the workers from Jagannathprasad are at the respective destinations to bargain for their rights, each one of them was asked if he/she was a member of any trade union at the destination. Findings revealed that only six per cent of the migrants had membership in trade unions at the destination. The workers were enquired if they had select entitlement documents that would help them avail benefits such as voting rights or subsidized food. They were also asked if they had a labour card, health insurance, accident insurance or life insurance which they can benefit from at
75 Labour Migration from Jagannathprasad Block
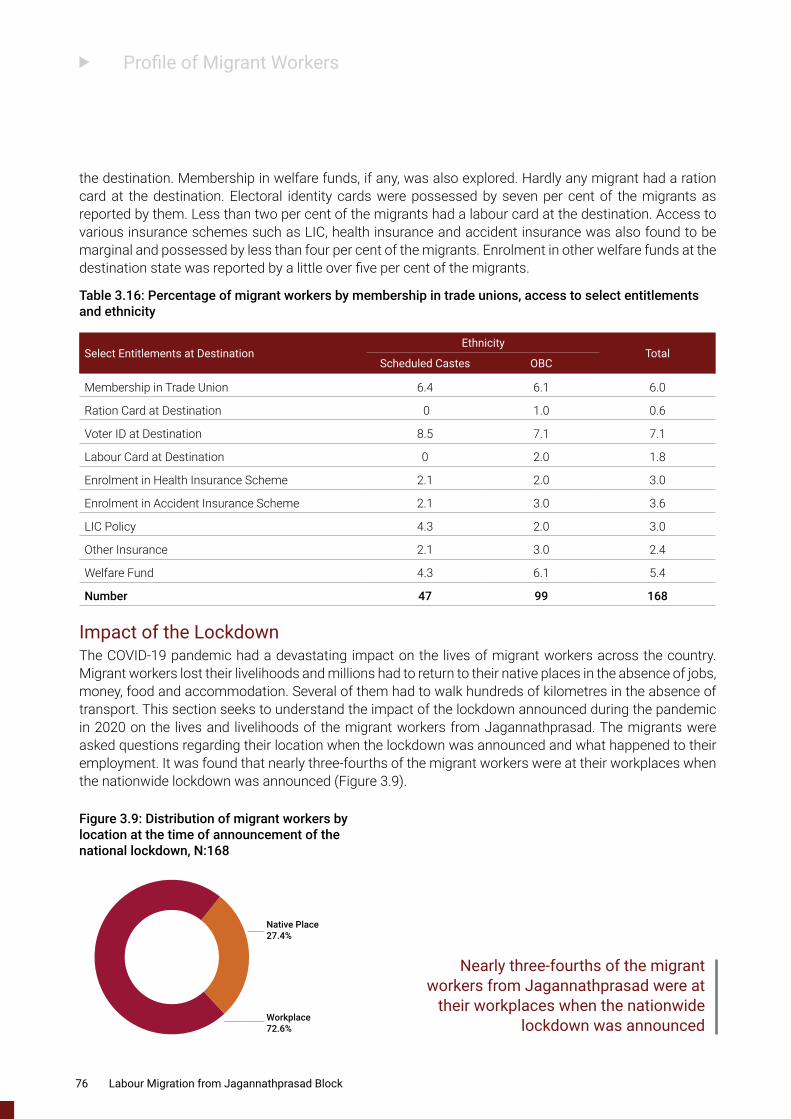
f Profile of Migrant Workers
the destination. Membership in welfare funds, if any, was also explored. Hardly any migrant had a ration card at the destination. Electoral identity cards were possessed by seven per cent of the migrants as reported by them. Less than two per cent of the migrants had a labour card at the destination. Access to various insurance schemes such as LIC, health insurance and accident insurance was also found to be marginal and possessed by less than four per cent of the migrants. Enrolment in other welfare funds at the destination state was reported by a little over five per cent of the migrants.
Table 3.16: Percentage of migrant workers by membership in trade unions, access to select entitlements and ethnicity
Select Entitlements at DestinationEthnicity
TotalScheduled Castes OBC
Membership in Trade Union 6.4 6.1 6.0
Ration Card at Destination 0 1.0 0.6
Voter ID at Destination 8.5 7.1 7.1
Labour Card at Destination 0 2.0 1.8
Enrolment in Health Insurance Scheme 2.1 2.0 3.0
Enrolment in Accident Insurance Scheme 2.1 3.0 3.6
LIC Policy 4.3 2.0 3.0
Other Insurance 2.1 3.0 2.4
Welfare Fund 4.3 6.1 5.4
Number 47 99 168
Impact of the LockdownThe COVID-19 pandemic had a devastating impact on the lives of migrant workers across the country. Migrant workers lost their livelihoods and millions had to return to their native places in the absence of jobs, money, food and accommodation. Several of them had to walk hundreds of kilometres in the absence of transport. This section seeks to understand the impact of the lockdown announced during the pandemic in 2020 on the lives and livelihoods of the migrant workers from Jagannathprasad. The migrants were asked questions regarding their location when the lockdown was announced and what happened to their employment. It was found that nearly three-fourths of the migrant workers were at their workplaces when the nationwide lockdown was announced (Figure 3.9).
Native Place27.4%
Workplace72.6%
Figure 3.9: Distribution of migrant workers by location at the time of announcement of the national lockdown, N:168
Nearly three-fourths of the migrant workers from Jagannathprasad were at
their workplaces when the nationwide lockdown was announced
76 Labour Migration from Jagannathprasad Block
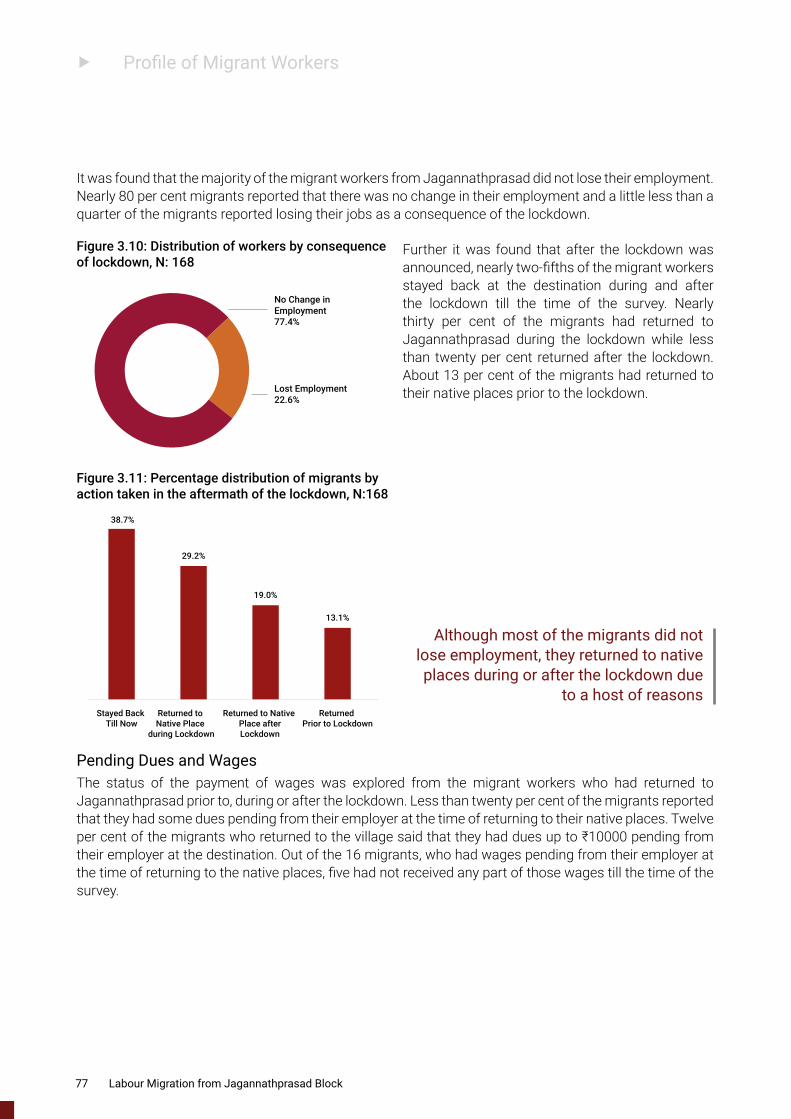
f Profile of Migrant Workers
It was found that the majority of the migrant workers from Jagannathprasad did not lose their employment. Nearly 80 per cent migrants reported that there was no change in their employment and a little less than a quarter of the migrants reported losing their jobs as a consequence of the lockdown.
Lost Employment22.6%
No Change inEmployment77.4%
Figure 3.10: Distribution of workers by consequence of lockdown, N: 168
Figure 3.11: Percentage distribution of migrants by action taken in the aftermath of the lockdown, N:168
38.7%
29.2%
19.0%
13.1%
Stayed Back Till Now
Returned to Native Place
during Lockdown
Returned to Native Place afterLockdown
Returned Prior to Lockdown
Further it was found that after the lockdown was announced, nearly two-fifths of the migrant workers stayed back at the destination during and after the lockdown till the time of the survey. Nearly thirty per cent of the migrants had returned to Jagannathprasad during the lockdown while less than twenty per cent returned after the lockdown. About 13 per cent of the migrants had returned to their native places prior to the lockdown.
Pending Dues and Wages The status of the payment of wages was explored from the migrant workers who had returned to Jagannathprasad prior to, during or after the lockdown. Less than twenty per cent of the migrants reported that they had some dues pending from their employer at the time of returning to their native places. Twelve per cent of the migrants who returned to the village said that they had dues up to ₹10000 pending from their employer at the destination. Out of the 16 migrants, who had wages pending from their employer at the time of returning to the native places, five had not received any part of those wages till the time of the survey.
Although most of the migrants did not lose employment, they returned to native places during or after the lockdown due
to a host of reasons
77 Labour Migration from Jagannathprasad Block
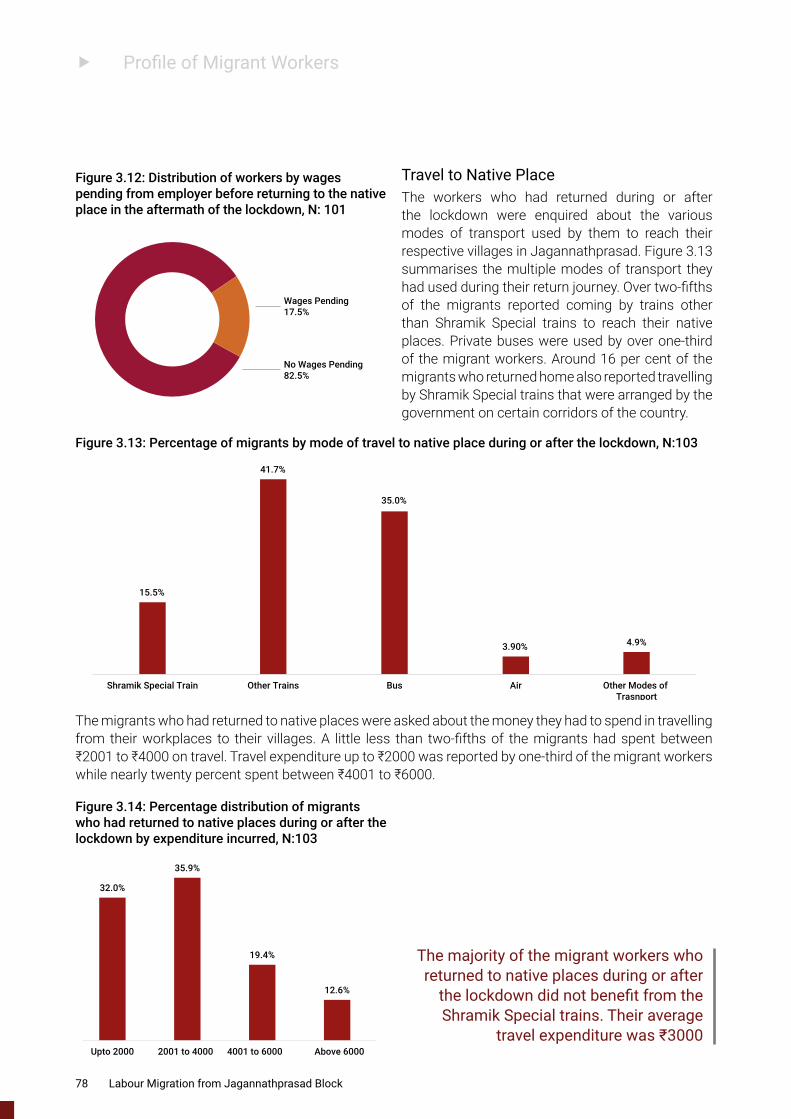
f Profile of Migrant Workers
Travel to Native PlaceThe workers who had returned during or after the lockdown were enquired about the various modes of transport used by them to reach their respective villages in Jagannathprasad. Figure 3.13 summarises the multiple modes of transport they had used during their return journey. Over two-fifths of the migrants reported coming by trains other than Shramik Special trains to reach their native places. Private buses were used by over one-third of the migrant workers. Around 16 per cent of the migrants who returned home also reported travelling by Shramik Special trains that were arranged by the government on certain corridors of the country.
Figure 3.12: Distribution of workers by wages pending from employer before returning to the native place in the aftermath of the lockdown, N: 101
Figure 3.13: Percentage of migrants by mode of travel to native place during or after the lockdown, N:103
Figure 3.14: Percentage distribution of migrants who had returned to native places during or after the lockdown by expenditure incurred, N:103
No Wages Pending82.5%
Wages Pending17.5%
15.5%
41.7%
35.0%
3.90% 4.9%
Shramik Special Train Other Trains Bus Air Other Modes of Trasnport
The migrants who had returned to native places were asked about the money they had to spend in travelling from their workplaces to their villages. A little less than two-fifths of the migrants had spent between ₹2001 to ₹4000 on travel. Travel expenditure up to ₹2000 was reported by one-third of the migrant workers while nearly twenty percent spent between ₹4001 to ₹6000.
32.0%
35.9%
19.4%
12.6%
Upto 2000 2001 to 4000 4001 to 6000 Above 6000
The majority of the migrant workers who returned to native places during or after
the lockdown did not benefit from the Shramik Special trains. Their average
travel expenditure was ₹3000
78 Labour Migration from Jagannathprasad Block
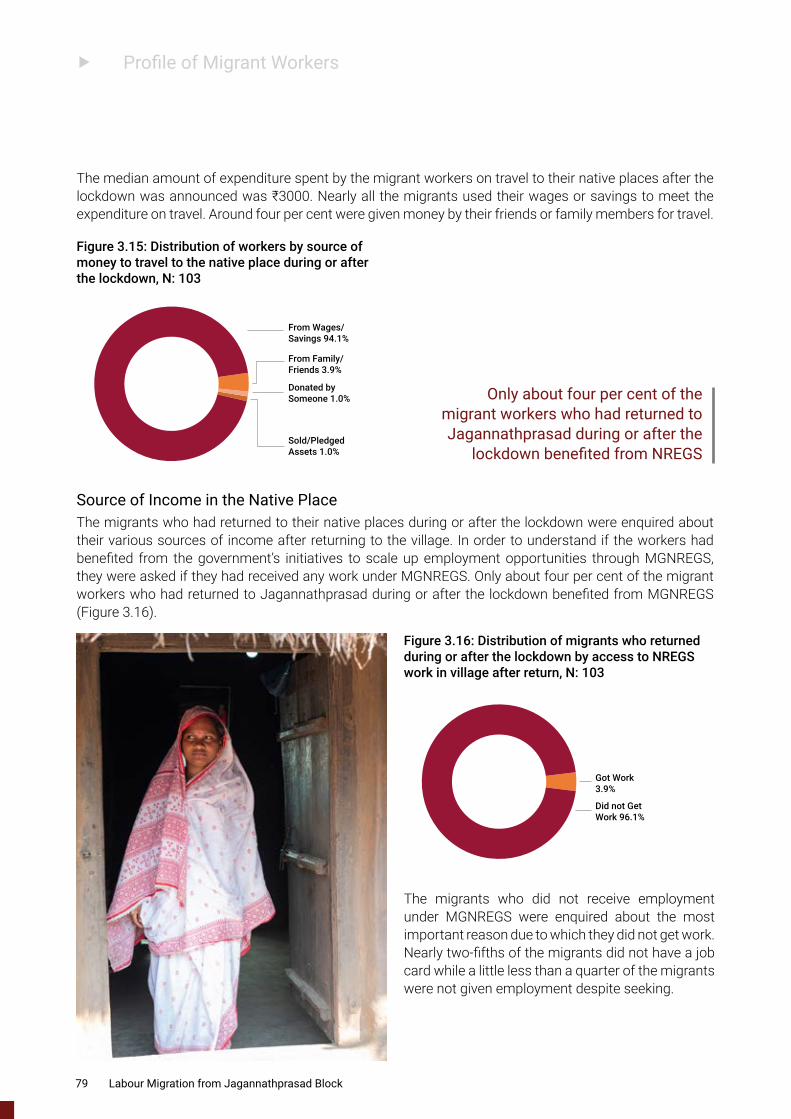
f Profile of Migrant Workers
The median amount of expenditure spent by the migrant workers on travel to their native places after the lockdown was announced was ₹3000. Nearly all the migrants used their wages or savings to meet the expenditure on travel. Around four per cent were given money by their friends or family members for travel.
Donated by Someone 1.0%
Sold/Pledged Assets 1.0%
From Family/Friends 3.9%
From Wages/Savings 94.1%
Figure 3.15: Distribution of workers by source of money to travel to the native place during or after the lockdown, N: 103
Figure 3.16: Distribution of migrants who returned during or after the lockdown by access to NREGS work in village after return, N: 103
Source of Income in the Native PlaceThe migrants who had returned to their native places during or after the lockdown were enquired about their various sources of income after returning to the village. In order to understand if the workers had benefited from the government’s initiatives to scale up employment opportunities through MGNREGS, they were asked if they had received any work under MGNREGS. Only about four per cent of the migrant workers who had returned to Jagannathprasad during or after the lockdown benefited from MGNREGS (Figure 3.16).
Got Work3.9%
Did not Get Work 96.1%
The migrants who did not receive employment under MGNREGS were enquired about the most important reason due to which they did not get work. Nearly two-fifths of the migrants did not have a job card while a little less than a quarter of the migrants were not given employment despite seeking.
Only about four per cent of the migrant workers who had returned to Jagannathprasad during or after the
lockdown benefited from NREGS
79 Labour Migration from Jagannathprasad Block
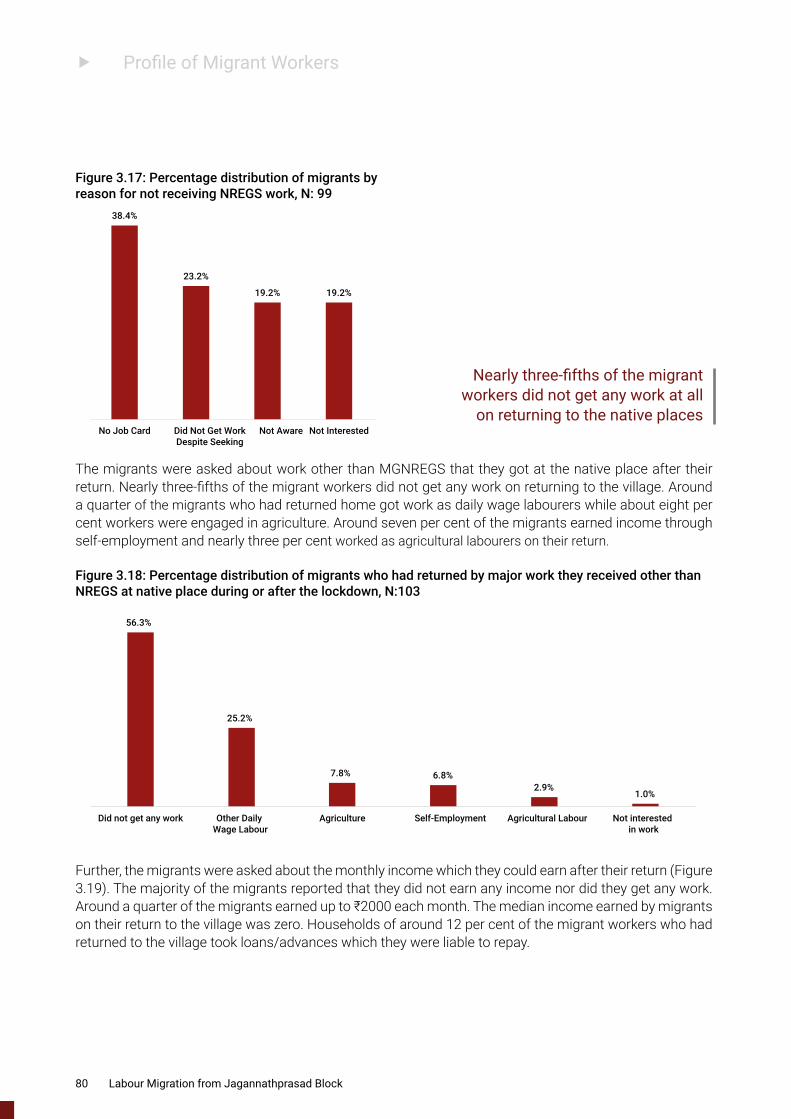
f Profile of Migrant Workers
The migrants were asked about work other than MGNREGS that they got at the native place after their return. Nearly three-fifths of the migrant workers did not get any work on returning to the village. Around a quarter of the migrants who had returned home got work as daily wage labourers while about eight per cent workers were engaged in agriculture. Around seven per cent of the migrants earned income through self-employment and nearly three per cent worked as agricultural labourers on their return.
38.4%
23.2%
19.2% 19.2%
No Job Card Did Not Get WorkDespite Seeking
Not Aware Not Interested
Figure 3.17: Percentage distribution of migrants by reason for not receiving NREGS work, N: 99
Figure 3.18: Percentage distribution of migrants who had returned by major work they received other than NREGS at native place during or after the lockdown, N:103
56.3%
25.2%
7.8% 6.8%2.9%
1.0%
Did not get any work Other Daily Wage Labour
Agriculture Self-Employment Agricultural Labour Not interested in work
Further, the migrants were asked about the monthly income which they could earn after their return (Figure 3.19). The majority of the migrants reported that they did not earn any income nor did they get any work. Around a quarter of the migrants earned up to ₹2000 each month. The median income earned by migrants on their return to the village was zero. Households of around 12 per cent of the migrant workers who had returned to the village took loans/advances which they were liable to repay.
Nearly three-fifths of the migrant workers did not get any work at all
on returning to the native places
80 Labour Migration from Jagannathprasad Block
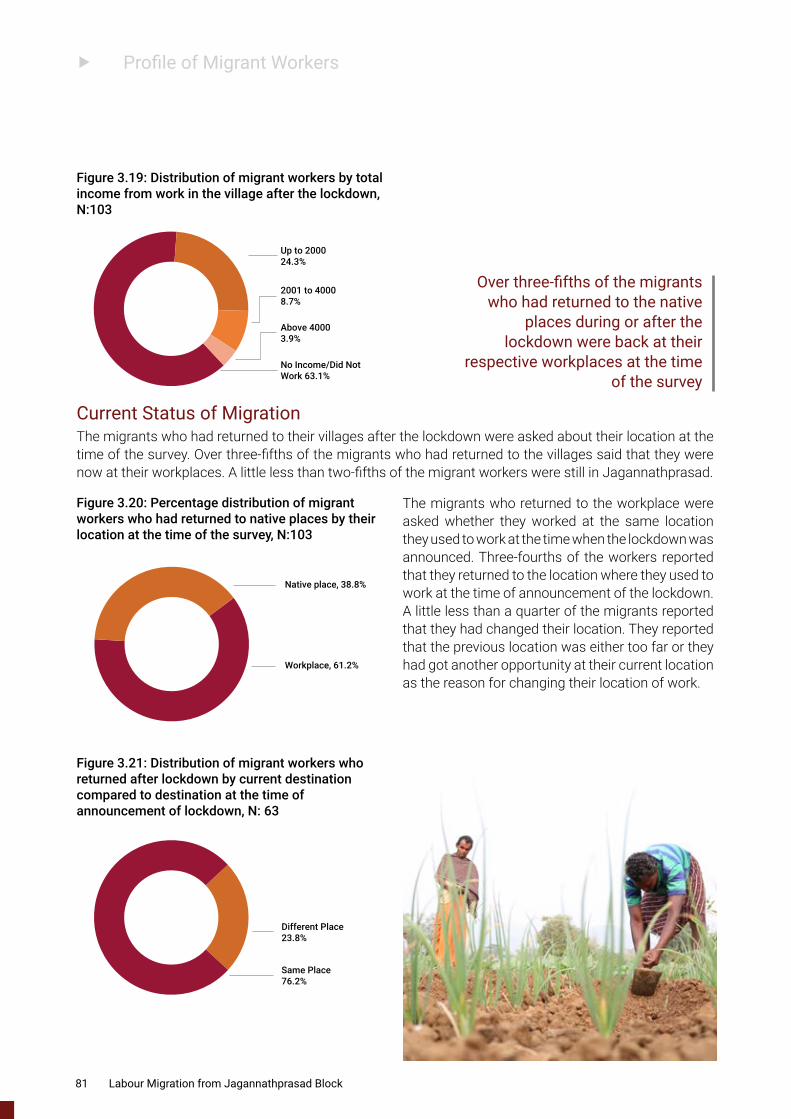
f Profile of Migrant Workers
Current Status of MigrationThe migrants who had returned to their villages after the lockdown were asked about their location at the time of the survey. Over three-fifths of the migrants who had returned to the villages said that they were now at their workplaces. A little less than two-fifths of the migrant workers were still in Jagannathprasad.
No Income/Did Not Work 63.1%
Up to 2000 24.3%
2001 to 4000 8.7%
Above 4000 3.9%
Figure 3.19: Distribution of migrant workers by total income from work in the village after the lockdown, N:103
Figure 3.20: Percentage distribution of migrant workers who had returned to native places by their location at the time of the survey, N:103
Figure 3.21: Distribution of migrant workers who returned after lockdown by current destination compared to destination at the time of announcement of lockdown, N: 63
Workplace, 61.2%
Native place, 38.8%
The migrants who returned to the workplace were asked whether they worked at the same location they used to work at the time when the lockdown was announced. Three-fourths of the workers reported that they returned to the location where they used to work at the time of announcement of the lockdown. A little less than a quarter of the migrants reported that they had changed their location. They reported that the previous location was either too far or they had got another opportunity at their current location as the reason for changing their location of work.
Different Place23.8%
Same Place76.2%
Over three-fifths of the migrants who had returned to the native
places during or after the lockdown were back at their
respective workplaces at the time of the survey
81 Labour Migration from Jagannathprasad Block
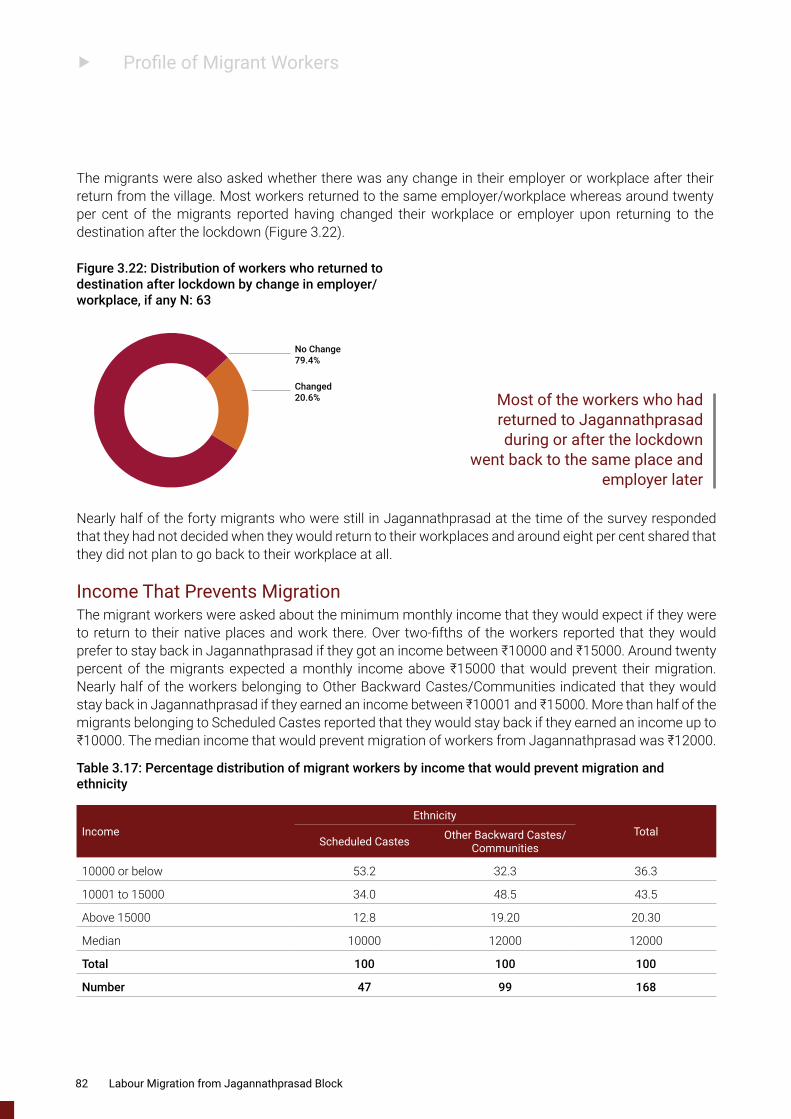
f Profile of Migrant Workers
Figure 3.22: Distribution of workers who returned to destination after lockdown by change in employer/workplace, if any N: 63
The migrants were also asked whether there was any change in their employer or workplace after their return from the village. Most workers returned to the same employer/workplace whereas around twenty per cent of the migrants reported having changed their workplace or employer upon returning to the destination after the lockdown (Figure 3.22).
Changed20.6%
No Change79.4%
Nearly half of the forty migrants who were still in Jagannathprasad at the time of the survey responded that they had not decided when they would return to their workplaces and around eight per cent shared that they did not plan to go back to their workplace at all.
Income That Prevents MigrationThe migrant workers were asked about the minimum monthly income that they would expect if they were to return to their native places and work there. Over two-fifths of the workers reported that they would prefer to stay back in Jagannathprasad if they got an income between ₹10000 and ₹15000. Around twenty percent of the migrants expected a monthly income above ₹15000 that would prevent their migration. Nearly half of the workers belonging to Other Backward Castes/Communities indicated that they would stay back in Jagannathprasad if they earned an income between ₹10001 and ₹15000. More than half of the migrants belonging to Scheduled Castes reported that they would stay back if they earned an income up to ₹10000. The median income that would prevent migration of workers from Jagannathprasad was ₹12000.
Table 3.17: Percentage distribution of migrant workers by income that would prevent migration and ethnicity
Income Ethnicity
TotalScheduled Castes Other Backward Castes/
Communities
10000 or below 53.2 32.3 36.3
10001 to 15000 34.0 48.5 43.5
Above 15000 12.8 19.20 20.30
Median 10000 12000 12000
Total 100 100 100
Number 47 99 168
Most of the workers who had returned to Jagannathprasad during or after the lockdown
went back to the same place and employer later
82 Labour Migration from Jagannathprasad Block
Labour Migration from Jagannathprasad Block
Summary and Conclusions
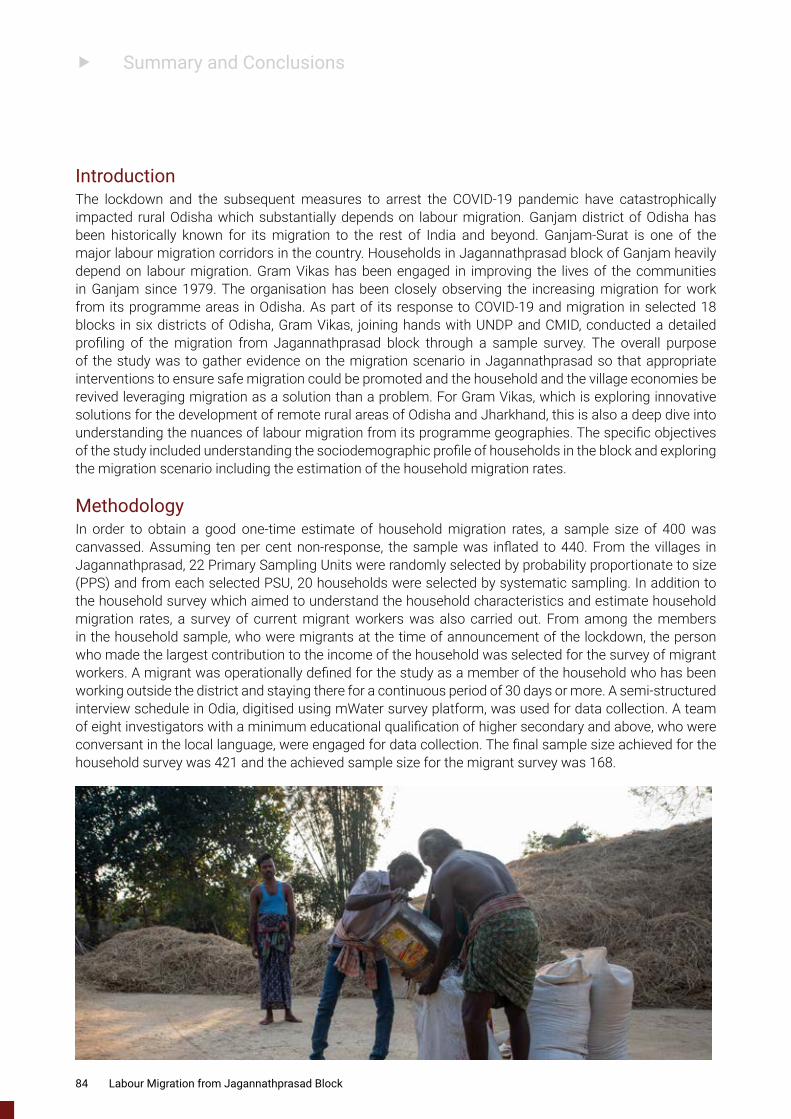
f Summary and Conclusions
IntroductionThe lockdown and the subsequent measures to arrest the COVID-19 pandemic have catastrophically impacted rural Odisha which substantially depends on labour migration. Ganjam district of Odisha has been historically known for its migration to the rest of India and beyond. Ganjam-Surat is one of the major labour migration corridors in the country. Households in Jagannathprasad block of Ganjam heavily depend on labour migration. Gram Vikas has been engaged in improving the lives of the communities in Ganjam since 1979. The organisation has been closely observing the increasing migration for work from its programme areas in Odisha. As part of its response to COVID‐19 and migration in selected 18 blocks in six districts of Odisha, Gram Vikas, joining hands with UNDP and CMID, conducted a detailed profiling of the migration from Jagannathprasad block through a sample survey. The overall purpose of the study was to gather evidence on the migration scenario in Jagannathprasad so that appropriate interventions to ensure safe migration could be promoted and the household and the village economies be revived leveraging migration as a solution than a problem. For Gram Vikas, which is exploring innovative solutions for the development of remote rural areas of Odisha and Jharkhand, this is also a deep dive into understanding the nuances of labour migration from its programme geographies. The specific objectives of the study included understanding the sociodemographic profile of households in the block and exploring the migration scenario including the estimation of the household migration rates.
MethodologyIn order to obtain a good one-time estimate of household migration rates, a sample size of 400 was canvassed. Assuming ten per cent non-response, the sample was inflated to 440. From the villages in Jagannathprasad, 22 Primary Sampling Units were randomly selected by probability proportionate to size (PPS) and from each selected PSU, 20 households were selected by systematic sampling. In addition to the household survey which aimed to understand the household characteristics and estimate household migration rates, a survey of current migrant workers was also carried out. From among the members in the household sample, who were migrants at the time of announcement of the lockdown, the person who made the largest contribution to the income of the household was selected for the survey of migrant workers. A migrant was operationally defined for the study as a member of the household who has been working outside the district and staying there for a continuous period of 30 days or more. A semi-structured interview schedule in Odia, digitised using mWater survey platform, was used for data collection. A team of eight investigators with a minimum educational qualification of higher secondary and above, who were conversant in the local language, were engaged for data collection. The final sample size achieved for the household survey was 421 and the achieved sample size for the migrant survey was 168.
84 Labour Migration from Jagannathprasad Block
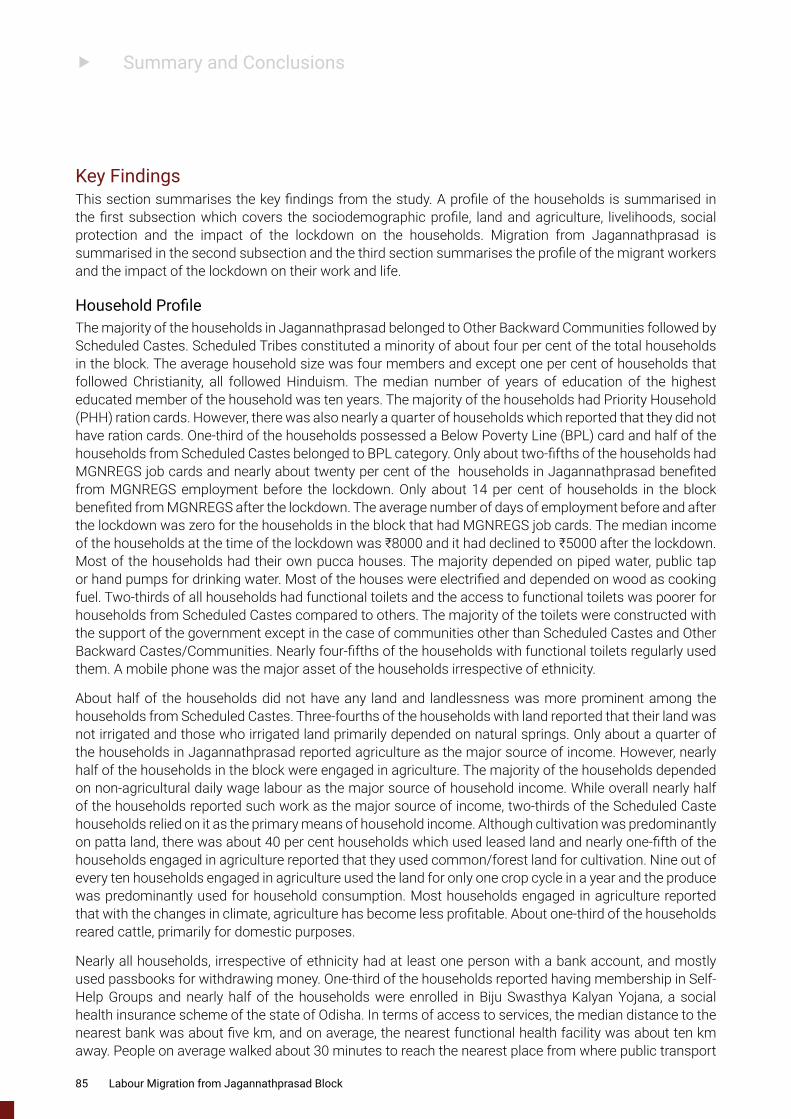
f Summary and Conclusions
Key FindingsThis section summarises the key findings from the study. A profile of the households is summarised in the first subsection which covers the sociodemographic profile, land and agriculture, livelihoods, social protection and the impact of the lockdown on the households. Migration from Jagannathprasad is summarised in the second subsection and the third section summarises the profile of the migrant workers and the impact of the lockdown on their work and life.
Household ProfileThe majority of the households in Jagannathprasad belonged to Other Backward Communities followed by Scheduled Castes. Scheduled Tribes constituted a minority of about four per cent of the total households in the block. The average household size was four members and except one per cent of households that followed Christianity, all followed Hinduism. The median number of years of education of the highest educated member of the household was ten years. The majority of the households had Priority Household (PHH) ration cards. However, there was also nearly a quarter of households which reported that they did not have ration cards. One-third of the households possessed a Below Poverty Line (BPL) card and half of the households from Scheduled Castes belonged to BPL category. Only about two-fifths of the households had MGNREGS job cards and nearly about twenty per cent of the households in Jagannathprasad benefited from MGNREGS employment before the lockdown. Only about 14 per cent of households in the block benefited from MGNREGS after the lockdown. The average number of days of employment before and after the lockdown was zero for the households in the block that had MGNREGS job cards. The median income of the households at the time of the lockdown was ₹8000 and it had declined to ₹5000 after the lockdown. Most of the households had their own pucca houses. The majority depended on piped water, public tap or hand pumps for drinking water. Most of the houses were electrified and depended on wood as cooking fuel. Two-thirds of all households had functional toilets and the access to functional toilets was poorer for households from Scheduled Castes compared to others. The majority of the toilets were constructed with the support of the government except in the case of communities other than Scheduled Castes and Other Backward Castes/Communities. Nearly four-fifths of the households with functional toilets regularly used them. A mobile phone was the major asset of the households irrespective of ethnicity.
About half of the households did not have any land and landlessness was more prominent among the households from Scheduled Castes. Three-fourths of the households with land reported that their land was not irrigated and those who irrigated land primarily depended on natural springs. Only about a quarter of the households in Jagannathprasad reported agriculture as the major source of income. However, nearly half of the households in the block were engaged in agriculture. The majority of the households depended on non-agricultural daily wage labour as the major source of household income. While overall nearly half of the households reported such work as the major source of income, two-thirds of the Scheduled Caste households relied on it as the primary means of household income. Although cultivation was predominantly on patta land, there was about 40 per cent households which used leased land and nearly one-fifth of the households engaged in agriculture reported that they used common/forest land for cultivation. Nine out of every ten households engaged in agriculture used the land for only one crop cycle in a year and the produce was predominantly used for household consumption. Most households engaged in agriculture reported that with the changes in climate, agriculture has become less profitable. About one-third of the households reared cattle, primarily for domestic purposes.
Nearly all households, irrespective of ethnicity had at least one person with a bank account, and mostly used passbooks for withdrawing money. One-third of the households reported having membership in Self-Help Groups and nearly half of the households were enrolled in Biju Swasthya Kalyan Yojana, a social health insurance scheme of the state of Odisha. In terms of access to services, the median distance to the nearest bank was about five km, and on average, the nearest functional health facility was about ten km away. People on average walked about 30 minutes to reach the nearest place from where public transport
85 Labour Migration from Jagannathprasad Block
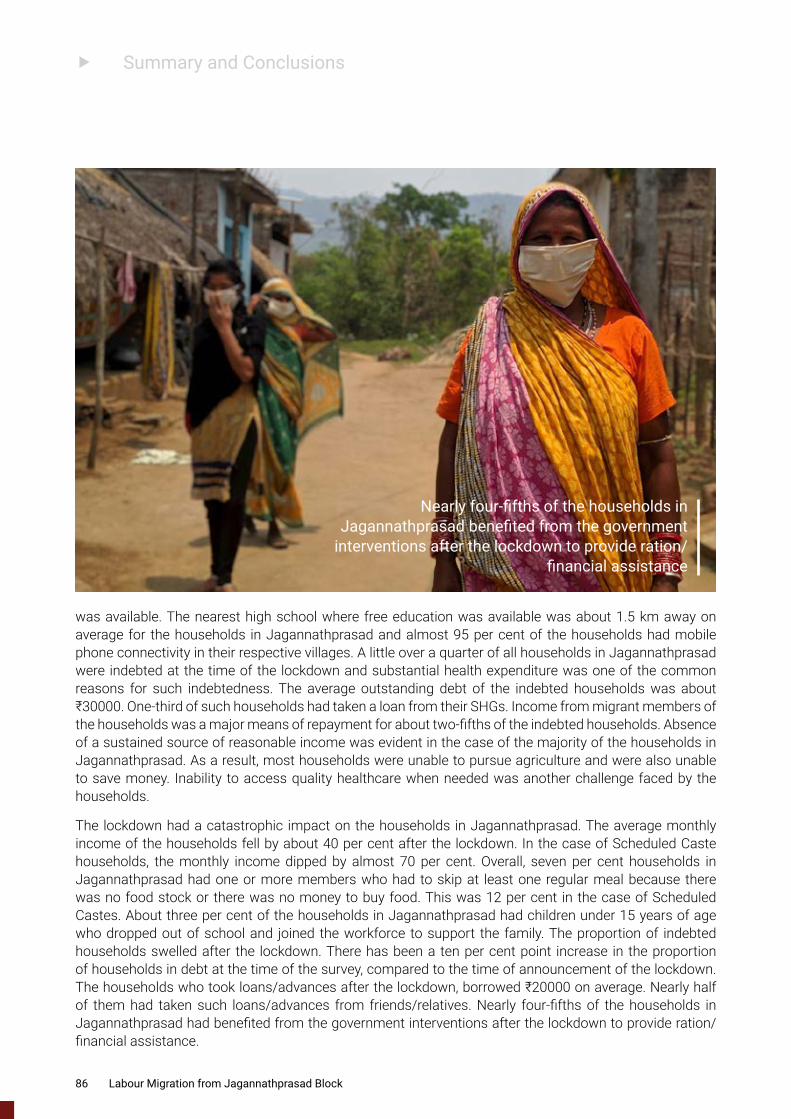
f Summary and Conclusions
was available. The nearest high school where free education was available was about 1.5 km away on average for the households in Jagannathprasad and almost 95 per cent of the households had mobile phone connectivity in their respective villages. A little over a quarter of all households in Jagannathprasad were indebted at the time of the lockdown and substantial health expenditure was one of the common reasons for such indebtedness. The average outstanding debt of the indebted households was about ₹30000. One-third of such households had taken a loan from their SHGs. Income from migrant members of the households was a major means of repayment for about two-fifths of the indebted households. Absence of a sustained source of reasonable income was evident in the case of the majority of the households in Jagannathprasad. As a result, most households were unable to pursue agriculture and were also unable to save money. Inability to access quality healthcare when needed was another challenge faced by the households.
The lockdown had a catastrophic impact on the households in Jagannathprasad. The average monthly income of the households fell by about 40 per cent after the lockdown. In the case of Scheduled Caste households, the monthly income dipped by almost 70 per cent. Overall, seven per cent households in Jagannathprasad had one or more members who had to skip at least one regular meal because there was no food stock or there was no money to buy food. This was 12 per cent in the case of Scheduled Castes. About three per cent of the households in Jagannathprasad had children under 15 years of age who dropped out of school and joined the workforce to support the family. The proportion of indebted households swelled after the lockdown. There has been a ten per cent point increase in the proportion of households in debt at the time of the survey, compared to the time of announcement of the lockdown. The households who took loans/advances after the lockdown, borrowed ₹20000 on average. Nearly half of them had taken such loans/advances from friends/relatives. Nearly four-fifths of the households in Jagannathprasad had benefited from the government interventions after the lockdown to provide ration/financial assistance.
Nearly four-fifths of the households in Jagannathprasad benefited from the government
interventions after the lockdown to provide ration/financial assistance
86 Labour Migration from Jagannathprasad Block
f Summary and Conclusions
Migration from JagannathprasadThe majority of the households in Jagannathprasad had a history of labour migration. Almost three-fifths of the households reported having a person who had migrated for work in the past ten years. Jagannathprasad demonstrated significant proportion of intra-state migration in addition to inter-state movements. At the time of announcement of the lockdown, nearly two-fifths of the households had an inter-district migrant worker. A little less than 20 per cent of the households had a member who was an inter-state migrant labourer at the time of announcement of the national lockdown. About ten per cent of the households had seasonal migrants who spend no more than six months at the destination. About 12 per cent of the population of Jagannathprasad worked elsewhere outside the district at the time of announcement of the lockdown. Only eight per cent of all migrants were women/girls. The total estimated number of migrant workers from Jagannathprasad was 16245. At the time of the survey, during November 2020 to January 2021, about 30 per cent of the households had at least one member who had migrated for work outside the district. Inter-state migration at the time of the survey was about 22 per cent. About 17 per cent of the households in Jagannathprasad had usual residents who had worked elsewhere outside the district for more than 30 days but currently did not have an intention to go out of the district for work. The absence of others to take care of the family members and the COVID-19 pandemic were the major reasons for such return migration. Most of such returnees were engaged as non-agricultural daily wage labourers in Jagannathprasad.
About 40 per cent of the households which did not have migrant members were enquired about the reason. The majority of them had sufficient income from Jagannathprasad so that they did not find a need to migrate. There was also a substantial proportion of households in Jagannathprasad with members who wished to migrate but were unable to do so. Lack of information and resources, presence of aged persons in the households, lack of other male members in the family, fear of going out, etc., were some of the major reasons cited by the members of such households.
Examining the impact of labour migration from Jagannathprasad, it was found that the majority of the households with migrant workers were able to cope with their poverty through labour migration. It also helped such households to improve their savings. Half of the households with migrants reported that they were able to improve agriculture with the income from migrant members of the households. More than a quarter of the households with migration history were able to build a new house while about 20 per cent of the households were able to renovate their house with the income from the migrant members of the households. Nearly half of the households with migration history mentioned that they were able to improve the education of the children with the income from migrant members of the household. About three quarters of the households with migration history mentioned that their status in the village improved due to the income from the migrant member of the family. There were also negative impacts of migration as mentioned by the households with migrants. More than four-fifths of the households with migrants shared that they were not able to seek quality healthcare in the absence of the member/s who had migrated for work. Also, about 20 per cent of Scheduled Caste households had to give up agriculture due to the migration of members from such households. More than 90 per cent of the households with a history of migration disclosed that no one from the household would have migrated if they had a monthly income of ₹10000 in Jagannathprasad.
Profile of Migrant WorkersOverall, 60 per cent of the migrant workers belonged to Other Backward Castes/Communities and about 30 per cent were from Scheduled Castes. About 96 per cent of them were male with an average age of 30 years. The median number of years of education was eight and three-fifths of the workers were married. Among those who were married, most migrated without spouse and children. Examining their migration history, most migrants were either unemployed or students before migration and made their first move out of the district for work at the age of 18 years. Unemployment and low wages were the two major reasons cited for
87 Labour Migration from Jagannathprasad Block
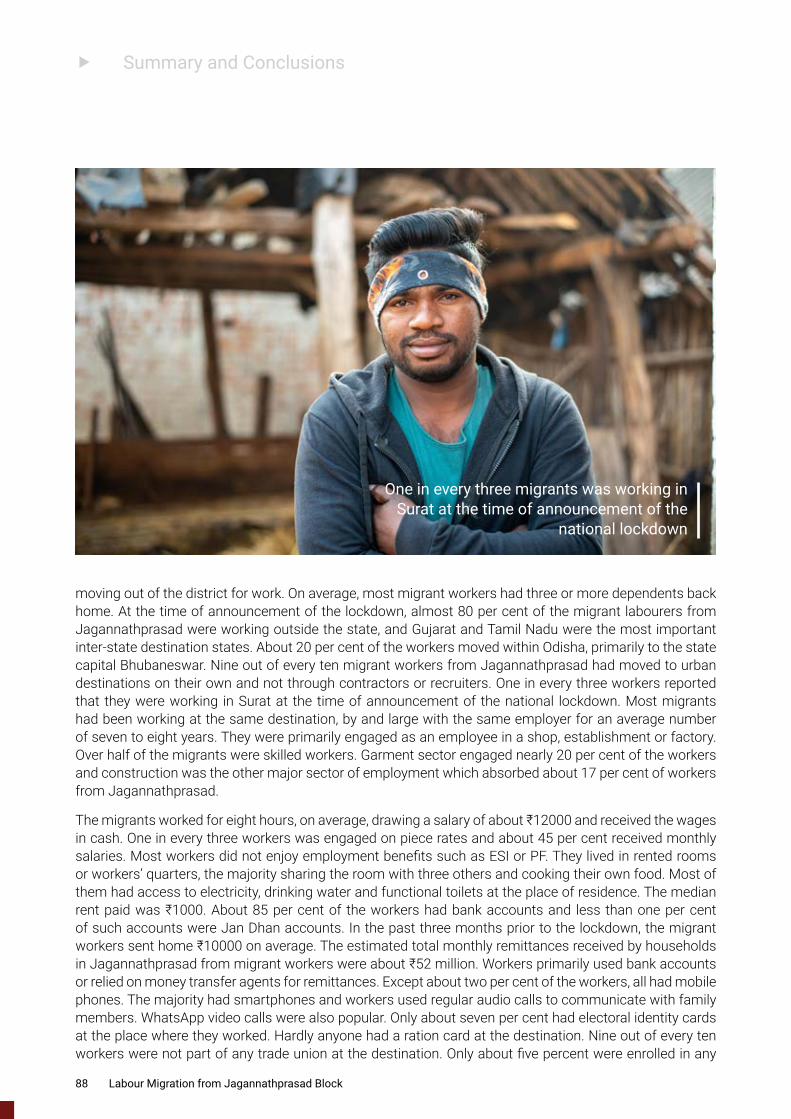
f Summary and Conclusions
moving out of the district for work. On average, most migrant workers had three or more dependents back home. At the time of announcement of the lockdown, almost 80 per cent of the migrant labourers from Jagannathprasad were working outside the state, and Gujarat and Tamil Nadu were the most important inter-state destination states. About 20 per cent of the workers moved within Odisha, primarily to the state capital Bhubaneswar. Nine out of every ten migrant workers from Jagannathprasad had moved to urban destinations on their own and not through contractors or recruiters. One in every three workers reported that they were working in Surat at the time of announcement of the national lockdown. Most migrants had been working at the same destination, by and large with the same employer for an average number of seven to eight years. They were primarily engaged as an employee in a shop, establishment or factory. Over half of the migrants were skilled workers. Garment sector engaged nearly 20 per cent of the workers and construction was the other major sector of employment which absorbed about 17 per cent of workers from Jagannathprasad.
The migrants worked for eight hours, on average, drawing a salary of about ₹12000 and received the wages in cash. One in every three workers was engaged on piece rates and about 45 per cent received monthly salaries. Most workers did not enjoy employment benefits such as ESI or PF. They lived in rented rooms or workers’ quarters, the majority sharing the room with three others and cooking their own food. Most of them had access to electricity, drinking water and functional toilets at the place of residence. The median rent paid was ₹1000. About 85 per cent of the workers had bank accounts and less than one per cent of such accounts were Jan Dhan accounts. In the past three months prior to the lockdown, the migrant workers sent home ₹10000 on average. The estimated total monthly remittances received by households in Jagannathprasad from migrant workers were about ₹52 million. Workers primarily used bank accounts or relied on money transfer agents for remittances. Except about two per cent of the workers, all had mobile phones. The majority had smartphones and workers used regular audio calls to communicate with family members. WhatsApp video calls were also popular. Only about seven per cent had electoral identity cards at the place where they worked. Hardly anyone had a ration card at the destination. Nine out of every ten workers were not part of any trade union at the destination. Only about five percent were enrolled in any
One in every three migrants was working in Surat at the time of announcement of the
national lockdown
88 Labour Migration from Jagannathprasad Block
f Summary and Conclusions
of the welfare funds for workers at the destination. Most migrants reported that if they get an average monthly income of ₹12000 at the native place they prefer not to migrate for work.
Most migrants were at their workplaces at the time of the announcement of the lockdown. Only about one-fifth of the workers reported a loss of employment due to the lockdown. While half of the workers returned to their native places during or after the lockdown, nearly 40 per cent did not return at all during or after the lockdown. Only about 15 per cent of the workers who had returned reported that they had benefited from Shramik trains organised by the government. On average, the workers who had returned incurred about ₹3000 rupees for travel which they managed from their wages/savings. Only about four per cent of the workers who had returned to their native places had benefited from the MGNREGS interventions of the government. One in every two workers reported that they did not get any work at all at the native place after their return. The majority of the workers had no income after they had returned. Three-fifths of the migrants were at their work destinations at the time of the survey. Most of them who had returned during or after the lockdown went back to the same places and to the same employers.
Conclusion � Socially and economically disadvantaged populations comprise the majority of the households in
Jagannathprasad. High prevalence of landlessness, small size of the landholdings, dependence on natural water sources for irrigation and changes in climatic conditions have reduced dependence of the households in Jagannathprasad on agriculture as a major source of income. The households currently engaged in agriculture do so primarily for their own consumption.
� Daily wage labour contributes substantially to the income of households in Jagannathprasad. The households in Jagannathprasad have only marginally benefited from the MGNREGS, an important government intervention to guarantee employment opportunities to the rural poor. While there has been a significant reduction in the household income in Jagannathprasad after the lockdown, particularly in the case of marginalised populations, measures to enhance MGNREGS opportunities do not appear to have had a strong impact, at the time of the survey.
� Households in Jagannathprasad, by and large, have fairly good access to services such as electricity, water and mobile phone network with near universal availability. There is universal access to banking services although households still rely on passbooks for withdrawing money. Although suboptimal, households in Jagannathprasad have access to formal credit through SHGs, banks and cooperative societies. Indebtedness is highly prevalent in Jagannathprasad and the lockdown has further exacerbated it. Although they have access to sources of formal credit, the households did not benefit much from it after the lockdown and predominantly relied on relatives and friends for loans/advances.
� Nearly half of the households have enrolled in the social health insurance scheme of the state government. However, mere enrolment does not seem to reduce the high out-of-pocket expenditure on health incurred by the households, the prime reason for their indebtedness. Access to quality and affordable healthcare services appears to be a challenge in Jagannathprasad.
� Households from Jagannathprasad substantially depend on migration for work, portraying the typical scenario of Ganjam district which is historically known for high levels of labour migration. The disadvantaged communities tend to have higher migration rates compared to the rest. There were also households with members who wished to migrate but were unable to do so due to a host of reasons including lack of information or money.
� Inter-state migrant workers from Jagannathprasad were primarily men who moved mostly to Surat, leveraging the social capital created by the historic Ganjam-Surat labour migration corridor. There has also been substantial intra-state migration, predominantly to Bhubaneswar, the state capital.
� Migration has been a way of life for men from the households of Jagannathprasad. In addition to younger men, a substantial number of middle-aged persons from Jagannathprasad also worked at distant places toiling their productive years away from the rest of the family members.
89 Labour Migration from Jagannathprasad Block
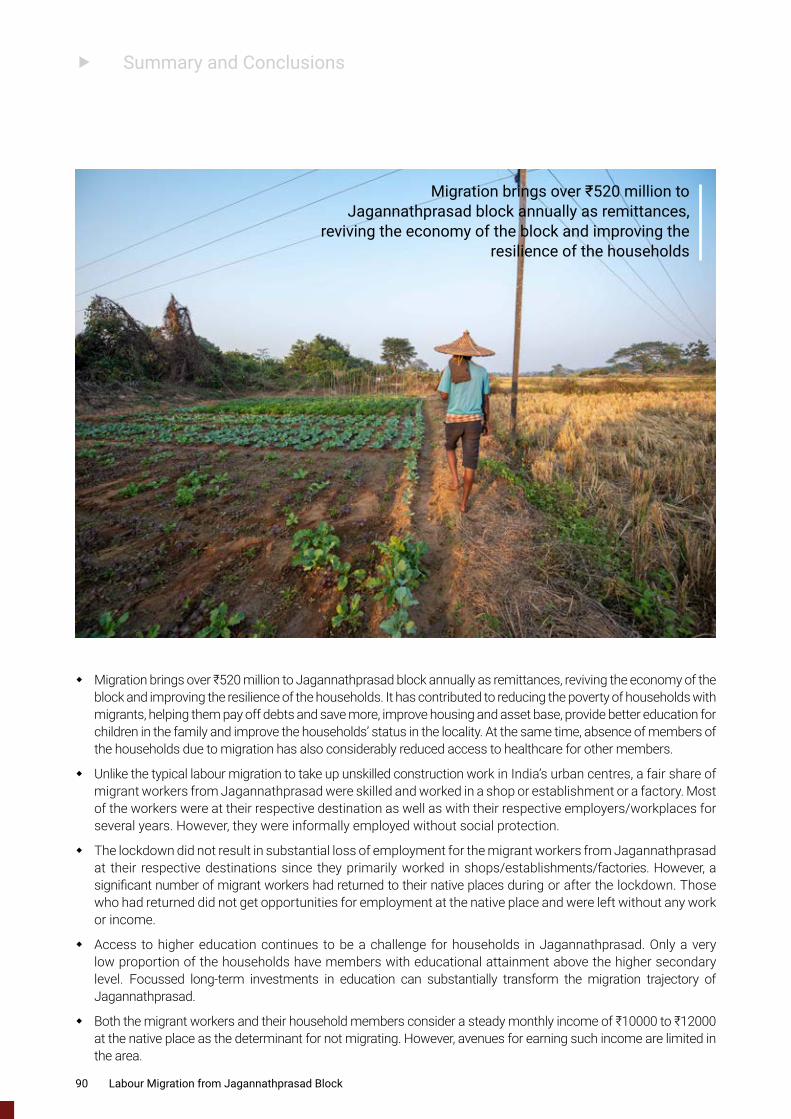
f Summary and Conclusions
� Migration brings over ₹520 million to Jagannathprasad block annually as remittances, reviving the economy of the block and improving the resilience of the households. It has contributed to reducing the poverty of households with migrants, helping them pay off debts and save more, improve housing and asset base, provide better education for children in the family and improve the households’ status in the locality. At the same time, absence of members of the households due to migration has also considerably reduced access to healthcare for other members.
� Unlike the typical labour migration to take up unskilled construction work in India’s urban centres, a fair share of migrant workers from Jagannathprasad were skilled and worked in a shop or establishment or a factory. Most of the workers were at their respective destination as well as with their respective employers/workplaces for several years. However, they were informally employed without social protection.
� The lockdown did not result in substantial loss of employment for the migrant workers from Jagannathprasad at their respective destinations since they primarily worked in shops/establishments/factories. However, a significant number of migrant workers had returned to their native places during or after the lockdown. Those who had returned did not get opportunities for employment at the native place and were left without any work or income.
� Access to higher education continues to be a challenge for households in Jagannathprasad. Only a very low proportion of the households have members with educational attainment above the higher secondary level. Focussed long-term investments in education can substantially transform the migration trajectory of Jagannathprasad.
� Both the migrant workers and their household members consider a steady monthly income of ₹10000 to ₹12000 at the native place as the determinant for not migrating. However, avenues for earning such income are limited in the area.
Migration brings over ₹520 million to Jagannathprasad block annually as remittances,
reviving the economy of the block and improving the resilience of the households
90 Labour Migration from Jagannathprasad Block
Labour Migration from Jagannathprasad Block
References
1 Government of India, 2018, SDG India Index Baseline Report 2018, NITI Aayog and the United Nations. Available at https://niti.gov.in/writereadda-ta/files/SDX_Index_India_21.12.2018.pdf
2 Gram Vikas and CMID, 2019, Challenges of Migrant Workers and Families Left Behind: Insights from Thuamul Rampur, India, Gram Vikas, Bhu-baneswar. Available at http://cmid.org.in/wp-content/uploads/2012/10/Challenges-of-Migrants-and-Families-Lelft-Behind-Insights-from-Kalahan-di-2019-Gram-Vikas-CMID.pdf
3 Government of Odisha, 2020, Odisha Economic Survey 2019-2020, Planning and Convergence Department, Government of Odisha. Available at https://pc.odisha.gov.in/Download/Economic_Survey_2019-20.pdf
4 Government of Odisha, 2013, District Human Development Report Ganjam, Planning and Coordination Department, Government of Odisha. Avail-able at http://phdma.odisha.gov.in/sites/default/files/2021-01/Ganjam-DHDR.pdf VV
91
Gram Vikas is a community development organization working in Odisha and Jharkhand since 1979. Gram Vikas works with rural poor and tribal communities to help them lead a dignified life, by building capacities, strengthening community institutions and mobilising resources. We focus on issues around water, livelihoods, sanitation and hygiene, habitat and technologies, education, and mitigating the effects of natural disasters. Lives of more than 600,000 people in 1700 villages have benefitted from the partnership with Gram Vikas. The Safe and Dignified Migration Programme was launched in 2019 as part of the Gram Vikas Decade Five programmatic framework.
The Centre for Migration and Inclusive Development is an independent non-profit that advocates for and promotes social inclusion of migrants in India. Established in 2016, CMID’s priorities include designing, piloting and implementing programmes for mainstreaming as well as improving the quality of life of migrants. CMID’s work also includes technical support in the formulation, refinement and implementation of strategies, policies and programmes that promote inclusive and sustainable development, working with diverse state and non-state actors.

gramvikas.org
Related Documents