University of South CarolinaScholar Commons
Theses and Dissertations
1-1-2013
Generational Differences In Motivation to AttendCollegeJohn Michael CoteUniversity of South Carolina
Follow this and additional works at: https://scholarcommons.sc.edu/etd
Part of the Higher Education Administration Commons
This Open Access Thesis is brought to you by Scholar Commons. It has been accepted for inclusion in Theses and Dissertations by an authorizedadministrator of Scholar Commons. For more information, please contact [email protected].
Recommended CitationCote, J. M.(2013). Generational Differences In Motivation to Attend College. (Master's thesis). Retrieved fromhttps://scholarcommons.sc.edu/etd/1411

GENERATIONAL DIFFERENCES IN MOTIVATIONS TO ATTEND COLLEGE
by
John Cote
Bachelor of Arts & Bachelor of Science Loyola University Chicago, 2011
Submitted in Partial Fulfillment of the Requirements
For the Degree of Master in Education
Higher Education and Student Affairs
College of Education
University of South Carolina
2013
Accepted by:
Jennifer Keup Ph.D., Chair
Jennifer L. Bloom Ed.D., Committee Member
Spencer Platt Ph.D., Committee Member
Lacy Ford, Vice Provost and Dean of Graduate Studies

ii
DEDICATION
This work is dedicated to my parents, Michael and Sally Coté. Your unconditional
love and support means more to me than I will ever be able to express.
iii
ACKNOWLEDGEMENTS
First, I would like to thank my Mom and Dad. I truly appreciate all that you have
done for me since I started this process. You have both been incredible listeners and
supporters throughout this journey. Thank you for providing me with a clear and level
head when I was overwhelmed and needed your guidance. Thank you to my sisters as
well. Thoughts of you both continually came to mind as I tried to think of examples for
why people behave the way they do depending on when they were born.
I would like to thank Dr. Nichole Knutson for letting me hang out in her office
and talk about the struggles I was experiencing. I greatly appreciated our conversations
and the guidance you gave me when I was struggling to write. Thank you for being a
mentor and role model for me in the field of higher education.
Thank you to my friends around the country and my friends and supervisors in the
Student Success Center. Thank you for putting up with me constantly trying to view the
reason for every behavior and situation we experience from a generational perspective.
Thank you for being a distraction when I needed to clear my head and the constant
encouragement you gave me throughout this process. I could not have done this without
you.
Dr. Jennifer Keup (chair) gave my thesis life and perspective. I consider myself
extremely lucky to have you as my chair and I have taken every edit and comment and
soaked it up like a sponge. I have learned a great deal from you over the past months and

iv
for that I am truly grateful. I would also like to thank Dr. Jenny Bloom (committee) and
Dr. Spencer Platt (committee) for their time and support throughout this process.
My wonderful girlfriend Samantha has been a beacon of hope and support for me
over the past year. Whether you are listening to my generational rants or offering advice
and ideas on how to improve my writing, it made me incredibly happy to be able to share
this experience with you. Your support and opinions mean a great deal to me and I am
grateful you gave me both during this process.
Finally, I would like to thank the amazing educators whose teachings have
motivated me to be the curious and achievement oriented person I am today, especially
my 8th grade teacher, Susan Condon. You constantly challenged me to work hard and rise
to the potential you saw in me. You pushed me to be a better writer, expand my
vocabulary, and most of all, you taught me to be the best that I could be. Thank you for
making a difference in my life.

v
ABSTRACT
The National Center for Education Statistics recently released a report indicating
that the amount of full-time students attending college has increased by 45 percent over
the past ten years (NCES, 2012). While many reasons assist in explaining this increase in
college attendance, this study explored the differences in motivations for attending
college across generations. This quantitative study used data collected by the Cooperative
Institutional Research Program (CIRP) Freshman Survey to explore the differences in
reasons for attending college amongst the Baby Boomer, Generation X, and Millennial
generations and predict reasons that may be important to future generations of college
students. These reasons were then aligned with motivation theories in order to understand
the types of motivation students utilize when deciding to attend college. A two-way
repeated measures ANOVA suggested that there is a statistically significant difference in
the reasons why the Baby Boomer, Generation X, and Millennial generations wanted to
attend college. After aligning each reason with the appropriate motivation theory, it was
found that each generation may be motivated to attend college in similar ways. All three
generations attended college because of their need to achieve (achievement theory) and
the internal rewards (i.e. increase in knowledge, learning about subjects that interest
them) that college provides (drive theory). Further, a linear regression suggested that
future generations may attend college for similar reasons as past and present generations
and will be motivated in the same way, both through their need for achievement and
internal rewards.

vi
Table of Contents Dedication………………………………………………………………………... ii Acknowledgements………………………………………………………………. iii Abstract……………………………………………………………………........... v Table of Contents………………………………………………………………… vi List of Tables……………………………………………………………………... viii List of Figures…………………………………………………………………….. x Chapter One: Introduction…………………………………………………..…….. 1
Purpose and Theoretical Foundation of the Study……………………...……. 4 Theoretical Lens……………………………………………………………… 6 Generation Theory…………………………………………………...…… 7 Motivation Theory…………………………………………………..……. 8 Methodology……………………………………….…………………………. 9 Significance of the Study……………………………………………………… 10
Chapter Two: Literature Review………………………………………………….. 12 Motivation…………………………………………………………………….. 13 History of Motivation…………………………………………………….. 14 Motivation Theory and the Current Study………………………..………. 26
Motivation Theory and Reason for Attending College Alignment……….. 26 Generation Theory………………………………………………………..…… 30 History of Generation Theory…………………………………………….. 30 Determining the Length of a Generation…………………………………. 34 Cycles and Patterns of Generations………………………………………. 36 Generation Descriptions………………………………………………….. 41 Motivation and Generation Theory…………………………………………… 49
Chapter Three: Methods………………………………………………………….. 53 Research Tools & Data Collection…………………………………………… 54 Sample & Population………………………………………………...…..…… 56 Data Analysis………………………………………………………………… 57 Descriptive Analysis……………………………...………………………. 59 Two-Way Repeated Measures ANOVA…………………………………. 60 Trends Analysis………………………………………………………….. 61 Time Series Extrapolation………………………………………..……… 62

vii
Linear Regression………………………………………….…………….. 63 Limitations………………………………..…………………………………. 63
Chapter Four: Results & Discussion…………………………..………………… 66 Descriptive Analysis…………………………………………………………. 67 Two-Way Repeated Measures ANOVA…………….………………………. 73 Time Series Extrapolation…………………………………………………… 78 Linear Regression…………………………………..……………………….. 79 Achievement Theory……………………………..……………………… 88 Drive Theory………………………………………..……………………. 92 Field Theory……………………………………………………..……….. 96 Social Learning Theory………………………………………………….. 100 Conclusions………………………………………………………………….. 106
Chapter Five: Implications & Recommendations……………………………….. 109
Implications for Practice…………………………………………………….. 109 Recommendations for Future Research………………………..……………. 113 Conclusions…………………………………………………………………... 115
References……………..…………………………………………………………. 118 Appendix A………………………………………………………………………. 127 Appendix B………………………………………………………………………. 131

viii
List of Tables 1.1. Overall Postsecondary Enrollments between 1939-40 and 1979-80………… 3
2.1. Motivation Theory and Reason for Attending College Alignment………….. 27 2.2. Generation Archetypes, Names, and Birth Years………………………………….. 39 2.3. Generation Archetypes, Phase of Life, and Turnings……………………………. 40 3.1. Response Options provided by the CIRP Freshman Survey………………….. 55 3.2. Years Question and Response Options Were Excluded from CIRP Freshman Survey…………………………………………………………... 59 4.1. Average Percent and Rank for Important Reasons for Deciding to Go to College Across Generations………………………………………………. 68 4.2. Response Aligned with Achievement Theory ……………………………………… 69 4.3. Response Options Aligned with Drive Theory……………………………………... 70 4.4. Response Options Aligned with Field Theory……………………………………… 71 4.5. Response Options Aligned with Social Learning Theory……………………… 72 4.6. Significance Values for the Shapiro-Wilk Test for Normal Distribution of Data…………………………………………………………………………… 75 4.7. Linear Regression Results for “I could not find a job”……………………... 84 4.8. Reasons Aligned with Achievement Theory: Results………………………. 90 4.9. Reasons Aligned with Drive Theory: Results………………………………. 94 4.10. Reasons Aligned with Field Theory: Results……………………………… 98 4.11. Reasons Aligned with Social Learning Theory: Results…………………... 102

ix
4.12. Last First Year of College Importance of Response Options and Rank Order for each Generation…………………………………………………. 104

x
List of Figures 4.1. Two-Way Repeated Measures ANOVA Boxplot…………………………… 74 4.2. “I could not find a job” Scatterplot………………………………………….. 82 4.3. “I could not find a job” Normal P-P Plot……………………………………. 83 4.4. “I could not find a job” Trend Line………………………………………….. 87 4.5. Reasons Aligned with Achievement Theory, Responses Over Time, and Trend Lines…………………………………………………………………… 91 4.6. Reasons Aligned with Drive Theory, Responses Over Time, and Trend Lines…………………………………………………………………… 95 4.7. Reasons Aligned with Field Theory, Responses Over Time, and Trend Lines…………………………………………………………………… 99 4.8. Reasons Aligned with Social Learning Theory, Responses Over Time, and Trend Lines…………………………………………………………………… 103
1
CHAPTER ONE
INTRODUCTION
In 1980, Arthur Levine wrote When Dreams and Heroes Died. This book served
as snapshot of college students in the late 1970s in which Levine described the students
that were attending college and their experiences therein. Levine (1980) used data
collected by the Cooperative Institutional Research Program’s (CIRP) Freshman Survey,
studies from the Carnegie Commission and Carnegie Council on Policy Studies in Higher
Education, and personal interviews of undergraduate students and university officials.
From these data, he found that college students were focused on their personal futures
with an emphasis on material gain, a disdain toward the government, and a pessimistic
outlook of America’s future. Levine (1980) thought this emphasis on the individual
would persist and the gap that existed between civic service and personal gain would
continue to widen as time went on. For the next decade, his research confirmed these
expectations.
Then, in 1990, students’ responses to questions on national surveys and in
individual interviews began to change. Students began reporting that they felt optimistic
about the future of the United States. Their beliefs and attitudes were not as closely
focused on the individual and, while there was still fear about the condition of the United
States, it seemed as though this new cohort of college students cared enough to do
something about these challenges and concerns (Levine & Cureton, 1998). Levine and
Cureton (1998) documented these changes in their book, When Hope and Fear Collide.

2
Further, they began to look at the events that affected this new group of students,
including the Challenger explosion, the Exxon Valdez oil spill, and the Rodney King trial.
Levine and Cureton (1998) found that these events caused college students to distrust the
U.S. government and become more socially and politically active. They also found that
college students of the 90’s were more optimistic about their lives after college than the
college students of the 70’s. More specifically, college students of the 90’s wanted good
paying jobs, positive and healthy relationships, and a good family life. However, Levine
and Cureton (1998) found that 90’s college students also feared life after college. The
amount of national debt, the burgeoning unemployment rate, and an increasing number of
social problems (i.e. homelessness, broken families, AIDS, drugs, healthcare) made them
fearful about their probability of success (Levine & Cureton, 1998). These types of social
and economic events played a large role in determining how college students viewed the
world and their society.
In addition to perspectives on social and economic matters, access to higher
education represents another important influence on young people’s perspective of
society and their role in it. Access to higher education has changed significantly over the
past seventy years. In 1940, less than one in twelve Americans attended an institution of
higher education (Kim & Rury, 2007). In 1980, more than one in three Americans
attended some form of higher education (Kim & Rury, 2007). During the mid to late
1940s, college attendance began to rapidly rise (see Table 1.1). This increase was largely
due to two new policies in the United States, the G.I. Bill (1944) and the Truman
Commission (1947). The G.I. Bill provided veterans of World War II with the funds to
attend college and many of them took advantage of this opportunity. In 1947, recipients

3
of the G.I. Bill accounted for almost fifty percent of college attendees (Kim & Rury,
2007). That same year, the Truman Commission, developed by President Truman, was
created to provide the United States with recommendations for future change in higher
education (Kim & Rury, 2007). President Truman’s Commission is most popularly
known for creating a network of public community colleges that students would be able
to attend for free (Thelin, 2004). This commission came just in time for thousands of
veterans coming back from World War II with their G.I. Bill in hand. Between the G.I.
Bill and the Truman Commission, higher education was more accessible then ever before
(Kim & Rury, 2007). With the large increase in college attendance, one can infer that
many people may have wanted to attend college before WWII, but never had the access
to before the G.I. Bill and the Truman Commission.
Table 1.1 Overall Postsecondary Enrollments between 1939-40 and 1979-80
Year Students 1939-40 1949-50 1959-60 1969-70 1979-80 Male 893,250 1,853,068 2,332,617 4,746,201 5,682,877 Female 600,953 805,953 1,307,320 3,258,495 5,877,022
Note: Adapted from Kim & Rury, 2007 College became even more accessible between 1960-1970. There were three
factors that accounted for the significant increase in college enrollment during this era.
First, there was a huge increase in the country’s birthrate after World War II and those
children were starting to attend college. These children of the veterans of WWII had
more exposure to higher education than any previous generation due to the fact that many
of their parents, specifically their fathers, attended college (Kim & Rury, 2007). Second,
due to the civil rights movement and the desegregation of higher education institutions, it

4
was a possibility for many more minority students to attend college than ever before
(Kim & Rury, 2007). Finally, women began to attend college at a greater rate than any
other time in history (Kim & Rury, 2007). This increase was due to the women’s
movement of the 1960s and the change in gender roles that expanded the vista of
possibilities for women both educationally and in their careers (Kim & Rury, 2007).
These women were more likely to work than their mothers and they pushed for greater
independence like their brothers were given, including attending college (Strauss &
Howe, 1991). This increase in access and attendance shows that people wanted to go to
college, but why? What were their motivations for attending college?
Purpose and Theoretical Foundation of the Study
In addition to legislative and social movements that facilitate access to higher
education, individual motivation to attend college is a significant aspect of the college
choice process. Many researchers try to understand why students go to college and how
they choose which college to attend. Understanding students’ motivations for attending
college is important for college staff, faculty, and administrators because students’
motivations often reflect what they want/need from their education. For instance, a
student who would like to attend medical school is likely to seek a college education that
will provide him or her with the appropriate science background and opportunities to
research and intern with professionals in the medical field in order to be a competitive
applicant for medical school. This study examines students’ reasons for attending college
through a motivation lens in order to see the differences in why students attend college
and how that decision has changed over time for different cohorts of incoming students.

5
Generational theory offers a framework to explore the differences in motivation to
attend college over time (Comte, 1839, as cited in Strauss & Howe, 1997; Ferrari, 1874;
Huntington, 1981; Lancaster & Stillman 2002; Marías, 1967; Mill, 1843, as cited in
Strauss & Howe, 1997; Modelski, 1987; Ortega y Gasset 1961; Raines 2003; Schlesinger,
1986; Strauss & Howe, 1991, 1997; Wechssler 1930). Strauss and Howe (1991, 1997)
define a generation as “a cohort-group whose length approximates the span of a phase of
life and whose boundaries are fixed by peer personality” (1991, p. 61). A span of life, and
thus a generation’s length, is roughly eighteen to twenty-two years (Strauss & Howe,
1991, 1997). As each phase of life comes to an end, a new generation is born. During
youth and young adulthood each generation develops their peer personality. “A peer
personality is a generational persona recognized and determined by (1) a common age
location; (2) common beliefs and behavior; and (3) perceived membership in a common
generation” (Strauss & Howe 1991, p. 64). Together, these three variables allow
researchers to better understand the thoughts, values, and behaviors of a generation,
including the motivation and decision to attend college.
Generation research has been conducted for decades, however the application of
generation research to the college experience is fairly new. Levine (1980) was arguably
the first to try to understand the college experience from a generational perspective. As
time progressed, the notion of using generation research to define the current cohort of
students attending college has become increasingly popular (Deal, Altman, & Rogelberg,
2010; Levine, 1981; Levine & Cureton, 1998; Levine & Dean, 2012; Martin & Tulgan,
2001; Moore, 2007; Myers & Sadaghiani, 2010; Oblinger & Oblinger, 2005; O’Brien,
2007; Smola & Sutton, 2002; Strauss & Howe, 1997; Sweeney, 2006; Tapscott, 2009;

6
Taylor & Keeter, 2010; Trunk, 2010; Twenge, 2000; 2001; Twenge & Campbell, 2001;
2009; Twenge & Im, 2007; Weiler, 2005; Zemke, 2001). However, there are still many
aspects of a generation that must be examined. While students and administrators at the
college itself may not be able to ignore the generational perspective, past research in
higher education has done just that. This study continues the line of scholarship on
generations and their experience with higher education by exploring the notion of
motivation to attend college through a generational perspective. The purpose of this
study goes beyond using generational theory to just describe student characteristics and
strives to understand generational differences in reasons for attending college. It used
motivation theories to categorize the reasons for attending college and then examined
changes over time in the reasons for attending college. Thus, colleges and universities
can better understand why students, past and present, are motivated to attend college.
Research was then conducted to assist in predicting the reasons why the next generations
may want to attend college.
Therefore, this study is directed by the following research questions:
1. What are the differences in reasons for attending college amongst first-year
students in the Baby Boomer, Generation X, and Millennial generations?
2. What do past generation’s reasons for attending college suggest about future
cohorts of first-year students’ in the Millennial generation and iGeneration
reasons for attending college?
Theoretical Lens
The current study draws from and creates an intersection between two bodies of
theory: generation theory and motivation theory. Each body of theory provides a unique

7
lens through which to view students’ reasons for attending college. Generation and
motivation theory provide the context from which this study makes conclusions about the
past, present, future generations’ motivations for attending college.
Generation Theory
Generations are used to help researchers segment and define history (Strauss &
Howe, 1991, 1997). Each generation encounters major historical events, compelling
messages, family trends, and technological advances that produce the experiential lens
through which they will continue to view their lives (Raines, 2002; Strauss & Howe,
1991, 2000; Zapatka, 2009). This experiential lens can also be referred to as a
generational lens because as one person in history experiences these factors their age peer
group also experiences them in some form (Strauss & Howe, 1991, 2000). Strauss and
Howe (1991) argue that peer groups interpret these historical events similarly, which
helps create a generation’s identity.
As Strauss and Howe (1991) began to examine generations, they noticed a pattern
in behaviors. In their book, The Fourth Turning, Strauss and Howe (1997) examined this
pattern and found that every four generations, a new generational cycle begins and each
generation plays a role in the cycle. Strauss and Howe (1997) believed these cycles could
be used to better understand future events and how each generation will react to these
events. They do this by using information from past generations and the role of each
generation in their cycle to predict the beliefs, values, characteristics, and expectations of
the future generation. This study utilizes Strauss and Howe’s (1997) cycles and
generational roles to provide a foundation for understanding reason why future students
and generations may want to attend college.

8
This study uses generation theory as the lens in which to view changes in reasons
for attending college over time. The segmenting of generations may provide alternative
explanations for the changes in reasons for attending college. This study also uses
generation research to assist in identifying patterns over time associated with generational
characteristics in students’ reasons for attending college. Understanding the cyclical
nature and roles of generations may assist in creating a more accurate profile in reasons
why past, present, and future students want to attend college.
Motivation Theory
The implications of generation theory indicate how one can expect people born in
a certain time period to think and behave. This is similar to the goals of motivation
research. Motivation can be defined in multiple ways. For this study motivation will be
defined as “the underlying reasons for behavior” (Guay et al., 2010). Motivation is
defined as such because the National Center for Education Statistics states that over the
past ten years the amount of full time students attending college has increased by 45
percent and the amount of part-time students has increased by 26 percent (NCES, 2012).
More people are attending college than ever before; clearly the college-going behavior
exists. This study will explore some of the underlying reasons why students, past,
present, and future, are attending college.
Over time motivation theory and research has experienced significant change. It
has transitioned from a mechanistic approach to a more cognitive approach and from
broad general theories to theories based on the individual (Graham & Weiner, 1990;
Weiner, 1990). Through the years researchers found that people are motivated differently
from one another and there is no one theory that is applicable to everyone (Broussard &

9
Garrison, 2004; Deci et al., 1999; Graham & Weiner, 1990; Guay et al., 2010; Pintrich,
1996; Stiepk, 1996; Usher & Kober, 2012; Weiner, 1990). The CIRP Freshman Survey
provides a unique opportunity to understand the motivation of hundreds of thousands of
college students in their decision to go to college (Astin, 2003). The CIRP data act as a
gateway for this study to understand motivation by examining the reasons students want
to attend college. By analyzing the trends in students’ reasons for attending college, this
research may indicate what types of motivations cohorts of students may have
experienced during different time periods. This research provides the unique opportunity
to see and better understand the Baby Boomer’s, Generation X’s, and Millennial’s
college choice process and to project similar decisions for the iGeneration.
Methodology
The Cooperative Institutional Research Program (CIRP) Freshman Survey is the
primary source for the data used in this study. CIRP has been collecting data from
entering college freshman since 1966 (Astin, 2003). For the past forty-five years, CIRP
has produced a monograph summarizing the data for each year they are collected. These
monographs not only show the data collected from each year, but also discuss some of
the changes that have been noted amongst first-time full-time students over time. While
CIRP discusses the trends in their data, they do not provide an explanation for why these
changes may have occurred nor do they discuss the changes from a generational
perspective. Looking at these changes through a generational lens may provide a new
context to understand the changes in these trends.
This study used the data collected by CIRP to understand better the differences in
motivations for attending college. First, these data were used in descriptive analyses to

10
determine differences in motivation to attend college across three generations. Next, a
two-way repeated measures ANOVA was conducted to see if there were statistically
significant differences in motivations to attend college amongst generations. Finally,
trends analyses were conducted to view the potential changes in motivations for attending
college amongst future generations.
Significance of the Study
In President Obama’s 2012 race for presidency, he challenged Americans to
enroll in at least one year of post-secondary education. President Obama wants America
to once again have the “highest proportion of college graduates” by 2020 ("Higher
education," 2012). This is not only a call to the people of America, but to America’s
colleges and universities as well. Colleges and universities need to offer what Americans
want in order to attract them to higher education. The implications of this research may
provide colleges and university this information. By understanding what motivates each
generation to attend college, post-secondary institutions can begin to adapt to different
generational needs and attract an array of generations to their institutions.
Understanding the differences in motivation to attend college between generations
provides colleges and universities with the opportunity to cater education to the unique
needs of the current generation as well as to prepare for future generations (Levine,
1980). “Using history to understand the lives of students and tracking popular culture
forms and trends will offer student affairs educators important tools for working with
these students in the future” (Coomes & DeBard, 2004, p. 29). Generation research
provides colleges and universities with information that assists in the creation of
programs that are relevant and, thus, will help develop students to their fullest extent.

11
Because each generation has their own set of qualities and characteristics unique
unto themselves, colleges and universities may not know the extent to which their own
programs are effective for their students. Therefore, understanding generational
differences can guide and direct college faculty, staff, and administration as they work
with a variety of generations on college campuses. As Levine and Cureton (1998)
showed, generations differ in their values, beliefs, characteristics and expectations.
Through generation research, colleges may understand better the differences between
generations and use that information to guide their practices to give each upcoming
generation of students the best possible experience. Colleges may use this research to
assess their current programs to better understand if their programs align with their
students’ wants and needs. This study is significant because it will add not just address
the generation that is currently attending college, but identify patterns for past generation,
and suggest the direction for future generations as well.
While understanding generational differences is important to college faculty,
staff, and administrators, it is also important to higher education research. Pascarella
(2006) discusses the popularity of higher education research over the past ten years and
states, “the next two decades may be a time of unprecedented advances in our
understanding of how college affects students” (p. 508). With the research on higher
education becoming more popular, it is important that this research is guided and directed
towards the needs of current students in higher education. Pascarella (2006) suggests ten
directions for future research in higher education. In particular, this study will assist in
bringing “systemic inquiry to bear on the rational myths of higher education” (Pascarella,
2006, p. 509-510).

12
CHAPTER TWO
LITERATURE REVIEW
Examining the generational differences in motivations for attending college draws
upon the intersection between the bodies of literature on generations and motivation and,
thus, requires the proper context of both topics. Comparing motivations across time is
difficult without understanding the characteristics of the individuals one is trying to
compare (i.e., generational personalities). Conversely, a hallmark of different
generations is how they view their universe and the various pathways of choice in it,
which is a function of motivation. This chapter is divided into several sections that
approach the review of research from a more theoretical perspective than a typical
literature review in order to address motivation theory and generation theory as well as
how the current study will fill the gaps in the previous literature.
First, the chapter will discuss motivation theory and address what motivation is
and how it is defined for this study. Then a brief history of motivation research covers the
changes in motivation theory from early mechanistic perspective to contemporary
cognitive perspective as well as a shift in scope from broad general theories to a focus on
the individual differences in motivation. The review of motivation theory continues by
addressing some of the historically popular theories of motivation, which act as the
foundation for much of today’s motivation research.
Next, the chapter will address generation theory. It defines generation theory and
provides a brief history of it as a foundation for one of the leading theories in current

13
generation research. This section concludes with a description of the six generations that
are currently alive in America. The final section will discuss how the current study will
fill the gaps between the motivation and generation literature base.
Motivation
Motivation comes from the Latin motive which means, “to move.” The goal of
early motivation research was to understand what moved a resting organism to a state of
activity (Graham & Weiner, 1990; Weiner, 1990). For the purpose of this study
motivation will be defined as “the reasons for underlying behavior” (Guay et al., 2010)
and the behavior that is being studied will be attending college. By defining motivation
and behavior in these terms, it allows the researcher to identify the reasons that students
attend college and to understand better the context in which students are motivated
toward this action.
Motivation is typically defined from two perspectives, intrinsic and extrinsic
motivation. “Intrinsic motivation energizes and sustains activities through the
spontaneous satisfactions inherent in effective volitional action” (Deci et al., 1999).
Intrinsic motivation is an individual’s inherent need to perform tasks from which they
derive interest and pleasure. For instance, a person may be intrinsically motivated to
build model airplanes. Building model airplanes may make this person happy. No
external force is pushing them to build model airplanes. Extrinsic motivation is
motivation through external reinforcement. This type of motivation is often used when a
child is not performing as well as they could in the classroom. To motivate the student,
parents may offer a monetary reward for every ‘A’ the student receives. If the student
values the money more than the amount of time it may take to achieve the ‘A’, the

14
student would be motivated to study harder. From an education perspective, intrinsic
motivation is more powerful and longer lasting than extrinsic motivation (Deci et al.,
1999). Therefore, the assumption can be made that a student who is intrinsically
motivated to attend college will be more like to matriculate to college and persist from
year to year than a student who is extrinsically motivated.
A recent review of motivation literature by the Center on Education Policy,
discusses four major facets of motivation: competence, control/autonomy, interest/value,
and relatedness (Usher & Kober, 2012). Competence refers to the person’s belief about
whether or not they have the ability to complete the task (Usher & Kober, 2012).
Control/autonomy refers to the degree that a person feels in control and can see how their
work will have a direct effect on the outcome and having the autonomy to decide how
they want to complete the task (Usher & Kober, 2012). Interest/value refers to how much
interest the person has in the task and/or if they value the outcome of the task (Usher &
Kober, 2012). Relatedness refers to the person’s sense of social acceptance if they decide
to complete the task or not (Usher & Kober, 2012). These four factors have been
determined to effect a person’s motivation (Usher & Kober, 2012).
History of Motivation Theory
Over the past eighty years there have been many thoughts and theories about how
these conditions are operationalized and organized that have helped shape contemporary
motivation theories and offer different insights as to how people are motivated. It is
important to understand the history of motivation research because motivation theories
used in this study are derived from the trends of motivation history. The following
section will provide a brief history of the trends in motivation.

15
Motivation research began in the early 1930s. During the early stages of
motivation research, theories were broad and tried to account for an individual’s every
thought and behavior. Researchers then began to develop more focused theories that
accounted for certain types of human behaviors. Motivation was also initially thought to
be unemotional, robotic, and driven by a person’s environment (mechanistic). Now
motivation researchers consider humans to be rational, educated, and curious decision
makers (cognitive); they have agency within the context of motivation.
1930-1960 Motivation Research: The Mechanistic Era.
Researchers between the 1930s and 1960s focused on exploring motor behaviors
through mechanical concepts such as instinct, drive, arousal, and need as an explanation
for organisms moving from a resting place to action (Graham & Weiner, 1996; Weiner,
1990). Thus, the term mechanistic was applied to this era of motivation research. During
this time, experiments were typically conducted on non-human species (Graham &
Weiner, 1996; Weiner, 1990). Researchers thought human behavior was too complex to
study and therefore not ready for experimentation (Graham & Weiner, 1996; Weiner,
1990). Experimentation between 1930-1960 was typically concerned with depriving the
non-human organism of a primary need such as food (Graham & Weiner, 1996; Weiner,
1990). Thus, experiments included watching hungry mice run through a maze to find
food and placing monkeys in a room without visual stimulation (Graham & Weiner,
1996; Weiner, 1990).
In 1941, Paul Young commissioned the first chapter on motivation in the
Encyclopedia of Educational Research to capture this era of mechanistic research. Young
also wrote the chapter on motivation in the Encyclopedia of Educational Research in

16
1950. Young was most well known in the field of motivation for his hedonic theory of
motivation and one of the first to outline an experimental approach to the study of
motivation (Weiner, 1990). The main topics of research presented by Young (1941,
1950) are all closely tied with drive theory, which was the main motivational theory of
the time (Weiner, 1990).
Drive theory.
Drive theory and drive reduction theory were developed by Hull in the 1940s.
Drive theory refers to an organism’s innate need to fulfill certain indispensible needs
(Hull, 1943). Researchers believed that organisms operated between two different states,
on and off (Graham & Weiner, 1996; Weiner, 1990). They believed that an organism
preferred being in the off state as opposed to being on or moving. Once an organism was
in the on state they would do whatever was necessary to fall back into the off state
(Graham & Weiner, 1996; Weiner, 1990). The off state was presumed to be the ideal
state, a place of equilibrium, and once this equilibrium was off balance, the organism
would take notice (e.g. shivering to tell the organism it is cold and sweating to tell the
organism it is hot) and take the necessary steps to fall back into equilibrium (Graham &
Weiner, 1996; Weiner, 1990).
Drive reduction theory is the organism’s imperative to get back to a state of
equilibrium by satisfying their innate need, which most often represent primary needs
such as hunger, sex, understanding, etc. (Hull, 1943). Secondary needs such as material
objects, career and academic goals, satisfying social norms, etc., are needs that the
organism can be conditioned to need (Hull, 1943). If one of these needs becomes active
in the organism, it will seek out a way to satisfy the need in the same way as a primary

17
need. For instance, as a student approaches the age in which their cultural norms deem it
time for them to attend college, the student may feel a sense of anxiety if they do not
attend college. This anxiety will persist until they can satisfy it. Social norms or
conditioning may lead the student to believe their only way to satisfy this anxiety is to
attend college, which may bring them back to equilibrium.
While drive theory is not as valued as it once was, some motivation theorists still
believe that it has some value. Pink (2009) draws from the works of Harlow (1949) and
Deci (1969) to explain a new form of drive theory. Harlow (1949) conducted an
experiment where he placed a puzzle and a rhesus monkey in the same room. To
Harlow’s surprise, the monkey worked on the puzzle until it was solved without any
reinforcement or reward. In the absence of a need to reduce a primary need such as
hunger, thirst, or shelter, Harlow determined that “the performance of the task provided
intrinsic reward” (1949 as cited in Pink, 2009, p. 3). He called this phenomenon intrinsic
motivation, where the pleasure derived from the activity is its own reward. (Harlow, 1949
as cited in Pink, 2009).
Several decades later, Pink (2009) used this evolution of drive theory (i.e.,
intrinsic motivation) as the basis of in the research in his book Drive, in which he cites
countless examples of business managers who understand that people are motivated to do
better when external rewards do not exist and it is the task itself that people are rewarded
by. Pink (2009) says this enjoyment of work arrives through three different elements:
autonomy, mastery, and purpose. Pink (2009) proposes that people have a desire to be
autonomous or self-directed to remain motivated. He also suggests that in order to find
something that matters to a person, they have to be engaged in the activity: it has to mean

18
something to them and they have to care about it beyond just the need to complete it.
Through autonomy comes engagement and through engagement comes mastery (Pink,
2009). Lastly, Pink (2009) discusses the need for purpose in his revised version of drive
theory. While autonomy and mastery are important in this drive motivation, purpose
gives the other two elements context (Pink, 2009). Purpose drives people to do things
beyond themselves and when people can align themselves with the purpose of an activity,
organization, or company, their motivation increases (Pink, 2009).
Pink’s (2009) drive theory may be more applicable in today’s field of motivation
and may have a more practical use. However, with the trends in motivation research,
there is never just one motivation theory to explain all behaviors. The following section
discusses another important theory in the history of motivation that is similar to Hull’s
drive theory: Lewin’s field theory.
1960-1970 Motivation Research: The Achievement Era.
The 1960’s brought about a shift in motivational psychology away from the
mechanistic perspective and toward cognitive perspective (Graham & Weiner, 1996;
Weiner, 1990). This shift is seen through certain aspects of drive theory and
reinforcement theory, in terms of providing a reward to an individual for completing a
task (Graham & Weiner, 1996; Weiner, 1990). However, researchers found that rewards
in a competitive setting come from social comparison, which tells an individual that one
person is better than the other because one person would receive the reward and the other
would not (Weiner, 1990). Therefore, motivation researchers began to understand that
there were multiple meanings that can be attached to rewards. Once the field of

19
motivation realized this, cognitive concepts of motivation began to dominate motivation
research.
Not only did the theoretical perspective of motivation shift in the 1960s, so did
the way motivation was studied (Graham & Weiner, 1996; Weiner, 1990). Once the
cognitive perspective overtook the mechanistic perspective, human behavior and research
on human subjects became the primary focus of motivation studies. From researchers’
new ability to study human behavior came the main focus of motivation research for the
next decade: achievement motivation. Achievement motivation opened the doors for new
types of experiments to explore human motivation. Some of the first human experiments
on motivation in the early 1960s focused on manipulating the success and failure of
participants when performing certain activities (Graham & Weiner, 1996; Weiner, 1990).
This was particularly exciting for educational psychologists because could utilize these
experimentation methods to study achievement in the classroom (Graham & Weiner,
1996; Weiner, 1990).
As achievement motivation began to take over the field in 1970, other researchers
were still clinging to the broad, generalizable theoretical approach of Hull’s drive theory
(Graham & Weiner, 1996; Weiner, 1990). In order to prove that broad generalizable
theories still had a purpose, researchers “isolated the determinants of behavior through
the mathematical equation Motive X Probability X Incentive” (Weiner, 1990, p. 66). This
equation was dominant in some of the leading research in motivation such as Lewin’s
field theory (1936), Atkinson’s achievement theory (1957, 1964), and Rotter’s (1954)
social learning theory (Graham & Weiner, 1996; Weiner, 1990).
Field theory.

20
Lewin developed field theory in 1936. Field theory states both the organism and
their environment determine the organism’s behavior. Lewin believed there are three
factors that attributed to an organism’s motivation to achieve a goal: tension (the extent
of the organism’s need), valance (what exactly the need is), and the organism’s
psychological distance from the goal. Similar to Hull’s drive theory, Lewin also thought
tensions, or disequilibrium, motivated organisms to move (Hall & Lindzey, 1978).
However, field theory is more concerned with how far this tension could push a person to
satisfy it and emphasizes the importance of the environment a person is in at the time of
the tension (Hall & Lindzey, 1978). Lewin was one of the first motivation theorists to try
to explain behaviors other than those that were exhibited from fulfilling basic or primary
needs such as goals (Bernard & Weiner, 1996). For instance, a student whose curiosity
(tension) about biology is brought out by her class’s lab assignment (environment) and
surpasses what she is able to learn from their teacher, she will look elsewhere in order to
satisfy her curiosity. She will try to figure out the aspects of biology that she is curious
about (valance) and measure her own psychological ability to do so. She may realize that
majoring in biology in college could satisfy her curiosity.
Achievement theory.
Murray was the first to coin the term achievement theory in 1938 (Atkinson,
1964). Achievement motivation is better known as the need for achievement or n Ach,
which is one of twenty psychological human needs (Atkinson, 1964; Beck, 1978;
McClelland, 1953; Pintrich, 1996; Ryan, 2012). It is defined as a person’s need or desire
for significant accomplishment, mastery of skills, or to perform at a high level (Atkinson,
1964; McClelland, 1961; Murray, 1938). After noting n Ach, McClelland wanted to

21
know what caused n Ach and why did people who had it perform better than those
without it (Beck, 1978). McClelland (1953) stated that n Ach was derived from previous
experience with achievement where the person who accomplished the achievement,
experienced a positive, hedonic feeling. This feeling encouraged them to continue to seek
out this feeling, which resulted in a need to continue to achieve (McClelland, 1953). On
the opposite side, if a person experienced a negative feeling after failing a task, this
person may develop a fear of failure and then actively avoid situation where they have
the potential to fail (McClelland, 1953). For instance, if a person felt they succeeded
academically in high school, they may be more motivated to attend college than a student
who felt like they struggled academically in high school. Achievement theory does not
account for societal pressures and cultural norms and the way these factors interact with a
person’s need for achievement. To explore this concept, motivation research turned to
social learning theory.
Social learning theory.
Social learning theory is based on the work of Rotter (1954). Rotter (1954) noted
that the ways in which people behave are derived from their social surroundings. These
surroundings, as well as the interaction that a person has with their surroundings,
determine someone’s personality and behavior (Rotter, 1954). There are four main
elements to Rotter’s social learning theory: behavior potential, expectancy, reinforcement
value, and psychological situation. These four elements assist in predicting someone’s
motivation and behavior (Pintrich, 1996; Rotter, 1954; Weiner, 1991; Wlodkowski,
1986). Rotter (1954) suggests that there are a certain number of behaviors a person could
illicit based on their personality and their current environment and behavior potential is

22
the probability of a person performing a certain behavior. Expectancy is the belief that a
certain outcome will happen based on a certain behavior; the outcome that a person
expects may not indicate what will actually happen but what the person thinks will
happen (Pintrich, 1996; Rotter, 1954; Wlodkowski, 1986). Reinforcement value is the
value that a person places on a particular outcome compared to other potential outcomes
(Rotter, 1954). The value placed on expectancy and reinforcement are typically different
and neither one is a better indicator of which outcome will actually take place (Pintrich,
1996; Rotter, 1954; Wlodkowski, 1986). The psychological situation gives context for
the person to determine the expectancy and reinforcement value of a situation (Pintrich,
1996; Rotter, 1954; Wlodkowski, 1986). For instance, a person who is in a positive
situation, will typically view all possible outcomes as positive, which will effect how
they place the expectancy and reinforcement value (Pintrich, 1996; Rotter, 1954;
Wlodkowski, 1986). If a student who grew up in an environment where his role models
were successful and had attended some form of higher education, he may place a high
expectancy on higher education thinking it will make him successful. If higher education
is valued in his community he may also place a higher value on reinforcement, knowing
that his community will be proud of him for attending college. If all his peers are
attending college as well that will affect the psychological situation and the context he
uses to determine these values. Based on Rotter’s social learning theory, one could
determine from these clues that his probability for attending some form of higher
education would be high.

23
1970-1990 Motivation Research: The Cognitive Era.
Between 1930 and 1970, researchers such as Atkinson, Hull, Rotter, and Lewin
created broad generalizable motivation theories. However, towards the end of the 1960s,
a new approach began to develop. Studying individual differences in motivation started
to gain popularity amongst researchers because they began to realize that their current
motivation theories were not applicable to everyone (Graham & Weiner, 1996; Weiner,
1990). When this was coupled with the increased attention that achievement motivation
was receiving, researchers wanted to know more about the differences between
individuals that were high or low in achievement needs, high or low in internal control,
and high or low in other characteristics that may affect a person’s motivation (Graham &
Weiner, 1996; Weiner, 1990).
During his time as editor of the Journal of Educational Psychology from 1979-
1984 Ball encouraged motivation research and publications (Weiner, 1990). In this body
of work, Ball identified that Hull’s (1943) drive theory, Lewin’s (1936) field theory,
Atkinson’s (1964) achievement theory, and Rotter’ (1954) social learning theory started
to decline in popularity and applicability (Graham & Weiner, 1996; Weiner, 1990). At
this same time, motivation research saw an increase in concentrated focus on attribution
theory, human behavior, cognitions that were thought to affect motivation, and the
individual differences in motivation, specifically with a person’s need for achievement
(Graham & Weiner, 1996; Weiner, 1990).
1990-2010 Motivation Research.
Over the previous 60 years motivation research had changed from broad,
generalizable theories to theories that focus on the difference between individuals. The

24
field of motivation began to focus heavily on achievement, but only in certain areas such
as power, affiliation, exploratory behavior/curiosity, altruism, and aggression (Weiner,
1990). During the latter part of the 1990s there was a push to understand how emotions
affect motivation, which had been relatively unexplored in theories of drive,
achievement, and cognition (Weiner, 1990). Further, between 1990 and 2010, motivation
research continued to focus on individual differences. Broussard and Garrison’s (2004)
literature review shows that current motivation theory still focuses on cognition. They
also state that current motivation research is focused around three questions: Can I do this
task? Do I want to do this task and why? What do I have to do to succeed in performing
this task? These questions are all driven by past motivation theories that have become
more relevant between 1990 and 2010. For example, Atkinson’s (1964) achievement
theory assists in answering the first question (Can I do this task?). Achievement theory
states that the more a person succeeds and achieves the goals the set for themselves, the
more likely they are to seek out other opportunities where they need to achieve. By
providing students with academic opportunities in which they can succeed, students then
will start to build confidence in their academic ability and seek out other academic
opportunities. Achievement theory can be used to assist educators and educational
researchers with helping students understand that they are academically competent and
begin to associate positive attributes to education (Lai, 2011).
Broussard and Garrison (2004) note that expectancy-values theories and intrinsic
motivation theories (Deci & Ryan, 1985; Pink, 2009) assist in explaining the second
question (Do I want to do this task and why?). Understanding what a person expects from
a task and how the value that task provides understanding for why they want to perform

25
that task (Pintrich, 1996; Stipek, 2002; Weiner, 1991). This is the root of expectancy-
value theory. Theories based on intrinsic motivation, such as Pink’s (2009) interpretation
of drive theory, also provide motivation for a person to complete a task based on the self-
perceived rewards for completing the task (Lai, 2011).
Broussard and Garrison (2004) state that the final question (What do I have to do
to succeed in performing this task?) is answered by theories that have a self-regulation
component such as social learning theory. People who are able to utilize self-regulating
strategies can frame the way they perceive events and they have a higher sense of self-
efficacy (Schunk & Zimmerman, 2007). Utilizing social learning theory can provide an
example of the type of behavior needed to achieve a goal. People utilizing this motivation
theory use the behavior of others to assist in determining their own behavior. Therefore
by watching others perform a task or reach a goal, a person trying to achieve the same
goal can then either behave similarly or differently depending on their desired outcome.
Motivation researchers still rely on and utilize many other motivation theories to
help explain behavior. Some motivation researchers use older theories, which have been
deemed to no longer have relevance to motivation research due to advances in the field,
have changed parts of it to make it relevant in today’s society, such as Pink (2009) did
with drive theory. While some of the theories used in this study may be missing certain
factors that can affect motivation, this study strives to utilize them in a way where they
explain the necessary behaviors that are being analyzed. The following section connects
the motivation theories explored in this section to the current study.

26
Motivation Theory and the Current Study
The motivational theories described in the previous section provide a lens through
which the reasons students want to attend college can be viewed. It is important to align
these motivational theories with the reasons that students want to attend college in order
for higher education researchers and practitioners to understand the events that may have
lead up to a student wanting to attend college. For instance, if a student attends college
because that is what all of their friends are doing, one may see that this student was
motivated by social expectations, which may be explained by Rotter’s social learning
theory. If a student achieves many accomplishments, both academic and/or social, in high
school, they will likely be confident in their ability to succeed and seek out other
opportunities where they can succeed, academically and/or socially, such as attending
college. This type of behavior can be explained by Atkinson’s achievement theory.
Motivation Theory and Reason for Attending College Alignment
Many researchers have studied the college choice process and the factors that
affect it (Alwin & Otto, 1977; Attinasi, 1989; Borus & Carpenter, 1984; Hamrick &
Stage, 1995, 2000, 2004; Hearn, 1984; Hossler, Schmit, & Vesper, 1999; Lee & Ekstrom,
1987; Litten and Hall, 1989; Manski and Wise, 1983; Perna & Titus, 2004; St. John,
1990). All of the motivational theories are factors that have the potential to affect a
student’s decision whether and where to attend college. These factors are important to
this study because they will assist in understanding how students engage in the college
choice process. Table 2.1 shows the reasons the CIRP Freshman Survey provides for
students to indicate which of them were “very important” in their decision to attend
college aligned with the motivation theories that are most likely utilized based on the

27
reason. The following section will provide explanations for why the researcher paired
each reason with their corresponding motivation theory.
Table 2.1
Motivation Theory and Reason for Attending College Alignment
Motivation Theory Reason provided by CIRP and noted by students as “very important” in their decision to attend college
Drive Theory
To learn more about things that interest me
To make me a more cultured person
To improve my reading and study skills
To gain a general education and appreciation of ideas
Wanted to get away from homea
Field Theory
My parents wanted me to goa
Wanted to get away from homea
I could not find a job
There was nothing better to do
Achievement Theory
To prepare for graduate or professional school
To be able to make more money
To be able to get a better job
To get training for a specific career
Social Learning Theory A mentor/role model encouraged me to go
My parents wanted me to goa
a These reasons are listed multiple times under different motivation theories because they can be interpreted in different ways
Drive Theory.
The following reasons were listed under drive theory because, as Pink (2009)

28
suggests in the most current update to drive theory, oftentimes people are motivated or
driven to do tasks not just because of an external reward, but also for the enjoyment they
receive from performing and completing the task. These reasons suggest that a student
who selects one or more of these reasons receives self-fulfillment by completing these
tasks where they feel like they are bettering themselves. These reasons are: “to learn
about things that interest me,” “to make me a more cultured person,” “to improve my
reading and study skills,” “to gain a general education and appreciation of ideas,” and
“wanting to get away from home.” The reason “wanted to get away from home” is listed
in two different motivation theories because it can be interpreted in different ways. For
example, a student may want to get away from home to explore new cultures, activities,
and curriculums. There may not be something that is pushing the student away from
home, but something that is calling him or her to explore. In this case the student receives
fulfillment from leaving home and following and satisfying their curiosity. The other
interpretation of this reason is addressed in Lewin’s (1936) field theory
Field Theory.
The following reasons were listed under field theory because one of the main
concepts of Lewin’s (1936) field theory is that the environment the person is in presents
tension that motivates an individual to action. These reasons all have to do with tension in
a student’s environment. The reasons are: “my parents wanted me to go,” “wanted to get
away from home,” “I could not find a job,” and “there was nothing better to do.” “My
parents wanted me to go” and “wanted to get away from home” are listed in two separate
theories because these reasons can be interpreted differently. In field theory, “my parents
wanted me to go” is interpreted as a student who is in conflict with their parents due to

29
lack of independence or other issues. The environment that the student is in creates a
tension that puts the student in disequilibrium. In order to return to a state of equilibrium
the student must fix the tension. A solution may be to go to college and the student may
feel like his or her parents are forcing them to go to college depending on the conflict
between them. “Wanted to get away from home” is interpreted in a similar manner, as
“my parents wanted me to go.” There may be some form of tension in the student’s home
environment that is putting them in disequilibrium and therefore the tension must be
solved. The student may decide to remove themselves from the tension and the
environment by attending college.
Achievement Theory.
The reasons that were listed under achievement theory where categorized under
this theory because they represent a situation in which people who have a need for
achievement typically set and act upon goals to meet that need (Atkinson, 1964). In this
case, students are setting long-term goals they want to accomplish. The student then
decides that the goals can be best accomplished through attending college. Their need for
achievement motivates them to accomplish their goals, which in turn motivates them to
attend college. The reasons from the CIRP Freshman Survey that fall under this category
are: “to prepare for graduate or professional school,” “to be able to make more money,”
“to be able to get a better job,” and “to get training for a specific career.”
Social Learning Theory.
The reasons listed under social learning theory were placed there because
attending college may be a socially learned goal due to external influences, such as social
norms or role models/someone a student respects tells them that college is a good option

30
(Rotter, 1954). The student picks up on the social norms or listens to their role models
and starts to think that they need to attend college because that is what everyone else is
doing and/or that is what my role models think is best. The reasons are: “a mentor/role
model encouraged me to go” and “my parents wanted me to go.” “My parents wanted me
to go” is listed under two motivation theories because it can be interpreted in different
ways. In a social learning theory context, this reason is interpreted as the parents acting as
role models, guiding their student toward this path. Another interpretation is that the
student could be picking up on social cues from their parents or previous siblings that
attended college that it is time for him or her to go to college. In this situation the student
may feel that their parents wanted them to go to college due to certain social norms or
cues.
Generation Theory
The following sections will outline past and present theories on generation and
discuss how they relate to this study. However, it is important to note one must be
cautious to apply generation theory to a group of people as opposed to an individual.
While everyone in a generation is an individual and must be treated as such, generation
theory provides possible explanations for their beliefs, values, behaviors, and
expectations in the aggregate (Schleslinger, 1986; Strauss & Howe, 1991, 1997, 2000;
Zemke, Raines, & Filipczak, 2000).
History of Generation Theory.
Over the years, generation theorists have recognized different factors that
influence a generation’s identity. In terms of this study, it is important to understand these
factors in order to comprehend and appropriately assess the different reasons why each

31
generation wants to attend college and how the motivation to attend college changes
across generations.
While the popularity of generational research has increased in the late 20th and
early 21st centuries, its roots can be traced back much farther. Comte, a French
philosopher, was the first to recognize the importance of generational theory in 1839 by
stating that generations had become “the master regulators of the pace of social change”
(Strauss & Howe 1997, p. 63). This led Mill, in 1843, to discuss how historical change
can be measured in “intervals of one generation, during which a new set of human beings
have been educated, have grown up from childhood, and taken possession of society”
(Schlesinger, 1986, p. 86; Howe & Strauss, 1997).
Ortega y Gasset, Spain’s leading generational theorist of the early 20th century,
confirmed what previous researchers found: that the study of generations is pivotal to the
development of a culture’s history (Ortega y Gasset, 1961). He took this concept further
by stating that generations are “… the pivot responsible for the movements of historical
evolution” (Ortega y Gasset, 1961, p. 15). It was his writings that began to shed light on
how each generation affects one another and on the patterns that can be traced in and
across generations. He stated that a generation has two variables that affect its position in
history (Ortega y Gasset, 1961). First, the reception, how the previous generations will
view and behave towards the new generation (Ortega y Gasset, 1961). This can be seen
through the ideas and values of the previous generations (Ortega y Gasset, 1961). Second
are the thoughts and ideas of the generation itself (Ortega y Gasset, 1961). Ortega y
Gasset states, “the spirit of every generation depends upon the equation established
between these two ingredients and on the attitude which the majority of the individuals

32
concerned adopts toward each” (Ortega y Gasset 1961, p. 17). This is how Ortega y
Gasset defines a generation’s identity.
In 1980, Levine showed the nation how a generation’s identity affected their
collegiate experience in his book When Dreams and Heroes Died. In 1990, Levine
continued this line of research with Cureton in When Hope and Fear Collide. In this
book, they discussed differences between the generational identities of college students
across two generations: the Baby Boomers and Generation X. These differences began to
open the doors to how generation theory can affect how college faculty, staff, and
administrators work with their students. By better understanding students’ generational
identity and by examining the events that that helped them develop, colleges and
universities could be more attuned to the needs of their students. Levine’s most recent
publication with Dean (2012), Generation on a Tightrope, focuses on the current
generation of students working their way through college. Levine and Dean describe how
Millennials have grown up and the large-scale events that had the greatest affect them.
These events were “the advent of the World Wide Web, the worldwide economic
recession, the September 11 attack and its aftermath, and the election of Barack Obama
as president” (p. 19). Levine and Dean (2012) used these events to classify how the
Millennial generation’s college experience is different from previous generations. For
instance, they discussed the differences in technology and how it has not only changed
the way relationships are built and maintained for the Millennial generation, but how it
has also affected their access to education, such as the introduction of online classes and
universities. One of the many way the economic recession effected higher education was
through the increase in students’ working hours while attending school (69% in 2009 vs.

33
60% in 1993) (Levine & Dean, 2012). Through events like the ones listed above, Levine
and Dean (2012) illustrate the effects of events on the college population and how they
differ amongst generations.
Arguably, two of the most popular generation researchers of the 20th century are
Strauss and Howe. Their research has set the tone for many researchers looking to
explore generations and their impact. They focus on America’s generations and describe
the nature of each generation and their contribution to American culture. Strauss and
Howe (1991) broadly define a generation as “a special cohort-group whose length
approximately matches that of a basic phase of life.” This phase of life ranges from 18 to
24 years (Strauss & Howe, 1991, 1997). Strauss and Howe (1991) use two variables to
describe a generation: age location and peer personality. A generation’s age location is
determined by major historical events, compelling messages, family trends, and
technological advances that occur during a generation’s childhood and early adulthood
(Raines 2002; Strauss and Howe 1991, 2000; Zapatka 2009). A generation’s identity is a
set of generally common behaviors and attitudes that a generation expresses throughout
its lifecycle (Strauss & Howe, 1991, 1997).
While Strauss and Howe may be two of the most popular generational researchers
of the 20th and 21st century their work is not without fault. Strauss and Howe’s work is
typically unscientific in terms of how they sample populations. Their samples tend to be
unrepresentative of the population they are trying to measure. The data is then analyzed
to view historical trends and derive characteristics of how cohorts of people behave over
time (Strauss & Howe, 2000, 2003). These characteristics and historical trends serve as
the foundation from which Strauss and Howe predict how future generations will think

34
and behave (Strauss & Howe, 1997, 2000, 2003). However, the impact of the theoretical
contribution made by Strauss and Howe (1990, 1997) to generational research cannot be
ignored. Their research is cited in most generational research and due to the way they
have framed generation theory and research in the 21st century, no study involving
generations would be complete without analyzing their findings.
Determining the Length of a Generation.
In determining who belongs in which generation, the argument is often proposed
that generation theory may be useless because people are constantly being born. How
can one tell the difference between someone born now, a year from now, or even a
decade? Making the distinction that generations are defined by specific years becomes
complicated. However, Spitzer, a historian, thinks that, “specifying generations is no
more arbitrary than specifying social classes, or ideologies, or political movements where
there is inevitably a shading off or ambiguity at the boundaries of categories” (as cited in
Strauss & Howe, 1991, p. 59). While some people born at the beginning or end of a
generation may share similarities with the previous or subsequent generations,
researchers can still assign a description to a generation with the understanding that the
description may not accurately represent each individual in a generation.
This study uses the duration of American generations as defined by Strauss and
Howe (1991). Strauss and Howe (1991, 1997) use the phases of life a person goes
through to help define the length of a generation. The phases of life are youth, rising
adulthood, midlife, and elderhood (Strauss & Howe, 1991, 1997). The youth segment is
defined from ages zero to twenty-two, during which individuals are growing, learning,
and being protected by their parents and elders. The young adult segment is defined from

35
ages twenty-two to forty-three. In America, the age twenty-two typically means just
graduating college, being of legal age for most activities, and when many who went into
the armed forces at age eighteen are released from duty. During this time, young adults
are just starting their career and beginning to build their families. The midlife segment is
defined from ages forty-four to sixty-five. The early to mid-forties designation suggests
that this is the time period when young adults move into the leadership positions that
require the time and experiences of someone in their midlife. During this time, people are
taking over the leadership positions of their elders. Elderhood is then defined from ages
sixty-six to eighty-seven. The designation of sixty-five is given because this is the age
most of the leaders of American society transition from their positions into retirement,
starting the final phase of life, elderhood. This is the time when the elders of society are
mentoring and passing on their values to the younger generations.
As each phase of life comes to an end, a new generation is born. During youth and
young adulthood each generation develops their peer personality. “A peer personality is a
generational persona recognized and determined by (1) a common age location; (2)
common beliefs and behavior; and (3) perceived membership in a common generation”
(Strauss & Howe, 1991, p. 64). These three variables give a generation their peer
personality, which allows researchers to better understand the thoughts, values, and
behaviors of a generation.
The beliefs and behaviors of a generation help researchers to understand the
boundaries of generations. Examining the frequency of measurable social pathologies,
use of technologies, and compelling social messages in generations shows researchers the
differences in time between them (Strauss & Howe, 1991). The increasing or decreasing

36
frequency of these social behaviors, use of technologies, and compelling social messages,
act as indicators for behaviors and beliefs of a generation (Strauss & Howe, 1991). Some
of these indicators include: education, accidents, divorce, drug use, alcoholism, voting,
and unemployment (Strauss & Howe, 1991). While each individual in a generation may
not exhibit the same beliefs and behaviors that are noted by the indicators, these
individuals are typically aware they are different than their peers and are straying away
from the generational norm (Strauss & Howe, 1991).
Lastly, the extent to which an individual identifies with their generation assists
researchers in determining the boundaries of a generation (Strauss & Howe, 1991). An
individual’s perception of their own generation, gives researchers an indication when
generations begin to change (Strauss & Howe, 1991). Individuals also intuitively
understand who belongs in the previous and following generations (Strauss & Howe,
1991). Researchers also use an individual’s expectations of their own future to tell where
they belong in a generation and to understand generational boundaries (Strauss & Howe,
1991).
Cycles and Patterns of Generations
In their book, The Fourth Turning, Strauss and Howe state “The reward of a
historian is to locate patterns that recur over time…” which has been extremely valuable
in generation research (p. 2). These patterns or cycles assist in understanding generations
and how they are similar and different from previous generation. They allow researchers
to draw conclusions about future generations from their placement in a generation cycle
and from previous generations who were in the same place in their generation cycle. This
study utilizes these cycles as a foundation to assist in predicting the motivations of future

37
generations of students in their decision to attend college.
Researchers from across centuries have noticed a repeating four-part generational
cycle (Huntington, 1981; Marías, 1967; Modelski, 1987; Schlesinger, 1986; Strauss &
Howe, 1991, 1997; Wechssler, 1930). The cycle of these archetypes can be seen in the
Old Testament and epics from authors like Homer and Virgil, the philosopher Polybius
may have been the first deliberately write about it. He saw that in the political regimes of
the Greco-Roman city-states that a pattern, “from kingship to aristocracy to democracy to
anarchy- from which a new kingship would emerge” (Strauss & Howe 1997, p. 87).
Fifteen hundred years after Polybius discussed this political trend, philosopher Ibn
Khaldun also observed a similar pattern in the political realm of the Islamic culture. He
named the four cycles ignoring, despising, founding, and admiring (Strauss & Howe,
1997). Other names have been given to this cycle such as reflective, anticustom,
initiating, and conformist by Julián Marías (1967), the protégé of Ortega y Gasset;
revolutionary, reactionary, harmonizing, and preparatory by Giuseppe Ferrari (1874);
organic, personal, mechanical, and mathematical by Eduard Wechssler (1930);
moralizing, cynical, institutionalizing, and hypocritical by Samuel Huntington (1981);
reason, intuition, feeling, and sensation by the well-known psychologist Carl Jung; and
lastly, normative, competitive, constructive, and adaptive by George Modelski (1987) (as
cited in Strauss and Howe 1997).
Strauss and Howe (1997) describe this cycle using the seasons in a year as a
metaphor. Just as summer and winter are described as harsher, opposing, and more
prominent times of the year, spring and fall are milder and less prominent, but also
oppose each other. Each of the four seasons happens over the cycle of a year. When the

38
last season in the cycle ends, the seasons repeat the cycle.
Generations go through a similar four-part cycle depending on the historical
location of their birth. Strauss and Howe (1997) describe these historical locations as
turnings. The first turning is called a High, which is a time of building community and
putting aside individualism. People born during a High create a new civic order by which
people live. The second turning is an Awakening, when the new order proposed by
people born in the High is challenged. This is typically a time of spiritual exploration as
opposed to scientific exploration. The third turning is called the Unraveling. During this
time, individualism is high and people challenge everything. The fourth turning is called
Crisis. Problems that were ignored in the past now affect the immediate safety of a
society and need to be solved. Communities must unite in order to solve these problems
and the communities take an aggressive and determined stance against the problems that
threaten their livelihood. The turning in which a person is placed depends on when they
are born (Strauss & Howe, 1991, 1997).
An archetype is assigned to the people born during a turning. These archetypes
can be traced throughout history and are the patterns that have been spotted by many
education researchers. They assist in creating descriptions for generations’ behaviors and
attitudes. By understanding the current and future generation’s archetype, researchers
begin to understand and predict students’ behaviors and attitudes. These archetypes will
assist this study by providing some descriptive characteristics about past, current, and
future generations’ behaviors and attitudes and how they affect students’ reasons for
attending college.

39
Using Strauss and Howe’s (1997) archetypes, individuals born during a High are
called a Prophet generation, those born during an Awakening are called a Nomad
generation, individuals born during an Unraveling are called a Hero generation, and
anyone born during a Crisis is part of an Artist generation (Strauss & Howe 1997). Table
2.3 shows the current generations that are still alive in America, their archetype, and their
birth year.
Table 2.2 Generation Archetypes, Names, and Birth Years Generation Types Generation Name Birth Year Hero G.I. 1901-1924 Artist Silent 1925-1942 Prophet Baby Boomer 1943-1960 Nomad Generation X 1961-1981 Hero Millennial 1982-2003 Artist iGeneration 2004-?
A generation cycle begins with a Prophet generation. A Prophet generation grows
up during a post-Crisis period, being particularly self-absorbed. As they grow older, there
is a great emphasis on family and spiritual development. They are also known for their
determination in the areas of values, morals, and religion. They expect their children to
be dutiful and listen without question and their reward is endless opportunities for
success. They strive to set good examples for their children by showing them the
strengths of a hero. Examples of members from a Prophet generation include Benjamin
Franklin, Abraham Lincoln, and Franklin Roosevelt (Strauss & Howe, 1997).
A Nomad generation grows up unprotected and often left alone, since their
parents and elders are challenging the status quo. This forces them to create a tough
exterior and, as they grow older, they value honor and personal survival. They are known

40
for their practical approach to leadership with an emphasis on the self as opposed to the
community. Examples of members from a Nomad generation include Nathaniel Bacon,
Dwight Eisenhower, and George Washington (Strauss & Howe, 1997).
A Hero generation is typically protected as children. They grow up appreciating
their generational community and strive to overcome challenges and achieve excellence.
They are overly confident and known for their values of community and technology and
their contributions to economic and political affluence. Examples of members from a
Hero generation are Thomas Jefferson, John F. Kennedy, and Ronald Reagan (Strauss &
Howe, 1997).
An Artist generation grows up seeing the sacrifices of their parents, who are
facing a crisis. They are extremely protected (more so than Heroes). As they grow, they
conform and look to their parents as role models and guides. During adulthood they are
flexible and work to build a consensus on the issues they face. Examples of members
from an Artist generation are John Quincy Adams, Andrew Jackson, and Theodore
Roosevelt (Strauss & Howe, 1997). To better understand the archetypes and how they
relate to each phase of life in terms of the turnings they progress through see table 2.3.
Table 2.3 Generation Archetypes, Phase of Life, and Turnings Generation Archetype Phase of Life Prophet Nomad Hero Artist Childhood High Awakening Unraveling Crisis Young Adult Awakening Unraveling Crisis High Midlife Unraveling Crisis High Awakening Elderhood Crisis High Awakening Unraveling

41
These descriptions of the different archetypes provide this study with necessary
descriptive characteristics that may assist in understanding why past, current, and future
generations of students want to attend college.
Generation descriptions.
As previously discussed, it is important to have an understanding of each
generation’s identity because their identity has effected their surrounding generations
through the roles in which they play (i.e., positions of power, parents, political leadership,
children, etc.). Currently there are six generations alive in America. This study focuses on
understanding the differences in reasons for attending college between three of the six
generations: the Baby Boomers generation, Generation X, and the Millennial generation.
The CIRP Freshman Survey started in 1966 and collection of the data used for this study
did not start until 1971. Hence there is no data for when the G.I. or Silent generation were
in college. The iGeneration generation has not reached college yet, so there is not data for
this generation. The next section will focus on providing a brief description of the
generational identity for G.I.s, Silent, and iGeneration’s and a more in-depth description
of the Baby Boomers, Generation X, and Millennials, as they are the main focus of this
study.
The G.I. Generation.
The G.I. generation was born between 1901 and 1924 (Strauss & Howe, 1991,
1997). Strauss and Howe (1997) found their role to be Hero, which means they were born
during an Unraveling and grew up during a Crisis: World War II. They are also known as
the greatest generation for not just their heroic actions in World War II, but for their
commendations in academia and politics. Their generation has won the most Nobel prizes

42
and is responsible for many of the major laws and amendments over the past 100 years
(Strauss & Howe, 1991, 1997). From their youth to old age, the government has followed
and catered to the needs of the G.I. generation. This was a determined generation focused
on developing America to becoming a great super power. They also were steadfast
parents, who wanted to be role models for their children (Strauss & Howe, 1991).
Through their hard work and dedication, Americans that came of age in this generation
saw economic and industrial growth like was never seen before (Strauss & Howe, 1991).
The Silent Generation.
The Silent generation was born between 1925 and 1942 (Strauss & Howe, 1991).
Strauss and Howe (1997) deemed this generation to be Artists. They were born during a
Crisis, the Great Depression, and grew up during a High. Members of the Silent
generation had a great respect for the G.I. generation and saw them as the heroes of the
time (Strauss & Howe, 1991). They wanted to be just like the G.I. and imitated their
actions and behaviors as much as they could (Strauss & Howe, 1991). This generation
was born during the Great Depression, which resulted in lower birth rates. Thus, the
Silent generation was smaller than both the previous generation (G.I.) and the following
generation (Baby Boomers) (Strauss & Howe, 1991). This generation got married earlier
than any other generation and was also affected by the sexual revolution and divorce
epidemic of the late 20th century (Strauss & Howe, 1991).
The Silent generation boasted support for underrepresented people. They are
home to many of the feminist leaders of the 1960s-1980s as well as many of the civil
rights leaders (Strauss & Howe, 1991). They are a generation of understanding and led
with this philosophy. This generation is also known as the Lucky Few due to the fact that

43
they received some of the best benefits that this country has to offer, simply by being
born at the right time (Carlson, 2008). These benefits included rising to adulthood during
an affluent time in American history (1947-1964), having a stable family structure, easier
access to higher education, and a clear pathway to white-collar jobs (Carlson, 2008;
Strauss & Howe, 1991).
Baby Boomer Generation.
The Baby Boomer generations represents the start of a new cycle of generations
in America. The cycle begins with Baby Boomers being born during a High (1943-1960)
and rising to adulthood during an Awakening (Strauss & Howe, 1997). As previously
discussed, generations born during an Awakening challenge the status quo and break
away from the community that their previous generations built (Strauss & Howe, 1997).
This is exactly what the Boomer generation did. The generation was not as protected
during childhood as previous generations were; their parents (G.I. and Silent) were off
saving America from the crises of the world. These children also had access to new
technology, the television, and new medical treatments, most notably immunizations for
childhood illnesses such as polio and diphtheria (Strauss & Howe, 1991).
The challenging and rebellious nature of this generation begins to show during
their teenage years. Accidental death rates, drunk driving, illegitimate births, teen
unemployment, and crime rates all rose during this time period (Lancaster & Stillman,
2002; Strauss & Howe, 1991). SAT scores decreased each year during the Baby
Boomer’s high school years (Strauss & Howe, 1991). During the sexual revolution of the
1970’s, premarital sexual activity doubled in women and rose by three percent in men
(Strauss & Howe, 1991). Then came the age of protesting the Vietnam War. Strauss and

44
Howe (1991) state that, “the effort to avoid service in Vietnam was a more pervasive
generational bond than service in the war itself” (p. 306). Into the 1980’s, Boomers split
away from the religions of their parents and explored New Age and evangelical religions
(Strauss & Howe, 1991). This generation is also known as the “Me generation” (Stillman
& Lancaster, 2002). This generation’s focus on themselves is shown by the importance
they place on their individual careers.
Currently, Baby Boomers hold many of the leadership positions in this country
and the transition may not be easy as they begin to retire. As parents, they are protective
of their children and provide them an environment where they feel special (Levine &
Dean, 2012). They want their children to grow up striving to succeed with the power and
knowledge that they can do anything (Levine & Dean, 2012). The nature of this
generation is still to challenging authority. However, instead of distrusting their elders,
now they distrust the youth of this country (Strauss & Howe, 1991).
Generation X.
Born between 1961 and 1981, Strauss and Howe’s (1991, 1997) generation theory
describes Generation X as being born during an Awakening and rising to adulthood
during an Unraveling. Members born during an Awakening are known as Nomads and
are known for being survivors and being unprotected as children (Strauss & Howe,
1997).
Generation X is often said to be the forgotten, middle child, generation. This
generation was also smaller than the previous and following generations. The low
numbers of Generation X contributed to a change in American culture and economy. This
was the first generation whose mothers began using contraception to prevent pregnancy

45
(Lancaster & Stillman, 2002; Strauss & Howe, 1991; Zemke, Raines, & Filipczak, 2000).
This was also the first generation whose families needed a dual income in order to
survive (Lancaster & Stillman, 2002; Zemke, Raines, & Filipczak, 2000). This meant that
parents were leaving their children home alone or in day cares for more time than any
previous generation. This created an overarching theme of this generation, survivors
(Lancaster & Stillman, 2002; Zemke, Raines, & Filipczak, 2000). Early members of this
generation grew up witnessing the only war that America has ever lost, the Vietnam War.
They witnessed Richard Nixon as the first U.S. President to resign in one of the biggest
political scandals in U.S. history. They saw Iran take sixty-six Americans hostage in 1979
and the disaster of the Space Shuttle Challenger in 1986. This generation grew up during
a time where America was struggling and they were left on their own to figure out their
own survival.
Their self-reliant attitude is contrasted by a need to have a sense of family, even if
that meant creating a surrogate family made of close friends (Zemke, Raines, &
Filipczak, 2000). Members of Generation X are also known for their non-conforming
attitudes. They have a strong dislike for many of the topics, events, and ideas of the
generations just before (Baby Boomers) and after them (Millennials) (Zemke, Raines, &
Filipczak, 2000). Generation X holds their personal lives dearly and do not share the
same work values as the Baby Boomers before them. They would rather work as they
need to instead of spending their lives working. (Lancaster & Stillman, 2002; Zemke,
Raines, & Filipczak, 2000).
The Millennial Generation.
Millennials were born between 1982 and 2004 during an Unraveling phase.

46
Strauss and Howe (1991, 1997) note that those born during an Unraveling take on the
generational persona of Hero. The Millennial generation has more trust in the
government and place a higher importance on community then members of the Baby
Boomer generation or Generation X (Levine & Dean, 2012; Strauss & Howe, 2000;
Winograd & Hais, 2008). Generation researchers have deemed this generation to be very
protected by their parents (Carney-Hall, 2008; Howe & Strauss, 2000; Marsh, 2007),
better educated (Levine & Dean, 2012; Strauss & Howe, 2000; Taylor & Keeter 2010),
more interpersonally connected (Coomes & DeBard; 2004; Lancaster & Stillman 2002;
Levine & Dean, 2012; Prensky, 2001), and more diverse (Coomes & DeBard, 2004;
Levine & Dean, 2012; Strauss & Howe, 2000; Wilson & Gerber, 2008; Winograd &
Hais, 2008) than previous generations.
When a generation has been studied as much as the Millennial generation has,
researchers often develop contradictory perspectives. Kelley (2012) calls these
contradictory perspectives “tensions.” She states that there may be value in these tensions
in that they are unique to generation literature and these tensions are unique to this
generation. Kelley (2012) describes the tensions in the Millennial generational identity as
We/I, Conventional/Customizable, and Technologically Entrenched/Experiential.
We/I: Many researchers have deemed this generation to be team-oriented with an
emphasis on helping each other succeed (Howe & Strauss, 2003; Meyers & Sadaghiani,
2010; Moore, 2007; Zemke, 2001). However there is also an emphasis of needing to
succeed and be the best (DeWall, 2011; Twenge et al., 2008; Westerman, 2011).
Conventional/Customizable: This generation has grown up in a very structured
environment and researchers have found they enjoy the structure and following the rules
47
(Raines, 2002; Howe & Strauss, 2000). However, with the technology available to them
and having grown up in the most diverse generation the United States has seen, they are
used to different and unique lifestyles and using technology in new ways that benefit
them and make their life better such as in communicating with others and creating more
sophisticated learning environments (Dede, 2005; Harris & Hofer 2011; McCann &
Giles, 2006; Myers & Sanaghiani, 2010; New Politics Institute, 2006; Tapscott 2009).
Technologically Entrenched/Experiential: Murillo (2011) argues that Millennials are not
just utilizing technology as a tool to make their lives easier; they are using it to live their
lives. Kelly (2012) notes that while there is no empirical evidence to show the extent to
which Millennials are experiential, much of the research conducted on Millennials in the
workplace suggests their experiential nature. Experiential refers to the idea that
Millennials learn best though active learning or learning by doing (Kelly, 2012). Raines
(2002) states that Millennials want to be challenged and to work on projects where they
are constantly learning. This is a generation that has been pushed by their parents to
experience new things and from that they enjoy working with hands-on experiences
(Weiler, 2005), games, and case studies (Sweeney, 2006).
Kelley’s (2012) descriptions of the unique intrapersonal tensions that exist in
Millennials provides an insight into the sometimes contradictory nature of defining
generational identities, but also offers an interesting insight to the thoughts and
perceptions of Millennials. Some of the key events that have taken place during their
lifetime add to Millennials’ thoughts and perceptions as well as their generational
identity. In 2009, Levine and Dean surveyed undergraduate students asking them about
the most influential events in their lives. They responded with the “advent of the World

48
Wide Web, the worldwide economic recession, the September 11 attack and its
aftermath, and the election of Barack Obama as president” (p. 19). These events provide
a context through which researchers can view the thoughts and behavior of Millennials.
iGeneration.
The iGeneration is the term to describe the current infants in America who were
born since 2005. While not a universally-accepted term, iGeneration has been mentioned
by numerous researchers and, according to a survey on USA Today’s website, it has been
an overwhelming choice for the name of this generation after famous Apple products
(iPod, iPhone, iPad, iTouch) that many people use today (Horovitz, 2012). Another name
offered by Strauss and Howe (who also named the previous generation) from a survey in
2005 is the Homeland generation. This name was chosen due to the events of 9/11 where
more parents may choose to keep their children at home and indoors (Strauss & Howe,
2003). Other names such as the Neomillennials (Dede, 2005) and the Pluralists (Frank N.
Magid Associates, Inc., 2012) have also been assigned to this new generation. A survey
conducted by Frank N. Magid Associates, Inc. (2012) predicts that this generation will be
the last generation of Caucasian majority, be the most positive about the changes in
diversity in America, have more diverse social circles than previous generations, be more
likely to believe in the “American Dream,” be more individualistic due to Generation X’s
protective parenting style, and observe an increase in mixed gender roles in society.
Strauss and Howe (2008) compare this generation with the Silent generation. Both
generations were born during a Crisis and rose/will rise to adulthood during a High
(Strauss & Howe, 1997). Strauss and Howe (1997) state that these generations may be
more indecisive and more likely to see the previous generation for their faults and work

49
to fix those faults. They grow up protected by their parents, even more so than the
previous generation. In this case, Generation X will typically raise members of the
iGeneration. Frank N. Magid Associates, Inc. reports that Generation X parenting styles
will be much more individual. They state that Generation X parents will be more realistic,
push their children to be the best, teach their children how to be successful, and look out
for their own children’s interests and not worry about other people’s children. However,
for now, the oldest members of the iGeneration are barely through 3rd grade and it is
important that generation researchers do not try to assign a generational identity to them
too soon as it will change with new events, compelling messages, impact of new
technology, and family trends (Raines, 2003; Strauss & Howe, 1991; Zapatka, 2009).
Motivation and Generation Theory
Over the past eighty years, motivation theory has progressed from general broad
theories to ones that are based on understanding the motivation of an individual within
his or her environment. For instance, Rotter’s social learning theory requires the observer
to understand the cultural and societal norms of the time and the individual’s perspective
on these norms in order to understand how a person’s motivation. In another example, the
environment and a need or tension, create motivation for a behavior in Lewin’s field
theory. In this study, the researcher suggests that generation theory can assist in
explaining the backgrounds and environment for groups of people born during a certain
time. This understanding provides some insight into the underlying reasons why each
group attended college.
A generation’s identity is formed by major historical events, compelling
messages, family trends, and technological advances that produce the experiential lens

50
through which they will continue to view their lives (Raines, 2002; Strauss & Howe,
1991, 2000; Zapatka, 2009). A generation’s identity provides a snapshot into a
generation’s thoughts, feelings, and behaviors, which allows researchers to understand
what motivates each generation to behave and act in certain ways. Many researchers use
a generation’s identity to collect details about what motivates each generation. Typically
research has used this information to discuss how to motivate generations academically
and in the workplace.
McGlynn (2008) discusses part of the Millennial’s generational identity: 1) their
attachment to technology, 2) their attraction toward community contrasted with a self-
centered attitude, and 3) their close connection to their parents. She then discusses how to
use their generational identity, to motivate them to persist through academic programs,
specifically in college. She suggests that in order to motivate Millennials to persist
through colligate academics, colleges need to be engage them in their academics through
convenient access to the classroom via online classroom software, direct them towards
personal strengths and they can use their strengths to benefit the community, and engage
their parents because their close connection with their Millennial gives them the
opportunity to academically motivate their student.
Raines (2003) discusses the compelling messages that have directed at Millennials
and how these messages can assist supervisors in motivating their Millennial workforce.
“Be smart- you are special,” “connect 24/7,” “achieve now,” and “serve your
community” are the messages Millennials have continuously heard throughout their
childhood (Raines, 2003, p. 20). Using these messages, Raines (2003) suggests that
supervisors: challenge their Millennial employees, Millennials want to achieve and will

51
rise to the challenge; let them work with their friends, this generation thrives off of peer
to peer connection (especially virtually) and a supportive community; respect them, they
have been told they are special their whole lives and they work better in an environment
that supports and respects them as an individual; and be flexible, this generation has a lot
they want to accomplish from recreational activities to saving their community, they need
to feel like their jobs care about the whole person, not just who he/she is at work.
McGlynn (2008) and Raines (2003) both use generational identity to describe
how to motivate Millennials academically and in the workplace. There is an intersection
between motivation and generations and it lies in the context that a generation’s identity
can provide about their environment and background. Motivation theory needs to
understand the background and environment of a person to understand how and why they
are motivated to behave a certain way. For instance, achievement theory needs to
understand a person’s experience with achievement to determine how likely they are to
seek out other opportunities to succeed. Being raised in an achievement oriented
environment means that someone who has succeeded at many achievements will have a
need for achievement and someone who has failed to reach their achievements may
develop a fear of failure. Understanding their environment is necessary to determining
their level of achievement and a generation’s identity can assist in describing that
environment.
In this study, motivation theory is used to better understand the reason why
students want to attend college. Generation theory is used to provide context for
understanding the environments that helped shape a person’s motivation. Thus, this study
uses the intersection of these theoretical positions to explore why generations of students

52
were motivated to attend college. This study provides a generation and motivation
context through which to view the reasons why students want to attend college.

53
CHAPTER THREE
METHODS
The purpose of this study was to explore the differences between generations’
reasons for attending college and to predict the reasons why future generations may want
to attend college. This study focuses on two research questions:
1. What are the differences in reasons for attending college amongst first-year
students in the Baby Boomer, Generation X, and Millennial generations?
2. What do past generation’s reasons for attending college suggest about future
cohorts of first-year students’ in the Millennial generation and iGeneration
reasons for attending college?
This chapter discusses the methods that were used to conduct this study. The
current study uses quantitative, longitudinal data in secondary data analyses to address
the research questions. In order to appropriately answer the first research question
descriptive analyses and a two-way repeated measures ANOVA were conducted to
analyze the differences in reasons for attending college across the Baby Boomer,
Generation X, and Millennial generations. Next, time series extrapolation and liner
regressions were conducted in order to answer the second research question. These data
and analytical approaches were selected in order understand the extent to which
differences between generations are significant and accurately predict changes in future
students’ reasons for attending college.

54
Research Tools & Data Collection
This study uses data collected by the Cooperative Institute Research Program
(CIRP) Freshman Survey in secondary data analyses. This national, longitudinal survey
has been collecting data from first-time full-time students for the past forty-five years
(Higher Education Research Institute, 2013). CIRP, which is located at the Higher
Education Research Institute (HERI) at the University of California, Los Angeles, has
surveyed over 15 million students and 1,900 institutions since 1966 (Higher Education
Research Institute, 2013). The survey is administered to students before they begin
classes at their new institution, often during orientation or welcome week activities. A
copy of the most recent CIRP Freshman Survey is provided in Appendix A. Historically,
students complete the survey as a paper instrument, although CIRP introduced online
survey administration for the Freshman Survey in 2012 Higher Education Research
Institute, 2013). Once the student finishes the survey, the completed questionnaires are
collected and sent to a third-party survey-processing firm contracted by the CIRP
headquarters ("Higher education research," 2013). The data is collected and analyzed by
CIRP and results are distributed to participating colleges and universities. CIRP then
aggregates the national data and weights them such that the survey respondents
approximate the responses of all first-time, full-time, first-year students attending
accredited four-year colleges and universities in the United States that year. Thus, the
aggregate data are nationally representative. CIRP publishes an annual monograph that
illustrates the national average results of weighted survey data (i.e., national norms) as
well as an analysis of key themes that the data indicate about the students entering four-
year colleges and universities that year. The CIRP Freshman Survey has high validity and

55
reliability as well as a small standard error due to the large sample size (Pryor et al.,
2012).
The survey asks students about range of items including demographics, family
characteristics, high school experiences, personal beliefs and values, reasons for
attending college, and expectations about the collegiate experience. This study uses data
from one bank of questions on the survey that asks: “In deciding to go to college, how
important to you was each of the following reasons?” (Pryor et al., 2012). The survey
then provides a number of different response options depending on the year. Between
1971 and 2006, the number of response options has changed from year to year, but has
always included a variation of the same thirteen response options. The response options
are as follows:
Table 3.1 Response Options provided by the CIRP Freshman Survey
Reasons why students may want to attend college A mentor/role model encouraged me to go I could not find a job My parents wanted me to go There was nothing better to do To be able to get a better job To be able to make more money To get training for a specific career To gain a general education and appreciation of ideas To improve my reading and study skills To learn more about things that interest me To make me a more cultured person To prepare for graduate or professional school Wanted to get away from home
The student then responds whether they felt that reason was “very important,” “somewhat
important,” or “not important.” In their annual reports of weighted national data, CIRP
publishes the percentage of students that indicated each reason was “very important” in

56
deciding to go to college. Again, the number of reasons presented to students differs from
year to year. Some years all thirteen reasons are presented, some years only five reasons
are presented, and some years the question is not asked on the survey. This means there
are missing data for some questions depending on the year.
Sample & Population
The population for this study is first-time full-time students attending four-year
colleges and universities in the United States. The CIRP Freshman Survey defines first-
time full-time students as either students who have graduated high school in the past year
or have been out of high school for more than a year and have not taken classes at another
postsecondary institution and will be attending a postsecondary institution full-time
(Pryor et al., 2012).
The sample that the CIRP Freshman Survey uses, and thus is the sample for the
current study, is the institutions that participate in the survey each year the question of
interest was asked from 1971-2006 The sample includes four-year private and public
colleges and universities. While community colleges can utilize the CIRP Freshman
Survey, their results are not included in the national norms. Colleges and universities
must meet certain requirements to be included in the national norms. They must admit
first-time first-year students and grant baccalaureate-level degrees or higher as listed in
the U.S. Department of Education’s Integrated Postsecondary Education Data System
(IPEDS) (Pryor et al., 2012). Colleges and universities pay a fee in order to participate in
the CIRP Freshman Survey by contacting the CIRP office. While the recruitment efforts
of CIRP attempt to garner a balanced institutional sample each year, the fact that the

57
survey is a fee-based service does introduce a degree of self-selection bias among the
participating institutions.
Data Analysis
The secondary data collected by CIRP and used in this study was first divided into
three variables. There were two primary variables of interest used in this study:
generation and reason for attending college. The variable “reasons” represent the
response options that CIRP lists for students to indicate how important that reason was in
deciding to attend college. The response options can be seen in Table 3.2. The variable
titled “generations” indicates the students in one of three generation that the responded to
the CIRP question about reasons for attending college (i.e., “In deciding to go to college,
how important to you was each of the following reasons?”). The three levels of the
variable “generations” are Baby Boomer (BM), Generation X (X), and Millennial (ML).
The third variable is the measurement of one of the primary variables “reasons.” The
third variable designated as “response” is the aggregate percentage of students who
selected the respective response option (i.e. “I could not find a job”) as “very important”
in deciding to attend college for a specific year.
There are three generations examined in this study, the Baby Boomer, Generation
X, and Millennial generations. The data provided by the CIRP Freshman Survey was split
according to the years each generation began to attend college, starting when the first
year in the generation began college and ending when the last year in the generation
began college. This study assumes that traditional college students, especially the ones
who fill out the CIRP Freshman Survey, begin college at the age of eighteen. The Baby
Boomer generation was born between 1943 and 1960, therefore, according to the

58
assumption of this study, the Baby Boomer generation’s first year in college was in 1961
and their last first year in college was 1978. The CIRP Freshman Survey did not start
asking the question, “In deciding to go to college, how important to you was each of the
following reasons?” until 1971. Therefore, the only data collected pertain to the Baby
Boomer generation was between 1971 and 1978. Generation X was born between 1961
and 1981, therefore Generation X’s first year in college was in 1979 and their last first
year was in 1999. Data for this generation was collected from the CIRP Freshman Survey
between the 1979 and 1999. Lastly, Millennials were born between 1982 and 2004,
therefore, Millennial’s first year in college was in 2000 and their last first year in college
will be in 2022. Data was collected from the CIRP Freshman Survey for the Millennial
generation between 2000 and 2006. While CIRP does provide data for the Millennial
generation between 2007 and 2012, the researcher chose to exclude this data because
between 2007 and 2012, CIRP did not use many of the response options that they
typically used on their survey between 1971 and 2006. Using the data with a significant
amount of missing points can affect the reliability of statistical results and therefore data
collected by the CIRP Freshman Survey between 2007 and 2012 was not included in this
study.
However, depending on the response option, only certain years have data because
the CIRP Freshman Survey either did not provide the initial question (“In deciding to go
to college, how important to you was each of the following reasons?”) or CIRP did not
provide the response option for that year. Table 3.3 shows the years in which the CIRP
Freshman Survey did not provide the question, “In deciding to go to college, how
important to you was each of the following reasons?” and did not provide each response

59
option. Appendix B shows an expanded version of table 3.3 that shows each individual
year the CIRP Freshman Survey provided and did not provide the initial question and the
individual response options.
Table 3.2 Years the Question and Response Options were excluded from the CIRP Freshman Survey
Question/Reason Years excluded from CIRP Freshman Survey
In deciding to go to college, how important to you was each of the following reasons? 1966-1970; 1972-1975
A mentor/role model encouraged me to go 1971-1991; 2004 I could not find a job 1971; 1985-1988 My parents wanted me to go 1985-1988 There was nothing better to do 1966-1970; 1972-1975
To be able to get a better job 1985-1988 To be able to make more money 1966-1970; 1972-1975
To get training for a specific career 1971-1998 To gain a general education and appreciation of ideas 1966-1970; 1972-1975
To improve my reading and study skills 2004-2006 To learn more about things that interest me 1998 To make me a more cultured person 1998 To prepare for graduate or professional school 1995-1998 Wanted to get away from home 1971; 1985-1988
Descriptive Analysis
To answer the first research question (What are the differences in reasons for
attending college amongst the Baby Boomer, Generation X, and Millennial generations?),
this analysis provides a descriptive introduction to the differences in reasons for attending
college for the Baby Boomer, Generation X, and Millennial generations. CIRP provides
an average of the students’ responses for each response option that were indicated as
“very important” each year. These aggregate responses were then averaged over the
range of years for each generation for each response option. For instance, CIRP provides
response option data for reasons for going to college for the Baby Boomer generation

60
between 1971 and 1979. Then, for each response option, the available data between 1971
and 1979 was averaged. This provides one percentage that represents the importance of
that response option in deciding to attend college for the Baby Boomer generation. This
process was done for each response option across each generation. Generational
responses were averaged according to the years that CIRP recorded data for that response
option. Table 3.3 and Appendix B indicate which years the CIRP Freshman Survey did
not collect data for both the initial question, “In deciding to go to college, how important
to you was each of the following reasons?” and each response option.
Two-Way Repeated Measures ANOVA
A two-way repeated measures analysis of variance (ANOVA) with unbalanced
data was then conducted to assist in answering the first research question Using SPSS, a
two-way repeated measures ANOVA was selected because it shows statistically
significant differences between two factors, in this case generations and reasons, and their
effect on another variable, in this case students’ response to the question, “In deciding to
go to college, how important to you was each of the following reasons?” Repeated
measures indicates that the same type of subject is being studied over time, in this case
that subject is first-time full-time college students. There are a different number of years
for each generation and there is missing data in some years due to the fact CIRP did not
provide a certain reason for a particular year or did not ask the question entirely. This
creates a different number of data points for each generation and therefore the data are
considered unbalanced. However, an ANOVA is robust, meaning that if there are missing
data, the analyses may still provide meaningful results.

61
Trends Analysis
This study utilizes trends analysis methods in order to understand better the
differences amongst generations as well as predict the reasons why members of the
iGeneration will want to attend college. Cohen, Manion, and Morrison (2005) discuss
when it is appropriate to use trends analysis and the strengths and weaknesses of trends
analysis.
Cohen, Manion, and Morrison (2005) state that using trends analysis is
appropriate for two reasons. First, trends analysis can be used if “the selected factors” are
“studied continuously over time” (Cohen, Manion, & Morrison, 2005, p.179). This study
analyzes secondary data collected over the past forty-five years. Secondly, trends analysis
is appropriate if the researcher is using collected data to predict future trends (Cohen,
Manion, & Morrison, 2005). This indicates that trends analysis is appropriate for this
study because the researcher wants to use data to predict future generation’s reasons for
attending college.
The strengths and weaknesses of trends analysis must also be discussed in order
to see the positive aspects of the analysis as well as the potential limitations of this
method. Due to the fact that variables are being studied continuously over time, the study
maintains a clear focus and allows researchers to see patterns in data over time and use
the collected data as a base from which to predict and forecast future trends. However,
unforeseen variables and attempting to predict too far into the future can negatively affect
the accuracy of a trends analysis (Cohen, Manion, & Morrison, 2005). Metcalf (2013)
states that while using trends analysis for predictive purposes may provide a general
indication of which way (negative or positive) trends are heading, it is very difficult to

62
predict specific points when the trend line will change direction. The further a study is
predicting into the future, the more data the trends analysis will need to be accurate
(Cohen, Manion, & Morrison, 2005; Metcalf, 2013). Metcalf (2013) also discusses the
role of unforeseen variables; the farther a trends analysis tries to predict into the future,
the higher the potential for unpredicted factors to arise that may affect the forecast of
future trends.
While trends analysis has both strengths and weaknesses, it was deemed
appropriate for this study because the goal is to understand how first-year college
students’ reasons for attending college have changed between the Baby Boomer,
Generation X, and Millennial generations. This data will then be used to predict the
reasons why the rest of the Millennial generation and the future iGeneration will want to
attend college.
Time Series Extrapolation.
In order to address the second research question (What do past generation’s
reasons for attending college suggest about future cohorts of first-year students’ in the
Millennial generation and iGeneration reasons for attending college?) multiple statistical
analyses were conducted. First, a time series extrapolation was conducted. A time series
extrapolation predicts future values of a variable based on values that have already been
collected for that variable. The assumption of a time series extrapolation is that the
variable will continue to behave similarly in the future as it did in the past. This study
uses time series extrapolation to provide a prediction of the future response percentages
for reasons for attending college based on students’ previous responses to the question,

63
“In deciding to go to college, how important to you was each of the following reasons?”
and the generation to which they belong.
Linear Regression.
Lastly, using SPSS, the response percentages for each year and reason were
plotted on a graph and a linear regression was calculated in order to see the directionality
of response options. This was done in order to see increases or decreases in past and
current students’ reasons for attending college and to project potential directions for the
responses of future cohorts on these measures. This is similar to the time series
extrapolation. However, a linear regression will provide a general direction
(increasing/decreasing) in the degree to which future students from the Millennial
generation and the early cohorts of the iGeneration place importance on the respective
reasons for attending college. A linear regression also provides a regression equation
which may be used to predict the future value of each response option based on the year.
The linear regression was then used to predict the future value of each response
option for the last first year of college for the Millennial generation and the iGeneration.
These future values were then ranked within their respective generation and placed
alongside with the values and rank within the generation of each response option from the
Baby Boomer generation and Generation X. This was done in order to see the changes in
the ranking of importance of reasons to attend college across each generation.
Limitations
When interpreting the methodology and results of this study, certain limitations
must be considered. For this quantitative exploratory study there were three overarching
limitations: 1) the generalizability of generation theory, 2) the use of secondary data, and

64
3) the effects of missing data.
When working with generation theory it is important to understand that
generation theory and generation descriptions do not account for every member of a
generation. Generation theory is aggregate and, therefore, hides individual differences.
The assumption can be made that describing generations can lead to stereotyping. While
the attributes to generations may not apply to every person, they are valuable in making
generalizations, not stereotyping them. Generalizations “give us the insights, awareness,
and empathy that can lead to new approaches, changes in our own behavior, and
adaptations that can create more understanding, cohesiveness, creativity, and
productivity” (Raines, 2003, p. 11).
Using secondary data to conduct this study poses another limitation. These data
were collected previously and were not collected for the purpose of this study. For
instance, the question and the response options put forth by the CIRP Freshman Survey
were not designed to test the motivation theories with which they are being aligned. The
researcher used the available data to evaluate and align motivation theories with the
response options provided by CIRP. This is a subjective process, which may differ
between researchers’ interpretation of the response options and motivation theories. The
researcher recognizes that this may cause a bias in the study. However, the researcher did
a thorough review of motivation theory to inform the best alignment of the reasons
to motivational theory.
Another limitation that exists in the data with respect to the fact that the reasons
for attending college were determined a priori, does not allow for an open-ended
response, and, thus, may not represent the full range of motivations for students to attend
65
college. Just from talking with students, one may hear many reasons why they wanted to
attend college that may not be included on the survey. CIRP has predetermined these
reasons and students may feel like they have to choose one that does not necessarily
apply to them. Therefore the data may be skewed to show that some reasons are more
important than they actually are due to the fact that students cannot indicate their own
reasons for attending college
Finally, there are missing data in the key variables of interest for the current
study. Due to CIRP providing only some of the response options each year or sometimes
leaving out the question entirely, gaps exist for certain years in the trends for the reasons
for attending college. Also, since CIRP did not start asking this question until 1971, there
is no data for G.I. and Silent generations (which is why their motivations for attending
college were not examined in this study) and there is a significant portion of data missing
from the Baby Boomer generation. There are data that reflect a portion of why
Millennials want to attend college. However, the Millennial generation is still going to
college. Each year more data is added to the Millennial generation which could affect the
analyses in this study. The missing data could show that there are differences between
generations when there may not be any differences at all. The years that data is missing
can be seen in Table 3.3 and Appendix B.

66
CHAPTER FOUR
RESULTS & DISCUSSION
The purpose of this study is to understand better the differences between
generations’ motivations for attending college. This study focused on two research
questions:
1. What are the differences in reasons for attending college amongst first-year
students in the Baby Boomer, Generation X, and Millennial generations?
2. What do past generation’s reasons for attending college suggest about future
cohorts of first-year students’ in the Millennial generation and iGeneration
reasons for attending college?
First, an examination of “reasons for attending college” was conducted. In order
to do this an average of the aggregates of each year across the range of years for each
generation was generated in order to see how important each reason for going to college
was to each generation. Next, a two-way repeated measures ANOVA was conducted in
order to detect statistically significant differences in the reasons why each generation
wanted to attend college. Following the two-way repeated measures ANOVA, a time
series extrapolation was conducted in order to predict trends regarding the importance of
each response option for the rest of the Millennial generation as well as the early cohorts
of the iGeneration. Lastly, a linear regression for each response option was conducted in
order to provide further information about the importance of each response option for

67
future cohorts of students, most notably the rest of the Millennial generation and the early
cohorts of the iGeneration.
Descriptive Analysis
This section provides a descriptive introduction to the two-way repeated measures
ANOVA and the time series analysis. Comparing averages of the aggregates of the
“reasons” for each year across the range of years for each generation provides suggestive
evidence about the importance of each reason as compared to the other reasons in a
generation. This will provide context for the ANOVA and time series analysis discussed
later in this chapter by showing which response options were the most important for each
generation in their decisions to attend college. Note that the percentages cannot be
compared across different generations because the generations do not have an equal
representation of available data. For instance, the CIRP Freshman Survey only provides
data for the Baby Boomer generation between 1971 and 1979, eight years of data, while
there is available data for Generation X between 1980 and 2000, twenty years of data. It
would be inaccurate to compare the Baby Boomer response percentages to the Generation
X response percentages because Generation X has more data. However the rank order
provided for each reason can be compared across generations. Table 4.1 shows the results
of averaging the aggregates of “reasons” for each year across the range of years for each
generation. This table suggests the importance that each generation placed on the
respective reason for attending college. The average percentage of annual aggregate
responses that a certain reason was “very important” to a generation’s decision to go to
college for each response option for each generation are shown in bold. The rank of how
important each response option was to a generation is in parentheses.
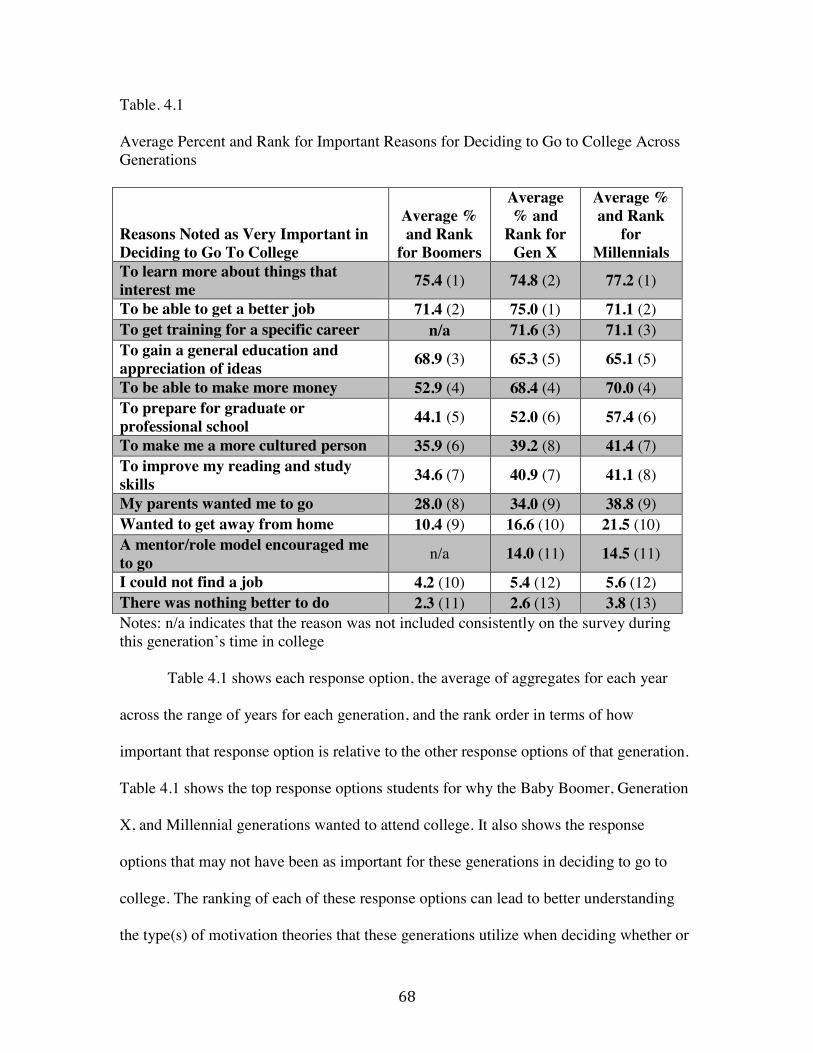
68
Table. 4.1
Average Percent and Rank for Important Reasons for Deciding to Go to College Across Generations
Reasons Noted as Very Important in Deciding to Go To College
Average % and Rank
for Boomers
Average % and
Rank for Gen X
Average % and Rank
for Millennials
To learn more about things that interest me 75.4 (1) 74.8 (2) 77.2 (1)
To be able to get a better job 71.4 (2) 75.0 (1) 71.1 (2) To get training for a specific career n/a 71.6 (3) 71.1 (3) To gain a general education and appreciation of ideas 68.9 (3) 65.3 (5) 65.1 (5)
To be able to make more money 52.9 (4) 68.4 (4) 70.0 (4) To prepare for graduate or professional school 44.1 (5) 52.0 (6) 57.4 (6)
To make me a more cultured person 35.9 (6) 39.2 (8) 41.4 (7) To improve my reading and study skills 34.6 (7) 40.9 (7) 41.1 (8)
My parents wanted me to go 28.0 (8) 34.0 (9) 38.8 (9) Wanted to get away from home 10.4 (9) 16.6 (10) 21.5 (10) A mentor/role model encouraged me to go n/a 14.0 (11) 14.5 (11)
I could not find a job 4.2 (10) 5.4 (12) 5.6 (12) There was nothing better to do 2.3 (11) 2.6 (13) 3.8 (13) Notes: n/a indicates that the reason was not included consistently on the survey during this generation’s time in college Table 4.1 shows each response option, the average of aggregates for each year
across the range of years for each generation, and the rank order in terms of how
important that response option is relative to the other response options of that generation.
Table 4.1 shows the top response options students for why the Baby Boomer, Generation
X, and Millennial generations wanted to attend college. It also shows the response
options that may not have been as important for these generations in deciding to go to
college. The ranking of each of these response options can lead to better understanding
the type(s) of motivation theories that these generations utilize when deciding whether or

69
not to attend college. The top five reasons for attending college are similar across all
three generations. “To learn more about things that interest me,” “to be able to get a
better job,” “to get training for a specific career,” “to gain a general education and
appreciation of ideas,” and “to be able to make more money” were in the top five for each
generation. However, “to get training for a specific career,” was not a provided response
option for the Baby Boomer generation, their other top reason for attending college was
“to prepare for graduate or professional school.” The bottom five reasons for attending
college for each generation were similar as well. “My parents wanted me to go,” “wanted
to get away from home,” “a mentor/role model encouraged me to go,” “I could not find a
job,” and “there was nothing better to do” were in the bottom five for each generation.
However, “a mentor/role model encouraged me to go,” was not a provided response
option for the Baby Boomer generation, their other bottom reason for attend college was
“to improve my reading and study skills.”
Tables 4.2-4.5 show each response option, the average of aggregates for each year
across the range of years for each generation, and the ranking of importance for each
generation categorized by the motivation theory they were aligned with in table 2.1.
Table 4.2 Response Options aligned with Achievement Theory
Baby
Boomers Generation
X Millennials To prepare for graduate or professional school 44.1% (5) 52% (6) 57.4% (6)
To be able to make more money 52.9% (4) 68.4% (4) 70% (4) To be able to get a better job 71.4% (2) 75% (1) 71.1% (2) To get training for a specific career n/a 71.6% (3) 71.1% (3) Notes: n/a indicates that the reason was not included consistently on the survey during this generation’s time in college

70
Table 4.2 indicates that three of the response options (“to prepare for graduate
school,” “to be able to make more money,” and “to be able to get a better job” for Baby
Boomers, “to be able to make more money,” “to be able to get a better job,” and “to get
training for a specific career” for Generation X and Millennials) aligned under
achievement theory are ranked in the top five most important reasons why students
decide to attend college for all three generations. This suggests that all three generations
may typically be motivated to attend college because of their need for achievement.
Table 4.3 Response Options aligned with Drive Theory
Baby
Boomers Generation
X Millennials To learn more about things that interest me 75.4% (1) 74.8% (2) 77.1% (1)
To gain a general education and appreciation of ideas 68.9% (3) 65.3% (5) 65.1% (5)
To make me a more cultured person 35.9% (6) 39.2% (8) 41.4% (7) To improve my reading and study skills 34.6% (7) 40.9% (7) 41.1% (8)
Wanted to get away from home 10.4% (9) 16.6% (10) 21.5% (10)
Table 4.3 shows that two of the response options (“to learn more about things that
interest me” and “to gain a general education and appreciation of ideas”) aligned under
drive theory are ranked in the top five most important reasons why students decide to
attend college for all three generations. It is also interesting to note that the reason,
“wanted to get away from home” was in the bottom three for each generation. This
indicates that “wanted to get away from home” may not have typically been an important
reason in deciding to attend college for the Baby Boomer, Generation X, and Millennial
generations. Drive theory is defined as the enjoyment one receives when completing the

71
task for the sake of completing it as opposed to completing the task for an external
reward. This table and rank order of these response options suggest that all three
generations may be motivated to attend college because of the enjoyment they receive
from accomplishing tasks. While this type of motivation may be important to each
generation when deciding to attend college, it may not be a very influential type of
motivation because only two of the four response options listed under drive theory are in
the top five reasons for attending college for each generation.
Table 4.4 Response Options aligned with Field Theory
Baby Boomers
Generation X Millennials
My parents wanted me to go 28% (8) 34% (9) 38.8% (9) Wanted to get away from home 10.4% (9) 16.6% (10) 21.5% (10) I could not find a job 4.2% (10) 5.4% (12) 5.6% (12) There was nothing better to do 2.3% (11) 2.6% (13) 3.8% (13)
Table 4.4 indicates that all of the response options aligned under field theory are
ranked in the bottom five reasons why students decide to attend college for all three
generations (only eleven response options were given for the Baby Boomer generation).
Field theory is implemented when a person is motivated by their environment and a
particular need or tension. A person will be motivated to act in a certain way depending
on how that person’s environment is affecting them at the time the need or tension
occurs. Field theory relies on the timing of the need or tension and the nature of the
environment at the time the need or tension occurs. Table 4.4 and the ranking order
suggest that all three generations do not typically use field theory as a means of
motivation when deciding to attend college.

72
Table 4.5 Response Options aligned with Social Learning Theory
Baby Boomers
Generation X Millennials
A mentor/role model encouraged me to go n/a 14% (11) 14.5% (11)
My parents wanted me to go 28% (8) 34% (9) 38.8% (9) Notes: n/a indicates that the reason was not included consistently on the survey during this generation’s time in college Table 4.5 shows that all of the response options aligned under social learning
theory are ranked in the bottom five reasons why students decide to attend college for all
three generations (only eleven response options were given for the Baby Boomer
generation). Social learning theory is when a person is motivated to do something based
on the social norms of their community, by what others expect of them, and/or by what
other people are doing. Table 4.5 and the ranking of the response options under social
learning theory, suggest that all three generations were not typically motivated to attend
college based on social norms, expectations, and/or what other people were doing.
Tables 4.2-4.5 indicated that all three generations use both achievement
motivation and drive motivation when deciding whether or not attend college. It suggests
that generations choose to attend college because they have a desire to make themselves
better. Whether it is through getting a better job, making more money, to learn more
about things that interest them, or to gain a general education, the Baby Boomer,
Generation X, and Millennial generations want to become better people. They enjoy
learning for the sake of learning, but appreciate the knowledge for what it can do for their
careers and life after college. While there may be subtle differences in the ranking order
for each generation, the top five response options are similar across each generation.

73
Despite this suggestive evidence, the question remains, is there a significant difference in
why generations want to attend college? To answer this question, a two-way repeated
measures ANOVA was conducted.
Two-Way Repeated Measure ANOVA
The following section discusses the results of the two-way repeated measures
ANOVA. A two-way repeated measures ANOVA was selected for this study because it
shows significant differences between two factors, in this case generations and reasons,
and their effect on another variable, in this case response. Repeated measures indicates
that the same type of subject is being studied over time, in this case that subject is first-
time full-time college students. In order for the two-way repeated measures ANOVA to
report valid data, three assumptions must be tested. These assumptions are: there are no
outliers in any group, each group's data (or residuals) is normally distributed, and each
group's data (or residuals) has equal variance (called homogeneity of variances).
The first assumption requires detection of any outliers in the trends data for each
response option for each year. A boxplot was used to detect for any outliers in this
dataset. The boxplot test was chosen to detect for any outliers because it is a widely
accepted and convenient way of graphically illustrating the dataset in order to view any
outliers. Figure 4.1 shows the boxplot for the two-way repeated measures ANOVA. The
boxplot tests for outliers by putting the data on a chart. If there are any outliers they will
be indicated by a small circle or star and they will set outside of the box as can be seen in
figure 4.1. There were ten outliers detected in this dataset as assessed by inspection of a
boxplot. The researcher decided not to remove these outliers because there were not
many outliers and he believes they will not materially affect the results.

74
Figure 4.1. Two-Way Repeated Measures ANOVA Boxplot
The second assumption tests the normal distribution of the data set. A Shapiro-
Wilk’s test was conducted in order to test the normal distribution of the dataset. A
Shapiro-Wilk test is used when the dataset contains less than 2,000 cases, which fits the
parameters of the current study. In the Shapiro-Wilk test, the null hypothesis is that the
dataset is normally distributed and the alternative hypothesis is that the dataset is not
normally distributed. In order to prove that the data is normally distributed, the
alternative hypothesis must be rejected. The Shapiro-Wilk test typically uses a 95%
confidence level. Therefore in order to reject the alternative hypothesis the significance
value must be p>0.05. If p>0.05 then, according to the Shapiro-Wilk test, the dataset is
normally distributed. Table 4.6 shows the significance values for the Shapiro-Wilk tests
for each reason within each generation.

75
Table 4.6 Significance Values for the Shapiro-Wilk Test for Normal Distribution of Data
Reason Baby Boomer Generation X Millennial A mentor/role model encouraged me to go
Xa 0.872 0.077
I could not find a job 1 0.167 0.682
My parents wanted me to go 0.016b 0.042 0.201
There was nothing better to do 0.85 0.001b 0.034b
To be able to get a better job 0.771 0.051 0.168
To be able to make more money 0.445 0.023b 0.995
To get training for a specific career Xa Xa 0.289
To gain a general education and appreciation of ideas
0.836 0.417 0.15
To improve my reading and study skills
0.509 0.49 0.659
To learn more about things that interest me
0.845 0.417 0.15
To make me a more cultured person
0.86 0.213 0.156
To prepare for graduate or professional school
0.114 0.04 0.787
Wanted to get away from home 0.446 0.003 0.821
aNot enough data provided bNot normally distributed There are four data points that are not normally distributed (p < .05) and three
data points that did not have enough data available to provide significance levels for the
Shapiro-Wilk test. The researcher determined that the four data points that were not

76
normally distributed were caused by a lack of data for the variable. Due to the somewhat
robust nature of the two-way repeated measures ANOVA, the researcher decided to leave
these data points even though they were not normally distributed.
The final assumption required an ANOVA is a test for homogeneity of variance.
This test was required in order to make sure that the variance (how spread out the
distribution is) within each group (in this case, generation) is equal. Levene’s test of
homogeneity of variance was used in order to assess this data set. Levene’s test was
chosen because this dataset has a relatively normal distribution, meaning that the
response percentages for each across each generation are normally distributed. In
Levene’s test, the null hypothesis is that the dataset has homogeneity of variance and the
alternative hypothesis is that the data set does not have homogeneity of variance. In order
to determine if there is homogeneity of variance the alternative hypothesis must be
rejected. Levene’s test typically uses a confidence level of 95%. Therefore in order to
reject the alternative hypothesis the significance value must be p>0.05. If p>0.05 then,
according to the Levene’s test, the dataset has homogeneity of variance. According to
Levene’s test of homogeneity of variance, this data set does not have equal variances (p <
.05). Since this assumption for a two-way repeated measures ANOVA was not met, it
needs to be understood how this could potentially effect the results. Unequal variances
may mean that the significance value for the two-way repeated measures ANOVA may
be underestimated, meaning the significance value may be larger than indicated. The two-
way repeated measures ANOVA is fairly robust and may be able to handle unequal
variances. Unequal variances become an issue if the significance value is only marginally
significant. In order to understand the effect unequal variances will have on the results,

77
the significance value of the two-way repeated measures ANOVA will be examined in
the following paragraph.
After checking for outliers, normal distribution, and homogeneity of variance, the
two-way repeated measures ANOVA was then conducted. A two-way repeated measures
ANOVA was selected because it shows significant differences between two factors, in
this case generations and reasons, and their effect on another variable, in this case
response to the question, “In deciding to go to college, how important to you was each of
the following reasons?” Repeated measures indicates that the same subject is being
studied over time, in this case that subject is first-time full-time college students. The
goal of this model is to reveal if there are statistically significant differences in why
different generations want to attend college. The two-way repeated measures ANOVA
revealed that there is a statistically significant difference between the reasons why Baby
Boomers, Generation X, and Millennials wanted to attend college, F(2, 333)= 39.067, p <
.0001, partial n2= .190. The F indicates an F-test was used, the F-statistic (39.067) and
the degrees of freedom (2, 333) indicate a point on the F-distribution that determines the
statistical significance, p<0.0001 indicates that the two-way repeated measures ANOVA
is statistically significant at the 99.99% confidence level and that there is a 0.01% chance
that this model committed a Type I error (i.e., false positive). Since the significance value
of the two-way repeated measures ANOVA is so low, it can be seen that the unequal
variances did not greatly affect the significance of the results.
The two-way repeated measures ANOVA indicated that there is a statistically
significant difference between the reasons why different generations wanted to attend
college. The researcher then wanted to understand what exactly those differences were. In

78
order to do this a post-hoc test was conducted to determine which specific reasons are
significantly different amongst the generations. However, due to the unbalanced data set,
SPSS was unable to conduct any post-hoc tests. The researcher was unable to conduct
post-hoc test because of missing data points in the dataset as well as not having enough
data points for the Baby Boomer generation.
Time Series Extrapolation
Ideally, a time series extrapolation would use previous data points to predict the
relative percentage that each reason should get for each future year (i.e., using changes in
reasons for attending college across Baby Boomer, Gen X, and Millennial generations to
predict the responses of the iGeneration). The researcher attempted to employ this
statistical test, but limitations in the data made the extrapolation inaccurate and the results
unreliable. Two specific issues with the data made a time series extrapolation an
unrealistic option for data analysis in this study.
One of the issues in creating an accurate prediction comes from the lack of data
for the variables of interest at certain time points. This was particularly relevant for the
Baby Boomer generation although there were some missing data for Generation X (1985-
1988). As shown in table 3.3, the CIRP Freshman Survey did not ask the question, “In
deciding to go to college, how important to you was each of the following reasons?” at
all, during 1966-1970 and 1972-1975. When conducting an extrapolation, large gaps in a
data set affect the reliability of the prediction. It also makes the points at both ends of that
gap somewhat less useful because these points then act as outliers, which also affect the
reliability of the extrapolation.

79
The other issue in conducting the time series extrapolation was trying to predict
too far into the future. One of the goals of this study was to try to predict the reasons the
iGeneration would want to attend college. The iGeneration will begin their first year in
college in 2023. The last cohort of the iGeneration will enter college between 2041 and
2045 based on the current assumptions regarding the duration of a generation. Therefore
the time series extrapolation would need to predict between 35 and 39 years into the
future. The current data set only provides information for 36 years and there are gaps in
the data set. While the two-way repeated measure ANOVA is robust with unbalanced
data, a time series extrapolation needs a balanced dataset in order to be accurate and
reliable.
Given these reasons, a time series extrapolation with the limited data set yielded
unreliable and inaccurate predictions. Therefore results derived from the time series
extrapolation were not recorded for this study. However an examination of linear trends
for the data available for each reason for attending college provided the researcher with
suggestive evidence to predict future directions of responses on these items among first-
year students in the iGeneration.
Linear Regression
In order to best understand the results of this study, the following section will
discuss in full detail the results of one of the response options for a reason to attend
college in the CIRP Freshman Survey. Thereafter, in order to organize the data in a
meaningful manner, the results for each reason will be discussed in the context of the
motivation theory that it falls under.

80
In order to derive predictions from the data set, trends lines based upon linear
regressions were drawn using SPSS. A linear regression was calculated based on the data
for each question. From these regression equations, trend lines were drawn and increases
and decreases in the importance of a reason for attending college can be tracked across
time. Tracking these patterns in responses to the survey questions about reasons for
attending college across generations offers suggestive evidence for predictions for future
student responses on these measures. Similar to the time series extrapolation, a problem
with linear regressions is that the further into the future the prediction must go, the less
accurate and reliable it becomes. Therefore the linear regression is illustrated and
discussed solely in terms of directionality (increasing/decreasing), which represents more
accurate insight for the remaining Millennial generation as well as the early cohorts of the
iGeneration.
In order to accurately calculate the linear regressions, the data set must be tested
for three assumptions regarding errors: independence of errors, homoscedasticity of
errors, and normally distributed errors.
Linear Regression Assumptions for “I could not find a job”
The independence of errors assumption is necessary in order to see if the error
terms are related to each other. If the error terms are related to each other, then the linear
regression will not have independence of errors, which could affect the significance of
the linear regression. The Durbin-Watson test is used in this study because it is the most
common and most widely accepted way of testing the independence of errors. The
Durbin-Watson test measures the correlation between the error terms and the previous
error term producing the D-statistic. The D-statistic ranges between 0 and 4. The closer
81
the D-statistic is to 2, the more likely there is independence of errors. The smaller the D-
statistic is, the more likely there is positive autocorrelation, which means the error terms
are correlated and therefore, not independent. This can lead to inflation in the
significance of the linear regression. A D-statistic between 1.5 and 2.5 is a comfortable
range to assume there is independence of errors.
As shown in Table 4.7 that the D-statistic for the reason “I could not find a job” is
0.924. This statistic is outside of the likely range for independence of errors and it seems
that the independence of errors may be positively auto-correlated. This means that the
dataset for the reason “I could not find a job” has violated the assumption of
independence. Since this assumption for a linear regression was not met, it needs to be
understood how this could potentially affect the results. Since the D-statistic is lower than
1.5 and therefore likely to be positively auto-correlated, the significance for this linear
regression may be inflated.
The next assumption that must be tested is that there is homoscedasticity of errors.
This means that the variance around the regression line is similar for all values. If the
variance for all values is not similar, it means there is heteroscedasticity of errors. If
heteroscedasticity of errors is present, it could bias the significance of the regression. The
presence of heteroscedasticity may also indicate that there are other violations in the
assumptions of the linear regression. A scatterplot is typically used to check for
homoscedasticity. If homoscedasticity of errors is present, the points on the scatterplot
will be spread evenly across the x-axis (Regression Standardized Prediction Value) and
the y-axis (Regression Standardized Residuals). If they are not evenly spread and differ in

82
height, looking more like a funnel shape, then there is a violation of homoscedasticity of
errors.
Figure 4.2 shows the scatterplot for the reason “I could not find a job.” The points
in the scatterplot are spread evenly the x-axis and y-axis. From the scatterplot it can be
determined that this linear regression has homoscedasticity of errors. This means that this
linear regression has independence of errors and that this assumption holds true.
Figure 4.2. “I could not find a job” Scatterplot
The final assumption that must be tested is the normally distributed errors.
Testing for normally distributed errors identifies if there are any outliers in the dataset for
this linear regression and if the dataset for this linear regression is normally distributed.
Testing for normally distributed errors is done visually by observing one of three
different figures. By observing a histogram, boxplot, or a normal probability plot,
whether or not there is a normal distribution of errors can be seen. All three figures are
used interchangeably to observe the normal distribution of errors and one method is not

83
better than the other. This study used a normal probability plot to see if there was a
normal distribution of errors. In order to see if there is a normal distribution of errors in a
normal probability plot, the points along the line will slightly bend around the line. If the
points on the normal probability plot are far off of line (i.e. make an “S” shape or look
skewed one way or another) that suggests that either the dataset for that linear regression
is not normally distributed and/or the dataset for that linear regression contains outliers.
Figure 4.3 shows the normal probability plot of the linear regression for the
reason “I could not find a job.” The points along the line slightly bend around line
suggesting that the dataset for this linear regression is normally distributed.
Figure 4.3. “I could not find a job” Normal P-P Plot
A linear regression is fairly robust to faults in the dataset, meaning that if one
assumption is not met it may not significantly affect the results of the linear regression.
However, it is important to understand that since the reason “I could not find a job” did

84
not meet the independence of errors assumption, the significance value of the results may
be inflated/overestimated.
Linear Regression Results for “I could not find a job”
Table 4.7 shows the results of the linear regression for reason “I could not find a
job.” The following section will define what each of these statistics mean and why they
are important to know when conducting a linear regression.
Table 4.7 Linear Regression Results for “I could not find a job”
F-Statistic
Regression and Residual
Degrees of Freedom
(respectively) P-value
Regression Equation
R2
Rate of Change per Year
I could not find a job
9.112 (1, 25) p<0.01 0.0004 (Y>1971) + 0.0434
26.7% 0.04%
The F-test is typically used when trying to determine if a model is a good fit for
the dataset. In the context of this study, the F-test determines if the regression equation is
statistically significant for this dataset. Running the F-test returns an F-statistic, which,
when used with the degrees of freedom, corresponds to a specific point along the F-
distribution. Locating that point on the F-distribution returns a p-value. The p-value
determines whether or not the model is statistically significant depending on the
confidence level the researcher has put forth. For this study, a 99% confidence level
(p<0.01) is used in order to reduce the likelihood of receiving a false positive (Type I
error).

85
For the reason “I could not find a job” the regression equation is statistically
significant at a confidence level of 99%, F(1, 25)= 9.112, p< 0.01. Where F indicates that
the F-test was used, the F-statistic (9.112) and the regression and residual degrees of
freedom (1, 25, respectively) indicate a point on the F-distribution that determines the
statistical significance, and p< 0.01 indicates that the regression equation is statistically
significant as determined by the 99% confidence level and there is only a 1% chance that
this model committed a Type I error (false positive).
The next statistic in table 4.7 is the regression equation. A linear regression is
usually set up as y=mx+b. Where y is the predicted value, m is the slope of the equation,
x is a value along the x-axis, and b is the y-intercept. The regression equation determines
the slope and position of the linear regression. The regression equation provides valuable
information such as the direction of the linear regression (positive/negative) as indicated
by the slope. The regression equation is also the basis for predicting future values along
the linear regression. By determining the value of x and plugging it into the regression
equation, the predicted value can be determined and plotted along the linear regression.
The regression equation for the reason “I could not find a job” is
y=0.0004x+0.0434. Table 4.7 shows the regression equation as
y=0.0004(Y>1971)+0.0434. For this study, the x-value is the years since 1971. In order
to receive an accurate prediction for how important this reason will be for first-time full-
time students in 2020, the years since 1971 would need to be calculated. In this case 49
would be the x-value. The slope also suggests that the linear regression is positive and
may continue to increase. The slope also determines the percent rate of increase per year.
To determine the percent rate of increase per year, the slope (0.0004) is multiplied by

86
100. This indicates that each year the reason “I could not find a job” will increase in
importance by 0.04%. This statistic is shown in the last column in Table 4.7.
Lastly, it is important to consider how much variation in the percentage response
of students who indicate one of the given reasons was very important in their decision to
attend college (response variable) is explained by the year the response was given
(explanatory variable). In order to do this, the R2 statistic is calculated. The R2 value
indicates the proportion of variance in the future response variable that can be explained
by the explanatory variable. In this study the future response variable is the percentage of
students who responded that a response option (“I could not find a job”) was very
important when deciding to attend college and the explanatory variable is the generation
the response was given. The R2 ranges between 0 and 1. The closer the R2 is to 1, the
better the explanatory variable is able to explain the variance in the response variable and
the better the linear regression will predict future values. If R2 is closer to 0 it suggests
that the explanatory variable does not explain much of the variance in the response
variable and that it may not provide a good prediction of future response values. There is
no one answer in determining a good R2 value because there are many other variables
that could affect the response variable along with the explanatory variable(s) in the study.
However an R2 that is very close to 1, may indicate that the explanatory variable(s) is too
similar to the response variable.
The R2 value for the reason “I could not find a job” is 26.7% as indicated by table
4.7. In this study, the future response variable is the percentage of students who
responded “I could not find a job” was a very important reason as to why they decided to
attend college and the explanatory variable is the generation in which the response is

given. The generation in which
explained variability in the pe
was a very important reason as to why they decided to attend college.
indicates that the generation in which the response is given in
percentage of students that will respond “I could not find a job” is a very important
reasons in deciding why they want to attend college. However, and R
also indicates that there are other variables that also assist in predicting the percentage of
students that will respond “I could not find a job” is a very important reasons in deciding
why they want to attend college.
Figure 4.4 shows the linear regression and the dataset for the
find a job.” This figure is included to provide a visual example of what the linear
regression looks like compared to the actual dataset.
Figure 4.4. “I could not find a job” Trend Line
0%
1%
2%
3%
4%
5%
6%
7%
8%
9%
71 76 81 86 91 96 01
87
in which the response is given accounted for 26.7% of the
explained variability in the percentage of students who responded “I could not find a job”
was a very important reason as to why they decided to attend college. This statistic
indicates that the generation in which the response is given in good predictor of the
at will respond “I could not find a job” is a very important
reasons in deciding why they want to attend college. However, and R2 value of 26.7%
also indicates that there are other variables that also assist in predicting the percentage of
ll respond “I could not find a job” is a very important reasons in deciding
why they want to attend college.
Figure 4.4 shows the linear regression and the dataset for the reason “I could not
This figure is included to provide a visual example of what the linear
regression looks like compared to the actual dataset.
. “I could not find a job” Trend Line
01 06
I could not find a job
Linear (I could not find a job)
the response is given accounted for 26.7% of the
rcentage of students who responded “I could not find a job”
This statistic
good predictor of the
at will respond “I could not find a job” is a very important
value of 26.7%
also indicates that there are other variables that also assist in predicting the percentage of
ll respond “I could not find a job” is a very important reasons in deciding
reason “I could not
This figure is included to provide a visual example of what the linear
I could not find a job
Linear (I could not find a

88
Linear Regressions for Response Options
The following sections will discuss the results of the linear regressions for each of
the response options provided by the CIRP Freshman Survey under the motivation theory
to which they have been aligned.
Achievement Theory
Table 4.8 shows the necessary statistics in order to interpret the findings from
each response option’s linear regression. Figure 4.5 shows the trend lines for each
response option under achievement theory. The response options “to be able to get a
better job” and “to get training for a specific career” were unable to meet many of the
assumptions that are necessary when running a linear regression (i.e.- low Durbin-
Watson statistic, heteroscedasticity of errors), which creates a bias in the model. While
the model does suggest that the rest of the Millennial generation and the early cohorts of
the iGeneration may find these reasons continually less important, the biases present may
be providing a false result. Therefore it is difficult to derive any conclusions from these
two models. The trend lines for both response options are indicated by dashes on figure
4.5.
The response options “to prepare for graduate or professional school” and “to be
able to make more money” provide more accurate models from which to base
predictions. The linear model for both response options suggests that they will each
continue to increase slightly (0.5% per year) in importance for the remaining Millennials
and early cohorts of the iGeneration. The generation in which the response is given
explains 76.4% of the variance in the percentage of students who responded, “to prepare
for graduate or professional school” as a very important reason in deciding to attend

89
college. This suggests that the generation in which the response was given is a good
indicator for this response option and will provide more accurate predictions. The
generation in which the response is given explains 58.7% of the variance in the
percentage of students who responded, “to be able to make more money” as a very
important reason in deciding to attend college. This suggests that the generation in which
the response was given is a good indicator for this response option and will provide more
accurate predictions.
Overall, the reasons listed under achievement theory may be likely to be relevant
motivators for the rest of the Millennial generation and the iGeneration to attend college
because two of the response options (“to prepare for graduate or professional school” and
“to be able to make more money”) will continue to increase in importance at a rate of
0.5%/year and three of these response options were in the top five for each generation
which can be seen from table 4.8. The significantly fast increase in importance (0.5% per
year) in the response options, “to prepare for graduate or professional school” and “to be
able to make more money” may indicate that this reason may be a more important reason
to future generations when deciding to attend college as soon as the early cohorts of the
iGeneration. “To be able to get a better job,” “to get training for a specific career,” and
“to be able to make more money” were in the top five for Generation X and Millennials
and “to be able to get a better job,” “to be able to make more money,” and “to prepare for
graduate or professional school” were in the top five for the Baby Boomers.

90
Table 4.8 Reasons Aligned with Achievement Theory: Results
Notes: a The threshold for a lack of independence is between 1.5 and 2.5. If the Durbin-Watson statistic is less than 1.5 the statistical significance may be inflated. If it is above 2.5 the statistical significance may be underrated; b Y>1970 indicates “years since 1971”; c This study uses a confidence level of 99%, there p must be less than 0.01 in order to be considered statistically significant.
Independence of Errors (Durbin-Watson)
Homoscedasticity of Errors?
Normal Distribution of Errors?
Regression Equation
Explained Variance
Rate of Change
per Year P-valuec
To prepare for graduate or professional school 0.731a Yes Yes 0.005 (Y>1971)b +
0.4245 76.4% 0.5% p<0.01
To be able to make more money 0.317a Yes Yes 0.005 (Y>1971)b +
0.5655 58.7% 0.5% p<0.01
To be able to get a better job 0.863a No Yes -0.0003 (Y>1971)b
+ 0.7419 1.63% -0.03% p>0.01
To get training for a specific career 0.842a No Yes -0.0024 (Y>1971)b
+ 0.7886 11.4% -0.24% p<0.01

91
Figure 4.5. Reasons Aligned with Achievement Theory, Responses Over Time, and Trend Lines
0%
10%
20%
30%
40%
50%
60%
70%
80%
90%
100%
71 76 81 86 91 96 01 06
To be able to get a better job
To be able to make more money
To get training for a specific career
To prepare for graduate or professional school
Linear (To be able to get a better job)
Linear (To be able to make more money)
Linear (To get training for a specific career)
Linear (To prepare for graduate or professional school)

92
Drive Theory
Table 4.9 shows the statistics for interpreting the drive theory linear regressions.
Figure 4.6 shows the trend lines for each response option under drive theory. The
response options “to make me a more cultured person” and “wanted to get away from
home” were unable to validate two of the three the necessary assumptions needed to
conduct a linear regression (low Durbin-Watson statistic, heteroscedasticity of errors).
The linear regression for each response option does suggest that the rest of the Millennial
generation and the early cohorts of the iGeneration may find these reasons continually
more important. However, the biases present in these statistics may be providing a false
result. Therefore, it is difficult to derive any conclusions from these two models because
of the bias present.
The response options “to learn more about things that interest me,” “to gain a
general education and appreciation of ideas,” and “to improve my reading and study
skills” provide more accurate linear regressions from which to base predictions. The
linear regressions for the response options “to learn more about things that interest me”
and “to improve my reading and study skills” suggest that they will continue to increase
(0.09% per year and 0.22% per year, respectively) in importance for the remaining
Millennials and early cohorts of the iGeneration. The linear regression for the response
option “to gain a general education and appreciation of ideas” suggests that it will
decrease (-0.15%/year) in importance for future college students. The generation in
which the response is given explains 21.4%of the variance in the percentage of students
who responded “to learn more about things that interest me,” 22.1% of the variance for
“to gain a general education and appreciation of ideas,” and 23.1% of the variance for “to

93
improve my reading and study skills” as very important reasons in deciding to attend
college. This suggests that the generation in which the response was given is a good
indicator for these response options and will provide more accurate predictions.
The reasons listed under drive theory may likely be relevant motivators for the
rest of the Millennial generation and the early cohorts of the iGeneration to attend college
because some of the response options will continue to increase in importance over time
(with the exception of the reason “to gain a general education and appreciation of ideas”
which will decrease at a rate of -.015% per year) and two of the response options (“to
learn more about things that interest me” and “to gain a general education and
appreciation of ideas”) have been in the top five reasons for attending college for all three
of the past generations which can be seen from table 4.9. However, with the indication
that the response option “to gain a general education and appreciation of ideas” will
decrease over time, this response option may not be as important to future generations as
it has been for past generations.

94
Table 4.9 Reasons Aligned with Drive Theory: Results
Notes: aThe threshold for a lack of independence is between 1.5 and 2.5. If the Durbin-Watson statistic is less than 1.5 the statistical significance may be inflated. If it is above 2.5 the statistical significance may be underrated; bY>1970 indicates “years since 1971”; cThis study uses a confidence level of 99%, there p must be less than 0.01 in order to be considered statistically significant.
Independence of Errors (Durbin-Watson)
Homoscedasticity of Errors?
Normal Distribution of Errors?
Regression Equation
Explained Variance
Rate of Change per Year P-Valuec
To learn more about things that interest me 1.283a Yes Yes 0.0009 (Y>1971)b
+ 0.7361 21.4% 0.09% p<0.01
To gain a general education and appreciation of ideas
0.831a Yes Yes -0.0015
(Y>1971)b + 0.6876
22.1% -0.15% p<0.01
To make me a more cultured person 1.076a No Yes 0.0024 (Y>1971)b
+ 0.3446 47.6% 0.24% p<0.01
To improve my reading and study skills 0.946a Yes Yes 0.0022 (Y>1971)b
+ 0.3580 23.1% 0.22% p<0.01
Wanted to get away from home 0.367a No Yes 0.0047 (Y>1971)b
+ 0.0698 89.5% 0.47% p<0.01

95
Figure 4.6. Reasons Aligned with Drive Theory, Responses Over Time, and Trend Lines
0%
10%
20%
30%
40%
50%
60%
70%
80%
90%
71 76 81 86 91 96 01 06
To gain a general education and appreciation of ideas
To improve my reading and study skills
To learn more about things that interest me
To make me a more cultured person
Wanted to get away from home
Linear (To gain a general education and appreciation of ideas)
Linear (To improve my reading and study skills)
Linear (To learn more about things that interest me)
Linear (To make me a more cultured person)
Linear (Wanted to get away from home)

96
Field Theory
Table 4.10 shows the statistics for interpreting the field theory response options’
linear regressions. Figure 4.7 shows the trend lines for each response option under field
theory. The response options “wanted to get away from home” was unable to validate
two of the three the necessary assumptions needed to conduct a linear regression (low
Durbin-Watson statistic, heteroscedasticity of errors). The linear regression for this
response option does suggest that the rest of the Millennial generation and the early
cohorts of the iGeneration may find this reason continually more important, the biases
present may be providing a false result. Therefore, it is difficult to derive any conclusions
from this linear regression because of the bias present in the model.
The response options “my parents wanted me to go,” “I could not find a job,” and
“there was nothing better to do” provide more accurate linear regressions from which to
base predictions. The linear regressions for the response option “my parents wanted me to
go,” suggests that it will increase in importance at a significant rate of 0.35% per year.
The generation in which the response is given also explains 62.3% of the variance in the
percentage of students who responded, “my parents wanted me to go” as a very important
reason in deciding to attend college. The rate of increase in importance each year
indicates that this reason will become more important quickly for future generations of
college students as soon as the early cohorts of the iGeneration.
The linear regressions for the response options, “I could not find a job,” and
“there was nothing better to do” suggest that they will continue to increase (0.04% per
year and 0.06% per year, respectively) in importance for the remaining Millennials and
early cohorts of the iGeneration. The generation in which the response is given explains

97
26.7% and 82.1% of the variance in the percentage of students who responded, “my
parents wanted me to go,” “I could not find a job,” and “there was nothing better to do”
(respectively) as very important reasons in deciding to attend college. This suggests that
the generation in which the response was given is a good indicator for these response
options and will provide more accurate predictions.
Overall, the reasons listed under field theory may be relevant motivators for the
rest of the Millennial generation and the early cohorts of the iGeneration to attend
college. While all of the response options have typically not been as important to the past
three generations, they continue to increase in importance over time. While, table 4.10
indicates that all five reasons have been in the bottom five reasons noted as very
important for attending college for all three generations, the response option “my parents
wanted me to go” may increase at a relatively fast pace (0.35% per year). This rate
indicates that this reason will move out of the bottom five reasons as early as the early
cohorts of the iGeneration. This emergent reason may be one of the biggest differences in
why future generations of students may want to attend college.
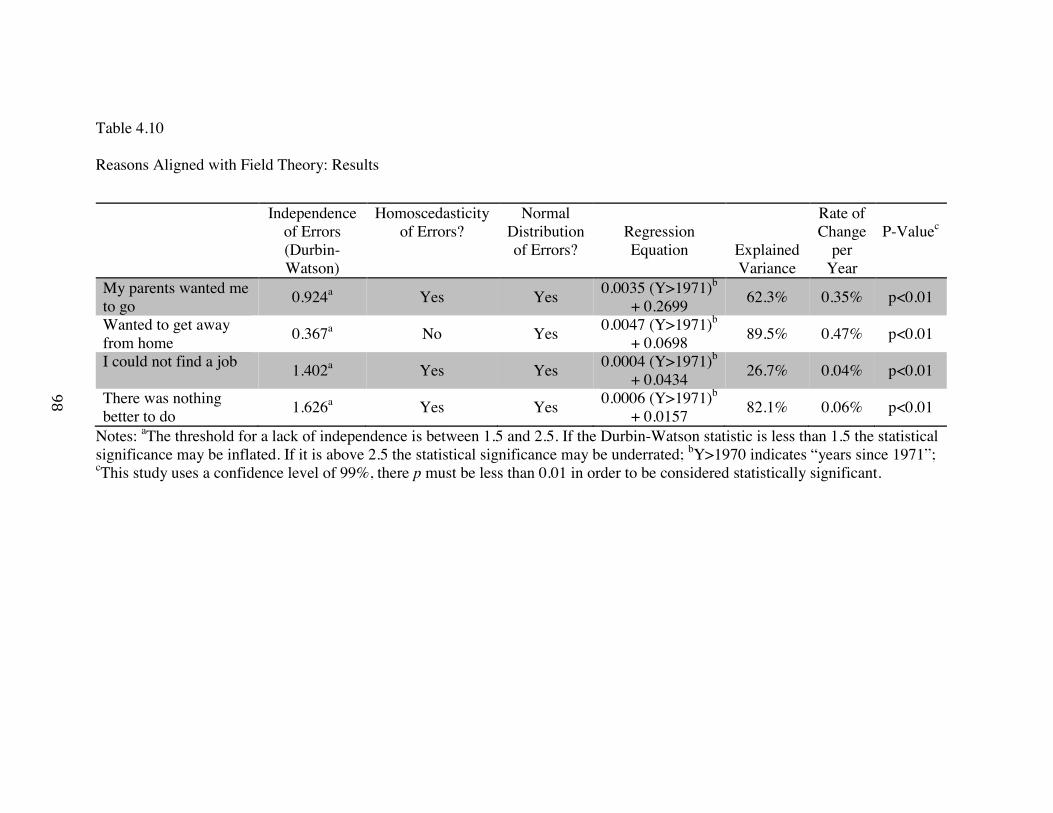
98
Table 4.10 Reasons Aligned with Field Theory: Results
Notes: aThe threshold for a lack of independence is between 1.5 and 2.5. If the Durbin-Watson statistic is less than 1.5 the statistical significance may be inflated. If it is above 2.5 the statistical significance may be underrated; bY>1970 indicates “years since 1971”; cThis study uses a confidence level of 99%, there p must be less than 0.01 in order to be considered statistically significant.
Independence of Errors (Durbin-Watson)
Homoscedasticity of Errors?
Normal Distribution of Errors?
Regression Equation
Explained Variance
Rate of Change
per Year
P-Valuec
My parents wanted me to go 0.924a Yes Yes 0.0035 (Y>1971)b
+ 0.2699 62.3% 0.35% p<0.01
Wanted to get away from home 0.367a No Yes 0.0047 (Y>1971)b
+ 0.0698 89.5% 0.47% p<0.01
I could not find a job 1.402a Yes Yes 0.0004 (Y>1971)b + 0.0434 26.7% 0.04% p<0.01
There was nothing better to do 1.626a Yes Yes 0.0006 (Y>1971)b
+ 0.0157 82.1% 0.06% p<0.01

99
Figure 4.7. Reasons Aligned with Field Theory, Responses Over Time, and Trend Lines
0%
10%
20%
30%
40%
50%
60%
71 76 81 86 91 96 01 06
I could not find a job
There was nothing better to do
Wanted to get away from home
My parents wanted me to go
Linear (I could not find a job)
Linear (There was nothing better to do)Linear (Wanted to get away from home)Linear (My parents wanted me to go)

100
Social Learning Theory
Table 4.11 shows the statistics for interpreting the social learning theory response
options’ linear regressions. Figure 4.8 shows the trend lines for each response option
under social learning theory. The response options “a mentor/role model encouraged me
to go” and “my parents wanted me to go” provide accurate linear regressions from which
to base predictions, however they both violate the assumption of independence of errors,
which indicates that the significance value of this linear regression may be inflated. This
is important to know when interpreting the results of this linear regression. The linear
regressions for the response option “my parents wanted me to go,” suggests that it will
increase in importance at a significant rate of 0.35% per year. The generation the
response is given also explains 62.3% of the variance in the percentage of students who
responded, “my parents wanted me to go” as a very important reason in deciding to
attend college. The rate of increase in importance each year indicates that this reason will
become more important quickly for future generations of college students.
The linear regressions for the response options “a mentor/role model encouraged
me to go” suggest that it will continue to increase (0.12% per year) in importance for the
remaining Millennials and early cohorts of the iGeneration. The generation in which the
response is given explains 19.8%of the variance in the percentage of students who
responded, “a mentor/role model encouraged me to go” as very important reasons in
deciding to attend college. This suggests that the generation in which the response was
given is a good indicator for this response option and will provide more accurate
predictions.

101
The reason “a mentor/role model encouraged me to go” may not be relevant a
motivator for the rest of the Millennial generation and the early cohorts of the
iGeneration to attend college because while it continue to increase in importance over
time, is has typically not been as important to the past three generations. However, the
response option “my parents wanted me to go” may increase at a relatively fast pace
(0.35% per year). This rate indicates that this reason will move out of the bottom five
reasons as early as the early cohorts of the iGeneration. This emergent reason may be one
of the biggest differences in why future generations of students may want to attend
college.

102
Table 4.11 Reasons Aligned with Social Learning Theory: Results Independence
of Errors (Durbin-Watson)
Homoscedasticity of Errors?
Normal Distribution of Errors?
Regression Equation
Explained Variance
Rate of Change
per Year P-Valuec
A mentor/role model encouraged me to go 1.195a Yes Yes 0.0012 (Y>1971)b
+ 0.1079 19.8% 0.12% p<0.01
My parents wanted me to go 0.924a Yes Yes 0.0035 (Y>1971)b
+ 0.2699 62.3% 0.35% p<0.01
Notes: aThe threshold for a lack of interdependence is between 1.5 and 2.5. If the Durbin-Watson statistic is less than 1.5 the statistical significance may be inflated. If it is above 2.5 the statistical significance may be underrated; bY>1970 indicates “years since 1971”; cThis study uses a confidence level of 99%, there p must be less than 0.01 in order to be considered statistically significant.

103
Figure 4.8. Reasons Aligned with Social Learning Theory, Responses Over Time, and Trend Lines
0%
10%
20%
30%
40%
50%
60%
71 76 81 86 91 96 01 06
My parents wanted me to go
A mentor/role model encouraged me to go
Linear (My parents wanted me to go)
Linear (A mentor/role model encouraged me to go)

104
Table 4.12 shows each generation and the response percentage for reason for
attending college in the last cohort of first-year students for each generation. This table
shows the changes in the importance of each response option over time as well as the
rank order for each response option within a generation. The CIRP Freshman Survey
provided data for Baby Boomer generation and Generation X. Since Millennials and the
iGeneration have not had their last first year of college, the linear regression equation was
used to calculate the predicated importance of each response option for the last cohort of
first-year students in the Millennial generation and the iGeneration in their last first year
of college. The predicted importance of each generation is shown in bold and the rank of
how important each response option was to a generation is in parentheses.
Table 4.12
Last First Year of College Importance of Response Options and Rank Order for each Generation Baby
Boomer (1978)
Generation X (1999)
Millennial (2022)
iGeneration (2044)
A mentor/role model encouraged me to go n/a 12.8% (11) 16.9% (11) 20.0% (11) I could not find a job 3.5% (10) 4.1% (12) 6.4% (12) 7.4% (12) My parents wanted me to go 29.2% (8) 33.3% (9) 44.8% (9) 53.9% (7) There was nothing better to do 1.8% (11) 3.2% (13) 4.6% (13) 6.2% (13) To be able to get a better job 73.1% (2) 71.6% (3) 72.7% (3) 71.9% (4)
To be able to make more money 57.9% (4) 69.3% (4) 82.1% (1) 95.1% (1) To get training for a specific career n/a 71.6% (2) 66.6% (5) 60.4% (5)
To gain a general education and appreciation of ideas
71.5% (3) 62.8% (5) 61.1% (6) 57.2% (6)
To improve my reading and study skills 38.6% (6) 39.4% (8) 47.0% (7) 52.7% (9)

105
To learn more about things that interest me 75.6% (1) 74.8% (1) 78.2% (2) 80.5% (3) To make me a more cultured person 36.5% (7) 39.5% (7) 46.7% (8) 52.9% (8)
To prepare for graduate or professional school
47.5% (5) 56.2% (6) 68.0% (4) 81.0% (2)
Wanted to get away from home 8.7% (9) 20.1% (10) 31.0% (10) 43.2% (10)
Note: n/a indicates that this response option was not provided by the CIRP Freshman Survey during the respective year. Bold rows meet two out of three of the linear regression assumptions and are more accurate than non-bold rows. The results of table 4.12 indicate that the top five most important reasons for the
Millennial and iGeneration stayed the same. “To be able to make more money,” “to
prepare for graduate or professional school,” “to learn more about things that interest
me,” “to be able to get a better job,” and “to get training for a specific career” are the top
five predicted reasons when deciding to come to college for the Millennial generation and
iGeneration. “To be able to make more money” was the fourth most important reason for
both the Baby Boomer generation and Generation X, however it jumped to the most
important predicted reason for Millennials and the iGeneration. “To prepare for graduate
or professional school” was also more important to the iGeneration than it was to the
Baby Boomer, Generation X, and Millennial generations. “To get training for a specific
career” was the second most important reason to Generation X. However, it dropped to
the fifth most important reason for both the Millennial generation and the iGeneration.
The bottom five reasons that were typically least important to each generation typically
stayed the same across each generation. “There was nothing better to do,” “I could not
find a job,” “a mentor/role model encouraged me to go,” “wanted to get away from
home,” and “my parents wanted me to go” were typically the least important reasons in
deciding to attend college for each past and future generation. However, “a mentor/role

106
model encouraged me to go” was not a response option when the Baby Boomer
generation was in their last first year of college. Their last bottom five reason was “to
make me a more cultured person.” The predictions for the iGeneration actually had a
significant increase in the importance of the reason, “my parents wanted me to go” in
deciding to attend college. The increase was so significant that it was not in the bottom
five least important reasons for the iGeneration. Therefore the last bottom five reason for
the iGeneration was “to improve my reading and study skills.”
Conclusions
The results of study indicate that there are significant differences in why different
generations want to attend college. While averaging the aggregate of each year across the
range of years for each generation could show the subtle differences in response options
across generations by looking at the rank order, this study could not statistically prove the
specific differences in response options across generations. For the most part, each
generation responded that the same five response options were the most important
reasons when deciding to attend college (“to learn more about things that interest me,”
“to be able to get a better job,” “to get training for a specific career,” “to gain a general
education and appreciation of ideas,” and “to be able to make more money”; the response
option “to get training for a specific career” was not provided by CIRP during the Baby
Boomer generation, therefore “to prepare for graduate or professional school” succeeds).
However, there are subtle differences in the ranking order of each response options as
table 4.1 indicates. This is further supported by the results of the two-way repeated
measures ANOVA that indicated that there are statistically significant differences in why
the Baby Boomers, Generation X, and Millennials attend college.
107
The linear regressions found that many of the response options may continue to
increase in importance as time goes on. While many of the response options may increase
over time, in terms of their rate of increase or decrease each year, the same top five
response options may not change for future generations because the growth rate per year
for other reasons for attending college would take some time to surpass the top five
response options. However, there is empirical evidence of emergent areas of motivation
as well as some areas that may become less important. “My parents wanted me to go,”
“to prepare for graduate or professional school,” and “to be able to make more money”
all indicate that they will increase at relatively fast rates (0.35% per year, 0.5% per year,
and 0.5% per year, respectively). All three also indicate that the generation the response
is given is a good predictor of the percentage of students who will respond to each
response option (62.3%, 76.4%, and 58.7%, respectively). This data suggests that these
reasons will become more important to future generations as soon as the early cohorts of
the iGeneration.
The linear regression also shows that one of the top five response options (“to
gain a general education and appreciation of ideas”) may decrease in importance (-0.15%
per year) when deciding to attend college for future generations. This reason also
indicates that the generation the response is given is a good predictor of the percentage of
students who will respond to this response option (22.1%). This data suggests that this
reason will become less important to future generations. This change may take some time
due to the predicted slower rate of decrease in importance for this reason (-0.15%).
Overall, the results show that each generation uses a mix of achievement and
drive theories as motivators to attend college. Reasons under field theory and social

108
learning theory do not play as large of a role as a motivator for any of the generations
when deciding to attend college. This may indicate that students typically want to attend
college to better themselves and are not motivated to attend by external pressures such as
their environment, parents, and friends.
The results also suggest shifts in the most important reasons in deciding to attend
college for future. These changes indicate a shift in type motivation students will utilize
when deciding to attend college. The emergence of the reason, “my parents wanted me to
go” suggests that future generations may utilize social learning theory more when
deciding to attend college. The results also show that drive theory may not be as readily
utilized by future generations when deciding to attend college. While the response option
“to gain a general education and appreciation of ideas” slowly decreases in the
percentage of students that find this reason to be very important in deciding to attend
college each year and thusly decreases in rank order for the iGeneration, the response
option “to learn more about things that interest me” increases in the percentage of
students who find it to be a very important reason in deciding to attend college, but also
decreases in its rank order for the iGeneration. Decreases in rank order from both of these
response options for the iGeneration and no significant gains in rank order from the other
response options under drive theory indicate that this type of motivation may become less
utilized in future generations of college students.

109
CHAPTER FIVE
IMPLICATIONS & RECOMMENDATIONS The purpose of this quantitative study was to explore the differences between
generations’ reasons for attending college and to predict the reasons why future
generations may want to attend college. Using data collected by the CIRP Freshman
Survey, the researcher found that there are statistically significant differences in the
reasons why different generations want to attend college, which response options will
increase and decrease in importance for future generations wanting to attend college, and
the types of motivation that future generations may utilize when determining whether or
not to attend college.
Implications for Practice
The current study offers a scholar-practitioner approach for faculty, staff, and
institutions regarding generational differences and trends in reasons why students want to
attend college because the implications discussed in this section are grounded in research
and practical for institutions to implement. By understanding the reasons that will remain
important to future generations, the emergent reasons that will become important to
future generations, and the reasons that will decrease in importance for future
generations, colleges and universities can strengthen programs that already reflect the
most important reasons why future students will want to attend college, create and initiate
new programs that reflect the emergent reasons future generations will want to attend to

110
college, and cut back on programs that are not consistent with the important reasons why
future students want to attend college.
As the results of this study show, there are statistically significant differences in
the reasons why generations want to attend. Institutions can use this information to better
inform their practices as generations change over time. The differences in generations
affect their collegiate experiences and from this study it is shown that they come to
college with different expectations (Levine, 1980; Levine & Cureton, 1996; Levine &
Dean, 2012). Colleges need to adapt to these changes in order to provide an appropriate
education for their students. The response options that are explored in the following
sections have met all but one of one of the assumptions of conducting a linear regression
and, thus, are more reliable. Response options that did not meet two out of three of the
assumptions are not explore because the results of their linear regression may not be
accurate.
Reasons that will Persist in Importance Across Generations
“To learn more about things that interest me” is a reason that has and will
continue to persist across generations as an important reason in deciding to attend
college. Colleges and universities that offer opportunities for their students to explore the
subjects that interest them such as undergraduate research and/or a variety of majors will
continue to attract students. Offering a multitude of majors and providing undergraduates
with research opportunities allows them explore their passions. Students may also be
unsure of what interests them and may want to attend college to figure that out. By
offering exploratory programs such as clubs and organizations that meet for personal
exploration, an undecided major, and academic career and major exploration advisors,

111
colleges and universities are telling students that it is perfectly fine not to know what the
are interested, but the school offers programs to help them figure it out. The continuation
of these types of programs both allow students to further explore topics that already
interest them and programs that allow a student to figure out what interests them will be
important in attracting future generations to colleges and universities.
Another reason that will continue to persist in importance in generations is “to
improve my reading and study skills.” Through a first year seminar and/or a first year
English course, institutions can provide a time and place for students to improve their
reading and study skills. Institutions have the opportunity to work with students on their
reading and study skills in these types of courses because often, especially in a first year
seminar course, the curriculum is more flexible and revolves around the transition to
college. Since students across generations have continually found this to be an important
reason in deciding to come to college, it will be important that colleges continue reflect
this in one way or another, whether it is through academic coaching, first year seminar,
English courses, or tutoring.
Reasons that will Emerge in Importance Across Generations
The reason “my parents wanted me to go” continues to increase, indicating that
parents will continue to play a larger role in their child’s academic aspirations. Research
has deemed this phenomenon “helicopter parents” (Carney-Hall, 2008; Howe & Strauss,
2003; Monaco & Martin, 2007). These parents are highly involved in their child’s life
and want to be involved in all decisions made (Carney-Hall, 2008; Howe & Strauss,
2003; Monaco & Martin, 2007). As this trend continues to increase as is indicated by this
study, institutions may find it beneficial to offer parent programs not only while students

112
are attending college, but also continuing to work in a holistic way with the student’s
family during their college search process. These programs could serve as a way to keep
parents involved and informed with and informed about the college process in ways that
are appropriate for both parents and students. This type of involvement may attract
parents to an institution so they can feel involved in their child’s process as well as
increase student success in that college environment.
As the reason “to be able to make more money” increases, students are going to
be looking for institutions to that provide them with the necessary education and
experience to obtain high paying jobs. For institutions, this means having an effective
career center that not only assists students in obtaining jobs as they graduate, but also
provides necessary internship experiences. Since this is one of the Millennials’ top three
reasons for attending college, it would benefit institutions to market their career centers to
potential students as well as post-graduate job information, especially average salary for
graduates.
Finally, more and more students are and will continue coming to college to
prepare for graduate or professional school. These are students driven by a need for
achievement. They will be attracted to institutions that offer five-year bachelors and
masters degree programs. Institutions that create and market direct admit programs to
their or other institution’s graduate schools will be very popular with Millennials and the
iGeneration.
Reasons that will Decrease in Importance Across Generations
Students continually want “to gain a general education and appreciation of ideas.”
The decrease over time in this reason for attending college shows that students may

113
become less interested in a general education and instead want to focus solely on their
area of interest, such as their major. Colleges and universities that offer a core curriculum
or a general education that all students must take, may receive some push back from
future Millennials and members of the iGeneration. While a core curriculum/general
education allows for students to explore and learn about various subjects, it also requires
them to take extra classes in areas students may not be interested and therefore, they may
not perform as well. Core curriculums and general educations that allow students to pick
and choose classes under certain disciplinary headings they want to take in order to
complete the requirement will be more popular and ultimately more successful amongst
generations that want to only focus on academic areas they want to learn about.
Recommendations for Future Research
Examining motivations/reasons for attending college qualitatively across the
current generation in college could provide a better, deeper understanding of the reasons
and motivations students attend college. While the college choice process and the reasons
provided by the CIRP Freshman Survey cover many reasons students may want to attend
college, however they may be missing some reasons. In order to figure out the reasons
they may be missing as well as to understand where a student’s reason for attending
college comes from, could be better understood using a qualitative study. A qualitative
longitudinal study could provide more information on the differences between
generations why generations want to attend college and what has influenced the
formation of those reasons.
This study did not use demographic information such as sex, race, ethnicity, type
of school, religion, and socio-economic status. Exploring differences between
114
generations, using the demographic factors previously listed could provide a better
insight as to why the differences amongst generations exist. For instance, in Chapter 1,
the civil and women’s rights movements in the 1960s and 70s increased college access
for minority and women students. These historical events could have prompted minority
and women students to attend college for a different reason then white males at the time.
Therefore these demographic factors should be taken into account in future studies to
provide a better insight into the difference both between generations and within a
generation.
The differences in motivations to attend college between generations are also
reflected in the student-parent relationship, since the parent and student typically come
from different generations. These differences in motivations to attend college can create
disconnect between students and their parents. The research findings of this study also
suggest that students and parents will continue to grow closer and students will continue
to rely on the advice of their parents in terms of whether and where to attend college.
Between the generational disconnect and the suggested growing relationship between
students and their parents, this creates a tension in the research, which should be further
explored. In the coming decades, the relationship between students and their parents
should be further examined, specifically in terms of how it affects a student’s decision
whether and where to attend college and the student’s collegiate experience.
Pascarella (2006) noted that a future direction for higher education research is a
replication of existing studies. He illustrated that the replication of existing studies could
provide more valid results and often time in higher education, studies are not replicated
like they are in other fields (i.e. sciences). Future research should replicate the differences

115
in reasons why generations want to attend college. A limitation that this study had was an
unbalanced data set. As time goes on and if CIRP continues to ask these questions on
their Freshman Survey, more data will be present on the Millennial generation. The more
data there is the more accurate predictions about future generations will be. In this way
replicating the study in the future will produce more accurate results and allow
researchers to better understand the differences between Generation X, the Millennial
generation, and the iGeneration. Unfortunately it would be difficult to collect further
information on this subject matter about the Baby Boomer generation. Since this
generation was a large part of the reason the data set was unbalanced, future research may
choose to leave this generation out when comparing difference between generations.
Conclusions
The purpose of this study was to understand better the motivations of generations
to attend college. In order to do this, the researcher explored the differences in reasons
why different generations wanted to attend college. This study also wanted to predict the
reasons why future generations may want to attend college. As higher education
transitions from one generation to the next, it is important to understand the differences
between each generation so college faculty, staff, and administrators can provide them
each with a collegiate experience that meets their unique needs. The generations explored
in this study were the Baby Boomer, Generation X, and Millennial generations.
This study was guided by two research questions: 1) What are the differences in
reasons for attending college amongst the Boomer, Generation X, and Millennial
generations? 2) What do past generation’s reasons for attending college suggest about
future generation(s) reasons for attending college? This study found that there are

116
significant differences in the reasons why different generations want to attend college.
This study also found that generations are motivated to attend college in similar ways.
First, all three generations were motivated to attend college because they had goals they
wanted to achieve, such as “to make more money,” to get training for a specific career,”
and/or “to prepare for graduate or professional school.” Secondly, each generation
appreciates the other benefits that college has to offer. They receive sense of fulfillment
from learning “about things that interest” them and gaining “a general education and
appreciation of ideas.” Overall this study found the Baby Boomer, Generation X, and
Millennial generations are typically motivated to attend college through achievement
based needs as well as internal rewards they perceive they will acquire from attending
college. This study also found that future generations may be typically motivated to
attend college by similar types of motivation as past generations. The remainder of the
Millennial generation and iGeneration that will attend college may find that the most
important reasons they decide to attend college will be “to make more money”. The
iGeneration may also find that attending college because they want “to prepare for
graduate or professional school” will be more important to them than it has been to
previous generations. The iGeneration and the remainder of the Millennial generation
may be more motivated to attend college because of the goals they want to achieve than
past generations were because four of the typically top five most important reasons in
deciding to attend college are all under achievement theory (“to make more money,” “to
prepare for graduate or professional school,” “to be able to get a better job,” and “to get
training for a specific career” are all aligned with achievement motivation and “to learn
more about things that interest me” is aligned with drive motivation). This may indicate

117
that the remainder of the Millennial generation and the iGeneration may typically be
motivated to attend college to accomplish their external goals (achievement) as opposed
to receiving internal rewards (drive).

118
REFERENCES Alwin, D. F., & Otto, L. B. (1977). High school context effects on aspirations. Sociology
of Education, 50(4), 259–273. Astin, A. (2003). Studying how college affects students: A personal history of the CIRP.
About Campus, 8(3), 21-28. Atkinson, J. (1964). An introduction to motivation. Princeton, NJ: Van Nostrand. Attinasi, L. C., Jr. (1989). Getting in: Mexican Americans’ perceptions of university
attendance and the implications for freshman year persistence. Journal of Higher Education, 60(3), 247–277.
Bandura, A. (1982). Self-efficacy mechanism in human agency. American Psychologist,
37, 122-147. Beck, R. C. (1978). Motivation: Theories and principles. Englewood Cliffs, NJ: Prentice-
Hall. Borus, M. E., & Carpenter, S. A. (1984). Factors associated with college attendance of
high school seniors. Economics of Education Review 3(3), 169–176. Broussard, S. C., & Garrison, M. E. B. (2004). The relationship between classroom
motivation and academic achievement in elementary school-aged children. Family and Consumer Sciences Research Journal, 33(2), 106–120.
Carlson, Elwood (2008). The Lucky Few: Between the Greatest Generation and the Baby
Boom. Springer. ISBN 978-1-4020-8540-6. Carney-Hall, K. C. (2008). Understanding current trends in family involvement. New
Directions for Student Services, 3-14. Cohen, L., Manion, L., & Morrison, K. (2003). Research methods in education. (5 ed.,
pp. 1-464). Rutledge. Coomes, M. (2004). Understanding the historical and cultural influences that shape
generations. In M. Coomes & R. DeBard (Eds.), New Directions for Student Services: Serving the Millennial Generation (Vol. 106, pp. 17-31). San Francisco, CA: Jossey-Bass.
Coomes, M., & DeBard, R. (2004). A generational approach to understanding students.
New Directions for Student Services. 106, 5-16.

119
Corno, L. (1993). The best-laid plans: Modern conceptions of volition and educational
research. Educational Researcher, 22(2), 14–22. Covington, M. V. (1992). Making the grade: A self-worth perspective on motivation and
school reform. New York: Cambridge University Press. Deal J. J., Altman, D. G., & Rogelberg, S. G. (2010). Millennial in the workforce: What
we know and what we need to do (if anything). Journal of Business and Psychology,25(2), 191-199.
DeBard, R. (2004). Millennials coming to college. In M. Coomes & R. DeBard (Eds.),
New Directions for Student Services: Serving the Millennial Generation (1 ed., Vol. 106, pp. 33-45). San Francisco, CA: Jossey-Bass.
Deci, E. (1971). Effects of externally mediated rewards on intrinsic motivation. Journal
of Personality and Social Psychology, 18, 114. Deci, E. L., Koestner, R., & Ryan, R. M. (1999). A meta-analytic review of experiments
examining the effects of extrinsic rewards on intrinsic motivation. Psychological Bulletin, 125(6), 627–668.
Deci, E. L., & Ryan, R. M. (1985). Intrinsic motivation and self-determination in human
behavior. New York: Plenum Publishing Co. Dede, C. (2005). Planning for neo-millennial learning styles: Implications for
investments in technology and faculty. In D.G. Oblinger & J.L. Oblinger (Eds.) Educating the Net Generation (1-20). Washington, DC: Educause.
DeWall, N.C., Pond, R.S., Campbell, W.K., & Twenge, J.M. (2011). Tuning in to
psychological change: Linguistic markers of psychological traits and emotions over time in popular U.S. song lyrics. Journal of Aesthetics, Creativity, and the Arts, Online First Publication, March 21, 2011. doi: 10.1037/a0023195.
Donnison, S. (2007). Unpacking the millennials: a cautionary tale for teacher education.
Australian Journal of Teacher Education , 1-13. Dede, C. (2005). Planning for neo-millennial learning styles: Implications for
investments in technology and faculty. In D.G. Oblinger & J.L. Oblinger (Eds.) Educating the Net Generation (1-20). Washington, DC: Educause.
Fine, A. (2008, August 21). It’s time to focus on a new generation. Chronicle of
Philanthrophy, 20, 21. Retrieved November 21, 2008 from Expanded Academic ASAP via Gale: http://find.galegroup.com/itx/start.do?prodID=EAIM
Graham, S., & Weiner, B. (1996). Theories and principles of motivation. In Handbook of

120
Educational Psychology, ed. David C. Berliner and Robert C. Calfee. New York: Macmillan.
Greenberg, S. (2009). Where Is Graceland?: 1980s Pop Culture. Living in the Eighties:
Viewpoints on American Culture. Oxford, New York: Oxford University Press. Guay, F., Chanal, J., Ratelle, C. F., Marsh, H. W., Larose, S., & Boivin, M. (2010).
Intrinsic, identified, and controlled types of motivation for school subjects in young elementary school children. British Journal of Educational Psychology, 80(4), 711–735.
Hall, C. S., & Lindzey, G. (1978). Theories of personality (3rd ed.). New York: John Wiley & Sons. Hamrick, F. A., and Stage, F. K. (1995, November). Student predisposition to college�in
high minority enrollment, high school lunch participation schools. Paper�presented at the annual meeting of the Association for the Study of Higher Education, Orlando, FL.
Hamrick, F. A., and Stage, F. K. (2000). Community activities, educational mentors, and
college predisposition decisions of white, African American, and Hispanic eighth graders. Paper presented at the annual meeting of the American Educational Research Association, New Orleans, LA.
Hamrick, F. A., and Stage, F. K. (2004). College predisposition at high-minority
enrollment, low-income schools. Review of Higher Education, 27(2), 151–168. Harlow, H. F. (1949). The formation of learning sets. Psychological Review, 56, 51-65. Hearn, J. C. (1984). The relative roles of academic, ascribed, and socioeconomic
characteristics in college destination. Sociology of Education, 57(1), 22–30. Hossler, D., Schmit, J., & Vesper, N. (1999). Going to college: How social, economic,
and educational factors influence the decisions students make. Baltimore: Johns Hopkins University Press.
Horovitz, B. (2012, May 04). After gen x, millennials, what should next generation be?.
Retrieved from http://usatoday30.usatoday.com/money/advertising/story/2012-05-03/naming-the-next-generation/54737518/1
Higher education research institute: Home of the cooperative institutional research
program. (2013). Retrieved from http://www.heri.ucla.edu/index.php Howe, N., & Strauss, W. (2003). Millennials go to college. American Association of
Collegiate Registrars and Admissions Officers.

121
Howe, N., & Strauss, W. (2000). Millennials rising: The next great generation. New York: Vintage Books.
Hull, C. (1943). Principles of behavior. New York: Appleton-Century-Crofts. Kelley, H. (1967). Attribution theory in social psychology. In D. Levine (Ed.), Nebraska
symposium on motivation (Vol. 15, pp. 192-238). Lincoln: University of Nebraska Press.
Kelly, M. (2012). Instructional behaviors of millennial faculty: An exploratory study.
(Unpublished doctoral dissertation), Available from University of South Carolina Dissertations and Theses.
Kim, D., & Rury, J. (2007). The changing profile of college access: The truman
commission and enrollment patterns in the postwar era. History of Education Quarterly, 47(3), 302-327.
Lai, E. (2011). Motivation: Literature review. (pp. 1-44). Pearson. Lancaster, L., & Stillman, D. (2002). When generations collide. (pp. 1-352). New York,
NY: HarperCollins. Lee, V. E., and Ekstrom, R. B. (1987). Student access to guidance counseling in high
school. American Educational Research Journal, 24(2), 287–310. Levine, A. (1980). When dreams and heroes died: a portrait of today’s college student: a
report for the Carnegie Council on Policy Studies in Higher Education. San Francisco, CA: Jossey-Bass.
Levine, A., & Cureton, J. S. (1998). When hope and fear collide: A portrait of today's
college student. San Francisco, CA: Jossey-Bass Publishers. Levine, A., & Dean, D. (2012). Generation on a tightrope: A portrait of today’s college
student. (pp. 1-227). San Francisco, CA: Jossey-Bass. Lewin, K. (1935). A dynamic theory of personality. New York: McGraw-Hill. Lewin, K. (1936). Principles of topological psychology. New York: McGraw-Hill. Litten, L. H., & Hall, A. E. (1989). In the eyes of our beholders: Some evidence on how
high-school students and their parents view quality in colleges. Journal of Higher Education, 60(3), 302–324.
Magid General Strategies. Magid General Strategies, (2012). The first generation of the
twenty-first century. Los Angeles, CA: Frank N. Magid Associates, Inc.

122
Manski, C. F., & Wise, D. A. (1983). College choice in America. Boston: Harvard University Press.
Marsh, B. (2007). Helicopter parents. Miamiam, 8-10. Martin C.A. & Tulgan, B. (2001). Managing Millennials: Global citizens born in the late
seventies and early eighties. Amherst, MA: HRD Press. McCann, R. M., & Giles, H. (2006). Communication with people from different ages in
the workplace: Thai and American data. Human Communication Research, 32, 74–108.
McClelland, D.C., Atkinson, J.W., Clark, R.A., & Lowell, E.L. (1953). The achievement motive. NY: Appleton-Century-Crofts.
McClelland, D.C. (1961). The achieving society. NY: Van Nostrand. McGlynn, A. P. (2005). Teaching millennials, our newest cultural cohort. The Hispanic
Outlook in Higher Education , 12-16. Moeller, J., & Koeller, O. (1999). Spontaneous cognitions following academic test
results. Journal of Experimental Education. 67, 150-164. Metcalf, T. (2013). The pros & cons of trend analysis in forecasting. Retrieved from
http://smallbusiness.chron.com/pros-cons-trend-analysis-forecasting-58786.html Monaco, M., & Martin, M. (2007). The millennial student: A new generation of learners.
Athletic Training Education Journal, 2, 42-46. Moore, A. (2007). They’ve never taken a swim and thought about Jaws:
Understanding the millennial generation. College and University, 82(4), 41-48. Murillo, A. (2011, January 26). Difference between generation x and y. Murray, H. A. (1938). Explorations in Personality. New York: Oxford University Press. Myers, K. K., & Sadaghiani, K. (2010). Millennials in the workplace: A communication
perspective on Millennials’ organizational relationships and performance. Journal of Business and Psychology, 25, 225–238.
National Center for Education Statistics. U.S. Department of Education, Institute of
Education Science. (2012). Fast facts. Oblinger, D. G. & Oblinger, J.L. (2005). Is it age or IT: First steps toward understanding
the Net Generation. In D.G. Oblinger & J.L. Oblinger (Eds.) Educating the Net Generation (1-20). Washington, DC: Educause.

123
O'Brien, J. (2007). Now is the time to prepare for millennial faculty. Academic Leader, 23(2), 1-6.
Ortega y Gasset, J. (1961). The modern theme. New York, NY: Harper. Pascarella, E. (2006). How college affects students: Ten directions for future research.
Journal of College Student Development, 57(5), 508-520. Perna, L. W., & Titus, M. A. (2004). Understanding differences in the choice of college
attended: The role of state public policies. Review of Higher Education, 27(4), 501–525.
Pink, D. (2009). Drive: the surprising truth about what motivates us. (pp. 1-241). New
York, NY: Penguin Group. Prensky, M. (2001). Digital natives, digital immigrants, part II: Do they really think
differently? On The Horizon , 1-9. Pintrich, P., & Schunk, D. (1996). Motivation in education. (1 ed., pp. 1-434). Englewood Cliffs, NJ: Prentice-Hall, Inc. Pryor, J., Eagan, K., Blake, L. P., Hurtado, S., Berdan, J., & Case, M. H. (2012). The
american freshman: National norms fall 2012. (pp. 1-90). Los Angeles, CA: Higher Education Research Institute.
Raines, C. (2003). Connecting generations: The sourcebook for a new workplace. Menlo
Park, CA: Crisp Publications. Rotter, J. (1954). Social learning and clinical psychology. Englewood Cliffs, NJ: Prentice
Hall. Ryan, R. M., & Deci, E. L. (2008). Self-determination theory and the role of basic
psychological needs in personality and the organization of behavior. In O. P. John, R. W.
Robbins, & L. A. Pervin (Eds.), Handbook of personality: Theory and research (pp. 654-
678). New York: The Guilford Press. Schlesinger, Jr., A. M. (1986). The cycles of American history. Boston: Houghton Mifflin
Company. Schunk, D. H., & Zimmerman, B. J. (2007). Influencing children’s self-efficacy and self-
regulation of reading and writing through modeling. Reading and Writing Quarterly, 23, 7-25.
Sessa, V.I., Kabacoff, R.I., Deal, J., & Brown, H. (2007). Research tools for the

124
psychologist-manager: Generational differences in leader values and leadership behaviors. Psychologist-Manager Journal, 10(1), 47-74.
Smola, K. W., & Sutton, C. D. (2002). Generational differences: Revisiting generational
work values for the new millennium. Journal of Organizational Behavior, 23, 363–382.
St. John, E. P. (1990). Price response in enrollment decisions: An analysis of the high
school and beyond sophomore cohort. Research in Higher Education, 31(2), 161–176.
Stipek, D. J. (1996). Motivation and instruction. In D. C. Berliner & R. C. Calfee (Eds.),
Handbook of educational psychology (pp. 85–113). New York: Macmillan. Strauss, W., & Howe, N. (1991). Generations: The history of America's future, 1584 to
2069. New York: William Morrow and Company, Inc. Strauss, W., & Howe, N. (1997). The fourth turning: An American prophecy. New York:
Broadway Books. Sweeney, R. (2006). Millennial behaviors and demographics. Retrieved June 1, 2011
from: http://library2.njit.edu/staff-folders/ sweeney/Millennials/Article- Millennial- Behaviors.doc.
Tapscott, D. (1998). Growing up digital: The rise of the net generation. New York:
McGraw-Hill. Tapscott, D. (2009). Growing up digital: How the net generation is changing your world.
New York, NY: McGraw Hill. Taylor, Paul & Scott Keeter, eds. 2010. Millennials: A Portrait of Generation Next. Pew
Research Center for the People and the Press. Retrieved September 14, 2011 from (http://pewsocialtrends.org/2010/02/24/millennials-confident-connected-open-to-change/).
Thelin, J. R. (2004). A history of American higher education. Baltimore: John Hopkins
Press. Trunk P. (2010). What Gen Y Really Wants. Time. Retrieved from
http://www.time.com/time/magazine/article/0,9171,1640395,00.html Twenge, J. M. (2000). The age of anxiety? Birth cohort change in anxiety and
neuroticism, 1952–1993. Journal of Personality and Social Psychology, 79, 1007– 1021.
Twenge, J. M. (2001). Birth cohort changes in extraversion: A cross-temporal meta-

125
analysis, 1966–1993. Personality and Individual Differences, 30, 735–748. Twenge, J. M., & Campbell, W. K. (2001). Age and birth cohort differences in self-
esteem: A cross-temporal meta-analysis. Personality and Social Psychology Review, 5, 321–344.
Twenge, J. M., & Campbell, W. K. (2009). The narcissism epidemic: Living in the age of
entitlement. New York, NY: Free Press. Twenge, J. M., & Im, C. (2007). Changes in the need for social approval, 1958–2001.
Journal of Research in Personality, 41, 171–189. Twenge, J. M., Konrath, S., Foster, J. D., Campbell, W. K., & Bushman, B. J. (2008).
Egos inflating over time: A cross-temporal meta-analysis of the Narcissistic personality inventory. Journal of Personality, 76, 875-902.
Usher, A., & Kober, N. (2012). Student motivation: An overlooked piece of school
reform. Center on Education Policy, 1-12. Weiler, A. (2005). Information-seeking behavior in Millennials students: Motivation,
critical thinking, and leaning theory. Journal of Academic Librarianship, 31(1), 46- 53.
Weiner, B. (1972). Theories of motivation: From mechanism to cognition. Chicago, IL:
Rand McNally. Weiner, B. (1985). An attributional theory of achievement motivation and emotion.
Psychological Review, 92, 548-573. Weiner, B. (1986). An attributional theory of achievement motivation and emotion. New
York: Springer-Verlag. Weiner, B. (1990). History of motivational research in education. Journal of Educational
Psychology, 82(4), 616-622. Weiner, B. (1992). Human motivation: Metaphors, theories, and research. Newbury
Park, CA: Sage. Weiner, B. (1994). Motivationspsychologie. (3 ed., pp. 1-378). Beltzpvu. Westerman, J.W., Bergman, J.Z., Bergman, S.M. & Daly, J.P. (2010). Are business
schools producing narcissistic employees? An empirical examination of narcissism in millennial students and its implications. Journal of Management Education, first published on May 12, 2011 doi:10.1177/1052562911408097.
Wilson, M., & Gerber, L. E. (2008). How Generational Theory Can Improve Teaching:
126
Strategies for Working with the "Millennials". Currents in Teaching and Learning, 1(1), 29-44. Retrieved April 17, 2012, from http://www.worcester.edu/currents/arc
Winogard, M., & Hais, M. D. (2008). Millennial makeover: mypace, youtube, and the
future of American politics. New Brunswick: Rutgers University Press. Wlodkowski, R. (1986). Enhancing adult motivation to learn. (2 ed., pp. 1-314). San
Francisco, CA: Jossey-Bass. Zapatka, J. (2009). Understanding second-wave millennial college students through a
generational lens. (Master's thesis), Available from ProQuest: Dissertations and Theses. (1464032).
Zemke, R. (2001). Here comes the Millennials. Training, 38 (7), 44-49. Zemke, R., Raines, C., & Filipczak, B. (2000). Generations at work: Managing the clash
of veterans, boomers, xers, and nexters in your workplace. New York, NY: American Management Association.

127
APPENDIX A
CIRP Freshman Survey 2006, p. 1

128
APPENDIX A
CIRP Freshman Survey 2006, p. 2

129
APPENDIX A
CIRP Freshman Survey 2006, p. 3

130
APPENDIX A
CIRP Freshman Survey 2006, p. 4

131
APPENDIX B
Years Response Options were not provided on the CIRP Freshman Survey (1971-1988)
X=Included; --- = Not Included 71 72 73 74 75 76 77 78 79 80 81 82 83 84 85 86 87 88 A mentor/role model encouraged me to go
- - - - - - - - - - - - - - - - - -
I could not find a job - - - - X X X X X X X X X X - - - - My parents wanted me to go X - - - X X X X X X X X X X - - - - There was nothing better to do X - - - X X X X X X X X X X X X X X To be able to get a better job X - - - X X X X X X X X X X - - - - To be able to make more money X - - - X X X X X X X X X X X X X X To get training for a specific career
X - - - - - - - - - - - - - - - - -
To gain a general education and appreciation of ideas
X - - - X X X X X X X X X X X X X X
To improve my reading and study skills
X - - - X X X X X X X X X X X X X X
To learn more about things that interest me
X - - - X X X X X X X X X X X X X X
To make me a more cultured person
X - - - X X X X X X X X X X X X X X
To prepare for graduate or professional school
X - - - X X X X X X X X X X X X X X
Wanted to get away from home - - - - X X X X X X X X X X - - - -

132
APPENDIX B
Years Response Options were not provided on the CIRP Freshman Survey (1989-2006) X=Included; --- = Not Included 89 90 91 92 93 94 95 96 97 98 99 00 01 02 03 04 05 06 A mentor/role model encouraged me to go
- - - X X X X X X X X X X X X - X X
I could not find a job X X X X X X X X X X X X X X X X X X My parents wanted me to go X X X X X X X X X X X X X X X X X X There was nothing better to do X X X X X X X X X X X X X X X X X X To be able to get a better job X X X X X X X X X X X X X X X X X X To be able to make more money X X X X X X X X X X X X X X X X X X To get training for a specific career
- - - - - - - - - - X X X X X X X X
To gain a general education and appreciation of ideas
X X X X X X X X X X X X X X X X X X
To improve my reading and study skills
X X X X X X X X X X X X X X X - - -
To learn more about things that interest me
X X X X X X X X X - X X X X X X X X
To make me a more cultured person
X X X X X X X X X - X X X X X X X X
To prepare for graduate or professional school
X X X X X X - - - - X X X X X X X X
Wanted to get away from home X X X X X X X X X X X X X X X X X X