A comparison of WISC-IV test performance for Afrikaans,
English and Xhosa speaking South African Grade 7 learners.
A thesis submitted in partial fulfilment
of the requirements for the degree of
MASTERS IN ARTS
in
Counselling Psychology
RHODES UNIVERSITY
by
ADELE VAN DER MERWE
Supervised by Professor Ann Edwards
December 2008
Psychology Department
Rhodes University, Grahamstown, South Africa
i
ABSTRACT
This study builds on South African cross-cultural research which demonstrated the
importance of careful stratification of multicultural/multilingual normative samples for quality
of education in respect of English and African language (predominantly Xhosa) speaking
adults and children tested with the WAIS-III and WISC-IV, respectively. The aim of the
present study was to produce an expanded set of preliminary comparative norms on the
WISC-IV for white and coloured Afrikaans, white English and black Xhosa speaking Grade 7
children, aged 12 to 13 years, stratified for advantaged versus disadvantaged education. The
results of this study replicate the findings of the prior South African cross-cultural studies in
respect of quality of education, as groups with advantaged private/former Model C schooling
outperformed those with disadvantaged former DET or HOR township schooling.
Furthermore, a downward continuum of WISC-IV IQ test performance emerged as follows: 1)
white English advantaged (high average), 2) white Afrikaans advantaged and black Xhosa
advantaged (average), 3) coloured Afrikaans advantaged (below average), 4) black Xhosa
disadvantaged (borderline), and 5) coloured Afrikaans disadvantaged (extremely low). The
present study has demonstrated that while language and ethnic variables reveal subtle
effects on IQ test performance, quality of education has the most significant effect –
impacting significantly on verbal performance with this effect replicated in respect of the
FSIQ. Therefore caution should be exercised in interpreting test results of individuals from
different language/ethnic groups, and in particular those with disadvantaged schooling, as
preliminary data suggest that these individuals achieve scores which are 20 – 35 points
lower than the UK standardisation.
ii
TABLE OF CONTENTS
CHAPTER 1. LITERATURE REVIEW 1
1.1. Objective 1
1.2. Wechsler Intelligence Scales 1
1.3. General issues in cognitive testing 3
1.4. Culture-specific issues 7
1.4.1. Socioeconomic status 11
1.4.2. Language 12
1.4.3. Education, including quality of education 15
1.5. Rationale for the present study 21
CHAPTER 2. METHODOLOGY 22
2.1. Participants 22
2.1.1. Age 24
2.1.2. Level of education 24
2.1.3. Gender 24
2.1.4. Language 24
2.1.5. Quality of education 25
2.2. Procedure 25
2.2.1. Data collection 25
2.2.2. Test administration 26
2.2.3. Language of assessment 26
2.2.4. Scoring 28
2.3. Data analysis 29
2.4. Data presentation 30
CHAPTER 3. RESULTS 31
3.1. Overall significance 31
3.2. WISC-IV performance trends 31
3.2.1. Quality of education: advantaged schooling 32
iii
3.2.2. Quality of education: disadvantaged schooling 35
3.3. Results summary 38
CHAPTER 4. DISCUSSION 40
4.1. WISC-IV performance continuum effect 41
4.1.1. Advantaged group comparisons 42
4.1.2. Disadvantaged group comparisons 46
4.2. WISC-IV specific Index scores and subtest findings 48
4.3. WISC-IV versus WAIS-III outcomes 50
CHAPTER 5. EVALUATION AND RECOMMENDATIONS 54
5.1. Evaluation of the present study 54
5.1.1. Strengths 54
5.1.2. Limitations 55
5.2. Recommendations for future study 59
5.2.1. Official languages 59
5.2.2. Regions 59
5.2.3. Level of education 59
5.2.4. Quality of education 60
5.3. Final summary 60
CHAPTER 6. REFERENCES 62
APPENDICES 67
Appendix A: Letter sent to schools 68
Appendix B: Letter sent to parents 70
Appendix C: Informed consent – Headmaster 72
Appendix D: Informed consent – Parent/Guardian 74
Appendix E: Informed consent – Child participant 76
Appendix F: Screening questionnaire for potential participants 78
iv
LIST OF TABLES
Table 1: Total combined sample including new and pre-existing Grade 7 samples,
stratified for ethnicity1, language2, quality of education3, and gender. 22
Table 2: ANOVA and Scheffe's post hoc comparative analyses of WISC-IV
performance of English, Xhosa and Afrikaans Grade 7 learners aged 12-13
years, stratified for advantaged versus disadvantaged quality of
education.(N=69) 39
Table 3: Comparative table of WAIS-III and WISC-IV Index and IQ scores for South
African participants stratified for ethnic group, language, level and quality of
education. 53
Table 4: Future research options: Identification of gaps in available cross-cultural
WAIS-III and WISC-IV data in need of further research, for white English,
white Afrikaans, black Xhosa and coloured Afrikaans participants with
advantaged and disadvantaged education. 61
Table 5: Future research options: Proposal for WAIS-III and WISC-IV research
within the advantaged group, with refined stratification for quality of
education that differentiates between private and former Model C schools in
the Eastern Cape, South Africa. 61
v
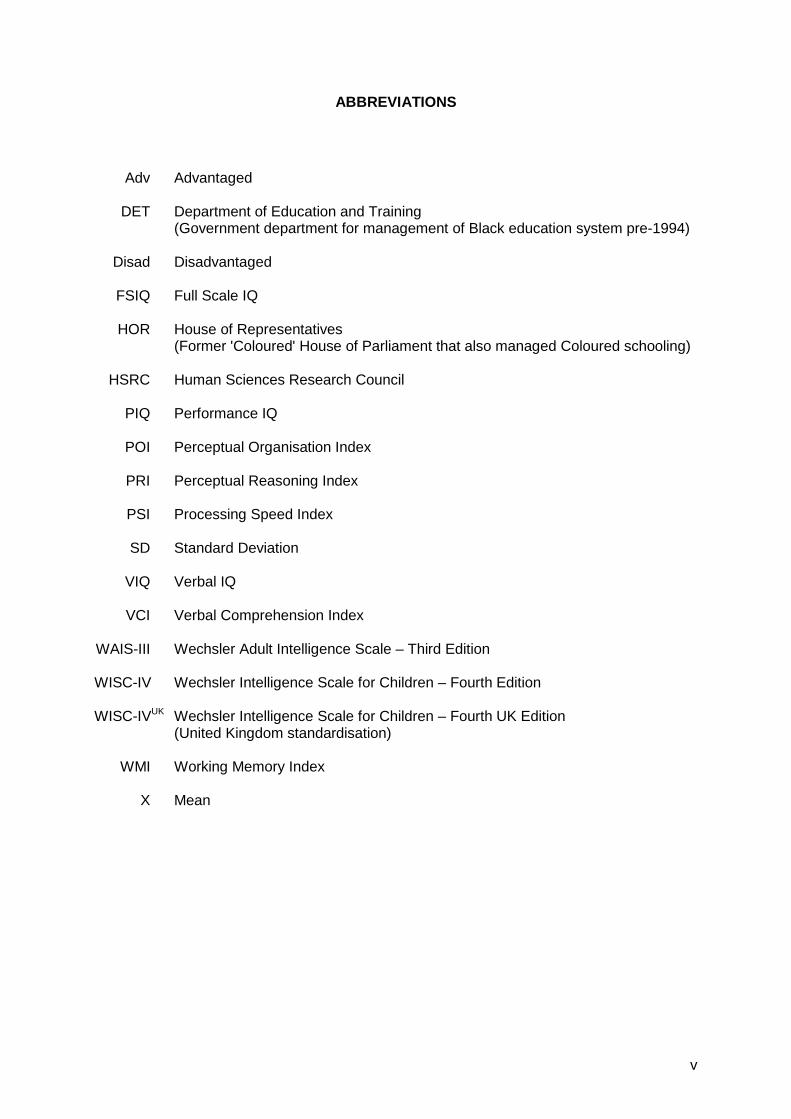
ABBREVIATIONS
Adv Advantaged DET Department of Education and Training (Government department for management of Black education system pre-1994) Disad Disadvantaged FSIQ Full Scale IQ HOR House of Representatives (Former 'Coloured' House of Parliament that also managed Coloured schooling) HSRC Human Sciences Research Council PIQ Performance IQ POI Perceptual Organisation Index PRI Perceptual Reasoning Index PSI Processing Speed Index SD Standard Deviation VIQ Verbal IQ VCI Verbal Comprehension Index WAIS-III Wechsler Adult Intelligence Scale – Third Edition WISC-IV Wechsler Intelligence Scale for Children – Fourth Edition WISC-IVUK Wechsler Intelligence Scale for Children – Fourth UK Edition (United Kingdom standardisation) WMI Working Memory Index X Mean

vi
ACKNOWLEDGEMENTS
This research project has been greatly challenging, but has ultimately proven rewarding.
Already the usefulness of the data for clinical practice has been apparent in that clinicians
have enquired about the findings and applied them to their cases. It has been a privilege to
contribute to the data base of knowledge and to know that this work is timeous and relevant
for use in clinical practice.
I would like to express my thanks and appreciation to –
� The members of the research team: Prof. Ann Edwards, for expert supervision and for
her guidance throughout the research process; Dean and Teri, for assisting with data
collection; and Prof. Sarah Radloff for her expertise in statistical analysis.
� The schools who agreed to work with the research team and who facilitated access to the
participants. Your cooperation was critical to the success of this project.
� All the participants who gave of their time. Your valuable input will be put to good use and
in future will enable more culture fair clinical assessment practices.
� Friends, family, colleagues and my therapist who kept me sane and motivated. Your
encouragement helped me to persevere through the difficult times.
� My wonderful fiancé, Paul Greenway, who never stopped believing that the deadlines
would be reached, that the project would be completed by the hand-in date…and for
proofreading numerous chapters.
And finally –
� To God be all the glory for giving me this opportunity and the strength to see it through to
the end.
1
CHAPTER 1. LITERATURE REVIEW
1.1. Objective
The objective of the this study was to provide preliminary cross-cultural normative data with
respect to performance of South African children on the Wechsler Intelligence Scale for
Children-Fourth Edition (WISC-IV). The intention was not to produce a new standardisation
of the WISC-IV for the South African context, but rather to generate cross-cultural normative
data that would provide a pragmatic indication of WISC-IV test performance for use within
clinical settings in South Africa. The need for cross-cultural norms that take into account
additional demographic variables, besides age, was recognised in light of considerable
evidence from intelligence and language research that suggest a significant ethnic variable,
including access to differing quality of education, on test scores in children. Seeking to
include Afrikaans speaking Grade 7 children, this study extended preliminary normative data
for performance on the WISC-IV generated by Van Tonder (2007) in relation to English and
Xhosa speaking Grade 7 children.
1.2. Wechsler Intelligence Scales
The Wechsler Intelligence Scales have led the way in assessment of intelligence in adults
and children for almost seven decades, since the release of the original Wechsler-Bellevue
Intelligence Scale (W-B) in 1939 (Saklofske, Weiss, Beal, & Coalson, 2003). They are widely
used in many countries, are available in a number of languages, have been extensively
researched and have contributed much to the understanding of cognition over the years
(Ardila, 1996; Saklofske, et al., 2003; Wechsler, 2004). Wechsler defined intelligence as "the
aggregate or global capacity of the individual to act purposefully, to think rationally and to
deal effectively with his environment" (Wechsler, 2004, p. 3) and asserted that intelligence is
both a global entity relating to the individual's behaviour as a whole (represented by the Full
Scale IQ score or FSIQ) and also specific, consisting of different distinct abilities. He thus
assumed a theory of general intelligence, while also recognising other types of intelligence
such as verbal and performance intelligence (Ardila, 1996). The Wechsler Intelligence Scales
make use of various subtests, which are divided broadly into verbal and non-verbal abilities.
Index scores measuring various modalities (verbal comprehension, perceptual organisation,
working memory and processing speed) and IQ scores (including verbal – VIQ, performance
– PIQ, and FSIQ) are derived from composite subtest scores and together yield an effective
measure of intelligence (Saklofske, et al., 2003; Wechsler, 2004).
2
Over years of study, the Wechsler Intelligence Scales have been shown to be valid and
reliable measures of intelligence (Saklofske, et al., 2003). The Wechsler Intelligence Scales
have gone through constant revisions which have contributed to their reputation of being well
designed and robust (Ardila, 1996). The W-B was revised and released as the W-B II in 1946
– both these scales included norms for ages 10 to 59 years (Saklofske, et al., 2003).
Currently, the Wechsler tests are widely used as standardised measures for individual testing
of children and adults and cover the age range from 2.5 to 89 years. The Wechsler Adult
Intelligence Scale (WAIS) which covers the upper age ranges was first released in 1955 and
has since been revised twice (WAIS-R, 1981; WAIS-III, 1997). A scale for use with preschool
children which covers the youngest age groups, the Wechsler Preschool and Primary Scale
of Intelligence (WPPSI), was released in 1967, and has also been revised twice (WPPSI-R,
1989; WPPSI-III, 2002). The intermediate age ranges are catered for by the Wechsler
Intelligence Scale for Children (WISC) which was first released in 1949, and this marked the
division of the Wechsler Intelligence Scales into separate tests for children and adults
(Saklofske, et al., 2003; Strauss, Sherman, & Spreen, 2006).
The WISC has gone through two previous revisions (WISC-R, 1974; WISC-III, 1991) to the
current version WISC-IV released in 2003. The WISC-IV is intended for use with children
aged 6 years to 16 years 11 months (Saklofske, et al., 2003; Strauss, et al., 2006). This test
is a versatile instrument used in research, clinical assessments, and other types of
assessments such as neuropsychological assessments. It is also anticipated that the WISC-
IV will pick up where its forerunners left off as the dominant tool for assessment of intellectual
functioning of children (Prifitera, Weiss, Saklofske, & Rolfhus, 2005). The current version of
the test was revised to keep up with changes in norms as population scores become inflated
over time (known as the Flynn effect), as well as to ensure that test items remain current and
unbiased (Prifitera, et al., 2005). It also encompasses a fundamental theoretical shift as it
was designed with current trends in factor analysis theories in mind, and incorporated this
with the traditional Wechsler approach. This is believed to introduce stronger psychometric
properties (Baron, 2005). Strauss, et al. (2006, p. 311) describe the WISC-IV as a "first-
generation hybrid". However, the test remains a good measure of g (the general intelligence
factor) and consistently measures the same constructs across age groups 6 to 16 (Keith,
Fine, Taub, Reynolds, & Kranzler, 2006).
The WISC-IV's main departure from the traditional Wechsler model is that it boasts four
domain index scores. These are the Verbal Comprehension Index (VCI), the Perceptual
Reasoning Index (PRI), the Working Memory Index (WMI), and the Processing Speed Index
(PSI). These index scores replace Verbal IQ (VIQ) and Performance IQ (PIQ) scores
3
characteristic of the older Wechsler tests. The test still boasts a Full Scale IQ (FSIQ) which is
derived from the four domain index scores, thus representing a general composite score for
the entire scale (Baron, 2005; Prifitera, et al., 2005; Strauss, et al., 2006). The VCI was
designed to replace the VIQ and measures "verbal knowledge, reasoning and
conceptualisation"; the PRI was designed to replace the PIQ and measures "interpretation,
reasoning, an organisation of visually presented nonverbal information"; the WMI and PSI
are new indices and measure "attention, concentration, and working memory for verbal
material" and "speed of mental and graphomotor processing", respectively (Strauss, et al.,
2006, p. 311). The test consists of a core battery of ten subtests, used to calculate composite
scores and forming the basis of the FSIQ, including: Vocabulary, Similarities,
Comprehension which contribute to the VCI score; Block Design, Picture Concepts, Matrix
Reasoning which contribute to the PRI score; Digit Span, Letter-Number Sequencing which
contribute to the WMI score; and Coding, Symbol Search which contribute to the PSI score
(Wechsler, 2004).
The WISC-IV has been standardised on an American population, as well as, being adapted
and standardised for use in Canada, the United Kingdom, France and Belgium, the
Netherlands, Germany, Austria and Switzerland, Sweden, Lithuania, Slovenia, Greece,
Japan, South Korea, and Taiwan (Van de Vijver, Mylonas, Pavlopoulos, & Georgas, 2003).
To date there has been no attempt at a South African standardisation. WISC-IV test
differences were found between ethnic groups within the American population (Sattler &
Dumont as cited in Strauss, et al., 2006; Prifitera, et al., 2005) and furthermore preliminary
WISC-IV research in South Africa (Van Tonder, 2007) has also revealed significant effects
for ethnicity in association with differing quality of education. Due consideration needs to be
given therefore, to the use of a test such as the WISC-IV for individuals who do not relate to
the standardisation sample, and particularly in cross-cultural settings. Relevant literature
pertaining generally to the application of cognitive tests will be reviewed, with particular
consideration given to the application of the WISC-IV test, as well as issues specific to
cognitive testing in the South African context.
1.3. General issues in cognitive testing
Standardised, norm-referenced tests pertain to very specific groups, and the norms serve as
a standard against which a person's performance can be evaluated (Lezak, Howieson, &
Loring, 2004; Manly & Echemendia, 2007; Mitrushina, Boone, Razani, & D'Elia, 2005).
However, individuals do not necessarily come from a homogenous group. It is therefore
4
necessary to exercise care when selecting tests and interpreting norms as one cannot
assume, even within a certain race/ethnic/culture or language group that individuals would
have acquired the same knowledge and developed the same characteristics (Harris &
Llorente, 2005; Sattler, 1992). Mitrushina, et al. (2005, p. 18) argue that "all normative data
are of limited use" as performance typical of a specific group is the norm for that group and
each group represents its own norm. Norms are therefore useful only for those groups who
have similar characteristics to the normative sample. However, whilst raw scores obtained on
a test can vary for groups that differ according to certain characteristics, the standard
normalized scores are comparable (Ardila, 1996). Sattler (1992) highlights the importance of
norm-referenced tests for clinical and psycho-educational assessment as a means to ensure
accurate placement and diagnosis. Appropriate norms are also essential for
neuropsychological assessment, aiding in appropriate neurocognitive classification
(Anderson, 2001). Strauss, et al. (2006) in turn emphasise that use of appropriate norms is
as important as test selection, due to the fact that considerable importance is attached to
scores for making an appropriate diagnosis, and for taking decisions for treatment and
placement. At times scores also have implications for financial compensation. The problem is
that when inadequate norms are used, healthy individuals may mistakenly be deemed
cognitively impaired. Such misdiagnosis may lead to needless treatment or therapeutic
neglect (Anderson, 2001; Mitrushina, et al., 2005; Skuy, Schutte, Fridjhon, & O'Carroll, 2001;
Strauss, et al., 2006).
A particularly pertinent concern with regard to testing in South Africa therefore, is
questionable generalisability of commonly employed westernised tests due to the fact that
many tests have not been standardised and normed for cross-cultural use. Available norms
are more appropriate for use with the white population (Kanjee, 1999). In addition, a number
of variables, such as the subject characteristics of age, gender, IQ and education have also
been found to impact on psychological test performance. This necessitates the use of norms
that account for these variables when evaluating and interpreting test scores (Adams, Boake,
& Crain, 1982; Lezak, et al., 2004). Within the South African context, Anderson (2001)
argues for the use of "demographically-sensitive normative data" (p. 31) representative of the
group to which the testee belongs and which compensate for subject characteristic variables.
Anderson (2001) asserts that selection of appropriate norms is essential in order to avoid
disparity when concluding what is deemed normal for one group and problematic for another.
However, obtaining appropriate locally derived equivalent norms for psychological test
commonly used in South African would be a considerable challenge due to both South
Africa's cultural diversity and the impact of this country’s apartheid legacy (Anderson, 2001).
5
Clinical practice is situated within a political, social and historical context (Claassen as cited
in Meiring, Van de Vijver, Rothmann, & Barrick, 2005; Kanjee, 1999) and this point is well
illustrated in the South African situation. Psychological tests were imported from abroad in
the early 1900s for use essentially with the white population (Van de Vijver & Rothmann,
2004). Separate test development concentrated on Afrikaans and English speaking groups
(the official languages during the apartheid era) while excluding African language speakers
(Stead, 2002). Cross-cultural issues came to the fore in the 1920s, 1940s and 1950s when
testing was used to determine the extent to which black South Africans could be educated
and trained (Meiring, et al., 2005). With the caveat that test scores should be interpreted with
caution, tests normed on the white population were also used with other ethnic groups
(Stead, 2002). Rashid Ahmed (in Kanjee, 1999, p. 292) asserts that clinical practice has a
role to play in "reproducing unequal power relations that lead to discrimination and the
exploitation of economically and politically marginalised groups". This was evidenced in
South Africa as tests were used to validate exploitation of black labourers, to deny black
individuals access to education, as well as limiting black individuals from gaining access to
economic resources. Psychological testing and IQ tests in particular, were also used to
promote white supremacy and to claim genetic inferiority of black individuals. As a result of
past biases , discriminatory testing practices and the negative impact of testing on the lives
of many South Africans, assessment remains a contentious activity in South Africa – in
particular because of past misuse of psychological testing in support of racist policies of
segregation under the apartheid government (Kanjee, 1999; Stead, 2002).
After South Africa's first democratic elections in 1994, the country adopted a new constitution
which guaranteed basic human rights and equality. Van de Vijver and Rothmann (2004) have
pointed out that this has also impacted on psychological assessment practice in South Africa
as test users now need to be more cognisant of test bias and discriminatory test practices, as
this has now been legislated against. The Ethical Rules of Conduct for Practitioners
registered under the Health Professionals Act 56 of 1974, Annexure 12, Section 48
(Government Gazette, 2006), requires sensitivity with regard to cultural diversity and
stipulates that any psychologist using assessment methods should not only be familiar with
the reliability and validity of a test, but also with standardisation procedures and the proper
application and uses of such tests. Furthermore, a psychologist should recognise the
predictive limitations of tests with regard to individuals from different linguistic, cultural and
socio-economic backgrounds, and should make "every effort to identify situations in which
particular assessment methods or norms may not be applicable or may require adjustment in
administration, scoring and interpretation" because of various demographic, cultural and
socio-economic factors which are known to impact on test performance. Psychologists are
6
further governed by the Employment Equity Act 55 of 1998, Section 8 (Government Gazette,
1998), which makes explicit that psychological testing and assessment methods used should
"be applied fairly to all employees" and should not be "biases against any employee or
group".
Therefore, when choosing appropriate norms, the relevance of the norms should be carefully
considered. For some purposes a broadly representative sample or nationally relevant norms
may be most appropriate, while at other times a specific subgroup sample (defined by
demographic criteria such as gender, education, ethnicity, socioeconomic status, etc.)
particular to a segment of the population, is more appropriate. Other considerations
pertaining to relevance of norms include sample size and composition, date of norming, as
well as subject specific characteristics (Sattler, 1992; Strauss, et al., 2006).
Sample size
The common assumption is that a large sample size (N) results in norms being more
representative of the general population and therefore increases the reliability and stability of
the resulting scores (Sattler, 1992; Strauss, et al., 2006). Strauss, et al. (2006) offers a ‘rule-
of-thumb’ estimate of at least 200 subjects for representative and reliable norms. Sattler
(1992) recommends at least 100 subjects per subgroup, while Mitrushina, et al. (2005) assert
that a sample size of 50 should be adequate. There seems to be no clear agreement on what
constitutes a sufficient sample size, however Strauss, et al. (2006, p 45) assert that "even
large normative sets yield small cell sizes when scores are divided into demographically
defined subgroups according to variables such as age, gender, and education". These
authors also argue that using a "smaller, homogenous normative dataset comprised only of
individuals from a similar demographic subgroup" yields statistically more powerful data that
are a better demographic fit than more generic population norms.
Date of norming
Leading authors in the field of assessment have flagged the date of norming as a very
important consideration in choosing and interpreting test scores (Sattler, 1992; Mitrushina, et
al., 2005; Strauss, et al., 2006). This, it is argued, is due to the Flynn effect in which there is
a "trend towards increased IQ scores over time with each subsequent generation", and
therefore the average 'lifespan' of a normed test is estimated at 15 to 20 years (Strauss, et
al., 2006, p. 45). Flynn demonstrated that test scores, particularly for intelligence measures,
increase by on average 0.3 IQ points per annum. In light of this, more recently collected
norms should always be used in preference over older data sets, as long as the normative
sample is adequately matched to the testee. New norms should therefore be generated for
7
tests to ensure they remain current and to correct for the Flynn effect (Mitrushina, et al.,
2005; Nell, 1994). The reason for rising scores is not clear. However Mitrushina, et al. (2005,
p. 19) propose that greater access to information over time may increase the "fund of
knowledge" of the individual. Cocodia, et al. (2003) provided evidence for the Flynn effect in
Australia, Singapore and Korea and proposed that IQ gains were linked to factors such as
industrialisation, better diet and health, more stimulation and better education. Husén and
Tuijnman (1991) demonstrated the Flynn effect in the Netherlands and showed that IQ gains
were linked to environmental factors, the most important of which was formal schooling.
Subject characteristics
A number of factors have been identified as impacting on cognitive test performance. These
include subject characteristics such as age, gender, race/ethnicity/culture, language, socio-
economic status, parental IQ and level of education, learned abilities/formal schooling, test
taking attitudes and test-wiseness, and education (both level and quality of education, with
the latter sometimes being measured indirectly in terms of reading level). It is difficult to
clearly separate the relative impact of each factor as they are interconnected and at times
exercise reciprocal effects. However, it is important to have an awareness of these
influences when assessing individuals from cultural, language, socio-economic and
educational backgrounds that differ from those of the sample for which tests were normed, in
order to avoid making claims that are biased or incorrect. Both international and Southern
African studies covering 30 years of research were reviewed for the purposes of the present
study. More detailed discussion of the subject characteristics of culture in general, and
specific interrelated factors of socio-economic status, language and education follow.
1.4. Culture-specific issues
'Ethnicity', 'culture' and 'race' are terms which are often substituted for each other in the
literature (Lezak, et al., 2004; Strauss, et al., 2006). Ardila, Rosselli, and Puente (as cited in
Strauss, et al., 2006) offer a useful way to separate these terms: ethnicity and culture are
viewed as being characterised by a common language, by customs, heritage or nationality,
while race is seen to be linked to genetic traits. These terms are also often associated with
distinctions between a minority and a majority group (Lezak, et al., 2004; Strauss, et al.,
2006) and in the international literature, the term 'minority group' is frequently used to isolate
other-than-white groups considered to be socio-economically and educationally
disadvantaged from a white majority group which is more advantaged. For example, in the
United States, the African American and Hispanic groups are referred to as minorities while
8
the white group constitutes the majority. However, this terminology needs to be applied
differently in South Africa which has a black African majority which for many years was
marginalised and discriminated against by a politically and economically more powerful white
minority.
Numerous studies document lower performance on cognitive tests in the other-than-white
populations, amongst these: Jensen in his 1969 article reported a 12 point IQ differential
between Blacks and Whites (as cited in Amante, VanHouten, Grieve, Bader, & Margules,
1977); Jensen and Reynolds (1982) reported a disparity of 1 SD (15 or 16 points) between
Blacks and Whites on intelligence tests; Kramer, Allen, and Gergen (1995) demonstrated
race differences on cognitive tests with highest scores among white children, intermediate
scores among Hispanic children and lowest scores achieved by black children; and Prifitera,
et al. (2005) also found persistent group differences between African Americans, Hispanics
and Whites in the WISC-IV standardisation sample, despite matching of the sample for a
number of subject characteristics, including age, gender, geographic region, socio-economic
status and level of education. With regard to the WISC-IV in particular, white children
achieved higher IQ scores than their African American (by 11.5 point) and Hispanic (by 10
points) peers when children were matched for parental education. The differences observed
between these groups on individual index scores varied, but PSI and WMI scores showed
the least variation between groups (Sattler & Dumont as cited in Strauss, et al., 2006;
Prifitera, et al., 2005). Differences between ethnic groups tended to increase with age and
Strauss, et al. (2006) attribute this to the negative environmental influences which have a
cumulative effect on development of cognitive abilities, especially in groups consisting of
largely disadvantaged individuals. Furthermore, with regard to Southern African research,
Rushton and Jenson (2003) reported that in South Africa, race differences exist between
groups tested on the Raven's which has resulted in a ranking in terms of scores with Whites
scoring the highest, followed by Indians, Coloureds and Blacks (who score the lowest); Zindi
(1994) demonstrated a 25 point IQ differential between black Zimbabwean children and white
British children matched for social class on the WISC-R and demonstrated almost the same
magnitude of difference on the Raven's.
Ardila (1996) notes that while for many years score variations were explained through
postulated genetic differences between races, differences may be better explained by
examining aspects of cultural learning. Cultural environment exerts an influence on the
development of cognitive abilities in that "culture dictates what is and what is not situationally
relevant" as well as prescribing "what should be learned and at what age" (Ardila, 1996, pp.
239-240). Thus, while cognitive processes are considered to be universal across cultures,
9
their expression varies in different cultures as different cultural environments encourage
development of different ability patterns (Harris & Llorente, 2005). Ardila (1996) also argues
that acceptance of testing does not happen with the same ease in all countries and for all
cultures, and therefore, culture impacts on test performance in that it shapes test taking
attitudes. Whilst testing assumes that testees will be motivated to perform well, this cannot
be taken for granted.
According to Lezak, et al. (2004) the influence of 'culture' and attitudes towards testing,
which is a function of learning and experience acquired through social interaction, should be
taken into account when assessing all individuals. Mitrushina, et al. (2005) advise that
focussing on ethnicity/race differences alone may lead to faulty claims with regard to test
performance, as cultural influences such as acculturation to the predominant culture amongst
others, may better account for these differences. There is growing support for level of
acculturation, literacy and English fluency, quality of education, and socio-economic status
as an explanation for variance in test scores, rather than the broader concepts of ethnicity or
race (Ardila, 1996; Harris & Llorente, 2005; Manly, Byrd, Touradji, & Stern, 2004; Manly,
Jacobs, Touradji, Small, & Stern, 2002; Shuttleworth-Edwards, Donnelly, Reid, & Radloff,
2004). Further consideration with respect to variables of culture and acculturation is
warranted, in that this has specific relevance for test selection and norming in the South
African context.
Due to the legacy of apartheid in South Africa, test users need to acknowledge that race is a
mediator of the quality of education, economic opportunities, urbanization and socio-
economic status of many South Africans (Nell, 1994), and as such, cultural issues are likely
to impact on test performance. Van de Vijver and Rothmann (2004) therefore assert that
research is needed to determine whether South African assessment methods are non-
discriminatory and free from bias. Two papers have reviewed different solutions to this
problem in light of the multicultural nature of the South African context (Stead, 2002; Van de
Vijver & Rothmann, 2004). Firstly, some have argued that non-indigenous American and
European tests should not be used in South Africa due to questionable validity of test scores
among black South Africans (for example, Sehlapelo and Terre Blanche, as cited in Stead,
2002). They have called for the development of tests specific to the South African context
based on the argument that tests currently used in this country have not been developed with
this context in mind and are therefore inherently problematic. Also, given past uses of
assessment in South Africa, they question whether tests that have not been standardised for
black South Africans will be reliable measures or have true predictive validity. Secondly,
Stead (2002) cites Shuttleworth-Jordan (1996) who has argued in favour of another position,

10
suggesting that modification and standardisation of existing tests would be sufficient to allow
for their use with some previously disadvantaged black South Africans. Shuttleworth-Jordan
(1996) does not dispute that cultural differences in test scores exist, but again draws
attention to the impact of acculturation, making strong arguments in favour of the position
that apparent cultural effects on test performance may be better accounted for in terms of
socio-economic status and education factors. Shuttleworth-Jordan (1996) further states that
many black South Africans have been part of an acculturation process, including moving
from rural to urbanised conditions, having had opportunities to access westernised education
and obtain literacy in English. As acculturation is a powerful mediator of test performance, it
would be considered appropriate clinical practice to continue using internationally recognised
cognitive tests with urbanised, westernised and highly educated groups.
While Shuttleworth-Jordan (1996) made a convincing case for the use of internationally
recognised cognitive tests with certain groups involved in an acculturation process, it would
also be important to consider which of the westernised tests should be standardised and
normed for the South African context. Nell (1994) argued for norming of newer versions of
tests, making a case with reference to the SAWAIS which was adapted from the 1939
version of the Wechsler-Bellevue Adult Intelligence Scale. Nell (1994) stated that norms for
the SAWAIS were outdated even for use with the white population as they did not reflect
educational and socioeconomic changes with regard to the South African population. Nell
used the research of Verster and Prinsloo (1988) which demonstrated the effect of
acculturation on the white population norms over time to illustrate his point. Verster and
Prinsloo (1988) followed trends for English and Afrikaans speaking white South Africans over
a 30 year period. These researchers found that the gap between test scores of English and
Afrikaans speaking white South Africans narrowed due to a process of acculturation amongst
the Afrikaans group.
More specifically, a summary of the Verster and Prinsloo (1988) literature review and findings
is as follows. Over many years, it has been well established that there is a performance gap
between the white South African English and Afrikaans groups. The Afrikaans population is
descended from Dutch, German, Belgian and French Huguenot immigrants who arrived in
this country between 1650 and 1800, and forged an independent national character
exemplified in their own unique language. This group has historically been more
conservative, come from an impoverished rural base, and emphasised their separateness
from other groups. While the English population is largely descended from British settlers
who arrived from 1820 onwards and who retained strong cultural ties with the wider English
speaking world – this group has historically been wealthier and has adopted more liberal-
11
democratic views. Over recent generations, the test performance gap between English and
Afrikaans speakers in South Africa has been shrinking from about 10 IQ points in the 1950s
to only 5 IQ points in the 1980s. This is attributed to progressive acculturation of the
Afrikaans speaking group towards adopting more westernised English values, moving from
rural to urban areas, accessing improved quality of education and gaining material wealth.
Accordingly Verster and Prinsloo (1988) demonstrated how the gap between English and
Afrikaans white South Africans has decreased with cultural convergence. Differences
between these groups, however, appear to remain with regard to performance measures
(which represent abstract, nonverbal reasoning), while differences in terms of verbal
measures (which represent school curriculum learning) have decreased.
In light of the above-cited research, Nell (1994) argued that old norms can be problematic in
that they inflate scores, with the implication that someone may appear 'average' despite
being severely impaired. For this reason, Nell (1994) called for norming of the most recent
Wechsler test for use with adults in South Africa.
1.4.1. Socioeconomic status
Numerous studies have investigated the effects of socio-economic factors on cognitive test
performance. In the 1970s Amante, et al. (1977) demonstrated that when groups of similar
socio-economic status are compared, black and white score differences decrease (although
they are not totally eradicated). Hale, Raymond, and Gajar (1982) also examined the impact
of socio-economic status on IQ scores. Kramer, et al. (1995) noted that cognitive
development was linked to environmental, social and hereditary factors, with lower
intellectual functioning proving to be associated with minority status and socio-economic
status. In the United States, it has been shown that children from lower income families are
mostly black and have parents with lower education levels – this also impacts on poverty
levels, and such children are more likely to experience health problems and poor nutrition.
Recently, Prifitera, et al. (2005) found a substantial correlation between socio-economic
status and IQ with regard to the WISC-IV standardisation sample. When this WISC-IV
sample was stratified for socio-economic status, a performance continuum effect was noted
in the direction of lower scores in relation to lower socio-economic status of a group. These
researchers comment that a similar effect was noted on the WISC-III.
It was noted that comparatively poorer performance on the WISC was generally found for
individuals from ethnic minorities, which was related to lower socio-economic status of this
group, as well as representivity of the normative sample (Harris & Llorente, 2005). Lezak, et
al. (2004) also draw attention to the fact that when a group has been socio-economically
12
disadvantaged, these factors should be considered in test score interpretation. This also
pertains to the African American group, which has been disadvantaged in the past and
continues to be so. In South Africa Skuy, et al. (2001) demonstrated that children from
Soweto scored lower on tests of cognitive ability than their American counterparts and that
socio-economic status needs to be considered in explaining this outcome, due to the legacy
of apartheid in South Africa. Under apartheid, the African majority were denied equal
opportunities, which has perpetuated adverse social conditions, including high levels of
unemployment, limited educational opportunities, unsatisfactory living conditions and poor
nutrition. In order to obtain a representative normative sample, IQ test developers stratify
socio-economic status within racial/ethnic groups. According to Prifitera, et al. (2005) the
implication of this practice is that other-than-white subgroups may consist of a larger
proportion of lower socio-economic status individuals as this most often reflects this
population subset's characteristics. Therefore, direct comparisons between Whites and
other-than-white groups will not take into account the impact of socio-economic status
differences which could impact on scores for a particular group. Marcopulos, McLain, and
Giuliano (1997) noted that distinguishing between direct effects and interactions of variables
such as ethnicity/race and socio-economic status on test performance is difficult. This is due
to the fact that American minority groups are often socio-economically disadvantaged – and
in South Africa it is the black majority which was, and largely remains, underprivileged.
1.4.2. Language
Leading neuropsychological texts of Lezak, et al. (2004) and Mitrushina, et al. (2005),
comment on the importance of language with regard to effects on cognitive test scores.
Lezak, et al. (2004) further comment on the need to develop instruments written in the
testee's language and call for standardised tests for specific cultural and language groups.
This they consider preferable to the use of interpreters. Mitrushina, et al. (2005) highlight
difficulties associated with translating tests into other languages, and state that even when
tests can be administered in English, biculturalism and bilingualism can impact on test
performance. These mechanisms are not yet clearly understood.
Ardila (1999) highlights the importance of language in moderating test performance. In South
Africa (which has adopted 11 official languages, nine of which are African languages)
development of tests can prove problematic. These groups are not culturally homogeneous
and even within these official language groups there are differences in language use. There
are also socio-economic status differences within the black African groups which can lead to
varying levels of English language competency. Ardila, Rosselli, Matute, and Guajardo
(2005) comment that poverty impacts on language skills and children from impoverished
13
communities were found to have lower verbal skills when compared to both the general
population as well as their own cognitive abilities. As a large proportion of the South African
population are black and impoverished, language issues become a potentially serious
problem.
Sattler (1992) also draws attention to the fact that language differences may impact on
knowledge acquisition, which further exaggerates test performance differences. Skuy, et al.
(2001) presented evidence in favour of language having considerable effect on cognitive test
performance when black South African children performed very poorly on many verbal tasks.
They link this finding to the fact that this group of children are being educated in a language
which is not their first language. Furthermore, Ceci (1991) states that, the language used in
teaching is more formal and may differ a great deal from the child's first language. The
language used in IQ tests is often similar to that of formal schooling and therefore children
are able to understand the questions of the tests. While most children are taught in English in
South Africa, English is the first language of only 8.2% of the country (according to Stats SA,
2001). English competency varies widely and can therefore be a complicating factor when
westernised tests are used.
English however remains the main language of assessment in South Africa, as previously
mentioned, and whilst some test norms are available for Afrikaans speakers, few tests are
available in any of the other nine African languages (Stead, 2002). Fleisch (2007) reviewed
several studies pertaining to the state of Foundation and Intermediate Phase schooling in
South Africa and offered valuable comment on the language situation in South African
schools. According to Fleisch (2007), although the majority of South African children are
taught and assessed in English by the time they complete Grade 3, the level of English
language proficiency among the majority of black South Africans cannot be considered
equivalent to that of English first language individuals. An interesting phenomenon, however,
is that despite English not being their first language, the majority of South Africans prefer for
their children to be educated in English. This is because English has become the language
with the most status. It is the language of political, economical and intellectual power, as well
as being the language of international relations. Furthermore, the legacy of apartheid
language policies led to the devaluation of the status of African first languages. This trend is
also observed amongst Afrikaans first language speakers who prefer for their children to
attend English-medium schools (Broom, 2004). This phenomenon has implications in that the
majority of South African children are being educated in a language that they do not speak at
home or in their community, and it has led to a complex multilingual situation in most schools
(advantaged and disadvantaged).
14
Fleisch (2007) also comments that research has shown that most children assessed in a
language other than their first language perform far worse on tests than those who receive
the test in their first language, though they are being educated in the same school and
receiving the same quality of education. Furthermore, Fleisch (2007) comments that
research has shown that the performance of children attending advantaged schools is much
better than their same language peers in township schools, which can be accounted for by
the fact that children in advantaged English-medium schools are immersed in the language,
are taught by teachers proficient in English, and generally have greater access to English
language books. It is therefore evident that the language situation in South Africa is complex
and assessment presents many challenges in a context where English language proficiency
cannot be assumed.
Consequently, possibly the most pivotal challenge in the South African context revolves
around the decision whether or not to translate tests. One option is to translate tests into the
testee's first language, while the other is to present tests in English. Nell (1994) commented
on the challenges associated with deciding which option is better and asserts that language
is the most important intermediary of test performance. The test language can either allow a
non-native speaker of that language to access concepts that are unavailable to them in their
first language, and conversely may deny the testee access to the language with which they
are most familiar and which has mediated their knowledge acquisition or experience.
Language therefore may introduce test bias when tests (such as intelligence tests which are
usually developed for use with English speakers) are administered to testees with a different
first language. As such, a test administered in English may hinder an individual who is not an
English first language speaker from understanding the instructions or from adequately
expressing themselves. Stead (2002) proposes two strategies towards solving this problem.
The first would be to develop norms for tests which correct for education level and English
language proficiency, while the second would entail developing norms in the testee's home
language. Stead (2002) however argues that South African test users need to take
cognisance of the possible implication of test translation in order to ensure linguistic
equivalence with the original test, as well as conceptual equivalence. Furthermore, test users
need to evaluate available normative data to ensure that they are appropriate and will not
disadvantage the testee.
The most recent tendency in South Africa has been to norm tests in English only, rather than
to go the route of translating the tests, for example, the Human Sciences Research Council
WAIS-III standardisation for English speaking South Africans conducted by Claassen,
Krynauw, Paterson, and Mathe (2001). This decision was made on the basis of complexity
15
associated with multiple translations that would be required for the various official languages
and the variety of specific dialects within designated African language groups. Therefore, the
large scale norming project, undertaken by the HSRC group, chose to norm the WAIS-III only
for English speaking South Africans, reasoning that the majority of South Africans are
currently educated through the medium of English from Grade 4 onwards and that even
those learners who attend Afrikaans-medium schools study English as a subject at school
(Claassen, et al., 2001). The test was also administered to a comparison group in order to
obtain data on how the test could be applied to non-English first language speakers. The
comparison group consisted of African language speakers and Afrikaans speakers with
"considerable exposure to English" in that they "spoke English at work/school most of the
time ", as well as a group with limited English competency, in this case "Afrikaans speakers
with poor exposure to English" whose first language was Afrikaans and "who spoke
Afrikaans at work/school most of the time " (Claassen, et al., 2001, p. 11). The HSRC
standardisation of the WAIS-III found that "subjects with Afrikaans as language of learning
scored disproportionately poorly in the verbal subtests as well as in tests loading on working
memory when the tests were presented in English" (pp. 72-73). They concluded that people
who are trained in Afrikaans would be better catered for in providing an Afrikaans translation
of the WAIS-III. While an Afrikaans translation of the WAIS-III was done, the test was not
normed for administration in languages other than English.
The HSRC standardisation of the WAIS-III was heavily criticised by Nell (1999) who
considered this standardisation to be flawed, due to the fact that the HSRC group did not
control for quality of education. Especially since quality of education is a pertinent issue
within the South African context and has far reaching implications with regard to
representativeness of norms for groups (for example black African first language individuals),
with vastly differing educational exposure.
1.4.3. Education, including quality of education
Various education factors have been linked to IQ performance across a number of studies,
including parental education level, access to formal education and effects of schooling, level
of education, and quality of education. Parental education level has been known to impact
upon children's cognitive development and test scores (for example, Ardila, et al., 2005) with
the effects of parental education level evident on most IQ tests. This was also found to be the
case for the WISC-IV where the mean FSIQ of children whose parents had tertiary education
qualifications compared to those whose parents had less than nine years of education, was
on average 20 points higher (Sattler and Dumont as cited in Strauss, et al., 2006). This is
16
likely due to the fact that parents with higher educational levels are apt to provide more
intellectual stimulation and foster a culture of learning within their families.
Other studies have shown that formal education, in and of itself, impacts on test
performance. Nell (2000) highlighted issues which had already been identified by Kendall,
Verster, and Von Mollendorf (1988) in their review of various studies which illustrated that
formal education impacts markedly on test performance and a strong positive relationship
was found between amount of formal schooling across various Southern African studies and
test performance. These researchers attributed effects of schooling, in part, to test-wiseness
and test sophistication, as formal schooling develops familiarity with test procedures and
materials, including using a pencil, being familiar with booklets, letters and numbers, paying
attention and following instructions, and examination situations.
Ardila (1996) emphasizes level of education as a highly significant variable of
neuropsychological test performance. Ardila (1999) found that educational attainment
correlates significantly with scores on intelligence tests. In particular, education shows a high
level of correlation with verbal intelligence subtests (specifically Vocabulary) and this is
explained by the fact that many educational systems are biased in favour of verbal ability. As
intelligence tests were initially designed to predict school performance, this is not surprising.
Brody (1997) supported Ardila's argument stating that the relationship between intelligence
test scores and educational achievement are reciprocal. Brody (1997) as well as Byrd,
Jacobs, Hilton, Stern, and Manly (2005) also showed that scores on intelligence tests are
positively correlated, not only with level of education (grades achieved), but also with
performance on reading comprehension and mathematical knowledge i.e., subjects closely
linked with curriculum content. Byrd, et al. (2005) go on to conclude that while educational
level has been documented to be a strong predictor of performance on intelligence tests,
their research has shown that reading level and literacy are more accurate reflections of
academic achievement than years of education. They related this to reading achievement
being a measure of quality of education. While groups may have reached the same level of
education, the quality of their educational experience may differ. Such differences in quality
of education have been observed amongst elderly African Americans from the South and
North of the United States as some were more likely to have had lower quality of education
due to segregated schooling (Manly, et al., 2004). Recent cross-cultural literature and
research in the South African context has also highlighted quality of education as an
important factor, even when samples have been matched in terms of educational level (Nell,
1999; Shuttleworth-Edwards, Kemp, Rust, Muirhead, Hartman, & Radloff, 2004; Van Tonder,
2007).
17
At one time, the dominant belief was that intelligence could not be altered by years of
schooling completed but was in itself a predictor of how far one could progress in schooling
(Ceci, 1991). This view has largely been contested. Ardila, Rosselli, and Rosas (1989) have
argued that school is a culture in its own right as those who access formal education are
trained in terms of particular cognitive abilities. Therefore, cognitive abilities are learned and,
due to the fact that intelligence tests were designed to tap into these particular abilities, those
with formal training will usually outperform those without. This view is supported by Ostrosky-
Solís, Ramirez, and Ardila (2004) who comment that education reinforces acquisition of
certain cognitive skills. Kaufman, Mclean, and Reynolds (1988) also found that increased
educational levels corresponded with increased mean scores across age groups. Intelligence
is largely a measure of cumulative learning (Ceci, 1991; Husén & Tuijnman, 1991). However,
according to Ceci (1991) intelligence is also influenced by differences in schooling as the
higher grade level an individual attains, the higher the IQ score. Education is consequently
an "aptitude development program" and intelligence in turn is "an aptitude for learning in
education and a primary product of learning in education" (Snow & Yalow, 1982). Mitrushina,
et al. (2005) recognised that those with low intelligence scores usually have not completed
much education, and identify two groups with low education: those with low cognitive ability
who could not manage the demands of schooling, and those who were not afforded the
opportunity to complete schooling but who could have benefited from further education. They
comment that it would be appropriate to correct test scores for the latter group only.
South Africa's racialised past has left a legacy of educational inequality that sets ethnic
groups apart. A negative effect on educational achievement is most clearly evidenced for the
underprivileged black group (Fleisch, 2007). Prior to the desegregation of South African
schools in 1991, white learners, as well as, a minority of other race groups who had the
financial means, attended privately funded Independent (hereafter private) schools or
government funded Model C schools run by various provincial Departments of Education.
These children enjoyed access to more than 75% of available resources (Broom, 2004;
Claassen, et al., 2001). Private and former Model C schools remain well-resourced and
children educated in these schools achieve academic competency, perform in the upper
range and comprise the majority of university entrants and graduates (Fleisch, 2007).
Conversely, black learners attended schools run by the Department of Education and
Training (DET) and coloured learners attended schools run by the House of Representatives
(HOR), the coloured house of parliament. These children attended vastly under-resourced
schools and were mostly taught by under-qualified teachers (Broom, 2004; Claassen, et al.,
2001). The vast majority of black and coloured South African children (those from working-
class and poor families) – and approximately 80% of all learners in South Africa – are still
18
attending former DET or HOR (hereafter township) schools (Broom, 2004; Claassen, et al.,
2001; Fleisch, 2007). Although township schools are generally referred to as "previously
disadvantaged", many continue to be relatively ill-resourced or resources may be
underutilised. These schools often lack basic supplies, books or even desks. They also
receive only basic government funding, there is absenteeism from the classroom (for
teachers and learners), ineffective teaching methods are used, there are higher teacher-
learner ratios in township schools, and teachers are often under-qualified or have weak
subject knowledge and do not understand the demands of the new curriculum. All these
factors therefore, contribute to a poorer quality of education in township schools (Cooper,
2004; Fleisch, 2007; Matomela, 2008a & 2008b; Nell, 1999).
Besides commenting on the language situation in South African schools, Fleisch (2007) also
reviewed literature on both large- and small-scale studies covering the past decade and
pertaining to reading and mathematic achievement. As scholastic achievement, particularly
reading ability and mathematics achievement is considered to be a good indicator of quality
of education and correlates with performance on IQ tests (Brody, 1997; Manly, et al., 2004),
consideration of Fleisch's findings are pertinent to this discussion. According to Fleisch
(2007) the main impact of segregated development of education in South Africa was that
schools differed with regard to the quality of education offered to their learners. Current
research supports a bimodal distribution pattern of achievement, and points towards the
existence of two education 'systems' in South Africa – one advantaged and the other
disadvantaged, as discussed above. Although children were free to move between schools
after desegregation, the pattern of school attendance has not shifted significantly. Currently,
private and former Model C schools still cater largely for the elite and white middle classes.
More recently however, the emerging black middle class have also sent their children to
these schools. Children from poorer socioeconomic groups still cannot afford to attend
former Model C or private schools as these school fees are higher. Therefore, the inequality
in the South African education system continues, especially in the poorer Eastern Cape
Province (Cull, 2001; Fleisch, 2007; Shuttleworth-Edwards, Donnelly, et al., 2004).
Fleisch (2007) goes on to comment that township schools are doomed to fail in attempts to
try and transform learners' underperformance, as children attending these inadequate
schools bring a variety of health, socioeconomic, family and community problems with them
to school. Therefore, at the start of formal schooling an achievement gap develops which
continues to some extent for the rest of formal schooling. The reality of township schooling is
that after seven years, most learners in these schools will have acquired only the most basic
numeracy and very limited functional level of literacy, while a small minority is benefiting from
19
attendance at privileged schools and are achieving the required academic competency
levels. Fleisch also contends that South African children who do not achieve the required
level of reading and numeracy, gain learning that "remains context-bound and non-
generalisable" (Fleisch, 2007, p. 30).
As quality of education impacts on IQ test performance, comparisons should be made
between individuals who have remained in disadvantaged schools and those who have
accessed better quality education. It is possible to make this comparison between those
black and coloured South African children who have gained access to better quality
education in more advantaged schools and those who remain in the relatively
underprivileged schools characterised by poorer quality of education (Shuttleworth-Edwards,
Donnelly, et al., 2004). In this regard, Shuttleworth-Edwards, Kemp, et al., 2004 took up the
challenge of developing cross-cultural norms for the WAIS-III, heeding Nell's (1999) criticism
of the HSRC standardisation (as previously discussed) in respect of addressing the issue of
quality of education.
Shuttleworth-Edwards, Kemp, et al. (2004) generated preliminary normative data for South
African adults tested with the WAIS-III in respect of a sample that was stratified for white
English first language and black African first language, level (Grade 12 and graduate) and
quality of education (advantaged private/former Model C schooling versus disadvantaged
township schooling). The results of the Shuttleworth-Edwards, Kemp, et al. (2004) study
revealed significant effects for both level and quality of education in the direction of poorer
performance for Grade 12s versus graduates across both black African and white English
first language groups, and for disadvantaged schooling in relation to advantaged schooling in
the black African first language group. In the black African first language group, the effects of
quality of education were more pronounced than for level of education. There was a
significant lowering of both VIQ and PIQ scores for the black African first language group for
Grade 12s versus graduates, and disadvantaged versus advantaged education. There was a
significant lowering only with regard to the VIQ (and specifically the VCI) score for the white
English first language group for low level Grade 12 education versus high level graduate
education. The Vocabulary subtest revealed the most significant lowering when a low level
and poor quality of education co-occurred.
With regard to the graduate sample, the mean FSIQ score of the white English advantaged
group was 123.00 while the black African advantaged group had a mean FSIQ score of
113.40 (lower by 9.60 points). There was a more substantial lowering observed between the
mean scores of the white English advantaged and black Xhosa disadvantaged group with the
20
latter obtaining a mean FSIQ score of 94.90 (lower by 28.1 points). When the graduate black
African groups were compared, the black African advantaged group mean FSIQ score
differed from the black African disadvantaged score showing a lowering of 18.5 points. With
regard to the Grade 12 sample, the mean FSIQ score of the white English advantaged group
was 106.57 while the black African advantaged group had a mean FSIQ score of 99.90
(lower by 6.67 points). There was a more substantial lowering observed between the mean
scores of the white English advantaged and black Xhosa disadvantaged group with the latter
obtaining a mean FSIQ score of 74.40 (lower by 32.17 points). When the Grade 12 black
African groups were compared, the black African advantaged group mean FSIQ score
differed from the black African disadvantaged score showing a lowering of 25.5 points
(Shuttleworth-Edwards, Kemp, et al., 2004). Shuttleworth-Edwards, Kemp, et al. (2004)
concluded that quality of education plays a highly significant role in IQ performance of adults
when tested with the WAIS-III, over and above effects of level of education. They also
demonstrated the importance of stratifying samples in respect of both level and quality of
education.
Building on the research done by Shuttleworth-Edwards, Kemp, et al. (2004) in providing
cross-cultural norms for use with adults on the WAIS-III in South Africa, Van Tonder (2007)
generated preliminary normative data for South African children tested with the WISC-IV.
Van Tonder's sample was stratified for white English first language and black Xhosa first
language, and quality of education (advantaged private/former Model C schooling versus
disadvantaged township schooling), while level of education was controlled for and limited to
Grade 7. Findings of the Shuttleworth-Edwards, Kemp, et al. (2004) study were broadly
replicated by Van Tonder (2007) in that trends with regard to ranking of scores were largely
the same as for the adult Grade 12 sample with the white English advantaged group scoring
highest, the black Xhosa advantaged scoring intermediate, and the black Xhosa
disadvantaged groups scoring the lowest. Therefore, Van Tonder's results also revealed
significant effects for quality of education in the direction of poorer performance for learners
with disadvantaged education, with the black Xhosa speaking children with disadvantaged
education performing significantly lower on the WISC-IV than both white English and black
Xhosa speaking children with advantaged education. Van Tonder (2007) concluded that
quality of education plays a highly significant role in IQ performance of children (selected to
represent a non-clinical sample of normal intelligence) when tested with the WISC-IV. And,
on the basis of large differences between the VCI scores across the three groups, Van
Tonder stated that the verbal index, in particular, is culturally biased. It is of note that unlike
Shuttleworth-Edwards, Kemp et al. (2004), van Tonder did not apply Bonferroni’s adjustment
21
for the multiple comparisons in the analysis of the WISC-IV test results, and this limits the
ability to make fine comparisons between the two studies in terms of significant differences.
1.5. Rationale for the present study
From the above review of South African cross-cultural research conducted so far in respect
of the adult and child Wechsler Intelligence Scales, it is evident that the focus has been
exclusively on black versus white South Africans, whereas there appears to be no research
in respect of Afrikaans speaking white or Afrikaans speaking coloured individuals. As with
any test data this severely limits the clinical use of this internationally renowned test in
respect of this large sector of the South African population. According to the principal of a
coloured township school, these schools were also historically disadvantaged and remain
under-resourced (M. Meiring, personal communication, January 22, 2008). Therefore it would
seem feasible to suggest that former HOR schools would be subject to the same quality of
education expectations as the former DET schools (also refer to discussion on page 17
above). It should thus be a matter for concern that there is a paucity of literature with regard
to coloured children when there is a potential for IQ testing to be influenced by disparities in
quality of education within this group who still predominantly attend former HOR schools. The
coloured group is of particular interest, as this group, being predominantly Afrikaans first
language speakers, offer a unique opportunity to study the impact of quality of education on
performance in IQ tests such as the WISC-IV. As with the middle-class black group, some
coloured children have accessed former Model C schooling which makes this a
heterogeneous group in terms of quality of education.
For the purposes of the present research therefore, it was decided to provide preliminary
normative indications on the WISC-IV to facilitate clinical practice in respect of Afrikaans
speaking white and coloured children in South Africa, and at the same time to investigate
whether quality of education, more so than first language or race, significantly impacts on IQ
test performance. In order to make the new data comparable to the earlier Van Tonder data
in respect of white English and black Xhosa speaking Grade 7 children, it was decided
similarly to target Grade 7 children, and to analyse all the data from both data collections
(van Tonder in addition to those of the present study) using Bonferroni’s correction for the
multiple subgroup comparisons.
22
CHAPTER 2. METHODOLOGY
The objective of the present study was to provide clinically useful preliminary cross-cultural
normative indicators for performance on the WISC-IV (including the ten core subtests, the
four index scores and the FSIQ score) for English, Xhosa and Afrikaans Grade 7 learners,
stratified for advantaged versus disadvantaged quality of education. The methodology
employed was as follows.
2.1. Participants
Participants were drawn from two cross-cultural data collections conducted at different times,
including: 1) participants tested by Van Tonder in 2007 (Sample A), and 2) participants
tested by this researcher in 2008 (Sample B). The final combined sample (N = 69) was made
up of Grade 7 participants with an age range of 12 to 13 years, as summarised in Table 1.
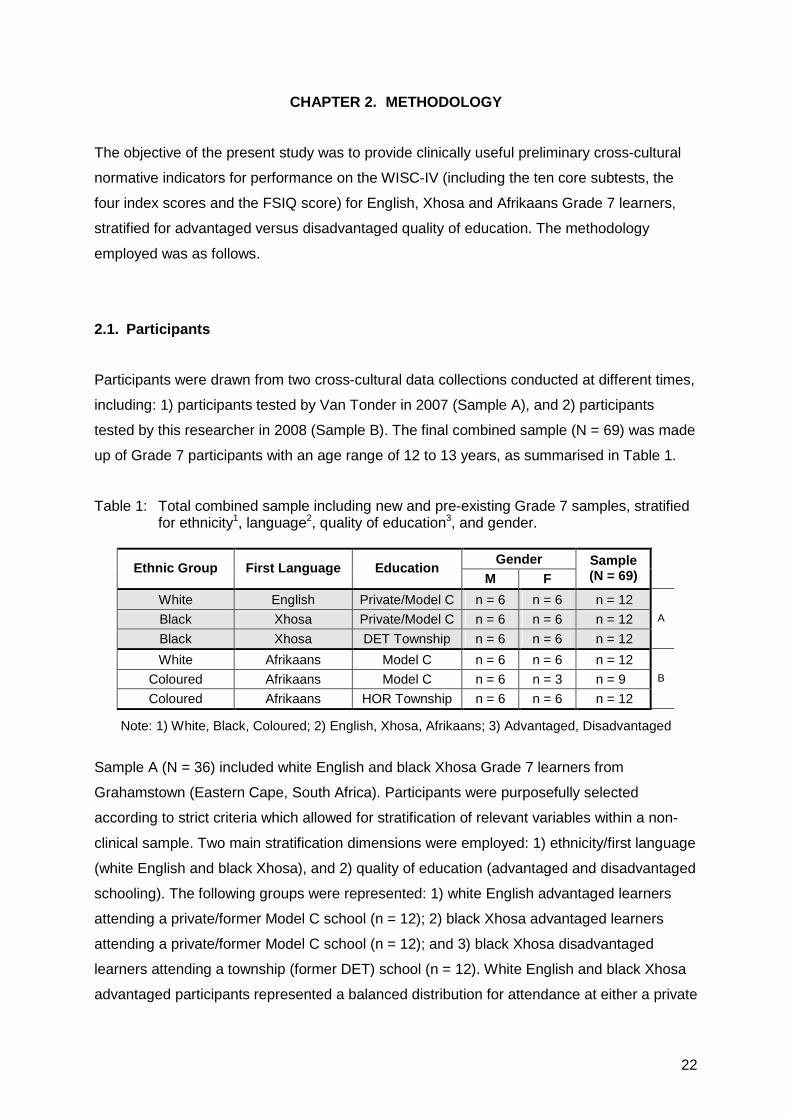
Table 1: Total combined sample including new and pre-existing Grade 7 samples, stratified for ethnicity1, language2, quality of education3, and gender.
Gender
Ethnic Group First Language Education M F
Sample (N = 69)
White English Private/Model C n = 6 n = 6 n = 12
Black Xhosa Private/Model C n = 6 n = 6 n = 12
Black Xhosa DET Township n = 6 n = 6 n = 12
A
White Afrikaans Model C n = 6 n = 6 n = 12
Coloured Afrikaans Model C n = 6 n = 3 n = 9
Coloured Afrikaans HOR Township n = 6 n = 6 n = 12
B
Note: 1) White, Black, Coloured; 2) English, Xhosa, Afrikaans; 3) Advantaged, Disadvantaged
Sample A (N = 36) included white English and black Xhosa Grade 7 learners from
Grahamstown (Eastern Cape, South Africa). Participants were purposefully selected
according to strict criteria which allowed for stratification of relevant variables within a non-
clinical sample. Two main stratification dimensions were employed: 1) ethnicity/first language
(white English and black Xhosa), and 2) quality of education (advantaged and disadvantaged
schooling). The following groups were represented: 1) white English advantaged learners
attending a private/former Model C school (n = 12); 2) black Xhosa advantaged learners
attending a private/former Model C school (n = 12); and 3) black Xhosa disadvantaged
learners attending a township (former DET) school (n = 12). White English and black Xhosa
advantaged participants represented a balanced distribution for attendance at either a private
23
or former Model C school. T-test analyses were conducted to investigate differences
between these advantaged school types and in each case the differences were not
significant with p > 0.05 for all measures (Van Tonder, 2007). However there were consistent
trends in the direction of the private school participants doing better than those attending
former Model C schools with regard to performance on the WISC-IV.
Sample B (N = 33) consisted of white Afrikaans and coloured Afrikaans Grade 7 learners,
targeted to extend the existing sample. All participants were purposefully selected using
criteria applied to sample A for ease of comparison. Sample B was therefore also stratified
according to two main dimensions of ethnicity/first language and quality of education as
follows: 1) ethnicity/first language (white Afrikaans and coloured Afrikaans), and 2) quality of
education (advantaged and disadvantaged schooling). Due to the fact that there are no
private Afrikaans-medium schools in the Eastern Cape vicinity where this study was taking
place (to the knowledge of this researcher), in contrast to the Van Tonder (2007) data
collection, the advantaged participants were drawn exclusively from former Model C schools.
Accordingly, the following groups were represented: 1) white Afrikaans advantaged learners
attending a former Model C school (n = 12); 2) coloured Afrikaans advantaged learners
attending a former Model C school (n = 9); and 3) coloured Afrikaans disadvantaged learners
attending a township (former HOR) school (n = 12). The intention was to sample Grade 7
learners from Grahamstown (Eastern Cape, South Africa) only, in keeping with Van Tonder's
sampling criteria. However due to the scarcity of white Afrikaans, and in particular coloured
Afrikaans learners able to meet the criteria for advantaged education in Grahamstown, the
comparative study criteria was extended. Grade 7 learners from Port Elizabeth (Eastern
Cape, South Africa) and Cape Town (Western Cape, South Africa) who attended schools
considered relatively equivalent in terms of socioeconomic status and quality of education to
the targeted schools in Grahamstown, were therefore included.
Additionally, both samples were stratified according to dimensions of age, level of education,
and gender.
Inclusion and exclusion criteria
Inclusion criteria. All participants were between 12 and 13 years of age; all participants were
in Grade 7 at the time of the data collection; only children who had been in the designated
school type for three or more years consecutively were allowed to participate in the study to
ensure clear distinctions in terms of differential levels of quality of education.
Exclusion criteria. All participants who had repeated a grade or who were known to have a
learning disability, a history of medical, psychiatric or neurological disorder were excluded
24
from this study, in keeping with previous protocols for cross-cultural norming to ensure that
the sample was representative of a non-clinical population.
2.1.1. Age
Participants were all between the ages of 12.01 and 13.11 years (X = 13.04, SD = 0.34). Age
differences between the comparative groups were not statistically significant (p > 0.05 in all
instances). Participants with advantaged schooling (X = 13.12, SD 0.33) were on average 4
months older than participants with disadvantaged schooling (X = 12.89, SD = 0.29).
2.1.2. Level of education
To investigate the effects of quality of education, level of education was restricted to Grade 7
(the final year of Intermediate Phase education in South Africa). To ensure an equal
performance distribution, the researchers consulted with the schools to verify learners' marks
for Grade 6 and Grade 7. This was done as the objective was to test a cross-section of
children across all performance levels so that the sample would be representative of
normally performing children within a specific targeted school situation. Across comparative
groups, care was taken not to create an uneven mark distribution within a group. This was
not possible within the coloured Afrikaans advantaged schooling group however, as this
group did not typically perform well academically. Therefore, learners which were
representative of this group tended to be in the bottom performance range within their class.
2.1.3. Gender
The goal was to sample an equivalent number of males (n = 6) and females (n = 6) in each
group in order to minimise possible gender differences. A target total of n = 12 participants
was met for all groups with the exception of the coloured Afrikaans advantaged group due to
the paucity of coloured children in former Model C Afrikaans-medium schools. In particular
there were few female learners who met the selection criteria, which meant that the gender
criteria for this group could not be met and therefore an unequal number of males (n = 6) and
females (n = 3) were sampled.
2.1.4. Language
Three first language groups were compared in this study, namely English, Xhosa and
Afrikaans. According to the 2001 census data cited by Statistics South Africa in their
provincial profile reports for 2004, Zulu (23.8%) is the most widely spoken language in South
Africa, followed by Xhosa (17.6%) and Afrikaans (13.3%), with English (8.2%) ranked fifth.
For the purposes of this study, those language groups most prevalent in the Eastern Cape
were selected – i.e. Xhosa (83.4%), Afrikaans (9.3%) and English (3.6%) (Stats SA, 2006).
25
2.1.5. Quality of education
It has been proposed that quality of education may be a greater determinant of intellectual
functioning than level of education. The research conducted by Shuttleworth-Edwards,
Kemp, et al. (2004) and Van Tonder (2007) which was previously reviewed, strongly
supports this claim in that African first language individuals with disadvantaged education
tend to have poorer performance on IQ tests, with a difference of approximately 20 points on
average between individuals with advantaged versus disadvantaged schooling. It is widely
recognised that due to the segregated development of education in South Africa, two school
'systems' (one historically advantaged and the other historically disadvantaged), continue to
exist more than a decade after the first democratic elections in 1994 which confirmed the end
of apartheid (Fleisch, 2007).
As the racialised legacy of apartheid continues in Education, it was considered appropriate to
replicate this dimension of advantaged versus disadvantaged schooling in the present WISC-
IV study. For the purposes of the study, advantaged schooling will be defined as that which is
provided by private and former Model C schools while disadvantaged schooling will be
defined as that which is provided by township (former DET or HOR) schools.
The combined sample used in this study was divided into six groups based on ethnicity,
language and quality of education. No assumptions were made about exact equivalence of
quality of education amongst schools in the advantaged (private/former Model C schools
targeted in Sample A or former Model C schools targeted in Sample B) grouping or the
disadvantaged (township: former DET schools targeted in Sample A or former HOR school
targeted in Sample B) grouping even though it is possible that wide variations within groups
may exist. However it is considered unlikely that any of the disadvantaged schools would be
in a position to offer the quality of education offered in the advantaged schools.
2.2. Procedure
2.2.1. Data collection
Sample A data was collected by three intern clinical psychologists, and a Xhosa speaking
intern clinical psychologist was used as translator for testing black Xhosa disadvantaged
learners. Sample B data was collected by an intern counselling psychologist and two
psychology honours students (who practiced the test with each other in English and then in
Afrikaans to ensure familiarity with pronunciation and comparable test administration
procedure between administrators). All test administrators were trained in the standardised
26
administration and scoring of the WISC-IV according to the manual (Wechsler, 2004), under
the supervision of Prof. Ann Edwards, a registered clinical psychologist. Test administrators
were randomly assigned participants from various schools, and care was taken to ensure
that each administrator tested a cross section of learners during the respective data
collection periods – i.e. each administrator tested participants from each of the comparative
groups, with equal gender, level of education and quality of education distribution.
Only schools with learners who met the selection criteria were approached for participation.
Participation in the research was entirely voluntary and necessary permission in the form of
signed consent was obtained from the schools, the parents/guardians, as well as, from the
children prior to the undertaking (see Appendix A through E, and Van Tonder, 2007). The
headmaster and class teachers were asked to identify potential participants, according to the
sampling criteria.
2.2.2. Test administration
Participants were screened using the Screening Questionnaire (see appendix F, and Van
Tonder, 2007). Sample A received the full WISC- IVUK battery (core and additional subtests)
as well as Digit-Symbol Coding Incidental Immediate and Delayed recall tasks. Sample B
received the WISC- IVUK ten core subtests only, together with the aforementioned memory
task. During both data collection periods, all tests were individually administered in the
morning during school hours. A decision was taken to restrict the data collection to the core
subtests only for the second phase of the research (Sample B) which became the focus of
the extended study, due to more limited researcher capacity, and in the interests of putting
the available resources into gaining an equivalent number of participants in the extended
sample. The test battery was completed with each participant in a single sitting, and a break
was generally taken half way through testing. Each test took between 80 to 150 minutes to
administer depending on the learner's ability. Tests were administered in a testing room at
the particular school and attempts were made to minimise noise and distraction.
2.2.3. Language of assessment
It is not currently the policy of the South African government to provide mother-tongue
instruction for African first language speakers beyond the Foundation Phase (Grades 1 to 3),
and English (or Afrikaans) becomes the primary language of instruction and testing at school
when children enter the Intermediate Phase (Grades 4 to 7) (Broom, 2004; Fleisch, 2007). In
a clinical setting it is often considered appropriate to conduct testing in a child's language of
tuition. However, if a child is not considered sufficiently proficient in their language of tuition,
in order to administer a test such as the WISC-IV that does not have a relevant translation, a
27
clinician would normally employ a translator to repeat instructions that are given in English in
the child's first language, unless the clinician was sufficiently bilingual to translate. At present
there is a shortage of Xhosa speaking practitioners, and therefore the use of an English
speaking clinician with a Xhosa speaking translator is a frequently employed mode of test
administration being used for testing Xhosa first language children attending disadvantaged
schools. Such children would not be considered proficient in English to the extent that
children in the historically advantaged English-medium schools would be, due to the common
practice amongst teachers in disadvantaged schools to employ codeswitching (switching
between the use of English and African first language) in the classroom, resulting in varying
levels of English proficiency amongst learners (Broom, 2004; Fleisch, 2007). Similarly,
English speaking clinicians may also choose to employ an Afrikaans translator when
administering a test such as the WISC-IV that does not have a formal Afrikaans translation,
in order to repeat the instructions given in English in Afrikaans. However, there are many
Afrikaans or bilingual English/Afrikaans clinicians in practice who would use their own
informal translation of the WISC-IV test and administer the test to the testee directly in
Afrikaans, thereby removing the need for an initial instruction given to the testee in English.
The aim of the present study was to produce norms that could be utilised in such typical
clinical situations (described above) as they currently apply in the South African context, and
therefore test administration, and specifically the language of assessment with different
groups, was tailored to match the current state of regularly applied clinical practice in South
Africa. The research was done in the full knowledge that these practices deviate from the
ideal of test administration with formally translated and standardized tests. However, in the
absence of such a facility, it was considered that the provision of normative indications would
substantially increase the ability to interpret test data derived on the basis of such commonly
employed practices in relation to the use of the WISC-IV.
Specifically with respect to Sample A of the present study, participants all attended English-
medium schools and clinical assessment conditions were replicated for this group as follows.
The WISC-IV was administered in the standardised English version to those participants
attending private/former Model C schools who would have received good quality English
language tuition. It was thus assumed that both English and Xhosa first language speakers in
advantaged schools were relatively proficient in English. Those participants attending a
township (former DET) school would have received English language tuition only from Grade
4 upwards as African first language instruction (in Xhosa) is provided for Grade 1 to 3. In
addition due to codeswitching being a regular practice in township schools, English language
tuition is likely to be of a lower quality. Van Tonder (2007) used a Xhosa translator when
28
testing black Xhosa disadvantaged participants, as it was assumed that these Xhosa first
language participants would have questionable English proficiency due to mixed-
Xhosa/English language use in the classroom and general disadvantaged schooling.
Instructions were therefore given in English by the test administrator and repeated in Xhosa
by the translator.
Specifically with respect to Sample B, all participants attended Afrikaans-medium schools,
and therefore the WISC-IV was administered in Afrikaans. This again replicated the kind of
situation typically encountered in a clinical situation and is the testing practice recommended
by Claassen, et al. (2001) who conducted the WAIS-III standardisation for South African use.
This group of participants was not considered proficient in English due to the fact that their
education would have been in Afrikaans. To facilitate test administration in Afrikaans, the test
instructions were translated into Afrikaans and the translation verified by an Afrikaans first
language speaking clinician – a process similar to that used by Van Tonder (2007) for
translating the test for the Xhosa translator. Use of the translated test ensured consistency
amongst administrators during testing, and a translator was not employed as the
administrators were considered sufficiently bilingual to administer the test in Afrikaans.
It is recognised that such translations as used for data collection in the present study have
limitations as they do not conform to strict standardisation criteria. However, it was noted that
past cross-national studies of the WISC have never designed any subtests from scratch (Van
de Vijver, 2003). Various countries differed with regard to the level of application (direct literal
translation) or adaptation needed, but in the WISC-III cross-cultural studies, 90% of items
were closely translated or copied and 10% were adapted. The greatest number of
adaptations was required for the Vocabulary subtest, while generally performance subtests
were used as is (Van de Vijver, Mylonas, et al., 2003). The researchers therefore
acknowledge that translation may impact on verbal subtests in particular, but it would be
unlikely that the performance subtests would be affected by translation. The method
employed in the present study was therefore considered reasonable in keeping with the aims
of the study, in that it allowed the researchers to obtain preliminary normative data for clinical
utility (for the Xhosa disadvantaged and Afrikaans speaking participants) in the absence of
formal standardised translations of the WISC-IV.
2.2.4. Scoring
The WISC-IV tests were scored as indicated in the standardised manual (Wechsler, 2004).
Cross verification of scoring was done to ensure consistency, therefore increasing the
reliability of scoring. In cases of scoring differences, the research teams conferred to reach
29
consensus. It should be noted that the WISC-IVUK and related UK norms have been used in
relation to the South African sample in this study to generate cross-cultural norms. The
WISC-IVUK standardised manual (Wechsler, 2004, p. 284) states that "close correspondence"
was demonstrated between the UK and US normative data sets. However, some minor
differences were observed on certain subtests. Therefore the means and standard deviations
included in the WISC-IVUK manual pertain to the UK scaling and norms.
2.3. Data analysis
Only the WISC-IV core subtest results pertain to the present comparative study, therefore
additional subtest data from Sample A, as well as data pertaining to Digit-Symbol Coding
recall tasks for both Sample A and B were disregarded. Relevant comparative data for
Sample A were extracted, while WISC-IV raw scores for Sample B were calculated and
converted to scaled scores using age-specific UK norms for each participant. The data for
Sample A were combined with the new data set of Sample B, and submitted for analysis.
Descriptive statistics were generated to determine the mean scores and standard deviations
for all WISC-IV core subtest scaled scores, index and IQ scores. Levene's statistics were
generated to ensure normal distribution and homogeneity of variance. An ANOVA analysis
was used to examine differences between comparative groups for quality of education, and
post-hoc Scheffe’s multiple comparisons were used to examine pair-wise differences
between groups stratified for ethnicity/first language and advantaged versus disadvantaged
quality of education.
For the post hoc pair-wise comparisons, the use of Scheffe's test ensures that the overall
level of significance does not exceed a 5% level of significance. However, when multiple test
measures are being investigated in respect of the same groups (as was the case for the
present study) it is necessary to make an adjustment in the level of significance towards
stringency in order to reduce the risk of a Type I error (i.e. the identification of any significant
differences between groups where these do not exist). Such an adjustment (i.e. Bonferroni
adjustment) serves to protect against Type I error, but does so at the cost of possibly
minimizing significance, and therefore increases the likelihood of Type II error (i.e. failure to
identify a real difference). Therefore, in order to protect against Type I error, a Bonferroni
adjustment was made towards stringency by setting the level of significance at the 1% level
(0.01). It was decided that any more stringent adjustment then this would inevitably increase
the risk of Type II error, especially in light of the small sample numbers.
30
Sample size
It is acknowledged that a relatively small sample size, with the target total for each group set
at n = 12 participants, was used. However, this was considered adequate for the purposes of
the present study in light of the research previously done by Shuttleworth-Edwards, Kemp, et
al. (2004) with respect to WAIS-III performance of an adult population, comprising similar
small yet well-controlled and carefully stratified samples. It has been pointed out that well-
stratified norming studies with small participant numbers are preferable to poorly stratified
studies with large participant numbers (Strauss, et al., 2004). Despite the small sample
numbers, the WAIS-III performance study delivered statistically significant differences
between comparative groups and was particularly relevant in that it provided practitioner-
orientated indications for cross-cultural assessment where a paucity of such literature exists.
The importance of the Shuttleworth-Edwards, Kemp, et al. (2004) research is further evident
in that it was cited in the leading neuropsychological text of Strauss, et al. (2006). As the
present study had similar aims to that of Shuttleworth-Edwards, Kemp, et al. (2004) which
effectively used a similar sample format in the past – the relatively small sample used for this
comparative study was considered adequate to achieve the objective of providing
practitioner-oriented cross-cultural normative indicators for use in clinical practice on well
controlled and carefully stratified samples where no such resource previously existed. As
discussed above, precautions were taken to ensure that differences between comparative
groups were statistically significant.
2.4. Data presentation
The results will be set out in a single table covering the different comparative groups,
including: means, standard deviations, ANOVA p-values and the direction of significant
differences for the Scheffe's post hoc analyses, for all ten core subtest scaled scores, index
and IQ scores.
31
CHAPTER 3. RESULTS
A comparative analysis of WISC-IV performance, including core subtests, indices and FSIQ,
was conducted using an ANOVA and Scheffe's post hoc pairwise comparisons, in respect of
English, Xhosa and Afrikaans first language, Grade 7 learners, stratified for advantaged
versus disadvantaged quality of education (see summary of analyses, Table 2, at the end of
the chapter, p. 39). The results of these analyses will firstly be discussed in terms of broad
overall trends, following which, evidence for statistical significance according to Scheffe's
post hoc analyses will be discussed.
3.1. Overall significance
The ANOVA revealed significant differences between the mean scores of the six
comparative groups for quality of education, evident on all four factor indices (VCI, PRI and
WMI at p = 0.000; PSI at p = 0.001); the FSIQ (p = 0.000); and all ten core subtest mean
scores (p ranging from 0.000 to 0.001 for nine of the ten subtests, and for the Coding subtest
at 0.050). All results were therefore highly significant at the 1% level (p ≤ 0.001) with the
exception of the Coding subtest which was just significant at p ≤ 0.05.
Note: in respect of post hoc pair-wise comparisons a Bonferroni adjustment (as discussed in
section 2.3, p. 29) was made towards stringency by setting the level of significance at the 1%
level. Therefore, in this chapter when post hoc significance is reported, the level of
significance is at most p ≤ 0.01 in all instances, and in cases where the level of significance
is reported as being at p ≤ 0.001, this would be considered a highly significant difference.
3.2. WISC-IV performance trends
WISC-IV performance revealed a performance continuum where a downward trend for
performance with lower quality of education was observed when Grade 7 ethnic/first
language groups were stratified for advantaged versus disadvantaged quality of education. In
other words, the overall trend revealed that groups with advantaged schooling performed
better than those with disadvantaged schooling. The historically advantaged white English
group obtained the highest mean scores across all four indices, as well as on the FSIQ. This
group also obtained the highest mean scores on 8 out of 10 of the core subtests. When the
advantaged groups were ranked according to their performance on the WISC-IV, the
32
following continuum emerged: 1) white English advantaged participants performed best, 2)
followed by white Afrikaans advantaged and black Xhosa advantaged participants with lower
mean scores compared to the white English advantaged group but with largely
corresponding scores when compared to each other, 3) followed by coloured Afrikaans
advantaged participants with the poorest performance in the advantaged grouping. A further
downward trend was observed between advantaged and disadvantaged groups. Within the
disadvantaged grouping, black Xhosa disadvantaged participants performed somewhat
better than their coloured Afrikaans disadvantaged counterparts. The performance of the
coloured Afrikaans disadvantaged group was poorest overall, and they obtained the weakest
mean scores on all four indices and on the FSIQ, as well as the lowest mean scores on 9 out
of 10 of the core subtests with the exception of the Coding subtest for which they were
marginally better than the black Xhosa disadvantaged group and the same as the coloured
Afrikaans advantaged group
Significant differences (p ≤ 0.01) between comparative groups were mostly observed with
regard to the VCI and verbal subtests of Similarities, Vocabulary and Comprehension – with
statistically significant differences occurring both within advantaged, and between
advantaged and disadvantaged, groupings. These differences were largely replicated on the
FSIQ. Significant differences with regard to the PRI and WMI were only observed in
comparisons between the advantaged and disadvantaged groupings. Although the ANOVA
revealed a significant overall group effect for the PSI and the Coding subtest (p = 0.001 and
p = 0.050, respectively) there were no significant differences revealed on the Scheffe's post
hoc analyses for the subgroup comparisons in respect of these two measures.
3.2.1. Quality of education: advantaged schooling
White English Advantaged
Overall trends in respect of the white English advantaged group were as follows. Mean index
scores tended to range between average (90 – 109) and superior (120 – 129) for the white
English advantaged group. The mean VCI score was 120.92 (SD = 14.76) and in the
superior range, the mean PRI score was 111.67 (SD = 18.10) and in the high average (110 –
119) range, while the mean WMI and PSI scores were 101.25 (SD = 13.37) and 96.17 (SD =
14.89) respectively, and within the average range. The mean FSIQ score of 112.83 (SD =
13.17) was in the high average range. This group obtained the highest mean scores on the
verbal subtests of Similarities, Vocabulary and Comprehension (X = 14.08, 13.75 and 12.92
respectively), and on the performance subtests of Block Design, Picture Concepts and Matrix
Reasoning (X = 11.83, 11.67 and 10.75 respectively). White English advantaged participants
also obtained the highest mean scores on the Digit Span (X = 11.42) and Symbol Search (X
33
= 10.75) subtests. The only two subtests on which the white English advantaged group did
not achieve the highest mean scores were Letter-Number Sequencing and Coding, where
the white Afrikaans advantaged group achieved the highest mean scores. Therefore, overall
white advantaged participants achieved the highest mean scores on WISC-IV core subtests
compared to all other groups.
Post hoc analyses supported these trends and revealed that the white English advantaged
group performed significantly better (p ≤ 0.01) than most other groups with regard to the VCI
and FSIQ. Significant differences were observed between the white English advantaged
group and other advantaged groups, in the direction of better performance for the white
English advantaged group compared with the following: 1) white Afrikaans advantaged and
coloured Afrikaans advantaged groups on the VCI (p = 0.000, and therefore a highly
significant difference in both instances) and on the verbal subtests of Similarities,
Vocabulary, and Comprehension (p ≤ 0.01 in all instances); 2) black Xhosa advantaged
group on the verbal subtest of Vocabulary (p = 0.001); and 3) black Xhosa advantaged (p =
0.008) and coloured Afrikaans advantaged groups (p = 0.000) on the FSIQ. Furthermore, the
white English advantaged group performed significantly better than both the disadvantaged
(black Xhosa disadvantaged and coloured Afrikaans disadvantaged) groups on the VCI, PRI
and FSIQ (p = 0.000, and therefore highly significant differences in all instances). Only with
regard to the PSI were there no significant differences (p ≤ 0.01) between the white English
advantaged group and other groups, however a strong trend towards significant difference
on the PSI in favour of the white English advantaged group (p = 0.019) was observed in
respect of the coloured Afrikaans disadvantaged group.
White Afrikaans Advantaged
Overall trends in respect of the white Afrikaans advantaged group were as follows. All mean
index scores for the white Afrikaans advantaged group were within the average range and
were within 1 SD of the UK norms. The mean VCI score was 92.58 (SD = 12.40), the mean
PRI score was 97.50 (SD = 16.83), the mean WMI score was 97.00 (SD = 12.13) and the
mean PSI score was 96.17 (SD 15.09). The mean FSIQ score of 94.42 (SD = 13.25) was
also in the average range and was within 1 SD of the UK norm. The white Afrikaans
advantaged group obtained lower mean scores than the white English advantaged group on
8 out of 10 of the core subtests, with exception of the Letter-Number Sequencing (X = 10.33)
and Coding (X = 8.33) subtests. Compared to the white English advantaged group, the white
Afrikaans advantaged group showed less fluctuation between mean index scores and mean
FSIQ score. White Afrikaans advantaged mean scores were generally lower than those of
their white English advantaged counterparts.
34
Post hoc analyses revealed significant differences between the white English advantaged
and white Afrikaans advantaged groups in the direction of lower scores for the white
Afrikaans speaking group, with regard to the VCI (p = 0.000) and the three verbal subtest of
Similarities (p = 0.003), Vocabulary (p = 0.000) and Comprehension (p = 0.008) (therefore, p
≤ 0.01 in all instances, and a highly significant difference noted for the Vocabulary subtest).
Black Xhosa Advantaged
Overall trends in respect of the black Xhosa advantaged group were as follows. Mean index
scores for the black Xhosa advantaged group were in the average range, with the exception
of the mean PSI score which was in the low average (80 – 89) range. The mean VCI score
was 101.30 (SD = 10.12), the mean PRI score was 92.75 (SD = 7.57), the mean WMI score
was 100.08 (SD = 10.08), while the mean PSI score was 84.50 (SD = 12.30). The mean
FSIQ score of 93.92 (SD = 5.85) was in the average range and was within 1 SD of the UK
norm. Mean scores of the black Xhosa advantaged group were generally lower than those of
the white English advantaged group, but were largely equivalent to those of the white
Afrikaans advantaged group.
Post hoc analyses revealed that although there was an overall trend for the black Xhosa
advantaged mean scores to be lower than those of the white English advantaged group,
significant differences (p ≤ 0.01) in the direction of poorer performance for the Xhosa
speaking advantaged group were observed only with regard to the FSIQ (p = 0.008) and
Vocabulary subtest (p = 0.001). No statistically significant differences were observed
between mean scores of the white Afrikaans and black Xhosa advantaged group, thus
supporting the trend of comparative equivalence.
Coloured Afrikaans Advantaged
Overall trends in respect of the coloured Afrikaans advantaged group were as follows. With
the exception of the mean PRI score which was in the (lower) average range, mean index
scores for the coloured Afrikaans advantaged group were in the low average range. The
mean VCI score was 85.00 (SD = 6.08), the mean PRI score was 90.67 (SD = 10.09), the
mean WMI score was 85.67 (SD = 12.45), and the mean PSI score was 84.33 (SD = 6.12).
The mean FSIQ score of 82.67 (SD = 7.43) was in the low average range and was between
1 and 2 SD of the UK norm. Mean scores of the coloured Afrikaans advantaged group were
generally lower than those of the other advantaged groups.
Post hoc analyses revealed that although there was an overall trend for the coloured
Afrikaans advantaged mean scores to be lower than those of the other advantaged (white
35
English advantaged, white Afrikaans advantaged and black Xhosa advantaged) groups,
significant differences (p ≤ 0.01) in the direction of poorer performance for the coloured
Afrikaans advantaged group were observed only when this group was compared to the white
English advantaged group. These significant differences were found in respect of the FSIQ,
VCI, and the verbal subtests of Similarities and Vocabulary (p = 0.000, and therefore highly
significant in all instances) as well as on the verbal subtest of Comprehension (p = 0.002).
No statistically significant differences (p ≤ 0.01) were observed between the mean scores of
white Afrikaans advantaged, black Xhosa advantaged and coloured Afrikaans advantaged
groups. However, a strong trend towards significant differences between the black Xhosa
advantaged and coloured Afrikaans advantaged groups in respect of the Similarities subtest
(p = 0.013) was observed in favour of better performance of the black Xhosa advantaged
group.
3.2.2. Quality of education: disadvantaged schooling
Black Xhosa Disadvantaged
Overall trends in respect of the black Xhosa disadvantaged group were as follows. The black
Xhosa disadvantaged group mean index scores tended to range between low average and
borderline (70 – 79). The mean VCI score was 80.42 (SD = 13.59), the mean PRI score was
80.83 (SD = 11.21), the mean WMI score was 86.50 (SD = 12.99) and were all within the low
average range, while the mean PSI score was 79.83 (SD = 16.28) and within the borderline
range. The mean FSIQ score of 77.08 (SD = 13.79) was in the borderline range and was
between 1 and 2 SD of the UK norm. A clear downward trend in performance was observed
in the direction of the black Xhosa disadvantaged group, with mean scores of this
disadvantaged group generally lower than those of all the advantaged groups.
Post hoc analyses revealed that although there was an overall trend for the black Xhosa
disadvantaged mean scores to be lower than those of the advantaged (white English
advantaged, white Afrikaans advantaged, black Xhosa advantaged and coloured Afrikaans
advantaged) groups, significant differences (p ≤ 0.01) were observed only between the white
English advantaged and black Xhosa disadvantaged groups in the direction of poorer
performance for the disadvantaged group, with regard to the FSIQ, VCI, and the three verbal
subtests of Similarities, Vocabulary and Comprehension (p = 0.000, and therefore highly
significant in all cases), as well as between the PRI (p = 0.000) and two of the performance
subtests namely Block Design (p = 0.001) and Matrix Reasoning (p = 0.006). Furthermore,
there were significant differences (p ≤ 0.01) between the black Xhosa advantaged and black
Xhosa disadvantaged groups in the direction of poorer performance for the disadvantaged
group, with regard to the VCI (p = 0.005) and one verbal subtest of Similarities (p = 0.000).
36
No statistically significant differences (p ≤ 0.01) were observed between the black Xhosa
disadvantaged group and the white Afrikaans advantaged and coloured Afrikaans
advantaged groups, however differences between the white Afrikaans advantaged and black
Xhosa disadvantaged groups approached significance on the FSIQ (p = 0.020) and on the
Block Design subtest (p = 0.046) in favour of better performance of the white Afrikaans
advantaged group.
Coloured Afrikaans Disadvantaged
Overall trends in respect of the coloured Afrikaans disadvantaged group were as follows.
Mean index scores for the coloured Afrikaans disadvantaged group ranged between
borderline and extremely low (below 70). The mean VCI score was 65.06 (SD = 11.25) and
within the mild mental retardation range, while the mean PRI score was 73.83 (SD = 12.04),
the mean WMI score was 71.00 (SD = 11.78), and the mean PSI score was 75.33 (SD =
11.24) and were all within the borderline range. The mean FSIQ score of 64.25 (SD = 9.73)
was in the mild mental retardation range and was between 2 and 3 SD of the UK norm. The
coloured Afrikaans disadvantaged group obtained the lowest mean scores on the verbal
subtests of Similarities, Vocabulary and Comprehension (X = 4.33, 3.17 and 4.58
respectively), and on the performance subtests of Block Design, Picture Concepts and Matrix
Reasoning (X = 4.92, 6.92 and 5.33 respectively). Coloured Afrikaans disadvantaged
participants also obtained the lowest mean scores on the Digit Span (X = 6.00), Letter-
Number Sequencing (X = 4.00) and Symbol Search (X = 5.00) subtests. Coding was the only
subtest on which the coloured Afrikaans disadvantaged group did not achieve the lowest
mean score, as the black Xhosa disadvantaged group achieved the lowest mean score (X =
5.83) for this subtest. Therefore, a further downward trend in performance for disadvantaged
groups is observed in the direction of poorer performance for the coloured Afrikaans
disadvantaged group, with mean scores of this group being consistently lower overall than
those of other groups.
Post hoc analyses confirmed the trend with regard to the coloured Afrikaans disadvantaged
group having the weakest WISC-IV performance overall, as significant differences (p ≤ 0.01)
in the direction of poorer performance for this group were revealed when the coloured
Afrikaans disadvantaged group was compared to advantaged groups (white English
advantaged, white Afrikaans advantaged and black Xhosa advantaged). In comparison to the
white English advantaged group, the coloured Afrikaans disadvantaged group performance
was significantly weaker on the FSIQ (p = 0.000), all indices (p = 0.000) and subtests (p
ranging from 0.000 to 0.005 for nine of the ten subtests), with the exception of the PSI and
Coding subtest where differences were non-significant, although differences in respect of the
37
PSI revealed a strong trend towards significant difference (p = 0.019) in the direction of
poorer performance for the coloured Afrikaans disadvantaged group. Similar significant
differences (p ≤ 0.01) as found between the coloured Afrikaans disadvantaged and white
English advantaged groups were observed when the coloured Afrikaans disadvantaged
group performance was compared to the white Afrikaans advantaged group. The coloured
Afrikaans disadvantaged group performance was significantly weaker on the FSIQ (p =
0.000) and indices (p ranging from 0.000 to 0.005), again with the exception of the PSI and
Coding subtest when compared to the white Afrikaans advantaged group, although
differences in respect of the PSI here too revealed a strong trend towards significant
difference (p = 0.019) in the direction of poorer performance for the coloured Afrikaans
disadvantaged group. Significant lowering in performance for the coloured Afrikaans
disadvantaged group was also observed on the Vocabulary (p = 0.000), Comprehension (p =
0.008), Block Design (p = 0.001), Letter-Number Sequencing (p = 0.000) and Symbol Search
(p = 0.001) subtests when compared to the white Afrikaans advantaged group. Furthermore
there were significant differences (p ≤ 0.01) in the direction of poorer performance for the
coloured Afrikaans disadvantaged group when this group was compared to the black Xhosa
advantaged group, observed on the FSIQ, VCI and WMI (p = 0.000 in all instances), as well
as Similarities (p = 0.000), Vocabulary (p = 0.000), Comprehension (p = 0.001) and Letter-
Number Sequencing subtests (p = 0.000) (p ≤ 0.001, and therefore highly significant in all
instances).
Despite the trend for the coloured Afrikaans disadvantaged group to be poorest of all six
comparative groups (as per the results continuum described above), the post hoc analyses
did not reveal any significant differences (p ≤ 0.01) between this group and the coloured
Afrikaans advantaged and black Xhosa disadvantaged groups. However, an overview of the
post hoc results clearly reveals that the coloured Afrikaans disadvantaged group has by far
the most frequent occurrence of significantly lowered scores compared with other groups,
including 21 instances of significant lowering compared with only 10 instances of significant
lowering for the next most poorly performing black Xhosa disadvantaged group. Furthermore,
differences between the coloured Afrikaans advantaged and coloured Afrikaans
disadvantaged groups approached significance on both the VCI (p = 0.021) and FSIQ (p =
0.023) in favour of better performance of the coloured Afrikaans advantaged group, while
differences between the black Xhosa disadvantaged and coloured Afrikaans disadvantaged
groups approached significance on the Vocabulary (p = 0.013) and Letter-Number
Sequencing (p = 0.029) subtests in favour of better performance of the black Xhosa
disadvantaged group.
38
3.3. Results summary
The initial ANOVA analysis revealed highly significant differences for quality of education
between the six comparative groups, in respect of mean scores for all four indices, the FSIQ,
and on nine out of ten of the core subtests (p ≤ 0.001 in all instances), with the exception of
the Coding subtest which was just significant at p = 0.05. Furthermore, a specific trend in
respect of quality of education was noted in that groups with advantaged schooling were
observed to perform better on the WISC-IV than those with disadvantaged schooling, when
groups were stratified for advantaged versus disadvantaged quality of education. Post hoc
pair-wise comparisons of groups provided supportive evidence in respect of this broad trend
and suggested a "performance continuum" in respect of quality of education. In terms of a
WISC-IV performance continuum, groups may be ranked in order of best to poorest
performance in respect of mean scores obtained by Grade 7 ethnic/first language groups
stratified for advantaged versus disadvantaged quality of education, as follows: 1) white
English advantaged, 2) white Afrikaans advantaged and black Xhosa advantaged with
largely comparable performance, 3) coloured Afrikaans advantaged, 4) black Xhosa
disadvantaged, and 5) coloured Afrikaans disadvantaged. Additionally, in respect of specific
performance trends, quality of education was observed to impact most significantly on verbal
performance both within the advantaged, and between advantaged and disadvantaged,
groupings, and this effect was replicated in respect of the FSIQ.
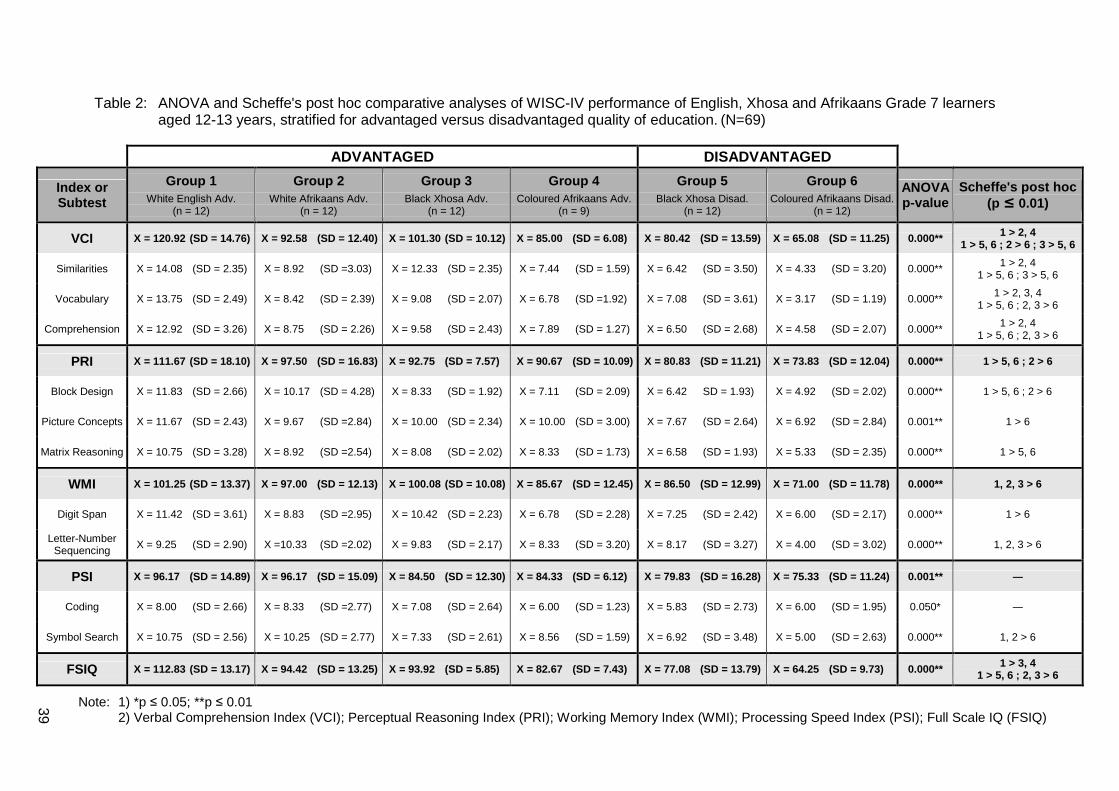
39
Table 2: ANOVA and Scheffe's post hoc comparative analyses of WISC-IV performance of English, Xhosa and Afrikaans Grade 7 learners aged 12-13 years, stratified for advantaged versus disadvantaged quality of education. (N=69)
ADVANTAGED DISADVANTAGED
Index or Subtest
Group 1 White English Adv.
(n = 12)
Group 2 White Afrikaans Adv.
(n = 12)
Group 3 Black Xhosa Adv.
(n = 12)
Group 4 Coloured Afrikaans Adv.
(n = 9)
Group 5 Black Xhosa Disad.
(n = 12)
Group 6 Coloured Afrikaans Disad.
(n = 12)
ANOVA p-value
Scheffe's post hoc (p ≤ 0.01)
VCI X = 120.92 (SD = 14.76) X = 92.58 (SD = 12.40) X = 101.30 (SD = 10.12) X = 85.00 (SD = 6.08) X = 80.42 (SD = 13.59) X = 65.08 (SD = 11.25) 0.000** 1 > 2, 4 1 > 5, 6 ; 2 > 6 ; 3 > 5, 6
Similarities X = 14.08 (SD = 2.35) X = 8.92 (SD =3.03) X = 12.33 (SD = 2.35) X = 7.44 (SD = 1.59) X = 6.42 (SD = 3.50) X = 4.33 (SD = 3.20) 0.000** 1 > 2, 4 1 > 5, 6 ; 3 > 5, 6
Vocabulary X = 13.75 (SD = 2.49) X = 8.42 (SD = 2.39) X = 9.08 (SD = 2.07) X = 6.78 (SD =1.92) X = 7.08 (SD = 3.61) X = 3.17 (SD = 1.19) 0.000** 1 > 2, 3, 4 1 > 5, 6 ; 2, 3 > 6
Comprehension X = 12.92 (SD = 3.26) X = 8.75 (SD = 2.26) X = 9.58 (SD = 2.43) X = 7.89 (SD = 1.27) X = 6.50 (SD = 2.68) X = 4.58 (SD = 2.07) 0.000** 1 > 2, 4 1 > 5, 6 ; 2, 3 > 6
PRI X = 111.67 (SD = 18.10) X = 97.50 (SD = 16.83) X = 92.75 (SD = 7.57) X = 90.67 (SD = 10.09) X = 80.83 (SD = 11.21) X = 73.83 (SD = 12.04) 0.000** 1 > 5, 6 ; 2 > 6
Block Design X = 11.83 (SD = 2.66) X = 10.17 (SD = 4.28) X = 8.33 (SD = 1.92) X = 7.11 (SD = 2.09) X = 6.42 SD = 1.93) X = 4.92 (SD = 2.02) 0.000** 1 > 5, 6 ; 2 > 6
Picture Concepts X = 11.67 (SD = 2.43) X = 9.67 (SD =2.84) X = 10.00 (SD = 2.34) X = 10.00 (SD = 3.00) X = 7.67 (SD = 2.64) X = 6.92 (SD = 2.84) 0.001** 1 > 6
Matrix Reasoning X = 10.75 (SD = 3.28) X = 8.92 (SD =2.54) X = 8.08 (SD = 2.02) X = 8.33 (SD = 1.73) X = 6.58 (SD = 1.93) X = 5.33 (SD = 2.35) 0.000** 1 > 5, 6
WMI X = 101.25 (SD = 13.37) X = 97.00 (SD = 12.13) X = 100.08 (SD = 10.08) X = 85.67 (SD = 12.45) X = 86.50 (SD = 12.99) X = 71.00 (SD = 11.78) 0.000** 1, 2, 3 > 6
Digit Span X = 11.42 (SD = 3.61) X = 8.83 (SD =2.95) X = 10.42 (SD = 2.23) X = 6.78 (SD = 2.28) X = 7.25 (SD = 2.42) X = 6.00 (SD = 2.17) 0.000** 1 > 6
Letter-Number Sequencing X = 9.25 (SD = 2.90) X =10.33 (SD =2.02) X = 9.83 (SD = 2.17) X = 8.33 (SD = 3.20) X = 8.17 (SD = 3.27) X = 4.00 (SD = 3.02) 0.000** 1, 2, 3 > 6
PSI X = 96.17 (SD = 14.89) X = 96.17 (SD = 15.09) X = 84.50 (SD = 12.30) X = 84.33 (SD = 6.12) X = 79.83 (SD = 16.28) X = 75.33 (SD = 11.24) 0.001** ―
Coding X = 8.00 (SD = 2.66) X = 8.33 (SD =2.77) X = 7.08 (SD = 2.64) X = 6.00 (SD = 1.23) X = 5.83 (SD = 2.73) X = 6.00 (SD = 1.95) 0.050* ―
Symbol Search X = 10.75 (SD = 2.56) X = 10.25 (SD = 2.77) X = 7.33 (SD = 2.61) X = 8.56 (SD = 1.59) X = 6.92 (SD = 3.48) X = 5.00 (SD = 2.63) 0.000** 1, 2 > 6
FSIQ X = 112.83 (SD = 13.17) X = 94.42 (SD = 13.25) X = 93.92 (SD = 5.85) X = 82.67 (SD = 7.43) X = 77.08 (SD = 13.79) X = 64.25 (SD = 9.73) 0.000** 1 > 3, 4 1 > 5, 6 ; 2, 3 > 6
Note: 1) *p ≤ 0.05; **p ≤ 0.01 2) Verbal Comprehension Index (VCI); Perceptual Reasoning Index (PRI); Working Memory Index (WMI); Processing Speed Index (PSI); Full Scale IQ (FSIQ)
39
40
CHAPTER 4. DISCUSSION
The objective of the present study was to provide clinically useful cross-cultural normative
indicators for use on the WISC-IV in respect of South African children. These norms relate
specifically to Grade 7 children (in their final year of Intermediate Phase education), aged 12
to 13 years, and with groups stratified for ethnicity/first language as well as quality of
education. Past research has demonstrated the importance of stratifying a sample for quality
of education by illustrating that this variable affects performance on cognitive tests (Manly, et
al., 2004; Shuttleworth-Edwards, Kemp et al., 2004).
The literature review chapter highlighted the legacy of apartheid in South Africa in respect of
past segregated education and the subsequent development of two schooling systems.
These schooling systems persist more than a decade after South Africa's first demographic
elections and can be operationalised as advantaged schooling (delivered by private and
former Model C schools) versus more disadvantaged schooling (delivered by the vast
majority of township schools, and particularly former DET and HOR schools for black and
coloured children, respectively) (Fleisch, 2007). After South African schools were
desegregated in 1991, children were free to attend any school of their choice. Therefore, in
recent years, it has been possible to investigate the effects of quality of education within
different ethnic/first language population groups as some black and coloured individuals
(formerly only allowed to attend DET or HOR schools, respectively) have accessed better
quality of education (in private or former Model C schools). Specific ethnic/first language
groups in South Africa should therefore no longer be considered homogenous. The present
study compared the performance of South African children across differing quality of
education. Specifically those black and coloured children who attend advantaged schools
were compared with children of the same groups who remain in the relatively underprivileged
schools which are characterised by poorer quality of education. Accordingly, six comparative
groups were targeted for investigation. The advantaged schooling groups included white
English advantaged, white Afrikaans advantaged, black Xhosa advantaged, and coloured
Afrikaans advantaged learners. Disadvantaged schooling groups included black Xhosa
disadvantaged and coloured Afrikaans disadvantaged learners.
An ANOVA analysis revealed highly significant differences for quality of education between
the six comparative groups in respect of all four index scores, FSIQ, and all but one of the
core subtests – Coding being the exception. Furthermore, pair-wise post hoc comparative
analyses for the present study revealed a clear trend in respect of quality of education where
groups with advantaged schooling outperformed those with disadvantaged schooling on the
41
WISC-IV. This trend replicates the findings of the Shuttleworth-Edwards, Kemp, et al. (2004)
study in respect of adults tested on the WAIS-III, as well as findings of the Van Tonder
(2007) study in respect of children tested on the WISC-IV, reinforcing the conclusion from
these prior studies that quality of education is one of the most significant variables impacting
on IQ test performance in South Africa.
For discussion purposes, a comparative table of cross-cultural normative data has been
compiled (that will also have clinical utility) using the composite mean index and FSIQ scores
of Shuttleworth-Edwards, Kemp, et al. (2004), Van Tonder (2007) and the present study (see
Table 3, at the end of the chapter, p. 53). The Wechsler Intelligence Scales provide two
types of age-corrected standard scores, namely: 1) scaled scores derived from the total raw
score of each of the subtests which are scaled to metric with a mean of 10 and a SD of 3;
and 2) composite scores for indices and FSIQ based on the sums of subtest scaled scores
which are scaled to a metric with a mean of 100 and a SD of 15 (Wechsler, 2004). Scores on
the WISC-IV are therefore comparable with those of the WAIS-III as both instruments use
age-corrected standard scores, scaled to metric.
In the discussion to follow, results of the present study as summarised in Table 2 (p. 39) in
respect of the WISC-IV will be considered, along with an overview of comparative data
between the WISC-IV and WAIS-III studies as summarized in the comparative template
contained in Table 3 (p. 53).
4.1. WISC-IV performance continuum effect
The results of the present study revealed a trend for performance on the WISC-IV where
comparative groups may be ranked along a continuum in order of best to poorest
performance as follows: 1) white English advantaged, 2) white Afrikaans advantaged and
black Xhosa advantaged with largely comparable performance, 3) coloured Afrikaans
advantaged, 4) black Xhosa disadvantaged, and 5) coloured Afrikaans disadvantaged. This
continuum reflects differences in respect of quality of education, where groups that attended
advantaged schools with better quality of education, outranked those with disadvantaged
schooling. Additionally, differences in respect of ethnicity/first language were revealed, where
the groups with English as a first language outranked those with another first language. This
trend replicated the finding of previous studies as in the Shuttleworth-Edwards, Kemp, et al.
(2004) WAIS-III study, as well as the Van Tonder (2007) WISC-IV study, where a
performance trend was noted in which, for the most part, white English advantaged groups
42
achieved higher mean scores across indices and in all cases achieved higher mean scores
on the FSIQ than black African/Xhosa first language advantaged groups, and both
advantaged schooling groups achieved consistently higher mean scores across indices and
FSIQ than their disadvantaged schooling counterparts. More detailed discussion will follow in
the order of highest to lowest performing groups in respect of this continuum.
4.1.1. Advantaged group comparisons
It was noted that white English first language participants performed best overall and were
ranked at the top of the WISC-IV performance continuum in the present study (see Table 2,
p. 39). This was also a consistent finding across all three comparative studies (see Table 3,
p. 53), and was not unexpected as this group most closely resembled the standardisation
samples of the WISC-IV and WIAS-III which consists of mostly white English speaking
individuals. The white English first language participants received the test in its standardised
English-version, which was their first language. Therefore issues of bilingualism and/or test
translation were not expected to impact on the performance of these participants. Across all
indices and in respect of the FSIQ, mean scores of the South African Grade 7, Grade 12 and
graduate white English advantaged groups were equivalent to, or somewhat higher than,
mean scores of the US/UK standardisation samples. The graduate white English advantaged
mean FSIQ score was in the superior range (X = 123.00), while the mean FSIQ score of the
Grade 12 white English advantaged group was in the higher average range (X = 106.57),
and the Grade 7 white English advantaged mean FSIQ score was in the high average range
(X = 112.83).
The generally higher mean scores for these white English advantaged groups can be
accounted for in that the South African sample was specifically stratified for ethnicity/first
language, level of education and quality of education, which is not the general practice when
tests are standardised. In terms of the graduate WAIS-III white English advantaged group in
particular, it would be expected that this group would achieve higher mean scores than that
of the US standardisation sample as this upper level of education is not representative of the
general population. In addition, higher mean scores for the Grade 12 and Grade 7 white
English advantaged samples compared with the white Afrikaans advantaged sample may be
accounted for by the fact that a proportion of the white English advantaged participants
received private schooling whereas the Afrikaans sample was purely made up of non-private,
Model C learners. Ardila, et al. (2005) reported that children who attended private schools
generally had parents with a higher level of education and performed better on tests of
executive function than children who attended public schools. Parents with higher levels of
education are more likely to have the financial means to provide for their children, and
43
generally provide more stimulating environments, as well as fostering a culture of learning in
their families. Children with parents that have a higher level of education are also more likely
to develop better verbal skills, and the converse is true in that children from poorer
communities are more likely to have lower verbal skills. The mean VCI score of the white
English advantaged Grade 7 learners in the Van Tonder (2007) study was particularly high
(X = 120.92) falling in the superior range. As previously mentioned, Van Tonder (2007) did
not find significant differences between the private and former Model C school groups,
although there was a strong trend in the direction of the private school learners performing
better than their former Model C school counterparts that may have reached significance with
higher sample numbers. This private versus former Model C school dynamic, therefore, is a
likely contributing factor in the higher mean scores for the white English advantaged groups.
When the top ranking white English advantaged group was compared to the white Afrikaans
advantaged group which was ranked second in terms of WISC-IV performance (see Table 2,
Group 1 and 2, p. 39), a lowering of more than 1 SD (18.41 points) in respect of the mean
FSIQ score in the direction of the white Afrikaans advantaged group was noted. This finding
is not altogether unexpected given past research that has documented a lowering of scores
for Afrikaans speakers in comparison to English speakers on cognitive tests (Claassen, et
al., 2001; Verster & Prinsloo, 1988). Verster and Prinsloo (1988) however documented a
diminishing gap between the scores of these two groups, with a difference of approximately
only 5 points by the 1980s. This trend of a diminishing gap between the two groups was not
evident in the present study. Possible explanations for this are three fold.
Firstly, as indicated above, the white Afrikaans speaking sample was drawn from former
Model C schools only, while the white English speaking sample was drawn from both private
and former Model C schools. Sampling differences may have introduced a higher quality of
education for the English speaking group, as private schools are known to offer more
challenging curricula and are better resourced than government funded schools. Secondly,
Broom (2004) has commented on the phenomenon that most South Africans prefer that their
children should be educated in English – a trend also observed amongst many Afrikaans first
language speakers who have placed their children in English-medium schools. Therefore, a
possible explanation for the phenomenon of a large gap in performance between the white
English and white Afrikaans speaking groups in the present study may be that as these
learners have remained in Afrikaans-medium schools, they would not have been involved in
a process of acculturation to the same degree as learners who are now attending English-
medium schools. Such learners may also not have the financial means to access private
schooling and may be socio-economically less advantaged than their white English
44
counterparts. Therefore, the group of white Afrikaans first language participants sampled in
the present study may represent a subculture of white Afrikaans first language speakers in
South Africa who are still influenced more by Afrikaans cultural practices than English values.
Finally (thirdly), the explanation for this white English versus white Afrikaans discrepancy
may relate to test administration rather than culture-specific differences, in that in the present
study, the WISC-IV was administered in Afrikaans to white Afrikaans speaking learners.
According to Claassen, et al. (2001) it is preferable that individuals who speak Afrikaans as a
first language and who are educated in this language are tested in Afrikaans, however to
date there are no formal standardised translations of the WISC-IV or WAIS-III in Afrikaans. It
is well known that translation of tests may impact on verbal subtests in particular (Van de
Vijver, Mylonas, et al., 2003), and in the present study performance of the white Afrikaans
speaking group was significantly lower on the VCI (by 28.34 points, almost 2 SD) and verbal
subtest (by 4 or 5 points, approximately 1.5 SD) than that of their English speaking
counterparts. Therefore taken together, the issues of a somewhat lesser degree of
advantaged schooling (former Model C only), remaining in a more traditional Afrikaans
setting where the effects of acculturation would be less pronounced (Afrikaans-medium
schooling), as well as test translation effects, may account for the relatively poorer
performance of white Afrikaans speaking learners as compared to their white English
speaking counterparts in the present study.
When the top ranking white English advantaged group was compared to the black Xhosa
advantaged group which was also ranked second in terms of WISC-IV performance (see
Table 2, Group 1 and 3, p. 39), a lowering of more than 1 SD (18.91 points) in respect of the
mean FSIQ score in the direction of the black Xhosa advantaged group was noted. This
lowering was statistically significant in the present study. Comparisons of black African
advantaged and white English advantaged adult samples also revealed a lowering in mean
FSIQ score (as mentioned previously) but this lowering was less significant than for the
Grade 7 WISC-IV sample. On the WAIS-III, the difference between the Grade 12 white
English advantaged and black African advantaged groups mean FSIQ scores were less than
1 SD (6.67 points) in the direction of poorer performance for the African language speakers.
A difference of less than 1 SD (9.60 points) was also noted for the graduate white English
advantaged and black African advantaged groups, in the direction of poorer performance for
the African language speakers. Therefore, even when groups are equivalent in terms of
quality of education, a lowering for the black African groups relative to the white English
groups is less than for the black African groups with disadvantaged education, but is still in
evidence (see Table 3, p. 53). Therefore, besides quality of education, it is proposed that
45
once again, language-specific issues may be at play. For example, research by Broom
(2004) illustrated that performance of English first language learners is consistently higher
than that of second language learners even when they have been educated in the same
school. Furthermore, while the performance of second language learners attending
advantaged schools is much better than that of their disadvantaged schooling counterparts,
they still score below first language English speakers by virtue of the fact that they are
learning in a second (or even third) language. This explanation is supported by the fact that
as learners progress higher in the school system their learning in a second language is likely
to become more efficient and less of a hindrance, and hence the differences between the
groups is much less for the young adult groups of the Shuttleworth-Edwards, Kemp et al.
(2004) study than the Grade 7 groups of the present analysis.
The coloured Afrikaans advantaged group was ranked third along the WISC-IV performance
continuum, and obtained the lowest scores in the advantaged schooling subset (see Table 2,
Group 4, p. 39). When compared to the top ranking white English advantaged group, the
coloured Afrikaans advantaged group mean FSIQ score was lower by 2 SD (30.16 points)
and the difference between mean FSIQ scores of these groups was statistically significant.
The coloured Afrikaans advantaged group mean FSIQ scores differed from the second
ranked white Afrikaans and black Xhosa advantaged groups by less than 1 SD (11 points)
and these differences were not statistically significant. The same three fold explanation
applied to the white Afrikaans advantaged group in comparison to white English advantaged
learners (discussed above) would also be relevant to the coloured Afrikaans advantaged
group, in that this group was sampled only from former Model C schools and learners have
remained in an Afrikaans-medium school, furthermore the WISC-IV translation issues would
apply to this group as they also received the test in Afrikaans. In addition, the following
sampling considerations may account for overall lowering of scores for this coloured
Afrikaans group within the advantaged subset.
First, the coloured Afrikaans advantaged population elicited in the present study tended to be
amongst the lower achievers in the bottom half of the class, although this was considered
representative of the average coloured Afrikaans speaking individual attending former Model
C schools. Secondly, the coloured Afrikaans advantaged group was also smaller than other
comparative groups (n = 9, compared to n = 12), with only three females sampled while six
male participants were sampled. This was due to the paucity of coloured learners in former
Model C schools who met the selection criteria of having attended the designated school for
at least three years prior to participation in the research. Therefore it was noted that coloured
Afrikaans speakers had not accessed advantaged schooling to the same extent as black
46
Xhosa speakers, which made this quality of education comparison less effective with regard
to the coloured Afrikaans speaking group in the present study. A reason for this may be that
the coloured population of South Africa remains relatively socio-economically disadvantaged.
However, the general trend of better performance for individuals who have accessed
advantaged schooling over those who have remained within relatively disadvantaged schools
was still illustrated convincingly with respect to the coloured Afrikaans speaking group
regardless of sampling difficulties.
4.1.2. Disadvantaged group comparisons
In terms of a broad overview of the WISC-IV performance continuum, as indicated above, a
general downward trend in performance was noted between advantaged and disadvantaged
schooling groups. While the performance of the advantaged groups in respect of the FSIQ
ranged from high to low average along the continuum, the performance of the disadvantaged
groups were in the borderline and extremely low (mild mental retardation) ranges for the
black Xhosa disadvantaged and coloured Afrikaans disadvantaged groups respectively (see
Table 2, Group 5 and 6, p. 39). The same trend was noted in respect of the Grade 12
disadvantaged black African language group in the Shuttleworth-Edwards, Kemp, et al.
(2004) study, in that this group also had a mean FSIQ score in the borderline range of
performance (see Table 3, p. 53). As all participants in these studies were representative of a
non-clinical population, were judged to be of average academic standard and had never
failed a grade before, the findings of these studies are cause for concern. Practitioners
applying the US or UK norms to individuals who are currently attending underprivileged
schools, or who had received this poorer quality of education in the past, need to exercise
caution to avoid potential misdiagnosis. Children may be mistakenly classified as mentally
handicapped or intellectually compromised with implications for placement in special schools.
With regard to both adults and children, treatment or compensation may be inappropriately
advised in the particular case if quality of education is not accounted for.
More specifically, within the disadvantaged subset, the black Xhosa group performed better
on the WISC-IV than their coloured Afrikaans counterparts, and although there were no
statistically significant differences between these two groups, the results on the Vocabulary
and Letter-Number Sequencing subtests approached significance in the direction of better
performance for the black Xhosa group, and may well have reached significance with a
larger sample size. The overall poorer performance of the disadvantaged groups in
comparison to advantaged groups was not unexpected in light of the differences in quality of
education received. Fleisch (2007) comments that children who attend township schools tend
to underachieve academically as they acquire only limited knowledge and skills during their
47
first seven years of schooling. Such children tend to use inappropriate concrete techniques
and have learning that remains context-bound and non-generalisable. This has implications
for performance on cognitive tests as formal schooling develops test-wiseness in that
children become familiar with test procedures and materials, learning what is required of
them and learning how to manage examination situations. But, children in disadvantaged
schools do not seem to develop these skills to the same extent as their advantaged
schooling counterparts (Ardila, 1996; Kendall, et al, 1988). Furthermore, it has implications
for test performance as cognitive tests tap curriculum content, and scores of intelligence
tests have been shown to correlate positively with performance on reading comprehension
and mathematical knowledge (Brody, 1997; Byrd, et al. 2005) – two areas where Fleisch
(2007) has demonstrated that children with disadvantaged schooling lack competence.
Specifically with regard to black children, Fleisch (2007) goes on to comment that while there
is a difference in performance between children in the advantaged schooling subset, in that
children educated in a second language or additional language do not perform as well as
English speaking counterparts in the same schools, this difference is more pronounced for
children in disadvantaged schools. A number of reasons may account for this performance
gap. Firstly, most teachers in disadvantaged schools are not English first language speakers
and often make use of codeswitching, language mixing or translation, whereas children in
advantaged schools have the advantage of 'immersion' in an English language environment,
are taught by teachers proficient in English, and are in classrooms with more adequate
resources. Proficiency in the language of learning becomes more important as children
progress in school as they need to use their language to learn rather than learning to use
their language (Broom, 2004; Fleisch, 2007). Fleisch (2007) also suggests that the difference
in performance between black African language speakers and white English speakers
attending advantaged schools is not as significant as the difference in performance observed
for black African language speakers attending disadvantaged schools because for urban
township children who are not as immersed in English at home and in their community as the
children of the new black middle-class, language may be a far greater barrier. Furthermore,
this language barrier may become more pronounced for children living in rural areas as
English is more likely to seem like a foreign language. Quality of education and language
issues therefore interact to impact on test performance of children in disadvantaged schools
as questionable English language proficiency has a marked impact on test performance.
Within the disadvantaged subset, a further lowering in scores was noted in respect of the
coloured Afrikaans disadvantaged group who achieved the lowest performance on the
WISC-IV overall. This difference between the two disadvantaged groups may be explicable
48
in terms of methodological differences. Van Tonder's (2007) method allowed for presenting
test instructions in English, then repeating them in Xhosa for those participants from
township schools who were deemed to possess questionable English proficiency, as
previously noted. This procedure has limitations in terms of strict standardisation criteria as
there would be repetition of instructions. This researcher considered that, in Van Tonder's
study, the Xhosa first language children attending township schools were given a distinct
advantage over other groups as they received the test in their language of tuition (English),
with repetition of instructions in their first language (Xhosa).The present study attempted to
minimise confounding effects, especially repetition, by providing instructions in only one
language. This was preferred as some participants may have had differential exposure to
English and so it was necessary to ensure that no participants enjoyed an unfair advantage.
The coloured Afrikaans disadvantaged group therefore received instructions only once in
Afrikaans. Furthermore, the coloured Afrikaans disadvantaged learners who received the test
in Afrikaans may also have been subject to test translation effects (as discussed above with
regard to other Afrikaans speaking groups). A last consideration which may explain why the
coloured Afrikaans disadvantaged group did not perform as well as their black Xhosa
disadvantaged counterparts could relate to the fact that the disadvantaged coloured
Afrikaans group were all sampled from a single former HOR township school while the
disadvantaged black Xhosa group were sampled from two different former DET township
schools. Van Tonder (2007) noted that there was a strong within group difference between
the two DET township schools in respect of WISC-IV performance. Therefore it was
considered that within the disadvantaged schooling subgroups differences in quality of
education may exist which may have impacted on the performance of the disadvantaged
groups. As only one school was sampled in respect of the coloured Afrikaans disadvantaged
group, it may be that this school was of a lower educational standard overall.
4.2. WISC-IV specific Index scores and subtest findings
A further observation pertaining to the present study that warrants mentioning is that
significant differences between comparative groups were largely observed in respect of
verbal performance (as measured by the verbal subtests of Similarities, Vocabulary and
Comprehension, and represented by the composite VCI score), with these differences
replicated on the FSIQ. Significant differences between comparative groups in respect of the
VCI and FSIQ were observed both within the advantaged groupings, as well as between the
advantaged and disadvantaged groupings (see Table 2, p. 39). The correlation between
schooling and performance on intelligence test has been discussed previously. Ardila (1999)
49
specifically comments on the bidirectional relationship between schooling and IQ and
suggests that IQ scores are a measure of school learning, as much as being predictive of
school performance. Moreover, Ardila (1999) remarks that the largest correlations between
IQ and school performance are found with regard to verbal intelligence subtests (and
particularly the Vocabulary subtest) and not with FSIQ, a finding which is attributed to the fact
that many educational systems are biased in favour of verbal ability. As intelligence tests
were initially designed to predict school performance this is not surprising. The finding of the
present study is therefore consistent with previous research in that the greatest differences in
IQ performance was noted with respect to verbal functioning which suggests that verbal
performance measures are particularly sensitive to cultural differences.
While verbal tasks reveal themselves as sensitive to variables such as quality of education
as well as ethnicity/first language, it was noted that there were significant differences in
respect of the PRI observed only for the comparisons of advantaged versus disadvantaged
groups, where advantaged groups performed significantly better on both the Block Design
and Matric Reasoning subtests. Non-verbal performance measures therefore seem to be
more sensitive to quality of education effects rather than cultural effects. Furthermore,
differences related to quality of education were also noted in respect of the WMI (and more
specifically for the Letter-Number Sequencing subtest). There were no significant differences
on the PSI (and on the Coding subtest in particular) which would suggest that this index is
relatively unaffected by any cultural differences including quality of education. However, it is
of note that differences between the white (English and Afrikaans) advantaged groups and
coloured Afrikaans disadvantaged group, were strongly approaching significance for the PSI
(p = 0.019). This raises questions with regard to overly strict adjustments towards stringency
as, had a Bonferroni adjustment not been setting the level of significance at 1%, a significant
difference at the 5% level (0.05) would have been recorded for this index. Given the small
sample size, caution is therefore advised with regard to overly stringent statistical
adjustments that could lead to missing clinically significant results, therefore increasing the
possibility of a Type II error. More specifically, the PSI comprises two subtests, namely
Coding and Symbol Search. Significant differences were observed on the Symbol Search
subtest between the white (English and Afrikaans) advantaged groups and the coloured
Afrikaans advantaged group in favour of the white advantaged learners, and while no
significant differences were found in respect of the Coding subtest, the trend was
consistently in the direction of favouring advantaged schooling groups.
Of particular note in respect of the Coding subtest, is that for five out of the six comparative
groups, the exception being the coloured Afrikaans disadvantaged group, this mean score
50
was the lowest score obtained across all subtests (with mean scores ranging from X = 8.33
to X = 5.83 across groups). A possible explanation for this Coding subtest phenomenon
could be that South African learners at the end of the Intermediate Phase of schooling may
not be as speed orientated as their UK and US counterparts. This may be due to the fact that
South Africa has adopted an Outcomes Based Education (OBE) curriculum, which places
less emphasis on speeded tasks. This phenomenon of lowered performance on the Coding
subtest was not evident in the research of Shuttleworth-Edwards, Kemp, et al. (2004) in
respect of adult participants tested on the WAIS-III, and with the exception of black African
language disadvantaged participants in Grade 12, all other groups obtained mean scores for
the Coding subtest which were equivalent or higher than the US standardisation sample
mean scores. A reason for this effect may be that the relatively new OBE curriculum was
only fully introduced at Senior Phase level more recently (by end 2005), and the Grade 12
class of 2008 was the first to write exams in terms of this new curriculum. It is postulated that
as the research of Shuttleworth-Edwards, Kemp, et al. (2004) was conducted prior to the
introduction of the OBE curriculum, effects on speeded tasks would not be evident in adult
populations at that time, and may only become evident with future cohorts. An alternative or
additional explanation in respect of the Coding subtest phenomenon may involve learner
motivation, as proposed by Cocodia, et al. (2003) who suggested that learners require more
entertainment now than previously to remain stimulated and engaged, and that learners are
prone to exhibiting shorter attention spans. Therefore it is suggested that their performance
would be weaker on tasks that are mundane and less likely to hold their attention, such as
the Coding subtest which requires rote copying.
The preceding discussion has considered the results of the present study in respect of the
WISC-IV (see Table 2, p. 39), with specific comparisons to the WAIS-III adult study as
deemed appropriate. What follows is a broader overview of comparative data between the
WISC-IV and WAIS-III studies pertaining specifically to Table 3 (p. 53).
4.3. WISC-IV versus WAIS-III outcomes
Comparisons between advantaged and disadvantaged groups where ethnicity/language and
level of education were constant, as in comparisons between the Grade 7 black Xhosa
advantaged and disadvantaged groups and the Grade 7 coloured Afrikaans advantaged and
disadvantaged groups, revealed that learners with advantaged schooling performed more
than 1 SD better on the WISC-IV than their disadvantaged schooling counterparts in respect
of the FSIQ. The mean FSIQ score of black Xhosa speaking learners differed by 16.84
51
points, while that of coloured Afrikaans speaking learners differed by 18.42 points, in favour
of advantaged over disadvantaged schooling groups. Similar differences were noted for the
adult WAIS-III sample, where at the Grade 12 and graduate levels of education the black
African language advantaged schooling groups mean FSIQ scores were again more than 1
SD better than those of the disadvantaged schooling groups. The mean FSIQ score of Grade
12 black African language speakers differed by 25.5 points, while that of graduate black
African language speakers differed by 18.5 points, in favour of the advantaged over
disadvantaged schooling groups. Overall therefore, this research lends credence to the fact
that quality of education impacts considerably on IQ scores fairly consistently at both the
young adolescent and young adult levels, with differences of more than 1 SD observed
between advantaged and disadvantaged schooling groups. This factor should therefore be
accounted for when testing different ethnic groups in South Africa from at least the
intermediary Grade 7 level through to the graduate level.
When disadvantaged schooling groups were compared to white English advantaged
schooling counterparts, differences on the FSIQ became more pronounced. The
performance of the white English advantaged schooling groups was more than 2 SD better
than that of their disadvantaged schooling counterparts, in all cases except for the graduate
level of education where the difference was approaching 2 SD (1.87) in favour of the white
English advantaged schooling group. The mean FSIQ score of the Grade 7 black Xhosa
speaking disadvantaged learners differed by a massive 35.75 points, while that of coloured
Afrikaans speaking disadvantaged learners differed by an even greater margin of 48.58
points, in favour of the white English advantaged schooling groups. Similar differences were
noted for the adult WAIS-III sample, where the mean FSIQ score of the Grade 12 black
African language speaking disadvantaged group differed by 32.17 points, while that of the
graduate black African language speaking disadvantaged group differed by 28.1 points, in
favour of the white English advantaged schooling groups. These wide discrepancies between
the South African language/ethnic groups again highlights the need for careful stratification to
control for confounding variables that impact on interpretation of test scores and highlights
that norms developed for white English speaking samples are not appropriate for use with
other ethnic/first language groups, especially where there is relatively disadvantaged quality
of education.
In conclusion, findings of the present study largely replicated the results of previous South
African studies that have investigated the influence of quality of education on IQ test
performance. Quality of education has been shown to impact significantly on both WIAS-III
52
and WISC-IV performance and should therefore be accounted for in test interpretation with
multicultural and multilingual populations. However, the present study has also shown that
while quality of education is an important moderating factor in performance on intelligence
tests, subtle effects of culture may still influence performance and should be taken into
account when interpreting test results. It is therefore essential that appropriate cross-cultural
norms are used in clinical practice to ensure that misdiagnosis is avoided. In particular,
considerable care should be exercised in interpreting test results of individuals from
disadvantaged schooling backgrounds, as preliminary normative indicators would suggest
that these individuals achieve scores which are more than 2 SD lower than the UK
standardisation sample.
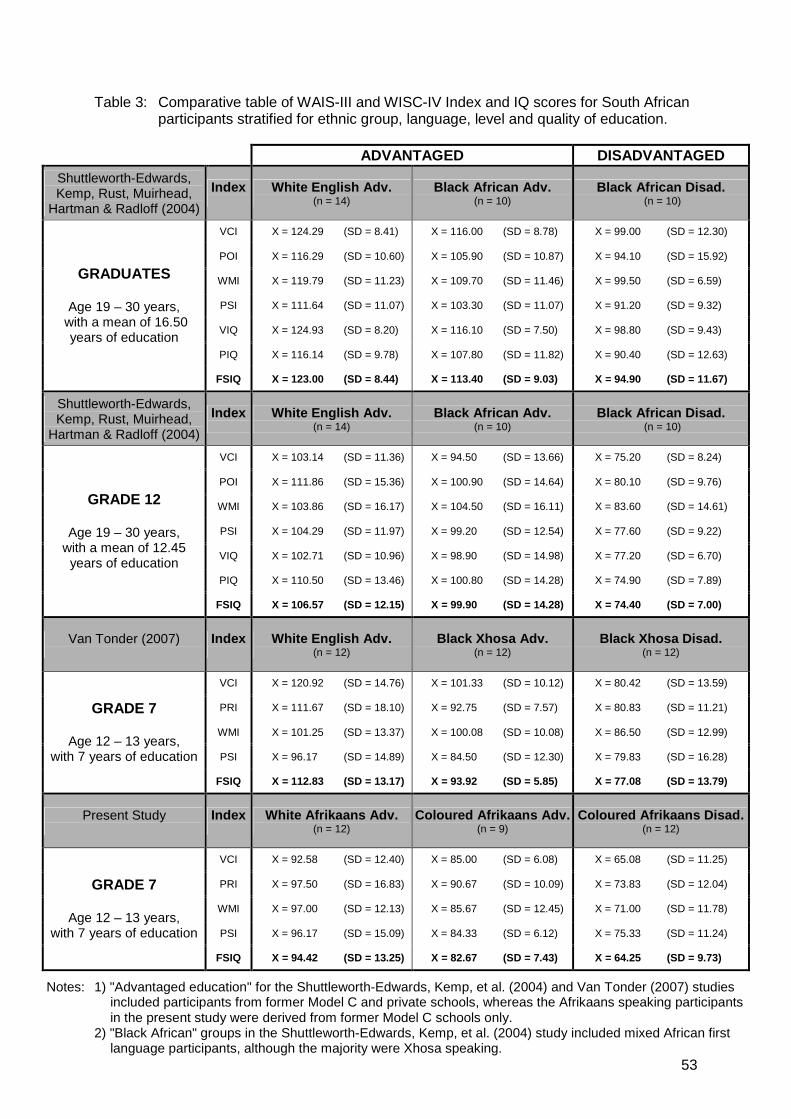
53
Table 3: Comparative table of WAIS-III and WISC-IV Index and IQ scores for South African participants stratified for ethnic group, language, level and quality of education.
ADVANTAGED DISADVANTAGED
Shuttleworth-Edwards, Kemp, Rust, Muirhead,
Hartman & Radloff (2004)
Index
White English Adv. (n = 14)
Black African Adv. (n = 10)
Black African Disad. (n = 10)
VCI X = 124.29 (SD = 8.41) X = 116.00 (SD = 8.78) X = 99.00 (SD = 12.30)
POI X = 116.29 (SD = 10.60) X = 105.90 (SD = 10.87) X = 94.10 (SD = 15.92)
WMI X = 119.79 (SD = 11.23) X = 109.70 (SD = 11.46) X = 99.50 (SD = 6.59)
PSI X = 111.64 (SD = 11.07) X = 103.30 (SD = 11.07) X = 91.20 (SD = 9.32)
VIQ X = 124.93 (SD = 8.20) X = 116.10 (SD = 7.50) X = 98.80 (SD = 9.43)
PIQ X = 116.14 (SD = 9.78) X = 107.80 (SD = 11.82) X = 90.40 (SD = 12.63)
GRADUATES
Age 19 – 30 years, with a mean of 16.50
years of education
FSIQ X = 123.00 (SD = 8.44) X = 113.40 (SD = 9.03) X = 94.90 (SD = 11.67)
Shuttleworth-Edwards, Kemp, Rust, Muirhead,
Hartman & Radloff (2004)
Index
White English Adv. (n = 14)
Black African Adv. (n = 10)
Black African Disad. (n = 10)
VCI X = 103.14 (SD = 11.36) X = 94.50 (SD = 13.66) X = 75.20 (SD = 8.24)
POI X = 111.86 (SD = 15.36) X = 100.90 (SD = 14.64) X = 80.10 (SD = 9.76)
WMI X = 103.86 (SD = 16.17) X = 104.50 (SD = 16.11) X = 83.60 (SD = 14.61)
PSI X = 104.29 (SD = 11.97) X = 99.20 (SD = 12.54) X = 77.60 (SD = 9.22)
VIQ X = 102.71 (SD = 10.96) X = 98.90 (SD = 14.98) X = 77.20 (SD = 6.70)
PIQ X = 110.50 (SD = 13.46) X = 100.80 (SD = 14.28) X = 74.90 (SD = 7.89)
GRADE 12
Age 19 – 30 years, with a mean of 12.45
years of education
FSIQ X = 106.57 (SD = 12.15) X = 99.90 (SD = 14.28) X = 74.40 (SD = 7.00)
Van Tonder (2007)
Index
White English Adv. (n = 12)
Black Xhosa Adv. (n = 12)
Black Xhosa Disad. (n = 12)
VCI X = 120.92 (SD = 14.76) X = 101.33 (SD = 10.12) X = 80.42 (SD = 13.59)
PRI X = 111.67 (SD = 18.10) X = 92.75 (SD = 7.57) X = 80.83 (SD = 11.21)
WMI X = 101.25 (SD = 13.37) X = 100.08 (SD = 10.08) X = 86.50 (SD = 12.99)
PSI X = 96.17 (SD = 14.89) X = 84.50 (SD = 12.30) X = 79.83 (SD = 16.28)
GRADE 7
Age 12 – 13 years, with 7 years of education
FSIQ X = 112.83 (SD = 13.17) X = 93.92 (SD = 5.85) X = 77.08 (SD = 13.79)
Present Study
Index
White Afrikaans Adv. (n = 12)
Coloured Afrikaans Adv. (n = 9)
Coloured Afrikaans Disad. (n = 12)
VCI X = 92.58 (SD = 12.40) X = 85.00 (SD = 6.08) X = 65.08 (SD = 11.25)
PRI X = 97.50 (SD = 16.83) X = 90.67 (SD = 10.09) X = 73.83 (SD = 12.04)
WMI X = 97.00 (SD = 12.13) X = 85.67 (SD = 12.45) X = 71.00 (SD = 11.78)
PSI X = 96.17 (SD = 15.09) X = 84.33 (SD = 6.12) X = 75.33 (SD = 11.24)
GRADE 7
Age 12 – 13 years, with 7 years of education
FSIQ X = 94.42 (SD = 13.25) X = 82.67 (SD = 7.43) X = 64.25 (SD = 9.73)
Notes: 1) "Advantaged education" for the Shuttleworth-Edwards, Kemp, et al. (2004) and Van Tonder (2007) studies included participants from former Model C and private schools, whereas the Afrikaans speaking participants in the present study were derived from former Model C schools only.
2) "Black African" groups in the Shuttleworth-Edwards, Kemp, et al. (2004) study included mixed African first language participants, although the majority were Xhosa speaking.
54
CHAPTER 5. EVALUATION AND RECOMMENDATIONS
5.1. Evaluation of the present study
There is a great need for culturally relevant normative data for clinical use in South Africa,
and in addition, norms for use with South African children have been particularly lacking
(Nell, 1994; Sattler, 1992; Strauss, et al., 2006). In the absence of relevant norms,
misdiagnosis can occur with serious implications for individuals, including unnecessary
treatment or even treatment failure. An example would be when inappropriate norms are
applied in the diagnosis and treatment of individuals suffering the effects of road traffic
accidents, assaults and specific learning disabilities, all of which are at a high incidence in
South Africa (Skuy, et al., 2001). Here may be implications for financial compensation, and in
medico-legal assessments, the clinician has the burden of offering proof (based on relevant
normative data) to substantiate a diagnosis and to draw conclusions regarding future
prognosis. Accordingly, the chief value of this study is in the provision of South African cross-
cultural normative indications for the WISC-IV where no such data were previously available
for use in clinical and medico-legal settings. The results of the present study added to a
growing body of evidence that quality of education impacts on intellectual functioning, and on
IQ test performance in particular, at both the adult and child levels. It serves to highlight the
importance of stratifying for quality of education when developing norms for cognitive tests,
particularly in a multicultural and multilingual context such as South Africa, where there is a
legacy of educational segregation.
5.1.1. Strengths
A relative strength of the study is that it is based on established research design and it
extends and refines existing data. It also makes use of strict criteria to stratify target groups
across a number of demographic variables which have proven valuable in the past for
delivering the existing cross-cultural normative databases for use with the Wechsler
Intelligence Scales in South Africa. By building on the data of Shuttleworth-Edwards, Kemp,
et al. (2004) who provided norms for use with adults on the WAIS-III and Van Tonder (2007)
who provided preliminary norms for use with children on the WISC-IV, this research has
ensured that there are now norms available not only for use with adults, but also more far-
reaching norms for use with children. Norms for children now cover white English and white
Afrikaans, as well as black Xhosa and coloured Afrikaans groups for educational level Grade
7, within the age range of 12 to 13 years. Data pertaining to these white English and
Afrikaans, black Xhosa and coloured Afrikaans groups are particularly pertinent to the
Eastern Cape where Xhosa is the first language of the majority of the population, followed by
55
Afrikaans and English. Individuals representing these cultural/language groups are thus very
likely to be encountered in clinical practice in this region.
Despite the considerable strengths of the study, a number of limitations and cautionary
comments apply.
5.1.2. Limitations
Sample size
Whilst there does not seem to be agreement on what constitutes adequate sample size, as
previously mentioned, leading neuropsychological texts offer estimates ranging from 50 to
200 subjects to ensure reliability and representivity of norms. It is also known that when
larger studies are stratified for specific demographic characteristics, small subgroup sizes
generally result (Mitrushina, et al., 2005; Sattler, 1992; Strauss, et al., 2006). The present
study sampled 69 subjects, with target subgroups consisting of 12 subjects. Therefore the
sample may be considered relatively small. As argued in the literature review however,
preference should be given to well-stratified norming studies with smaller participant
numbers over poorly stratified studies with large participant numbers which may not offer
appropriate norms for a specific group being assessed (Strauss, et al., 2006). This sampling
strategy was effectively employed by Shuttleworth-Edwards, Kemp, et al. (2004) and Van
Tonder (2007) on whose research the present study was modelled. It is of relevance that the
work of Shuttleworth-Edwards, Kemp, et al. (2004) using subgroups of only 10 to 14
participants has been favourably reviewed and cited in a seminal neuropsychological text
(Strauss, et al., 2006). Findings of the aforementioned studies have been consistently
replicated, and are regarded as having adequate statistical significance. In particular,
significant differences between groups in the present study were for the most part highly
significant (p ≥ 0.001) rather than merely significant at the 1% level (p ≥ 0.01). Therefore,
despite relatively small sample sizes, results were considered statistically powerful.
Bonferroni adjustment
Conventionally, statistical significance is set at the 5% level (0.05) meaning that there is a
1:20 probability that differences between groups will occur as a result of chance. This is also
known as the Type I error (α). When multiple comparisons are made, the study-wide error
rate increases and α is no longer 0.05, therefore an adjustment in the level of significant
towards stringency should be made in order to reduce the risk of a Type I error and to ensure
that α remains at 0.05 (Brandt, 2007; Perneger, 1998). In the present study, a Bonferroni
adjustment was made towards stringency by setting the level of significance at the 1% level
(0.01). As discussed in the methodology section, such a Bonferroni adjustment however,
56
increases the risk of Type II error. A number of between-group differences in respect of this
study were described as approaching significance as they were significant at p ≥ 0.05. This is
a possible limitation of the present study where lack of significant differences (as seen
between the coloured Afrikaans advantaged, black Xhosa disadvantaged and coloured
Afrikaans disadvantaged groups, which were at the bottom of the performance continuum)
may be an artefact of an overly stringent adjustment as differences between these groups
appear to be descriptively large and therefore clinically meaningful. For example, a difference
of 18.42 and 19.92 points between the coloured Afrikaans advantaged and coloured
Afrikaans disadvantaged groups in respect of the FSIQ and VCI, respectively and a
difference of 12.83 and 15.38 points between the black Xhosa disadvantaged and coloured
Afrikaans disadvantaged groups in respect of the FSIQ and VCI, respectively. Less stringent
adjustment may therefore be warranted in a study such as this, where the analysis is already
at risk of Type II error due to small sample numbers. Both Brandt (2007) and Perneger
(1998) advocate that it would be more prudent to simply describe what has been done,
explain the rationale behind this decision, and then discuss the implications of each result so
that the reader can come to practical conclusions without the help of Bonferroni adjustments.
Generalisability
In the present study, groups were very carefully stratified for age, gender, ethnicity/language,
level, and quality of education. Sampling was done in the Eastern Cape, and in addition the
Afrikaans advantaged group sampling was also done in the Western Cape. The resultant
norms are thus very specific for the groups investigated, as well as being regionally specific.
Therefore, caution should be exercised when applying the norms to individuals from other
regions of South Africa or to individuals from other ethnic/language groups such as other
black African language groups. These results provide only a broad interpretative guide
except when applied to the specific Grade 7 population and in the age range of 12 to 13
years for which they are well suited. Norms could however be applied to give some
preliminary indications with regard to other groups' expected performance on the WISC-IV, in
the absence of norms for that specific group. In such cases where the demographic variables
differ from those of the standardisation sample, interpretations would need to be made with
great caution.
In addition, the WISC-IVUK and related UK norms were used in the present study to generate
cross-cultural norms in relation to the South African sample. It was noted that the WISC-IVUK
normative data differs somewhat from that of the US standardisation (Wechsler, 2004), and
that the means and standard deviations included in the WISC-IVUK manual therefore pertain
to the UK scaling and norms. Consequently, it was considered by this researcher, that some
57
minor discrepancies between scores could occur when applying the US versus UK norms,
and therefore caution would need to be exercised by clinicians who employ the cross-cultural
norms of the present study in conjunction with the US standardisation of the WISC-IV.
Sampling
A further limitation of this research is that the white Afrikaans advantaged and coloured
Afrikaans advantaged groups were sampled only from former Model C schools, whereas the
white English advantaged and black Xhosa advantaged groups were sampled from both
private and former Model C schools. This represents a deviation from the method employed
by Van Tonder (2007) and impacts on the degree of certainty with which direct comparisons
between Sample A (existing white English and black Xhosa sample) and Sample B (new
white Afrikaans and coloured Afrikaans sample) can be made. It is commonly known that
private schools in South Africa are most well-resourced, have lower teacher-pupil ratios, and
offer what is considered a more challenging curriculum. However, in the absence of private
Afrikaans-medium schools within the Eastern Cape, sampling of Afrikaans speaking
participants in the present study was by necessity more limited. As indicated in the
discussion chapter, Van Tonder (2007) does not report significant differences between the
private and former Model C groups, although it is considered that with larger sample
numbers a strong trend that favoured the performance for private school over Model C
learners in that study, may have reached significance. It was therefore considered that the
scores of the white Afrikaans and coloured Afrikaans advantaged groups who were sampled
from former Model C schools only, may be somewhat lowered in comparison to those of the
white English and black Xhosa advantaged groups who were sampled from both private and
former Model C schools.
Van Tonder (2007) also limited data collection to a specific region, i.e. Grahamstown
(Eastern Cape, South Africa). However, due to the unavailability of Afrikaans first language
learners able to meet the selection criteria for advantaged education in Grahamstown, as
previously discussed, the regional criteria for the present study was extended to include
Grade 7 learners from Port Elizabeth (Eastern Cape, South Africa) for white Afrikaans
advantaged, and Cape Town (Western Cape, South Africa) for both white and coloured
Afrikaans advantaged, groups. Wider sampling therefore represents a further methodological
deviation from that employed by Van Tonder (2007). The schools were however chosen on
the basis of being relatively equivalent to the targeted schools in Grahamstown with regard to
socio-economic status of the learners and quality of education provided. Hence, the Eastern
Cape and Western Cape samples were considered comparable for the purposes of this
study.
58
Language
Another deviation from the method employed by Van Tonder (2007) concerns the language
in which testing was conducted in the present study. For instance, this issue needs to be
considered as a limitation when making direct comparisons between Sample A (existing
white English and black Xhosa sample) and Sample B (new white Afrikaans and coloured
Afrikaans sample). The aim of this study was to produce norms that could be utilised in
typical clinical settings (as described in section 2.2.3, p. 26) as they currently apply in the
South African context, and therefore it was considered appropriate to conduct testing in the
child's language of tuition. Participants from Sample A were tested in English (in the case of
the white English and black Xhosa advantaged groups) or English with Xhosa translation (in
the case of the black Xhosa disadvantaged group), while participants from Sample B were all
tested in Afrikaans by English/Afrikaans bilingual test administrators using a consistent (but
not standardised) translation of the test. In the absence of a formally translated version of the
WISC-IV standardised for use in South Africa, these test administration practices were
deemed adequate (despite the fact that they represent a deviation from the ideal of a formal
translation), in order to obtain much needed normative indicators to enhance the ability to
interpret WISC-IV test data in the South African setting. Nevertheless it is important to be
cautious about making absolute comparisons between the subgroups in this study due to
these sampling variations in respect of translation issues.
Another potential limitation of the present study in terms of making direct comparisons
between subgroup IQ test performances, is that the weaker scores for the coloured Afrikaans
disadvantaged group compared to the black Xhosa disadvantaged group may be partially
accounted for by the fact that the Xhosa disadvantaged group had the benefit of receiving
the test instructions twice (in English and then in Xhosa via a translator), while the Afrikaans
disadvantaged group only received instructions once (in Afrikaans). It was also recognised
that such translations, as used for data collection in the present study, have limitations as
they do not conform to strict standardisation criteria. The researchers moreover acknowledge
that translation may impact on verbal subtests in particular. Again, however, this method was
in keeping with the aims of the study, in that it allowed the researchers to obtain preliminary
normative data specifically for tests as typically applied in clinical settings in this country (for
the Xhosa disadvantaged and Afrikaans speaking participants) in the absence of formal
standardised translations of the WISC-IV. In other words, the objective of the study was not
to make direct comparisons of IQ test performance with strictly comparable administration
procedures, and it is important that caution is applied when using the present data to make
such comparisons.
59
5.2. Recommendations for future study
While it would be very useful to replicate the aforementioned WAIS-III and WISC-IV studies
with larger sample sizes in order to increase the statistical power of the normative data which
is available, this is likely to prove an arduous and expensive exercise. In light of the urgent
need for cross-cultural normative data for use in the South African clinical setting, and given
the scarcity of resources to dedicate to such a task, it would be prudent in the first instance to
focus on refining and extending the current preliminary normative data set using similarly
small, but well stratified samples. The following more specific research suggestions could be
implemented towards the objective of refining and extending available norms.
5.2.1. Official languages
In South Africa, 11 official languages are recognised. It would thus be useful to extend the
present normative data set to include other ethnic/first language groups. Besides English,
Xhosa and Afrikaans groups, which were the focus of the present study, it would be useful to
produce black Zulu speaking population norms as this constitutes the most represented
ethnic/language group in South Africa with 23.8% of South Africans claiming Zulu as their
first language. Other black African language groups to consider for inclusion are: Ndebele,
Pedi, Sotho, SeSwati, Tsonga, Tswana and Venda.
5.2.2. Regions
South Africa is also divided into nine provinces. The present research has focused largely on
the Eastern Cape, and included some Afrikaans speaking advantaged learners from the
Western Cape. It is therefore also recommended that, as the current sample is limited in its
geographical scope, it would be useful to sample groups across the other provinces in South
Africa (i.e. Northern Cape, Free State, KwaZulu-Natal, North West, Gauteng, Mpumalanga
and Limpopo).
5.2.3. Level of education
In order to provide a wider coverage across the spectrum of cognitive testing in South Africa,
existing normative data can be extended upwards, with respect to white Afrikaans and
coloured Afrikaans groups, to complete the currently available set of data for WAIS-III
derived on white English and black African first language participants. The existing normative
data set can also be extended downwards to Grade 3 level (which is the final year of
Foundation Phase education in South Africa), for all groups previously studied for the WISC-
IV. See table on future research options (Table 4, p. 61) for suggested sampling strategy.
60
5.2.4. Quality of education
The present normative data could be extended in order to comment more exactly on the
variable of quality of education without the confounding variable of translation issues.
Specifically the influence of private versus former Model C advantaged schooling could be
addressed within the advantaged subset by stratifying for private versus former Model C
schooling and eliciting the sample from English-medium schools. See table on future
research options (Table 5, p. 61) for suggested sampling strategy. For the purposes of such
research, in order to minimise the effects of test translation, only the standardised English-
version of the test should be administered to all groups. Due to the fact that many South
Africans view English as the language with the most status, as well as the language of
political and economic empowerment, many parents are preferentially sending their children
to English-medium schools. It should therefore be possible to select white Afrikaans
advantaged, coloured Afrikaans advantaged and coloured Afrikaans disadvantaged children
who are attending English-medium schools.
5.3. Final summary
This study has provided clinically useful South African cross-cultural norms on the WISC-IV
for use with white and coloured Afrikaans, white English and black Xhosa speaking Grade 7
children, aged 12 to 13 years, stratified for advantaged versus disadvantaged quality of
education. The present study has also demonstrated that while language and ethnic
variables reveal subtle effects on IQ test performance, quality of education has the most
significant effect, and a descending IQ test performance continuum has been revealed as
follows: 1) white English advantaged (high average), 2) white Afrikaans advantaged and
black Xhosa advantaged (average), 3) coloured Afrikaans advantaged (below average), 4)
black Xhosa disadvantaged (borderline), and 5) coloured Afrikaans disadvantaged
(extremely low). In light of the findings of this study, it is recommended that considerable
care is exercised in interpreting test results of individuals from different language/ethnic
groups, and in particular those with disadvantaged schooling, as preliminary data suggest
that these individuals may achieve scores which are 20 – 35 points lower than the UK
standardisation. Further research is however needed to refine these data and to address the
limitations and cautionary comments that apply to this study as these norms are of a
preliminary nature and apply to a specific subset of the South African population only.
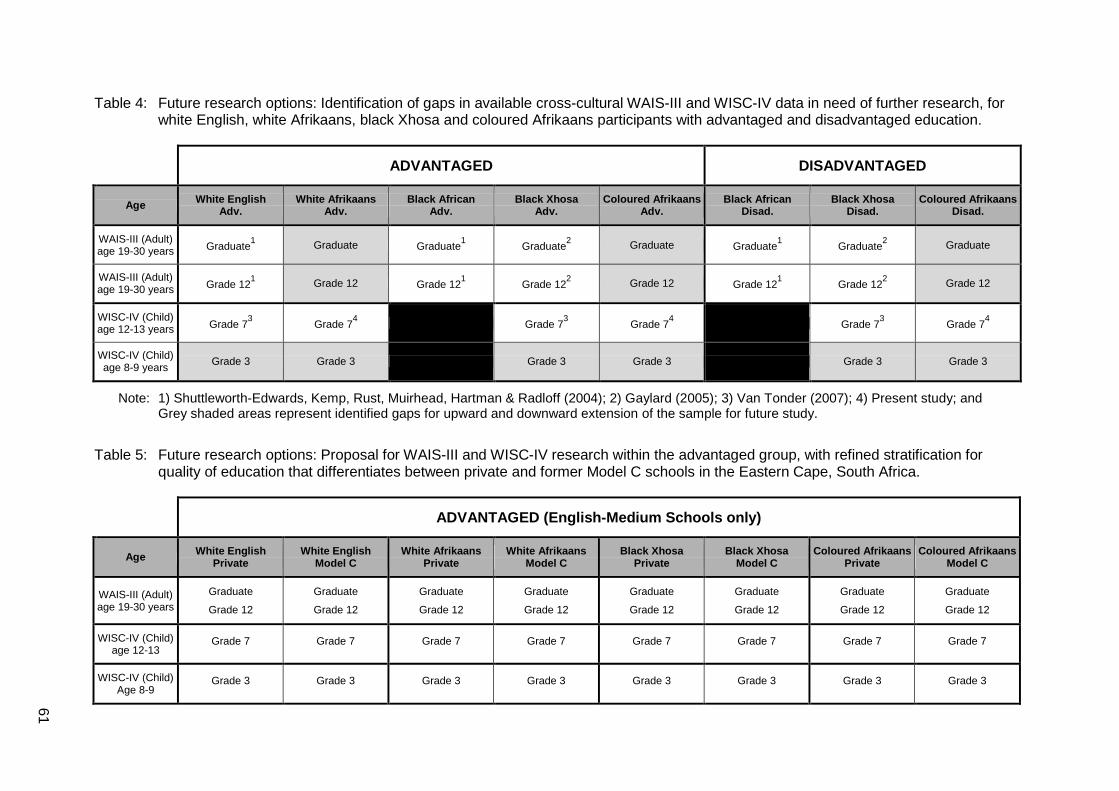
61
Table 4: Future research options: Identification of gaps in available cross-cultural WAIS-III and WISC-IV data in need of further research, for white English, white Afrikaans, black Xhosa and coloured Afrikaans participants with advantaged and disadvantaged education.
ADVANTAGED DISADVANTAGED
Age White English Adv.
White Afrikaans Adv.
Black African Adv.
Black Xhosa Adv.
Coloured Afrikaans Adv.
Black African Disad.
Black Xhosa Disad.
Coloured Afrikaans Disad.
WAIS-III (Adult) age 19-30 years Graduate
1 Graduate Graduate
1 Graduate
2 Graduate Graduate
1 Graduate
2 Graduate
WAIS-III (Adult) age 19-30 years Grade 12
1 Grade 12 Grade 12
1 Grade 12
2 Grade 12 Grade 12
1 Grade 12
2 Grade 12
WISC-IV (Child) age 12-13 years Grade 7
3 Grade 7
4 Grade 7
3 Grade 7
4 Grade 7
3 Grade 7
4
WISC-IV (Child) age 8-9 years
Grade 3 Grade 3 Grade 3 Grade 3 Grade 3 Grade 3
Note: 1) Shuttleworth-Edwards, Kemp, Rust, Muirhead, Hartman & Radloff (2004); 2) Gaylard (2005); 3) Van Tonder (2007); 4) Present study; and Grey shaded areas represent identified gaps for upward and downward extension of the sample for future study.
Table 5: Future research options: Proposal for WAIS-III and WISC-IV research within the advantaged group, with refined stratification for quality of education that differentiates between private and former Model C schools in the Eastern Cape, South Africa.
ADVANTAGED (English-Medium Schools only)
Age White English Private
White English Model C
White Afrikaans Private
White Afrikaans Model C
Black Xhosa Private
Black Xhosa Model C
Coloured Afrikaans Private
Coloured Afrikaans Model C
WAIS-III (Adult) age 19-30 years
Graduate
Grade 12
Graduate
Grade 12
Graduate
Grade 12
Graduate
Grade 12
Graduate
Grade 12
Graduate
Grade 12
Graduate
Grade 12
Graduate
Grade 12
WISC-IV (Child) age 12-13
Grade 7 Grade 7 Grade 7 Grade 7 Grade 7 Grade 7 Grade 7 Grade 7
WISC-IV (Child) Age 8-9
Grade 3 Grade 3 Grade 3 Grade 3 Grade 3 Grade 3 Grade 3 Grade 3
61
62
CHAPTER 6. REFERENCES
Adams, R. L., Boake, C., & Crain, C. (1982). Bias in a neuropsychological test classification related to education, age, and ethnicity. Journal of Consulting and Clinical Psychology, 50 (1), 143-145.
Amante, D., VanHouten, V. W., Grieve, J. H., Bader, C. A., & Margules, P. H. (1977). Neuropsychological deficit, ethnicity and socioeconomic status. Journal of Consulting and Clinical Psychology, 45 (4), 524-535.
Anderson, S. J. (2001). On the importance of collecting local neuropsychological normative data. South African Journal of Psychology, 31 (3), 29-34.
Ardila, A. (1996). Towards a cross-cultural neuropsychology. Journal of Social and Evolutionary Systems, 19 (3), 237-248.
Ardila, A. (1999). A neuropsychological approach to intelligence. Neuropsychological Review, 9 (3), 117-136.
Ardila, A., Rosselli, M., & Rosas, P. (1989). Neuropsychological assessment in illiterates: visuospatial and memory abilities. Brain and Cognition, 11, 147-166.
Ardila, A., Rosselli, M., Matute, E., & Guajardo, S. (2005). The influence of the parents' educational level on the development of executive functions. Developmental Neuropsychology, 28 (1), 539-560.
Baron, I. S. (2005). Test review: Wechsler Intelligence Scale for Children–Fourth Edition (WISC-IV). Child Neuropsychology, 11, 471-475.
Brandt, J. (2007). 2005 INS presidential address: Neuropsychological crimes and misdemeanors. The Clinical Neuropsychologist, 21, 553-568.
Brody, N. (1997). Intelligence, schooling, and society. American Psychologist, 52, 1046-1050.
Broom, Y. (2004). Reading English in multilingual South African primary schools. Bilingual Education in Bilingualism, 7 (6), 506-528.
Byrd, D. A., Jacobs, D. M., Hilton, H. J., Stern, Y., & Manly, J. J. (2005). Sources of error on visuoperceptual tasks: Role of education, literacy, and search strategy. Brain and Cognition, 58, 251-257.
Ceci, S. J. (1991). How much does schooling influence general intelligence and its cognitive components? A reassessment of the evidence. Developmental Psychology, 27 (5), 703-722.
Claassen, N. C. W., Krynauw, A. H., Paterson, H., & Mathe, M. (2001). A standardisation of the WAIS-III for English-speaking South Africans. Pretoria: Human Sciences Research Council.
Cocodia, E. A., Kim, J. S., Shin, H. S., Kim, J. W., Ee, J., Wee, M. S. W., & Howard, R. W. (2003). Evidence that rising population intelligence is impacting in formal education. Personality and Individual Differences, 35, 797-810.
63
Cooper, B. (2004, July 7). “Burn-out” threat saps teacher’s moral. Unions cite assessment system, workloads for discontent. The Herald, Port Elizabeth, South Africa: Times Media.
Cull, P. (2001, Dec 31). EC Matric results show West-East split. Results mirror the spending patterns of the apartheid era. The Herald, Port Elizabeth, South Africa: Times Media.
Fleisch, B. (2007). Primary education in crisis. Why South African schoolchildren underachieve in reading and mathematics. Cape Town: Juta.
Gaylard, E. K. (2005). Cross-cultural differences in IQ test performance: Extension of an existing normative database on WAIS-III test performance. Unpublished Masters Thesis, Rhodes University, Grahamstown.
Government Gazette. (1998, Oct 19). Republic of South Africa, no.19370, Cape Town.
Government Gazette. (2006, Aug 4). Republic of South Africa, no.29079, Cape Town.
Hale, R. L., Raymond, M. R., & Gajar, A. H. (1982). Evaluating socioeconomic status bias in the WISC-R. Journal of School Psychology, 20 (2), 145-149.
Harris, J. G., & Llorente, A. M. (2005). Cultural considerations in the use of the Wechsler Intelligence Scale for Children–Fourth Edition (WISC-IV). In A. Prifitera, D. H. Saklofske, and L. G. Weiss (Eds.), WISC-IV clinical use and interpretation. Scientist-practitioner perspectives (pp. 381-413). San Diego, CA: Elsevier Academic Press.
Husén, T., & Tuijnman, A. (1991). The contribution of formal schooling to the increase in intellectual capital. Educational Researcher, 20 (7), 17-25.
Jensen, A. R., & Reynolds, C. R. (1982). Race, social class and ability patterns on the WISC-R. Personality and Individual Differences, 3, 423-438.
Kanjee, A. (1999). Assessment research. In M. Terre Blanche and K. Durrheim (Eds.), Research in practice: Applied methods for the social sciences (pp. 287-306). Cape Town: University of Cape Town Press.
Kaufman, A. S., McLean, J. E., & Reynolds, C. R. (1988). Sex, race, residence, region, and education differences on the 11 WAIS-R subtests. Journal of Clinical Psychology, 44 (2), 231-247.
Keith, T. Z., Fine, J. G., Taub, G. E., Reynolds, M. R., & Kranzler, J. H. (2006). Higher order, multisample, confirmatory factor analysis of the Wechsler Intelligence Scale for Children–Fourth Edition: What does it measure? School Psychology Review, 35 (1), 108-127.
Kendall, I. M., Verster, M. A., & Van Mollendorf, J. W. (1988). Test performance of blacks in Southern Africa. In S. H. Irvine and J. W. Berry (Eds.), Human abilities in cultural context (pp. 299-339). Cambridge: Cambridge University Press
Kramer, R. A., Allen, L., & Gergen, P. J. (1995). Health and social characteristics and children's cognitive functioning: Results from a national cohort. American Journal of Public Health, 85 (3), 312-318.
Lezak, M. D., Howieson, D. B., & Loring, D. W. (2004). Neuropsychological assessment (4th ed.). New York: Oxford University Press.
64
Manly, J. J., & Echemendia, R. J. (2007). Race-specific norms: Using the model of hypertension to understand issues of race, culture, and education in neuropsychology. Archives of Clinical Neuropsychology, 22, 319-325.
Manly, J. J., Byrd, D. A., Touradji, P., & Stern, Y. (2004). Acculturation, reading level, and neuropsychological test performance among African American elders. Applied Neuropsychology, 11 (1), 37-46.
Manly, J. J., Jacobs, D. M., Touradji, P., Small, S. A., & Stern, Y. (2002). Reading level attenuates differences in neuropsychological test performance between African American and white elders. Journal of the International Neuropsychological Society, 8, 341-348.
Marcopulos, B. A., McLain, C. A., & Giuliano, A. J. (1997). Cognitive impairment or inadequate norms? A study of healthy, rural, older adults with limited education. The Clinical Neuropsychologist, 11 (2), 111-131.
Matomela, D. (2008a, January 14). Eastern Cape schools far from ready for 2008. The Herald, Port Elizabeth, South Africa: Times Media.
Matomela, D. (2008b, January 17). New year, same old story. The Herald, Port Elizabeth, South Africa: Times Media.
Meiring, D., Van de Vijver, A. J. R., Rothmann, S., & Barrick, M. R. (2005). Construct, item, and method bias of cognitive and personality tests in South Africa. South African Journal of Industrial Psychology, 31 (1), 1-8.
Mitrushina, M., Boone, K. B., Razani, J., & D'Elia, L. F. (2005). Handbook of normative data for neuropsychological assessment, (2nd ed.). New York: Oxford University Press.
Nell, V. (1994). Interpretation and misinterpretation of the South African Wechsler-Bellevue Adult Intelligence Scale: A history and a prospectus. South African Journal of Psychology, 24 (2), 100-109.
Nell, V. (1999). Standardising the WAIS-III and WMS-III for South Africa: Legislative, psychometric, and policy issues. South African Journal of Psychology, 29 (3), 128-137.
Nell, V. (2000). Cross-cultural neuropsychological assessment. Theory and practice. Mahwah, NJ: Lawrence Erlbaum Associates.
Ostrosky-Solís, E., Ramirez, M., & Ardila, A. (2004). Effects of culture and education on neuropsychological testing: A preliminary study with indigenous and nonindigenous population. Applied Neuropsychology, 11 (4), 186-193.
Perneger, T. V. (1998). What's wrong with Bonferroni adjustments? British Medical Journal, 316, 1236-1239.
Prifitera, A., Weiss, L. G., Saklofske, D. H., & Rolfhus, E. (2005). The WISC-IV in the clinical assessment context. In A. Prifitera, D. H. Saklofske, and L. G. Weiss (Eds.), WISC-IV clinical use and interpretation. Scientist-practitioner perspectives (pp. 3-32). San Diego, CA: Elsevier Academic Press.
Rushton, J. P., & Jensen, A. R. (2003). African-white IQ differences from Zimbabwe on the Wechsler Intelligence Scale for Children–Revised are mainly on the g factor. Personality and Individual Differences, 34, 177-183.
65
Saklofske, D. H., Weiss, L. G., Beal, A. L., & Coalson, D. (2003). The Wechsler scales for assessing children's intelligence: Past to present. In J. Georgas, L. G. Weiss, F. J. R. van de Vijver, and D. H. Saklofske (Eds.), Culture and children's intelligence. Cross-cultural analysis of the WISC-III (pp. 3-21). San Diego, CA: Academic Press.
Sattler, J. M. (1992). Assessment of children: Revised and updated (3rd ed.). San Diego, CA: Jerome M. Sattler.
Shuttleworth-Edwards, A. B., Donnelly, M. J. R., Reid, I., & Radloff, S. E. (2004). A cross-cultural study with culture fair normative indications on WAIS-III Digit Symbol–incidental learning. Journal of Clinical and Experimental Neuropsychology, 26 (7), 921-932.
Shuttleworth-Edwards, A. B., Kemp, R. D., Rust, A. L., Muirhead, J. G. L., Hartman, N. L., & Radloff, S. E. (2004). Cross-cultural effects on IQ test performance: A review and preliminary normative indications on WAIS-III test performance. Journal of Clinical and Experimental Neuropsychology, 26 (7), 903-920.
Shuttleworth-Jordan, A. B. (1996). On not reinventing the wheel: A clinical perspective on culturally relevant test usage in South Africa. South African Journal of Psychology, 26 (2), 96-102.
Skuy, M., Schutte, E., Fridjhon, P., & O'Carroll, S. (2001). Suitability of published neuropsychological test norms for urban African secondary school students in South Africa. Personality and Individual Differences, 30, 1413-1425.
Snow, R. E., & Yalow, E. (1982). Education and intelligence. In R. J. Sternberg (Ed.), Handbook of Human Intelligence (pp. 493-585). Cambridge: Cambridge University Press.
Stats SA. (2001). Education in South Africa: Selected findings from Census'96. Available from Stats SA website http://www.statssa.gov.za
Stats SA. (2006). Provincial Profile 2004: Eastern Cape. Available from Stats SA website http://www.statssa.gov.za
Stead. G. B. (2002). The transformation of psychology in a post-apartheid South Africa: An overview. International Journal of Group Tensions, 31 (1), 79-102.
Strauss, E., Sherman, E. M. S., & Spreen, O. (2006). A compendium of neuropsychological tests: Administration, norms and commentary (3rd ed.). New York: Oxford University Press.
Van de Vijver, F. J. R. (2003). Principles of adaptation of intelligence tests to other cultures. In J. Georgas, L. G. Weiss, F. J. R. van de Vijver, and D. H. Saklofske (Eds.), Culture and children's intelligence. Cross-cultural analysis of the WISC-III (pp. 255-263). San Diego, CA: Academic Press.
Van de Vijver, F. J. R., Mylonas, K., Pavlopoulos, V., & Georgas, J. (2003). Methodology of combining the WISC-III data sets. In J. Georgas, L. G. Weiss, F. J. R. van de Vijver, and D. H. Saklofske (Eds.), Culture and children's intelligence. Cross-cultural analysis of the WISC-III (pp. 265-276). San Diego, CA: Academic Press.
Van de Vijver, A. J. R, & Rothman, S. (2004). Assessment in multicultural groups: The South African case. South African Journal of Industrial Psychology, 30 (4), 1-7.
66
Van Tonder, P. (2007). WISC-IV performance of South African Grade 7 English and Xhosa speaking children with advantaged versus disadvantaged education. Unpublished Masters Thesis, Rhodes University, Grahamstown.
Verster, J. M., & Prinsloo, R. J. (1988). The diminishing test performance gap between English speakers and Afrikaans speakers in South Africa. In S. H. Irvine and J. W. Berry (Eds.), Human abilities in cultural context (pp. 534-559). Cambridge: Cambridge University Press.
Wechsler, D. (2004). WISC-IV (UK). Wechsler Intelligence Scale for Children–Fourth UK Edition. London: Harcourt Assessment.
Zindi, F. (1994). Differences in psychometric performance. The Psychologist: Bulletin of the British Psychological Society, 7, 549-552.
67
APPENDICES
Note: Documents used were adapted from those used by Van Tonder (2007) to ensure
consistency in the research process. As additional data collection for the research was
conducted in Afrikaans-medium schools, all documentation was made available in both
English and Afrikaans.
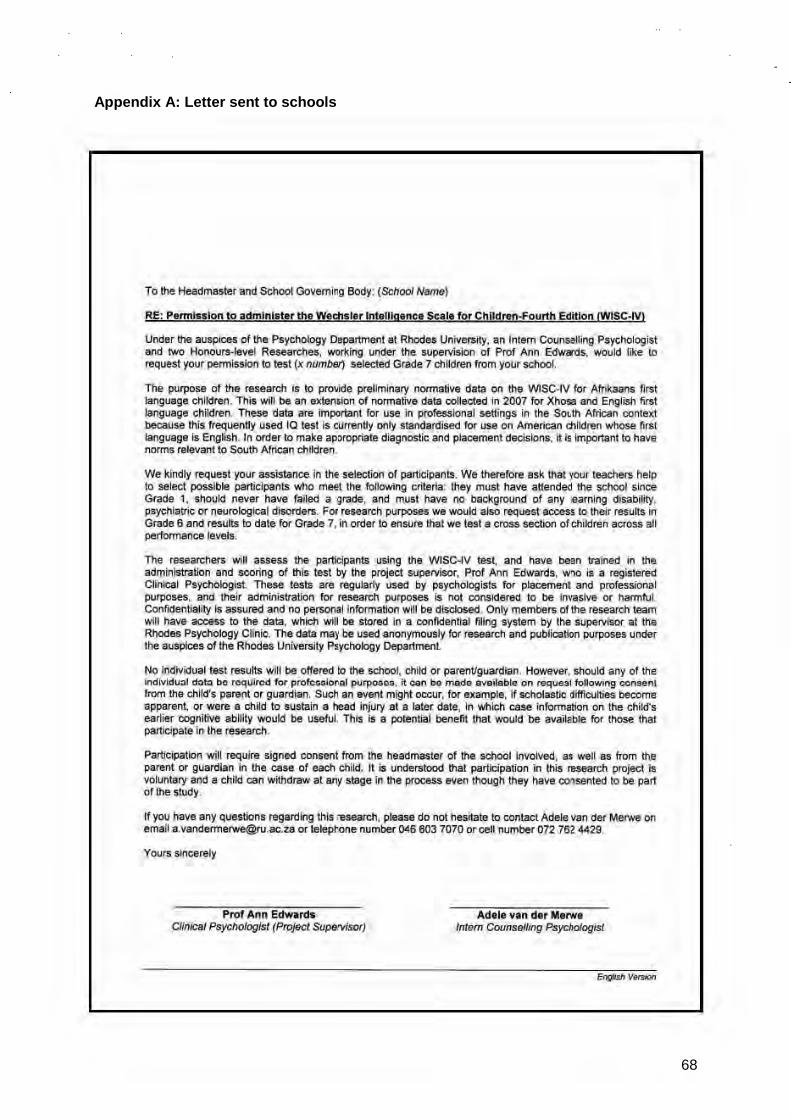
68
Appendix A: Letter sent to schools
To It!e Headmaster ~nd ScI'o:Iol GoIiamlrg Body: (School Name)
RE ; Permlulon to ,dmlnl.t.r!fl. Wtchsl.r In!tlllg. ne. Sea l. for Chl!d!'!!l;;fourth Edition IWlSC-OO
Under It!e auspices 0/ thft Psycholog1 Dapilrtment at RhOOes Unloer3i!)'. sn Int&m Coonl9lling Psyeholog ist and two Honoura-level R.searches. working urode< tile supervisjon 01 Pro! Ann Edw;lrds. would like to request your perm"sion to test (x numl:wj sel8cted Grade 7 cMdren from your scI'ocO,
The purpose ot tile research is to pnMje preliminar)' normative data on tile WlSC~V lor Afrikaans first languagft chlldl'!!1, This will be an .>tIerlaion 0/ normative data COllected in 2007 tor Xhosa and Er.gI ish first w-guage children, 'These data are importanl lor use in profess",,",1 sellings in the SoI.th Alric<ln conte>rt becaIlse !his treqoontl1 tlSed 10 tHt is Cl.>l'rently or1ly standan:lise(J for """ on AmericoIn ctlildren whose ftrat w-guage .. English. tn 0<0er to make aporopMle diagnostic:...,d plaoement doosions. ~ is Important to have norms relevant to Sooth AfrIcan children,
We kindly requesl )'OUr ~$$istance in llIe selection 0/ pa~ts, We therefore ask that yoor teachers help 10 select possible pattic;pants whO meet the !<>IIowing criteria: they must have attended the school since Grade t . sI>ould never have failed a ~, and must have no background 0/ any 'earning disabii ly, p$yeI'Iiatric ()( neyrological dOsorders. F()( re ..... rch purposes we would also request _, to their f!$U~' in Grade 6 and f!$ulb to date tor Grade 7, in 0<0er to ensure that we test a cress MCtion of children across all performao:1ce Ie, els,
The resean::llets wi' ISS,". tile pat1ieipants using the WlSC-IV tes~ and ha\'e be. n trained in tile administration and scoring 0/ this lesl by the pn:lject supervisor, Prof Ann Edwards, w"IO is a registefed C~nk:al Psychologist. These testa are regularly used by psyci>olog ists lor placement and pmfeS5ional purposes, and the~ administration lor research purposes is not cons.ld8<9d to be invasive ()( harmful. Contldentialil\l is as",red and no person~ inIormation will be dOsciosed. Only members 0/ the research team will have access to the data, which wOt be storlOd in a conf\def1tial ffing s)'Stem by the ",pervlsor at the Rhodes P$ydIoIogy Clinic. Th. data 0'18\' be used 8OOI1)11llOUsly lor research and publication P<JrposeI urode< th4t auspices 01 tn. Rhodes UniversJly P,)'ehoIcgy Department
No individual test re",lt, wiM be ohred 10 tile school, child or parer1l1gtJardian_ Howe_, shookj a"'l (>1 lb. incIjyidu~1 d~1a be requin>d lot profe"""'''' p«posCI, ~.,..... be"'- ..... illoble on request _"9 eo"""n! Irom tn. child', pal'!!1t ()( guafd..." SucI1 an flent might occur, tor example, if scholastic dit!lculties bec:omtI apparent or were I mild to $U$lain I he;od injury 8t s I8ter date, In which case information or1 the mild's ea~~ cognltw. abiif\l would bo "seM This is I potentiat benefit that would be .... ailoble tor those thai pat1ieipate in the research_
Participatiorl will require ligned consenl trom the headmaster 01 the school In...oM!d, .. ~I I I from the parenI or guardian in the case 0/ each chikj, II is underatood tn., participation in this ~ project Is volunl8r)' and I mild can withdraw at anf $!age In tn. proceu ...,.... tnough they NIve """....,ted to be part ofthe$tudy_
~ )'011 _ 1101 questions regard ing this research, please do not hesitate to contact AdeIe .... n der Merwe on ema, a,vand~.8C.Z1 or teleptone number CI46 603 7070 or (>III number 072 762 442'9,
Yours s"-'ely
ProIAnn Edwlrds Ad.,. Yin d., M ...... Cliniclli Psychologi5f (Proje<;t SUpe'VisorJ Intem Counu/ling Psychologjsl
69
Aan die SkooIhooI en Skool- Behee~iggaam: (School MIme)
IMlke: Tot.\tmmlos Vi. ~dTllnl.t ... 1t yu dlt "W!ebtl • • !nt.lIIs. nc. $ql. lor Chlld!!n.fo!!rtl! Edition !WJsc:/YI".
Onder Deskerming van die ~rtement van Sielkunde by Rhodes Un~r$ilelt. "Ill ·n Inlem BeradingsS0e4kunclge en !Wee H9r1eu.-·vlak Navorsers. in samewerking mel Pro! Ann Edwa<ds wie " .ranlwo<>f(jelik ~ vt die IOesig van die ~I!.'denle. ';. u toesterrrning om (x IMIm!>et) u ~ .... soekte 9ra;od 71eer1inge vaa u sI<.cd Ie -Die doel van die ~ag is 0" V<>OrIopige normatiewft ~ hi bekom len opsigle van die "WISC-IV" Ioets vir Afrikaaas -.tetaal-sprekeOOe kinders. Oil sal 'n uilbreiding wee5 '>'lIn OiWQrs.ing III"<It in 2007 gedoen is mel )(t1osa en Engeis _Itetaal-s~kencle kinders. Hierdie data is bel&ngfik vir ge!lruik in professionele stdirlgs fr1 die Sui<! Awil<aans.e kOl1tekt. omdat hierdie IK Ioets _t gereeld gebtut; word. tans sIegs \lHtanciardisee< is 1M opsigte yen EngelS -.letaal~.nde Amert:aanse kinders, Oil is belangrik om ,elevante norml vir Suid Affikaonse u,ders t. ".. om Ie verseke. dat kooekle diagnose gemaak word en oak om regte besluite te neem Ie<I opeigte van die piuing '>'lIn kincllH'S me! akademiese probleme.
Ons ""' vi. u samewerking met die llitsoek van die deelnemers. D~ sal waardee. WCI<d ind;en u onde<wyllH'S moonUika deelneme.- kan identilSeer. l1l"<I1 aan die VQIgende ~istel voIdoen: hulle moat vanaf Graad 1 by die skool wees, moes neg nooit·n g.aad gedruip he! nie. en moat geen agtergrond'" van enige )ee'gebrek, psigiatriese of nelMOk>g ine s1t\Jrings nie. Vir navorsings <IoeIeincIes, "Ill 0111 001< v~ toegang t01 hie<die )eeri" ge Ie rapport v~ Graad 5 en enige punte wa1 VOOI'oo!li9 vi. Gtaad 7 beskikbaar is. D~ sal ono in staat stel em kincIers Ie !OatS "'at elk" prast;nie vtak verteenwocrdig_
Die navorse", sal die leartinge IOets dell. gebtuik Ie maak van die ""W1SC..llf" Ioetl_ HuUe is 18<1 volle opgeN!; om hierdie iOe!l Ie adminisln!", e" Ie mer!<, en is deur die projek !OHigoouer Prof Ann Edwards. ·n geregis!feerde KW1iese Sielkufldige. opge4ei. Hie<die Ioets word gereeld deu. siellwncligel ge!)n.lr. ..... pmlenionele doeteOndes en die pta.iog van I<indoen. en die ildminis1raSie da.tV.n ..... I18vor.irIg doeleindes word nie as incIringenci of 51<_ beskou nie, Verb'OUlikheid word _k", en geen persoonOk" inligtiog sal belwld gem88k word nie, Sleg. Iede van die ~ngspan sal toegan9 h6 101 hie<die data, en dit oal in 'n veltrOOlike iasse<ing$lelsel gestoor word deu. die prcjek Ioesigooue,. in die Rhodes SiellIuncie Kliniek. DOe data mag 8tIOOliem gabtuik w.>rd vir navorsing en publikasie OOeN!;ndei OM'" die t>eskermlng van die Rhodes Univemteit SieIk~ncIe Departmenl_
Goon individuete toetsujtslae .. I aan die 51<001, kind of OUM/voog vers1rek word nie. Maar, indien enige incIMdoe!e data ..... profession6le doeteindes bencdig word. on dd op .anVfaag beskikbla, gea1e! WCI<d indien die kind Ie ou"'/Voog toe.lemming d8arIoe verleen. So ·n geleenlheid mag byvocrt>eeld VQCrI<om indien die kind akademie$, ~eme 9r1!wikkel, 01 indian die kind op ·n Iat"" stadium ·n hooIbesering opdoen_ tn so·n geval sal ~ inligligtiog van die kind.., ke>gnitiewe vermoe wei beiangrik _ I. Oil is·n pO!ensJ6Ie voorOee! vi, en;ge <llleineme' 88a hierdie navor..,g,
Deelname sat &kriftelik. loeste<nmOog Yereit van die SI<ooIhoof van die betrckke 51<001. asccI< die .kriflehke te>estenvnirlg van die oue' of voog yen elke leerting ",at d .... lneem. Deetname 88" hierdie aavor.ingt.prOjel< it ge~ en at Vfyw;Uig 8<1 'n ie«iiog kan ter enige tyd van die I18vor.tno 9r1ttfek at he! hy of -V ingestem om dee! Ie "'eel van d .. prcjek
Ind<en u enige ,,",e I>et met be1reUlng I~ hierdie navorsiog. ken u met vrymcedigheid kontak maaI< met Adele van dar Me""" by apes a,vanclerme"""'@"UC.ZIIcftelek>Nes by 046 503 7070 of Hlfoonoommer 072 762 4429.
--
70
Appendix B: Letter sent to parents
TO the ParentlGua<dian
RE; P, rmlHlon 10 admlnltt' r !hl Wreh1;ler InltlHgenc, $gi l, for Chlldttn;f0YQh Edition !WlSC-IV!
Unde, the auspices 01 the Psychology Department at Rhodes Un~rsi!y, an tnt.m COIInse1ling PsyctlDlogist arlC! two Konoura-level Researches. worbIg under the supervision 01 Prof Ann Edw;lrds, would like to req...est YOll' permission to test your child,
The purpoSe of the ,eseatch is to provide preliminary nc>rTTIaIive data on the WlSC-IV tor AlTikaans first IiIngUlge cIlddren, This will be an extension 01 normalille da.ta collected in 2007 fof XIIMa 3M English firsl language cI'1i\dren. These data are Important lor lISe in prof .. sional 5eIIings In the South African context becaouse this frequently used IQ test is cum!""Y only standardised tor use on American cll41d,en whose r~st language is Engisll, In orde< to make aP!'fOl)lt8te diagllOltic and placement dIocisions, ~ is important to have norms relevant to South AlTican eMd" n,
The researchers wi! aSMls YOU' child using \he WlSC-N ,est. and have been trained in \he adminisiralion and sconng 01 this lest by the project supetVisor. Prol Ann Edw;lrds, who is 8 reglst.red Ci nieal Psychologist TheM "s~ are regularly used by psyctlDlog isis tor placement and professional pYrposes. and th eir admk1i&tratioo tor researdl pYr;JOSe' ~ nol COIl$i(Sefed to be inVlsNe IJ( hilnnlul. COnf\del1llality is assured and no per3OfIIIlintorm8tior1 will be cflSdosed. Only members 01 the research learn wil have access 10 the data, whk:rl will be stored in a ex>nIidential liling system by the SUpeMsot at the Rho<:Ie$ Psychology Clinic, The data may be \/Sed aflOO)IIT\OIIsly lor research and pYblieabon put'p05Ils .......de< the auspices of the Rhodes UniveAity F>.yc:l'lology Department
No individu'" leSI results will be offered to \he school, cNkl 0< parenllguardian, However, should an~ 01 the Individual data be requ~ed tor proIessklnal purposes, ~ can be made .vailable on . eq...est following con.....,t from \he cI'1i1d's parent IJ( guardian. SucIl an ......,t might occur, tor eX8l'f1l)le. ~ scholastic difficulties be<:ome apparet1~ or were a child to sustain a Ileac! i1jury at a later date, in 'llhlch ca&e lnIotmatioo on the cI'1ikfs ea rlie, cognitive ability would be useful. T~ ill • poIefltial benefil that would be available for those that particlpale in the research.
Parlk;ipation will require signed con.....,t from the lleadmaster 01 the school Involved, as well as /rom II1e parent or guardian In the case 01 each mild. n ill understood thaI participatiOn in this research project is volllntllry and a Child can withdraw at any stage in the process even Ihough they have consenled to be pari 01 \he Study
II you have any qllllstjo", regard ing tIlis resnrdl, pleilse IX> nOllle$itate to contact Adele van llel Merwe on ema~ a.vandeo'r1erweCru.ac.ZlI 0< telepllone number 046 603 7010 or oeM number on 162 4429,
ProlAnn Edward, Clinicar Psyr:hologlst (Project Supervisot)
Ad, .. nn de. Marwe Intern Counselling P$ydIoIogl$l
Ertgt;oII _
71
A¥I die OuerNoog
In",k.; To!!t.mmlng vir .dmlolttr .. l. van dl. "WlSh.ltr Int.llig.na Suit for Chlldr. n.Fourth Edition IWlSC-N)"
Onder beskem'oinr.i van die Depan&mef11 van Slelkunde by Rr.:..as Unhter.~eit ¥fa 'n Intern Beradeng •• Slelkundige en ~ Hofl&llrs-vlak Navorsers, in $llmewerklng met Prof Ann EdWards wi, "erantwoordehk is vir die IOe$ig van die S\uden~, vir II ioesremmlog om u ~ind Ie toels.
Die doel v., die navonlog is om voorlopige notm81iewe aata ~ bekorn ten opsigl! van die 'WISCN" toels vir AAikaans eerstelail~$pIlIkeode kiode<li, Oil uI 'n uttbfoiding woos van naVOfSing wat II 2007 gedoen is met Xilosa en Engels "rstetaa~preker<le kinder., Hiefdie data is belangrik vir gebn.lik in professionelt S).~ings in die SU>d Afrikaan$ll kontekl omelat hie<die tK \oeIs wat gereeid gebruik wotd, tans slegs gliltandardiseer is ten opslg~ van Engels eenlletaakprekeoGe Ameriknnse ltinders. Oit is belangrik om .. ""'an)e rlOnl1. vir SY>d AlrikABnse ~irders te 1\6, om ~ verseker da! korrekte diagnose \llI"""'" wotd en ook om regie be$lurte ~ neem ten Opsigte van die plallng van kioden me! akademiese probIeme
Die navor.ers sal u Itind tGets d ... , gebruik Ie maak van die 'WISC-IV' toets. Hu ... is len volle 9P9!~ om llierdie toe!s ~ administreer en Ie mer!< , n is deur die prcjek ~r. Prof Ann EIIWatds, 'n !lefegistreerlie Kliniesl! Siclkundige, opgelei. Hierdie ~ word Aereeld dellf sielkundiges gebruik vir profeuior.ele doeleiodes en die plasing van k inder., en die adminis1rllsie van die IoeIS v~ navoraingsOoeIeindes wotd nie as indrir>gerld of skadelik b •• kau nie. Vertroulikhe-id woro versek" en geen JIIIrwonlike in~!ing »1 beI<,rId gemaak word nie. Slegs !ede van die r-.a...ningspan ""I toegMg he !Qt hlerdle eIata. en dt sa! in 'n vertroulike I;"sseringstelsel \llI1IOOf woro deur die pmjek toeslgllouer, in die Rhode. Sielkunde KMlieI<. Die data mag 8norniem oebruik word vir na~s en pui)lil<aaie doe!eindes onder die be$k ...... 1ng van die Rhodes Universilett Sielkuode ~rtme!lI.
GOO/\ indivOd<JeIe toelsuilslae »1 un die skool, kind of ouerlVoog ve[$trek woro n~. Maar, indien enige indiv>duele data vi' proIe$5iolle'" aoeleinde. berlg.dig word, karl art op aanvrilag lleskil\baar gc~tcl word lrodien die kind Ie ouerlVoog toesterrmlog daartoe verleen. So 'n gelHnl!leid mag byvooItleeId voorkom indien die kind akademiese prob!eme ontwil<kel. of indien die kirod OIl 'n later stadium 'n hooIbesemg opcIoen. In SO 'n oeval ..... YfOMr inligligting van die kind Ie kognme- vem\Of! _I bel9ngrik wen D~ is 'n potensi!1e VOOfdeel vir ,"nige deelnemer un hlerdie navonlog
Deelname ""I sl<riftelike toes~mmirog vereis van die SI<ooIhooI van die betrokke skool. asook die .kriftelil<e Ioestenming van die ouer 01 voog van elke kind waf dee"'eem. Deelname aan hiefdie na...ningsprcjek is gehell e<1 aI vrywi~ig en 'n kind !<an enlge tyd van die ~ onttrek iii hot hy of a~ ingestem om dee! te wees van die pmjel<.
lrodien u enige ""'" he! mel betrel<king k>! hierdie nllYOl'Sing, kan u met vrymoedigheid kontal< """'" met Adele "an der Merwe by epos 8.vandftrmerweOr\l.8C.UO of teIeIonies by 046 603 7070 of setfoonnomme, 072 762 4429.
--
72
Appendix C: Informed consent – Headmaster
RHODES UNIVERSITY
DEPARTMENT OF PSYCHOLOGY
CONSENT FORM: HEADMASTER
_______________ hal'9 been infonll6d 01 th$ n~tulll 01 ttJilllISfJarcIi which wiN
be condtIcted ()tI Afn1<aans $p(IakiIIg cNld<en ill my SCIIOOI. by an In',,", CounseRing Psychologist (AdeI~ "'"
dar MerwtJ) and ,.,.., HonounHe"'1l Rese8rc/>ef$ (Ten Rlchler and DNn Prigg6) from RlICdu U~. and
h6r8by COtlsent to ,he participa,ion 01 my Grllde 7"'~ ';' this proi9d,
, undel1itand thlt:
1. TM aOOvlHTlflntioned In!em Counsel~ng Psycl>ologisl ~nd HOtIO<lt1'-levei Researchers are conducting
resean:t\ to provkSe pre~mitlar\l roonnatMI data on the Wechilier Intelligence ScaiIt lor Chikl"",·Fourth
Edition (WISC~V) lor _. ftl'Sl language c!1ildren. as a requirement lor a Master Degree in
Counselmg Psyd1ology and Honours Degf1ltlS in Psychology at Rtlodes Unlversit)l.
2. The re~eardl will inV!llve wining NriIIaatlS ,", language GI'ao'e 7 children as pao1i(; ipants fIvm your
&ehooI. PartieiJlllnts llliji be assessed using the WedI$le< Inlelligen<>! Scale lor Chlldre,,"Foorth Ed ition
(WISC-IV).
3. Pa<1icipation in tile ",search is stricti)' voluntary. Ir.:Iividuals have the right to wlllldraw Ironl the Study at
any stage.
4 The inkllmation collected on participants will be stricti)' confidential. with no person ... information being
disclosed, AecMs to til .. data win be restricted to members 01 the resean:t\ team, On '8q..est. ~ may be
accessed lor professional pul'pOMl "';!h parental'gua,diln consent.
5, Dati arising out of tIlis prnje<;I may be used anonyrnoualy lor thesis and publication purpose • .
Slgned: _ ________ _ D-II.: __________ _
Nam.: _ ________ ___ _ School: _ ________ _
Addre •• : _____________________________ _
Contlcl Telephon. Numbere: ____ __________________ _
EmIH: _ _______________________ _

73
RHODES UNIVERSITEIT
SIELKUNDE DEPARTEM£NT
TOESTEMMINGSVORM: SKOOLHOOF
£1< i& deeglil< iflgelig ten opsigte van d~ n.vorsing .... r ~ AfriJr/Jllr>$!J{Jl8kWldlt l<inders in my .skoal gelloen $IJI word, IHur 'n Intern Bet8dings SNlllwndige (~~
van der MIl,...,,) an fWH HOO8Urs-vlaJr NlJI/Of'S&fS, (Teri RiehIIV tH>d Dean Prigge) venaf R~ u_~,
&n \'OriNn h;"""e ~e."",;"g tot d~ deiI/rnImfI -an my GfHd 71Hrlif1g6 iflltierdie projek ,
Ell ..... llIan d~t:
1. Die bog&noemde Inrem 6eradings S"kurldlge en KoMurs ...... ak Navorw .. bllsig" om r>aVOf'Sing te
cIoen om I'OO!Iopige normatiewe data Ie bekom vi' die"'Nech1lle.- Intelliger.ce Scale 10< Children-Fourth
Edftion (WlSC·IV)" toeIS vir Afrikaans ~tetaaf.sprek.1Ide kWlders, as dee! van die _aoates van 'n
Meestersgraoo in l\efadings Sielkunde en Honeursgrade in $je(kunde by Rhodes Univer$~eiL
2. Die navorsing sal .....,...~ige Afrikaans eerstetaal G<aad 7 kWlders van my 51<00/ as deelnemers betrek.
[)eejneme<s sal met die 'Wechs~ Intelligence Scale tor Children-Fourtll Edition (\'VISC~V)" lOets _ .... 3. [)eejname in die ~g it ~en at vrywillig. Enige dee/nemel' he! die reg om lef enige tyd van
die navorsing te ontlrek.
~ . 0iI!I iNg~ng Wal ten opsigte van lndividuele deelnemers versamet word, &81 geheeJ en al verttoul<k wees,
en gee<"> persoonlil<!! inligring sal vefldaar WOI"d nie. Toegang tot hie«lie inhgting &81 beper\< word tot die
""=Ie van die narvoningspan. 100 ..... navraag gedoen wotd, mag die In ligtiog vi, profenioneie doel'lodes
bekom wont, maar dan s"'ll" met die toesternming van die OUII'IVoog,
5. Date bekom as gevoig van die projel< mag anoniem gebn.Jil< word vir proefsktil en publikasie doeIeinde • .
G~k.n :' ___________________________________________ ___ o..tum: _______________________________________________ _
N • • m: _ ____________________________________________ ____
Ad~.: ______________________________________________________________________________________________________ ____
KOfIU,k T. ,efoon Nomma .. : ___________________________________________________________________________________ _
E-pot.: ___________________ _
--
74
Appendix D: Informed consent – Parent/Guardian
RHODES UNIVERSITY
DEPARTMENT OF' PSYCHOLOGY
CONSENT FORM: PARENT/GUARDIAN
__________________ h8V8 been inl'l:lml8d 01 !tit nalll/1l 01 tmJ ruSE/arcl!
wI>iI:h wiJllHI conducIIJd on my chM, by anlnlem Counsa/iing Psychologist (AdII'" van der Merwe) and I'lOO
Honour:5.1f1vei R_tellers, (Ten /U:htfJr aOO Dean f'rigf;e) from Rllod!Js UniwI3ity, 1100 I hMUby 119"'6 lo
I und.,.tand thlt;
I. The ~ntioned Intern CounseWng PsydlologOst and Honourt-level Researchers are conducting
researcl1 to porcwide prelim;"ary norm9l~ data on the Wechale< Intelhger.ce Scale for Child"",_Founl'l
Edition (WISC-IV) for Afrikaans first iangllalle dliklren, as 8 requirement for a Master Degree in
Counselling Psychology and I-Iooou" Degrees in Psychology ~t Rhodes University,
2, The _rcI1 will involve wil~ng Aflil<;lans nrsllanguage Grade 7 ch<1(Ir$T1 as partici;>ants /rQm II number
of Grahamstowfl schools. Pa.-ticip.ants will btl assessed using the Wechsler Inteillgence ScaO! for
Chiklren-Foorth Edition (WISC-IV).
J Parti<:ipation in the researcl1 is strictly ""1IIn1aty, IlIdividll8ts ha .... ihe right to withdraw /rQm the study at
any stage.
4. The inlonnation collected on Individual partldpants wiU be strictly confidential. with no personal
informatiOl\ being disclosed. Aa:.esa to this <lata witl "" r1Istricted to members of the res.e.arcl1 team, On
f""LH!5~ ~ ITIiIY he accessed for proIes&ional purposes with p"rentaVguard"n consent
5 0813 arising out of Ihis P<Oject ITIiIY be ..sed anonymously for thesis alld ""bIication purposes.
S~n~' _ ________________ ___ 0...: _________________ _
Nam" ____________ _
Add' ... : ______________________________ __
Em.II' ______________________________ _
75
RHODES UNIVERSITEIT
SIELKUNDE DEPARTEM.ENT
TOESTEMMINGSVORM: OUERNOOG
,, _________________ is dellfllilc irIg4Iig !lin Of»IgIe vall aft na~ WIlt
met my kind gec/oen UI wont, deur :n Il1l8rn Beradings Sielk~ (A4e1fl Win der ,"""",! en IwH
HoniJur&.vImr Na~ef3. (Ten Ricllter end iJelJf> PrlfIrIe) Wine' RhodtJ$ Universlfe~, en verlHn hierrtHte
roeslOOlmi"lllol: my kind se dfHI/nerIIe In hierdie proje/I.
Ek " ... "'an dot:
I. Die bogenoemde Intern Beradlngs Sietkuooige en Honeurs-vlak Navorsen besig is om naVOf'SO>g Ie
doen om VQ(lI\Qpi\I8 OO<matiewe data Ie bekorn "';r die 'Wechsler Intel1lg8tlCe Scale for Childr",,"Foorth
Edition (WISC-IV)" Ioel$ ..... Alril<aans ee/'$te~~sprekende kinders, as dllfll van die vefeisleS van 'n
t.leeet~raad in Beradings SletkUl'lde en Honeursgrade in Sielkunde by Rhodes Univers~eit
2. Die n.av<IfSing sal vrywi llige AIlikaans !Ief'$\eI&III Graad 7 kinders as deel"""..,... betrel< en d ie
deelnemers sal van venlkillende &kole in die Grah""...!ad omgewing 3lkornstig _. Deelroemers sal
IMI die Wechsler InteNigence Scale for Childre<>-foorth Ed it"", (WlSC-N)" Ioets getcell word.
3 Deelname in die ... vorsing is geheel en al vrywilig. Enige dMlnemef he! die reg om tel' enige tyd VM
die na"Ol'Sing Ie onttrek.
~. Die I1ligting wallen cpsig!e van individuele deelnemers .ersatnel word, sal ge/>eel en at vertrou~~ _,
en geen persoonlil<e inligting sal be+:.end gemaak word nie. Toegar.g ~ hie<die Inligting sal bepert word
tot die lede van die "lWOf"aingspan. Indien n8YfMg ~ word. mag die inligtir>go ..... pro!essionele
doeteindes bekom word, maar dan slegs me! die loesten"lfnlng van die OUoerl\loog.
5. Data bekom .s gevolg "80 die projek mag aflOlllem gebruik word ..... proefskril en poJ~;kasie doeleindes
G.tek.n: _______ ____ _ o.tum: _ ______ ___ __ _
N • • m: ____________ _
Ad ... : ___ _ _________ _____ _
KCHWok T t l.loon Nom ...... ' _____________________ _ _ _
E.pol' ____ _ _____ _ ___________________ _
--
76
Appendix E: Informed consent – Child participant
RHODES UNIVERSITY
DEPARTMENT OF PSYCHOLOGY
CONSENT FORM: CHILD PARTICIPANT
____________________ have been informed of the nature of the research
which will be conducted on me, by an Intern C<Junselling Psychologist (Adele van der MefWe) and two
Honours-fevel Researchers. (Teri Richter and Dean Prigge) from Rhodes University. and I hereby agree to
participate in this project.
I understand that:
1. The above-mentioned Intern Counselling Psychologist and Honours-level Researchers are conducting
research to provide preliminary normative data on the Wechsler Intelligence Scale for Children·Fourth
Edition (WiSe-IV) for Afrikaans first language children, as a requirement for a Master Degree in
Counselling Psychology and Honours Degrees in Psychology at Rhodes University.
2. The research will involve willing Afrikaans first language Grade 7 children as participants from a number
of Grahamstown schools. Participants will be assessed using the Wechsler Intelligence Scale for
Children-Fourth Ed~ion (WISC-IV).
3. Participation in the research is strictly voluntary. Individuals have the right to withdraw from the study at
any stage.
4. The information collected on individual partiCipants will be strictly confidential, with no personal
information being disclosed. Access to this data will be restricted to members of the research team. On
request, it may be accessed for professional purposes with parental/guardian consent.
5. Data arising out of this project may be used anonymously for thesis and publication purposes.
Signed: ___________ _ Date: ____________ _
Name: _____________ _
Address: ______________________________ ___
Contact Telephone Numbers: _________________________ _
Email: _______________________________ _
English Version
77
RHODES UNIVERSITEIT
SIELKUNDE DEPARTEMENT
TOESTEMMINGSVORM : DEELNEMENDE KIND
,, _ ___ _ _ ___ _ _ _ ___ __ is dHgIik ingtJlifI ~n opsIgte van die ""VCo'SitIg WlI!
met my fIEIrkYtn SIll wot!1, dlJur 'n Inlflm 8eradings S;"Ikund/fIEI (Adele van der Me"",,) ~n /wee ~un-vlak
NaVOf5tK$. (T9fi Richter and Dean Prigge) vanal Rh<>d<n UrtMtrsitl1it. en verlaen /tierr.- toesl&mming 101
my <1Hname in hierdM prt'.>jM.
Ek ve .. tun dal!
1. Die bogenoemde Intem Beradings Siell<ulld~e en Honeurs-vlak Na~ be$1g II GIll navorsmg Ie
doen om voorIopige normatiewe data Ie bekom vir die "Wechsler Intelligence Scale for CllKlren-I'oorth
Edition (WISC-IV)" toets "';r Afril<aarl$ eerstetaa~sprekend. kirK!e .... as deel van die verei,tel van 'n
Meestersgr""d ill Beradingl Sietkuond. en Honeursgrade in Siell<uncle by RIIodes Unt..ersiteit.
2, Die navorsing sal vrywilis/e Alri<aans eerstetaal Graad 71<inc1er. ... deelnemers t>etrek en die
deelnemel'$ .. I van versk&nde skole in die Grahamstad ~ a!\l;omstig _.S, OeeJneme ... sal
met die 'Wechsler Intelligence Scale 10< Children-fourth Edrtion (WISC-IV)" t()ets getoets word
3. Deel""",. ill die R8"i0f'SlrIg is get-I en at vrywilig. Enige deelneme< het die reg om Ie< enige Iyd van
die f'\8vorsing Ie DI1ttre l<.
a, Die inligting Wal ten opSigte van indivduele deelnemers verumei word. sal geheel en at vertroulik weel,
en gean persoonlil<e inligti"" sal bekend gotrnaal< word nie. T~ 101 hiefdie inligting sal beperI< word
101 die led. van die flaJVOningspan. Indian navraag gecloen word, mag die iIIligting .... proI'o.slonete
doejeir.des bekom word , maar clan slegs mel die toestemming van die """"/Voog.
S. Data bekom a, gevoIg ""n die projek ITI&\I 31\D11;em gebruik word vir proefskrilan pubhkasie doel";nc!es
Gete~." : _ _____ _____ _ Dltum: ____________ _
Na.m: _ _ __________ _
Adr .. : __________ ____________ ____ _ _
Konllk T."'oon Homm . .. : _____ __________________ _
E-pos: _______ _ _______ ____ _
- -

78
Appendix F: Screening questionnaire for potential participants
RHODES UNIVERSITY
DEPARTMENT OF PSYCHOLOGY
SCREENING QUESTIONNAIRE FOR POTENTIAL PARTICIPANTS
O81e: _____ _
Name or Par\icip8nt ____ ________________ _
Name of TeslAdminislT8tOC __________________ _
101m with an X thaI which is appIicabla to {Wticipant.
AC!d!m!e HI,IOrI
Has failed. grade at school
IS urtdergotng remedial teaching
Has 8 learning disability
filed'B' H!ttort
o o o
• I. on any rnedicatict1 for an reason 0 ~au specify type of _a/X;ln and IlIason for medication;
• Has any Dlt>e< ne<JroIogical dOsorder 0 ~au~ity:
Has epj~pay 0
Has previously _lalned a head injury invoMng 10 .. of consciousr>e$S ar>dlor hospitab.ation 0
Has eny problem involving eyesight 0
Has ..,y problem involving heeling 0
Emotional WeM=Hlnq
Hila depresoivelirTiLa~ mood much of the time 0
I. presently seeing a psychologist I psychiatrist 0

79
RHODES VNIVERSITEIT
SIELKUNDE DEPARTEMENT
KEURING VRAE VIR POTENSIELE DEELNEMERS
... m _____ _
N ... m VOIn Oeelneme.c _____________________ _ _
Naam.,.., Toe\! Administrator: ___________ ________ _
Ak.s!tmIH' Gn kltd, nl.
He! 'n graad gedop OJ) skoal
Onde<ga;on (emedie ... ond\HTig
He! "n leefgebrek
Medlc.1 H!!!ory
!1; op e!Iige meclikasie W enig& r&de
$p6sil'lseer /JSS&bIitf Iipe ~ &n mde .... die mtdikasi&:
He! enISle neurologiese toestand
Sp&$iI'Iseer aSMbliet
o o o
o
o
Het epilepsy 0
He! "an I&wre 'n hooIbeserirlg opgedoen en ge'o'Olglik bewusein \IerIoor en/a{ was in die hospitaal 0
He! enige probIeem Ie l1\iIke met sig 0 He! enige problem Ie make met ~hoof 0
Emotlon.1 W, lj-l!!!nq
He! depreMievelgeirrilee«le buie vir die _Ie IIIIn <I", tyd
S"", op die oombUk '0 sie/k~ndlge , paigiator
o o
--