processes Article Thermal Analysis and Energy Efficiency Improvements in Tunnel Kiln for Sustainable Environment Syed Ali Hussnain 1 , Muhammad Farooq 1, * , Muhammad Amjad 1 , Fahid Riaz 2 , Zia Ur Rehman Tahir 1 , Muhammad Sultan 3 , Ijaz Hussain 4 , Muhammad Ali Shakir 5 , Muhammad Abdul Qyyum 6, * , Ning Han 7, * and Awais Bokhari 8,9 Citation: Hussnain, S.A.; Farooq, M.; Amjad, M.; Riaz, F.; Tahir, Z.U.R.; Sultan, M.; Hussain, I.; Shakir, M.A.; Qyyum, M.A.; Han, N.; et al. Thermal Analysis and Energy Efficiency Improvements in Tunnel Kiln for Sustainable Environment. Processes 2021, 9, 1629. https://doi.org/ 10.3390/pr9091629 Academic Editors: Ahmed Hadjadj and Hossein Aminian Received: 16 July 2021 Accepted: 4 September 2021 Published: 9 September 2021 Publisher’s Note: MDPI stays neutral with regard to jurisdictional claims in published maps and institutional affil- iations. Copyright: © 2021 by the authors. Licensee MDPI, Basel, Switzerland. This article is an open access article distributed under the terms and conditions of the Creative Commons Attribution (CC BY) license (https:// creativecommons.org/licenses/by/ 4.0/). 1 Department of Mechanical Engineering, University of Engineering and Technology Lahore, Lahore 54000, Pakistan; [email protected] (S.A.H.); [email protected] (M.A.); [email protected] (Z.U.R.T.) 2 Department of Mechanical Engineering, National University of Singapore, Singapore 117575, Singapore; [email protected] 3 Department of Agricultural Engineering, Bahauddin Zakariya University, Multan 60800, Pakistan; [email protected] 4 Department of Chemistry, Faculty of Science, Universiti Teknologi Malaysia, Johor Bahru 81310 UTM, Malaysia; [email protected] 5 Department of Mechanical Engineering, College of Engineering and Technology, University of Sargodha, Sargodha 40100, Pakistan; [email protected] 6 School of Chemical Engineering, Yeungnam University, Gyeongsan 712-749, Korea 7 Department of Materials Engineering, KU Leuven, 3001 Leuven, Belgium 8 Sustainable Process Integration Laboratory–SPIL, NETME Centre, Faculty of Mechanical Engineering, Brno University of Technology–VUT Brno, Technická 2896/2, 616 69 Brno, Czech Republic; [email protected] 9 Department of Chemical Engineering, Lahore Campus, COMSATS University Islamabad (CUI), Punjab 54000, Pakistan * Correspondence: [email protected] (M.F.); [email protected] (M.A.Q.); [email protected] (N.H.) Abstract: Kiln is a prime need in the ceramics industry, where energy loss is a major part which consumes about 60% production cost through thermal energy for different applications. Higher density of fired and tunnel kiln refractory material lowers the thermal diffusivity and the proper selection of fired material minimizes the energy loss along the kiln. In particular, this research analysed the results of a heat recovery system comprised of a metallic recuperator which gives around 8% energy savings in natural gas consumption. In this work, detailed power quality analysis of low-power factor motors of a tunnel kiln was carried out and a power factor improvement solution was suggested to save electrical energy with payback period of 0.8 y. The motor operating at a low- power factor consumes more reactive power which does not produce beneficial work. A low-power factor around 0.4 causes network power loss, increases in transformer loss and voltage drops. The solution with accumulative capacitance power of 148.05 uF was installed to achieve the power factor to 0.9. Flu gas analyzer was installed to monitor the range of O 2 in pre-heating, oxidation, and firing zones of the kiln which should be ≥8% and 3%, respectively. Regression analysis for thermal energy consumption of a tunnel kiln is done to find the forecast thermal energy consumption. This analysis can be used to find operational efficiency, supporting decisions regarding dependent variable of thermal energy consumption and independent variable of production. This research is very helpful for the ceramics industry to mitigate the energy loss at SMEs as well as in mass production level. Keywords: tunnel kiln; thermal analysis; power quality analysis; techno-economic analysis; energy efficiency 1. Introduction Firing and drying process of ceramics manufacturing requires intensive thermal energy consumption. These processes can be improved by improving the product quality, Processes 2021, 9, 1629. https://doi.org/10.3390/pr9091629 https://www.mdpi.com/journal/processes

Welcome message from author
This document is posted to help you gain knowledge. Please leave a comment to let me know what you think about it! Share it to your friends and learn new things together.
Transcript
processes
Article
Thermal Analysis and Energy Efficiency Improvements inTunnel Kiln for Sustainable Environment
Syed Ali Hussnain 1, Muhammad Farooq 1,* , Muhammad Amjad 1 , Fahid Riaz 2 , Zia Ur Rehman Tahir 1,Muhammad Sultan 3 , Ijaz Hussain 4, Muhammad Ali Shakir 5, Muhammad Abdul Qyyum 6,* , Ning Han 7,*and Awais Bokhari 8,9
�����������������
Citation: Hussnain, S.A.; Farooq, M.;
Amjad, M.; Riaz, F.; Tahir, Z.U.R.;
Sultan, M.; Hussain, I.; Shakir, M.A.;
Qyyum, M.A.; Han, N.; et al. Thermal
Analysis and Energy Efficiency
Improvements in Tunnel Kiln for
Sustainable Environment. Processes
2021, 9, 1629. https://doi.org/
10.3390/pr9091629
Academic Editors: Ahmed Hadjadj
and Hossein Aminian
Received: 16 July 2021
Accepted: 4 September 2021
Published: 9 September 2021
Publisher’s Note: MDPI stays neutral
with regard to jurisdictional claims in
published maps and institutional affil-
iations.
Copyright: © 2021 by the authors.
Licensee MDPI, Basel, Switzerland.
This article is an open access article
distributed under the terms and
conditions of the Creative Commons
Attribution (CC BY) license (https://
creativecommons.org/licenses/by/
4.0/).
1 Department of Mechanical Engineering, University of Engineering and Technology Lahore,Lahore 54000, Pakistan; [email protected] (S.A.H.); [email protected] (M.A.);[email protected] (Z.U.R.T.)
2 Department of Mechanical Engineering, National University of Singapore, Singapore 117575, Singapore;[email protected]
3 Department of Agricultural Engineering, Bahauddin Zakariya University, Multan 60800, Pakistan;[email protected]
4 Department of Chemistry, Faculty of Science, Universiti Teknologi Malaysia,Johor Bahru 81310 UTM, Malaysia; [email protected]
5 Department of Mechanical Engineering, College of Engineering and Technology, University of Sargodha,Sargodha 40100, Pakistan; [email protected]
6 School of Chemical Engineering, Yeungnam University, Gyeongsan 712-749, Korea7 Department of Materials Engineering, KU Leuven, 3001 Leuven, Belgium8 Sustainable Process Integration Laboratory–SPIL, NETME Centre, Faculty of Mechanical Engineering,
Brno University of Technology–VUT Brno, Technická 2896/2, 616 69 Brno, Czech Republic;[email protected]
9 Department of Chemical Engineering, Lahore Campus, COMSATS University Islamabad (CUI),Punjab 54000, Pakistan
* Correspondence: [email protected] (M.F.); [email protected] (M.A.Q.); [email protected] (N.H.)
Abstract: Kiln is a prime need in the ceramics industry, where energy loss is a major part whichconsumes about 60% production cost through thermal energy for different applications. Higherdensity of fired and tunnel kiln refractory material lowers the thermal diffusivity and the properselection of fired material minimizes the energy loss along the kiln. In particular, this researchanalysed the results of a heat recovery system comprised of a metallic recuperator which givesaround 8% energy savings in natural gas consumption. In this work, detailed power quality analysisof low-power factor motors of a tunnel kiln was carried out and a power factor improvement solutionwas suggested to save electrical energy with payback period of 0.8 y. The motor operating at a low-power factor consumes more reactive power which does not produce beneficial work. A low-powerfactor around 0.4 causes network power loss, increases in transformer loss and voltage drops. Thesolution with accumulative capacitance power of 148.05 uF was installed to achieve the power factorto 0.9. Flu gas analyzer was installed to monitor the range of O2 in pre-heating, oxidation, and firingzones of the kiln which should be ≥8% and 3%, respectively. Regression analysis for thermal energyconsumption of a tunnel kiln is done to find the forecast thermal energy consumption. This analysiscan be used to find operational efficiency, supporting decisions regarding dependent variable ofthermal energy consumption and independent variable of production. This research is very helpfulfor the ceramics industry to mitigate the energy loss at SMEs as well as in mass production level.
Keywords: tunnel kiln; thermal analysis; power quality analysis; techno-economic analysis;energy efficiency
1. Introduction
Firing and drying process of ceramics manufacturing requires intensive thermalenergy consumption. These processes can be improved by improving the product quality,
Processes 2021, 9, 1629. https://doi.org/10.3390/pr9091629 https://www.mdpi.com/journal/processes
Processes 2021, 9, 1629 2 of 21
lowering the process time, and promoting the economic and environmental heat gain.The main process that employs the intensive use of natural gas is the firing of sanitaryware. By limit the use of thermal energy consumption, accurate design of tunnel kiln wasincorporated [1]. The different methods for the optimization of kiln performance have beenadopted. The clear prediction of thermal energy formulation in kiln operations had beenproposed [2].
The mass and energy balance throughout the kiln is based on the economic evaluationof the system [3]. Energy flow against the entire length of the kiln depends on the heatdistribution and air and gas flow rates in all zones was incorporated [4]. Exhaust emissionsof the kiln depends on the physio-chemical properties of the gases and flow rate; this pointis very critical for a tunnel kiln [5]. Energy cost analysis and techno-economic analysis ofthe gas consumption of furnaces were expressed [6]. The emission gas analysis of NOx andSox were explained [7]. The cost comparison of alternative fuels and conventional fuelswere well defined [8]. The improved operation for firing process and pressing techniquesby means of LCA approach was introduced [9]. The fuel cost minimization in improvingthe energy consumption per unit brick by 2.7% lowered their standard operation andthe optimization approach was adopted [10]. The numerical simulation to optimize thebiological waste water treatment process was expressed [11]. The performance of the kilnis analyzed by numerical model. In the tunnel kiln, 10% of thermal fuel savings can beachieved after installing heat recovery burners in the entire kiln. The modeling approachto validate the waste integration to water system and environment low impact and itsadvantages compared with available outdated technologies were outlined [12].
For convective heat transfer, coefficient correlation along the tunnel kiln was ex-pressed [13]. The numerical simulation of the tunnel kiln for governing the heat transferphenomenon and the study of heat fluxes and temperature profiles were carried out [14].The detailed study of heat pattern and temperature profile was discussed [15]. The typ-ical process of ceramics kiln is purely time dependent. The assessment strategies fordifferent control of ceramics manufacturing are very complex. The approach of lumpedand distributed numerical analysis under time-dependent operating parameters is welldefined [16]. The investigation of hydrogen production by different process parametersunder best energy efficiency formation was incorporated by modelling the entire plant [17].Recently, augmentation techniques with diverse attack angles head-to-head tunnel kilnwall by using guide vanes was conducted [18].
Experimentally, the pressure drops and entire heat transfer for ten dissimilar patternsof brick settings were examined. The results were achieved by using extensive range ofReynold numbers from 11,867 to 25,821. Under convective heat transfer and pressuredrop of different brick settings, the different results were discussed. The average Nusseltnumbers were greatly influenced by attack angle. The extreme augmentation of about 94.5%was gained from longitudinal specific bricks arrangement in the middle column setting twoat the attack angle of 135 ◦C and Reynold number = 22,407. The empirical correlation andof Nusselt number were examined under independent factors specific range as a purposeof the brick settings, Reynold number, diverse attack angle. A mathematical model usedfor simulation of roof tiles in the kiln manufacturing process was introduced [19]. Theexperimental results revealed that the required mean flow velocity must be in the range of20 m/s by using tiles of roofs showing specific numerical simulation to envisage moisturecontents, temperature profile in the hollow setting of ceramic bricks during the procedureof drying in industry [20]. In the preheating zone of the tunnel kiln two axial flows inmixing ware by means of side nozzle is examined. By using the CFD computational fluiddynamic tool fluent, a 3-D temperature field between two tunnel kiln cars was used. Theinvestigation of maximum difference temperature and distribution of the pressure areevaluated using contours was introduced. It was examined that by increasing the mixingquality, the impulse flow rate goes to 4 N. The typical behavior of injection velocity, nozzleposition of gas, and flow pattern had been analysed [21].
Processes 2021, 9, 1629 3 of 21
By using the suitable thermal insulation, it was revealed that approximately 35% ofenergy gain and reduction of temperature inside the wall from 249.34 ◦C to 79.49 ◦C canbe achieved [22]. Recovered air mass flow optimization study revealed that reductionof natural gas by 4.6% daily consumption can be achieved by passing the air to pre heatthe sanitary ware from cooling to preheating zone [23]. In ceramics manufacturing, theefficiency of a tunnel kiln is not more than 30% due to its convective and radiation losses.The mass ratio between tunnel kiln car and fired material should be more than 50%.Different thermal properties of fired material and constructive material can influence thespecific energy losses [24]. The simulation of a dimension-less model in preheating zonepredicting gas flow, evaporation of bound water, and normative heat transfer between gaswas developed. The temperature profile results in entering the ambient air in preheatingzone and not entering the preheating zone to monitor the quality of the fired bricksexamined [25].
AC induction motors usually work with a load much less as compared to theirmaximum rating. Many surveys show that the average load factor for these motorsis 57–68% of their ratings, and machine often operate with more less load, even in between3–16% [20]. It was observed that 44% of motors installed in industrial sector are loadedat less than 40% of their rated power [26]. It is observed that AC motors have the highestefficiency at 75% of load [27]. The main purpose is to save energy by improving thepower factor of the motor of the tunnel kiln [28]. This can be achieved by decreasingthe distribution losses and improving the electrical load operation for a better energyefficiency level. The power factor improvement of an industrial AC motor can be achievedby installing the power factors. For industrial operation, AC induction motors are widelyused. It is estimated that 70–80% is the average efficiency of the electricity consumed bythese motors in the whole world. Power factor correction is gained by adding the capacitiveload to offset the inductive load in the power network [29,30]. By reducing the tunnelchannel height, aerodynamic characteristics such as pressure and velocity can be changedby modeling. The uniform velocity distribution along the tunnel length was visualizedin a simulation. [31]. The experimental analysis and thermodynamics calculation of akiln for ceramic porcelain tiles was carried out [32]. Exergy analysis of ceramics kilnsexpressed that 83% of accumulative energy input of kiln was demolished and only 10% ofexergy input can be controlled in the physio-chemical transformation of the entire ceramicconfiguration. Over 61% of heat recovery can be achieved by increasing the entire energyperformance of the kiln [33]. Specific energy consumption of table ware ceramics kiln wasanalyzed and determined to be 19,363 MJ/t. It was observed that there is a linear relationbetween kiln loading capacity and thermal energy consumption LPG, an increase in one kgof product of ceramics per m3 loading can reduce the energy consumption by 0.67 kg LPGper kg. Therefore, it was observed that increasing the loading capacity of the kiln, reducingthe actual heat capacity, and repairing the kiln insulator which reduce the specific thermalenergy consumption of the kiln [34].
The investigation of the sanitary ware ceramics industry tunnel kiln was done, andit was observed that 76% of thermal energy consumed in this particular kiln. The rest ofthe energy was consumed in the drying process of the ceramics industry [35]. Best avail-able techniques (BAT) for energy efficiency for ceramics production such as installationof superlative burners to reduce the thermal energy of the entire kiln, a large number ofwell-controlled burners which can optimize the temperature profile in entire tunnel kiln,installation of metallic recuperator heat exchangers to save thermal energy consumption,introduction of high loading rate and reduction in kiln energy consumption, and intro-duction of environmental management structure to monitor the flu gas regularly werementioned [36]. The convective heat transfer analysis of tunnel kiln was investigated,and three turbulence models were accounted for in this study: k-e, k-w and RNG k-w. Itwas observed that 17% of convective heat transfer enhanced by the longitudinal bricksarrangement and 27% was enhanced by transverse lattice setting arrangement of bricks in
Processes 2021, 9, 1629 4 of 21
the tunnel kiln [37]. The regression analysis depends on the dependent and independentvariable and their correlation, interception and slope [38].
The thermogravimetric analysis of gaseous fuels with high volatile matter was dis-cussed to enhance the system efficiency [39]. A parametric study of inside pressure andits study was well defined [40]. Turbulence flow of gaseous fluid and its characteristicwith solid particles in the enclosed chamber were introduced [41]. The detailed analysis ofnano particles and their energy distributive with respect to solar thermal power was de-fined [42]. Development of solid-based absorbent and effective carbon capture applicationswith respect to a sustainable environment was discussed [43]. Evaporator cooling andits effect on environmental sustainability in Pakistan was introduced for form house [44].Environmental sustainability is very important because greenhouse gases such as CO andCO2 continuously damage the ozone layer. The stack analysis of kilns is very important tomonitor CO and CO2 [45]. The detail of heat transfer mechanism in heat exchangers wasdiscussed. In the kiln, it is very important to maintain the pressure draught for air and fuelchemistry. The main factor is that by increasing the heat transfer, there will be a high rangeof pressure drop [46].
Techno-economic analysis of thermal energy consumption gives a better idea topredict future energy consumption demand. There is almost 8% savings, which has beenachieved after installing the heat recovery system. a detailed analysis of thermal energyconsumption of the tunnel kiln has been carried out, and the results of pre, post and forecastare mentioned in this paper. Thermal energy consumption from July 2019 to January 2020is expressed in a linear relation. Thermal energy consumption in July 19 was 4190 MMBtu,whereas in August 2019, the thermal energy consumption was 4158 MMBtu. January2020, the thermal energy consumption is slighter higher i.e., 4199 MMBtu. The productionvalues from July 2019 to January 2020 are in the range of 178t to 195t. The techno-economicanalysis predicts the future thermal energy consumption, which gives the statistic view fora tunnel kiln. The forecast future consumption from Febuary-2020 to September 2020 is inthe range of 4150 to 4189 MMBtu.
In the present research, thermal energy consumption analysis for pre- and post-heatrecovery system at the tunnel kiln were conducted. Power quality analysis of tunnelkiln motors were also conducted to suggest a power factor improvement solution with apayback period of 0.8 months. Regression analysis for thermal energy consumption of thetunnel kiln was also done to find the forecast thermal energy consumption.
2. Materials and Methods
The chemical composition of ceramics body comprises aluminum oxide Al2O3 (15%),P-I (14%), potash S-2 gulf (17%), potash feldspar S-3 (4%), TA clay (22%), China clay D.W(13%), Black clay HK 3
4 (10%), and A A-7 (5%). These composition materials with describedpercentages are mixed in ball mills for 13 h to prepare the ceramics body for firing inthe tunnel kiln. Results of shrinkage for six batches showed good compromise betweenfired maturity and shrinkage. Porcelain material has the highest level of fired shrinkagecompared to stoneware. The set standard for the test of shrinkage was 10.5 ± 1.5% fordiameter wise, and 8 ± 1% for length wise. The mechanical strength of green, glazed, andunglazed batches is mentioned below.
Table 1 shows the properties of ceramics bodies which were fired in tunnel kiln. Theset testing standard for the green body, un-glazed, and glazed batches were 50 ± 10,850 ± 100. Experimentally, it is observed that when the ceramics body is heated up, its sizeand volume is increased in small increments, which is called thermal expansion. The valuesof thermal expansion for six batches are mentioned below. The set testing standard forthermal expansion was 0.38 ± 0.02. tunnel kiln car heating capacity is taken Cp 980 J/kgK,density ρ car 1250 kg/m3, thermal conductivity λ car 1 W/m K, total cycle time of tunnelkiln 70 h, height of the tunnel kiln car h car 1.1 m, initial temperature 303 K, length 2.25 m,useful length 1.08 m, velocity of the kiln car 3.0 m/h.
Processes 2021, 9, 1629 5 of 21
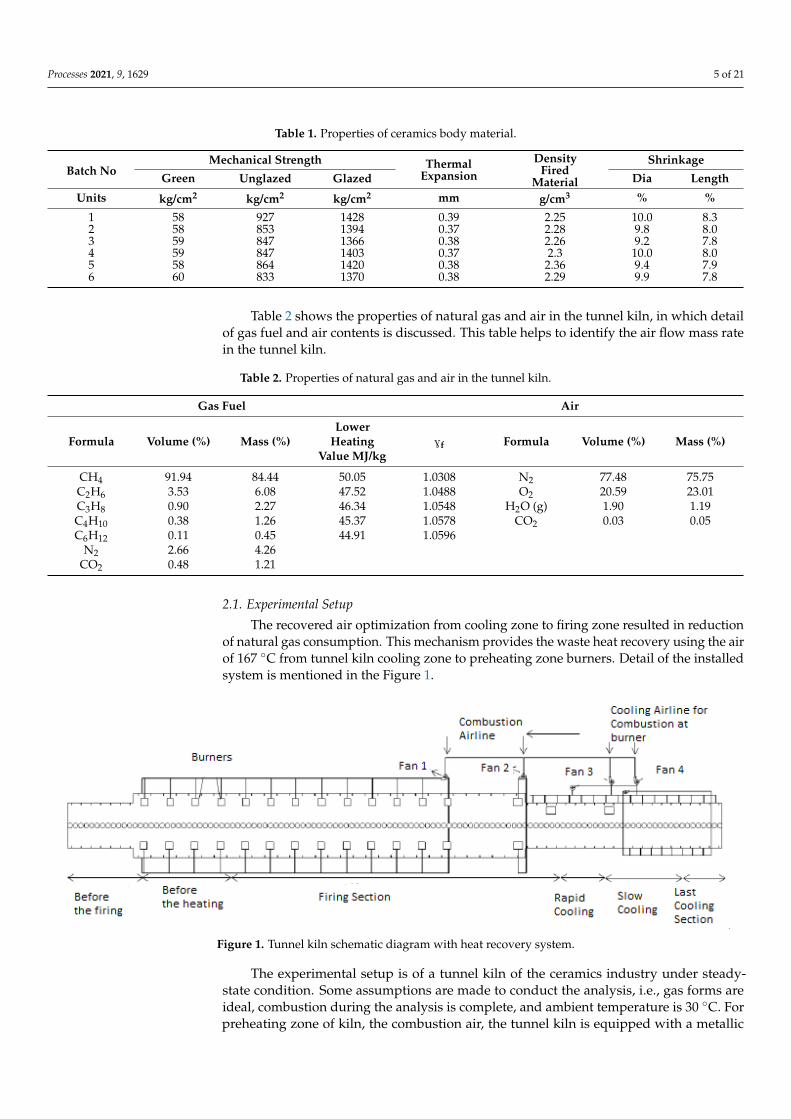
Table 1. Properties of ceramics body material.
Batch NoMechanical Strength Thermal
ExpansionDensity
FiredMaterial
Shrinkage
Green Unglazed Glazed Dia Length
Units kg/cm2 kg/cm2 kg/cm2 mm g/cm3 % %
1 58 927 1428 0.39 2.25 10.0 8.32 58 853 1394 0.37 2.28 9.8 8.03 59 847 1366 0.38 2.26 9.2 7.84 59 847 1403 0.37 2.3 10.0 8.05 58 864 1420 0.38 2.36 9.4 7.96 60 833 1370 0.38 2.29 9.9 7.8
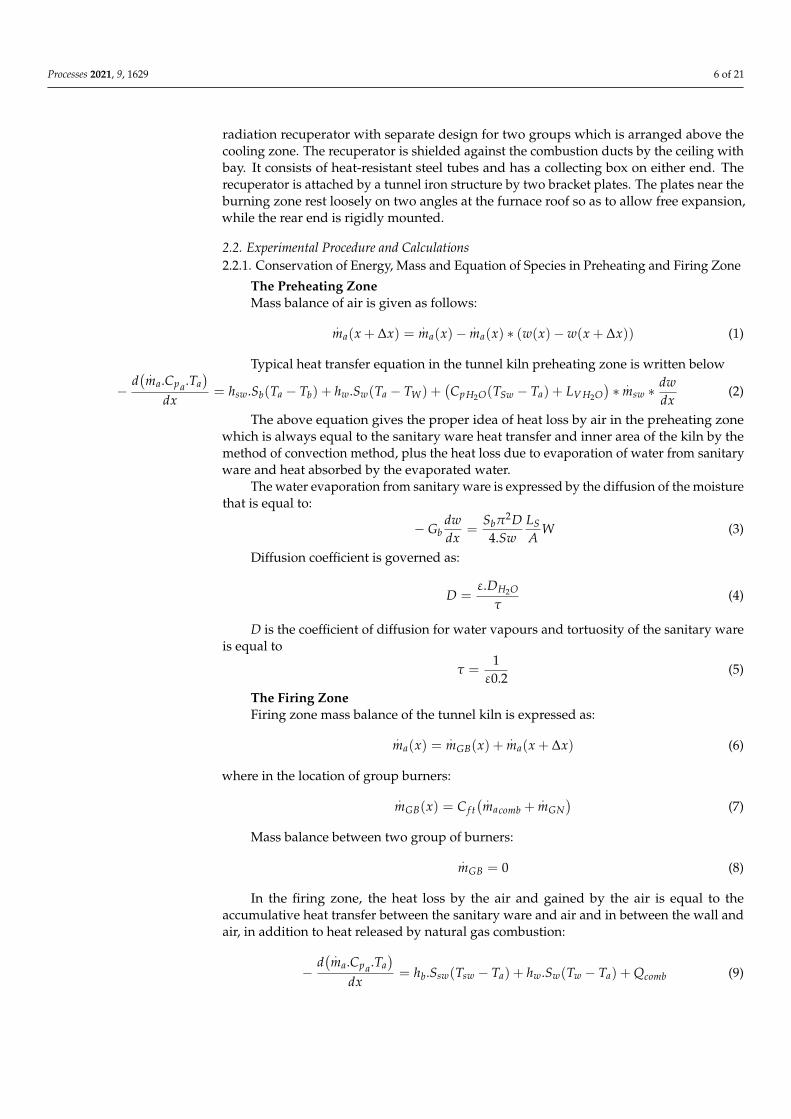
Table 2 shows the properties of natural gas and air in the tunnel kiln, in which detailof gas fuel and air contents is discussed. This table helps to identify the air flow mass ratein the tunnel kiln.
Table 2. Properties of natural gas and air in the tunnel kiln.
Gas Fuel Air
Formula Volume (%) Mass (%)Lower
HeatingValue MJ/kg
Gf Formula Volume (%) Mass (%)
CH4 91.94 84.44 50.05 1.0308 N2 77.48 75.75C2H6 3.53 6.08 47.52 1.0488 O2 20.59 23.01C3H8 0.90 2.27 46.34 1.0548 H2O (g) 1.90 1.19C4H10 0.38 1.26 45.37 1.0578 CO2 0.03 0.05C6H12 0.11 0.45 44.91 1.0596
N2 2.66 4.26CO2 0.48 1.21
2.1. Experimental Setup
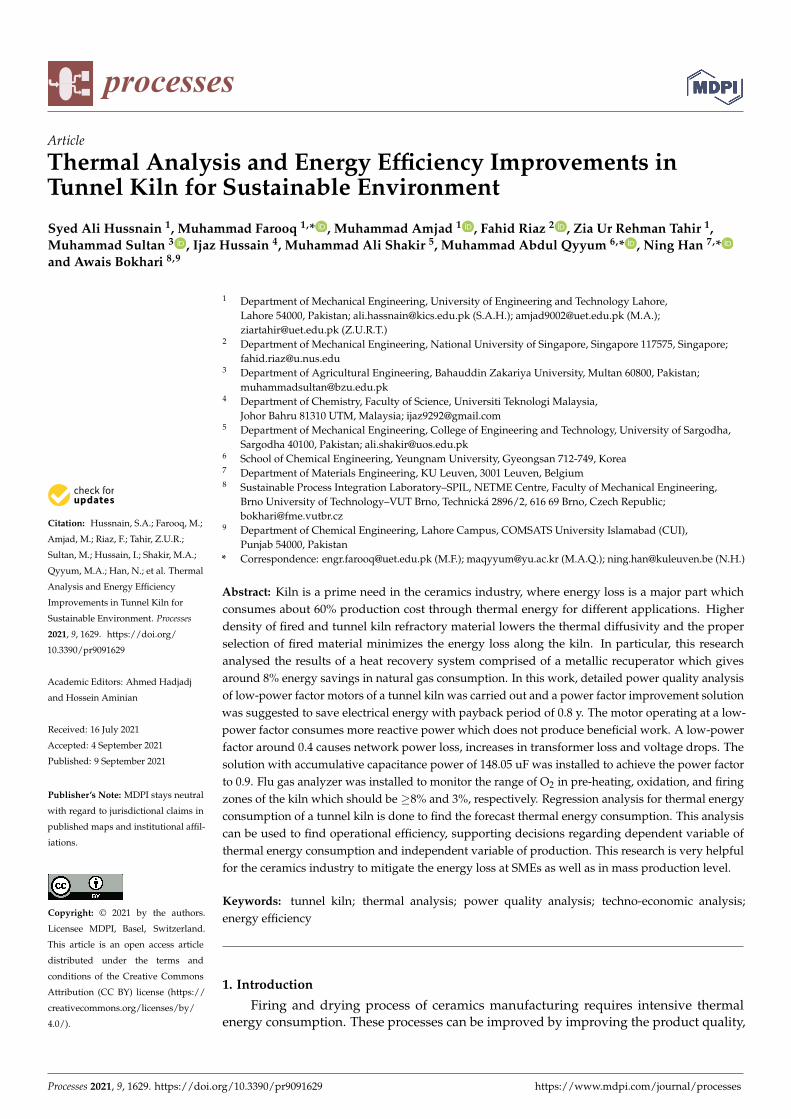
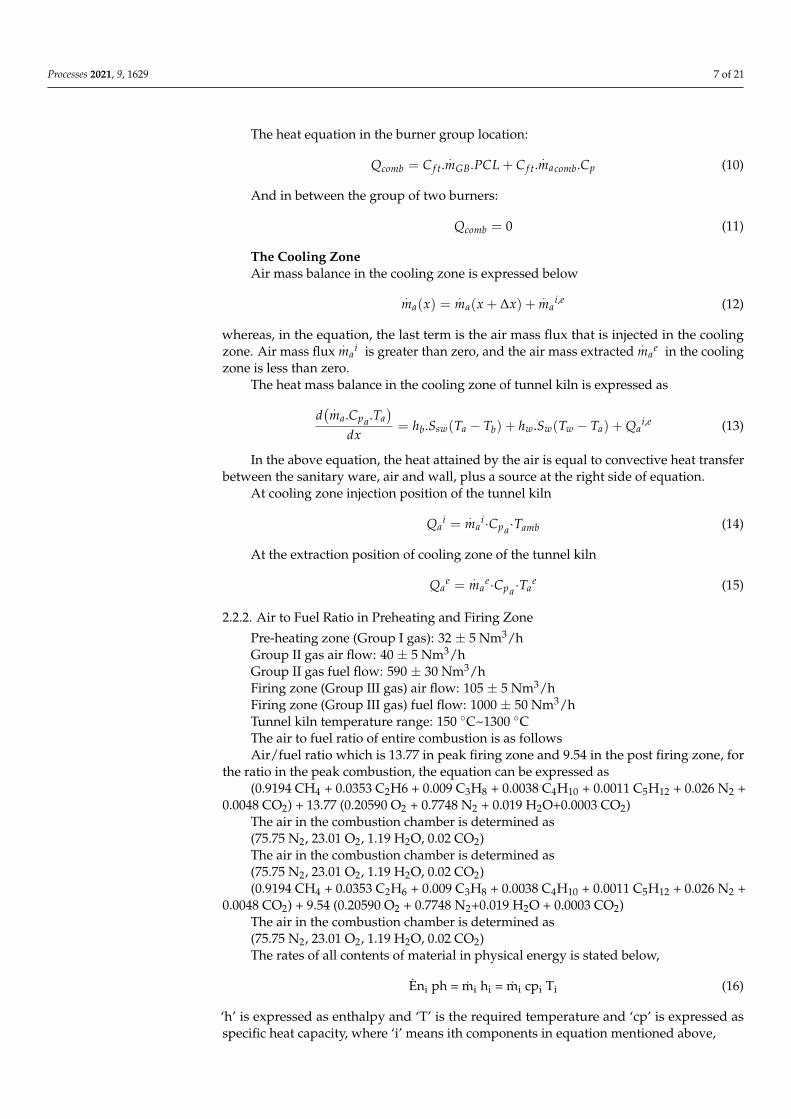
The recovered air optimization from cooling zone to firing zone resulted in reductionof natural gas consumption. This mechanism provides the waste heat recovery using the airof 167 ◦C from tunnel kiln cooling zone to preheating zone burners. Detail of the installedsystem is mentioned in the Figure 1.
Processes 2021, 9, x FOR PEER REVIEW 6 of 21
Figure 1. Tunnel kiln schematic diagram with heat recovery system.
The experimental setup is of a tunnel kiln of the ceramics industry under steady-state
condition. Some assumptions are made to conduct the analysis, i.e., gas forms are ideal,
combustion during the analysis is complete, and ambient temperature is 30 °C. For pre-
heating zone of kiln, the combustion air, the tunnel kiln is equipped with a metallic radi-
ation recuperator with separate design for two groups which is arranged above the cool-
ing zone. The recuperator is shielded against the combustion ducts by the ceiling with
bay. It consists of heat-resistant steel tubes and has a collecting box on either end. The
recuperator is attached by a tunnel iron structure by two bracket plates. The plates near
the burning zone rest loosely on two angles at the furnace roof so as to allow free expan-
sion, while the rear end is rigidly mounted.
2.2. Experimental Procedure and Calculations
2.2.1. Conservation of Energy, Mass and Equation of Species in Preheating and Firing
Zone
The Preheating Zone
Mass balance of air is given as follows:
��𝑎(𝑥 + Δ𝑥) = ��𝑎(𝑥) − ��𝑎(𝑥) ∗ (𝑤(𝑥) − 𝑤(𝑥 + 𝛥𝑥)) (1)
Typical heat transfer equation in the tunnel kiln preheating zone is written below
−𝑑 (��𝑎. 𝐶𝑝𝑎
. 𝑇𝑎)
𝑑𝑥= ℎ𝑠𝑤 . 𝑆𝑏(𝑇𝑎 − 𝑇𝑏) + ℎ𝑤 . 𝑆𝑤(𝑇𝑎 − 𝑇𝑊) + (𝐶𝑝𝐻2𝑂
(𝑇𝑆𝑤 − 𝑇𝑎) + 𝐿𝑉𝐻2𝑂) ∗ ��𝑠𝑤 ∗
𝑑𝑤
𝑑𝑥 (2)
The above equation gives the proper idea of heat loss by air in the preheating zone
which is always equal to the sanitary ware heat transfer and inner area of the kiln by the
method of convection method, plus the heat loss due to evaporation of water from sani-
tary ware and heat absorbed by the evaporated water.
The water evaporation from sanitary ware is expressed by the diffusion of the mois-
ture that is equal to:
−𝐺𝑏ⅆ𝑤
ⅆ𝑥=
𝑆𝑏𝜋2𝐷
4.𝑆𝑤
𝐿𝑆
𝐴𝑤 (3)
Diffusion coefficient is governed as:
𝐷 =Ɛ. 𝐷𝐻2𝑂
𝜏 (4)
D is the coefficient of diffusion for water vapours and tortuosity of the sanitary ware
is equal to
Figure 1. Tunnel kiln schematic diagram with heat recovery system.
The experimental setup is of a tunnel kiln of the ceramics industry under steady-state condition. Some assumptions are made to conduct the analysis, i.e., gas forms areideal, combustion during the analysis is complete, and ambient temperature is 30 ◦C. Forpreheating zone of kiln, the combustion air, the tunnel kiln is equipped with a metallic
Processes 2021, 9, 1629 6 of 21
radiation recuperator with separate design for two groups which is arranged above thecooling zone. The recuperator is shielded against the combustion ducts by the ceiling withbay. It consists of heat-resistant steel tubes and has a collecting box on either end. Therecuperator is attached by a tunnel iron structure by two bracket plates. The plates near theburning zone rest loosely on two angles at the furnace roof so as to allow free expansion,while the rear end is rigidly mounted.
2.2. Experimental Procedure and Calculations2.2.1. Conservation of Energy, Mass and Equation of Species in Preheating and Firing Zone
The Preheating ZoneMass balance of air is given as follows:
.ma(x + ∆x) =
.ma(x)− .
ma(x) ∗ (w(x)− w(x + ∆x)) (1)
Typical heat transfer equation in the tunnel kiln preheating zone is written below
−d( .ma.Cpa.Ta
)dx
= hsw.Sb(Ta − Tb) + hw.Sw(Ta − TW) +(Cp H2O(TSw − Ta) + LV H2O
)∗ .
msw ∗ dwdx
(2)
The above equation gives the proper idea of heat loss by air in the preheating zonewhich is always equal to the sanitary ware heat transfer and inner area of the kiln by themethod of convection method, plus the heat loss due to evaporation of water from sanitaryware and heat absorbed by the evaporated water.
The water evaporation from sanitary ware is expressed by the diffusion of the moisturethat is equal to:
− Gbdwdx
=Sbπ2D4.Sw
LSA
W (3)
Diffusion coefficient is governed as:
D =ε.DH2O
τ(4)
D is the coefficient of diffusion for water vapours and tortuosity of the sanitary wareis equal to
τ =1ε0.2
(5)
The Firing ZoneFiring zone mass balance of the tunnel kiln is expressed as:
.ma(x) =
.mGB(x) +
.ma(x + ∆x) (6)
where in the location of group burners:
.mGB(x) = C f t
( .macomb +
.mGN
)(7)
Mass balance between two group of burners:
.mGB = 0 (8)
In the firing zone, the heat loss by the air and gained by the air is equal to theaccumulative heat transfer between the sanitary ware and air and in between the wall andair, in addition to heat released by natural gas combustion:
−d( .ma.Cpa.Ta
)dx
= hb.Ssw(Tsw − Ta) + hw.Sw(Tw − Ta) + Qcomb (9)
Processes 2021, 9, 1629 7 of 21
The heat equation in the burner group location:
Qcomb = C f t..
mGB.PCL + C f t..
macomb.Cp (10)
And in between the group of two burners:
Qcomb = 0 (11)
The Cooling ZoneAir mass balance in the cooling zone is expressed below
.ma(x) =
.ma(x + ∆x) +
.ma
i,e (12)
whereas, in the equation, the last term is the air mass flux that is injected in the coolingzone. Air mass flux
.ma
i is greater than zero, and the air mass extracted.
mae in the cooling
zone is less than zero.The heat mass balance in the cooling zone of tunnel kiln is expressed as
d( .ma.Cpa.Ta
)dx
= hb.Ssw(Ta − Tb) + hw.Sw(Tw − Ta) + Qai,e (13)
In the above equation, the heat attained by the air is equal to convective heat transferbetween the sanitary ware, air and wall, plus a source at the right side of equation.
At cooling zone injection position of the tunnel kiln
Qai =
.ma
i·Cpa·Tamb (14)
At the extraction position of cooling zone of the tunnel kiln
Qae =
.ma
e·Cpa·Tae (15)
2.2.2. Air to Fuel Ratio in Preheating and Firing Zone
Pre-heating zone (Group I gas): 32 ± 5 Nm3/hGroup II gas air flow: 40 ± 5 Nm3/hGroup II gas fuel flow: 590 ± 30 Nm3/hFiring zone (Group III gas) air flow: 105 ± 5 Nm3/hFiring zone (Group III gas) fuel flow: 1000 ± 50 Nm3/hTunnel kiln temperature range: 150 ◦C~1300 ◦CThe air to fuel ratio of entire combustion is as followsAir/fuel ratio which is 13.77 in peak firing zone and 9.54 in the post firing zone, for
the ratio in the peak combustion, the equation can be expressed as(0.9194 CH4 + 0.0353 C2H6 + 0.009 C3H8 + 0.0038 C4H10 + 0.0011 C5H12 + 0.026 N2 +
0.0048 CO2) + 13.77 (0.20590 O2 + 0.7748 N2 + 0.019 H2O+0.0003 CO2)The air in the combustion chamber is determined as(75.75 N2, 23.01 O2, 1.19 H2O, 0.02 CO2)The air in the combustion chamber is determined as(75.75 N2, 23.01 O2, 1.19 H2O, 0.02 CO2)(0.9194 CH4 + 0.0353 C2H6 + 0.009 C3H8 + 0.0038 C4H10 + 0.0011 C5H12 + 0.026 N2 +
0.0048 CO2) + 9.54 (0.20590 O2 + 0.7748 N2+0.019 H2O + 0.0003 CO2)The air in the combustion chamber is determined as(75.75 N2, 23.01 O2, 1.19 H2O, 0.02 CO2)The rates of all contents of material in physical energy is stated below,
Eni ph = mi hi = mi cpi Ti (16)
‘h’ is expressed as enthalpy and ‘T’ is the required temperature and ‘cp’ is expressed asspecific heat capacity, where ‘i’ means ith components in equation mentioned above,
Processes 2021, 9, 1629 8 of 21
Ephfuel = m fuel (LHV) (17)
Highest activity which can be obtained by mass and heat transfer is known as exergy,and by this, the system reaches equilibrium with the environmental conditions. Due tothe effect of irreversibility the exergy can be destroyed or consumed that can arise in thesystem as divergent to energy conservation.
The exergy equation of concerned material is expressed in the general way men-tioned below,
Ex = Exph + Exch (18)
By this analysis we know that ‘Exch’ is expressed as the chemical exergy rate and‘Exph’ is known as physical exergy rate and
The physical exergy equation of formed gas can be stated as
Exph = mi [(hi − ho)] − To (si − so)] (19)
where si, p, and R are the gas constant and ‘o’ is expressed as the environmental state inthe equation above.
Exphgas = mi [ cp (Ti − To) − To In (Ti/To)] + RTo In (Pi/Po)] (20)
The overall gas content specific chemical exergy is calculated in the equation men-tioned below
e ex ch = ∑ Xk’ ε − 0k + RTo ∑ Xk’ ln Xk’ (21)
Molar gas constant is denoted by R and ‘x’ is molar rate. Specific chemical exergy ofhydrocarbon fuel such as ‘Ca Hb’ is formulated.
3. Results and Discussion3.1. Thermal Analysis of Tunnel Kiln3.1.1. Effect of Thermal Conductivity and Energy Loss for different Temperature Profiles ofTunnel Kiln
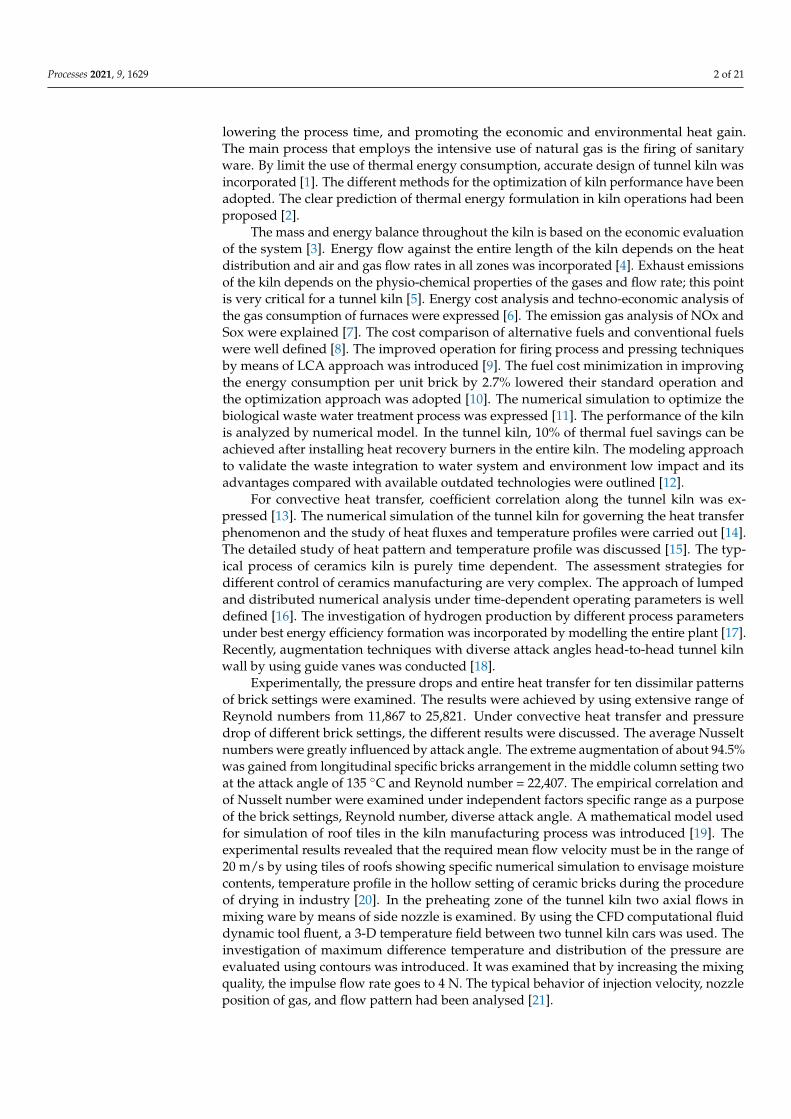
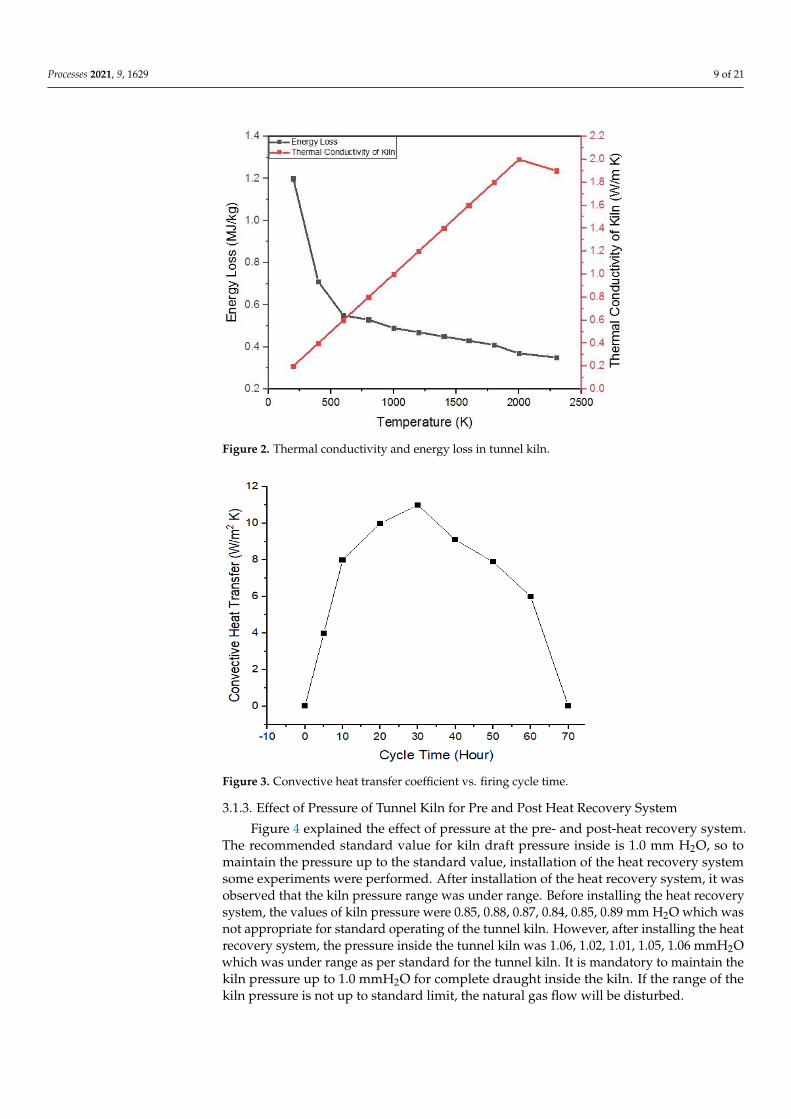
In Figure 2, the conductivity of the tunnel kiln car is examined with respect to energyloss. The tunnel kiln furniture is made up of the refractory material and constructivematerial and the selected kiln is also made of refractory blocks and steel structure. Experi-mentally, it is observed that by increasing the conductivity of the tunnel kiln, car energyloss increased. It is observed that the thermal conductivity of insulated material is less thanthe constructed material. Thermal conductivity of the material is ranged from 0.02 W/m Kto 2 W/m K. The thermal conductivity of the material of the tunnel kiln is 0.5 W/m K at1300 ◦C, and the energy loss will be 0.43 MJ/kg. Therefore, by this graph, it is clear that ifthe thermal conductivity is low, there is low energy loss in the tunnel kiln. In general, themost important part of this research is to conserve energy.
3.1.2. Effect of Heat Transfer for Different Cycle Times of Kiln
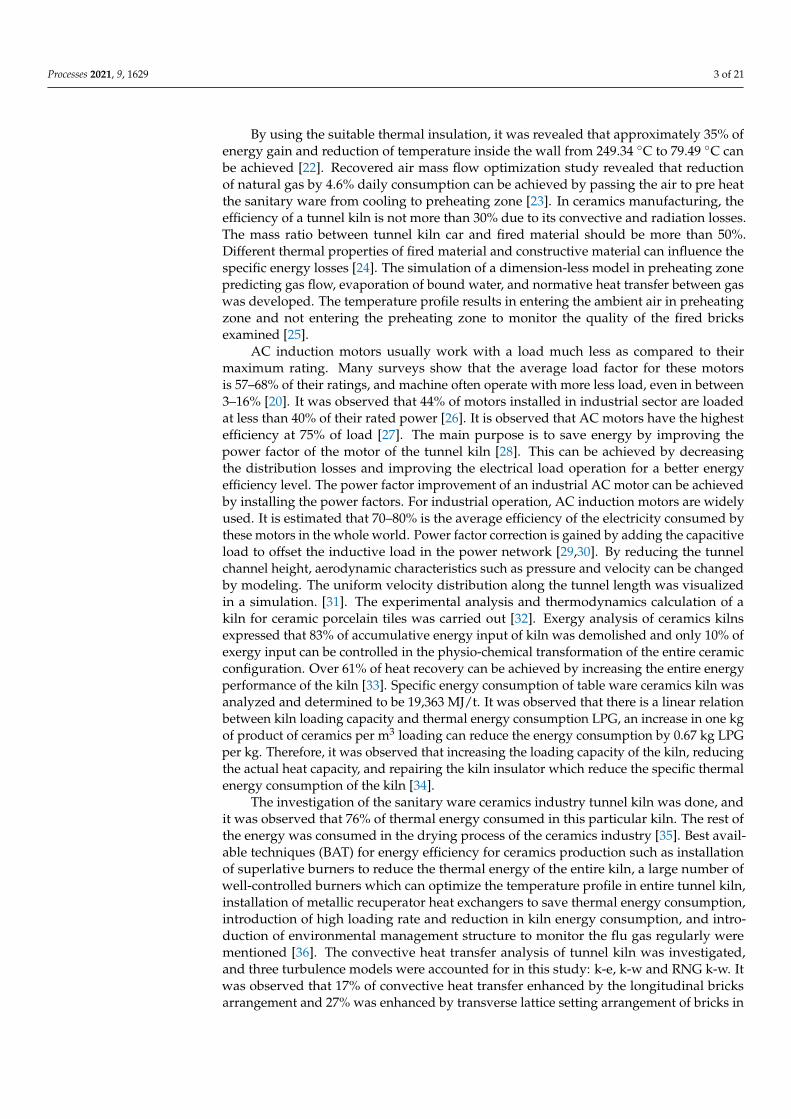
Figure 3, represents the heat transfer along the cycle time for a tunnel kiln. After 10 h,heat transfer value was 8 W/m2 K, whereas after 20 h, the heat transfer was increased only20% i.e., 10 W/m2 K. After 30 h in firing zone, the heat transfer value was quite similarand only 1 W/m2 K increment was observed. Convective heat transfer will increase byincreasing the temperature of the tunnel kiln.
Processes 2021, 9, 1629 9 of 21
Processes 2021, 9, x FOR PEER REVIEW 9 of 21
than the constructed material. Thermal conductivity of the material is ranged from 0.02
W/m K to 2 W/m K. The thermal conductivity of the material of the tunnel kiln is 0.5 W/m
K at 1300 °C, and the energy loss will be 0.43 MJ/kg. Therefore, by this graph, it is clear
that if the thermal conductivity is low, there is low energy loss in the tunnel kiln. In gen-
eral, the most important part of this research is to conserve energy.
Figure 2. Thermal conductivity and energy loss in tunnel kiln.
3.1.2. Effect of Heat Transfer for Different Cycle Times of Kiln
Figure 3, represents the heat transfer along the cycle time for a tunnel kiln. After 10
h, heat transfer value was 8 W/m2 K, whereas after 20 h, the heat transfer was increased
only 20% i.e., 10 W/m2 K. After 30 h in firing zone, the heat transfer value was quite similar
and only 1 W/m2 K increment was observed. Convective heat transfer will increase by
increasing the temperature of the tunnel kiln.
Figure 3. Convective heat transfer coefficient vs. firing cycle time.
3.1.3. Effect of Pressure of Tunnel Kiln for Pre and Post Heat Recovery System
Figure 4 explained the effect of pressure at the pre- and post-heat recovery system.
The recommended standard value for kiln draft pressure inside is 1.0 mm H2O, so to main-
tain the pressure up to the standard value, installation of the heat recovery system some
Figure 2. Thermal conductivity and energy loss in tunnel kiln.
Processes 2021, 9, x FOR PEER REVIEW 9 of 21
than the constructed material. Thermal conductivity of the material is ranged from 0.02
W/m K to 2 W/m K. The thermal conductivity of the material of the tunnel kiln is 0.5 W/m
K at 1300 °C, and the energy loss will be 0.43 MJ/kg. Therefore, by this graph, it is clear
that if the thermal conductivity is low, there is low energy loss in the tunnel kiln. In gen-
eral, the most important part of this research is to conserve energy.
Figure 2. Thermal conductivity and energy loss in tunnel kiln.
3.1.2. Effect of Heat Transfer for Different Cycle Times of Kiln
Figure 3, represents the heat transfer along the cycle time for a tunnel kiln. After 10
h, heat transfer value was 8 W/m2 K, whereas after 20 h, the heat transfer was increased
only 20% i.e., 10 W/m2 K. After 30 h in firing zone, the heat transfer value was quite similar
and only 1 W/m2 K increment was observed. Convective heat transfer will increase by
increasing the temperature of the tunnel kiln.
Figure 3. Convective heat transfer coefficient vs. firing cycle time.
3.1.3. Effect of Pressure of Tunnel Kiln for Pre and Post Heat Recovery System
Figure 4 explained the effect of pressure at the pre- and post-heat recovery system.
The recommended standard value for kiln draft pressure inside is 1.0 mm H2O, so to main-
tain the pressure up to the standard value, installation of the heat recovery system some
Figure 3. Convective heat transfer coefficient vs. firing cycle time.
3.1.3. Effect of Pressure of Tunnel Kiln for Pre and Post Heat Recovery System
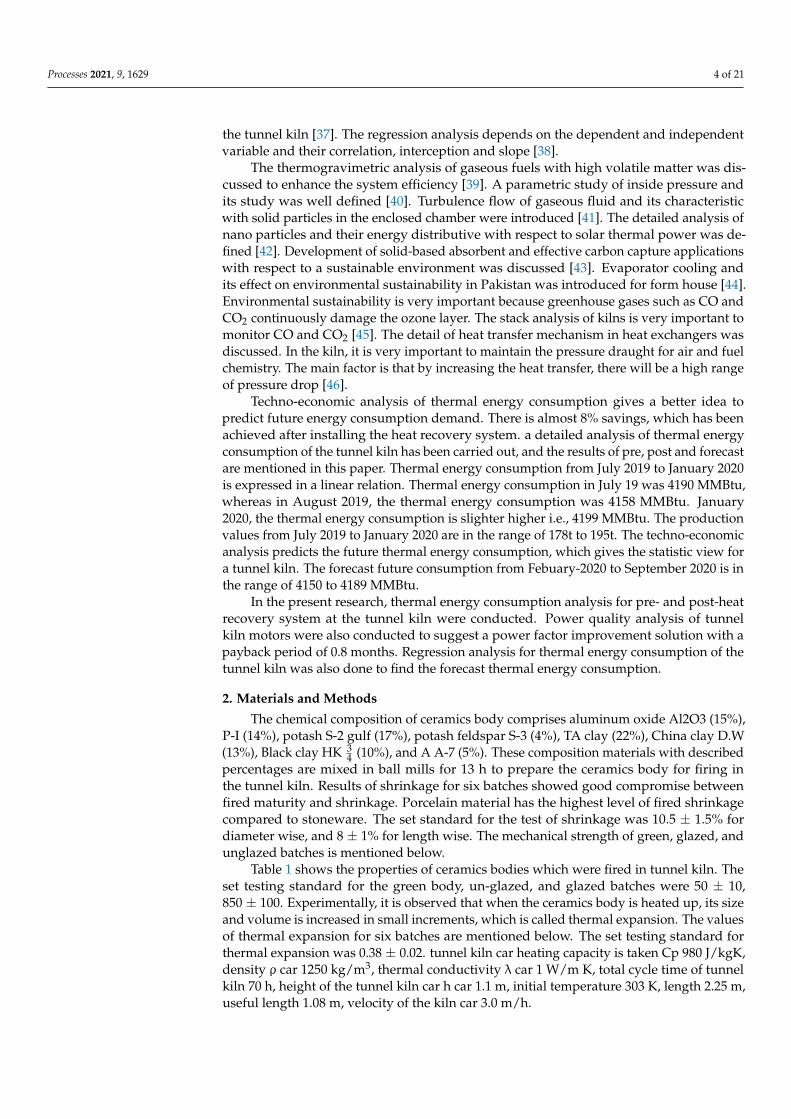
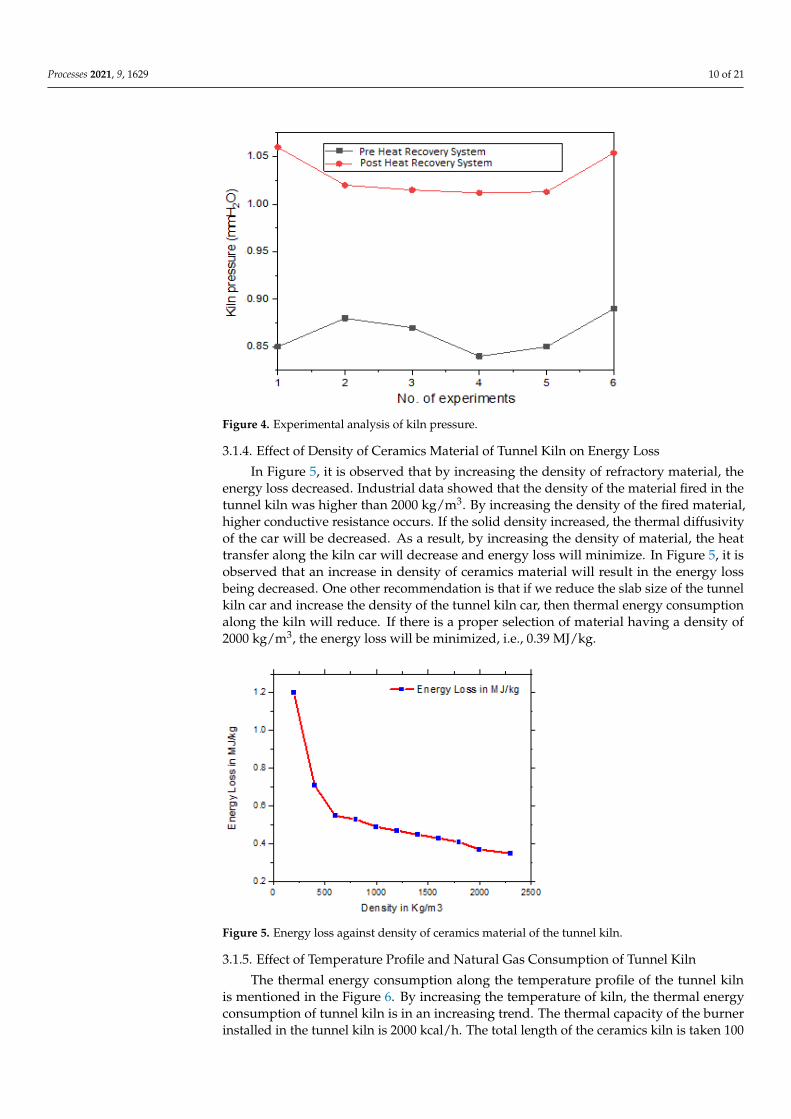
Figure 4 explained the effect of pressure at the pre- and post-heat recovery system.The recommended standard value for kiln draft pressure inside is 1.0 mm H2O, so tomaintain the pressure up to the standard value, installation of the heat recovery systemsome experiments were performed. After installation of the heat recovery system, it wasobserved that the kiln pressure range was under range. Before installing the heat recoverysystem, the values of kiln pressure were 0.85, 0.88, 0.87, 0.84, 0.85, 0.89 mm H2O which wasnot appropriate for standard operating of the tunnel kiln. However, after installing the heatrecovery system, the pressure inside the tunnel kiln was 1.06, 1.02, 1.01, 1.05, 1.06 mmH2Owhich was under range as per standard for the tunnel kiln. It is mandatory to maintain thekiln pressure up to 1.0 mmH2O for complete draught inside the kiln. If the range of thekiln pressure is not up to standard limit, the natural gas flow will be disturbed.
Processes 2021, 9, 1629 10 of 21
Processes 2021, 9, x FOR PEER REVIEW 10 of 21
experiments were performed. After installation of the heat recovery system, it was ob-
served that the kiln pressure range was under range. Before installing the heat recovery
system, the values of kiln pressure were 0.85, 0.88, 0.87, 0.84, 0.85, 0.89 mm H2O which
was not appropriate for standard operating of the tunnel kiln. However, after installing
the heat recovery system, the pressure inside the tunnel kiln was 1.06, 1.02, 1.01, 1.05, 1.06
mmH2O which was under range as per standard for the tunnel kiln. It is mandatory to
maintain the kiln pressure up to 1.0 mmH2O for complete draught inside the kiln. If the
range of the kiln pressure is not up to standard limit, the natural gas flow will be dis-
turbed.
Figure 4. Experimental analysis of kiln pressure.
3.1.4. Effect of Density of Ceramics Material of Tunnel Kiln on Energy Loss
In Figure 5, it is observed that by increasing the density of refractory material, the
energy loss decreased. Industrial data showed that the density of the material fired in the
tunnel kiln was higher than 2000 kg/m3. By increasing the density of the fired material,
higher conductive resistance occurs. If the solid density increased, the thermal diffusivity
of the car will be decreased. As a result, by increasing the density of material, the heat
transfer along the kiln car will decrease and energy loss will minimize. In Figure 5, it is
observed that an increase in density of ceramics material will result in the energy loss
being decreased. One other recommendation is that if we reduce the slab size of the tunnel
kiln car and increase the density of the tunnel kiln car, then thermal energy consumption
along the kiln will reduce. If there is a proper selection of material having a density of
2000 kg/m3, the energy loss will be minimized, i.e., 0.39 MJ/kg.
Figure 4. Experimental analysis of kiln pressure.
3.1.4. Effect of Density of Ceramics Material of Tunnel Kiln on Energy Loss
In Figure 5, it is observed that by increasing the density of refractory material, theenergy loss decreased. Industrial data showed that the density of the material fired in thetunnel kiln was higher than 2000 kg/m3. By increasing the density of the fired material,higher conductive resistance occurs. If the solid density increased, the thermal diffusivityof the car will be decreased. As a result, by increasing the density of material, the heattransfer along the kiln car will decrease and energy loss will minimize. In Figure 5, it isobserved that an increase in density of ceramics material will result in the energy lossbeing decreased. One other recommendation is that if we reduce the slab size of the tunnelkiln car and increase the density of the tunnel kiln car, then thermal energy consumptionalong the kiln will reduce. If there is a proper selection of material having a density of2000 kg/m3, the energy loss will be minimized, i.e., 0.39 MJ/kg.
Processes 2021, 9, x FOR PEER REVIEW 11 of 21
Figure 5. Energy loss against density of ceramics material of the tunnel kiln.
3.1.5. Effect of Temperature Profile and Natural Gas Consumption of Tunnel Kiln
The thermal energy consumption along the temperature profile of the tunnel kiln is
mentioned in the Figure 6. By increasing the temperature of kiln, the thermal energy con-
sumption of tunnel kiln is in an increasing trend. The thermal capacity of the burner in-
stalled in the tunnel kiln is 2000 kcal/h. The total length of the ceramics kiln is taken 100
m, which includes 30 m pre-heating zone, 20 m firing zone, 30 m cooling zone. Total 44
tunnel kiln cars were traveling in the kiln. The process is totally sequential because the
process of the tunnel kiln is always continuous. Different products are loaded on the tun-
nel kiln cars, which is heated up at the maximum temperature and cooled down at ambi-
ent temperature. Natural gas consumption along the tunnel kiln temperature is explained
below. In Figure 6, thermal energy consumption along the temperature profile of the tun-
nel kiln is explained. There are three zone of the tunnel kiln i.e., pre-heating, oxidation
and firing zone. Thermal energy consumption at the temperature of 202 °C to 560 °C in
preheating is 0.591 MMBtu/h. Thermal energy consumption at a temperature of 742 °C to
939 °C in oxidation zone is (0.739~0.750) MMBtu/h. Thermal energy consumption at a tem-
perature of 1076 °C to 1183 °C in firing is 1.846~1.898 MMBtu/h.
Figure 6. Temperature profile along thermal energy consumption (mmBTU/h).
Figure 5. Energy loss against density of ceramics material of the tunnel kiln.
3.1.5. Effect of Temperature Profile and Natural Gas Consumption of Tunnel Kiln
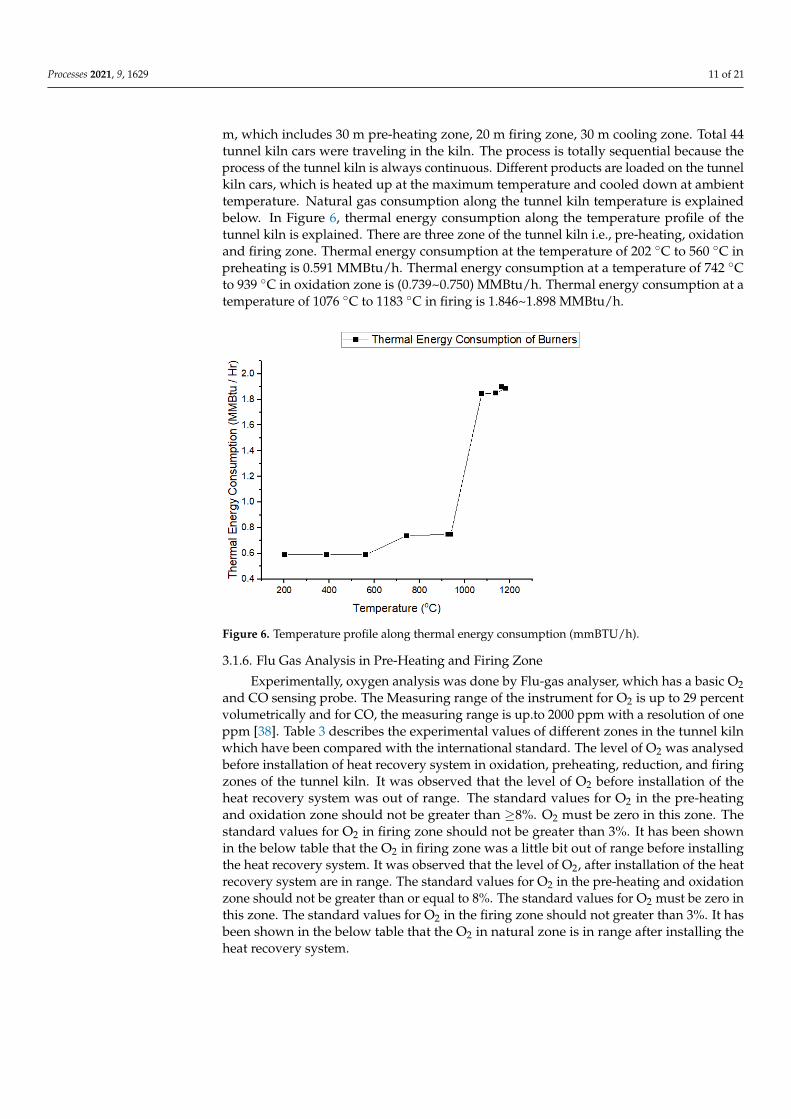
The thermal energy consumption along the temperature profile of the tunnel kilnis mentioned in the Figure 6. By increasing the temperature of kiln, the thermal energyconsumption of tunnel kiln is in an increasing trend. The thermal capacity of the burnerinstalled in the tunnel kiln is 2000 kcal/h. The total length of the ceramics kiln is taken 100
Processes 2021, 9, 1629 11 of 21
m, which includes 30 m pre-heating zone, 20 m firing zone, 30 m cooling zone. Total 44tunnel kiln cars were traveling in the kiln. The process is totally sequential because theprocess of the tunnel kiln is always continuous. Different products are loaded on the tunnelkiln cars, which is heated up at the maximum temperature and cooled down at ambienttemperature. Natural gas consumption along the tunnel kiln temperature is explainedbelow. In Figure 6, thermal energy consumption along the temperature profile of thetunnel kiln is explained. There are three zone of the tunnel kiln i.e., pre-heating, oxidationand firing zone. Thermal energy consumption at the temperature of 202 ◦C to 560 ◦C inpreheating is 0.591 MMBtu/h. Thermal energy consumption at a temperature of 742 ◦Cto 939 ◦C in oxidation zone is (0.739~0.750) MMBtu/h. Thermal energy consumption at atemperature of 1076 ◦C to 1183 ◦C in firing is 1.846~1.898 MMBtu/h.
Processes 2021, 9, x FOR PEER REVIEW 11 of 21
Figure 5. Energy loss against density of ceramics material of the tunnel kiln.
3.1.5. Effect of Temperature Profile and Natural Gas Consumption of Tunnel Kiln
The thermal energy consumption along the temperature profile of the tunnel kiln is
mentioned in the Figure 6. By increasing the temperature of kiln, the thermal energy con-
sumption of tunnel kiln is in an increasing trend. The thermal capacity of the burner in-
stalled in the tunnel kiln is 2000 kcal/h. The total length of the ceramics kiln is taken 100
m, which includes 30 m pre-heating zone, 20 m firing zone, 30 m cooling zone. Total 44
tunnel kiln cars were traveling in the kiln. The process is totally sequential because the
process of the tunnel kiln is always continuous. Different products are loaded on the tun-
nel kiln cars, which is heated up at the maximum temperature and cooled down at ambi-
ent temperature. Natural gas consumption along the tunnel kiln temperature is explained
below. In Figure 6, thermal energy consumption along the temperature profile of the tun-
nel kiln is explained. There are three zone of the tunnel kiln i.e., pre-heating, oxidation
and firing zone. Thermal energy consumption at the temperature of 202 °C to 560 °C in
preheating is 0.591 MMBtu/h. Thermal energy consumption at a temperature of 742 °C to
939 °C in oxidation zone is (0.739~0.750) MMBtu/h. Thermal energy consumption at a tem-
perature of 1076 °C to 1183 °C in firing is 1.846~1.898 MMBtu/h.
Figure 6. Temperature profile along thermal energy consumption (mmBTU/h).
Figure 6. Temperature profile along thermal energy consumption (mmBTU/h).
3.1.6. Flu Gas Analysis in Pre-Heating and Firing Zone
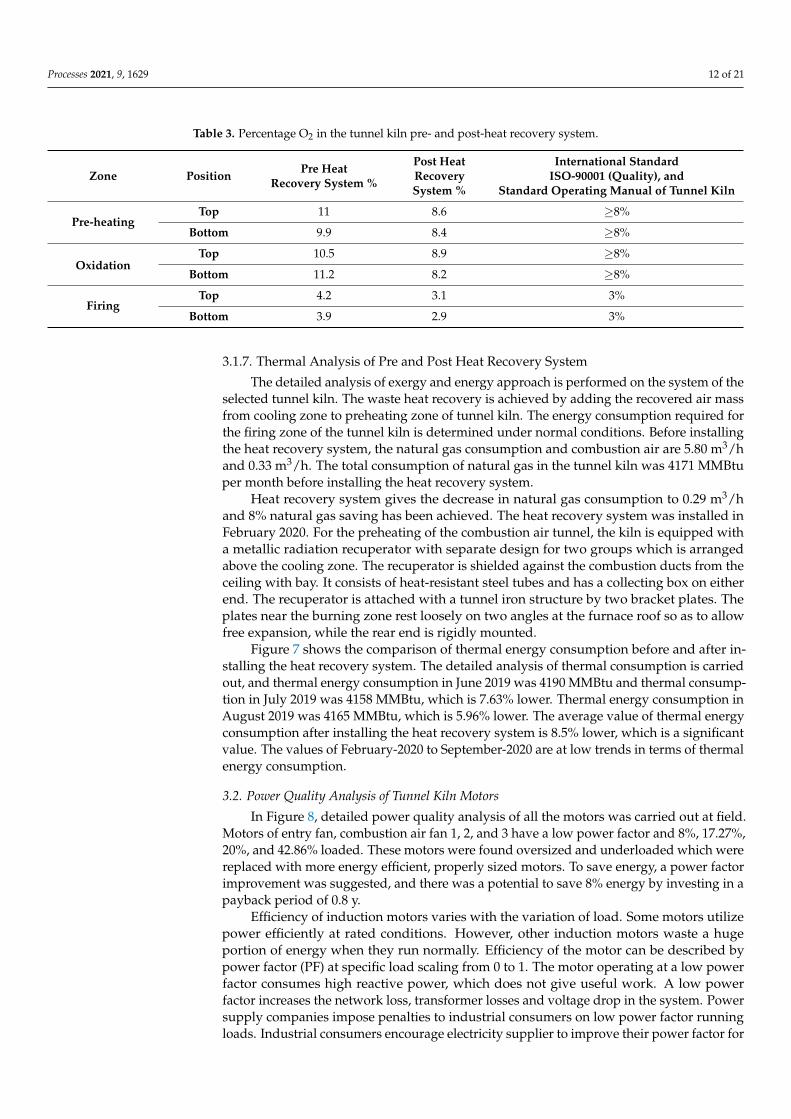
Experimentally, oxygen analysis was done by Flu-gas analyser, which has a basic O2and CO sensing probe. The Measuring range of the instrument for O2 is up to 29 percentvolumetrically and for CO, the measuring range is up.to 2000 ppm with a resolution of oneppm [38]. Table 3 describes the experimental values of different zones in the tunnel kilnwhich have been compared with the international standard. The level of O2 was analysedbefore installation of heat recovery system in oxidation, preheating, reduction, and firingzones of the tunnel kiln. It was observed that the level of O2 before installation of theheat recovery system was out of range. The standard values for O2 in the pre-heatingand oxidation zone should not be greater than ≥8%. O2 must be zero in this zone. Thestandard values for O2 in firing zone should not be greater than 3%. It has been shownin the below table that the O2 in firing zone was a little bit out of range before installingthe heat recovery system. It was observed that the level of O2, after installation of the heatrecovery system are in range. The standard values for O2 in the pre-heating and oxidationzone should not be greater than or equal to 8%. The standard values for O2 must be zero inthis zone. The standard values for O2 in the firing zone should not greater than 3%. It hasbeen shown in the below table that the O2 in natural zone is in range after installing theheat recovery system.
Processes 2021, 9, 1629 12 of 21
Table 3. Percentage O2 in the tunnel kiln pre- and post-heat recovery system.
Zone Position Pre HeatRecovery System %
Post HeatRecoverySystem %
International StandardISO-90001 (Quality), and
Standard Operating Manual of Tunnel Kiln
Pre-heatingTop 11 8.6 ≥8%
Bottom 9.9 8.4 ≥8%
OxidationTop 10.5 8.9 ≥8%
Bottom 11.2 8.2 ≥8%
FiringTop 4.2 3.1 3%
Bottom 3.9 2.9 3%
3.1.7. Thermal Analysis of Pre and Post Heat Recovery System
The detailed analysis of exergy and energy approach is performed on the system of theselected tunnel kiln. The waste heat recovery is achieved by adding the recovered air massfrom cooling zone to preheating zone of tunnel kiln. The energy consumption required forthe firing zone of the tunnel kiln is determined under normal conditions. Before installingthe heat recovery system, the natural gas consumption and combustion air are 5.80 m3/hand 0.33 m3/h. The total consumption of natural gas in the tunnel kiln was 4171 MMBtuper month before installing the heat recovery system.
Heat recovery system gives the decrease in natural gas consumption to 0.29 m3/hand 8% natural gas saving has been achieved. The heat recovery system was installed inFebruary 2020. For the preheating of the combustion air tunnel, the kiln is equipped witha metallic radiation recuperator with separate design for two groups which is arrangedabove the cooling zone. The recuperator is shielded against the combustion ducts from theceiling with bay. It consists of heat-resistant steel tubes and has a collecting box on eitherend. The recuperator is attached with a tunnel iron structure by two bracket plates. Theplates near the burning zone rest loosely on two angles at the furnace roof so as to allowfree expansion, while the rear end is rigidly mounted.
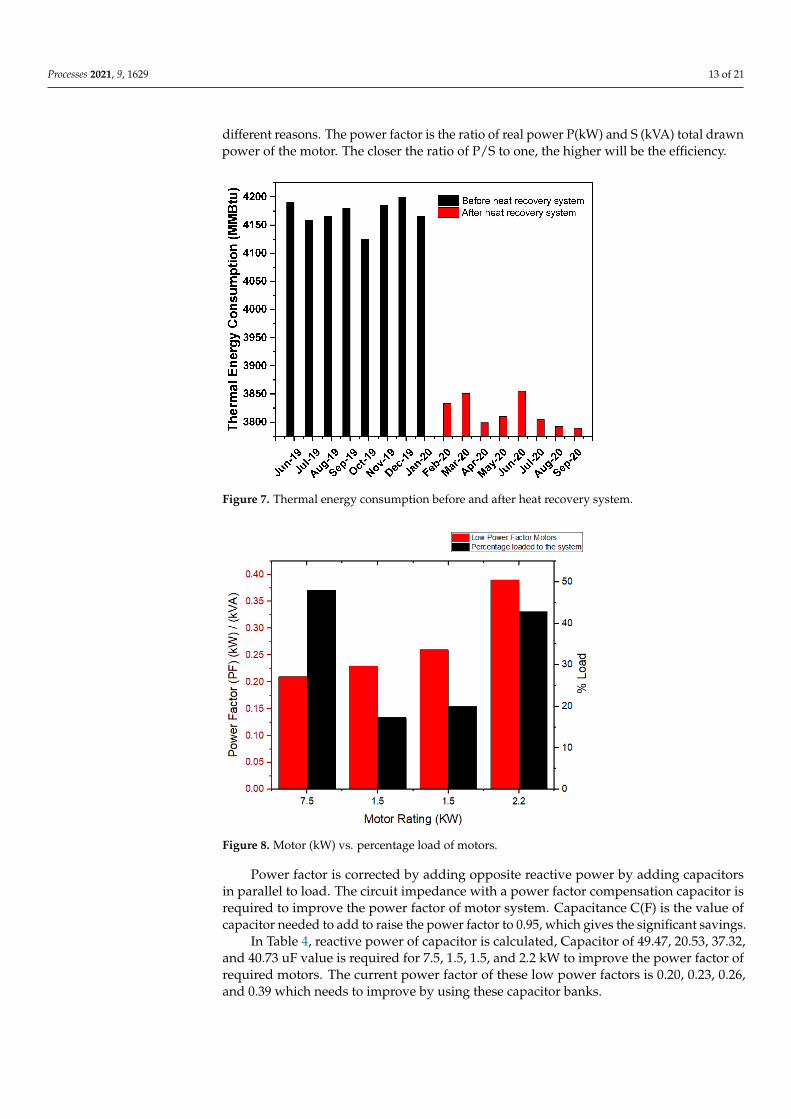
Figure 7 shows the comparison of thermal energy consumption before and after in-stalling the heat recovery system. The detailed analysis of thermal consumption is carriedout, and thermal energy consumption in June 2019 was 4190 MMBtu and thermal consump-tion in July 2019 was 4158 MMBtu, which is 7.63% lower. Thermal energy consumption inAugust 2019 was 4165 MMBtu, which is 5.96% lower. The average value of thermal energyconsumption after installing the heat recovery system is 8.5% lower, which is a significantvalue. The values of February-2020 to September-2020 are at low trends in terms of thermalenergy consumption.
3.2. Power Quality Analysis of Tunnel Kiln Motors
In Figure 8, detailed power quality analysis of all the motors was carried out at field.Motors of entry fan, combustion air fan 1, 2, and 3 have a low power factor and 8%, 17.27%,20%, and 42.86% loaded. These motors were found oversized and underloaded which werereplaced with more energy efficient, properly sized motors. To save energy, a power factorimprovement was suggested, and there was a potential to save 8% energy by investing in apayback period of 0.8 y.
Efficiency of induction motors varies with the variation of load. Some motors utilizepower efficiently at rated conditions. However, other induction motors waste a hugeportion of energy when they run normally. Efficiency of the motor can be described bypower factor (PF) at specific load scaling from 0 to 1. The motor operating at a low powerfactor consumes high reactive power, which does not give useful work. A low powerfactor increases the network loss, transformer losses and voltage drop in the system. Powersupply companies impose penalties to industrial consumers on low power factor runningloads. Industrial consumers encourage electricity supplier to improve their power factor for
Processes 2021, 9, 1629 13 of 21
different reasons. The power factor is the ratio of real power P(kW) and S (kVA) total drawnpower of the motor. The closer the ratio of P/S to one, the higher will be the efficiency.
Figure 7. Thermal energy consumption before and after heat recovery system.
Processes 2021, 9, x FOR PEER REVIEW 13 of 21
energy consumption after installing the heat recovery system is 8.5% lower, which is a
significant value. The values of February-2020 to September-2020 are at low trends in
terms of thermal energy consumption
Jun-1
9
Jul-1
9
Aug-1
9
Sep
-19
Oct
-19
Nov-
19
Dec
-19
Jan-2
0
Feb-2
0
Mar
-20
Apr-
20
May
-20
Jun-2
0
Jul-2
0
Aug-2
0
Sep
-20 --
3800
3850
3900
3950
4000
4050
4100
4150
4200
Th
erm
al
En
erg
y C
on
su
mp
tio
n (
MM
Btu
)
Before heat recovery system
After heat recovery system
Figure 7. Thermal energy consumption before and after heat recovery system.
3.2. Power Quality Analysis of Tunnel Kiln Motors
In Figure 8, detailed power quality analysis of all the motors was carried out at field.
Motors of entry fan, combustion air fan 1, 2, and 3 have a low power factor and 8%, 17.27%,
20%, and 42.86% loaded. These motors were found oversized and underloaded which
were replaced with more energy efficient, properly sized motors. To save energy, a power
factor improvement was suggested, and there was a potential to save 8% energy by in-
vesting in a payback period of 0.8 y.
Figure 8. Motor (kW) vs. percentage load of motors.
Efficiency of induction motors varies with the variation of load. Some motors utilize
power efficiently at rated conditions. However, other induction motors waste a huge por-
tion of energy when they run normally. Efficiency of the motor can be described by power
Figure 8. Motor (kW) vs. percentage load of motors.
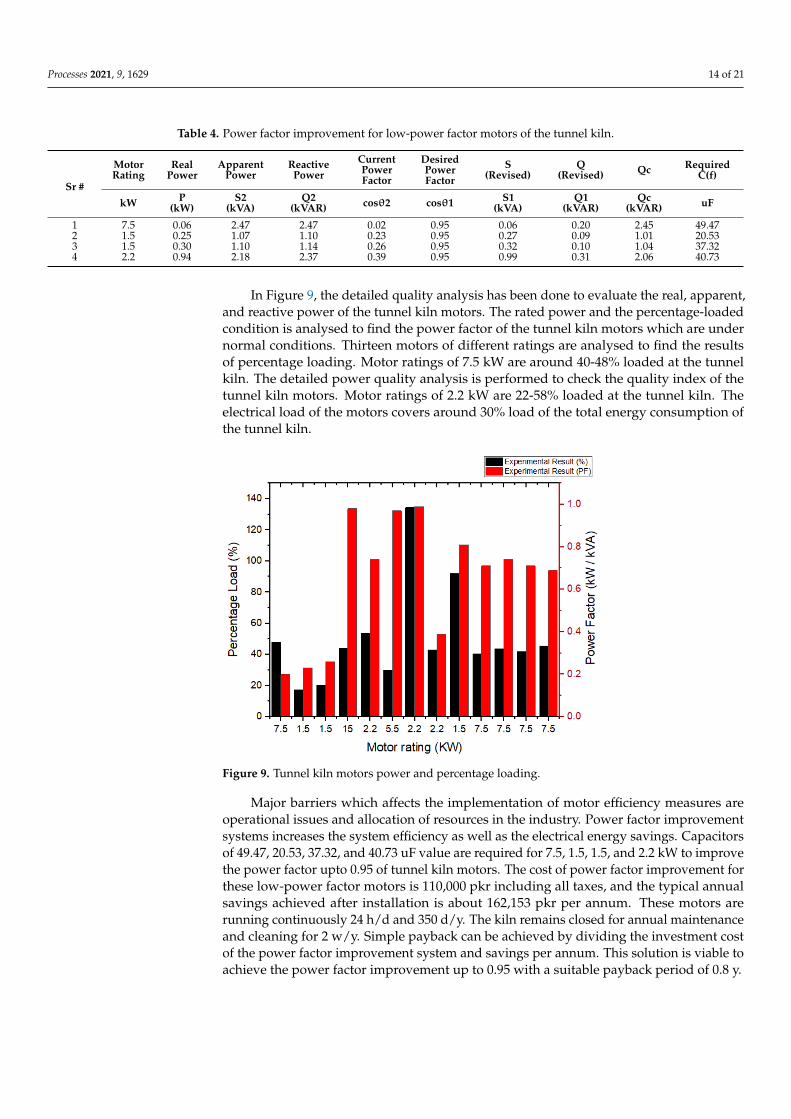
Power factor is corrected by adding opposite reactive power by adding capacitorsin parallel to load. The circuit impedance with a power factor compensation capacitor isrequired to improve the power factor of motor system. Capacitance C(F) is the value ofcapacitor needed to add to raise the power factor to 0.95, which gives the significant savings.
In Table 4, reactive power of capacitor is calculated, Capacitor of 49.47, 20.53, 37.32,and 40.73 uF value is required for 7.5, 1.5, 1.5, and 2.2 kW to improve the power factor ofrequired motors. The current power factor of these low power factors is 0.20, 0.23, 0.26,and 0.39 which needs to improve by using these capacitor banks.
Processes 2021, 9, 1629 14 of 21
Table 4. Power factor improvement for low-power factor motors of the tunnel kiln.
Sr #
MotorRating
RealPower
ApparentPower
ReactivePower
CurrentPowerFactor
DesiredPowerFactor
S(Revised)
Q(Revised) Qc Required
C(f)
kW P(kW)
S2(kVA)
Q2(kVAR) cosθ2 cosθ1 S1
(kVA)Q1
(kVAR)Qc
(kVAR) uF
1 7.5 0.06 2.47 2.47 0.02 0.95 0.06 0.20 2.45 49.472 1.5 0.25 1.07 1.10 0.23 0.95 0.27 0.09 1.01 20.533 1.5 0.30 1.10 1.14 0.26 0.95 0.32 0.10 1.04 37.324 2.2 0.94 2.18 2.37 0.39 0.95 0.99 0.31 2.06 40.73
In Figure 9, the detailed quality analysis has been done to evaluate the real, apparent,and reactive power of the tunnel kiln motors. The rated power and the percentage-loadedcondition is analysed to find the power factor of the tunnel kiln motors which are undernormal conditions. Thirteen motors of different ratings are analysed to find the resultsof percentage loading. Motor ratings of 7.5 kW are around 40-48% loaded at the tunnelkiln. The detailed power quality analysis is performed to check the quality index of thetunnel kiln motors. Motor ratings of 2.2 kW are 22-58% loaded at the tunnel kiln. Theelectrical load of the motors covers around 30% load of the total energy consumption ofthe tunnel kiln.
Processes 2021, 9, x FOR PEER REVIEW 15 of 21
Figure 9. Tunnel kiln motors power and percentage loading.
Major barriers which affects the implementation of motor efficiency measures are
operational issues and allocation of resources in the industry. Power factor improvement
systems increases the system efficiency as well as the electrical energy savings. Capacitors
of 49.47, 20.53, 37.32, and 40.73 uF value are required for 7.5, 1.5, 1.5, and 2.2 kW to im-
prove the power factor upto 0.95 of tunnel kiln motors. The cost of power factor improve-
ment for these low-power factor motors is 110,000 pkr including all taxes, and the typical
annual savings achieved after installation is about 162,153 pkr per annum. These motors
are running continuously 24 h/d and 350 d/y. The kiln remains closed for annual mainte-
nance and cleaning for 2 w/y. Simple payback can be achieved by dividing the investment
cost of the power factor improvement system and savings per annum. This solution is
viable to achieve the power factor improvement up to 0.95 with a suitable payback period
of 0.8 y.
3.3. Techno-Economic Analysis of Tunnel Kiln System
3.3.1. Regression Analysis of Thermal Consumption of Tunnel Kiln
In Figure 10, techno-economic analysis of thermal energy consumption and its pro-
duction data of tunnel kiln ceramics was analysed. It is observed that the regression dur-
ing the set period of June 2019 to January 2020 was examined critically. The regression
line during this period is linear and the values of the dependent variable (thermal energy
consumption) are denoted with Y-axis, and value of production independent variable is
denoted with X-axis. The regression expression is mentioned below is y = 3.2799x + 3567.4.
The correlation between X-variable and Y-variable is R = 3.2733, Interception between X-
variable and Y-variable is 3567.4 [47]. Regression analysis for thermal energy consump-
tion of the tunnel kiln is useful to finding the forecast consumption. This analysis can be
used to find predict analytics, operational efficiency, and supporting decisions regarding
two dependent and independent variables.
Figure 9. Tunnel kiln motors power and percentage loading.
Major barriers which affects the implementation of motor efficiency measures areoperational issues and allocation of resources in the industry. Power factor improvementsystems increases the system efficiency as well as the electrical energy savings. Capacitorsof 49.47, 20.53, 37.32, and 40.73 uF value are required for 7.5, 1.5, 1.5, and 2.2 kW to improvethe power factor upto 0.95 of tunnel kiln motors. The cost of power factor improvement forthese low-power factor motors is 110,000 pkr including all taxes, and the typical annualsavings achieved after installation is about 162,153 pkr per annum. These motors arerunning continuously 24 h/d and 350 d/y. The kiln remains closed for annual maintenanceand cleaning for 2 w/y. Simple payback can be achieved by dividing the investment costof the power factor improvement system and savings per annum. This solution is viable toachieve the power factor improvement up to 0.95 with a suitable payback period of 0.8 y.
Processes 2021, 9, 1629 15 of 21
3.3. Techno-Economic Analysis of Tunnel Kiln System3.3.1. Regression Analysis of Thermal Consumption of Tunnel Kiln
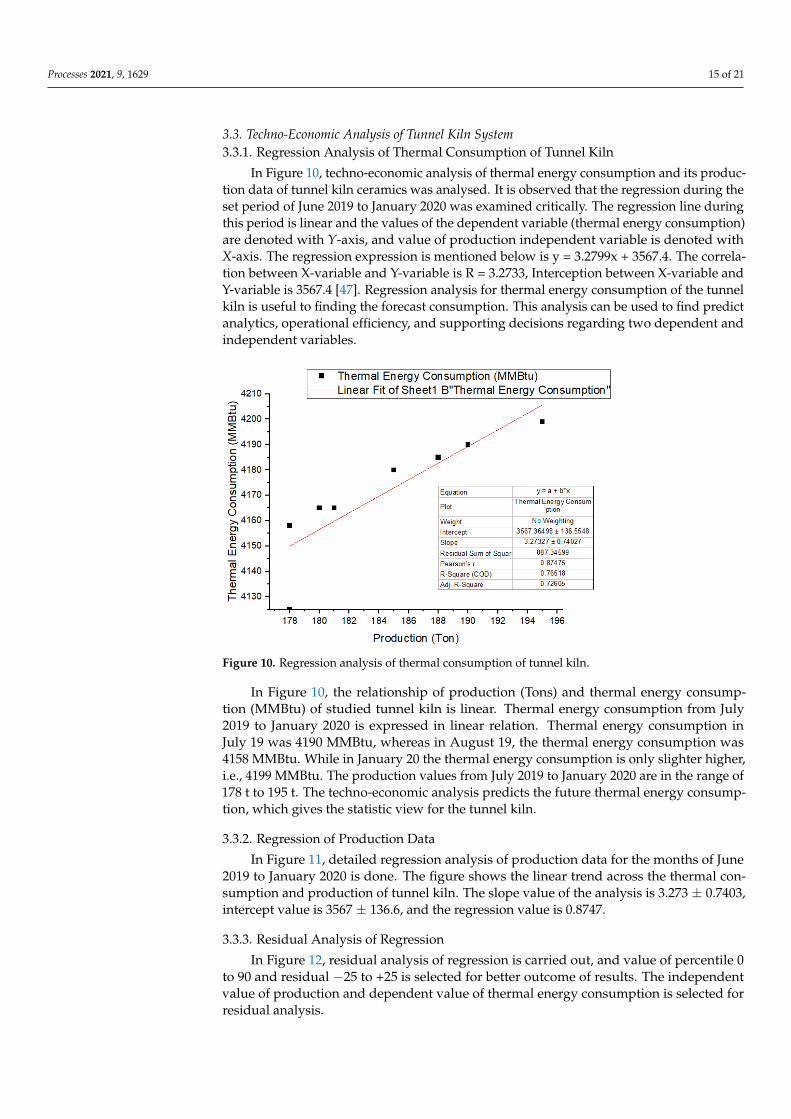
In Figure 10, techno-economic analysis of thermal energy consumption and its produc-tion data of tunnel kiln ceramics was analysed. It is observed that the regression during theset period of June 2019 to January 2020 was examined critically. The regression line duringthis period is linear and the values of the dependent variable (thermal energy consumption)are denoted with Y-axis, and value of production independent variable is denoted withX-axis. The regression expression is mentioned below is y = 3.2799x + 3567.4. The correla-tion between X-variable and Y-variable is R = 3.2733, Interception between X-variable andY-variable is 3567.4 [47]. Regression analysis for thermal energy consumption of the tunnelkiln is useful to finding the forecast consumption. This analysis can be used to find predictanalytics, operational efficiency, and supporting decisions regarding two dependent andindependent variables.
Processes 2021, 9, x FOR PEER REVIEW 16 of 21
Figure 10. Regression analysis of thermal consumption of tunnel kiln.
In Figure 10, the relationship of production (Tons) and thermal energy consumption
(MMBtu) of studied tunnel kiln is linear. Thermal energy consumption from July 2019 to
January 2020 is expressed in linear relation. Thermal energy consumption in July 19 was
4190 MMBtu, whereas in August 19, the thermal energy consumption was 4158 MMBtu.
While in January 20 the thermal energy consumption is only slighter higher, i.e., 4199
MMBtu. The production values from July 2019 to January 2020 are in the range of 178 t to
195 t. The techno-economic analysis predicts the future thermal energy consumption,
which gives the statistic view for the tunnel kiln.
3.3.2. Regression of Production Data
In Figure 11, detailed regression analysis of production data for the months of June
2019 to January 2020 is done. The figure shows the linear trend across the thermal con-
sumption and production of tunnel kiln. The slope value of the analysis is 3.273 ± 0.7403,
intercept value is 3567 ± 136.6, and the regression value is 0.8747.
Figure 11. Regression of production data.
Figure 10. Regression analysis of thermal consumption of tunnel kiln.
In Figure 10, the relationship of production (Tons) and thermal energy consump-tion (MMBtu) of studied tunnel kiln is linear. Thermal energy consumption from July2019 to January 2020 is expressed in linear relation. Thermal energy consumption inJuly 19 was 4190 MMBtu, whereas in August 19, the thermal energy consumption was4158 MMBtu. While in January 20 the thermal energy consumption is only slighter higher,i.e., 4199 MMBtu. The production values from July 2019 to January 2020 are in the range of178 t to 195 t. The techno-economic analysis predicts the future thermal energy consump-tion, which gives the statistic view for the tunnel kiln.
3.3.2. Regression of Production Data
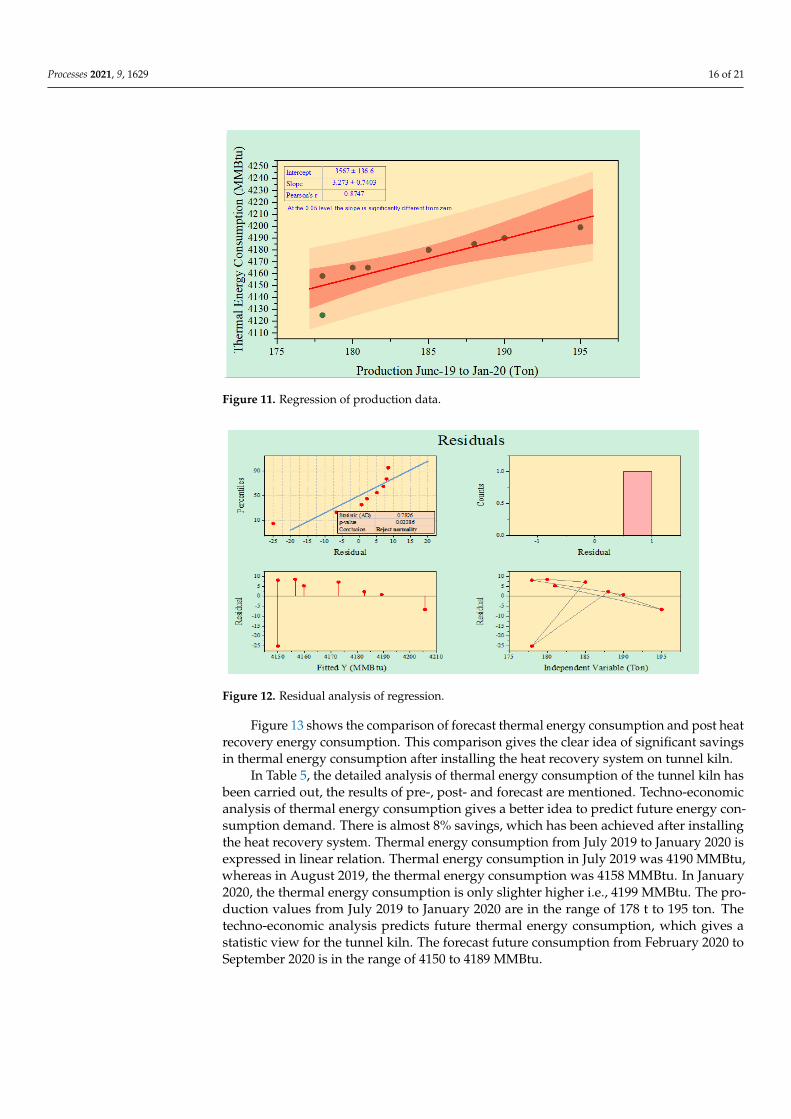
In Figure 11, detailed regression analysis of production data for the months of June2019 to January 2020 is done. The figure shows the linear trend across the thermal con-sumption and production of tunnel kiln. The slope value of the analysis is 3.273 ± 0.7403,intercept value is 3567 ± 136.6, and the regression value is 0.8747.
3.3.3. Residual Analysis of Regression
In Figure 12, residual analysis of regression is carried out, and value of percentile 0to 90 and residual −25 to +25 is selected for better outcome of results. The independentvalue of production and dependent value of thermal energy consumption is selected forresidual analysis.
Processes 2021, 9, 1629 16 of 21
Processes 2021, 9, x FOR PEER REVIEW 16 of 21
Figure 10. Regression analysis of thermal consumption of tunnel kiln.
In Figure 10, the relationship of production (Tons) and thermal energy consumption
(MMBtu) of studied tunnel kiln is linear. Thermal energy consumption from July 2019 to
January 2020 is expressed in linear relation. Thermal energy consumption in July 19 was
4190 MMBtu, whereas in August 19, the thermal energy consumption was 4158 MMBtu.
While in January 20 the thermal energy consumption is only slighter higher, i.e., 4199
MMBtu. The production values from July 2019 to January 2020 are in the range of 178 t to
195 t. The techno-economic analysis predicts the future thermal energy consumption,
which gives the statistic view for the tunnel kiln.
3.3.2. Regression of Production Data
In Figure 11, detailed regression analysis of production data for the months of June
2019 to January 2020 is done. The figure shows the linear trend across the thermal con-
sumption and production of tunnel kiln. The slope value of the analysis is 3.273 ± 0.7403,
intercept value is 3567 ± 136.6, and the regression value is 0.8747.
Figure 11. Regression of production data.
Figure 11. Regression of production data.
Processes 2021, 9, x FOR PEER REVIEW 17 of 21
3.3.3. Residual Analysis of Regression
In Figure 12, residual analysis of regression is carried out, and value of percentile 0
to 90 and residual −25 to +25 is selected for better outcome of results. The independent
value of production and dependent value of thermal energy consumption is selected for
residual analysis.
Figure 12. Residual analysis of regression.
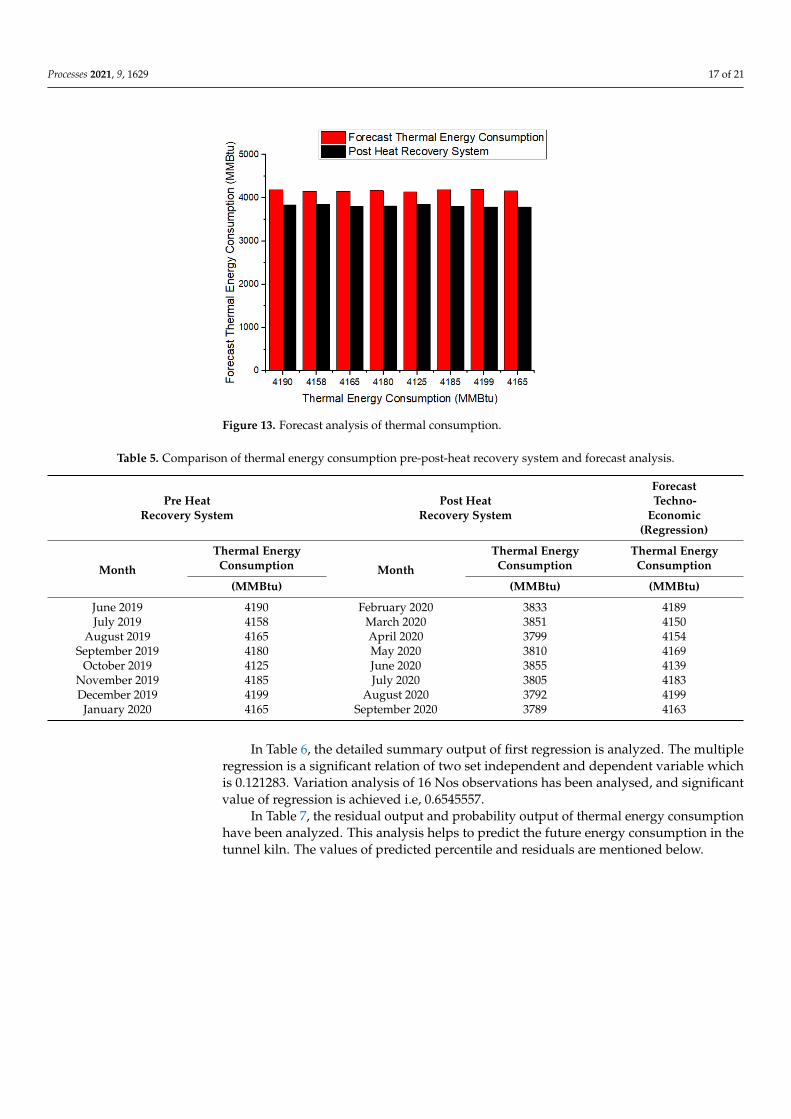
Figure 13 shows the comparison of forecast thermal energy consumption and post
heat recovery energy consumption. This comparison gives the clear idea of significant
savings in thermal energy consumption after installing the heat recovery system on tunnel
kiln.
Figure 13. Forecast analysis of thermal consumption.
In Table 5, the detailed analysis of thermal energy consumption of the tunnel kiln has
been carried out, the results of pre-, post- and forecast are mentioned. Techno-economic
analysis of thermal energy consumption gives a better idea to predict future energy con-
sumption demand. There is almost 8% savings, which has been achieved after installing
the heat recovery system. Thermal energy consumption from July 2019 to January 2020 is
expressed in linear relation. Thermal energy consumption in July 2019 was 4190 MMBtu,
whereas in August 2019, the thermal energy consumption was 4158 MMBtu. In January
Figure 12. Residual analysis of regression.
Figure 13 shows the comparison of forecast thermal energy consumption and post heatrecovery energy consumption. This comparison gives the clear idea of significant savingsin thermal energy consumption after installing the heat recovery system on tunnel kiln.
In Table 5, the detailed analysis of thermal energy consumption of the tunnel kiln hasbeen carried out, the results of pre-, post- and forecast are mentioned. Techno-economicanalysis of thermal energy consumption gives a better idea to predict future energy con-sumption demand. There is almost 8% savings, which has been achieved after installingthe heat recovery system. Thermal energy consumption from July 2019 to January 2020 isexpressed in linear relation. Thermal energy consumption in July 2019 was 4190 MMBtu,whereas in August 2019, the thermal energy consumption was 4158 MMBtu. In January2020, the thermal energy consumption is only slighter higher i.e., 4199 MMBtu. The pro-duction values from July 2019 to January 2020 are in the range of 178 t to 195 ton. Thetechno-economic analysis predicts future thermal energy consumption, which gives astatistic view for the tunnel kiln. The forecast future consumption from February 2020 toSeptember 2020 is in the range of 4150 to 4189 MMBtu.
Processes 2021, 9, 1629 17 of 21
Processes 2021, 9, x FOR PEER REVIEW 17 of 21
3.3.3. Residual Analysis of Regression
In Figure 12, residual analysis of regression is carried out, and value of percentile 0
to 90 and residual −25 to +25 is selected for better outcome of results. The independent
value of production and dependent value of thermal energy consumption is selected for
residual analysis.
Figure 12. Residual analysis of regression.
Figure 13 shows the comparison of forecast thermal energy consumption and post
heat recovery energy consumption. This comparison gives the clear idea of significant
savings in thermal energy consumption after installing the heat recovery system on tunnel
kiln.
Figure 13. Forecast analysis of thermal consumption.
In Table 5, the detailed analysis of thermal energy consumption of the tunnel kiln has
been carried out, the results of pre-, post- and forecast are mentioned. Techno-economic
analysis of thermal energy consumption gives a better idea to predict future energy con-
sumption demand. There is almost 8% savings, which has been achieved after installing
the heat recovery system. Thermal energy consumption from July 2019 to January 2020 is
expressed in linear relation. Thermal energy consumption in July 2019 was 4190 MMBtu,
whereas in August 2019, the thermal energy consumption was 4158 MMBtu. In January
Figure 13. Forecast analysis of thermal consumption.
Table 5. Comparison of thermal energy consumption pre-post-heat recovery system and forecast analysis.
Pre HeatRecovery System
Post HeatRecovery System
ForecastTechno-
Economic(Regression)
Month
Thermal EnergyConsumption Month
Thermal EnergyConsumption
Thermal EnergyConsumption
(MMBtu) (MMBtu) (MMBtu)
June 2019 4190 February 2020 3833 4189July 2019 4158 March 2020 3851 4150
August 2019 4165 April 2020 3799 4154September 2019 4180 May 2020 3810 4169
October 2019 4125 June 2020 3855 4139November 2019 4185 July 2020 3805 4183December 2019 4199 August 2020 3792 4199
January 2020 4165 September 2020 3789 4163
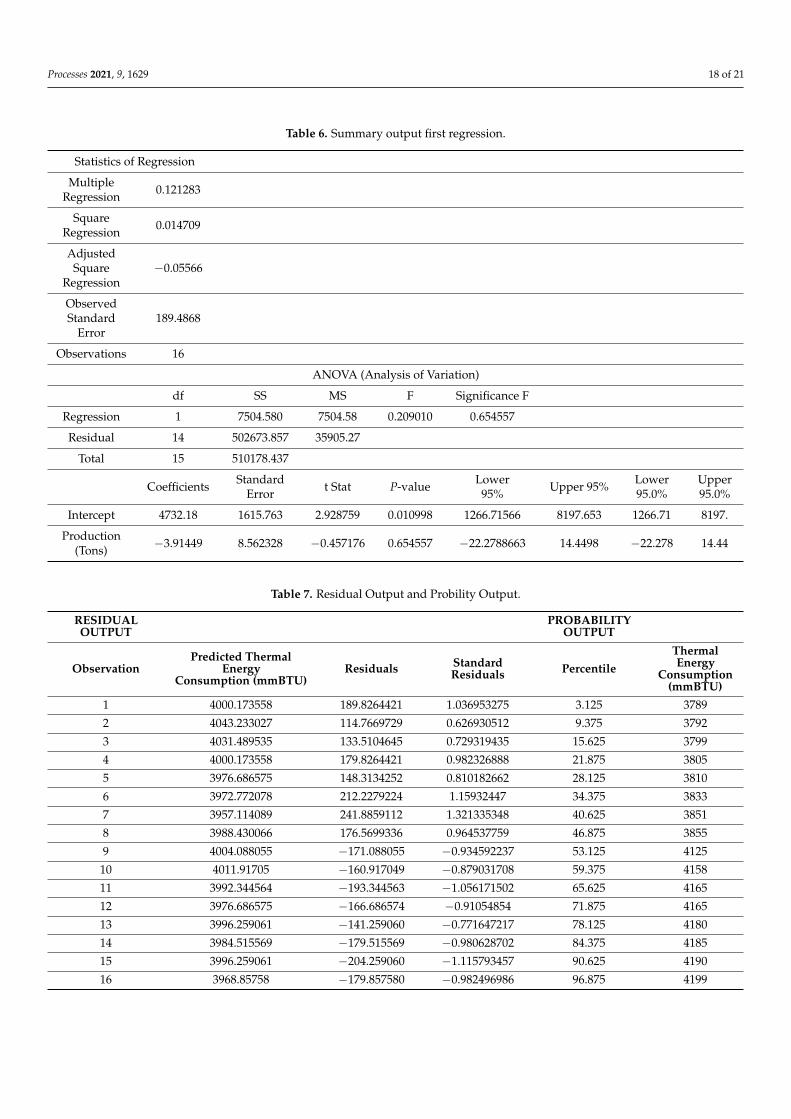
In Table 6, the detailed summary output of first regression is analyzed. The multipleregression is a significant relation of two set independent and dependent variable whichis 0.121283. Variation analysis of 16 Nos observations has been analysed, and significantvalue of regression is achieved i.e, 0.6545557.
In Table 7, the residual output and probability output of thermal energy consumptionhave been analyzed. This analysis helps to predict the future energy consumption in thetunnel kiln. The values of predicted percentile and residuals are mentioned below.
Processes 2021, 9, 1629 18 of 21
Table 6. Summary output first regression.
Statistics of Regression
MultipleRegression 0.121283
SquareRegression 0.014709
AdjustedSquare
Regression−0.05566
ObservedStandard
Error189.4868
Observations 16
ANOVA (Analysis of Variation)
df SS MS F Significance F
Regression 1 7504.580 7504.58 0.209010 0.654557
Residual 14 502673.857 35905.27
Total 15 510178.437
Coefficients StandardError t Stat P-value Lower
95% Upper 95% Lower95.0%
Upper95.0%
Intercept 4732.18 1615.763 2.928759 0.010998 1266.71566 8197.653 1266.71 8197.
Production(Tons) −3.91449 8.562328 −0.457176 0.654557 −22.2788663 14.4498 −22.278 14.44
Table 7. Residual Output and Probility Output.
RESIDUALOUTPUT
PROBABILITYOUTPUT
ObservationPredicted Thermal
EnergyConsumption (mmBTU)
Residuals StandardResiduals Percentile
ThermalEnergy
Consumption(mmBTU)
1 4000.173558 189.8264421 1.036953275 3.125 3789
2 4043.233027 114.7669729 0.626930512 9.375 3792
3 4031.489535 133.5104645 0.729319435 15.625 3799
4 4000.173558 179.8264421 0.982326888 21.875 3805
5 3976.686575 148.3134252 0.810182662 28.125 3810
6 3972.772078 212.2279224 1.15932447 34.375 3833
7 3957.114089 241.8859112 1.321335348 40.625 3851
8 3988.430066 176.5699336 0.964537759 46.875 3855
9 4004.088055 −171.088055 −0.934592237 53.125 4125
10 4011.91705 −160.917049 −0.879031708 59.375 4158
11 3992.344564 −193.344563 −1.056171502 65.625 4165
12 3976.686575 −166.686574 −0.91054854 71.875 4165
13 3996.259061 −141.259060 −0.771647217 78.125 4180
14 3984.515569 −179.515569 −0.980628702 84.375 4185
15 3996.259061 −204.259060 −1.115793457 90.625 4190
16 3968.85758 −179.857580 −0.982496986 96.875 4199
Processes 2021, 9, 1629 19 of 21
4. Conclusions
Installing the heat recovery system on the cooling zone to preheat the ware of pre-heating zone of the tunnel kiln gives 8% natural gas consumption. O2 analysis afterinstalling the heat recovery system is in range which clearly depicts that the combustionefficiency is improved after installing the heat recovery system. Mechanical strength,shrinkage (diameter, length wise), and thermal expansion of proper selected ceramics bodymaterial are in range of standard values. Density of selected material i.e., (2.1~2.3 g/cm3)gives better results to improve the thermal energy consumption along the tunnel kiln.Detailed power quality analysis of low power factor motors of the tunnel kiln was carriedout and a power factor improvement solution was suggested to save electrical energywith a payback period of 0.8 y. Regression analysis for thermal energy consumption ofthe tunnel kiln is done to find the forecast thermal energy consumption of the tunnel kiln.This analysis gives the predicted analytics, regarding dependent variable thermal energyconsumption and independent production variables. The model will be validated with anumerical simulation. It is necessary to re-investigate the experimental setup of the kilnand continue this study for a variable air velocity and inlet gas at different zones. Theresults obtained with simulation should be compared with experimental results.
Author Contributions: Conceptualisation, methodology, visualisation, writing—original draft S.A.H.and M.F. supervision, M.A. and N.H.; validation, F.R. and M.A.; data curation, Z.U.R.T.; formalanalysis, M.S.; investigation, I.H.; writing—original draft, M.A.S., M.A.Q. and N.H.; writing—reviewand editing, A.B. and N.H.; visualisation, F.R. and A.B.; project administration, A.B.; fundingacquisition, A.B. All authors have read and agreed to the published version of the manuscript.
Funding: This research received no external funding.
Institutional Review Board Statement: Not applicable.
Informed Consent Statement: Not applicable.
Acknowledgments: The authors would like to acknowledge the project “Sustainable Process Integra-tion Laboratory–SPIL funded by EU CZ Operational Programme Research and Development, Educa-tion, Priority1: Strengthening capacity for quality research” (Grant No. CZ.02.1.01/0.0/0.0/15_003/0000456). The project LTACH19033 “Transmission Enhancement and Energy Optimised Integrationof Heat Exchangers in Petrochemical Industry Waste Heat Utilisation”, under the bilateral collabora-tion of the Czech Republic and the People’s Republic of China (parteners Xi’an Jiaotong Universityand Sinopec Research Institute Shanghai; SPIL VUT, Brno University of Technology and EVECOsro, Brno), programme INTER-EXCELLENCE, INTER-ACTION of the Czech Ministry of Education,Youth and Sports.
Conflicts of Interest: The authors declare no conflict of interest.
References1. Gabaldón-Estevan, D.; Mezquita, A.; Ferrer, S.; Monfort, E. Unwanted effects of European Union environmental policy to promote
a post-carbon industry. The case of energy in the European ceramic tile sector. J. Clean. Prod. 2016, 117, 41–49. [CrossRef]2. Kaya, S.; Mançuhan, E.; Küçükada, K. Modelling and optimization of the firing zone of a tunnel kiln to predict the optimal feed
locations and mass fluxes of the fuel and secondary air. Appl. Energy 2009, 86, 325–332. [CrossRef]3. Imran, M.; Muhammad, H.A.; Sher, F.; Farooq, M.; Baik, Y.-J.; Rehman, Z. Exergoeconomic optimization of a binary geothermal
power plant. In Thermodynamic Analysis and Optimization of Geothermal Power Plants; Elsevier: Amsterdam, The Netherlands, 2021;pp. 315–326. [CrossRef]
4. Arslan, M.; Farooq, M.; Naqvi, M.; Sultan, U.; Tahir, Z.-U.-R.; Nawaz, S.; Waheed, N.; Naqvi, S.R.; Ali, Q.; Tariq, M.S.; et al.Impact of varying load conditions and cooling energy comparison of a double-inlet pulse tube refrigerator. Processes 2020, 8, 352.[CrossRef]
5. Imran, S.; Korakianitis, T.; Shaukat, R.; Farooq, M.; Condoor, S.; Jayaram, S. Experimentally tested performance and emissionsadvantages of using natural-gas and hydrogen fuel mixture with diesel and rapeseed methyl ester as pilot fuels. Appl. Energy2018, 229, 1260–1268. [CrossRef]
6. Ashraf, H.; Sultan, M.; Shamshiri, R.; Abbas, F.; Farooq, M.; Sajjad, U.; Md-Tahir, H.; Mahmood, M.; Ahmad, F.; Taseer, Y.; et al.CDynamic Evaluation of Desiccant Dehumidification Evaporative Cooling Options for Greenhouse Air-Conditioning Applicationin Multan (Pakistan). Energies 2021, 14, 1097. [CrossRef]
Processes 2021, 9, 1629 20 of 21
7. Hassan, Z.U.; Usman, M.; Asim, M.; Kazim, A.H.; Farooq, M.; Umair, M.; Imtiaz, M.U.; Asim, S.S. Use of diesel and emulsifieddiesel in CI engine: A comparative analysis of engine characteristics. Sci. Prog. 2021, 104, 00368504211020930. [CrossRef]
8. Farooq, M.; Almustapha, M.; Imran, M.; Saeed, M.; Andresen, J.M. In-situ regeneration of activated carbon with electric potentialswing desorption (EPSD) for the H2S removal from biogas. Bioresour. Technol. 2018, 249, 125–131. [CrossRef]
9. Peng, J.; Zhao, Y.; Jiao, L.; Zheng, W.; Zeng, L. CO2 emission calculation and reduction options in ceramic tile manufacture-theFoshan case. Energy Procedia 2012, 16, 467–476. [CrossRef]
10. Mezquita, A.; Boix, J.; Monfort, E.; Mallol, G. Energy saving in ceramic tile kilns: Cooling gas heat recovery. Appl. Therm. Eng.2014, 65, 102–110. [CrossRef]
11. Wu, X.; Yang, Y.; Wu, G.; Mao, J.; Zhou, T. Simulation and optimization of a coking wastewater biological treatment process byactivated sludge models (ASM). J. Environ. Manag. 2016, 165, 235–242. [CrossRef]
12. Milani, M.; Montorsi, L.; Stefani, M. An integrated approach to energy recovery from biomass and waste: Anaerobic digestion–gasification–water treatment. Waste Manag. Res. 2014, 32, 614–625. [CrossRef] [PubMed]
13. Almeida, G.D.S.; da Silva, J.B.; e Silva, C.J.; Swarnakar, R.; Neves, G.A.; de Lima, A.G.B. Heat and mass transport in an industrialtunnel dryer: Modeling and simulation applied to hollow bricks. Appl. Therm. Eng. 2013, 55, 78–86. [CrossRef]
14. Oba, R.; Possamai, T.S.; Nunes, A.T.; Nicolau, V.P. Numerical simulation of tunnel kilns applied to white tile with natural gas.In Proceedings of the 21st Brazilian Congress of Mechanical Engineering, Natal, Brazil, 24–28 October 2011.
15. Han, J.; Sun, Q.; Xing, H.; Zhang, Y.; Sun, H. Experimental study on thermophysical properties of clay after high temperature.Appl. Therm. Eng. 2017, 111, 847–854. [CrossRef]
16. Sun, R.; Ismail, T.M.; Ren, X.; El-Salam, M.A. Numerical simulation of gas concentration and dioxin formation for MSWcombustion in a fixed bed. J. Environ. Manag. 2015, 157, 111–117. [CrossRef]
17. Refaey, H.; Abdel-Aziz, A.A.; Ali, R.; Abdelrahman, H.; Salem, M. Augmentation of convective heat transfer in the cooling zoneof brick tunnel kiln using guide vanes: An experimental study. Int. J. Therm. Sci. 2017, 122, 172–185. [CrossRef]
18. Mercati, S.; Milani, M.; Montorsi, L.; Paltrinieri, F. Design of the steam generator in an energy conversion system based on thealuminum combustion with water. Appl. Energy 2012, 97, 686–694. [CrossRef]
19. Redemann, T.; Specht, E. Mathematical model to investigate the influence of circulation systems on the firing of ceramics. EnergyProcedia 2017, 120, 620–627. [CrossRef]
20. Araújo, M.V.; Santos, R.; Da Silva, R.M.; De Lima, A.B. Drying of industrial hollow ceramic brick: Analysis of the moisturecontent and temperature parameters. Defect Diffus. Forum 2017, 380, 72–78. [CrossRef]
21. Al-Hasnawi AG, T.; Refaey, H.; Redemann, T.; Attalla, D.M.; Specht, E. CFD simulation of flow mixing in tunnel kilns by air sideinjection. ASME J. Therm. Sci. Eng. Appl. 2017, 10, 031007. [CrossRef]
22. Gomez, R.S.; Porto, T.R.N.; Magalhães, H.L.F.; Moreira, G.; André, A.M.M.C.N.; Melo, R.B.F.; Lima, A.G.B. Natural gasintermittent kiln for the ceramic industry: A transient thermal analysis. Energies 2019, 12, 1568. [CrossRef]
23. Soussi, N.; Kriaa, W.; Mhiri, H.; Bournot, P. Reduction of the energy consumption of a tunnel kiln by optimization of the recoveredair mass flow from the cooling zone to the firing zone. Appl. Therm. Eng. 2017, 124, 1382–1391. [CrossRef]
24. Zhang, Y.; Wang, J.; Redemann, T.; Specht, E. Thermal behavior of kiln cars while traveling through a tunnel kiln. Adv. Mech. Eng.2015, 7, 1687814015588468. [CrossRef]
25. Mancuhan, E.; Kucukada, K.; Alpman, E. Mathematical modeling and simulation of the preheating zone of a tunnel kiln. J. Therm.Sci. Technol. 2011, 31, 79–86.
26. Agamloh, E.B. The partial-load efficiency of induction motors. IEEE Trans. Ind. Appl. 2009, 45, 332–340. [CrossRef]27. Hurst, J.; Dominguez, H. Raising the standard for electric motor efficiency. Intech-Res. Triangle Park NC- 2007, 54, 30.28. Challenge, M. Determining electric motor load and efficiency. Program of the US Department of Energy. 1997.29. Parihar, V.R.; Thakare, S.; Ghanode, A. Improving Power Quality of Induction Motors using Capacitor Bank. Int. J. Innov. Res.
Electr. Electron. Instrum. Control Eng. 2018, 6, 37–45. [CrossRef]30. Gnacinski, P.; Tarasiuk, T. Energy-efficient operation of induction motors and power quality standards. Electr. Power Syst. Res.
2016, 135, 10–17. [CrossRef]31. Dmytrochenkova, E.; Tadlya, K. Analysis of aerodynamic characteristics in the tunnel kiln channel when changing the geometric
characteristics of the channel. Innov. Solut. Mod. Sci. 2019, 6, 37–47. [CrossRef]32. Ferrer, S.; Mezquita, A.; Aguilella, V.; Monfort, E. Beyond the energy balance: Exergy analysis of an industrial roller kiln firing
porcelain tiles. Appl. Therm. Eng. 2019, 150, 1002–1015. [CrossRef]33. Chuenwong, K.; Chiarakorn, S.; Sajjakulnukit, B. Specific energy consumption and carbon intensity of ceramic tablewares: Small
enterprises (SEs) in Thailand. J. Clean. Prod. 2017, 147, 395–405. [CrossRef]34. Damrongsak, D.; Wongsapai, W.; Thinate, N. Factor impacts and target setting of energy consumption in Thailand’s hospital
building. Chem. Eng. Trans. 2018, 70, 1585–1590. [CrossRef]35. Salminen, E.; Mjöberg, J.; Anhava, J. Nordic Ceramics Industry: Best Available Technique (BAT); Nordic Council of Ministers:
Copenhagen, Denmark, 2019.36. Abou-Ziyan, H.Z.; Almesri, I.F.; Alrahmani, M.A.; Almutairi, J.H. Convective heat transfer coefficients of multifaceted longitudinal
and transversal bricks of lattice setting in tunnel kilns. J. Therm. Sci. Eng. Appl. 2018, 10, 051014. [CrossRef]37. Pal, M.; Bharati, P. Introduction to Correlation and Linear Regression Analysis. In Applications of Regression Techniques; Springer:
Singapore, 2019; pp. 1–18. [CrossRef]
Processes 2021, 9, 1629 21 of 21
38. Kaisan, M.; Anafi, F.; Nuszkowski, J.; Kulla, D.; Umaru, S. Exhaust emissions of biodiesel binary and multi-blends from Cotton,Jatropha and Neem oil from stationary multi cylinder CI engine. Transp. Res. Part D Transp. Environ. 2017, 53, 403–414. [CrossRef]
39. Siddiqi, M.H.; Liu, X.-M.; Hussain, M.A.; Qureshi, T.; Waqas, M.; Farooq, M.; Iqbal, T.; Nawaz, S.; Nawaz, S. Evolution of kineticand hydrothermal study of refused derived fuels: Thermo-gravimetric analysis. Energy Rep. 2021, 7, 1757–1764. [CrossRef]
40. Riaz, F.; Farooq, M.; Imran, M.; Lee, P.S.; Chou, S.K. CEnergy analysis of a new combined cooling and power system forlow-temperature heat utilization. In Energy Sustainability; American Society of Mechanical Engineers: New York, NY, USA, 2020.[CrossRef]
41. Ijaz, M.; Farhan, M.; Farooq, M.; Moeenuddin, G.; Nawaz, S.; Soudagar, M.E.M.; Saqib, H.M.; Ali, Q. Numerical investigation ofparticles characteristics on cyclone performance for sustainable environment. Part. Sci. Technol. 2021, 39, 495–503. [CrossRef]
42. Sattar, A.; Farooq, M.; Amjad, M.; Saeed, M.A.; Nawaz, S.; Mujtaba, M.; Anwar, S.; El-Sherbeeny, A.M.; Soudagar, M.E.M.; Filho,E.P.B.; et al. Performance Evaluation of a Direct Absorption Collector for Solar Thermal Energy Conversion. Energies 2020,13, 4956. [CrossRef]
43. Mumtaz, H.; Farhan, M.; Amjad, M.; Riaz, F.; Kazim, A.H.; Sultan, M.; Farooq, M.; Mujtaba, M.; Hussain, I.; Imran, M.; et al.Biomass waste utilization for adsorbent preparation in CO2 capture and sustainable environment applications. Sustain. EnergyTechnol. Assess. 2021, 46, 101288. [CrossRef]
44. Shahzad, K.; Sultan, M.; Bilal, M.; Ashraf, H.; Farooq, M.; Miyazaki, T.; Sajjad, U.; Ali, I.; Hussain, M. Experiments on Energy-Efficient Evaporative Cooling Systems for Poultry Farm Application in Multan (Pakistan). Sustainability 2021, 13, 2836. [CrossRef]
45. Kashif, M.; Awan, M.; Nawaz, S.; Amjad, M.; Talib, B.; Farooq, M.; Nizami, A.; Rehan, M. Untapped renewable energy potentialof crop residues in Pakistan: Challenges and future directions. J. Environ. Manag. 2020, 256, 109924. [CrossRef]
46. Imran, M.; Pambudi, N.A.; Farooq, M. Thermal and hydraulic optimization of plate heat exchanger using multi objective geneticalgorithm. Case Stud. Therm. Eng. 2017, 10, 570–578. [CrossRef]
47. Chatterjee, S.; Hadi, A.S. Regression Analysis by Example; John Wiley & Sons: Hoboken, NJ, USA, 2015.
Related Documents