horticulturae Review Nitrogen Related Diffuse Pollution from Horticulture Production—Mitigation Practices and Assessment Strategies Maria do Rosário Cameira 1,2, * and Mariana Mota 1,2 1 Department of Biosystems Engineering, Instituto Superior de Agronomia, University of Lisbon, Tapada da Ajuda, 1349-017 Lisboa, Portugal; [email protected] 2 Linking Landscape, Environment, Agriculture and Food (LEAF), Instituto Superior de Agronomia, University of Lisbon, Tapada da Ajuda, 1349-017 Lisboa, Portugal * Correspondence: [email protected]; Tel.: +351-21-3653478 Academic Editor: Douglas D. Archbold Received: 24 October 2016; Accepted: 22 February 2017; Published: 28 February 2017 Abstract: Agriculture is considered one of the main nitrogen (N) pollution sources through the diffuse emissions of ammonia (NH 3 ) and nitrous oxide (N 2 O) to the atmosphere and nitrate (NO 3 - ) to water bodies. The risk is particularly high in horticultural production systems (HPS), where the use of water and fertilizers is intensive and concentrated in space and time, and more specifically, in the case of vegetable crops that have high growth rates, demanding an abundant supply of water and nitrogen forms. Therefore, to comply with the EU environmental policies aimed at reducing diffuse pollution in agriculture, there is the need for mitigation practices or strategies acting at different levels such as the source, the timing and the transport of N. HPS are often well suited for improvement practices, but efficient and specific tools capable of describing and quantifying N losses for these particular production systems are required. The most common mitigation strategies found in the literature relate to crop, irrigation and fertilization management. Nevertheless, only the success of a mitigation strategy under specific conditions will allow its implementation to be increasingly targeted and more cost effective. Assessment methods are therefore required to evaluate and to quantify the impact of mitigation strategies in HPS and to select the most promising ones. Keywords: horticulture; diffuse pollution; N emissions; N leaching; mitigation strategies; fertigation management; crop management 1. Introduction Diffuse or non-point source pollution refers to both water and air pollution caused by a variety of activities that have no specific point of discharge. Furthermore, the long-range transport ability and multiple sources of the pollutant contribute to the diffuse nature of the process. The management of diffuse pollution is complex and requires the careful analysis and understanding of various processes [1]. Agriculture is seen as one of the main N pollution sources through the diffuse emission of ammonia (NH 3 ) and nitrous oxide (N 2 O) to air and nitrate (NO 3 - ) to surface and ground waters [2]. NO 3 - leaching to ground waters represents a loss of soil fertility and also a threat to the wider environment and human health [3,4]. NO 3 - that enters drinking water supplies creates a risk of methemoglobinemia in infants/young children and has been linked to cancer and heart disease [5]. Half of the European population live in areas where concentrations in drinking water exceed 5.6 mg N-NO 3 ·L -1 , and about 20% live in areas where concentrations exceed the recommended level of 11.3 mg N-NO 3 ·L -1 [6]. NO 3 - and ammonium (NH 4 + ) transported with subsurface flow or surface runoff entering rivers or lakes contributes, together with phosphorous, to eutrophication, resulting in algae blooms and suffocation of aquatic life [7]. Horticulturae 2017, 3, 25; doi:10.3390/horticulturae3010025 www.mdpi.com/journal/horticulturae

Welcome message from author
This document is posted to help you gain knowledge. Please leave a comment to let me know what you think about it! Share it to your friends and learn new things together.
Transcript

horticulturae
Review
Nitrogen Related Diffuse Pollution from HorticultureProduction—Mitigation Practices andAssessment Strategies
Maria do Rosário Cameira 1,2,* and Mariana Mota 1,2
1 Department of Biosystems Engineering, Instituto Superior de Agronomia, University of Lisbon,Tapada da Ajuda, 1349-017 Lisboa, Portugal; [email protected]
2 Linking Landscape, Environment, Agriculture and Food (LEAF), Instituto Superior de Agronomia,University of Lisbon, Tapada da Ajuda, 1349-017 Lisboa, Portugal
* Correspondence: [email protected]; Tel.: +351-21-3653478
Academic Editor: Douglas D. ArchboldReceived: 24 October 2016; Accepted: 22 February 2017; Published: 28 February 2017
Abstract: Agriculture is considered one of the main nitrogen (N) pollution sources through the diffuseemissions of ammonia (NH3) and nitrous oxide (N2O) to the atmosphere and nitrate (NO3
−) to waterbodies. The risk is particularly high in horticultural production systems (HPS), where the use of waterand fertilizers is intensive and concentrated in space and time, and more specifically, in the case ofvegetable crops that have high growth rates, demanding an abundant supply of water and nitrogenforms. Therefore, to comply with the EU environmental policies aimed at reducing diffuse pollutionin agriculture, there is the need for mitigation practices or strategies acting at different levels such asthe source, the timing and the transport of N. HPS are often well suited for improvement practices,but efficient and specific tools capable of describing and quantifying N losses for these particularproduction systems are required. The most common mitigation strategies found in the literaturerelate to crop, irrigation and fertilization management. Nevertheless, only the success of a mitigationstrategy under specific conditions will allow its implementation to be increasingly targeted and morecost effective. Assessment methods are therefore required to evaluate and to quantify the impact ofmitigation strategies in HPS and to select the most promising ones.
Keywords: horticulture; diffuse pollution; N emissions; N leaching; mitigation strategies; fertigationmanagement; crop management
1. Introduction
Diffuse or non-point source pollution refers to both water and air pollution caused by a variety ofactivities that have no specific point of discharge. Furthermore, the long-range transport ability andmultiple sources of the pollutant contribute to the diffuse nature of the process. The management ofdiffuse pollution is complex and requires the careful analysis and understanding of various processes [1].
Agriculture is seen as one of the main N pollution sources through the diffuse emission ofammonia (NH3) and nitrous oxide (N2O) to air and nitrate (NO3
−) to surface and ground waters [2].NO3
− leaching to ground waters represents a loss of soil fertility and also a threat to thewider environment and human health [3,4]. NO3
− that enters drinking water supplies creates arisk of methemoglobinemia in infants/young children and has been linked to cancer and heartdisease [5]. Half of the European population live in areas where concentrations in drinking waterexceed 5.6 mg N-NO3·L−1, and about 20% live in areas where concentrations exceed the recommendedlevel of 11.3 mg N-NO3·L−1 [6]. NO3
− and ammonium (NH4+) transported with subsurface flow
or surface runoff entering rivers or lakes contributes, together with phosphorous, to eutrophication,resulting in algae blooms and suffocation of aquatic life [7].
Horticulturae 2017, 3, 25; doi:10.3390/horticulturae3010025 www.mdpi.com/journal/horticulturae

Horticulturae 2017, 3, 25 2 of 23
Atmospheric emissions of some nitrogen oxides, e.g., N2O (a greenhouse gas) and NOx, and NH3
are contributing, directly and indirectly, to negative effects on human health [8]. N2O in the atmospherecontributes to the depletion of the ozone layer and makes a significant contribution to climate change.The NH3 emissions contribute to acid rain causing acidification and eutrophication of the ecosystems.The latter also represent an indirect source of N2O greenhouse gas [9].
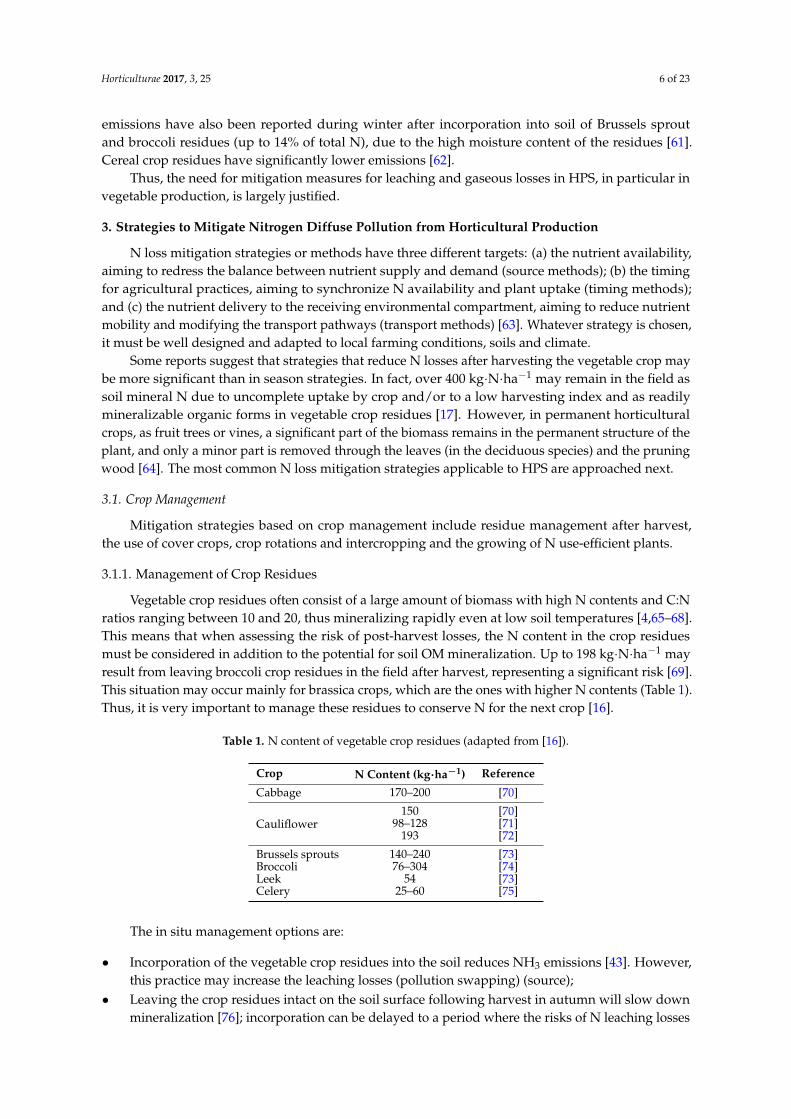
In response to the main environmental and health threats posed by agriculture, several countriesaround the world have implemented various policy measures and regulation tools developed underinternational conventions. Figure 1 shows the example of how, for the European Union (EU),agriculture can comply with these regulations [10]. Thus, the application of fertilizers, manures andother organic materials has to comply with policy measures dealing with the emissions to air,ground water and surface water. This is a difficult task since measures to reduce losses to onecompartment will often have an impact on the emissions to other compartments as a result of thenitrogen cycle (pollution swapping) [11].
Horticulturae 2017, 3, 10.3390/horticulturae3010025 2 of 22
runoff entering rivers or lakes contributes, together with phosphorous, to eutrophication, resulting
in algae blooms and suffocation of aquatic life [7].
Atmospheric emissions of some nitrogen oxides, e.g., N2O (a greenhouse gas) and NOx, and
NH3 are contributing, directly and indirectly, to negative effects on human health [8]. N2O in the
atmosphere contributes to the depletion of the ozone layer and makes a significant contribution to
climate change. The NH3 emissions contribute to acid rain causing acidification and eutrophication
of the ecosystems. The latter also represent an indirect source of N2O greenhouse gas [9].
In response to the main environmental and health threats posed by agriculture, several
countries around the world have implemented various policy measures and regulation tools
developed under international conventions. Figure 1 shows the example of how, for the European
Union (EU), agriculture can comply with these regulations [10]. Thus, the application of fertilizers,
manures and other organic materials has to comply with policy measures dealing with the emissions
to air, ground water and surface water. This is a difficult task since measures to reduce losses to one
compartment will often have an impact on the emissions to other compartments as a result of the
nitrogen
cycle (pollution swapping) [11].
Figure 1. Overview of the EU policy instruments affecting the use and losses of nitrogen in
agriculture (CLRTAP, Convention on Long Range Transport of Atmospheric Pollutants; IPPC,
directive on integrated pollution, prevention and control; CAP, common agricultural policy)
(adapted from [10]).
Although some improvements have led to the reduction of N inputs, diffuse pollution of
agricultural origin remains a major threat for waters. The technologies and measures to reduce these
emissions exist, but the diversity of the cropping systems and the complex diffuse N pathways have
resulted in regulatory obligations that are not equally efficient for different types of production
systems. Some authors state that the risk is higher in horticultural production systems (HPS) than in
arable lands [12]. Vegetable production, in particular, requires an intensive use of resources, namely
water and fertilizers, in concentrated space and time. Reported N application rates show values as
high as 600–900 kg∙ha−1 [13–15]. Vegetable crops in general present shallower root systems compared
to arable plants. Furthermore, the nitrogen use efficiency (NUE) of many vegetables is often less than
50% and can be as low as 20%, [14,16]. Contrary to arable crops, vegetables are harvested in a
vegetative stage when daily N uptake rates are still high, leaving soils with considerable mineral N
amounts. Their residues also take a particular position relative to arable crops due to often large
amounts of biomass, with a high N content (up to 200 kg∙ha−1) and low C:N ratios, left behind on the
field [16,17]. These adverse characteristics can be exacerbated by the incorrect management of
irrigation and/or by the precipitation occurring during the post‐harvest season, both situations
Figure 1. Overview of the EU policy instruments affecting the use and losses of nitrogen in agriculture(CLRTAP, Convention on Long Range Transport of Atmospheric Pollutants; IPPC, directive onintegrated pollution, prevention and control; CAP, common agricultural policy) (adapted from [10]).
Although some improvements have led to the reduction of N inputs, diffuse pollution ofagricultural origin remains a major threat for waters. The technologies and measures to reduce theseemissions exist, but the diversity of the cropping systems and the complex diffuse N pathways haveresulted in regulatory obligations that are not equally efficient for different types of production systems.Some authors state that the risk is higher in horticultural production systems (HPS) than in arablelands [12]. Vegetable production, in particular, requires an intensive use of resources, namely waterand fertilizers, in concentrated space and time. Reported N application rates show values as highas 600–900 kg·ha−1 [13–15]. Vegetable crops in general present shallower root systems compared toarable plants. Furthermore, the nitrogen use efficiency (NUE) of many vegetables is often less than 50%and can be as low as 20%, [14,16]. Contrary to arable crops, vegetables are harvested in a vegetativestage when daily N uptake rates are still high, leaving soils with considerable mineral N amounts.Their residues also take a particular position relative to arable crops due to often large amounts ofbiomass, with a high N content (up to 200 kg·ha−1) and low C:N ratios, left behind on the field [16,17].These adverse characteristics can be exacerbated by the incorrect management of irrigation and/or bythe precipitation occurring during the post-harvest season, both situations maintaining excessivelyhigh moisture conditions in the soil surface and drainage fluxes out of the root zone.
Considering fruit crops, which constitute another important part of HPS, the use of resources isnot so intensive, but it follows a similar tendency. In particular, intensive and hedgerow orchards arecharacterized by high plant densities, contributing to a weaker and more superficial root development.This is reinforced by the application of water and nutrients exclusively to the root zone [18,19].

Horticulturae 2017, 3, 25 3 of 23
Moreover, the need to correct the soil reaction and/or to supply micronutrients may require theapplication of N forms that will increase pollution.
Horticultural production is important worldwide. For example, in the EU, it was, for the yearof 2014, 30 million tons for fruits and 63 million tons for vegetables, the latter having increased 4%in relation to 2013 [20]. Water and N availability remain globally the most limiting plant growthfactors, and water application is a management option in irrigated systems that strongly interactswith the efficient use of N [21]. Therefore, irrigated horticulture requires specific practices to increasewater and nutrient use efficiency, which is considered to be a major challenge for the food productionduring this century [22]. Nitrogen losses to water bodies and the atmosphere and the correspondentmitigation strategies are thus significant concerns in HPS. Recent studies highlighted that there is thedanger of pollution swapping between nitrate (NO3
−) leaching and N2O and NH3 gaseous losses,which requires a holistic approach to the diffuse pollution issue, including the N and water dynamicsand management in the soil-plant-atmosphere systems [5,23].
The objective of this review paper is to identify the main strategies available to mitigate thevarious N losses from HPS with emphasis on vegetable production and to present methods to assesstheir application success. The first part of the work outlines the threats to the environment and healthassociated with N losses from HPS. In the second part the EU policy tools concerning N diffusepollution are presented, followed by the major pathways for N losses and its underlying processes.A description of the available strategies to mitigate these losses is then presented; followed by therevision of three methods to evaluate the success of the different types of measures.
2. Nitrogen Loss Pathways and Processes
The N present in the soil is subject to several transformations that influence its availability toplants and influence the potential for losses though the various pathways. Horticulture soils generallycontain large pools of N, most of which are in organic forms. Around 1%–3% of the N bound inorganic forms may become mineralized and available to crop uptake or be potentially lost withinthe growth period [24]. In this process, bacteria digest organic material and release NH4
+, which ispositively charged and therefore can be bound to negatively-charged soil particles and organic matter(OM). Thus, NH4
+ does not move downward in soils and can be volatilized at the soil surface. It canalso be absorbed by the plants or subject to nitrification, which is the conversion to NO3
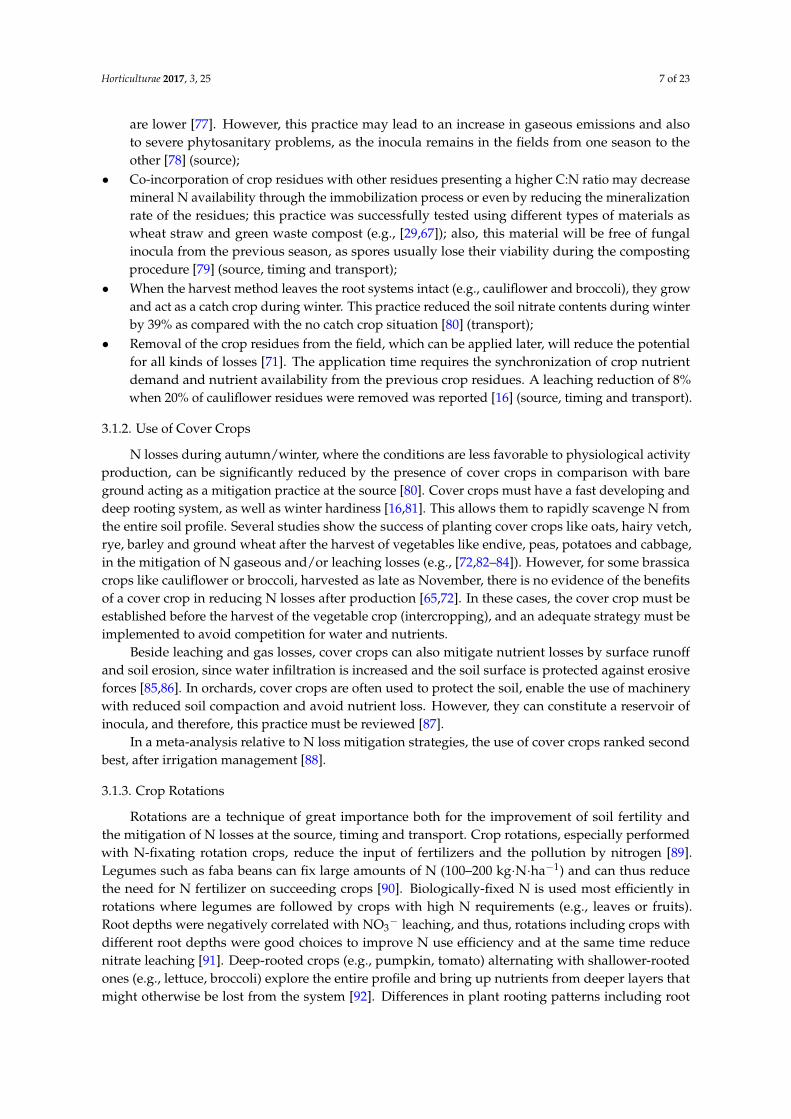
−. This N formis negatively charged and water soluble, and depending on the conditions, it can move below the croprooting zone (leached), be absorbed by crops or denitrified. A temporary reduction in the available N canoccur (immobilization) when the bacteria that decompose high C:N residues use the soil N to grow andbuild bacterial biomass. However, there is often a net gain of N during the growing season. Tracing the Npath through the environmental reservoirs is thus a challenge due to the complex N cycle [25]. In HPS,all of the tree N loss pathways occur: leaching, volatilization and denitrification [9] (Figure 2).Horticulturae 2017, 3, 10.3390/horticulturae3010025 4 of 22
Figure 2. Simplified diagram of the nitrogen cycle in a horticultural system, showing the main
transformations and pathways for loss.
2.1. Nitrate Leaching
Leaching refers to the loss of NO3− from the soil root zone into ground and surface waters and
results from the combination of three physical processes: convection, diffusion and hydrodynamic
dispersion [26]. The convective transport of nitrate in the root zone occurs due to the mass flow of
water through the soil during drainage after precipitation and/or irrigation events. Diffusive
transport occurs due to the concentration gradient between the soil solution with nitrate that is
moving by convection and the surrounding soil with a lower concentration. During irrigation and
precipitation events, the convective transport will predominate while diffusion gains importance
between events, when the soil water fluxes are low. However, the large variations in soil pore sizes
cause a range of pore water velocities. As a result, some portions of the flowing solution move ahead
while other portions lag behind, causing the incoming solution to mix or disperse with the
antecedent solution. This process is called hydrodynamic dispersion and can predominate over
diffusion when the convective velocity is sufficiently high
Factors affecting nitrate leaching have been reviewed, although more extensively for arable
crops than for horticultural crops (e.g., [9,12]). The amount of NO3− leached from the root zone is
determined by its concentration in the soil solution and the drainage flux through the soil. While the
amount of NO3− present in the soil solution is a result of the N budget, the drainage flux depends on
the soil hydraulic properties, temperature and water inputs.
Horticultural crops, vegetables in particular, are mainly produced in sandy to loamy soils,
which are less retentive for water and highly to moderately conductive. Soil water contents are
usually high since vegetables are irrigated, increasing the leaching risk during the crop season.
When irrigation is correctly managed, leaching will be minimized, but N will accumulate in the soil
profile, increasing the post‐harvest leaching potential. Leaching losses for a variety of vegetable
crops, climates, soils and management practices are presented by several authors [12,21,27–35]. A
leaching loss of 207 kg NO3‐N ha−1 was reported from a cabbage crop on a sandy soil harvested in
September; a broccoli crop in a loamy soil harvested in November leached 282 kg∙ NO3‐N ha−1, while
in a sandy soil planted with cauliflower harvested in November, leaching reached a value of 293
kg∙NO3‐N ha−1.
Nitrate losses from other horticultural systems, e.g., orchards have been less studied. Data
collected in an apple orchard show concentrations up to 66 mg NO3‐N∙L−1 in the leachate [36]. After
the analysis of current fertigation practices in an intensive olive grove, it was found that nitrate
leaching accounted for 75% of the fertilization inputs [37]. Other researchers found that 53%–78% of
the applied nitrogen was leached in a commercial apple orchard [38]. Results suggest that if an
Figure 2. Simplified diagram of the nitrogen cycle in a horticultural system, showing the maintransformations and pathways for loss.

Horticulturae 2017, 3, 25 4 of 23
2.1. Nitrate Leaching
Leaching refers to the loss of NO3− from the soil root zone into ground and surface waters and
results from the combination of three physical processes: convection, diffusion and hydrodynamicdispersion [26]. The convective transport of nitrate in the root zone occurs due to the mass flow ofwater through the soil during drainage after precipitation and/or irrigation events. Diffusive transportoccurs due to the concentration gradient between the soil solution with nitrate that is moving byconvection and the surrounding soil with a lower concentration. During irrigation and precipitationevents, the convective transport will predominate while diffusion gains importance between events,when the soil water fluxes are low. However, the large variations in soil pore sizes cause a range ofpore water velocities. As a result, some portions of the flowing solution move ahead while other portionslag behind, causing the incoming solution to mix or disperse with the antecedent solution. This processis called hydrodynamic dispersion and can predominate over diffusion when the convective velocity issufficiently high.
Factors affecting nitrate leaching have been reviewed, although more extensively for arable cropsthan for horticultural crops (e.g., [9,12]). The amount of NO3
− leached from the root zone is determinedby its concentration in the soil solution and the drainage flux through the soil. While the amount ofNO3
− present in the soil solution is a result of the N budget, the drainage flux depends on the soilhydraulic properties, temperature and water inputs.
Horticultural crops, vegetables in particular, are mainly produced in sandy to loamy soils,which are less retentive for water and highly to moderately conductive. Soil water contents are usuallyhigh since vegetables are irrigated, increasing the leaching risk during the crop season. When irrigationis correctly managed, leaching will be minimized, but N will accumulate in the soil profile, increasingthe post-harvest leaching potential. Leaching losses for a variety of vegetable crops, climates, soils andmanagement practices are presented by several authors [12,21,27–35]. A leaching loss of 207 kg NO3-Nha−1 was reported from a cabbage crop on a sandy soil harvested in September; a broccoli crop in aloamy soil harvested in November leached 282 kg·NO3-N ha−1, while in a sandy soil planted withcauliflower harvested in November, leaching reached a value of 293 kg·NO3-N ha−1.
Nitrate losses from other horticultural systems, e.g., orchards have been less studied.Data collected in an apple orchard show concentrations up to 66 mg NO3-N·L−1 in the leachate [36].After the analysis of current fertigation practices in an intensive olive grove, it was found that nitrateleaching accounted for 75% of the fertilization inputs [37]. Other researchers found that 53%–78%of the applied nitrogen was leached in a commercial apple orchard [38]. Results suggest that if anirrigated orchard is located in a light textured and free draining soil and there is a high N input,the potential for leaching can be high, thus requiring the application of mitigation strategies [39,40].
2.2. Ammonia Volatilization
Ammonia volatilization is the transformation of NH4+ into NH3 in the soil and its transport from
the soil surface to the atmosphere [9]. Agriculture accounts for 50% of the NH3 that is volatilizedworldwide [41], which is undesirable since it represents a loss of N from the soil-plant system and athreat to the environment. The relative concentrations of NH4
+ and NH3 in the soil depend on thepH of the soil solution, being favored by high values. Other factors affecting NH3 production aretemperature, soil texture, soil cation exchange capacity and soil moisture [9]. The rate of exchangeof NH3 between soil surface or plant material and the atmosphere depends on micrometeorologicalcircumstances (especially wind speed and temperature) and ambient NH3 concentration [42].
This process is the most important N loss pathway from agricultural soils receiving NH4+-based
synthetic fertilizers and some type of manures. NH3 volatilization can also be produced bymineralization of soil OM and crop residues, especially from vegetable crops [43], which have high Nlevels and low C:N ratios. About 5%–16% of the N content of vegetable crop residues can be lost asNH3 [44]. Volatilization losses from poultry manure and dairy slurry were found to be 9%–20% and14%–35% of total N applied, respectively [44,45]. The potential risk of ammonia volatilization from

Horticulturae 2017, 3, 25 5 of 23
urea fertilizer can represent up to 65% of the N applied, depending on soil and climatic conditions [46].This aspect is very important in orchards, as urea application is common at the post-harvest stage,to enable a fast-nutrient uptake that confers adequate nutrient storage and a good plant performancefor the following spring.
2.3. Nitrification and Denitrification
Agriculture accounts for 70% of the N2O emissions to the atmosphere in Europe [47]. Some of thehighest fluxes to date have been measured in irrigated and fertilized systems [48,49]. N2O emissionsfrom cultivated soils result from the biological nitrification and denitrification processes [50].Thus, the understanding of the soil and environmental factors regulating the microbial populations isnecessary to choose appropriate N2O mitigation strategies. The major soil parameters that regulatethe nitrification-denitrification processes are temperature, percentage of soil pores filled with water,oxygen level and pH.
Nitrification is an aerobic process resulting from two distinct steps: the oxidation of NH3 or NH4+
to NO2− by ammonia-oxidizing bacteria, such as Nitrosospira and Nitrosomonas, and the oxidation of
NO2− to NO3
− by the nitrite-oxidizing bacteria (e.g., Nitrobacter) [51]. During the first step, a portionof the NH4
+ may be converted to N2O during the decomposition of nitrite [52,53].The optimum soil temperatures for the nitrifying microbial populations range from
25 ◦C–30 ◦C [54]. However, lower nitrification rates have been found at temperatures below 5 ◦C [53].As to the optimum soil pH, it varies between 4.5 and 7.5 [54].
Nitrifying bacteria are sensitive to changes in soil water content. The maximum nitrificationrate occurs when the soil moisture is near field capacity (−10 kPa) [54]. As the soil gets wetter,the nitrification rate decreases, and it is estimated that the process becomes restricted when thewater-filled pore space is greater than 60%. However, as water drains and oxygen re-enters thesoil, nitrification quickly resumes as the bacteria population recovers. The nitrification rate isalso significantly slower when the soil is dry, although it still can occur near the wilting point(−1500 kPa) [55]. In dry environments, a surge in microbial activity (including nitrification) iscommonly seen when a soil is rewetted by irrigation or rainfall following a prolonged dry period.
The whole process of nitrification is dependent on the ammonia available in the soil;however, high concentrations of ammonium/ammonia can restrict the activity of Nitrobacter [55].Thus, the process is dependent on management practices, particularly from the type of fertilizer applied.
The other main driver for N2O production is denitrification. It consists of a microbially-mediatedprocess of the reduction of NO3
− and/or nitrite (NO2−), which may ultimately produce N2 [56].
In addition to the terminal product, NO and N2O are generated as obligatory free intermediates [57].The rate of denitrification and the relative proportions of NO, N2O and N2 produced depend on theoutcomes of complex interactions between soil properties, soil micro-organisms, climatic factors andmanagement practices. Increased soil N supply, decreased soil pH, C availability and water contentgenerally increase the N2O:N2 ratio, thus increasing N2O emissions. Mitigation approaches shouldfocus on ways to enhance the reduction of N2O to N2, thus lowering the N2O:N2 product ratio.
As denitrification is favored by high NO3− and C availability, it is likely to occur in
wet horticulture soils, in particular immediately after rainfall or an irrigation event when soilpores may become filled with water and the oxygen supply may be temporarily restricted [58].Extensive descriptions of the denitrification processes and the regulation of the N2O:N2 ratio can befound in previous literature [56].
Available data provide evidence of the need for strategies to reduce soil N2O emissions in HPS.Losses are expected to be derived primarily from denitrification during peak soil moisture periods,when more than 60% of the pore space is filled with water [59]. At lower soil moistures, nitrificationwill be the major source of N2O. Losses are important especially for cole crop production and mustaccount for the post-harvest period. Field emissions of N2O following a cauliflower crop harvested inSeptember on a silty clay loam varied from 1.1%–3.7% of the N content of the residues [60]. High N2O
Horticulturae 2017, 3, 25 6 of 23
emissions have also been reported during winter after incorporation into soil of Brussels sproutand broccoli residues (up to 14% of total N), due to the high moisture content of the residues [61].Cereal crop residues have significantly lower emissions [62].
Thus, the need for mitigation measures for leaching and gaseous losses in HPS, in particular invegetable production, is largely justified.
3. Strategies to Mitigate Nitrogen Diffuse Pollution from Horticultural Production
N loss mitigation strategies or methods have three different targets: (a) the nutrient availability,aiming to redress the balance between nutrient supply and demand (source methods); (b) the timingfor agricultural practices, aiming to synchronize N availability and plant uptake (timing methods);and (c) the nutrient delivery to the receiving environmental compartment, aiming to reduce nutrientmobility and modifying the transport pathways (transport methods) [63]. Whatever strategy is chosen,it must be well designed and adapted to local farming conditions, soils and climate.
Some reports suggest that strategies that reduce N losses after harvesting the vegetable crop maybe more significant than in season strategies. In fact, over 400 kg·N·ha−1 may remain in the field assoil mineral N due to uncomplete uptake by crop and/or to a low harvesting index and as readilymineralizable organic forms in vegetable crop residues [17]. However, in permanent horticulturalcrops, as fruit trees or vines, a significant part of the biomass remains in the permanent structure of theplant, and only a minor part is removed through the leaves (in the deciduous species) and the pruningwood [64]. The most common N loss mitigation strategies applicable to HPS are approached next.
3.1. Crop Management
Mitigation strategies based on crop management include residue management after harvest,the use of cover crops, crop rotations and intercropping and the growing of N use-efficient plants.
3.1.1. Management of Crop Residues
Vegetable crop residues often consist of a large amount of biomass with high N contents and C:Nratios ranging between 10 and 20, thus mineralizing rapidly even at low soil temperatures [4,65–68].This means that when assessing the risk of post-harvest losses, the N content in the crop residuesmust be considered in addition to the potential for soil OM mineralization. Up to 198 kg·N·ha−1 mayresult from leaving broccoli crop residues in the field after harvest, representing a significant risk [69].This situation may occur mainly for brassica crops, which are the ones with higher N contents (Table 1).Thus, it is very important to manage these residues to conserve N for the next crop [16].
Table 1. N content of vegetable crop residues (adapted from [16]).
Crop N Content (kg·ha−1) Reference
Cabbage 170–200 [70]
Cauliflower150 [70]
98–128 [71]193 [72]
Brussels sprouts 140–240 [73]Broccoli 76–304 [74]Leek 54 [73]Celery 25–60 [75]
The in situ management options are:
• Incorporation of the vegetable crop residues into the soil reduces NH3 emissions [43]. However,this practice may increase the leaching losses (pollution swapping) (source);
• Leaving the crop residues intact on the soil surface following harvest in autumn will slow downmineralization [76]; incorporation can be delayed to a period where the risks of N leaching losses
Horticulturae 2017, 3, 25 7 of 23
are lower [77]. However, this practice may lead to an increase in gaseous emissions and alsoto severe phytosanitary problems, as the inocula remains in the fields from one season to theother [78] (source);
• Co-incorporation of crop residues with other residues presenting a higher C:N ratio may decreasemineral N availability through the immobilization process or even by reducing the mineralizationrate of the residues; this practice was successfully tested using different types of materials aswheat straw and green waste compost (e.g., [29,67]); also, this material will be free of fungalinocula from the previous season, as spores usually lose their viability during the compostingprocedure [79] (source, timing and transport);
• When the harvest method leaves the root systems intact (e.g., cauliflower and broccoli), they growand act as a catch crop during winter. This practice reduced the soil nitrate contents during winterby 39% as compared with the no catch crop situation [80] (transport);
• Removal of the crop residues from the field, which can be applied later, will reduce the potentialfor all kinds of losses [71]. The application time requires the synchronization of crop nutrientdemand and nutrient availability from the previous crop residues. A leaching reduction of 8%when 20% of cauliflower residues were removed was reported [16] (source, timing and transport).
3.1.2. Use of Cover Crops
N losses during autumn/winter, where the conditions are less favorable to physiological activityproduction, can be significantly reduced by the presence of cover crops in comparison with bareground acting as a mitigation practice at the source [80]. Cover crops must have a fast developing anddeep rooting system, as well as winter hardiness [16,81]. This allows them to rapidly scavenge N fromthe entire soil profile. Several studies show the success of planting cover crops like oats, hairy vetch,rye, barley and ground wheat after the harvest of vegetables like endive, peas, potatoes and cabbage,in the mitigation of N gaseous and/or leaching losses (e.g., [72,82–84]). However, for some brassicacrops like cauliflower or broccoli, harvested as late as November, there is no evidence of the benefitsof a cover crop in reducing N losses after production [65,72]. In these cases, the cover crop must beestablished before the harvest of the vegetable crop (intercropping), and an adequate strategy must beimplemented to avoid competition for water and nutrients.
Beside leaching and gas losses, cover crops can also mitigate nutrient losses by surface runoffand soil erosion, since water infiltration is increased and the soil surface is protected against erosiveforces [85,86]. In orchards, cover crops are often used to protect the soil, enable the use of machinerywith reduced soil compaction and avoid nutrient loss. However, they can constitute a reservoir ofinocula, and therefore, this practice must be reviewed [87].
In a meta-analysis relative to N loss mitigation strategies, the use of cover crops ranked secondbest, after irrigation management [88].
3.1.3. Crop Rotations
Rotations are a technique of great importance both for the improvement of soil fertility andthe mitigation of N losses at the source, timing and transport. Crop rotations, especially performedwith N-fixating rotation crops, reduce the input of fertilizers and the pollution by nitrogen [89].Legumes such as faba beans can fix large amounts of N (100–200 kg·N·ha−1) and can thus reducethe need for N fertilizer on succeeding crops [90]. Biologically-fixed N is used most efficiently inrotations where legumes are followed by crops with high N requirements (e.g., leaves or fruits).Root depths were negatively correlated with NO3
− leaching, and thus, rotations including crops withdifferent root depths were good choices to improve N use efficiency and at the same time reducenitrate leaching [91]. Deep-rooted crops (e.g., pumpkin, tomato) alternating with shallower-rootedones (e.g., lettuce, broccoli) explore the entire profile and bring up nutrients from deeper layers thatmight otherwise be lost from the system [92]. Differences in plant rooting patterns including root

Horticulturae 2017, 3, 25 8 of 23
density and root branching at different soil depths also result in more efficient extraction of nutrientsfrom all soil layers when a series of different crops is grown.
3.1.4. Use of N Use-Efficient Plants
The use of plants associated with mycorrhizae can reduce N losses through leaching by actingat the source and transport. Mycorrhizae contribute to the formation of stable aggregates in the soil,developing a macroporous structure that favors infiltration and water retention, penetration of rootsand air and prevents erosion. Furthermore, mycorrhizae promote the capacity of plants to acquire Nfrom inorganic sources, with different studies showing that mycorrhizal plants have an increased plantN content, reducing the soil nitrate content [93]. Furthermore, an adequate choice of the rootstock isimportant, since fast-growing rootstocks have usually a better NUE and are less prone to N lossesthrough leaching, when compared to slow-growing ones [39,94].
3.2. Irrigation and Fertilization Management
Vegetable crops are irrigated frequently due to their shallow rooting system and high sensitivityto moisture stress. The amount of irrigation water applied is frequently far greater than the actualcrop needs. This has significant impact on soil NO3
− level, and it is clear that controlling the amountof drainage from irrigation is critical to the protection of groundwater. Since convection is the mainprocess of nitrate transport in the root zone, the control of the NO3
− available for leaching mustbe complemented with the control of the hydraulic fluxes due to irrigation. Thus, an integratedmanagement of both irrigation and fertilization practices should be considered.
3.2.1. Irrigation Water Management
In irrigated horticulture, excessive water applications increase N leaching, leading to a low crop Navailability, which is compensated by increasing fertilization rates. As a consequence, when crops areover irrigated, it is common to observe low NUE with a negative impact on groundwater quality [21].A meta-analysis of several strategies to control nitrate leaching led to the conclusion that the group ofstrategies based on improving water irrigation management had the largest effect [88]. Irrigation watermanagement has a significant impact on N losses not only because it controls the nutrient delivery tothe water bodies (transport type method), but also as a mitigation method at the source, since moisturecontent controls most of the biochemical reactions leading to N transformations [95]. Irrigation watermanagement can be improved at different levels, as described next.
• Adjustment of water application to crop needs: irrigation requirements
The adjustment of water application to crop needs without decreasing yields and nutrient uptakeefficiency is the irrigation management practice most effective in decreasing N losses [88]. Crop needsrefer to the actual water requirements for evapotranspiration (ETc), which primarily depend oncrop development and climatic factors. A suitable method for estimating ETc for vegetable cropproduction is the FAO method based on reference evapotranspiration (ETo) and the crop coefficients(Kc) [96]. Irrigation requirements are primarily determined by crop water requirements, but alsodepend on the characteristics of the irrigation system, management practices and the soil characteristics.Irrigation systems are generally rated with respect to application efficiency, which is the fraction ofthe water that has been applied by the irrigation system and that is available to the plant for use [97].Applied water that is not available to the plant may have been lost from the root zone throughevaporation or wind drifts of spray droplets, leaks in the pipe system, surface and subsurface runoff ordeep percolation within the irrigated area.

Horticulturae 2017, 3, 25 9 of 23
• Irrigation scheduling
While the determination of the irrigation requirements only provides general guidelines due to thevariable nature of vegetable production, irrigation scheduling provides the means to determine whenand how much to irrigate according to the in situ conditions of the plants in a given field. Irrigationscheduling is generally based on experience, being generally accepted that vegetable growers overirrigate to ensure that water is not limiting the production, originating drainage fluxes that carrynitrates beyond the depth of crop roots. The use of soil moisture sensors or soil matric potential sensorsis the most appropriate technique to schedule the irrigation of vegetable crops [98]. These sensorscan be used as a standalone, complementing the FAO method or even complementing the growerexperience. Tensiometers are an example of soil matric potential sensors whose readings are comparedwith the soil matric potential (SMP) at field capacity, allowing one to adjust the irrigation frequency,once the thresholds are defined. Field capacity is the moisture content or the SMP at which a soil isholding the maximum amount of water it can against the force of gravity. Table 2 contains guidelinesfor using SMP data to schedule irrigation events.
Table 2. Irrigation guidelines for different soil type when using tensiometers.
Soil Texture SMP a (cb) Soil Moisture Status and Irrigation Requirements
Sand, loamy sand 5–10 Soil at field capacityNo irrigation requiredSandy loam, loam, silty loam 10–20
Clay loam, clay 20–40
Sand, loamy sand 20–40 50% available water depletedIrrigation requiredSandy loam, loam, silt loam 40–60
Clay loam, clay 50–10a SMP, soil matrix potential.
The utility of tensiometers in fine-textured soils is limited due to the range of detection; thus,tensiometers are practical in sandy or coarse-textured soils. Details about the use of tensiometersto schedule the irrigation of vegetable crops are provided by several authors, e.g., [99–102].SMP thresholds for several vegetables produced in a variety of soil types are also provided [98].
• Irrigation technologies
Using more efficient systems for water delivery decreases the use of water since it minimizes losses.Different types of irrigation systems have been adapted for use in horticultural crops. Hand-movedsprinklers and travelling guns are systems that present larger application efficiencies (Ea) than thesurface irrigation systems; nevertheless, the uniformity of water distribution (UD) is greatly affectedby wind conditions. When the UD is low, there is the tendency to over irrigate some of the areasin order to provide enough water to the others, causing considerable drainage fluxes and leachingin some parts of the field. Drip systems potentially optimize Ea and UD, and although they reducethe root development and the volume of soil used by the plants, they are very commonly used inhorticultural systems, both for vegetables and for fruits trees and vineyards, as they reduce waterconsumption and the growth of competitor plants [103]. If fertilizer injection is combined with dripirrigation, greater yield increases are possible. The cost of installing a drip system is relatively high.However, the labor cost through the season is very low. A major advantage of drip systems is that lesswater is required. Drip irrigation provides the crop with a uniform supply of water through the season.
3.2.2. Fertilizer Management
Fertilizer management strategies target both N source and N timing control, since they aim toredress the balance between nutrient supply and demand to minimize the potential loss and to definethe best application timing. A meta-analysis study regarding N mitigation practices ranks fertilizermanagement strategies after irrigation water management and the use of cover crops [86]. The largest

Horticulturae 2017, 3, 25 10 of 23
effect was achieved by the reduction of the recommended amounts followed by improved fertilizertechnologies. This group of strategies attained a leaching reduction of almost 40%.
• Fertilizer amounts and formulations
The fertilizer amount to be supplied must compensate for the exported nutrients, assuming thatthe remaining organs will store or restores to the soil the nutrients retained. HPS require, in some cases,high levels of N fertilizers (>200 kg·ha−1) [17]. Furthermore, as horticultural crops are usually highlyvalued, the relative cost of this input is less important to farmers, and thus, they may apply it in excess,endangering environmental quality. The literature shows that the best relationship between nitrateleaching and yield is obtained when applying the recommended N fertilizer amount. Values below therecommended ones will reduce leaching, but also reduce yields. The focus is then the calculation ofthe recommended amount to meet plant demand and reducing excessive N input, considering otherpotential N sources, such as soil mineral N and potentially mineralizable N from the soil endogenousOM and from incorporated organic materials and the N provided by the irrigation water.
As to the formulations, the N use efficiency of foliar urea application is higher than whenN is applied to the soil. In addition, it promotes fungal disease control, reducing overwinteringspores [103,104]. The lowest N losses reported are associated with ammonium sulfate or diammoniumphosphate fertilizers, as ammonium is stored in the soil cationic exchange sites and, therefore, is muchless likely to be leached past the tree roots [9].
It is also important to consider the interaction of the N fertilizer with other nutrients, namely withCa or S; since the need to supply these secondary macronutrients requires the use of formulationsthat potentially contribute to N leaching, for instance Ca(NO3)2. The same applies to the formulationsused to control the soil reaction, e.g., the use of (NH4)2SO4 to acidify the soil can contribute to N lossesthrough volatilization [105].
• Fertilizer application method
When urea is spread at the surface, the NH3 volatilization losses can be as high as 50% of theapplied N [105]. Moreover, incorporating urea at depths higher than 7.5 cm can result in negligibleNH3 emissions and maximum N retention. Application of urea before the onset of rain can significantlyreduce the amount of ammonia volatilization because it washes the urea and ammonium below thesoil surface. A study reports that 10–16 mm of rainfall soon after application of urea reduced the lossby over 80% [106]. Applying irrigation water after the application of urea fertilizer can also reducethe risk of ammonia volatilization [107]. Similarly, volatilization from applications of anhydrousammonia can be minimized if the fertilizer is injected to depths below 10 cm when soils are moist,generally after winter or rainy seasons [41]. Measurements of volatilization losses from manure accountfor 68% of total NH4
+ present for surface application, 17% for surface incorporation and 2% for deepplacement [42]. Foliar applications until run-off also contribute to N loss, which can be minimized bysurfactants, reducing the part of the nutrient supply that drips to the soil.
• Optimized timing of fertilizer application
The date of application also affects the various pathways for the losses. For example, in the caseof manure the greatest losses occur when it is applied in autumn because the soil is warm enough formineralization. Besides, there is sufficient rainfall over the autumn and winter period to leach theresulting nitrate out of the soil profile. Woody crops, as pome or stone fruits, store N in perennialorgans before leaf fall and use these reserves to enhance new metabolic activity at bud break. In thiscontext, the delay of N supply to the active vegetative growth phase can minimize N losses. Results inyoung pear orchards demonstrate that the N supplied before bud break is not utilized by the trees,as they use first the stored N [108].
Applying nitrogen fertilizers and animal slurries at times when the risk of leaching is low, that isoutside the rainy season, is a practice that reduces N losses associated with precipitation, which cannot

Horticulturae 2017, 3, 25 11 of 23
be controlled in open air HPS. Splitting fertilizer applications to match plant demand will also reducevolatilization and leaching losses [106].
• Improved fertilizer technics
A reliable way to reduce NH3 volatilization is to coat urea fertilizer with a urease inhibitor, becauseit reduces the conversion rate of urea into ammonium in the soil [47,109]. A reduction of 42% in thecumulative NH3 emissions through the slower release of NH4
+ to the soil solution from the hydrolysisof urea was reposted, which also promoted a lower exchangeable N pool [107]. Because ammoniavolatilization losses from urea-based fertilizers are variable and unpredictable, the addition of a ureaseinhibitor can be a potentially valuable mitigation method [110].
The use of a nitrification inhibitor keeps the nitrogen in the NH4+ form, which the plants can use,
preventing the accumulation of NO3− in the soil profile, thus reducing the loss potential to the water
bodies and to the atmosphere as N2O. In some cases the addition of a nitrification inhibitor reducedthe N2O emissions by 45% (in season) and 40% (winter period) during a lettuce-cauliflower rotation, ascompared with conventional fertilizer [111]. When the inhibitor was applied to poultry manure and toinorganic fertilizer (broccoli, lettuce and cauliflower crops), the reductions in N2O losses were of 64%and 32%, respectively [60]. Nevertheless, the beneficial effect of nitrification inhibitors in decreasingdirect N2O emission can be undermined or even outweighed by an increase in NH3 volatilization [112].The use of fertilizers with N in readably usable forms, as amino acids or algae extracts, can alsocontribute to reduce N losses, as it promotes a faster N uptake [113]. However, this option is still quiteexpensive and not overall established.
The use of fertilizer techniques can reduce nitrate leaching by 20%–30% compared with standardfertilizers. Nevertheless, it may incur an additional cost for the farmer [88].
• Organic manures and composts
Agricultural wastes, industrial wastes and sewage sludge (biosolids) usually contain largeamounts of nitrogen. Much of the N in these manures and wastes can be released throughmineralization processes in the soil, which ultimately results in a risk of nitrate leaching [53,114].However, it is very difficult to predict the mineralization rate of these organic wastes and manuresbecause of the variability of the constituent materials [115]. Nitrate leaching losses were reported to besignificantly higher from poultry manure (low C:N) or slurry than from straw-based (higher C:N) farmyard manure when applied to an arable free-draining soil in the U.K. [116]. In fact, the addition oforganic carbon in these wastes may also increase the rate of mineralization/immobilization turnoverof soil N, as well as the applied N [117]. Well matured compost should substitute for fresh manuresince it presents higher C:N, hence lower mineralization rates. The calculation of the crop needsshould consider the soil mineral N at transplanting, which must be always assessed, and also, the Nfrom organic sources by estimating a mineralization coefficient [118]. In the EU, very large manureapplications are not allowed due to the EU limit of 170 kg·ha−1 for the nitrate vulnerable zones(Nitrates Directive), and the allowed application periods should be respected according to eachcountry’s action program and rainfall pattern.
• Monitoring of plant and/or soil N status
The synchronization between N fertilization and crop N demand is essential in order to minimizethe amount of N that over the season is in the soil constituting a potential loss. This may beimproved by regular analysis of soil solution, plant sap analysis, leaf chlorophyll measurementsor plant tissue testing. This management practice is particularly important for vegetable crops,since for woody species, the buffering capacity conferred by the perennial structures reduces theimpact of the monitoring. For these cases, the N correction of fertilization management will havean effect predominantly in the coming season. Tissue testing involves taking samples from theplant (most commonly leaves) at various times during the growth period and sending them to a

Horticulturae 2017, 3, 25 12 of 23
laboratory for mineral nutrient analysis [15]. Petiole sap testing involves taking leaf petioles andcollecting the sap, which is then tested for nitrate and/or potassium using portable meters [119].Chlorophyll meters are used to measure the “greenness” of individual leaves and to monitor nitrogenstatus after proper calibration against the crop with proper fertilization [120,121]. Monitoring thesoil N status by collecting soil samples, or placing suction cups beyond the root system to collect soilsolution, also constitute efficient mitigation practices, as they provide information regarding the Nstored in the soil and/or moving beyond the roots’ depth.
4. Assessment of the Effectiveness of Mitigation Measures
The success of a mitigation strategy under specific conditions will allow its implementation to beincreasingly targeted and more cost effective. Assessment methods are therefore required to evaluateand to quantify the impact of mitigation strategies. These methods provide evidence of a reductionin nutrient loadings or concentration in the receiving compartments (water body or atmosphere) oran improvement in ecological response [73]. Assessment methods must also recognize responsesto mitigation that are often site-specific, since a positive response in one area may not be repeatedelsewhere. They must be both practical and suited to their end users. The most commonly-usedassessment methods are described below.
4.1. Measurements
Long time series of N concentrations in the environmental compartments provide the best analysisof mitigation success, since they describe actual changes resulting from the implementation of amitigation practice either at the source, timing or transport (Table 3). However, it is not always clearwhy any response to mitigation has been achieved because of the complex environmental processesinvolved and our incomplete knowledge of nutrient dynamics. Variations in weather between yearsadd another layer of complexity and make it difficult to distinguish the effect of the mitigation methodfrom environmental noise [122].
Table 3. Assessment method features applicable at field and farm scales (from [73]).
Mitigation TypeAssessment Method
Measurement Budget Modelling
Source Y Y YTiming Y N YTransport Y N Y
Data requirements medium low medium/highUncertainty low medium medium
Y, sensitive; N, not sensitive.
In the medium-term, the continued development and installation of automated in situ samplingand analytical equipment facilitating high frequency sampling will help improve our understandingand provide more representative assessments [123]. Moreover, sometimes, long time series arenecessary to reveal the impact of a mitigation strategy. In this case, or where the measurement is notcost effective, alternatives are required, e.g., nutrient budgets and modelling [73].
4.2. Farm Surveys and Nutrient Budgets
Nutrient budgets are commonly used to assess nutrient management by evaluating inputs andoutputs over a period of time. First, there is a need for a survey to collect enough information to enablea thorough system analysis of the crop production practices [124]. The surveyed information is thenused to perform the particular water and N budgets. The overall objective is to compare the totalamount of water applied with the crop evapotranspiration and the total amount of N fertilizer appliedwith crop N uptake to identify and quantify possible N surplus and its origin. As the nutrient budgetis significantly influenced by horticulture practices, the balances assessment provides an overview of

Horticulturae 2017, 3, 25 13 of 23
current practices and allows the improvement of NUE. The nutrient budget can be calculated usingsimple tools as spreadsheets and user-friendly interfaces. A positive balance indicates a potentialloss of nutrients to the environment or a nutrient accumulation in the soil, usually designated assurplus. A negative balance signifies soil nutrient depletion. Different budget levels can be consideredin association with the system boundaries according to the available data and the purposes of thestudy (Figure 3). Farm gate balances, for example, demand minimal and routinely available datain farm records compared with soil surface or soil system balances. Thus, the budgets quantifywater and nutrients that enter and leave the farm gate with no consideration of internal transfersor loss processes [63]. The key information to be collected in the horticultural farm consists of thearea occupied by each crop, the amounts of N applied in fertilizers (mineral and organic) and soilamendments, the N fixation by the crops, the irrigation volumes and yields per crop.
Horticulturae 2017, 3, 10.3390/horticulturae3010025 13 of 22
4.2. Farm Surveys and Nutrient Budgets
Nutrient budgets are commonly used to assess nutrient management by evaluating inputs and
outputs over a period of time. First, there is a need for a survey to collect enough information to
enable a thorough system analysis of the crop production practices [124]. The surveyed information
is then used to perform the particular water and N budgets. The overall objective is to compare the
total amount of water applied with the crop evapotranspiration and the total amount of N fertilizer
applied with crop N uptake to identify and quantify possible N surplus and its origin. As the
nutrient budget is significantly influenced by horticulture practices, the balances assessment
provides an overview of current practices and allows the improvement of NUE. The nutrient budget
can be calculated using simple tools as spreadsheets and user‐friendly interfaces. A positive balance
indicates a potential loss of nutrients to the environment or a nutrient accumulation in the soil,
usually designated as surplus. A negative balance signifies soil nutrient depletion. Different budget
levels can be considered in association with the system boundaries according to the available data
and the purposes of the study (Figure 3). Farm gate balances, for example, demand minimal and
routinely available data in farm records compared with soil surface or soil system balances. Thus,
the budgets quantify water and nutrients that enter and leave the farm gate with no consideration
of internal transfers or loss processes [63]. The key information to be collected in the horticultural
farm consists of the area occupied by each crop, the amounts of N applied in fertilizers (mineral and
organic) and soil amendments, the N fixation by the crops, the irrigation volumes and yields per crop.
Figure 3. Schematization of the nitrogen budget for horticultural crops, with examples of inputs and
outputs considered at three levels: (a) farm gate; (b) soil surface; (c) soil system. Adapted from [63].
The soil surface budgets account for the water and N fluxes through the soil surface boundary
while the soil system budgets also consider all of the inputs and outputs resulting from biochemical
processes occurring with the soil profile. These two approaches correspond to a more scientific
approach often requiring field experiments and the use of mathematical models.
Some studies have calculated the N balances for different vegetable production systems and
have estimated that between 9% and 90% of the N applied is not used by the crops and, thus, is
potentially lost [125]. These surpluses should be used to estimate potential nutrient loss. To improve
the relationship between surpluses and losses, some researchers propose that the budgets should be
averaged over a significant number of years to eliminate the effect of temporal variation in climate
and farming practices [126,127]. Although the variety of existent accounting systems and the extent
of their adoption is encouraging, a uniform and coherent concept for budget calculations at the field
and farm scale is required [126,128]. Nonetheless, the more simple budgeting approaches like the
farm gate budget fail to consider the timing and transport aspects of mitigation (Table 4) and assume
a direct causal relationship between potential and actual nutrient loss [73].
Figure 3. Schematization of the nitrogen budget for horticultural crops, with examples of inputs andoutputs considered at three levels: (a) farm gate; (b) soil surface; (c) soil system. Adapted from [63].
The soil surface budgets account for the water and N fluxes through the soil surface boundarywhile the soil system budgets also consider all of the inputs and outputs resulting from biochemicalprocesses occurring with the soil profile. These two approaches correspond to a more scientificapproach often requiring field experiments and the use of mathematical models.
Some studies have calculated the N balances for different vegetable production systems andhave estimated that between 9% and 90% of the N applied is not used by the crops and, thus,is potentially lost [125]. These surpluses should be used to estimate potential nutrient loss. To improvethe relationship between surpluses and losses, some researchers propose that the budgets should beaveraged over a significant number of years to eliminate the effect of temporal variation in climateand farming practices [126,127]. Although the variety of existent accounting systems and the extent oftheir adoption is encouraging, a uniform and coherent concept for budget calculations at the field andfarm scale is required [126,128]. Nonetheless, the more simple budgeting approaches like the farm gatebudget fail to consider the timing and transport aspects of mitigation (Table 4) and assume a directcausal relationship between potential and actual nutrient loss [73].

Horticulturae 2017, 3, 25 14 of 23
Table 4. Main features of selected models for the simulation of the water and N-related process in horticultural systems.
Model Type N Loss Mitigation Measures Pros Cons Application Examples
Export-coefficient E fertilizer management simplicity and minimum data requirements does not allow extrapolation beyond the rangeof available information [129]
Sticks C irrigation and fertilizer management adaptability to various crops; reasonableamount of input data so far, it has not been used much for vegetables [130]
DNDC PB
fertilizer and manure management; cropmanagement (cover crops, rotation,tillage); nitrification inhibitors and slowrelease fertilizers; irrigation management
big detail in simulating the soilbiogeochemical processes; holistic in relationto the different N path losses
big amount of crop physiological parameters asinput data; needs more evaluation for vegetableproduction systems
[131,132]
EU-Rotate PB fertilizer managementdatabase with parameters for most vegetablecrops; big detail in the N transformations;simple calibration; economic assessment
research model that needs more work;additional studies are necessary to calibrate themineralization factor of this model forMediterranean conditions
[133,134]
RZWQM2 PB
fertilizer and manure management; cropmanagement (rotation, mulching, tillage);cover crops; irrigation management;nitrification inhibitors andslow-release fertilizers
database with parameters for most vegetablecrops and fruit trees; holistic for thesoil-crop-atmosphere system and for thedifferent N path losses; extensive database
considerable amount of soil, crop parameters;average to high difficulty in parameterizationand calibration
[36,135–137]
SWAT PBreduced fertilization; cover crops, filterstrips; crop management (rotation andtillage); fertilization strategies
holistic in relation to the different N pathlosses (with a modified version)
requires a big amount of soil, crop parameters;difficult parameterization and calibration [138–140]
VegSyst C
dry matter production and crop uptakeas a result of fertilization management;when incorporated in a DSS predicts Nfertilization requirements
specific for vegetable productionit does not predict N losses, but as it predictsuptake, it can be used to optimize cropuptake efficiency
[141–143]
E, empirical; C, conceptual; PB, process based.

Horticulturae 2017, 3, 25 15 of 23
4.3. Modelling Water and N-Related Processes in Horticultural Systems
The increasing concern about the quality of the environment, together with the development ofhardware, software and user-friendly interfaces led to an increase in the use of modelling in agriculturalsystems. Lately, the evaluation of the implementation of the environmental policies has also beena driver for modelling applications. There is a range in the complexity and variety of models forassessing the environmental impact of the water and N cycles in agricultural production systems.These models provide mechanisms for comparing the relative effects of differing mitigation practiceson yields and N losses for different soil-crop-climate systems. The running of a number of scenarioshas already demonstrated that nitrogen management in field vegetable rotations can be improved inEurope by following at least good agricultural practices.
Considering the approach by which the various models simulate water and nitrogen dynamicsin the soil, it is possible to distinguish from simple empirical applications to comprehensive,fully process-driven models. Examples of these types of models applicable at plot and farm scales aregiven in Table 4, including application case references. Empirical models evaluate inputs and outputs,but provide no consideration of internal dynamics, adopting instead a ‘black box’ approach. They arebuilt on quantitative relationships rather than process understanding and generally have low datarequirements. These features limit the evaluation of some mitigation methods. Conceptual modelsoccupy an intermediate position in terms of complexity, being process informed and requiringgreater empirical evidence to support the selection of coefficients, but not yet offering a full processrepresentation. Process models attempt to simulate the complete systems and quantify all processesthat constitute them. They are therefore computationally intense, require expertise and have large datarequirements. The wide range of inputs and parameters, the inclusion of transport processes, short timesteps and high spatial resolution allow the simulation of source, time and transport mitigation methods.
Simulation models need preparatory work of calibration and validation before being used withdifferent crops and soils, which is a rather expensive and time-consuming task. Some of the modelsthat simulate the N dynamics in the soil-plant system are too complex to be used and/or understoodby farmers or are still in the state of research at the moment. They require a large amount of inputdata, and in some cases, research is necessary to obtain calibration factors for specific horticulturecrops. The more complex models are useful to test new strategies at a regional level and for legislationpurposes. In most cases, advisors should support farmers when they want to use prediction models,and the latter should be involved in the demonstration of models. Some models have been simplifiedto make them easier to be used by farmers and consultants, reducing the number of required inputsand assuming the possible risk of loss of accuracy. These simplified models work well and providesimple and useful information for farmers to design appropriate and to compare different fertilizationand irrigation strategies.
5. Conclusions
The reduction of N emissions to water bodies and the atmosphere by horticultural productionsystems is required. Current directives and international conventions regarding agriculture considerthe threats from NO3
− leaching, NH3 and N2O emissions separately. However, when not combinedwith an integrated approach to N and irrigation management, the policy measures may inducemitigation strategies/practices with antagonistic effects (swapping pollution).
The combined use of fertigation and drip irrigation to frequently apply small amounts of water andN throughout a crop cycle provides the technical possibility for precise N and irrigation management.A combination of optimal water management and applying recommended fertilization rates should bethe most profitable choice for the farmer. The recommendations must be corrected in situ by usingsoil and plant monitoring devices. In addition to the in-crop season good practices, the use of covercrops to catch the N released from the horticultural crop residues during the winter period also seemsindispensable. The use of fast-growing rootstocks, mycorrhizal plants or more ready-to-assimilate

Horticulturae 2017, 3, 25 16 of 23
fertilizers, as amino acids, are other examples of mitigation strategies that can also contribute to reduceN losses.
Mitigation strategies need to be assessed and the best ones selected and broadly applied atlow cost. Simulation models can make long-term assessments as opposed to an expensive andtime-consuming pure classical field research. Once models have been calibrated and validated againstselected field data, they can be used before and during the cropping season considering the croptype, management practices and environmental conditions for better fertilization and irrigationstrategies. A range of potential mitigation practices can be evaluated using models, and the mostpromising ones can be field tested. Additional studies are still necessary to create complete referencedatabases (climatic data, physical and chemical soil parameters and crop calibration factors) fordifferent European areas to promote the use of prediction models. The combined use of soil and plantmonitoring sensors and simulation models is a useful group of tools for designing optimal irrigationand N management practices that mitigate N losses. The combination of these techniques with croprotation and intercropping systems will undoubtedly improve the NUE of horticulture crops andminimize N losses as a whole.
Author Contributions: Maria do Rosário Cameira outlined the paper; Maria do Rosário Cameira and MarianaMota wrote the paper.
Conflicts of Interest: The authors declare no conflict of interest.
References
1. World Meteorological Organization. Planning of Water Quality Monitoring Systems; Technical report series 3;WMO: Geneva, Switzerland, 2013; p. 117.
2. Oenema, O.; Bleeker, A.; Braathen, N.A.; Budnakova, M.; Bull, K.; Cermak, P.; Geupel, M.; Hicks, K.; Hoft, R.;Kozlova, N.; et al. Nitrogen in current European policies. In The European Nitrogen Assessment; Sutton, M.,Howard, C., Erisman, J., Billen, G., Bleeker, A., Grennfelt, P., Grinsven, H., Grizzetti, B., Eds.; CambridgeUniversity Press: Cambridge, UK, 2011; pp. 62–81.
3. Addiscott, T.M. Fertilizers and nitrate leaching. In Agricultural Chemicals and the Environment Issues;Hester, R.E., Harrison, R.M., Eds.; CABI: Oxfordshire, UK, 1996; pp. 1–26.
4. Di, H.J.; Cameron, K.C. Nitrate leaching in temperate agroecosystems: Sources, factors and mitigatingstrategies. Nutr. Cycl. Agroecosyst. 2002, 64, 237–256. [CrossRef]
5. Ward, M.H.; DeKok, T.M.; Levallois, P.; Brender, J.; Gulis, G.; Nolan, B.T.; VanDerslice, J. Workgroup report:Drinking-water nitrate and health-recent findings and research needs. Environ. Health Perspect. 2005, 113,1607–1614. [CrossRef] [PubMed]
6. Grizzetti, B.; Bouraoui, F.; Billen, G.; van Grinsven, H.; Cardoso, A.C.; Thieu, V.; Garnier, J.; Curtis, C.;Howarth, R.W.; Johnes, P. Nitrogen as a threat to European water quality. In The European Nitrogen Assessment;Sutton, M., Howard, C., Erisman, J., Billen, G., Bleeker, A., Grennfelt, P., Grinsven, H., Grizzetti, B., Eds.;Cambridge University Press: Cambridge, UK, 2011; pp. 379–404.
7. Smith, V.H.; Tilman, G.D.; Nekola, J.C. Eutrophication: Impacts of excess nutrient inputs on freshwater,marine, and terrestrial ecosystems. Environ. Pollut. 1999, 100, 179–196. [CrossRef]
8. Moldanovaá, J.; Grennfelt, P.; Jonsson, Å.; Simpson, D.; Spranger, T.; Aas, W.; Munthe, J.; Rabl, A. Nitrogenas a threat to European air quality. In The European Nitrogen Assessment; Sutton, M., Howard, C., Erisman, J.,Billen, G., Bleeker, A., Grennfelt, P., Grinsven, H., Grizzetti, B., Eds.; Cambridge University Press: Cambridge,UK, 2011; pp. 405–433.
9. Cameron, K.C.; Rate, A.W.; Noonan, M.J.; Moore, S.; Smith, N.P.; Kerr, L.E. Lysimeter study of thefate of nutrients following subsurface injection and surface application of dairy pond sludge to pasture.Agric. Ecosyst. Environ. 1996, 58, 187–197. [CrossRef]
10. Oenema, O.; Oudendag, D.A.; Witzke, H.P.; Monteny, G.J.; Velthof, G.L.; Pietrzak, S.; Pinto, M.; Britz, W.;Schwaiger, E.; Erisman, J.W.; et al. Integrated Measures in Agriculture to Reduce Ammonia Emissions; FinalSummary Report; Alterra: Wageningen, The Netherlands, 2007.
11. Stevens, C.J.; Quinton, J.N. Diffuse pollution swapping in arable agricultural systems. Crit. Rev. Environ.Sci. Technol. 2009, 39, 478–520. [CrossRef]

Horticulturae 2017, 3, 25 17 of 23
12. Goulding, K. Nitrate leaching from arable and horticultural land. Soil Use Manag. 2000, 16, 145–151.[CrossRef]
13. Pionke, H.B.; Sharma, M.L.; Hirschberg, K.J. Impact of irrigated horticulture on nitrate concentrations ingroundwater. Agric. Ecosys. Environ. 1990, 32, 119–132. [CrossRef]
14. Zhu, J.H.; Li, X.L.; Christie, P.; Li, J.L. Environmental implications of low nitrogen use efficiency in excessivelyfertilized hot pepper (Capsicum frutescens L.) cropping systems. Agric. Ecosys. Environ. 2005, 111, 70–80.[CrossRef]
15. Peña-Fleitas, M.T.; Gallardo, M.; Thompson, R.B.; Farneselli, M.; Padilla, F.M. Assessing crop N status offertigated vegetable crops using plant and soil monitoring techniques. Ann. Appl. Biol. 2015, 167, 387–405.[CrossRef] [PubMed]
16. Agneessens, L.; De Waele, J.; De Neve, S. Review of alternative management options of vegetable cropresidues to reduce nitrate leaching in intensive vegetable rotations. Agronomy 2014, 4, 529–555. [CrossRef]
17. Congreves, K.A.; Van Eerd, L.L. Nitrogen cycling and management in intensive horticultural systems.Nutr. Cycl. Agroecosyst. 2015, 102, 299–318. [CrossRef]
18. Connor, D.J.; Gómez-del-Campo, M.; Rousseaux, M.C.; Searles, P.S. Structure, management and productivityof hedgerow olive orchards: A review. Sci. Hortic. 2014, 169, 71–93. [CrossRef]
19. Rufat, J.; Villar, J.M.; Pasqual, M.; Falguera, V.; Arbonés, A. Productive and vegetative response to differentirrigation and fertilization strategies of an Arbequina olive orchard grown undersuper-intensive conditions.Agric. Water Manag. 2014, 144, 33–41. [CrossRef]
20. FAO. Statistical Year Book, Europe and Central Asia Food and Agriculture; FAO: Budapest, Hungary, 2014.21. Vázquez, N.; Pardo, A.; Suso, M.L.; Quemada, M. Drainage and nitrate leaching under processing tomato
growth with drip irrigation and plastic mulching. Agric. Ecosyst. Environ. 2006, 112, 313–323.22. Tilman, D.; Cassman, K.G.; Matson, P.A.; Naylor, R.; Polasky, S. Agricultural sustainability and intensive
production practices. Nature 2002, 418, 671–677. [CrossRef] [PubMed]23. Agostini, F.; Tei, F.; Silgram, M.; Farneselli, M.; Benincasa, P.; Aller, M.F. Decreasing nitrate leaching
in vegetable crops with better N management. In Genetic Engineering, Biofertilisation, Soil Quality andOrganic Farming; Sustainable Agriculture Reviews; Lichtfouse, E., Ed.; Springer: Heidelberg, Germany, 2010;Volume 4, pp. 147–200.
24. Christensen, B.T. Tightening the Nitrogen Cycle. In Managing Soil Quality—Challenges in Modern Agriculture;CAB International: Wallingford, UK, 2004; pp. 47–67.
25. Galloway, J.N.; Dentener, F.J.; Capone, D.G.; Boyer, E.W.; Howarth, R.W.; Seitzinger, S.P.; Asner, G.P.;Cleveland, C.C.; Green, P.A.; Holland, E.A.; et al. Nitrogen cycles: Past, present, and future. Biogeochemistry2004, 70, 153–226. [CrossRef]
26. Hillel, D. Environmental Soil Physics: Fundamentals, Applications, and Environmental Considerations; AcademicPress: London, UK, 1998; p. 771.
27. Mitchell, R.; Webb, J.; Harrison, R. Crop residues can affect N leaching over at least two winters. Eur. J. Agron.2001, 15, 17–29. [CrossRef]
28. Wyland, L.J.; Jackson, L.E.; Chaney, W.E.; Klonsky, K.; Koike, S.T.; Kimple, B. Winter cover crops in avegetable cropping system: Impacts on nitrate leaching, soil water, crop yield, pests and management costs.Agric. Ecosyst. Environ. 1996, 59, 1–17. [CrossRef]
29. De Neve, S.; Sáez, S.G.; Daguilar, B.C.; Sleutel, S.; Hofman, G. Manipulating N mineralization from high Ncrop residues using on-and off-farm organic materials. Soil Biol. Biochem. 2004, 36, 127–134. [CrossRef]
30. Feaga, J.B.; Selker, J.S.; Dick, R.P.; Hemphill, D.D. Long-term nitrate leaching under vegetable productionwith cover crops in the Pacific Northwest. Soil Sci. Soc. Am. J. 2010, 74, 186–195. [CrossRef]
31. Campiglia, E.; Mancinelli, R.; Radicetti, E.; Marinari, S. Legume cover crops and mulches: Effects on nitrateleaching and nitrogen input in a pepper crop (Capsicum annuum L.). Nutr. Cycl. Agroecosyst. 2011, 89, 399–412.[CrossRef]
32. Bruin, A.J.; Ball Coelho, B.R.; Beyaert, R.P.; Reeleder, R.D.; Roy, R.C.; Capell, B. High value crops incoarse-textured soil and nitrate leaching—How risky is it? Can. J. Plant Sci. 2010, 90, 515–528. [CrossRef]
33. Sharma, P.; Shukla, M.K.; Sammis, T.W.; Adhikari, P. Nitrate-nitrogen leaching from onion bed under furrowand drip irrigation systems. Appl. Environ. Soil Sci. 2012, 2012, 650206. [CrossRef]

Horticulturae 2017, 3, 25 18 of 23
34. Chotangui, A.H.; Sugahara, K.; Okabe, M.; Kasuga, S.; Isobe, K.; Higo, M.; Torigoe, Y. Evaluation ofNO3-N Leaching in Commercial Fields of Leafy Vegetables by the Soil Nitrogen Balance Estimation System.Environ. Control Biol. 2015, 53, 145–157. [CrossRef]
35. Woli, P.; Hoogenboom, G.; Alva, A. Simulation of potato yield, nitrate leaching, and profit marginsas influenced by irrigation and nitrogen management in different soils and production regions.Agric. Water Manag. 2016, 171, 120–130. [CrossRef]
36. Merwin, I.A.; Ray, J.A.; Steenhuis, T.S.; Boll, J. Groundcover management systems influence fungicide andnitrate-N concentrations in leachate and runoff from a New York apple orchard. J. Am. Soc. Hortic. Sci. 1996,121, 249–257.
37. Cameira, M.R.; Pereira, A.; Ahuja, L.; Ma, L. Sustainability and environmental assessment of fertigation in anintensive olive grove under Mediterranean conditions. Agric. Water Manag. 2014, 146, 346–360. [CrossRef]
38. Hardie, M.A.; Oliver, G.; Clothier, B.E.; Bound, S.A.; Green, S.A.; Close, D.C. Effect of biochar on nutrientleaching in a young apple orchard. J. Environ. Qual. 2015, 44, 1273–1282. [CrossRef] [PubMed]
39. Lea-Cox, J.D.; Syvertsen, J.P.; Graetz, D.A. Springtime 15Nitrogen uptake, partitioning, and leaching lossesfrom young bearing citrus trees of differing nitrogen status. J. Am. Soc. Hort. Sci. 2001, 126, 242–251.
40. Lehmann, J.; Schroth, G. Nutrient leaching. In Trees, Crops and Soil Fertility; Schroth, G., Sinclair, F.L., Eds.;CABI: Oxfordshire, UK, 2003; pp. 151–166.
41. Sommer, S.G.; Schjoerring, J.K.; Denmead, O.T. Ammonia emission from mineral fertilizers and fertilizedcrops. Adv. Agron. 2004, 82, 557–622.
42. Huijsmans, J.F.M.; Hol, J.M.G.; Vermeulen, G.D. Effect of application method, manure characteristics, weatherand field conditions on ammonia volatilization from manure applied to arable land. Atmos. Environ. 2003,37, 3669–3680. [CrossRef]
43. Miola, E.C.; Rochette, P.; Chantigny, M.H.; Angers, D.A.; Aita, C.; Gasser, M.O.; Pelster, D.E.; Bertrand, N.Ammonia volatilization after surface application of laying-hen and broiler-chicken manures. J. Environ. Qual.2014, 43, 1864–1872. [CrossRef] [PubMed]
44. De Ruijter, F.J.; Huijsmans, J.F.M.; Rutgers, B. Ammonia volatilization from crop residues and frozen greenmanure crops. Atmos. Environ. 2010, 44, 3362–3368. [CrossRef]
45. Sadeghpour, A.; Hashemi, M.; Weis, S.A.; Spargo, J.T.; Mehrvarz, S.; Herbert, S.J. Assessing tillage systemsfor reducing ammonia volatilization from spring-applied slurry manure. Commun. Soil Sci. Plant Anal. 2015,46, 724–735. [CrossRef]
46. Sutton, M.A.; Grinsven, H. Summary for policy makers. In The European Nitrogen Assessment; Sutton, M.A.,Howard, C.M., Erisman, J.W., Billen, G., Grennfelt, P., van Grinsven, H., Grizzetti, B., Eds.; CambridgeUniverity Press: Cambridge, UK, 2011; pp. 2–18.
47. Bishop, P.; Manning, M. Urea Volatilisation: The Risk Management and Mitigation Strategies; Occasional Reportno. 24; Massey University: Palmerston North, New Zealand, 2010.
48. Rochette, P.; Tremblay, N.; Fallon, E.; Angers, D.A.; Chantigny, M.H.; MacDonald, J.D.; Bertrand, N.;Parent, L.É. N2O emissions from an irrigated and non-irrigated organic soil in eastern Canada as influencedby N fertilizer addition. Europ. J. Soil Sci. 2010, 61, 186–196. [CrossRef]
49. Trost, B.; Prochnow, A.; Drastig, K.; Meyer-Aurich, A.; Ellmer, F.; Baumecker, M. Irrigation, soil organiccarbon and N2O emissions. A review. Agron. Sustain. Dev. 2013, 33, 733–749. [CrossRef]
50. Benckiser, G.; Schartel, T.; Weiske, A. Control of NO3− and N2O emissions in agroecosystems: A review.
Agron. Sustain. Dev. 2015, 35, 1059–1074. [CrossRef]51. Prosser, J.I. The ecology of nitrifying bacteria. In Biology of the Nitrogen Cycle; Bolhe, H., Fergusoin, S.J.,
Newton, W.E., Eds.; Elsevier: Oxford, UK, 2006; pp. 223–245.52. Kool, D.M.; Müller, C.; Wrage, N.; Oenema, O.; Van Groenigen, J.W. Oxygen exchange between nitrogen
oxides and H2O can occur during nitrifier pathways. Soil Biol. Biochem. 2009, 41, 1632–1641. [CrossRef]53. Cameron, K.C.; Di, H.J.; Moir, J.L. Nitrogen losses from the soil/plant system: A review. Ann. Appl. Biol.
2013, 162, 145–173. [CrossRef]54. Haynes, R. Mineral Nitrogen in the Plant-Soil System; Elsevier: Amsterdam, The Netherlands, 2012.55. Monaghan, R.M.; Barraclough, D. Some chemical and physical factors affecting the rate and dynamics of
nitrification in urine-affected soil. Plant Soil 1992, 143, 11–18. [CrossRef]
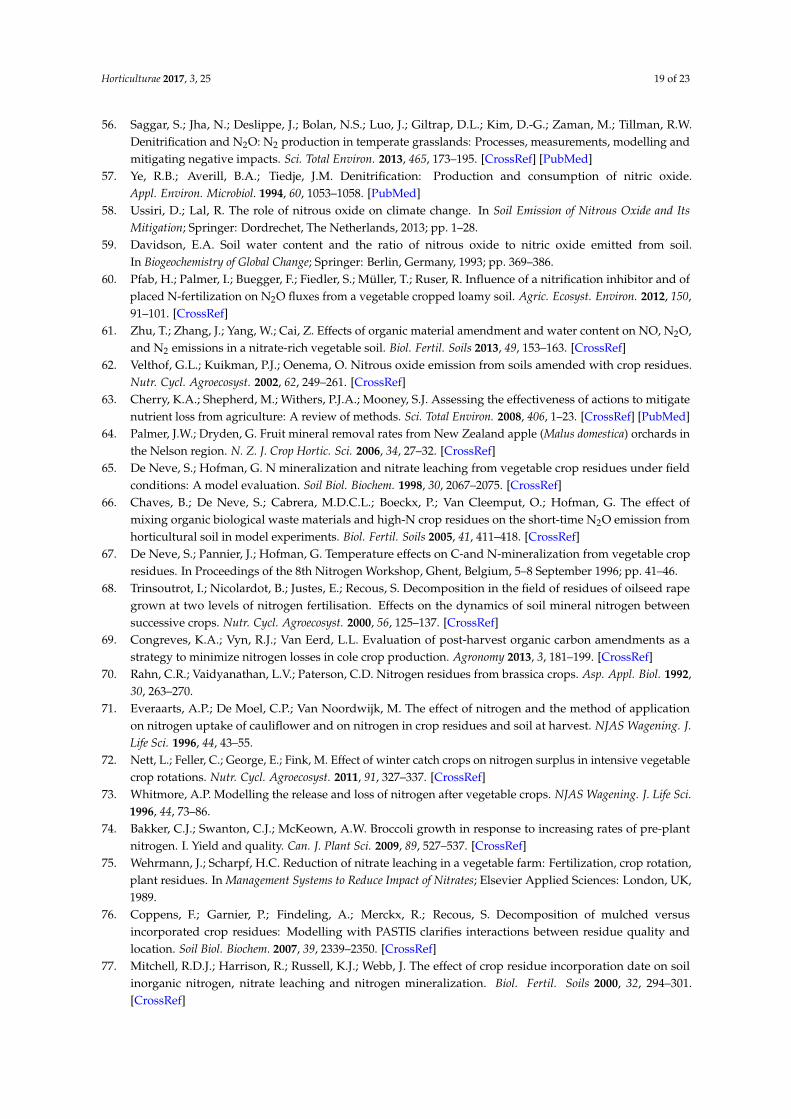
Horticulturae 2017, 3, 25 19 of 23
56. Saggar, S.; Jha, N.; Deslippe, J.; Bolan, N.S.; Luo, J.; Giltrap, D.L.; Kim, D.-G.; Zaman, M.; Tillman, R.W.Denitrification and N2O: N2 production in temperate grasslands: Processes, measurements, modelling andmitigating negative impacts. Sci. Total Environ. 2013, 465, 173–195. [CrossRef] [PubMed]
57. Ye, R.B.; Averill, B.A.; Tiedje, J.M. Denitrification: Production and consumption of nitric oxide.Appl. Environ. Microbiol. 1994, 60, 1053–1058. [PubMed]
58. Ussiri, D.; Lal, R. The role of nitrous oxide on climate change. In Soil Emission of Nitrous Oxide and ItsMitigation; Springer: Dordrechet, The Netherlands, 2013; pp. 1–28.
59. Davidson, E.A. Soil water content and the ratio of nitrous oxide to nitric oxide emitted from soil.In Biogeochemistry of Global Change; Springer: Berlin, Germany, 1993; pp. 369–386.
60. Pfab, H.; Palmer, I.; Buegger, F.; Fiedler, S.; Müller, T.; Ruser, R. Influence of a nitrification inhibitor and ofplaced N-fertilization on N2O fluxes from a vegetable cropped loamy soil. Agric. Ecosyst. Environ. 2012, 150,91–101. [CrossRef]
61. Zhu, T.; Zhang, J.; Yang, W.; Cai, Z. Effects of organic material amendment and water content on NO, N2O,and N2 emissions in a nitrate-rich vegetable soil. Biol. Fertil. Soils 2013, 49, 153–163. [CrossRef]
62. Velthof, G.L.; Kuikman, P.J.; Oenema, O. Nitrous oxide emission from soils amended with crop residues.Nutr. Cycl. Agroecosyst. 2002, 62, 249–261. [CrossRef]
63. Cherry, K.A.; Shepherd, M.; Withers, P.J.A.; Mooney, S.J. Assessing the effectiveness of actions to mitigatenutrient loss from agriculture: A review of methods. Sci. Total Environ. 2008, 406, 1–23. [CrossRef] [PubMed]
64. Palmer, J.W.; Dryden, G. Fruit mineral removal rates from New Zealand apple (Malus domestica) orchards inthe Nelson region. N. Z. J. Crop Hortic. Sci. 2006, 34, 27–32. [CrossRef]
65. De Neve, S.; Hofman, G. N mineralization and nitrate leaching from vegetable crop residues under fieldconditions: A model evaluation. Soil Biol. Biochem. 1998, 30, 2067–2075. [CrossRef]
66. Chaves, B.; De Neve, S.; Cabrera, M.D.C.L.; Boeckx, P.; Van Cleemput, O.; Hofman, G. The effect ofmixing organic biological waste materials and high-N crop residues on the short-time N2O emission fromhorticultural soil in model experiments. Biol. Fertil. Soils 2005, 41, 411–418. [CrossRef]
67. De Neve, S.; Pannier, J.; Hofman, G. Temperature effects on C-and N-mineralization from vegetable cropresidues. In Proceedings of the 8th Nitrogen Workshop, Ghent, Belgium, 5–8 September 1996; pp. 41–46.
68. Trinsoutrot, I.; Nicolardot, B.; Justes, E.; Recous, S. Decomposition in the field of residues of oilseed rapegrown at two levels of nitrogen fertilisation. Effects on the dynamics of soil mineral nitrogen betweensuccessive crops. Nutr. Cycl. Agroecosyst. 2000, 56, 125–137. [CrossRef]
69. Congreves, K.A.; Vyn, R.J.; Van Eerd, L.L. Evaluation of post-harvest organic carbon amendments as astrategy to minimize nitrogen losses in cole crop production. Agronomy 2013, 3, 181–199. [CrossRef]
70. Rahn, C.R.; Vaidyanathan, L.V.; Paterson, C.D. Nitrogen residues from brassica crops. Asp. Appl. Biol. 1992,30, 263–270.
71. Everaarts, A.P.; De Moel, C.P.; Van Noordwijk, M. The effect of nitrogen and the method of applicationon nitrogen uptake of cauliflower and on nitrogen in crop residues and soil at harvest. NJAS Wagening. J.Life Sci. 1996, 44, 43–55.
72. Nett, L.; Feller, C.; George, E.; Fink, M. Effect of winter catch crops on nitrogen surplus in intensive vegetablecrop rotations. Nutr. Cycl. Agroecosyst. 2011, 91, 327–337. [CrossRef]
73. Whitmore, A.P. Modelling the release and loss of nitrogen after vegetable crops. NJAS Wagening. J. Life Sci.1996, 44, 73–86.
74. Bakker, C.J.; Swanton, C.J.; McKeown, A.W. Broccoli growth in response to increasing rates of pre-plantnitrogen. I. Yield and quality. Can. J. Plant Sci. 2009, 89, 527–537. [CrossRef]
75. Wehrmann, J.; Scharpf, H.C. Reduction of nitrate leaching in a vegetable farm: Fertilization, crop rotation,plant residues. In Management Systems to Reduce Impact of Nitrates; Elsevier Applied Sciences: London, UK,1989.
76. Coppens, F.; Garnier, P.; Findeling, A.; Merckx, R.; Recous, S. Decomposition of mulched versusincorporated crop residues: Modelling with PASTIS clarifies interactions between residue quality andlocation. Soil Biol. Biochem. 2007, 39, 2339–2350. [CrossRef]
77. Mitchell, R.D.J.; Harrison, R.; Russell, K.J.; Webb, J. The effect of crop residue incorporation date on soilinorganic nitrogen, nitrate leaching and nitrogen mineralization. Biol. Fertil. Soils 2000, 32, 294–301.[CrossRef]
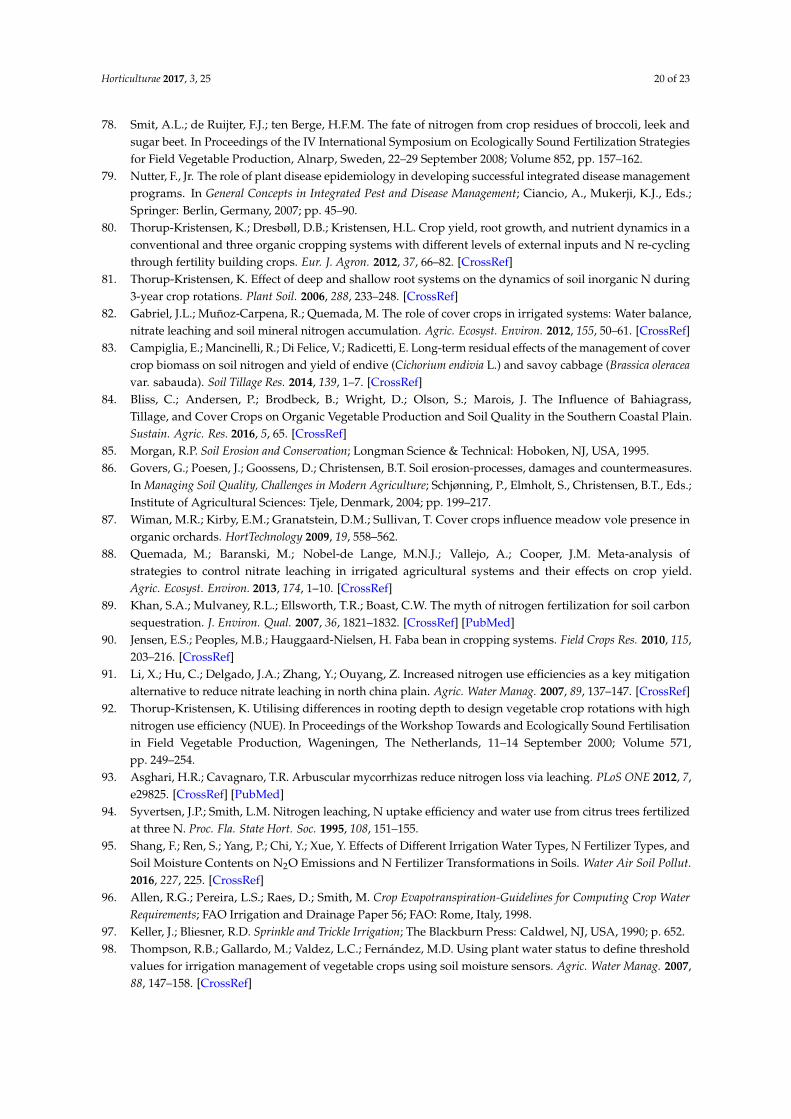
Horticulturae 2017, 3, 25 20 of 23
78. Smit, A.L.; de Ruijter, F.J.; ten Berge, H.F.M. The fate of nitrogen from crop residues of broccoli, leek andsugar beet. In Proceedings of the IV International Symposium on Ecologically Sound Fertilization Strategiesfor Field Vegetable Production, Alnarp, Sweden, 22–29 September 2008; Volume 852, pp. 157–162.
79. Nutter, F., Jr. The role of plant disease epidemiology in developing successful integrated disease managementprograms. In General Concepts in Integrated Pest and Disease Management; Ciancio, A., Mukerji, K.J., Eds.;Springer: Berlin, Germany, 2007; pp. 45–90.
80. Thorup-Kristensen, K.; Dresbøll, D.B.; Kristensen, H.L. Crop yield, root growth, and nutrient dynamics in aconventional and three organic cropping systems with different levels of external inputs and N re-cyclingthrough fertility building crops. Eur. J. Agron. 2012, 37, 66–82. [CrossRef]
81. Thorup-Kristensen, K. Effect of deep and shallow root systems on the dynamics of soil inorganic N during3-year crop rotations. Plant Soil. 2006, 288, 233–248. [CrossRef]
82. Gabriel, J.L.; Muñoz-Carpena, R.; Quemada, M. The role of cover crops in irrigated systems: Water balance,nitrate leaching and soil mineral nitrogen accumulation. Agric. Ecosyst. Environ. 2012, 155, 50–61. [CrossRef]
83. Campiglia, E.; Mancinelli, R.; Di Felice, V.; Radicetti, E. Long-term residual effects of the management of covercrop biomass on soil nitrogen and yield of endive (Cichorium endivia L.) and savoy cabbage (Brassica oleraceavar. sabauda). Soil Tillage Res. 2014, 139, 1–7. [CrossRef]
84. Bliss, C.; Andersen, P.; Brodbeck, B.; Wright, D.; Olson, S.; Marois, J. The Influence of Bahiagrass,Tillage, and Cover Crops on Organic Vegetable Production and Soil Quality in the Southern Coastal Plain.Sustain. Agric. Res. 2016, 5, 65. [CrossRef]
85. Morgan, R.P. Soil Erosion and Conservation; Longman Science & Technical: Hoboken, NJ, USA, 1995.86. Govers, G.; Poesen, J.; Goossens, D.; Christensen, B.T. Soil erosion-processes, damages and countermeasures.
In Managing Soil Quality, Challenges in Modern Agriculture; Schjønning, P., Elmholt, S., Christensen, B.T., Eds.;Institute of Agricultural Sciences: Tjele, Denmark, 2004; pp. 199–217.
87. Wiman, M.R.; Kirby, E.M.; Granatstein, D.M.; Sullivan, T. Cover crops influence meadow vole presence inorganic orchards. HortTechnology 2009, 19, 558–562.
88. Quemada, M.; Baranski, M.; Nobel-de Lange, M.N.J.; Vallejo, A.; Cooper, J.M. Meta-analysis ofstrategies to control nitrate leaching in irrigated agricultural systems and their effects on crop yield.Agric. Ecosyst. Environ. 2013, 174, 1–10. [CrossRef]
89. Khan, S.A.; Mulvaney, R.L.; Ellsworth, T.R.; Boast, C.W. The myth of nitrogen fertilization for soil carbonsequestration. J. Environ. Qual. 2007, 36, 1821–1832. [CrossRef] [PubMed]
90. Jensen, E.S.; Peoples, M.B.; Hauggaard-Nielsen, H. Faba bean in cropping systems. Field Crops Res. 2010, 115,203–216. [CrossRef]
91. Li, X.; Hu, C.; Delgado, J.A.; Zhang, Y.; Ouyang, Z. Increased nitrogen use efficiencies as a key mitigationalternative to reduce nitrate leaching in north china plain. Agric. Water Manag. 2007, 89, 137–147. [CrossRef]
92. Thorup-Kristensen, K. Utilising differences in rooting depth to design vegetable crop rotations with highnitrogen use efficiency (NUE). In Proceedings of the Workshop Towards and Ecologically Sound Fertilisationin Field Vegetable Production, Wageningen, The Netherlands, 11–14 September 2000; Volume 571,pp. 249–254.
93. Asghari, H.R.; Cavagnaro, T.R. Arbuscular mycorrhizas reduce nitrogen loss via leaching. PLoS ONE 2012, 7,e29825. [CrossRef] [PubMed]
94. Syvertsen, J.P.; Smith, L.M. Nitrogen leaching, N uptake efficiency and water use from citrus trees fertilizedat three N. Proc. Fla. State Hort. Soc. 1995, 108, 151–155.
95. Shang, F.; Ren, S.; Yang, P.; Chi, Y.; Xue, Y. Effects of Different Irrigation Water Types, N Fertilizer Types, andSoil Moisture Contents on N2O Emissions and N Fertilizer Transformations in Soils. Water Air Soil Pollut.2016, 227, 225. [CrossRef]
96. Allen, R.G.; Pereira, L.S.; Raes, D.; Smith, M. Crop Evapotranspiration-Guidelines for Computing Crop WaterRequirements; FAO Irrigation and Drainage Paper 56; FAO: Rome, Italy, 1998.
97. Keller, J.; Bliesner, R.D. Sprinkle and Trickle Irrigation; The Blackburn Press: Caldwel, NJ, USA, 1990; p. 652.98. Thompson, R.B.; Gallardo, M.; Valdez, L.C.; Fernández, M.D. Using plant water status to define threshold
values for irrigation management of vegetable crops using soil moisture sensors. Agric. Water Manag. 2007,88, 147–158. [CrossRef]

Horticulturae 2017, 3, 25 21 of 23
99. Granados, M.R.; Thompson, R.B.; Fernández, M.D.; Martínez-Gaitán, C.; Gallardo, M. Prescriptive–correctivenitrogen and irrigation management of fertigated and drip-irrigated vegetable crops using modeling andmonitoring approaches. Agric. Water Manag. 2013, 119, 121–134. [CrossRef]
100. Rekika, D.; Caron, J.; Rancourt, G.T.; Lafond, J.A.; Gumiere, S.J.; Jenni, S.; Gosselin, A. Optimal irrigationfor onion and celery production and spinach seed germination in Histosols. Agron. J. 2014, 106, 981–994.[CrossRef]
101. Létourneau, G.; Caron, J.; Anderson, L.; Cormier, J. Matric potential-based irrigation management offield-grown strawberry: Effects on yield and water use efficiency. Agric. Water Manag. 2015, 161, 102–113.[CrossRef]
102. Rahil, M.H.; Qanadillo, A. Effects of different irrigation regimes on yield and water use efficiency of cucumbercrop. Agric. Water Manag. 2015, 148, 10–15. [CrossRef]
103. Berrie, A.; Ellerker, B.; Lower, K. Evaluation of alternative treatments to urea to eliminate leaf litter in organicapple production. IOBC/WPRS Bull. 2006, 29, 139.
104. Mitre, V.; Mitre, J.; Sestras, A.; Petrisor, P.; Sestras, R.E. Reducing primary inoculum of apple scab using foliarapplication of urea in autumn. Bull. UASVM Hortic. 2012, 69, 415–416.
105. Rochette, P.; Angers, D.A.; Chantigny, M.H.; Gasser, M.O.; MacDonald, J.D.; Pelster, D.E.; Bertrand, N.Ammonia volatilization and nitrogen retention: How deep to incorporate urea? J. Environ. Qual. 2013, 42,1635–1642. [CrossRef] [PubMed]
106. Black, A.S.; Sherlock, R.R.; Smith, N.P.; Cameron, K.C.; Goh, K.M. Effects of form of nitrogen, season,and urea application rate on ammonia volatilisation from pastures. N. Z. J. Agric. Res. 1985, 28, 469–474.[CrossRef]
107. Sanz-Cobena, A.; Misselbrook, T.H.; Arce, A.; Mingot, J.I.; Diez, J.A.; Vallejo, A. An inhibitor of ureaseactivity effectively reduces ammonia emissions from soil treated with urea under Mediterranean conditions.Agric. Ecosyst. Environ. 2008, 126, 243–249. [CrossRef]
108. Neto, C.; Carranca, C.; Clemente, J.; de Varennes, A. Nitrogen distribution, remobilization and re-cycling inyoung orchard of non-bearing ‘Rocha’ pear trees. Sci. Hortic. 2008, 118, 299–307. [CrossRef]
109. Shan, L.; He, Y.; Chen, J.; Huang, Q.; Wang, H. Ammonia volatilization from a Chinese cabbage field underdifferent nitrogen treatments in the Taihu Lake Basin, China. J. Environ. Sci. 2015, 38, 14–23. [CrossRef][PubMed]
110. Chambers, B.; Dampney, P. Nitrogen Efficiency and Ammonia Emissions from Urea-Based and Ammonium NitrateFertilisers; The International Fertiliser Society: Colchester, UK, 2009; p. 657.
111. Riches, D.; Mattner, S.; Davies, R.; Porter, I. Mitigation of nitrous oxide emissions with nitrification inhibitorsin temperate vegetable cropping in southern Australia. Soil Res. 2016, 54, 533–543. [CrossRef]
112. Lam, S.K.; Suter, H.; Mosier, A.R.; Chen, D. Using nitrification inhibitors to mitigate agricultural N2Oemission: A double-edged sword? Glob. Chang. Biol. 2016, 23, 485–489. [CrossRef] [PubMed]
113. Shehata, S.M.; Abdel-Azem, H.S.; El-Yazied, A.A.; Abou, A.; El-Gizawy, A.M. Effect of foliar spraying withamino acids and seaweed extract on growth chemical constitutes, yield and its quality of celeriac plant.Eur. J. Sci. Res. 2011, 58, 257–265.
114. Elwell, D.L.; Keener, H.M.; Carey, D.S.; Schlak, P.P. Composting unamended chicken manure.Compost. Sci. Util. 1998, 6, 22–35. [CrossRef]
115. Van Kessel, J.S.; Reeves, J. Nitrogen mineralization potential of dairy manures and its relationship tocomposition. Biol. Fertil. Soils 2002, 36, 118–123. [CrossRef]
116. Chambers, B.J.; Smith, K.A.; Pain, B.F. Strategies to encourage better use of nitrogen in animal manures.Soil Use Manag. 2000, 16, 157–166. [CrossRef]
117. Heinrich, A.L.; Pettygrove, G.S. Influence of dissolved carbon and nitrogen on mineralization of dilute liquiddairy manure. Soil Sci. Soc. Am. J. 2012, 76, 700–709. [CrossRef]
118. Schepers, J.S.; Mosier, A.R. Accounting for nitrogen in nonequilibrium soil-crop systems. In ManagingNitrogen for Groundwater Quality and Farm Profitability; Soil Science Society of America: Fitchburg, WI, USA,1991; pp. 125–138.
119. Farneselli, M.; Tei, F.; Simonne, E. Reliability of petiole sap test for N nutritional status assessing in processingtomato. J. Plant Nutr. 2014, 37, 270–278. [CrossRef]
120. Parry, C.; Blonquist, J.; Bugbee, B. In situ measurement of leaf chlorophyll concentration: Analysis of theoptical/absolute relationship. Plant Cell Environ. 2014, 37, 2508–2520. [CrossRef] [PubMed]

Horticulturae 2017, 3, 25 22 of 23
121. Padilla, F.M.; Peña-Fleitas, M.T.; Gallardo, M.; Thompson, R.B. Threshold values of canopy reflectanceindices and chlorophyll meter readings for optimal nitrogen nutrition of tomato. Ann. Appl. Biol. 2015, 166,271–285. [CrossRef]
122. Lord, E.I.; Anthony, S.G.; Goodlass, G. Agricultural nitrogen balance and water quality in the UK.Soil Use Manag. 2002, 18, 363–369. [CrossRef]
123. Harris, G.; Heathwaite, A.L. Inadmissible evidence: Knowledge and prediction in land and riverscapes.J. Hydrol. 2005, 304, 3–19. [CrossRef]
124. Thompson, R.B.; Martínez-Gaitan, C.; Gallardo, M.; Giménez, C.; Fernández, M.D. Identification of irrigationand N management practices that contribute to nitrate leaching loss from an intensive vegetable productionsystem by use of a comprehensive survey. Agric. Water Manag. 2007, 89, 261–274. [CrossRef]
125. HongYeng, L.; Agamuthu, P. Nitrogen flow in organic and conventional vegetable farming systems: A casestudy of Malaysia. Nutr. Cycl. Agroecosyst. 2015, 103, 131–151. [CrossRef]
126. Oborn, I.; Edwards, A.C.; Witter, E.; Oenema, O.; Ivarsson, K.; Withers, P.J.A.L.; Nilsson, S.I.; Stinzing, A.R.Element balances as a tool for sustainable nutrient management: A critical appraisal of their merits andlimitations within an agronomic and environmental context. Eur. J. Agron. 2003, 20, 211–225. [CrossRef]
127. Bechmann, M.; Eggestad, H.O.; Vagstad, N. Nitrogen balances and leaching in four agricultural catchmentsin southeastern Norway. Environ. Pollut. 1998, 102, 493–499. [CrossRef]
128. Oenema, O.; Kros, H.; de Vries, W. Approaches and uncertainties in nutrient budgets: Implications fornutrient management and environmental policies. Eur. J. Agron. 2003, 20, 3–16. [CrossRef]
129. Ding, X.; Shen, Z.; Hong, Q.; Yang, Z.; Wu, X.; Liu, R. Development and test of the export coefficient modelin the upper reach of the Yangtze River. J. Hydrol. 2010, 383, 233–244. [CrossRef]
130. Brisson, N.; Gary, C.; Justes, E.; Roche, R.; Mary, B.; Ripoche, D.; Zimmer, D.; Sierra, J.; Bertuzzi, P.; Burger, P.;et al. An overview of the crop model STICS. Eur. J. Agron. 2003, 18, 309–332.
131. Zhang, Y.; Niu, H.; Wang, S.; Xu, K.; Wang, R. Application of the DNDC model to estimate N2O emissionsunder different types of irrigation in vineyards in Ningxia, China. Agric. Water Manag. 2016, 163, 295–304.[CrossRef]
132. Uzoma, K.C.; Smith, W.; Grant, B.; Desjardins, R.L.; Gao, X.; Hanis, K.; Tenuta, M.; Goglio, P.; Li, C. Assessingthe effects of agricultural management on nitrous oxide emissions using flux measurements and the DNDCmodel. Agric. Ecosyst. Environ. 2015, 206, 71–83. [CrossRef]
133. Rahn, C.R.; Zang, K.; Lillywhite, R.D.; Ramos, C.; De Paz, J.M.; Doltra, J.; Riley, H.; Fink, M.; Nendel, C.;Thorup-Kristensen, K.; et al. Development of a Model Based Decision Support System to Optimise Nitrogen Usein Horticultural Crop Rotations Across Europe—EU-ROTATE N; Final Scientific Report QLK5–2002–01100;Horticulture Research International: Wellesbourne, UK, 2007.
134. Nendel, C.; Venezia, A.; Piro, F.; Ren, T.; Lillywhite, R.D.; Rahn, C.R. The performance of the EU-Rotate-Nmodel in predicting the growth and nitrogen uptake of rotations of field vegetable crops in a Mediterraneanenvironment. J. Agric. Sci. 2013, 151, 538–555. [CrossRef]
135. Bakhsh, A.; Kanwar, R.S.; Jaynes, D.B.; Colvin, T.S.; Ahuja, L.R. Simulating effects of variable nitrogenapplication rates on corn yields and NO3–N losses in subsurface drain water. Trans. ASAE. 2001, 44, 269.[CrossRef]
136. Fang, Q.X.; Ma, L.; Halvorson, A.D.; Malone, R.W.; Ahuja, L.R.; Del Grosso, S.J.; Hatfield, J.L. Evaluatingfour nitrous oxide emission algorithms in response to N rate on an irrigated corn field. Environ. Model. Softw.2015, 72, 56–70. [CrossRef]
137. Cameira, M.R.; Tedesco, S.; Leitão, T.E. Water and nitrogen budgets under different production systems inLisbon urban farming. Biosys. Eng. 2014, 125, 65–79. [CrossRef]
138. Chaplot, V.; Saleh, A.; Jaynes, D.B.; Arnold, J. Predicting water, sediment and NO3-N loads under scenarios ofland-use and management practices in a flat watershed. Water Air Soil Pollut. 2004, 154, 271–293. [CrossRef]
139. Santhi, C.; Srinivasan, R.; Arnold, J.G.; Williams, J.R. A modeling approach to evaluate the impacts of waterquality management plans implemented in a watershed in Texas. Environ. Model. Softw. 2006, 21, 1141–1157.[CrossRef]
140. Arabi, M.; Frankenberger, J.R.; Engel, B.A.; Arnold, J. Representation of agricultural conservation practiceswith SWAT. Hydrol. Process. 2008, 22, 3042–3055. [CrossRef]
Horticulturae 2017, 3, 25 23 of 23
141. Giménez, C.; Gallardo, M.; Martínez-Gaitán, C.; Stöckle, C.O.; Thompson, R.B.; Granados, M.R. VegSyst, asimulation model of daily crop growth, nitrogen uptake and evapotranspiration for pepper crops for use inan on-farm decision support system. Irrig. Sci. 2013, 31, 465–477. [CrossRef]
142. Gallardo, M.; Thompson, R.B.; Giménez, C.; Padilla, F.M.; Stöckle, C.O. Prototype decision support systembased on the VegSyst simulation model to calculate crop N and water requirements for tomato under plasticcover. Irrig. Sci. 2014, 32, 237–253. [CrossRef]
143. Gallardo, M.; Fernández, M.D.; Giménez, C.; Padilla, F.M.; Thompson, R.B. Revised VegSyst modelto calculate dry matter production, critical N uptake and ET of several vegetable species grown inMediterranean greenhouses. Agric. Syst. 2016, 146, 30–43. [CrossRef]
© 2017 by the authors. Licensee MDPI, Basel, Switzerland. This article is an open accessarticle distributed under the terms and conditions of the Creative Commons Attribution(CC BY) license (http://creativecommons.org/licenses/by/4.0/).
Related Documents