Int. J. Six Sigma and Competitive Advantage, Vol. 2, No. 1, 2006 69 Copyright © 2006 Inderscience Enterprises Ltd. Implementation of Six Sigma quality system in Celestica with practical examples Leila Jannesari Ladani* and Diganta Das CALCE Electronic Product and System Center, Department of Mechanical Engineering, University of Maryland, College Park, MD 20742, USA E-mail: [email protected] E-mail: [email protected] *Corresponding author Jerry L. Cartwright Celestica, Inc., 5214 Palmer Lane NW, Rochester, MN 55901, USA E-mail: [email protected] Robert Yenkner Celestica Inc., 102 Joseph Circle, Higganum, CT 06441 E-mail: [email protected] Jafar Razmi University of Maryland, College Park, MD 20742, USA E-mail: [email protected] Abstract: This paper presents the Six Sigma methodology and the way it is implemented in an EMS company. The importance of EMS industry and its role in electronic manufacturing are discussed. The competitive advantages of Six Sigma for EMS companies are presented. Qualities and responsibilities of infrastructure levels and training procedure at each level is presented. Greenbelt and Black Belt course of study at each step as used in Celestica is provided. A comparison between Six Sigma implementation in Celestica, General Electric and Motorola is provided. Two technical examples of the projects implemented successfully through DMAIC process in Celestica are provided. Keywords: Six Sigma; Celestica; EMS industry; defects reduction; training; soldering.

Implementation of Six Sigma quality system in Celestica with ...
Jan 21, 2015
Welcome message from author
This document is posted to help you gain knowledge. Please leave a comment to let me know what you think about it! Share it to your friends and learn new things together.
Transcript

Int. J. Six Sigma and Competitive Advantage, Vol. 2, No. 1, 2006 69
Copyright © 2006 Inderscience Enterprises Ltd.
Implementation of Six Sigma quality system in Celestica with practical examples
Leila Jannesari Ladani* and Diganta Das CALCE Electronic Product and System Center, Department of Mechanical Engineering, University of Maryland, College Park, MD 20742, USA E-mail: [email protected] E-mail: [email protected] *Corresponding author
Jerry L. Cartwright Celestica, Inc., 5214 Palmer Lane NW, Rochester, MN 55901, USA E-mail: [email protected]
Robert Yenkner Celestica Inc., 102 Joseph Circle, Higganum, CT 06441 E-mail: [email protected]
Jafar Razmi University of Maryland, College Park, MD 20742, USA E-mail: [email protected]
Abstract: This paper presents the Six Sigma methodology and the way it is implemented in an EMS company. The importance of EMS industry and its role in electronic manufacturing are discussed. The competitive advantages of Six Sigma for EMS companies are presented. Qualities and responsibilities of infrastructure levels and training procedure at each level is presented. Greenbelt and Black Belt course of study at each step as used in Celestica is provided. A comparison between Six Sigma implementation in Celestica, General Electric and Motorola is provided. Two technical examples of the projects implemented successfully through DMAIC process in Celestica are provided.
Keywords: Six Sigma; Celestica; EMS industry; defects reduction; training; soldering.

70 L.J. Ladani et al.
Reference to this paper should be made as follows: Ladani, L.J., Das, D., Cartwright, J.L., Yenkner, R. and Razmi, J. (2006) ‘Implementation of Six Sigma quality system in Celestica with practical examples’, Int. J. Six Sigma and Competitive Advantage, Vol. 2, No. 1, pp.69–88.
Biographical notes: Leila Jannesari Ladani is a PhD candidate at the University of Maryland’s Calce Electronic Product and System Center. She holds a MS Degree in Mechanical Engineering with specialisation in Fluid Mechanics from Isfahan University of Technology and a MS Degree in Mechanical Engineering with specialisation in solid mechanics from the University of Maryland. She is a Six Sigma Black Belt from the Celestica corporation.
Diganta Das (PhD, Mechanical Engineering, University of Maryland, College Park; BTech, Manufacturing Science and Engineering, Indian Institute of Technology) is a Researcher in the Calce Center. He has published in the areas of electronic part uprating, operational environments of electronic parts, organised international conferences and workshops, and worked in international standards developments. He is the technical editor for the IEEE Standards Society working group in reliability society. He is a Six Sigma black belt from the Celestica Corporation. He serves on the Editorial Board of the Journal Microelectronics Reliability. He is a member of IEEE and IMAPS.
Jerry L. Cartwright, PE, is a Master Black Belt with Celestica and holds a BS Degree in Mechanical Engineering from the University of Kentucky. He is a Registered Professional Engineer, an ASQ Certified Quality Engineer and Certified Reliability Engineer. He has 20 years experience in quality and reliability engineering and management. He is responsible for the development and selection of Six Sigma projects, mentoring Six Sigma Black and Green Belts across Celestica’s Americas Operations region and driving Six Sigma initiatives to produce breakthrough results. He also facilitates the Six Sigma Council for the Corporation.
Robert Yenkner holds a BS Degree in Business Administration from Susquehanna University, and is a member of the Association for Manufacturing. He previously held the positions of Principal Consultant with the consulting firm PricewaterhouseCoopers; Manager of Business Performance with Spectrum Management Group; Supply Chain Manager, Manager of Business Development and Operational Audit Supervisor with the Black & Decker Corporation; Plant Manager in a diamond tool machining company; and Production Planning Supervisor for the Wiremold Company. He has over 20 years of hands-on international experience in a variety of industries including electronics, aerospace, automotive, consumer goods and electrical.
Jafar Razmi is a graduate student at the University of Maryland. He has 12 years’ work experience in establishment and documentation of Quality Management Systems in a chemical company. He has held auditing positions in Quality Management Systems.

Implementation of Six Sigma quality system in Celestica 71
1 Introduction
Six Sigma draws its name from properties of Gaussian or normal distribution (White, 1992). A normal distribution is defined by two key factors: the value of the standard deviation and the value of the mean of the distribution. Standard deviation, σ, is a measure of the spread of a distribution. The mean of a distribution, µ, is the measure of central tendency (http://www.itl.nist.gov/div898/handbook/index.htm). These concepts are represented in Figure 1.
Figure 1 Illustration of mean and standard deviation
Over time, the process band-width will increase in size due to process centring errors, which degrade capability and increase the likelihood of defects. Consequently, a potential loss of yield can occur that would increase costs. The average time-to-time centring error for a typical process is 1.5σ (Davis, 2005; McCarthy and Stauffer, 2001). This amount of shift and drift is inevitable and has to be accounted for during the design cycle of the process, product or service. Process shift is demonstrated in Figure 2. Owing to change in process variation during time, the total process variation is subdivided into short-term and long-term components.
Figure 2 Six Sigma shift to the right and left
The objective of Six Sigma quality is to reduce process output variation so that on a long-term basis, which is the customer’s aggregate experience with our process over time, will result in no more than 3.4 defects per million opportunities (DPMO). For a process with only one specification limit (Upper or Lower), this results in six process

72 L.J. Ladani et al.
standard deviations between the mean of the process and the customer’s specification limit (hence, Six Sigma). For a process with two specification limits (Upper and Lower), this translates to slightly more than six process standard deviations between the mean and each specification limit such that the total defect rate corresponds to equivalent of six process standard deviations.
Six Sigma provides a set of tools to be used when a focused technical breakthrough approach is required to resolve complicated technical issues such as design and manufacturing or business process issues. Six Sigma tools are based on data and statistical analysis to assure that aggressive improvement targets are achieved through elimination of variation within the process and recentring that may cause defects. Six Sigma is also applied to improve targeted business processes including SCM (Supply Chain Management), Information Technology (IT) and Accounts Payable and Billing. It improves the capability of measurement systems. Six Sigma is generally implemented through projects. The results of Six Sigma projects improve customer satisfaction and to real cost savings to the bottom line.
Six Sigma was initiated in Celestica from April 2001 through the Celestica lean manufacturing initiative to adopt an industry recognised process and add shareholder value through the improvements Six Sigma could bring. In January 2002, it started with the corporate recognition and awareness, and then they began, training Green Belts (GBs), Black Belts (BBs) and Champions. The initial effort in 2002 included resources for training services, material, instructors and travelling. Six Sigma is now implemented in all the Celestica sites in various stages of maturity.
2 Electronic manufacturing services (EMS) industry and Six Sigma role in EMS industry
Electronic manufacturing services industry is a part of electronic manufacturing, which provides services for other electronic companies. It includes; contract circuit or wiring board fabrication, assembly, system builds and packaging. The EMS definition comes from contract manufacturing, which is an agreement where a manufacturer is contracted by an original electronic manufacturer (OEM) to perform specific manufacturing activities. This provides an option for the OEM to acquire high technology products at an affordable cost (Sandborn, 2003).
Before the 1980’s, the EMS industry was utilised to reduce labour costs and provide additional manufacturing capabilities. At that time, EMS customers provided all board designs, components and testing. Today, the EMS industry has expanded its services to not only provide consignment, but also complete turnkey services such as product design, material management, final assembly, and in some cases, after sales services. Figure 3 shows schematically how EMS industry has evolved during the last two decades. Figure 4 shows annual income of EMS industry in different sites of the globe for the two years; 1997 and 2001. North America had the highest increase in income for the year 2001 (http://www.ableco.com/ems/).

Implementation of Six Sigma quality system in Celestica 73
Figure 3 Evolution of EMS industry
Source: Sandborn (2003)
Figure 4 EMS industry growth
Source: http://www.ableco.com/ems/
Contract manufacturers need to deliver on time, continue cost reductions and improve yields and quality to be an advantage to OEMs. Consequently, it is essential for a contract manufacturer to have a methodology to keep costs low and yields high to compete with other contract manufacturers. Six Sigma deployment is part of the solution to these requirements.

74 L.J. Ladani et al.
3 Levels of Six Sigma infrastructure, deployment stages and training in Celestica
Six Sigma implementation requires the creation of an infrastructure to assure that performance improvement activities have the necessary resources. The human resource levels typically used in Six Sigma organisation are: Leadership, Champions, Master Black Belts, Black Belts and Green Belts. Table 1 shows qualification, responsibilities, training and the number of employees trained for each level as it is implemented in Celestica. There is a minimum of one Black Belt for each site and three Master Black Belts so far in company. Black Belts are selected by the site general manager and Master Black Belts are appointed. The first group of Black Belts was trained by an outside group.
Table 1 Qualification, responsibilities, training and the number of employee for different human resource levels as implemented in Celestica
Champion Master Black Belt Black Belt Green Belt
Qualifications Senior executives and managers, such as a vice presidents or directors of manufacturing or marketing
Familiar with basic and advanced statistical tools
Technical degree
Master Black Belt might be a chief engineer or head of customer service
Mastery of basic and advanced statistical tools
Technical degree or orientation
Black Belt might be an engineer or billing administrator with five years or more of experience
Mastery of basic statistic tools
Technical and support background
Their current positions are associated with the problems needed to be solved
Familiarity with basic statistical tools
Responsibilities Create new understandable vision of Six Sigma
Support and leadership to employees to create new ideas, find a problem, make decisions and implement changes brought by Six Sigma
Apply quality tools and methods to achieve process improvement
Transfer leader and champion commands to the team
Train Green Belts and Black Belts
Assist Champions in identifying projects, collecting information, implement changes in the organisation, coordinating projects and designing cross-functional experience
Apply the breakthrough strategy for a specific project
Find needed changes and respond to them
Managing schedules
Implement Six Sigma on their area of work
Lead projects in their area of work
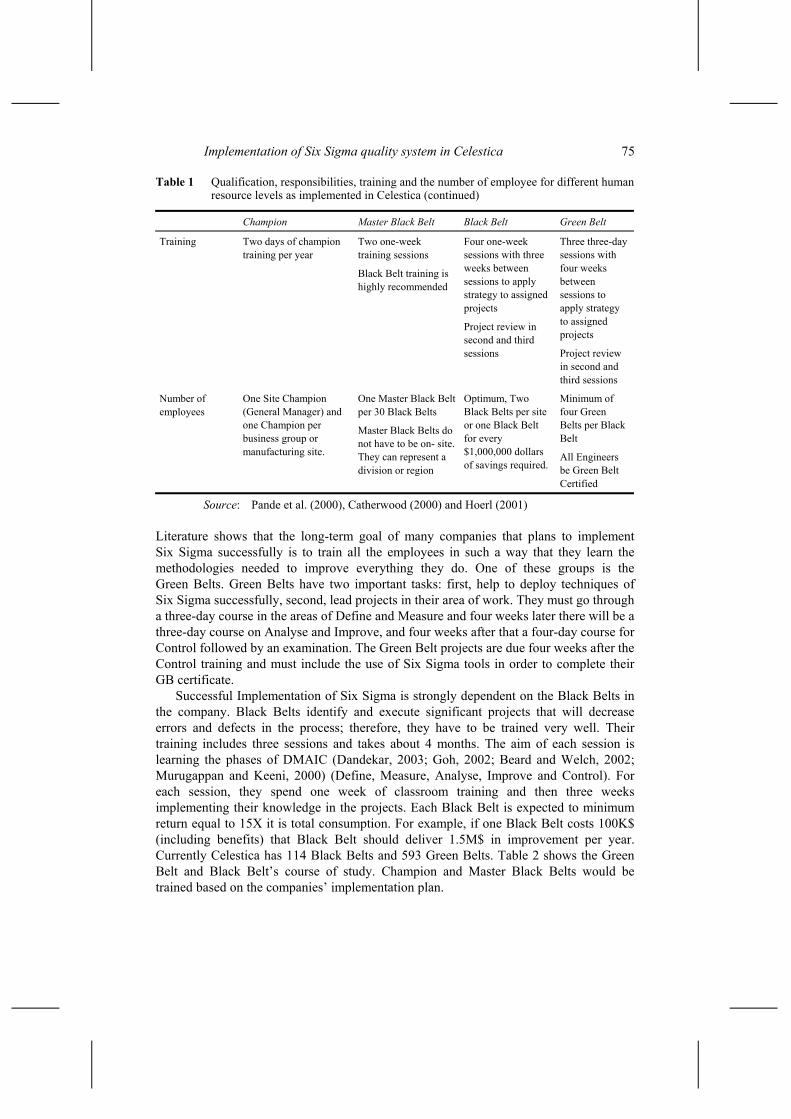
Implementation of Six Sigma quality system in Celestica 75
Table 1 Qualification, responsibilities, training and the number of employee for different human resource levels as implemented in Celestica (continued)
Champion Master Black Belt Black Belt Green Belt
Training Two days of champion training per year
Two one-week training sessions
Black Belt training is highly recommended
Four one-week sessions with three weeks between sessions to apply strategy to assigned projects
Project review in second and third sessions
Three three-day sessions with four weeks between sessions to apply strategy to assigned projects
Project review in second and third sessions
Number of employees
One Site Champion (General Manager) and one Champion per business group or manufacturing site.
One Master Black Belt per 30 Black Belts
Master Black Belts do not have to be on- site. They can represent a division or region
Optimum, Two Black Belts per site or one Black Belt for every $1,000,000 dollars of savings required.
Minimum of four Green Belts per Black Belt
All Engineers be Green Belt Certified
Source: Pande et al. (2000), Catherwood (2000) and Hoerl (2001)
Literature shows that the long-term goal of many companies that plans to implement Six Sigma successfully is to train all the employees in such a way that they learn the methodologies needed to improve everything they do. One of these groups is the Green Belts. Green Belts have two important tasks: first, help to deploy techniques of Six Sigma successfully, second, lead projects in their area of work. They must go through a three-day course in the areas of Define and Measure and four weeks later there will be a three-day course on Analyse and Improve, and four weeks after that a four-day course for Control followed by an examination. The Green Belt projects are due four weeks after the Control training and must include the use of Six Sigma tools in order to complete their GB certificate.
Successful Implementation of Six Sigma is strongly dependent on the Black Belts in the company. Black Belts identify and execute significant projects that will decrease errors and defects in the process; therefore, they have to be trained very well. Their training includes three sessions and takes about 4 months. The aim of each session is learning the phases of DMAIC (Dandekar, 2003; Goh, 2002; Beard and Welch, 2002; Murugappan and Keeni, 2000) (Define, Measure, Analyse, Improve and Control). For each session, they spend one week of classroom training and then three weeks implementing their knowledge in the projects. Each Black Belt is expected to minimum return equal to 15X it is total consumption. For example, if one Black Belt costs 100K$ (including benefits) that Black Belt should deliver 1.5M$ in improvement per year. Currently Celestica has 114 Black Belts and 593 Green Belts. Table 2 shows the Green Belt and Black Belt’s course of study. Champion and Master Black Belts would be trained based on the companies’ implementation plan.

76 L.J. Ladani et al.
Table 2 Green Belt and Black Belt course of study in Celestica
Implementation of Six Sigma initially requires changing the culture and the way employees think about themselves and the company. There are different practical and technical ways to manage and control processes. Table 3 shows stages of Six Sigma initial deployment.
Table 3 Six Sigma initial deployment stages in Celestica
Week 1 Orientation and planning Weeks 1–6 Champion review and training Week 7 First group of Black Belts begin first five days class and begin the Define and
Measure phase of Six Sigma Weeks 8–10 Black Belts implement the knowledge that they have learned in the Define and
Measure phase training to their projects Week 11 The first group of Black Belts comes back to the second five days of training
to review the Measure phase and learn the Analysis and Improve phase Weeks 12–14 The Black Belts apply what they have learned in Analysis and Improve phase
to their projects Week 15 The first group of Black Belts returns to the third five-day training course to
review the Analysis and Improve phase and learn the Control phase Weeks 16–18 Black Belts apply their knowledge of the Control phase to their projects Week 16 Black Belts take 16 hours of exams Weeks 18–24 Black Belts complete and submit their projects for review and their Black Belt
Certification
Source: Pande et al. (2000)

Implementation of Six Sigma quality system in Celestica 77
The basic concepts of Six Sigma are the same in all companies. The process of implementation varies depending on the goals that are required to be achieved. Two important factors in determining the level of quality in service companies are customer satisfaction and cycle-time reduction. The strategy for Six Sigma deployment in Celestica is to select a site per region. The criteria for selection are:
• good measurement system
• supportive site leadership
• resident full-time Black Belts
• four potential Green Belts
• customer pressure
• good change oriented culture.
At the next step available, Black Belts and Green Belts resources and improvement projects at selected sites are identified with the cooperation of Black Belts and world class management (WCM) leaders. Number of formally trained Black Belts is increased and criteria are developed to qualify existing skills as Black Belts. WCM sigma council reviews the project monthly or quarterly. Figure 5 shows flowchart of Six Sigma deployment in Celestica.
Figure 5 Celestica Six Sigma deployment
In Celestica, projects are selected using Critical to Quality (CTQ) tree, which translates broad customer requirements into specific critical to quality requirements. High-volume repetitive projects that are in touch or affect the customers are to be selected. Improvement in the cost of quality and manufacturing process improvement including, efficiency, cycle time and number of defects are factors that are considered in selecting projects. Minimum project requirements are:

78 L.J. Ladani et al.
• fix issues
• improve cost by 250 K annually
• improve process by 70%
• must be completed in less than 6 months.
Tools such as Pareto analysis and cause and effect diagram are used in the selection process. Common Six Sigma tools and techniques that are used in Celestica are (Snee, 2003):
• project definition
• process mapping
• cause and effect diagram
• failure modes and effect analysis (FMEA)
• variable and attribute measurement system analysis
• graphical data analysis
• confidence intervals
• hypothesis testing
• analysis of variance (ANOVA)
• design of experiment
• attribute and variable control charts
• correlation and regression analysis
• proportions testing
• advance SPC
• root cause analysis techniques
• EVOP/PLEX
• response surface methods
• project plan
• project scoping tools.
By implementing the methods and tools described in this section, Celestica continues to save more. Celestica was able to save significantly during the year 2002. After that, each year savings have increased significantly. Celestica is leading EMS companies in Six Sigma and it is expected to continue to be leader.

Implementation of Six Sigma quality system in Celestica 79
4 Comparison of Six Sigma implementation in Celestica with other companies
Table 4 shows a comparison of Six Sigma model in Celestica with GE and Motorola. All three companies are using DMAIC approach and the same Six Sigma tools, but the implementation and deployment of these tools and techniques differ in each company. Celestica is evolving from a company dependent on a small number of Six Sigma experts to a company where Six Sigma techniques and principles are practiced by the majority of the employee population.
Table 4 Comparison of Six Sigma model in Celestica with Six Sigma model in Motorola and GE
Celestica Six Sigma model GE Six Sigma model
Motorola Six Sigma model
Approach Total culture approach Applied to all processes – Opera/trans
Cross corporate – applied to all functions Technical and transactional processes
Total culture approach Applied to all processes
Quality Delivery Cost Yield Quality Yield Company metric based Cycle time Cost Quality Capacity Cycle time Cost Project selection
Customer improvements Technical level problems and cost reductions
Highest annual impact Typical results -Avg $100K cost Red’ns COQ based selection
Customer problems Technical level problems
Project duration 4 weeks–4 months GB 1–3 months to completion BB 2–4 months to completion
3 weeks–12 Months Dedicated core team BB 3 months/9 months completion
Always improving, no time limit Problem oriented Duration varies
Involvement Everyone involved, all departments, supported by Trained MBBs, BBs, GBs and champions Training for all employees (Orientation and basic 6 Six Sigma Tools (‘Yellow Belts’)
Trained expert facilitation Champions, Black Belts, Master Black Belt, Green Belts Projects limited by resource availability
Everyone involved, all departments, supported by Trained MBBs, BBs, GBs Trained people required for projects everywhere
Review Review part of the monthly operations review (financials and deployment metrics) Everyone involved (suppliers, customers, partners)
Reviewed by champions Special review structure
Improvement review part of the MOR, part of every review Everyone involved (suppliers, customers, partners)
80 L.J. Ladani et al.
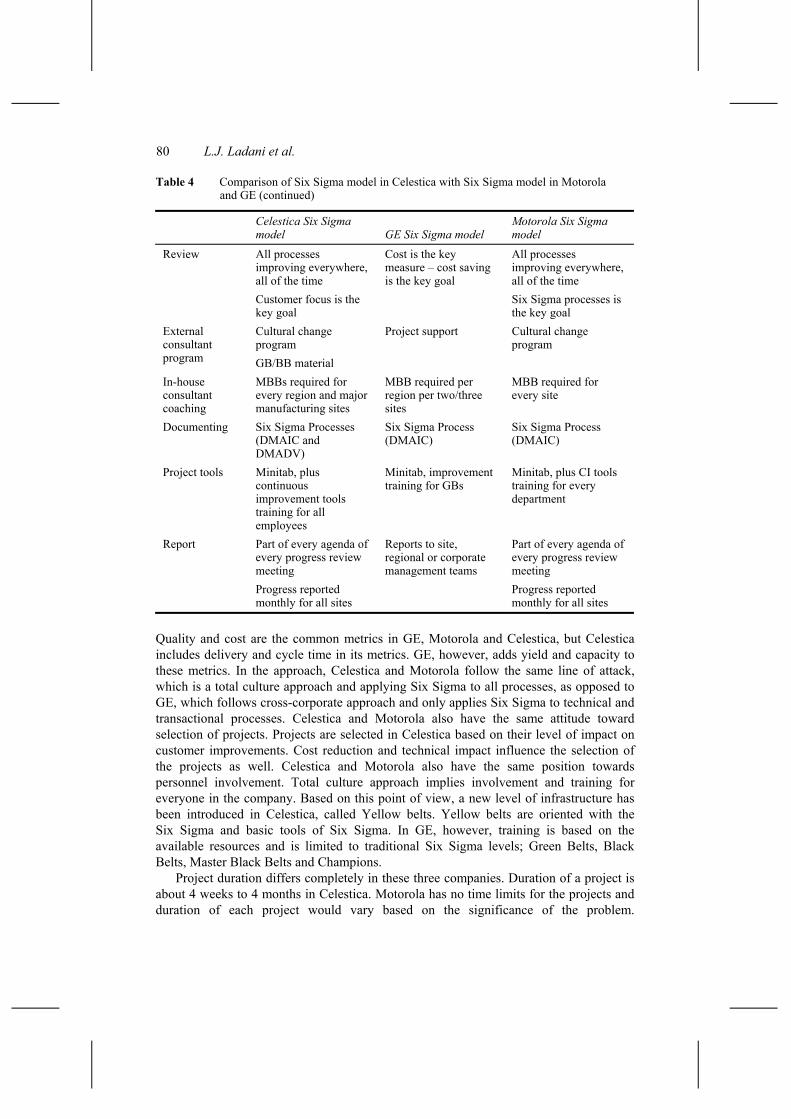
Table 4 Comparison of Six Sigma model in Celestica with Six Sigma model in Motorola and GE (continued)
Celestica Six Sigma model GE Six Sigma model
Motorola Six Sigma model
All processes improving everywhere, all of the time
All processes improving everywhere, all of the time
Review
Customer focus is the key goal
Cost is the key measure – cost saving is the key goal
Six Sigma processes is the key goal
Cultural change program
External consultant program GB/BB material
Project support Cultural change program
In-house consultant coaching
MBBs required for every region and major manufacturing sites
MBB required per region per two/three sites
MBB required for every site
Documenting Six Sigma Processes (DMAIC and DMADV)
Six Sigma Process (DMAIC)
Six Sigma Process (DMAIC)
Project tools Minitab, plus continuous improvement tools training for all employees
Minitab, improvement training for GBs
Minitab, plus CI tools training for every department
Part of every agenda of every progress review meeting
Part of every agenda of every progress review meeting
Report
Progress reported monthly for all sites
Reports to site, regional or corporate management teams
Progress reported monthly for all sites
Quality and cost are the common metrics in GE, Motorola and Celestica, but Celestica includes delivery and cycle time in its metrics. GE, however, adds yield and capacity to these metrics. In the approach, Celestica and Motorola follow the same line of attack, which is a total culture approach and applying Six Sigma to all processes, as opposed to GE, which follows cross-corporate approach and only applies Six Sigma to technical and transactional processes. Celestica and Motorola also have the same attitude toward selection of projects. Projects are selected in Celestica based on their level of impact on customer improvements. Cost reduction and technical impact influence the selection of the projects as well. Celestica and Motorola also have the same position towards personnel involvement. Total culture approach implies involvement and training for everyone in the company. Based on this point of view, a new level of infrastructure has been introduced in Celestica, called Yellow belts. Yellow belts are oriented with the Six Sigma and basic tools of Six Sigma. In GE, however, training is based on the available resources and is limited to traditional Six Sigma levels; Green Belts, Black Belts, Master Black Belts and Champions.
Project duration differs completely in these three companies. Duration of a project is about 4 weeks to 4 months in Celestica. Motorola has no time limits for the projects and duration of each project would vary based on the significance of the problem.
Implementation of Six Sigma quality system in Celestica 81
Similar to Celestica, GE has a time limit for each project, but time could be as long as 12 months until the project ends.
Projects are reviewed in comparatively same manner in both Celestica and Motorola. In both companies, everyone is being involved in the review. In GE, however, projects are reviewed by champions and special review structure. The key goal is different in all companies; Celestica stresses on customer satisfaction, GE is looking for cost saving and Motorola focuses on process improvement.
Celestica requires MBBs in every regions and major manufacturing sites. GE requires two to three Master Black Belts per region and Motorola requires Master Black Belt for each site. All the differences and similarities of these companies have been categorised at Table 2.
5 Six Sigma implementation example in Celestica
Implementation of Six Sigma is often done through projects. Next example shows the process of implementing Six Sigma on a Green Belt Project.
5.1 Defect reduction in surface mount soldering by controlling humidity
An analysis of SMT solder per card (DPU-Defect per Unit) vs. space humidity shows the consequence (DPU increase) of operating outside the process engineering specification limits. There were four GB involved in this project:
• goal/objective: improve SMT quality by determining optimal humidity
• financial benefits: rework reduction due to humidity caused defects
• non-financial benefits • DPU improvements • Cycle time reduction.
5.1.1 Define
Problem statement. Rework reduction by determining the optimal humidity for the minimum defects level (Defect per Unit-DPU (DPU = Total defects/Total cards)). The project will include defect rates for days with different humidity levels.
5.1.2 Measure
A fishbone diagram was provided for manufacturing process defects. As it is observed in Figure 6, Cause and Effect diagram indicates that humidity is one of the reasons for solder defects.
Therefore, engineers group plan a measurement step to clarify the severity of the effect. Process engineering identified five days – November 29–December 3 – where the relative humidity (RH) levels were below the lower shutdown limit of 30% RH. For three cards, Card A, B, and C, the DPU was calculated for this time-period below specification, and for two other time-periods – November 15–28 and December 4–17. In these two time-periods, RH was within specification. Humidity data were collected for these

82 L.J. Ladani et al.
time-periods. Table 5 shows time-period and relative humidity in each period. Table 6 shows statistic of defects during these periods.
Figure 6 Cause and effect diagram for solder defects
Table 5 Time periods analysed
Before – RH in spec November 15–November 28 During – RH < 30% November 29–December 3 After – RH in spec December 4–December 17
Table 6 Cards defect information
November 15–28 November 29–December 3 December 3–December 17
DefectsNum cards
DPU (million) Defects
Num cards
DPU (million) Defects
Num cards
DPU (million)
Card A 58 536 108,209.0 17 248 68,548.4 20 328 60,975.6 Card B 238 1152 206,597.2 64 348 183,908.0 0 0 0.0 Card C 17 93 182,795.7 102 312 326,923.1 303 2124 142,655.4 Totals 313 1781 175,744.0 183 908 201,541.9 323 2452 131,729.2
5.1.3 Analyse
The normality of humidity was checked for the time-period within specification (November 15–28 and December 4–17). The analysis shows that the data may be normal and the mean of this data is 35.7%RH. The standard deviation is 3.93 and the 95% confidence interval for the mean is (34.05, 37.3). In addition, the normality of the humidity was checked for the time-period not within specification (November 29–December 3). The analysis shows that this data also may be normal. The mean of this data is 4.0%RH, the standard deviation is 1.22 and the 95% confidence

Implementation of Six Sigma quality system in Celestica 83
interval for the mean is (22.48, 25.52). Further analysis of the humidity shows that there is a significant difference in the mean humidity between the data within the specification and not within the specification time-period.
A Hypothesis test of DPU (Defect per Unit) was conducted using the Null Hypothesis for the proportions being equal (p1 = p2). The Alternate Hypothesis for the proportion defective from the days with the RH below specification was greater than the proportion defective from the days that were in specification (p1 > p2). This analysis shows there is a significant difference (95% CL) in the proportion defective for Cards A/B/C grouped together. Hypothesis testing result is shown in Table 7. Difference in result means that null hypothesis is rejected and alternate hypothesis accepted.
Table 7 Hypothesis testing for proportions
Hypothesis inputs Null hypothesis H0: P1 = P2 Alternative hypothesis H1: P1 > P2 One tailed test Significance level 0.05 n1 = Sample size of the first n2 = Sample size of the second d1 = number of defects for the first d2 = number of defects for the second Calculated p1 = proportion of first (d1/n1) – calculated p2 = proportion of second (d2/n2) – calculated Results Chance (cannot reject are =) Hypothesis is accepted at the significance level Difference Hypothesis is rejected at the significance level DPMO
Card p1 p2 n1 n2 d1 d2 p S z Result
A/B/C cards before/after to during
0.150 0.202 4233 908 636 183 0.16 0.0134 3.83 Difference
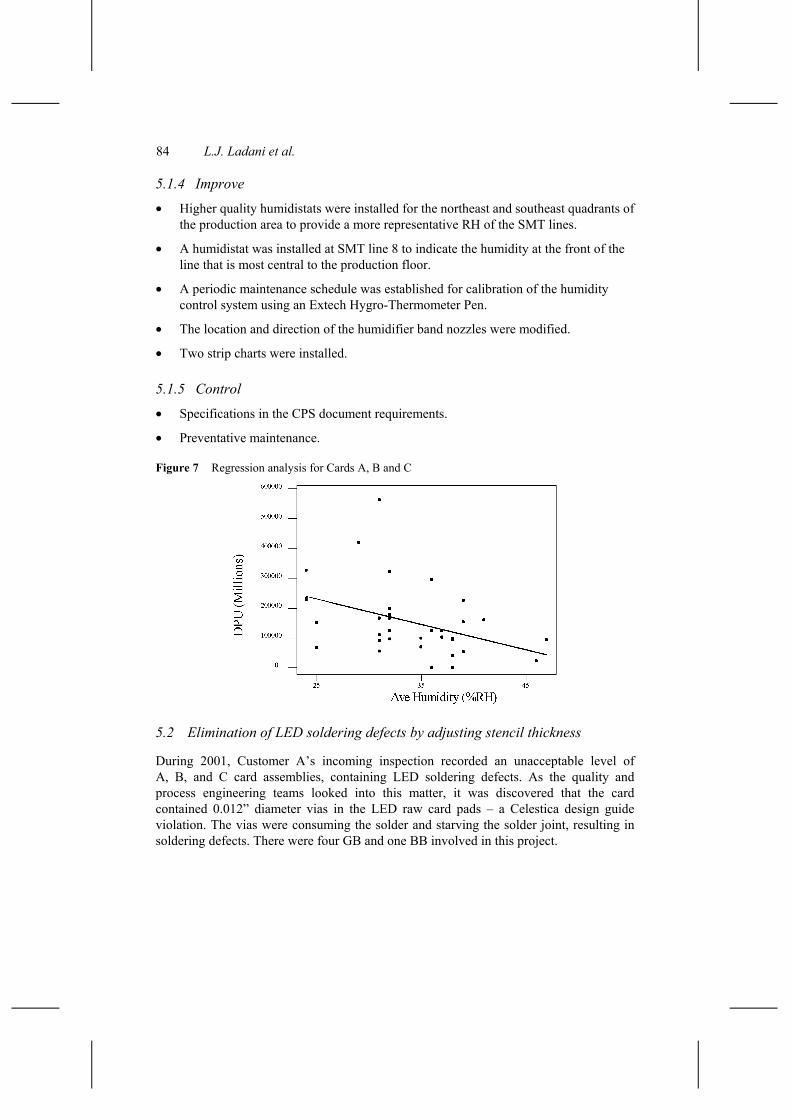
Regression Analysis of Humidity vs. DPU (defect per unit) conducted for Cards A, B and C indicates that the DPU decreases as the RH increases. However, a R2 value of 16.5% means we cannot conclude that there is a correlation between DPU and Humidity. Please refer to Figure 7.
84 L.J. Ladani et al.
5.1.4 Improve
• Higher quality humidistats were installed for the northeast and southeast quadrants of the production area to provide a more representative RH of the SMT lines.
• A humidistat was installed at SMT line 8 to indicate the humidity at the front of the line that is most central to the production floor.
• A periodic maintenance schedule was established for calibration of the humidity control system using an Extech Hygro-Thermometer Pen.
• The location and direction of the humidifier band nozzles were modified.
• Two strip charts were installed.
5.1.5 Control
• Specifications in the CPS document requirements.
• Preventative maintenance.
Figure 7 Regression analysis for Cards A, B and C
5.2 Elimination of LED soldering defects by adjusting stencil thickness
During 2001, Customer A’s incoming inspection recorded an unacceptable level of A, B, and C card assemblies, containing LED soldering defects. As the quality and process engineering teams looked into this matter, it was discovered that the card contained 0.012” diameter vias in the LED raw card pads – a Celestica design guide violation. The vias were consuming the solder and starving the solder joint, resulting in soldering defects. There were four GB and one BB involved in this project.

Implementation of Six Sigma quality system in Celestica 85
• Goal/objective • Reduce in-house solder and assembly defects on Cards A, B, and C to a level
that more closely matched current sector DPMO rates (solder = ~30 DPMO, assembly = ~250 DPMO).
• Eliminate LED soldering defects on Cards A, B, and C shipped to the customer. This includes improving incoming quality levels and system line first pass yield (FPY) at the customer.
• Financial benefits: savings
• Non-financial benefits • DPMO improvements • the elimination of LED defects on this card set affected customer A system line
first pass yield and significantly increased customer satisfaction.
5.2.1 Define
Problem statement. During 2001, Customer A was rejecting an unacceptable level of Cards A, B, and C assemblies for LED soldering defects. The incoming LED solder defect level was 0.25%. More significantly, LED defects were affecting customer A system line first pass yield (FPY). These cards were put on customer A ‘Tier 1’ card list, which designated them as having significant impact on system line FPY.
5.2.2 Measure
New stencil was designed and introduced in the system. Queries were written to pull defect data that could be attributable to insufficient solder for Cards A, B, and C for the time-period 2 months prior to the new stencil introduction and 2 months after the new stencil introduction. Soldering and placement defects claimed against part number 44H7340 that could be caused by insufficient solder were summed for comparison purposes.
Data from customer A’s incoming inspection were sorted for LED defects that could be attributable to insufficient solder. Data from before and after the stencil introduction into Celestica manufacturing were divided for comparison.
5.2.3 Analyse
To validate that the stencil change made a statistical improvement in LED defects while not increasing soldering problems on the other parts on the boards, a hypothesis test of proportions was run using a 95% confidence level. The results of this testing is shown in Table 8. The null hypothesis is that the stencil changes made no difference, while the alternative hypothesis is that the stencil changes did make a difference (improvement). Table 8 indicates that both Cards B, and C showed improvement both in-house and at the vendor, while Card A showed that defect levels stayed about the same. At less discrimination, 90% confidence level, Card A does show improvement. N1, N2, D1, D2, P1 and P2 shows sample size of the first, sample size of the second, number of defects of the first, number of defects of the second, proportion of the first and proportion of the second, respectively.

86 L.J. Ladani et al.
Table 8 Hypothesis testing of proportions at 95% confidence (alpha = 0.05)
P1 P2 N1 N2 D1 D2 p Result
Card B 0.021 0.005 4011 3922 84 19 0.01 Difference Card A 0.007 0.003 1383 1222 10 4 0.01 Chance Card C 0.022 0.002 935 1023 21 2 0.01 Difference Sums 0.018 0.004 6329 6167 115 25 0.01 Difference Card B consequential 0.057 0.035 4011 3922 230 136 0.05 Difference Card A consequential 0.177 0.162 1383 1222 245 198 0.17 Chance Card C consequential 0.278 0.107 935 1023 260 109 0.19 Difference Card B customer A audit 0.004 0.000 2862 971 12 0 0.00 Difference Card A customer A audit 0.000 0.000 3346 1401 1 0 0.00 Chance Card C customer A audit 0.011 0.000 274 757 3 0 0.00 Difference
Stencil thickness increases may result in the increase on solder defects on the other parts contained on the board. These are considered the consequential metrics. Both Card B and C showed a difference between the original and new stencil, but the change was actually an improvement. The Card A showed no statistical defect differences between the two stencils.
Using MiniTAB, calculations were made to determine what percentage of cards was defective before and after the stencil change and the expected lower and upper bounds of defective cards at a 95% confidence interval. The resulting data are shown in Table 9.
Table 9 Defect bounding at 95% confidence interval
Percent cards defective before stencil change
Percent cards defective after stencil change
Lower control interval (%)
Upper control interval (%)
Card B 2.09 0.48 0.29 0.76 Card A 0.72 0.33 0.09 0.84 Card C 2.25 0.20 0.02 0.70
5.2.4 Improve
Table 10 contains the changes that were made to each of the stencils. The thickness of each stencil was increased. The finest pitched component on Card B was 0.025", while Card A and Card C both had 0.020" pitch components. Due to space constraints around the fine pitch components, the stencils could not be stepped down in these regions. To aid in paste release, all fine pitch apertures were laser cut. In addition, to ensure full filling of the fine pitch apertures on Card A and Card B, print speeds were lowered from 20 mm/s to 16 mm/s. Stencil changes contained in Table 9 were reviewed and approved by customer A prior to implementation.

Implementation of Six Sigma quality system in Celestica 87
Table 10 Stencil modification
Original LED
aperture (mils) New LED
aperture (mils) Original
thickness (mils) New thickness
(mils) Card B top 60 × 55 66 × 57 6 7 Card B bottom 60 × 55 60 × 55 6 8 Card A 60 × 55 66 × 57 6 7 Card C 60 × 55 68 × 57 6 7
To ensure that any LED defects that were created in spite of the stencil changes were caught, visual inspection of LEDs was reemphasised to the functional test operators. Even though there is still a low level LED defect level, these defects are caught and repaired prior to the product shipping to the customer.
5.2.5 Control
• No via in 1206 or smaller pad added to the Celestica-Rochester design guide checklist.
• Ask customer A to send stencil Gerber data with specially sized apertures where this design guide specification had to be violated. This will act as notification of the violation. The stencil may then be designed such that the violation is masked.
6 Summary and observation
Six Sigma is an effective process that can be used to mitigate the defect rate, increase the margin of the company and increase customer satisfaction. The degree of the success in each company depends on the company metrics. Implementation of Six Sigma in Celestica has been a success in aspects of customer satisfaction and savings. Several steps are involved in the process to make it an effective deployment. Even though the Six Sigma method is robust and comprehensive, there is still room for improvement in deploying it. Champions Master Black Belts have a key role in implementing Six Sigma by managing and connecting the projects.
References Beard, L. and Welch, E. (2002) ‘Six Sigma in the technical writers world’, GE Medical Systems
Information Technology, Society for Technical Communication (STC) 49th Conference, May. Catherwood, P. (2002) ‘What’s different about Six Sigma?’, IEEE, Manufacturing Engineer,
Vol. 81, No. 4, pp.186–189. Dandekar, G.S. (2003) ‘Transactional Six Sigma – a practical approach’, IEEMA Journal, Vol. 23,
No. 6, pp.23–27. Davis, B. (2005) Statistical Reason for the 1.5σ Shift, International Quality Institute, http://www.
i-q-i.com, Reviewed 2005. Goh, T.N. (2002) ‘A strategic assessment of Six Sigma’, Quality and Reliability International,
Vol. 18, No. 5, pp.403–410.
88 L.J. Ladani et al.
Hoerl, R.W. (2001) ‘Six Sigma Black Belts: what do they need to know?’, Journal of Quality Technology, Vol. 33, No. 4, pp.391–406.
McCarthy, B.M. and Stauffer, R. (2001) ‘Enhancing Six Sigma through simulation with IGRAFX process for Six Sigma’, Proceeding of the 2001 Winter Simulation Conference, Arlington, VA, USA, Vol. 2, pp.1241–1247.
Murugappan, M. and Keeni, G. (2002) ‘Quality improvement – the Six Sigma way’, Quality Software, 2000, Proceedings, First Asia-Pacific Conference on 30–31 October, 2000, pp.248–257.
Pande, P.S., Robert, R.P. and Cavanagh, R.R. (2002) The Six Sigma Way, McGraw-Hill, New York.
Sandborn, p. (2003) Contract Assembly Assessment, Web book, Calce electronic product and System Center, www.calce.umd.edu.
Snee, R.D. (2003) ‘Eight essential tools’, Quality Progress, Vol. 36, No. 12, pp.86–88. White, R. (1992) ‘An introduction to Six Sigma with a design example’, Applied Power Electronics
Conference and Exposition, APEC ‘92. Conference Proceedings, Seventh Annual, pp.28–35.
Bibliography Harry, M. and Schroeder, R. (2000) ‘Six Sigma the breakthrough management strategy
revolutionizing the worlds top corporations’, Currency Book, Vol. 1, No. 1, New York. Heradesky, J.L. (1998) Productivity and Quality Improvement, McGraw-Hill, New York, USA. Hutchins, G.B. (1991) Introduction to Quality: Control, Assurance and Management, Collier
Macmillan, New York, USA. Montgomery, D.C. and Runger, G.C. (1994) Applied Statistics and Probability for Engineering,
Vol. 1, John Willey & Sons, New York. Rao, A., Carr, L.P., Dambolena, I., Kopp, R.J., Martin, J., Rafi, F. and Schlesinger, P.F. (1996)
Total Quality Management: A Cross Functional Perspective, John Willey & Sons, USA. Sammy, G.S. (2002) Six Sigma for Electronics Design and Manufacturing, McGraw-Hill,
New York. Tennant, G. (2001) Six Sigma: SPC and TQM in Manufacturing and Services, Gower Publishing
Company, Hampshire.
Website http://www.ableco.com/ems/, EMS industry, reviewed January 2003.
Related Documents