THE FINAL TOLLGATE Applying Six Sigma to Six Sigma ® M A G A Z I N E An Individual Copy $ 24 95 EACH This copyrighted reprint from iSixSigma is for individual use only. It may not be republished, electronically or physically reproduced, changed, posted to a website or otherwise distributed without written permission. For reprint permissions, please contact iSixSigma at [email protected] or (206) 922-5314 x700. This report and others can be ordered at www.isixsigma.com/store

Welcome message from author
This document is posted to help you gain knowledge. Please leave a comment to let me know what you think about it! Share it to your friends and learn new things together.
Transcript

THE FINAL TOLLGATE
Applying Six Sigmato Six Sigma
®
M A G A Z I N E
An Individual Copy
$2495 EACH
This copyrighted reprint from iSixSigma is for individual use only. It may not be republished, electronically or physically reproduced, changed, posted to
a website or otherwise distributed without written permission.For reprint permissions, please contact iSixSigma
at [email protected] or (206) 922-5314 x700.This report and others can be ordered
at www.isixsigma.com/store
■ No Reproduction Without Permission ■
THE FINAL TOLLGATE
1
Applying Six Sigma to Six Sigma
BY BRYCE CURRIE AND HOLLY DUCKWORTH
The Final Tollgate features a Six Sigma project as it would bepresented to a panel of company executives at the final proj-ect review. The objectives of such a presentation are to com-municate significant results of the project and share high-
lights of how results were achieved. The slides are the projectleader’s visual presentation and the accompanying text is theverbal presentation. It is assumed that the audience has abasic understanding of Six Sigma.
Do you have an exemplary Six Sigma project to share? Would you like to see it here? Submit it to us at isixsigma.com/submit.
Copyright ©2020 iSixSigma.com www.isixsigma.com/store
TRW Automotive is one of the world’s largest automotive
suppliers, producing braking, steering and suspension systems,
and occupant safety systems in nearly 200 locations on four
continents. After introducing Lean in manufacturing, then Six
Sigma company-wide, they were doing well applying the
methodologies in both manufacturing and business processes.
But, in general, as Six Sigma deployments become more mature,
there is a danger of stagnating. To counter apparent sub-
optimization of Six Sigma at TRW, the vice president of global
quality, program management and Business Excellence
challenged his group to examine itself. Through a DMAIC
project, the company used Six Sigma to advance its Six Sigma
program in order to meet changing business needs.

■ No Reproduction Without Permission ■
DefineSix years into TRW’s Six Sigma deployment, a team focused a DMAIC project to determine how the process improvementprogram could benefit from continuous process improve-ment. Voice-of-the-customer interviews with business leadersrevealed there were inconsistencies in the strength and per-formance of the Six Sigma efforts across business units andsites; some businesses had redundant resources and otherswere lacking resources.
The problem statement was summed up as: The Six Sigmaprogram is missing opportunities for process improvement.
The objectives of the project were to identify what thestakeholders of the Six Sigma program need, determine thegap between current and desired performance, investigatethe root causes of waning performance, find solutions tothose causes, and implement monitoring methods to contin-ually adjust the program proactively to the shifts and trendsof the organization’s needs.
The first task was to determine which customer was thefocus of service for the Six Sigma program. Of course the pri-mary customer was the business itself. The significant sav-ings reaped had become an expectation for the executivesand shareholders. The Champion for this project was theCEO, in demand of continued performance improvement.The process owner was the head of the enterprise processimprovement program, with a focus on ensuring a sustain-
able program. The customers of consideration were the business shareholders, operating units and members of theSix Sigma function: Master Black Belts, Black Belts andGreen Belts.
A critical-to-quality (CTQ) tree identified the customerneed as optimizing business processes and specified the driv-ers by which the Six Sigma program could meet that need.The measurable CTQs included financial objectives; thenumber of Green Belt, Black Belt and Master Black Belt projects per year; the time to complete projects; and thenumber of Belts trained.
MeasureIt seemed that the Measure phase would be relatively simplebecause data on the number of Belts, number of projectsand project duration was readily available. All the CTQ metrics looked acceptable when viewed from a company-wide perspective.
Stratifying the data by business unit, however, revealedsignificant differences. Some business units had only GreenBelts and no Black Belts. Other business units regularly con-ducted four Black Belt training classes per year, and othershad not offered a class in three years. Some Master BlackBelts were not assigned projects; other business units had noMaster Black Belts at all.
TRW Automotive is a large global organization with
THE FINAL TOLLGATE
2
DEFINE
Applying Six Sigma to Six Sigma
D M A I C
CTQ Tree
Linkage between business objectives
and project assignments
Efficient deployment of Six Sigma
functional resources
Minimize time to complete projects
Trained practitioners ready to lead
projects
$ savings objective% yield objective
Customer satisfaction objective
1-2 projects/GB/year2-3 projects/BB/year
1-2 projects/MBB/year
< 4 months/GB project< 6 months/BB project
< 9 months/MBB project
# trained GBs# trained BBs
# trained MBBs
Critical-to-quality Characteristics
Process DriversCustomer Need
Project objective: Improve the cross-company performance of the Six Sigma program
Optimize business processes through Six Sigma program
deployment
Best projects always being
worked
Maximum number of improvement projects quickly
completed
Copyright ©2020 iSixSigma.com www.isixsigma.com/store
■ No Reproduction Without Permission ■
THE FINAL TOLLGATE
3
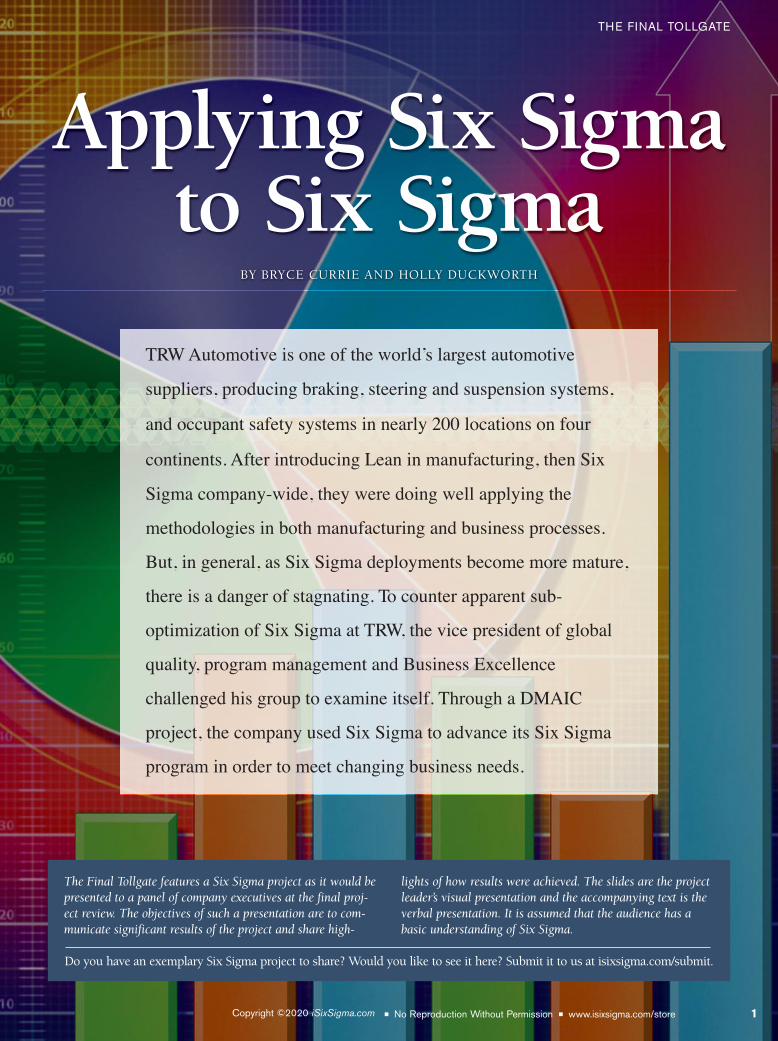
13 business units in the United States, Europe, Asia andSouth America. For an understanding of the current state ofSix Sigma in every business unit, the Measure phase involvedsurveying program leaders at each unit – directors of organi-zational excellence, Master Black Belts, Black Belts and direc-tors of operations.
The survey instruments were assessed for both validityand reliability. The validity of the survey was determinedwith a focus group of Master Black Belts from the UnitedStates and the European Union.
Face validity, that is survey questions that appear asthough they will elicit the information they are intended togain, was evaluated by the focus group. Content validity,which is related to whether the questions reflect the specificintended domain of the content, was analyzed by the MasterBlack Belts through brainstorming and affinity exercises toensure that the survey instrument covered as many potentialcontent topics as was valid.
The survey instrument was then tested across all MasterBlack Belts in the company. Test-retest reliability was assessedto determine whether the survey would yield similar resultswhen given to the same people at different times. In addi-tion, inter-item reliability was tested to determine whethersurvey items designed to measure the same aspect had mini-mal variability in their responses. Cronbach’s alpha was cal-culated for inter-item reliability.
MEASURE
Applying Six Sigma to Six Sigma
D M A I C
Survey of Program Leaders (Selected Questions from Survey)
Directors of organizational excellence, Master Black Belts, Black Belts and directors of operations were surveyed for current-state program attitudes.
5. Please indicate your opinion about your operating unit’s performance on the following Six Sigma program aspects.
People – hiring, retaining, utilizing Black Belts and Master Black Belts
Communication – thorough and technically correct use of project tracking and performance scorecard systems
Processes – leading training events, completing projects, providing Six Sigma body of knowledge (BOK) material
Organizational structure – full utilization of DMAIC, IDOV and influence skills
Leadership – Achievement of income statement and balance sheet objectives, and report card objectives
Worst in the company Could improve a lot About average Doing well A best practice
People � � � � �
Communication � � � � �
Processes � � � � �
Organizational structure � � � � �
Leadership � � � � �
6. What issues surrounding the Six Sigma program need immediate resolution in your business segment?
TRW Automotive, headquartered in Livonia, Mich., USA,is one of the world’s largest suppliers to the automotiveindustry, serving virtually all major vehicle manufacturersworldwide. A leader in automotive safety systems, thecompany employs more than 60,000 globally at 13 oper-ating divisions that produce products in these areas:
• Braking systems• Steering and suspension systems• Driver assist systems• Commercial steering systems• Inflatable restraint systems• Steering wheel systems• Seat belt systems• Safety electronics• Body control systems• Engine components• Engineered fasteners and components• Automotive aftermarket• Global electronics
In 2001, the company deployed Six Sigma as part of itscontinuous process improvement program, which focus-es on achieving business excellence via four strategic pri-orities: best quality, lowest cost, global reach and innova-tive technology.
www.isixsigma.com/storeCopyright ©2020 iSixSigma.com
■ No Reproduction Without Permission ■
The survey was deployed to all of the targets and collect-ed the CTQ measures from every unit in the company. Theresponses were stratified by respondent position and operat-ing unit. This resulted in not only baseline data for the stateof the program, but also attitudinal data from the leaders andpractitioners across the company.
Comparisons would be made among individuals andacross units in the Analyze phase.
AnalyzeThe primary focus in the Analyze phase was to furtherunderstand the differences among business units by compar-ing attitudinal data from the survey and performance datafrom the CTQ characteristics. Primary questions included:
• How different are the different business units?
• Is there any correlation between attitude and performance?
• What are the causal factors of performance that is below optimum?
• What are the best practices of the performing business units?
• What is working now that was not considered in the original deployment?
Regression studies were done to determine how variousfactors affected program performance outcomes. The factorswere things related to people, communication, processes,organizational structure and leadership practices. For exam-ple, regression of number of Master Black Belts (a peoplepractice factor) to total annual savings within a business unitwas studied. The proportion of part-time Black Belts (anorganizational structure factor) was regressed to the numberof projects completed. The use of intra-project managementtools, such as project management software, (a processespractice factor) was regressed to time to complete a project.Causal factors for outcomes were the key data points sought.
Next, we turned our attention to the comparison of attitu-dinal data from the survey results. For example, we wanted tounderstand if poorly performing business units even knewthey were performing poorly. If business units knew theywere one of the best performing, how had they intentionallyaltered their Six Sigma deployment? Was there any connec-
THE FINAL TOLLGATE
4
ANALYZE
Applying Six Sigma to Six Sigma
D M A I C
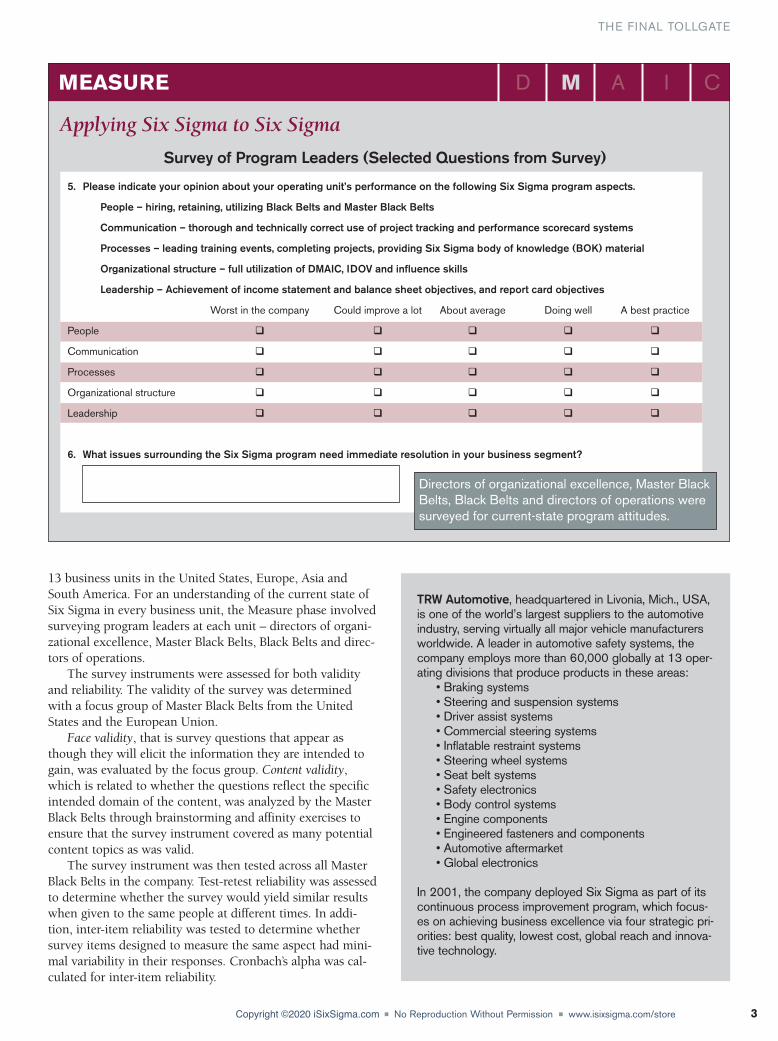
Cluster Analysis – Organizational Structure
■ Cluster analysis was performed to find patterns of attitude versus input factors. ■ Groups from clusters were then analyzed for differences in performance.
0 1 2 3 4 50.0
0.4
0.8
1.2
Pro
po
rtio
n o
f p
art-
tim
e B
lack
Bel
ts
Business leader survey rating
Business units: #4, #5, #7, #13
Business units: #1, #6, #10, #12
Business units: #2, #8, #9
“We wanted to understand if poorly performing businessunits knew they wereperforming poorly.”
www.isixsigma.com/storeCopyright ©2020 iSixSigma.com
took the same time to complete projects, we could concludethat the perception of part-time Black Belts as “bad” neededto be altered.
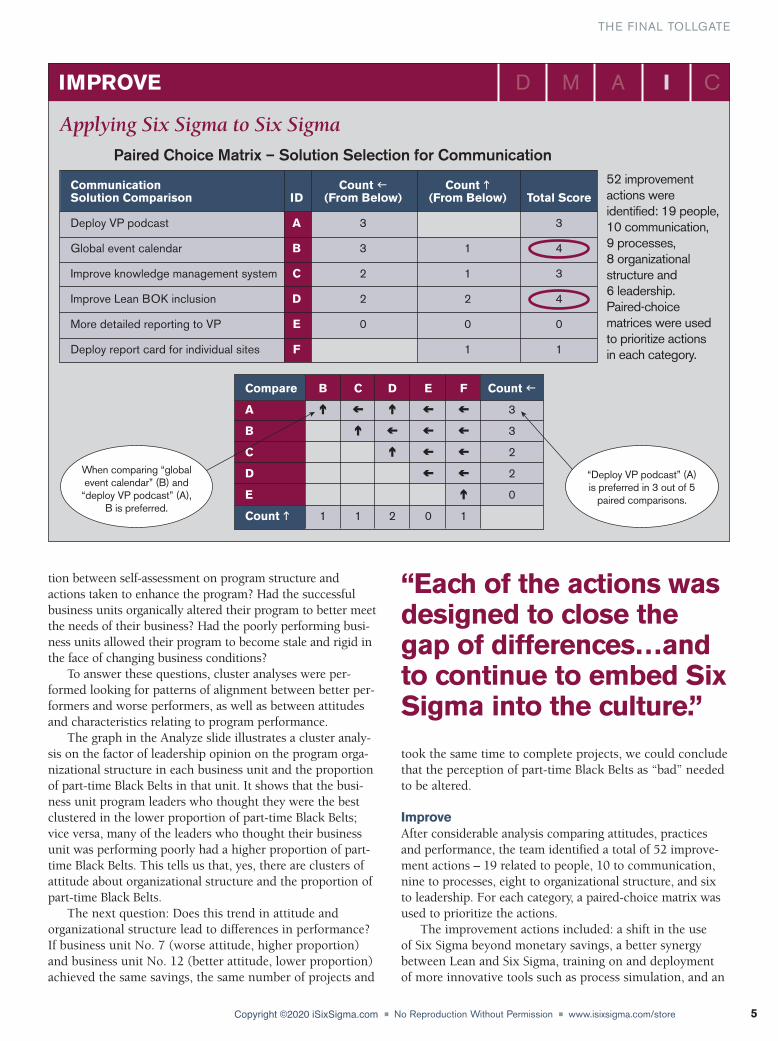
ImproveAfter considerable analysis comparing attitudes, practicesand performance, the team identified a total of 52 improve-ment actions – 19 related to people, 10 to communication,nine to processes, eight to organizational structure, and sixto leadership. For each category, a paired-choice matrix wasused to prioritize the actions.
The improvement actions included: a shift in the use of Six Sigma beyond monetary savings, a better synergybetween Lean and Six Sigma, training on and deployment of more innovative tools such as process simulation, and an
■ No Reproduction Without Permission ■
THE FINAL TOLLGATE
5
tion between self-assessment on program structure andactions taken to enhance the program? Had the successfulbusiness units organically altered their program to better meetthe needs of their business? Had the poorly performing busi-ness units allowed their program to become stale and rigid inthe face of changing business conditions?
To answer these questions, cluster analyses were per-formed looking for patterns of alignment between better per-formers and worse performers, as well as between attitudesand characteristics relating to program performance.
The graph in the Analyze slide illustrates a cluster analy-sis on the factor of leadership opinion on the program orga-nizational structure in each business unit and the proportionof part-time Black Belts in that unit. It shows that the busi-ness unit program leaders who thought they were the bestclustered in the lower proportion of part-time Black Belts;vice versa, many of the leaders who thought their businessunit was performing poorly had a higher proportion of part-time Black Belts. This tells us that, yes, there are clusters ofattitude about organizational structure and the proportion ofpart-time Black Belts.
The next question: Does this trend in attitude and organizational structure lead to differences in performance?If business unit No. 7 (worse attitude, higher proportion)and business unit No. 12 (better attitude, lower proportion)achieved the same savings, the same number of projects and
IMPROVE
Applying Six Sigma to Six Sigma
D M A I C
Paired Choice Matrix – Solution Selection for Communication
Communication Count � Count �Solution Comparison ID (From Below) (From Below) Total Score
Deploy VP podcast A 3 3
Global event calendar B 3 1 4
Improve knowledge management system C 2 1 3
Improve Lean BOK inclusion D 2 2 4
More detailed reporting to VP E 0 0 0
Deploy report card for individual sites F 1 1
Compare B C D E F Count �
A � � � � �� � � � � 3
B � � � �� � � � 3
C � � �� � � 2
D � �� � 2
E �� 0
Count � 1 1 2 0 1
52 improvement actions were identified: 19 people, 10 communication, 9 processes, 8 organizational structure and 6 leadership. Paired-choice matrices were used to prioritize actions in each category.
When comparing “global event calendar” (B) and
“deploy VP podcast” (A), B is preferred.
“Deploy VP podcast” (A) is preferred in 3 out of 5
paired comparisons.
“Each of the actions wasdesigned to close thegap of differences…andto continue to embed SixSigma into the culture.”
www.isixsigma.com/storeCopyright ©2020 iSixSigma.com
■ No Reproduction Without Permission ■
increase of project leader skills through external certifica-tion. Each of the actions was designed to close the gap ofdifferences among business units, to further engage eachbusiness leader in the program, and to continue to embedSix Sigma into the culture of the organization.
These improvement actions were difficult for some business units and easy for others. The disparity betweenbusinesses had to be addressed.
For example, one of the improvement actions was“improve training equanimity.” Those businesses not offeringup Black Belts and Master Black Belts to conduct trainingwere now required to contribute. In some cases this meantidentifying, placing, training and preparing Black Belts forthis “new” training responsibility. A certain allocation of timefor Black Belts in each business unit had to be removed fromthe available time for projects and focused on conductingtraining. This then led to Black Belts who heretofore wereconsumed with classroom responsibilities now having timeto complete projects. Even though the new training equa-nimity necessitates significant shifts within some businessunits, the whole company benefits.
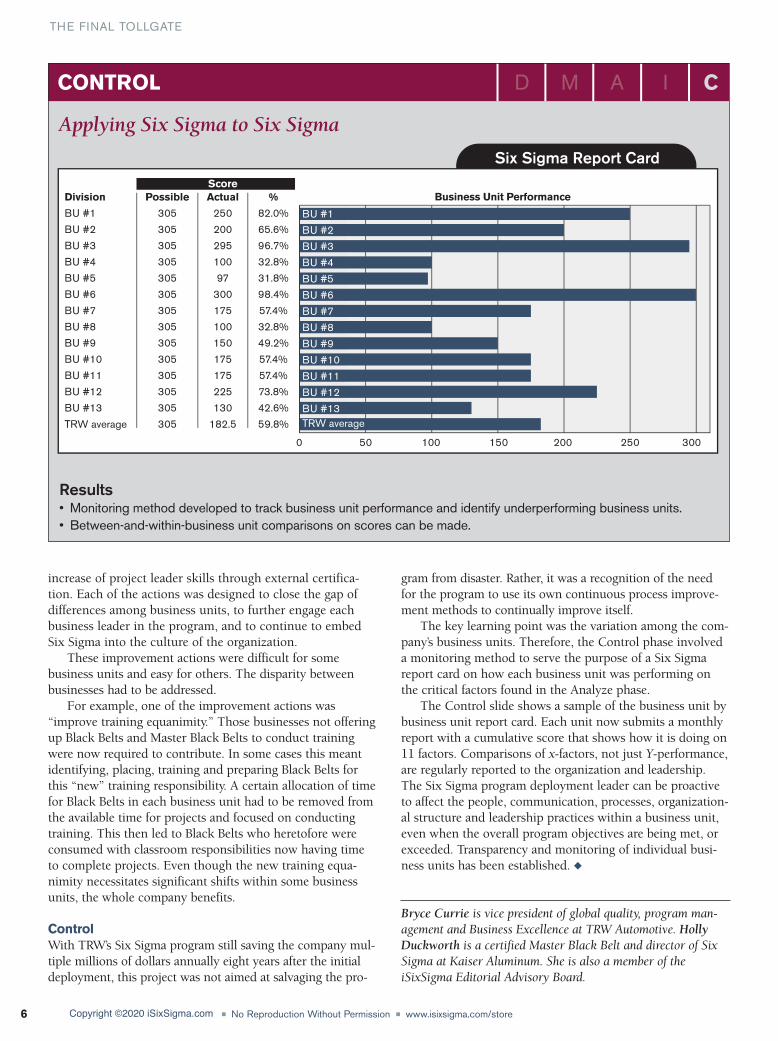
ControlWith TRW’s Six Sigma program still saving the company mul-tiple millions of dollars annually eight years after the initialdeployment, this project was not aimed at salvaging the pro-
gram from disaster. Rather, it was a recognition of the needfor the program to use its own continuous process improve-ment methods to continually improve itself.
The key learning point was the variation among the com-pany’s business units. Therefore, the Control phase involveda monitoring method to serve the purpose of a Six Sigmareport card on how each business unit was performing onthe critical factors found in the Analyze phase.
The Control slide shows a sample of the business unit bybusiness unit report card. Each unit now submits a monthlyreport with a cumulative score that shows how it is doing on11 factors. Comparisons of x-factors, not just Y-performance,are regularly reported to the organization and leadership.The Six Sigma program deployment leader can be proactiveto affect the people, communication, processes, organization-al structure and leadership practices within a business unit,even when the overall program objectives are being met, orexceeded. Transparency and monitoring of individual busi-ness units has been established. ◆
THE FINAL TOLLGATE
6
CONTROL
Applying Six Sigma to Six Sigma
D M A I C
Results• Monitoring method developed to track business unit performance and identify underperforming business units.• Between-and-within-business unit comparisons on scores can be made.
Business Unit Performance
0 50 100 150 200 250 300
BU #1
BU #2
BU #3
BU #4
BU #5
BU #6
BU #7
BU #8
BU #9
BU #10
BU #11
BU #12
BU #13TRW average
Six Sigma Report Card ScoreDivision Possible Actual %
BU #1 305 250 82.0%
BU #2 305 200 65.6%
BU #3 305 295 96.7%
BU #4 305 100 32.8%
BU #5 305 97 31.8%
BU #6 305 300 98.4%
BU #7 305 175 57.4%
BU #8 305 100 32.8%
BU #9 305 150 49.2%
BU #10 305 175 57.4%
BU #11 305 175 57.4%
BU #12 305 225 73.8%
BU #13 305 130 42.6%
TRW average 305 182.5 59.8%
Bryce Currie is vice president of global quality, program man-agement and Business Excellence at TRW Automotive. HollyDuckworth is a certified Master Black Belt and director of SixSigma at Kaiser Aluminum. She is also a member of theiSixSigma Editorial Advisory Board.
www.isixsigma.com/store Copyright ©2020 iSixSigma.com
Related Documents