Prepared for the International Scientific Conference “Our Common Future Under Climate Change” 9 July 2015 by Dr Chris Hope Cambridge Judge Business School, University of Cambridge [email protected] www.chrishopepolicy.com @cwhope Carbon price in a long-term, normative perspective

Welcome message from author
This document is posted to help you gain knowledge. Please leave a comment to let me know what you think about it! Share it to your friends and learn new things together.
Transcript
Prepared for the International Scientific Conference “Our
Common Future Under Climate Change”
9 July 2015
by
Dr Chris Hope
Cambridge Judge Business School, University of Cambridge
www.chrishopepolicy.com
@cwhope
Carbon price in a long-term, normative perspective

Plan of talk
• How the carbon price should be set.
• The PAGE09 integrated assessment model.
• Climate change impacts and the social cost of CO2.

•Equal to the extra NPV of global impact that would be caused if one
more tonne of CO2 is put up into the atmosphere today.
•This goes by the name of the social cost of CO2 (SCCO2).
•The polluter pays principle tells us that the SCCO2 is what anyone who
puts a tonne of carbon dioxide into the atmosphere this year should
have to pay, and economic theory agrees that the best way for them to
pay is by charging a climate change tax equal to this on every tonne of
emissions.
How the carbon price should be set

Calculating the social cost of CO2
0
50000
100000
150000
2000 2050 2100 2150 2200
Mtonnes
year
Total CO2 emissions

Calculating the social cost of CO2
1. Find mean NPV of global impacts with spike of
emissions
2. Find mean NPV of global impacts without spike of
emissions
3. Subtract (2) from (1)
4. Divide by size of spike (100 billion tonnes of CO2)
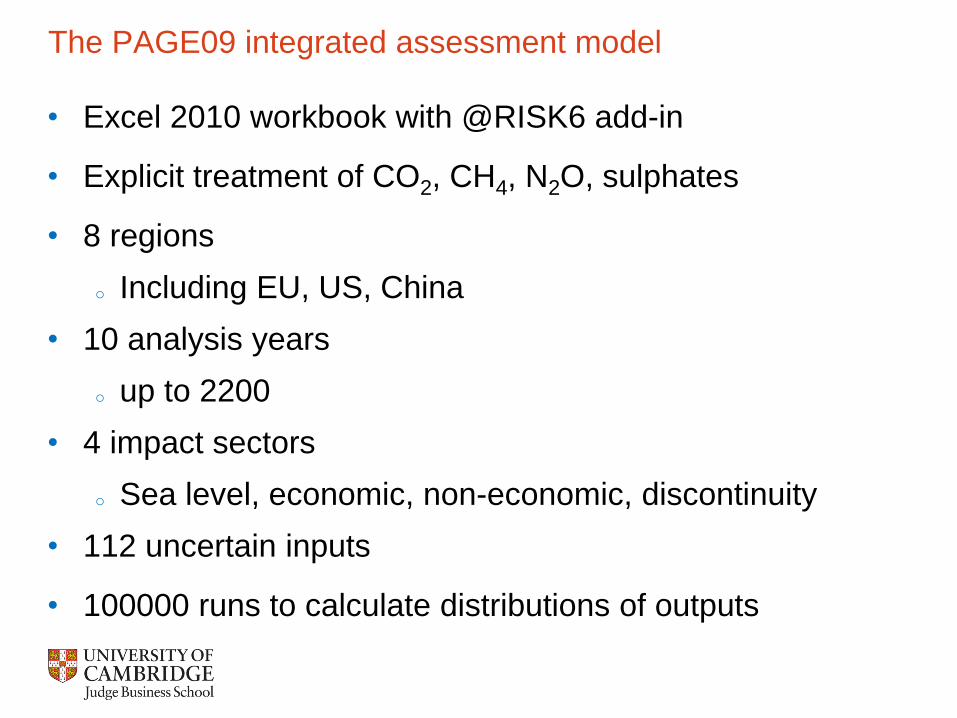
The PAGE09 integrated assessment model
• Excel 2010 workbook with @RISK6 add-in
• Explicit treatment of CO2, CH4, N2O, sulphates
• 8 regions
o Including EU, US, China
• 10 analysis years
o up to 2200
• 4 impact sectors
o Sea level, economic, non-economic, discontinuity
• 112 uncertain inputs
• 100000 runs to calculate distributions of outputs

Integrated Assessment Models for Climate Change Policy
Source: Parson and Fisher-Vanden, 1997

Source: 100000 PAGE09 runs
Climate sensitivity probability distribution

Climate change impacts and the social cost of CO2
• Business as usual scenario: A1B.
• Moderate adaptation.
• Currency unit: $2005, PPP exchange rates, EU mean GDP/cap.

0
10000
20000
30000
40000
50000
60000
70000
2010 2020 2030 2040 2050 2060 2070 2080 2090 2100
Mtonnes
Year
Global emissions of CO2 by date, BAU scenario
Source: PAGE09; A1B scenario

Global mean temperature rise by date, BAU scenario.
0
1
2
3
4
5
6
2020 2030 2040 2050 2060 2070 2080 2090 2100
DegC
Year
95%
Mean
5%
Source: 10000 PAGE09 runs; A1B scenario
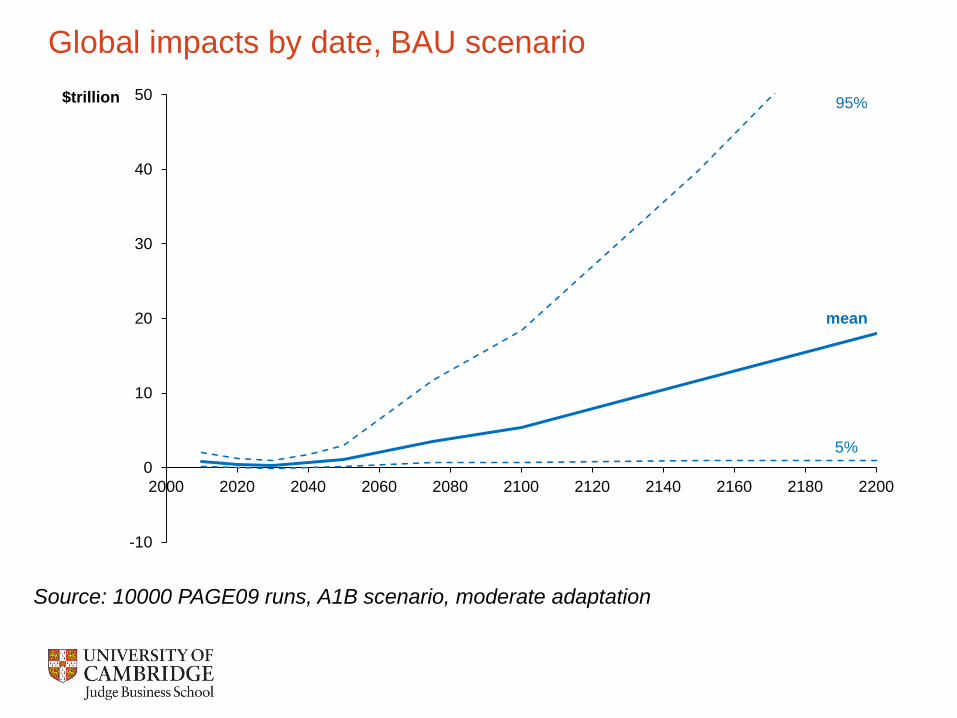
Global impacts by date, BAU scenario
-10
0
10
20
30
40
50
2000 2020 2040 2060 2080 2100 2120 2140 2160 2180 2200
$trillion 95%
Source: 10000 PAGE09 runs, A1B scenario, moderate adaptation
mean
5%

NPV of global impacts, BAU scenario
Source: 100000 PAGE09 runs; A1B scenario
Mean value is about $400 trillion

The social cost of CO2, BAU scenario
Source: 100000 PAGE09 runs, A1B scenario, 2010
Mean value is about $100 per tonne of CO2
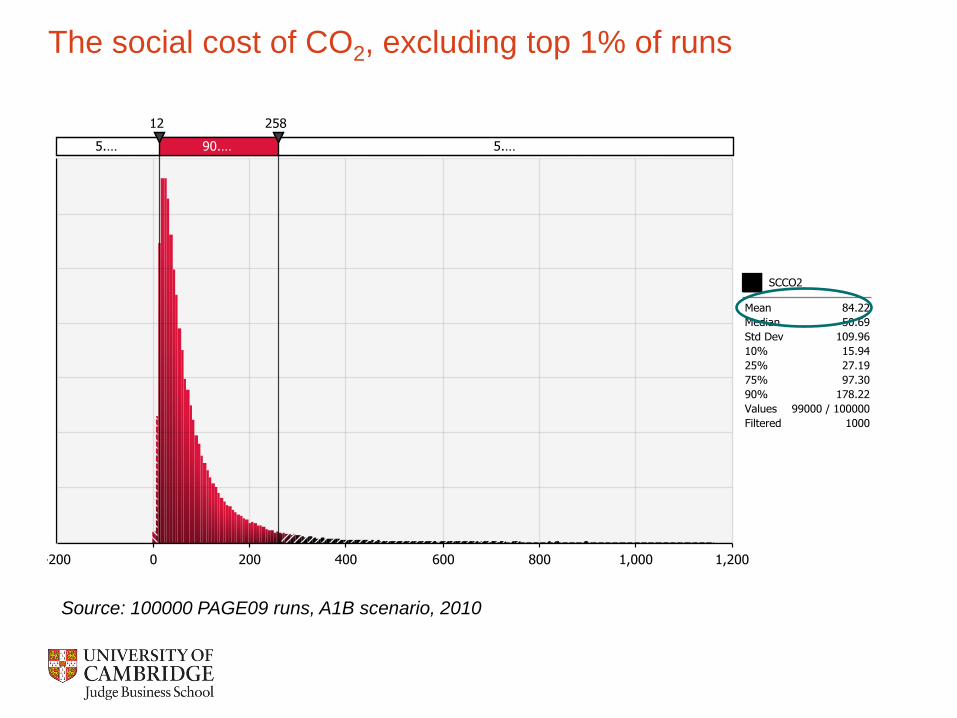
The social cost of CO2, excluding top 1% of runs
Source: 100000 PAGE09 runs, A1B scenario, 2010

Source: 100000 PAGE09 runs, A1B scenario
95%
0
100
200
300
400
500
600
2010 2020 2030 2040 2050
$/tonne CO2
Year
SCCO2 by date, BAU scenario
mean
5%
Use of the SCCO2 from the PAGE model by policy makers
• Stern Review on the Economics of Climate Change (2007):
“Preliminary calculations adopting the approach to valuation taken in this Review suggest that the social cost of carbon today, if we remain on a BAU trajectory, is of the order of $85 per tonne of CO2”
http://webarchive.nationalarchives.gov.uk/+/http:/www.hm-treasury.gov.uk/media/4/3/Executive_Summary.pdf
• US EPA Inter-Agency Task Force (2010, 2013):
“EPA has used the SCC to analyze the carbon dioxide impacts of various rulemakings since the interagency group first published SCC estimates in 2010.”
http://www.epa.gov/climatechange/EPAactivities/economics/scc.html

References
• Hope C, 2013, Critical issues for the calculation of the social cost of CO2: why the estimates from PAGE09 are higher than those from PAGE2002, Climatic Change, 117, Issue 3 (2013), Page 531-543.
• Hope C, 2011,The social cost of CO2 from the PAGE09 model, Judge Business School working paper 05/2011, discussion paper in Economics ejournal.
• Hope C, 2011, How high should climate change taxes be?, Judge Business School working paper 09/2011, chapter in Fouquet R (ed), Handbook on Energy and Climate Change, Edward Elgar, 2013.
http://www.jbs.cam.ac.uk/research/working_papers/2011/index.html

Discussion points
• Should we set carbon price at SCCO2 under BAU or ‘optimal’ scenario?
• What other taxes should be reduced?
• What should be done in other regions?
• How should we improve the model?

Related Documents