Financial Statement Analysis of Reliance communication Page 1 Financial Statement Analysis Of Reliance Communication Submitted By: Name: Upendra Mahla Enrollment No: 0400201142 Batch: 2014-16 Class: 2 Roll No: 53 Submitted To: Gurmeet Singh

Welcome message from author
This document is posted to help you gain knowledge. Please leave a comment to let me know what you think about it! Share it to your friends and learn new things together.
Transcript

Financial Statement Analysis of Reliance communication Page 1
Financial Statement Analysis
Of
Reliance Communication
Submitted By:
Name: Upendra Mahla
Enrollment No: 0400201142
Batch: 2014-16
Class: 2
Roll No: 53
Submitted To: Gurmeet Singh

Financial Statement Analysis of Reliance communication Page 2
Contents
1. Introduction ………………………… 03 (A) Industry ………………………… 03 (B) Company ………………………… 05 2. Accounting Policies ………………………… 13 3. Corporate Governance ………………………… 19 4. Corporate Social Responsibility (CSR) ……………………….... 25 5. Financial Statement Analysis ………………………… 29
(A) Ratio Analysis ………………………… 29 (Like Profitability, Activity, Solvency, and Liquidity Ratios & Comments on them)
(B) Trend Analysis (Line Chart & Comments) ………………………… 39 (C) Comparison with Industry ……………………….... 51 (comparison & comments) (D) Common Size Statements ………………………… 58
(with comments) (optional)
6. Conclusion ………………………… 61
(Like overall comments on profitability, activity,
solvency and liquidity of the company)
Financial Statement Analysis of Reliance communication Page 3
1. Introduction
(A) Industry
The history of Indian telecom can be started with the introduction of telegraph. The Indian
postal and telecom sectors are one of the world‟s oldest. In 1850, the first experimental electric
telegraph line was started between Calcutta and Diamond Harbo1ur. In 1851, it was opened for the
use of the British East India Company.
India's telecommunication network is the second largest in the world based on the total
number of telephone users (both fixed and mobile phone). It has one of the lowest call tariffs in the
world enabled by the mega telephone networks and hyper-competition among them. It has the world's
third-largest Internet user-base. According to the Internet and Mobile Association of India
(IAMAI), the Internet user base in the country stood at 190 million at the end of June, 2013. Major
sectors of the Indian telecommunication industry are telephony, internet and television broadcast
Industry in the country which is in an ongoing process of transforming into next generation network
, employs an extensive system of modern network elements such as digital telephone
exchanges, mobile switching centers, media gateways and signaling at the core, interconnected by a
wide variety of transmission systems using fiber-optics or Microwave radio relay networks.
The access network, which connects the subscriber to the core, is highly diversified with different
copper-pair, optic-fiber and wireless technologies. DTH, a relatively new broadcasting technology
has attained significant popularity in the Television segment. The introduction of private FM has
given a fillip to the radio broadcasting in India. Telecommunication in India has greatly been
supported by the INSAT system of the country, one of the largest domestic satellite systems in the
world. India possesses a diversified communications system, which links all parts of the country by
telephone, Internet, radio, television and satellite.
Indian telecom industry underwent a high pace of market liberalization and growth since the
1990s and now has become the world's most competitive and one of the fastest growing telecom
markets. The Industry has grown over twenty times in just ten years, from under 37 million
subscribers in the year 2001 to over 846 million subscribers in the year 2011. India has the world's
second-largest mobile phone user base with over 929.37 million users as of May 2012. It has
the world's third-largest Internet user-base with over 137 million as of June 2012.
The total revenue of the Indian telecom sector grew by 7% to 2832 billion (US$46 billion) for 2010–
11 financial year, while revenues from telecom equipment segment stood at 1170
billion (US$19 billion).
Telecommunication has supported the socioeconomic development of India and has played a
significant role to narrow down the rural-urban digital divide to some extent. It also has helped to

Financial Statement Analysis of Reliance communication Page 4
increase the transparency of governance with the introduction of e-governance in India. The
government has pragmatically used modern telecommunication facilities to deliver mass education
programmers for the rural folk of India. 1
Communications in India
Revenue (Total) USD 33,350 million
Telephony Internet access Broadcasting
Telephone
Subscribers (Total)
(2013)
915.19 million
(December 2013)
Percent household
access (total), 2012
10.2% of
households
(137
million)
Television
broadcast stations
(2009)
1,400
Fixed lines
(December 2013)
28.89 million Percent broadband
household access
1.18% of
households
(14.31
million)
Radio broadcast
stations (1997)
800
Mobile phones
(2013)
886.3 million Broadband internet
users 55.20
million
(December
2013)
Monthly telephone
additions (Net)
(December 2013)
5.5 million Internet Service
Providers (2012)
155
Teledensity (2013)
74.02% country code top-
level domain
.in
Rural Teledensity
42.67%
1 (http://en.wikipedia.org/wiki/Telecommunications_in_India)

Financial Statement Analysis of Reliance communication Page 5
(B) Company
RCOM is a fully integrated and converged telecommunications service
provider operating across the full spectrum of wireless, wire line, voice,
data, video, internet and IT infrastructure services and have an extensive
international presence through the provision of long distance voice, data
and internet services and submarine cable network infrastructure. With a
customer base of around 119.4 million (including 111 million wireless
customers, 1.2 million wire line customers, over 2.6 million overseas retail
customers and 4.8 million Reliance Digital TV customers) as on March 31,
2014, our corporate clientele includes over 39,000Indian and
multinational corporations including small and medium enterprises and
over 290 global, regional and domestic carriers.
The enterprise customer base of the Company includes 880 of the top 1,000
enterprises in India. RCOM is India‟s first telecom service provider offering nationwide CDMA
and GSM mobile services with digital voice clarity. The Company has established a pan-India,
next generation, integrated (wireless and wire line), convergent (voice, data and video) digital
network capable of supporting best-of-class services spanning the entire communications
value chain, covering over 21,000 cities and towns and over 4,00,000 villages. RCOM also
provides 3G services in 13 circles including key metros of Delhi, Mumbai and Kolkata. RCOM‟s
3G services are available in 334 towns across 13 circles. Recently, we have launched 3G services
in additional 5 circles namely Andhra Pradesh, Karnataka, Kerala, Tamil Nadu and Uttar Pradesh
(East), through Intra Circle Roaming arrangements taking our 3G coverage to 18 circles. Our3G
network has the capacity to provide speeds up to 28 Mbps. RCOM‟s network is “Built for
Internet” and it‟s common packet core delivers a seamless experience across 1x, 2G, HSD
and 3G. RCOM has deployed end-to-end IP enabled connectivity across our transport and
access network and backhaul including microwave. i.e. “Ethernet Super Highway”. RCOM
continues to provide nationwide seamless Wireless Broadband experience on its network, in
1,624 top towns across the country. This, coupled with our extensive 1X Data presence
offering high quality internet connectivity in over 19,000 towns, has positioned RCOM
extremely well to take advantage of the expected rapid increase in data consumption across
the country. RCOM has adopted a spectrum based “ Go to Market” strategy to maximize
revenue growth. The Company has a differential approach in terms of products, services, and
retail engagements for improving our reach and enhancing channel efficiency, for our 3G States
900 MHz Circles, 3G Metro 1800 MHz circles, and 3G Dark circles. The Company has adopted
“Circle as a Country approach rather than having a Pan India “Fit for all” approach. RCOM offers
the most comprehensive portfolio of Enterprise, IT infrastructure, National and International
long distance voice, video and data network services on an integrated and highly scalable
platform. Our business segments comprise Carrier, Enterprise and Consumer business units.
RCOM has the largest optic fiber network of over 2,80,000 km and the largest IDC space of
11,00,000 sq. ft. including the latest IDC 5 being set up in Navi Mumbai.

Financial Statement Analysis of Reliance communication Page 6
In India, RCOM provide long distance business services including wholesale voice, bandwidth
and infrastructure services, national and international private leased circuits, broadband
internet access, audio and video conferencing, MPLS-VPN, remote access VPN, Centrex,
toll-free services voice services for offices, voice VPN for corporates and managed
internet data center (“IDC”) VPN, Centrex, toll-free services voice services for offices,
voice VPN for corporates and managed internet data center (“IDC”) services. RCOM offer
unique, value-added products and services to large, medium and small enterprises for their
communications, networking, and IT infrastructure needs across the country. The Company
has a range of more than 38 products to suit the needs of all customer segments,
more than any other service provider in India.
RCOM offers Nationwide Direct-To-Home (DTH) service through its wholly owned
subsidiary, Reliance B i g TV Limited in about 8,350 towns across t h e c o u n t r y . Reliance
D i g i t a l TV was the first Company to introduce High Definition DVR. Using the state- of-the
art MPEG 4 technology, it offers close to 250 channels in HD like quality. The Company
a l s o offers 4 exclusive movie channels and 5 interactive services. A unique c o m b i n a t i o n
of High Definition content and digital voice / picture quality delivers a vastly superior viewing
experience to its subscribers.
New Initiatives
3G Speed @ 2G Prices
As an inherent part of RCOM‟s objective to take high-speed data services to every
Smartphone and tablet user in the country, RCOM announced the launch of an exciting
new 3G data offer at 2G data prices for Smartphone and Tablet users, targeting the fast-
growing segment. The aggressive and affordable pricing is all set to trigger a wave of 3G
adoption in the country, ensuring greater traction from mid- to high-level data users, and
resulting in significant data usage and revenue growth across customer segments. By
breaking the 3G entry barrier, the Company plans to bring about a behavioral change and
take the benefits of quick data access to everyone and impact not just lives, but lifestyles as
well.
With this offer, all new and existing Reliance subscribers can avail of best-priced 3G
services, across the post-paid and pre-paid segments. Reliance 3G customers can enjoy
the Smartphone experience on the Company‟s „Built-for-Internet‟ superior network with
lightning-fast video streaming on their Smartphones and tablets, without any delay
and buffering, anytime, anywhere.
Launch of “Zero Plan”
RCOM launched first of its kind plan called “Zero Plan” with multiple handset
manufacturers. This revolutionary way to buy Smartphones offer includes handset cost,
unlimited local and STD calls, unlimited SMS, national roaming and unlimited 3G data
Financial Statement Analysis of Reliance communication Page 7
for 24 months. So the customer gets benefit of zero down- payment on the handset, zero bills
for next 24 months and zero limits on voice, data and SMS. This offer from RCOM is part of
the Company‟s efforts to bring more Smartphone customers to its built-for-video 3G
network, which will increase the acquisition of high value post-paid customers to its
customer base and further cement its position as India‟s leading data services provider.
RCOM shall meet this objective by creating new alliances and partnerships including with
select credit card companies. The proposition is win-win for both customer and RCOM
as with the single swipe of a credit card, it promises to deliver a quality customer to RCOM
and on the other side it offers a total peace of mind to customers, taking away the
tediousness of monthly bills for the next two years.
Reliance Globalcom Network Expansion
Reliance Globalcom (RGCOM) started the year with induction of state of the art high
capacity technology systems (100G) in submarine network to enhance the fiber carrying
capacity by many fold with an intent to meet the growing traffic demand in data services.
High capacity systems has been inducted in Trans-Atlantic (FA-1) cable network between
UK, France and US East coast, Hawk European network is upgraded with higher capacity
system.
With the induction of Hawk cable system, added to the Reliance Globalcom
network last year which connects the Middle East and extends connectivity further to
London, Paris and Frankfurt through our European terrestrial network, latency has been
improved offering better customer experience for various emerging and real time and
high bandwidth intensive applications.
For enhancing the performance and reliability of our IP services, RGCOM has augmented
capacity on the several segments of IP Network such as Singapore and London, Dubai
and Paris, Mumbai and Paris, Paris and New York on FA-1 cable. Mumbai – Suez segment
has been upgraded with latest technology that increased the fiber carrying capacity by
5 times. Additional capacity has been built on Trans-Atlantic cable between London and New
York reducing the cost per unit of bandwidth. Established interconnect at F r a n k f u r t and
H o n g K o n g to improve service coverage in Eastern Europe and China. The Company has
also set up new Point of Presence (Pop) in Shanghai, Mainland China to increase the
geographical coverage. Egypt to Marseilles-London Paris Hawk network is also upgraded
with additional capacity.
Reliance Globalcom Network Upgrades
RCOM successfully upgraded global Transmission and IP backbones, spread over multiple
cable systems and segments. Deployment of high-end carrier-grade routers in key
business markets in Asia, Europe, the US and the Middle East regions enabled us to
offer economical and scalable services to our customers.
Financial Statement Analysis of Reliance communication Page 8
The upgrades across various segments of our global network enabled Reliance Globalcom
to provide more cost effective 10
Gig Ethernet based solutions with improved manageability.
New partnerships
Partnership with Twitter in India
RCOM announced a partnership with Twitter in India to launch a first of its kind
bundled prepaid plan „Reliance Twitter Access Pack‟ for all Reliance GSM subscribers in the
country. Through this partnership, RCOM becomes the first telecom operator in the country
to partner with Twitter in India on the new „Twitter Access‟ program. Reliance GSM prepaid
customers across the country can now follow friends, family, news, cricket, entertainment
and all their interests with unlimited Twitter access without paying any extra data
consumption charges.
New relationship with leading handset manufacturers
RCOM has developed relationship with leading handset manufacturers to bring their
flagship Smartphones under our newly launched “Zero Plan” scheme. With these tie-
ups, the Company is also trying to penetrate GSM+CDMA handset in the market to make
CDMA handset ecosystem more accessible and affordable.
Long-term Agreements
Intra-Circle roaming agreements with other operators
RCOM unveiled plans to expand its network significantly through strategic 2G GSM Intra-
Circle Roaming (ICR) agreements with existing opera tors , offering our customers wider
coverage and uninterrupted service ac ross the country. These a r r a n g e m e n t s will help in a
fast-paced expansion of RCOM‟s GSM network footprint at no extra cost, optimize
Capex and Opex spends and allow the Company‟s customers a seamless roaming experience
on partner networks. In addition, increased capacities will significantly improve both outdoor
and in-building coverage, providing RCOM customers with an enriched mobility and data
experience.
The ICR arrangements offers RCOM customers‟ seamless mobility and a wider
footprint, while providing an impetus to the Company‟s yields, both in terms of revenue
market share and customer market share. These ICR agreements will increase RCOM‟s
national 2G GSM network foot print by 10,000 base stations and bring in market of over 150
million addressable populations.
Financial Statement Analysis of Reliance communication Page 9
Industry Structure and Regulatory Developments
Industry Update
Wireless
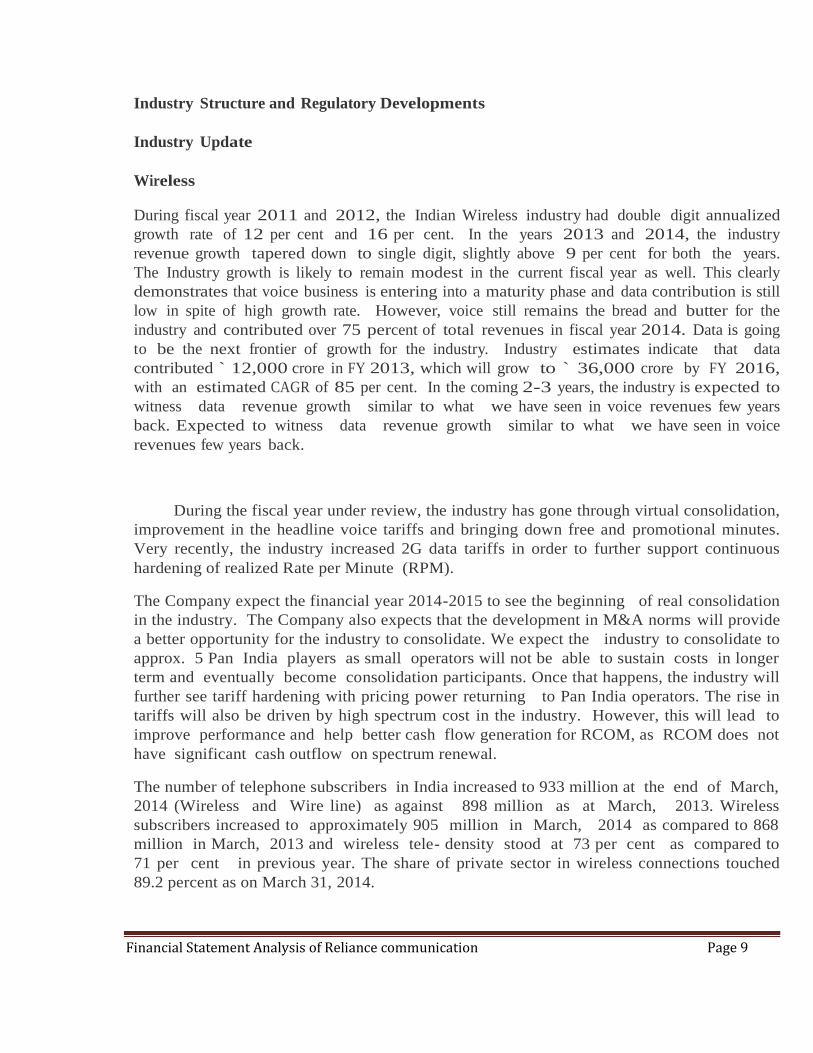
During fiscal year 2011 and 2012, the Indian Wireless industry had double digit annualized
growth rate of 12 per cent and 16 per cent. In the years 2013 and 2014, the industry
revenue growth tapered down to single digit, slightly above 9 per cent for both the years.
The Industry growth is likely to remain modest in the current fiscal year as well. This clearly
demonstrates that voice business is entering into a maturity phase and data contribution is still
low in spite of high growth rate. However, voice still remains the bread and butter for the
industry and contributed over 75 percent of total revenues in fiscal year 2014. Data is going
to be the next frontier of growth for the industry. Industry estimates indicate that data
contributed ` 12,000 crore in FY 2013, which will grow to ` 36,000 crore by FY 2016,
with an estimated CAGR of 85 per cent. In the coming 2-3 years, the industry is expected to
witness data revenue growth similar to what we have seen in voice revenues few years
back. Expected to witness data revenue growth similar to what we have seen in voice
revenues few years back.
During the fiscal year under review, the industry has gone through virtual consolidation,
improvement in the headline voice tariffs and bringing down free and promotional minutes.
Very recently, the industry increased 2G data tariffs in order to further support continuous
hardening of realized Rate per Minute (RPM).
The Company expect the financial year 2014-2015 to see the beginning of real consolidation
in the industry. The Company also expects that the development in M&A norms will provide
a better opportunity for the industry to consolidate. We expect the industry to consolidate to
approx. 5 Pan India players as small operators will not be able to sustain costs in longer
term and eventually become consolidation participants. Once that happens, the industry will
further see tariff hardening with pricing power returning to Pan India operators. The rise in
tariffs will also be driven by high spectrum cost in the industry. However, this will lead to
improve performance and help better cash flow generation for RCOM, as RCOM does not
have significant cash outflow on spectrum renewal.
The number of telephone subscribers in India increased to 933 million at the end of March,
2014 (Wireless and Wire line) as against 898 million as at March, 2013. Wireless
subscribers increased to approximately 905 million in March, 2014 as compared to 868
million in March, 2013 and wireless tele- density stood at 73 per cent as compared to
71 per cent in previous year. The share of private sector in wireless connections touched
89.2 percent as on March 31, 2014.

Financial Statement Analysis of Reliance communication Page 10
Internet and Broadband
Total internet subscriber base has increased to approximately 252 million at the end of
March 31, 2014. We have seen a tremendous growth in our broadband subscriber base
both in terms of quality and quantity. Our Internet subscriber base as of March 31, 2014 is
37.6 million. The Company commands 14.9 per cent of market share. Customers now prefer
higher bandwidth plans. Commensurate with the increasing bandwidth demand, the Company
is currently augmenting its capacity to provide better customer experience and further improve
revenue.
Telecom Infrastructure
a) Government had conducted 3 rounds of spectrum auction for 800MHz / 900MHz /
1800MHz bands. All operators who have won the spectrum through auction are long term
customers, which assure future revenue opportunities.
b) The demand for telecom infrastructure in India is driven by the subscriber growth in the
mobile Industry and focus on expansion of rural market.
c) The Company expects BWA spectrum holders to firm up their roll-out plan and start
offering 4G services soon. This will also lead to greater demand for Telecom Infrastructure.
d) Hyper competition in the mobile industry, regulatory / legal uncertainty and falling
revenues have put cost pressure on the Telecom industry, which has impacted the
incremental towers and tenancies. Tower companies are now focusing on increasing tenancy
on existing towers as against adding further towers.
e) With the completion of network footprint expansion, the focus will be on ensuring
delivery of the best QoS to customers and also building up network capacity as traffic
grows.
Industry Trends
1. Moderating Competitive Intensity
During the year under review, Indian Telecom Sector witnessed virtual
consolidation as many operators have either completely exited the business or reduced their
footprint considerably. The Company expects the year 2014 to see the beginning of real
consolidation in the industry. The Company also expects that the development in M&A
norms will provide a better opportunity for the industry to consolidate. As stated earlier,
the Company expects the industry will consolidate to approx. 5 Pan India players as
small operators will not be able to sustain costs and eventually become consolidation
participants. This has led to reduction in competitive intensity, which was at its peak
during last few years. This has also opened new revenue opportunities for Pan India players
including RCOM to gain incremental revenue market share.
Financial Statement Analysis of Reliance communication Page 11
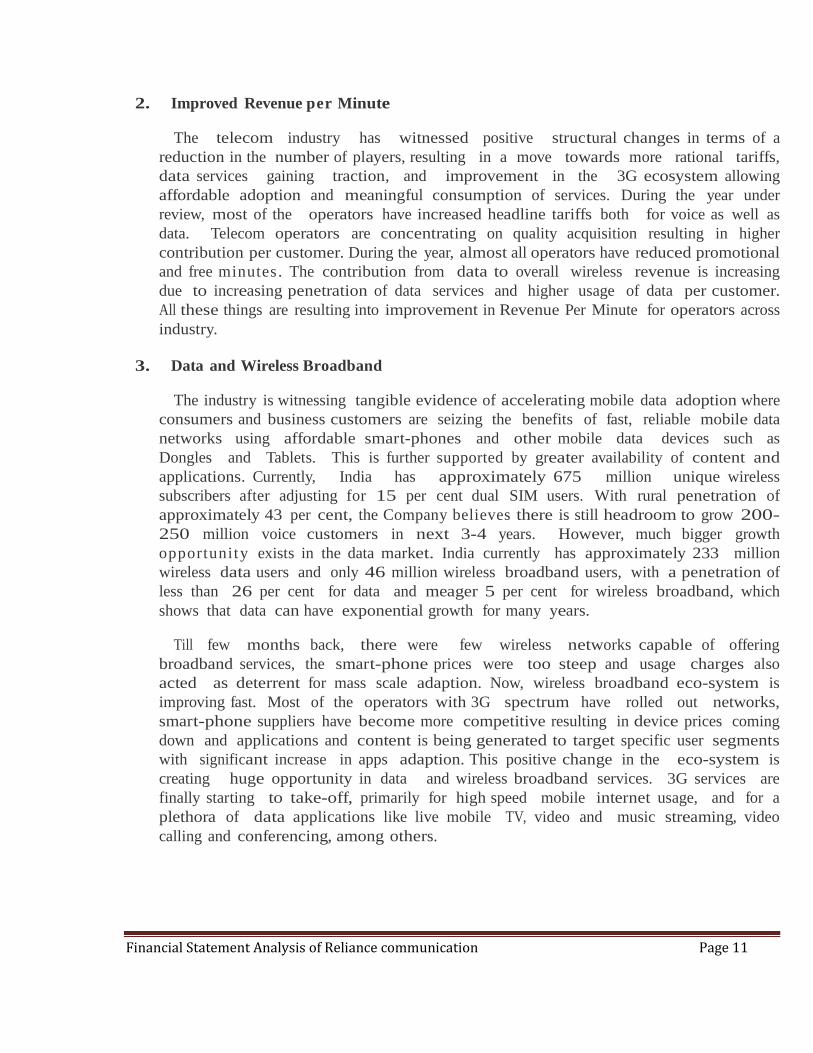
2. Improved Revenue per Minute
The telecom industry has witnessed positive structural changes in terms of a
reduction in the number of players, resulting in a move towards more rational tariffs,
data services gaining traction, and improvement in the 3G ecosystem allowing
affordable adoption and meaningful consumption of services. During the year under
review, most of the operators have increased headline tariffs both for voice as well as
data. Telecom operators are concentrating on quality acquisition resulting in higher
contribution per customer. During the year, almost all operators have reduced promotional
and free minutes. The contribution from data to overall wireless revenue is increasing
due to increasing penetration of data services and higher usage of data per customer.
All these things are resulting into improvement in Revenue Per Minute for operators across
industry.
3. Data and Wireless Broadband
The industry is witnessing tangible evidence of accelerating mobile data adoption where
consumers and business customers are seizing the benefits of fast, reliable mobile data
networks using affordable smart-phones and other mobile data devices such as
Dongles and Tablets. This is further supported by greater availability of content and
applications. Currently, India has approximately 675 million unique wireless
subscribers after adjusting for 15 per cent dual SIM users. With rural penetration of
approximately 43 per cent, the Company believes there is still headroom to grow 200-
250 million voice customers in next 3-4 years. However, much bigger growth
opportunity exists in the data market. India currently has approximately 233 million
wireless data users and only 46 million wireless broadband users, with a penetration of
less than 26 per cent for data and meager 5 per cent for wireless broadband, which
shows that data can have exponential growth for many years.
Till few months back, there were few wireless networks capable of offering
broadband services, the smart-phone prices were too steep and usage charges also
acted as deterrent for mass scale adaption. Now, wireless broadband eco-system is
improving fast. Most of the operators with 3G spectrum have rolled out networks,
smart-phone suppliers have become more competitive resulting in device prices coming
down and applications and content is being generated to target specific user segments
with significant increase in apps adaption. This positive change in the eco-system is
creating huge opportunity in data and wireless broadband services. 3G services are
finally starting to take-off, primarily for high speed mobile internet usage, and for a
plethora of data applications like live mobile TV, video and music streaming, video
calling and conferencing, among others.

Financial Statement Analysis of Reliance communication Page 12
4. Mobile Number Portability (MNP)
With intense competition in the telecom sector, there is enough choice for customers to choose
a quality network provider by MNP. By the end of March, 2014, about 117 million
subscribers have submitted their requests to different service providers for porting their
mobile numbers. The Company is witnessing an increasing trend of high ARPU customers
coming into our network compared to much lower ARPU customers leaving our network.
5. Rural Penetration
Rural area network coverage remains one of the key parameters for the growth of
wireless business. While urban wireless teledensity is greatly saturated at 139.9 per cent, there
is a lot of potential for rural growth with rural wireless teledensity still at 43.3 per cent as on
March 31, 2014.
6. Enterprise Business
Enterprises have begun to keep an intense eye on consumer trends and are eager to adopt
solutions that integrate the Enterprise and Consumer worlds without sacrificing security and
data integrity. Trends like Smart Cities, Big Data, Cloud, etc. Are opening up many new
opportunities for the Communications business and are reshaping the ICT ecosystem. Our
endeavor is to help CIOs connect the dots by creating enabling services.
In the Enterprise Mobility space, RCOM is working on a Mobile Device Management
solution that will help Enterprises offer BYOD (Bring Your Own Device) and
effectively manage devices, applications, content and security compliances. The Company is
building a mobility platform to help Enterprises design and develop Mobile and M2M
applications. These applications are then distributed and the end devices are managed using the
same platform. The Company is looking at creating an on-the-tap Big Data Service to help
Enterprises arrive at decision points by using the humongous volume of data at their disposal.
This also allows integration of social media platforms to increase the accuracy of results. RCOM
has already leveraged Cloud as an enabler for business and revenue growth. It already
provides Mail, Storage, Video Conferencing, Audio Conferencing, Web Conferencing, Hosted
Contact Center, Hosted Voice and other services on the Cloud model to various customers.
RCOM is once again on the threshold of creating and leading a new category in the
Voice domain by enabling customers‟ Business Processes through its Intelligent Telephony
Platform. This next-generation communication platform enables companies to connect
effectively and contextually with their customers at the right time.2
2 Annual Report 2013-14

Financial Statement Analysis of Reliance communication Page 13
2. Accounting Policies
2.01 Basis of Preparation of Financial Statements
The Financial Statements are prepared under historical cost convention / fair
valuation under a Scheme approved by the Hon‟ble High Court, in accordance with
the generally accepted accounting principles (GAAP) in India and the provisions of
the Companies Act, 2013 (to the extent notified) and provisions of the Companies Act,
1956 (to the extent applicable) read with the Companies Accounting Standards Rules,
2006 (Accounting Standard Rules) as well as applicable pronouncements of the
Institute of Chartered Accountants of India (ICAI).
All assets and liabilities have been classified as current or non-current as per
the Company‟s normal operating cycle and other criteria set out in Revised Schedule
VI to the Companies Act, 1956. Based on the nature of the services and their
realization in cash & cash equivalents, the Company has ascertained its operating
cycle as twelve months for the purpose of current or non-current classification of
assets and liabilities.
2.02 Use of Estimates
The preparation and presentation of Financial Statements requires estimates
and assumptions to be made that affect the reported amount of assets and liabilities
and disclosure of contingent liabilities on the date of the Financial Statements and the
reported amount of revenues and expenses during the reporting period. Difference
between the actual results and estimates is recognized in the period in which the results
are known / materialized.
2.03 Fixed Assets
(i) Fixed Assets are stated at cost / fair value net of Modvat / Cenvat, Value
Added Tax and include amount added on revaluation less accumulated depreciation,
amortization and impairment loss, if any.
(ii) All costs including financing cost of qualifying assets till commencement of
commercial operations, net charges of foreign exchange contracts and adjustments
arising up to March 31, 2007 from exchange rate variations, relating to borrowings
attributable to Fixed Assets are capitalized.
(iii) Expenses incurred relating to project, prior to commencement of commercial
operation, are considered as project development expenditure and shown under Capital
Work-in-Progress.
(iv) Telecom Licenses are stated at fair value or at cost as applicable less accumulated
amortization.

Financial Statement Analysis of Reliance communication Page 14
(v) Indefeasible Rights of Connectivity (IRC) are stated at cost less accumulated
amortization.
(vi) In respect of accounting periods commencing on or after April 1, 2011, consequent
to the insertion of para 46A of AS 11 „The Effects of Changes in Foreign Exchange
Rates‟, related to acquisition of depreciable assets pursuant to notifications dated
December 29, 2011 and August 9, 2012 issued by Ministry of Corporate Affairs (MCA),
under the Companies (Accounting Standards) (Second Amendment) Rules, 2011, the cost
of depreciable capital assets includes foreign exchange differences arising on translation of
long term foreign currency monetary items as at the balance sheet date in so far as they
relate to the acquisition of such assets.
2.04 Lease
In respect of Operating Leases, lease rentals are expensed on straight line basis with
reference to lease terms and considerations except for lease rentals pertaining to the
period up to the date of commencement of commercial operations, which are
capitalised.
2.05 Depreciation / Amortization
(i) Depreciation on Fixed Assets is provided on Straight Line Method at the rates and in the
manner prescribed in Schedule
XIV to the Companies Act, 1956 except in case of the following assets which are
depreciated as given below.
(a) Telecom Electronic Equipment‟s - 18 years
(b) Furniture, Fixtures and Office Equipment‟s - 10 years
(c) Customer Premises Equipment‟s - 3 years
(d) Vehicles - 5 years
(ii) Leasehold Land is depreciated over the period of the lease term.
(iii) Intangible assets, namely Telecom Licenses and Brand License are amortized over the
period of Licenses. IRC and Software are amortized from the date of acquisition or
commencement of commercial services, whichever is later.
The life of amortization of the intangible assets is as follows.
(a) Telecom Licenses - 12.5 to 20 years

Financial Statement Analysis of Reliance communication Page 15
(b) Brand License - 10 years
(c) Indefeasible Right of Connectivity - 15, 20 years
(d) Software - 5 years
(iv) Depreciation on foreign exchange differences, capitalized pursuant to Para 46A
of AS 11 „The Effects of Changes in Foreign Exchange Rates‟ vide notifications dated
December 29, 2011 and August 9, 2012 by Ministry of Corporate Affairs (MCA), under
the Companies (Accounting Standards) (Second Amendment) Rules, 2011, is provided
over the balance useful life of depreciable capital assets.
(v) Depreciation on additions is calculated pro rata from the following month of addition.
Significant Accounting Policies to the Balance Sheet and Statement of Profit and Loss
2.06 Impairment of Assets
An asset is treated as impaired when the carrying cost of assets exceeds its
recoverable value. An impairment loss is charged to the Statement of Profit and Loss in the
year in which an asset is identified as impaired. The impairment loss recognized in prior
accounting period is increased/ reversed where there has been change in the estimate of
recoverable value. The recoverable value is the higher of the assets‟ net selling price and
value in use.
2.07 Investments
Current Investments are carried at lower of cost and market value computed Investment
wise. Long Term Investments are stated at cost or fair value as required under order
of the High Court. Provision for diminution in the value of long term investments
is made only if such a decline is other than temporary in the opinion of the
management.
2.08 Inventories of Stores and Spares
Inventories of stores and spares are accounted for at cost, determined on weighted
average basis or net realizable value, whichever is less.
2.09 Employee Benefits
Short term employee benefits
All employee benefits payable wholly within twelve months of rendering the service
are classified as short term employee benefits. These benefits include compensated
absences such as paid annual leave and sickness leave. The undiscounted amount of short
Financial Statement Analysis of Reliance communication Page 16
term employee benefits expected to be paid in exchange for the services rendered by
employees are recognized as an expense during the period.
Long term employee benefits
(i) Defined contribution plan
The Company‟s contribution towards Employees‟ Superannuation Plan is recognized as an
expense during the period in which it accrues.
(ii) Defined benefit plans
Provident Fund
Provident Fund contributions are made to a Trust administered by the Trustees. Interest
payable to the Provident Fund members, shall not be at a rate lower than the statutory rate.
Liability is recognized for any shortfall in the income of the fund vis-à-vis liability of the
interest to the members as per statutory rates.
Gratuity Plan
The Company‟s gratuity benefit scheme is a defined benefit plan. The Company‟s net
obligation in respect of the gratuity benefit scheme is calculated by estimating the
amount of future benefit that employees have earned in return for their service in the
current and prior periods; that benefit is discounted to determine its present value and
the fair value of any plan assets is deducted.
The present value of the obligation under such defined benefit plan is
determined based on actuarial valuation using the
Projected Unit Credit Method.
The obligation is measured at the present value of the estimated future cash flows. The
discount rates used for determining the present value of the obligation under defined
benefit plan, are based on the market yields on Government Securities as at the Balance
Sheet date. Actuarial gains and losses are recognized immediately in the Statement of
Profit and Loss.
(iii) Other Long term employment benefits
Compensated absences which are not expected to occur within twelve months after
the end of the period in which the employee renders the related services are recognised
as a liability at the present value of the defined benefit obligation at the Balance Sheet
date, determined based on actuarial valuation using Projected Unit Credit Method. The
discount rates used for determining the present value of the obligation under defined

Financial Statement Analysis of Reliance communication Page 17
benefit plan, are based on the market yields on Government Securities as at the
Balance Sheet date.
2.10 Borrowing Cost
Borrowing costs that are attributable to the acquisition or construction of qualifying
assets are capitalized as part of the cost of such assets up to the commencement of
commercial operations. A qualifying asset is one that necessarily takes substantial period of
time to get ready for intended use. Other borrowing costs are recognized as expense in the
year in which they are incurred.
2.11 Issue Expenses and Premium on Foreign Currency Convertible Bonds (FCCBs)
The Premium payable/paid on redemption of Foreign Currency Convertible Bonds
(FCCBs) is charged to Securities Premium Account over the period of the Issue. Issue
expenses are debited to Securities Premium Account at the time of the issue.
2.12 Foreign Currency Transactions
(i) Transactions denominated in foreign currencies are recorded at the exchange rates
prevailing at the time of the transaction. Significant Accounting Policies to the Balance
Sheet and Statement of Profit and Loss
(ii) Monetary items denominated in foreign currencies at the year-end are restated at year
end rates. In case of monetary items, which are covered by forward exchange contracts,
the difference between the transaction rate and rate on the date of the contract is
recognized as exchange difference and the premium paid on forward contracts is
recognized over the life of the contract.
(iii) Non-Monetary foreign currency items are carried at cost.
(iv) Exchange difference arising either on settlement or on translation of monetary items
other than those mentioned above is recognized in the Statement of Profit and Loss.
(v) Any loss arising out of marking of a class of derivative contracts to market price is
recognized in the Statement of Profit and Loss. Income, if any, arising out of marking a
class of derivative contracts to market price is not recognized in the Statement of Profit and
Loss.
(vi) All long term foreign currency monetary items consisting of liabilities which relate
to acquisition of depreciable capital assets at the end of the period/ year have been
restated at the rate prevailing at the Balance Sheet date. The exchange difference, arising
as a result has been added or deducted from the cost of the assets as per the
notifications issued by the Ministry of Corporate Affairs (MCA) dated December 29,
2011 and August 9, 2012. Exchange difference on other long term foreign currency
monetary items is accumulated in “Foreign Currency Monetary Items Translation

Financial Statement Analysis of Reliance communication Page 18
Difference Account (FCMITDA)” which will be amortized over the balance period of
monetary assets or liabilities.
2.13 Revenue Recognition
(i) Revenue is recognized as and when the services are provided on the basis of actual
usage of the Company‟s network. Revenue on upfront charges for services with
lifetime validity and fixed validity periods of one year or more are recognized over
the estimated useful life of subscribers and specified fixed validity period, as appropriate.
The estimated useful life is consistent with estimated churn of the subscribers.
(ii) Interest income on investment is recognized on time proportion basis. Dividend is
recognized when right to receive is established.
2.14 Provision for Doubtful Debts and Loans and Advances
Provision is made in the accounts for doubtful debts, loans and advances in cases
where the management considers the debts, loans and advances to be doubtful of recovery.
2.15 Taxes on Income and Deferred Tax
Provision for Income Tax is made on the basis of taxable income for the year at
current rates. Tax expense comprises of Current Tax and Deferred Tax at the applicable
enacted or substantively enacted rates. Current Tax represents the amount of Income Tax
payable/ recoverable in respect of the taxable income/ loss for the reporting period.
Deferred Tax represents the effect of timing difference between taxable income and
accounting income for the reporting period that originate in one period and are capable
of reversal in one or more subsequent periods. The Deferred Tax Asset is recognized and
carried forward only to the extent that there is a reasonable certainty that the assets will be
realized in future. However, where there is unabsorbed depreciation or carried forward loss
under taxation laws, Deferred Tax Assets are recognized only if there is virtual certainty of
realization of assets.
2.16 Government Grants
Subsidies granted by the Government for providing telecom services in rural areas
are recognized as Other Operating Income in accordance with the relevant terms and
conditions of the scheme of agreement.
2.17 Provisions, Contingent Liabilities and Contingent Assets
Provisions involving substantial degree of estimation in measurement are recognized
when there is a present obligation as a result of past events and it is probable that there will
be an outflow of resources. A disclosure for a contingent liability is made when there is a
possible obligation or a present obligation that may, but probably will not, require an
outflow of resources. When there is a possible obligation or a present obligation in respect

Financial Statement Analysis of Reliance communication Page 19
of which the likelihood of outflow of resources is remote, no provision or disclosure is
made. Contingent assets are neither recognized nor disclosed in the Financial Statements.
2.18 Earning per Share
In determining Earning per Share, the Company considers the net profit after
tax and includes the post-tax effect of any extraordinary/ exceptional item. The number
of shares used in computing Basic Earnings per Share is the weighted average number of
shares including owned by the trust, outstanding during the period. The number of
shares used in computing Diluted Earnings per Share comprises the weighted average
shares considered for deriving Basic Earnings per Share and also the weighted average
number of shares that could have been issued on the conversion of all dilutive potential
Equity Shares unless the results would be anti - dilutive. Dilutive potential Equity Shares
are deemed converted as of the beginning of the period, unless issued at a later date.
2.19 Employee Stock Option Scheme
In respect of stock options granted pursuant to the Company‟s Employee Stock
Option Scheme, the intrinsic value of the options (excess of market price of the share
over the exercise price of the option) is treated as discount and accounted as employee
compensation cost over the vesting period. Employees compensation cost recognized
earlier on grant of options is reversed in the period when the options are surrendered by any
employee.3
3. Corporate Governance
Our corporate governance philosophy
Reliance Communications follows the highest standards of corporate governance
principles and best practices by adopting the “Reliance Group – Corporate
Governance Policies and Code of Conduct” as is the norm for all constituent
companies in the group. These policies p resc r ibe a set of sys tems and processes
guided by the core principles of transparency, disclosure, accountability,
compliances, ethical conduct and the commitment to promote the interests of all
stakeholders. The policies and the code are reviewed periodically to ensure their
continuing relevance, effectiveness and responsiveness to the needs of our
stakeholders.
3 Annual Report 2013-14

Financial Statement Analysis of Reliance communication Page 20
Governance practices beyond regulatory requirements
Our governance practices go beyond the mere letter of statutory and regulatory
r e q u i r e me n t s . With this in m i n d , we have formulated a number of policies and
introduced the f o l l o w i n g set of governance practices:
A. Values and commitments
We have set out and adopted a policy document on „values and commitments‟ of
Reliance Communications. We believe that any business conduct can be ethical only when
it rests on the nine core values viz; honesty, integrity, respect, fairness,
purposefulness, trust, responsibility, citizenship and caring.
B. Code of ethics
Our policy document on „code of ethics‟ demands that our employees conduct the
business with impeccable integrity and by excluding any consideration of personal profit or
advantage.
C. Business policies
Our „Business Policies‟ cover a comprehensive range of issues such as fair market
practices, insider information, financial records and accounting integrity, external
communication, work ethics, personal conduct, policy on prevention of sexual
harassment, health, safety, environment and quality.
D. Separation of the Board‟s supervisory role from the executive management
In line with the best global practices, we have adopted the policy of separating the
Board‟s supervisory role from the executive management. We have a l so split the p os t s
o f Chairman and CEO.
E. Prohibition of insider trading policy
This document contains the policy on prohibiting trading in the equity shares of the
Company, based on insider or privileged information.
F. Policy on prevention of sexual harassment
Our policy on prevention of sexual harassment aims at promoting a productive work
environment and protects individual rights against sexual harassment.
Financial Statement Analysis of Reliance communication Page 21
G. Whistle blower policy
Our Whistle Blower policy encourages disclosure in good faith of any wrongful
conduct on a matter of general concern and protects the whistle blower from any
adverse personnel action.
H. Environment policy
The Company is committed to achieve excellence in environmental performance,
preservation and promotion of clean environment. These are the fundamental concern in all
our business activities.
I. Risk management
Our risk management procedures ensure that the management controls various
business related risks through means of a properly defined framework.
J. Boardroom practices
a. Chairman
In line with the highest global standards of corporate governance, the Board has
separated the Chairman‟s role from that of an executive in managing day to day business
affairs.
b. Board charter
The Board of Directors has adopted a comprehensive charter, which sets out clear
and transparent guidelines on matters relating to the composition of the Board, the scope
and function of various Board committees etc.
c. Board committees
The Board constituted Audit Committee, Nomination/ Remuneration Committee,
Stakeholders Relationship Committee and ESOS Compensation Committee. The Board
rotates the Chairman of these Committees. Pursuant to the provisions of Section 135 of
the Companies Act, 2013, read with the Companies (Corporate Social Responsibility
Policy) Rules, 2014, the Board has constituted Corporate Social Responsibility
Committee. Pursuant to implementation of Section 178 of the Companies Act, 2013, the
Board has renamed Shareholders / Investors Grievance Committee as Stakeholders
Relationship Committee.
d. Selection of Independent Directors
Considering the requirement of skill sets on the Board, eminent people having an
independent standing in their respective field / profession, and who can effectively

Financial Statement Analysis of Reliance communication Page 22
contribute to the Company‟s business and policy decisions are considered by the
Nomination/ Remuneration Committee, for appointment, as Independent Directors on
the Board. The Committee, inter alia, considers qualification, positive attributes, area
of expertise and number of Directorships and Memberships held in various committees
of other companies by such persons. The Board considers the Committee‟s
recommendation, and takes appropriate decision. Every Independent Director, at the
first meeting of the Board in which he participates as a Director and thereafter at the
first meeting of the Board in every financial year, gives a declaration that he meets the
criteria of independence as provided under law.
e. Tenure of independent directors
Tenure of independent directors on the Board of the Company shall not exceed
the time period as per provisions of the Companies Act, 2013 and Listing Agreement
entered into with the Stock Exchanges, amended from time to time.
f. Independent director‟s interaction with stakeholders
Member(s) of the Stakeholders Relationship Committee interact with the stakeholders
on their suggestions and queries, if any, which are forwarded to the Company Secretary.
g. Lead independent director
Recognizing the need for a representative and spokesperson for the independent
directors, the Board designated Shri Deepak Shourie, an independent director as the lead
independent director.
h. Training of Board Members
The Board members are periodically given formal orientation and training with
respect to the Company‟s vision, strategic direction, and core values including ethics,
corporate governance practices, financial matters and business operations. The Directors are
facilitated to get familiar with the Company‟s functions at the operational levels. Periodic
presentations are made at the Board and Committee Meetings, on business and
performance updates of the Company, global business environment, business strategy
and risks involved. The Board members are also provided with necessary documents /
brochures, reports and internal policies to enable them to familiarize with the Company‟s
procedures and practices.
Periodic updates and training programs for Board members are also
conducted on relevant statutory changes and landmark judicial pronouncements
encompassing important laws.

Financial Statement Analysis of Reliance communication Page 23
i. Meeting of Independent Directors with operating team
The independent directors of the Company meet in executive sessions with the
various operating teams as and when they deem necessary. These discussions may
include topics such as, operating policies and procedures, risk management strategies,
measures to improve efficiencies, performance and compensation, strategic issues for
Board consideration, flow of information to directors, management progression and
succession and others as the independent directors may determine. During these
executive sessions, the independent directors have access to members of management
and other advisors, as the independent directors may determine and deem fit.
j. Commitment of directors
The meeting dates for the entire financial year are scheduled in the beginning
of the year and an annual calendar of meetings of the Board and its committees is
circulated to the directors. This enables the directors to plan their commitments and
facilitates attendance at the meetings of the Board and its committees.
K. Governance practices being followed to promote the interests of our stakeholders
We have introduced several trend setting governance practices to improve
stakeholders satisfaction. Some of the major ones among them are:
1. Customers
We have taken various customer caring initiatives, which give various services to
our subscribers at all times. We also have captive contact centers having one of the largest
facilities accommodating approx. 8000 personnel on round the clock shift basis. In addition
to this, we have provided various on line measures on Reliance World platform which
also gives ready access to the customers. Our customers can view and pay their bills
online and manage their account information online.
2. Employees
Our endeavor has been to create a high performing and engaged organization.
Through the year, the Company has rolled out several employees initiatives towards this.
Re- engineering of Organization Design, re-visiting work flows and processes, enhancing
automation has enabled us to be an efficient, productive and agile organization. One of the
key factors of our success and achievement has been the capability and commitment of our
employees. On a periodic basis, the Company reviewed the HR policies, processes and
procedures to make it more transparent, employee friendly and automated. The continuous
focus on learning and development and capability building of employees has led to
developing and retaining our talent, and has facilitated in professional and personal
growth and enrichment of our employees. The Company has been organizing, throughout
Financial Statement Analysis of Reliance communication Page 24
the year, series of employee engagement events involving all employees and their
families to create a „Happy People Organization‟.
3. Shareholders
The Company recognizes the importance of two-way communication with
shareholders and of giving a balanced report of results and progress and responds to
questions and issues raised in a timely and consistent manner. To ensure this, the
Company‟s corporate website, www.rcom.co.in has information for institutional and
retail shareholders alike. Shareholders seeking information may contact the Company
directly throughout the year. They also have an opportunity to ask questions in person at
the Annual General Meeting.
4. Lenders
The Company has been prompt in honoring all debt obligations to its lenders5
Society the Company, in keeping with its Corporate Social Responsibility policy, focuses
on healthcare, education, and other social initiatives.
L. Role of the Company Secretary in Governance Process
The Company Secretary plays a key role in ensuring that the Board procedures
are followed and regularly reviewed. The Company Secretary ensures that all relevant
information, details and documents are made available to the directors and senior
management for effective decision making at the meetings. The Company Secretary is
primarily responsible to ensure compliance with applicable statutory requirements and
is the interface between the management and regulatory authorities for governance
matters. All the directors of the Company have access to the advice and services of the
Company Secretary.
M. Independent Statutory Auditors
The Company‟s accounts are audited by a panel of two leading independent audit firms
namely:
1. M/s. Charturvedi & Shah, Chartered Accountants.
2. M/s. B S R & Co. LLP, Chartered Accountants.4
4 Annual Report 2013-14

Financial Statement Analysis of Reliance communication Page 25
4. Corporate Social Responsibility (CSR)
The belief of our Founder for the Reliance Group is the beacon guiding
our Business and Social Policy at Reliance Communications. The legacy of building
long standing and equitable ties with all our stakeholders has been strengthened by each
passing year with the Company promoting and practicing its socio-economic, health and
environmental initiatives so as to foster inclusive growth. The program being undertaken at
Reliance Communications has been drawn from the Group‟s philosophy and the CSR
Policy at the helm. The underlying philosophy behind our interventions since the very
inception is that of an “Enabler” for growth and change than merely being a “Provider”.
For us CSR is not mere catchphrase backed b y token gestures but a firm commitment that
stems from our belief and faith in the communities that nourish and sustain us. The
Company as a corporate entity envisages nourishing and sustaining the ecosystems in
which we operate by aiming for growth through sustainable development. Our
philosophy of corporate sustainability is founded on three pillars of our people, processes
and products and services.
Over the years our focus has been to work on key thematic areas as perceived by
the stakeholders, which includes Education, Employability, Economic Empowerment,
Environment and initiating Technology driven endeavors enabling us to make a greater
impact on the quality of life of our stakeholder groups including the communities.
Below listed are key endeavors undertaken by Reliance
Communication during the year 2013-14.
1. PRAYAG-Providing G r a s s root Advancement t o Youth
Aspiring Growth
PRAYAG offers employability skills to UN or under employed peri-urban and u r b a n
slum yo u t h in India. Through t h e program platform we have successfully trained 3,110
youth of which 45 percent are female students. This year under the intervention, we
expanded the combined capacity to extend employment based employability skills to
3090 students per annum across Bihar, Jharkhand, Tamil Nadu, Karnataka, Maharashtra,
Madhya Pradesh and West Bengal.
2. Reliance ASHA
Reliance ASHA is an RCOM endeavor to create comprehensive rehabilitation
opportunities for individuals with disabilities, with an agenda to facilitate their
integration into the mainstream of the society. Based out of Northern India, the project
create handmade paper and paper products by recycling paper and other w as t es . The
Financial Statement Analysis of Reliance communication Page 26
unit is currently extending enabling employability skills and a livelihood platform for 25
differently abled youth.
3. Project Swavlambhan
As part of our core agenda we focus on the need to create a pool of self-reliant
and empowered women members through a series of interventions in the area of skill
building, livelihood, awareness on women specific issues etc. The program since its
inception has extended a helping hand to 90 women members by imparting skills on
cutting, sewing and tailoring and thus empowering 90 families to learn skills to support
themselves in an honorable manner.
4. Cyber Woman
Cyber Woman is an Internet literacy programs fo r women from u n d e r p r i v i l eg ed
communities. We have r e a c h e d out to 1500 women from across 4 states including
Bihar, Jharkhand, West Bengal and Karnataka in financial year
2013-14. The objective is to bridge the digital divide and extend impetus on
promoting digital tools and its applications thus enabling the women from within the
communities in India to effectively utilize technology for furthering their development
and societal growth.
5. Volunteering Initiative for Developing Young Aptitude
VIDYA is an employee led intervention at Reliance Communications with a mission to
establish Reading Rooms in order to improve l i t e racy levels . The project intends to
reach out to ONE MILLION children from underserved communities. Project
VIDYA, focuses on establishing a learning environment for developing reading
skills and cultivate and develop literacy skills in primary and secondary school children.
In its first phase, we are increasing access to age- appropriate and culturally-relevant
reading materials and other aids to 22 VIDYA Centers across the country,
By doing so, the Company believes that we shall b e contributing to the country‟s
mission of making education a right for all under RTE Act.
6. Run for Woman Empowerment
This year Reliance Communications launched and institutionalized an annual event
- “Run for Woman Empowerment” in Patna which from financial year 2013-
14, shall be held each year on the occasion of International Women‟s Day in the
month of March. The Run was organized in the heart of Patna city on March 8, 2014,
where in more than 700 women from all walks of life joined the Run for Women
empowerment, prosperity and pledged their support in creating and shaping better

Financial Statement Analysis of Reliance communication Page 27
India. Defined to create awareness on and strengthen Women Empowerment in
the Bihar–Jharkhand belt, the Run is part of the larger agenda at RCOM to focus on and
cater to the various facets of empowerment through deployment of focused social
endeavors across the year.
7. Blood Donation Campaigns
Recognizing the paucity of blood, the need for creating awareness on voluntary
blood donation and the voluntary donor base we have been organizing blood
donation campaign, wherein employees, across the RCOM along with Group have
contributed more than 1.2 lakh units of blood from 100 cities over the last few years.
The campaigns are supported by national and state level Blood banks from across the
country. Our focus has been on promoting the cause of Thalassemia children and
generating awareness on Thalassemia amongst the masses and those suffering from it.
8. Green Mile
Started in year 2011-12 on the occasion of „World Environment Day‟, June 5, the
objective has been to build in green process across our operations. Through our efforts in
partnership with our customers, we have saved more-than 1,000 trees in FY 2013-14.
9. The Proscenium Repertory
TPR as it is called is a tool to promote community development and bring about socio-cultural
change. It is a journey led by our employee base to creatively determine and express its social,
cultural and environmental concerns and address issues of importance relevant to the community
while celebrating its differences. Since its inception last December, TPR has staged 24 plays on
variety of social issues including Save Girl child, Women Empowerment, Energy
Conservation and Right to Vote. TPR is an amalgamation of individuals / group of
individuals sharing a common space or interest/s. It involves collaboration between professional
artists and other stakeholder groups.
10. Employee Volunteering
Employee Volunteering is integrated with the RCOM CSR framework and focuses on
selfless voluntary service offered by employees with enabling support motivation and
facilitation from the Company. In the year 2013-14, 750 employees at RCOM contributed their
voluntary services to varied social interventions. More than 3.3 man years were extended
by the employee base in the areas of health, education, employability and environment.

Financial Statement Analysis of Reliance communication Page 28
11. Awareness Campaigns:
As part of the Awareness campaigns we at RCOM have been creating social awareness
through sending messages to our customer base across India. Over 200 million socially relevant
messages to our customers pan India. Issues covered were of social relevance under aspects
like save the girl child, promoting voluntary blood donation, safety, women empowerment,
environmental concerns etc.
We also partner with external NGO‟s / institutions in achieving the developmental goals,
by actively engaging along with them for implementing various social plans and
interventions thus co-creating socio-economic value adds within the earmarked communities.
RCOM has a partnership with 108 organizations from across the country.5
5 Annual Report 2013-14

Financial Statement Analysis of Reliance communication Page 29
5. Financial Statement Analysis
(A) Ratio Analysis
Balance Sheet [6]
Standalone Balance Sheet
------------------- in Rs. Cr. -------------------
Mar '05 Dec '06 Mar '07 Mar '08 Mar '09 Mar '10 Mar '11 Mar '12 Mar '13 Mar '14
12 mths 9 mths 15 mths 12 mths 12 mths 12 mths 12 mths 12 mths 12 mths 12 mths
Sources Of Funds
Total Share Capital 0.01 0.05 1,022.3
1 1,032.0
1 1,032.0
1 1,032.0
1 1,032.0
0 1,032.0
0 1,032.0
0 1,021.0
0
Equity Share Capital 0.01 0.05 1,022.3
1 1,032.0
1 1,032.0
1 1,032.0
1 1,032.0
0 1,032.0
0 1,032.0
0 1,021.0
0
Share Application Money 0 611.57 0 0 0 0 0 0 0 0
Preference Share Capital 0 0 0 0 0 0 0 0 0 0
Reserves 0 14,783.
43 19,503.
23 23,808.
02 50,658.
31 49,466.
88 47,112.
48 43,866.
00 32,110.
00 30,359.
00
Revaluation Reserves 0 0 0 0 0 0 0 0 0 0
Net worth 0.01 15,395.
05 20,525.
54 24,840.
03 51,690.
32 50,498.
89 48,144.
48 44,898.
00 33,142.
00 31,380.
00
Secured Loans 0 0 5,113.5
7 950
3,000.00
3,000.00
15,226.02
26,265.00
29,112.00
28,362.00
Unsecured Loans 0 0 9,454.2
7 19,336.
43 27,903.
61 21,478.
28 16,226.
72 1,606.0
0 1,215.0
0 1,765.0
0
Total Debt 0 0 14,567.
84 20,286.
43 30,903.
61 24,478.
28 31,452.
74 27,871.
00 30,327.
00 30,127.
00
Total Liabilities 0.01 15,395.
05 35,093.
38 45,126.
46 82,593.
93 74,977.
17 79,597.
22 72,769.
00 63,469.
00 61,507.
00
Application Of Funds
Gross Block 0 198.09 20,625.
82 21,576.
32 37,941.
15 39,838.
17 40,904.
17 47,164.
00 47,362.
00 47,432.
00
Less: Accum. Depreciation
0 31.85 2,527.3
7 4,688.6
9 6,533.3
8 9,225.6
9 12,063.
27 9,780.0
0 11,304.
00 13,009.
00
Net Block 0 166.24 18,098.
45 16,887.
63 31,407.
77 30,612.
48 28,840.
90 37,384.
00 36,058.
00 34,423.
00
Capital Work in Progress 0 0 2,185.6
0 7,117.5
6 3,643.8
6 1,683.5
2 9,907.6
6 765 735 731
Investments 0 12,074.
10 5,434.4
3 13,844.
14 31,364.
75 31,898.
60 32,102.
13 31,889.
00 21,013.
00 21,042.
00
Inventories 0 0 98.51 201.22 253.14 298.34 306.11 329 304 269
Sundry Debtors 0 0 802.11 1,093.2
1 1,482.2
2 1,738.6
3 1,969.2
5 1,940.0
0 2,066.0
0 1,994.0
0
Cash and Bank Balance 0 0.05 28.08 192.65 534.89 81.92 3,812.9 178 228 127
6 http://www.moneycontrol.com/financials/reliancecommunications/balance-sheet/RC13#RC13

Financial Statement Analysis of Reliance communication Page 30
5
Total Current Assets 0 0.05 928.7 1,487.0
8 2,270.2
5 2,118.8
9 6,088.3
1 2,447.0
0 2,598.0
0 2,390.0
0
Loans and Advances 0.01 3,158.9
1 19,137.
97 17,028.
20 23,272.
50 17,886.
79 13,065.
25 13,221.
00 15,532.
00 18,291.
00
Fixed Deposits 0 0 40.37 0.01 0.26 0.26 0.26 0 0 0
Total CA, Loans & Advances
0.01 3,158.9
6 20,107.
04 18,515.
29 25,543.
01 20,005.
94 19,153.
82 15,668.
00 18,130.
00 20,681.
00
Differed Credit 0 0 0 0 0 0 0 0 0 0
Current Liabilities
0 1.68 6,309.3
3 7,214.3
1 5,774.7
4 5,836.5
3 7,551.9
4 6,026.0
0 5,233.0
0 7,923.0
0
Provisions 0 2.57 4,422.8
1 4,023.8
5 3,590.7
2 3,386.8
4 2,855.3
5 6,911.0
0 7,234.0
0 7,447.0
0
Total CL & Provisions 0 4.25 10,732.
14 11,238.
16 9,365.4
6 9,223.3
7 10,407.
29 12,937.
00 12,467.
00 15,370.
00
Net Current Assets 0.01 3,154.7
1 9,374.9
0 7,277.1
3 16,177.
55 10,782.
57 8,746.5
3 2,731.0
0 5,663.0
0 5,311.0
0
Miscellaneous Expenses 0 0 0 0 0 0 0 0 0 0
Total Assets 0.01 15,395.
05 35,093.
38 45,126.
46 82,593.
93 74,977.
17 79,597.
22 72,769.
00 63,469.
00 61,507.
00

Financial Statement Analysis of Reliance communication Page 31
Profit and Loss 7
Standalone Profit & Loss account
------------------- in Rs. Cr. -------------------
Mar '05 Dec '06 Mar '07 Mar '08 Mar '09 Mar '10 Mar '11 Mar '12 Mar '13 Mar '14
12 mths 9 mths 15 mths 12 mths 12 mths 12 mths 12 mths 12 mths 12 mths 12 mths
Income
Sales Turnover 0 0 12,756.
30 14,792.
05 15,086.
66 13,554.
60 13,308.7
1 11,110.
00 11,267.
00 11,176.
00
Excise Duty 0 0 0 0 0 0 0 0 0 0
Net Sales 0 0 12,756.
30 14,792.
05 15,086.
66 13,554.
60 13,308.7
1 11,110.
00 11,267.
00 11,176.
00
Other Income 0 13.26 231.89 520.53 4,148.1
3 2,455.1
7 1,056.98 753
1,553.00
1,269.00
Stock Adjustments 0 0 0 0 0 0 0 0 0 0
Total Income 0 13.26 12,988.
19 15,312.
58 19,234.
79 16,009.
77 14,365.6
9 11,863.
00 12,820.
00 12,445.
00
Expenditure
Raw Materials 0 0 16.48 15.15 29.95 50.39 64.92 0 0 12
Power & Fuel Cost 0 0 266.74 91.76 138.32 144.27 159.79 0 0 1,063.0
0
Employee Cost 0 1.11 684.4 858.65 754.56 672.39 608.07 476 290 286
Other Manufacturing Expenses
0 0 3,091.6
0 4,052.4
5 5,837.2
5 7,850.4
9 8,140.60
6,911.00
7,270.00
6,780.00
Selling and Admin Expenses 0 0.23 2,841.5
3 2,622.5
8 2,197.8
4 1,974.7
3 2,037.89 0 0 0
Miscellaneous Expenses 0 0.33 342.54 978.17 898.81 668.9 586.97 1,315.0
0 979
1,218.00
Preoperative Exp Capitalized
0 0 0 0 0 0 0 0 0 0
Total Expenses 0 1.67 7,243.2
9 8,618.7
6 9,856.7
3 11,361.
17 11,598.2
4 8,702.0
0 8,539.0
0 9,359.0
0
Operating Profit
0 -1.67 5,513.0
1 6,173.2
9 5,229.9
3 2,193.4
3 1,710.47
2,408.00
2,728.00
1,817.00
PBDIT 0 11.59 5,744.9
0 6,693.8
2 9,378.0
6 4,648.6
0 2,767.45
3,161.00
4,281.00
3,086.00
Interest 0 0 456.55 870.05 1,153.2
4 1,253.8
4 853.69
1,265.00
1,976.00
1,796.00
PBDT 0 11.59 5,288.3
5 5,823.7
7 8,224.8
2 3,394.7
6 1,913.76
1,896.00
2,305.00
1,290.00
Depreciation 0 2.74 1,836.1
2 1,843.6
6 1,933.5
1 1,511.2
4 1,594.27
1,741.00
1,681.00
2,048.00
Other Written Off 0 0 0 0 0 0 0 0 0 0
Profit Before Tax 0 8.85 3,452.2
3 3,980.1
1 6,291.3
1 1,883.5
2 319.49 155 624 -758
7 http://www.moneycontrol.com/financials/reliancecommunications/profit-loss/RC13#RC13

Financial Statement Analysis of Reliance communication Page 32
Extra-ordinary items 0 0 0 0 0 0 101.52 0 0 0
PBT (Post Extra-ord Items) 0 8.85 3,452.2
3 3,980.1
1 6,291.3
1 1,883.5
2 421.01 155 624 -758
Tax 0 3.2 1,043.3
8 1,393.6
6 1,488.6
4 1,404.5
9 1,179.00 -1 0
-1,488.0
0
Reported Net Profit 0 5.65 2,408.8
5 2,586.4
5 4,802.6
7 478.93 -757.99 156 624 730
Total Value Addition 0 1.66 7,226.8
1 8,603.6
1 9,826.7
8 11,310.
78 11,533.3
2 8,702.0
0 8,539.0
0 9,347.0
0
Preference Dividend 0 0 0 0 0 0 0 0 0 0
Equity Dividend 0 0 102.23 154.8 165.12 175.44 103.2 52 52 0
Corporate Dividend Tax 0 0 17.37 26.31 28.06 29.14 17.14 8 9 0
Per share data (annualized)
Shares in issue (lakhs) 0.1 1 20,446.
15 20,640.
27 20,640.
27 20,640.
27 20,640.2
7 20,640.
27 20,640.
27 20,427.
48
Earnings Per Share (Rs) 0 565.39 11.78 12.53 23.27 2.32 -3.67 0.76 3.02 3.57
Equity Dividend (%) 0 0 10 15 16 17 10 5 5 0
Book Value (Rs) 10 1,478,3
47.67 100.39 120.35 250.43 244.66 233.26 217.53 160.57 153.62
8
Financial Statement Analysis of Reliance communication Page 33
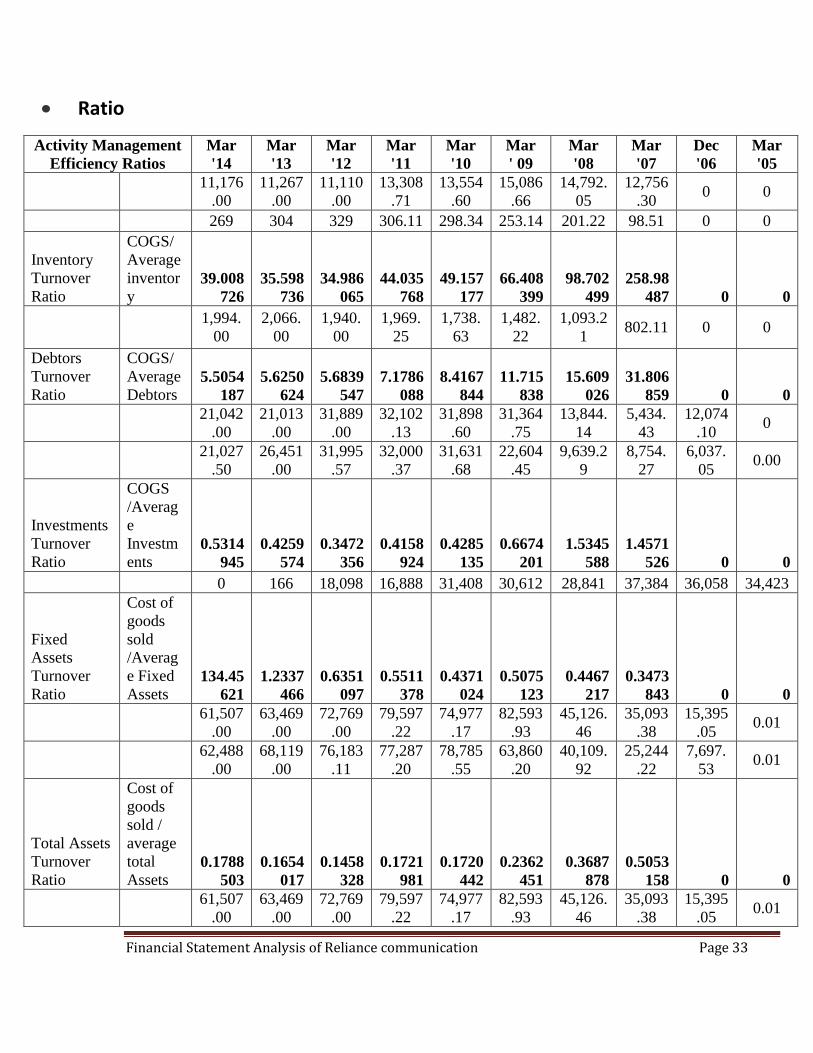
Ratio
Activity Management
Efficiency Ratios
Mar
'14
Mar
'13
Mar
'12
Mar
'11
Mar
'10
Mar
' 09
Mar
'08
Mar
'07
Dec
'06
Mar
'05
11,176
.00
11,267
.00
11,110
.00
13,308
.71
13,554
.60
15,086
.66
14,792.
05
12,756
.30 0 0
269 304 329 306.11 298.34 253.14 201.22 98.51 0 0
Inventory
Turnover
Ratio
COGS/
Average
inventor
y 39.008
726
35.598
736
34.986
065
44.035
768
49.157
177
66.408
399
98.702
499
258.98
487 0 0
1,994.
00
2,066.
00
1,940.
00
1,969.
25
1,738.
63
1,482.
22
1,093.2
1 802.11 0 0
Debtors
Turnover
Ratio
COGS/
Average
Debtors 5.5054
187
5.6250
624
5.6839
547
7.1786
088
8.4167
844
11.715
838
15.609
026
31.806
859 0 0
21,042
.00
21,013
.00
31,889
.00
32,102
.13
31,898
.60
31,364
.75
13,844.
14
5,434.
43
12,074
.10 0
21,027
.50
26,451
.00
31,995
.57
32,000
.37
31,631
.68
22,604
.45
9,639.2
9
8,754.
27
6,037.
05 0.00
Investments
Turnover
Ratio
COGS
/Averag
e
Investm
ents 0.5314
945
0.4259
574
0.3472
356
0.4158
924
0.4285
135
0.6674
201
1.5345
588
1.4571
526 0 0
0 166 18,098 16,888 31,408 30,612 28,841 37,384 36,058 34,423
Fixed
Assets
Turnover
Ratio
Cost of
goods
sold
/Averag
e Fixed
Assets 134.45
621
1.2337
466
0.6351
097
0.5511
378
0.4371
024
0.5075
123
0.4467
217
0.3473
843 0 0
61,507
.00
63,469
.00
72,769
.00
79,597
.22
74,977
.17
82,593
.93
45,126.
46
35,093
.38
15,395
.05 0.01
62,488
.00
68,119
.00
76,183
.11
77,287
.20
78,785
.55
63,860
.20
40,109.
92
25,244
.22
7,697.
53 0.01
Total Assets
Turnover
Ratio
Cost of
goods
sold /
average
total
Assets 0.1788
503
0.1654
017
0.1458
328
0.1721
981
0.1720
442
0.2362
451
0.3687
878
0.5053
158 0 0
61,507
.00
63,469
.00
72,769
.00
79,597
.22
74,977
.17
82,593
.93
45,126.
46
35,093
.38
15,395
.05 0.01
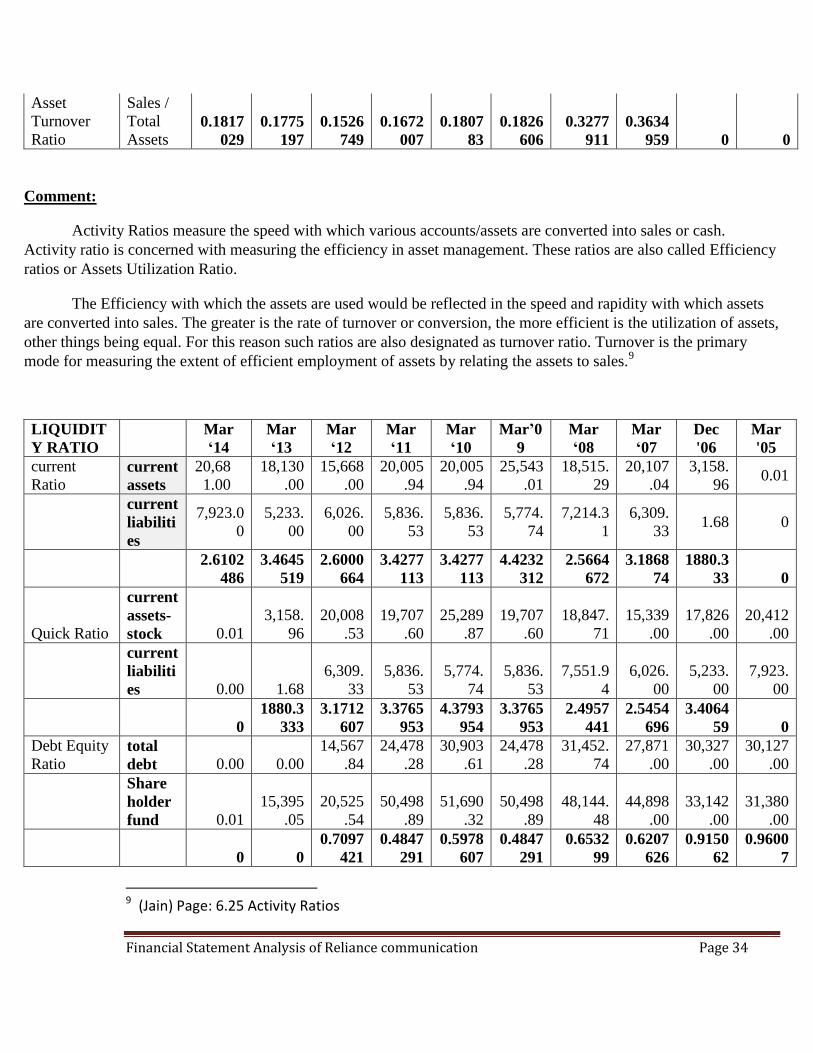
Financial Statement Analysis of Reliance communication Page 34
Asset
Turnover
Ratio
Sales /
Total
Assets 0.1817
029
0.1775
197
0.1526
749
0.1672
007
0.1807
83
0.1826
606
0.3277
911
0.3634
959 0 0
Comment:
Activity Ratios measure the speed with which various accounts/assets are converted into sales or cash.
Activity ratio is concerned with measuring the efficiency in asset management. These ratios are also called Efficiency
ratios or Assets Utilization Ratio.
The Efficiency with which the assets are used would be reflected in the speed and rapidity with which assets
are converted into sales. The greater is the rate of turnover or conversion, the more efficient is the utilization of assets,
other things being equal. For this reason such ratios are also designated as turnover ratio. Turnover is the primary
mode for measuring the extent of efficient employment of assets by relating the assets to sales.9
LIQUIDIT
Y RATIO Mar
„14
Mar
„13
Mar
„12
Mar
„11
Mar
„10
Mar‟0
9
Mar
„08
Mar
„07
Dec
'06
Mar
'05
current
Ratio current
assets
20,68
1.00
18,130
.00
15,668
.00
20,005
.94
20,005
.94
25,543
.01
18,515.
29
20,107
.04
3,158.
96 0.01
current
liabiliti
es
7,923.0
0
5,233.
00
6,026.
00
5,836.
53
5,836.
53
5,774.
74
7,214.3
1
6,309.
33 1.68 0
2.6102
486
3.4645
519
2.6000
664
3.4277
113
3.4277
113
4.4232
312
2.5664
672
3.1868
74
1880.3
33 0
Quick Ratio
current
assets-
stock 0.01
3,158.
96
20,008
.53
19,707
.60
25,289
.87
19,707
.60
18,847.
71
15,339
.00
17,826
.00
20,412
.00
current
liabiliti
es 0.00 1.68
6,309.
33
5,836.
53
5,774.
74
5,836.
53
7,551.9
4
6,026.
00
5,233.
00
7,923.
00
0
1880.3
333
3.1712
607
3.3765
953
4.3793
954
3.3765
953
2.4957
441
2.5454
696
3.4064
59 0
Debt Equity
Ratio total
debt 0.00 0.00
14,567
.84
24,478
.28
30,903
.61
24,478
.28
31,452.
74
27,871
.00
30,327
.00
30,127
.00
Share
holder
fund 0.01
15,395
.05
20,525
.54
50,498
.89
51,690
.32
50,498
.89
48,144.
48
44,898
.00
33,142
.00
31,380
.00
0 0
0.7097
421
0.4847
291
0.5978
607
0.4847
291
0.6532
99
0.6207
626
0.9150
62
0.9600
7
9 (Jain) Page: 6.25 Activity Ratios

Financial Statement Analysis of Reliance communication Page 35
Long term
debt equity
Ratio
Long
term
Debt 0.01
15,395
.05
20,525
.54
50,498
.89
51,690
.32
50,498
.89
48,144.
48
44,898
.00
33,142
.00
31,380
.00
total
Equity 0.00 0.00
14,567
.84
24,478
.28
30,903
.61
24,478
.28
31,452.
74
27,871
.00
30,327
.00
30,127
.00
0 0
1.4089
625
2.0630
081
1.6726
305
2.0630
081
1.5306
927
1.6109
217 0 0
Comment:
Liquidity ratio is the ability of a firm to satisfy its short term obligation as they become due. The importance
of adequate liquidity in the sense of the ability of a firm to meet current/short-term obligation when they become
due for payment can hardly be overstressed.
The liquidity ratio measure the ability of a firm to meet short term obligation and reflect the short-term
financial strength/solvency of a firm.10
PROFITABILITY RATIO
Mar
'14
Mar
'13
Mar
'12
Mar
'11
Mar
'10
Mar'0
9
Mar
'08
Mar
'07
Dec
'06
Mar
'05
Operating Profit Margin(%)
Operating profit *100
0.00 -1.67 5,513.01
2,193.43
5,229.93
2,193.43
1,710.47
2,408.00
2,728.00
1,817.00
Net Sales 0.00 0.00 12,756.30
13,554.60
15,086.66
13,554.60
13,308.71
11,110.00
11,267.00
11,176.00
0 0 43.217939
16.182182
34.665923
16.182182
12.85226
21.674167
0 0
Gross profit margin(%)
Gross profit(net p.-Dep) *100
0.00 -1.11 12,055.42
13,918.25
14,302.15
12,831.82
12,635.72
10,634.00
10,977.00
10,878.00
Net sales 0.00 0.00 12,756.30
14,792.05
15,086.66
13,554.60
13,308.71
11,110.00
11,267.00
11,176.00
0 0 94.505617
94.092773
94.799976
94.667641
94.943236
95.715572
0 0
Cash profit PAT+Depre 0.00 8.39 4,244. 1,990 6,736.1 1,990. 836.28 1,89 2,30 2,77
10
(Jain): Page 6.3 Liquidity ratio

Financial Statement Analysis of Reliance communication Page 36
Margin(%) ciation *100
97 .17 8 17 7.00 5.00 8.00
Gross Sales 0.00 0.00 12,756.30
13,554.60
15,086.66
13,554.60
13,308.71
11,110.00
11,267.00
11,176.00
0 0 33.277439
14.682617
44.649909
14.682617
6.2837044
17.074707
0 0
Renturn on Capital Employed (%)
EAT+Interest-Tax saved on Int.*100
0.00 11.59
5,288.35
5,823.77
8,224.82
3,394.76
1,913.76
1,896.00
2,305.00
1,290.00
Capital Employed
0.01 15,393.37
28,784.05
37,912.15
76,819.19
69,140.64
72,045.28
66,743.00
58,236.00
53,584.00
0 0.0752922
18.372501
15.361223
10.706726
4.9099343
2.6563295
2.8407473
3.958033
2.407435
Return on Net Worth(%)
PAT *100 0 5.65 2408.85
478.93
4802.67
478.93 -757.99
156 624 730
Net Worth 0.01 15,395.05
20,525.54
50,498.89
51,690.32
50,498.89
48,144.48
44,898.00
33,142.00
31,380.00
0 0.0367001
11.735867
0.9483971
9.2912367
0.9483971
-1.574407
0.3474542
1.882807
2.326322
Return on long term fund
PBIT *100 0.00 8.85 3,908.78
4,850.16
7,444.55
3,137.36
1,173.18
1,420.00
2,600.00
1,038.00
Long term funds 0.00 0.00 14,567.84
20,286.43
30,903.61
24,478.28
31,452.74
27,871.00
30,327.00
30,127.00
0 0 26.831569
23.908396
24.08958
12.816914
3.7299771
5.0949015
0 0

Financial Statement Analysis of Reliance communication Page 37
Comment:
These ratios are based on the premise that a firm should earn sufficient profit on each rupee of sales.
If adequate profits are not earned on sales, there will be difficulty in meeting the operating expances and no returns
will be available to the owners 11
DEBT COVERAGE RATIO
Mar
'14 Mar '13
Mar
'12
Mar
'11
Mar
'10
Mar'0
9
Mar
'08
Mar
'07
Dec
'06
Mar
'05
Interest cover
EBIT(EBT+ Interest)
0.00 8.85 3,908.78
3,137.36
7,444.55
3,137.36
1,274.70
1,420.00
2,600.00
1,038.00
Interest 0.00 0.00 456.55 1,253.84
1,153.24
1,253.84
853.69
1,265.00
1,976.00
1,796.00
0 0 8.5615595
2.5022012
6.4553345
2.5022012
1.493165
1.1225296
0 0
Total debt Coverage ratio
Total Liabilities
0.01 15,395. 05
35,093.38
45,126.46
82,593.93
74,977.17
79,597.22
72,769.00
63,469.00
61,507.00
Net Worth
0.01 15,395. 05
20,525.54
24,840.03
51,690.32
50,498.89
48,144.48
44,898.00
33,142.00
31,380.00
1 1 1.7097421
1.816683
1.5978607
1.4847291
1.653299
1.6207626
1.915062
1.96007
Comment:
The coverage ratios measure the firm‟s ability to pay certain fixed charges. These types of ratios are
computed from information available in the profit and loss account. 12
11
(Jain): Page 6.18 profitability ratios
12 (Jain): Page 6.15 Coverage ratios

Financial Statement Analysis of Reliance communication Page 38
Investme
nt
Valuatio
n Ratios
Mar
'14
Mar
'13
Mar
'12
Mar
'11
Mar
'10
Mar'
09
Mar
'08
Mar
'07
Dec
'06
Mar
'05
Dividend
Per Share Dividend
*100
0 0 102.23 175.44 165.12 175.4
4
103.2 52 52 0
Share
issue
0.10 1.00 20,446
.15
20,640.
27
20,640.
27
20,64
0.27
20,640.
27
20,64
0.27
20,640
.27
20,427
.48
0 0 0.4999
963
0.8499
889
0.7999
895
0.849
9889
0.4999
935
0.251
9347
0.2519
35
0
Operatin
g Profit
Per Share
(Rs)
Operating
Profit
*100
0.00 -1.67 5,513.
01
2,193.4
3
5,229.9
3
2,193
.43
1,710.4
7
2,408
.00
2,728.
00
1,817.
00
Share
issue
0.10 1.00 20,446
.15
20,640.
27
20,640.
27
20,64
0.27
20,640.
27
20,64
0.27
20,640
.27
20,427
.48
0 -167 26.963
56
10.626
944
25.338
477
10.62
6944
8.2870
524
11.66
6514
13.216
88
8.8948
81
Net
Operatin
g Profit
Per Share
(Rs)
Net
Operating
Profit
*100
0 5.65 2408.8
5
478.93 4802.6
7
478.9
3
-757.99 156 624 730
Share
issue
0.10 1.00 20,446
.15
20,640.
27
20,640.
27
20,64
0.27
20,640.
27
20,64
0.27
20,640
.27
20,427
.48
0 565 11.781
436
2.3203
669
23.268
446
2.320
3669
-
3.6723
84
0.755
8041
3.0232
16
3.5736
17
Free
Reserves
Per Share
(Rs)
Free
Reserves
*100
0 0.23 2841.5
3
1974.7
3
2197.8
4
1974.
73
2037.8
9
0 0 0
Share
issue
0.10 1.00 20,446
.15
20,640.
27
20,640.
27
20,64
0.27
20,640.
27
20,64
0.27
20,640
.27
20,427
.48
0 23 13.897
629
9.5673
652
10.648
31
9.567
3652
9.8733
689
0 0 0
Earnings
per Share Reported
Net Profit
*100
0.00 5.65 2,408.
85
478.93 4,802.6
7
478.9
3
-757.99 156.0
0
624.00 730.00
Share in
issue
0.10 1.00 20,446
.15
20,640.
27
20,640.
27
20,64
0.27
20,640.
27
20,64
0.27
20,640
.27
20,427
.48
0
565
11.781
436
2.3203
669
23.268
446
2.320
3669
-
3.6723
84
0.755
8041
3.0232
16
3.5736
17

Financial Statement Analysis of Reliance communication Page 39
Comment:
The Investment valuation ratios are also known as dividend payout ratio or pay-out ratio. These measures
the relationship between the earnings belonging to the ordinary shareholders and the dividend paid to them.13
(B) Trend Analysis
Activity Management Efficiency Ratios
Mar
'05
Mar
'06
Mar
'07
Mar
'08
Mar'09 Mar
'10
Mar
'11
Mar
'12
Mar
'13
Mar
'14
Avg
Inventory
Turnover
Ratio
0 0 258.985 98.7025 66.4084 49.1572 44.0358 34.9861 35.5987 39.0087 62.688
224
Mar
'05
Mar
'06
Mar
'07
Mar
'08
Mar'09 Mar
'10
Mar
'11
Mar
'12
Mar
'13
Mar
'14
Avg
Debtors
Turnover
Ratio
0 0 31.8069 15.609 11.7158 8.41678 7.17861 5.68395 5.62506 5.50542 9.1541553
13
(Jain): page 6.24 Investment Valuation

Financial Statement Analysis of Reliance communication Page 40
Mar
'05
Mar
'06
Mar
'07
Mar
'08
Mar'09 Mar
'10
Mar
'11
Mar
'12
Mar
'13
Mar
'14
Avg
Investments
Turnover
Ratio
0 0 1.457
15
1.53456 0.66742 0.428
51
0.41589 0.34724 0.42596 0.53149 0.5808225
Mar
'05
Mar
'06
Mar
'07
Mar
'08
Mar'09 Mar
'10
Mar
'11
Mar
'12
Mar
'13
Mar
'14
Avg
Fixed
Assets
Turnover
Ratio
0 0 1.39
683
0.84
56
0.62477 0.4371 0.4477 0.33552 0.30683 0.31714 0.4711479

Financial Statement Analysis of Reliance communication Page 41
Mar
'05
Mar
'06
Mar
'07
Mar
'08
Mar'09 Mar
'10
Mar
'11
Mar
'12
Mar
'13
Mar
'14
Avg
Total Assets
Turnover
Ratio
0 0 0.50532 0.36
879
0.23
625
0.17
204
0.1722 0.14583 0.1654 0.17885 0.1944676
Mar
'05
Mar
'06
Mar
'07
Mar
'08
Mar'09 Mar
'10
Mar
'11
Mar
'12
Mar
'13
Mar
'14
Avg
Asset
Turnover
Ratio
0 0 0.3635 0.32
779
0.18266 0.18078 0.16
72
0.15267 0.17752 0.1817 0.1733829

Financial Statement Analysis of Reliance communication Page 42
Comment:
Management efficiency ratio includes the debtor inventory and assets, if the debtors turnover ratio is
low that is shows company has not good relationship with debtors. In the reliance communication all
the ratio at the current year is below the average so this indicate the company not good relationship
with debtors
LIQUIDITY RATIO
Mar
'05
Mar
'06
Mar
'07
Mar
'08
Mar'09 Mar
'10
Mar
'11
Mar
'12
Mar
'13
Mar
'14
Avg
current
Ratio
0 1880.33 3.18
687
2.56
647
4.42323 3.42771 3.42771 2.60007 3.46455 2.61025 190.60402
Mar
'05
Mar
'06
Mar
'07
Mar
'08
Mar'09 Mar
'10
Mar
'11
Mar
'12
Mar
'13
Mar
'14
Avg
Quick
Ratio
0 1880.33 3.17
126
2.53
858
4.3794 3.3766 3.3766 2.54547 3.406
46
2.5763 190.5704

Financial Statement Analysis of Reliance communication Page 43
Mar
'05
Mar
'06
Mar
'07
Mar
'08
Mar'09 Mar
'10
Mar
'11
Mar
'12
Mar
'13
Mar
'14
Avg
Debt
Equity
Ratio
0 0 0.70
974
0.81
668
0.59786 0.48473 0.48473 0.62076 0.91506 0.96007 0.5589639
Mar
'05
Mar
'06
Mar
'07
Mar
'08
Mar'09 Mar
'10
Mar
'11
Mar
'12
Mar
'13
Mar
'14
Avg
Long term
debt equity
Ratio
0 0 1.40
896
1.22
447
1.67263 2.06301 2.06301 1.61
092
1.09282 1.04159 1.2177408

Financial Statement Analysis of Reliance communication Page 44
Comment:
Current ratio is high while comparing, as well as quick ratio is also high, debtors ratio is low,
and Company is also paying interest is very high, so the overall liquidity ratio is good for the
company because company‟s asset is more than its liability, But the current year current ratio and
quick ratio is below the average but the case of debt Equity ratio and long-term debt equity ratio
going above the average so company get the longer benefit.
PROFITABILITY RATIO
Mar
'05
Mar
'06
Mar
'07
Mar
'08
Mar'09 Mar
'10
Mar
'11
Mar
'12
Mar
'13
Mar
'14
Avg
Operating
Profit
Margin(%)
0 0 43.21
79
41.73
38
34.6659 16.1822 16.18
22
21.6742 24.2123 16.2581 21.412658
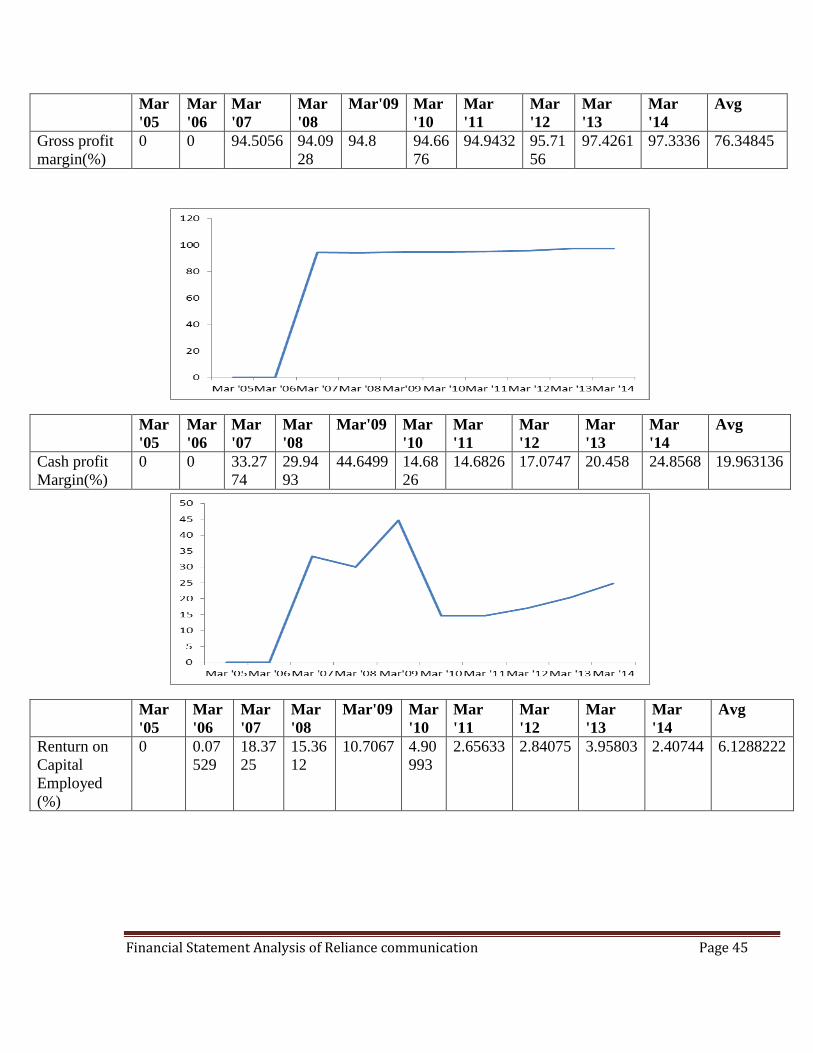
Financial Statement Analysis of Reliance communication Page 45
Mar
'05
Mar
'06
Mar
'07
Mar
'08
Mar'09 Mar
'10
Mar
'11
Mar
'12
Mar
'13
Mar
'14
Avg
Gross profit
margin(%)
0 0 94.5056 94.09
28
94.8 94.66
76
94.9432 95.71
56
97.4261 97.3336 76.34845
Mar
'05
Mar
'06
Mar
'07
Mar
'08
Mar'09 Mar
'10
Mar
'11
Mar
'12
Mar
'13
Mar
'14
Avg
Cash profit
Margin(%)
0 0 33.27
74
29.94
93
44.6499 14.68
26
14.6826 17.0747 20.458 24.8568 19.963136
Mar
'05
Mar
'06
Mar
'07
Mar
'08
Mar'09 Mar
'10
Mar
'11
Mar
'12
Mar
'13
Mar
'14
Avg
Renturn on
Capital
Employed
(%)
0 0.07
529
18.37
25
15.36
12
10.7067 4.90
993
2.65633 2.84075 3.95803 2.40744 6.1288222

Financial Statement Analysis of Reliance communication Page 46
Mar
'05
Mar
'06
Mar
'07
Mar
'08
Mar'09 Mar
'10
Mar
'11
Mar
'12
Mar
'13
Mar
'14
Avg
Return on Net
Worth(%)
0 0.03
67
11.73
59
10.41
24
9.29124 0.9484 0.9484 0.34745 1.88281 2.32632 3.7929609
Mar
'05
Mar
'06
Mar
'07
Mar
'08
Mar'09 Mar
'10
Mar
'11
Mar
'12
Mar
'13
Mar
'14
Avg
Return on
long term
fund
0 0 26.83
16
23.90
84
24.0896 12.81
69
3.72998 5.0949 8.57322 3.44541 10.848997

Financial Statement Analysis of Reliance communication Page 47
Comment:
Profitability ratio is based on the premise that the firm should earn sufficient profit on each
rupee of sales if adequate are not earn on sale there will be difficulty in meeting the operating
expenses and no return available to the owner, if we see the graphs the operating profit margin in the
current year is below the average and this is lower than the previous years rather in the gross profit
margin ratio and cash profit Margin it works well but as we seen as the return on capital employed it
goes down the average.
DEBT COVERAGE RATIO
Mar
'05
Mar
'06
Mar
'07
Mar
'08
Mar'09 Mar
'10
Mar
'11
Mar
'12
Mar
'13
Mar
'14
Avg
Interest
cover
0 0 8.56
156
5.57
458
6.45533 2.50
22
2.5022 1.12253 1.31579 0.57795 2.8612143
Mar
'05
Mar
'06
Mar
'07
Mar
'08
Mar'09 Mar
'10
Mar
'11
Mar
'12
Mar
'13
Mar
'14
Avg
Total debt
Coverage ratio
1 1 1.70
974
1.81
668
1.59786 1.48
473
1.6533 1.62076 1.91506 1.96007 1.5758209

Financial Statement Analysis of Reliance communication Page 48
Comment:
The debt to coverage ratio is about the company cover interest or total debt in this case as we
see the graph that in the current year interest cover is get poor performance to the total debt Coverage
ratio get the better performance it get over all benefited to the company
Investment Valuation Ratios
Mar
'05
Mar
'06
Mar
'07
Mar
'08
Mar'09 Mar
'10
Mar
'11
Mar
'12
Mar
'13
Mar
'14
Avg
Dividend Per
Share
0 0 0.5 0.74999 0.79999 0.84999 0.84999 0.25
193
0.25
193
0 0.4253823
Mar
'05
Mar
'06
Mar
'07
Mar
'08
Mar'09 Mar
'10
Mar
'11
Mar
'12
Mar
'13
Mar
'14
Avg
Operating Profit
Per Share (Rs)
0 -167 26.96
36
29.909 25.3385 10.62
69
10.62
69
11.6665 13.2169 8.89488 -2.975684
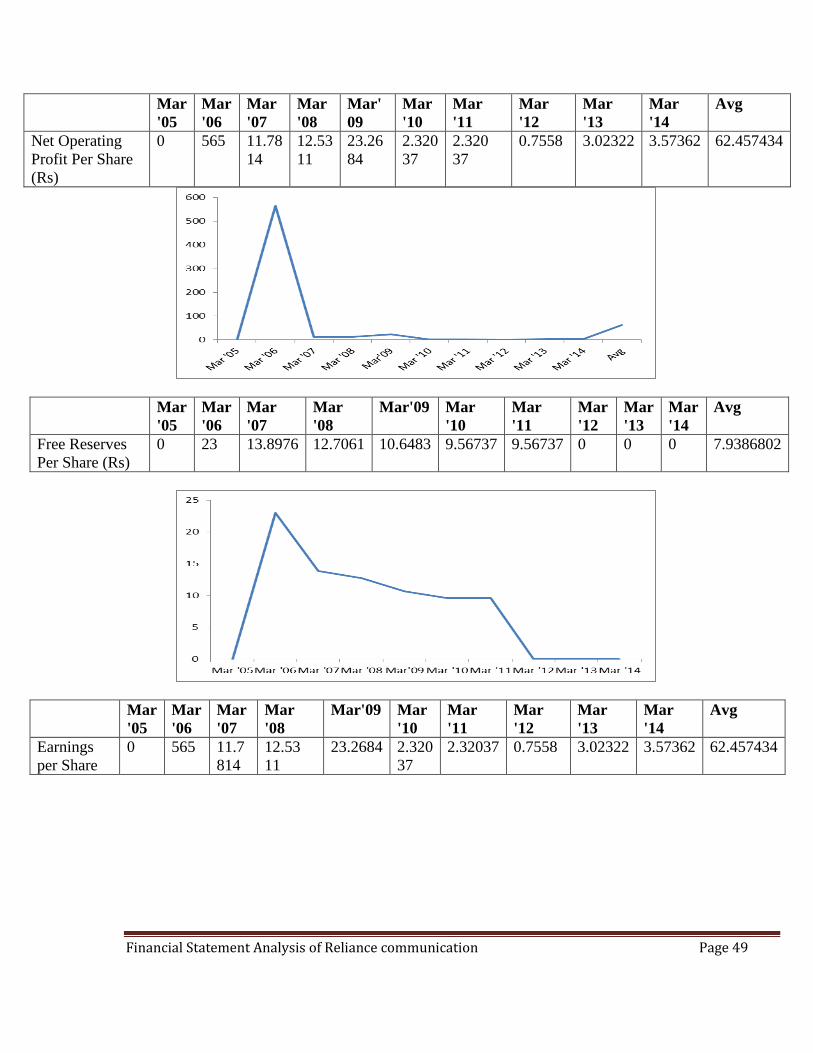
Financial Statement Analysis of Reliance communication Page 49
Mar
'05
Mar
'06
Mar
'07
Mar
'08
Mar'
09
Mar
'10
Mar
'11
Mar
'12
Mar
'13
Mar
'14
Avg
Net Operating
Profit Per Share
(Rs)
0 565 11.78
14
12.53
11
23.26
84
2.320
37
2.320
37
0.7558 3.02322 3.57362 62.457434
Mar
'05
Mar
'06
Mar
'07
Mar
'08
Mar'09 Mar
'10
Mar
'11
Mar
'12
Mar
'13
Mar
'14
Avg
Free Reserves
Per Share (Rs)
0 23 13.8976 12.7061 10.6483 9.56737 9.56737 0 0 0 7.9386802
Mar
'05
Mar
'06
Mar
'07
Mar
'08
Mar'09 Mar
'10
Mar
'11
Mar
'12
Mar
'13
Mar
'14
Avg
Earnings
per Share
0 565 11.7
814
12.53
11
23.2684 2.320
37
2.32037 0.7558 3.02322 3.57362 62.457434

Financial Statement Analysis of Reliance communication Page 50
Comment:
Investment valuation ratio is bed while comparing with Average because the earning per share
ratio is low, so it is loss making company compare to the earlier years. The company has to focus on
their dividend per share as it is very low, and only get the operating profit per share is above the
average so we can say that this company get benefit but no longer chance to get remain in same
condition

Financial Statement Analysis of Reliance communication Page 51
(B) Comparison with Industry
In this case We are comparing with the other industry in terms of the average of the total
industry and company data with particular years with the different kind of Ratio like Activity ratio,
profitability ratio etc.
Activity Management Efficiency Ratios
Inventory Turnover Ratio
Mar '05 Mar '06 Mar '07 Mar '08 Mar'09 Mar '10 Mar '11 Mar '12 Mar '13 Mar '14
Reliance Comm
0 0 258.98 49
98.7025 66.4084 49.15718 44.03577 34.98607 35.59874 39.00873
average 174.44 84
134.59 51
310.92 13
280.8176 291.8246 197.5449 336.3057 375.1933 583.1422 4113.947
Comment: The Company is having very low inventory turnover ratio as compared to the industry Average
Debtors Turnover Ratio
Mar '05 Mar '06 Mar '07 Mar '08 Mar'09 Mar '10 Mar '11 Mar '12 Mar '13 Mar '14
Reliance Comm 0 0 31.80686 15.60903 11.71584 8.416784 7.178609 5.683955 5.625062 5.505419
average 5.833098 6.684635 12.3804 11.78093 737.7402 737.5613 11.80101 11.2331 11.14892 13.68647

Financial Statement Analysis of Reliance communication Page 52
Comment: The Company is having very low Debtors turnover ratio as compared to the industry Average
Investments Turnover Ratio
Mar '05 Mar '06 Mar '07 Mar '08 Mar'09 Mar '10 Mar '11 Mar '12 Mar '13 Mar '14
Reliance Comm 0 0 1.457153 1.534559 0.66742 0.428514 0.415892 0.347236 0.425957 0.531494
average 1916.072 44.31398 4711.128 1696.478 122.4682 126.686 3.564396 4.481573 3.611244 4.493331
Comment: The Company is having very low investment turnover ratio as compared to the industry Average
Fixed Assets Turnover Ratio
Mar '05 Mar '06 Mar '07 Mar '08 Mar'09 Mar '10 Mar '11 Mar '12 Mar '13 Mar '14
Reliance Comm 0 0 1.396826 0.845596 0.624766 0.437102 0.447702 0.335523 0.306827 0.317135
average 21.84874 12.90655 12.26731 12.39588 9.612332 9.690528 11.66759 14.6957 8.16219 8.740879

Financial Statement Analysis of Reliance communication Page 53
Comment: The Company is having very low Fixed Assets turnover ratio as compared to the industry Average
Total Assets Turnover Ratio
Mar '05 Mar '06 Mar '07 Mar '08 Mar'09 Mar '10 Mar '11 Mar '12 Mar '13 Mar '14
Reliance Comm 0 0 0.505316 0.368788 0.236245 0.172044 0.172198 0.145833 0.165402 0.17885
average 2.427638 1.434062 1.363035 1.377319 1.068037 1.076725 1.296399 1.836963 1.020274 1.09261
Comment: The Company is having very low Total Assets turnover ratio as compared to the industry Average
LIQUIDITY RATIO
current Ratio
Mar '05 Mar '06 Mar '07 Mar '08 Mar'09 Mar '10 Mar '11 Mar '12 Mar '13 Mar '14
Reliance Comm 0 1880.333 3.186874 2.566467 4.423231 3.427711 3.427711 2.600066 3.464552 2.610249
average 1.301218 210.7534 1.861994 3.390174 2.133701 1.864376 1.802238 0.992703 1.417474 1.604208

Financial Statement Analysis of Reliance communication Page 54
Comment: The Company is having very Good current ratio as compared to the industry Average so liquidity get
more than average industry
Quick Ratio
Mar '05 Mar '06 Mar '07 Mar '08 Mar'09 Mar '10 Mar '11 Mar '12 Mar '13 Mar '14
Reliance Comm 0 1880.333 3.171261 2.538575 4.379395 3.376595 3.376595 2.54547 3.406459 2.576297
average 1.351876 210.5009 2.608592 3.627799 2.248663 2.32287 2.058664 1.807562 1.79693 2.280858
Comment: The Company is having very Good Quick ratio as compared to the industry Average so liquidity get more
than average industry
Debt Equity Ratio
Mar '05 Mar '06 Mar '07 Mar '08 Mar'09 Mar '10 Mar '11 Mar '12 Mar '13 Mar '14
Reliance Comm 0 0 0.709742 0.816683 0.597861 0.484729 0.484729 0.620763 0.915062 0.96007
average -
1.16809 4.738758 5.764768 9.385859 14.30222 14.74083 16.43803 15.7704 17.22188 18.80161
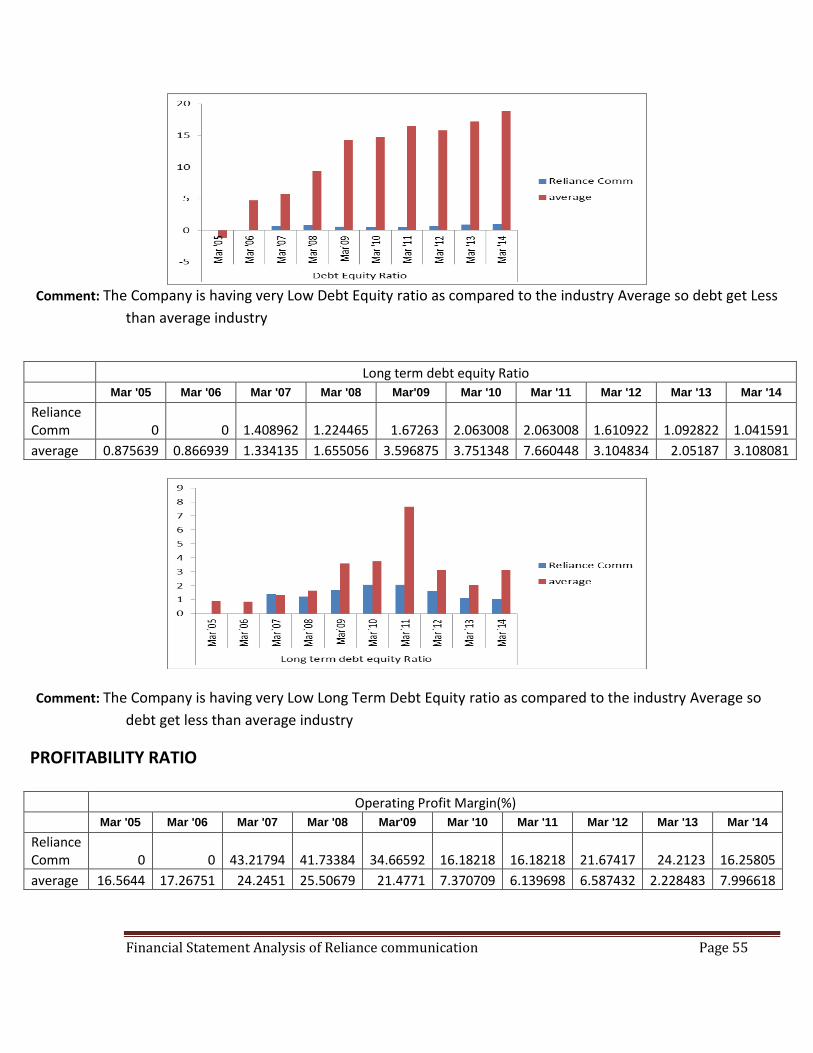
Financial Statement Analysis of Reliance communication Page 55
Comment: The Company is having very Low Debt Equity ratio as compared to the industry Average so debt get Less
than average industry
Long term debt equity Ratio
Mar '05 Mar '06 Mar '07 Mar '08 Mar'09 Mar '10 Mar '11 Mar '12 Mar '13 Mar '14
Reliance Comm 0 0 1.408962 1.224465 1.67263 2.063008 2.063008 1.610922 1.092822 1.041591
average 0.875639 0.866939 1.334135 1.655056 3.596875 3.751348 7.660448 3.104834 2.05187 3.108081
Comment: The Company is having very Low Long Term Debt Equity ratio as compared to the industry Average so
debt get less than average industry
PROFITABILITY RATIO Operating Profit Margin(%)
Mar '05 Mar '06 Mar '07 Mar '08 Mar'09 Mar '10 Mar '11 Mar '12 Mar '13 Mar '14
Reliance Comm 0 0 43.21794 41.73384 34.66592 16.18218 16.18218 21.67417 24.2123 16.25805
average 16.5644 17.26751 24.2451 25.50679 21.4771 7.370709 6.139698 6.587432 2.228483 7.996618

Financial Statement Analysis of Reliance communication Page 56
Comment: The Company is having very high Operating Profit Margin ratio as compared to the industry Average so
Profit get more than average industry
Return on Capital Employed (%)
Mar '05 Mar '06 Mar '07 Mar '08 Mar'09 Mar '10 Mar '11 Mar '12 Mar '13 Mar '14
Reliance Comm 0 0.075292 18.3725 15.36122 10.70673 4.909934 2.656329 2.840747 3.958033 2.407435
average 87.63017 28.41426 44.72069 51.38983 97.28981 39.5359 21.27132 5.453566 12.25442 115.0514
Comment: The Company is having very Low Return on Capital Employed ratio as compared to the industry Average
Return on Net Worth(%)
Mar '05 Mar '06 Mar '07 Mar '08 Mar'09 Mar '10 Mar '11 Mar '12 Mar '13 Mar '14
Reliance Comm 0 0.0367 11.73587 10.41243 9.291237 0.948397 0.948397 0.347454 1.882807 2.326322
average 144.4836 20.2436 26.73704 20.60958 14.86088 3.255104 -8.25493 -37.6026 48.59202 46.28049

Financial Statement Analysis of Reliance communication Page 57
Comment: The Company is having very Low Return on Net worth ratio as compared to the industry Average
Total debt Coverage ratio
Mar '05 Mar '06 Mar '07 Mar '08 Mar'09 Mar '10 Mar '11 Mar '12 Mar '13 Mar '14
Reliance Comm 1 1 1.709742 1.816683 1.597861 1.484729 1.653299 1.620763 1.915062 1.96007
average -
1.43365 1.722096 3.89587 1.142529 1.109772 1.390195 1.143576 2.099149 1.650676 3.563406
Comment: The Company is having low Total Debt Coverage ratio as compared to the industry Average but the
previous year it was at high so it is frequently change at the every year.

Financial Statement Analysis of Reliance communication Page 58
(C) Common Size Statements
Balance Sheet (Common Size)
Standalone Balance Sheet
------------------- in Rs. Cr. -------------------
Common Size Mar '05 Dec '06 Mar '07 Mar '08 Mar '09 Mar '10 Mar '11 Mar '12 Mar '13 Mar '14
12 mths 9 mths 15 mths 12 mths 12 mths 12 mths 12 mths 12 mths 12 mths 12 mths
Sources Of Funds
Total Share Capital 100.00 0.00 2.91 2.29 1.25 1.38 1.30 1.42 1.63 1.66
Equity Share Capital 100.00 0.00 2.91 2.29 1.25 1.38 1.30 1.42 1.63 1.66
Share Application Money
0 3.972511 0 0 0 0 0 0 0 0
Preference Share Capital
0 0 0 0 0 0 0 0 0 0
Reserves 0.00 96.03 55.58 52.76 61.33 65.98 59.19 60.28 50.59 49.36
Revaluation Reserves
0 0 0 0 0 0 0 0 0 0
Networth 100.00 100.00 58.49 55.05 62.58 67.35 60.49 61.70 52.22 51.02
Secured Loans 0.00 0.00 14.57 2.11 3.63 4.00 19.13 36.09 45.87 46.11
Unsecured Loans 0.00 0.00 26.94 42.85 33.78 28.65 20.39 2.21 1.91 2.87
Total Debt 0.00 0.00 41.51 44.95 37.42 32.65 39.51 38.30 47.78 48.98
Total Liabilities 100.00 100.00 100.00 100.00 100.00 100.00 100.00 100.00 100.00 100.00
Application Of Funds
Mar '05 Dec '05 Mar '07 Mar '08 Mar'09 Mar '10 Mar '11 Mar '12 Mar '13 Mar '14
Gross Block 0.00 1.29 58.77 47.81 45.94 53.13 51.39 64.81 74.62 77.12
Less: Accum. Depreciation
0.00 0.21 7.20 10.39 7.91 12.30 15.16 13.44 17.81 21.15
Net Block 0.00 1.08 51.57 37.42 38.03 40.83 36.23 51.37 56.81 55.97
Capital Work in Progress
0 0 6.227955 15.77248 4.411777 2.245377 12.44724 1.051272 1.158046 1.188483
Investments 0.00 78.43 15.49 30.68 37.97 42.54 40.33 43.82 33.11 34.21
Inventories 0 0 0.280708 0.445902 0.306487 0.397908 0.384574 0.452116 0.478974 0.437349
Sundry Debtors 0.00 0.00 2.29 2.42 1.79 2.32 2.47 2.67 3.26 3.24
Cash and Bank Balance
0 0.000325 0.080015 0.426911 0.647614 0.10926 4.790305 0.24461 0.35923 0.206481
Total Current Assets 0.00 0.00 2.65 3.30 2.75 2.83 7.65 3.36 4.09 3.89
Loans and Advances
100.00 20.52 54.53 37.73 28.18 23.86 16.41 18.17 24.47 29.74
Fixed Deposits 0 0 0.115036 2.22E-05 0.000315 0.000347 0.000327 0 0 0
Total CA, Loans & Advances
100.00 20.52 57.30 41.03 30.93 26.68 24.06 21.53 28.57 33.62
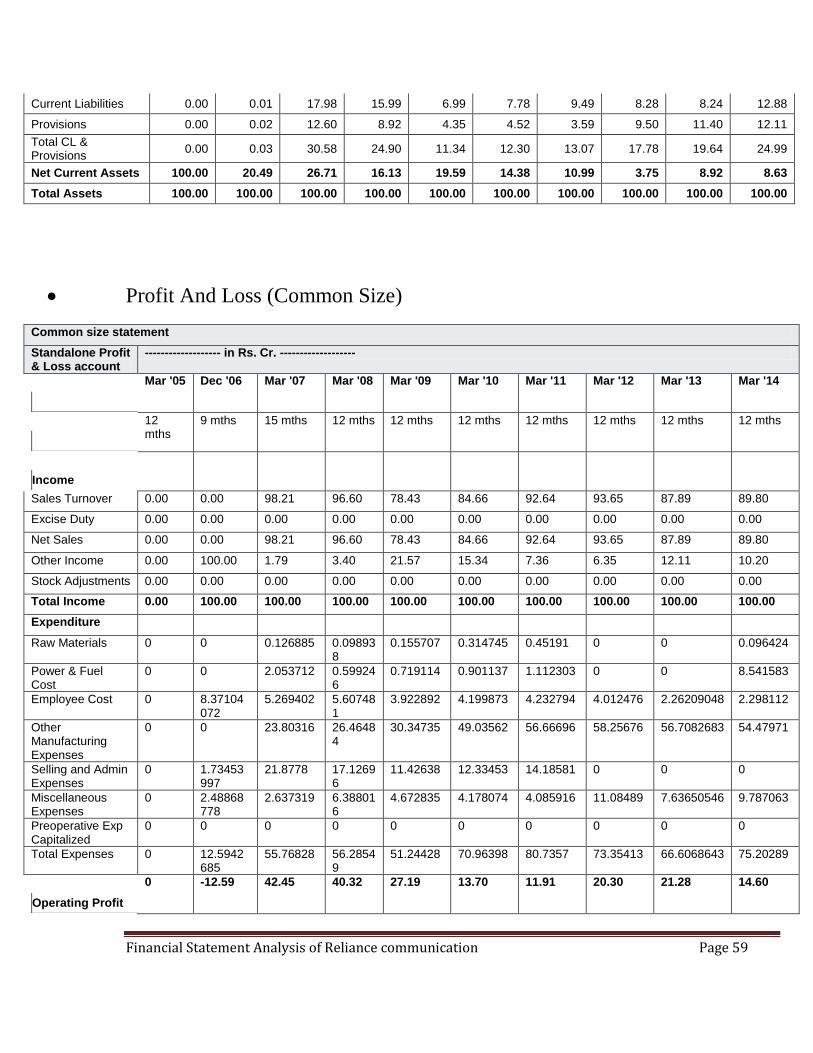
Financial Statement Analysis of Reliance communication Page 59
Current Liabilities 0.00 0.01 17.98 15.99 6.99 7.78 9.49 8.28 8.24 12.88
Provisions 0.00 0.02 12.60 8.92 4.35 4.52 3.59 9.50 11.40 12.11
Total CL & Provisions
0.00 0.03 30.58 24.90 11.34 12.30 13.07 17.78 19.64 24.99
Net Current Assets 100.00 20.49 26.71 16.13 19.59 14.38 10.99 3.75 8.92 8.63
Total Assets 100.00 100.00 100.00 100.00 100.00 100.00 100.00 100.00 100.00 100.00
Profit And Loss (Common Size)
Common size statement
Standalone Profit & Loss account
------------------- in Rs. Cr. -------------------
Mar '05 Dec '06 Mar '07 Mar '08 Mar '09 Mar '10 Mar '11 Mar '12 Mar '13 Mar '14
12 mths
9 mths 15 mths 12 mths 12 mths 12 mths 12 mths 12 mths 12 mths 12 mths
Income
Sales Turnover 0.00 0.00 98.21 96.60 78.43 84.66 92.64 93.65 87.89 89.80
Excise Duty 0.00 0.00 0.00 0.00 0.00 0.00 0.00 0.00 0.00 0.00
Net Sales 0.00 0.00 98.21 96.60 78.43 84.66 92.64 93.65 87.89 89.80
Other Income 0.00 100.00 1.79 3.40 21.57 15.34 7.36 6.35 12.11 10.20
Stock Adjustments 0.00 0.00 0.00 0.00 0.00 0.00 0.00 0.00 0.00 0.00
Total Income 0.00 100.00 100.00 100.00 100.00 100.00 100.00 100.00 100.00 100.00
Expenditure
Raw Materials 0 0 0.126885 0.098938
0.155707 0.314745 0.45191 0 0 0.096424
Power & Fuel Cost
0 0 2.053712 0.599246
0.719114 0.901137 1.112303 0 0 8.541583
Employee Cost 0 8.37104072
5.269402 5.607481
3.922892 4.199873 4.232794 4.012476 2.26209048 2.298112
Other Manufacturing Expenses
0 0 23.80316 26.46484
30.34735 49.03562 56.66696 58.25676 56.7082683 54.47971
Selling and Admin Expenses
0 1.73453997
21.8778 17.12696
11.42638 12.33453 14.18581 0 0 0
Miscellaneous Expenses
0 2.48868778
2.637319 6.388016
4.672835 4.178074 4.085916 11.08489 7.63650546 9.787063
Preoperative Exp Capitalized
0 0 0 0 0 0 0 0 0 0
Total Expenses 0 12.5942685
55.76828 56.28549
51.24428 70.96398 80.7357 73.35413 66.6068643 75.20289
Operating Profit
0 -12.59 42.45 40.32 27.19 13.70 11.91 20.30 21.28 14.60

Financial Statement Analysis of Reliance communication Page 60
PBDIT 0 87.41 44.23 43.71 48.76 29.04 19.26 26.65 33.39 24.80
Interest 0 0.00 3.52 5.68 6.00 7.83 5.94 10.66 15.41 14.43
PBDT 0 87.41 40.72 38.03 42.76 21.20 13.32 15.98 17.98 10.37
Depreciation 0 20.66 14.14 12.04 10.05 9.44 11.10 14.68 13.11 16.46
Other Written Off 0 0.00 0.00 0.00 0.00 0.00 0.00 0.00 0.00 0.00
Profit Before Tax 0 66.74 26.58 25.99 32.71 11.76 2.22 1.31 4.87 -6.09
Extra-ordinary items
0 0.00 0.00 0.00 0.00 0.00 0.71 0.00 0.00 0.00
PBT (Post Extra-ord Items)
0 66.74 26.58 25.99 32.71 11.76 2.93 1.31 4.87 -6.09
Tax 0 24.13 8.03 9.10 7.74 8.77 8.21 -0.01 0.00 -11.96
Reported Net Profit
0 42.61 18.55 16.89 24.97 2.99 -5.28 1.32 4.87 5.87
Total Value Addition
0 1.66 7,226.81 8,603.61
9,826.78 11,310.78 11,533.32 8,702.00 8,539.00 9,347.00
Preference Dividend
0 0 0 0 0 0 0 0 0 0
Equity Dividend 0 0 102.23 154.8 165.12 175.44 103.2 52 52 0
Corporate Dividend Tax
0 0 17.37 26.31 28.06 29.14 17.14 8 9 0
Per share data (annualized)
Shares in issue (lakhs)
0.1 1 20,446.15 20,640.27
20,640.27 20,640.27 20,640.27 20,640.27 20,640.27 20,427.48
Earnings Per Share (Rs)
0 565.39 11.78 12.53 23.27 2.32 -3.67 0.76 3.02 3.57
Equity Dividend (%)
0 0 10 15 16 17 10 5 5 0
Book Value (Rs) 10 1,478,347.67
100.39 120.35 250.43 244.66 233.26 217.53 160.57 153.62
Comment:
The common size statement refers the commonly expenditure and revenue for the all year by this we
can state the increasing and decreasing in which year the expenditure high or low that we can
measure in this case Reliance communication in the balance sheet of 10 year data in March 2010
networth is highest 67.8 % by this we can say that this is the best year for the reliance
communication.
Financial Statement Analysis of Reliance communication Page 61
Conclusion
India's teledensity has improved from under 4% in March 2001 to around 73% by the end of
March 2013.
Cellular telephony continues to be the fastest growing segment in the Indian telecom industry.
The mobile subscriber base (GSM and CDMA combined) has grown from under 2 m at the
end of FY00 to touch 863 m at the end of March 2013.
Tariff reduction and decline in handset costs has helped the segment to gain in scale.
The cellular segment is playing an important role in the industry by making itself available in
the rural and semi urban areas where teledensity is the lowest.
Broadband penetration received a boost from the auction of broadband spectrum.
The network providers have stated that they would be looking at boosting the contribution of
data to their revenues.
This bodes well for the future of broadband services.
As per the Reliance Communication all Ratios are Analyze we can conclude that it is lover in
the activity ratio but little bit higher in profit margin and it has low debt overall we can say
that this company get more benefit in the future right now it get struggle but as per the growth
of ratio it get good and as per the industry average it‟s performance is very good as compare
to the industry average so we can say this is the above average company.
Bibliography:
1) http://en.wikipedia.org/wiki/Reliance_Communications. (n.d.). Retrieved from
http://en.wikipedia.org: http://en.wikipedia.org/wiki/Reliance_Communications
2) http://en.wikipedia.org/wiki/Telecommunications_in_India. (n.d.). Retrieved from
http://en.wikipedia.org/wiki/Telecommunications_in_India:
http://en.wikipedia.org/wiki/Telecommunications_in_India
3) Jain, M. Y. (n.d.). Management Accounting. Mc Graw Hill.
Related Documents