Foods 2022, 11, 1732. https://doi.org/10.3390/foods11121732 www.mdpi.com/journal/foods Review Consumer Perception of Beef Quality and How to Control, Improve and Predict It? Focus on Eating Quality Jingjing Liu 1 , Marie‐Pierre Ellies‐Oury 1,2 , Todor Stoyanchev 3 and Jean‐François Hocquette 1, * 1 INRAE, Clermont‐Ferrand, VetAgro Sup, UMR1213, Recherches sur les Herbivores, F‐63122 Saint Genès Champanelle, France; [email protected] (J.L.); marie‐pierre.ellies@agro‐bordeaux.fr (M.‐P.E.‐O.) 2 Bordeaux Sciences Agro, 1 Cours du Général de Gaulle, CS 40201, 33175 Gradignan, France 3 Veterinary Faculty, Trakia University, 6000 Stara Zagora, Bulgaria; todor.stoyanchev@uni‐sz.bg * Correspondence: jean‐[email protected] Abstract: Quality refers to the characteristics of products that meet the demands and expectations of the end users. Beef quality is a convergence between product characteristics on one hand and consumers’ experiences and demands on the other. This paper reviews the formation of consumer beef quality perception, the main factors determining beef sensory quality, and how to measure and predict beef eating quality at scientific and industrial levels. Beef quality is of paramount importance to consumers since consumer perception of quality determines the decision to purchase and repeat the purchase. Consumer perception of beef quality undergoes a multi‐step process at the time of purchase and consumption in order to achieve an overall value assessment. Beef quality perception is determined by a set of quality attributes, including intrinsic (appearance, safety, technological, sensory and nutritional characteristics, convenience) and extrinsic (price, image, livestock farming systems, commercial strategy, etc.) quality traits. The beef eating qualities that are the most valued by consumers are highly variable and depend mainly on the composition and characteristics of the original muscle and the post‐mortem processes involved in the conversion of muscle into meat, the mechanisms of which are summarized in this review. Furthermore, in order to guarantee good qual‐ ity beef for consumers in advance, the prediction of beef quality by combining different traits in scenarios where the animal, carcass, and muscle cuts can be evaluated is also discussed in the cur‐ rent review. Keywords: beef quality attributes; beef eating quality; consumer perception; pre‐ and post‐mortem determinisms; beef grading scheme 1. Introduction Beef quality is of paramount importance to consumers since consumer perception of quality determines the decision to purchase and repeat purchase, which is of utmost im‐ portance for the development and success of the beef market and industry. Beef quality is multifactorial, and consumer perception of beef quality mainly depends on four dimen‐ sions: (1) search quality (visual appeal): the morphological property of beef such as the appearance (e.g., color, visible fat), technological, and convenience quality attributes (e.g., cooking yield, shelf life); (2) experience quality (sensory appeal): the eating experience of beef such as beef tenderness, juiciness, and flavor liking; (3) credence quality: the safety, nutritional, and health value of a product and other additional values related to certain attributes such as animal welfare and environmental sustainability; (4) quality of value (cost effectiveness): the cost/price of the product is perceived to correspond as much as possible to the value and image of the product [1,2]. Prior to purchase, only search quality can be reached by consumers, and based on the appearance of the product, consumers might develop expectations according to the Citation: Liu, J.; Ellies‐Oury, M.‐P.; Stoyanchev, T.; Hocquette, J.‐F. Consumer Perception of Beef Quality and How to Control, Improve and Predict It? Focus on Eating Quality. Foods 2022, 11, 1732. https://doi.org/10.3390/ foods11121732 Academic Editors: Virginia Celia Resconi and María Del Mar Campo Arribas Received: 25 April 2022 Accepted: 7 June 2022 Published: 13 June 2022 Publisher’s Note: MDPI stays neu‐ tral with regard to jurisdictional claims in published maps and institu‐ tional affiliations. Copyright: © 2022 by the authors. Li‐ censee MDPI, Basel, Switzerland. This article is an open access article distributed under the terms and con‐ ditions of the Creative Commons At‐ tribution (CC BY) license (https://cre‐ ativecommons.org/licenses/by/4.0/).

Welcome message from author
This document is posted to help you gain knowledge. Please leave a comment to let me know what you think about it! Share it to your friends and learn new things together.
Transcript
Foods 2022, 11, 1732. https://doi.org/10.3390/foods11121732 www.mdpi.com/journal/foods
Review
Consumer Perception of Beef Quality and How to Control,
Improve and Predict It? Focus on Eating Quality
Jingjing Liu 1, Marie‐Pierre Ellies‐Oury 1,2, Todor Stoyanchev 3 and Jean‐François Hocquette 1,*�
1 INRAE, Clermont‐Ferrand, VetAgro Sup, UMR1213, Recherches sur les Herbivores,
F‐63122 Saint Genès Champanelle, France; [email protected] (J.L.); marie‐pierre.ellies@agro‐bordeaux.fr (M.‐P.E.‐O.)�
2 Bordeaux Sciences Agro, 1 Cours du Général de Gaulle, CS 40201, 33175 Gradignan, France 3 Veterinary Faculty, Trakia University, 6000 Stara Zagora, Bulgaria; todor.stoyanchev@uni‐sz.bg�* Correspondence: jean‐[email protected]
Abstract: Quality refers to the characteristics of products that meet the demands and expectations
of the end users. Beef quality is a convergence between product characteristics on one hand and
consumers’ experiences and demands on the other. This paper reviews the formation of consumer
beef quality perception, the main factors determining beef sensory quality, and how to measure and
predict beef eating quality at scientific and industrial levels. Beef quality is of paramount importance
to consumers since consumer perception of quality determines the decision to purchase and repeat
the purchase. Consumer perception of beef quality undergoes a multi‐step process at the time of
purchase and consumption in order to achieve an overall value assessment. Beef quality perception
is determined by a set of quality attributes, including intrinsic (appearance, safety, technological,
sensory and nutritional characteristics, convenience) and extrinsic (price, image, livestock farming
systems, commercial strategy, etc.) quality traits. The beef eating qualities that are the most valued
by consumers are highly variable and depend mainly on the composition and characteristics of the
original muscle and the post‐mortem processes involved in the conversion of muscle into meat, the
mechanisms of which are summarized in this review. Furthermore, in order to guarantee good qual‐
ity beef for consumers in advance, the prediction of beef quality by combining different traits in
scenarios where the animal, carcass, and muscle cuts can be evaluated is also discussed in the cur‐
rent review.
Keywords: beef quality attributes; beef eating quality; consumer perception; pre‐ and post‐mortem
determinisms; beef grading scheme
1. Introduction
Beef quality is of paramount importance to consumers since consumer perception of
quality determines the decision to purchase and repeat purchase, which is of utmost im‐
portance for the development and success of the beef market and industry. Beef quality is
multifactorial, and consumer perception of beef quality mainly depends on four dimen‐
sions: (1) search quality (visual appeal): the morphological property of beef such as the
appearance (e.g., color, visible fat), technological, and convenience quality attributes (e.g., cooking yield, shelf life); (2) experience quality (sensory appeal): the eating experience of
beef such as beef tenderness, juiciness, and flavor liking; (3) credence quality: the safety,
nutritional, and health value of a product and other additional values related to certain
attributes such as animal welfare and environmental sustainability; (4) quality of value
(cost effectiveness): the cost/price of the product is perceived to correspond as much as
possible to the value and image of the product [1,2].
Prior to purchase, only search quality can be reached by consumers, and based on
the appearance of the product, consumers might develop expectations according to the
Citation: Liu, J.; Ellies‐Oury, M.‐P.;
Stoyanchev, T.; Hocquette, J.‐F.
Consumer Perception of Beef
Quality and How to Control,
Improve and Predict It? Focus on
Eating Quality. Foods 2022, 11, 1732.
https://doi.org/10.3390/
foods11121732
Academic Editors: Virginia Celia
Resconi and María Del Mar Campo
Arribas
Received: 25 April 2022
Accepted: 7 June 2022
Published: 13 June 2022
Publisher’s Note: MDPI stays neu‐
tral with regard to jurisdictional
claims in published maps and institu‐
tional affiliations.
Copyright: © 2022 by the authors. Li‐
censee MDPI, Basel, Switzerland.
This article is an open access article
distributed under the terms and con‐
ditions of the Creative Commons At‐
tribution (CC BY) license (https://cre‐
ativecommons.org/licenses/by/4.0/).
Foods 2022, 11, 1732 2 of 28
available information conveyed by the extrinsic cues of a product at the time of purchase.
Extrinsic quality cues primarily have their influence on the search and credence quality of
the product from the outside, such as brand, origin, price, and image [1]. The image value
is more related to the livestock and industrial production system [1], which would create
an overall image of the product presented to consumers.
On the other hand, the experienced quality is the key criteria that is most responsible
for the actual demand and satisfaction of consumers and their repeat purchase intention
[3]. However, experienced quality can only be determined after purchase and is mainly
related to the intrinsic properties of the product. These intrinsic factors cover the physical
characteristics of the beef product itself, such as meat color, muscle cut, fat content and
marbling distribution, [4] etc.
Quality is sought because it contributes to the fulfillment of purchase motives [1].
Consumers expect good quality when they eat beef, but the presumed and/or experienced
eating quality may not always match their expectations and the price they paid is usually
higher than what the product actually deserved [5]. This is, at least in part, the major rea‐
son why beef consumption has declined, especially in Europe [6]. Maintaining consistency
between expectations and actual experience is beneficial to a long‐term consistent con‐
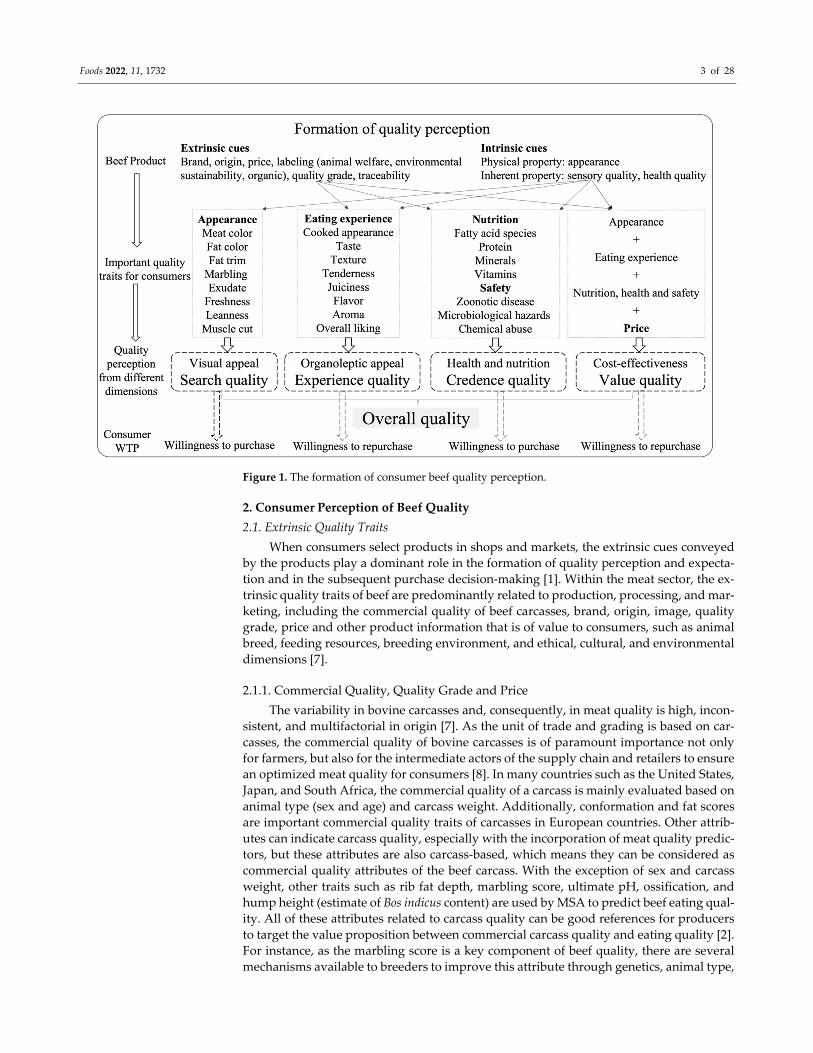
sumption level and to the success of the beef industry. The study of consumer decision‐
making on intrinsic and extrinsic cues is essential in order to understand how consumer
quality perception for beef products is formed (Figure 1). More precisely, consumers’ in‐
ability to predict their own quality experience after purchase is sometimes due to the scar‐
city of extrinsic cues and misinterpretation of intrinsic cues. For instance, a higher mar‐
bling level may not be good for the credence quality for normal consumers, but it is actu‐
ally good for the eating quality of the product [1,2]. In this situation, an appropriate ex‐
trinsic cue is needed to inform consumers of the relevant eating quality through the visible
marbling. This indicates that the perception of beef quality is affected by both intrinsic
and extrinsic quality cues, and the perceived intrinsic cues are affected by the perceived
extrinsic cues and vice versa. This is useful for the industry to align the value more accu‐
rately with the quality of the product for marketing purposes.
Much scientific and industrial effort has therefore been devoted to closing the gap
between expectation and experience through the consistency of extrinsic (e.g., brand,
grade, price, etc.) and intrinsic (e.g., marbling level, eating quality, etc.) cues of the product
and aligning value as closely as possible with the quality of the product. The Meat Stand‐
ards Australia (MSA) system is a good example. In this system, beef eating quality is con‐
sistently guaranteed by a specified quality grade and a money‐back guarantee. Indeed,
the quality of beef that consumers receive is that for which they are prepared to pay [2]
that ensures consumer satisfaction to large extent. In addition, the price premiums gener‐
ated predominantly from the MSA‐guaranteed quality are being noticed by the Australian
beef industry [6]. Overall, understanding quality factors and ultimately improving beef
quality is imperative to both consumers and the industry.
The aims of this review article are therefore to first describe consumers’ perception
of beef quality, then the main factors affecting beef eating quality, and finally the main
methods of measurement and prediction of beef eating quality.
Foods 2022, 11, 1732 3 of 28
Figure 1. The formation of consumer beef quality perception.
2. Consumer Perception of Beef Quality
2.1. Extrinsic Quality Traits
When consumers select products in shops and markets, the extrinsic cues conveyed
by the products play a dominant role in the formation of quality perception and expecta‐
tion and in the subsequent purchase decision‐making [1]. Within the meat sector, the ex‐
trinsic quality traits of beef are predominantly related to production, processing, and mar‐
keting, including the commercial quality of beef carcasses, brand, origin, image, quality
grade, price and other product information that is of value to consumers, such as animal
breed, feeding resources, breeding environment, and ethical, cultural, and environmental
dimensions [7].
2.1.1. Commercial Quality, Quality Grade and Price
The variability in bovine carcasses and, consequently, in meat quality is high, incon‐
sistent, and multifactorial in origin [7]. As the unit of trade and grading is based on car‐
casses, the commercial quality of bovine carcasses is of paramount importance not only
for farmers, but also for the intermediate actors of the supply chain and retailers to ensure
an optimized meat quality for consumers [8]. In many countries such as the United States,
Japan, and South Africa, the commercial quality of a carcass is mainly evaluated based on
animal type (sex and age) and carcass weight. Additionally, conformation and fat scores
are important commercial quality traits of carcasses in European countries. Other attrib‐
utes can indicate carcass quality, especially with the incorporation of meat quality predic‐
tors, but these attributes are also carcass‐based, which means they can be considered as
commercial quality attributes of the beef carcass. With the exception of sex and carcass
weight, other traits such as rib fat depth, marbling score, ultimate pH, ossification, and
hump height (estimate of Bos indicus content) are used by MSA to predict beef eating qual‐
ity. All of these attributes related to carcass quality can be good references for producers
to target the value proposition between commercial carcass quality and eating quality [2].
For instance, as the marbling score is a key component of beef quality, there are several
mechanisms available to breeders to improve this attribute through genetics, animal type,
Foods 2022, 11, 1732 4 of 28
carcass weight and fat level, high‐energy diets, and maturity patterns, to ultimately im‐
prove the quality of beef products for consumers [9].
There are several beef grading schemes (i.e., MAS, USDA, JMGA) around the world
to score beef eating quality. It has been shown that quality grade is a reliable predictor of
expected quality in studies on consumer willingness to purchase. Indeed, Lyford et al.
(2010) found that consumers from different countries (Japan, Australia, the United States,
and Ireland) would be willing to pay more for beef with a higher quality grade [10]. This
implies that a higher grade is linked to a better quality perception and that consumers
would indeed be willing to pay a premium for the product that is perceived as valuable
to them. On the other hand, price is also used as an indicator of quality since a higher price
should logically correspond to a higher quality. Unlike the predominant extrinsic cues
such as brand and quality grade, which are associated to a large extent with experience
and credence quality, price only influences credence quality expectations of consumers
[3]. In fact, price may be more related to the packaging characteristics of the product in
certain circumstances, and is also a strong driver of perceived quality [11]. It has also been
observed that in France, there is no apparent link between the market price of beef and
the perceived tenderness of the meat by consumers. This implies that consumers can ei‐
ther obtain good beef at a low price or be disappointed by expensive beef by pure chance
[12]. This emphasizes that an accurate grading scheme for at least beef eating quality is
paramount in order to enable value‐based purchasing for consumers.
2.1.2. Brand
Specifically, when consumers have prior knowledge of the brand, it is regarded as
the most dominant factor in forming expected quality as consumers rely on brand as a
trustworthy quality indicator to help them reduce purchase uncertainty due to the high
biological variability in beef quality [3]. For example, Certified Angus Beef brand is re‐
puted to be tender, juicier, and flavorful, and indeed receives a higher palatability percep‐
tion by consumers [13]. Brand is also linked to the image of a product, such as the “Label
Rouge” in France, which represents a superior quality in terms of palatability and cre‐
dence [14]. In addition, the information given by labels could raise consumers’ expecta‐
tions of extraordinarily high quality. The labelling of a superior fatty acid composition or
information that the cattle were raised on natural pasture or certain specialized breeds
such as Aberdeen Angus beef, could create a sense of luxury and pleasure among con‐
sumers, as they traditionally associate them with good quality [15]. In terms of “luxury”,
some beef brands aim to produce highly marbled products (e.g., Japanese Wagyu) with
more than 10% or even 20% fat. Despite the fact that these brands are not intended for
everyday consumer consumption or the mainstream market, and do not have a strong
focus on the health and nutrition issues that consumers value, they still have a market
share due to the premium and luxury they are associated with, which can give consumers
a sense of social importance when consuming these products [2].
2.1.3. Origin
Origin has often been considered by consumers as an important predictor to product
value, while this quality cue does not seem to have an impact on eating quality [16]. In
fact, as pointed out by Loureiro and Umberger [17], origin can only become a symbol of
superior quality if consumers associate this origin with higher quality and safety. Despite
the lack of direct influence of origin on quality, an indirect relationship actually exists
through the emotional connection established for consumers that influences perceived in‐
trinsic cues, which in turn influence expected quality [3]. Consumers also believe that local
breeds are closer to the terroir [18]. In Europe, quality origin (‘PDO’ for protected desig‐
nation of origin and ‘PGI’ for protected geographical indication) represents excellence in
European agricultural food production and is valued by consumers for the unique com‐
bination of human and environmental factors that are based on specific quality
Foods 2022, 11, 1732 5 of 28
characteristics derived from a specific geographical origin [14]. As in 2019, the European
Union had a total of 1421 PDO and PGI registered products.
2.1.4. Image
In contrast to monogastric animals, the arguments against beef production do not so
much concern food competition with humans but are more related to environmental sus‐
tainability in terms of greenhouse gas (GHG) emissions and use of land and water [7].
Another issue in relation to beef production is animal welfare, such as the animal suffering
caused by factory farming systems to boost meat productivity. The environmental, ethical,
and cultural aspects related to how the product is produced and processed all contribute
to the quality perception of consumers. These image value attributes are therefore useful
indicators of the quality of a beef product. Since livestock production is considered as a
primary source of greenhouse gas emissions, the “low‐carbon diet” has become a new
trend in the catering sector [19]. A “carbon label” can remind consumers of the GHG im‐
pact of the food product. This image has a positive association with consumers’ perception
of the quality of the food product [20]. The animal welfare assessment system developed
following the European Welfare Quality project could improve the quality of the product
image if the assessment can be applied on the products and the information could be pro‐
vided to consumers. Indeed, animal welfare on‐package labels can boost consumer appre‐
ciation and purchase intention [21]. Some animal welfare regulations during animal
transport and slaughter to reduce animal stress can be a decisive factor for image‐related
quality attributes. Furthermore, some consumers are more willing to pay for on‐farm
slaughtered beef products [22].
In fact, image quality is a broad concept since almost all the extrinsic attributes can
constitute the holistic image of a product. In other words, consumer perception of food
quality at the time of searching/purchasing is based on the overall image of the product,
which is indeed a major driver of purchase decision‐making [23]. More importantly, con‐
sumer perception is also associated with ethical and environmental sustainability, and
therefore improving the image value of beef products could be a key strategy for the in‐
dustry.
2.2. Intrinsic Quality Traits
Intrinsic quality traits mainly include three categories: (1) appearance, which is part
of the physical characteristics of the product that visually define a given category of beef
product such as muscle cut, meat color, fat color, fat trim, marbling, and exudate [24]; (2)
sensory quality, which is the perceived overall quality of beef (e.g., eating experience) and
preferences for individual sensory responses during beef consumption (e.g., taste, tender‐
ness, juiciness, flavor, aroma, freshness, and leanness) [1]; (3) health quality, which is as‐
sociated with credence quality, including safety, nutritional composition, and healthiness
of the product [25]. In contrast to extrinsic quality factors, most intrinsic factors are more
relevant for predicting the quality of experience during consumption [26]. The contribu‐
tions of factors such as brand and price are likely to decline over time due to fierce do‐
mestic market competition, so other factors, such as the sensory quality of beef, will con‐
tinue to become increasingly important to consumers [5].
2.2.1. Appearance
Consumers can detect differences in quality through the visual appearance of the
beef product. Indeed, the appearance of fresh meat is of great importance for consumer
purchase [27]. A whole raw steak on display could give the feeling of a good quality pre‐
mium food. At the time of purchase, meat color and fat color are critical indicators of
freshness and quality for consumers [28]. Bright, cherry‐red meat color and white fat color
are more desirable than dark meat and yellow fat to consumers [29]. In addition, marbling
represents the visual appraisal of intramuscular fat (IMF) content and consumer
Foods 2022, 11, 1732 6 of 28
perception of marbling is negative to a large extent due to the sign of excess fat [30], which
is not as “trimmable” as preferred by most consumers. Nevertheless, quality preferences
vary from one individual to another, Killinger et al. (2004) found that consumers who
preferred low marbling appeared to want lean products, whereas those who preferred
high marbling favored products of superior eating quality [31]. Overall, when consumers
select beef products, they rule out the influence of extrinsic quality traits, with the appear‐
ance of the product playing a predominant role at this point. For instance, as it is well
known in the beef industry, Pale Soft Exudative (PSE) and Dark Firm Dry (DFD) meat
products are unacceptable to consumers in shops due to their appearance defects, which
are obviously related to low quality [32]. However, appearance cannot guarantee con‐
sistent eating quality at all times. It has been observed that around 15% of the retail beef
in some cities in the United States does not meet the expectations of the bright cherry‐red
lean designation [33]. Additionally, another important factor is the morphological integ‐
rity or intactness of the primal cuts; for some consumers, when these muscle cuts are taken
directly from the carcass without any processing, this implies naturalness and safety. On
the other hand, meat that has been processed, even for the purpose of tenderization, may
induce negative consumer attitudes [34].
2.2.2. Technological and Convenience Quality Attributes
Technological and convenience quality attributes are also factors that consumers take
into consideration when selecting beef products at the time of purchase. Technological
quality is associated with the storage (e.g., shelf life) and processing (e.g., cooking yield)
of food, which are influenced by the chemical and microbiological properties (e.g., wa‐
ter/fat holding capacity, antioxidant capacity, bacterial growth) and storage requirements
(shelf life, temperature, light, package) of the meat [7]. These quality attributes are also
related to the practicality and usability of a product, which is known as convenience qual‐
ity. A product design based on consumer benefits (e.g., time and effort saving), such as
ready‐to‐cook foods or foods that can be kept at a normal temperature for a long time,
would play a positive role in shaping consumer quality perception. Despite these trends,
the proper evaluation and indication of technological and convenience quality attributes
need to be better explored and formalized [35].
2.2.3. Eating Quality
Beef muscle contains approximately 75% water, and the ability to hold water and
bind it in the meat during processing is strongly associated with beef texture and palata‐
bility [36]. Due to the limited ability of objective and accurate measurements to capture
the variance of meat eating quality from actual consumer eating experience, sensory eval‐
uations of meat by trained panelists or untrained consumers have been developed and are
widely used in meat sensory research.
Meat tenderness depends mainly on three primary factors: (1) background toughness
related to connective tissue; (2) degree of muscle contraction; (3) integrity/degradation of
the myofibrillar structure during aging and tenderization [37]. In early research on beef
sensory evaluation, tenderness was assessed by muscle fiber, connective tissue, and IMF
characteristics in addition to global tenderness evaluation [38]. The perception of tender‐
ness through direct measurements (consumer and/or sensory panel) includes three as‐
pects: the ease with which the teeth penetrate the meat at first, the ease with which the
meat splits into fragments during chewing, and the amount of residue left after chewing.
This illustrates the complexity of tenderness in its definition and measurement. Consumer
satisfaction with meat tenderness is based on the interaction between the physical/textural
characteristics of the meat and the “mouthfeel”—an experience related to the sensations
of biting and chewing [39].
Meat juiciness is defined as the perceived amount of juice and the level of lubrication
when meat is masticated in the mouth. It is mainly affected by the inherent properties of
the meat such as water holding capacity (WHC), fat content, and pre‐rigor muscle
Foods 2022, 11, 1732 7 of 28
metabolism; the physiological state of the tasters such as taste sensation also has an impact
on the perception of meat juiciness. Therefore, as a unique subjective property of meat, a
relevant measure of juiciness is achieved by sensory evaluation with consumers and/or
panelists. The evaluation of meat juiciness can be performed in two steps: (1) initial juici‐
ness, which is the initial impression of meat fluids released by the first chews of the meat
and which is related to the water content of the meat; (2) sustained or overall juiciness, the
perception of juiciness during sustained mastication known to be associated with fat con‐
tent, which is considered to be the result of the stimulating effect of fat on salivary flow
with different individual tasters [40]. As early as 1972, meat scientists found that juiciness
accounted for part of the variance (less than 19%) in meat texture [41]. In the first Meat
Descriptive Sensory Evaluation published by the American Meat Science Association
(AMSA), juiciness was used as a key factor in evaluating meat eating quality [42]. With
the development of sensory evaluation, juiciness plays a consistent role in meat eating
quality. In the MSA system, 10% of the variability in consumer acceptance is explained by
juiciness [43]. For American consumers, juiciness accounts for less 10% of the overall pal‐
atability of beef [44].
Flavor is a very complex sensation detected by humans, which involves a combina‐
tion of olfactory and gustatory sensations that detect basic taste and aromas [45]. Physical
factors (i.e., breed, sex, and age) and chemical traits (i.e., fatty acid profile) have heavy
impacts on the reactions within beef during the cooking process with regard to the pro‐
duction of volatile aroma compounds and the taste of the beef [46]. Flavor has always been
considered as an important component of beef eating quality to consumers. Efforts have
been made and documented to formally improve beef flavor for more than two hundred
years. In the evolution of beef sensory quality research, flavor was included in the sensory
description system in 1995 by the American Meat Science Association [47] twenty years
after the introduction of tenderness and juiciness. Nevertheless, meat scientists still re‐
garded beef flavor as the second most important attribute for beef eating quality and con‐
sumer acceptance, with tenderness being the first most important [48]. In recent decades,
in the MSA system, flavor liking has become as important as tenderness [43]. Furthermore,
with the improvement of tenderness in recent decades, flavor is considered the most im‐
portant determinant of variability in beef eating quality [49]. Beef flavor has been ex‐
panded to describe specific components such as species‐specific flavor (beef broth) or de‐
scriptive attributes formed from the Beef Lexicon (fat flavor, bloody, grainy, grassy, card‐
board, painty, fishy), and these attributes are related to consumer sensory attributes [46].
In current studies, flavor liking is used in the MSA system with untrained consumers, and
typical flavor and abnormal flavor are used in beef evaluation with panelists.
2.2.4. Health Quality
With the improvement of people’s living standards especially in developing coun‐
tries, and the increase in food safety issues, consumer perception of beef quality is highly
influenced by the potential health and nutritional benefits as well as the quality of safety
in the daily purchase of meat. Furthermore, with the development of more safety control
and traceability systems, consumer perception of meat safety has been improved, in par‐
ticular with the provision of information on safety supervision [50].
As indicated by Clinquart et al. (2022), microbiological quality is essential for beef
safety and health quality. Indeed, foods of animal origin (e.g., beef, chicken, and pork) are
major reservoirs of many foodborne pathogens such as Shiga toxin‐producing E. coli, Sal‐
monella, and Campylobacter [7]. Illness and even death that are caused by meat‐related
foodborne pathogens raise great concern for the conventional meat industry [51]. In Eu‐
rope, the prevalence of Salmonella in cattle is about 2% [52]. Bacterial contamination of
meat occurs during the muscle to meat conversion, transport and slaughter, processing,
storage and cooking, pre‐slaughter stress is identified as a factor affecting Salmonella and
pathogenic E. coli contamination of animals [53]. A hygienic operating environment on
the slaughter floor and chilling are essential elements in controlling all biological hazards.

Foods 2022, 11, 1732 8 of 28
The microbiological issue of beef products can be serious when the meat is raw or under‐
cooked. The meat product, especially processed beef (ground beef), must therefore meet
at least the microbiological criteria set out in the relevant regulations [7]. There is no doubt
that microbiological quality can affect human health, while synthetic pesticides, antimi‐
crobials, and growth hormones used during animal production to treat infections and pre‐
vent diseases and also to optimize growth are another problem that threaten human
health [54] and should therefore be rejected for consumption, especially for sensitive in‐
dividuals.
Meat plays a crucial role in human evolution through the supply of essential macro
and micronutrients, including high biological value proteins, fatty acids, iron, zinc, sele‐
nium, and vitamins B3, B6, and B12. Many factors such as animal type, farming system,
muscle type, processing, and cooking have an impact on the concentration of these macro
and micronutrients. Consumers eat meat because it is delicious in taste and necessary for
its good nutritional quality [55]. Thus, consumers tend to prefer organic food, which en‐
sures that synthetic fertilizers, pesticides, and hormones are avoided in the production
process and that the use of veterinary drugs is minimized [56]. In addition, previous stud‐
ies have demonstrated that organic beef has higher nutritional value than conventional
beef in terms of improved bioactive compound content and a better balanced fatty acid
(FA) composition, with a higher level of poly‐unsaturated fatty acids (PUFAs) especially
n‐3 PUFAs [35]. In view of the importance consumers place on nutritional value, they
would be willing to pay a premium for organic meat [57], especially for a better composi‐
tion of beneficial FAs [58]. In addition, concern about chronic nutrition‐related complica‐
tions is in contradiction with the desire to consume meat, which might have a higher fat
content for better eating quality.
In general, consumers already perceive meat as a healthy component in their diet.
With the evaluation of consumer expectations, an increased interest in credence quality
and health quality has been observed, which were identified above as often as being re‐
lated to the quality of the production process [59]. Consumers consider high animal wel‐
fare standards or natural grass feeding to be associated with increased safety, healthiness
and eating quality of food [60]. On the other hand, consumers are increasingly concerned
about food‐related risks and prefer natural foods (i.e., non‐invasive technologies or non‐
chemical processes) to artificially produced foods [61]. Similarly, some consumers are op‐
posed to novel products such as cell‐based meat, due to concerns about unnaturalness
and high degree of artificial production, with no assurance that cell‐based meat will be
safe and healthy [62].
3. Main Factors Affecting Beef Eating Quality
As one of the most commonly consumed protein sources, beef is an important food
in the world [63]. However, a global decline in beef consumption has been observed over
the last two decades in Europe [6]. Beef consumption is highly associated with beef eating
quality and consumer satisfaction. The complexity of guaranteeing beef eating quality and
the inability to select beef with consistent palatability have therefore been regarded as
major factors in explaining the decline of beef consumption [64]. This is because beef qual‐
ity, especially palatability, is characterized by inherent variability and depends on many
interacting factors that are complicated to handle, such as ante‐mortem factors including
sex, age, maturity and breed of animals, carcass fat level, FA composition of cuts, and post‐
mortem factors involving the slaughter process, carcass handling, aging, storage, and cook‐
ing [65]. This section mainly focuses on the factors that affect beef eating quality. The
ranges of factors affecting each set of core quality attributes are summarized in Table 1.

Foods 2022, 11, 1732 9 of 28
Table 1. Factors affecting the major quality attributes of beef at various stages of the farm‐to‐fork
continuum.
Stage Factors Beef Quality Attributes
Intrinsic Quality Extrinsic Quality
Appear‐
ance Sensory
Nutri‐
tional Safety
Technologi‐
cal
Conven‐
ience Image Commercial
Animal
Breed/Genetics
Gender
Age
Farming Feeding—grass/grain
Grazing‐indoor/outdoor
Pre‐slaughter Transport/load/mix/rest‐stress
Slaughter
Slaughter practices
Hygiene
Animal welfare
Carcass han‐
dling
Electrical stimulation
Aging time/temperature
Hanging
Carcass char‐
acteristics
Carcass weight
Conformation
Marbling
Maturity/ossification
Rib fat thickness/fat cover
Hump height
Temperature/pH
Meat color/fat color
Meat
Muscle cut
Nutrients: proteins/FA/miner‐
als and vitamins
Meat prod‐
ucts
Packaging/portioning/shelf life
Brand/origin/label/grade and
traceability
Ethical and environmental
sustainability
Processing Storage
Cooking/smoking/fermentation
In black: major/direct factor of variation; in grey: weaker/indirect factor of variation; in white: not
a factor of variation. This analysis is based on the studies of Clinquart et al. (2022), Prache et al.
(2021), [7,35] and expertise of authors.
3.1. Antemortem Factors Affecting Beef Eating Quality
3.1.1. Breed
Bos taurus and Bos indicus are the two main cattle breed groups in the world. They
are genetically adapted to survive with high productivity in adverse conditions, including
heat, drought, and poor‐quality pastures. It is well known that the meat produced by Bos
indicus cattle tends to be of lower quality [66]. Indeed, some beef cuts from Bos indicus
cattle can be tough due to the genetical effect on the calpain‐calpastatin system, muscle
fiber size, and metabolic properties, which result in inhibited protein degradation and
ultimately decreased sensory tenderness [67]. This has led some labeling systems to ex‐
clude Bos indicus meat from their certified brands, thus hindering the presence of Bos in‐
dicus meat in major markets [68]. In fact, it has been observed that other differences such
as IMF deposition and FA profile of meat produced by Bos taurus and Bos indicus cattle
depend mainly on feeding system [69].
Breed‐related differences in beef eating quality have long been discussed with re‐
spect to grow path and age at physiological maturity, which are mainly reflected in muscle
Foods 2022, 11, 1732 10 of 28
structure, the content and solubility of connective tissue and the amount, and the compo‐
sition and distribution of adipose tissue, especially IMF in beef [70]. The beef produced by
the Wagyu breed, notably characterized by its intense marbling [71], has a more intense
flavor and juiciness than that of the Angus breed [72]. Intramuscular adipose tissue ma‐
tures late and accumulates as the animal grows and matures, with IMF being deposited
after intermuscular fat, which is itself deposited after subcutaneous fat [73]. Therefore, at
similar levels of maturity, early maturing breeds (e.g., traditional British beef breeds such
as Angus and Hereford) have a tendency to deposit more IMF and can be slaughtered at
lower weights with a higher fat content, compared to late‐maturing beef breeds (e.g., con‐
tinental European breeds such as French Limousin, Charolais, Blonde d’Aquitaine and
Belgian Blue), which have relatively less IMF. With a different level of marbling, the beef
eating quality is therefore different for these two types of breeds.
Beef quality is multi‐determined and must be analyzed based on many factors to
avoid a biased comparison. In general, the eating quality of meat from beef breeds is con‐
sidered better than dairy breeds. However, untrained consumers reported hardly any dif‐
ferences in eating quality between meat from dairy and beef breeds, except for a few mus‐
cles [74]. Although breed has an important effect on beef sensory quality, beyond differ‐
ences in carcass characteristics, breed might explain only a small part of the variability in
beef quality or sometimes may not explain it at all. For instance, Conanec et al. (2021)
observed very few differences in beef sensory quality between beef aged under the same
conditions and produced by young bulls from 15 European breeds reared under relatively
similar conditions [75].
3.1.2. Sex
There are several differences between sex categories related to hormone level and
muscle composition and in interaction with genotype [76]. Heifers are identified as more
tender than bulls and steers with less intramuscular connective tissue content and smaller
muscle fiber diameter [77]. In contrast, bulls grow more rapidly and produce carcasses
with less fat and more red‐oxidative muscle than steers [78]. Steers are rated less tough
and more palatable with more IMF compared to bulls [79]. Moreover, it was found that
even after adjusting for different carcass traits, meat from bulls had lower eating quality
scores than meat from females and steers [74]. Sex also influences meat color especially in
combination with age; female animals tend to deposit more pigment with age than males
[80]. However, in general, due to higher physical activity and myoglobin concentrations,
the meat from intact males is darker than that of females and castrated males [81]. None‐
theless, in practice, the meat from females usually comes from dairy cows or cull cows
slaughtered at a later age, which usually results in a darker color [7].
3.1.3. Animal Age and Maturity
In general, increasing age and maturity is correlated with a decrease in eating quality.
With increasing age and maturity of the animal, the collagen content increases and the
heat stability of the collagen declines, the shear force and toughness of the cooked beef
proportionally increase [82]. Meat color and fat color are generally influenced by animal
age, with L* and a* values higher for older animals than younger ones [83]. Meanwhile,
older animals tend to contain more fat, and the percentage of IMF increases with a con‐
comitant increase in the percentage of monounsaturated fatty acids (MUFAs) and a de‐
crease in that of PUFAs, and this is associated with better flavor intensity [84], but lower
healthiness due to higher proportions of saturated fat. In addition, it was found that the
decrease in tenderness appears to be less pronounced with beef from animals over 18
months of age compared to animals under 18 months of age, although this is animal‐ and
muscle‐dependent [85]. Moreover, the flavor intensity of beef tends to increase up to the
age of 18 months and thereafter reaches a plateau [86]. Kopuzlu et al. (2018) also found
for Eastern Anatolian Red bulls that beef tenderness, juiciness, flavor, and overall accept‐
ability increased until the animals reached 19 months of age [83].
Foods 2022, 11, 1732 11 of 28
3.1.4. Feeding System, Fat Content and Marbling
The feeding system has effects on beef quality since the nutrient composition and
energy intake of the diet can affect the animal’s growth rate, degree of maturity, and car‐
cass composition, particularly the amount of IMF and the FA profile [87]. Diet composi‐
tion and finishing management have different effects on beef quality traits, especially for
different animal categories. Specific analyzes are therefore necessary to determine the im‐
pact of feeding on beef sensory quality in specific circumstances, such as when animals
are inconsistently characterized. In the beef industry, different finishing systems are used,
resulting in beef product variations. In general, beef produced in extensive production
systems is considered to have a healthier FA composition, and pasture‐based feeding
strategies are developed for this purpose as consumers prefer grass‐fed beef as it is per‐
ceived to be healthier and “greener” [88]. However, scientists found that rearing systems
(indoor rearing vs. outdoor grazing) had no major impact on Warner Bratzler shear force
(WBSF), texture profile, WHC, and most of the sensory attributes of m. longissimus dorsi
lumborum from Podolian beef [89]. However, in general, due to higher IMF accumulation,
grain‐finished beef from feedlot systems is perceived as superior to that of grazing sys‐
tems and/or forage/pasture‐finished cattle, which tend to produce leaner beef [90]. In ad‐
dition, from the perspective of eating quality, some consumers prefer grain‐fed/finished
beef because pasture/forage‐fed/finished beef contains specific pastoral flavors such as
“grassy”, “wild” and “barny” and lacks the normal beef flavor [91]. In contrast, for‐
age/pasture‐finished beef generally has an increased conjugated linoleic acid (CLA) and
PUFA to SFA (saturated fatty acid) ratio [92], which is better for human health, especially
in reducing the incidence of many diseases such as heart and cardiovascular diseases. Ad‐
ditionally, pasture quality is an important element in differentiating beef quality. There‐
fore, meat from pasture‐fed cattle may not only be of comparable quality to meat from
grain‐fed animals [93] but may even be more tender [94].
One of the traits most influenced by feeding practices is IMF, which is well known to
affect beef eating quality. It has been reported that grain‐finished beef is considered to
have a more acceptable flavor than forage‐finished beef [95] due to a higher IMF content.
The fat content of a beef carcass is composed of adipose tissue deposited in the abdominal
cavity (perirenal, mesenteric, and omental), intermuscular, subcutaneous, and intramus‐
cular [73]. Of these, IMF content plays a key role in beef eating quality [96], although the
relationships between them may depend on confounding effects such as animal breed,
sex, and age, and feeding systems. IMF content refers to the lipid deposit in muscle and is
an objective measure of the total triglyceride and phospholipid content present on a mi‐
croscopic level [9]. The visible portion of the IMF is termed “marbling” and is widely used
as an indicator of IMF content and meat quality in beef grading systems in the USA and
Australia [70]. While marbling accounts for nearly 75% of the variation in IMF [97], chem‐
ical IMF% and marbling level are similar in their prediction of eating quality in m. longis‐
simus thoracis and lumborum and other cuts [98].
Fat is not defined as a basic sensory trait but provides meat with specific mouthfeel
and lubrication between muscle fibers that could increase the perception of tenderness
and juiciness, and in particular provides meat with a flavor profile and aromas [37]. Nu‐
merous studies have investigated the relationship between IMF/marbling and beef sen‐
sory quality. It has been reported that 10–15% of the variance in tenderness evaluation could be explained by marbling [99], and that 2% to 56% of the variation in flavor could
be explained by IMF content [100]. Although no evidence shows that excess fat leads to a
progressive increase in flavor and palatability [101], higher IMF content could lead to di‐
minishing returns on beef sensory traits. Undoubtedly, a range of acceptability for IMF
and marbling could improve beef eating quality [102]. However, significant but varied
associations with sensory quality attributes are often observed as this relationship is
highly dependent on confounding factors, including animal breed, age, and sex. Never‐
theless, several studies agree that there is a curvilinear relationship between IMF content
Foods 2022, 11, 1732 12 of 28
and beef flavor; flavor intensity increases with IMF content, then reaches a plateau at
higher levels of IMF [4,103].
3.1.5. Pre‐Slaughter Stress
Prior to slaughter, animals are exposed to certain situations that can trigger a stress
response that can reduce the eating quality of the meat. Improper handling during
transport and at the abattoir can lead to muscle glycogen depletion and inadequate acid‐
ification and ultimately high pH, resulting in dark cut beef and reduced sensory tender‐
ness [104], juiciness, and flavor [105]. However, higher pH is not always the only reason
for the reduced quality of stressed cattle. This has been confirmed by several studies: pre‐
slaughter stress was found to have a negative impact on consumer‐assessed eating quality,
even if the ultimate pH of the carcass was compliant (pH ≤ 5.7) [106] and, with a compliant
pH, WBSF was higher in stressed cattle [104].
There is no doubt that pre‐slaughter stress is associated with lower beef eating quality
and it has been demonstrated that mixing and transporting animals prior to slaughter was
associated with lower eating quality for some cuts and that a two‐week rest period in the
slaughterhouse prior to slaughter is beneficial in improving consumer perception of beef
sensory scores [107]. The beef industry and some quality grading systems, such as MSA,
have developed pathways to minimize the adverse effects of physical activity and emo‐
tional stress prior to slaughter. For instance, different lairage periods are recommended
according to the transport journey to enable animals to rest, rehydrate, and replenish their
glycogen stores [108]. In the MSA system, some pre‐slaughter pathways that may maximize
stress could be penalized such that cattle sold in the saleyard prior to slaughter are de‐
ducted 5 points from the final MSA meat quality score [43].
3.2. Post‐Mortem Factors Affecting Beef Eating Quality
3.2.1. Post‐Harvest Aging and pH/Temperature Decline
Post‐harvest aging is a value‐adding process which involves storing the carcass at cold
temperatures for varying periods of time, profoundly affecting the biophysical and bio‐
chemical modification conditions of the carcass through regulating post‐mortem energy
metabolism, proteolysis, and apoptosis [109]. These processes lead to a progressive in‐
crease in tenderness and flavor with the disintegration of muscle structure and the release
and accumulation of peptides and free amino acids. Based on theoretical knowledge, sev‐
eral practical adjustments could be implemented to improve beef palatability with some
treatments such as aging, with some breeds showing optimum tenderness at short aging
periods and other breeds requiring longer aging to achieve similar consumer acceptance
[110]. Several beef grading systems use aging time as a parameter to guarantee/predict
beef quality. According to MSA, five days of aging is required as a minimum aging period;
for the French Label Rouge, ten days is generally considered [91]. Longer aging times up
to a certain level are generally good for better palatability; for m. longissimus dorsi, it takes
4.3 and 10 days to reach 50 percent and 80 percent of total aging, respectively. The aging
process affects muscles differently: slow‐twitch muscles are thought to age more slowly
than fast‐twitch muscles [111]. The tenderness of m. psoas major and m. semitendinosus
needs 7 and 14 days to improve, whilst m. longissimus lumborum can achieve the most ten‐
der score at 21 days [112].
Extensive consumer studies have shown that beef eating quality is negatively af‐
fected when the carcass enters rigor mortis, which refers to contraction of muscle fibers
[113]. If the temperature drops too quickly (below 12 °C) and the pH is high (above 6) during rigor, this combination known as “cold shortening” could cause muscle contrac‐
tions that could increase toughness by up to four times. In contrast, the combination of a
high temperature of carcass (above 35 °C) and rapid pH decline (below 6), called “heat shortening” could cause muscle protein denaturation and muscle shortening, which could
lead to increased meat toughness and dryness [114]. Therefore, the control of pH and
Foods 2022, 11, 1732 13 of 28
temperature decline within the optimum pH/temperature window (pH of 6 between 15–
35 °C) would be an effective way to limit the extent of muscle shortening and optimize
eating quality. Meanwhile, after muscle toughening, tenderization also takes place during
the post‐mortem period [115] based on certain biochemical reactions such as proteolysis.
Among these, calpains play a primary role in meat tenderization during post‐mortem aging
and could be optimally activated under regulation of the physiological pH of skeletal
muscle [116]. Calpain activity is optimized with an intermediate pH decline to 6.0 at 1.5 h
post‐mortem [117]. In addition, being compatible with pH, temperature plays a key role
during post‐mortem aging, with a too‐low temperature having negative impacts on tender‐
ization by slowing down enzyme activity. Meat eating quality was found to be greatly
improved when carcasses reach 21 °C at pH 6 [109]. Aging of 86% can be achieved when
carcasses are held at 30 °C for 24 h [118]. Nevertheless, for microbiological growth and
food safety reasons, high temperature aging is not practically useful for the industry.
Therefore, an optimal pH/temperature intervention can be conducted post‐mortem to op‐
timize the tenderization.
Aging methods can generally be classified as wet and dry or a combined method in
a stepwise dry/wet aging process. Dry aging is less applied than wet aging due to higher
cost, more stringent operational requirements, lower sealing yields, and longer aging
time. However, in contrast to the “wet‐aged flavor” which is sour, metallic, and bloody,
dry aging is increasingly appealing to consumers because of the perceived “dry‐aged fla‐
vor” as nutty, roasted, or butter, which is due to the concentration of typical aroma com‐
pounds that dry aging provides. Dry aging is also found to improve the eating quality of
beef with a lower marbling level [119].
3.2.2. Electrical Stimulation (ES)
Two mechanisms could explain the effect of ES on tenderization. The primary effect
is to reduce cold shortening by accelerating glycolysis and rapid pH drop to avoid the
temperature drop at which cold toughness occurs [120]. The secondary effect is to accel‐
erate proteolysis by stimulating the release of Ca ions at a higher temperature [121] and
to increase disruption of muscle structure [91]. Based on these two effective tenderization
mechanisms, ES has therefore been applied in the worldwide meat industry for decades
to achieve optimal tenderization, especially in combination with pH/temperature con‐
trols. It has been reported that when carcasses were electrically stimulated and held at 35
°C for 3 h, a fast drop in pH to 6 and significant increases in μ‐calpain activity and ulti‐
mately in tenderness were observed [122]. In addition to the beneficial effect of ES on ten‐
derness, some improvements are observed regarding juiciness and flavor and overall sat‐
isfaction [123], as the perception on those sensory traits in electrically stimulated meat is
more impacted by the fat content [124].
The voltage of ES has long been investigated, with the use of high‐voltage ES (3600
V) being first investigated [125], followed by low‐voltage ES (32 V) [126], which was more
used in the industry due to safety concerns. In fact, high and low voltage ES with different
durations can achieve the same tenderization effect [127]. Recent research has focused on
combining chilling methods (Tenderstretch, super chilled storage, and long aging time)
with new technologies such as the so‐called new generation medium voltage ES. The ten‐
derness of meat subjected to medium voltage ES has been improved due to various rea‐
sons such as physical disruption of the muscle structure [128] and myofibrillar degrada‐
tion [129].
3.2.3. Carcass Suspension
Several hanging methods have been used to improve meat tenderness during post‐
mortem aging. Achilles tendon is the most traditional and widely used carcass suspension
method, although it cannot prevent the majority of muscle shortening, but, with the ap‐
propriate aging process, Achilles tendon still can achieve the tenderization potential of
beef cuts [91]. In comparison with Achilles tendon, Tenderstretch increases tension and
Foods 2022, 11, 1732 14 of 28
results in more tender meat, but this varies between muscles, with improved eating qual‐
ity in most hindquarter muscles [130]. In general, different muscles could respond differ‐
ently to post‐mortem aging and, therefore, muscle‐specific aging strategies could improve
tenderness and overall eating quality [112]. In fact, Tenderstretch could effectively shorten
aging time and improve beef tenderness by up to 40% [131], and indeed performs better
on improving beef sensory quality (flavor, juiciness, and overall liking) than that of Achil‐
les tendon [132].
4. Main Methods for Measuring and Predicting Beef Quality
In order to ensure in advance a good quality of beef at consumer level, a relevant
method is to predict beef quality in scenarios where the beef carcass and muscle cuts can
be evaluated by combining different quality traits (for instance at farm level, at abattoir
level, or by some specific approaches such as consumer sensory testing). Perceived qual‐
ity, particularly at the time of tasting, depends on a combination of parameters that have
been largely evaluated by consumers or more generally by human panels in recent dec‐
ades of research. In fact, many traits are initially and still largely measured by objective
methods [120]. In the beef sector, there are mainly three categories for beef quality meas‐
urement/prediction: (1) instrumental methods (intrusive mechanical measurement and
non‐destructive instrumental measurement), (2) the omics approach, and (3) the car‐
cass/cut grading schemes [6].
4.1. Mechanical Measurement of Beef Quality
4.1.1. Physical Texture Measurement
Evaluation of beef quality is complicated, especially with respect to sensory quality,
which in reality can only be measured by consumers or sensory panels [133]. However,
since consumer evaluation is time‐consuming and costly, it cannot be widely used for all
quality measurements. A widely‐used method of evaluating meat quality is to measure
the physical texture of meat products. The physical texture of beef is mainly related to
mechanical attributes, which are generally characterized by hardness, cohesiveness, vis‐
cosity, springiness, and adhesiveness [134]. Mechanical measurements of the strength re‐
quired to break down the meat are mainly categorized as shearing, biting, compressing a
standardized piece of meat. The most commonly used measurement for meat tough‐
ness/tenderness is the WBSF. The Slice shear force (SSF) is a faster alternative to WBSF but
is less used [135]. For overall physical texture, there is the texture profile analysis (TPA),
and some devices are used such as the MIRINZ tenderometer with a biting action for
measuring overall tenderness of meat [133]. The WBSF was found to be more effective in
classifying beef as tender (68% accuracy) than the SSF (47%), compared to consumer per‐
ceived sensory tenderness (80%) [136]. Many studies have tried to relate the meat physical
texture measurement to consumer‐rated tenderness/mouth‐feel‐taste, with physical meas‐
urements being able to explain a variable variation in tenderness assessed by human pan‐
els but no more than 60% [133]. Platter et al. (2003) found that WBSF can only explain 23%
of the total variance of consumer‐scored tenderness [137]. Various correlations between
WBSF and consumer evaluated tenderness have been observed, ranging from low (e.g., r
= −0.19, −0.26) [138] to high values (e.g., r = −0.72, −0.82) [139]. Different factors such as
aging process, cooking temperature [140], and muscle cuts [141] might contribute to these
inconsistencies. Except for the above, the lack of strong correlations between physical
shear force and consumer‐perceived tenderness indicates that they seem to be two non‐
equivalent issues, the latter being not only related to mechanical force but also associated
with sensations generated by moisture and fat within the meat.
4.1.2. Juiciness Measurement
According to a National Beef Tenderness Survey conducted in the United States at
the food service and retail level, over 94% of rib and loin beef were rated tender or very
Foods 2022, 11, 1732 15 of 28
tender. Such a large proportion of tender beef has magnified the importance of juiciness
and flavor to the consumer eating experience [142]. This is the reason why the importance
of beef sensory traits has renewed attention from meat scientists in recent years. For many
years, tenderness was considered as the dominant factor in determining eating quality
and with the clarification of a higher contribution of flavor liking to overall consumer
satisfaction, the importance of juiciness should not be neglected [49].
The measurement of juiciness has previously focused on total water content, WHC,
and water fractions of meat, although the consistency between sensory juiciness and these
parameters varies [143]. One of the reasons could be that the meat evaluated by consumer
or panels has been cooked, which means that with physical/chemical alterations and intra‐
and extra‐myofibrillar water movements, the perception of juiciness may be altered.
Cooking loss, drip loss, and compression‐based methods have been usually used to quan‐
tify expressible moisture in meat. Cooking loss has been reported to be able to explain 60‐
80% of the juiciness variance [144], but it has also been reported that cooking loss cannot
explain the juiciness of cooked meat due to heat‐induced changes [143,145]. Compression‐
based methods have evolved from filter paper press methods from the Carver hydraulic
press apparatus, the Instron‐based press method to the pressed juice percentage (PJP)
method with various capabilities to predict juiciness scored by a sensory panel [146]. PJP
was observed to be strongly correlated with sensory juiciness scored by trained and un‐
trained consumers (r = 0.69, 0.45), respectively. IMF content can also be a good indicator
of juiciness. Thompson (2004) found that consumers were satisfied and dissatisfied with
beef juiciness when IMF was above 20% or below 2%, respectively [103]. However, it is
difficult to define a threshold of juiciness for consumer perception based on IMF content
due to the different distribution of IMF [147].
4.1.3. Flavor Measurement
Flavor is perceived by consumers through two pathways, namely odor detected by
the nose and taste perceived by the mouth and tongue. There are receptors on the olfactory
bulb in the nose and mouth that detect volatile compounds; when they come into contact
with the olfactory bulb and are recognized by these receptors, flavor is thus perceived. In
addition to these volatile compounds, there are volatile aromatic compounds generated
in the mouth during chewing or swallowing of meat. However, the amount or types of
receptors and the amount or concentration of volatile compounds needed for perception
vary between individuals [86]. The perception of flavor is therefore complicated to define
due to the individual diversity of the taster. This is the reason why meat flavor is further
described and assessed by highly trained descriptive attributes with panelists, which are
the most accurate methods for measuring meat flavor.
Mechanical measurement of flavor on the basis of consumer perception is challeng‐
ing due to the complexity of the meat matrix and consumer perception. In recent decades,
significant progress has been made in identifying and quantifying meat flavor compounds
[148]. Thousands of volatile compounds have been identified as constituting the aromas
of meat odor/flavor using mechanical and/or chemical measurements such as olfactome‐
try, flame ionization detection (FID), and thiobarbituric acid reactive substances (TBARS).
TBARS have been shown to have a predictive ability for the consumer’s flavor liking
threshold, but this is highly dependent on the method used for TBARS determination. FA
profile can contribute to consumer flavor liking, as CLA, SFAs, and MUFAs have been
associated with flavor liking, although some effects are muscle‐dependent [149]. Addi‐
tionally, the electronic nose (e‐nose) and electronic tongue (e‐tongue) are also useful tools
for evaluating meat flavor attributes [150].
4.2. Non‐Destructive Instrumental Methods for Beef Quality Prediction
There has been a demand to predict beef quality by non‐destructive instrumental
methods, which are considered as having many clear‐cut advantages, such as ease of use,
non‐destructiveness, speed, cost‐effectiveness, reproducibility, and a high potential

Foods 2022, 11, 1732 16 of 28
accuracy [12]. Ongoing work with various emerging technologies has been conducted
with the aim of predicting beef quality directly or indirectly, i.e., predicting consumer
sensory attributes directly related to quality, such as tenderness or flavor, or predicting
indirect quality‐related parameters that have been shown to have an impact on meat qual‐
ity such as meat color, pH, IMF content, or marbling [6].
The use of Near‐InfraRed Spectroscopy (NIRS) to predict the chemical composition,
technological parameters, and sensory feature, of meat quality attributes, such as WBSF
values and trained panel or untrained consumer sensory scores, is a topic with important
applications in meat plants, as both WBSF and sensory measurements are time‐consuming
and destructive; however, due to the complexity of predicting these attributes, the deter‐
minant coefficients proposed in the literature are variable. NIRS can correctly detect 80‐
95% dark cut beef depending on the instrument used [6]. Several studies have suggested
that the sensory quality of meat can be accurately predicted by NIRS but with relatively
low accuracy (R2 = 0.10–0.58) [151,152], although Ripoll et al. reported that beef tenderness
could be predicted by NIRS with high accuracy (R2 = 0.98) [153]. Computer vision tech‐
niques have been utilized to visually assess meat quality in the processing line as they are
non‐invasive and consistent to assessing color, IMF and, most importantly eating quality
[154]. It has been reported that computer vision has the ability to assess marbling and
predict quality attributes with R2 values for tenderness (0.72), WBSF (0.83), juiciness (0.60),
flavor (0.78), and overall consumer acceptability (0.82), respectively.
Hyperspectral imaging is a more promising technique for the objective assessment
of meat quality attributes such as color, tenderness, and texture. Through an integrated
system of spectroscopy and imaging techniques, images of the entire sample surface can
be recorded, thus reducing the negative effect of non‐uniform distribution of meat con‐
stituents. Several studies have demonstrated that hyperspectral imaging technique can
predict meat tenderness and WBSF quite well, with R2 values of around 0.9. With appro‐
priate statistical methods such as discriminant analysis, the classification of tenderness
between tender and tough meat can reach an accuracy of 75% to 96% [155,156].
4.3. Omics Approaches
4.3.1. Genomics
The criteria for defining consumer beef eating quality are based on several traits (e.g.,
tenderness, juiciness, and flavor, etc.), which are quantitative traits determined by sets of
components regulated by the joint action of numerous genes and environmental regula‐
tions (growth, rearing and processing factors) [157]. Each individual component contrib‐
uting to the palatability phenotype is consequently difficult to control and costly to meas‐
ure. All beef eating quality traits are difficult to improve based merely upon phenotypic
selection, but there may be effective candidate genes for genomic selection if genetic mark‐
ers that account for a significant variance for those quality traits are identified [158].
Within the meat sector, numerous genes have been identified as being involved in
valuable estimates of genetic parameters. They provide key insights into the regions that
underpin variation in physical meat characteristics, including muscle fibers, connective
tissue, IMF, meat color, fat color, shear force, and sensory meat quality traits such as ten‐
derness, juiciness, flavor, chewiness, etc. [159]. So far, some sensory‐related traits includ‐
ing tenderness and color have been confirmed with notable representations of related bi‐
omarkers on chromosomes [119]. Despite its relevant potential to predict meat quality
variation, some limitations have still been noted, the most common being that, thanks to
numerous association studies, predictive information can be obtained but not deep scien‐
tific knowledge of the underlying mechanisms, at least in the earliest stages of omics de‐
velopment. Moreover, predictive reliability appears to be less consistent, in particular
with human‐evaluated meat eating quality. For instance, recent heritability estimates for
tenderness, juiciness and flavor scores range from 0.1 to 0.2 [160]. This indicates that the
Foods 2022, 11, 1732 17 of 28
proportion of variability in beef eating quality explained by genetic factors is moderate to
weak.
4.3.2. Proteomics
An emerging body of literature has examined the proteomic pathways involved in
meat eating quality variations [161]. All these works also contribute to the elucidation of
the biological mechanisms involved in muscle to meat conversion and in meat qualities
[162]. Despite the many factors regulating beef eating quality, and therefore the large
number of biomarkers involved in the regulation of quality by these factors, with more
and more results from proteomic studies, robust candidate biomarkers can still be identi‐
fied due to their consistent associations with meat qualities. Gagaoua et al. (2019) found
some biomarkers that related to muscle structure (MyHC‐I, MyHC‐IIa, MyHC‐IIx), oxi‐
dative stress (DJ‐1, PRDX6), and proteolysis (CAPN1) that were consistently associated
with tenderization of longissimus thoracis muscle. Despite various results depending on
animal breeds (Aberdeen Angus, Limousin, and Blond d’Aquitaine), end‐point cooking
temperature of beef (55 or 74 °C), and consumer origin (France and UK), some of these
biomarkers performed as robust predictors for tenderness [163]. Protein network research
has revealed the functional annotation of 124 proteins in the longissimus dorsi muscle,
which are crucial in the production of high‐quality beef [119]. More and more integrated
proteomics studies have been carried out to create a repertoire of biomarkers, especially
for beef quality defects (i.e., dark, firm, and dry beef). The ultimate goal of these bi‐
omarkers is to guarantee the eating quality for consumers by proposing a list of validated
biomarkers for the development of routine bioanalytical tools to be used by breeders and
producers to improve the potential merits of breeds and to detect potential quality during
the pre‐ and post‐mortem periods [119].
4.3.3. Metabolomics
Skeletal muscle is characterized by a set of functionally cooperative genes designed
to address the spatiotemporal requirements of each muscle. Gene expression is then reg‐
ulated, including protein modification, during muscle development, growth, and matu‐
ration. In the later stages, muscle metabolites determine the muscle characteristics, which
are the major phenotypic components of meat eating quality. During the development
and physiological specialization of muscle, many well‐known factors all impact on the
genome, transcriptome, and proteome profiles of muscle, making it very difficult to un‐
derstand the precise mechanisms behind meat quality variations through these molecular
markers [164]. Nonetheless, changes in muscle metabolome profiles (small hydrophilic
molecules/metabolites such as polyphenols, organic acids (carnitine, creatine, and carno‐
sine), amino acids, vitamins and minerals, etc.) can be quantified by metabolomics as po‐
tential indicators reflecting the metabolic process and screened to predict sensory quality
[165]. For example, Ma et al. (2017) reported that an increase in the amount of free amino
acids was associated with the degree of proteolysis, which suggests more tender meat, but
also with more precursors of aromatic compounds that play a role in the sensory aspects
of cooked meat [166]. Furthermore, Antonelo et al. (2020) found a positive correlation be‐
tween carnitine and consumer acceptance of beef steaks, while strong negative correla‐
tions were observed between carnitine and creatine and consumer sensory scores for ten‐
derness, juiciness, and overall liking [167].
4.4. Grading Schemes for Beef Eating Quality
With the advancement of international trade of beef carcasses, carcass classification
standards and beef quality grading schemes are required to provide a description of car‐
casses and muscle cuts with the definition of quality to purchasers and destination mar‐
kets [168]. Based on this objective, two categories of grading schemes, based on carcass
and muscle cut, have been used to classify carcasses and predict beef quality.
Foods 2022, 11, 1732 18 of 28
4.4.1. Carcass‐based Grading Schemes of Beef Quality
A small number of countries have carcass grading schemes to directly predict beef
eating quality. Most of them focus more on a generic scenario of beef quality in relation to
carcass characteristics. The current carcass‐based grading systems in these regions
(mainly Europe, USA, and Japan) primarily encompass two categories of carcass classifi‐
cation, namely yield and quality grading.
Yield is determined by various criteria depending on the system but basically can be
defined as lean or saleable meat yield and can be determined by carcass weight and com‐
position. In the USDA (United States Department of Agriculture) system, the yield grad‐
ing is an indication of yield of boneless, trimmed retail cuts. The JMGA (Japanese Meat
Grading Association) yield grade refers to the proportion of meat produced by the animal
that can be eaten and is determined by eye muscle area, rib thickness, cold left side carcass
weight, and subcutaneous fat thickness through a regression calculation [169]. In contrast
with the USDA and JMGA systems, which have a parallel quality evaluation criterion re‐
lated to beef palatability, the European classification system places emphasis only on the
description of production yield rather than beef eating quality. The EUROP grid is estab‐
lished to classify carcasses according to the assessment of carcass weight, muscle shape,
and fat level, described by conformation score and fat score, respectively [170]. Since the
EUROP grid is widely applied and regarded as traditionally important for the European
beef industry, carcasses are assigned and traded to differentially priced sales markets ac‐
cording to the European classification scores [171]. However, meat experts have gradually
become aware of the weakness of the EUROP grid nowadays within Europe, as European
classification scores have little relation to eating quality at consumer level and cannot re‐
flect carcass composition [172] and consumer satisfaction [173].
Carcass maturity and IMF level (marbling) are two major attributes that are used for
quality segments. For example, according to the combinations of maturity and marbling
level, carcasses can be graded into one of eight categories as in the USDA system. Maturity
indicates the physiological age of the animal (ossification, dentition) rather than the chron‐
ological age. The amount and distribution of marbling on the m. longissimus dorsi are crit‐
ical assessments in most carcass grading systems due to the strong association between
marbling score and beef palatability. In the USDA, graders evaluate marbling between the
12th and 13th ribs, but in the JMGA, carcass grading is performed at the rib site, between
the 5th and 6th ribs [174]. Recently, carcass grading with marbling assessment was con‐
ducted in a French private meat plant. This study found no significant difference in mar‐
bling score between the 5th and 10th ribs, such that marbling score could be measured at
the quarter carcass level [175]. This could provide a theoretical basis for the introduction
of marbling score in the European carcass grading system.
Since eating quality varies depending on the cut, carcass‐based grading systems lack
some degree of accuracy and consistency. Studies of consumer preference for beef eating
quality based on the USDA quality grade have shown a far less relevant relationship with
consumer preference between USDA grades [176]. Recent studies have also indicated that
American consumers were unable to detect differences in eating quality between different
USDA grades for tenderloin steaks [177]. In addition, it has been observed that the USDA
maturity grade has no impact on eating quality for grain‐finished cattle up to the age of
30 months and that only marbling grade is important for eating quality [178]. In fact, in
the early days of the MSA system, it was found that carcass grading using only carcass
parameters cannot predict the eating quality of a carcass from a variety of production
systems. Besides, different muscle cuts have different eating quality for different car‐
casses, and quality also varies as a result of multiple factors [91].
4.4.2. Cut‐Based Grading Scheme—The MSA Grading System
Unlike the aforementioned carcass grading schemes, the MSA grading system is a
beef eating quality grading system, aimed at delivering an eating quality guarantee to
Foods 2022, 11, 1732 19 of 28
consumers. There are two ways in which the MSA system differs from other grading
schemes: (1) the grading of beef quality is based on each of the MSA muscle cuts rather
than the whole carcass; (2) the definition of eating quality depends on the responses of
untrained consumers [168], and actual consumer performance has been shown to be con‐
sistent with a high degree of accuracy when tasting samples with a wide range of quality
variance [179].
In the MSA prediction model, different Critical Control Points (CCPs) have been used
from the breeding, production, pre‐slaughter, processing, and value‐adding aspects of the
supply chain that have an impact on eating quality. In addition, consumer preference is
evaluated through large‐scale consumer testing [168]. The parameters used in the predic‐
tion model are based on inputs including: animal type and production (Bos indicus con‐
tent, hormone growth promotants, milk fed veal classification and sex, sale yard, and sell‐
ing method), carcass characteristics (carcass weight, ossification score, hump height,
USDA marbling score, rib fat depth, and ultimate pH), post‐slaughter factors (hanging
method and aging time), the prediction of beef eating quality being provided for different
muscle cuts, and various cooking methods.
Another crucial part of the MSA system is the extensive use of sensory testing of beef
by untrained consumers to develop a combined eating quality score (MQ4, 0–100) based
on tenderness, flavor liking, juiciness, and overall liking. To link the carcass characteristics
with consumer valued palatability, carcass production and grading inputs (that are statis‐
tically related to this combined eating quality score (MQ4)) are combined to form eating
quality prediction algorithms for specific muscle cuts (39 cuts in total) in combination with
a defined aging period and one of eight different cooking methods [43]. Meanwhile, beef
samples are graded by consumers as Unsatisfactory (2 star), Good Everyday (3 star), Bet‐
ter Than Everyday (4 star), and Premium quality (5 star). These categories should corre‐
spond to the MQ4 score, and this connection enables the muscle cuts to be allocated to
these four quality grades [43]. Consequently, beef can be classified into grades that corre‐
spond to consumer expectations. The consumer’s willingness to pay for these grades has
been estimated from consumers’ answers: if a 3‐star beef is set at a unit monetary value of
1, then 2‐star, 3‐star, 4‐star, and 5‐star quality graded products can be subsequently valued
at 0.5, 1, 1.5 and 2 respectively [2].
The MQ4 score can be used to reflect the overall consumer eating experience of a
muscle cut [43]. The eating quality value of a whole carcass, termed MSA Index, can also
be predicted in MSA grading scheme. The MSA index is the sum of the weighted MQ4
scores of all MSA cuts (39 muscle cuts), where the weighting of each cut was calculated as
the percentage of the total weight of the MSA cuts in the carcass. The MSA Index is used
to value the potential eating quality of beef carcasses and enables producers to monitor
the impact of genetic and breeding practices and management on the eating quality of
each carcass [180].
4.4.3. The Future Grading Scheme for Beef Palatability in Europe and Other Countries
There are various grading schemes to evaluate beef quality with different standards.
In addition, different rearing and feeding systems, environmental conditions, animal type,
breed, and processing practices add to the variability of quality evaluation between coun‐
tries. However, for scientific research on meat quality evaluation for further industrial
applications, there is a need to develop and/or share a set of generic principles and/or
establish an international database containing a significant number of assessments on beef
quality traits from different countries [181]. The MSA protocol has always been consid‐
ered as a good standard with critical steps including rigorous beef carcass assessment and
untrained consumer evaluation of beef palatability. Over the past two decades, independ‐
ent and/or collaborative studies have concluded that this consumer‐focused and cooking‐
and cut‐based quality grading scheme is applicable for many countries such as Ireland,
the United States, South Korea, Northern Ireland, Japan, France, Poland, South Africa, and
China. It would therefore be very useful to have a platform for comprehensive data
Foods 2022, 11, 1732 20 of 28
pooling and analysis to maximize research efficiency for the benefit of the global beef in‐
dustry [181].
To this end, a collaborative, non‐profit, and independent foundation, the Interna‐
tional Meat Research 3G Foundation (3G Foundation), has been established to improve
consumer satisfaction of beef quality by promoting worldwide collaborative meat re‐
search throughout the bovine supply chain. The platform is designed to coordinate and
support global scientific research on beef quality evaluation and prediction by collecting
a large amount of data based on a standard methodology (MSA) for further data sharing
and modeling and ultimate integrative investigations on beef quality prediction.
4.4.4. Advanced Technology in Consumer Perception of Beef Quality
Human sensory evaluations are applied as useful tools for generating data for the
description, discrimination and prediction of meat eating quality. However, time and cost
constraints, as well as the lack of flexibility required for successful commercialization,
make human sensory testing unsuitable for today’s rapidly changing industrial environ‐
ment [119]. Moreover, the data generated by human evaluation shows great variability
between individuals and the information required for quality perception is becoming in‐
creasingly complex as consumer purchasing decisions become more sensitive to both in‐
trinsic and extrinsic factors, including nutritional quality and safety, animal welfare, and
environmental and agroecological sustainability. Hence, human sensory evaluations are
to some extent heterogeneous methods for generating meat eating quality data based on
different emotions, attitudes and responses that are influenced by different intrinsic and
extrinsic cues. To better reflect real‐world consumer assessments, with the expansion of
beef industry into emerging markets, there is a trend to develop and adopt novel and
rapid sensory techniques (i.e., Check All That Apply, Napping, Flash Profile, Temporal
Dominance of Sensations) to produce data from conventional methods (Quantitative De‐
scriptive Analysis) [182] in order to better understand complex consumer perceptions.
Virtual reality is also being used as a tool to improve the analysis of consumer perception
on food quality with more realistic parameters through the measurement of consumer
psychological and physiological responses [182]. Overall, in order to reduce the variability
due to human involvement in meat quality definition and to increase the efficiency of
meat quality prediction, novel advanced techniques and methods have been explored and
implemented in a more holistic way, taking into account various aspects of consumer
quality perception. More information on consumer perception and prediction of meat
quality would help to establish a greater degree of accuracy in this area.
5. Conclusions
Beef is an essential part of the human diet. Providing consistently good quality of
meat is of importance to consumers, which generally implies the production of safe,
healthy, and tasty beef. However, meat, especially beef, has gradually become an ideolog‐
ical battleground over the past decades. Producing meat in an environmentally sustaina‐
ble and animal welfare‐friendly manner is therefore critical for the continued success of
the conventional meat industry. Beef quality is a complex concept and tends to become
more broadly based on different dimensions. Among these, extrinsic quality traits, which
include not only factors external to the product but also factors that add value to the prod‐
uct such as animal welfare and environmental sustainability, are becoming increasingly
important to consumers.
Intrinsic beef quality traits such as eating quality are of paramount importance to
consumer perception of a beef product. However, beef eating quality has a multifactorial
determinism with various pre‐ and post‐mortem factors that have a direct or indirect impact
on the ultimate palatability of the beef product. These determining factors include endog‐
enous factors of the animal, rearing and handling conditions, and pre‐slaughter and post‐
mortem management. Due to the complexity of the determinism of beef eating quality,
several approaches (mechanical measurements, non‐destructive instrumental methods,

Foods 2022, 11, 1732 21 of 28
and omics approaches) have been developed to assess and predict the eating quality of
beef. Despite this, the prediction of quality remains poor at industry level, since some
grading systems are simplistic and based on carcasses rather than muscle cuts and most
importantly, beef quality should be ultimately appraised by real people. This is why sen‐
sory evaluations by untrained consumers and panelists have been widely applied in beef
eating quality studies in recent decades. However, so far, no perfect system has been ap‐
plied worldwide, despite several grading systems, which are well known but mainly im‐
plemented locally rather than globally. Therefore, establishing a robust prediction by us‐
ing more global and accurate approaches, including modelling approaches based on all
the above quality determining parameters, would be an efficient solution to guarantee
beef eating quality and avoid consumer dissatisfaction. This would be a useful and pow‐
erful solution provided that international collaborations could be widely developed.
Author Contributions: Conceptualization, J.L., M.‐P.E.‐O., T.S. and J.‐F.H.; writing—original draft
preparation, J.L.; writing—review and editing, J.L., M.‐P.E.‐O., T.S. and J.‐F.H. All authors have read
and agreed to the published version of the manuscript.
Funding: This research received no external funding.
Data Availability Statement: Not applicable.
Acknowledgments: This work was supported by the Bulgarian Ministry of Education and Science
under the project GREENANIMO (contract No Д01‐287/07.10.2020 and Trakia University’s refer‐
ence number М004/7.10.2020), part of the National Program “European Scientific Networks”.
Conflicts of Interest: The authors declare no conflict of interest.
References
1. Grunert, K.G.; Bredahl, L.; Brunsø, K. Consumer perception of meat quality and implications for product development in the
meat sector—A review. Meat Sci. 2004, 66, 259–272. https://doi.org/10.1016/s0309‐1740(03)00130‐x.
2. Pethick, D.; Hocquette, J.‐F.; Scollan, N.; Dunshea, F. Review: Improving the nutritional, sensory and market value of meat
products from sheep and cattle. Animal 2021, 15, 100356. https://doi.org/10.1016/j.animal.2021.100356.
3. Banović, M.; Grunert, K.G.; Barreira, M.M.; Fontes, M. Beef quality perception at the point of purchase: A study from Portugal.
Food Qual. Prefer. 2009, 20, 335–342. https://doi.org/10.1016/j.foodqual.2009.02.009.
4. Hocquette, J.‐F.; Meurice, P.; Brun, J.P.; Jurie, C.; Denoyelle, C.; Bauchart, D.; Renand, G.; Nute, G.R.; Picard, B. The challenge
and limitations of combining data: A case study examining the relationship between intramuscular fat content and flavour
intensity based on the BIF‐BEEF database. Anim. Prod. Sci. 2011, 51, 975–981. https://doi.org/10.1071/an10044.
5. Henchion, M.; McCarthy, M.; Resconi, V.C.; Troy, D. Meat consumption: Trends and quality matters. Meat Sci. 2014, 98, 561–
568. https://doi.org/10.1016/j.meatsci.2014.06.007.
6. Farmer, L.J.; Farrell, D.T. Review: Beef‐eating quality: A European journey. Animal 2018, 12, 2424–2433.
https://doi.org/10.1017/s1751731118001672.
7. Clinquart, A.; Ellies‐Oury, M.; Hocquette, J.; Guillier, L.; Santé‐Lhoutellier, V.; Prache, S. Review: On‐farm and processing fac‐
tors affecting bovine carcass and meat quality. Animal 2022, 16, 100426. https://doi.org/10.1016/j.animal.2021.100426.
8. Ellies‐Oury, M.‐P.; Hocquette, J.‐F.; Chriki, S.; Conanec, A.; Farmer, L.; Chavent, M.; Saracco, J. Various Statistical Approaches
to Assess and Predict Carcass and Meat Quality Traits. Foods 2020, 9, 525. https://doi.org/10.3390/foods9040525.
9. Pethick, D.W.; Harper, G.; Oddy, V.H. Growth, development and nutritional manipulation of marbling in cattle: A review. Aust.
J. Exp. Agric. 2004, 44, 705–715. https://doi.org/10.1071/ea02165.
10. Lyford, C.; Thompson, J.; Polkinghorne, R.; Miller, M.; Nishimura, T.; Neath, K.; Allen, P.; Belasco, E. Is Willingness to Pay
(WTP) for Beef Quality Grades Affected by Consumer Demographics and Meat Consumption Preferences? Australas. Agribus.
Rev. 2010, 18, 1–17. https://doi.org/10.22004/ag.econ.125701.
11. Loose, S.M.; Szolnoki, G. Market price differentials for food packaging characteristics. Food Qual. Prefer. 2012, 25, 171–182.
https://doi.org/10.1016/j.foodqual.2012.02.009.
12. Hocquette, J.‐F.; Botreau, R.; Picard, B.; Jacquet, A.; Pethick, D.W.; Scollan, N.D. Opportunities for predicting and manipulating
beef quality. Meat Sci. 2012, 92, 197–209. https://doi.org/10.1016/j.meatsci.2012.04.007.
13. Wilfong, A.K.; McKillip, K.V.; Gonzalez, J.M.; Houser, T.A.; Unruh, J.A.; Boyle, E.A.E.; O’Quinn, T.G. The effect of branding on
consumer palatability ratings of beef strip loin steaks. J. Anim. Sci. 2016, 94, 4930–4942. https://doi.org/10.2527/jas.2016‐0893.
14. Hocquette, J.‐F.; Botreau, R.; Legrand, I.; Polkinghorne, R.; Pethick, D.W.; Lherm, M.; Picard, B.; Doreau, M.; Terlouw, E.M.C.
Win–win strategies for high beef quality, consumer satisfaction, and farm efficiency, low environmental impacts and improved
animal welfare. Anim. Prod. Sci. 2014, 54, 1537–1548. https://doi.org/10.1071/an14210.

Foods 2022, 11, 1732 22 of 28
15. Grunert, K.G.; Loose, S.M.; Zhou, Y.; Tinggaard, S. Extrinsic and intrinsic quality cues in Chinese consumers’ purchase of pork
ribs. Food Qual. Prefer. 2015, 42, 37–47. https://doi.org/10.1016/j.foodqual.2015.01.001.
16. Becker, T.; Benner, E.; Glitsch, K. Consumer perception of fresh meat quality in Germany. Br. Food J. 2000, 102, 246–266.
https://doi.org/10.1108/00070700010324763.
17. Loureiro, M.L.; Umberger, W.J. A choice experiment model for beef: What US consumer responses tell us about relative prefer‐
ences for food safety, country‐of‐origin labeling and traceability. Food Policy 2007, 32, 496–514. https://doi.org/10.1016/j.food‐
pol.2006.11.006.
18. Raulet, M.; Clinquart, A.; Prache, S. Construction of beef quality through official quality signs, the example of Label Rouge.
Animal 2021, 16, 100357. https://doi.org/10.1016/j.animal.2021.100357.
19. Shen, Y.‐C.; Chen, H.‐S. Exploring Consumers’ Purchase Intention of an Innovation of the Agri‐Food Industry: A Case of Arti‐
ficial Meat. Foods 2020, 9, 745. https://doi.org/10.3390/foods9060745.
20. Camilleri, A.R. What’ s Your Beef ? How’ Carbon Labels’ Can Steer Us towards Environmentally Friendly Food Choices. 2018.
Available online: https://theconversation.com/whats‐your‐beef‐how‐carbon‐labels‐can‐steer‐us‐towards‐environmentally‐
friendly‐food‐choices‐108424 (accessed on 17 December 2018).
21. Cornish, A.R.; Briley, D.; Wilson, B.J.; Raubenheimer, D.; Schlosberg, D.; McGreevy, P.D. The price of good welfare: Does in‐
forming consumers about what on‐package labels mean for animal welfare influence their purchase intentions?. Appetite 2020,
148, 104577. https://doi.org/10.1016/j.appet.2019.104577.
22. Carlsson, F.; Frykblom, P.; Lagerkvist, C.J. Consumer willingness to pay for farm animal welfare: Mobile abattoirs versus trans‐
portation to slaughter. Eur. Rev. Agric. Econ. 2007, 34, 321–344. https://doi.org/10.1093/erae/jbm025.
23. Aboah, J.; Lees, N. Consumers use of quality cues for meat purchase: Research trends and future pathways. Meat Sci. 2020, 166,
108142. https://doi.org/10.1016/j.meatsci.2020.108142.
24. Acebrón, L.B.; Dopico, D.C. The importance of intrinsic and extrinsic cues to expected and experienced quality: An empirical
application for beef. Food Qual. Prefer. 2000, 11, 229–238. https://doi.org/10.1016/s0950‐3293(99)00059‐2.
25. Lähteenmäki, L. Claiming health in food products. Food Qual. Prefer. 2013, 27, 196–201. https://doi.org/10.1016/j.food‐
qual.2012.03.006.
26. Marreiros, C.; Ness, M. A Conceptual Framework of Consumer Food Choice Behaviour; University of Evora, CEFAGE‐UE: Évora,
Portugal, 2009.
27. Borgogno, M.; Favotto, S.; Corazzin, M.; Cardello, A.V.; Piasentier, E. The role of product familiarity and consumer involvement
on liking and perceptions of fresh meat. Food Qual. Prefer. 2015, 44, 139–147. https://doi.org/10.1016/j.foodqual.2015.04.010.
28. Smith, G.C.; Belk, K.E.; Sofos, J.N.; Tatum, J.D.; Williams, S.N. Economic Implications of Improved Color Stability in Beef. In
Antioxidants in Muscle Foods: Nutritional Strategies to Improve Quality; John Wiley and Sons: Hoboken, NJ, USA, 2000; pp. 397–
426.
29. Ardeshiri, A.; Rose, J.M. How Australian consumers value intrinsic and extrinsic attributes of beef products. Food Qual. Prefer.
2018, 65, 146–163. https://doi.org/10.1016/j.foodqual.2017.10.018.
30. Morales, R.; Aguiar, A.; Subiabre, I.; Realini, C. Beef acceptability and consumer expectations associated with production sys‐
tems and marbling. Food Qual. Prefer. 2013, 29, 166–173. https://doi.org/10.1016/j.foodqual.2013.02.006.
31. Killinger, K.M.; Calkins, C.R.; Umberger, W.; Feuz, D.M.; Eskridge, K.M. Consumer sensory acceptance and value for beef steaks
of similar tenderness, but differing in marbling level. J. Anim. Sci. 2004, 82, 3294–3301. https://doi.org/10.2527/2004.82113294x.
32. Adzitey, F.; Nurul, H. Pale Soft Exudative (PSE) and Dark Firm Dry (DFD) Meats: Causes and Measures to Reduce These Inci‐
dences‐a Mini Review. Int. Food Res. J. 2011, 18, 11‐20.
33. Killinger, K.M.; Calkins, C.R.; Umberger, W.; Feuz, D.M.; Eskridge, K.M. A comparison of consumer sensory acceptance and
value of domestic beef steaks and steaks from a branded, Argentine beef program. J. Anim. Sci. 2004, 82, 3302–3307.
https://doi.org/10.2527/2004.82113302x.
34. Yang, L.; Arnold, N.L.; Drape, T.; Williams, R.C.; Archibald, T.; Chapman, B.; Boyer, R. A survey of United States consumer
awareness, purchasing, and handling of mechanically tenderized beef products. Food Control 2021, 120, 107505.
https://doi.org/10.1016/j.foodcont.2020.107505.
35. Prache, S.; Adamiec, C.; Astruc, T.; Baéza‐Campone, E.; Bouillot, P.; Clinquart, A.; Feidt, C.; Fourat, E.; Gautron, J.; Girard, A.;
et al. Review: Quality of animal‐source foods. Animal 2021, 16, 100376. https://doi.org/10.1016/j.animal.2021.100376.
36. Warner, R.D. The Eating Quality of Meat—IV Water‐Holding Capacity and Juiciness. In Lawrie’s Meat Science, 8th ed.; Toldra’
F., Ed.; Woodhead Publishing: Cambridge, UK, 2017; ISBN 9780081006979.
37. Hopkins, D.L.; Geesink, G.H. Protein Degradation Post Mortem and Tenderization. In Applied Muscle Biology and Meat Science;
CRC Press: Boca Raton, FL, USA, 2009; pp. 149–173. https://doi.org/10.1201/b15797‐9.
38. Miller, R.K. The Eating Quality of Meat: V—Sensory Evaluation of Meat. In Lawrie’ s Meat Science, 8th ed.; Toldra’ F., Ed.; Wood‐
head Publishing: Cambridge, UK, 2017; pp. 461–499, ISBN 9780081006979.
39. Warner, R.; Miller, R.K.; Ha, M.; Wheeler, T.; Dunshea, F.; Li, X.; Vaskoska, R.; Purslow, P. Meat Tenderness: Underlying Mech‐
anisms, Instrumental Measurement, and Sensory Assessment. Meat Muscle Biol. 2021, 4, 17–18.
https://doi.org/10.22175/mmb.10489.
40. Winger, R.J.; Hagyard, C.J. Juiciness—Its importance and some contributing factors. In Quality Attributes and Their Measurement
in Meat, Poultry and Fish Products; Springer USA: Princeton, NJ, USA, 1994; pp. 94–124. https://doi.org/10.1007/978‐1‐4615‐2167‐
9_4.
Foods 2022, 11, 1732 23 of 28
41. Harries, J.M.; Rhodes, D.N.; Chrystall, B.B. MEAT TEXTURE: I. Subjective Assessment of the Texture of Cooked Beef. J. Texture
Stud. 1972, 3, 101–114. https://doi.org/10.1111/j.1745‐4603.1972.tb00613.x.
42. Cross, H.R.; Bernholdt, H.F.; Dikeman, M.E.; Greene, B.E.; Moody, W.G.; Staggs, R.; West, R.L. Guidelines for Cookery and Sensory
Evaluation of Meat; American Meat Science Association: Chicago, IL, USA, 1978.
43. Watson, R.; Gee, A.; Polkinghorne, R.; Porter, M. Consumer assessment of eating quality‐development of protocols for Meat
Standards Australia (MSA) testing. Aust. J. Exp. Agric. 2008, 48, 1360–1367. https://doi.org/10.1071/ea07176.
44. O’Quinn, T.G.; Legako, J.F.; Brooks, J.C.; Miller, M.F. Evaluation of the contribution of tenderness, juiciness, and flavor to the
overall consumer beef eating experience1. Transl. Anim. Sci. 2018, 2, 26–36. https://doi.org/10.1093/tas/txx008.
45. Delwiche, J. The impact of perceptual interactions on perceived flavor. Food Qual. Prefer. 2004, 15, 137–146.
https://doi.org/10.1016/s0950‐3293(03)00041‐7.
46. Kerth, C.R.; Miller, R.K. Beef flavor: A review from chemistry to consumer. J. Sci. Food Agric. 2015, 95, 2783–2798.
https://doi.org/10.1002/jsfa.7204.
47. Stock, N.L.; Board., M. Research Guidelines for Cookery, Sensory Evaluation, and Instrumental Tenderness Measurements of Fresh Meat;
American Meat Science Association: Chicago, IL, USA, 1995.
48. Miller, M.F.; Huffman, K.L.; Gilbert, S.Y.; Hamman, L.L.; Ramsey, C.B. Retail consumer acceptance of beef tenderized with
calcium chloride. J. Anim. Sci. 1995, 73, 2308–2314. https://doi.org/10.2527/1995.7382308x.
49. Liu, J.; Ellies‐Oury, M.‐P.; Chriki, S.; Legrand, I.; Pogorzelski, G.; Wierzbicki, J.; Farmer, L.; Troy, D.; Polkinghorne, R.; Hocquette,
J.‐F. Contributions of tenderness, juiciness and flavor liking to overall liking of beef in Europe. Meat Sci. 2020, 168, 108190.
https://doi.org/10.1016/j.meatsci.2020.108190.
50. Angulo, A.M.; Gil, J.M. Risk perception and consumer willingness to pay for certified beef in Spain. Food Qual. Prefer. 2007, 18,
1106–1117. https://doi.org/10.1016/j.foodqual.2007.05.008.
51. Heredia, N.; García, S. Animals as sources of food‐borne pathogens: A review. Anim. Nutr. 2018, 4, 250–255.
https://doi.org/10.1016/j.aninu.2018.04.006.
52. Gutema, F.D.; Agga, G.; Abdi, R.D.; De Zutter, L.; Duchateau, L.; Gabriël, S. Corrigendum: Prevalence and Serotype Diversity
of Salmonella in Apparently Healthy Cattle: Systematic Review and Meta‐Analysis of Published Studies, 2000–2017. Front.
Veter.‐Sci. 2019, 6, 102. https://doi.org/10.3389/fvets.2019.00102.
53. Niyonzima, E.; Ongol, M.P.; Kimonyo, A.; Sindic, M. Risk Factors and Control Measures for Bacterial Contamination in the
Bovine Meat Chain: A Review on Salmonella and Pathogenic E.coli. J. Food Res. 2015, 4, 98. https://doi.org/10.5539/jfr.v4n5p98.
54. Ma, F.; Xu, S.; Tang, Z.; Li, Z.; Zhang, L. Use of antimicrobials in food animals and impact of transmission of antimicrobial
resistance on humans. Biosaf. Health 2021, 3, 32–38. https://doi.org/10.1016/j.bsheal.2020.09.004.
55. Ellies‐Oury, M.‐P.; Lee, A.; Jacob, H.; Hocquette, J.‐F. Meat consumption—What French consumers feel about the quality of
beef?. Ital. J. Anim. Sci. 2019, 18, 646–656. https://doi.org/10.1080/1828051x.2018.1551072.
56. Prache, S.; Lebret, B.; Baéza, E.; Martin, B.; Gautron, J.; Feidt, C.; Médale, F.; Corraze, G.; Raulet, M.; Lefèvre, F.; et al. Review:
Quality and authentication of organic animal products in Europe. Animal 2021, 16, 100405. https://doi.org/10.1016/j.ani‐
mal.2021.100405.
57. Sarma, P.; Raha, S. Consumers’ willingness to pay for organic beef: Evidence from Dhaka City. J. Bangladesh Agric. Univ. 2016,
14, 83–91. https://doi.org/10.3329/jbau.v14i1.30602.
58. Flowers, S.; McFadden, B.R.; Carr, C.C.; Mateescu, R.G. Consumer preferences for beef with improved nutrient profile. J. Anim.
Sci. 2019, 97, 4699–4709. https://doi.org/10.1093/jas/skz327.
59. Henchion, M.M.; McCarthy, M.; Resconi, V.C. Beef quality attributes: A systematic review of consumer perspectives. Meat Sci.
2017, 128, 1–7. https://doi.org/10.1016/j.meatsci.2017.01.006.
60. Fallon, R.J.; Earley, B. Animal Welfare Guidelines for Beef Cattle Farms; Teagasc: Oak Park, Carlow, Ireland, 2008.
61. Buch, S.; Pinto, S.; Aparnathi, K.D. Evaluation of efficacy of turmeric as a preservative in paneer. J. Food Sci. Technol. 2012, 51,
3226–3234. https://doi.org/10.1007/s13197‐012‐0871‐0.
62. Chriki, S.; Hocquette, J.‐F. The Myth of Cultured Meat: A Review. Front. Nutr. 2020, 7, 7. https://doi.org/10.3389/fnut.2020.00007.
63. Holman, B.W.; Fowler, S.M.; Hopkins, D.L. Red meat (beef and sheep) products for an ageing population: A review. Int. J. Food
Sci. Technol. 2020, 55, 919–934. https://doi.org/10.1111/ijfs.14443.
64. Hocquette, J.‐F.; Ellies‐Oury, M.‐P.; Lherm, M.; Pineau, C.; Deblitz, C.; Farmer, L. Current situation and future prospects for
beef production in Europe—A review. Asian‐Australas. J. Anim. Sci. 2018, 31, 1017. https://doi.org/10.5713/ajas.18.0196.
65. Devlin, D.; Gault, N.; Moss, B.; Tolland, E.; Tollerton, J.; Farmer, L.; Gordon, A. Factors affecting eating quality of beef. Adv.
Anim. Biosci. 2017, 8, s2–s5. https://doi.org/10.1017/s2040470017001583.
66. EBLEX Quality Standard Mark Scheme for Beef and Lamb. Available online: https://issuu.com/ahdb1/docs/scheme‐operating‐
guide (accessed on 23 January 2022).
67. Wright, S.A.; Ramos, P.M.; Johnson, D.D.; Scheffler, J.; Elzo, M.A.; Mateescu, R.G.; Bass, A.L.; Carr, C.C.; Scheffler, T.L. Brahman
genetics influence muscle fiber properties, protein degradation, and tenderness in an Angus‐Brahman multibreed herd. Meat
Sci. 2018, 135, 84–93. https://doi.org/10.1016/j.meatsci.2017.09.006.
68. Bressan, M.C.; Rodrigues, E.C.; Rossato, L.V.; Neto‐Fonseca, I.; Alves, S.; Bessa, R.J.; Gama, L.T. Discrimination of Meat Pro‐
duced by Bos taurus and Bos indicus Finished under an Intensive or Extensive System. Animals 2020, 10, 1737.
https://doi.org/10.3390/ani10101737.
Foods 2022, 11, 1732 24 of 28
69. Bressan, M.C.; Rossato, L.V.; Rodrigues, E.C.; Alves, S.P.; Bessa, R.J.B.; Ramos, E.M.; Gama, L.T. Genotype x environment inter‐
actions for fatty acid profiles in Bos indicus and Bos taurus finished on pasture or grain. J. Anim. Sci. 2010, 89, 221–232.
https://doi.org/10.2527/jas.2009‐2672.
70. Bonny, S.; Polkinghorne, R.; Strydom, P.; Matthews, K.; López‐Campos, Ó.; Nishimura, T.; Hocquette, J.F. Quality Assurance
Schemes in Major Beef Producing Countries. In New Aspects of Meat Quality; Woodhead Publishing: Cambridge, UK, 2017; pp.
223–255. https://doi.org/10.1016/b978‐0‐08‐100593‐4.00011‐4.
71. Motoyama, M.; Sasaki, K.; Watanabe, A. Wagyu and the factors contributing to its beef quality: A Japanese industry overview.
Meat Sci. 2016, 120, 10–18. https://doi.org/10.1016/j.meatsci.2016.04.026.
72. Frank, D.; Ball, A.; Hughes, J.; Krishnamurthy, R.; Piyasiri, U.; Stark, J.; Watkins, P.; Warner, R. Sensory and Flavor Chemistry
Characteristics of Australian Beef: Influence of Intramuscular Fat, Feed, and Breed. J. Agric. Food Chem. 2016, 64, 4299–4311.
https://doi.org/10.1021/acs.jafc.6b00160.
73. Pethick, D.W.; Harper, G.S.; Hocquette, J.F.; Wang, Y. Marbling Biology—What Do We Know about Getting Fat into Muscle?
In Proceedings of the Australian Beef–the Leader Conference, Armidale, Australia, 7–8 March 2006; pp. 103–110.
74. Bonny, S.P.F.; Hocquette, J.‐F.; Pethick, D.W.; Farmer, L.J.; Legrand, I.; Wierzbicki, J.; Allen, P.; Polkinghorne, R.J.; Gardner, G.
The variation in the eating quality of beef from different sexes and breed classes cannot be completely explained by carcass
measurements. Animal 2016, 10, 987–995. https://doi.org/10.1017/s175173111500292x.
75. Conanec, A.; Campo, M.; Richardson, I.; Ertbjerg, P.; Failla, S.; Panea, B.; Chavent, M.; Saracco, J.; Williams, J.; Ellies‐Oury, M.‐
P.; et al. Has breed any effect on beef sensory quality? Livest. Sci. 2021, 250, 104548. https://doi.org/10.1016/j.livsci.2021.104548.
76. Bonfatti, V.; Albera, A.; Carnier, P. Genetic associations between daily BW gain and live fleshiness of station‐tested young bulls
and carcass and meat quality traits of commercial intact males in Piemontese cattle. J. Anim. Sci. 2013, 91, 2057–2066.
https://doi.org/10.2527/jas.2012‐5386.
77. Venkata Reddy, B.; Sivakumar, A.S.; Jeong, D.W.; Woo, Y.‐B.; Park, S.‐J.; Lee, S.‐Y.; Byun, J.‐Y.; Kim, C.‐H.; Cho, S.‐H.; Hwang,
I. Beef quality traits of heifer in comparison with steer, bull and cow at various feeding environments. Anim. Sci. J. 2014, 86, 1–
16. https://doi.org/10.1111/asj.12266.
78. Seideman, S.C.; Cross, H.R.; Oltjen, R.R.; Schanbacher, B.D. Utilization of the Intact Male for Red Meat Production: A Review.
J. Anim. Sci. 1982, 55, 826–840. https://doi.org/10.2527/jas1982.554826x.
79. Nogalski, Z.; Pogorzelska‐Przybyłek, P.; Sobczuk‐Szul, M.; Nogalska, A.; Modzelewska‐Kapituła, M.; Purwin, C. Italian Journal
of Animal Science Carcass Characteristics and Meat Quality of Bulls and Steers Slaughtered at Two Different Ages Carcass
Characteristics and Meat Quality of Bulls and Steers Slaughtered at Two Different Ages. Ital. J. Anim. Sci. 2018, 17, 279–288.
https://doi.org/10.1080/1828051x.2017.1383861.
80. Monin, G. Facteurs biologiques des qualités de la viande bovine. INRAE Prod. Anim. 1991, 4, 151–160.
https://doi.org/10.20870/productions‐animales.1991.4.2.4327.
81. Neethling, N.E.; Suman, S.P.; Sigge, G.O.; Hoffman, L.C.; Hunt, M.C. Exogenous and Endogenous Factors Influencing Color of
Fresh Meat from Ungulates. Meat Muscle Biol. 2017, 1, 253–275. https://doi.org/10.22175/mmb2017.06.0032.
82. Hopkins, D.L.; Stanley, D.F.; Martin, L.C.; Toohey, E.S.; Gilmour, A.R. Genotype and age effects on sheep meat production. 3.
Meat quality. Aust. J. Exp. Agric. 2007, 47, 1155–1164. https://doi.org/10.1071/ea06299.
83. Kopuzlu, S.; Esenbuga, N.; Onenc, A.; Macit, M.; Yanar, M.; Yuksel, S.; Ozluturk, A.; Unlu, N. Effects of slaughter age and
muscle type on meat quality characteristics of Eastern Anatolian Red bulls. Arch. Anim. Breed. 2018, 61, 497–504.
https://doi.org/10.5194/aab‐61‐497‐2018.
84. Watkins, P.J.; Frank, D.; Singh, T.K.; Young, O.A.; Warner, R.D. Sheepmeat Flavor and the Effect of Different Feeding Systems:
A Review Project Investigating Interactions between Pater Natalis and Rangifer Tarandus View Project Vitamins in Legumes
View Project. Artic. J. Agric. Food Chem. 2013, 61, 3561–3579. https://doi.org/10.1021/jf303768e.
85. Hopkins, D.L. The Eating Quality of Meat: II‐Tenderness; Elsevier Ltd.: Amsterdam, The Netherlands, 2017; ISBN 9780081006979.
86. Flores, M. The Eating Quality of Meat: III—Flavor. In Lawrie’s Meat Science, 8th ed.; Woodhead Publishing: Cambridge, UK,
2017; pp. 383–417, ISBN 9780081006979.
87. Janssen, J.; Cammack, K.; Legako, J.; Cox, R.; Grubbs, J.; Underwood, K.; Hansen, J.; Kruse, C.; Blair, A. Influence of Grain‐ and
Grass‐Finishing Systems on Carcass Characteristics, Meat Quality, Nutritional Composition, and Consumer Sensory Attributes
of Bison. Foods 2021, 10, 1060. https://doi.org/10.3390/foods10051060.
88. Stampa, E.; Schipmann‐Schwarze, C.; Hamm, U. Consumer perceptions, preferences, and behavior regarding pasture‐raised
livestock products: A review. Food Qual. Prefer. 2020, 82, 103872. https://doi.org/10.1016/j.foodqual.2020.103872.
89. Marino, R.; Albenzio, M.; Caroprese, M.; Napolitano, F.; Santillo, A.; Braghieri, A. Effect of grazing and dietary protein on eating
quality of Podolian beef. J. Anim. Sci. 2011, 89, 3752–3758. https://doi.org/10.2527/jas.2010‐3699.
90. Duckett, S.K.; Neel, J.P.S.; Fontenot, J.P.; Clapham, W.M. Effects of winter stocker growth rate and finishing system on: III.
Tissue proximate, fatty acid, vitamin, and cholesterol content1. J. Anim. Sci. 2009, 87, 2961–2970. https://doi.org/10.2527/jas.2009‐
1850.
91. Pogorzelski, G.; Pogorzelska‐Nowicka, E.; Pogorzelski, P.; Półtorak, A.; Hocquette, J.‐F.; Wierzbicka, A. Towards an integration
of pre‐ and post‐slaughter factors affecting the eating quality of beef. Livest. Sci. 2022, 255, 104795.
https://doi.org/10.1016/j.livsci.2021.104795.
Foods 2022, 11, 1732 25 of 28
92. Elmore, J.; Warren, H.; Mottram, D.; Scollan, N.; Enser, M.; Richardson, R.; Wood, J. A comparison of the aroma volatiles and
fatty acid compositions of grilled beef muscle from Aberdeen Angus and Holstein‐Friesian steers fed diets based on silage or
concentrates. Meat Sci. 2004, 68, 27–33. https://doi.org/10.1016/j.meatsci.2004.01.010.
93. Latimori, N.; Kloster, A.; García, P.; Carduza, F.; Grigioni, G.; Pensel, N. Diet and genotype effects on the quality index of beef
produced in the Argentine Pampeana region. Meat Sci. 2008, 79, 463–469. https://doi.org/10.1016/j.meatsci.2007.10.008.
94. Realini, C.; Duckett, S.; Brito, G.; Dalla‐Rizza, M.; De Mattos, D. Effect of pasture vs. concentrate feeding with or without anti‐
oxidants on carcass characteristics, fatty acid composition, and quality of Uruguayan beef. Meat Sci. 2004, 66, 567–577.
https://doi.org/10.1016/s0309‐1740(03)00160‐8.
95. OʹQuinn, T.; Woerner, D.; Engle, T.; Chapman, P.; Legako, J.; Brooks, J.; Belk, K.; Tatum, J. Identifying consumer preferences for
specific beef flavor characteristics in relation to cattle production and postmortem processing parameters. Meat Sci. 2016, 112,
90–102. https://doi.org/10.1016/j.meatsci.2015.11.001.
96. Boito, B.; Kuss, F.; de Menezes, L.F.G.; Lisbinski, E.; de Paris, M.; Cullmann, J.R. Influence of subcutaneous fat thickness on the
carcass characteristics and meat quality of beef cattle. Ciência Rural 2017, 48, 1‐7. https://doi.org/10.1590/0103‐8478cr20170333.
97. Ferguson, D.M. Objective on‐line assessment of marbling: A brief review. Aust. J. Exp. Agric. 2004, 44, 681–685.
https://doi.org/10.1071/ea02161.
98. Irshad, A.; Gurunathan, K.; Kumar, S.; Kumar, A.; Vishnuraj; Shukla, V. Factors Influencing Carcass Composition of Livestock:
A Review. J. Anim. Prod. Adv. 2013, 3, 177. https://doi.org/10.5455/japa.20130531093231.
99. Dikeman, M.E. The Relationship of Animal Leanness to Meat Tenderness. In Proceedings of the Reciprocal Meat Conference,
Provo, Utah, 11 June 1996; pp. 87–101.
100. Hocquette, J.F.; Meurice, P.; Brun, J.P.; Jurie, C.; Denoyelle, C.; Bauchart, D.; Picard, B. BIF‐Beef: A Data Warehouse for Mus‐cle
Biology to Predict Beef Quality. Application to the Relationship between Intramuscular Fat Level and Flavour. Anim. Prod. Sci.
2011, 51, 975–981. https://doi.org/10.4081/ijas.2013.e41.
101. Toldrá, F. The Storage and Preservation of Meat: III‐Meat Processing. In Lawrie’s Meat Science, 8th ed.; Woodhead Publishing:
Cambridge, UK, 2017; ISBN 9780081006979.
102. Bonny, S.P.F.; Gardner, G.; Pethick, D.W.; Allen, P.; Legrand, I.; Wierzbicki, J.; Farmer, L.J.; Polkinghorne, R.J.; Hocquette, J.‐F.
Untrained consumer assessment of the eating quality of European beef: 2. Demographic factors have only minor effects on
consumer scores and willingness to pay. Animal 2017, 11, 1399–1411. https://doi.org/10.1017/s1751731117000076.
103. Thompson, J.M. The effects of marbling on flavour and juiciness scores of cooked beef, after adjusting to a constant tenderness.
Aust. J. Exp. Agric. 2004, 44, 645–652. https://doi.org/10.1071/ea02171.
104. Gruber, S.L.; Tatum, J.D.; Engle, T.E.; Chapman, P.L.; Belk, K.E.; Smith, G.C. Relationships of behavioral and physiological
symptoms of preslaughter stress to beef longissimus muscle tenderness. J. Anim. Sci. 2010, 88, 1148–1159.
https://doi.org/10.2527/jas.2009‐2183.
105. Hemsworth, P.H.; Rice, M.; Karlen, M.G.; Calleja, L.; Barnett, J.L.; Nash, J.; Coleman, G.J. Human–animal interactions at abat‐
toirs: Relationships between handling and animal stress in sheep and cattle. Appl. Anim. Behav. Sci. 2011, 135, 24–33.
https://doi.org/10.1016/j.applanim.2011.09.007.
106. Ferguson, D.; Warner, R. Have we underestimated the impact of pre‐slaughter stress on meat quality in ruminants? Meat Sci.
2008, 80, 12–19. https://doi.org/10.1016/j.meatsci.2008.05.004.
107. Loudon, K.M.; Tarr, G.; Lean, I.J.; Polkinghorne, R.; McGilchrist, P.; Dunshea, F.R.; Gardner, G.E.; Pethick, D.W. The Impact of
Pre‐Slaughter Stress on Beef Eating Quality. Animals 2019, 9, 612. https://doi.org/10.3390/ani9090612.
108. del Campo, M.; Brito, G.; de Lima, J.S.; Hernández, P.; Montossi, F. Finishing diet, temperament and lairage time effects on
carcass and meat quality traits in steers. Meat Sci. 2010, 86, 908–914. https://doi.org/10.1016/j.meatsci.2010.07.014.
109. Kim, Y.H.B.; Ma, D.; Setyabrata, D.; Farouk, M.M.; Lonergan, S.M.; Huff‐Lonergan, E.; Hunt, M.C. Understanding postmortem
biochemical processes and post‐harvest aging factors to develop novel smart‐aging strategies. Meat Sci. 2018, 144, 74–90.
https://doi.org/10.1016/j.meatsci.2018.04.031.
110. Monsón, F.; Sañudo, C.; Sierra, I. Influence of Breed and Ageing Time on the Sensory Meat Quality and Consumer Accepta‐
bility in Intensively Reared Beef. Meat Sci. 2005, 71, 471–479. https://doi.org/10.1016/j.meatsci.2005.04.026.
111. Dransfield, E. Optimisation of tenderisation, ageing and tenderness. Meat Sci. 1994, 36, 105–121. https://doi.org/10.1016/0309‐
1740(94)90037‐x.
112. Nair, M.N.; Canto, A.C.; Rentfrow, G.; Suman, S.P. Muscle‐specific effect of aging on beef tenderness. LWT—Food Sci. Technol.
2019, 100, 250–252. https://doi.org/10.1016/j.lwt.2018.10.038.
113. Jacob, R.H.; Hopkins, D. Techniques to reduce the temperature of beef muscle early in the post mortem period—A review. Anim.
Prod. Sci. 2014, 54, 482–493. https://doi.org/10.1071/an12338.
114. Warner, R.D.; Dunshea, F.R.; Gutzke, D.; Lau, J.; Kearney, G. Factors influencing the incidence of high rigor temperature in beef
carcasses in Australia. Anim. Prod. Sci. 2013, 54, 363–374. https://doi.org/10.1071/an13455.
115. Hopkins, D.; Thompson, J. The relationship between tenderness, proteolysis, muscle contraction and dissociation of actomyosin.
Meat Sci. 2001, 57, 1–12. https://doi.org/10.1016/s0309‐1740(00)00065‐6.
116. Goll, D.E.; Thompson, V.F.; Li, H.; Wei, W.; Cong, J. The Calpain System. Physiol. Rev. 2003, 83, 731–801.
https://doi.org/10.1152/physrev.00029.2002.
Foods 2022, 11, 1732 26 of 28
117. Hwang, I.; Thompson, J. The interaction between pH and temperature decline early postmortem on the calpain system and
objective tenderness in electrically stimulated beef longissimus dorsi muscle. Meat Sci. 2001, 58, 167–174.
https://doi.org/10.1016/s0309‐1740(00)00147‐9.
118. Devine, C.E.; Hopkins, D.L.; Hwang, I.H.; Ferguson, D.M.; Richards, I. Electrical Stimulation. In Encyclopedia of Meat Sciences;
Dikeman., M., Devine., C., Eds.; Academic Press: Oxford, UK, 2014; pp. 486–496, ISBN 9780123847317.
119. Gagaoua, M.; Duffy, G.; Alvarez, C.; Burgess, C.M.; Hamill, R.; Crofton, E.; Botinestean, C.; Ferragina, A.; Cafferky, J.; Mul‐len,
A.M.; et al. Current Research and Emerging Tools to Improve Fresh Red Meat Quality; Compuscript: Shannon, Ireland, 2022; pp. 1–
23. https://doi.org/10.15212/ijafr‐2020‐0141.
120. Dikeman, M.; Devine, C.E. Sensory and Meat Quality, Optimization of. In Encyclopedia of Meat Sciences; Elsevier Ltd.: Amster‐
dam, The Netherlands, 2014; pp. 267–271, ISBN 9780123847317.
121. Hwang, I.; Devine, C.; Hopkins, D. The biochemical and physical effects of electrical stimulation on beef and sheep meat ten‐
derness. Meat Sci. 2003, 65, 677–691. https://doi.org/10.1016/s0309‐1740(02)00271‐1.
122. Rhee, M.; Kim, B. Effect of low voltage electrical stimulation and temperature conditioning on postmortem changes in glycolysis
and calpains activities of Korean native cattle (Hanwoo). Meat Sci. 2001, 58, 231–237. https://doi.org/10.1016/s0309‐
1740(00)00155‐8.
123. Arroyo, C.; Lascorz, D.; OʹDowd, L.; Noci, F.; Arimi, J.; Lyng, J.G. Effect of Pulsed Electric Field treatments at various stages
during conditioning on quality attributes of beef longissimus thoracis et lumborum muscle. Meat Sci. 2015, 99, 52–59.
https://doi.org/10.1016/j.meatsci.2014.08.004.
124. Juárez, M.; Aldai, N.; López‐Campos, Ó.; Dugan, M.E.R.; Uttaro, B.; Aalhus, J.L. Beef Texture and Juiciness; CRC Press: Boca Raton,
FL, USA, 2012. https://doi.org/10.1201/B11479‐10.
125. Chrystall, B.B.; Hagyard, C. Electrical stimulation and lamb tenderness. N. Z. J. Agric. Res. 1976, 19, 7–11.
https://doi.org/10.1080/00288233.1976.10421039.
126. Taylor, D.G.; Marshall, A.R. Low Voltage Electrical Stimulation of Beef Carcasses. J. Food Sci. 1980, 45, 144–145.
https://doi.org/10.1111/j.1365‐2621.1980.tb03891.x.
127. Gursansky, B.; OʹHalloran, J.; Egan, A.; Devine, C. Tenderness enhancement of beef from Bos indicus and Bos taurus cattle
following electrical stimulation. Meat Sci. 2010, 86, 635–641. https://doi.org/10.1016/j.meatsci.2010.05.002.
128. Zhang, Y.; Ji, X.; Mao, Y.; Luo, X.; Zhu, L.; Hopkins, D.L. Effect of new generation medium voltage electrical stimulation on the
meat quality of beef slaughtered in a Chinese abattoir. Meat Sci. 2019, 149, 47–54. https://doi.org/10.1016/j.meatsci.2018.11.011.
129. Ji, X.; Luo, X.; Zhu, L.; Mao, Y.; Lu, X.; Chen, X.; Hopkins, D.L.; Zhang, Y. Effect of medium voltage electrical stimulation and
prior ageing on beef shear force during superchilled storage. Meat Sci. 2021, 172, 108320.
https://doi.org/10.1016/j.meatsci.2020.108320.
130. Hopkins, D.L. Tenderizing Mechanisms: Mechanical. In Encyclopedia of Meat Sciences; Devine, C., Dikeman, M., Eds.; Elsevier:
Oxford, UK, 2014; Volume 3, pp. 443–451, ISBN 9780123847317.
131. Nian, Y.; Allen, P.; Harrison, S.M.; Kerry, J.P. Effect of castration and carcass suspension method on the quality and fatty acid
profile of beef from male dairy cattle. J. Sci. Food Agric. 2018, 98, 4339–4350. https://doi.org/10.1002/jsfa.8960.
132. Moran, L.; Barron, L.J.R.; Wilson, S.S.; OʹSullivan, M.G.; Kerry, J.P.; Prendiville, R.; Moloney, A.P. Effect of pelvic suspension
and post‐mortem ageing on the quality of three muscles from Holstein Friesian bulls and steers. J. Sci. Food Agric. 2021, 101,
1892–1900. https://doi.org/10.1002/jsfa.10804.
133. Purchas, R.W. Tenderness Measurement. In Encyclopedia of Meat Sciences; Elsevier: Oxford, UK, 2014; pp. 452–459, ISBN
9780123847317.
134. Aaslyng, M.; Meinert, L.; Bejerholm, C. Sensory Assessment of Meat. In Encyclopedia of Meat Sciences; Elsevier Ltd.: Oxford, UK,
2014; pp. 272–279, ISBN 9780123847317.
135. Derington, A.; Brooks, J.; Garmyn, A.; Thompson, L.; Wester, D.; Miller, M. Relationships of slice shear force and Warner‐
Bratzler shear force of beef strip loin steaks as related to the tenderness gradient of the strip loin. Meat Sci. 2011, 88, 203–208.
https://doi.org/10.1016/j.meatsci.2010.12.030.
136. Battaglia, C.; Vilella, G.F.; Bernardo, A.P.S.; Gomes, C.L.; Biase, A.G.; Albertini, T.Z.; Pflanzer, S.B. Comparison of methods for
measuring shear force and sarcomere length and their relationship with sensorial tenderness of longissimus muscle in beef. J.
Texture Stud. 2020, 51, 252–262. https://doi.org/10.1111/jtxs.12473.
137. Platter, W.J.; Tatum, J.D.; Belk, K.E.; Chapman, P.L.; Scanga, J.A.; Smith, G.C. Relationships of consumer sensory ratings, mar‐
bling score, and shear force value to consumer acceptance of beef strip loin steaks. J. Anim. Sci. 2003, 81, 2741–2750.
https://doi.org/10.2527/2003.81112741x.
138. Rodas‐González, A.; Huerta‐Leidenz, N.; Jerez‐Timaure, N.J.; Miller, M.F. Establishing tenderness thresholds of Venezuelan
beef steaks using consumer and trained sensory panels. Meat Sci. 2009, 83, 218–223. https://doi.org/10.1016/j.meatsci.2009.04.021.
139. Liang, R.; Zhu, H.; Mao, Y.; Zhang, Y.; Zhu, L.; Cornforth, D.; Wang, R.; Meng, X.; Luo, X. Tenderness and sensory attributes of
the longissimus lumborum muscles with different quality grades from Chinese fattened yellow crossbred steers. Meat Sci. 2016,
112, 52–57. https://doi.org/10.1016/j.meatsci.2015.10.004.
140. Sasaki, K.; Motoyama, M.; Narita, T.; Hagi, T.; Ojima, K.; Oe, M.; Nakajima, I.; Kitsunai, K.; Saito, Y.; Hatori, H.; et al. Charac‐
terization and classification of Japanese consumer perceptions for beef tenderness using descriptive texture characteristics as‐
sessed by a trained sensory panel. Meat Sci. 2013, 96, 994–1002. https://doi.org/10.1016/j.meatsci.2013.10.021.
Foods 2022, 11, 1732 27 of 28
141. Shackelford, S.D.; Wheeler, T.L.; Koohmaraie, M. Relationship between shear force and trained sensory panel tenderness ratings
of 10 major muscles from Bos indicus and Bos taurus cattle1. J. Anim. Sci. 1995, 73, 3333–3340.
https://doi.org/10.2527/1995.73113333x.
142. McKillip, K.V.; Wilfong, A.K.; Gonzalez, J.M.; Houser, T.A.; Unruh, J.A.; Boyle, E.A.E.; O’Quinn, T.G. Repeatability and Accu‐
racy of the Pressed Juice Percentage Method at Sorting Steaks into Juiciness Categories. Meat Muscle Biol. 2017, 1, 242–252.
https://doi.org/10.22175/mmb2017.07.0034.
143. Pearce, K.L.; Rosenvold, K.; Andersen, H.J.; Hopkins, D. Water distribution and mobility in meat during the conversion of
muscle to meat and ageing and the impacts on fresh meat quality attributes—A review. Meat Sci. 2011, 89, 111–124.
https://doi.org/10.1016/j.meatsci.2011.04.007.
144. Bouton, P.E.; Ford, A.L.; Harris, P.V.; Ratcliff, D. Objective assessment of meat juiciness. J. Food Sci. 1975, 40, 884–885.
https://doi.org/10.1111/j.1365‐2621.1975.tb00581.x.
145. Young, O.A.; Hopkins, D.; Pethick, D.W. Critical control points for meat quality in the Australian sheep meat supply chain.
Aust. J. Exp. Agric. 2005, 45, 593–601. https://doi.org/10.1071/ea04006.
146. Lucherk, L.W.; O’Quinn, T.G.; Legako, J.F.; Rathmann, R.J.; Brooks, J.C.; Miller, M.F. Assessment of objective measures of beef
steak juiciness and their relationships to sensory panel juiciness ratings. J. Anim. Sci. 2017, 95, 2421–2437.
https://doi.org/10.2527/jas.2016.0930.
147. Holman, B.W.B.; Collins, D.; Hopkins, D.L. The Relationship between Aged Beef Intramuscular Fat Content and Australian
Consumer Rankings for Juiciness. In Proceedings of the Physical Education and Sport for Children and Youth with Special Needs Re‐
searches—Best Practices—Situation, the 33rd Conference of the Australian Association of Animal Sciences, Fremantle, Australia; CSIRO:
Cairns, Australia, 31 January 2021–2 February 2021.
148. Resconi, V.C.; Campo, M.D.M.; Montossi, F.; Ferreira, V.; Sañudo, C.; Escudero, A. Gas Chromatographic‐Olfactometric Aroma
Profile and Quantitative Analysis of Volatile Carbonyls of Grilled Beef from Different Finishing Feed Systems. J. Food Sci. 2012,
77, S240–S246. https://doi.org/10.1111/j.1750‐3841.2012.02720.x.
149. Listrat, A.; Gagaoua, M.; Andueza, D.; Gruffat, D.; Normand, J.; Mairesse, G.; Picard, B.; Hocquette, J.‐F. What are the drivers
of beef sensory quality using metadata of intramuscular connective tissue, fatty acids and muscle fiber characteristics? Livest.
Sci. 2020, 240, 104209. https://doi.org/10.1016/j.livsci.2020.104209.
150. Tan, J.; Xu, J. Applications of electronic nose (e‐nose) and electronic tongue (e‐tongue) in food quality‐related properties deter‐mination: A review. Artif. Intell. Agric. 2020, 4, 104–115. https://doi.org/10.1016/j.aiia.2020.06.003.
151. Liu, Y.; Lyon, B.G.; Windham, W.R.; Realini, C.E.; Pringle, T.D.; Duckett, S. Prediction of color, texture, and sensory character‐
istics of beef steaks by visible and near infrared reflectance spectroscopy. A feasibility study. Meat Sci. 2003, 65, 1107–1115.
https://doi.org/10.1016/s0309‐1740(02)00328‐5.
152. Prieto, N.; Roehe, R.; Lavín, P.; Batten, G.; Andrés, S. Application of near infrared reflectance spectroscopy to predict meat and
meat products quality: A review. Meat Sci. 2009, 83, 175–186. https://doi.org/10.1016/j.meatsci.2009.04.016.
153. Ripoll, G.; Albertí, P.; Panea, B.; Olleta, J.; Sañudo, C. Near‐infrared reflectance spectroscopy for predicting chemical, instru‐
mental and sensory quality of beef. Meat Sci. 2008, 80, 697–702. https://doi.org/10.1016/j.meatsci.2008.03.009.
154. Taheri‐Garavand, A.; Fatahi, S.; Omid, M.; Makino, Y. Meat quality evaluation based on computer vision technique: A review.
Meat Sci. 2019, 156, 183–195. https://doi.org/10.1016/j.meatsci.2019.06.002.
155. Cluff, K.; Naganathan, G.K.; Subbiah, J.; Samal, A.; Calkins, C.R. Optical scattering with hyperspectral imaging to classify longis‐
simus dorsi muscle based on beef tenderness using multivariate modeling. Meat Sci. 2013, 95, 42–50.
https://doi.org/10.1016/j.meatsci.2013.04.014.
156. Naganathan, G.K.; Cluff, K.; Samal, A.; Calkins, C.R.; Jones, D.D.; Lorenzen, C.L.; Subbiah, J. A prototype on‐line AOTF hyper‐
spectral image acquisition system for tenderness assessment of beef carcasses. J. Food Eng. 2015, 154, 1–9.
https://doi.org/10.1016/j.jfoodeng.2014.12.015.
157. Picard, B.; Gagaoua, M.; Hollung, K. Gene and Protein Expression as a Tool to Explain/Predict Meat (and Fish) Quality. In New
Aspects of Meat Quality; Woodhead Publishing: Cambridge, UK, 2017; pp. 321–354, ISBN 9780081005934
158. Leal‐Gutiérrez, J.D.; Mateescu, R.G. Genetic basis of improving the palatability of beef cattle: Current insights. Food Biotechnol.
2019, 33, 193–216. https://doi.org/10.1080/08905436.2019.1616299.
159. Leal‐Gutiérrez, J.D.; Rezende, F.M.; Reecy, J.M.; Kramer, L.M.; Peñagaricano, F.; Mateescu, R.G. Whole Genome Sequence Data
Provides Novel Insights Into the Genetic Architecture of Meat Quality Traits in Beef. Front. Genet. 2020, 11, 538640.
https://doi.org/10.3389/fgene.2020.538640.
160. Berry, D.; Conroy, S.; Hegarty, P.; Evans, R.; Pabiou, T.; Judge, M. Inter‐animal genetic variability exist in organoleptic properties
of prime beef meat. Meat Sci. 2021, 173, 108401. https://doi.org/10.1016/j.meatsci.2020.108401.
161. Gagaoua, M.; Warner, R.D.; Purslow, P.; Ramanathan, R.; Mullen, A.M.; López‐Pedrouso, M.; Franco, D.; Lorenzo, J.M.; To‐
masevic, I.; Picard, B.; et al. Dark‐cutting beef: A brief review and an integromics meta‐analysis at the proteome level to decipher
the underlying pathways. Meat Sci. 2021, 181, 108611. https://doi.org/10.1016/j.meatsci.2021.108611.
162. Yang, B.; Liu, X. Application of proteomics to understand the molecular mechanisms determining meat quality of beef muscles
during postmortem aging. PLoS ONE 2021, 16, e0246955. https://doi.org/10.1371/journal.pone.0246955.
163. Gagaoua, M.; Terlouw, C.; Richardson, I.; Hocquette, J.‐F.; Picard, B. The associations between proteomic biomarkers and beef
tenderness depend on the end‐point cooking temperature, the country origin of the panelists and breed. Meat Sci. 2019, 157,
107871. https://doi.org/10.1016/j.meatsci.2019.06.007.
Foods 2022, 11, 1732 28 of 28
164. Muroya, S.; Ueda, S.; Komatsu, T.; Miyakawa, T.; Ertbjerg, P. MEATabolomics: Muscle and Meat Metabolomics in Domestic
Animals. Metabolites 2020, 10, 188. https://doi.org/10.3390/metabo10050188.
165. Jeong, J.Y.; Kim, M.; Ji, S.‐Y.; Baek, Y.‐C.; Lee, S.; Oh, Y.K.; Reddy, K.E.; Seo, H.‐W.; Cho, S.; Lee, H.‐J. Metabolomics Analysis of
the Beef Samples with Different Meat Qualities and Tastes. Korean J. Food Sci. Anim. Resour. 2020, 40, 924–937.
https://doi.org/10.5851/kosfa.2020.e59.
166. Ma, D.; Kim, Y.H.B.; Cooper, B.; Oh, J.‐H.; Chun, H.; Choe, J.‐H.; Schoonmaker, J.P.; Ajuwon, K.; Min, B. Metabolomics Profiling
to Determine the Effect of Postmortem Aging on Color and Lipid Oxidative Stabilities of Different Bovine Muscles. J. Agric. Food
Chem. 2017, 65, 6708–6716. https://doi.org/10.1021/acs.jafc.7b02175.
167. Antonelo, D.S.; Cônsolo, N.R.; Gómez, J.F.; Beline, M.; Goulart, R.S.; Corte, R.; Colnago, L.A.; Schilling, M.W.; Gerrard, D.E.;
Silva, S.L. Metabolite profile and consumer sensory acceptability of meat from lean Nellore and Angus × Nellore crossbreed
cattle fed soybean oil. Food Res. Int. 2020, 132, 109056. https://doi.org/10.1016/j.foodres.2020.109056.
168. Bonny, S.P.; OʹReilly, R.A.; Pethick, D.W.; Gardner, G.E.; Hocquette, J.‐F.; Pannier, L. Update of Meat Standards Australia and
the cuts based grading scheme for beef and sheepmeat. J. Integr. Agric. 2018, 17, 1641–1654. https://doi.org/10.1016/s2095‐
3119(18)61924‐0.
169. Polkinghorne, R.; Thompson, J. Meat standards and grading: A world view. Meat Sci. 2010, 86, 227–235.
https://doi.org/10.1016/j.meatsci.2010.05.010.
170. Fisher, A. Beef Carcass Classification in the EU: An Historical Perspective. In Book of Abstracts of the 58th Annual Meeting of the
European Federation of Animal; Wageningen Academic Publishers: Wageningen, The Netherlands, 2007; p. 19.
171. Tarrés, J.; Fina, M.; Varona, L.; Piedrafita, J. Carcass conformation and fat cover scores in beef cattle: A comparison of threshold
linear models vs grouped data models. Genet. Sel. Evol. 2011, 43, 16. https://doi.org/10.1186/1297‐9686‐43‐16.
172. Pabiou, T.; Fikse, W.; Cromie, A.; Keane, M.; Näsholm, A.; Berry, D. Use of digital images to predict carcass cut yields in cattle.
Livest. Sci. 2011, 137, 130–140. https://doi.org/10.1016/j.livsci.2010.10.012.
173. Bonny, S.P.F.; Pethick, D.W.; Legrand, I.; Wierzbicki, J.; Allen, P.; Farmer, L.J.; Polkinghorne, R.J.; Hocquette, J.‐F.; Gardner, G.
European conformation and fat scores have no relationship with eating quality. Animal 2016, 10, 996–1006.
https://doi.org/10.1017/s1751731115002839.
174. Strong, J. Differences in carcass grading schemes used in the USA, Japan and Australia. Aust. J. Exp. Agric. 2004, 44, 675–680.
https://doi.org/10.1071/ea02172.
175. Liu, J.; Pogorzelski, G.; Neveu, A.; Legrand, I.; Pethick, D.; Ellies‐Oury, M.‐P.; Hocquette, J.‐F. Are Marbling and the Prediction
of Beef Eating Quality Affected by Different Grading Sites?. Front. Veter.‐Sci. 2021, 8, 611153.
https://doi.org/10.3389/fvets.2021.611153.
176. Smith, G.C.; Tatum, J.D.; Belk, K.E. International perspective: Characterisation of United States Department of Agriculture and
Meat Standards Australia systems for assessing beef quality. Aust. J. Exp. Agric. 2008, 48, 1465–1480.
https://doi.org/10.1071/ea08198.
177. OʹQuinn, T.G.; Brooks, J.C.; Miller, M.F. Consumer Assessment of Beef Tenderloin Steaks from Various USDA Quality Grades
at 3 Degrees of Doneness. J. Food Sci. 2015, 80, S444–S449. https://doi.org/10.1111/1750‐3841.12775.
178. Acheson, R.J.; Woerner, D.R.; Tatum, J.D. Effects of USDA carcass maturity on sensory attributes of beef produced by grain‐
finished steers and heifers classified as less than 30 months old using dentition. J. Anim. Sci. 2014, 92, 1792–1799.
https://doi.org/10.2527/jas.2013‐7553.
179. Hwanga, I.H.; Polkinghorne, R.; Lee, J.M.; Thompson, J.M. Demographic and design effects on beef sensory scores given by
Korean and Australian consumers. Aust. J. Exp. Agric. 2008, 48, 1387–1395. https://doi.org/10.1071/ea05113.
180. McGilchrist, P.; Polkinghorne, R.; Ball, A.; Thompson, J. The Meat Standards Australia Index indicates beef carcass quality.
Animal 2019, 13, 1750–1757. https://doi.org/10.1017/s1751731118003713.
181. Hocquette, J.‐F.; Ellies‐Oury, M.‐P.; Legrand, I.; Pethick, D.; Gardner, G.; Wierzbicki, J.; Polkinghorne, R.J. Research in Beef
Tenderness and Palatability in the Era of Big Data. Meat Muscle Biol. 2020, 4, 1–13. https://doi.org/10.22175/mmb.9488.
182. Ruiz‐Capillas, C.; Herrero, A.; Pintado, T.; Delgado‐Pando, G. Sensory Analysis and Consumer Research in New Meat Products
Development. Foods 2021, 10, 429. https://doi.org/10.3390/foods10020429.
Related Documents